UNITED STATES
SECURITIES AND EXCHANGE COMMISSION
Washington, D.C. 20549
FORM 10-K
Annual Report Pursuant to Section 13 or 15(d) of the Securities Exchange Act of 1934
For the fiscal year ended December 31, 2006
Commission file number: 1-9972
HOOPER HOLMES, INC.
(Exact name of Registrant as specified in its charter)
New York | 22-1659359 |
| (State or other jurisdiction of incorporation or organization) | (I.R.S. Employer Identification No.) |
| | |
170 Mt.Airy Road | |
Basking Ridge, NJ | 07920 |
| (Address of principal executive offices) | (Zip Code) |
Registrant’s telephone number, including area code: (908) 766-5000
Securities registered pursuant to Section 12(b) of the Act:
| | |
Title of Each Class | Name of Each Exchange on Which Registered |
| Common Stock ($.04 par value per share) | American Stock Exchange |
Securities registered pursuant to Section 12(g) of the Act: None
Indicate by check mark if the registrant is a well-known seasoned issuer, as defined in Rule 405 of the Securities Act.
Indicate by check mark if the registrant is not required to file reports pursuant to Section 13 of Section 15(d) of the Act.
Indicate by check mark whether the Registrant (1) has filed all reports required to be filed by Section 13 or 15(d) of the Securities Exchange Act of 1934 during the preceding 12 months and (2) has been subject to such filing requirements for the past 90 days.
Indicate by check mark if disclosure of delinquent filers pursuant to Item 405 of Regulation S-K (§229.405 of this chapter) is not contained herein, and will not be contained, to the best of the Registrant’s knowledge, in definitive proxy or information statements incorporated by reference in Part III of this Form 10-K or any amendments to this Form 10-K. x
Indicate by check mark whether the Registrant is a large accelerated filer, an accelerated filer, or a non-accelerated filer. See definition of “accelerated filer and large accelerated filer” in Rule 12b-2 of the Exchange Act. (Check one):
| Large Accelerated Filer | * | Accelerated Filer | x | Non-Accelerated Filer | * | |
Indicate by check mark whether the Registrant is a shell company (as defined in Rule 12b-2 of the Exchange Act.
The aggregate market value of the shares of common stock held by non-affiliates of the Registrant (64,149,850 shares), based on the closing price of these shares on June 30, 2006 (the last business day of the registrant’s most recently completed second fiscal quarter) on the American Stock Exchange, was $195,657,042.
The number of shares outstanding of the Registrant’s common stock as of February 28, 2007 was 68,018,879.
PART I |
| | | |
| | Cautionary Statement Regarding Forward-Looking Statements | 3 |
| Item 1 | Business | 4 |
| Item 1A | Risk Factors | 12 |
| Item 1B | Unresolved Staff Comments | 16 |
| Item 2 | Properties | 16 |
| Item 3 | Legal Proceedings | 16 |
| Item 4 | Submission of Matters to a Vote of Security Holders | 16 |
| | | |
PART II |
| | | |
| Item 5 | Market for Registrant’s Common Equity, Related Stockholder Matters | |
| | and Issuer Purchases of Equity Securities | 17 |
| Item 6 | Selected Financial Data | 19 |
| Item 7 | Management’s Discussion and Analysis of Financial Condition and Results of Operations | 19 |
| Item 7A | Quantitative and Qualitative Disclosures about Market Risk | 42 |
| Item 8 | Financial Statements and Supplementary Data | 43 |
| Item 9 | Changes in and Disagreements with Accountants on Accounting and Financial Disclosure | 74 |
| Item 9A | Controls and Procedures | 74 |
| Item 9B | Other Information | 76 |
| | | |
PART III |
| | | |
| Item 10 | Directors and Executive Officers of the Registrant | 76 |
| Item 11 | Executive Compensation | 76 |
| Item 12 | Security Ownership of Certain Beneficial Owners and Management and Related Stockholder Matters | 76 |
| Item 13 | Certain Relationships and Related Transactions | 76 |
| Item 14 | Principal Accountant Fees and Services | 76 |
| | | |
PART IV |
| | | |
| Item 15 | Exhibits and Financial Statement Schedules | 77 |
| | Schedule II - Valuation and Qualifying Accounts | 80 |
| | Signatures | 81 |
FORM 10K
PART 1
Cautionary Statement Regarding Forward-Looking Statements
This annual report on Form 10-K (particularly Items 1, 1A and 7) contains “forward-looking statements” within the meaning of Section 27A of the Securities Act of 1933, Section 21E of the Securities Exchange Act of 1934 and the Private Securities Litigation Reform Act of 1995. We intend that such forward-looking statements be subject to the safe harbors created by this legislation.
In some cases, you can identify forward-looking statements by our use of terms such as “anticipate,” “believe,” “continue,” “could,” “should,” “estimate,” “expect,” “forecast,” “intend,” “goal,” “may,” “will,” “plan,” “seek” and variations of these words or similar expressions.
Forward-looking statements are based on management’s current assumptions, estimates and expectations of future events. We cannot guarantee that these assumptions and estimates are accurate or that the expectations will be realized. All of these forward-looking statements are subject to risks and uncertainties. Some of the factors that could cause our actual results to differ materially from those projected in any such forward-looking statements include, without limitation:
| | · | our ability to implement the strategic plans in connection with management’s recently completed strategic review of all aspects of the Company’s operations; |
| | · | our ability to effect several expense management initiatives, including (i) aligning our costs with existing, and possibly declining, levels of revenues, (ii) making better use of our assets, particularly our branch offices and branch office personnel within our Portamedic paramedical examination business, and (iii) generating cost efficiencies through an enhanced information technology platform; |
| | · | our meeting or exceeding our customers’ expectations with respect to the quality and timeliness of our services on a consistent basis; |
| | · | our ability to enhance and expand our technology and network infrastructure; |
| | · | our ability to finance our operations; and |
| | · | our ability to anticipate key trends and developments affecting our businesses, and proactively position ourselves to seize opportunities presented by these trends and developments. |
The section of this annual report under the caption “Risk Factors” addresses some of the important risk factors that are affecting or may affect our business, results of operations and financial condition. These risk factors are not necessarily all of the factors that could cause actual results to differ materially from those expressed in any of our forward-looking statements. Other unknown or unpredictable factors not identified could also have material adverse effects on our future results.
The forward-looking statements included in this annual report are made as of the date of this report. Other than as required by law, we expressly disclaim any intent or obligation to update any forward-looking statements to reflect events or circumstances that subsequently occur or of which we hereafter become aware. Unless otherwise indicated, all references to a year reflect our fiscal year that ends December 31.
ITEM 1
Business Description
Hooper Holmes, Inc. and its subsidiaries currently engage in businesses that are managed as two separate divisions: the Health Information Division and the Claims Evaluation Division.
Our Health Information Division (HID) provides medical-related risk assessment information to life and health insurance carriers, information that is integral to such carriers’ underwriting decisions. These services include:
| | · | performing paramedical and medical examinations of individual insurance policy applicants - mainly life insurance policy applicants - throughout the United States (under the Portamedic brand name) and in the United Kingdom (under the Medicals Direct brand name); |
| | · | completing telephone interviews of applicants and collecting applicants’ medical records; |
| | · | testing the blood, urine and other specimens obtained in connection with a portion of the paramedical examinations we coordinate, as well as specimens provided by third-party health information service providers; and |
| | · | underwriting life insurance policies on an outsourced basis for life insurance companies. |
We believe our network of branch and contract affiliate offices - through which we coordinate the activities of over 9,000 paramedical examiners - is the most extensive in our industry, enabling us to provide timely examinations of insurance applicants located anywhere in the United States.
Our Claims Evaluation Division (CED) provides medical claims evaluation services to property and casualty (P&C) insurance carriers, law firms, self-insureds and third party administrators for use in processing personal injury accident claims. The core activity of this business consists of arranging for independent medical exams (IMEs). An IME is a medical examination by a doctor (other than a claimant’s physician) for the purpose of rendering an objective opinion regarding the nature, origin, treatment and causal relationship of an injury. We provide our claims evaluation services in connection with automobile, liability, disability and workers’ compensation claims.
Our Claims Evaluation Division has been built through four acquisitions, the first of which was completed in November 2002. In early 2006, we merged the acquired companies - D&D Associates, Medimax, Allegiance Health and Michigan Evaluation Group - into Hooper Evaluations, Inc., a wholly owned direct subsidiary of Hooper Holmes, Inc. However, we continue to use the D&D Associates and Michigan Evaluation Group names for marketing purposes. The CED’s business activities and revenues are generated nationally with core market concentration.
The following table provides the Company’s revenues for each of the three most recent completed fiscal years, broken down by division and, in the case of the Health Information Division, further broken down by service activity:
| | | | | | |
(in millions) | 2006 | % Change | 2005 | % Change | 2004 |
| Health Information Division: | | | | | |
| Service Activity: | | | | | |
| Paramedical Exams/Tele-interviewing | $222.0 | -5.3% | $234.4 | -5.1% | $247.0 |
| Outsourced Underwriting | 20.6 | -17.1% | 24.8 | 54.2% | 16.1 |
| Lab Services | 17.9 | -6.6% | 19.2 | 14.5% | 16.7 |
| Other | 2.1 | -38.2% | 3.4 | - | 3.4 |
| | | | | | |
| Total HID | $262.6 | -6.8% | $281.8 | -0.5% | $283.2 |
| Claims Evaluation Division | 31.3 | -18.7% | 38.5 | -11.5% | 43.5 |
| Total | $293.9 | -8.3% | $320.3 | -2.0% | $326.7 |
Our Strategy
During 2006, we restructured our senior management team through a combination of our best internal talent, augmented by external hires to obtain new and necessary skills. These changes included a new chief executive officer (January, 2006), a new chief financial officer (May, 2006), and several other key positions.
In the first quarter of 2006, we initiated an extensive review of all aspects of the Company’s business, including an assessment of our organization’s strengths and challenges. As a result of this review, we formulated a turnaround program to address the continuation of negative financial trends we have been experiencing. The Company is pursuing the financial and other goals of our turnaround program in three phases: expense management, revenue enhancement and growth investment.
Details regarding the implementation of our turnaround program, including the expected financial impact of the program, are presented in Part II, Item 7, under our “Management Discussion and Analysis of Financial Condition and Results of Operations”.
Financial Information About Operating Segments
Financial information relating to our two segments is incorporated herein by reference to Note 5 of the Notes to Consolidated Financial Statements included under Item 8 of this report.
Our Services
Underwriting decisions are based on statistical probabilities of mortality and morbidity, such that insurance companies generally require quantitative data reflecting an applicant’s general health. The businesses that comprise our Health Information Division gather and provide that data.
Health Information Division
Paramedical and Medical Examinations
Our Portamedic business performs paramedical and medical examinations of insurance policy applicants. Our extensive branch office network, which is augmented by additional offices of our contract affiliates (i.e., independently owned and operated businesses), enables us to provide such examinations throughout the United States. Our branch offices recruit, monitor and manage our network of paramedical examiners.
Through our wholly-owned subsidiary, Medicals Direct Group, we also provide paramedical examinations in the United Kingdom, referred to in the U.K. as “screenings.”
A paramedical exam typically consists of questions about an applicant’s medical history, measurements of the applicant’s height and weight, blood pressure and pulse. Blood and urine specimens are also collected, to be tested by a laboratory. Insurance carriers have different guidelines for determining when a more complete medical examination is required and the scope of such examination. The likelihood that a more complete medical examination will be required of an applicant is influenced by the applicant’s age and the amount of insurance being sought. In general, insurance carriers insist upon more stringent underwriting requirements as the age of the applicant and amount of coverage increases.
Almost all of our paramedical examiners are registered nurses, licensed practitioner nurses, emergency medical technicians (EMTs), phlebotomists or other medically trained professionals. Many work on a part-time basis. Also, the paramedical examiners have the ability to work for more than one of the national paramedical examination arrangers/suppliers.
When a medical examination beyond the capability of a paramedical examiner is required, we contract with physicians who are licensed and in good standing and practice in the specialty area approved by the insurance company. These physicians provide services such as medical exams, treadmill electrocardiograms (ECGs or EKGs), X-rays, etc.
Infolink Tele-Underwriting Services
We conduct telephone interviews (which we refer as to tele-interviews or tele-underwriting) on behalf of our insurance company customers. We conduct such interviews from our call centers located in Overland Park, Kansas, Harlan, Iowa and Allentown, PA. A tele-interview enables us to gather much of the medical information needed in connection with the life insurance application process in a more-time efficient manner compared to the alternative of a paramedical examiner gathering such information while conducting a paramedical exam. As a result, the paramedical examiner can focus on the actual examination of the applicant.
A tele-interview provides two potential benefits to the insurance company:
| | (1) | It can reduce the underwriting cycle time in several respects: |
| | · | if an insurance agent or broker sends an application directly to one of our call centers at the same time he or she submits the application to the insurance company’s central office, we can typically conduct a tele-interview within one to four days, depending on the applicant’s availability; |
| | · | the person in our call center conducting a tele-interview can pull up on his or her computer screen, from our extensive library of insurance company-specific forms (which vary depending on the applicant’s state of residence), the appropriate underwriting questionnaire. The applicant’s answers to the base questions in the questionnaire, and any additional questions that are asked based on the applicant’s responses to the base questions, are input on a real-time basis. Our tele-interviews are quite effective as data-collection tools, allowing us to drill down into existing medical conditions and ask the “right” questions. The completed, typewritten reports are far less likely to contain errors, such as incomplete responses or unanswered questions. The greater quality control reduces the likelihood that the carrier will determine that the applicant must be re-contacted to obtain additional or clarifying information; |
| | · | the interviewer can electronically send a request to one of our attending physician statement (APS) centers to order the applicant’s medical records either on a same- or next-day basis, as opposed to after the paramedical examination; and |
| | · | the interviewer can also schedule the paramedical exam during the interview, at which point one of our branch offices promptly coordinates to make the necessary arrangements. |
Reducing the underwriting cycle time is key for the insurance agents and brokers, and the insurance companies they work with, because it reduces the likelihood of the applicant not pursuing the policy.
| | (2) | It can reduce the insurance company’s costs in the following respects. |
| | · | the tele-interview allows insurance companies to avoid the cost of certain application work if, for example, it is clear that the applicant will not meet the underwriting standards; and |
| | · | our lower internal costs in handling the APS retrieval through one of our three processing centers (a high-volume business that lends itself to a factory-type environment) enables us to pass along cost savings as we are able to negotiate national contracts which may lower average medical facility fees to our insurance company customers. |
Cost containment has become increasingly important in the life insurance industry, in part because of the shift that has occurred from higher-margin whole life products to products with reduced margins, such as term insurance, annuities and other retirement products.
Lab Services
Our wholly-owned subsidiary, Heritage Labs International, LLC., processes the blood and urine specimens obtained in connection with a portion of the paramedical examinations handled by Portamedic, as well as the specimens provided by third-party health information service providers. Most insurance carriers use more than one lab. Heritage Labs’ laboratory provides testing services which consist of certain specimen profiles designed to provide insurance companies with specific information of relevance to the assessment of the applicant’s health profile, such as:
| | · | the presence of antibodies or antigens to the human immunodeficiency virus (HIV); |
| | · | cholesterol and related lipids; |
| | · | liver or kidney disorders; |
| | · | the presence of antibodies to hepatitis; |
| | · | prostate specific antigen; |
| | · | tobacco/nicotine use; and |
| | · | the use of certain medications, cocaine and other drugs. |
Heritage Labs’ laboratory currently operates at approximately 65% of capacity. We are exploring business opportunities, including opportunities in the wellness and disease management markets, to utilize the additional capacity of our laboratory.
Outsourced Underwriting
We made our initial entry into the outsourced underwriting business through the acquisition of Medicals Direct Group, which provides outsourced underwriting services in connection with life insurance policies that are underwritten in the United Kingdom. We built on this platform in 2004 by acquiring Mid-America Agency Services, Inc. (MAAS), an insurance services organization based in Omaha, Nebraska that provides underwriting services to the insurance underwriting industry on an outsourced basis, without the mortality and morbidity risks, using professionals who are trained in medical, non-medical and financial aspects of underwriting.
At various times during the calendar year, the level of insurance application activity can vary significantly. It is costly for carriers to maintain an underwriting staff sufficient to handle the peak periods on a year-round basis. To date, MAAS’s outsourced underwriting services have been utilized extensively by one primary customer, and more recently by other customers, to deal with overflow and regular new business processing activity.
Claims Evaluation Division
Claims Evaluation Services
Our Claims Evaluation Division provides medical claims evaluation services to insurance adjusters for use in processing personal injury accident claims, primarily on behalf of property and casualty insurance carriers. While we also serve disability insurance carriers, revenues from these carriers have not been significant. We provide our claims evaluation services primarily in connection with automobile claims and workers’ compensation claims, with a small volume of services rendered in connection with general liability claims and, on the life and health insurance side of the insurance industry, private disability claims.
Our claims evaluation services encompass arranging:
| | · | independent medical examinations (IMEs); |
| | · | peer reviews (i.e., an analysis of a prior treatment performed by a doctor in the same specialty to determine the appropriateness of the treatment); |
| | · | file reviews (i.e., the review of a claim file for purposes other than to review the appropriateness and necessity of the treatment); |
| | · | radiology reviews (i.e., the review of imaging studies, such as X-rays and MRIs, to confirm previous readings and interpretations of diagnostic studies); |
| | · | functional capacity evaluations (i.e., an extensive set of tests done by a licensed therapist designed to test the ability to perform specific job tasks and activities of daily living); and |
| | · | other ancillary services that assist in processing claims. |
The administration of the above services must be performed efficiently and effectively, working within the parameters of applicable law, regulations and customer protocols. Customer service success is measured by the overall accuracy, timeliness and quality of these services. Managing and maintaining a credentialed provider network available to provide these services is critical. Our Claims Evaluation Division’s provider panel includes practitioners of multiple specialties in 46 states.
Customers
Health Information Division
The businesses that comprise our Health Information Division provide risk assessment services to over 700 life insurance companies in the United States, including most of the top 100 insurance companies in the United States, and virtually all of the roughly 50 life insurance companies operating in the United Kingdom.
Although no single customer represented more than 10% of the Health Information Division’s total revenue in 2006, the division’s three largest customers represented 7%, 6% and 5%, respectively. The division’s top 10 customers represented approximately 39% of division revenues in 2006.
We have written agreements with certain carrier customers, with terms of between one and three years.
Claims Evaluation Division
Our Claims Evaluation Division’s customer base includes property & casualty insurance companies, third party administrators, employers and other self-insured entities, law firms and public sector entities.
The CED’s largest 5 clients accounted for approximately 63% of the division’s revenues in 2006.
We typically enter into oral and written agreements with our Claims Evaluation Division’s customers. Service standards are addressed on a case-by case basis with our customers.
Sales and Marketing
Health Information Division
Our core Portamedic business requires a two-step sales process, notwithstanding the greater proportion of life insurance sold through what we refer to as the alternative distribution channel (i.e., sales through direct mail, telephone and the Internet directly to the public). First, our Portamedic corporate sales representatives must negotiate with the national office of a life insurance carrier to get on its list of approved outside risk assessment service providers. Second, our field sales personnel must sell to the carrier’s local agents and to the community of independent brokers and agents that sell that carrier’s products.
To more effectively address sales at the national carrier level, we have recently augmented our corporate sales team. We also have a sales team whose primary focus is the alternative distribution channel. Success at the local level requires establishing, maintaining and nurturing relationships with the agents and brokers. In 2006, we increased the number of field sales personnel in our HID division and implemented new sales incentive programs.
Claims Evaluation Division
The Claims Evaluation Division markets its claims evaluation services to insurance claims adjusters working generally in four distinct lines of insurance: automobile, workers’ compensation, disability and general liability. The division’s target customers include the entities that handle such claims. The sales process occurs at three levels: the national/regional contracting level, the claims processing center or branch level, and the local claims office/individual adjuster level. Individual adjusters have historically had significant discretion in the choice of outside claims evaluation service vendors.
The Claims Evaluation Division has a full-time sales staff dedicated to soliciting business from prospective customers and generating revenue growth from existing customers. Their responsibilities include developing and maintaining customer contact.
Information Technology
In 2006, we completed several major upgrades of our information technology (IT) infrastructure and applications, including:
| | · | new branch office software applications that automate operations previously performed manually, which will improve the quality and timeliness of our paramedical examination network. The new applications (i) improve accuracy and timeliness of services to be provided based on individual carrier requirements, (ii) provide rules-based outcomes of processes based on carrier and broker requirements, (iii) allow paramedical examiners to log on and manage their work flow remotely, and (iv) allow carriers/brokers to view the work flow remotely; and |
| | · | development of a new data center, with high-speed (T-1) connections to all of our offices, and storage area networks. |
Competition
Health Information Division
Our core Portamedic business is the largest of the four national firms, whose businesses encompass arranging paramedical examinations, providing specimen analysis, conducting interviews of insurance applicants and medical records collection for the life insurance industry. The other three firms are ExamOne, a subsidiary of Quest Diagnostics Incorporated, Examination Management Services, Inc. (EMSI) and American Para Professional Systems, Inc. (APPS). In addition, a significant number of regional and local firms also compete in this industry. Although we have exclusive relationships with certain of our carrier customers, most customers generally use two or more risk assessment service providers.
Our Heritage Labs subsidiary is one of three national laboratories, the others being LabOne and the privately-held Clinical Reference Laboratory (CRL). LabOne and CRL both focus on activities beyond the testing of blood, urine and oral fluid specimens for the life and health insurance industries.
In management’s view, the principal competitive factors in the medical-related risk assessment services market are (i) the ability to further the cost containment objectives of insurance carriers, (ii) the ability to further reduce underwriting cycle time, and (iii) the efforts made to establish, maintain and nurture relationships with the agents and brokers that determine which company they will use to provide risk assessment services.
Claims Evaluation Division
The outsourced medical claims management services industry is relatively fragmented. Management believes that the Claims Evaluation Division may be one of the leading providers of IMEs in the Northeast and Midwest regions of the United States. Our competition includes numerous businesses that provide services on a regional, local or, in some cases, customer-specific basis. Certain competitors that are publicly held offer services beyond medical evaluative services.
Government Regulation
The businesses that comprise our Health Information Division, in particular, our paramedical examination and lab businesses are subject to federal and state regulation. The paramedical examiners we utilize are subject to licensing and certification requirements and regulations with respect to the drawing of blood and needle disposal. We are subject to federal and state regulation relating to the transportation, handling and disposal of the various specimens obtained in the course of a paramedical or medical examination. The Food and Drug Administration governs certain aspects of Heritage Labs’ business, including the manufacture of specimen collection kits. In addition, certain aspects of the risk assessment services we provide may be subject to certain provisions of the Health Information Portability and Accountability Act of 1996 (“HIPAA”) relating to the privacy of protected health information.
The business conducted by our Claims Evaluation Division is regulated or affected by the laws and regulations of the states in which we operate and, to a lesser extent, federal laws and regulations. Many states require entities that provide some of the services we provide, such as medical review services, to be registered with or licensed by the state. These laws typically establish minimum standards for qualifications of personnel, confidentiality and internal quality control. In addition, because workers’ compensation claims, automobile insurance claims and general liability claims are generally governed by state law, the demand for most of the division’s services is affected by the insurance laws of the various states in which we conduct business. These state regulatory regimes and other laws frequently change. The changes may create a greater or lesser demand for some or all of our services or require us to develop new or modified services to meet the needs of our customers and compete effectively with other providers of claims evaluation services.
The CED’s business may also be indirectly subject to certain regulations promulgated under HIPAA. These regulations establish standards relating to the privacy and security of protected health information, which is individually identifiable health information, such as an individual’s medical records. These regulations are designed to protect the confidentiality, integrity and availability of health information through restrictions on the use and disclosure of the information, and through required implementation of safeguards to secure electronically maintained protected health information. We believe that we comply with these privacy and security standards to the extent that we are required to do so by contract with our customers.
Employees
We employ approximately 3,000 persons in our Health Information Division and 150 persons in our Claims Evaluation Division. In addition to approximately 120 personnel in the corporate headquarters in Basking Ridge, New Jersey, our Health Information Division employs a field staff that receives and processes the orders for the division’s services. In our Claims Evaluation Division, our employees are based in the regional operations centers and perform administrative, scheduling, quality reviews and marketing-related functions.
General Information
Hooper Holmes, Inc. is a New York corporation. Our principal executive offices are located at 170 Mt. Airy Road, Basking Ridge, New Jersey 07920. Our telephone number is (908) 766-5000. Our website address is www.hooperholmes.com. We have included our website address as an inactive textual reference only. The information on our website is not incorporated by reference into this annual report on Form 10-K. We make available through our website our annual reports on Form 10-K, our quarterly reports on Form 10-Q, our current reports on Form 8-K, Forms 3, 4 and 5 filings, and all amendments to these reports and filings as soon as reasonably practicable after such material is electronically filed with the SEC. These documents may also be accessed through the SEC’s website at www.sec.gov.
Risks Related to the Company Generally
If we are unable to implement the plans outlined in our September 2006 strategic review, we may not realize the anticipated financial improvements.
In September 2006, we completed a strategic review which resulted in detailed plans to implement expense management initiatives, along with related incremental revenue opportunities. The implementation period for these plans is expected to cover eight quarters. These plans, when fully implemented, are expected to result in approximately $17.5 million of additional operating income on an annual basis.
If we are unable to complete some, or all, of the strategic review detailed plans, we may not realize the additional operating income expected as a result of their implementation.
If the Company is unable to comply with the terms of its Loan & Security Agreement with CitiCapital Commercial Corporation dated October 10, 2006, the Company may not have sufficient cash to meet its operating and capital requirement needs.
On October 10, 2006, the Company entered into a three year Loan and Security Agreement with CitiCapital Commercial Corporation. The agreement requires the Company to adhere to certain financial covenants, which are fully discussed in Note 9 to the consolidated financial statements contained in this annual report on Form 10-K. The amount of available borrowings under this facility is limited to 90% of eligible receivables, plus 65% of the fair market value of the Company’s headquarters, not to exceed $25 million in aggregate. The agreement contains one financial covenant whereby the Company must maintain a fixed charge coverage ratio of 1:1, if the available borrowing base, less amounts outstanding under the credit facility, is less than $10 million. The borrowing base at December 31, 2006 was $19.2 million. If the Company fails to comply with this financial covenant, the Company’s ability to borrow under this facility could be limited and have a negative effect on the Company’s ability to finance its operations.
If we cannot maintain and upgrade our information technology platform so that our customers are able to readily access critical data related to their underwriting decisions or processing of claims, the competitiveness of our businesses will suffer.
In each of our businesses, the speed with which we make information available to our customers is critical. As a result, we are dependent on our information technology platform and our ability to store, retrieve, process, manage and enable timely customer access to the health-related and other data we gather on behalf of our customers. Disruption of the operation of our IT systems for any extended period of time, loss of stored data, programming errors or other system failures could cause customers to turn elsewhere to address their service needs. In addition, we must continue to enhance our IT systems to keep pace with our competitors’ service and product enhancements.
Acquisitions, alliances or other investments present many risks, and we may not realize the anticipated financial and strategic goals of any of our acquisitions or other investments.
As part of our business strategy, we have pursued acquisitions and other strategic investments that will complement our existing services and leverage our existing capabilities. There is no guarantee that these activities will be profitable, or that we will continue to offset the decline in operating results of our Portamedic business through these types of activities. Any such acquisition or other investment involves a number of risks, including:
| | · | we may find that the acquired company or assets do not further our business strategy, or that we overpaid for the company or assets, or that economic conditions have changed, all of which may result in a future impairment charge; |
| | · | we may have difficulty integrating the operations (including IT systems) and personnel of an acquired business and may have difficulty retaining its customers and/or key personnel; |
| | · | our ongoing business and management’s attention may be disrupted or diverted by transition or integration issues and the complexity of managing diverse locations; and |
| | · | we may have difficulty maintaining uniform standards, controls, procedures and policies across locations. |
An ill-advised acquisition, business alliance or other investment could hurt our business, results of operations and financial condition or cash flows, particularly in the case of a significant acquisition or multiple acquisitions in a short period of time. From time to time, we may enter into negotiations for acquisitions or other investments that are not ultimately consummated. Such negotiations could result in significant diversion of management’s time from our business as well as significant out-of-pocket costs.
The consideration that we pay in connection with an acquisition or other investment could affect our financial condition. If we were to proceed with one or more significant acquisitions or other investments in which the consideration included cash, we could be required to use a substantial portion of our available cash to consummate such acquisitions. To the extent we issue shares of stock or other rights to purchase stock, including options or other rights, our then-existing shareholders may experience dilution in their share ownership in our company and their earnings per share may decrease. In addition, acquisitions or other investments may result in the incurrence of debt, large one-time write-offs and restructuring charges. They may also result in goodwill and other intangible assets that are subject to impairment tests, which could result in future impairment charges. Any of these factors may decrease our operating results and weaken our financial condition.
Risks Related to Our Health Information Division
We expect that the market for our life insurance risk assessment services will continue to contract.
Each of our paramedical examination, tele-underwriting, attending physician statement (APS) retrieval, lab specimen testing and outsourced underwriting businesses is directly influenced by the level of life insurance application activity in the United States and in the United Kingdom. Based on available data, life insurance application activity in North America has declined in each of the last four years. The data are consistent with the fundamental changes that reportedly have been occurring within the life insurance industry over a number of years, changes that have resulted in the slow decline of the market for life insurance. We do not foresee a change in this trend.
Our paramedical examination, lab specimen testing and APS retrieval businesses are also affected by decisions of life insurance carriers as to the policy amount thresholds, and the age of applicants and other criteria for which life insurance carriers require such services. In general, a raising of these thresholds and other criteria has a negative effect on the demand for our services.
We may experience unintended negative consequences as a result of the elimination of geographic overlaps among some of our Portamedic branch offices.
During 2006 and continuing into 2007, we will eliminate the geographic overlap that exists among some of our branch offices. The restructuring of Portamedic’s branch structure is motivated by the objective of lowering the division’s operating costs and improving efficiencies. However, the elimination of certain offices could have unintended negative consequences, including a loss of locally generated business and/or loss of employees. Further, we may not realize the anticipated levels of cost improvements, greater efficiencies and improved synergies from this restructuring.
Improper actions by our paramedical examiners or our physician practitioners could cause us to lose business and result in claims against us or our incurring expenses to indemnify our life insurance carrier customers.
In the first quarter of 2006, a life insurance company client informed us that, after investigation, the client determined that it issued certain life insurance policies that were procured by fraudulent means employed by insurance applicants, the client’s agents, the Company’s sub-contracted examiners and others. As of the date of filing this Form 10-K, no claim has been asserted against the Company by the client, nor has the client produced any evidence pertaining to the matter. The service agreement between the Company and the client contains certain indemnification provisions which may be applicable. While the Company believes it is probable that the client will assert a claim against the Company for partial indemnification, it also believes that the Company has meritorious defenses to any such claim. However, the risk exists in this situation (and in other instances where allegations of wrongdoing are made regarding our paramedical examiners or physician practitioners) that the client relationship may be damaged, such that we experience a drop-off in the volume of business from the client or the loss of the client’s business.
We have experienced downward pricing pressure from our life insurance carrier customers, which has hurt our operating margins and otherwise adversely affected our operating results.
For the past several years, we have experienced downward pricing pressure from our life insurance carrier customers. We attribute this pressure to the carriers’ efforts to address cost items in a more rigorous manner in an attempt to maintain their profitability and level of return to their investors and other stakeholders.
With price having become the primary basis of competition in the paramedical examination business, we have experienced declines in our average revenue per exam. This has been a significant factor in the decline in revenues derived by our core paramedical examination business in each of the last three years, and the related declines in operating margins and cash flow from operating activities. Although the Company recently instituted increased pricing for certain customers in response to improved levels of service, price increases may not be widely accepted by our customers and may not be sufficient to reverse past pricing declines.
Our Health Information Division’s ten largest customers represented approximately 39% of division revenues in 2006. The loss of a significant volume of business from any of these customers could be expected to result in a material reduction in our revenues and negatively affect our cash flows from operating activities.
In 2006, our Health Information Division’s top 10 customers represented, in the aggregate, approximately 39% of the division’s revenues (excluding UK volume). The loss of a significant volume of business from any of these customers could be expected to result in a material reduction in our revenues and negatively affect our cash flows from operating activities.
Heritage Labs’ failure to provide accurate laboratory test results may result in claims against us.
Our Heritage Labs subsidiary processes the blood, urine and other specimens obtained in connection with a portion of our paramedical examinations, as well as specimens provided by third-party health information service providers. Our insurance company clients and these third-party health information service providers rely on the accuracy of the test results and other data in connection with their insurance underwriting, treatment and other decisions. In addition, federal and state laws regulate the disclosure of specimen test results and other nonpublic medical-related personal information. If Heritage Labs does not provide accurate test results or does not protect the confidentiality of such results in accordance with applicable laws, we could face significant liability.
Our classification of most of our paramedical examiners outside of the States of California, Montana and Oregon as independent contractors, rather than employees, exposes us to possible litigation and legal liability.
We classify most of our paramedical examiners outside the States of California, Montana and Oregon as independent contractors, making such examiners personally responsible for their employment taxes and workers’ compensation. In the past, some state agencies have claimed that we improperly classified our examiners as independent contractors, rather than employees, for purposes of state unemployment tax laws and that we were, therefore, liable for arrears of taxes or for penalties for failure to comply with these laws. Should any jurisdictions in which we conduct operations determine that our paramedical examiners are employees, we may be exposed to liability, as well as increased operating costs.
Risks Related to Our Claims Evaluation Division
There are signs that the outsourced medical claims management market in the United States may be contracting, which may limit the potential growth of our Claims Evaluation Division’s business.
Our management perceives that the outsourced medical claims management market in the United States, including the market for the Claims Evaluation Division’s claims evaluation services, may be contracting. There are a number of factors that may be contributing to the trend including the decrease in manufacturing employment levels in the United States and the associated decline in the rates of workplace injuries and, in turn, workers’ compensation claims, the reported decline in the number of people injured in automobile accidents in the United States, and changes in state laws and regulations that, in general encourage the use of managed care techniques in handling workers’ compensation and automobile-related personal injury insurance claims.
Our Claims Evaluation Division’s business is being affected by increased customer procurement demands, driven primarily by heightened federal laws and regulations, that are increasing operating costs.
Our Claims Evaluation division’s business is being affected by increased customer procurement demands. These demands are being primarily driven by heightened compliance and security standards being imposed at the federal and state levels. Compliance with these demands entails higher operating costs, which has contributed to reduced margins and profitability.
Our Claims Evaluation Division has a significant degree of customer concentration, such that the loss of any one of its larger customers would have a material effect on its operating results.
Our Claims Evaluation Division’s 5 largest clients accounted for 63% of the division’s revenues in 2006. The loss of any of these customers would likely result in a reduction in the Claims Evaluation Division’s revenues and profitability, and that reduction may be material.
The nature of the claims evaluation services we provide exposes us to possible litigation and liability.
Through our network of physician practitioners, our Claims Evaluation Division provides assessments of the appropriateness of healthcare providers’ medical treatment plans. The nature of this work is such that we could be exposed to claims for adverse medical consequences. The Claims Evaluation Division does not grant or deny claims for payment of benefits and, to date, has not been made a defendant in any litigation relating to any such decision. However, this does not preclude future exposure to claims that may arise or result from the decisions of our customers. We maintain professional liability insurance and such other coverage as we believe appropriate, but such insurance may prove insufficient.
Our Claims Evaluation Division could be negatively affected by changes in what is a fragmented, but highly competitive market.
The market for claims evaluation services market is fragmented, but competitive. We compete with many smaller vendors who generally provide such services on a local level, particularly companies with established relationships with one or more local insurance company claims adjusters. We also compete with larger companies that offer a broader selection of complementary services. Changes in the competitive landscape, including the performance by our property and casualty carrier customers of a greater degree of claims evaluation services in-house, could negatively affect our business.
If any of the members of our physician panel were to be found to lack proper credentials or be determined to be less than “independent”, the damage to our reputation and business could be considerable.
The nature of the Claims Evaluation Division’s business is such that the proper credentialing and “independence” of each member of the division’s panel of physicians that perform IMEs has been, and remains, of paramount importance. Even though our credentialing process is accredited by URAC, there remains an exposure to liability resulting from improper conduct during an examination encounter even with the most rigorous of credentialing processes.
ITEM 1B | Unresolved Staff Comments |
Not applicable.
We own a five building complex located at 170 Mt. Airy Road, Basking Ridge, New Jersey approximately 45 miles southwest of New York City. Of approximately 53,000 total square feet of office space, we maintain our operations in approximately 45,000 square feet and the balance is leased or available for lease to several tenants. Management believes that this arrangement provides for our foreseeable expansion needs.
Our asset-based lending agreement with CitiCapital Commercial Corporation includes a provision using fair value of our office building as collateral.
We lease our regional operations centers and field offices under a number of operating leases with varying terms and expirations, typically three years in duration. We also lease 9,200 sq feet in Allentown, PA for a business continuity and operations center.
On January 25, 2005 Sylvia Gayed, one of the Company’s examiners in California, filed a class-action lawsuit against the Company in the Superior Court of California, Los Angeles County, alleging violations of California’s wage and hour laws. The complaint alleged that the Company failed to pay overtime wages, provide meal and rest periods and reimbursement for expenses incurred by examiners in performing examinations. We currently employ approximately 400 examiners in California and have employed in excess of 1,400 examiners in California over the past 60 months. Following mediation on December 6, 2006, the parties reached a settlement, pursuant to which the Company will pay the sum of $1.2 million to the class members in full settlement of this lawsuit.
ITEM 4 | Submission Of Matters To A Vote Of Security Holders |
No matters were submitted to a vote of securities holders during the fourth quarter of the fiscal year covered by this report.
PART II
ITEM 5 Market For The Registrant’s Common Equity, Related Stockholder Matters And Issuer Purchases Of Equity Securities
Market Information
Our common stock is traded on the American Stock Exchange (AMEX) under the symbol “HH.” Options of our common stock are also traded on the AMEX.
Common Stock Price Range
The following table shows, for the periods indicated, the high and low closing sales prices per share of our common stock based on published financial sources: (dollars)
| | 2006 | 2005 |
| Quarter | High | Low | High | Low |
| First | 3.80 | 2.24 | 5.95 | 3.51 |
| Second | 3.25 | 2.50 | 4.45 | 3.22 |
| Third | 3.85 | 2.71 | 4.36 | 3.86 |
| Fourth | 3.65 | 2.92 | 3.87 | 2.50 |
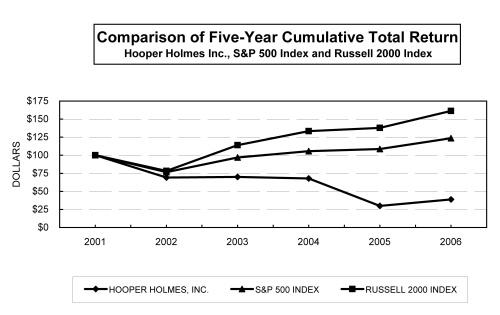
The following graph shows a comparison of cumulative total returns for an investment in our common stock, the [S&P 500 Composite Index] and the [Russell 2000 Index]. It covers the period commencing December 31, 2001 and ending December 31, 2006. The graph assumes that the value for the investment in our common stock and in each index was $100 on December 31, 2001 and that all dividends were reinvested. This graph is not deemed to be “soliciting material” or to be “filed” with the SEC or subject to the SEC’s proxy rules or to the liabilities of Section 18 of the Securities Exchange Act of 1934, and the graph shall not be deemed to be incorporated by reference into any prior or subsequent filing by us under the Securities Act of 1933, as amended, or the Securities Exchange Act of 1934.
Holders
According to the records of our transfer agent, Registrar and Transfer Company, Cranford, NJ, as of February 15, 2007, there were 1,025 holders of record of our common stock.
Dividends
No dividends were paid in 2006, as directed by a resolution of the Board of Directors. In 2005, the Company paid quarterly dividends per share as follows: (dollars)
| Quarter | 2005 |
| First | .015 |
| Second | .015 |
| Third | .015 |
| Fourth | .015 |
As mentioned above, our Board of Directors suspended the payment of cash dividends on the Company’s common stock in 2006. Furthermore, we are precluded from declaring or making any dividend payments or other distributions of assets with respect to any class of our equity securities under the terms of our Loan and Security Agreement with CitiCapital Commercial Corporation.
Recent Sales of Unregistered Securities
Stock Grants to Non-Employee Directors
On January 28, 2003, our Board of Directors authorized the issuance of shares of the Company’s common stock to the then non-employee directors of the Company for future services. Such resolution provided for the issuance of 5,000 shares to each of these directors on each of January 31, 2005, 2004 and 2003. Accordingly, we have issued an aggregate of 90,000 shares of our common stock to the six non-employee directors who served on the Board during this time. All of these shares issued are “restricted securities” within the meaning of Rule 144 under the Securities Act of 1933 (the “Securities Act”). These share issuances were exempt from registration pursuant to Section 4(2) of the Securities Act as “transactions not involving a public offering.” No underwriter participated in these transactions, nor was any commission paid.
Each of the stock award agreements memorializing the share issuances to each of the non-employee directors provides that the shares may not be sold or transferred by the director until four years from the date of issue, and then only if covered by an effective registration statement or an exemption from registration under the Securities Act. In January 2006, the Board adopted a resolution removing all contractual restrictions with respect to any such shares held by a director who retires from the Board and is not removed with cause.
Purchase of Equity Securities by the Issuer and Affiliated Purchaser
On May 30, 2000, the Board of Directors authorized the repurchase in any calendar year of up to 2,500,000 shares of the Company’s common stock for an aggregate purchase price not to exceed $25.0 million. On April 27, 2005 the Board of Directors amended its earlier resolution limiting the repurchases to between 1.0 and 1.5 million shares of the Company’s common stock in any calendar year. Shares may be repurchased in open market purchases or through privately negotiated transactions. Under the terms of our credit agreement with CitiCapital Commercial Corporation, we are not permitted to purchase any shares of our common stock. We did not purchase any shares in 2006 or in 2004; we purchased 30,800 shares in 2005.
ITEM 6 | Selected Financial Data |
The following table of selected financial data should be read in conjunction with our consolidated financial statements and related notes, the “Management’s Discussion and Analysis of Financial Condition and Results of Operations,” and other financial information appearing elsewhere in this annual report. The statement of operations data set forth below for each of the years in the three year periods ended December 31, 2006, and the balance sheet data as of December 31, 2006 and 2005, have been derived from, and are qualified by reference to, our consolidated financial statements appearing elsewhere in this annual report. The statement of operations data for the years ended December 31, 2003 and 2002, and the balance sheet data as of December 31, 2004, 2003 and 2002, are derived from the Company’s consolidated financial statements that are not included in this annual report.
| | | For the years ended December 31, | |
(in thousands except for share data) | | 2006 | | 2005 | (c) | 2004 | | 2003 | | 2002 | |
| Statement of operations data: | | | | | | | | | | | |
| Revenues | | $ | 293,862 | | $ | 320,346 | | $ | 326,651 | | $ | 300,182 | | $ | 260,317 | |
| Operating income (loss) | | | (55,672 | )(a) | | (134,319 | )(b) | | 17,581 | | | 26,794 | | | 21,872 | |
| Interest expense | | | 421 | | | 524 | | | 632 | | | 386 | | | 113 | |
| Net income (loss) | | | (85,181 | ) | | (96,623 | ) | | 10,015 | | | 15,847 | | | 14,293 | |
| Basic earnings (loss) per share | | | (1.28 | ) | | (1.47 | ) | | .15 | | | .24 | | | .22 | |
| Diluted earnings (loss) per share | | $ | (1.28 | ) | $ | (1.47 | ) | $ | .15 | | $ | .24 | | $ | .21 | |
| Cash dividends per share | | | - | | $ | .06 | | $ | .06 | | $ | .05 | | $ | .04 | |
| Weighted average shares - basic | | | 66,804,605 | | | 65,513,451 | | | 64,996,778 | | | 64,733,346 | | | 64,868,163 | |
| Weighted average shares - diluted | | | 66,804,605 | | | 65,513,451 | | | 66,534,421 | | | 66,598,604 | | | 67,229,119 | |
| Balance Sheet Data (as of December 31): | | | | | | | | | | | | | | | | |
| Working capital | | $ | 19,998 | | $ | 33,772 | | $ | 38,296 | | $ | 53,378 | | $ | 59,173 | |
| Total assets | | | 84,897 | | | 162,331 | | | 275,109 | | | 256,019 | | | 236,953 | |
| Current maturities of long-term debt | | | - | | | 1,000 | | | 1,067 | | | 1,028 | | | 173 | |
| Long-term debt, less current maturities | | | - | | | - | | | 1,000 | | | 2,000 | | | 3,314 | |
| Total long-term debt | | | - | | | 1,000 | | | 2,067 | | | 3,028 | | | 3,487 | |
| Stockholders’ equity | | $ | 48,808 | | $ | 128,902 | | $ | 227,959 | | $ | 219,876 | | $ | 206,211 | |
(a) Includes goodwill and long-lived asset impairment charges of $36.2 million and $1.8 million, respectively, along with special charges totaling $10.5 million.
(b) | Includes goodwill and long-lived asset impairment charges of $115.6 million and $18.0 million, respectively, along with special charges totaling $6.6 million. |
(c) | Certain reclassifications have been made to conform to the 2006 presentation. |
ITEM 7 Management Discussion and Analysis of Financial Condition and Results of Operations
The following discussion and analysis contains forward-looking statements. See page 3 of this annual report on Form 10-K for information regarding our use of forward-looking statements in this annual report. This discussion and analysis should be read in conjunction with our audited consolidated financial statements and related notes included in Item 8 of this annual report.
Overview
Hooper Holmes, Inc. and its subsidiaries currently engage in businesses that are managed as two separate divisions: the Health Information Division and the Claims Evaluation Division.
Our Health Information Division (HID) provides medical-related risk assessment information to life and health insurance carriers, information that is integral to such carriers’ underwriting decisions. These services include:
| | · | arranging paramedical and medical examinations of individual insurance policy applicants - mainly life insurance policy applicants - throughout the United States (under the Portamedic brand name) and in the United Kingdom (under the Medicals Direct brand name); |
| | · | performing telephone interviews of applicants and collecting applicants’ medical records; |
| | · | testing the blood, urine and other specimens obtained in connection with a portion of the paramedical examinations we coordinate, as well as specimens provided by third-party health information service providers; and |
| | · | underwriting life insurance policies on an outsourced basis for life insurance companies. |
Our Health Information Division accounted for 89.3%, 88.0% and 86.7% of our total revenues in 2006, 2005 and 2004, respectively. Our core Portamedic paramedical examination business accounted for 60.1% of our HID revenue and 53.7% of our total revenue in 2006. In 2005 and 2004, Portamedic accounted for 61.0% and 66.7% of HID revenues and 53.7% and 57.9% of our total revenues, respectively.
Our Claims Evaluation Division (CED) provides medical claims evaluation services to property and casualty (P&C) insurance carriers, law firms, self-insureds and third party administrators for use in processing personal injury accident claims. The core activity of this business consists of arranging for independent medical exams (IMEs). An IME is a medical examination by a doctor (other than a claimant’s physician) for the purpose of rendering an objective opinion regarding the nature, origin, treatment and causal relationship of an injury. We provide our claims evaluation services in connection with automobile, liability, disability and workers’ compensation claims.
Our Claims Evaluation Division accounted for 10.7%, 12.0% and 13.3% of our total revenues in 2006, 2005 and 2004, respectively.
Status of Our Strategic Review and Turnaround Program
In the first quarter of 2006, our management team initiated an extensive review of all aspects of the Company’s business. The review was undertaken to assess our organizational strengths and challenges and to help plot a future course of action.
As a result of our review, management formulated a turnaround program to address the continuation of the negative financial trends we have been experiencing, particularly in our core Portamedic business. Management anticipates that the Company will pursue the financial and other goals of this program in three phases:
Phase 1 - Expense Management
Phase 2 - Revenue Enhancement
Phase 3 - Growth Investment
Expense Management
In May 2006, the Company began a strategic review process which divided the Company into teams, each with specific accountability and responsibility. The process was led by an executive team, with support from external consultants, EHS Partners. Although the strategic review’s primary focus was expense management, there were also incremental revenue opportunities identified during this first phase of our turnaround program.
The Company’s strategic review was completed in September, 2006, at which time detailed plans were formulated to implement expense management initiatives identified during the review, along with the related incremental revenue opportunities. The implementation period is expected to cover eight quarters, with the majority of the initiatives to be completed by December 31, 2007. The two year implementation period reflects management’s decision to move in a careful, methodical manner in order to protect existing revenues and our ability to deliver client service. Management recognizes that our wholly-owned branches, dedicated Portamedic examiners, customer service representatives and branch managers are essential to our success.
Management’s plans, when fully implemented, are expected to result in approximately $17.5 million of additional operating income on an annual basis, comprised of $11.5 million in annual cost reductions and approximately $6.0 million of additional operating income from new revenue initiatives. The expected impact on gross margin of these plans is an increase of approximately $12.7 million, with an expected SG&A expense reduction of $4.8 million. For calendar year 2007, management expects the plan initiatives should generate approximately $6.8 million in cost reductions and $3.5 million of additional operating income from revenue initiatives.
The expense management initiatives currently being implemented focus on:
| · | aligning costs with revenues to improve operating margins; |
| · | improving utilization of Company assets, including a balancing of branch office volumes and operating costs, while eliminating geographic overlap among our branch offices; |
| · | improving our information technology platform to generate cost efficiencies; |
| · | consolidation of our regional service centers; and |
| · | enhancing operational controls on a Company-wide basis with a focus on reducing costs. |
The financial benefit of these expense management initiatives should begin to have a positive impact in our first quarter 2007 financial results.
Revenue Enhancement
The focus of Phase 2 of our turnaround program, which began in the first quarter of 2007, will be to reverse the decline in revenues and profitability we are experiencing in each of our two divisions and pursue opportunities for revenue enhancement. As noted previously, although the focus of Phase 1 was primarily expense management, there were also revenue enhancement initiatives identified. Additional initiatives will be identified during Phase 2 which are expected to increase revenues. These initiatives, including the revenue enhancement opportunities already implemented, consist of:
| | · | seeking opportunities to grow and expand our current services by delivering new and increased value to our customers. The life insurance market in the United States continues to decline based on the reduction in life insurance activity. In order to stabilize and ultimately grow our Portamedic market share in a flat or declining market, we need to deliver higher levels of service, speed and quality, which we believe are critical metrics to our customers’ success; |
| | · | increasing the number of local sales and marketing people calling upon local insurance agents in our Portamedic business. While we have national contracts with a large number of leading insurance carriers, the majority of our Portamedic business is generated locally through our branch offices and the local insurance agents and brokers they serve. We are also increasing the sales force in our other businesses, including Heritage Labs, MAAS and the Claims Evaluation Division. In addition, sales incentive plans have been implemented in 2007 for all sales personnel of the Company; |
| | · | introducing new products and services which address the critical business needs of new and existing customers and, as a result, provide additional revenue opportunities for our Company; and |
| | · | obtaining price increases from customers in response to improved service levels provided by the Company, along with charging for ancillary services not currently charged for, but in conformance with industry standards (e.g. cancellation fees, etc.). |
We believe that the revenue enhancement initiatives described above should help stabilize revenue declines experienced by our Company over the past several years.
Growth Investment
The final phase of our turnaround program is growth investment. Beginning in the second half of 2007, with the benefits of our reduced cost structure, we plan to pursue a phase of organic growth. This phase will include our development of an optimal growth strategy which focuses on our core capabilities. We believe that the wellness and disease management markets present a major opportunity to leverage our core capabilities, primarily our ability to deliver medical examinations at any location in the U.S., along with the related lab testing and fulfillment services. As health care premiums continue to rise (approximately 11% annually in the last 15 years), wellness and disease management programs have developed into a large market which continues to grow at approximately 20% per annum. Most major corporations are turning to the wellness market for services and methodologies to control and reduce health-care costs (i.e., identify and mitigate employee health risks, before the risks result in an expensive medical claim).
We believe that our core capabilities represent a significant asset to current and potential wellness customers, including the ability to schedule medical screenings for large groups of employees, manufacture the necessary collection kits, conduct group screenings at any location and analyze and transmit the related medical data.
In addition to the wellness market, we will continue to leverage our core skills to extend our current services into new growth markets. All organic and acquisition opportunities identified during this phase will be screened for growth potential, profitability and risk.
Conversely, we continually evaluate each of our current business units based on their growth potential, expected return on equity and strategic importance to our turnaround program, in order to ensure we are investing only in those businesses which we believe offer the greatest potential sustainable return to our shareholders.
Key Factors and Industry Trends Affecting Our Businesses
Our revenue, profitability and cash flows are directly affected by the demand for our services, the prices we can charge for the services we provide, the relative volume of the higher-margin services we provide relative to services with lower margins, and our efforts to grow our business and manage our operating and other expenses. In the periods covered by the consolidated financial statements included in this annual report, the businesses that comprise our Health Information Division and our Claims Evaluation Division have been influenced by several key factors or trends, discussed below.
Health Information Division
Decline in Life Insurance Application Activity
We believe that the level of life insurance application activity in the United States and in the United Kingdom had a significant effect on the businesses that comprise our Health Information Division. In general, the lower the level of application activity, the lower the demand for our paramedical examination, tele-underwriting, lab specimen testing and outsourced underwriting services.
Based on data available from the Medical Information Bureau Group, Inc. (MIB), a clearinghouse of policy application information based in Westwood, Massachusetts that is owned by participants in the insurance industry, it appears that life insurance application activity in North America has declined during each of the last four years. The MIB Life Index is the life insurance industry’s timeliest measure of application activity across the United States and Canada. The index is based on the number of searches member company underwriters perform on the MIB database. Since the vast majority of individually underwritten life insurance policies in North America include a MIB search as a routine underwriting requirement, the MIB Life Index provides what our management believes is a reliable proxy for new application activity. The MIB data suggest a decline in application activity of 3.8% in 2006, 3.4% in 2005, 2.3% in 2004 and 4.1% in 2003. Our volume of paramedical examinations performed in 2006 has declined at a higher rate: 8.3% in 2006 and 3.8% in 2005.
The MIB data is consistent with a fundamental change that has been occurring within the life insurance industry over a number of years, that is the reported shift in consumers’ preferences away from individual life insurance and toward other wealth accumulation and investment products, such as annuities and mutual funds.
We also believe that we have lost market share for the services we provide to the insurance industry from 2003 through mid-2006. In an attempt to reverse this loss, management has implemented several initiatives, including the hiring of additional salespersons in the fourth quarter of 2006, along with implementing sales incentive plans for all sales personnel of the Company.
Pricing Pressure from Life Insurance Carriers
For the past several years, we have experienced downward pricing pressure from our life insurance carrier customers. We attribute this pressure to the carriers’ efforts to address cost issues in a more rigorous manner in an attempt to maintain their profitability and level of return to their stakeholders.
As discussed in Item 1. “Business - Sales and Marketing - Health Information Division,” our core Portamedic business must negotiate with the headquarters offices of life insurance carriers to get on their lists of approved outside risk assessment service providers. In the past, those negotiations have increasingly focused on pricing levels as carriers have focused on lowering their costs. However, as we improve our levels of service, speed and quality, we believe we can offer improved value to certain customers, which should help mitigate past pricing declines.
In addition, we anticipate that life insurance carriers’ cost containment objectives will serve to increase the level of interest and demand for tele-interviewing/underwriting and for outsourced underwriting services, both of which we believe further those objectives. Accordingly, we see our businesses that provide those services as having growth potential.
Claims Evaluation Division
Contraction of the Outsourced Claims Management Market in the United States
Our management perceives that the outsourced medical claims management market in the United States, including the market for the Claims Evaluation Division’s claims evaluation services, may be contracting. There are a number of factors that may be contributing to this trend, including:
| | · | the decrease in manufacturing employment levels in the United States and the associated decline in the rates of workplace injuries and, in turn, workers’ compensation claims; |
| | · | the reported decline in the number of people injured in automobile accidents in the United States; and |
| | · | changes in state laws and regulations that, in general, encourage the use of managed care techniques in handling workers’ compensation and automobile-related personal injury insurance claims. Managed care laws generally channel claimants into provider networks and suggest treatment protocols and other constraints on the activity of the physician practitioners in such networks. |
In addition to the factors cited above, the market for claims evaluation services in New York (where a significant portion of the CED’s revenues were derived in the periods covered by the consolidated financial statements included in this annual report) has been adversely affected by the implementation of regulatory changes (for example, shortening the period of time for filing a personal injury and property claim) and efforts to curb auto injury insurance fraud.
Write-Down of Long-Lived Assets and Goodwill
In the fourth quarter of 2006, the Company's management initiated our annual testing for impairment of goodwill, in accordance with applicable accounting pronouncements. We also deemed it appropriate to test for impairment of long-lived assets, since certain impairment indicators were present. During the course of the testing process, we considered a number of events and circumstances that constitute impairment indicators under the literature, including:
| | · | a preliminary expectation that the operating loss in the fourth quarter of 2006 was going to be greater than our fourth quarter forecast; |
| | · | the completion of our 2007 operating budget that reflected an assumption that some of the negative trends adversely affecting the Company's results (discussed above) would continue to a greater extent than our previous forecasts for 2007 and thereafter: and |
| | · | notification during the fourth quarter of a further decline in projected revenue for 2007 from a major customer within the MAAS business. |
Upon completion of the impairment tests, we recorded non-cash impairment charges to long-lived assets and goodwill of $1.8 million and $36.2 million, respectively. For more information regarding these impairment charges, see the discussion under "Results of Operations - Impairment of Long-Lived Assets and Goodwill."
Key Financial and Other Metrics Monitored by Management
In our periodic reports filed with the SEC, we provide certain financial information and metrics about our businesses and each of our two segments, information that our management uses in evaluating the Company’s performance and financial condition. Our objective in providing this information is to help our shareholders and investors generally understand our overall performance and assess the profitability of our businesses and our prospects for future net cash flows.
In 2006, our management primarily focused on tracking our actual results relative to our forecasts and budgets, and measuring the degree of success of efforts to align our costs with lower revenue levels.
With respect to our Health Information Division, our management monitors the following metrics:
| | · | the MIB Life Index data, which, as discussed previously, serves as a proxy for the level of life insurance application activity and indirectly serves to give us a sense of changes in our market share; |
| | · | the number of paramedical examinations and screenings performed by Portamedic and Medicals Direct, respectively; |
| | · | the average revenue per paramedical examination; |
| | · | time service performance, from examination order to completion; |
| | · | the number of tele-interviewing/underwriting reports we generate; |
| | · | the number of specimens tested by our Heritage Labs subsidiary; |
| | · | the average revenue per specimen tested; |
| | · | budget to actual performance at the branch level as well as in the aggregate; and |
| | · | customer and product line profitability. |
With respect to our Claims Evaluation Division, our management monitors the following metrics:
| | · | the number of incoming cases by client and by insurance adjuster; |
| | · | time of service, which measures the time to complete a claim, from receipt to issuing a report; and |
| | · | budget to actual financial performance, including customer and product line profitability. |
Certain of the above-cited metrics are discussed in the comparative discussion and analysis of our results of operations that follows.
Results of Operations
Comparative Discussion and Analysis of Results of Operations in 2006, 2005 and 2004
The table below sets forth certain consolidated statements of operations and other data, and certain key statistics, for the periods indicated.
Revenues by Component Businesses and Reporting Segments
(in thousands) | For the Years Ended December 31 |
| | 2006 | % Change | 2005 | % Change | 2004 |
| | | | | | |
| HID | | | | | |
| Portamedic | $157,869 | -8.2% | $ 171,916 | -9.1% | $ 189,100 |
| Infolink | 32,098 | 2.6% | 31,275 | 12.1% | 27,902 |
| Medicals Direct Group (MDG) | 38,770 | -8.1% | 42,198 | 4.6% | 40,337 |
| Other | 33,822 | -7.3% | 36,466 | 41.1% | 25,839 |
| Total HID | 262,559 | -6.8% | 281,855 | -0.5% | 283,178 |
| CED | 31,303 | -18.7% | 38,491 | -11.5% | 43,473 |
| Total | $293,862 | -8.3% | $ 320,346 | -1.9% | $ 326,651 |
Revenues
Consolidated revenues for the year ended December 31, 2006 were $293.9 million, a decline of $26.5 million or 8.3% from the corresponding period of the prior year. The revenue for the year ended December 31, 2005 was $320.3 million or $6.3 million and 1.9% below the same period in the prior year. As explained in greater detail below, similar market forces influenced the revenues and operating results of our two divisions, and the component businesses within our Health Information Division throughout the three year period ended December 31, 2006.
Health Information Division
Our Health Information Division’s (HID) revenues of $262.6 million for the year ended December 31, 2006 were $19.3 million or 6.8% below the prior year. Revenues for the year ended December 31, 2005 were $1.3 million or 0.5% below the corresponding period in the prior year.
Portamedic
The decline in revenues of our Portamedic business has been the primary reason for the decline in HID revenues. The decline in Portamedic revenues for the years ended December 31, 2006 and 2005 reflected a combination of:
| | · | fewer paramedical examinations performed; 2,264,000 in 2006, 2,470,000 in 2005, and 2,566,000 in 2004; and |
| | · | lower average revenue per paramedical examination; $72.01 in 2006, $73.15 in 2005, and $77.47 in 2004. |
We attribute a portion of the reduction in the number of paramedical examinations performed in 2006 and 2005 to a decline in life insurance application activity in the United States (as reported by the MIB Life Index) and therefore the need for fewer paramedical examinations. We also believe that we have lost market share for the services we provide to the insurance industry from 2003 through mid-2006. In an attempt to reverse this loss, management has implemented several initiatives, including the hiring of additional salespersons in the fourth quarter of 2006, along with implementing sales incentive plans for all sales personnel of the Company. In addition, the reduction in revenue in 2006 reflects the continuing effect of the loss of a significant customer which began in the first quarter of 2005, and accounted for approximately 2.0% of the Portamedic’s revenues in 2005 and 3.3% in 2004. In 2005, two customers were lost; the total of both customers’ revenue accounted for 4.2% of Portamedic’s revenues in 2004. The lower average revenue per exam is primarily attributable to downward pricing pressure in both 2006 and 2005 from our insurance company customers in an effort to control their costs.
Infolink
Our Infolink business (tele-underwriting/interviewing and attending physician statement (APS) retrieval, which represents the larger of the two Infolink revenue components) increased 2.6% to $32.1 million for the full year of 2006 versus the same period of the prior year. This increase in revenue reflects an increase in the number of tele-interviewing units partially offset by a reduced number of APS units. The tele-interviewing business, which represents 23% of the Infolink revenue, continues to grow significantly, with 2006 growth in units at 32.4%. The increase in our tele-interviewing business results primarily from new customer volume and increases at existing customers. APS revenues, which represents 70% of the Infolink revenue, is down 3.3% from 2005. This is due to both a decline in units and average price.
Tele-interviewing has become an increasingly accepted practice by insurance companies because of its time and cost advantages. The decrease in APS units for the year ended December 31, 2006, is primarily attributable to the decline in APS orders during the period in which branch office APS services were consolidated to our centralized facility in Kansas City. The consolidation, which is now complete, should improve the quality and reduce the time service for APS retrieval, which we believe will result in an increase in orders in 2007.
Our revenues in 2005 from our Infolink business was $31.3 million, an increase of 12.1% compared to 2004. The increase is attributable to an increase in customers utilizing our tele-underwriting services, along with an increased number of reports requested from existing customers.
Medicals Direct Group
Medicals Direct Group’s (MDG) 2006 revenues were down $3.4 million or 8.1%, compared to the prior year. Of this amount, approximately $3.9 million (or 9.2%) represents a decline in MDG’s revenue, partially offset by a favorable change in the Pound Sterling/U.S.$ average exchange rate of $0.5 million (or 1.1%). The decline in MDG’s revenues (excluding the foreign exchange impact) for the full year of 2006 is primarily attributable to a decrease in MDG’s outsourced underwriting business of $3.0 million or 40.0% and a decrease in MDG’s medical screening business of $1.1 million or 3.6%, partially offset by incremental revenue of $1.5 million from the January 2006 acquisition of Doctors Direct.
MDG’s outsourced underwriting business represented approximately 11.7% of its total revenues for the year ended December 31, 2006. Three of MDG’s underwriting clients terminated their contracts in 2006 due to a reduction in their volumes of life insurance applications, while several other clients reduced their use of MDG’s underwriting services.
The screenings business (nurse and physician exams) represented 75.0% of MDG’s total revenues for the year ended December 31, 2006. The reduction in revenues primarily resulted from a combined revenue decline of $3.5 million from two of MDG’s customers. Partially offsetting these declines are both revenues from new customers and volume increases from other existing accounts.
Reductions in both the underwriting and screenings businesses resulted from declining life insurance policy sales and therefore, the need for MDG’s services. Declines in policy sales is partially attributable to the decline in the U.K housing market, among other factors, which is a key driver in purchasing life insurance policies in the U.K.
Medicals Direct Group (MDG) experienced an increase in revenues of $1.9 million, or 4.6% in 2005 compared to 2004. MDG’s results in 2005 reflect:
| | · | substantial growth in revenues derived by MDG’s Definitech physician exams business, up 37.8% over 2004. This business represented approximately 26.8% of MDG’s revenues in 2005; |
| | · | an 8.0% increase in revenues derived by MDG’s underwriting business, which represented approximately 18.0% of MDG’s revenues in 2005; |
| | · | a 4.1% decline in MDG’s revenues from screenings, reflecting the reported 30% reduction in the number of life insurance policies underwritten compared to the prior year and the increased competition MDG is facing in the U.K. market, which our management views as a mature market. Screenings represented 44.2% of MDG’s revenues in 2005. |
Other
Our remaining HID revenues consist principally of the revenues derived by Heritage Labs and Mid-America Agency Services (MAAS), our outsourced underwriting business in the U.S.
Heritage Labs’ revenues in 2006 were $17.9 million, a decline of $1.3 million or 6.8% compared to 2005. Heritage Labs tested fewer specimens (805,000 vs. 861,000) in 2006 compared to the prior year. Heritage’s average revenue per specimen tested was higher in 2006 ($15.08 vs. $14.16). The reduced demand for Heritage Labs’ services is primarily attributable to the loss of a client as a result of that client being acquired by another insurance company, which is not a customer of Heritage Labs, along with volume reductions at a customer resulting from its decision to distribute their lab-testing among several suppliers. The increased average revenue per specimen is primarily the result of greater utilization of additional tests. Heritage Labs’ laboratory currently operates at approximately 65% of capacity. We are exploring business opportunities, including opportunities in the wellness and disease management markets, to utilize the additional capacity of our laboratory.
Heritage Labs’ revenues in 2005 increased to $19.2 million, an increase of 14.5% from the 2004 level of $16.7 million. The increased revenues reflected increases in the number of specimens tested (861,000 in 2005 vs. 800,000 in 2004), as well as increases in the average revenue per specimen tested ($14.16 in 2005 and $13.71 in 2004).
MAAS’s revenues in 2006 of $16.0 million were down $1.3 million or 7.7% compared to the prior year. The decrease was attributable to a reduction in the number of life insurance applications being underwritten by MAAS’ customers in 2006.
MAAS has been notified by a major client that in order to mitigate the client’s risk in utilizing MAAS as its sole outsourced underwriter, the client will expand its underwriter supplier network beginning in 2007. As a result of the reduction in revenue from this client, MAAS’s 2007 annual revenues are expected to decline by approximately $7.0 million. We are aggressively pursuing additional revenue opportunities to replace this expected loss in volume, including the hiring of 2 new sales people.
Our revenues in 2005 from MAAS’ outsourced underwriting business increased to $17.3 million, compared to $9.1 million in the eight-month period of 2004 (i.e. from the time of our acquisition of MAAS in May 2004). The increase was due to a full year of revenues in 2005 and an increase in volume from MAAS’s principal customer.
Claims Evaluation Division
Our Claims Evaluation Division (CED) operates under the name of Hooper Evaluations, Inc. following the merger into Hooper Evaluations, Inc. of the four companies (i.e., D&D Associates, Medimax, Allegiance Health and Michigan Evaluation Group) we acquired between November 2002 and May 2004. The merger was effected in February 2006.
Our Claims Evaluation Division’s revenues for 2006 were $31.3 million, down $7.2 million (or 18.7%) compared to the full year of 2005. The decline is primarily attributable to the following:
| · | a reduction in peer reviews in New York State, which we believe reflects increased cost consciousness on the part of property and casualty insurance carriers, self-insureds and third-party administrators and the perception that such reviews have been of limited value in litigating claims; |
| · | a decrease in the number of independent medical exams (IMEs) ordered by our customers when evaluating a claim; and |
| · | a decrease in the number of claims referred to the division by its existing customer base. The Company has recently hired additional salespersons to expand our customer base, while offering several new products/services. |
CED experienced a decline in revenues in 2005 of $5.0 million, compared to 2004 ($38.5 million in 2005 vs. $43.5 million in 2004). The decrease in 2005 was attributable to several factors, including:
| | · | the reported decline in automobile accident-related claims activity in the New York market, which management believes reflected more conservative automobile insurance underwriting standards; |
| | · | the continuing effects of regulatory changes adopted in the mid-1990s that, among other things, require claimants and medical practitioners to notify insurers of potential no-fault auto claims on a more timely basis, which has, in turn, resulted in a decline in the number of claims that may be considered for an IME or peer review; and |
| | · | heightened enforcement of insurance fraud laws by the New York State Attorney General, the New York State Insurance Bureau and the district attorney’s office and special investigative units of insurance companies, which reduced the need for additional claims evaluation services. |
Cost of Operations
Our total cost of operations amounted to $225.0 million in 2006, compared to $238.7 million in 2005 and $236.4 million in 2004. The following table shows the cost of operations as a percentage of revenues (and, in the case of the HID, further broken down by certain of the component businesses) during the last three years.
| | For the Years Ended December 31, |
| | | As a % of | | As a % of | | As a % of |
(in thousands) | 2006 | Revenues | 2005 | Revenues | 2004 | Revenues |
| HID | | | | | | |
| Portamedic/ Infolink | $152,089 | 80.1% | $157,316 | 77.4% | $159,280 | 73.4% |
| Medicals Direct | 29,329 | 75.3% | 31,904 | 75.6% | 30,511 | 75.6% |
| Other | 21,031 | 62.2% | 22,112 | 60.6% | 16,650 | 64.4% |
| Total HID | 202,449 | 77.1% | 211,332 | 75.0% | 206,441 | 72.9% |
| | | | | | | |
| CED | 22,594 | 72.2% | 27,413 | 71.2% | 29,918 | 68.8% |
| Total | $225,043 | 76.6% | $238,745 | 74.5% | $236,359 | 72.3% |
Health Information Division
Cost of operations for the Health Information Division was $202.4 million in 2006, compared to $211.3 million in 2005 and $206.4 million in 2004. As a percentage of the HID revenues, cost of operations increased to 77.1% in 2006, compared to 75.0% in 2005 and 72.9% in 2004. Certain amounts reported as HID Cost of Operations in the 2005 and 2004 Form 10-K have been reclassified to conform with the 2006 financial statement presentation. The increase in the cost of operations as a percentage of the HID’s revenues in 2006 was primarily attributable to:
| | · | a decline in revenues in our Portamedic, Medicals Direct, Heritage Labs and MAAS businesses, without a corresponding adjustment to the applicable cost structures; |
| | · | higher fees paid to contract paramedical examiners, reflecting the Company's efforts to retain and recruit qualified examiners; |
| | · | the lower average revenue per Portamedic examination; and |
| | · | the higher proportion of segment revenues derived by our lower-margin tele-interviewing/underwriting business relative to our higher-margin Portamedic paramedical exam business. |
The increase in cost of operations was partially offset by lower material costs for Heritage Labs.
As noted previously in the “Overview” section of management’s discussion and analysis, the Company completed a strategic review in September 2006 which resulted in detailed plans to implement expense management initiatives identified during the review. Many of these initiatives are targeted to reduce our cost of operations, such as our balancing of office volumes with operating costs, while eliminating geographic overlap among our offices. Additional expense management initiatives are discussed in the “Overview” section.
The increase in cost of operations as a percentage of revenues for the Health Information Division in 2005 compared to 2004 was due to the following:
| | · | the lower average revenue per Portamedic examination; |
| | · | the higher proportion of segment revenues derived by our lower-margin tele-interviewing/underwriting business relative to our higher-margin Portamedic paramedical exam business; |
| | · | an increase in Portamedic and Infolink branch operating expenses of approximately $1.2 million despite a decrease in revenue; and |
| | · | higher fees paid to contract paramedical examiners, reflecting the Company's efforts to retain and recruit qualified examiners. |
Claims Evaluation Division
Cost of operations for the CED totaled $22.6 million in 2006, compared to $27.4 million in 2005 and $29.9 million in 2004. As a percentage of revenues, cost of operations represented 72.2%, 71.2% and 68.8% in 2006, 2005 and 2004, respectively. The percentage increase in 2006 and 2005 was primarily attributable to:
| | · | lower revenue levels of our higher margin peer review revenue; and |
| | · | increased costs associated with administering claims to our expanding geographic customer base. Revenues generated in regions where our network of physicians is less extensive tend to have a higher physician cost. |
Selling, General and Administrative Expenses
(in thousands) | For the years ended December 31, | Change Increase (Decrease) |
| | 2006 | 2005 | 2004 | 2006 vs. 2005 | 2005 vs. 2004 |
| HID | $67,549 | $65,856 | $61,514 | $1,693 | $4,342 |
| CED | 8,416 | 9,841 | 9,697 | (1,426) | 144 |
| Total | $75,965 | $75,697 | $71,211 | $ 267 | $4,486 |
As reflected in the table above, consolidated selling, general and administrative (SG&A) expenses in 2006 were $0.3 million above 2005. The 2005 SG&A amount was $4.5 million or 6.3% higher than in 2004. Certain amounts reported as HID SG&A expense in the 2005 and 2004 Form 10-K have been reclassified to conform with the 2006 financial statement presentation, including restructuring and other charges of approximately $6.6 million in 2005, and $1.5 million in 2004.
As previously described, the Company completed a strategic review in September 2006 which includes detailed implementation plans to reduce SG&A expenses. The implementation period will cover eight quarters and is expected to reduce SG&A expenses for both our HID and CED divisions.
Health Information Division
The HID’s SG&A represented 25.7%, 23.4% and 21.8% of segment revenues in 2006, 2005 and 2004, respectively. The SG&A for the HID segment includes segment SG&A plus SG&A for all corporate overhead departments. SG&A expenses for the HID segment increased $1.7 million to $67.5 million for the year ended December 31, 2006 compared to $65.9 million in the same period last year.
The $1.7 million increase in SG&A in 2006 compared with the prior year was primarily due to:
| | · | increased IT costs such as additional data networks, new software license and maintenance fees and increased depreciation expense in 2006 totaling approximately $2.0 million, resulting from our new branch operating system and financial operating systems; |
| | · | additional 2006 expenses totaling $0.4 million attributable to bank fees related to our previous credit facility and expenses associated with the completion of our 2006 strategic review; |
| | · | increased bad debt expense associated with the Company’s review of the collectability of certain Portamedic accounts receivable of approximately $0.7 million; and |
| | · | increased SG&A at MDG, primarily due to the full year impact of Doctors Direct acquired in January 2006, totaling $1.1 million. |
The increases listed above have been partially offset by reduced intangible asset amortization expense in 2006 of approximately $2.3 million as a result of the Company’s impairment charge recorded in 2005 for intangible assets.
The $4.1 million increase in SG&A in 2005 compared with 2004 was primarily due to:
| | · | increased MAAS staffing and facility costs of $1.4 million; |
| | · | increased IT costs such as salaries, software development, data transmission media upgrades and leased computer equipment charges, totaling $1.7 million; and |
| | · | additional SG&A at MDG, primarily due to the full year impact in 2005 of two acquisitions completed in 2004, totaling $1.1 million. |
Claims Evaluation Division
The CED’s SG&A represented 26.9%, 25.6% and 22.3% of segment revenues in 2006, 2005 and 2004, respectively. The CED’s SG&A represented a greater percentage of its revenues in 2006 primarily as a result of a decline in revenues. In absolute terms, SG&A was $1.4 million lower than in 2005. The increase in the division’s SG&A, in absolute terms and as a percentage of division revenues in 2005 over 2004, was also due to a decline in revenues without a corresponding adjustment to SG&A expenses.
Impairment of Long-Lived Assets and Goodwill
In the fourth quarter of 2006, the Company’s management initiated the testing for impairment of long-lived assets and its annual goodwill impairment testing in accordance with Statement of Financial Accounting Standards (SFAS) No. 144 “Accounting for the Impairment or Disposal of Long-Lived Assets” (SFAS No. 144) and SFAS No. 142 “Goodwill and Other Intangible Assets” (SFAS No. 142), respectively.
Long-Lived Assets
Under SFAS No. 144, long-lived assets, including amortizable intangible assets, are to be tested for impairment when impairment indicators are present. As discussed in the Overview, there were several events and circumstances that constituted impairment indicators in the fourth quarter of 2006.
Accordingly, we initiated an impairment analysis of our long-lived assets and determined that the carrying values of some of the long-lived assets exceeded their projected undiscounted net cash flows. With the assistance of an independent valuation firm, we calculated the fair values of our long-lived assets. The fair values were determined based on discounted cash flows and indicated that an impairment of certain of our intangible assets existed. Accordingly, during the fourth quarter of 2006 the Company recorded an impairment charge totaling $1.8 million. The impairment charge consisted of an impairment of HID intangible assets (e.g., customer relationships, non-competition agreements and trade names) and is recorded within impairment of goodwill and intangible assets on the consolidated statement of operations.
Goodwill
Under SFAS No. 142, the impairment test involves determining the fair value of the reporting unit and comparing that value to its carrying amount. If the carrying amount exceeds the fair value, an impairment loss is recognized for any excess of the carrying amount of the reporting unit’s goodwill over the implied fair value of that goodwill. The implied fair value of goodwill is determined in the same manner as would occur in a purchase transaction, treating the fair value of the reporting unit as the equivalent of the purchase price and deducting from that amount, the fair value of the net assets assigned to the reporting unit.
As part of our annual impairment assessment under SFAS No. 142, the Company considered all of the impairment indicators previously discussed, as well as the impairment recorded on its long-lived assets. With the assistance of the independent valuation firm, we determined the fair values of each of our reporting units utilizing both discounted cash flows and market-based methodologies. We have defined our reporting segments (HID and CED) as our reporting units for goodwill accounting. The analysis indicated that the carrying amount of each reporting unit exceeded its fair value. Accordingly, under SFAS No. 142, we were required to perform the second step of the impairment testing for both reporting units. This entailed adjusting the assets and liabilities of each reporting unit to their fair market values as of December 31, 2006, for purposes of comparing the implied fair value of the reporting unit’s goodwill to the carrying amount of such goodwill. The analysis indicated a goodwill impairment of $34.8 million for HID and $1.4 million for CED. These amounts were recorded in the fourth quarter of 2006.
In the fourth quarter of 2005, the Company's management performed its annual testing for impairment of goodwill, in accordance with applicable accounting pronouncements. We also deemed it appropriate to test for impairment of long-lived assets, since certain impairment indicators were present. During the course of the testing process, we considered a number of events and circumstances that constitute impairment indicators under the literature, including:
| · | the Company's operating loss in the third quarter of 2005; |
| · | a preliminary expectation of an operating loss in the fourth quarter of 2005; |
| · | projections of operating results in future periods that reflected an assumption that some of the negative trends adversely affecting each of the Company's two divisions (discussed above) would continue; and |
| · | a decline in the market price of our common stock over a sustained period of time. |
With the assistance of an independent valuation firm, we determined that certain intangible assets as well as goodwill for both reporting units were impaired. Upon completion of the impairment tests, we recorded non-cash impairment charges to certain intangible assets and goodwill of $18.0 million ($17.3 million in CED and $0.7 million in HID) and $115.6 million ($26.0 million in CED and $89.6 million in HID), respectively
Restructuring and Other Charges
For the year ended December 31, 2006, the Company recorded restructuring and other charges of approximately $10.5 million. The charges are primarily attributable to:
| · | restructuring charges for employee severance and branch office closures totaling $2.3 million; |
| · | a fee payable to outside consultants, including expenses, of $5.6 million based on the results of the Company’s 2006 strategic review; |
| · | a contract cancellation fee related to the early termination of a software resale agreement totaling $0.5 million; |
| · | legal and audit fees related to the Company’s restatement of its 2004 and 2005 financial statements of approximately $0.9 million; and |
| · | a litigation settlement charge of $1.2 million pertaining to a lawsuit filed against the Company alleging violations of California wage and hour laws. The payment of this settlement is expected to occur in the third quarter of 2007. |
For the year ended December 31, 2005, the Company recorded approximately $6.6 million of restructuring and other charges pertaining to:
| · | restructuring charges for employee severance and branch office closure costs of $0.6 million; |
| · | an aggregate of $4.6 million in costs associated with the severance packages of our former chief executive officer, chief financial officer and other senior management members; and |
| · | the cancellation of a software development project and contract cancellation fees approximating $1.4 million. |
In 2004, the Company recorded restructuring and other charges of approximately $1.5 million for expenses associated with an audit committee investigation of our former chief executive officer.
Operating Income (Loss)
Our consolidated operating loss for the year ended December 31, 2006 totaled $55.7 million, compared to an operating loss of $134.3 million in the prior year. The decrease results from a lower impairment charge on goodwill and intangibles of $95.6 million ($38.0 million vs. $133.6 million) partially offset by unfavorable operating results and increased special charges. Our operating loss in 2005 of $134.3 million reflected a decrease of $151.9 million from the 2004 operating income of $17.6 million. The decrease in operating income resulted from the goodwill and impairment charge of $133.6 million, unfavorable operating results, as well as increased restructuring and other charges. As a percentage of revenues, the consolidated operating loss for the year ended December 31, 2006 was (18.9%) compared to a consolidated operating loss of (41.9%) for the year ended December 31, 2005 and an operating profit of 5.4% in 2004.
Health Information Division. As a result of the factors discussed above, the HID segment recorded an operating loss of $56.0 million for the year ended December 31, 2006, compared to an operating loss of $135.6 million in 2005 and a $13.7 million operating profit in 2004. As a percentage of revenues, the operating income/(loss) was (21.3%) for the year ended December 31, 2006, compared to (48.1%) in the year ended December 31, 2005 and 4.8% in 2004.
Claims Evaluation Division. Operating income in 2006 was $0.4 million compared to $1.2 million in 2005 and $3.9 million in 2004. As a percentage of revenues, the CED's operating income was 1.2% in 2006, 3.2% in 2005 and 8.9% in 2004.
Income Taxes
Income taxes recorded for the year ended December 31, 2006, totaled $28.9 million, and primarily results from the $31.3 million non-cash charge to record a full valuation allowance for the Company’s deferred tax assets, partially offset by a $2.4 million tax benefit resulting from the Company’s ability to carryback a portion of the 2006 federal net operating loss to 2004.
The Company has significant deferred tax assets attributable to tax deductible intangibles, capital loss carryforwards, and federal and state net operating loss carryforwards, which may reduce taxable income in future periods. During the third quarter of 2006 the Company concluded that based on the decline in revenues and margin, the cumulative tax and operating losses, the lack of taxes in the carryback period, and the uncertainty surrounding the extent or timing of future taxable income, it was no longer more likely than not that it would realize the tax benefits of its deferred tax assets. Accordingly, the Company recorded a full valuation allowance on its net U.S. deferred tax assets in the third quarter of 2006. In addition, the Company recorded a valuation allowance on the additional U.S. deferred tax assets created during the fourth quarter of 2006.
The effective tax rate (benefit) for the years ended December 31, 2006, 2005 and 2004 was 51.3%, (28.5%) and 40.5%, respectively.
Net Income (Loss)
Net loss for the year ended December 31, 2006 was $85.2 million or $(1.28) per share compared to a net loss of $96.6 million or $(1.47) per share in the same period of the prior year. In 2004, the Company reported net income of $10.0 million or $0.15 per diluted share.
Liquidity and Financial Resources
The Company’s primary sources of cash are: i) cash flows from operating activities, ii) the Company’s holdings of cash and cash equivalents and iii) its credit agreement with CitiCapital Commercial Corporation. At December 31, 2006 and 2005, our working capital was $19.9 million and $33.8 million, respectively. Our current ratio as of December 31, 2006 and 2005 was 1.6 to 1 and 2.0 to 1, respectively. The decline in our cash and cash equivalents in 2006 is principally attributable to the following:
| · | restructuring payments related to employee severance and branch office closure costs totaling $2.9 million; |
| · | capital expenditures of $6.1 million; |
| · | seller financed debt, performance-related and other payments in connection with prior years’ acquisitions of $3.8 million; |
| · | our acquisition of Doctors Direct in January 2006 for $1.1 million; and |
| · | principal payments under our prior credit agreement (specifically, to repay the remaining balance under the term loan in full) of $1.0 million. |
These payments were partially offset by income tax refunds of $5.4 million received in 2006, a reduction in accounts receivable of $4.6 million and stock option proceeds of $3.7 million.
Based on our current budgeted level of revenue and operating income, our existing cash and cash equivalents, and borrowing capability under our credit agreement with CitiCapital Commercial Corporation, entered into on October 10, 2006, we believe that we have sufficient funds to meet the Company’s short term and long term cash needs.
Cash Flows from Operating Activities
For the year ended December 31, 2006, net cash provided by operating activities was $4.6 million compared to $5.1 million in the same period of the prior year.
The net cash provided by operating activities in 2006 reflects a net loss of $85.2 million, and includes non-cash charges of $6.5 million in depreciation and amortization, goodwill and intangibles impairment charges of $38.0 million and deferred income taxes of $31.3 million (valuation allowance). Changes in working capital items included:
| | · | a decrease in accounts receivable of $4.6 million, primarily a result of increased cash collections and decreased revenues during the period. Consolidated days sales outstanding (DSO), measured on a rolling 90-day basis was 48 days at December 31, 2006, compared to 51 days at December 31, 2005. The DSO calculation has been revised to include the allowance for doubtful accounts for all periods reported; |
| | · | an increase in accounts payable and accrued expenses of $5.2 million, primarily due to higher accruals for restructuring and special charges; and |
| | · | a decrease in income tax receivable of $2.4 million reflecting tax refunds received in 2006 totaling $5.4 million, partially offset by income tax receivables recorded relating to our operating loss in 2006 which we may carry-back to recoup taxes paid in previous years, and state income tax overpayments. |
The net cash provided by operating activities in 2005 reflects a net loss of $96.6 million, and includes the non-cash impairment charges in the aggregate amount of $133.6 million offset by the related deferred tax benefit ($38.0 million), as well $8.7 million in depreciation and amortization. Changes in working capital items included:
| | · | an increase in accounts receivable of $2.5 million, reflecting new contract terms with certain customers that allow for payment beyond the Company-standard of net 30 days. Consolidated days sales outstanding, measured on a rolling 90-day basis, increased to 51 days at December 31, 2005, compared to 46 days at December 31, 2004; |
| | · | an increase in accounts payable and accrued expenses of $2.1 million, primarily due to increased accruals for severance and restructuring costs and an increase in accounts payable. |
| | · | an increase in income tax receivable of $5.6 million relating to the recording of a receivable for income tax refunds due from federal and local governments. |
Cash Flows used in Investing Activities
In 2006, we used $7.7 million in net cash for investing activities, as follows:
| · | our UK subsidiary, Medicals Direct Group, acquired Doctors Direct for $1.1 million in January 2006; |
| · | we made required performance related payments related to prior year acquisitions totaling $0.9 million; and |
| · | we invested $6.1 million in capital expenditures. These expenditures pertained primarily to our upgrading of the Company’s branch operating system software and hardware. |
During 2005, we used net cash of $4.8 million in investing activities. The Company used net cash of $6.9 million on capital expenditures, including the upgrading of the Company’s financial software system, branch operating software and hardware and software for the CED’s IT systems development project. The Company also redeemed marketable securities of $7.9 million and purchased $1.4 million of marketable securities. In addition, the Company made required performance related payments related to the Allegiance Health Inc., Michigan Evaluation Group, Inc., Medimax Inc. and D&D Associates, Inc. acquisitions totaling $4.4 million.
Cash Flows used in Financing Activities
In 2006, we used $0.5 million in net cash for financing activities, as follows:
| · | we made our final debt repayment of $1.0 million in satisfaction of the outstanding balance under our prior revolving credit loan; |
| · | we made our final payments of $2.9 million for the seller financed debt agreements established for the acquisitions of Heritage Labs, LLC and Michigan Evaluations Group; and |
| · | offsetting these payments, we received $3.7 million in proceeds from stock option exercises. |
During 2005, cash flows used in financing activities were $5.5 million. Dividends of $3.9 million were paid in 2005. Also, a $1.0 million bank debt payment and $1.8 million debt repayments on the seller financed acquisitions of Heritage Labs International, LLC and Michigan Evaluations Group were made. Partially offsetting these uses was $1.4 million received in proceeds derived from the exercise of stock options.
Our Credit Facility
On October 10, 2006, the Company entered into a 3 year Loan and Security Agreement, which replaced its amended and restated revolving credit facility dated as of October 29, 1999. The agreement provides the Company with a senior secured revolving credit facility, the proceeds of which are to be used for general working capital purposes. Under the terms of the Loan and Security Agreement, the lenders have agreed to make revolving credit loans to the Company in an aggregate principal amount at any one time outstanding which, when combined with the aggregate undrawn amount of all unexpired letters of credit, does not exceed:
(i) 90% of “Eligible Receivables” (as that term is defined in the loan and security agreement) of the Company and the Company’s subsidiaries providing guarantees of the indebtedness under the facility; plus
(ii) 65% of the fair market value of the Company’s corporate headquarters located in Basking Ridge, New Jersey -
provided that in no event can the aggregate amount of the revolving credit loans and letters of credit outstanding at any time exceed $25 million. The maximum aggregate face amount of letters of credit that may be outstanding at any time may not exceed $1 million. The Company’s available borrowing base at December 31, 2006 was approximately $19.2 million. As of December 31, 2006, the Company did not have any amounts outstanding under the Loan and Security Agreement. CitiCapital, in its sole discretion based upon its reasonable credit judgment, may (A) establish and change reserves required against Eligible Receivables, (B) change the advance rate against Eligible Receivables or the fair market value of the Company’s corporate headquarters, and (C) impose additional restrictions to the standards of eligibility for Eligible Receivables, any of which could reduce the aggregate amount of indebtedness that may be incurred under the revolving credit facility. See Note 10, Long Term Debt, included in this report on Form 10-K for additional information.
Off-Balance Sheet Arrangements
We do not have any off-balance sheet arrangements that have or are reasonably likely to have a current or future effect on our financial condition, revenues or expenses, results of operations, liquidity, capital expenditures or capital resources that are material to investors.
Share Repurchases
In April 2005, our Board of Directors adopted a resolution authorizing the repurchase of up to 1.5 million shares of our common stock in any calendar year on the open market or through private transactions, provided that such purchases are for the purpose of funding the Stock Purchase Plan, stock option plans and other permissible purposes. All share repurchases are to be made in compliance with applicable rules and regulations and may be discontinued at any time. The Company did not purchase any shares during 2006. For the year ended December 31, 2005, the Company acquired approximately 30,800 shares of treasury stock for approximately $0.1 million.
Under the terms of the Loan and Security Agreement, the Company is not permitted to purchase any shares of its common stock.
Dividends
On February 3, 2006, the Board suspended payment of cash dividends for 2006. No dividends were paid in 2006. Further, we are precluded from declaring or making any dividend payments or other distributions of assets with respect to any class of our equity securities under the terms of the Loan and Security Agreement entered into on October 10, 2006.
Contractual Obligations
The following table sets forth our schedule of contractual obligations at December 31, 2006, including future minimum lease payments under non-cancelable operating leases, employment contract payments and other contractual obligations, comprised of fees payable to an outside consultant based on the results of the Company’s 2006 strategic review of $3.9 million, $1.2 million pertaining to an employment lawsuit settlement and $0.5 million for software license fees.
| | Operating Leases | | Employment Contracts | | Other Obligations | | Total | |
| 2007 | | $ | 10,659 | | $ | 629 | | $ | 4,592 | | $ | 15,880 | |
| 2008 | | | 6,802 | | | 17 | | | 1,042 | | | 7,861 | |
| 2009 | | | 3,039 | | | - | | | - | | | 3,039 | |
| 2010 | | | 1,821 | | | - | | | - | | | 1,821 | |
| 2011 | | | 845 | | | - | | | - | | | 845 | |
| Thereafter | | | 505 | | | - | | | - | | | 505 | |
| | | $ | 23,671 | | $ | 646 | | $ | 5,634 | | $ | 29,951 | |
Litigation
On January 25, 2005 Sylvia Gayed, one of the Company’s examiners in California, filed a class-action lawsuit against the Company in the Superior Court of California, Los Angeles County, alleging violations of California’s wage and hour laws. The complaint alleged that the Company failed to pay overtime wages, provide meal and rest periods and reimbursement for expenses incurred by examiners in performing examinations. We currently employ approximately 400 examiners in California and have employed in excess of 1,400 examiners in California over the past 60 months. Following a mediation on December 6, 2006, the parties reached a settlement, pursuant to which the Company will pay the sum of $1.2 million to the class members in full settlement of this lawsuit.
In the past, some state agencies have claimed that we improperly classified our examiners as independent contractors for purposes of state unemployment tax laws and that we were therefore liable for taxes in arrears, or for penalties for failure to comply with such state agencies’ interpretations of the laws. We received an adverse determination in the State of California, and as a result, converted our examiners located in the State of California to employees. There are no assurances that we will not be subject to similar claims in other states in the future.
On July 11, 2003, the Company received a determination from the Internal Revenue Service that one individual the Company contracted with as an independent contractor should have been classified as an employee in 2002. This ruling also applies to any other individuals engaged by the Company under similar circumstances. The ruling states that the Company may not be subject to adverse consequences, as the Company may be entitled to relief under applicable tax laws (Section 530 of the Revenue Act of 1978). Management believes that the Company qualifies for relief under Section 530. To date, the Company has not received any further communication from the Internal Revenue Service and considers the matter closed.
The Company is a party to a number of legal actions arising in the ordinary course of its business. In the opinion of management, the Company has substantial legal defenses and/or insurance coverage with respect to all of its pending legal actions. Accordingly, none of these actions is expected to have a material adverse effect on the Company’s liquidity, its consolidated results of operations or its consolidated financial position.
Inflation
Inflation has not had, nor is it expected to have, a material impact on our consolidated financial results.
Critical Accounting Policies
A critical accounting policy is one that is important to the portrayal of a company’s operating results and/or financial condition and requires management’s most difficult, subjective or complex judgments, often as a result of the need to make estimates about the effect of matters that are inherently uncertain. Our consolidated financial statements and accompanying notes are prepared in accordance with US generally accepted accounting principles (US GAAP). Preparation of financial statements in accordance with US GAAP requires management to make estimates and assumptions that affect the reported amounts of assets, liabilities, revenues and expenses. We base these determinations upon the best information available to us during the period in which we are accounting for our results. Our estimates and assumptions could change materially as conditions within and beyond our control change or as further information becomes available. Further, these estimates and assumptions are affected by management’s application of accounting policies. Changes in our estimates are recorded in the period the change occurs.
We have identified the accounting policies discussed below as critical to us. The discussion below is not intended to be a comprehensive list of our accounting policies. Our significant accounting policies are more fully described in Note 1 to the consolidated financial statements included elsewhere in this annual report.
Revenue Recognition
Revenue is recognized for paramedical and medical examinations when the examination of the insurance policy applicant is completed. Revenues generated from medical record collection, laboratory testing, independent medical exam, peer review or similar services and other services are recognized when the related service is completed. In all cases, there must be evidence of an agreement with the customer, the sales price must be fixed or determinable, delivery of services must occur and collectibility must be reasonably assured. Revenue in our Medicals Direct Group for certain services performed for the legal profession is recognized upon the successful outcome of the case.
Allowance for Doubtful Accounts
The Company maintains allowances for doubtful accounts for (i) estimated losses resulting from the inability of our customers to make required payments, and (ii) amounts that customers may deduct from their remittances to the Company for billed items not in compliance with customer specifications. Management continuously assesses the financial condition of our customers, the markets in which these customers participate as well as historical trends relating to customer deductions and adjusts the allowance for doubtful accounts based on this periodic review. If the financial condition of our customers were to deteriorate, resulting in their inability to make payments, our ability to collect on accounts could be negatively impacted, in which case additional allowances may be required.
We must make significant management judgments and estimates in determining allowances for doubtful accounts in any accounting period. One significant uncertainty inherent in our analysis is whether our past experience will be indicative of future periods. Adverse changes in general economic conditions could affect our allowance estimates, collection of accounts receivable, cash flows and results of operations.
Impairment of Long-lived Assets, including Intangible Assets and Assets to be Disposed
Long-lived assets with determinable useful lives are reviewed for impairment whenever events or changes in circumstances indicate that their carrying value may not be recoverable. Impairment is a condition that exists when the carrying amount of a long-lived asset exceeds its fair value.
The following are examples of events or changes in circumstances that may indicate an asset’s carrying value may not be recoverable:
| | · | a significant decrease in the market price of a long-lived asset; |
| | · | a significant adverse change in the extent or manner in which a long-lived asset is being used or in its physical condition; |
| | · | a significant adverse change in legal factors or in the business climate that could affect the value of a long-lived asset, including an adverse action or assessment by a regulator; |
| | · | a current period operating cash flow loss combined with a history of operating or cash flow losses or a projection or forecast that demonstrates continuing losses associated with the use of the long lived asset; and |
| | · | a current expectation that, more likely than not, a long-lived asset will be sold or otherwise disposed of significantly before the end of its previously estimated useful life. |
The process to identify if there is an impairment includes the following steps:
| | · | a comparison of the undiscounted net cash flows from the business group to the carrying value of the long-lived assets; and |
| | · | if the carrying value exceeds the undiscounted net cash flows, an impairment is identified. The amount of the impairment is based on the excess of the carrying value of the long-lived assets to its fair value. We estimate the fair value of the long-lived assets with the assistance of a third-party appraiser. |
As discussed in the Overview, there were several events and circumstances that constituted impairment indicators in the fourth quarter of 2006. Accordingly, we initiated an impairment analysis of our long-lived assets and determined that the carrying values of some of the long-lived assets exceeded their projected undiscounted net cash flows. With the assistance of an independent valuation firm, we calculated the fair values of our long-lived assets. The fair values were determined based on discounted cash flows and indicated that an impairment of certain of our intangible assets existed. Accordingly, during the fourth quarter of 2006 the Company recorded an impairment charge totaling $1.8 million. The impairment charge consisted of an impairment of HID intangible assets (e.g., customer relationships, non-competition agreements and trade names) and is recorded within impairment of goodwill and intangible assets on the consolidated statement of operations.
| | Assets to be disposed of are reported at the lower of their carrying amount or fair value less the costs to sell. |
Goodwill Impairment
We are required to test the carrying value of goodwill for impairment annually or when events or changes in circumstances indicate that the carrying value may not be recoverable. Goodwill is tested at the reporting unit level by comparing the carrying value to its fair value. We have defined our two segments (HID and CED) as our SFAS No. 142 Reporting Units. An impairment loss shall be recognized if the carrying value exceeds the fair value.
The goodwill impairment test involves a two step process of determining impairment. In step one, the fair value of the reporting unit is compared to its carrying value and if the carrying value exceeds the fair value there is an impairment. We estimate the fair value of our reporting units with the assistance of a third-party appraiser, which includes a combination of discounted cash flows and market multiples.
The second step identifies the amount of the impairment by comparing the implied fair value of the reporting unit’s goodwill to the carrying value of that goodwill. The implied fair value of the goodwill is determined as though the reporting unit was involved in a business acquisition. (i.e. the existing assets and liabilities are adjusted to fair market value and a valuation is placed on any unrecorded intangibles). The fair value of the reporting unit is then compared to the fair value of the assets and liabilities of that reporting unit and the difference is implied goodwill.
As part of our annual impairment assessment under SFAS No. 142, the Company considered all of the impairment indicators previously discussed, as well as the impairment recorded on its long-lived assets. With the assistance of the independent valuation firm, we determined the fair values of each of our reporting units utilizing both discounted cash flows and market-based methodologies. We have defined our reporting segments (HID and CED) as our reporting units for goodwill accounting. The analysis indicated that the carrying amount of each reporting unit exceeded its fair value. Accordingly, under SFAS No. 142, we were required to perform the second step of the impairment testing for both reporting units. This entailed adjusting the assets and liabilities of each reporting unit to their fair market values as of December 31, 2006, for purposes of comparing the implied fair value of the reporting unit’s goodwill to the carrying amount of such goodwill. The analysis indicated a goodwill impairment of $34.8 million for HID and $1.4 million for CED. These amounts were recorded in the fourth quarter of 2006.
Accounting for Income Taxes
As part of the process of preparing our consolidated financial statements, we are required to estimate our income taxes in each of the jurisdictions which we operate. This process involves estimating our actual current tax expense together with assessing temporary differences resulting from different treatment of items for tax and accounting purposes. These differences result in deferred tax assets and liabilities, which are included within our consolidated balance sheet.
We assess the realization of our deferred tax assets to determine whether an income tax valuation allowance is required. During the third quarter of 2006 the Company concluded that based on the decline in revenues and margin, the cumulative tax and operating losses, the lack of taxes in the carryback period, and the uncertainty surrounding the extent or timing of future taxable income, it was no longer more likely than not that it would realize the tax benefits of its deferred tax assets. Accordingly, the Company recorded a full valuation allowance on its net U.S. deferred tax assets in the third quarter of 2006. In addition, the Company recorded a valuation allowance on the additional U.S. deferred tax assets created during the fourth quarter of 2006. Based on this assessment, during the year ended December 31, 2006, we recorded a full valuation allowance on our net U.S. deferred tax assets totaling $44.2 million.
We intend to reinvest the unremitted earnings of our UK subsidiary. Accordingly, no provision has been made for U.S. or additional non-U.S. taxes with respect to these earnings. In the event of repatriation to the U.S., such earnings would be subject to U.S. income taxes. Foreign tax credits would be available to reduce the amount of U.S. tax otherwise payable in future years.
Share-Based Compensation
In December, 2004 the Financial Accounting Standards Board issued SFAS No. 123 revised 2004, “Share-Based Payment” (“SFAS No. 123R). SFAS No. 123R addresses the accounting for transactions in which an enterprise receives employee services in exchange for (a) equity instruments of the enterprise or (b) liabilities that are based on the fair value of the enterprise’s equity instruments or that may be settled by the issuance of such equity instruments. SFAS No. 123R supersedes Accounting Principles Board Opinion No. 25, “Accounting for Stock Issued to Employees” (“APB No. 25”) and requires companies to recognize compensation cost in an amount equal to the fair value of the share-based payments, such as stock options granted to employees.
On January 1, 2006, the Company adopted SFAS No. 123R using the modified prospective method. Compensation cost for stock options is recognized over the vesting period based on the estimated fair value on the date of the grant. SFAS No. 123R also requires that we estimate a forfeiture rate for all share based awards. We monitor share option exercise and employee termination patterns to estimate forfeiture rates within the valuation model. We estimate the fair values with the assistance of a third-party valuation company. The estimated fair values are based on assumptions, including estimated lives, volatility, dividend yield, and risk-free interest rates. These estimates also consider the probability that the options will be exercised prior to the end of their contractual lives and the probability of termination or retirement of the holder, which are based on reasonable facts but are subject to change based on a variety of external factors.
Recently Issued Accounting Standards
In June 2006, the Financial Accounting Standards Board (“FASB”) issued FASB Interpretation No. 48, “Accounting for Uncertainty in Income Taxes” (“FIN 48”). FIN 48 is intended to clarify the accounting for uncertainty in income taxes recognized in a company’s financial statements in accordance with SFAS No. 109, “Accounting for Income Taxes”. FIN 48 prescribes a recognition threshold and a measurement attribute for the financial statement recognition and measurement of a tax position taken or expected to be taken in a tax return. FIN 48 also provides guidance on the related de-recognition, classification, interest and penalties, accounting for interim periods, disclosure and transition of uncertain tax positions. FIN 48 is effective for fiscal years beginning after December 15, 2006, with the cumulative effect of the change in accounting principle recorded as an adjustment to opening retained earnings. We are currently assessing the expected effect of adopting FIN 48, and we do not presently expect it to have a material impact on our consolidated financial statements.
In September 2006, the FASB issued SFAS No. 157, “Fair Value Measurements” (“SFAS 157”). SFAS 157 establishes a single authoritative definition of fair value, sets out a framework for measuring fair value, and requires additional disclosures about fair-value measurement. SFAS 157 applies only to fair value measurements that are already required or permitted by other accounting standards (except for measurements of share-based payments) and is intended to increase the consistency of those measurements. Accordingly, SFAS 157 does not require any new fair value measurements. However, for some entities, the application of SFAS 157 will change current practice. SFAS 157 is effective for fiscal years beginning after November 15, 2007, and interim periods within those fiscal years. We are still in the process of reviewing the impact, however, we do not expect the adoption of SFAS 157 to have a material impact on our consolidated financial statements.
In September 2006, the Securities and Exchange Commission (“SEC”) issued Staff Accounting Bulletin 108, “Considering the Effects of Prior Year Misstatements When Quantifying Misstatements in Current Year Financial Statement” (“SAB 108”). SAB 108 clarifies the staff’s views regarding the process of quantifying financial statement misstatements. The SEC staff believes registrants must quantify errors using both a balance sheet and income statement approach and evaluate whether either approach results in quantifying a misstatement that, when all relevant quantitative and qualitative factors are considered, is material. SAB 108 allows registrants to adjust prior year financial statements for errors in the carrying amount of assets and liabilities as of the beginning of this fiscal year that were immaterial under a company’s previous method for evaluating errors but material under the method prescribed by SAB 108, with an offsetting adjustment being made to the opening balance of retained earnings. We adopted SAB 108 during the fourth quarter of 2006, effective January 1, 2006, however it did not have a material impact on our consolidated financial statements as of January 1, 2006.
ITEM 7A | Quantitative and Qualitative Disclosures About Market Risk |
The Company is exposed to interest rate risk primarily through its borrowing activities, which are described in Note 10 to the Consolidated Financial Statements. The Company’s credit facility is based on variable rates and is therefore subject to interest rate fluctuations. Accordingly, our interest expense will vary as a result of interest rate changes and the level of any outstanding borrowings. As of December 31, 2006, there were no borrowings outstanding.
We have foreign currency rate exposure to exchange rate fluctuations with respect to the British Pound. We anticipate that such foreign currency exchange rate risk will remain a market risk exposure for the foreseeable future. We assess our market risk based on changes in foreign currency exchange rates by measuring the potential impact on earnings, fair values and cash flows. While our U.K. subsidiary’s results of operations and financial condition are subject to foreign exchange rate fluctuations, we do not consider the related risk to be material to our financial condition or results of operations. If the exchange rate between the British Pound and the U.S. Dollar were to decrease 10%, the effect on net income would have been negligible.
Based on the Company’s market risk sensitive instruments outstanding at December 31, 2006, the Company has determined that there was no material market risk exposure to the Company’s consolidated financial position, results of operations or cash flows as of such date.
ITEM 8 | Financial Statements and Supplementary Data |
| Financial Highlights (unaudited) | 43 |
| | |
INDEX TO CONSOLIDATED FINANCIAL STATEMENTS | |
| | |
Consolidated Financial Statements: | |
| | |
| Reports of Independent Registered Public Accounting Firm | 44-45 |
| Consolidated Balance Sheets | 46 |
| Consolidated Statements of Operations | 47 |
| Consolidated Statements of Stockholders’ Equity | 48 |
| Consolidated Statements of Cash Flows | 49 |
| Notes to Consolidated Financial Statements | 50 |
| Quarterly Financial Data (Unaudited) | 73 |
Financial Highlights (Unaudited)
| | Years ended December 31, |
(in thousands, except per share data and ratios) | 2006 | 2005 | 2004 |
| | | | |
Revenues | $293,862 | $320,346 | $326,651 |
Operating income (loss) | (55,672) | (134,319) | 17,581 |
Net income (loss) | (85,181) | (96,623) | 10,015 |
Earnings (loss) per share — basic | $(1.28) | $(1.47) | $0.15 |
Earnings (loss) per share — diluted | $(1.28) | $(1.47) | $0.15 |
Weighted average number of shares — basic | 66,804,605 | 65,513,451 | 64,996,778 |
Weighted average number of shares — diluted | 66,804,605 | 65,513,451 | 66,534,421 |
Return on stockholders’ equity | (174.5%) | (75.0%) | 4.4% |
Dividend payout rate | - | N/M | 38.9% |
Net cash provided by operating activities | $4,556 | $5,115 | $20,638 |
Working capital | $19,998 | $33,772 | $38,296 |
Cash dividends paid | - | $3,929 | $3,900 |
Cash dividend per share | - | $.06 | $.06 |
Book value per weighted average share outstanding | $.73 | $1.97 | $3.43 |
Closing stock price per common share | $3.31 | $2.55 | $5.92 |
Current ratio | 1.6:1 | 2.0:1 | 2.1:1 |
Quick ratio | 1.3:1 | 1.7:1 | 1.7:1 |
REPORT OF INDEPENDENT REGISTERED PUBLIC ACCOUNTING FIRM
The Board of Directors and Stockholders
Hooper Holmes, Inc.:
We have audited the accompanying consolidated balance sheets of Hooper Holmes, Inc. and subsidiaries as of December 31, 2006 and 2005, and the related consolidated statements of operations, stockholders’ equity and cash flows for each of the years in the three-year period ended December 31, 2006. In connection with our audits of the consolidated financial statements, we also have audited the consolidated financial statement schedule, “Schedule II - Valuation and Qualifying Accounts.” These consolidated financial statements and financial statement schedule are the responsibility of the Company’s management. Our responsibility is to express an opinion on these consolidated financial statements and financial statement schedule based on our audits.
We conducted our audits in accordance with the standards of the Public Company Accounting Oversight Board (United States). Those standards require that we plan and perform the audit to obtain reasonable assurance about whether the financial statements are free of material misstatement. An audit includes examining, on a test basis, evidence supporting the amounts and disclosures in the financial statements. An audit also includes assessing the accounting principles used and significant estimates made by management, as well as evaluating the overall financial statement presentation. We believe that our audits provide a reasonable basis for our opinion.
In our opinion, the consolidated financial statements referred to above present fairly, in all material respects, the consolidated financial position of Hooper Holmes, Inc. and subsidiaries as of December 31, 2006 and 2005, and the results of their operations and their cash flows for each of the years in the three-year period ended December 31, 2006, in conformity with U.S. generally accepted accounting principles. Also in our opinion, the related financial statement schedule, when considered in relation to the basic consolidated financial statements taken as a whole, presents fairly, in all material respects, the information set forth therein.
As discussed in Notes 1 and 4 to the consolidated financial statements, Hooper Holmes, Inc. adopted the provisions of Statement of Financial Accounting Standards No. 123R, “Share-Based Payment,” effective January 1, 2006.
We also have audited, in accordance with the standards of the Public Company Accounting Oversight Board (United States), the effectiveness of Hooper Holmes, Inc. and subsidiaries’ internal control over financial reporting as of December 31, 2006, based on criteria established in Internal Control-Integrated Framework issued by the Committee of Sponsoring Organizations of the Treadway Commission (COSO), and our report dated March 15, 2007 expressed an unqualified opinion on management’s assessment of, and the effective operation of, internal control over financial reporting.
/s/ KPMG LLP
Short Hills, New Jersey
March 15, 2007
REPORT OF INDEPENDENT REGISTERED PUBLIC ACCOUNTING FIRM
The Board of Directors and Stockholders
Hooper Holmes, Inc.:
We have audited management’s assessment, included in the accompanying Management’s Report on Internal Control Over Financial Reporting (Item 9A(b)), that Hooper Holmes, Inc. and subsidiaries maintained effective internal control over financial reporting as of December 31, 2006, based on criteria established in Internal Control-Integrated Framework issued by the Committee of Sponsoring Organizations of the Treadway Commission (COSO). Hooper Holmes, Inc.’s management is responsible for maintaining effective internal control over financial reporting and for its assessment of the effectiveness of internal control over financial reporting. Our responsibility is to express an opinion on management’s assessment and an opinion on the effectiveness of the Company’s internal control over financial reporting based on our audit.
We conducted our audit in accordance with the standards of the Public Company Accounting Oversight Board (United States). Those standards require that we plan and perform the audit to obtain reasonable assurance about whether effective internal control over financial reporting was maintained in all material respects. Our audit included obtaining an understanding of internal control over financial reporting, evaluating management’s assessment, testing and evaluating the design and operating effectiveness of internal control, and performing such other procedures as we considered necessary in the circumstances. We believe that our audit provides a reasonable basis for our opinion.
A company’s internal control over financial reporting is a process designed to provide reasonable assurance regarding the reliability of financial reporting and the preparation of financial statements for external purposes in accordance with generally accepted accounting principles. A company’s internal control over financial reporting includes those policies and procedures that (1) pertain to the maintenance of records that, in reasonable detail, accurately and fairly reflect the transactions and dispositions of the assets of the company; (2) provide reasonable assurance that transactions are recorded as necessary to permit preparation of financial statements in accordance with generally accepted accounting principles, and that receipts and expenditures of the company are being made only in accordance with authorizations of management and directors of the company; and (3) provide reasonable assurance regarding prevention or timely detection of unauthorized acquisition, use, or disposition of the company’s assets that could have a material effect on the financial statements.
Because of its inherent limitations, internal control over financial reporting may not prevent or detect misstatements. Also, projections of any evaluation of effectiveness to future periods are subject to the risk that controls may become inadequate because of changes in conditions, or that the degree of compliance with the policies or procedures may deteriorate.
In our opinion, management’s assessment that Hooper Holmes, Inc. maintained effective internal control over financial reporting as of December 31, 2006, is fairly stated in all material respects, based on criteria established in Internal Control - Integrated Framework issued by the Committee of Sponsoring Organizations of the Treadway Commission (COSO). Also, in our opinion, Hooper Holmes, Inc. maintained, in all material respects, effective internal control over financial reporting as of December 31, 2006, based on criteria established in Internal Control-Integrated Framework issued by the Committee of Sponsoring Organizations of the Treadway Commission (COSO).
We also have audited, in accordance with the standards of the Public Company Accounting Oversight Board (United States), the consolidated balance sheets of Hooper Holmes, Inc. and subsidiaries as of December 31, 2006 and 2005, and the related consolidated statements of operations, stockholders’ equity, and cash flows for each of the years in the three-year period ended December 31, 2006, and our report dated March 15, 2007 expressed an unqualified opinion on those consolidated financial statements.
/s/ KPMG LLP
Short Hills, New Jersey
March 15, 2007
Consolidated Balance Sheets
(In thousands, except share data)
| | | December 31, 2006 | | | | December 31, 2005 | |
| | | | |
ASSETS (Note 9) | | | | | | | |
| Current Assets: | | | | | | | |
| Cash and cash equivalents | | $ | 7,941 | | | | | $ | 11,683 | |
| Accounts receivable, net | | | 37,466 | | | | | | 42,121 | |
| Deferred income taxes | | | - | | | | | | 1,295 | |
| Income tax receivable | | | 3,209 | | | | | | 5,612 | |
| Other current assets | | | 5,139 | | | | | | 5,290 | |
| Total current assets | | | 53,755 | | | | | | 66,001 | |
| | | | | | | | | | | |
| Property, plant and equipment, net | | | 15,839 | | | | | | 13,478 | |
| Goodwill | | | 5,702 | | | | | | 40,038 | |
| Intangible assets, net | | | 8,721 | | | | | | 12,203 | |
| Deferred income taxes | | | 310 | | | | | | 30,269 | |
| Other assets | | $ | 570 | | | | | $ | 342 | |
| Total assets | | $ | 84,897 | | | | | $ | 162,331 | |
| | | | | | | | | | | |
LIABILITIES AND STOCKHOLDERS' EQUITY | | | | | | | | | | |
| Current liabilities: | | | | | | | | | | |
| Current maturities of long-term debt | | $ | - | | | | | $ | 1,000 | |
| Accounts payable | | | 12,796 | | | | | | 13,706 | |
| Accrued expenses | | | 17,170 | | | | | | 14,333 | |
| Income taxes payable | | | 3,791 | | | | | | 3,190 | |
| Total current liabilities | | | 33,757 | | | | | | 32,229 | |
| Other long-term liabilities | | | 2,332 | | | | | | 1,200 | |
| Commitments and Contingencies (Note 10) | | | | | | | | | | |
| | | | | | | | | | | |
| Stockholders’ Equity: | | | | | | | | | | |
| Common stock, par value $.04 per share; authorized 240,000,000 shares, issued 67,933,274 and 67,499,074 shares as of December 31, 2006 and 2005, respectively. | | | 2,717 | | | | | | 2,700 | |
| Additional paid-in capital | | | 115,219 | | | | | | 121,278 | |
| Accumulated other comprehensive income | | | 1,550 | | | | | | 354 | |
| Retained earnings (deficit) | | | (70,607 | ) | | | | | 14,574 | |
| | | | 48,879 | | | | | | 138,906 | |
| Less: Treasury stock, at cost 9,395 shares and 1,328,795 shares as of December 31, 2006 and 2005, respectively | | | 71 | | | | | | 10,004 | |
| Total stockholders' equity | | | 48,808 | | | | | | 128,902 | |
| Total liabilities and stockholders' equity | | $ | 84,897 | | | | | $ | 162,331 | |
See accompanying notes to consolidated financial statements. |
Consolidated Statements of Operations
(In thousands, except share data)
| | | Years ended December 31, | |
| | | 2006 | | 2005 | | 2004 | |
Revenues | | $ | 293,862 | | $ | 320,346 | | $ | 326,651 | |
Cost of operations | | | 225,043 | | | 238,745 | | | 236,359 | |
Gross profit | | | 68,819 | | | 81,601 | | | 90,292 | |
Selling, general and administrative expenses | | | 75,965 | | | 75,697 | | | 71,211 | |
Impairment of goodwill and intangibles | | | 38,019 | | | 133,584 | | | - | |
Restructuring and other charges | | | 10,507 | | | 6,639 | | | 1,500 | |
Operating income (loss) | | | (55,672 | ) | | (134,319 | ) | | 17,581 | |
Other income (expense): | | | | | | | | | | |
Interest expense | | | (421 | ) | | (524 | ) | | (632 | ) |
Interest income | | | 196 | | | 297 | | | 245 | |
Other expense, net | | | (417 | ) | | (530 | ) | | (347 | ) |
| | | | (642 | ) | | (757 | ) | | (734 | ) |
Income (loss) before income taxes | | | (56,314 | ) | | (135,076 | ) | | 16,847 | |
Income tax provision (benefit) | | | 28,867 | | | (38,453 | ) | | 6,832 | |
Net income (loss) | | $ | (85,181 | ) | $ | (96,623 | ) | $ | 10,015 | |
Earnings (loss) per share: | | | | | | | | | | |
Basic | | $ | (1.28 | ) | $ | (1.47 | ) | $ | 0.15 | |
Diluted | | $ | (1.28 | ) | $ | (1.47 | ) | $ | 0.15 | |
Weighted average number of shares — basic | | | 66,804,605 | | | 65,513,451 | | | 64,996,778 | |
Weighted average number of shares — diluted | | | 66,804,605 | | | 65,513,451 | | | 66,534,421 | |
See accompanying notes to consolidated financial statements.
Consolidated Statements of Stockholders’ Equity
(In thousands, except share data)
| | | | | | | | | |
| | | | Accumulated | | | |
| | Common Stock | Additional | Other Com- | Retained | Treasury Stock | |
| | Number of Shares | Amount | Paid in Capital | prehensive Income | Earnings (Deficit) | Number of Shares | Amount | Total |
| Balance, December 31, 2003 | 67,499,074 | $2,700 | $127,488 | $856 | $109,011 | (2,662,151) | $(20,179) | $219,876 |
| Net income | | | | | 10,015 | | | 10,015 |
| Cash dividends ($.060 per share) | | | | | (3,900) | | | (3,900) |
| Unrealized gains (loss) on marketable securities, net of tax | | | | (9) | | | | (9) |
| Foreign currency translation | | | | 619 | | | | 619 |
| Exercise of stock options | | | (1,496) | | | 235,000 | 1,781 | 285 |
| Exercise of stock option-tax benefit | | | 409 | | | | | 409 |
| Issuance of stock awards | | | (21) | | | 30,000 | 227 | 206 |
| Issuance of shares for employee stock purchase plan | | | (294) | | | 99,156 | 752 | 458 |
| Balance, December 31, 2004 | 67,499,074 | 2,700 | 126,086 | 1,466 | 115,126 | (2,297,995) | (17,419) | 227,959 |
| Net loss | | | | | (96,623) | | | (96,623) |
| Cash dividends ($.060 per share) | | | | | (3,929) | | | (3,929) |
| Unrealized gains (loss) on marketable securities, net of tax | | | | 6 | | | | 6 |
| Foreign currency translation | | | | (1,118) | | | | (1,118) |
| Exercise of stock options | | | (5,930) | | | 968,500 | 7,298 | 1,368 |
| Exercise of stock options-tax benefit | | | 844 | | | | | 844 |
| Issuance of stock awards | | | (83) | | | 31,500 | 239 | 156 |
| Purchase of treasury stock | | | | | | (30,800) | (122) | (122) |
| Modification of stock options | | | 361 | | | | | 361 |
| Balance, December 31, 2005 | 67,499,074 | 2,700 | 121,278 | 354 | 14,574 | (1,328,795) | (10,004) | 128,902 |
| Net loss | | | | | (85,181) | | | (85,181) |
| Unrealized gains (loss) on marketable securities, net of tax | | | | 1 | | | | 1 |
| Foreign currency translation | | | | 1,195 | | | | 1,195 |
| Exercise of stock options | 434,200 | 17 | (6,284) | | | 1,319,400 | 9,933 | 3,666 |
| Share-based compensation | | | 226 | | | | | 226 |
| Balance, December 31, 2006 | 67,933,274 | $2,717 | $115,219 | $1,550 | $(70,607) | (9,395) | $(71) | $48,808 |
See accompanying notes to consolidated financial statements.
Consolidated Statements of Cash Flows
(In thousands, except share data)
| | | Years ended December 31, | |
| | | 2006 | | 2005 | | 2004 | |
Cash flows from operating activities: | | | | | | | |
| Net income (loss) | | $ | (85,181 | ) | $ | (96,623 | ) | $ | 10,015 | |
Adjustments to reconcile net income (loss) to net cash provided by operating activities: | | | | | | | | | | |
| Depreciation | | | 3,763 | | | 3,590 | | | 3,549 | |
| Amortization | | | 2,774 | | | 5,073 | | | 5,232 | |
| Impairment of goodwill and intangibles | | | 38,019 | | | 133,584 | | | - | |
| Provision for bad debt expense | | | 1,402 | | | 787 | | | 174 | |
| Deferred income taxes | | | 31,292 | | | (37,999 | ) | | 3,121 | |
| Net realized losses on marketable securities | | | | | | | | | | |
| available for sale | | | - | | | 9 | | | 1 | |
| Share based compensation expense | | | 226 | | | - | | | - | |
| Issuance of directors stock awards | | | - | | | 156 | | | 206 | |
| Modification of stock options | | | - | | | 361 | | | - | |
| Write-offs of software | | | - | | | 1,420 | | | - | |
| Loss (gain) on sale of fixed assets | | | 126 | | | 140 | | | (111 | ) |
| Change in assets and liabilities, net of effect from acquisitions of businesses: | | | | | | | | | | |
| Accounts receivable | | | 4,631 | | | (2,525 | ) | | (789 | ) |
| Other assets | | | (101 | ) | | 674 | | | 417 | |
| Income tax receivable | | | 2,403 | | | (5,612 | ) | | - | |
| Accounts payable and accrued expenses | | | 5,202 | | | 2,080 | | | (1,177 | ) |
Net cash provided by operating activities | | | 4,556 | | | 5,115 | | | 20,638 | |
| | | | | | | | | | | |
Cash flows from investing activities: | | | | | | | | | | |
| Purchases of marketable securities | | | - | | | (1,396 | ) | | (7,064 | ) |
| Redemptions of marketable securities | | | 385 | | | 7,896 | | | 20,411 | |
| Business acquisitions, net of cash acquired | | | (1,963 | ) | | (4,421 | ) | | (26,871 | ) |
| Capital expenditures | | | (6,110 | ) | | (6,871 | ) | | (4,276 | ) |
Net cash used in investing activities | | | (7,688 | ) | | (4,792 | ) | | (17,800 | ) |
| | | | | | | | | | | |
Cash flows from financing activities: | | | | | | | | | | |
| Principal payments on long-term debt | | | (1,000 | ) | | (1,021 | ) | | (1,540 | ) |
| Seller financed debt | | | (2,927 | ) | | (1,796 | ) | | - | |
| Debt financing fees | | | (215 | ) | | - | | | - | |
| Proceeds from employee stock purchase plan | | | - | | | - | | | 458 | |
| Proceeds related to the exercise of stock options | | | 3,666 | | | 1,368 | | | 285 | |
| Treasury stock acquired | | | - | | | (122 | ) | | - | |
| Dividends paid | | | - | | | (3,929 | ) | | (3,900 | ) |
Net cash used in financing activities | | | (476 | ) | | (5,500 | ) | | (4,697 | ) |
| Effect of exchange rate changes on cash | | | (134 | ) | | (113 | ) | | 181 | |
| | | | | | | | | | | |
Net decrease in cash and cash equivalents | | | (3,742 | ) | | (5,290 | ) | | (1,678 | ) |
Cash and cash equivalents at beginning of year | | | 11,683 | | | 16,973 | | | 18,651 | |
Cash and cash equivalents at end of year | | $ | 7,941 | | $ | 11,683 | | $ | 16,973 | |
| Supplemental disclosure of non-cash investing activity: | | | | | | | | | | |
| Change in net unrealized (loss) gain on marketable securities | | $ | 1 | | $ | 10 | | $ | (30 | ) |
| Supplemental disclosure of cash flow information: | | | | | | | | | | |
| Cash paid during the year for: | | | | | | | | | | |
| Interest | | $ | 234 | | $ | 636 | | $ | 306 | |
| Income taxes | | $ | 495 | | $ | 3,692 | | $ | 5,598 | |
See accompanying notes to consolidated financial statements
Notes to Consolidated Financial Statements
Note 1 — Summary of Significant Accounting Policies
(a) Description of the Business
Hooper Holmes, Inc. and its subsidiaries (Hooper Holmes or the Company) provide outsourced risk assessment services to the life and health insurance industry and medical evaluation and claims management services to the automobile insurance industry and the workers’ compensation industry. The Company provides paramedical and medical examinations, independent medical examinations, personal health interviews and record collection, and laboratory testing, which help life insurance companies evaluate the risks associated with underwriting policies and help property and casualty claims handlers evaluate physical injuries for claims management.
The Company currently engages in two principal businesses, which are operated as business segments:
| | · | our Company’s Health Information Division (HID) is one of the leading providers of outsourced risk assessment services to the life and health insurance industry. The core activity of that business consists of arranging for paramedical examinations on behalf of insurance carriers, primarily in connection with such carriers’ processing and evaluation of the risks associated with underwriting insurance policies - mainly life insurance policies; and |
| | · | our Company’s Claims Evaluation Division (CED) provides medical claims services to insurance adjusters for use in processing accident claims, primarily on behalf of property and casualty insurance carriers. The core activity of this business consists of arranging for independent medical exams (IMEs). An IME is a medical examination by a doctor (other than the claimant’s physician) for the purpose of rendering an objective opinion regarding the nature, origin, treatment and causal relationship of an injury. |
(b) Principles of Consolidation
The consolidated financial statements include the accounts of Hooper Holmes, Inc. and its majority owned subsidiaries. All significant intercompany transactions and balances have been eliminated in consolidation.
(c) Liquidity
At December 31, 2006, the Company had $7.9 million in cash and cash equivalents and no outstanding debt. Based on our current projections, our existing cash and cash equivalents, and borrowing capability under our new Loan and Security Agreement entered into on October 10, 2006, we believe that we will have sufficient funds to meet the Company’s short-term and long-term cash needs.
(d) Cash and Cash Equivalents
The Company considers highly liquid investments with original maturities at the date of purchase of less than 90 days to be cash equivalents.
(e) Accounts Receivable
Trade accounts receivable are recorded at the invoiced amount and do not bear interest. The Company maintains reserves against its accounts receivable for potential losses. Allowances for uncollectible accounts are estimated based on the Company’s periodic review of accounts receivable balances and historical reference. Accounts receivable are net of an allowance for doubtful accounts in the amount of $3.7 million and $2.5 million in 2006 and 2005, respectively.
(f) Inventory
Inventory, which consists of finished goods and component inventory, is valued at the lower of average cost or market using the first-in first-out (FIFO) inventory method. As of December 31, 2006 and 2005, inventory totaling $2.6 million and $2.4 million, respectively, is included in other current assets on the consolidated balance sheet.
(g) Property, Plant and Equipment
Property, plant and equipment are stated at cost less accumulated depreciation. Depreciation is computed using the straight-line method over the assets’ estimated useful lives. Leasehold improvements are amortized over the shorter of the estimated useful life of the improvement or the remaining lease term. The cost of maintenance and repairs is charged to operations as incurred. Significant renewals and betterments are capitalized.
(h) Long-Lived Assets
Long-lived assets and intangible assets with determinable useful lives are reviewed for impairment whenever events or changes in circumstances indicate that the carrying amount of an asset may not be recoverable. Recoverability of assets to be held and used is measured by a comparison of the carrying amount of the assets to the future undiscounted net cash flows expected to be generated by the asset. If such assets are considered to be impaired, the impairment to be recognized is measured by the amount by which the carrying amount of the assets exceeds the fair value of the assets and would be charged to earnings. Assets to be disposed of are reported at the lower of the carrying amount or fair value less the costs to sell. Intangible assets are amortized on a straight line basis over their respective estimated useful lives.
(i) Goodwill
We have defined our reportable segments as our reporting units for our goodwill accounting. We test goodwill for impairment on an annual basis in our fourth fiscal quarter and more often if events occur or circumstances change that would likely reduce the fair value of a reporting unit to an amount below its carrying value. When necessary, we record charges for goodwill impairments for the amount by which the fair value is less than the carrying value of the asset.
We use a two-step process to test goodwill for impairment. First, the reporting unit’s fair value is compared to its carrying value. We utilize a combination of discounted cash flows and market multiples to determine fair value estimates. If a reporting unit’s carrying amount exceeds its fair value, an indication exists that the reporting unit’s goodwill may be impaired, and the second step of the impairment test would be performed. The second step of the goodwill impairment test is used to measure the amount of the impairment loss. In the second step, the implied fair value of the reporting unit’s goodwill is determined by allocating the reporting unit’s fair value to all of its assets and liabilities other than goodwill in a manner similar to a purchase price allocation. The resulting implied fair value of the goodwill that results from the application of this second step is then compared to the carrying amount of the goodwill and an impairment charge would be recorded for the difference.
(j) Deferred Rent
The Company accounts for scheduled rent increases contained in its leases on a straight-line basis over the term of the lease.
(k) Advertising
Costs related to space in publications are expensed as incurred. Advertising expense was approximately $0.4 million, $0.5 million, and $0.5 million in 2006, 2005 and 2004, respectively.
(l) Revenue Recognition
Revenue is recognized for paramedical and medical examinations when the examination of the insurance policy applicant is completed. Revenues generated from medical record collection, laboratory testing, independent medical exam, peer review or similar services and other services are recognized when the related service is completed. Revenue in our Medicals Direct Group for certain services performed for the legal profession is recognized upon the successful outcome of the case.
(m) Share-Based Compensation
In December, 2004 the Financial Accounting Standards Board issued Statement of Financial Accounting Standards (SFAS) No. 123 revised 2004, “Share-Based Payment” (“SFAS No. 123R). SFAS No. 123R addresses the accounting for transactions in which an enterprise receives employee services in exchange for (a) equity instruments of the enterprise or (b) liabilities that are based on the fair value of the enterprise’s equity instruments or that may be settled by the issuance of such equity instruments. SFAS No. 123R supersedes Accounting Principles Board Opinion No. 25, “Accounting for Stock Issued to Employees” (“APB No. 25”) and requires companies to recognize compensation cost in an amount equal to the fair value of the share-based payments, such as stock options granted to employees.
On January 1, 2006, the Company adopted SFAS No. 123R using the modified prospective method. Under this method, the Company is required to record compensation cost for the unvested portion of previously granted awards that remain outstanding as of January 1, 2006. We previously accounted for our share-based compensation under the recognition and measurement principles of APB No. 25 and related interpretations. Prior to our adoption of SFAS No. 123R, no share-based compensation cost was reflected in net income for stock options, as all stock options granted had an exercise price equal to the market value of the common stock on the date of the grant.
(n) Income Taxes
Income taxes are accounted for under the asset and liability method. Deferred tax assets and liabilities are recognized for the future tax consequences attributable to differences between the financial statement carrying amounts of existing assets and liabilities and their respective tax bases and operating loss and tax credit carry forwards. Deferred tax assets and liabilities are measured using enacted tax rates expected to apply to taxable income in the years in which those temporary differences are expected to be recovered or settled. A valuation allowance is provided when it is more likely than not that some portion or all of the deferred tax assets will not be realized. The ultimate realization of deferred tax assets is dependent upon the generation of future taxable income and the reversal of deferred tax liabilities during the period in which related temporary differences become deductible. Management considers the scheduled reversal of deferred tax liabilities, projected future taxable income and tax planning strategies in making this assessment.
No provision has been made for federal income or withholding taxes which may be payable on the remittance of the undistributed retained earnings of our foreign subsidiary. These earnings have been reinvested to meet future operating requirements and the Company intends to continue such policy for the foreseeable future.
(o) Earnings Per Common Share
“Basic” earnings (loss) per share equals net income (loss) divided by the weighted average common shares outstanding during the period. “Diluted” earnings per share equals net income divided by the sum of the weighted average common shares outstanding during the period plus dilutive common stock equivalents. Common stock equivalents were 0 for the years ended December 31, 2006 and 2005, and 1,537,643 for the year ended December 31, 2004.
Our net loss and weighted average shares outstanding used for computing diluted loss per share were the same as that used for computing basic loss per share for the years ended December 31, 2006 and 2005 because the inclusion of common stock equivalents would be antidilutive. Options to purchase 2,958,644 shares of the Company’s common stock were excluded from the calculation of diluted earnings per share for the year ended December 31, 2004, because their exercise prices exceeded the average market price of outstanding common shares for such period and were, therefore, antidilutive.
(p) Foreign Currency
The balance sheet of the Company’s foreign subsidiary is translated into United States Dollars at current year-end rates. Revenues, costs and expenses are translated at average monthly rates during each monthly period. Net exchange gains or losses resulting from the translation of foreign financial statements and the effect of exchange rate changes on intercompany transactions of a long-term investment nature are accumulated and credited or charged directly to accumulated other comprehensive income. Transactional foreign currency gains or losses are included in other expense, net.
(q) Use of Estimates
The preparation of the consolidated financial statements requires management to make estimates and assumptions that affect reported amounts and disclosures in these consolidated financial statements. The most significant of these estimates involve the evaluation of the recoverability of goodwill and identifiable intangible assets, valuations of accounts receivable and deferred tax assets and the assessment of contingencies. Actual results could differ from those estimates.
(r) Concentration of Credit Risk
The Company’s accounts receivable are due primarily from insurance companies. No one customer accounts for more than 10% of consolidated revenues. The Company’s top ten customers within the Health Information Division represent approximately 39% of the revenues. The Company’s top five customers within our Claims Evaluation Division represent approximately 63% of the revenues.
(s) Fair Value of Financial Instruments
The carrying value for all financial instruments at December 31, 2006 and 2005, approximates fair value due to the short maturity of these instruments.
(t) Recently Issued Accounting Standards
In June 2006, the Financial Accounting Standards Board (“FASB”) issued FASB Interpretation No. 48, “Accounting for Uncertainty in Income Taxes” (“FIN 48”). FIN 48 is intended to clarify the accounting for uncertainty in income taxes recognized in a company’s financial statements in accordance with SFAS No. 109, “Accounting for Income Taxes”. FIN 48 prescribes a recognition threshold and a measurement attribute for the financial statement recognition and measurement of a tax position taken or expected to be taken in a tax return. FIN 48 also provides guidance on the related de-recognition, classification, interest and penalties, accounting for interim periods, disclosure and transition of uncertain tax positions. FIN 48 is effective for fiscal years beginning after December 15, 2006, with the cumulative effect of the change in accounting principle recorded as an adjustment to opening retained earnings. The Company is currently assessing the expected effect of adopting FIN 48, and we do not presently expect it to have a material impact on its consolidated financial statements.
In September 2006, the FASB issued SFAS No. 157, “Fair Value Measurements” (“SFAS 157”). SFAS 157 establishes a single authoritative definition of fair value, sets out a framework for measuring fair value, and requires additional disclosures about fair-value measurement. SFAS 157 applies only to fair value measurements that are already required or permitted by other accounting standards (except for measurements of share-based payments) and is intended to increase the consistency of those measurements. Accordingly, SFAS 157 does not require any new fair value measurements. However, for some entities, the application of SFAS 157 will change current practice. SFAS 157 is effective for fiscal years beginning after November 15, 2007, and interim periods within those fiscal years. We are still in the process of reviewing the impact, however, we do not expect the adoption of SFAS 157 to have a material impact on our consolidated financial statements.
In September 2006, the Securities and Exchange Commission (“SEC”) issued Staff Accounting Bulletin 108, “Considering the Effects of Prior Year Misstatements When Quantifying Misstatements in Current Year Financial Statement” (“SAB 108”). SAB 108 clarifies the staff’s views regarding the process of quantifying financial statement misstatements. The SEC staff believes registrants must quantify errors using both a balance sheet and income statement approach and evaluate whether either approach results in quantifying a misstatement that, when all relevant quantitative and qualitative factors are considered, is material. SAB 108 allows registrants to adjust prior year financial statements for errors in the carrying amount of assets and liabilities as of the beginning of this fiscal year that were immaterial under a company’s previous method for evaluating errors but material under the method prescribed by SAB 108, with an offsetting adjustment being made to the opening balance of retained earnings. We adopted SAB 108 during the fourth quarter of 2006, effective January 1, 2006, however it did not have a material impact on our consolidated financial statements as of January 1, 2006.
(u) Reclassifications
Certain amounts in the 2005 and 2004 consolidated financial statements have been reclassified to conform with the 2006 financial statement presentation.
Note 2 — Impairment of Goodwill and Intangibles
Intangibles
In accordance with SFAS No. 144, “Accounting for the Impairment or Disposal of Long-Lived Assets,” long-lived assets, including amortizable intangible assets, are to be tested for impairment whenever events or changes in circumstances indicate that the carrying amount of an asset may not be recoverable. The following events and circumstances triggered an impairment evaluation of the Company’s long-lived assets during the fourth quarter of 2006:
| | · | a preliminary expectation that the operating loss in the fourth quarter of 2006 was going to be greater than our fourth quarter forecast; |
| | · | the completion of our 2007 operating budget that reflected an assumption that some of the negative trends adversely affecting the Company's results would continue to a greater extent than our preliminary forecasts for 2007 and thereafter; |
| | · | notification during the fourth quarter of a further decline in projected revenue for 2007 from a major customer within the MAAS business. |
The evaluation resulted in a determination that the carrying values of certain intangible assets exceeded their projected undiscounted net cash flows. With the assistance of an independent valuation firm, the Company calculated the fair values of its intangible assets. The fair values were determined based on discounted cash flows and indicated that an impairment of the Company’s intangible assets existed. Accordingly during the fourth quarter of 2006 the Company recorded an impairment charge totaling $1.8 million in HID. The impairment charge consisted of a write-off of the MAAS tradename and write-down of MAAS customer relationships agreements. The amounts are recorded in impairment of goodwill and intangibles on the consolidated statement of operations.
In the fourth quarter of 2005, the following indicators were identified that triggered our impairment testing of intangible assets:
| · | the Company's operating loss in the third quarter of 2005; |
| · | a preliminary expectation of an operating loss in the fourth quarter of 2005; |
| · | projections of operating results in future periods that reflected an assumption that some of the negative trends adversely affecting each of the Company's two divisions would continue; and |
| · | a decline in the market price of our common stock over a sustained period of time. |
Based on the recoverability testing, it was determined that the MAAS and CED intangible assets may not be recoverable. With the assistance of an independent valuation firm we determined that an impairment of the intangible assets existed. Accordingly, the Company recorded an impairment charge totaling $18.0 million. The $18.0 million charge consisted of a $17.3 million impairment of CED intangible assets (e.g. tradenames, customer relationships and non-competition agreements) and a $0.7 million impairment of HID intangible assets (e.g. customer relationships and non-competition agreements.) These amounts are recorded in impairment of goodwill and intangibles on the consolidated statement of operations.
The following table presents certain information regarding the Company’s intangible assets as of December 31, 2006 and 2005. All identifiable intangible assets are being amortized over their useful lives, as indicated below, with no residual values.
| | | Weighted | | | | | | | |
| | | Average | | Gross | | | | | |
| | | Useful Life | | Carrying | | Accumulated | | Net | |
(in thousands) | | (years) | | Amount | | Amortization | | Balance | |
| At December 31, 2006 | | | | | | | | | |
| Non-Competition agreements | | | 4.5 | | $ | 9,277 | | $ | 8,863 | | $ | 414 | |
| Customer relationships | | | 9.4 | | | 16,033 | | | 10,332 | | | 5,701 | |
| Contractor network | | | 7.0 | | | 5,700 | | | 5,700 | | | 0 | |
| Trademarks and tradenames | | | 10.8 | | | 3,214 | | | 608 | | | 2,606 | |
| | | | | | $ | 34,224 | | $ | 25,503 | | $ | 8,721 | |
| At December 31, 2005 | | | | | | | | | | | | | |
| Non-Competition agreements | | | 4.5 | | $ | 9,265 | | $ | 8,441 | | $ | 824 | |
| Customer relationships | | | 9.7 | | | 15,794 | | | 8,882 | | | 6,912 | |
| Contractor network | | | 7.0 | | | 5,700 | | | 5,319 | | | 381 | |
| Trademarks and tradenames | | | 13.7 | | | 4,342 | | | 256 | | | 4,086 | |
| | | | | | | | | | | | | | |
| | | | | | $ | 35,101 | | $ | 22,898 | | $ | 12,203 | |
The aggregate intangible amortization expense for the years ended December 31, 2006, 2005, and 2004 was approximately $2.8 million, $5.1 million and $5.2 million, respectively. The estimated acquired intangible amortization expense for the fiscal years ended December 31, 2007 to December 31, 2011 is $2.0 million, $1.6 million, $1.1 million, $1.1 million, and $1.0 million, respectively.
Goodwill
The Company considered all of the impairment indicators previously discussed, as well as the impairment recorded on its long-lived assets when performing its annual goodwill impairment analysis. With the assistance of the independent valuation firm, the Company determined the fair values of each reporting unit based on discounted cash flow and market-based methodologies. The analysis indicated that the carrying amount of each reporting unit exceeded its fair value. Accordingly, in accordance with SFAS No. 142, “Goodwill and Other Intangible Assets,” the Company was required to perform the second step of the impairment test to calculate the implied value of goodwill for each reporting unit. The analysis indicated a goodwill impairment charge of $34.8 million for HID and $1.4 million for CED. Accordingly, the Company recorded a goodwill impairment charge totaling $36.2 million during the fourth quarter of 2006, which is included in impairment of goodwill and intangibles on the consolidated statement of operations.
In the fourth quarter of 2005, the Company performed its annual goodwill impairment testing and considered all of the impairment indicators existing at that time as previously discussed. With the assistance of an independent valuation firm, the Company identified an impairment of goodwill totaling $115.6 million; $89.6 million for HID and $26.0 million for CED. The amount is included in impairment of goodwill and intangibles on the consolidated statement of operations.
The changes in the carrying amount of goodwill by operating segment for the period from December 31, 2004 to December 31, 2006 are as follows:
(in thousands)
| | | HID | | CED | | Total | |
| Balance as of December 31, 2004 | | $ | 123,787 | | $ | 31,568 | | $ | 155,355 | |
| Acquisition adjustments and earn-outs | | | (132 | ) | | 1,032 | | | 900 | |
| Goodwill impairment | | | (89,600 | ) | | (26,000 | ) | | (115,600 | ) |
| Foreign currency translation adjustment | | | (617 | ) | | - | | | (617 | ) |
| Balance as of December 31, 2005 | | $ | 33,438 | | $ | 6,600 | | $ | 40,038 | |
| Doctors Direct acquisition | | | 598 | | | - | | | 598 | |
| Michigan Evaluations Group, Inc. earn-out | | | - | | | 502 | | | 502 | |
| Foreign currency translation adjustment | | | 824 | | | - | | | 824 | |
| Goodwill impairment | | | (34,860 | ) | | (1,400 | ) | | (36,260 | ) |
| Balance as of December 31, 2006 | | $ | - | | $ | 5,702 | | $ | 5,702 | |
Note 3 — Acquisitions
2006
On January 3, 2006, Medicals Direct Group, the Company’s U.K. subsidiary, purchased Doctors Direct, a primary care provider located in the U.K. for $1.1 million in cash, which included the repayment on the date of acquisition of $0.6 million of loans assumed. The acquisition of Doctors Direct compliments MDG’s existing clinics and screenings businesses and provides an entry into the servicing of private patient care. During the third quarter of 2006, the Company finalized the allocation of the purchase price for this acquisition as set forth below.
| | | | | Weighted Average | |
| | | Amount | | Useful Life | |
| Current assets | | $ | 301 | | | | |
| Intangible assets (customer relationship and tradename) | | | 882 | | | 9.2 years | |
| Goodwill | | | 598 | | | | |
| Current liabilities | | | (674 | ) | | | |
| Total | | $ | 1,107 | | | | |
The Company recorded goodwill of $0.6 million in connection with the acquisition, which was included in the HID reporting unit.
2005
In 2005, there were no new acquisitions; only acquisition related payments related to prior year acquisitions as noted below.
2004
During 2004, the Company acquired seven companies for an aggregate purchase price of $27.8 million: five companies in the United States and two companies in the U.K. Upon acquisition, the acquired companies were included within the HID and CED segments.
Within the HID segment, the Company acquired Mid-America Agency Services, Inc. (MAAS) in May 2004, two paramedical examination businesses and Medicals Direct Group (MDG) purchased two companies in July 2004 and October 2004, involved in the Medico-Legal business.
Within the CED segment, the Company purchased Allegiance Health, Inc. in January 2004 and Michigan Evaluation Group, Inc. in May 2004.
The following table sets forth the purchase prices, including acquisition costs, of the 2004 acquisitions:
| | | | |
(in millions) | | 2004 | |
| HID | | Purchase Price | |
| MAAS | | $ | 9.0 | |
| U.K. Acquisitions | | | 1.0 | |
| Other | | | 1.0 | |
| | | | | |
| CED | | | | |
| Allegiance Health, Inc. | | | 11.7 | |
| Michigan Evaluation Group | | | 5.1 | |
| Total | | $ | 27.8 | |
The allocation of the purchase prices for these acquisitions is set forth below:
| | | Total | | Weighted Average | |
(in millions) | | | | Useful Life | |
| Goodwill | | $ | 18.7 | | | | |
| Identifiable intangible assets | | | 9.8 | | | 15.7 years | |
| Identifiable tangible assets | | | 6.0 | | | | |
| Non-competiton agreements | | | 1.3 | | | 2.8 years | |
| Liabilities assumed | | | (8.0 | ) | | | |
| Total | | $ | 27.8 | | | | |
Approximately $0.8 million and $3.7 million of goodwill was expected to be deductible for tax purposes related to the 2004 HID and CED acquisitions, respectively.
The $9.8 million of acquired identifiable intangible assets consisted of customer relationships, $7.8 million, tradenames, $1.8 million and contractor network, $0.2 million. A significant amount of the intangible assets and goodwill related to these 2004 acquisitions has become impaired as of December 31, 2006 and accordingly has been written-off.
These acquisitions have been accounted for using the purchase method of accounting and the purchase price has been assigned to the net assets acquired based on the fair value of such assets and liabilities at the date of acquisition. The consolidated financial statements include the results of operations since the date of acquisition. No pro forma financial information has been presented for these acquisitions, as the effect on the Company’s historical financial statements would not have been material.
Acquisition - Related Payments:
For the years ended December 31, 2006 and 2005, the Company made the following payments related to prior year acquisitions:
| | | 2006 | | | | 2005 | | | |
| D & D Associates | | $ | - | | | | | $ | 1,550 | | | (c) | |
| Michigan Evaluation Group, Inc. | | | 502 | | | (a) | | | 300 | | | (f) | |
| | | | 100 | | | (e) | | | 100 | | | (e) | |
| | | | 50 | | | (f) | | | - | | | | |
| Allegiance Health, Inc. | | | 54 | | | (b) | | | 1,000 | | | (c) | |
| | | | - | | | | | | 646 | | | (b) | |
| Medimax, Inc. | | | 250 | | | (c) | | | 925 | | | (c) | |
| Heritage Labs, Inc. | | | 2,827 | | | (d) | | | 1,696 | | | (d) | |
| Total | | $ | 3,783 | | | | | $ | 6,217 | | | | |
| (a) - | Represents additional consideration that was recorded as additional purchase price during the three months ended June 30, 2006 upon the achievement of certain performance criteria. |
| (b) - | Represents additional purchase price recorded in 2005 to reimburse the seller for certain tax consequences of the acquisition. |
| (c) - | Represents additional consideration that was recorded as additional purchase price in 2004 upon the achievement of certain performance criteria. |
| (d) - | Represents the payment of seller financed debt which was recorded as additional purchase price in 2003 upon acquisition. |
| (e) - | Represents the payment of seller financed debt which was recorded as additional purchase price in 2004 upon acquisition. |
| (f) - | Represents additional consideration that was recorded as additional purchase price in 2005 upon the achievement of certain performance criteria. |
Note 4 ¾ Share-Based Compensation
Stock Option Plans— The Company’s stockholders approved stock option plans providing for the grant of options exercisable for up to 4,000,000 shares of common stock in 1992 and 1994, 2,400,000 shares in 1997, 2,000,000 shares in 1999 and 3,000,000 shares in 2002, which provide that options may be granted to management. Options are granted at fair value on the date of grant and are exercisable as follows: 25% after two years and 25% on each of three anniversary dates thereafter, with contract lives of 10 years from the date of grant. At December 31, 2006, the Company is authorized to grant options exercisable for approximately 1,862,200 shares under the plans.
On January 31, 2005, the Company accelerated the vesting of all of the Company’s unvested stock options awarded to officers and employees under the 1992, 1994, 1997 and 1999 Stock Option Plans, which had an exercise price greater than $5.05, the closing price of the Company’s common stock on January 31, 2005. As a result of the acceleration, options to acquire approximately 1.6 million shares of the Company’s common stock, with exercise prices ranging from $5.47 to $10.47, which would have otherwise vested over the next 48 months following such acceleration, became immediately exercisable.
On December 20, 2005, the Company accelerated the vesting of all unvested options which had an exercise price equal to or greater than $2.65, the closing price of the Company’s common stock on December 20, 2005. As a result of the acceleration, options to acquire 2,060,000 shares of the Company’s common stock, with exercise prices ranging from $3.46 to $5.02, which would have otherwise vested over the 5 years following such acceleration, became immediately exercisable.
The Company’s decision to accelerate the vesting of these options (which represented all remaining unvested stock options outstanding) was in response to a review of the Company’s long term incentive compensation programs in light of changes in market practices and changes in accounting rules resulting from the issuance of SFAS No. 123R. Accelerating the vesting of these options prior to the Company’s adoption of SFAS No. 123R has resulted in the Company not being required to recognize compensation expense of $0.9 million in 2006 and $0.8 million in compensation expense in subsequent years through 2010.
As a result of the Company’s acceleration of vesting of all unvested options, the adoption of SFAS No. 123R had no impact on stock option awards that were outstanding as of January 1, 2006. However, the adoption of SFAS No. 123R resulted in the Company recording $0.2 million of compensation cost in selling, general and administrative expenses for the year ended December 31, 2006 related to share-based compensation granted during 2006. The effect on income (loss) before income taxes, net loss, cash flows from operating activities and cash flows from financing activities from the adoption of SFAS No. 123R for the year ended December 31, 2006, was $0.2 million, $0 and $0, respectively. There was no material effect on basic and diluted loss per share for the year ended December 31, 2006 from the adoption of SFAS No. 123R.
Stock Purchase Plan— In 2003, the Company’s shareholders approved the 2004 Employee Stock Purchase Plan, which provides for granting of purchase rights for up to 2,000,000 shares of Company stock. The plan provides for the purchase of shares on the date 13 months from the grant date (the purchase date). During the period between the grant date and the purchase date, up to 10% of a participating employee’s compensation is withheld to fund the purchase of shares under the plan. Employees can cancel their purchases at any time during the period without penalty. The purchase price is 95% of the closing price of the common stock on the grant date. In February 2004, the Company granted purchase rights for approximately 69,874 shares with the aggregate purchase price payable for such shares being approximately $0.4 million. The February 2004 plan offering terminated in February 2005 in accordance with the plan’s automatic termination provision. In February 2005, the Company granted purchase rights for approximately 62,790 shares with the aggregate purchase price payable for such shares being approximately $0.3 million. The February 2005 plan offering terminated in February 2006 in accordance with the plan’s automatic termination provision. In February 2006, purchase rights for 94,435 shares were granted with an aggregate fair value of $0.1 million, based on a Black Scholes pricing model.
Stock Awards— On January 28, 2003, the Company’s Board of Directors passed a resolution to award non-employee directors of the Company up to a maximum of 15,000 shares of the Company’s common stock as compensation. Each non-employee director was awarded 5,000 shares on January 31, 2005, 2004 and 2003, which vested immediately. All shares awarded are restricted under SEC Rule 144, and may not be sold or transferred by the director until four years from the date of issue. In January 2006, the Board adopted a resolution removing all contractual restrictions with respect to any such shares held by a director who retires from the Board and is not removed with cause.
At January 1, 2006, and December 31, 2006, 75,000 shares of stock awards with a weighted average grant date fair value of $5.80 per share were restricted. For the twelve month period ended December 31, 2005, the Company recorded $0.2 million of compensation expense related to the grant of stock awards. No grants of stock awards were made during the year ended December 31, 2006.
The following table illustrates the effect on net income (loss) and earnings (loss) per share if we had applied the fair value recognition provisions of SFAS No. 123, “Accounting for Stock-Based Compensation” to all share-based employee compensation for the years ended December 31, 2005 and 2004. Option forteitures were accounted for as they occurred and no amounts of compensation expense were capitalized, but instead were considered period expenses in the pro forma amounts below.
(thousands of dollars, except per share data) | | 2005 | | 2004 | |
| | | | | | |
| Net income (loss), as reported | | $ | (96,623 | ) | $ | 10,015 | |
| Add: Share-based employee compensation expense | | | | | | | |
| included in reported net income (loss), net of | | | | | | | |
| related tax effects | | | 305 | | | 124 | |
| Deduct: Total share-based employee compensation | | | | | | | |
| expense determined under fair value based | | | | | | | |
| method for all awards, net of related tax effects | | | 2,889 | | | 2,257 | |
| Pro forma net income (loss) | | $ | (99,207 | ) | $ | 7,882 | |
| Earnings (loss) per share; | | | | | | | |
| Basic, as reported | | $ | (1.47 | ) | $ | 0.15 | |
| Basic, pro forma | | | (1.51 | ) | | 0.12 | |
| Diluted, as reported | | $ | (1.47 | ) | $ | 0.15 | |
| Diluted, pro forma | | | (1.51 | ) | | 0.12 | |
During 2006, 2005 and 2004 options granted totaled 1,172,500 shares, 355,000 shares and 50,000 shares, respectively. The fair value of each stock option granted during the year is estimated on the date of grant using the Black-Scholes option pricing model with the following assumptions:
| | 2006 | 2005 | 2004 |
| Expected life (years) | 6.3 | 6.4 | 7.0 |
| Expected volatility | 46.78% | 55.72% | 51.35% |
| Expected dividend yield | 0% | 1.4% | .82% |
| Risk-free interest rate | 4.96% | 4.20% | 3.25% |
| Weighted average fair value of options granted during the year | $ 1.55 | $ 1.87 | $ 3.71 |
The expected life of options granted is derived from the Company’s historical experience and represents the period of time that options granted are expected to be outstanding. Expected volatility is based on the Company’s long-term historical volatility. The risk-free interest rate for periods within the contractual life of the options is based on the U.S. Treasury yield curve in effect at the time of the grant. SFAS No. 123R specifies that initial accruals be based on the estimated number of instruments for which the requisite service is expected to be rendered. Therefore, the Company is required to incorporate the probability of pre-vesting forfeitures in determining the number of vested options. The forfeiture rate is based on the historical forfeiture experience.
The following table summarizes stock option activity:
| | Under Option |
| | Shares | | Weighted |
| Available for | | Average Exercise |
| Grant | Shares | Price Per Share |
| Balance, December 31, 2003 | 478,575 | 10,930,125 | $ 5.41 |
| Authorized | (22,700) | — | — |
| Granted | (50,000) | 50,000 | 7.22 |
| Exercised | — | (235,000) | 1.21 |
| Cancelled | 221,275 | (221,275) | 6.95 |
| Balance, December 31, 2004 | 627,150 | 10,523,850 | $ 5.48 |
| Authorized | (68,000) | — | — |
| Granted | (355,000) | 355,000 | 3.60 |
| Exercised | — | (968,500) | 1.41 |
| Cancelled | 377,225 | (377,225) | 7.25 |
| Balance, December 31, 2005 | 581,375 | 9,533,125 | $ 5.75 |
| Authorized | (446,000) | — | — |
| Granted | (1,172,500) | 1,172,500 | 2.92 |
| Exercised | — | (1,753,600) | 2.09 |
| Cancelled | 2,801,050 | (2,801,050) | 7.29 |
| Forfeitures | 98,275 | (98,275) | 4.26 |
| Balance, December 31, 2006 | 1,862,200 | 6,052,700 | $ 5.58 |
Total share-based compensation expense recorded in 2006 was $0.2 million for stock option grants in 2006 and for the value of the lookback feature on the Employee Stock Purchase Plan.
The total intrinsic value of stock options exercised during the years ended December 31, 2006, 2005 and 2004 was $1.7 million $2.1 million, and $1.0 million, respectively. Treasury shares totaling 1.3 million have been utilized and reissued upon stock option exercises at the average cost of the shares in treasury. No stock options vested during the year ended December 31, 2006. The fair value of shares vested in the year ended December 31, 2005 was $13.4 million. As of December 31, 2006, there was approximately $1.6 million of total unrecognized compensation cost related to stock options. The cost is expected to be recognized over 4.5 years.
Prior to the adoption of SFAS No. 123R, we presented all tax benefits of deductions resulting from the exercise of stock options as operating cash flows in the Statement of Cash Flows. SFAS No. 123R requires that the cash flows resulting from tax benefits resulting from tax deductions in excess of the compensation cost recognized for those options (excess tax benefits) be classified as financing cash flows. Cash received from stock options exercised were $3.7 million, $1.4 million and $0.3 million for the years ended December 31, 2006, 2005, and 2004, respectively and the tax benefits realized from stock options exercised were $0, $0.8 million and $0.4 million for the years ended December 31, 2006, 2005 and 2004, respectively.
In November 2005, the FASB issued FASB Staff Position 123R-3, “Transition Election Related to Accounting for the Tax Effects of Share-based Payment Awards (“FSP 123R-3”). FSP 123R-3 provides an elective alternative transition method of calculating the additional paid-in capital pool (“APIC Pool”) of excess tax benefits available to absorb tax deficiencies recognized subsequent to the adoption of SFAS No. 123R to the method otherwise required by paragraph 81 of SFAS No. 123R. We have elected to adopt the alternative transition method.
The following table summarizes information concerning options outstanding at December 31, 2006:
| Options Outstanding | Options Exercisable |
| | Weighted | | | |
| | Average | Weighted | | Weighted |
| Number | Remaining | Average | Number | Average |
| Range of | Outstanding | Contractual | Exercise | Exercisable | Exercise |
| Exercise Prices | at 12/31/06 | Term (Years) | Price | at 12/31/06 | Price |
| | | | | | |
| $2.03-$4.10 | 2,240,600 | 6.5 | $ 2.95 | 1,068,100 | $ 2.96 |
| 5.02 - 7.22 | 3,171,500 | 4.8 | 6.07 | 3,171,500 | 6.07 |
| 10.76-12.88 | 640,600 | 3.2 | 12.38 | 640,600 | 12.38 |
| | 6,052,700 | 4.8 | $ 5.58 | 4,880,200 | $ 6.22 |
The aggregate intrinsic value of options outstanding and options exercisable at December 31, 2006 is $0.9 million and $0.5 million, respectively.
Note 5 — Operating Segments
The Company has two reportable operating segments: the Health Information Division (HID) and the Claims Evaluation Division (CED). The HID operating segment includes the Company’s core health information operations: Portamedic, Infolink, Heritage Labs, Medicals Direct and Mid-America Agency Services (MAAS). It provides a full range of paramedical services to the life insurance industry in the U.S. and the United Kingdom. The CED operating segment, which consists of Hooper Evaluations, Inc., provides independent medical examinations (IMEs) and case management services primarily for property and casualty insurers and claims handlers.
The segments’ accounting policies are the same as those described in Note 1: Summary of Significant Accounting Policies, except that interest expense and non-operating income and expenses are not allocated to the individual operating segment when determining segment profit or loss.
Each of the Company’s subsidiaries operates in only one of the Company’s two operating segments. The total assets of each segment are comprised of the assets of the subsidiaries operating in that segment. Corporate related assets, including goodwill and intangible assets, and expenses are included in the Health Information Division.
The following table illustrates revenues and long-lived assets by country of origin:
(In thousands)
| Revenues by Country: | |
| | | U.S. | | U.K. | | Total | |
| 2006 | | $ | 255,092 | | $ | 38,770 | | $ | 293,862 | |
| 2005 | | $ | 278,148 | | $ | 42,198 | | $ | 320,346 | |
| 2004 | | $ | 286,313 | | $ | 40,338 | | $ | 326,651 | |
| | | | | | | | | | | |
| Long-lived Assets by Country: | |
| | | | U.S. | | | U.K. | | | Total | |
| 2006 | | $ | 14,702 | | $ | 1,137 | | $ | 15,839 | |
| 2005 | | $ | 12,456 | | $ | 1,022 | | $ | 13,478 | |
A summary of segment information as of and for the years ended December 31, 2006, 2005 and 2004, is presented below:
(In thousands) | | December 31, 2006 | | December 31, 2005 | | December 31, 2004 | |
| | | HID | | CED | | Total | | HID | | CED | | Total | | HID | | CED | | Total | |
| Revenue | | $ | 262,559 | | $ | 31,303 | | $ | 293,862 | | $ | 281,855 | | $ | 38,491 | | $ | 320,346 | | $ | 283,178 | | $ | 43,473 | | $ | 326,651 | |
| Depreciation and | | | | | | | | | | | | | | | | | | | | | | | | | | | | |
| amortization | | | 5,757 | | | 780 | | | 6,537 | | | 6,157 | | | 2,506 | | | 8,663 | | | 6,492 | | | 2,289 | | | 8,781 | |
| Operating income | | | | | | | | | | | | | | | | | | | | | | | | | | | | |
| (loss) | | | (56,038 | ) | | 366 | | | (55,672 | ) | | (135,555 | ) | | 1,236 | | | (134,319 | ) | | 13,723 | | | 3,858 | | | 17,581 | |
| Capital Expenditures | | | 5,745 | | | 365 | | | 6,110 | | | 6,394 | | | 477 | | | 6,871 | | | 3,641 | | | 635 | | | 4,276 | |
| Total assets | | $ | 71,049 | | $ | 13,848 | | $ | 84,897 | | $ | 134,792 | | $ | 27,539 | | $ | 162,331 | | $ | 236,262 | | $ | 38,847 | | $ | 275,109 | |
Total assets and operating income/(loss) at December 31, 2006 and 2005 reflect impairment charges to goodwill and intangibles of $36.2 million and $1.8 million and $115.6 million and $18.0 million, respectively.
Note 6 — Comprehensive Income (Loss)
Comprehensive income (loss) includes net income (loss) and other comprehensive income (loss) which refers to those expenses, gains and losses which are excluded from net income (loss) as described in the following:
(In thousands) | | Years Ended December 31, | |
| | | | |
| | | 2006 | | 2005 | | 2004 | |
| Net income (loss) | | $ | (85,181 | ) | $ | (96,623 | ) | $ | 10,015 | |
| Other comprehensive income: | | | | | | | | | | |
| Unrealized holding gains (losses) arising during period, net of tax | | | 1 | | | 1 | | | (10 | ) |
| Less: reclassification adjustment for (gains) losses included in net income (loss), net of tax | | | - | | | 5 | | | 1 | |
| Net unrealized gain (loss) on securities, net of tax | | | 1 | | | 6 | | | (9 | ) |
| Foreign currency translation | | | 1,195 | | | (1,118 | ) | | 619 | |
| Total comprehensive income (loss) | | $ | (83,985 | ) | $ | (97,735 | ) | $ | 10,625 | |
Note 7 — Restructuring and Other Charges
In 2006, the Company recorded restructuring and other charges totaling $10.5 million which consisted primarily of:
| · | restructuring charges totaling $2.3 million; |
| · | a contract cancellation fee related to early termination of a software resale agreement totaling $0.5 million; |
| · | a fee payable to outside consultants of $5.6 million based on the results of the Company’s 2006 strategic review; |
| · | a litigation settlement charge of $1.2 million related to a lawsuit filed against the Company; and |
| · | outside legal and audit fees of $0.9 million associated with the restatement of the Company’s 2004 and 2005 consolidated financial statements recorded in the first quarter of 2006. |
The restructuring charges consisted primarily of employee severance of $1.3 million and branch office closure costs of $1.0 million, and were recorded primarily as a result of the ongoing reorganization in the core Portamedic business in the HID segment.
A summary of the 2006 restructuring charges and related payments are outlined in the table below:
(In millions) | | 2006 | | Balance at | |
| | | Charges | | Payments | | December 31, 2006 | |
| Severance | | $ | 1.3 | | $ | (1.0 | ) | $ | 0.3 | |
| Lease Obligation | | | 1.0 | | | (0.5 | ) | | 0.5 | |
| Total | | $ | 2.3 | | $ | (1.5 | ) | $ | 0.8 | |
At December 31, 2006, $0.8 million of restructuring charges and $4.6 million of other charges are recorded in accrued expenses in the accompanying consolidated balance sheet. Cash payments are expected to be completed in 2007. Included in the $4.6 million of other charges is approximately $2.9 million of outside consultant’s fees as described above. In addition, $0.1 million of the restructuring charges and $1.0 million of the outside consultant fees are recorded in other long-term liabilities, as payment is expected to be made in 2008.
In 2005 the Company recorded restructuring and other charges of $6.6 million, which included employee severance packages totaling $4.6 million, branch office closures costs of $0.6 million and the write off of certain purchased business application software totaling $1.4 million. These charges were recorded as a result of the continued decline in the core Portamedic business in the HID segment, the reorganization of the CED segment and to abandon certain unusable software.
Included in the employee severance packages was a charge related to the Company’s former Chief Executive Officer and former Chief Financial Officer totaling $3.2 million and severance amounts for certain other employees totaling $1.4 million. Also included in the $4.6 million is $0.4 million of compensation expense associated with the modification of stock option awards resulting from the extension of the expiration date. During 2006 cash payments of $1.4 million were made and the remaining liability was $0.7 million, of which $0.4 million is recorded in accrued expenses and $0.3 million is in other long-term liabilities in the accompanying balance sheet. Cash payments are expected to be completed in 2010.
A roll-forward of the 2005 restructuring and other charges is outlined in the table below:
(In millions) | | 2005 | | 2006 | |
| | | Charges | | Less Non-Cash Charges | | 2005 Payments | | Balance at December 31, 2005 | | 2006 Payments | | Balance at December 31, 2006 | |
| Severance\Lease Obligations - HID | | $ | 4.9 | | | (0.4 | ) | $ | (2.7 | ) | $ | 1.8 | | $ | (1.1 | ) | $ | 0.7 | |
| Software Write-off-HID | | | 1.4 | | | (1.4 | ) | | - | | | - | | | - | | | - | |
| Lease Obligation - CED | | | 0.3 | | | - | | | - | | | 0.3 | | | (0.3 | ) | | - | |
| Total | | $ | 6.6 | | $ | (1.8 | ) | $ | (2.7 | ) | $ | 2.1 | | $ | (1.4 | ) | $ | 0.7 | |
Note 8 — Property, Plant and Equipment
Property and equipment, at cost, consists of the following:
(In thousands) | | | | | | Estimated | |
| | | December 31, | | December 31, | | Useful Life | |
| | | 2006 | | 2005 | | In Years | |
| Land and improvements | | $ | 628 | | $ | 628 | | | 10 - 20 | |
| Building and leasehold improvements | | | 6,955 | | | 6,926 | | | 10 - 45 | |
| Furniture, fixtures and equipment | | | 38,842 | | | 33,009 | | | 3 - 10 | |
| | | | 46,425 | | | 40,563 | | | | |
| | | | | | | | | | | |
| Less accumulated depreciation and amortization | | | 30,586 | | | 27,085 | | | | |
| Total | | $ | 15,839 | | $ | 13,478 | | | | |
Note 9— Debt
2006 Loan and Security Agreement
On October 10, 2006, the Company entered into a three year Loan and Security Agreement (the “Loan and Security Agreement”) with CitiCapital Commercial Corporation (“CitiCapital”). The Loan and Security Agreement expires on October 10, 2009.
The Loan and Security Agreement provides the Company with a new senior secured revolving credit facility, the proceeds of which are to be used for general working capital purposes. In connection with this agreement, the Company paid a non-refundable closing fee of $0.2 million to the lender. Under the terms of the Loan and Security Agreement, the lenders have agreed to make revolving credit loans to the Company in an aggregate principal at any one time outstanding which, when combined with the aggregate undrawn amount of all unexpired letters of credit, does not exceed:
| | (i) | 90% of “Eligible Receivables” (as that term is defined in the Loan and Security Agreement) of the Company and the Company’s subsidiaries providing guarantees of the indebtedness under the facility; plus |
| | (ii) | 65% of the fair market value of the Company’s corporate headquarters located in Basking Ridge, New Jersey - |
provided that in no event can the aggregate amount of the revolving credit loans and letters of credit outstanding at any time exceed $25 million. The maximum aggregate face amount of letters of credit that may be outstanding at any time may not exceed $1 million. The Company’s available borrowing base at December 31, 2006 was approximately $19.2 million. The Company had no borrowings from this credit facility as of December 31, 2006.
CitiCapital, in its sole discretion based upon its reasonable credit judgment, may (A) establish and change reserves required against Eligible Receivables, (B) change the advance rate against Eligible Receivables or the fair market value of the Company’s corporate headquarters, and (C) impose additional restrictions to the standards of eligibility for Eligible Receivables, any of which could reduce the aggregate amount of indebtedness that may be incurred under the revolving credit facility.
Borrowings of revolving credit loans shall take the form of either LIBOR rate advances or base rate advances, with the applicable interest rate being the LIBOR rate plus 1.75% or the rate of interest publicly announced from time to time by Citibank, N.A. as its base rate, respectively. Interest is payable monthly in arrears. The form of the revolving credit loans shall be at the Company’s option, subject to certain conditions set forth in the Loan and Security Agreement.
The Company is also obligated to pay, on a monthly basis in arrears, an unused line fee (commitment fee) equal to 0.375% per annum on the difference between the maximum amount of the revolving credit facility and the average daily aggregate outstanding amount of revolving credit loans and unexpired letters of credit during the preceding month. The Company incurred commitment fees of $0.05 million and $0.04 million in 2006 and 2005, respectively.
The revolving credit loans are payable in full, together with all accrued and unpaid interest, on the earlier of October 10, 2009 or the date of termination of the loan commitments, termination being one of the actions CitiCapital may take upon the occurrence of an event of default. The Company may prepay any revolving credit loan, in whole or in part. The Company may also terminate the Loan and Security Agreement, provided that on the date of such termination all of its obligations are paid in full. The Company will be required to pay an early termination fee equal to $0.1 million if the termination occurs prior to the second anniversary of the date of the parties’ execution of the Loan and Security Agreement; no fee is payable if the termination occurs after the second anniversary or if the revolving credit facility is replaced by a credit facility from CitCapital or any of its affiliates.
As security for the Company’s payment and other obligations under the Loan and Security Agreement, the Company has granted to the agent, for the benefit of the lenders, a lien on and security interest in all of the Company’s property, including its receivables (which, together with the receivables of the subsidiary guarantors that become Eligible Receivables, are to be subject to a lockbox account arrangement), equipment, inventory and real estate owned and used by the Company as its corporate headquarters. In addition, the obligations are secured under the terms of security agreements and guarantees provided by the subsidiary guarantors. Guarantees have been provided by all of the Company’s direct subsidiaries other than its U.K. subsidiary, Medicals Direct Group. The Company has pledged 65% of the outstanding shares of Medicals Direct Group as further security.
The Loan and Security Agreement contains covenants that, among other things, restrict the Company’s ability, and that of its subsidiaries, to:
| · | pay any dividends or distributions on, or purchase, redeem or retire any shares of any class of its capital stock or other equity interests; |
| · | incur additional indebtedness; |
| · | sell or otherwise dispose of any of its assets, other than in the ordinary course of business; |
| · | create liens on its assets; and |
| · | enter into transactions with any of its affiliates on other than an arm’s-length or no less favorable basis. |
The Loan and Security Agreement also contains a financial covenant, which goes into effect when the difference between the lesser of (A) the borrowing base (that is, the aggregate of the amounts described in (i) and (ii) above) and (B) the maximum amount of the revolving credit facility, and the sum of the aggregate outstanding amount of the revolving credit loans and face amount of letters of credit, is less than $10 million. At that time, the Company must maintain a fixed charge coverage ratio (as defined in the Loan and Security Agreement), on a trailing 12-month basis, of no less than 1:1.
The failure of the Company or any subsidiary guarantor to comply with any of the covenants, or the breach of any of its or their representations and warranties, contained in the Loan and Security Agreement constitutes an event of default under the agreement.
Former Credit Facility
On October 11, 2006, in connection with the Company entering into the Loan and Security Agreement, the Company terminated its Amended and Restated Revolving Credit and Term Note Agreement dated October 29, 1999.
On October 29, 1999, the Company entered into a $100 million Amended and Restated Revolving Credit and Term Loan Agreement with three banks. The senior credit facility initially consisted of a $65.0 million, six-year term loan, and a $35.0 million, three-year revolving loan, both unsecured. During 2001, the three-year revolving loan expiration date was extended for one year to October 31, 2003. During 2003, the revolving loan expiration date was extended for three years to October 31, 2006. As of December 31, 2006 and December 31, 2005, $0 and $1.0 million were outstanding under the term loan, respectively. The final principal payment under the term loan of $1.0 million was paid in January 2006.
Prior to the amendment of the credit agreement in April 2006 (described below), the revolving loan bore interest at either the prime rate minus ½% to plus ¼% or LIBOR plus ¾% to 1¾%, depending on the ratio of the Company’s consolidated funded debt, as defined, to earnings before interest, taxes, depreciation and amortization, or “EBITDA.” As of December 31, 2005, interest was payable at an effective average annual interest rate of 5.11%. Also, commitment fees of up to 0.3% were charged on the unused revolving loan, and the agreement contained certain financial covenants, including covenants related to the incurrence of consolidated net losses, the payment of dividends, fixed charge coverage and funded debt to “EBITDA” ratio, and stock re-purchases.
For the year ended December 31, 2005, the Company was not in compliance with a reporting requirement that required the Company to deliver its 2005 audited consolidated financials statements to the lenders within 100 days of its fiscal year-end. In addition, the Company was not in compliance with two financial covenants: (i) that the Company not incur a consolidated net loss in any two fiscal quarters in any twelve consecutive months; and (ii) that the Company not permit its consolidated fixed charge coverage ratio to be less than 1.50 to 1.0 for the period ended December 31, 2005. The Company recognized a consolidated net loss for the quarters ended September 30, 2005 and December 31, 2005. At December 31, 2005, the Company’s consolidated fixed charge coverage ratio was 1.10 to 1.00. On April 25, 2006, the Company obtained a waiver of the above-described issues of non-compliance from the lenders.
On April 25, 2006, the Company entered into an amendment to the Amended and Restated Credit Agreement with the lenders. In conjunction with this amendment, one of the lenders withdrew from the credit facility. The significant terms of this amendment were as follows:
| | i) | the maximum available revolving credit amount was reduced from $35.0 million to $15.0 million; |
| | ii) | the expiration date of the revolving loan was extended from October 31, 2006 to January 2, 2007; |
| | iii) | indebtedness incurred under the revolving loan would bear interest at either the prime rate plus 0.25% or LIBOR plus 1.50% and commitment fees of up to 0.25% would be charged on the unused portion of the facility; |
| | iv) | the Company’s consolidated monthly pre-tax income could not be less than $0.6 million for April and May 2006, $0.8 million for June and July 2006, and $0.9 million in the months thereafter; |
| | v) | the consolidated fixed charge coverage ratio could not be less than 0.65 to 1.00 for the quarter ended March 31, 2006, 1.20 to 1.00 for the quarter ending June 30, 2006 and 1.50 to 1.00 for each quarter thereafter, measured on an actual year-to-date basis; |
| | vi) | the consolidated funded debt to EBITDA ratio could not exceed 2.50 to 1.00 at any time, measured on a quarterly basis and year-to-date cumulatively for 2006; |
| | vii) | the Company could not convey, lease, sell, transfer or assign any assets or properties owned or later acquired except in the ordinary course of business; |
| | viii) | the Company could not declare or make any dividend payments or other distribution of assets; |
| | ix) | the Company could not purchase, redeem or otherwise acquire for value any shares of any class of stock of the Company; and |
| | x) | the Company could not make loans or advances to any subsidiary or affiliate of the Company unless the subsidiary became a guarantor of the obligations under the agreement, and if not, advances or loans could not exceed $0.5 million. |
To secure the Company’s obligations under the credit facility, as amended, the Company granted to the lenders a security interest in and lien upon all property and assets of the Company and its domestic subsidiaries under the terms of a security agreement. The Company paid a waiver and modification fee of $0.1 million in connection with the amendment and the waiver.
Under the terms of the Company’s Amended and Restated Credit Agreement, as amended on April 25, 2006, the Company’s consolidated monthly pre-tax income could not be less than $0.6 million for April and May 2006, and $0.8 million for June and July 2006, and $0.9 million in the months thereafter. For the months of April 2006 to June 2006, the Company was not in compliance with the monthly consolidated pre-tax income requirement. Additionally, the Company was not in compliance with the consolidated fixed charge coverage ratio as of June 30, 2006. Accordingly, the Company requested a waiver from its lenders of such violations. This resulted in the Company’s agreeing to the terms of a Notice of Default, Reservation of Rights and Amendatory Letter (Amended and Restated) dated July 31, 2006, provided by Wachovia Bank, National Association, as agent and lender under the credit agreement. Under the terms of the letter, the Company and the lenders agreed to the following:
| (1) | During the period from July 13, 2006 to October 10, 2006 (referred to in the letter as the “Forbearance Period”) (a) the maximum amount the Company could borrow under the revolving credit facility provided under the credit agreement was reduced to $3.0 million from $15.0 million, and (b) the aggregate amount of all loans or advances to any subsidiary or affiliate of the Company under the credit agreement was increased from $0.5 million to $1.5 million. These revised terms applied to the revolving credit facility during the Forbearance Period unless the lenders provided the Company with written notice stating that these terms no longer applied. |
(2) Although the lenders did not grant a waiver of the covenant violations, they agreed to forbear from terminating the credit commitments under the credit agreement, declaring all credit obligations immediately due and payable, and exercising their rights and remedies under the credit agreement, until the earlier of (i) the expiration of the Forbearance Period or the occurrence of an event of default under the credit agreement other than the actual or anticipated violations of the financial covenants for which the Company sought a waiver.
Note 10 —Commitments and Contingencies
The Company leases branch field offices under a number of operating leases which expire in various years through 2014. These leases generally contain renewal options and require the Company to pay all executory costs (such as property taxes, maintenance and insurance). The Company also leases telephone, computer and other miscellaneous equipment. These leases also expire in various years through 2014. The following is a schedule of future minimum lease payments for operating leases (with initial or remaining terms in excess of one year) as of December 31, 2006:
(In thousands)
Year ending December 31, | | Operating Leases | |
| 2007 | | $ | 10,659 | |
| 2008 | | | 6,802 | |
| 2009 | | | 3,039 | |
| 2010 | | | 1,821 | |
| 2011 | | | 845 | |
| Thereafter | | | 505 | |
| | | $ | 23,671 | |
Included in accrued expenses at December 31, 2006 and 2005 is a liability for reimbursement of examiners travel costs of approximately $2.6 million and $1.0 million, respectively.
Rental expense under operating leases totaled $16.0 million, $18.2 million, and $15.8 million in 2006, 2005 and 2004, respectively.
The Company has employment retention contracts with the executive officers of the Company for one or two year periods from the date a change in control occurs as further defined in the contracts.
A life insurance company client has informed the Company that, after investigation, it has determined that certain life insurance policies that it issued were procured by fraudulent means employed by insurance applicants, the client’s agents, the Company’s sub-contracted examiners and others. No claim has been asserted against the Company by the client, nor has the client produced any evidence pertaining to the matter. The service agreement between the Company and client contains certain indemnification provisions which may be applicable. While the Company believes that it is probable that the client will assert a claim against it for partial indemnification, it also believes that it has meritorious defenses to any such claim. The amount of the unasserted claim cannot be reasonably estimated by the Company at this time.
On July 11, 2003, the Company received a determination from the Internal Revenue Service that one individual the Company contracted with as an independent contractor, should have been classified as an employee in 2002. This ruling also applies to any other individuals engaged by the Company under similar circumstances. The ruling stated that the Company may not be subject to adverse consequences as the Company may be entitled to relief under applicable tax laws (Section 530 of the Revenue Act of 1978). Management believes that the Company qualifies for relief under Section 530. To date, the Company has not received any further communication from the Internal Revenue Service and considers the matter closed.
In the past, some state agencies have claimed that we improperly classified our examiners as independent contractors for purposes of state unemployment tax laws and that we were therefore liable for taxes in arrears, or for penalties for failure to comply with their interpretation of the laws. We received an adverse determination in the State of California, and as a result, converted our independent contractors to employees. There are no assurances that we will not be subject to similar claims in other states in the future.
Note 11 — Litigation
On January 25, 2005 Sylvia Gayed, one of the Company’s examiners in California, filed a class-action lawsuit against the Company in the Superior Court of California, Los Angeles County, alleging violations of California’s wage and hour laws. The complaint alleged that the Company failed to pay overtime wages, provide meal and rest periods and reimbursement for expenses incurred by examiners in performing examinations. We currently employ approximately 400 examiners in California and have employed in excess of 1,400 examiners in California over the past 60 months. Following a mediation on December 6, 2006, the parties reached a settlement, pursuant to which the Company will pay the sum of $1.2 million to the class members in full settlement of this lawsuit.
The Company is a party to a number of legal actions arising in the ordinary course of its business. In the opinion of management, the Company has substantial legal defenses and/or insurance coverage with respect to all of its pending legal actions. Accordingly, none of these actions is expected to have a material adverse effect on the Company’s liquidity, its consolidated results of operations or its consolidated financial position.
Note 12 — Related Party Transaction
For the years ended December 31, 2006, 2005 and 2004, we paid approximately $0, $0.1 million and $0.3 million, respectively to Douglas Consulting, a United Kingdom based IT company 100% owned by John L. Spenser, former Executive Vice President and Chief Operating Officer, U.S. Operations, of the Company, for information technology (IT) consulting services provided to our U.K. subsidiary, Medicals Direct Group. This arrangement terminated in April 2005.
For the years ended December 31, 2006 and 2005, we paid approximately $0.1 million and $0.1 million, respectively, to Paul Kolacki, a member of the Company’s Board of Directors since August 2005, for consulting services related to the Company’s Health Information Division. The Company terminated this arrangement in 2007 and no further services will be provided subsequent to March 31, 2007. Mr. Kolacki remains a member of the Company’s Board of Directors.
Kenneth Rossano, a member of the Company’s Board of Directors since 1967, provides consulting services to Korn Ferry International in Boston, MA. Mr. Rossano’s compensation from Korn Ferry is not directly or indirectly tied to any fees paid by the Company to Korn Ferry. For the years ended December 31, 2006 and 2005, respectively, the Company paid Korn Ferry International $0.5 million and $0.3 million for professional services.
Note 13 — Income Taxes
The income tax provision (benefit) is based on income (loss) before income taxes as follows:
(in thousands) | | Years Ended December 31, | |
| | | 2006 | | 2005 | | 2004 | |
| | | | | | | | |
| United States | | $ | (49,071 | ) | $ | (136,101 | ) | $ | 15,062 | |
| Non-United States | | | (7,243 | ) | | 1,025 | | | 1,785 | |
| | | $ | (56,314 | ) | $ | (135,076 | ) | $ | 16,847 | |
The components of the income tax provision (benefit) are as follows:
(in thousands) | | 2006 | | 2005 | | 2004 | |
| Federal: | | | | | | | |
| Current | | $ | (2,382 | ) | $ | (1,918 | ) | $ | 2,328 | |
| Deferred | | | 25,671 | | | (30,841 | ) | | 2,650 | |
| State and local: | | | | | | | | | | |
| Current | | | 25 | | | 657 | | | 668 | |
| Deferred | | | 5,606 | | | (6,934 | ) | | 601 | |
| Non-U.S.: | | | | | | | | | | |
| Current | | | (28 | ) | | 796 | | | 673 | |
| Deferred | | | (25 | ) | | (213 | ) | | (88 | ) |
| | | $ | 28,867 | | $ | (38,453 | ) | $ | 6,832 | |
The following reconciles the “statutory” federal income tax rates to the effective income tax rates:
| | 2006 | 2005 | 2004 |
| Computed “expected” income tax provision (benefit) | (35%) | (35%) | 35% |
| Increase (reduction) in income tax provision (benefit) resulting from: | | | |
| State tax, net of federal benefit | 6 | (3) | 5 |
| Non deductible portion of impairment charge | 9 | 8 | - |
| Change in federal valuation allowance | 70 | - | - |
| Other | 1 | 2 | 1 |
| Effective income tax rate | 51% | (28%) | 41% |
The tax effects of temporary differences that give rise to the deferred tax assets and liabilities at December 31, 2006 and 2005 are as follows:
(in thousands) | | 2006 | | 2005 | |
| Deferred tax assets: | | | | | |
| Receivable allowance | | $ | 989 | | $ | 568 | |
| Goodwill | | | 25,744 | | | 20,801 | |
| Intangible assets | | | 8,298 | | | 9,169 | |
| Investment loss | | | 2,533 | | | 2,796 | |
| Compensation expense | | | 598 | | | 542 | |
| Federal net operating loss carryforward | | | 5,778 | | | - | |
| State net operating loss carryforward | | | 1,722 | | | 787 | |
| Foreign net operating loss carry forward | | | 1,000 | | | - | |
| Foreign accumulated depreciation | | | 310 | | | 285 | |
| Legal settlement | | | 470 | | | 195 | |
| AMT credit carry forward | | | 157 | | | - | |
| Other | | | 544 | | | 48 | |
| Gross deferred tax assets | | $ | 48,143 | | $ | 35,191 | |
| Valuation allowance | | | (46,665 | ) | | (1,500 | ) |
| | | $ | 1,478 | | $ | 33,691 | |
| Deferred tax liabilities: | | | | | | | |
| Accumulated depreciation | | | (660 | ) | | (687 | ) |
| Acquisition bases adjustment, primarily intangibles | | | (508 | ) | | (1,440 | ) |
| Gross deferred tax liabilities | | | (1,168 | ) | | (2,127 | ) |
| Net deferred tax assets | | $ | 310 | | $ | 31,564 | |
The Company has significant deferred tax assets attributable to tax deductible intangibles, capital loss carryforwards, and federal and state net operating loss carryforwards, which may reduce taxable income in future periods. During the third quarter of 2006 the Company concluded that based on the decline in revenues and margin, the cumulative tax and operating losses, the lack of taxes in the carryback period, and the uncertainty surrounding the extent or timing of future taxable income, it was no longer more likely than not that it would realize the tax benefits of its deferred tax assets. Accordingly, the Company recorded a full valuation allowance on its net U.S. deferred tax assets in the third quarter of 2006. In addition, the Company recorded a valuation allowance on the additional U.S. deferred tax assets created during the fourth quarter of 2006.
For the year ended December 31, 2006, the Company increased its valuation allowance on its net U.S. deferred tax assets by $44.2 million. Additionally, in conjunction with the acquisition of Doctors Direct by MDG, the Company established a valuation allowance of $1.0 million related to acquired foreign net operating losses. The Company has determined that it is more likely than not, that the $0.3 million net deferred tax asset, attributable to its foreign subsidiary is realizable.
The Company will carryback approximately $7.5 million of the federal tax net operating loss generated in 2006.
As of December 31, 2006, the Company has U.S. federal and state net operating loss carryforwards of approximately $16.5 million and $41.2 million, respectively, and a foreign net operating loss carryforward of approximately $3.3 million as of December 31, 2006. The net operating loss carryforwards, if unutilized, will expire in the years 2010 through 2026.
Note 14 — Capital Stock
Stock Repurchase Program— On May 30, 2000, the Board of Directors adopted a resolution authorizing the repurchase in any calendar year of up to 2.5 million shares of the Company’s common stock for an aggregate purchase price not to exceed $25.0 million per year. On April 27, 2005 the Board of Directors amended its earlier resolution limiting the repurchases to between 1.0 and 1.5 million shares of the Company’s common stock in any calendar year. Effective April 25, 2006, in accordance with a covenant contained in the Company’s Amended and Restated Credit Agreement, the Company was prohibited from purchasing any shares of its common stock. Although the agreement was terminated on October 11, 2006, the Company is also prohibited from purchasing, redeeming or retiring any of its shares under its Loan and Security Agreement. For the year ended December 31, 2005, the Company purchased 30,800 shares at a total cost of $0.1 million. The Company did not purchase any shares during 2006 and 2004.
Rights Agreement — On May 23, 2000, the Board of Directors adopted a Rights Agreement to replace the Rights Agreement which expired on June 16, 2000. The Board declared a dividend of one Common Share Purchase Right (a “Right”) for each outstanding share of common stock distributable on June 30, 2000.
The Rights Agreement was not adopted in response to any known effort to acquire control of the Company. Rather, the Rights Agreement was adopted in an effort to ensure that all of the Company’s shareholders are treated fairly in the event an attempt is made to take over the Company without paying all shareholders a full and fair price for all of their shares of common stock.
Until a person or group acquires 20% or more of the Company’s common stock or announces a tender or exchange offer to acquire 30% or more of the Company’s common stock (other than a Permitted Offer), the Rights will be evidenced by the common stock certificates, will automatically trade with the common stock and will not be exercisable. Thereafter, separate Rights certificates will be distributed; if: (i) any person or group acquires 20% or more of the Company’s common stock (other than by a tender offer for all shares which the Company’s Board of Directors determines to be in the best interests of the Company and its shareholders, or by an inadvertent acquisition after which such person or group promptly divests a sufficient number of shares so that such person’s ownership is less than 20%) or (ii) the Company is involved in a merger or other business combination or sells more than 50% of its assets or earning power, each Right (other than Rights beneficially owned by 20% or more shareholders or certain transferees thereof, which Rights become void) will entitle the holder, upon payment of the exercise price of $110 (as adjusted), to buy a number of shares of common stock of the Company or of the acquiring company having a market value of twice the exercise price. If any person or group acquires between 20% and 50% of the Company’s common stock, the Company’s Board of Directors may, at its option, exchange each Right for a share of Company common stock.
The Rights Agreement will expire on June 15, 2010. In addition, the Rights may be redeemed for $0.01 per Right on or prior to the tenth day after any person or group acquires 20% or more of the Company’s common stock, thus clearing the way for an acquisition which the Board believes to be in the best interests of the Company and its shareholders.
Note 15 — 401k Savings and Retirement Plan
The Company’s 401k Savings and Retirement Plan is available to all employees with at least one year of employment service with greater than 1,000 hours of service. The Company matches 25% of the first 10% of employee salary contributions. The Company’s charge to expense for 2006, 2005 and 2004 was $0.5 million, $0.7 million and $0.5 million, respectively. The Company’s common stock is not an investment option to employees participating in the 401k savings and retirement plan.
Quarterly Financial Data (Unaudited)
(dollars in thousands, except per share data)
| | 2006 Quarters (e) |
| | | | | | | |
| | First | Second | Third | | Fourth | |
| | | | | | | |
| Revenues | $ 76,802 | $ 75,637 | $ 70,216 | | $ 71,207 | |
| Gross profit | $ 18,100 | $ 18,320 | $ 15,759 | | $ 16,640 | |
| Net loss | $(1,351) | $ (464) | $(41,958) | (a) | $(41,408) | (b) |
| | | | | | | |
| Net loss per share: | | | | | | |
| Basic (d) | $ (0.02) | $ (0.01) | $ (0.63) | | $ (0.61) | |
| Diluted (d) | $ (0.02) | $ (0.01) | $ (0.63) | | $ (0.61) | |
| | 2005 Quarters (e) |
| | | | | |
| | First | Second | Third | Fourth |
| Revenues | $ 82,029 | $ 84,389 | $ 77,429 | $76,499 | |
| Gross profit | $ 23,067 | $ 23,599 | $ 18,709 | $16,226 | |
| Net income | $ 2,032 | $ 3,093 | $(2,436) | $(99,312) | (c) |
| | | | | | |
| Net income (loss) per share: | | | | | |
| Basic | $ 0.03 | $ 0.05 | $ (0.04) | $(1.51) | |
| Diluted | $ 0.03 | $ 0.05 | $ (0.04) | $(1.51) | |
(a) Includes a charge of $31.3 million to record a deferred tax valuation allowance.
(b) Includes an after tax goodwill and intangible impairment charge of $38.0 million.
(c) Includes an after tax goodwill and intangible asset impairment charge of $95.6 million.
(d) Due to rounding, the sum of the quarters will not equal the full year.
(e) Certain amounts have been reclassified to conform with the fourth quarter of 2006 presentation.
ITEM 9 | Changes in and Disagreements with Accountants on Accounting and Financial -Disclosure |
None
ITEM 9A | Controls and Procedures |
(a) Evaluation of Disclosure Controls and Procedures
The Company’s Chief Executive Officer and Chief Financial Officer, with the assistance of our disclosure committee, have conducted an evaluation of the effectiveness of the Company’s disclosure controls and procedures (as defined in Rule 13a-15(e) and 15d-15(e) under the Securities Exchange Act of 1934, as amended (the “Exchange Act”)) as of December 31, 2006. The Company’s disclosure controls and procedures are designed to ensure that information required to be disclosed in the reports the Company files under the Exchange Act is recorded, processed, summarized and reported within the time periods specified in the Securities and Exchange Commission’s rules and forms and that such information is accumulated and communicated to the Company’s management, including the Company’s Chief Executive Officer and Chief Financial Officer, to allow for timely decisions regarding required disclosures. Based on this evaluation, the Company’s Chief Executive Officer and Chief Financial Officer concluded that, as of December 31, 2006, the Company’s disclosure controls and procedures were not effective because of the Company’s late filing of two current reports on Form 8-K relating to actions taken by the Compensation Committee of the Company’s Board of Directors at their May, 2006 and February, 2007 meetings. The Company intends to put in place procedures to ensure that appropriate personnel are alerted to actions of the Board and each of its committees that trigger a Form 8-K filing requirement.
(b) Management’s Report on Internal Control Over Financial Reporting
Management is responsible for establishing and maintaining adequate internal control over financial reporting. The Company’s internal control over financial reporting is a process designed under the supervision of the Company’s principal executive officer and principal financial officer, and carried out by the Company’s Board of Directors, management and other personnel, to provide reasonable assurance regarding the reliability of the Company’s financial reporting and the preparation of the Company’s consolidated financial statements for external reporting purposes in accordance with U.S. generally accepted accounting principles. The Company’s internal control over financial reporting includes policies and procedures that:
| · | pertain to the maintenance of records that, in reasonable detail, accurately and fairly reflect transactions and dispositions of assets of the Company; |
| · | provide reasonable assurance that transactions are recorded as necessary to permit preparation of consolidated financial statements in accordance with U.S. generally accepted accounting principles, and that receipts and expenditures are being made only in accordance with authorizations of management and directors of the Company; and |
| · | provide reasonable assurance regarding prevention or timely detection of unauthorized acquisition, use or disposition of the Company’s assets that could have a material effect on the consolidated financial statements. |
Because of inherent limitations, internal control over financial reporting may not prevent or detect misstatements. In addition, projections of any evaluation of effectiveness to future periods are subject to the risk that controls may become inadequate because of changes in conditions, or that the degree of compliance with the policies or procedures may deteriorate.
As of December 31, 2006 management has assessed the effectiveness of the Company’s internal control over financial reporting based on the framework established in Internal Control - Integrated Framework issued by the Committee of Sponsoring Organizations of the Treadway Commission (COSO). Based on this assessment, management concluded that as of` December 31, 2006 our internal controls over financial reporting were effective.
(c) Changes in Internal Control over Financial Reporting
During the fourth quarter of 2006, the Company continued with its implementation of a new financial accounting system to replace its legacy mainframe system. During the third quarter of 2007, the Company expects to complete the implementation of this new system when it replaces its Accounts Receivable and Billing modules.
Other than as described above, there have been no changes in the Company’s internal control over financial reporting during the quarter ended December 31, 2006 and subsequent to the Evaluation Date that have materially affected, or are reasonably likely to materially affect, the Company’s internal control over financial reporting.
(d) Remediation of Material Weaknesses in Internal Control Over Financial Reporting
A material weakness is a significant deficiency, as defined by the Public Company Accounting Oversight Board (“PCAOB”) Auditing Standard No. 2, or a combination of significant deficiencies, that results in more than a remote likelihood that a material misstatement of the Company’s annual or interim consolidated financial statements would not be prevented or detected by Company personnel in the normal course of performing their assigned functions. As of December 31, 2005, management identified material weaknesses in the Company’s internal control over financial reporting (disclosed in Item 9A in the Company’s annual report on form 10-K for the year ended December 31, 2005). In 2006, management dedicated significant resources to address these issues and has taken the following steps to remediate the material weaknesses identified as of December 31, 2005:
Inadequate Financial Statement Preparation and Review Procedures
Management created and filled the position of Director of Financial Reporting, such position having responsibility for overseeing the preparation of the consolidated financial statements. Management has also implemented review procedures on all SEC filings and related documentation by the Controller, Chief Financial Officer and the Disclosure Committee.
Ineffective Controls over the Application of Unapplied Cash Receipts
Management has implemented controls to monitor and clear unapplied cash receipts in a timely manner.
Inadequate Management Oversight of Subsidiaries’ Financial Information
The Company has hired a new Chief Financial Officer and a Director of Financial Reporting. The CFO has changed reporting lines within the Company to ensure that finance personnel in all subsidiaries report to him directly, as opposed to subsidiary management. Additionally, the CFO and Controller have increased their oversight of the subsidiary finance departments through enhanced reporting, meetings and the monitoring of status reports.
Inadequate Review of Customer Contracts
In 2006, management implemented a new Customer Contract Policy which outlines required procedures to ensure all significant customer contracts are reviewed and approved by the business unit leader, in-house counsel, Chief Financial Officer and Chief Executive Officer, as required in the policy. Additionally, certain subsidiaries have strengthened their control environments by updating/establishing contracts with existing clients and analyzing the workflow for certain accounting treatments.
Inadequate Expertise in U.S. Generally Accepted Accounting Principles
The CFO and Controller have increased their oversight of the subsidiary finance departments through enhanced reporting, meetings and the monitoring of status reports. Additionally, the Chief Financial Officer and the former Chief Operating Officer increased their oversight at our U.K. subsidiary with on-site visits to ensure that the Company’s financial and accounting policies and procedures are being followed.
Based on the additional internal controls implemented in 2006, and the results of evaluating and testing, management has determined that each of the aforementioned deficiencies has been remediated as of December 31, 2006 and no longer constitute a material weakness to the financial statements based on the criteria in Internal Control - Integrated Framework issued by COSO.
Management’s assessment of the effectiveness of the Company’s internal control over financial reporting as of December 31, 2006 has been audited by KPMG LLP, an independent registered public accounting firm, as stated in their auditors’ report which is included in Item 8 of this Form 10-K.
None.
Part III
ITEM 10 | Directors and Executive Officers of the Registrant |
The information required by Item 10 will be included in our proxy statement for the 2007 annual meeting of shareholders, which will be mailed within 120 days after the close of our year ended December 31, 2006, and is hereby incorporated in this annual report on Form 10-K by reference to the proxy statement.
ITEM 11 | Executive Compensation |
The information required by Item 11 will be included in our proxy statement for the 2007 annual meeting of shareholders, which will be mailed within 120 days after the close of our year ended December 31, 2006, and is hereby incorporated in this annual report on Form 10-K by reference to the proxy statement.
ITEM 12 | Security Ownership of Certain Beneficial Owners and Management and Related Stockholder Matters |
The information required by Item 12 will be included in our proxy statement for the 2007 annual meeting of shareholders, which will be mailed within 120 days after the close of our year ended December 31, 2006, and is hereby incorporated in this annual report on Form 10-K by reference to the proxy statement.
ITEM 13 | Certain Relationships and Related Transactions |
The information required by Item 13 will be included in our proxy statement for the 2007 annual meeting of shareholders, which will be mailed within 120 days after the close of our year ended December 31, 2006, and is hereby incorporated in this annual report on Form 10-K by reference to the proxy statement.
ITEM 14 | Principal Accountant Fees and Services |
The information required by Item 14 will be included in our proxy statement for the 2007 annual meeting of shareholders, which will be mailed within 120 days after the close of our year ended December 31, 2006, and is hereby incorporated in this annual report on Form 10-K by reference to the proxy statement.
ITEM 15 | Exhibits and Financial Statement Schedules |
(a) (1) The following financial statements and independent auditors’ report are included in the Registrant’s 2006 Annual Report to Shareholders.
Reports of Independent Registered Public Accounting Firm
Consolidated Balance Sheets —
December 31, 2006 and 2005
Consolidated Statements of Operations —
Years ended December 31, 2006, 2005 and 2004
Consolidated Statements of Stockholders’ Equity —
Years ended December 31, 2006, 2005 and 2004
Consolidated Statements of Cash Flows —
Years ended December 31, 2006, 2005 and 2004
Notes to Consolidated Financial Statements
(2) The following financial statement schedule is included in the report:
Schedule II - Valuation and Qualifying Accounts
Schedules other than those listed above are omitted because they are not required, inapplicable,
or the information is otherwise shown in the financial statements or notes thereto.
(3) Exhibits included herein
(b) EXHIBIT
3.1 Restated Certificate of Incorporation of Hooper Holmes, Inc., as amended (1)
3.2 Certificate of Amendment of the Certificate of Incorporation of Hooper Holmes, Inc. (2)
3.3 Bylaws of Hooper Holmes, Inc., as amended (3)
4.1 Rights Agreement between Hooper Holmes, Inc. and First City Transfer Company (4)
4.2 Amendment to Rights Agreement (5)
10.1 Employment Agreement by and between Hooper Holmes, Inc., and James D. Calver (6)
10.2 Form of Indemnification Agreement (7)
10.3 Hooper Holmes, Inc. 1992 Stock Option Plan as amended (8)
10.4 Employee Retention Agreement by and between Hooper Holmes, Inc. and James D. Calver (9)
10.5 Hooper Holmes, Inc. 1994 Stock Option Plan (10)
10.6 Amended and Restated Revolving Credit and Term Loan Agreement between Hooper Holmes, Inc. and First Union National Bank and Fleet Bank, N.A. (11)
10.7 Employee Retention Agreement by and between Hooper Holmes, Inc. and Michael Shea (12) 10.8 1997 Stock Option Plan (13)
10.9 1997 Director Option Plan (14)
10.10 Employee Retention Agreement by and between Hooper Holmes, Inc. and Executive Officers of Hooper Holmes, Inc. (15)
10.11 1999 Stock Option Plan (16)
10.12 2002 Stock Option Plan (17)
10.13 Amendment to Amended and Restated Credit Agreement (Second) between Hooper Holmes, Inc. and Wachovia Bank, National Association, Fleet National Bank and Brown Brothers Harriman & Co. (18)
10.14 Stock Purchase Plan (2004) of Hooper Holmes, Inc. (19)
10.15 Agreement and General Release by and between Hooper Holmes, Inc. and Alexander Warren (20)
| | | | 10.16 | Agreement and General Release by and between Hooper Holmes, Inc. and Raymond A |
10.17 Employee Retention Agreement by and between Hooper Holmes, Inc. and John L. Spenser (22)
10.18 Severance and Release Agreement by and between Hooper Holmes, Inc. and Fred Lash (23)
| | | | 10.19 | Resignation and Release Agreement by and between Hooper Holmes, Inc. and James M. McNamee (24) |
10.20 Letter Agreement by and between Hooper Holmes, Inc. and Fred Lash (25)
10.21 Employment Agreement by and between Hooper Holmes, Inc. and John L. Spenser (26)
10.22 Agreement and General Release by and between Hooper Holmes, Inc. and David J. Goldberg (27)
| | | | 10.23 | Amendment to the Amended and Restated Credit Agreement (second) between Hooper Holmes, Inc. and Wachovia Bank, National Association and Bank of America NA (formerly Fleet National Bank) (28) |
| | | | 10.24 | Loan and Security Agreement between Hooper Holmes, Inc. and CitiCapital Commercial Corporation (29) |
| | | | 10.25 | Termination of Amended and Restated Revolving Credit Agreement (second) between Hooper Holmes, Inc. and Wachovia Bank, National Association and Bank of America N.A. (formerly Fleet National Bank) (30) |
14 Hooper Holmes, Inc. Code of Conduct (31)
21 Subsidiaries of Hooper Holmes, Inc.
23 Consent of Independent Registered Public Accounting Firm
24 Power of attorney
| | | | 31.1 | Certification of Chief Executive Officer pursuant to Rule 13a-14(a) of the Securities Exchange Act, as amended |
| | | | 31.2 | Certification of Chief Financial Officer pursuant to Rule 13a-14(a) of the Securities Exchange Act, as amended |
32.1 Certification of Chief Executive Officer pursuant to 18 U.S.C. Section 1350.
32.2 Certification of Chief Financial Officer pursuant to 18 U.S.C. Section 1350.
| | | (1) | Incorporated by reference to Exhibit 3.1 of the Company’s Annual Report on Form 10-K for the fiscal year ended December 31, 1992. |
| | | (2) | Incorporated by reference to Exhibit 3.2 of the Company’s Annual Report on Form 10-K for the fiscal year ended December 31, 1999. |
(3) Incorporated by reference to Exhibit 3.3 of the Company’s Annual Report on Form 10-K for
the fiscal year ended December 31, 1999.
| | | (4) | Incorporated by reference to Exhibit 4.1 of the Company’s Report on Form 10-K for the fiscal year ended December 31, 2000. |
| | | (5) | | Incorporated by reference to Exhibit 4.2 of the Company’s Report on Form 10-K for the fiscal year ended December 31, 2002. |
| | | (6) | | Incorporated by reference to Exhibit 10.1 of the Company’s Current Report on Form 8-K dated January 13, 2006. |
(7) Incorporated by reference to Exhibit 10.4 of the Company’s Annual Report on Form 10-K
for the fiscal year ended December 31, 1990.
(8) Incorporated by reference to Exhibit 10.11 of the Company’s Annual Report on Form 10-K
for the fiscal year ended December 31, 1992.
| | | (9) | | Incorporated by reference to Exhibit 10.2 of the Company’s Current Report on Form 8-K dated January 13, 2006. |
(10) Incorporated by reference to Exhibit 10.16 of the Company’s Annual Report on Form 10-K
for the fiscal year ended December 31, 1994.
(11) Incorporated by reference to Exhibit 10.1 of the Company’s Form 10-Q for the quarter ended September 30, 1999.
(12) Incorporated by reference to Exhibit 10.1 to the Company’s Current Report on Form 8-K dated May 23, 2006.
(13) Incorporated by reference to Exhibit 10.10 of the Company’s Annual Report on Form 10-K for the fiscal year ended December 31, 1997.
(14) Incorporated by reference to Exhibit 10.11 of Company’s Annual Report on Form 10-K for the fiscal year ended December 31, 1997.
(15) Incorporated by reference to Exhibit 10.14 of the Company’s Annual Report on Form 10-K for the fiscal year ended December 31, 1996.
(16) Incorporated by reference to Exhibit 10.13 of the Company’s Annual Report on Form 10-K for the fiscal year ended December 31, 1999.
(17) Incorporated by reference to Attachment to the Company’s Proxy Statement for the Annual
Meeting of Shareholders held on May 21, 2002.
(18) Incorporated by reference to Exhibit 10.13 of the Company’s Annual Report on Form 10-K for the fiscal year ended December 31, 2003.
(19) Incorporated by reference to Attachment to the Company’s Proxy Statement for the Annual
Meeting of Shareholders held on May 20, 2003.
(20) Incorporated by reference to the Company’s Current Report on Form 8-K dated March 18, 2005.
(21) Incorporated by reference to the Company’s Current Report on Form 8-K dated May 5, 2005.
(22) Incorporated by reference to the Exhibit 10.1 of the Company’s Current Report on Form 8-K dated March 24, 2005.
(23) Incorporated by reference to the Exhibit 10.1 of the Company’s Current Report on Form 8-K dated July 19, 2005.
(24) Incorporated by reference to the Exhibit 10.1 of the Company’s Current Report on Form 8-K dated August 30, 2005.
(25) Incorporated by reference to the Exhibit 10.1 of the Company’s Current Report on Form 8-K dated September 20, 2005.
(26) Incorporated by reference to the Exhibit 10.1 of the Company’s Current Report on Form 8-K dated November 22, 2005.
(27) Incorporated by reference to the Exhibit 10.1 of the Company’s Current Report on Form 8-K dated December 15, 2005.
(28) Incorporated by reference to Exhibit 1.01 of the Company’s Current Report on Form 8-K dated May 2, 2006.
(29) Incorporated by reference to Exhibit 1.01 of the Company’s Current Report on Form 8-K dated October 13, 2006.
(30) Incorporated by reference to Exhibit 1-02 of the Company’s Current Report on Form 8-K dated October 13, 2006.
(31) Incorporated by reference to the Exhibit 14 of the Company’s Annual Report on Form 10-K for the fiscal year ended December 31, 2003.
Schedule II
Hooper Holmes, Inc
Valuation and Qualifying Accounts
For the Three Years Ended December 31, 2006
(In thousands)
| | Balance at Beginning of Period | Additions Charged to Costs and Expenses | Deductions (1) | Other Adjustments (2) | Balance at End of Period |
| | | | | | |
Description | | | | | |
| | | | | | |
Year ended December 31, 2006 | | | | | |
Reserves and allowances Accounts receivable allowance | $2,475 | $1,402 | $(416) | $211 | $3,672 |
| | | | | | |
Year ended December 31, 2005 | | | | | |
Reserves and allowances Accounts receivable allowance | $2,235 | $787 | $(500) | $(47) | $2,475 |
| | | | | | |
Year ended December 31, 2004 | | | | | |
Reserves and allowances Accounts receivable allowance | $1,563 | $174 | $(139) | $637 | $2,235 |
| | | | | | |
| | (1) | Represents accounts receivable write-offs, net of recoveries. |
| | (2) | Primarily relates to acquisitions and foreign currency. |
SIGNATURES
Pursuant to the requirements of Section 13 or 15(d) of the Securities Exchange Act of 1934, the Registrant has duly caused this report to be signed on its behalf by the undersigned, thereunto duly authorized.
HOOPER HOLMES, INC.
(Registrant)
By: /s/ James D. Calver
James D. Calver
Chief Executive Officer
Date: March 15, 2007
Pursuant to the requirements of the Securities Exchange Act of 1934, this report has been signed below by the following persons on behalf of the Registrant and in the capacities and on the dates indicated:
___/s/ James D Calver______________________________ Date: March 15, 2007
James D. Calver Chief Executive Officer, Director
________________________________________________ Date: March 15, 2007
* Benjamin A. Currier Director
________________________________________________ Date: March 15, 2007
* Quentin J. Kennedy Director
________________________________________________ Date: March 15, 2007
* Kenneth R. Rossano Director
________________________________________________ Date: March 15, 2007
* Elaine Rigolosi Director
________________________________________________ Date: March 15, 2007
* John W. Remshard Director
________________________________________________ Date: March 15, 2007
* Roy E. Lowrance Director
________________________________________________ Date: March 15, 2007
* Paul W. Kolacki Director
________________________________________________ Date: March 15, 2007
* G. Earle Wight Director
_/s/ Michael J. Shea_________________________________ Date: March 15, 2007
Michael J. Shea Senior V.P. and Chief
Financial and Accounting Officer
*James D. Calver, by signing his name hereto, does hereby sign this report for the persons before whose printed name an asterisk appears, pursuant to the power of attorney duly executed by such person and filed as Exhibit 24 hereto with the Securities and Exchange Commission.
Directors
Benjamin A. Currier
Retired. Formerly Senior Vice President, Security Life of Denver Ins. Co. — ING/Barings
Mr. Currier, age 73, served as Interim Chief Executive Officer of the Company from August 2005 until January 2006 and as Lead Director from September 2004 until August 2005. He was Senior Vice President of Operations for Security Life of Denver Insurance Company, a subsidiary of ING/Barings, in Denver, Colorado prior to his retirement in 1997. He has been a director of the Company since 1996, and he is Chairman of the Board, Chair of the Governance and Nominating Committee, and a member of the Compensation Committee. (Term expires at the Annual Meeting in 2008.)
Quentin J. Kennedy
Retired. Formerly Executive Vice President, Secretary and Director, Federal Paper Board Company
Mr. Kennedy, age 73, was Executive Vice President, Secretary, Treasurer and Director of Federal Paper Board Company in Montvale, New Jersey until his retirement in 1996. He had served in various executive positions with Federal Paper Board since 1960. Mr. Kennedy has been a director of the Company since 1991. He was the Chair of the Audit Committee until February 5, 2007 and is a member of the Audit Committee and the Governance and Nominating Committee. (Term expires at the Annual Meeting in 2009.)
Roy E. Lowrance
Chief Technology Officer, Reuters
Mr. Lowrance, age 56, has served as the Chief Technology Officer for Reuters since February 2006. He was the Chief Technology Officer and Chief Architect for Capital One Financial Corporation from 2002 through 2005. From 2000 to 2002, Mr. Lowrance served as a vice president, director and partner of Boston Consulting Group. Mr. Lowrance has been a director of the Company since March 2, 2005 and is the Chair of the Strategic Oversight Committee and a member of the Audit Committee. (Term expires at the Annual Meeting in 2009.)
James D. Calver
Chief Executive Officer & President
Mr. Calver, age 40, has served as Chief Executive Officer, President and a director of the Company since January 2006. From March 2004 to 2005, he served as Senior Vice President and Chief Marketing Officer of Human Resources and Investor Solutions for Mellon Financial Corporation. From August 2002 to March 2004 Mr. Calver was Vice President of Consulting and Benchmarking at Gartner, Inc. and from April 2001 to August 2002 he was President and CEO of XOSOFT. (Term expires at the Annual Meeting in 2007.)
Dr. Elaine L. Rigolosi
Professor of Education Department of Organization and Leadership, Teachers College, Columbia University
Dr. Rigolosi, Ed.D, J.D., age 62, is Professor of Education in the Department of Organization and Leadership at Teachers College, Columbia University. She has been associated with Columbia University since 1976, and has maintained a private consulting practice in management for health care organizations since 1974. Dr. Rigolosi has been a director of the Company since 1989, and she is the Chair of the Compensation Committee and a member of the Governance and Nominating Committee. (Term expires at the Annual Meeting in 2008.)
Kenneth R. Rossano
Private Investor. Formerly Senior Vice President, Cassidy & Associates
Mr. Rossano, age 72, is a private investor and consultant to Korn Ferry International in Boston, MA. From 1992 to 1999, he was Senior Vice President, Cassidy & Associates in Boston, Massachusetts. He has been a director of the Company since 1967, and is a member of the Audit Committee and the Compensation Committee. Mr. Rossano is also a director of Active International, Inc. and Chairman of Gibbs College located in Boston, Massachusetts. (Term expires at the Annual Meeting in 2007.)
Directors
G. Earle Wight
Retired, Formerly Senior Vice President, Hooper Holmes, Inc.
Mr. Wight, age 73, was Senior Vice President of the Company from 1985 until his retirement in 2002, and has been a director of the Company since 1966. Mr. Wight is a member of the Strategic Oversight Committee. (Term expires at the Annual Meeting in 2007. Mr. Wight has expressed his intention not to stand for re-election at the Annual Meeting in 2007.)
Paul W. Kolacki
Retired, Formerly Executive Vice President and COO, Hooper Holmes, Inc.
Mr. Kolacki, age 65, was Executive Vice President and Chief Operating Officer of the Company prior to his retirement in March 2000. He has been a paid consultant to the Company since his retirement. Mr. Kolacki became a director of the Company on August 24, 2005 and is a member of the Strategic Oversight Committee. (Term expires at the Annual Meeting in 2009)
John W. Remshard
Retired, Former Senior Vice President and Chief Financial Officer, Wellchoice
Mr. Remshard, age 59, was Senior Vice President and Chief Financial Officer of Wellchoice until his retirement in December 2005. He was Senior Vice President of Health Choice from 1996 until 2002. Mr. Remshard became a director of the Company on July 27, 2006 and is the Chair of the Audit Committee. (Term expires at the Annual Meeting in 2008.)
Officers
James D. Calver
Chief Executive Officer and President
Robert William Jewett
Senior Vice President, General Counsel and Secretary
Joseph A. Marone
Vice President, and Controller
Michael J. Shea
Senior Vice President and Chief Financial Officer
Ronald J. Levesque
Senior Vice President
Burt R. Wolder
Senior Vice President and Chief Marketing Officer
Christopher J. Behling
Senior Vice President