UNITED STATES
SECURITIES AND EXCHANGE COMMISSION
Washington, D.C. 20549
FORM N-CSR
CERTIFIED SHAREHOLDER REPORT OF REGISTERED
MANAGEMENT INVESTMENT COMPANIES
Investment Company Act file number 811-3990
Northwestern Mutual Series Fund, Inc.
(Exact name of registrant as specified in charter)
720 East Wisconsin Avenue,
Milwaukee Wisconsin 53202
(Address of principal executive offices) (Zip code)
Barbara E. Courtney, Controller and Chief Accounting Officer Northwestern Mutual Series Fund, Inc.
(Name and address of agent for service)
Registrant’s telephone number, including area code: 414-271-1444
Date of fiscal year end: December 31
Date of reporting period: December 31, 2012
Form N-CSR is to be used by management investment companies to file reports with the Commission not later than 10 days after the transmission to stockholders of any report that is required to be transmitted to stockholders under Rule 30e-1 under the Investment Company Act of 1940 (17 CFR 270.30e-1). The Commission may use the information provided on Form N-CSR in its regulatory, disclosure review, inspection, and policymaking roles.
A registrant is required to disclose the information specified by Form N-CSR, and the Commission will make this information public. A registrant is not required to respond to the collection of information contained in Form N-CSR unless the Form displays a currently valid Office of Management and Budget (“OMB”) control number. Please direct comments concerning the accuracy of the information collection burden estimate and any suggestions for reducing the burden to Secretary, Securities and Exchange Commission, 450 Fifth Street, NW, Washington, DC 20549-0609. The OMB has reviewed this collection of information under the clearance requirements of 44 U.S.C. § 3507.
| Item 1. | Reports to Stockholders |
[Attached EDGARIZED ANNUAL REPORT]
Annual Report December 31, 2012
Northwestern Mutual Series Fund, Inc.
A Series Fund Offering 28 Portfolios
| | · | | Focused Appreciation Portfolio |
| | · | | Large Cap Core Stock Portfolio |
| | · | | Large Cap Blend Portfolio |
| | · | | Index 500 Stock Portfolio |
| | · | | Large Company Value Portfolio |
| | · | | Domestic Equity Portfolio |
| | · | | Equity Income Portfolio |
| | · | | Mid Cap Growth Stock Portfolio |
| | · | | Index 400 Stock Portfolio |
| | · | | Mid Cap Value Portfolio |
| | · | | Small Cap Growth Stock Portfolio |
| | · | | Index 600 Stock Portfolio |
| | · | | Small Cap Value Portfolio |
| | · | | International Growth Portfolio |
| | · | | Research International Core Portfolio |
| | · | | International Equity Portfolio |
| | · | | Emerging Markets Equity Portfolio |
| | · | | Short-Term Bond Portfolio |
| | · | | Long-Term U.S. Government Bond Portfolio |
| | · | | Inflation Protection Portfolio |
| | · | | High Yield Bond Portfolio |
| | · | | Multi-Sector Bond Portfolio |
| | · | | Commodities Return Strategy Portfolio |
| | · | | Asset Allocation Portfolio |
Letter to Clients
December 31, 2012
At this time last year, we shared our views with contract holders about markets being dominated by macroeconomic themes, as opposed to individual, company specific factors. The macroeconomic landscape led to “risk on/risk off” trades and sharp volatility. A similar market environment was again the primary story of 2012, as markets continued to react to an uncertain economic outlook. Risk aversion in markets rose considerably over the summer of 2012 as the economic outlook dimmed, declining later in the year upon the announcements of additional stimulus from the world’s central banks. Measuring returns from the beginning to the end of the year, riskier assets generally outperformed their less risky counterparts, which was a notable divergence from 2011 market performance. For example, international markets outperformed the U.S., as the European Union took additional steps toward financial reform and economic growth stabilized in the developing world.
In the United States, investors’ preference for riskier assets was also evident, as all of the major U.S. equity indices posted double-digit returns. Mid-sized companies, as measured by the S&P MidCap 400® Index, led the rally, followed by the S&P SmallCap 600® Index and the S&P 500® Index of larger companies.
Similarly, within fixed income markets, high yield corporate bonds rallied along with other credit sensitive bonds. Within the universe of corporate debt, lower quality bonds generally outperformed higher quality, investment grade debt. Bonds that offered more stability and lower yields—Treasurys and mortgage-backed securities—lagged the corporate bond market while posting solid returns.
At a high level, markets responded favorably to the coordinated efforts of policy makers to stimulate the global economy. However, the economy continued to grow at a relatively slow pace with high unemployment. In our view, the optimism that markets expressed during 2012 was somewhat disconnected with the long-term outlook for global growth. Unanswered questions regarding growth rates and debt levels in the developed world lingered despite the robust market performance. In our opinion, the biggest concern for financial markets is whether developed countries across the globe will have the ability to grow their way out of debt without the help of economic and financial stimulus.
For all that was uncertain, we found some reasons for optimism. Profit margins on average hit all time highs, while companies continued to hold record amounts of cash on comparatively healthy balance sheets. How corporations decide to utilize these resources is likely to be an important influence on the economy at this point in the business cycle. With some clarity in economic policy, a broad-based move toward capital spending and infrastructure projects could increase economic growth.
Given all of the economic crosscurrents and market volatility, we have a somewhat cautious outlook going into 2013, as we believe that slow economic growth is likely to persist. We also think that the public and private sectors will continue to grapple with policy decisions that could shape the investment landscape for many years.
Despite all of the economic challenges that we have seen over the last several years, we continue to believe that spreading investment risk across many different asset classes can act as an implicit hedge against uncertainty.
While markets remain relatively unpredictable, investors still have control over determining their goals through careful financial planning and saving for the future. To reach your important financial targets, we would encourage you to work with a financial professional to develop a plan consistent with your risk tolerance, goals, and other wealth and life cycle considerations.

R. David Ells, CFA
President of Northwestern Mutual Series Fund, Inc.
Managing Director of Mason Street Advisors, LLC
Northwestern Mutual Series Fund, Inc.
Table of Contents
| | | | |
Expense Examples | | | i | |
Series Fund Overviews and Schedules of Investments: | | | | |
Growth Stock Portfolio | | | 1 | |
Focused Appreciation Portfolio | | | 5 | |
Large Cap Core Stock Portfolio | | | 8 | |
Large Cap Blend Portfolio | | | 12 | |
Index 500 Stock Portfolio | | | 15 | |
Large Company Value Portfolio | | | 22 | |
Domestic Equity Portfolio | | | 27 | |
Equity Income Portfolio | | | 30 | |
Mid Cap Growth Stock Portfolio | | | 35 | |
Index 400 Stock Portfolio | | | 39 | |
Mid Cap Value Portfolio | | | 45 | |
Small Cap Growth Stock Portfolio | | | 50 | |
Index 600 Stock Portfolio | | | 54 | |
Small Cap Value Portfolio | | | 62 | |
International Growth Portfolio | | | 66 | |
Research International Core Portfolio | | | 70 | |
International Equity Portfolio | | | 76 | |
Emerging Markets Equity Portfolio | | | 81 | |
Money Market Portfolio | | | 86 | |
Short-Term Bond Portfolio | | | 90 | |
Select Bond Portfolio | | | 97 | |
Long-Term U.S. Government Bond Portfolio | | | 112 | |
Inflation Protection Portfolio | | | 119 | |
High Yield Bond Portfolio | | | 129 | |
Multi-Sector Bond Portfolio | | | 140 | |
Commodities Return Strategy Portfolio | | | 161 | |
Balanced Portfolio | | | 165 | |
Asset Allocation Portfolio | | | 189 | |
Benchmark Definitions | | | 211 | |
Statements of Assets and Liabilities | | | 214 | |
Consolidated Statement of Assets and Liabilities (Commodities Return Strategy Portfolio) | | | 218 | |
Statements of Operations | | | 220 | |
Consolidated Statement of Operations (Commodities Return Strategy Portfolio) | | | 224 | |
Statements of Changes in Net Assets | | | 226 | |
Consolidated Statement of Changes in Net Assets (Commodities Return Strategy Portfolio) | | | 234 | |
Statement of Cash Flows | | | 235 | |
Financial Highlights | | | 236 | |
Notes to Financial Statements | | | 244 | |
Report of Independent Registered Public Accounting Firm | | | 265 | |
Proxy Voting and Portfolio Holdings | | | 266 | |
Director and Officer Information | | | 267 | |
Approval and Continuance of Investment Sub-Advisory Agreements | | | 270 | |
Mason Street Advisors, LLC (“Mason Street Advisors”), adviser to the Northwestern Mutual Series Fund, Inc., is a wholly owned subsidiary of The Northwestern Mutual Life Insurance Company. Mason Street Advisors is the principal investment adviser for all the Portfolios of the Northwestern Mutual Series Fund, Inc., and has engaged and oversees sub-advisers who provide day-to-day management for certain of the Portfolios. Each sub-adviser may be replaced without the approval of shareholders. Please see the Series Fund prospectus for more information.
The views expressed in the portfolio manager commentaries set forth in the following pages reflect those of the portfolio managers only through the end of the period covered by this report and do not necessarily represent the views of any affiliated organization. The views expressed are not guarantees of future performance or economic results and involve certain risks, uncertainties and assumptions that could cause actual outcomes and results to differ materially from the views expressed herein. These views are subject to change at any time based upon market conditions or other events and should not be relied upon as investment advice. Mason Street Advisors disclaims any responsibility to update these views.
Expense Examples (unaudited)
Example
As a shareholder of each Portfolio, you incur two types of costs: (1) transaction costs and (2) ongoing costs, including management fees and other Portfolio expenses. This Example is intended to help you understand your ongoing costs (in dollars) of investing in the Portfolios and to compare these costs with the ongoing costs of investing in other mutual funds.
The Example is based on an investment of $1,000 invested at the beginning of the period and held for the entire period (July 1, 2012 to December 31, 2012).
Actual Expenses
The first line of the table below provides information about actual account values and actual expenses. You may use the information in this line, together with the amount you invested, to estimate the expenses that you paid over the period. Simply divide your account value by $1,000 (for example, an $8,600 account value divided by $1,000 = 8.6), then multiply the result by the number in the first line under the heading entitled “Expenses Paid During Period” to estimate the expenses you paid on your account during this period.
Hypothetical Example for Comparison Purposes
The second line of the table below for each Portfolio provides information about hypothetical account values and hypothetical expenses based on each Portfolio’s actual expense ratio and an assumed rate of return of 5% per year before expenses, which is not the Portfolio’s actual return. The hypothetical account values and expenses may not be used to estimate the actual ending account balance or expenses you paid for the period. You may use this information to compare the ongoing costs of investing in a Portfolio and other funds. To do so, compare this 5% hypothetical example with the 5% hypothetical examples that appear in the shareholder reports of the other funds.
Please note that the expenses shown in the table are meant to highlight your ongoing costs only and do not reflect any transactional costs or separate account charges. Therefore, the second line of the table is useful in comparing ongoing costs only, and will not help you determine the relative total costs of owning different funds. In addition, if these transactional costs or separate account charges were included, your costs would have been higher.
| | | | | | | | | | | | | | | | |
| | | Beginning Account Value
July 1, 2012 | | | Ending Account Value
December 31, 2012 | | | Expenses Paid During
Period July 1, 2012 to
December 31, 2012* | | | Annualized
Expense Ratio | |
| | | | |
Growth Stock Portfolio | | | | | | | | | | | | | | | | |
Actual | | | $1,000.00 | | | | $1,032.55 | | | | $2.30 | | | | 0.45 | % |
Hypothetical (5% return before expenses) | | | 1,000.00 | | | | 1,022.87 | | | | 2.29 | | | | 0.45 | |
| | | | |
Focused Appreciation Portfolio | | | | | | | | | | | | | | | | |
Actual | | | 1,000.00 | | | | 1,057.83 | | | | 3.88 | | | | 0.75 | |
Hypothetical (5% return before expenses) | | | 1,000.00 | | | | 1,021.37 | | | | 3.81 | | | | 0.75 | |
| | | | |
Large Cap Core Stock Portfolio | | | | | | | | | | | | | | | | |
Actual | | | 1,000.00 | | | | 1,044.00 | | | | 2.41 | | | | 0.47 | |
Hypothetical (5% return before expenses) | | | 1,000.00 | | | | 1,022.77 | | | | 2.39 | | | | 0.47 | |
| | | | |
Large Cap Blend Portfolio | | | | | | | | | | | | | | | | |
Actual | | | 1,000.00 | | | | 1,088.71 | | | | 4.46 | | | | 0.85 | |
Hypothetical (5% return before expenses) | | | 1,000.00 | | | | 1,020.86 | | | | 4.32 | | | | 0.85 | |
| | | | |
Index 500 Stock Portfolio | | | | | | | | | | | | | | | | |
Actual | | | 1,000.00 | | | | 1,058.42 | | | | 1.14 | | | | 0.22 | |
Hypothetical (5% return before expenses) | | | 1,000.00 | | | | 1,024.03 | | | | 1.12 | | | | 0.22 | |
Expense Examples (unaudited)
| | | | | | | | | | | | | | | | |
| | | Beginning Account Value
July 1, 2012 | | | Ending Account Value
December 31, 2012 | | | Expenses Paid During
Period July 1, 2012 to
December 31, 2012* | | | Annualized
Expense Ratio | |
| | | | |
Large Company Value Portfolio | | | | | | | | | | | | | | | | |
Actual | | | $1,000.00 | | | | $1,076.72 | | | | $4.18 | | | | 0.80 | % |
Hypothetical (5% return before expenses) | | | 1,000.00 | | | | 1,021.11 | | | | 4.06 | | | | 0.80 | |
| | | | |
Domestic Equity Portfolio | | | | | | | | | | | | | | | | |
Actual | | | 1,000.00 | | | | 1,088.59 | | | | 3.10 | | | | 0.59 | |
Hypothetical (5% return before expenses) | | | 1,000.00 | | | | 1,022.17 | | | | 3.00 | | | | 0.59 | |
| | | | |
Equity Income Portfolio | | | | | | | | | | | | | | | | |
Actual | | | 1,000.00 | | | | 1,082.92 | | | | 3.61 | | | | 0.69 | |
Hypothetical (5% return before expenses) | | | 1,000.00 | | | | 1,021.67 | | | | 3.51 | | | | 0.69 | |
| | | | |
Mid Cap Growth Stock Portfolio | | | | | | | | | | | | | | | | |
Actual | | | 1,000.00 | | | | 1,052.89 | | | | 2.73 | | | | 0.53 | |
Hypothetical (5% return before expenses) | | | 1,000.00 | | | | 1,022.47 | | | | 2.69 | | | | 0.53 | |
| | | | |
Index 400 Stock Portfolio | | | | | | | | | | | | | | | | |
Actual | | | 1,000.00 | | | | 1,090.90 | | | | 1.52 | | | | 0.29 | |
Hypothetical (5% return before expenses) | | | 1,000.00 | | | | 1,023.68 | | | | 1.48 | | | | 0.29 | |
| | | | |
Mid Cap Value Portfolio | | | | | | | | | | | | | | | | |
Actual | | | 1,000.00 | | | | 1,087.05 | | | | 4.98 | | | | 0.95 | |
Hypothetical (5% return before expenses) | | | 1,000.00 | | | | 1,020.36 | | | | 4.82 | | | | 0.95 | |
| | | | |
Small Cap Growth Stock Portfolio | | | | | | | | | | | | | | | | |
Actual | | | 1,000.00 | | | | 1,027.85 | | | | 3.11 | | | | 0.61 | |
Hypothetical (5% return before expenses) | | | 1,000.00 | | | | 1,022.07 | | | | 3.10 | | | | 0.61 | |
| | | | |
Index 600 Stock Portfolio | | | | | | | | | | | | | | | | |
Actual | | | 1,000.00 | | | | 1,075.51 | | | | 1.77 | | | | 0.34 | |
Hypothetical (5% return before expenses) | | | 1,000.00 | | | | 1,023.43 | | | | 1.73 | | | | 0.34 | |
| | | | |
Small Cap Value Portfolio | | | | | | | | | | | | | | | | |
Actual | | | 1,000.00 | | | | 1,103.14 | | | | 4.76 | | | | 0.90 | |
Hypothetical (5% return before expenses) | | | 1,000.00 | | | | 1,020.61 | | | | 4.57 | | | | 0.90 | |
| | | | |
International Growth Portfolio | | | | | | | | | | | | | | | | |
Actual | | | 1,000.00 | | | | 1,147.81 | | | | 4.37 | | | | 0.81 | |
Hypothetical (5% return before expenses) | | | 1,000.00 | | | | 1,021.06 | | | | 4.12 | | | | 0.81 | |
| | | | |
Research International Core Portfolio | | | | | | | | | | | | | | | | |
Actual | | | 1,000.00 | | | | 1,128.45 | | | | 5.83 | | | | 1.09 | |
Hypothetical (5% return before expenses) | | | 1,000.00 | | | | 1,019.66 | | | | 5.53 | | | | 1.09 | |
| | | | |
International Equity Portfolio | | | | | | | | | | | | | | | | |
Actual | | | 1,000.00 | | | | 1,172.63 | | | | 3.77 | | | | 0.69 | |
Hypothetical (5% return before expenses) | | | 1,000.00 | | | | 1,021.67 | | | | 3.51 | | | | 0.69 | |
Expense Examples (unaudited)
| | | | | | | | | | | | | | | | |
| | | Beginning Account Value
July 1, 2012 | | | Ending Account Value
December 31, 2012 | | | Expenses Paid During
Period July 1, 2012 to
December 31, 2012* | | | Annualized
Expense Ratio | |
| | | | |
Emerging Markets Equity Portfolio | | | | | | | | | | | | | | | | |
Actual | | | $1,000.00 | | | | $1,125.23 | | | | $7.85 | | | | 1.47 | % |
Hypothetical (5% return before expenses) | | | 1,000.00 | | | | 1,017.75 | | | | 7.46 | | | | 1.47 | |
| | | | |
Money Market Portfolio | | | | | | | | | | | | | | | | |
Actual | | | 1,000.00 | | | | 1,000.39 | | | | 0.85 | | | | 0.17 | |
Hypothetical (5% return before expenses) | | | 1,000.00 | | | | 1,024.28 | | | | 0.87 | | | | 0.17 | |
| | | | |
Short-Term Bond Portfolio | | | | | | | | | | | | | | | | |
Actual | | | 1,000.00 | | | | 1,010.73 | | | | 2.22 | | | | 0.44 | |
Hypothetical (5% return before expenses) | | | 1,000.00 | | | | 1,022.92 | | | | 2.24 | | | | 0.44 | |
| | | | |
Select Bond Portfolio | | | | | | | | | | | | | | | | |
Actual | | | 1,000.00 | | | | 1,019.20 | | | | 1.62 | | | | 0.32 | |
Hypothetical (5% return before expenses) | | | 1,000.00 | | | | 1,023.53 | | | | 1.63 | | | | 0.32 | |
| | | | |
Long-Term U.S. Government Bond Portfolio | | | | | | | | | | | | | | | | |
Actual | | | 1,000.00 | | | | 994.50 | | | | 3.47 | | | | 0.69 | |
Hypothetical (5% return before expenses) | | | 1,000.00 | | | | 1,021.42 | | | | 3.52 | | | | 0.69 | |
| | | | |
Inflation Protection Portfolio | | | | | | | | | | | | | | | | |
Actual | | | 1,000.00 | | | | 1,032.30 | | | | 3.32 | | | | 0.65 | |
Hypothetical (5% return before expenses) | | | 1,000.00 | | | | 1,021.87 | | | | 3.30 | | | | 0.65 | |
| | | | |
High Yield Bond Portfolio | | | | | | | | | | | | | | | | |
Actual | | | 1,000.00 | | | | 1,071.81 | | | | 2.55 | | | | 0.49 | |
Hypothetical (5% return before expenses) | | | 1,000.00 | | | | 1,022.67 | | | | 2.49 | | | | 0.49 | |
| | | | |
Multi-Sector Bond Portfolio | | | | | | | | | | | | | | | | |
Actual | | | 1,000.00 | | | | 1,073.52 | | | | 4.59 | | | | 0.88 | |
Hypothetical (5% return before expenses) | | | 1,000.00 | | | | 1,020.71 | | | | 4.47 | | | | 0.88 | |
| | | | |
Commodities Return Strategy Portfolio | | | | | | | | | | | | | | | | |
Actual | | | 1,000.00 | | | | 1,024.70 | | | | 4.63 | | | | 0.91 | |
Hypothetical (5% return before expenses) | | | 1,000.00 | | | | 1,020.33 | | | | 4.62 | | | | 0.91 | |
| | | | |
Balanced Portfolio | | | | | | | | | | | | | | | | |
Actual | | | 1,000.00 | | | | 1,047.22 | | | | 1.54 | | | | 0.30 | |
Hypothetical (5% return before expenses) | | | 1,000.00 | | | | 1,023.63 | | | | 1.53 | | | | 0.30 | |
| | | | |
Asset Allocation Portfolio | | | | | | | | | | | | | | | | |
Actual | | | 1,000.00 | | | | 1,054.46 | | | | 2.89 | | | | 0.56 | |
Hypothetical (5% return before expenses) | | | 1,000.00 | | | | 1,022.32 | | | | 2.85 | | | | 0.56 | |
| * | Expenses are equal to the Portfolio’s annualized expense ratio, multiplied by the average account value over the period, multiplied by 184/366 (to reflect the one-half year period). |
Growth Stock Portfolio
| | | | |
| Objective: | | Portfolio Strategy: | | Net Assets: |
| Long-term growth of capital. Current income is a secondary objective. | | Invest in well-established companies with above average potential for earnings growth. | | $534 million |
Portfolio Overview
Mason Street Advisors acts as the investment adviser for the Growth Stock Portfolio (the “Portfolio”). Normally, the Portfolio invests in the equity securities of well established, medium and large capitalization companies that are selected for their above average earnings growth potential, with an emphasis on companies that have strong financial characteristics. In evaluating individual companies, the Portfolio considers factors such as the company management team, product outlook, competitive position, global exposure, financial characteristics and valuation.
Market Overview
Equity markets finished the year with solid gains despite economic uncertainty and significant volatility. Throughout the year, investors shifted their focus from uncertainty regarding the pace of global economic growth to evaluating fiscal and economic stimulus measures implemented globally. The economic slowdown in China, fiscal and debt crises in Europe, and the slow pace of growth in the U.S. drove volatility. As these issues arose, policy makers responded with stimulus and financing measures designed to calm markets. Ultimately, investors embraced risk, as record profit margins in the U.S. and remarkable cash flow generation propelled equity markets during the year.
As measured by the relevant Russell Indices, growth-oriented stocks posted double-digit returns, but trailed value shares, in part due to the volatility of growth expectations. Growth investors base investments on evaluating the future growth opportunities of more expensive, rapid growth companies. The economic environment added to concerns about the growth that these types of companies could experience going forward.
Portfolio Results
The Growth Stock Portfolio returned 12.94% for the twelve months ended December 31, 2012. By comparison, the Russell 1000® Growth Index (the “Index”) returned 15.26%. (The Index is unmanaged, cannot be invested in directly, and does not include administrative expenses or sales charges.) The Portfolio trailed the 16.00% average return of its Large Cap Growth Funds peer group, according to Lipper® Analytical Services, Inc., an independent mutual fund ranking agency.
The Portfolio’s underperformance relative to the Index was largely attributable to stock selection in the Healthcare and Energy sectors. In the Healthcare space, the Portfolio’s position in Express Scripts was a negative contributor. The company faced difficulty managing its growth plans, as markets became somewhat concerned with its long-term growth potential, particularly after it acquired MedCo. The Portfolio’s performance was also hurt by Allergan, as the company missed its high growth targets which led to underperformance relative to slower growth large pharmaceutical companies. This positioning hurt performance relative to the Index. The Portfolio did not hold Amgen or Regeneron, as their paths to sustainable, long-term growth were unclear to the portfolio managers. Both Index stocks participated in the biotechnology rally, adding return to the Index, and in turn, detracting from the Portfolio’s relative results.
The Portfolio’s holdings in Energy lagged as a result of holdings in the equipment and services and oil, gas and consumable fuels industries. National Oilwell Varco, Inc. was a stock that we favored for its strong exposure to offshore drilling. However, the company made acquisitions unrelated to its core business and the stock declined during 2012. Similarly, the portfolio managers felt Weatherford International, Ltd. had turnaround growth potential, but its shares declined as the company struggled to execute on its plans. In the oil, gas & consumable fuels industry, Portfolio holdings in Occidental Petroleum Corp., Anadarko Petroleum Corp., and Concho Resources, Inc., hurt performance compared with the Index. Occidental Petroleum was the most significant detractor, as the stock’s price sank on market concerns about returns on capital due to higher than expected production costs.
Shifting to positive contributors to relative results, the Portfolio’s emphasis on holdings in some higher quality banks in the Financials sector helped performance. Picks in banks, such as J.P. Morgan and Chase & Co. and Wells Fargo & Co. worked well for the Portfolio. Cellular tower operator American Tower also did well thanks to growing demand for telecommunication infrastructure needed to support new, data-intensive smartphones. In the beverages industry, the Portfolio benefited from seeking growth in a mid-sized, faster growing company (Monster Beverage Corp.), while deemphasizing the slower growth, household names (PepsiCo Inc. and Coca-Cola Co.).
Portfolio Manager Outlook
We believe that the current environment of slow global growth and heightened volatility is likely to persist in 2013. Early in the year, the economy could benefit from capital spending decisions that companies have delayed due to economic and legislative uncertainty. The pace of global growth will largely depend upon China. If China improves, Europe is likely to follow, as Chinese consumers are a large source of demand for European exports. The cyclical growth stocks in the Portfolio may benefit from this theme.
Growth Stock Portfolio
|
Relative Performance 
|
| | | | | | | | | | | | |
Average Annual Total Returns For Periods Ended December 31, 2012 | |
| | | 1 Year | | | 5 Years | | | 10 Years | |
Growth Stock Portfolio | | | 12.94% | | | | 0.99% | | | | 5.56% | |
Russell 1000® Growth Index | | | 15.26% | | | | 3.12% | | | | 7.52% | |
Lipper® Variable Insurance Products (VIP) Large Cap Growth Funds Average | | | 16.00% | | | | 1.45% | | | | 7.23% | |
|
The performance data quoted represents past
performance. Past performance is historical and does
not guarantee future performance. Investment return
and principal value will fluctuate, so that shares, when
redeemed, may be worth more or less than their
original cost. Current performance may be lower or
higher than the performance data quoted. For the
most recent month-end performance information visit
www.northwesternmutual.com. |
This chart assumes an initial investment of $10,000 made on 12/31/02. Returns shown include deductions for management and other portfolio expenses, and reinvestment of all dividends. Returns exclude deductions for separate account sale loads and account fees. Please refer to the Benchmark Definitions section of this report for information about the indices cited in the above chart and graph. |
| The Portfolio may invest in derivative instruments as a cash management strategy, to seek to enhance returns, for hedging purposes or as alternatives to direct investments. Use of these instruments may involve certain costs and imposes certain risks such as liquidity risk, interest rate risk, market risk, credit risk, management risk and the risk of mispricing or improper valuation. Certain derivatives involve leverage, which could magnify losses, and portfolios investing in derivatives could lose more than the principal amount invested in those instruments. |
Top 10 Equity Holdings 12/31/12
| | | | |
Security Description | | | % of Net Assets | |
Apple, Inc. | | | 7.1% | |
Qualcomm, Inc. | | | 2.8% | |
Google, Inc. - Class A | | | 2.6% | |
Monsanto Co. | | | 2.2% | |
Visa, Inc. - Class A | | | 2.0% | |
Schlumberger, Ltd. | | | 2.0% | |
American Tower Corp. | | | 2.0% | |
EMC Corp. | | | 1.8% | |
International Business Machines Corp. | | | 1.8% | |
Microsoft Corp. | | | 1.7% | |
Sector Allocation 12/31/12
Sector Allocation is based on Net Assets.
Sector Allocation and Top 10 Holdings are subject to change.
Growth Stock Portfolio
Schedule of Investments
December 31, 2012
| | | | | | | | | | |
| | | Common Stocks (94.1%) | | Shares/
$ Par | | | Value
$ (000’s) | |
| |
| | Consumer Discretionary (14.8%) | |
| * | | Amazon.com, Inc. | | | 22,750 | | | | 5,713 | |
| | Comcast Corp. - Class A | | | 175,250 | | | | 6,551 | |
| * | | Delphi Automotive PLC | | | 135,000 | | | | 5,164 | |
| | Dick’s Sporting Goods, Inc. | | | 95,900 | | | | 4,362 | |
| * | | Dollar General Corp. | | | 162,900 | | | | 7,182 | |
| | Las Vegas Sands Corp. | | | 95,900 | | | | 4,427 | |
| | Limited Brands, Inc. | | | 123,800 | | | | 5,826 | |
| | Macy’s, Inc. | | | 118,550 | | | | 4,626 | |
| * | | Michael Kors Holdings, Ltd. | | | 121,000 | | | | 6,175 | |
| | News Corp. - Class A | | | 146,500 | | | | 3,742 | |
| * | | Priceline.com, Inc. | | | 7,500 | | | | 4,659 | |
| | Starbucks Corp. | | | 146,450 | | | | 7,853 | |
| | Target Corp. | | | 89,000 | | | | 5,266 | |
| | Viacom, Inc. - Class B | | | 147,600 | | | | 7,784 | |
| | | | | | | | | | |
| | Total | | | | | | | 79,330 | |
| | | | | | | | | | |
| |
| | Consumer Staples (6.8%) | |
| | Costco Wholesale Corp. | | | 59,900 | | | | 5,916 | |
| | CVS Caremark Corp. | | | 133,229 | | | | 6,442 | |
| | The Estee Lauder Cos., Inc. - Class A | | | 89,800 | | | | 5,375 | |
| | PepsiCo, Inc. | | | 83,500 | | | | 5,714 | |
| | Philip Morris International, Inc. | | | 97,200 | | | | 8,130 | |
| | Whole Foods Market, Inc. | | | 54,400 | | | | 4,968 | |
| | | | | | | | | | |
| | Total | | | | | | | 36,545 | |
| | | | | | | | | | |
| |
| | Energy (6.9%) | |
| | Anadarko Petroleum Corp. | | | 95,250 | | | | 7,078 | |
| * | | Concho Resources, Inc. | | | 45,700 | | | | 3,681 | |
| | National-Oilwell Varco, Inc. | | | 76,900 | | | | 5,256 | |
| | Occidental Petroleum Corp. | | | 94,500 | | | | 7,240 | |
| | Schlumberger, Ltd. | | | 154,000 | | | | 10,671 | |
| * | | Weatherford International, Ltd. | | | 243,954 | | | | 2,730 | |
| | | | | | | | | | |
| | Total | | | | | | | 36,656 | |
| | | | | | | | | | |
| |
| | Financials (7.2%) | |
| | American Express Co. | | | 147,400 | | | | 8,472 | |
| | American Tower Corp. | | | 134,525 | | | | 10,395 | |
| | Invesco, Ltd. | | | 123,400 | | | | 3,219 | |
| | JPMorgan Chase & Co. | | | 186,400 | | | | 8,196 | |
| | Wells Fargo & Co. | | | 234,250 | | | | 8,007 | |
| | | | | | | | | | |
| | Total | | | | | | | 38,289 | |
| | | | | | | | | | |
| |
| | Health Care (11.4%) | |
| | Abbott Laboratories | | | 57,000 | | | | 3,734 | |
| * | | Alexion Pharmaceuticals, Inc. | | | 55,700 | | | | 5,225 | |
| | AmerisourceBergen Corp. | | | 160,000 | | | | 6,909 | |
| | | | | | | | | | |
| | | Common Stocks (94.1%) | | Shares/
$ Par | | | Value
$ (000’s) | |
| |
| | Health Care continued | |
| * | | Biogen Idec, Inc. | | | 35,000 | | | | 5,133 | |
| * | | Catamaran Corp. | | | 137,400 | | | | 6,473 | |
| * | | Express Scripts Holding Co. | | | 107,250 | | | | 5,791 | |
| * | | Gilead Sciences, Inc. | | | 110,300 | | | | 8,102 | |
| | Johnson & Johnson | | | 73,400 | | | | 5,145 | |
| | Perrigo Co. | | | 35,400 | | | | 3,683 | |
| | UnitedHealth Group, Inc. | | | 68,300 | | | | 3,705 | |
| * | | Vertex Pharmaceuticals, Inc. | | | 60,850 | | | | 2,552 | |
| * | | Watson Pharmaceuticals, Inc. | | | 49,700 | | | | 4,274 | |
| | | | | | | | | | |
| | Total | | | | | | | 60,726 | |
| | | | | | | | | | |
| |
| | Industrials (11.1%) | |
| | The Boeing Co. | | | 100,050 | | | | 7,540 | |
| | C.H. Robinson Worldwide, Inc. | | | 42,400 | | | | 2,681 | |
| | Cummins, Inc. | | | 28,975 | | | | 3,139 | |
| | Danaher Corp. | | | 155,150 | | | | 8,673 | |
| | FedEx Corp. | | | 59,768 | | | | 5,482 | |
| | Honeywell International, Inc. | | | 110,400 | | | | 7,007 | |
| | Precision Castparts Corp. | | | 33,712 | | | | 6,386 | |
| | SPX Corp. | | | 55,075 | | | | 3,863 | |
| | Union Pacific Corp. | | | 52,500 | | | | 6,600 | |
| | United Technologies Corp. | | | 94,777 | | | | 7,773 | |
| | | | | | | | | | |
| | Total | | | | | | | 59,144 | |
| | | | | | | | | | |
| |
| | Information Technology (32.0%) | |
| | Apple, Inc. | | | 71,200 | | | | 37,952 | |
| | Avago Technologies, Ltd. | | | 127,700 | | | | 4,043 | |
| * | | Baidu, Inc., ADR | | | 15,000 | | | | 1,504 | |
| | Broadcom Corp. - Class A | | | 193,450 | | | | 6,425 | |
| * | | Citrix Systems, Inc. | | | 45,900 | | | | 3,018 | |
| * | | Cognizant Technology Solutions Corp. - Class A | | | 103,700 | | | | 7,679 | |
| * | | eBay, Inc. | | | 149,900 | | | | 7,648 | |
| * | | EMC Corp. | | | 386,000 | | | | 9,766 | |
| * | | Facebook, Inc. - Class A | | | 56,400 | | | | 1,502 | |
| * | | Google, Inc. - Class A | | | 19,742 | | | | 14,004 | |
| | Intel Corp. | | | 119,700 | | | | 2,469 | |
| | International Business Machines Corp. | | | 50,500 | | | | 9,673 | |
| | MasterCard, Inc. - Class A | | | 13,000 | | | | 6,387 | |
| | Microsoft Corp. | | | 338,400 | | | | 9,045 | |
| * | | NetApp, Inc. | | | 72,200 | | | | 2,422 | |
| | Oracle Corp. | | | 234,500 | | | | 7,814 | |
| | Qualcomm, Inc. | | | 243,500 | | | | 15,102 | |
| * | | Salesforce.com, Inc. | | | 39,800 | | | | 6,690 | |
| | Visa, Inc. - Class A | | | 70,700 | | | | 10,717 | |
| * | | VMware, Inc. - Class A | | | 25,200 | | | | 2,372 | |
| * | | Yahoo!, Inc. | | | 224,100 | | | | 4,460 | |
| | | | | | | | | | |
| | Total | | | | | | | 170,692 | |
| | | | | | | | | | |
| | | | | | | | | | |
| | | Common Stocks (94.1%) | | Shares/
$ Par | | | Value
$ (000’s) | |
| |
| | Materials (3.9%) | |
| | BHP Billiton, Ltd., ADR | | | 53,800 | | | | 4,220 | |
| | CF Industries Holdings, Inc. | | | 25,000 | | | | 5,079 | |
| | Monsanto Co. | | | 121,781 | | | | 11,527 | |
| | | | | | | | | | |
| | Total | | | | | | | 20,826 | |
| | | | | | | | | | |
| | | |
| | Total Common Stocks | | | | | | | | |
| | (Cost: $436,681) | | | | | | | 502,208 | |
| | | | | | | | | | |
| |
| | | Short-Term Investments (5.8%) | |
| |
| | Federal Government & Agencies (0.4%) | |
| (b) | | Federal Home Loan Mortgage Corp., 0.12%, 3/4/13 | | | 2,000,000 | | | | 2,000 | |
| | | | | | | | | | |
| | Total | | | | | | | 2,000 | |
| | | | | | | | | | |
| |
| | Finance Services (1.9%) | |
| | Alpine Securitization Corp., 0.18%, 1/9/13 | | | 5,000,000 | | | | 5,000 | |
| | Govco LLC,
0.23%, 1/22/13 | | | 5,000,000 | | | | 4,999 | |
| | | | | | | | | | |
| | Total | | | | | | | 9,999 | |
| | | | | | | | | | |
| |
| | Personal Credit Institutions (0.9%) | |
| | Old Line Funding LLC, 0.19%, 3/25/13 | | | 5,000,000 | | | | 4,998 | |
| | | | | | | | | | |
| | Total | | | | | | | 4,998 | |
| | | | | | | | | | |
| |
| | Restaurants (1.7%) | |
| | Darden Restaurants, Inc., 0.28%, 1/2/13 | | | 9,100,000 | | | | 9,100 | |
| | | | | | | | | | |
| | Total | | | | | | | 9,100 | |
| | | | | | | | | | |
| |
| | Retail Food and Drug (0.9%) | |
| | CVS Caremark Corp., 0.28%, 1/2/13 | | | 5,000,000 | | | | 5,000 | |
| | | | | | | | | | |
| | Total | | | | | | | 5,000 | |
| | | | | | | | | | |
| | | |
| | Total Short-Term Investments | | | | | | | | |
| | (Cost: $31,096) | | | | | | | 31,097 | |
| | | | | | | | | | |
| | | |
| | Total Investments (99.9%) | | | | | | | | |
| | (Cost: $467,777)(a) | | | | | | | 533,305 | |
| | | | | | | | | | |
| | Other Assets, Less | | | | | | | | |
| | Liabilities (0.1%) | | | | | | | 510 | |
| | | | | | | | | | |
| | Net Assets (100.0%) | | | | | | | 533,815 | |
| | | | | | | | | | |
The Accompanying Notes are an Integral Part of the Financial Statements.
Growth Stock Portfolio
ADR after the name of a security represents—American Depositary Receipt.
| (a) | At December 31, 2012 the aggregate cost of securities for federal tax purposes (in thousands) was $468,317 and the net unrealized appreciation of investments based on that cost was $64,988 which is comprised of $75,696 aggregate gross unrealized appreciation and $10,708 aggregate gross unrealized depreciation. |
| (b) | All or a portion of the securities have been pledged as collateral for open futures positions or when-issued securities. Information regarding open futures contracts as of period end is summarized below. |
| | | | | | | | |
| Issuer (000’s) | | Number of
Contracts | | Expiration Date | | Unrealized
Appreciation/
(Depreciation)
(000’s) | |
S&P 500 Mini Index Futures (Long) (Total Notional Value at December 31, 2012, $16,920) | | 237 | | 3/13 | | $ | (92) | |
The following is a summary of the inputs used in valuing the Portfolio’s assets and liabilities at December 31, 2012. See Note 3 for additional information on portfolio valuation.
| | | | | | | | | | | | | | |
| | | Valuation Inputs | | | |
| Description | | Level 1 –
Quoted Prices | | | Level 2 –
Other Significant
Observable Inputs | | | Level 3 – Significant Unobservable Inputs | | | |
| | | (Amounts in thousands) | | | |
Assets: | | | | | | | | | | | | | | |
Common Stocks | | $ | 502,208 | | | $ | - | | | $ | - | | | |
Short-Term Investments | | | - | | | | 31,097 | | | | - | | | |
Liabilities: | | | | | | | | | | | | | | |
Other Financial Instruments^ | | | | | | | | | | | | | | |
Futures | | | (92 | ) | | | - | | | | - | | | |
Total | | $ | 502,116 | | | $ | 31,097 | | | $ | - | | | |
^ Other financial instruments are derivative instruments such as futures, forwards, written options and swaps contracts, which are valued at the unrealized appreciation (depreciation) on the instrument and short sales, which are valued at market value.
The Accompanying Notes are an Integral Part of the Financial Statements.
Focused Appreciation Portfolio
| | | | |
| Objective: | | Portfolio Strategy: | | Net Assets: |
Long-term growth of capital. | | Invest in equity securities selected for their growth potential. | | $389 million |
Portfolio Overview
Mason Street Advisors, the investment adviser for the Focused Appreciation Portfolio (the “Portfolio”), has engaged Janus Capital Management LLC (“Janus”) to act as sub-adviser for the Portfolio. In seeking to implement its growth strategy, the Portfolio employs a “bottom up” approach. That is, the Portfolio looks at companies one at a time to determine if a company is an attractive investment opportunity and is consistent with the Portfolio’s investment policies. The Portfolio may invest in companies of any size, from larger, well established companies to smaller, emerging growth companies. As a non-diversified fund, the Portfolio may hold larger positions in a smaller number of companies and, in anticipation of such investments, may hold a correspondingly larger position in cash pending investment. The Portfolio invests primarily in a core group of 20-40 common stocks.
Market Overview
In 2012, there was evidence that investors began to recognize the underlying fundamentals of individual businesses once again. This was a stark contrast from 2011, a year in which correlations were high and market sentiment was dominated more strongly by macroeconomic events. In the recent environment, it appears company analysis and individual stock selection have increased in importance for generating relative performance.
Portfolio Results
The Focused Appreciation Portfolio returned 20.14% for the twelve months ended December 31, 2012. By comparison, the Russell® 1000 Growth Index (the “Index”) returned 15.26%. (The Index is unmanaged, cannot be invested in directly, and does not include administrative expenses or sales charges.) The Portfolio outperformed the 16.00% average return of its Large Cap Growth Funds peer group, according to Lipper® Analytical Services, Inc., an independent mutual fund ranking agency.
In providing attribution commentary on this Portfolio, it should be noted that the concentrated nature of the Portfolio can result in one holding, or a small number of holdings, producing a significant effect on the Portfolio’s relative results.
The Portfolio’s stock selections in the Information Technology and Consumer Discretionary sectors were the largest contributors to relative performance. Meanwhile, the Portfolio’s holdings in the Materials and Industrials sectors hurt relative performance.
Within Information Technology, the sector experienced a proliferation of data usage through mobile devices at work and at home, with broad implications for content owners, Internet companies and device manufacturers. The data growth trend provided a solid backdrop for companies with strong competitive positions, such as Apple, eBay and Crown Castle, three of the Portfolio’s top performing stocks during the year. On the downside, the Portfolio held a position in Facebook, which underperformed as the company experienced difficulty monetizing its position as the leading social networking company.
One of the predominant themes represented in some of the Portfolio’s Consumer Discretionary holdings was the growing wealth of many emerging market consumers. The portfolio manager‘s main investing thesis in the sector was identifying companies with strong brands and growth prospects in their core markets that were well positioned to capture growth from emerging markets, based on the view that emerging consumers were willing to pay a premium for brands that represented quality or social status. Within the sector, the portfolio manager invested in luxury goods, lifestyle and fashion brands that had the potential to deliver rapid earnings growth in emerging economies and solid earnings in more mature markets. This theme resulted in the Consumer Discretionary sector being the second largest contributor to relative performance.
The Portfolio’s relative underperformance in the Materials sector was due to one holding in particular, Turquoise Hill Resource Partners. The Portfolio also lagged the Index in the Industrials sector. The Portfolio’s holdings were largely concentrated in transport services, logistics and asset light companies that tend to underperform the more cyclical names in the sector in a broad rally. For example, one of the Portfolio’s weakest holdings in the sector was the logistics company C.H. Robinson Worldwide. The company was impacted by a shortage of trucking capacity, which reduced profitability as truckers were able to demand better pricing.
Portfolio Manager Outlook
The following forward looking comments are the opinion of Janus, the Portfolio’s sub-adviser.
We have been encouraged to see the market respond more to the underlying fundamentals of companies this year. We think this will be the case going into 2013. Much attention has been paid to today’s macroeconomic risks and uncertainties. We believe these are “known unknowns” that are already priced into the market, so we expect business fundamentals to be the biggest driver of stock performance in the coming months. In that environment, we believe the type of wide moat, long-duration growth companies we seek to identify should be recognized by the market for the strength of their businesses and the elements that set them apart from their competitors.
| | | | | | |
| | Focused Appreciation Portfolio | | | 5 | |
Focused Appreciation Portfolio
Relative Performance

| | | | | | | | | | | | |
Average Annual Total Returns For Periods Ended December 31, 2012 | |
| | | 1 Year | | | 5 Years | | | Since
Inception* | |
Focused Appreciation Portfolio | | | 20.14% | | | | 1.06% | | | | 9.26% | |
Russell 1000® Growth Index | | | 15.26% | | | | 3.12% | | | | 7.11% | |
Lipper® Variable Insurance Products (VIP) Large Cap Growth Funds Average | | | 16.00% | | | | 1.45% | | | | - | |
*Inception date of 5/1/03
|
The performance data quoted represents past performance. Past performance is historical and does not guarantee future performance. Investment return and principal value will fluctuate, so that shares, when redeemed, may be worth more or less than their original cost. Current performance may be lower or higher than the performance data quoted. For the most recent month-end performance information visit www.northwesternmutual.com. |
This chart assumes an initial investment of $10,000 made on 5/1/03 (commencement of the Portfolio’s operations). Returns shown reflect fee waivers, deductions for management and other portfolio expenses, and reinvestment of all dividends. In the absence of fee waivers, total return would be reduced. Returns exclude deductions for separate account sale loads and account fees. Please refer to the Benchmark Definitions section of this report for information about the indices cited in the above chart and graph. |
| As a non-diversified portfolio, the Portfolio may hold fewer securities because of its focused investment strategy. Holding fewer securities increases the risk that the value of the Portfolio could go down because of the poor performance of a single investment. |
|
| The Portfolio may invest in derivative instruments for hedging purposes, to earn income or to seek to enhance returns. Use of these instruments may involve certain costs and imposes certain risks such as liquidity risk, interest rate risk, market risk, credit risk, management risk and the risk of mispricing or improper valuation. Certain derivatives involve leverage, which could magnify losses, and portfolios investing in derivatives could lose more than the principal amount invested in those instruments. |
Top 10 Equity Holdings 12/31/12
| | | | |
Security Description | | | % of Net Assets | |
Apple, Inc. | | | 10.4% | |
Celgene Corp. | | | 6.3% | |
News Corp. - Class A | | | 5.8% | |
Express Scripts Holding Co. | | | 5.6% | |
eBay, Inc. | | | 5.3% | |
FANUC Corp., ADR | | | 4.7% | |
Precision Castparts Corp. | | | 4.5% | |
Limited Brands, Inc. | | | 4.4% | |
Crown Castle International Corp. | | | 4.2% | |
Oracle Corp. | | | 4.0% | |
Sector Allocation 12/31/12

Sector Allocation is based on Net Assets.
Sector Allocation and Top 10 Holdings are subject to change.
| | | | |
| 6 | | Focused Appreciation Portfolio | | |
Focused Appreciation Portfolio
Schedule of Investments
December 31, 2012
| | | | | | | | | | |
| | | Common Stocks (91.4%) | | Shares/
$ Par | | | Value
$ (000’s) | |
| |
| | Consumer Discretionary (21.3%) | |
| * | | Amazon.com, Inc. | | | 35,129 | | | | 8,822 | |
| | Compagnie Financiere Richemont SA, ADR | | | 1,448,952 | | | | 11,287 | |
| | Limited Brands, Inc. | | | 362,408 | | | | 17,055 | |
| | Marriott International, Inc. - Class A | | | 254,773 | | | | 9,496 | |
| * | | MGM Resorts International | | | 671,144 | | | | 7,812 | |
| | News Corp. - Class A | | | 878,728 | | | | 22,443 | |
| | NIKE, Inc. - Class B | | | 112,500 | | | | 5,805 | |
| | | | | | | | | | |
| | Total | | | | | | | 82,720 | |
| | | | | | | | | | |
| |
| | Consumer Staples (1.5%) | |
| * | | Monster Beverage Corp. | | | 109,223 | | | | 5,776 | |
| | | | | | | | | | |
| | Total | | | | | | | 5,776 | |
| | | | | | | | | | |
| |
| | Financials (1.7%) | |
| | Prudential PLC, ADR | | | 226,107 | | | | 6,455 | |
| | | | | | | | | | |
| | Total | | | | | | | 6,455 | |
| | | | | | | | | | |
| |
| | Health Care (14.8%) | |
| * | | Celgene Corp. | | | 313,232 | | | | 24,658 | |
| * | | Express Scripts Holding Co. | | | 404,986 | | | | 21,869 | |
| * | | Gilead Sciences, Inc. | | | 61,153 | | | | 4,492 | |
| * | | Intuitive Surgical, Inc. | | | 4,757 | | | | 2,333 | |
| * | | Vertex Pharmaceuticals, Inc. | | | 103,280 | | | | 4,331 | |
| | | | | | | | | | |
| | Total | | | | | | | 57,683 | |
| | | | | | | | | | |
| | | | | | | | | | |
| | | Common Stocks (91.4%) | | Shares/
$ Par | | | Value
$ (000’s) | |
| |
| | Industrials (16.1%) | |
| | C.H. Robinson Worldwide, Inc. | | | 110,231 | | | | 6,969 | |
| * | | FANUC Corp., ADR | | | 588,672 | | | | 18,290 | |
| | Iron Mountain, Inc. | | | 223,546 | | | | 6,941 | |
| | Precision Castparts Corp. | | | 91,430 | | | | 17,319 | |
| | United Parcel Service, Inc. - Class B | | | 178,734 | | | | 13,178 | |
| | | | | | | | | | |
| | Total | | | | | | | 62,697 | |
| | | | | | | | | | |
| |
| | Information Technology (29.2%) | |
| | Amphenol Corp. - Class A | | | 69,729 | | | | 4,511 | |
| | Apple, Inc. | | | 75,695 | | | | 40,348 | |
| * | | eBay, Inc. | | | 401,198 | | | | 20,469 | |
| * | | EMC Corp. | | | 538,976 | | | | 13,636 | |
| | MasterCard, Inc. - Class A | | | 9,047 | | | | 4,444 | |
| | Microsoft Corp. | | | 423,333 | | | | 11,316 | |
| | Oracle Corp. | | | 471,303 | | | | 15,704 | |
| | TE Connectivity, Ltd. | | | 87,329 | | | | 3,242 | |
| | | | | | | | | | |
| | Total | | | | | | | 113,670 | |
| | | | | | | | | | |
| |
| | Materials (2.6%) | |
| * | | Turquoise Hill Resources, Ltd. | | | 1,330,386 | | | | 10,124 | |
| | | | | | | | | | |
| | Total | | | | | | | 10,124 | |
| | | | | | | | | | |
| | | | | | | | | | |
| | | Common Stocks (91.4%) | | Shares/
$ Par | | | Value
$ (000’s) | |
| |
| | Telecommunication Services (4.2%) | |
| * | | Crown Castle International Corp. | | | 224,006 | | | | 16,164 | |
| | | | | | | | | | |
| | Total | | | | | | | 16,164 | |
| | | | | | | | | | |
| | | |
| | Total Common Stocks | | | | | | | | |
| | (Cost: $264,607) | | | | | | | 355,289 | |
| | | | | | | | | | |
| |
| | | Short-Term Investments (4.9%) | |
| |
| | Commercial Banks Non-US (4.9%) | |
| | BNP Paribas Finance, Inc., 0.01%, 1/2/13 | | | 19,000,000 | | | | 19,000 | |
| | | | | | | | | | |
| | Total | | | | | | | 19,000 | |
| | | | | | | | | | |
| | | |
| | Total Short-Term Investments | | | | | | | | |
| | (Cost: $19,000) | | | | | | | 19,000 | |
| | | | | | | | | | |
| | | |
| | Total Investments (96.3%) | | | | | | | | |
| | (Cost: $283,607)(a) | | | | | | | 374,289 | |
| | | | | | | | | | |
| | Other Assets, Less | | | | | | | | |
| | Liabilities (3.7%) | | | | | | | 14,331 | |
| | | | | | | | | | |
| | Net Assets (100.0%) | | | | | | | 388,620 | |
| | | | | | | | | | |
ADR after the name of a security represents—American Depositary Receipt.
| (a) | At December 31, 2012 the aggregate cost of securities for federal tax purposes (in thousands) was $285,463 and the net unrealized appreciation of investments based on that cost was $88,826 which is comprised of $103,040 aggregate gross unrealized appreciation and $14,214 aggregate gross unrealized depreciation. |
The following is a summary of the inputs used in valuing the Portfolio’s assets and liabilities at December 31, 2012. See Note 3 for additional information on portfolio valuation.
| | | | | | | | | | | | | | |
| | | Valuation Inputs | | | |
| Description | | Level 1 –
Quoted Prices | | | Level 2 –
Other Significant
Observable Inputs | | | Level 3 – Significant
Unobservable Inputs | | | |
| | | (Amounts in thousands) | | | |
Assets: | | | | | | | | | | | | | | |
Common Stocks | | $ | 355,289 | | | $ | - | | | $ | - | | | |
Short-Term Investments | | | - | | | | 19,000 | | | | - | | | |
Total | | $ | 355,289 | | | $ | 19,000 | | | $ | - | | | |
The Accompanying Notes are an Integral Part of the Financial Statements.
| | | | | | |
| | Focused Appreciation Portfolio | | | 7 | |
Large Cap Core Stock Portfolio
| | | | |
| Objective: | | Portfolio Strategy: | | Net Assets: |
| Long-term growth of capital and income. | | Invest primarily in equity securities of large capitalization companies. | | $385 million |
Portfolio Overview
Mason Street Advisors acts as the investment adviser for the Large Cap Core Stock Portfolio (the “Portfolio”). Normally, the Portfolio invests in equity securities of large capitalization companies that may include both “growth” and “value” stocks, and may represent companies across all market sectors. In selecting investments, the Portfolio looks for companies with characteristics such as strong management teams, solid balance sheets, consistent earnings growth, sustainable cash flows and leading market shares in their industries. The Portfolio may be broadly diversified, potentially reflecting all sectors of the S&P 500® Index (the “Index”). Economic outlook and/or absolute valuation determines the relative attractiveness of market sectors and sector weights may differ from those in the Index, reflecting the economic outlook.
Market Overview
Equity markets finished the year with solid gains despite economic uncertainty and significant volatility. Throughout the year, investors shifted their focus from uncertainty regarding the pace of global economic growth to evaluating fiscal and economic stimulus measures implemented globally. The economic slowdown in China, fiscal and debt crises in Europe, and the slow pace of growth in the U.S. drove volatility. As these issues arose, policy makers responded with stimulus and financing measures designed to calm markets. Ultimately, investors embraced risk, as record profit margins in the U.S. and remarkable cash flow generation propelled equity markets during the year.
Portfolio Results
The Portfolio returned 11.63% for the twelve months ended December 31, 2012. By comparison, the Index returned 16.00%. (The Index is unmanaged, cannot be invested in directly, and does not include administrative expenses or sales charges.) The Portfolio trailed the 15.02% average return of its Large Cap Core Funds peer group, according to Lipper® Analytical Services, Inc., an independent mutual fund ranking agency.
The broad market environment worked against the Portfolio’s investment process. While the Portfolio focused on companies with strong financial characteristics and attractive valuations, the stocks that performed best in the Index generally had highly levered balance sheets with low returns on equity. Stock selection in the Energy sector was the biggest detractor to performance relative to the Index. The Portfolio’s positions in Occidental Petroleum Corp., Weatherford International Ltd. and Anadarko Petroleum Corp. were the largest negative contributors. Occidental Petroleum Corp. continued to follow its growth strategy, but investors grew impatient with its execution. Weatherford International Ltd. experienced accounting issues.
The Materials sector was another source of performance weakness. In the metals and mining industry, HudBay Minerals, a small copper producer, was growing production that the portfolio managers believed had the potential to pay off in the long term, but the stock declined during the Portfolio’s holding period over concerns about China’s near-term rate of growth. Similarly, Cliff’s Natural Resources, Inc. was unable to lower costs at one of its mines while iron ore prices declined, hurting the company’s profitability.
In the Industrials sector, machinery stocks weighed on performance. Dover Corp. declined after an acquisition did not deliver anticipated cost savings, while Caterpillar Inc. tumbled as slower growth in China weighed on its orders for machinery. The Portfolio’s positioning in Health Care stocks also underperformed the Index’s Health Care holdings. In particular, the Portfolio did not hold Abbott Laboratories when the shares rallied after the company announced spinoff plans. Bristol-Meyers Squibb Co. also detracted from performance, as the stock fell when one of its highly anticipated drug offerings failed during testing.
Looking at positive contributors to relative results, the Portfolio’s positioning in the Utilities sector aided the Portfolio. The Portfolio avoided underperformers in the electrical utilities space and overweighted American Water Works Co. In the Consumer Discretionary sector, the Portfolio’s positions in media stocks News Corp., CIA and Comcast Corp. delivered solid results. Both companies pursued shareholder friendly policies with share buybacks and dividend payouts, driving their share prices higher.
Portfolio Manager Outlook
We are cautiously optimistic going into 2013. While Washington will likely dominate the headlines near-term, once investors can look past this and focus on the economy’s fundamentals, it is likely they will see an improving housing market and a rebound in China. If the economy’s fundamentals allow companies to maintain their record high margins, equity valuations are reasonable and should not be an impediment for another positive year in the stock market. Also to the benefit of equities, there seem to be a lack of alternative investments with expectations of outsized returns.
| | | | |
| 8 | | Large Cap Core Stock Portfolio | | |
Large Cap Core Stock Portfolio
Relative Performance
| | | | | | | | | | | | |
Average Annual Total Returns
For Periods Ended December 31, 2012 | |
| | | 1 Year | | | 5 Years | | | 10 Years | |
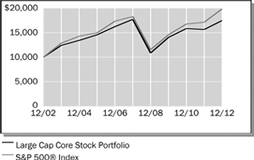
Large Cap Core Stock Portfolio | | | 11.63% | | | | -0.27% | | | | 5.74% | |
S&P 500® Index | | | 16.00% | | | | 1.66% | | | | 7.10% | |
Lipper® Variable Insurance Products (VIP) Large Cap Core Funds Average | | | 15.02% | | | | 0.53% | | | | 6.55% | |
The performance data quoted represents past performance. Past performance is historical and does not guarantee future performance. Investment return and principal value will fluctuate, so that shares, when redeemed, may be worth more or less than their original cost. Current performance may be lower or higher than the performance data quoted. For the most recent month-end performance information visit www.northwesternmutual.com.
This chart assumes an initial investment of $10,000 made on 12/31/02. Returns shown include deductions for management and other portfolio expenses, and reinvestment of all dividends. Returns exclude deductions for separate account sale loads and account fees. Please refer to the Benchmark Definitions section of this report for information about the indices cited in the above chart and graph.
The Portfolio may invest in derivative instruments as a cash management strategy, to generate income or as alternatives to direct investments. Use of these instruments may involve certain costs and imposes certain risks such as liquidity risk, interest rate risk, market risk, credit risk, management risk and the risk of mispricing or improper valuation. Certain derivatives involve leverage, which could magnify losses, and portfolios investing in derivatives could lose more than the principal amount invested in those instruments.
Top 10 Equity Holdings 12/31/12
| | | | |
| Security Description | | % of Net Assets | |
Apple, Inc. | | | 4.1% | |
JPMorgan Chase & Co. | | | 2.7% | |
Exxon Mobil Corp. | | | 2.6% | |
Chevron Corp. | | | 2.6% | |
Microsoft Corp. | | | 2.5% | |
Johnson & Johnson | | | 2.5% | |
International Business Machines Corp. | | | 2.4% | |
Wells Fargo & Co. | | | 2.4% | |
General Electric Co. | | | 2.2% | |
Citigroup, Inc. | | | 2.2% | |
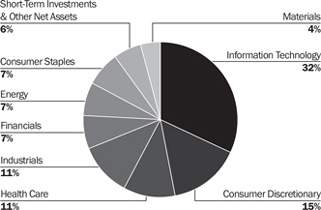
Sector Allocation 12/31/12
Sector Allocation is based on Net Assets.
Sector Allocation and Top 10 Holdings are subject to change.
| | | | | | |
| | Large Cap Core Stock Portfolio | | | 9 | |
Large Cap Core Stock Portfolio
Schedule of Investments
December 31, 2012
| | | | | | | | | | |
| | | Common Stocks (96.9%) | | Shares/ $ Par | | | Value $ (000’s) | |
| |
| | Consumer Discretionary (11.0%) | |
| | Comcast Corp. - Class A | | | 141,100 | | | | 5,274 | |
| * | | Delphi Automotive PLC | | | 89,375 | | | | 3,419 | |
| | Dick’s Sporting Goods, Inc. | | | 66,500 | | | | 3,025 | |
| * | | Dollar General Corp. | | | 97,150 | | | | 4,283 | |
| | Las Vegas Sands Corp. | | | 61,700 | | | | 2,848 | |
| | Macy’s, Inc. | | | 90,750 | | | | 3,541 | |
| | News Corp. - Class A | | | 239,975 | | | | 6,129 | |
| | Starbucks Corp. | | | 59,800 | | | | 3,207 | |
| | Target Corp. | | | 78,300 | | | | 4,633 | |
| | Viacom, Inc. - Class B | | | 112,200 | | | | 5,917 | |
| | | | | | | | | | |
| | Total | | | | | | | 42,276 | |
| | | | | | | | | | |
| |
| | Consumer Staples (8.7%) | |
| | Beam, Inc. | | | 47,775 | | | | 2,919 | |
| | Church & Dwight Co., Inc. | | | 73,050 | | | | 3,913 | |
| | Costco Wholesale Corp. | | | 22,800 | | | | 2,252 | |
| | CVS Caremark Corp. | | | 124,172 | | | | 6,004 | |
| | The Estee Lauder Cos., Inc. - Class A | | | 38,400 | | | | 2,299 | |
| | Mead Johnson Nutrition Co. | | | 43,975 | | | | 2,897 | |
| | PepsiCo, Inc. | | | 71,300 | | | | 4,879 | |
| | Philip Morris International, Inc. | | | 97,650 | | | | 8,167 | |
| | | | | | | | | | |
| | Total | | | | | | | 33,330 | |
| | | | | | | | | | |
| |
| | Energy (12.0%) | |
| | Anadarko Petroleum Corp. | | | 86,025 | | | | 6,393 | |
| | Chevron Corp. | | | 91,050 | | | | 9,846 | |
| | Exxon Mobil Corp. | | | 116,874 | | | | 10,115 | |
| | National-Oilwell Varco, Inc. | | | 35,500 | | | | 2,426 | |
| | Occidental Petroleum Corp. | | | 67,375 | | | | 5,162 | |
| | Schlumberger, Ltd. | | | 87,300 | | | | 6,049 | |
| * | | Weatherford International, Ltd. | | | 347,853 | | | | 3,892 | |
| * | | Whiting Petroleum Corp. | | | 56,600 | | | | 2,455 | |
| | | | | | | | | | |
| | Total | | | | | | | 46,338 | |
| | | | | | | | | | |
| |
| | Financials (15.7%) | |
| | American Express Co. | | | 91,650 | | | | 5,268 | |
| | American Tower Corp. | | | 96,250 | | | | 7,437 | |
| | BlackRock, Inc. | | | 15,625 | | | | 3,230 | |
| | Citigroup, Inc. | | | 211,030 | | | | 8,348 | |
| | The Goldman Sachs Group, Inc. | | | 38,550 | | | | 4,917 | |
| | Invesco, Ltd. | | | 181,550 | | | | 4,737 | |
| | JPMorgan Chase & Co. | | | 236,946 | | | | 10,418 | |
| | MetLife, Inc. | | | 106,250 | | | | 3,500 | |
| | | | | | | | | | |
| | | Common Stocks (96.9%) | | Shares/
$ Par | | | Value
$ (000’s) | |
| |
| | Financials continued | |
| | PNC Financial Services Group, Inc. | | | 61,080 | | | | 3,562 | |
| | Wells Fargo & Co. | | | 267,250 | | | | 9,135 | |
| | | | | | | | | | |
| | Total | | | | | | | 60,552 | |
| | | | | | | | | | |
| |
| | Health Care (11.2%) | |
| | Abbott Laboratories | | | 41,800 | | | | 2,738 | |
| * | | Alexion Pharmaceuticals, Inc. | | | 15,800 | | | | 1,482 | |
| | AmerisourceBergen Corp. | | | 102,500 | | | | 4,426 | |
| * | | Biogen Idec, Inc. | | | 15,400 | | | | 2,259 | |
| | Eli Lilly and Co. | | | 38,700 | | | | 1,909 | |
| * | | Express Scripts Holding Co. | | | 45,300 | | | | 2,446 | |
| * | | Gilead Sciences, Inc. | | | 46,100 | | | | 3,386 | |
| | Johnson & Johnson | | | 135,200 | | | | 9,477 | |
| | Perrigo Co. | | | 26,000 | | | | 2,705 | |
| | Pfizer, Inc. | | | 226,150 | | | | 5,672 | |
| | UnitedHealth Group, Inc. | | | 82,750 | | | | 4,488 | |
| * | | Watson Pharmaceuticals, Inc. | | | 25,700 | | | | 2,210 | |
| | | | | | | | | | |
| | Total | | | | | | | 43,198 | |
| | | | | | | | | | |
| |
| | Industrials (11.5%) | |
| | The Boeing Co. | | | 75,300 | | | | 5,675 | |
| | Cummins, Inc. | | | 23,550 | | | | 2,552 | |
| | Danaher Corp. | | | 91,434 | | | | 5,111 | |
| | FedEx Corp. | | | 65,553 | | | | 6,012 | |
| | General Electric Co. | | | 406,625 | | | | 8,535 | |
| | Precision Castparts Corp. | | | 22,220 | | | | 4,209 | |
| | SPX Corp. | | | 40,600 | | | | 2,848 | |
| | Union Pacific Corp. | | | 28,950 | | | | 3,640 | |
| | United Technologies Corp. | | | 69,275 | | | | 5,681 | |
| | | | | | | | | | |
| | Total | | | | | | | 44,263 | |
| | | | | | | | | | |
| |
| | Information Technology (20.4%) | |
| | Apple, Inc. | | | 29,400 | | | | 15,671 | |
| | Avago Technologies, Ltd. | | | 77,000 | | | | 2,438 | |
| | Broadcom Corp. - Class A | | | 106,450 | | | | 3,535 | |
| * | | Cognizant Technology Solutions Corp. -
Class A | | | 45,700 | | | | 3,384 | |
| * | | eBay, Inc. | | | 39,600 | | | | 2,020 | |
| * | | EMC Corp. | | | 127,900 | | | | 3,236 | |
| * | | Google, Inc. - Class A | | | 8,150 | | | | 5,781 | |
| | Intel Corp. | | | 243,600 | | | | 5,026 | |
| | International Business Machines Corp. | | | 48,850 | | | | 9,357 | |
| | Microsoft Corp. | | | 360,100 | | | | 9,626 | |
| | Oracle Corp. | | | 175,400 | | | | 5,844 | |
| | Qualcomm, Inc. | | | 82,500 | | | | 5,117 | |
| | Visa, Inc. - Class A | | | 27,500 | | | | 4,169 | |
| * | | Yahoo!, Inc. | | | 166,400 | | | | 3,311 | |
| | | | | | | | | | |
| | Total | | | | | | | 78,515 | |
| | | | | | | | | | |
| | | | | | | | | | |
| | | Common Stocks (96.9%) | | Shares/
$ Par | | | Value
$ (000’s) | |
| | | |
| | Materials (3.4%) | | | | | | | | |
| | BHP Billiton, Ltd., ADR | | | 39,900 | | | | 3,130 | |
| | Celanese Corp. | | | 46,600 | | | | 2,075 | |
| | CF Industries Holdings, Inc. | | | 10,800 | | | | 2,194 | |
| | Monsanto Co. | | | 59,500 | | | | 5,632 | |
| | | | | | | | | | |
| | Total | | | | | | | 13,031 | |
| | | | | | | | | | |
| | | |
| | Telecommunication Services (1.0%) | | | | | | | | |
| | Vodafone Group PLC, ADR | | | 147,900 | | | | 3,726 | |
| | | | | | | | | | |
| | Total | | | | | | | 3,726 | |
| | | | | | | | | | |
| | | |
| | Utilities (2.0%) | | | | | | | | |
| | American Water Works Co., Inc. | | | 204,550 | | | | 7,595 | |
| | | | | | | | | | |
| | Total | | | | | | | 7,595 | |
| | | | | | | | | | |
| | | |
| | Total Common Stocks | | | | | | | | |
| | (Cost: $334,905) | | | | | | | 372,824 | |
| | | | | | | | | | |
| | |
| | | Short-Term Investments (3.0%) | | | | |
| | Federal Government & Agencies (0.5%) | |
| (b) | | Federal Home Loan Mortgage Corp., 0.12%, 3/4/13 | | | 2,000,000 | | | | 2,000 | |
| | | | | | | | | | |
| | Total | | | | | | | 2,000 | |
| | | | | | | | | | |
| | | |
| | Restaurants (2.5%) | | | | | | | | |
| | Darden Restaurants, Inc., 0.28%, 1/2/13 | | | 9,500,000 | | | | 9,500 | |
| | | | | | | | | | |
| | Total | | | | | | | 9,500 | |
| | | | | | | | | | |
| | | |
| | Total Short-Term Investments | | | | | | | | |
| | (Cost: $11,499) | | | | | | | 11,500 | |
| | | | | | | | | | |
| | | |
| | Total Investments (99.9%) | | | | | | | | |
| | (Cost: $346,404)(a) | | | | | | | 384,324 | |
| | | | | | | | | | |
| | Other Assets, Less | | | | | | | | |
| | Liabilities (0.1%) | | | | | | | 355 | |
| | | | | | | | | | |
| | Net Assets (100.0%) | | | | | | | 384,679 | |
| | | | | | | | | | |
The Accompanying Notes are an Integral Part of the Financial Statements.
| | | | |
| 10 | | Large Cap Core Stock Portfolio | | |
Large Cap Core Stock Portfolio
ADR after the name of a security represents—American Depositary Receipt.
| (a) | At December 31, 2012 the aggregate cost of securities for federal tax purposes (in thousands) was $346,914 and the net unrealized appreciation of investments based on that cost was $37,410 which is comprised of $46,198 aggregate gross unrealized appreciation and $8,788 aggregate gross unrealized depreciation. |
| (b) | All or a portion of the securities have been pledged as collateral for open futures positions or when-issued securities. Information regarding open futures contracts as of period end is summarized below. |
| | | | | | | | |
| Issuer (000’s) | | Number of
Contracts | | Expiration Date | | Unrealized
Appreciation/
(Depreciation)
(000’s) | |
S&P 500 Mini Index Futures (Long) (Total Notional Value at December 31, 2012, $4,855) | | 68 | | 3/13 | | $ | (26) | |
The following is a summary of the inputs used in valuing the Portfolio’s assets and liabilities at December 31, 2012. See Note 3 for additional information on portfolio valuation.
| | | | | | | | | | | | | | |
| | | Valuation Inputs | | | |
| Description | | Level 1 –
Quoted Prices | | | Level 2 –
Other Significant
Observable Inputs | | | Level 3 – Significant
Unobservable Inputs | | | |
| | | (Amounts in thousands) | | | |
Assets: | | | | | | | | | | | | | | |
Common Stocks | | $ | 372,824 | | | $ | - | | | $ | - | | | |
Short-Term Investments | | | - | | | | 11,500 | | | | - | | | |
Liabilities: | | | | | | | | | | | | | | |
Other Financial Instruments^ | | | | | | | | | | | | | | |
Futures | | | (26 | ) | | | - | | | | - | | | |
Total | | $ | 372,798 | | | $ | 11,500 | | | $ | - | | | |
^ Other financial instruments are derivative instruments such as futures, forwards, written options and swaps contracts, which are valued at the unrealized appreciation (depreciation) on the instrument and short sales, which are valued at market value.
The Accompanying Notes are an Integral Part of the Financial Statements.
| | | | | | |
| | Large Cap Core Stock Portfolio | | | 11 | |
Large Cap Blend Portfolio
| | | | |
| Objective: | | Portfolio Strategy: | | Net Assets: |
| Long-term growth of capital and income. | | Invest primarily in equity securities of U.S. large capitalization companies listed or traded on U.S. securities exchanges. | | $79 million |
Portfolio Overview
Effective October 1, 2012, the Board of Directors of the Northwestern Mutual Series Fund, Inc. appointed Fiduciary Management, Inc. (“FMI”) to act as sub-adviser to the Large Cap Blend Portfolio (the “Portfolio”). Prior to that time, the Portfolio was sub-advised by Capital Guardian Trust Company (“Capital Guardian”). Normally, the Portfolio invests in equity securities of large capitalization companies listed or traded on U.S. securities exchanges. In selecting investments, greater consideration is given to potential appreciation and future dividends than to current income. The Portfolio uses fundamental analysis to look for stocks of good businesses that are selling at value prices, typically invested in a core group of 20-30 large capitalization stocks and ADRs.
Market Overview
Equity markets finished the year with solid gains despite economic uncertainty and significant volatility. Throughout the year, investors shifted their focus from uncertainty regarding the pace of global economic growth to evaluating fiscal and economic stimulus measures implemented globally. The economic slowdown in China, fiscal and debt crises in Europe, and the slow pace of growth in the U.S. drove volatility. As these issues arose, policy makers responded with stimulus and financing measures designed to calm markets. Ultimately, investors embraced risk, as record profit margins in the U.S. and remarkable cash flow generation propelled equity markets during the year.
Portfolio Results
The Portfolio returned 15.20% for the twelve months ended December 31, 2012. By comparison, the S&P 500® Index (the “Index”) returned 16.00%. (The Index is unmanaged, cannot be invested in directly, and does not include administrative expenses or sales charges.) The Portfolio outperformed the 15.02% average return of its Large Cap Core Funds peer group, according to Lipper® Analytical Services, Inc., an independent mutual fund ranking agency.
As noted above, prior to October 1, 2012, the Portfolio was managed by Capital Guardian. With respect to the period prior to October 1, 2012, the Portfolio underperformed the Index primarily due to stock selection and an overweight stance within the Materials sector, especially among metals and mining stocks Allegheny Technologies, Cliffs Natural Resources and Barrick Gold. Stock selection in the Telecommunication Services and Utilities sectors was a drag on relative results during the period as well.
On the positive side, stock selection in the Consumer Discretionary sector was the largest contributor to relative returns. Individual stocks within this sector included Comcast, Home Depot, Time Warner Cable and Scripps Networks Interactive.
The following attribution comments relate to the period October 1, 2012 through December 31, 2012, during which FMI acted as the Portfolio’s sub-adviser.
The Portfolio outperformed the Index during the October 1, 2012 through December 31, 2012 period primarily due to stock selection in the Information Technology sector. Within the sector, electronic equipment company TE Connectivity Ltd. was a strong performer for the Portfolio during the period. An overweight position in the Industrials sector was beneficial as well.
In terms of detractors, the Energy and Financials sectors held back relative returns for the Portfolio. Within the Energy sector, the Portfolio’s investment in Devon Energy detracted from Portfolio performance. In Financials, the Portfolio was hurt by an underweight in Real Estate Investment Trusts (“REITs”) and lower quality money center banks.
Portfolio Manager Outlook
The following forward looking comments are the opinion of FMI, the Portfolio’s current sub-adviser.
Regarding our investments and outlook for 2013, the summary is that it is more of the same. The Federal Reserve induced rally has kept the market trading higher, even while fundamentals appear to be darkening. Of course, there is a chance we are reading the tea leaves incorrectly. A mid-December purchasing managers survey showed expectations for a pick-up in growth in 2013 versus 2012. We hope these expectations come to fruition, but we are not staking the Portfolio on such an outcome. The Portfolio remains fairly balanced with a mixture of reasonably priced cyclical and more defensive businesses. Overall, the Portfolio is still tilted toward the cautious side.
The extensive stock market valuation work that we do every quarter again shows stocks to be well above their long-term valuation averages. Valuations for the market have been elevated for almost three years. We continue to find reasonable businesses at decent prices and our stocks trade at a very meaningful discount to the S&P 500. We do not see great opportunities in some of the assets that have been hot the past several years: gold, bonds, farmland, timber and REITs. Owning high quality equities of well financed and durable business franchises, particularly those that operate on a global basis, seems like the prudent approach, and that is the one we are taking.
| | | | |
| 12 | | Large Cap Blend Portfolio | | |
Large Cap Blend Portfolio
Relative Performance
| | | | | | | | | | | | |
Average Annual Total Returns
For Periods Ended December 31, 2012 | |
| | | 1 Year | | | 5 Years | | | Since
Inception* | |
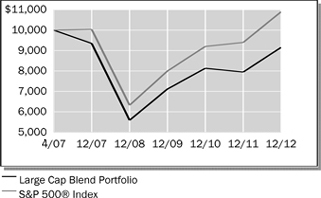
Large Cap Blend Portfolio | | | 15.20% | | | | -0.42% | | | | -1.54% | |
S&P 500® Index | | | 16.00% | | | | 1.66% | | | | 1.53% | |
Lipper® Variable Insurance Products (VIP) Large Cap Core Funds Average | | | 15.02% | | | | 0.53% | | | | - | |
| * | Inception date of 4/30/07 |
|
The performance data quoted represents past
performance. Past performance is historical and does
not guarantee future performance. Investment return
and principal value will fluctuate, so that shares, when
redeemed, may be worth more or less than their
original cost. Current performance may be lower or
higher than the performance data quoted. For the
most recent month-end performance information visit
www.northwesternmutual.com. |
This chart assumes an initial investment of $10,000 made on 4/30/07 (commencement of the Portfolio’s operations). Returns shown reflect fee waivers, deductions for management and other portfolio expenses, and reinvestment of all dividends. In the absence of fee waivers, total return would be reduced. Returns exclude deductions for separate account sale loads and account fees. Please refer to the Benchmark Definitions section of this report for information about the indices cited in the above chart and graph. The Portfolio may hold fewer securities than other diversified portfolios because of its more focused investment strategy. Holding fewer securities increases the risk that the value of the Portfolio could go down because of the poor performance of a single investment. |
Top 10 Equity Holdings 12/31/12
| | | | |
Security Description | | | % of Net Assets | |
The Bank of New York Mellon Corp. | | | 5.4% | |
3M Co. | | | 5.4% | |
Berkshire Hathaway, Inc. - Class B | | | 5.2% | |
Sysco Corp. | | | 4.5% | |
TE Connectivity, Ltd. | | | 4.3% | |
Accenture PLC - Class A | | | 4.2% | |
Illinois Tool Works, Inc. | | | 4.1% | |
Kimberly-Clark Corp. | | | 3.8% | |
Covidien PLC | | | 3.7% | |
Wal-Mart Stores, Inc. | | | 3.6% | |
Sector Allocation 12/31/12

Sector Allocation is based on Net Assets.
Sector Allocation and Top 10 Holdings are subject to change.
| | | | | | |
| | Large Cap Blend Portfolio | | | 13 | |
Large Cap Blend Portfolio
Schedule of Investments
December 31, 2012
| | | | | | | | | | |
| | | Common Stocks (93.7%) | | Shares/
$ Par | | | Value
$ (000’s) | |
| |
| | Consumer Discretionary (6.5%) | |
| | Omnicom Group, Inc. | | | 53,200 | | | | 2,658 | |
| | Time Warner, Inc. | | | 51,200 | | | | 2,449 | |
| | | | | | | | | | |
| | Total | | | | | | | 5,107 | |
| | | | | | | | | | |
| |
| | Consumer Staples (15.6%) | |
| | Danone SA, ADR | | | 41,750 | | | | 559 | |
| | Kimberly-Clark Corp. | | | 35,200 | | | | 2,972 | |
| | Nestle SA, ADR | | | 36,500 | | | | 2,379 | |
| | Sysco Corp. | | | 112,000 | | | | 3,546 | |
| | Wal-Mart Stores, Inc. | | | 41,500 | | | | 2,831 | |
| | | | | | | | | | |
| | Total | | | | | | | 12,287 | |
| | | | | | | | | | |
| |
| | Energy (6.1%) | |
| | Devon Energy Corp. | | | 53,800 | | | | 2,800 | |
| | Schlumberger, Ltd. | | | 28,900 | | | | 2,002 | |
| | | | | | | | | | |
| | Total | | | | | | | 4,802 | |
| | | | | | | | | | |
| |
| | Financials (18.7%) | |
| | American Express Co. | | | 41,200 | | | | 2,368 | |
| | The Bank of New York Mellon Corp. | | | 166,400 | | | | 4,277 | |
| * | | Berkshire Hathaway, Inc. - Class B | | | 45,200 | | | | 4,054 | |
| | Comerica, Inc. | | | 82,900 | | | | 2,515 | |
| | Willis Group Holdings PLC | | | 44,900 | | | | 1,506 | |
| | | | | | | | | | |
| | Total | | | | | | | 14,720 | |
| | | | | | | | | | |
| | | | | | | | | | |
| | | Common Stocks (93.7%) | | Shares/
$ Par | | | Value
$ (000’s) | |
| |
| | Health Care (10.3%) | |
| | AmerisourceBergen Corp. | | | 63,100 | | | | 2,724 | |
| | Covidien PLC | | | 50,900 | | | | 2,939 | |
| | GlaxoSmithKline PLC, ADR | | | 55,600 | | | | 2,417 | |
| | | | | | | | | | |
| | Total | | | | | | | 8,080 | |
| | | | | | | | | | |
| |
| | Industrials (20.3%) | |
| | 3M Co. | | | 45,600 | | | | 4,234 | |
| | Cintas Corp. | | | 54,100 | | | | 2,213 | |
| | Expeditors International of Washington, Inc. | | | 61,400 | | | | 2,428 | |
| | Illinois Tool Works, Inc. | | | 53,200 | | | | 3,235 | |
| | Ingersoll-Rand PLC | | | 45,100 | | | | 2,163 | |
| | PACCAR, Inc. | | | 38,150 | | | | 1,725 | |
| | | | | | | | | | |
| | Total | | | | | | | 15,998 | |
| | | | | | | | | | |
| |
| | Information Technology (13.8%) | |
| | Accenture PLC - Class A | | | 50,075 | | | | 3,330 | |
| | Automatic Data Processing, Inc. | | | 38,800 | | | | 2,212 | |
| | Microsoft Corp. | | | 72,600 | | | | 1,940 | |
| | TE Connectivity, Ltd. | | | 91,700 | | | | 3,404 | |
| | | | | | | | | | |
| | Total | | | | | | | 10,886 | |
| | | | | | | | | | |
| | | | | | | | | | |
| | | Common Stocks (93.7%) | | Shares/
$ Par | | | Value
$ (000’s) | |
| |
| | Materials (2.4%) | |
| | Monsanto Co. | | | 19,800 | | | | 1,874 | |
| | | | | | | | | | |
| | Total | | | | | | | 1,874 | |
| | | | | | | | | | |
| | | |
| | Total Common Stocks | | | | | | | | |
| | (Cost: $73,207) | | | | | | | 73,754 | |
| | | | | | | | | | |
| | |
| | | Short-Term Investments (6.4%) | | | | |
| |
| | Other Holdings (6.4%) | |
| | JPMorgan U.S. Government Money Market Fund | | | 2,562,973 | | | | 2,563 | |
| | JPMorgan U.S. Treasury Plus Money Market Fund | | | 2,500,551 | | | | 2,501 | |
| | | | | | | | | | |
| | Total | | | | | | | 5,064 | |
| | | | | | | | | | |
| | | |
| | Total Short-Term Investments | | | | | | | | |
| | (Cost: $5,064) | | | | | | | 5,064 | |
| | | | | | | | | | |
| | | |
| | Total Investments (100.1%) | | | | | | | | |
| | (Cost: $78,271)(a) | | | | | | | 78,818 | |
| | | | | | | | | | |
| | Other Assets, Less | | | | | | | | |
| | Liabilities (-0.1%) | | | | | | | (118 | ) |
| | | | | | | | | | |
| | Net Assets (100.0%) | | | | | | | 78,700 | |
| | | | | | | | | | |
ADR after the name of a security represents—American Depositary Receipt.
| (a) | At December 31, 2012 the aggregate cost of securities for federal tax purposes (in thousands) was $78,271 and the net unrealized appreciation of investments based on that cost was $547 which is comprised of $2,294 aggregate gross unrealized appreciation and $1,747 aggregate gross unrealized depreciation. |
The following is a summary of the inputs used in valuing the Portfolio’s assets and liabilities at December 31, 2012. See Note 3 for additional information on portfolio valuation.
| | | | | | | | | | | | | | |
| | | Valuation Inputs | | | |
| Description | | Level 1 – Quoted Prices | | | Level 2 –
Other Significant
Observable Inputs | | | Level 3 – Significant
Unobservable Inputs | | | |
| | | (Amounts in thousands) | | | |
Assets: | | | | | | | | | | | | | | |
Common Stocks | | $ | 73,754 | | | $ | - | | | $ | - | | | |
Short-Term Investments | | | 5,064 | | | | - | | | | - | | | |
Total | | $ | 78,818 | | | $ | - | | | $ | - | | | |
The Accompanying Notes are an Integral Part of the Financial Statements.
| | | | |
| 14 | | Large Cap Blend Portfolio | | |
Index 500 Stock Portfolio
| | | | |
| Objective: | | Portfolio Strategy: | | Net Assets: |
| Investment results that approximate the performance of the S&P 500® Index. | | Invest in stocks included in the S&P 500® Index in approximately the same proportion as each stock’s weighting in the Index. | | $1.7 billion |
Portfolio Overview
Mason Street Advisors acts as the investment adviser for the Index 500 Stock Portfolio (the “Portfolio”). The S&P 500® Index (the “Index”) is composed of the stocks of primarily large capitalization companies that represent a broad spectrum of the U.S. economy and a substantial part of the U.S. stock market’s total capitalization. The Portfolio attempts to achieve its objective by investing all, or substantially all, of its assets in the stocks that make up the Index, holding each stock in approximately the same proportion as its weighting in the Index. This is known as a full replication strategy. The Portfolio may also invest in S&P 500® Index stock futures and, to a lesser extent, swap agreements to help achieve full replication.
Market Overview
Equity markets finished the year with solid gains (as measured by the Index) despite economic uncertainty and significant volatility. Throughout the year, investors shifted their focus from uncertainty regarding the pace of global economic growth to evaluating fiscal and economic stimulus measures implemented globally. The economic slowdown in China, fiscal and debt crises in Europe, and the slow pace of growth in the U.S. drove volatility. As these issues arose, policy makers responded with stimulus and financing measures designed to calm markets. Ultimately, investors embraced risk, as record profit margins in the U.S. and remarkable cash flow generation propelled equity markets during the year. In that environment, mid cap stocks outperformed shares of large and small sized companies. For the year, returns for the S&P 500®, MidCap 400®, and SmallCap 600® Indices were 16.00%, 17.88%, and 16.33%, respectively.
Within the S&P 500 Index®, every economic sector generated positive returns. Financial stocks led the rally on improving balance sheets, solid earnings, and better credit conditions. The Consumer Discretionary sector also delivered solid gains, as consumer spending continued amid slow economic growth. Performance varied widely within the sector according to spending trends, as media and internet retail stocks generally posted large gains, while hotels, restaurants and traditional retail box stores underperformed overall. Healthcare stocks outperformed the broader Index, primarily fueled by higher share prices in biotechnology.
Meanwhile, Energy was a notable laggard. Relatively flat prices for crude oil and natural gas weighed on the sector’s return during the year. Similarly, the Utilities sector, known for its stable stock prices and dividend yields, contributed very little to the Index’s performance, as investors embraced riskier stocks. Traditionally more economically sensitive stocks in the Information Technology, Materials and Industrials sectors slightly lagged the broader Index, reflecting uncertainty around global economic growth and capital spending.
Portfolio Results
The Index 500 Stock Portfolio had a total return of 15.76% for the twelve months ended December 31, 2012. That was in line with the Index, which returned 16.00%. (The Index is unmanaged, cannot be invested in directly, and does not include administrative expenses or sales charges.) Portfolio performance slightly lagged the Index due to transaction costs, administrative expenses, cash flow effects and costs associated with the use of stock index futures contracts. The Portfolio outperformed the 15.39% average return for its peer group, S&P 500 Index Objective Funds, according to Lipper® Analytical Services, Inc.
As the Portfolio seeks to track the performance and weightings of stocks in the Index, the portfolio managers make adjustments to the Portfolio’s holdings as the Index changes. Standard & Poor’s modifies the composition of the Index as companies go public or private, merge, divest or have major changes in market capitalization. Additionally, Standard & Poor’s adjusts the Index to better reflect the companies that are most representative of the composition of the U.S. economy. During 2012, there were 18 stocks added to the Index, and a like number of companies were eliminated. The portfolio managers try to make these adjustments in a way that minimizes the cost and market impact of trading.
Portfolio Manager Outlook
We have a cautiously optimistic view of equity markets heading into 2013. Currently, stocks appear relatively attractive given reasonable valuations, record high profit margins and cash positions, as well as relatively low energy prices. Extremely low interest rates have also led to improving fundamentals in the housing market and steady increases in employment.
Nevertheless, the market still faces a number of risks—from uncertainty surrounding further economic stimulus and concerns over the developed world’s ongoing debt crisis, among others—that have the potential for creating a volatile market environment for the foreseeable future.
| | | | | | |
| | Index 500 Stock Portfolio | | | 15 | |
Index 500 Stock Portfolio
Relative Performance

| | | | | | | | | | | | |
Average Annual Total Returns
For Periods Ended December 31, 2012 | |
| | | 1 Year | | | 5 Years | | | 10 Years | |
Index 500 Stock Portfolio | | | 15.76% | | | | 1.56% | | | | 6.97% | |
S&P 500® Index | | | 16.00% | | | | 1.66% | | | | 7.10% | |
Lipper® Variable Insurance Products (VIP) S&P 500 Index Objective Funds Average | | | 15.39% | | | | 1.29% | | | | 6.73% | |
|
The performance data quoted represents past
performance. Past performance is historical and does
not guarantee future performance. Investment return
and principal value will fluctuate, so that shares, when
redeemed, may be worth more or less than their
original cost. Current performance may be lower or
higher than the performance data quoted. For the
most recent month-end performance information visit
www.northwesternmutual.com. |
This chart assumes an initial investment of $10,000 made on 12/31/02. Returns shown include deductions for management and other portfolio expenses, and reinvestment of all dividends. Returns exclude deductions for separate account sale loads and account fees. Please refer to the Benchmark Definitions section of this report for information about the indices cited in the above chart and graph. |
| “Standard & Poor’s®”, “S&P®”, “S&P 500” and “Standard & Poor’s 500” are trademarks of The McGraw-Hill Companies, Inc. and have been licensed for use by Northwestern Mutual Life Insurance Company. The Portfolio is not sponsored, endorsed, sold or promoted by Standard & Poor’s, and Standard & Poor’s makes no representation regarding the advisability of investing in the Portfolio. |
|
| The Portfolio may invest in derivative instruments such as futures and swap agreements to help achieve full replication. Use of these instruments may involve certain costs and imposes certain risks such as liquidity risk, market risk, credit risk, management risk and the risk of mispricing or improper valuation. Certain derivatives involve leverage, which could magnify losses, and portfolios investing in derivatives could lose more than the principal amount invested in those instruments. |
Top 10 Equity Holdings 12/31/12
| | | | |
Security Description | | | % of Net Assets | |
Apple, Inc. | | | 3.9% | |
Exxon Mobil Corp. | | | 3.1% | |
General Electric Co. | | | 1.7% | |
Chevron Corp. | | | 1.6% | |
International Business Machines Corp. | | | 1.6% | |
Microsoft Corp. | | | 1.6% | |
Johnson & Johnson | | | 1.5% | |
AT&T, Inc. | | | 1.5% | |
Google, Inc. - Class A | | | 1.5% | |
The Procter & Gamble Co. | | | 1.4% | |
Sector Allocation 12/31/12

Sector Allocation is based on equities.
Sector Allocation and Top 10 Holdings are subject to change.
| | | | |
| 16 | | Index 500 Stock Portfolio | | |
Index 500 Stock Portfolio
Schedule of Investments
December 31, 2012
| | | | | | | | | | |
| | | Common Stocks (98.7%) | | Shares/
$ Par | | | Value
$ (000’s) | |
| |
| | Consumer Discretionary (11.4%) | |
| | Abercrombie & Fitch Co. - Class A | | | 10,500 | | | | 504 | |
| * | | Amazon.com, Inc. | | | 47,800 | | | | 12,005 | |
| * | | Apollo Group, Inc. - Class A | | | 13,200 | | | | 276 | |
| * | | AutoNation, Inc. | | | 5,129 | | | | 204 | |
| * | | AutoZone, Inc. | | | 4,925 | | | | 1,746 | |
| * | | Bed Bath & Beyond, Inc. | | | 30,300 | | | | 1,694 | |
| | Best Buy Co., Inc. | | | 35,275 | | | | 418 | |
| * | | Big Lots, Inc. | | | 7,600 | | | | 216 | |
| * | | BorgWarner, Inc. | | | 15,400 | | | | 1,103 | |
| | Cablevision Systems Corp. - Class A | | | 28,500 | | | | 426 | |
| * | | CarMax, Inc. | | | 30,200 | | | | 1,134 | |
| | Carnival Corp. | | | 58,809 | | | | 2,162 | |
| | CBS Corp. - Class B | | | 78,024 | | | | 2,969 | |
| * | | Chipotle Mexican Grill, Inc. | | | 4,200 | | | | 1,249 | |
| | Coach, Inc. | | | 37,400 | | | | 2,076 | |
| | Comcast Corp. - Class A | | | 350,805 | | | | 13,113 | |
| | D.R. Horton, Inc. | | | 36,900 | | | | 730 | |
| | Darden Restaurants, Inc. | | | 16,950 | | | | 764 | |
| * | | Delphi Automotive PLC | | | 39,000 | | | | 1,492 | |
| * | | DIRECTV | | | 79,700 | | | | 3,998 | |
| * | | Discovery Communications, Inc. - Class A | | | 31,500 | | | | 2,000 | |
| * | | Dollar General Corp. | | | 34,700 | | | | 1,530 | |
| * | | Dollar Tree, Inc. | | | 30,000 | | | | 1,217 | |
| | Expedia, Inc. | | | 12,250 | | | | 753 | |
| | Family Dollar Stores, Inc. | | | 12,600 | | | | 799 | |
| | Ford Motor Co. | | | 503,265 | | | | 6,517 | |
| * | | Fossil, Inc. | | | 7,100 | | | | 661 | |
| | GameStop Corp. -
Class Class A | | | 16,000 | | | | 401 | |
| | Gannett Co., Inc. | | | 30,350 | | | | 547 | |
| | The Gap, Inc. | | | 39,275 | | | | 1,219 | |
| | Garmin, Ltd. | | | 14,400 | | | | 588 | |
| | Genuine Parts Co. | | | 20,500 | | | | 1,303 | |
| * | | The Goodyear Tire &
Rubber Co. | | | 32,300 | | | | 446 | |
| | H&R Block, Inc. | | | 35,800 | | | | 665 | |
| | Harley-Davidson, Inc. | | | 29,900 | | | | 1,460 | |
| | Harman International Industries, Inc. | | | 8,900 | | | | 397 | |
| | Hasbro, Inc. | | | 15,225 | | | | 547 | |
| | The Home Depot, Inc. | | | 197,400 | | | | 12,209 | |
| | International Game Technology | | | 35,100 | | | | 497 | |
| | The Interpublic Group of Cos., Inc. | | | 56,900 | | | | 627 | |
| * | | J.C. Penney Co., Inc. | | | 18,850 | | | | 372 | |
| | Johnson Controls, Inc. | | | 90,300 | | | | 2,772 | |
| | Kohl’s Corp. | | | 27,967 | | | | 1,202 | |
| | Leggett & Platt, Inc. | | | 18,633 | | | | 507 | |
| | Lennar Corp. - Class A | | | 21,700 | | | | 839 | |
| | | | | | | | | | |
| | | Common Stocks (98.7%) | | Shares/
$ Par | | | Value
$ (000’s) | |
| |
| | Consumer Discretionary continued | |
| | Limited Brands, Inc. | | | 31,587 | | | | 1,487 | |
| | Lowe’s Cos., Inc. | | | 148,500 | | | | 5,275 | |
| | Macy’s, Inc. | | | 52,146 | | | | 2,035 | |
| | Marriott International, Inc. - Class A | | | 32,456 | | | | 1,210 | |
| | Mattel, Inc. | | | 45,288 | | | | 1,658 | |
| | McDonald’s Corp. | | | 132,478 | | | | 11,686 | |
| | The McGraw-Hill Cos., Inc. | | | 36,620 | | | | 2,002 | |
| * | | NetFlix, Inc. | | | 7,300 | | | | 677 | |
| | Newell Rubbermaid, Inc. | | | 37,992 | | | | 846 | |
| | News Corp. - Class A | | | 266,200 | | | | 6,799 | |
| | NIKE, Inc. - Class B | | | 97,800 | | | | 5,046 | |
| | Nordstrom, Inc. | | | 20,034 | | | | 1,072 | |
| | Omnicom Group, Inc. | | | 34,900 | | | | 1,744 | |
| * | | O’Reilly Automotive, Inc. | | | 15,100 | | | | 1,350 | |
| | PetSmart, Inc. | | | 14,200 | | | | 970 | |
| * | | Priceline.com, Inc. | | | 6,600 | | | | 4,100 | |
| * | | PulteGroup, Inc. | | | 44,835 | | | | 814 | |
| | Ralph Lauren Corp. | | | 8,100 | | | | 1,214 | |
| | Ross Stores, Inc. | | | 29,400 | | | | 1,592 | |
| | Scripps Networks Interactive - Class A | | | 11,500 | | | | 666 | |
| | Staples, Inc. | | | 88,950 | | | | 1,014 | |
| | Starbucks Corp. | | | 98,200 | | | | 5,266 | |
| | Starwood Hotels & Resorts Worldwide, Inc. | | | 25,900 | | | | 1,486 | |
| | Target Corp. | | | 85,857 | | | | 5,080 | |
| | Tiffany & Co. | | | 15,767 | | | | 904 | |
| | Time Warner Cable, Inc. | | | 39,792 | | | | 3,867 | |
| | Time Warner, Inc. | | | 125,033 | | | | 5,980 | |
| | The TJX Cos., Inc. | | | 96,300 | | | | 4,088 | |
| * | | TripAdvisor, Inc. | | | 14,450 | | | | 606 | |
| * | | Urban Outfitters, Inc. | | | 14,400 | | | | 567 | |
| | VF Corp. | | | 11,657 | | | | 1,760 | |
| | Viacom, Inc. - Class B | | | 61,024 | | | | 3,218 | |
| | The Walt Disney Co. | | | 233,957 | | | | 11,649 | |
| | The Washington Post Co. - Class B | | | 600 | | | | 219 | |
| | Whirlpool Corp. | | | 10,244 | | | | 1,042 | |
| | Wyndham Worldwide Corp. | | | 18,486 | | | | 984 | |
| | Wynn Resorts, Ltd. | | | 10,500 | | | | 1,181 | |
| | Yum! Brands, Inc. | | | 59,660 | | | | 3,961 | |
| | | | | | | | | | |
| | Total | | | | | | | 193,469 | |
| | | | | | | | | | |
| |
| | Consumer Staples (10.5%) | |
| | Altria Group, Inc. | | | 267,322 | | | | 8,399 | |
| | Archer-Daniels-Midland Co. | | | 86,903 | | | | 2,380 | |
| | Avon Products, Inc. | | | 57,000 | | | | 819 | |
| | Beam, Inc. | | | 20,967 | | | | 1,281 | |
| | Brown-Forman Corp. -
Class B | | | 20,033 | | | | 1,267 | |
| | Campbell Soup Co. | | | 23,622 | | | | 824 | |
| | The Clorox Co. | | | 17,250 | | | | 1,263 | |
| | | | | | | | | | |
| | | Common Stocks (98.7%) | | Shares/
$ Par | | | Value
$ (000’s) | |
| |
| | Consumer Staples continued | |
| | The Coca-Cola Co. | | | 509,150 | | | | 18,457 | |
| | Coca-Cola Enterprises, Inc. | | | 35,600 | | | | 1,130 | |
| | Colgate-Palmolive Co. | | | 58,622 | | | | 6,128 | |
| | ConAgra Foods, Inc. | | | 53,767 | | | | 1,586 | |
| * | | Constellation Brands, Inc. - Class A | | | 20,000 | | | | 708 | |
| | Costco Wholesale Corp. | | | 57,064 | | | | 5,636 | |
| | CVS Caremark Corp. | | | 164,561 | | | | 7,957 | |
| * | | Dean Foods Co. | | | 24,500 | | | | 404 | |
| | Dr. Pepper Snapple Group, Inc. | | | 27,500 | | | | 1,215 | |
| | The Estee Lauder Cos., Inc. - Class A | | | 31,700 | | | | 1,898 | |
| | General Mills, Inc. | | | 85,134 | | | | 3,440 | |
| | H.J. Heinz Co. | | | 42,317 | | | | 2,441 | |
| | The Hershey Co. | | | 19,700 | | | | 1,423 | |
| | Hormel Foods Corp. | | | 17,700 | | | | 552 | |
| | The J.M. Smucker Co. | | | 14,300 | | | | 1,233 | |
| | Kellogg Co. | | | 32,657 | | | | 1,824 | |
| | Kimberly-Clark Corp. | | | 51,656 | | | | 4,361 | |
| | Kraft Foods Group, Inc. | | | 78,198 | | | | 3,556 | |
| | The Kroger Co. | | | 67,805 | | | | 1,764 | |
| | Lorillard, Inc. | | | 17,046 | | | | 1,989 | |
| | McCormick & Co., Inc. | | | 17,500 | | | | 1,112 | |
| | Mead Johnson Nutrition Co. | | | 26,831 | | | | 1,768 | |
| | Molson Coors Brewing Co. - Class B | | | 20,600 | | | | 881 | |
| | Mondelez International, Inc. | | | 234,596 | | | | 5,975 | |
| * | | Monster Beverage Corp. | | | 19,700 | | | | 1,042 | |
| | PepsiCo, Inc. | | | 204,225 | | | | 13,975 | |
| | Philip Morris International, Inc. | | | 220,522 | | | | 18,444 | |
| | The Procter & Gamble Co. | | | 360,964 | | | | 24,506 | |
| | Reynolds American, Inc. | | | 42,800 | | | | 1,773 | |
| | Safeway, Inc. | | | 31,600 | | | | 572 | |
| | Sysco Corp. | | | 77,625 | | | | 2,458 | |
| | Tyson Foods, Inc. - Class A | | | 37,900 | | | | 735 | |
| | Walgreen Co. | | | 113,446 | | | | 4,199 | |
| | Wal-Mart Stores, Inc. | | | 220,800 | | | | 15,065 | |
| | Whole Foods Market, Inc. | | | 22,800 | | | | 2,082 | |
| | | | | | | | | | |
| | Total | | | | | | | 178,522 | |
| | | | | | | | | | |
| |
| | Energy (10.8%) | |
| | Anadarko Petroleum Corp. | | | 65,924 | | | | 4,899 | |
| | Apache Corp. | | | 51,646 | | | | 4,054 | |
| | Baker Hughes, Inc. | | | 58,064 | | | | 2,371 | |
| | Cabot Oil & Gas Corp. | | | 27,700 | | | | 1,378 | |
| * | | Cameron International Corp. | | | 32,600 | | | | 1,841 | |
The Accompanying Notes are an Integral Part of the Financial Statements.
| | | | | | |
| | Index 500 Stock Portfolio | | | 17 | |
Index 500 Stock Portfolio
| | | | | | | | | | |
| | | Common Stocks (98.7%) | | Shares/
$ Par | | | Value
$ (000’s) | |
| | |
| | Energy continued | | | | | |
| | Chesapeake Energy Corp. | | | 68,400 | | | | 1,137 | |
| | Chevron Corp. | | | 258,314 | | | | 27,934 | |
| | ConocoPhillips | | | 160,238 | | | | 9,292 | |
| | CONSOL Energy, Inc. | | | 30,100 | | | | 966 | |
| * | | Denbury Resources, Inc. | | | 51,100 | | | | 828 | |
| | Devon Energy Corp. | | | 49,700 | | | | 2,586 | |
| | Diamond Offshore Drilling, Inc. | | | 9,200 | | | | 625 | |
| | Ensco PLC - Class A | | | 30,700 | | | | 1,820 | |
| | EOG Resources, Inc. | | | 35,720 | | | | 4,315 | |
| | EQT Corp. | | | 19,700 | | | | 1,162 | |
| | Exxon Mobil Corp. | | | 601,801 | | | | 52,086 | |
| * | | FMC Technologies, Inc. | | | 31,400 | | | | 1,345 | |
| | Halliburton Co. | | | 122,538 | | | | 4,251 | |
| | Helmerich & Payne, Inc. | | | 14,000 | | | | 784 | |
| | Hess Corp. | | | 39,200 | | | | 2,076 | |
| | Kinder Morgan, Inc. | | | 83,517 | | | | 2,951 | |
| | Marathon Oil Corp. | | | 93,266 | | | | 2,860 | |
| | Marathon Petroleum Corp. | | | 44,733 | | | | 2,818 | |
| | Murphy Oil Corp. | | | 24,400 | | | | 1,453 | |
| * | | Nabors Industries, Ltd. | | | 38,300 | | | | 553 | |
| | National-Oilwell Varco, Inc. | | | 56,400 | | | | 3,855 | |
| * | | Newfield Exploration Co. | | | 17,800 | | | | 477 | |
| | Noble Corp. | | | 33,400 | | | | 1,163 | |
| | Noble Energy, Inc. | | | 23,500 | | | | 2,391 | |
| | Occidental Petroleum Corp. | | | 106,940 | | | | 8,193 | |
| | Peabody Energy Corp. | | | 35,400 | | | | 942 | |
| | Phillips 66 | | | 82,619 | | | | 4,387 | |
| | Pioneer Natural Resources Co. | | | 16,300 | | | | 1,737 | |
| | QEP Resources, Inc. | | | 23,500 | | | | 711 | |
| | Range Resources Corp. | | | 21,500 | | | | 1,351 | |
| * | | Rowan Cos., PLC. - Class A | | | 16,350 | | | | 511 | |
| | Schlumberger, Ltd. | | | 175,284 | | | | 12,145 | |
| * | | Southwestern Energy Co. | | | 46,100 | | | | 1,540 | |
| | Spectra Energy Corp. | | | 87,936 | | | | 2,408 | |
| | Tesoro Corp. | | | 18,500 | | | | 815 | |
| | Valero Energy Corp. | | | 73,100 | | | | 2,494 | |
| | The Williams Companies, Inc. | | | 88,900 | | | | 2,911 | |
| * | | WPX Energy, Inc. | | | 26,300 | | | | 391 | |
| | | | | | | | | | |
| | Total | | | | | | | 184,807 | |
| | | | | | | | | | |
| | | |
| | Financials (15.3%) | | | | | | | | |
| | ACE, Ltd. | | | 44,900 | | | | 3,583 | |
| | Aflac, Inc. | | | 61,850 | | | | 3,285 | |
| | The Allstate Corp. | | | 63,628 | | | | 2,556 | |
| | American Express Co. | | | 128,475 | | | | 7,385 | |
| * | | American International Group, Inc. | | | 194,891 | | | | 6,880 | |
| | American Tower Corp. | | | 52,200 | | | | 4,033 | |
| | Ameriprise Financial, Inc. | | | 27,155 | | | | 1,701 | |
| | Aon PLC | | | 42,100 | | | | 2,341 | |
| | Apartment Investment & Management Co. -
Class A | | | 19,256 | | | | 521 | |
| | Assurant, Inc. | | | 10,400 | | | | 361 | |
| | | | | | | | | | |
| | | Common Stocks (98.7%) | | Shares/
$ Par | | | Value
$ (000’s) | |
| | |
| | Financials continued | | | | | |
| | AvalonBay Communities, Inc. | | | 15,073 | | | | 2,044 | |
| | Bank of America Corp. | | | 1,422,696 | | | | 16,503 | |
| | The Bank of New York Mellon Corp. | | | 154,263 | | | | 3,965 | |
| | BB&T Corp. | | | 92,400 | | | | 2,690 | |
| * | | Berkshire Hathaway, Inc. - Class B | | | 240,766 | | | | 21,597 | |
| | BlackRock, Inc. | | | 16,600 | | | | 3,431 | |
| | Boston Properties, Inc. | | | 19,900 | | | | 2,106 | |
| | Capital One Financial Corp. | | | 76,829 | | | | 4,451 | |
| * | | CBRE Group, Inc. | | | 39,800 | | | | 792 | |
| | The Charles Schwab Corp. | | | 144,711 | | | | 2,078 | |
| | The Chubb Corp. | | | 34,600 | | | | 2,606 | |
| | Cincinnati Financial Corp. | | | 19,375 | | | | 759 | |
| | Citigroup, Inc. | | | 387,064 | | | | 15,312 | |
| | CME Group, Inc. | | | 40,500 | | | | 2,054 | |
| | Comerica, Inc. | | | 25,150 | | | | 763 | |
| | Discover Financial Services | | | 66,656 | | | | 2,570 | |
| * | | E*TRADE Financial Corp. | | | 33,960 | | | | 304 | |
| | Equity Residential | | | 42,500 | | | | 2,408 | |
| | Federated Investors, Inc. - Class B | | | 12,500 | | | | 253 | |
| | Fifth Third Bancorp | | | 118,434 | | | | 1,799 | |
| | First Horizon National Corp. | | | 32,666 | | | | 324 | |
| | Franklin Resources, Inc. | | | 18,250 | | | | 2,294 | |
| * | | Genworth Financial, Inc. - Class A | | | 64,900 | | | | 487 | |
| | The Goldman Sachs Group, Inc. | | | 58,300 | | | | 7,437 | |
| | The Hartford Financial Services Group, Inc. | | | 57,550 | | | | 1,291 | |
| | HCP, Inc. | | | 59,700 | | | | 2,697 | |
| | Health Care REIT, Inc. | | | 34,300 | | | | 2,102 | |
| | Host Hotels & Resorts, Inc. | | | 95,694 | | | | 1,499 | |
| | Hudson City Bancorp, Inc. | | | 62,700 | | | | 510 | |
| | Huntington Bancshares, Inc. | | | 112,942 | | | | 722 | |
| * | | IntercontinentalExchange, Inc. | | | 9,600 | | | | 1,189 | |
| | Invesco, Ltd. | | | 58,600 | | | | 1,529 | |
| | JPMorgan Chase & Co. | | | 501,829 | | | | 22,065 | |
| | KeyCorp | | | 123,275 | | | | 1,038 | |
| | Kimco Realty Corp. | | | 53,800 | | | | 1,039 | |
| | Legg Mason, Inc. | | | 15,500 | | | | 399 | |
| | Leucadia National Corp. | | | 26,200 | | | | 623 | |
| | Lincoln National Corp. | | | 36,330 | | | | 941 | |
| | Loews Corp. | | | 41,021 | | | | 1,672 | |
| | M&T Bank Corp. | | | 16,000 | | | | 1,575 | |
| | Marsh & McLennan Cos., Inc. | | | 71,880 | | | | 2,478 | |
| | MetLife, Inc. | | | 143,974 | | | | 4,742 | |
| | Moody’s Corp. | | | 25,550 | | | | 1,286 | |
| | Morgan Stanley | | | 182,413 | | | | 3,488 | |
| | | | | | | | | | |
| | | Common Stocks (98.7%) | | Shares/
$ Par | | | Value
$ (000’s) | |
| | |
| | Financials continued | | | | | |
| | The NASDAQ OMX Group, Inc. | | | 15,500 | | | | 388 | |
| | Northern Trust Corp. | | | 28,850 | | | | 1,447 | |
| | NYSE Euronext | | | 32,100 | | | | 1,012 | |
| | People’s United Financial, Inc. | | | 45,900 | | | | 555 | |
| | Plum Creek Timber Co., Inc. | | | 21,300 | | | | 945 | |
| | PNC Financial Services Group, Inc. | | | 69,789 | | | | 4,069 | |
| | Principal Financial Group, Inc. | | | 36,400 | | | | 1,038 | |
| | The Progressive Corp. | | | 73,400 | | | | 1,549 | |
| | Prologis, Inc. | | | 60,797 | | | | 2,218 | |
| | Prudential Financial, Inc. | | | 61,200 | | | | 3,264 | |
| | Public Storage | | | 19,000 | | | | 2,754 | |
| | Regions Financial Corp. | | | 186,490 | | | | 1,328 | |
| | Simon Property Group, Inc. | | | 40,836 | | | | 6,456 | |
| | SLM Corp. | | | 61,042 | | | | 1,046 | |
| | State Street Corp. | | | 61,400 | | | | 2,886 | |
| | SunTrust Banks, Inc. | | | 71,133 | | | | 2,017 | |
| | T. Rowe Price Group, Inc. | | | 33,600 | | | | 2,188 | |
| | Torchmark Corp. | | | 12,575 | | | | 650 | |
| | The Travelers Cos., Inc. | | | 50,310 | | | | 3,613 | |
| | U.S. Bancorp | | | 248,221 | | | | 7,928 | |
| | Unum Group | | | 36,331 | | | | 756 | |
| | Ventas, Inc. | | | 39,000 | | | | 2,524 | |
| | Vornado Realty Trust | | | 22,374 | | | | 1,792 | |
| | Wells Fargo & Co. | | | 646,231 | | | | 22,088 | |
| | XL Group PLC | | | 39,700 | | | | 995 | |
| | Zions Bancorporation | | | 24,300 | | | | 520 | |
| | | | | | | | | | |
| | Total | | | | | | | 260,584 | |
| | | | | | | | | | |
| | | |
| | Health Care (11.8%) | | | | | | | | |
| | Abbott Laboratories | | | 208,650 | | | | 13,667 | |
| | Aetna, Inc. | | | 44,208 | | | | 2,047 | |
| | Agilent Technologies, Inc. | | | 46,037 | | | | 1,885 | |
| * | | Alexion Pharmaceuticals, Inc. | | | 25,600 | | | | 2,401 | |
| | Allergan, Inc. | | | 40,634 | | | | 3,727 | |
| | AmerisourceBergen Corp. | | | 31,100 | | | | 1,343 | |
| | Amgen, Inc. | | | 101,243 | | | | 8,739 | |
| | Baxter International, Inc. | | | 72,500 | | | | 4,833 | |
| | Becton, Dickinson and Co. | | | 25,950 | | | | 2,029 | |
| * | | Biogen Idec, Inc. | | | 31,190 | | | | 4,575 | |
| * | | Boston Scientific Corp. | | | 181,222 | | | | 1,038 | |
| | Bristol-Myers Squibb Co. | | | 217,913 | | | | 7,102 | |
| | C.R. Bard, Inc. | | | 10,100 | | | | 987 | |
| | Cardinal Health, Inc. | | | 44,825 | | | | 1,846 | |
| * | | CareFusion Corp. | | | 29,312 | | | | 838 | |
| * | | Celgene Corp. | | | 55,800 | | | | 4,393 | |
| * | | Cerner Corp. | | | 19,200 | | | | 1,491 | |
| | CIGNA Corp. | | | 37,787 | | | | 2,020 | |
| | Coventry Health Care, Inc. | | | 17,800 | | | | 798 | |
| | Covidien PLC | | | 62,500 | | | | 3,609 | |
The Accompanying Notes are an Integral Part of the Financial Statements.
| | | | |
| 18 | | Index 500 Stock Portfolio | | |
Index 500 Stock Portfolio
| | | | | | | | | | |
| | | Common Stocks (98.7%) | | Shares/
$ Par | | | Value
$ (000’s) | |
| |
| | Health Care continued | |
| * | | DaVita, Inc. | | | 11,100 | | | | 1,227 | |
| | DENTSPLY International, Inc. | | | 18,700 | | | | 741 | |
| * | | Edwards Lifesciences Corp. | | | 15,200 | | | | 1,371 | |
| | Eli Lilly and Co. | | | 134,806 | | | | 6,649 | |
| * | | Express Scripts Holding Co. | | | 107,741 | | | | 5,818 | |
| * | | Forest Laboratories, Inc. | | | 30,866 | | | | 1,090 | |
| * | | Gilead Sciences, Inc. | | | 100,000 | | | | 7,345 | |
| * | | Hospira, Inc. | | | 21,765 | | | | 680 | |
| | Humana, Inc. | | | 20,900 | | | | 1,434 | |
| * | | Intuitive Surgical, Inc. | | | 5,200 | | | | 2,550 | |
| | Johnson & Johnson | | | 365,837 | | | | 25,645 | |
| * | | Laboratory Corp. of America Holdings | | | 12,500 | | | | 1,083 | |
| * | | Life Technologies Corp. | | | 22,680 | | | | 1,113 | |
| | McKesson Corp. | | | 31,205 | | | | 3,026 | |
| | Medtronic, Inc. | | | 133,500 | | | | 5,476 | |
| | Merck & Co., Inc. | | | 401,283 | | | | 16,428 | |
| * | | Mylan, Inc. | | | 53,800 | | | | 1,478 | |
| | Patterson Cos., Inc. | | | 11,000 | | | | 376 | |
| | PerkinElmer, Inc. | | | 15,200 | | | | 482 | |
| | Perrigo Co. | | | 11,600 | | | | 1,207 | |
| | Pfizer, Inc. | | | 971,892 | | | | 24,375 | |
| | Quest Diagnostics, Inc. | | | 21,000 | | | | 1,224 | |
| | St. Jude Medical, Inc. | | | 40,700 | | | | 1,471 | |
| | Stryker Corp. | | | 38,100 | | | | 2,089 | |
| * | | Tenet Heathcare Corp. | | | 14,062 | | | | 457 | |
| | Thermo Fisher Scientific, Inc. | | | 47,500 | | | | 3,029 | |
| | UnitedHealth Group, Inc. | | | 134,844 | | | | 7,314 | |
| * | | Varian Medical Systems, Inc. | | | 14,400 | | | | 1,011 | |
| * | | Waters Corp. | | | 11,500 | | | | 1,002 | |
| * | | Watson Pharmaceuticals, Inc. | | | 16,900 | | | | 1,453 | |
| | WellPoint, Inc. | | | 40,100 | | | | 2,443 | |
| | Zimmer Holdings, Inc. | | | 22,937 | | | | 1,529 | |
| | | | | | | | | | |
| | Total | | | | | | | 201,984 | |
| | | | | | | | | | |
| |
| | Industrials (10.0%) | |
| | 3M Co. | | | 84,076 | | | | 7,806 | |
| | The ADT Corp. | | | 30,700 | | | | 1,427 | |
| | Avery Dennison Corp. | | | 13,150 | | | | 459 | |
| | The Boeing Co. | | | 89,576 | | | | 6,750 | |
| | C.H. Robinson Worldwide, Inc. | | | 21,300 | | | | 1,347 | |
| | Caterpillar, Inc. | | | 86,276 | | | | 7,729 | |
| | Cintas Corp. | | | 14,033 | | | | 574 | |
| | CSX Corp. | | | 136,100 | | | | 2,685 | |
| | Cummins, Inc. | | | 23,300 | | | | 2,525 | |
| | Danaher Corp. | | | 76,800 | | | | 4,293 | |
| | Deere & Co. | | | 51,720 | | | | 4,470 | |
| | Dover Corp. | | | 23,667 | | | | 1,555 | |
| | The Dun & Bradstreet Corp. | | | 5,900 | | | | 464 | |
| | Eaton Corp. PLC | | | 61,003 | | | | 3,306 | |
| | Emerson Electric Co. | | | 95,600 | | | | 5,063 | |
| | Equifax, Inc. | | | 15,800 | | | | 855 | |
| | | | | | | | | | |
| | | Common Stocks (98.7%) | | Shares/
$ Par | | | Value
$ (000’s) | |
| |
| | Industrials continued | |
| | Expeditors International of Washington, Inc. | | | 27,600 | | | | 1,092 | |
| | Fastenal Co. | | | 35,600 | | | | 1,662 | |
| | FedEx Corp. | | | 38,520 | | | | 3,533 | |
| | Flowserve Corp. | | | 6,600 | | | | 969 | |
| | Fluor Corp. | | | 22,000 | | | | 1,292 | |
| | General Dynamics Corp. | | | 43,800 | | | | 3,034 | |
| | General Electric Co. | | | 1,384,206 | | | | 29,054 | |
| | Honeywell International, Inc. | | | 103,450 | | | | 6,566 | |
| | Illinois Tool Works, Inc. | | | 56,300 | | | | 3,424 | |
| | Ingersoll-Rand PLC | | | 37,000 | | | | 1,774 | |
| | Iron Mountain, Inc. | | | 23,785 | | | | 739 | |
| * | | Jacobs Engineering Group, Inc. | | | 17,200 | | | | 732 | |
| | Joy Global, Inc. | | | 14,000 | | | | 893 | |
| | L-3 Communications Holdings, Inc. | | | 12,400 | | | | 950 | |
| | Lockheed Martin Corp. | | | 35,408 | | | | 3,268 | |
| | Masco Corp. | | | 47,100 | | | | 785 | |
| | Norfolk Southern Corp. | | | 41,757 | | | | 2,582 | |
| | Northrop Grumman Corp. | | | 32,420 | | | | 2,191 | |
| | PACCAR, Inc. | | | 46,615 | | | | 2,107 | |
| | Pall Corp. | | | 14,650 | | | | 883 | |
| | Parker Hannifin Corp. | | | 19,712 | | | | 1,677 | |
| | Pentair, Ltd. | | | 27,780 | | | | 1,365 | |
| | Pitney Bowes, Inc. | | | 26,537 | | | | 282 | |
| | Precision Castparts Corp. | | | 19,200 | | | | 3,637 | |
| * | | Quanta Services, Inc. | | | 28,100 | | | | 767 | |
| | Raytheon Co. | | | 43,500 | | | | 2,504 | |
| | Republic Services, Inc. | | | 39,507 | | | | 1,159 | |
| | Robert Half International, Inc. | | | 18,540 | | | | 590 | |
| | Rockwell Automation, Inc. | | | 18,350 | | | | 1,541 | |
| | Rockwell Collins, Inc. | | | 18,550 | | | | 1,079 | |
| | Roper Industries, Inc. | | | 13,000 | | | | 1,449 | |
| | Ryder System, Inc. | | | 6,700 | | | | 335 | |
| | Snap-on, Inc. | | | 7,717 | | | | 610 | |
| | Southwest Airlines Co. | | | 97,367 | | | | 997 | |
| | Stanley Black & Decker, Inc. | | | 22,242 | | | | 1,645 | |
| * | | Stericycle, Inc. | | | 11,300 | | | | 1,054 | |
| | Textron, Inc. | | | 37,200 | | | | 922 | |
| | Tyco International, Ltd. | | | 61,500 | | | | 1,799 | |
| | Union Pacific Corp. | | | 62,120 | | | | 7,810 | |
| | United Parcel Service, Inc. - Class B | | | 94,400 | | | | 6,960 | |
| | United Technologies Corp. | | | 111,334 | | | | 9,130 | |
| | W.W. Grainger, Inc. | | | 7,900 | | | | 1,599 | |
| | Waste Management, Inc. | | | 57,585 | | | | 1,943 | |
| | Xylem, Inc. | | | 24,500 | | | | 664 | |
| | | | | | | | | | |
| | Total | | | | | | | 170,356 | |
| | | | | | | | | | |
| |
| | Information Technology (18.8%) | |
| | Accenture PLC - Class A | | | 84,300 | | | | 5,606 | |
| * | | Adobe Systems, Inc. | | | 65,350 | | | | 2,462 | |
| * | | Advanced Micro Devices, Inc. | | | 79,900 | | | | 192 | |
| | | | | | | | | | |
| | | Common Stocks (98.7%) | | Shares/
$ Par | | | Value
$ (000’s) | |
| |
| | Information Technology continued | |
| * | | Akamai Technologies, Inc. | | | 23,400 | | | | 957 | |
| | Altera Corp. | | | 42,311 | | | | 1,457 | |
| | Amphenol Corp. - Class A | | | 21,200 | | | | 1,372 | |
| | Analog Devices, Inc. | | | 39,757 | | | | 1,672 | |
| | Apple, Inc. | | | 124,200 | | | | 66,202 | |
| | Applied Materials, Inc. | | | 158,100 | | | | 1,809 | |
| * | | Autodesk, Inc. | | | 29,668 | | | | 1,049 | |
| | Automatic Data Processing, Inc. | | | 64,050 | | | | 3,651 | |
| * | | BMC Software, Inc. | | | 18,860 | | | | 748 | |
| | Broadcom Corp. - Class A | | | 68,400 | | | | 2,272 | |
| | CA, Inc. | | | 44,292 | | | | 974 | |
| | Cisco Systems, Inc. | | | 700,800 | | | | 13,771 | |
| * | | Citrix Systems, Inc. | | | 24,620 | | | | 1,619 | |
| * | | Cognizant Technology Solutions Corp. - Class A | | | 39,600 | | | | 2,932 | |
| | Computer Sciences Corp. | | | 20,550 | | | | 823 | |
| | Corning, Inc. | | | 195,100 | | | | 2,462 | |
| | Dell, Inc. | | | 192,633 | | | | 1,951 | |
| * | | eBay, Inc. | | | 153,700 | | | | 7,842 | |
| * | | Electronic Arts, Inc. | | | 40,300 | | | | 586 | |
| * | | EMC Corp. | | | 278,074 | | | | 7,035 | |
| * | | F5 Networks, Inc. | | | 10,400 | | | | 1,010 | |
| | Fidelity National Information Services, Inc. | | | 32,900 | | | | 1,145 | |
| * | | First Solar, Inc. | | | 7,900 | | | | 244 | |
| * | | Fiserv, Inc. | | | 17,625 | | | | 1,393 | |
| | FLIR Systems, Inc. | | | 19,800 | | | | 442 | |
| * | | Google, Inc. - Class A | | | 35,100 | | | | 24,899 | |
| | Harris Corp. | | | 15,000 | | | | 734 | |
| | Hewlett-Packard Co. | | | 259,526 | | | | 3,698 | |
| | Intel Corp. | | | 656,863 | | | | 13,551 | |
| | International Business Machines Corp. | | | 140,239 | | | | 26,863 | |
| | Intuit, Inc. | | | 36,700 | | | | 2,184 | |
| | Jabil Circuit, Inc. | | | 24,667 | | | | 476 | |
| * | | JDS Uniphase Corp. | | | 30,850 | | | | 418 | |
| * | | Juniper Networks, Inc. | | | 68,100 | | | | 1,340 | |
| | KLA-Tencor Corp. | | | 22,000 | | | | 1,051 | |
| * | | Lam Research Corp. | | | 22,587 | | | | 816 | |
| | Linear Technology Corp. | | | 30,550 | | | | 1,048 | |
| * | | LSI Corp. | | | 73,000 | | | | 517 | |
| | MasterCard, Inc. - Class A | | | 14,100 | | | | 6,927 | |
| | Microchip Technology, Inc. | | | 25,700 | | | | 838 | |
| * | | Micron Technology, Inc. | | | 134,350 | | | | 853 | |
| | Microsoft Corp. | | | 999,892 | | | | 26,727 | |
| | Molex, Inc. | | | 18,250 | | | | 499 | |
| | Motorola Solutions, Inc. | | | 37,053 | | | | 2,063 | |
| * | | NetApp, Inc. | | | 47,300 | | | | 1,587 | |
| | NVIDIA Corp. | | | 82,450 | | | | 1,013 | |
| | Oracle Corp. | | | 496,125 | | | | 16,531 | |
| | Paychex, Inc. | | | 42,735 | | | | 1,331 | |
| | Qualcomm, Inc. | | | 224,934 | | | | 13,950 | |
| * | | Red Hat, Inc. | | | 25,500 | | | | 1,350 | |
The Accompanying Notes are an Integral Part of the Financial Statements.
| | | | | | |
| | Index 500 Stock Portfolio | | | 19 | |
Index 500 Stock Portfolio
| | | | | | | | | | |
| | | Common Stocks (98.7%) | | Shares/
$ Par | | | Value
$ (000’s) | |
| | |
| | Information Technology continued | | | | | |
| | SAIC, Inc. | | | 37,500 | | | | 424 | |
| * | | Salesforce.com, Inc. | | | 17,200 | | | | 2,891 | |
| * | | SanDisk Corp. | | | 31,900 | | | | 1,390 | |
| | Seagate Technology PLC | | | 44,300 | | | | 1,350 | |
| * | | Symantec Corp. | | | 91,554 | | | | 1,722 | |
| | TE Connectivity, Ltd. | | | 55,800 | | | | 2,071 | |
| * | | Teradata Corp. | | | 22,300 | | | | 1,380 | |
| * | | Teradyne, Inc. | | | 24,750 | | | | 418 | |
| | Texas Instruments, Inc. | | | 147,900 | | | | 4,576 | |
| | Total System Services, Inc. | | | 21,178 | | | | 454 | |
| * | | VeriSign, Inc. | | | 20,500 | | | | 796 | |
| | Visa, Inc. - Class A | | | 68,800 | | | | 10,429 | |
| | Western Digital Corp. | | | 28,900 | | | | 1,228 | |
| | Western Union Co. | | | 78,732 | | | | 1,072 | |
| | Xerox Corp. | | | 166,770 | | | | 1,137 | |
| | Xilinx, Inc. | | | 34,400 | | | | 1,235 | |
| * | | Yahoo!, Inc. | | | 137,400 | | | | 2,734 | |
| | | | | | | | | | |
| | Total | | | | | | | 320,249 | |
| | | | | | | | | | |
| | Materials (3.7%) | |
| | Air Products and Chemicals, Inc. | | | 28,067 | | | | 2,358 | |
| | Airgas, Inc. | | | 9,300 | | | | 849 | |
| | Alcoa, Inc. | | | 140,907 | | | | 1,223 | |
| | Allegheny Technologies, Inc. | | | 14,117 | | | | 429 | |
| | Ball Corp. | | | 20,264 | | | | 907 | |
| | Bemis Co., Inc. | | | 13,600 | | | | 455 | |
| | CF Industries Holdings, Inc. | | | 8,300 | | | | 1,686 | |
| | Cliffs Natural Resources, Inc. | | | 18,800 | | | | 725 | |
| | The Dow Chemical Co. | | | 158,309 | | | | 5,117 | |
| | E.I. du Pont de Nemours
and Co. | | | 123,128 | | | | 5,537 | |
| | Eastman Chemical Co. | | | 20,250 | | | | 1,378 | |
| | Ecolab, Inc. | | | 34,800 | | | | 2,502 | |
| | FMC Corp. | | | 18,100 | | | | 1,059 | |
| | Freeport-McMoRan Copper & Gold, Inc. | | | 125,276 | | | | 4,284 | |
| | International Flavors & Fragrances, Inc. | | | 10,800 | | | | 719 | |
| | International Paper Co. | | | 57,966 | | | | 2,309 | |
| | LyondellBasell Industries
NV - Class A | | | 50,100 | | | | 2,860 | |
| | MeadWestvaco Corp. | | | 23,079 | | | | 735 | |
| | Monsanto Co. | | | 70,606 | | | | 6,683 | |
| | The Mosaic Co. | | | 36,500 | | | | 2,067 | |
| | Newmont Mining Corp. | | | 65,480 | | | | 3,041 | |
| | Nucor Corp. | | | 41,932 | | | | 1,811 | |
| * | | Owens-Illinois, Inc. | | | 21,700 | | | | 462 | |
| | PPG Industries, Inc. | | | 20,267 | | | | 2,743 | |
| | Praxair, Inc. | | | 39,200 | | | | 4,290 | |
| | Sealed Air Corp. | | | 25,642 | | | | 449 | |
| | The Sherwin-Williams Co. | | | 11,313 | | | | 1,740 | |
| | Sigma-Aldrich Corp. | | | 15,900 | | | | 1,170 | |
| | United States Steel Corp. | | | 19,050 | | | | 455 | |
| | Vulcan Materials Co. | | | 17,100 | | | | 890 | |
| | | | | | | | | | |
| | | Common Stocks (98.7%) | | Shares/
$ Par | | | Value
$ (000’s) | |
| | |
| | Materials continued | | | | | |
| | Weyerhaeuser Co. | | | 71,453 | | | | 1,988 | |
| | | | | | | | | | |
| | Total | | | | | | | 62,921 | |
| | | | | | | | | | |
| |
| | Telecommunication Services (3.0%) | |
| | AT&T, Inc. | | | 749,775 | | | | 25,275 | |
| | CenturyLink, Inc. | | | 82,433 | | | | 3,225 | |
| * | | Crown Castle International Corp. | | | 38,700 | | | | 2,793 | |
| | Frontier Communications Corp. | | | 131,797 | | | | 564 | |
| * | | MetroPCS Communications, Inc. | | | 41,800 | | | | 415 | |
| * | | Sprint Nextel Corp. | | | 396,602 | | | | 2,249 | |
| | Verizon Communications, Inc. | | | 376,742 | | | | 16,302 | |
| | Windstream Corp. | | | 77,592 | | | | 642 | |
| | | | | | | | | | |
| | Total | | | | | | | 51,465 | |
| | | | | | | | | | |
| | |
| | Utilities (3.4%) | | | | | |
| | The AES Corp. | | | 81,500 | | | | 872 | |
| | AGL Resources, Inc. | | | 15,554 | | | | 622 | |
| | Ameren Corp. | | | 32,067 | | | | 985 | |
| | American Electric
Power Co., Inc. | | | 64,040 | | | | 2,733 | |
| | CenterPoint Energy, Inc. | | | 56,462 | | | | 1,087 | |
| | CMS Energy Corp. | | | 34,800 | | | | 849 | |
| | Consolidated Edison, Inc. | | | 38,650 | | | | 2,147 | |
| | Dominion Resources, Inc. | | | 75,876 | | | | 3,930 | |
| | DTE Energy Co. | | | 22,750 | | | | 1,366 | |
| | Duke Energy Corp. | | | 92,930 | | | | 5,929 | |
| | Edison International | | | 43,020 | | | | 1,944 | |
| | Entergy Corp. | | | 23,509 | | | | 1,499 | |
| | Exelon Corp. | | | 112,813 | | | | 3,355 | |
| | FirstEnergy Corp. | | | 55,206 | | | | 2,306 | |
| | Integrys Energy Group, Inc. | | | 10,332 | | | | 540 | |
| | NextEra Energy, Inc. | | | 55,814 | | | | 3,862 | |
| | NiSource, Inc. | | | 40,873 | | | | 1,017 | |
| | Northeast Utilities | | | 41,400 | | | | 1,618 | |
| | NRG Energy, Inc. | | | 42,500 | | | | 977 | |
| | ONEOK, Inc. | | | 27,000 | | | | 1,154 | |
| | Pepco Holdings, Inc. | | | 30,300 | | | | 594 | |
| | PG&E Corp. | | | 56,725 | | | | 2,279 | |
| | Pinnacle West Capital Corp. | | | 14,500 | | | | 739 | |
| | PPL Corp. | | | 76,768 | | | | 2,198 | |
| | Public Service Enterprise Group, Inc. | | | 66,772 | | | | 2,043 | |
| | SCANA Corp. | | | 17,400 | | | | 794 | |
| | Sempra Energy | | | 29,702 | | | | 2,107 | |
| | Southern Co. | | | 115,400 | | | | 4,940 | |
| | TECO Energy, Inc. | | | 26,900 | | | | 451 | |
| | Wisconsin Energy Corp. | | | 30,400 | | | | 1,120 | |
| | Xcel Energy, Inc. | | | 64,320 | | | | 1,718 | |
| | | | | | | | | | |
| | Total | | | | | | | 57,775 | |
| | | | | | | | | | |
| | | |
| | Total Common Stocks | | | | | | | | |
| | (Cost: $1,253,062) | | | | | | | 1,682,132 | |
| | | | | | | | | | |
| | | | | | | | | | |
| | | Short-Term Investments (1.2%) | | Shares/
$ Par | | | Value
$ (000’s) | |
| | Electronics (0.5%) | |
| (b) | | International Business Machines Corp., 0.05%, 1/2/13 | | | 8,200,000 | | | | 8,200 | |
| | | | | | | | | | |
| | Total | | | | | | | 8,200 | |
| | | | | | | | | | |
| | | |
| | Energy (0.6%) | | | | | | | | |
| | Xcel Energy, Inc., 0.23%, 1/7/13 | | | 10,000,000 | | | | 10,000 | |
| | | | | | | | | | |
| | Total | | | | | | | 10,000 | |
| | | | | | | | | | |
| | Federal Government & Agencies (0.1%) | |
| | Federal Home Loan Mortgage Corp., 0.13%, 2/25/13 | | | 2,000,000 | | | | 1,999 | |
| | | | | | | | | | |
| | Total | | | | | | | 1,999 | |
| | | | | | | | | | |
| | | |
| | Total Short-Term Investments | | | | | | | | |
| | (Cost: $20,199) | | | | | | | 20,199 | |
| | | | | | | | | | |
| | | |
| | Total Investments (99.9%) | | | | | | | | |
| | (Cost: $1,273,261)(a) | | | | | | | 1,702,331 | |
| | | | | | | | | | |
| | Other Assets, Less | | | | | | | | |
| | Liabilities (0.1%) | | | | | | | 2,140 | |
| | | | | | | | | | |
| | Net Assets (100.0%) | | | | | | | 1,704,471 | |
| | | | | | | | | | |
The Accompanying Notes are an Integral Part of the Financial Statements.
| | | | |
| 20 | | Index 500 Stock Portfolio | | |
Index 500 Stock Portfolio
| (a) | At December 31, 2012 the aggregate cost of securities for federal tax purposes (in thousands) was $1,282,928 and the net unrealized appreciation of investments based on that cost was $419,403 which is comprised of $601,298 aggregate gross unrealized appreciation and $181,895 aggregate gross unrealized depreciation. |
| (b) | All or a portion of the securities have been pledged as collateral for open futures positions or when-issued securities. Information regarding open futures contracts as of period end is summarized below. |
| | | | | | | | |
| Issuer (000’s) | | Number of
Contracts | | Expiration Date | | Unrealized
Appreciation/
(Depreciation)
(000’s) | |
S&P 500 Mini Index Futures (Long) (Total Notional Value at December 31, 2012, $20,795) | | 293 | | 3/13 | | $ | 9 | |
The following is a summary of the inputs used in valuing the Portfolio’s assets and liabilities at December 31, 2012. See Note 3 for additional information on portfolio valuation.
| | | | | | | | | | | | | | |
| | | Valuation Inputs | | | |
| Description | | Level 1 –
Quoted Prices | | | Level 2 – Other Significant
Observable Inputs | | | Level 3 –
Significant
Unobservable Inputs | | | |
| | | (Amounts in thousands) | | | |
Assets: | | | | | | | | | | | | | | |
Common Stocks | | $ | 1,682,132 | | | $ | - | | | $ | - | | | |
Short-Term Investments | | | - | | | | 20,199 | | | | - | | | |
Other Financial Instruments^ | | | | | | | | | | | | | | |
Futures | | | 9 | | | | - | | | | - | | | |
Total | | $ | 1,682,141 | | | $ | 20,199 | | | $ | - | | | |
^ Other financial instruments are derivative instruments such as futures, forwards, written options and swaps contracts, which are valued at the unrealized appreciation (depreciation) on the instrument and short sales, which are valued at market value.
The Accompanying Notes are an Integral Part of the Financial Statements.
| | | | | | |
| | Index 500 Stock Portfolio | | | 21 | |
Large Company Value Portfolio
| | | | |
| Objective: | | Portfolio Strategy: | | Net Assets: |
| Long-term of capital growth. Income | | Invest primarily in equity securities of larger companies | | $87 million |
| is a secondary objective. | | that are temporarily out of favor in the market. | | |
Portfolio Overview
Mason Street Advisors, the investment adviser for the Large Company Value Portfolio (the “Portfolio”), has engaged American Century Investment Management, Inc. (“American Century”) to act as sub-adviser for the Portfolio. The Portfolio looks for stocks of companies that it believes are undervalued at the time of purchase. The Portfolio attempts to purchase the stocks of these undervalued companies and hold each stock until it has returned to favor in the market and the price has increased to, or is higher than, a level the Portfolio believes more accurately reflects the fair value of the company. Companies may be undervalued due to market declines, poor economic conditions, actual or anticipated bad news regarding the issuer or its industry, or because they have been overlooked by the market.
Market Overview
Stocks recorded strong gains in 2012, driven by the Federal Reserve’s (the Fed) extraordinary fiscal and monetary stimulus. Though the unemployment rate declined and the housing market showed signs of improvement, U.S. economic growth overall was lackluster. As a result, the Fed extended a number of its liquidity measures and launched a third round of quantitative easing (QE3). In December, the Fed identified its threshold levels for unemployment and inflation, indicating that it would continue holding short-term interest rates close to zero as long as unemployment remained above 6.5% and inflation was below 2.5%. In this environment, investors generally favored smaller and riskier companies, as measured by the relevant Russell Indices.
Portfolio Results
The Portfolio returned 16.47% for the twelve months ended December 31, 2012. By comparison, its benchmark, the Russell®1000 Value Index (the “Index”), returned 17.51%. (This Index is unmanaged, cannot be invested in directly and does not include administrative expenses or sales charges.) According to Lipper® Analytical Services, Inc., an independent mutual fund ranking agency, the average return of the Large Cap Value Funds peer group was 15.71%.
In Information Technology, which was among the weakest performing sectors in the Index, the Portfolio was hampered by an overweight relative to the Index in the semiconductor and semiconductor equipment industry. More specifically, the Portfolio was overweight Marvell Technology and Intel Corp. Shares of both companies dropped on weaker-than-expected revenues. Marvell’s hard drive business has also been affected by slowing PC sales and the company has seen weak results in its mobile and wireless business. Intel provided guidance that offered a weak outlook for its core PC business. Within computers and peripherals, an overweight in Hewlett-Packard detracted from performance. The company experienced a steady drop in revenues and struggled to regain a competitive position in the consumer and enterprise markets. It also took a significant asset-impairment charge related to its acquisition of software firm, Autonomy Corp.
In the Energy sector, which posted the second-weakest results in the Index, the Portfolio was hindered by its mix of large, integrated oil and gas companies. Many of these names declined as the global economy weakened, demand for oil fell, and fears increased about an oil supply cushion. Two of the Portfolio’s top overweights—Exxon Mobil and Chevron Corp.—detracted from the Portfolio’s relative results this year. We continued to favor these companies because they both had a track record of strong returns and continued to expand their oil and gas production capabilities.
On a positive note, the Energy sector provided notable contributor Valero Energy. Shares of the oil refiner climbed on strong earnings and the announcement it would spin off its retail business.
Although an overweight in Consumer Discretionary—the strongest performing sector in the Index—contributed positively, security selection within the sector dampened results. In specialty retailing, an overweight in Staples detracted. The office supply retailer announced a sharp drop in earnings and lowered its full-year outlook. Its shares declined further on news of a restructuring plan, including a reduction in its North American retail footprint.
In the Industrials sector, strong security selection added to results. The Portfolio held Ingersoll-Rand. The diversified industrial company started to reduce costs, boosting its profit margins as the prolonged slump in residential and commercial construction continued to weigh on demand for its products. Ingersoll-Rand’s share price also appreciated on news that activist investor Nelson Peltz had taken a position in the stock.
Forward currency exchange contracts were used to insulate the Portfolio from adverse currency movements.
Portfolio Manager Outlook
The following forward looking comments are the opinion of American Century, the Portfolio’s sub-adviser.
We continue to be bottom-up investment managers, evaluating each company individually and building our Portfolio one stock at a time. As of December 31, 2012, the Portfolio was broadly diversified, with ongoing overweight positions in the Health Care, Energy and Consumer Discretionary sectors. Our valuation work contributed to our smaller relative weightings in Utilities, Financials and Materials stocks. We are still finding greater value opportunities among mega-cap stocks and have maintained our bias toward these firms.
| | | | |
| 22 | | Large Company Value Portfolio | | |
Large Company Value Portfolio
|
| Relative Performance |
|
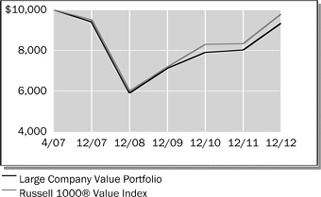
|
| | | | | | | | | | | | |
Average Annual Total Returns
For Periods Ended December 31, 2012 | |
| | | 1 Year | | | 5 Years | | | Since
Inception* | |
Large Company Value Portfolio | | | 16.47 | % | | | -0.13 | % | | | -1.19 | % |
Russell 1000® Value Index | | | 17.51 | % | | | 0.59 | % | | | -0.37 | % |
Lipper® Variable Insurance Products (VIP) Large Cap Value Funds Average | | | 15.71 | % | | | 0.35 | % | | | - | |
| * | Inception date of 4/30/07 |
|
The performance data quoted represents past performance. Past performance is historical and does not guarantee future performance. Investment return and principal value will fluctuate, so that shares, when redeemed, may be worth more or less than their original cost. Current performance may be lower or higher than the performance data quoted. For the most recent month-end performance information visit www.northwesternmutual.com. This chart assumes an initial investment of $10,000 made on 4/30/07 (commencement of the Portfolio’s operations). Returns shown reflect fee waivers, deductions for management and other portfolio expenses, and reinvestment of all dividends. In the absence of fee waivers, total return would be reduced. Returns exclude deductions for separate account sale loads and account fees. Please refer to the Benchmark Definitions section of this report for information about the indices cited in the above chart and graph. The Portfolio may invest in derivative instruments for cash management purposes or to hedge foreign currency exposure. Use of these instruments may involve certain costs and imposes certain risks such as liquidity risk, market risk, credit risk, management risk and the risk of mispricing or improper valuation. Certain derivatives involve leverage, which could magnify losses, and portfolios investing in derivatives could lose more than the principal amount invested in those instruments. |
Top 10 Equity Holdings 12/31/12
| | |
| Security Description | | % of Net Assets |
Exxon Mobil Corp. | | 6.7% |
General Electric Co. | | 3.8% |
Pfizer, Inc. | | 3.4% |
Chevron Corp. | | 3.4% |
JPMorgan Chase & Co. | | 3.4% |
Wells Fargo & Co. | | 3.2% |
The Procter & Gamble Co. | | 2.8% |
Johnson & Johnson | | 2.8% |
Cisco Systems, Inc. | | 2.5% |
Merck & Co., Inc. | | 2.3% |
Sector Allocation 12/31/12
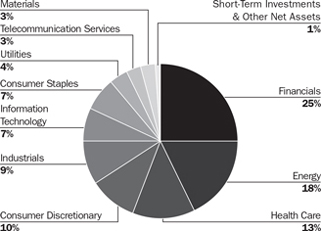
Sector Allocation is based on Net Assets.
Sector Allocation and Top 10 Holdings are subject to change.
| | | | | | |
| | Large Company Value Portfolio | | | 23 | |
Large Company Value Portfolio
Schedule of Investments
December 31, 2012
| | | | | | | | | | |
| | | Common Stocks (97.8%) | | Shares/
$ Par | | | Value
$ (000’s) | |
| |
| | Consumer Discretionary (9.5%) | |
| | Autoliv, Inc. | | | 2,570 | | | | 173 | |
| | Carnival Corp. | | | 11,930 | | | | 439 | |
| | CBS Corp. - Class B | | | 17,260 | | | | 657 | |
| | Comcast Corp. - Class A | | | 29,470 | | | | 1,102 | |
| | Ford Motor Co. | | | 97,500 | | | | 1,263 | |
| | Kohl’s Corp. | | | 9,270 | | | | 398 | |
| | Lowe’s Cos., Inc. | | | 19,410 | | | | 689 | |
| | Macy’s, Inc. | | | 14,770 | | | | 576 | |
| | Staples, Inc. | | | 18,350 | | | | 209 | |
| | Target Corp. | | | 20,440 | | | | 1,209 | |
| | Time Warner Cable, Inc. | | | 4,260 | | | | 414 | |
| | Time Warner, Inc. | | | 24,060 | | | | 1,151 | |
| | | | | | | | | | |
| | Total | | | | | | | 8,280 | |
| | | | | | | | | | |
| | | |
| | Consumer Staples (7.1%) | | | | | | | | |
| | Altria Group, Inc. | | | 12,480 | | | | 392 | |
| | CVS Caremark Corp. | | | 19,500 | | | | 943 | |
| | Kraft Foods Group, Inc. | | | 6,561 | | | | 298 | |
| | The Kroger Co. | | | 24,700 | | | | 643 | |
| | Mondelez International, Inc. | | | 19,520 | | | | 497 | |
| | PepsiCo, Inc. | | | 5,710 | | | | 391 | |
| | The Procter & Gamble Co. | | | 35,770 | | | | 2,428 | |
| | Wal-Mart Stores, Inc. | | | 8,980 | | | | 613 | |
| | | | | | | | | | |
| | Total | | | | | | | 6,205 | |
| | | | | | | | | | |
| | | |
| | Energy (16.6%) | | | | | | | | |
| | Apache Corp. | | | 11,570 | | | | 908 | |
| | Baker Hughes, Inc. | | | 17,890 | | | | 731 | |
| | Chevron Corp. | | | 27,220 | | | | 2,944 | |
| | Exxon Mobil Corp. | | | 67,720 | | | | 5,861 | |
| | National-Oilwell Varco, Inc. | | | 11,030 | | | | 754 | |
| | Occidental Petroleum Corp. | | | 10,840 | | | | 830 | |
| | Schlumberger, Ltd. | | | 10,230 | | | | 709 | |
| | Total SA, ADR | | | 16,580 | | | | 862 | |
| * | | Ultra Petroleum Corp. | | | 12,510 | | | | 227 | |
| | Valero Energy Corp. | | | 16,700 | | | | 570 | |
| | | | | | | | | | |
| | Total | | | | | | | 14,396 | |
| | | | | | | | | | |
| | | |
| | Financials (25.3%) | | | | | | | | |
| | The Allstate Corp. | | | 18,120 | | | | 728 | |
| * | | American International Group, Inc. | | | 15,589 | | | | 550 | |
| | Ameriprise Financial, Inc. | | | 14,980 | | | | 938 | |
| | Bank of America Corp. | | | 69,460 | | | | 806 | |
| | The Bank of New York Mellon Corp. | | | 24,560 | | | | 631 | |
| * | | Berkshire Hathaway, Inc. - Class B | | | 14,010 | | | | 1,257 | |
| | BlackRock, Inc. | | | 3,690 | | | | 763 | |
| | The Chubb Corp. | | | 4,400 | | | | 331 | |
| | Citigroup, Inc. | | | 48,930 | | | | 1,936 | |
| | The Goldman Sachs Group, Inc. | | | 9,320 | | | | 1,189 | |
| | | | | | | | | | |
| | | Common Stocks (97.8%) | | Shares/
$ Par | | | Value
$ (000’s) | |
| |
| | Financials continued | |
| | JPMorgan Chase & Co. | | | 66,730 | | | | 2,934 | |
| | KeyCorp | | | 46,500 | | | | 391 | |
| | Loews Corp. | | | 14,190 | | | | 578 | |
| | MetLife, Inc. | | | 35,280 | | | | 1,162 | |
| | Morgan Stanley | | | 15,800 | | | | 302 | |
| | PNC Financial Services Group, Inc. | | | 20,370 | | | | 1,188 | |
| | Principal Financial Group, Inc. | | | 17,830 | | | | 508 | |
| | Prudential Financial, Inc. | | | 15,740 | | | | 839 | |
| | Torchmark Corp. | | | 2,800 | | | | 145 | |
| | The Travelers Cos., Inc. | | | 12,540 | | | | 901 | |
| | U.S. Bancorp | | | 36,370 | | | | 1,162 | |
| | Wells Fargo & Co. | | | 80,920 | | | | 2,766 | |
| | | | | | | | | | |
| | Total | | | | | | | 22,005 | |
| | | | | | | | | | |
| | | |
| | Health Care (13.4%) | | | | | | | | |
| | Abbott Laboratories | | | 7,370 | | | | 483 | |
| * | | Abbott Laboratories - When Issued | | | 6,310 | | | | 198 | |
| | Aetna, Inc. | | | 15,080 | | | | 698 | |
| | Amgen, Inc. | | | 1,930 | | | | 167 | |
| * | | Gilead Sciences, Inc. | | | 3,330 | | | | 245 | |
| | Johnson & Johnson | | | 34,150 | | | | 2,394 | |
| | Medtronic, Inc. | | | 30,720 | | | | 1,260 | |
| | Merck & Co., Inc. | | | 49,280 | | | | 2,017 | |
| | Pfizer, Inc. | | | 118,780 | | | | 2,979 | |
| | Quest Diagnostics, Inc. | | | 7,420 | | | | 432 | |
| | WellPoint, Inc. | | | 12,540 | | | | 764 | |
| | | | | | | | | | |
| | Total | | | | | | | 11,637 | |
| | | | | | | | | | |
| | | |
| | Industrials (9.0%) | | | | | | | | |
| | The ADT Corp. | | | 3,560 | | | | 165 | |
| | Avery Dennison Corp. | | | 5,010 | | | | 175 | |
| | Dover Corp. | | | 9,590 | | | | 630 | |
| | Eaton Corp. PLC | | | 13,060 | | | | 708 | |
| | General Electric Co. | | | 156,830 | | | | 3,292 | |
| | Honeywell International, Inc. | | | 4,820 | | | | 306 | |
| | Ingersoll-Rand PLC | | | 4,140 | | | | 199 | |
| | Northrop Grumman Corp. | | | 4,820 | | | | 326 | |
| | PACCAR, Inc. | | | 12,640 | | | | 571 | |
| | Raytheon Co. | | | 9,080 | | | | 523 | |
| | Southwest Airlines Co. | | | 48,080 | | | | 492 | |
| | Tyco International, Ltd. | | | 14,480 | | | | 424 | |
| | | | | | | | | | |
| | Total | | | | | | | 7,811 | |
| | | | | | | | | | |
| |
| | Information Technology (7.2%) | |
| * | | Adobe Systems, Inc. | | | 8,120 | | | | 306 | |
| | Applied Materials, Inc. | | | 42,670 | | | | 488 | |
| | Cisco Systems, Inc. | | | 110,310 | | | | 2,168 | |
| * | | Fiserv, Inc. | | | 850 | | | | 67 | |
| | Intel Corp. | | | 42,410 | | | | 875 | |
| | Microsoft Corp. | | | 40,150 | | | | 1,073 | |
| * | | NetApp, Inc. | | | 10,550 | | | | 354 | |
| | | | | | | | | | |
| | | Common Stocks (97.8%) | | Shares/
$ Par | | | Value
$ (000’s) | |
| |
| | Information Technology continued | |
| | Oracle Corp. | | | 28,540 | | | | 951 | |
| | | | | | | | | | |
| | Total | | | | | | | 6,282 | |
| | | | | | | | | | |
| | | |
| | Materials (2.5%) | | | | | | | | |
| | E.I. du Pont de Nemours and Co. | | | 7,340 | | | | 330 | |
| | Freeport-McMoRan Copper & Gold, Inc. | | | 20,380 | | | | 697 | |
| | International Paper Co. | | | 17,180 | | | | 684 | |
| | Nucor Corp. | | | 11,550 | | | | 499 | |
| | | | | | | | | | |
| | Total | | | | | | | 2,210 | |
| | | | | | | | | | |
| |
| | Telecommunication Services (3.3%) | |
| | AT&T, Inc. | | | 56,100 | | | | 1,891 | |
| | CenturyLink, Inc. | | | 18,460 | | | | 722 | |
| | Verizon Communications, Inc. | | | 5,030 | | | | 218 | |
| | | | | | | | | | |
| | Total | | | | | | | 2,831 | |
| | | | | | | | | | |
| | | |
| | Utilities (3.9%) | | | | | | | | |
| | American Electric Power Co., Inc. | | | 11,760 | | | | 502 | |
| | Exelon Corp. | | | 9,240 | | | | 275 | |
| | NV Energy, Inc. | | | 22,240 | | | | 403 | |
| | PG&E Corp. | | | 14,420 | | | | 579 | |
| | Pinnacle West Capital Corp. | | | 10,660 | | | | 544 | |
| | PPL Corp. | | | 18,630 | | | | 533 | |
| | Xcel Energy, Inc. | | | 18,970 | | | | 507 | |
| | | | | | | | | | |
| | Total | | | | | | | 3,343 | |
| | | | | | | | | | |
| | | |
| | Total Common Stocks | | | | | | | | |
| | (Cost: $74,880) | | | | | | | 85,000 | |
| | | | | | | | | | |
| | |
| | | Foreign Common Stocks (0.9%) | | | | |
| | | |
| | Energy (0.9%) | | | | | | | | |
| (l) | | Royal Dutch Shell PLC - Class A | | | 24,190 | | | | 831 | |
| | | | | | | | | | |
| | Total | | | | | | | 831 | |
| | | | | | | | | | |
| | | |
| | Total Foreign Common Stocks | | | | | | | | |
| | (Cost: $838) | | | | | | | 831 | |
| | | | | | | | | | |
The Accompanying Notes are an Integral Part of the Financial Statements.
| | | | |
| 24 | | Large Company Value Portfolio | | |
Large Company Value Portfolio
| | | | | | | | | | |
| | | Short Term Investments (1.5%) | | Shares/
$ Par | | | Value
$ (000’s) | |
| |
| | Other Holdings (1.5%) | |
| | JPMorgan Money Market Fund | | | 1,294,582 | | | | 1,295 | |
| | | | | | | | | | |
| | Total | | | | | | | 1,295 | |
| | | | | | | | | | |
| | | |
| | Total Short-Term Investments | | | | | | | | |
| | (Cost: $1,295) | | | | | | | 1,295 | |
| | | | | | | | | | |
| | | |
| | Total Investments (100.2%) | | | | | | | | |
| | (Cost: $77,013)(a) | | | | | | | 87,126 | |
| | | | | | | | | | |
| | Other Assets, Less | | | | | | | | |
| | Liabilities (-0.2%) | | | | | | | (211 | ) |
| | | | | | | | | | |
| | Net Assets (100.0%) | | | | | | | 86,915 | |
| | | | | | | | | | |
ADR after the name of a security represents—American Depositary Receipt.
| (a) | At December 31, 2012 the aggregate cost of securities for federal tax purposes (in thousands) was $79,627 and the net unrealized appreciation of investments based on that cost was $7,499 which is comprised of $11,143 aggregate gross unrealized appreciation and $3,644 aggregate gross unrealized depreciation. |
| (h) | Forward foreign currency contracts outstanding on December 31, 2012. |
| | | | | | | | | | | | | | | | | | | | |
| Type | | Counterparty | | Currency | | Principal Amount Covered by Contract (000’s) | | Settlement
Month | | Unrealized Appreciation
(000’s) | | | Unrealized (Depreciation) (000’s) | | | Net Unrealized Appreciation/ (Depreciation) (000’s) | |
Sell | | UBS AG | | EUR | | 1,149 | | 1/13 | | $ | - | | | $ | - | (m) | | $ | - | (m) |
| | | | | | | | | | | | | | | | | | | | |
| | | | | | | | | | $ | - | | | $ | - | (m) | | $ | - | (m) |
| | | | | | | | | | | | | | | | | | | | |
EUR — Euro
| (l) | As of December 31, 2012 portfolio securities with an aggregate value of $831 (in thousands) were fair valued under procedures adopted by the Board of Directors. |
| (m) | Amount is less than one thousand. |
| (o) | Short Sales outstanding on 12/31/2012. |
| | | | | | | | | | | | |
| Description | | Shares | | | Proceeds (000’s) | | | Value (000’s) | |
AbbVie, Inc. - When Issued | | | 5,630 | | | $ | 194 | | | $ | 192 | |
The Accompanying Notes are an Integral Part of the Financial Statements.
| | | | | | |
| | Large Company Value Portfolio | | | 25 | |
Large Company Value Portfolio
The following is a summary of the inputs used in valuing the Portfolio’s assets and liabilities at December 31, 2012. See Note 3 for additional information on portfolio valuation.
| | | | | | | | | | | | | | |
| | | Valuation Inputs | | | |
| Description | | Level 1 – Quoted Prices | | | Level 2 – Other Significant Observable Inputs | | | Level 3 – Significant Unobservable Inputs | | | |
| | | (Amounts in thousands) | | | |
Assets: | | | | | | | | | | | | | | |
Domestic Common Stocks | | $ | 85,000 | | | $ | - | | | $ | - | | | |
Foreign Common Stocks | | | - | | | | 831 | | | | - | | | |
Short-Term Investments | | | 1,295 | | | | - | | | | - | | | |
Liabilities: | | | | | | | | | | | | | | |
Short Sales | | | (192 | ) | | | - | | | | - | | | |
Other Financial Instruments^ | | | | | | | | | | | | | | |
Forward Currency Contracts | | | - | | | | - | (m) | | | - | | | |
Total | | $ | 86,103 | | | $ | 831 | | | $ | - | | | |
^ Other financial instruments are derivative instruments such as futures, forwards, written options and swaps contracts, which are valued at the unrealized appreciation (depreciation) on the instrument and short sales, which are valued at market value.
The Accompanying Notes are an Integral Part of the Financial Statements.
| | | | |
| 26 | | Large Company Value Portfolio | | |
Domestic Equity Portfolio
| | | | |
| Objective: | | Portfolio Strategy: | | Net Assets: |
| Long-term growth of capital and income. | | Invest primarily in equity securities of U.S. issuers that are selling at attractive prices relative to their intrinsic value. | | $400 million |
Portfolio Overview
Effective October 1, 2012, the Board of Directors of the Northwestern Mutual Series Fund, Inc. appointed Delaware Management Company, as series of Delaware Management Business Trust (“Delaware”) to act as sub-adviser to the Portfolio. Prior to that time, the Portfolio was sub-advised by Capital Guardian Trust Company (“Capital Guardian”). The Portfolio primarily invests in a core group of 30-40 equity securities of large capitalization U.S. issuers that have long-term capital appreciation potential. Typically, the Portfolio seeks securities that are undervalued in relation to their intrinsic value, as indicated by multiple factors, including the earnings and cash flow potential or the asset valuation of the respective issuers.
Market Overview
Equity markets finished the year with solid gains despite economic uncertainty and significant volatility. Throughout the year, investors shifted their focus from uncertainty regarding the pace of global economic growth to evaluating fiscal and economic stimulus measures implemented globally. The economic slowdown in China, fiscal and debt crises in Europe, and the slow pace of growth in the U.S. drove volatility. As these issues arose, policy makers responded with stimulus and financing measures designed to calm markets. Ultimately, investors embraced risk, as record profit margins in the U.S. and remarkable cash flow generation propelled equity markets during the year.
As measured by the relevant Russell Indices, large cap value stocks performed better than their growth counterparts during the past year. The value-oriented Financials sector drove strong results for value stocks, as many large financial institutions rebounded in 2012 after a number of years of lackluster results.
Portfolio Results
The Portfolio returned 14.35% for the twelve months ended December 31, 2012. By comparison, the Russell 1000® Value Index (the “Index”) returned 17.51%. (The Index is unmanaged, cannot be invested in directly, and does not include administrative expenses or sales charges.) The Portfolio also underperformed the 15.71% average return of its Large Cap Value Funds peer group, according to Lipper® Analytical Services, Inc., an independent mutual fund ranking agency.
As noted above, prior to October 1, 2012, the Portfolio was managed by Capital Guardian. With respect to the period prior to October 1, 2012, the Portfolio underperformed the Index primarily due to stock selection and an overweight stance within the Information Technology sector, especially among semiconductors and equipment companies. Stock selection and an overweight stance in the Materials sector also pulled from relative returns.
On the positive side, stock selection within the Consumer Discretionary sector and an underweight stance in the Utilities sector contributed to relative results.
The following attribution comments relate to the period October 1, 2012 through December 31, 2012, during which Delaware acted as the Portfolio’s sub-adviser.
The Portfolio trailed the Index during the October 1, 2012 through December 31, 2012 period primarily due to an underweight position in the Financials sector, which was the second best performing sector of the Index. Stock selection within the Materials sector was also detrimental for relative results during the period.
In terms of contributors, stock selection within the Energy sector provided the biggest boost to relative results during the period. Strong stock picks in the Industrials and Consumer Discretionary sectors helped the Portfolio’s relative results as well.
Portfolio Manager Outlook
The following forward looking comments are the opinion of Delaware, the Portfolio’s current sub-adviser.
Looking out about five years, we are optimistic about the prospects for equities, especially those of higher quality companies trading well below their long-term average valuation multiples. While we think annualized total returns for equities during this period will be below historical averages, it is our belief that these returns will be competitive versus other asset classes. Near-term, there are several developments that could make conditions more challenging for stocks. One is that the broad market, as measured by the S&P 500® Index, has recently been generating above-average returns that, in our view, will be difficult to sustain. A second is that the market’s valuation looks stretched to us. The price-to-earnings ratio for the S&P 500® Index based on 5-year average earnings remains above 20.
In light of these circumstances, we remain focused on shares of companies that look demonstrably undervalued, and that have strong cash flows, manageable debt levels, diversified businesses and good dividends. To us, these represent some of the best investment opportunities in the current environment, because we think they will hold up comparatively well and have the potential to perform competitively in a market upturn.
| | | | | | |
| | Domestic Equity Portfolio | | | 27 | |
Domestic Equity Portfolio
Relative Performance

| | | | | | | | | | | | |
Average Annual Total Returns For Periods Ended December 31, 2012 | |
| | | 1 Year | | | 5 Years | | | 10 Years | |
Domestic Equity Portfolio | | | 14.35 | % | | | 1.05 | % | | | 6.92 | % |
Russell 1000® Value Index | | | 17.51 | % | | | 0.59 | % | | | 7.38 | % |
Lipper® Variable Insurance Products (VIP) Large Cap Value Funds Average | | | 15.71 | % | | | 0.35 | % | | | 6.54 | % |
The performance data quoted represents past performance. Past performance is historical and does not guarantee future performance. Investment return and principal value will fluctuate, so that shares, when redeemed, may be worth more or less than their original cost. Current performance may be lower or higher than the performance data quoted. For the most recent month-end performance information visit www.northwesternmutual.com.
This chart assumes an initial investment of $10,000 made on 12/31/02. Returns shown include deductions for management and other portfolio expenses, and reinvestment of all dividends. Returns exclude deductions for separate account sale loads and account fees. Please refer to the Benchmark Definitions section of this report for information about the indices cited in the above chart and graph.
The Portfolio may hold fewer securities than other diversified portfolios because of its more focused investment strategy. Holding fewer securities increases the risk that the value of the Portfolio could go down because of the poor performance of a single investment.
Top 10 Equity Holdings 12/31/12
| | |
| Security Description | | % of Net Assets |
Halliburton Co. | | 3.3% |
Lowe’s Cos., Inc. | | 3.2% |
Cardinal Health, Inc. | | 3.2% |
The Travelers Cos., Inc. | | 3.2% |
Waste Management, Inc. | | 3.2% |
The Bank of New York Mellon Corp. | | 3.2% |
Comcast Corp. - Class A | | 3.2% |
Cisco Systems, Inc. | | 3.1% |
Northrop Grumman Corp. | | 3.1% |
Johnson & Johnson | | 3.1% |
Sector Allocation 12/31/12

Sector Allocation is based on Net Assets.
Sector Allocation and Top 10 Holdings are subject to change.
| | | | |
| 28 | | Domestic Equity Portfolio | | |
Domestic Equity Portfolio
Schedule of Investments
December 31, 2012
| | | | | | | | | | |
| | | Common Stocks (98.6%) | | Shares/
$ Par | | | Value
$ (000’s) | |
| |
| | Consumer Discretionary (6.4%) | |
| | Comcast Corp. - Class A | | | 339,700 | | | | 12,698 | |
| | Lowe’s Cos., Inc. | | | 365,100 | | | | 12,968 | |
| | | | | | | | | | |
| | Total | | | | | | | 25,666 | |
| | | | | | | | | | |
| |
| | Consumer Staples (13.7%) | |
| | Archer-Daniels-Midland Co. | | | 447,100 | | | | 12,246 | |
| | CVS Caremark Corp. | | | 250,900 | | | | 12,131 | |
| | Kraft Foods Group, Inc. | | | 262,566 | | | | 11,939 | |
| | Mondelez International, Inc. | | | 293,900 | | | | 7,486 | |
| | Safeway, Inc. | | | 601,600 | | | | 10,883 | |
| | | | | | | | | | |
| | Total | | | | | | | 54,685 | |
| | | | | | | | | | |
| |
| | Energy (15.1%) | |
| | Chevron Corp. | | | 112,846 | | | | 12,203 | |
| | ConocoPhillips | | | 212,500 | | | | 12,323 | |
| | Halliburton Co. | | | 377,700 | | | | 13,102 | |
| | Marathon Oil Corp. | | | 375,600 | | | | 11,516 | |
| | Occidental Petroleum Corp. | | | 148,500 | | | | 11,377 | |
| | | | | | | | | | |
| | Total | | | | | | | 60,521 | |
| | | | | | | | | | |
| |
| | Financials (12.3%) | |
| | The Allstate Corp. | | | 306,800 | | | | 12,324 | |
| | The Bank of New York Mellon Corp. | | | 494,700 | | | | 12,714 | |
| | Marsh & McLennan Cos., Inc. | | | 334,600 | | | | 11,534 | |
| | The Travelers Cos., Inc. | | | 178,000 | | | | 12,784 | |
| | | | | | | | | | |
| | Total | | | | | | | 49,356 | |
| | | | | | | | | | |
| | | | | | | | | | |
| | | Common Stocks (98.6%) | | Shares/ $ Par | | | Value
$ (000’s) | |
| |
| | Health Care (18.0%) | |
| | Baxter International, Inc. | | | 174,000 | | | | 11,599 | |
| | Cardinal Health, Inc. | | | 311,800 | | | | 12,840 | |
| | Johnson & Johnson | | | 176,300 | | | | 12,359 | |
| | Merck & Co., Inc. | | | 269,400 | | | | 11,029 | |
| | Pfizer, Inc. | | | 489,000 | | | | 12,264 | |
| | Quest Diagnostics, Inc. | | | 203,000 | | | | 11,829 | |
| | | | | | | | | | |
| | Total | | | | | | | 71,920 | |
| | | | | | | | | | |
| |
| | Industrials (9.4%) | |
| | Northrop Grumman Corp. | | | 182,900 | | | | 12,360 | |
| | Raytheon Co. | | | 212,600 | | | | 12,237 | |
| | Waste Management, Inc. | | | 378,800 | | | | 12,781 | |
| | | | | | | | | | |
| | Total | | | | | | | 37,378 | |
| | | | | | | | | | |
| |
| | Information Technology (11.9%) | |
| | Cisco Systems, Inc. | | | 636,300 | | | | 12,503 | |
| | Intel Corp. | | | 572,600 | | | | 11,813 | |
| | Motorola Solutions, Inc. | | | 217,000 | | | | 12,082 | |
| | Xerox Corp. | | | 1,655,400 | | | | 11,290 | |
| | | | | | | | | | |
| | Total | | | | | | | 47,688 | |
| | | | | | | | | | |
| |
| | Materials (3.0%) | |
| | E.I. du Pont de Nemours and Co. | | | 263,300 | | | | 11,841 | |
| | | | | | | | | | |
| | Total | | | | | | | 11,841 | |
| | | | | | | | | | |
| | | | | | | | | | |
| | | Common Stocks (98.6%) | | Shares/ $ Par | | | Value
$ (000’s) | |
| |
| | Telecommunication Services (5.8%) | |
| | AT&T, Inc. | | | 343,200 | | | | 11,569 | |
| | Verizon Communications, Inc. | | | 266,600 | | | | 11,536 | |
| | | | | | | | | | |
| | Total | | | | | | | 23,105 | |
| | | | | | | | | | |
| |
| | Utilities (3.0%) | |
| | Edison International | | | 265,900 | | | | 12,016 | |
| | | | | | | | | | |
| | Total | | | | | | | 12,016 | |
| | | | | | | | | | |
| | | |
| | Total Common Stocks | | | | | | | | |
| | (Cost: $380,937) | | | | | | | 394,176 | |
| | | | | | | | | | |
| |
| | | Short-Term Investments (1.3%) | |
| |
| | Other Holdings (1.3%) | |
| | JPMorgan U.S. Government Money Market Fund | | | 2,688,183 | | | | 2,688 | |
| | JPMorgan U.S. Treasury Plus Money Market Fund | | | 2,688,183 | | | | 2,688 | |
| | | | | | | | | | |
| | Total | | | | | | | 5,376 | |
| | | | | | | | | | |
| | | |
| | Total Short-Term Investments | | | | | | | | |
| | (Cost: $5,376) | | | | | | | 5,376 | |
| | | | | | | | | | |
| | | |
| | Total Investments (99.9%) | | | | | | | | |
| | (Cost: $386,313)(a) | | | | | | | 399,552 | |
| | | | | | | | | | |
| | Other Assets, Less | | | | | | | | |
| | Liabilities (0.1%) | | | | | | | 506 | |
| | | | | | | | | | |
| | Net Assets (100.0%) | | | | | | | 400,058 | |
| | | | | | | | | | |
| (a) | At December 31, 2012 the aggregate cost of securities for federal tax purposes (in thousands) was $386,314 and the net unrealized appreciation of investments based on that cost was $13,238 which is comprised of $22,056 aggregate gross unrealized appreciation and $8,818 aggregate gross unrealized depreciation. |
The following is a summary of the inputs used in valuing the Portfolio’s assets and liabilities at December 31, 2012. See Note 3 for additional information on portfolio valuation.
| | | | | | | | | | | | | | |
| | | Valuation Inputs | | | |
| Description | | Level 1 –Quoted Prices | | | Level 2 – Other Significant Observable Inputs | | | Level 3 – Significant
Unobservable Inputs | | | |
| | | (Amounts in thousands) | | | |
Assets: | | | | | | | | | | | | | | |
Common Stocks | | $ | 394,176 | | | $ | - | | | $ | - | | | |
Short-Term Investments | | | 5,376 | | | | - | | | | - | | | |
Total | | $ | 399,552 | | | $ | - | | | $ | - | | | |
The Accompanying Notes are an Integral Part of the Financial Statements.
| | | | | | |
| | Domestic Equity Portfolio | | | 29 | |
Equity Income Portfolio
| | | | |
| Objective: | | Portfolio Strategy: | | Net Assets: |
| Long-term growth of capital and income. | | Invests in commons stocks with a focus on well-established, dividend paying companies. | | $409 million |
Portfolio Overview
Mason Street Advisors, the investment adviser for the Equity Income Portfolio (the “Portfolio”), has engaged T. Rowe Price Associates, Inc. (“T. Rowe Price”) to act as sub-adviser for the Portfolio. Normally, the Portfolio invests in common stocks, with 65% in the stocks of well established companies paying dividends. Under normal market conditions, the Portfolio will seek to have a dividend which generally exceeds the dividend yield of the S&P 500® Index. The Portfolio will typically employ a value approach in selecting investments, with an effort made to identify companies that appear to be undervalued by various measures and may be temporarily out of favor, but that have good prospects for capital appreciation and dividend growth.
Market Overview
U.S. stock market indices produced solid returns in 2012 despite muted U.S. economic growth, a recession and sovereign debt crisis in Europe, and a slowdown in emerging economies. Domestic stocks were supported by strong U.S. corporate earnings and actions by central banks to reduce or suppress interest rates in hopes of stimulating growth. As measured by the various Russell® indices, mid and small cap shares narrowly surpassed their large cap counterparts, and value stocks outperformed growth stocks across all market capitalizations.
Portfolio Results
The Portfolio returned 17.23% for the twelve months ended December 31, 2012. By comparison, the Russell 1000® Value Index (“the Index”) returned 17.51%. (The Index is unmanaged, cannot be invested in directly, and does not include administrative expenses or sales charges.) The Portfolio outperformed the 14.99% average return of its Equity Income Funds peer group, according to Lipper® Analytical Services, Inc., an independent mutual fund ranking agency.
The leading contributors to relative results were the Industrial and Business Services, Consumer Discretionary, and Materials sectors. The Telecommunication Services, Utilities and Energy sectors detracted from performance.
Stock selection and an overweight position in the Industrials and Business Services sector contributed to relative results. Shares of diversified building products company USG rose as the housing market improved. Shares of Cooper Industries advanced after diversified power products manufacturer Eaton announced it would acquire the electrical products company at a premium. The Consumer Discretionary sector contributed due to an overweight position in the Index’s strongest-performing sector.
The Materials sector contributed due to stock selection. International Paper continued to benefit from synergies related to its acquisition of Temple-Inland, as well as higher containerboard prices. The share price of Vulcan Materials rose on the expectation that Martin Marietta would renew its bid for the leading U.S. aggregates producer.
At the other end of the spectrum, the Telecommunication Services sector detracted from performance relative to the Index due to stock selection and an overweight position. Declining revenue at Telefonica, Europe’s largest integrated telecommunications operator, hurt the company’s share price, reflecting economic problems in Spain
Stock selection in the Utilities sector detracted from performance relative to the Index. Exelon and Entergy suffered, as low natural gas prices more than offset improvements in the supply and demand balance for power, resulting in lower power prices and lower earnings power for coal and nuclear power producers.
Portfolio Manager Outlook
The following forward looking comments are the opinion of T. Rowe Price, the Portfolio’s sub-adviser.
We are reasonably optimistic that the policymakers in Washington will come up with a compromise on government spending. We expect the U.S. economy to grow in the range of 2% to 3% in 2013. We are encouraged by positive trends in the housing industry and unemployment rate. In our view, the main impediments to global growth remain the same as last year: an economic slowdown in China and sovereign debt problems in Europe. In addition, continuing turmoil in the Middle East carries the potential to escalate into more widespread violence.
We continue to seek opportunities to invest in high quality companies selling at attractive valuations with good dividend yields. We are currently finding value in select Energy and Information Technology stocks. We maintain our focus on investing in quality companies that are well managed, with strong competitive and financial positions and attractive value characteristics. In most cases, we also prefer firms with histories of providing attractive dividend yields.
| | | | |
| 30 | | Equity Income Portfolio | | |
Equity Income Portfolio
Relative Performance

| | | | | | | | | | | | |
Average Annual Total Returns For Periods Ended December 31, 2012 | |
| | | 1 Year | | | 5 Years | | | Since Inception* | |
Equity Income Portfolio | | | 17.23 | % | | | 1.39 | % | | | 7.18 | % |
Russell 1000® Value Index | | | 17.51 | % | | | 0.59 | % | | | 7.26 | % |
Lipper® Variable Insurance Products (VIP) Equity Income Funds Average | | | 14.99 | % | | | 0.78 | % | | | - | |
| * | Inception date of 5/1/03 |
The performance data quoted represents past performance. Past performance is historical and does not guarantee future performance. Investment return and principal value will fluctuate, so that shares, when redeemed, may be worth more or less than their original cost. Current performance may be lower or higher than the performance data quoted. For the most recent month-end performance information visit www.northwesternmutual.com.
This chart assumes an initial investment of $10,000 made on 5/1/03 (commencement of the Portfolio’s operations). Returns shown reflect fee waivers, deductions for management and other portfolio expenses, and reinvestment of all dividends. In the absence of fee waivers, total return would be reduced. Returns exclude deductions for separate account sale loads and account fees. Please refer to the Benchmark Definitions section of this report for information about the indices cited in the above chart and graph.
Top 10 Equity Holdings 12/31/12
| | |
| Security Description | | % of Net Assets |
General Electric Co. | | 2.7% |
JPMorgan Chase & Co. | | 2.6% |
Chevron Corp. | | 2.4% |
Exxon Mobil Corp. | | 2.1% |
Wells Fargo & Co. | | 1.9% |
AT&T, Inc. | | 1.8% |
Royal Dutch Shell PLC - Class A, ADR | | 1.6% |
U.S. Bancorp | | 1.6% |
American Express Co. | | 1.5% |
International Paper Co. | | 1.4% |
Sector Allocation 12/31/12

Sector Allocation is based on Net Assets.
Sector Allocation and Top 10 Holdings are subject to change.
| | | | | | |
| | Equity Income Portfolio | | | 31 | |
Equity Income Portfolio
Schedule of Investments
December 31, 2012
| | | | | | | | | | |
| | | Common Stocks (93.9%) | | Shares/ $ Par | | | Value $ (000’s) | |
| | | |
| | Consumer Discretionary (11.3%) | | | | | | | | |
| | Cablevision Systems Corp. - Class A | | | 111,100 | | | | 1,660 | |
| | Carnival Corp. | | | 57,500 | | | | 2,114 | |
| | Comcast Corp. - Class A | | | 68,100 | | | | 2,545 | |
| | Ford Motor Co. | | | 170,400 | | | | 2,207 | |
| | Genuine Parts Co. | | | 32,600 | | | | 2,073 | |
| | Hasbro, Inc. | | | 41,000 | | | | 1,472 | |
| | Johnson Controls, Inc. | | | 70,600 | | | | 2,167 | |
| | Kohl’s Corp. | | | 85,400 | | | | 3,670 | |
| | Macy’s, Inc. | | | 62,500 | | | | 2,439 | |
| * | | Madison Square Garden, Inc. - Class A | | | 37,050 | | | | 1,643 | |
| | Mattel, Inc. | | | 114,600 | | | | 4,197 | |
| | The McGraw-Hill Cos., Inc. | | | 69,100 | | | | 3,778 | |
| * | | The New York Times Co. - Class A | | | 117,600 | | | | 1,003 | |
| | Staples, Inc. | | | 212,800 | | | | 2,426 | |
| | Tiffany & Co. | | | 7,100 | | | | 407 | |
| | Time Warner, Inc. | | | 111,300 | | | | 5,323 | |
| | The Walt Disney Co. | | | 78,100 | | | | 3,889 | |
| | Whirlpool Corp. | | | 27,400 | | | | 2,788 | |
| | WPP PLC, ADR | | | 5,400 | | | | 394 | |
| | | | | | | | | | |
| | Total | | | | | | | 46,195 | |
| | | | | | | | | | |
| | | |
| | Consumer Staples (5.6%) | | | | | | | | |
| | Archer-Daniels-Midland Co. | | | 124,900 | | | | 3,421 | |
| | Avon Products, Inc. | | | 164,000 | | | | 2,355 | |
| | Campbell Soup Co. | | | 99,000 | | | | 3,454 | |
| | The Clorox Co. | | | 54,000 | | | | 3,954 | |
| | ConAgra Foods, Inc. | | | 63,800 | | | | 1,882 | |
| | Energizer Holdings, Inc. | | | 20,800 | | | | 1,664 | |
| | McCormick & Co., Inc. | | | 29,400 | | | | 1,868 | |
| | PepsiCo, Inc. | | | 50,000 | | | | 3,421 | |
| | The Procter & Gamble Co. | | | 12,300 | | | | 835 | |
| | | | | | | | | | |
| | Total | | | | | | | 22,854 | |
| | | | | | | | | | |
| | | |
| | Energy (14.0%) | | | | | | | | |
| | Anadarko Petroleum Corp. | | | 53,700 | | | | 3,990 | |
| | Apache Corp. | | | 43,700 | | | | 3,431 | |
| | BP PLC, ADR | | | 55,300 | | | | 2,303 | |
| | Chevron Corp. | | | 90,400 | | | | 9,776 | |
| | ConocoPhillips | | | 29,400 | | | | 1,705 | |
| | CONSOL Energy, Inc. | | | 87,000 | | | | 2,793 | |
| | Diamond Offshore Drilling, Inc. | | | 45,900 | | | | 3,119 | |
| | Exxon Mobil Corp. | | | 101,200 | | | | 8,759 | |
| | Hess Corp. | | | 66,700 | | | | 3,532 | |
| | Murphy Oil Corp. | | | 76,900 | | | | 4,579 | |
| | Petroleo Brasileiro SA, ADR | | | 60,200 | | | | 1,172 | |
| | Royal Dutch Shell PLC - Class A, ADR | | | 96,400 | | | | 6,647 | |
| | Schlumberger, Ltd. | | | 55,300 | | | | 3,832 | |
| | Spectra Energy Corp. | | | 52,550 | | | | 1,439 | |
| | | | | | | | | | |
| | Total | | | | | | | 57,077 | |
| | | | | | | | | | |
| | | | | | | | | | |
| | | Common Stocks (93.9%) | | Shares/ $ Par | | | Value $ (000’s) | |
| | | |
| | Financials (20.1%) | | | | | | | | |
| | The Allstate Corp. | | | 115,300 | | | | 4,632 | |
| | American Express Co. | | | 109,300 | | | | 6,283 | |
| | Bank of America Corp. | | | 434,123 | | | | 5,036 | |
| | The Bank of New York Mellon Corp. | | | 96,900 | | | | 2,490 | |
| | Capital One Financial Corp. | | | 47,200 | | | | 2,734 | |
| | The Chubb Corp. | | | 24,100 | | | | 1,815 | |
| | JPMorgan Chase & Co. | | | 241,488 | | | | 10,618 | |
| | Legg Mason, Inc. | | | 106,300 | | | | 2,734 | |
| | Lincoln National Corp. | | | 77,776 | | | | 2,014 | |
| | Loews Corp. | | | 32,900 | | | | 1,341 | |
| | Marsh & McLennan Cos., Inc. | | | 127,200 | | | | 4,385 | |
| | Northern Trust Corp. | | | 76,200 | | | | 3,822 | |
| | Och-Ziff Capital Management Group - Class A | | | 58,400 | | | | 555 | |
| | PNC Financial Services Group, Inc. | | | 72,100 | | | | 4,204 | |
| | Regions Financial Corp. | | | 180,500 | | | | 1,285 | |
| | SLM Corp. | | | 166,600 | | | | 2,854 | |
| | Sun Life Financial, Inc. | | | 59,300 | | | | 1,573 | |
| | SunTrust Banks, Inc. | | | 126,800 | | | | 3,595 | |
| | U.S. Bancorp | | | 205,500 | | | | 6,564 | |
| | Wells Fargo & Co. | | | 223,700 | | | | 7,646 | |
| | Weyerhaeuser Co. | | | 109,635 | | | | 3,050 | |
| | Willis Group Holdings PLC | | | 53,500 | | | | 1,794 | |
| | XL Group PLC | | | 51,600 | | | | 1,293 | |
| | | | | | | | | | |
| | Total | | | | | | | 82,317 | |
| | | | | | | | | | |
| | | |
| | Health Care (7.1%) | | | | | | | | |
| | Agilent Technologies, Inc. | | | 37,300 | | | | 1,527 | |
| | Amgen, Inc. | | | 21,600 | | | | 1,864 | |
| | Bristol-Myers Squibb Co. | | | 97,800 | | | | 3,187 | |
| | Johnson & Johnson | | | 77,300 | | | | 5,419 | |
| | Merck & Co., Inc. | | | 111,300 | | | | 4,557 | |
| | Pfizer, Inc. | | | 205,026 | | | | 5,142 | |
| | Quest Diagnostics, Inc. | | | 35,900 | | | | 2,092 | |
| | Thermo Fisher Scientific, Inc. | | | 83,900 | | | | 5,351 | |
| | | | | | | | | | |
| | Total | | | | | | | 29,139 | |
| | | | | | | | | | |
| | | |
| | Industrials (14.1%) | | | | | | | | |
| | 3M Co. | | | 59,900 | | | | 5,562 | |
| | Avery Dennison Corp. | | | 28,800 | | | | 1,006 | |
| | The Boeing Co. | | | 44,700 | | | | 3,369 | |
| | Eaton Corp. PLC | | | 36,570 | | | | 1,982 | |
| | Emerson Electric Co. | | | 88,800 | | | | 4,703 | |
| | General Electric Co. | | | 525,300 | | | | 11,026 | |
| | Honeywell International, Inc. | | | 69,100 | | | | 4,386 | |
| | Illinois Tool Works, Inc. | | | 83,200 | | | | 5,059 | |
| | Ingersoll-Rand PLC | | | 50,100 | | | | 2,403 | |
| | Lockheed Martin Corp. | | | 21,000 | | | | 1,938 | |
| | Masco Corp. | | | 120,200 | | | | 2,002 | |
| | Norfolk Southern Corp. | | | 67,900 | | | | 4,199 | |
The Accompanying Notes are an Integral Part of the Financial Statements.
| | | | |
| 32 | | Equity Income Portfolio | | |
Equity Income Portfolio
| | | | | | | | | | |
| | | Common Stocks (93.9%) | | Shares/ $ Par | | | Value $ (000’s) | |
| | | |
| | Industrials continued | | | | | | | | |
| * | | United Continental Holdings, Inc. | | | 125,900 | | | | 2,943 | |
| | United Parcel Service, Inc. - Class B | | | 53,400 | | | | 3,937 | |
| | United Technologies Corp. | | | 8,300 | | | | 681 | |
| * | | USG Corp. | | | 51,800 | | | | 1,454 | |
| | Xylem, Inc. | | | 38,000 | | | | 1,030 | |
| | | | | | | | | | |
| | Total | | | | | | | 57,680 | |
| | | | | | | | | | |
| | | |
| | Information Technology (8.1%) | | | | | | | | |
| | Analog Devices, Inc. | | | 68,000 | | | | 2,860 | |
| | Applied Materials, Inc. | | | 207,000 | | | | 2,368 | |
| | CA, Inc. | | | 42,000 | | | | 923 | |
| | Cisco Systems, Inc. | | | 171,100 | | | | 3,362 | |
| | Computer Sciences Corp. | | | 86,400 | | | | 3,460 | |
| | Corning, Inc. | | | 238,200 | | | | 3,006 | |
| | Dell, Inc. | | | 275,300 | | | | 2,789 | |
| * | | First Solar, Inc. | | | 21,700 | | | | 670 | |
| | Harris Corp. | | | 78,300 | | | | 3,834 | |
| | Hewlett-Packard Co. | | | 98,300 | | | | 1,401 | |
| | Microsoft Corp. | | | 184,300 | | | | 4,926 | |
| | Nokia Corp. OYJ, ADR | | | 240,300 | | | | 949 | |
| | Texas Instruments, Inc. | | | 80,400 | | | | 2,488 | |
| | | | | | | | | | |
| | Total | | | | | | | 33,036 | |
| | | | | | | | | | |
| | | |
| | Materials (4.8%) | | | | | | | | |
| | Cliffs Natural Resources, Inc. | | | 35,900 | | | | 1,384 | |
| | E.I. du Pont de Nemours and Co. | | | 43,700 | | | | 1,965 | |
| | International Paper Co. | | | 143,500 | | | | 5,717 | |
| | MeadWestvaco Corp. | | | 66,400 | | | | 2,116 | |
| | Newmont Mining Corp. | | | 25,000 | | | | 1,161 | |
| | Nucor Corp. | | | 95,800 | | | | 4,137 | |
| | Vulcan Materials Co. | | | 60,400 | | | | 3,144 | |
| | | | | | | | | | |
| | Total | | | | | | | 19,624 | |
| | | | | | | | | | |
| | | |
| | Telecommunication Services (3.2%) | | | | | | | | |
| | AT&T, Inc. | | | 216,035 | | | | 7,283 | |
| | CenturyLink, Inc. | | | 55,190 | | | | 2,159 | |
| | Verizon Communications, Inc. | | | 84,100 | | | | 3,639 | |
| | | | | | | | | | |
| | Total | | | | | | | 13,081 | |
| | | | | | | | | | |
| | | |
| | Utilities (5.6%) | | | | | | | | |
| | The AES Corp. | | | 99,600 | | | | 1,066 | |
| | Duke Energy Corp. | | | 82,000 | | | | 5,231 | |
| | Entergy Corp. | | | 64,200 | | | | 4,093 | |
| | Exelon Corp. | | | 116,900 | | | | 3,477 | |
| | FirstEnergy Corp. | | | 37,700 | | | | 1,574 | |
| | NiSource, Inc. | | | 165,900 | | | | 4,129 | |
| | TECO Energy, Inc. | | | 42,300 | | | | 709 | |
| | Xcel Energy, Inc. | | | 97,800 | | | | 2,612 | |
| | | | | | | | | | |
| | Total | | | | | | | 22,891 | |
| | | | | | | | | | |
| | |
| | Total Common Stocks | | | | | |
| | (Cost: $348,767) | | | | | | | 383,894 | |
| | | | | | | | | | |
| | | | | | | | | | | | |
| | | Foreign Common Stocks (0.8%) | | Country | | Shares/ $ Par | | | Value $ (000’s) | |
| | |
| | Consumer Discretionary (0.2%) | | | | | |
| (l) | | WPP PLC | | United Kingdom | | | 57,461 | | | | 836 | |
| | | | | | | | | | | | |
| | Total | | | | | | | | | 836 | |
| | | | | | | | | | | | |
| | | |
| | Telecommunication Services (0.6%) | | | | | | | | |
| (l) | | Telefonica SA | | Spain | | | 80,725 | | | | 1,095 | |
| (l) | | Vodafone Group PLC | | United Kingdom | | | 492,427 | | | | 1,239 | |
| | | | | | | | | | | | |
| | Total | | | | | | | | | 2,334 | |
| | | | | | | | | | | | |
| | | |
| | Total Foreign Common Stocks | | | | | | | | |
| | (Cost: $3,283) | | | | | | | | | 3,170 | |
| | | | | | | | | | | | |
| | | | |
| | | Preferred Stocks (0.6%) | | | | | | | | | | |
| | | |
| | Consumer Discretionary (0.6%) | | | | | | | | |
| | General Motors Co., Series B, 4.75%, 12/1/13 | | | | | 56,300 | | | | 2,484 | |
| | | | | | | | | | | | |
| | | | |
| | Total Preferred Stocks | | | | | | | | | | |
| | (Cost: $2,648) | | | | | | | 2,484 | |
| | | | | | | | | | | | |
| | | | |
| | | Short-Term Investments (4.6%) | | | | | | | | | | |
| | | |
| | Other Holdings (4.6%) | | | | | | | | |
| | T. Rowe Price Reserve Investment Fund | | | | | 19,020,794 | | | | 19,021 | |
| | | | | | | | | | | | |
| | Total | | | | | | | | | 19,021 | |
| | | | | | | | | | | | |
| | | |
| | Total Short-Term Investments | | | | | | | | |
| | (Cost: $19,021) | | | | | | | 19,021 | |
| | | | | | | | | | | | |
| | | |
| | Total Investments (99.9%) | | | | | | | | |
| | (Cost: $373,719)(a) | | | | | | | 408,569 | |
| | | | | | | | | | | | |
| | Other Assets, Less | | | | | | | | | | |
| | Liabilities (0.1%) | | | | | | | | | 528 | |
| | | | | | | | | | | | |
| | Net Assets (100.0%) | | | | | | | | | 409,097 | |
| | | | | | | | | | | | |
The Accompanying Notes are an Integral Part of the Financial Statements
| | | | | | |
| | Equity Income Portfolio | | | 33 | |
Equity Income Portfolio
ADR after the name of a security represents—American Depositary Receipt.
| (a) | At December 31, 2012 the aggregate cost of securities for federal tax purposes (in thousands) was $374,685 and the net unrealized appreciation of investments based on that cost was $33,884 which is comprised of $57,048 aggregate gross unrealized appreciation and $23,164 aggregate gross unrealized depreciation. |
| (l) | As of December 31, 2012 portfolio securities with an aggregate value of $3,170 (in thousands) were fair valued under procedures adopted by the Board of Directors. |
The following is a summary of the inputs used in valuing the Portfolio’s assets and liabilities at December 31, 2012. See Note 3 for additional information on portfolio valuation.
| | | | | | | | | | | | | | |
| | | Valuation Inputs | | | |
| Description | | Level 1 – Quoted Prices | | | Level 2 – Other Significant Observable Inputs | | | Level 3 – Significant Unobservable Inputs | | | |
| | | (Amounts in thousands) | | | |
Assets: | | | | | | | | | | | | | | |
Domestic Common Stocks | | $ | 383,894 | | | $ | - | | | $ | - | | | |
Foreign Common Stocks | | | - | | | | 3,170 | | | | - | | | |
Preferred Stocks | | | 2,484 | | | | - | | | | - | | | |
Short-Term Investments | | | 19,021 | | | | - | | | | - | | | |
Total | | $ | 405,399 | | | $ | 3,170 | | | $ | - | | | |
The Accompanying Notes are an Integral Part of the Financial Statements.
| | | | |
| 34 | | Equity Income Portfolio | | |
Mid Cap Growth Stock Portfolio
| | | | |
| Objective: | | Portfolio Strategy: | | Net Assets: |
| Long-term growth of capital. | | Invests primarily in equity securities of mid-sized companies with potential for above average growth. | | $829 million |
Portfolio Overview
Mason Street Advisors acts as the investment adviser for the Mid Cap Growth Stock Portfolio (the “Portfolio”). Normally, the Portfolio invests in stocks of mid-sized companies. In keeping with its growth strategy, the Portfolio selects companies for their above average growth potential, giving consideration to factors such as company management, growth rate of revenues and earnings, opportunities for margin expansion, strong financial characteristics and attractive valuations.
Market Overview
Equity markets finished the year with solid gains despite economic uncertainty and significant volatility. Throughout the year, investors shifted their focus from uncertainty regarding the pace of global economic growth to evaluating fiscal and economic stimulus measures implemented throughout the world. The economic slowdown in China, fiscal and debt crises in Europe, and the slow pace of growth in the U.S. drove volatility. As these issues arose, policy makers responded with stimulus and financing measures designed to calm markets. Ultimately, investors embraced risk, as record profit margins in the U.S. and remarkable cash flow generation propelled equity markets during the year.
Portfolio Results
The Portfolio returned 11.97% for the twelve months ended December 31, 2012. By comparison, the Russell® Midcap Growth Index returned 15.81%. (The Index is unmanaged, cannot be invested in directly, and does not include administrative expenses or sales charges.) The Portfolio trailed the 14.20% average return of its Mid Cap Growth Funds peer group, according to Lipper® Analytical Services, Inc., an independent mutual fund ranking agency.
Holdings in the Information Technology sector were responsible for the majority of the Portfolio’s underperformance relative to the Index. The leading detractors in the software industry were Informatica Corp., Fortinet Inc. and AutoDesk Inc. The information services industry was another source of weakness. Verifone Systems, a maker of credit card scanners, declined on poor execution and fear that its product would be replaced by smart phone technology. Global Payments, a payments processor, had a highly publicized security breach, sending its shares lower. In the computer industry, the Portfolio’s holding in NetApp Inc. detracted from performance. The company suffered from poor execution and sluggish business spending.
Holdings in the Healthcare sector also detracted from performance relative to the Index. The performance of the Healthcare sector was led by a sharp rally in biotechnology stocks during 2012. From a fundamental perspective, picking the winners and losers in biotechnology requires an investor to assume considerable risk, looking several years into the future to determine the products that may or may not pan out. As such, the Portfolio held an underweight position in the biotechnology industry, avoiding Regeneron Pharmaceuticals Inc. and Amylin Inc., two biotechnology stocks that had remarkably strong returns.
On the positive side, holdings in the Telecommunications Sector helped offset some of the Portfolio’s underperformance. A relatively large position in SBA Communications Corp. generated strong returns for the Portfolio, as the stock outperformed on consistent earnings growth. Within the Consumer Discretionary sector, the Portfolio also experienced higher returns than the Index. A significant overweight in Polaris Industries helped relative performance, as the maker of all terrain vehicles rose on improving profit margins and increasing market share. Similarly, the Portfolio’s substantial holdings in Chicos FAS Inc. worked for the Portfolio, as the stock rallied sharply on solid execution.
Portfolio Manager Outlook
We are a taking a cautious view going into 2013. We expect the market to remain volatile as resolution about the “Fiscal Cliff” remains in the headlines and the resulting uncertainty swings the market around. Once resolved, we expect enterprise spending to improve, which could provide a nice tailwind for many industries. An improving Chinese economy should also provide many companies with a better outlook for future growth. However, we remain concerned that the improved global economy could lead to higher commodity prices and in turn higher inflation, as we enter the back half of the year. This could potentially cool off growth and weigh on the valuations of many stocks, making the investing environment more challenging. Therefore, we believe 2013 will be similar to the last couple of years, where the market can have solid rallies, followed by corrections that lead to a range bound market for the year.
| | | | | | |
| | Mid Cap Growth Stock Portfolio | | | 35 | |
Mid Cap Growth Stock Portfolio
Relative Performance
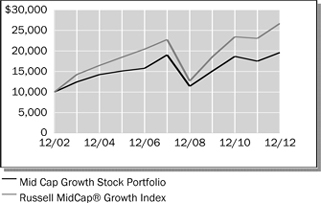
| | | | | | | | | | | | |
Average Annual Total Returns For Periods Ended December 31, 2012 | |
| | | 1 Year | | | 5 Years | | | 10 Years | |
Mid Cap Growth Stock Portfolio | | | 11.97% | | | | 0.59% | | | | 6.97% | |
Russell MidCap® Growth Index | | | 15.81% | | | | 3.23% | | | | 10.32% | |
Lipper® Variable Insurance Products (VIP) Mid Cap Growth Funds Average | | | 14.20% | | | | 1.96% | | | | 9.17% | |
The performance data quoted represents past performance. Past performance is historical and does not guarantee future performance. Investment return and principal value will fluctuate, so that shares, when redeemed, may be worth more or less than their original cost. Current performance may be lower or higher than the performance data quoted. For the most recent month-end performance information visit www.northwesternmutual.com.
This chart assumes an initial investment of $10,000 made on 12/31/02. Returns shown include deductions for management and other portfolio expenses, and reinvestment of all dividends. Returns exclude deductions for separate account sale loads and account fees. Please refer to the Benchmark Definitions section of this report for information about the indices cited in the above chart and graph.
Investing in small and medium-sized companies involves a greater degree of risk than investing in large company stocks.
The Portfolio may invest in derivative instruments for hedging purposes, as a cash management strategy or to earn income. Use of these instruments may involve certain costs and imposes certain risks such as liquidity risk, interest rate risk, market risk, credit risk, management risk and the risk of mispricing or improper valuation. Certain derivatives involve leverage, which could magnify losses, and portfolios investing in derivatives could lose more than the principal amount invested in those instruments.
Top 10 Equity Holdings 12/31/12
| | |
| Security Description | | % of Net Assets |
SBA Communications Corp. - Class A | | 2.7% |
Alliance Data Systems Corp. | | 2.3% |
Global Payments, Inc. | | 2.1% |
Airgas, Inc. | | 2.1% |
Corrections Corp. of America | | 2.0% |
Robert Half International, Inc. | | 1.9% |
AmerisourceBergen Corp. | | 1.9% |
Kansas City Southern | | 1.8% |
B/E Aerospace, Inc. | | 1.8% |
Raymond James Financial, Inc. | | 1.8% |
Sector Allocation 12/31/12
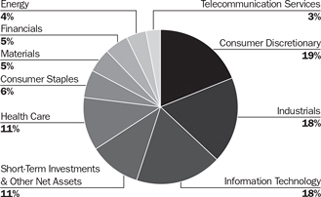
Sector Allocation is based on Net Assets.
Sector Allocation and Top 10 Holdings are subject to change.
| | | | |
| 36 | | Mid Cap Growth Stock Portfolio | | |
Mid Cap Growth Stock Portfolio
Schedule of Investments
December 31, 2012
| | | | | | | | | | |
| | | Common Stocks (89.1%) | | Shares/ $ Par | | | Value $ (000’s) | |
| |
| | Consumer Discretionary (19.0%) | |
| * | | Bed Bath & Beyond, Inc. | | | 136,223 | | | | 7,616 | |
| * | | BorgWarner, Inc. | | | 170,600 | | | | 12,218 | |
| | Brunswick Corp. | | | 239,400 | | | | 6,964 | |
| | Chico’s FAS, Inc. | | | 733,301 | | | | 13,537 | |
| | Coach, Inc. | | | 106,200 | | | | 5,895 | |
| | Dick’s Sporting Goods, Inc. | | | 107,600 | | | | 4,895 | |
| | The Gap, Inc. | | | 155,300 | | | | 4,821 | |
| * | | LKQ Corp. | | | 523,000 | | | | 11,035 | |
| | Macy’s, Inc. | | | 262,500 | | | | 10,243 | |
| | Marriott International, Inc. - Class A | | | 153,400 | | | | 5,717 | |
| | The McGraw-Hill Cos., Inc. | | | 245,100 | | | | 13,400 | |
| * | | O’Reilly Automotive, Inc. | | | 141,260 | | | | 12,632 | |
| * | | Penn National Gaming, Inc. | | | 149,900 | | | | 7,362 | |
| | Polaris Industries, Inc. | | | 168,700 | | | | 14,196 | |
| | Ralph Lauren Corp. | | | 22,400 | | | | 3,358 | |
| | Ross Stores, Inc. | | | 183,200 | | | | 9,920 | |
| | Scripps Networks Interactive - Class A | | | 90,200 | | | | 5,224 | |
| | Ulta Salon, Cosmetics & Fragrance, Inc. | | | 49,900 | | | | 4,903 | |
| | Wynn Resorts, Ltd. | | | 33,600 | | | | 3,780 | |
| | | | | | | | | | |
| | Total | | | | | | | 157,716 | |
| | | | | | | | | | |
| |
| | Consumer Staples (6.1%) | |
| | Beam, Inc. | | | 216,200 | | | | 13,208 | |
| | Church & Dwight Co., Inc. | | | 232,500 | | | | 12,455 | |
| | McCormick & Co., Inc. | | | 225,900 | | | | 14,351 | |
| | Mead Johnson Nutrition Co. | | | 164,900 | | | | 10,865 | |
| | | | | | | | | | |
| | Total | | | | | | | 50,879 | |
| | | | | | | | | | |
| |
| | Energy (4.4%) | |
| * | | Cameron International Corp. | | | 141,800 | | | | 8,006 | |
| * | | Concho Resources, Inc. | | | 106,000 | | | | 8,539 | |
| * | | FMC Technologies, Inc. | | | 143,600 | | | | 6,150 | |
| | Noble Energy, Inc. | | | 93,400 | | | | 9,503 | |
| * | | Southwestern Energy Co. | | | 122,300 | | | | 4,086 | |
| | | | | | | | | | |
| | Total | | | | | | | 36,284 | |
| | | | | | | | | | |
| |
| | Financials (4.7%) | |
| * | | CBRE Group, Inc. | | | 640,800 | | | | 12,752 | |
| * | | IntercontinentalExchange, Inc. | | | 57,683 | | | | 7,142 | |
| | Lazard, Ltd. - Class A | | | 144,300 | | | | 4,306 | |
| | Raymond James Financial, Inc. | | | 376,000 | | | | 14,487 | |
| | | | | | | | | | |
| | Total | | | | | | | 38,687 | |
| | | | | | | | | | |
| | | | | | | | | | |
| | | Common Stocks (89.1%) | | Shares/ $ Par | | | Value $ (000’s) | |
| |
| | Health Care (10.5%) | |
| * | | Alexion Pharmaceuticals, Inc. | | | 37,800 | | | | 3,546 | |
| | AmerisourceBergen Corp. | | | 364,500 | | | | 15,739 | |
| * | | Catamaran Corp. | | | 229,400 | | | | 10,807 | |
| * | | Cerner Corp. | | | 106,300 | | | | 8,253 | |
| * | | DaVita, Inc. | | | 95,150 | | | | 10,517 | |
| * | | Express Scripts Holding Co. | | | 79,700 | | | | 4,304 | |
| * | | IDEXX Laboratories, Inc. | | | 102,712 | | | | 9,532 | |
| * | | Mettler-Toledo International, Inc. | | | 46,300 | | | | 8,950 | |
| * | | Mylan, Inc. | | | 131,900 | | | | 3,625 | |
| | Perrigo Co. | | | 84,500 | | | | 8,790 | |
| * | | Vertex Pharmaceuticals, Inc. | | | 77,500 | | | | 3,250 | |
| | | | | | | | | | |
| | Total | | | | | | | 87,313 | |
| | | | | | | | | | |
| |
| | Industrials (18.4%) | |
| * | | B/E Aerospace, Inc. | | | 295,000 | | | | 14,573 | |
| | Corrections Corp. of America | | | 472,400 | | | | 16,756 | |
| | Cummins, Inc. | | | 98,946 | | | | 10,721 | |
| | Dover Corp. | | | 170,200 | | | | 11,184 | |
| * | | Fortune Brands Home & Security, Inc. | | | 127,200 | | | | 3,717 | |
| | Graco, Inc. | | | 222,000 | | | | 11,431 | |
| | Kansas City Southern | | | 175,600 | | | | 14,659 | |
| | Knight Transportation, Inc. | | | 311,800 | | | | 4,562 | |
| | MSC Industrial Direct Co., Inc. - Class A | | | 93,700 | | | | 7,063 | |
| * | | Owens Corning, Inc. | | | 219,300 | | | | 8,112 | |
| | Regal-Beloit Corp. | | | 119,958 | | | | 8,453 | |
| | Robert Half International, Inc. | | | 501,200 | | | | 15,948 | |
| | Roper Industries, Inc. | | | 105,300 | | | | 11,739 | |
| * | | WESCO International, Inc. | | | 200,860 | | | | 13,544 | |
| | | | | | | | | | |
| | Total | | | | | | | 152,462 | |
| | | | | | | | | | |
| |
| | Information Technology (17.7%) | |
| * | | Alliance Data Systems Corp. | | | 134,100 | | | | 19,412 | |
| | Amphenol Corp. - Class A | | | 145,000 | | | | 9,381 | |
| * | | Aruba Networks, Inc. | | | 203,500 | | | | 4,223 | |
| | Avago Technologies, Ltd. | | | 207,500 | | | | 6,569 | |
| * | | Citrix Systems, Inc. | | | 139,900 | | | | 9,198 | |
| * | | F5 Networks, Inc. | | | 93,100 | | | | 9,045 | |
| * | | Fortinet, Inc. | | | 464,100 | | | | 9,779 | |
| * | | Freescale Semiconductor Holdings I, Ltd. | | | 347,100 | | | | 3,821 | |
| | Global Payments, Inc. | | | 378,600 | | | | 17,151 | |
| | Microchip Technology, Inc. | | | 244,095 | | | | 7,955 | |
| | | | | | | | | | |
| | | Common Stocks (89.1%) | | Shares/
$ Par | | | Value
$ (000’s) | |
| |
| | Information Technology continued | |
| * | | NetApp, Inc. | | | 138,300 | | | | 4,640 | |
| * | | NetSuite, Inc. | | | 41,500 | | | | 2,793 | |
| * | | Red Hat, Inc. | | | 112,700 | | | | 5,969 | |
| * | | ServiceNow, Inc. | | | 59,069 | | | | 1,774 | |
| * | | Skyworks Solutions, Inc. | | | 207,600 | | | | 4,214 | |
| * | | Teradata Corp. | | | 80,200 | | | | 4,964 | |
| * | | TIBCO Software, Inc. | | | 196,600 | | | | 4,327 | |
| * | | VeriFone Systems, Inc. | | | 416,200 | | | | 12,353 | |
| * | | Zebra Technologies Corp. - Class A | | | 239,800 | | | | 9,419 | |
| | | | | | | | | | |
| | Total | | | | | | | 146,987 | |
| | | | | | | | | | |
| |
| | Materials (5.5%) | |
| | Airgas, Inc. | | | 187,761 | | | | 17,141 | |
| | CF Industries Holdings, Inc. | | | 38,700 | | | | 7,862 | |
| | PPG Industries, Inc. | | | 100,100 | | | | 13,549 | |
| | Westlake Chemical Corp. | | | 87,900 | | | | 6,970 | |
| | | | | | | | | | |
| | Total | | | | | | | 45,522 | |
| | | | | | | | | | |
| |
| | Telecommunication Services (2.8%) | |
| * | | SBA Communications Corp. - Class A | | | 319,600 | | | | 22,698 | |
| | | | | | | | | | |
| | Total | | | | | | | 22,698 | |
| | | | | | | | | | |
| | | |
| | Total Common Stocks | | | | | | | | |
| | (Cost: $623,270) | | | | | | | 738,548 | |
| | | | | | | | | | |
| |
| | | Short-Term Investments (10.8%) | |
| |
| | Autos (1.2%) | |
| | American Honda Finance Corp., 0.14%, 1/25/13 | | | 10,000,000 | | | | 9,999 | |
| | | | | | | | | | |
| | Total | | | | | | | 9,999 | |
| | | | | | | | | | |
| |
| | Consumer Products/Retailing (1.2%) | |
| | Wal-Mart Stores, Inc., 0.10%, 1/30/13 | | | 10,000,000 | | | | 9,999 | |
| | | | | | | | | | |
| | Total | | | | | | | 9,999 | |
| | | | | | | | | | |
| |
| | Electric Utilities (2.0%) | |
| | American Electric Power Co., Inc., 0.30%, 1/2/13 | | | 6,200,000 | | | | 6,200 | |
| | Emerson Electric Co., 0.11%, 1/16/13 | | | 10,000,000 | | | | 9,999 | |
| | | | | | | | | | |
| | Total | | | | | | | 16,199 | |
| | | | | | | | | | |
| |
| | Federal Government & Agencies (1.6%) | |
| | Federal Home Loan Mortgage Corp., 0.12%, 2/27/13 | | | 10,000,000 | | | | 9,999 | |
| (b) | | Federal Home Loan Mortgage Corp., 0.12%, 3/4/13 | | | 3,000,000 | | | | 3,000 | |
| | | | | | | | | | |
| | Total | | | | | | | 12,999 | |
| | | | | | | | | | |
The Accompanying Notes are an Integral Part of the Financial Statements.
| | | | | | |
| | Mid Cap Growth Stock Portfolio | | | 37 | |
Mid Cap Growth Stock Portfolio
| | | | | | | | |
| | | Short-Term Investments (10.8%) | | Shares/ $ Par | | Value $ (000’s) | |
| |
| | Finance Services (3.0%) | |
| | Alpine Securitization Corp., 0.18%, 1/22/13 | | 10,000,000 | | | 9,999 | |
| | Govco LLC, 0.23%, 1/22/13 | | 10,000,000 | | | 9,999 | |
| | Jupiter Securitization Co. LLC, 0.16%, 2/4/13 | | 5,000,000 | | | 4,999 | |
| | | | | | | | |
| | Total | | | | | 24,997 | |
| | | | | | | | |
| | | | | | | | |
| | | Short-Term Investments (10.8%) | | Shares/ $ Par | | Value $ (000’s) | |
| |
| | Personal Credit Institutions (0.6%) | |
| | Old Line Funding LLC, 0.19%, 3/25/13 | | 5,000,000 | | | 4,999 | |
| | | | | | | | |
| | Total | | | | | 4,999 | |
| | | | | | | | |
| |
| | Restaurants (0.6%) | |
| | Darden Restaurants, Inc., 0.28%, 1/2/13 | | 5,000,000 | | | 5,000 | |
| | | | | | | | |
| | Total | | | | | 5,000 | |
| | | | | | | | |
| | | | | | | | |
| | | Short-Term Investments (10.8%) | | Shares/ $ Par | | Value $ (000’s) | |
| |
| | Retail Food and Drug (0.6%) | |
| | CVS Caremark Corp., 0.28%, 1/2/13 | | 5,000,000 | | | 5,000 | |
| | | | | | | | |
| | Total | | | | | 5,000 | |
| | | | | | | | |
| | | |
| | Total Short-Term Investments | | | | | | |
| | (Cost: $89,190) | | | | | 89,192 | |
| | | | | | | | |
| | | |
| | Total Investments (99.9%) | | | | | | |
| | (Cost: $712,460)(a) | | | | | 827,740 | |
| | | | | | | | |
| | Other Assets, Less | | | | | | |
| | Liabilities (0.1%) | | | | | 1,213 | |
| | | | | | | | |
| | Net Assets (100.0%) | | | | | 828,953 | |
| | | | | | | | |
| (a) | At December 31, 2012 the aggregate cost of securities for federal tax purposes (in thousands) was $714,281 and the net unrealized appreciation of investments based on that cost was $113,459 which is comprised of $126,959 aggregate gross unrealized appreciation and $13,500 aggregate gross unrealized depreciation. |
| (b) | All or a portion of the securities have been pledged as collateral for open futures positions or when-issued securities. Information regarding open futures contracts as of period end is summarized below. |
| | | | | | | | |
| Issuer (000’s) | | Number of Contracts | | Expiration Date | | Unrealized Appreciation/ (Depreciation) (000’s) | |
S&P 400 Mini Index Futures (Long) (Total Notional Value at December 31, 2012, $58,883) | | 583 | | 3/13 | | $ | 471 | |
The following is a summary of the inputs used in valuing the Portfolio’s assets and liabilities at December 31, 2012. See Note 3 for additional information on portfolio valuation.
| | | | | | | | | | | | | | |
| | | Valuation Inputs | | | |
| Description | | Level 1 – Quoted Prices | | | Level 2 – Other Significant
Observable Inputs | | | Level 3 – Significant Unobservable Inputs | | | |
| | | (Amounts in thousands) | | | |
Assets: | | | | | | | | | | | | | | |
Common Stocks | | $ | 738,548 | | | $ | - | | | $ | - | | | |
Short-Term Investments | | | - | | | | 89,192 | | | | - | | | |
Other Financial Instruments^ | | | | | | | | | | | | | | |
Futures | | | 471 | | | | - | | | | - | | | |
Total | | $ | 739,019 | | | $ | 89,192 | | | $ | - | | | |
^ Other financial instruments are derivative instruments such as futures, forwards, written options and swaps contracts, which are valued at the unrealized appreciation (depreciation) on the instrument and short sales, which are valued at market value.
The Accompanying Notes are an Integral Part of the Financial Statements.
| | | | |
| 38 | | Mid Cap Growth Stock Portfolio | | |
Index 400 Stock Portfolio
| | | | |
| Objective: | | Portfolio Strategy: | | Net Assets: |
| Investment results that approximate the performance of the S&P MidCap 400® Index. | | Invest in stocks that make up the S&P MidCap 400® Index, holding each stock in approximately the same proportion as its weighting in the Index. | | $479 million |
Portfolio Overview
Mason Street Advisors acts as the investment adviser for the Index 400 Stock Portfolio (the “Portfolio”). The Portfolio seeks investment results that approximate the performance of the S&P MidCap 400® Index (the “Index”), which is composed of the stocks of companies whose capitalizations generally are smaller than those of companies that comprise the S&P 500® Index. The Index does not include the very large issues that account for most of the weighting in the S&P 500® Index. The Portfolio attempts to achieve its objective by investing all, or substantially all, of its assets in the stocks that make up the Index, holding each stock in approximately the same proportion as its weighting in the Index. This is known as a full replication strategy. The Portfolio may also invest in S&P MidCap 400® Index stock futures and, to a lesser extent, swap agreements, to help achieve full replication.
Market Overview
Equity markets finished the year with solid gains (as measured by the Index) despite economic uncertainty and significant volatility. Throughout the year, investors shifted their focus from uncertainty regarding the pace of global economic growth to evaluating fiscal and economic stimulus measures implemented globally. The economic slowdown in China, fiscal and debt crises in Europe, and the slow pace of growth in the U.S. drove volatility. As these issues arose, policy makers responded with stimulus and financing measures designed to calm markets. Ultimately, investors embraced risk, as record profit margins in the U.S. and remarkable cash flow generation propelled equity markets during the year. In that environment, mid cap stocks outperformed shares of large and small sized companies. For the year, returns for the S&P 500®, MidCap 400®, and SmallCap 600® Indices were 16.00%, 17.88%, and 16.33%, respectively.
Within the S&P 400 Index®, every economic sector posted a positive return. The Healthcare sector had the biggest gains, led by biotechnology stocks. Stocks in the Consumer Discretionary sector also outperformed the aggregate Index, reflecting strong demand for mid-sized apparel companies, homebuilders and specialty retail. The economically sensitive Industrials and Materials sectors also had strongly positive results. The Information Technology sector trailed the broader Index—slow capital spending weighed on several technology industries. The Financials sector performed in line with the Index despite a strong performance from Real Estate Investment Trusts (REITs).
Stocks in the Energy sector lagged the benchmark by a considerable margin, as relatively flat oil and natural gas prices restrained profits. Similarly, the traditionally defensive Utilities sector had a modest positive return.
Portfolio Results
The Index 400 Stock Portfolio had a total return of 17.64% in the twelve months ended December 31, 2012. That was in line with the 17.88% return of the Index. (The Index is unmanaged, cannot be invested in directly and does not include administrative expenses or sales charges.) Portfolio performance slightly lagged the Index due to transaction costs, administrative expenses, cash flow effects and costs associated with the use of stock index futures contracts. The average return for the Portfolio’s peer group, Mid Cap Core Funds, was 16.07%, according to Lipper® Analytical Services, Inc., an independent mutual fund ranking agency. However, the Mid Cap Core Funds peer group is not strictly comparable to the Portfolio because many of the funds in the group are actively managed.
As the Portfolio seeks to track the performance and weightings of stocks in the Index, the portfolio managers make adjustments to the Portfolio’s holdings as the Index changes. Standard & Poor’s modifies the composition of the Index as companies go public or private, merge, divest or have major changes in market capitalization. Additionally, Standard & Poor’s adjusts the Index to better reflect the companies that are most representative of the composition of the U.S. economy. During 2012, there were 24 stocks added to the Index, and a like number of companies were eliminated. The portfolio managers try to make these adjustments in a way that minimizes the cost and market impact of trading.
Portfolio Manager Outlook
We have a cautiously optimistic view of equity markets heading into 2013. Currently, stocks appear relatively attractive given reasonable valuations, record high profit margins and cash positions, as well as relatively low energy prices. Extremely low interest rates have also led to improving fundamentals in the housing market and steady increases in employment.
Nevertheless, the market still faces a number of risks—from uncertainty surrounding further economic stimulus and concerns over the developed world’s ongoing debt crisis, among others—that have the potential for creating a volatile market environment for the foreseeable future.
| | | | | | |
| | Index 400 Stock Portfolio | | | 39 | |
Index 400 Stock Portfolio
Relative Performance

| | | | | | | | | | | | |
Average Annual Total Returns
For Periods Ended December 31, 2012 | |
| | | 1 Year | | | 5 Years | | | 10 Years | |
Index 400 Stock Portfolio | | | 17.64% | | | | 4.93% | | | | 10.30% | |
S&P MidCap 400® Index | | | 17.88% | | | | 5.14% | | | | 10.52% | |
Lipper® Variable Insurance Products (VIP) Mid Cap Core Funds Average | | | 16.07% | | | | 2.82% | | | | 8.96% | |
The performance data quoted represents past performance. Past performance is historical and does not guarantee future performance. Investment return and principal value will fluctuate, so that shares, when redeemed, may be worth more or less than their original cost. Current performance may be lower or higher than the performance data quoted. For the most recent month-end performance information visit www.northwesternmutual.com.
This chart assumes an initial investment of $10,000 made on 12/31/02. Returns shown include deductions for management and other portfolio expenses, and reinvestment of all dividends. Returns exclude deductions for separate account sale loads and account fees. Please refer to the Benchmark Definitions section of this report for information about the indices cited in the above chart and graph.
“Standard & Poor’s®”, “S&P®”, “S&P MidCap 400 Index” and “Standard & Poor’s MidCap 400 Index” are trademarks of The McGraw-Hill Companies, Inc. and have been licensed for use by Northwestern Mutual Life Insurance Company. The Portfolio is not sponsored, endorsed, sold or promoted by Standard & Poor’s, and Standard & Poor’s makes no representation regarding the advisability of investing in the Portfolio.
Investing in small and medium-sized companies involves a greater degree of risk than investing in large company stocks.
The Portfolio may invest in derivative instruments such as futures and swap agreements to help achieve full replication. Use of these instruments may involve certain costs and imposes certain risks such as liquidity risk, market risk, credit risk, management risk and the risk of mispricing or improper valuation. Certain derivatives involve leverage, which could magnify losses, and portfolios investing in derivatives could lose more than the principal amount invested in those instruments.
Top 10 Equity Holdings 12/31/12
| | | | |
| Security Description | | % of Net Assets | |
Regeneron Pharmaceuticals, Inc. | | | 1.1% | |
Equinix, Inc. | | | 0.8% | |
HollyFrontier Corp. | | | 0.8% | |
Kansas City Southern | | | 0.8% | |
AMETEK, Inc. | | | 0.8% | |
Vertex Pharmaceuticals, Inc. | | | 0.8% | |
Rackspace Hosting, Inc. | | | 0.7% | |
The Macerich Co. | | | 0.7% | |
PVH Corp. | | | 0.6% | |
Trimble Navigation, Ltd. | | | 0.6% | |
Sector Allocation 12/31/12

Sector Allocation is based on equities.
Sector Allocation and Top 10 Holdings are subject to change.
| | | | |
| 40 | | Index 400 Stock Portfolio | | |
Index 400 Stock Portfolio
Schedule of Investments
December 31, 2012
| | | | | | | | | | |
| | | Common Stocks (97.9%) | | Shares/
$ Par | | | Value
$ (000’s) | |
| |
| | Consumer Discretionary (13.0%) | |
| | Aaron’s, Inc. | | | 27,700 | | | | 783 | |
| | Advance Auto Parts, Inc. | | | 28,900 | | | | 2,091 | |
| * | | Aeropostale, Inc. | | | 30,875 | | | | 402 | |
| * | | AMC Networks, Inc. - Class A | | | 22,600 | | | | 1,119 | |
| | American Eagle Outfitters, Inc. | | | 71,050 | | | | 1,457 | |
| * | | Ann, Inc. | | | 19,050 | | | | 645 | |
| * | | Ascena Retail Group, Inc. | | | 49,600 | | | | 917 | |
| * | | Bally Technologies, Inc. | | | 16,200 | | | | 724 | |
| * | | Barnes & Noble, Inc. | | | 14,900 | | | | 225 | |
| | Bob Evans Farms, Inc. | | | 11,100 | | | | 446 | |
| | Brinker International, Inc. | | | 28,775 | | | | 892 | |
| * | | Cabela’s, Inc. | | | 18,200 | | | | 760 | |
| * | | Carter’s, Inc. | | | 20,000 | | | | 1,113 | |
| | The Cheesecake Factory, Inc. | | | 19,650 | | | | 643 | |
| | Chico’s FAS, Inc. | | | 65,600 | | | | 1,211 | |
| | Cinemark Holdings, Inc. | | | 40,300 | | | | 1,047 | |
| * | | Deckers Outdoor Corp. | | | 13,900 | | | | 560 | |
| | DeVry, Inc. | | | 22,500 | | | | 534 | |
| | Dick’s Sporting Goods, Inc. | | | 38,700 | | | | 1,760 | |
| * | | DreamWorks Animation SKG, Inc. - Class A | | | 28,300 | | | | 469 | |
| | Foot Locker, Inc. | | | 59,400 | | | | 1,908 | |
| | Gentex Corp. | | | 56,200 | | | | 1,058 | |
| | Guess?, Inc. | | | 24,200 | | | | 594 | |
| * | | Hanesbrands, Inc. | | | 38,600 | | | | 1,383 | |
| | HSN, Inc. | | | 14,300 | | | | 788 | |
| | International Speedway Corp. - Class A | | | 10,100 | | | | 279 | |
| * | | Jarden Corp. | | | 28,900 | | | | 1,494 | |
| | John Wiley & Sons, Inc. - Class A | | | 18,500 | | | | 720 | |
| | KB Home | | | 30,200 | | | | 477 | |
| * | | Lamar Advertising Co. - Class A | | | 21,800 | | | | 845 | |
| * | | Life Time Fitness, Inc. | | | 15,800 | | | | 778 | |
| * | | LKQ Corp. | | | 117,100 | | | | 2,471 | |
| | M.D.C. Holdings, Inc. | | | 15,300 | | | | 562 | |
| | Matthews International Corp. - Class A | | | 10,800 | | | | 347 | |
| | Meredith Corp. | | | 14,200 | | | | 489 | |
| * | | Mohawk Industries, Inc. | | | 22,900 | | | | 2,072 | |
| * | | The New York Times Co. - Class A | | | 48,000 | | | | 409 | |
| * | | NVR, Inc. | | | 1,800 | | | | 1,656 | |
| * | | Office Depot, Inc. | | | 112,400 | | | | 369 | |
| * | | Panera Bread Co. - Class A | | | 11,100 | | | | 1,763 | |
| | Polaris Industries, Inc. | | | 25,300 | | | | 2,129 | |
| | PVH Corp. | | | 27,800 | | | | 3,086 | |
| | Regis Corp. | | | 22,700 | | | | 384 | |
| | Rent-A-Center, Inc. | | | 23,200 | | | | 797 | |
| * | | Saks, Inc. | | | 40,000 | | | | 420 | |
| | | | | | | | | | |
| | | Common Stocks (97.9%) | | Shares/
$ Par | | | Value
$ (000’s) | |
| |
| | Consumer Discretionary continued | |
| | Scholastic Corp. | | | 10,400 | | | | 307 | |
| * | | Scientific Games Corp. - Class A | | | 20,800 | | | | 180 | |
| | Service Corp. International | | | 83,800 | | | | 1,157 | |
| | Signet Jewelers, Ltd. | | | 31,900 | | | | 1,703 | |
| | Sotheby’s | | | 26,700 | | | | 898 | |
| | Strayer Education, Inc. | | | 4,700 | | | | 264 | |
| * | | Tempur-Pedic International, Inc. | | | 23,500 | | | | 740 | |
| | Thor Industries, Inc. | | | 17,300 | | | | 648 | |
| * | | Toll Brothers, Inc. | | | 59,000 | | | | 1,908 | |
| | Tractor Supply Co. | | | 27,800 | | | | 2,456 | |
| | Tupperware Brands Corp. | | | 21,800 | | | | 1,397 | |
| * | | Under Armour, Inc. | | | 30,500 | | | | 1,480 | |
| | Valassis Communications, Inc. | | | 15,500 | | | | 400 | |
| * | | The Warnaco Group, Inc. | | | 16,100 | | | | 1,152 | |
| | The Wendy’s Co. | | | 110,900 | | | | 521 | |
| | Williams-Sonoma, Inc. | | | 34,000 | | | | 1,488 | |
| * | | WMS Industries, Inc. | | | 21,500 | | | | 376 | |
| | | | | | | | | | |
| | Total | | | | | | | 62,151 | |
| | | | | | | | | | |
| |
| | Consumer Staples (3.7%) | |
| | Church & Dwight Co., Inc. | | | 55,100 | | | | 2,952 | |
| | Energizer Holdings, Inc. | | | 24,400 | | | | 1,952 | |
| | Flowers Foods, Inc. | | | 45,200 | | | | 1,052 | |
| * | | Green Mountain Coffee Roasters, Inc. | | | 48,500 | | | | 2,006 | |
| | Harris Teeter Supermarkets, Inc. | | | 19,400 | | | | 748 | |
| | Hillshire Brands Co. | | | 48,200 | | | | 1,356 | |
| | Ingredion, Inc. | | | 30,201 | | | | 1,946 | |
| | Lancaster Colony Corp. | | | 7,600 | | | | 526 | |
| * | | Post Holdings, Inc. | | | 12,850 | | | | 440 | |
| * | | Ralcorp Holdings, Inc. | | | 21,700 | | | | 1,945 | |
| * | | Smithfield Foods, Inc. | | | 49,200 | | | | 1,061 | |
| | SUPERVALU, INC. | | | 84,100 | | | | 208 | |
| | Tootsie Roll Industries, Inc. | | | 8,077 | | | | 209 | |
| * | | United Natural Foods, Inc. | | | 19,400 | | | | 1,040 | |
| | Universal Corp. | | | 9,200 | | | | 459 | |
| | | | | | | | | | |
| | Total | | | | | | | 17,900 | |
| | | | | | | | | | |
| |
| | Energy (5.9%) | |
| * | | Alpha Natural Resources, Inc. | | | 86,900 | | | | 846 | |
| | Arch Coal, Inc. | | | 83,600 | | | | 612 | |
| * | | Atwood Oceanics, Inc. | | | 22,400 | | | | 1,026 | |
| * | | Bill Barrett Corp. | | | 19,000 | | | | 338 | |
| | CARBO Ceramics, Inc. | | | 7,700 | | | | 603 | |
| | Cimarex Energy Co. | | | 34,100 | | | | 1,969 | |
| * | | Dresser-Rand Group, Inc. | | | 29,800 | | | | 1,673 | |
| * | | Dril-Quip, Inc. | | | 14,300 | | | | 1,045 | |
| | Energen Corp. | | | 28,400 | | | | 1,280 | |
| | | | | | | | | | |
| | | Common Stocks (97.9%) | | Shares/
$ Par | | | Value
$ (000’s) | |
| |
| | Energy continued | |
| * | | Forest Oil Corp. | | | 46,600 | | | | 312 | |
| * | | Helix Energy Solutions Group, Inc. | | | 38,600 | | | | 797 | |
| | HollyFrontier Corp. | | | 79,780 | | | | 3,714 | |
| * | | Northern Oil and Gas, Inc. | | | 23,300 | | | | 392 | |
| | Oceaneering International, Inc. | | | 42,500 | | | | 2,286 | |
| * | | Oil States International, Inc. | | | 21,600 | | | | 1,545 | |
| | Patterson-UTI Energy, Inc. | | | 58,800 | | | | 1,095 | |
| * | | Plains Exploration & Production Co. | | | 50,866 | | | | 2,388 | |
| * | | Quicksilver Resources, Inc. | | | 47,000 | | | | 134 | |
| * | | Rosetta Resources, Inc. | | | 20,700 | | | | 939 | |
| | SM Energy Co. | | | 26,000 | | | | 1,357 | |
| * | | Superior Energy Services, Inc. | | | 62,100 | | | | 1,287 | |
| | Tidewater, Inc. | | | 19,600 | | | | 876 | |
| * | | Unit Corp. | | | 17,000 | | | | 766 | |
| | World Fuel Services Corp. | | | 28,400 | | | | 1,169 | |
| | | | | | | | | | |
| | Total | | | | | | | 28,449 | |
| | | | | | | | | | |
| |
| | Financials (21.6%) | |
| * | | Affiliated Managers Group, Inc. | | | 20,400 | | | | 2,655 | |
| * | | Alexander & Baldwin, Inc. | | | 16,900 | | | | 496 | |
| | Alexandria Real Estate Equities, Inc. | | | 25,100 | | | | 1,740 | |
| * | | Alleghany Corp. | | | 6,700 | | | | 2,247 | |
| | American Campus Communities, Inc. | | | 41,200 | | | | 1,901 | |
| | American Financial Group, Inc. | | | 29,850 | | | | 1,180 | |
| | Apollo Investment Corp. | | | 79,904 | | | | 668 | |
| | Arthur J. Gallagher & Co. | | | 49,000 | | | | 1,698 | |
| | Aspen Insurance Holdings, Ltd. | | | 28,000 | | | | 898 | |
| | Associated Banc-Corp. | | | 67,663 | | | | 888 | |
| | Astoria Financial Corp. | | | 32,200 | | | | 301 | |
| | BancorpSouth, Inc. | | | 32,700 | | | | 475 | |
| | Bank of Hawaii Corp. | | | 17,700 | | | | 780 | |
| | BioMed Realty Trust, Inc. | | | 60,800 | | | | 1,175 | |
| | BRE Properties, Inc. | | | 30,300 | | | | 1,540 | |
| | Brown & Brown, Inc. | | | 46,500 | | | | 1,184 | |
| | Camden Property Trust | | | 33,100 | | | | 2,258 | |
| | Cathay General Bancorp | | | 28,900 | | | | 564 | |
| | CBOE Holdings, Inc. | | | 34,400 | | | | 1,013 | |
| | City National Corp. | | | 18,700 | | | | 926 | |
| | Commerce Bancshares, Inc. | | | 30,672 | | | | 1,075 | |
| | Corporate Office Properties Trust | | | 31,800 | | | | 794 | |
| | Cullen/Frost Bankers, Inc. | | | 24,200 | | | | 1,313 | |
The Accompanying Notes are an Integral Part of the Financial Statements.
| | | | | | |
| | Index 400 Stock Portfolio | | | 41 | |
Index 400 Stock Portfolio
| | | | | | | | | | |
| | | Common Stocks (97.9%) | | Shares/
$ Par | | | Value
$ (000’s) | |
| |
| | Financials continued | |
| | Duke Realty Corp. | | | 108,400 | | | | 1,503 | |
| | East West Bancorp, Inc. | | | 55,300 | | | | 1,188 | |
| | Eaton Vance Corp. | | | 45,400 | | | | 1,446 | |
| | Equity One, Inc. | | | 24,300 | | | | 511 | |
| | Essex Property Trust, Inc. | | | 14,400 | | | | 2,112 | |
| | Everest Re Group, Ltd. | | | 20,400 | | | | 2,243 | |
| | Federal Realty Investment Trust | | | 25,500 | | | | 2,653 | |
| | Federated Investors, Inc. - Class B | | | 37,500 | | | | 759 | |
| | Fidelity National Financial, Inc. - Class A | | | 83,491 | | | | 1,966 | |
| | First American Financial Corp. | | | 42,000 | | | | 1,012 | |
| | First Niagara Financial Group, Inc. | | | 138,910 | | | | 1,102 | |
| | FirstMerit Corp. | | | 43,210 | | | | 613 | |
| | Fulton Financial Corp. | | | 78,500 | | | | 754 | |
| | Greenhill & Co., Inc. | | | 10,400 | | | | 541 | |
| | Hancock Holding Co. | | | 33,400 | | | | 1,060 | |
| | Hanover Insurance Group, Inc. | | | 17,600 | | | | 682 | |
| | HCC Insurance Holdings, Inc. | | | 39,950 | | | | 1,487 | |
| | Highwoods Properties, Inc. | | | 30,900 | | | | 1,034 | |
| | Home Properties, Inc. | | | 20,200 | | | | 1,238 | |
| | Hospitality Properties Trust | | | 48,700 | | | | 1,141 | |
| | International Bancshares Corp. | | | 21,500 | | | | 388 | |
| | Janus Capital Group, Inc. | | | 73,800 | | | | 629 | |
| | Jefferies Group, Inc. | | | 50,400 | | | | 936 | |
| | Jones Lang LaSalle, Inc. | | | 17,400 | | | | 1,461 | |
| | Kemper Corp. | | | 21,400 | | | | 631 | |
| | Liberty Property Trust | | | 46,600 | | | | 1,667 | |
| | The Macerich Co. | | | 53,788 | | | | 3,136 | |
| | Mack-Cali Realty Corp. | | | 32,700 | | | | 854 | |
| | Mercury General Corp. | | | 14,300 | | | | 568 | |
| * | | MSCI, Inc. | | | 48,100 | | | | 1,491 | |
| | National Retail Properties, Inc. | | | 43,400 | | | | 1,354 | |
| | New York Community Bancorp, Inc. | | | 173,021 | | | | 2,267 | |
| | Old Republic International Corp. | | | 95,075 | | | | 1,013 | |
| | OMEGA Healthcare Investors, Inc. | | | 44,100 | | | | 1,052 | |
| | Potlatch Corp. | | | 15,947 | | | | 625 | |
| | Prosperity Bancshares, Inc. | | | 17,300 | | | | 727 | |
| | Protective Life Corp. | | | 31,200 | | | | 892 | |
| | Raymond James Financial, Inc. | | | 43,925 | | | | 1,692 | |
| | Rayonier, Inc. | | | 48,499 | | | | 2,514 | |
| | Realty Income Corp. | | | 52,600 | | | | 2,115 | |
| | Regency Centers Corp. | | | 35,600 | | | | 1,677 | |
| | Reinsurance Group of America, Inc. | | | 29,100 | | | | 1,557 | |
| | SEI Investments Co. | | | 53,100 | | | | 1,239 | |
| | | | | | | | | | |
| | | Common Stocks (97.9%) | | Shares/
$ Par | | | Value
$ (000’s) | |
| |
| | Financials continued | |
| | Senior Housing Properties Trust | | | 69,600 | | | | 1,645 | |
| * | | Signature Bank | | | 18,200 | | | | 1,298 | |
| | SL Green Realty Corp. | | | 35,600 | | | | 2,729 | |
| | StanCorp Financial Group, Inc. | | | 17,400 | | | | 638 | |
| * | | SVB Financial Group | | | 17,500 | | | | 979 | |
| | Synovus Financial Corp. | | | 309,900 | | | | 759 | |
| | Taubman Centers, Inc. | | | 24,300 | | | | 1,913 | |
| | TCF Financial Corp. | | | 64,400 | | | | 782 | |
| | Trustmark Corp. | | | 25,500 | | | | 573 | |
| | UDR, Inc. | | | 98,602 | | | | 2,345 | |
| | Valley National Bancorp | | | 77,886 | | | | 724 | |
| | W.R. Berkley Corp. | | | 43,350 | | | | 1,636 | |
| | Waddell & Reed Financial, Inc. - Class A | | | 33,700 | | | | 1,173 | |
| | Washington Federal, Inc. | | | 41,865 | | | | 706 | |
| | Webster Financial Corp. | | | 31,600 | | | | 649 | |
| | Weingarten Realty Investors | | | 44,000 | | | | 1,178 | |
| | Westamerica Bancorporation | | | 10,800 | | | | 460 | |
| | | | | | | | | | |
| | Total | | | | | | | 103,486 | |
| | | | | | | | | | |
| |
| | Health Care (9.2%) | |
| * | | Allscripts Healthcare Solutions, Inc. | | | 67,600 | | | | 637 | |
| * | | Bio-Rad Laboratories, Inc. - Class A | | | 7,900 | | | | 830 | |
| * | | Charles River Laboratories International, Inc. | | | 19,100 | | | | 716 | |
| | Community Health Systems, Inc. | | | 35,900 | | | | 1,104 | |
| | The Cooper Cos., Inc. | | | 18,900 | | | | 1,748 | |
| * | | Covance, Inc. | | | 21,600 | | | | 1,248 | |
| * | | Endo Pharmaceuticals Holdings, Inc. | | | 45,000 | | | | 1,182 | |
| * | | Health Management Associates, Inc. - Class A | | | 101,000 | | | | 941 | |
| * | | Health Net, Inc. | | | 32,000 | | | | 778 | |
| * | | Henry Schein, Inc. | | | 34,700 | | | | 2,792 | |
| | Hill-Rom Holdings, Inc. | | | 24,000 | | | | 684 | |
| * | | HMS Holdings Corp. | | | 34,200 | | | | 886 | |
| * | | Hologic, Inc. | | | 105,100 | | | | 2,105 | |
| * | | IDEXX Laboratories, Inc. | | | 21,500 | | | | 1,995 | |
| * | | LifePoint Hospitals, Inc. | | | 19,400 | | | | 732 | |
| | Masimo Corp. | | | 20,500 | | | | 431 | |
| * | | MEDNAX, Inc. | | | 19,600 | | | | 1,559 | |
| * | | Mettler-Toledo International, Inc. | | | 12,100 | | | | 2,339 | |
| | Omnicare, Inc. | | | 43,600 | | | | 1,574 | |
| | Owens & Minor, Inc. | | | 24,950 | | | | 711 | |
| * | | Regeneron Pharmaceuticals, Inc. | | | 29,700 | | | | 5,081 | |
| | ResMed, Inc. | | | 56,400 | | | | 2,344 | |
| | STERIS Corp. | | | 23,000 | | | | 799 | |
| | Techne Corp. | | | 13,600 | | | | 929 | |
| | Teleflex, Inc. | | | 16,100 | | | | 1,148 | |
| * | | Thoratec Corp. | | | 23,200 | | | | 870 | |
| | | | | | | | | | |
| | | Common Stocks (97.9%) | | Shares/
$ Par | | | Value
$ (000’s) | |
| |
| | Health Care continued | |
| * | | United Therapeutics Corp. | | | 18,600 | | | | 994 | |
| | Universal Health Services, Inc. - Class B | | | 34,900 | | | | 1,687 | |
| * | | VCA Antech, Inc. | | | 34,600 | | | | 728 | |
| * | | Vertex Pharmaceuticals, Inc. | | | 85,400 | | | | 3,582 | |
| * | | WellCare Health Plans, Inc. | | | 17,000 | | | | 828 | |
| | | | | | | | | | |
| | Total | | | | | | | 43,982 | |
| | | | | | | | | | |
| |
| | Industrials (16.9%) | |
| | Acuity Brands, Inc. | | | 16,800 | | | | 1,138 | |
| * | | Aecom Technology Corp. | | | 42,600 | | | | 1,014 | |
| * | | AGCO Corp. | | | 38,200 | | | | 1,876 | |
| * | | Alaska Air Group, Inc. | | | 27,700 | | | | 1,194 | |
| | Alliant Techsystems, Inc. | | | 12,900 | | | | 799 | |
| | AMETEK, Inc. | | | 95,712 | | | | 3,596 | |
| * | | B/E Aerospace, Inc. | | | 41,000 | | | | 2,025 | |
| | The Brink’s Co. | | | 18,800 | | | | 536 | |
| | Carlisle Cos., Inc. | | | 24,800 | | | | 1,457 | |
| | CLARCOR, Inc. | | | 19,700 | | | | 941 | |
| * | | Clean Harbors, Inc. | | | 20,800 | | | | 1,144 | |
| | Con-way, Inc. | | | 22,100 | | | | 615 | |
| * | | Copart, Inc. | | | 41,772 | | | | 1,232 | |
| | The Corporate Executive Board Co. | | | 13,200 | | | | 627 | |
| | Corrections Corp. of America | | | 39,400 | | | | 1,398 | |
| | Crane Co. | | | 18,800 | | | | 870 | |
| | Deluxe Corp. | | | 20,100 | | | | 648 | |
| | Donaldson Co., Inc. | | | 53,200 | | | | 1,747 | |
| * | | Esterline Technologies Corp. | | | 12,200 | | | | 776 | |
| | Exelis, Inc. | | | 73,900 | | | | 833 | |
| * | | Fortune Brands Home & Security, Inc. | | | 64,100 | | | | 1,873 | |
| * | | FTI Consulting, Inc. | | | 16,300 | | | | 538 | |
| | Gardner Denver, Inc. | | | 19,300 | | | | 1,322 | |
| | GATX Corp. | | | 18,500 | | | | 801 | |
| * | | General Cable Corp. | | | 19,600 | | | | 596 | |
| * | | Genesee & Wyoming, Inc. - Class A | | | 17,200 | | | | 1,309 | |
| | Graco, Inc. | | | 23,900 | | | | 1,231 | |
| | Granite Construction, Inc. | | | 14,000 | | | | 471 | |
| | Harsco Corp. | | | 31,800 | | | | 747 | |
| | Herman Miller, Inc. | | | 23,000 | | | | 493 | |
| | HNI Corp. | | | 17,800 | | | | 535 | |
| | Hubbell, Inc. - Class B | | | 21,000 | | | | 1,777 | |
| | Huntington Ingalls Industries, Inc. | | | 19,500 | | | | 845 | |
| | IDEX Corp. | | | 32,580 | | | | 1,516 | |
| | ITT Corp. | | | 36,500 | | | | 856 | |
| | J.B. Hunt Transport Services, Inc. | | | 35,900 | | | | 2,144 | |
| * | | JetBlue Airways Corp. | | | 89,625 | | | | 512 | |
| | Kansas City Southern | | | 43,400 | | | | 3,623 | |
| | KBR, Inc. | | | 58,100 | | | | 1,738 | |
| | Kennametal, Inc. | | | 31,400 | | | | 1,256 | |
| * | | Kirby Corp. | | | 22,000 | | | | 1,362 | |
| | Landstar System, Inc. | | | 18,300 | | | | 960 | |
The Accompanying Notes are an Integral Part of the Financial Statements.
| | | | |
| 42 | | Index 400 Stock Portfolio | | |
Index 400 Stock Portfolio
| | | | | | | | | | |
| | | Common Stocks (97.9%) | | Shares/
$ Par | | | Value
$ (000’s) | |
| |
| | Industrials continued | |
| | Lennox International, Inc. | | | 18,000 | | | | 945 | |
| | Lincoln Electric Holdings, Inc. | | | 32,700 | | | | 1,592 | |
| | Manpower, Inc. | | | 30,900 | | | | 1,311 | |
| | Matson, Inc. | | | 16,800 | | | | 415 | |
| | Mine Safety Appliances Co. | | | 12,200 | | | | 521 | |
| | MSC Industrial Direct Co., Inc. - Class A | | | 18,300 | | | | 1,379 | |
| | Nordson Corp. | | | 22,200 | | | | 1,401 | |
| * | | Oshkosh Corp. | | | 36,000 | | | | 1,067 | |
| | R.R. Donnelley & Sons Co. | | | 71,000 | | | | 639 | |
| | Regal-Beloit Corp. | | | 17,500 | | | | 1,233 | |
| | Rollins, Inc. | | | 25,930 | | | | 572 | |
| * | | The Shaw Group, Inc. | | | 26,256 | | | | 1,224 | |
| | SPX Corp. | | | 20,000 | | | | 1,403 | |
| * | | Terex Corp. | | | 43,500 | | | | 1,223 | |
| | The Timken Co. | | | 31,300 | | | | 1,497 | |
| | Towers Watson & Co. - Class A | | | 22,500 | | | | 1,265 | |
| | Trinity Industries, Inc. | | | 31,150 | | | | 1,116 | |
| | Triumph Group, Inc. | | | 19,700 | | | | 1,286 | |
| * | | United Rentals, Inc. | | | 36,523 | | | | 1,663 | |
| | URS Corp. | | | 30,300 | | | | 1,190 | |
| | UTI Worldwide, Inc. | | | 40,900 | | | | 548 | |
| | Valmont Industries, Inc. | | | 9,200 | | | | 1,256 | |
| | Wabtec Corp. | | | 18,900 | | | | 1,655 | |
| | Waste Connections, Inc. | | | 48,350 | | | | 1,634 | |
| | Watsco, Inc. | | | 11,700 | | | | 876 | |
| | Werner Enterprises, Inc. | | | 17,550 | | | | 380 | |
| | Woodward, Inc. | | | 23,700 | | | | 904 | |
| | | | | | | | | | |
| | Total | | | | | | | 81,166 | |
| | | | | | | | | | |
| |
| | Information Technology (15.2%) | |
| * | | ACI Worldwide, Inc. | | | 15,500 | | | | 677 | |
| * | | Acxiom Corp. | | | 29,402 | | | | 513 | |
| | ADTRAN, Inc. | | | 24,700 | | | | 483 | |
| * | | Advent Software, Inc. | | | 12,500 | | | | 267 | |
| * | | Alliance Data Systems Corp. | | | 19,600 | | | | 2,837 | |
| * | | ANSYS, Inc. | | | 36,500 | | | | 2,458 | |
| | AOL, Inc. | | | 33,000 | | | | 977 | |
| * | | Arrow Electronics, Inc. | | | 41,800 | | | | 1,592 | |
| * | | Atmel Corp. | | | 173,200 | | | | 1,134 | |
| * | | Avnet, Inc. | | | 54,100 | | | | 1,656 | |
| | Broadridge Financial Solutions, Inc. | | | 48,200 | | | | 1,103 | |
| * | | Cadence Design Systems, Inc. | | | 110,300 | | | | 1,490 | |
| * | | Ciena Corp. | | | 39,500 | | | | 620 | |
| * | | Compuware Corp. | | | 84,000 | | | | 913 | |
| * | | Concur Technologies, Inc. | | | 17,800 | | | | 1,202 | |
| | Convergys Corp. | | | 43,000 | | | | 706 | |
| * | | CoreLogic, Inc. | | | 38,400 | | | | 1,034 | |
| * | | Cree, Inc. | | | 45,800 | | | | 1,556 | |
| | Cypress Semiconductor Corp. | | | 51,800 | | | | 562 | |
| | Diebold, Inc. | | | 24,900 | | | | 762 | |
| | DST Systems, Inc. | | | 12,100 | | | | 733 | |
| | | | | | | | | | |
| | | Common Stocks (97.9%) | | Shares/
$ Par | | | Value
$ (000’s) | |
| |
| | Information Technology continued | |
| * | | Equinix, Inc. | | | 19,200 | | | | 3,959 | |
| | FactSet Research Systems, Inc. | | | 16,000 | | | | 1,409 | |
| | Fair Isaac Corp. | | | 13,800 | | | | 580 | |
| * | | Fairchild Semiconductor International, Inc. | | | 50,000 | | | | 720 | |
| * | | Gartner, Inc. | | | 36,900 | | | | 1,698 | |
| | Global Payments, Inc. | | | 31,100 | | | | 1,409 | |
| * | | Informatica Corp. | | | 42,500 | | | | 1,289 | |
| * | | Ingram Micro, Inc. - Class A | | | 59,200 | | | | 1,002 | |
| * | | Integrated Device Technology, Inc. | | | 56,830 | | | | 415 | |
| | InterDigital, Inc. | | | 16,100 | | | | 662 | |
| * | | International Rectifier Corp. | | | 27,200 | | | | 482 | |
| | Intersil Corp. - Class A | | | 50,000 | | | | 415 | |
| * | | Itron, Inc. | | | 15,400 | | | | 686 | |
| | Jack Henry & Associates, Inc. | | | 33,900 | | | | 1,331 | |
| | Lender Processing Services, Inc. | | | 33,400 | | | | 822 | |
| | Lexmark International, Inc. - Class A | | | 25,400 | | | | 589 | |
| | ManTech International Corp. - Class A | | | 9,300 | | | | 241 | |
| * | | MEMC Electronic Materials, Inc. | | | 91,000 | | | | 292 | |
| * | | Mentor Graphics Corp. | | | 37,200 | | | | 633 | |
| * | | MICROS Systems, Inc. | | | 31,600 | | | | 1,341 | |
| * | | Monster Worldwide, Inc. | | | 46,100 | | | | 259 | |
| | National Instruments Corp. | | | 37,275 | | | | 962 | |
| * | | NCR Corp. | | | 63,000 | | | | 1,605 | |
| * | | NeuStar, Inc. - Class A | | | 26,107 | | | | 1,095 | |
| * | | Parametric Technology Corp. | | | 47,100 | | | | 1,060 | |
| | Plantronics, Inc. | | | 16,800 | | | | 619 | |
| * | | Polycom, Inc. | | | 69,100 | | | | 723 | |
| * | | QLogic Corp. | | | 36,500 | | | | 355 | |
| * | | Rackspace Hosting, Inc. | | | 43,200 | | | | 3,209 | |
| * | | RF Micro Devices, Inc. | | | 110,100 | | | | 493 | |
| * | | Riverbed Technology, Inc. | | | 63,300 | | | | 1,248 | |
| * | | Rovi Corp. | | | 40,800 | | | | 630 | |
| * | | Semtech Corp. | | | 26,100 | | | | 756 | |
| * | | Silicon Laboratories, Inc. | | | 15,100 | | | | 631 | |
| * | | Skyworks Solutions, Inc. | | | 76,600 | | | | 1,555 | |
| * | | Solarwinds, Inc. | | | 24,100 | | | | 1,264 | |
| | Solera Holdings, Inc. | | | 27,100 | | | | 1,449 | |
| * | | Synopsys, Inc. | | | 58,800 | | | | 1,872 | |
| * | | Tech Data Corp. | | | 14,900 | | | | 678 | |
| | Tellabs, Inc. | | | 136,100 | | | | 310 | |
| * | | TIBCO Software, Inc. | | | 61,200 | | | | 1,347 | |
| * | | Trimble Navigation, Ltd. | | | 49,700 | | | | 2,971 | |
| * | | ValueClick, Inc. | | | 27,900 | | | | 542 | |
| * | | VeriFone Systems, Inc. | | | 42,500 | | | | 1,261 | |
| * | | Vishay Intertechnology, Inc. | | | 51,887 | | | | 552 | |
| | | | | | | | | | |
| | | Common Stocks (97.9%) | | Shares/
$ Par | | | Value
$ (000’s) | |
| |
| | Information Technology continued | |
| * | | WEX, Inc. | | | 15,200 | | | | 1,146 | |
| * | | Zebra Technologies Corp. - Class A | | | 20,000 | | | | 786 | |
| | | | | | | | | | |
| | Total | | | | | | | 72,628 | |
| | | | | | | | | | |
| |
| | Materials (7.1%) | |
| | Albemarle Corp. | | | 35,200 | | | | 2,187 | |
| | AptarGroup, Inc. | | | 26,200 | | | | 1,250 | |
| | Ashland, Inc. | | | 28,900 | | | | 2,324 | |
| | Cabot Corp. | | | 23,500 | | | | 935 | |
| | Carpenter Technology Corp. | | | 17,400 | | | | 898 | |
| | Commercial Metals Co. | | | 45,800 | | | | 681 | |
| | Compass Minerals International, Inc. | | | 13,000 | | | | 971 | |
| | Cytec Industries, Inc. | | | 18,000 | | | | 1,239 | |
| | Domtar Corp. | | | 13,900 | | | | 1,161 | |
| | Grief, Inc. - Class A | | | 11,900 | | | | 530 | |
| | Intrepid Potash, Inc. | | | 21,100 | | | | 449 | |
| * | | Louisiana-Pacific Corp. | | | 54,500 | | | | 1,053 | |
| | Martin Marietta Materials, Inc. | | | 18,100 | | | | 1,706 | |
| | Minerals Technologies, Inc. | | | 13,900 | | | | 555 | |
| | NewMarket Corp. | | | 4,200 | | | | 1,101 | |
| | Olin Corp. | | | 31,600 | | | | 682 | |
| | Packaging Corp. of America | | | 38,700 | | | | 1,489 | |
| | Reliance Steel & Aluminum Co. | | | 29,800 | | | | 1,851 | |
| | Rock-Tenn Co. - Class A | | | 28,000 | | | | 1,957 | |
| | Royal Gold, Inc. | | | 25,600 | | | | 2,082 | |
| | RPM International, Inc. | | | 52,100 | | | | 1,530 | |
| | The Scotts Miracle-Gro Co. - Class A | | | 15,200 | | | | 670 | |
| | Sensient Technologies Corp. | | | 19,600 | | | | 697 | |
| | Silgan Holdings, Inc. | | | 19,313 | | | | 803 | |
| | Sonoco Products Co. | | | 39,700 | | | | 1,180 | |
| | Steel Dynamics, Inc. | | | 86,400 | | | | 1,186 | |
| | The Valspar Corp. | | | 33,300 | | | | 2,078 | |
| | Worthington Industries, Inc. | | | 20,700 | | | | 538 | |
| | | | | | | | | | |
| | Total | | | | | | | 33,783 | |
| | | | | | | | | | |
| |
| | Telecommunication Services (0.5%) | |
| | Telephone and Data Systems, Inc. | | | 39,862 | | | | 882 | |
| * | | tw telecom, Inc. | | | 59,600 | | | | 1,518 | |
| | | | | | | | | | |
| | Total | | | | | | | 2,400 | |
| | | | | | | | | | |
| |
| | Utilities (4.8%) | |
| | Alliant Energy Corp. | | | 43,700 | | | | 1,919 | |
| | Aqua America, Inc. | | | 55,133 | | | | 1,402 | |
| | Atmos Energy Corp. | | | 35,600 | | | | 1,250 | |
| | Black Hills Corp. | | | 17,400 | | | | 632 | |
| | Cleco Corp. | | | 23,900 | | | | 956 | |
| | Great Plains Energy, Inc. | | | 60,377 | | | | 1,226 | |
| | Hawaiian Electric Industries, Inc. | | | 38,400 | | | | 965 | |
The Accompanying Notes are an Integral Part of the Financial Statements.
| | | | | | |
| | Index 400 Stock Portfolio | | | 43 | |
Index 400 Stock Portfolio
| | | | | | | | | | |
| | | Common Stocks (97.9%) | | Shares/
$ Par | | | Value $ (000’s) | |
| |
| | Utilities continued | |
| | IDACORP, Inc. | | | 19,800 | | | | 858 | |
| | MDU Resources Group, Inc. | | | 74,400 | | | | 1,580 | |
| | National Fuel Gas Co. | | | 32,900 | | | | 1,668 | |
| | NV Energy, Inc. | | | 92,781 | | | | 1,683 | |
| | OGE Energy Corp. | | | 38,900 | | | | 2,191 | |
| | PNM Resources, Inc. | | | 31,350 | | | | 643 | |
| | Questar Corp. | | | 69,000 | | | | 1,364 | |
| | UGI Corp. | | | 44,400 | | | | 1,452 | |
| | Vectren Corp. | | | 32,400 | | | | 953 | |
| | Westar Energy, Inc. | | | 49,800 | | | | 1,425 | |
| | WGL Holdings, Inc. | | | 20,300 | | | | 796 | |
| | | | | | | | | | |
| | Total | | | | | | | 22,963 | |
| | | | | | | | | | |
| | | |
| | Total Common Stocks | | | | | | | | |
| | (Cost: $391,058) | | | | | | | 468,908 | |
| | | | | | | | | | |
| | | | | | | | | | |
| | | Short-Term Investments (1.3%) | | Shares/ $ Par | | | Value
$ (000’s) | |
| |
| | Federal Government & Agencies (0.4%) | |
| | Federal Home Loan Mortgage Corp., 0.13%, 2/25/13 | | | 2,000,000 | | | | 2,000 | |
| | | | | | | | | | |
| | Total | | | | | | | 2,000 | |
| | | | | | | | | | |
| |
| | Restaurants (0.9%) | |
| (b) | | Darden Restaurants, Inc., 0.28%, 1/2/13 | | | 4,300,000 | | | | 4,300 | |
| | | | | | | | | | |
| | Total | | | | | | | 4,300 | |
| | | | | | | | | | |
| | | |
| | Total Short-Term Investments | | | | | | | | |
| | (Cost: $6,300) | | | | | | | 6,300 | |
| | | | | | | | | | |
| | | |
| | Total Investments (99.2%) | | | | | | | | |
| | (Cost: $397,358)(a) | | | | | | | 475,208 | |
| | | | | | | | | | |
| | Other Assets, Less | | | | | | | | |
| | Liabilities (0.8%) | | | | | | | 3,833 | |
| | | | | | | | | | |
| | Net Assets (100.0%) | | | | | | | 479,041 | |
| | | | | | | | | | |
| (a) | At December 31, 2012 the aggregate cost of securities for federal tax purposes (in thousands) was $398,320 and the net unrealized appreciation of investments based on that cost was $76,888 which is comprised of $115,959 aggregate gross unrealized appreciation and $39,071 aggregate gross unrealized depreciation. |
| (b) | All or a portion of the securities have been pledged as collateral for open futures positions or when-issued securities. Information regarding open futures contracts as of period end is summarized below. |
| | | | | | |
| Issuer (000’s) | | Number of
Contracts | | Expiration Date | | Unrealized
Appreciation/
(Depreciation)
(000’s) |
S&P 400 Mini Index Futures (Long) (Total Notional Value at December 31, 2012, $10,502) | | 104 | | 3/13 | | $86 |
The following is a summary of the inputs used in valuing the Portfolio’s assets and liabilities at December 31, 2012. See Note 3 for additional information on portfolio valuation.
| | | | | | | | | | | | | | |
| | | Valuation Inputs | | | |
| Description | | Level 1 –
Quoted Prices | | | Level 2 –
Other Significant
Observable Inputs | | | Level 3 – Significant Unobservable Inputs | | | |
| | | (Amounts in thousands) | | | |
Assets: | | | | | | | | | | | | | | |
Common Stocks | | $ | 468,908 | | | $ | - | | | $ | - | | | |
Short-Term Investments | | | - | | | | 6,300 | | | | - | | | |
Other Financial Instruments^ | | | | | | | | | | | | | | |
Futures | | | 86 | | | | - | | | | - | | | |
Total | | $ | 468,994 | | | $ | 6,300 | | | $ | - | | | |
^ Other financial instruments are derivative instruments such as futures, forwards, written options and swaps contracts, which are valued at the unrealized appreciation (depreciation) on the instrument and short sales, which are valued at market value.
The Accompanying Notes are an Integral Part of the Financial Statements.
| | | | |
| 44 | | Index 400 Stock Portfolio | | |
Mid Cap Value Portfolio
| | | | |
| Objective: | | Portfolio Strategy: | | Net Assets: |
Long-term capital growth. Current income is a secondary objective. | | Invest primarily in equity securities of mid-sized companies that are determined to be undervalued. | | $163 million |
Portfolio Overview
Mason Street Advisors, the investment adviser for the Mid Cap Value Portfolio (the “Portfolio”), has engaged American Century Investment Management, Inc. (“American Century”) to act as sub-adviser for the Portfolio. The Portfolio invests primarily in a diversified portfolio of equity securities of mid-sized companies that are determined to be undervalued. In selecting securities, the Portfolio attempts to identify companies whose long-term earnings, cash flows and/or assets are not reflected in the current market price of their securities and hold each security until it has returned to favor in the market and the price has increased to, or is higher than a level the Portfolio believes more accurately reflects the fair value of the company.
Market Overview
Stocks recorded strong gains in 2012, driven by the Federal Reserve’s (the Fed) extraordinary fiscal and monetary stimulus. The unemployment rate declined and the housing market showed signs of improvement, though U.S. economic growth overall was lackluster. As a result, the Fed extended a number of its liquidity measures and launched a third round of quantitative easing (QE3). In December, the Fed identified its threshold levels for unemployment and inflation, indicating that it would continue holding short-term interest rates close to zero as long as unemployment remained above 6.5% and inflation was below 2.5%. In this environment, investors generally favored riskier, lower-quality securities.
Portfolio Results
The Portfolio returned 16.57% for the twelve months ended December 31, 2012. By comparison, the Russell® MidCap Value Index (the “Index”) returned 18.51%. (This Index is unmanaged, cannot be invested in directly and does not include administrative expenses or sales charges.) According to Lipper® Analytical Services, Inc., an independent mutual fund ranking agency, the average return of the Mid Cap Value Funds peer group was 17.33%.
In Energy, the only sector in which the Portfolio declined in absolute terms, the Portfolio was hampered by security selection. A top detractor was Ultra Petroleum, a natural gas exploration and production company. Its shares declined, largely because of supply and demand. New extraction techniques, which produced a significant amount of natural gas supply, put pressure on prices. An investment in Imperial Oil also hurt performance. Falling energy prices and worries about Europe’s financial problems weighed on Imperial’s share price during the reporting period. In addition, the Portfolio was underweight relative to the Index in U.S. oil refiners, which generally performed well as the price difference between Brent and West Texas Intermediate (WTI) crude widened. For example, the Portfolio did not own Valero Energy, a stock in the Index, which appreciated more than 66%.
An underweight position in the Consumer Discretionary sector, which posted the strongest sector return in the Index, dampened performance. Specifically, the Portfolio was underweight household durables. Many of these stocks performed well, as the housing market improved.
The Portfolio’s holdings in the Materials sector detracted from relative performance. In particular, the Portfolio was hurt by its investment in gold producer Newmont Mining Corp. As risk appetite increased during the year, investors shifted away from sectors and industries they perceived as defensive and into riskier names. Newmont’s share price was also negatively impacted when the company provided lower-than-expected earnings guidance, citing the higher cost of finding gold and a decline in the amount of gold it expected to produce.
In Industrials, an overweight position contributed positively to relative performance. The sector also provided two notable contributors. Shares of Thomas & Betts Corp., a maker of electrical components, appreciated on the news it would be acquired by Swiss engineering firm ABB Ltd. The deal, which closed in May, was valued at $3.9 billion. Oshkosh Corp., the specialty vehicle manufacturer, reported stronger-than-expected earnings.
The Portfolio’s underweight in Information Technology, one of the weakest performing sectors in the Index, enhanced relative performance. Effective security selection also boosted results. Within computers and peripherals, the Portfolio owned SanDisk Corp. and Western Digital. SanDisk, a maker of flash drive memory chip products, outperformed as supply and demand fundamentals improved during the second half of the reporting period. Western Digital reported unexpectedly strong profits, benefiting from the acquisition of Hitachi’s hard drive operations.
Forward currency exchange contracts were used to insulate the Portfolio from adverse currency movements.
| | | | | | |
| | Mid Cap Value Portfolio | | | 45 | |
Mid Cap Value Portfolio
Portfolio Manager Outlook
The following forward looking comments are the opinion of American Century, the Portfolio’s sub-adviser.
We continue to follow our disciplined, bottom-up process, selecting companies one at a time for the Portfolio. As of December 31, 2012, we see opportunity in Health Care and Industrials, reflected by the Portfolio’s overweight positions in these sectors relative to the benchmark. Fundamental analysis and valuation work have led to smaller relative weightings in Consumer Discretionary, Financials, Information Technology and Materials stocks.
Relative Performance

| | | | | | |
Average Annual Total Returns For Periods Ended December 31, 2012 |
| | | 1 Year | | 5 Years | | Since
Inception* |
Mid Cap Value Portfolio | | 16.57% | | 2.14% | | 8.07% |
Russell MidCap® Value Index | | 18.51% | | 3.79% | | 10.65% |
Lipper® Variable Insurance Products (VIP) Mid Cap Value Funds Average | | 17.33% | | 2.88% | | - |
| * | Inception date of 5/1/03 |
The performance data quoted represents past performance. Past performance is historical and does not guarantee future performance. Investment return and principal value will fluctuate, so that shares, when redeemed, may be worth more or less than their original cost. Current performance may be lower or higher than the performance data quoted. For the most recent month-end performance information visit www.northwesternmutual.com.
This chart assumes an initial investment of $10,000 made on 5/1/03 (commencement of the Portfolio’s operations). Returns shown reflect fee waivers, deductions for management and other portfolio expenses, and reinvestment of all dividends. In the absence of fee waivers, total return would be reduced. Returns exclude deductions for separate account sale loads and account fees. Please refer to the Benchmark Definitions section of this report for information about the indices cited in the above chart and graph.
Investing in small and medium-sized companies involves a greater degree of risk than investing in large company stocks.
The Portfolio may invest in derivative instruments as a cash management strategy or to hedge foreign currency exposure. Use of these instruments may involve certain costs and imposes certain risks such as liquidity risk, interest rate risk, market risk, credit risk, management risk and the risk of mispricing or improper valuation. Certain derivatives involve leverage, which could magnify losses, and portfolios investing in derivatives could lose more than the principal amount invested in those instruments.
The Portfolio may engage in active and frequent trading in pursuit of its investment objective. Active and frequent trading may cause higher brokerage expenses and other transaction costs, which may adversely affect the Portfolio’s performance.
Top 10 Equity Holdings 12/31/12
| | |
| Security Description | | % of Net Assets |
iShares Russell Midcap Value Index Fund | | 3.5% |
Republic Services, Inc. | | 3.3% |
Northern Trust Corp. | | 2.8% |
Imperial Oil, Ltd. | | 2.3% |
CareFusion Corp. | | 1.8% |
Great Plains Energy, Inc. | | 1.7% |
Applied Materials, Inc. | | 1.7% |
PG&E Corp. | | 1.5% |
Lowe’s Cos., Inc. | | 1.4% |
AGL Resources, Inc. | | 1.4% |
Sector Allocation 12/31/12

Sector Allocation is based on Net Assets.
Sector Allocation and Top 10 Holdings are subject to change.
| | | | |
| 46 | | Mid Cap Value Portfolio | | |
Mid Cap Value Portfolio
Schedule of Investments
December 31, 2012
| | | | | | | | | | |
| | | Common Stocks (90.4%) | | Shares/ $ Par | | | Value $ (000’s) | |
| | | |
| | Consumer Discretionary (5.3%) | | | | | | | | |
| | Autoliv, Inc. | | | 10,762 | | | | 725 | |
| | Carnival Corp. | | | 18,303 | | | | 673 | |
| | CEC Entertainment, Inc. | | | 37,607 | | | | 1,248 | |
| | Hasbro, Inc. | | | 23,083 | | | | 829 | |
| | International Game Technology | | | 72,135 | | | | 1,022 | |
| | International Speedway Corp. - Class A | | | 15,475 | | | | 428 | |
| | Lowe’s Cos., Inc. | | | 65,376 | | | | 2,322 | |
| | Target Corp. | | | 22,450 | | | | 1,328 | |
| | | | | | | | | | |
| | Total | | | | | | | 8,575 | |
| | | | | | | | | | |
| | | |
| | Consumer Staples (6.1%) | | | | | | | | |
| | Campbell Soup Co. | | | 12,204 | | | | 426 | |
| | The Clorox Co. | | | 12,231 | | | | 895 | |
| | ConAgra Foods, Inc. | | | 27,673 | | | | 816 | |
| | Dr. Pepper Snapple Group, Inc. | | | 33,884 | | | | 1,497 | |
| | General Mills, Inc. | | | 39,461 | | | | 1,595 | |
| | Kellogg Co. | | | 20,593 | | | | 1,150 | |
| | Kimberly-Clark Corp. | | | 9,719 | | | | 821 | |
| | Kraft Foods Group, Inc. | | | 36,887 | | | | 1,677 | |
| | Sysco Corp. | | | 34,997 | | | | 1,108 | |
| | | | | | | | | | |
| | Total | | | | | | | 9,985 | |
| | | | | | | | | | |
| | | |
| | Energy (5.2%) | | | | | | | | |
| | Apache Corp. | | | 15,924 | | | | 1,250 | |
| | Devon Energy Corp. | | | 28,328 | | | | 1,474 | |
| | EQT Corp. | | | 18,060 | | | | 1,065 | |
| | Helmerich & Payne, Inc. | | | 14,357 | | | | 804 | |
| | Murphy Oil Corp. | | | 24,314 | | | | 1,448 | |
| | Peabody Energy Corp. | | | 23,445 | | | | 624 | |
| * | | Southwestern Energy Co. | | | 32,052 | | | | 1,071 | |
| | Spectra Energy Partners LP | | | 24,502 | | | | 765 | |
| | | | | | | | | | |
| | Total | | | | | | | 8,501 | |
| | | | | | | | | | |
| | | |
| | Financials (24.9%) | | | | | | | | |
| | ACE, Ltd. | | | 17,755 | | | | 1,417 | |
| | The Allstate Corp. | | | 25,979 | | | | 1,044 | |
| | American Tower Corp. | | | 20,353 | | | | 1,573 | |
| | Aon PLC | | | 29,080 | | | | 1,617 | |
| | Capitol Federal Financial, Inc. | | | 123,474 | | | | 1,443 | |
| | The Charles Schwab Corp. | | | 116,444 | | | | 1,672 | |
| | The Chubb Corp. | | | 29,580 | | | | 2,228 | |
| | Comerica, Inc. | | | 55,640 | | | | 1,688 | |
| | Commerce Bancshares, Inc. | | | 58,244 | | | | 2,042 | |
| | Cullen/Frost Bankers, Inc. | | | 16,299 | | | | 885 | |
| | Franklin Resources, Inc. | | | 4,055 | | | | 510 | |
| | HCC Insurance Holdings, Inc. | | | 54,890 | | | | 2,042 | |
| | HCP, Inc. | | | 26,394 | | | | 1,192 | |
| | KeyCorp | | | 117,084 | | | | 986 | |
| | Marsh & McLennan Cos., Inc. | | | 51,012 | | | | 1,758 | |
| | Northern Trust Corp. | | | 89,509 | | | | 4,490 | |
| | People’s United Financial, Inc. | | | 135,932 | | | | 1,643 | |
| | | | | | | | | | |
| | | Common Stocks (90.4%) | | Shares/ $ Par | | | Value
$ (000’s) | |
| | | |
| | Financials continued | | | | | | | | |
| | Piedmont Office Realty Trust, Inc. - Class A | | | 104,881 | | | | 1,893 | |
| | PNC Financial Services Group, Inc. | | | 36,726 | | | | 2,141 | |
| | Principal Financial Group, Inc. | | | 21,907 | | | | 625 | |
| | Reinsurance Group of America, Inc. | | | 30,731 | | | | 1,645 | |
| | State Street Corp. | | | 10,969 | | | | 516 | |
| | SunTrust Banks, Inc. | | | 29,840 | | | | 846 | |
| | Symetra Financial Corp. | | | 64,504 | | | | 837 | |
| | The Travelers Cos., Inc. | | | 17,571 | | | | 1,262 | |
| | Unum Group | | | 57,080 | | | | 1,188 | |
| | Westamerica Bancorporation | | | 28,999 | | | | 1,235 | |
| | Weyerhaeuser Co. | | | 10,954 | | | | 305 | |
| | | | | | | | | | |
| | Total | | | | | | | 40,723 | |
| | | | | | | | | | |
| | | |
| | Health Care (12.6%) | | | | | | | | |
| | Agilent Technologies, Inc. | | | 21,061 | | | | 862 | |
| | Becton, Dickinson and Co. | | | 21,812 | | | | 1,706 | |
| * | | Boston Scientific Corp. | | | 152,437 | | | | 873 | |
| * | | CareFusion Corp. | | | 104,455 | | | | 2,985 | |
| | CIGNA Corp. | | | 16,139 | | | | 863 | |
| * | | Hospira, Inc. | | | 43,353 | | | | 1,354 | |
| | Humana, Inc. | | | 17,840 | | | | 1,224 | |
| * | | Life Technologies Corp. | | | 11,311 | | | | 555 | |
| * | | LifePoint Hospitals, Inc. | | | 53,436 | | | | 2,017 | |
| | Medtronic, Inc. | | | 27,806 | | | | 1,141 | |
| | Patterson Cos., Inc. | | | 42,237 | | | | 1,446 | |
| | STERIS Corp. | | | 39,070 | | | | 1,357 | |
| | Stryker Corp. | | | 34,366 | | | | 1,884 | |
| | Zimmer Holdings, Inc. | | | 33,343 | | | | 2,223 | |
| | | | | | | | | | |
| | Total | | | | | | | 20,490 | |
| | | | | | | | | | |
| | | |
| | Industrials (14.3%) | | | | | | | | |
| | ABB, Ltd., ADR | | | 71,344 | | | | 1,483 | |
| | The ADT Corp. | | | 29,922 | | | | 1,391 | |
| | Brady Corp. - Class A | | | 20,850 | | | | 696 | |
| | Corrections Corp. of America | | | 13,754 | | | | 488 | |
| | Emerson Electric Co. | | | 8,001 | | | | 424 | |
| | General Dynamics Corp. | | | 30,194 | | | | 2,092 | |
| | Heartland Express, Inc. | | | 102,372 | | | | 1,338 | |
| | ITT Corp. | | | 76,068 | | | | 1,785 | |
| | Kaydon Corp. | | | 48,077 | | | | 1,150 | |
| | L-3 Communications Holdings, Inc. | | | 4,040 | | | | 310 | |
| | Northrop Grumman Corp. | | | 21,223 | | | | 1,434 | |
| | Republic Services, Inc. | | | 181,354 | | | | 5,319 | |
| | Rockwell Collins, Inc. | | | 13,722 | | | | 798 | |
| | Southwest Airlines Co. | | | 126,140 | | | | 1,292 | |
| | Tyco International, Ltd. | | | 52,230 | | | | 1,528 | |
| | Waste Management, Inc. | | | 22,475 | | | | 758 | |
| | Woodward, Inc. | | | 27,521 | | | | 1,049 | |
| | | | | | | | | | |
| | Total | | | | | | | 23,335 | |
| | | | | | | | | | |
The Accompanying Notes are an Integral Part of the Financial Statements.
| | | | | | |
| | Mid Cap Value Portfolio | | | 47 | |
Mid Cap Value Portfolio
| | | | | | | | | | |
| | | Common Stocks (90.4%) | | Shares/ $ Par | | | Value $ (000’s) | |
| | | |
| | Information Technology (6.2%) | | | | | | | | |
| | Analog Devices, Inc. | | | 17,090 | | | | 719 | |
| | Applied Materials, Inc. | | | 234,550 | | | | 2,683 | |
| | KLA-Tencor Corp. | | | 16,476 | | | | 787 | |
| | Microchip Technology, Inc. | | | 20,121 | | | | 656 | |
| | Molex, Inc. - Class A | | | 27,943 | | | | 624 | |
| * | | SanDisk Corp. | | | 19,985 | | | | 871 | |
| | TE Connectivity, Ltd. | | | 33,957 | | | | 1,260 | |
| * | | Teradyne, Inc. | | | 96,025 | | | | 1,622 | |
| | Western Digital Corp. | | | 21,002 | | | | 892 | |
| | | | | | | | | | |
| | Total | | | | | | | 10,114 | |
| | | | | | | | | | |
| | | |
| | Materials (3.0%) | | | | | | | | |
| | Bemis Co., Inc. | | | 39,661 | | | | 1,327 | |
| | Minerals Technologies, Inc. | | | 6,899 | | | | 276 | |
| | Newmont Mining Corp. | | | 35,167 | | | | 1,633 | |
| | Nucor Corp. | | | 17,625 | | | | 761 | |
| | Sonoco Products Co. | | | 29,275 | | | | 870 | |
| | | | | | | | | | |
| | Total | | | | | | | 4,867 | |
| | | | | | | | | | |
| | | |
| | Telecommunication Services (1.8%) | | | | | | | | |
| | CenturyLink, Inc. | | | 31,504 | | | | 1,233 | |
| * | | tw telecom, Inc. | | | 64,943 | | | | 1,654 | |
| | | | | | | | | | |
| | Total | | | | | | | 2,887 | |
| | | | | | | | | | |
| | | |
| | Utilities (11.0%) | | | | | | | | |
| | AGL Resources, Inc. | | | 56,575 | | | | 2,261 | |
| | The Empire District Electric Co. | | | 71,851 | | | | 1,464 | |
| | Great Plains Energy, Inc. | | | 139,480 | | | | 2,833 | |
| | IDACORP, Inc. | | | 19,630 | | | | 851 | |
| | Northeast Utilities | | | 25,003 | | | | 977 | |
| | NV Energy, Inc. | | | 58,616 | | | | 1,063 | |
| | PG&E Corp. | | | 60,265 | | | | 2,422 | |
| | Portland General Electric Co. | | | 41,648 | | | | 1,140 | |
| | Westar Energy, Inc. | | | 68,132 | | | | 1,950 | |
| | WGL Holdings, Inc. | | | 11,294 | | | | 443 | |
| | Wisconsin Energy Corp. | | | 15,201 | | | | 560 | |
| | Xcel Energy, Inc. | | | 75,477 | | | | 2,016 | |
| | | | | | | | | | |
| | Total | | | | | | | 17,980 | |
| | | | | | | | | | |
| | | |
| | Total Common Stocks
(Cost: $137,625) | | | | | | | 147,457 | |
| | | | | | | | | | |
| | | | | | | | | | | | |
| | | Foreign Common Stocks (3.9%) | | Country | | | | | | |
| | | | |
| | Energy (2.3%) | | | | | | | | | | |
| | Imperial Oil, Ltd. | | Canada | | | 87,468 | | | | 3,765 | |
| | | | | | | | | | | | |
| | Total | | | | | | | | | 3,765 | |
| | | | | | | | | | | | |
| | | | |
| | Industrials (0.9%) | | | | | | | | | | |
| (l) | | Royal Philips Electronics NV | | Netherlands | | | 57,634 | | | | 1,546 | |
| | | | | | | | | | | | |
| | Total | | | | | | | | | 1,546 | |
| | | | | | | | | | | | |
| | | | | | | | | | | | |
| | | Foreign Common Stocks (3.9%) | | Country | | Shares/
$ Par | | | Value
$ (000’s) | |
| |
| | Telecommunication Services (0.7%) | |
| | Rogers Communications, Inc. - Class B | | Canada | | | 23,870 | | | | 1,086 | |
| | | | | | | | | | | | |
| | Total | | | | | | | | | 1,086 | |
| | | | | | | | | | | | |
| | | |
| | Total Foreign Common Stocks | | | | | | | | |
| | (Cost: $6,291) | | | | | | | 6,397 | |
| | | | | | | | | | | | |
| | | Investment Companies (3.5%) | | | | | | | | |
| | | | |
| | Investment Companies (3.5%) | | | | | | | | | | |
| | iShares Russell Midcap Value Index Fund | | | | | 114,249 | | | | 5,740 | |
| | | | | | | | | | | | |
| | Total | | | | | | | | | 5,740 | |
| | | | | | | | | | | | |
| | | |
| | Total Investment Companies | | | | | | | | |
| | (Cost: $5,590) | | | | | | | | | 5,740 | |
| | | | | | | | | | | | |
| | | Short-Term Investments (1.8%) | | | | | | | | |
| | | | |
| | Other Holdings (1.8%) | | | | | | | | | | |
| | JPMorgan Money Market Fund | | | | | 2,925,935 | | | | 2,926 | |
| | | | | | | | | | | | |
| | Total | | | | | | | | | 2,926 | |
| | | | | | | | | | | | |
| | | |
| | Total Short-Term Investments | | | | | | | | |
| | (Cost: $2,926) | | | | | | | | | 2,926 | |
| | | | | | | | | | | | |
| | | | |
| | Total Investments (99.6%) | | | | | | | | | | |
| | (Cost: $152,432)(a) | | | | | | | | | 162,520 | |
| | | | | | | | | | | | |
| | Other Assets, Less | | | | | | | | | | |
| | Liabilities (0.4%) | | | | | | | | | 703 | |
| | | | | | | | | | | | |
| | Net Assets (100.0%) | | | | | | | | | 163,223 | |
| | | | | | | | | | | | |
The Accompanying Notes are an Integral Part of the Financial Statements.
| | | | |
| 48 | | Mid Cap Value Portfolio | | |
Mid Cap Value Portfolio
ADR after the name of a security represents—American Depositary Receipt.
| (a) | At December 31, 2012 the aggregate cost of securities for federal tax purposes (in thousands) was $154,378 and the net unrealized appreciation of investments based on that cost was $8,142 which is comprised of $12,577 aggregate gross unrealized appreciation and $4,435 aggregate gross unrealized depreciation. |
| (h) | Forward foreign currency contracts outstanding on December 31, 2012. |
| | | | | | | | | | | | | | | | | | | | |
| Type | | Counterparty | | Currency | | Principal
Amount
Covered by
Contract (000’s) | | Settlement
Month | | Unrealized
Appreciation
(000’s) | | | Unrealized
(Depreciation)
(000’s) | | | Net Unrealized
Appreciation/
(Depreciation)
(000’s) | |
Sell | | UBS AG | | CAD | | 4,142 | | 1/13 | | $ | - | | | $ | (1 | ) | | $ | (1 | ) |
Sell | | Credit Suisse International | | CHF | | 1,144 | | 1/13 | | | - | | | | - | (m) | | | - | (m) |
Sell | | UBS AG | | EUR | | 982 | | 1/13 | | | - | | | | - | (m) | | | - | (m) |
| | | | | | | | | | | | | | | | | | | | |
| | | | | | | | | | $ | - | | | $ | (1 | ) | | $ | (1 | ) |
| | | | | | | | | | | | | | | | | | | | |
CAD — Canadian Dollar
CHF — Swiss Franc
EUR — Euro
| (l) | As of December 31, 2012 portfolio securities with an aggregate value of $1,546 (in thousands) were fair valued under procedures adopted by the Board of Directors. |
| (m) | Amount is less than one thousand. |
The following is a summary of the inputs used in valuing the Portfolio’s assets and liabilities at December 31, 2012. See Note 3 for additional information on portfolio valuation.
| | | | | | | | | | | | | | |
| | | Valuation Inputs | | | |
| Description | | Level 1 – Quoted Prices | | | Level 2 – Other Significant Observable Inputs | | | Level 3 – Significant Unobservable Inputs | | | |
| | | (Amounts in thousands) | | | |
Assets: | | | | | | | | | | | | | | |
Domestic Common Stocks | | $ | 147,457 | | | $ | - | | | $ | - | | | |
Foreign Common Stocks | | | 4,851 | | | | 1,546 | | | | - | | | |
Investment Companies | | | 5,740 | | | | - | | | | - | | | |
Short-Term Investments | | | 2,926 | | | | - | | | | - | | | |
Liabilities: | | | | | | | | | | | | | | |
Other Financial Instruments^ | | | | | | | | | | | | | | |
Forward Currency Contracts | | | - | | | | (1 | ) | | | - | | | |
Total | | $ | 160,974 | | | $ | 1,545 | | | $ | - | | | |
^ Other financial instruments are derivative instruments such as futures, forwards, written options and swaps contracts, which are valued at the unrealized appreciation (depreciation) on the instrument and short sales, which are valued at market value.
The Accompanying Notes are an Integral Part of the Financial Statements.
| | | | | | |
| | Mid Cap Value Portfolio | | | 49 | |
Small Cap Growth Stock Portfolio
| | | | |
| Objective: | | Portfolio Strategy: | | Net Assets: |
| Long-term growth of capital | | Invest primarily in equity securities of small-sized companies with potential for above average growth. | | $376 million |
Portfolio Overview
Mason Street Advisors acts as the investment adviser for the Small Cap Growth Stock Portfolio (the “Portfolio”). Normally, the Portfolio invests in common stocks of U.S. companies with market capitalizations that do not exceed the maximum market capitalizations of any security in the Russell 2000® Growth Index (the “Index”) at the time of purchase. The Portfolio employs a growth strategy, selecting securities for their above average growth potential, giving consideration to factors such as company management, growth rate of revenues and earnings, opportunities for margin expansion and strong financial characteristics.
Market Overview
Equity markets finished the year with solid gains despite economic uncertainty and significant volatility. Throughout the year, investors shifted their focus from uncertainty regarding the pace of global economic growth to evaluating fiscal and economic stimulus measures implemented globally. The economic slowdown in China, fiscal and debt crises in Europe, and the slow pace of growth in the U.S. drove volatility. As these issues arose, policy makers responded with stimulus and financing measures designed to calm markets. Ultimately, investors embraced risk, as record profit margins in the U.S. and remarkable cash flow generation propelled equity markets during the year.
Within the Index, consumer-based stocks led the rally, followed by stocks in the Financials and Materials sectors. Energy and Utilities stocks declined during the year. Within the broader universe of small companies, value stocks outperformed growth shares.
Portfolio Results
The Portfolio returned 9.48% for the twelve months ended December 31, 2012. By comparison, the Index returned 14.59%. (The Index is unmanaged, cannot be invested in directly, and does not include administrative expenses or sales charges.) The Portfolio trailed the 14.09% average return of its Small Cap Growth Funds peer group, according to Lipper® Analytical Services, Inc., an independent mutual fund ranking agency.
Stock selection in the Consumer Discretionary sector was one of the main sources of underperformance relative to the Index. In the specialty retail industry, the Portfolio held a large overweight in Body Central, which hurt performance when the stock declined, as the company’s fashion products failed to meet consumer expectations. Similarly, the Portfolio’s position in Hibbett Sports underperformed, as the sporting goods retailer’s stock declined on weak demand.
The Industrials sector also weighed on performance due to stock selection. The Portfolio’s long-term overweight position in GrafTech International Ltd., a global leader in gratified electrodes, detracted from performance. The stock declined when weak economic conditions in Europe pressured prices for its products. The leading detractor in the professional services industry was Huron, Inc.
The Materials and Energy sectors also hurt performance relative to the Index, largely due to the performance of two stocks whose businesses provided inputs for the natural gas industry. In the Materials sector, chemical maker Balchem Corp. finished the year lower. Sales for one of its products used in natural gas production declined as fracking activity slowed. In the Energy sector, the stock price of pipeline maker Heckman Corp., which had experienced growth related to delivering water for natural gas production, dropped as natural gas production weakened.
Stock selection in the Technology sector was one source of strength for the Portfolio’s performance relative to the Index. Based on the portfolio manager’s investment theme of growth in data usage, the Portfolio held positions in software as a service (SaaS) and infrastructure. Portfolio overweights in SaaS providers SPS Commerce Inc. and Cornerstone OnDemand Inc. contributed positively to relative performance, as both companies experienced solid growth. Similarly, the Portfolio participated in the initial public offering of Synacor Inc., which advanced in anticipation of strong growth. Infrastructure picks, such as Equinix, InterXion Holding N.V., and AboveNet Inc. also helped the Portfolio’s relative performance, as the shares rose on strong demand for data centers and related telecommunications services.
During the period, the Portfolio used futures contracts to help maintain a fully invested position and total return swap agreements to gain additional exposure to the biotechnology industry. The biotechnology swaps were modest contributors to relative performance during the year.
| | | | |
| 50 | | Small Cap Growth Stock Portfolio | | |
Small Cap Growth Stock Portfolio
Portfolio Manager Outlook
Looking ahead to 2013, we expect to see muted economic growth in the first part of the year driven by the payroll tax hike’s impact on consumer spending. However, as the fiscal cliff and the debt ceiling issues abate and as housing, autos, and manufacturing continue their recovery, we expect economic growth to accelerate as the year progresses. We will continue to employ our investment strategy as bottom-up stock pickers, while remaining cognizant of the risks and opportunities that a volatile environment can create for stock selection. We have positioned the Portfolio for sustainable economic growth by maintaining an overweight in Industrials and Energy while keeping an underweight in Consumer Discretionary and Staples.
Relative Performance

| | | | | | | | | | | | |
Average Annual Total Returns
For Periods Ended December 31, 2012 | |
| | | 1 Year | | | 5 Years | | | 10 Years | |
Small Cap Growth Stock Portfolio | | | 9.48 | % | | | -0.28 | % | | | 7.31 | % |
Russell 2000® Growth Index | | | 14.59 | % | | | 3.49 | % | | | 9.80 | % |
Lipper® Variable Insurance Products (VIP) Small Cap Growth Funds Average | | | 14.09 | % | | | 2.75 | % | | | 8.98 | % |
The performance data quoted represents past performance. Past performance is historical and does not guarantee future performance. Investment return and principal value will fluctuate, so that shares, when redeemed, may be worth more or less than their original cost. Current performance may be lower or higher than the performance data quoted. For the most recent month-end performance information visit www.northwesternmutual.com.
This chart assumes an initial investment of $10,000 made on 12/31/02. Returns shown include deductions for management and other portfolio expenses, and reinvestment of all dividends. Returns exclude deductions for separate account sale loads and account fees. Please refer to the Benchmark Definitions section of this report for information about the indices cited in the above chart and graph.
Stocks of smaller or newer companies, such as those held in this Portfolio, are more likely to realize more substantial growth as well as suffer more significant losses than larger or more established issuers.
Investments in such companies can be both more volatile and more speculative. Investing in small company stocks involves a greater degree of risk than investing in medium or large company stocks.
The Portfolio may invest in derivative instruments for hedging purposes, as a cash management strategy, to earn income and seek to enhance returns; or as alternatives to direct investments. Use of these instruments may involve certain costs and imposes certain risks such as liquidity risk, interest rate risk, market risk, credit risk, management risk and the risk of mispricing or improper valuation. Certain derivatives involve leverage, which could magnify losses, and portfolios investing in derivatives could lose more than the principal amount invested in those instruments.
Top 10 Equity Holdings 12/31/12
| | |
| Security Description | | % of Net Assets |
SPDR S&P Biotech ETF | | 2.9% |
Valmont Industries, Inc. | | 1.6% |
East West Bancorp, Inc. | | 1.5% |
LKQ Corp. | | 1.5% |
Actuant Corp. - Class A | | 1.5% |
InterXion Holding NV | | 1.4% |
Synchronoss Technologies, Inc. | | 1.4% |
SPS Commerce, Inc. | | 1.4% |
tw telecom, Inc. | | 1.4% |
Hexcel Corp. | | 1.4% |
Sector Allocation 12/31/12

Sector Allocation is based on Net Assets.
Sector Allocation and Top 10 Holdings are subject to change.
| | | | | | |
| | Small Cap Growth Stock Portfolio | | | 51 | |
Small Cap Growth Stock Portfolio
Schedule of Investments
December 31, 2012
| | | | | | | | | | |
| | | Common Stocks (85.8%) | | Shares/
$ Par | | | Value
$ (000’s) | |
| |
| | Consumer Discretionary (11.8%) | |
| * | | Bally Technologies, Inc. | | | 91,408 | | | | 4,087 | |
| | Chico’s FAS, Inc. | | | 187,300 | | | | 3,457 | |
| * | | Chuy’s Holdings, Inc. | | | 79,300 | | | | 1,772 | |
| * | | Genesco, Inc. | | | 55,350 | | | | 3,044 | |
| * | | Grand Canyon Education, Inc. | | | 203,003 | | | | 4,764 | |
| * | | Hibbett Sports, Inc. | | | 58,300 | | | | 3,072 | |
| * | | Life Time Fitness, Inc. | | | 90,000 | | | | 4,429 | |
| * | | LKQ Corp. | | | 273,630 | | | | 5,774 | |
| | Penske Automotive Group, Inc. | | | 107,100 | | | | 3,223 | |
| * | | Red Robin Gourmet Burgers, Inc. | | | 65,550 | | | | 2,313 | |
| * | | SHFL Entertainment, Inc. | | | 124,150 | | | | 1,800 | |
| | Ulta Salon, Cosmetics & Fragrance, Inc. | | | 33,400 | | | | 3,282 | |
| * | | Vitamin Shoppe, Inc. | | | 59,200 | | | | 3,396 | |
| | | | | | | | | | |
| | Total | | | | | | | 44,413 | |
| | | | | | | | | | |
| |
| | Consumer Staples (0.8%) | |
| * | | United Natural Foods, Inc. | | | 56,419 | | | | 3,024 | |
| | | | | | | | | | |
| | Total | | | | | | | 3,024 | |
| | | | | | | | | | |
| |
| | Energy (6.9%) | |
| * | | Approach Resources, Inc. | | | 156,300 | | | | 3,909 | |
| * | | Dril-Quip, Inc. | | | 58,850 | | | | 4,299 | |
| | EXCO Resources, Inc. | | | 518,000 | | | | 3,507 | |
| * | | Gulfport Energy Corp. | | | 120,500 | | | | 4,606 | |
| * | | Hornbeck Offshore Services, Inc. | | | 90,900 | | | | 3,121 | |
| * | | Kodiak Oil & Gas Corp. | | | 362,900 | | | | 3,212 | |
| * | | Rosetta Resources, Inc. | | | 73,400 | | | | 3,329 | |
| | | | | | | | | | |
| | Total | | | | | | | 25,983 | |
| | | | | | | | | | |
| |
| | Financials (6.1%) | |
| | AmREIT, Inc., - Class B | | | 114,050 | | | | 1,956 | |
| | Boston Private Financial Holdings, Inc. | | | 496,702 | | | | 4,475 | |
| | East West Bancorp, Inc. | | | 269,850 | | | | 5,799 | |
| | Education Realty Trust, Inc. | | | 235,950 | | | | 2,511 | |
| | Greenhill & Co., Inc. | | | 88,850 | | | | 4,619 | |
| * | | Stifel Financial Corp. | | | 110,050 | | | | 3,518 | |
| | | | | | | | | | |
| | Total | | | | | | | 22,878 | |
| | | | | | | | | | |
| |
| | Health Care (14.0%) | |
| * | | Akorn, Inc. | | | 227,250 | | | | 3,036 | |
| * | | Align Technology, Inc. | | | 79,684 | | | | 2,211 | |
| * | | Conceptus, Inc. | | | 89,401 | | | | 1,878 | |
| * | | DexCom, Inc. | | | 239,442 | | | | 3,259 | |
| * | | Endologix, Inc. | | | 205,942 | | | | 2,933 | |
| * | | Exact Sciences Corp. | | | 346,300 | | | | 3,667 | |
| * | | Fluidigm Corp. | | | 175,150 | | | | 2,506 | |
| | | | | | | | | | |
| | | Common Stocks (85.8%) | | Shares/
$ Par | | | Value
$ (000’s) | |
| |
| | Health Care continued | |
| * | | Health Management Associates, Inc. - Class A | | | 362,550 | | | | 3,379 | |
| * | | HealthStream, Inc. | | | 126,100 | | | | 3,065 | |
| * | | HMS Holdings Corp. | | | 62,300 | | | | 1,615 | |
| * | | Impax Laboratories, Inc. | | | 231,800 | | | | 4,750 | |
| * | | IPC The Hospitalist Co. | | | 53,100 | | | | 2,109 | |
| * | | Jazz Pharmaceuticals PLC | | | 31,200 | | | | 1,660 | |
| * | | MAP Pharmaceuticals, Inc. | | | 200,600 | | | | 3,151 | |
| * | | Neogen Corp. | | | 42,750 | | | | 1,937 | |
| * | | Omnicell, Inc. | | | 216,281 | | | | 3,216 | |
| * | | Team Health Holdings, Inc. | | | 82,400 | | | | 2,371 | |
| | U.S. Physical Therapy, Inc. | | | 110,200 | | | | 3,035 | |
| | Universal Health Services, Inc. - Class B | | | 58,550 | | | | 2,831 | |
| | | | | | | | | | |
| | Total | | | | | | | 52,609 | |
| | | | | | | | | | |
| |
| | Industrials (22.0%) | |
| | Actuant Corp. - Class A | | | 201,650 | | | | 5,628 | |
| * | | Beacon Roofing Supply, Inc. | | | 106,100 | | | | 3,531 | |
| | Celadon Group, Inc. | | | 210,800 | | | | 3,809 | |
| * | | Chart Industries, Inc. | | | 61,342 | | | | 4,090 | |
| * | | DXP Enterprises, Inc. | | | 56,650 | | | | 2,780 | |
| | Graco, Inc. | | | 90,248 | | | | 4,647 | |
| * | | Heritage-Crystal Clean, Inc. | | | 201,650 | | | | 3,027 | |
| * | | Hexcel Corp. | | | 189,700 | | | | 5,114 | |
| * | | Huron Consulting Group, Inc. | | | 130,137 | | | | 4,384 | |
| * | | The Keyw Holding Corp. | | | 299,860 | | | | 3,805 | |
| | Lindsay Corp. | | | 57,800 | | | | 4,631 | |
| | The Manitowoc Co., Inc. | | | 146,400 | | | | 2,296 | |
| * | | Mistras Group, Inc. | | | 122,450 | | | | 3,023 | |
| * | | NCI Building Systems, Inc. | | | 164,383 | | | | 2,285 | |
| * | | Oshkosh Corp. | | | 125,150 | | | | 3,711 | |
| * | | Performant Financial Corp. | | | 150,600 | | | | 1,521 | |
| | Snap-on, Inc. | | | 60,400 | | | | 4,771 | |
| | Sun Hydraulics Corp. | | | 110,850 | | | | 2,891 | |
| * | | Thermon Group Holdings, Inc. | | | 113,950 | | | | 2,567 | |
| | TransDigm Group, Inc. | | | 24,950 | | | | 3,402 | |
| | Valmont Industries, Inc. | | | 45,100 | | | | 6,159 | |
| * | | WESCO International, Inc. | | | 68,680 | | | | 4,631 | |
| | | | | | | | | | |
| | Total | | | | | | | 82,703 | |
| | | | | | | | | | |
| |
| | Information Technology (21.9%) | |
| * | | Aspen Technology, Inc. | | | 104,350 | | | | 2,884 | |
| * | | BroadSoft, Inc. | | | 98,800 | | | | 3,589 | |
| * | | Calix, Inc. | | | 467,000 | | | | 3,591 | |
| | | | | | | | | | |
| | | Common Stocks (85.8%) | | Shares/
$ Par | | | Value
$ (000’s) | |
| |
| | Information Technology continued | |
| * | | Cardtronics, Inc. | | | 85,500 | | | | 2,030 | |
| * | | Cavium, Inc. | | | 113,150 | | | | 3,531 | |
| * | | Cornerstone OnDemand, Inc. | | | 84,550 | | | | 2,497 | |
| * | | Diodes, Inc. | | | 239,350 | | | | 4,153 | |
| * | | EXA Corp. | | | 104,225 | | | | 1,014 | |
| * | | ExactTarget, Inc. | | | 83,800 | | | | 1,676 | |
| * | | EZchip Semiconductor, Ltd. | | | 66,950 | | | | 2,214 | |
| | FEI Co. | | | 82,400 | | | | 4,570 | |
| * | | Finisar Corp. | | | 157,550 | | | | 2,568 | |
| * | | Fortinet, Inc. | | | 171,750 | | | | 3,619 | |
| * | | InterXion Holding NV | | | 225,536 | | | | 5,359 | |
| * | | Microsemi Corp. | | | 174,865 | | | | 3,679 | |
| * | | MicroStrategy, Inc. - Class A | | | 21,250 | | | | 1,984 | |
| | MKS Instruments, Inc. | | | 123,355 | | | | 3,180 | |
| * | | Nanometrics, Inc. | | | 181,700 | | | | 2,620 | |
| * | | Proofpoint, Inc. | | | 68,400 | | | | 842 | |
| * | | Skyworks Solutions, Inc. | | | 137,300 | | | | 2,787 | |
| * | | Sourcefire, Inc. | | | 42,687 | | | | 2,016 | |
| * | | SPS Commerce, Inc. | | | 140,400 | | | | 5,233 | |
| * | | Synacor, Inc. | | | 238,600 | | | | 1,305 | |
| * | | Synchronoss Technologies, Inc. | | | 250,532 | | | | 5,284 | |
| * | | Tangoe, Inc. | | | 317,650 | | | | 3,771 | |
| * | | TIBCO Software, Inc. | | | 64,700 | | | | 1,424 | |
| * | | The Ultimate Software Group, Inc. | | | 52,800 | | | | 4,985 | |
| | | | | | | | | | |
| | Total | | | | | | | 82,405 | |
| | | | | | | | | | |
| |
| | Materials (1.0%) | |
| | Balchem Corp. | | | 101,950 | | | | 3,711 | |
| | | | | | | | | | |
| | Total | | | | | | | 3,711 | |
| | | | | | | | | | |
| |
| | Telecommunication Services (1.3%) | |
| * | | tw telecom, Inc. | | | 203,100 | | | | 5,173 | |
| | | | | | | | | | |
| | Total | | | | | | | 5,173 | |
| | | | | | | | | | |
| | Total Common Stocks | | | | | | | | |
| | (Cost: $290,001) | | | | | | | 322,899 | |
| | | | | | | | | | |
| |
| | | Investment Companies (4.1%) | |
| |
| | Investment Companies (4.1%) | |
| | Market Vectors Junior Gold Miners ETF | | | 224,500 | | | | 4,445 | |
| | SPDR S&P Biotech ETF | | | 122,300 | | | | 10,752 | |
| | | | | | | | | | |
| | Total | | | | | | | 15,197 | |
| | | | | | | | | | |
| | Total Investment Companies | | | | | | | | |
| | (Cost: $17,273) | | | | | | | 15,197 | |
| | | | | | | | | | |
The Accompanying Notes are an Integral Part of the Financial Statements.
| | | | |
| 52 | | Small Cap Growth Stock Portfolio | | |
Small Cap Growth Stock Portfolio
| | | | | | | | | | |
| | | Short-Term
Investments (11.0%) | | Shares/
$ Par | | | Value
$ (000’s) | |
| |
| | Autos (1.3%) | |
| | American Honda Finance Corp., 0.14%, 1/25/13 | | | 5,000,000 | | | | 5,000 | |
| | | | | | | | | | |
| | Total | | | | | | | 5,000 | |
| | | | | | | | | | |
| |
| | Commercial Banks US (1.3%) | |
| | Bank of America NA, 0.20%, 1/3/13 | | | 5,000,000 | | | | 5,000 | |
| | | | | | | | | | |
| | Total | | | | | | | 5,000 | |
| | | | | | | | | | |
| |
| | Consumer Products/Retailing (1.3%) | |
| | Wal-Mart Stores, Inc., 0.10%, 1/30/13 | | | 5,000,000 | | | | 5,000 | |
| | | | | | | | | | |
| | Total | | | | | | | 5,000 | |
| | | | | | | | | | |
| |
| | Federal Government & Agencies (1.9%) | |
| (b) | | Federal Home Loan Banks, 0.08%, 3/20/13 | | | 1,000,000 | | | | 1,000 | |
| | Federal Home Loan Mortgage Corp., 0.12%, 2/25/13 | | | 1,000,000 | | | | 1,000 | |
| | | | | | | | | | |
| | | Short-Term
Investments (11.0%) | | Shares/
$ Par | | | Value
$ (000’s) | |
| |
| | Federal Government & Agencies continued | |
| | Federal Home Loan Mortgage Corp., 0.135%, 2/25/13 | | | 5,000,000 | | | | 4,999 | |
| | | | | | | | | | |
| | Total | | | | | | | 6,999 | |
| | | | | | | | | | |
| |
| | Finance Services (1.3%) | |
| | Govco LLC, 0.23%, 1/22/13 | | | 5,000,000 | | | | 4,999 | |
| | | | | | | | | | |
| | Total | | | | | | | 4,999 | |
| | | | | | | | | | |
| |
| | Machinery (1.3%) | |
| | John Deere Canada ULC, 0.15%, 1/29/13 | | | 5,000,000 | | | | 4,999 | |
| | | | | | | | | | |
| | Total | | | | | | | 4,999 | |
| | | | | | | | | | |
| |
| | Personal Credit Institutions (1.4%) | |
| | Old Line Funding LLC, 0.19%, 3/25/13 | | | 5,000,000 | | | | 4,998 | |
| | | | | | | | | | |
| | Total | | | | | | | 4,998 | |
| | | | | | | | | | |
| | | | | | | | | | |
| | | Short-Term
Investments (11.0%) | | Shares/
$ Par | | | Value
$ (000’s) | |
| | | |
| | Restaurants (1.2%) | | | | | | | | |
| | Darden Restaurants, Inc., 0.28%, 1/2/13 | | | 4,400,000 | | | | 4,400 | |
| | | | | | | | | | |
| | Total | | | | | | | 4,400 | |
| | | | | | | | | | |
| | | |
| | Total Short-Term Investments | | | | | | | | |
| | (Cost: $41,394) | | | | | | | 41,395 | |
| | | | | | | | | | |
| | | |
| | Total Investments (100.9%) | | | | | | | | |
| | (Cost: $348,668)(a) | | | | | | | 379,491 | |
| | | | | | | | | | |
| | Other Assets, Less | | | | | | | | |
| | Liabilities (-0.9%) | | | | | | | (3,265 | ) |
| | | | | | | | | | |
| | Net Assets (100.0%) | | | | | | | 376,226 | |
| | | | | | | | | | |
| (a) | At December 31, 2012 the aggregate cost of securities for federal tax purposes (in thousands) was $350,535 and the net unrealized appreciation of investments based on that cost was $28,956 which is comprised of $44,440 aggregate gross unrealized appreciation and $15,484 aggregate gross unrealized depreciation. |
| (b) | All or a portion of the securities have been pledged as collateral for open futures positions or when-issued securities. Information regarding open futures contracts as of period end is summarized below. |
| | | | | | | | |
| Issuer (000’s) | | Number of
Contracts | | Expiration Date | | Unrealized
Appreciation/
(Depreciation)
(000’s) | |
Russell 2000 Mini Index Futures (Long) (Total Notional Value at December 31, 2012, $21,828) | | 262 | | 3/13 | | $ | 353 | |
The following is a summary of the inputs used in valuing the Portfolio’s assets and liabilities at December 31, 2012. See Note 3 for additional information on portfolio valuation.
| | | | | | | | | | | | | | |
| | | Valuation Inputs | | | |
| Description | | Level 1 -
Quoted Prices | | | Level 2 -
Other Significant
Observable Inputs | | | Level 3 - Significant Unobservable Inputs | | | |
| | | (Amounts in thousands) | | | |
Assets: | | | | | | | | | | | | | | |
Common Stocks | | $ | 322,899 | | | $ | - | | | $ | - | | | |
Investment Companies | | | 15,197 | | | | - | | | | - | | | |
Short-Term Investments | | | - | | | | 41,395 | | | | - | | | |
Other Financial Instruments^ | | | | | | | | | | | | | | |
Futures | | | 353 | | | | - | | | | - | | | |
Total | | $ | 338,449 | | | $ | 41,395 | | | $ | - | | | |
^ Other financial instruments are derivative instruments such as futures, forwards, written options and swaps contracts, which are valued at the unrealized appreciation (depreciation) on the instrument and short sales, which are valued at market value.
The Accompanying Notes are an Integral Part of the Financial Statements.
| | | | | | |
| | Small Cap Growth Stock Portfolio | | | 53 | |
Index 600 Stock Portfolio
| | | | |
| Objective: | | Portfolio Strategy: | | Net Assets: |
| Investment results that approximate the performance of the S&P SmallCap 600® Index. | | Invest in stocks included in the S&P SmallCap 600® Index in approximately the same proportion as each stock’s weighting in the Index. | | $74 million |
Portfolio Overview
Mason Street Advisors acts as the investment adviser for the Index 600 Stock Portfolio (the “Portfolio”). The Portfolio attempts to achieve its objective by investing all, or substantially all, of its assets in stocks that make up the S&P SmallCap 600® Index (“Index”), holding each stock in approximately the same proportion as its weighting in the Index. This is known as a full replication strategy. The Portfolio may also invest in exchange traded funds and swap agreements, and to a lesser extent, futures contracts, for cash management purposes and to help achieve full replication.
Market Overview
Equity markets finished the year with solid gains (as measured by the Index) despite economic uncertainty and significant volatility. Throughout the year, investors shifted their focus from uncertainty regarding the pace of global economic growth to evaluating fiscal and economic stimulus measures implemented globally. The economic slowdown in China, fiscal and debt crises in Europe, and the slow pace of growth in the U.S. drove volatility. As these issues arose, policy makers responded with stimulus and financing measures designed to calm markets. Ultimately, investors embraced risk, as record profit margins in the U.S. and remarkable cash flow generation propelled equity markets during the year. In that environment, mid cap stocks outperformed shares of large and small sized companies. For the year, returns for the S&P 500®, MidCap 400®, and SmallCap 600® Indices were 16.00%, 17.88%, and 16.33%, respectively.
Within the S&P SmallCap 600® Index, the Consumer Discretionary sector drove performance more than any other sector, as consumers continued to spend despite slow economic growth. Returns for industries within the sector varied widely—specialty retail, hotel, restaurant and leisure stocks experienced solid performance, while consumer services and internet retailers had negative returns overall. Stocks in the economically sensitive Materials and Industrials sectors also outperformed other small cap stocks, as investors preferred companies with more business in the U.S. and less exposure to slowing global growth. The Financial sector also delivered solid performance, driven by Real Estate Investment Trusts (REITs).
Meanwhile, the Energy sector finished the year relatively unchanged due to flat oil and persistently low natural gas prices. The traditionally defensive Utilities sector also lagged the broad Index, reflecting investors’ preference for riskier stocks.
Portfolio Results
The Portfolio posted a total return of 15.80% in the twelve months ended December 31, 2012. That was in line with the 16.33% return of the Index. (The Index is unmanaged, cannot be invested in directly and does not include administrative expenses or sales charges.) Portfolio performance slightly lagged the Index due to transaction costs, administrative expenses, cash flow effects and the costs associated with the use of exchange traded funds and other derivative instruments used to achieve full replication. The average return for the Portfolio’s peer group, Small Cap Core Funds, was 15.68%, according to Lipper® Analytical Services, Inc., an independent mutual fund ranking agency. However, the Small Cap Core Funds peer group is not strictly comparable to the Portfolio because many of the funds in the group are actively managed.
As the Portfolio seeks to track the performance and weightings of stocks in the Index, the portfolio managers make adjustments to the Portfolio’s holdings as the Index changes. Standard & Poor’s modifies the composition of the Index as companies go public or private, merge, divest or have major changes in market capitalization. Additionally, Standard & Poor’s adjusts the Index to better reflect the companies that are most representative of the composition of the U.S. economy. During 2012, there were 38 stocks added to the Index, and a like number of companies were eliminated. The portfolio managers try to make these adjustments in a way that minimizes the cost and market impact of trading.
Portfolio Manager Outlook
We have a cautiously optimistic view of equity markets heading into 2013. Currently, stocks appear relatively attractive given reasonable valuations, record high profit margins and cash positions, as well as relatively low energy prices. Extremely low interest rates have also led to improving fundamentals in the housing market and steady increases in employment.
Nevertheless, the market still faces a number of risks—from uncertainty surrounding further economic stimulus and concerns over the developed world’s ongoing debt crisis, among others— that have the potential for creating a volatile market environment for the foreseeable future.
| | | | | | |
| | 54 | | | Index 600 Stock Portfolio | | |
Index 600 Stock Portfolio
Relative Performance

| | | | | | | | | | | | |
Average Annual Total Returns For Periods Ended December 31, 2012 | |
| | | 1 Year | | | 5 Years | | | Since Inception* | |
Index 600 Stock Portfolio | | | 15.80% | | | | 4.81% | | | | 3.12 | % |
S&P SmallCap 600® Index | | | 16.33% | | | | 5.13% | | | | 3.47 | % |
Lipper® Variable Insurance Products (VIP) Small Cap Core Funds Average | | | 15.68% | | | | 3.41% | | | | - | |
| * | Inception date of 4/30/07 |
The performance data quoted represents past performance. Past performance is historical and does not guarantee future performance. Investment return and principal value will fluctuate, so that shares, when redeemed, may be worth more or less than their original cost. Current performance may be lower or higher than the performance data quoted. For the most recent month-end performance information visit www.northwesternmutual.com.
This chart assumes an initial investment of $10,000 made on 4/30/07 (commencement of the Portfolio’s operations). Returns shown reflect fee waivers, deductions for management and other portfolio expenses, and reinvestment of all dividends. In the absence of fee waivers, total return would be reduced. Returns exclude deductions for separate account sale loads and account fees. Please refer to the Benchmark Definitions section of this report for information about the indices cited in the above chart and graph.
“Standard & Poor’s®”, “S&P®”, “S&P SmallCap 600” and “Standard & Poor’s SmallCap 600” are trademarks of The McGraw-Hill Companies, Inc. and have been licensed for use by Northwestern Mutual Life Insurance Company. The Portfolio is not sponsored, endorsed, sold or promoted by Standard & Poor’s, and Standard & Poor’s makes no representation regarding the advisability of investing in the Portfolio.
Stocks of smaller or newer companies, such as those held in this Portfolio, are more likely to realize more substantial growth as well as suffer more significant losses than larger or more established issuers. Investments in such companies can be both more volatile and more speculative. Investing in small company stocks involves a greater degree of risk than investing in medium or large company stocks.
The Portfolio may invest in exchange-traded funds and derivative instruments such as futures contracts and swap agreements for cash management purposes and to help achieve full replication. Use of these instruments may involve certain costs and imposes certain risks such as liquidity risk, market risk, credit risk, management risk and the risk of mispricing or improper valuation. Certain derivatives involve leverage, which could magnify losses, and portfolios investing in derivatives could lose more than the principal amount invested in those instruments.
Top 10 Equity Holdings 12/31/12
| | |
| Security Description | | % of Net Assets |
iShares S&P SmallCap 600 Index Fund | | 2.3% |
Extra Space Storage, Inc. | | 0.6% |
Kilroy Realty Corp. | | 0.6% |
Tanger Factory Outlet Centers, Inc. | | 0.6% |
CommVault Systems, Inc. | | 0.5% |
Cymer, Inc. | | 0.5% |
Mid-America Apartment Communities, Inc. | | 0.5% |
Eagle Materials, Inc. | | 0.5% |
Post Properties, Inc. | | 0.5% |
Cubist Pharmaceuticals, Inc. | | 0.5% |
Sector Allocation 12/31/12

Sector Allocation is based on equities.
Sector Allocation and Top 10 Holdings are subject to change.
| | | | | | |
| | Index 600 Stock Portfolio | | | 55 | |
Index 600 Stock Portfolio
Schedule of Investments
December 31, 2012
| | | | | | | | | | |
| | | Common Stocks (89.0%) | | Shares/
$ Par | | | Value $ (000’s) | |
| |
| | Consumer Discretionary (13.4%) | |
| | American Greetings Corp. - Class A | | | 4,016 | | | | 68 | |
| * | | American Public Education, Inc. | | | 2,295 | | | | 83 | |
| | Arbitron, Inc. | | | 3,324 | | | | 155 | |
| * | | Arctic Cat, Inc. | | | 1,683 | | | | 56 | |
| | Big 5 Sporting Goods Corp. | | | 2,126 | | | | 28 | |
| * | | Biglari Holdings, Inc. | | | 153 | | | | 60 | |
| * | | BJ’s Restaurants, Inc. | | | 3,133 | | | | 103 | |
| * | | Blue Nile, Inc. | | | 1,588 | | | | 61 | |
| | Blyth, Inc. | | | 1,429 | | | | 22 | |
| * | | Boyd Gaming Corp. | | | 7,150 | | | | 48 | |
| | Brown Shoe Co., Inc. | | | 5,177 | | | | 95 | |
| | Brunswick Corp. | | | 11,373 | | | | 331 | |
| | The Buckle, Inc. | | | 3,479 | | | | 155 | |
| * | | Buffalo Wild Wings, Inc. | | | 2,363 | | | | 172 | |
| | Callaway Golf Co. | | | 9,018 | | | | 59 | |
| * | | Capella Education Co. | | | 1,453 | | | | 41 | |
| * | | Career Education Corp. | | | 6,479 | | | | 23 | |
| | The Cato Corp. - Class A | | | 3,423 | | | | 94 | |
| | CEC Entertainment, Inc. | | | 2,136 | | | | 71 | |
| * | | The Children’s Place Retail Stores, Inc. | | | 2,997 | | | | 133 | |
| * | | Christopher & Banks Corp. | | | 4,698 | | | | 26 | |
| * | | Coinstar, Inc. | | | 3,834 | | | | 199 | |
| * | | Coldwater Creek, Inc. | | | 2,559 | | | | 12 | |
| * | | Corinthian Colleges, Inc. | | | 9,914 | | | | 24 | |
| | Cracker Barrel Old Country Store, Inc. | | | 3,009 | | | | 193 | |
| * | | Crocs, Inc. | | | 11,558 | | | | 166 | |
| * | | Digital Generation, Inc. | | | 3,230 | | | | 35 | |
| * | | DineEquity, Inc. | | | 1,967 | | | | 132 | |
| | Drew Industries, Inc. | | | 2,389 | | | | 77 | |
| * | | The E.W. Scripps Co. - Class A | | | 3,630 | | | | 39 | |
| | Ethan Allen Interiors, Inc. | | | 3,297 | | | | 85 | |
| * | | Fifth & Pacific Cos., Inc. | | | 14,377 | | | | 179 | |
| | The Finish Line, Inc. - Class A | | | 6,458 | | | | 122 | |
| | Fred’s, Inc. - Class A | | | 4,289 | | | | 57 | |
| * | | Genesco, Inc. | | | 3,068 | | | | 169 | |
| | Group 1 Automotive, Inc. | | | 2,713 | | | | 168 | |
| | Harte-Hanks, Inc. | | | 5,502 | | | | 33 | |
| | Haverty Furniture Cos., Inc. | | | 2,496 | | | | 41 | |
| * | | Helen of Troy, Ltd. | | | 4,041 | | | | 135 | |
| * | | Hibbett Sports, Inc. | | | 3,279 | | | | 173 | |
| | Hillenbrand, Inc. | | | 7,955 | | | | 180 | |
| | Hot Topic, Inc. | | | 5,375 | | | | 52 | |
| | | | | | | | | | |
| | | Common Stocks (89.0%) | | Shares/
$ Par | | | Value
$ (000’s) | |
| |
| | Consumer Discretionary continued | |
| * | | Iconix Brand Group, Inc. | | | 8,667 | | | | 193 | |
| | Interval Leisure Group, Inc. | | | 4,912 | | | | 95 | |
| * | | iRobot Corp. | | | 3,314 | | | | 62 | |
| * | | ITT Educational Services, Inc. | | | 2,100 | | | | 36 | |
| * | | Jack in the Box, Inc. | | | 5,451 | | | | 156 | |
| | JAKKS Pacific, Inc. | | | 2,629 | | | | 33 | |
| * | | Jos. A. Bank Clothiers, Inc. | | | 3,550 | | | | 151 | |
| * | | Kirkland’s, Inc. | | | 1,908 | | | | 20 | |
| * | | K-Swiss, Inc. - Class A | | | 3,041 | | | | 10 | |
| | La-Z-Boy, Inc. | | | 6,662 | | | | 94 | |
| | Lincoln Educational Services Corp. | | | 2,693 | | | | 15 | |
| | Lithia Motors, Inc. -
Class A | | | 2,662 | | | | 100 | |
| * | | Live Nation, Inc. | | | 17,931 | | | | 167 | |
| * | | Lumber Liquidators Holdings, Inc. | | | 3,448 | | | | 182 | |
| * | | M/I Homes, Inc. | | | 2,723 | | | | 72 | |
| * | | Maidenform Brands, Inc. | | | 2,995 | | | | 58 | |
| | The Marcus Corp. | | | 2,509 | | | | 31 | |
| * | | MarineMax, Inc. | | | 3,019 | | | | 27 | |
| * | | Marriott Vacations Worldwide Corp. | | | 3,640 | | | | 152 | |
| | The Men’s Wearhouse, Inc. | | | 6,077 | | | | 189 | |
| * | | Meritage Homes Corp. | | | 3,933 | | | | 147 | |
| * | | Monarch Casino & Resort, Inc. | | | 1,196 | | | | 13 | |
| | Monro Muffler Brake, Inc. | | | 3,736 | | | | 131 | |
| | Movado Group, Inc. | | | 2,252 | | | | 69 | |
| * | | Multimedia Games, Inc. | | | 3,595 | | | | 53 | |
| | Nutrisystem, Inc. | | | 3,626 | | | | 30 | |
| | OfficeMax, Inc. | | | 11,020 | | | | 108 | |
| | Oxford Industries, Inc. | | | 1,811 | | | | 84 | |
| * | | Papa John’s International, Inc. | | | 2,204 | | | | 121 | |
| | The Pep Boys - Manny, Moe & Jack | | | 6,746 | | | | 66 | |
| | Perry Ellis International, Inc. | | | 1,527 | | | | 30 | |
| | PetMed Express, Inc. | | | 2,542 | | | | 28 | |
| * | | Pinnacle Entertainment, Inc. | | | 7,485 | | | | 119 | |
| | Pool Corp. | | | 5,933 | | | | 251 | |
| * | | Quiksilver, Inc. | | | 15,809 | | | | 67 | |
| * | | Red Robin Gourmet Burgers, Inc. | | | 1,647 | | | | 58 | |
| * | | Ruby Tuesday, Inc. | | | 7,601 | | | | 60 | |
| * | | Rue21, Inc. | | | 1,994 | | | | 57 | |
| * | | Ruth’s Hospitality Group, Inc. | | | 4,513 | | | | 33 | |
| | | | | | | | | | |
| | | Common Stocks (89.0%) | | Shares/
$ Par | | | Value
$ (000’s) | |
| |
| | Consumer Discretionary continued | |
| | The Ryland Group, Inc. | | | 5,736 | | | | 209 | |
| * | | Select Comfort Corp. | | | 7,119 | | | | 186 | |
| * | | SHFL Entertainment, Inc. | | | 7,109 | | | | 103 | |
| * | | Skechers U.S.A., Inc. -
Class A | | | 4,875 | | | | 90 | |
| | Sonic Automotive, Inc. - Class A | | | 4,652 | | | | 97 | |
| * | | Sonic Corp. | | | 6,922 | | | | 72 | |
| | Spartan Motors, Inc. | | | 3,953 | | | | 20 | |
| | Stage Stores, Inc. | | | 4,054 | | | | 101 | |
| | Standard Motor Products, Inc. | | | 2,493 | | | | 55 | |
| * | | Standard Pacific Corp. | | | 13,999 | | | | 103 | |
| | Stein Mart, Inc. | | | 3,499 | | | | 26 | |
| * | | Steven Madden, Ltd. | | | 5,191 | | | | 219 | |
| | Sturm, Ruger & Co., Inc. | | | 2,434 | | | | 111 | |
| | Superior Industries International, Inc. | | | 2,942 | | | | 60 | |
| | Texas Roadhouse, Inc. | | | 7,449 | | | | 125 | |
| | True Religion Apparel, Inc. | | | 3,079 | | | | 78 | |
| * | | Tuesday Morning Corp. | | | 5,399 | | | | 34 | |
| * | | Universal Electronics, Inc. | | | 1,911 | | | | 37 | |
| | Universal Technical Institute, Inc. | | | 2,751 | | | | 28 | |
| * | | Vitamin Shoppe, Inc. | | | 3,832 | | | | 220 | |
| * | | VOXX International Corp. | | | 2,408 | | | | 16 | |
| * | | Winnebago Industries, Inc. | | | 3,600 | | | | 62 | |
| | Wolverine World Wide, Inc. | | | 6,227 | | | | 255 | |
| * | | Zale Corp. | | | 3,330 | | | | 14 | |
| * | | Zumiez, Inc. | | | 2,828 | | | | 55 | |
| | | | | | | | | | |
| | Total | | | | | | | 9,899 | |
| | | | | | | | | | |
| |
| | Consumer Staples (3.4%) | |
| * | | Alliance One International, Inc. | | | 10,466 | | | | 38 | |
| | The Andersons, Inc. | | | 2,197 | | | | 94 | |
| | B&G Foods, Inc. | | | 6,677 | | | | 189 | |
| * | | The Boston Beer Co., Inc. - Class A | | | 1,066 | | | | 143 | |
| | Calavo Growers, Inc. | | | 1,616 | | | | 41 | |
| | Cal-Maine Foods, Inc. | | | 1,763 | | | | 71 | |
| | Casey’s General Stores, Inc. | | | 4,867 | | | | 258 | |
| * | | Central Garden & Pet Co. - Class A | | | 5,227 | | | | 55 | |
| * | | Darling International, Inc. | | | 14,961 | | | | 240 | |
| | Diamond Foods, Inc. | | | 2,804 | | | | 38 | |
| * | | The Hain Celestial Group, Inc. | | | 5,696 | | | | 309 | |
The Accompanying Notes are an Integral Part of the Financial Statements.
| | | | |
| 56 | | Index 600 Stock Portfolio | | |
Index 600 Stock Portfolio
| | | | | | | | | | |
| | | Common Stocks (89.0%) | | Shares/
$ Par | | | Value
$ (000’s) | |
| |
| | Consumer Staples continued | |
| | Inter Parfums, Inc. | | | 2,059 | | | | 40 | |
| | J & J Snack Foods Corp. | | | 1,882 | | | | 120 | |
| * | | Medifast, Inc. | | | 1,736 | | | | 46 | |
| | Nash Finch Co. | | | 1,559 | | | | 33 | |
| * | | Prestige Brands Holdings, Inc. | | | 6,416 | | | | 129 | |
| | Sanderson Farms, Inc. | | | 2,539 | | | | 121 | |
| * | | Seneca Foods Corp. - Class A | | | 985 | | | | 30 | |
| | Snyders-Lance, Inc. | | | 6,108 | | | | 147 | |
| | Spartan Stores, Inc. | | | 2,764 | | | | 43 | |
| * | | TreeHouse Foods, Inc. | | | 4,597 | | | | 240 | |
| | WD-40 Co. | | | 1,877 | | | | 88 | |
| | | | | | | | | | |
| | Total | | | | | | | 2,513 | |
| | | | | | | | | | |
| |
| | Energy (3.6%) | |
| * | | Approach Resources, Inc. | | | 4,210 | | | | 105 | |
| * | | Basic Energy Services, Inc. | | | 3,475 | | | | 40 | |
| | Bristow Group, Inc. | | | 4,571 | | | | 245 | |
| * | | Carrizo Oil & Gas, Inc. | | | 4,634 | | | | 97 | |
| * | | Cloud Peak Energy, Inc. | | | 7,762 | | | | 150 | |
| * | | Comstock Resources, Inc. | | | 5,690 | | | | 86 | |
| | Contango Oil & Gas Co. | | | 1,621 | | | | 69 | |
| * | | Exterran Holdings, Inc. | | | 8,245 | | | | 181 | |
| * | | Geospace Technologies Corp. | | | 1,620 | | | | 144 | |
| | Gulf Island Fabrication, Inc. | | | 1,831 | | | | 44 | |
| * | | Gulfport Energy Corp. | | | 6,300 | | | | 241 | |
| * | | Hornbeck Offshore Services, Inc. | | | 4,048 | | | | 139 | |
| * | | ION Geophysical Corp. | | | 15,260 | | | | 99 | |
| | Lufkin Industries, Inc. | | | 4,271 | | | | 248 | |
| * | | Matrix Service Co. | | | 3,292 | | | | 38 | |
| * | | PDC Energy, Inc. | | | 3,845 | | | | 128 | |
| | Penn Virginia Corp. | | | 6,999 | | | | 31 | |
| * | | PetroQuest Energy, Inc. | | | 7,161 | | | | 35 | |
| * | | Pioneer Energy Services Corp. | | | 7,880 | | | | 57 | |
| | SEACOR Holdings, Inc. | | | 2,517 | | | | 211 | |
| * | | Stone Energy Corp. | | | 6,289 | | | | 129 | |
| * | | Swift Energy Co. | | | 5,453 | | | | 84 | |
| * | | TETRA Technologies, Inc. | | | 9,919 | | | | 75 | |
| | | | | | | | | | |
| | Total | | | | | | | 2,676 | |
| | | | | | | | | | |
| |
| | Financials (18.9%) | |
| | Acadia Realty Trust | | | 6,437 | | | | 161 | |
| * | | AMERISAFE, Inc. | | | 2,310 | | | | 63 | |
| | Bank Mutual Corp. | | | 5,473 | | | | 24 | |
| | Bank of the Ozarks, Inc. | | | 3,746 | | | | 125 | |
| | Banner Corp. | | | 2,220 | | | | 68 | |
| | BBCN Bancorp, Inc. | | | 9,914 | | | | 115 | |
| | Boston Private Financial Holdings, Inc. | | | 10,028 | | | | 90 | |
| | Brookline Bancorp, Inc. | | | 8,897 | | | | 76 | |
| | | | | | | | | | |
| | | Common Stocks (89.0%) | | Shares/
$ Par | | | Value
$ (000’s) | |
| |
| | Financials continued | |
| | Calamos Asset Management, Inc. | | | 2,590 | | | | 27 | |
| | Cash America International, Inc. | | | 3,691 | | | | 146 | |
| | Cedar Realty Trust, Inc. | | | 6,945 | | | | 37 | |
| | City Holding Co. | | | 1,884 | | | | 66 | |
| | Colonial Properties Trust | | | 10,522 | | | | 225 | |
| | Columbia Banking System, Inc. | | | 5,042 | | | | 91 | |
| | Community Bank System, Inc. | | | 5,029 | | | | 138 | |
| | Cousins Properties, Inc. | | | 11,508 | | | | 96 | |
| | CVB Financial Corp. | | | 11,186 | | | | 116 | |
| | DiamondRock Hospitality Co. | | | 24,791 | | | | 223 | |
| | Dime Community Bancshares | | | 3,664 | | | | 51 | |
| | EastGroup Properties, Inc. | | | 3,765 | | | | 203 | |
| * | | eHealth, Inc. | | | 2,573 | | | | 71 | |
| | Employers Holdings, Inc. | | | 3,903 | | | | 80 | |
| * | | Encore Capital Group, Inc. | | | 2,954 | | | | 90 | |
| | EPR Properties | | | 5,951 | | | | 274 | |
| | Extra Space Storage, Inc. | | | 13,011 | | | | 474 | |
| * | | EZCORP, Inc. - Class A | | | 5,742 | | | | 114 | |
| | F.N.B. Corp. | | | 17,759 | | | | 189 | |
| * | | Financial Engines, Inc. | | | 5,231 | | | | 145 | |
| * | | First BanCorp. | | | 8,905 | | | | 41 | |
| * | | First Cash Financial Services, Inc. | | | 3,347 | | | | 166 | |
| | First Commonwealth Financial Corp. | | | 13,036 | | | | 89 | |
| | First Financial Bancorp. | | | 7,433 | | | | 109 | |
| | First Financial Bankshares, Inc. | | | 3,800 | | | | 148 | |
| | First Midwest Bancorp, Inc. | | | 9,508 | | | | 119 | |
| * | | Forestar Group, Inc. | | | 4,407 | | | | 76 | |
| | Franklin Street Properties Corp. | | | 9,166 | | | | 113 | |
| | Getty Realty Corp. | | | 3,394 | | | | 61 | |
| | Glacier Bancorp, Inc. | | | 9,139 | | | | 134 | |
| | Government Properties Income Trust | | | 5,484 | | | | 131 | |
| * | | Hanmi Financial Corp. | | | 4,001 | | | | 54 | |
| | Healthcare Realty Trust, Inc. | | | 11,082 | | | | 266 | |
| | HFF, Inc. - Class A | | | 4,143 | | | | 62 | |
| | Home Bancshares, Inc. | | | 2,916 | | | | 96 | |
| | Horace Mann Educators Corp. | | | 5,002 | | | | 100 | |
| | Independent Bank Corp. | | | 2,887 | | | | 84 | |
| | Infinity Property & Casualty Corp. | | | 1,483 | | | | 86 | |
| | Inland Real Estate Corp. | | | 9,873 | | | | 83 | |
| | Interactive Brokers Group, Inc. - Class A | | | 5,188 | | | | 71 | |
| | | | | | | | | | |
| | | Common Stocks (89.0%) | | Shares/
$ Par | | | Value
$ (000’s) | |
| |
| | Financials continued | |
| * | | Investment Technology Group, Inc. | | | 4,821 | | | | 43 | |
| | Kilroy Realty Corp. | | | 9,475 | | | | 449 | |
| | Kite Realty Group Trust | | | 9,281 | | | | 52 | |
| | LaSalle Hotel Properties | | | 11,975 | | | | 304 | |
| | Lexington Realty Trust | | | 19,293 | | | | 202 | |
| | LTC Properties, Inc. | | | 3,874 | | | | 136 | |
| | MarketAxess Holdings, Inc. | | | 4,738 | | | | 167 | |
| | Meadowbrook Insurance Group, Inc. | | | 5,944 | | | | 34 | |
| | Medical Properties Trust, Inc. | | | 17,223 | | | | 206 | |
| | Mid-America Apartment Communities, Inc. | | | 5,370 | | | | 348 | |
| * | | National Financial Partners Corp. | | | 5,061 | | | | 87 | |
| | National Penn Bancshares, Inc. | | | 15,389 | | | | 143 | |
| * | | The Navigators Group, Inc. | | | 1,338 | | | | 68 | |
| | NBT Bancorp, Inc. | | | 4,287 | | | | 87 | |
| | Northwest Bancshares, Inc. | | | 12,403 | | | | 151 | |
| | Old National Bancorp | | | 12,882 | | | | 153 | |
| | Oritani Financial Corp. | | | 4,945 | | | | 76 | |
| | PacWest Bancorp | | | 4,088 | | | | 101 | |
| | Parkway Properties, Inc. | | | 4,238 | | | | 59 | |
| | Pennsylvania Real Estate Investment Trust | | | 6,685 | | | | 118 | |
| * | | Pinnacle Financial Partners, Inc. | | | 4,143 | | | | 78 | |
| * | | Piper Jaffray Cos., Inc. | | | 2,066 | | | | 66 | |
| * | | Portfolio Recovery Associates, Inc. | | | 2,145 | | | | 229 | |
| | Post Properties, Inc. | | | 6,912 | | | | 345 | |
| | PrivateBancorp, Inc. | | | 7,944 | | | | 122 | |
| | ProAssurance Corp. | | | 7,808 | | | | 329 | |
| | Prospect Capital Corp. | | | 23,357 | | | | 254 | |
| | Provident Financial Services, Inc. | | | 6,878 | | | | 103 | |
| | PS Business Parks, Inc. | | | 2,283 | | | | 148 | |
| | RLI Corp. | | | 2,157 | | | | 140 | |
| | S&T Bancorp, Inc. | | | 3,777 | | | | 68 | |
| | Sabra Health Care REIT, Inc. | | | 4,707 | | | | 102 | |
| | Safety Insurance Group, Inc. | | | 1,615 | | | | 75 | |
| | Saul Centers, Inc. | | | 1,618 | | | | 69 | |
| | Selective Insurance Group, Inc. | | | 6,987 | | | | 135 | |
| | Simmons First National Corp. - Class A | | | 2,110 | | | | 54 | |
| | Sovran Self Storage, Inc. | | | 3,866 | | | | 240 | |
| | Sterling Bancorp | | | 3,933 | | | | 36 | |
| | Stewart Information Services Corp. | | | 2,262 | | | | 59 | |
| * | | Stifel Financial Corp. | | | 6,335 | | | | 203 | |
| | Susquehanna Bancshares, Inc. | | | 23,688 | | | | 248 | |
The Accompanying Notes are an Integral Part of the Financial Statements.
| | | | | | |
| | Index 600 Stock Portfolio | | | 57 | |
Index 600 Stock Portfolio
| | | | | | | | | | |
| | | Common Stocks (89.0%) | | Shares/
$ Par | | | Value
$ (000’s) | |
| |
| | Financials continued | |
| * | | SWS Group, Inc. | | | 3,592 | | | | 19 | |
| | Tanger Factory Outlet Centers, Inc. | | | 11,930 | | | | 408 | |
| * | | Texas Capital Bancshares, Inc. | | | 5,156 | | | | 231 | |
| | Tompkins Financial Corp. | | | 1,460 | | | | 58 | |
| | Tower Group, Inc. | | | 4,388 | | | | 78 | |
| | TrustCo Bank Corp. NY | | | 11,933 | | | | 63 | |
| | UMB Financial Corp. | | | 4,126 | | | | 181 | |
| | Umpqua Holdings Corp. | | | 14,219 | | | | 168 | |
| | United Bankshares, Inc. | | | 5,812 | | | | 141 | |
| * | | United Community Banks, Inc. | | | 5,866 | | | | 55 | |
| | United Fire Group, Inc. | | | 2,777 | | | | 61 | |
| | Universal Health Realty Income Trust | | | 1,612 | | | | 82 | |
| | Urstadt Biddle Properties, Inc. - Class A | | | 3,243 | | | | 64 | |
| | ViewPoint Financial Group | | | 4,525 | | | | 95 | |
| * | | Virtus Investment Partners, Inc. | | | 737 | | | | 89 | |
| * | | Wilshire Bancorp, Inc. | | | 7,880 | | | | 46 | |
| | Wintrust Financial Corp. | | | 4,629 | | | | 170 | |
| * | | World Acceptance Corp. | | | 1,642 | | | | 122 | |
| | | | | | | | | | |
| | Total | | | | | | | 13,885 | |
| | | | | | | | | | |
| |
| | Health Care (9.4%) | |
| | Abaxis, Inc. | | | 2,621 | | | | 97 | |
| * | | ABIOMED, Inc. | | | 4,586 | | | | 62 | |
| * | | Acorda Therapeutics, Inc. | | | 5,102 | | | | 127 | |
| * | | Affymetrix, Inc. | | | 8,980 | | | | 29 | |
| | Air Methods Corp. | | | 4,428 | | | | 163 | |
| * | | Akorn, Inc. | | | 8,608 | | | | 115 | |
| * | | Align Technology, Inc. | | | 9,098 | | | | 253 | |
| | Almost Family, Inc. | | | 1,055 | | | | 21 | |
| * | | Amedisys, Inc. | | | 3,931 | | | | 44 | |
| * | | AMN Healthcare Services, Inc. | | | 5,639 | | | | 65 | |
| * | | AmSurg Corp. | | | 4,024 | | | | 121 | |
| | Analogic Corp. | | | 1,554 | | | | 115 | |
| * | | ArQule, Inc. | | | 7,445 | | | | 21 | |
| * | | Bio-Reference Laboratories, Inc. | | | 3,097 | | | | 89 | |
| * | | Cambrex Corp. | | | 3,794 | | | | 43 | |
| | Cantel Medical Corp. | | | 2,730 | | | | 81 | |
| * | | Centene Corp. | | | 6,559 | | | | 269 | |
| | Chemed Corp. | | | 2,450 | | | | 168 | |
| | Computer Programs and Systems, Inc. | | | 1,323 | | | | 67 | |
| | CONMED Corp. | | | 3,619 | | | | 101 | |
| * | | CorVel Corp. | | | 783 | | | | 35 | |
| * | | Cross Country Healthcare, Inc. | | | 3,926 | | | | 19 | |
| | CryoLife, Inc. | | | 3,172 | | | | 20 | |
| * | | Cubist Pharmaceuticals, Inc. | | | 8,182 | | | | 344 | |
| | | | | | | | | | |
| | | Common Stocks (89.0%) | | Shares/
$ Par | | | Value
$ (000’s) | |
| |
| | Health Care continued | |
| * | | Cyberonics, Inc. | | | 3,028 | | | | 159 | |
| * | | Emergent Biosolutions, Inc. | | | 3,229 | | | | 52 | |
| | Ensign Group, Inc. | | | 2,220 | | | | 60 | |
| * | | Enzo Biochem, Inc. | | | 4,241 | | | | 11 | |
| * | | Gentiva Health Services, Inc. | | | 3,619 | | | | 36 | |
| * | | Greatbatch, Inc. | | | 3,010 | | | | 70 | |
| * | | Haemonetics Corp. | | | 6,552 | | | | 268 | |
| * | | Hanger Orthopedic Group, Inc. | | | 4,351 | | | | 119 | |
| * | | HealthStream, Inc. | | | 2,499 | | | | 61 | |
| * | | Healthways, Inc. | | | 4,311 | | | | 46 | |
| | Hi-Tech Pharmacal Co., Inc. | | | 1,409 | | | | 49 | |
| * | | ICU Medical, Inc. | | | 1,631 | | | | 99 | |
| * | | Integra LifeSciences Holdings | | | 2,474 | | | | 96 | |
| | Invacare Corp. | | | 3,692 | | | | 60 | |
| * | | IPC The Hospitalist Co. | | | 2,119 | | | | 84 | |
| * | | Kindred Healthcare, Inc. | | | 6,769 | | | | 73 | |
| | Landauer, Inc. | | | 1,201 | | | | 74 | |
| * | | LHC Group, Inc. | | | 1,878 | | | | 40 | |
| * | | Luminex Corp. | | | 4,800 | | | | 80 | |
| * | | Magellan Health Services, Inc. | | | 3,512 | | | | 172 | |
| * | | The Medicines Co. | | | 6,843 | | | | 164 | |
| * | | Medidata Solutions, Inc. | | | 2,831 | | | | 111 | |
| | Meridian Bioscience, Inc. | | | 5,245 | | | | 106 | |
| * | | Merit Medical Systems, Inc. | | | 5,067 | | | | 70 | |
| * | | Molina Healthcare, Inc. | | | 3,787 | | | | 103 | |
| * | | Momenta Pharmaceuticals, Inc. | | | 5,779 | | | | 68 | |
| * | | MWI Veterinary Supply, Inc. | | | 1,528 | | | | 168 | |
| * | | Natus Medical, Inc. | | | 3,805 | | | | 43 | |
| * | | Neogen Corp. | | | 2,836 | | | | 129 | |
| * | | NuVasive, Inc. | | | 5,530 | | | | 86 | |
| * | | Omnicell, Inc. | | | 4,215 | | | | 63 | |
| * | | Palomar Medical Technologies, Inc. | | | 2,264 | | | | 21 | |
| * | | PAREXEL International Corp. | | | 7,473 | | | | 221 | |
| * | | PharMerica Corp. | | | 3,746 | | | | 53 | |
| * | | PSS World Medical, Inc. | | | 6,392 | | | | 185 | |
| | Quality Systems, Inc. | | | 5,053 | | | | 88 | |
| | Questcor Pharmaceuticals, Inc. | | | 7,425 | | | | 198 | |
| * | | Salix Pharmaceuticals, Ltd. | | | 6,354 | | | | 257 | |
| | Spectrum Pharmaceuticals, Inc. | | | 6,593 | | | | 74 | |
| * | | SurModics, Inc. | | | 1,545 | | | | 35 | |
| * | | Symmetry Medical, Inc. | | | 4,673 | | | | 49 | |
| * | | ViroPharma, Inc. | | | 8,373 | | | | 191 | |
| | West Pharmaceutical Services, Inc. | | | 4,335 | | | | 237 | |
| | | | | | | | | | |
| | Total | | | | | | | 6,898 | |
| | | | | | | | | | |
| | | | | | | | | | |
| | | Common Stocks (89.0%) | | Shares/
$ Par | | | Value
$ (000’s) | |
| |
| | Industrials (14.1%) | |
| | A.O. Smith Corp. | | | 4,927 | | | | 311 | |
| | AAON, Inc. | | | 2,368 | | | | 49 | |
| | AAR Corp. | | | 5,074 | | | | 95 | |
| | ABM Industries, Inc. | | | 6,407 | | | | 128 | |
| | Actuant Corp. - Class A | | | 9,258 | | | | 258 | |
| * | | Aegion Corp. | | | 4,990 | | | | 111 | |
| * | | Aerovironment, Inc. | | | 2,421 | | | | 53 | |
| | Albany International Corp. - Class A | | | 3,670 | | | | 83 | |
| | Allegiant Travel Co. | | | 1,936 | | | | 142 | |
| | American Science and Engineering, Inc. | | | 1,055 | | | | 69 | |
| | Apogee Enterprises, Inc. | | | 3,606 | | | | 86 | |
| | Applied Industrial Technologies, Inc. | | | 5,341 | | | | 224 | |
| | Arkansas Best Corp. | | | 3,027 | | | | 29 | |
| | Astec Industries, Inc. | | | 2,663 | | | | 89 | |
| | AZZ, Inc. | | | 3,216 | | | | 124 | |
| | Barnes Group, Inc. | | | 5,981 | | | | 134 | |
| | Belden, Inc. | | | 5,610 | | | | 252 | |
| | Brady Corp. - Class A | | | 5,845 | | | | 195 | |
| | Briggs & Stratton Corp. | | | 6,038 | | | | 127 | |
| | Cascade Corp. | | | 1,069 | | | | 69 | |
| | CDI Corp. | | | 1,769 | | | | 30 | |
| | CIRCOR International, Inc. | | | 2,214 | | | | 88 | |
| | Comfort Systems USA, Inc. | | | 4,736 | | | | 58 | |
| * | | Consolidated Graphics, Inc. | | | 1,038 | | | | 36 | |
| | Cubic Corp. | | | 2,038 | | | | 98 | |
| | Curtiss-Wright Corp. | | | 5,943 | | | | 195 | |
| * | | Dolan Co. | | | 3,660 | | | | 14 | |
| * | | Dycom Industries, Inc. | | | 4,141 | | | | 82 | |
| | EMCOR Group, Inc. | | | 8,453 | | | | 293 | |
| | Encore Wire Corp. | | | 2,362 | | | | 72 | |
| * | | EnerSys | | | 6,159 | | | | 232 | |
| * | | Engility Holdings, Inc. | | | 2,106 | | | | 41 | |
| * | | EnPro Industries, Inc. | | | 2,631 | | | | 108 | |
| | ESCO Technologies, Inc. | | | 3,386 | | | | 127 | |
| * | | Exponent, Inc. | | | 1,680 | | | | 94 | |
| * | | Federal Signal Corp. | | | 7,914 | | | | 60 | |
| | Forward Air Corp. | | | 3,732 | | | | 131 | |
| | Franklin Electric Co., Inc. | | | 2,449 | | | | 152 | |
| | G & K Services, Inc. - Class A | | | 2,429 | | | | 83 | |
| * | | GenCorp, Inc. | | | 7,686 | | | | 70 | |
| | The GEO Group, Inc. | | | 8,998 | | | | 254 | |
| * | | Gibraltar Industries, Inc. | | | 3,650 | | | | 58 | |
| | Griffon Corp. | | | 5,792 | | | | 66 | |
| | Healthcare Services Group, Inc. | | | 8,605 | | | | 200 | |
| | Heartland Express, Inc. | | | 5,833 | | | | 76 | |
| | Heidrick & Struggles International, Inc. | | | 2,078 | | | | 32 | |
| * | | Hub Group, Inc. - Class A | | | 4,510 | | | | 152 | |
The Accompanying Notes are an Integral Part of the Financial Statements.
| | | | |
| 58 | | Index 600 Stock Portfolio | | |
Index 600 Stock Portfolio
| | | | | | | | | | |
| | | Common Stocks (89.0%) | | Shares/
$ Par | | | Value
$ (000’s) | |
| |
| | Industrials continued | |
| * | | II-VI, Inc. | | | 6,930 | | | | 127 | |
| | Insperity, Inc. | | | 2,804 | | | | 91 | |
| | Interface, Inc. | | | 7,288 | | | | 117 | |
| | John Bean Technologies Corp. | | | 3,675 | | | | 65 | |
| | Kaman Corp. | | | 3,372 | | | | 124 | |
| | Kaydon Corp. | | | 4,078 | | | | 98 | |
| | Kelly Services, Inc. - Class A | | | 3,439 | | | | 54 | |
| | Knight Transportation, Inc. | | | 7,496 | | | | 110 | |
| * | | Korn/Ferry International | | | 6,174 | | | | 98 | |
| | Lindsay Corp. | | | 1,616 | | | | 129 | |
| * | | Lydall, Inc. | | | 2,158 | | | | 31 | |
| * | | Mobile Mini, Inc. | | | 4,819 | | | | 100 | |
| * | | Moog, Inc. - Class A | | | 5,761 | | | | 236 | |
| | Mueller Industries, Inc. | | | 3,569 | | | | 179 | |
| | National Presto Industries, Inc. | | | 621 | | | | 43 | |
| * | | Navigant Consulting, Inc. | | | 6,499 | | | | 72 | |
| * | | NCI Building Systems, Inc. | | | 2,404 | | | | 33 | |
| * | | Old Dominion Freight Line, Inc. | | | 8,976 | | | | 308 | |
| * | | On Assignment, Inc. | | | 5,538 | | | | 112 | |
| * | | Orbital Sciences Corp. | | | 7,558 | | | | 104 | |
| * | | Orion Marine Group, Inc. | | | 3,450 | | | | 25 | |
| * | | Powell Industries, Inc. | | | 1,150 | | | | 48 | |
| | Quanex Building Products Corp. | | | 4,691 | | | | 96 | |
| | Resources Connection, Inc. | | | 5,268 | | | | 63 | |
| | Robbins & Myers, Inc. | | | 5,409 | | | | 322 | |
| | Simpson Manufacturing Co., Inc. | | | 5,096 | | | | 167 | |
| | SkyWest, Inc. | | | 6,511 | | | | 81 | |
| | Standex International Corp. | | | 1,617 | | | | 83 | |
| * | | Sykes Enterprises, Inc. | | | 4,951 | | | | 75 | |
| * | | Teledyne Technologies, Inc. | | | 4,687 | | | | 305 | |
| | Tennant Co. | | | 2,361 | | | | 104 | |
| * | | Tetra Tech, Inc. | | | 8,111 | | | | 214 | |
| | The Toro Co. | | | 7,462 | | | | 321 | |
| * | | TrueBlue, Inc. | | | 5,103 | | | | 80 | |
| | UniFirst Corp. | | | 1,902 | | | | 139 | |
| | United Stationers, Inc. | | | 5,110 | | | | 158 | |
| | Universal Forest Products, Inc. | | | 2,514 | | | | 96 | |
| | Viad Corp. | | | 2,574 | | | | 70 | |
| | Vicor Corp. | | | 2,468 | | | | 13 | |
| | Watts Water Technologies, Inc. - Class A | | | 3,556 | | | | 153 | |
| | | | | | | | | | |
| | Total | | | | | | | 10,374 | |
| | | | | | | | | | |
| | | | | | | | | | |
| | | Common Stocks (89.0%) | | Shares/
$ Par | | | Value
$ (000’s) | |
| |
| | Information Technology (16.4%) | |
| * | | 3D Systems Corp. | | | 6,232 | | | | 332 | |
| * | | Advanced Energy Industries, Inc. | | | 4,475 | | | | 62 | |
| * | | Agilysys, Inc. | | | 1,800 | | | | 15 | |
| | Anixter International, Inc. | | | 3,400 | | | | 218 | |
| * | | Arris Group, Inc. | | | 14,402 | | | | 215 | |
| * | | ATMI, Inc. | | | 4,067 | | | | 85 | |
| * | | Avid Technology, Inc. | | | 3,857 | | | | 29 | |
| | Badger Meter, Inc. | | | 1,817 | | | | 86 | |
| | Bel Fuse, Inc. - Class B | | | 1,337 | | | | 26 | |
| * | | Benchmark Electronics, Inc. | | | 7,044 | | | | 117 | |
| | Black Box Corp. | | | 2,101 | | | | 51 | |
| | Blackbaud, Inc. | | | 5,737 | | | | 131 | |
| * | | Blucora, Inc. | | | 5,176 | | | | 81 | |
| * | | Bottomline Technologies, Inc. | | | 4,749 | | | | 125 | |
| | Brooks Automation, Inc. | | | 8,426 | | | | 68 | |
| | Cabot Microelectronics Corp. | | | 2,946 | | | | 105 | |
| * | | CACI International, Inc. - Class A | | | 2,900 | | | | 160 | |
| * | | Cardtronics, Inc. | | | 5,649 | | | | 134 | |
| * | | CEVA, Inc. | | | 2,848 | | | | 45 | |
| * | | Checkpoint Systems, Inc. | | | 5,157 | | | | 55 | |
| * | | CIBER, Inc. | | | 8,502 | | | | 28 | |
| * | | Cirrus Logic, Inc. | | | 8,319 | | | | 241 | |
| | Cognex Corp. | | | 5,076 | | | | 187 | |
| | Coherent, Inc. | | | 3,043 | | | | 154 | |
| | Cohu, Inc. | | | 2,893 | | | | 31 | |
| * | | CommVault Systems, Inc. | | | 5,373 | | | | 375 | |
| * | | comScore, Inc. | | | 4,119 | | | | 57 | |
| | Comtech Telecommunications Corp. | | | 2,210 | | | | 56 | |
| * | | CSG Systems International, Inc. | | | 4,283 | | | | 78 | |
| | CTS Corp. | | | 4,292 | | | | 46 | |
| * | | Cymer, Inc. | | | 3,954 | | | | 358 | |
| | Daktronics, Inc. | | | 4,725 | | | | 52 | |
| * | | DealerTrack Holdings, Inc. | | | 5,426 | | | | 156 | |
| * | | Dice Holdings, Inc. | | | 6,363 | | | | 58 | |
| * | | Digi International, Inc. | | | 3,349 | | | | 32 | |
| * | | Digital River, Inc. | | | 4,514 | | | | 65 | |
| * | | Diodes, Inc. | | | 4,559 | | | | 79 | |
| * | | DSP Group, Inc. | | | 2,766 | | | | 16 | |
| * | | DTS, Inc. | | | 2,373 | | | | 40 | |
| | Ebix, Inc. | | | 4,073 | | | | 65 | |
| | Electro Scientific Industries, Inc. | | | 3,174 | | | | 32 | |
| * | | Electronics for Imaging, Inc. | | | 5,915 | | | | 112 | |
| * | | Entropic Communications, Inc. | | | 11,249 | | | | 59 | |
| | EPIQ Systems, Inc. | | | 4,059 | | | | 52 | |
| * | | Exar Corp. | | | 5,835 | | | | 52 | |
| | | | | | | | | | |
| | | Common Stocks (89.0%) | | Shares/
$ Par | | | Value
$ (000’s) | |
| |
| | Information Technology continued | |
| * | | Exlservice Holdings, Inc. | | | 3,308 | | | | 88 | |
| * | | FARO Technologies, Inc. | | | 2,156 | | | | 77 | |
| | FEI Co. | | | 4,841 | | | | 268 | |
| | Forrester Research, Inc. | | | 1,841 | | | | 49 | |
| (n)* | | Gerber Scientific, Inc. | | | 2,359 | | | | 0 | |
| * | | GT Advance Technologies, Inc. | | | 15,119 | | | | 46 | |
| * | | Harmonic, Inc. | | | 14,708 | | | | 75 | |
| | Heartland Payment Systems, Inc. | | | 4,768 | | | | 141 | |
| * | | Higher One Holdings, Inc. | | | 4,018 | | | | 42 | |
| * | | Hittite Microwave Corp. | | | 3,443 | | | | 214 | |
| * | | iGATE Corp. | | | 3,874 | | | | 61 | |
| * | | Insight Enterprises, Inc. | | | 5,660 | | | | 98 | |
| * | | Interactive Intelligence Group | | | 1,891 | | | | 63 | |
| * | | Intermec, Inc. | | | 7,129 | | | | 70 | |
| * | | Intevac, Inc. | | | 2,981 | | | | 14 | |
| * | | Ixia | | | 6,711 | | | | 114 | |
| | j2 Global, Inc. | | | 5,477 | | | | 167 | |
| * | | Kopin Corp. | | | 7,832 | | | | 26 | |
| * | | Kulicke and Soffa Industries, Inc. | | | 9,534 | | | | 114 | |
| * | | Liquidity Services, Inc. | | | 3,117 | | | | 127 | |
| | Littelfuse, Inc. | | | 2,774 | | | | 171 | |
| * | | LivePerson, Inc. | | | 6,388 | | | | 84 | |
| * | | LogMeIn, Inc. | | | 2,836 | | | | 64 | |
| * | | Manhattan Associates, Inc. | | | 2,524 | | | | 152 | |
| | MAXIMUS, Inc. | | | 4,331 | | | | 274 | |
| * | | Measurement Specialties, Inc. | | | 1,948 | | | | 67 | |
| * | | Mercury Computer Systems, Inc. | | | 4,096 | | | | 38 | |
| | Methode Electronics, Inc. | | | 4,473 | | | | 45 | |
| | Micrel, Inc. | | | 5,971 | | | | 57 | |
| * | | Microsemi Corp. | | | 11,474 | | | | 241 | |
| * | | MicroStrategy, Inc. - Class A | | | 1,127 | | | | 105 | |
| | MKS Instruments, Inc. | | | 6,686 | | | | 172 | |
| | Monolithic Power Systems | | | 4,011 | | | | 89 | |
| | Monotype Imaging Holdings, Inc. | | | 4,702 | | | | 75 | |
| | MTS Systems Corp. | | | 1,994 | | | | 102 | |
| * | | Nanometrics, Inc. | | | 2,706 | | | | 39 | |
| * | | NETGEAR, Inc. | | | 4,862 | | | | 192 | |
| * | | NetScout Systems, Inc. | | | 4,567 | | | | 119 | |
| * | | Newport Corp. | | | 4,866 | | | | 65 | |
| | NIC, Inc. | | | 7,471 | | | | 122 | |
| * | | OpenTable, Inc. | | | 2,887 | | | | 141 | |
| * | | Oplink Communications, Inc. | | | 2,430 | | | | 38 | |
| * | | OSI Systems, Inc. | | | 2,387 | | | | 153 | |
| | Park Electrochemical Corp. | | | 2,458 | | | | 63 | |
The Accompanying Notes are an Integral Part of the Financial Statements.
| | | | | | |
| | Index 600 Stock Portfolio | | | 59 | |
Index 600 Stock Portfolio
| | | | | | | | | | |
| | | Common Stocks (89.0%) | | Shares/
$ Par | | | Value
$ (000’s) | |
| |
| | Information Technology continued | |
| | PC-Tel, Inc. | | | 2,211 | | | | 16 | |
| * | | Perficient, Inc. | | | 4,207 | | | | 50 | |
| * | | Pericom Semiconductor Corp. | | | 2,720 | | | | 22 | |
| * | | Plexus Corp. | | | 4,457 | | | | 115 | |
| | Power Integrations, Inc. | | | 3,680 | | | | 124 | |
| * | | Procera Networks, Inc. | | | 2,466 | | | | 46 | |
| * | | Progress Software Corp. | | | 8,119 | | | | 170 | |
| * | | QuinStreet, Inc. | | | 3,260 | | | | 22 | |
| * | | RadiSys Corp. | | | 2,871 | | | | 9 | |
| * | | Rofin-Sinar Technologies, Inc. | | | 3,568 | | | | 77 | |
| * | | Rogers Corp. | | | 2,107 | | | | 105 | |
| * | | Rubicon Technology, Inc. | | | 2,151 | | | | 13 | |
| * | | Rudolph Technologies, Inc. | | | 4,109 | | | | 55 | |
| * | | ScanSource, Inc. | | | 3,513 | | | | 112 | |
| * | | Sigma Designs, Inc. | | | 4,251 | | | | 22 | |
| * | | Sourcefire, Inc. | | | 3,822 | | | | 180 | |
| * | | Stamps.com, Inc. | | | 1,784 | | | | 45 | |
| * | | STR Holdings, Inc. | | | 4,869 | | | | 12 | |
| * | | Super Micro Computer, Inc. | | | 3,345 | | | | 34 | |
| | Supertex, Inc. | | | 1,326 | | | | 23 | |
| * | | Symmetricom, Inc. | | | 5,194 | | | | 30 | |
| * | | Synaptics, Inc. | | | 4,185 | | | | 125 | |
| * | | Synchronoss Technologies, Inc. | | | 3,446 | | | | 73 | |
| * | | SYNNEX Corp. | | | 3,368 | | | | 116 | |
| * | | Take-Two Interactive Software, Inc. | | | 11,529 | | | | 127 | |
| * | | TeleTech Holdings, Inc. | | | 2,866 | | | | 51 | |
| | Tessera Technologies, Inc. | | | 6,636 | | | | 109 | |
| * | | TriQuint Semiconductor, Inc. | | | 21,127 | | | | 102 | |
| * | | TTM Technologies, Inc. | | | 6,661 | | | | 61 | |
| * | | Tyler Technologies, Inc. | | | 3,339 | | | | 162 | |
| * | | Ultratech, Inc. | | | 3,433 | | | | 128 | |
| | United Online, Inc. | | | 11,558 | | | | 65 | |
| * | | VASCO Data Security International, Inc. | | | 3,664 | | | | 30 | |
| * | | Veeco Instruments, Inc. | | | 4,974 | | | | 147 | |
| * | | ViaSat, Inc. | | | 5,088 | | | | 198 | |
| * | | Virtusa Corp. | | | 2,560 | | | | 42 | |
| * | | Volterra Semiconductor Corp. | | | 3,183 | | | | 55 | |
| * | | Websense, Inc. | | | 4,637 | | | | 70 | |
| * | | XO Group, Inc. | | | 3,123 | | | | 29 | |
| | | | | | | | | | |
| | Total | | | | | | | 12,115 | |
| | | | | | | | | | |
| |
| | Materials (5.8%) | |
| | A. Schulman, Inc. | | | 3,722 | | | | 108 | |
| * | | A.M. Castle & Co. | | | 2,113 | | | | 31 | |
| | AK Steel Holding Corp. | | | 17,268 | | | | 79 | |
| | AMCOL International Corp. | | | 3,207 | | | | 98 | |
| | American Vanguard Corp. | | | 3,030 | | | | 94 | |
| | | | | | | | | | |
| | | Common Stocks (89.0%) | | Shares/
$ Par | | | Value
$ (000’s) | |
| |
| | Materials continued | |
| | Balchem Corp. | | | 3,731 | | | | 136 | |
| | Buckeye Technologies, Inc. | | | 4,914 | | | | 141 | |
| * | | Calgon Carbon Corp. | | | 7,246 | | | | 103 | |
| * | | Century Aluminum Co. | | | 6,520 | | | | 57 | |
| * | | Clearwater Paper Corp. | | | 2,948 | | | | 115 | |
| | Deltic Timber Corp. | | | 1,383 | | | | 98 | |
| | Eagle Materials, Inc. | | | 5,906 | | | | 346 | |
| | Globe Specialty Metals, Inc. | | | 8,104 | | | | 111 | |
| | H.B. Fuller Co. | | | 6,337 | | | | 221 | |
| | Hawkins, Inc. | | | 1,165 | | | | 45 | |
| | Haynes International, Inc. | | | 1,562 | | | | 81 | |
| * | | Headwaters, Inc. | | | 7,768 | | | | 67 | |
| | Innophos Holdings, Inc. | | | 2,759 | | | | 128 | |
| | Kaiser Aluminum Corp. | | | 2,135 | | | | 132 | |
| | KapStone Paper & Packaging Corp. | | | 4,876 | | | | 108 | |
| | Koppers Holdings, Inc. | | | 2,614 | | | | 100 | |
| * | | Kraton Performance Polymers, Inc. | | | 4,100 | | | | 99 | |
| * | | LSB Industries, Inc. | | | 2,390 | | | | 85 | |
| | Materion Corp. | | | 2,596 | | | | 67 | |
| | Myers Industries, Inc. | | | 3,945 | | | | 60 | |
| | Neenah Paper, Inc. | | | 2,015 | | | | 57 | |
| | Olympic Steel, Inc. | | | 1,165 | | | | 26 | |
| * | | OM Group, Inc. | | | 4,113 | | | | 91 | |
| | P.H. Glatfelter Co. | | | 5,444 | | | | 95 | |
| | PolyOne Corp. | | | 11,316 | | | | 231 | |
| | Quaker Chemical Corp. | | | 1,662 | | | | 90 | |
| * | | RTI International Metals, Inc. | | | 3,853 | | | | 106 | |
| | Schweitzer-Mauduit International, Inc. | | | 3,943 | | | | 154 | |
| | Stepan Co. | | | 2,112 | | | | 117 | |
| * | | Stillwater Mining Co. | | | 14,840 | | | | 190 | |
| * | | SunCoke Energy, Inc. | | | 8,888 | | | | 139 | |
| * | | Texas Industries, Inc. | | | 2,635 | | | | 134 | |
| | Tredegar Corp. | | | 3,060 | | | | 62 | |
| | Wausau Paper Corp. | | | 5,890 | | | | 51 | |
| | Zep, Inc. | | | 2,844 | | | | 41 | |
| | | | | | | | | | |
| | Total | | | | | | | 4,294 | |
| | | | | | | | | | |
| |
| | Telecommunication Services (0.5%) | |
| | Atlantic Tele-Network, Inc. | | | 1,187 | | | | 43 | |
| * | | Cbeyond, Inc. | | | 3,788 | | | | 34 | |
| * | | Cincinnati Bell, Inc. | | | 25,335 | | | | 139 | |
| * | | General Communication, Inc. - Class A | | | 4,132 | | | | 40 | |
| | Lumos Networks Corp. | | | 1,883 | | | | 19 | |
| | Neutral Tandem, Inc. | | | 3,848 | | | | 10 | |
| | NTELOS Holdings Corp. | | | 1,962 | | | | 26 | |
| | USA Mobility, Inc. | | | 2,782 | | | | 32 | |
| | | | | | | | | | |
| | Total | | | | | | | 343 | |
| | | | | | | | | | |
| | | | | | | | | | |
| | | Common Stocks (89.0%) | | Shares/
$ Par | | | Value
$ (000’s) | |
| |
| | Utilities (3.5%) | |
| | ALLETE, Inc. | | | 4,441 | | | | 182 | |
| | American States Water Co. | | | 2,441 | | | | 117 | |
| | Avista Corp. | | | 7,592 | | | | 183 | |
| | CH Energy Group, Inc. | | | 1,899 | | | | 124 | |
| | El Paso Electric Co. | | | 5,096 | | | | 163 | |
| | The Laclede Group, Inc. | | | 2,665 | | | | 103 | |
| | New Jersey Resources Corp. | | | 5,296 | | | | 210 | |
| | Northwest Natural Gas Co. | | | 3,414 | | | | 151 | |
| | NorthWestern Corp. | | | 4,728 | | | | 164 | |
| | Piedmont Natural Gas Co., Inc. | | | 9,156 | | | | 287 | |
| | South Jersey Industries, Inc. | | | 3,972 | | | | 200 | |
| | Southwest Gas Corp. | | | 5,862 | | | | 248 | |
| | UIL Holdings Corp. | | | 6,421 | | | | 230 | |
| | UNS Energy Corp. | | | 5,257 | | | | 223 | |
| | | | | | | | | | |
| | Total | | | | | | | 2,585 | |
| | | | | | | | | | |
| | | |
| | Total Common Stocks | | | | | | | | |
| | (Cost: $58,030) | | | | | | | 65,582 | |
| | | | | | | | | | |
| |
| | | Investment Companies (2.3%) | |
| |
| | Investment Companies (2.3%) | |
| | iShares S&P SmallCap 600 Index Fund | | | 22,077 | | | | 1,727 | |
| | | | | | | | | | |
| | Total | | | | | | | 1,727 | |
| | | | | | | | | | |
| | | |
| | Total Investment Companies | | | | | | | | |
| | (Cost: $1,687) | | | | | | | 1,727 | |
| | | | | | | | | | |
| | |
| | | Short-Term Investments (8.4%) | | | | |
| |
| | Electric Utilities (1.1%) | |
| | American Electric Power Co., Inc., 0.30%, 1/2/13 | | | 800,000 | | | | 800 | |
| | | | | | | | | | |
| | Total | | | | | | | 800 | |
| | | | | | | | | | |
| |
| | Federal Government & Agencies (4.2%) | |
| | Federal Home Loan Banks, 0.11%, 2/1/13 | | | 3,100,000 | | | | 3,100 | |
| | | | | | | | | | |
| | Total | | | | | | | 3,100 | |
| | | | | | | | | | |
| |
| | Finance Services (2.2%) | |
| | Alpine Securitization Corp., 0.18%, 1/9/13 | | | 800,000 | | | | 800 | |
| | Govco LLC, 0.23%, 1/22/13 | | | 800,000 | | | | 800 | |
| | | | | | | | | | |
| | Total | | | | | | | 1,600 | |
| | | | | | | | | | |
The Accompanying Notes are an Integral Part of the Financial Statements.
| | | | |
| 60 | | Index 600 Stock Portfolio | | |
Index 600 Stock Portfolio
| | | | | | | | | | |
| | | Short-Term Investments (8.4%) | | Shares/
$ Par | | | Value
$ (000’s) | |
| |
| | Personal Credit Institutions (0.9%) | |
| | Chariot Funding LLC, 0.21%, 3/28/13 | | | 700,000 | | | | 699 | |
| | | | | | | | | | |
| | Total | | | | | | | 699 | |
| | | | | | | | | | |
| | | |
| | Total Short-Term Investments | | | | | | | | |
| | (Cost: $6,199) | | | | | | | 6,199 | |
| | | | | | | | | | |
| | | |
| | Total Investments (99.7%) | | | | | | | | |
| | (Cost: $65,916)(a) | | | | | | | 73,508 | |
| | | | | | | | | | |
| | Other Assets, Less | | | | | | | | |
| | Liabilities (0.3%) | | | | | | | 214 | |
| | | | | | | | | | |
| | Net Assets (100.0%) | | | | | | | 73,722 | |
| | | | | | | | | | |
| (a) | At December 31, 2012 the aggregate cost of securities for federal tax purposes (in thousands) was $66,385 and the net unrealized appreciation of investments based on that cost was $7,123 which is comprised of $12,042 aggregate gross unrealized appreciation and $4,919 aggregate gross unrealized depreciation. |
| (j) | Swap agreements outstanding on December 31, 2012. |
Total Return Swaps
| | | | | | | | | | | | | | |
| Reference Entity | | Counterparty | | Payment Made
by the Fund | | Payment Received by the Fund | | Expiration Date | | Notional Amount (000’s) | | Unrealized Appreciation/ (Depreciation) (000’s) | |
S&P SmallCap 600 Index | | JPMorgan Chase London | | 1-Month Usd Libor - 12 Bps | | S&P SmallCap 600 Index | | 5/13 | | 6,406 | | $ | - | |
| | | | | | | | | | | | | | |
| | | | | | | | | | | | $ | - | |
| | | | | | | | | | | | | | |
| (n) | Security valued in good faith by the Board of Directors. |
The following is a summary of the inputs used in valuing the Portfolio’s assets and liabilities at December 31, 2012. See Note 3 for additional information on portfolio valuation.
| | | | | | | | | | | | | | |
| | | Valuation Inputs | | | |
| Description | | Level 1 - Quoted Prices | | | Level 2 - Other Significant Observable Inputs | | | Level 3 - Significant Unobservable Inputs | | | |
| | | (Amounts in thousands) | | | |
Assets: | | | | | | | | | | | | | | |
Common Stocks | | $ | 65,582 | | | $ | - | | | $ | - | | | |
Investment Companies | | | 1,727 | | | | - | | | | - | | | |
Short-Term Investments | | | - | | | | 6,199 | | | | - | | | |
Other Financial Instruments^ | | | - | | | | 6,199 | | | | - | | | |
Total Return Swaps | | | - | | | | - | | | | - | | | |
Total | | $ | 67,309 | | | $ | 6,199 | | | $ | - | | | |
^ Other financial instruments are derivative instruments such as futures, forwards, written options and swaps contracts, which are valued at the unrealized appreciation (depreciation) on the instrument and short sales, which are valued at market value.
The Accompanying Notes are an Integral Part of the Financial Statements.
| | | | | | |
| | Index 600 Stock Portfolio | | | 61 | |
Small Cap Value Portfolio
| | | | |
| Objective: | | Portfolio Strategy: | | Net Assets: |
| Long-term growth of capital. | | Invest primarily in equity securities of small-sized companies whose common stocks are believed to be undervalued. | | $410 million |
Portfolio Overview
Mason Street Advisors, the investment adviser for the Small Cap Value Portfolio (“the Portfolio”), has engaged T. Rowe Price Associates, Inc. (“T. Rowe Price”) to act as sub-adviser for the Portfolio. Normally, the Portfolio invests in common stocks of companies with market capitalizations that do not exceed the maximum market capitalization of any security in the S&P SmallCap 600® Index at the time of purchase. Reflecting a value approach to investing, the Portfolio will seek the stocks of companies whose current stock prices do not appear to adequately reflect their underlying value as measured by assets, earnings, cash flow or business franchises.
Market Overview
Major U.S. stock market Indices produced solid returns in 2012 despite muted U.S. economic growth, a eurozone recession and sovereign debt crisis, and a slowdown in emerging economies. Domestic equities were supported by strong U.S. corporate earnings and actions by central banks around the world to reduce or suppress interest rates in hopes of stimulating growth. Small and mid cap stocks narrowly surpassed their large cap counterparts. As measured by various Russell® Indexes, value stocks outperformed growth stocks across all market capitalizations.
Portfolio Results
The Portfolio returned 16.33% for the twelve months ended December 31, 2012. By comparison, the Russell 2000® Value Index (the “Index”) returned 18.05%. (The Index is unmanaged, cannot be invested in directly and does not include administrative expenses or sales charges.) The Portfolio underperformed the 16.38% average return of its Small Cap Value Funds peer group, according to Lipper® Analytical Services, Inc., an independent mutual fund ranking agency.
Stock selection, especially in the Energy and Materials sectors, drove the Portfolio’s underperformance relative to the Index. The Portfolio’s Energy sector produced a negative absolute return and performance fell short of that of the Index. A notable detractor was CARBO Ceramics, a leading manufacturer of lightweight ceramic proppants used by pressure pumpers to complete oil and gas wells. The company suffered along with other firms exposed to natural gas, as prices for the commodity stayed around historic lows. Further, logistic constraints hindered the firm from reaching more profitable oil-producing clients.
The Financials sector was one of the Index’s best performers during the year. As a result, the Portfolio’s substantially underweight position detracted from performance relative to the Index.
Materials stocks within the Portfolio had a double-digit gain, but lagged those in the Index. In particular, AptarGroup weighed on performance. The company, which has a stable business supplying dispensing systems for household products, failed to attract investors in a rising market. In addition, AptarGroup had significant exposure to the European market, which was particularly weak during the year.
On the positive end of the spectrum, stock selection in the Information Technology sector was a positive contributor to performance. A top contributor was Cymer, a supplier of light sources used in the photolithography process for semiconductor manufacturing. During the period, a large customer reported that it would acquire Cymer for a significant premium. Stock selection and an overweight position helped the Industrials and Business Services sector to outperform its Index counterpart. An improving housing market boosted Beacon Roofing Supply, a distributor of roofing and other building materials in the United States and Canada.
The Portfolio’s Consumer Discretionary stocks also contributed positively to relative performance. Recreational vehicle manufacturer Winnebago was a top contributor within the sector. The firm, which sells motor homes through independent dealers under the Winnebago, Itasca, and Era brand names, reported sharply higher revenue due to increased deliveries of motor homes and travel trailers. The Portfolio also benefited from holding single-family homebuilders M/I Homes and Meritage. Positive signs in the housing market, including increased housing starts and home prices and decreased drag from foreclosures, acted as tailwinds for homebuilders.
Portfolio Manager Outlook
The following forward looking comments are the opinion of T. Rowe Price, the Portfolio’s sub-adviser.
The market proved surprisingly resilient in the face of global economic challenges during 2012. Yet, we still consider stocks to be relatively inexpensive when viewed against the previous 50 years or against bond yields. So what did we learn? First, those who thought they would wait to invest until the world economic background improved missed a 15% move. Second, when the Federal Reserve is aggressively lowering interest rates and providing liquidity to our economy, that backdrop can be beneficial for stocks. Third, do not count out the U.S.—the resilience that our economy and markets demonstrated in 2012 is amazing to us.
| | | | |
| 62 | | Small Cap Value Portfolio | | |
Small Cap Value Portfolio
We believe U.S. equities will continue to rise in 2013, although maybe not at the pace of 2012. With small company value stocks valued at close to their 30-year average compared to large companies and growth companies, we think small cap value stocks may continue to perform relatively well.
Relative Performance

| | | | | | | | | | | | |
Average Annual Total Returns For Periods Ended December 31, 2012 | |
| | | 1 Year | | | 5 Years | | | 10 Years | |
Small Cap Value Portfolio | | | 16.33% | | | | 5.21% | | | | 10.40% | |
Russell 2000® Value Index | | | 18.05% | | | | 3.55% | | | | 9.50% | |
Lipper® Variable Insurance Products (VIP) Small Cap Value Funds Average | | | 16.38% | | | | 4.15% | | | | 9.95% | |
The performance data quoted represents past performance. Past performance is historical and does not guarantee future performance. Investment return and principal value will fluctuate, so that shares, when redeemed, may be worth more or less than their original cost. Current performance may be lower or higher than the performance data quoted. For the most recent month-end performance information visit www.northwesternmutual.com.
This chart assumes an initial investment of $10,000 made on 12/31/02. Returns shown include deductions for management and other portfolio expenses, and reinvestment of all dividends. Returns exclude deductions for separate account sale loads and account fees. Please refer to the Benchmark Definitions section of this report for information about the indices cited in the above chart and graph.
Stocks of smaller or newer companies, such as those held in this Portfolio, are more likely to realize more substantial growth as well as suffer more significant losses than larger or more established issuers. Investments in such companies can be both more volatile and more speculative. Investing in small company stocks involves a greater degree of risk than investing in medium or large company stocks.
Top 10 Equity Holdings 12/31/12
| | |
| Security Description | | % of Net Assets |
Aaron’s, Inc. | | 2.1% |
Genesee & Wyoming, Inc. - Class A | | 2.1% |
Landstar System, Inc. | | 2.1% |
ProAssurance Corp. | | 2.1% |
Beacon Roofing Supply, Inc. | | 1.8% |
Kirby Corp. | | 1.7% |
Nordson Corp. | | 1.5% |
Alaska Air Group, Inc. | | 1.4% |
SVB Financial Group | | 1.3% |
AptarGroup, Inc. | | 1.3% |
Sector Allocation 12/31/12

Sector Allocation is based on Net Assets.
Sector Allocation and Top 10 Holdings are subject to change.
| | | | | | |
| | Small Cap Value Portfolio | | | 63 | |
Small Cap Value Portfolio
Schedule of Investments
December 31, 2012
| | | | | | | | | | |
| | | Common Stocks (96.6%) | | Shares/
$ Par | | | Value
$ (000’s) | |
| |
| | Consumer Discretionary (13.6%) | |
| | Aaron’s, Inc. | | | 309,000 | | | | 8,738 | |
| * | | Ascent Media Corp. - Class A | | | 44,000 | | | | 2,725 | |
| | Brunswick Corp. | | | 55,900 | | | | 1,626 | |
| | CSS Industries, Inc. | | | 81,000 | | | | 1,773 | |
| | Culp, Inc. | | | 86,600 | | | | 1,300 | |
| | Drew Industries, Inc. | | | 124,100 | | | | 4,002 | |
| | Ethan Allen Interiors, Inc. | | | 48,800 | | | | 1,255 | |
| * | | Fifth & Pacific Co. | | | 90,100 | | | | 1,122 | |
| | Fred’s, Inc. - Class A | | | 118,800 | | | | 1,581 | |
| | Haverty Furniture Cos., Inc. | | | 142,600 | | | | 2,326 | |
| * | | M/I Homes, Inc. | | | 69,100 | | | | 1,831 | |
| * | | MarineMax, Inc. | | | 128,000 | | | | 1,144 | |
| | Matthews International
Corp. - Class A | | | 101,400 | | | | 3,255 | |
| | The Men’s Wearhouse, Inc. | | | 99,000 | | | | 3,085 | |
| * | | Meritage Homes Corp. | | | 112,500 | | | | 4,202 | |
| * | | Modine Manufacturing Co. | | | 160,100 | | | | 1,302 | |
| * | | Orient-Express Hotels, Ltd. - Class A | | | 217,500 | | | | 2,543 | |
| | Pool Corp. | | | 101,625 | | | | 4,301 | |
| | Saga Communications, Inc. - Class A | | | 44,200 | | | | 2,055 | |
| * | | Stanley Furniture Co., Inc. | | | 91,000 | | | | 409 | |
| | Stein Mart, Inc. | | | 227,000 | | | | 1,712 | |
| | True Religion Apparel, Inc. | | | 32,400 | | | | 824 | |
| * | | Winnebago Industries, Inc. | | | 155,000 | | | | 2,655 | |
| | | | | | | | | | |
| | Total | | | | | | | 55,766 | |
| | | | | | | | | | |
| |
| | Consumer Staples (0.6%) | |
| * | | Alliance One International, Inc. | | | 280,400 | | | | 1,021 | |
| | Nash Finch Co. | | | 69,000 | | | | 1,468 | |
| | | | | | | | | | |
| | Total | | | | | | | 2,489 | |
| | | | | | | | | | |
| |
| | Energy (4.8%) | |
| * | | Atwood Oceanics, Inc. | | | 43,500 | | | | 1,992 | |
| * | | C&J Energy Services, Inc. | | | 61,700 | | | | 1,323 | |
| | CARBO Ceramics, Inc. | | | 27,900 | | | | 2,186 | |
| * | | Cloud Peak Energy, Inc. | | | 101,000 | | | | 1,952 | |
| * | | Hercules Offshore, Inc. | | | 150,000 | | | | 927 | |
| * | | Northern Oil and Gas, Inc. | | | 145,000 | | | | 2,439 | |
| * | | Oasis Petroleum, Inc. | | | 117,500 | | | | 3,737 | |
| * | | PDC Energy, Inc. | | | 42,389 | | | | 1,408 | |
| * | | Swift Energy Co. | | | 88,000 | | | | 1,354 | |
| | Teekay Tankers, Ltd. -
Class A | | | 276,000 | | | | 800 | |
| * | | TETRA Technologies, Inc. | | | 200,000 | | | | 1,518 | |
| | | | | | | | | | |
| | Total | | | | | | | 19,636 | |
| | | | | | | | | | |
| |
| | Financials (22.6%) | |
| | Acadia Realty Trust | | | 73,800 | | | | 1,851 | |
| | Alterra Capital Holdings, Ltd. | | | 115,600 | | | | 3,259 | |
| | Ares Capital Corp. | | | 286,000 | | | | 5,005 | |
| | | | | | | | | | |
| | | Common Stocks (96.6%) | | Shares/
$ Par | | | Value
$ (000’s) | |
| |
| | Financials continued | |
| | Assured Guaranty, Ltd. | | | 105,094 | | | | 1,495 | |
| | CBL & Associates Properties, Inc. | | | 245,100 | | | | 5,199 | |
| | Cedar Realty Trust, Inc. | | | 213,000 | | | | 1,125 | |
| | Columbia Banking System, Inc. | | | 69,000 | | | | 1,238 | |
| | Compass Diversified Holdings | | | 138,000 | | | | 2,030 | |
| | East West Bancorp, Inc. | | | 192,300 | | | | 4,132 | |
| | Employers Holdings, Inc. | | | 63,000 | | | | 1,296 | |
| | First Potomac Realty Trust | | | 161,000 | | | | 1,990 | |
| | Glacier Bancorp, Inc. | | | 181,700 | | | | 2,673 | |
| | Hatteras Financial Corp. | | | 59,800 | | | | 1,484 | |
| | Hercules Technology Growth Capital, Inc. | | | 202,800 | | | | 2,257 | |
| | Home Bancshares, Inc. | | | 117,700 | | | | 3,886 | |
| | JMP Group, Inc. | | | 94,000 | | | | 571 | |
| | KCAP Financial, Inc. | | | 167,000 | | | | 1,535 | |
| | Kilroy Realty Corp. | | | 107,600 | | | | 5,097 | |
| | LaSalle Hotel Properties | | | 131,000 | | | | 3,326 | |
| * | | Markel Corp. | | | 5,800 | | | | 2,514 | |
| | Meadowbrook Insurance Group, Inc. | | | 131,400 | | | | 759 | |
| | National Interstate Corp. | | | 118,800 | | | | 3,424 | |
| * | | Piper Jaffray Cos., Inc. | | | 36,000 | | | | 1,157 | |
| | Potlatch Corp. | | | 78,800 | | | | 3,088 | |
| | ProAssurance Corp. | | | 203,600 | | | | 8,590 | |
| | PS Business Parks, Inc. | | | 5,800 | | | | 377 | |
| | Radian Group, Inc. | | | 149,500 | | | | 913 | |
| | Redwood Trust, Inc. | | | 172,000 | | | | 2,905 | |
| * | | Safeguard Scientifics, Inc. | | | 78,000 | | | | 1,150 | |
| | Saul Centers, Inc. | | | 34,000 | | | | 1,455 | |
| * | | Signature Bank | | | 48,600 | | | | 3,467 | |
| * | | Stifel Financial Corp. | | | 81,000 | | | | 2,590 | |
| * | | SVB Financial Group | | | 95,000 | | | | 5,317 | |
| | Washington Real Estate Investment Trust | | | 70,300 | | | | 1,838 | |
| | Wintrust Financial Corp. | | | 97,600 | | | | 3,582 | |
| | | | | | | | | | |
| | Total | | | | | | | 92,575 | |
| | | | | | | | | | |
| |
| | Health Care (3.9%) | |
| | Analogic Corp. | | | 32,300 | | | | 2,400 | |
| | Landauer, Inc. | | | 31,800 | | | | 1,947 | |
| * | | Momenta Pharmaceuticals, Inc. | | | 109,000 | | | | 1,284 | |
| | National Healthcare Corp. | | | 57,500 | | | | 2,704 | |
| * | | Quidel Corp. | | | 97,000 | | | | 1,811 | |
| * | | Triple-S Management Corp. - Class B | | | 86,100 | | | | 1,590 | |
| | West Pharmaceutical Services, Inc. | | | 75,200 | | | | 4,117 | |
| | | | | | | | | | |
| | Total | | | | | | | 15,853 | |
| | | | | | | | | | |
| |
| | Industrials (26.1%) | |
| * | | Aegion Corp. | | | 142,000 | | | | 3,151 | |
| * | | Alaska Air Group, Inc. | | | 136,200 | | | | 5,869 | |
| | | | | | | | | | |
| | | Common Stocks (96.6%) | | Shares/
$ Par | | | Value
$ (000’s) | |
| |
| | Industrials continued | |
| | Astec Industries, Inc. | | | 50,900 | | | | 1,696 | |
| * | | Beacon Roofing Supply, Inc. | | | 225,100 | | | | 7,491 | |
| | Belden, Inc. | | | 92,400 | | | | 4,157 | |
| | Cascade Corp. | | | 36,300 | | | | 2,334 | |
| | CIRCOR International, Inc. | | | 58,800 | | | | 2,328 | |
| | Comfort Systems USA, Inc. | | | 124,000 | | | | 1,508 | |
| * | | Dolan Co. | | | 147,000 | | | | 572 | |
| | Franklin Electric Co., Inc. | | | 35,578 | | | | 2,212 | |
| * | | FTI Consulting, Inc. | | | 36,800 | | | | 1,214 | |
| | G & K Services, Inc. - Class A | | | 84,300 | | | | 2,879 | |
| * | | Genesee & Wyoming, Inc. - Class A | | | 114,600 | | | | 8,719 | |
| * | | Gibraltar Industries, Inc. | | | 163,000 | | | | 2,595 | |
| * | | Hub Group, Inc. - Class A | | | 72,300 | | | | 2,429 | |
| | IDEX Corp. | | | 94,200 | | | | 4,383 | |
| | Kaman Corp. | | | 72,400 | | | | 2,664 | |
| * | | Kirby Corp. | | | 113,100 | | | | 7,000 | |
| * | | Kratos Defense & Security Solutions, Inc. | | | 200,500 | | | | 1,009 | |
| | Landstar System, Inc. | | | 164,800 | | | | 8,645 | |
| | McGrath Rentcorp | | | 158,000 | | | | 4,585 | |
| | Mine Safety Appliances Co. | | | 59,200 | | | | 2,528 | |
| * | | Navigant Consulting, Inc. | | | 167,000 | | | | 1,864 | |
| | Nordson Corp. | | | 95,400 | | | | 6,022 | |
| * | | On Assignment, Inc. | | | 137,200 | | | | 2,782 | |
| * | | Proto Labs, Inc. | | | 23,500 | | | | 926 | |
| | Quanex Building Products Corp. | | | 94,000 | | | | 1,919 | |
| | Robbins & Myers, Inc. | | | 51,500 | | | | 3,062 | |
| | Universal Forest Products, Inc. | | | 67,000 | | | | 2,549 | |
| | Waste Connections, Inc. | | | 121,000 | | | | 4,089 | |
| | Woodward, Inc. | | | 105,100 | | | | 4,007 | |
| | | | | | | | | | |
| | Total | | | | | | | 107,188 | |
| | | | | | | | | | |
| |
| | Information Technology (9.2%) | |
| * | | Accelrys, Inc. | | | 102,300 | | | | 926 | |
| * | | Advanced Energy Industries, Inc. | | | 150,000 | | | | 2,071 | |
| * | | ATMI, Inc. | | | 70,000 | | | | 1,461 | |
| | Brooks Automation, Inc. | | | 138,000 | | | | 1,111 | |
| | Cabot Microelectronics Corp. | | | 57,900 | | | | 2,056 | |
| | Cognex Corp. | | | 35,300 | | | | 1,300 | |
| * | | Cymer, Inc. | | | 9,000 | | | | 814 | |
| | Electro Rent Corp. | | | 188,400 | | | | 2,897 | |
| | Electro Scientific Industries, Inc. | | | 120,800 | | | | 1,202 | |
| * | | Entegris, Inc. | | | 66,900 | | | | 614 | |
| * | | Ixia | | | 197,000 | | | | 3,345 | |
| | Littelfuse, Inc. | | | 65,900 | | | | 4,067 | |
| | Methode Electronics, Inc. | | | 73,200 | | | | 734 | |
| * | | Newport Corp. | | | 113,000 | | | | 1,520 | |
The Accompanying Notes are an Integral Part of the Financial Statements.
| | | | |
| 64 | | Small Cap Value Portfolio | | |
Small Cap Value Portfolio
| | | | | | | | | | |
| | | Common Stocks (96.6%) | | Shares/ $ Par | | | Value $ (000’s) | |
| |
| | Information Technology continued | |
* | | Progress Software Corp. | | | 156,500 | | | | 3,285 | |
* | | Sonus Networks, Inc. | | | 474,500 | | | | 807 | |
* | | SYNNEX Corp. | | | 87,600 | | | | 3,012 | |
* | | Teradyne, Inc. | | | 176,000 | | | | 2,973 | |
* | | TNS, Inc. | | | 50,355 | | | | 1,044 | |
* | | Websense, Inc. | | | 109,000 | | | | 1,639 | |
| | Xyratex, Ltd. | | | 91,100 | | | | 766 | |
| | | | | | | | | | |
| | Total | | | | | | | 37,644 | |
| | | | | | | | | | |
| |
| | Materials (11.2%) | |
| | AMCOL International Corp. | | | 73,300 | | | | 2,249 | |
| | American Vanguard Corp. | | | 114,400 | | | | 3,554 | |
| | AptarGroup, Inc. | | | 109,200 | | | | 5,211 | |
| | Carpenter Technology Corp. | | | 77,300 | | | | 3,991 | |
* | | Clearwater Paper Corp. | | | 82,400 | | | | 3,227 | |
| | Deltic Timber Corp. | | | 54,600 | | | | 3,856 | |
| | Franco-Nevada Corp. | | | 67,200 | | | | 3,842 | |
| | Innospec, Inc. | | | 146,700 | | | | 5,060 | |
| | Minerals Technologies, Inc. | | | 67,400 | | | | 2,691 | |
| | Myers Industries, Inc. | | | 180,800 | | | | 2,739 | |
* | | North American Palladium, Ltd. | | | 680,000 | | | | 884 | |
| | Royal Gold, Inc. | | | 50,286 | | | | 4,089 | |
| | Schnitzer Steel Industries, Inc. | | | 50,000 | | | | 1,516 | |
* | | Texas Industries, Inc. | | | 26,600 | | | | 1,357 | |
| | Wausau Paper Corp. | | | 178,000 | | | | 1,541 | |
| | | | | | | | | | |
| | Total | | | | | | | 45,807 | |
| | | | | | | | | | |
| | | | | | | | | | |
| | | Common Stocks (96.6%) | | Shares/ $ Par | | | Value $ (000’s) | |
| |
| | Telecommunication Services (0.5%) | |
* | | Premiere Global Services, Inc. | | | 207,000 | | | | 2,024 | |
| | | | | | | | | | |
| | Total | | | | | | | 2,024 | |
| | | | | | | | | | |
| |
| | Utilities (4.1%) | |
| | Black Hills Corp. | | | 50,467 | | | | 1,834 | |
| | Cleco Corp. | | | 107,500 | | | | 4,301 | |
| | El Paso Electric Co. | | | 97,400 | | | | 3,108 | |
| | NorthWestern Corp. | | | 64,900 | | | | 2,254 | |
| | PNM Resources, Inc. | | | 79,300 | | | | 1,626 | |
| | Southwest Gas Corp. | | | 74,100 | | | | 3,143 | |
| | Vectren Corp. | | | 22,000 | | | | 647 | |
| | | | | | | | | | |
| | Total | | | | | | | 16,913 | |
| | | | | | | | | | |
| | |
| | Total Common Stocks | | | | | |
| | (Cost: $288,455) | | | | | | | 395,895 | |
| | | | | | | | | | |
| | | |
| | | Preferred Stocks (0.5%) | | | | | | |
| |
| | Financials (0.5%) | |
| | East West Bancorp, Inc., 8.00%, 12/31/49 | | | 1,359 | | | | 1,999 | |
| | | | | | | | | | |
| | Total | | | | | | | 1,999 | |
| | | | | | | | | | |
| | |
| | Total Preferred Stocks | | | | | |
| | (Cost: $1,348) | | | | | | | 1,999 | |
| | | | | | | | | | |
| | | | | | | | |
| | | Investment Companies (0.7%) | | Shares/ $ Par | | Value $ (000’s) | |
| | | |
| | Investment Companies (0.7%) | | | | | | |
| | iShares Russell 2000 Value Index Fund | | 39,100 | | | 2,953 | |
| | | | | | | | |
| | Total | | | | | 2,953 | |
| | | | | | | | |
| | | |
| | Total Investment Companies | | | | | | |
| | (Cost: $2,238) | | | | | 2,953 | |
| | | | | | | | |
| | | |
| | | Short-Term Investments (2.2%) | | | | | |
| | | |
| | Other Holdings (2.2%) | | | | | | |
| | T. Rowe Price Reserve Investment Fund | | 8,950,187 | | | 8,950 | |
| | | | | | | | |
| | Total | | | | | 8,950 | |
| | | | | | | | |
| | | |
| | Total Short-Term Investments | | | | | | |
| | (Cost: $8,950) | | | | | 8,950 | |
| | | | | | | | |
| | | |
| | Total Investments (100.0%) | | | | | | |
| | (Cost: $300,991)(a) | | | | | 409,797 | |
| | | | | | | | |
| | Other Assets, Less | | | | | | |
| | Liabilities (0.0%) | | | | | (149 | ) |
| | | | | | | | |
| | Net Assets (100.0%) | | | | | 409,648 | |
| | | | | | | | |
| (a) | At December 31, 2012 the aggregate cost of securities for federal tax purposes (in thousands) was $301,861 and the net unrealized appreciation of investments based on that cost was $107,936 which is comprised of $130,675 aggregate gross unrealized appreciation and $22,739 aggregate gross unrealized depreciation. |
The following is a summary of the inputs used in valuing the Portfolio’s assets and liabilities at December 31, 2012. See Note 3 for additional information on portfolio valuation.
| | | | | | | | | | | | | | |
| | | Valuation Inputs | | | |
| Description | | Level 1 –
Quoted Prices | | | Level 2 – Other Significant
Observable Inputs | | | Level 3 - Significant Unobservable Inputs | | | |
| | | (Amounts in thousands) | | | |
Assets: | | | | | | | | | | | | | | |
Common Stocks | | $ | 395,895 | | | $ | - | | | $ | - | | | |
Preferred Stocks | | | - | | | | 1,999 | | | | - | | | |
Investment Companies | | | 2,953 | | | | - | | | | - | | | |
Short-Term Investments | | | 8,950 | | | | - | | | | - | | | |
Total | | $ | 407,798 | | | $ | 1,999 | | | $ | - | | | |
The Accompanying Notes are an Integral Part of the Financial Statements.
| | | | |
| | Small Cap Value Portfolio | | 65 |
International Growth Portfolio
| | | | |
| Objective: | | Portfolio Strategy: | | Net Assets: |
| Long-term growth of capital. | | Invest primarily in securities of issuers from countries | | $330 million |
| | outside the U.S. that have above average growth potential. | | |
Portfolio Overview
Mason Street Advisors, the investment adviser for the International Growth Portfolio (the “Portfolio”), has engaged Janus Capital Management LLC (“Janus”) to act as sub-adviser for the Portfolio. Normally, the Portfolio invests in a core group of equity securities of 60–100 issuers from countries outside the United States, including emerging markets. The Portfolio’s investments in equity securities may include small, medium and large capitalization issues. The Portfolio employs a “bottom up” approach in choosing investments and assesses companies for their growth potential. In other words, the Portfolio looks at companies one at a time to determine if a company is an attractive investment opportunity and if it is consistent with the Portfolio’s investment policies.
Market Overview
International markets rose strongly in early 2012. The European Central Bank’s (ECB) decision to inject liquidity through its Long Term Refinancing Operation took a significant amount of fear out of the market. During the middle of the year, stocks declined due to concerns of slowing global growth, particularly in China, and renewed worries over the European sovereign debt crisis. However, equity markets charged higher in September, following the ECB’s announcement that it would buy sovereign debt to reduce the borrowing costs of peripheral European countries. Additional Chinese stimulus measures also aided the rebound in equities. International markets continued to perform strongly over the final three months, as two big overhangs, China’s slowing economic growth and the European sovereign debt crisis, reduced significantly.
Portfolio Results
The Portfolio returned 17.99% for the twelve months ended December 31, 2012. By comparison, the MSCI® All Country World (ex-US) Growth Index (the “Index”) returned 17.08%. (The Index is unmanaged, cannot be invested in directly, and does not include administrative expenses or sales charges.) The Portfolio underperformed the 19.45% average return of its International Growth Funds peer group, according to Lipper® Analytical Services, Inc., an independent mutual fund ranking agency.
The Portfolio’s holdings within Information Technology contributed the most to relative performance, followed by the holdings and an underweight in Materials. The Portfolio’s holdings and overweight in Financials, which generally performed strongly, also aided performance. Relative detractors included the holdings and an overweight in the Energy sector and the holdings in Consumer Discretionary. On a country basis, the Portfolio’s holdings in the U.K., Japan and Italy were key contributors. Meanwhile, the Portfolio’s holdings in Brazil and France detracted.
In Financials, U.K. insurer Prudential benefited from increasing market share and widening profit margins in its Asian markets. In Materials, chemicals maker LyondellBasell’s shares rallied sharply during the year on lower costs. The primary input to the company’s production process is natural gas, a commodity that experienced considerable price pressure due to excess supply. The company also made several decisions that were beneficial to shareholders, including a special dividend, debt reduction and refinancing. Mitsubishi Estate also recorded strong gains. The company was among Japanese real estate firms that benefited from the anticipation of an inflationist monetary policy.
There were also several securities that detracted from performance relative to the Index. In Energy, OGX Petroleo e Gas Participacoes, a Brazilian exploration and production company, traded lower after it reported slow production. Similarly, Yamada Denki, a Japanese electronics retailer, also suffered after one of its competitors was effectively acquired by another company, significantly altering the competitive landscape for Yamada.
Finally, Japanese e-commerce company Rakuten, was another key detractor. The stock suffered from investor fears over the company’s aggressive acquisition strategy, which included Kobo (a competing e-reader to Amazon’s Kindle) and numerous e-commerce sites such as Buy.com, Play.com and PriceMinister.
Portfolio Manager Outlook
The following forward looking comments are the opinion of Janus, the Portfolio’s sub-adviser.
We have a positive outlook for global growth in 2013, as there are signs that the Chinese economy is improving and Europe has seen relative stability since the European Central Bank took action on the debt crisis. We are particularly upbeat about the prospect for international markets. Since global markets peaked in 2007, stock markets in China, Europe, Japan, Brazil and India have continued to sell well below their peaks, while U.S. stocks have much less of a discount relative to their peak, which leads us to conclude that non-U.S. markets may have more ground to regain.
Emerging markets look particularly attractive to us. In China, we anticipate some relaxation of policies that have hindered growth and potentially some small stimulus measures. We have already seen loan demand accelerate and house prices stabilize. We think China’s growth in 2013 could be higher than forecasts. Meanwhile in India, the general paralysis in economic activity began to ease during the fourth quarter. In Europe, we expect 2013 growth to be weak, but we see nascent signs of improving consumption, which imply that conditions are not deteriorating faster than expected.
| | | | |
| 66 | | International Growth Portfolio | | |
International Growth Portfolio
Finally, we think Japan has the potential to escape deflation under the pro-growth policies of the new government. In terms of positioning, we intend to enter 2013 with more emerging markets exposure and a smaller weight in Energy.
|
Relative Performance |

|
| | | | | | | | | | | | |
Average Annual Total Returns
For Periods Ended December 31, 2012 | |
| | | 1 Year | | | 5 Years | | | 10 Years | |
International Growth Portfolio | | | 17.99 | % | | | -4.59 | % | | | 7.99 | % |
MSCI® All Country World (ex-US) Growth Index (Gross) | | | 17.08 | % | | | -2.55 | % | | | 9.36 | % |
MSCI EAFE® Index (Gross) | | | 17.90 | % | | | -3.21 | % | | | 8.70 | % |
Lipper® Variable Insurance Products (VIP) International Growth Funds Average | | | 19.45 | % | | | -2.49 | % | | | 8.96 | % |
The performance data quoted represents past performance. Past performance is historical and does not guarantee future performance. Investment return and principal value will fluctuate, so that shares, when redeemed, may be worth more or less than their original cost. Current performance may be lower or higher than the performance data quoted. For the most recent month-end performance information visit www.northwesternmutual.com.
This chart assumes an initial investment of $10,000 made on 12/31/02. Returns shown include deductions for management and other portfolio expenses, and reinvestment of all dividends. Returns exclude deductions for separate account sale loads and account fees. Please refer to the Benchmark Definitions section of this report for information about the indices cited in the above chart and graph.
Investors should be aware of the risks of investments in foreign securities, particularly investments in securities of companies in developing nations. These include the risks of currency fluctuation, of political and economic instability and of less well-developed government supervision and regulation of business and industry practices, as well as differences in accounting standards.
The Portfolio may invest a relatively large percentage of its assets in issuers located in a single country, a small number of countries or a particular geographical region. The Portfolio’s performance may be more volatile than that of a more geographically diversified fund, and may be tied more closely to the performance of a single country or region.
Top 10 Equity Holdings 12/31/12
| | |
| Security Description | | % of Net Assets |
Fanuc Corp. | | 3.7% |
Kuehne + Nagel International AG | | 3.1% |
Prudential PLC | | 2.9% |
Reckitt Benckiser Group PLC | | 2.9% |
Taiwan Semiconductor Manufacturing Co., Ltd. | | 2.9% |
AIA Group, Ltd. | | 2.8% |
ARM Holdings PLC | | 2.8% |
The Weir Group PLC | | 2.6% |
Novartis AG | | 2.5% |
ThyssenKrupp AG | | 2.5% |
Sector Allocation 12/31/12

Sector Allocation is based on Net Assets.
Sector Allocation and Top 10 Holdings are subject to change.
| | | | | | |
| | International Growth Portfolio | | | 67 | |
International Growth Portfolio
Schedule of Investments
December 31, 2012
| | | | | | | | | | | | |
| | | Foreign Common Stocks (95.9%) | | Country | | Shares/
$ Par | | | Value
$ (000’s) | |
| | |
| | Consumer Discretionary (12.3%) | | | | | |
| | Compagnie Financiere Richemont SA | | Switzerland | | | 68,507 | | | | 5,475 | |
| * | | Ctrip.com International, Ltd., ADR | | China | | | 110,922 | | | | 2,528 | |
| | Isuzu Motors, Ltd. | | Japan | | | 1,032,000 | | | | 6,139 | |
| | Kabel Deutschland Holding AG | | Germany | | | 69,918 | | | | 5,226 | |
| | Prada S.p.A | | Italy | | | 417,300 | | | | 4,037 | |
| | Rakuten, Inc. | | Japan | | | 371,300 | | | | 2,892 | |
| | Renault SA | | France | | | 88,929 | | | | 4,905 | |
| | Samsonite International SA | | Luxembourg | | | 1,618,200 | | | | 3,385 | |
| | WPP PLC | | Ireland | | | 404,248 | | | | 5,879 | |
| | | | | | | | | | | | |
| | Total | | | | | | | | | 40,466 | |
| | | | | | | | | | | | |
| | |
| | Consumer Staples (13.0%) | | | | | |
| | Beiersdorf AG | | Germany | | | 20,602 | | | | 1,683 | |
| | Danone SA | | France | | | 109,419 | | | | 7,226 | |
| | ITC, Ltd. | | India | | | 764,852 | | | | 3,996 | |
| | Japan Tobacco, Inc. | | Japan | | | 263,800 | | | | 7,427 | |
| | Reckitt Benckiser Group PLC | | United Kingdom | | | 154,014 | | | | 9,651 | |
| | SABMiller PLC | | United Kingdom | | | 131,705 | | | | 6,201 | |
| | Unilever NV | | Netherlands | | | 174,920 | | | | 6,598 | |
| | | | | | | | | | | | |
| | Total | | | | | | | | | 42,782 | |
| | | | | | | | | | | | |
| | |
| | Energy (8.6%) | | | | | |
| | AMEC PLC | | United Kingdom | | | 198,043 | | | | 3,241 | |
| | Canadian Natural Resources, Ltd. | | Canada | | | 162,306 | | | | 4,683 | |
| | Encana Corp. | | Canada | | | 173,444 | | | | 3,435 | |
| * | | OGX Petroleo e Gas Participacoes SA | | Brazil | | | 742,600 | | | | 1,588 | |
| | Petrofac, Ltd. | | United Kingdom | | | 192,534 | | | | 5,218 | |
| | Reliance Industries, Ltd. | | India | | | 383,679 | | | | 5,918 | |
| | Tullow Oil PLC | | United Kingdom | | | 220,303 | | | | 4,488 | |
| | | | | | | | | | | | |
| | Total | | | | | | | | | 28,571 | |
| | | | | | | | | | | | |
| | |
| | Financials (18.4%) | | | | | |
| | AIA Group, Ltd. | | Hong Kong | | | 2,322,800 | | | | 9,258 | |
| | Banco Bilbao Vizcaya Argentaria SA | | Spain | | | 172,294 | | | | 1,581 | |
| | Banco do Brasil SA | | Brazil | | | 544,600 | | | | 6,806 | |
| | BNP Paribas SA | | France | | | 6,935 | | | | 391 | |
| | China Construction Bank Corp. - Class H | | China | | | 4,662,000 | | | | 3,800 | |
| | DBS Group Holdings, Ltd. | | Singapore | | | 152,000 | | | | 1,861 | |
| | Grupo BTG Pactual | | Brazil | | | 176,900 | | | | 2,677 | |
| | Hang Lung Properties, Ltd. | | Hong Kong | | | 1,284,411 | | | | 5,150 | |
| | HSBC Holdings PLC | | United Kingdom | | | 308,279 | | | | 3,261 | |
| | ICICI Bank, Ltd. | | India | | | 96,070 | | | | 2,020 | |
| * | | ING Groep NV | | Netherlands | | | 153,553 | | | | 1,468 | |
| | Mitsubishi Estate Co., Ltd. | | Japan | | | 282,000 | | | | 6,733 | |
| | Prudential PLC | | United Kingdom | | | 692,752 | | | | 9,669 | |
| | Standard Chartered PLC | | United Kingdom | | | 112,778 | | | | 2,860 | |
| | | | | | | | | | | | |
| | | Foreign Common Stocks (95.9%) | | Country | | Shares/
$ Par | | | Value
$ (000’s) | |
| | |
| | Financials continued | | | | | |
| | Turkiye Halk Bankasi A.S. | | Turkey | | | 332,858 | | | | 3,280 | |
| | | | | | | | | | | | |
| | Total | | | | | | | | | 60,815 | |
| | | | | | | | | | | | |
| | |
| | Health Care (6.8%) | | | | | |
| | Elekta AB - Class B | | Sweden | | | 214,797 | | | | 3,388 | |
| | Novartis AG | | Switzerland | | | 128,330 | | | | 8,121 | |
| | Novo Nordisk A/S | | Denmark | | | 24,342 | | | | 3,974 | |
| | Shire PLC | | Ireland | | | 228,432 | | | | 7,018 | |
| | | | | | | | | | | | |
| | Total | | | | | | | | | 22,501 | |
| | | | | | | | | | | | |
| | |
| | Industrials (16.5%) | | | | | |
| | A.P. Moller - Maersk A/S | | Denmark | | | 1,036 | | | | 7,927 | |
| | Canadian Pacific Railway, Ltd. | | Canada | | | 71,491 | | | | 7,267 | |
| | Fanuc Corp. | | Japan | | | 65,400 | | | | 12,146 | |
| | Koninklijke Vopak NV | | Netherlands | | | 57,222 | | | | 4,033 | |
| | Kuehne + Nagel International AG | | Switzerland | | | 82,567 | | | | 10,043 | |
| | Nabtesco Corp. | | Japan | | | 160,500 | | | | 3,547 | |
| | Vallourec SA | | France | | | 17,897 | | | | 934 | |
| | The Weir Group PLC | | United Kingdom | | | 272,510 | | | | 8,461 | |
| | | | | | | | | | | | |
| | Total | | | | | | | | | 54,358 | |
| | | | | | | | | | | | |
| | |
| | Information Technology (12.6%) | | | | | |
| | ARM Holdings PLC | | United Kingdom | | | 719,332 | | | | 9,201 | |
| | Hexagon AB - Class B | | Sweden | | | 254,107 | | | | 6,389 | |
| | Keyence Corp. | | Japan | | | 22,600 | | | | 6,229 | |
| | Samsung Electronics Co., Ltd. | | South Korea | | | 2,989 | | | | 4,306 | |
| | Taiwan Semiconductor Manufacturing Co., Ltd. | | Taiwan | | | 2,846,000 | | | | 9,517 | |
| | Telefonaktiebolaget LM Ericsson - Class B | | Sweden | | | 576,439 | | | | 5,799 | |
| | | | | | | | | | | | |
| | Total | | | | | | | | | 41,441 | |
| | | | | | | | | | | | |
| | |
| | Materials (7.7%) | | | | | |
| | LyondellBasell Industries NV | | Netherlands | | | 110,116 | | | | 6,287 | |
| | Potash Corp. of Saskatchewan, Inc. | | Canada | | | 126,030 | | | | 5,139 | |
| | Rio Tinto PLC | | United Kingdom | | | 99,630 | | | | 5,808 | |
| | ThyssenKrupp AG | | Germany | | | 344,025 | | | | 8,080 | |
| | | | | | | | | | | | |
| | Total | | | | | | | | | 25,314 | |
| | | | | | | | | | | | |
| | Total Foreign Common Stocks | | | | | | | | |
| | (Cost: $280,044) | | | | | | | | | 316,248 | |
| | | | | | | | | | | | |
The Accompanying Notes are an Integral Part of the Financial Statements.
| | | | |
| 68 | | International Growth Portfolio | | |
International Growth Portfolio
| | | | | | | | | | | | |
| | | Short-Term Investments (4.0%) | | Country | | Shares/
$ Par | | | Value
$ (000’s) | |
| | |
| | Commercial Banks Non-US (4.0%) | | | | | |
| | BNP Paribas Finance, Inc., 0.01%, 1/2/13 | | United States | | | 13,100,000 | | | | 13,100 | |
| | | | | | | | | | | | |
| | Total | | | | | | | | | 13,100 | |
| | | | | | | | | | | | |
| | | | |
| | Total Short-Term Investments | | | | | | | | | | |
| | (Cost: $13,100) | | | | | | | | | 13,100 | |
| | | | | | | | | | | | |
| | | | |
| | Total Investments (99.9%) | | | | | | | | | | |
| | (Cost: $293,144)(a) | | | | | | | | | 329,348 | |
| | | | | | | | | | | | |
| | Other Assets, Less | | | | | | | | | | |
| | Liabilities (0.1%) | | | | | | | | | 370 | |
| | | | | | | | | | | | |
| | Net Assets (100.0%) | | | | | | | | | 329,718 | |
| | | | | | | | | | | | |
ADR after the name of a security represents—American Depositary Receipt.
| (a) | At December 31, 2012 the aggregate cost of securities for federal tax purposes (in thousands) was $295,503 and the net unrealized appreciation of investments based on that cost was $33,845 which is comprised of $48,465 aggregate gross unrealized appreciation and $14,620 aggregate gross unrealized depreciation. |
| | | | | | |
Investments Percentage by Country is based on Net Assets: | | | | | | |
United Kingdom | | | 20.6% | | | |
Japan | | | 13.7% | | | |
Switzerland | | | 7.2% | | | |
Canada | | | 6.2% | | | |
Netherlands | | | 5.6% | | | |
Other | | | 46.6% | | | |
Total | | | 99.9% | | | |
| (l) | As of December 31, 2012 portfolio securities with an aggregate value of $275,838 (in thousands) were fair valued under procedures adopted by the Board of Directors. |
The following is a summary of the inputs used in valuing the Portfolio’s assets and liabilities at December 31, 2012. See Note 3 for additional information on portfolio valuation.
| | | | | | | | | | | | | | |
| | | Valuation Inputs | | | |
| Description | | Level 1 –
Quoted Prices | | | Level 2 –
Other Significant
Observable Inputs | | | Level 3 – Significant
Unobservable Inputs | | | |
| | | (Amounts in thousands) | | | |
| Assets: | | | | | | | | | | | |
Foreign Common Stocks | | | | | | | | | | | | | | |
Consumer Discretionary | | $ | 2,528 | | | $ | 37,938 | | | $ | - | | | |
Energy | | | 9,706 | | | | 18,865 | | | | - | | | |
Financials | | | 9,483 | | | | 51,332 | | | | - | | | |
Industrials | | | 7,267 | | | | 47,091 | | | | - | | | |
Materials | | | 11,426 | | | | 13,888 | | | | - | | | |
All Others | | | - | | | | 106,724 | | | | - | | | |
Short-Term Investments | | | - | | | | 13,100 | | | | - | | | |
Total | | $ | 40,410 | | | $ | 288,938 | | | $ | - | | | |
The Accompanying Notes are an Integral Part of the Financial Statements.
| | | | | | | | |
| | International Growth Portfolio | | | 69 | | | |
Research International Core Portfolio
| | | | |
| Objective: | | Portfolio Strategy: | | Net Assets: |
| Capital appreciation. | | Invest primarily in foreign equity securities, including | | $261 million |
| | emerging markets. | | |
Portfolio Overview
Mason Street Advisors, the investment adviser for the Research International Core Portfolio (the “Portfolio”), has engaged Massachusetts Financial Services Company (“MFS®”) to act as sub-adviser for the Portfolio. The Portfolio normally invests in foreign equity securities, including emerging market equity securities. A team of research analysts selects investments for the Portfolio. MFS allocates the Portfolio’s assets to analysts by broad market sectors, which generally approximate the sector weightings in the MSCI EAFE® Index. When investing in foreign markets, the Portfolio is not constrained to any particular investment style. The Portfolio may invest in stocks of companies it believes to have above average earnings growth potential compared to other companies (growth companies), and in the stocks of companies it believes are undervalued compared to their perceived worth (value companies), or in a combination of growth and value companies. The Portfolio also may invest in companies of any size.
Market Overview
In the aftermath of additional liquidity measures by the Federal Reserve Bank (Fed) and a commensurate improvement in macroeconomic conditions, the beginning of 2012 was characterized by a risk-on sentiment. During this time, global equity valuations rose, credit spreads contracted, and high-quality sovereign yields increased modestly.
During the middle of the year, conditions worsened, driven by broadly weaker global macroeconomic indicators, as well as renewed concerns over the Europe’s capacity and determination to address its ongoing crisis. Despite this deterioration, broad market sentiment remained relatively resilient as equity markets generally maintained gains and credit spreads did not indicate deterioration.
However, this renewed weakness in the fundamentals precipitated a further round of monetary easing by the Fed (QE3) and the European Central Bank (rate cut and a new bond purchase facility) in the second half of the year, which soon instilled additional confidence in risk markets.
Portfolio Results
For the twelve months ended December 31, 2012, the Portfolio provided a total return of 16.76%. By comparison, its primary and secondary benchmarks, the MSCI® All Country World (ex-US) Index and MSCI EAFE® Index, returned 17.39% and 17.90%, respectively. (These Indices are unmanaged, cannot be invested in directly, and do not include administrative expenses or sales charges.) The Portfolio underperformed the average return of its peer group, International Core Funds, which was 17.56%, according to Lipper® Analytical Services, Inc., an independent mutual fund ranking agency. The performance attribution commentary is presented against the MSCI EAFE® Index (the “Index”).
Stock selection in the Financial Services sector detracted from the Portfolio’s performance relative to the Index. Holdings of poor-performing Brazilian diversified bank Itau Unibanco Holding hindered relative performance.
Security selection in both the Capital Goods and Telecom/Catv sectors held back relative performance. Within the Capital Goods sector, holdings of Australian mining company Iluka Resources, parcel delivery services company Yamato Holdings, and mining equipment manufacturer Joy Global hurt relative results. In the Telecom/Catv sector, holdings of poor-performing telecommunications company China Unicom Hong Kong weighed on results.
Elsewhere in the Portfolio, shares of pharmaceutical company Santen Pharmaceutical, oil and gas exploration company INPEX, television broadcasting company Nippon Television, digital camera and office equipment company Canon, and medical diagnostics company Diagnosticos Da America negatively impacted relative performance, as all five stocks underperformed the broad Index during the year.
The Portfolio’s currency exposure was a detractor from relative performance. Because the Portfolio’s investment decisions were driven by the fundamentals of each individual opportunity, the Portfolio had different currency exposure than the Index during the year.
Stock selection in the Healthcare and Technology sectors supported relative performance. In the Health Care sector, holdings of German healthcare products maker Bayer and healthcare service provider Rhone-Klinikum contributed to relative performance. There were no individual securities within the Technology sector that were among the Portfolio’s top relative contributors. The Portfolio outperformed the Index within the Technology sector due to smaller contributions from the Portfolio’s diversified Technology holdings.
Elsewhere in the Portfolio, holdings of Dutch brewer Heineken, financial services firm Barclays, paint and specialty chemical manufacturer Akzo Nobel, diversified bank Erste Group Bank, reinsurance company Swiss Reinsurance, and casino operator Sands China, aided relative performance. Not holding shares of Spanish telecommunications company Telefónica, also benefited relative performance.
| | | | | | |
| | 70 | | Research International Core Portfolio | | |
Research International Core Portfolio
Portfolio Manager Outlook
The following forward looking comments are the opinion of MFS, the Portfolio’s sub-adviser.
The Research International Core Portfolio is a sector-neutral portfolio that emphasizes bottom-up fundamental research. Because of this approach, the Portfolio’s sector weightings vary only modestly from those of the Index. Instead, we attempt to outperform the Index by holding what we believe to be the most attractive opportunities among growth and value companies within each sector of the Index without regard to market capitalization.
Relative Performance

| | | | | | | | | | |
Average Annual Total Returns For Periods Ended December 31, 2012 | |
| | | 1 Year | | 5 Years | | | Since
Inception* | |
Research International Core Portfolio | | 16.76% | | | -2.69% | | | | -1.45% | |
MSCI® All Country World (ex-US) Index (Gross) | | 17.39% | | | -2.44% | | | | -0.85% | |
MSCI EAFE® Index (Gross) | | 17.90% | | | -3.21% | | | | -2.39% | |
Lipper® Variable Insurance Products (VIP) International Core Funds Average | | 17.56% | | | -3.50% | | | | - | |
| * | Inception date of 4/30/07 |
The performance data quoted represents past performance. Past performance is historical and does not guarantee future performance. Investment return and principal value will fluctuate, so that shares, when redeemed, may be worth more or less than their original cost. Current performance may be lower or higher than the performance data quoted. For the most recent month-end performance information visit www.northwesternmutual.com.
This chart assumes an initial investment of $10,000 made on 4/30/07 (commencement of the Portfolio’s operations). Returns shown reflect fee waivers, deductions for management and other portfolio expenses, and reinvestment of all dividends. In the absence of fee waivers, total return would be reduced. Returns exclude deductions for separate account sale loads and account fees. Please refer to the Benchmark Definitions section of this report for information about the indices cited in the above chart and graph.
Investors should be aware of the risks of investments in foreign securities, particularly investments in securities of companies in developing nations. These include the risks of currency fluctuation, of political and economic instability and of less well-developed government supervision and regulation of business and industry practices, as well as differences in accounting standards.
Investments in the securities of companies in developing nations impose risks different from, and greater than, risks of investing in developed countries.
The Portfolio may invest a relatively large percentage of its assets in issuers located in a single country, a small number of countries, or a particular geographic region. The Portfolio’s performance may be more volatile than that of a more geographically diversified fund, and may be tied more closely to the performance of a single country or region.
The Portfolio may invest in derivative instruments to increase or decrease exposure to a particular market, segment of the market or security. Use of these instruments may involve certain costs and imposes certain risks such as liquidity risk, interest rate risk, market risk, credit risk, management risk and the risk of mispricing or improper valuation. Certain derivatives involve leverage, which could magnify losses, and portfolios investing in derivatives could lose more than the principal amount invested in those instruments.
| | | | | | |
| | Research International Core Portfolio | | | 71 | |
Research International Core Portfolio
Top 10 Equity Holdings 12/31/12
| | |
| Security Description | | % of Net Assets |
Royal Dutch Shell PLC - Class A | | 3.1% |
Roche Holding AG | | 2.8% |
Nestle SA | | 2.8% |
Rio Tinto PLC | | 2.6% |
Novartis AG | | 2.2% |
BP PLC | | 2.1% |
Heineken NV | | 2.0% |
Westpac Banking Corp. | | 2.0% |
Bayer AG | | 2.0% |
Barclays PLC | | 1.9% |
Sector Allocation 12/31/12
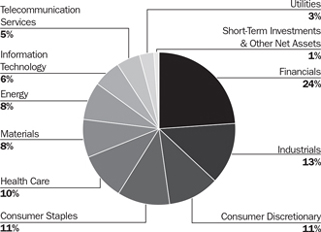
Sector Allocation is based on Net Assets.
Sector Allocation and Top 10 Holdings are subject to change.
| | | | |
| 72 | | Research International Core Portfolio | | |
Research International Core Portfolio
Schedule of Investments
December 31, 2012
| | | | | | | | | | | | |
| | | Foreign Common Stocks (98.9%) | | Country | | Shares/
$ Par | | | Value
$ (000’s) | |
| | |
| | Consumer Discretionary (10.7%) | | | | | |
| | Arcos Dorados Holdings, Inc. | | Virgin Islands
(British) | | | 147,670 | | | | 1,766 | |
| | Compass Group PLC | | United Kingdom | | | 109,270 | | | | 1,293 | |
| | DENSO Corp. | | Japan | | | 96,400 | | | | 3,350 | |
| | GKN PLC | | United Kingdom | | | 412,498 | | | | 1,539 | |
| | Hennes & Mauritz AB - B Shares | | Sweden | | | 52,330 | | | | 1,819 | |
| | Honda Motor Co., Ltd. | | Japan | | | 119,600 | | | | 4,402 | |
| | Li & Fung, Ltd. | | Hong Kong | | | 1,328,000 | | | | 2,393 | |
| | LVMH Moet Hennessy Louis Vuitton SA | | France | | | 14,209 | | | | 2,647 | |
| | Nippon Television Holdings | | Japan | | | 116,000 | | | | 1,541 | |
| | Publicis Groupe SA | | France | | | 40,048 | | | | 2,398 | |
| | Sands China, Ltd. | | Macau | | | 652,800 | | | | 2,929 | |
| | Whitbread PLC | | United Kingdom | | | 46,735 | | | | 1,864 | |
| | | | | | | | | | | | |
| | Total | | | | 27,941 | |
| | | | | | | | | | | | |
| | |
| | Consumer Staples (10.7%) | | | | | |
| | Danone SA | | France | | | 71,711 | | | | 4,736 | |
| | Heineken NV | | Netherlands | | | 78,579 | | | | 5,240 | |
| | Japan Tobacco, Inc. | | Japan | | | 141,200 | | | | 3,975 | |
| | Lawson, Inc. | | Japan | | | 23,000 | | | | 1,561 | |
| | M Dias Branco SA | | Brazil | | | 37,900 | | | | 1,445 | |
| | Nestle SA | | Switzerland | | | 110,553 | | | | 7,201 | |
| | Reckitt Benckiser Group PLC | | United Kingdom | | | 49,907 | | | | 3,127 | |
| | Wumart Stores, Inc. | | China | | | 255,000 | | | | 551 | |
| | | | | | | | | | | | |
| | Total | | | | 27,836 | |
| | | | | | | | | | | | |
| | |
| | Energy (8.1%) | | | | | |
| | BG Group PLC | | United Kingdom | | | 118,409 | | | | 1,986 | |
| | BP PLC | | United Kingdom | | | 777,995 | | | | 5,392 | |
| | Cairn Energy PLC | | United Kingdom | | | 111,520 | | | | 489 | |
| | Cenovus Energy, Inc. | | Canada | | | 31,810 | | | | 1,067 | |
| | CNOOC, Ltd. | | Hong Kong | | | 464,000 | | | | 1,019 | |
| | INPEX Corp. | | Japan | | | 377 | | | | 2,009 | |
| | Reliance Industries, Ltd. | | India | | | 86,332 | | | | 1,332 | |
| | Royal Dutch Shell PLC - Class A | | Netherlands | | | 226,087 | | | | 7,991 | |
| | | | | | | | | | | | |
| | Total | | | | 21,285 | |
| | | | | | | | | | | | |
| | |
| | Financials (24.4%) | | | | | |
| | Aeon Credit Service Co., Ltd. | | Japan | | | 67,600 | | | | 1,363 | |
| | AIA Group, Ltd. | | Hong Kong | | | 644,000 | | | | 2,567 | |
| | Banco Santander SA | | Spain | | | 212,300 | | | | 1,711 | |
| | Barclays PLC | | United Kingdom | | | 1,151,321 | | | | 4,973 | |
| | BNP Paribas SA | | France | | | 64,485 | | | | 3,633 | |
| | BOC Hong Kong Holdings, Ltd. | | Hong Kong | | | 307,500 | | | | 963 | |
| | DBS Group Holdings, Ltd. | | Singapore | | | 184,000 | | | | 2,253 | |
| | Delta Lloyd NV | | Netherlands | | | 54,760 | | | | 911 | |
| * | | Erste Group Bank AG | | Austria | | | 112,398 | | | | 3,593 | |
| * | | Grupo Financiero Santander Mexico SAB de CV, ADR - Class B | | Mexico | | | 65,270 | | | | 1,056 | |
| | GSW Immobilien AG | | Germany | | | 26,169 | | | | 1,106 | |
| | Hang Lung Properties, Ltd. | | Hong Kong | | | 546,000 | | | | 2,189 | |
| | | | | | | | | | | | |
| | | Foreign Common Stocks (98.9%) | | Country | | Shares/
$ Par | | | Value
$ (000’s) | |
| | |
| | Financials continued | | | | | |
| | HDFC Bank, Ltd., ADR | | India | | | 28,500 | | | | 1,161 | |
| | Hiscox, Ltd. | | Bermuda | | | 156,447 | | | | 1,139 | |
| | HSBC Holdings PLC | | United Kingdom | | | 236,785 | | | | 2,505 | |
| | ICICI Bank, Ltd. | | India | | | 45,436 | | | | 956 | |
| * | | ING Groep NV | | Netherlands | | | 353,988 | | | | 3,384 | |
| | Itau Unibanco Holding SA, ADR | | Brazil | | | 49,910 | | | | 822 | |
| | KBC Groep NV | | Belgium | | | 51,437 | | | | 1,790 | |
| | Mitsubishi UFJ Financial Group, Inc. | | Japan | | | 340,200 | | | | 1,828 | |
| | PT Bank Mandiri Tbk | | Indonesia | | | 1,000,500 | | | | 846 | |
| | PT Bank Rakyat Indonesia Tbk | | Indonesia | | | 1,195,500 | | | | 871 | |
| | Siam Commercial Bank PCL | | Thailand | | | 187,300 | | | | 1,108 | |
| | Sony Financial Holdings, Inc. | | Japan | | | 68,500 | | | | 1,231 | |
| | Standard Chartered PLC | | United Kingdom | | | 165,652 | | | | 4,200 | |
| | Sumitomo Mitsui Financial Group, Inc. | | Japan | | | 119,800 | | | | 4,346 | |
| | Swiss Re AG | | Switzerland | | | 48,877 | | | | 3,565 | |
| | UBS AG | | Switzerland | | | 149,332 | | | | 2,347 | |
| | Westpac Banking Corp. | | Australia | | | 190,920 | | | | 5,225 | |
| | | | | | | | | | | | |
| | Total | | | | 63,642 | |
| | | | | | | | | | | | |
| | |
| | Health Care (9.8%) | | | | | |
| | Bayer AG | | Germany | | | 54,002 | | | | 5,126 | |
| | Diagnosticos da America SA | | Brazil | | | 163,000 | | | | 1,049 | |
| | Miraca Holdings, Inc. | | Japan | | | 37,000 | | | | 1,488 | |
| | Novartis AG | | Switzerland | | | 91,190 | | | | 5,770 | |
| | Roche Holding AG | | Switzerland | | | 36,421 | | | | 7,416 | |
| | Santen Pharmaceutical Co., Ltd. | | Japan | | | 87,400 | | | | 3,342 | |
| | Sonova Holding AG | | Switzerland | | | 12,769 | | | | 1,414 | |
| | | | | | | | | | | | |
| | Total | | | | 25,605 | |
| | | | | | | | | | | | |
| | |
| | Industrials (12.8%) | | | | | |
| | East Japan Railway Co. | | Japan | | | 23,300 | | | | 1,504 | |
| | Glory, Ltd. | | Japan | | | 83,200 | | | | 1,925 | |
| | Hutchison Whampoa, Ltd. | | Hong Kong | | | 214,000 | | | | 2,270 | |
| | JGC Corp. | | Japan | | | 109,000 | | | | 3,391 | |
| | Joy Global, Inc. | | United States | | | 41,830 | | | | 2,668 | |
| | Keppel Corp., Ltd. | | Singapore | | | 172,400 | | | | 1,567 | |
| | Kuehne + Nagel International AG | | Switzerland | | | 17,450 | | | | 2,122 | |
| | Legrand SA | | France | | | 21,024 | | | | 887 | |
| | Mitsubishi Corp. | | Japan | | | 88,800 | | | | 1,705 | |
| | Schindler Holding AG | | Switzerland | | | 22,461 | | | | 3,243 | |
| | Schneider Electric SA | | France | | | 55,036 | | | | 4,103 | |
| | Siemens AG | | Germany | | | 42,126 | | | | 4,577 | |
| | Sinotruk Hong Kong, Ltd. | | China | | | 777,000 | | | | 598 | |
| | Yamato Holdings Co., Ltd. | | Japan | | | 182,700 | | | | 2,774 | |
| | | | | | | | | | | | |
| | Total | | | | 33,334 | |
| | | | | | | | | | | �� | |
| | |
| | Information Technology (6.0%) | | | | | |
| | Amadeus IT Holding SA - Class A | | Spain | | | 62,204 | | | | 1,560 | |
| | ASML Holding NV | | Netherlands | | | 9,349 | | | | 605 | |
| | Canon, Inc. | | Japan | | | 70,500 | | | | 2,762 | |
The Accompanying Notes are an Integral Part of the Financial Statements.
| | | | | | |
| | Research International Core Portfolio | | | 73 | |
Research International Core Portfolio
| | | | | | | | | | | | |
| | | Foreign Common Stocks (98.9%) | | Country | | Shares/
$ Par | | | Value
$ (000’s) | |
| | |
| | Information Technology continued | | | | | |
| * | | Cognizant Technology Solutions Corp. - Class A | | United States | | | 18,390 | | | | 1,362 | |
| | Dassault Systemes SA | | France | | | 14,925 | | | | 1,670 | |
| | Nomura Research Institute, Ltd. | | Japan | | | 64,600 | | | | 1,335 | |
| | Taiwan Semiconductor Manufacturing Co., Ltd. | | Taiwan | | | 600,189 | | | | 2,007 | |
| | Telefonaktiebolaget LM Ericsson - Class B | | Sweden | | | 289,651 | | | | 2,914 | |
| | Yahoo! Japan Corp. | | Japan | | | 4,235 | | | | 1,369 | |
| | | | | | | | | | | | |
| | Total | | | | 15,584 | |
| | | | | | | | | | | | |
| | |
| | Materials (8.3%) | | | | | |
| | Akzo Nobel NV | | Netherlands | | | 67,382 | | | | 4,445 | |
| | Chugoku Marine Paints, Ltd. | | Japan | | | 90,000 | | | | 537 | |
| | Iluka Resources, Ltd. | | Australia | | | 275,966 | | | | 2,677 | |
| | Linde AG | | Germany | | | 25,144 | | | | 4,383 | |
| | Newcrest Mining, Ltd. | | Australia | | | 43,935 | | | | 1,027 | |
| | Nippon Paint Co., Ltd. | | Japan | | | 98,000 | | | | 841 | |
| | Rio Tinto PLC | | United Kingdom | | | 114,570 | | | | 6,679 | |
| | Symrise AG | | Germany | | | 30,884 | | | | 1,105 | |
| | | | | | | | | | | | |
| | Total | | | | 21,694 | |
| | | | | | | | | | | | |
| | |
| | Telecommunication Services (5.0%) | | | | | |
| | Bezeq Israeli Telecommunication Corp., Ltd. | | Israel | | | 663,810 | | | | 767 | |
| | BT Group PLC | | United Kingdom | | | 268,810 | | | | 1,014 | |
| | China Unicom Hong Kong, Ltd. | | Hong Kong | | | 934,000 | | | | 1,512 | |
| | KDDI Corp. | | Japan | | | 56,800 | | | | 4,007 | |
| | Telecom Italia S.p.A. | | Italy | | | 531,725 | | | | 480 | |
| * | | Telecom Italia S.p.A. - Rights | | Italy | | | 1,494,238 | | | | 1,182 | |
| | Tim Participacoes SA, ADR | | Brazil | | | 38,621 | | | | 766 | |
| | Vodafone Group PLC | | United
Kingdom | | | 1,379,858 | | | | 3,471 | |
| | | | | | | | | | | | |
| | Total | | | | 13,199 | |
| | | | | | | | | | | | |
| | |
| | Utilities (3.1%) | | | | | |
| | CEZ AS | | Czech Republic | | | 30,753 | | | | 1,106 | |
| | China Resources Gas Group, Ltd. | | Hong Kong | | | 128,000 | | | | 265 | |
| | Cia de Saneamento Basico do Estado de Sao Paulo | | Brazil | | | 10,300 | | | | 437 | |
| | EDP - Energias do Brasil SA | | Brazil | | | 284,100 | | | | 1,732 | |
| | GDF Suez | | France | | | 75,196 | | | | 1,549 | |
| | Suez Environnement Co. | | France | | | 87,550 | | | | 1,055 | |
| | Tokyo Gas Co., Ltd. | | Japan | | | 453,000 | | | | 2,068 | |
| | | | | | | | | | | | |
| | Total | | | | 8,212 | |
| | | | | | | | | | | | |
| | |
| | Total Foreign Common Stocks | | | | | |
| | (Cost: $229,061) | | | | | | | | | 258,332 | |
| | | | | | | | | | | | |
| | | |
| | Total Investments (98.9%) | | | | | | | | |
| | (Cost: $229,061)(a) | | | | | | | 258,332 | |
| | | | | | | | | | | | |
| | Other Assets, Less | | | | | | | | | | |
| | Liabilities (1.1%) | | | | | | | | | 2,936 | |
| | | | | | | | | | | | |
| | Net Assets (100.0%) | | | | 261,268 | |
| | | | | | | | | | | | |
The Accompanying Notes are an Integral Part of the Financial Statements.
| | | | |
| 74 | | Research International Core Portfolio | | |
Research International Core Portfolio
ADR after the name of a security represents—American Depositary Receipt.
| (a) | At December 31, 2012 the aggregate cost of securities for federal tax purposes (in thousands) was $234,361 and the net unrealized appreciation of investments based on that cost was $23,971 which is comprised of $32,946 aggregate gross unrealized appreciation and $8,975 aggregate gross unrealized depreciation. |
| | | | | | |
Investments Percentage by Country is based on Net Assets: | | | | | | |
Japan | | | 20.9% | | | |
United Kingdom | | | 14.7% | | | |
Switzerland | | | 12.7% | | | |
France | | | 8.7% | | | |
Netherlands | | | 8.6% | | | |
Germany | | | 6.2% | | | |
Hong Kong | | | 5.0% | | | |
Other | | | 22.1% | | | |
Total | | | 98.9% | | | |
| (l) | As of December 31, 2012 portfolio securities with an aggregate value of $243,001 (in thousands) were fair valued under procedures adopted by the Board of Directors. |
The following is a summary of the inputs used in valuing the Portfolio’s assets and liabilities at December 31, 2012. See Note 3 for additional information on portfolio valuation.
| | | | | | | | | | | | | | |
| | | Valuation Inputs | | | |
| Description | | Level 1 –
Quoted Prices | | | Level 2 –
Other Significant
Observable Inputs | | | Level 3 – Significant Unobservable Inputs | | | |
| | | (Amounts in thousands) | | | |
Assets: | | | | | | | | | | | | | | |
Foreign Common Stocks | | | | | | | | | | | | | | |
Consumer Discretionary | | $ | 1,766 | | | $ | 26,175 | | | $ | - | | | |
Consumer Staples | | | 1,445 | | | | 26,391 | | | | - | | | |
Energy | | | 1,067 | | | | 20,218 | | | | - | | | |
Financials | | | 3,039 | | | | 60,603 | | | | - | | | |
Health Care | | | 1,049 | | | | 24,556 | | | | - | | | |
Industrials | | | 2,668 | | | | 30,666 | | | | - | | | |
Information Technology | | | 1,362 | | | | 14,222 | | | | - | | | |
Materials | | | - | | | | 21,694 | | | | - | | | |
Telecommunication Services | | | 766 | | | | 12,433 | | | | - | | | |
Utilities | | | 2,169 | | | | 6,043 | | | | - | | | |
Total | | $ | 15,331 | | | $ | 243,001 | | | $ | - | | | |
The Accompanying Notes are an Integral Part of the Financial Statements.
| | | | | | |
| | Research International Core Portfolio | | | 75 | |
International Equity Portfolio
| | | | |
| Objective: | | Portfolio Strategy: | | Net Assets: |
| Long-term growth of capital. Any income realized will be identical. | | Invests primarily in equity securities of issuers outside of the U.S. with favorable long-term potential relative to current market values. | | $1.5 billion |
Portfolio Overview
Mason Street Advisors, the investment adviser for the International Equity Portfolio (“the Portfolio”), has engaged Templeton Investment Counsel, LLC (“Templeton”) to act as sub-adviser for the Portfolio. The Portfolio may purchase securities in any foreign country, developed or undeveloped. The Portfolio’s strategy reflects a bottom up, value oriented and long-term investment philosophy. In choosing equity investments, the Portfolio will focus on the market price of a company’s securities in relation to its long-term earnings, asset value and cash flow potential. A company’s historical value measures, including price/earnings ratio, profit margins and liquidation value, also will be considered.
Market Overview
International stocks finished the year with solid gains amid considerable volatility. For most of 2012, the headlines from the European debt crisis caused concern about the durability of the financial system, while the economic slowdowns in the U.S. and China created worries about the pace of global growth. The outlook improved in the last several months of 2012, bringing relief for investors. The European Central Bank took extraordinary measures to back the Euro, and U.S. consumers increased spending, driving Chinese exports higher. In that environment, the MSCI® All Country World (ex-US) Index (the “Index”) rose 17.39%, while the MSCI® Emerging Market Index advanced 18.63%.
Portfolio Results
For the twelve months ended December 31, 2012, the Portfolio returned 21.52%, while the Index returned 17.39%. (The index is unmanaged, cannot be invested in directly and does not include administrative expenses or sales charges.) The Portfolio outperformed the average return for the Portfolio’s peer group, International Value Funds, which was 17.30%, according to Lipper® Analytical Services, Inc., an independent mutual fund rating agency.
Stock selection in the Financials sector was among the biggest contributors to performance relative to the Index. In particular, European financials were trading at relatively extreme discounts relative to their historical book value, reflecting concerns over the sovereign debt crisis. The Portfolio’s value-oriented investment process identified several financial institutions that had long-term appreciation potential given their low valuations and relative importance to the global financial system. These positions had a positive impact on performance during 2012, as the European Central Bank implemented broad measures to avoid sovereign defaults in the weaker European economies. In particular, the Portfolio’s holdings in Lloyds Banking Gp, DBS Group Hldgs, Swiss Re AG and BNP Paribas were responsible for the majority of the Portfolio’s relative performance in the Financials sector.
In the Materials sector, stock selection added to the Portfolio’s outperformance relative to the Index. The biggest contributor in the sector was Lyondellbasell. The stock rose sharply, as cost reductions related to low natural gas prices in the U.S. gave the company an advantage over its global competitors. The Portfolio also held Australian steel maker Bluescope Steel, which sells most of its products in China. The stock had a solid balance sheet with manageable debt, meaning the company had increased potential to weather the economic slowdown in China. The stock increased in 2012, as the Chinese economy began to recover. In addition, the Portfolio entirely avoided mining stocks that were in the Index, which helped relative performance, as stock prices generally fell in the mining industry.
Overall, the Portfolio’s holdings in the Healthcare and Information Technology sectors also outperformed the Index. The top three relative contributors were Bayer AG, Sanofi, and Merck KgaA. In the Technology sector, Samsung Electronics was the biggest contributor, as the stock outperformed on solid demand for its television and cellular phones. Taiwan Semiconductor also rallied, as the company delivered strong earnings in each of its business subdivisions.
On the other end of the spectrum, stock selection in the Consumer Staples and Industrials sectors detracted from relative performance. Specifically, some stock specific challenges weighed on relative performance in those sectors, as U.K. grocer Tesco, China’s largest specialty steel manufacturer Citic Pacific and diversified manufacturer Shanghai Electric declined sharply.
Portfolio Manager Outlook
The following forward looking comments are the opinion of Templeton, the Portfolio’s sub-adviser.
The portfolio managers believe the best way to generate performance over time versus the Index is through superior individual security selection using a value-oriented approach. From a country perspective, we believe several of our holdings in Japan, including the automakers, have the potential to benefit if Japan begins to pursue economic policies that could boost the company’s exports. Similarly, we are seeing valuation opportunities in Brazil, China, and India. Many companies in these countries have attractively priced free cash flow, as investors fully discounted the economic slowdown in emerging markets.
| | | | |
| 76 | | International Equity Portfolio | | |
International Equity Portfolio
Our investment thesis for healthcare will be based on European drug companies with emerging markets exposure that are exiting slower growth businesses and pursuing the development of new treatments for disease. We are also finding value in highly profitable technology stocks with exposure to business capital spending, as the pace of spending has not kept up with depreciating assets.
Relative Performance

| | | | | | | | | | | | |
Average Annual Total Returns
For Periods Ended December 31, 2012 | |
| | | 1 Year | | | 5 Years | | | 10 Years | |
International Equity Portfolio | | | 21.52% | | | | -2.52% | | | | 9.78% | |
MSCI® All Country World (ex-US) Index (Gross) | | | 17.39% | | | | -2.44% | | | | 10.22% | |
MSCI EAFE® Index (Gross) | | | 17.90% | | | | -3.21% | | | | 8.70% | |
Lipper® Variable Insurance Products (VIP) International Value Funds Average | | | 17.30% | | | | -4.41% | | | | 7.43% | |
The performance data quoted represents past performance. Past performance is historical and does not guarantee future performance. Investment return and principal value will fluctuate, so that shares, when redeemed, may be worth more or less than their original cost. Current performance may be lower or higher than the performance data quoted. For the most recent month-end performance information visit www.northwesternmutual.com.
This chart assumes an initial investment of $10,000 made on 12/31/02. Returns shown include deductions for management and other portfolio expenses, and reinvestment of all dividends. Returns exclude deductions for separate account sale loads and account fees. Please refer to the Benchmark Definitions section of this report for information about the indices cited in the above chart and graph.
Investors should be aware of the risks of investments in foreign securities, particularly investments in securities of companies in developing nations. These include the risks of currency fluctuation, of political and economic instability and of less well-developed government supervision and regulation of business and industry practices, as well as differences in accounting standards.
Top 10 Equity Holdings 12/31/12
| | |
| Security Description | | % of Net Assets |
Roche Holding AG | | 2.7% |
Bayer AG | | 2.5% |
Samsung Electronics Co., Ltd. | | 2.4% |
Telenor ASA | | 2.3% |
HSBC Holdings PLC | | 2.1% |
Merck KGaA | | 2.1% |
Royal Dutch Shell PLC - Class B | | 2.0% |
Kingfisher PLC | | 2.0% |
Taiwan Semiconductor Manufacturing Co., Ltd. | | 2.0% |
Singapore Telecommunications, Ltd. | | 1.9% |
Sector Allocation 12/31/12
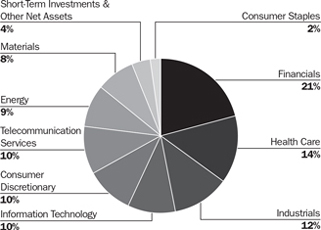
Sector Allocation is based on Net Assets.
Sector Allocation and Top 10 Holdings are subject to change.
| | | | | | |
| | International Equity Portfolio | | | 77 | |
International Equity Portfolio
Schedule of Investments
December 31, 2012
| | | | | | | | | | | | |
| | | Foreign Common Stocks (95.9%) | | Country | | Shares/
$ Par | | | Value
$ (000’s) | |
| |
| | Consumer Discretionary (9.7%) | |
| | Cie Generale des Etablissements Michelin | | France | | | 264,268 | | | | 25,044 | |
| * | | Hyundai Mobis | | South Korea | | | 66,060 | | | | 18,034 | |
| | Kingfisher PLC | | United Kingdom | | | 6,466,180 | | | | 29,876 | |
| | Marks & Spencer Group PLC | | United Kingdom | | | 3,687,520 | | | | 22,998 | |
| * | | Mazda Motor Corp. | | Japan | | | 1,955,880 | | | | 3,988 | |
| | Nissan Motor Co., Ltd. | | Japan | | | 2,114,490 | | | | 20,043 | |
| | Toyota Motor Corp. | | Japan | | | 534,020 | | | | 24,893 | |
| | | | | | | | | | | | |
| | Total | | | | | | | | | 144,876 | |
| | | | | | | | | | | | |
| | |
| | Consumer Staples (2.4%) | | | | | |
| | Carrefour SA | | France | | | 317,780 | | | | 8,226 | |
| | Tesco PLC | | United Kingdom | | | 4,916,610 | | | | 27,017 | |
| | | | | | | | | | | | |
| | Total | | | | | | | | | 35,243 | |
| | | | | | | | | | | | |
| | | | |
| | Energy (8.8%) | | | | | | | | | | |
| | China Coal Energy Co., Ltd. | | China | | | 11,855,740 | | | | 13,257 | |
| | China Shenhua Energy Co., Ltd. | | China | | | 2,712,940 | | | | 12,122 | |
| | ENI SpA | | Italy | | | 899,565 | | | | 22,183 | |
| | Galp Energia SGPS SA | | Portugal | | | 1,126,050 | | | | 17,487 | |
| | Petroleo Brasileiro SA, ADR | | Brazil | | | 370,530 | | | | 7,214 | |
| | Repsol SA | | Spain | | | 234,660 | | | | 4,817 | |
| * | | Respol SA - Rights | | Spain | | | 234,660 | | | | 143 | |
| | Royal Dutch Shell PLC - Class B | | United Kingdom | | | 849,205 | | | | 30,065 | |
| | Statoil ASA | | Norway | | | 491,680 | | | | 12,335 | |
| | Talisman Energy, Inc. | | Canada | | | 1,011,970 | | | | 11,469 | |
| | | | | | | | | | | | |
| | Total | | | | | | | | | 131,092 | |
| | | | | | | | | | | | |
| | |
| | Financials (21.1%) | | | | | |
| | Aegon NV | | Netherlands | | | 931,090 | | | | 5,931 | |
| | AIA Group, Ltd. | | Hong Kong | | | 5,984,820 | | | | 23,854 | |
| | Aviva PLC | | United Kingdom | | | 2,395,180 | | | | 14,464 | |
| | AXA SA | | France | | | 554,855 | | | | 10,032 | |
| | Bangkok Bank Public Co., Ltd. | | Thailand | | | 2,559,200 | | | | 17,532 | |
| | BNP Paribas SA | | France | | | 219,470 | | | | 12,366 | |
| | Cheung Kong Holdings, Ltd. | | Hong Kong | | | 741,850 | | | | 11,484 | |
| | China Life Insurance Co., Ltd. | | China | | | 6,621,000 | | | | 21,882 | |
| | Credit Suisse Group AG | | Switzerland | | | 951,410 | | | | 23,859 | |
| | DBS Group Holdings, Ltd. | | Singapore | | | 2,175,000 | | | | 26,628 | |
| | Housing Development Finance Corp., Ltd. | | India | | | 47,610 | | | | 725 | |
| | HSBC Holdings PLC | | United Kingdom | | | 2,956,937 | | | | 31,392 | |
| * | | ING Groep NV | | Netherlands | | | 1,845,152 | | | | 17,638 | |
| * | | Lloyds Banking Group PLC | | United Kingdom | | | 20,101,110 | | | | 16,112 | |
| | NKSJ Holdings, Inc. | | Japan | | | 397,200 | | | | 8,448 | |
| | Nordea Bank AB | | Sweden | | | 2,758,570 | | | | 26,425 | |
| | Standard Chartered PLC | | United Kingdom | | | 867,390 | | | | 21,994 | |
| | Swiss Reinsurance Co., Ltd. | | Switzerland | | | 302,612 | | | | 22,074 | |
| | | | | | | | | | | | |
| | Total | | | | | | | | | 312,840 | |
| | | | | | | | | | | | |
| | | | | | | | | | | | |
| | | Foreign Common Stocks (95.9%) | | Country | | Shares/
$ Par | | | Value
$ (000’s) | |
| | |
| | Health Care (13.8%) | | | | | |
| * | | Algeta ASA | | Norway | | | 270,370 | | | | 7,591 | |
| * | | Basilea Pharmaceutica AG | | Switzerland | | | 87,430 | | | | 4,276 | |
| | Bayer AG | | Germany | | | 384,080 | | | | 36,459 | |
| * | | Elan Corp. PLC, ADR | | Ireland | | | 1,915,120 | | | | 19,553 | |
| | Getinge AB - Class B | | Sweden | | | 591,650 | | | | 20,047 | |
| | GlaxoSmithKline PLC | | United Kingdom | | | 633,240 | | | | 13,753 | |
| | Ipsen SA | | France | | | 282,440 | | | | 8,551 | |
| | Merck KGaA | | Germany | | | 233,520 | | | | 30,799 | |
| * | | Prothena Corp. PLC | | Ireland | | | 46,710 | | | | 342 | |
| | Roche Holding AG | | Switzerland | | | 195,570 | | | | 39,821 | |
| | Sanofi | | France | | | 246,075 | | | | 23,328 | |
| | | | | | | | | | | | |
| | Total | | | | | | | | | 204,520 | |
| | | | | | | | | | | | |
| | | | |
| | Industrials (11.8%) | | | | | | | | | | |
| | ABB, Ltd. | | Switzerland | | | 180,460 | | | | 3,745 | |
| | Deutsche Lufthansa AG | | Germany | | | 898,420 | | | | 16,881 | |
| | G4S PLC | | United Kingdom | | | 4,897,450 | | | | 20,456 | |
| | Hutchison Whampoa, Ltd. | | Hong Kong | | | 1,389,983 | | | | 14,746 | |
| * | | International Consolidated Airlines Group SA | | United Kingdom | | | 5,205,520 | | | | 16,052 | |
| | ITOCHU Corp. | | Japan | | | 2,092,640 | | | | 22,060 | |
| * | | Qantas Airways, Ltd. | | Australia | | | 8,270,480 | | | | 13,018 | |
| | Randstad Holding NV | | Netherlands | | | 293,300 | | | | 10,823 | |
| | Shanghai Electric Group Co., Ltd. | | China | | | 31,604,000 | | | | 13,741 | |
| | Siemens AG | | Germany | | | 170,620 | | | | 18,538 | |
| | Siemens AG, ADR | | Germany | | | 228,990 | | | | 25,068 | |
| | | | | | | | | | | | |
| | Total | | | | | | | | | 175,128 | |
| | | | | | | | | | | | |
| | |
| | Information Technology (10.3%) | | | | | |
| * | | Flextronics International, Ltd. | | Singapore | | | 1,704,200 | | | | 10,583 | |
| | Infineon Technologies AG | | Germany | | | 1,580,200 | | | | 12,818 | |
| | Samsung Electronics Co., Ltd. | | South Korea | | | 24,520 | | | | 35,322 | |
| | Siliconware Precision Industries Co. | | Taiwan | | | 13,391,000 | | | | 14,319 | |
| | Software AG | | Germany | | | 519,740 | | | | 22,069 | |
| | Taiwan Semiconductor Manufacturing Co., Ltd. | | Taiwan | | | 8,880,235 | | | | 29,695 | |
| * | | Trend Micro, Inc. | | Japan | | | 932,980 | | | | 28,119 | |
| | | | | | | | | | | | |
| | Total | | | | | | | | | 152,925 | |
| | | | | | | | | | | | |
| | |
| | Materials (8.2%) | | | | | |
| | Akzo Nobel NV | | Netherlands | | | 336,140 | | | | 22,172 | |
| * | | BlueScope Steel, Ltd. | | Australia | | | 4,285,762 | | | | 15,739 | |
| | CRH PLC | | Ireland | | | 558,050 | | | | 11,669 | |
| | HeidelbergCement AG | | Germany | | | 303,280 | | | | 18,366 | |
| | LyondellBasell Industries NV | | Netherlands | | | 399,680 | | | | 22,818 | |
| | POSCO | | South Korea | | | 37,010 | | | | 12,180 | |
| | Rexam PLC | | United Kingdom | | | 2,717,150 | | | | 19,100 | |
| | | | | | | | | | | | |
| | Total | | | | | | | | | 122,044 | |
| | | | | | | | | | | | |
| | |
| | Telecommunication Services (9.5%) | | | | | |
| | China Mobile, Ltd. | | Hong Kong | | | 2,046,500 | | | | 23,974 | |
The Accompanying Notes are an Integral Part of the Financial Statements.
| | | | |
| 78 | | International Equity Portfolio | | |
International Equity Portfolio
| | | | | | | | | | | | |
| | | Foreign Common Stocks (95.9%) | | Country | | Shares/ $ Par | | | Value $ (000’s) | |
| | | |
| | Telecommunication Services continued | | | | | | | | |
| | China Telecom Corp., Ltd. | | China | | | 45,846,000 | | | | 25,688 | |
| | Singapore Telecommunications, Ltd. | | Singapore | | | 10,531,850 | | | | 28,645 | |
| | Telenor ASA | | Norway | | | 1,699,790 | | | | 34,526 | |
| * | | Turkcell Iletisim Hizmetleri AS | | Turkey | | | 1,369,410 | | | | 8,870 | |
| | Vodafone Group PLC | | United Kingdom | | | 7,868,633 | | | | 19,795 | |
| | | | | | | | | | | | |
| | Total | | | | | | | | | 141,498 | |
| | | | | | | | | | | | |
| | | | |
| | Utilities (0.3%) | | | | | | | | | | |
| | Centrais Eletricas Brasileiras SA | | Brazil | | | 1,543,190 | | | | 4,769 | |
| | | | | | | | | | | | |
| | Total | | | | | | | | | 4,769 | |
| | | | | | | | | | | | |
| | | | |
| | Total Foreign Common Stocks | | | | | | | | | | |
| | (Cost: $1,234,794) | | | | | | | | | 1,424,935 | |
| | | | | | | | | | | | |
| | | | |
| | Total Investments (95.9%) | | | | | | | | | | |
| | (Cost: $1,234,794)(a) | | | | | | | | | 1,424,935 | |
| | | | | | | | | | | | |
| | Other Assets, Less | | | | | | | | | | |
| | Liabilities (4.1%) | | | | | | | | | 60,761 | |
| | | | | | | | | | | | |
| | Net Assets (100.0%) | | | | | | | | | 1,485,696 | |
| | | | | | | | | | | | |
ADR after the name of a security represents—American Depositary Receipt.
| (a) | At December 31, 2012 the aggregate cost of securities for federal tax purposes (in thousands) was $1,234,794 and the net unrealized appreciation of investments based on that cost was $190,141 which is comprised of $276,228 aggregate gross unrealized appreciation and $86,087 aggregate gross unrealized depreciation. |
| | | | | | |
Investments Percentage by Country is based on Net Assets: | | | | | | |
United Kingdom | | | 19.1% | | | |
Germany | | | 12.2% | | | |
Japan | | | 7.2% | | | |
Switzerland | | | 6.3% | | | |
France | | | 5.9% | | | |
China | | | 5.8% | | | |
Netherlands | | | 5.3% | | | |
Hong Kong | | | 5.0% | | | |
Other | | | 29.1% | | | |
Total | | | 95.9% | | | |
| (l) | As of December 31, 2012 portfolio securities with an aggregate value of $1,323,119 (in thousands) were fair valued under procedures adopted by the Board of Directors. |
The Accompanying Notes are an Integral Part of the Financial Statements.
| | | | | | |
| | International Equity Portfolio | | | 79 | |
International Equity Portfolio
The following is a summary of the inputs used in valuing the Portfolio’s assets and liabilities at December 31, 2012. See Note 3 for additional information on portfolio valuation.
| | | | | | | | | | | | | | |
| | | Valuation Inputs | | | |
| Description | | Level 1 –
Quoted Prices | | | Level 2 – Other Significant
Observable Inputs | | | Level 3 –
Significant
Unobservable Inputs | | | |
| | | (Amounts in thousands) | | | |
Assets: | | | | | | | | | | | | | | |
Foreign Common Stocks | | | | | | | | | | | | | | |
Consumer Discretionary | | $ | - | | | $ | 144,876 | | | $ | - | | | |
Consumer Staples | | | - | | | | 35,243 | | | | - | | | |
Financials | | | - | | | | 312,840 | | | | - | | | |
Energy | | | 18,683 | | | | 112,409 | | | | - | | | |
Health Care | | | 19,895 | | | | 184,625 | | | | - | | | |
Industrials | | | 25,068 | | | | 150,060 | | | | - | | | |
Information Technology | | | 10,583 | | | | 142,342 | | | | - | | | |
Telecommunication Services | | | - | | | | 141,498 | | | | - | | | |
Materials | | | 22,818 | | | | 99,226 | | | | - | | | |
Utilities | | | 4,769 | | | | - | | | | - | | | |
Total | | $ | 101,816 | | | $ | 1,323,119 | | | $ | - | | | |
The Accompanying Notes are an Integral Part of the Financial Statements.
| | | | |
| 80 | | International Equity Portfolio | | |
Emerging Markets Equity Portfolio
| | | | |
| Objective: | | Portfolio Strategy: | | Net Assets: |
| Capital appreciation. | | Invest primarily in equity securities of issuers that are tied economically to emerging market countries. | | $256 million |
Portfolio Overview
Mason Street Advisors, the investment adviser for the Emerging Markets Equity Portfolio (“the Portfolio”), has engaged Massachusetts Financial Services Company (“MFS®”) to act as sub-adviser for the Portfolio. The Portfolio normally invests in equity securities of issuers that are tied economically to emerging market countries. Emerging market countries may include countries determined to have emerging market economies, taking into account a number of factors, including whether a particular country has a low to middle economy according to the International Bank for Reconstruction and Development (the World Bank), the country’s foreign currency debt rating, its political and economic stability, and the development of its financial and capital markets. When investing in emerging market equities, the Portfolio may invest in companies of any size. Investments are selected primarily based on fundamental analysis of individual issuers and their potential in light of their current financial condition and market, economic, political and regulatory conditions. The Portfolio may also invest in securities of companies that are not tied economically to emerging markets countries.
Market Overview
In the aftermath of additional liquidity measures by the Federal Reserve Bank (Fed) and a commensurate improvement in macroeconomic conditions, the beginning of 2012 was characterized by a risk-on sentiment. During this time, global equity valuations rose, credit spreads contracted, and high-quality sovereign yields increased modestly.
During the middle of the year, conditions worsened, driven by broadly weaker global macroeconomic indicators, as well as renewed concerns over Europe’s capacity and determination to address its ongoing crisis. Despite this deterioration, broad market sentiment remained relatively resilient, as equity markets generally maintained gains and credit spreads did not indicate deterioration.
However, this renewed weakness in the fundamentals precipitated a further round of monetary easing by the Fed (QE3) and the ECB (rate cut and a new bond purchase facility) in the second half of the year, which soon instilled additional confidence in risk markets.
Portfolio Results
For the twelve months ended December 31, 2012, the Portfolio returned 18.83%. This compares with a return of 18.63% for the Portfolio’s benchmark, the MSCI® Emerging Markets Index (the “Index”). (This Index is unmanaged, cannot be invested in directly and does not include administrative expenses or sales charges.) The average return of its peer group, Emerging Markets Funds, was 18.23%, according to Lipper® Analytical Services, Inc., an independent mutual fund ranking agency.
Stock selection and, to a lesser extent, an overweight position in the Retailing sector contributed to performance relative to the Index. Within the sector, South African retailer Mr Price Group, Russian retail chain operator O’Key Group, and Thailand-based convenience store operator CP ALL benefited relative returns as all three stocks turned in strong performance over the period.
Stock selection in the Special Products & Services sector was another primary contributor to relative performance. Brazilian private education provider Kroton Educacional benefited relative performance as the stock outpaced the Index.
Security selection in the technology, transportation, and leisure sectors also positively impacted relative results. Within the transportation sector, airport facilities manager Grupo Aeroportuario del Sureste of Mexico benefited relative performance as the stock advanced. Elsewhere in the Portfolio, Hong Kong listed automaker Geely Automobile Holdings, banking firm ICICI Bank of India, and Mexican exchange Bolsa Mexicana de Valores aided relative results as all three stocks outperformed the Index. An underweight position in the poor-performing Brazilian oil company Petroleo Brasileiro and not holding shares of OGX Petroleo e Gas Participacoes, also of Brazil, aided relative performance.
Stock selection in the Autos & Housing sector detracted from relative performance. South Korean automotive companies Mando and Kia Motors, and housing construction company Urbi Desarrollos Urbanos of Mexico hindered relative results, as all three stocks turned in weak performance over the period.
Security selection in the Energy and Health Care sectors also detracted from relative performance. Within the Energy sector, oil drilling rig manufacturer Lamprell of the United Arab Emirates and oil and gas exploration companies, INPEX of Japan and Bankers Petroleum of Canada, weakened relative results.
Stocks in other sectors that detracted from relative performance included telecommunications service provider China Unicom Hong Kong, mining company Iluka Resources of Australia, and South Korean supermarket operator E-Mart Company.
The Portfolio’s cash position was another negative factor for relative performance. In a period when the Index rose, holding cash hurt performance versus the Index, which has no cash position. The Portfolio’s relative currency exposure, resulting primarily from differences between the Portfolio’s and the Index’s exposures to holdings of securities denominated in foreign currencies, also weakened relative performance. All of the Portfolio’s investment decisions are driven by the fundamentals of each individual opportunity and as such, it is common for the Portfolio to have different currency exposures than the Index.
| | | | | | |
| | Emerging Markets Equity Portfolio | | | 81 | |
Emerging Markets Equity Portfolio
Portfolio Manager Outlook
The following forward looking comments are the opinion of MFS, the Portfolio’s sub-adviser.
Regardless of changing economic and market conditions, we will continue to adhere to our investment process, building a Portfolio of companies that we regard as undergoing fundamental operational improvements and whose shares trade at discounted valuations. As a result, the Portfolio’s sector and industry allocation will reflect where we are finding what we believe to be the best investment opportunities at any given time.
Relative Performance
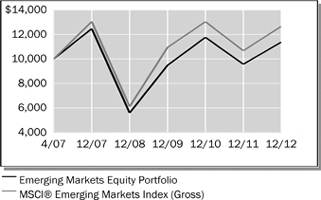
| | | | | | | | | | | | |
Average Annual Total Returns
For Periods Ended December 31, 2012 | |
| | | 1 Year | | | 5 Years | | | Since
Inception* | |
Emerging Markets Equity Portfolio | | | 18.83% | | | | -1.83% | | | | 2.29% | |
MSCI® Emerging Markets Index (Gross) | | | 18.63% | | | | -0.61% | | | | 4.24% | |
Lipper® Variable Insurance Products (VIP) Emerging Markets Funds Average | | | 18.23% | | | | -2.10% | | | | - | |
| * | Inception date of 4/30/07 |
The performance data quoted represents past performance. Past performance is historical and does not guarantee future performance. Investment return and principal value will fluctuate, so that shares, when redeemed, may be worth more or less than their original cost. Current performance may be lower or higher than the performance data quoted. For the most recent month-end performance information visit www.northwesternmutual.com.
This chart assumes an initial investment of $10,000 made on 4/30/07 (commencement of the Portfolio’s operations). Returns shown reflect fee waivers, deductions for management and other portfolio expenses, and reinvestment of all dividends. In the absence of fee waivers, total return would be reduced. Returns exclude deductions for separate account sale loads and account fees. Please refer to the Benchmark Definitions section of this report for information about the indices cited in the above chart and graph.
Investors should be aware of the risks of investments in foreign securities, particularly investments in securities
of companies in developing nations. These include the risks of currency fluctuation, of political and economic instability and of less well-developed government supervision and regulation of business and industry practices, as well as differences in accounting standards.
Investments in the securities of companies in developing nations impose risks different from, and greater than, risks of investing in developed countries.
The Portfolio may invest a relatively large percentage of its assets in issuers located in a single country, a small number of countries, or a particular geographic region. The Portfolio’s performance may be more volatile than that of a more geographically diversified fund, and may be tied more closely to the performance of a single country or region.
Top 10 Equity Holdings 12/31/12
| | | | |
| Security Description | | % of Net Assets | |
Samsung Electronics Co., Ltd. | | | 4.6% | |
Taiwan Semiconductor Manufacturing Co., Ltd. | | | 3.5% | |
Hon Hai Precision Industry Co., Ltd. | | | 1.9% | |
China Construction Bank Corp. - Class H | | | 1.8% | |
Vale SA, ADR | | | 1.7% | |
Naspers, Ltd. - Class N | | | 1.7% | |
China Unicom Hong Kong, Ltd. | | | 1.6% | |
Li & Fung, Ltd. | | | 1.6% | |
Standard Chartered PLC | | | 1.5% | |
Bank of China, Ltd. - Class H | | | 1.5% | |
Sector Allocation 12/31/12

Sector Allocation is based on Net Assets.
Sector Allocation and Top 10 Holdings are subject to change.
| | | | |
| 82 | | Emerging Markets Equity Portfolio | | |
Emerging Markets Equity Portfolio
Schedule of Investments
December 31, 2012
| | | | | | | | | | | | |
| | | Foreign Common Stocks (98.7%) | | Country | | Shares/
$ Par | | | Value
$ (000’s) | |
| |
| | Consumer Discretionary (16.0%) | |
| | Abril Educacao SA | | Brazil | | | 45,410 | | | | 887 | |
| | Ajisen China Holdings, Ltd. | | Hong Kong | | | 1,386,000 | | | | 1,343 | |
| | Anhanguera Educacional Participacoes SA | | Brazil | | | 54,800 | | | | 925 | |
| | Arcos Dorados Holdings, Inc. | | Virgin Islands
(British) | | | 63,080 | | | | 754 | |
| | Arezzo Industria e Comercio SA | | Brazil | | | 38,250 | | | | 738 | |
| | Astro Malaysia Holdings Bhd | | Malaysia | | | 800,100 | | | | 788 | |
| | Companhia Hering | | Brazil | | | 31,900 | | | | 654 | |
| * | | Dish TV India, Ltd. | | India | | | 1,673,926 | | | | 2,332 | |
| | Estacio Participacoes SA | | Brazil | | | 54,570 | | | | 1,111 | |
| | Exide Industries, Ltd. | | India | | | 330,872 | | | | 869 | |
| | Geely Automobile Holdings, Ltd. | | Hong Kong | | | 3,980,000 | | | | 1,899 | |
| | Guangzhou Automobile Group Co., Ltd. | | China | | | 1,868,000 | | | | 1,683 | |
| * | | Kia Motors Corp. | | South Korea | | | 73,330 | | | | 3,927 | |
| * | | Kroton Educacional SA | | Brazil | | | 37,078 | | | | 837 | |
| | Li & Fung, Ltd. | | Hong Kong | | | 2,212,000 | | | | 3,986 | |
| | Lojas Renner SA | | Brazil | | | 20,800 | | | | 810 | |
| (n) | | M Video OAO | | Russia | | | 210,490 | | | | 1,655 | |
| * | | Mando Corp. | | South Korea | | | 12,005 | | | | 1,459 | |
| | Minor International PCL | | Thailand | | | 1,826,610 | | | | 1,170 | |
| | Mitra Adiperkasa Tbk PT | | Indonesia | | | 932,000 | | | | 653 | |
| | Mr. Price Group, Ltd. | | South Africa | | | 135,325 | | | | 2,267 | |
| | Naspers, Ltd. - Class N | | South Africa | | | 67,327 | | | | 4,338 | |
| | PDG Realty SA Empreendimentos e Participacoes | | Brazil | | | 362,000 | | | | 585 | |
| | Shangri-La Asia, Ltd. | | Hong Kong | | | 724,000 | | | | 1,459 | |
| | Stella International Holdings, Ltd. | | Hong Kong | | | 1,184,000 | | | | 3,210 | |
| * | | Urbi Desarrollos Urbanos SAB de CV | | Mexico | | | 1,149,374 | | | | 725 | |
| | | | | | | | | | | | |
| | Total | | | | | | | | | 41,064 | |
| | | | | | | | | | | | |
| | | | |
| | Consumer Staples (9.5%) | | | | | | | | | | |
| | Arca Continental SAB de CV | | Mexico | | | 116,143 | | | | 870 | |
| | BIM Birlesik Magazalar AS | | Turkey | | | 17,567 | | | | 862 | |
| | Brazil Pharma SA | | Brazil | | | 148,000 | | | | 1,040 | |
| | Clicks Group, Ltd. | | South Africa | | | 301,700 | | | | 2,369 | |
| | Companhia de Bebidas das Americas, ADR | | Brazil | | | 61,110 | | | | 2,566 | |
| | CP ALL PCL | | Thailand | | | 1,092,200 | | | | 1,642 | |
| | Dabur India, Ltd. | | India | | | 1,281,632 | | | | 3,011 | |
| | Dairy Farm International Holdings, Ltd. | | Hong Kong | | | 136,800 | | | | 1,491 | |
| * | | E-Mart Co., Ltd. | | South Korea | | | 11,102 | | | | 2,487 | |
| | Hengan International Group Co., Ltd. | | China | | | 97,000 | | | | 875 | |
| | Kimberly-Clark de Mexico SAB de CV - Class A | | Mexico | | | 329,584 | | | | 851 | |
| | M Dias Branco SA | | Brazil | | | 46,800 | | | | 1,784 | |
| | O’Key Group SA GDR | | Luxembourg | | | 240,800 | | | | 2,817 | |
| | | | | | | | | | | | |
| | | Foreign Common Stocks (98.7%) | | Country | | Shares/
$ Par | | | Value
$ (000’s) | |
| |
| | Consumer Staples continued | |
| | Raia Drogasil SA | | Brazil | | | 67,500 | | | | 760 | |
| | Wumart Stores, Inc. | | China | | | 408,000 | | | | 881 | |
| | | | | | | | | | | | |
| | Total | | | | | | | | | 24,306 | |
| | | | | | | | | | | | |
| | | | |
| | Energy (7.7%) | | | | | | | | | | |
| | China Shenhua Energy Co., Ltd. - Class H | | China | | | 491,000 | | | | 2,194 | |
| | CNOOC, Ltd. | | Hong Kong | | | 897,000 | | | | 1,970 | |
| | Gazprom OAO, ADR | | Russia | | | 408,594 | | | | 3,865 | |
| | INPEX Corp. | | Japan | | | 307 | | | | 1,636 | |
| | Lamprell PLC | | United Arab
Emirates | | | 551,500 | | | | 842 | |
| | NovaTek OAO GDR | | Russia | | | 11,050 | | | | 1,324 | |
| | Petroleo Brasileiro SA, ADR | | Brazil | | | 126,974 | | | | 2,472 | |
| | Reliance Industries, Ltd. | | India | | | 243,259 | | | | 3,753 | |
| | Tenaris SA, ADR | | Luxembourg | | | 38,728 | | | | 1,623 | |
| | | | | | | | | | | | |
| | Total | | | | | | | | | 19,679 | |
| | | | | | | | | | | | |
| | | | |
| | Financials (25.3%) | | | | | | | | | | |
| | Akbank TAS | | Turkey | | | 253,570 | | | | 1,255 | |
| | Asian Property Development PCL | | Thailand | | | 3,853,000 | | | | 1,070 | |
| | Banco Santander Brasil SA | | Brazil | | | 184,400 | | | | 1,348 | |
| | Banco Santander Chile, ADR | | Chile | | | 16,892 | | | | 481 | |
| | Bancolombia SA, ADR | | Colombia | | | 8,364 | | | | 557 | |
| | Bangkok Bank PCL | | Thailand | | | 476,400 | | | | 3,264 | |
| | Bank Negara Indonesia Persero Tbk PT | | Indonesia | | | 5,151,831 | | | | 1,985 | |
| | Bank of China, Ltd. - Class H | | China | | | 8,650,000 | | | | 3,939 | |
| | Bank Pekao SA | | Poland | | | 31,750 | | | | 1,734 | |
| * | | BDO Unibank, Inc. | | Philippines | | | 91,580 | | | | 163 | |
| | BM&FBOVESPA SA | | Brazil | | | 341,800 | | | | 2,336 | |
| | Bolsa Mexicana de Valores SAB de CV | | Mexico | | | 404,600 | | | | 1,026 | |
| | Brasil Brokers Participacoes SA | | Brazil | | | 393,900 | | | | 1,308 | |
| | Brasil Insurance Participacoes e Administracao SA | | Brazil | | | 185,900 | | | | 1,815 | |
| | CETIP SA - Balcao Organizados | | Brazil | | | 102,742 | | | | 1,273 | |
| | China Construction Bank Corp. -
Class H | | China | | | 5,522,020 | | | | 4,501 | |
| | China Pacific Insurance Group Co., Ltd. - Class H | | China | | | 849,600 | | | | 3,187 | |
| | Chinatrust Financial Holding Co., Ltd. | | Taiwan | | | 2,951,733 | | | | 1,748 | |
| | CIMB Group Holdings Bhd | | Malaysia | | | 425,000 | | | | 1,062 | |
| | Credicorp, Ltd. | | Bermuda | | | 15,761 | | | | 2,310 | |
| | First Pacific Co., Ltd. | | Hong Kong | | | 1,250,000 | | | | 1,385 | |
| | Grupo Financiero Banorte SAB de CV | | Mexico | | | 102,900 | | | | 668 | |
| * | | Grupo Financiero Santander Mexico SAB de CV, ADR | | Mexico | | | 73,580 | | | | 1,191 | |
| | Hana Financial Group, Inc. | | South Korea | | | 80,630 | | | | 2,653 | |
| | Hang Lung Properties, Ltd. | | Hong Kong | | | 668,000 | | | | 2,679 | |
| | Housing Development Finance Corp., Ltd. | | India | | | 117,906 | | | | 1,794 | |
The Accompanying Notes are an Integral Part of the Financial Statements.
| | | | | | |
| | Emerging Markets Equity Portfolio | | | 83 | |
Emerging Markets Equity Portfolio
| | | | | | | | | | | | |
| | | Foreign Common Stocks (98.7%) | | Country | | Shares/
$ Par | | | Value
$ (000’s) | |
| |
| | Financials continued | |
| | ICICI Bank, Ltd. | | India | | | 176,901 | | | | 3,720 | |
| | Itau Unibanco Holding SA, ADR | | Brazil | | | 89,578 | | | | 1,474 | |
| | Komercni Banka AS | | Czech Republic | | | 12,605 | | | | 2,666 | |
| | LPS Brasil - Consultoria de Imoveis SA | | Brazil | | | 77,800 | | | | 1,436 | |
| | Sberbank of Russia | | Russia | | | 862,600 | | | | 2,644 | |
| | Standard Chartered PLC | | United Kingdom | | | 154,725 | | | | 3,947 | |
| | Turkiye Garanti Bankasi AS | | Turkey | | | 417,868 | | | | 2,176 | |
| | | | | | | | | | | | |
| | Total | | | | | | | | | 64,795 | |
| | | | | | | | | | | | |
| | | | |
| | Health Care (2.0%) | | | | | | | | | | |
| | Diagnosticos da America SA | | Brazil | | | 91,200 | | | | 587 | |
| | Fleury SA | | Brazil | | | 94,900 | | | | 1,068 | |
| * | | Genomma Lab Internacional SAB de CV - Class B | | Mexico | | | 671,700 | | | | 1,388 | |
| | OdontoPrev SA | | Brazil | | | 112,600 | | | | 590 | |
| | Top Glove Corp. Bhd | | Malaysia | | | 783,400 | | | | 1,444 | |
| | | | | | | | | | | | |
| | Total | | | | | | | | | 5,077 | |
| | | | | | | | | | | | |
| | | | |
| | Industrials (4.6%) | | | | | | | | | | |
| | Alfa SAB de CV - Class A | | Mexico | | | 326,080 | | | | 697 | |
| | Copa Holdings SA | | Panama | | | 6,776 | | | | 674 | |
| | Crompton Greaves, Ltd. | | India | | | 250,294 | | | | 531 | |
| | Embraer SA, ADR | | Brazil | | | 36,030 | | | | 1,027 | |
| | Global Ports Investments PLC GDR | | Cyprus | | | 80,460 | | | | 1,134 | |
| | Glory, Ltd. | | Japan | | | 73,700 | | | | 1,705 | |
| | Grupo Aeroportuario del Sureste SAB de CV, ADR | | Mexico | | | 7,790 | | | | 888 | |
| * | | Promotora y Operadora de Infraestructura SAB de CV | | Mexico | | | 138,200 | | | | 925 | |
| | Sinotruk Hong Kong, Ltd. | | Hong Kong | | | 2,353,500 | | | | 1,811 | |
| | Thermax, Ltd. | | India | | | 86,934 | | | | 981 | |
| * | | TK Corp. | | South Korea | | | 65,237 | | | | 1,327 | |
| | | | | | | | | | | | |
| | Total | | | | | | | | | 11,700 | |
| | | | | | | | | | | | |
| | |
Information Technology (15.3%) | | | | | | | | |
| | Asustek Computer, Inc. | | Taiwan | | | 242,000 | | | | 2,730 | |
| * | | Cognizant Technology Solutions Corp. | | United States | | | 46,690 | | | | 3,457 | |
| | Hon Hai Precision Industry Co., Ltd. | | Taiwan | | | 1,546,706 | | | | 4,764 | |
| | Samsung Electronics Co., Ltd. | | South Korea | | | 8,247 | | | | 11,880 | |
| * | | Seoul Semiconductor Co., Ltd. | | South Korea | | | 64,348 | | | | 1,473 | |
| | Siliconware Precision Industries Co. | | Taiwan | | | 3,502,000 | | | | 3,745 | |
| | Taiwan Semiconductor Manufacturing Co., Ltd. | | Taiwan | | | 2,687,290 | | | | 8,986 | |
| | Totvs SA | | Brazil | | | 30,600 | | | | 603 | |
| | VTech Holdings, Ltd. | | Bermuda | | | 155,600 | | | | 1,749 | |
| | | | | | | | | | | | |
| | Total | | | | | | | | | 39,387 | |
| | | | | | | | | | | | |
| | | | |
| | Materials (9.0%) | | | | | | | | | | |
| | Anhui Conch Cement Co., Ltd. -
Class H | | China | | | 694,000 | | | | 2,582 | |
| | Chugoku Marine Paints, Ltd. | | Japan | | | 216,000 | | | | 1,288 | |
| | Formosa Plastics Corp. | | Taiwan | | | 374,000 | | | | 1,015 | |
| | Gerdau SA, ADR | | Brazil | | | 194,870 | | | | 1,752 | |
| | | | | | | | | | | | |
| | | Foreign Common Stocks (98.7%) | | Country | | Shares/
$ Par | | | Value
$ (000’s) | |
| |
| | Materials continued | |
| | Gold Fields, Ltd. | | South Africa | | | 156,495 | | | | 1,948 | |
| | Grupo Mexico SAB de CV - Series B | | Mexico | | | 328,501 | | | | 1,192 | |
| | Iluka Resources, Ltd. | | Australia | | | 321,576 | | | | 3,120 | |
| | Mexichem SAB de CV | | Mexico | | | 165,400 | | | | 924 | |
| | Mining and Metallurgical Co. Norilsk Nickel, ADR | | Russia | | | 53,183 | | | | 1,007 | |
| | MOIL, Ltd. | | India | | | 196,605 | | | | 948 | |
| | Steel Authority of India, Ltd. | | India | | | 1,221,536 | | | | 2,028 | |
| | Ternium SA, ADR | | Luxembourg | | | 39,090 | | | | 921 | |
| | Vale SA, ADR | | Brazil | | | 209,747 | | | | 4,396 | |
| | | | | | | | | | | | |
| | Total | | | | | | | | | 23,121 | |
| | | | | | | | | | | | |
| | |
| | Real Estate Investment Trusts (0.4%) | | | | | |
| * | | Macquarie Mexico Real Estate Management SA de CV | | Mexico | | | 566,300 | | | | 1,128 | |
| | | | | | | | | | | | |
| | Total | | | | | | | | | 1,128 | |
| | | | | | | | | | | | |
| | |
| | Telecommunication Services (7.3%) | | | | | |
| | America Movil SAB de CV - Series L, ADR | | Mexico | | | 132,450 | | | | 3,065 | |
| | China Mobile, Ltd. | | Hong Kong | | | 128,000 | | | | 1,499 | |
| | China Unicom Hong Kong, Ltd. | | Hong Kong | | | 2,494,000 | | | | 4,038 | |
| | ENTEL Chile SA | | Chile | | | 24,611 | | | | 509 | |
| | Mobile Telesystems OAO, ADR | | Russia | | | 174,563 | | | | 3,255 | |
| | MTN Group, Ltd. | | South Africa | | | 85,404 | | | | 1,800 | |
| | Tim Participacoes SA, ADR | | Brazil | | | 62,949 | | | | 1,248 | |
| * | | Turkcell Iletisim Hizmetleri AS | | Turkey | | | 239,430 | | | | 1,551 | |
| | XL Axiata Tbk PT | | Indonesia | | | 3,017,500 | | | | 1,792 | |
| | | | | | | | | | | | |
| | Total | | | | | | | | | 18,757 | |
| | | | | | | | | | | | |
| | |
| | Utilities (1.6%) | | | | | |
| | Aguas Andinas SA - Class A | | Chile | | | 2,604,738 | | | | 1,850 | |
| | EDP - Energias do Brasil SA | | Brazil | | | 166,300 | | | | 1,014 | |
| | Tractebel Energia SA | | Brazil | | | 29,000 | | | | 472 | |
| | Transmissora Alianca de Energia Eletrica SA | | Brazil | | | 85,190 | | | | 907 | |
| | | | | | | | | | | | |
| | Total | | | | | | | | | 4,243 | |
| | | | | | | | | | | | |
| | | |
| | Total Foreign Common Stocks | | | | | | | | |
| | (Cost: $231,934) | | | | | | | | | 253,257 | |
| | | | | | | | | | | | |
| | | |
| | Total Investments (98.7%) | | | | | | | | |
| | (Cost: $231,934)(a) | | | | | | | | | 253,257 | |
| | | | | | | | | | | | |
| | Other Assets, Less | | | | | | | | | | |
| | Liabilities (1.3%) | | | | | | | | | 3,219 | |
| | | | | | | | | | | | |
| | Net Assets (100.0%) | | | | | | | | | 256,476 | |
| | | | | | | | | | | | |
The Accompanying Notes are an Integral Part of the Financial Statements
| | | | |
| 84 | | Emerging Markets Equity Portfolio | | |
Emerging Markets Equity Portfolio
ADR after the name of a security represents—American Depositary Receipt.
GDR after the name of a security represents—Global Depositary Receipt.
| (a) | At December 31, 2012 the aggregate cost of securities for federal tax purposes (in thousands) was $233,428 and the net unrealized appreciation of investments based on that cost was $19,829 which is comprised of $37,197 aggregate gross unrealized appreciation and $17,368 aggregate gross unrealized depreciation. |
| | | | | | |
Investments Percentage by Country is based on Net Assets: | | | | | | |
Brazil | | | 15.5% | | | |
Hong Kong | | | 10.4% | | | |
South Korea | | | 9.8% | | | |
Taiwan | | | 9.0% | | | |
India | | | 7.8% | | | |
China | | | 7.7% | | | |
Mexico | | | 6.1% | | | |
Russia | | | 5.4% | | | |
South Africa | | | 5.1% | | | |
Other | | | 21.9% | | | |
Total | | | 98.7% | | | |
| (l) | As of December 31, 2012 portfolio securities with an aggregate value of $165,568 (in thousands) were fair valued under procedures adopted by the Board of Directors. |
| (n) | Security valued in good faith by the Board of Directors. |
The following is a summary of the inputs used in valuing the Portfolio’s assets and liabilities at December 31, 2012. See Note 3 for additional information on portfolio valuation.
| | | | | | | | | | | | | | |
| | | Valuation Inputs | | | |
| Description | | Level 1 – Quoted Prices | | | Level 2 – Other Significant
Observable Inputs | | | Level 3 – Significant Unobservable Inputs | | | |
| | | (Amounts in thousands) | | | |
Assets: | | | | | | | | | | | | | | |
Foreign Common Stocks | | | | | | | | | | | | | | |
Consumer Discretionary | | $ | 8,026 | | | $ | 33,038 | | | $ | - | | | |
Consumer Staples | | | 12,179 | | | | 12,127 | | | | - | | | |
Energy | | | 9,284 | | | | 10,395 | | | | - | | | |
Financials | | | 19,867 | | | | 44,928 | | | | - | | | |
Health Care | | | 3,633 | | | | 1,444 | | | | - | | | |
Industrials | | | 5,345 | | | | 6,355 | | | | - | | | |
Information Technology | | | 4,060 | | | | 35,327 | | | | - | | | |
Materials | | | 10,192 | | | | 12,929 | | | | - | | | |
Telecommunication Services | | | 8,077 | | | | 10,680 | | | | - | | | |
All Others | | | 5,371 | | | | - | | | | - | | | |
Total | | $ | 86,034 | | | $ | 167,223 | | | $ | - | | | |
The Accompanying Notes are an Integral Part of the Financial Statements.
| | | | | | |
| | Emerging Markets Equity Portfolio | | | 85 | |
Money Market Portfolio
| | | | |
| Objective: | | Portfolio Strategy: | | Net Assets: |
| Maximum current income to the extent consistent with liquidity and stability of capital. | | Invest in high quality, short-term, dollar-denominated money market instruments that present minimal credit risks. | | $483 million |
Portfolio Overview
Mason Street Advisors acts as the investment adviser for the Money Market Portfolio (the “Portfolio”). The Portfolio invests only in high quality, short term, dollar-denominated money market instruments that present minimal credit risks. The Portfolio may invest more than 25% of its total assets in domestic or dollar-denominated foreign bank obligations. As a money market fund, the Portfolio is subject to maturity, quality, liquidity, and diversification requirements. The Portfolio attempts to maximize its return by trading to take advantage of changing money market conditions and trends. The Portfolio will also trade to take advantage of what are believed to be disparities in yield relationships between different money market instruments. This procedure may increase or decrease the Portfolio’s yield depending upon management’s ability to correctly time and execute such transactions.
Market Overview
The combination of slow economic growth and low inflation continue to hold down money market yields. The Federal Reserve (“the Fed”) extended its short-term interest rate policy during 2012, keeping its rate target in a range between 0% and 0.25% for the entire year. During the year, the Fed also announced an official inflation target of 2.0% along with the other half of its mandate, maximum employment.
Fed policies are important for money market investors, because they determine rates on money market securities. Record low Fed rate policy meant continued historically low yields on Treasury bills and LIBOR (the London interbank offered rate), two prominent money market benchmarks. Against that backdrop, the Merrill Lynch® 3-Month T-Bill Index returned just 0.11% for the full year. By way of comparison, stocks and bonds returned 16.00% and 4.22%, as measured by the S&P 500® Index and Barclays® Aggregate Bond Index, respectively.
Portfolio Results
The Money Market Portfolio returned 0.15% for the twelve months ended December 31, 2012; by comparison, the Portfolio’s benchmark, the Merrill Lynch 3-Month Treasury Bill (T-Bill) Index, returned 0.11%. (This Index is unmanaged, cannot be invested in directly and does not include administrative expenses or sales charges.) The Portfolio outperformed the (0.03%) average return of the Money Market Funds peer group tracked by Lipper® Analytical Services, an independent mutual fund ranking agency. As of December 31, 2012, the Portfolio’s 7-day yield was 0.02%.
The Portfolio’s absolute return reflects the historically low yields currently available on money market instruments. Relative to the peer group and benchmark, performance benefited from the management fee waiver that was in place during the period. The Portfolio’s investment adviser waived its entire management fee (30 basis points) through the first six months of 2012, and waived half of its fee (15 basis points) for the last six months. In the absence of the fee waiver, the Portfolio’s return would have been lower. The Portfolio’s adviser will continue to monitor this voluntary waiver in light of market and economic developments, and may discontinue the waiver at any time.
With respect to Portfolio positioning, the Portfolio maintained a conservative bias, with high standards for liquidity and credit quality. The Portfolio limited its exposure to European financial institutions; however, the Portfolio did hold a limited amount of what the portfolio manager believed were high quality, attractively valued securities issued by Swiss and British (non-euro currency countries) banks. In addition, the portfolio manager continued to look for opportunities to diversify the Portfolio’s holdings despite a slowdown in commercial paper issuance in 2012.
| | | | |
| 86 | | Money Market Portfolio | | |
Money Market Portfolio
Portfolio Manager Outlook
The key determinant of money market rates is Fed interest rate policy. Unfortunately, Fed Chairman Bernanke recently stated that rates would stay near zero until “at least 2015.” As a result, money market investors should expect low yields to persist for some time. The Fed’s inflation target of 2.0% may eventually provide justification for somewhat higher interest rates if inflation picks up in the years ahead. In the meantime, we will work hard to maximize the Portfolio’s yield consistent with maintaining safety and liquidity.
Because the Portfolio may invest a significant portion of its assets in securities of companies in the banking industry, developments affecting that industry will have a disproportionate impact on the Portfolio, including interest rate risk, credit risk, and risks associated with regulatory changes.
AN INVESTMENT IN THE MONEY MARKET PORTFOLIO IS NOT INSURED OR GUARANTEED BY THE FEDERAL DEPOSIT INSURANCE CORPORATION OR ANY OTHER GOVERNMENT AGENCY. ALTHOUGH THE MONEY MARKET PORTFOLIO SEEKS TO PRESERVE THE VALUE OF YOUR INVESTMENT AT $1.00 PER SHARE, IT IS POSSIBLE TO LOSE MONEY BY INVESTING IN THE MONEY MARKET PORTFOLIO.
| | | | | | |
| | Money Market Portfolio | | | 87 | |
Money Market Portfolio
Schedule of Investments
December 31, 2012
| | | | | | | | | | |
| | | Money Market Investments
(99.6%) | | Shares/
$ Par | | | Value
$ (000’s) | |
| |
| | Autos (10.0%) | |
| | American Honda Finance Corp.,
0.19%, 2/5/13 | | | 5,000,000 | | | | 4,999 | |
| | American Honda Finance Corp., 0.331%, 12/5/13 144A | | | 12,500,000 | | | | 12,500 | |
| | Fcar Owner Trust I, 0.22%, 2/7/13 | | | 4,900,000 | | | | 4,899 | |
| | Fcar Owner Trust I, 0.24%, 3/1/13 | | | 8,500,000 | | | | 8,497 | |
| | Toyota Motor Credit Corp., 0.513%, 2/1/13 | | | 10,000,000 | | | | 10,000 | |
| | Toyota Motor Credit Corp., 0.55%, 1/24/13 | | | 7,500,000 | | | | 7,497 | |
| | | | | | | | | | |
| | Total | | | | | | | 48,392 | |
| | | | | | | | | | |
| | |
| | Commercial Banks Non-US (6.5%) | | | | | |
| | Bank of Nova Scotia/Houston, 0.745%, 10/18/13 | | | 15,000,000 | | | | 15,051 | |
| | Royal Bank of Canada, 0.07%, 1/31/13 | | | 10,000,000 | | | | 10,000 | |
| | Toronto Dominion Holdings USA, Inc., 0.18%, 1/29/13 | | | 6,500,000 | | | | 6,499 | |
| | | | | | | | | | |
| | Total | | | | | | | 31,550 | |
| | | | | | | | | | |
| | |
| | Commercial Banks US (10.8%) | | | | | |
| | Bank of America NA, 0.20%, 1/14/13 | | | 5,500,000 | | | | 5,500 | |
| | Bank of America NA, 0.25%, 1/3/13 | | | 7,000,000 | | | | 7,000 | |
| | Bank of America NA, 0.25%, 1/15/13 | | | 5,000,000 | | | | 5,000 | |
| | BP Capital Markets PLC, 0.512%, 2/8/13 | | | 10,000,000 | | | | 10,000 | |
| | BP Capital Markets PLC, 0.512%, 5/7/13 | | | 7,000,000 | | | | 7,000 | |
| | Wachovia Corp., 2.083%, 5/1/13 | | | 15,645,000 | | | | 15,735 | |
| | Wells Fargo Co., 0.14%, 2/19/13 | | | 2,000,000 | | | | 2,000 | |
| | | | | | | | | | |
| | Total | | | | | | | 52,235 | |
| | | | | | | | | | |
| |
| | Federal Government & Agencies (9.9%) | |
| | Federal Home Loan Bank, 0.025%, 1/18/13 | | | 3,200,000 | | | | 3,200 | |
| | Federal Home Loan Bank, 0.08%, 3/20/13 | | | 14,000,000 | | | | 13,998 | |
| | Federal Home Loan Bank, 0.125%, 2/20/13 | | | 5,000,000 | | | | 4,999 | |
| | Federal Home Loan Mortgage Corp., 0.08%, 4/1/13 | | | 4,200,000 | | | | 4,199 | |
| | Federal Home Loan Mortgage Corp., 0.09%, 3/25/13 | | | 13,300,000 | | | | 13,297 | |
| | | | | | | | | | |
| | | Money Market Investments
(99.6%) | | Shares/
$ Par | | | Value
$ (000’s) | |
| |
| | Federal Government & Agencies continued | |
| | Federal Home Loan Mortgage Corp., 0.12%, 1/28/13 | | | 3,000,000 | | | | 3,000 | |
| | Federal National Mortgage Association, 0.13%, 2/6/13 | | | 5,000,000 | | | | 4,999 | |
| | | | | | | | | | |
| | Total | | | | | | | 47,692 | |
| | | | | | | | | | |
| | |
| | Finance Services (11.1%) | | | | | |
| | Alpine Securitization Corp., 0.18%, 1/30/13 | | | 7,500,000 | | | | 7,499 | |
| | Alpine Securitization Corp., 0.20%, 1/23/13 | | | 10,000,000 | | | | 9,999 | |
| | Govco LLC, 0.27%, 1/31/13 | | | 10,500,000 | | | | 10,497 | |
| | Govco LLC,
0.28%, 2/1/13 | | | 5,000,000 | | | | 4,999 | |
| | Govco LLC, 0.28%, 2/11/13 | | | 3,000,000 | | | | 2,999 | |
| | Jupiter Securitization Co. LLC,
0.21%, 2/27/13 | | | 10,000,000 | | | | 9,997 | |
| | Jupiter Securitization Co. LLC,
0.25%, 3/27/13 | | | 7,500,000 | | | | 7,495 | |
| | | | | | | | | | |
| | Total | | | | | | | 53,485 | |
| | | | | | | | | | |
| | |
| | Government (17.4%) | | | | | |
| | US Treasury, 0.375%, 6/30/13 | | | 15,000,000 | | | | 15,019 | |
| | US Treasury, 0.625%, 4/30/13 | | | 14,000,000 | | | | 14,023 | |
| | US Treasury, 1.375%, 2/15/13 | | | 10,000,000 | | | | 10,015 | |
| | US Treasury, 1.375%, 3/15/13 | | | 10,000,000 | | | | 10,025 | |
| | US Treasury, 2.75%, 2/28/13 | | | 10,000,000 | | | | 10,041 | |
| | US Treasury, 2.875%, 1/31/13 | | | 15,000,000 | | | | 15,034 | |
| | US Treasury, 3.125%, 4/30/13 | | | 5,000,000 | | | | 5,048 | |
| | US Treasury, 3.375%, 7/31/13 | | | 5,000,000 | | | | 5,093 | |
| | | | | | | | | | |
| | Total | | | | | | | 84,298 | |
| | | | | | | | | | |
| | |
| | Health Care/Pharmaceuticals (1.7%) | | | | | |
| | Roche Holdings, Inc., 0.12%, 1/7/13 | | | 8,100,000 | | | | 8,100 | |
| | | | | | | | | | |
| | Total | | | | | | | 8,100 | |
| | | | | | | | | | |
| | |
| | Information Technology (3.6%) | | | | | |
| | Google, Inc., 0.09%, 1/16/13 | | | 5,000,000 | | | | 5,000 | |
| | Google, Inc.,
0.13%, 3/7/13 | | | 6,000,000 | | | | 5,998 | |
| | Google, Inc.,
0.14%, 1/4/13 | | | 6,500,000 | | | | 6,500 | |
| | | | | | | | | | |
| | Total | | | | | | | 17,498 | |
| | | | | | | | | | |
| | | | | | | | | | |
| | | Money Market Investments
(99.6%) | | Shares/
$ Par | | | Value
$ (000’s) | |
| |
| | Machinery (7.2%) | |
| | Caterpillar Financial Services Corp., 0.17%, 1/22/13 | | | 7,500,000 | | | | 7,499 | |
| | Caterpillar Financial Services Corp., 0.17%, 3/4/13 | | | 5,000,000 | | | | 4,999 | |
| | Caterpillar Financial Services Corp., 0.18%, 3/4/13 | | | 4,800,000 | | | | 4,798 | |
| | John Deere Canada ULC, 0.16%, 1/24/13 | | | 12,500,000 | | | | 12,499 | |
| | John Deere Canada ULC, 0.16%, 2/6/13 | | | 5,000,000 | | | | 4,999 | |
| | | | | | | | | | |
| | Total | | | | | | | 34,794 | |
| | | | | | | | | | |
| | |
| | Miscellaneous Business Credit Institutions (3.8%) | | | | | |
| | General Electric Capital Corp.,
0.14%, 3/28/13 | | | 8,500,000 | | | | 8,497 | |
| | General Electric Capital Corp.,
0.37%, 1/2/13 | | | 10,000,000 | | | | 10,000 | |
| | | | | | | | | | |
| | Total | | | | | | | 18,497 | |
| | | | | | | | | | |
| |
| | Personal Credit Institutions (11.1%) | |
| | Chariot Funding LLC, 0.19%, 1/18/13 | | | 2,500,000 | | | | 2,500 | |
| | Chariot Funding LLC, 0.21%, 3/18/13 | | | 7,000,000 | | | | 6,997 | |
| | Chariot Funding LLC, 0.21%, 3/19/13 | | | 8,000,000 | | | | 7,996 | |
| | Old Line Funding LLC, 0.05%, 1/3/13 | | | 9,800,000 | | | | 9,800 | |
| | Old Line Funding LLC, 0.15%, 1/16/13 | | | 3,690,000 | | | | 3,690 | |
| | Old Line Funding LLC, 0.18%, 1/17/13 | | | 5,000,000 | | | | 5,000 | |
| | Straight-A Funding LLC, 0.18%, 1/17/13 | | | 5,000,000 | | | | 5,000 | |
| | Straight-A Funding LLC, 0.18%, 1/25/13 | | | 12,500,000 | | | | 12,498 | |
| | | | | | | | | | |
| | Total | | | | | | | 53,481 | |
| | | | | | | | | | |
| |
| | Short Term Business Credit (6.5%) | |
| | Atlantic Asset Securitization LLC, 0.14%, 1/2/13 | | | 14,000,000 | | | | 14,000 | |
| | Sheffield Receivables Corp.,
0.17%, 1/9/13 | | | 5,500,000 | | | | 5,500 | |
| | Sheffield Receivables Corp.,
0.19%, 2/4/13 | | | 5,800,000 | | | | 5,799 | |
The Accompanying Notes are an Integral Part of the Financial Statements.
| | | | |
| 88 | | Money Market Portfolio | | |
Money Market Portfolio
| | | | | | | | | | |
| | | Money Market Investments
(99.6%) | | Shares/
$ Par | | | Value
$ (000’s) | |
| |
| | Short Term Business Credit continued | |
| | Sheffield Receivables Corp., 0.21%, 1/8/13 | | | 6,200,000 | | | | 6,200 | |
| | | | | | | | | | |
| | Total | | | | | | | 31,499 | |
| | | | | | | | | | |
| | | |
| | Total Money Market Investments | | | | | | | | |
| | (Cost: $481,521) | | | | | | | 481,521 | |
| | | | | | | | | | |
| | | |
| | Total Investments (99.6%) | | | | | | | | |
| | (Cost: $481,521)(a) | | | | | | | 481,521 | |
| | | | | | | | | | |
| | Other Assets, Less | | | | | | | | |
| | Liabilities (0.4%) | | | | | | | 1,916 | |
| | | | | | | | | | |
| | Net Assets (100.0%) | | | | | | | 483,437 | |
| | | | | | | | | | |
144A after the name of a security represents a security exempt from registration under Rule 144A of the Securities Act of 1933. These securities may be resold as transactions exempt from registration, normally to qualified institutional buyers. At December 31, 2012 the value of these securities (in thousands) was $12,500 representing 2.6% of the net assets.
The following is a summary of the inputs used in valuing the Portfolio’s assets and liabilities at December 31, 2012. See Note 3 for additional information on portfolio valuation.
| | | | | | | | | | | | | | |
| | | Valuation Inputs | | | |
| Description | | Level 1 –
Quoted Prices | | | Level 2 –
Other Significant
Observable Inputs | | | Level 3 – Significant
Unobservable Inputs | | | |
| | | (Amounts in thousands) | | | |
Assets: | | | | | | | | | | | | | | |
US Government | | $ | - | | | $ | 84,298 | | | $ | - | | | |
Corporate Bonds | | | - | | | | 53,286 | | | | - | | | |
Commercial Paper | | | - | | | | 343,937 | | | | - | | | |
Total | | $ | - | | | $ | 481,521 | | | $ | - | | | |
The Accompanying Notes are an Integral Part of the Financial Statements.
| | | | | | |
| | | | Money Market Portfolio | | 89 |
Short-Term Bond Portfolio
| | | | |
| Objective: | | Portfolio Strategy: | | Net Assets: |
| Provide as high a level of current income as is consistent with prudent investment risk. | | Invest primarily in a diversified portfolio of investment grade debt securities. | | $145 million |
Portfolio Overview
Mason Street Advisors acts as the investment adviser for the Short-Term Bond Portfolio (the “Portfolio”). Normally, the Portfolio invests in a diversified portfolio of investment grade debt securities. The Portfolio may invest up to 20% of net assets in non-investment grade securities and up to 30% of net assets in foreign securities. Debt securities may be of any duration, but under normal market conditions, the Portfolio attempts to maintain an effective duration (the percentage price change of the Portfolio, stated in years, for a given change in interest rates, and adjusted for prepayments and yield curve shifts for mortgage based securities) of between zero and three years, and a dollar weighted average maturity of not more than three years. Both a top down and bottom up investment approach is used to construct the portfolio of investments. The top down investment approach involves an evaluation of the overall economic environment and its potential impact on the level and direction of interest rates. The bottom up investment approach focuses on fundamental research of issuers to identify issuers that appear to have strong relative credit quality, solid balance sheets, improving company specific fundamentals and free cash flows.
Market Overview
Bonds delivered solid returns in 2012, as slow economic growth, low inflation and an uncertain outlook increased investors’ appetite for the relative stability of fixed income. 2012 was an unusual year for the bond market. The debt crisis in Europe dimmed the economic outlook, while the Federal Reserve continued to purchase Treasury bonds to stimulate the economy. As a result, Treasury yields declined along with yields on higher-risk investments. Lower yields meant bond prices rose for both bond segments. Typically, investors express a clear preference for either riskier, higher-yielding investments or lower-risk Treasurys.
During 2012, all sectors of the bond market experienced positive total returns. Bond purchases by the Federal Reserve drove Treasury yields lower, contributing to solid performance for debt backed by the U.S. government. Meanwhile, high yield corporate bonds led the rally, followed by investment grade corporate bonds. Record amounts of corporate bond issuance reflected improvements in balance sheets and strong demand for additional lending to Corporate America. Mortgage-backed securities (MBS) lagged the broader fixed income market, largely affected by interest rate volatility. (MBS typically performs better when interest rates are stable, because rate volatility affects the likelihood of refinancing the underlying mortgages.) For the year, the broad Barclays Capital® U.S. Aggregate Bond Index returned 4.22%.
Portfolio Results
The Portfolio returned 2.07% for the twelve months ended December 31, 2012; by comparison, the Portfolio’s benchmark, the Barclays Capital® Aggregate 1-3 Year Index (the “Index”), returned 1.33%. (The Index is unmanaged, cannot be invested in directly and does not include administrative expenses or sales charges.) The Portfolio trailed the 3.03% average return of its Short-Intermediate Investment Grade Debt Funds peer group, according to Lipper® Analytical Services, Inc., an independent mutual fund ranking agency.
The Portfolio’s absolute return reflects the low interest rate environment and performance of short-term investment grade bonds generally. Relative to the Index, the Portfolio outperformed as a result of both strong security selection and sector allocation decisions. Security selection in the investment grade corporate sector provided the biggest benefit to relative performance during the year. Strong security selection among asset-backed securities and mortgage-backed securities also contributed to relative results.
Based on the belief that credit conditions would improve, the management team also allocated more of the Portfolio to investment grade corporate bonds and less to Treasurys in 2012. This decision was another generator of outperformance relative to the Index, as corporate bonds overall were the best performers during 2012, significantly outpacing Treasurys.
For a portion of the year, the portfolio managers kept the Portfolio’s duration (price sensitivity to rate changes) shorter than that of the Index. This positioning hindered relative performance in 2012, as the yield curve made a significant shift lower. As a tool in managing the Portfolio’s duration and yield curve exposure during the year, Treasury futures contracts were used.
| | | | |
| 90 | | Short-Term Bond Portfolio | | |
Short-Term Bond Portfolio
Portfolio Manager Outlook
We expect a relatively stable investing environment in 2013 marked by slow growth, low inflation and modest volatility. We do not expect any major policy shifts by the Federal Reserve or the U.S. Treasury, although events in Europe could cause intermittent volatility in the bond market.
The Portfolio will begin the year with sector allocations relatively close to those of the Index, based on the view that many of the sectors appear to be reasonably valued, offering limited upside for performance relative to the Index. Similarly, Treasury yields are near historic lows, leaving little room for appreciation, so we seek to minimize the Portfolio’s interest rate sensitivity. In that environment, we believe that security selection can provide opportunity for performance relative to the Index. We will continue to focus our efforts on picking attractively valued bonds, while monitoring changes in relative value at the sector level.
|
Relative Performance 
|
| | | | | | | | | | | | |
Average Annual Total Returns
For Periods Ended December 31, 2012 | |
| | | 1 Year | | | 5 Years | | | Since
Inception* | |
Short-Term Bond Portfolio | | | 2.07% | | | | 3.21% | | | | 3.38% | |
Barclays® U.S. Aggregate 1-3 Years Index | | | 1.33% | | | | 3.05% | | | | 3.53% | |
Lipper® Variable Insurance Products (VIP) Short-Intermediate Investment Grade Debt Funds Average | | | 3.03% | | | | 2.90% | | | | - | |
| * | Inception date of 4/30/07 |
|
| The performance data quoted represents past performance. Past performance is historical and does not guarantee future performance. Investment return and principal value will fluctuate, so that shares, when redeemed, may be worth more or less than their original cost. Current performance may be lower or higher than the performance data quoted. For the most recent month-end performance information visit www.northwesternmutual.com. |
|
This chart assumes an initial investment of $10,000 made on 4/30/07 (commencement of the Portfolio’s operations). Returns shown reflect fee waivers, deductions for management and other portfolio expenses, and reinvestment of all dividends. In the absence of fee waivers, total return would be reduced. Returns exclude deductions for separate account sale loads and account fees. Please refer to the Benchmark Definitions section of this report for information about the indices cited in the above chart and graph. |
Return of principal is not guaranteed. Bond funds have the same interest rate, inflation and credit risks that are associated with the underlying bonds owned by the Portfolio. When interest rates rise, bond prices fall. With a fixed income fund, when interest rates rise, the value of the fund’s existing bonds drops, which could negatively affect overall fund performance. |
Investing in bonds issued by foreign corporations and governments carries additional risk, including foreign currency risk, and may increase the volatility of the Portfolio’s performance. The Portfolio may invest in derivative instruments to adjust the Portfolio’s duration and yield curve exposure, to hedge foreign currency exposure or other purposes as part of its investment strategy. Use of these instruments may involve certain costs and impose certain risks such as liquidity risk, interest rate risk, market risk, credit risk, management risk and the risk of mispricing or improper valuation. Certain derivatives involve leverage, which could magnify losses, and portfolios investing in derivatives could lose more than the principal amount invested in those investments. |
|
| | | | | | |
| | Short-Term Bond Portfolio | | | 91 | |
Short-Term Bond Portfolio
Top 10 Fixed Income Holdings 12/31/12
| | | | |
| Security Description | | % of Net Assets | |
US Treasury, Various | | | 45.7% | |
Federal Home Loan Mortgage Corp., Various | | | 5.5% | |
Federal Home Loan Mortgage Corp.4, Series 4100, Class AD, 1.75%, 8/15/27 | | | 3.8% | |
Federal Home Loan Mortgage Corp.5, Series 4092, Class CL, 1.25%, 6/15/27 | | | 3.6% | |
Federal National Mortgage Association, Various | | | 2.4% | |
Residential Asset Securities Corp., Series 2006-KS4, Class A3, 0.36%, 6/25/36 | | | 2.0% | |
Ford Credit Auto Owner Trust1, Series 2009-E, Class D, 5.53%, 5/15/16 | | | 1.5% | |
Federal National Mortgage Association1, Series 2011-113, Class AG, 2.5%, 11/25/26 | | | 1.4% | |
Federal Home Loan Mortgage Corp.2, Series 3718, Class BC, 2.00%, 2/15/25 | | | 1.2% | |
Federal National Mortgage Association3, Series 2010-95, Class BK, 1.50%, 2/25/20 | | | 1.1% | |
Sector Allocation 12/31/12

Sector Allocation is based on Net Assets.
Sector Allocation and Top 10 Holdings are subject to change.
The Corporate Bonds sector includes bonds of companies and governments headquartered outside the United States.
The Government and Structured Product categories include domestic taxable bonds.
Consistent with the Portfolio’s stated parameters, no more than 30% of the Portfolio is invested in foreign securities, and no more than 20% is invested in high yield securities.
| | | | |
| 92 | | Short-Term Bond Portfolio | | |
Short-Term Bond Portfolio
Schedule of Investments
December 31, 2012
| | | | | | | | | | |
| | | Corporate Bonds (20.5%) | | Shares/
$ Par | | | Value
$ (000’s) | |
| |
| | Aerospace/Defense (0.6%) | |
| | Boeing Capital Corp., 5.80%, 1/15/13 | | | 80,000 | | | | 80 | |
| | L-3 Communications Corp.,
3.95%, 11/15/16 | | | 300,000 | | | | 325 | |
| | Northrop Grumman Corp., 1.85%, 11/15/15 | | | 380,000 | | | | 390 | |
| | | | | | | | | | |
| | Total | | | | | | | 795 | |
| | | | | | | | | | |
| |
| | Auto Manufacturing (0.8%) | |
| | American Honda Finance Corp., 2.375%, 3/18/13 144A | | | 50,000 | | | | 50 | |
| | Daimler Finance North America LLC, 2.625%, 9/15/16 144A | | | 500,000 | | | | 519 | |
| | Ford Motor Credit Co. LLC,
3.00%, 6/12/17 | | | 500,000 | | | | 514 | |
| | PACCAR, Inc., 6.875%, 2/15/14 | | | 45,000 | | | | 48 | |
| | | | | | | | | | |
| | Total | | | | | | | 1,131 | |
| | | | | | | | | | |
| |
| | Banking (3.9%) | |
| | Bank of America Corp., 3.625%, 3/17/16 | | | 200,000 | | | | 212 | |
| | Bank of Nova Scotia, 1.375%, 12/18/17 | | | 500,000 | | | | 501 | |
| | Canadian Imperial Bank of Commerce, 2.35%, 12/11/15 | | | 100,000 | | | | 105 | |
| | Citigroup, Inc., 6.125%, 11/21/17 | | | 250,000 | | | | 297 | |
| | Citigroup, Inc., 6.50%, 8/19/13 | | | 200,000 | | | | 207 | |
| | DnB NOR Boligkreditt, 2.90%, 3/29/16 144A | | | 375,000 | | | | 399 | |
| | Eksportfinans ASA, 2.00%, 9/15/15 | | | 1,000,000 | | | | 957 | |
| | Fifth Third Bank, 4.75%, 2/1/15 | | | 600,000 | | | | 643 | |
| | Morgan Stanley, 3.80%, 4/29/16 | | | 250,000 | | | | 262 | |
| | Nordea Bank AB, 3.125%, 3/20/17 144A | | | 325,000 | | | | 346 | |
| | Regions Financial Corp., 4.875%, 4/26/13 | | | 100,000 | | | | 101 | |
| | The Royal Bank of Scotland PLC, 4.375%, 3/16/16 | | | 200,000 | | | | 216 | |
| | Standard Chartered PLC, 3.20%, 5/12/16 144A | | | 270,000 | | | | 284 | |
| | Standard Chartered PLC, 3.85%, 4/27/15 144A | | | 160,000 | | | | 169 | |
| | SunTrust Banks, Inc., 3.60%, 4/15/16 | | | 450,000 | | | | 481 | |
| | U.S. Bancorp, 3.442%, 2/1/16 | | | 450,000 | | | | 474 | |
| | | | | | | | | | |
| | Total | | | | | | | 5,654 | |
| | | | | | | | | | |
| | | | | | | | | | |
| | | Corporate Bonds (20.5%) | | Shares/
$ Par | | | Value
$ (000’s) | |
| |
| | Beverage/Bottling (0.7%) | |
| | Anheuser-Busch InBev Worldwide, Inc., 3.625%, 4/15/15 | | | 250,000 | | | | 267 | |
| | Heineken NV, 1.40%, 10/1/17 144A | | | 280,000 | | | | 279 | |
| | Pernod Ricard SA, 2.95%, 1/15/17 144A | | | 250,000 | | | | 263 | |
| | SABMiller Holdings, Inc., 2.45%, 1/15/17 144A | | | 250,000 | | | | 260 | |
| | | | | | | | | | |
| | Total | | | | | | | 1,069 | |
| | | | | | | | | | |
| |
| | Cable/Media/Broadcasting/Satellite (0.6%) | |
| | Comcast Corp., 4.95%, 6/15/16 | | | 250,000 | | | | 282 | |
| | Discovery Communications LLC,
3.70%, 6/1/15 | | | 180,000 | | | | 192 | |
| | Time Warner, Inc., 3.15%, 7/15/15 | | | 135,000 | | | | 142 | |
| | Viacom, Inc., 4.375%, 9/15/14 | | | 250,000 | | | | 265 | |
| | | | | | | | | | |
| | Total | | | | | | | 881 | |
| | | | | | | | | | |
| |
| | Conglomerate/Diversified
Manufacturing (0.2%) | |
| | Eaton Corp., 1.50%, 11/2/17 144A | | | 335,000 | | | | 336 | |
| | | | | | | | | | |
| | Total | | | | | | | 336 | |
| | | | | | | | | | |
| |
| | Consumer Products (0.2%) | |
| | Unilever Capital Corp., 2.75%, 2/10/16 | | | 250,000 | | | | 265 | |
| | | | | | | | | | |
| | Total | | | | | | | 265 | |
| | | | | | | | | | |
| |
| | Electric Utilities (2.7%) | |
| | Arizona Public Service Co., 4.65%, 5/15/15 | | | 262,000 | | | | 284 | |
| | Consolidated Edison Co. of New York, 3.85%, 6/15/13 | | | 250,000 | | | | 254 | |
| | Consumers Energy Co., 5.50%, 8/15/16 | | | 500,000 | | | | 578 | |
| | Entergy Arkansas, Inc., 5.40%, 8/1/13 | | | 250,000 | | | | 257 | |
| | Entergy Corp., 4.70%, 1/15/17 | | | 340,000 | | | | 368 | |
| | Entergy Mississippi, Inc., 3.25%, 6/1/16 | | | 500,000 | | | | 525 | |
| | Exelon Corp., 4.90%, 6/15/15 | | | 250,000 | | | | 272 | |
| | Jersey Central Power & Light Co.,
5.65%, 6/1/17 | | | 250,000 | | | | 291 | |
| | NextEra Energy Capital Holdings, Inc., 1.20%, 6/1/15 | | | 250,000 | | | | 252 | |
| | | | | | | | | | |
| | | Corporate Bonds (20.5%) | | Shares/
$ Par | | | Value
$ (000’s) | |
| |
| | Electric Utilities continued | |
| | NextEra Energy Capital Holdings, Inc., 2.60%, 9/1/15 | | | 500,000 | | | | 521 | |
| | PacifiCorp,
5.45%, 9/15/13 | | | 250,000 | | | | 258 | |
| | | | | | | | | | |
| | Total | | | | | | | 3,860 | |
| | | | | | | | | | |
| |
| | Electronics (0.2%) | |
| | Hewlett-Packard Co., 2.60%, 9/15/17 | | | 350,000 | | | | 341 | |
| | | | | | | | | | |
| | Total | | | | | | | 341 | |
| | | | | | | | | | |
| |
| | Food Processors (0.8%) | |
| | ConAgra Foods, Inc., 5.875%, 4/15/14 | | | 250,000 | | | | 266 | |
| | H.J. Heinz Co., 5.35%, 7/15/13 | | | 250,000 | | | | 256 | |
| | Kraft Foods, Inc., 4.125%, 2/9/16 | | | 400,000 | | | | 436 | |
| | Mead Johnson Nutrition Co., 3.50%, 11/1/14 | | | 200,000 | | | | 209 | |
| | Mondelez International, Inc., 6.50%, 8/11/17 | | | 25,000 | | | | 31 | |
| | | | | | | | | | |
| | Total | | | | | | | 1,198 | |
| | | | | | | | | | |
| |
| | Gas Pipelines (1.5%) | |
| | CenterPoint Energy Resources Corp., 6.15%, 5/1/16 | | | 250,000 | | | | 286 | |
| | Energy Transfer Partners LP, 5.95%, 2/1/15 | | | 400,000 | | | | 438 | |
| | Enterprise Products Operating LLC, 3.20%, 2/1/16 | | | 100,000 | | | | 106 | |
| | ONEOK Partners LP, 2.00%, 10/1/17 | | | 125,000 | | | | 126 | |
| | ONEOK Partners LP, 3.25%, 2/1/16 | | | 230,000 | | | | 243 | |
| | Plains All American Pipeline LP/PAA Finance Corp., 5.625%, 12/15/13 | | | 175,000 | | | | 183 | |
| | Spectra Energy Capital LLC, 5.90%, 9/15/13 | | | 200,000 | | | | 207 | |
| | Spectra Energy Partners LP, 2.95%, 6/15/16 | | | 521,000 | | | | 536 | |
| | | | | | | | | | |
| | Total | | | | | | | 2,125 | |
| | | | | | | | | | |
| |
| | Health Care/Pharmaceuticals (1.2%) | |
| | AbbVie, Inc., 1.75%, 11/6/17 144A | | | 500,000 | | | | 505 | |
| | Express Scripts Holding Co., 2.65%, 2/15/17 144A | | | 355,000 | | | | 369 | |
| | Express Scripts Holding Co., 3.125%, 5/15/16 | | | 60,000 | | | | 63 | |
| | Medtronic, Inc., 3.00%, 3/15/15 | | | 250,000 | | | | 263 | |
The Accompanying Notes are an Integral Part of the Financial Statements.
| | | | | | |
| | Short-Term Bond Portfolio | | | 93 | |
Short-Term Bond Portfolio
| | | | | | | | | | |
| | | Corporate Bonds (20.5%) | | Shares/
$ Par | | | Value
$ (000’s) | |
| |
| | Health Care/Pharmaceuticals continued | |
| | Stryker Corp.,
3.00%, 1/15/15 | | | 135,000 | | | | 141 | |
| | Thermo Fisher Scientific, Inc.,
3.25%, 11/20/14 | | | 250,000 | | | | 261 | |
| | UnitedHealth Group, Inc.,
1.40%, 10/15/17 | | | 70,000 | | | | 70 | |
| | Watson Pharmaceuticals, Inc.,
1.875%, 10/1/17 | | | 115,000 | | | | 117 | |
| | | | | | | | | | |
| | Total | | | | | | | 1,789 | |
| | | | | | | | | | |
| |
| | Independent Finance (0.4%) | |
| | General Electric Capital Corp.,
2.30%, 4/27/17 | | | 400,000 | | | | 415 | |
| | Nissan Motor Acceptance Corp.,
3.25%, 1/30/13 144A | | | 65,000 | | | | 65 | |
| | Nissan Motor Acceptance Corp.,
4.50%, 1/30/15 144A | | | 30,000 | | | | 32 | |
| | | | | | | | | | |
| | Total | | | | | | | 512 | |
| | | | | | | | | | |
| |
| | Information/Data Technology (0.6%) | |
| | Adobe Systems, Inc.,
3.25%, 2/1/15 | | | 250,000 | | | | 262 | |
| | Intel Corp.,
1.35%, 12/15/17 | | | 330,000 | | | | 330 | |
| | Xerox Corp.,
4.25%, 2/15/15 | | | 250,000 | | | | 263 | |
| | | | | | | | | | |
| | Total | | | | | | | 855 | |
| | | | | | | | | | |
| |
| | Life Insurance (0.8%) | |
| | Aetna, Inc.,
1.50%, 11/15/17 | | | 110,000 | | | | 110 | |
| | American International Group, Inc.,
3.65%, 1/15/14 | | | 115,000 | | | | 118 | |
| | Metropolitan Life Global Funding I,
2.50%, 1/11/13 144A | | | 250,000 | | | | 250 | |
| | Metropolitan Life Global Funding I,
3.125%, 1/11/16 144A | | | 250,000 | | | | 265 | |
| | WellPoint, Inc.,
1.875%, 1/15/18 | | | 470,000 | | | | 476 | |
| | | | | | | | | | |
| | Total | | | | | | | 1,219 | |
| | | | | | | | | | |
| | | |
| | Machinery (0.1%) | | | | | | | | |
| | Caterpillar Financial Services Corp.,
2.65%, 4/1/16 | | | 200,000 | | | | 210 | |
| | | | | | | | | | |
| | Total | | | | | | | 210 | |
| | | |
| | Metals/Mining (0.1%) | | | | | | | | |
| | Teck Resources, Ltd.,
3.15%, 1/15/17 | | | 165,000 | | | | 173 | |
| | | | | | | | | | |
| | Total | | | | | | | 173 | |
| | | | | | | | | | |
| |
| | Oil & Gas Field Machines and Services (0.1%) | |
| | National Oilwell Varco, Inc.,
1.35%, 12/1/17 | | | 105,000 | | | | 106 | |
| | | | | | | | | | |
| | Total | | | | | | | 106 | |
| | | | | | | | | | |
| | | | | | | | | | |
| | | Corporate Bonds (20.5%) | | Shares/
$ Par | | | Value
$ (000’s) | |
| |
| | Oil and Gas (2.2%) | |
| | Anadarko Petroleum Corp.,
5.95%, 9/15/16 | | | 350,000 | | | | 403 | |
| | BG Energy Capital PLC,
2.875%, 10/15/16 144A | | | 500,000 | | | | 528 | |
| | BP Capital Markets PLC,
1.375%, 11/6/17 | | | 185,000 | | | | 185 | |
| | BP Capital Markets PLC,
1.846%, 5/5/17 | | | 500,000 | | | | 511 | |
| | EnCana Holdings Finance Corp.,
5.80%, 5/1/14 | | | 105,000 | | | | 112 | |
| | Marathon Petroleum Corp.,
3.50%, 3/1/16 | | | 100,000 | | | | 106 | |
| | Petrohawk Energy Corp.,
6.25%, 6/1/19 | | | 500,000 | | | | 569 | |
| | Statoil ASA,
1.20%, 1/17/18 | | | 440,000 | | | | 440 | |
| | Talisman Energy, Inc.,
5.125%, 5/15/15 | | | 245,000 | | | | 264 | |
| | | | | | | | | | |
| | Total | | | | | | | 3,118 | |
| | | | | | | | | | |
| |
| | Other Finance (0.2%) | |
| | Prudential Covered Trust 2012-1,
2.997%, 9/30/15 144A | | | 332,500 | | | | 345 | |
| | | | | | | | | | |
| | Total | | | | | | | 345 | |
| | | | | | | | | | |
| |
| | Other Holdings (0.1%) | |
| (f) | | Morgan Stanley,
5.40%, 5/15/15 144A | | | 325,038 | | | | 173 | |
| | | | | | | | | | |
| | Total | | | | | | | 173 | |
| | | | | | | | | | |
| |
| | Other Services (0.3%) | |
| | CC Holdings GS V LLC,
2.381%, 12/15/17 144A | | | 230,000 | | | | 231 | |
| | Waste Management, Inc.,
2.60%, 9/1/16 | | | 200,000 | | | | 210 | |
| | | | | | | | | | |
| | Total | | | | | | | 441 | |
| | | | | | | | | | |
| |
| | Real Estate Investment Trusts (0.9%) | |
| | ERP Operating LP,
6.584%, 4/13/15 | | | 275,000 | | | | 308 | |
| | Health Care REIT, Inc.,
3.625%, 3/15/16 | | | 290,000 | | | | 306 | |
| | Ventas Realty LP/Ventas Capital Corp.,
2.00%, 2/15/18 | | | 500,000 | | | | 501 | |
| | World Financial Properties Tower B Corp.,
6.91%, 9/1/13 144A | | | 160,233 | | | | 162 | |
| | | | | | | | | | |
| | Total | | | | | | | 1,277 | |
| | | | | | | | | | |
| |
| | Retail Food and Drug (0.2%) | |
| | Delhaize Group,
6.50%, 6/15/17 | | | 250,000 | | | | 284 | |
| | | | | | | | | | |
| | Total | | | | | | | 284 | |
| | | | | | | | | | |
| |
| | Retail Stores (0.6%) | |
| | Costco Wholesale Corp.,
1.125%, 12/15/17 | | | 500,000 | | | | 503 | |
| | | | | | | | | | |
| | | Corporate Bonds (20.5%) | | Shares/
$ Par | | | Value
$ (000’s) | |
| | | |
| | Retail Stores continued | | | | | | | | |
| | Nordstrom, Inc.,
6.75%, 6/1/14 | | | 145,000 | | | | 157 | |
| | Walgreen Co.,
1.80%, 9/15/17 | | | 255,000 | | | | 257 | |
| | | | | | | | | | |
| | Total | | | | | | | 917 | |
| | | | | | | | | | |
| | |
| | Telecommunications (0.5%) | | | | | |
| | America Movil SAB de CV,
2.375%, 9/8/16 | | | 75,000 | | | | 78 | |
| | America Movil SAB de CV,
3.625%, 3/30/15 | | | 140,000 | | | | 148 | |
| | France Telecom SA,
4.375%, 7/8/14 | | | 250,000 | | | | 263 | |
| | Telefonica Emisiones SAU,
2.582%, 4/26/13 | | | 50,000 | | | | 50 | |
| | Telefonica Emisiones SAU,
5.855%, 2/4/13 | | | 200,000 | | | | 201 | |
| | | | | | | | | | |
| | Total | | | | | | | 740 | |
| | | | | | | | | | |
| | | |
| | Total Corporate
Bonds | | | | | | | | |
| | (Cost: $28,990) | | | | | | | 29,814 | |
| | | | | | | | | | |
| | | |
| | | Governments (48.9%) | | | | | | |
| | | |
| | Governments (48.9%) | | | | | | | | |
| | Canada Government International Bond,
0.875%, 2/14/17 | | | 850,000 | | | | 857 | |
| | Federal Home Loan Mortgage Corp.,
2.25%, 1/23/17 | | | 750,000 | | | | 767 | |
| | Federal National Mortgage Association,
0.50%, 8/9/13 | | | 3,000,000 | | | | 3,006 | |
| | US Treasury,
0.125%, 12/31/14 | | | 11,580,000 | | | | 11,551 | |
| (b) | | US Treasury,
0.25%, 8/31/14 | | | 40,290,000 | | | | 40,301 | |
| | US Treasury,
0.25%, 9/30/14 | | | 14,410,000 | | | | 14,413 | |
| | | | | | | | | | |
| | | |
| | Total
Governments | | | | | | | | |
| | (Cost: $70,859) | | | | | | | 70,895 | |
| | | | | | | | | | |
| | | |
| | | Municipal Bonds (0.4%) | | | | | | |
| | | |
| | Municipal Bonds (0.4%) | | | | | | | | |
| | State of Illinois, Series 2010-3,
4.79%, 4/1/16 GO | | | 300,000 | | | | 322 | |
| | State of Illinois, Series 2011,
4.961%, 3/1/16 GO | | | 195,000 | | | | 214 | |
| | | | | | | | | | |
| | | |
| | Total Municipal
Bonds | | | | | | | | |
| | (Cost: $510) | | | | | | | 536 | |
| | | | | | | | | | |
The Accompanying Notes are an Integral Part of the Financial Statements.
| | | | |
| 94 | | Short-Term Bond Portfolio | | |
Short-Term Bond Portfolio
| | | | | | | | | | |
| | | Structured Products (27.6%) | | Shares/
$ Par | | | Value
$ (000’s) | |
| | |
| | Structured Products (27.6%) | | | | | |
| | Ally Auto Receivables Trust, Series 2012-2, Class B,
1.76%, 2/15/17 144A | | | 750,000 | | | | 760 | |
| | Bear Stears Commercial Mortgage Securities, Inc., Series 2007-PW17, Class AAB,
5.703%, 6/11/50 | | | 712,313 | | | | 756 | |
| | Commercial Mortgage Pass-Through Certificate, Series 2001-J2A, Class C,
6.586%, 7/16/34 | | | 993,090 | | | | 1,079 | |
| | DBRR Trust, Series 2012-EZ1, Class A,
0.946%, 9/25/45 144A | | | 495,704 | | | | 497 | |
| | Discover Card Master Trust I, Series 2012-B3, Class B3,
0.659%, 5/15/18 | | | 1,000,000 | | | | 1,000 | |
| | FDIC Structured Sale Guaranteed Notes, Series 2010-S2, Class 2A,
2.57%, 7/29/47 144A | | | 542,274 | | | | 550 | |
| | Federal Home Loan Mortgage Corp., Series 4092, Class CL,
1.25%, 6/15/27 | | | 5,206,868 | | | | 5,190 | |
| | Federal Home Loan Mortgage Corp., Series K009, Class X1,
1.506%, 8/25/20 IO | | | 2,496,243 | | | | 206 | |
| | Federal Home Loan Mortgage Corp., Series 4100, Class AD,
1.75%, 8/15/27 | | | 5,455,696 | | | | 5,509 | |
| | Federal Home Loan Mortgage Corp., Series 3718, Class BC,
2.00%, 2/15/25 | | | 1,673,065 | | | | 1,703 | |
| | Federal Home Loan Mortgage Corp.,
2.50%, 10/1/27 | | | 5,682,345 | | | | 5,951 | |
| | Federal Home Loan Mortgage Corp.,
5.00%, 4/1/18 | | | 165,338 | | | | 177 | |
| | Federal Home Loan Mortgage Corp.,
5.50%, 5/1/22 | | | 749,968 | | | | 809 | |
| | Federal Home Loan Mortgage Corp., Series 2439, Class LH,
6.00%, 4/15/32 | | | 180,937 | | | | 202 | |
| | Federal Home Loan Mortgage Corp.,
7.00%, 12/1/35 | | | 207,422 | | | | 239 | |
| | Federal National Mortgage Association, Series 2010-95, Class BK,
1.50%, 2/25/20 | | | 1,616,677 | | | | 1,638 | |
| | | | | | | | |
| | | Structured Products (27.6%) | | Shares/
$ Par | | Value
$ (000’s) | |
| |
| | Structured Products continued | |
| | Federal National Mortgage Association, Series 2012-113, Class AB,
1.50%, 10/25/27 | | 483,715 | | | 487 | |
| | Federal National Mortgage Association, Series 2011-113, Class AG,
2.5%, 11/25/26 | | 1,984,357 | | | 2,046 | |
| | Federal National Mortgage Association,
6.00%, 8/1/22 | | 412,320 | | | 455 | |
| | Ford Credit Auto Owner Trust, Series 2011-B, Class B,
2.27%, 1/15/17 | | 200,000 | | | 207 | |
| | Ford Credit Auto Owner Trust, Series 2009-E, Class D,
5.53%, 5/15/16 144A | | 2,128,000 | | | 2,229 | |
| | Golden Credit Card Trust, Series 2012-5A, Class A,
0.79%, 9/15/17 144A | | 725,000 | | | 727 | |
| | Honda Auto Receivables Owner Trust, Series 2012-2, Class A4,
0.91%, 5/15/18 | | 150,000 | | | 151 | |
| | John Deere Owner Trust, Series 2012-A, Class A4,
0.99%, 6/15/18 | | 600,000 | | | 606 | |
| | JPMorgan Chase Commercial Mortgage Securities Corp., Series 2004-CB8, Class A1A,
4.158%, 1/12/39 144A | | 1,051,623 | | | 1,083 | |
| | JPMorgan Chase Commercial Mortgage Securities Corp., Series 2006-LDP7, Class A4,
5.871%, 4/15/45 | | 935,805 | | | 1,077 | |
| | LB-UBS Commercial Mortgage Trust, Series 2004-C6, Class A6,
5.02%, 8/15/29 | | 425,000 | | | 448 | |
| | Louisiana Public Facilities Authority,
5.75%, 2/1/19 | | 62,878 | | | 69 | |
| | MASTR Asset Securitization Trust, Series 2003-10, Class 1A1,
5.25%, 11/25/23 | | 42,168 | | | 44 | |
| | Residential Asset Securities Corp., Series 2006-KS4, Class A3,
0.36%, 6/25/36 | | 2,965,394 | | | 2,859 | |
| | Sparebank 1 Boligkreditt AS.,
2.30%, 6/30/17 144A | | 550,000 | | | 574 | |
| | | | | | | | | | |
| | | Structured Products (27.6%) | | Shares/
$ Par | | | Value
$ (000’s) | |
| | |
| | Structured Products continued | | | | | |
| | Wells Fargo Mortgage Backed Securities Trust, Series 2004-EE, Class 2A2,
2.625%, 12/25/34 | | | 683,885 | | | | 704 | |
| | | | | | | | | | |
| | | |
| | Total Structured Products | | | | | | | | |
| | (Cost: $39,520) | | | | | | | 40,032 | |
| | | | | | | | | | |
| | |
| | | Short-Term Investments (2.1%) | | | | |
| | |
| | Commercial Banks US (0.7%) | | | | | |
| (b) | | Bank of America NA,
0.20%, 1/3/13 | | | 1,000,000 | | | | 1,000 | |
| | | | | | | | | | |
| | Total | | | | | | | 1,000 | |
| | | | | | | | | | |
| | | |
| | Federal Government & Agencies (0.7%) | | | | | | | | |
| (b) | | Federal Home Loan Mortgage Corp.,
0.135%, 2/25/13 | | | 1,000,000 | | | | 1,000 | |
| | | | | | | | | | |
| | Total | | | | | | | 1,000 | |
| | | | | | | | | | |
| | | |
| | Finance Services (0.7%) | | | | | | | | |
| (b) | | Govco LLC,
0.23%, 1/22/13 | | | 1,000,000 | | | | 1,000 | |
| | | | | | | | | | |
| | Total | | | | | | | 1,000 | |
| | | | | | | | | | |
| | | |
| | Total Short-Term Investments | | | | | | | | |
| | (Cost: $3,000) | | | | | | | 3,000 | |
| | | | | | | | | | |
| | | |
| | Total Investments (99.5%) | | | | | | | | |
| | (Cost: $142,879)(a) | | | | | | | 144,277 | |
| | | | | | | | | | |
| | Other Assets, Less | | | | | | | | |
| | Liabilities (0.5%) | | | | | | | 759 | |
| | | | | | | | | | |
| | Net Assets (100.0%) | | | | | | | 145,036 | |
| | | | | | | | | | |
The Accompanying Notes are an Integral Part of the Financial Statements.
| | | | | | |
| | Short-Term Bond Portfolio | | | 95 | |
Short-Term Bond Portfolio
144A after the name of a security represents a security exempt from registration under Rule 144A of the Securities Act of 1933. These securities may be resold as transactions exempt from registration, normally to qualified institutional buyers. At December 31, 2012 the value of these securities (in thousands) was $12,250 representing 8.5% of the net assets.
IO — Interest Only Security
GO — General Obligation
| (a) | At December 31, 2012 the aggregate cost of securities for federal tax purposes (in thousands) was $142,879 and the net unrealized appreciation of investments based on that cost was $1,398 which is comprised of $1,477 aggregate gross unrealized appreciation and $79 aggregate gross unrealized depreciation. |
| (b) | All or a portion of the securities have been pledged as collateral for open futures positions or when-issued securities. Information regarding open futures contracts as of period end is summarized below. |
| | | | | | | | |
| Issuer (000’s) | | Number of Contracts | | Expiration Date | | Unrealized Appreciation/ (Depreciation) (000’s) | |
US Five Year Treasury Note Futures (Short) (Total Notional Value at December 31, 2012, $7,841) | | 63 | | 3/13 | | $ | 3 | |
US Long Treasury Bond Futures (Short) (Total Notional Value at December 31, 2012, $1,345) | | 9 | | 3/13 | | | 17 | |
US Ten Year Treasury Note Futures (Short) (Total Notional Value at December 31, 2012, $10,120) | | 76 | | 3/13 | | | 28 | |
US Two Year Treasury Note Futures (Long) (Total Notional Value at December 31, 2012, $13,886) | | 63 | | 3/13 | | | 3 | |
| (f) | Foreign Bond — par value is foreign denominated |
— Morgan Stanley — Brazilian Real
The following is a summary of the inputs used in valuing the Portfolio’s assets and liabilities at December 31, 2012. See Note 3 for additional information on portfolio valuation.
| | | | | | | | | | | | | | |
| | | Valuation Inputs | | | |
| Description | | Level 1 – Quoted Prices | | | Level 2 – Other Significant Observable Inputs | | | Level 3 – Significant Unobservable Inputs | | | |
| | | (Amounts in thousands) | | | |
Assets: | | | | | | | | | | | | | | |
Government & US Agency Bonds | | $ | - | | | $ | 70,895 | | | $ | - | | | |
Foreign Bonds | | | - | | | | 173 | | | | - | | | |
Municipal Bonds | | | - | | | | 536 | | | | - | | | |
Corporate Bonds | | | - | | | | 29,641 | | | | - | | | |
Structured Products | | | - | | | | 39,482 | | | | 550 | | | |
Short-Term Investments | | | - | | | | 3,000 | | | | - | | | |
Other Financial Instruments^ | | | | | | | | | | | | | | |
Futures | | | 51 | | | | - | | | | - | | | |
Total | | $ | 51 | | | $ | 143,727 | | | $ | 550 | | | |
^ Other financial instruments are derivative instruments such as futures, forwards, written options and swaps contracts, which are valued at the unrealized appreciation (depreciation) on the instrument and short sales, which are valued at market value.
The Accompanying Notes are an Integral Part of the Financial Statements.
| | | | |
| 96 | | Short-Term Bond Portfolio | | |
Select Bond Portfolio
| | | | |
| Objective: | | Portfolio Strategy: | | Net Assets: |
| Provide as high a level of total return as is consistent with prudent investment risk. A secondary objective is to seek preservation of shareholders’ capital. | | Invest primarily in a diversified portfolio of investment grade debt securities with maturities exceeding one year. | | $1.7 billion |
Portfolio Overview
Mason Street Advisors acts as the investment adviser for the Select Bond Portfolio (the “Portfolio”). Normally, the Portfolio invests in a diversified portfolio of investment grade debt securities with maturities exceeding one year. The Portfolio may invest up to 20% of net assets in non-investment grade securities and up to 30% of net assets in foreign securities. Debt securities may be of any duration, but under normal market conditions, the Portfolio attempts to maintain an effective duration (the percentage price change of the Portfolio, stated in years, for a given change in interest rates, and adjusted for prepayments and yield curve shifts for mortgage based securities) of between three and eight years and a dollar weighted average maturity of between five and ten years. Both a top down and bottom up investment approach is used to construct the portfolio of investments. The top down investment approach involves an evaluation of the overall economic environment and its potential impact on the level and direction of interest rates. The bottom up investment approach focuses on fundamental research of issuers to identify issuers that appear to have strong relative credit quality, solid balance sheets, improving company specific fundamentals and free cash flows.
Market Overview
Bonds delivered solid returns in 2012, as slow economic growth, low inflation and an uncertain outlook increased investors’ appetite for the relative stability of fixed income. 2012 was an unusual year for the bond market. The debt crisis in Europe dimmed the economic outlook, while the Federal Reserve continued to purchase Treasury bonds to stimulate the economy. As a result, Treasury yields declined along with yields on higher-risk investments. Lower yields meant bond prices rose for both bond segments. Typically, investors express a clear preference for either riskier, higher-yielding investments or lower-risk Treasurys.
During 2012, all sectors of the bond market experienced positive total returns. Bond purchases by the Federal Reserve drove Treasury yields lower, contributing to solid performance for debt backed by the U.S. government. Meanwhile, high yield corporate bonds led the rally, followed by investment grade corporate bonds. Record amounts of corporate bond issuance reflected improvements in balance sheets and strong demand for additional lending to Corporate America. Mortgage-backed securities (MBS) lagged the broader fixed income market, largely affected by interest rate volatility. (MBS typically performs better when interest rates are stable, because rate volatility affects the likelihood of refinancing the underlying mortgages.) For the year, the broad Barclays® U.S. Aggregate Bond Index (the “Index”) returned 4.22%.
Portfolio Results
The Portfolio returned 4.96% for the twelve months ended December 31, 2012; by comparison, the Index returned 4.22%. (The Index is unmanaged, cannot be invested in directly and does not include administrative expenses or sales charges.) The Portfolio underperformed the 6.91% average return of its Corporate Debt Funds A-Rated peer group, according to Lipper® Analytical Services, Inc., an independent mutual fund ranking agency.
The Portfolio’s absolute returns reflected the solid performance of investment grade bonds in 2012. Relative to the Index, the Portfolio benefited from a number of sector allocation decisions. The primary sector allocation contributor during the period was the decision to underweight Treasury securities. Based on the belief that credit conditions would improve, the management team chose to overweight risk assets, including commercial mortgage-backed securities (CMBS) and investment grade corporate bonds. This decision worked well for the Portfolio, as overall CMBS and corporate bonds were the best performers during 2012, significantly outperforming Treasurys. While we were overweight in these higher yielding categories relative to the Index, we were likely underweight relative to the peer group, which presumably held much larger positions in riskier bonds.
Security selection also had a positive contribution to performance relative to the Index. In particular, it was beneficial to have a general overweight to lower quality corporates, as well as an overweight to the Real Estate Investment Trusts (REITs) industry. Additionally, an underweight to the information technology industry was helpful. Within the structured products allocation, strong security selection among MBS contributed to the Portfolio’s relative results this year.
Elsewhere, the portfolio managers kept the Portfolio’s duration (price sensitivity to rate changes) shorter than that of the Index for a portion of the year. This positioning hindered relative performance in 2012, as the yield curve made a significant shift lower. As a tool in managing the Portfolio’s duration and yield curve exposure during the year, Treasury futures contracts were used.
Select Bond Portfolio
Portfolio Manager Outlook
We expect a relatively stable investing environment in 2013 marked by slow growth, low inflation and modest volatility. We do not expect any major policy shifts by the Federal Reserve or the U.S. Treasury, although events in Europe could cause intermittent volatility in the bond market.
The Portfolio will begin the year with sector allocations relatively close to those of the Index, based on the view that many of the sectors appear to be reasonably valued, offering limited upside for performance relative to the Index. Similarly, Treasury yields are near historic lows, leaving little room for appreciation, so we seek to minimize the Portfolio’s interest rate sensitivity. In that environment, we believe that security selection can provide opportunity for performance relative to the Index. We will continue to focus our efforts on picking attractively valued bonds, while monitoring changes in relative value at the sector level.
Relative Performance

| | | | | | | | | | | | |
Average Annual Total Returns For Periods Ended December 31, 2012 | |
| | | 1 Year | | | 5 Years | | | 10 Years | |
Select Bond Portfolio | | | 4.96% | | | | 6.25% | | | | 5.37% | |
Barclays® U.S. Aggregate Index | | | 4.22% | | | | 5.95% | | | | 5.18% | |
Lipper® Variable Insurance Products (VIP) Corporate Debt Funds A-Rated Average | | | 6.91% | | | | 6.06% | | | | 4.99% | |
|
The performance data quoted represents past performance. Past performance is historical and does not guarantee future performance. Investment return and principal value will fluctuate, so that shares, when redeemed, may be worth more or less than their original cost. Current performance may be lower or higher than the performance data quoted. For the most recent month-end performance information visit www.northwesternmutual.com. |
| This chart assumes an initial investment of $10,000 made on 12/31/02. Returns shown include deductions for management and other portfolio expenses, and reinvestment of all dividends. Returns exclude deductions for separate account sale loads and account fees. Please refer to the Benchmark Definitions section of this report for information about the indices cited in the above chart and graph. |
|
Return of principal is not guaranteed. Bond funds have the same interest rate, inflation and credit risks that are associated with the underlying bonds owned by the Portfolio. When interest rates rise, bond prices fall. With a fixed income fund, when interest rates rise, the value of the fund’s existing bonds drops, which could negatively affect overall fund performance. |
Investing in bonds issued by foreign corporations and governments carries additional risk, including foreign currency risk, and may increase the volatility of the Portfolio’s performance. The Portfolio may invest in derivative instruments to adjust the Portfolio’s duration and yield curve exposure, to hedge foreign currency exposure or other purposes as part of its investment strategy. Use of these instruments may involve certain costs and impose certain risks such as liquidity risk, interest rate risk, market risk, credit risk, management risk and the risk of mispricing or improper valuation. Certain derivatives involve leverage, which could magnify losses, and portfolios investing in derivatives could lose more than the principal amount invested in those investments. |
Select Bond Portfolio
Top 10 Fixed Income Holdings 12/31/12
| | | | |
Security Description | | | % of Net Assets | |
US Treasury, Various | | | 35.2% | |
Federal Home Loan Mortgage Corp., Various | | | 17.5% | |
Federal National Mortgage Association, Various | | | 12.5% | |
Citigroup Commercial Mortgage Trust, Series 2010-RR3, Class MLSR, 5.737%, 6/14/50 | | | 0.6% | |
JPMorgan Chase & Co., Various | | | 0.5% | |
Morgan Stanley, Various | | | 0.5% | |
Ford Credit Auto Owner Trust, Series 2009-E, Class D, 5.53%, 5/15/16 | | | 0.5% | |
Canada Government International Bond, 0.875%, 2/14/17 | | | 0.5% | |
GE Capital Credit Card Master Note Trust, Series 2012-1, Class B, 1.62%, 1/15/18 | | | 0.4% | |
Federal Home Loan Mortgage Corp.3, Series K001, Class A2, 5.651%, 4/25/16 | | | 0.4% | |
Sector Allocation 12/31/12

|
Sector Allocation is based on Net Assets. Sector Allocation and Top 10 Holdings are subject to change. The Corporate Bonds sector includes bonds of companies and governments headquartered outside the United States. The Government and Structured Product categories include domestic taxable bonds. Consistent with the Portfolio’s stated parameters, no more than 30% of the Portfolio is invested in foreign securities, and no more than 20% is invested in high yield securities. |
|
|
|
|
Select Bond Portfolio
Schedule of Investments
December 31, 2012
| | | | | | | | | | |
| | | Corporate Bonds (23.1%) | | Shares/
$ Par | | | Value
$ (000’s) | |
| |
| | Aerospace/Defense (0.5%) | |
| | BAE Systems Holdings, Inc., 6.375%, 6/1/19 144A | | | 740,000 | | | | 884 | |
| | Boeing Capital Corp., 2.125%, 8/15/16 | | | 745,000 | | | | 775 | |
| | General Dynamics Corp., 2.25%, 11/15/22 | | | 1,200,000 | | | | 1,174 | |
| | L-3 Communications Corp., 5.20%, 10/15/19 | | | 950,000 | | | | 1,083 | |
| | Litton Industries, Inc., 6.75%, 4/15/18 | | | 1,000,000 | | | | 1,153 | |
| | Lockheed Martin Corp., 3.35%, 9/15/21 | | | 315,000 | | | | 333 | |
| | Lockheed Martin Corp., 4.07%, 12/15/42 144A | | | 267,000 | | | | 262 | |
| | Lockheed Martin Corp., 7.65%, 5/1/16 | | | 500,000 | | | | 606 | |
| | Meccanica Holdings USA, Inc., 6.25%, 1/15/40 144A | | | 650,000 | | | | 561 | |
| | Raytheon Co., 3.125%, 10/15/20 | | | 1,000,000 | | | | 1,064 | |
| | | | | | | | | | |
| | Total | | | | | | | 7,895 | |
| | | | | | | | | | |
| |
| | Auto Manufacturing (0.8%) | |
| | American Honda Finance Corp., 2.125%, 2/28/17 144A | | | 1,520,000 | | | | 1,555 | |
| | Daimler Finance North America LLC, 2.625%, 9/15/16 144A | | | 170,000 | | | | 177 | |
| | Daimler Finance North America LLC, 3.00%, 3/28/16 144A | | | 1,910,000 | | | | 1,998 | |
| | Ford Motor Co., 7.45%, 7/16/31 | | | 1,180,000 | | | | 1,499 | |
| | Ford Motor Credit Co. LLC, 3.00%, 6/12/17 | | | 1,250,000 | | | | 1,284 | |
| | Ford Motor Credit Co. LLC, 4.25%, 2/3/17 | | | 940,000 | | | | 1,007 | |
| | Ford Motor Credit Co. LLC, 5.75%, 2/1/21 | | | 1,255,000 | | | | 1,445 | |
| | PACCAR, Inc., 6.875%, 2/15/14 | | | 140,000 | | | | 149 | |
| | Toyota Motor Credit Corp., 1.75%, 5/22/17 | | | 1,845,000 | | | | 1,889 | |
| | Toyota Motor Credit Corp., 3.30%, 1/12/22 | | | 1,800,000 | | | | 1,942 | |
| | Volkswagen International Finance NV, 2.875%, 4/1/16 144A | | | 1,075,000 | | | | 1,128 | |
| | | | | | | | | | |
| | Total | | | | | | | 14,073 | |
| | | | | | | | | | |
| |
| | Banking (3.3%) | |
| | Bank of America Corp., 3.625%, 3/17/16 | | | 885,000 | | | | 938 | |
| | | | | | | | | | |
| | | Corporate Bonds (23.1%) | | Shares/
$ Par | | | Value
$ (000’s) | |
| |
| | Banking continued | |
| | Bank of America Corp., 3.75%, 7/12/16 | | | 335,000 | | | | 358 | |
| | Bank of America Corp., 5.75%, 12/1/17 | | | 985,000 | | | | 1,148 | |
| | Bank of Montreal, 2.55%, 11/6/22 | | | 1,720,000 | | | | 1,703 | |
| | The Bank of New York Mellon Corp., 3.55%, 9/23/21 | | | 2,025,000 | | | | 2,206 | |
| | Bank of Nova Scotia, 1.375%, 12/18/17 | | | 1,275,000 | | | | 1,277 | |
| | Barclays Bank PLC, 5.00%, 9/22/16 | | | 125,000 | | | | 140 | |
| | Barclays Bank PLC, 6.05%, 12/4/17 144A | | | 170,000 | | | | 188 | |
| | Citigroup, Inc., 3.953%, 6/15/16 | | | 6,155,000 | | | | 6,625 | |
| | Eksportfinans ASA, 2.00%, 9/15/15 | | | 6,000,000 | | | | 5,743 | |
| | Fifth Third Bank, 4.75%, 2/1/15 | | | 1,215,000 | | | | 1,303 | |
| | The Goldman Sachs Group, Inc., 5.95%, 1/18/18 | | | 3,105,000 | | | | 3,613 | |
| | The Goldman Sachs Group, Inc., 6.15%, 4/1/18 | | | 1,115,000 | | | | 1,310 | |
| | HSBC Bank PLC, 4.75%, 1/19/21 144A | | | 30,000 | | | | 35 | |
| | HSBC Holdings PLC, 5.10%, 4/5/21 | | | 875,000 | | | | 1,033 | |
| | JPMorgan Chase & Co., 3.15%, 7/5/16 | | | 6,890,000 | | | | 7,300 | |
| | JPMorgan Chase & Co., 6.00%, 1/15/18 | | | 720,000 | | | | 862 | |
| (d) | | Lehman Brothers Holdings, Inc., 5.50%, 4/4/16 | | | 385,000 | | | | 90 | |
| (d) | | Lehman Brothers Holdings, Inc., 6.875%, 5/2/18 | | | 480,000 | | | | 115 | |
| | Merrill Lynch & Co., Inc., 6.40%, 8/28/17 | | | 3,110,000 | | | | 3,652 | |
| | Morgan Stanley, 2.875%, 7/28/14 | | | 1,100,000 | | | | 1,124 | |
| | Morgan Stanley, 3.80%, 4/29/16 | | | 1,175,000 | | | | 1,234 | |
| | Morgan Stanley, 4.75%, 3/22/17 | | | 1,830,000 | | | | 1,996 | |
| | Nordea Bank AB, 4.875%, 1/27/20 144A | | | 440,000 | | | | 507 | |
| | The Northern Trust Co., 5.85%, 11/9/17 | | | 250,000 | | | | 299 | |
| | PNC Financial Services Group, Inc., 2.854%, 11/9/22 | | | 1,255,000 | | | | 1,262 | |
| | PNC Funding Corp., 4.375%, 8/11/20 | | | 750,000 | | | | 855 | |
| | | | | | | | | | |
| | | Corporate Bonds (23.1%) | | Shares/
$ Par | | | Value
$ (000’s) | |
| |
| | Banking continued | |
| | The Royal Bank of Scotland Group PLC, 6.125%, 12/15/22 | | | 635,000 | | | | 670 | |
| | Standard Chartered PLC, 3.20%, 5/12/16 144A | | | 960,000 | | | | 1,009 | |
| | State Street Corp., 2.875%, 3/7/16 | | | 585,000 | | | | 621 | |
| | SunTrust Banks, Inc., 6.00%, 9/11/17 | | | 570,000 | | | | 674 | |
| | U.S. Bancorp, 3.442%, 2/1/16 | | | 1,065,000 | | | | 1,122 | |
| | Wachovia Corp., 5.75%, 2/1/18 | | | 280,000 | | | | 335 | |
| (d,n) | | Washington Mutual Bank, 6.75%, 5/20/36 | | | 520,000 | | | | - | |
| (d,n) | | Washington Mutual Bank, 6.875%, 6/15/11 | | | 505,000 | | | | - | |
| | Wells Fargo & Co., 2.625%, 12/15/16 | | | 1,815,000 | | | | 1,916 | |
| | Wells Fargo & Co., 4.60%, 4/1/21 | | | 1,085,000 | | | | 1,248 | |
| | Wells Fargo & Co., 7.98%, 12/31/49 | | | 250,000 | | | | 287 | |
| | | | | | | | | | |
| | Total | | | | | | | 54,798 | |
| | | | | | | | | | |
| |
| | Beverage/Bottling (0.9%) | |
| | Anheuser-Busch Cos. LLC,
5.75%, 4/1/36 | | | 200,000 | | | | 254 | |
| | Anheuser-Busch InBev Worldwide, Inc., 2.50%, 7/15/22 | | | 1,575,000 | | | | 1,585 | |
| | Anheuser-Busch InBev Worldwide, Inc., 5.375%, 1/15/20 | | | 1,180,000 | | | | 1,436 | |
| | Anheuser-Busch InBev Worldwide, Inc., 8.20%, 1/15/39 | | | 1,260,000 | | | | 2,069 | |
| | Beam, Inc., 3.25%, 5/15/22 | | | 460,000 | | | | 477 | |
| | The Coca-Cola Co., 1.65%, 3/14/18 | | | 1,200,000 | | | | 1,229 | |
| | The Coca-Cola Co., 3.15%, 11/15/20 | | | 1,170,000 | | | | 1,273 | |
| | Heineken NV, 1.40%, 10/1/17 144A | | | 430,000 | | | | 429 | |
| | Heineken NV, 2.75%, 4/1/23 144A | | | 645,000 | | | | 633 | |
| | Heineken NV, 4.00%, 10/1/42 144A | | | 170,000 | | | | 164 | |
| | PepsiCo, Inc., 2.75%, 3/5/22 | | | 1,000,000 | | | | 1,027 | |
| | PepsiCo, Inc., 3.125%, 11/1/20 | | | 1,590,000 | | | | 1,704 | |
| | PepsiCo, Inc., 7.90%, 11/1/18 | | | 345,000 | | | | 466 | |
| | Pernod-Ricard SA, 5.75%, 4/7/21 144A | | | 840,000 | | | | 1,005 | |
The Accompanying Notes are an Integral Part of the Financial Statements.
| | | | |
| 100 | | Select Bond Portfolio | | |
Select Bond Portfolio
| | | | | | | | | | |
| | | Corporate Bonds (23.1%) | | Shares/
$ Par | | | Value
$ (000’s) | |
| |
| | Beverage/Bottling continued | |
| | SABMiller Holdings, Inc., 3.75%, 1/15/22 144A | | | 920,000 | | | | 994 | |
| | | | | | | | | | |
| | Total | | | | | | | 14,745 | |
| | | | | | | | | | |
| |
| | Cable/Media/Broadcasting/Satellite (1.0%) | |
| | CCO Holdings LLC/CCO Holdings Capital Corp., 5.125%, 2/15/23 | | | 1,875,000 | | | | 1,870 | |
| | Comcast Corp., 5.875%, 2/15/18 | | | 800,000 | | | | 964 | |
| | DIRECTV Holdings LLC/DIRECTV Financing Co., Inc., 2.40%, 3/15/17 | | | 840,000 | | | | 861 | |
| | DIRECTV Holdings LLC/DIRECTV Financing Co., Inc., 3.80%, 3/15/22 | | | 1,260,000 | | | | 1,300 | |
| | DIRECTV Holdings LLC/DIRECTV Financing Co., Inc., 4.60%, 2/15/21 | | | 150,000 | | | | 162 | |
| | DIRECTV Holdings LLC/DIRECTV Financing Co., Inc., 5.15%, 3/15/42 | | | 600,000 | | | | 607 | |
| | Discovery Communications LLC, 5.05%, 6/1/20 | | | 326,000 | | | | 377 | |
| | DISH DBS Corp., 5.00%, 3/15/23 144A | | | 2,500,000 | | | | 2,500 | |
| | Historic TW, Inc., 6.625%, 5/15/29 | | | 880,000 | | | | 1,123 | |
| | Historic TW, Inc., 6.875%, 6/15/18 | | | 180,000 | | | | 227 | |
| | NBCUniversal Media LLC, 2.875%, 4/1/16 | | | 890,000 | | | | 938 | |
| | NBCUniversal Media LLC, 6.40%, 4/30/40 | | | 695,000 | | | | 892 | |
| | News America, Inc., 6.90%, 8/15/39 | | | 170,000 | | | | 223 | |
| | TCI Communications, Inc., 8.75%, 8/1/15 | | | 735,000 | | | | 877 | |
| | Time Warner Cable, Inc., 6.55%, 5/1/37 | | | 900,000 | | | | 1,114 | |
| | Time Warner Entertainment Co. LP, 8.375%, 3/15/23 | | | 690,000 | | | | 975 | |
| | Videotron Ltee, 5.00%, 7/15/22 | | | 600,000 | | | | 629 | |
| | The Walt Disney Co., 2.55%, 2/15/22 | | | 1,000,000 | | | | 1,023 | |
| | | | | | | | | | |
| | Total | | | | | | | 16,662 | |
| | | | | | | | | | |
| |
| | Conglomerate/Diversified Manufacturing (0.6%) | |
| | Celanese US Holdings LLC, 4.625%, 11/15/22 | | | 1,250,000 | | | | 1,309 | |
| | The Dow Chemical Co., 3.00%, 11/15/22 | | | 800,000 | | | | 798 | |
| | E.I. du Pont de Nemours & Co.,
3.625%, 1/15/21 | | | 1,500,000 | | | | 1,648 | |
| | | | | | | | | | |
| | | Corporate Bonds (23.1%) | | Shares/
$ Par | | | Value
$ (000’s) | |
| |
| | Conglomerate/Diversified Manufacturing continued | |
| | Eastman Chemical Co., 7.25%, 1/15/24 | | | 110,000 | | | | 143 | |
| | Eaton Corp., 2.75%, 11/2/22 144A | | | 2,700,000 | | | | 2,692 | |
| | Honeywell International, Inc., 4.25%, 3/1/21 | | | 1,000,000 | | | | 1,169 | |
| | Monsanto Co., 5.125%, 4/15/18 | | | 55,000 | | | | 65 | |
| | United Technologies Corp., 3.10%, 6/1/22 | | | 1,620,000 | | | | 1,716 | |
| | United Technologies Corp., 4.50%, 6/1/42 | | | 750,000 | | | | 833 | |
| | | | | | | | | | |
| | Total | | | | | | | 10,373 | |
| | | | | | | | | | |
| |
| | Consumer Products (0.1%) | |
| | The Procter & Gamble Co., 5.55%, 3/5/37 | | | 460,000 | | | | 617 | |
| | Unilever Capital Corp., 4.25%, 2/10/21 | | | 1,000,000 | | | | 1,154 | |
| | | | | | | | | | |
| | Total | | | | | | | 1,771 | |
| | | | | | | | | | |
| |
| | Electric Utilities (2.4%) | |
| | AEP Texas Central Co., 6.65%, 2/15/33 | | | 575,000 | | | | 731 | |
| | Alabama Power Co., 3.95%, 6/1/21 | | | 1,170,000 | | | | 1,308 | |
| | Ameren Corp., 8.875%, 5/15/14 | | | 350,000 | | | | 383 | |
| | Appalachian Power Co., 4.60%, 3/30/21 | | | 590,000 | | | | 680 | |
| | Arizona Public Service Co., 5.05%, 9/1/41 | | | 535,000 | | | | 613 | |
| | Arizona Public Service Co., 8.75%, 3/1/19 | | | 115,000 | | | | 152 | |
| | Bruce Mansfield Unit, 6.85%, 6/1/34 | | | 383,874 | | | | 400 | |
| | Carolina Power & Light Co., 2.80%, 5/15/22 | | | 910,000 | | | | 934 | |
| | Carolina Power & Light Co., 5.15%, 4/1/15 | | | 320,000 | | | | 350 | |
| | CenterPoint Energy, Inc., 6.50%, 5/1/18 | | | 375,000 | | | | 457 | |
| | Commonwealth Edison Co., 4.00%, 8/1/20 | | | 565,000 | | | | 632 | |
| | Commonwealth Edison Co., 5.875%, 2/1/33 | | | 100,000 | | | | 127 | |
| | Commonwealth Edison Co., 6.15%, 9/15/17 | | | 140,000 | | | | 170 | |
| | Connecticut Light & Power Co., 5.65%, 5/1/18 | | | 160,000 | | | | 194 | |
| | Consumers Energy Co., 5.15%, 2/15/17 | | | 1,000,000 | | | | 1,160 | |
| | The Detroit Edison Co., 3.45%, 10/1/20 | | | 635,000 | | | | 696 | |
| | The Detroit Edison Co., 5.45%, 2/15/35 | | | 105,000 | | | | 125 | |
| | Dominion Resources, Inc., 1.40%, 9/15/17 | | | 1,250,000 | | | | 1,250 | |
| | DTE Energy Co., 6.375%, 4/15/33 | | | 415,000 | | | | 539 | |
| | | | | | | | | | |
| | | Corporate Bonds (23.1%) | | Shares/
$ Par | | | Value
$ (000’s) | |
| |
| | Electric Utilities continued | |
| | Duke Energy Corp., 6.25%, 6/15/18 | | | 50,000 | | | | 61 | |
| | Duke Energy Indiana, Inc., 3.75%, 7/15/20 | | | 1,180,000 | | | | 1,307 | |
| | Duke Energy Ohio, Inc., 2.10%, 6/15/13 | | | 485,000 | | | | 489 | |
| | Entergy Corp., 4.70%, 1/15/17 | | | 1,050,000 | | | | 1,137 | |
| | Entergy Mississippi, Inc., 6.25%, 4/1/34 | | | 660,000 | | | | 669 | |
| | Exelon Generation Co. LLC, 4.25%, 6/15/22 144A | | | 1,250,000 | | | | 1,300 | |
| | Exelon Generation Co. LLC, 6.20%, 10/1/17 | | | 455,000 | | | | 537 | |
| | IPALCO Enterprises, Inc., 5.00%, 5/1/18 | | | 1,740,000 | | | | 1,823 | |
| | Kiowa Power Partners LLC, 4.811%, 12/30/13 144A | | | 113,836 | | | | 115 | |
| | Mississippi Power Co., 4.75%, 10/15/41 | | | 970,000 | | | | 1,072 | |
| | Monongahela Power Co., Inc., 5.70%, 3/15/17 144A | | | 615,000 | | | | 696 | |
| | Nevada Power Co., 5.95%, 3/15/16 | | | 165,000 | | | | 189 | |
| | NextEra Energy Capital Holdings, Inc., 4.50%, 6/1/21 | | | 1,105,000 | | | | 1,228 | |
| | NSTAR LLC, 4.50%, 11/15/19 | | | 55,000 | | | | 62 | |
| | NV Energy, Inc., 6.25%, 11/15/20 | | | 535,000 | | | | 629 | |
| | Ohio Edison Co., 6.875%, 7/15/36 | | | 130,000 | | | | 168 | |
| | Ohio Power Co., 5.375%, 10/1/21 | | | 600,000 | | | | 727 | |
| | Pacific Gas & Electric Co., 3.50%, 10/1/20 | | | 1,750,000 | | | | 1,918 | |
| | Pacific Gas & Electric Co., 5.625%, 11/30/17 | | | 300,000 | | | | 362 | |
| | PacifiCorp., 3.85%, 6/15/21 | | | 1,170,000 | | | | 1,319 | |
| | Peco Energy Co., 2.375%, 9/15/22 | | | 785,000 | | | | 792 | |
| | Potomac Electric Power Co., 6.50%, 11/15/37 | | | 170,000 | | | | 243 | |
| | PPL Capital Funding, Inc., 4.20%, 6/15/22 | | | 670,000 | | | | 721 | |
| | PPL Energy Supply LLC, 6.50%, 5/1/18 | | | 145,000 | | | | 174 | |
| | Public Service Co. of Colorado, 3.20%, 11/15/20 | | | 785,000 | | | | 856 | |
| | Public Service Co. of Colorado, 5.80%, 8/1/18 | | | 500,000 | | | | 613 | |
| | Public Service Co. of New Mexico, 5.35%, 10/1/21 | | | 650,000 | | | | 714 | |
| | Public Service Electric & Gas Co., 3.50%, 8/15/20 | | | 685,000 | | | | 752 | |
The Accompanying Notes are an Integral Part of the Financial Statements.
| | | | | | |
| | Select Bond Portfolio | | | 101 | |
Select Bond Portfolio
| | | | | | | | | | |
| | | Corporate Bonds (23.1%) | | Shares/
$ Par | | | Value
$ (000’s) | |
| |
| | Electric Utilities continued | |
| | Public Service Electric & Gas Co.,
3.65%, 9/1/42 | | | 535,000 | | | | 526 | |
| | Public Service Electric & Gas Co.,
5.00%, 1/1/13 | | | 1,000,000 | | | | 1,000 | |
| | Puget Energy, Inc., 5.625%, 7/15/22 | | | 1,835,000 | | | | 1,976 | |
| | Puget Sound Energy, Inc., 6.274%, 3/15/37 | | | 370,000 | | | | 494 | |
| | San Diego Gas & Electric Co.,
6.125%, 9/15/37 | | | 170,000 | | | | 234 | |
| | Sempra Energy, 2.30%, 4/1/17 | | | 1,020,000 | | | | 1,059 | |
| | Sempra Energy, 6.15%, 6/15/18 | | | 215,000 | | | | 264 | |
| | South Carolina Electric & Gas Co.,
6.05%, 1/15/38 | | | 265,000 | | | | 344 | |
| | Tampa Electric Co., 5.40%, 5/15/21 | | | 95,000 | | | | 117 | |
| | Union Electric Co., 3.90%, 9/15/42 | | | 715,000 | | | | 725 | |
| | Union Electric Co., 6.40%, 6/15/17 | | | 140,000 | | | | 171 | |
| | Union Electric Co., 6.70%, 2/1/19 | | | 195,000 | | | | 246 | |
| | Virginia Electric & Power Co.,
3.45%, 9/1/22 | | | 945,000 | | | | 1,022 | |
| | Virginia Electric & Power Co.,
5.40%, 4/30/18 | | | 60,000 | | | | 72 | |
| | | | | | | | | | |
| | Total | | | | | | | 39,824 | |
| | | | | | | | | | |
| |
| | Electronics (0.2%) | |
| | Hewlett-Packard Co., 3.00%, 9/15/16 | | | 910,000 | | | | 916 | |
| | Hewlett-Packard Co., 3.75%, 12/1/20 | | | 130,000 | | | | 126 | |
| | Hewlett-Packard Co., 4.65%, 12/9/21 | | | 835,000 | | | | 838 | |
| | International Business Machines Corp., 1.95%, 7/22/16 | | | 540,000 | | | | 561 | |
| | International Business Machines Corp., 2.00%, 1/5/16 | | | 980,000 | | | | 1,013 | |
| | | | | | | | | | |
| | Total | | | | | | | 3,454 | |
| | | | | | | | | | |
| |
| | Food Processors (0.5%) | |
| | Archer-Daniels-Midland Co.,
4.479%, 3/1/21 | | | 335,000 | | | | 378 | |
| | General Mills, Inc., 3.15%, 12/15/21 | | | 900,000 | | | | 941 | |
| | Kellogg Co., 3.25%, 5/21/18 | | | 375,000 | | | | 408 | |
| | Kraft Foods Group, Inc., 2.25%, 6/5/17 144A | | | 285,000 | | | | 295 | |
| | Kraft Foods Group, Inc., 3.50%, 6/6/22 144A | | | 380,000 | | | | 406 | |
| | Kraft Foods Group, Inc., 6.125%, 8/23/18 144A | | | 750,000 | | | | 919 | |
| | Mead Johnson Nutrition Co.,
4.90%, 11/1/19 | | | 960,000 | | | | 1,096 | |
| | Mondelez International, Inc.,
6.125%, 2/1/18 | | | 265,000 | | | | 322 | |
| | | | | | | | | | |
| | | Corporate Bonds (23.1%) | | Shares/
$ Par | | | Value
$ (000’s) | |
| |
| | Food Processors continued | |
| | Mondelez International, Inc.,
6.50%, 8/11/17 | | | 1,250,000 | | | | 1,527 | |
| | Mondelez International, Inc.,
6.50%, 2/9/40 | | | 1,485,000 | | | | 1,995 | |
| | | | | | | | | | |
| | Total | | | | | | | 8,287 | |
| | | | | | | | | | |
| |
| | Gas Pipelines (0.9%) | |
| | Access Midstream Partners LP/ACMP Finance Corp.,
4.875%, 5/15/23 | | | 1,250,000 | | | | 1,269 | |
| | CenterPoint Energy Resources Corp., 6.125%, 11/1/17 | | | 120,000 | | | | 144 | |
| | El Paso LLC, 7.00%, 6/15/17 | | | 420,000 | | | | 480 | |
| | El Paso Pipeline Partners Operating Co. LLC, 4.70%, 11/1/42 | | | 500,000 | | | | 490 | |
| | El Paso Pipeline Partners Operating Co. LLC, 5.00%, 10/1/21 | | | 1,815,000 | | | | 2,057 | |
| | Energy Transfer Partners LP,
4.65%, 6/1/21 | | | 460,000 | | | | 505 | |
| | Energy Transfer Partners LP,
6.05%, 6/1/41 | | | 1,205,000 | | | | 1,371 | |
| | Energy Transfer Partners LP, 6.70%, 7/1/18 | | | 440,000 | | | | 530 | |
| | Enterprise Products Operating LLC, 3.20%, 2/1/16 | | | 880,000 | | | | 930 | |
| | Kinder Morgan Energy Partners LP, 5.95%, 2/15/18 | | | 1,270,000 | | | | 1,521 | |
| | Kinder Morgan Energy Partners LP, 6.375%, 3/1/41 | | | 1,150,000 | | | | 1,423 | |
| | Kinder Morgan Energy Partners LP, 6.50%, 2/1/37 | | | 200,000 | | | | 244 | |
| | Kinder Morgan Finance Co. LLC, 6.00%, 1/15/18 144A | | | 1,430,000 | | | | 1,572 | |
| | Magellan Midstream Partners LP, 6.55%, 7/15/19 | | | 445,000 | | | | 550 | |
| | ONEOK Partners LP, 2.00%, 10/1/17 | | | 625,000 | | | | 630 | |
| | Plains All American Pipeline LP/PAA Finance Corp., 6.50%, 5/1/18 | | | 220,000 | | | | 272 | |
| | Spectra Energy Partners LP, 2.95%, 6/15/16 | | | 455,000 | | | | 468 | |
| | Williams Partners LP, 4.00%, 11/15/21 | | | 225,000 | | | | 241 | |
| | Williams Partners LP, 4.125%, 11/15/20 | | | 90,000 | | | | 98 | |
| | Williams Partners LP, 5.25%, 3/15/20 | | | 740,000 | | | | 852 | |
| | | | | | | | | | |
| | Total | | | | | | | 15,647 | |
| | | | | | | | | | |
| | | | | | | | | | |
| | | Corporate Bonds (23.1%) | | Shares/
$ Par | | | Value
$ (000’s) | |
| |
| | Health Care/Pharmaceuticals (1.3%) | |
| | AbbVie, Inc., 1.75%, 11/6/17 144A | | | 980,000 | | | | 991 | |
| | AbbVie, Inc., 2.90%, 11/6/22 144A | | | 440,000 | | | | 448 | |
| | Amgen, Inc., 3.875%, 11/15/21 | | | 1,500,000 | | | | 1,647 | |
| | Express Scripts Holding Co., 2.65%, 2/15/17 144A | | | 545,000 | | | | 566 | |
| | Express Scripts Holding Co.,
3.125%, 5/15/16 | | | 220,000 | | | | 232 | |
| | Express Scripts Holding Co., 3.50%, 11/15/16 144A | | | 900,000 | | | | 962 | |
| | Express Scripts Holding Co., 3.90%, 2/15/22 144A | | | 285,000 | | | | 307 | |
| | Fresenius Medical Care US Finance II, Inc., 5.625%, 7/31/19 144A | | | 620,000 | | | | 666 | |
| | Fresenius Medical Care US Finance II, Inc., 5.875%, 1/31/22 144A | | | 465,000 | | | | 504 | |
| | GlaxoSmithKline Capital, Inc.,
6.375%, 5/15/38 | | | 425,000 | | | | 587 | |
| | Medco Health Solutions, Inc.,
7.125%, 3/15/18 | | | 1,050,000 | | | | 1,309 | |
| | Medtronic, Inc., 3.125%, 3/15/22 | | | 1,000,000 | | | | 1,062 | |
| | Merck & Co., Inc., 3.875%, 1/15/21 | | | 2,145,000 | | | | 2,407 | |
| | Merck & Co., Inc., 4.75%, 3/1/15 | | | 500,000 | | | | 545 | |
| | Merck & Co., Inc., 5.75%, 11/15/36 | | | 250,000 | | | | 331 | |
| | Merck & Co., Inc., 6.40%, 3/1/28 | | | 125,000 | | | | 173 | |
| | The Novartis Capital Corp., 2.40%, 9/21/22 | | | 1,860,000 | | | | 1,865 | |
| | Pfizer, Inc., 5.35%, 3/15/15 | | | 450,000 | | | | 496 | |
| | Roche Holdings, Inc., 6.00%, 3/1/19 144A | | | 590,000 | | | | 734 | |
| | Sanofi-Aventis SA, 2.625%, 3/29/16 | | | 1,750,000 | | | | 1,842 | |
| | Teva Pharmaceutical Finance Co. BV, 2.95%, 12/18/22 | | | 920,000 | | | | 931 | |
| | Teva Pharmaceutical Finance IV LLC, 2.25%, 3/18/20 | | | 430,000 | | | | 434 | |
| | Thermo Fisher Scientific, Inc.,
1.85%, 1/15/18 | | | 405,000 | | | | 411 | |
| | Thermo Fisher Scientific, Inc.,
3.15%, 1/15/23 | | | 520,000 | | | | 531 | |
| | Watson Pharmaceuticals, Inc.,
1.875%, 10/1/17 | | | 135,000 | | | | 137 | |
| | Watson Pharmaceuticals, Inc.,
3.25%, 10/1/22 | | | 295,000 | | | | 301 | |
| | Watson Pharmaceuticals, Inc.,
4.625%, 10/1/42 | | | 180,000 | | | | 187 | |
The Accompanying Notes are an Integral Part of the Financial Statements.
| | | | |
| 102 | | Select Bond Portfolio | | |
Select Bond Portfolio
| | | | | | | | | | |
| | | Corporate Bonds (23.1%) | | Shares/
$ Par | | | Value
$ (000’s) | |
| |
| | Health Care/Pharmaceuticals continued | |
| | Wyeth LLC, 5.50%, 2/15/16 | | | 35,000 | | | | 40 | |
| | Wyeth LLC, 5.95%, 4/1/37 | | | 835,000 | | | | 1,114 | |
| | | | | | | | | | |
| | Total | | | | | | | 21,760 | |
| | | | | | | | | | |
| |
| | Independent Finance (0.4%) | |
| | General Electric Capital Corp.,
5.625%, 5/1/18 | | | 3,635,000 | | | | 4,317 | |
| | General Electric Capital Corp./LJ VP Holdings LLC, 3.80%, 6/18/19 144A | | | 1,550,000 | | | | 1,651 | |
| | International Lease Finance Corp.,
5.75%, 5/15/16 | | | 335,000 | | | | 353 | |
| | | | | | | | | | |
| | Total | | | | | | | 6,321 | |
| | | | | | | | | | |
| |
| | Information/Data Technology (0.6%) | |
| | Fidelity National Information Services, Inc., 5.00%, 3/15/22 | | | 1,500,000 | | | | 1,609 | |
| | Intel Corp., 3.30%, 10/1/21 | | | 1,000,000 | | | | 1,060 | |
| | Microsoft Corp., 0.875%, 11/15/17 | | | 340,000 | | | | 338 | |
| | Microsoft Corp., 2.125%, 11/15/22 | | | 900,000 | | | | 891 | |
| | Mylan, Inc., 3.125%, 1/15/23 144A | | | 830,000 | | | | 823 | |
| | NCR Corp., 4.625%, 2/15/21 144A | | | 750,000 | | | | 750 | |
| | Oracle Corp., 1.20%, 10/15/17 | | | 900,000 | | | | 903 | |
| | Oracle Corp., 2.50%, 10/15/22 | | | 900,000 | | | | 908 | |
| | Oracle Corp., 3.875%, 7/15/20 | | | 2,190,000 | | | | 2,470 | |
| | Xerox Corp., 4.25%, 2/15/15 | | | 400,000 | | | | 421 | |
| | | | | | | | | | |
| | Total | | | | | | | 10,173 | |
| | | | | | | | | | |
| |
| | Life Insurance (0.6%) | |
| | Aetna, Inc., 1.50%, 11/15/17 | | | 140,000 | | | | 140 | |
| | Aetna, Inc., 2.75%, 11/15/22 | | | 395,000 | | | | 392 | |
| | American International Group, Inc., 4.875%, 6/1/22 | | | 930,000 | | | | 1,062 | |
| | MassMutual Global Funding II, 2.30%, 9/28/15 144A | | | 1,250,000 | | | | 1,298 | |
| | Metropolitan Life Global Funding I, 3.65%, 6/14/18 144A | | | 1,340,000 | | | | 1,467 | |
| | New York Life Global Funding, 2.45%, 7/14/16 144A | | | 1,140,000 | | | | 1,195 | |
| | Prudential Financial, Inc., 5.375%, 6/21/20 | | | 420,000 | | | | 491 | |
| | Prudential Financial, Inc., 5.70%, 12/14/36 | | | 145,000 | | | | 165 | |
| | | | | | | | | | |
| | | Corporate Bonds (23.1%) | | Shares/
$ Par | | | Value
$ (000’s) | |
| |
| | Life Insurance continued | |
| | Teachers Insurance & Annuity Association-College Retirement Equity Fund, 6.85%, 12/16/39 144A | | | 1,665,000 | | | | 2,258 | |
| | UnitedHealth Group, Inc., 1.40%, 10/15/17 | | | 180,000 | | | | 180 | |
| | UnitedHealth Group, Inc., 2.75%, 2/15/23 | | | 210,000 | | | | 212 | |
| | UnitedHealth Group, Inc., 2.875%, 3/15/22 | | | 210,000 | | | | 215 | |
| | UnitedHealth Group, Inc., 3.95%, 10/15/42 | | | 90,000 | | | | 90 | |
| | UnitedHealth Group, Inc., 4.70%, 2/15/21 | | | 595,000 | | | | 693 | |
| | WellPoint, Inc., 1.875%, 1/15/18 | | | 395,000 | | | | 400 | |
| | WellPoint, Inc., 3.30%, 1/15/23 | | | 545,000 | | | | 559 | |
| | | | | | | | | | |
| | Total | | | | | | | 10,817 | |
| | | | | | | | | | |
| |
| | Machinery (0.4%) | |
| | Caterpillar Financial Services Corp., 1.625%, 6/1/17 | | | 855,000 | | | | 871 | |
| | Deere & Co., 2.60%, 6/8/22 | | | 1,200,000 | | | | 1,215 | |
| | John Deere Capital Corp., 0.70%, 9/4/15 | | | 900,000 | | | | 900 | |
| | John Deere Capital Corp., 1.20%, 10/10/17 | | | 615,000 | | | | 616 | |
| | John Deere Capital Corp., 2.25%, 4/17/19 | | | 690,000 | | | | 710 | |
| | John Deere Capital Corp., 2.80%, 1/27/23 | | | 925,000 | | | | 947 | |
| | Roper Industries, Inc., 1.85%, 11/15/17 | | | 665,000 | | | | 665 | |
| | Roper Industries, Inc., 3.125%, 11/15/22 | | | 990,000 | | | | 996 | |
| | | | | | | | | | |
| | Total | | | | | | | 6,920 | |
| | | | | | | | | | |
| |
| | Metals/Mining (0.6%) | |
| | Barrick Gold Corp., 2.90%, 5/30/16 | | | 625,000 | | | | 656 | |
| | Barrick Gold Corp., 3.85%, 4/1/22 | | | 1,210,000 | | | | 1,281 | |
| | Barrick North America Finance LLC, 6.80%, 9/15/18 | | | 375,000 | | | | 463 | |
| | Freeport-McMoRan Copper & Gold, Inc., 3.55%, 3/1/22 | | | 1,125,000 | | | | 1,116 | |
| | Newmont Mining Corp., 3.50%, 3/15/22 | | | 1,515,000 | | | | 1,562 | |
| | Newmont Mining Corp., 6.25%, 10/1/39 | | | 245,000 | | | | 295 | |
| | Rio Tinto Finance USA PLC,
1.625%, 8/21/17 | | | 1,885,000 | | | | 1,909 | |
| | Rio Tinto Finance USA, Ltd.,
4.125%, 5/20/21 | | | 900,000 | | | | 994 | |
| | Rio Tinto Finance USA, Ltd.,
9.00%, 5/1/19 | | | 225,000 | | | | 309 | |
| | | | | | | | | | |
| | | Corporate Bonds (23.1%) | | Shares/
$ Par | | | Value
$ (000’s) | |
| |
| | Metals/Mining continued | |
| | Teck Resources, Ltd., 3.00%, 3/1/19 | | | 335,000 | | | | 345 | |
| | Teck Resources, Ltd., 5.20%, 3/1/42 | | | 1,250,000 | | | | 1,278 | |
| | | | | | | | | | |
| | Total | | | | | | | 10,208 | |
| | | | | | | | | | |
| |
| | Natural Gas Distributors (0.1%) | |
| | NiSource Finance Corp., 5.80%, 2/1/42 | | | 1,530,000 | | | | 1,742 | |
| | | | | | | | | | |
| | Total | | | | | | | 1,742 | |
| | | | | | | | | | |
| |
| | Oil & Gas Field Machines and Services (0.2%) | |
| | National Oilwell Varco, Inc.,
1.35%, 12/1/17 | | | 195,000 | | | | 196 | |
| | National Oilwell Varco, Inc.,
2.60%, 12/1/22 | | | 685,000 | | | | 695 | |
| | Oil States International, Inc.,
5.125%, 1/15/23 144A | | | 625,000 | | | | 634 | |
| | Rowan Cos., Inc., 4.875%, 6/1/22 | | | 1,540,000 | | | | 1,672 | |
| | | | | | | | | | |
| | Total | | | | | | | 3,197 | |
| | | | | | | | | | |
| |
| | Oil and Gas (2.6%) | |
| | Anadarko Petroleum Corp., 6.375%, 9/15/17 | | | 1,140,000 | | | | 1,362 | |
| | Apache Corp., 3.25%, 4/15/22 | | | 1,000,000 | | | | 1,060 | |
| | Apache Corp., 4.75%, 4/15/43 | | | 605,000 | | | | 659 | |
| | BP Capital Markets PLC, 1.846%, 5/5/17 | | | 1,230,000 | | | | 1,257 | |
| | BP Capital Markets PLC, 2.50%, 11/6/22 | | | 2,155,000 | | | | 2,135 | |
| | BP Capital Markets PLC, 4.50%, 10/1/20 | | | 295,000 | | | | 340 | |
| | BP Capital Markets PLC, 4.75%, 3/10/19 | | | 1,936,000 | | | | 2,245 | |
| | Canadian Natural Resources, Ltd., 5.70%, 5/15/17 | | | 595,000 | | | | 701 | |
| | Canadian Natural Resources, Ltd., 5.85%, 2/1/35 | | | 140,000 | | | | 172 | |
| | Canadian Natural Resources, Ltd., 6.45%, 6/30/33 | | | 255,000 | | | | 324 | |
| | Cenovus Energy, Inc., 4.45%, 9/15/42 | | | 1,255,000 | | | | 1,305 | |
| | ConocoPhillips, 6.00%, 1/15/20 | | | 2,345,000 | | | | 2,976 | |
| | Continental Resources, Inc.,
5.00%, 9/15/22 | | | 1,250,000 | | | | 1,347 | |
| | Devon Energy Corp., 1.875%, 5/15/17 | | | 595,000 | | | | 607 | |
| | Devon Energy Corp., 3.25%, 5/15/22 | | | 910,000 | | | | 950 | |
| | Encana Corp., 3.90%, 11/15/21 | | | 795,000 | | | | 863 | |
| | EnCana Corp., 6.50%, 2/1/38 | | | 325,000 | | | | 406 | |
The Accompanying Notes are an Integral Part of the Financial Statements.
| | | | | | |
| | Select Bond Portfolio | | | 103 | |
Select Bond Portfolio
| | | | | | | | | | |
| | | Corporate Bonds (23.1%) | | Shares/
$ Par | | | Value
$ (000’s) | |
| |
| | Oil and Gas continued | |
| | Ensco PLC,
4.70%, 3/15/21 | | | 880,000 | | | | 990 | |
| | EOG Resources, Inc., 4.40%, 6/1/20 | | | 340,000 | | | | 393 | |
| | Hess Corp.,
5.60%, 2/15/41 | | | 585,000 | | | | 692 | |
| | Husky Energy, Inc., 3.95%, 4/15/22 | | | 1,355,000 | | | | 1,456 | |
| | Husky Energy, Inc., 7.25%, 12/15/19 | | | 195,000 | | | | 253 | |
| | Marathon Oil Corp., 6.60%, 10/1/37 | | | 130,000 | | | | 174 | |
| | Nabors Industries, Inc., 6.15%, 2/15/18 | | | 960,000 | | | | 1,129 | |
| | Newfield Exploration Co., 6.875%, 2/1/20 | | | 1,770,000 | | | | 1,894 | |
| | Noble Energy, Inc., 4.15%, 12/15/21 | | | 305,000 | | | | 337 | |
| | Noble Energy, Inc., 6.00%, 3/1/41 | | | 425,000 | | | | 512 | |
| | Occidental Petroleum Corp., 3.125%, 2/15/22 | | | 1,000,000 | | | | 1,064 | |
| | Occidental Petroleum Corp., 4.125%, 6/1/16 | | | 385,000 | | | | 427 | |
| | Pemex Project Funding Master Trust, 6.625%, 6/15/35 | | | 200,000 | | | | 254 | |
| | Petro-Canada, 6.05%, 5/15/18 | | | 480,000 | | | | 584 | |
| | Petrohawk Energy Corp., 6.25%, 6/1/19 | | | 1,260,000 | | | | 1,435 | |
| | QEP Resources, Inc., 5.375%, 10/1/22 | | | 600,000 | | | | 643 | |
| | Shell International Finance BV,
1.125%, 8/21/17 | | | 1,255,000 | | | | 1,261 | |
| | Shell International Finance BV,
4.30%, 9/22/19 | | | 2,303,000 | | | | 2,668 | |
| | Southwestern Energy Co.,
4.10%, 3/15/22 | | | 755,000 | | | | 812 | |
| | Statoil ASA,
2.45%, 1/17/23 | | | 1,900,000 | | | | 1,895 | |
| | Suncor Energy, Inc.,
6.85%, 6/1/39 | | | 210,000 | | | | 290 | |
| | Talisman Energy, Inc.,
3.75%, 2/1/21 | | | 1,055,000 | | | | 1,132 | |
| | Total Capital International SA,
1.50%, 2/17/17 | | | 480,000 | | | | 484 | |
| | Total Capital SA,
4.45%, 6/24/20 | | | 1,440,000 | | | | 1,668 | |
| | Transocean, Inc.,
6.375%, 12/15/21 | | | 960,000 | | | | 1,167 | |
| | Weatherford International, Ltd.,
5.95%, 4/15/42 | | | 1,810,000 | | | | 1,964 | |
| | | | | | | | | | |
| | Total | | | | | | | 44,287 | |
| | | | | | | | | | |
| |
| | Other Finance (0.5%) | |
| | American Express Co., 6.15%, 8/28/17 | | | 875,000 | | | | 1,055 | |
| | American Express Credit Corp.,
5.125%, 8/25/14 | | | 760,000 | | | | 814 | |
| | | | | | | | | | |
| | | Corporate Bonds (23.1%) | | Shares/
$ Par | | | Value
$ (000’s) | |
| |
| | Other Finance continued | |
| | Berkshire Hathaway Finance Corp., 3.00%, 5/15/22 | | | 1,250,000 | | | | 1,302 | |
| | CVS Pass-Through Trust, 6.036%, 12/10/28 | | | 811,792 | | | | 949 | |
| | The NASDAQ OMX Group, Inc., 5.55%, 1/15/20 | | | 235,000 | | | | 256 | |
| | Prudential Covered Trust 2012-1, 2.997%, 9/30/15 144A | | | 1,966,500 | | | | 2,039 | |
| | SLM Corp., 6.00%, 1/25/17 | | | 770,000 | | | | 834 | |
| | SLM Corp., 7.25%, 1/25/22 | | | 75,000 | | | | 83 | |
| | SLM Corp., 8.00%, 3/25/20 | | | 570,000 | | | | 651 | |
| | | | | | | | | | |
| | Total | | | | | | | 7,983 | |
| | | | | | | | | | |
| |
| | Other Holdings (0.3%) | |
| (f) | | Federative Republic of Brazil,
8.50%, 1/5/24 | | | 3,145,000 | | | | 1,877 | |
| (f) | | Morgan Stanley, 5.40%, 5/15/15 144A | | | 6,114,421 | | | | 3,249 | |
| | | | | | | | | | |
| | Total | | | | | | | 5,126 | |
| | | | | | | | | | |
| |
| | Other Services (0.2%) | |
| | American Tower Corp., 4.625%, 4/1/15 | | | 295,000 | | | | 314 | |
| | American Tower Corp., 7.00%, 10/15/17 | | | 300,000 | | | | 359 | |
| | CC Holdings GS V LLC, 3.849%, 4/15/23 144A | | | 880,000 | | | | 895 | |
| | Republic Services, Inc., 5.25%, 11/15/21 | | | 515,000 | | | | 607 | |
| | Waste Management, Inc., 2.90%, 9/15/22 | | | 740,000 | | | | 732 | |
| | Waste Management, Inc., 4.60%, 3/1/21 | | | 655,000 | | | | 742 | |
| | | | | | | | | | |
| | Total | | | | | | | 3,649 | |
| | | | | | | | | | |
| |
| | Paper and Forest Products (0.1%) | |
| | Georgia-Pacific LLC, 5.40%, 11/1/20 144A | | | 1,430,000 | | | | 1,701 | |
| | Georgia-Pacific LLC, 7.75%, 11/15/29 | | | 90,000 | | | | 123 | |
| | | | | | | | | | |
| | Total | | | | | | | 1,824 | |
| | | | | | | | | | |
| |
| | Property and Casualty Insurance (0.0%) | |
| | The Hartford Financial Services Group, Inc., 6.625%, 4/15/42 | | | 300,000 | | | | 381 | |
| | | | | | | | | | |
| | Total | | | | | | | 381 | |
| | | | | | | | | | |
| |
| | Railroads (0.4%) | |
| | Burlington Northern Santa Fe LLC, 3.05%, 3/15/22 | | | 1,950,000 | | | | 2,012 | |
| | Burlington Northern Santa Fe LLC, 3.05%, 9/1/22 | | | 685,000 | | | | 708 | |
| | Burlington Northern Santa Fe LLC, 3.60%, 9/1/20 | | | 585,000 | | | | 634 | |
| | | | | | | | |
| | | Corporate Bonds (23.1%) | | Shares/
$ Par | | Value
$ (000’s) | |
| |
| | Railroads continued | |
| | Canadian National Railway Co., 5.85%, 11/15/17 | | 120,000 | | | 145 | |
| | CSX Corp., 3.70%, 10/30/20 | | 115,000 | | | 124 | |
| | CSX Corp., 4.25%, 6/1/21 | | 315,000 | | | 354 | |
| | CSX Corp., 5.60%, 5/1/17 | | 725,000 | | | 847 | |
| | Norfolk Southern Corp., 2.903%, 2/15/23 144A | | 1,099,000 | | | 1,106 | |
| | Union Pacific Corp., 4.30%, 6/15/42 | | 1,255,000 | | | 1,325 | |
| | | | | | | | |
| | Total | | | | | 7,255 | |
| | | | | | | | |
| |
| | Real Estate Investment Trusts (1.0%) | |
| | AvalonBay Communities, Inc., 2.85%, 3/15/23 | | 705,000 | | | 696 | |
| | AvalonBay Communities, Inc., 2.95%, 9/15/22 | | 365,000 | | | 364 | |
| | AvalonBay Communities, Inc., 3.95%, 1/15/21 | | 970,000 | | | 1,043 | |
| | Boston Properties LP, 3.85%, 2/1/23 | | 990,000 | | | 1,040 | |
| | BRE Properties, Inc., 5.20%, 3/15/21 | | 810,000 | | | 914 | |
| | BRE Properties, Inc., 5.50%, 3/15/17 | | 360,000 | | | 408 | |
| | Colonial Realty LP, 6.05%, 9/1/16 | | 255,000 | | | 284 | |
| | DDR Corp., 4.75%, 4/15/18 | | 880,000 | | | 975 | |
| | Duke Realty LP, 6.50%, 1/15/18 | | 1,000,000 | | | 1,186 | |
| | Essex Portfolio LP, 3.625%, 8/15/22 144A | | 1,885,000 | | | 1,882 | |
| | HCP, Inc., 3.75%, 2/1/16 | | 520,000 | | | 552 | |
| | HCP, Inc., 3.75%, 2/1/19 | | 335,000 | | | 353 | |
| | HCP, Inc., 6.00%, 1/30/17 | | 290,000 | | | 333 | |
| | HCP, Inc., 6.70%, 1/30/18 | | 170,000 | | | 205 | |
| | Health Care REIT, Inc., 3.625%, 3/15/16 | | 440,000 | | | 465 | |
| | Health Care REIT, Inc., 4.125%, 4/1/19 | | 1,505,000 | | | 1,619 | |
| | Ventas Realty LP/Ventas Capital Corp., 2.00%, 2/15/18 | | 1,900,000 | | | 1,901 | |
| | Ventas Realty LP/Ventas Capital Corp., 4.25%, 3/1/22 | | 420,000 | | | 445 | |
| | Ventas Realty LP/Ventas Capital Corp., 4.75%, 6/1/21 | | 2,010,000 | | | 2,198 | |
| | WEA Finance LLC, 7.125%, 4/15/18 144A | | 305,000 | | | 376 | |
| | | | | | | | |
| | Total | | | | | 17,239 | |
| | | | | | | | |
| |
| | Restaurants (0.3%) | |
| | Darden Restaurants, Inc., 3.35%, 11/1/22 | | 300,000 | | | 290 | |
| | Darden Restaurants, Inc., 4.50%, 10/15/21 | | 950,000 | | | 1,022 | |
| | Darden Restaurants, Inc., 6.20%, 10/15/17 | | 540,000 | | | 638 | |
The Accompanying Notes are an Integral Part of the Financial Statements.
| | | | |
| 104 | | Select Bond Portfolio | | |
Select Bond Portfolio
| | | | | | | | |
| | | Corporate Bonds (23.1%) | | Shares/
$ Par | | Value
$ (000’s) | |
| |
| | Restaurants continued | |
| | McDonald’s Corp., 2.625%, 1/15/22 | | 1,000,000 | | | 1,027 | |
| | Yum! Brands, Inc., 3.75%, 11/1/21 | | 630,000 | | | 671 | |
| | Yum! Brands, Inc., 3.875%, 11/1/20 | | 560,000 | | | 608 | |
| | | | | | | | |
| | Total | | | | | 4,256 | |
| | | | | | | | |
| |
| | Retail Food and Drug (0.4%) | |
| | CVS Caremark Corp., 6.25%, 6/1/27 | | 1,475,000 | | | 1,948 | |
| | Delhaize Group SA, 4.125%, 4/10/19 | | 1,310,000 | | | 1,352 | |
| | Delhaize Group SA, 5.70%, 10/1/40 | | 570,000 | | | 534 | |
| | The Kroger Co., 7.50%, 4/1/31 | | 735,000 | | | 954 | |
| | Safeway, Inc., 6.35%, 8/15/17 | | 1,770,000 | | | 2,010 | |
| | | | | | | | |
| | Total | | | | | 6,798 | |
| | | | | | | | |
| |
| | Retail Stores (0.8%) | |
| | Costco Wholesale Corp., 1.70%, 12/15/19 | | 2,210,000 | | | 2,225 | |
| | The Home Depot, Inc., 4.40%, 4/1/21 | | 250,000 | | | 295 | |
| | The Home Depot, Inc., 5.40%, 3/1/16 | | 250,000 | | | 286 | |
| | The Home Depot, Inc., 5.875%, 12/16/36 | | 585,000 | | | 769 | |
| | Limited Brands, Inc., 5.625%, 2/15/22 | | 1,200,000 | | | 1,305 | |
| | Lowe’s Cos., Inc., 3.80%, 11/15/21 | | 200,000 | | | 221 | |
| | Macy’s Retail Holdings, Inc.,
5.90%, 12/1/16 | | 698,000 | | | 820 | |
| | Macy’s Retail Holdings, Inc.,
7.875%, 7/15/15 | | 545,000 | | | 635 | |
| | Nordstrom, Inc., 6.25%, 1/15/18 | | 330,000 | | | 400 | |
| | Nordstrom, Inc., 7.00%, 1/15/38 | | 225,000 | | | 319 | |
| | Target Corp., 2.90%, 1/15/22 | | 1,000,000 | | | 1,060 | |
| | Target Corp., 6.50%, 10/15/37 | | 405,000 | | | 565 | |
| | Wal-Mart Stores, Inc., 2.80%, 4/15/16 | | 450,000 | | | 480 | |
| | Wal-Mart Stores, Inc., 3.25%, 10/25/20 | | 735,000 | | | 800 | |
| | Wal-Mart Stores, Inc., 3.625%, 7/8/20 | | 390,000 | | | 433 | |
| | Wal-Mart Stores, Inc., 4.875%, 7/8/40 | | 625,000 | | | 739 | |
| | Wal-Mart Stores, Inc., 5.625%, 4/15/41 | | 1,480,000 | | | 1,938 | |
| | | | | | | | |
| | Total | | | | | 13,290 | |
| | | | | | | | |
| |
| | Telecommunications (1.1%) | |
| | America Movil SAB de CV,
2.375%, 9/8/16 | | 705,000 | | | 733 | |
| | | | | | | | | | |
| | | Corporate Bonds (23.1%) | | Shares/
$ Par | | | Value
$ (000’s) | |
| |
| | Telecommunications continued | |
| | America Movil SAB de CV,
5.00%, 3/30/20 | | | 1,525,000 | | | | 1,774 | |
| | AT&T, Inc., 2.625%, 12/1/22 | | | 1,875,000 | | | | 1,878 | |
| | AT&T, Inc., 2.95%, 5/15/16 | | | 1,310,000 | | | | 1,387 | |
| | AT&T, Inc., 3.00%, 2/15/22 | | | 1,000,000 | | | | 1,040 | |
| | AT&T, Inc., 5.55%, 8/15/41 | | | 2,260,000 | | | | 2,712 | |
| | CenturyLink, Inc., 5.15%, 6/15/17 | | | 665,000 | | | | 717 | |
| | CenturyLink, Inc., 6.45%, 6/15/21 | | | 1,365,000 | | | | 1,508 | |
| | Qwest Corp., 6.50%, 6/1/17 | | | 920,000 | | | | 1,074 | |
| | Telefonica Emisiones SAU, 3.729%, 4/27/15 | | | 855,000 | | | | 879 | |
| | TW Telecom Holdings, Inc., 5.375%, 10/1/22 144A | | | 250,000 | | | | 262 | |
| | Verizon Communications, Inc.,
3.50%, 11/1/21 | | | 1,000,000 | | | | 1,094 | |
| | Verizon Communications, Inc.,
5.85%, 9/15/35 | | | 1,105,000 | | | | 1,388 | |
| | Verizon Communications, Inc.,
6.25%, 4/1/37 | | | 425,000 | | | | 559 | |
| | Verizon Communications, Inc.,
6.35%, 4/1/19 | | | 1,180,000 | | | | 1,491 | |
| | Vodafone Group PLC, 5.375%, 1/30/15 | | | 40,000 | | | | 44 | |
| | | | | | | | | | |
| | Total | | | | | | | 18,540 | |
| | | | | | | | | | |
| | Total Corporate Bonds | | | | | | | | |
| | (Cost: $360,516) | | | | | | | 389,295 | |
| | | | | | | | | | |
| | |
| | | Governments (35.9%) | | | | |
| |
| | Governments (35.9%) | |
| | Canada Government International Bond, 0.875%, 2/14/17 | | | 7,500,000 | | | | 7,561 | |
| | Israel Government AID Bond, 5.50%, 4/26/24 | | | 1,910,000 | | | | 2,528 | |
| | Overseas Private Investment Corp., 4.10%, 11/15/14 | | | 579,600 | | | | 604 | |
| | US Department of Housing & Urban Development, 6.08%, 8/1/13 | | | 460,000 | | | | 460 | |
| | US Department of Housing & Urban Development, 6.17%, 8/1/14 | | | 490,000 | | | | 490 | |
| | US Treasury, 0.125%, 12/31/14 | | | 200,000,000 | | | | 199,500 | |
| | US Treasury, 0.25%, 9/30/14 | | | 78,435,000 | | | | 78,453 | |
| (g) | | US Treasury, 0.50%, 7/31/17 | | | 120,223,000 | | | | 119,500 | |
| | | | | | | | | | |
| | | Governments (35.9%) | | Shares/
$ Par | | | Value
$ (000’s) | |
| |
| | Governments continued | |
| | US Treasury, 0.625%, 5/31/17 | | | 23,875,000 | | | | 23,912 | |
| (g) | | US Treasury, 0.625%, 9/30/17 | | | 2,805,000 | | | | 2,800 | |
| | US Treasury, 0.75%, 6/30/17 | | | 24,470,000 | | | | 24,615 | |
| (g) | | US Treasury, 1.625%, 8/15/22 | | | 3,910,000 | | | | 3,884 | |
| | US Treasury, 1.625%, 11/15/22 | | | 1,430,000 | | | | 1,414 | |
| | US Treasury, 1.75%, 5/15/22 | | | 11,195,000 | | | | 11,292 | |
| (g) | | US Treasury, 2.75%, 8/15/42 | | | 17,440,000 | | | | 16,841 | |
| | US Treasury, 3.00%, 5/15/42 | | | 20,995,000 | | | | 21,389 | |
| | US Treasury, 4.50%, 2/15/36 | | | 23,510,000 | | | | 30,941 | |
| | US Treasury, 5.375%, 2/15/31 | | | 40,970,000 | | | | 58,485 | |
| | | | | | | | | | |
| | Total Governments | | | | | | | | |
| | (Cost: $604,214) | | | | | | | 604,669 | |
| | | | | | | | | | |
| | |
| | | Municipal Bonds (1.8%) | | | | |
| |
| | Municipal Bonds (1.8%) | |
| | American Municipal Power, Inc., Series 2010, 5.939%, 2/15/47 RB | | | 1,930,000 | | | | 2,241 | |
| | Bay Area Toll Authority San Francisco Bay Area Toll Bridge, Series 2009-F, 6.263%, 4/1/49 RB | | | 100,000 | | | | 139 | |
| | Board of Regents of the University of Texas System, Series 2010C, 4.794%, 8/15/46 RB | | | 1,525,000 | | | | 1,807 | |
| | Board of Regents of the University of Texas System, Series 2009B, 6.276%, 8/15/41 RB | | | 500,000 | | | | 587 | |
| | The City of New York, Series C-1, 5.517%, 10/1/37 GO | | | 870,000 | | | | 1,075 | |
| | Connecticut Housing Finance Authority, Series D-2, 5.00%, 11/15/26 RB | | | 1,095,000 | | | | 1,095 | |
| | Dallas Area Rapid Transit, Series 2010B, 5.022%, 12/1/48 RB | | | 1,740,000 | | | | 2,084 | |
| | Dallas Independent School District, Series 2010C, 6.45%, 2/15/35 GO, PSF | | | 1,755,000 | | | | 2,207 | |
| | Dormitory Authority of the State of New York, Series 2010H, 5.389%, 3/15/40 RB | | | 290,000 | | | | 357 | |
| | Energy Northwest, Series E, 2.197%, 7/1/19 RB | | | 1,685,000 | | | | 1,727 | |
The Accompanying Notes are an Integral Part of the Financial Statements.
| | | | | | |
| | Select Bond Portfolio | | | 105 | |
Select Bond Portfolio
| | | | | | | | |
| | | Municipal Bonds (1.8%) | | Shares/
$ Par | | Value
$ (000’s) | |
| |
| | Municipal Bonds continued | |
| | The Illinois State Toll Highway Authority, Series A, 6.184%, 1/1/34 RB | | 280,000 | | | 354 | |
| | Los Angeles Unified School District, Series RY, 6.758%, 7/1/34 GO | | 875,000 | | | 1,168 | |
| | Metropolitan Transportation Authority, Series 2010C-1, 6.687%, 11/15/40 RB | | 285,000 | | | 368 | |
| | Metropolitan Transportation Authority, Series 2009C, 7.336%, 11/15/39 RB | | 550,000 | | | 806 | |
| | Montana Facility Finance Authority, Series 2010A, 4.75%, 5/20/37 RB, GNMA, FHA | | 3,970,000 | | | 4,312 | |
| | New Jersey Turnpike Authority, Series 2009F, 7.414%, 1/1/40 RB | | 775,000 | | | 1,144 | |
| | New York City Municipal Water Finance Authority, Series AA, 5.44%, 6/15/43 RB | | 640,000 | | | 802 | |
| | New York City Municipal Water Finance Authority, Series AA-1, 5.75%, 6/15/41 RB | | 170,000 | | | 220 | |
| | Port Authority New York & New Jersey, Series 168, 4.926%, 10/1/51 RB | | 1,510,000 | | | 1,673 | |
| | State of California, Series 2010, 5.70%, 11/1/21 GO | | 1,140,000 | | | 1,358 | |
| | State of Illinois, Series 2011, 4.961%, 3/1/16 GO | | 1,970,000 | | | 2,158 | |
| | Texas Transportation Commission, Series 2010A, 4.681%, 4/1/40 GO | | 522,000 | | | 612 | |
| | University of California Regents Medical Center, Series H, 6.548%, 5/15/48 RB | | 1,230,000 | | | 1,638 | |
| | | | | | | | |
| | | |
| | Total Municipal Bonds | | | | | | |
| | (Cost: $25,661) | | | | | 29,932 | |
| | | | | | | | |
| | | | | | | | |
| |
| | | Structured Products (36.9%) | |
| |
| | Structured Products (36.9%) | |
| | Asset Securitization Corp., Series 1997-D5, Class PS1, 1.253%, 2/14/43 IO | | 3,539,788 | | | 115 | |
| | | | | | | | |
| | | Structured Products (36.9%) | | Shares/
$ Par | | Value
$ (000’s) | |
| |
| | Structured Products continued | |
| | Banc of America Funding Corp., Series 2007-1, Class TA1A, 0.27%, 1/25/37 | | 578,056 | | | 308 | |
| | Banc of America Funding Corp., Series 2007-4, Class TA1A, 0.30%, 5/25/37 | | 735,011 | | | 461 | |
| | Bear Stearns Commercial Mortgage Securities Trust, Series 2007-PWR18, Class A2, 5.613%, 6/11/50 | | 1,260,448 | | | 1,290 | |
| | Chase Issuance Trust, Series 2012-A5, Class A5,
0.59%, 8/15/17 | | 3,500,000 | | | 3,503 | |
| | Citigroup Commercial Mortgage Trust, Series 2010-RR3, Class MLSR, 5.737%, 6/14/50 144A | | 8,150,000 | | | 9,387 | |
| | Citigroup Mortgage Loan Trust, Inc., Series 2005-1, Class 3A1, 6.50%, 4/25/35 | | 232,866 | | | 236 | |
| | CNH Equipment Trust, Series 2012-A, Class A4,
1.38%, 2/15/18 | | 2,335,000 | | | 2,380 | |
| | Credit Suisse Mortgage Capital Certificates, Series 2009-RR1, Class A3A, 5.383%, 2/15/40 144A | | 1,490,000 | | | 1,656 | |
| | Discover Card Master Trust, Series 2012-A1, Class A1, 0.81%, 8/15/17 | | 3,360,000 | | | 3,383 | |
| | Discover Card Master Trust I, Series 2012-B3, Class B3,
0.659%, 5/15/18 | | 5,500,000 | | | 5,500 | |
| | DLJ Commercial Mortgage Corp., Series 1998-CF1, Class S, 1.169%, 2/15/31 IO | | 5,323,616 | | | 143 | |
| | DLJ Mortgage Acceptance Corp., Series 1997-CF2, Class S, 0.463%,
10/15/30 IO 144A | | 5,001,864 | | | 55 | |
| | FDIC Structured Sale Guaranteed Notes, Series 2010-S2, Class 2A, 2.57%, 7/29/47 144A | | 6,371,714 | | | 6,467 | |
| | Federal Home Loan Mortgage Corp., Series K009, Class X1, 1.506%, 8/25/20 IO | | 26,556,659 | | | 2,193 | |
| | Federal Home Loan Mortgage Corp., 3.00%, 11/1/21 | | 621,332 | | | 654 | |
| | Federal Home Loan Mortgage Corp., 3.00%, 11/1/25 | | 1,212,233 | | | 1,274 | |
| | | | | | | | |
| | | Structured Products (36.9%) | | Shares/
$ Par | | Value
$ (000’s) | |
| |
| | Structured Products continued | |
| | Federal Home Loan Mortgage Corp., 3.00%, 8/1/26 | | 3,727,433 | | | 3,920 | |
| | Federal Home Loan Mortgage Corp., 3.00%, 11/1/26 | | 1,735,296 | | | 1,825 | |
| | Federal Home Loan Mortgage Corp., 3.00%, 12/1/26 | | 2,198,137 | | | 2,312 | |
| | Federal Home Loan Mortgage Corp., 3.00%, 1/1/27 | | 3,592,269 | | | 3,778 | |
| | Federal Home Loan Mortgage Corp., 3.00%, 5/1/27 | | 441,123 | | | 465 | |
| | Federal Home Loan Mortgage Corp., 3.00%, 10/1/42 | | 624,989 | | | 654 | |
| | Federal Home Loan Mortgage Corp., 3.00%, 11/1/42 | | 7,958,962 | | | 8,328 | |
| | Federal Home Loan Mortgage Corp., 3.50%, 4/1/26 | | 3,347,793 | | | 3,520 | |
| | Federal Home Loan Mortgage Corp., 3.50%, 6/1/26 | | 540,673 | | | 569 | |
| | Federal Home Loan Mortgage Corp., 3.50%, 7/1/26 | | 2,264,578 | | | 2,381 | |
| | Federal Home Loan Mortgage Corp., 3.50%, 1/1/41 | | 1,297,447 | | | 1,397 | |
| | Federal Home Loan Mortgage Corp., 3.50%, 12/1/41 | | 2,024,071 | | | 2,154 | |
| | Federal Home Loan Mortgage Corp., 3.50%, 4/1/42 | | 1,548,006 | | | 1,651 | |
| | Federal Home Loan Mortgage Corp., 3.50%, 6/1/42 | | 99,507 | | | 106 | |
| | Federal Home Loan Mortgage Corp., 3.50%, 7/1/42 | | 1,904,103 | | | 2,031 | |
| | Federal Home Loan Mortgage Corp., 3.50%, 9/1/42 | | 20,074,875 | | | 21,408 | |
| | Federal Home Loan Mortgage Corp., 4.00%, 10/1/20 | | 383,119 | | | 407 | |
| | Federal Home Loan Mortgage Corp., 4.00%, 7/1/24 | | 334,776 | | | 354 | |
| | Federal Home Loan Mortgage Corp., 4.00%, 2/1/25 | | 447,916 | | | 473 | |
| | Federal Home Loan Mortgage Corp., 4.00%, 6/1/25 | | 474,835 | | | 502 | |
| | Federal Home Loan Mortgage Corp., 4.00%, 8/1/25 | | 6,067,496 | | | 6,414 | |
The Accompanying Notes are an Integral Part of the Financial Statements.
| | | | |
| 106 | | Select Bond Portfolio | | |
Select Bond Portfolio
| | | | | | | | |
| | | Structured Products (36.9%) | | Shares/
$ Par | | Value
$ (000’s) | |
| |
| | Structured Products continued | |
| | Federal Home Loan Mortgage Corp., 4.00%, 9/1/25 | | 10,395 | | | 11 | |
| | Federal Home Loan Mortgage Corp., 4.00%, 5/1/26 | | 2,212,688 | | | 2,360 | |
| | Federal Home Loan Mortgage Corp., 4.00%, 12/1/26 | | 231,463 | | | 245 | |
| | Federal Home Loan Mortgage Corp., 4.00%, 8/1/31 | | 1,030,001 | | | 1,111 | |
| | Federal Home Loan Mortgage Corp., 4.00%, 11/1/40 | | 3,391,609 | | | 3,624 | |
| | Federal Home Loan Mortgage Corp., 4.00%, 12/1/40 | | 6,760,959 | | | 7,372 | |
| | Federal Home Loan Mortgage Corp., 4.00%, 1/1/41 | | 9,213,024 | | | 9,844 | |
| | Federal Home Loan Mortgage Corp., 4.00%, 2/1/41 | | 21,033,629 | | | 22,474 | |
| | Federal Home Loan Mortgage Corp., 4.00%, 4/1/41 | | 10,165,038 | | | 10,868 | |
| | Federal Home Loan Mortgage Corp., 4.00%, 8/1/41 | | 3,981,881 | | | 4,257 | |
| | Federal Home Loan Mortgage Corp., 4.00%, 9/1/41 | | 1,623,586 | | | 1,735 | |
| | Federal Home Loan Mortgage Corp., 4.00%, 10/1/41 | | 1,839,125 | | | 1,966 | |
| | Federal Home Loan Mortgage Corp., 4.00%, 1/1/42 | | 9,436,214 | | | 10,088 | |
| | Federal Home Loan Mortgage Corp., 4.50%, 5/1/19 | | 518,660 | | | 563 | |
| | Federal Home Loan Mortgage Corp., 4.50%, 7/1/20 | | 1,103,651 | | | 1,178 | |
| | Federal Home Loan Mortgage Corp., Series 3065, Class TN, 4.50%, 10/15/33 | | 257,021 | | | 260 | |
| | Federal Home Loan Mortgage Corp., Series 3248, Class LN, 4.50%, 7/15/35 | | 549,642 | | | 557 | |
| | Federal Home Loan Mortgage Corp., 4.50%, 9/1/39 | | 70,962 | | | 76 | |
| | Federal Home Loan Mortgage Corp., 4.50%, 12/1/39 | | 158,352 | | | 170 | |
| | Federal Home Loan Mortgage Corp., 4.50%, 3/1/40 | | 6,772,562 | | | 7,293 | |
| | | | | | | | |
| | | Structured Products (36.9%) | | Shares/
$ Par | | Value
$ (000’s) | |
| |
| | Structured Products continued | |
| | Federal Home Loan Mortgage Corp., 4.50%, 4/1/40 | | 4,530,139 | | | 4,877 | |
| | Federal Home Loan Mortgage Corp., 4.50%, 9/1/40 | | 1,484,658 | | | 1,626 | |
| | Federal Home Loan Mortgage Corp., 4.50%, 10/1/40 | | 6,560,948 | | | 7,065 | |
| | Federal Home Loan Mortgage Corp., 4.50%, 1/1/41 | | 2,352,943 | | | 2,576 | |
| | Federal Home Loan Mortgage Corp., 4.50%, 2/1/41 | | 84,709 | | | 91 | |
| | Federal Home Loan Mortgage Corp., 4.50%, 3/1/41 | | 7,449,131 | | | 8,038 | |
| | Federal Home Loan Mortgage Corp., 4.50%, 4/1/41 | | 5,374,966 | | | 5,800 | |
| | Federal Home Loan Mortgage Corp., 4.50%, 5/1/41 | | 533,565 | | | 575 | |
| | Federal Home Loan Mortgage Corp., 4.50%, 6/1/41 | | 3,719,913 | | | 4,006 | |
| | Federal Home Loan Mortgage Corp., 4.50%, 7/1/41 | | 18,493,580 | | | 19,955 | |
| | Federal Home Loan Mortgage Corp., 4.50%, 8/1/41 | | 112,323 | | | 121 | |
| | Federal Home Loan Mortgage Corp., 5.00%, 10/1/19 | | 800,050 | | | 860 | |
| | Federal Home Loan Mortgage Corp., 5.00%, 2/1/20 | | 171,897 | | | 188 | |
| | Federal Home Loan Mortgage Corp., 5.00%, 5/1/20 | | 653,448 | | | 713 | |
| | Federal Home Loan Mortgage Corp., 5.00%, 4/1/22 | | 171,482 | | | 184 | |
| | Federal Home Loan Mortgage Corp., 5.00%, 9/1/35 | | 2,356,629 | | | 2,594 | |
| | Federal Home Loan Mortgage Corp., 5.00%, 11/1/35 | | 866,119 | | | 953 | |
| | Federal Home Loan Mortgage Corp., 5.00%, 12/1/35 | | 8,161,467 | | | 9,007 | |
| | Federal Home Loan Mortgage Corp., 5.00%, 11/1/38 | | 11,472,923 | | | 12,346 | |
| | Federal Home Loan Mortgage Corp., 5.00%, 12/1/38 | | 375,898 | | | 404 | |
| | Federal Home Loan Mortgage Corp., 5.00%, 1/1/39 | | 5,149,347 | | | 5,541 | |
| | | | | | | | |
| | | Structured Products (36.9%) | | Shares/
$ Par | | Value
$ (000’s) | |
| |
| | Structured Products continued | |
| | Federal Home Loan Mortgage Corp., 5.00%, 2/1/39 | | 689,190 | | | 742 | |
| | Federal Home Loan Mortgage Corp., 5.00%, 9/1/39 | | 3,076,029 | | | 3,310 | |
| | Federal Home Loan Mortgage Corp., 5.00%, 11/1/39 | | 115,365 | | | 127 | |
| | Federal Home Loan Mortgage Corp., 5.00%, 12/1/39 | | 1,119,758 | | | 1,236 | |
| | Federal Home Loan Mortgage Corp., 5.00%, 3/1/40 | | 5,102,897 | | | 5,491 | |
| | Federal Home Loan Mortgage Corp., 5.00%, 4/1/40 | | 2,365,229 | | | 2,567 | |
| | Federal Home Loan Mortgage Corp., 5.00%, 2/1/41 | | 148,350 | | | 162 | |
| | Federal Home Loan Mortgage Corp., 5.00%, 4/1/41 | | 202,520 | | | 220 | |
| | Federal Home Loan Mortgage Corp., 5.00%, 5/1/41 | | 647,682 | | | 707 | |
| | Federal Home Loan Mortgage Corp., 5.00%, 3/1/38 | | 3,829,134 | | | 4,124 | |
| | Federal Home Loan Mortgage Corp., 5.50%, 9/1/19 | | 224,836 | | | 244 | |
| | Federal Home Loan Mortgage Corp., 5.50%, 11/1/19 | | 728,201 | | | 789 | |
| | Federal Home Loan Mortgage Corp., 5.50%, 12/1/19 | | 141,859 | | | 154 | |
| | Federal Home Loan Mortgage Corp., 5.50%, 3/1/20 | | 1,049,883 | | | 1,140 | |
| | Federal Home Loan Mortgage Corp., 5.50%, 3/1/22 | �� | 176,206 | | | 190 | |
| | Federal Home Loan Mortgage Corp., 5.50%, 4/1/22 | | 706,028 | | | 762 | |
| | Federal Home Loan Mortgage Corp., 5.50%, 6/1/35 | | 725,585 | | | 788 | |
| | Federal Home Loan Mortgage Corp., 5.50%, 5/1/37 | | 2,137,782 | | | 2,323 | |
| | Federal Home Loan Mortgage Corp., 5.50%, 6/1/37 | | 2,307,727 | | | 2,555 | |
| | Federal Home Loan Mortgage Corp., 5.50%, 4/1/38 | | 439,278 | | | 475 | |
The Accompanying Notes are an Integral Part of the Financial Statements.
| | | | | | |
| | Select Bond Portfolio | | | 107 | |
Select Bond Portfolio
| | | | | | | | |
| | | Structured Products (36.9%) | | Shares/
$ Par | | Value
$ (000’s) | |
| |
| | Structured Products continued | |
| | Federal Home Loan Mortgage Corp., Series K001, Class A2, 5.651%, 4/25/16 | | 6,313,516 | | | 7,046 | |
| | Federal Home Loan Mortgage Corp., Series 2840, Class LK, 6.00%, 11/15/17 | | 134,760 | | | 136 | |
| | Federal Home Loan Mortgage Corp., Series 2439, Class LH, 6.00%, 4/15/32 | | 922,779 | | | 1,032 | |
| | Federal Home Loan Mortgage Corp., 6.00%, 4/1/37 | | 246,446 | | | 268 | |
| | Federal Home Loan Mortgage Corp., 6.00%, 5/1/37 | | 21,200 | | | 23 | |
| | Federal Home Loan Mortgage Corp., 6.00%, 7/1/37 | | 94,781 | | | 103 | |
| | Federal Home Loan Mortgage Corp., 6.00%, 8/1/37 | | 553,318 | | | 602 | |
| | Federal Home Loan Mortgage Corp., 6.00%, 11/1/37 | | 863,000 | | | 940 | |
| | Federal Home Loan Mortgage Corp., 6.00%, 1/1/38 | | 2,105,396 | | | 2,291 | |
| | Federal Home Loan Mortgage Corp., 6.00%, 2/1/38 | | 460,210 | | | 501 | |
| | Federal Home Loan Mortgage Corp., 6.00%, 3/1/38 | | 357,983 | | | 390 | |
| | Federal Home Loan Mortgage Corp., 6.00%, 11/1/39 | | 4,764,982 | | | 5,202 | |
| | Federal Home Loan Mortgage Corp. TBA, 3.00%, 1/1/43 | | 14,115,000 | | | 14,757 | |
| | Federal Home Loan Mortgage Corp. TBA, 3.50%, 1/1/28 | | 2,610,000 | | | 2,744 | |
| | Federal National Mortgage Association, 2.50%, 7/1/27 | | 4,480,472 | | | 4,689 | |
| | Federal National Mortgage Association, 2.50%, 8/1/27 | | 2,938,123 | | | 3,075 | |
| | Federal National Mortgage Association, 3.00%, 10/1/26 | | 121,400 | | | 128 | |
| | Federal National Mortgage Association, 3.00%, 3/1/27 | | 1,941,368 | | | 2,052 | |
| | Federal National Mortgage Association, 3.00%, 4/1/27 | | 1,253,800 | | | 1,325 | |
| | Federal National Mortgage Association, 3.00%, 6/1/27 | | 2,918,698 | | | 3,085 | |
| | | | | | | | |
| | | Structured Products (36.9%) | | Shares/
$ Par | | Value
$ (000’s) | |
| |
| | Structured Products continued | |
| | Federal National Mortgage Association, 3.00%, 11/1/42 | | 2,170,151 | | | 2,276 | |
| | Federal National Mortgage Association, 3.50%, 1/1/26 | | 629,214 | | | 668 | |
| | Federal National Mortgage Association, 3.50%, 4/1/26 | | 2,029,163 | | | 2,154 | |
| | Federal National Mortgage Association, 3.50%, 9/1/26 | | 2,643,910 | | | 2,806 | |
| | Federal National Mortgage Association, 3.50%, 11/1/41 | | 1,162,846 | | | 1,241 | |
| | Federal National Mortgage Association, 3.50%, 12/1/41 | | 1,261,791 | | | 1,346 | |
| | Federal National Mortgage Association, 3.50%, 2/1/42 | | 6,495,218 | | | 6,930 | |
| | Federal National Mortgage Association, 3.50%, 6/1/42 | | 7,163,309 | | | 7,659 | |
| | Federal National Mortgage Association, 3.50%, 10/1/42 | | 19,413,233 | | | 20,756 | |
| | Federal National Mortgage Association, 4.00%, 4/1/26 | | 1,057,934 | | | 1,144 | |
| | Federal National Mortgage Association, 4.00%, 5/1/26 | | 1,603,686 | | | 1,718 | |
| | Federal National Mortgage Association, 4.00%, 10/1/41 | | 3,556,904 | | | 3,818 | |
| | Federal National Mortgage Association, 4.00%, 1/1/42 | | 1,773,244 | | | 1,903 | |
| | Federal National Mortgage Association, 4.50%, 6/1/19 | | 2,155,103 | | | 2,375 | |
| | Federal National Mortgage Association, 4.50%, 8/1/19 | | 239,835 | | | 259 | |
| | Federal National Mortgage Association, 4.50%, 12/1/19 | | 171,615 | | | 189 | |
| | Federal National Mortgage Association, 4.50%, 7/1/20 | | 526,429 | | | 575 | |
| | Federal National Mortgage Association, 4.50%, 9/1/20 | | 1,106,219 | | | 1,192 | |
| | Federal National Mortgage Association, 4.50%, 9/1/24 | | 1,366,966 | | | 1,471 | |
| | Federal National Mortgage Association, 4.50%, 11/1/40 | | 2,784,736 | | | 3,098 | |
| | Federal National Mortgage Association, 4.50%, 1/1/41 | | 2,193,859 | | | 2,402 | |
| | | | | | | | |
| | | Structured Products (36.9%) | | Shares/
$ Par | | Value
$ (000’s) | |
| |
| | Structured Products continued | |
| | Federal National Mortgage Association, 4.50%, 2/1/41 | | 11,020,531 | | | 11,958 | |
| | Federal National Mortgage Association, 4.50%, 3/1/41 | | 386,682 | | | 421 | |
| | Federal National Mortgage Association, 4.50%, 4/1/41 | | 394,683 | | | 428 | |
| | Federal National Mortgage Association, 4.50%, 5/1/41 | | 17,259,018 | | | 18,736 | |
| | Federal National Mortgage Association, 5.00%, 3/1/20 | | 726,600 | | | 800 | |
| | Federal National Mortgage Association, 5.00%, 5/1/20 | | 2,041,748 | | | 2,231 | |
| | Federal National Mortgage Association, 5.00%, 3/1/34 | | 260,656 | | | 292 | |
| | Federal National Mortgage Association, 5.00%, 4/1/35 | | 931,667 | | | 1,055 | |
| | Federal National Mortgage Association, 5.00%, 7/1/35 | | 1,663,286 | | | 1,884 | |
| | Federal National Mortgage Association, 5.00%, 10/1/35 | | 1,233,784 | | | 1,397 | |
| | Federal National Mortgage Association, 5.00%, 2/1/38 | | 354,195 | | | 384 | |
| | Federal National Mortgage Association, 5.00%, 4/1/38 | | 824,347 | | | 893 | |
| | Federal National Mortgage Association, 5.00%, 4/1/41 | | 8,661,806 | | | 9,426 | |
| | Federal National Mortgage Association, 5.32%, 4/1/14 | | 1,249,379 | | | 1,290 | |
| | Federal National Mortgage Association, Series 2006-M1, Class C, 5.355%, 2/25/16 | | 2,945,092 | | | 3,037 | |
| | Federal National Mortgage Association, 5.50%, 4/1/21 | | 466,533 | | | 505 | |
| | Federal National Mortgage Association, 5.50%, 9/1/34 | | 368,962 | | | 408 | |
| | Federal National Mortgage Association, 5.50%, 3/1/35 | | 2,056,530 | | | 2,328 | |
| | Federal National Mortgage Association, 5.50%, 7/1/35 | | 479,583 | | | 530 | |
| | Federal National Mortgage Association, 5.50%, 8/1/35 | | 571,337 | | | 626 | |
The Accompanying Notes are an Integral Part of the Financial Statements.
| | | | |
| 108 | | Select Bond Portfolio | | |
Select Bond Portfolio
| | | | | | | | |
| | | Structured Products (36.9%) | | Shares/
$ Par | | Value
$ (000’s) | |
| |
| | Structured Products continued | |
| | Federal National Mortgage Association, 5.50%, 9/1/35 | | 6,952,617 | | | 7,692 | |
| | Federal National Mortgage Association, 5.50%, 10/1/35 | | 1,569,140 | | | 1,736 | |
| | Federal National Mortgage Association, 5.50%, 11/1/35 | | 5,733,253 | | | 6,342 | |
| | Federal National Mortgage Association, 5.50%, 1/1/36 | | 3,400,179 | | | 3,761 | |
| | Federal National Mortgage Association, 5.50%, 2/1/37 | | 2,058,781 | | | 2,277 | |
| | Federal National Mortgage Association, 5.50%, 3/1/37 | | 539,248 | | | 595 | |
| | Federal National Mortgage Association, 5.50%, 5/1/37 | | 835,418 | | | 924 | |
| | Federal National Mortgage Association, 5.50%, 6/1/37 | | 163,105 | | | 180 | |
| | Federal National Mortgage Association, 5.50%, 2/1/38 | | 3,269,471 | | | 3,614 | |
| | Federal National Mortgage Association, 5.50%, 3/1/38 | | 290,616 | | | 320 | |
| | Federal National Mortgage Association, 5.50%, 4/1/38 | | 4,420,111 | | | 4,877 | |
| | Federal National Mortgage Association, 5.50%, 5/1/38 | | 6,326,146 | | | 6,994 | |
| | Federal National Mortgage Association, 5.50%, 6/1/38 | | 1,981,430 | | | 2,188 | |
| | Federal National Mortgage Association, 6.00%, 5/1/35 | | 49,059 | | | 55 | |
| | Federal National Mortgage Association, 6.00%, 6/1/35 | | 15,618 | | | 17 | |
| | Federal National Mortgage Association, 6.00%, 7/1/35 | | 1,811,957 | | | 1,996 | |
| | Federal National Mortgage Association, 6.00%, 10/1/35 | | 488,332 | | | 538 | |
| | Federal National Mortgage Association, 6.00%, 11/1/35 | | 1,273,938 | | | 1,420 | |
| | Federal National Mortgage Association, 6.00%, 6/1/36 | | 1,379,453 | | | 1,537 | |
| | Federal National Mortgage Association, 6.00%, 9/1/36 | | 650,791 | | | 725 | |
| | Federal National Mortgage Association, 6.00%, 1/1/37 | | 4,854 | | | 5 | |
| | | | | | | | |
| | | Structured Products (36.9%) | | Shares/
$ Par | | Value
$ (000’s) | |
| |
| | Structured Products continued | |
| | Federal National Mortgage Association, 6.00%, 6/1/37 | | 8,728 | | | 10 | |
| | Federal National Mortgage Association, 6.00%, 10/1/37 | | 3,923 | | | 4 | |
| | Federal National Mortgage Association, 6.00%, 11/1/37 | | 4,852,113 | | | 5,330 | |
| | Federal National Mortgage Association, 6.00%, 6/1/38 | | 2,074,221 | | | 2,266 | |
| | Federal National Mortgage Association, 6.00%, 10/1/38 | | 3,181,502 | | | 3,480 | |
| | Federal National Mortgage Association, Series 2002-W4, Class A4, 6.25%, 5/25/42 | | 2,760,507 | | | 3,132 | |
| | Federal National Mortgage Association, 6.50%, 10/1/36 | | 481,512 | | | 541 | |
| | Federal National Mortgage Association, 6.50%, 7/1/37 | | 4,922,724 | | | 5,523 | |
| | Federal National Mortgage Association, 6.50%, 9/1/37 | | 2,149,765 | | | 2,407 | |
| | Federal National Mortgage Association, 6.75%, 4/25/18 | | 169,553 | | | 178 | |
| | Federal National Mortgage Association TBA, 2.50%, 1/1/28 | | 6,650,000 | | | 6,953 | |
| | Federal National Mortgage Association TBA, 3.50%, 1/1/43 | | 285,000 | | | 304 | |
| | Ford Credit Auto Owner Trust, Series 2012-A, Class A4, 1.15%, 6/15/17 | | 3,090,000 | | | 3,134 | |
| | Ford Credit Auto Owner Trust, Series 2009-E, Class D, 5.53%, 5/15/16 144A | | 7,217,732 | | | 7,561 | |
| | Ford Credit Auto Owner Trust, Series 2009-D, Class D, 8.14%, 2/15/16 144A | | 5,500,000 | | | 5,827 | |
| | GE Capital Credit Card Master Note Trust, Series 2012-1, Class B, 1.62%, 1/15/18 | | 7,000,000 | | | 7,066 | |
| | Golden Credit Card Trust, Series 2012-2A, Class A1,
1.77%, 1/15/19 144A | | 6,205,000 | | | 6,390 | |
| | Goldman Sachs Mortgage Securities Corp. II, Series 2009-RR, Class CSA, 5.286%, 12/17/39 144A | | 600,000 | | | 681 | |
| | | | | | | | |
| | | Structured Products (36.9%) | | Shares/
$ Par | | Value
$ (000’s) | |
| |
| | Structured Products continued | |
| | Goldman Sachs Mortgage Securities Corp. II, Series 2009-RR1, Class GGA, 5.842%, 7/12/38 144A | | 600,000 | | | 690 | |
| | Government National Mortgage Association, 5.50%, 10/15/31 | | 14,202 | | | 16 | |
| | Government National Mortgage Association, 5.50%, 11/15/31 | | 6,124 | | | 7 | |
| | Government National Mortgage Association, 5.50%, 12/15/31 | | 68,569 | | | 76 | |
| | Government National Mortgage Association, 5.50%, 1/15/32 | | 172,456 | | | 191 | |
| | Government National Mortgage Association, 5.50%, 2/15/32 | | 52,829 | | | 59 | |
| | Government National Mortgage Association, 5.50%, 3/15/32 | | 70,999 | | | 78 | |
| | Government National Mortgage Association, 5.50%, 7/15/32 | | 6,437 | | | 7 | |
| | Government National Mortgage Association, 5.50%, 9/15/32 | | 1,121,007 | | | 1,239 | |
| | Honda Auto Receivables Owner Trust, Series 2012-2, Class A4, 0.91%, 5/15/18 | | 670,000 | | | 675 | |
| | JPMorgan Chase Commercial Mortgage Securities Corp., Series 2007-C1, Class ASB, 5.857%, 2/15/51 | | 4,451,141 | | | 4,906 | |
| | JPMorgan Chase Commercial Mortgage Securities Corp., Series 2006-LDP7, Class A4, 5.871%, 4/15/45 | | 3,400,000 | | | 3,913 | |
| | Louisiana Public Facilities Authority, Series 2008, Class A3,
6.55%, 8/1/20 | | 2,400,000 | | | 2,958 | |
| | MASTR Asset Securitization Trust, Series 2004-9, Class 6A1,
5.00%, 9/25/19 | | 304,718 | | | 315 | |
| | MASTR Asset Securitization Trust, Series 2003-10, Class 1A1,
5.25%, 11/25/23 | | 467,864 | | | 489 | |
| | MASTR Asset Securitization Trust, Series 2003-12, Class 1A1,
5.25%, 12/25/24 | | 271,790 | | | 286 | |
| | Merrill Lynch Alternative Note Asset Trust, Series 2007-A1, Class A2A, 0.28%, 1/25/37 | | 1,413,583 | | | 542 | |
| | Mid-State Trust, Series 6, Class A3,
7.54%, 7/1/35 | | 247,244 | | | 251 | |
The Accompanying Notes are an Integral Part of the Financial Statements.
| | | | | | |
| | Select Bond Portfolio | | | 109 | |
Select Bond Portfolio
| | | | | | | | | | |
| | | Structured Products (36.9%) | | Shares/
$ Par | | | Value
$ (000’s) | |
| |
| | Structured Products continued | |
| | Oncor Electric Delivery Transition Bond Co., Series 2004-1, Class A3, 5.29%, 5/15/18 | | | 3,569,515 | | | | 3,898 | |
| | Residential Funding Mortgage Securities I, Series 2003-S18, Class A1, 4.50%, 10/25/18 | | | 156,901 | | | | 161 | |
| | Sequoia Mortgage Trust, Series 2011-2, Class A1, 3.90%, 9/25/41 | | | 2,809,139 | | | | 2,879 | |
| | UBS-Barclays Commercial Mortgage Trust, Series 2012-C3, Class A4, 3.091%, 8/10/49 | | | 4,725,000 | | | | 4,937 | |
| | Wachovia Bank Commercial Mortgage Trust, Series 2006-C23, Class AM, 5.466%, 1/15/45 | | | 3,330,000 | | | | 3,675 | |
| | Washington Mutual Alternative Mortgage Pass-Through Certficates, Series 2006-6, Class 4A, 6.873%, 11/25/34 | | | 517,643 | | | | 517 | |
| | Wells Fargo Mortgage Backed Securities Trust, Series 2004-EE, Class 2A2, 2.625%, 12/25/34 | | | 907,495 | | | | 934 | |
| | Wells Fargo Mortgage Backed Securities Trust, Series 2003-12, Class A1, 4.75%, 11/25/18 | | | 52,009 | | | | 54 | |
| | Wells Fargo Mortgage Backed Securities Trust, Series 2005-1, Class 2A1, 5.00%, 1/25/20 | | | 259,194 | | | | 273 | |
| | | | | | | | | | |
| | | |
| | Total Structured Products | | | | | | | | |
| | (Cost: $596,578) | | | | | | | 622,936 | |
| | | | | | | | | | |
| |
| | | Short-Term Investments (7.4%) | |
| |
| | Autos (0.8%) | |
| (b) | | American Honda Finance Corp., 0.331%, 12/5/13 144A | | | 5,000,000 | | | | 4,999 | |
| (b) | | Toyota Motor Credit Corp., 0.20%, 1/2/13 | | | 10,000,000 | | | | 10,000 | |
| | | | | | | | | | |
| | Total | | | | | | | 14,999 | |
| | | | | | | | | | |
| |
| | Commercial Banks Non-US (0.3%) | |
| (b) | | Bank of Nova Scotia/Houston, 0.745%, 10/18/13 | | | 5,000,000 | | | | 5,017 | |
| | | | | | | | | | |
| | Total | | | | | | | 5,017 | |
| | | | | | | | | | |
| |
| | Commercial Banks US (0.7%) | |
| (b) | | Bank of America NA, 0.20%, 1/3/13 | | | 11,000,000 | | | | 11,000 | |
| | | | | | | | | | |
| | Total | | | | | | | 11,000 | |
| | | | | | | | | | |
| | | | | | |
| | | Short-Term
Investments (7.4%) | | Shares/
$ Par | | Value
$ (000’s) |
| |
| | Consumer Products/Retailing (0.6%) |
| (b) | | Wal-Mart Stores, Inc., 0.10%, 1/30/13 | | 10,000,000 | | 9,999 |
| | | | | | |
| | Total | | | | 9,999 |
| | | | | | |
| |
| | Electronics (0.4%) |
| (b) | | International Business Machines Corp., 0.05%, 1/2/13 | | 7,400,000 | | 7,400 |
| | | | | | |
| | Total | | | | 7,400 |
| | | | | | |
| |
| | Federal Government & Agencies
(0.3%) |
| (b) | | Federal Home Loan Mortgage Corp., 0.135%, 2/25/13 | | 5,000,000 | | 4,999 |
| | | | | | |
| | Total | | | | 4,999 |
| | | | | | |
| |
| | Finance Services (1.5%) |
| (b) | | Alpine Securitization Corp., 0.17%, 1/22/13 | | 10,000,000 | | 9,999 |
| (b) | | Alpine Securitization Corp., 0.18%, 1/2/13 | | 5,000,000 | | 5,000 |
| (b) | | Govco LLC, 0.23%, 1/22/13 | | 5,000,000 | | 4,999 |
| (b) | | Govco LLC, 0.27%, 1/31/13 | | 5,000,000 | | 4,999 |
| | | | | | |
| | Total | | | | 24,997 |
| | | | | | |
| |
| | Miscellaneous Business Credit Institutions
(0.6%) |
| (b) | | General Electric Capital Corp.,
1.016%, 4/24/14 | | 10,000,000 | | 10,073 |
| | | | | | |
| | Total | | | | 10,073 |
| | | | | | |
| |
| | Personal Credit Institutions (0.6%) |
| (b) | | Old Line Funding LLC, 0.05%, 1/3/13 | | 5,000,000 | | 5,000 |
| (b) | | Straight-A Funding LLC, 0.16%, 1/7/13 | | 5,000,000 | | 5,000 |
| | | | | | |
| | Total | | | | 10,000 |
| | | | | | |
| |
| | Restaurants (1.0%) |
| (b) | | Darden Restaurants, Inc., 0.28%, 1/2/13 | | 16,700,000 | | 16,700 |
| | | | | | |
| | Total | | | | 16,700 |
| | | | | | |
| |
| | Retail Food and Drug (0.6%) |
| (b) | | CVS Caremark Corp., 0.27%, 1/2/13 | | 10,000,000 | | 10,000 |
| | | | | | |
| | Total | | | | 10,000 |
| | | | | | |
| | | |
| | Total Short-Term Investments | | | | |
| | (Cost: $125,112) | | | | 125,184 |
| | | | | | |
| | | |
| | Total Investments (105.1%) | | | | |
| | (Cost: $1,712,081)(a) | | | | 1,772,016 |
| | | | | | |
| | Other Assets, Less Liabilities
(-5.1%) | | | | (86,723) |
| | | | | | |
| | Net Assets (100.0%) | | | | 1,685,293 |
| | | | | | |
The Accompanying Notes are an Integral Part of the Financial Statements.
| | | | |
| 110 | | Select Bond Portfolio | | |
Select Bond Portfolio
144A after the name of a security represents a security exempt from registration under Rule 144A of the Securities Act of 1933. These securities may be resold as transactions exempt from registration, normally to qualified institutional buyers. At December 31, 2012 the value of these securities (in thousands) was $92,501 representing 5.5% of the net assets.
IO — Interest Only Security
GO — General Obligation
RB — Revenue Bond
FHA — Federal Housing Authority
GNMA — Government National Mortgage Association
PSF — Permanent School Fund
| (a) | At December 31, 2012 the aggregate cost of securities for federal tax purposes (in thousands) was $1,713,160 and the net unrealized appreciation of investments based on that cost was $58,856 which is comprised of $64,387 aggregate gross unrealized appreciation and $5,531 aggregate gross unrealized depreciation. |
| (b) | All or a portion of the securities have been pledged as collateral for open futures positions or when-issued securities. Information regarding open futures contracts as of period end is summarized below. |
| | | | | | | | |
| Issuer (000’s) | | Number of
Contracts | | Expiration Date | | Unrealized
Appreciation/
(Depreciation)
(000’s) | |
US Five Year Treasury Note Futures (Long) (Total Notional Value at December 31, 2012, $27,373) | | 220 | | 3/13 | | $ | (3) | |
US Long Treasury Bond Futures (Short) (Total Notional Value at December 31, 2012, $48,548) | | 325 | | 3/13 | | | 610 | |
US Two Year Treasury Note Futures (Long) (Total Notional Value at December 31, 2012, $13,450) | | 61 | | 3/13 | | | (2) | |
US Ultra Long Treasury Bond Futures (Long) (Total Notional Value at December 31, 2012, $3,813) | | 23 | | 3/13 | | | (74) | |
| (f) | Foreign Bond — par value is foreign denominated |
— Federative Republic — Brazilian Real
— Morgan Stanley — Brazilian Real
| (g) | All or portion of the securities have been loaned. See Note 4G in the Notes to Financial Statements. |
| (n) | Security valued in good faith by the Board of Directors. |
The following is a summary of the inputs used in valuing the Portfolio’s assets and liabilities at December 31, 2012. See Note 3 for additional information on portfolio valuation.
| | | | | | | | | | | | | | |
| | | Valuation Inputs | | | |
| Description | | Level 1 -
Quoted Prices | | | Level 2 -
Other Significant
Observable Inputs | | | Level 3 - Significant
Unobservable Inputs | | | |
| | | (Amounts in thousands) | | | |
Assets: | | | | | | | | | | | | | | |
Government & US Agency Bonds | | $ | - | | | $ | 604,669 | | | $ | - | | | |
Foreign Bonds | | | - | | | | 5,126 | | | | - | | | |
Municipal Bonds | | | - | | | | 29,932 | | | | - | | | |
Corporate Bonds | | | - | | | | 384,169 | | | | - | | | |
Structured Products | | | - | | | | 616,469 | | | | 6,467 | | | |
Short-Term Investments | | | - | | | | 125,184 | | | | - | | | |
Other Financial Instruments^ | | | | | | | | | | | | | | |
Futures | | | 610 | | | | - | | | | - | | | |
Liabilities: | | | | | | | | | | | | | | |
Other Financial Instruments^ | | | | | | | | | | | | | | |
Futures | | | (79 | ) | | | - | | | | - | | | |
Total | | $ | 531 | | | $ | 1,765,549 | | | $ | 6,467 | | | |
^ Other financial instruments are derivative instruments such as futures, forwards, written options and swaps contracts, which are valued at the unrealized appreciation (depreciation) on the instrument and short sales, which are valued at market value.
The Accompanying Notes are an Integral Part of the Financial Statements.
| | | | | | |
| | Select Bond Portfolio | | | 111 | |
Long-Term U.S. Government Bond Portfolio
| | | | |
| Objective: | | Portfolio Strategy: | | Net Assets: |
| Maximum total return, consistent with preservation of capital and prudent investment management. | | Invest primarily in a diversified portfolio of fixed income securities that are issued or guaranteed by the U.S. Government, its agencies or government sponsored enterprises, and in derivatives designed to replicate such securities. | | $113 million |
Portfolio Overview
Mason Street Advisors, the investment adviser for the Long-Term U.S. Government Bond Portfolio (the “Portfolio”), has engaged Pacific Investment Management Company LLC (“PIMCO”) to act as sub-adviser for the Portfolio. The Portfolio seeks to achieve its investment objective by investing in a diversified portfolio of fixed income securities that are issued or guaranteed by the U.S. Government, its agencies or government sponsored enterprises (“U.S. Government Securities”), which may be represented by forwards or derivatives, such as options, futures contracts or swap agreements. Assets not invested in U.S. Government Securities may be invested in other types of non-government related investment grade fixed income instruments, such as corporate debt securities of U.S. issuers and mortgage- and asset-backed securities, or in preferred stocks. The Portfolio may, without limitation, seek to obtain market exposure to the securities in which it primarily invests by entering into a series of purchase and sale contracts or by using other investment techniques (such as buy backs or dollar rolls).
Market Overview
2012 was a year defined globally by a dynamic, polarized political process. The year began with a focus on Europe, as the seemingly inevitable Greek tragedy fueled speculation of when, not if, the European Union (EU) would see its membership shrink. In late July, a few determined statements from the European Central Bank (ECB) President Mario Draghi—later reinforced in early September by the ECB Governing Council—stabilized markets and postponed any sovereign exits from the EU. The markets spent the remainder of the year weighing the efficacy of a “do whatever it takes to safeguard monetary union” policy stance versus the Greek austerity commitment and Spanish financial system stability.
The eurozone had to compete with the United States for headlines, as the U.S. political climate often relegated geopolitical instability and uprising to second page news. Markets confronted an evolving monetary policy that produced multiple extensions of rate guidance (now mid-2015), a third quantitative easing (QE3) mortgage purchase program and additional, targeted Treasury purchases with the expiry of “Operation Twist”, the explicit use of unemployment and inflation quantitative thresholds and a growing NY Federal Reserve balance sheet and System Open Market Account which currently stands at $2.65 trillion.
While the President’s reelection likely cemented the fate of the Affordable Care Act and Dodd-Frank reforms, market participants quickly turned their attention to the uncertainty surrounding the impending fiscal cliff. Both political parties recognized that averting the cliff was essential to avoiding a recession in 2013, but negotiations were strained for much of the quarter with Democrats seeking increased tax revenue from the wealthiest Americans and Republicans asking for spending cuts on entitlement programs. Ultimately, hopes of a grand bargain abated and gave way to a short-term deal, thus opening the door to further fiscal negotiations, most notably on a debt ceiling increase and spending cuts (the “sequester”), in 2013.
Portfolio Results
The Portfolio returned 3.75% for the twelve months ended December 31, 2012. By comparison, the Portfolio’s benchmark, the Barclays® Long-Term U.S. Treasury Index (the “Index”) returned 3.56%. (This Index is unmanaged, cannot be invested in directly and does not include administrative expenses or sales charges.) The Portfolio outperformed the 2.94% average return of the Long Government peer group according to Morningstar®, Inc., an independent mutual fund ranking agency.
Relative to the Index, the Portfolio’s duration underweight to the long end of the curve detracted from performance, as yields fell across most of the curve; although exposure obtained via Treasury futures slightly offset this negative impact. Tactical exposure to Agency mortgages, however, added to returns. Additionally, an allocation to municipal bonds contributed to performance. A focus on the corporate sector also added to relative performance.
Portfolio Manager Outlook
The following forward looking comments are the opinion of PIMCO, the Portfolio’s sub-adviser.
We expect the global economy to grow at a real rate of 1.5 to 2.0% in 2013, representing a slowdown from the 2.2% pace of growth seen over the past twelve months. Real growth, we believe, will be moderated by efforts to resolve debt overhangs through fiscal restraint as evidenced by the slowing in corporate profits, capital expenditures and global trade.
Simultaneously, inflation will likely decrease in the near term. We expect households will continue to delever their balance sheets while the corporate sector remains reluctant to engage its own. Nominal growth could, however, be bolstered by the continued resolve of central banks. The balance of these forces will determine if GDP growth has slowed to stall speed or if a coordinated global slowdown can be averted.
| | | | |
| 112 | | Long-Term U.S. Government Bond Portfolio | | |
Long-Term U.S. Government Bond Portfolio
Relative Performance
| | | | | | | | | | | | |
Average Annual Total Returns
For Periods Ended December 31, 2012 | |
| | | 1 Year | | | 5 Years | | | Since
Inception* | |
Long-Term U.S. Government Bond Portfolio | | | 3.75 | % | | | 10.69 | % | | | 10.78 | % |
Barclays® Long-Term U.S. Treasury Index | | | 3.56 | % | | | 9.71 | % | | | 9.95 | % |
Morningstar® US Insurance Fund Long Government Average | | | 2.94 | % | | | 8.61 | % | | | - | |
| * | Inception date of 4/30/07 |
The performance data quoted represents past performance. Past performance is historical and does not guarantee future performance. Investment return and principal value will fluctuate, so that shares, when redeemed, may be worth more or less than their original cost. Current performance may be lower or higher than the performance data quoted. For the most recent month-end performance information visit www.northwesternmutual.com.
This chart assumes an initial investment of $10,000 made on 4/30/07 (commencement of the Portfolio’s operations). Returns shown reflect fee waivers, deductions for management and other portfolio expenses, and reinvestment of all dividends. In the absence of fee waivers, total return would be reduced. Returns exclude deductions for separate account sale loads and account fees. Please refer to the Benchmark Definitions section of this report for information about the indices cited in the above chart and graph.
Return of principal is not guaranteed. Bond funds have the same interest rate, inflation and credit risks that are associated with the underlying bonds owned by the Portfolio. When interest rates rise, bond prices fall. With a fixed income fund, when interest rates rise, the value of the fund’s existing bonds drops, which could negatively affect overall fund performance.
The Portfolio may invest in securities that are issued or guaranteed by the U.S. Government or its agencies, and in derivatives designed to replicate such securities. This guarantee is to timely repayment of the principal and interest if held to maturity, and does not apply to derivative securities held by the Portfolio. Guarantee does not eliminate market risk. The Portfolio may use derivative instruments for hedging or other purposes as part of its investment strategy. Use of these instruments may involve certain costs and risks such as liquidity risk, interest rate risk, market risk, credit risk, management risk and the risk that the Portfolio could not close out a position when it would be most advantageous to do so. The potential leverage created by use of derivatives may cause the Portfolio to be more sensitive to interest rate movements and thus more volatile than other long-term U.S. Government bond funds that do not use derivatives. Portfolios investing in derivatives could lose more than the principal amount invested in those instruments.
| | | | | | |
| | Long-Term U.S. Government Bond Portfolio | | | 113 | |
Long-Term U.S. Government Bond Portfolio
Top 10 Fixed Income Holdings 12/31/12
| | |
| Security Description | | % of Market Value |
US Treasury, Various | | 82.4% |
Residual Funding Stripped, Various | | 4.5% |
Federal National Mortgage Association, Various | | 4.4% |
Financing Corp., Various | | 2.3% |
Israel Government AID Bond, Various | | 2.3% |
Federal Home Loan Mortgage Corp., Series 4092, Class AY, 3.00%, 8/15/32 | | 2.0% |
Tennessee Valley Authority, Various | | 1.9% |
Federal Home Loan Mortgage Corp., Series 2752, Class EZ, 5.50%, 2/15/34 | | 0.8% |
Vessel Management Services, Inc., 3.432%, 8/15/36 | | 0.6% |
Iowa State Special Obligation Build America Bonds, 6.75%, 6/1/34 | | 0.4% |
Sector Allocation 12/31/12
Sector Allocation is based on fixed income investments.
Sector Allocation and Top 10 Holdings are subject to change.
The Government and Structured Product categories include domestic taxable bonds.
Consistent with the Portfolio’s stated parameters, no more than 10% of the Portfolio is invested in securities rated A by Moody’s or S&P and no more than 25% of the Portfolio is invested in securities rated Aa by Moody’s or AA by S&P.
| | | | |
| 114 | | Long-Term U.S. Government Bond Portfolio | | |
Long-Term U.S. Government Bond Portfolio
Schedule of Investments
December 31, 2012
| | | | | | | | | | |
| | | Corporate Bonds (0.6%) | | Shares/
$ Par | | | Value
$ (000’s) | |
| | |
| | Transportation (0.6%) | | | | | |
| | Vessel Management Services, Inc., 3.432%, 8/15/36 | | | 672,000 | | | | 701 | |
| | | | | | | | | | |
| | Total Corporate Bonds | | | | | | | | |
| | (Cost: $672) | | | | | | | 701 | |
| | | | | | | | | | |
| | |
| | | Governments (97.0%) | | | | |
| | |
| | Governments (97.0%) | | | | | |
| | Federal National Mortgage Association, 2.25%, 3/15/16 | | | 700,000 | | | | 739 | |
| | Federal National Mortgage Association, 5.625%, 7/15/37 | | | 300,000 | | | | 432 | |
| | Federal National Mortgage Association, 5.625%, 4/17/28 | | | 100,000 | | | | 135 | |
| | Federal National Mortgage Association, 6.625%, 11/15/30 | | | 1,100,000 | | | | 1,675 | |
| | Federal National Mortgage Association, 7.125%, 1/15/30 | | | 700,000 | | | | 1,100 | |
| | Financing Corp., 8.60%, 9/26/19 | | | 700,000 | | | | 1,008 | |
| | Financing Corp. Stripped, 0.00%, 12/27/18 | | | 500,000 | | | | 455 | |
| | Financing Corp. Stripped, 0.00%, 9/26/19 | | | 1,300,000 | | | | 1,168 | |
| | Israel Government AID Bond,
0.00%, 5/15/21 | | | 200,000 | | | | 169 | |
| | Israel Government AID Bond,
0.00%, 2/15/23 | | | 100,000 | | | | 78 | |
| | Israel Government AID Bond,
0.00%, 5/15/23 | | | 500,000 | | | | 387 | |
| | Israel Government AID Bond,
5.50%, 9/18/33 | | | 300,000 | | | | 404 | |
| | Israel Government AID Bond,
5.50%, 9/18/23 | | | 800,000 | | | | 1,055 | |
| | Israel Government AID Bond,
5.50%, 12/4/23 | | | 300,000 | | | | 397 | |
| | Israel Government AID Bond,
5.50%, 4/26/24 | | | 100,000 | | | | 132 | |
| | Residual Funding Corp. Stripped,
0.00%, 4/15/30 | | | 4,100,000 | | | | 2,454 | |
| | Residual Funding Corp. Stripped,
0.00%, 10/15/20 | | | 2,000,000 | | | | 1,751 | |
| | Resolution Funding Corp. Stripped,
0.00%, 1/15/20 | | | 700,000 | | | | 629 | |
| | | | | | | | | | |
| | | Governments (97.0%) | | Shares/
$ Par | | | Value
$ (000’s) | |
| | |
| | Governments continued | | | | | |
| | Resolution Funding Corp. Stripped, 0.00%, 4/15/28 | | | 400,000 | | | | 255 | |
| | Tennessee Valley Authority, 4.625%, 9/15/60 | | | 300,000 | | | | 359 | |
| | Tennessee Valley Authority, 5.375%, 4/1/56 | | | 1,100,000 | | | | 1,498 | |
| | Tennessee Valley Authority Stripped,
0.00%, 5/1/20 | | | 500,000 | | | | 273 | |
| | US Treasury, 0.375%, 7/31/13 | | | 1,105,000 | | | | 1,107 | |
| | US Treasury, 2.00%, 11/15/21 | | | 3,800,000 | | | | 3,944 | |
| | US Treasury, 3.125%, 11/15/41 | | | 8,300,000 | | | | 8,688 | |
| | US Treasury, 3.50%, 2/15/39 | | | 3,100,000 | | | | 3,504 | |
| | US Treasury, 3.75%, 8/15/41 | | | 500,000 | | | | 588 | |
| | US Treasury, 4.25%, 11/15/40 | | | 15,750,000 | | | | 20,111 | |
| | US Treasury, 4.375%, 11/15/39 | | | 5,600,000 | | | | 7,285 | |
| | US Treasury, 4.375%, 5/15/41 | | | 5,600,000 | | | | 7,296 | |
| | US Treasury, 4.50%, 5/15/38 | | | 100,000 | | | | 132 | |
| | US Treasury, 4.50%, 8/15/39 | | | 2,505,000 | | | | 3,320 | |
| | US Treasury, 5.375%, 2/15/31 | | | 1,800,000 | | | | 2,569 | |
| | US Treasury, 5.50%, 8/15/28 | | | 100,000 | | | | 141 | |
| | US Treasury, 6.00%, 2/15/26 | | | 1,100,000 | | | | 1,592 | |
| | US Treasury, 6.25%, 5/15/30 | | | 13,900,000 | | | | 21,493 | |
| | US Treasury, 6.25%, 8/15/23 | | | 100,000 | | | | 143 | |
| | US Treasury, 6.75%, 8/15/26 | | | 100,000 | | | | 154 | |
| | US Treasury, 7.125%, 2/15/23 | | | 1,100,000 | | | | 1,659 | |
| | US Treasury, 8.75%, 8/15/20 | | | 600,000 | | | | 929 | |
| | US Treasury Stripped, 0.00%, 5/15/33 | | | 1,000,000 | | | | 555 | |
| | US Treasury Stripped, 0.00%, 5/15/37 | | | 1,700,000 | | | | 815 | |
| | US Treasury Stripped, 0.00%, 5/15/40 | | | 11,400,000 | | | | 4,942 | |
| | US Treasury Stripped, 0.00%, 8/15/40 | | | 2,100,000 | | | | 901 | |
| | US Treasury Stripped, 0.00%, 2/15/41 | | | 2,300,000 | | | | 969 | |
| | | | | | | | | | |
| | | Governments (97.0%) | | Shares/
$ Par | | | Value
$ (000’s) | |
| | |
| | Governments continued | | | | | |
| | US Treasury Stripped, 0.00%, 5/15/42 | | | 800,000 | | | | 318 | |
| | | | | | | | | | |
| | Total Governments | | | | | | | | |
| | (Cost: $104,804) | | | | | | | 109,708 | |
| | | | | | | | | | |
| | |
| | | Municipal Bonds (0.9%) | | | | |
| | |
| | Municipal Bonds (0.9%) | | | | | |
| | Iowa State Special Obligation Build America Bonds, Series 2009-B, 6.75%, 6/1/34 RB | | | 400,000 | | | | 478 | |
| | New York City Municipal Water Finance Authority, Series GG, 5.00%, 6/15/43 RB | | | 300,000 | | | | 337 | |
| | Poway Unified Public School District, Series 2007, 4.50%, 9/15/37 RB, AMBAC | | | 200,000 | | | | 200 | |
| | | | | | | | | | |
| | Total Municipal Bonds | | | | | | | | |
| | (Cost: $881) | | | | | | | 1,015 | |
| | | | | | | | | | |
| | |
| | | Structured Products (6.0%) | | | | |
| | |
| | Structured Products (6.0%) | | | | | |
| | Credit Suisse First Boston Mortgage Securities Corp., Series 2003-AR18, Class 2A3, 2.559%, 7/25/33 | | | 4,375 | | | | 4 | |
| | Credit Suisse First Boston Mortgage Securities Corp., Series 2003-AR20, Class 2A1, 2.687%, 8/25/33 | | | 5,235 | | | | 5 | |
| | Federal Home Loan Mortgage Corp., Series 3346, Class FA, 0.439%, 2/15/19 | | | 36,203 | | | | 36 | |
| | Federal Home Loan Mortgage Corp., Series 4092, Class AY, 3.00%, 8/15/32 | | | 2,200,000 | | | | 2,241 | |
| | Federal Home Loan Mortgage Corp., Series 3203, Class ZW, 5.00%, 11/15/35 | | | 409,785 | | | | 467 | |
The Accompanying Notes are an Integral Part of the Financial Statements.
| | | | | | |
| | Long-Term U.S. Government Bond Portfolio | | | 115 | |
Long-Term U.S. Government Bond Portfolio
| | | | | | | | | | |
| | | Structured Products (6.0%) | | Shares/
$ Par | | | Value
$ (000’s) | |
| | |
| | Structured Products continued | | | | | |
| | Federal Home Loan Mortgage Corp., Series 2752, Class EZ, 5.50%, 2/15/34 | | | 811,863 | | | | 922 | |
| | Federal Home Loan Mortgage Corp. Structured Pass-Through Securities, Series T61, Class 1A1, 1.535%, 7/25/44 | | | 26,832 | | | | 27 | |
| | Federal National Mortgage Association, Series 2007-114, Class A6, 0.41%, 10/27/37 | | | 100,000 | | | | 100 | |
| | Federal National Mortgage Association, Series 2007-39, Class NZ, 4.25%, 5/25/37 | | | 254,354 | | | | 281 | |
| | Federal National Mortgage Association, 5.00%, 6/1/35 | | | 319,320 | | | | 349 | |
| | Federal National Mortgage Association, 5.00%, 2/1/36 | | | 547,046 | | | | 595 | |
| | General Motors Acceptance Corp. Mortgage Corp. Loan Trust, Series 2004-AR1, Class 22A, 3.632%, 6/25/34 | | | 15,987 | | | | 16 | |
| | Massachusetts Educational Financing Authority, Series 2008-1, Class A1, 1.265%, 4/25/38 | | | 211,455 | | | | 212 | |
| | Merrill Lynch Floating Trust, Series 2008-LAQA, Class A1, 0.751%, 7/9/21 144A | | | 321,787 | | | | 320 | |
| | Merrill Lynch Mortgage Investors, Inc., Series 2003-A3, Class 1A, 2.545%, 5/25/33 | | | 12,858 | | | | 13 | |
| | Merrill Lynch Mortgage Investors, Inc., Series 2003-A4, Class 3A, 3.195%, 5/25/33 | | | 4,218 | | | | 4 | |
| | MLCC Mortgage Investors, Inc., Series 2005-3, Class 4A, 0.46%, 11/25/35 | | | 31,314 | | | | 29 | |
| | SLM Student Loan Trust, Series 2007-2, Class A2, 0.315%, 7/25/17 | | | 219,926 | | | | 220 | |
| | SLM Student Loan Trust, Series 2008-7, Class A2, 0.815%, 10/25/17 | | | 132,514 | | | | 133 | |
| | | | | | | | | | |
| | | Structured Products (6.0%) | | Shares/
$ Par | | | Value
$ (000’s) | |
| | |
| | Structured Products continued | | | | | |
| | SLM Student Loan Trust, Series 2003-7A,
Class A5A,
1.508%, 12/15/33 144A | | | 232,999 | | | | 230 | |
| | SLM Student Loan Trust, Series 2008-9, Class A, 1.815%, 4/25/23 | | | 383,260 | | | | 399 | |
| | South Carolina Student Loan Corp., Series 2008-1, Class A2, 0.861%, 3/1/18 | | | 165,287 | | | | 166 | |
| | Structured Asset Mortgage Investments, Inc., Series 2004-AR5, Class 1A1,
0.87%, 10/19/34 | | | 11,857 | | | | 12 | |
| | Washington Mutual Mortgage Pass-Through Certificates, Series 2004-AR1, Class A,
2.569%, 3/25/34 | | | 39,348 | | | | 40 | |
| | | | | | | | | | |
| | Total Structured Products | | | | | | | | |
| | (Cost: $6,393) | | | | | | | 6,821 | |
| | | | | | | | | | |
| | |
| | | Short-Term Investments (59.7%) | | | | |
| |
| | Federal Government & Agencies (16.8%) | |
| | Federal Home Loan Bank, 0.03%, 1/14/13 | | | 10,000,000 | | | | 10,000 | |
| | Federal Home Loan Bank, 0.16%, 2/19/13 | | | 100,000 | | | | 100 | |
| | Federal National Mortgage Association, 0.155%, 3/6/13 | | | 900,000 | | | | 900 | |
| | US Treasury Bill, 0.004%, 7/25/13 | | | 95,000 | | | | 95 | |
| (b) | | US Treasury Bill, 0.142%, 12/12/13 | | | 6,000,000 | | | | 5,992 | |
| | US Treasury Bill, 0.18%, 11/14/13 | | | 500,000 | | | | 499 | |
| | US Treasury Bill, 0.19%, 8/22/13 | | | 1,400,000 | | | | 1,399 | |
| | | | | | | | | | |
| | Total | | | | | | | 18,985 | |
| | | | | | | | | | |
| | |
| | Other Holdings (0.1%) | | | | | |
| | JPMorgan Money Market Fund | | | 113,289 | | | | 113 | |
| | | | | | | | | | |
| | Total | | | | | | | 113 | |
| | | | | | | | | | |
| | | | | | | | | | |
| | | Short-Term Investments (59.7%) | | Shares/
$ Par | | | Value
$ (000’s) | |
| | |
| | Repurchase Agreements (42.8%) | | | | | |
| | US Treasury Inflation Repurchase, 0.23%, dated 12/31/12, due 1/2/13, (collateralized by US Treasury Inflation Index Bond, 3.875%, 4/15/29, valued at $202,909, repurchase proceeds of $200,000) | | | 200,000 | | | | 200 | |
| | US Treasury Repurchase, 0.22%, dated 12/31/12, due 1/2/13, (collateralized by US Treasury Note, 2.125%, 12/31/15, valued at $12,791,713, repurchase proceeds of $12,500,000) | | | 12,500,000 | | | | 12,500 | |
| | US Treasury Repurchase, 0.23%, dated 12/31/12, due 1/2/13, (collateralized by US Treasury Note, 0.125%, 12/31/14, valued at $204,488, repurchase proceeds of $200,000) | | | 200,000 | | | | 200 | |
| | US Treasury Repurchase, 0.23%, dated 12/31/12, due 1/2/13, (collateralized by US Treasury Note, 0.125%, 12/31/14, valued at $510,720, repurchase proceeds of $500,000) | | | 500,000 | | | | 500 | |
| | US Treasury Repurchase, 0.23%, dated 12/31/12, due 1/2/13, (collateralized by US Treasury Note, 0.875%, 4/30/17, valued at $17,971,389, repurchase proceeds of $17,600,000) | | | 17,600,000 | | | | 17,600 | |
| | US Treasury Repurchase, 0.23%, dated 12/31/12, due 1/2/13, (collateralized by US Treasury Note, 1.50%, 7/31/16, valued at $16,430,529, repurchase proceeds of $16,200,000) | | | 16,200,000 | | | | 16,200 | |
The Accompanying Notes are an Integral Part of the Financial Statements.
| | | | |
| 116 | | Long-Term U.S. Government Bond Portfolio | | |
Long-Term U.S. Government Bond Portfolio
| | | | | | | | | | |
| | | Short-Term Investments (59.7%) | | Shares/
$ Par | | | Value
$ (000’s) | |
| | |
| | Repurchase Agreements continued | | | | | |
| | US Treasury Repurchase, 0.23%, dated 12/31/12, due 1/2/13, (collateralized by US Treasury Note, 2.125%, 12/31/15, valued at $205,215, repurchase proceeds of $200,000) | | | 200,000 | | | | 200 | |
| | US Treasury Repurchase, 0.23%, dated 12/31/12, due 1/2/13, (collateralized by US Treasury Note, 3.375%, 7/31/13, valued at $201,691, repurchase proceeds of $200,000) | | | 200,000 | | | | 200 | |
| | US Treasury Repurchase, 0.24%, dated 12/31/12, due 1/2/13, (collateralized by US Treasury Note, 2.50%, 3/31/15, valued at $202,822, repurchase proceeds of $200,000) | | | 200,000 | | | | 200 | |
| | US Treasury Repurchase, 0.25%, dated 12/31/12, due 1/2/13, (collateralized by US Treasury Note, 0.25%, 1/15/15, valued at $203,952, repurchase proceeds of $200,000) | | | 200,000 | | | | 200 | |
| | US Treasury Repurchase, 0.25%, dated 12/31/12, due 1/2/13, (collateralized by US Treasury Note, 1.00%, 9/30/16, valued at $203,585, repurchase proceeds of $200,000) | | | 200,000 | | | | 200 | |
| | | | | | | | | | |
| | | Short-Term Investments (59.7%) | | Shares/
$ Par | | | Value
$ (000’s) | |
| | |
| | Repurchase Agreements continued | | | | | |
| | US Treasury Repurchase, 0.25%, dated 12/31/12, due 1/2/13, (collateralized by US Treasury Note, 1.50%, 6/30/16, valued at $204,218, repurchase proceeds of $200,000) | | | 200,000 | | | | 200 | |
| | | | | | | | | | |
| | Total | | | | | | | 48,400 | |
| | | | | | | | | | |
| | | |
| | Total Short-Term Investments | | | | | | | | |
| | (Cost: $67,497) | | | | | | | 67,498 | |
| | | | | | | | | | |
| | | |
| | Total Investments (164.2%) | | | | | | | | |
| | (Cost: $180,247)(a) | | | | | | | 185,743 | |
| | | | | | | | | | |
| | Other Assets, Less | | | | | | | | |
| | Liabilities (-64.2%) | | | | | | | (72,607 | ) |
| | | | | | | | | | |
| | Net Assets (100.0%) | | | | | | | 113,136 | |
| | | | | | | | | | |
The Accompanying Notes are an Integral Part of the Financial Statements.
| | | | | | |
| | Long-Term U.S. Government Bond Portfolio | | | 117 | |
Long-Term U.S. Government Bond Portfolio
144A after the name of a security represents a security exempt from registration under Rule 144A of the Securities Act of 1933. These securities may be resold as transactions exempt from registration, normally to qualified institutional buyers. At December 31, 2012 the value of these securities (in thousands) was $550 representing 0.5% of the net assets.
RB — Revenue Bond
AMBAC — American Municipal Bond Assurance Corp.
| (a) | At December 31, 2012 the aggregate cost of securities for federal tax purposes (in thousands) was $184,996 and the net unrealized appreciation of investments based on that cost was $747 which is comprised of $9,918 aggregate gross unrealized appreciation and $9,171 aggregate gross unrealized depreciation. |
| (b) | All or a portion of the securities have been pledged as collateral for open futures positions or when-issued securities. Information regarding open futures contracts as of period end is summarized below. |
| | | | | | | | |
| Issuer (000’s) | | Number of
Contracts | | Expiration Date | | Unrealized
Appreciation/
(Depreciation)
(000’s) | |
US Long Treasury Bond Futures (Long) (Total Notional Value at December 31, 2012, $897) | | 6 | | 3/13 | | $ | (12 | ) |
The following is a summary of the inputs used in valuing the Portfolio’s assets and liabilities at December 31, 2012. See Note 3 for additional information on portfolio valuation.
| | | | | | | | | | | | | | |
| | | Valuation Inputs | | | |
| Description | | Level 1 – Quoted Prices | | | Level 2 – Other Significant
Observable Inputs | | | Level 3 – Significant
Unobservable Inputs | | | |
| | | (Amounts in thousands) | | | |
Assets: | | | | | | | | | | | | | | |
Government & US Agency Bonds | | $ | - | | | $ | 109,708 | | | $ | - | | | |
Municipal Bonds | | | - | | | | 1,015 | | | | - | | | |
Corporate Bonds | | | - | | | | 701 | | | | - | | | |
Structured Products | | | - | | | | 6,821 | | | | - | | | |
Short-Term Investments | | | 113 | | | | 67,385 | | | | - | | | |
Liabilities: | | | | | | | | | | | | | | |
Other Financial Instruments^ | | | | | | | | | | | | | | |
Futures | | | (12 | ) | | | - | | | | - | | | |
Total | | $ | 101 | | | $ | 185,630 | | | $ | - | | | |
^ Other financial instruments are derivative instruments such as futures, forwards, written options and swaps contracts, which are valued at the unrealized appreciation (depreciation) on the instrument and short sales, which are valued at market value.
The Accompanying Notes are an Integral Part of the Financial Statements.
| | | | |
| 118 | | Long-Term U.S. Government Bond Portfolio | | |
Inflation Protection Portfolio
| | | | |
| Objective: | | Portfolio Strategy: | | Net Assets: |
| Total return using a strategy that seeks to | | Invest substantially all assets in investment grade debt | | $254 million |
protect against U.S. inflation. | | securities, with a majority in inflation-linked debt securities. | | |
Portfolio Overview
Mason Street Advisors, the investment adviser for the Inflation Protection Portfolio (the “Portfolio”), has engaged American Century Investment Management, Inc. (“American Century”) to act as sub-adviser for the Portfolio. The Portfolio invests substantially all of its assets in investment grade debt securities. To help protect against U.S. inflation, under normal conditions, the Portfolio will invest over 50% of its net assets in inflation-linked debt securities. These securities include inflation-linked U.S. Treasury Securities, inflation-linked securities issued by U.S. government agencies and instrumentalities other than the U.S. Treasury, and inflation-linked securities issued by other entities such as domestic and foreign corporations and governments. The Portfolio also may invest in fixed income securities that are not linked to inflation, including mortgage-and asset-backed securities. The Portfolio invests in investment grade securities, but may also invest in high yield securities (so called “junk bonds”) up to a limit of 10% of Portfolio assets. Due to Internal Revenue Code provisions governing insurance product funds, no more than 55% of the Portfolio’s assets may be invested in securities issued by the same entity, such as the U.S. Treasury.
Market Overview
Despite persistent concerns about weakening global economies and Europe’s ongoing financial crisis, investors largely focused on central bank stimulus measures, which fueled much of the period’s market optimism—and long-term inflation expectations.
The year began on an upbeat note, as select economic data improved and ongoing efforts from the European Central Bank (ECB) helped calm the latest round of default fears in the eurozone. But, a barrage of disappointing U.S. economic data released in the second calendar quarter of 2012, combined with ongoing problems in Europe, stifled the prevailing investor optimism, reigniting recession fears and triggering a short-term market selloff.
In this environment, investors presumed the ECB and the U.S. Federal Reserve (the Fed) would step in with additional stimulus measures. This anticipation—and the eventual announcements of the programs in September 2012—sparked a rally among riskier assets late in the period. Also, the Fed announced it would maintain its current ultra-low interest rate policy until unemployment dips to 6.5% or the one- to two-year inflation outlook exceeds 2.5%. These announcements further fueled longer-term inflation fears. Meanwhile, current inflation, as measured by the Consumer Price Index (CPI), eased during the year, primarily due to declines in the index’s energy component and used cars and trucks.
Returns on Treasury securities remained positive for the year, as yields generally declined. Treasury inflation-protected securities (TIPS) outperformed their nominal Treasury counterparts, as the inflationary implications of the Fed’s bond-buying and near-zero interest rate policy triggered demand for TIPS.
Portfolio Results
The Portfolio returned 7.35% for the twelve months ended December 31, 2012. The Portfolio’s benchmark, the Barclays® US Treasury Inflation Protected Securities Index (the “Index”), returned 6.98% for the year. (This Index is unmanaged, cannot be invested in directly and does not include administrative expenses or sales charges.) The average return of the Inflation-Protected Bond peer group was 7.37%, according to Morningstar ® Inc., an independent mutual fund rating agency.
The Portfolio’s performance benefited from the generally favorable climate for TIPS, stemming largely from growing long-term inflation expectations associated with the Fed’s ongoing stimulus efforts. The Portfolio’s outperformance relative to the Index was due to strong performance from some of the Portfolio’s non-Index securities (held in the Portfolio, but not present in the Index).
The Portfolio was as fully invested in TIPS as allowed by IRS portfolio diversification regulations for insurance products (55% of the Portfolio). The remainder of the Portfolio included non-dollar inflation-linked bonds, investment-grade corporate, mortgage and agency securities, and, earlier in the year, a small allocation to high-yield bonds. Although all of these sectors generated positive results for the year, the corporate and higher-yielding mortgage securities held in the Portfolio outperformed TIPS and helped account for the Portfolio’s better results relative to the all-TIPS Index.
In an effort to maintain maximum portfolio inflation protection and provide TIPS-like performance without investing further in TIPS, the Portfolio held inflation “swaps” to create an inflation-linked “overlay” for the non-inflation-linked securities. Inflation swaps are fixed-maturity instruments, negotiated through a counterparty (investment bank), that return the rate of inflation (CPI). The Portfolio’s swaps outperformed and drove the Portfolio’s better relative results for the year, primarily because we used corporate securities as the counterparts to the swap agreements, and corporates generally outperformed TIPS.
| | | | | | |
| | Inflation Protection Portfolio | | | 119 | |
Inflation Protection Portfolio
Portfolio Manager Outlook
The following forward looking comments are the opinion of American Century, the Portfolio’s sub-adviser.
We expect inflation to remain relatively contained in the near term. Longer term, though, record federal debt and the Fed’s aggressive monetary policy eventually may result in higher inflation than what is currently priced into the Treasury market. We believe this scenario underscores the importance of securing potential inflation hedges and protecting purchasing power with TIPS.
Relative Performance

| | | | | | | | | | | | |
Average Annual Total Returns
For Periods Ended December 31, 2012 | |
| | | 1 Year | | | 5 Years | | | Since
Inception* | |
Inflation Protection Portfolio | | | 7.35% | | | | 6.59% | | | | 7.03% | |
Barclays® U.S. Treasury Inflation Protected Securities (TIPS) Index | | | 6.98% | | | | 7.04% | | | | 7.65% | |
Lipper® Variable Insurance Products (VIP) Inflation Protected Bonds Funds Average | | | 7.37% | | | | 6.84% | | | | - | |
| * | Inception date of 4/30/07 |
|
The performance data quoted represents past
performance. Past performance is historical and does
not guarantee future performance. Investment return
and principal value will fluctuate, so that shares, when
redeemed, may be worth more or less than their
original cost. Current performance may be lower or
higher than the performance data quoted. For the
most recent month-end performance information visit
www.northwesternmutual.com. |
| This chart assumes an initial investment of $10,000 made on 4/30/07 (commencement of the Portfolio’s operations). Returns shown reflect fee waivers, deductions for management and other portfolio expenses, and reinvestment of all dividends. In the absence of fee waivers, total return would be reduced. Returns exclude deductions for separate account sale loads and account fees. Please refer to the Benchmark Definitions section of this report for information about the indices cited in the above chart and graph. |
|
Return of principal is not guaranteed. Bond funds have the same interest rate, inflation and credit risks that are associated with the underlying bonds owned by the Portfolio. When interest rates rise, bond prices fall. With a fixed income fund, when interest rates rise, the value of the fund’s existing bonds drops, which could negatively affect overall fund performance. |
| Investing in bonds issued by foreign corporations and governments carries additional risk, including foreign currency risk, and may increase the volatility of the Portfolio’s performance. |
|
This Portfolio invests over 50% of its assets in
inflation-linked bonds. Inflation-linked bonds issued by
the U.S. Government, known as TIPs, are fixed income
securities whose principal value is periodically
adjusted according to the rate of inflation. Neither the
current market value of the inflation-linked bonds nor
the share value of the fund that invests in them is
guaranteed, and either or both may fluctuate. Those
portions of the Portfolio which are not invested in
inflation linked securities will not be automatically
protected from inflation. The Portfolio may use
derivative instruments for hedging or other purposes
as part of its investment strategy. Use of these
instruments may involve certain costs and risks such
as liquidity risk, interest rate risk, counterparty risk,
market risk, credit risk, management risk and the risk
that the Portfolio could not close out a position when
it would be most advantageous to do so. Portfolios
investing in derivatives could lose more than the
principal amount invested in those instruments. As a non-diversified portfolio, the Portfolio may invest
a greater percentage of its assets in a single security
or a small number of securities. Holding fewer
securities increases the risk that the value of the
Portfolio could go down because of the poor
performance of a single investment. |
| | | | |
| 120 | | Inflation Protection Portfolio | | |
Inflation Protection Portfolio
Top 10 Fixed Income Holdings 12/31/12
| | | | |
| Security Description | | % of Net Assets | |
US Treasury Inflation Index Bond, Various | | | 53.1% | |
Federal Home Loan Mortgage Corp., Various | | | 7.8% | |
United Kingdom Gilt Inflation Linked, Various | | | 6.8% | |
France Government Bond OAT, Various | | | 4.6% | |
Federal National Mortgage Association, Various | | | 4.0% | |
Deutsche Bundesrepublik Inflation Linked Bond, Various | | | 1.4% | |
Canadian Government Bond, Various | | | 0.9% | |
Bundesrepublik Deutschland Bundesobligation Inflation Linked Bond, 0.75%, 4/15/18 | | | 0.4% | |
Comcast Corp., Various | | | 0.4% | |
General Electric Capital Corp., Various | | | 0.4% | |
Sector Allocation 12/31/12

Sector Allocation is based on Net Assets.
Sector Allocation and Top 10 Holdings are subject to change.
The Corporate Bonds sector includes bonds of companies and governments headquartered outside the United States.
The Government and Structured Product categories include domestic taxable bonds.
Consistent with the Portfolio’s stated parameters, no more than 20% of the Portfolio is invested in foreign securities, and no more than 10% is invested in high yield securities.
| | | | | | |
| | Inflation Protection Portfolio | | | 121 | |
Inflation Protection Portfolio
Schedule of Investments
December 31, 2012
| | | | | | | | | | |
| | | Corporate Bonds (10.8%) | | Shares/
$ Par | | | Value
$ (000’s) | |
| |
| | Aerospace/Defense (0.6%) | |
| | Boeing Capital Corp., 2.125%, 8/15/16 | | | 130,000 | | | | 135 | |
| | L-3 Communications Corp., 5.20%, 10/15/19 | | | 50,000 | | | | 57 | |
| | Lockheed Martin Corp., 2.125%, 9/15/16 | | | 100,000 | | | | 104 | |
| | Lockheed Martin Corp., 4.25%, 11/15/19 | | | 385,000 | | | | 434 | |
| | Raytheon Co., 2.50%, 12/15/22 | | | 300,000 | | | | 296 | |
| | Raytheon Co., 3.125%, 10/15/20 | | | 110,000 | | | | 117 | |
| | Thermo Fisher Scientific, Inc.,
3.20%, 3/1/16 | | | 300,000 | | | | 319 | |
| | | | | | | | | | |
| | Total | | | | | | | 1,462 | |
| | | | | | | | | | |
| |
| | Auto Manufacturing (0.2%) | |
| | Ford Motor Credit Co. LLC, 5.00%, 5/15/18 | | | 100,000 | | | | 110 | |
| | Ford Motor Credit Co. LLC, 7.00%, 10/1/13 | | | 100,000 | | | | 105 | |
| | Toyota Motor Credit Corp., 3.30%, 1/12/22 | | | 300,000 | | | | 324 | |
| | | | | | | | | | |
| | Total | | | | | | | 539 | |
| | | | | | | | | | |
| |
| | Banking (1.3%) | |
| | Bank of America Corp., 5.75%, 12/1/17 | | | 350,000 | | | | 408 | |
| | The Bear Stearns Cos. LLC, 4.11%, 1/10/14 | | | 70,000 | | | | 70 | |
| | Capital One Financial Corp., 3.15%, 7/15/16 | | | 100,000 | | | | 106 | |
| | Citigroup, Inc., 4.587%, 12/15/15 | | | 500,000 | | | | 546 | |
| | Citigroup, Inc., 6.01%, 1/15/15 | | | 140,000 | | | | 153 | |
| | The Goldman Sachs Group, Inc.,
5.75%, 1/24/22 | | | 230,000 | | | | 272 | |
| | The Goldman Sachs Group, Inc.,
6.15%, 4/1/18 | | | 200,000 | | | | 235 | |
| | The International Bank for Reconstruction & Development, 7.625%, 1/19/23 | | | 500,000 | | | | 749 | |
| | JPMorgan Chase & Co., 4.50%, 1/24/22 | | | 500,000 | | | | 565 | |
| | PNC Bank, N.A., 6.00%, 12/7/17 | | | 200,000 | | | | 241 | |
| | | | | | | | | | |
| | Total | | | | | | | 3,345 | |
| | | | | | | | | | |
| |
| | Basic Materials (0.3%) | |
| | BHP Billiton Finance USA, Ltd.,
3.25%, 11/21/21 | | | 180,000 | | | | 194 | |
| | | | | | | | | | |
| | | Corporate Bonds (10.8%) | | Shares/
$ Par | | | Value
$ (000’s) | |
| |
| | Basic Materials continued | |
| | CF Industries, Inc., 6.875%, 5/1/18 | | | 180,000 | | | | 220 | |
| | Ecolab, Inc.,
4.35%, 12/8/21 | | | 160,000 | | | | 179 | |
| | Rio Tinto Finance USA, Ltd.,
3.75%, 9/20/21 | | | 280,000 | | | | 299 | |
| | | | | | | | | | |
| | Total | | | | | | | 892 | |
| | | | | | | | | | |
| |
| | Beverage/Bottling (0.6%) | |
| | Anheuser-Busch InBev Worldwide, Inc., 5.375%, 1/15/20 | | | 400,000 | | | | 487 | |
| | Anheuser-Busch InBev Worldwide, Inc., 7.75%, 1/15/19 | | | 120,000 | | | | 160 | |
| | Brown-Forman Corp., 3.75%, 1/15/43 | | | 100,000 | | | | 100 | |
| | The Coca-Cola Co., 3.625%, 3/15/14 | | | 100,000 | | | | 104 | |
| | Coca-Cola Refreshments USA, Inc., 4.25%, 3/1/15 | | | 100,000 | | | | 107 | |
| | Dr. Pepper Snapple Group, Inc.,
2.90%, 1/15/16 | | | 320,000 | | | | 337 | |
| | SABMiller Holdings, Inc., 2.45%, 1/15/17 144A | | | 200,000 | | | | 209 | |
| | | | | | | | | | |
| | Total | | | | | | | 1,504 | |
| | | | | | | | | | |
| |
| | Cable/Media/Broadcasting/Satellite (1.0%) | |
| | Comcast Corp., 5.90%, 3/15/16 | | | 120,000 | | | | 138 | |
| | Comcast Corp., 6.50%, 11/15/35 | | | 200,000 | | | | 257 | |
| | DIRECTV Holdings LLC/DIRECTV Financing Co., Inc., 3.55%, 3/15/15 | | | 400,000 | | | | 421 | |
| | NBCUniversal Media LLC, 4.375%, 4/1/21 | | | 340,000 | | | | 382 | |
| | NBCUniversal Media LLC, 5.15%, 4/30/20 | | | 240,000 | | | | 284 | |
| | News America, Inc., 6.90%, 8/15/39 | | | 110,000 | | | | 144 | |
| | Time Warner Cable, Inc., 6.75%, 7/1/18 | | | 360,000 | | | | 450 | |
| | Time Warner, Inc., 4.875%, 3/15/20 | | | 110,000 | | | | 128 | |
| | Viacom, Inc.,
4.50%, 3/1/21 | | | 250,000 | | | | 281 | |
| | | | | | | | | | |
| | Total | | | | | | | 2,485 | |
| | | | | | | | | | |
| |
| | Conglomerate/Diversified
Manufacturing (0.4%) | |
| | The Dow Chemical Co., 2.50%, 2/15/16 | | | 130,000 | | | | 135 | |
| | | | | | | | | | |
| | | Corporate Bonds (10.8%) | | Shares/
$ Par | | | Value
$ (000’s) | |
| |
| | Conglomerate/Diversified Manufacturing continued | |
| | The Dow Chemical Co., 5.90%, 2/15/15 | | | 50,000 | | | | 55 | |
| | Eastman Chemical Co., 2.40%, 6/1/17 | | | 300,000 | | | | 310 | |
| | General Electric Co., 5.25%, 12/6/17 | | | 60,000 | | | | 71 | |
| | United Technologies Corp., 4.50%, 6/1/42 | | | 50,000 | | | | 56 | |
| | United Technologies Corp., 4.875%, 5/1/15 | | | 300,000 | | | | 329 | |
| | | | | | | | | | |
| | Total | | | | | | | 956 | |
| | | | | | | | | | |
| |
| | Electric Utilities (0.4%) | |
| | Constellation Energy Group, Inc., 5.15%, 12/1/20 | | | 260,000 | | | | 297 | |
| | Dominion Resources, Inc., 6.40%, 6/15/18 | | | 170,000 | | | | 211 | |
| | Duke Energy Corp., 3.55%, 9/15/21 | | | 150,000 | | | | 158 | |
| | Duke Energy Ohio, Inc., 2.10%, 6/15/13 | | | 70,000 | | | | 70 | |
| | FirstEnergy Solutions Corp.,
6.05%, 8/15/21 | | | 40,000 | | | | 46 | |
| | Pacific Gas & Electric Co., 5.80%, 3/1/37 | | | 29,000 | | | | 36 | |
| | Sempra Energy, 2.00%, 3/15/14 | | | 120,000 | | | | 122 | |
| | Sempra Energy, 6.50%, 6/1/16 | | | 50,000 | | | | 59 | |
| | | | | | | | | | |
| | Total | | | | | | | 999 | |
| | | | | | | | | | |
| |
| | Electronics (0.3%) | |
| | Arrow Electronics, Inc., 3.375%, 11/1/15 | | | 155,000 | | | | 161 | |
| | Cisco Systems, Inc., 5.90%, 2/15/39 | | | 65,000 | | | | 84 | |
| | International Business Machines Corp., 1.95%, 7/22/16 | | | 150,000 | | | | 156 | |
| | International Business Machines Corp., 2.00%, 1/5/16 | | | 350,000 | | | | 362 | |
| | | | | | | | | | |
| | Total | | | | | | | 763 | |
| | | | | | | | | | |
| |
| | Food Processors (0.3%) | |
| | General Mills, Inc., 3.15%, 12/15/21 | | | 300,000 | | | | 313 | |
| | H.J. Heinz Co., 2.00%, 9/12/16 | | | 90,000 | | | | 93 | |
| | Kraft Foods Group, Inc., 5.375%, 2/12/20 144A | | | 130,000 | | | | 156 | |
| | Kraft Foods, Inc., 5.375%, 2/10/20 | | | 120,000 | | | | 145 | |
The Accompanying Notes are an Integral Part of the Financial Statements.
| | | | |
| 122 | | Inflation Protection Portfolio | | |
Inflation Protection Portfolio
| | | | | | | | | | |
| | | Corporate Bonds (10.8%) | | Shares/
$ Par | | | Value
$ (000’s) | |
| | |
| | Food Processors continued | | | | | |
| | Mondelez International, Inc., 6.125%, 2/1/18 | | | 120,000 | | | | 146 | |
| | | | | | | | | | |
| | Total | | | | | | | 853 | |
| | | | | | | | | | |
| | |
| | Gaming/Leisure/Lodging (0.1%) | | | | | |
| | The Walt Disney Co., 2.35%, 12/1/22 | | | 300,000 | | | | 303 | |
| | | | | | | | | | |
| | Total | | | | | | | 303 | |
| | | | | | | | | | |
| | |
| | Gas Pipelines (0.3%) | | | | | |
| | Enterprise Products Operating LLC, 3.70%, 6/1/15 | | | 80,000 | | | | 85 | |
| | Kinder Morgan Energy Partners LP, 5.30%, 9/15/20 | | | 150,000 | | | | 175 | |
| | Plains All American Pipeline LP/PAA Finance Corp., 3.65%, 6/1/22 | | | 200,000 | | | | 212 | |
| | Williams Partners LP, 3.80%, 2/15/15 | | | 150,000 | | | | 158 | |
| | Williams Partners LP, 4.125%, 11/15/20 | | | 80,000 | | | | 87 | |
| | | | | | | | | | |
| | Total | | | | | | | 717 | |
| | | | | | | | | | |
| | |
| | Health Care/Pharmaceuticals (0.7%) | | | | | |
| | AbbVie, Inc., 2.90%, 11/6/22 144A | | | 200,000 | | | | 204 | |
| | Aetna, Inc.,
2.75%, 11/15/22 | | | 100,000 | | | | 99 | |
| | Amgen, Inc.,
5.85%, 6/1/17 | | | 90,000 | | | | 107 | |
| | Catholic Health Initiatives, 2.95%, 11/1/22 | | | 100,000 | | | | 101 | |
| | Express Scripts Holding Co., 3.125%, 5/15/16 | | | 150,000 | | | | 158 | |
| | Express Scripts Holding Co., 7.25%, 6/15/19 | | | 100,000 | | | | 128 | |
| | Gilead Sciences, Inc., 4.40%, 12/1/21 | | | 160,000 | | | | 182 | |
| | Medtronic, Inc., 3.00%, 3/15/15 | | | 200,000 | | | | 210 | |
| | Roche Holdings, Inc., 6.00%, 3/1/19 144A | | | 190,000 | | | | 236 | |
| | Sanofi,
1.20%, 9/30/14 | | | 150,000 | | | | 152 | |
| | Teva Pharmaceutical Finance IV LLC,
2.25%, 3/18/20 | | | 170,000 | | | | 172 | |
| | | | | | | | | | |
| | Total | | | | | | | 1,749 | |
| | | | | | | | | | |
| | |
| | Independent Finance (0.4%) | | | | | |
| | General Electric Capital Corp.,
2.10%, 12/11/19 | | | 250,000 | | | | 250 | |
| | General Electric Capital Corp.,
4.375%, 9/16/20 | | | 50,000 | | | | 56 | |
| | General Electric Capital Corp.,
5.625%, 9/15/17 | | | 500,000 | | | | 590 | |
| | | | | | | | | | |
| | | Corporate Bonds (10.8%) | | Shares/
$ Par | | | Value
$ (000’s) | |
| | |
| | Independent Finance continued | | | | | |
| | General Electric Capital Corp.,
6.00%, 8/7/19 | | | 60,000 | | | | 73 | |
| | | | | | | | | | |
| | Total | | | | | | | 969 | |
| | | | | | | | | | |
| | |
| | Information/Data Technology (0.6%) | | | | | |
| | Adobe Systems, Inc., 3.25%, 2/1/15 | | | 300,000 | | | | 314 | |
| | Baxter International, Inc., 1.85%, 1/15/17 | | | 200,000 | | | | 206 | |
| | Intel Corp.,
2.70%, 12/15/22 | | | 260,000 | | | | 260 | |
| | Microsoft Corp., 2.125%, 11/15/22 | | | 180,000 | | | | 178 | |
| | Oracle Corp., 2.50%, 10/15/22 | | | 300,000 | | | | 303 | |
| | Oracle Corp.,
5.75%, 4/15/18 | | | 300,000 | | | | 365 | |
| | | | | | | | | | |
| | Total | | | | | | | 1,626 | |
| | | | | | | | | | |
| | |
| | Life Insurance (0.1%) | | | | | |
| | MetLife, Inc.,
6.75%, 6/1/16 | | | 120,000 | | | | 142 | |
| | Prudential Financial, Inc., 3.74%, 3/10/15 | | | 240,000 | | | | 240 | |
| | | | | | | | | | |
| | Total | | | | | | | 382 | |
| | | | | | | | | | |
| | |
| | Machinery (0.0%) | | | | | |
| | Deere & Co.,
2.60%, 6/8/22 | | | 60,000 | | | | 61 | |
| | | | | | | | | | |
| | Total | | | | | | | 61 | |
| | | | | | | | | | |
| | |
| | Metals/Mining (0.1%) | | | | | |
| | Barrick North America Finance LLC, 4.40%, 5/30/21 | | | 80,000 | | | | 88 | |
| | Newmont Mining Corp., 6.25%, 10/1/39 | | | 70,000 | | | | 84 | |
| | | | | | | | | | |
| | Total | | | | | | | 172 | |
| | | | | | | | | | |
| | |
| | Oil and Gas (1.3%) | | | | | |
| | Anadarko Petroleum Corp., 5.95%, 9/15/16 | | | 100,000 | | | | 115 | |
| | Apache Corp., 4.75%, 4/15/43 | | | 150,000 | | | | 163 | |
| | BP Capital Markets PLC, 2.50%, 11/6/22 | | | 60,000 | | | | 60 | |
| | Cenovus Energy, Inc., 4.50%, 9/15/14 | | | 200,000 | | | | 212 | |
| | ConocoPhillips, Co., 2.40%, 12/15/22 | | | 280,000 | | | | 279 | |
| | ConocoPhillips, Co., 4.75%, 2/1/14 | | | 69,000 | | | | 72 | |
| | Ensco PLC,
4.70%, 3/15/21 | | | 250,000 | | | | 281 | |
| | EOG Resources, Inc., 2.50%, 2/1/16 | | | 300,000 | | | | 314 | |
| | Noble Energy, Inc., 4.15%, 12/15/21 | | | 180,000 | | | | 199 | |
| | Occidental Petroleum Corp., 1.75%, 2/15/17 | | | 370,000 | | | | 379 | |
| | | | | | | | | | |
| | | Corporate Bonds (10.8%) | | Shares/
$ Par | | | Value
$ (000’s) | |
| | |
| | Oil and Gas continued | | | | | |
| | Shell International Finance BV,
2.375%, 8/21/22 | | | 650,000 | | | | 653 | |
| | Statoil ASA,
2.45%, 1/17/23 | | | 250,000 | | | | 249 | |
| | Talisman Energy, Inc., 3.75%, 2/1/21 | | | 150,000 | | | | 161 | |
| | Talisman Energy, Inc., 7.75%, 6/1/19 | | | 50,000 | | | | 65 | |
| | | | | | | | | | |
| | Total | | | | | | | 3,202 | |
| | | | | | | | | | |
| | |
| | Other Finance (0.2%) | | | | | |
| | Caterpillar Financial Services Corp.,
1.125%, 12/15/14 | | | 200,000 | | | | 202 | |
| | Caterpillar Financial Services Corp.,
1.25%, 11/6/17 | | | 60,000 | | | | 60 | |
| | John Deere Capital Corp., 3.15%, 10/15/21 | | | 290,000 | | | | 306 | |
| | | | | | | | | | |
| | Total | | | | | | | 568 | |
| | | | | | | | | | |
| | |
| | Other Services (0.0%) | | | | | |
| | Republic Services, Inc., 3.80%, 5/15/18 | | | 100,000 | | | | 110 | |
| | | | | | | | | | |
| | Total | | | | | | | 110 | |
| | | | | | | | | | |
| | |
| | Paper and Forest Products (0.1%) | | | | | |
| | Georgia-Pacific LLC, 5.40%, 11/1/20 144A | | | 140,000 | | | | 167 | |
| | | | | | | | | | |
| | Total | | | | | | | 167 | |
| | | | | | | | | | |
| | |
| | Railroads (0.1%) | | | | | |
| | CSX Corp.,
4.25%, 6/1/21 | | | 200,000 | | | | 225 | |
| | | | | | | | | | |
| | Total | | | | | | | 225 | |
| | | | | | | | | | |
| |
| | Real Estate Investment Trusts (0.3%) | |
| | DDR Corp.,
4.75%, 4/15/18 | | | 80,000 | | | | 89 | |
| | Health Care REIT, Inc., 3.75%, 3/15/23 | | | 300,000 | | | | 300 | |
| | Ventas Realty LP/Ventas Capital Corp., 2.00%, 2/15/18 | | | 250,000 | | | | 250 | |
| | | | | | | | | | |
| | Total | | | | | | | 639 | |
| | | | | | | | | | |
| | |
| | Retail Food and Drug (0.1%) | | | | | |
| | Safeway, Inc., 4.75%, 12/1/21 | | | 130,000 | | | | 134 | |
| | | | | | | | | | |
| | Total | | | | | | | 134 | |
| | | | | | | | | | |
| | |
| | Retail Stores (0.5%) | | | | | |
| | CVS Caremark Corp., 2.75%, 12/1/22 | | | 500,000 | | | | 502 | |
| | The Gap, Inc., 5.95%, 4/12/21 | | | 40,000 | | | | 46 | |
| | Wal-Mart Stores, Inc., 3.25%, 10/25/20 | | | 200,000 | | | | 218 | |
| | Wal-Mart Stores, Inc., 3.625%, 7/8/20 | | | 200,000 | | | | 222 | |
The Accompanying Notes are an Integral Part of the Financial Statements.
| | | | | | |
| | Inflation Protection Portfolio | | | 123 | |
Inflation Protection Portfolio
| | | | | | | | | | |
| | | Corporate Bonds (10.8%) | | Shares/
$ Par | | | Value
$ (000’s) | |
| |
| | Retail Stores continued | |
| | Wal-Mart Stores, Inc., 5.625%, 4/15/41 | | | 200,000 | | | | 262 | |
| | | | | | | | | | |
| | Total | | | | | | | 1,250 | |
| | | | | | | | | | |
| |
| | Telecommunications (0.5%) | |
| | AT&T, Inc., 2.625%, 12/1/22 | | | 250,000 | | | | 250 | |
| | AT&T, Inc., 5.10%, 9/15/14 | | | 100,000 | | | | 107 | |
| | AT&T, Inc., 6.55%, 2/15/39 | | | 110,000 | | | | 145 | |
| | British Telecommunications PLC,
5.95%, 1/15/18 | | | 100,000 | | | | 120 | |
| | CC Holdings GS V LLC, 3.849%, 4/15/23 144A | | | 90,000 | | | | 92 | |
| | Cellco Partnership/Verizon Wireless Capital LLC, 5.55%, 2/1/14 | | | 100,000 | | | | 105 | |
| | Cellco Partnership/Verizon Wireless Capital LLC, 8.50%, 11/15/18 | | | 60,000 | | | | 83 | |
| | Deutsche Telekom International Finance BV,
6.75%, 8/20/18 | | | 130,000 | | | | 161 | |
| | Verizon Communications, Inc.,
6.10%, 4/15/18 | | | 150,000 | | | | 184 | |
| | | | | | | | | | |
| | Total | | | | | | | 1,247 | |
| | | | | | | | | | |
| | | |
| | Total Corporate Bonds | | | | | | | | |
| | (Cost: $25,983) | | | | | | | 27,319 | |
| | | | | | | | | | |
| | | |
| | | Foreign Bonds (14.8%) | | Par | | | | |
| | |
| | Foreign Bonds (14.8%) | | | | | |
| | Bundesrepublik Deutschland Bundesobligation Inflation Linked Bond, 0.75%, 4/15/18 | | | 763,418 | | | | 1,099 | |
| | Commonwealth of Australia Treasury Indexed Bonds, 4.00%, 8/20/20 | | | 621,567 | | | | 831 | |
| | Deutsche Bundesrepublik Inflation Linked Bond, 0.10%, 4/15/23 | | | 733,533 | | | | 1,017 | |
| | Deutsche Bundesrepublik Inflation Linked Bond, 1.75%, 4/15/20 | | | 1,671,608 | | | | 2,613 | |
| | France Government Bond OAT,
1.10%, 7/25/22 | | | 3,401,742 | | | | 4,936 | |
| | France Government Bond OAT,
1.30%, 7/25/19 | | | 1,146,161 | | | | 1,704 | |
| | | | | | | | | | |
| | | Foreign Bonds (14.8%) | | Par | | | Value
$ (000’s) | |
| |
| | Foreign Bonds continued | |
| | France Government Bond OAT,
1.85%, 7/25/27 | | | 624,916 | | | | 986 | |
| | France Government Bond OAT,
2.25%, 7/25/20 | | | 2,629,662 | | | | 4,131 | |
| | Government of Canada Real Return Bonds, 4.25%, 12/1/21 | | | 705,854 | | | | 1,001 | |
| | Government of Canada Real Return Bonds, 4.25%, 12/1/26 | | | 834,612 | | | | 1,346 | |
| | Japanese Government CPI Linked Bond, 1.10%, 12/10/16 | | | 52,132,500 | | | | 648 | |
| | United Kingdom Gilt Inflation Linked, 1.875%, 11/22/22 | | | 1,932,854 | | | | 4,039 | |
| | United Kingdom Gilt Inflation Linked, 2.50%, 4/16/20 | | | 1,986,747 | | | | 4,113 | |
| | United Kingdom Gilt Inflation Linked, 2.50%, 7/17/24 | | | 4,132,677 | | | | 9,184 | |
| | | | | | | | | | |
| | Total Foreign Bonds | | | | | | | | |
| | (Cost: $36,808) | | | | | | | 37,648 | |
| | | | | | | | | | |
| | | |
| | | Governments (53.1%) | | $ Par | | | | |
| | |
| | Governments (53.1%) | | | | | |
| | US Treasury Inflation Index Bond, 0.125%, 4/15/16 | | | 1,047,980 | | | | 1,104 | |
| | US Treasury Inflation Index Bond, 0.125%, 4/15/17 | | | 3,870,072 | | | | 4,144 | |
| | US Treasury Inflation Index Bond, 0.125%, 1/15/22 | | | 1,430,842 | | | | 1,554 | |
| | US Treasury Inflation Index Bond, 0.125%, 7/15/22 | | | 8,550,150 | | | | 9,282 | |
| | US Treasury Inflation Index Bond, 0.50%, 4/15/15 | | | 7,471,870 | | | | 7,796 | |
| | US Treasury Inflation Index Bond, 0.625%, 7/15/21 | | | 8,426,251 | | | | 9,578 | |
| | US Treasury Inflation Index Bond, 0.75%, 2/15/42 | | | 5,169,786 | | | | 5,662 | |
| | US Treasury Inflation Index Bond, 1.125%, 1/15/21 | | | 11,196,281 | | | | 13,150 | |
| | US Treasury Inflation Index Bond, 1.25%, 7/15/20 | | | 1,484,518 | | | | 1,761 | |
| | US Treasury Inflation Index Bond, 1.375%, 1/15/20 | | | 3,316,101 | | | | 3,931 | |
| | | | | | | | | | |
| | | Governments (53.1%) | | Shares/
$ Par | | | Value
$ (000’s) | |
| |
| | Governments continued | |
| | US Treasury Inflation Index Bond,
1.625%, 1/15/15 | | | 3,634,350 | | | | 3,861 | |
| | US Treasury Inflation Index Bond,
1.625%, 1/15/18 | | | 883,336 | | | | 1,024 | |
| | US Treasury Inflation Index Bond,
1.75%, 1/15/28 | | | 2,644,487 | | | | 3,423 | |
| | US Treasury Inflation Index Bond,
1.875%, 7/15/19 | | | 541,685 | | | | 659 | |
| | US Treasury Inflation Index Bond,
2.00%, 1/15/26 | | | 4,545,333 | | | | 5,961 | |
| | US Treasury Inflation Index Bond,
2.125%, 2/15/40 | | | 3,141,125 | | | | 4,609 | |
| | US Treasury Inflation Index Bond,
2.125%, 2/15/41 | | | 5,107,211 | | | | 7,542 | |
| | US Treasury Inflation Index Bond,
2.125%, 1/15/19 | | | 4,174,964 | | | | 5,069 | |
| | US Treasury Inflation Index Bond,
2.375%, 1/15/17 | | | 458,820 | | | | 533 | |
| | US Treasury Inflation Index Bond,
2.375%, 1/15/25 | | | 4,172,412 | | | | 5,629 | |
| | US Treasury Inflation Index Bond,
2.375%, 1/15/27 | | | 3,125,711 | | | | 4,310 | |
| | US Treasury Inflation Index Bond,
2.50%, 7/15/16 | | | 4,295,325 | | | | 4,936 | |
| | US Treasury Inflation Index Bond,
2.50%, 1/15/29 | | | 5,349,341 | | | | 7,630 | |
| | US Treasury Inflation Index Bond,
3.375%, 4/15/32 | | | 2,013,459 | | | | 3,319 | |
| | US Treasury Inflation Index Bond,
3.625%, 4/15/28 | | | 5,291,740 | | | | 8,388 | |
| | US Treasury Inflation Index Bond,
3.875%, 4/15/29 | | | 6,120,929 | | | | 10,145 | |
| | | | | | | | | | |
| | Total Governments | | | | | | | | |
| | (Cost: $120,509) | | | | | | | 135,000 | |
| | | | | | | | | | |
| | | |
| | | Municipal Bonds (0.0%) | | | | | | |
| | |
| | Municipal Bonds (0.0%) | | | | | |
| | Bay Area Toll Authority, Series S-1, 6.918%, 4/1/40 RB | | | 15,000 | | | | 21 | |
The Accompanying Notes are an Integral Part of the Financial Statements.
| | | | |
| 124 | | Inflation Protection Portfolio | | |
Inflation Protection Portfolio
| | | | | | | | | | |
| | | Municipal Bonds (0.0%) | | Shares/
$ Par | | | Value
$ (000’s) | |
| |
| | Municipal Bonds continued | |
| | Department of Water and Power of the City of Los Angeles Power System, Series A, 5.716%, 7/1/39 RB | | | 15,000 | | | | 18 | |
| | Texas Transportation Commission State of Texas, Series 2009A, 5.517%, 4/1/39 GO | | | 30,000 | | | | 39 | |
| | | | | | | | | | |
| | Total Municipal Bonds | | | | | | | | |
| | (Cost: $60) | | | | | | | 78 | |
| | | | | | | | | | |
| |
| | | Structured Products (14.6%) | |
| | |
| | Structured Products (14.6%) | | | | | |
| | Banc of America Commercial Mortgage, Inc., Series 2004-1, Class A4, 4.76%, 11/10/39 | | | 350,000 | | | | 362 | |
| | Banc of America Commercial Mortgage, Inc., Series 2005-5, Class A4, 5.115%, 10/10/45 | | | 250,000 | | | | 277 | |
| | Banc of America Commercial Mortgage, Inc., Series 2005-5, Class AM, 5.176%, 10/10/45 | | | 200,000 | | | | 220 | |
| | Banc of America Mortgage Securities, Inc., Series 2004-7, Class 7A1, 5.00%, 8/25/19 | | | 102,373 | | | | 105 | |
| | BB-UBS Trust, Series 2012, Class A, 3.43%, 11/5/36 | | | 425,000 | | | | 436 | |
| | Citicorp Mortgage Securities, Inc., Series 2007-8, Class 1A3, 6.00%, 9/25/37 | | | 146,067 | | | | 152 | |
| | Countrywide Home Loan Mortgage Pass Through Trust, Series 2003-35, Class 1A3, 5.00%, 9/25/18 | | | 75,447 | | | | 78 | |
| | Credit Suisse Mortgage Capital Certificates, Series 2007-TF2A, Class A1, 0.389%, 4/15/22 144A | | | 82,369 | | | | 78 | |
| | Federal Home Loan Mortgage Corp., 4.00%, 5/1/42 | | | 10,274,109 | | | | 11,164 | |
| | Federal Home Loan Mortgage Corp., 4.50%, 4/1/41 | | | 7,943,693 | | | | 8,698 | |
| | | | | | | | | | |
| | | Structured Products (14.6%) | | Shares/
$ Par | | | Value
$ (000’s) | |
| |
| | Structured Products continued | |
| | Federal National Mortgage Association, 4.00%, 5/1/41 | | | 2,869,528 | | | | 3,079 | |
| | Federal National Mortgage Association, 4.00%, 9/1/41 | | | 6,438,100 | | | | 7,075 | |
| | GE Capital Commercial Mortgage Corp., Series 2005-C3, Class A5, 4.979%, 7/10/45 | | | 31,877 | | | | 32 | |
| | Greenwich Capital Commercial Funding Corp., Series 2005-GG3, Class A4, 4.799%, 8/10/42 | | | 100,000 | | | | 107 | |
| | Greenwich Capital Commercial Funding Corp., Series 2004-GG1, Class B, 5.426%, 6/10/36 | | | 150,000 | | | | 157 | |
| | GS Mortgage Securities Corp. II, Series 2012-ALOH, Class A, 3.551%, 4/10/34 | | | 400,000 | | | | 432 | |
| | GS Mortgage Securities Corp. II, Series 2005-GG4, Class A4A, 4.751%, 7/10/39 | | | 750,000 | | | | 809 | |
| | GS Mortgage Securities Corp. II, Series 2004-GG2, Class A6, 5.396%, 8/10/38 | | | 575,000 | | | | 608 | |
| | LB-UBS Commercial Mortgage Trust, Series 2004-C2, Class A4, 4.367%, 3/15/36 | | | 300,000 | | | | 311 | |
| | LB-UBS Commercial Mortgage Trust, Series 2004-C1, Class A4, 4.568%, 1/15/31 | | | 150,000 | | | | 156 | |
| | LB-UBS Commercial Mortgage Trust, Series 2005-C2, Class A4, 4.998%, 4/15/30 | | | 272,068 | | | | 278 | |
| | LB-UBS Commercial Mortgage Trust, Series 2005-C5, Class AM, 5.017%, 9/15/40 | | | 300,000 | | | | 326 | |
| | LB-UBS Commercial Mortgage Trust, Series 2005-C7, Class AM, 5.263%, 11/15/40 | | | 175,000 | | | | 192 | |
| | LB-UBS Commercial Mortgage Trust, Series 2004-C4, Class A4, 5.533%, 6/15/29 | | | 250,000 | | | | 266 | |
| | PHHMC Mortgage Pass-Through Certificates, Series 2007-6, Class A1,
6.002%, 12/18/37 | | | 181,932 | | | | 193 | |
| | | | | | | | | | |
| | | Structured Products (14.6%) | | Shares/
$ Par | | | Value
$ (000’s) | |
| |
| | Structured Products continued | |
| | Sequoia Mortgage Trust, Series 2011-1, Class A1, 4.125%, 2/25/41 | | | 251,706 | | | | 256 | |
| | Wells Fargo Mortgage Backed Securities, Series 2005-AR16, Class 1A1, 2.757%, 8/25/33 | | | 365,132 | | | | 374 | |
| | Wells Fargo Mortgage Backed Securities, Series 2005-AR14, Class A1, 5.331%, 8/25/35 | | | 171,917 | | | | 173 | |
| | Wells Fargo Mortgage Backed Securities, Series 2005-17, Class 1A1, 5.50%, 1/25/36 | | | 191,374 | | | | 198 | |
| | Wells Fargo Mortgage Backed Securities, Series 2007-3, Class 3A1, 5.50%, 4/25/22 | | | 90,362 | | | | 93 | |
| | Wells Fargo Mortgage Backed Securities, Series 2006-10, Class A4, 6.00%, 8/25/36 | | | 212,305 | | | | 220 | |
| | Wells Fargo Mortgage Backed Securities, Series 2007-AR10, Class 1A1, 6.056%, 1/25/38 | | | 157,690 | | | | 161 | |
| | | | | | | | | | |
| | Total Structured Products | | | | | | | | |
| | (Cost: $35,750) | | | | | | | 37,066 | |
| | | | | | | | | | |
| |
| | | Short-Term Investments (6.4%) | |
| |
| | Commercial Banks Non-US (3.1%) | |
| (k) | | BNP Paribas Finance, Inc., 0.14%, 1/3/13 | | | 8,000,000 | | | | 8,000 | |
| | | | | | | | | | |
| | Total | | | | | | | 8,000 | |
| | | | | | | | | | |
| | |
| | Other Holdings (3.3%) | | | | | |
| | JPMorgan Money Market Fund | | | 8,386,817 | | | | 8,387 | |
| | | | | | | | | | |
| | Total | | | | | | | 8,387 | |
| | | | | | | | | | |
| | | |
| | Total Short-Term Investments | | | | | | | | |
| | (Cost: $16,387) | | | | | | | 16,387 | |
| | | | | | | | | | |
| | | |
| | Total Investments (99.7%) | | | | | | | | |
| | (Cost: $235,497)(a) | | | | | | | 253,498 | |
| | | | | | | | | | |
| | Other Assets, Less | | | | | | | | |
| | Liabilities (0.3%) | | | | | | | 678 | |
| | | | | | | | | | |
| | Net Assets (100.0%) | | | | | | | 254,176 | |
| | | | | | | | | | |
The Accompanying Notes are an Integral Part of the Financial Statements.
| | | | | | |
| | Inflation Protection Portfolio | | | 125 | |
Inflation Protection Portfolio
144A after the name of a security represents a security exempt from registration under Rule 144A of the Securities Act of 1933. These securities may be resold as transactions exempt from registration, normally to qualified institutional buyers. At December 31, 2012 the value of these securities (in thousands) was $1,142 representing 0.5% of the net assets.
GO — General Obligation
RB — Revenue Bond
| (a) | At December 31, 2012 the aggregate cost of securities for federal tax purposes (in thousands) was $235,549 and the net unrealized appreciation of investments based on that cost was $17,949 which is comprised of $18,121 aggregate gross unrealized appreciation and $172 aggregate gross unrealized depreciation. |
| (h) | Forward foreign currency contracts outstanding on December 31, 2012. |
| | | | | | | | | | | | | | | | | | | | |
| Type | | Counterparty | | Currency | | Principal
Amount
Covered by
Contract (000’s) | | Settlement
Month | | Unrealized
Appreciation
(000’s) | | | Unrealized
(Depreciation)
(000’s) | | | Net Unrealized
Appreciation/
(Depreciation)
(000’s) | |
Buy | | HSBC Bank USA | | AUD | | 4,666 | | 1/13 | | $ | - | | | $ | (36 | ) | | $ | (36 | ) |
Sell | | Westpac Banking | | AUD | | 5,559 | | 1/13 | | | - | | | | (74 | ) | | | (74 | ) |
Buy | | HSBC Bank USA | | CAD | | 4,625 | | 1/13 | | | - | | | | (7 | ) | | | (7 | ) |
Sell | | Barclays Bank PLC | | CAD | | 6,761 | | 1/13 | | | - | | | | (16 | ) | | | (16 | ) |
Sell | | Westpac Banking | | CAD | | 181 | | 1/13 | | | - | | | | - | (m) | | | - | (m) |
Sell | | HSBC Bank USA | | EUR | | 12,450 | | 1/13 | | | - | | | | (211 | ) | | | (211 | ) |
Sell | | HSBC Bank USA | | GBP | | 4,885 | | 1/13 | | | - | | | | (89 | ) | | | (89 | ) |
Sell | | UBS AG | | GBP | | 5,765 | | 1/13 | | | - | | | | (139 | ) | | | (139 | ) |
Buy | | HSBC Bank USA | | JPY | | 145,801 | | 1/13 | | | - | | | | (91 | ) | | | (91 | ) |
Sell | | UBS AG | | JPY | | 200,815 | | 1/13 | | | 203 | | | | - | | | | 203 | |
| | | | | | | | | | | | | | | | | | | | |
| | | | | | | | | | $ | 203 | | | $ | (663 | ) | | $ | (460 | ) |
| | | | | | | | | | | | | | | | | | | | |
AUD — Australian Dollar
CAD — Canadian Dollar
EUR — Euro
GBP — British Pound
JPY — Japanese Yen
| (j) | Swap agreements outstanding on December 31, 2012. |
Total Return Swaps
| | | | | | | | | | | | | | |
| Reference Entity | | Counterparty | | Payment Made
by the Fund | | Payment
Received by the
Fund | | Expiration Date | | Notional
Amount (000’s) | | Unrealized
Appreciation/
(Depreciation)
(000’s) | |
U.S. Consumer Price Index - All Urban Consumers - Not Seasonally Adjusted (CPURNSA) | | Bank of America, N.A. | | 2.900% | | CPURNSA Index Total Return at Maturity | | 5/13 | | 2,500 | | $ | (164 | ) |
U.S. Consumer Price Index - All Urban Consumers - Not Seasonally Adjusted (CPURNSA) | | Bank of America, N.A. | | 1.765% | | CPURNSA Index Total Return at Maturity | | 8/14 | | 7,700 | | | 11 | |
U.S. Consumer Price Index - All Urban Consumers - Not Seasonally Adjusted (CPURNSA) | | Bank of America, N.A. | | 1.570% | | CPURNSA Index Total Return at Maturity | | 9/14 | | 5,000 | | | 45 | |
U.S. Consumer Price Index - All Urban Consumers - Not Seasonally Adjusted (CPURNSA) | | Bank of America, N.A. | | 1.870% | | CPURNSA Index Total Return at Maturity | | 9/16 | | 6,000 | | | 95 | |
U.S. Consumer Price Index - All Urban Consumers - Not Seasonally Adjusted (CPURNSA) | | Bank of America, N.A. | | 2.420% | | CPURNSA Index Total Return at Maturity | | 4/18 | | 2,000 | | | (8 | ) |
U.S. Consumer Price Index - All Urban Consumers - Not Seasonally Adjusted (CPURNSA) | | Bank of America, N.A. | | 2.510% | | CPURNSA Index Total Return at Maturity | | 3/19 | | 2,000 | | | (13 | ) |
The Accompanying Notes are an Integral Part of the Financial Statements.
| | | | |
| 126 | | Inflation Protection Portfolio | | |
Inflation Protection Portfolio
| | | | | | | | | | | | | | |
| Reference Entity | | Counterparty | | Payment Made
by the Fund | | Payment
Received by the
Fund | | Expiration Date | | Notional
Amount (000’s) | | Unrealized
Appreciation/
(Depreciation)
(000’s) | |
U.S. Consumer Price Index - All Urban Consumers - Not Seasonally Adjusted (CPURNSA) | | Bank of America, N.A. | | 2.640% | | CPURNSA Index Total Return at Maturity | | 2/20 | | 2,800 | | $ | (46 | ) |
U.S. Consumer Price Index - All Urban Consumers - Not Seasonally Adjusted (CPURNSA) | | Bank of America, N.A. | | 2.670% | | CPURNSA Index Total Return at Maturity | | 4/22 | | 3,000 | | | (24 | ) |
U.S. Consumer Price Index - All Urban Consumers - Not Seasonally Adjusted (CPURNSA) | | Barclays Bank PLC | | 2.770% | | CPURNSA Index Total Return at Maturity | | 6/14 | | 1,000 | | | (60 | ) |
U.S. Consumer Price Index - All Urban Consumers - Not Seasonally Adjusted (CPURNSA) | | Barclays Bank PLC | | 1.770% | | CPURNSA Index Total Return at Maturity | | 9/14 | | 1,000 | | | 3 | |
U.S. Consumer Price Index - All Urban Consumers - Not Seasonally Adjusted (CPURNSA) | | Barclays Bank PLC | | 2.095% | | CPURNSA Index Total Return at Maturity | | 10/15 | | 2,500 | | | (16 | ) |
U.S. Consumer Price Index - All Urban Consumers - Not Seasonally Adjusted (CPURNSA) | | Barclays Bank PLC | | 2.303% | | CPURNSA Index Total Return at Maturity | | 1/16 | | 1,700 | | | 7 | |
U.S. Consumer Price Index - All Urban Consumers - Not Seasonally Adjusted (CPURNSA) | | Barclays Bank PLC | | 2.520% | | CPURNSA Index Total Return at Maturity | | 5/16 | | 5,400 | | | (81 | ) |
U.S. Consumer Price Index - All Urban Consumers - Not Seasonally Adjusted (CPURNSA) | | Barclays Bank PLC | | 2.720% | | CPURNSA Index Total Return at Maturity | | 8/17 | | 2,000 | | | (131 | ) |
U.S. Consumer Price Index - All Urban Consumers - Not Seasonally Adjusted (CPURNSA) | | Barclays Bank PLC | | 2.345% | | CPURNSA Index Total Return at Maturity | | 9/17 | | 13,000 | | | 91 | |
U.S. Consumer Price Index - All Urban Consumers - Not Seasonally Adjusted (CPURNSA) | | Barclays Bank PLC | | 2.895% | | CPURNSA Index Total Return at Maturity | | 12/27 | | 1,700 | | | (91 | ) |
| | | | | | | | | | | | | | |
| | | | | | | | | | | | $ | (382 | ) |
| | | | | | | | | | | | | | |
| (k) | Securities with an aggregate value of $8,000 (in thousands) have been pledged as collateral for swap and forward currency contracts outstanding on December 31, 2012. |
| (m) | Amount is less than one thousand. |
The Accompanying Notes are an Integral Part of the Financial Statements.
| | | | | | |
| | Inflation Protection Portfolio | | | 127 | |
Inflation Protection Portfolio
The following is a summary of the inputs used in valuing the Portfolio’s assets and liabilities at December 31, 2012. See Note 3 for additional information on portfolio valuation.
| | | | | | | | | | | | | | |
| | | Valuation Inputs | | | |
| Description | | Level 1 – Quoted Prices | | | Level 2 –
Other Significant
Observable Inputs | | | Level 3 – Significant
Unobservable Inputs | | | |
| | | (Amounts in thousands) | | | |
Assets: | | | | | | | | | | | | | | |
US Government | | $ | - | | | $ | 135,000 | | | $ | - | | | |
Foreign Bonds | | | - | | | | 37,648 | | | | - | | | |
Municipal Bonds | | | - | | | | 78 | | | | - | | | |
Corporate Bonds | | | - | | | | 27,319 | | | | - | | | |
Structured Products | | | - | | | | 37,066 | | | | - | | | |
Short-Term Investments | | | 8,387 | | | | 8,000 | | | | - | | | |
Other Financial Instruments^ | | | | | | | | | | | | | | |
Forward Currency Contracts | | | - | | | | 203 | | | | - | | | |
Total Return Swaps | | | - | | | | 252 | | | | - | | | |
Liabilities: | | | | | | | | | | | | | | |
Other Financial Instruments^ | | | | | | | | | | | | | | |
Forward Currency Contracts | | $ | - | | | $ | (663 | ) | | $ | - | | | |
Total Return Swaps | | | - | | | | (634 | ) | | | - | | | |
Total | | $ | 8,387 | | | $ | 244,269 | | | $ | - | | | |
^ Other financial instruments are derivative instruments such as futures, forwards, written options and swaps contracts, which are valued at the unrealized appreciation (depreciation) on the instrument and short sales, which are valued at market value.
The Accompanying Notes are an Integral Part of the Financial Statements.
| | | | |
| 128 | | Inflation Protection Portfolio | | |
High Yield Bond Portfolio
| | | | |
| Objective: | | Portfolio Strategy: | | Net Assets: |
| High current income and capital appreciation. | | Invest primarily in non-investment grade debt securities. | | $461 million |
Portfolio Overview
Mason Street Advisors acts as the investment adviser for the High Yield Bond Portfolio (the “Portfolio”). Normally, the Portfolio invests in non-investment grade debt securities, which are securities that are rated below investment grade by at least one major rating agency or, if unrated, determined by management to be of comparable quality. The Portfolio may invest up to 30% of net assets in foreign securities. The primary investment strategy of the Portfolio is to identify, based on industry and credit analysis, and to invest in industries or individual companies that are attractively priced or which have stable or improving fundamental financial characteristics relative to the overall high yield market.
Market Overview
High yield bonds posted solid returns during 2012 amid considerable uncertainty resulting from an economic slowdown in China, fiscal and debt crises in Europe, and the slow pace of growth in the U.S. As these issues arose, policy makers responded with stimulus and financing measures that calmed markets and drove down yields across the fixed income markets. In this environment, investors accepted more risk, reaching for income in high yield bonds, where fundamentals continued to be solid and stable. Investors’ propensity for additional yield in 2012, led to lower rated CCCs outperforming higher rated B and BB bonds as an asset class in the high yield market.
Companies took advantage of historically low yields and strong demand from investors, producing a record amount of corporate bond issuance in 2012. Similarly, robust corporate profits and below average default rates made high yield an attractive investment during the year. For the year, the Barclays® U.S. Corporate High-Yield 2% Issuer Capped Index (the “Index”) returned 15.78%, while the Barclays® Aggregate Bond Index (a measure of broad, taxable bond market performance) returned 4.22%.
Portfolio Results
The Portfolio returned 13.89% for the twelve months ended December 31, 2012; by comparison, the Index returned 15.78%. (The Index is unmanaged, cannot be invested in directly and does not include administrative expenses or sales charges.) The average return for the Portfolio’s peer group, High Current Yield Funds, was 14.09%, according to Lipper® Analytical Services, Inc., an independent mutual fund ranking agency.
In 2012, the Portfolio was positioned somewhat less aggressively than the Index in terms of credit quality, leading to less return relative to the Index. Specifically, an underweight in lower-quality CCC bonds and an overweight in higher-quality BB and B bonds was held throughout the year. In general, the lowest quality bonds outperformed, as investors embraced risk. The Portfolio’s overweight position in higher rated B and BB bonds was the primary source of underperformance relative to the Index.
The Portfolio’s cash position, which is held intermittently in anticipation of identifying attractively valued bonds and for general management of asset flows, also dragged on performance relative to the Index. For fundamental investors in high yield, identifying and buying attractively valued bonds sometimes requires cash to be held intermittently, as does receiving payment for refinanced bonds and the general management of fund flows. While the high yield bond market posted double-digit returns, holding even a small amount of cash that yielded near 0.0% created a wide disparity in return.
Security selection produced mixed results relative to the Index. Selecting strong performers such as Ally Financial and Sprint helped generate outperformance relative to the Index, while holding Nextel International and not holding Royal Bank of Scotland hurt relative results.
Portfolio Manager Outlook
In our view, fundamentals in the high yield bond market should remain relatively sound in 2013. We do not expect either significant deterioration or vast improvements in the credit environment, which means the upside for bond prices may be more restrained than it was during 2012. Nevertheless, current yields of roughly 6% could go a long way toward delivering returns above inflation if the current rate of inflation remains flat. Given all of the economic uncertainty, we are likely to take a more cautious approach to risk and favor bonds rated BB and B, while underweighting potentially more volatile CCCs.
| | | | | | |
| | High Yield Bond Portfolio | | | 129 | |
High Yield Bond Portfolio
|
Relative Performance 
|
| | | | | | | | | | | | |
Average Annual Total Returns
For Periods Ended December 31, 2012 | |
| | | 1 Year | | | 5 Years | | | 10 Years | |
High Yield Bond Portfolio | | | 13.89% | | | | 9.31% | | | | 9.97% | |
Barclays® U.S. Corporate High Yield 2% Issuer Capped Index | | | 15.78% | | | | 10.45% | | | | 10.60% | |
Lipper® Variable Insurance Products (VIP) High Current Yield Funds Average | | | 14.09% | | | | 7.89% | | | | 8.97% | |
|
The performance data quoted represents past performance. Past performance is historical and does not guarantee future performance. Investment return and principal value will fluctuate, so that shares, when redeemed, may be worth more or less than their original cost. Current performance may be lower or higher than the performance data quoted. For the most recent month-end performance information visit www.northwesternmutual.com. |
This chart assumes an initial investment of $10,000 made on 12/31/02. Returns shown include deductions for management and other portfolio expenses, and reinvestment of all dividends. Returns exclude deductions for separate account sale loads and account fees. Please refer to the Benchmark Definitions section of this report for information about the indices cited in the above chart and graph. |
The Portfolio invests in lower quality securities, which may represent a significant risk for loss of principal and interest. Bonds and other debt obligations are affected by changes in interest rates, inflation risk and the creditworthiness of their issuers. High yield bonds generally have greater price swings and higher default risks than investment grade bonds. Return of principal is not guaranteed. When interest rates rise, bond prices fall. With a fixed income fund, when interest rates rise, the value of the fund’s existing bonds drops, which could negatively affect overall fund performance. |
|
| Investing in bonds issued by foreign corporations and governments carries additional risk, including foreign currency risk, and may increase the volatility of the Portfolio’s performance. |
Top 10 Fixed Income Holdings 12/31/12
| | | | |
Security Description | | | % of Net Assets | |
Sprint Nextel Corp., Various | | | 2.9% | |
HCA, Inc., Various | | | 2.1% | |
CIT Group, Inc., Various | | | 1.6% | |
International Lease Finance Corp., Various | | | 1.6% | |
DISH DBS Corp., Various | | | 1.6% | |
Chesapeake Energy Corp., Various | | | 1.6% | |
General Motors Financial Co., Various | | | 1.4% | |
Reynolds Group Issuer, Inc./Reynolds Group Issuer LLC/Reynolds Group Issuer LU, Various | | | 1.4% | |
First Data Corp., Various | | | 1.4% | |
The AES Corp., Various | | | 1.3% | |
Sector Allocation 12/31/12
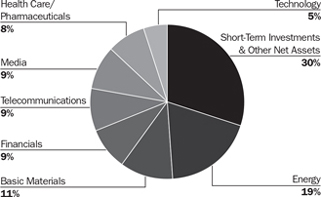
|
| Sector Allocation is based on Net Assets. |
| Sector Allocation and Top 10 Holdings are subject to change. |
| | | | |
| 130 | | High Yield Bond Portfolio | | |
High Yield Bond Portfolio
Schedule of Investments
December 31, 2012
| | | | | | | | |
| | | Common Stocks (0.4%) | | Shares/
$ Par | | | Value
$ (000’s) |
| |
| | Consumer Discretionary (0.0%) |
| * | | Motors Liquidation Co. GUC Trust | | | 3,977 | | | 84 |
| | | | | | | | |
| | Total | | | | | | 84 |
| | | | | | | | |
| |
| | Financials (0.2%) |
| * | | E*TRADE Financial Corp. | | | 105,647 | | | 946 |
| | | | | | | | |
| | Total | | | | | | 946 |
| | | | | | | | |
| |
| | Materials (0.2%) |
| (n)* | | Catalyst Paper Corp. | | | 20,223 | | | 24 |
| (n)* | | NewPage Group, Inc. | | | 6,020 | | | 563 |
| | | | | | | | |
| | Total | | | | | | 587 |
| | | | | | | | |
| | | |
| | Total Common Stocks | | | | | | |
| | (Cost: $1,423) | | | | | | 1,617 |
| | | | | | | | |
| | | |
| | | Preferred Stocks (1.0%) | | | | | |
| |
| | Financials (1.0%) |
| | Ally Financial, Inc, 7.00%, 2/4/13 144A | | | 1,302 | | | 1,279 |
| | Ally Financial, Inc., 8.50%, 5/15/16 | | | 93,329 | | | 2,452 |
| | GMAC Capital Trust I, 8.125%, 2/15/40 | | | 24,559 | | | 654 |
| | | | | | | | |
| | | |
| | Total Preferred Stocks | | | | | | |
| | (Cost: $3,856) | | | | | | 4,385 |
| | | | | | | | |
| | | |
| | | Bonds (89.0%) | | | | | |
| |
| | Aerospace/Defense (1.2%) |
| | B/E Aerospace, Inc., 5.25%, 4/1/22 | | | 730,000 | | | 774 |
| | Bombardier, Inc., 5.75%, 3/15/22 144A | | | 770,000 | | | 791 |
| | Bombardier, Inc., 7.75%, 3/15/20 144A | | | 1,240,000 | | | 1,407 |
| | Huntington Ingalls Industries, Inc., 6.875%, 3/15/18 | | | 550,000 | | | 598 |
| | Huntington Ingalls Industries, Inc., 7.125%, 3/15/21 | | | 550,000 | | | 598 |
| | TransDigm, Inc., 5.50%, 10/15/20 144A | | | 720,000 | | | 749 |
| | Triumph Group, Inc., 8.625%, 7/15/18 | | | 610,000 | | | 677 |
| | | | | | | | |
| | Total | | | | | | 5,594 |
| | | | | | | | |
| | | | | | | | | | |
| | | Bonds (89.0%) | | Shares/
$ Par | | | Value
$ (000’s) | |
| |
| | Autos/Vehicle Parts (3.6%) | |
| | American Axle & Manufacturing Holdings, Inc.,
6.625%, 10/15/22 | | | 355,000 | | | | 360 | |
| | American Axle & Manufacturing Holdings, Inc.,
7.875%, 3/1/17 | | | 1,055,000 | | | | 1,092 | |
| | American Axle & Manufacturing Holdings, Inc., 9.25%, 1/15/17 144A | | | 648,000 | | | | 719 | |
| | Chrysler Group LLC/CG Co-Issuer, Inc., 8.00%, 6/15/19 | | | 715,000 | | | | 779 | |
| | Chrysler Group LLC/CG Co-Issuer, Inc., 8.25%, 6/15/21 | | | 905,000 | | | | 996 | |
| | Cooper-Standard Automotive, Inc., 8.50%, 5/1/18 | | | 615,000 | | | | 661 | |
| | Exide Technologies, 8.625%, 2/1/18 | | | 740,000 | | | | 627 | |
| | Ford Motor Credit Co. LLC, 4.25%, 2/3/17 | | | 865,000 | | | | 927 | |
| | Ford Motor Credit Co. LLC, 5.00%, 5/15/18 | | | 855,000 | | | | 943 | |
| | Ford Motor Credit Co. LLC, 5.875%, 8/2/21 | | | 1,245,000 | | | | 1,450 | |
| | Ford Motor Credit Co. LLC, 8.125%, 1/15/20 | | | 1,590,000 | | | | 2,037 | |
| | General Motors Financial Co., Inc., 4.75%, 8/15/17 144A | | | 975,000 | | | | 1,025 | |
| | The Goodyear Tire & Rubber Co.,
8.25%, 8/15/20 | | | 820,000 | | | | 900 | |
| | Jaguar Land Rover PLC, 7.75%, 5/15/18 144A | | | 905,000 | | | | 987 | |
| | Navistar International Corp., 8.25%, 11/1/21 | | | 950,000 | | | | 917 | |
| | Tower Automotive Holdings USA LLC/TA Holdings Finance, Inc., 10.625%, 9/1/17 144A | | | 1,112,000 | | | | 1,218 | |
| | Visteon Corp., 6.75%, 4/15/19 | | | 688,000 | | | | 733 | |
| | | | | | | | | | |
| | Total | | | | | | | 16,371 | |
| | | | | | | | | | |
| |
| | Basic Materials (11.7%) | |
| | AK Steel Corp., 7.625%, 5/15/20 | | | 510,000 | | | | 444 | |
| | AK Steel Corp., 8.375%, 4/1/22 | | | 860,000 | | | | 740 | |
| | AK Steel Corp., 8.75%, 12/1/18 144A | | | 925,000 | | | | 976 | |
| | | | | | | | | | |
| | | Bonds (89.0%) | | Shares/
$ Par | | | Value
$ (000’s) | |
| |
| | Basic Materials continued | |
| | Aleris International, Inc., 7.625%, 2/15/18 | | | 460,000 | | | | 468 | |
| | Aleris International, Inc., 7.875%, 11/1/20 144A | | | 600,000 | | | | 600 | |
| | Alpha Natural Resources, Inc.,
6.00%, 6/1/19 | | | 1,790,000 | | | | 1,647 | |
| | Alpha Natural Resources, Inc.,
9.75%, 4/15/18 | | | 800,000 | | | | 864 | |
| | ArcelorMittal, 5.75%, 8/5/20 | | | 915,000 | | | | 917 | |
| | ArcelorMittal, 6.125%, 6/1/18 | | | 2,005,000 | | | | 2,032 | |
| | ArcelorMittal, 6.75%, 2/25/22 | | | 1,230,000 | | | | 1,291 | |
| | Arch Coal, Inc., 8.75%, 8/1/16 | | | 655,000 | | | | 681 | |
| | Arch Coal, Inc., 9.875%, 6/15/19 144A | | | 825,000 | | | | 858 | |
| | Ardagh Packaging Finance PLC, 7.375%, 10/15/17 144A | | | 485,000 | | | | 527 | |
| | Ardagh Packaging Finance PLC, 9.125%, 10/15/20 144A | | | 430,000 | | | | 469 | |
| | Ardagh Packaging Finance PLC/Ardagh MP Holdings USA, Inc., 9.125%, 10/15/20 144A | | | 445,000 | | | | 483 | |
| | Berry Plastics Corp., 8.25%, 11/15/15 | | | 680,000 | | | | 711 | |
| (c) | | Boe Merger Corp., 9.50%, 11/1/17 144A | | | 360,000 | | | | 360 | |
| | Cascades, Inc., 7.875%, 1/15/20 | | | 810,000 | | | | 863 | |
| (c) | | Catalyst Paper Corp., 11.00%, 10/30/17 | | | 350,456 | | | | 266 | |
| | Celanese US Holdings LLC, 4.625%, 11/15/22 | | | 825,000 | | | | 864 | |
| | Chemtura Corp., 7.875%, 9/1/18 | | | 615,000 | | | | 660 | |
| | Cloud Peak Energy Resources LLC/Cloud Peak Energy Finance Corp., 8.25%, 12/15/17 | | | 710,000 | | | | 760 | |
| | CONSOL Energy, Inc., 8.00%, 4/1/17 | | | 1,545,000 | | | | 1,672 | |
| | CONSOL Energy, Inc., 8.25%, 4/1/20 | | | 1,540,000 | | | | 1,667 | |
The Accompanying Notes are an Integral Part of the Financial Statements.
| | | | | | |
| | High Yield Bond Portfolio | | | 131 | |
High Yield Bond Portfolio
| | | | | | | | | | |
| | | Bonds (89.0%) | | Shares/
$ Par | | | Value
$ (000’s) | |
| | |
| | Basic Materials continued | | | | | |
| | Essar Steel Algoma, Inc., 9.375%, 3/15/15 144A | | | 920,000 | | | | 833 | |
| | FMG Resources (August 2006) Pty, Ltd., 6.00%, 4/1/17 144A | | | 575,000 | | | | 586 | |
| | FMG Resources (August 2006) Pty, Ltd., 6.875%, 2/1/18 144A | | | 635,000 | | | | 656 | |
| | FMG Resources (August 2006) Pty, Ltd., 6.875%, 4/1/22 144A | | | 765,000 | | | | 782 | |
| | FMG Resources (August 2006) Pty, Ltd., 7.00%, 11/1/15 144A | | | 1,230,000 | | | | 1,291 | |
| | FMG Resources (August 2006) Pty, Ltd., 8.25%, 11/1/19 144A | | | 1,215,000 | | | | 1,294 | |
| | GrafTech International, Ltd., 6.375%, 11/15/20 144A | | | 370,000 | | | | 383 | |
| | Hexion US Finance Corp., 6.625%, 4/15/20 | | | 405,000 | | | | 412 | |
| | Hexion US Finance Corp./Hexion Nova Scotia Finance ULC, 8.875%, 2/1/18 | | | 1,255,000 | | | | 1,289 | |
| | HudBay Minerals, Inc., 9.50%, 10/1/20 144A | | | 405,000 | | | | 428 | |
| | Huntsman International LLC, 4.875%, 11/15/20 144A | | | 1,385,000 | | | | 1,401 | |
| | Ineos Finance PLC, 7.50%, 5/1/20 144A | | | 400,000 | | | | 419 | |
| | Ineos Finance PLC, 8.375%, 2/15/19 144A | | | 540,000 | | | | 582 | |
| | Inmet Mining Corp., 7.50%, 6/1/21 144A | | | 245,000 | | | | 254 | |
| | Molycorp, Inc., 10.00%, 6/1/20 144A | | | 1,230,000 | | | | 1,144 | |
| | New Gold, Inc., 6.25%, 11/15/22 144A | | | 370,000 | | | | 383 | |
| (d) | | Patriot Coal Corp., 8.25%, 4/30/18 | | | 780,000 | | | | 388 | |
| | Peabody Energy Corp., 4.75%, 12/15/41 | | | 1,950,000 | | | | 1,860 | |
| | Peabody Energy Corp., 6.00%, 11/15/18 | | | 1,705,000 | | | | 1,812 | |
| | Peabody Energy Corp., 6.25%, 11/15/21 | | | 610,000 | | | | 648 | |
| | Peabody Energy Corp., 6.50%, 9/15/20 | | | 765,000 | | | | 820 | |
| | | | | | | | | | |
| | | Bonds (89.0%) | | Shares/
$ Par | | | Value
$ (000’s) | |
| | |
| | Basic Materials continued | | | | | |
| | Quadra FNX Mining, Ltd., 7.75%, 6/15/19 144A | | | 905,000 | | | | 939 | |
| | Rain CII Carbon LLC/CII Carbon Corp., 8.25%, 1/15/21 144A | | | 310,000 | | | | 317 | |
| | Resolute Forest Products, 10.25%, 10/15/18 | | | 727,000 | | | | 832 | |
| | Reynolds Group Issuer, Inc./Reynolds Group Issuer LLC/Reynolds Group Issuer LU, 5.75%, 10/15/20 144A | | | 1,345,000 | | | | 1,389 | |
| | Reynolds Group Issuer, Inc./Reynolds Group Issuer LLC/Reynolds Group Issuer LU, 6.875%, 2/15/21 | | | 205,000 | | | | 221 | |
| | Reynolds Group Issuer, Inc./Reynolds Group Issuer LLC/Reynolds Group Issuer LU, 7.125%, 4/15/19 | | | 1,340,000 | | | | 1,440 | |
| | Reynolds Group Issuer, Inc./Reynolds Group Issuer LLC/Reynolds Group Issuer LU, 7.875%, 8/15/19 | | | 485,000 | | | | 540 | |
| | Reynolds Group Issuer, Inc./Reynolds Group Issuer LLC/Reynolds Group Issuer LU, 8.25%, 2/15/21 | | | 740,000 | | | | 751 | |
| | Reynolds Group Issuer, Inc./Reynolds Group Issuer LLC/Reynolds Group Issuer LU, 9.00%, 4/15/19 | | | 1,070,000 | | | | 1,113 | |
| | Reynolds Group Issuer, Inc./Reynolds Group Issuer LLC/Reynolds Group Issuer LU, 9.875%, 8/15/19 | | | 1,010,000 | | | | 1,081 | |
| | Rockwood Specialties Group, Inc., 4.625%, 10/15/20 | | | 1,490,000 | | | | 1,542 | |
| | Sawgrass Merger Sub, Inc., 8.75%, 12/15/20 144A | | | 310,000 | | | | 312 | |
| | Sealed Air Corp., 6.50%, 12/1/20 144A | | | 370,000 | | | | 400 | |
| | Sealed Air Corp., 8.125%, 9/15/19 144A | | | 425,000 | | | | 478 | |
| | Sealed Air Corp., 8.375%, 9/15/21 144A | | | 785,000 | | | | 897 | |
| | Severstal Columbus LLC, 10.25%, 2/15/18 | | | 940,000 | | | | 989 | |
| | Steel Dynamics, Inc., 6.125%, 8/15/19 144A | | | 385,000 | | | | 408 | |
| | Steel Dynamics, Inc., 6.375%, 8/15/22 144A | | | 385,000 | | | | 408 | |
| | | | | | | | | | |
| | | Bonds (89.0%) | | Shares/
$ Par | | | Value
$ (000’s) | |
| | |
| | Basic Materials continued | | | | | |
| | Thompson Creek Metals Co., Inc.,
7.375%, 6/1/18 | | | 305,000 | | | | 250 | |
| | United States Steel Corp., 7.375%, 4/1/20 | | | 930,000 | | | | 993 | |
| | Verso Paper Holdings LLC/Verso Paper, Inc., 8.75%, 2/1/19 | | | 430,000 | | | | 163 | |
| | | | | | | | | | |
| | Total | | | | | | | 53,948 | |
| | | | | | | | | | |
| | |
| | Builders/Building Materials (0.6%) | | | | | |
| | KB Home,
7.25%, 6/15/18 | | | 610,000 | | | | 663 | |
| | KB Home,
9.10%, 9/15/17 | | | 720,000 | | | | 837 | |
| | USG Corp., 7.875%, 3/30/20 144A | | | 575,000 | | | | 640 | |
| | Vulcan Materials Co., 6.40%, 11/30/17 | | | 760,000 | | | | 830 | |
| | | | | | | | | | |
| | Total | | | | | | | 2,970 | |
| | | | | | | | | | |
| | |
| | Capital Goods (1.1%) | | | | | |
| | Case New Holland, Inc., 7.875%, 12/1/17 | | | 1,015,000 | | | | 1,200 | |
| | CNH Capital LLC, 3.875%, 11/1/15 144A | | | 280,000 | | | | 289 | |
| | CNH Capital LLC, 6.25%, 11/1/16 | | | 485,000 | | | | 535 | |
| | JMC Steel Group, 8.25%, 3/15/18 144A | | | 405,000 | | | | 423 | |
| | The Manitowoc Co., Inc., 5.875%, 10/15/22 | | | 300,000 | | | | 300 | |
| | SPX Corp.,
6.875%, 9/1/17 | | | 615,000 | | | | 686 | |
| | Terex Corp.,
6.00%, 5/15/21 | | | 620,000 | | | | 653 | |
| | United Rentals North America, Inc., 5.75%, 7/15/18 144A | | | 290,000 | | | | 312 | |
| | United Rentals North America, Inc., 6.125%, 6/15/23 | | | 300,000 | | | | 317 | |
| | United Rentals North America, Inc., 7.375%, 5/15/20 144A | | | 405,000 | | | | 444 | |
| | | | | | | | | | |
| | Total | | | | | | | 5,159 | |
| | | | | | | | | | |
| | |
| | Consumer Products/Retailing (2.7%) | | | | | |
| | AMC Networks, Inc., 4.75%, 12/15/22 | | | 615,000 | | | | 618 | |
| | AutoNation, Inc., 5.50%, 2/1/20 | | | 540,000 | | | | 580 | |
| | Brookfield Residential Properties, Inc., 6.50%, 12/15/20 144A | | | 430,000 | | | | 441 | |
| | Hanesbrands, Inc., 6.375%, 12/15/20 | | | 615,000 | | | | 676 | |
| | Levi Strauss & Co., 6.875%, 5/1/22 | | | 575,000 | | | | 617 | |
| | Levi Strauss & Co., 7.625%, 5/15/20 | | | 615,000 | | | | 670 | |
The Accompanying Notes are an Integral Part of the Financial Statements.
| | | | |
| 132 | | High Yield Bond Portfolio | | |
High Yield Bond Portfolio
| | | | | | | | | | |
| | | Bonds (89.0%) | | Shares/
$ Par | | | Value
$ (000’s) | |
| |
| | Consumer Products/Retailing continued | |
| | Limited Brands, Inc., 5.625%, 2/15/22 | | | 495,000 | | | | 538 | |
| | Limited Brands, Inc., 8.50%, 6/15/19 | | | 580,000 | | | | 708 | |
| | PVH Corp.,
4.50%, 12/15/22 | | | 265,000 | | | | 268 | |
| | Revlon Consumer Products Corp.,
9.75%, 11/15/15 | | | 675,000 | | | | 710 | |
| | Rite Aid Corp., 7.50%, 3/1/17 | | | 377,000 | | | | 387 | |
| | Rite Aid Corp., 10.375%, 7/15/16 | | | 470,000 | | | | 497 | |
| | Sally Holdings LLC/Sally Capital, Inc., 5.75%, 6/1/22 | | | 60,000 | | | | 65 | |
| | Sally Holdings LLC/Sally Capital, Inc., 6.875%, 11/15/19 | | | 425,000 | | | | 470 | |
| | Spectrum Brands Escrow Corp., 6.375%, 11/15/20 144A | | | 90,000 | | | | 95 | |
| | Spectrum Brands Escrow Corp., 6.625%, 11/15/22 144A | | | 155,000 | | | | 166 | |
| | Spectrum Brands, Inc., 9.50%, 6/15/18 | | | 830,000 | | | | 942 | |
| | SUPERVALU, Inc., 7.50%, 11/15/14 | | | 390,000 | | | | 378 | |
| | SUPERVALU, Inc., 8.00%, 5/1/16 | | | 1,420,000 | | | | 1,353 | |
| | Toys R US Property Co. I LLC, 10.75%, 7/15/17 | | | 815,000 | | | | 878 | |
| | Toys R US Property Co. II LLC, 8.50%, 12/1/17 | | | 810,000 | | | | 859 | |
| | Toys R US, Inc., 7.375%, 9/1/16 144A | | | 465,000 | | | | 475 | |
| | | | | | | | | | |
| | Total | | | | | | | 12,391 | |
| | | | | | | | | | |
| |
| | Energy (18.5%) | |
| | Access Midstream Partners LP/ACMP Finance Corp.,
4.875%, 5/15/23 | | | 820,000 | | | | 832 | |
| | Access Midstream Partners LP/ACMP Finance Corp.,
6.125%, 7/15/22 | | | 685,000 | | | | 738 | |
| | AmeriGas Finance LLC/AmeriGas Finance Corp.,
6.75%, 5/20/20 | | | 915,000 | | | | 1,004 | |
| | AmeriGas Partners LP/AmeriGas Finance Corp.,
6.25%, 8/20/19 | | | 1,185,000 | | | | 1,268 | |
| | | | | | | | | | |
| | | Bonds (89.0%) | | Shares/
$ Par | | | Value
$ (000’s) | |
| |
| | Energy continued | |
| | Atlas Pipeline Partners LP/Atlas Pipeline Finance Corp., 6.625%, 10/1/20 144A | | | 790,000 | | | | 818 | |
| | Atwood Oceanics, Inc., 6.50%, 2/1/20 | | | 340,000 | | | | 365 | |
| | Bill Barrett Corp., 7.00%, 10/15/22 | | | 860,000 | | | | 886 | |
| | Bill Barrett Corp., 7.625%, 10/1/19 | | | 1,280,000 | | | | 1,350 | |
| | Bristow Group, Inc., 6.25%, 10/15/22 | | | 300,000 | | | | 321 | |
| | Carrizo Oil & Gas, Inc., 7.50%, 9/15/20 | | | 445,000 | | | | 457 | |
| | Carrizo Oil & Gas, Inc., 8.625%, 10/15/18 | | | 1,000,000 | | | | 1,080 | |
| | Chaparral Energy, Inc., 8.25%, 9/1/21 | | | 615,000 | | | | 667 | |
| | Chesapeake Energy Corp., 2.50%, 5/15/37 | | | 1,640,000 | | | | 1,472 | |
| | Chesapeake Energy Corp., 6.125%, 2/15/21 | | | 1,400,000 | | | | 1,452 | |
| | Chesapeake Energy Corp., 6.875%, 11/15/20 | | | 1,255,000 | | | | 1,360 | |
| | Chesapeake Energy Corp., 7.25%, 12/15/18 | | | 750,000 | | | | 817 | |
| | Chesapeake Energy Corp., 9.50%, 2/15/15 | | | 765,000 | | | | 864 | |
| | Chesapeake Oilfield Operating LLC/Chesapeake Oilfield Finance, Inc., 6.625%, 11/15/19 144A | | | 425,000 | | | | 401 | |
| | Cimarex Energy Co., 5.875%, 5/1/22 | | | 960,000 | | | | 1,051 | |
| | CITGO Petroleum Corp., 11.50%, 7/1/17 144A | | | 570,000 | | | | 658 | |
| | Compagnie Generale de Geophysique-Veritas, 9.50%, 5/15/16 | | | 905,000 | | | | 971 | |
| | Comstock Resources, Inc., 7.75%, 4/1/19 | | | 615,000 | | | | 624 | |
| | Comstock Resources, Inc., 9.50%, 6/15/20 | | | 955,000 | | | | 1,027 | |
| | Concho Resources, Inc., 5.50%, 4/1/23 | | | 585,000 | | | | 613 | |
| | Concho Resources, Inc., 7.00%, 1/15/21 | | | 615,000 | | | | 686 | |
| | Continental Resources, Inc., 5.00%, 9/15/22 | | | 1,235,000 | | | | 1,331 | |
| | Crosstex Energy LP/Crosstex Energy Finance Corp., 8.875%, 2/15/18 | | | 1,200,000 | | | | 1,296 | |
| | Denbury Resources, Inc., 8.25%, 2/15/20 | | | 947,000 | | | | 1,065 | |
| | | | | | | | | | |
| | | Bonds (89.0%) | | Shares/
$ Par | | | Value
$ (000’s) | |
| |
| | Energy continued | |
| | Drill Rigs Holdings, Inc., 6.50%, 10/1/17 144A | | | 1,015,000 | | | | 1,010 | |
| | El Paso LLC, 7.25%, 6/1/18 | | | 590,000 | | | | 682 | |
| | El Paso LLC, 7.75%, 1/15/32 | | | 1,095,000 | | | | 1,287 | |
| | Energy Transfer Equity LP, 7.50%, 10/15/20 | | | 1,580,000 | | | | 1,825 | |
| | EP Energy LLC/EP Energy Finance, Inc., 9.375%, 5/1/20 | | | 1,435,000 | | | | 1,618 | |
| | EP Energy LLC/Everest Acquisition Finance, Inc.,
7.75%, 9/1/22 | | | 290,000 | | | | 307 | |
| | Exterran Holdings, Inc., 7.25%, 12/1/18 | | | 1,115,000 | | | | 1,182 | |
| | Forest Oil Corp., 7.25%, 6/15/19 | | | 725,000 | | | | 729 | |
| | Forest Oil Corp., 7.50%, 9/15/20 144A | | | 620,000 | | | | 651 | |
| | Hiland Partners LP/Hiland Partners Finance Corp., 7.25%, 10/1/20 144A | | | 300,000 | | | | 321 | |
| | Hilcorp Energy I LP/Hilcorp Finance Co., 7.625%, 4/15/21 144A | | | 485,000 | | | | 529 | |
| | Hilcorp Energy I LP/Hilcorp Finance Co., 8.00%, 2/15/20 144A | | | 940,000 | | | | 1,029 | |
| | Hornbeck Offshore Services, Inc., 5.875%, 4/1/20 | | | 345,000 | | | | 361 | |
| | Inergy Midstream LP/NRGM Finance Corp., 6.00%, 12/15/20 144A | | | 495,000 | | | | 511 | |
| | Key Energy Services, Inc., 6.75%, 3/1/21 | | | 875,000 | | | | 875 | |
| | Kodiak Oil & Gas Corp., 8.125%, 12/1/19 | | | 855,000 | | | | 943 | |
| | Linn Energy LLC/Linn Energy Finance Corp., 6.25%, 11/1/19 144A | | | 1,155,000 | | | | 1,161 | |
| | Linn Energy LLC/Linn Energy Finance Corp., 6.50%, 5/15/19 | | | 1,440,000 | | | | 1,454 | |
| | Linn Energy LLC/Linn Energy Finance Corp., 7.75%, 2/1/21 | | | 730,000 | | | | 777 | |
| | Magnum Hunter Resources Corp., 9.75%, 5/15/20 144A | | | 1,235,000 | | | | 1,281 | |
| | MarkWest Energy Partners LP/MarkWest Energy Finance Corp., 5.50%, 2/15/23 | | | 985,000 | | | | 1,069 | |
The Accompanying Notes are an Integral Part of the Financial Statements.
| | | | | | |
| | High Yield Bond Portfolio | | | 133 | |
High Yield Bond Portfolio
| | | | | | | | | | |
| | | Bonds (89.0%) | | Shares/
$ Par | | | Value
$ (000’s) | |
| |
| | Energy continued | |
| | MarkWest Energy Partners LP/MarkWest Energy Finance Corp., 6.25%, 6/15/22 | | | 545,000 | | | | 594 | |
| | MarkWest Energy Partners LP/MarkWest Energy Finance Corp., 6.75%, 11/1/20 | | | 615,000 | | | | 670 | |
| | MEG Energy Corp., 6.375%, 1/30/23 144A | | | 870,000 | | | | 907 | |
| | Newfield Exploration Co., 5.625%, 7/1/24 | | | 375,000 | | | | 405 | |
| | Newfield Exploration Co., 7.125%, 5/15/18 | | | 975,000 | | | | 1,029 | |
| | NGPL PipeCo LLC, 9.625%, 6/1/19 144A | | | 285,000 | | | | 328 | |
| | Northern Tier Energy LLC/Northern Tier Finance Corp., 7.125%, 11/15/20 144A | | | 430,000 | | | | 445 | |
| | Oasis Petroleum, Inc., 6.50%, 11/1/21 | | | 1,090,000 | | | | 1,158 | |
| | Offshore Group Investment, Ltd., 7.50%, 11/1/19 144A | | | 1,505,000 | | | | 1,520 | |
| | Offshore Group Investment, Ltd., 11.50%, 8/1/15 | | | 545,000 | | | | 594 | |
| | OGX Austria GmbH, 8.50%, 6/1/18 144A | | | 1,285,000 | | | | 1,156 | |
| | Oil States International, Inc., 5.125%, 1/15/23 144A | | | 405,000 | | | | 411 | |
| | Oil States International, Inc., 6.50%, 6/1/19 | | | 605,000 | | | | 644 | |
| | Pacific Drilling V, Ltd., 7.25%, 12/1/17 144A | | | 1,255,000 | | | | 1,302 | |
| | PBF Holding Co. LLC/PBF Finance Corp., 8.25%, 2/15/20 144A | | | 1,125,000 | | | | 1,212 | |
| | Penn Virginia Resource Partners LP/Penn Virginia Resource Finance Corp. II, 8.375%, 6/1/20 144A | | | 860,000 | | | | 927 | |
| | Petroleum Geo-Services ASA, 7.375%, 12/15/18 144A | | | 910,000 | | | | 983 | |
| | Plains Exploration & Production Co., 6.125%, 6/15/19 | | | 1,150,000 | | | | 1,254 | |
| | Plains Exploration & Production Co., 6.625%, 5/1/21 | | | 850,000 | | | | 936 | |
| | Plains Exploration & Production Co., 6.75%, 2/1/22 | | | 565,000 | | | | 634 | |
| | | | | | | | | | |
| | | Bonds (89.0%) | | Shares/
$ Par | | | Value
$ (000’s) | |
| |
| | Energy continued | |
| | Plains Exploration & Production Co., 8.625%, 10/15/19 | | | 745,000 | | | | 847 | |
| | QEP Resources, Inc., 5.25%, 5/1/23 | | | 590,000 | | | | 631 | |
| | QEP Resources, Inc., 6.875%, 3/1/21 | | | 1,130,000 | | | | 1,302 | |
| | Range Resources Corp., 5.00%, 8/15/22 | | | 575,000 | | | | 601 | |
| | Range Resources Corp., 5.75%, 6/1/21 | | | 725,000 | | | | 776 | |
| | Regency Energy Partners LP/Regency Energy Finance Corp., 5.50%, 4/15/23 | | | 420,000 | | | | 448 | |
| | Rosetta Resources, Inc., 9.50%, 4/15/18 | | | 615,000 | | | | 683 | |
| | Samson Investment Co., 9.75%, 2/15/20 144A | | | 1,890,000 | | | | 1,999 | |
| | SandRidge Energy, Inc., 7.50%, 3/15/21 | | | 1,035,000 | | | | 1,107 | |
| | SandRidge Energy, Inc., 7.50%, 2/15/23 | | | 580,000 | | | | 621 | |
| | SandRidge Energy, Inc., 8.00%, 6/1/18 144A | | | 470,000 | | | | 498 | |
| | SandRidge Energy, Inc., 9.875%, 5/15/16 | | | 910,000 | | | | 981 | |
| | SESI LLC, 6.375%, 5/1/19 | | | 965,000 | | | | 1,033 | |
| | SESI LLC, 6.875%, 6/1/14 | | | 573,000 | | | | 574 | |
| | SM Energy Co., 6.50%, 11/15/21 | | | 460,000 | | | | 492 | |
| | SM Energy Co., 6.50%, 1/1/23 | | | 335,000 | | | | 358 | |
| | SM Energy Co., 6.625%, 2/15/19 | | | 610,000 | | | | 644 | |
| | Swift Energy Co., 7.875%, 3/1/22 144A | | | 300,000 | | | | 313 | |
| | Swift Energy Co., 8.875%, 1/15/20 | | | 900,000 | | | | 979 | |
| | Targa Resources Partners LP/Targa Resources Partners Finance Corp., 5.25%, 5/1/23 144A | | | 725,000 | | | | 750 | |
| | Targa Resources Partners LP/Targa Resources Partners Finance Corp., 6.375%, 8/1/22 144A | | | 540,000 | | | | 589 | |
| | Tesoro Corp., 4.25%, 10/1/17 | | | 395,000 | | | | 409 | |
| | Tesoro Corp., 5.375%, 10/1/22 | | | 395,000 | | | | 421 | |
| | Tesoro Logistics LP/Tesoro Logistics Finance Corp., 5.875%, 10/1/20 144A | | | 420,000 | | | | 436 | |
| | Trinidad Drilling, Ltd., 7.875%, 1/15/19 144A | | | 925,000 | | | | 983 | |
| | | | | | | | | | |
| | | Bonds (89.0%) | | Shares/
$ Par | | | Value
$ (000’s) | |
| |
| | Energy continued | |
| | Unit Corp., 6.625%, 5/15/21 144A | | | 695,000 | | | | 713 | |
| | Venoco, Inc., 8.875%, 2/15/19 | | | 740,000 | | | | 694 | |
| | W&T Offshore, Inc., 8.50%, 6/15/19 144A | | | 750,000 | | | | 806 | |
| | W&T Offshore, Inc., 8.50%, 6/15/19 | | | 905,000 | | | | 973 | |
| | WPX Energy, Inc., 5.25%, 1/15/17 | | | 545,000 | | | | 578 | |
| | WPX Energy, Inc., 6.00%, 1/15/22 | | | 685,000 | | | | 738 | |
| | | | | | | | | | |
| | Total | | | | | | | 85,162 | |
| | | | | | | | | | |
| | | |
| | Financials (8.8%) | | | | | | | | |
| | AerCap Aviation Solutions BV, 6.375%, 5/30/17 | | | 690,000 | | | | 724 | |
| | Air Lease Corp., 5.625%, 4/1/17 | | | 1,915,000 | | | | 2,030 | |
| | Aircastle, Ltd., 6.25%, 12/1/19 144A | | | 435,000 | | | | 453 | |
| | Aircastle, Ltd., 6.75%, 4/15/17 | | | 920,000 | | | | 989 | |
| | Aircastle, Ltd., 7.625%, 4/15/20 | | | 285,000 | | | | 318 | |
| | Ally Financial, Inc., 4.625%, 6/26/15 | | | 845,000 | | | | 881 | |
| | Ally Financial, Inc., 5.50%, 2/15/17 | | | 990,000 | | | | 1,059 | |
| | Ally Financial, Inc., 7.50%, 9/15/20 | | | 925,000 | | | | 1,117 | |
| | Ally Financial, Inc., 8.00%, 3/15/20 | | | 2,070,000 | | | | 2,536 | |
| | AmSouth Bank, 5.20%, 4/1/15 | | | 930,000 | | | | 972 | |
| | AWAS Aviation Capital, Ltd., 7.00%, 10/17/16 144A | | | 1,656,400 | | | | 1,748 | |
| | CIT Group, Inc., 4.25%, 8/15/17 | | | 1,160,000 | | | | 1,194 | |
| | CIT Group, Inc., 4.75%, 2/15/15 144A | | | 1,300,000 | | | | 1,352 | |
| | CIT Group, Inc., 5.00%, 5/15/17 | | | 575,000 | | | | 609 | |
| | CIT Group, Inc., 5.00%, 8/15/22 | | | 870,000 | | | | 928 | |
| | CIT Group, Inc., 5.25%, 3/15/18 | | | 1,915,000 | | | | 2,049 | |
| | CIT Group, Inc., 5.375%, 5/15/20 | | | 765,000 | | | | 836 | |
| | CIT Group, Inc., 5.50%, 2/15/19 144A | | | 535,000 | | | | 583 | |
| | E*TRADE Financial Corp., 6.00%, 11/15/17 | | | 1,240,000 | | | | 1,268 | |
| | E*TRADE Financial Corp., 6.375%, 11/15/19 | | | 620,000 | | | | 635 | |
| | E*TRADE Financial Corp., 6.75%, 6/1/16 | | | 605,000 | | | | 637 | |
The Accompanying Notes are an Integral Part of the Financial Statements.
| | | | |
| 134 | | High Yield Bond Portfolio | | |
High Yield Bond Portfolio
| | | | | | | | | | |
| | | Bonds (89.0%) | | Shares/
$ Par | | | Value
$ (000’s) | |
| |
| | Financials continued | |
| | Icahn Enterprises LP/Icahn Enterprises Finance Corp., 7.75%, 1/15/16 | | | 410,000 | | | | 425 | |
| | Icahn Enterprises LP/Icahn Enterprises Finance Corp., 8.00%, 1/15/18 | | | 965,000 | | | | 1,036 | |
| (c) | | Igloo Holdings Corp., 8.25%, 12/15/17 144A | | | 430,000 | | | | 425 | |
| | International Lease Finance Corp., 5.75%, 5/15/16 | | | 660,000 | | | | 696 | |
| | International Lease Finance Corp., 6.25%, 5/15/19 | | | 660,000 | | | | 703 | |
| | International Lease Finance Corp., 7.125%, 9/1/18 144A | | | 1,325,000 | | | | 1,537 | |
| | International Lease Finance Corp., 8.625%, 9/15/15 | | | 1,235,000 | | | | 1,388 | |
| | International Lease Finance Corp., 8.75%, 3/15/17 | | | 1,840,000 | | | | 2,125 | |
| | International Lease Finance Corp., 8.875%, 9/1/17 | | | 925,000 | | | | 1,087 | |
| | JPMorgan Chase & Co., 7.90%, 4/29/49 | | | 1,120,000 | | | | 1,269 | |
| | Regions Financial Corp., 7.75%, 11/10/14 | | | 1,795,000 | | | | 1,990 | |
| | The Royal Bank of Scotland Group PLC, 6.125%, 12/15/22 | | | 1,230,000 | | | | 1,298 | |
| | SLM Corp., 6.00%, 1/25/17 | | | 880,000 | | | | 953 | |
| | SLM Corp., 8.00%, 3/25/20 | | | 965,000 | | | | 1,103 | |
| | SLM Corp., 8.45%, 6/15/18 | | | 970,000 | | | | 1,135 | |
| | Wells Fargo & Co., 7.98%, 3/29/49 | | | 560,000 | | | | 643 | |
| | | | | | | | | | |
| | Total | | | | | | | 40,731 | |
| | | | | | | | | | |
| |
| | Foods (2.6%) | |
| (c) | | Alphabet Holding Co., Inc., 7.75%, 11/1/17 144A | | | 300,000 | | | | 309 | |
| | Bumble Bee Acquisition Corp., 9.00%, 12/15/17 144A | | | 851,000 | | | | 915 | |
| | Constellation Brands, Inc., 6.00%, 5/1/22 | | | 220,000 | | | | 252 | |
| | Constellation Brands, Inc., 7.25%, 9/1/16 | | | 635,000 | | | | 733 | |
| | Cott Beverages, Inc., 8.125%, 9/1/18 | | | 615,000 | | | | 680 | |
| | Cott Beverages, Inc., 8.375%, 11/15/17 | | | 905,000 | | | | 984 | |
| | | | | | | | | | |
| | | Bonds (89.0%) | | Shares/
$ Par | | | Value
$ (000’s) | |
| |
| | Foods continued | |
| | Dean Foods Co., 7.00%, 6/1/16 | | | 820,000 | | | | 900 | |
| | Dean Foods Co., 9.75%, 12/15/18 | | | 820,000 | | | | 943 | |
| | Dole Food Co., Inc., 8.00%, 10/1/16 144A | | | 675,000 | | | | 702 | |
| | Dole Food Co., Inc., 13.875%, 3/15/14 | | | 399,000 | | | | 442 | |
| | JBS Finance II, Ltd., 8.25%, 1/29/18 144A | | | 630,000 | | | | 668 | |
| | JBS USA LLC/JBS USA Finance, Inc., 7.25%, 6/1/21 144A | | | 725,000 | | | | 727 | |
| | Land O’ Lakes, Inc., 6.00%, 11/15/22 144A | | | 1,020,000 | | | | 1,104 | |
| | Pilgrim’s Pride Corp., 7.875%, 12/15/18 | | | 885,000 | | | | 897 | |
| | Post Holdings, Inc., 7.375%, 2/15/22 144A | | | 150,000 | | | | 164 | |
| | Smithfield Foods, Inc., 6.625%, 8/15/22 | | | 785,000 | | | | 867 | |
| | TreeHouse Foods, Inc., 7.75%, 3/1/18 | | | 500,000 | | | | 543 | |
| | | | | | | | | | |
| | Total | | | | | | | 11,830 | |
| | | | | | | | | | |
| |
| | Gaming/Leisure/Lodging (3.8%) | |
| | AMC Entertainment, Inc., 8.75%, 6/1/19 | | | 910,000 | | | | 1,008 | |
| | AMC Entertainment, Inc., 9.75%, 12/1/20 | | | 980,000 | | | | 1,132 | |
| | Caesars Entertainment Operating Co., Inc., 8.50%, 2/15/20 | | | 1,265,000 | | | | 1,256 | |
| | Caesars Entertainment Operating Co., Inc., 10.00%, 12/15/18 | | | 1,138,000 | | | | 754 | |
| | Caesars Entertainment Operating Co., Inc., 11.25%, 6/1/17 | | | 1,210,000 | | | | 1,296 | |
| | Caesars Entertainment Operating Co., Inc., 12.75%, 4/15/18 | | | 1,645,000 | | | | 1,213 | |
| | Chester Downs & Marina LLC, 9.25%, 2/1/20 144A | | | 360,000 | | | | 354 | |
| | Choice Hotels International, Inc., 5.75%, 7/1/22 | | | 560,000 | | | | 620 | |
| | Cinemark USA, Inc., 5.125%, 12/15/22 144A | | | 245,000 | | | | 248 | |
| | The Geo Group, Inc., 6.625%, 2/15/21 | | | 460,000 | | | | 511 | |
| | The Geo Group, Inc., 7.75%, 10/15/17 | | | 620,000 | | | | 666 | |
| | Host Hotels & Resorts LP, 5.875%, 6/15/19 | | | 180,000 | | | | 196 | |
| | MGM Resorts International, 6.75%, 10/1/20 144A | | | 595,000 | | | | 608 | |
| | | | | | | | | | |
| | | Bonds (89.0%) | | Shares/
$ Par | | | Value
$ (000’s) | |
| |
| | Gaming/Leisure/Lodging continued | |
| | MGM Resorts International, 7.625%, 1/15/17 | | | 685,000 | | | | 733 | |
| | MGM Resorts International, 7.75%, 3/15/22 | | | 565,000 | | | | 605 | |
| | MGM Resorts International, 8.625%, 2/1/19 144A | | | 855,000 | | | | 953 | |
| | Penn National Gaming, Inc., 8.75%, 8/15/19 | | | 545,000 | | | | 621 | |
| | Regal Entertainment Group, 9.125%, 8/15/18 | | | 730,000 | | | | 814 | |
| | Royal Caribbean Cruises, Ltd., 5.25%, 11/15/22 | | | 430,000 | | | | 455 | |
| | Scientific Games International, Inc., 6.25%, 9/1/20 144A | | | 980,000 | | | | 1,012 | |
| | Scientific Games International, Inc., 9.25%, 6/15/19 | | | 340,000 | | | | 378 | |
| | Seminole Indian Tribe of Florida, 7.75%, 10/1/17 144A | | | 300,000 | | | | 324 | |
| | Speedway Motorsports, Inc., 6.75%, 2/1/19 | | | 430,000 | | | | 456 | |
| | Speedway Motorsports, Inc., 8.75%, 6/1/16 | | | 680,000 | | | | 727 | |
| | Wynn Las Vegas LLC/Wynn Las Vegas Capital Corp., 7.875%, 5/1/20 | | | 500,000 | | | | 566 | |
| | | | | | | | | | |
| | Total | | | | | | | 17,506 | |
| | | | | | | | | | |
| |
| | Health Care/Pharmaceuticals (8.2%) | |
| | Biomet, Inc., 6.50%, 8/1/20 144A | | | 825,000 | | | | 877 | |
| | Biomet, Inc., 6.50%, 10/1/20 144A | | | 1,370,000 | | | | 1,361 | |
| | Centene Corp., 5.75%, 6/1/17 | | | 1,620,000 | | | | 1,741 | |
| | CHS/Community Health Systems, Inc., 5.125%, 8/15/18 | | | 575,000 | | | | 599 | |
| | CHS/Community Health Systems, Inc., 7.125%, 7/15/20 | | | 870,000 | | | | 929 | |
| | CHS/Community Health Systems, Inc., 8.00%, 11/15/19 | | | 2,170,000 | | | | 2,349 | |
| | Elan Finance PLC/Elan Finance Corp., 6.25%, 10/15/19 144A | | | 1,295,000 | | | | 1,353 | |
| | Endo Health Solutions, Inc., 7.00%, 7/15/19 | | | 340,000 | | | | 363 | |
| | Endo Health Solutions, Inc., 7.25%, 1/15/22 | | | 605,000 | | | | 649 | |
| | Fresenius Medical Care US Finance II, Inc., 5.625%, 7/31/19 144A | | | 1,210,000 | | | | 1,299 | |
The Accompanying Notes are an Integral Part of the Financial Statements.
| | | | | | |
| | High Yield Bond Portfolio | | | 135 | |
High Yield Bond Portfolio
| | | | | | | | | | |
| | | Bonds (89.0%) | | Shares/
$ Par | | | Value
$ (000’s) | |
| |
| | Health Care/Pharmaceuticals continued | |
| | Fresenius Medical Care US Finance II, Inc., 5.875%, 1/31/22 144A | | | 335,000 | | | | 363 | |
| | Fresenius Medical Care US Finance, Inc., 6.50%, 9/15/18 144A | | | 245,000 | | | | 274 | |
| | HCA Holdings, Inc., 6.25%, 2/15/21 | | | 495,000 | | | | 507 | |
| | HCA Holdings, Inc., 7.75%, 5/15/21 | | | 1,230,000 | | | | 1,335 | |
| | HCA, Inc., 5.875%, 3/15/22 | | | 1,730,000 | | | | 1,881 | |
| | HCA, Inc., 6.50%, 2/15/20 | | | 1,400,000 | | | | 1,575 | |
| | HCA, Inc., 7.25%, 9/15/20 | | | 1,595,000 | | | | 1,766 | |
| | HCA, Inc., 7.875%, 2/15/20 | | | 680,000 | | | | 756 | |
| | HCA, Inc., 8.00%, 10/1/18 | | | 730,000 | | | | 845 | |
| | HCA, Inc., 8.50%, 4/15/19 | | | 680,000 | | | | 758 | |
| | HCA, Inc., 9.875%, 2/15/17 | | | 87,000 | | | | 92 | |
| | Health Management Associates, Inc., 6.125%, 4/15/16 | | | 1,110,000 | | | | 1,199 | |
| | Health Management Associates, Inc., 7.375%, 1/15/20 | | | 570,000 | | | | 616 | |
| | Hologic, Inc., 6.25%, 8/1/20 144A | | | 230,000 | | | | 248 | |
| | MPT Operating Partnership LP/MPT Finance Corp., 6.375%, 2/15/22 | | | 810,000 | | | | 850 | |
| | MPT Operating Partnership LP/MPT Finance Corp., 6.875%, 5/1/21 | | | 885,000 | | | | 960 | |
| | Mylan, Inc., 6.00%, 11/15/18 144A | | | 925,000 | | | | 1,022 | |
| | Mylan, Inc., 7.625%, 7/15/17 144A | | | 305,000 | | | | 343 | |
| | Mylan, Inc., 7.875%, 7/15/20 144A | | | 185,000 | | | | 219 | |
| | Prospect Medical Holdings, Inc., 8.375%, 5/1/19 144A | | | 1,000,000 | | | | 1,052 | |
| | Service Corp. International, 4.50%, 11/15/20 | | | 370,000 | | | | 376 | |
| | Service Corp. International, 7.00%, 5/15/19 | | | 430,000 | | | | 471 | |
| | Service Corp. International, 8.00%, 11/15/21 | | | 225,000 | | | | 277 | |
| | Tenet Healthcare Corp., 6.25%, 11/1/18 | | | 915,000 | | | | 1,004 | |
| | Tenet Healthcare Corp., 8.875%, 7/1/19 | | | 930,000 | | | | 1,042 | |
| | | | | | | | | | |
| | | Bonds (89.0%) | | Shares/
$ Par | | | Value
$ (000’s) | |
| |
| | Health Care/Pharmaceuticals continued | |
| | Valeant Pharmaceuticals International, 6.50%, 7/15/16 144A | | | 1,045,000 | | | | 1,099 | |
| | Valeant Pharmaceuticals International, 6.75%, 10/1/17 144A | | | 1,465,000 | | | | 1,582 | |
| | Valeant Pharmaceuticals International, 6.875%, 12/1/18 144A | | | 1,585,000 | | | | 1,708 | |
| | Vanguard Health Systems, Inc., 0.00%, 2/1/16 | | | 17,000 | | | | 13 | |
| | VPI Escrow Corp., 6.375%, 10/15/20 144A | | | 1,390,000 | | | | 1,491 | |
| | Warner Chilcott Co. LLC/Warner Chilcott Finance LLC, 7.75%, 9/15/18 | | | 655,000 | | | | 698 | |
| | | | | | | | | | |
| | Total | | | | | | | 37,942 | |
| | | | | | | | | | |
| |
| | Media (8.6%) | |
| | Cablevision Systems Corp., 7.75%, 4/15/18 | | | 615,000 | | | | 684 | |
| | CCO Holdings LLC/CCO Holdings Capital Corp., 6.50%, 4/30/21 | | | 1,125,000 | | | | 1,214 | |
| | CCO Holdings LLC/CCO Holdings Capital Corp., 7.00%, 1/15/19 | | | 1,515,000 | | | | 1,634 | |
| | CCO Holdings LLC/CCO Holdings Capital Corp., 7.25%, 10/30/17 | | | 825,000 | | | | 899 | |
| | CCO Holdings LLC/CCO Holdings Capital Corp., 7.375%, 6/1/20 | | | 570,000 | | | | 633 | |
| | CCO Holdings LLC/CCO Holdings Capital Corp., 7.875%, 4/30/18 | | | 340,000 | | | | 366 | |
| | Cequel Communications Holdings I LLC/Cequel Capital Corp., 6.375%, 9/15/20 144A | | | 1,225,000 | | | | 1,276 | |
| | Clear Channel Worldwide Holdings, Inc., 7.625%, 3/15/20 | | | 485,000 | | | | 489 | |
| | CSC Holdings LLC, 7.625%, 7/15/18 | | | 870,000 | | | | 1,005 | |
| | CSC Holdings LLC, 7.875%, 2/15/18 | | | 535,000 | | | | 619 | |
| | CSC Holdings LLC, 8.625%, 2/15/19 | | | 445,000 | | | | 532 | |
| (c) | | Dex One Corp., 14.00%, 1/29/17 | | | 789,110 | | | | 262 | |
| | DISH DBS Corp., 5.00%, 3/15/23 144A | | | 1,620,000 | | | | 1,620 | |
| | | | | | | | | | |
| | | Bonds (89.0%) | | Shares/
$ Par | | | Value
$ (000’s) | |
| |
| | Media continued | |
| | DISH DBS Corp., 5.875%, 7/15/22 | | | 775,000 | | | | 833 | |
| | DISH DBS Corp., 6.75%, 6/1/21 | | | 1,210,000 | | | | 1,380 | |
| | DISH DBS Corp., 7.125%, 2/1/16 | | | 1,310,000 | | | | 1,467 | |
| | DISH DBS Corp., 7.875%, 9/1/19 | | | 1,760,000 | | | | 2,086 | |
| | Hughes Satellite Systems Corp., 6.50%, 6/15/19 | | | 965,000 | | | | 1,064 | |
| | Hughes Satellite Systems Corp., 7.625%, 6/15/21 | | | 605,000 | | | | 688 | |
| | Inmarsat Finance PLC, 7.375%, 12/1/17 144A | | | 285,000 | | | | 306 | |
| | Intelsat Jackson Holdings SA, 7.25%, 4/1/19 | | | 1,050,000 | | | | 1,129 | |
| | Intelsat Jackson Holdings SA, 7.25%, 10/15/20 | | | 770,000 | | | | 837 | |
| | Intelsat Jackson Holdings SA, 8.50%, 11/1/19 | | | 1,020,000 | | | | 1,142 | |
| (c) | | Intelsat Luxembourg SA, 11.50%, 2/4/17 | | | 1,935,000 | | | | 2,056 | |
| | Lamar Media Corp., 5.00%, 5/1/23 144A | | | 1,000,000 | | | | 1,028 | |
| | LIN Television Corp., 6.375%, 1/15/21 144A | | | 600,000 | | | | 630 | |
| | Mediacom LLC/Mediacom Capital Corp., 9.125%, 8/15/19 | | | 325,000 | | | | 360 | |
| | Nielsen Finance LLC/Nielsen Finance Co., 7.75%, 10/15/18 | | | 605,000 | | | | 676 | |
| | QVC, Inc., 5.125%, 7/2/22 144A | | | 260,000 | | | | 273 | |
| | QVC, Inc., 7.375%, 10/15/20 144A | | | 410,000 | | | | 456 | |
| | QVC, Inc., 7.50%, 10/1/19 144A | | | 1,530,000 | | | | 1,688 | |
| | Sinclair Television Group, Inc., 6.125%, 10/1/22 144A | | | 1,195,000 | | | | 1,268 | |
| | Sirius XM Radio, Inc., 5.25%, 8/15/22 144A | | | 290,000 | | | | 293 | |
| | Starz LLC/Starz Finance Corp., 5.00%, 9/15/19 144A | | | 295,000 | | | | 302 | |
| | Unitymedia Hessen GmbH & Co. KG/Unitymedia NRW GmbH, 5.50%, 1/15/23 144A | | | 1,235,000 | | | | 1,275 | |
| | Univision Communications, Inc., 6.75%, 9/15/22 144A | | | 715,000 | | | | 738 | |
The Accompanying Notes are an Integral Part of the Financial Statements.
| | | | |
| 136 | | High Yield Bond Portfolio | | |
High Yield Bond Portfolio
| | | | | | | | | | |
| | | Bonds (89.0%) | | Shares/
$ Par | | | Value
$ (000’s) | |
| |
| | Media continued | |
| | Univision Communications, Inc., 7.875%, 11/1/20 144A | | | 800,000 | | | | 866 | |
| | UPCB Finance III, Ltd., 6.625%, 7/1/20 144A | | | 985,000 | | | | 1,055 | |
| | UPCB Finance V, Ltd., 7.25%, 11/15/21 144A | | | 340,000 | | | | 374 | |
| | Videotron Ltee, 5.00%, 7/15/22 | | | 960,000 | | | | 1,007 | |
| | Virgin Media Finance PLC, 8.375%, 10/15/19 | | | 451,000 | | | | 512 | |
| | WMG Acquisition Corp., 6.00%, 1/15/21 144A | | | 240,000 | | | | 253 | |
| | WMG Acquisition Corp., 11.50%, 10/1/18 | | | 1,065,000 | | | | 1,230 | |
| | XM Satellite Radio, Inc., 7.625%, 11/1/18 144A | | | 930,000 | | | | 1,037 | |
| | | | | | | | | | |
| | Total | | | | | | | 39,542 | |
| | | | | | | | | | |
| |
| | Other Holdings (–%) | |
| (n)* | | General Motors Co. Escrow, 7.20%, 1/15/13 | | | 380,000 | | | | - | |
| (n)* | | General Motors Co. Escrow, 8.375%, 7/15/33 | | | 3,515,000 | | | | - | |
| | | | | | | | | | |
| | Total | | | | | | | - | |
| | | | | | | | | | |
| |
| | Real Estate (0.1%) | |
| | DuPont Fabros Technology LP, 8.50%, 12/15/17 | | | 560,000 | | | | 612 | |
| | | | | | | | | | |
| | Total | | | | | | | 612 | |
| | | | | | | | | | |
| |
| | Services (0.8%) | |
| (c) | | ARAMARK Holdings Corp., 8.625%, 5/1/16 144A | | | 300,000 | | | | 307 | |
| | Clean Harbors, Inc., 5.125%, 6/1/21 144A | | | 310,000 | | | | 321 | |
| | Clean Harbors, Inc., 5.25%, 8/1/20 | | | 550,000 | | | | 573 | |
| | FTI Consulting, Inc., 6.00%, 11/15/22 144A | | | 495,000 | | | | 512 | |
| | HDTFS, Inc., 5.875%,
10/15/20 144A | | | 300,000 | | | | 313 | |
| | HDTFS, Inc., 6.25%, 10/15/22 144A | | | 180,000 | | | | 192 | |
| | Mobile Mini, Inc., 7.875%, 12/1/20 | | | 615,000 | | | | 675 | |
| | Trans Union LLC/TransUnion Financing Corp., 11.375%, 6/15/18 | | | 610,000 | | | | 711 | |
| | | | | | | | | | |
| | Total | | | | | | | 3,604 | |
| | | | | | | | | | |
| | | | | | | | | | |
| | | Bonds (89.0%) | | Shares/
$ Par | | | Value
$ (000’s) | |
| |
| | Technology (4.6%) | |
| | Amkor Technology, Inc., 6.375%, 10/1/22 144A | | | 475,000 | | | | 468 | |
| | Amkor Technology, Inc., 6.625%, 6/1/21 | | | 965,000 | | | | 962 | |
| | Equinix, Inc., 7.00%, 7/15/21 | | | 215,000 | | | | 239 | |
| | Equinix, Inc., 8.125%, 3/1/18 | | | 1,245,000 | | | | 1,373 | |
| | First Data Corp., 6.75%, 11/1/20 144A | | | 1,450,000 | | | | 1,464 | |
| | First Data Corp., 7.375%, 6/15/19 144A | | | 870,000 | | | | 900 | |
| | First Data Corp., 8.25%, 1/15/21 144A | | | 740,000 | | | | 740 | |
| | First Data Corp., 9.875%, 9/24/15 | | | 1,930,000 | | | | 1,969 | |
| (c) | | First Data Corp., 10.55%, 9/24/15 | | | 1,214,022 | | | | 1,243 | |
| | Freescale Semiconductor, Inc., 9.25%, 4/15/18 144A | | | 1,140,000 | | | | 1,245 | |
| | Freescale Semiconductor, Inc., 10.125%, 3/15/18 144A | | | 1,105,000 | | | | 1,221 | |
| | Iron Mountain, Inc., 7.75%, 10/1/19 | | | 1,060,000 | | | | 1,195 | |
| | Iron Mountain, Inc., 8.375%, 8/15/21 | | | 125,000 | | | | 139 | |
| | Jabil Circuit, Inc., 4.70%, 9/15/22 | | | 795,000 | | | | 836 | |
| | MEMC Electronic Materials, Inc., 7.75%, 4/1/19 | | | 800,000 | | | | 672 | |
| | NCR Corp., 4.625%, 2/15/21 144A | | | 490,000 | | | | 490 | |
| | NCR Corp., 5.00%, 7/15/22 144A | | | 240,000 | | | | 244 | |
| | Nuance Communications, Inc., 5.375%, 8/15/20 144A | | | 890,000 | | | | 930 | |
| | Seagate HDD Cayman, 6.875%, 5/1/20 | | | 735,000 | | | | 782 | |
| | Seagate HDD Cayman, 7.75%, 12/15/18 | | | 1,230,000 | | | | 1,351 | |
| | SunGard Data Systems, Inc., 7.375%, 11/15/18 | | | 1,050,000 | | | | 1,125 | |
| | SunGard Data Systems, Inc., 7.625%, 11/15/20 | | | 925,000 | | | | 1,010 | |
| | West Corp., 11.00%, 10/15/16 | | | 415,000 | | | | 432 | |
| | | | | | | | | | |
| | Total | | | | | | | 21,030 | |
| | | | | | | | | | |
| |
| | Telecommunications (8.7%) | |
| | Cincinnati Bell, Inc., 8.25%, 10/15/17 | | | 660,000 | | | | 711 | |
| | Clearwire Communications LLC/Clearwire Finance, Inc., 8.25%, 12/1/40 144A | | | 725,000 | | | | 795 | |
| | | | | | | | | | |
| | | Bonds (89.0%) | | Shares/
$ Par | | | Value
$ (000’s) | |
| |
| | Telecommunications continued | |
| | Clearwire Communications LLC/Clearwire Finance, Inc., 12.00%, 12/1/15 144A | | | 965,000 | | | | 1,037 | |
| | Clearwire Communications LLC/Clearwire Finance, Inc., 14.75%, 12/1/16 144A | | | 935,000 | | | | 1,283 | |
| | Cricket Communications, Inc., 7.75%, 10/15/20 | | | 2,840,000 | | | | 2,897 | |
| | Crown Castle International Corp., 5.25%, 1/15/23 144A | | | 1,200,000 | | | | 1,284 | |
| | CyrusOne LP/CyrusOne Finance Corp., 6.375%, 11/15/22 144A | | | 310,000 | | | | 323 | |
| | Digicel Group, Ltd., 8.25%, 9/30/20 144A | | | 395,000 | | | | 435 | |
| | Frontier Communications Corp., 8.125%, 10/1/18 | | | 610,000 | | | | 701 | |
| | Frontier Communications Corp., 8.25%, 4/15/17 | | | 1,305,000 | | | | 1,507 | |
| | Frontier Communications Corp., 8.50%, 4/15/20 | | | 825,000 | | | | 949 | |
| | Frontier Communications Corp., 8.75%, 4/15/22 | | | 825,000 | | | | 957 | |
| | Frontier Communications Corp., 9.25%, 7/1/21 | | | 575,000 | | | | 674 | |
| | GCI, Inc., 8.625%, 11/15/19 | | | 1,130,000 | | | | 1,201 | |
| | MetroPCS Wireless, Inc., 6.625%, 11/15/20 | | | 1,135,000 | | | | 1,206 | |
| | MetroPCS Wireless, Inc., 7.875%, 9/1/18 | | | 1,050,000 | | | | 1,137 | |
| | NII Capital Corp., 7.625%, 4/1/21 | | | 1,705,000 | | | | 1,292 | |
| | NII Capital Corp., 8.875%, 12/15/19 | | | 1,715,000 | | | | 1,363 | |
| | PAETEC Holding Corp., 8.875%, 6/30/17 | | | 450,000 | | | | 483 | |
| | SBA Communications Corp., 5.625%, 10/1/19 144A | | | 715,000 | | | | 751 | |
| | SBA Telecommunications, Inc., 5.75%, 7/15/20 144A | | | 580,000 | | | | 616 | |
| | SBA Telecommunications, Inc., 8.25%, 8/15/19 | | | 308,000 | | | | 344 | |
The Accompanying Notes are an Integral Part of the Financial Statements.
| | | | | | |
| | High Yield Bond Portfolio | | | 137 | |
High Yield Bond Portfolio
| | | | | | | | | | |
| | | Bonds (89.0%) | | Shares/
$ Par | | | Value
$ (000’s) | |
| |
| | Telecommunications continued | |
| | Sprint Capital Corp., 6.90%, 5/1/19 | | | 1,185,000 | | | | 1,292 | |
| | Sprint Nextel Corp., 6.00%, 12/1/16 | | | 1,565,000 | | | | 1,702 | |
| | Sprint Nextel Corp., 6.00%, 11/15/22 | | | 1,340,000 | | | | 1,377 | |
| | Sprint Nextel Corp., 7.00%, 3/1/20 144A | | | 575,000 | | | | 668 | |
| | Sprint Nextel Corp., 7.00%, 8/15/20 | | | 2,010,000 | | | | 2,196 | |
| | Sprint Nextel Corp., 8.375%, 8/15/17 | | | 2,160,000 | | | | 2,511 | |
| | Sprint Nextel Corp., 9.00%, 11/15/18 144A | | | 1,020,000 | | | | 1,260 | |
| | Sprint Nextel Corp., 9.125%, 3/1/17 | | | 575,000 | | | | 677 | |
| | Sprint Nextel Corp., 11.50%, 11/15/21 | | | 1,140,000 | | | | 1,550 | |
| | TW Telecom Holdings, Inc., 5.375%, 10/1/22 144A | | | 160,000 | | | | 168 | |
| (c) | | Wind Acquisition Holding Finance SA, 12.25%, 7/15/17 144A | | | 1,182,405 | | | | 1,206 | |
| | Windstream Corp., 7.00%, 3/15/19 | | | 680,000 | | | | 695 | |
| | Windstream Corp., 7.75%, 10/15/20 | | | 1,645,000 | | | | 1,777 | |
| | Windstream Corp., 7.875%, 11/1/17 | | | 1,075,000 | | | | 1,209 | |
| | | | | | | | | | |
| | Total | | | | | | | 40,234 | |
| | | | | | | | | | |
| |
| | Transportation (0.3%) | |
| | Continental Airlines, Inc., 6.75%, 9/15/15 144A | | | 615,000 | | | | 646 | |
| | Kansas City Southern de Mexico SAB de CV, 8.00%, 2/1/18 | | | 480,000 | | | | 529 | |
| | | | | | | | | | |
| | Total | | | | | | | 1,175 | |
| | | | | | | | | | |
| |
| | Utilities (3.1%) | |
| | The AES Corp., 7.75%, 10/15/15 | | | 1,495,000 | | | | 1,678 | |
| | The AES Corp., 8.00%, 10/15/17 | | | 585,000 | | | | 676 | |
| | The AES Corp., 8.00%, 6/1/20 | | | 1,170,000 | | | | 1,345 | |
| | Calpine Corp., 7.50%, 2/15/21 144A | | | 832,000 | | | | 919 | |
| | Calpine Corp., 7.875%, 7/31/20 144A | | | 1,606,000 | | | | 1,803 | |
| | DPL, Inc., 6.50%, 10/15/16 | | | 1,520,000 | | | | 1,607 | |
| | DPL, Inc., 7.25%, 10/15/21 | | | 510,000 | | | | 546 | |
| | GenOn Americas Generation LLC, 8.50%, 10/1/21 | | | 570,000 | | | | 650 | |
| | NRG Energy, Inc., 7.625%, 1/15/18 | | | 1,765,000 | | | | 1,959 | |
| | | | | | | | | | |
| | | Bonds (89.0%) | | Shares/
$ Par | | | Value
$ (000’s) | |
| |
| | Utilities continued | |
| | NRG Energy, Inc., 7.625%, 5/15/19 | | | 1,210,000 | | | | 1,295 | |
| | NRG Energy, Inc., 8.25%, 9/1/20 | | | 230,000 | | | | 258 | |
| | NSG Holdings LLC/NSG Holdings, Inc., 7.75%, 12/15/25 144A | | | 705,000 | | | | 726 | |
| | Puget Energy, Inc., 5.625%, 7/15/22 | | | 950,000 | | | | 1,023 | |
| | | | | | | | | | |
| | Total | | | | | | | 14,485 | |
| | | | | | | | | | |
| | | |
| | Total Bonds | | | | | | | | |
| | (Cost: $382,232) | | | | | | | 410,286 | |
| | | | | | | | | | |
| |
| | | Bank Loan Obligations (3.4%) | |
| |
| | Bank Loan Obligations (3.4%) | |
| | Allison Transmission, Inc., 4.25%, due 8/23/19 | | | 995,006 | | | | 1,003 | |
| | Aramark Corp., 3.25%, due 7/26/16 | | | 1,000,000 | | | | 1,003 | |
| | Chesapeake Energy Corp., 5.75%, due 12/2/17 | | | 1,500,000 | | | | 1,501 | |
| | Chrysler Group LLC, 6.00%, due 5/24/17 | | | 1,243,687 | | | | 1,269 | |
| | DaVita Healthcare Partners, Inc., 4.00%, due 11/1/19 | | | 1,500,000 | | | | 1,509 | |
| | FMG Resources (August 2006) Pty, Ltd., 5.25%, due 10/18/17 | | | 997,500 | | | | 1,005 | |
| | Kinetic Concepts, Inc., 5.50%, due 5/4/18 | | | 1,994,962 | | | | 2,015 | |
| | MGM Resorts International, 4.25%, due 12/20/19 | | | 1,000,000 | | | | 1,010 | |
| | Navistar, Inc., 7.00%, due 8/17/17 | | | 1,250,000 | | | | 1,254 | |
| | The Neiman Marcus Group, Inc., 4.75%, due 5/16/18 | | | 1,000,000 | | | | 1,001 | |
| | Offshore Group Investment, Ltd., 6.25%, due 10/25/17 | | | 987,500 | | | | 985 | |
| | Serta Simmons Holdings, Inc., 5.00%, due 10/1/19 | | | 1,000,000 | | | | 1,000 | |
| | Warner Chilcott Corp., 4.25%, due 3/15/18 | | | 1,243,683 | | | | 1,250 | |
| | | | | | | | | | |
| | | |
| | Total Bank Loan Obligations | | | | | | | | |
| | (Cost: $15,659) | | | | | | | 15,805 | |
| | | | | | | | | | |
| |
| | | Short-Term Investments (5.1%) | |
| |
| | Electronics (0.8%) | |
| (b) | | International Business Machines Corp., 0.05%, 1/2/13 | | | 3,700,000 | | | | 3,700 | |
| | | | | | | | | | |
| | Total | | | | | | | 3,700 | |
| | | | | | | | | | |
| | | | | | | | | | |
| | | Short-Term
Investments (5.1%) | | Shares/
$ Par | | | Value
$ (000’s) | |
| |
| | Federal Government & Agencies (1.1%) | |
| | Federal Home Loan Mortgage Corp., 0.13%, 2/25/13 | | | 5,000,000 | | | | 4,999 | |
| | | | | | | | | | |
| | Total | | | | | | | 4,999 | |
| | | | | | | | | | |
| |
| | Finance Services (2.1%) | |
| | Alpine Securitization Corp., 0.18%, 1/17/13 | | | 5,000,000 | | | | 4,999 | |
| | Govco LLC, 0.27%, 2/4/13 | | | 5,000,000 | | | | 4,999 | |
| | | | | | | | | | |
| | Total | | | | | | | 9,998 | |
| | | | | | | | | | |
| |
| | Machinery (1.1%) | |
| | John Deere Canada ULC, 0.15%, 1/29/13 | | | 5,000,000 | | | | 5,000 | |
| | | | | | | | | | |
| | Total | | | | | | | 5,000 | |
| | | | | | | | | | |
| | | |
| | Total Short-Term Investments | | | | | | | | |
| | (Cost: $23,697) | | | | | | | 23,697 | |
| | | | | | | | | | |
| | | |
| | Total Investments (98.9%) | | | | | | | | |
| | (Cost: $426,867)(a) | | | | | | | 455,790 | |
| | | | | | | | | | |
| | Other Assets, Less | | | | | | | | |
| | Liabilities (1.1%) | | | | | | | 5,152 | |
| | | | | | | | | | |
| | Net Assets (100.0%) | | | | | | | 460,942 | |
| | | | | | | | | | |
The Accompanying Notes are an Integral Part of the Financial Statements.
| | | | |
| 138 | | High Yield Bond Portfolio | | |
High Yield Bond Portfolio
144A after the name of a security represents a security exempt from registration under Rule 144A of the Securities Act of 1933. These securities may be resold as transactions exempt from registration, normally to qualified institutional buyers. At December 31, 2012 the value of these securities (in thousands) was $122,847 representing 26.6% of the net assets.
| (a) | At December 31, 2012 the aggregate cost of securities for federal tax purposes (in thousands) was $427,082 and the net unrealized appreciation of investments based on that cost was $28,708 which is comprised of $32,599 aggregate gross unrealized appreciation and $3,891 aggregate gross unrealized depreciation. |
| (b) | All or a portion of the securities have been pledged as collateral for when-issued securities. |
| (n) | Security valued in good faith by the Board of Directors. |
The following is a summary of the inputs used in valuing the Portfolio’s assets and liabilities at December 31, 2012. See Note 3 for additional information on portfolio valuation.
| | | | | | | | | | | | | | |
| | | Valuation Inputs | | | |
| Description | | Level 1 –
Quoted Prices | | | Level 2 –
Other Significant
Observable Inputs | | | Level 3 – Significant Unobservable Inputs | | | |
| | | (Amounts in thousands) | | | |
Assets: | | | | | | | | | | | | | | |
Common Stocks | | $ | 1,030 | | | $ | - | | | $ | 587 | | | |
Preferred Stocks | | | 3,106 | | | | 1,279 | | | | - | | | |
Corporate Bonds | | | - | | | | 410,286 | | | | - | (m) | | |
Bank Loans | | | - | | | | 15,805 | | | | - | (m) | | |
Short-Term Investments | | | - | | | | 23,697 | | | | - | | | |
Total | | $ | 4,136 | | | $ | 451,067 | | | $ | 587 | | | |
The Accompanying Notes are an Integral Part of the Financial Statements.
| | | | | | |
| | High Yield Bond Portfolio | | | 139 | |
Multi-Sector Bond Portfolio
| | | | |
| Objective: | | Portfolio Strategy: | | Net Assets: |
| Maximum total return, consistent with prudent investment management. | | Invest primarily in a diversified portfolio of fixed income instruments of varying maturities and quality, and in derivatives designed to replicate such securities. | | $373 million |
Portfolio Overview
Mason Street Advisors, the investment adviser for the Multi-Sector Bond Portfolio (the “Portfolio”), has engaged Pacific Investment Management Company LLC (“PIMCO”) to act as sub-adviser for the Portfolio. Normally, the Portfolio invests in a diversified portfolio of fixed income instruments of varying maturities, which may be represented by forwards or derivatives such as options, futures contracts or swap agreements. The Portfolio may invest all of its assets in high yield securities subject to a maximum of 10% of its total assets in securities rated below B by Moody’s or equivalently rated by S&P or Fitch or, if unrated, determined to be of comparable quality (so called “junk bonds”). The Portfolio may invest, without limitation, in securities denominated in foreign currencies and U.S. dollar denominated securities of foreign issuers. In addition, the Portfolio may invest without limit in fixed income securities of issuers that are economically tied to emerging securities markets. The Portfolio may, without limitation, seek to obtain market exposure to the securities in which it primarily invests by entering into a series of purchase and sale contracts or by using other investment techniques (such as buy backs or dollar rolls).
Market Overview
2012 was a year defined globally by a dynamic, polarized political process. The year began with a focus on Europe, as the seemingly inevitable Greek tragedy fueled speculation of when, not if, the European Union (EU) would see its membership shrink. In late July, a few determined statements from the European Central Bank (ECB) President Mario Draghi—later reinforced in early September by the ECB Governing Council—stabilized markets and postponed any sovereign exits from the EU. The markets spent the remainder of the year weighing the efficacy of a “do whatever it takes to safeguard monetary union” policy stance versus the Greek austerity commitment and Spanish financial system stability.
The eurozone had to compete with the United States for headlines, as the U.S. political climate often relegated geopolitical instability and uprising to second page news. Markets confronted an evolving monetary policy that produced multiple extensions of rate guidance (now mid-2015), a third quantitative easing (QE3) mortgage purchase program and additional, targeted Treasury purchases with the expiry of “Operation Twist”, the explicit use of unemployment and inflation quantitative thresholds, and a growing NY Federal Reserve balance sheet and System Open Market Account which currently stands at $2.65 trillion.
While the President’s reelection may have cemented the fate of the Affordable Care Act and Dodd-Frank reforms, market participants quickly turned their attention to the uncertainty surrounding the impending fiscal cliff. Both political parties recognized that averting the cliff was essential to avoiding a recession in 2013, but negotiations were strained for much of the quarter with Democrats seeking increased tax revenue from the wealthiest Americans and Republicans asking for spending cuts on entitlement programs. Ultimately, hopes of a grand bargain abated and gave way to a short-term deal, thus opening the door to further fiscal negotiations, most notably on a debt ceiling increase and spending cuts (the “sequester”), in 2013.
Portfolio Results
The Portfolio returned 14.94% for the twelve months ended December 31, 2012. By comparison, the Barclays® Global Credit Hedged USD Index returned 11.65%. The Portfolio’s custom benchmark, comprised of 1/3 Barclays® Global Aggregate Credit component, 1/3 Merrill Lynch Global High Yield BB-B rated constrained and 1/3 J.P. Morgan EMBI Global, all U.S. dollar Hedged Index (the “Equal Weighted Composite Index”), returned 15.72%. (These Indices are unmanaged, cannot be invested in directly and do not include administrative expenses or sales charges.) The Portfolio outperformed the 11.87% average return of the Multisector Bond category according to Morningstar®, Inc., an independent mutual fund ranking agency.
When compared to the Equal Weighted Composite Index, the Portfolio was underweight spread duration, particularly in the high yield and emerging markets (EM) sectors. These positions detracted from performance, as spreads tightened across the board. However, EM local rate exposure, particularly via interest rate swaps in Brazil, was positive for performance as the Monetary Policy Committee cut the policy rate.
Sectors that traded at a spread to U.S. Treasurys outperformed, as global central banks extended their commitment to monetary easing. The Portfolio’s focus on financials within the investment grade corporate sector added to relative performance amid accommodative monetary policy and improving housing data.
| | | | |
| 140 | | Multi-Sector Bond Portfolio | | |
Multi-Sector Bond Portfolio
During the period, the Portfolio used certain forward currency contracts to manage how the Portfolio was exposed to various foreign currency. In addition, the Portfolio utilized credit default swaps on a basket of credit entities to manage the Portfolio’s corporate bond exposure.
Portfolio Manager Outlook
The following forward looking comments are the opinion of PIMCO, the Portfolio’s sub-adviser.
We expect the global economy to grow at a real rate of 1.5 to 2.0% in 2013, representing a slowdown from the 2.2% pace of growth seen over the past twelve months. Real growth, we believe, will be moderated by efforts to resolve debt overhangs through fiscal restraint as evidenced by the slowing in corporate profits, capital expenditures and global trade.
Simultaneously, inflation will likely decrease in the near term. We expect households will continue to delever their balance sheets while the corporate sector remains reluctant to engage its own. Nominal growth could, however, be bolstered by the continued resolve of central banks. The balance of these forces will determine if GDP growth has slowed to stall speed or if a coordinated global slowdown can be averted.
Relative Performance

| | | | | | | | | | | | |
Average Annual Total Returns
For Periods Ended December 31, 2012 | |
| | | 1 Year | | | 5 Years | | | Since
Inception* | |
Multi-Sector Bond Portfolio | | | 14.94% | | | | 9.20% | | | | 8.28% | |
Barclays® Global Credit Hedged USD Index | | | 11.65% | | | | 7.10% | | | | 6.51% | |
Equal Weighted Composite of Barclays® Global Aggregate — Credit Component, Hedged USD; Merrill Lynch® Global High Yield BB-B Rated Constrained Index; JP Morgan® EMBI Global | | | 15.72% | | | | 9.08% | | | | 8.23% | |
Morningstar® US Insurance Fund Multisector Bond Average | | | 11.87% | | | | 6.79% | | | | - | |
| * | Inception date of 4/30/07 |
|
The performance data quoted represents past performance. Past performance is historical and does not guarantee future performance. Investment return and principal value will fluctuate, so that shares, when redeemed, may be worth more or less than their original cost. Current performance may be lower or higher than the performance data quoted. For the most recent month-end performance information visit www.northwesternmutual.com. |
This chart assumes an initial investment of $10,000 made on 4/30/07 (commencement of the Portfolio’s operations). Returns shown reflect fee waivers, deductions for management and other portfolio expenses, and reinvestment of all dividends. In the absence of fee waivers, total return would be reduced. Returns exclude deductions for separate account sale loads and account fees. Please refer to the Benchmark Definitions section of this report for information about the indices cited in the above chart and graph. |
The Portfolio invests in lower-quality securities, which may present a significant risk for loss of principal and interest. Bonds and other debt obligations are affected by changes in interest rates, inflation risk and the creditworthiness of their issuers. High yield bonds generally have greater price swings and higher default risks than investment grade bonds. Return of principal is not guaranteed. When interest rates rise, bond prices fall. With a fixed income fund, when interest rates rise, the value of the fund’s existing bonds drops, which could negatively affect overall fund performance. |
| Investing in bonds issued by foreign corporations and governments carries additional risk, including foreign currency risk, and may increase the volatility of the Portfolio’s performance. |
| | | | | | |
| | Multi-Sector Bond Portfolio | | | 141 | |
Multi-Sector Bond Portfolio
The Portfolio may use derivative instruments for hedging purposes or as alternatives to direct investments. Use of these instruments may involve certain costs and risks such as liquidity risk, interest rate risk, market risk, credit risk, management risk and the risk of mispricing or improper valuation. Certain derivatives involve leverage, which could magnify losses, and portfolios investing in derivatives could lose more than the principal amount invested in those instruments.
The Portfolio may also invest in municipal securities, which may be more sensitive to certain adverse conditions than other fixed income securities, may be or become illiquid, and may have yields which move differently and adversely compared to the yields of the overall debt securities markets.
Top 10 Fixed Income Holdings 12/31/12
| | | | |
| Security Description | | % of Market Value | |
US Treasury, Various | | | 5.9% | |
Indonesia Government International Bond, Various | | | 2.7% | |
Republic of South Africa, Various | | | 2.5% | |
Petroleos de Venezuela SA, Various | | | 1.7% | |
Province of Quebec Canada, Various | | | 1.5% | |
American International Group, Inc., Various | | | 1.3% | |
Petroleos Mexicanos, Various | | | 1.2% | |
Australian Index Linked, Various | | | 1.2% | |
The Royal Bank of Scotland PLC, Various | | | 1.2% | |
Ally Financial, Inc., Various | | | 1.2% | |
Sector Allocation 12/31/12

Sector Allocation is based on Net Assets.
Sector Allocation and Top 10 Holdings are subject to change.
| | | | |
| 142 | | Multi-Sector Bond Portfolio | | |
Multi-Sector Bond Portfolio
Schedule of Investments
December 31, 2012
| | | | | | | | | | |
| | | Corporate Bonds (60.2%) | | Shares/ $ Par | | | Value
$ (000’s) | |
| | |
| | Aerospace/Defense (1.1%) | | | | | |
| | American Airlines Pass Through Trust, Series 2009-1, Class A, 10.375%, 7/2/19 | | | 85,784 | | | | 91 | |
| | American Airlines Pass Through Trust, Series 2011-1, Class A, 5.25%, 1/31/21 | | | 189,455 | | | | 199 | |
| (b) | | American Airlines Pass Through Trust, Series 2011-2, Class A, 8.625%, 10/15/21 | | | 376,053 | | | | 390 | |
| | Continental Airlines Pass Through Trust, Series 2009-2, Class A, 7.25%, 11/10/19 | | | 262,974 | | | | 304 | |
| | Continental Airlines Pass Through Trust, Series 2010-1, Class A, 4.75%, 1/12/21 | | | 95,434 | | | | 104 | |
| | Delta Air Lines Pass Through Trust, Series 2009-1, Class A, 7.75%, 12/17/19 | | | 230,085 | | | | 264 | |
| | Delta Air Lines Pass Through Trust, Series 2012-1, Class A, 4.75%, 5/7/20 | | | 500,000 | | | | 535 | |
| | United Airlines Pass Through Trust, Series 2009-2, Class A, 9.75%, 1/15/17 | | | 318,933 | | | | 369 | |
| | US Airways Pass-Through Trust, 5.90%, 10/1/24 | | | 1,500,000 | | | | 1,635 | |
| | Waha Aerospace BV, 3.925%, 7/28/20 144A | | | 240,000 | | | | 260 | |
| | | | | | | | | | |
| | Total | | | | | | | 4,151 | |
| | | | | | | | | | |
| | |
| | Autos/Vehicle Parts (1.1%) | | | | | |
| | Ford Motor Credit Co. LLC, 2.75%, 5/15/15 | | | 300,000 | | | | 306 | |
| | Ford Motor Credit Co. LLC, 3.875%, 1/15/15 | | | 200,000 | | | | 209 | |
| | Ford Motor Credit Co. LLC, 7.00%, 4/15/15 | | | 900,000 | | | | 1,003 | |
| | Ford Motor Credit Co. LLC, 8.00%, 6/1/14 | | | 400,000 | | | | 436 | |
| (k) | | Ford Motor Credit Co. LLC, 8.70%, 10/1/14 | | | 1,800,000 | | | | 2,016 | |
| | Meritor, Inc., 8.125%, 9/15/15 | | | 165,000 | | | | 174 | |
| | | | | | | | | | |
| | Total | | | | | | | 4,144 | |
| | | | | | | | | | |
| | |
| | Banking (10.1%) | | | | | |
| | Abbey National Treasury Services PLC, 1.893%, 4/25/14 | | | 600,000 | | | | 599 | |
| | | | | | | | | | |
| | | Corporate Bonds (60.2%) | | Shares/ $ Par | | | Value
$ (000’s) | |
| | |
| | Banking continued | | | | | |
| | Banco Bradesco SA, 2.41%, 5/16/14 144A | | | 1,000,000 | | | | 1,007 | |
| | Banco do Brasil SA, 2.219%, 2/15/13 | | | 300,000 | | | | 300 | |
| | Banco do Brasil SA, 6.00%, 1/22/20 144A | | | 200,000 | | | | 233 | |
| | Banco do Brasil SR (Cayman), 3.875%, 10/10/22 | | | 1,200,000 | | | | 1,209 | |
| | Banco Mercantil del Norte SA, 4.375%, 7/19/15 144A | | | 100,000 | | | | 105 | |
| | Banco Santander
Brasil SA, 2.408%, 3/18/14 144A | | | 400,000 | | | | 399 | |
| | Banco Santander
Brasil SA, 4.25%, 1/14/16 144A | | | 1,500,000 | | | | 1,556 | |
| | Banco Santander Chile, 3.875%, 9/20/22 144A | | | 1,000,000 | | | | 1,025 | |
| | Banco Votorantim SA, 5.25%, 2/11/16 144A | | | 800,000 | | | | 842 | |
| | Bank of America Corp., 5.75%, 12/1/17 | | | 500,000 | | | | 583 | |
| | Bank of America Corp., 6.00%, 9/1/17 | | | 120,000 | | | | 141 | |
| | BBVA Bancomer SA/Texas, 4.50%, 3/10/16 | | | 1,000,000 | | | | 1,063 | |
| (k) | | The Bear Stearns LLC, 7.25%, 2/1/18 | | | 2,400,000 | | | | 3,007 | |
| | Cantor Fitzgerald LP, 7.875%, 10/15/19 144A | | | 1,500,000 | | | | 1,538 | |
| | Citigroup, Inc., 6.125%, 5/15/18 | | | 772,000 | | | | 925 | |
| | The Export-Import Bank of Korea, 3.75%, 10/20/16 | | | 700,000 | | | | 752 | |
| | The Export-Import Bank of Korea, 4.00%, 1/29/21 | | | 200,000 | | | | 215 | |
| | The Export-Import Bank of Korea, 4.375%, 9/15/21 | | | 1,200,000 | | | | 1,326 | |
| | The Export-Import Bank of Korea, 5.125%, 6/29/20 | | | 250,000 | | | | 287 | |
| | The Goldman Sachs Group, Inc., 5.25%, 7/27/21 | | | 400,000 | | | | 456 | |
| | The Goldman Sachs Group, Inc., 6.15%, 4/1/18 | | | 500,000 | | | | 587 | |
| | The Goldman Sachs Group, Inc., 6.75%, 10/1/37 | | | 450,000 | | | | 510 | |
| | | | | | | | | | |
| | | Corporate Bonds (60.2%) | | Shares/ $ Par | | | Value
$ (000’s) | |
| | |
| | Banking continued | | | | | |
| (k) | | The Goldman Sachs Group, Inc., 7.50%, 2/15/19 | | | 2,300,000 | | | | 2,894 | |
| | HSBC Bank PLC, 4.125%, 8/12/20 144A | | | 800,000 | | | | 890 | |
| | Intesa Sanpaolo SpA, 2.712%, 2/24/14 144A | | | 1,600,000 | | | | 1,598 | |
| | Macquarie Group, Ltd., 6.25%, 1/14/21 144A | | | 300,000 | | | | 333 | |
| (k) | | Merrill Lynch & Co., Inc., 6.875%, 4/25/18 | | | 1,500,000 | | | | 1,808 | |
| | Morgan Stanley, 5.625%, 9/23/19 | | | 400,000 | | | | 452 | |
| | Morgan Stanley, 5.95%, 12/28/17 | | | 200,000 | | | | 226 | |
| | Morgan Stanley, 6.00%, 4/28/15 | | | 500,000 | | | | 545 | |
| (k) | | Morgan Stanley, 7.30%, 5/13/19 | | | 2,800,000 | | | | 3,403 | |
| | Norddeutsche Landesbank Girozentrale, 0.875%, 10/16/15 144A | | | 200,000 | | | | 200 | |
| | Rabobank
Nederland NV, 11.00%, 12/29/49 144A | | | 200,000 | | | | 270 | |
| (k) | | The Royal Bank of Scotland Group PLC, 2.55%, 9/18/15 | | | 3,100,000 | | | | 3,173 | |
| | RSHB Capital SA for OJSC Russian Agricultural Bank, 7.125%, 1/14/14 | | | 500,000 | | | | 526 | |
| | Turkiye Garanti
Bankasi AS, 2.819%, 4/20/16 144A | | | 200,000 | | | | 198 | |
| | Vnesheconombank Via VEB Finance PLC, 5.375%, 2/13/17 144A | | | 200,000 | | | | 219 | |
| | Vnesheconombank Via VEB Finance PLC, 5.45%, 11/22/17 144A | | | 1,200,000 | | | | 1,335 | |
| | Vnesheconombank Via VEB Finance PLC, 6.025%, 7/5/22 144A | | | 400,000 | | | | 465 | |
| | Vnesheconombank Via VEB Finance PLC, 6.80%, 11/22/25 | | | 100,000 | | | | 122 | |
| | Vnesheconombank Via VEB Finance PLC, 6.902%, 7/9/20 | | | 400,000 | | | | 488 | |
| | | | | | | | | | |
| | Total | | | | | | | 37,810 | |
| | | | | | | | | | |
| | |
| | Basic Materials (4.0%) | | | | | |
| | Berry Plastics Corp., 5.09%, 2/15/15 | | | 300,000 | | | | 300 | |
The Accompanying Notes are an Integral Part of the Financial Statements.
| | | | | | |
| | Multi-Sector Bond Portfolio | | | 143 | |
Multi-Sector Bond Portfolio
| | | | | | | | | | |
| | | Corporate Bonds (60.2%) | | Shares/ $ Par | | | Value
$ (000’s) | |
| | |
| | Basic Materials continued | | | | | |
| | Berry Plastics Corp., 8.25%, 11/15/15 | | | 400,000 | | | | 418 | |
| | Celanese US
Holdings LLC, 6.625%, 10/15/18 | | | 100,000 | | | | 110 | |
| | CONSOL Energy, Inc., 8.00%, 4/1/17 | | | 1,500,000 | | | | 1,624 | |
| | CSN Islands IX Corp., 10.00%, 1/15/15 | | | 200,000 | | | | 226 | |
| | CSN Resources SA, 6.50%, 7/21/20 144A | | | 100,000 | | | | 109 | |
| | CSN Resources SA, 6.50%, 7/21/20 | | | 200,000 | | | | 217 | |
| | Desarrolladora Homex
SAB de CV, 9.50%, 12/11/19 144A | | | 150,000 | | | | 161 | |
| | FMG Resources (August 2006) Pty, Ltd., 6.00%, 4/1/17 144A | | | 800,000 | | | | 816 | |
| | FMG Resources (August 2006) Pty, Ltd., 6.375%, 2/1/16 144A | | | 100,000 | | | | 103 | |
| | FMG Resources (August 2006) Pty, Ltd., 7.00%, 11/1/15 144A | | | 300,000 | | | | 315 | |
| | FMG Resources (August 2006) Pty, Ltd., 8.25%, 11/1/19 144A | | | 1,500,000 | | | | 1,597 | |
| (k) | | Hexion US Finance Corp./Hexion Nova Scotia Finance ULC, 8.875%, 2/1/18 | | | 1,700,000 | | | | 1,747 | |
| | Huntsman International LLC, 8.625%, 3/15/21 | | | 600,000 | | | | 686 | |
| | Ineos Finance PLC, 7.50%, 5/1/20 144A | | | 200,000 | | | | 209 | |
| | Ineos Finance PLC, 8.375%, 2/15/19 144A | | | 200,000 | | | | 216 | |
| | Ineos Finance PLC, 9.00%, 5/15/15 144A | | | 1,200,000 | | | | 1,275 | |
| | Newcrest
Finance Pty, Ltd., 4.20%, 10/1/22 144A | | | 200,000 | | | | 206 | |
| | Newcrest
Finance Pty, Ltd., 4.45%, 11/15/21 144A | | | 400,000 | | | | 421 | |
| | Newcrest
Finance Pty, Ltd., 5.75%, 11/15/41 144A | | | 200,000 | | | | 221 | |
| (c) | | Noranda Aluminum Acquisition Corp., 4.524%, 5/15/15 | | | 600,000 | | | | 564 | |
| (k) | | Reynolds Group Issuer, Inc./Reynolds Group Issuer LLC/Reynolds Group Issuer LU, 7.125%, 4/15/19 | | | 1,900,000 | | | | 2,043 | |
| | | | | | | | | | |
| | | Corporate Bonds (60.2%) | | Shares/ $ Par | | | Value
$ (000’s) | |
| | |
| | Basic Materials continued | | | | | |
| | Reynolds Group Issuer, Inc./Reynolds Group Issuer LLC/Reynolds Group Issuer LU, 7.875%, 8/15/19 | | | 200,000 | | | | 222 | |
| | Reynolds Group Issuer, Inc./Reynolds Group Issuer LLC/Reynolds Group Issuer LU, 8.50%, 5/15/18 | | | 400,000 | | | | 410 | |
| | Reynolds Group Issuer, Inc./Reynolds Group Issuer LLC/Reynolds Group Issuer LU, 9.875%, 8/15/19 | | | 100,000 | | | | 107 | |
| | Sappi Papier
Holding GmbH, 7.75%, 7/15/17 144A | | | 400,000 | | | | 436 | |
| | | | | | | | | | |
| | Total | | | | | | | 14,759 | |
| | | | | | | | | | |
| | |
| | Builders/Building Materials (0.9%) | | | | | |
| | Agile Property
Holdings, Ltd., 8.875%, 4/28/17 144A | | | 150,000 | | | | 161 | |
| | Cemex Finance LLC, 9.375%, 10/12/22 144A | | | 300,000 | | | | 337 | |
| | Cemex Finance LLC, 9.50%, 12/14/16 144A | | | 600,000 | | | | 653 | |
| | Cemex SAB de CV, 9.50%, 6/15/18 144A | | | 1,300,000 | | | | 1,466 | |
| | Corporacion GEO
SAB de CV, 9.25%, 6/30/20 144A | | | 200,000 | | | | 215 | |
| | HD Supply, Inc., 8.125%, 4/15/19 144A | | | 300,000 | | | | 342 | |
| | Urbi Desarrollos Urbanos SAB de CV, 9.50%, 1/21/20 144A | | | 100,000 | | | | 95 | |
| | | | | | | | | | |
| | Total | | | | | | | 3,269 | |
| | | | | | | | | | |
| | |
| | Consumer Products/Retailing (0.6%) | | | | | |
| | CVS Pass-Through Trust, 5.926%, 1/10/34 144A | | | 881,222 | | | | 1,060 | |
| | CVS Pass-Through Trust, 7.507%, 1/10/32 144A | | | 94,206 | | | | 124 | |
| | Jarden Corp., 6.125%, 11/15/22 | | | 100,000 | | | | 108 | |
| | Rock-Tenn Co., 4.45%, 3/1/19 144A | | | 200,000 | | | | 216 | |
| | Sally Holdings LLC/Sally Capital, Inc., 6.875%, 11/15/19 | | | 100,000 | | | | 111 | |
| | Spectrum Brands, Inc., 9.50%, 6/15/18 | | | 400,000 | | | | 454 | |
| | | | | | | | | | |
| | Total | | | | | | | 2,073 | |
| | | | | | | | | | |
| | | | | | | | | | |
| | | Corporate Bonds (60.2%) | | Shares/ $ Par | | | Value
$ (000’s) | |
| | |
| | Electric Utilities (0.9%) | | | | | |
| | Centrais Eletricas
Brasileiras SA, 6.875%, 7/30/19 144A | | | 400,000 | | | | 455 | |
| | Centrais Eletricas Brasileiras SA, 6.875%, 7/30/19 | | | 200,000 | | | | 228 | |
| | Centrais Eletricas
Brasileiras SA, 7.75%, 11/30/15 144A | | | 1,300,000 | | | | 1,482 | |
| | Enel Finance
International SA, 5.70%, 1/15/13 144A | | | 100,000 | | | | 100 | |
| | Entergy Corp., 3.625%, 9/15/15 | | | 100,000 | | | | 105 | |
| | Exelon
Generation Co. LLC, 4.25%, 6/15/22 144A | | | 500,000 | | | | 520 | |
| | Israel Electric Corp., Ltd., 7.25%, 1/15/19 144A | | | 200,000 | | | | 217 | |
| | Korea Hydro & Nuclear Power Co., Ltd., 3.125%, 9/16/15 144A | | | 100,000 | | | | 104 | |
| | Korea Hydro & Nuclear Power Co., Ltd., 6.25%, 6/17/14 | | | 100,000 | | | | 107 | |
| | Oncor Electric
Delivery Co. LLC, 4.10%, 6/1/22 | | | 200,000 | | | | 218 | |
| | | | | | | | | | |
| | Total | | | | | | | 3,536 | |
| | | | | | | | | | |
| | |
| | Energy (9.1%) | | | | | |
| | AK Transneft OAO, 7.70%, 8/7/13 | | | 200,000 | | | | 209 | |
| | Anadarko Finance Co., 7.50%, 5/1/31 | | | 100,000 | | | | 132 | |
| | Anadarko Petroleum Corp., 5.95%, 9/15/16 | | | 300,000 | | | | 345 | |
| | Anadarko Petroleum Corp., 6.375%, 9/15/17 | | | 300,000 | | | | 358 | |
| | CNOOC Finance 2012, Ltd., 3.875%, 5/2/22 | | | 1,500,000 | | | | 1,597 | |
| | Compagnie Generale de Geophysique-Veritas, 7.75%, 5/15/17 | | | 100,000 | | | | 104 | |
| | Continental Resources, Inc., 7.125%, 4/1/21 | | | 100,000 | | | | 113 | |
| | Ecopetrol SA, 7.625%, 7/23/19 | | | 720,000 | | | | 931 | |
| | El Paso Corp., 8.25%, 2/15/16 | | | 100,000 | | | | 112 | |
| | EP Energy LLC/Everest Acquisition Finance, Inc., 7.75%, 9/1/22 | | | 100,000 | | | | 106 | |
| | Gazprom OAO, 5.625%, 7/22/13 | | | 14,580 | | | | 15 | |
| | Gazprom OAO, 6.51%, 3/7/22 | | | 1,000,000 | | | | 1,192 | |
| | Gazprom OAO, 7.288%, 8/16/37 | | | 700,000 | | | | 912 | |
The Accompanying Notes are an Integral Part of the Financial Statements.
| | | | |
| 144 | | Multi-Sector Bond Portfolio | | |
Multi-Sector Bond Portfolio
| | | | | | | | |
| | | Corporate Bonds (60.2%) | | Shares/ $ Par | | Value
$ (000’s) | |
| | |
| | Energy continued | | | | |
| | Gazprom OAO, 8.625%, 4/28/34 | | 1,000,000 | | | 1,439 | |
| | Gazprom OAO, 9.25%, 4/23/19 | | 200,000 | | | 265 | |
| | Harvest Operations Corp., 6.875%, 10/1/17 | | 100,000 | | | 111 | |
| | Indian Oil Corp., Ltd., 4.75%, 1/22/15 | | 1,100,000 | | | 1,150 | |
| | KazMunayGas
National Co., 6.375%, 4/9/21 144A | | 900,000 | | | 1,101 | |
| | KazMunayGas National Co., 7.00%, 5/5/20 144A | | 300,000 | | | 373 | |
| | KazMunayGas National Co., 8.375%, 7/2/13 | | 300,000 | | | 310 | |
| | KazMunayGas National Co., 11.75%, 1/23/15 | | 700,000 | | | 836 | |
| | Linn Energy LLC/Linn Energy Finance Corp., 7.75%, 2/1/21 | | 100,000 | | | 106 | |
| | Majapahit Holding BV, 7.25%, 6/28/17 | | 100,000 | | | 118 | |
| | Majapahit Holding BV, 7.75%, 1/20/20 144A | | 100,000 | | | 126 | |
| | Majapahit Holding BV, 7.75%, 1/20/20 | | 100,000 | | | 126 | |
| | Majapahit Holding BV, 8.00%, 8/7/19 | | 100,000 | | | 126 | |
| | Midcontinent Express Pipeline LLC, 6.70%, 9/15/19 144A | | 1,500,000 | | | 1,584 | |
| | Nakilat, Inc., 6.067%, 12/31/33 | | 200,000 | | | 242 | |
| | Newfield Exploration Co., 6.875%, 2/1/20 | | 300,000 | | | 321 | |
| | Newfield Exploration Co., 7.125%, 5/15/18 | | 100,000 | | | 105 | |
| | NGPL PipeCo LLC, 7.119%, 12/15/17 144A | | 500,000 | | | 545 | |
| | NGPL PipeCo LLC, 7.768%, 12/15/37 144A | | 200,000 | | | 210 | |
| | NGPL PipeCo LLC, 9.625%, 6/1/19 144A | | 700,000 | | | 805 | |
| | OGX Austria GmbH, 8.375%, 4/1/22 144A | | 700,000 | | | 585 | |
| | OGX Austria GmbH, 8.375%, 4/1/22 | | 800,000 | | | 668 | |
| | OGX Austria GmbH, 8.50%, 6/1/18 144A | | 600,000 | | | 540 | |
| | Pemex Project Funding Master Trust, 5.75%, 3/1/18 | | 1,440,000 | | | 1,681 | |
| | Petrohawk Energy Corp., 7.25%, 8/15/18 | | 100,000 | | | 113 | |
| | Petroleos de Venezuela SA, 4.90%, 10/28/14 | | 100,000 | | | 96 | |
| | Petroleos de Venezuela SA, 5.00%, 10/28/15 | | 100,000 | | | 92 | |
| | | | | | | | | | |
| | | Corporate Bonds (60.2%) | | Shares/ $ Par | | | Value
$ (000’s) | |
| | |
| | Energy continued | | | | | |
| | Petroleos de Venezuela SA, 5.375%, 4/12/27 | | | 1,900,000 | | | | 1,330 | |
| | Petroleos de Venezuela SA, 5.50%, 4/12/37 | | | 1,800,000 | | | | 1,233 | |
| (k) | | Petroleos de Venezuela SA, 8.50%, 11/2/17 | | | 4,200,000 | | | | 4,147 | |
| | Pride International, Inc., 8.50%, 6/15/19 | | | 500,000 | | | | 660 | |
| | Ras Laffan Liquefied Natural Gas Co., Ltd. II, 5.298%, 9/30/20 | | | 398,750 | | | | 448 | |
| | Ras Laffan Liquefied Natural Gas Co., Ltd. III, 6.75%, 9/30/19 | | | 550,000 | | | | 690 | |
| | Rockies Express
Pipeline LLC, 5.625%, 4/15/20 144A | | | 1,000,000 | | | | 982 | |
| (k) | | Rockies Express
Pipeline LLC, 6.85%, 7/15/18 144A | | | 2,900,000 | | | | 3,031 | |
| | SandRidge Energy, Inc., 7.50%, 3/15/21 | | | 200,000 | | | | 214 | |
| | SandRidge Energy, Inc., 7.50%, 2/15/23 | | | 400,000 | | | | 428 | |
| | SandRidge Energy, Inc., 8.125%, 10/15/22 | | | 400,000 | | | | 438 | |
| | SandRidge Energy, Inc., 8.75%, 1/15/20 | | | 100,000 | | | | 109 | |
| | SandRidge Energy, Inc., 9.875%, 5/15/16 | | | 100,000 | | | | 108 | |
| | Tengizchevroil Finance Co. SARL, 6.124%, 11/15/14 | | | 57,273 | | | | 59 | |
| | | | | | | | | | |
| | Total | | | | | | | 33,777 | |
| | | | | | | | | | |
| | |
| | Financials (2.2%) | | | | | |
| | Ally Financial, Inc., 3.51%, 2/11/14 | | | 800,000 | | | | 814 | |
| | Ally Financial, Inc., 3.709%, 6/20/14 | | | 1,000,000 | | | | 1,023 | |
| | Ally Financial, Inc., 4.625%, 6/26/15 | | | 1,000,000 | | | | 1,043 | |
| | Ally Financial, Inc., 6.75%, 12/1/14 | | | 400,000 | | | | 432 | |
| | Ally Financial, Inc., 7.50%, 12/31/13 | | | 400,000 | | | | 423 | |
| | Ally Financial, Inc., 8.30%, 2/12/15 | | | 300,000 | | | | 334 | |
| | AWAS Aviation
Capital, Ltd., 7.00%, 10/17/16 144A | | | 808,000 | | | | 852 | |
| | CIT Group, Inc., 5.25%, 4/1/14 144A | | | 1,200,000 | | | | 1,242 | |
| | Eksportfinans ASA, 0.505%, 4/5/13 | | | 100,000 | | | | 100 | |
| | Eksportfinans ASA, 1.875%, 4/2/13 | | | 100,000 | | | | 100 | |
| | Eksportfinans ASA, 2.00%, 9/15/15 | | | 200,000 | | | | 191 | |
| | Eksportfinans ASA, 5.50%, 5/25/16 | | | 200,000 | | | | 208 | |
| | | | | | | | | | |
| | | Corporate Bonds (60.2%) | | Shares/ $ Par | | | Value
$ (000’s) | |
| | |
| | Financials continued | | | | | |
| | International Lease Finance Corp., 6.75%, 9/1/16 144A | | | 1,200,000 | | | | 1,347 | |
| | | | | | | | | | |
| | Total | | | | | | | 8,109 | |
| | | | | | | | | | |
| | |
| | Gas Pipelines (0.2%) | | | | | |
| | El Paso Corp., 12.00%, 12/12/13 | | | 800,000 | | | | 872 | |
| (n)* | | Selectica, 8.75%, 11/15/15 | | | 500,000 | | | | - | |
| | | | | | | | | | |
| | Total | | | | | | | 872 | |
| | | | | | | | | | |
| |
| | Health Care/Pharmaceuticals (2.2%) | |
| | Amgen, Inc., 3.625%, 5/15/22 | | | 800,000 | | | | 860 | |
| | Amgen, Inc., 5.375%, 5/15/43 | | | 900,000 | | | | 1,061 | |
| | Baptist Health South Florida Obligated Group, 4.59%, 8/15/21 | | | 100,000 | | | | 112 | |
| | Boston Scientific Corp., 6.00%, 1/15/20 | | | 1,200,000 | | | | 1,400 | |
| (k) | | HCA, Inc., 6.50%, 2/15/20 | | | 2,200,000 | | | | 2,475 | |
| | HCA, Inc., 9.875%, 2/15/17 | | | 130,000 | | | | 137 | |
| | Mylan, Inc., 7.625%, 7/15/17 144A | | | 100,000 | | | | 112 | |
| | Mylan, Inc., 7.875%, 7/15/20 144A | | | 300,000 | | | | 355 | |
| | Valeant Pharmaceuticals International, 6.50%, 7/15/16 144A | | | 600,000 | | | | 631 | |
| | Warner Chilcott Co. LLC/Warner Chilcott Finance LLC, 7.75%, 9/15/18 | | | 900,000 | | | | 958 | |
| | | | | | | | | | |
| | Total | | | | | | | 8,101 | |
| | | | | | | | | | |
| | |
| | Independent Finance (6.1%) | | | | | |
| | Alliance Data Systems Corp., 5.25%, 12/1/17 144A | | | 600,000 | | | | 609 | |
| | American International Group, Inc., 5.05%, 10/1/15 | | | 300,000 | | | | 331 | |
| | American International Group, Inc., 5.60%, 10/18/16 | | | 200,000 | | | | 228 | |
| (k) | | American International Group, Inc., 5.85%, 1/16/18 | | | 2,400,000 | | | | 2,837 | |
| | Anglo American
Capital PLC, 2.625%, 9/27/17 144A | | | 200,000 | | | | 204 | |
| | Anglo American
Capital PLC, 4.125%, 9/27/22 144A | | | 1,400,000 | | | | 1,463 | |
The Accompanying Notes are an Integral Part of the Financial Statements.
| | | | | | |
| | Multi-Sector Bond Portfolio | | | 145 | |
Multi-Sector Bond Portfolio
| | | | | | | | | | |
| | | Corporate Bonds (60.2%) | | Shares/ $ Par | | | Value
$ (000’s) | |
| | |
| | Independent Finance continued | | | | | |
| | Banco Continental SA via Continental Senior Trustee II Cayman, Ltd., 5.75%, 1/18/17 144A | | | 600,000 | | | | 657 | |
| | Fibria Overseas Finance, Ltd., 6.75%, 3/3/21 144A | | | 200,000 | | | | 221 | |
| | GATX Corp., 4.75%, 6/15/22 | | | 200,000 | | | | 210 | |
| | Hyundai Capital Services, Inc., 4.375%, 7/27/16 144A | | | 200,000 | | | | 215 | |
| | Hyundai Capital Services, Inc., 6.00%, 5/5/15 | | | 1,300,000 | | | | 1,427 | |
| | Indo Energy Finance BV, 7.00%, 5/7/18 144A | | | 200,000 | | | | 209 | |
| | IPIC GMTN, Ltd., 5.00%, 11/15/20 144A | | | 1,500,000 | | | | 1,705 | |
| | The Korea Development Bank, 3.00%, 9/14/22 | | | 1,000,000 | | | | 996 | |
| (n) | | LBG Capital No. 1 PLC, 8.50%, 12/17/49 144A | | | 660,000 | | | | 683 | |
| | Odebrecht Drilling Norbe VIII/IX, Ltd., 6.35%, 6/30/21 | | | 1,425,000 | | | | 1,608 | |
| (n) | | Peru Enhanced Pass-Through Finance, Ltd., 0.00%, 5/31/18 144A | | | 147,929 | | | | 135 | |
| | Reliance Holdings USA, Inc., 4.50%, 10/19/20 | | | 300,000 | | | | 314 | |
| | SABIC Capital I BV, 3.00%, 11/2/15 | | | 1,200,000 | | | | 1,241 | |
| | SB Capital SA, 5.40%, 3/24/17 | | | 500,000 | | | | 547 | |
| | SB Capital SA, 5.499%, 7/7/15 | | | 300,000 | | | | 324 | |
| | SB Capital SA, 5.717%, 6/16/21 | | | 200,000 | | | | 224 | |
| | SB Capital SA, 6.125%, 2/7/22 144A | | | 1,500,000 | | | | 1,714 | |
| | SB Capital SA, 6.125%, 2/7/22 | | | 400,000 | | | | 457 | |
| | Schaeffler Finance BV, 7.75%, 2/15/17 144A | | | 300,000 | | | | 333 | |
| | Temasek Financial I, Ltd., 3.375%, 7/23/42 144A | | | 500,000 | | | | 474 | |
| | TNK-BP Finance SA, 7.25%, 2/2/20 144A | | | 400,000 | | | | 485 | |
| | TNK-BP Finance SA, 7.50%, 3/13/13 144A | | | 200,000 | | | | 202 | |
| | TNK-BP Finance SA, 7.50%, 3/13/13 | | | 600,000 | | | | 607 | |
| | TNK-BP Finance SA, 7.875%, 3/13/18 144A | | | 100,000 | | | | 121 | |
| | | | | | | | | | |
| | | Corporate Bonds (60.2%) | | Shares/ $ Par | | | Value
$ (000’s) | |
| | |
| | Independent Finance continued | | | | | |
| (k) | | TNK-BP Finance SA, 7.875%, 3/13/18 | | | 1,500,000 | | | | 1,821 | |
| | | | | | | | | | |
| | Total | | | | | | | 22,602 | |
| | | | | | | | | | |
| | |
| | Industrial - Other (0.2%) | | | | | |
| | Rhodia SA, 6.875%, 9/15/20 144A | | | 500,000 | | | | 564 | |
| | Sinochem Overseas Capital Co., Ltd., 4.50%, 11/12/20 144A | | | 100,000 | | | | 107 | |
| | | | | | | | | | |
| | Total | | | | | | | 671 | |
| | | | | | | | | | |
| | |
| | Media (0.7%) | | | | | |
| | Clear Channel Worldwide Holdings, Inc., 6.50%, 11/15/22 144A | | | 500,000 | | | | 519 | |
| | Columbus International, Inc., 11.50%, 11/20/14 144A | | | 100,000 | | | | 111 | |
| | CSC Holdings LLC, 7.625%, 7/15/18 | | | 100,000 | | | | 115 | |
| | CSC Holdings LLC, 7.875%, 2/15/18 | | | 400,000 | | | | 463 | |
| | CSC Holdings LLC, 8.625%, 2/15/19 | | | 200,000 | | | | 239 | |
| | DISH DBS Corp., 7.125%, 2/1/16 | | | 325,000 | | | | 364 | |
| | EchoStar DBS Corp., 7.75%, 5/31/15 | | | 700,000 | | | | 783 | |
| | Quebecor Media, Inc., 7.75%, 3/15/16 | | | 162,000 | | | | 166 | |
| | | | | | | | | | |
| | Total | | | | | | | 2,760 | |
| | | | | | | | | | |
| | |
| | Metals/Mining (2.3%) | | | | | |
| | AngloGold Ashanti Holdings PLC, 5.375%, 4/15/20 | | | 100,000 | | | | 103 | |
| | ArcelorMittal, 7.50%, 10/15/39 | | | 100,000 | | | | 94 | |
| | CSN Islands XI Corp., 6.875%, 9/21/19 144A | | | 700,000 | | | | 784 | |
| | Gerdau Holdings, Inc., 7.00%, 1/20/20 144A | | | 200,000 | | | | 232 | |
| | Gerdau Holdings, Inc., 7.00%, 1/20/20 | | | 600,000 | | | | 698 | |
| | Gerdau Trade, Inc., 5.75%, 1/30/21 144A | | | 800,000 | | | | 880 | |
| | Gold Fields Orogen Holding BVI, Ltd., 4.875%, 10/7/20 | | | 200,000 | | | | 197 | |
| | Severstal OAO, 6.70%, 10/25/17 144A | | | 700,000 | | | | 767 | |
| | Southern Copper Corp., 5.25%, 11/8/42 | | | 500,000 | | | | 500 | |
| | Steel Dynamics, Inc., 7.625%, 3/15/20 | | | 300,000 | | | | 332 | |
| | Teck Resources, Ltd., 4.50%, 1/15/21 | | | 1,500,000 | | | | 1,632 | |
| | Vale Overseas, Ltd., 4.375%, 1/11/22 | | | 800,000 | | | | 854 | |
| | | | | | | | | | |
| | | Corporate Bonds (60.2%) | | Shares/ $ Par | | | Value
$ (000’s) | |
| | |
| | Metals/Mining continued | | | | | |
| | Vale Overseas, Ltd., 4.625%, 9/15/20 | | | 400,000 | | | | 432 | |
| | Vale Overseas, Ltd., 6.875%, 11/21/36 | | | 100,000 | | | | 124 | |
| | Xstrata Canada Financial Corp., 3.60%, 1/15/17 144A | | | 1,000,000 | | | | 1,053 | |
| | | | | | | | | | |
| | Total | | | | | | | 8,682 | |
| | | | | | | | | | |
| | |
| | Oil and Gas (2.0%) | | | | | |
| (k) | | Petrobras International Finance Co., 5.375%, 1/27/21 | | | 2,400,000 | | | | 2,702 | |
| | Petrobras International Finance Co., 5.875%, 3/1/18 | | | 600,000 | | | | 687 | |
| | Petrobras International Finance Co., 7.875%, 3/15/19 | | | 230,000 | | | | 287 | |
| | Petroleos Mexicanos, 4.875%, 3/15/15 | | | 1,490,000 | | | | 1,606 | |
| | Petroleos Mexicanos, 8.00%, 5/3/19 | | | 1,200,000 | | | | 1,569 | |
| | QGOG Constellation SA, 6.25%, 11/9/19 144A | | | 500,000 | | | | 521 | |
| | | | | | | | | | |
| | Total | | | | | | | 7,372 | |
| | | | | | | | | | |
| | |
| | Other Finance (4.3%) | | | | | |
| | AK Transneft OAO, 8.70%, 8/7/18 144A | | | 1,000,000 | | | | 1,295 | |
| | Alrosa Finance SA, 7.75%, 11/3/20 144A | | | 500,000 | | | | 580 | |
| | Alrosa Finance SA, 7.75%, 11/3/20 | | | 900,000 | | | | 1,044 | |
| | Banque PSA Finance, 2.254%, 4/4/14 144A | | | 1,000,000 | | | | 988 | |
| | Banque PSA Finance, 4.375%, 4/4/16 144A | | | 500,000 | | | | 504 | |
| | Braskem Finance, Ltd., 5.375%, 5/2/22 144A | | | 400,000 | | | | 414 | |
| | Braskem Finance, Ltd., 5.75%, 4/15/21 144A | | | 250,000 | | | | 263 | |
| | Braskem Finance, Ltd., 5.75%, 4/15/21 | | | 700,000 | | | | 739 | |
| | Dolphin Energy, Ltd., 5.50%, 12/15/21 144A | | | 1,300,000 | | | | 1,516 | |
| | Dolphin Energy, Ltd., 5.50%, 12/15/21 | | | 200,000 | | | | 233 | |
| | Novatek Finance, Ltd., 6.604%, 2/3/21 144A | | | 1,100,000 | | | | 1,290 | |
| | Prudential Covered Trust 2012-1, 2.997%, 9/30/15 144A | | | 475,000 | | | | 493 | |
| | QNB Finance, Ltd., 3.375%, 2/22/17 | | | 1,200,000 | | | | 1,257 | |
| | RCI Banque SA, 2.217%, 4/11/14 144A | | | 900,000 | | | | 900 | |
| | Rosneft Oil Co. via Rosneft International Finance, Ltd., 4.199%, 3/6/22 144A | | | 700,000 | | | | 716 | |
The Accompanying Notes are an Integral Part of the Financial Statements.
| | | | |
| 146 | | Multi-Sector Bond Portfolio | | |
Multi-Sector Bond Portfolio
| | | | | | | | | | |
| | | Corporate Bonds (60.2%) | | Shares/ $ Par | | | Value
$ (000’s) | |
| |
| | Other Finance continued | |
| | SLM Corp., 5.00%, 4/15/15 | | | 600,000 | | | | 632 | |
| (k) | | SLM Corp., 6.25%, 1/25/16 | | | 2,700,000 | | | | 2,936 | |
| | SteelRiver Transmission Co. LLC, 4.71%, 6/30/17 144A | | | 87,385 | | | | 91 | |
| | | | | | | | | | |
| | Total | | | | | | | 15,891 | |
| | | | | | | | | | |
| |
| | Other Services (0.2%) | |
| | Ecolab, Inc., 3.00%, 12/8/16 | | | 800,000 | | | | 850 | |
| | | | | | | | | | |
| | Total | | | | | | | 850 | |
| | | | | | | | | | |
| |
| | Paper and Forest Products (0.3%) | |
| | Celulosa Arauco y Constitucion SA, 7.25%, 7/29/19 | | | 300,000 | | | | 356 | |
| | Georgia-Pacific LLC, 8.00%, 1/15/24 | | | 100,000 | | | | 140 | |
| | Georgia-Pacific LLC, 8.875%, 5/15/31 | | | 300,000 | | | | 450 | |
| | | | | | | | | | |
| | Total | | | | | | | 946 | |
| | | | | | | | | | |
| |
| | Real Estate Investment Trusts (1.2%) | |
| (k) | | American Tower Corp., 7.25%, 5/15/19 | | | 1,500,000 | | | | 1,840 | |
| | Longfor Properties Co., Ltd., 9.50%, 4/7/16 144A | | | 200,000 | | | | 220 | |
| | Qatari Diar Finance QSC, 5.00%, 7/21/20 | | | 1,100,000 | | | | 1,284 | |
| | SL Green Realty Corp., 5.00%, 8/15/18 | | | 1,100,000 | | | | 1,195 | |
| | | | | | | | | | |
| | Total | | | | | | | 4,539 | |
| | | | | | | | | | |
| |
| | Services (0.2%) | |
| | ARAMARK Corp., 3.813%, 2/1/15 | | | 250,000 | | | | 249 | |
| | Hutchison Whampoa International, Ltd., 5.75%, 9/11/19 | | | 200,000 | | | | 238 | |
| | Pearson PLC, 5.50%, 5/6/13 144A | | | 100,000 | | | | 102 | |
| | | | | | | | | | |
| | Total | | | | | | | 589 | |
| | | | | | | | | | |
| |
| | Technology (0.6%) | |
| | Advanced Micro Devices, Inc., 7.50%, 8/15/22 144A | | | 300,000 | | | | 247 | |
| | Audatex North America, Inc., 6.75%, 6/15/18 144A | | | 100,000 | | | | 107 | |
| | First Data Corp., 6.75%, 11/1/20 144A | | | 1,000,000 | | | | 1,010 | |
| | First Data Corp., 7.375%, 6/15/19 144A | | | 500,000 | | | | 517 | |
| | Hewlett-Packard Co., 4.65%, 12/9/21 | | | 400,000 | | | | 402 | |
| | | | | | | | | | |
| | Total | | | | | | | 2,283 | |
| | | | | | | | | | |
| | | | | | | | | | |
| | | Corporate Bonds (60.2%) | | Shares/ $ Par | | | Value
$ (000’s) | |
| |
| | Telecommunications (3.5%) | |
| (k) | | America Movil SAB de CV, 2.375%, 9/8/16 | | | 1,700,000 | | | | 1,767 | |
| | America Movil SAB de CV, 4.375%, 7/16/42 | | | 200,000 | | | | 208 | |
| | Brocade Communications Systems, Inc., 6.875%, 1/15/20 | | | 1,100,000 | | | | 1,185 | |
| | Deutsche Telekom International Finance BV, 8.75%, 6/15/30 | | | 700,000 | | | | 1,049 | |
| | Digicel Group, Ltd., 8.25%, 9/30/20 144A | | | 600,000 | | | | 660 | |
| | Eileme 2 AB, 11.625%, 1/31/20 144A | | | 600,000 | | | | 699 | |
| | Frontier Communications Corp., 7.875%, 4/15/15 | | | 66,000 | | | | 74 | |
| | Qtel International Finance, Ltd., 3.375%, 10/14/16 144A | | | 300,000 | | | | 314 | |
| | Qtel International Finance, Ltd., 4.75%, 2/16/21 144A | | | 200,000 | | | | 226 | |
| | Qtel International Finance, Ltd., 4.75%, 2/16/21 | | | 1,100,000 | | | | 1,243 | |
| | Qwest Corp., 7.25%, 9/15/25 | | | 500,000 | | | | 579 | |
| | Telecom Italia Capital SA, 7.721%, 6/4/38 | | | 100,000 | | | | 108 | |
| | Telefonos de Mexico SAB de CV, 5.50%, 1/27/15 | | | 100,000 | | | | 109 | |
| | Telefonos de Mexico SAB de CV, 5.50%, 11/15/19 | | | 700,000 | | | | 822 | |
| | tw telecom holdings, inc., 8.00%, 3/1/18 | | | 600,000 | | | | 657 | |
| | Vimpel Communications Via VIP Finance Ireland, Ltd., 7.748%, 2/2/21 144A | | | 1,200,000 | | | | 1,386 | |
| | Vimpel Communications Via VIP Finance Ireland, Ltd., 9.125%, 4/30/18 144A | | | 900,000 | | | | 1,090 | |
| | Wind Acquisition Finance SA, 7.25%, 2/15/18 144A | | | 300,000 | | | | 304 | |
| | Windstream Corp., 7.875%, 11/1/17 | | | 100,000 | | | | 112 | |
| | Windstream Corp., 8.125%, 8/1/13 | | | 600,000 | | | | 622 | |
| | | | | | | | | | |
| | Total | | | | | | | 13,214 | |
| | | | | | | | | | |
| | | | | | | | | | |
| | | Corporate Bonds (60.2%) | | Shares/ $ Par | | | Value
$ (000’s) | |
| |
| | Tobacco (0.9%) | |
| | Altria Group, Inc., 2.85%, 8/9/22 | | | 1,600,000 | | | | 1,583 | |
| | Altria Group, Inc., 9.70%, 11/10/18 | | | 237,000 | | | | 332 | |
| | Altria Group, Inc., 10.20%, 2/6/39 | | | 800,000 | | | | 1,338 | |
| | Reynolds American, Inc., 6.75%, 6/15/17 | | | 50,000 | | | | 61 | |
| | | | | | | | | | |
| | Total | | | | | | | 3,314 | |
| | | | | | | | | | |
| |
| | Transportation (1.2%) | |
| | Asciano Finance, Ltd., 4.625%, 9/23/20 144A | | | 500,000 | | | | 519 | |
| | Asciano Finance, Ltd., 5.00%, 4/7/18 144A | | | 800,000 | | | | 864 | |
| | DP World, Ltd., 6.85%, 7/2/37 | | | 200,000 | | | | 234 | |
| | Penske Truck Leasing Co. LP/PTL Finance Corp., 2.50%, 3/15/16 144A | | | 700,000 | | | | 702 | |
| | Penske Truck Leasing Co. LP/PTL Finance Corp., 3.75%, 5/11/17 144A | | | 300,000 | | | | 314 | |
| (k) | | RZD Capital, Ltd., 5.739%, 4/3/17 | | | 1,600,000 | | | | 1,792 | |
| | | | | | | | | | |
| | Total | | | | | | | 4,425 | |
| | | | | | | | | | |
| |
| | Utilities (0.6%) | |
| | The AES Corp., 7.75%, 3/1/14 | | | 700,000 | | | | 746 | |
| | The AES Corp., 8.00%, 10/15/17 | | | 100,000 | | | | 115 | |
| | The AES Corp., 8.00%, 6/1/20 | | | 300,000 | | | | 345 | |
| | NRG Energy, Inc., 7.625%, 1/15/18 | | | 600,000 | | | | 666 | |
| | Puget Energy, Inc., 5.625%, 7/15/22 | | | 200,000 | | | | 215 | |
| | | | | | | | | | |
| | Total | | | | | | | 2,087 | |
| | | | | | | | | | |
| |
| | Yankee Sovereign (3.6%) | |
| | Indonesia Government International Bond, 6.75%, 3/10/14 | | | 500,000 | | | | 529 | |
| (k) | | Indonesia Government International Bond, 6.875%, 1/17/18 | | | 5,100,000 | | | | 6,228 | |
| | Peruvian Government International Bond, 7.35%, 7/21/25 | | | 800,000 | | | | 1,159 | |
| | Qatar Government International Bond, 5.25%, 1/20/20 144A | | | 1,200,000 | | | | 1,434 | |
| | Russian Government International Bond, 4.50%, 4/4/22 144A | | | 800,000 | | | | 916 | |
| | Russian Government International Bond, 7.50%, 3/31/30 | | | 292,950 | | | | 376 | |
The Accompanying Notes are an Integral Part of the Financial Statements.
| | | | | | |
| | Multi-Sector Bond Portfolio | | | 147 | |
Multi-Sector Bond Portfolio
| | | | | | | | | | |
| | | Corporate Bonds (60.2%) | | Shares/
$ Par | | | Value
$ (000’s) | |
| |
| | Yankee Sovereign continued | |
| | Venezuela Government International Bond, 7.75%, 10/13/19 | | | 100,000 | | | | 94 | |
| | Venezuela Government International Bond, 8.25%, 10/13/24 | | | 200,000 | | | | 184 | |
| | Venezuela Government International Bond, 9.25%, 5/7/28 | | | 1,100,000 | | | | 1,084 | |
| | Venezuela Government International Bond, 9.375%, 1/13/34 | | | 1,400,000 | | | | 1,386 | |
| | | | | | | | | | |
| | Total | | | | | | | 13,390 | |
| | | | | | | | | | |
| | | |
| | Total Corporate Bonds | | | | | | | | |
| | (Cost: $207,807) | | | | | | | 224,216 | |
| | | | | | | | | | |
| | | |
| | | Foreign Bonds (18.0%) | | Par | | | | |
| |
| | Autos/Vehicle Parts (0.2%) | |
| | Fiat Finance & Trade SA, 7.625%, 9/15/14 | | | 500,000 | | | | 699 | |
| | | | | | | | | | |
| | Total | | | | | | | 699 | |
| | | | | | | | | | |
| |
| | Banking (2.5%) | |
| | Banco do Brasil SA, 4.50%, 1/20/16 144A | | | 500,000 | | | | 703 | |
| | Banco Nacional de Desenvolvimento Economico e Social, 4.125%, 9/15/17 144A | | | 300,000 | | | | 426 | |
| | Bank of Scotland PLC, 6.375%, 8/16/19 | | | 100,000 | | | | 173 | |
| | Barclays Bank PLC, 10.00%, 5/21/21 | | | 1,200,000 | | | | 2,618 | |
| | Caisse Centrale du Credit Immobilier de France SA, 3.096%, 8/9/13 | | | 700,000 | | | | 930 | |
| | Lloyds TSB Bank PLC, 6.50%, 3/24/20 | | | 600,000 | | | | 904 | |
| | Lloyds TSB Bank PLC, 9.625%, 4/6/23 | | | 400,000 | | | | 838 | |
| | Merrill Lynch & Co., Inc., 0.456%, 1/31/14 | | | 1,100,000 | | | | 1,441 | |
| | The Royal Bank of Scotland Group PLC, 2.014%, 3/30/15 | | | 1,100,000 | | | | 958 | |
| | The Royal Bank of Scotland Group PLC, 6.934%, 4/9/18 | | | 100,000 | | | | 149 | |
| | Royal Bank of Scotland NV, 0.94%, 6/8/15 | | | 300,000 | | | | 371 | |
| | | | | | | | | | |
| | Total | | | | | | | 9,511 | |
| | | | | | | | | | |
| |
| | Basic Materials (0.8%) | |
| | Grohe Holdings GmbH, 4.183%, 9/15/17 | | | 100,000 | | | | 133 | |
| | Ineos Group Holdings SA, 7.875%, 2/15/16 | | | 400,000 | | | | 523 | |
| | | | | | | | | | |
| | | Foreign Bonds (18.0%) | | Par | | | Value
$ (000’s) | |
| |
| | Basic Materials continued | |
| | Kinove German Bondco GmbH, 10.00%, 6/15/18 | | | 1,080,000 | | | | 1,578 | |
| | Obrascon Huarte Lain SA, 8.75%, 3/15/18 | | | 300,000 | | | | 432 | |
| | Smurfit Kappa Acquisitions, 7.75%, 11/15/19 | | | 300,000 | | | | 438 | |
| | | | | | | | | | |
| | Total | | | | | | | 3,104 | |
| | | | | | | | | | |
| |
| | Beverage/Bottling (0.1%) | |
| | Ardagh Packaging Finance PLC, 7.375%, 10/15/17 | | | 100,000 | | | | 144 | |
| | OI European Group BV, 6.75%, 9/15/20 | | | 200,000 | | | | 299 | |
| | | | | | | | | | |
| | Total | | | | | | | 443 | |
| | | | | | | | | | |
| |
| | Energy (0.4%) | |
| | NXP BV/NXP Funding LLC, 2.96%, 10/15/13 | | | 37,305 | | | | 49 | |
| | Tokyo Electric Power Co., 4.50%, 3/24/14 | | | 950,000 | | | | 1,272 | |
| | | | | | | | | | |
| | Total | | | | | | | 1,321 | |
| | | | | | | | | | |
| |
| | Finance Lessors (0.1%) | |
| | The Great Rolling Stock Co., 6.875%, 7/27/35 | | | 100,000 | | | | 203 | |
| | | | | | | | | | |
| | Total | | | | | | | 203 | |
| | | | | | | | | | |
| |
| | Governments (10.3%) | |
| | The Autonomous Community of Madrid Spain, 4.20%, 9/24/14 | | | 1,700,000 | | | | 2,166 | |
| | Banque Centrale de Tunisie SA, 6.25%, 2/20/13 | | | 300,000 | | | | 397 | |
| | Brazil Notas do Tesouro Nacional Series F, 10.00%, 1/1/14 | | | 186,000 | | | | 93 | |
| | Brazil Notas do Tesouro Nacional Series F, 10.00%, 1/1/17 | | | 3,251,000 | | | | 1,671 | |
| | Brazil Notas do Tesouro Nacional Series F, 10.00%, 1/1/21 | | | 604,000 | | | | 311 | |
| | Commonwealth of Australia Treasury Indexed Bonds, 3.00%, 9/20/25 | | | 400,000 | | | | 571 | |
| | Commonwealth of Australia Treasury Indexed Bonds, 4.00%, 8/20/20 | | | 2,100,000 | | | | 4,206 | |
| | Indonesia Treasury Bond, 6.625%, 5/15/33 | | | 3,257,000,000 | | | | 356 | |
| | Indonesia Treasury Bond, 7.00%, 5/15/27 | | | 5,953,000,000 | | | | 682 | |
| | Indonesia Treasury Bond, 10.00%, 2/15/28 | | | 21,000,000,000 | | | | 3,036 | |
| | | | | | | | | | |
| | | Foreign Bonds (18.0%) | | Par | | | Value
$ (000’s) | |
| |
| | Governments continued | |
| | Mexican Bonos, 6.00%, 6/18/15 | | | 47,000,000 | | | | 3,756 | |
| | New South Wales Treasury Corp., 2.75%, 11/20/25 | | | 300,000 | | | | 406 | |
| | Province of Ontario Canada, 3.15%, 6/2/22 | | | 3,100,000 | | | | 3,231 | |
| | Province of Ontario Canada, 4.00%, 6/2/21 | | | 100,000 | | | | 112 | |
| | Province of Ontario Canada, 4.20%, 3/8/18 | | | 300,000 | | | | 335 | |
| | Province of Ontario Canada, 4.20%, 6/2/20 | | | 300,000 | | | | 339 | |
| | Province of Quebec Canada, 4.50%, 12/1/18 | | | 1,700,000 | | | | 1,932 | |
| | Province of Quebec Canada, 4.50%, 12/1/19 | | | 300,000 | | | | 343 | |
| | Province of Quebec Canada, 4.50%, 12/1/20 | | | 2,900,000 | | | | 3,323 | |
| | Republic of South Africa, 7.25%, 1/15/20 | | | 4,000,000 | | | | 499 | |
| | Republic of South Africa, 8.00%, 12/21/18 | | | 39,900,000 | | | | 5,182 | |
| | Republic of South Africa, 13.50%, 9/15/15 | | | 29,700,000 | | | | 4,227 | |
| | United Kingdom Gilt Bond, 3.75%, 9/7/21 | | | 700,000 | | | | 1,336 | |
| | | | | | | | | | |
| | Total | | | | | | | 38,510 | |
| | | | | | | | | | |
| |
| | Independent Finance (1.5%) | |
| | American International Group, Inc., 8.625%, 5/22/38 | | | 100,000 | | | | 197 | |
| | Conti-Gummi Finance BV, 8.50%, 7/15/15 | | | 400,000 | | | | 570 | |
| | GMAC International Finance BV, 7.50%, 4/21/15 | | | 400,000 | | | | 577 | |
| | IPIC GMTN, Ltd., 4.875%, 5/14/16 | | | 700,000 | | | | 1,025 | |
| | LBG Capital No. 1 PLC, 6.439%, 5/23/20 | | | 1,400,000 | | | | 1,832 | |
| | LBG Capital No. 1 PLC, 7.869%, 8/25/20 | | | 100,000 | | | | 172 | |
| | LBG Capital No. 1 PLC, 11.04%, 3/19/20 | | | 500,000 | | | | 945 | |
| | Mondi Finance PLC, 5.75%, 4/3/17 | | | 100,000 | | | | 152 | |
| | Telenet Finance III Luxembourg SCA, 6.625%, 2/15/21 144A | | | 100,000 | | | | 140 | |
| | | | | | | | | | |
| | Total | | | | | | | 5,610 | |
| | | | | | | | | | |
The Accompanying Notes are an Integral Part of the Financial Statements.
| | | | |
| 148 | | Multi-Sector Bond Portfolio | | |
Multi-Sector Bond Portfolio
| | | | | | | | | | |
| | | Foreign Bonds (18.0%) | | Par | | | Value
$ (000’s) | |
| |
| | Media (0.5%) | |
| | UPC Holding BV, 8.375%, 8/15/20 | | | 1,300,000 | | | | 1,925 | |
| | | | | | | | | | |
| | Total | | | | | | | 1,925 | |
| | | | | | | | | | |
| |
| | Other Finance (0.4%) | |
| | ING Groep NV, 5.14%, 3/17/49 | | | 600,000 | | | | 780 | |
| | UPCB Finance II, Ltd., 6.375%, 7/1/20 | | | 400,000 | | | | 562 | |
| | | | | | | | | | |
| | Total | | | | | | | 1,342 | |
| | | | | | | | | | |
| |
| | Retail Food and Drug (0.0%) | |
| | Spirit Issuer PLC, 6.582%, 12/28/18 | | | 100,000 | | | | 150 | |
| | | | | | | | | | |
| | Total | | | | | | | 150 | |
| | | | | | | | | | |
| |
| | Structured Products (0.3%) | |
| | EMF-NL BV, 1.009%, 4/17/41 | | | 299,217 | | | | 335 | |
| | Epic Opera PLC, 0.778%, 7/28/16 | | | 44,499 | | | | 71 | |
| | Eurosail-NL BV, 0.959%, 10/17/40 | | | 219,610 | | | | 274 | |
| | Opera Germany PLC, 0.425%, 10/20/14 | | | 100,000 | | | | 130 | |
| | Real Estate Capital No. 5 PLC, 0.758%, 7/25/16 | | | 190,299 | | | | 306 | |
| | | | | | | | | | |
| | Total | | | | | | | 1,116 | |
| | | | | | | | | | |
| |
| | Telecommunications (0.8%) | |
| | Telenet Finance V Luxembourg SCA, 6.25%, 8/15/22 144A | | | 100,000 | | | | 141 | |
| | Telenet Finance V Luxembourg SCA, 6.75%, 8/15/24 144A | | | 300,000 | | | | 423 | |
| | Virgin Media Secured Finance PLC, 7.00%, 1/15/18 | | | 900,000 | | | | 1,583 | |
| | Wind Acquisition Finance SA, 7.375%, 2/15/18 | | | 600,000 | | | | 804 | |
| | | | | | | | | | |
| | Total | | | | | | | 2,951 | |
| | | | | | | | | | |
| | | |
| | Total Foreign Bonds | | | | | | | | |
| | (Cost: $63,440) | | | | | | | 66,886 | |
| | | | | | | | | | |
| | | |
| | | Governments (6.2%) | | $ Par | | | | |
| |
| | Governments (6.2%) | |
| (k) | | US Treasury, 0.25%, 12/15/14 | | | 6,500,000 | | | | 6,500 | |
| (k) | | US Treasury, 0.25%, 5/15/15 | | | 4,200,000 | | | | 4,195 | |
| (k) | | US Treasury, 1.625%, 8/15/22 | | | 1,000,000 | | | | 993 | |
| (k) | | US Treasury, 3.00%, 5/15/42 | | | 1,500,000 | | | | 1,528 | |
| (b) | | US Treasury, 3.125%, 11/15/41 | | | 3,200,000 | | | | 3,349 | |
| | | | | | | | | | |
| | | Governments (6.2%) | | Shares/
$ Par | | | Value
$ (000’s) | |
| |
| | Governments continued | |
| (k) | | US Treasury, 3.75%, 8/15/41 | | | 100,000 | | | | 118 | |
| (k) | | US Treasury, 6.375%, 8/15/27 | | | 4,300,000 | | | | 6,515 | |
| | | | | | | | | | |
| | | |
| | Total Governments | | | | | | | | |
| | (Cost: $22,963) | | | | | | | 23,198 | |
| | | | | | | | | | |
| |
| | | Municipal Bonds (3.3%) | |
| |
| | Municipal Bonds (3.3%) | |
| | Alameda County California Association of Joint Powers Authorities, Series 2010-A, 7.046%, 12/1/44 RB | | | 100,000 | | | | 127 | |
| | American Municipal Power, Inc., Series 2010-B, 7.834%, 2/15/41 RB | | | 100,000 | | | | 140 | |
| | Bay Area Toll Authority, Series 2010-S1, 6.918%, 4/1/40 RB | | | 200,000 | | | | 276 | |
| | Buckeye Tobacco Settlement Financing Authority, Series 2007-A2, 5.875%, 6/1/30 RB | | | 100,000 | | | | 91 | |
| | Buckeye Tobacco Settlement Financing Authority, Series 2007-A2, 5.875%, 6/1/47 RB | | | 700,000 | | | | 626 | |
| | Buckeye Tobacco Settlement Financing Authority, Series 2007-A2, 6.50%, 6/1/47 RB | | | 300,000 | | | | 292 | |
| | California State, Series 2010, 7.30%, 10/1/39 GO | | | 200,000 | | | | 277 | |
| | California State, Series 2010, 7.70%, 11/1/30 GO | | | 200,000 | | | | 248 | |
| | California State, Series 2010, 7.95%, 3/1/36 GO | | | 1,100,000 | | | | 1,367 | |
| | The California State University, Series 2010-B, 6.484%, 11/1/41 RB | | | 300,000 | | | | 355 | |
| | Chicago Illinois Water Revenue, Series 2010-B, 6.742%, 11/1/40 RB | | | 100,000 | | | | 137 | |
| | City of Riverside, Series 2010-A, 7.605%, 10/1/40 RB | | | 200,000 | | | | 273 | |
| | | | | | | | | | |
| | | Municipal Bonds (3.3%) | | Shares/
$ Par | | | Value
$ (000’s) | |
| |
| | Municipal Bonds continued | |
| | Clovis Unified School District of California, Series 2001-B, 0.00%, 8/1/20 GO, NATL-RE, FGIC | | | 100,000 | | | | 81 | |
| | Golden State Tobacco Securitization Corp., Series 2007-A2, 5.30%, 6/1/37 RB | | | 100,000 | | | | 90 | |
| | Golden State Tobacco Securitization Corp., Series 2007-A1, 5.75%, 6/1/47 RB | | | 100,000 | | | | 94 | |
| | Indiana Finance Authority, Series 2009-B, 6.596%, 2/1/39 RB | | | 300,000 | | | | 402 | |
| | Irvine Ranch California Water District, Series 2010-B, 6.622%, 5/1/40 GO | | | 100,000 | | | | 133 | |
| | Los Angeles County California Public Works Financing Authority, Series 2010-B, 7.488%, 8/1/33 RB | | | 100,000 | | | | 128 | |
| | Los Angeles County California Public Works Financing Authority, Series 2010-B, 7.618%, 8/1/40 RB | | | 200,000 | | | | 265 | |
| | Metropolitan Government of Nashville & Davidson County Tennessee, Series 2010-B, 6.568%, 7/1/37 RB | | | 100,000 | | | | 135 | |
| | New Jersey Turnpike Authority, Series 2010-A, 7.102%, 1/1/41 RB | | | 200,000 | | | | 288 | |
| | New York City Municipal Water Finance Authority, Series 2011-CC, 5.882%, 6/15/44 RB | | | 100,000 | | | | 133 | |
| | New York City Municipal Water Finance Authority, Series 2010-EE, 6.011%, 6/15/42 RB | | | 300,000 | | | | 403 | |
| | New York City Transitional Finance Authority, Series 2011-A1, 5.508%, 8/1/37 RB | | | 300,000 | | | | 373 | |
| | New York Metropolitan Transportation Authority, Series 2010-A2, 6.089%, 11/15/40 RB | | | 500,000 | | | | 639 | |
The Accompanying Notes are an Integral Part of the Financial Statements.
| | | | | | |
| | Multi-Sector Bond Portfolio | | | 149 | |
Multi-Sector Bond Portfolio
| | | | | | | | | | |
| | | Municipal Bonds (3.3%) | | Shares/
$ Par | | | Value
$ (000’s) | |
| |
| | Municipal Bonds continued | |
| | New York State Urban Development Corp., Series 2009-E, 5.77%, 3/15/39 RB | | | 100,000 | | | | 123 | |
| | North Texas Tollway Authority, Series 2009-B, 6.718%, 1/1/49 RB | | | 200,000 | | | | 270 | |
| | Northern Tobacco Securitization Corp., Series 2006-A, 5.00%, 6/1/46 RB | | | 200,000 | | | | 175 | |
| | Orange County California Local Transportation Authority, Series 2010-A, 6.908%, 2/15/41 RB | | | 200,000 | | | | 280 | |
| | Port Authority New York & New Jersey, Series 168, 4.926%, 10/1/51 RB | | | 200,000 | | | | 222 | |
| | Port Authority New York & New Jersey, Series 2010, 5.647%, 11/1/40 RB | | | 1,100,000 | | | | 1,346 | |
| | San Diego County Regional Airport Authority, Series 2010-C, 6.628%, 7/1/40 RB | | | 100,000 | | | | 113 | |
| | San Diego Redevelopment Agency, Series 2010-A, 7.625%, 9/1/30 TRAN | | | 100,000 | | | | 107 | |
| | Tennessee State School Bond Authority, Series 2010, 4.848%, 9/15/27 GO | | | 100,000 | | | | 117 | |
| | Tobacco Securitization Authority of Southern California, Series 2006-A, 5.00%, 6/1/37 RB | | | 100,000 | | | | 89 | |
| | Tobacco Settlement Finance Authority of West Virginia, Series 2007-A, 7.467%, 6/1/47 RB | | | 1,270,000 | | | | 1,014 | |
| | Triborough Bridge & Tunnel Authority, Series 2010-A2, 5.55%, 11/15/40 RB | | | 800,000 | | | | 941 | |
| | University of California Regents Medical Center, Series 2010-H, 6.398%, 5/15/31 RB | | | 100,000 | | | | 125 | |
| | | | | | | | | | |
| | | Municipal Bonds (3.3%) | | Shares/
$ Par | | | Value
$ (000’s) | |
| |
| | Municipal Bonds continued | |
| | University of California Regents Medical Center, Series 2010-H, 6.548%, 5/15/48 RB | | | 100,000 | | | | 133 | |
| | | | | | | | | | |
| | | |
| | Total Municipal Bonds | | | | | | | | |
| | (Cost: $10,293) | | | | | | | 12,428 | |
| | | | | | | | | | |
| |
| | | Structured Products (4.3%) | |
| |
| | Structured Products (4.3%) | |
| | ACE Securities Corp., Series 2004-RM2, Class M2, 1.005%, 1/25/35 | | | 86,893 | | | | 74 | |
| | ACE Securities Corp., Series 2004-HE4, Class M1, 1.11%, 12/25/34 | | | 94,900 | | | | 80 | |
| | Aircraft Certificate Owner Trust, Series 2003-1A, Class D, 6.455%, 9/20/22 144A | | | 19,010 | | | | 19 | |
| (n) | | Aircraft Certificate Owner Trust, Series 2003-1A, Class E, 7.001%, 9/20/22 144A | | | 400,000 | | | | 391 | |
| | American Home Mortgage Investment Trust, Series 2005-2, Class 4A1, 2.01%, 9/25/45 | | | 13,435 | | | | 13 | |
| | Ameriquest Mortgage Securities, Inc., Series 2004-R5, Class M1, 1.08%, 7/25/34 | | | 73,639 | | | | 63 | |
| | Arkle Master Issuer PLC, Series 2012-1A, Class 2A1, 2.011%, 5/17/60 144A | | | 300,000 | | | | 308 | |
| | Asset Backed Securities Corp. Home Equity, Series 2003-HE4, Class M1, 1.454%, 8/15/33 | | | 62,159 | | | | 57 | |
| | Banc of America Commercial Mortgage, Inc., Series 2007-3, Class A4, 5.685%, 6/10/49 | | | 100,000 | | | | 116 | |
| | Banc of America Commercial Mortgage, Inc., Series 2007-4, Class A4, 5.729%, 2/10/51 | | | 100,000 | | | | 118 | |
| | Banc of America Funding Corp., Series 2007-D, Class 1A4, 0.441%, 6/20/47 | | | 300,000 | | | | 272 | |
| | | | | | | | | | |
| | | Structured Products (4.3%) | | Shares/
$ Par | | | Value
$ (000’s) | |
| |
| | Structured Products continued | |
| | Banc of America Funding Corp., Series 2007-6, Class A1, 0.50%, 7/25/37 | | | 207,839 | | | | 172 | |
| | Banc of America Funding Corp., Series 2005-H, Class 5A1, 3.169%, 11/20/35 | | | 410,423 | | | | 375 | |
| | Banc of America Large Loan Trust, Series 2010-HLTN, Class HLTN, 2.509%, 11/15/15 144A | | | 91,548 | | | | 91 | |
| | Bear Stearns Adjustable Rate Mortgage Trust, Series 2007-3, Class 1A1, 3.099%, 5/25/47 | | | 51,201 | | | | 40 | |
| | Bear Stearns Adjustable Rate Mortgage Trust, Series 2004-3, Class 4A, 4.689%, 7/25/34 | | | 44,890 | | | | 45 | |
| | Bear Stearns Asset Backed Securities Trust, Series 2006-HE10, Class 1A2, 0.41%, 12/25/36 | | | 100,000 | | | | 75 | |
| | Bear Stearns Asset Backed Securities Trust, Series 2005-HE11, Class M1, 0.64%, 11/25/35 | | | 100,000 | | | | 88 | |
| | Bear Stearns Asset Backed Securities Trust, Series 2005-SD3, Class 1A, 0.70%, 7/25/35 | | | 138,206 | | | | 133 | |
| | Bear Stearns Asset Backed Securities Trust, Series 2004-B01, Class 1A3, 0.76%, 10/25/34 | | | 258,849 | | | | 257 | |
| | Bear Stearns Asset Backed Securities Trust, Series 2006-6, Class 2A1, 4.749%, 11/25/36 | | | 481,146 | | | | 362 | |
| | Bear Stearns Commercial Mortgage Securities, Series 2007-PW16, Class A2, 5.663%, 6/11/40 | | | 151,362 | | | | 155 | |
| | CHL Mortgage Pass-Through Trust, Series 2006-9, Class A1, 6.00%, 5/25/36 | | | 526,296 | | | | 480 | |
| | Citicorp Mortgage Securities, Inc., Series 2007-8, Class 1A3, 6.00%, 9/25/37 | | | 24,345 | | | | 25 | |
The Accompanying Notes are an Integral Part of the Financial Statements.
| | | | |
| 150 | | Multi-Sector Bond Portfolio | | |
Multi-Sector Bond Portfolio
| | | | | | | | | | |
| | | Structured Products (4.3%) | | Shares/
$ Par | | | Value
$ (000’s) | |
| |
| | Structured Products continued | |
| | Citigroup Mortgage Loan Trust, Inc., Series 2007-AHL1, Class A2C, 0.42%, 12/25/36 | | | 100,000 | | | | 40 | |
| | Citigroup Mortgage Loan Trust, Inc., Series 2007-10, Class 22AA, 3.091%, 9/25/37 | | | 48,171 | | | | 36 | |
| | Citigroup Mortgage Loan Trust, Inc., Series 2007-10, Class 2A3A, 5.94%, 9/25/37 | | | 236,593 | | | | 185 | |
| | Countrywide Alternative Loan Trust, Series 2007-0A3, Class 1A1, 0.35%, 4/25/47 | | | 105,080 | | | | 82 | |
| | Countrywide Alternative Loan Trust, Series 2006-OC9, Class A2A, 0.37%, 12/25/46 | | | 61,662 | | | | 48 | |
| | Countrywide Alternative Loan Trust, Series 2006-0A12, Class A1B, 0.401%, 9/20/46 | | | 73,922 | | | | 42 | |
| | Countrywide Alternative Loan Trust, Series 2006-0A17, Class 1A1A, 0.406%, 12/20/46 | | | 87,061 | | | | 56 | |
| | Countrywide Alternative Loan Trust, Series 2006-0A9, Class 2A1A, 0.421%, 7/20/46 | | | 33,125 | | | | 16 | |
| | Countrywide Alternative Loan Trust, Series 2005-59, Class 1A1, 0.541%, 11/20/35 | | | 19,856 | | | | 14 | |
| | Countrywide Alternative Loan Trust, Series 2005-62, Class 2A1, 1.14%, 12/25/35 | | | 17,457 | | | | 13 | |
| | Countrywide Alternative Loan Trust, Series 2005-76, Class 1A1, 1.641%, 1/25/36 | | | 49,546 | | | | 41 | |
| | Countrywide Alternative Loan Trust, Series 2006-OA6, Class 2A, 4.249%, 7/25/46 | | | 52,234 | | | | 39 | |
| | Countrywide Alternative Loan Trust, Series 2005-79CB, Class A3, 5.50%, 1/25/36 | | | 823,979 | | | | 633 | |
| | | | | | | | | | |
| | | Structured Products (4.3%) | | Shares/
$ Par | | | Value
$ (000’s) | |
| |
| | Structured Products continued | |
| | Countrywide Alternative Loan Trust, Series 2004-28CB, Class 5A1, 5.75%, 1/25/35 | | | 75,504 | | | | 72 | |
| | Countrywide Alternative Loan Trust, Series 2005-J1, Class 3A1, 6.50%, 8/25/32 | | | 66,416 | | | | 66 | |
| | Countrywide Asset-Backed Certificates, Series 2007-1, Class 2A3, 0.35%, 7/25/37 | | | 100,000 | | | | 60 | |
| | Countrywide Asset-Backed Certificates, Series 2006-7, Class 2A3, 0.36%, 4/25/46 | | | 410,788 | | | | 369 | |
| | Countrywide Asset-Backed Certificates, Series 2005-17, Class 4A2A, 0.47%, 5/25/36 | | | 75,410 | | | | 73 | |
| | Countrywide Asset-Backed Certificates, Series 2006-3, Class 2A3, 0.50%, 6/25/36 | | | 100,000 | | | | 70 | |
| | Countrywide Asset-Backed Certificates, Series 2006-4, Class 2A3, 0.50%, 7/25/36 | | | 100,000 | | | | 65 | |
| | Countrywide Asset-Backed Certificates, Series 2005-AB, Class 2A4, 0.56%, 3/25/36 | | | 190,536 | | | | 120 | |
| | Countrywide Asset-Backed Certificates, Series 2005-14, Class 3A3, 0.56%, 4/25/36 | | | 200,000 | | | | 180 | |
| | Countrywide Asset-Backed Certificates, Series 2005-4, Class AF6, 4.74%, 10/25/35 | | | 196,282 | | | | 188 | |
| | Countrywide Asset-Backed Certificates, Series 2006-1, Class AF5, 5.884%, 7/25/36 | | | 100,000 | | | | 51 | |
| | Countrywide Home Loan Mortgage Pass Through Trust, Series 2005-HYB8, Class 1A1X, 2.856%, 12/20/35 | | | 27,376 | | | | 22 | |
| | Countrywide Home Loan Mortgage Pass Through Trust, Series 2005-22, Class 3A1, 5.163%, 10/25/35 | | | 72,603 | | | | 60 | |
| | | | | | | | | | |
| | | Structured Products (4.3%) | | Shares/
$ Par | | | Value
$ (000’s) | |
| |
| | Structured Products continued | |
| | Countrywide Home Loan Mortgage Pass-Through Trust, Series 2006-OA4, Class A1, 1.125%, 4/25/46 | | | 71,002 | | | | 38 | |
| | Credit Suisse Mortgage Capital Certificates, Series 2007-C4, Class A4, 5.762%, 9/15/39 | | | 200,000 | | | | 231 | |
| | Federal National Mortgage Association, Series 2003-W6, Class F, 0.56%, 9/25/42 | | | 55,612 | | | | 55 | |
| | First Franklin Mortgage Loan Asset Backed Certificates, Series 2006-FF10, Class A4, 0.36%, 7/25/36 | | | 72,884 | | | | 64 | |
| | First Horizon Mortgage Pass-Through Trust, Series 2005-5, Class 2A1, 5.00%, 10/25/20 | | | 39,895 | | | | 41 | |
| | First Horizon Mortgage Pass-Through Trust, Series 2007-2, Class 1A5, 5.75%, 5/25/37 | | | 1,231,285 | | | | 1,083 | |
| | GE Capital Commercial Mortgage Corp., Series 2007-C1, Class A4, 5.543%, 12/10/49 | | | 100,000 | | | | 114 | |
| | GSAA Home Equity Trust, Series 2006-4, Class 4A2, 0.44%, 3/25/36 | | | 71,290 | | | | 56 | |
| | GSR Mortgage Loan Trust, Series 2005-AR6, Class 1A1, 2.654%, 9/25/35 | | | 46,358 | | | | 47 | |
| | GSR Mortgage Loan Trust, Series 2006-AR1, Class 2A1, 2.774%, 1/25/36 | | | 10,342 | | | | 9 | |
| | GSR Mortgage Loan Trust, Series 2007-AR1, Class 2A1, 2.856%, 3/25/47 | | | 41,958 | | | | 33 | |
| | GSR Mortgage Loan Trust, Series 2006-2F, Class 3A6, 6.00%, 2/25/36 | | | 446,690 | | | | 391 | |
| | Harborview Mortgage Loan Trust, Series 2005-3, Class 2A1A, 0.45%, 6/19/35 | | | 67,570 | | | | 54 | |
| | Harborview Mortgage Loan Trust, Series 2005-10, Class 2A1A, 0.52%, 11/19/35 | | | 28,816 | | | | 21 | |
| | HomeBanc Mortgage Trust, Series 2005-1, Class A1, 0.46%, 3/25/35 | | | 26,519 | | | | 20 | |
The Accompanying Notes are an Integral Part of the Financial Statements.
| | | | | | |
| | Multi-Sector Bond Portfolio | | | 151 | |
Multi-Sector Bond Portfolio
| | | | | | | | | | |
| | | Structured Products (4.3%) | | Shares/
$ Par | | | Value
$ (000’s) | |
| |
| | Structured Products continued | |
| | IndyMac Index Mortgage Loan Trust, Series 2005-AR12, Class 2A1A, 0.45%, 7/25/35 | | | 5,748 | | | | 5 | |
| | IndyMac Index Mortgage Loan Trust, Series 2005-AR14, Class 2A1A, 0.51%, 7/25/35 | | | 29,263 | | | | 23 | |
| | IndyMac Index Mortgage Loan Trust, Series 2004-AR6, Class 5A1, 2.702%, 10/25/34 | | | 82,685 | | | | 81 | |
| | IXIS Real Estate Capital Trust, Series 2005-HE1, Class M3, 0.99%, 6/25/35 | | | 100,000 | | | | 97 | |
| | JPMorgan Chase Commercial Mortgage Securities Corp., Series 2004-CBX, Class A5, 4.654%, 1/12/37 | | | 80,649 | | | | 82 | |
| | JPMorgan Mortgage Trust, Series 2005-ALT1, Class 2A1, 2.917%, 10/25/35 | | | 37,176 | | | | 30 | |
| | JPMorgan Mortgage Trust, Series 2007-A1, Class 6A1, 3.028%, 7/25/35 | | | 76,592 | | | | 76 | |
| | JPMorgan Mortgage Trust, Series 2007-A4, Class 3A1, 5.414%, 6/25/37 | | | 275,440 | | | | 246 | |
| | JPMorgan Reremic, Series 2009-10, Class 4A1, 0.71%, 3/26/37 144A | | | 453,241 | | | | 420 | |
| | Lehman XS Trust, Series 2005-4, Class 1A3, 0.61%, 10/25/35 | | | 69,517 | | | | 62 | |
| | Merrill Lynch Alternative Note Asset Trust, Series 2007-OAR1, Class A1, 0.38%, 2/25/37 | | | 48,024 | | | | 41 | |
| | Merrill Lynch Mortgage Investors, Inc., Series 2005-A6, Class 2A3, 0.59%, 8/25/35 | | | 100,000 | | | | 81 | |
| | Merrill Lynch Mortgage Investors, Inc., Series 2005-A9, Class 5A1, 5.079%, 12/25/35 | | | 1,052,468 | | | | 969 | |
| | Merrill Lynch Mortgage Investors, Inc., Series 2006-A3, Class 6A1, 5.378%, 5/25/36 | | | 73,387 | | | | 70 | |
| | | | | | | | | | |
| | | Structured Products (4.3%) | | Shares/
$ Par | | | Value
$ (000’s) | |
| |
| | Structured Products continued | |
| | MLCC Mortgage Investors, Inc., Series 2006-1, Class 1A, 2.765%, 2/25/36 | | | 21,813 | | | | 20 | |
| | Morgan Stanley Capital I Trust, Series 2007-HQ11, Class A31, 5.439%, 2/12/44 | | | 100,000 | | | | 105 | |
| | Morgan Stanley Capital, Inc., Series 2006-HE8, Class A2C, 0.35%, 10/25/36 | | | 100,000 | | | | 50 | |
| | Morgan Stanley Capital, Inc., Series 2007-HE5, Class A2C, 0.46%, 3/25/37 | | | 99,053 | | | | 47 | |
| | Morgan Stanley Capital, Inc., Series 2005-HE7, Class A2C, 0.53%, 11/25/35 | | | 71,423 | | | | 68 | |
| | Morgan Stanley Dean Witter Capital I, Inc., Series 2002-HE1, Class M1, 1.11%, 7/25/32 | | | 33,794 | | | | 29 | |
| | Morgan Stanley Dean Witter Capital I, Inc., Series 2003-NC2, Class M1, 1.56%, 2/25/33 | | | 86,317 | | | | 73 | |
| | Morgan Stanley Mortgage Loan Trust, Series 2005-5AR, Class 1A1, 0.48%, 9/25/35 | | | 14,472 | | | | 14 | |
| | Morgan Stanley Mortgage Loan Trust, Series 2005-3AR, Class 4A, 2.565%, 7/25/35 | | | 977,220 | | | | 848 | |
| | Nomura Asset Acceptance Corp., Series 2005-AR4, Class 3A1, 3.22%, 8/25/35 | | | 52,271 | | | | 48 | |
| | Park Place Securities, Inc., Series 2005-WCW2, Class M1, 0.71%, 7/25/35 | | | 100,000 | | | | 90 | |
| | Residential Accredit Loans, Inc., Series 2007-QA1, Class A1, 0.35%, 1/25/37 | | | 63,311 | | | | 47 | |
| | Residential Accredit Loans, Inc., Series 2006-QA7, Class 1A1, 0.40%, 8/25/36 | | | 29,278 | | | | 20 | |
| | Residential Accredit Loans, Inc., Series 2006-QA8, Class A1, 0.40%, 9/25/36 | | | 62,669 | | | | 41 | |
| | | | | | | | | | |
| | | Structured Products (4.3%) | | Shares/
$ Par | | | Value
$ (000’s) | |
| |
| | Structured Products continued | |
| | Residential Accredit Loans, Inc., Series 2005-QA3, Class NB2, 3.278%, 3/25/35 | | | 599,255 | | | | 447 | |
| | Residential Asset Mortgage Products Trust, Series 2006-NC2, Class A2, 0.40%, 2/25/36 | | | 54,781 | | | | 50 | |
| | SLM Student Loan Trust, Series 2012-D, Class A1, 1.259%, 6/15/23 144A | | | 87,750 | | | | 88 | |
| | SLM Student Loan Trust, Series 2011-B, Class A3, 2.459%, 6/16/42 144A | | | 100,000 | | | | 103 | |
| | SLM Student Loan Trust, Series 2010-A, Class 1A, 3.20%, 5/16/44 144A | | | 71,084 | | | | 75 | |
| | SLM Student Loan Trust, Series 2012-B, Class A2, 3.48%, 10/15/30 144A | | | 400,000 | | | | 424 | |
| | Structured Asset Investment Loan Trust, Series 2006-BNC3, Class A3, 0.36%, 9/25/36 | | | 74,428 | | | | 50 | |
| | Structured Asset Investment Loan Trust, Series 2005-5, Class M2, 0.67%, 6/25/35 | | | 100,000 | | | | 86 | |
| | Suntrust Alternative Loan Trust, Series 2005-1F, Class 1A1, 0.86%, 12/25/35 | | | 63,856 | | | | 40 | |
| | Wachovia Bank Commercial Mortgage Trust, Series 2007-WHL8, Class A1, 0.289%, 6/15/20 144A | | | 100,442 | | | | 99 | |
| | WaMu Mortgage Pass-Through Certificates, Series 2007-0A1, Class A1A, 0.866%, 2/25/47 | | | 39,153 | | | | 29 | |
| | WaMu Mortgage Pass-Through Certificates, Series 2002-AR19, Class A6, 2.461%, 2/25/33 | | | 4,756 | | | | 5 | |
| | WaMu Mortgage Pass-Through Certificates, Series 2006-AR2, Class 1A1, 2.469%, 3/25/36 | | | 759,606 | | | | 659 | |
| | WaMu Mortgage Pass-Through Certificates, Series 2007-HY1, Class 4A1, 2.685%, 2/25/37 | | | 39,349 | | | | 31 | |
The Accompanying Notes are an Integral Part of the Financial Statements.
| | | | |
| 152 | | Multi-Sector Bond Portfolio | | |
Multi-Sector Bond Portfolio
| | | | | | | | | | |
| | | Structured Products (4.3%) | | Shares/
$ Par | | | Value
$ (000’s) | |
| |
| | Structured Products continued | |
| | WaMu Mortgage Pass-Through Certificates, Series 2007-HY1, Class 3A1, 5.146%, 2/25/37 | | | 16,949 | | | | 16 | |
| | WaMu Mortgage Pass-Through Certificates, Series 2006-AR12, Class 3A3, 6.087%, 10/25/36 | | | 93,182 | | | | 82 | |
| | Wells Fargo Mortgage Backed Securities Trust, Series 2006-AR10, Class 5A6, 2.614%, 7/25/36 | | | 11,380 | | | | 10 | |
| | Wells Fargo Mortgage Backed Securities Trust, Series 2006-AR5, Class 2A1, 2.616%, 4/25/36 | | | 349,748 | | | | 315 | |
| | Wells Fargo Mortgage Backed Securities Trust, Series 2006-AR10, Class 4A1, 2.623%, 7/25/36 | | | 694,922 | | | | 600 | |
| | Wells Fargo Mortgage Backed Securities Trust, Series 2005-14, Class 1A9, 5.50%, 12/25/35 | | | 38,880 | | | | 39 | |
| | Wells Fargo Mortgage Backed Securities Trust, Series 2007-AR8, Class A1, 5.988%, 11/25/37 | | | 326,353 | | | | 291 | |
| | | | | | | | | | |
| | | |
| | Total Structured Products | | | | | | | | |
| | (Cost: $16,065) | | | | | | | 16,029 | |
| | | | | | | | | | |
| |
| | | Short-Term Investments (6.8%) | |
| |
| | Federal Government & Agencies (0.5%) | |
| (b) | | Federal Home Loan Mortgage Corp., 0.14%, 3/5/13 | | | 200,000 | | | | 200 | |
| (b) | | Federal Home Loan Mortgage Corp., 0.15%, 2/25/13 | | | 1,600,000 | | | | 1,600 | |
| (b) | | Federal National Mortgage Association, 0.17%, 2/20/13 | | | 200,000 | | | | 200 | |
| | | | | | | | | | |
| | Total | | | | | | | 2,000 | |
| | | | | | | | | | |
| |
| | Governments (0.1%) | |
| (b) | | US Treasury Bill, 0.145%, 2/14/13 | | | 270,000 | | | | 270 | |
| (b) | | US Treasury Bill, 0.19%, 8/22/13 | | | 30,000 | | | | 30 | |
| | | | | | | | | | |
| | Total | | | | | | | 300 | |
| | | | | | | | | | |
| | | | | | | | | | |
| | | Short-Term
Investments (6.8%) | | Shares/
$ Par | | | Value
$ (000’s) | |
| |
| | Repurchase Agreements (6.2%) | |
| | US Treasury Repurchase, 0.23%, dated 12/31/12, due 1/2/13, (collateralized by US Treasury Note, 0.125%, 12/31/14, valued at $407,993, repurchase proceeds of $400,000) | | | 400,000 | | | | 400 | |
| | US Treasury Repurchase, 0.25%, dated 12/31/12, due 1/2/13, (collateralized by US Treasury Note, 1.50%, 6/30/16, valued at $23,307,828, repurchase proceeds of $22,800,000) | | | 22,800,000 | | | | 22,800 | |
| | | | | | | | | | |
| | Total | | | | | | | 23,200 | |
| | | | | | | | | | |
| | | |
| | Total Short-Term Investments | | | | | | | | |
| | (Cost: $25,499) | | | | | | | 25,500 | |
| | | | | | | | | | |
| | | |
| | Total Investments (98.8%) | | | | | | | | |
| | (Cost: $346,067)(a) | | | | | | | 368,257 | |
| | | | | | | | | | |
| | Other Assets, Less
Liabilities (1.2%) | | | | | | | 4,399 | |
| | | | | | | | | | |
| | Net Assets (100.0%) | | | | | | | 372,656 | |
| | | | | | | | | | |
The Accompanying Notes are an Integral Part of the Financial Statements.
| | | | | | |
| | Multi-Sector Bond Portfolio | | | 153 | |
Multi-Sector Bond Portfolio
144A after the name of a security represents a security exempt from registration under Rule 144A of the Securities Act of 1933. These securities may be resold as transactions exempt from registration, normally to qualified institutional buyers. At December 31, 2012 the value of these securities (in thousands) was $79,951 representing 21.4% of the net assets.
GO — General Obligation
RB — Revenue Bond
TRAN — Tax Allocation Bond
FGIC — Financial Guaranty Insurance Co.
NATL-RE — National Public Finance Guarantee Corp.
| (a) | At December 31, 2012 the aggregate cost of securities for federal tax purposes (in thousands) was $346,098 and the net unrealized appreciation of investments based on that cost was $22,159 which is comprised of $23,496 aggregate gross unrealized appreciation and $1,337 aggregate gross unrealized depreciation. |
| (b) | All or a portion of the securities have been pledged as collateral for open futures positions or when-issued securities. Information regarding open futures contracts as of period end is summarized below. |
| | | | | | | | |
| Issuer (000’s) | | Number of
Contracts | | Expiration Date | | Unrealized Appreciation/ (Depreciation) (000’s) | |
Euro Bund Future (Long) (Total Notional Value at December 31, 2012, $569) | | 3 | | 3/13 | | $ | 4 | |
Euro-Bobl Future Medium-Term (Long) (Total Notional Value at December 31, 2012, $3,315) | | 20 | | 3/13 | | | 22 | |
US Ultra Long Treasury Bond Futures (Long) (Total Notional Value at December 31, 2012, $2,152) | | 13 | | 3/13 | | | (38 | ) |
| (h) | Forward foreign currency contracts outstanding on December 31, 2012. |
| | | | | | | | | | | | | | | | | | | | |
| Type | | Counterparty | | Currency | | Principal Amount Covered by Contract (000’s) | | Settlement Month | | Unrealized Appreciation (000’s) | | | Unrealized (Depreciation) (000’s) | | | Net Unrealized Appreciation/ (Depreciation)
(000’s) | |
Sell | | Barclays Bank PLC | | AUD | | 9,280 | | 1/13 | | $ | 59 | | | $ | - | | | $ | 59 | |
Buy | | HSBC Bank USA | | BRL | | 1,668 | | 2/13 | | | 2 | | | | - | | | | 2 | |
Sell | | Citibank, N.A. | | CAD | | 10,367 | | 3/13 | | | 67 | | | | - | | | | 67 | |
Buy | | Citibank, N.A. | | CNY | | 4,361 | | 2/13 | | | - | | | | (2 | ) | | | (2 | ) |
Buy | | Goldman Sachs International | | CNY | | 7,472 | | 2/13 | | | - | | | | (4 | ) | | | (4 | ) |
Buy | | UBS AG | | CNY | | 36,342 | | 2/13 | | | 54 | | | | - | | | | 54 | |
Sell | | BNP Paribas S.A. | | CNY | | 15,400 | | 2/13 | | | - | | | | (24 | ) | | | (24 | ) |
Sell | | UBS AG | | CNY | | 32,776 | | 2/13 | | | - | | | | (68 | ) | | | (68 | ) |
Buy | | Barclays Bank PLC | | EUR | | 209 | | 1/13 | | | - | (m) | | | - | | | | - | (m) |
Sell | | Bank of America, N.A. | | EUR | | 6,154 | | 1/13 | | | - | | | | (118 | ) | | | (118 | ) |
Sell | | BNP Paribas S.A. | | EUR | | 6,157 | | 1/13 | | | - | | | | (182 | ) | | | (182 | ) |
Sell | | Goldman Sachs International | | EUR | | 1,603 | | 1/13 | | | - | | | | (40 | ) | | | (40 | ) |
Sell | | UBS AG | | EUR | | 6,154 | | 1/13 | | | - | | | | (71 | ) | | | (71 | ) |
Sell | | Bank of America, N.A. | | GBP | | 5,582 | | 3/13 | | | - | | | | (80 | ) | | | (80 | ) |
Buy | | Barclays Bank Plc | | IDR | | 1,038,415 | | 1/13 | | | 1 | | | | - | | | | 1 | |
Buy | | Citibank, N.A. | | IDR | | 34,614 | | 1/13 | | | - | | | | - | (m) | | | - | (m) |
Buy | | HSBC Bank USA | | IDR | | 1,230,600 | | 1/13 | | | 1 | | | | - | | | | 1 | |
Sell | | Citibank, N.A. | | IDR | | 10,005,655 | | 1/13 | | | - | | | | (7 | ) | | | (7 | ) |
Sell | | Morgan Stanley & Co., Inc. | | IDR | | 28,267,892 | | 1/13 | | | - | | | | (37 | ) | | | (37 | ) |
Buy | | JP Morgan Chase Bank, N.A. | | KRW | | 2,744,250 | | 2/13 | | | 51 | | | | - | | | | 51 | |
Buy | | JP Morgan Chase Bank, N.A. | | MXN | | 2,632 | | 4/13 | | | 2 | | | | - | | | | 2 | |
Sell | | JP Morgan Chase Bank, N.A. | | MXN | | 52,799 | | 4/13 | | | - | | | | (32 | ) | | | (32 | ) |
Buy | | Citibank, N.A. | | SGD | | 978 | | 1/13 | | | 1 | | | | - | | | | 1 | |
Buy | | Goldman Sachs International | | SGD | | 978 | | 1/13 | | | - | (m) | | | - | | | | - | (m) |
Buy | | UBS AG | | SGD | | 1,709 | | 2/13 | | | - | (m) | | | - | | | | - | (m) |
Sell | | HSBC Bank USA | | ZAR | | 75,985 | | 1/13 | | | - | | | | (440 | ) | | | (440 | ) |
Sell | | JP Morgan Chase Bank, N.A. | | ZAR | | 4,125 | | 1/13 | | | - | | | | (15 | ) | | | (15 | ) |
| | | | | | | | | | | | | | | | | | | | |
| | | | | | | | | | $ | 238 | | | $ | (1,120 | ) | | $ | (882 | ) |
| | | | | | | | | | | | | | | | | | | | |
AUD — Australian Dollar
BRL — Brazilian Real
CAD — Canadian Dollar
CNY — China Yuan Renminbi
EUR — Euro
The Accompanying Notes are an Integral Part of the Financial Statements.
| | | | |
| 154 | | Multi-Sector Bond Portfolio | | |
Multi-Sector Bond Portfolio
GBP — British Pound
IDR — Indonesian Rupiah
KRW — South Korean Won
MXN — Mexican New Peso
SGD — Singapore Dollar
ZAR — South African Rand
| (i) | Written options outstanding on December 31, 2012. |
| | | | | | | | | | | | | | | | |
| Description | | Counterparty | | Floating Rate Index | | Pay/
Receive
Floating
Rate | | Exercise
Rate | | Expiration
Date | | Notional
Amount
(000’s) | | Value
(000’s) | |
Call - OTC 5-Year Interest Rate Swap | | Morgan Stanley Capital Services | | 3-Month USD LIBOR | | Receive | | 0.80% | | 3/13 | | 1,600 | | $ | (3 | ) |
Call - OTC 7-Year Interest Rate Swap | | Goldman Sachs Bank | | 3-Month USD LIBOR | | Receive | | 1.20% | | 3/13 | | 1,400 | | | (4 | ) |
Call - OTC 5-Year Interest Rate Swap | | Citibank N.A. | | 3-Month USD LIBOR | | Receive | | 1.70% | | 3/13 | | 1,100 | | | (43 | ) |
Put - OTC 5-Year Interest Rate Swap | | Morgan Stanley Capital Services | | 3-Month USD LIBOR | | Receive | | 1.20% | | 3/13 | | 1,600 | | | (1 | ) |
Put - OTC 7-Year Interest Rate Swap | | Goldman Sachs Bank | | 3-Month USD LIBOR | | Receive | | 1.65% | | 3/13 | | 1,400 | | | (3 | ) |
Put - OTC 5-Year Interest Rate Swap | | Citibank N.A. | | 3-Month USD LIBOR | | Receive | | 1.70% | | 3/13 | | 1,100 | | | - | (m) |
| | | | | | | | | | | | | | | | |
(Premium Received $45) | | | | | | | | | | | | | | $ | (54 | ) |
| | | | | | | | | | | | | | | | |
OTC — Over-the-Counter
| (j) | Swap agreements outstanding on December 31, 2012. |
Interest Rate Swaps
| | | | | | | | | | | | | | | | | | | | | | |
| Floating Rate Index | | Counterparty | | Pay/ Receive Floating Rate | | Fixed
Rate | | Expiration
Date | | Currency | | Upfront
Premium Paid/
(Received)
(000’s) | | | Notional
Amount (000’s) | | | Unrealized
Appreciation/
(Depreciation)
(000’s) | |
28 Day Mexico Interbank TIIE Banxico | | Barclays Bank PLC | | Pay | | 5.80% | | 6/16 | | MXN | | | 1 | | | | 5,900 | | | $ | 9 | |
28 Day Mexico Interbank TIIE Banxico | | HSBC Bank USA | | Pay | | 5.80% | | 6/16 | | MXN | | | - | (m) | | | 5,800 | | | | 9 | |
28 Day Mexico Interbank TIIE Banxico | | Barclays Bank PLC | | Pay | | 5.60% | | 9/16 | | MXN | | | 12 | | | | 72,000 | | | | 67 | |
28 Day Mexico Interbank TIIE Banxico | | Barclays Bank PLC | | Pay | | 5.00% | | 9/17 | | MXN | | | (38 | ) | | | 58,900 | | | | (16 | ) |
28 Day Mexico Interbank TIIE Banxico | | Goldman Sachs International | | Pay | | 5.50% | | 9/17 | | MXN | | | (6 | ) | | | 32,000 | | | | 30 | |
28 Day Mexico Interbank TIIE Banxico | | Goldman Sachs International | | Pay | | 5.00% | | 9/17 | | MXN | | | (22 | ) | | | 31,000 | | | | (6 | ) |
28 Day Mexico Interbank TIIE Banxico | | Morgan Stanley Capital Services LLC | | Pay | | 5.50% | | 9/17 | | MXN | | | (1 | ) | | | 10,000 | | | | 9 | |
28 Day Mexico Interbank TIIE Banxico | | Morgan Stanley Capital Services LLC | | Pay | | 5.00% | | 9/17 | | MXN | | | (42 | ) | | | 55,000 | | | | (8 | ) |
Brazil Cetip Interbank Deposit | | HSBC Bank USA | | Pay | | 10.14% | | 1/15 | | BRL | | | 1 | | | | 10,600 | | | | 265 | |
The Accompanying Notes are an Integral Part of the Financial Statements.
| | | | | | |
| | Multi-Sector Bond Portfolio | | | 155 | |
Multi-Sector Bond Portfolio
| | | | | | | | | | | | | | | | | | | | | | |
| Floating Rate Index | | Counterparty | | Pay/Receive
Floating Rate | | Fixed
Rate | | Expiration
Date | | Currency | | Upfront
Premium Paid/
(Received)
(000’s) | | | Notional
Amount (000’s) | | | Unrealized
Appreciation/
(Depreciation)
(000’s) | |
Brazil Cetip Interbank Deposit | | HSBC Bank USA | | Pay | | 7.78% | | 1/15 | | BRL | | | 56 | | | | 30,800 | | | $ | (17 | ) |
Brazil Cetip Interbank Deposit | | JPMorgan Chase Bank, N.A. | | Pay | | 8.13% | | 1/15 | | BRL | | | - | | | | 16,600 | | | | 83 | |
Brazil Cetip Interbank Deposit | | JPMorgan Chase Bank, N.A. | | Pay | | 9.31% | | 1/15 | | BRL | | | 88 | | | | 17,200 | | | | 199 | |
Brazil Cetip Interbank Deposit | | Morgan Stanley Capital Services LLC | | Pay | | 7.80% | | 1/15 | | BRL | | | 1 | | | | 6,200 | | | | 8 | |
Brazil Cetip Interbank Deposit | | Morgan Stanley Capital Services LLC | | Pay | | 8.63% | | 1/15 | | BRL | | | 69 | | | | 14,000 | | | | 68 | |
Brazil Cetip Interbank Deposit | | UBS AG | | Pay | | 8.26% | | 1/15 | | BRL | | | 23 | | | | 11,000 | | | | 46 | |
Australian 6 Month Bank Bill | | Citibank N.A. | | Pay | | 3.50% | | 3/18 | | AUD | | | 3 | | | | 7,900 | | | | 73 | |
| | | | | | | | | | | | | | | | | | | | | | |
| | | | | | | | | | | | | | | | | | | | $ | 819 | |
| | | | | | | | | | | | | | | | | | | | | | |
Credit Default Swaps on Corporate or Sovereign Issues
| | | | | | | | | | | | | | | | | | | | | | | | |
| Reference Entity | | Counterparty | | Buy/Sell Protection | | (Pay)/Receive
Fixed Rate | | Expiration Date | | Currency | | Implied Credit Spread | | Upfront Premium Paid/
(Received)
(000’s) | | | Notional Amount (000’s) | | | Unrealized
Appreciation/
(Depreciation)
(000’s) | |
Advanced Micro Devices, 7.75%, 8/1/20 | | Morgan Stanley Capital Services LLC | | Sell | | 5.00% | | 9/17 | | USD | | 9.776% | | | (6 | ) | | | 100 | | | $ | (10 | ) |
Advanced Micro Devices, 7.75%, 8/1/20 | | Goldman Sachs International | | Sell | | 5.00% | | 9/17 | | USD | | 9.776% | | | (26 | ) | | | 500 | | | | (57 | ) |
Advanced Micro Devices, 7.75%, 8/1/20 | | JPMorgan Chase Bank, N.A. | | Sell | | 5.00% | | 12/17 | | USD | | 9.914% | | | (8 | ) | | | 100 | | | | (9 | ) |
Alcoa, Inc., 5.72%, 2/23/19 | | BNP Paribas SA | | Sell | | 1.00% | | 6/21 | | USD | | 3.604% | | | (25 | ) | | | 300 | | | | (28 | ) |
Alcoa, Inc., 5.72%, 2/23/19 | | Goldman Sachs International | | Sell | | 1.00% | | 6/18 | | USD | | 3.124% | | | (25 | ) | | | 500 | | | | (27 | ) |
Arcelormittal, 6.125%, 6/1/18 | | Barclays Bank PLC | | Sell | | 1.00% | | 6/16 | | EUR | | 3.015% | | | (20 | ) | | | 350 | | | | (11 | ) |
Ardagh Packaging Finance, 9.25%, 10/15/20 | | Barclays Bank PLC | | Sell | | 5.00% | | 9/17 | | EUR | | 5.095% | | | (20 | ) | | | 200 | | | | 20 | |
AT&T Inc., 2.50%, 8/15/15 | | Citibank N.A. | | Sell | | 1.00% | | 9/17 | | USD | | 0.795% | | | - | (m) | | | 100 | | | | 1 | |
BP Capital Markets America, 4.20%, 6/15/18 | | Goldman Sachs International | | Sell | | 1.00% | | 9/17 | | USD | | 0.581% | | | 10 | | | | 1,100 | | | | 12 | |
Caterpillar, Inc, 5.70%, 8/15/16 | | Goldman Sachs International | | Sell | | 1.00% | | 6/17 | | USD | | 0.611% | | | (1 | ) | | | 100 | | | | 2 | |
Caterpillar, Inc, 5.70%, 8/15/16 | | UBS AG | | Sell | | 1.00% | | 6/17 | | USD | | 0.611% | | | (1 | ) | | | 200 | | | | 5 | |
The Accompanying Notes are an Integral Part of the Financial Statements.
| | | | |
| 156 | | Multi-Sector Bond Portfolio | | |
Multi-Sector Bond Portfolio
| | | | | | | | | | | | | | | | | | | | | | | | |
| Reference Entity | | Counterparty | | Buy/Sell
Protection | | (Pay)/Receive
Fixed Rate | | Expiration
Date | | Currency | | Implied
Credit
Spread | | Upfront
Premium Paid/ (Received) (000’s) | | | Notional Amount
(000’s) | | | Unrealized Appreciation/ (Depreciation)
(000’s) | |
Excelon Generation Co. LLC, 6.20%, 10/1/17 | | JPMorgan Chase Bank, N.A. | | Sell | | 1.00% | | 6/17 | | USD | | 1.556% | | | (45 | ) | | | 700 | | | $ | 28 | |
Federative Republic of Brazil, 12.25%, 3/6/30 | | Citibank N.A. | | Sell | | 1.00% | | 9/17 | | USD | | 1.004% | | | (43 | ) | | | 2,000 | | | | 43 | |
Federative Republic of Brazil, 12.25%, 3/6/30 | | Goldman Sachs International | | Sell | | 1.00% | | 9/17 | | USD | | 1.004% | | | (1 | ) | | | 80 | | | | 1 | |
Federative Republic of Brazil, 12.25%, 3/6/30 | | HSBC Bank USA | | Sell | | 1.00% | | 9/22 | | USD | | 1.451% | | | (78 | ) | | | 1,200 | | | | 31 | |
Federative Republic of Brazil, 12.25%, 3/6/30 | | Barclays Bank PLC | | Sell | | 1.00% | | 9/21 | | USD | | 1.406% | | | (46 | ) | | | 1,200 | | | | 8 | |
Federative Republic of Brazil, 12.25%, 3/6/30 | | Citibank N.A. | | Sell | | 1.00% | | 9/21 | | USD | | 1.406% | | | (11 | ) | | | 300 | | | | 2 | |
Federative Republic of Brazil, 12.25%, 3/6/30 | | Goldman Sachs International | | Sell | | 1.00% | | 9/21 | | USD | | 1.406% | | | (16 | ) | | | 400 | | | | 3 | |
Federative Republic of Brazil, 12.25%, 3/6/30 | | HSBC Bank USA | | Sell | | 1.00% | | 9/16 | | USD | | 0.819% | | | (13 | ) | | | 600 | | | | 17 | |
Federative Republic of Brazil, 12.25%, 3/6/30 | | HSBC Bank USA | | Sell | | 1.00% | | 6/17 | | USD | | 0.953% | | | (2 | ) | | | 200 | | | | 3 | |
Federative Republic of Brazil, 12.25%, 3/6/30 | | Morgan Stanley Capital Services LLC | | Sell | | 1.00% | | 3/17 | | USD | | 0.896% | | | (16 | ) | | | 1,100 | | | | 21 | |
Frontier Communications, 5.00%, 9/20/17 | | Goldman Sachs International | | Sell | | 5.00% | | 9/17 | | USD | | 4.394% | | | (3 | ) | | | 125 | | | | 6 | |
HCA, Inc., 8.00%, 10/1/18 | | Goldman Sachs International | | Sell | | 5.00% | | 6/17 | | USD | | 3.374% | | | (3 | ) | | | 200 | | | | 17 | |
Hewlett-Packard Co.,
5.40%, 3/1/17 | | UBS AG | | Sell | | 1.00% | | 12/17 | | USD | | 3.046% | | | (34 | ) | | | 400 | | | | (3 | ) |
Hewlett-Packard Co.,
5.40%, 3/1/17 | | Citibank N.A. | | Sell | | 1.00% | | 12/17 | | USD | | 3.046% | | | (83 | ) | | | 1,100 | | | | (20 | ) |
Metlife, Inc., 4.75%, 2/8/21 | | Citibank N.A. | | Sell | | 1.00% | | 12/17 | | USD | | 1.556% | | | (14 | ) | | | 300 | | | | 6 | |
Nokia Corp., 6.75%, 2/4/19 | | Barclays Bank PLC | | Sell | | 5.00% | | 9/14 | | EUR | | 2.669% | | | (3 | ) | | | 200 | | | | 14 | |
Nokia Corp., 6.75%, 2/4/19 | | BNP Paribas SA | | Sell | | 5.00% | | 9/14 | | EUR | | 2.669% | | | (1 | ) | | | 100 | | | | 7 | |
Nokia Corp., 6.75%, 2/4/19 | | Citibank N.A. | | Sell | | 5.00% | | 6/15 | | EUR | | 3.712% | | | (4 | ) | | | 200 | | | | 12 | |
Nokia Corp., 6.75%, 2/4/19 | | HSBC Bank USA | | Sell | | 5.00% | | 6/14 | | EUR | | 2.235% | | | 4 | | | | 600 | | | | 29 | |
Nokia Corp., 6.75%, 2/4/19 | | HSBC Bank USA | | Sell | | 5.00% | | 9/14 | | EUR | | 2.669% | | | (7 | ) | | | 100 | | | | 12 | |
Nokia Corp., 6.75%, 2/4/19 | | Barclays Bank PLC | | Sell | | 1.00% | | 3/14 | | EUR | | 1.614% | | | (7 | ) | | | 400 | | | | 3 | |
NRG Energy, Inc., 7.375%, 2/1/16 | | Barclays Bank PLC | | Sell | | 5.00% | | 6/16 | | USD | | 2.211% | | | 26 | | | | 1,100 | | | | 79 | |
NRG Energy, Inc.,
7.375%, 2/1/16 | | Citibank N.A. | | Sell | | 5.00% | | 6/16 | | USD | | 2.211% | | | 6 | | | | 200 | | | | 13 | |
Pacific Gas & Electric, 4.80%, 3/1/14 | | Goldman Sachs International | | Sell | | 1.00% | | 9/17 | | USD | | 0.831% | | | (2 | ) | | | 400 | | | | 5 | |
People’s Republic of China, 4.75%, 10/29/13 | | Citibank N.A. | | Sell | | 1.00% | | 12/16 | | USD | | 0.453% | | | (11 | ) | | | 300 | | | | 18 | |
People’s Republic of China, 4.75%, 10/29/13 | | Morgan Stanley Capital Services LLC | | Sell | | 1.00% | | 9/16 | | USD | | 0.417% | | | 1 | | | | 200 | | | | 4 | |
The Accompanying Notes are an Integral Part of the Financial Statements.
| | | | | | |
| | Multi-Sector Bond Portfolio | | | 157 | |
Multi-Sector Bond Portfolio
| | | | | | | | | | | | | | | | | | | | | | | | |
| Reference Entity | | Counterparty | | Buy/Sell
Protection | | (Pay)/Receive
Fixed Rate | | Expiration
Date | | Currency | | Implied
Credit
Spread | | Upfront Premium Paid/ (Received) (000’s) | | | Notional Amount (000’s) | | | Unrealized
Appreciation/
(Depreciation)
(000’s) | |
People’s Republic of China, 4.75%, 10/29/13 | | UBS AG | | Sell | | 1.00% | | 6/17 | | USD | | 0.537% | | | (6 | ) | | | 500 | | | $ | 17 | |
Petrobras International Finance Co., 8.375%, 12/10/18 | | Morgan Stanley Capital Services LLC | | Sell | | 1.00% | | 9/15 | | USD | | 1.088% | | | (4 | ) | | | 200 | | | | 3 | |
Republic of Indonesia, 7.25%, 4/20/15 | | HSBC Bank USA | | Sell | | 1.00% | | 6/17 | | USD | | 1.099% | | | (6 | ) | | | 200 | | | | 5 | |
Republic of Indonesia, 7.25%, 4/20/15 | | UBS AG | | Sell | | 1.00% | | 9/17 | | USD | | 1.190% | | | (3 | ) | | | 120 | | | | 2 | |
Republic of South Africa, 6.50%, 6/2/14 | | BNP Paribas SA | | Sell | | 1.00% | | 9/17 | | USD | | 1.384% | | | (2 | ) | | | 120 | | | | - | (m) |
Republic of South Africa, 6.50%, 6/2/14 | | HSBC Bank USA | | Sell | | 1.00% | | 6/17 | | USD | | 1.315% | | | (5 | ) | | | 200 | | | | 3 | |
Republic of Venezuela, 9.25%, 9/15/27 | | HSBC Bank USA | | Sell | | 5.00% | | 6/17 | | USD | | 6.265% | | | (20 | ) | | | 200 | | | | 10 | |
Republic of Venezuela, 9.25%, 9/15/27 | | HSBC Bank USA | | Sell | | 5.00% | | 9/17 | | USD | | 6.340% | | | (18 | ) | | | 120 | | | | 12 | |
Rio Tinto Finance USA, Ltd., 6.50%, 7/15/18 | | Citibank N.A. | | Sell | | 1.00% | | 9/17 | | USD | | 0.795% | | | (2 | ) | | | 100 | | | | 3 | |
Rio Tinto Finance USA, Ltd., 6.50%, 7/15/18 | | Barclays Bank PLC | | Sell | | 1.00% | | 9/17 | | USD | | 0.795% | | | (2 | ) | | | 100 | | | | 3 | |
Rio Tinto Finance USA, Ltd., 6.50%, 7/15/18 | | BNP Paribas SA | | Sell | | 1.00% | | 9/17 | | USD | | 0.795% | | | (2 | ) | | | 100 | | | | 3 | |
Rio Tinto Finance USA, Ltd., 6.50%, 7/15/18 | | UBS AG | | Sell | | 1.00% | | 9/17 | | USD | | 0.795% | | | (3 | ) | | | 200 | | | | 5 | |
Russian Government International Bond, 7.50%, 3/31/30 | | HSBC Bank USA | | Sell | | 1.00% | | 9/17 | | USD | | 1.233% | | | (6 | ) | | | 200 | | | | 4 | |
Russian Government International Bond, 7.50%, 3/31/30 | | Morgan Stanley Capital Services LLC | | Sell | | 1.00% | | 3/17 | | USD | | 1.088% | | | (261 | ) | | | 5,700 | | | | 242 | |
Russian Government International Bond, 7.50%, 3/31/30 | | HSBC Bank USA | | Sell | | 1.00% | | 6/17 | | USD | | 1.165% | | | (13 | ) | | | 300 | | | | 11 | |
Shell International Finance BV, 5.20%, 3/22/17 | | JPMorgan Chase Bank, N.A. | | Sell | | 1.00% | | 9/17 | | USD | | 0.442% | | | 11 | | | | 800 | | | | 10 | |
SLM Corp., 6.25%, 1/25/16 | | Citibank N.A. | | Sell | | 5.00% | | 6/17 | | USD | | 3.047% | | | (2 | ) | | | 200 | | | | 19 | |
Sprint Nextel Corp.,
6.00%, 12/1/16 | | UBS AG | | Sell | | 5.00% | | 3/17 | | USD | | 2.645% | | | (75 | ) | | | 1,100 | | | | 180 | |
United Mexican States, 5.95%, 3/19/19 | | Goldman Sachs International | | Sell | | 1.00% | | 3/17 | | USD | | 0.782% | | | (63 | ) | | | 4,200 | | | | 103 | |
United Mexican States, 5.95%, 3/19/19 | | Goldman Sachs International | | Sell | | 1.00% | | 9/17 | | USD | | 0.892% | | | (1 | ) | | | 80 | | | | 1 | |
United Mexican States, 5.95%, 3/19/19 | | HSBC Bank USA | | Sell | | 1.00% | | 6/17 | | USD | | 0.840% | | | (2 | ) | | | 200 | | | | 4 | |
United Mexican States, 7.50%, 4/8/33 | | Citibank N.A. | | Sell | | 1.00% | | 9/16 | | USD | | 0.712% | | | (11 | ) | | | 500 | | | | 16 | |
UPC Holding BV,
8.00%, 11/1/16 | | Goldman Sachs International | | Sell | | 5.00% | | 9/17 | | EUR | | 4.162% | | | (5 | ) | | | 100 | | | | 10 | |
(n)Valeant Pharmaceuticals, 6.875%, 12/1/18 | | Goldman Sachs International | | Sell | | 5.00% | | 6/16 | | USD | | 0.000% | | | (3 | ) | | | 200 | | | | 4 | |
Volkswagen International Finance NV, 5.375%, 5/22/18 | | Citibank N.A. | | Sell | | 1.00% | | 9/17 | | EUR | | 0.833% | | | (8 | ) | | | 300 | | | | 11 | |
| | | | | | | | | | | | | | | | | | | | | | | | |
| | | | | | | | | | | | | | | | | | | | | | $ | 938 | |
| | | | | | | | | | | | | | | | | | | | | | | | |
The Accompanying Notes are an Integral Part of the Financial Statements.
| | | | |
| 158 | | Multi-Sector Bond Portfolio | | |
Multi-Sector Bond Portfolio
Credit Default Swaps on Credit Indices
| | | | | | | | | | | | | | | | | | | | | | | | |
| Reference Entity | | Counterparty | | Buy/Sell
Protection | | (Pay)/Receive
Fixed Rate | | Expiration Date | | Currency | | Implied
Credit
Spread | | Upfront
Premium Paid/
(Received)
(000’s) | | | Notional
Amount
(000’s) | | | Unrealized
Appreciation/
(Depreciation)
(000’s) | |
Markit CDX Emerging Markets Index, Series 17 | | Morgan Stanley Capital Services LLC | | Sell | | 5.00% | | 6/17 | | USD | | 2.052% | | | 1,226 | | | | 17,200 | | | $ | 936 | |
Markit CDX Emerging Markets Index, Series 18 | | Barclays Bank PLC | | Sell | | 5.00% | | 12/17 | | USD | | 2.088% | | | 61 | | | | 500 | | | | 8 | |
Markit CDX Emerging Markets Index, Series 18 | | Barclays Bank PLC | | Sell | | 5.00% | | 12/17 | | USD | | 2.106% | | | 369 | | | | 2,770 | | | | 7 | |
Markit CDX Emerging Markets Index, Series 18 | | BNP Paribas SA | | Sell | | 5.00% | | 12/17 | | USD | | 2.088% | | | 121 | | | | 900 | | | | 2 | |
Markit CDX Emerging Markets Index, Series 18 | | HSBC Bank USA | | Sell | | 5.00% | | 12/17 | | USD | | 2.088% | | | 748 | | | | 5,600 | | | | 16 | |
Markit MCDX Index, Series 18 | | Citibank N.A. | | Sell | | 1.00% | | 6/17 | | USD | | 1.558% | | | (126 | ) | | | 4,700 | | | | 25 | |
| | | | | | | | | | | | | | | | | | | | | | | | |
| | | | | | | | | | | | | | | | | | | | | | $ | 994 | |
| | | | | | | | | | | | | | | | | | | | | | | | |
Centrally Cleared Interest Rate Swaps
| | | | | | | | | | | | | | | | | | | | |
| Floating Rate Index | | Pay/Receive Floating Rate | | Fixed Rate | | Expiration
Date | | Currency | | Upfront
Premium Paid/
(Received)
(000’s) | | | Notional
Amount
(000’s) | | | Unrealized
Appreciation/
(Depreciation)
(000’s) | |
6-Month Australian Bank Bill | | Pay | | 4.00% | | 3/23 | | AUD | | | - | | | | 700 | | | $ | (3 | ) |
| | | | | | | | | | | | | | | | | | | | |
| | | | | | | | | | | | | | | | | | $ | (3 | ) |
| | | | | | | | | | | | | | | | | | | | |
Centrally Cleared Credit Default Swap on Credit Indices
| | | | | | | | | | | | | | | | | | | | | | | | |
| Reference Entity | | Buy/Sell Protection | | (Pay)/Receive
Fixed Rate | | Expiration
Date | | Currency | | Implied
Credit
Spead | | | Upfront
Premium Paid/
(Received)
(000’s) | | | Notional
Amount
(000’s) | | | Unrealized
Appreciation/
(Depreciation)
(000’s) | |
Markit CDX Emerging Markets Index, Series 19 | | Sell | | 1.00% | | 12/17 | | USD | | | 1.000 | % | | | - | | | | 1,000 | | | $ | (1 | ) |
| | | | | | | | | | | | | | | | | | | | | | | | |
| | | | | | | | | | | | | | | | | | | | | | $ | (1 | ) |
| | | | | | | | | | | | | | | | | | | | | | | | |
| (k) | Cash in the amount of $4,945 and securities with an aggregate value of $71,516 (in thousands) has been pledged as collateral for swap contracts outstanding, short sales or written options on December 31, 2012. |
| (m) | Amount is less than one thousand. |
| (n) | Security valued in good faith by the Board of Directors. |
| (o) | Short sales outstanding on December 31, 2012. |
| | | | | | | | | | | | |
| Description | | Coupon | | Maturity
Date | | Principal
Amount (000’s) | | | Proceeds (000’s) | | Value (000’s) |
Federal National Mortgage Association TBA | | 3.50% | | 1/13 | | $ | 3,300 | | | $3,516 | | $3,518 |
The Accompanying Notes are an Integral Part of the Financial Statements.
| | | | | | |
| | Multi-Sector Bond Portfolio | | | 159 | |
Multi-Sector Bond Portfolio
The following is a summary of the inputs used in valuing the Portfolio’s assets and liabilities at December 31, 2012. See Note 3 for additional information on portfolio valuation.
| | | | | | | | | | | | | | |
| | | Valuation Inputs | | | |
| Description | | Level 1 –
Quoted Prices | | | Level 2 –
Other Significant
Observable Inputs | | | Level 3 – Significant
Unobservable Inputs | | | |
| | | (Amounts in thousands) | | | |
Assets: | | | | | | | | | | | | | | |
US Government | | $ | - | | | $ | 23,198 | | | $ | - | | | |
Foreign Bonds | | | - | | | | 66,886 | | | | - | | | |
Municipal Bonds | | | - | | | | 12,428 | | | | - | | | |
Corporate Bonds | | | - | | | | 223,398 | | | | 818 | | | |
Structured Products | | | - | | | | 15,619 | | | | 410 | | | |
Short-Term Investments | | | - | | | | 25,500 | | | | - | | | |
Other Financial Instruments^ | | | | | | | | | | | | | | |
Futures | | | 26 | | | | - | | | | - | | | |
Forward Currency Contracts | | | - | | | | 238 | | | | - | | | |
Interest Rate Swaps | | | - | | | | 866 | | | | - | | | |
Credit Default Swaps | | | - | | | | 2,093 | | | | 4 | | | |
Liabilities: | | | | | | | | | | | | | | |
Short Sales | | | - | | | | (3,518 | ) | | | - | | | |
Other Financial Instruments^ | | | | | | | | | | | | | | |
Futures | | | (38 | ) | | | - | | | | - | | | |
Forward Currency Contracts | | | - | | | | (1,120 | ) | | | - | | | |
Interest Rate Swaps | | | - | | | | (50 | ) | | | - | | | |
Credit Default Swaps | | | - | | | | (166 | ) | | | - | | | |
Written Options | | | - | | | | (54 | ) | | | - | | | |
Total | | $ | (12 | ) | | $ | 365,318 | | | $ | 1,232 | | | |
^ Other financial instruments are derivative instruments such as futures, forwards, written options and swaps contracts, which are valued at the unrealized appreciation (depreciation) on the instrument and short sales, which are valued at market value.
The Accompanying Notes are an Integral Part of the Financial Statements.
| | | | |
| 160 | | Multi-Sector Bond Portfolio | | |
Commodities Return Strategy Portfolio
| | | | |
| Objective: | | Portfolio Strategy: | | Net Assets: |
| Total return. | | Invest primarily in commodity linked derivative instruments, cash and fixed income securities to achieve positive total return relative to the performance of the Dow Jones-UBS Commodity Index Total Return. | | $153 million |
Portfolio Overview
Mason Street Advisors, the investment adviser for the Commodities Return Strategy Portfolio (the “Portfolio”), has engaged Credit Suisse Asset Management, LLC (“Credit Suisse”) to act as sub-adviser for the Portfolio. The Portfolio is designed to achieve positive total return relative to the performance of the Dow Jones-UBS Commodity Index Total Return (the “DJ-UBS Index”). The DJ-UBS Index is a broadly diversified futures index currently composed of futures contracts on 22 physical commodities. The Portfolio, which is actively managed, intends to invest primarily, either directly or indirectly, through a wholly-owned subsidiary, in commodity linked swap agreements and commodity linked derivative instruments, other derivatives that provide exposure to returns of the commodities markets, cash and fixed income securities. While the Portfolio seeks to achieve positive total return relative to the DJ-UBS Index, it is not an index fund and there can be no guarantee that this performance will be achieved. The Portfolio does not intend to invest in physical commodities.
Market Overview
The broad commodities market, as represented by the Dow Jones UBS Commodity Index Total Return (the “Index”) declined slightly in 2012. Energy was the worst performing sector, down 9.36%, led lower by Natural Gas. Livestock decreased 3.54%, as supplies increased due to farmers having to cut herd sizes as a result of high feed costs. Industrial Metals ended the year slightly higher, up 0.67% on the back of inventory re-stocking and cuts in production. Agriculture increased, up 3.98%. An exceptionally warm and dry summer in the U.S. Midwest remained the driving force behind grains performance. One of the top performers in the sector was corn, as the new crop entered the growing season amid exceptionally challenging weather conditions and extremely tight global supplies. Precious Metals ended the year 6.29% higher, as both gold and silver gained on Central Bank pledges for further stimulus and market support.
Portfolio Results
For the year ended December 31, 2012, the Portfolio returned (2.35%). By comparison, the Index returned (1.06%). (The Index is unmanaged, cannot be invested in directly and does not include administrative expenses or sales charges.) The Portfolio underperformed the 0.42% average return of its Commodities Broad Basket category peer group, according to Morningstar®, Inc., an independent mutual fund ranking agency.
The Portfolio gained exposure to commodity markets by investing in swap agreements, through a wholly-owned subsidiary, that return the rate of the Index. For the period, the Portfolio’s use of swap agreements detracted from results versus the Index. The structure of the swap agreements led to the following 2012 attribution results for the Portfolio.
The Portfolio’s underperformance was primarily related to longer-dated curve positioning within the Agriculture and Livestock sectors, while further maturity positions in Energy and Industrial Metals had a positive impact on performance. Overall, for the year, an estimated two thirds of the underperformance came from the Agriculture sector, with the remainder coming from Livestock.
Looking at the timeline of performance relative to the Index, the majority of underperformance can be attributed to the volatility that was observed in the second quarter of 2012. The second quarter was a volatile quarter, as the Index declined 9.52% during April and May before rallying back 5.49% in June. The majority of the positive returns in June were gained on the last few days of the month. The Portfolio underperformed by approximately 1.0% during that period, as elevated forward curve volatility levels continued to be a detractor.
Portfolio Manager Outlook
The following forward looking comments are the opinion of Credit Suisse, the Portfolio’s sub-adviser.
Commodities ended 2012 lower, as a result of disappointing growth momentum. Although markets were largely focused on the looming U.S. fiscal cliff towards the end of the year, the U.S. managed to avert economic calamity with lawmakers approving a deal on January 1, 2013. For the year ahead, the rate of global growth will likely once again be the key to commodity performance. To that end, recent developments suggest that 2013 may be a better year for the asset class. Evidence continues to suggest that global growth may have troughed, with the possibility of a modest rebound over the course of 2013.
Commodities could benefit from a rebound in global growth along with continued low interest rates. Inflation may overshoot expectations if economic activity begins to pick up more robustly than expected. Commodities may also continue to provide exposure to “tail risk” events on the supply side, with the Energy and Agriculture sectors remaining particularly vulnerable. That means unexpected decreases in supply related to weather or politics can have a beneficial effect on commodity prices. We continue to believe that a strategic allocation to commodities has the potential to deliver long-term diversification benefits.
| | | | | | |
| | Commodities Return Strategy Portfolio | | | 161 | |
Commodities Return Strategy Portfolio
Relative Performance
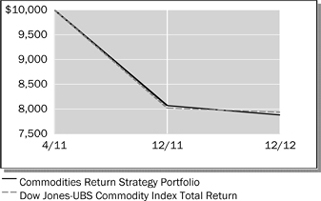
| | | | | | | | |
Average Annual Total Returns
For Periods Ended December 31, 2012 | |
| | | 1 Year | | | Since
Inception* | |
Commodities Return Strategy Portfolio | | | -2.35% | | | | -13.26% | |
Dow Jones-UBS Commodity Index Total Return | | | -1.06% | | | | -12.88% | |
Morningstar® US Insurance Fund Commodities Broad Basket Average | | | 0.42% | | | | - | |
| * | Inception date of 4/29/11 |
The performance data quoted represents past performance. Past performance is historical and does not guarantee future performance. Investment return and principal value will fluctuate, so that shares, when redeemed, may be worth more or less than their original cost. Current performance may be lower or higher than the performance data quoted. For the most recent month-end performance information visit www.northwesternmutual.com.
This chart assumes an initial investment of $10,000 made on 4/29/11 (commencement of the Portfolio’s operations). Returns shown reflect fee waivers, deductions for management and other portfolio expenses, and reinvestment of all dividends. In the absence of fee waivers, total return would be reduced. Returns exclude deductions for separate account sale loads and account fees. Please refer to the Benchmark Definitions section of this report for information about the indices cited in the above chart and graph.
The Portfolio is designed to achieve positive total return relative to the Dow Jones-UBS Commodity Index Total Return by investing, either directly or indirectly through a wholly-owned subsidiary, in commodity index-linked and commodity-linked derivative instruments backed by a portfolio of fixed income securities. Use of these instruments may involve certain risks such as commodity, counterparty, correlation, management, credit, interest rate, liquidity and market risks and the risk of mispricing or improper valuation. Certain derivatives involve leverage, which could magnify losses, and portfolios investing in derivatives could lose more than the principal amount invested in those instruments.
Exposure to commodity markets should only form a small part of a diversified portfolio. As any time, the loss associated with a particular investment held by the Portfolio may be significantly higher than 50% of the value of the investment. Investors considering an investment in the Portfolio should be willing to accept significant volatility in the Portfolio’s performance, particularly over shorter time periods.
The Portfolio is non-diversified, which means it may invest a greater portion of its assets in the securities of a smaller number of issuers than a diversified fund and may therefore be subject to greater volatility.
Top 10 Fixed Income Holdings 12/31/12
| | |
| Security Description | | % of Net Assets |
Federal Farm Credit Banks, Various | | 25.7% |
Federal Home Loan Bank, Various | | 16.7% |
US Treasury, Various | | 16.4% |
Federal Home Loan Mortgage Corp., Various | | 11.3% |
Federal National Mortgage Association, Various | | 9.3% |
Sector Allocation 12/31/12

Sector Allocation is based on Net Assets.
Sector Allocation and Top 10 Holdings are subject to change.
| | | | |
| 162 | | Commodities Return Strategy Portfolio | | |
Commodities Return Strategy Portfolio
Consolidated Schedule of Investments
December 31, 2012
| | | | | | | | | | |
| | | Governments (79.3%) | | Shares/ $ Par | | | Value $ (000’s) | |
| |
| | Governments (79.3%) | |
| | Federal Farm Credit Banks,
0.18%, 1/26/15 | | | 2,500,000 | | | | 2,500 | |
| | Federal Farm Credit Banks,
0.20%, 1/28/15 | | | 3,000,000 | | | | 2,999 | |
| | Federal Farm Credit Banks,
0.23%, 3/4/15 | | | 2,500,000 | | | | 2,502 | |
| | Federal Farm Credit Banks,
0.23%, 5/5/15 | | | 3,350,000 | | | | 3,353 | |
| | Federal Farm Credit Banks,
0.231%, 6/22/15 | | | 4,000,000 | | | | 3,999 | |
| | Federal Farm Credit Banks,
0.236%, 3/20/15 | | | 4,000,000 | | | | 4,000 | |
| | Federal Farm Credit Banks,
0.241%, 2/13/15 | | | 4,000,000 | | | | 4,001 | |
| | Federal Farm Credit Banks,
0.241%, 7/20/15 | | | 4,000,000 | | | | 3,999 | |
| | Federal Farm Credit Banks,
0.243%, 4/6/15 | | | 1,500,000 | | | | 1,500 | |
| | Federal Farm Credit Banks,
0.28%, 10/14/14 | | | 2,000,000 | | | | 2,000 | |
| | Federal Farm Credit Banks,
0.29%, 8/3/15 | | | 3,000,000 | | | | 3,008 | |
| | Federal Farm Credit Banks,
0.30%, 12/11/14 | | | 1,500,000 | | | | 1,501 | |
| | Federal Farm Credit Banks,
0.34%, 5/19/14 | | | 4,000,000 | | | | 4,010 | |
| | Federal Home Loan Bank,
0.00%, 4/15/13 | | | 4,000,000 | | | | 3,999 | |
| | Federal Home Loan Bank,
0.19%, 11/25/13 | | | 3,000,000 | | | | 3,002 | |
| | Federal Home Loan Bank,
0.24%, 4/16/13 | | | 4,000,000 | | | | 4,001 | |
| | Federal Home Loan Bank,
0.28%, 3/8/13 | | | 2,000,000 | | | | 2,001 | |
| | Federal Home Loan Bank,
0.29%, 11/8/13 | | | 4,000,000 | | | | 4,004 | |
| | Federal Home Loan Bank,
0.32%, 3/15/13 | | | 4,000,000 | | | | 4,001 | |
| | Federal Home Loan Bank,
0.32%, 5/17/13 | | | 3,000,000 | | | | 3,002 | |
| | Federal Home Loan Bank,
0.40%, 7/2/14 | | | 1,500,000 | | | | 1,503 | |
| | Federal Home Loan
Mortgage Corp., 0.375%, 10/15/13 | | | 3,000,000 | | | | 3,005 | |
| | Federal Home Loan
Mortgage Corp., 0.625%, 12/23/13 | | | 4,000,000 | | | | 4,016 | |
| | Federal Home Loan
Mortgage Corp., 1.625%, 4/15/13 | | | 4,000,000 | | | | 4,017 | |
| | Federal Home Loan
Mortgage Corp., 4.50%, 1/15/14 | | | 6,000,000 | | | | 6,267 | |
| | Federal National
Mortgage Association, 0.183%, 11/8/13 | | | 3,000,000 | | | | 3,000 | |
| | | | | | | | | | |
| | | Governments (79.3%) | | Shares/ $ Par | | | Value $ (000’s) | |
| |
| | Governments continued | |
| | Federal National
Mortgage Association, 0.192%, 9/11/14 | | | 2,500,000 | | | | 2,500 | |
| | Federal National
Mortgage Association, 0.221%, 3/14/13 | | | 2,000,000 | | | | 2,001 | |
| | Federal National
Mortgage Association, 0.38%, 8/9/13 | | | 2,000,000 | | | | 2,002 | |
| | Federal National
Mortgage Association, 3.625%, 2/12/13 | | | 4,695,000 | | | | 4,713 | |
| | US Treasury,
0.125%, 9/30/13 | | | 2,000,000 | | | | 1,999 | |
| | US Treasury,
0.25%, 1/31/14 | | | 6,000,000 | | | | 6,004 | |
| | US Treasury,
0.50%, 5/31/13 | | | 2,000,000 | | | | 2,003 | |
| | US Treasury,
0.625%, 1/31/13 | | | 1,000,000 | | | | 1,000 | |
| | US Treasury,
0.625%, 2/28/13 | | | 2,000,000 | | | | 2,002 | |
| | US Treasury,
1.00%, 7/15/13 | | | 5,000,000 | | | | 5,023 | |
| | US Treasury,
1.25%, 2/15/14 | | | 4,000,000 | | | | 4,046 | |
| | US Treasury,
1.375%, 5/15/13 | | | 1,000,000 | | | | 1,005 | |
| | US Treasury,
1.875%, 2/28/14 | | | 2,000,000 | | | | 2,039 | |
| | | | | | | | | | |
| | Total Governments | | | | | | | | |
| | (Cost: $121,466) | | | | | | | 121,527 | |
| | | | | | | | | | |
| | | Short-Term Investments (18.3%) | | | | |
| |
| | Federal Government & Agencies (13.1%) | |
| | Federal Home Loan,
0.07%, 8/20/13 | | | 5,000,000 | | | | 4,996 | |
| | Federal Home Loan,
0.08%, 3/13/13 | | | 6,000,000 | | | | 6,000 | |
| | Federal National
Mortgage Association, 0.13%, 2/19/13 | | | 3,000,000 | | | | 2,999 | |
| | Federal National
Mortgage Association, 0.14%, 4/1/13 | | | 6,000,000 | | | | 5,999 | |
| | | | | | | | | | |
| | Total | | | | | | | 19,994 | |
| | | | | | | | | | |
| |
| | Government (5.2%) | |
| | US Treasury Bill,
0%, 3/21/13 | | | 2,000,000 | | | | 2,000 | |
| | US Treasury Bill,
0%, 4/11/13 | | | 2,000,000 | | | | 2,000 | |
| | US Treasury Bill,
0%, 5/9/13 | | | 2,000,000 | | | | 1,999 | |
| | | | | | | | | | |
| | | Short-Term Investments (18.3%) | | Shares/ $ Par | | | Value $ (000’s) | |
| |
| | Governments continued | |
| (k) | | US Treasury Bill, 0.00%, 1/31/13 | | | 2,000,000 | | | | 2,000 | |
| | | | | | | | | | |
| | Total | | | | | | | 7,999 | |
| | | | | | | | | | |
| | | |
| | Total Short-Term Investments | | | | | | | | |
| | (Cost: $27,988) | | | | | | | 27,993 | |
| | | | | | | | | | |
| | | |
| | Total Investments (97.6%) | | | | | | | | |
| | (Cost: $149,454)(a) | | | | | | | 149,520 | |
| | | | | | | | | | |
| | Other Assets, Less
Liabilities (2.4%) | | | | | | | 3,688 | |
| | | | | | | | | | |
| | Net Assets (100.0%) | | | | | | | 153,208 | |
| | | | | | | | | | |
The Accompanying Notes are an Integral Part of the Financial Statements.
| | | | | | |
| | Commodities Return Strategy Portfolio | | | 163 | |
Commodities Return Strategy Portfolio
| (a) | At December 31, 2012 the aggregate cost of securities for federal tax purposes (in thousands) was $149,454 and the net unrealized appreciation of investments based on that cost was $66 which is comprised of $3,299 aggregate gross unrealized appreciation and $3,233 aggregate gross unrealized depreciation. |
| (j) | Swap agreements outstanding on December 31, 2012. |
Total Return Swaps
| | | | | | | | | | | | | | |
| Reference Entity | | Counterparty | | Payment Made
by the Fund | | Payment
Received by the
Fund | | Expiration Date | | Notional
Amount (000’s) | | Unrealized
Appreciation/
(Depreciation)
(000’s) | |
Dow Jones-UBS Commodity Index | | Citigroup | | USTB3M | | DJUBS | | 1/13 | | 5,567 | | $ | (2 | ) |
Dow Jones-UBS Commodity Index | | Citigroup | | USTB3M | | DJUBS | | 1/13 | | 33,280 | | | (11 | ) |
Dow Jones-UBS Commodity Index | | Morgan Stanley | | USTB3M | | DJUBS | | 1/13 | | 1,868 | | | (1 | ) |
Dow Jones-UBS Commodity Index | | Morgan Stanley | | USTB3M | | DJUBS | | 1/13 | | 18,193 | | | (6 | ) |
Dow Jones-UBS Commodity Index | | Morgan Stanley | | USTB3M | | DJUBS | | 12/13 | | 9,237 | | | 21 | |
Dow Jones-UBS Commodity Index | | Morgan Stanley | | USTB3M | | DJUBS | | 12/13 | | 8,239 | | | 24 | |
Dow Jones-UBS Commodity Index | | Societe General | | USTB3M | | DJUBS | | 1/13 | | 16,495 | | | (6 | ) |
Dow Jones-UBS Commodity Index | | Societe General | | USTB3M | | DJUBS | | 1/13 | | 21,756 | | | (8 | ) |
Dow Jones-UBS Commodity Index | | UBS | | USTB3M | | DJUBS | | 1/13 | | 1,981 | | | (1 | ) |
Dow Jones-UBS Commodity Index | | UBS AG | | USTB3M | | DJUBS | | 10/13 | | 14,050 | | | 41 | |
Dow Jones-UBS Commodity Index | | UBS AG | | USTB3M | | DJUBS | | 10/13 | | 22,034 | | | 51 | |
| | | | | | | | | | | | | | |
| | | | | | | | | | | | $ | 102 | |
| | | | | | | | | | | | | | |
USTB3M — US T-Bill 3-Month Auction Results Index plus Financing Fee
DJUBS — Dow Jones-UBS Commodity Index Total Return
| (k) | Cash or securities with an aggregate value of $2,000 (in thousands) has been pledged as collateral for swap contracts outstanding, short sales or written options on December 31, 2012. |
The following is a summary of the inputs used in valuing the Portfolio’s assets and liabilities at December 31, 2012. See Note 3 for additional information on portfolio valuation.
| | | | | | | | | | | | | | |
| | | Valuation Inputs | | | |
| Description | | Level 1 –
Quoted Prices | | | Level 2 –
Other Significant
Observable Inputs | | | Level 3 – Significant Unobservable Inputs | | | |
| | | (Amounts in thousands) | | | |
Assets: | | | | | | | | | | | | | | |
US Government & Agency Bonds | | $ | - | | | $ | 121,527 | | | $ | - | | | |
Short-Term Investments | | | - | | | | 27,993 | | | | - | | | |
Other Financial Instruments^ | | | | | | | | | | | | | | |
Total Return Swaps | | | - | | | | 137 | | | | - | | | |
Liabilities: | | | | | | | | | | | | | | |
Other Financial Instruments^ | | | | | | | | | | | | | | |
Total Return Swaps | | | - | | | | (35 | ) | | | - | | | |
Total | | $ | - | | | $ | 149,622 | | | $ | - | | | |
^ Other financial instruments are derivative instruments such as futures, forwards, written options and swaps contracts, which are valued at the unrealized appreciation (depreciation) on the instrument and short sales, which are valued at market value.
The Accompanying Notes are an Integral Part of the Financial Statements.
| | | | |
| 164 | | Commodities Return Strategy Portfolio | | |
Balanced Portfolio
| | | | |
| Objective: | | Portfolio Strategy: | | Net Assets: |
Realize as high a level of total return as is consistent with prudent investment risk, through income and capital appreciation. | | Invest in the stock, bond and money market sectors, attempting to capitalize on the variation in return potential produced by the interaction of changing financial markets and economic conditions. | | $2.2 billion |
Portfolio Overview
Mason Street Advisors acts as the investment adviser for the Balanced Portfolio (the “Portfolio”). The Portfolio seeks to achieve its objective by investing in stock, bond and money market sectors. The Portfolio is tactically and strategically managed to capitalize on changing financial markets and economic conditions following a flexible policy of allocating assets across the three market sectors. The Portfolio may invest in options, futures, forwards, exchange-traded funds and swap agreements to gain exposure to certain markets, sectors or regions. Under normal market conditions, the Portfolio’s equity exposure will typically range between 35% and 55% of assets.
Market Overview
Equity markets finished the year with solid gains despite economic uncertainty and significant volatility. Throughout the year, investors shifted their focus from uncertainty regarding the pace of global economic growth to evaluating fiscal and economic stimulus measures implemented globally. The economic slowdown in China, fiscal and debt crises in Europe, and the slow pace of growth in the U.S. drove volatility. As these issues arose, policy makers responded with stimulus and financing measures that calmed markets. Ultimately, investors embraced risk, as record profit margins in the U.S. and remarkable cash flow generation propelled equity markets during the year. In that environment, mid cap stocks outperformed shares of large and small sized companies, while value stocks generally outperformed growth shares. For the year, returns for the S&P 500®, MidCap 400® , and SmallCap 600® Indices were 16.00%, 17.88%, and 16.33%, respectively.
In the fixed income market, bonds also delivered solid gains. Investment grade and high yield bonds led the rally, as improving corporate balance sheets and record bond issuance sent investors looking for yield. Treasurys lagged during 2012 after strong gains in 2011 pushed Treasury yields to historic lows.
Portfolio Results
The Portfolio returned 9.69% for the twelve months ended December 31, 2012, trailing the 16.00% return of the broad stock market, as measured by the S&P 500® Index. The Portfolio also trailed the Balanced Portfolio Blended Composite Benchmark return of 11.06%. (The benchmark weights are detailed in the “Benchmark Definitions” section of this annual report.) The Mixed-Asset Target Allocation Moderate Funds peer group had an average return of 11.20%, according to Lipper® Analytical Services, Inc., an independent mutual fund ranking agency.
During the year, high level asset allocation decisions helped relative performance, while individual security selection within the underlying sleeves weighed on performance. Security selection weakness within the domestic equity portion of the Portfolio was the primary detractor from relative results, while weakness in the high yield portion of the Portfolio, which had an underweight to the lowest quality securities of the market, also held back Portfolio performance last year.
With respect to the Portfolio’s asset allocation decisions, several positions added to performance during the year. The Portfolio generated relative performance from having a higher allocation to equity during certain periods when stocks performed well and a lower allocation less equity when the market declined. These moves helped offset the Portfolio’s overall underweight position in equities, while delivering relative return with lower volatility.
Certain asset allocation decisions within the equity and fixed income portfolios also worked well. The Portfolio held an overweight in high yield bonds amid strong performance in the first half of the year and an overweight in emerging markets equity during the rally in the second half of the year.
During the period, the Portfolio made use of total return swap agreements with the intention of reducing the growth bias inherent in the Portfolio’s equity strategies. Use of these instruments helped relative results somewhat during a year in which growth generally underperformed value stocks.
Portfolio Manager Outlook
We are taking a cautious view going into 2013. The economic and fiscal policies that investors have come to expect in recent years can not continue forever. The record amounts of both fiscal and economic stimulus in recent years leave little room for additional policy measures. We have seen some early signs that policy may be shifting, albeit modestly. With interest rates at historic lows, the Federal Reserve could begin to signal that its bond buying programs used to lower interest rates could slow, as the long-term cost of keeping rates low may outweigh the short-term economic benefit. If growth in China and Europe pick up, higher commodity prices are likely to tax economic growth. Given the uncertainty, we will remain underweight in equity, overweight in cash and neutral within fixed income.
Balanced Portfolio
Relative Performance

| | | | | | | | | | | | |
Average Annual Total Returns
For Periods Ended December 31, 2012 | |
| | | 1 Year | | | 5 Years | | | 10 Years | |
Balanced Portfolio | | | 9.69% | | | | 3.31% | | | | 6.17% | |
S&P 500® Index | | | 16.00% | | | | 1.66% | | | | 7.10% | |
Barclays® U.S. Aggregate Index | | | 4.22% | | | | 5.95% | | | | 5.18% | |
Balanced Portfolio Blended Composite Benchmark | | | 11.06% | | | | 4.31% | | | | 7.32% | |
Lipper® Variable Insurance Products (VIP) Mixed Asset Target Allocation Moderate Funds Average | | | 11.20% | | | | 2.78% | | | | 6.39% | |
The performance data quoted represents past performance. Past performance is historical and does not guarantee future performance. Investment return and principal value will fluctuate, so that shares, when redeemed, may be worth more or less than their original cost. Current performance may be lower or higher than the performance data quoted. For the most recent month-end performance information visit www.northwesternmutual.com.
This chart assumes an initial investment of $10,000 made on 12/31/02. Returns shown include deductions for management and other portfolio expenses, and reinvestment of all dividends. Returns exclude deductions for separate account sale loads and account fees. Please refer to the Benchmark Definitions section of this report for information about the indices cited in the above chart and graph.
Investors should be aware of the risks of investments in foreign securities, particularly investments in securities of companies in developing nations. These include the risks of currency fluctuation, of political and economic instability and of less well-developed government supervision and regulation of business and industry practices, as well as differences in accounting standards. Small cap stocks also may carry additional risk. Smaller or newer issuers are more likely to realize more substantial growth as well as suffer more significant losses than larger or more established issuers. Investments in such companies can be both volatile and more speculative. Bonds and other debt obligations are affected by changes in interest rates, inflation risk and the creditworthiness of their issuers. High yield bonds generally have greater price swings and higher default risks than investment grade bonds.
The Portfolio may obtain its exposure to foreign securities by investing in other Series Fund portfolios (Underlying Portfolios). Each of the Underlying Portfolios has its own investment risks, and the Portfolio is indirectly exposed to all the risks of the Underlying Portfolios in which it invests, including that risk that an Underlying Portfolio will not perform as expected. To the extent that the Portfolio invests a significant portion of its assets in a single Underlying Portfolio, it will be particularly sensitive to the risks associated with that Underlying Portfolio, and changes in the value of that Underlying Portfolio may have a significant effect on the Portfolio’s net asset value. The Portfolio will bear a pro rata share of the Underlying Portfolio’s expenses.
The Portfolio may use derivative instruments to gain exposure to certain markets, sectors or regions as alternatives to direct investments, to adjust the Portfolio for the adviser’s view on style or term structure and duration, to provide increased flexibility in asset allocation, to earn income and to otherwise seek to enhance returns or to hedge foreign currency exposure. Use of these instruments may involve certain costs and risks such as liquidity risk, interest rate risk, market risk, credit risk, management risk and the risk of mispricing or improper valuation. Certain derivatives involve leverage, which could magnify losses, and portfolios investing in derivatives could lose more than the principal amount invested in those investments.
Balanced Portfolio
Top 5 Equity Holdings 12/31/12
| | |
| Security Description | | % of Net Assets |
Northwestern Mutual Series Fund, Inc., Research International Core Portfolio | | 4.8% |
Northwestern Mutual Series Fund, Inc., International Equity Portfolio | | 2.1% |
SPDR S&P MidCap 400 ETF Trust | | 1.5% |
Apple, Inc. | | 0.9% |
iShares MSCI EAFE Index Fund | | 0.9% |
Top 5 Fixed Income Holdings 12/31/12
| | |
| Security Description | | % of Net Assets |
US Treasury, Various | | 12.9% |
Federal Home Loan Mortgage Corp., Various | | 6.8% |
Federal National Mortgage Association, Various | | 4.6% |
Israel Government AID Bond, Various | | 1.1% |
Discover Card Master Trust, 0.81%, 8/15/17 | | 0.2% |
Sector Allocation 12/31/12

Sector Allocation is based on Net Assets.
Sector Allocation and Top 10 Holdings are subject to change.
The Investment Grade Segment includes bonds of companies and governments headquarted outside the United States.
Balanced Portfolio
Schedule of Investments
December 31, 2012
| | | | | | | | | | |
| | | Domestic Common Stocks and Warrants (29.9%) | | Shares/ $ Par | | | Value $ (000’s) | |
| | | |
| | Large Cap Common Stocks (21.0%) | | | | | | | | |
| | | |
| | Consumer Discretionary (2.4%) | | | | | | | | |
| | Comcast Corp. - Class A | | | 182,125 | | | | 6,808 | |
| * | | Delphi Automotive PLC | | | 114,325 | | | | 4,373 | |
| * | | Dollar General Corp. | | | 125,600 | | | | 5,538 | |
| | Las Vegas Sands Corp. | | | 77,775 | | | | 3,590 | |
| | Macy’s, Inc. | | | 167,375 | | | | 6,531 | |
| | News Corp. - Class A | | | 309,775 | | | | 7,912 | |
| | Starbucks Corp. | | | 76,650 | | | | 4,110 | |
| | Target Corp. | | | 100,025 | | | | 5,918 | |
| | Viacom, Inc. - Class B | | | 146,625 | | | | 7,733 | |
| | | | | | | | | | |
| | Total | | | | | | | 52,513 | |
| | | | | | | | | | |
| | | |
| | Consumer Staples (1.6%) | | | | | | | | |
| | Costco Wholesale Corp. | | | 29,225 | | | | 2,886 | |
| | CVS Caremark Corp. | | | 159,300 | | | | 7,702 | |
| | The Estee Lauder Cos., Inc. - Class A | | | 49,425 | | | | 2,959 | |
| | Mead Johnson Nutrition Co. | | | 87,600 | | | | 5,772 | |
| | PepsiCo, Inc. | | | 91,575 | | | | 6,266 | |
| | Philip Morris International, Inc. | | | 125,200 | | | | 10,472 | |
| | | | | | | | | | |
| | Total | | | | | | | 36,057 | |
| | | | | | | | | | |
| | | |
| | Energy (2.7%) | | | | | | | | |
| | Anadarko Petroleum Corp. | | | 110,475 | | | | 8,209 | |
| | Chevron Corp. | | | 116,800 | | | | 12,631 | |
| | Exxon Mobil Corp. | | | 150,050 | | | | 12,987 | |
| | National-Oilwell Varco, Inc. | | | 45,450 | | | | 3,106 | |
| | Occidental Petroleum Corp. | | | 86,475 | | | | 6,625 | |
| | Schlumberger, Ltd. | | | 112,025 | | | | 7,762 | |
| * | | Weatherford International, Ltd. | | | 445,461 | | | | 4,985 | |
| * | | Whiting Petroleum Corp. | | | 72,725 | | | | 3,154 | |
| | | | | | | | | | |
| | Total | | | | | | | 59,459 | |
| | | | | | | | | | |
| | | |
| | Financials (3.5%) | | | | | | | | |
| | American Express Co. | | | 117,525 | | | | 6,755 | |
| | American Tower Corp. | | | 123,275 | | | | 9,526 | |
| | BlackRock, Inc. | | | 20,325 | | | | 4,201 | |
| | Citigroup, Inc. | | | 267,100 | | | | 10,567 | |
| | The Goldman Sachs Group, Inc. | | | 49,525 | | | | 6,317 | |
| | Invesco, Ltd. | | | 235,450 | | | | 6,143 | |
| | JPMorgan Chase & Co. | | | 304,075 | | | | 13,370 | |
| | MetLife, Inc. | | | 136,250 | | | | 4,488 | |
| | PNC Financial Services Group, Inc. | | | 78,325 | | | | 4,567 | |
| | Wells Fargo & Co. | | | 342,675 | | | | 11,713 | |
| | | | | | | | | | |
| | Total | | | | | | | 77,647 | |
| | | | | | | | | | |
| | | |
| | Health Care (2.5%) | | | | | | | | |
| | Abbott Laboratories | | | 54,225 | | | | 3,552 | |
| | | | | | | | | | |
| | | Domestic Common Stocks and Warrants (29.9%) | | Shares/ $ Par | | | Value $ (000’s) | |
| | | |
| | Health Care continued | | | | | | | | |
| * | | Alexion Pharmaceuticals, Inc. | | | 27,775 | | | | 2,606 | |
| | AmerisourceBergen Corp. | | | 202,175 | | | | 8,730 | |
| * | | Biogen Idec, Inc. | | | 19,875 | | | | 2,915 | |
| | Eli Lilly and Co. | | | 49,575 | | | | 2,445 | |
| * | | Express Scripts Holding Co. | | | 73,700 | | | | 3,980 | |
| * | | Gilead Sciences, Inc. | | | 59,000 | | | | 4,333 | |
| | Johnson & Johnson | | | 173,400 | | | | 12,155 | |
| | Pfizer, Inc. | | | 277,925 | | | | 6,970 | |
| | UnitedHealth Group, Inc. | | | 106,225 | | | | 5,762 | |
| * | | Watson Pharmaceuticals, Inc. | | | 33,600 | | | | 2,890 | |
| | | | | | | | | | |
| | Total | | | | | | | 56,338 | |
| | | | | | | | | | |
| | | |
| | Industrials (2.6%) | | | | | | | | |
| | The Boeing Co. | | | 96,425 | | | | 7,267 | |
| | Cummins, Inc. | | | 49,893 | | | | 5,406 | |
| | Danaher Corp. | | | 117,200 | | | | 6,551 | |
| | FedEx Corp. | | | 84,067 | | | | 7,711 | |
| | General Electric Co. | | | 521,300 | | | | 10,942 | |
| | Precision Castparts Corp. | | | 28,414 | | | | 5,382 | |
| | SPX Corp. | | | 52,975 | | | | 3,716 | |
| | Union Pacific Corp. | | | 37,050 | | | | 4,658 | |
| | United Technologies Corp. | | | 88,700 | | | | 7,274 | |
| | | | | | | | | | |
| | Total | | | | | | | 58,907 | |
| | | | | | | | | | |
| | | |
| | Information Technology (4.3%) | | | | | | | | |
| | Apple, Inc. | | | 37,050 | | | | 19,749 | |
| | Broadcom Corp. - Class A | | | 136,500 | | | | 4,533 | |
| * | | Cognizant Technology Solutions Corp. - Class A | | | 58,525 | | | | 4,334 | |
| * | | eBay, Inc. | | | 51,250 | | | | 2,615 | |
| * | | EMC Corp. | | | 163,875 | | | | 4,146 | |
| * | | Google, Inc. - Class A | | | 10,450 | | | | 7,413 | |
| | Intel Corp. | | | 314,300 | | | | 6,484 | |
| | International Business Machines Corp. | | | 62,625 | | | | 11,996 | |
| | Microsoft Corp. | | | 461,800 | | | | 12,344 | |
| | Oracle Corp. | | | 225,275 | | | | 7,506 | |
| | Qualcomm, Inc. | | | 106,000 | | | | 6,574 | |
| | Visa, Inc. - Class A | | | 35,350 | | | | 5,358 | |
| * | | Yahoo!, Inc. | | | 213,400 | | | | 4,247 | |
| | | | | | | | | | |
| | Total | | | | | | | 97,299 | |
| | | | | | | | | | |
| | | |
| | Materials (0.8%) | | | | | | | | |
| | BHP Billiton, Ltd., ADR | | | 51,200 | | | | 4,016 | |
| | Celanese Corp. | | | 58,900 | | | | 2,623 | |
| | CF Industries Holdings, Inc. | | | 21,200 | | | | 4,307 | |
| | Monsanto Co. | | | 75,850 | | | | 7,179 | |
| | | | | | | | | | |
| | Total | | | | | | | 18,125 | |
| | | | | | | | | | |
| | | |
| | Telecommunication Services (0.2%) | | | | | | | | |
| | Vodafone Group PLC, ADR | | | 189,725 | | | | 4,779 | |
| | | | | | | | | | |
| | Total | | | | | | | 4,779 | |
| | | | | | | | | | |
The Accompanying Notes are an Integral Part of the Financial Statements.
Balanced Portfolio
| | | | | | | | | | |
| | | Domestic Common Stocks and Warrants (29.9%) | | Shares/ $ Par | | | Value $ (000’s) | |
| | | |
| | Utilities (0.4%) | | | | | | | | |
| | American Water Works Co., Inc. | | | 262,325 | | | | 9,740 | |
| | | | | | | | | | |
| | Total | | | | | | | 9,740 | |
| | | | | | | | | | |
| | | |
| | Total Large Cap Common Stocks | | | | | | | 470,864 | |
| | | | | | | | | | |
| | | |
| | Mid Cap Common Stocks (6.9%) | | | | | | | | |
| | | |
| | Consumer Discretionary (1.5%) | | | | | | | | |
| * | | Bed Bath & Beyond, Inc. | | | 26,300 | | | | 1,471 | |
| * | | BorgWarner, Inc. | | | 33,600 | | | | 2,406 | |
| | Brunswick Corp. | | | 46,300 | | | | 1,347 | |
| | Chico’s FAS, Inc. | | | 170,500 | | | | 3,147 | |
| | Coach, Inc. | | | 20,600 | | | | 1,144 | |
| | Dick’s Sporting Goods, Inc. | | | 106,150 | | | | 4,829 | |
| | The Gap, Inc. | | | 30,100 | | | | 934 | |
| * | | LKQ Corp. | | | 141,900 | | | | 2,994 | |
| | Marriott International, Inc. - Class A | | | 29,900 | | | | 1,114 | |
| | The McGraw-Hill Cos., Inc. | | | 45,700 | | | | 2,498 | |
| * | | O’Reilly Automotive, Inc. | | | 27,280 | | | | 2,439 | |
| * | | Penn National Gaming, Inc. | | | 29,000 | | | | 1,424 | |
| | Polaris Industries, Inc. | | | 33,000 | | | | 2,777 | |
| | Ralph Lauren Corp. | | | 4,300 | | | | 645 | |
| | Ross Stores, Inc. | | | 36,600 | | | | 1,982 | |
| | Scripps Networks Interactive - Class A | | | 17,400 | | | | 1,008 | |
| | Ulta Salon, Cosmetics & Fragrance, Inc. | | | 14,550 | | | | 1,430 | |
| | Wynn Resorts, Ltd. | | | 6,500 | | | | 731 | |
| | | | | | | | | | |
| | Total | | | | | | | 34,320 | |
| | | | | | | | | | |
| | | |
| | Consumer Staples (0.7%) | | | | | | | | |
| | Beam, Inc. | | | 104,325 | | | | 6,373 | |
| | Church & Dwight Co., Inc. | | | 139,825 | | | | 7,490 | |
| | McCormick & Co., Inc. | | | 43,000 | | | | 2,732 | |
| | | | | | | | | | |
| | Total | | | | | | | 16,595 | |
| | | | | | | | | | |
| | | |
| | Energy (0.3%) | | | | | | | | |
| * | | Cameron International Corp. | | | 28,000 | | | | 1,581 | |
| * | | Concho Resources, Inc. | | | 19,100 | | | | 1,539 | |
| * | | FMC Technologies, Inc. | | | 27,800 | | | | 1,191 | |
| | Noble Energy, Inc. | | | 17,700 | | | | 1,801 | |
| * | | Southwestern Energy Co. | | | 23,600 | | | | 788 | |
| | | | | | | | | | |
| | Total | | | | | | | 6,900 | |
| | | | | | | | | | |
| | | |
| | Financials (0.4%) | | | | | | | | |
| * | | CBRE Group, Inc. | | | 115,600 | | | | 2,300 | |
| * | | E*TRADE Financial Corp. | | | 49,640 | | | | 444 | |
| * | | IntercontinentalExchange, Inc. | | | 11,500 | | | | 1,424 | |
| | Lazard, Ltd. - Class A | | | 28,100 | | | | 839 | |
| | Raymond James Financial, Inc. | | | 73,900 | | | | 2,847 | |
| | | | | | | | | | |
| | Total | | | | | | | 7,854 | |
| | | | | | | | | | |
| | | |
| | Health Care (0.7%) | | | | | | | | |
| * | | Catamaran Corp. | | | 45,600 | | | | 2,148 | |
| * | | Cerner Corp. | | | 21,200 | | | | 1,646 | |
| | | | | | | | | | |
| | | Domestic Common Stocks and Warrants (29.9%) | | Shares/ $ Par | | | Value $ (000’s) | |
| | | |
| | Health Care continued | | | | | | | | |
| * | | DaVita, Inc. | | | 18,500 | | | | 2,045 | |
| * | | IDEXX Laboratories, Inc. | | | 20,100 | | | | 1,865 | |
| * | | Mettler-Toledo International, Inc. | | | 9,100 | | | | 1,759 | |
| * | | Mylan, Inc. | | | 25,600 | | | | 704 | |
| | Perrigo Co. | | | 50,175 | | | | 5,220 | |
| * | | Vertex Pharmaceuticals, Inc. | | | 14,600 | | | | 612 | |
| | | | | | | | | | |
| | Total | | | | | | | 15,999 | |
| | | | | | | | | | |
| | | |
| | Industrials (1.3%) | | | | | | | | |
| * | | B/E Aerospace, Inc. | | | 60,400 | | | | 2,984 | |
| | Corrections Corp. of America | | | 90,300 | | | | 3,203 | |
| | Dover Corp. | | | 32,300 | | | | 2,122 | |
| * | | Fortune Brands Home & Security, Inc. | | | 24,600 | | | | 719 | |
| | Graco, Inc. | | | 56,150 | | | | 2,891 | |
| | Kansas City Southern | | | 32,600 | | | | 2,721 | |
| | Knight Transportation, Inc. | | | 63,200 | | | | 925 | |
| | MSC Industrial Direct Co., Inc. - Class A | | | 18,200 | | | | 1,372 | |
| * | | Owens Corning, Inc. | | | 41,900 | | | | 1,550 | |
| | Regal-Beloit Corp. | | | 23,298 | | | | 1,642 | |
| | Robert Half International, Inc. | | | 99,700 | | | | 3,173 | |
| | Roper Industries, Inc. | | | 21,100 | | | | 2,352 | |
| * | | WESCO International, Inc. | | | 50,617 | | | | 3,413 | |
| | | | | | | | | | |
| | Total | | | | | | | 29,067 | |
| | | | | | | | | | |
| | | |
| | Information Technology (1.5%) | | | | | | | | |
| * | | Alliance Data Systems Corp. | | | 25,400 | | | | 3,677 | |
| | Amphenol Corp. - Class A | | | 28,000 | | | | 1,812 | |
| * | | Aruba Networks, Inc. | | | 39,300 | | | | 815 | |
| | Avago Technologies, Ltd. | | | 139,425 | | | | 4,414 | |
| * | | Citrix Systems, Inc. | | | 27,200 | | | | 1,788 | |
| * | | F5 Networks, Inc. | | | 18,000 | | | | 1,749 | |
| * | | Fortinet, Inc. | | | 115,150 | | | | 2,426 | |
| * | | Freescale Semiconductor Holdings I, Ltd. | | | 67,500 | | | | 743 | |
| | Global Payments, Inc. | | | 74,500 | | | | 3,375 | |
| | Microchip Technology, Inc. | | | 45,100 | | | | 1,470 | |
| * | | NetApp, Inc. | | | 26,800 | | | | 899 | |
| * | | NetSuite, Inc. | | | 7,900 | | | | 532 | |
| * | | Red Hat, Inc. | | | 21,800 | | | | 1,155 | |
| * | | ServiceNow, Inc. | | | 11,407 | | | | 343 | |
| * | | Skyworks Solutions, Inc. | | | 61,000 | | | | 1,238 | |
| * | | Teradata Corp. | | | 15,600 | | | | 965 | |
| * | | TIBCO Software, Inc. | | | 47,600 | | | | 1,048 | |
| * | | VeriFone Systems, Inc. | | | 77,500 | | | | 2,300 | |
| * | | Zebra Technologies Corp. - Class A | | | 46,400 | | | | 1,823 | |
| | | | | | | | | | |
| | Total | | | | | | | 32,572 | |
| | | | | | | | | | |
| | | |
| | Materials (0.3%) | | | | | | | | |
| | Airgas, Inc. | | | 35,870 | | | | 3,275 | |
| | PPG Industries, Inc. | | | 19,100 | | | | 2,585 | |
| | Westlake Chemical Corp. | | | 17,100 | | | | 1,356 | |
| | | | | | | | | | |
| | Total | | | | | | | 7,216 | |
| | | | | | | | | | |
The Accompanying Notes are an Integral Part of the Financial Statements.
Balanced Portfolio
| | | | | | | | | | |
| | | Domestic Common Stocks and Warrants (29.9%) | | Shares/ $ Par | | | Value $ (000’s) | |
| | | |
| | Telecommunication Services (0.2%) | | | | | | | | |
| * | | SBA Communications Corp. - Class A | | | 66,900 | | | | 4,751 | |
| | | | | | | | | | |
| | Total | | | | | | | 4,751 | |
| | | | | | | | | | |
| | | |
| | Total Mid Cap Common Stocks | | | | | | | 155,274 | |
| | | | | | | | | | |
| | | |
| | Small Cap Common Stocks (2.0%) | | | | | | | | |
| | | |
| | Consumer Discretionary (0.2%) | | | | | | | | |
| * | | Bally Technologies, Inc. | | | 13,500 | | | | 604 | |
| * | | Chuy’s Holdings, Inc. | | | 12,000 | | | | 268 | |
| * | | Genesco, Inc. | | | 8,050 | | | | 443 | |
| * | | Grand Canyon Education, Inc. | | | 30,050 | | | | 705 | |
| * | | Hibbett Sports, Inc. | | | 8,400 | | | | 443 | |
| * | | Life Time Fitness, Inc. | | | 13,250 | | | | 652 | |
| * | | Motors Liquidation Co. GUC Trust | | | 1,317 | | | | 28 | |
| | Penske Automotive Group, Inc. | | | 15,500 | | | | 466 | |
| * | | Red Robin Gourmet Burgers, Inc. | | | 9,900 | | | | 349 | |
| * | | SHFL Entertainment, Inc. | | | 18,400 | | | | 267 | |
| * | | Vitamin Shoppe, Inc. | | | 8,600 | | | | 493 | |
| | | | | | | | | | |
| | Total | | | | | | | 4,718 | |
| | | | | | | | | | |
| | | |
| | Consumer Staples (0.0%) | | | | | | | | |
| * | | United Natural Foods, Inc. | | | 8,250 | | | | 442 | |
| | | | | | | | | | |
| | Total | | | | | | | 442 | |
| | | | | | | | | | |
| | | |
| | Energy (0.2%) | | | | | | | | |
| * | | Approach Resources, Inc. | | | 23,050 | | | | 576 | |
| * | | Dril-Quip, Inc. | | | 8,700 | | | | 636 | |
| | EXCO Resources, Inc. | | | 77,100 | | | | 522 | |
| * | | Gulfport Energy Corp. | | | 17,650 | | | | 675 | |
| * | | Hornbeck Offshore Services, Inc. | | | 13,400 | | | | 460 | |
| * | | Kodiak Oil & Gas Corp. | | | 53,700 | | | | 475 | |
| * | | Rosetta Resources, Inc. | | | 10,800 | | | | 490 | |
| | | | | | | | | | |
| | Total | | | | | | | 3,834 | |
| | | | | | | | | | |
| | | |
| | Financials (0.2%) | | | | | | | | |
| | AmREIT, Inc., - Class B | | | 17,200 | | | | 295 | |
| | Boston Private Financial Holdings, Inc. | | | 73,600 | | | | 663 | |
| | East West Bancorp, Inc. | | | 40,100 | | | | 862 | |
| | Education Realty Trust, Inc. | | | 36,150 | | | | 385 | |
| | Greenhill & Co., Inc. | | | 13,250 | | | | 689 | |
| * | | Stifel Financial Corp. | | | 16,400 | | | | 524 | |
| | | | | | | | | | |
| | Total | | | | | | | 3,418 | |
| | | | | | | | | | |
| | | |
| | Health Care (0.4%) | | | | | | | | |
| * | | Akorn, Inc. | | | 33,900 | | | | 453 | |
| * | | Align Technology, Inc. | | | 11,500 | | | | 319 | |
| * | | Conceptus, Inc. | | | 13,230 | | | | 278 | |
| * | | DexCom, Inc. | | | 35,291 | | | | 480 | |
| * | | Endologix, Inc. | | | 30,091 | | | | 429 | |
| * | | Exact Sciences Corp. | | | 53,150 | | | | 563 | |
| * | | Fluidigm Corp. | | | 26,050 | | | | 373 | |
| | | | | | | | | | |
| | | Domestic Common Stocks and Warrants (29.9%) | | Shares/ $ Par | | | Value $ (000’s) | |
| | | |
| | Health Care continued | | | | | | | | |
| * | | Health Management Associates, Inc. - Class A | | | 54,200 | | | | 505 | |
| * | | HealthStream, Inc. | | | 18,650 | | | | 453 | |
| * | | HMS Holdings Corp. | | | 9,600 | | | | 249 | |
| * | | Impax Laboratories, Inc. | | | 34,250 | | | | 702 | |
| * | | IPC The Hospitalist Co. | | | 7,850 | | | | 312 | |
| * | | Jazz Pharmaceuticals PLC | | | 4,550 | | | | 242 | |
| * | | MAP Pharmaceuticals, Inc. | | | 30,300 | | | | 476 | |
| * | | Neogen Corp. | | | 6,100 | | | | 276 | |
| * | | Omnicell, Inc. | | | 31,856 | | | | 474 | |
| * | | Team Health Holdings, Inc. | | | 12,250 | | | | 352 | |
| | U.S. Physical Therapy, Inc. | | | 16,600 | | | | 457 | |
| | Universal Health Services, Inc. - Class B | | | 8,600 | | | | 416 | |
| | | | | | | | | | |
| | Total | | | | | | | 7,809 | |
| | | | | | | | | | |
| | | |
| | Industrials (0.5%) | | | | | | | | |
| | Actuant Corp. - Class A | | | 30,900 | | | | 863 | |
| * | | Beacon Roofing Supply, Inc. | | | 15,650 | | | | 521 | |
| | Celadon Group, Inc. | | | 31,500 | | | | 569 | |
| * | | Chart Industries, Inc. | | | 9,108 | | | | 607 | |
| * | | DXP Enterprises, Inc. | | | 8,350 | | | | 410 | |
| * | | Heritage-Crystal Clean, Inc. | | | 30,939 | | | | 464 | |
| * | | Hexcel Corp. | | | 27,950 | | | | 754 | |
| * | | Huron Consulting Group, Inc. | | | 19,389 | | | | 653 | |
| * | | The Keyw Holding Corp. | | | 44,871 | | | | 569 | |
| | Lindsay Corp. | | | 8,650 | | | | 693 | |
| | The Manitowoc Co., Inc. | | | 21,000 | | | | 329 | |
| * | | Mistras Group, Inc. | | | 18,841 | | | | 465 | |
| * | | NCI Building Systems, Inc. | | | 24,450 | | | | 340 | |
| * | | Oshkosh Corp. | | | 18,750 | | | | 556 | |
| * | | Performant Financial Corp. | | | 22,300 | | | | 225 | |
| | Snap-on, Inc. | | | 8,950 | | | | 707 | |
| | Sun Hydraulics Corp. | | | 16,445 | | | | 429 | |
| * | | Thermon Group Holdings, Inc. | | | 16,850 | | | | 380 | |
| | TransDigm Group, Inc. | | | 3,700 | | | | 505 | |
| | Valmont Industries, Inc. | | | 6,600 | | | | 901 | |
| | | | | | | | | | |
| | Total | | | | | | | 10,940 | |
| | | | | | | | | | |
| | | |
| | Information Technology (0.5%) | | | | | | | | |
| * | | Aspen Technology, Inc. | | | 15,400 | | | | 426 | |
| * | | BroadSoft, Inc. | | | 14,500 | | | | 527 | |
| * | | Calix, Inc. | | | 70,021 | | | | 538 | |
| * | | Cardtronics, Inc. | | | 19,350 | | | | 459 | |
| * | | Cavium, Inc. | | | 16,900 | | | | 527 | |
| * | | Cornerstone OnDemand, Inc. | | | 12,522 | | | | 370 | |
| * | | Diodes, Inc. | | | 35,200 | | | | 611 | |
| * | | EXA Corp. | | | 16,000 | | | | 156 | |
| * | | ExactTarget, Inc. | | | 12,500 | | | | 250 | |
| * | | EZchip Semiconductor, Ltd. | | | 9,950 | | | | 329 | |
| | FEI Co. | | | 13,900 | | | | 771 | |
| * | | Finisar Corp. | | | 23,500 | | | | 383 | |
| * | | InterXion Holding NV | | | 33,176 | | | | 788 | |
| * | | Microsemi Corp. | | | 26,100 | | | | 549 | |
| * | | MicroStrategy, Inc. - Class A | | | 3,250 | | | | 303 | |
| | MKS Instruments, Inc. | | | 18,150 | | | | 468 | |
| * | | Nanometrics, Inc. | | | 27,150 | | | | 392 | |
The Accompanying Notes are an Integral Part of the Financial Statements.
Balanced Portfolio
| | | | | | | | | | | | |
| | | Domestic Common Stocks and Warrants (29.9%) | | Shares/ $ Par | | | Value $ (000’s) | |
| | | |
| | Information Technology continued | | | | | | | | |
| * | | Proofpoint, Inc. | | | | | 10,500 | | | | 129 | |
| * | | Sourcefire, Inc. | | | | | 6,350 | | | | 300 | |
| * | | SPS Commerce, Inc. | | | | | 20,925 | | | | 780 | |
| * | | Synacor, Inc. | | | | | 35,800 | | | | 196 | |
| * | | Synchronoss Technologies, Inc. | | | | | 37,450 | | | | 790 | |
| * | | Tangoe, Inc. | | | | | 46,700 | | | | 554 | |
| * | | The Ultimate Software Group, Inc. | | | | | 7,786 | | | | 735 | |
| | | | | | | | | | | | |
| | Total | | | | | | | | | 11,331 | |
| | | | | | | | | | | | |
| | | |
| | Materials (0.0%) | | | | | | | | |
| | Balchem Corp. | | | | | 14,911 | | | | 543 | |
| (n)* | | NewPage Group, Inc. | | | | | 700 | | | | 65 | |
| | | | | | | | | | | | |
| | Total | | | | | | | | | 608 | |
| | | | | | | | | | | | |
| | | |
| | Telecommunication Services (0.0%) | | | | | | | | |
| * | | tw telecom, Inc. | | | | | 30,000 | | | | 764 | |
| | | | | | | | | | | | |
| | Total | | | | | | | | | 764 | |
| | | | | | | | | | | | |
| | | |
| | Total Small Cap Common Stocks | | | | | | | 43,864 | |
| | | | | | | | | | | | |
| | | |
| | Total Domestic Common Stocks and Warrants | | | | | | | | |
| | (Cost: $600,420) | | | | | | | 670,002 | |
| | | | | | | | | | | | |
| | | | |
| | | Foreign Common Stocks (0.0%) | | Country | | | | | | |
| | | |
| | Materials (0.0%) | | | | | | | | |
| (n)* | | Catalyst Paper Corp. | | Canada
| | | 5,430 | | | | 6 | |
| | | | | | | | | | | | |
| | | |
| | Total Foreign Common Stocks | | | | | | | | |
| | (Cost: $6) | | | | | | | 6 | |
| | | | | | | | | | | | |
| | | | |
| | | Preferred Stocks (0.1%) | | | | | | | | |
| | | |
| | Financials (0.1%) | | | | | | | | |
| | Ally Financial, Inc,
7.00%, 2/4/13 144A | | | | | 357 | | | | 351 | |
| | Ally Financial, Inc.,
8.50%, 5/15/16 | | | | | 31,671 | | | | 832 | |
| | GMAC Capital Trust I,
8.125%, 2/15/40 | | | | | 11,788 | | | | 314 | |
| | | | | | | | | | | | |
| | | |
| | Total Preferred Stocks | | | | | | | | |
| | (Cost: $1,404) | | | | | | | 1,497 | |
| | | | | | | | | | | | |
| | | | |
| | | Investment Grade Segment (9.0%) | | | | | | | | |
| | | |
| | Aerospace/Defense (0.1%) | | | | | | | | |
| | BAE Systems Holdings, Inc., 6.375%, 6/1/19 144A | | | 180,000 | | | | 215 | |
| | Boeing Capital Corp., 2.125%, 8/15/16 | | | 460,000 | | | | 479 | |
| | L-3 Communications Corp., 5.20%, 10/15/19 | | | 635,000 | | | | 724 | |
| | Lockheed Martin Corp., 3.35%, 9/15/21 | | | 175,000 | | | | 185 | |
| | Meccanica Holdings USA, Inc., 6.25%, 1/15/40 144A | | | 450,000 | | | | 388 | |
| | | | | | | | | | | | |
| | Total | | | | | | | | | 1,991 | |
| | | | | | | | | | | | |
| | | | | | | | | | |
| | | Investment Grade Segment (9.0%) | | Shares/ $ Par | | | Value $ (000’s) | |
| | | |
| | Auto Manufacturing (0.4%) | | | | | | | | |
| | American Honda Finance Corp., 2.125%, 2/28/17 144A | | | 980,000 | | | | 1,003 | |
| | Daimler Finance North America LLC, 2.625%, 9/15/16 144A | | | 60,000 | | | | 62 | |
| | Daimler Finance North America LLC, 3.00%, 3/28/16 144A | | | 655,000 | | | | 685 | |
| | Ford Motor Co., 7.45%, 7/16/31 | | | 780,000 | | | | 991 | |
| | Ford Motor Credit Co. LLC, 3.00%, 6/12/17 | | | 705,000 | | | | 724 | |
| | Ford Motor Credit Co. LLC, 4.25%, 2/3/17 | | | 790,000 | | | | 846 | |
| | Ford Motor Credit Co. LLC, 5.00%, 5/15/18 | | | 410,000 | | | | 452 | |
| | Ford Motor Credit Co. LLC, 5.75%, 2/1/21 | | | 700,000 | | | | 806 | |
| | Ford Motor Credit Co. LLC, 5.875%, 8/2/21 | | | 520,000 | | | | 606 | |
| | Ford Motor Credit Co. LLC, 8.125%, 1/15/20 | | | 325,000 | | | | 416 | |
| | PACCAR, Inc., 6.875%, 2/15/14 | | | 80,000 | | | | 86 | |
| | Toyota Motor Credit Corp., 1.75%, 5/22/17 | | | 1,085,000 | | | | 1,111 | |
| | Toyota Motor Credit Corp., 3.30%, 1/12/22 | | | 1,025,000 | | | | 1,106 | |
| | Volkswagen International Finance NV, 2.875%, 4/1/16 144A | | | 730,000 | | | | 766 | |
| | | | | | | | | | |
| | Total | | | | | | | 9,660 | |
| | | | | | | | | | |
| | | |
| | Banking (1.3%) | | | | | | | | |
| | Bank of America Corp., 3.625%, 3/17/16 | | | 580,000 | | | | 614 | |
| | Bank of America Corp., 3.75%, 7/12/16 | | | 155,000 | | | | 166 | |
| | Bank of America Corp., 5.75%, 12/1/17 | | | 870,000 | | | | 1,014 | |
| | Bank of Montreal, 2.55%, 11/6/22 | | | 960,000 | | | | 950 | |
| | The Bank of New York Mellon Corp., 3.55%, 9/23/21 | | | 1,225,000 | | | | 1,335 | |
| | Bank of Nova Scotia, 1.375%, 12/18/17 | | | 685,000 | | | | 686 | |
| | Barclays Bank PLC, 5.00%, 9/22/16 | | | 100,000 | | | | 112 | |
| | Barclays Bank PLC, 6.05%, 12/4/17 144A | | | 140,000 | | | | 155 | |
| | Citigroup, Inc., 3.953%, 6/15/16 | | | 2,955,000 | | | | 3,181 | |
| | Fifth Third Bank, 4.75%, 2/1/15 | | | 740,000 | | | | 794 | |
| | The Goldman Sachs Group, Inc., 5.95%, 1/18/18 | | | 1,915,000 | | | | 2,228 | |
| | The Goldman Sachs Group, Inc., 6.15%, 4/1/18 | | | 835,000 | | | | 981 | |
| | HSBC Holdings PLC, 5.10%, 4/5/21 | | | 590,000 | | | | 697 | |
| | JPMorgan Chase & Co., 3.15%, 7/5/16 | | | 3,735,000 | | | | 3,957 | |
| | JPMorgan Chase & Co., 6.00%, 1/15/18 | | | 540,000 | | | | 646 | |
| | Merrill Lynch & Co., Inc., 6.40%, 8/28/17 | | | 2,185,000 | | | | 2,566 | |
| | Morgan Stanley, 2.875%, 7/28/14 | | | 780,000 | | | | 797 | |
| | Morgan Stanley, 4.75%, 3/22/17 | | | 395,000 | | | | 431 | |
| | Nordea Bank AB, 4.875%, 1/27/20 144A | | | 320,000 | | | | 369 | |
| | PNC Financial Services Group, Inc., 2.854%, 11/9/22 | | | 700,000 | | | | 704 | |
| | PNC Funding Corp., 4.375%, 8/11/20 | | | 440,000 | | | | 502 | |
| | The Royal Bank of Scotland Group PLC, 6.125%, 12/15/22 | | | 750,000 | | | | 792 | |
| | Standard Chartered PLC, 3.20%, 5/12/16 144A | | | 655,000 | | | | 689 | |
| | State Street Corp., 2.875%, 3/7/16 | | | 390,000 | | | | 414 | |
| | SunTrust Banks, Inc., 6.00%, 9/11/17 | | | 405,000 | | | | 478 | |
| | U.S. Bancorp, 3.442%, 2/1/16 | | | 700,000 | | | | 737 | |
| | Wachovia Corp., 5.75%, 2/1/18 | | | 215,000 | | | | 257 | |
| | Wells Fargo & Co., 2.625%, 12/15/16 | | | 1,115,000 | | | | 1,177 | |
| | Wells Fargo & Co., 4.60%, 4/1/21 | | | 715,000 | | | | 822 | |
| | Wells Fargo & Co., 7.98%, 3/29/49 | | | 255,000 | | | | 293 | |
| | | | | | | | | | |
| | Total | | | | | | | 28,544 | |
| | | | | | | | | | |
The Accompanying Notes are an Integral Part of the Financial Statements.
Balanced Portfolio
| | | | | | | | | | |
| | | Investment Grade Segment (9.0%) | | Shares/ $ Par | | | Value $ (000’s) | |
| | | |
| | Beverage/Bottling (0.3%) | | | | | | | | |
| | Anheuser-Busch Cos. LLC, 5.75%, 4/1/36 | | | 255,000 | | | | 324 | |
| | Anheuser-Busch InBev Worldwide, Inc., 2.50%, 7/15/22 | | | 985,000 | | | | 991 | |
| | Anheuser-Busch InBev Worldwide, Inc., 5.375%, 1/15/20 | | | 220,000 | | | | 268 | |
| | Anheuser-Busch InBev Worldwide, Inc., 8.20%, 1/15/39 | | | 1,020,000 | | �� | | 1,675 | |
| | Beam, Inc., 3.25%, 5/15/22 | | | 275,000 | | | | 285 | |
| | The Coca-Cola Co., 1.65%, 3/14/18 | | | 750,000 | | | | 768 | |
| | The Coca-Cola Co., 3.15%, 11/15/20 | | | 775,000 | | | | 843 | |
| | Dr. Pepper Snapple Group, Inc., 6.82%, 5/1/18 | | | 245,000 | | | | 309 | |
| | Heineken NV, 1.40%, 10/1/17 144A | | | 270,000 | | | | 269 | |
| | Heineken NV, 2.75%, 4/1/23 144A | | | 400,000 | | | | 393 | |
| | Heineken NV, 4.00%, 10/1/42 144A | | | 110,000 | | | | 107 | |
| | PepsiCo, Inc., 3.125%, 11/1/20 | | | 300,000 | | | | 322 | |
| | PepsiCo, Inc., 7.90%, 11/1/18 | | | 80,000 | | | | 108 | |
| | Pernod-Ricard SA, 5.75%, 4/7/21 144A | | | 430,000 | | | | 514 | |
| | SABMiller Holdings, Inc., 3.75%, 1/15/22 144A | | | 580,000 | | | | 626 | |
| | | | | | | | | | |
| | Total | | | | | | | 7,802 | |
| | | | | | | | | | |
| | | |
| | Cable/Media/Broadcasting/Satellite (0.3%) | | | | | | | | |
| | DIRECTV Holdings LLC/DIRECTV Financing Co., Inc., 2.40%, 3/15/17 | | | 655,000 | | | | 671 | |
| | DIRECTV Holdings LLC/DIRECTV Financing Co., Inc., 3.80%, 3/15/22 | | | 700,000 | | | | 722 | |
| | DIRECTV Holdings LLC/DIRECTV Financing Co., Inc., 4.60%, 2/15/21 | | | 90,000 | | | | 98 | |
| | DIRECTV Holdings LLC/DIRECTV Financing Co., Inc., 5.15%, 3/15/42 | | | 375,000 | | | | 379 | |
| | Discovery Communications LLC, 5.05%, 6/1/20 | | | 225,000 | | | | 260 | |
| | Historic TW, Inc., 6.625%, 5/15/29 | | | 580,000 | | | | 740 | |
| | Historic TW, Inc., 6.875%, 6/15/18 | | | 195,000 | | | | 246 | |
| | NBCUniversal Media LLC, 2.875%, 4/1/16 | | | 570,000 | | | | 601 | |
| | NBCUniversal Media LLC, 6.40%, 4/30/40 | | | 180,000 | | | | 231 | |
| | News America, Inc., 6.90%, 8/15/39 | | | 120,000 | | | | 157 | |
| | TCI Communications, Inc., 8.75%, 8/1/15 | | | 1,030,000 | | | | 1,229 | |
| | Time Warner Entertainment Co. LP, 8.375%, 3/15/23 | | | 1,650,000 | | | | 2,332 | |
| | | | | | | | | | |
| | Total | | | | | | | 7,666 | |
| | | | | | | | | | |
| | | |
| | Conglomerate/Diversified Manufacturing (0.1%) | | | | | | | | |
| | Eastman Chemical Co., 7.25%, 1/15/24 | | | 85,000 | | | | 111 | |
| | Eaton Corp., 2.75%, 11/2/22 144A | | | 1,685,000 | | | | 1,680 | |
| | Monsanto Co., 5.125%, 4/15/18 | | | 55,000 | | | | 65 | |
| | United Technologies Corp., 3.10%, 6/1/22 | | | 390,000 | | | | 413 | |
| | United Technologies Corp., 4.50%, 6/1/42 | | | 470,000 | | | | 522 | |
| | | | | | | | | | |
| | Total | | | | | | | 2,791 | |
| | | | | | | | | | |
| | | |
| | Consumer Products (0.0%) | | | | | | | | |
| | The Procter & Gamble Co., 5.55%, 3/5/37 | | | 645,000 | | | | 865 | |
| | | | | | | | | | |
| | Total | | | | | | | 865 | |
| | | | | | | | | | |
| | | |
| | Electric Utilities (1.1%) | | | | | | | | |
| | Alabama Power Co., 3.95%, 6/1/21 | | | 780,000 | | | | 872 | |
| | Ameren Corp., 8.875%, 5/15/14 | | | 300,000 | | | | 328 | |
| | Appalachian Power Co., 4.60%, 3/30/21 | | | 390,000 | | | | 449 | |
| | Arizona Public Service Co., 5.05%, 9/1/41 | | | 355,000 | | | | 407 | |
| | Arizona Public Service Co., 8.75%, 3/1/19 | | | 95,000 | | | | 125 | |
| | Bruce Mansfield Unit, 6.85%, 6/1/34 | | | 471,749 | | | | 492 | |
| | | | | | | | | | |
| | | Investment Grade Segment (9.0%) | | Shares/ $ Par | | | Value $ (000’s) | |
| | | |
| | Electric Utilities continued | | | | | | | | |
| | Carolina Power & Light Co., 2.80%, 5/15/22 | | | 535,000 | | | | 549 | |
| | Carolina Power & Light Co., 5.15%, 4/1/15 | | | 420,000 | | | | 460 | |
| | CenterPoint Energy, Inc., 6.50%, 5/1/18 | | | 380,000 | | | | 464 | |
| | Commonwealth Edison Co., 4.00%, 8/1/20 | | | 410,000 | | | | 458 | |
| | Commonwealth Edison Co., 5.875%, 2/1/33 | | | 115,000 | | | | 146 | |
| | Commonwealth Edison Co., 6.15%, 9/15/17 | | | 105,000 | | | | 127 | |
| | Connecticut Light & Power Co., 5.65%, 5/1/18 | | | 150,000 | | | | 182 | |
| | The Detroit Edison Co., 3.45%, 10/1/20 | | | 410,000 | | | | 450 | |
| | Dominion Resources, Inc., 1.40%, 9/15/17 | | | 705,000 | | | | 705 | |
| | DTE Energy Co., 6.375%, 4/15/33 | | | 175,000 | | | | 227 | |
| | Duke Energy Corp., 6.25%, 6/15/18 | | | 40,000 | | | | 49 | |
| | Duke Energy Indiana, Inc., 3.75%, 7/15/20 | | | 775,000 | | | | 858 | |
| | Entergy Corp., 4.70%, 1/15/17 | | | 660,000 | | | | 715 | |
| | Entergy Mississippi, Inc., 6.25%, 4/1/34 | | | 1,030,000 | | | | 1,044 | |
| | Exelon Generation Co. LLC, 4.25%, 6/15/22 144A | | | 705,000 | | | | 733 | |
| | Exelon Generation Co. LLC, 6.20%, 10/1/17 | | | 535,000 | | | | 632 | |
| | Kiowa Power Partners LLC, 4.811%, 12/30/13 144A | | | 215,521 | | | | 217 | |
| | Mississippi Power Co., 4.75%, 10/15/41 | | | 595,000 | | | | 657 | |
| | Monongahela Power Co., Inc., 5.70%, 3/15/17 144A | | | 860,000 | | | | 974 | |
| | Nevada Power Co., 5.95%, 3/15/16 | | | 60,000 | | | | 69 | |
| | NextEra Energy Capital Holdings, Inc., 4.50%, 6/1/21 | | | 800,000 | | | | 889 | |
| | NSTAR LLC, 4.50%, 11/15/19 | | | 40,000 | | | | 45 | |
| | Ohio Edison Co., 6.875%, 7/15/36 | | | 145,000 | | | | 188 | |
| | Ohio Power Co., 5.375%, 10/1/21 | | | 375,000 | | | | 454 | |
| | Pacific Gas & Electric Co., 3.50%, 10/1/20 | | | 1,175,000 | | | | 1,288 | |
| | Pacific Gas & Electric Co., 5.625%, 11/30/17 | | | 225,000 | | | | 272 | |
| | PacifiCorp., 3.85%, 6/15/21 | | | 780,000 | | | | 880 | |
| | Peco Energy Co., 2.375%, 9/15/22 | | | 440,000 | | | | 444 | |
| | Potomac Electric Power Co., 6.50%, 11/15/37 | | | 180,000 | | | | 257 | |
| | PPL Capital Funding, Inc., 4.20%, 6/15/22 | | | 380,000 | | | | 409 | |
| | PPL Energy Supply LLC, 6.50%, 5/1/18 | | | 150,000 | | | | 180 | |
| | Public Service Co. of Colorado, 3.20%, 11/15/20 | | | 520,000 | | | | 567 | |
| | Public Service Co. of Colorado, 5.80%, 8/1/18 | | | 140,000 | | | | 172 | |
| | Public Service Co. of New Mexico, 5.35%, 10/1/21 | | | 405,000 | | | | 445 | |
| | Public Service Electric & Gas Co., 3.65%, 9/1/42 | | | 300,000 | | | | 295 | |
| | Public Service Electric & Gas Co., 5.00%, 1/1/13 | | | 1,500,000 | | | | 1,500 | |
| | Puget Sound Energy, Inc., 6.274%, 3/15/37 | | | 550,000 | | | | 735 | |
| | San Diego Gas & Electric Co., 6.125%, 9/15/37 | | | 200,000 | | | | 275 | |
| | Sempra Energy, 2.30%, 4/1/17 | | | 635,000 | | | | 659 | |
| | Sempra Energy, 6.15%, 6/15/18 | | | 250,000 | | | | 307 | |
| | South Carolina Electric & Gas Co., 6.05%, 1/15/38 | | | 295,000 | | | | 383 | |
| | Tampa Electric Co., 5.40%, 5/15/21 | | | 530,000 | | | | 652 | |
| | Union Electric Co., 3.90%, 9/15/42 | | | 405,000 | | | | 410 | |
| | Union Electric Co., 6.40%, 6/15/17 | | | 180,000 | | | | 220 | |
| | Union Electric Co., 6.70%, 2/1/19 | | | 180,000 | | | | 227 | |
| | Virginia Electric & Power Co., 3.45%, 9/1/22 | | | 680,000 | | | | 735 | |
The Accompanying Notes are an Integral Part of the Financial Statements.
Balanced Portfolio
| | | | | | | | | | |
| | | Investment Grade Segment (9.0%) | | Shares/ $ Par | | | Value $ (000’s) | |
| | | |
| | Electric Utilities continued | | | | | | | | |
| | Virginia Electric & Power Co., 5.40%, 4/30/18 | | | 55,000 | | | | 66 | |
| | | | | | | | | | |
| | Total | | | | | | | 25,343 | |
| | | | | | | | | | |
| | | |
| | Electronics (0.1%) | | | | | | | | |
| | Hewlett-Packard Co., 3.00%, 9/15/16 | | | 555,000 | | | | 559 | |
| | Hewlett-Packard Co., 3.75%, 12/1/20 | | | 80,000 | | | | 77 | |
| | Hewlett-Packard Co., 4.65%, 12/9/21 | | | 535,000 | | | | 537 | |
| | International Business Machines Corp., 1.95%, 7/22/16 | | | 400,000 | | | | 416 | |
| | International Business Machines Corp., 2.00%, 1/5/16 | | | 520,000 | | | | 537 | |
| | | | | | | | | | |
| | Total | | | | | | | 2,126 | |
| | | | | | | | | | |
| | | |
| | Food Processors (0.2%) | | | | | | | | |
| | Archer-Daniels-Midland Co., 4.479%, 3/1/21 | | | 230,000 | | | | 260 | |
| | Kellogg Co., 3.25%, 5/21/18 | | | 235,000 | | | | 256 | |
| | Kraft Foods Group, Inc., 2.25%, 6/5/17 144A | | | 180,000 | | | | 186 | |
| | Kraft Foods Group, Inc., 3.50%, 6/6/22 144A | | | 240,000 | | | | 256 | |
| | Kraft Foods Group, Inc., 6.125%, 8/23/18 144A | | | 303,000 | | | | 371 | |
| | Mead Johnson Nutrition Co., 4.90%, 11/1/19 | | | 640,000 | | | | 731 | |
| | Mondelez International, Inc., 6.125%, 2/1/18 | | | 107,000 | | | | 130 | |
| | Mondelez International, Inc., 6.50%, 8/11/17 | | | 410,000 | | | | 501 | |
| | Mondelez International, Inc., 6.50%, 2/9/40 | | | 930,000 | | | | 1,249 | |
| | | | | | | | | | |
| | Total | | | | | | | 3,940 | |
| | | | | | | | | | |
| | | |
| | Gaming/Leisure/Lodging (0.0%) | | | | | | | | |
| | Choice Hotels International, Inc., 5.75%, 7/1/22 | | | 225,000 | | | | 249 | |
| | Host Hotels & Resorts LP, 5.875%, 6/15/19 | | | 45,000 | | | | 49 | |
| | | | | | | | | | |
| | Total | | | | | | | 298 | |
| | | | | | | | | | |
| | | |
| | Gas Pipelines (0.3%) | | | | | | | | |
| | CenterPoint Energy Resources Corp., 6.125%, 11/1/17 | | | 140,000 | | | | 168 | |
| | Energy Transfer Partners LP, 4.65%, 6/1/21 | | | 285,000 | | | | 313 | |
| | Energy Transfer Partners LP, 6.05%, 6/1/41 | | | 715,000 | | | | 813 | |
| | Energy Transfer Partners LP, 6.70%, 7/1/18 | | | 305,000 | | | | 368 | |
| | Enterprise Products Operating LLC, 3.20%, 2/1/16 | | | 585,000 | | | | 618 | |
| | Kinder Morgan Energy Partners LP, 5.95%, 2/15/18 | | | 800,000 | | | | 958 | |
| | Kinder Morgan Energy Partners LP, 6.375%, 3/1/41 | | | 795,000 | | | | 984 | |
| | Kinder Morgan Energy Partners LP, 6.50%, 2/1/37 | | | 280,000 | | | | 342 | |
| | Magellan Midstream Partners LP, 6.55%, 7/15/19 | | | 335,000 | | | | 414 | |
| | ONEOK Partners LP, 2.00%, 10/1/17 | | | 355,000 | | | | 358 | |
| | Plains All American Pipeline LP/PAA Finance Corp., 6.50%, 5/1/18 | | | 175,000 | | | | 216 | |
| | Spectra Energy Partners LP, 2.95%, 6/15/16 | | | 315,000 | | | | 324 | |
| | Williams Partners LP, 4.00%, 11/15/21 | | | 135,000 | | | | 144 | |
| | Williams Partners LP, 4.125%, 11/15/20 | | | 54,000 | | | | 59 | |
| | Williams Partners LP, 5.25%, 3/15/20 | | | 460,000 | | | | 530 | |
| | | | | | | | | | |
| | Total | | | | | | | 6,609 | |
| | | | | | | | | | |
| | | | | | | | | | |
| | | Investment Grade Segment (9.0%) | | Shares/ $ Par | | | Value $ (000’s) | |
| | | |
| | Health Care/Pharmaceuticals (0.5%) | | | | | | | | |
| | AbbVie, Inc., 1.75%, 11/6/17 144A | | | 615,000 | | | | 622 | |
| | AbbVie, Inc., 2.90%, 11/6/22 144A | | | 275,000 | | | | 280 | |
| | Amgen, Inc., 3.875%, 11/15/21 | | | 935,000 | | | | 1,027 | |
| | Express Scripts Holding Co., 2.65%, 2/15/17 144A | | | 330,000 | | | | 343 | |
| | Express Scripts Holding Co., 3.125%, 5/15/16 | | | 155,000 | | | | 163 | |
| | Express Scripts Holding Co., 3.50%, 11/15/16 144A | | | 560,000 | | | | 599 | |
| | Express Scripts Holding Co., 3.90%, 2/15/22 144A | | | 175,000 | | | | 189 | |
| | Medco Health Solutions, Inc., 7.125%, 3/15/18 | | | 750,000 | | | | 935 | |
| | Merck & Co., Inc., 3.875%, 1/15/21 | | | 590,000 | | | | 662 | |
| | Merck & Co., Inc., 5.75%, 11/15/36 | | | 30,000 | | | | 40 | |
| | Mylan, Inc., 3.125%, 1/15/23 144A | | | 520,000 | | | | 515 | |
| | Mylan, Inc., 6.00%, 11/15/18 144A | | | 410,000 | | | | 453 | |
| | Mylan, Inc., 7.625%, 7/15/17 144A | | | 145,000 | | | | 163 | |
| | Mylan, Inc., 7.875%, 7/15/20 144A | | | 85,000 | | | | 100 | |
| | The Novartis Capital Corp., 2.40%, 9/21/22 | | | 1,080,000 | | | | 1,083 | |
| | Pfizer, Inc., 5.35%, 3/15/15 | | | 370,000 | | | | 407 | |
| | Roche Holdings, Inc., 6.00%, 3/1/19 144A | | | 385,000 | | | | 479 | |
| | Sanofi-Aventis SA, 2.625%, 3/29/16 | | | 1,155,000 | | | | 1,216 | |
| | Teva Pharmaceutical Finance Co. BV, 2.95%, 12/18/22 | | | 580,000 | | | | 587 | |
| | Teva Pharmaceutical Finance IV LLC, 2.25%, 3/18/20 | | | 265,000 | | | | 267 | |
| | Thermo Fisher Scientific, Inc., 1.85%, 1/15/18 | | | 255,000 | | | | 258 | |
| | Thermo Fisher Scientific, Inc., 3.15%, 1/15/23 | | | 325,000 | | | | 332 | |
| | Watson Pharmaceuticals, Inc., 1.875%, 10/1/17 | | | 85,000 | | | | 86 | |
| | Watson Pharmaceuticals, Inc., 3.25%, 10/1/22 | | | 180,000 | | | | 184 | |
| | Watson Pharmaceuticals, Inc., 4.625%, 10/1/42 | | | 110,000 | | | | 115 | |
| | Wyeth LLC, 5.50%, 2/15/16 | | | 25,000 | | | | 29 | |
| | Wyeth LLC, 5.95%, 4/1/37 | | | 630,000 | | | | 840 | |
| | | | | | | | | | |
| | Total | | | | | | | 11,974 | |
| | | | | | | | | | |
| | | |
| | Independent Finance (0.2%) | | | | | | | | |
| | General Dynamics Corp., 2.25%, 11/15/22 | | | 750,000 | | | | 734 | |
| | General Electric Capital Corp., 5.625%, 5/1/18 | | | 1,735,000 | | | | 2,061 | |
| | General Electric Capital Corp./LJ VP Holdings LLC, 3.80%, 6/18/19 144A | | | 950,000 | | | | 1,012 | |
| | | | | | | | | | |
| | Total | | | | | | | 3,807 | |
| | | | | | | | | | |
| | | |
| | Information/Data Technology (0.1%) | | | | | | | | |
| | Microsoft Corp., 0.875%, 11/15/17 | | | 210,000 | | | | 209 | |
| | Microsoft Corp., 2.125%, 11/15/22 | | | 565,000 | | | | 559 | |
| | Oracle Corp., 1.20%, 10/15/17 | | | 565,000 | | | | 567 | |
| | Oracle Corp., 2.50%, 10/15/22 | | | 565,000 | | | | 570 | |
| | Oracle Corp., 3.875%, 7/15/20 | | | 760,000 | | | | 857 | |
| | | | | | | | | | |
| | Total | | | | | | | 2,762 | |
| | | | | | | | | | |
| | | |
| | Life Insurance (0.3%) | | | | | | | | |
| | Aetna, Inc., 1.50%, 11/15/17 | | | 125,000 | | | | 125 | |
| | Aetna, Inc., 2.75%, 11/15/22 | | | 225,000 | | | | 223 | |
| | American International Group, Inc., 4.875%, 6/1/22 | | | 575,000 | | | | 657 | |
| | MassMutual Global Funding II, 2.30%, 9/28/15 144A | | | 850,000 | | | | 883 | |
The Accompanying Notes are an Integral Part of the Financial Statements.
Balanced Portfolio
| | | | | | | | | | |
| | | Investment Grade Segment (9.0%) | | Shares/ $ Par | | | Value $ (000’s) | |
| | | |
| | Life Insurance continued | | | | | | | | |
| | Metropolitan Life Global Funding I, 3.65%, 6/14/18 144A | | | 720,000 | | | | 788 | |
| | New York Life Global Funding, 2.45%, 7/14/16 144A | | | 780,000 | | | | 817 | |
| | Prudential Financial, Inc., 5.375%, 6/21/20 | | | 250,000 | | | | 292 | |
| | Prudential Financial, Inc., 5.70%, 12/14/36 | | | 170,000 | | | | 194 | |
| | Teachers Insurance & Annuity Association-College Retirement Equity Fund, 6.85%, 12/16/39 144A | | | 385,000 | | | | 522 | |
| | UnitedHealth Group, Inc., 1.40%, 10/15/17 | | | 100,000 | | | | 100 | |
| | UnitedHealth Group, Inc., 2.75%, 2/15/23 | | | 120,000 | | | | 121 | |
| | UnitedHealth Group, Inc., 2.875%, 3/15/22 | | | 120,000 | | | | 123 | |
| | UnitedHealth Group, Inc., 3.95%, 10/15/42 | | | 50,000 | | | | 50 | |
| | UnitedHealth Group, Inc., 4.70%, 2/15/21 | | | 400,000 | | | | 466 | |
| | WellPoint, Inc., 1.875%, 1/15/18 | | | 220,000 | | | | 223 | |
| | WellPoint, Inc., 3.30%, 1/15/23 | | | 305,000 | | | | 313 | |
| | | | | | | | | | |
| | Total | | | | | | | 5,897 | |
| | | | | | | | | | |
| | | |
| | Machinery (0.2%) | | | | | | | | |
| | Caterpillar Financial Services Corp., 1.625%, 6/1/17 | | | 510,000 | | | | 520 | |
| | John Deere Capital Corp., 0.70%, 9/4/15 | | | 560,000 | | | | 560 | |
| | John Deere Capital Corp., 1.20%, 10/10/17 | | | 380,000 | | | | 381 | |
| | John Deere Capital Corp., 2.25%, 4/17/19 | | | 430,000 | | | | 442 | |
| | John Deere Capital Corp., 2.80%, 1/27/23 | | | 580,000 | | | | 593 | |
| | Roper Industries, Inc., 1.85%, 11/15/17 | | | 415,000 | | | | 415 | |
| | Roper Industries, Inc., 3.125%, 11/15/22 | | | 615,000 | | | | 619 | |
| | | | | | | | | | |
| | Total | | | | | | | 3,530 | |
| | | | | | | | | | |
| | | |
| | Metals/Mining (0.3%) | | | | | | | | |
| | Barrick Gold Corp., 2.90%, 5/30/16 | | | 425,000 | | | | 446 | |
| | Barrick Gold Corp., 3.85%, 4/1/22 | | | 745,000 | | | | 789 | |
| | Barrick North America Finance LLC, 6.80%, 9/15/18 | | | 370,000 | | | | 457 | |
| | Freeport-McMoRan Copper & Gold, Inc., 3.55%, 3/1/22 | | | 670,000 | | | | 664 | |
| | Newmont Mining Corp., 3.50%, 3/15/22 | | | 925,000 | | | | 954 | |
| | Newmont Mining Corp., 6.25%, 10/1/39 | | | 146,000 | | | | 176 | |
| | Rio Tinto Finance USA PLC, 1.625%, 8/21/17 | | | 1,050,000 | | | | 1,063 | |
| | Rio Tinto Finance USA, Ltd., 4.125%, 5/20/21 | | | 600,000 | | | | 663 | |
| | Rio Tinto Finance USA, Ltd., 9.00%, 5/1/19 | | | 200,000 | | | | 275 | |
| | Teck Resources, Ltd., 3.00%, 3/1/19 | | | 215,000 | | | | 222 | |
| | Teck Resources, Ltd., 5.20%, 3/1/42 | | | 705,000 | | | | 720 | |
| | | | | | | | | | |
| | Total | | | | | | | 6,429 | |
| | | | | | | | | | |
| | | |
| | Natural Gas Distributors (0.0%) | | | | | | | | |
| | NiSource Finance Corp., 5.80%, 2/1/42 | | | 915,000 | | | | 1,042 | |
| | | | | | | | | | |
| | Total | | | | | | | 1,042 | |
| | | | | | | | | | |
| | | |
| | Oil & Gas Field Machines and Services (0.1%) | | | | | | | | |
| | National Oilwell Varco, Inc., 1.35%, 12/1/17 | | | 120,000 | | | | 121 | |
| | National Oilwell Varco, Inc., 2.60%, 12/1/22 | | | 430,000 | | | | 436 | |
| | Rowan Cos., Inc., 4.875%, 6/1/22 | | | 840,000 | | | | 912 | |
| | | | | | | | | | |
| | Total | | | | | | | 1,469 | |
| | | | | | | | | | |
| | | |
| | Oil and Gas (1.0%) | | | | | | | | |
| | Anadarko Petroleum Corp., 6.375%, 9/15/17 | | | 780,000 | | | | 932 | |
| | Apache Corp., 4.75%, 4/15/43 | | | 370,000 | | | | 403 | |
| | BP Capital Markets PLC, 1.846%, 5/5/17 | | | 725,000 | | | | 741 | |
| | | | | | | | | | |
| | | Investment Grade Segment (9.0%) | | Shares/ $ Par | | | Value $ (000’s) | |
| | | |
| | Oil and Gas continued | | | | | | | | |
| | BP Capital Markets PLC, 2.50%, 11/6/22 | | | 1,200,000 | | | | 1,189 | |
| | BP Capital Markets PLC, 4.50%, 10/1/20 | | | 185,000 | | | | 213 | |
| | BP Capital Markets PLC, 4.75%, 3/10/19 | | | 1,320,000 | | | | 1,531 | |
| | Canadian Natural Resources, Ltd., 5.70%, 5/15/17 | | | 391,000 | | | | 461 | |
| | Canadian Natural Resources, Ltd., 5.85%, 2/1/35 | | | 90,000 | | | | 111 | |
| | Canadian Natural Resources, Ltd., 6.45%, 6/30/33 | | | 335,000 | | | | 426 | |
| | Cenovus Energy, Inc., 4.45%, 9/15/42 | | | 700,000 | | | | 728 | |
| | ConocoPhillips, 6.00%, 1/15/20 | | | 1,175,000 | | | | 1,491 | |
| | Devon Energy Corp., 1.875%, 5/15/17 | | | 365,000 | | | | 372 | |
| | Devon Energy Corp., 3.25%, 5/15/22 | | | 555,000 | | | | 579 | |
| | Encana Corp., 3.90%, 11/15/21 | | | 475,000 | | | | 516 | |
| | Ensco PLC, 4.70%, 3/15/21 | | | 585,000 | | | | 658 | |
| | EOG Resources, Inc., 4.40%, 6/1/20 | | | 245,000 | | | | 284 | |
| | Hess Corp., 5.60%, 2/15/41 | | | 420,000 | | | | 497 | |
| | Husky Energy, Inc., 3.95%, 4/15/22 | | | 590,000 | | | | 634 | |
| | Husky Energy, Inc., 7.25%, 12/15/19 | | | 80,000 | | | | 104 | |
| | Marathon Oil Corp., 6.60%, 10/1/37 | | | 140,000 | | | | 187 | |
| | Nabors Industries, Inc., 6.15%, 2/15/18 | | | 655,000 | | | | 770 | |
| | Noble Energy, Inc., 6.00%, 3/1/41 | | | 280,000 | | | | 337 | |
| | Occidental Petroleum Corp., 4.125%, 6/1/16 | | | 315,000 | | | | 349 | |
| | Pemex Project Funding Master Trust, 6.625%, 6/15/35 | | | 245,000 | | | | 311 | |
| | Petrohawk Energy Corp., 6.25%, 6/1/19 | | | 695,000 | | | | 791 | |
| | Shell International Finance BV, 1.125%, 8/21/17 | | | 700,000 | | | | 703 | |
| | Shell International Finance BV, 4.30%, 9/22/19 | | | 1,580,000 | | | | 1,830 | |
| | Southwestern Energy Co., 4.10%, 3/15/22 | | | 460,000 | | | | 495 | |
| | Statoil ASA, 2.45%, 1/17/23 | | | 1,035,000 | | | | 1,033 | |
| | Suncor Energy, Inc., 6.85%, 6/1/39 | | | 265,000 | | | | 366 | |
| | Talisman Energy, Inc., 3.75%, 2/1/21 | | | 700,000 | | | | 751 | |
| | Total Capital International SA, 1.50%, 2/17/17 | | | 105,000 | | | | 106 | |
| | Total Capital SA, 4.45%, 6/24/20 | | | 950,000 | | | | 1,100 | |
| | Transocean, Inc., 6.375%, 12/15/21 | | | 590,000 | | | | 717 | |
| | Weatherford International, Ltd., 5.95%, 4/15/42 | | | 1,120,000 | | | | 1,216 | |
| | | | | | | | | | |
| | Total | | | | | | | 22,932 | |
| | | | | | | | | | |
| | | |
| | Other Finance (0.2%) | | | | | | | | |
| | American Express Co., 6.15%, 8/28/17 | | | 590,000 | | | | 711 | |
| | American Express Credit Corp., 5.125%, 8/25/14 | | | 590,000 | | | | 632 | |
| | Berkshire Hathaway Finance Corp., 3.00%, 5/15/22 | | | 705,000 | | | | 735 | |
| | CVS Pass-Through Trust, 6.036%, 12/10/28 | | | 517,367 | | | | 605 | |
| | The NASDAQ OMX Group, Inc., 5.55%, 1/15/20 | | | 180,000 | | | | 196 | |
| | Prudential Covered Trust 2012-1, 2.997%, 9/30/15 144A | | | 1,391,750 | | | | 1,443 | |
| | | | | | | | | | |
| | Total | | | | | | | 4,322 | |
| | | | | | | | | | |
| | | |
| | Other Holdings (0.1%) | | | | | | | | |
| (f) | | Federative Republic of Brazil, 8.50%, 1/5/24 | | | 1,855,000 | | | | 1,107 | |
| (f) | | Morgan Stanley, 5.40%, 5/15/15 144A | | | 4,067,704 | | | | 2,161 | |
| | | | | | | | | | |
| | Total | | | | | | | 3,268 | |
| | | | | | | | | | |
| | | |
| | Other Services (0.1%) | | | | | | | | |
| | American Tower Corp., 4.625%, 4/1/15 | | | 195,000 | | | | 207 | |
| | American Tower Corp., 7.00%, 10/15/17 | | | 200,000 | | | | 239 | |
The Accompanying Notes are an Integral Part of the Financial Statements.
Balanced Portfolio
| | | | | | | | | | |
| | | Investment Grade Segment (9.0%) | | Shares/ $ Par | | | Value $ (000’s) | |
| | | |
| | Other Services continued | | | | | | | | |
| | CC Holdings GS V LLC, 3.849%, 4/15/23 144A | | | 550,000 | | | | 560 | |
| | Republic Services, Inc., 5.25%, 11/15/21 | | | 425,000 | | | | 501 | |
| | Waste Management, Inc., 2.90%, 9/15/22 | | | 460,000 | | | | 455 | |
| | Waste Management, Inc., 4.60%, 3/1/21 | | | 440,000 | | | | 499 | |
| | | | | | | | | | |
| | Total | | | | | | | 2,461 | |
| | | | | | | | | | |
| | | |
| | Paper and Forest Products (0.1%) | | | | | | | | |
| | Georgia-Pacific LLC, 5.40%, 11/1/20 144A | | | 890,000 | | | | 1,059 | |
| | Georgia-Pacific LLC, 7.75%, 11/15/29 | | | 50,000 | | | | 68 | |
| | | | | | | | | | |
| | Total | | | | | | | 1,127 | |
| | | | | | | | | | |
| | | |
| | Property and Casualty Insurance (0.0%) | | | | | | | | |
| | The Hartford Financial Services Group, Inc., 6.625%, 4/15/42 | | | 185,000 | | | | 235 | |
| | | | | | | | | | |
| | Total | | | | | | | 235 | |
| | | | | | | | | | |
| | | |
| | Railroads (0.2%) | | | | | | | | |
| | Burlington Northern Santa Fe LLC, 3.05%, 3/15/22 | | | 455,000 | | | | 470 | |
| | Burlington Northern Santa Fe LLC, 3.05%, 9/1/22 | | | 375,000 | | | | 387 | |
| | Burlington Northern Santa Fe LLC, 3.60%, 9/1/20 | | | 390,000 | | | | 422 | |
| | Canadian National Railway Co., 5.85%, 11/15/17 | | | 140,000 | | | | 169 | |
| | CSX Corp., 3.70%, 10/30/20 | | | 70,000 | | | | 76 | |
| | CSX Corp., 4.25%, 6/1/21 | | | 200,000 | | | | 225 | |
| | CSX Corp., 5.60%, 5/1/17 | | | 490,000 | | | | 572 | |
| | Norfolk Southern Corp., 2.903%, 2/15/23 144A | | | 789,000 | | | | 794 | |
| | Union Pacific Corp., 4.30%, 6/15/42 | | | 700,000 | | | | 739 | |
| | | | | | | | | | |
| | Total | | | | | | | 3,854 | |
| | | | | | | | | | |
| | | |
| | Real Estate Investment Trusts (0.4%) | | | | | | | | |
| | AvalonBay Communities, Inc., 2.85%, 3/15/23 | | | 385,000 | | | | 380 | |
| | AvalonBay Communities, Inc., 2.95%, 9/15/22 | | | 205,000 | | | | 204 | |
| | AvalonBay Communities, Inc., 3.95%, 1/15/21 | | | 675,000 | | | | 726 | |
| | Boston Properties LP, 3.85%, 2/1/23 | | | 580,000 | | | | 609 | |
| | BRE Properties, Inc., 5.20%, 3/15/21 | | | 535,000 | | | | 604 | |
| | BRE Properties, Inc., 5.50%, 3/15/17 | | | 245,000 | | | | 278 | |
| | Colonial Realty LP, 6.05%, 9/1/16 | | | 360,000 | | | | 401 | |
| | DDR Corp., 4.75%, 4/15/18 | | | 580,000 | | | | 643 | |
| | Essex Portfolio LP, 3.625%, 8/15/22 144A | | | 1,050,000 | | | | 1,048 | |
| | HCP, Inc., 3.75%, 2/1/16 | | | 335,000 | | | | 356 | |
| | HCP, Inc., 3.75%, 2/1/19 | | | 195,000 | | | | 206 | |
| | HCP, Inc., 6.00%, 1/30/17 | | | 400,000 | | | | 459 | |
| | HCP, Inc., 6.70%, 1/30/18 | | | 200,000 | | | | 241 | |
| | Health Care REIT, Inc., 3.625%, 3/15/16 | | | 290,000 | | | | 306 | |
| | Health Care REIT, Inc., 4.125%, 4/1/19 | | | 935,000 | | | | 1,006 | |
| | Ventas Realty LP/Ventas Capital Corp., 2.00%, 2/15/18 | | | 1,035,000 | | | | 1,036 | |
| | Ventas Realty LP/Ventas Capital Corp., 4.25%, 3/1/22 | | | 270,000 | | | | 286 | |
| | Ventas Realty LP/Ventas Capital Corp., 4.75%, 6/1/21 | | | 515,000 | | | | 563 | |
| | WEA Finance LLC, 7.125%, 4/15/18 144A | | | 360,000 | | | | 444 | |
| | | | | | | | | | |
| | Total | | | | | | | 9,796 | |
| | | | | | | | | | |
| | | |
| | Restaurants (0.1%) | | | | | | | | |
| | Darden Restaurants, Inc., 3.35%, 11/1/22 | | | 165,000 | | | | 160 | |
| | Darden Restaurants, Inc., 4.50%, 10/15/21 | | | 600,000 | | | | 645 | |
| | | | | | | | | | |
| | | Investment Grade Segment (9.0%) | | Shares/ $ Par | | | Value $ (000’s) | |
| | | |
| | Restaurants continued | | | | | | | | |
| | Darden Restaurants, Inc., 6.20%, 10/15/17 | | | 360,000 | | | | 425 | |
| | Yum! Brands, Inc., 3.75%, 11/1/21 | | | 455,000 | | | | 484 | |
| | Yum! Brands, Inc., 3.875%, 11/1/20 | | | 355,000 | | | | 386 | |
| | | | | | | | | | |
| | Total | | | | | | | 2,100 | |
| | | | | | | | | | |
| | | |
| | Retail Food and Drug (0.2%) | | | | | | | | |
| | CVS Caremark Corp., 6.25%, 6/1/27 | | | 715,000 | | | | 944 | |
| | Delhaize Group SA, 4.125%, 4/10/19 | | | 815,000 | | | | 841 | |
| | Delhaize Group SA, 5.70%, 10/1/40 | | | 770,000 | | | | 722 | |
| | Safeway, Inc., 6.35%, 8/15/17 | | | 1,170,000 | | | | 1,329 | |
| | | | | | | | | | |
| | Total | | | | | | | 3,836 | |
| | | | | | | | | | |
| | | |
| | Retail Stores (0.3%) | | | | | | | | |
| | Costco Wholesale Corp., 1.70%, 12/15/19 | | | 1,385,000 | | | | 1,395 | |
| | The Home Depot, Inc., 4.40%, 4/1/21 | | | 205,000 | | | | 242 | |
| | The Home Depot, Inc., 5.40%, 3/1/16 | | | 175,000 | | | | 200 | |
| | The Home Depot, Inc., 5.875%, 12/16/36 | | | 70,000 | | | | 92 | |
| | Lowe’s Cos., Inc., 3.80%, 11/15/21 | | | 125,000 | | | | 138 | |
| | Macy’s Retail Holdings, Inc., 5.90%, 12/1/16 | | | 251,000 | | | | 295 | |
| | Macy’s Retail Holdings, Inc., 7.875%, 7/15/15 | | | 336,000 | | | | 391 | |
| | Nordstrom, Inc., 6.25%, 1/15/18 | | | 225,000 | | | | 273 | |
| | Nordstrom, Inc., 7.00%, 1/15/38 | | | 265,000 | | | | 375 | |
| | Target Corp., 6.50%, 10/15/37 | | | 470,000 | | | | 656 | |
| | Wal-Mart Stores, Inc., 2.80%, 4/15/16 | | | 300,000 | | | | 320 | |
| | Wal-Mart Stores, Inc., 3.25%, 10/25/20 | | | 480,000 | | | | 523 | |
| | Wal-Mart Stores, Inc., 3.625%, 7/8/20 | | | 250,000 | | | | 278 | |
| | Wal-Mart Stores, Inc., 4.875%, 7/8/40 | | | 415,000 | | | | 490 | |
| | | | | | | | | | |
| | Total | | | | | | | 5,668 | |
| | | | | | | | | | |
| | | |
| | Telecommunications (0.4%) | | | | | | | | |
| | America Movil SAB de CV, 2.375%, 9/8/16 | | | 430,000 | | | | 447 | |
| | America Movil SAB de CV, 5.00%, 3/30/20 | | | 1,010,000 | | | | 1,175 | |
| | AT&T Corp., 8.00%, 11/15/31 | | | 380,000 | | | | 575 | |
| | AT&T, Inc., 2.625%, 12/1/22 | | | 1,050,000 | | | | 1,052 | |
| | AT&T, Inc., 2.95%, 5/15/16 | | | 865,000 | | | | 916 | |
| | CenturyLink, Inc., 5.15%, 6/15/17 | | | 465,000 | | | | 501 | |
| | CenturyLink, Inc., 6.45%, 6/15/21 | | | 340,000 | | | | 376 | |
| | Qwest Corp., 6.50%, 6/1/17 | | | 595,000 | | | | 695 | |
| | Telefonica Emisiones SAU, 3.729%, 4/27/15 | | | 555,000 | | | | 570 | |
| | Verizon Communications, Inc., 5.85%, 9/15/35 | | | 505,000 | | | | 634 | |
| | Verizon Communications, Inc., 6.25%, 4/1/37 | | | 400,000 | | | | 526 | |
| | Verizon Communications, Inc., 6.35%, 4/1/19 | | | 770,000 | | | | 973 | |
| | | | | | | | | | |
| | Total | | | | | | | 8,440 | |
| | | | | | | | | | |
| | | |
| | Total Investment Grade Segment | | | | | | | | |
| | (Cost: $186,020) | | | | | | | 202,584 | |
| | | | | | | | | | |
| | | |
| | | Governments (14.3%) | | | | | | |
| | | |
| | Governments (14.3%) | | | | | | | | |
| | Canada Government International Bond, 0.875%, 2/14/17 | | | 4,375,000 | | | | 4,410 | |
| | Israel Government AID Bond, 0.00%, 11/15/22 | | | 2,600,000 | | | | 2,061 | |
| | Israel Government AID Bond, 0.00%, 11/15/23 | | | 11,500,000 | | | | 8,662 | |
The Accompanying Notes are an Integral Part of the Financial Statements.
Balanced Portfolio
| | | | | | | | | | |
| | | Governments (14.3%) | | Shares/ $ Par | | | Value $ (000’s) | |
| | | |
| | Governments continued | | | | | | | | |
| | Israel Government AID Bond, 5.50%, 4/26/24 | | | 9,840,000 | | | | 13,023 | |
| | Overseas Private Investment Corp., 4.10%, 11/15/14 | | | 873,600 | | | | 910 | |
| | US Department of Housing & Urban Development, 6.17%, 8/1/14 | | | 2,455,000 | | | | 2,457 | |
| (g) | | US Treasury, 0.125%, 12/31/14 | | | 76,300,000 | | | | 76,109 | |
| | US Treasury, 0.25%, 9/30/14 | | | 24,810,000 | | | | 24,816 | |
| | US Treasury, 0.50%, 7/31/17 | | | 4,820,000 | | | | 4,791 | |
| | US Treasury, 0.625%, 5/31/17 | | | 57,560,000 | | | | 57,650 | |
| (g) | | US Treasury, 0.625%, 8/31/17 | | | 9,550,000 | | | | 9,541 | |
| (g) | | US Treasury, 0.625%, 9/30/17 | | | 7,900,000 | | | | 7,886 | |
| | US Treasury, 0.75%, 6/30/17 | | | 39,530,000 | | | | 39,765 | |
| | US Treasury, 1.625%, 11/15/22 | | | 390,000 | | | | 386 | |
| | US Treasury, 2.75%, 8/15/42 | | | 1,230,000 | | | | 1,188 | |
| (g) | | US Treasury, 3.00%, 5/15/42 | | | 5,260,000 | | | | 5,359 | |
| | US Treasury, 3.125%, 2/15/42 | | | 16,945,000 | | | | 17,718 | |
| | US Treasury, 4.50%, 2/15/36 | | | 1,900,000 | | | | 2,500 | |
| | US Treasury, 5.375%, 2/15/31 | | | 29,475,000 | | | | 42,075 | |
| | | | | | | | | | |
| | | |
| | Total Governments | | | | | | | | |
| | (Cost: $314,018) | | | | | | | 321,307 | |
| | | | | | | | | | |
| | | | | | | | | | |
| | | |
| | | Municipal Bonds (0.8%) | | | | | | |
| | | |
| | Municipal Bonds (0.8%) | | | | | | | | |
| | American Municipal Power, Inc., Series 2010, 5.939%, 2/15/47 RB | | | 1,312,000 | | | | 1,524 | |
| | Bay Area Toll Authority San Francisco Bay Area Toll Bridge, Series 2009-F, 6.263%, 4/1/49 RB | | | 70,000 | | | | 97 | |
| | Board of Regents of the University of Texas System, Series 2010C, 4.794%, 8/15/46 RB | | | 1,040,000 | | | | 1,232 | |
| | Board of Regents of the University of Texas System, Series 2009B, 6.276%, 8/15/41 RB | | | 400,000 | | | | 470 | |
| | The City of New York, Series C-1,
5.517%, 10/1/37 GO | | | 590,000 | | | | 729 | |
| | Connecticut Housing Finance Authority, Series D-2, 5.00%, 11/15/26 RB | | | 715,000 | | | | 715 | |
| | Dallas Area Rapid Transit, Series 2010B, 5.022%, 12/1/48 RB | | | 1,185,000 | | | | 1,420 | |
| | Dallas Independent School District, Series 2010C, 6.45%, 2/15/35 GO, PSF | | | 1,170,000 | | | | 1,471 | |
| | Dormitory Authority of the State of New York,
Series 2010H, 5.389%, 3/15/40 RB | | | 200,000 | | | | 246 | |
| | Energy Northwest, Series E, 2.197%, 7/1/19 RB | | | 935,000 | | | | 959 | |
| | Los Angeles Unified School District, Series RY, 6.758%, 7/1/34 GO | | | 585,000 | | | | 781 | |
| | Metropolitan Transportation Authority,
Series 2010C-1, 6.687%, 11/15/40 RB | | | 203,000 | | | | 262 | |
| | Metropolitan Transportation Authority, Series 2009C, 7.336%, 11/15/39 RB | | | 415,000 | | | | 608 | |
| | Montana Facility Finance Authority, Series 2010A, 4.75%, 5/20/37 RB, GNMA, FHA | | | 2,550,000 | | | | 2,769 | |
| | New York City Municipal Water Finance Authority, Series AA, 5.44%, 6/15/43 RB | | | 432,000 | | | | 541 | |
| | | | | | | | | | |
| | | Municipal Bonds (0.8%) | | Shares/ $ Par | | | Value $ (000’s) | |
| | New York City Municipal Water Finance Authority, Series AA-1, 5.75%, 6/15/41 RB | | | 115,000 | | | | 149 | |
| | Port Authority New York & New Jersey, Series 168, 4.926%, 10/1/51 RB | | | 930,000 | | | | 1,031 | |
| | State of California, Series 2010, 5.70%, 11/1/21 GO | | | 780,000 | | | | 929 | |
| | State of Illinois, Series 2011, 4.961%, 3/1/16 GO | | | 1,315,000 | | | | 1,440 | |
| | Texas Transportation Commission, Series 2010A, 4.681%, 4/1/40 GO | | | 355,000 | | | | 416 | |
| | University of California Regents Medical Center,
Series H, 6.548%, 5/15/48 RB | | | 820,000 | | | | 1,092 | |
| | | | | | | | | | |
| | | |
| | Total Municipal Bonds | | | | | | | | |
| | (Cost: $16,291) | | | | | | | 18,881 | |
| | | | | | | | | | |
| | | |
| | | Structured Products (14.6%) | | | | | | |
| | | |
| | Structured Products (14.6%) | | | | | | | | |
| | Asset Securitization Corp., Series 1997-D5, Class PS1, 1.253%, 2/14/43 IO | | | 4,937,074 | | | | 160 | |
| | Banc of America Funding Corp., Series 2007-1,
Class TA1A, 0.27%, 1/25/37 | | | 837,100 | | | | 446 | |
| | Banc of America Funding Corp., Series 2007-4,
Class TA1A, 0.30%, 5/25/37 | | | 927,792 | | | | 582 | |
| | Chase Issuance Trust, Series 2012-A5, Class A5, 0.59%, 8/15/17 | | | 2,200,000 | | | | 2,202 | |
| | Citigroup Commercial Mortgage Trust,
Series 2010-RR3, Class MLSR, 5.737%, 6/14/50 144A | | | 1,485,000 | | | | 1,710 | |
| | Citigroup Mortgage Loan Trust, Inc., Series 2005-1, Class 3A1, 6.50%, 4/25/35 | | | 260,813 | | | | 264 | |
| | CNH Equipment Trust, Series 2012-A, Class A4, 1.38%, 2/15/18 | | | 2,495,000 | | | | 2,543 | |
| | Credit Suisse Mortgage Capital Certificates,
Series 2009-RR1, Class A3A, 5.383%, 2/15/40 144A | | | 1,125,000 | | | | 1,250 | |
| | Discover Card Master Trust, Series 2012-A1, Class A1, 0.81%, 8/15/17 | | | 5,240,000 | | | | 5,275 | |
| | Discover Card Master Trust I, Series 2012-B3,
Class B3, 0.659%, 5/15/18 | | | 500,000 | | | | 500 | |
| | DLJ Commercial Mortgage Corp., Series 1998-CF1, Class S, 1.169%, 2/15/31 IO | | | 11,269,928 | | | | 303 | |
| | DLJ Mortgage Acceptance Corp., Series 1997-CF2, Class S, 0.463%, 10/15/30 IO 144A | | | 896,414 | | | | 10 | |
| | FDIC Structured Sale Guaranteed Notes,
Series 2010-S2, Class 2A, 2.57%, 7/29/47 144A | | | 4,005,713 | | | | 4,066 | |
The Accompanying Notes are an Integral Part of the Financial Statements.
Balanced Portfolio
| | | | | | | | | | |
| | | Structured Products (14.6%) | | Shares/ $ Par | | | Value $ (000’s) | |
| | | |
| | Structured Products continued | | | | | | | | |
| | Federal Home Loan Mortgage Corp., Series K009, Class X1, 1.506%, 8/25/20 IO | | | 17,101,328 | | | | 1,412 | |
| | Federal Home Loan Mortgage Corp., 3.00%, 11/1/21 | | | 479,741 | | | | 505 | |
| | Federal Home Loan Mortgage Corp., 3.00%, 11/1/25 | | | 935,986 | | | | 983 | |
| | Federal Home Loan Mortgage Corp., 3.00%, 11/1/26 | | | 1,339,853 | | | | 1,409 | |
| | Federal Home Loan Mortgage Corp., 3.00%, 11/1/42 | | | 1,661,875 | | | | 1,740 | |
| | Federal Home Loan Mortgage Corp., 3.50%, 10/1/25 | | | 236,329 | | | | 249 | |
| | Federal Home Loan Mortgage Corp., 3.50%, 11/1/25 | | | 196,539 | | | | 207 | |
| | Federal Home Loan Mortgage Corp., 3.50%, 1/1/26 | | | 55,303 | | | | 58 | |
| | Federal Home Loan Mortgage Corp., 3.50%, 2/1/26 | | | 995,856 | | | | 1,047 | |
| | Federal Home Loan Mortgage Corp., 3.50%, 3/1/26 | | | 53,175 | | | | 56 | |
| | Federal Home Loan Mortgage Corp., 3.50%, 5/1/26 | | | 379,381 | | | | 399 | |
| | Federal Home Loan Mortgage Corp., 3.50%, 7/1/26 | | | 1,864,322 | | | | 1,961 | |
| | Federal Home Loan Mortgage Corp., 3.50%, 8/1/26 | | | 43,982 | | | | 46 | |
| | Federal Home Loan Mortgage Corp., 3.50%, 2/1/42 | | | 2,111,764 | | | | 2,247 | |
| | Federal Home Loan Mortgage Corp., 3.50%, 4/1/42 | | | 1,897,252 | | | | 2,023 | |
| | Federal Home Loan Mortgage Corp., 3.50%, 6/1/42 | | | 1,173,785 | | | | 1,252 | |
| | Federal Home Loan Mortgage Corp., 3.50%, 7/1/42 | | | 3,720,757 | | | | 3,968 | |
| | Federal Home Loan Mortgage Corp., 3.50%, 9/1/42 | | | 10,279,550 | | | | 10,963 | |
| | Federal Home Loan Mortgage Corp., 4.00%, 10/1/20 | | | 446,397 | | | | 474 | |
| | Federal Home Loan Mortgage Corp., 4.00%, 7/1/24 | | | 2,269,041 | | | | 2,400 | |
| | Federal Home Loan Mortgage Corp., 4.00%, 8/1/25 | | | 2,103,826 | | | | 2,224 | |
| | Federal Home Loan Mortgage Corp., 4.00%, 5/1/26 | | | 600,602 | | | | 635 | |
| | Federal Home Loan Mortgage Corp., 4.00%, 6/1/26 | | | 957,297 | | | | 1,012 | |
| | Federal Home Loan Mortgage Corp., 4.00%, 12/1/26 | | | 308,617 | | | | 326 | |
| | Federal Home Loan Mortgage Corp., 4.00%, 9/1/40 | | | 1,388,887 | | | | 1,484 | |
| | Federal Home Loan Mortgage Corp., 4.00%, 11/1/40 | | | 481,354 | | | | 514 | |
| | Federal Home Loan Mortgage Corp., 4.00%, 1/1/41 | | | 10,968,503 | | | | 11,720 | |
| | | | | | | | | | |
| | | Structured Products (14.6%) | | Shares/ $ Par | | | Value $ (000’s) | |
| | | |
| | Structured Products continued | | | | | | | | |
| | Federal Home Loan Mortgage Corp., 4.00%, 2/1/41 | | | 12,063,278 | | | | 12,890 | |
| | Federal Home Loan Mortgage Corp., 4.00%, 3/1/41 | | | 162,048 | | | | 173 | |
| | Federal Home Loan Mortgage Corp., 4.00%, 4/1/41 | | | 7,941,436 | | | | 8,490 | |
| | Federal Home Loan Mortgage Corp., 4.00%, 5/1/41 | | | 1,221,250 | | | | 1,306 | |
| | Federal Home Loan Mortgage Corp., 4.00%, 8/1/41 | | | 394,695 | | | | 422 | |
| | Federal Home Loan Mortgage Corp., 4.00%, 9/1/41 | | | 1,849,655 | | | | 1,976 | |
| | Federal Home Loan Mortgage Corp., 4.00%, 10/1/41 | | | 602,154 | | | | 644 | |
| | Federal Home Loan Mortgage Corp., 4.00%, 3/1/42 | | | 365,000 | | | | 390 | |
| | Federal Home Loan Mortgage Corp., 4.50%, 5/1/19 | | | 755,168 | | | | 821 | |
| | Federal Home Loan Mortgage Corp., Series 3065,
Class TN, 4.50%, 10/15/33 | | | 276,908 | | | | 280 | |
| | Federal Home Loan Mortgage Corp., Series 3248,
Class LN, 4.50%, 7/15/35 | | | 1,920,661 | | | | 1,946 | |
| | Federal Home Loan Mortgage Corp., 4.50%, 9/1/39 | | | 502,160 | | | | 539 | |
| | Federal Home Loan Mortgage Corp., 4.50%, 9/1/40 | | | 1,241,027 | | | | 1,369 | |
| | Federal Home Loan Mortgage Corp., 4.50%, 1/1/41 | | | 2,808,268 | | | | 3,075 | |
| | Federal Home Loan Mortgage Corp., 4.50%, 3/1/41 | | | 318,928 | | | | 344 | |
| | Federal Home Loan Mortgage Corp., 4.50%, 7/1/41 | | | 19,972,494 | | | | 21,551 | |
| | Federal Home Loan Mortgage Corp., 5.00%, 2/1/20 | | | 316,503 | | | | 345 | |
| | Federal Home Loan Mortgage Corp., 5.00%, 5/1/20 | | | 1,205,081 | | | | 1,315 | |
| | Federal Home Loan Mortgage Corp., 5.00%, 11/1/35 | | | 7,418,350 | | | | 8,354 | |
| | Federal Home Loan Mortgage Corp., 5.00%, 12/1/35 | | | 5,723,836 | | | | 6,317 | |
| | Federal Home Loan Mortgage Corp., 5.00%, 8/1/39 | | | 608,840 | | | | 672 | |
| | Federal Home Loan Mortgage Corp., 5.00%, 2/1/41 | | | 678,708 | | | | 739 | |
| | Federal Home Loan Mortgage Corp., 5.00%, 3/1/41 | | | 226,296 | | | | 246 | |
| | Federal Home Loan Mortgage Corp., 5.00%, 4/1/41 | | | 1,175,495 | | | | 1,277 | |
| | Federal Home Loan Mortgage Corp., 5.00%, 5/1/41 | | | 6,007,269 | | | | 6,538 | |
| | Federal Home Loan Mortgage Corp., 5.00%, 3/1/38 | | | 6,755,684 | | | | 7,276 | |
| | Federal Home Loan Mortgage Corp., 5.50%, 9/1/19 | | | 297,364 | | | | 323 | |
The Accompanying Notes are an Integral Part of the Financial Statements.
Balanced Portfolio
| | | | | | | | | | |
| | | Structured Products (14.6%) | | Shares/ $ Par | | | Value $ (000’s) | |
| | | |
| | Structured Products continued | | | | | | | | |
| | Federal Home Loan Mortgage Corp., 5.50%, 11/1/19 | | | 673,577 | | | | 730 | |
| | Federal Home Loan Mortgage Corp., 5.50%, 12/1/19 | | | 131,120 | | | | 142 | |
| | Federal Home Loan Mortgage Corp., 5.50%, 3/1/20 | | | 970,821 | | | | 1,053 | |
| | Federal Home Loan Mortgage Corp., 5.50%, 6/1/33 | | | 56,716 | | | | 63 | |
| | Federal Home Loan Mortgage Corp., 5.50%, 6/1/35 | | | 1,362,205 | | | | 1,479 | |
| | Federal Home Loan Mortgage Corp., 5.50%, 1/1/37 | | | 2,600,611 | | | | 2,814 | |
| | Federal Home Loan Mortgage Corp., 5.50%, 4/1/38 | | | 902,218 | | | | 975 | |
| | Federal Home Loan Mortgage Corp., 5.50%, 8/1/38 | | | 449,350 | | | | 486 | |
| | Federal Home Loan Mortgage Corp., Series 2840,
Class LK, 6.00%, 11/15/17 | | | 379,181 | | | | 383 | |
| | Federal Home Loan Mortgage Corp., Series 2439,
Class LH, 6.00%, 4/15/32 | | | 768,983 | | | | 860 | |
| | Federal Home Loan Mortgage Corp., 6.00%, 11/1/39 | | | 1,107,519 | | | | 1,209 | |
| | Federal Home Loan Mortgage Corp. TBA, 3.00%, 1/1/43 | | | 4,230,000 | | | | 4,422 | |
| | Federal Hone Loan Mortgage Corp., 3.50%, 12/1/25 | | | 1,190,000 | | | | 1,251 | |
| | Federal National Mortgage Association, 3.00%, 10/1/26 | | | 87,259 | | | | 92 | |
| | Federal National Mortgage Association, 3.00%, 3/1/27 | | | 1,303,393 | | | | 1,378 | |
| | Federal National Mortgage Association, 3.00%, 6/1/27 | | | 1,959,549 | | | | 2,071 | |
| | Federal National Mortgage Association, 3.50%, 4/1/26 | | | 1,046,403 | | | | 1,111 | |
| | Federal National Mortgage Association, 3.50%, 10/1/42 | | | 8,771,819 | | | | 9,379 | |
| | Federal National Mortgage Association, 4.50%, 6/1/19 | | | 4,007,670 | | | | 4,416 | |
| | Federal National Mortgage Association, 4.50%, 12/1/19 | | | 330,997 | | | | 365 | |
| | Federal National Mortgage Association, 4.50%, 11/1/40 | | | 3,181,983 | | | | 3,540 | |
| | Federal National Mortgage Association, 4.50%, 1/1/41 | | | 2,388,251 | | | | 2,615 | |
| | Federal National Mortgage Association, 4.50%, 2/1/41 | | | 4,824,314 | | | | 5,234 | |
| | Federal National Mortgage Association, 4.50%, 3/1/41 | | | 416,426 | | | | 453 | |
| | Federal National Mortgage Association, 4.50%, 4/1/41 | | | 425,043 | | | | 461 | |
| | Federal National Mortgage Association, 4.50%, 5/1/41 | | | 14,853,570 | | | | 16,125 | |
| | | | | | | | | | |
| | | Structured Products (14.6%) | | Shares/ $ Par | | | Value $ (000’s) | |
| | | |
| | Structured Products continued | | | | | | | | |
| | Federal National Mortgage Association, 5.00%, 3/1/20 | | | 1,339,708 | | | | 1,475 | |
| | Federal National Mortgage Association, 5.00%, 5/1/20 | | | 1,995,333 | | | | 2,185 | |
| | Federal National Mortgage Association, 5.00%, 4/1/35 | | | 1,716,545 | | | | 1,944 | |
| | Federal National Mortgage Association, 5.00%, 7/1/35 | | | 2,458,487 | | | | 2,785 | |
| | Federal National Mortgage Association, 5.00%, 10/1/35 | | | 1,141,142 | | | | 1,293 | |
| | Federal National Mortgage Association, 5.00%, 5/1/38 | | | 2,912,008 | | | | 3,154 | |
| | Federal National Mortgage Association, Series 2006-M1, Class C, 5.355%, 2/25/16 | | | 4,561,099 | | | | 4,703 | |
| | Federal National Mortgage Association, 5.50%, 4/1/21 | | | 655,461 | | | | 710 | |
| | Federal National Mortgage Association, 5.50%, 3/1/35 | | | 4,188,631 | | | | 4,742 | |
| | Federal National Mortgage Association, 5.50%, 9/1/35 | | | 5,120,775 | | | | 5,665 | |
| | Federal National Mortgage Association, 5.50%, 11/1/35 | | | 6,221,425 | | | | 6,882 | |
| | Federal National Mortgage Association, 5.50%, 11/1/37 | | | 3,522,333 | | | | 3,892 | |
| | Federal National Mortgage Association, 6.00%, 5/1/35 | | | 91,364 | | | | 102 | |
| | Federal National Mortgage Association, 6.00%, 6/1/35 | | | 400,628 | | | | 441 | |
| | Federal National Mortgage Association, 6.00%, 7/1/35 | | | 2,721,819 | | | | 2,999 | |
| | Federal National Mortgage Association, 6.00%, 10/1/35 | | | 454,175 | | | | 500 | |
| | Federal National Mortgage Association, 6.00%, 11/1/35 | | | 3,477,600 | | | | 3,883 | |
| | Federal National Mortgage Association, 6.00%, 9/1/36 | | | 926,537 | | | | 1,032 | |
| | Federal National Mortgage Association, 6.00%, 3/1/38 | | | 561,426 | | | | 620 | |
| | Federal National Mortgage Association, 6.00%, 10/1/38 | | | 454,500 | | | | 497 | |
| | Federal National Mortgage Association, Series 2002-W4, Class A4, 6.25%, 5/25/42 | | | 3,856,031 | | | | 4,375 | |
| | Federal National Mortgage Association, 6.50%, 7/1/37 | | | 3,440,818 | | | | 3,860 | |
| | Federal National Mortgage Association, 6.75%, 4/25/18 | | | 395,623 | | | | 415 | |
| | Federal National Mortgage Association TBA, 2.50%, 1/1/28 | | | 5,760,000 | | | | 6,023 | |
| | Federal National Mortgage Association TBA, 3.50%, 1/1/43 | | | 270,000 | | | | 288 | |
The Accompanying Notes are an Integral Part of the Financial Statements.
Balanced Portfolio
| | | | | | | | | | |
| | | Structured Products (14.6%) | | Shares/ $ Par | | | Value $ (000’s) | |
| | | |
| | Structured Products continued | | | | | | | | |
| | Ford Credit Auto Owner Trust, Series 2012-A, Class A4, 1.15%, 6/15/17 | | | 845,000 | | | | 857 | |
| | Ford Credit Auto Owner Trust, Series 2009-E, Class D, 5.53%, 5/15/16 144A | | | 4,401,638 | | | | 4,611 | |
| | Ford Credit Auto Owner Trust, Series 2009-D, Class D, 8.14%, 2/15/16 144A | | | 4,200,000 | | | | 4,449 | |
| | Golden Credit Card Trust, Series 2012-2A, Class A1, 1.77%, 1/15/19 144A | | | 3,070,000 | | | | 3,162 | |
| | Goldman Sachs Mortgage Securities Corp. II, Series 2009-RR, Class CSA, 5.286%, 12/17/39 144A | | | 500,000 | | | | 568 | |
| | Goldman Sachs Mortgage Securities Corp. II, Series 2009-RR1, Class GGA, 5.842%, 7/12/38 144A | | | 400,000 | | | | 460 | |
| | Government National Mortgage Association, 5.00%, 7/15/33 | | | 931,697 | | | | 1,026 | |
| | Government National Mortgage Association, 5.50%, 1/15/32 | | | 55,145 | | | | 61 | |
| | Government National Mortgage Association, 5.50%, 2/15/32 | | | 631,819 | | | | 697 | |
| | Government National Mortgage Association, 5.50%, 9/15/32 | | | 17,347 | | | | 19 | |
| | Honda Auto Receivables Owner Trust, Series 2012-2, Class A4, 0.91%, 5/15/18 | | | 740,000 | | | | 746 | |
| | JPMorgan Chase Commercial Mortgage Securities Corp., Series 2007-CB18, Class A4, 5.44%, 6/12/47 | | | 1,975,000 | | | | 2,273 | |
| | JPMorgan Chase Commercial Mortgage Securities Corp., Series 2007-C1, Class ASB, 5.857%, 2/15/51 | | | 473,526 | | | | 522 | |
| | Louisiana Public Facilities Authority, Series 2008, Class A3, 6.55%, 8/1/20 | | | 2,250,000 | | | | 2,773 | |
| | MASTR Asset Securitization Trust, Series 2003-10, Class 1A1, 5.25%, 11/25/23 | | | 301,284 | | | | 315 | |
| | MASTR Asset Securitization Trust, Series 2003-12, Class 1A1, 5.25%, 12/25/24 | | | 238,140 | | | | 251 | |
| | Merrill Lynch Alternative Note Asset Trust, Series 2007-A1, Class A2A, 0.28%, 1/25/37 | | | 2,040,347 | | | | 782 | |
| | Oncor Electric Delivery Transition Bond Co., Series 2004-1, Class A3, 5.29%, 5/15/18 | | | 2,135,897 | | | | 2,332 | |
| | Residential Funding Mortgage Securities I, Series 2003-S18, Class A1, 4.50%, 10/25/18 | | | 120,401 | | | | 124 | |
| | | | | | | | | | |
| | | Structured Products (14.6%) | | Shares/ $ Par | | | Value $ (000’s) | |
| | | |
| | Structured Products continued | | | | | | | | |
| | Sequoia Mortgage Trust, Series 2011-2, Class A1, 3.90%, 9/25/41 | | | 1,681,942 | | | | 1,724 | |
| | UBS-Barclays Commercial Mortgage Trust, Series 2012-C3, Class A4, 3.091%, 8/10/49 | | | 4,680,000 | | | | 4,890 | |
| | Wachovia Bank Commercial Mortgage Trust, Series 2006-C23, Class AM, 5.466%, 1/15/45 | | | 4,000,000 | | | | 4,415 | |
| | Washington Mutual Alternative Mortgage Pass-Through Certficates, Series 2006-6, Class 4A, 6.873%, 11/25/34 | | | 620,350 | | | | 620 | |
| | Wells Fargo Mortgage Backed Securities Trust, Series 2004-EE, Class 2A2, 2.625%, 12/25/34 | | | 491,647 | | | | 506 | |
| | Wells Fargo Mortgage Backed Securities Trust, Series 2003-12, Class A1, 4.75%, 11/25/18 | | | 38,322 | | | | 40 | |
| | Wells Fargo Mortgage Backed Securities Trust, Series 2005-1, Class 2A1, 5.00%, 1/25/20 | | | 242,860 | | | | 255 | |
| | | | | | | | | | |
| | | |
| | Total Structured Products | | | | | | | | |
| | (Cost: $310,754) | | | | | | | 326,293 | |
| | | | | | | | | | |
| | | |
| | | Below Investment Grade Segment (6.8%) | | | | | | |
| | | |
| | Aerospace/Defense (0.1%) | | | | | | | | |
| | B/E Aerospace, Inc., 5.25%, 4/1/22 | | | 250,000 | | | | 265 | |
| | Bombardier, Inc., 5.75%, 3/15/22 144A | | | 150,000 | | | | 154 | |
| | Bombardier, Inc., 7.75%, 3/15/20 144A | | | 230,000 | | | | 261 | |
| | Huntington Ingalls Industries, Inc., 6.875%, 3/15/18 | | | 455,000 | | | | 495 | |
| | Huntington Ingalls Industries, Inc., 7.125%, 3/15/21 | | | 265,000 | | | | 288 | |
| | TransDigm, Inc., 5.50%, 10/15/20 144A | | | 250,000 | | | | 260 | |
| | Triumph Group, Inc., 8.625%, 7/15/18 | | | 290,000 | | | | 322 | |
| | | | | | | | | | |
| | Total | | | | | | | 2,045 | |
| | | | | | | | | | |
| | | |
| | Autos/Vehicle Parts (0.1%) | | | | | | | | |
| | American Axle & Manufacturing Holdings, Inc., 6.625%, 10/15/22 | | | 125,000 | | | | 127 | |
| | American Axle & Manufacturing Holdings, Inc., 7.875%, 3/1/17 | | | 188,000 | | | | 194 | |
| | American Axle & Manufacturing Holdings, Inc., 9.25%, 1/15/17 144A | | | 160,000 | | | | 178 | |
| | Chrysler Group LLC/CG Co-Issuer, Inc., 8.00%, 6/15/19 | | | 145,000 | | | | 158 | |
| | Chrysler Group LLC/CG Co-Issuer, Inc., 8.25%, 6/15/21 | | | 245,000 | | | | 269 | |
| | Cooper-Standard Automotive, Inc., 8.50%, 5/1/18 | | | 290,000 | | | | 312 | |
| | Exide Technologies, 8.625%, 2/1/18 | | | 155,000 | | | | 131 | |
| | General Motors Financial Co., Inc., 4.75%, 8/15/17 144A | | | 340,000 | | | | 357 | |
| | The Goodyear Tire & Rubber Co., 8.25%, 8/15/20 | | | 365,000 | | | | 401 | |
| | Jaguar Land Rover PLC, 7.75%, 5/15/18 144A | | | 165,000 | | | | 180 | |
The Accompanying Notes are an Integral Part of the Financial Statements.
Balanced Portfolio
| | | | | | | | | | |
| | | Below Investment Grade Segment (6.8%) | | Shares/ $ Par | | | Value
$ (000’s) | |
| | | |
| | Autos/Vehicle Parts continued | | | | | | | | |
| | Navistar International Corp., 8.25%, 11/1/21 | | | 380,000 | | | | 367 | |
| | Tower Automotive Holdings USA LLC/TA Holdings Finance, Inc., 10.625%, 9/1/17 144A | | | 272,000 | | | | 298 | |
| | Visteon Corp., 6.75%, 4/15/19 | | | 189,000 | | | | 201 | |
| | | | | | | | | | |
| | Total | | | | | | | 3,173 | |
| | | | | | | | | | |
| | | |
| | Basic Materials (0.8%) | | | | | | | | |
| | AK Steel Corp., 7.625%, 5/15/20 | | | 125,000 | | | | 109 | |
| | AK Steel Corp., 8.375%, 4/1/22 | | | 340,000 | | | | 292 | |
| | AK Steel Corp., 8.75%, 12/1/18 144A | | | 300,000 | | | | 317 | |
| | Aleris International, Inc., 7.625%, 2/15/18 | | | 220,000 | | | | 224 | |
| | Aleris International, Inc., 7.875%, 11/1/20 144A | | | 210,000 | | | | 210 | |
| | Alpha Natural Resources, Inc., 6.00%, 6/1/19 | | | 450,000 | | | | 414 | |
| | Alpha Natural Resources, Inc., 9.75%, 4/15/18 | | | 280,000 | | | | 302 | |
| | ArcelorMittal, 5.75%, 8/5/20 | | | 235,000 | | | | 235 | |
| | ArcelorMittal, 6.125%, 6/1/18 | | | 665,000 | | | | 674 | |
| | ArcelorMittal, 6.75%, 2/25/22 | | | 405,000 | | | | 425 | |
| | Arch Coal, Inc., 8.75%, 8/1/16 | | | 45,000 | | | | 47 | |
| | Arch Coal, Inc., 9.875%, 6/15/19 144A | | | 265,000 | | | | 276 | |
| | Ardagh Packaging Finance PLC, 7.375%, 10/15/17 144A | | | 220,000 | | | | 239 | |
| | Ardagh Packaging Finance PLC, 9.125%, 10/15/20 144A | | | 205,000 | | | | 223 | |
| | Ardagh Packaging Finance PLC/Ardagh MP Holdings USA, Inc., 9.125%, 10/15/20 144A | | | 125,000 | | | | 136 | |
| | Berry Plastics Corp., 8.25%, 11/15/15 | | | 130,000 | | | | 136 | |
| (c) | | Boe Merger Corp., 9.50%, 11/1/17 144A | | | 125,000 | | | | 125 | |
| | Cascades, Inc., 7.875%, 1/15/20 | | | 100,000 | | | | 106 | |
| (c) | | Catalyst Paper Corp., 11.00%, 10/30/17 | | | 94,104 | | | | 72 | |
| | Celanese US Holdings LLC, 4.625%, 11/15/22 | | | 965,000 | | | | 1,011 | |
| | Chemtura Corp., 7.875%, 9/1/18 | | | 120,000 | | | | 129 | |
| | Cloud Peak Energy Resources LLC/Cloud Peak Energy Finance Corp., 8.25%, 12/15/17 | | | 315,000 | | | | 337 | |
| | CONSOL Energy, Inc., 8.00%, 4/1/17 | | | 300,000 | | | | 325 | |
| | CONSOL Energy, Inc., 8.25%, 4/1/20 | | | 415,000 | | | | 449 | |
| | Essar Steel Algoma, Inc., 9.375%, 3/15/15 144A | | | 560,000 | | | | 507 | |
| | FMG Resources (August 2006) Pty, Ltd., 6.00%, 4/1/17 144A | | | 225,000 | | | | 229 | |
| | FMG Resources (August 2006) Pty, Ltd., 6.875%, 2/1/18 144A | | | 165,000 | | | | 170 | |
| | FMG Resources (August 2006) Pty, Ltd., 6.875%, 4/1/22 144A | | | 150,000 | | | | 153 | |
| | FMG Resources (August 2006) Pty, Ltd., 7.00%, 11/1/15 144A | | | 405,000 | | | | 425 | |
| | FMG Resources (August 2006) Pty, Ltd., 8.25%, 11/1/19 144A | | | 320,000 | | | | 341 | |
| | GrafTech International, Ltd., 6.375%, 11/15/20 144A | | | 120,000 | | | | 124 | |
| | Hexion US Finance Corp., 6.625%, 4/15/20 | | | 160,000 | | | | 163 | |
| | Hexion US Finance Corp./Hexion Nova Scotia Finance ULC, 8.875%, 2/1/18 | | | 425,000 | | | | 437 | |
| | HudBay Minerals, Inc., 9.50%, 10/1/20 144A | | | 145,000 | | | | 153 | |
| | Huntsman International LLC, 4.875%, 11/15/20 144A | | | 455,000 | | | | 460 | |
| | | | | | | | | | |
| | | Below Investment Grade Segment (6.8%) | | Shares/ $ Par | | | Value
$ (000’s) | |
| | | |
| | Basic Materials continued | | | | | | | | |
| | Ineos Finance PLC, 7.50%, 5/1/20 144A | | | 160,000 | | | | 168 | |
| | Ineos Finance PLC, 8.375%, 2/15/19 144A | | | 580,000 | | | | 625 | |
| | Inmet Mining Corp., 7.50%, 6/1/21 144A | | | 80,000 | | | | 83 | |
| | Molycorp, Inc., 10.00%, 6/1/20 144A | | | 455,000 | | | | 423 | |
| | New Gold, Inc., 6.25%, 11/15/22 144A | | | 120,000 | | | | 124 | |
| (d) | | Patriot Coal Corp., 8.25%, 4/30/18 | | | 150,000 | | | | 75 | |
| | Peabody Energy Corp., 4.75%, 12/15/41 | | | 740,000 | | | | 706 | |
| | Peabody Energy Corp., 6.00%, 11/15/18 | | | 305,000 | | | | 324 | |
| | Peabody Energy Corp., 6.25%, 11/15/21 | | | 575,000 | | | | 611 | |
| | Peabody Energy Corp., 6.50%, 9/15/20 | | | 305,000 | | | | 327 | |
| | Quadra FNX Mining, Ltd., 7.75%, 6/15/19 144A | | | 245,000 | | | | 254 | |
| | Rain CII Carbon LLC/CII Carbon Corp., 8.25%, 1/15/21 144A | | | 100,000 | | | | 102 | |
| | Resolute Forest Products, 10.25%, 10/15/18 | | | 171,000 | | | | 196 | |
| | Reynolds Group Issuer, Inc./Reynolds Group Issuer LLC/Reynolds Group Issuer LU, 5.75%, 10/15/20 144A | | | 475,000 | | | | 490 | |
| | Reynolds Group Issuer, Inc./Reynolds Group Issuer LLC/Reynolds Group Issuer LU, 6.875%, 2/15/21 | | | 515,000 | | | | 555 | |
| | Reynolds Group Issuer, Inc./Reynolds Group Issuer LLC/Reynolds Group Issuer LU, 7.125%, 4/15/19 | | | 415,000 | | | | 446 | |
| | Reynolds Group Issuer, Inc./Reynolds Group Issuer LLC/Reynolds Group Issuer LU, 8.25%, 2/15/21 | | | 170,000 | | | | 173 | |
| | Reynolds Group Issuer, Inc./Reynolds Group Issuer LLC/Reynolds Group Issuer LU, 9.00%, 4/15/19 | | | 385,000 | | | | 400 | |
| | Reynolds Group Issuer, Inc./Reynolds Group Issuer LLC/Reynolds Group Issuer LU, 9.875%, 8/15/19 | | | 475,000 | | | | 508 | |
| | Rockwood Specialties Group, Inc., 4.625%, 10/15/20 | | | 450,000 | | | | 466 | |
| | Sawgrass Merger Sub, Inc., 8.75%, 12/15/20 144A | | | 100,000 | | | | 101 | |
| | Sealed Air Corp., 6.50%, 12/1/20 144A | | | 120,000 | | | | 130 | |
| | Sealed Air Corp., 8.125%, 9/15/19 144A | | | 215,000 | | | | 242 | |
| | Sealed Air Corp., 8.375%, 9/15/21 144A | | | 275,000 | | | | 314 | |
| | Severstal Columbus LLC, 10.25%, 2/15/18 | | | 185,000 | | | | 195 | |
| | Steel Dynamics, Inc., 6.125%, 8/15/19 144A | | | 135,000 | | | | 143 | |
| | Steel Dynamics, Inc., 6.375%, 8/15/22 144A | | | 135,000 | | | | 143 | |
| | Thompson Creek Metals Co., Inc., 7.375%, 6/1/18 | | | 80,000 | | | | 66 | |
| | United States Steel Corp., 7.375%, 4/1/20 | | | 220,000 | | | | 235 | |
| | Verso Paper Holdings LLC/Verso Paper, Inc., 8.75%, 2/1/19 | | | 205,000 | | | | 78 | |
| | | | | | | | | | |
| | Total | | | | | | | 18,678 | |
| | | | | | | | | | |
| | | |
| | Builders/Building Materials (0.0%) | | | | | | | | |
| | KB Home, 7.25%, 6/15/18 | | | 290,000 | | | | 315 | |
| | KB Home, 9.10%, 9/15/17 | | | 120,000 | | | | 140 | |
| | USG Corp., 7.875%, 3/30/20 144A | | | 225,000 | | | | 250 | |
| | Vulcan Materials Co., 6.40%, 11/30/17 | | | 300,000 | | | | 328 | |
| | | | | | | | | | |
| | Total | | | | | | | 1,033 | |
| | | | | | | | | | |
| | | |
| | Capital Goods (0.1%) | | | | | | | | |
| | Case New Holland, Inc., 7.875%, 12/1/17 | | | 205,000 | | | | 242 | |
| | CNH Capital LLC, 3.875%, 11/1/15 144A | | | 100,000 | | | | 103 | |
| | CNH Capital LLC, 6.25%, 11/1/16 | | | 130,000 | | | | 143 | |
| | JMC Steel Group, 8.25%, 3/15/18 144A | | | 185,000 | | | | 193 | |
| | The Manitowoc Co., Inc., 5.875%, 10/15/22 | | | 105,000 | | | | 105 | |
The Accompanying Notes are an Integral Part of the Financial Statements.
Balanced Portfolio
| | | | | | | | | | |
| | | Below Investment Grade Segment (6.8%) | | Shares/ $ Par | | | Value $ (000’s) | |
| | | |
| | Capital Goods continued | | | | | | | | |
| | SPX Corp., 6.875%, 9/1/17 | | | 295,000 | | | | 329 | |
| | Terex Corp., 6.00%, 5/15/21 | | | 200,000 | | | | 211 | |
| | United Rentals North America, Inc., 5.75%, 7/15/18 144A | | | 115,000 | | | | 124 | |
| | United Rentals North America, Inc., 6.125%, 6/15/23 | | | 105,000 | | | | 111 | |
| | United Rentals North America, Inc., 7.375%, 5/15/20 144A | | | 160,000 | | | | 176 | |
| | | | | | | | | | |
| | Total | | | | | | | 1,737 | |
| | | | | | | | | | |
| | | |
| | Consumer Products/Retailing (0.3%) | | | | | | | | |
| | AMC Networks, Inc., 4.75%, 12/15/22 | | | 200,000 | | | | 201 | |
| | AutoNation, Inc., 5.50%, 2/1/20 | | | 165,000 | | | | 177 | |
| | Brookfield Residential Properties, Inc., 6.50%, 12/15/20 144A | | | 140,000 | | | | 143 | |
| | Hanesbrands, Inc., 6.375%, 12/15/20 | | | 250,000 | | | | 275 | |
| | Levi Strauss & Co., 6.875%, 5/1/22 | | | 225,000 | | | | 241 | |
| | Levi Strauss & Co., 7.625%, 5/15/20 | | | 240,000 | | | | 262 | |
| | Limited Brands, Inc., 5.625%, 2/15/22 | | | 1,140,000 | | | | 1,240 | |
| | Limited Brands, Inc., 8.50%, 6/15/19 | | | 110,000 | | | | 134 | |
| | PVH Corp., 4.50%, 12/15/22 | | | 85,000 | | | | 86 | |
| | Revlon Consumer Products Corp., 9.75%, 11/15/15 | | | 335,000 | | | | 353 | |
| | Rite Aid Corp., 10.375%, 7/15/16 | | | 455,000 | | | | 481 | |
| | Sally Holdings LLC/Sally Capital, Inc., 5.75%, 6/1/22 | | | 20,000 | | | | 22 | |
| | Sally Holdings LLC/Sally Capital, Inc., 6.875%, 11/15/19 | | | 110,000 | | | | 122 | |
| | Spectrum Brands Escrow Corp., 6.375%, 11/15/20 144A | | | 30,000 | | | | 31 | |
| | Spectrum Brands Escrow Corp., 6.625%, 11/15/22 144A | | | 50,000 | | | | 54 | |
| | Spectrum Brands, Inc., 9.50%, 6/15/18 | | | 165,000 | | | | 187 | |
| | SUPERVALU, Inc., 7.50%, 11/15/14 | | | 185,000 | | | | 179 | |
| | SUPERVALU, Inc., 8.00%, 5/1/16 | | | 315,000 | | | | 300 | |
| | Toys R US Property Co. I LLC, 10.75%, 7/15/17 | | | 175,000 | | | | 189 | |
| | Toys R US Property Co. II LLC, 8.50%, 12/1/17 | | | 130,000 | | | | 138 | |
| | Toys R US, Inc., 7.375%, 9/1/16 144A | | | 750,000 | | | | 767 | |
| | | | | | | | | | |
| | Total | | | | | | | 5,582 | |
| | | | | | | | | | |
| | | |
| | Energy (1.6%) | | | | | | | | |
| | Access Midstream Partners LP/ACMP Finance Corp., 4.875%, 5/15/23 | | | 970,000 | | | | 985 | |
| | Access Midstream Partners LP/ACMP Finance Corp., 6.125%, 7/15/22 | | | 175,000 | | | | 189 | |
| | AmeriGas Finance LLC/AmeriGas Finance Corp., 6.75%, 5/20/20 | | | 110,000 | | | | 121 | |
| | AmeriGas Partners LP/AmeriGas Finance Corp., 6.25%, 8/20/19 | | | 330,000 | | | | 353 | |
| | Atlas Pipeline Partners LP/Atlas Pipeline Finance Corp., 6.625%, 10/1/20 144A | | | 270,000 | | | | 279 | |
| | Atwood Oceanics, Inc., 6.50%, 2/1/20 | | | 90,000 | | | | 97 | |
| | Bill Barrett Corp., 7.00%, 10/15/22 | | | 190,000 | | | | 196 | |
| | Bill Barrett Corp., 7.625%, 10/1/19 | | | 405,000 | | | | 427 | |
| | Bristow Group, Inc., 6.25%, 10/15/22 | | | 105,000 | | | | 112 | |
| | Carrizo Oil & Gas, Inc., 7.50%, 9/15/20 | | | 155,000 | | | | 159 | |
| | Carrizo Oil & Gas, Inc., 8.625%, 10/15/18 | | | 260,000 | | | | 281 | |
| | Chaparral Energy, Inc., 8.25%, 9/1/21 | | | 295,000 | | | | 320 | |
| | Chesapeake Energy Corp., 2.50%, 5/15/37 | | | 655,000 | | | | 588 | |
| | Chesapeake Energy Corp., 6.125%, 2/15/21 | | | 475,000 | | | | 493 | |
| | | | | | | | | | |
| | | Below Investment Grade Segment (6.8%) | | Shares/ $ Par | | | Value
$ (000’s) | |
| | | |
| | Energy continued | | | | | | | | |
| | Chesapeake Energy Corp., 6.875%, 11/15/20 | | | 325,000 | | | | 352 | |
| | Chesapeake Energy Corp., 7.25%, 12/15/18 | | | 170,000 | | | | 185 | |
| | Chesapeake Energy Corp., 9.50%, 2/15/15 | | | 305,000 | | | | 345 | |
| | Chesapeake Oilfield Operating LLC/Chesapeake Oilfield Finance, Inc., 6.625%, 11/15/19 144A | | | 225,000 | | | | 212 | |
| | Cimarex Energy Co., 5.875%, 5/1/22 | | | 380,000 | | | | 416 | |
| | CITGO Petroleum Corp., 11.50%, 7/1/17 144A | | | 270,000 | | | | 312 | |
| | Compagnie Generale de Geophysique-Veritas, 9.50%, 5/15/16 | | | 550,000 | | | | 590 | |
| | Comstock Resources, Inc., 7.75%, 4/1/19 | | | 260,000 | | | | 264 | |
| | Comstock Resources, Inc., 9.50%, 6/15/20 | | | 205,000 | | | | 220 | |
| | Concho Resources, Inc., 5.50%, 4/1/23 | | | 205,000 | | | | 215 | |
| | Concho Resources, Inc., 7.00%, 1/15/21 | | | 135,000 | | | | 151 | |
| | Continental Resources, Inc., 5.00%, 9/15/22 | | | 960,000 | | | | 1,034 | |
| | Crosstex Energy LP/Crosstex Energy Finance Corp., 8.875%, 2/15/18 | | | 505,000 | | | | 545 | |
| | Denbury Resources, Inc., 8.25%, 2/15/20 | | | 228,000 | | | | 257 | |
| | Drill Rigs Holdings, Inc., 6.50%, 10/1/17 144A | | | 355,000 | | | | 353 | |
| | El Paso LLC, 7.00%, 6/15/17 | | | 515,000 | | | | 588 | |
| | El Paso LLC, 7.25%, 6/1/18 | | | 515,000 | | | | 595 | |
| | El Paso LLC, 7.75%, 1/15/32 | | | 320,000 | | | | 376 | |
| | El Paso Pipeline Partners Operating Co. LLC, 4.70%, 11/1/42 | | | 280,000 | | | | 275 | |
| | El Paso Pipeline Partners Operating Co. LLC, 5.00%, 10/1/21 | | | 1,115,000 | | | | 1,264 | |
| | Energy Transfer Equity LP, 7.50%, 10/15/20 | | | 355,000 | | | | 410 | |
| | EP Energy LLC/EP Energy Finance, Inc., 9.375%, 5/1/20 | | | 290,000 | | | | 327 | |
| | EP Energy LLC/Everest Acquisition Finance, Inc., 7.75%, 9/1/22 | | | 100,000 | | | | 106 | |
| | Exterran Holdings, Inc., 7.25%, 12/1/18 | | | 330,000 | | | | 350 | |
| | Forest Oil Corp., 7.25%, 6/15/19 | | | 495,000 | | | | 497 | |
| | Forest Oil Corp., 7.50%, 9/15/20 144A | | | 215,000 | | | | 226 | |
| | Hiland Partners LP/Hiland Partners Finance Corp., 7.25%, 10/1/20 144A | | | 105,000 | | | | 112 | |
| | Hilcorp Energy I LP/Hilcorp Finance Co., 7.625%, 4/15/21 144A | | | 120,000 | | | | 131 | |
| | Hilcorp Energy I LP/Hilcorp Finance Co., 8.00%, 2/15/20 144A | | | 215,000 | | | | 235 | |
| | Hornbeck Offshore Services, Inc., 5.875%, 4/1/20 | | | 135,000 | | | | 141 | |
| | Inergy Midstream LP/NRGM Finance Corp., 6.00%, 12/15/20 144A | | | 160,000 | | | | 165 | |
| | Key Energy Services, Inc., 6.75%, 3/1/21 | | | 260,000 | | | | 260 | |
| | Kinder Morgan Finance Co. LLC, 6.00%, 1/15/18 144A | | | 910,000 | | | | 1,000 | |
| | Kodiak Oil & Gas Corp., 8.125%, 12/1/19 | | | 355,000 | | | | 391 | |
| | Linn Energy LLC/Linn Energy Finance Corp., 6.25%, 11/1/19 144A | | | 275,000 | | | | 276 | |
| | Linn Energy LLC/Linn Energy Finance Corp., 6.50%, 5/15/19 | | | 570,000 | | | | 576 | |
| | Linn Energy LLC/Linn Energy Finance Corp., 7.75%, 2/1/21 | | | 190,000 | | | | 202 | |
| | Magnum Hunter Resources Corp., 9.75%, 5/15/20 144A | | | 315,000 | | | | 327 | |
| | MarkWest Energy Partners LP/MarkWest Energy Finance Corp., 5.50%, 2/15/23 | | | 340,000 | | | | 369 | |
| | MarkWest Energy Partners LP/MarkWest Energy Finance Corp., 6.25%, 6/15/22 | | | 335,000 | | | | 365 | |
The Accompanying Notes are an Integral Part of the Financial Statements.
Balanced Portfolio
| | | | | | | | | | |
| | | Below Investment Grade Segment (6.8%) | | Shares/ $ Par | | | Value $ (000’s) | |
| | | |
| | Energy continued | | | | | | | | |
| | MarkWest Energy Partners LP/MarkWest Energy Finance Corp., 6.75%, 11/1/20 | | | 145,000 | | | | 158 | |
| | MEG Energy Corp., 6.375%, 1/30/23 144A | | | 300,000 | | | | 313 | |
| | Newfield Exploration Co., 5.625%, 7/1/24 | | | 150,000 | | | | 162 | |
| | Newfield Exploration Co., 6.875%, 2/1/20 | | | 1,170,000 | | | | 1,252 | |
| | Newfield Exploration Co., 7.125%, 5/15/18 | | | 270,000 | | | | 285 | |
| | NGPL PipeCo LLC, 9.625%, 6/1/19 144A | | | 115,000 | | | | 132 | |
| | Northern Tier Energy LLC/Northern Tier Finance Corp., 7.125%, 11/15/20 144A | | | 140,000 | | | | 145 | |
| | Oasis Petroleum, Inc., 6.50%, 11/1/21 | | | 480,000 | | | | 510 | |
| | Offshore Group Investment, Ltd., 7.50%, 11/1/19 144A | | | 525,000 | | | | 530 | |
| | Offshore Group Investment, Ltd., 11.50%, 8/1/15 | | | 221,000 | | | | 241 | |
| | OGX Austria GmbH, 8.50%, 6/1/18 144A | | | 320,000 | | | | 288 | |
| | Oil States International, Inc., 5.125%, 1/15/23 144A | | | 485,000 | | | | 492 | |
| | Oil States International, Inc., 6.50%, 6/1/19 | | | 165,000 | | | | 176 | |
| | Pacific Drilling V, Ltd., 7.25%, 12/1/17 144A | | | 410,000 | | | | 425 | |
| | PBF Holding Co. LLC/PBF Finance Corp., 8.25%, 2/15/20 144A | | | 590,000 | | | | 636 | |
| | Penn Virginia Resource Partners LP/Penn Virginia Resource Finance Corp. II, 8.375%, 6/1/20 144A | | | 340,000 | | | | 366 | |
| | Petroleum Geo-Services ASA, 7.375%, 12/15/18 144A | | | 300,000 | | | | 324 | |
| | Plains Exploration & Production Co., 6.125%, 6/15/19 | | | 375,000 | | | | 409 | |
| | Plains Exploration & Production Co., 6.625%, 5/1/21 | | | 270,000 | | | | 297 | |
| | Plains Exploration & Production Co., 6.75%, 2/1/22 | | | 145,000 | | | | 163 | |
| | Plains Exploration & Production Co., 7.625%, 4/1/20 | | | 255,000 | | | | 284 | |
| | Plains Exploration & Production Co., 8.625%, 10/15/19 | | | 365,000 | | | | 415 | |
| | QEP Resources, Inc., 5.25%, 5/1/23 | | | 205,000 | | | | 219 | |
| | QEP Resources, Inc., 5.375%, 10/1/22 | | | 375,000 | | | | 402 | |
| | QEP Resources, Inc., 6.875%, 3/1/21 | | | 240,000 | | | | 277 | |
| | Range Resources Corp., 5.00%, 8/15/22 | | | 225,000 | | | | 235 | |
| | Range Resources Corp., 5.75%, 6/1/21 | | | 195,000 | | | | 209 | |
| | Regency Energy Partners LP/Regency Energy Finance Corp., 5.50%, 4/15/23 | | | 150,000 | | | | 160 | |
| | Rosetta Resources, Inc., 9.50%, 4/15/18 | | | 290,000 | | | | 322 | |
| | Samson Investment Co., 9.75%, 2/15/20 144A | | | 920,000 | | | | 973 | |
| | SandRidge Energy, Inc., 7.50%, 3/15/21 | | | 435,000 | | | | 465 | |
| | SandRidge Energy, Inc., 7.50%, 2/15/23 | | | 200,000 | | | | 214 | |
| | SandRidge Energy, Inc., 8.00%, 6/1/18 144A | | | 260,000 | | | | 276 | |
| | SandRidge Energy, Inc., 9.875%, 5/15/16 | | | 220,000 | | | | 237 | |
| | SESI LLC, 6.375%, 5/1/19 | | | 265,000 | | | | 284 | |
| | SM Energy Co., 6.50%, 11/15/21 | | | 225,000 | | | | 241 | |
| | SM Energy Co., 6.50%, 1/1/23 | | | 135,000 | | | | 144 | |
| | SM Energy Co., 6.625%, 2/15/19 | | | 230,000 | | | | 243 | |
| | Swift Energy Co., 7.875%, 3/1/22 144A | | | 105,000 | | | | 110 | |
| | Swift Energy Co., 8.875%, 1/15/20 | | | 235,000 | | | | 256 | |
| | Targa Resources Partners LP/Targa Resources Partners Finance Corp., 5.25%, 5/1/23 144A | | | 250,000 | | | | 259 | |
| | Targa Resources Partners LP/Targa Resources Partners Finance Corp., 6.375%, 8/1/22 144A | | | 165,000 | | | | 180 | |
| | | | | | | | | | |
| | | Below Investment Grade Segment (6.8%) | | Shares/ $ Par | | | Value $ (000’s) | |
| | | |
| | Energy continued | | | | | | | | |
| | Tesoro Corp., 4.25%, 10/1/17 | | | 140,000 | | | | 145 | |
| | Tesoro Corp., 5.375%, 10/1/22 | | | 140,000 | | | | 149 | |
| | Tesoro Logistics LP/Tesoro Logistics Finance Corp., 5.875%, 10/1/20 144A | | | 145,000 | | | | 150 | |
| | Trinidad Drilling, Ltd., 7.875%, 1/15/19 144A | | | 405,000 | | | | 430 | |
| | Unit Corp., 6.625%, 5/15/21 144A | | | 240,000 | | | | 246 | |
| | Venoco, Inc., 8.875%, 2/15/19 | | | 130,000 | | | | 122 | |
| | W&T Offshore, Inc., 8.50%, 6/15/19 144A | | | 260,000 | | | | 280 | |
| | W&T Offshore, Inc., 8.50%, 6/15/19 | | | 245,000 | | | | 263 | |
| | WPX Energy, Inc., 5.25%, 1/15/17 | | | 555,000 | | | | 588 | |
| | WPX Energy, Inc., 6.00%, 1/15/22 | | | 270,000 | | | | 291 | |
| | | | | | | | | | |
| | Total | | | | | | | 35,988 | |
| | | | | | | | | | |
| | | |
| | Financials (0.7%) | | | | | | | | |
| | AerCap Aviation Solutions BV, 6.375%, 5/30/17 | | | 275,000 | | | | 289 | |
| | Air Lease Corp., 5.625%, 4/1/17 | | | 305,000 | | | | 323 | |
| | Aircastle, Ltd., 6.25%, 12/1/19 144A | | | 140,000 | | | | 146 | |
| | Aircastle, Ltd., 6.75%, 4/15/17 | | | 215,000 | | | | 231 | |
| | Aircastle, Ltd., 7.625%, 4/15/20 | | | 115,000 | | | | 128 | |
| | Ally Financial, Inc., 4.625%, 6/26/15 | | | 160,000 | | | | 167 | |
| | Ally Financial, Inc., 5.50%, 2/15/17 | | | 470,000 | | | | 503 | |
| | Ally Financial, Inc., 7.50%, 9/15/20 | | | 380,000 | | | | 459 | |
| | Ally Financial, Inc., 8.00%, 3/15/20 | | | 370,000 | | | | 453 | |
| | AmSouth Bank, 5.20%, 4/1/15 | | | 195,000 | | | | 204 | |
| | AWAS Aviation Capital, Ltd., 7.00%, 10/17/16 144A | | | 68,680 | | | | 72 | |
| | CIT Group, Inc., 4.25%, 8/15/17 | | | 400,000 | | | | 412 | |
| | CIT Group, Inc., 4.75%, 2/15/15 144A | | | 220,000 | | | | 229 | |
| | CIT Group, Inc., 5.00%, 5/15/17 | | | 225,000 | | | | 238 | |
| | CIT Group, Inc., 5.00%, 8/15/22 | | | 300,000 | | | | 320 | |
| | CIT Group, Inc., 5.25%, 3/15/18 | | | 755,000 | | | | 808 | |
| | CIT Group, Inc., 5.375%, 5/15/20 | | | 305,000 | | | | 333 | |
| | CIT Group, Inc., 5.50%, 2/15/19 144A | | | 250,000 | | | | 272 | |
| | E*TRADE Financial Corp., 6.00%, 11/15/17 | | | 400,000 | | | | 409 | |
| | E*TRADE Financial Corp., 6.375%, 11/15/19 | | | 200,000 | | | | 205 | |
| | E*TRADE Financial Corp., 6.75%, 6/1/16 | | | 355,000 | | | | 374 | |
| | Eksportfinans ASA, 2.00%, 9/15/15 | | | 4,000,000 | | | | 3,829 | |
| | Icahn Enterprises LP/Icahn Enterprises Finance Corp., 7.75%, 1/15/16 | | | 385,000 | | | | 399 | |
| | Icahn Enterprises LP/Icahn Enterprises Finance Corp., 8.00%, 1/15/18 | | | 150,000 | | | | 161 | |
| (c) | | Igloo Holdings Corp., 8.25%, 12/15/17 144A | | | 140,000 | | | | 138 | |
| | International Lease Finance Corp., 5.75%, 5/15/16 | | | 415,000 | | | | 437 | |
| | International Lease Finance Corp., 6.25%, 5/15/19 | | | 300,000 | | | | 319 | |
| | International Lease Finance Corp., 7.125%, 9/1/18 144A | | | 185,000 | | | | 215 | |
| | International Lease Finance Corp., 8.625%, 9/15/15 | | | 85,000 | | | | 95 | |
| | International Lease Finance Corp., 8.75%, 3/15/17 | | | 285,000 | | | | 329 | |
| | JPMorgan Chase & Co., 7.90%, 4/29/49 | | | 275,000 | | | | 312 | |
| (d) | | Lehman Brothers Holdings, Inc., 5.50%, 4/4/16 | | | 490,000 | | | | 115 | |
| | Regions Financial Corp., 7.75%, 11/10/14 | | | 355,000 | | | | 394 | |
| | SLM Corp., 6.00%, 1/25/17 | | | 820,000 | | | | 888 | |
| | SLM Corp., 7.25%, 1/25/22 | | | 45,000 | | | | 50 | |
| | SLM Corp., 8.00%, 3/25/20 | | | 840,000 | | | | 960 | |
The Accompanying Notes are an Integral Part of the Financial Statements.
Balanced Portfolio
| | | | | | | | | | |
| | | Below Investment Grade Segment (6.8%) | | Shares/ $ Par | | | Value $ (000’s) | |
| | | |
| | Financials continued | | | | | | | | |
| | SLM Corp., 8.45%, 6/15/18 | | | 195,000 | | | | 228 | |
| (d,n) | | Washington Mutual Bank, 6.75%, 5/20/36 | | | 580,000 | | | | - | |
| (d,n) | | Washington Mutual Bank, 6.875%, 6/15/11 | | | 1,115,000 | | | | - | |
| | | | | | | | | | |
| | Total | | | | | | | 15,444 | |
| | | | | | | | | | |
| | | |
| | Foods (0.2%) | | | | | | | | |
| (c) | | Alphabet Holding Co., Inc., 7.75%, 11/1/17 144A | | | 105,000 | | | | 108 | |
| | Bumble Bee Acquisition Corp., 9.00%, 12/15/17 144A | | | 130,000 | | | | 140 | |
| | Constellation Brands, Inc., 6.00%, 5/1/22 | | | 90,000 | | | | 103 | |
| | Constellation Brands, Inc., 7.25%, 9/1/16 | | | 165,000 | | | | 191 | |
| | Cott Beverages, Inc., 8.125%, 9/1/18 | | | 160,000 | | | | 177 | |
| | Cott Beverages, Inc., 8.375%, 11/15/17 | | | 195,000 | | | | 212 | |
| | Dean Foods Co., 7.00%, 6/1/16 | | | 160,000 | | | | 176 | |
| | Dean Foods Co., 9.75%, 12/15/18 | | | 365,000 | | | | 420 | |
| | Dole Food Co., Inc., 8.00%, 10/1/16 144A | | | 110,000 | | | | 114 | |
| | Dole Food Co., Inc., 13.875%, 3/15/14 | | | 191,000 | | | | 212 | |
| | JBS Finance II, Ltd., 8.25%, 1/29/18 144A | | | 135,000 | | | | 143 | |
| | JBS USA LLC/JBS USA Finance, Inc., 7.25%, 6/1/21 144A | | | 195,000 | | | | 195 | |
| | Land O’ Lakes, Inc., 6.00%, 11/15/22 144A | | | 330,000 | | | | 357 | |
| | Pilgrim’s Pride Corp., 7.875%, 12/15/18 | | | 400,000 | | | | 406 | |
| | Post Holdings, Inc., 7.375%, 2/15/22 144A | | | 55,000 | | | | 60 | |
| | Smithfield Foods, Inc., 6.625%, 8/15/22 | | | 270,000 | | | | 298 | |
| | TreeHouse Foods, Inc., 7.75%, 3/1/18 | | | 345,000 | | | | 374 | |
| | | | | | | | | | |
| | Total | | | | | | | 3,686 | |
| | | | | | | | | | |
| | | |
| | Gaming/Leisure/Lodging (0.3%) | | | | | | | | |
| | AMC Entertainment, Inc., 8.75%, 6/1/19 | | | 555,000 | | | | 615 | |
| | AMC Entertainment, Inc., 9.75%, 12/1/20 | | | 110,000 | | | | 127 | |
| | Caesars Entertainment Operating Co., Inc., 8.50%, 2/15/20 | | | 465,000 | | | | 462 | |
| | Caesars Entertainment Operating Co., Inc., 10.00%, 12/15/18 | | | 251,000 | | | | 166 | |
| | Caesars Entertainment Operating Co., Inc., 11.25%, 6/1/17 | | | 360,000 | | | | 386 | |
| | Caesars Entertainment Operating Co., Inc., 12.75%, 4/15/18 | | | 145,000 | | | | 107 | |
| | Chester Downs & Marina LLC, 9.25%, 2/1/20 144A | | | 365,000 | | | | 359 | |
| | Cinemark USA, Inc., 5.125%, 12/15/22 144A | | | 80,000 | | | | 81 | |
| | The Geo Group, Inc., 6.625%, 2/15/21 | | | 220,000 | | | | 244 | |
| | MGM Resorts International, 6.75%, 10/1/20 144A | | | 210,000 | | | | 214 | |
| | MGM Resorts International, 7.625%, 1/15/17 | | | 590,000 | | | | 631 | |
| | MGM Resorts International, 7.75%, 3/15/22 | | | 225,000 | | | | 241 | |
| | MGM Resorts International, 8.625%, 2/1/19 144A | | | 360,000 | | | | 401 | |
| | Penn National Gaming, Inc., 8.75%, 8/15/19 | | | 265,000 | | | | 302 | |
| | Regal Entertainment Group, 9.125%, 8/15/18 | | | 245,000 | | | | 273 | |
| | Royal Caribbean Cruises, Ltd., 5.25%, 11/15/22 | | | 140,000 | | | | 148 | |
| | Scientific Games International, Inc., 6.25%, 9/1/20 144A | | | 345,000 | | | | 356 | |
| | Scientific Games International, Inc., 9.25%, 6/15/19 | | | 165,000 | | | | 184 | |
| | Seminole Indian Tribe of Florida, 7.75%, 10/1/17 144A | | | 495,000 | | | | 535 | |
| | Speedway Motorsports, Inc., 6.75%, 2/1/19 | | | 205,000 | | | | 217 | |
| | Speedway Motorsports, Inc., 8.75%, 6/1/16 | | | 330,000 | | | | 353 | |
| | | | | | | | | | |
| | | Below Investment Grade Segment (6.8%) | | Shares/ $ Par | | | Value $ (000’s) | |
| | | |
| | Gaming/Leisure/Lodging continued | | | | | | | | |
| | Wynn Las Vegas LLC/Wynn Las Vegas Capital Corp., 7.875%, 5/1/20 | | | 110,000 | | | | 125 | |
| | | | | | | | | | |
| | Total | | | | | | | 6,527 | |
| | | | | | | | | | |
| | | |
| | Health Care/Pharmaceuticals (0.6%) | | | | | | | | |
| | Biomet, Inc., 6.50%, 8/1/20 144A | | | 285,000 | | | | 303 | |
| | Biomet, Inc., 6.50%, 10/1/20 144A | | | 360,000 | | | | 358 | |
| | Centene Corp., 5.75%, 6/1/17 | | | 440,000 | | | | 473 | |
| | CHS/Community Health Systems, Inc., 5.125%, 8/15/18 | | | 200,000 | | | | 209 | |
| | CHS/Community Health Systems, Inc., 7.125%, 7/15/20 | | | 300,000 | | | | 320 | |
| | CHS/Community Health Systems, Inc., 8.00%, 11/15/19 | | | 390,000 | | | | 422 | |
| | Elan Finance PLC/Elan Finance Corp., 6.25%, 10/15/19 144A | | | 455,000 | | | | 475 | |
| | Endo Health Solutions, Inc., 7.00%, 7/15/19 | | | 90,000 | | | | 96 | |
| | Endo Health Solutions, Inc., 7.25%, 1/15/22 | | | 160,000 | | | | 172 | |
| | Fresenius Medical Care US Finance II, Inc., 5.625%, 7/31/19 144A | | | 635,000 | | | | 682 | |
| | Fresenius Medical Care US Finance II, Inc., 5.875%, 1/31/22 144A | | | 665,000 | | | | 722 | |
| | Fresenius Medical Care US Finance, Inc., 6.50%, 9/15/18 144A | | | 65,000 | | | | 73 | |
| | HCA Holdings, Inc., 6.25%, 2/15/21 | | | 160,000 | | | | 164 | |
| | HCA Holdings, Inc., 7.75%, 5/15/21 | | | 240,000 | | | | 260 | |
| | HCA, Inc., 5.875%, 3/15/22 | | | 770,000 | | | | 837 | |
| | HCA, Inc., 6.50%, 2/15/20 | | | 455,000 | | | | 512 | |
| | HCA, Inc., 7.25%, 9/15/20 | | | 510,000 | | | | 565 | |
| | HCA, Inc., 7.875%, 2/15/20 | | | 130,000 | | | | 145 | |
| | HCA, Inc., 8.00%, 10/1/18 | | | 190,000 | | | | 220 | |
| | HCA, Inc., 8.50%, 4/15/19 | | | 325,000 | | | | 362 | |
| | HCA, Inc., 9.875%, 2/15/17 | | | 45,000 | | | | 48 | |
| | Health Management Associates, Inc., 6.125%, 4/15/16 | | | 560,000 | | | | 605 | |
| | Health Management Associates, Inc., 7.375%, 1/15/20 | | | 150,000 | | | | 162 | |
| | Hologic, Inc., 6.25%, 8/1/20 144A | | | 80,000 | | | | 86 | |
| | MPT Operating Partnership LP/MPT Finance Corp., 6.375%, 2/15/22 | | | 250,000 | | | | 262 | |
| | MPT Operating Partnership LP/MPT Finance Corp., 6.875%, 5/1/21 | | | 235,000 | | | | 255 | |
| | Prospect Medical Holdings, Inc., 8.375%, 5/1/19 144A | | | 375,000 | | | | 395 | |
| | Service Corp. International, 4.50%, 11/15/20 | | | 120,000 | | | | 122 | |
| | Service Corp. International, 7.00%, 5/15/19 | | | 205,000 | | | | 224 | |
| | Service Corp. International, 8.00%, 11/15/21 | | | 110,000 | | | | 135 | |
| | Tenet Healthcare Corp., 6.25%, 11/1/18 | | | 405,000 | | | | 444 | |
| | Tenet Healthcare Corp., 8.875%, 7/1/19 | | | 285,000 | | | | 319 | |
| | Valeant Pharmaceuticals International, 6.50%, 7/15/16 144A | | | 200,000 | | | | 210 | |
| | Valeant Pharmaceuticals International, 6.75%, 10/1/17 144A | | | 735,000 | | | | 794 | |
| | Valeant Pharmaceuticals International, 6.875%, 12/1/18 144A | | | 1,040,000 | | | | 1,121 | |
| | Vanguard Health Systems, Inc., 0.00%, 2/1/16 | | | 4,000 | | | | 3 | |
| | VPI Escrow Corp., 6.375%, 10/15/20 144A | | | 320,000 | | | | 343 | |
| | Warner Chilcott Co. LLC/Warner Chilcott Finance LLC, 7.75%, 9/15/18 | | | 115,000 | | | | 122 | |
| | | | | | | | | | |
| | Total | | | | | | | 13,020 | |
| | | | | | | | | | |
The Accompanying Notes are an Integral Part of the Financial Statements.
Balanced Portfolio
| | | | | | | | | | |
| | | Below Investment Grade Segment (6.8%) | | Shares/ $ Par | | | Value $ (000’s) | |
| | | |
| | Media (0.7%) | | | | | | | | |
| | CCO Holdings LLC/CCO Holdings Capital Corp., 5.125%, 2/15/23 | | | 1,050,000 | | | | 1,047 | |
| | CCO Holdings LLC/CCO Holdings Capital Corp., 6.50%, 4/30/21 | | | 150,000 | | | | 162 | |
| | CCO Holdings LLC/CCO Holdings Capital Corp., 7.00%, 1/15/19 | | | 225,000 | | | | 243 | |
| | CCO Holdings LLC/CCO Holdings Capital Corp., 7.25%, 10/30/17 | | | 145,000 | | | | 158 | |
| | CCO Holdings LLC/CCO Holdings Capital Corp., 7.375%, 6/1/20 | | | 280,000 | | | | 311 | |
| | CCO Holdings LLC/CCO Holdings Capital Corp., 7.875%, 4/30/18 | | | 160,000 | | | | 172 | |
| | Cequel Communications Holdings I LLC/Cequel Capital Corp., 6.375%, 9/15/20 144A | | | 405,000 | | | | 422 | |
| | Clear Channel Worldwide Holdings, Inc., 7.625%, 3/15/20 | | | 190,000 | | | | 191 | |
| | CSC Holdings LLC, 7.625%, 7/15/18 | | | 170,000 | | | | 196 | |
| | CSC Holdings LLC, 7.875%, 2/15/18 | | | 105,000 | | | | 121 | |
| | CSC Holdings LLC, 8.625%, 2/15/19 | | | 300,000 | | | | 358 | |
| (c) | | Dex One Corp., 14.00%, 1/29/17 | | | 370,888 | | | | 123 | |
| | DISH DBS Corp., 5.00%, 3/15/23 144A | | | 1,930,000 | | | | 1,930 | |
| | DISH DBS Corp., 5.875%, 7/15/22 | | | 265,000 | | | | 285 | |
| | DISH DBS Corp., 6.75%, 6/1/21 | | | 520,000 | | | | 593 | |
| | DISH DBS Corp., 7.125%, 2/1/16 | | | 275,000 | | | | 308 | |
| | DISH DBS Corp., 7.875%, 9/1/19 | | | 485,000 | | | | 575 | |
| | Hughes Satellite Systems Corp., 6.50%, 6/15/19 | | | 375,000 | | | | 413 | |
| | Hughes Satellite Systems Corp., 7.625%, 6/15/21 | | | 165,000 | | | | 188 | |
| | Inmarsat Finance PLC, 7.375%, 12/1/17 144A | | | 115,000 | | | | 124 | |
| | Intelsat Jackson Holdings SA, 7.25%, 4/1/19 | | | 360,000 | | | | 387 | |
| | Intelsat Jackson Holdings SA, 7.25%, 10/15/20 | | | 295,000 | | | | 321 | |
| | Intelsat Jackson Holdings SA, 8.50%, 11/1/19 | | | 500,000 | | | | 560 | |
| (c) | | Intelsat Luxembourg SA, 11.50%, 2/4/17 | | | 325,000 | | | | 345 | |
| | Lamar Media Corp., 5.00%, 5/1/23 144A | | | 350,000 | | | | 360 | |
| | LIN Television Corp., 6.375%, 1/15/21 144A | | | 210,000 | | | | 220 | |
| | Mediacom LLC/Mediacom Capital Corp., 9.125%, 8/15/19 | | | 435,000 | | | | 482 | |
| | Nielsen Finance LLC/Nielsen Finance Co., 7.75%, 10/15/18 | | | 290,000 | | | | 324 | |
| | QVC, Inc., 5.125%, 7/2/22 144A | | | 105,000 | | | | 110 | |
| | QVC, Inc., 7.375%, 10/15/20 144A | | | 195,000 | | | | 217 | |
| | QVC, Inc., 7.50%, 10/1/19 144A | | | 230,000 | | | | 254 | |
| | Sinclair Television Group, Inc., 6.125%, 10/1/22 144A | | | 345,000 | | | | 366 | |
| | Sirius XM Radio, Inc., 5.25%, 8/15/22 144A | | | 100,000 | | | | 101 | |
| | Starz LLC/Starz Finance Corp., 5.00%, 9/15/19 144A | | | 105,000 | | | | 108 | |
| | Unitymedia Hessen GmbH & Co. KG/Unitymedia NRW GmbH, 5.50%, 1/15/23 144A | | | 400,000 | | | | 413 | |
| | Univision Communications, Inc., 6.75%, 9/15/22 144A | | | 255,000 | | | | 263 | |
| | Univision Communications, Inc., 7.875%, 11/1/20 144A | | | 725,000 | | | | 785 | |
| | UPCB Finance III, Ltd., 6.625%, 7/1/20 144A | | | 360,000 | | | | 386 | |
| | | | | | | | | | |
| | | Below Investment Grade Segment (6.8%) | | Shares/ $ Par | | | Value $ (000’s) | |
| | | |
| | Media continued | | | | | | | | |
| | UPCB Finance V, Ltd., 7.25%, 11/15/21 144A | | | 505,000 | | | | 555 | |
| | Videotron Ltee, 5.00%, 7/15/22 | | | 750,000 | | | | 787 | |
| | Virgin Media Finance PLC, 8.375%, 10/15/19 | | | 74,000 | | | | 84 | |
| | WMG Acquisition Corp., 6.00%, 1/15/21 144A | | | 85,000 | | | | 90 | |
| | WMG Acquisition Corp., 11.50%, 10/1/18 | | | 285,000 | | | | 329 | |
| | XM Satellite Radio, Inc., 7.625%, 11/1/18 144A | | | 390,000 | | | | 435 | |
| | | | | | | | | | |
| | Total | | | | | | | 16,202 | |
| | | | | | | | | | |
| | | |
| | Other Holdings (–%) | | | | | | | | |
| (n)* | | General Motors Co. Escrow, 7.20%, 1/15/13 | | | 200,000 | | | | - | |
| (n)* | | General Motors Co. Escrow, 8.375%, 7/15/33 | | | 1,090,000 | | | | - | |
| | | | | | | | | | |
| | Total | | | | | | | - | |
| | | | | | | | | | |
| | | |
| | Real Estate (0.0%) | | | | | | | | |
| | DuPont Fabros Technology LP, 8.50%, 12/15/17 | | | 125,000 | | | | 137 | |
| | | | | | | | | | |
| | Total | | | | | | | 137 | |
| | | | | | | | | | |
| | | |
| | Services (0.1%) | | | | | | | | |
| (c) | | ARAMARK Holdings Corp., 8.625%, 5/1/16 144A | | | 85,000 | | | | 87 | |
| | Clean Harbors, Inc., 5.125%, 6/1/21 144A | | | 100,000 | | | | 103 | |
| | Clean Harbors, Inc., 5.25%, 8/1/20 | | | 190,000 | | | | 198 | |
| | FTI Consulting, Inc., 6.00%, 11/15/22 144A | | | 160,000 | | | | 166 | |
| | HDTFS, Inc., 5.875%, 10/15/20 144A | | | 105,000 | | | | 110 | |
| | HDTFS, Inc., 6.25%, 10/15/22 144A | | | 60,000 | | | | 64 | |
| | Mobile Mini, Inc., 7.875%, 12/1/20 | | | 485,000 | | | | 532 | |
| | Trans Union LLC/TransUnion Financing Corp., 11.375%, 6/15/18 | | | 290,000 | | | | 338 | |
| | | | | | | | | | |
| | Total | | | | | | | 1,598 | |
| | | | | | | | | | |
| | | |
| | Technology (0.3%) | | | | | | | | |
| | Amkor Technology, Inc., 6.375%, 10/1/22 144A | | | 165,000 | | | | 163 | |
| | Amkor Technology, Inc., 6.625%, 6/1/21 | | | 280,000 | | | | 279 | |
| | Equinix, Inc., 7.00%, 7/15/21 | | | 245,000 | | | | 272 | |
| | Equinix, Inc., 8.125%, 3/1/18 | | | 280,000 | | | | 309 | |
| | Fidelity National Information Services, Inc., 5.00%, 3/15/22 | | | 935,000 | | | | 1,003 | |
| | First Data Corp., 6.75%, 11/1/20 144A | | | 305,000 | | | | 308 | |
| | First Data Corp., 7.375%, 6/15/19 144A | | | 400,000 | | | | 414 | |
| | First Data Corp., 8.25%, 1/15/21 144A | | | 170,000 | | | | 170 | |
| | First Data Corp., 9.875%, 9/24/15 | | | 280,000 | | | | 286 | |
| (c) | | First Data Corp., 10.55%, 9/24/15 | | | 496,424 | | | | 508 | |
| | Freescale Semiconductor, Inc., 10.125%, 3/15/18 144A | | | 467,000 | | | | 516 | |
| | Iron Mountain, Inc., 7.75%, 10/1/19 | | | 255,000 | | | | 288 | |
| | Iron Mountain, Inc., 8.375%, 8/15/21 | | | 50,000 | | | | 55 | |
| | Jabil Circuit, Inc., 4.70%, 9/15/22 | | | 275,000 | | | | 289 | |
| | MEMC Electronic Materials, Inc., 7.75%, 4/1/19 | | | 155,000 | | | | 130 | |
| | NCR Corp., 4.625%, 2/15/21 144A | | | 580,000 | | | | 580 | |
| | NCR Corp., 5.00%, 7/15/22 144A | | | 85,000 | | | | 86 | |
| | Nuance Communications, Inc., 5.375%, 8/15/20 144A | | | 310,000 | | | | 324 | |
| | Seagate HDD Cayman, 7.75%, 12/15/18 | | | 290,000 | | | | 319 | |
| | SunGard Data Systems, Inc., 7.375%, 11/15/18 | | | 380,000 | | | | 407 | |
The Accompanying Notes are an Integral Part of the Financial Statements.
Balanced Portfolio
| | | | | | | | | | |
| | | Below Investment Grade Segment (6.8%) | | Shares/ $ Par | | | Value
$ (000’s) | |
| | | |
| | Technology continued | | | | | | | | |
| | SunGard Data Systems, Inc., 7.625%, 11/15/20 | | | 240,000 | | | | 262 | |
| | West Corp., 11.00%, 10/15/16 | | | 195,000 | | | | 203 | |
| | | | | | | | | | |
| | Total | | | | | | | 7,171 | |
| | | | | | | | | | |
| | | |
| | Telecommunications (0.6%) | | | | | | | | |
| | Cincinnati Bell, Inc., 8.25%, 10/15/17 | | | 435,000 | | | | 469 | |
| | Clearwire Communications LLC/Clearwire Finance, Inc., 8.25%, 12/1/40 144A | | | 195,000 | | | | 214 | |
| | Clearwire Communications LLC/Clearwire Finance, Inc., 12.00%, 12/1/15 144A | | | 195,000 | | | | 210 | |
| | Clearwire Communications LLC/Clearwire Finance, Inc., 14.75%, 12/1/16 144A | | | 275,000 | | | | 377 | |
| | Cricket Communications, Inc., 7.75%, 10/15/20 | | | 540,000 | | | | 551 | |
| | Crown Castle International Corp., 5.25%, 1/15/23 144A | | | 270,000 | | | | 289 | |
| | CyrusOne LP/CyrusOne Finance Corp., 6.375%, 11/15/22 144A | | | 100,000 | | | | 104 | |
| | Digicel Group, Ltd., 8.25%, 9/30/20 144A | | | 135,000 | | | | 148 | |
| | Frontier Communications Corp., 8.125%, 10/1/18 | | | 105,000 | | | | 121 | |
| | Frontier Communications Corp., 8.25%, 4/15/17 | | | 175,000 | | | | 202 | |
| | Frontier Communications Corp., 8.50%, 4/15/20 | | | 385,000 | | | | 443 | |
| | Frontier Communications Corp., 8.75%, 4/15/22 | | | 160,000 | | | | 186 | |
| | Frontier Communications Corp., 9.25%, 7/1/21 | | | 230,000 | | | | 270 | |
| | GCI, Inc., 8.625%, 11/15/19 | | | 555,000 | | | | 590 | |
| | MetroPCS Wireless, Inc., 6.625%, 11/15/20 | | | 245,000 | | | | 260 | |
| | MetroPCS Wireless, Inc., 7.875%, 9/1/18 | | | 545,000 | | | | 590 | |
| | NII Capital Corp., 7.625%, 4/1/21 | | | 475,000 | | | | 360 | |
| | NII Capital Corp., 8.875%, 12/15/19 | | | 905,000 | | | | 719 | |
| | PAETEC Holding Corp., 8.875%, 6/30/17 | | | 220,000 | | | | 236 | |
| | SBA Communications Corp., 5.625%, 10/1/19 144A | | | 250,000 | | | | 262 | |
| | SBA Telecommunications, Inc., 5.75%, 7/15/20 144A | | | 200,000 | | | | 212 | |
| | SBA Telecommunications, Inc., 8.25%, 8/15/19 | | | 150,000 | | | | 168 | |
| | Sprint Capital Corp., 6.90%, 5/1/19 | | | 330,000 | | | | 360 | |
| | Sprint Nextel Corp., 6.00%, 12/1/16 | | | 200,000 | | | | 217 | |
| | Sprint Nextel Corp., 6.00%, 11/15/22 | | | 435,000 | | | | 447 | |
| | Sprint Nextel Corp., 7.00%, 3/1/20 144A | | | 225,000 | | | | 262 | |
| | Sprint Nextel Corp., 7.00%, 8/15/20 | | | 700,000 | | | | 765 | |
| | Sprint Nextel Corp., 8.375%, 8/15/17 | | | 575,000 | | | | 668 | |
| | Sprint Nextel Corp., 9.00%, 11/15/18 144A | | | 540,000 | | | | 667 | |
| | Sprint Nextel Corp., 9.125%, 3/1/17 | | | 225,000 | | | | 265 | |
| | Sprint Nextel Corp., 11.50%, 11/15/21 | | | 295,000 | | | | 401 | |
| | TW Telecom Holdings, Inc., 5.375%, 10/1/22 144A | | | 195,000 | | | | 204 | |
| (c) | | Wind Acquisition Holding Finance SA, 12.25%, 7/15/17 144A | | | 584,407 | | | | 596 | |
| | Windstream Corp., 7.00%, 3/15/19 | | | 215,000 | | | | 220 | |
| | Windstream Corp., 7.75%, 10/15/20 | | | 540,000 | | | | 583 | |
| | Windstream Corp., 7.875%, 11/1/17 | | | 225,000 | | | | 253 | |
| | | | | | | | | | |
| | Total | | | | | | | 12,889 | |
| | | | | | | | | | |
| | | |
| | Transportation (0.0%) | | | | | | | | |
| | Continental Airlines, Inc., 6.75%, 9/15/15 144A | | | 295,000 | | | | 310 | |
| | | | | | | | | | |
| | | Below Investment Grade Segment (6.8%) | | Shares/ $ Par | | | Value $ (000’s) | |
| | | |
| | Transportation continued | | | | | | | | |
| | Kansas City Southern de Mexico SAB de CV, 8.00%, 2/1/18 | | | 230,000 | | | | 253 | |
| | | | | | | | | | |
| | Total | | | | | | | 563 | |
| | | | | | | | | | |
| | | |
| | Utilities (0.3%) | | | | | | | | |
| | The AES Corp., 7.75%, 10/15/15 | | | 160,000 | | | | 180 | |
| | The AES Corp., 8.00%, 10/15/17 | | | 640,000 | | | | 739 | |
| | The AES Corp., 8.00%, 6/1/20 | | | 100,000 | | | | 115 | |
| | Calpine Corp., 7.50%, 2/15/21 144A | | | 223,000 | | | | 246 | |
| | Calpine Corp., 7.875%, 7/31/20 144A | | | 410,000 | | | | 460 | |
| | DPL, Inc., 6.50%, 10/15/16 | | | 200,000 | | | | 212 | |
| | DPL, Inc., 7.25%, 10/15/21 | | | 135,000 | | | | 144 | |
| | GenOn Americas Generation LLC, 8.50%, 10/1/21 | | | 200,000 | | | | 228 | |
| | IPALCO Enterprises, Inc., 5.00%, 5/1/18 | | | 1,200,000 | | | | 1,257 | |
| | NRG Energy, Inc., 7.625%, 1/15/18 | | | 415,000 | | | | 461 | |
| | NRG Energy, Inc., 7.625%, 5/15/19 | | | 330,000 | | | | 353 | |
| | NRG Energy, Inc., 8.25%, 9/1/20 | | | 35,000 | | | | 39 | |
| | NV Energy, Inc., 6.25%, 11/15/20 | | | 340,000 | | | | 400 | |
| | Puget Energy, Inc., 5.625%, 7/15/22 | | | 1,470,000 | | | | 1,583 | |
| | | | | | | | | | |
| | Total | | | | | | | 6,417 | |
| | | | | | | | | | |
| | | |
| | Total Below Investment Grade Segment | | | | | | | | |
| | (Cost: $144,208) | | | | | | | 151,890 | |
| | | | | | | | | | |
| | | |
| | | Investment Companies (12.3%) | | | | | | |
| | | |
| | Investment Companies (12.3%) | | | | | | | | |
| | iShares Barclays MBS Bond Fund | | | 162,207 | | | | 17,518 | |
| | iShares MSCI EAFE Index Fund | | | 340,930 | | | | 19,372 | |
| | iShares MSCI Emerging Markets Index | | | 76,960 | | | | 3,413 | |
| | iShares Russell 2000 Index Fund | | | 121,830 | | | | 10,269 | |
| | iShares Russell Midcap Index Fund | | | 41,662 | | | | 4,712 | |
| | Market Vectors Junior Gold Miners | | | 33,400 | | | | 661 | |
| (q) | | Northwestern Mutual Series Fund, Inc., Emerging Markets Equity Portfolio | | | 4,984,386 | | | | 5,273 | |
| (q) | | Northwestern Mutual Series Fund, Inc., International Equity Portfolio | | | 26,381,905 | | | | 47,329 | |
| (q) | | Northwestern Mutual Series Fund, Inc., Research International Core Portfolio | | | 128,571,137 | | | | 106,843 | |
| | SPDR S&P Biotech | | | 18,200 | | | | 1,600 | |
| | SPDR S&P MidCap 400 ETF Trust | | | 178,838 | | | | 33,212 | |
| | Vanguard Emerging Markets | | | 222,500 | | | | 9,908 | |
| | Vanguard MSCI EAFE | | | 406,240 | | | | 14,312 | |
| | | | | | | | | | |
| | | |
| | Total Investment Companies | | | | | | | | |
| | (Cost: $246,102) | | | | | | | 274,422 | |
| | | | | | | | | | |
The Accompanying Notes are an Integral Part of the Financial Statements.
Balanced Portfolio
| | | | | | | | | | |
| | | Short-Term Investments (14.3%) | | Shares/ $ Par | | | Value $ (000’s) | |
| | | |
| | Autos (0.9%) | | | | | | | | |
| | American Honda Finance Corp., 0.15%, 3/25/13 | | | 10,000,000 | | | | 9,994 | |
| | American Honda Finance Corp., 0.17%, 2/5/13 | | | 9,000,000 | | | | 8,999 | |
| | | | | | | | | | |
| | Total | | | | | | | 18,993 | |
| | | | | | | | | | |
| | | |
| | Commercial Banks Non-US (1.6%) | | | | | | | | |
| | Bank of Nova Scotia/Houston, 0.745%, 10/18/13 | | | 5,000,000 | | | | 5,016 | |
| | Royal Bank of Canada, 0.07%, 1/25/13 | | | 10,000,000 | | | | 10,000 | |
| (b) | | Toronto Dominion Holdings USA, Inc., 0.18%, 1/3/13 | | | 20,000,000 | | | | 20,000 | |
| | | | | | | | | | |
| | Total | | | | | | | 35,016 | |
| | | | | | | | | | |
| | | |
| | Commercial Banks US (1.0%) | | | | | | | | |
| | Bank of America NA, 0.25%, 2/1/13 | | | 10,000,000 | | | | 10,000 | |
| | BP Capital Markets PLC, 0.512%, 2/8/13 | | | 7,000,000 | | | | 7,000 | |
| (b) | | BP Capital Markets PLC, 0.512%, 5/7/13 | | | 4,800,000 | | | | 4,805 | |
| | | | | | | | | | |
| | Total | | | | | | | 21,805 | |
| | | | | | | | | | |
| | | |
| | Consumer Products/Retailing (0.4%) | | | | | | | | |
| | Wal-Mart Stores, Inc., 0.10%, 1/30/13 | | | 10,000,000 | | | | 9,999 | |
| | | | | | | | | | |
| | Total | | | | | | | 9,999 | |
| | | | | | | | | | |
| | | |
| | Electric Utilities (0.9%) | | | | | | | | |
| | Emerson Electric Co., 0.12%, 1/14/13 | | | 10,000,000 | | | | 9,999 | |
| | Emerson Electric Co., 0.15%, 2/25/13 | | | 10,000,000 | | | | 9,998 | |
| | | | | | | | | | |
| | Total | | | | | | | 19,997 | |
| | | | | | | | | | |
| | | |
| | Electronics (0.5%) | | | | | | | | |
| | International Business Machines Corp., 0.05%, 1/2/13 | | | 10,800,000 | | | | 10,800 | |
| | | | | | | | | | |
| | Total | | | | | | | 10,800 | |
| | | | | | | | | | |
| | | |
| | Federal Government & Agencies (1.3%) | | | | | | | | |
| (b) | | Federal Home Loan Banks, 0.12%, 2/20/13 | | | 20,000,000 | | | | 19,999 | |
| | Federal Home Loan Mortgage Corp., 0.13%, 2/25/13 | | | 10,000,000 | | | | 10,000 | |
| | | | | | | | | | |
| | Total | | | | | | | 29,999 | |
| | | | | | | | | | |
| | | |
| | Finance Services (1.8%) | | | | | | | | |
| | Alpine Securitization Corp., 0.18%, 1/2/13 | | | 5,000,000 | | | | 5,000 | |
| (b) | | Alpine Securitization Corp., 0.18%, 1/22/13 | | | 15,000,000 | | | | 14,998 | |
| (b) | | Govco LLC, 0.22%, 1/22/13 | | | 20,000,000 | | | | 19,998 | |
| | | | | | | | | | |
| | Total | | | | | | | 39,996 | |
| | | | | | | | | | |
| | | | | | | | | | |
| | | Short-Term Investments (14.3%) | | Shares/ $ Par | | | Value $ (000’s) | |
| | | |
| | Information Technology (0.9%) | | | | | | | | |
| | Google, Inc., 0.11%, 2/4/13 | | | 10,000,000 | | | | 9,999 | |
| | Google, Inc., 0.12%, 2/12/13 | | | 10,000,000 | | | | 9,998 | |
| | | | | | | | | | |
| | Total | | | | | | | 19,997 | |
| | | | | | | | | | |
| | | |
| | Machinery (0.9%) | | | | | | | | |
| | John Deere Canada ULC, 0.12%, 2/19/13 | | | 9,745,000 | | | | 9,743 | |
| | John Deere Canada ULC, 0.15%, 1/24/13 | | | 10,000,000 | | | | 9,999 | |
| | | | | | | | | | |
| | Total | | | | | | | 19,742 | |
| | | | | | | | | | |
| |
| | Miscellaneous Business Credit Institutions (0.9%) | |
| | General Electric Capital Corp., 0.12%, 3/18/13 | | | 10,000,000 | | | | 9,997 | |
| | General Electric Capital Corp., 1.016%, 4/24/14 | | | 10,000,000 | | | | 10,073 | |
| | | | | | | | | | |
| | Total | | | | | | | 20,070 | |
| | | | | | | | | | |
| | | |
| | Personal Credit Institutions (2.2%) | | | | | | | | |
| | Chariot Funding LLC, 0.19%, 1/28/13 | | | 10,000,000 | | | | 9,999 | |
| | Old Line Funding LLC, 0.05%, 1/3/13 | | | 10,000,000 | | | | 10,000 | |
| | Old Line Funding LLC, 0.19%, 3/25/13 | | | 10,000,000 | | | | 9,997 | |
| | Straight-A Funding LLC, 0.17%, 2/6/13 | | | 10,000,000 | | | | 9,998 | |
| | Straight-A Funding LLC, 0.19%, 3/27/13 | | | 10,000,000 | | | | 9,996 | |
| | | | | | | | | | |
| | Total | | | | | | | 49,990 | |
| | | | | | | | | | |
| | | |
| | Restaurants (0.8%) | | | | | | | | |
| (b) | | Darden Restaurants, Inc., 0.28%, 1/2/13 | | | 18,800,000 | | | | 18,800 | |
| | | | | | | | | | |
| | Total | | | | | | | 18,800 | |
| | | | | | | | | | |
| | | |
| | Short Term Business Credit (0.2%) | | | | | | | | |
| (k) | | Sheffield Receivables Corp., 0.17%, 1/16/13 | | | 5,000,000 | | | | 5,000 | |
| | | | | | | | | | |
| | Total | | | | | | | 5,000 | |
| | | | | | | | | | |
| | | |
| | Total Short-Term Investments | | | | | | | | |
| | (Cost: $320,123) | | | | | | | 320,204 | |
| | | | | | | | | | |
| | | |
| | Total Investments (102.1%) | | | | | | | | |
| | (Cost: $2,139,346)(a) | | | | | | | 2,287,086 | |
| | | | | | | | | | |
| | Other Assets, Less | | | | | | | | |
| | Liabilities (-2.1%) | | | | | | | (46,854 | ) |
| | | | | | | | | | |
| | Net Assets (100.0%) | | | | | | | 2,240,232 | |
| | | | | | | | | | |
The Accompanying Notes are an Integral Part of the Financial Statements.
Balanced Portfolio
ADR after the name of a security represents—American Depositary Receipt.
144A after the name of a security represents a security exempt from registration under Rule 144A of the Securities Act of 1933. These securities may be resold as transactions exempt from registration, normally to qualified institutional buyers. At December 31, 2012 the value of these securities (in thousands) was $92,199 representing 4.1% of the net assets.
IO — Interest Only Security
GO — General Obligation
RB — Revenue Bond
FHA — Federal Housing Authority
GNMA — Government National Mortgage Association
PSF — Permanent School Fund
| (a) | At December 31, 2012 the aggregate cost of securities for federal tax purposes (in thousands) was $2,143,835 and the net unrealized appreciation of investments based on that cost was $143,251 which is comprised of $167,559 aggregate gross unrealized appreciation and $24,308 aggregate gross unrealized depreciation. |
| (b) | All or a portion of the securities have been pledged as collateral for open futures positions or when-issued securities. Information regarding open futures contracts as of period end is summarized below. |
| | | | | | | | |
| Issuer (000’s) | | Number of Contracts | | Expiration Date | | Unrealized Appreciation/ (Depreciation) (000’s) | |
British Pound Currency Futures (Short) (Total Notional Value at December 31, 2012, $22,593) | | 225 | | 3/13 | | $ | (245 | ) |
S&P 500 Mini Index Futures (Long) (Total Notional Value at December 31, 2012, $73,606) | | 1,031 | | 3/13 | | | (402 | ) |
US Five Year Treasury Note Futures (Long) (Total Notional Value at December 31, 2012, $8,356) | | 67 | | 3/13 | | | (20 | ) |
US Long Treasury Bond Futures (Short) (Total Notional Value at December 31, 2012, $30,525) | | 205 | | 3/13 | | | 288 | |
US Ten Year Treasury Note Futures (Short) (Total Notional Value at December 31, 2012, $23,445) | | 176 | | 3/13 | | | 75 | |
US Two Year Treasury Note Futures (Long) (Total Notional Value at December 31, 2012, $16,537) | | 75 | | 3/13 | | | (3 | ) |
US Ultra Long Treasury Bond Futures (Long) (Total Notional Value at December 31, 2012, $992) | | 6 | | 3/13 | | | (16 | ) |
| (f) | Foreign Bond — par value is foreign denominated |
— Federated Republic of Brazil – Brazilian Real
— Morgan Stanley – Brazilian Real
| (g) | All or portion of the securities have been loaned. See Note 4G in the Notes to Financial Statements. |
| (h) | Forward foreign currency contracts outstanding on December 31, 2012. |
| | | | | | | | | | | | | | | | | | | | |
| Type | | Counterparty | | Currency | | Principal
Amount
Covered by Contract (000’s) | | Settlement
Month | | Unrealized
Appreciation
(000’s) | | | Unrealized
(Depreciation)
(000’s) | | | Net Unrealized Appreciation/ (Depreciation)
(000’s) | |
Sell | | Barclays Bank PLC | | EUR | | 28,750 | | 2/13 | | $ | - | | | $ | (738 | ) | | $ | (738 | ) |
| | | | | | | | | | | | | | | | | | | | |
| | | | | | | | | | $ | - | | | $ | (738 | ) | | $ | (738 | ) |
| | | | | | | | | | | | | | | | | | | | |
EUR — Euro
| (j) | Swap agreements outstanding on December 31, 2012. |
Total Return Swaps
| | | | | | | | | | | | | | |
| Reference Entity | | Counterparty | | Payment Made
by the Fund | | Payment Received by the Fund | | Expiration Date | | Notional Amount (000’s) | | Unrealized Appreciation/ (Depreciation) (000’s) | |
MSCI Daily Net EAFE Index Total Return | | Credit Suisse International | | 3-Month USD LIBOR -15 Basis Points (Bps) | | MSCI Daily Net EAFE Index Total Return | | 8/13 | | 35,744 | | $ | 2,590 | |
Russell 2000 Growth Index Total Return | | Credit Suisse International | | Russell 2000 Growth Index Total Return | | 3-Month USD LIBOR -82 Bps | | 5/13 | | 30,192 | | | (1,608 | ) |
The Accompanying Notes are an Integral Part of the Financial Statements.
Balanced Portfolio
| | | | | | | | | | | | | | |
| Reference Entity | | Counterparty | | Payment Made by the Fund | | Payment Received by the Fund | | Expiration Date | | Notional Amount (000’s) | | Unrealized Appreciation/ (Depreciation) (000’s) | |
Russell 2000 Value Index Total Return | | Credit Suisse International | | 3-Month USD LIBOR - 70 Bps | | Russell 2000 Value Index Total Return | | 5/13 | | 31,065 | | $ | 2,054 | |
Russell Midcap Growth Index Total Return | | Bank of America N.A. | | Russell Midcap Growth Index Total Return | | 3-Month USD LIBOR - 33 Bps | | 5/13 | | 87,929 | | | (3,319 | ) |
Russell Midcap Index Total Return | | Credit Suisse International | | 3-Month USD LIBOR - 15 Bps | | Russell Midcap Index Total Return | | 8/13 | | 10,044 | | | 526 | |
Russell Midcap Value Index Total Return | | Bank of America N.A. | | 3-Month USD LIBOR - 26 Bps | | Russell Midcap Value Index Total Return | | 5/13 | | 92,029 | | | 3,850 | |
| | | | | | | | | | | | | | |
| | | | | | | | | | | | $ | 4,093 | |
| | | | | | | | | | | | | | |
| (k) | Securities with an aggregate value of $5,000 (in thousands) have been pledged as collateral for swap contracts outstanding on December 31, 2012. |
| (n) | Security valued in good faith by the Board of Directors. |
The following is a summary of the inputs used in valuing the Portfolio’s assets and liabilities at December 31, 2012. See Note 3 for additional information on portfolio valuation.
| | | | | | | | | | | | | | |
| | �� | Valuation Inputs | | | |
| Description | | Level 1 – Quoted Prices | | | Level 2 – Other Significant Observable Inputs | | | Level 3 – Significant Unobservable Inputs | | | |
| | | (Amounts in thousands) | | | |
Assets: | | | | | | | | | | | | | | |
Domestic Common Stocks | | $ | 669,937 | | | $ | - | | | $ | 65 | | | |
Foreign Common Stocks | | | - | | | | - | | | | 6 | | | |
Preferred Stocks | | | 1,146 | | | | 351 | | | | - | | | |
Government & US Agency Bonds | | | - | | | | 321,307 | | | | - | | | |
Foreign Bonds | | | - | | | | 3,268 | | | | - | | | |
Municipal Bonds | | | - | | | | 18,881 | | | | - | | | |
Corporate Bonds | | | - | | | | 351,206 | | | | - | | | |
Structured Products | | | - | | | | 322,227 | | | | 4,066 | | | |
Investment Companies | | | 274,422 | | | | - | | | | - | | | |
Short-Term Investments | | | - | | | | 320,204 | | | | - | | | |
Other Financial Instruments^ | | | | | | | | | | | | | | |
Futures | | | 363 | | | | - | | | | - | | | |
Total Return Swaps | | | - | | | | 9,020 | | | | - | | | |
Liabilities: | | | | | | | | | | | | | | |
Other Financial Instruments^ | | | | | | | | | | | | | | |
Futures | | | (686 | ) | | | - | | | | - | | | |
Forward Currency Contracts | | | - | | | | (738 | ) | | | - | | | |
Total Return Swaps | | | - | | | | (4,927 | ) | | | - | | | |
Total | | $ | 945,182 | | | $ | 1,340,799 | | | $ | 4,137 | | | |
^ Other financial instruments are derivative instruments such as futures, forwards, written options and swaps contracts, which are valued at the unrealized appreciation (depreciation) on the instrument and short sales, which are valued at market value.
The Accompanying Notes are an Integral Part of the Financial Statements.
Asset Allocation Portfolio
| | | | |
| Objective: | | Portfolio Strategy: | | Net Assets: |
Realize as high a level of total return as is consistent with reasonable investment risk. | | Invest in the stock, bond and money market sectors, attempting to capitalize on the variation in return potential produced by the interaction of changing financial markets and economic conditions. | | $236 million |
Portfolio Overview
Mason Street Advisors acts as the investment adviser for the Asset Allocation Portfolio (the “Portfolio”). The Portfolio seeks to achieve its objective by investing in stock, bond and money market sectors. The Portfolio is tactically and strategically managed to capitalize on changing financial markets and economic conditions following a flexible policy of allocating assets across the three market sectors. The Portfolio may invest in options, futures, forwards, exchange-traded funds and swap agreements to gain exposure to certain markets, sectors or regions. Under normal market conditions, the Portfolio’s equity exposure will typically range between 55-75% of assets.
Market Overview
Equity markets finished the year with solid gains despite economic uncertainty and significant volatility. Throughout the year, investors shifted their focus from uncertainty regarding the pace of global economic growth to evaluating fiscal and economic stimulus measures implemented globally. The economic slowdown in China, fiscal and debt crises in Europe, and the slow pace of growth in the U.S. drove volatility. As these issues arose, policy makers responded with stimulus and financing measures that calmed markets. Ultimately, investors embraced risk, as record profit margins in the U.S. and remarkable cash flow generation propelled equity markets during the year. In that environment, mid cap stocks outperformed shares of large and small sized companies, while value stocks generally outperformed growth shares. For the year, returns for the S&P 500®, MidCap 400®, and SmallCap 600® Indices were 16.00%, 17.88%, and 16.33%, respectively.
In the fixed income market, bonds also delivered solid gains. Investment grade and high yield corporate bonds led the rally, as improving corporate balance sheets and record bond issuance sent investors looking for yield. Treasurys lagged during 2012 after strong gains in 2011 pushed Treasury yields to historic lows.
Portfolio Results
The Portfolio returned 11.02% for the twelve months ended December 31, 2012, trailing the 16.00% return of the broad stock market, as measured by the S&P 500® Index. The Portfolio also trailed the Asset Allocation Portfolio Blended Composite Benchmark return of 13.54%. (The benchmark weights are detailed in the “Benchmark Definitions” section of this annual report.) The Mixed-Asset Target Allocation Growth Funds peer group had an average return of 13.50%, according to Lipper® Analytical Services, Inc., an independent mutual fund ranking agency.
During the year, high level asset allocation decisions helped relative performance, while individual security selection within the underlying sleeves weighed on performance. Security selection weakness within the domestic equity portion of the Portfolio was the primary detractor from relative results, while weakness in the high yield portion of the Portfolio, which had an underweight to the lowest quality securities of the market, also held back Portfolio performance last year.
With respect to the Portfolio’s asset allocation decisions, several positions added to performance during the year. The Portfolio generated relative performance from having a higher allocation to equity during certain periods when stocks performed well and a lower allocation less equity when the market declined. These moves helped offset the Portfolio’s overall underweight position in equities, while delivering relative return with lower volatility.
Certain asset allocation decisions within the equity and fixed income portfolios also worked well. The Portfolio held an overweight in high yield bonds amid strong performance in the first half of the year and an overweight in emerging markets equity during the rally in the second half of the year.
During the period, the Portfolio made use of total return swap agreements with the intention of reducing the growth bias inherent in the Portfolio’s equity strategies. Use of these instruments helped relative results somewhat during a year in which growth generally underperformed value stocks.
Portfolio Manager Outlook
We are taking a cautious view going into 2013. The economic and fiscal policies that investors have come to expect in recent years can not continue forever. The record amounts of both fiscal and economic stimulus in recent years leave little room for additional policy measures. We have seen some early signs that policy may be shifting, albeit modestly. With interest rates at historic lows, the Federal Reserve could begin to signal that its bond buying programs used to lower interest rates could slow, as the long-term cost of keeping rates low may outweigh the short-term economic benefit. If growth in China and Europe pick up, higher commodity prices are likely to tax economic growth. Given the uncertainty, we anticipate remaining underweight in equity, overweight in cash and neutral within fixed income.
| | | | | | |
| | Asset Allocation Portfolio | | | 189 | |
Asset Allocation Portfolio
Relative Performance

| | | | | | | | | | | | |
Average Annual Total Returns
For Periods Ended December 31, 2012 | |
| | | 1 Year | | | 5 Years | | | 10 Years | |
Asset Allocation Portfolio | | | 11.02 | % | | | 2.17 | % | | | 6.63 | % |
S&P 500® Index | | | 16.00 | % | | | 1.66 | % | | | 7.10 | % |
Barclays® U.S. Aggregate Index | | | 4.22 | % | | | 5.95 | % | | | 5.18 | % |
Asset Allocation Portfolio Blended Composite Benchmark | | | 13.54 | % | | | 3.63 | % | | | 8.05 | % |
Lipper® Variable Insurance Products (VIP) Mixed Asset Target Allocation Growth Funds Average | | | 13.50 | % | | | 1.93 | % | | | 6.70 | % |
The performance data quoted represents past performance. Past performance is historical and does not guarantee future performance. Investment return and principal value will fluctuate, so that shares, when redeemed, may be worth more or less than their original cost. Current performance may be lower or higher than the performance data quoted. For the most recent month-end performance information visit www.northwesternmutual.com.
This chart assumes an initial investment of $10,000 made on 12/31/02. Returns shown include deductions for management and other portfolio expenses, and reinvestment of all dividends. Returns exclude deductions for separate account sale loads and account fees. Please refer to the Benchmark Definitions section of this report for information about the indices cited in the above chart and graph.
Investors should be aware of the risks of investments in foreign securities, particularly investments in securities of companies in developing nations. These include the risks of currency fluctuation, of political and economic instability and of less well-developed government supervision and regulation of business and industry practices, as well as differences in accounting standards. Small cap stocks also may carry additional risk. Smaller or newer issuers are more likely to realize more substantial growth as well as suffer more significant losses than larger or more established issuers. Investments in such companies can be both volatile and more speculative. Bonds and other debt obligations are affected by changes in interest rates, inflation risk and the creditworthiness of their issuers. High yield bonds generally have greater price swings and higher default risks than investment grade bonds.
The Portfolio may obtain its exposure to foreign securities by investing in other Series Fund portfolios (Underlying Portfolios). Each of the Underlying Portfolios has its own investment risks, and the Portfolio is indirectly exposed to all the risks of the Underlying Portfolios in which it invests, including that risk that an Underlying Portfolio will not perform as expected. To the extent that the Portfolio invests a significant portion of its assets in a single Underlying Portfolio, it will be particularly sensitive to the risks associated with that Underlying Portfolio, and changes in the value of that Underlying Portfolio may have a significant effect on the Portfolio’s net asset value. The Portfolio will bear a pro rata share of the Underlying Portfolio’s expenses.
The Portfolio may use derivative instruments to gain exposure to certain markets, sectors or regions as alternatives to direct investments, to adjust the Portfolio for the adviser’s view on style or term structure and duration, to provide increased flexibility in asset allocation, to earn income and to otherwise seek to enhance returns or to hedge foreign currency exposure. Use of these instruments may involve certain costs and risks such as liquidity risk, interest rate risk, market risk, credit risk, management risk and the risk of mispricing or improper valuation. Certain derivatives involve leverage, which could magnify losses, and portfolios investing in derivatives could lose more than the principal amount invested in those investments.
| | | | |
| 190 | | Asset Allocation Portfolio | | |
Asset Allocation Portfolio
Top 5 Equity Holdings 12/31/12
| | |
| Security Description | | % of Net Assets |
Northwestern Mutual Series Fund, Inc., Research International Core Portfolio | | 7.0% |
Northwestern Mutual Series Fund, Inc., International Equity Portfolio | | 3.1% |
SPDR S&P MidCap 400 ETF Trust | | 1.4% |
iShares MSCI EAFE Index Fund | | 1.4% |
Apple, Inc. | | 1.2% |
Top 5 Fixed Income Holdings 12/31/12
| | |
| Security Description | | % of Net Assets |
US Treasury, Various | | 7.8% |
Federal Home Loan Mortgage Corp., Various | | 4.5% |
Federal National Mortgage Association, Various | | 2.4% |
Sprint Nextel Corp., Various | | 0.2% |
DISH DBS Corp., Various | | 0.2% |
Sector Allocation 12/31/12

Sector Allocation is based on Net Assets.
Sector Allocation and Top 10 Holdings are subject to change.
| | | | | | |
| | Asset Allocation Portfolio | | | 191 | |
Asset Allocation Portfolio
Schedule of Investments
December 31, 2012
| | | | | | | | | | |
| | | Domestic Common Stocks and Warrants (39.9%) | | Shares/ $ Par | | | Value $ (000’s) | |
| | | |
| | Large Cap Common Stocks (27.9%) | | | | | | | | |
| | | |
| | Consumer Discretionary (3.1%) | | | | | | | | |
| | Comcast Corp. - Class A | | | 25,275 | | | | 945 | |
| * | | Delphi Automotive PLC | | | 15,900 | | | | 608 | |
| * | | Dollar General Corp. | | | 17,600 | | | | 776 | |
| | Las Vegas Sands Corp. | | | 10,625 | | | | 490 | |
| | Macy’s, Inc. | | | 22,719 | | | | 887 | |
| | News Corp. - Class A | | | 43,400 | | | | 1,108 | |
| | Starbucks Corp. | | | 10,675 | | | | 572 | |
| | Target Corp. | | | 14,075 | | | | 833 | |
| | Viacom, Inc. - Class B | | | 20,450 | | | | 1,079 | |
| | | | | | | | | | |
| | Total | | | | | | | 7,298 | |
| | | | | | | | | | |
| | Consumer Staples (2.1%) | | | | | | | | |
| | Costco Wholesale Corp. | | | 4,125 | | | | 407 | |
| | CVS Caremark Corp. | | | 22,130 | | | | 1,070 | |
| | The Estee Lauder Cos., Inc. - Class A | | | 7,050 | | | | 422 | |
| | Mead Johnson Nutrition Co. | | | 11,884 | | | | 783 | |
| | PepsiCo, Inc. | | | 12,650 | | | | 866 | |
| | Philip Morris International, Inc. | | | 17,525 | | | | 1,466 | |
| | | | | | | | | | |
| | Total | | | | | | | 5,014 | |
| | | | | | | | | | |
| | | |
| | Energy (3.5%) | | | | | | | | |
| | Anadarko Petroleum Corp. | | | 15,350 | | | | 1,141 | |
| | Chevron Corp. | | | 16,450 | | | | 1,779 | |
| | Exxon Mobil Corp. | | | 21,025 | | | | 1,820 | |
| | National-Oilwell Varco, Inc. | | | 6,350 | | | | 434 | |
| | Occidental Petroleum Corp. | | | 12,200 | | | | 934 | |
| | Schlumberger, Ltd. | | | 15,625 | | | | 1,083 | |
| * | | Weatherford International, Ltd. | | | 62,105 | | | | 695 | |
| * | | Whiting Petroleum Corp. | | | 10,150 | | | | 440 | |
| | | | | | | | | | |
| | Total | | | | | | | 8,326 | |
| | | | | | | | | | |
| | | |
| | Financials (4.6%) | | | | | | | | |
| | American Express Co. | | | 16,500 | | | | 948 | |
| | American Tower Corp. | | | 17,275 | | | | 1,335 | |
| | BlackRock, Inc. | | | 2,800 | | | | 579 | |
| | Citigroup, Inc. | | | 37,225 | | | | 1,473 | |
| | The Goldman Sachs Group, Inc. | | | 6,800 | | | | 867 | |
| | Invesco, Ltd. | | | 32,900 | | | | 858 | |
| | JPMorgan Chase & Co. | | | 42,825 | | | | 1,883 | |
| | MetLife, Inc. | | | 19,150 | | | | 631 | |
| | PNC Financial Services Group, Inc. | | | 10,925 | | | | 637 | |
| | Wells Fargo & Co. | | | 48,250 | | | | 1,649 | |
| | | | | | | | | | |
| | Total | | | | | | | 10,860 | |
| | | | | | | | | | |
| | | |
| | Health Care (3.3%) | | | | | | | | |
| | Abbott Laboratories | | | 7,550 | | | | 495 | |
| * | | Alexion Pharmaceuticals, Inc. | | | 3,825 | | | | 359 | |
| | AmerisourceBergen Corp. | | | 27,408 | | | | 1,183 | |
| | | | | | | | | | |
| | | Domestic Common Stocks and Warrants (39.9%) | | Shares/ $ Par | | | Value $ (000’s) | |
| | | |
| | Health Care continued | | | | | | | | |
| * | | Biogen Idec, Inc. | | | 2,800 | | | | 411 | |
| | Eli Lilly and Co. | | | 6,850 | | | | 338 | |
| * | | Express Scripts Holding Co. | | | 10,139 | | | | 547 | |
| * | | Gilead Sciences, Inc. | | | 8,225 | | | | 604 | |
| | Johnson & Johnson | | | 24,175 | | | | 1,695 | |
| | Pfizer, Inc. | | | 39,325 | | | | 986 | |
| | UnitedHealth Group, Inc. | | | 14,850 | | | | 805 | |
| * | | Watson Pharmaceuticals, Inc. | | | 4,775 | | | | 411 | |
| | | | | | | | | | |
| | Total | | | | | | | 7,834 | |
| | | | | | | | | | |
| | | |
| | Industrials (3.5%) | | | | | | | | |
| | The Boeing Co. | | | 13,475 | | | | 1,015 | |
| | Cummins, Inc. | | | 6,802 | | | | 737 | |
| | Danaher Corp. | | | 16,425 | | | | 918 | |
| | FedEx Corp. | | | 11,740 | | | | 1,077 | |
| | General Electric Co. | | | 72,750 | | | | 1,527 | |
| | Precision Castparts Corp. | | | 3,968 | | | | 752 | |
| | SPX Corp. | | | 7,350 | | | | 516 | |
| | Union Pacific Corp. | | | 5,250 | | | | 660 | |
| | United Technologies Corp. | | | 12,375 | | | | 1,015 | |
| | | | | | | | | | |
| | Total | | | | | | | 8,217 | |
| | | | | | | | | | |
| | | |
| | Information Technology (5.8%) | | | | | | | | |
| | Apple, Inc. | | | 5,250 | | | | 2,798 | |
| | Broadcom Corp. - Class A | | | 19,075 | | | | 634 | |
| * | | Cognizant Technology Solutions Corp. - Class A | | | 8,225 | | | | 609 | |
| * | | eBay, Inc. | | | 7,150 | | | | 365 | |
| * | | EMC Corp. | | | 22,975 | | | | 581 | |
| * | | Google, Inc. - Class A | | | 1,400 | | | | 993 | |
| | Intel Corp. | | | 43,900 | | | | 906 | |
| | International Business Machines Corp. | | | 8,725 | | | | 1,671 | |
| | Microsoft Corp. | | | 64,800 | | | | 1,732 | |
| | Oracle Corp. | | | 31,700 | | | | 1,056 | |
| | Qualcomm, Inc. | | | 14,900 | | | | 924 | |
| | Visa, Inc. - Class A | | | 4,925 | | | | 747 | |
| * | | Yahoo!, Inc. | | | 29,800 | | | | 593 | |
| | | | | | | | | | |
| | Total | | | | | | | 13,609 | |
| | | | | | | | | | |
| | | |
| | Materials (1.1%) | | | | | | | | |
| | BHP Billiton, Ltd., ADR | | | 7,100 | | | | 557 | |
| | Celanese Corp. | | | 8,350 | | | | 372 | |
| | CF Industries Holdings, Inc. | | | 2,776 | | | | 564 | |
| | Monsanto Co. | | | 10,375 | | | | 982 | |
| | | | | | | | | | |
| | Total | | | | | | | 2,475 | |
| | | | | | | | | | |
| | | |
| | Telecommunication Services (0.3%) | | | | | | | | |
| | Vodafone Group PLC, ADR | | | 26,575 | | | | 669 | |
| | | | | | | | | | |
| | Total | | | | | | | 669 | |
| | | | | | | | | | |
The Accompanying Notes are an Integral Part of the Financial Statements.
| | | | |
| 192 | | Asset Allocation Portfolio | | |
Asset Allocation Portfolio
| | | | | | | | | | |
| | | Domestic Common Stocks and Warrants (39.9%) | | Shares/ $ Par | | | Value $ (000’s) | |
| | | |
| | Utilities (0.6%) | | | | | | | | |
| | American Water Works Co., Inc. | | | 36,800 | | | | 1,366 | |
| | | | | | | | | | |
| | Total | | | | | | | 1,366 | |
| | | | | | | | | | |
| | | |
| | Total Large Cap Common Stocks | | | | | | | 65,668 | |
| | | | | | | | | | |
| | | |
| | Mid Cap Common Stocks (8.6%) | | | | | | | | |
| | | |
| | Consumer Discretionary (1.9%) | | | | | | | | |
| * | | Bed Bath & Beyond, Inc. | | | 3,453 | | | | 193 | |
| * | | BorgWarner, Inc. | | | 4,302 | | | | 308 | |
| | Brunswick Corp. | | | 5,800 | | | | 169 | |
| | Chico’s FAS, Inc. | | | 22,135 | | | | 409 | |
| | Coach, Inc. | | | 2,600 | | | | 144 | |
| | Dick’s Sporting Goods, Inc. | | | 15,225 | | | | 693 | |
| | The Gap, Inc. | | | 3,800 | | | | 118 | |
| * | | LKQ Corp. | | | 20,158 | | | | 425 | |
| | Marriott International, Inc. - Class A | | | 3,893 | | | | 145 | |
| | The McGraw-Hill Cos., Inc. | | | 5,954 | | | | 325 | |
| * | | O’Reilly Automotive, Inc. | | | 3,567 | | | | 319 | |
| * | | Penn National Gaming, Inc. | | | 3,641 | | | | 179 | |
| | Polaris Industries, Inc. | | | 4,204 | | | | 354 | |
| | Ralph Lauren Corp. | | | 500 | | | | 75 | |
| | Ross Stores, Inc. | | | 4,665 | | | | 253 | |
| | Scripps Networks Interactive - Class A | | | 2,200 | | | | 127 | |
| | Ulta Salon, Cosmetics & Fragrance, Inc. | | | 2,100 | | | | 206 | |
| | Wynn Resorts, Ltd. | | | 800 | | | | 90 | |
| | | | | | | | | | |
| | Total | | | | | | | 4,532 | |
| | | | | | | | | | |
| | | |
| | Consumer Staples (0.9%) | | | | | | | | |
| | Beam, Inc. | | | 13,948 | | | | 852 | |
| | Church & Dwight Co., Inc. | | | 18,874 | | | | 1,011 | |
| | McCormick & Co., Inc. | | | 5,487 | | | | 349 | |
| | | | | | | | | | |
| | Total | | | | | | | 2,212 | |
| | | | | | | | | | |
| | | |
| | Energy (0.4%) | | | | | | | | |
| * | | Cameron International Corp. | | | 3,528 | | | | 199 | |
| * | | Concho Resources, Inc. | | | 2,374 | | | | 192 | |
| * | | FMC Technologies, Inc. | | | 3,501 | | | | 150 | |
| | Noble Energy, Inc. | | | 2,322 | | | | 236 | |
| * | | Southwestern Energy Co. | | | 2,962 | | | | 99 | |
| | | | | | | | | | |
| | Total | | | | | | | 876 | |
| | | | | | | | | | |
| | | |
| | Financials (0.4%) | | | | | | | | |
| * | | CBRE Group, Inc. | | | 14,740 | | | | 293 | |
| * | | E*TRADE Financial Corp. | | | 7,078 | | | | 64 | |
| * | | IntercontinentalExchange, Inc. | | | 1,552 | | | | 192 | |
| | Lazard, Ltd. - Class A | | | 3,586 | | | | 107 | |
| | Raymond James Financial, Inc. | | | 9,370 | | | | 361 | |
| | | | | | | | | | |
| | Total | | | | | | | 1,017 | |
| | | | | | | | | | |
| | | |
| | Health Care (0.9%) | | | | | | | | |
| * | | Catamaran Corp. | | | 5,800 | | | | 273 | |
| * | | Cerner Corp. | | | 2,728 | | | | 212 | |
| | | | | | | | | | |
| | | Domestic Common Stocks and Warrants (39.9%) | | Shares/ $ Par | | | Value $ (000’s) | |
| | | |
| | Health Care continued | | | | | | | | |
| * | | DaVita HealthCare Partners, Inc. | | | 2,339 | | | | 258 | |
| * | | IDEXX Laboratories, Inc. | | | 2,598 | | | | 241 | |
| * | | Mettler-Toledo International, Inc. | | | 1,198 | | | | 232 | |
| * | | Mylan, Inc. | | | 3,200 | | | | 88 | |
| | Perrigo Co. | | | 6,775 | | | | 705 | |
| * | | Vertex Pharmaceuticals, Inc. | | | 1,797 | | | | 75 | |
| | | | | | | | | | |
| | Total | | | | | | | 2,084 | |
| | | | | | | | | | |
| | | |
| | Industrials (1.6%) | | | | | | | | |
| * | | B/E Aerospace, Inc. | | | 7,764 | | | | 384 | |
| | Corrections Corp. of America | | | 11,478 | | | | 407 | |
| | Dover Corp. | | | 4,081 | | | | 268 | |
| * | | Fortune Brands Home & Security, Inc. | | | 3,100 | | | | 91 | |
| | Graco, Inc. | | | 7,831 | | | | 403 | |
| | Kansas City Southern | | | 4,163 | | | | 348 | |
| | Knight Transportation, Inc. | | | 7,954 | | | | 116 | |
| | MSC Industrial Direct Co., Inc. - Class A | | | 2,342 | | | | 177 | |
| * | | Owens Corning, Inc. | | | 5,354 | | | | 198 | |
| | Regal-Beloit Corp. | | | 2,953 | | | | 208 | |
| | Robert Half International, Inc. | | | 12,609 | | | | 401 | |
| | Roper Industries, Inc. | | | 2,601 | | | | 290 | |
| * | | WESCO International, Inc. | | | 7,031 | | | | 474 | |
| | | | | | | | | | |
| | Total | | | | | | | 3,765 | |
| | | | | | | | | | |
| | | |
| | Information Technology (1.8%) | | | | | | | | |
| * | | Alliance Data Systems Corp. | | | 3,101 | | | | 449 | |
| | Amphenol Corp. - Class A | | | 3,552 | | | | 230 | |
| * | | Aruba Networks, Inc. | | | 5,000 | | | | 104 | |
| | Avago Technologies, Ltd. | | | 18,956 | | | | 600 | |
| * | | Citrix Systems, Inc. | | | 3,449 | | | | 227 | |
| * | | F5 Networks, Inc. | | | 2,314 | | | | 225 | |
| * | | Fortinet, Inc. | | | 16,044 | | | | 338 | |
| * | | Freescale Semiconductor Holdings I, Ltd. | | | 8,601 | | | | 95 | |
| | Global Payments, Inc. | | | 9,625 | | | | 436 | |
| | Microchip Technology, Inc. | | | 5,936 | | | | 193 | |
| * | | NetApp, Inc. | | | 3,300 | | | | 111 | |
| * | | NetSuite, Inc. | | | 900 | | | | 60 | |
| * | | Red Hat, Inc. | | | 2,800 | | | | 148 | |
| * | | ServiceNow, Inc. | | | 1,465 | | | | 44 | |
| * | | Skyworks Solutions, Inc. | | | 8,950 | | | | 181 | |
| * | | Teradata Corp. | | | 1,950 | | | | 121 | |
| * | | TIBCO Software, Inc. | | | 6,550 | | | | 144 | |
| * | | VeriFone Systems, Inc. | | | 10,002 | | | | 297 | |
| * | | Zebra Technologies Corp. - Class A | | | 5,984 | | | | 235 | |
| | | | | | | | | | |
| | Total | | | | | | | 4,238 | |
| | | | | | | | | | |
| | | |
| | Materials (0.4%) | | | | | | | | |
| | Airgas, Inc. | | | 4,632 | | | | 423 | |
| | PPG Industries, Inc. | | | 2,490 | | | | 337 | |
| | Westlake Chemical Corp. | | | 2,189 | | | | 173 | |
| | | | | | | | | | |
| | Total | | | | | | | 933 | |
| | | | | | | | | | |
The Accompanying Notes are an Integral Part of the Financial Statements.
| | | | | | |
| | Asset Allocation Portfolio | | | 193 | |
Asset Allocation Portfolio
| | | | | | | | | | |
| | | Domestic Common Stocks and Warrants (39.9%) | | Shares/ $ Par | | | Value $ (000’s) | |
| | | |
| | Telecommunication Services (0.3%) | | | | | | | | |
| * | | SBA Communications Corp. - Class A | | | 8,329 | | | | 592 | |
| | | | | | | | | | |
| | Total | | | | | | | 592 | |
| | | | | | | | | | |
| | | |
| | Total Mid Cap Common Stocks | | | | | | | 20,249 | |
| | | | | | | | | | |
| | | |
| | Small Cap Common Stocks (3.4%) | | | | | | | | |
| | | |
| | Consumer Discretionary (0.4%) | | | | | | | | |
| * | | Bally Technologies, Inc. | | | 2,500 | | | | 112 | |
| * | | Chuy’s Holdings, Inc. | | | 2,100 | | | | 47 | |
| * | | Genesco, Inc. | | | 1,450 | | | | 80 | |
| * | | Grand Canyon Education, Inc. | | | 5,550 | | | | 130 | |
| * | | Hibbett Sports, Inc. | | | 1,550 | | | | 82 | |
| * | | Life Time Fitness, Inc. | | | 2,450 | | | | 121 | |
| * | | Motors Liquidation Co. GUC Trust | | | 295 | | | | 6 | |
| | Penske Automotive Group, Inc. | | | 2,800 | | | | 84 | |
| * | | Red Robin Gourmet Burgers, Inc. | | | 1,850 | | | | 65 | |
| * | | SHFL Entertainment, Inc. | | | 3,400 | | | | 49 | |
| * | | Vitamin Shoppe, Inc. | | | 1,600 | | | | 92 | |
| | | | | | | | | | |
| | Total | | | | | | | 868 | |
| | | | | | | | | | |
| | | |
| | Consumer Staples (0.0%) | | | | | | | | |
| * | | United Natural Foods, Inc. | | | 1,500 | | | | 80 | |
| | | | | | | | | | |
| | Total | | | | | | | 80 | |
| | | | | | | | | | |
| | | |
| | Energy (0.3%) | | | | | | | | |
| * | | Approach Resources, Inc. | | | 4,200 | | | | 105 | |
| * | | Dril-Quip, Inc. | | | 1,600 | | | | 117 | |
| | EXCO Resources, Inc. | | | 14,200 | | | | 96 | |
| * | | Gulfport Energy Corp. | | | 3,300 | | | | 126 | |
| * | | Hornbeck Offshore Services, Inc. | | | 2,500 | | | | 86 | |
| * | | Kodiak Oil & Gas Corp. | | | 9,950 | | | | 88 | |
| * | | Rosetta Resources, Inc. | | | 2,000 | | | | 91 | |
| | | | | | | | | | |
| | Total | | | | | | | 709 | |
| | | | | | | | | | |
| | | |
| | Financials (0.3%) | | | | | | | | |
| | Amreit, Inc., - Class B | | | 3,100 | | | | 53 | |
| | Boston Private Financial Holdings, Inc. | | | 13,750 | | | | 124 | |
| | East West Bancorp, Inc. | | | 7,350 | | | | 158 | |
| | Education Realty Trust, Inc. | | | 6,600 | | | | 70 | |
| | Greenhill & Co., Inc. | | | 2,450 | | | | 127 | |
| * | | Stifel Financial Corp. | | | 3,050 | | | | 98 | |
| | | | | | | | | | |
| | Total | | | | | | | 630 | |
| | | | | | | | | | |
| | | |
| | Health Care (0.6%) | | | | | | | | |
| * | | Akorn, Inc. | | | 6,250 | | | | 83 | |
| * | | Align Technology, Inc. | | | 2,566 | | | | 71 | |
| * | | Conceptus, Inc. | | | 2,450 | | | | 51 | |
| * | | DexCom, Inc. | | | 6,509 | | | | 89 | |
| * | | Endologix, Inc. | | | 6,538 | | | | 93 | |
| * | | Exact Sciences Corp. | | | 9,700 | | | | 103 | |
| * | | Fluidigm Corp. | | | 4,750 | | | | 68 | |
| | | | | | | | | | |
| | | Domestic Common Stocks and Warrants (39.9%) | | Shares/ $ Par | | | Value $ (000’s) | |
| | | |
| | Health Care continued | | | | | | | | |
| * | | Health Management Associates, Inc. - Class A | | | 9,950 | | | | 93 | |
| * | | HealthStream, Inc. | | | 3,450 | | | | 84 | |
| * | | HMS Holdings Corp. | | | 1,750 | | | | 45 | |
| * | | Impax Laboratories, Inc. | | | 6,300 | | | | 129 | |
| * | | IPC The Hospitalist Co. | | | 1,465 | | | | 58 | |
| * | | Jazz Pharmaceuticals PLC | | | 800 | | | | 42 | |
| * | | MAP Pharmaceuticals, Inc. | | | 5,450 | | | | 86 | |
| * | | Neogen Corp. | | | 1,350 | | | | 61 | |
| * | | Omnicell, Inc. | | | 5,902 | | | | 88 | |
| * | | Team Health Holdings, Inc. | | | 2,250 | | | | 65 | |
| | U.S. Physical Therapy, Inc. | | | 3,000 | | | | 83 | |
| | Universal Health Services, Inc. - Class B | | | 1,550 | | | | 75 | |
| | | | | | | | | | |
| | Total | | | | | | | 1,467 | |
| | | | | | | | | | |
| | | |
| | Industrials (0.8%) | | | | | | | | |
| | Actuant Corp. - Class A | | | 5,650 | | | | 158 | |
| * | | Beacon Roofing Supply, Inc. | | | 2,850 | | | | 95 | |
| | Celadon Group, Inc. | | | 5,750 | | | | 104 | |
| * | | Chart Industries, Inc. | | | 1,647 | | | | 110 | |
| * | | DXP Enterprises, Inc. | | | 1,500 | | | | 74 | |
| * | | Heritage-Crystal Clean, Inc. | | | 5,625 | | | | 84 | |
| * | | Hexcel Corp. | | | 5,050 | | | | 136 | |
| * | | Huron Consulting Group, Inc. | | | 3,550 | | | | 120 | |
| * | | The KEYW Holding Corp. | | | 8,228 | | | | 104 | |
| | Lindsay Corp. | | | 1,600 | | | | 128 | |
| | The Manitowoc Co., Inc. | | | 3,900 | | | | 61 | |
| * | | Mistras Group, Inc. | | | 3,400 | | | | 84 | |
| * | | NCI Building Systems, Inc. | | | 4,500 | | | | 63 | |
| * | | Oshkosh Corp. | | | 3,450 | | | | 102 | |
| * | | Performant Financial Corp. | | | 4,100 | | | | 41 | |
| | Snap-on, Inc. | | | 1,650 | | | | 130 | |
| | Sun Hydraulics Corp. | | | 3,000 | | | | 78 | |
| * | | Thermon Group Holdings, Inc. | | | 3,100 | | | | 70 | |
| | TransDigm Group, Inc. | | | 675 | | | | 92 | |
| | Valmont Industries, Inc. | | | 1,200 | | | | 164 | |
| | | | | | | | | | |
| | Total | | | | | | | 1,998 | |
| | | | | | | | | | |
| | | |
| | Information Technology (0.9%) | | | | | | | | |
| * | | Aspen Technology, Inc. | | | 2,800 | | | | 77 | |
| * | | BroadSoft, Inc. | | | 2,650 | | | | 96 | |
| * | | Calix, Inc. | | | 12,850 | | | | 99 | |
| * | | Cardtronics, Inc. | | | 3,200 | | | | 76 | |
| * | | Cavium, Inc. | | | 3,100 | | | | 97 | |
| * | | Cornerstone OnDemand, Inc. | | | 2,300 | | | | 68 | |
| * | | Diodes, Inc. | | | 6,450 | | | | 112 | |
| * | | EXA Corp. | | | 2,900 | | | | 28 | |
| * | | ExactTarget, Inc. | | | 2,250 | | | | 45 | |
| * | | EZchip Semiconductor, Ltd. | | | 1,800 | | | | 60 | |
| | FEI Co. | | | 2,550 | | | | 141 | |
| * | | Finisar Corp. | | | 4,300 | | | | 70 | |
| * | | InterXion Holding NV | | | 6,100 | | | | 145 | |
| * | | Microsemi Corp. | | | 4,800 | | | | 101 | |
| * | | MicroStrategy, Inc. - Class A | | | 600 | | | | 56 | |
| | MKS Instruments, Inc. | | | 3,300 | | | | 85 | |
| * | | Nanometrics, Inc. | | | 5,000 | | | | 72 | |
| * | | Proofpoint, Inc. | | | 1,900 | | | | 23 | |
The Accompanying Notes are an Integral Part of the Financial Statements.
| | | | |
| 194 | | Asset Allocation Portfolio | | |
Asset Allocation Portfolio
| | | | | | | | | | | | |
| | | Domestic Common Stocks and Warrants (39.9%) | | Shares/ $ Par | | | Value $ (000’s) | |
| | | |
| | Information Technology continued | | | | | | | | |
| * | | Sourcefire, Inc. | | | 1,150 | | | | 54 | |
| * | | SPS Commerce, Inc. | | | 3,850 | | | | 144 | |
| * | | Synacor, Inc. | | | 6,550 | | | | 36 | |
| * | | Synchronoss Technologies, Inc. | | | 6,850 | | | | 145 | |
| * | | Tangoe, Inc. | | | 8,600 | | | | 102 | |
| * | | The Ultimate Software Group, Inc. | | | 1,450 | | | | 137 | |
| | | | | | | | | | |
| | Total | | | | | | | 2,069 | |
| | | | | | | | | | |
| | | |
| | Materials (0.0%) | | | | | | | | |
| | Balchem Corp. | | | 2,750 | | | | 100 | |
| (n)* | | NewPage Group, Inc. | | | 220 | | | | 21 | |
| | | | | | | | | | |
| | Total | | | | | | | 121 | |
| | | | | | | | | | |
| | | |
| | Telecommunication Services (0.1%) | | | | | | | | |
| * | | tw telecom, Inc. | | | 5,500 | | | | 140 | |
| | | | | | | | | | |
| | Total | | | | | | | 140 | |
| | | | | | | | | | |
| | | |
| | Total Small Cap Common Stocks | | | | | | | 8,082 | |
| | | | | | | | | | |
| | | |
| | Total Domestic Common Stocks and Warrants | | | | | | | | |
| | (Cost: $83,002) | | | | | | | 93,999 | |
| | | | | | | | | | |
| | | | |
| | | Foreign Common Stocks (0.0%) | | Country | | | | | | |
| | | |
| | Materials (0.0%) | | | | | | | | |
| (n)* | | Catalyst Paper Corp. | | Canada | | | 936 | | | | 1 | |
| | | | | | | | | | | | |
| | | |
| | Total Foreign Common Stocks | | | | | | | | |
| | (Cost: $1) | | | | | | | 1 | |
| | | | | | | | | | | | |
| | | |
| | | Preferred Stocks (0.1%) | | | | | | |
| | | |
| | Financials (0.1%) | | | | | | | | |
| | Ally Financial, Inc, 7.00%, 2/4/13 144A | | | 91 | | | | 89 | |
| | Ally Financial, Inc., 8.50%, 5/15/16 | | | 4,589 | | | | 121 | |
| | GMAC Capital Trust I, 8.125%, 2/15/40 | | | 1,703 | | | | 45 | |
| | | | | | | | | | | | |
| | | |
| | Total Preferred Stocks | | | | | | | | |
| | (Cost: $220) | | | | | | | 255 | |
| | | | | | | | | | | | |
| | | |
| | | Investment Grade Segment (5.5%) | | | | | | |
| | | | |
| | Aerospace/Defense (0.1%) | | | | | | | | | | |
| | BAE Systems Holdings, Inc., 6.375%, 6/1/19 144A | | | 15,000 | | | | 18 | |
| | Boeing Capital Corp., 2.125%, 8/15/16 | | | 35,000 | | | | 36 | |
| | General Dynamics Corp., 2.25%, 11/15/22 | | | 50,000 | | | | 49 | |
| | L-3 Communications Corp., 5.20%, 10/15/19 | | | 45,000 | | | | 51 | |
| | Lockheed Martin Corp., 3.35%, 9/15/21 | | | 10,000 | | | | 11 | |
| | Meccanica Holdings USA, Inc., 6.25%, 1/15/40 144A | | | 15,000 | | | | 13 | |
| | | | | | | | | | | | |
| | Total | | | | | | | | | 178 | |
| | | | | | | | | | | | |
| | | | | | | | | | |
| | | Investment Grade Segment (5.5%) | | Shares/ $ Par | | | Value $ (000’s) | |
| | | |
| | Auto Manufacturing (0.2%) | | | | | | | | |
| | Daimler Finance North America LLC, 2.625%, 9/15/16 144A | | | 5,000 | | | | 5 | |
| | Daimler Finance North America LLC, 3.00%, 3/28/16 144A | | | 40,000 | | | | 42 | |
| | Ford Motor Co., 7.45%, 7/16/31 | | | 40,000 | | | | 51 | |
| | Ford Motor Credit Co. LLC, 3.00%, 6/12/17 | | | 45,000 | | | | 46 | |
| | Ford Motor Credit Co. LLC, 4.25%, 2/3/17 | | | 75,000 | | | | 80 | |
| | Ford Motor Credit Co. LLC, 5.00%, 5/15/18 | | | 15,000 | | | | 16 | |
| | Ford Motor Credit Co. LLC, 5.75%, 2/1/21 | | | 45,000 | | | | 52 | |
| | Ford Motor Credit Co. LLC, 8.125%, 1/15/20 | | | 20,000 | | | | 26 | |
| | PACCAR, Inc., 6.875%, 2/15/14 | | | 10,000 | | | | 11 | |
| | Toyota Motor Credit Corp., 1.75%, 5/22/17 | | | 70,000 | | | | 72 | |
| | Toyota Motor Credit Corp., 3.30%, 1/12/22 | | | 75,000 | | | | 81 | |
| | Volkswagen International Finance NV, 2.875%, 4/1/16 144A | | | 45,000 | | | | 47 | |
| | | | | | | | | | |
| | Total | | | | | | | 529 | |
| | | | | | | | | | |
| | | |
| | Banking (0.8%) | | | | | | | | |
| | Bank of America Corp., 3.625%, 3/17/16 | | | 35,000 | | | | 37 | |
| | Bank of America Corp., 3.75%, 7/12/16 | | | 10,000 | | | | 11 | |
| | Bank of America Corp., 5.75%, 12/1/17 | | | 20,000 | | | | 23 | |
| | Bank of Montreal, 2.55%, 11/6/22 | | | 60,000 | | | | 59 | |
| | The Bank of New York Mellon Corp., 3.55%, 9/23/21 | | | 80,000 | | | | 87 | |
| | Bank of Nova Scotia, 1.375%, 12/18/17 | | | 40,000 | | | | 40 | |
| | Citigroup, Inc., 3.953%, 6/15/16 | | | 200,000 | | | | 215 | |
| | Credit Suisse of New York, New York, 5.50%, 5/1/14 | | | 125,000 | | | | 133 | |
| | Fifth Third Bank, 4.75%, 2/1/15 | | | 45,000 | | | | 48 | |
| | The Goldman Sachs Group, Inc., 5.95%, 1/18/18 | | | 110,000 | | | | 128 | |
| | The Goldman Sachs Group, Inc., 6.15%, 4/1/18 | | | 50,000 | | | | 59 | |
| | HSBC Holdings PLC, 5.10%, 4/5/21 | | | 35,000 | | | | 41 | |
| | JPMorgan Chase & Co., 3.15%, 7/5/16 | | | 225,000 | | | | 238 | |
| | JPMorgan Chase & Co., 6.00%, 1/15/18 | | | 30,000 | | | | 36 | |
| | Merrill Lynch & Co., Inc., 6.22%, 9/15/26 | | | 20,000 | | | | 22 | |
| | Merrill Lynch & Co., Inc., 6.40%, 8/28/17 | | | 120,000 | | | | 141 | |
| | Morgan Stanley, 2.875%, 7/28/14 | | | 20,000 | | | | 21 | |
| | Morgan Stanley, 3.80%, 4/29/16 | | | 50,000 | | | | 53 | |
| | Morgan Stanley, 4.75%, 3/22/17 | | | 70,000 | | | | 76 | |
| | PNC Financial Services Group, Inc., 2.854%, 11/9/22 | | | 45,000 | | | | 45 | |
| | PNC Funding Corp., 4.375%, 8/11/20 | | | 30,000 | | | | 34 | |
| | The Royal Bank of Scotland Group PLC, 6.125%, 12/15/22 | | | 80,000 | | | | 85 | |
| | State Street Corp., 2.875%, 3/7/16 | | | 25,000 | | | | 27 | |
| | SunTrust Banks, Inc., 6.00%, 9/11/17 | | | 25,000 | | | | 30 | |
| | U.S. Bancorp, 3.442%, 2/1/16 | | | 45,000 | | | | 47 | |
| | Wachovia Corp., 5.75%, 2/1/18 | | | 5,000 | | | | 6 | |
| | Wells Fargo & Co., 2.625%, 12/15/16 | | | 70,000 | | | | 74 | |
| | Wells Fargo & Co., 4.60%, 4/1/21 | | | 45,000 | | | | 52 | |
| | | | | | | | | | |
| | Total | | | | | | | 1,868 | |
| | | | | | | | | | |
| | | |
| | Beverage/Bottling (0.2%) | | | | | | | | |
| | Anheuser-Busch Cos. LLC, 5.75%, 4/1/36 | | | 15,000 | | | | 19 | |
| | Anheuser-Busch InBev Worldwide, Inc., 2.50%, 7/15/22 | | | 65,000 | | | | 65 | |
| | Anheuser-Busch InBev Worldwide, Inc., 8.20%, 1/15/39 | | | 70,000 | | | | 115 | |
| | Beam, Inc., 3.25%, 5/15/22 | | | 15,000 | | | | 16 | |
| | The Coca-Cola Co., 1.65%, 3/14/18 | | | 50,000 | | | | 51 | |
| | The Coca-Cola Co., 3.15%, 11/15/20 | | | 50,000 | | | | 54 | |
| | Heineken NV, 1.40%, 10/1/17 144A | | | 20,000 | | | | 20 | |
| | Heineken NV, 2.75%, 4/1/23 144A | | | 30,000 | | | | 30 | |
| | Heineken NV, 4.00%, 10/1/42 144A | | | 5,000 | | | | 5 | |
The Accompanying Notes are an Integral Part of the Financial Statements.
| | | | | | |
| | Asset Allocation Portfolio | | | 195 | |
Asset Allocation Portfolio
| | | | | | | | | | |
| | | Investment Grade Segment (5.5%) | | Shares/ $ Par | | | Value $ (000’s) | |
| | | |
| | Beverage/Bottling continued | | | | | | | | |
| | PepsiCo, Inc., 7.90%, 11/1/18 | | | 35,000 | | | | 47 | |
| | Pernod-Ricard SA, 5.75%, 4/7/21 144A | | | 30,000 | | | | 36 | |
| | SABMiller Holdings, Inc., 3.75%, 1/15/22 144A | | | 45,000 | | | | 49 | |
| | | | | | | | | | |
| | Total | | | | | | | 507 | |
| | | | | | | | | | |
| | | |
| | Cable/Media/Broadcasting/Satellite (0.2%) | | | | | | | | |
| | DIRECTV Holdings LLC/DIRECTV Financing Co., Inc., 3.80%, 3/15/22 | | | 40,000 | | | | 41 | |
| | DIRECTV Holdings LLC/DIRECTV Financing Co., Inc., 4.60%, 2/15/21 | | | 5,000 | | | | 5 | |
| | DIRECTV Holdings LLC/DIRECTV Financing Co., Inc., 5.15%, 3/15/42 | | | 25,000 | | | | 25 | |
| | Discovery Communications LLC, 5.05%, 6/1/20 | | | 25,000 | | | | 29 | |
| | Historic TW, Inc., 6.625%, 5/15/29 | | | 40,000 | | | | 51 | |
| | Historic TW, Inc., 6.875%, 6/15/18 | | | 10,000 | | | | 13 | |
| | NBCUniversal Media LLC, 2.875%, 4/1/16 | | | 35,000 | | | | 37 | |
| | NBCUniversal Media LLC, 6.40%, 4/30/40 | | | 15,000 | | | | 19 | |
| | News America, Inc., 6.90%, 8/15/39 | | | 10,000 | | | | 13 | |
| | TCI Communications, Inc., 8.75%, 8/1/15 | | | 60,000 | | | | 72 | |
| | Time Warner Entertainment Co. LP, 8.375%, 3/15/23 | | | 55,000 | | | | 78 | |
| | | | | | | | | | |
| | Total | | | | | | | 383 | |
| | | | | | | | | | |
| | |
| | Conglomerate/Diversified Manufacturing (0.1%) | | | | | |
| | Eastman Chemical Co., 7.25%, 1/15/24 | | | 5,000 | | | | 7 | |
| | Eaton Corp., 2.75%, 11/2/22 144A | | | 115,000 | | | | 115 | |
| | United Technologies Corp., 3.10%, 6/1/22 | | | 25,000 | | | | 26 | |
| | United Technologies Corp., 4.50%, 6/1/42 | | | 30,000 | | | | 33 | |
| | | | | | | | | | |
| | Total | | | | | | | 181 | |
| | | | | | | | | | |
| | | |
| | Consumer Products (0.0%) | | | | | | | | |
| | The Procter & Gamble Co., 5.55%, 3/5/37 | | | 40,000 | | | | 54 | |
| | | | | | | | | | |
| | Total | | | | | | | 54 | |
| | | | | | | | | | |
| | | |
| | Electric Utilities (0.6%) | | | | | | | | |
| | Alabama Power Co., 3.95%, 6/1/21 | | | 50,000 | | | | 56 | |
| | Ameren Corp., 8.875%, 5/15/14 | | | 15,000 | | | | 16 | |
| | Appalachian Power Co., 4.60%, 3/30/21 | | | 20,000 | | | | 23 | |
| | Arizona Public Service Co., 5.05%, 9/1/41 | | | 10,000 | | | | 11 | |
| | Arizona Public Service Co., 8.75%, 3/1/19 | | | 10,000 | | | | 13 | |
| | Bruce Mansfield Unit, 6.85%, 6/1/34 | | | 27,750 | | | | 29 | |
| | Carolina Power & Light Co., 2.80%, 5/15/22 | | | 35,000 | | | | 36 | |
| | Carolina Power & Light Co., 5.15%, 4/1/15 | | | 25,000 | | | | 27 | |
| | CenterPoint Energy, Inc., 6.50%, 5/1/18 | | | 20,000 | | | | 24 | |
| | Commonwealth Edison Co., 4.00%, 8/1/20 | | | 25,000 | | | | 28 | |
| | Commonwealth Edison Co., 6.15%, 9/15/17 | | | 5,000 | | | | 6 | |
| | Connecticut Light & Power Co., 5.65%, 5/1/18 | | | 10,000 | | | | 12 | |
| | The Detroit Edison Co., 3.45%, 10/1/20 | | | 25,000 | | | | 27 | |
| | Dominion Resources, Inc., 1.40%, 9/15/17 | | | 45,000 | | | | 45 | |
| | DTE Energy Co., 6.375%, 4/15/33 | | | 5,000 | | | | 7 | |
| | Duke Energy Corp., 6.25%, 6/15/18 | | | 5,000 | | | | 6 | |
| | Duke Energy Indiana, Inc., 3.75%, 7/15/20 | | | 45,000 | | | | 50 | |
| | Entergy Corp., 4.70%, 1/15/17 | | | 40,000 | | | | 43 | |
| | Entergy Mississippi, Inc., 6.25%, 4/1/34 | | | 55,000 | | | | 56 | |
| | Exelon Generation Co. LLC, 4.25%, 6/15/22 144A | | | 45,000 | | | | 47 | |
| | Exelon Generation Co. LLC, 6.20%, 10/1/17 | | | 30,000 | | | | 35 | |
| | Kiowa Power Partners LLC, 4.811%, 12/30/13 144A | | | 9,593 | | | | 10 | |
| | Mississippi Power Co., 4.75%, 10/15/41 | | | 35,000 | | | | 39 | |
| | Monongahela Power Co., Inc., 5.70%, 3/15/17 144A | | | 45,000 | | | | 51 | |
| | Nevada Power Co., 5.95%, 3/15/16 | | | 10,000 | | | | 12 | |
| | | | | | | | | | |
| | | Investment Grade Segment (5.5%) | | Shares/ $ Par | | | Value $ (000’s) | |
| | | |
| | Electric Utilities continued | | | | | | | | |
| | NextEra Energy Capital Holdings, Inc., 4.50%, 6/1/21 | | | 95,000 | | | | 106 | |
| | NSTAR LLC, 4.50%, 11/15/19 | | | 10,000 | | | | 11 | |
| | Ohio Edison Co., 6.875%, 7/15/36 | | | 5,000 | | | | 7 | |
| | Ohio Power Co., 5.375%, 10/1/21 | | | 25,000 | | | | 30 | |
| | Pacific Gas & Electric Co., 3.50%, 10/1/20 | | | 75,000 | | | | 82 | |
| | Pacific Gas & Electric Co., 5.625%, 11/30/17 | | | 10,000 | | | | 12 | |
| | PacifiCorp., 3.85%, 6/15/21 | | | 50,000 | | | | 56 | |
| | Peco Energy Co., 2.375%, 9/15/22 | | | 30,000 | | | | 30 | |
| | Potomac Electric Power Co., 6.50%, 11/15/37 | | | 5,000 | | | | 7 | |
| | PPL Capital Funding, Inc., 4.20%, 6/15/22 | | | 25,000 | | | | 27 | |
| | PPL Energy Supply LLC, 6.50%, 5/1/18 | | | 10,000 | | | | 12 | |
| | Public Service Co. of Colorado, 3.20%, 11/15/20 | | | 30,000 | | | | 33 | |
| | Public Service Co. of Colorado, 5.80%, 8/1/18 | | | 10,000 | | | | 12 | |
| | Public Service Co. of New Mexico, 5.35%, 10/1/21 | | | 25,000 | | | | 28 | |
| | Public Service Electric & Gas Co., 3.65%, 9/1/42 | | | 20,000 | | | | 20 | |
| | Public Service Electric & Gas Co., 5.00%, 1/1/13 | | | 100,000 | | | | 100 | |
| | Puget Sound Energy, Inc., 6.274%, 3/15/37 | | | 30,000 | | | | 40 | |
| | San Diego Gas & Electric Co., 6.125%, 9/15/37 | | | 10,000 | | | | 14 | |
| | Sempra Energy, 2.30%, 4/1/17 | | | 45,000 | | | | 47 | |
| | Sempra Energy, 6.15%, 6/15/18 | | | 15,000 | | | | 18 | |
| | South Carolina Electric & Gas Co., 6.05%, 1/15/38 | | | 15,000 | | | | 20 | |
| | Tampa Electric Co., 5.40%, 5/15/21 | | | 5,000 | | | | 6 | |
| | Union Electric Co., 3.90%, 9/15/42 | | | 25,000 | | | | 25 | |
| | Union Electric Co., 6.40%, 6/15/17 | | | 10,000 | | | | 12 | |
| | Union Electric Co., 6.70%, 2/1/19 | | | 10,000 | | | | 13 | |
| | Virginia Electric & Power Co., 3.45%, 9/1/22 | | | 40,000 | �� | | | 43 | |
| | | | | | | | | | |
| | Total | | | | | | | 1,520 | |
| | | | | | | | | | |
| | | |
| | Electronics (0.0%) | | | | | | | | |
| | Hewlett-Packard Co., 3.00%, 9/15/16 | | | 35,000 | | | | 35 | |
| | Hewlett-Packard Co., 3.75%, 12/1/20 | | | 5,000 | | | | 5 | |
| | Hewlett-Packard Co., 4.65%, 12/9/21 | | | 30,000 | | | | 30 | |
| | International Business Machines Corp., 1.95%, 7/22/16 | | | 25,000 | | | | 26 | |
| | | | | | | | | | |
| | Total | | | | | | | 96 | |
| | | | | | | | | | |
| | | |
| | Food Processors (0.1%) | | | | | | | | |
| | Archer-Daniels-Midland Co., 4.479%, 3/1/21 | | | 10,000 | | | | 11 | |
| | General Mills, Inc., 3.15%, 12/15/21 | | | 40,000 | | | | 42 | |
| | Kellogg Co., 3.25%, 5/21/18 | | | 15,000 | | | | 16 | |
| | Kraft Foods Group, Inc., 2.25%, 6/5/17 144A | | | 10,000 | | | | 11 | |
| | Kraft Foods Group, Inc., 3.50%, 6/6/22 144A | | | 15,000 | | | | 16 | |
| | Kraft Foods Group, Inc., 6.125%, 8/23/18 144A | | | 40,000 | | | | 49 | |
| | Mead Johnson Nutrition Co., 4.90%, 11/1/19 | | | 35,000 | | | | 40 | |
| | Mondelez International, Inc., 6.125%, 2/1/18 | | | 15,000 | | | | 18 | |
| | Mondelez International, Inc., 6.50%, 8/11/17 | | | 20,000 | | | | 25 | |
| | Mondelez International, Inc., 6.50%, 2/9/40 | | | 65,000 | | | | 87 | |
| | | | | | | | | | |
| | Total | | | | | | | 315 | |
| | | | | | | | | | |
| | | |
| | Gaming/Leisure/Lodging (0.0%) | | | | | | | | |
| | Choice Hotels International, Inc., 5.75%, 7/1/22 | | | 30,000 | | | | 33 | |
| | Host Hotels & Resorts LP, 5.875%, 6/15/19 | | | 15,000 | | | | 17 | |
| | | | | | | | | | |
| | Total | | | | | | | 50 | |
| | | | | | | | | | |
| | | |
| | Gas Pipelines (0.2%) | | | | | | | | |
| | CenterPoint Energy Resources Corp., 6.125%, 11/1/17 | | | 10,000 | | | | 12 | |
| | Energy Transfer Partners LP, 4.65%, 6/1/21 | | | 25,000 | | | | 27 | |
| | Energy Transfer Partners LP, 6.05%, 6/1/41 | | | 40,000 | | | | 46 | |
The Accompanying Notes are an Integral Part of the Financial Statements.
| | | | |
| 196 | | Asset Allocation Portfolio | | |
Asset Allocation Portfolio
| | | | | | | | | | |
| | | Investment Grade Segment (5.5%) | | Shares/ $ Par | | | Value $ (000’s) | |
| | | |
| | Gas Pipelines continued | | | | | | | | |
| | Energy Transfer Partners LP, 6.70%, 7/1/18 | | | 35,000 | | | | 42 | |
| | Enterprise Products Operating LLC, 3.20%, 2/1/16 | | | 35,000 | | | | 37 | |
| | Kinder Morgan Energy Partners LP, 5.95%, 2/15/18 | | | 55,000 | | | | 66 | |
| | Kinder Morgan Energy Partners LP, 6.375%, 3/1/41 | | | 55,000 | | | | 68 | |
| | Kinder Morgan Energy Partners LP, 6.50%, 2/1/37 | | | 15,000 | | | | 18 | |
| | Magellan Midstream Partners LP, 6.55%, 7/15/19 | | | 30,000 | | | | 37 | |
| | ONEOK Partners LP, 2.00%, 10/1/17 | | | 20,000 | | | | 20 | |
| | Plains All American Pipeline LP/PAA Finance Corp., 6.50%, 5/1/18 | | | 15,000 | | | | 19 | |
| | Spectra Energy Partners LP, 2.95%, 6/15/16 | | | 30,000 | | | | 31 | |
| | Williams Partners LP, 4.00%, 11/15/21 | | | 10,000 | | | | 11 | |
| | Williams Partners LP, 4.125%, 11/15/20 | | | 5,000 | | | | 5 | |
| | Williams Partners LP, 5.25%, 3/15/20 | | | 33,000 | | | | 38 | |
| | | | | | | | | | |
| | Total | | | | | | | 477 | |
| | | | | | | | | | |
| | | |
| | Health Care/Pharmaceuticals (0.3%) | | | | | | | | |
| | AbbVie, Inc., 1.75%, 11/6/17 144A | | | 40,000 | | | | 40 | |
| | AbbVie, Inc., 2.90%, 11/6/22 144A | | | 20,000 | | | | 20 | |
| | Amgen, Inc., 3.875%, 11/15/21 | | | 65,000 | | | | 71 | |
| | Express Scripts Holding Co., 2.65%, 2/15/17 144A | | | 20,000 | | | | 21 | |
| | Express Scripts Holding Co., 3.125%, 5/15/16 | | | 25,000 | | | | 26 | |
| | Express Scripts Holding Co., 3.50%, 11/15/16 144A | | | 40,000 | | | | 43 | |
| | Express Scripts Holding Co., 3.90%, 2/15/22 144A | | | 10,000 | | | | 11 | |
| | GlaxoSmithKline Capital, Inc., 6.375%, 5/15/38 | | | 20,000 | | | | 28 | |
| | Medco Health Solutions, Inc., 7.125%, 3/15/18 | | | 25,000 | | | | 31 | |
| | Merck & Co., Inc., 3.875%, 1/15/21 | | | 15,000 | | | | 17 | |
| | Mylan, Inc., 3.125%, 1/15/23 144A | | | 35,000 | | | | 35 | |
| | Mylan, Inc., 6.00%, 11/15/18 144A | | | 60,000 | | | | 66 | |
| | Mylan, Inc., 7.625%, 7/15/17 144A | | | 20,000 | | | | 23 | |
| | Mylan, Inc., 7.875%, 7/15/20 144A | | | 15,000 | | | | 18 | |
| | The Novartis Capital Corp., 2.40%, 9/21/22 | | | 60,000 | | | | 60 | |
| | Pfizer, Inc., 5.35%, 3/15/15 | | | 15,000 | | | | 17 | |
| | Roche Holdings, Inc., 6.00%, 3/1/19 144A | | | 25,000 | | | | 31 | |
| | Sanofi-Aventis SA, 2.625%, 3/29/16 | | | 60,000 | | | | 63 | |
| | Teva Pharmaceutical Finance Co. BV, 2.95%, 12/18/22 | | | 40,000 | | | | 41 | |
| | Teva Pharmaceutical Finance IV LLC, 2.25%, 3/18/20 | | | 20,000 | | | | 20 | |
| | Thermo Fisher Scientific, Inc., 1.85%, 1/15/18 | | | 15,000 | | | | 15 | |
| | Thermo Fisher Scientific, Inc., 3.15%, 1/15/23 | | | 20,000 | | | | 20 | |
| | Watson Pharmaceuticals, Inc., 1.875%, 10/1/17 | | | 5,000 | | | | 5 | |
| | Watson Pharmaceuticals, Inc., 3.25%, 10/1/22 | | | 10,000 | | | | 10 | |
| | Watson Pharmaceuticals, Inc., 4.625%, 10/1/42 | | | 10,000 | | | | 10 | |
| | Wyeth LLC, 5.50%, 2/15/16 | | | 5,000 | | | | 6 | |
| | Wyeth LLC, 5.95%, 4/1/37 | | | 35,000 | | | | 47 | |
| | | | | | | | | | |
| | Total | | | | | | | 795 | |
| | | | | | | | | | |
| | | |
| | Independent Finance (0.1%) | | | | | | | | |
| | General Electric Capital Corp., 5.625%, 5/1/18 | | | 125,000 | | | | 148 | |
| | | | | | | | | | |
| | Total | | | | | | | 148 | |
| | | | | | | | | | |
| | | |
| | Information/Data Technology (0.1%) | | | | | | | | |
| | Microsoft Corp., 0.875%, 11/15/17 | | | 15,000 | | | | 15 | |
| | Microsoft Corp., 2.125%, 11/15/22 | | | 35,000 | | | | 35 | |
| | Oracle Corp., 1.20%, 10/15/17 | | | 35,000 | | | | 35 | |
| | Oracle Corp., 2.50%, 10/15/22 | | | 35,000 | | | | 35 | |
| | | | | | | | | | |
| | | Investment Grade Segment (5.5%) | | Shares/ $ Par | | | Value $ (000’s) | |
| | | |
| | Information/Data Technology continued | | | | | | | | |
| | Oracle Corp., 3.875%, 7/15/20 | | | 50,000 | | | | 56 | |
| | | | | | | | | | |
| | Total | | | | | | | 176 | |
| | | | | | | | | | |
| | | |
| | Life Insurance (0.1%) | | | | | | | | |
| | Aetna, Inc., 1.50%, 11/15/17 | | | 5,000 | | | | 5 | |
| | Aetna, Inc., 2.75%, 11/15/22 | | | 15,000 | | | | 15 | |
| | American International Group, Inc., 4.875%, 6/1/22 | | | 35,000 | | | | 40 | |
| | New York Life Global Funding, 2.45%, 7/14/16 144A | | | 80,000 | | | | 84 | |
| | Prudential Financial, Inc., 5.375%, 6/21/20 | | | 19,000 | | | | 22 | |
| | Prudential Financial, Inc., 5.70%, 12/14/36 | | | 5,000 | | | | 6 | |
| | Teachers Insurance & Annuity Association-College Retirement Equity Fund, 6.85%, 12/16/39 144A | | | 20,000 | | | | 27 | |
| | UnitedHealth Group, Inc., 1.40%, 10/15/17 | | | 5,000 | | | | 5 | |
| | UnitedHealth Group, Inc., 2.75%, 2/15/23 | | | 5,000 | | | | 5 | |
| | UnitedHealth Group, Inc., 2.875%, 3/15/22 | | | 5,000 | | | | 5 | |
| | UnitedHealth Group, Inc., 3.95%, 10/15/42 | | | 5,000 | | | | 5 | |
| | UnitedHealth Group, Inc., 4.70%, 2/15/21 | | | 25,000 | | | | 29 | |
| | WellPoint, Inc., 1.875%, 1/15/18 | | | 15,000 | | | | 15 | |
| | WellPoint, Inc., 3.30%, 1/15/23 | | | 20,000 | | | | 21 | |
| | | | | | | | | | |
| | Total | | | | | | | 284 | |
| | | | | | | | | | |
| | | |
| | Machinery (0.1%) | | | | | | | | |
| | John Deere Capital Corp., 0.70%, 9/4/15 | | | 40,000 | | | | 40 | |
| | John Deere Capital Corp., 1.20%, 10/10/17 | | | 25,000 | | | | 25 | |
| | John Deere Capital Corp., 2.25%, 4/17/19 | | | 30,000 | | | | 31 | |
| | John Deere Capital Corp., 2.80%, 1/27/23 | | | 40,000 | | | | 41 | |
| | Roper Industries, Inc., 1.85%, 11/15/17 | | | 30,000 | | | | 30 | |
| | Roper Industries, Inc., 3.125%, 11/15/22 | | | 40,000 | | | | 40 | |
| | | | | | | | | | |
| | Total | | | | | | | 207 | |
| | | | | | | | | | |
| | | |
| | Metals/Mining (0.2%) | | | | | | | | |
| | Barrick Gold Corp., 2.90%, 5/30/16 | | | 45,000 | | | | 47 | |
| | Barrick Gold Corp., 3.85%, 4/1/22 | | | 45,000 | | | | 48 | |
| | Barrick North America Finance LLC, 6.80%, 9/15/18 | | | 25,000 | | | | 31 | |
| | Freeport-McMoRan Copper & Gold, Inc., 3.55%, 3/1/22 | | | 40,000 | | | | 40 | |
| | Newmont Mining Corp., 3.50%, 3/15/22 | | | 60,000 | | | | 62 | |
| | Newmont Mining Corp., 6.25%, 10/1/39 | | | 10,000 | | | | 12 | |
| | Rio Tinto Finance USA PLC, 1.625%, 8/21/17 | | | 65,000 | | | | 66 | |
| | Rio Tinto Finance USA, Ltd., 4.125%, 5/20/21 | | | 50,000 | | | | 55 | |
| | Rio Tinto Finance USA, Ltd., 9.00%, 5/1/19 | | | 15,000 | | | | 20 | |
| | Teck Resources, Ltd., 3.00%, 3/1/19 | | | 30,000 | | | | 31 | |
| | Teck Resources, Ltd., 5.20%, 3/1/42 | | | 45,000 | | | | 46 | |
| | | | | | | | | | |
| | Total | | | | | | | 458 | |
| | | | | | | | | | |
| | | |
| | Natural Gas Distributors (0.0%) | | | | | | | | |
| | NiSource Finance Corp., 5.80%, 2/1/42 | | | 55,000 | | | | 63 | |
| | | | | | | | | | |
| | Total | | | | | | | 63 | |
| | | | | | | | | | |
| | | |
| | Oil & Gas Field Machines and Services (0.0%) | | | | | | | | |
| | National Oilwell Varco, Inc., 1.35%, 12/1/17 | | | 10,000 | | | | 10 | |
| | National Oilwell Varco, Inc., 2.60%, 12/1/22 | | | 30,000 | | | | 31 | |
| | Rowan Cos., Inc., 4.875%, 6/1/22 | | | 50,000 | | | | 54 | |
| | | | | | | | | | |
| | Total | | | | | | | 95 | |
| | | | | | | | | | |
| | | |
| | Oil and Gas (0.7%) | | | | | | | | |
| | Anadarko Petroleum Corp., 6.375%, 9/15/17 | | | 80,000 | | | | 96 | |
| | Apache Corp., 4.75%, 4/15/43 | | | 25,000 | | | | 27 | |
| | BP Capital Markets PLC, 1.846%, 5/5/17 | | | 45,000 | | | | 46 | |
| | BP Capital Markets PLC, 2.50%, 11/6/22 | | | 75,000 | | | | 74 | |
| | BP Capital Markets PLC, 4.50%, 10/1/20 | | | 10,000 | | | | 12 | |
The Accompanying Notes are an Integral Part of the Financial Statements.
| | | | | | |
| | Asset Allocation Portfolio | | | 197 | |
Asset Allocation Portfolio
| | | | | | | | | | |
| | | Investment Grade Segment (5.5%) | | Shares/ $ Par | | | Value $ (000’s) | |
| | | |
| | Oil and Gas continued | | | | | | | | |
| | BP Capital Markets PLC, 4.75%, 3/10/19 | | | 80,000 | | | | 93 | |
| | Canadian Natural Resources, Ltd., 5.70%, 5/15/17 | | | 25,000 | | | | 29 | |
| | Canadian Natural Resources, Ltd., 5.85%, 2/1/35 | | | 5,000 | | | | 6 | |
| | Canadian Natural Resources, Ltd., 6.45%, 6/30/33 | | | 45,000 | | | | 57 | |
| | Cenovus Energy, Inc., 4.45%, 9/15/42 | | | 45,000 | | | | 47 | |
| | ConocoPhillips, 6.00%, 1/15/20 | | | 85,000 | | | | 108 | |
| | Devon Energy Corp., 1.875%, 5/15/17 | | | 25,000 | | | | 25 | |
| | Devon Energy Corp., 3.25%, 5/15/22 | | | 35,000 | | | | 37 | |
| | Encana Corp., 3.90%, 11/15/21 | | | 30,000 | | | | 33 | |
| | Ensco PLC, 4.70%, 3/15/21 | | | 35,000 | | | | 39 | |
| | EOG Resources, Inc., 4.40%, 6/1/20 | | | 15,000 | | | | 17 | |
| | Hess Corp., 5.60%, 2/15/41 | | | 25,000 | | | | 30 | |
| | Husky Energy, Inc., 3.95%, 4/15/22 | | | 55,000 | | | | 59 | |
| | Husky Energy, Inc., 7.25%, 12/15/19 | | | 5,000 | | | | 7 | |
| | Marathon Oil Corp., 6.60%, 10/1/37 | | | 10,000 | | | | 13 | |
| | Nabors Industries, Inc., 6.15%, 2/15/18 | | | 20,000 | | | | 24 | |
| | Noble Energy, Inc., 4.15%, 12/15/21 | | | 10,000 | | | | 11 | |
| | Noble Energy, Inc., 6.00%, 3/1/41 | | | 15,000 | | | | 18 | |
| | Occidental Petroleum Corp., 4.125%, 6/1/16 | | | 20,000 | | | | 22 | |
| | Pemex Project Funding Master Trust, 6.625%, 6/15/35 | | | 15,000 | | | | 19 | |
| | Petrohawk Energy Corp., 6.25%, 6/1/19 | | | 45,000 | | | | 51 | |
| | Shell International Finance BV, 1.125%, 8/21/17 | | | 45,000 | | | | 45 | |
| | Shell International Finance BV, 4.30%, 9/22/19 | | | 120,000 | | | | 139 | |
| | Southwestern Energy Co., 4.10%, 3/15/22 | | | 30,000 | | | | 32 | |
| | Statoil ASA, 2.45%, 1/17/23 | | | 65,000 | | | | 65 | |
| | Suncor Energy, Inc., 6.85%, 6/1/39 | | | 15,000 | | | | 21 | |
| | Talisman Energy, Inc., 3.75%, 2/1/21 | | | 45,000 | | | | 48 | |
| | Total Capital International SA, 1.50%, 2/17/17 | | | 15,000 | | | | 15 | |
| | Total Capital SA, 4.45%, 6/24/20 | | | 100,000 | | | | 116 | |
| | Transocean, Inc., 6.375%, 12/15/21 | | | 35,000 | | | | 43 | |
| | Weatherford International, Ltd., 5.95%, 4/15/42 | | | 70,000 | | | | 76 | |
| | | | | | | | | | |
| | Total | | | | | | | 1,600 | |
| | | | | | | | | | |
| | | |
| | Other Finance (0.1%) | | | | | | | | |
| | American Express Co., 6.15%, 8/28/17 | | | 35,000 | | | | 42 | |
| | American Express Credit Corp., 5.125%, 8/25/14 | | | 10,000 | | | | 11 | |
| | Berkshire Hathaway Finance Corp., 3.00%, 5/15/22 | | | 45,000 | | | | 47 | |
| | CVS Pass-Through Trust, 6.036%, 12/10/28 | | | 37,856 | | | | 44 | |
| | | | | | | | | | |
| | Total | | | | | | | 144 | |
| | | | | | | | | | |
| | | |
| | Other Holdings (0.1%) | | | | | | | | |
| (f) | | Morgan Stanley, 5.40%, 5/15/15 144A | | | 325,416 | | | | 173 | |
| | | | | | | | | | |
| | Total | | | | | | | 173 | |
| | | | | | | | | | |
| | | |
| | Other Services (0.1%) | | | | | | | | |
| | American Tower Corp., 4.625%, 4/1/15 | | | 10,000 | | | | 11 | |
| | American Tower Corp., 7.00%, 10/15/17 | | | 15,000 | | | | 18 | |
| | CC Holdings GS V LLC, 3.849%, 4/15/23 144A | | | 35,000 | | | | 35 | |
| | Republic Services, Inc., 5.25%, 11/15/21 | | | 25,000 | | | | 29 | |
| | Waste Management, Inc., 2.90%, 9/15/22 | | | 30,000 | | | | 30 | |
| | Waste Management, Inc., 4.60%, 3/1/21 | | | 30,000 | | | | 34 | |
| | | | | | | | | | |
| | Total | | | | | | | 157 | |
| | | | | | | | | | |
| | | |
| | Paper and Forest Products (0.0%) | | | | | | | | |
| | Georgia-Pacific LLC, 5.40%, 11/1/20 144A | | | 65,000 | | | | 77 | |
| | Georgia-Pacific LLC, 7.75%, 11/15/29 | | | 5,000 | | | | 7 | |
| | | | | | | | | | |
| | Total | | | | | | | 84 | |
| | | | | | | | | | |
| | | | | | | | | | |
| | | Investment Grade Segment (5.5%) | | Shares/ $ Par | | | Value $ (000’s) | |
| | | |
| | Property and Casualty Insurance (0.0%) | | | | | | | | |
| | The Hartford Financial Services Group, Inc., 6.625%, 4/15/42 | | | 15,000 | | | | 19 | |
| | | | | | | | | | |
| | Total | | | | | | | 19 | |
| | | | | | | | | | |
| | | |
| | Railroads (0.1%) | | | | | | | | |
| | Burlington Northern Santa Fe LLC, 3.05%, 3/15/22 | | | 75,000 | | | | 77 | |
| | Burlington Northern Santa Fe LLC, 3.05%, 9/1/22 | | | 25,000 | | | | 26 | |
| | Burlington Northern Santa Fe LLC, 3.60%, 9/1/20 | | | 25,000 | | | | 27 | |
| | Canadian National Railway Co., 5.85%, 11/15/17 | | | 5,000 | | | | 6 | |
| | CSX Corp., 3.70%, 10/30/20 | | | 5,000 | | | | 5 | |
| | CSX Corp., 4.25%, 6/1/21 | | | 15,000 | | | | 17 | |
| | CSX Corp., 5.60%, 5/1/17 | | | 30,000 | | | | 35 | |
| | Norfolk Southern Corp., 2.903%, 2/15/23 144A | | | 48,000 | | | | 48 | |
| | Union Pacific Corp., 4.30%, 6/15/42 | | | 45,000 | | | | 48 | |
| | | | | | | | | | |
| | Total | | | | | | | 289 | |
| | | | | | | | | | |
| | | |
| | Real Estate Investment Trusts (0.3%) | | | | | | | | |
| | AvalonBay Communities, Inc., 2.85%, 3/15/23 | | | 20,000 | | | | 20 | |
| | AvalonBay Communities, Inc., 2.95%, 9/15/22 | | | 15,000 | | | | 15 | |
| | AvalonBay Communities, Inc., 3.95%, 1/15/21 | | | 75,000 | | | | 81 | |
| | Boston Properties LP, 3.85%, 2/1/23 | | | 40,000 | | | | 42 | |
| | BRE Properties, Inc., 5.20%, 3/15/21 | | | 35,000 | | | | 39 | |
| | BRE Properties, Inc., 5.50%, 3/15/17 | | | 15,000 | | | | 17 | |
| | Colonial Realty LP, 6.05%, 9/1/16 | | | 20,000 | | | | 22 | |
| | DDR Corp., 4.75%, 4/15/18 | | | 40,000 | | | | 44 | |
| | Essex Portfolio LP, 3.625%, 8/15/22 144A | | | 65,000 | | | | 65 | |
| | HCP, Inc., 3.75%, 2/1/16 | | | 25,000 | | | | 26 | |
| | HCP, Inc., 3.75%, 2/1/19 | | | 10,000 | | | | 11 | |
| | HCP, Inc., 6.00%, 1/30/17 | | | 25,000 | | | | 29 | |
| | HCP, Inc., 6.70%, 1/30/18 | | | 10,000 | | | | 12 | |
| | Health Care REIT, Inc., 3.625%, 3/15/16 | | | 15,000 | | | | 16 | |
| | Health Care REIT, Inc., 4.125%, 4/1/19 | | | 60,000 | | | | 65 | |
| | Ventas Realty LP/Ventas Capital Corp., 2.00%, 2/15/18 | | | 65,000 | | | | 65 | |
| | Ventas Realty LP/Ventas Capital Corp., 4.25%, 3/1/22 | | | 15,000 | | | | 16 | |
| | Ventas Realty LP/Ventas Capital Corp., 4.75%, 6/1/21 | | | 35,000 | | | | 38 | |
| | WEA Finance LLC, 7.125%, 4/15/18 144A | | | 25,000 | | | | 31 | |
| | | | | | | | | | |
| | Total | | | | | | | 654 | |
| | | | | | | | | | |
| | | |
| | Restaurants (0.1%) | | | | | | | | |
| | Darden Restaurants, Inc., 3.35%, 11/1/22 | | | 10,000 | | | | 10 | |
| | Darden Restaurants, Inc., 4.50%, 10/15/21 | | | 40,000 | | | | 43 | |
| | Darden Restaurants, Inc., 6.20%, 10/15/17 | | | 25,000 | | | | 29 | |
| | Yum! Brands, Inc., 3.75%, 11/1/21 | | | 30,000 | | | | 32 | |
| | Yum! Brands, Inc., 3.875%, 11/1/20 | | | 25,000 | | | | 27 | |
| | | | | | | | | | |
| | Total | | | | | | | 141 | |
| | | | | | | | | | |
| | | |
| | Retail Food and Drug (0.1%) | | | | | | | | |
| | CVS Caremark Corp., 6.25%, 6/1/27 | | | 40,000 | | | | 53 | |
| | Delhaize Group SA, 4.125%, 4/10/19 | | | 55,000 | | | | 57 | |
| | Delhaize Group SA, 5.70%, 10/1/40 | | | 40,000 | | | | 37 | |
| | The Kroger Co., 7.50%, 4/1/31 | | | 40,000 | | | | 52 | |
| | Safeway, Inc., 6.35%, 8/15/17 | | | 60,000 | | | | 68 | |
| | | | | | | | | | |
| | Total | | | | | | | 267 | |
| | | | | | | | | | |
| | | |
| | Retail Stores (0.2%) | | | | | | | | |
| | Costco Wholesale Corp., 1.70%, 12/15/19 | | | 90,000 | | | | 91 | |
| | The Home Depot, Inc., 5.40%, 3/1/16 | | | 50,000 | | | | 57 | |
The Accompanying Notes are an Integral Part of the Financial Statements.
| | | | |
| 198 | | Asset Allocation Portfolio | | |
Asset Allocation Portfolio
| | | | | | | | | | |
| | | Investment Grade Segment (5.5%) | | Shares/ $ Par | | | Value $ (000’s) | |
| | | |
| | Retail Stores continued | | | | | | | | |
| | Lowe’s Cos., Inc., 3.80%, 11/15/21 | | | 10,000 | | | | 11 | |
| | Macy’s Retail Holdings, Inc., 5.90%, 12/1/16 | | | 13,000 | | | | 15 | |
| | Macy’s Retail Holdings, Inc., 7.875%, 7/15/15 | | | 21,000 | | | | 25 | |
| | Nordstrom, Inc., 6.25%, 1/15/18 | | | 15,000 | | | | 18 | |
| | Nordstrom, Inc., 7.00%, 1/15/38 | | | 15,000 | | | | 21 | |
| | Target Corp., 6.50%, 10/15/37 | | | 15,000 | | | | 21 | |
| | Wal-Mart Stores, Inc., 2.80%, 4/15/16 | | | 20,000 | | | | 21 | |
| | Wal-Mart Stores, Inc., 3.25%, 10/25/20 | | | 35,000 | | | | 38 | |
| | Wal-Mart Stores, Inc., 3.625%, 7/8/20 | | | 15,000 | | | | 17 | |
| | Wal-Mart Stores, Inc., 4.875%, 7/8/40 | | | 30,000 | | | | 35 | |
| | | | | | | | | | |
| | Total | | | | | | | 370 | |
| | | | | | | | | | |
| | | |
| | Telecommunications (0.3%) | | | | | | | | |
| | America Movil SAB de CV, 5.00%, 3/30/20 | | | 65,000 | | | | 76 | |
| | AT&T Corp., 8.00%, 11/15/31 | | | 70,000 | | | | 106 | |
| | AT&T, Inc., 2.625%, 12/1/22 | | | 75,000 | | | | 75 | |
| | AT&T, Inc., 2.95%, 5/15/16 | | | 50,000 | | | | 53 | |
| | AT&T, Inc., 5.55%, 8/15/41 | | | 40,000 | | | | 48 | |
| | CenturyLink, Inc., 5.15%, 6/15/17 | | | 70,000 | | | | 75 | |
| | CenturyLink, Inc., 6.45%, 6/15/21 | | | 45,000 | | | | 50 | |
| | Qwest Corp., 6.50%, 6/1/17 | | | 40,000 | | | | 47 | |
| | Telefonica Emisiones SAU, 3.729%, 4/27/15 | | | 35,000 | | | | 36 | |
| | Verizon Communications, Inc., 5.85%, 9/15/35 | | | 30,000 | | | | 38 | |
| | Verizon Communications, Inc., 6.25%, 4/1/37 | | | 30,000 | | | | 39 | |
| | Verizon Communications, Inc., 6.35%, 4/1/19 | | | 50,000 | | | | 63 | |
| | | | | | | | | | |
| | Total | | | | | | | 706 | |
| | | | | | | | | | |
| | | |
| | Total Investment Grade Segment | | | | | | | | |
| | (Cost: $11,928) | | | | | | | 12,988 | |
| | | | | | | | | | |
| | | |
| | | Governments (8.0%) | | | | | | |
| | | |
| | Governments (8.0%) | | | | | | | | |
| | Canada Government International Bond, 0.875%, 2/14/17 | | | 275,000 | | | | 277 | |
| | Overseas Private Investment Corp., 4.10%, 11/15/14 | | | 25,200 | | | | 26 | |
| | US Department of Housing & Urban Development, 6.08%, 8/1/13 | | | 10,000 | | | | 10 | |
| | US Treasury, 0.25%, 5/31/14 | | | 395,000 | | | | 395 | |
| | US Treasury, 0.25%, 6/30/14 | | | 470,000 | | | | 470 | |
| | US Treasury, 0.25%, 8/31/14 | | | 6,120,000 | | | | 6,122 | |
| | US Treasury, 0.25%, 9/30/14 | | | 430,000 | | | | 430 | |
| | US Treasury, 0.50%, 7/31/17 | | | 960,000 | | | | 954 | |
| | US Treasury, 0.625%, 8/31/17 | | | 4,205,000 | | | | 4,201 | |
| | US Treasury, 0.75%, 6/30/17 | | | 435,000 | | | | 438 | |
| | US Treasury, 1.625%, 8/15/22 | | | 295,000 | | | | 293 | |
| | US Treasury, 1.625%, 11/15/22 | | | 85,000 | | | | 84 | |
| | US Treasury, 1.75%, 5/15/22 | | | 430,000 | | | | 434 | |
| | US Treasury, 2.75%, 8/15/42 | | | 1,085,000 | | | | 1,048 | |
| | US Treasury, 3.00%, 5/15/42 | | | 255,000 | | | | 260 | |
| | US Treasury, 3.125%, 2/15/42 | | | 135,000 | | | | 141 | |
| | US Treasury, 4.50%, 2/15/36 | | | 465,000 | | | | 612 | |
| | US Treasury, 5.375%, 2/15/31 | | | 1,780,000 | | | | 2,541 | |
| | | | | | | | | | |
| | | |
| | Total Governments | | | | | | | | |
| | (Cost: $18,743) | | | | | | | 18,736 | |
| | | | | | | | | | |
| | | |
| | | Municipal Bonds (0.5%) | | | | | | |
| | | |
| | Municipal Bonds (0.5%) | | | | | | | | |
| | American Municipal Power, Inc., Series 2010, 5.939%, 2/15/47 RB | | | 88,000 | | | | 102 | |
| | | | | | | | | | |
| | | Municipal Bonds (0.5%) | | Shares/ $ Par | | | Value $ (000’s) | |
| | | |
| | Municipal Bonds continued | | | | | | | | |
| | Bay Area Toll Authority San Francisco Bay Area Toll Bridge, Series 2009-F, 6.263%, 4/1/49 RB | | | 5,000 | | | | 7 | |
| | Board of Regents of the University of Texas System, Series 2010C, 4.794%, 8/15/46 RB | | | 60,000 | | | | 71 | |
| | Board of Regents of the University of Texas System, Series 2009B, 6.276%, 8/15/41 RB | | | 10,000 | | | | 12 | |
| | The City of New York, Series C-1, 5.517%, 10/1/37 GO | | | 40,000 | | | | 49 | |
| | Connecticut Housing Finance Authority, Series D-2, 5.00%, 11/15/26 RB | | | 45,000 | | | | 45 | |
| | Dallas Area Rapid Transit, Series 2010B, 5.022%, 12/1/48 RB | | | 75,000 | | | | 90 | |
| | Dallas Independent School District, Series 2010C, 6.45%, 2/15/35 GO, PSF | | | 75,000 | | | | 94 | |
| | Dormitory Authority of the State of New York,
Series 2010H, 5.389%, 3/15/40 RB | | | 15,000 | | | | 18 | |
| | Energy Northwest, Series E, 2.197%, 7/1/19 RB | | | 60,000 | | | | 62 | |
| | Los Angeles Unified School District, Series RY,
6.758%, 7/1/34 GO | | | 40,000 | | | | 53 | |
| | Metropolitan Transportation Authority, Series 2010C-1, 6.687%, 11/15/40 RB | | | 12,000 | | | | 16 | |
| | Metropolitan Transportation Authority, Series 2009C, 7.336%, 11/15/39 RB | | | 35,000 | | | | 51 | |
| | Montana Facility Finance Authority, Series 2010A, 4.75%, 5/20/37 RB, GNMA, FHA | | | 110,000 | | | | 119 | |
| | New Jersey Turnpike Authority, Series 2009F, 7.414%, 1/1/40 RB | | | 25,000 | | | | 37 | |
| | New York City Municipal Water Finance Authority, Series AA, 5.44%, 6/15/43 RB | | | 30,000 | | | | 38 | |
| | New York City Municipal Water Finance Authority, Series AA-1, 5.75%, 6/15/41 RB | | | 10,000 | | | | 13 | |
| | Port Authority New York & New Jersey, Series 168, 4.926%, 10/1/51 RB | | | 60,000 | | | | 67 | |
| | State of California, Series 2010, 5.70%, 11/1/21 GO | | | 80,000 | | | | 95 | |
| | State of Illinois, Series 2011, 4.961%, 3/1/16 GO | | | 85,000 | | | | 93 | |
| | Texas Transportation Commission, Series 2010A, 4.681%, 4/1/40 GO | | | 23,000 | | | | 27 | |
| | University of California Regents Medical Center,
Series H, 6.548%, 5/15/48 RB | | | 50,000 | | | | 67 | |
| | | | | | | | | | |
| | Total Municipal Bonds | | | | | | | | |
| | (Cost: $1,047) | | | | | | | 1,226 | |
| | | | | | | | | | |
| | | |
| | | Structured Products (8.8%) | | | | | | |
| | | |
| | Structured Products (8.8%) | | | | | | | | |
| | Asset Securitization Corp., Series 1997-D5, Class PS1, 1.253%, 2/14/43 IO | | | 279,444 | | | | 9 | |
| | Banc of America Funding Corp., Series 2007-1,
Class TA1A, 0.27%, 1/25/37 | | | 44,785 | | | | 24 | |
| | Banc of America Funding Corp., Series 2007-4,
Class TA1A, 0.30%, 5/25/37 | | | 52,462 | | | | 33 | |
| | Bear Stearns Commercial Mortgage Securities Trust, Series 2007-PWR18, Class A2, 5.613%, 6/11/50 | | | 56,982 | | | | 58 | |
| | Chase Issuance Trust, Series 2012-A5, Class A5, 0.59%, 8/15/17 | | | 75,000 | | | | 75 | |
The Accompanying Notes are an Integral Part of the Financial Statements.
| | | | | | |
| | Asset Allocation Portfolio | | | 199 | |
Asset Allocation Portfolio
| | | | | | | | | | |
| | | Structured Products (8.8%) | | Shares/ $ Par | | | Value $ (000’s) | |
| | | |
| | Structured Products continued | | | | | | | | |
| | Citigroup Commercial Mortgage Trust,
Series 2010-RR3, Class MLSR, 5.737%, 6/14/50 144A | | | 365,000 | | | | 420 | |
| | Citigroup Mortgage Loan Trust, Inc., Series 2005-1, Class 3A1, 6.50%, 4/25/35 | | | 13,619 | | | | 14 | |
| | CNH Equipment Trust, Series 2012-A, Class A4, 1.38%, 2/15/18 | | | 170,000 | | | | 173 | |
| | Credit Suisse Mortgage Capital Certificates,
Series 2009-RR1, Class A3A, 5.383%, 2/15/40 144A | | | 85,000 | | | | 94 | |
| | Discover Card Master Trust, Series 2012-A1, Class A1, 0.81%, 8/15/17 | | | 350,000 | | | | 352 | |
| | FDIC Structured Sale Guaranteed Notes,
Series 2010-S2, Class 2A, 2.57%, 7/29/47 144A | | | 200,286 | | | | 203 | |
| | Federal Home Loan Mortgage Corp., Series K009, Class X1, 1.506%, 8/25/20 IO | | | 1,024,565 | | | | 85 | |
| | Federal Home Loan Mortgage Corp., 3.00%, 11/1/21 | | | 69,129 | | | | 73 | |
| | Federal Home Loan Mortgage Corp., 3.00%, 11/1/25 | | | 134,873 | | | | 142 | |
| | Federal Home Loan Mortgage Corp., 3.00%, 11/1/26 | | | 193,069 | | | | 203 | |
| | Federal Home Loan Mortgage Corp., 3.00%, 11/1/42 | | | 92,334 | | | | 97 | |
| | Federal Home Loan Mortgage Corp., 3.50%, 2/1/26 | | | 209,399 | | | | 220 | |
| | Federal Home Loan Mortgage Corp., 3.50%, 7/1/26 | | | 270,339 | | | | 284 | |
| | Federal Home Loan Mortgage Corp., 3.50%, 8/1/26 | | | 9,522 | | | | 10 | |
| | Federal Home Loan Mortgage Corp., 3.50%, 4/1/42 | | | 99,110 | | | | 106 | |
| | Federal Home Loan Mortgage Corp., 3.50%, 6/1/42 | | | 75,566 | | | | 81 | |
| | Federal Home Loan Mortgage Corp., 3.50%, 7/1/42 | | | 237,543 | | | | 254 | |
| | Federal Home Loan Mortgage Corp., 3.50%, 9/1/42 | | | 840,499 | | | | 897 | |
| | Federal Home Loan Mortgage Corp., 4.00%, 10/1/20 | | | 32,363 | | | | 34 | |
| | Federal Home Loan Mortgage Corp., 4.00%, 8/1/25 | | | 49,163 | | | | 52 | |
| | Federal Home Loan Mortgage Corp., 4.00%, 5/1/26 | | | 38,605 | | | | 41 | |
| | Federal Home Loan Mortgage Corp., 4.00%, 6/1/26 | | | 61,532 | | | | 65 | |
| | Federal Home Loan Mortgage Corp., 4.00%, 9/1/40 | | | 133,175 | | | | 142 | |
| | Federal Home Loan Mortgage Corp., 4.00%, 1/1/41 | | | 355,304 | | | | 380 | |
| | | | | | | | | | |
| | | Structured Products (8.8%) | | Shares/ $ Par | | | Value $ (000’s) | |
| | | |
| | Structured Products continued | | | | | | | | |
| | Federal Home Loan Mortgage Corp., 4.00%, 2/1/41 | | | 723,796 | | | | 773 | |
| | Federal Home Loan Mortgage Corp., 4.00%, 4/1/41 | | | 899,455 | | | | 961 | |
| | Federal Home Loan Mortgage Corp., 4.00%, 5/1/41 | | | 7,019 | | | | 8 | |
| | Federal Home Loan Mortgage Corp., 4.00%, 8/1/41 | | | 33,002 | | | | 35 | |
| | Federal Home Loan Mortgage Corp., 4.00%, 9/1/41 | | | 73,986 | | | | 79 | |
| | Federal Home Loan Mortgage Corp., 4.00%, 10/1/41 | | | 28,186 | | | | 30 | |
| | Federal Home Loan Mortgage Corp., 4.50%, 5/1/19 | | | 53,941 | | | | 59 | |
| | Federal Home Loan Mortgage Corp., 4.50%, 7/1/20 | | | 92,898 | | | | 99 | |
| | Federal Home Loan Mortgage Corp., Series 3065,
Class TN, 4.50%, 10/15/33 | | | 14,770 | | | | 15 | |
| | Federal Home Loan Mortgage Corp., 4.50%, 9/1/39 | | | 36,549 | | | | 39 | |
| | Federal Home Loan Mortgage Corp., 4.50%, 12/1/39 | | | 20,768 | | | | 22 | |
| | Federal Home Loan Mortgage Corp., 4.50%, 4/1/40 | | | 6,646 | | | | 7 | |
| | Federal Home Loan Mortgage Corp., 4.50%, 9/1/40 | | | 60,438 | | | | 65 | |
| | Federal Home Loan Mortgage Corp., 4.50%, 12/1/40 | | | 1,112,651 | | | | 1,218 | |
| | Federal Home Loan Mortgage Corp., 4.50%, 1/1/41 | | | 577,445 | | | | 632 | |
| | Federal Home Loan Mortgage Corp., 4.50%, 2/1/41 | | | 11,294 | | | | 12 | |
| | Federal Home Loan Mortgage Corp., 4.50%, 4/1/41 | | | 45,060 | | | | 49 | |
| | Federal Home Loan Mortgage Corp., 4.50%, 5/1/41 | | | 212,605 | | | | 229 | |
| | Federal Home Loan Mortgage Corp., 4.50%, 6/1/41 | | | 70,187 | | | | 76 | |
| | Federal Home Loan Mortgage Corp., 4.50%, 7/1/41 | | | 753,679 | | | | 813 | |
| | Federal Home Loan Mortgage Corp., 4.50%, 8/1/41 | | | 14,977 | | | | 16 | |
| | Federal Home Loan Mortgage Corp., 5.00%, 11/1/19 | | | 64,130 | | | | 69 | |
| | Federal Home Loan Mortgage Corp., 5.00%, 2/1/20 | | | 15,358 | | | | 17 | |
| | Federal Home Loan Mortgage Corp., 5.00%, 5/1/20 | | | 59,058 | | | | 65 | |
| | Federal Home Loan Mortgage Corp., 5.00%, 11/1/39 | | | 57,683 | | | | 64 | |
| | Federal Home Loan Mortgage Corp., 5.00%, 4/1/41 | | | 178,826 | | | | 194 | |
| | Federal Home Loan Mortgage Corp., 5.00%, 5/1/41 | | | 348,697 | | | | 378 | |
The Accompanying Notes are an Integral Part of the Financial Statements.
| | | | |
| 200 | | Asset Allocation Portfolio | | |
Asset Allocation Portfolio
| | | | | | | | | | |
| | | Structured Products (8.8%) | | Shares/ $ Par | | | Value $ (000’s) | |
| | | |
| | Structured Products continued | | | | | | | | |
| | Federal Home Loan Mortgage Corp., 5.00%, 3/1/38 | | | 449,241 | | | | 484 | |
| | Federal Home Loan Mortgage Corp., 5.50%, 9/1/19 | | | 14,506 | | | | 16 | |
| | Federal Home Loan Mortgage Corp., 5.50%, 11/1/19 | | | 49,317 | | | | 53 | |
| | Federal Home Loan Mortgage Corp., 5.50%, 12/1/19 | | | 9,621 | | | | 10 | |
| | Federal Home Loan Mortgage Corp., 5.50%, 3/1/20 | | | 72,004 | | | | 79 | |
| | Federal Home Loan Mortgage Corp., 5.50%, 4/1/22 | | | 117,955 | | | | 127 | |
| | Federal Home Loan Mortgage Corp., 5.50%, 6/1/35 | | | 43,967 | | | | 48 | |
| | Federal Home Loan Mortgage Corp., 5.50%, 10/1/35 | | | 90,327 | | | | 98 | |
| | Federal Home Loan Mortgage Corp., Series K001, Class A2, 5.651%, 4/25/16 | | | 201,004 | | | | 224 | |
| | Federal Home Loan Mortgage Corp., Series 2840, Class LK, 6.00%, 11/15/17 | | | 18,740 | | | | 19 | |
| | Federal Home Loan Mortgage Corp., Series 2439, Class LH, 6.00%, 4/15/32 | | | 45,235 | | | | 51 | |
| | Federal Home Loan Mortgage Corp., 6.00%, 4/1/37 | | | 33,446 | | | | 36 | |
| | Federal Home Loan Mortgage Corp., 6.00%, 5/1/37 | | | 2,877 | | | | 3 | |
| | Federal Home Loan Mortgage Corp., 6.00%, 7/1/37 | | | 12,863 | | | | 14 | |
| | Federal Home Loan Mortgage Corp., 6.00%, 8/1/37 | | | 1,782 | | | | 2 | |
| | Federal Home Loan Mortgage Corp., 6.00%, 2/1/38 | | | 62,457 | | | | 68 | |
| | Federal Home Loan Mortgage Corp., 6.00%, 1/1/39 | | | 134,148 | | | | 146 | |
| | Federal Home Loan Mortgage Corp. TBA, 3.00%, 1/1/43 | | | 380,000 | | | | 397 | |
| | Federal National Mortgage Association, 3.50%, 2/1/42 | | | 45,805 | | | | 49 | |
| | Federal National Mortgage Association,
3.50%, 10/1/42 | | | 401,009 | | | | 429 | |
| | Federal National Mortgage Association, 4.50%, 6/1/19 | | | 145,308 | | | | 160 | |
| | Federal National Mortgage Association,
4.50%, 12/1/19 | | | 12,059 | | | | 13 | |
| | Federal National Mortgage Association, 4.50%, 7/1/20 | | | 42,037 | | | | 46 | |
| | Federal National Mortgage Association, 4.50%, 9/1/24 | | | 20,166 | | | | 22 | |
| | Federal National Mortgage Association,
4.50%, 11/1/40 | | | 194,936 | | | | 217 | |
| | Federal National Mortgage Association, 5.00%, 3/1/20 | | | 65,384 | | | | 72 | |
| | | | | | | | | | |
| | | Structured Products (8.8%) | | Shares/ $ Par | | | Value $ (000’s) | |
| | | |
| | Structured Products continued | | | | | | | | |
| | Federal National Mortgage Association, 5.00%, 5/1/20 | | | 103,573 | | | | 114 | |
| | Federal National Mortgage Association,
5.00%, 11/1/34 | | | 387,343 | | | | 436 | |
| | Federal National Mortgage Association, 5.00%, 4/1/35 | | | 62,910 | | | | 71 | |
| | Federal National Mortgage Association, 5.00%, 7/1/35 | | | 190,845 | | | | 216 | |
| | Federal National Mortgage Association,
5.00%, 10/1/35 | | | 39,116 | | | | 44 | |
| | Federal National Mortgage Association, 5.00%, 5/1/38 | | | 436,801 | | | | 473 | |
| | Federal National Mortgage Association, 5.32%, 4/1/14 | | | 99,677 | | | | 103 | |
| | Federal National Mortgage Association,
Series 2006-M1, Class C, 5.355%, 2/25/16 | | | 235,217 | | | | 243 | |
| | Federal National Mortgage Association, 5.50%, 4/1/21 | | | 43,293 | | | | 47 | |
| | Federal National Mortgage Association,
5.50%, 10/1/34 | | | 126,603 | | | | 139 | |
| | Federal National Mortgage Association, 5.50%, 3/1/35 | | | 80,220 | | | | 91 | |
| | Federal National Mortgage Association, 5.50%, 9/1/35 | | | 421,761 | | | | 466 | |
| | Federal National Mortgage Association,
5.50%, 11/1/35 | | | 404,954 | | | | 448 | |
| | Federal National Mortgage Association, 5.50%, 2/1/37 | | | 286,323 | �� | | | 317 | |
| | Federal National Mortgage Association,
5.50%, 11/1/37 | | | 221,596 | | | | 245 | |
| | Federal National Mortgage Association, 5.50%, 4/1/38 | | | 499,162 | | | | 551 | |
| | Federal National Mortgage Association,
6.00%, 10/1/34 | | | 104,444 | | | | 117 | |
| | Federal National Mortgage Association,
6.00%, 11/1/34 | | | 148,622 | | | | 165 | |
| | Federal National Mortgage Association, 6.00%, 5/1/35 | | | 3,303 | | | | 4 | |
| | Federal National Mortgage Association, 6.00%, 6/1/35 | | | 1,068 | | | | 1 | |
| | Federal National Mortgage Association, 6.00%, 7/1/35 | | | 80,237 | | | | 88 | |
| | Federal National Mortgage Association,
6.00%, 10/1/35 | | | 39,953 | | | | 44 | |
| | Federal National Mortgage Association,
6.00%, 11/1/35 | | | 80,073 | | | | 89 | |
| | Federal National Mortgage Association, 6.00%, 9/1/36 | | | 32,061 | | | | 36 | |
| | Federal National Mortgage Association,
Series 2002-W4, Class A4, 6.25%, 5/25/42 | | | 208,713 | | | | 237 | |
| | Federal National Mortgage Association TBA,
2.50%, 1/1/28 | | | 355,000 | | | | 371 | |
The Accompanying Notes are an Integral Part of the Financial Statements.
| | | | | | |
| | Asset Allocation Portfolio | | | 201 | |
Asset Allocation Portfolio
| | | | | | | | | | |
| | | Structured Products (8.8%) | | Shares/ $ Par | | | Value $ (000’s) | |
| | | |
| | Structured Products continued | | | | | | | | |
| | Federal National Mortgage Association TBA, 3.50%, 1/1/43 | | | 15,000 | | | | 16 | |
| | Ford Credit Auto Owner Trust, Series 2012-A, Class A4, 1.15%, 6/15/17 | | | 65,000 | | | | 66 | |
| | Ford Credit Auto Owner Trust, Series 2009-E, Class D, 5.53%, 5/15/16 144A | | | 312,630 | | | | 327 | |
| | Ford Credit Auto Owner Trust, Series 2009-D, Class D, 8.14%, 2/15/16 144A | | | 300,000 | | | | 318 | |
| | Golden Credit Card Trust, Series 2012-2A, Class A1, 1.77%, 1/15/19 144A | | | 225,000 | | | | 232 | |
| | Goldman Sachs Mortgage Securities Corp. II,
Series 2009-RR, Class CSA, 5.286%, 12/17/39 144A | | | 40,000 | | | | 45 | |
| | Goldman Sachs Mortgage Securities Corp. II,
Series 2009-RR1, Class GGA, 5.842%, 7/12/38 144A | | | 30,000 | | | | 35 | |
| | Honda Auto Receivables Owner Trust, Series 2012-2, Class A4, 0.91%, 5/15/18 | | | 40,000 | | | | 40 | |
| | Louisiana Public Facilities Authority, Series 2008,
Class A3, 6.55%, 8/1/20 | | | 150,000 | | | | 185 | |
| | MASTR Asset Securitization Trust, Series 2003-10,
Class 1A1, 5.25%, 11/25/23 | | | 18,050 | | | | 19 | |
| | MASTR Asset Securitization Trust, Series 2003-12,
Class 1A1, 5.25%, 12/25/24 | | | 14,495 | | | | 15 | |
| | Merrill Lynch Alternative Note Asset Trust,
Series 2007-A1, Class A2A, 0.28%, 1/25/37 | | | 111,067 | | | | 43 | |
| | Morgan Stanley Reremic Trust, Series 2009-GG10,
Class A4A, 5.789%, 8/12/45 144A | | | 300,000 | | | | 350 | |
| | Oncor Electric Delivery Transition Bond Co.,
Series 2004-1, Class A3, 5.29%, 5/15/18 | | | 106,553 | | | | 116 | |
| | Residential Funding Mortgage Securities I,
Series 2003-S18, Class A1, 4.50%, 10/25/18 | | | 7,110 | | | | 7 | |
| | Sequoia Mortgage Trust, Series 2011-2, Class A1, 3.90%, 9/25/41 | | | 105,185 | | | | 108 | |
| | UBS-Barclays Commercial Mortgage Trust,
Series 2012-C3, Class A4, 3.091%, 8/10/49 | | | 65,000 | | | | 68 | |
| | Washington Mutual Alternative Mortgage Pass-Through Certficates, Series 2006-6, Class 4A, 6.873%, 11/25/34 | | | 32,141 | | | | 32 | |
| | Wells Fargo Mortgage Backed Securities Trust,
Series 2003-12, Class A1, 4.75%, 11/25/18 | | | 2,737 | | | | 3 | |
| | Wells Fargo Mortgage Backed Securities Trust,
Series 2005-1, Class 2A1, 5.00%, 1/25/20 | | | 15,437 | | | | 16 | |
| | | | | | | | | | |
| | | |
| | Total Structured Products | | | | | | | | |
| | (Cost: $19,684) | | | | | | | 20,725 | |
| | | | | | | | | | |
| | | | | | | | | | |
| | | Below Investment Grade Segment (8.4%) | | Shares/ $ Par | | | Value $ (000’s) | |
| | | |
| | Aerospace/Defense (0.1%) | | | | | | | | |
| | B/E Aerospace, Inc., 5.25%, 4/1/22 | | | 35,000 | | | | 37 | |
| | Bombardier, Inc., 5.75%, 3/15/22 144A | | | 20,000 | | | | 21 | |
| | Bombardier, Inc., 7.75%, 3/15/20 144A | | | 35,000 | | | | 40 | |
| | Huntington Ingalls Industries, Inc., 6.875%, 3/15/18 | | | 65,000 | | | | 71 | |
| | Huntington Ingalls Industries, Inc., 7.125%, 3/15/21 | | | 40,000 | | | | 43 | |
| | TransDigm, Inc., 5.50%, 10/15/20 144A | | | 35,000 | | | | 36 | |
| | Triumph Group, Inc., 8.625%, 7/15/18 | | | 40,000 | | | | 44 | |
| | | | | | | | | | |
| | Total | | | | | | | 292 | |
| | | | | | | | | | |
| | | |
| | Autos/Vehicle Parts (0.2%) | | | | | | | | |
| | American Axle & Manufacturing Holdings, Inc., 6.625%, 10/15/22 | | | 15,000 | | | | 15 | |
| | American Axle & Manufacturing Holdings, Inc., 7.875%, 3/1/17 | | | 45,000 | | | | 47 | |
| | American Axle & Manufacturing Holdings, Inc., 9.25%, 1/15/17 144A | | | 16,000 | | | | 18 | |
| | Chrysler Group LLC/CG Co-Issuer, Inc., 8.00%, 6/15/19 | | | 30,000 | | | | 33 | |
| | Chrysler Group LLC/CG Co-Issuer, Inc., 8.25%, 6/15/21 | | | 40,000 | | | | 44 | |
| | Cooper-Standard Automotive, Inc., 8.50%, 5/1/18 | | | 40,000 | | | | 43 | |
| | Exide Technologies, 8.625%, 2/1/18 | | | 50,000 | | | | 42 | |
| | General Motors Financial Co., Inc., 4.75%, 8/15/17 144A | | | 50,000 | | | | 53 | |
| | The Goodyear Tire & Rubber Co., 8.25%, 8/15/20 | | | 50,000 | | | | 55 | |
| | Navistar International Corp., 8.25%, 11/1/21 | | | 55,000 | | | | 53 | |
| | Tower Automotive Holdings USA LLC/TA Holdings Finance, Inc., 10.625%, 9/1/17 144A | | | 36,000 | | | | 39 | |
| | Visteon Corp., 6.75%, 4/15/19 | | | 32,000 | | | | 34 | |
| | | | | | | | | | |
| | Total | | | | | | | 476 | |
| | | | | | | | | | |
| | | |
| | Basic Materials (1.1%) | | | | | | | | |
| | AK Steel Corp., 7.625%, 5/15/20 | | | 20,000 | | | | 17 | |
| | AK Steel Corp., 8.375%, 4/1/22 | | | 50,000 | | | | 43 | |
| | AK Steel Corp., 8.75%, 12/1/18 144A | | | 45,000 | | | | 48 | |
| | Aleris International, Inc., 7.625%, 2/15/18 | | | 35,000 | | | | 36 | |
| | Aleris International, Inc., 7.875%, 11/1/20 144A | | | 30,000 | | | | 30 | |
| | Alpha Natural Resources, Inc., 6.00%, 6/1/19 | | | 65,000 | | | | 60 | |
| | Alpha Natural Resources, Inc., 9.75%, 4/15/18 | | | 40,000 | | | | 43 | |
| | ArcelorMittal, 5.75%, 8/5/20 | | | 40,000 | | | | 40 | |
| | ArcelorMittal, 6.125%, 6/1/18 | | | 95,000 | | | | 96 | |
| | ArcelorMittal, 6.75%, 2/25/22 | | | 55,000 | | | | 58 | |
| | Arch Coal, Inc., 8.75%, 8/1/16 | | | 10,000 | | | | 10 | |
| | Arch Coal, Inc., 9.875%, 6/15/19 144A | | | 35,000 | | | | 36 | |
| | Ardagh Packaging Finance PLC, 7.375%, 10/15/17 144A | | | 30,000 | | | | 33 | |
| | Ardagh Packaging Finance PLC, 9.125%, 10/15/20 144A | | | 30,000 | | | | 33 | |
| | Ardagh Packaging Finance PLC/Ardagh MP Holdings USA, Inc., 9.125%, 10/15/20 144A | | | 20,000 | | | | 22 | |
| | Berry Plastics Corp., 8.25%, 11/15/15 | | | 20,000 | | | | 21 | |
| (c) | | BOE Merger Corp., 9.50%, 11/1/17 144A | | | 20,000 | | | | 20 | |
| | Cascades, Inc., 7.875%, 1/15/20 | | | 20,000 | | | | 21 | |
| (c) | | Catalyst Paper Corp., 11.00%, 10/30/17 | | | 16,224 | | | | 12 | |
| | Celanese US Holdings LLC, 4.625%, 11/15/22 | | | 90,000 | | | | 94 | |
| | Chemtura Corp., 7.875%, 9/1/18 | | | 15,000 | | | | 16 | |
The Accompanying Notes are an Integral Part of the Financial Statements.
| | | | |
| 202 | | Asset Allocation Portfolio | | |
Asset Allocation Portfolio
| | | | | | | | | | |
| | | Below Investment Grade Segment (8.4%) | | Shares/ $ Par | | | Value $ (000’s) | |
| | | |
| | Basic Materials continued | | | | | | | | |
| | Cloud Peak Energy Resources LLC/Cloud Peak Energy Finance Corp., 8.25%, 12/15/17 | | | 45,000 | | | | 48 | |
| | CONSOL Energy, Inc., 8.00%, 4/1/17 | | | 40,000 | | | | 43 | |
| | CONSOL Energy, Inc., 8.25%, 4/1/20 | | | 100,000 | | | | 108 | |
| | Essar Steel Algoma, Inc., 9.375%, 3/15/15 144A | | | 65,000 | | | | 59 | |
| | FMG Resources (August 2006) Pty, Ltd., 6.00%, 4/1/17 144A | | | 35,000 | | | | 36 | |
| | FMG Resources (August 2006) Pty, Ltd., 6.875%, 2/1/18 144A | | | 25,000 | | | | 26 | |
| | FMG Resources (August 2006) Pty, Ltd., 6.875%, 4/1/22 144A | | | 45,000 | | | | 46 | |
| | FMG Resources (August 2006) Pty, Ltd., 7.00%, 11/1/15 144A | | | 15,000 | | | | 16 | |
| | FMG Resources (August 2006) Pty, Ltd., 8.25%, 11/1/19 144A | | | 55,000 | | | | 59 | |
| | GrafTech International, Ltd., 6.375%, 11/15/20 144A | | | 15,000 | | | | 16 | |
| | Hexion US Finance Corp., 6.625%, 4/15/20 | | | 20,000 | | | | 20 | |
| | Hexion US Finance Corp./Hexion Nova Scotia Finance ULC, 8.875%, 2/1/18 | | | 60,000 | | | | 62 | |
| | HudBay Minerals, Inc., 9.50%, 10/1/20 144A | | | 20,000 | | | | 21 | |
| | Huntsman International LLC, 4.875%, 11/15/20 144A | | | 65,000 | | | | 66 | |
| | Ineos Finance PLC, 7.50%, 5/1/20 144A | | | 25,000 | | | | 26 | |
| | Ineos Finance PLC, 8.375%, 2/15/19 144A | | | 65,000 | | | | 70 | |
| | Inmet Mining Corp., 7.50%, 6/1/21 144A | | | 10,000 | | | | 10 | |
| | Molycorp, Inc., 10.00%, 6/1/20 144A | | | 65,000 | | | | 61 | |
| | New Gold, Inc., 6.25%, 11/15/22 144A | | | 15,000 | | | | 16 | |
| (d) | | Patriot Coal Corp., 8.25%, 4/30/18 | | | 25,000 | | | | 13 | |
| | Peabody Energy Corp., 4.75%, 12/15/41 | | | 105,000 | | | | 100 | |
| | Peabody Energy Corp., 6.00%, 11/15/18 | | | 50,000 | | | | 53 | |
| | Peabody Energy Corp., 6.25%, 11/15/21 | | | 65,000 | | | | 69 | |
| | Peabody Energy Corp., 6.50%, 9/15/20 | | | 45,000 | | | | 48 | |
| | Quadra FNX Mining, Ltd., 7.75%, 6/15/19 144A | | | 40,000 | | | | 42 | |
| | Rain CII Carbon LLC/CII Carbon Corp., 8.25%, 1/15/21 144A | | | 15,000 | | | | 15 | |
| | Resolute Forest Products, 10.25%, 10/15/18 | | | 18,000 | | | | 21 | |
| | Reynolds Group Issuer, Inc./Reynolds Group Issuer LLC/Reynolds Group Issuer LU, 5.75%, 10/15/20 144A | | | 65,000 | | | | 67 | |
| | Reynolds Group Issuer, Inc./Reynolds Group Issuer LLC/Reynolds Group Issuer LU, 6.875%, 2/15/21 | | | 55,000 | | | | 59 | |
| | Reynolds Group Issuer, Inc./Reynolds Group Issuer LLC/Reynolds Group Issuer LU, 7.125%, 4/15/19 | | | 30,000 | | | | 32 | |
| | Reynolds Group Issuer, Inc./Reynolds Group Issuer LLC/Reynolds Group Issuer LU, 8.25%, 2/15/21 | | | 25,000 | | | | 25 | |
| | Reynolds Group Issuer, Inc./Reynolds Group Issuer LLC/Reynolds Group Issuer LU, 9.00%, 4/15/19 | | | 55,000 | | | | 57 | |
| | Reynolds Group Issuer, Inc./Reynolds Group Issuer LLC/Reynolds Group Issuer LU, 9.875%, 8/15/19 | | | 70,000 | | | | 75 | |
| | Rockwood Specialties Group, Inc., 4.625%, 10/15/20 | | | 25,000 | | | | 26 | |
| | Sawgrass Merger Sub, Inc., 8.75%, 12/15/20 144A | | | 15,000 | | | | 15 | |
| | Sealed Air Corp., 6.50%, 12/1/20 144A | | | 15,000 | | | | 16 | |
| | Sealed Air Corp., 8.125%, 9/15/19 144A | | | 20,000 | | | | 23 | |
| | | | | | | | | | |
| | | Below Investment Grade Segment (8.4%) | | Shares/ $ Par | | | Value $ (000’s) | |
| | | |
| | Basic Materials continued | | | | | | | | |
| | Sealed Air Corp., 8.375%, 9/15/21 144A | | | 40,000 | | | | 46 | |
| | Severstal Columbus LLC, 10.25%, 2/15/18 | | | 65,000 | | | | 68 | |
| | Steel Dynamics, Inc., 6.125%, 8/15/19 144A | | | 20,000 | | | | 21 | |
| | Steel Dynamics, Inc., 6.375%, 8/15/22 144A | | | 20,000 | | | | 21 | |
| | Thompson Creek Metals Co., Inc., 7.375%, 6/1/18 | | | 15,000 | | | | 12 | |
| | United States Steel Corp., 7.375%, 4/1/20 | | | 30,000 | | | | 32 | |
| | Verso Paper Holdings LLC/Verso Paper, Inc., 8.75%, 2/1/19 | | | 30,000 | | | | 11 | |
| | | | | | | | | | |
| | Total | | | | | | | 2,565 | |
| | | | | | | | | | |
| | | |
| | Builders/Building Materials (0.1%) | | | | | | | | |
| | KB Home, 7.25%, 6/15/18 | | | 40,000 | | | | 44 | |
| | KB Home, 9.10%, 9/15/17 | | | 20,000 | | | | 23 | |
| | USG Corp., 7.875%, 3/30/20 144A | | | 35,000 | | | | 39 | |
| | Vulcan Materials Co., 6.40%, 11/30/17 | | | 45,000 | | | | 49 | |
| | | | | | | | | | |
| | Total | | | | | | | 155 | |
| | | | | | | | | | |
| | | |
| | Capital Goods (0.1%) | | | | | | | | |
| | Case New Holland, Inc., 7.875%, 12/1/17 | | | 20,000 | | | | 24 | |
| | CNH Capital LLC, 3.875%, 11/1/15 144A | | | 15,000 | | | | 15 | |
| | CNH Capital LLC, 6.25%, 11/1/16 | | | 20,000 | | | | 22 | |
| | JMC Steel Group, 8.25%, 3/15/18 144A | | | 25,000 | | | | 26 | |
| | The Manitowoc Co., Inc., 5.875%, 10/15/22 | | | 15,000 | | | | 15 | |
| | SPX Corp., 6.875%, 9/1/17 | | | 45,000 | | | | 50 | |
| | Terex Corp., 6.00%, 5/15/21 | | | 30,000 | | | | 32 | |
| | United Rentals North America, Inc., 5.75%, 7/15/18 144A | | | 15,000 | | | | 16 | |
| | United Rentals North America, Inc., 6.125%, 6/15/23 | | | 15,000 | | | | 16 | |
| | United Rentals North America, Inc., 7.375%, 5/15/20 144A | | | 20,000 | | | | 22 | |
| | | | | | | | | | |
| | Total | | | | | | | 238 | |
| | | | | | | | | | |
| | | |
| | Consumer Products/Retailing (0.3%) | | | | | | | | |
| | AMC Networks, Inc., 4.75%, 12/15/22 | | | 30,000 | | | | 30 | |
| | AutoNation, Inc., 5.50%, 2/1/20 | | | 25,000 | | | | 27 | |
| | Brookfield Residential Properties, Inc., 6.50%, 12/15/20 144A | | | 20,000 | | | | 21 | |
| | Hanesbrands, Inc., 6.375%, 12/15/20 | | | 60,000 | | | | 66 | |
| | Levi Strauss & Co., 6.875%, 5/1/22 | | | 35,000 | | | | 38 | |
| | Levi Strauss & Co., 7.625%, 5/15/20 | | | 30,000 | | | | 33 | |
| | Limited Brands, Inc., 5.625%, 2/15/22 | | | 95,000 | | | | 103 | |
| | Limited Brands, Inc., 8.50%, 6/15/19 | | | 15,000 | | | | 18 | |
| | PVH Corp., 4.50%, 12/15/22 | | | 15,000 | | | | 15 | |
| | Revlon Consumer Products Corp., 9.75%, 11/15/15 | | | 50,000 | | | | 53 | |
| | Rite Aid Corp., 7.50%, 3/1/17 | | | 31,000 | | | | 32 | |
| | Rite Aid Corp., 10.375%, 7/15/16 | | | 35,000 | | | | 37 | |
| | Sally Holdings LLC/Sally Capital, Inc., 6.875%, 11/15/19 | | | 20,000 | | | | 22 | |
| | Spectrum Brands Escrow Corp., 6.375%, 11/15/20 144A | | | 5,000 | | | | 5 | |
| | Spectrum Brands Escrow Corp., 6.625%, 11/15/22 144A | | | 5,000 | | | | 5 | |
| | Spectrum Brands, Inc., 9.50%, 6/15/18 | | | 30,000 | | | | 34 | |
| | SUPERVALU, Inc., 7.50%, 11/15/14 | | | 30,000 | | | | 29 | |
| | SUPERVALU, Inc., 8.00%, 5/1/16 | | | 50,000 | | | | 48 | |
| | Toys R US Property Co. I LLC, 10.75%, 7/15/17 | | | 30,000 | | | | 32 | |
| | Toys R US Property Co. II LLC, 8.50%, 12/1/17 | | | 20,000 | | | | 21 | |
| | Toys R US, Inc., 7.375%, 9/1/16 144A | | | 20,000 | | | | 20 | |
| | | | | | | | | | |
| | Total | | | | | | | 689 | |
| | | | | | | | | | |
The Accompanying Notes are an Integral Part of the Financial Statements.
| | | | | | |
| | Asset Allocation Portfolio | | | 203 | |
Asset Allocation Portfolio
| | | | | | | | | | |
| | | Below Investment Grade Segment (8.4%) | | Shares/ $ Par | | | Value $ (000’s) | |
| | | |
| | Energy (1.9%) | | | | | | | | |
| | Access Midstream Partners LP/ACMP Finance Corp., 4.875%, 5/15/23 | | | 85,000 | | | | 86 | |
| | Access Midstream Partners LP/ACMP Finance Corp., 6.125%, 7/15/22 | | | 30,000 | | | | 32 | |
| | AmeriGas Finance LLC/AmeriGas Finance Corp., 6.75%, 5/20/20 | | | 15,000 | | | | 16 | |
| | AmeriGas Partners LP/AmeriGas Finance Corp., 6.25%, 8/20/19 | | | 55,000 | | | | 59 | |
| | Atlas Pipeline Partners LP/Atlas Pipeline Finance Corp., 6.625%, 10/1/20 144A | | | 35,000 | | | | 37 | |
| | Atwood Oceanics, Inc., 6.50%, 2/1/20 | | | 15,000 | | | | 16 | |
| | Bill Barrett Corp., 7.00%, 10/15/22 | | | 25,000 | | | | 26 | |
| | Bill Barrett Corp., 7.625%, 10/1/19 | | | 45,000 | | | | 47 | |
| | Bristow Group, Inc., 6.25%, 10/15/22 | | | 15,000 | | | | 16 | |
| | Carrizo Oil & Gas, Inc., 7.50%, 9/15/20 | | | 20,000 | | | | 21 | |
| | Carrizo Oil & Gas, Inc., 8.625%, 10/15/18 | | | 50,000 | | | | 54 | |
| | Chaparral Energy, Inc., 8.25%, 9/1/21 | | | 40,000 | | | | 43 | |
| | Chesapeake Energy Corp., 2.50%, 5/15/37 | | | 100,000 | | | | 90 | |
| | Chesapeake Energy Corp., 6.125%, 2/15/21 | | | 75,000 | | | | 78 | |
| | Chesapeake Energy Corp., 6.875%, 11/15/20 | | | 55,000 | | | | 60 | |
| | Chesapeake Energy Corp., 9.50%, 2/15/15 | | | 45,000 | | | | 51 | |
| | Chesapeake Oilfield Operating LLC/Chesapeake Oilfield Finance, Inc., 6.625%, 11/15/19 144A | | | 40,000 | | | | 38 | |
| | Cimarex Energy Co., 5.875%, 5/1/22 | | | 55,000 | | | | 60 | |
| | CITGO Petroleum Corp., 11.50%, 7/1/17 144A | | | 40,000 | | | | 46 | |
| | Compagnie Generale de Geophysique-Veritas, 9.50%, 5/15/16 | | | 60,000 | | | | 64 | |
| | Comstock Resources, Inc., 7.75%, 4/1/19 | | | 30,000 | | | | 30 | |
| | Comstock Resources, Inc., 9.50%, 6/15/20 | | | 55,000 | | | | 59 | |
| | Concho Resources, Inc., 5.50%, 4/1/23 | | | 30,000 | | | | 31 | |
| | Continental Resources, Inc., 5.00%, 9/15/22 | | | 105,000 | | | | 113 | |
| | Crosstex Energy LP/Crosstex Energy Finance Corp., 8.875%, 2/15/18 | | | 50,000 | | | | 54 | |
| | Denbury Resources, Inc., 8.25%, 2/15/20 | | | 30,000 | | | | 34 | |
| | Drill Rigs Holdings, Inc., 6.50%, 10/1/17 144A | | | 50,000 | | | | 50 | |
| | El Paso LLC, 7.00%, 6/15/17 | | | 25,000 | | | | 29 | |
| | El Paso LLC, 7.25%, 6/1/18 | | | 70,000 | | | | 81 | |
| | El Paso LLC, 7.75%, 1/15/32 | | | 40,000 | | | | 47 | |
| | El Paso Pipeline Partners Operating Co. LLC, 4.70%, 11/1/42 | | | 20,000 | | | | 20 | |
| | El Paso Pipeline Partners Operating Co. LLC, 5.00%, 10/1/21 | | | 70,000 | | | | 79 | |
| | Energy Transfer Equity LP, 7.50%, 10/15/20 | | | 85,000 | | | | 98 | |
| | EP Energy LLC/EP Energy Finance, Inc., 9.375%, 5/1/20 | | | 35,000 | | | | 39 | |
| | EP Energy LLC/Everest Acquisition Finance, Inc., 7.75%, 9/1/22 | | | 15,000 | | | | 16 | |
| | Exterran Holdings, Inc., 7.25%, 12/1/18 | | | 60,000 | | | | 64 | |
| | Forest Oil Corp., 7.25%, 6/15/19 | | | 55,000 | | | | 55 | |
| | Forest Oil Corp., 7.50%, 9/15/20 144A | | | 30,000 | | | | 31 | |
| | Hiland Partners LP/Hiland Partners Finance Corp., 7.25%, 10/1/20 144A | | | 15,000 | | | | 16 | |
| | Hilcorp Energy I LP/Hilcorp Finance Co., 7.625%, 4/15/21 144A | | | 20,000 | | | | 22 | |
| | Hilcorp Energy I LP/Hilcorp Finance Co., 8.00%, 2/15/20 144A | | | 35,000 | | | | 38 | |
| | Hornbeck Offshore Services, Inc., 5.875%, 4/1/20 | | | 20,000 | | | | 21 | |
| | Inergy Midstream LP/NRGM Finance Corp., 6.00%, 12/15/20 144A | | | 20,000 | | | | 21 | |
| | Key Energy Services, Inc., 6.75%, 3/1/21 | | | 40,000 | | | | 40 | |
| | | | | | | | | | |
| | | Below Investment Grade Segment (8.4%) | | Shares/ $ Par | | | Value $ (000’s) | |
| | | |
| | Energy continued | | | | | | | | |
| | Kinder Morgan Finance Co. LLC, 6.00%, 1/15/18 144A | | | 60,000 | | | | 66 | |
| | Kodiak Oil & Gas Corp., 8.125%, 12/1/19 | | | 55,000 | | | | 61 | |
| | Linn Energy LLC/Linn Energy Finance Corp., 6.25%, 11/1/19 144A | | | 65,000 | | | | 65 | |
| | Linn Energy LLC/Linn Energy Finance Corp., 6.50%, 5/15/19 | | | 90,000 | | | | 91 | |
| | Linn Energy LLC/Linn Energy Finance Corp., 7.75%, 2/1/21 | | | 35,000 | | | | 37 | |
| | Magnum Hunter Resources Corp., 9.75%, 5/15/20 144A | | | 70,000 | | | | 73 | |
| | MarkWest Energy Partners LP/MarkWest Energy Finance Corp., 5.50%, 2/15/23 | | | 50,000 | | | | 54 | |
| | MarkWest Energy Partners LP/MarkWest Energy Finance Corp., 6.25%, 6/15/22 | | | 50,000 | | | | 54 | |
| | MarkWest Energy Partners LP/MarkWest Energy Finance Corp., 6.75%, 11/1/20 | | | 20,000 | | | | 22 | |
| | MEG Energy Corp., 6.375%, 1/30/23 144A | | | 45,000 | | | | 47 | |
| | Newfield Exploration Co., 5.625%, 7/1/24 | | | 20,000 | | | | 22 | |
| | Newfield Exploration Co., 6.875%, 2/1/20 | | | 60,000 | | | | 64 | |
| | Newfield Exploration Co., 7.125%, 5/15/18 | | | 65,000 | | | | 69 | |
| | NGPL PipeCo LLC, 9.625%, 6/1/19 144A | | | 15,000 | | | | 17 | |
| | Northern Tier Energy LLC/Northern Tier Finance Corp., 7.125%, 11/15/20 144A | | | 20,000 | | | | 21 | |
| | Oasis Petroleum, Inc., 6.50%, 11/1/21 | | | 75,000 | | | | 80 | |
| | Offshore Group Investment, Ltd., 7.50%, 11/1/19 144A | | | 70,000 | | | | 71 | |
| | Offshore Group Investment, Ltd., 11.50%, 8/1/15 | | | 34,000 | | | | 37 | |
| | OGX Austria GmbH, 8.50%, 6/1/18 144A | | | 55,000 | | | | 49 | |
| | Oil States International, Inc., 5.125%, 1/15/23 144A | | | 45,000 | | | | 46 | |
| | Oil States International, Inc., 6.50%, 6/1/19 | | | 25,000 | | | | 27 | |
| | PBF Holding Co. LLC/PBF Finance Corp., 8.25%, 2/15/20 144A | | | 35,000 | | | | 38 | |
| | Penn Virginia Resource Partners LP/Penn Virginia Resource Finance Corp. II, 8.375%, 6/1/20 144A | | | 50,000 | | | | 54 | |
| | Petroleum Geo-Services ASA, 7.375%, 12/15/18 144A | | | 40,000 | | | | 43 | |
| | Plains Exploration & Production Co., 6.125%, 6/15/19 | | | 20,000 | | | | 22 | |
| | Plains Exploration & Production Co., 6.625%, 5/1/21 | | | 40,000 | | | | 44 | |
| | Plains Exploration & Production Co., 6.75%, 2/1/22 | | | 25,000 | | | | 28 | |
| | Plains Exploration & Production Co., 8.625%, 10/15/19 | | | 55,000 | | | | 63 | |
| | QEP Resources, Inc., 5.25%, 5/1/23 | | | 30,000 | | | | 32 | |
| | QEP Resources, Inc., 5.375%, 10/1/22 | | | 25,000 | | | | 27 | |
| | QEP Resources, Inc., 6.875%, 3/1/21 | | | 30,000 | | | | 35 | |
| | Range Resources Corp., 5.00%, 8/15/22 | | | 35,000 | | | | 37 | |
| | Range Resources Corp., 5.75%, 6/1/21 | | | 35,000 | | | | 37 | |
| | Regency Energy Partners LP/Regency Energy Finance Corp., 5.50%, 4/15/23 | | | 20,000 | | | | 21 | |
| | Rosetta Resources, Inc., 9.50%, 4/15/18 | | | 45,000 | | | | 50 | |
| | Samson Investment Co., 9.75%, 2/15/20 144A | | | 85,000 | | | | 90 | |
| | SandRidge Energy, Inc., 7.50%, 3/15/21 | | | 65,000 | | | | 70 | |
| | SandRidge Energy, Inc., 7.50%, 2/15/23 | | | 30,000 | | | | 32 | |
| | SandRidge Energy, Inc., 8.00%, 6/1/18 144A | | | 35,000 | | | | 37 | |
| | SandRidge Energy, Inc., 9.875%, 5/15/16 | | | 30,000 | | | | 32 | |
| | SESI LLC, 6.375%, 5/1/19 | | | 45,000 | | | | 48 | |
| | SM Energy Co., 6.50%, 11/15/21 | | | 20,000 | | | | 21 | |
| | SM Energy Co., 6.50%, 1/1/23 | | | 20,000 | | | | 21 | |
The Accompanying Notes are an Integral Part of the Financial Statements.
| | | | |
| 204 | | Asset Allocation Portfolio | | |
Asset Allocation Portfolio
| | | | | | | | | | |
| | | Below Investment Grade Segment (8.4%) | | Shares/ $ Par | | | Value $ (000’s) | |
| | | |
| | Energy continued | | | | | | | | |
| | SM Energy Co., 6.625%, 2/15/19 | | | 35,000 | | | | 37 | |
| | Swift Energy Co., 7.875%, 3/1/22 144A | | | 15,000 | | | | 16 | |
| | Swift Energy Co., 8.875%, 1/15/20 | | | 25,000 | | | | 27 | |
| | Targa Resources Partners LP/Targa Resources Partners Finance Corp., 5.25%, 5/1/23 144A | | | 35,000 | | | | 36 | |
| | Targa Resources Partners LP/Targa Resources Partners Finance Corp., 6.375%, 8/1/22 144A | | | 25,000 | | | | 27 | |
| | Tesoro Corp., 4.25%, 10/1/17 | | | 20,000 | | | | 21 | |
| | Tesoro Corp., 5.375%, 10/1/22 | | | 20,000 | | | | 21 | |
| | Tesoro Logistics LP/Tesoro Logistics Finance Corp., 5.875%, 10/1/20 144A | | | 20,000 | | | | 21 | |
| | Trinidad Drilling, Ltd., 7.875%, 1/15/19 144A | | | 40,000 | | | | 42 | |
| | Unit Corp., 6.625%, 5/15/21 144A | | | 35,000 | | | | 36 | |
| | Venoco, Inc., 8.875%, 2/15/19 | | | 25,000 | | | | 23 | |
| | W&T Offshore, Inc., 8.50%, 6/15/19 144A | | | 35,000 | | | | 38 | |
| | W&T Offshore, Inc., 8.50%, 6/15/19 | | | 40,000 | | | | 43 | |
| | WPX Energy, Inc., 5.25%, 1/15/17 | | | 65,000 | | | | 69 | |
| | WPX Energy, Inc., 6.00%, 1/15/22 | | | 45,000 | | | | 48 | |
| | | | | | | | | | |
| | Total | | | | | | | 4,488 | |
| | | | | | | | | | |
| | | |
| | Financials (0.8%) | | | | | | | | |
| | AerCap Aviation Solutions BV, 6.375%, 5/30/17 | | | 40,000 | | | | 42 | |
| | Air Lease Corp., 5.625%, 4/1/17 | | | 45,000 | | | | 48 | |
| | Aircastle, Ltd., 6.25%, 12/1/19 144A | | | 20,000 | | | | 21 | |
| | Aircastle, Ltd., 6.75%, 4/15/17 | | | 25,000 | | | | 27 | |
| | Aircastle, Ltd., 7.625%, 4/15/20 | | | 15,000 | | | | 17 | |
| | Ally Financial, Inc., 4.625%, 6/26/15 | | | 25,000 | | | | 26 | |
| | Ally Financial, Inc., 5.50%, 2/15/17 | | | 45,000 | | | | 48 | |
| | Ally Financial, Inc., 7.50%, 9/15/20 | | | 90,000 | | | | 109 | |
| | Ally Financial, Inc., 8.00%, 3/15/20 | | | 45,000 | | | | 55 | |
| | AWAS Aviation Capital, Ltd., 7.00%, 10/17/16 144A | | | 16,160 | | | | 17 | |
| | CIT Group, Inc., 4.25%, 8/15/17 | | | 60,000 | | | | 62 | |
| | CIT Group, Inc., 4.75%, 2/15/15 144A | | | 65,000 | | | | 67 | |
| | CIT Group, Inc., 5.00%, 5/15/17 | | | 35,000 | | | | 37 | |
| | CIT Group, Inc., 5.00%, 8/15/22 | | | 45,000 | | | | 48 | |
| | CIT Group, Inc., 5.25%, 3/15/18 | | | 10,000 | | | | 11 | |
| | CIT Group, Inc., 5.375%, 5/15/20 | | | 45,000 | | | | 49 | |
| | CIT Group, Inc., 5.50%, 2/15/19 144A | | | 30,000 | | | | 33 | |
| | E*TRADE Financial Corp., 6.00%, 11/15/17 | | | 55,000 | | | | 56 | |
| | E*TRADE Financial Corp., 6.375%, 11/15/19 | | | 30,000 | | | | 31 | |
| | E*TRADE Financial Corp., 6.75%, 6/1/16 | | | 50,000 | | | | 53 | |
| | Eksportfinans ASA, 2.00%, 9/15/15 | | | 250,000 | | | | 239 | |
| | Icahn Enterprises LP/Icahn Enterprises Finance Corp., 7.75%, 1/15/16 | | | 55,000 | | | | 57 | |
| | Icahn Enterprises LP/Icahn Enterprises Finance Corp., 8.00%, 1/15/18 | | | 25,000 | | | | 27 | |
| (c) | | Igloo Holdings Corp., 8.25%, 12/15/17 144A | | | 20,000 | | | | 20 | |
| | International Lease Finance Corp., 5.75%, 5/15/16 | | | 55,000 | | | | 58 | |
| | International Lease Finance Corp., 6.25%, 5/15/19 | | | 40,000 | | | | 42 | |
| | International Lease Finance Corp., 7.125%, 9/1/18 144A | | | 40,000 | | | | 46 | |
| | International Lease Finance Corp., 8.625%, 9/15/15 | | | 15,000 | | | | 17 | |
| | International Lease Finance Corp., 8.75%, 3/15/17 | | | 55,000 | | | | 63 | |
| | International Lease Finance Corp., 8.875%, 9/1/17 | | | 40,000 | | | | 47 | |
| | JPMorgan Chase & Co., 7.90%, 4/29/49 | | | 35,000 | | | | 40 | |
| (d) | | Lehman Brothers Holdings, Inc., 5.50%, 4/4/16 | | | 35,000 | | | | 8 | |
| (d) | | Lehman Brothers Holdings, Inc., 6.875%, 5/2/18 | | | 25,000 | | | | 6 | |
| | Regions Financial Corp., 7.75%, 11/10/14 | | | 15,000 | | | | 17 | |
| | | | | | | | | | |
| | | Below Investment Grade Segment (8.4%) | | Shares/ $ Par | | | Value $ (000’s) | |
| | | |
| | Financials continued | | | | | | | | |
| | SLM Corp., 6.00%, 1/25/17 | | | 55,000 | | | | 59 | |
| | SLM Corp., 8.00%, 3/25/20 | | | 105,000 | | | | 120 | |
| | SLM Corp., 8.45%, 6/15/18 | | | 25,000 | | | | 29 | |
| | | | | | | | | | |
| | Total | | | | | | | 1,752 | |
| | | | | | | | | | |
| | | |
| | Foods (0.2%) | | | | | | | | |
| (c) | | Alphabet Holding Co., Inc., 7.75%, 11/1/17 144A | | | 15,000 | | | | 15 | |
| | Bumble Bee Acquisition Corp., 9.00%, 12/15/17 144A | | | 23,000 | | | | 25 | |
| | Constellation Brands, Inc., 6.00%, 5/1/22 | | | 10,000 | | | | 12 | |
| | Cott Beverages, Inc., 8.125%, 9/1/18 | | | 20,000 | | | | 22 | |
| | Cott Beverages, Inc., 8.375%, 11/15/17 | | | 20,000 | | | | 22 | |
| | Dean Foods Co., 7.00%, 6/1/16 | | | 45,000 | | | | 49 | |
| | Dean Foods Co., 9.75%, 12/15/18 | | | 50,000 | | | | 58 | |
| | Dole Food Co., Inc., 8.00%, 10/1/16 144A | | | 25,000 | | | | 26 | |
| | Dole Food Co., Inc., 13.875%, 3/15/14 | | | 30,000 | | | | 33 | |
| | JBS Finance II, Ltd., 8.25%, 1/29/18 144A | | | 40,000 | | | | 42 | |
| | JBS USA LLC/JBS USA Finance, Inc., 7.25%, 6/1/21 144A | | | 35,000 | | | | 35 | |
| | Land O’ Lakes, Inc., 6.00%, 11/15/22 144A | | | 45,000 | | | | 49 | |
| | Post Holdings, Inc., 7.375%, 2/15/22 144A | | | 5,000 | | | | 6 | |
| | Smithfield Foods, Inc., 6.625%, 8/15/22 | | | 40,000 | | | | 44 | |
| | TreeHouse Foods, Inc., 7.75%, 3/1/18 | | | 25,000 | | | | 27 | |
| | | | | | | | | | |
| | Total | | | | | | | 465 | |
| | | | | | | | | | |
| | | |
| | Gaming/Leisure/Lodging (0.4%) | | | | | | | | |
| | AMC Entertainment, Inc., 8.75%, 6/1/19 | | | 55,000 | | | | 61 | |
| | Caesars Entertainment Operating Co., Inc., 8.50%, 2/15/20 | | | 60,000 | | | | 59 | |
| | Caesars Entertainment Operating Co., Inc., 10.00%, 12/15/18 | | | 78,000 | | | | 52 | |
| | Caesars Entertainment Operating Co., Inc., 11.25%, 6/1/17 | | | 55,000 | | | | 59 | |
| | Caesars Entertainment Operating Co., Inc., 12.75%, 4/15/18 | | | 40,000 | | | | 29 | |
| | Chester Downs & Marina LLC, 9.25%, 2/1/20 144A | | | 40,000 | | | | 39 | |
| | Cinemark USA, Inc., 5.125%, 12/15/22 144A | | | 10,000 | | | | 10 | |
| | The Geo Group, Inc., 6.625%, 2/15/21 | | | 35,000 | | | | 39 | |
| | MGM Resorts International, 6.75%, 10/1/20 144A | | | 30,000 | | | | 31 | |
| | MGM Resorts International, 7.625%, 1/15/17 | | | 70,000 | | | | 75 | |
| | MGM Resorts International, 7.75%, 3/15/22 | | | 30,000 | | | | 32 | |
| | MGM Resorts International, 8.625%, 2/1/19 144A | | | 50,000 | | | | 56 | |
| | Penn National Gaming, Inc., 8.75%, 8/15/19 | | | 40,000 | | | | 46 | |
| | Regal Entertainment Group, 9.125%, 8/15/18 | | | 40,000 | | | | 45 | |
| | Royal Caribbean Cruises, Ltd., 5.25%, 11/15/22 | | | 20,000 | | | | 21 | |
| | Scientific Games International, Inc., 6.25%, 9/1/20 144A | | | 45,000 | | | | 46 | |
| | Scientific Games International, Inc., 9.25%, 6/15/19 | | | 25,000 | | | | 28 | |
| | Seminole Indian Tribe of Florida, 7.75%, 10/1/17 144A | | | 55,000 | | | | 59 | |
| | Speedway Motorsports, Inc., 6.75%, 2/1/19 | | | 30,000 | | | | 32 | |
| | Speedway Motorsports, Inc., 8.75%, 6/1/16 | | | 50,000 | | | | 53 | |
| | Wynn Las Vegas LLC/Wynn Las Vegas Capital Corp., 7.875%, 5/1/20 | | | 35,000 | | | | 40 | |
| | | | | | | | | | |
| | Total | | | | | | | 912 | |
| | | | | | | | | | |
| | | |
| | Health Care/Pharmaceuticals (0.7%) | | | | | | | | |
| | Biomet, Inc., 6.50%, 8/1/20 144A | | | 40,000 | | | | 43 | |
| | Biomet, Inc., 6.50%, 10/1/20 144A | | | 25,000 | | | | 25 | |
The Accompanying Notes are an Integral Part of the Financial Statements.
| | | | | | |
| | Asset Allocation Portfolio | | | 205 | |
Asset Allocation Portfolio
| | | | | | | | | | |
| | | Below Investment Grade Segment (8.4%) | | Shares/ $ Par | | | Value $ (000’s) | |
| | | |
| | Health Care/Pharmaceuticals continued | | | | | | | | |
| | Centene Corp., 5.75%, 6/1/17 | | | 75,000 | | | | 81 | |
| | CHS/Community Health Systems, Inc., 5.125%, 8/15/18 | | | 30,000 | | | | 31 | |
| | CHS/Community Health Systems, Inc., 7.125%, 7/15/20 | | | 45,000 | | | | 48 | |
| | CHS/Community Health Systems, Inc., 8.00%, 11/15/19 | | | 55,000 | | | | 60 | |
| | Elan Finance PLC/Elan Finance Corp., 6.25%, 10/15/19 144A | | | 65,000 | | | | 68 | |
| | Endo Health Solutions, Inc., 7.00%, 7/15/19 | | | 15,000 | | | | 16 | |
| | Endo Health Solutions, Inc., 7.25%, 1/15/22 | | | 30,000 | | | | 32 | |
| | Fresenius Medical Care US Finance II, Inc., 5.625%, 7/31/19 144A | | | 85,000 | | | | 91 | |
| | Fresenius Medical Care US Finance II, Inc., 5.875%, 1/31/22 144A | | | 55,000 | | | | 60 | |
| | Fresenius Medical Care US Finance, Inc., 6.50%, 9/15/18 144A | | | 10,000 | | | | 11 | |
| | HCA Holdings, Inc., 6.25%, 2/15/21 | | | 20,000 | | | | 20 | |
| | HCA Holdings, Inc., 7.75%, 5/15/21 | | | 35,000 | | | | 38 | |
| | HCA, Inc., 5.875%, 3/15/22 | | | 25,000 | | | | 27 | |
| | HCA, Inc., 6.50%, 2/15/20 | | | 80,000 | | | | 90 | |
| | HCA, Inc., 7.25%, 9/15/20 | | | 85,000 | | | | 94 | |
| | HCA, Inc., 7.875%, 2/15/20 | | | 25,000 | | | | 28 | |
| | HCA, Inc., 8.00%, 10/1/18 | | | 30,000 | | | | 35 | |
| | HCA, Inc., 8.50%, 4/15/19 | | | 50,000 | | | | 56 | |
| | HCA, Inc., 9.875%, 2/15/17 | | | 7,000 | | | | 7 | |
| | Health Management Associates, Inc., 6.125%, 4/15/16 | | | 45,000 | | | | 49 | |
| | Health Management Associates, Inc., 7.375%, 1/15/20 | | | 25,000 | | | | 27 | |
| | Hologic, Inc., 6.25%, 8/1/20 144A | | | 10,000 | | | | 11 | |
| | MPT Operating Partnership LP/MPT Finance Corp., 6.375%, 2/15/22 | | | 40,000 | | | | 42 | |
| | MPT Operating Partnership LP/MPT Finance Corp., 6.875%, 5/1/21 | | | 40,000 | | | | 43 | |
| | Prospect Medical Holdings, Inc., 8.375%, 5/1/19 144A | | | 55,000 | | | | 58 | |
| | Service Corp. International, 4.50%, 11/15/20 | | | 15,000 | | | | 15 | |
| | Service Corp. International, 7.00%, 5/15/19 | | | 30,000 | | | | 33 | |
| | Service Corp. International, 8.00%, 11/15/21 | | | 15,000 | | | | 18 | |
| | Tenet Healthcare Corp., 6.25%, 11/1/18 | | | 40,000 | | | | 44 | |
| | Tenet Healthcare Corp., 8.875%, 7/1/19 | | | 35,000 | | | | 39 | |
| | Valeant Pharmaceuticals International, 6.50%, 7/15/16 144A | | | 70,000 | | | | 74 | |
| | Valeant Pharmaceuticals International, 6.75%, 10/1/17 144A | | | 55,000 | | | | 59 | |
| | Valeant Pharmaceuticals International, 6.875%, 12/1/18 144A | | | 65,000 | | | | 70 | |
| | Vanguard Health Systems, Inc., 0.00%, 2/1/16 | | | 1,000 | | | | 1 | |
| | VPI Escrow Corp., 6.375%, 10/15/20 144A | | | 40,000 | | | | 43 | |
| | Warner Chilcott Co. LLC/Warner Chilcott Finance LLC, 7.75%, 9/15/18 | | | 50,000 | | | | 53 | |
| | | | | | | | | | |
| | Total | | | | | | | 1,640 | |
| | | | | | | | | | |
| | | |
| | Media (0.9%) | | | | | | | | |
| | Cablevision Systems Corp., 7.75%, 4/15/18 | | | 45,000 | | | | 50 | |
| | CCO Holdings LLC/CCO Holdings Capital Corp., 5.125%, 2/15/23 | | | 75,000 | | | | 75 | |
| | CCO Holdings LLC/CCO Holdings Capital Corp., 6.50%, 4/30/21 | | | 10,000 | | | | 11 | |
| | CCO Holdings LLC/CCO Holdings Capital Corp., 7.00%, 1/15/19 | | | 55,000 | | | | 59 | |
| | CCO Holdings LLC/CCO Holdings Capital Corp., 7.25%, 10/30/17 | | | 55,000 | | | | 60 | |
| | | | | | | | | | |
| | | Below Investment Grade Segment (8.4%) | | Shares/ $ Par | | | Value $ (000’s) | |
| | | |
| | Media continued | | | | | | | | |
| | CCO Holdings LLC/CCO Holdings Capital Corp., 7.375%, 6/1/20 | | | 20,000 | | | | 22 | |
| | CCO Holdings LLC/CCO Holdings Capital Corp., 7.875%, 4/30/18 | | | 20,000 | | | | 22 | |
| | Cequel Communications Holdings I LLC/Cequel Capital Corp., 6.375%, 9/15/20 144A | | | 55,000 | | | | 57 | |
| | Clear Channel Worldwide Holdings, Inc., 7.625%, 3/15/20 | | | 25,000 | | | | 25 | |
| | CSC Holdings LLC, 7.625%, 7/15/18 | | | 40,000 | | | | 46 | |
| | CSC Holdings LLC, 7.875%, 2/15/18 | | | 22,000 | | | | 26 | |
| | CSC Holdings LLC, 8.625%, 2/15/19 | | | 25,000 | | | | 30 | |
| (c) | | Dex One Corp., 14.00%, 1/29/17 | | | 59,010 | | | | 20 | |
| | DISH DBS Corp., 5.00%, 3/15/23 144A | | | 175,000 | | | | 175 | |
| | DISH DBS Corp., 5.875%, 7/15/22 | | | 40,000 | | | | 43 | |
| | DISH DBS Corp., 6.75%, 6/1/21 | | | 80,000 | | | | 91 | |
| | DISH DBS Corp., 7.125%, 2/1/16 | | | 85,000 | | | | 95 | |
| | DISH DBS Corp., 7.875%, 9/1/19 | | | 50,000 | | | | 59 | |
| | Hughes Satellite Systems Corp., 6.50%, 6/15/19 | | | 40,000 | | | | 44 | |
| | Hughes Satellite Systems Corp., 7.625%, 6/15/21 | | | 25,000 | | | | 28 | |
| | Inmarsat Finance PLC, 7.375%, 12/1/17 144A | | | 15,000 | | | | 16 | |
| | Intelsat Jackson Holdings SA, 7.25%, 4/1/19 | | | 50,000 | | | | 54 | |
| | Intelsat Jackson Holdings SA, 7.25%, 10/15/20 | | | 50,000 | | | | 54 | |
| | Intelsat Jackson Holdings SA, 8.50%, 11/1/19 | | | 75,000 | | | | 84 | |
| (c) | | Intelsat Luxembourg SA, 11.50%, 2/4/17 | | | 90,000 | | | | 96 | |
| | Lamar Media Corp., 5.00%, 5/1/23 144A | | | 50,000 | | | | 51 | |
| | LIN Television Corp., 6.375%, 1/15/21 144A | | | 30,000 | | | | 32 | |
| | Mediacom LLC/Mediacom Capital Corp., 9.125%, 8/15/19 | | | 50,000 | | | | 55 | |
| | Nielsen Finance LLC/Nielsen Finance Co., 7.75%, 10/15/18 | | | 45,000 | | | | 50 | |
| | QVC, Inc., 5.125%, 7/2/22 144A | | | 15,000 | | | | 16 | |
| | QVC, Inc., 7.375%, 10/15/20 144A | | | 30,000 | | | | 33 | |
| | QVC, Inc., 7.50%, 10/1/19 144A | | | 55,000 | | | | 61 | |
| | Sinclair Television Group, Inc., 6.125%, 10/1/22 144A | | | 10,000 | | | | 11 | |
| | Sirius XM Radio, Inc., 5.25%, 8/15/22 144A | | | 15,000 | | | | 15 | |
| | Starz LLC/Starz Finance Corp., 5.00%, 9/15/19 144A | | | 15,000 | | | | 15 | |
| | Unitymedia Hessen GmbH & Co. KG/Unitymedia NRW GmbH, 5.50%, 1/15/23 144A | | | 55,000 | | | | 57 | |
| | Univision Communications, Inc., 6.75%, 9/15/22 144A | | | 35,000 | | | | 36 | |
| | Univision Communications, Inc., 7.875%, 11/1/20 144A | | | 20,000 | | | | 22 | |
| | UPCB Finance V, Ltd., 7.25%, 11/15/21 144A | | | 55,000 | | | | 61 | |
| | Videotron Ltee, 5.00%, 7/15/22 | | | 80,000 | | | | 84 | |
| | Virgin Media Finance PLC, 8.375%, 10/15/19 | | | 17,000 | | | | 19 | |
| | WMG Acquisition Corp., 6.00%, 1/15/21 144A | | | 10,000 | | | | 11 | |
| | WMG Acquisition Corp., 11.50%, 10/1/18 | | | 50,000 | | | | 58 | |
| | XM Satellite Radio, Inc., 7.625%, 11/1/18 144A | | | 55,000 | | | | 61 | |
| | | | | | | | | | |
| | Total | | | | | | | 2,090 | |
| | | | | | | | | | |
| | | |
| | Other Holdings (0.0%) | | | | | | | | |
| (n)* | | General Motors Co. Escrow, 7.20%, 1/15/13 | | | 30,000 | | | | - | |
| (n)* | | General Motors Co. Escrow, 8.375%, 7/15/33 | | | 260,000 | | | | - | |
| | | | | | | | | | |
| | Total | | | | | | | - | |
| | | | | | | | | | |
| | | |
| | Real Estate (0.0%) | | | | | | | | |
| | DuPont Fabros Technology LP, 8.50%, 12/15/17 | | | 40,000 | | | | 44 | |
| | | | | | | | | | |
| | Total | | | | | | | 44 | |
| | | | | | | | | | |
The Accompanying Notes are an Integral Part of the Financial Statements.
| | | | |
| 206 | | Asset Allocation Portfolio | | |
Asset Allocation Portfolio
| | | | | | | | | | |
| | | Below Investment Grade Segment (8.4%) | | Shares/ $ Par | | | Value $ (000’s) | |
| | | |
| | Services (0.1%) | | | | | | | | |
| (c) | | ARAMARK Holdings Corp., 8.625%, 5/1/16 144A | | | 15,000 | | | | 15 | |
| | Clean Harbors, Inc., 5.125%, 6/1/21 144A | | | 15,000 | | | | 15 | |
| | Clean Harbors, Inc., 5.25%, 8/1/20 | | | 30,000 | | | | 31 | |
| | FTI Consulting, Inc., 6.00%, 11/15/22 144A | | | 20,000 | | | | 21 | |
| | HDTFS, Inc., 5.875%, 10/15/20 144A | | | 15,000 | | | | 16 | |
| | HDTFS, Inc., 6.25%, 10/15/22 144A | | | 10,000 | | | | 11 | |
| | Mobile Mini, Inc., 7.875%, 12/1/20 | | | 65,000 | | | | 71 | |
| | Trans Union LLC/TransUnion Financing Corp., 11.375%, 6/15/18 | | | 40,000 | | | | 47 | |
| | | | | | | | | | |
| | Total | | | | | | | 227 | |
| | | | | | | | | | |
| | | |
| | Technology (0.4%) | | | | | | | | |
| | Amkor Technology, Inc., 6.375%, 10/1/22 144A | | | 25,000 | | | | 25 | |
| | Amkor Technology, Inc., 6.625%, 6/1/21 | | | 25,000 | | | | 25 | |
| | Equinix, Inc., 7.00%, 7/15/21 | | | 25,000 | | | | 28 | |
| | Equinix, Inc., 8.125%, 3/1/18 | | | 35,000 | | | | 39 | |
| | Fidelity National Information Services, Inc., 5.00%, 3/15/22 | | | 65,000 | | | | 70 | |
| | First Data Corp., 6.75%, 11/1/20 144A | | | 70,000 | | | | 71 | |
| | First Data Corp., 7.375%, 6/15/19 144A | | | 50,000 | | | | 52 | |
| | First Data Corp., 8.25%, 1/15/21 144A | | | 25,000 | | | | 25 | |
| | First Data Corp., 9.875%, 9/24/15 | | | 65,000 | | | | 66 | |
| (c) | | First Data Corp., 10.55%, 9/24/15 | | | 38,382 | | | | 39 | |
| | Freescale Semiconductor, Inc., 9.25%, 4/15/18 144A | | | 30,000 | | | | 33 | |
| | Freescale Semiconductor, Inc., 10.125%, 3/15/18 144A | | | 71,000 | | | | 78 | |
| | Iron Mountain, Inc., 7.75%, 10/1/19 | | | 45,000 | | | | 51 | |
| | Iron Mountain, Inc., 8.375%, 8/15/21 | | | 10,000 | | | | 11 | |
| | Jabil Circuit, Inc., 4.70%, 9/15/22 | | | 40,000 | | | | 42 | |
| | MEMC Electronic Materials, Inc., 7.75%, 4/1/19 | | | 25,000 | | | | 21 | |
| | NCR Corp., 4.625%, 2/15/21 144A | | | 55,000 | | | | 55 | |
| | NCR Corp., 5.00%, 7/15/22 144A | | | 10,000 | | | | 10 | |
| | Nuance Communications, Inc., 5.375%, 8/15/20 144A | | | 45,000 | | | | 47 | |
| | Seagate HDD Cayman, 7.75%, 12/15/18 | | | 45,000 | | | | 49 | |
| | SunGard Data Systems, Inc., 7.375%, 11/15/18 | | | 55,000 | | | | 59 | |
| | SunGard Data Systems, Inc., 7.625%, 11/15/20 | | | 65,000 | | | | 71 | |
| | West Corp., 11.00%, 10/15/16 | | | 30,000 | | | | 31 | |
| | | | | | | | | | |
| | Total | | | | | | | 998 | |
| | | | | | | | | | |
| | | |
| | Telecommunications (0.8%) | | | | | | | | |
| | Cincinnati Bell, Inc., 8.25%, 10/15/17 | | | 50,000 | | | | 54 | |
| | Clearwire Communications LLC/Clearwire Finance, Inc., 8.25%, 12/1/40 144A | | | 35,000 | | | | 38 | |
| | Clearwire Communications LLC/Clearwire Finance, Inc., 12.00%, 12/1/15 144A | | | 20,000 | | | | 22 | |
| | Clearwire Communications LLC/Clearwire Finance, Inc., 14.75%, 12/1/16 144A | | | 45,000 | | | | 62 | |
| | Cricket Communications, Inc., 7.75%, 10/15/20 | | | 100,000 | | | | 102 | |
| | Crown Castle International Corp., 5.25%, 1/15/23 144A | | | 35,000 | | | | 37 | |
| | CyrusOne LP/CyrusOne Finance Corp., 6.375%, 11/15/22 144A | | | 15,000 | | | | 16 | |
| | Digicel Group, Ltd., 8.25%, 9/30/20 144A | | | 20,000 | | | | 22 | |
| | Frontier Communications Corp., 8.125%, 10/1/18 | | | 30,000 | | | | 34 | |
| | Frontier Communications Corp., 8.25%, 4/15/17 | | | 70,000 | | | | 81 | |
| | Frontier Communications Corp., 8.50%, 4/15/20 | | | 55,000 | | | | 63 | |
| | Frontier Communications Corp., 8.75%, 4/15/22 | | | 30,000 | | | | 35 | |
| | Frontier Communications Corp., 9.25%, 7/1/21 | | | 30,000 | | | | 35 | |
| | GCI, Inc., 8.625%, 11/15/19 | | | 70,000 | | | | 74 | |
| | MetroPCS Wireless, Inc., 6.625%, 11/15/20 | | | 30,000 | | | | 32 | |
| | | | | | | | | | |
| | | Below Investment Grade Segment (8.4%) | | Shares/ $ Par | | | Value $ (000’s) | |
| | | |
| | Telecommunications continued | | | | | | | | |
| | MetroPCS Wireless, Inc., 7.875%, 9/1/18 | | | 50,000 | | | | 54 | |
| | NII Capital Corp., 7.625%, 4/1/21 | | | 75,000 | | | | 57 | |
| | NII Capital Corp., 8.875%, 12/15/19 | | | 115,000 | | | | 91 | |
| | PAETEC Holding Corp., 8.875%, 6/30/17 | | | 30,000 | | | | 32 | |
| | SBA Communications Corp., 5.625%, 10/1/19 144A | | | 35,000 | | | | 37 | |
| | SBA Telecommunications, Inc., 5.75%, 7/15/20 144A | | | 30,000 | | | | 32 | |
| | SBA Telecommunications, Inc., 8.25%, 8/15/19 | | | 23,000 | | | | 26 | |
| | Sprint Capital Corp., 6.90%, 5/1/19 | | | 35,000 | | | | 38 | |
| | Sprint Nextel Corp., 6.00%, 12/1/16 | | | 40,000 | | | | 44 | |
| | Sprint Nextel Corp., 6.00%, 11/15/22 | | | 60,000 | | | | 62 | |
| | Sprint Nextel Corp., 7.00%, 3/1/20 144A | | | 35,000 | | | | 41 | |
| | Sprint Nextel Corp., 7.00%, 8/15/20 | | | 30,000 | | | | 33 | |
| | Sprint Nextel Corp., 8.375%, 8/15/17 | | | 85,000 | | | | 99 | |
| | Sprint Nextel Corp., 9.00%, 11/15/18 144A | | | 70,000 | | | | 86 | |
| | Sprint Nextel Corp., 9.125%, 3/1/17 | | | 35,000 | | | | 41 | |
| | Sprint Nextel Corp., 11.50%, 11/15/21 | | | 50,000 | | | | 68 | |
| | tw telecom holdings, Inc., 5.375%, 10/1/22 144A | | | 20,000 | | | | 21 | |
| (c) | | Wind Acquisition Holding Finance SA, 12.25%, 7/15/17 144A | | | 89,244 | | | | 91 | |
| | Windstream Corp., 7.00%, 3/15/19 | | | 65,000 | | | | 66 | |
| | Windstream Corp., 7.75%, 10/15/20 | | | 25,000 | | | | 27 | |
| | Windstream Corp., 7.875%, 11/1/17 | | | 50,000 | | | | 56 | |
| | | | | | | | | | |
| | Total | | | | | | | 1,809 | |
| | | | | | | | | | |
| | | |
| | Transportation (0.0%) | | | | | | | | |
| | Continental Airlines, Inc., 6.75%, 9/15/15 144A | | | 45,000 | | | | 47 | |
| | Kansas City Southern de Mexico SAB de CV, 8.00%, 2/1/18 | | | 35,000 | | | | 39 | |
| | | | | | | | | | |
| | Total | | | | | | | 86 | |
| | | | | | | | | | |
| | | |
| | Utilities (0.3%) | | | | | | | | |
| | The AES Corp., 7.75%, 10/15/15 | | | 10,000 | | | | 11 | |
| | The AES Corp., 8.00%, 10/15/17 | | | 35,000 | | | | 40 | |
| | The AES Corp., 8.00%, 6/1/20 | | | 45,000 | | | | 52 | |
| | Calpine Corp., 7.50%, 2/15/21 144A | | | 59,000 | | | | 65 | |
| | Calpine Corp., 7.875%, 7/31/20 144A | | | 63,000 | | | | 71 | |
| | DPL, Inc., 6.50%, 10/15/16 | | | 40,000 | | | | 42 | |
| | DPL, Inc., 7.25%, 10/15/21 | | | 20,000 | | | | 21 | |
| | GenOn Americas Generation LLC, 8.50%, 10/1/21 | | | 25,000 | | | | 29 | |
| | IPALCO Enterprises, Inc., 5.00%, 5/1/18 | | | 60,000 | | | | 63 | |
| | NRG Energy, Inc., 7.625%, 1/15/18 | | | 80,000 | | | | 89 | |
| | NRG Energy, Inc., 7.625%, 5/15/19 | | | 55,000 | | | | 59 | |
| | NRG Energy, Inc., 8.25%, 9/1/20 | | | 5,000 | | | | 6 | |
| | NSG Holdings LLC/NSG Holdings, Inc., 7.75%, 12/15/25 144A | | | 81,000 | | | | 83 | |
| | NV Energy, Inc., 6.25%, 11/15/20 | | | 25,000 | | | | 29 | |
| | Puget Energy, Inc., 5.625%, 7/15/22 | | | 125,000 | | | | 135 | |
| | | | | | | | | | |
| | Total | | | | | | | 795 | |
| | | | | | | | | | |
| | | |
| | Total Below Investment Grade Segment | | | | | | | | |
| | (Cost: $18,657) | | | | | | | 19,721 | |
| | | | | | | | | | |
| | | |
| | Investment Companies (16.6%) | | | | | | | | |
| | | |
| | Investment Companies (16.6%) | | | | | | | | |
| | iShares Barclays MBS Bond Fund | | | 7,840 | | | | 847 | |
| | iShares MSCI EAFE Index Fund | | | 57,000 | | | | 3,239 | |
The Accompanying Notes are an Integral Part of the Financial Statements.
| | | | | | |
| | Asset Allocation Portfolio | | | 207 | |
Asset Allocation Portfolio
| | | | | | | | | | |
| | | Investment Companies (16.6%) | | Shares/ $ Par | | | Value $ (000’s) | |
| | | |
| | Investment Companies continued | | | | | | | | |
| | iShares MSCI Emerging Markets Index | | | 13,750 | | | | 610 | |
| | iShares Russell 2000 Index Fund | | | 17,020 | | | | 1,435 | |
| | iShares Russell Midcap Index Fund | | | 10,303 | | | | 1,165 | |
| | Market Vectors Junior Gold Miners ETF | | | 6,150 | | | | 122 | |
| (q) | | Northwestern Mutual Series Fund, Inc., Emerging Markets Equity Portfolio | | | 996,877 | | | | 1,055 | |
| (q) | | Northwestern Mutual Series Fund, Inc., International Equity Portfolio | | | 4,058,755 | | | | 7,281 | |
| (q) | | Northwestern Mutual Series Fund, Inc., Research International Core Portfolio | | | 19,780,175 | | | | 16,437 | |
| | SPDR S&P Biotech ETF | | | 3,350 | | | | 294 | |
| | SPDR S&P MidCap 400 ETF Trust | | | 17,719 | | | | 3,291 | |
| | Vanguard Emerging Markets ETF | | | 33,990 | | | | 1,513 | |
| | Vanguard MSCI EAFE | | | 52,970 | | | | 1,866 | |
| | | | | | | | | | |
| | | |
| | Total Investment Companies | | | | | | | | |
| | (Cost: $34,908) | | | | | | | 39,155 | |
| | | | | | | | | | |
| | | |
| | | Short-Term Investments (12.3%) | | | | | | |
| | | |
| | Autos (1.3%) | | | | | | | | |
| | American Honda Finance Corp., 0.14%, 1/25/13 | | | 3,000,000 | | | | 3,000 | |
| | | | | | | | | | |
| | Total | | | | | | | 3,000 | |
| | | | | | | | | | |
| | | |
| | Commercial Banks US (1.9%) | | | | | | | | |
| (b) | | Bank of America NA, 0.20%, 1/3/13 | | | 3,000,000 | | | | 3,000 | |
| | BP Capital Markets PLC, 0.512%, 2/8/13 | | | 900,000 | | | | 900 | |
| | BP Capital Markets PLC, 0.512%, 5/7/13 | | | 700,000 | | | | 701 | |
| | | | | | | | | | |
| | Total | | | | | | | 4,601 | |
| | | | | | | | | | |
| | | |
| | Consumer Products/Retailing (1.3%) | | | | | | | | |
| | Wal-Mart Stores, Inc., 0.10%, 1/30/13 | | | 3,000,000 | | | | 3,000 | |
| | | | | | | | | | |
| | Total | | | | | | | 3,000 | |
| | | | | | | | | | |
| | | |
| | Electronics (1.3%) | | | | | | | | |
| (b) | | International Business Machines Corp., 0.05%, 1/2/13 | | | 3,000,000 | | | | 3,000 | |
| | | | | | | | | | |
| | Total | | | | | | | 3,000 | |
| | | | | | | | | | |
| | | |
| | Federal Government & Agencies (0.4%) | | | | | | | | |
| (b) | | Federal Home Loan Mortgage Corp., 0.12%, 3/4/13 | | | 1,000,000 | | | | 1,000 | |
| | | | | | | | | | |
| | Total | | | | | | | 1,000 | |
| | | | | | | | | | |
| | | | | | | | | | |
| | | Short-Term Investments (12.3%) | | Shares/ $ Par | | | Value $ (000’s) | |
| | | |
| | Finance Services (2.5%) | | | | | | | | |
| | Alpine Securitization Corp., 0.18%, 1/9/13 | | | 3,000,000 | | | | 3,000 | |
| (k) | | Govco LLC, 0.23%, 1/22/13 | | | 3,000,000 | | | | 2,999 | |
| | | | | | | | | | |
| | Total | | | | | | | 5,999 | |
| | | | | | | | | | |
| | | |
| | Personal Credit Institutions (1.2%) | | | | | | | | |
| | Chariot Funding LLC, 0.21%, 3/28/13 | | | 3,000,000 | | | | 2,999 | |
| | | | | | | | | | |
| | Total | | | | | | | 2,999 | |
| | | | | | | | | | |
| | | |
| | Restaurants (1.1%) | | | | | | | | |
| | Darden Restaurants, Inc., 0.28%, 1/2/13 | | | 2,500,000 | | | | 2,500 | |
| | | | | | | | | | |
| | Total | | | | | | | 2,500 | |
| | | | | | | | | | |
| | | |
| | Retail Food and Drug (1.3%) | | | | | | | | |
| | CVS Caremark Corp., 0.28%, 1/2/13 | | | 3,000,000 | | | | 3,000 | |
| | | | | | | | | | |
| | Total | | | | | | | 3,000 | |
| | | | | | | | | | |
| | | |
| | Total Short-Term Investments | | | | | | | | |
| | (Cost: $29,097) | | | | | | | 29,099 | |
| | | | | | | | | | |
| | | |
| | Total Investments (100.1%) | | | | | | | | |
| | (Cost: $217,287)(a) | | | | | | | 235,905 | |
| | | | | | | | | | |
| | | |
| | Other Assets, Less | | | | | | | | |
| | Liabilities (-0.1%) | | | | | | | (143 | ) |
| | | | | | | | | | |
| | Net Assets (100.0%) | | | | | | | 235,762 | |
| | | | | | | | | | |
The Accompanying Notes are an Integral Part of the Financial Statements.
| | | | |
| 208 | | Asset Allocation Portfolio | | |
Asset Allocation Portfolio
ADR after the name of a security represents—American Depositary Receipt.
144A after the name of a security represents a security exempt from registration under Rule 144A of the Securities Act of 1933. These securities may be resold as transactions exempt from registration, normally to qualified institutional buyers. At December 31, 2012 the value of these securities (in thousands) was $9,380 representing 4.0% of the net assets.
IO — Interest Only Security
GO — General Obligation
RB — Revenue Bond
FHA — Federal Housing Authority
GNMA — Government National Mortgage Association
PSF — Permanent School Fund
| (a) | At December 31, 2012 the aggregate cost of securities for federal tax purposes (in thousands) was $217,741 and the net unrealized appreciation of investments based on that cost was $18,164 which is comprised of $20,893 aggregate gross unrealized appreciation and $2,729 aggregate gross unrealized depreciation. |
| (b) | All or a portion of the securities have been pledged as collateral for open futures positions or when-issued securities. Information regarding open futures contracts as of period end is summarized below. |
| | | | | | | | |
| Issuer (000’s) | | Number of Contracts | | Expiration Date | | Unrealized Appreciation/ (Depreciation) (000’s) | |
British Pound Currency Futures (Short) (Total Notional Value at December 31, 2012, $3,515) | | 35 | | 3/13 | | $ | (38 | ) |
S&P 500 Mini Index Futures (Long) (Total Notional Value at December 31, 2012, $6,568) | | 92 | | 3/13 | | | (36 | ) |
US Five Year Treasury Note Futures (Long) (Total Notional Value at December 31, 2012, $374) | | 3 | | 3/13 | | | (1 | ) |
US Long Treasury Bond Futures (Short) (Total Notional Value at December 31, 2012, $2,242) | | 15 | | 3/13 | | | 30 | |
US Ten Year Treasury Note Futures (Short) (Total Notional Value at December 31, 2012, $534) | | 4 | | 3/13 | | | 2 | |
US Two Year Treasury Note Futures (Long) (Total Notional Value at December 31, 2012, $2,646) | | 12 | | 3/13 | | | - | (m) |
| (f) | Foreign Bond — par value is foreign denominated |
— Morgan Stanley — Brazilian Real
| (h) | Forward foreign currency contracts outstanding on December 31, 2012. |
| | | | | | | | | | | | | | | | | | | | |
| Type | | Counterparty | | Currency | | Principal Amount Covered by Contract (000’s) | | Settlement Month | | Unrealized Appreciation (000’s) | | | Unrealized (Depreciation) (000’s) | | | Net Unrealized Appreciation/ (Depreciation) (000’s) | |
Sell | | Barclays Bank PLC | | EUR | | 4,550 | | 2/13 | | $ | - | | | $ | (117 | ) | | $ | (117 | ) |
| | | | | | | | | | | | | | | | | | | | |
| | | | | | | | | | $ | - | | | $ | (117 | ) | | $ | (117 | ) |
| | | | | | | | | | | | | | | | | | | | |
EUR — Euro
| (j) | Swap agreements outstanding on December 31, 2012. |
Total Return Swaps
| | | | | | | | | | | | | | |
| Reference Entity | | Counterparty | | Payment Made by the Fund | | Payment Received by the Fund | | Expiration Date | | Notional Amount (000’s) | | Unrealized Appreciation/
(Depreciation) (000’s) | |
MSCI Daily Net EAFE Index | | Credit Suisse International | | 3-Month USD LIBOR -15 Basis Points (Bps) | | MSCI Daily Net EAFE Index Total Return | | 8/13 | | 5,105 | | $ | 370 | |
The Accompanying Notes are an Integral Part of the Financial Statements.
| | | | | | |
| | Asset Allocation Portfolio | | | 209 | |
Asset Allocation Portfolio
| | | | | | | | | | | | | | |
| Reference Entity | | Counterparty | | Payment Made by the Fund | | Payment Received by the Fund | | Expiration Date | | Notional Amount (000’s) | | Unrealized
Appreciation/ (Depreciation) (000’s) | |
Russell Midcap Growth Index | | Bank of America, N.A. | | Russell Midcap Growth Index Total Return | | 3-Month USD LIBOR - 33 Bps | | 5/13 | | 10,991 | | $ | (415 | ) |
Russell Midcap Index | | Credit Suisse International | | 3-Month USD LIBOR - 15 Bps | | Russell Midcap Index Total Return | | 8/13 | | 2,008 | | | 105 | |
Russell Midcap Value Index | | Bank of America, N.A. | | 3-Month USD LIBOR - 26 Bps | | Russell Midcap Value Index Total Return | | 5/13 | | 11,504 | | | 481 | |
| | | | | | | | | | | | | | |
| | | | | | | | | | | | $ | 541 | |
| | | | | | | | | | | | | | |
| (k) | Securities with an aggregate value of $2,999 (in thousands) have been pledged as collateral for swap contracts outstanding on December 31, 2012. |
| (m) | Amount is less than one thousand. |
| (n) | Security valued in good faith by the Board of Directors. |
The following is a summary of the inputs used in valuing the Portfolio’s assets and liabilities at December 31, 2012. See Note 3 for additional information on portfolio valuation.
| | | | | | | | | | | | | | |
| | | Valuation Inputs | | | |
| Description | | Level 1 – Quoted Prices | | | Level 2 – Other Significant Observable Inputs | | | Level 3 – Significant Unobservable Inputs | | | |
| | | (Amounts in thousands) | | | |
Assets: | | | | | | | | | | | | | | |
Domestic Common Stocks | | $ | 93,978 | | | $ | - | | | $ | 21 | | | |
Foreign Common Stocks | | | - | | | | - | | | | 1 | | | |
Preferred Stocks | | | 166 | | | | 89 | | | | - | | | |
Government & US Agency Bonds | | | - | | | | 18,736 | | | | - | | | |
Foreign Bonds | | | - | | | | 173 | | | | - | | | |
Municipal Bonds | | | - | | | | 1,226 | | | | - | | | |
Corporate Bonds | | | - | | | | 32,536 | | | | - | | | |
Structured Products | | | - | | | | 20,522 | | | | 203 | | | |
Investment Companies | | | 39,155 | | | | - | | | | - | | | |
Short-Term Investments | | | - | | | | 29,099 | | | | - | | | |
Other Financial Instruments^ | | | | | | | | | | | | | | |
Futures | | | 32 | | | | - | | | | - | | | |
Total Return Swaps | | | - | | | | 956 | | | | - | | | |
Liabilities: | | | | | | | | | | | | | | |
Other Financial Instruments^ | | | | | | | | | | | | | | |
Futures | | | (75 | ) | | | - | | | | - | | | |
Forward Currency Contracts | | | - | | | | (117 | ) | | | - | | | |
Total Return Swaps | | | - | | | | (415 | ) | | | - | | | |
Total | | $ | 133,256 | | | $ | 102,805 | | | $ | 225 | | | |
^ Other financial instruments are derivative instruments such as futures, forwards, written options and swaps contracts, which are valued at the unrealized appreciation (depreciation) on the instrument and short sales, which are valued at market value.
The Accompanying Notes are an Integral Part of the Financial Statements.
| | | | |
| 210 | | Asset Allocation Portfolio | | |
Benchmark Definitions (unaudited)
The following indices are used to illustrate investment market, sector or style performance or to serve as Portfolio performance comparisons. Unlike the Portfolios, the indices are not professionally managed and do not incur fees or expenses. It is not possible to invest directly in an index.
33%: Barclays® Global Aggregate - Credit Component, Hedged USD, Merrill Lynch® Global High- Yield BB-B Rated Constrained Index and JPMorgan® EMBI Global - The benchmark is an equally weighted blend of the following three indices: Barclays Capital® Global Aggregate - Credit Component, Hedged USD, Merrill Lynch® Global High Yield BB-B Rated Constrained Index and JPMorgan® EMBI Global. The Barclays Capital® Global Aggregate - Credit Component, Hedged USD Index provides a broad-based measure of the global investment-grade fixed income markets. The Merrill Lynch® Global High Yield BB-B Rated Constrained Index tracks the performance of below investment-grade bonds of corporate issuers domiciled in countries having an investment-grade foreign currency long term debt rating (based on a composite of Moody’s, S&P, and Fitch). The Index includes bonds denominated in U.S. dollars, Canadian dollars, sterling, and euro (or euro legacy currency), but excludes all multi-currency denominated bonds. Bonds must be rated below investment-grade but at least B3 based on a composite of Moody’s, S&P, and Fitch. Qualifying bonds are capitalization-weighted provided the total allocation to an individual issuer (defined by Bloomberg tickers) does not exceed 2%. Issuers that exceed the limit are reduced to 2% and the face value of each of their bonds is adjusted on a pro-rata basis. Similarly, the face value of bonds of all other issuers that fall below the 2% cap are increased on a pro-basis. The index is re-balanced on the last calendar day of the month. JPMorgan® EMBI Global tracks total returns for United States Dollar-denominated debt instruments issued by emerging market sovereign and quasi-sovereign entities, Brady bonds, loans, Eurobonds and local market instruments. This index only tracks the particular region or country.
Asset Allocation Portfolio Blended Composite - The Asset Allocation Portfolio Blended Composite Benchmark is an unmanaged, hypothetical combination of unmanaged indices that correspond to the Asset Allocation Portfolio’s model allocation and consists of the Russell 3000® Index (50%), the MSCI® All Country World (ex-US) Index (15%), the Barclays® U.S. Aggregate Index (25%), and the Barclays® U.S. Corporate High Yield 2% Issuer Capped Index (10%).
Balanced Portfolio Blended Composite - The Balanced Portfolio Blended Composite Benchmark is an unmanaged, hypothetical combination of unmanaged indices that correspond to the Balanced Portfolio’s model allocation and consists of the Russell 3000® Index (40%), the MSCI® All Country World (ex-US) Index (10%), the Barclays® U.S. Aggregate Index (45%) and the Barclays® U.S. Corporate High Yield 2% Issuer Capped Index (5%).
Barclays® U.S. Aggregate 1-3 Years Index - The Barclays® U.S. Aggregate 1-3 Years Index is an unmanaged index of publicly issued investment-grade fixed-rate debt securities including corporate, U.S. Treasury and government agency securities, mortgage pass-through and asset-backed securities with remaining maturities of one to three years.
Barclays® U.S. Aggregate Index - The Barclays® U.S. Aggregate Index is an unmanaged index of publicly issued investment-grade fixed-rate debt securities including corporate, U.S. Treasury and government agency securities, mortgage pass-through and asset-backed securities with remaining maturities of at least one year regardless of call features.
Barclays® U.S. Corporate High Yield 2% Issuer Capped Index - The Barclays® U. S. Corporate High Yield 2% Issuer Capped Index is an unmanaged index of U.S. Dollar-denominated, non-convertible, fixed-rate, noninvestment-grade debt. Issuers are capped at 2% of the Index. Index holdings must have at least one year to final maturity, at least $150 million par amount outstanding, and be publicly issued with a rating of Ba1 or lower.
Barclays® Global Credit Hedged USD Index - The Barclays® Global Credit Hedged USD Index is an unmanaged index composed of investment-grade and high yield credit securities from the Multiverse represented in U.S. dollars on a hedged basis (Multiverse is the merger of two groups: the Global Aggregate and the Global High Yield).
Barclays® Long-Term U.S. Treasury Index - The Barclays® Long-Term U.S. Treasury Index is an unmanaged index comprised of fixed-income securities with various maturities greater than 10 years.
Barclays® U.S. Treasury Inflation Protected Securities (TIPS) Index - The Barclays® U.S. Treasury Inflation Protected Securities (TIPS) Index is an unmanaged index of inflation-protected public obligations of the U.S. Treasury. The index is market capitalization weighted and includes all publicly-issued U.S. Treasury Inflation-Protected Securities that have at least one year remaining to maturity and have $250 million or more of outstanding face value.
| | | | | | |
| | Benchmark Definitions | | | 211 | |
Benchmark Definitions (unaudited)
Dow Jones-UBS Commodity Index Total ReturnSM - The DJ-UBS Index is a broadly diversified futures index composed of futures contracts on 22 physical commodities. The DJ- UBS Index is rebalanced as of the beginning of each calendar year so that as of that time no single commodity constitutes more than 15% or less than 2% of the Index, and each related group of commodities represented in the Index is limited to 33%. However, following this rebalancing and for the remainder of the calendar year these percentages may change so that a single commodity may constitute a lesser or greater percentage of the Index and different sectors may represent different proportions of the Index.
Lipper® Variable Insurance Products (VIP) Average - Each Lipper® Variable Insurance Products (VIP) Average is calculated by Lipper® Analytical Services, Inc. and reflects the investment return of certain portfolios underlying variable life and annuity products. Source: Lipper®, Inc.
Morningstar® Insurance Fund Category Averages - Each Morningstar® category average is an equal-weighted category return. The calculation is simply the average of the returns at the end of the period for all the underlying variable insurance funds in a given category. Source: Morningstar®, Inc.
MSCI EAFE® (Europe-Australasia-Far-East) Index - The MSCI EAFE® (“Europe-Australasia-Far East”) Index is an unmanaged, free float-adjusted, market capitalization-weighted index that is designed to measure developed market equity performance, excluding the U.S. & Canada.
MSCI® All Country World (ex-US) Index - The MSCI® All Country World (ex-US) Index is an unmanaged, free float-adjusted market capitalization-weighted index that is designed to measure equity performance of companies in the developed and emerging markets, excluding the U.S.
MSCI® All Country World (ex-US) Growth Index - The MSCI® All Country World (ex-US) Growth Index is an unmanaged, free float-adjusted market capitalization-weighted index that is designed to measure equity performance of companies in the developed and emerging markets, excluding the U.S., with higher historical and forecasted growth characteristics.
MSCI® Emerging Markets Index - The MSCI® Emerging Markets Index is an unmanaged, free float-adjusted, market capitalization-weighted index that is designed to measure equity market performance in the global emerging markets.
Russell 1000® Growth Index - The Russell 1000® Growth Index is an unmanaged index that measures the performance of those companies in the Russell 1000® Index with higher price-to-book ratios and higher forecasted growth values. The Russell 1000® Index is an unmanaged, market capitalization-weighted, large cap index that measures the performance of the 1000 largest companies in the Russell 3000® Index.
Russell 1000® Value Index - The Russell 1000® Value Index is an unmanaged index that measures the performance of those companies in the Russell 1000® Index with lower price-to-book ratios and lower forecasted growth values. The Russell 1000® Index is an unmanaged, market capitalization-weighted, large cap index that measures the performance of the 1000 largest companies in the Russell 3000® Index.
Russell 2000® Growth Index - The Russell 2000® Growth Index is an unmanaged index that measures the performance of those companies in the Russell 2000® Index with higher price-to-book ratios and higher forecasted growth values. The Russell 2000® Index is an unmanaged, market capitalization-weighted index that measures the performance of the 2000 smallest of the 3000 largest publicly traded U.S. companies, based on total market capitalization.
Russell 2000® Value Index - The Russell 2000® Value Index is an unmanaged index measures the performance of those companies in the Russell 2000® Index with lower price-to-book ratios and lower forecasted growth values. The Russell 2000® Index is an unmanaged, market-capitalization weighted index that measures the performance of the 2000 smallest of the 3000 largest publicly traded U.S. companies, based on total market capitalization.
Russell 3000® Index - The Russell 3000® Index measures the performance of the largest 3000 U.S. companies representing approximately 98% of the investable U.S. equity market.
Russell MidCap® Growth Index - The Russell MidCap® Growth Index is an unmanaged index that measures the performance of the Russell MidCap® companies with higher price-to-book ratios and higher forecasted growth values. The Russell MidCap® Index is an unmanaged index that measures the performance of the 800 smallest companies in the Russell 1000® Index, which represents approximately 25% of the total market capitalization of the Russell 1000® Index.
Russell MidCap® Value Index - The Russell MidCap® Value Index is an unmanaged index that measures the performance of the Russell MidCap® companies with lower price-to-book and lower forecasted growth values. The Russell MidCap® Index is an unmanaged index that measures the performance of the 800 smallest companies in the Russell 1000® Index, which represents approximately 25% of the total market capitalization of the Russell 1000® Index.
| | | | |
| 212 | | Benchmark Definitions | | |
Benchmark Definitions (unaudited)
S&P 500® Index - The S&P 500® Composite Stock Price Index is an unmanaged, capitalization-weighted index of 500 selected common stocks designed to measure the performance of the broad domestic economy.
S&P MidCap 400® Index - The S&P MidCap 400® Index is an unmanaged, capitalization-weighted index that measures the performance of the mid-range sector of the U.S. stock market.
S&P SmallCap 600® Index - The S&P SmallCap 600® Index is an unmanaged index of 600 selected common stocks of U.S.-based companies with small market capitalizations.
| | | | | | |
| | Benchmark Definitions | | | 213 | |
Statements of Assets and Liabilities
Northwestern Mutual Series Fund, Inc.
December 31, 2012 (in thousands)
| | | | | | | | | | | | | | | | | | | | |
| | | Growth
Stock
Portfolio | | | Focused
Appreciation
Portfolio | | | Large Cap Core Stock Portfolio | | | Large Cap Blend Portfolio | | | Index 500
Stock
Portfolio | |
Assets | | | | | | | | | | | | | | | | | | | | |
Unaffiliated Investments, at Value (1) | | $ | 533,305 | | | $ | 374,289 | | | $ | 384,324 | | | $ | 78,818 | | | $ | 1,702,331 | |
Affiliated Investments, at Value (2) | | | - | | | | - | | | | - | | | | - | | | | - | |
Investments in Repurchase Agreements, at Value (3) | | | - | | | | - | | | | - | | | | - | | | | - | |
Cash & Cash Equivalents | | | 81 | | | | 14,266 | | | | 92 | | | | - | | | | 49 | |
Foreign Currency, at Value (4) | | | - | | | | - | | | | - | | | | - | | | | - | |
Cash Collateral for Derivative Positions | | | - | | | | - | | | | - | | | | - | | | | - | |
Receivable for Portfolio Shares Sold | | | 135 | | | | 415 | | | | 132 | | | | 13 | | | | 430 | |
Receivable for Investment Securities Sold | | | - | | | | - | | | | - | | | | - | | | | - | |
Receivable for Treasury Roll Transactions | | | - | | | | - | | | | - | | | | - | | | | - | |
Futures Variation Margin | | | 428 | | | | - | | | | 123 | | | | - | | | | 531 | |
Outstanding Options Written, at Value (6) | | | - | | | | - | | | | - | | | | - | | | | - | |
Outstanding Swap Contracts, at Value (8) | | | - | | | | - | | | | - | | | | - | | | | - | |
Receivable for Foreign Currency | | | - | | | | - | | | | - | | | | - | | | | - | |
Prepaid Expenses and Other Assets | | | 6 | | | | 5 | | | | 4 | | | | 1 | | | | 19 | |
Dividends and Interest Receivable | | | 258 | | | | 68 | | | | 374 | | | | 108 | | | | 1,867 | |
| | | | | | | | | | | | | | | | | | | | |
Total Assets | | | 534,213 | | | | 389,043 | | | | 385,049 | | | | 78,940 | | | | 1,705,227 | |
| | | | | | | | | | | | | | | | | | | | |
Liabilities | | | | | | | | | | | | | | | | | | | | |
Payable for Portfolio Shares Redeemed | | | 168 | | | | 160 | | | | 195 | | | | 33 | | | | 400 | |
Payable for Investment Securities Purchased | | | - | | | | - | | | | - | | | | 141 | | | | - | |
Payable for Treasury Roll Transactions | | | - | | | | - | | | | - | | | | - | | | | - | |
Futures Variation Margin | | | - | | | | - | | | | - | | | | - | | | | - | |
Outstanding Options Written, at Value (6) | | | - | | | | - | | | | - | | | | - | | | | - | |
Securities Sold Short, at Value (7) | | | - | | | | - | | | | - | | | | - | | | | - | |
Outstanding Swap Contracts, at Value (9) | | | - | | | | - | | | | - | | | | - | | | | - | |
Payable for Foreign Currency | | | - | | | | - | | | | - | | | | - | | | | - | |
Collateral from Counterparty | | | - | | | | - | | | | - | | | | - | | | | - | |
Collateral for Securities on Loan (5) | | | - | | | | - | | | | - | | | | - | | | | - | |
Investment Advisory Fees | | | 192 | | | | 228 | | | | 143 | | | | 48 | | | | 288 | |
Compliance Fees Payable | | | 4 | | | | 4 | | | | 3 | | | | 3 | | | | 3 | |
Deferred Income for Treasury Roll Transactions | | | - | | | | - | | | | - | | | | - | | | | - | |
Accrued Expenses | | | 34 | | | | 31 | | | | 29 | | | | 15 | | | | 65 | |
| | | | | | | | | | | | | | | | | | | | |
Total Liabilities | | | 398 | | | | 423 | | | | 370 | | | | 240 | | | | 756 | |
| | | | | | | | | | | | | | | | | | | | |
Net Assets | | $ | 533,815 | | | $ | 388,620 | | | $ | 384,679 | | | $ | 78,700 | | | $ | 1,704,471 | |
| | | | | | | | | | | | | | | | | | | | |
Represented By: | | | | | | | | | | | | | | | | | | | | |
Aggregate Paid in Capital (10) (11) | | $ | 411,494 | | | $ | 298,298 | | | $ | 350,755 | | | $ | 78,086 | | | $ | 1,210,184 | |
Undistributed Net Investment Income (Loss) | | | 5,017 | | | | 2,567 | | | | 5,722 | | | | 54 | | | | 35,516 | |
Undistributed Accumulated Net Realized Gain (Loss) | | | 51,868 | | | | (2,927 | ) | | | (9,691 | ) | | | 13 | | | | 29,692 | |
Net Unrealized Appreciation (Depreciation) | | | 65,436 | | | | 90,682 | | | | 37,893 | | | | 547 | | | | 429,079 | |
| | | | | | | | | | | | | | | | | | | | |
Net Assets for Shares Outstanding (10) (11) | | $ | 533,815 | | | $ | 388,620 | | | $ | 384,679 | | | $ | 78,700 | | | $ | 1,704,471 | |
| | | | | | | | | | | | | | | | | | | | |
Net Asset Value, Offering and Redemption Price per Share | | $ | 2 .35 | | | $ | 2 .09 | | | $ | 1 .34 | | | $ | 0 .83 | | | $ | 2 .84 | |
| | | | | | | | | | | | | | | | | | | | |
(1) Unaffiliated Investments, at Cost | | $ | 467,777 | | | $ | 283,607 | | | $ | 346,404 | | | $ | 78,271 | | | $ | 1,273,261 | |
(2) Affiliated Investments, at Cost | | | - | | | | - | | | | - | | | | - | | | | - | |
(3) Investments in Repurchase Agreements, at Cost | | | - | | | | - | | | | - | | | | - | | | | - | |
(4) Foreign Currency, at Cost | | | - | | | | - | | | | - | | | | - | | | | - | |
(5) Securities on Loan | | | - | | | | - | | | | - | | | | - | | | | - | |
(6) Premiums Received on Options Written | | | - | | | | - | | | | - | | | | - | | | | - | |
(7) Proceeds Received from Short Sales | | | - | | | | - | | | | - | | | | - | | | | - | |
(8) Premiums Paid on Swap Contracts | | | - | | | | - | | | | - | | | | - | | | | - | |
(9) Premiums Received from Swap Contracts | | | - | | | | - | | | | - | | | | - | | | | - | |
(10) Shares Outstanding | | | 227,570 | | | | 185,808 | | | | 287,509 | | | | 94,884 | | | | 600,269 | |
(11) Shares Authorized, $.01 Par Value | | | 2,000,000 | | | | 2,000,000 | | | | 2,000,000 | | | | 2,000,000 | | | | 2,000,000 | |
The Accompanying Notes are an Integral Part of the Financial Statements.
| | | | |
| 214 | | Statements of Assets and Liabilities | | |
| | | | | | | | | | | | | | | | | | | | | | | | | | | | | | | | | | |
Large
Company
Value
Portfolio | | | Domestic
Equity
Portfolio | | | Equity
Income
Portfolio | | | Mid Cap
Growth
Stock
Portfolio | | | Index 400
Stock
Portfolio | | | Mid Cap
Value
Portfolio | | | Small Cap
Growth
Stock
Portfolio | | | Index 600
Stock
Portfolio | | | Small Cap
Value
Portfolio | |
| | | | | | | | | | | | | | | | | | | | | | | | | | | | | | | | | | | |
| $ | 87,126 | | | $ | 399,552 | | | $ | 408,569 | | | $ | 827,740 | | | $ | 475,208 | | | $ | 162,520 | | | $ | 379,491 | | | $ | 73,508 | | | $ | 409,797 | |
| | - | | | | - | | | | - | | | | - | | | | - | | | | - | | | | - | | | | - | | | | - | |
| | - | | | | - | | | | - | | | | - | | | | - | | | | - | | | | - | | | | - | | | | - | |
| | - | | | | - | | | | 68 | | | | 102 | | | | 71 | | | | - | | | | 88 | | | | 99 | | | | 75 | |
| | 9 | | | | - | | | | - | | | | - | | | | - | | | | - | | | | - | | | | - | | | | - | |
| | - | | | | - | | | | - | | | | - | | | | - | | | | - | | | | 1,150 | | | | - | | | | - | |
| | 12 | | | | 94 | | | | 590 | | | | 130 | | | | 112 | | | | 207 | | | | 92 | | | | 37 | | | | 275 | |
| | 471 | | | | - | | | | - | | | | - | | | | 4,744 | | | | 1,447 | | | | 22 | | | | 307 | | | | 153 | |
| | - | | | | - | | | | - | | | | - | | | | - | | | | - | | | | - | | | | - | | | | - | |
| | - | | | | - | | | | - | | | | 1,347 | | | | 240 | | | | - | | | | 574 | | | | - | | | | - | |
| | - | | | | - | | | | - | | | | - | | | | - | | | | - | | | | - | | | | - | | | | - | |
| | - | | | | - | | | | - | | | | - | | | | - | | | | - | | | | - | | | | - | | | | - | |
| | - | | | | - | | | | - | | | | - | | | | - | | | | - | | | | - | | | | - | | | | - | |
| | 1 | | | | 5 | | | | 5 | | | | 10 | | | | 5 | | | | 2 | | | | 4 | | | | 1 | | | | 4 | |
| | 124 | | | | 827 | | | | 467 | | | | 289 | | | | 306 | | | | 238 | | | | 20 | | | | 47 | | | | 296 | |
| | | | | | | | | | | | | | | | | | | | | | | | | | | | | | | | | | |
| | 87,743 | | | | 400,478 | | | | 409,699 | | | | 829,618 | | | | 480,686 | | | | 164,414 | | | | 381,441 | | | | 73,999 | | | | 410,600 | |
| | | | | | | | | | | | | | | | | | | | | | | | | | | | | | | | | | |
| | | | | | | | | | | | | | | | | | | | | | | | | | | | | | | | | | | |
| | 26 | | | | 201 | | | | 78 | | | | 265 | | | | 143 | | | | 37 | | | | 124 | | | | 4 | | | | 80 | |
| | 542 | | | | - | | | | 269 | | | | - | | | | 1,360 | | | | 1,007 | | | | 4,871 | | | | 247 | | | | 538 | |
| | - | | | | - | | | | - | | | | - | | | | - | | | | - | | | | - | | | | - | | | | - | |
| | - | | | | - | | | | - | | | | - | | | | - | | | | - | | | | - | | | | - | | | | - | |
| | - | | | | - | | | | - | | | | - | | | | - | | | | - | | | | - | | | | - | | | | - | |
| | 192 | | | | - | | | | - | | | | - | | | | - | | | | - | | | | - | | | | - | | | | - | |
| | - | | | | - | | | | - | | | | - | | | | - | | | | - | | | | - | | | | - | | | | - | |
| | - | | | | - | | | | - | | | | - | | | | - | | | | 1 | | | | - | | | | - | | | | - | |
| | - | | | | - | | | | - | | | | - | | | | - | | | | - | | | | - | | | | - | | | | - | |
| | - | | | | - | | | | - | | | | - | | | | - | | | | - | | | | - | | | | - | | | | - | |
| | 49 | | | | 189 | | | | 222 | | | | 354 | | | | 101 | | | | 116 | | | | 177 | | | | 10 | | | | 288 | |
| | 3 | | | | 3 | | | | 4 | | | | 3 | | | | 3 | | | | 3 | | | | 3 | | | | 3 | | | | 3 | |
| | - | | | | - | | | | - | | | | - | | | | - | | | | - | | | | - | | | | - | | | | - | |
| | 16 | | | | 27 | | | | 29 | | | | 43 | | | | 38 | | | | 27 | | | | 40 | | | | 13 | | | | 43 | |
| | | | | | | | | | | | | | | | | | | | | | | | | | | | | | | | | | |
| | 828 | | | | 420 | | | | 602 | | | | 665 | | | | 1,645 | | | | 1,191 | | | | 5,215 | | | | 277 | | | | 952 | |
| | | | | | | | | | | | | | | | | | | | | | | | | | | | | | | | | | |
| $ | 86,915 | | | $ | 400,058 | | | $ | 409,097 | | | $ | 828,953 | | | $ | 479,041 | | | $ | 163,223 | | | $ | 376,226 | | | $ | 73,722 | | | $ | 409,648 | |
| | | | | | | | | | | | | | | | | | | | | | | | | | | | | | | | | | |
| | | | | | | | | | | | | | | | | | | | | | | | | | | | | | | | | | | |
| $ | 82,895 | | | $ | 434,298 | | | $ | 368,605 | | | $ | 672,708 | | | $ | 378,051 | | | $ | 150,518 | | | $ | 386,651 | | | $ | 66,470 | | | $ | 293,449 | |
| | 77 | | | | 8,767 | | | | 7,979 | | | | 3,305 | | | | 5,967 | | | | 2,891 | | | | 2,246 | | | | 53 | | | | 5,972 | |
| | (6,172 | ) | | | (56,245 | ) | | | (2,338 | ) | | | 37,189 | | | | 17,087 | | | | (273 | ) | | | (43,846 | ) | | | (393 | ) | | | 1,420 | |
| | 10,115 | | | | 13,238 | | | | 34,851 | | | | 115,751 | | | | 77,936 | | | | 10,087 | | | | 31,175 | | | | 7,591 | | | | 108,807 | |
| | | | | | | | | | | | | | | | | | | | | | | | | | | | | | | | | | |
| $ | 86,915 | | | $ | 400,058 | | | $ | 409,097 | | | $ | 828,953 | | | $ | 479,041 | | | $ | 163,223 | | | $ | 376,226 | | | $ | 73,722 | | | $ | 409,648 | |
| | | | | | | | | | | | | | | | | | | | | | | | | | | | | | | | | | |
| $ | 0 .84 | | | $ | 0 .98 | | | $ | 1 .34 | | | $ | 3 .26 | | | $ | 1 .49 | | | $ | 1 .30 | | | $ | 1 .88 | | | $ | 1 .01 | | | $ | 1 .89 | |
| | | | | | | | | | | | | | | | | | | | | | | | | | | | | | | | | | |
| $ | 77,013 | | | $ | 386,313 | | | $ | 373,719 | | | $ | 712,460 | | | $ | 397,358 | | | $ | 152,432 | | | $ | 348,668 | | | $ | 65,916 | | | $ | 300,991 | |
| | - | | | | - | | | | - | | | | - | | | | - | | | | - | | | | - | | | | - | | | | - | |
| | - | | | | - | | | | - | | | | - | | | | - | | | | - | | | | - | | | | - | | | | - | |
| | 9 | | | | - | | | | - | | | | - | | | | - | | | | - | | | | - | | | | - | | | | - | |
| | - | | | | - | | | | - | | | | - | | | | - | | | | - | | | | - | | | | - | | | | - | |
| | - | | | | - | | | | - | | | | - | | | | - | | | | - | | | | - | | | | - | | | | - | |
| | 194 | | | | - | | | | - | | | | - | | | | - | | | | - | | | | - | | | | - | | | | - | |
| | - | | | | - | | | | - | | | | - | | | | - | | | | - | | | | - | | | | - | | | | - | |
| | - | | | | - | | | | - | | | | - | | | | - | | | | - | | | | - | | | | - | | | | - | |
| | 103,558 | | | | 409,673 | | | | 304,529 | | | | 254,148 | | | | 320,918 | | | | 125,290 | | | | 199,931 | | | | 73,223 | | | | 216,680 | |
| | 2,000,000 | | | | 2,000,000 | | | | 2,000,000 | | | | 2,000,000 | | | | 2,000,000 | | | | 2,000,000 | | | | 2,000,000 | | | | 2,000,000 | | | | 2,000,000 | |
The Accompanying Notes are an Integral Part of the Financial Statements.
| | | | | | |
| | Statements of Assets and Liabilities | | | 215 | |
Statements of Assets and Liabilities
Northwestern Mutual Series Fund, Inc.
December 31, 2012 (in thousands)
| | | | | | | | | | | | | | | | | | | | |
| | | International Growth Portfolio | | | Research International Core Portfolio | | | International Equity Portfolio | | | Emerging Markets Equity Portfolio | | | Money Market Portfolio | |
Assets | | | | | | | | | | | | | | | | | | | | |
Unaffiliated Investments, at Value (1) | | $ | 329,348 | | | $ | 258,332 | | | $ | 1,424,935 | | | $ | 253,257 | | | $ | 481,521 | |
Affiliated Investments, at Value (2) | | | - | | | | - | | | | - | | | | - | | | | - | |
Investments in Repurchase Agreements, at Value (3) | | | - | | | | - | | | | - | | | | - | | | | - | |
Cash & Cash Equivalents | | | 222 | | | | 3,859 | | | | 59,520 | | | | 3,045 | | | | 90 | |
Foreign Currency, at Value (4) | | | 104 | | | | 36 | | | | 58 | | | | 24 | | | | - | |
Cash Collateral for Derivative Positions | | | - | | | | - | | | | - | | | | - | | | | - | |
Receivable for Portfolio Shares Sold | | | 278 | | | | 488 | | | | 674 | | | | 493 | | | | 1,611 | |
Receivable for Investment Securities Sold | | | - | | | | 4 | | | | - | | | | 80 | | | | - | |
Receivable for Treasury Roll Transactions | | | - | | | | - | | | | - | | | | - | | | | - | |
Futures Variation Margin | | | - | | | | - | | | | - | | | | - | | | | - | |
Outstanding Options Written, at Value (6) | | | - | | | | - | | | | - | | | | - | | | | - | |
Outstanding Swap Contracts, at Value (8) | | | - | | | | - | | | | - | | | | - | | | | - | |
Receivable for Foreign Currency | | | - | | | | - | | | | - | | | | 1 | | | | - | |
Prepaid Expenses and Other Assets | | | 4 | | | | 2 | | | | 16 | | | | 2 | | | | 6 | |
Dividends and Interest Receivable | | | 171 | | | | 394 | | | | 2,012 | | | | 171 | | | | 590 | |
| | | | | | | | | | | | | | | | | | | | |
Total Assets | | | 330,127 | | | | 263,115 | | | | 1,487,215 | | | | 257,073 | | | | 483,818 | |
| | | | | | | | | | | | | | | | | | | | |
Liabilities | | | | | | | | | | | | | | | | | | | | |
Payable for Portfolio Shares Redeemed | | | 91 | | | | 8 | | | | 459 | | | | 22 | | | | 307 | |
Payable for Investment Securities Purchased | | | - | | | | 1,554 | | | | - | | | | 169 | | | | - | |
Payable for Treasury Roll Transactions | | | - | | | | - | | | | - | | | | - | | | | - | |
Futures Variation Margin | | | - | | | | - | | | | - | | | | - | | | | - | |
Outstanding Options Written, at Value (6) | | | - | | | | - | | | | - | | | | - | | | | - | |
Securities Sold Short, at Value (7) | | | - | | | | - | | | | - | | | | - | | | | - | |
Outstanding Swap Contracts, at Value (9) | | | - | | | | - | | | | - | | | | - | | | | - | |
Payable for Foreign Currency | | | - | | | | 3 | | | | - | | | | - | | | | - | |
Collateral from Counterparty | | | - | | | | - | | | | - | | | | - | | | | - | |
Collateral for Securities on Loan (5) | | | - | | | | - | | | | - | | | | - | | | | - | |
Investment Advisory Fees | | | 180 | | | | 184 | | | | 741 | | | | 239 | | | | 60 | |
Compliance Fees Payable | | | 3 | | | | 3 | | | | 4 | | | | 3 | | | | 4 | |
Deferred Income for Treasury Roll Transactions | | | - | | | | - | | | | - | | | | - | | | | - | |
Accrued Expenses | | | 135 | | | | 95 | | | | 315 | | | | 164 | | | | 10 | |
| | | | | | | | | | | | | | | | | | | | |
Total Liabilities | | | 409 | | | | 1,847 | | | | 1,519 | | | | 597 | | | | 381 | |
| | | | | | | | | | | | | | | | | | | | |
Net Assets | | $ | 329,718 | | | $ | 261,268 | | | $ | 1,485,696 | | | $ | 256,476 | | | $ | 483,437 | |
| | | | | | | | | | | | | | | | | | | | |
Represented By: | | | | | | | | | | | | | | | | | | | | |
Aggregate Paid in Capital (10) (11) | | $ | 358,273 | | | $ | 246,913 | | | $ | 1,259,675 | | | $ | 233,773 | | | $ | 483,025 | |
Undistributed Net Investment Income (Loss) | | | 5,268 | | | | 420 | | | | 35,439 | | | | 2,343 | | | | 415 | |
Undistributed Accumulated Net Realized Gain (Loss) | | | (69,988 | ) | | | (15,326 | ) | | | 421 | | | | (905 | ) | | | (3 | ) |
Net Unrealized Appreciation (Depreciation) | | | 36,165 | | | | 29,261 | | | | 190,161 | | | | 21,265 | | | | – | |
| | | | | | | | | | | | | | | | | | | | |
Net Assets for Shares Outstanding (10) (11) | | $ | 329,718 | | | $ | 261,268 | | | $ | 1,485,696 | | | $ | 256,476 | | | $ | 483,437 | |
| | | | | | | | | | | | | | | | | | | | |
Net Asset Value, Offering and Redemption Price per Share | | $ | 1 .21 | | | $ | 0 .83 | | | $ | 1 .79 | | | $ | 1 .06 | | | $ | 1 .00 | |
| | | | | | | | | | | | | | | | | | | | |
(1) Unaffiliated Investments, at Cost | | $ | 293,144 | | | $ | 229,061 | | | $ | 1,234,794 | | | $ | 231,934 | | | $ | 481,521 | |
(2) Affiliated Investments, at Cost | | | - | | | | - | | | | - | | | | - | | | | - | |
(3) Investments in Repurchase Agreements, at Cost | | | - | | | | - | | | | - | | | | - | | | | - | |
(4) Foreign Currency, at Cost | | | 104 | | | | 36 | | | | 59 | | | | 24 | | | | - | |
(5) Securities on Loan | | | - | | | | - | | | | - | | | | - | | | | - | |
(6) Premiums Received on Options Written | | | - | | | | - | | | | - | | | | - | | | | - | |
(7) Proceeds Received from Short Sales | | | - | | | | - | | | | - | | | | - | | | | - | |
(8) Premiums Paid on Swap Contracts | | | - | | | | - | | | | - | | | | - | | | | - | |
(9) Premiums Received from Swap Contracts | | | - | | | | - | | | | - | | | | - | | | | - | |
(10) Shares Outstanding | | | 272,788 | | | | 313,911 | | | | 828,078 | | | | 242,330 | | | | 483,437 | |
(11) Shares Authorized, $.01 Par Value | | | 2,000,000 | | | | 2,000,000 | | | | 2,000,000 | | | | 2,000,000 | | | | 2,000,000 | |
The Accompanying Notes are an Integral Part of the Financial Statements.
| | | | |
| 216 | | Statements of Assets and Liabilities | | |
| | | | | | | | | | | | | | | | | | | | | | | | | | | | | | |
Short-Term
Bond
Portfolio | | | Select Bond
Portfolio | | | Long-Term U.S. Government Bond Portfolio | | | Inflation Protection Portfolio | | | High Yield Bond Portfolio | | | Multi-Sector Bond Portfolio | | | Balanced Portfolio | | | Asset Allocation Portfolio | |
| | | | | | | | | | | | | | | | | | | | | | | | | | | | | | | |
| $ | 144,277 | | | $ | 1,772,016 | | | $ | 137,343 | | | $ | 253,498 | | | $ | 455,790 | | | $ | 345,057 | | | $ | 2,127,641 | | | $ | 211,132 | |
| | - | | | | - | | | | - | | | | - | | | | - | | | | - | | | | 159,445 | | | | 24,773 | |
| | - | | | | - | | | | 48,400 | | | | - | | | | - | | | | 23,200 | | | | - | | | | - | |
| | 147 | | | | 295 | | | | 37 | | | | - | | | | 105 | | | | 1,085 | | | | 582 | | | | 74 | |
| | - | | | | - | | | | - | | | | - | | | | - | | | | 454 | | | | - | | | | - | |
| | - | | | | - | | | | - | | | | - | | | | - | | | | - | | | | 890 | | | | - | |
| | 277 | | | | 1,508 | | | | 54 | | | | 463 | | | | 242 | | | | 341 | | | | 678 | | | | 55 | |
| | 279 | | | | 10,206 | | | | - | | | | - | | | | - | | | | 3,526 | | | | 7,351 | | | | 1,098 | |
| | - | | | | - | | | | 77 | | | | - | | | | - | | | | - | | | | - | | | | - | |
| | 20 | | | | 258 | | | | - | | | | - | | | | - | | | | - | | | | 1,935 | | | | 160 | |
| | - | | | | - | | | | - | | | | - | | | | - | | | | - | | | | - | | | | - | |
| | - | | | | - | | | | - | | | | 252 | | | | - | | | | 5,861 | | | | 9,020 | | | | 958 | |
| | - | | | | - | | | | - | | | | 203 | | | | - | | | | 238 | | | | - | | | | - | |
| | 4 | | | | 19 | | | | 2 | | | | 11 | | | | 4 | | | | 4 | | | | - | | | | 3 | |
| | 386 | | | | 8,292 | | | | 727 | | | | 1,227 | | | | 6,826 | | | | 4,965 | | | | 7,755 | | | | 709 | |
| | | | | | | | | | | | | | | | | | | | | | | | | | | | | | |
| | 145,390 | | | | 1,792,594 | | | | 186,640 | | | | 255,654 | | | | 462,967 | | | | 384,731 | | | | 2,315,267 | | | | 238,962 | |
| | | | | | | | | | | | | | | | | | | | | | | | | | | | | | |
| | | | | | | | | | | | | | | | | | | | | | | | | | | | | | | |
| | 6 | | | | 251 | | | | 133 | | | | 25 | | | | 805 | | | | 36 | | | | 993 | | | | 629 | |
| | 279 | | | | 39,493 | | | | - | | | | - | | | | 998 | | | | 473 | | | | 16,529 | | | | 1,903 | |
| | - | | | | - | | | | 72,219 | | | | - | | | | - | | | | - | | | | - | | | | - | |
| | - | | | | - | | | | 5 | | | | - | | | | - | | | | 17 | | | | - | | | | - | |
| | - | | | | - | | | | - | | | | - | | | | - | | | | 54 | | | | - | | | | - | |
| | - | | | | - | | | | - | | | | - | | | | - | | | | 3,518 | | | | - | | | | - | |
| | - | | | | - | | | | - | | | | 634 | | | | - | | | | 1,604 | | | | 4,927 | | | | 417 | |
| | - | | | | - | | | | - | | | | 663 | | | | - | | | | 1,120 | | | | 738 | | | | 117 | |
| | - | | | | - | | | | 1,000 | | | | - | | | | - | | | | 4,945 | | | | 780 | | | | - | |
| | - | | | | 67,069 | | | | - | | | | - | | | | - | | | | - | | | | 50,496 | | | | - | |
| | 43 | | | | 426 | | | | 53 | | | | 120 | | | | 169 | | | | 242 | | | | 536 | | | | 89 | |
| | 3 | | | | 4 | | | | 3 | | | | 3 | | | | 3 | | | | 3 | | | | 3 | | | | 3 | |
| | - | | | | - | | | | 69 | | | | - | | | | - | | | | - | | | | - | | | | - | |
| | 23 | | | | 58 | | | | 22 | | | | 33 | | | | 50 | | | | 63 | | | | 63 | | | | 42 | |
| | | | | | | | | | | | | | | | | | | | | | | | | | | | | | |
| | 354 | | | | 107,301 | | | | 73,504 | | | | 1,478 | | | | 2,025 | | | | 12,075 | | | | 75,035 | | | | 3,200 | |
| | | | | | | | | | | | | | | | | | | | | | | | | | | | | | |
| $ | 145,036 | | | $ | 1,685,293 | | | $ | 113,136 | | | $ | 254,176 | | | $ | 460,942 | | | $ | 372,656 | | | $ | 2,240,232 | | | $ | 235,762 | |
| | | | | | | | | | | | | | | | | | | | | | | | | | | | | | |
| | | | | | | | | | | | | | | | | | | | | | | | | | | | | | | |
| $ | 144,557 | | | $ | 1,576,044 | | | $ | 112,295 | | | $ | 229,290 | | | $ | 437,787 | | | $ | 332,699 | | | $ | 1,941,315 | | | $ | 214,253 | |
| | 273 | | | | 38,848 | | | | 23 | | | | 2,822 | | | | 27,546 | | | | 13,550 | | | | 73,431 | | | | 6,893 | |
| | (1,243 | ) | | | 9,934 | | | | (4,667 | ) | | | 4,902 | | | | (33,313 | ) | | | 2,364 | | | | 74,711 | | | | (4,384 | ) |
| | 1,449 | | | | 60,467 | | | | 5,485 | | | | 17,162 | | | | 28,922 | | | | 24,043 | | | | 150,775 | | | | 19,000 | |
| | | | | | | | | | | | | | | | | | | | | | | | | | | | | | |
| $ | 145,036 | | | $ | 1,685,293 | | | $ | 113,136 | | | $ | 254,176 | | | $ | 460,942 | | | $ | 372,656 | | | $ | 2,240,232 | | | $ | 235,762 | |
| | | | | | | | | | | | | | | | | | | | | | | | | | | | | | |
| $ | 1 .03 | | | $ | 1 .30 | | | $ | 1 .07 | | | $ | 1 .22 | | | $ | 0 .75 | | | $ | 1 .14 | | | $ | 1 .51 | | | $ | 1 .13 | |
| | | | | | | | | | | | | | | | | | | | | | | | | | | | | | |
| $ | 142,879 | | | $ | 1,712,081 | | | $ | 131,846 | | | $ | 235,497 | | | $ | 426,867 | | | $ | 322,867 | | | $ | 2,001,862 | | | $ | 195,904 | |
| | - | | | | - | | | | - | | | | - | | | | - | | | | - | | | | 137,484 | | | | 21,383 | |
| | - | | | | - | | | | 48,400 | | | | - | | | | - | | | | 23,200 | | | | - | | | | - | |
| | - | | | | - | | | | - | | | | - | | | | - | | | | 454 | | | | - | | | | - | |
| | - | | | | 65,470 | | | | - | | | | - | | | | - | | | | - | | | | 49,501 | | | | - | |
| | - | | | | - | | | | - | | | | - | | | | - | | | | 45 | | | | - | | | | - | |
| | - | | | | - | | | | - | | | | - | | | | - | | | | 3,516 | | | | - | | | | - | |
| | - | | | | - | | | | - | | | | - | | | | - | | | | 2,835 | | | | - | | | | - | |
| | - | | | | - | | | | - | | | | - | | | | - | | | | 1,330 | | | | - | | | | - | |
| | 141,299 | | | | 1,292,843 | | | | 105,935 | | | | 208,584 | | | | 613,468 | | | | 325,515 | | | | 1,486,784 | | | | 208,339 | |
| | 2,000,000 | | | | 2,000,000 | | | | 2,000,000 | | | | 2,000,000 | | | | 2,000,000 | | | | 2,000,000 | | | | 3,000,000 | | | | 2,000,000 | |
The Accompanying Notes are an Integral Part of the Financial Statements.
| | | | | | |
| | Statements of Assets and Liabilities | | | 217 | |
Consolidated Statement of Assets and Liabilities
Northwestern Mutual Series Fund, Inc.
December 31, 2012 (in thousands)
| | | | |
| | | Commodities
Return Strategy
Portfolio | |
Assets | | | | |
Unaffiliated Investments, at Value (1) | | $ | 149,520 | |
Affiliated Investments, at Value (2) | | | - | |
Investments in Repurchase Agreements, at Value (3) | | | - | |
Cash & Cash Equivalents | | | 3,098 | |
Foreign Currency, at Value (4) | | | - | |
Cash Collateral for Derivative Positions | | | - | |
Receivable for Portfolio Shares Sold | | | 343 | |
Receivable for Investment Securities Sold | | | - | |
Receivable for Treasury Roll Transactions | | | - | |
Futures Variation Margin | | | - | |
Outstanding Options Written, at Value (6) | | | - | |
Outstanding Swap Contracts, at Value (8) | | | 109 | |
Receivable for Foreign Currency | | | - | |
Prepaid Expenses and Other Assets | | | 4 | |
Dividends and Interest Receivable | | | 299 | |
| | | | |
Total Assets | | | 153,373 | |
| | | | |
Liabilities | | | | |
Payable for Portfolio Shares Redeemed | | | 15 | |
Payable for Investment Securities Purchased | | | - | |
Payable for Treasury Roll Transactions | | | - | |
Futures Variation Margin | | | - | |
Outstanding Options Written, at Value (6) | | | - | |
Securities Sold Short, at Value (7) | | | - | |
Outstanding Swap Contracts, at Value (9) | | | 7 | |
Payable for Foreign Currency | | | - | |
Collateral from Counterparty | | | - | |
Collateral for Securities on Loan (5) | | | - | |
Investment Advisory Fees | | | 103 | |
Compliance Fees Payable | | | 3 | |
Deferred Income for Treasury Roll Transactions | | | - | |
Accrued Expenses | | | 37 | |
| | | | |
Total Liabilities | | | 165 | |
| | | | |
Net Assets | | $ | 153,208 | |
| | | | |
Represented By: | | | | |
Aggregate Paid in Capital (10) (11) | | $ | 153,142 | |
Undistributed Net Investment Income (Loss) | | | (101 | ) |
Undistributed Accumulated Net Realized Gain (Loss) | | | - | |
Net Unrealized Appreciation (Depreciation) | | | 167 | |
| | | | |
Net Assets for Shares Outstanding (10) (11) | | $ | 153,208 | |
| | | | |
Net Asset Value, Offering and Redemption Price per Share | | $ | 0.79 | |
| | | | |
(1) Unaffiliated Investments, at Cost | | $ | 149,454 | |
(2) Affiliated Investments, at Cost | | | - | |
(3) Investments in Repurchase Agreements, at Cost | | | - | |
(4) Foreign Currency, at Cost | | | - | |
(5) Securities on Loan | | | - | |
(6) Premiums Received on Options Written | | | - | |
(7) Proceeds Received from Short Sales | | | - | |
(8) Premiums Paid on Swap Contracts | | | - | |
(9) Premiums Received from Swap Contracts | | | - | |
(10) Shares Outstanding | | | 194,346 | |
(11) Shares Authorized, $.01 Par Value | | | 2,000,000 | |
The Accompanying Notes are an Integral Part of the Financial Statements.
| | | | |
| 218 | | Consolidated Statement of Assets and Liabilities | | |
[THIS PAGE INTENTIONALLY LEFT BLANK]
Statements of Operations
Northwestern Mutual Series Fund, Inc.
For the Year Ended December 31, 2012 (in thousands)
| | | | | | | | | | | | | | | | | | | | | | | | |
| | | Growth Stock
Portfolio | | | Focused
Appreciation
Portfolio | | | Large Cap
Core Stock
Portfolio | | | Large Cap
Blend
Portfolio | | | Index 500
Stock Portfolio | | | Large
Company
Value
Portfolio | |
Investment Income | | | | | | | | | | | | | | | | | | | | | | | | |
Income | | | | | | | | | | | | | | | | | | | | | | | | |
Interest | | $ | 58 | | | $ | 20 | | | $ | 36 | | | $ | - | | | $ | 30 | | | $ | - | |
Unaffiliated Dividends (1) | | | 7,325 | | | | 5,200 | | | | 7,477 | | | | 1,422 | | | | 39,379 | | | | 2,254 | |
| | | | | | | | | | | | | | | | | | | | | | | | |
Total Income | | | 7,383 | | | | 5,220 | | | | 7,513 | | | | 1,422 | | | | 39,409 | | | | 2,254 | |
| | | | | | | | | | | | | | | | | | | | | | | | |
Expenses | | | | | | | | | | | | | | | | | | | | | | | | |
Investment Advisory Fees | | | 2,349 | | | | 2,755 | | | | 1,731 | | | | 581 | | | | 3,375 | | | | 582 | |
Custodian Fees | | | 16 | | | | 19 | | | | 16 | | | | 11 | | | | 38 | | | | 17 | |
Shareholder Reporting Fees | | | 51 | | | | 46 | | | | 38 | | | | 8 | | | | 99 | | | | 7 | |
Audit Fees | | | 22 | | | | 22 | | | | 22 | | | | 22 | | | | 21 | | | | 22 | |
Valuation Services | | | 1 | | | | - | | | | - | | | | 1 | | | | 3 | | | | 2 | |
Compliance Fees | | | 9 | | | | 10 | | | | 9 | | | | 10 | | | | 9 | | | | 9 | |
Directors Fees | | | 13 | | | | 13 | | | | 13 | | | | 13 | | | | 13 | | | | 13 | |
Professional Fees | | | 6 | | | | 6 | | | | 6 | | | | 9 | | | | 7 | | | | 9 | |
Trade Name Fees | | | - | | | | - | | | | - | | | | - | | | | 60 | | | | - | |
Other Expenses | | | 11 | | | | 6 | | | | 7 | | | | 1 | | | | 31 | | | | 1 | |
| | | | | | | | | | | | | | | | | | | | | | | | |
Total Expenses | | | 2,478 | | | | 2,877 | | | | 1,842 | | | | 656 | | | | 3,656 | | | | 662 | |
| | | | | | | | | | | | | | | | | | | | | | | | |
Less Waived Fees: | | | | | | | | | | | | | | | | | | | | | | | | |
Paid by Affiliate | | | (39 | ) | | | (223 | ) | | | (11 | ) | | | (25 | ) | | | (37 | ) | | | (24 | ) |
| | | | | | | | | | | | | | | | | | | | | | | | |
Net Expenses | | | 2,439 | | | | 2,654 | | | | 1,831 | | | | 631 | | | | 3,619 | | | | 638 | |
| | | | | | | | | | | | | | | | | | | | | | | | |
Net Investment Income (Loss) | | | 4,944 | | | | 2,566 | | | | 5,682 | | | | 791 | | | | 35,790 | | | | 1,616 | |
Realized and Unrealized Gain (Loss) on Investments | | | | | | | | | | | | | | | | | | | | | | | | |
Net Realized Gain (Loss) on: | | | | | | | | | | | | | | | | | | | | | | | | |
Unaffiliated Investment Securities | | | 60,082 | | | | (1,412 | ) | | | 33,646 | | | | 15,674 | | | | 34,809 | | | | 3,125 | |
Affiliated Investment Securities | | | - | | | | - | | | | - | | | | - | | | | - | | | | - | |
Futures Contracts | | | 2,517 | | | | - | | | | 2,566 | | | | - | | | | 3,560 | | | | 15 | |
Options Written | | | 99 | | | | - | | | | 7 | | | | - | | | | - | | | | - | |
Swap Contracts | | | - | | | | - | | | | - | | | | - | | | | - | | | | - | |
Foreign Currency Transactions | | | - | | | | - | | | | - | | | | - | | | | 182 | | | | (51 | ) |
| | | | | | | | | | | | | | | | | | | | | | | | |
Net Realized Gain (Loss) on Investments | | | 62,698 | | | | (1,412 | ) | | | 36,219 | | | | 15,674 | | | | 38,551 | | | | 3,089 | |
| | | | | | | | | | | | | | | | | | | | | | | | |
Net Unrealized Appreciation (Depreciation) of: | | | | | | | | | | | | | | | | | | | | | | | | |
Investment Securities | | | (1,214 | ) | | | 60,768 | | | | 1,553 | | | | (6,031 | ) | | | 170,013 | | | | 7,190 | |
Futures Contracts | | | (232 | ) | | | - | | | | (443 | ) | | | - | | | | (695 | ) | | | 1 | |
Options Written | | | - | | | | - | | | | - | | | | - | | | | - | | | | - | |
Short Sales | | | - | | | | - | | | | - | | | | - | | | | - | | | | 2 | |
Swap Contracts | | | - | | | | - | | | | - | | | | - | | | | - | | | | - | |
Foreign Currency Transactions | | | - | | | | - | | | | - | | | | - | | | | - | | | | (4 | ) |
| | | | | | | | | | | | | | | | | | | | | | | | |
Net Change in Unrealized Appreciation (Depreciation) of Investments | | | (1,446 | ) | | | 60,768 | | | | 1,110 | | | | (6,031 | ) | | | 169,318 | | | | 7,189 | |
| | | | | | | | | | | | | | | | | | | | | | | | |
Net Gain (Loss) on Investments | | | 61,252 | | | | 59,356 | | | | 37,329 | | | | 9,643 | | | | 207,869 | | | | 10,278 | |
| | | | | | | | | | | | | | | | | | | | | | | | |
Net Increase (Decrease) in Net Assets Resulting from Operations | | $ | 66,196 | | | $ | 61,922 | | | $ | 43,011 | | | $ | 10,434 | | | $ | 243,659 | | | $ | 11,894 | |
| | | | | | | | | | | | | | | | | | | | | | | | |
(1) Net of Foreign Dividend Tax | | $ | 4 | | | $ | 46 | | | $ | - | | | $ | 17 | | | $ | 29 | | | $ | 9 | |
The Accompanying Notes are an Integral Part of the Financial Statements.
| | | | |
| 220 | | Statements of Operations | | |
| | | | | | | | | | | | | | | | | | | | | | | | | | | | | | |
Domestic
Equity
Portfolio | | | Equity Income
Portfolio | | | Mid Cap
Growth Stock
Portfolio | | | Index 400
Stock Portfolio | | | Mid Cap Value
Portfolio | | | Small Cap
Growth Stock
Portfolio | | | Index 600
Stock Portfolio | | | Small Cap
Value
Portfolio | |
| | | | | | | | | | | | | | | | | | | | | | | | | | | | | | |
| | | | | | | | | | | | | | | | | | | | | | | | | | | | | | |
| $ | 1 | | | $ | 19 | | | $ | 108 | | | $ | 32 | | | $ | 2 | | | $ | 54 | | | $ | 12 | | | $ | 8 | |
| | 11,217 | | | | 10,513 | | | | 7,630 | | | | 7,279 | | | | 4,457 | | | | 1,777 | | | | 1,126 | | | | 9,401 | |
| | | | | | | | | | | | | | | | | | | | | | | | | | | | | | |
| | 11,218 | | | | 10,532 | | | | 7,738 | | | | 7,311 | | | | 4,459 | | | | 1,831 | | | | 1,138 | | | | 9,409 | |
| | | | | | | | | | | | | | | | | | | | | | | | | | | | | | |
| | | | | | | | | | | | | | | | | | | | | | | | | | | | | | |
| | 2,220 | | | | 2,363 | | | | 4,464 | | | | 1,174 | | | | 1,233 | | | | 2,165 | | | | 167 | | | | 3,298 | |
| | 10 | | | | 18 | | | | 17 | | | | 28 | | | | 36 | | | | 21 | | | | 41 | | | | 9 | |
| | 38 | | | | 42 | | | | 74 | | | | 46 | | | | 34 | | | | 65 | | | | 9 | | | | 78 | |
| | 22 | | | | 22 | | | | 23 | | | | 21 | | | | 22 | | | | 22 | | | | 21 | | | | 22 | |
| | 1 | | | | 2 | | | | 1 | | | | 2 | | | | 2 | | | | 1 | | | | 3 | | | | 1 | |
| | 10 | | | | 9 | | | | 9 | | | | 9 | | | | 9 | | | | 10 | | | | 9 | | | | 10 | |
| | 13 | | | | 13 | | | | 13 | | | | 13 | | | | 13 | | | | 13 | | | | 13 | | | | 13 | |
| | 6 | | | | 6 | | | | 6 | | | | 7 | | | | 6 | | | | 6 | | | | 10 | | | | 6 | |
| | - | | | | - | | | | - | | | | 31 | | | | - | | | | - | | | | 10 | | | | - | |
| | 7 | | | | 6 | | | | 16 | | | | 9 | | | | 2 | | | | 7 | | | | 1 | | | | 7 | |
| | | | | | | | | | | | | | | | | | | | | | | | | | | | | | |
| | 2,327 | | | | 2,481 | | | | 4,623 | | | | 1,340 | | | | 1,357 | | | | 2,310 | | | | 284 | | | | 3,444 | |
| | | | | | | | | | | | | | | | | | | | | | | | | | | | | | |
| | | | | | | | | | | | | | | | | | | | | | | | | | | | | | |
| | (12 | ) | | | (12 | ) | | | (190 | ) | | | (21 | ) | | | (12 | ) | | | (16 | ) | | | (53 | ) | | | (17 | ) |
| | | | | | | | | | | | | | | | | | | | | | | | | | | | | | |
| | 2,315 | | | | 2,469 | | | | 4,433 | | | | 1,319 | | | | 1,345 | | | | 2,294 | | | | 231 | | | | 3,427 | |
| | | | | | | | | | | | | | | | | | | | | | | | | | | | | | |
| | 8,903 | | | | 8,063 | | | | 3,305 | | | | 5,992 | | | | 3,114 | | | | (463 | ) | | | 907 | | | | 5,982 | |
| | | | | | | | | | | | | | | | | | | | | | | | | | | | | | |
| | | | | | | | | | | | | | | | | | | | | | | | | | | | | | |
| | 74,949 | | | | 12,436 | | | | 83,309 | | | | 15,185 | | | | 6,277 | | | | 40,170 | | | | 1,196 | | | | 2,348 | |
| | - | | | | - | | | | - | | | | - | | | | - | | | | - | | | | - | | | | - | |
| | - | | | | - | | | | 7,728 | | | | 5,307 | | | | - | | | | 688 | | | | - | | | | - | |
| | - | | | | - | | | | - | | | | - | | | | - | | | | 72 | | | | - | | | | - | |
| | - | | | | - | | | | - | | | | - | | | | - | | | | 1,438 | | | | 891 | | | | - | |
| | - | | | | (1 | ) | | | - | | | | - | | | | (140 | ) | | | - | | | | - | | | | - | |
| | | | | | | | | | | | | | | | | | | | | | | | | | | | | | |
| | 74,949 | | | | 12,435 | | | | 91,037 | | | | 20,492 | | | | 6,137 | | | | 42,368 | | | | 2,087 | | | | 2,348 | |
| | | | | | | | | | | | | | | | | | | | | | | | | | | | | | |
| | | | | | | | | | | | | | | | | | | | | | | | | | | | | | |
| | (30,765 | ) | | | 35,614 | | | | 1,128 | | | | 49,638 | | | | 12,655 | | | | (6,981 | ) | | | 6,172 | | | | 49,986 | |
| | - | | | | - | | | | (23 | ) | | | (1,064 | ) | | | - | | | | 309 | | | | - | | | | - | |
| | - | | | | - | | | | - | | | | - | | | | - | | | | - | | | | - | | | | - | |
| | - | | | | - | | | | - | | | | - | | | | - | | | | - | | | | - | | | | - | |
| | - | | | | - | | | | - | | | | - | | | | - | | | | 33 | | | | - | | | | - | |
| | - | | | | 1 | | | | - | | | | - | | | | (18 | ) | | | - | | | | - | | | | - | |
| | | | | | | | | | | | | | | | | | | | | | | | | | | | | | |
| | (30,765 | ) | | | 35,615 | | | | 1,105 | | | | 48,574 | | | | 12,637 | | | | (6,639 | ) | | | 6,172 | | | | 49,986 | |
| | | | | | | | | | | | | | | | | | | | | | | | | | | | | | |
| | 44,184 | | | | 48,050 | | | | 92,142 | | | | 69,066 | | | | 18,774 | | | | 35,729 | | | | 8,259 | | | | 52,334 | |
| | | | | | | | | | | | | | | | | | | | | | | | | | | | | | |
| $ | 53,087 | | | $ | 56,113 | | | $ | 95,447 | | | $ | 75,058 | | | $ | 21,888 | | | $ | 35,266 | | | $ | 9,166 | | | $ | 58,316 | |
| | | | | | | | | | | | | | | | | | | | | | | | | | | | | | |
| $ | 83 | | | $ | 78 | | | $ | (5 | ) | | $ | - | | | $ | 11 | | | $ | - | | | $ | - | | | $ | 6 | |
The Accompanying Notes are an Integral Part of the Financial Statements.
| | | | | | |
| | Statements of Operations | | | 221 | |
Statements of Operations
Northwestern Mutual Series Fund, Inc.
For the Year Ended December 31, 2012 (in thousands)
| | | | | | | | | | | | | | | | | | | | | | | | |
| | | International
Growth
Portfolio | | | Research
International
Core Portfolio | | | International
Equity
Portfolio | | | Emerging
Markets
Equity
Portfolio | | | Money Market
Portfolio | | | Short-Term
Bond Portfolio | |
Investment Income | | | | | | | | | | | | | | | | | | | | | | | | |
Income | | | | | | | | | | | | | | | | | | | | | | | | |
Interest | | $ | 10 | | | $ | 5 | | | $ | 16 | | | $ | 4 | | | $ | 1,082 | | | $ | 2,357 | |
Unaffiliated Dividends (1) | | | 8,079 | | | | 5,337 | | | | 43,280 | | | | 5,387 | | | | - | | | | - | |
Affiliated Dividends | | | - | | | | - | | | | - | | | | - | | | | - | | | | - | |
| | | | | | | | | | | | | | | | | | | | | | | | |
Total Income | | | 8,089 | | | | 5,342 | | | | 43,296 | | | | 5,391 | | | | 1,082 | | | | 2,357 | |
| | | | | | | | | | | | | | | | | | | | | | | | |
Expenses | | | | | | | | | | | | | | | | | | | | | | | | |
Investment Advisory Fees | | | 1,982 | | | | 1,570 | | | | 8,792 | | | | 2,315 | | | | 1,391 | | | | 509 | |
Custodian Fees | | | 253 | | | | 335 | | | | 745 | | | | 569 | | | | 8 | | | | 15 | |
Shareholder Reporting Fees | | | 56 | | | | 20 | | | | 132 | | | | 40 | | | | 19 | | | | 15 | |
Audit Fees | | | 23 | | | | 23 | | | | 23 | | | | 23 | | | | 13 | | | | 24 | |
Valuation Services | | | - | | | | - | | | | - | | | | - | | | | 1 | | | | 12 | |
Compliance Fees | | | 9 | | | | 10 | | | | 10 | | | | 9 | | | | 9 | | | | 10 | |
Directors Fees | | | 13 | | | | 13 | | | | 13 | | | | 13 | | | | 13 | | | | 13 | |
Professional Fees | | | 42 | | | | 52 | | | | 93 | | | | 56 | | | | 2 | | | | 9 | |
Interest Expense | | | - | | | | - | | | | - | | | | - | | | | - | | | | - | |
Other Expenses | | | 6 | | | | 2 | | | | 25 | | | | 3 | | | | 9 | | | | 3 | |
| | | | | | | | | | | | | | | | | | | | | | | | |
Total Expenses | | | 2,384 | | | | 2,025 | | | | 9,833 | | | | 3,028 | | | | 1,465 | | | | 610 | |
| | | | | | | | | | | | | | | | | | | | | | | | |
Less Waived Fees: | | | | | | | | | | | | | | | | | | | | | | | | |
Paid by Affiliate | | | (16 | ) | | | (11 | ) | | | (761 | ) | | | (13 | ) | | | (1,059 | ) | | | (12 | ) |
| | | | | | | | | | | | | | | | | | | | | | | | |
Net Expenses | | | 2,368 | | | | 2,014 | | | | 9,072 | | | | 3,015 | | | | 406 | | | | 598 | |
| | | | | | | | | | | | | | | | | | | | | | | | |
Net Investment Income (Loss) | | | 5,721 | | | | 3,328 | | | | 34,224 | | | | 2,376 | | | | 676 | | | | 1,759 | |
Realized and Unrealized Gain (Loss) on Investments | | | | | | | | | | | | | | | | | | | | | | | | |
Net Realized Gain (Loss) on: | | | | | | | | | | | | | | | | | | | | | | | | |
Unaffiliated Investment Securities | | | (7,449 | ) | | | (772 | ) | | | 22,758 | | | | 1,078 | | | | (3 | ) | | | 2,573 | |
Affiliated Investment Securities | | | - | | | | - | | | | - | | | | - | | | | - | | | | - | |
Futures Contracts | | | - | | | | - | | | | - | | | | - | | | | - | | | | (924 | ) |
Options Written | | | - | | | | - | | | | - | | | | - | | | | - | | | | - | |
Swap Contracts | | | - | | | | - | | | | - | | | | - | | | | - | | | | - | |
Foreign Currency Transactions | | | (347 | ) | | | 25 | | | | (949 | ) | | | (97 | ) | | | - | | | | 19 | |
| | | | | | | | | | | | | | | | | | | | | | | | |
Net Realized Gain (Loss) on Investments | | | (7,796 | ) | | | (747 | ) | | | 21,809 | | | | 981 | | | | (3 | ) | | | 1,668 | |
| | | | | | | | | | | | | | | | | | | | | | | | |
Net Unrealized Appreciation (Depreciation) of: | | | | | | | | | | | | | | | | | | | | | | | | |
Investment Securities | | | 51,546 | | | | 31,304 | | | | 212,544 | | | | 30,258 | | | | - | | | | (671 | ) |
Futures Contracts | | | - | | | | - | | | | - | | | | - | | | | - | | | | 207 | |
Options Written | | | - | | | | - | | | | - | | | | - | | | | - | | | | - | |
Short Sales | | | - | | | | - | | | | - | | | | - | | | | - | | | | - | |
Swap Contracts | | | - | | | | - | | | | - | | | | - | | | | - | | | | - | |
Foreign Currency Transactions | | | 4 | | | | 3 | | | | 30 | | | | 2 | | | | - | | | | (56 | ) |
| | | | | | | | | | | | | | | | | | | | | | | | |
Net Change in Unrealized Appreciation
(Depreciation) of Investments | | | 51,550 | | | | 31,307 | | | | 212,574 | | | | 30,260 | | | | - | | | | (520 | ) |
| | | | | | | | | | | | | | | | | | | | | | | | |
Net Gain (Loss) on Investments | | | 43,754 | | | | 30,560 | | | | 234,383 | | | | 31,241 | | | | (3 | ) | | | 1,148 | |
| | | | | | | | | | | | | | | | | | | | | | | | |
Net Increase (Decrease) in Net Assets Resulting from Operations | | $ | 49,475 | | | $ | 33,888 | | | $ | 268,607 | | | $ | 33,617 | | | $ | 673 | | | $ | 2,907 | |
| | | | | | | | | | | | | | | | | | | | | | | | |
(1) Net of Foreign Dividend Tax | | $ | 178 | | | $ | 229 | | | $ | 1,372 | | | $ | 200 | | | $ | - | | | $ | - | |
The Accompanying Notes are an Integral Part of the Financial Statements.
| | | | |
| 222 | | Statements of Operations | | |
| | | | | | | | | | | | | | | | | | | | | | | | | | |
Select Bond
Portfolio | | | Long-Term U.S. Government Bond Portfolio | | | Inflation Protection Portfolio | | | High Yield Bond Portfolio | | | Multi-Sector
Bond Portfolio | | | Balanced
Portfolio | | | Asset Allocation Portfolio | |
| | | | | | | | | | | | | | | | | | | | | | | | | | | |
| | | | | | | | | | | | | | | | | | | | | | | | | | | |
| $ | 41,874 | | | $ | 3,512 | | | $ | 5,545 | | | $ | 29,106 | | | $ | 14,959 | | | $ | 37,675 | | | $ | 3,114 | |
| | - | | | | - | | | | - | | | | 339 | | | | - | | | | 15,724 | | | | 2,153 | |
| | - | | | | - | | | | - | | | | - | | | | - | | | | 2,482 | | | | 382 | |
| | | | | | | | | | | | | | | | | | | | | | | | | | |
| | 41,874 | | | | 3,512 | | | | 5,545 | | | | 29,445 | | | | 14,959 | | | | 55,881 | | | | 5,649 | |
| | | | | | | | | | | | | | | | | | | | | | | | | | |
| | | | | | | | | | | | | | | | | | | | | | | | | | | |
| | 4,769 | | | | 640 | | | | 1,228 | | | | 1,835 | | | | 2,351 | | | | 6,732 | | | | 1,280 | |
| | 23 | | | | 8 | | | | 26 | | | | 26 | | | | 66 | | | | 61 | | | | 69 | |
| | 85 | | | | 10 | | | | 27 | | | | 71 | | | | 31 | | | | 54 | | | | 9 | |
| | 16 | | | | 29 | | | | 22 | | | | 25 | | | | 27 | | | | 16 | | | | 24 | |
| | 65 | | | | 6 | | | | 27 | | | | 31 | | | | 83 | | | | 81 | | | | 77 | |
| | 10 | | | | 10 | | | | 9 | | | | 9 | | | | 10 | | | | 9 | | | | 10 | |
| | 13 | | | | 13 | | | | 13 | | | | 13 | | | | 13 | | | | 13 | | | | 13 | |
| | 3 | | | | 11 | | | | 30 | | | | 6 | | | | 12 | | | | 4 | | | | 6 | |
| | - | | | | 42 | | | | - | | | | - | | | | - | | | | - | | | | - | |
| | 30 | | | | 2 | | | | 3 | | | | 8 | | | | 5 | | | | 44 | | | | 4 | |
| | | | | | | | | | | | | | | | | | | | | | | | | | |
| | 5,014 | | | | 771 | | | | 1,385 | | | | 2,024 | | | | 2,598 | | | | 7,014 | | | | 1,492 | |
| | | | | | | | | | | | | | | | | | | | | | | | | | |
| | | | | | | | | | | | | | | | | | | | | | | | | | | |
| | (46 | ) | | | (10 | ) | | | (22 | ) | | | (24 | ) | | | (34 | ) | | | (277 | ) | | | (207 | ) |
| | | | | | | | | | | | | | | | | | | | | | | | | | |
| | 4,968 | | | | 761 | | | | 1,363 | | | | 2,000 | | | | 2,564 | | | | 6,737 | | | | 1,285 | |
| | | | | | | | | | | | | | | | | | | | | | | | | | |
| | 36,906 | | | | 2,751 | | | | 4,182 | | | | 27,445 | | | | 12,395 | | | | 49,144 | | | | 4,364 | |
| | | | | | | | | | | | | | | | | | | | | | | | | | | |
| | | | | | | | | | | | | | | | | | | | | | | | | | | |
| | 40,925 | | | | (1,512 | ) | | | 5,336 | | | | 175 | | | | 2,467 | | | | 146,429 | | | | 20,348 | |
| | - | | | | - | | | | - | | | | - | | | | - | | | | 2 | | | | - | |
| | (3,291 | ) | | | 305 | | | | 33 | | | | - | | | | 1,026 | | | | 16,677 | | | | 2,000 | |
| | - | | | | (1 | ) | | | - | | | | - | | | | 70 | | | | (93 | ) | | | (11 | ) |
| | - | | | | - | | | | (29 | ) | | | - | | | | 2,814 | | | | 9,773 | | | | 1,153 | |
| | 331 | | | | - | | | | 524 | | | | - | | | | 76 | | | | 1,829 | | | | 223 | |
| | | | | | | | | | | | | | | | | | | | | | | | | | |
| | 37,965 | | | | (1,208 | ) | | | 5,864 | | | | 175 | | | | 6,453 | | | | 174,617 | | | | 23,713 | |
| | | | | | | | | | | | | | | | | | | | | | | | | | |
| | | | | | | | | | | | | | | | | | | | | | | | | | | |
| | 654 | | | | 2,838 | | | | 5,228 | | | | 26,650 | | | | 22,388 | | | | (918 | ) | | | (1,544 | ) |
| | 765 | | | | (53 | ) | | | - | | | | - | | | | (901 | ) | | | (2,189 | ) | | | (250 | ) |
| | - | | | | - | | | | - | | | | - | | | | (61 | ) | | | - | | | | - | |
| | 20 | | | | - | | | | - | | | | - | | | | (3 | ) | | | - | | | | - | |
| | - | | | | - | | | | 964 | | | | - | | | | 2,675 | | | | (10,701 | ) | | | (1,363 | ) |
| | (568 | ) | | | - | | | | (1,466 | ) | | | - | | | | (1,881 | ) | | | (2,739 | ) | | | (372 | ) |
| | | | | | | | | | | | | | | | | | | | | | | | | | |
| | | | | | | | | | | | | | | | | | | | | | | | | | |
| 871 | | | | 2,785 | | | | 4,726 | | | | 26,650 | | | | 22,217 | | | | (16,547 | ) | | | (3,529 | ) |
| | | | | | | | | | | | | | | | | | | | | | | | | | |
| | 38,836 | | | | 1,577 | | | | 10,590 | | | | 26,825 | | | | 28,670 | | | | 158,070 | | | | 20,184 | |
| | | | | | | | | | | | | | | | | | | | | | | | | | |
| | | | | | | | | | | | | | | | | | | | | | | | | | |
| $ | 75,742 | | | $ | 4,328 | | | $ | 14,772 | | | $ | 54,270 | | | $ | 41,065 | | | $ | 207,214 | | | $ | 24,548 | |
| | | | | | | | | | | | | | | | | | | | | | | | | | |
| $ | - | | | $ | - | | | $ | - | | | $ | - | | | $ | - | | | $ | 6 | | | $ | 1 | |
The Accompanying Notes are an Integral Part of the Financial Statements.
| | | | | | |
| | Statements of Operations | | | 223 | |
Consolidated Statement of Operations
Northwestern Mutual Series Fund, Inc.
For the Year Ended December 31, 2012 (in thousands)
| | | | |
| | | Commodities
Return
Strategy
Portfolio | |
Investment Income | | | | |
Income | | | | |
Interest | | $ | 267 | |
| | | | |
Total Income | | | 267 | |
| | | | |
Expenses | | | | |
Investment Advisory Fees | | | 999 | |
Custodian Fees | | | 24 | |
Shareholder Reporting Fees | | | 21 | |
Audit Fees | | | 32 | |
Valuation Services | | | 4 | |
Compliance Fees | | | 9 | |
Directors Fees | | | 13 | |
Professional Fees | | | 17 | |
Other Expenses | | | 2 | |
| | | | |
Total Expenses | | | 1,121 | |
| | | | |
Less Waived Fees: | | | | |
Paid by Affiliate | | | (13 | ) |
| | | | |
Net Expenses | | | 1,108 | |
| | | | |
Net Investment Income (Loss) | | | (841 | ) |
Realized and Unrealized Gain (Loss) on Investments | | | | |
Net Realized Gain (Loss) on: | | | | |
Unaffiliated Investment Securities | | | 30 | |
Affiliated Investment Securities | | | - | |
Futures Contracts | | | - | |
Options Written | | | - | |
Swap Contracts | | | (3,140 | ) |
Foreign Currency Transactions | | | - | |
| | | | |
Net Realized Gain (Loss) on Investments | | | (3,110 | ) |
| | | | |
Net Unrealized Appreciation (Depreciation) of: | | | | |
Investment Securities | | | 44 | |
Futures Contracts | | | - | |
Options Written | | | - | |
Short Sales | | | - | |
Swap Contracts | | | 331 | |
Foreign Currency Transactions | | | - | |
| | | | |
Net Change in Unrealized Appreciation (Depreciation) of Investments | | | 375 | |
| | | | |
Net Gain (Loss) on Investments | | | (2,735 | ) |
| | | | |
Net Increase (Decrease) in Net Assets Resulting from Operations | | $ | (3,576 | ) |
| | | | |
The Accompanying Notes are an Integral Part of the Financial Statements.
| | | | |
| 224 | | Consolidated Statement of Operations | | |
[THIS PAGE INTENTIONALLY LEFT BLANK]
225
Statements of Changes in Net Assets
Northwestern Mutual Series Fund, Inc.
(Amounts in thousands)
| | | | | | | | | | | | | | | | | | | | | | | | |
| | | Growth Stock Portfolio | | | Focused Appreciation
Portfolio | | | Large Cap Core Stock
Portfolio | |
| | | For the Year
Ended December 31, 2012 | | | For the Year
Ended December 31, 2011 | | | For the Year Ended December 31, 2012 | | | For the Year Ended December 31, 2011 | | | For the Year Ended December 31, 2012 | | | For the Year Ended December 31, 2011 | |
Change in Net Assets | | | | | | | | | | | | | | | | | | | | | | | | |
Operations | | | | | | | | | | | | | | | | | | | | | | | | |
Net Investment Income (Loss) | | $ | 4,944 | | | $ | 3,564 | | | $ | 2,566 | | | $ | 1,011 | | | $ | 5,682 | | | $ | 5,001 | |
Net Realized Gain (Loss) on Investments | | | 62,698 | | | | 19,509 | | | | (1,412 | ) | | | 7,925 | | | | 36,219 | | | | 20,272 | |
Net Change in Unrealized Appreciation (Depreciation) of Investments | | | (1,446 | ) | | | (29,373 | ) | | | 60,768 | | | | (27,889 | ) | | | 1,110 | | | | (29,763 | ) |
| | | | | | | | | | | | | | | | | | | | | | | | |
Net Increase (Decrease) in Net Assets Resulting from Operations | | | 66,196 | | | | (6,300 | ) | | | 61,922 | | | | (18,953 | ) | | | 43,011 | | | | (4,490 | ) |
| | | | | | | | | | | | | | | | | | | | | | | | |
Distributions to Shareholders from: | | | | | | | | | | | | | | | | | | | | | | | | |
Net Investment Income | | | (3,139 | ) | | | (4,271 | ) | | | (1,010 | ) | | | (572 | ) | | | (4,738 | ) | | | (4,523 | ) |
Net Realized Gain on Investments | | | - | | | | - | | | | - | | | | - | | | | - | | | | - | |
| | | | | | | | | | | | | | | | | | | | | | | | |
Net Decrease in Net Assets Resulting from Distributions to Shareholders | | | (3,139 | ) | | | (4,271 | ) | | | (1,010 | ) | | | (572 | ) | | | (4,738 | ) | | | (4,523 | ) |
| | | | | | | | | | | | | | | | | | | | | | | | |
Capital Transactions: | | | | | | | | | | | | | | | | | | | | | | | | |
Shares Sold | | | 22,764 | | | | 26,974 | | | | 66,064 | | | | 51,848 | | | | 19,247 | | | | 20,093 | |
Reinvestment of Distributions Paid | | | 3,139 | | | | 4,271 | | | | 1,010 | | | | 572 | | | | 4,738 | | | | 4,523 | |
Shares Redeemed | | | (69,152 | ) | | | (63,539 | ) | | | (44,486 | ) | | | (38,972 | ) | | | (54,648 | ) | | | (46,864 | ) |
| | | | | | | | | | | | | | | | | | | | | | | | |
Net Increase (Decrease) in Net Assets Resulting from Capital Transactions | | | (43,249 | ) | | | (32,294 | ) | | | 22,588 | | | | 13,448 | | | | (30,663 | ) | | | (22,248 | ) |
| | | | | | | | | | | | | | | | | | | | | | | | |
Total Increase (Decrease) in Net Assets | | | 19,808 | | | | (42,865 | ) | | | 83,500 | | | | (6,077 | ) | | | 7,610 | | | | (31,261 | ) |
Net Assets | | | | | | | | | | | | | | | | | | | | | | | | |
Beginning of Period | | | 514,007 | | | | 556,872 | | | | 305,120 | | | | 311,197 | | | | 377,069 | | | | 408,330 | |
| | | | | | | | | | | | | | | | | | | | | | | | |
End of Period | | $ | 533,815 | | | $ | 514,007 | | | $ | 388,620 | | | $ | 305,120 | | | $ | 384,679 | | | $ | 377,069 | |
| | | | | | | | | | | | | | | | | | | | | | | | |
Undistributed Net Investment Income (Loss) | | $ | 5,017 | | | $ | 3,564 | | | $ | 2,567 | | | $ | 1,011 | | | $ | 5,722 | | | $ | 5,001 | |
| | | | | | | | | | | | | | | | | | | | | | | | |
Portfolio Share Transactions: | | | | | | | | | | | | | | | | | | | | | | | | |
Shares Sold | | | 9,822 | | | | 12,604 | | | | 32,803 | | | | 28,437 | | | | 14,617 | | | | 16,154 | |
Reinvestment of Distributions Paid | | | 1,334 | | | | 2,066 | | | | 491 | | | | 328 | | | | 3,570 | | | | 3,866 | |
Shares Redeemed | | | (29,689 | ) | | | (29,525 | ) | | | (22,199 | ) | | | (21,095 | ) | | | (41,515 | ) | | | (37,694 | ) |
| | | | | | | | | | | | | | | | | | | | | | | | |
Net Increase (Decrease) in Shares Resulting from Portfolio Share Transactions | | | (18,533 | ) | | | (14,855 | ) | | | 11,095 | | | | 7,670 | | | | (23,328 | ) | | | (17,674 | ) |
| | | | | | | | | | | | | | | | | | | | | | | | |
The Accompanying Notes are an Integral Part of the Financial Statements.
| | | | |
| 226 | | Statements of Changes in Net Assets | | |
| | | | | | | | | | | | | | | | | | | | | | | | | | | | | | |
| Large Cap Blend Portfolio | | | Index 500 Stock Portfolio | | | Large Company Value
Portfolio | | | Domestic Equity Portfolio | |
For the Year Ended December 31, 2012 | | | For the Year Ended December 31, 2011 | | | For the Year Ended December 31, 2012 | | | For the Year Ended December 31, 2011 | | | For the Year Ended December 31, 2012 | | | For the Year Ended December 31, 2011 | | | For the Year Ended December 31, 2012 | | | For the Year
Ended
December 31, 2011 | |
| | | | | | | | | | | | | | | | | | | | | | | | | | | | | | | |
| | | | | | | | | | | | | | | | | | | | | | | | | | | | | | | |
| $ | 791 | | | $ | 554 | | | $ | 35,790 | | | $ | 30,082 | | | $ | 1,616 | | | $ | 1,212 | | | $ | 8,903 | | | $ | 9,031 | |
| | 15,674 | | | | 2,876 | | | | 38,551 | | | | 31,098 | | | | 3,089 | | | | 2,620 | | | | 74,949 | | | | 21,196 | |
|
(6,031 |
) | | | (4,883 | ) | | | 169,318 | | | | (29,380 | ) | | | 7,189 | | | | (2,732 | ) | | | (30,765 | ) | | | (26,738 | ) |
| | | | | | | | | | | | | | | | | | | | | | | | | | | | | | |
| 10,434 | | | | (1,453 | ) | | | 243,659 | | | | 31,800 | | | | 11,894 | | | | 1,100 | | | | 53,087 | | | | 3,489 | |
| | | | | | | | | | | | | | | | | | | | | | | | | | | | | | |
| | | | | | | | | | | | | | | | | | | | | | | | | | | | | | | |
| | (736 | ) | | | (550 | ) | | | (29,810 | ) | | | (27,053 | ) | | | (1,609 | ) | | | (1,205 | ) | | | (8,652 | ) | | | (8,356 | ) |
| (3,145 | ) | | | - | | | | (30,519 | ) | | | (36,188 | ) | | | - | | | | - | | | | - | | | | - | |
| | | | | | | | | | | | | | | | | | | | | | | | | | | | | | |
| | (3,881 | ) | | | (550 | ) | | | (60,329 | ) | | | (63,241 | ) | | | (1,609 | ) | | | (1,205 | ) | | | (8,652 | ) | | | (8,356 | ) |
| | | | | | | | | | | | | | | | | | | | | | | | | | | | | | |
| | | | | | | | | | | | | | | | | | | | | | | | | | | | | | | |
| | 8,359 | | | | 14,157 | | | | 84,780 | | | | 91,690 | | | | 16,192 | | | | 16,229 | | | | 19,983 | | | | 29,017 | |
| | 3,881 | | | | 549 | | | | 60,329 | | | | 63,241 | | | | 1,609 | | | | 1,205 | | | | 8,652 | | | | 8,356 | |
| | (9,361 | ) | | | (7,212 | ) | | | (193,769 | ) | | | (179,476 | ) | | | (10,845 | ) | | | (8,666 | ) | | | (58,823 | ) | | | (55,132 | ) |
| | | | | | | | | | | | | | | | | | | | | | | | | | | | | | |
|
2,879 |
| | | 7,494 | | | | (48,660 | ) | | | (24,545 | ) | | | 6,956 | | | | 8,768 | | | | (30,188 | ) | | | (17,759 | ) |
| | | | | | | | | | | | | | | | | | | | | | | | | | | | | | |
| | 9,432 | | | | 5,491 | | | | 134,670 | | | | (55,986 | ) | | | 17,241 | | | | 8,663 | | | | 14,247 | | | | (22,626 | ) |
| | | | | | | | | | | | | | | | | | | | | | | | | | | | | | | |
| | 69,268 | | | | 63,777 | | | | 1,569,801 | | | | 1,625,787 | | | | 69,674 | | | | 61,011 | | | | 385,811 | | | | 408,437 | |
| | | | | | | | | | | | | | | | | | | | | | | | | | | | | | |
| $ | 78,700 | | | $ | 69,268 | | | $ | 1,704,471 | | | $ | 1,569,801 | | | $ | 86,915 | | | $ | 69,674 | | | $ | 400,058 | | | $ | 385,811 | |
| | | | | | | | | | | | | | | | | | | | | | | | | | | | | | |
| $ | 54 | | | $ | 4 | | | $ | 35,516 | | | $ | 29,810 | | | $ | 77 | | | $ | 125 | | | $ | 8,767 | | | $ | 9,031 | |
| | | | | | | | | | | | | | | | | | | | | | | | | | | | | | |
| | | | | | | | | | | | | | | | | | | | | | | | | | | | | | | |
| | 10,144 | | | | 18,402 | | | | 30,570 | | | | 34,976 | | | | 20,250 | | | | 22,075 | | | | 21,305 | | | | 32,868 | |
| | 4,694 | | | | 733 | | | | 21,584 | | | | 26,296 | | | | 1,922 | | | | 1,642 | | | | 9,059 | | | | 10,228 | |
| | (11,477 | ) | | | (9,315 | ) | | | (69,725 | ) | | | (68,428 | ) | | | (13,598 | ) | | | (11,612 | ) | | | (62,470 | ) | | | (62,599 | ) |
| | | | | | | | | | | | | | | | | | | | | | | | | | | | | | |
|
3,361 |
| | | 9,820 | | | | (17,571 | ) | | | (7,156 | ) | | | 8,574 | | | | 12,105 | | | | (32,106 | ) | | | (19,503 | ) |
| | | | | | | | | | | | | | | | | | | | | | | | | | | | | | |
The Accompanying Notes are an Integral Part of the Financial Statements.
| | | | | | |
| | Statements of Changes in Net Assets | | | 227 | |
Statements of Changes in Net Assets
Northwestern Mutual Series Fund, Inc.
(Amounts in thousands)
| | | | | | | | | | | | | | | | | | | | | | | | |
| | | Equity Income Portfolio | | | Mid Cap Growth Stock
Portfolio | | | Index 400 Stock Portfolio | |
| | | For the Year
Ended
December 31,
2012 | | | For the Year
Ended
December 31,
2011 | | | For the Year
Ended
December 31,
2012 | | | For the Year
Ended
December 31,
2011 | | | For the Year
Ended
December 31,
2012 | | | For the Year
Ended
December 31,
2011 | |
Change in Net Assets | | | | | | | | | | | | | | | | | | | | | | | | |
Operations | | | | | | | | | | | | | | | | | | | | | | | | |
Net Investment Income (Loss) | | $ | 8,063 | | | $ | 5,743 | | | $ | 3,305 | | | $ | 1,048 | | | $ | 5,992 | | | $ | 4,306 | |
Net Realized Gain (Loss) on Investments | | | 12,435 | | | | 5,210 | | | | 91,037 | | | | (6,543 | ) | | | 20,492 | | | | 19,243 | |
Net Change in Unrealized Appreciation (Depreciation) of Investments | | | 35,615 | | | | (12,839 | ) | | | 1,105 | | | | (48,275 | ) | | | 48,574 | | | | (31,452 | ) |
| | | | | | | | | | | | | | | | | | | | | | | | |
Net Increase (Decrease) in Net Assets Resulting from Operations | | | 56,113 | | | | (1,886 | ) | | | 95,447 | | | | (53,770 | ) | | | 75,058 | | | | (7,903 | ) |
| | | | | | | | | | | | | | | | | | | | | | | | |
Distributions to Shareholders from: | | | | | | | | | | | | | | | | | | | | | | | | |
Net Investment Income | | | (5,715 | ) | | | (4,374 | ) | | | (1,047 | ) | | | (2,086 | ) | | | (4,278 | ) | | | (4,083 | ) |
Net Realized Gain on Investments | | | — | | | | — | | | | — | | | | — | | | | (20,389 | ) | | | (26,147 | ) |
| | | | | | | | | | | | | | | | | | | | | | | | |
Net Decrease in Net Assets Resulting from Distributions to Shareholders | | | (5,715 | ) | | | (4,374 | ) | | | (1,047 | ) | | | (2,086 | ) | | | (24,667 | ) | | | (30,230 | ) |
| | | | | | | | | | | | | | | | | | | | | | | | |
Capital Transactions: | | | | | | | | | | | | | | | | | | | | | | | | |
Shares Sold | | | 83,503 | | | | 76,511 | | | | 24,202 | | | | 29,235 | | | | 26,484 | | | | 35,323 | |
Reinvestment of Distributions Paid | | | 5,715 | | | | 4,374 | | | | 1,047 | | | | 2,086 | | | | 24,667 | | | | 30,230 | |
Shares Redeemed | | | (37,440 | ) | | | (27,011 | ) | | | (103,478 | ) | | | (104,611 | ) | | | (61,896 | ) | | | (59,037 | ) |
| | | | | | | | | | | | | | | | | | | | | | | | |
Net Increase (Decrease) in Net Assets Resulting from Capital Transactions | | | 51,778 | | | | 53,874 | | | | (78,229 | ) | | | (73,290 | ) | | | (10,745 | ) | | | 6,516 | |
| | | | | | | | | | | | | | | | | | | | | | | | |
Total Increase (Decrease) in Net Assets | | | 102,176 | | | | 47,614 | | | | 16,171 | | | | (129,146 | ) | | | 39,646 | | | | (31,617 | ) |
Net Assets | | | | | | | | | | | | | | | | | | | | | | | | |
Beginning of Period | | | 306,921 | | | | 259,307 | | | | 812,782 | | | | 941,928 | | | | 439,395 | | | | 471,012 | |
| | | | | | | | | | | | | | | | | | | | | | | | |
End of Period | | $ | 409,097 | | | $ | 306,921 | | | $ | 828,953 | | | $ | 812,782 | | | $ | 479,041 | | | $ | 439,395 | |
| | | | | | | | | | | | | | | | | | | | | | | | |
Undistributed Net Investment Income (Loss) | | $ | 7,979 | | | $ | 5,761 | | | $ | 3,305 | | | $ | 1,048 | | | $ | 5,967 | | | $ | 4,306 | |
| | | | | | | | | | | | | | | | | | | | | | | | |
Portfolio Share Transactions: | | | | | | | | | | | | | | | | | | | | | | | | |
Shares Sold | | | 65,567 | | | | 65,084 | | | | 7,606 | | | | 9,447 | | | | 18,148 | | | | 23,947 | |
Reinvestment of Distributions Paid | | | 4,409 | | | | 3,980 | | | | 328 | | | | 724 | | | | 17,420 | | | | 23,218 | |
Shares Redeemed | | | (29,259 | ) | | | (22,560 | ) | | | (32,457 | ) | | | (33,646 | ) | | | (42,730 | ) | | | (40,242 | ) |
| | | | | | | | | | | | | | | | | | | | | | | | |
Net Increase (Decrease) in Shares Resulting from Portfolio Share Transactions | | | 40,717 | | | | 46,504 | | | | (24,523 | ) | | | (23,475 | ) | | | (7,162 | ) | | | 6,923 | |
| | | | | | | | | | | | | | | | | | | | | | | | |
The Accompanying Notes are an Integral Part of the Financial Statements.
| | | | |
| 228 | | Statements of Changes in Net Assets | | |
| | | | | | | | | | | | | | | | | | | | | | | | | | | | | | |
Mid Cap Value Portfolio | | | Small Cap Growth Stock Portfolio | | | Index 600 Stock Portfolio | | | Small Cap Value Portfolio | |
For the Year Ended December 31, 2012 | | | For the Year Ended December 31, 2011 | | | For the Year Ended December 31, 2012 | | | For the Year Ended December 31, 2011 | | | For the Year Ended December 31, 2012 | | | For the Year Ended December 31, 2011 | | | For the Year Ended December 31, 2012 | | | For the Year Ended December 31, 2011 | |
| | | | | | | | | | | | | | | | | | | | | | | | | | | | | | | |
| | | | | | | | | | | | | | | | | | | | | | | | | | | | | | | |
| $ | 3,114 | | | $ | 1,975 | | | $ | (463 | ) | | $ | (831 | ) | | $ | 907 | | | $ | 318 | | | $ | 5,982 | | | $ | 1,820 | |
| | 6,137 | | | | 12,913 | | | | 42,368 | | | | 52,430 | | | | 2,087 | | | | 2,286 | | | | 2,348 | | | | 8,486 | |
|
12,637 |
| | | (15,155 | ) | | | (6,639 | ) | | | (62,051 | ) | | | 6,172 | | | | (2,123 | ) | | | 49,986 | | | | (14,914 | ) |
| | | | | | | | | | | | | | | | | | | | | | | | | | | | | | |
|
21,888 |
| | | (267 | ) | | | 35,266 | | | | (10,452 | ) | | | 9,166 | | | | 481 | | | | 58,316 | | | | (4,608 | ) |
| | | | | | | | | | | | | | | | | | | | | | | | | | | | | | |
| | | | | | | | | | | | | | | | | | | | | | | | | | | | | | | |
| | (2,021 | ) | | | (2,135 | ) | | | - | | | | (1,448 | ) | | | (1,766 | ) | | | (385 | ) | | | (1,466 | ) | | | (2,251 | ) |
| | - | | | | - | | | | - | | | | - | | | | (1,713 | ) | | | (1,522 | ) | | | (4,508 | ) | | | - | |
| | | | | | | | | | | | | | | | | | | | | | | | | | | | | | |
|
(2,021 |
) | | | (2,135 | ) | | | - | | | | (1,448 | ) | | | (3,479 | ) | | | (1,907 | ) | | | (5,974 | ) | | | (2,251 | ) |
| | | | | | | | | | | | | | | | | | | | | | | | | | | | | | |
| | | | | | | | | | | | | | | | | | | | | | | | | | | | | | | |
| | 34,700 | | | | 23,891 | | | | 15,904 | | | | 28,480 | | | | 17,563 | | | | 12,499 | | | | 40,451 | | | | 42,410 | |
| | 2,021 | | | | 2,135 | | | | - | | | | 1,448 | | | | 3,479 | | | | 1,907 | | | | 5,974 | | | | 2,251 | |
| | (17,622 | ) | | | (17,497 | ) | | | (54,303 | ) | | | (57,634 | ) | | | (7,019 | ) | | | (4,959 | ) | | | (51,685 | ) | | | (49,495 | ) |
| | | | | | | | | | | | | | | | | | | | | | | | | | | | | | |
|
19,099 |
| | | 8,529 | | | | (38,399 | ) | | | (27,706 | ) | | | 14,023 | | | | 9,447 | | | | (5,260 | ) | | | (4,834 | ) |
| | | | | | | | | | | | | | | | | | | | | | | | | | | | | | |
| | 38,966 | | | | 6,127 | | | | (3,133 | ) | | | (39,606 | ) | | | 19,710 | | | | 8,021 | | | | 47,082 | | | | (11,693 | ) |
| | | | | | | | | | | | | | | | | | | | | | | | | | | | | | | |
| | 124,257 | | | | 118,130 | | | | 379,359 | | | | 418,965 | | | | 54,012 | | | | 45,991 | | | | 362,566 | | | | 374,259 | |
| | | | | | | | | | | | | | | | | | | | | | | | | | | | | | |
| $ | 163,223 | | | $ | 124,257 | | | $ | 376,226 | | | $ | 379,359 | | | $ | 73,722 | | | $ | 54,012 | | | $ | 409,648 | | | $ | 362,566 | |
| | | | | | | | | | | | | | | | | | | | | | | | | | | | | | |
| $ | 2,891 | | | $ | 1,998 | | | $ | 2,246 | | | $ | - | | | $ | 53 | | | $ | 29 | | | $ | 5,972 | | | $ | 1,793 | |
| | | | | | | | | | | | | | | | | | | | | | | | | | | | | | |
| | | | | | | | | | | | | | | | | | | | | | | | | | | | | | | |
| | 28,290 | | | | 21,088 | | | | 8,595 | | | | 15,812 | | | | 17,665 | | | | 13,277 | | | | 22,829 | | | | 25,435 | |
| | 1,627 | | | | 2,011 | | | | - | | | | 874 | | | | 3,459 | | | | 2,091 | | | | 3,408 | | | | 1,466 | |
| | (14,307 | ) | | | (15,079 | ) | | | (29,293 | ) | | | (32,137 | ) | | | (7,076 | ) | | | (5,211 | ) | | | (29,098 | ) | | | (29,413 | ) |
| | | | | | | | | | | | | | | | | | | | | | | | | | | | | | |
|
15,610 |
| | | 8,020 | | | | (20,698 | ) | | | (15,451 | ) | | | 14,048 | | | | 10,157 | | | | (2,861 | ) | | | (2,512 | ) |
| | | | | | | | | | | | | | | | | | | | | | | | | | | | | | |
The Accompanying Notes are an Integral Part of the Financial Statements.
| | | | | | |
| | Statements of Changes in Net Assets | | | 229 | |
Statements of Changes in Net Assets
Northwestern Mutual Series Fund, Inc.
(Amounts in thousands)
| | | | | | | | | | | | | | | | | | | | | | | | |
| | | International Growth
Portfolio | | | Research International Core
Portfolio | | | International Equity Portfolio | |
| | | For the Year
Ended
December 31,
2012 | | | For the Year
Ended
December 31,
2011 | | | For the Year
Ended
December 31,
2012 | | | For the Year
Ended
December 31,
2011 | | | For the Year Ended December 31,
2012 | | | For the Year Ended December 31,
2011 | |
Change in Net Assets | | | | | | | | | | | | | | | | | | | | | | | | |
Operations | | | | | | | | | | | | | | | | | | | | | | | | |
Net Investment Income (Loss) | | $ | 5,721 | | | $ | 4,414 | | | $ | 3,328 | | | $ | 1,358 | | | $ | 34,224 | | | $ | 37,067 | |
Net Realized Gain (Loss) on Investments | | | (7,796 | ) | | | 2,626 | | | | (747 | ) | | | 592 | | | | 21,809 | | | | 29,162 | |
Net Change in Unrealized Appreciation (Depreciation) of Investments | | | 51,550 | | | | (46,763 | ) | | | 31,307 | | | | (10,879 | ) | | | 212,574 | | | | (201,709 | ) |
| | | | | | | | | | | | | | | | | | | | | | | | |
Net Increase (Decrease) in Net Assets Resulting from Operations | | | 49,475 | | | | (39,723 | ) | | | 33,888 | | | | (8,929 | ) | | | 268,607 | | | | (135,480 | ) |
| | | | | | | | | | | | | | | | | | | | | | | | |
Distributions to Shareholders from: | | | | | | | | | | | | | | | | | | | | | | | | |
Net Investment Income | | | (4,070 | ) | | | (3,374 | ) | | | (3,294 | ) | | | (1,332 | ) | | | (35,832 | ) | | | (28,606 | ) |
Net Realized Gain on Investments | | | - | | | | - | | | | - | | | | - | | | | - | | | | - | |
| | | | | | | | | | | | | | | | | | | | | | | | |
Net Decrease in Net Assets Resulting from Distributions to Shareholders | | | (4,070 | ) | | | (3,374 | ) | | | (3,294 | ) | | | (1,332 | ) | | | (35,832 | ) | | | (28,606 | ) |
| | | | | | | | | | | | | | | | | | | | | | | | |
Capital Transactions: | | | | | | | | | | | | | | | | | | | | | | | | |
Shares Sold | | | 49,961 | | | | 44,750 | | | | 171,439 | | | | 39,973 | | | | 148,774 | | | | 116,615 | |
Reinvestment of Distributions Paid | | | 4,070 | | | | 3,374 | | | | 3,294 | | | | 1,332 | | | | 35,832 | | | | 28,606 | |
Shares Redeemed | | | (35,933 | ) | | | (36,616 | ) | | | (36,015 | ) | | | (4,799 | ) | | | (149,755 | ) | | | (139,658 | ) |
| | | | | | | | | | | | | | | | | | | | | | | | |
Net Increase (Decrease) in Net Assets Resulting from Capital Transactions | | | 18,098 | | | | 11,508 | | | | 138,718 | | | | 36,506 | | | | 34,851 | | | | 5,563 | |
| | | | | | | | | | | | | | | | | | | | | | | | |
Total Increase (Decrease) in Net Assets | | | 63,503 | | | | (31,589 | ) | | | 169,312 | | | | 26,245 | | | | 267,626 | | | | (158,523 | ) |
Net Assets | | | | | | | | | | | | | | | | | | | | | | | | |
Beginning of Period | | | 266,215 | | | | 297,804 | | | | 91,956 | | | | 65,711 | | | | 1,218,070 | | | | 1,376,593 | |
| | | | | | | | | | | | | | | | | | | | | | | | |
End of Period | | $ | 329,718 | | | $ | 266,215 | | | $ | 261,268 | | | $ | 91,956 | | | $ | 1,485,696 | | | $ | 1,218,070 | |
| | | | | | | | | | | | | | | | | | | | | | | | |
Undistributed Net Investment Income (Loss) | | $ | 5,268 | | | $ | 4,496 | | | $ | 420 | | | $ | 322 | | | $ | 35,439 | | | $ | 35,752 | |
| | | | | | | | | | | | | | | | | | | | | | | | |
Portfolio Share Transactions: | | | | | | | | | | | | | | | | | | | | | | | | |
Shares Sold | | | 44,799 | | | | 38,690 | | | | 232,466 | | | | 51,270 | | | | 93,644 | | | | 69,216 | |
Reinvestment of Distributions Paid | | | 3,700 | | | | 3,067 | | | | 4,000 | | | | 1,845 | | | | 22,200 | | | | 18,491 | |
Shares Redeemed | | | (31,918 | ) | | | (31,461 | ) | | | (49,434 | ) | | | (5,949 | ) | | | (91,135 | ) | | | (81,767 | ) |
| | | | | | | | | | | | | | | | | | | | | | | | |
Net Increase (Decrease) in Shares Resulting from Portfolio Share Transactions | | | 16,581 | | | | 10,296 | | | | 187,032 | | | | 47,166 | | | | 24,709 | | | | 5,940 | |
| | | | | | | | | | | | | | | | | | | | | | | | |
The Accompanying Notes are an Integral Part of the Financial Statements.
| | | | |
| 230 | | Statements of Changes in Net Assets | | |
| | | | | | | | | | | | | | | | | | | | | | | | | | | | | | |
Emerging Markets Equity
Portfolio | | | Money Market Portfolio | | | Short-Term Bond Portfolio | | | Select Bond Portfolio | |
For the Year
Ended
December 31, 2012 | | | For the Year
Ended
December 31, 2011 | | | For the Year
Ended
December 31, 2012 | | | For the Year
Ended
December 31, 2011 | | | For the Year
Ended
December 31, 2012 | | | For the Year
Ended
December 31, 2011 | | | For the Year
Ended
December 31, 2012 | | | For the Year
Ended
December 31, 2011 | |
| | | | | | | | | | | | | | | | | | | | | | | | | | | | | | | |
| | | | | | | | | | | | | | | | | | | | | | | | | | | | | | | |
| $ | 2,376 | | | $ | 1,669 | | | $ | 676 | | | $ | 643 | | | $ | 1,759 | | | $ | 2,649 | | | $ | 36,906 | | | $ | 44,219 | |
| | 981 | | | | 11,755 | | | | (3 | ) | | | 2 | | | | 1,668 | | | | (2,305 | ) | | | 37,965 | | | | 25,113 | |
|
30,260 |
| | | (40,913 | ) | | | - | | | | - | | | | (520 | ) | | | 500 | | | | 871 | | | | 30,184 | |
| | | | | | | | | | | | | | | | | | | | | | | | | | | | | | |
|
33,617 |
| | | (27,489 | ) | | | 673 | | | | 645 | | | | 2,907 | | | | 844 | | | | 75,742 | | | | 99,516 | |
| | | | | | | | | | | | | | | | | | | | | | | | | | | | | | |
| | | | | | | | | | | | | | | | | | | | | | | | | | | | | | | |
| | (309 | ) | | | (1,340 | ) | | | (676 | ) | | | (643 | ) | | | (1,769 | ) | | | (2,242 | ) | | | (43,260 | ) | | | (47,795 | ) |
| | (93 | ) | | | - | | | | - | | | | (2 | ) | | | - | | | | (251 | ) | | | (34,872 | ) | | | (28,703 | ) |
| | | | | | | | | | | | | | | | | | | | | | | | | | | | | | |
|
(402 |
) | | | (1,340 | ) | | | (676 | ) | | | (645 | ) | | | (1,769 | ) | | | (2,493 | ) | | | (78,132 | ) | | | (76,498 | ) |
| | | | | | | | | | | | | | | | | | | | | | | | | | | | | | |
| | | | | | | | | | | | | | | | | | | | | | | | | | | | | | | |
| | 94,004 | | | | 78,927 | | | | 261,916 | | | | 288,387 | | | | 53,918 | | | | 47,668 | | | | 272,418 | | | | 195,170 | |
| | 402 | | | | 1,340 | | | | 676 | | | | 645 | | | | 1,769 | | | | 2,492 | | | | 78,132 | | | | 76,498 | |
| | (17,981 | ) | | | (45,267 | ) | | | (275,715 | ) | | | (268,760 | ) | | | (77,505 | ) | | | (13,215 | ) | | | (148,297 | ) | | | (171,352 | ) |
| | | | | | | | | | | | | | | | | | | | | | | | | | | | | | |
|
76,425 |
| | | 35,000 | | | | (13,123 | ) | | | 20,272 | | | | (21,818 | ) | | | 36,945 | | | | 202,253 | | | | 100,316 | |
| | | | | | | | | | | | | | | | | | | | | | | | | | | | | | |
| | 109,640 | | | | 6,171 | | | | (13,126 | ) | | | 20,272 | | | | (20,680 | ) | | | 35,296 | | | | 199,863 | | | | 123,334 | |
| | | | | | | | | | | | | | | | | | | | | | | | | | | | | | | |
| | 146,836 | | | | 140,665 | | | | 496,563 | | | | 476,291 | | | | 165,716 | | | | 130,420 | | | | 1,485,430 | | | | 1,362,096 | |
| | | | | | | | | | | | | | | | | | | | | | | | | | | | | | |
| $ | 256,476 | | | $ | 146,836 | | | $ | 483,437 | | | $ | 496,563 | | | $ | 145,036 | | | $ | 165,716 | | | $ | 1,685,293 | | | $ | 1,485,430 | |
| | | | | | | | | | | | | | | | | | | | | | | | | | | | | | |
| $ | 2,343 | | | $ | 303 | | | $ | 415 | | | $ | 416 | | | $ | 273 | | | $ | 320 | | | $ | 38,848 | | | $ | 42,269 | |
| | | | | | | | | | | | | | | | | | | | | | | | | | | | | | |
| | | | | | | | | | | | | | | | | | | | | | | | | | | | | | | |
| | 95,524 | | | | 78,053 | | | | 261,916 | | | | 288,387 | | | | 52,333 | | | | 46,117 | | | | 206,880 | | | | 149,815 | |
| | 412 | | | | 1,471 | | | | 676 | | | | 645 | | | | 1,723 | | | | 2,447 | | | | 60,944 | | | | 59,439 | |
| | (18,224 | ) | | | (41,932 | ) | | | (275,715 | ) | | | (268,761 | ) | | | (75,475 | ) | | | (12,802 | ) | | | (112,464 | ) | | | (131,284 | ) |
| | | | | | | | | | | | | | | | | | | | | | | | | | | | | | |
|
77,712 |
| | | 37,592 | | | | (13,123 | ) | | | 20,271 | | | | (21,419 | ) | | | 35,762 | | | | 155,360 | | | | 77,970 | |
| | | | | | | | | | | | | | | | | | | | | | | | | | | | | | |
The Accompanying Notes are an Integral Part of the Financial Statements.
| | | | | | |
| | Statements of Changes in Net Assets | | | 231 | |
Statements of Changes in Net Assets
Northwestern Mutual Series Fund, Inc.
(Amounts in thousands)
| | | | | | | | | | | | | | | | | | | | | | | | |
| | | Long-Term U.S.
Government Bond Portfolio | | | Inflation Protection
Portfolio | | | High Yield Bond Portfolio | |
| | | For the Year Ended December 31, 2012 | | | For the Year Ended December 31, 2011 | | | For the Year Ended December 31, 2012 | | | For the Year Ended December 31, 2011 | | | For the Year Ended December 31, 2012 | | | For the Year Ended December 31, 2011 | |
Change in Net Assets | | | | | | | | | | | | | | | | | | | | | | | | |
Operations | | | | | | | | | | | | | | | | | | | | | | | | |
Net Investment Income (Loss) | | $ | 2,751 | | | $ | 2,676 | | | $ | 4,182 | | | $ | 5,266 | | | $ | 27,445 | | | $ | 26,127 | |
Net Realized Gain (Loss) on Investments | | | (1,208 | ) | | | 23,355 | | | | 5,864 | | | | 1,701 | | | | 175 | | | | 5,272 | |
Net Change in Unrealized Appreciation (Depreciation) of Investments | | | 2,785 | | | | 4,108 | | | | 4,726 | | | | 9,090 | | | | 26,650 | | | | (15,182 | ) |
| | | | | | | | | | | | | | | | | | | | | | | | |
Net Increase (Decrease) in Net Assets Resulting from Operations | | | 4,328 | | | | 30,139 | | | | 14,772 | | | | 16,057 | | | | 54,270 | | | | 16,217 | |
| | | | | | | | | | | | | | | | | | | | | | | | |
Distributions to Shareholders from: | | | | | | | | | | | | | | | | | | | | | | | | |
Net Investment Income | | | (2,108 | ) | | | (2,665 | ) | | | (5,598 | ) | | | (56 | ) | | | (26,613 | ) | | | (25,673 | ) |
Net Realized Gain on Investments | | | (8,201 | ) | | | (14,522 | ) | | | (2,258 | ) | | | (1,196 | ) | | | - | | | | - | |
| | | | | | | | | | | | | | | | | | | | | | | | |
Net Decrease in Net Assets Resulting from Distributions to Shareholders | | | (10,309 | ) | | | (17,187 | ) | | | (7,856 | ) | | | (1,252 | ) | | | (26,613 | ) | | | (25,673 | ) |
| | | | | | | | | | | | | | | | | | | | | | | | |
Capital Transactions: | | | | | | | | | | | | | | | | | | | | | | | | |
Shares Sold | | | 30,564 | | | | 32,894 | | | | 79,866 | | | | 62,606 | | | | 75,159 | | | | 54,418 | |
Reinvestment of Distributions Paid | | | 10,309 | | | | 17,187 | | | | 7,856 | | | | 1,251 | | | | 26,613 | | | | 25,673 | |
Shares Redeemed | | | (68,905 | ) | | | (19,264 | ) | | | (18,837 | ) | | | (16,365 | ) | | | (44,776 | ) | | | (37,895 | ) |
| | | | | | | | | | | | | | | | | | | | | | | | |
Net Increase (Decrease) in Net Assets Resulting from Capital Transactions | | | (28,032 | ) | | | 30,817 | | | | 68,885 | | | | 47,492 | | | | 56,996 | | | | 42,196 | |
| | | | | | | | | | | | | | | | | | | | | | | | |
Total Increase (Decrease) in Net Assets | | | (34,013 | ) | | | 43,769 | | | | 75,801 | | | | 62,297 | | | | 84,653 | | | | 32,740 | |
Net Assets | | | | | | | | | | | | | | | | | | | | | | | | |
Beginning of Period | | | 147,149 | | | | 103,380 | | | | 178,375 | | | | 116,078 | | | | 376,289 | | | | 343,549 | |
| | | | | | | | | | | | | | | | | | | | | | | | |
End of Period | | $ | 113,136 | | | $ | 147,149 | | | $ | 254,176 | | | $ | 178,375 | | | $ | 460,942 | | | $ | 376,289 | |
| | | | | | | | | | | | | | | | | | | | | | | | |
Undistributed Net Investment Income (Loss) | | $ | 23 | | | $ | 25 | | | $ | 2,822 | | | $ | 3,949 | | | $ | 27,546 | | | $ | 26,252 | |
| | | | | | | | | | | | | | | | | | | | | | | | |
Portfolio Share Transactions: | | | | | | | | | | | | | | | | | | | | | | | | |
Shares Sold | | | 26,837 | | | | 28,959 | | | | 65,953 | | | | 55,492 | | | | 101,975 | | | | 74,505 | |
Reinvestment of Distributions Paid | | | 9,468 | | | | 15,235 | | | | 6,652 | | | | 1,083 | | | | 37,168 | | | | 37,755 | |
Shares Redeemed | | | (60,368 | ) | | | (18,045 | ) | | | (15,520 | ) | | | (14,543 | ) | | | (60,648 | ) | | | (51,933 | ) |
| | | | | | | | | | | | | | | | | | | | | | | | |
Net Increase (Decrease) in Shares Resulting from Portfolio Share Transactions | | | (24,063 | ) | | | 26,149 | | | | 57,085 | | | | 42,032 | | | | 78,495 | | | | 60,327 | |
| | | | | | | | | | | | | | | | | | | | | | | | |
The Accompanying Notes are an Integral Part of the Financial Statements.
| | | | |
| 232 | | Statements of Changes in Net Assets | | |
| | | | | | | | | | | | | | | | | | | | | | |
Multi-Sector Bond Portfolio | | | Balanced Portfolio | | | Asset Allocation Portfolio | |
For the Year Ended December 31, 2012 | | | For the Year Ended December 31, 2011 | | | For the Year Ended December 31, 2012 | | | For the Year Ended December 31, 2011 | | | For the Year Ended December 31, 2012 | | | For the Year Ended December 31, 2011 | |
| | | | | | | | | | | | | | | | | | | | | | | |
| | | | | | | | | | | | | | | | | | | | | | | |
| $ | 12,395 | | | $ | 9,838 | | | $ | 49,144 | | | $ | 51,247 | | | $ | 4,364 | | | $ | 4,222 | |
| | 6,453 | | | | 5,347 | | | | 174,617 | | | | 46,909 | | | | 23,713 | | | | 3,043 | |
|
22,217 |
| | | (6,023 | ) | | | (16,547 | ) | | | (51,923 | ) | | | (3,529 | ) | | | (7,267 | ) |
| | | | | | | | | | | | | | | | | | | | | | |
|
41,065 |
| | | 9,162 | | | | 207,214 | | | | 46,233 | | | | 24,548 | | | | (2 | ) |
| | | | | | | | | | | | | | | | | | | | | | |
| | | | | | | | | | | | | | | | | | | | | | | |
| | (1,319 | ) | | | (11,659 | ) | | | (26,176 | ) | | | (62,036 | ) | | | (545 | ) | | | (5,767 | ) |
| | (1,141 | ) | | | (4,168 | ) | | | - | | | | - | | | | - | | | | - | |
| | | | | | | | | | | | | | | | | | | | | | |
|
(2,460 |
) | | | (15,827 | ) | | | (26,176 | ) | | | (62,036 | ) | | | (545 | ) | | | (5,767 | ) |
| | | | | | | | | | | | | | | | | | | | | | |
| | | | | | | | | | | | | | | | | | | | | | | |
| | 121,444 | | | | 87,414 | | | | 95,710 | | | | 106,877 | | | | 17,527 | | | | 19,192 | |
| | 2,460 | | | | 15,827 | | | | 26,176 | | | | 62,036 | | | | 545 | | | | 5,767 | |
| | (24,725 | ) | | | (44,157 | ) | | | (250,832 | ) | | | (260,072 | ) | | | (36,570 | ) | | | (37,099 | ) |
| | | | | | | | | | | | | | | | | | | | | | |
|
99,179 |
| | | 59,084 | | | | (128,946 | ) | | | (91,159 | ) | | | (18,498 | ) | | | (12,140 | ) |
| | | | | | | | | | | | | | | | | | | | | | |
| | 137,784 | | | | 52,419 | | | | 52,092 | | | | (106,962 | ) | | | 5,505 | | | | (17,909 | ) |
| | | | | | | | | | | | | | | | | | | | | | | |
| | 234,872 | | | | 182,453 | | | | 2,188,140 | | | | 2,295,102 | | | | 230,257 | | | | 248,166 | |
| | | | | | | | | | | | | | | | | | | | | | |
| $ | 372,656 | | | $ | 234,872 | | | $ | 2,240,232 | | | $ | 2,188,140 | | | $ | 235,762 | | | $ | 230,257 | |
| | | | | | | | | | | | | | | | | | | | | | |
| $ | 13,550 | | | $ | (90 | ) | | $ | 73,431 | | | $ | 10,277 | | | $ | 6,893 | | | $ | (1,315 | ) |
| | | | | | | | | | | | | | | | | | | | | | |
| | | | | | | | | | | | | | | | | | | | | | | |
| | 112,153 | | | | 83,111 | | | | 65,209 | | | | 75,439 | | | | 16,052 | | | | 18,232 | |
| | 2,258 | | | | 15,658 | | | | 17,818 | | | | 45,783 | | | | 494 | | | | 5,790 | |
| | (22,867 | ) | | | (42,560 | ) | | | (170,791 | ) | | | (184,722 | ) | | | (33,552 | ) | | | (35,293 | ) |
| | | | | | | | | | | | | | | | | | | | | | |
|
91,544 |
| | | 56,209 | | | | (87,764 | ) | | | (63,500 | ) | | | (17,006 | ) | | | (11,271 | ) |
| | | | | | | | | | | | | | | | | | | | | | |
The Accompanying Notes are an Integral Part of the Financial Statements.
| | | | | | |
| | Statements of Changes in Net Assets | | | 233 | |
Consolidated Statement of Changes in Net Assets
Northwestern Mutual Series Fund, Inc.
(Amounts in thousands)
| | | | | | | | |
| | | Commodities Return
Strategy Portfolio | |
| | | For the Year Ended December 31, 2012 | | | For the Period From Commencement of Operations to December 31, 2011 | |
Change in Net Assets | | | | | | | | |
Operations | | | | | | | | |
Net Investment Income (Loss) | | $ | (841 | ) | | $ | (370 | ) |
Net Realized Gain (Loss) on Investments | | | (3,110 | ) | | | (14,391 | ) |
Net Change in Unrealized Appreciation (Depreciation) of Investments | | | 375 | | | | (208 | ) |
| | | | | | | | |
Net Increase (Decrease) in Net Assets Resulting from Operations | | | (3,576 | ) | | | (14,969 | ) |
| | | | | | | | |
Distributions to Shareholders from: | | | | | | | | |
Net Investment Income | | | - | | | | - | |
Net Realized Gain on Investments | | | (3 | ) | | | (3 | ) |
| | | | | | | | |
Net Decrease in Net Assets Resulting from Distributions to Shareholders | | | (3 | ) | | | (3 | ) |
| | | | | | | | |
Capital Transactions: | | | | | | | | |
Shares Sold | | | 72,049 | | | | 107,401 | |
Reinvestment of Distributions Paid | | | 3 | | | | 3 | |
Shares Redeemed | | | (6,164 | ) | | | (1,533 | ) |
| | | | | | | | |
Net Increase (Decrease) in Net Assets Resulting from Capital Transactions | | | 65,888 | | | | 105,871 | |
| | | | | | | | |
Total Increase (Decrease) in Net Assets | | | 62,309 | | | | 90,899 | |
Net Assets | | | | | | | | |
Beginning of Period | | | 90,899 | | | | - | |
| | | | | | | | |
End of Period | | $ | 153,208 | | | $ | 90,899 | |
| | | | | | | | |
Undistributed Net Investment Income (Loss) | | $ | (101 | ) | | $ | 229 | |
| | | | | | | | |
Portfolio Share Transactions: | | | | | | | | |
Shares Sold | | | 89,364 | | | | 114,372 | |
Reinvestment of Distributions Paid | | | 4 | | | | 4 | |
Shares Redeemed | | | (7,647 | ) | | | (1,750 | ) |
| | | | | | | | |
Net Increase (Decrease) in Shares Resulting from Portfolio Share Transactions | | | 81,721 | | | | 112,626 | |
| | | | | | | | |
The Accompanying Notes are an Integral Part of the Financial Statements.
| | | | |
| 234 | | Consolidated Statement of Changes in Net Assets | | |
Statement of Cash Flows
Northwestern Mutual Series Fund, Inc.
For the Year Ended December 31, 2012 (in thousands)
| | | | |
| | | Long-Term U.S. Government Bond Portfolio | |
Cash Flows from Operating Activities | | | | |
Net Increase (Decrease) in Net Assets Resulting from Operations | | $ | 4,328 | |
Adjustments to Reconcile Net Increase (Decrease) in Net Assets Resulting from Operations to Net Cash from Operating Activities | | | | |
Purchase of Investment Securities | | | (205,155 | ) |
Proceeds from Disposition of Investment Securities | | | 244,424 | |
Proceeds from Disposition (Purchase) of Short-Term Investments, net | | | 40,668 | |
Proceeds from (Payments for) Closed Futures Contracts | | | 278 | |
Cash Paid for Terminated Options Written | | | (12 | ) |
Premiums Received for Options Written | | | 11 | |
Amortization (Accretion) of Premium/Discount, net | | | 326 | |
(Increase) Decrease in: | | | | |
Cash Collateral for Derivative Positions | | | 1,009 | |
Dividends and Interest Receivable | | | 335 | |
Payable for Investment Securities Purchased | | | (24,709 | ) |
Payable for Investment Advisory Fees | | | (12 | ) |
Accrued Expenses | | | 11 | |
Change in Net Unrealized (Appreciation) Depreciation of: | | | | |
Investment Securities | | | (2,838 | ) |
Futures Contracts | | | 53 | |
Net Realized (Gain) Loss from: | | | | |
Investment Securities | | | 1,512 | |
Futures Contracts | | | (305 | ) |
Options Written | | | 1 | |
Paydowns | | | (11 | ) |
| | | | |
Total Adjustments | | | 55,586 | |
| | | | |
Net Cash (Used in) Provided by Operating Activities | | | 59,914 | |
| | | | |
Cash Flows from Financing Activities | | | | |
Cash Received from (Used for) Treasury Roll Transactions, net | | | (21,878 | ) |
Proceeds from Capital Shares Sold | | | 30,787 | |
Payment on Capital Shares Redeemed | | | (68,786 | ) |
| | | | |
Net Cash (Used in) Provided by Financing Activities | | | (59,877 | ) |
| | | | |
Net Increase (Decrease) in Cash | | | 37 | |
Cash: Beginning of Period | | | - | |
| | | | |
Cash: End of Period | | $ | 37 | |
| | | | |
Supplemental disclosure of cash flow information:
Noncash financing activities not included herein consist of reinvestment of dividends and distributions of $ 10,309.
The Accompanying Notes are an Integral Part of the Financial Statements.
| | | | | | |
| | Statement of Cash Flows | | | 235 | |
Financial Highlights
(For a share outstanding throughout the period)
| | | | | | | | | | | | | | | | | | | | | | | | |
| | | Net Asset Value, Beginning of Period | | | Net Investment Income (Loss) | | | Net Realized and Unrealized Gain (Loss) on Investments | | | Total from Investment Operations | | | Distributions from Net Investment Income | | | Distributions from Realized Gains on Investments | |
Growth Stock Portfolio | |
2012 | | $ | 2.09 | | | $ | 0.02 | | | $ | 0.25 | | | $ | 0.27 | | | $ | (0.01 | ) | | $ | - | |
2011 | | | 2.13 | | | | 0.01 | | | | (0.03 | ) | | | (0.02 | ) | | | (0.02 | ) | | | - | |
2010 | | | 1.92 | | | | 0.02 | | | | 0.21 | | | | 0.23 | | | | (0.02 | ) | | | - | |
2009 | | | 1.41 | | | | 0.01 | | | | 0.52 | | | | 0.53 | | | | (0.02 | ) | | | - | |
2008 | | | 2.49 | | | | 0.02 | | | | (0.94 | ) | | | (0.92 | ) | | | (0.02 | ) | | | (0.14 | ) |
Focused Appreciation Portfolio | |
2012 | | $ | 1.75 | | | $ | 0.01 | | | $ | 0.34 | | | $ | 0.35 | | | $ | (0.01 | ) | | $ | - | |
2011 | | | 1.86 | | | | 0.01 | | | | (0.12 | ) | | | (0.11 | ) | | | 0.00 | (e) | | | - | |
2010 | | | 1.70 | | | | 0.00 | (e) | | | 0.16 | | | | 0.16 | | | | - | | | | - | |
2009 | | | 1.20 | | | | - | | | | 0.50 | | | | 0.50 | | | | - | | | | - | |
2008 | | | 2.05 | | | | - | | | | (0.80 | ) | | | (0.80 | ) | | | (0.01 | ) | | | (0.04 | ) |
Large Cap Core Stock Portfolio | |
2012 | | $ | 1.21 | | | $ | 0.02 | | | $ | 0.13 | | | $ | 0.15 | | | $ | (0.02 | ) | | $ | - | |
2011 | | | 1.24 | | | | 0.02 | | | | (0.04 | ) | | | (0.02 | ) | | | (0.01 | ) | | | - | |
2010 | | | 1.12 | | | | 0.01 | | | | 0.12 | | | | 0.13 | | | | (0.01 | ) | | | - | |
2009 | | | 0.88 | | | | 0.01 | | | | 0.25 | | | | 0.26 | | | | (0.02 | ) | | | - | |
2008 | | | 1.45 | | | | 0.02 | | | | (0.57 | ) | | | (0.55 | ) | | | (0.02 | ) | | | - | |
Large Cap Blend Portfolio | |
2012 | | $ | 0.76 | | | $ | 0.01 | | | $ | 0.10 | | | $ | 0.11 | | | $ | (0.01 | ) | | $ | (0.03 | ) |
2011 | | | 0.78 | | | | 0.01 | | | | (0.02 | ) | | | (0.01 | ) | | | (0.01 | ) | | | - | |
2010 | | | 0.69 | | | | 0.01 | | | | 0.09 | | | | 0.10 | | | | (0.01 | ) | | | - | |
2009 | | | 0.55 | | | | 0.01 | | | | 0.14 | | | | 0.15 | | | | (0.01 | ) | | | - | |
2008 | | | 0.93 | | | | 0.01 | | | | (0.38 | ) | | | (0.37 | ) | | | (0.01 | ) | | | - | |
Index 500 Stock Portfolio | |
2012 | | $ | 2.54 | | | $ | 0.06 | | | $ | 0.34 | | | $ | 0.40 | | | $ | (0.05 | ) | | $ | (0.05 | ) |
2011 | | | 2.60 | | | | 0.05 | | | | (0.01 | ) | | | 0.04 | | | | (0.04 | ) | | | (0.06 | ) |
2010 | | | 2.33 | | | | 0.04 | | | | 0.30 | | | | 0.34 | | | | (0.05 | ) | | | (0.02 | ) |
2009 | | | 1.95 | | | | 0.05 | | | | 0.45 | | | | 0.50 | | | | (0.06 | ) | | | (0.06 | ) |
2008 | | | 3.26 | | | | 0.06 | | | | (1.22 | ) | | | (1.16 | ) | | | (0.06 | ) | | | (0.09 | ) |
Large Company Value Portfolio | |
2012 | | $ | 0.73 | | | $ | 0.02 | | | $ | 0.11 | | | $ | 0.13 | | | $ | (0.02 | ) | | $ | - | |
2011 | | | 0.74 | | | | 0.01 | | | | (0.01 | ) | | | 0.00 | (e) | | | (0.01 | ) | | | - | |
2010 | | | 0.67 | | | | 0.01 | | | | 0.07 | | | | 0.08 | | | | (0.01 | ) | | | - | |
2009 | | | 0.57 | | | | 0.01 | | | | 0.10 | | | | 0.11 | | | | (0.01 | ) | | | - | |
2008 | | | 0.93 | | | | 0.02 | | | | (0.36 | ) | | | (0.34 | ) | | | (0.02 | ) | | | - | |
Domestic Equity Portfolio | |
2012 | | $ | 0.87 | | | $ | 0.02 | | | $ | 0.11 | | | $ | 0.13 | | | $ | (0.02 | ) | | $ | - | |
2011 | | | 0.89 | | | | 0.02 | | | | (0.02 | ) | | | 0.00 | (e) | | | (0.02 | ) | | | - | |
2010 | | | 0.79 | | | | 0.02 | | | | 0.10 | | | | 0.12 | | | | (0.02 | ) | | | - | |
2009 | | | 0.63 | | | | 0.02 | | | | 0.16 | | | | 0.18 | | | | (0.02 | ) | | | - | |
2008 | | | 1.15 | | | | 0.03 | | | | (0.44 | ) | | | (0.41 | ) | | | (0.03 | ) | | | (0.08 | ) |
Equity Income Portfolio | |
2012 | | $ | 1.16 | | | $ | 0.03 | | | $ | 0.17 | | | $ | 0.20 | | | $ | (0.02 | ) | | $ | - | |
2011 | | | 1.19 | | | | 0.02 | | | | (0.03 | ) | | | (0.01 | ) | | | (0.02 | ) | | | - | |
2010 | | | 1.05 | | | | 0.02 | | | | 0.14 | | | | 0.16 | | | | (0.02 | ) | | | - | |
2009 | | | 0.87 | | | | 0.02 | | | | 0.19 | | | | 0.21 | | | | (0.03 | ) | | | - | |
2008 | | | 1.38 | | | | 0.03 | | | | (0.51 | ) | | | (0.48 | ) | | | - | | | | (0.03 | ) |
| (e) | Amount is less than $0.005. |
The Accompanying Notes are an Integral Part of the Financial Statements.
| | | | | | | | | | | | | | | | | | | | | | | | | | | | | | |
Total Distributions | | | Net Asset Value, End of Period | | | Total Return(d) | | | Net Assets, End of Period (thousands) | | | Ratio of Gross Expenses to Average Net Assets | | | Ratio of Net Expenses to Average Net Assets | | | Ratio of Net Investment Income (Loss) to Average Net Assets | | | Portfolio Turnover Rate | |
| | | | | | | | | | | | | | | | | | | | | | | | | | | | | | | |
| $ | (0.01 | ) | | $ | 2.35 | | | | 12.94 | % | | $ | 533,815 | | | | 0.45 | % | | | 0.44 | % | | | 0.90 | % | | | 68.40 | % |
| | (0.02 | ) | | | 2.09 | | | | (1.30 | ) | | | 514,007 | | | | - | | | | 0.44 | | | | 0.65 | | | | 47.15 | |
| | (0.02 | ) | | | 2.13 | | | | 12.37 | | | | 556,872 | | | | - | | | | 0.44 | | | | 0.83 | | | | 48.90 | |
| | (0.02 | ) | | | 1.92 | | | | 37.17 | | | | 535,535 | | | | - | | | | 0.44 | | | | 0.92 | | | | 50.16 | |
| | (0.16 | ) | | | 1.41 | | | | (38.86 | ) | | | 413,801 | | | | - | | | | 0.43 | | | | 0.88 | | | | 38.18 | |
| | | | | | | | | | | | | | | | | | | | | | | | | | | | | | | |
| $ | (0.01 | ) | | $ | 2.09 | | | | 20.14 | % | | $ | 388,620 | | | | 0.79 | % | | | 0.74 | % | | | 0.71 | % | | | 15.65 | % |
| | 0.00 | (e) | | | 1.75 | | | | (6.10 | ) | | | 305,120 | | | | 0.79 | (p) | | | 0.74 | (p) | | | 0.32 | | | | 45.98 | |
| | - | | | | 1.86 | | | | 9.33 | | | | 311,197 | | | | 0.79 | (p) | | | 0.77 | (p) | | | 0.21 | | | | 40.65 | |
| | - | | | | 1.70 | | | | 42.47 | | | | 264,946 | | | | - | | | | 0.79 | | | | (0.14 | ) | | | 23.61 | |
| | (0.05 | ) | | | 1.20 | | | | (40.01 | ) | | | 171,551 | | | | - | | | | 0.78 | | | | (0.09 | ) | | | 67.79 | |
| | | | | | | | | | | | | | | | | | | | | | | | | | | | | | | |
| $ | (0.02 | ) | | $ | 1.34 | | | | 11.63 | % | | $ | 384,679 | | | | 0.46 | % | | | 0.46 | % | | | 1.43 | % | | | 74.09 | % |
| | (0.01 | ) | | | 1.21 | | | | (1.21 | ) | | | 377,069 | | | | - | | | | 0.45 | | | | 1.26 | | | | 51.46 | |
| | (0.01 | ) | | | 1.24 | | | | 12.91 | | | | 408,330 | | | | - | | | | 0.46 | | | | 1.21 | | | | 43.16 | |
| | (0.02 | ) | | | 1.12 | | | | 29.33 | | | | 379,809 | | | | - | | | | 0.46 | | | | 1.35 | | | | 42.82 | |
| | (0.02 | ) | | | 0.88 | | | | (38.74 | ) | | | 310,665 | | | | - | | | | 0.44 | | | | 1.35 | | | | 50.12 | |
| | | | | | | | | | | | | | | | | | | | | | | | | | | | | | | |
| $ | (0.04 | ) | | $ | 0.83 | | | | 15.20 | % | | $ | 78,700 | | | | 0.87 | % | | | 0.84 | % | | | 1.05 | % | | | 132.66 | % |
| | (0.01 | ) | | | 0.76 | | | | (2.29 | ) | | | 69,268 | | | | - | | | | 0.82 | | | | 0.82 | | | | 35.91 | |
| | (0.01 | ) | | | 0.78 | | | | 14.29 | | | | 63,777 | | | | - | | | | 0.84 | | | | 0.83 | | | | 34.89 | |
| | (0.01 | ) | | | 0.69 | | | | 27.40 | | | | 47,031 | | | | - | | | | 0.85 | | | | 1.33 | | | | 39.32 | |
| | (0.01 | ) | | | 0.55 | | | | (40.25 | ) | | | 29,382 | | | | 0.87 | | | | 0.85 | | | | 1.15 | | | | 59.53 | |
| | | | | | | | | | | | | | | | | | | | | | | | | | | | | | | |
| $ | (0.10 | ) | | $ | 2.84 | | | | 15.76 | % | | $ | 1,704,471 | | | | 0.22 | % | | | 0.21 | % | | | 2.12 | % | | | 2.77 | % |
| | (0.10 | ) | | | 2.54 | | | | 1.95 | | | | 1,569,801 | | | | - | | | | 0.21 | | | | 1.86 | | | | 3.21 | |
| | (0.07 | ) | | | 2.60 | | | | 14.89 | | | | 1,625,787 | | | | - | | | | 0.21 | | | | 1.84 | | | | 4.14 | |
| | (0.12 | ) | | | 2.33 | | | | 26.40 | | | | 1,478,052 | | | | - | | | | 0.20 | | | | 2.34 | | | | 5.70 | |
| | (0.15 | ) | | | 1.95 | | | | (36.94 | ) | | | 1,231,610 | | | | - | | | | 0.20 | | | | 2.13 | | | | 4.10 | |
| | | | | | | | | | | | | | | | | | | | | | | | | | | | | | | |
| $ | (0.02 | ) | | $ | 0.84 | | | | 16.47 | % | | $ | 86,915 | | | | 0.82 | % | | | 0.79 | % | | | 1.99 | % | | | 34.71 | % |
| | (0.01 | ) | | | 0.73 | | | | 1.49 | | | | 69,674 | | | | - | | | | 0.78 | | | | 1.84 | | | | 47.30 | |
| | (0.01 | ) | | | 0.74 | | | | 10.95 | | | | 61,011 | | | | - | | | | 0.80 | | | | 1.67 | | | | 29.84 | |
| | (0.01 | ) | | | 0.67 | | | | 20.70 | | | | 45,465 | | | | - | | | | 0.80 | | | | 2.11 | | | | 26.95 | |
| | (0.02 | ) | | | 0.57 | | | | (37.23 | ) | | | 28,570 | | | | 0.81 | | | | 0.80 | | | | 2.41 | | | | 26.04 | |
| | | | | | | | | | | | | | | | | | | | | | | | | | | | | | | |
| $ | (0.02 | ) | | $ | 0.98 | | | | 14.35 | % | | $ | 400,058 | | | | 0.58 | % | | | 0.58 | % | | | 2.23 | % | | | 134.18 | % |
| | (0.02 | ) | | | 0.87 | | | | 0.91 | | | | 385,811 | | | | - | | | | 0.57 | | | | 2.26 | | | | 40.73 | |
| | (0.02 | ) | | | 0.89 | | | | 14.62 | | | | 408,437 | | | | - | | | | 0.58 | | | | 2.29 | | | | 48.18 | |
| | (0.02 | ) | | | 0.79 | | | | 29.52 | | | | 361,647 | | | | - | | | | 0.59 | | | | 2.99 | | | | 67.19 | |
| | (0.11 | ) | | | 0.63 | | | | (38.49 | ) | | | 281,556 | | | | - | | | | 0.57 | | | | 2.89 | | | | 60.11 | |
| | | | | | | | | | | | | | | | | | | | | | | | | | | | | | | |
| $ | (0.02 | ) | | $ | 1.34 | | | | 17.23 | % | | $ | 409,097 | | | | 0.68 | % | | | 0.68 | % | | | 2.21 | % | | | 16.21 | % |
| | (0.02 | ) | | | 1.16 | | | | (0.92 | ) | | | 306,921 | | | | - | | | | 0.67 | | | | 2.05 | | | | 13.79 | |
| | (0.02 | ) | | | 1.19 | | | | 15.33 | | | | 259,307 | | | | - | | | | 0.67 | | | | 2.00 | | | | 11.14 | |
| | (0.03 | ) | | | 1.05 | | | | 24.58 | | | | 203,716 | | | | - | | | | 0.67 | | | | 2.27 | | | | 12.49 | |
| | (0.03 | ) | | | 0.87 | | | | (35.81 | ) | | | 151,641 | | | | - | | | | 0.67 | | | | 2.61 | | | | 28.82 | |
| (d) | Total Return includes deductions for management and other fund expenses; excludes deductions for sales loads and account fees, not annualized for periods less than one year. |
| (p) | For the Focused Appreciation Portfolio, expense ratios reflect total expenses before a management fee waiver effective August 12, 2010, (“Gross Expense Ratio”) and after such waiver (“Net Expense Ratio”). |
The Accompanying Notes are an Integral Part of the Financial Statements.
Financial Highlights
(For a share outstanding throughout the period)
| | | | | | | | | | | | | | | | | | | | | | | | |
| | | Net Asset Value,
Beginning of
Period | | | Net Investment Income (Loss) | | | Net Realized and Unrealized Gain (Loss) on Investments | | | Total from Investment Operations | | | Distributions from Net Investment Income | | | Distributions from Realized Gains on Investments | |
Mid Cap Growth Stock Portfolio | | | | | | | | | | | | | | | | | | | | | | | | |
2012 | | $ | 2.92 | | | $ | 0.01 | | | $ | 0.33 | | | $ | 0.34 | | | $ | 0.00 | (e) | | $ | - | |
2011 | | | 3.12 | | | | 0.00 | (e) | | | (0.19 | ) | | | (0.19 | ) | | | (0.01 | ) | | | - | |
2010 | | | 2.52 | | | | 0.01 | | | | 0.60 | | | | 0.61 | | | | (0.01 | ) | | | - | |
2009 | | | 1.92 | | | | - | | | | 0.61 | | | | 0.61 | | | | (0.01 | ) | | | - | |
2008 | | | 3.68 | | | | 0.01 | | | | (1.35 | ) | | | (1.34 | ) | | | (0.01 | ) | | | (0.41 | ) |
Index 400 Stock Portfolio | |
2012 | | $ | 1.34 | | | $ | 0.02 | | | $ | 0.21 | | | $ | 0.23 | | | $ | (0.01 | ) | | $ | (0.07 | ) |
2011 | | | 1.47 | | | | 0.01 | | | | (0.04 | ) | | | (0.03 | ) | | | (0.01 | ) | | | (0.09 | ) |
2010 | | | 1.18 | | | | 0.01 | | | | 0.30 | | | | 0.31 | | | | (0.01 | ) | | | (0.01 | ) |
2009 | | | 0.90 | | | | 0.01 | | | | 0.32 | | | | 0.33 | | | | (0.02 | ) | | | (0.03 | ) |
2008 | | | 1.60 | | | | 0.02 | | | | (0.55 | ) | | | (0.53 | ) | | | (0.02 | ) | | | (0.15 | ) |
Mid Cap Value Portfolio | |
2012 | | $ | 1.13 | | | $ | 0.03 | | | $ | 0.16 | | | $ | 0.19 | | | $ | (0.02 | ) | | $ | - | |
2011 | | | 1.16 | | | | 0.02 | | | | (0.03 | ) | | | (0.01 | ) | | | (0.02 | ) | | | - | |
2010 | | | 0.98 | | | | 0.02 | | | | 0.17 | | | | 0.19 | | | | (0.01 | ) | | | - | |
2009 | | | 0.81 | | | | 0.02 | | | | 0.17 | | | | 0.19 | | | | (0.01 | ) | | | (0.01 | ) |
2008 | | | 1.28 | | | | 0.01 | | | | (0.46 | ) | | | (0.45 | ) | | | - | | | | (0.02 | ) |
Small Cap Growth Stock Portfolio | |
2012 | | $ | 1.72 | | | $ | 0.00 | (e) | | $ | 0.16 | | | $ | 0.16 | | | $ | - | | | $ | - | |
2011 | | | 1.77 | | | | 0.00 | (e) | | | (0.04 | ) | | | (0.04 | ) | | | (0.01 | ) | | | - | |
2010 | | | 1.42 | | | | 0.00 | (e) | | | 0.36 | | | | 0.36 | | | | (0.01 | ) | | | - | |
2009 | | | 1.09 | | | | - | | | | 0.33 | | | | 0.33 | | | | - | | | | - | |
2008 | | | 2.37 | | | | - | | | | (0.92 | ) | | | (0.92 | ) | | | - | | | | (0.36 | ) |
Index 600 Stock Portfolio | |
2012 | | $ | 0.91 | | | $ | 0.01 | | | $ | 0.14 | | | $ | 0.15 | | | $ | (0.03 | ) | | $ | (0.02 | ) |
2011 | | | 0.94 | | | | 0.01 | | | | (0.01 | ) | | | 0.00 | (e) | | | (0.01 | ) | | | (0.02 | ) |
2010 | | | 0.77 | | | | 0.01 | | | | 0.19 | | | | 0.20 | | | | (0.03 | ) | | | - | |
2009 | | | 0.64 | | | | 0.01 | | | | 0.15 | | | | 0.16 | | | | (0.03 | ) | | | (0.01 | ) |
2008 | | | 0.93 | | | | 0.01 | | | | (0.29 | ) | | | (0.28 | ) | | | - | | | | (0.01 | ) |
Small Cap Value Portfolio | |
2012 | | $ | 1.65 | | | $ | 0.03 | | | $ | 0.24 | | | $ | 0.27 | | | $ | (0.01 | ) | | $ | (0.02 | ) |
2011 | | | 1.69 | | | | 0.01 | | | | (0.04 | ) | | | (0.03 | ) | | | (0.01 | ) | | | - | |
2010 | | | 1.40 | | | | 0.01 | | | | 0.30 | | | | 0.31 | | | | (0.02 | ) | | | - | |
2009 | | | 1.14 | | | | 0.01 | | | | 0.30 | | | | 0.31 | | | | (0.01 | ) | | | (0.04 | ) |
2008 | | | 1.72 | | | | 0.01 | | | | (0.45 | ) | | | (0.44 | ) | | | (0.01 | ) | | | (0.13 | ) |
International Growth Portfolio | |
2012 | | $ | 1.04 | | | $ | 0.02 | | | $ | 0.17 | | | $ | 0.19 | | | $ | (0.02 | ) | | $ | - | |
2011 | | | 1.21 | | | | 0.02 | | | | (0.18 | ) | | | (0.16 | ) | | | (0.01 | ) | | | - | |
2010 | | | 1.05 | | | | 0.02 | | | | 0.15 | | | | 0.17 | | | | (0.01 | ) | | | - | |
2009 | | | 0.86 | | | | 0.02 | | | | 0.18 | | | | 0.20 | | | | (0.01 | ) | | | - | |
2008 | | | 1.82 | | | | 0.03 | | | | (0.80 | ) | | | (0.77 | ) | | | (0.02 | ) | | | (0.17 | ) |
Research International Core Portfolio | |
2012 | | $ | 0.72 | | | $ | 0.01 | | | $ | 0.11 | | | $ | 0.12 | | | $ | (0.01 | ) | | $ | - | |
2011 | | | 0.82 | | | | 0.01 | | | | (0.10 | ) | | | (0.09 | ) | | | (0.01 | ) | | | - | |
2010 | | | 0.75 | | | | 0.01 | | | | 0.07 | | | | 0.08 | | | | (0.01 | ) | | | - | |
2009 | | | 0.58 | | | | 0.01 | | | | 0.17 | | | | 0.18 | | | | (0.01 | ) | | | - | |
2008 | | | 1.04 | | | | 0.02 | | | | (0.46 | ) | | | (0.44 | ) | | | (0.01 | ) | | | (0.01 | ) |
| (e) | Amount is less than $0.005. |
The Accompanying Notes are an Integral Part of the Financial Statements.
| | | | | | | | | | | | | | | | | | | | | | | | | | | | | | |
Total Distributions | | | Net Asset Value, End of Period | | | Total Return(d) | | | Net Assets, End of Period (thousands) | | | Ratio of Gross Expenses to Average Net Assets | | | Ratio of Net Expenses to Average Net Assets | | | Ratio of Net Investment Income (Loss) to Average Net Assets | | | Portfolio Turnover Rate | |
| | | | | | | | | | | | | | | | | | | | | | | | | | | | | | | |
| $ | 0.00 | (e) | | $ | 3.26 | | | | 11.97 | % | | $ | 828,953 | | | | 0.54 | % | | | 0.52 | % | | | 0.39 | % | | | 63.30 | % |
| | (0.01 | ) | | | 2.92 | | | | (6.18 | ) | | | 812,782 | | | | - | | | | 0.53 | | | | 0.12 | | | | 50.26 | |
| | (0.01 | ) | | | 3.12 | | | | 23.86 | | | | 941,928 | | | | - | | | | 0.54 | | | | 0.33 | | | | 41.04 | |
| | (0.01 | ) | | | 2.52 | | | | 32.09 | (o) | | | 831,412 | | | | - | | | | 0.54 | | | | 0.23 | | | | 39.73 | |
| | (0.42 | ) | | | 1.92 | | | | (40.08 | ) | | | 695,626 | | | | - | | | | 0.53 | | | | 0.20 | | | | 43.67 | |
| | | | | | | | | | | | | | | | | | | | | | | | | | | | | | | |
| $ | (0.08 | ) | | $ | 1.49 | | | | 17.64 | % | | $ | 479,041 | | | | 0.28 | % | | | 0.28 | % | | | 1.27 | % | | | 10.91 | % |
| | (0.10 | ) | | | 1.34 | | | | (1.92 | ) | | | 439,395 | | | | - | | | | 0.27 | | | | 1.04 | | | | 13.15 | |
| | (0.02 | ) | | | 1.47 | | | | 26.29 | | | | 471,012 | | | | - | | | | 0.27 | | | | 1.10 | | | | 9.93 | |
| | (0.05 | ) | | | 1.18 | | | | 37.00 | | | | 400,128 | | | | - | | | | 0.26 | | | | 1.35 | | | | 13.40 | |
| | (0.17 | ) | | | 0.90 | | | | (36.28 | ) | | | 319,515 | | | | - | | | | 0.26 | | | | 1.50 | | | | 15.94 | |
| | | | | | | | | | | | | | | | | | | | | | | | | | | | | | | |
| $ | (0.02 | ) | | $ | 1.30 | | | | 16.57 | % | | $ | 163,223 | | | | 0.93 | % | | | 0.93 | % | | | 2.14 | % | | | 75.97 | % |
| | (0.02 | ) | | | 1.13 | | | | (0.61 | ) | | | 124,257 | | | | - | | | | 0.91 | | | | 1.66 | | | | 100.60 | |
| | (0.01 | ) | | | 1.16 | | | | 19.93 | | | | 118,130 | | | | - | | | | 0.92 | | | | 2.35 | | | | 121.65 | |
| | (0.02 | ) | | | 0.98 | | | | 23.24 | | | | 94,985 | | | | - | | | | 0.94 | | | | 1.91 | | | | 207.63 | |
| | (0.02 | ) | | | 0.81 | | | | (35.07 | ) | | | 74,681 | | | | - | | | | 0.89 | | | | 1.01 | | | | 50.78 | |
| | | | | | | | | | | | | | | | | | | | | | | | | | | | | | | |
| $ | - | | | $ | 1.88 | | | | 9.48 | % | | $ | 376,226 | | | | 0.59 | % | | | 0.59 | % | | | (0.12 | )% | | | 76.49 | % |
| | (0.01 | ) | | | 1.72 | | | | (2.78 | ) | | | 379,359 | | | | - | | | | 0.57 | | | | (0.20 | ) | | | 75.67 | |
| | (0.01 | ) | | | 1.77 | | | | 25.85 | | | | 418,965 | | | | - | | | | 0.59 | | | | 0.03 | | | | 74.54 | |
| | - | | | | 1.42 | | | | 31.17 | | | | 350,161 | | | | - | | | | 0.59 | | | | 0.15 | | | | 111.08 | |
| | (0.36 | ) | | | 1.09 | | | | (43.87 | ) | | | 284,621 | | | | - | | | | 0.57 | | | | 0.01 | | | | 146.28 | |
| | | | | | | | | | | | | | | | | | | | | | | | | | | | | | | |
| $ | (0.05 | ) | | $ | 1.01 | | | | 15.80 | % | | $ | 73,722 | | | | 0.42 | % | | | 0.35 | % | | | 1.36 | % | | | 38.47 | % |
| | (0.03 | ) | | | 0.91 | | | | 0.90 | | | | 54,012 | | | | 0.37 | | | | 0.35 | | | | 0.72 | | | | 52.75 | |
| | (0.03 | ) | | | 0.94 | | | | 25.90 | | | | 45,991 | | | | 0.42 | | | | 0.35 | | | | 0.88 | | | | 46.88 | |
| | (0.03 | ) | | | 0.77 | | | | 25.17 | | | | 30,716 | | | | 0.45 | | | | 0.35 | | | | 0.78 | | | | 51.96 | |
| | (0.01 | ) | | | 0.64 | | | | (31.30 | ) | | | 21,174 | | | | 0.55 | | | | 0.35 | | | | 1.38 | | | | 71.09 | |
| | | | | | | | | | | | | | | | | | | | | | | | | | | | | | | |
| $ | (0.03 | ) | | $ | 1.89 | | | | 16.33 | % | | $ | 409,648 | | | | 0.88 | % | | | 0.88 | % | | | 1.54 | % | | | 5.82 | % |
| | (0.01 | ) | | | 1.65 | | | | (1.36 | ) | | | 362,566 | | | | - | | | | 0.87 | | | | 0.63 | | | | 7.25 | |
| | (0.02 | ) | | | 1.69 | | | | 21.95 | | | | 374,259 | | | | - | | | | 0.87 | | | | 0.85 | | | | 11.51 | |
| | (0.05 | ) | | | 1.40 | | | | 28.18 | | | | 308,928 | | | | - | | | | 0.86 | | | | 0.76 | | | | 21.11 | |
| | (0.14 | ) | | | 1.14 | | | | (28.13 | ) | | | 240,817 | | | | - | | | | 0.87 | | | | 0.87 | | | | 22.94 | |
| | | | | | | | | | | | | | | | | | | | | | | | | | | | | | | |
| $ | (0.02 | ) | | $ | 1.21 | | | | 17.99 | % | | $ | 329,718 | | | | 0.80 | % | | | 0.80 | % | | | 1.92 | % | | | 65.36 | % |
| | (0.01 | ) | | | 1.04 | | | | (13.17 | ) | | | 266,215 | | | | - | | | | 0.78 | | | | 1.50 | | | | 82.02 | |
| | (0.01 | ) | | | 1.21 | | | | 16.43 | | | | 297,804 | | | | 0.81 | (q) | | | 0.69 | (q) | | | 1.40 | | | | 150.91 | |
| | (0.01 | ) | | | 1.05 | | | | 23.16 | | | | 246,868 | | | | - | | | | 0.85 | | | | 1.95 | | | | 218.24 | |
| | (0.19 | ) | | | 0.86 | | | | (46.19 | ) | | | 197,383 | | | | 0.80 | | | | 0.79 | | | | 1.96 | | | | 134.71 | |
| | | | | | | | | | | | | | | | | | | | | | | | | | | | | | | |
| $ | (0.01 | ) | | $ | 0.83 | | | | 16.76 | % | | $ | 261,268 | | | | 1.11 | % | | | 1.11 | % | | | 1.83 | % | | | 42.10 | % |
| | (0.01 | ) | | | 0.72 | | | | (10.48 | ) | | | 91,956 | | | | 1.37 | | | | 1.15 | | | | 1.79 | | | | 34.10 | |
| | (0.01 | ) | | | 0.82 | | | | 11.05 | | | | 65,711 | | | | 1.38 | | | | 1.15 | | | | 1.54 | | | | 47.90 | |
| | (0.01 | ) | | | 0.75 | | | | 30.82 | | | | 51,345 | | | | 1.69 | | | | 1.15 | | | | 1.94 | | | | 64.57 | |
| | (0.02 | ) | | | 0.58 | | | | (42.54 | ) | | | 33,435 | | | | 1.69 | | | | 1.15 | | | | 2.27 | | | | 77.80 | |
| (d) | Total Return includes deductions for management and other fund expenses; excludes deductions for sales loads and account fees, not annualized for periods less than one year. |
| (o) | Total return reflects the effect of a one-time class action settlement received on June 18, 2009. Absent the payment, returns would have been lower. |
| (q) | For the International Growth Portfolio, expense ratios reflect total expenses before a management fee waiver effective from October 1, 2010, through December 31, 2010, (“Gross Expense Ratio”) and after such waiver (“Net Expense Ratio”). |
The Accompanying Notes are an Integral Part of the Financial Statements.
Financial Highlights
(For a share outstanding throughout the period)
| | | | | | | | | | | | | | | | | | | | | | | | |
| | Net Asset Value,
Beginning of
Period | | | Net Investment Income (Loss) | | | Net Realized and Unrealized Gain (Loss) on Investments | | | Total from
Investment
Operations | | | Distributions
from Net
Investment
Income | | | Distributions
from Realized Gains on Investments | |
International Equity Portfolio | |
2012 | | $ | 1.52 | | | $ | 0.04 | | | $ | 0.27 | | | $ | 0.31 | | | $ | (0.04 | ) | | $ | - | |
2011 | | | 1.73 | | | | 0.05 | | | | (0.22 | ) | | | (0.17 | ) | | | (0.04 | ) | | | - | |
2010 | | | 1.65 | | | | 0.04 | | | | 0.09 | | | | 0.13 | | | | (0.05 | ) | | | - | |
2009 | | | 1.32 | | | | 0.04 | | | | 0.39 | | | | 0.43 | | | | (0.07 | ) | | | (0.03 | ) |
2008 | | | 2.67 | | | | 0.07 | | | | (1.16 | ) | | | (1.09 | ) | | | (0.05 | ) | | | (0.21 | ) |
Emerging Markets Equity Portfolio | |
2012 | | $ | 0.89 | | | $ | 0.01 | | | $ | 0.16 | | | $ | 0.17 | | | $ | 0.00 | (e) | | $ | 0.00 | (e) |
2011 | | | 1.11 | | | | 0.01 | | | | (0.22 | ) | | | (0.21 | ) | | | (0.01 | ) | | | - | |
2010 | | | 0.90 | | | | 0.01 | | | | 0.21 | | | | 0.22 | | | | (0.01 | ) | | | - | |
2009 | | | 0.53 | | | | 0.01 | | | | 0.37 | | | | 0.38 | | | | (0.01 | ) | | | - | |
2008 | | | 1.24 | | | | 0.02 | | | | (0.71 | ) | | | (0.69 | ) | | | (0.02 | ) | | | - | |
Money Market Portfolio | |
2012 | | $ | 1.00 | | | $ | 0.00 | (e) | | $ | 0.00 | (e) | | $ | 0.00 | (e) | | $ | 0.00 | (e) | | $ | - | |
2011 | | | 1.00 | | | | 0.00 | (e) | | | - | | | | 0.00 | (e) | | | 0.00 | (e) | | | 0.00 | (e) |
2010 | | | 1.00 | | | | 0.00 | (e) | | | - | | | | 0.00 | (e) | | | 0.00 | (e) | | | 0.00 | (e) |
2009 | | | 1.00 | | | | 0.01 | | | | - | | | | 0.01 | | | | (0.01 | ) | | | - | |
2008 | | | 1.00 | | | | 0.03 | | | | - | | | | 0.03 | | | | (0.03 | ) | | | - | |
Short-Term Bond Portfolio | |
2012 | | $ | 1.02 | | | $ | 0.01 | | | $ | 0.01 | | | $ | 0.02 | | | $ | (0.01 | ) | | $ | - | |
2011 | | | 1.03 | | | | 0.02 | | | | (0.01 | ) | | | 0.01 | | | | (0.02 | ) | | | 0.00 | (e) |
2010 | | | 1.02 | | | | 0.03 | | | | 0.02 | | | | 0.05 | | | | (0.03 | ) | | | (0.01 | ) |
2009 | | | 0.99 | | | | 0.04 | | | | 0.02 | | | | 0.06 | | | | (0.03 | ) | | | - | |
2008 | | | 1.00 | | | | 0.04 | | | | (0.01 | ) | | | 0.03 | | | | (0.04 | ) | | | - | |
Select Bond Portfolio | |
2012 | | $ | 1.31 | | | $ | 0.03 | | | $ | 0.03 | | | $ | 0.06 | | | $ | (0.04 | ) | | $ | (0.03 | ) |
2011 | | | 1.29 | | | | 0.04 | | | | 0.05 | | | | 0.09 | | | | (0.04 | ) | | | (0.03 | ) |
2010 | | | 1.26 | | | | 0.05 | | | | 0.03 | | | | 0.08 | | | | (0.05 | ) | | | 0.00 | (e) |
2009 | | | 1.21 | | | | 0.06 | | | | 0.05 | | | | 0.11 | | | | (0.06 | ) | | | - | |
2008 | | | 1.23 | | | | 0.06 | | | | (0.02 | ) | | | 0.04 | | | | (0.06 | ) | | | - | |
Long-Term U.S. Government Bond Portfolio | |
2012 | | $ | 1.13 | | | $ | 0.03 | | | $ | 0.02 | | | $ | 0.05 | | | $ | (0.02 | ) | | $ | (0.09 | ) |
2011 | | | 1.00 | | | | 0.03 | | | | 0.25 | | | | 0.28 | | | | (0.02 | ) | | | (0.13 | ) |
2010 | | | 1.00 | | | | 0.03 | | | | 0.08 | | | | 0.11 | | | | (0.05 | ) | | | (0.06 | ) |
2009 | | | 1.22 | | | | 0.03 | | | | (0.11 | ) | | | (0.08 | ) | | | - | | | | (0.14 | ) |
2008 | | | 1.04 | | | | 0.03 | | | | 0.19 | | | | 0.22 | | | | (0.02 | ) | | | (0.02 | ) |
Inflation Protection Portfolio | |
2012 | | $ | 1.18 | | | $ | 0.02 | | | $ | 0.06 | | | $ | 0.08 | | | $ | (0.03 | ) | | $ | (0.01 | ) |
2011 | | | 1.06 | | | | 0.04 | | | | 0.09 | | | | 0.13 | | | | 0.00 | (e) | | | (0.01 | ) |
2010 | | | 1.06 | | | | 0.03 | | | | 0.03 | | | | 0.06 | | | | (0.04 | ) | | | (0.02 | ) |
2009 | | | 0.99 | | | | 0.02 | | | | 0.07 | | | | 0.09 | | | | (0.02 | ) | | | - | |
2008 | | | 1.04 | | | | 0.05 | | | | (0.06 | ) | | | (0.01 | ) | | | (0.04 | ) | | | - | |
| (e) | Amount is less than $0.005. |
The Accompanying Notes are an Integral Part of the Financial Statements.
| | | | | | | | | | | | | | | | | | | | | | | | | | | | | | |
Total Distributions | | | Net Asset Value,
End of Period | | | Total Return(d) | | | Net Assets, End of Period (thousands) | | | Ratio of Gross Expenses to Average Net Assets | | | Ratio of Net
Expenses to
Average Net
Assets | | | Ratio of Net
Investment
Income (Loss) to Average Net Assets | | | Portfolio
Turnover Rate | |
| | | | | | | | | | | | | | | | | | | | | | | | | | | | | | |
| $ | (0.04 | ) | | $ | 1.79 | | | | 21.52 | % | | $ | 1,485,696 | | | | 0.73 | % | | | 0.68 | % | | | 2.55 | % | | | 41.34 | % |
| | (0.04 | ) | | | 1.52 | | | | (10.10 | ) | | | 1,218,070 | | | | 0.72 | (f) | | | 0.67 | (f) | | | 2.75 | | | | 32.06 | |
| | (0.05 | ) | | | 1.73 | | | | 7.67 | | | | 1,376,593 | | | | 0.72 | (f) | | | 0.67 | (f) | | | 2.33 | | | | 28.57 | |
| | (0.10 | ) | | | 1.65 | | | | 33.11 | (o) | | | 1,289,943 | | | | 0.72 | (f) | | | 0.66 | (f) | | | 2.79 | | | | 10.85 | |
| | (0.26 | ) | | | 1.32 | | | | (43.78 | ) | | | 1,009,367 | | | | 0.71 | (f) | | | 0.65 | (f) | | | 3.26 | | | | 2.98 | |
| | | | | | | | | | | | | | | | | | | | | | | | | | | | | | |
| $ | 0.00 | (e) | | $ | 1.06 | | | | 18.83 | % | | $ | 256,476 | | | | 1.49 | % | | | 1.48 | % | | | 1.17 | % | | | 27.32 | % |
| | (0.01 | ) | | | 0.89 | | | | (18.66 | ) | | | 146,836 | | | | 1.59 | | | | 1.50 | | | | 1.21 | | | | 45.56 | |
| | (0.01 | ) | | | 1.11 | | | | 24.08 | | | | 140,665 | | | | 1.57 | | | | 1.50 | | | | 0.98 | | | | 51.60 | |
| | (0.01 | ) | | | 0.90 | | | | 69.73 | | | | 113,931 | | | | 1.62 | | | | 1.50 | | | | 1.37 | | | | 66.35 | |
| | (0.02 | ) | | | 0.53 | | | | (55.22 | ) | | | 52,386 | | | | 1.79 | | | | 1.50 | | | | 2.10 | | | | 109.36 | |
| | | | | | | | | | | | | | | | | | | | | | | | | | | | | | |
| $ | 0.00 | (e) | | $ | 1.00 | | | | 0.15 | % | | $ | 483,437 | | | | 0.32 | %(l) | | | 0.09 | %(l) | | | 0.15 | % | | | - | % |
| | 0.00 | (e) | | | 1.00 | | | | 0.14 | | | | 496,563 | | | | 0.30 | (l) | | | 0.08 | (l) | | | 0.13 | | | | - | |
| | 0.00 | (e) | | | 1.00 | | | | 0.29 | | | | 476,291 | | | | 0.30 | (l) | | | 0.00 | (e),(l) | | | 0.29 | | | | - | |
| | (0.01 | ) | | | 1.00 | | | | 0.76 | (o) | | | 570,855 | | | | 0.34 | (l),(m) | | | 0.04 | (l),(m) | | | 0.62 | | | | - | |
| | (0.03 | ) | | | 1.00 | | | | 2.76 | | | | 622,620 | | | | 0.32 | (l),(m) | | | 0.32 | (l),(m) | | | 2.66 | | | | - | |
| | | | | | | | | | | | | | | | | | | | | | | | | | | | | | |
| $ | (0.01 | ) | | $ | 1.03 | | | | 2.07 | % | | $ | 145,036 | | | | 0.41 | % | | | 0.40 | % | | | 1.18 | % | | | 267.65 | % |
| | (0.02 | ) | | | 1.02 | | | | 0.55 | | | | 165,716 | | | | - | | | | 0.38 | | | | 1.79 | | | | 116.64 | |
| | (0.04 | ) | | | 1.03 | | | | 3.63 | | | | 130,420 | | | | - | | | | 0.39 | | | | 2.48 | | | | 115.08 | |
| | (0.03 | ) | | | 1.02 | | | | 7.22 | | | | 96,710 | | | | - | | | | 0.39 | | | | 3.54 | | | | 65.56 | |
| | (0.04 | ) | | | 0.99 | | | | 2.71 | | | | 69,797 | | | | - | | | | 0.40 | | | | 4.29 | | | | 74.86 | (g) |
| | | | | | | | | | | | | | | | | | | | | | | | | | | | | | |
| $ | (0.07 | ) | | $ | 1.30 | | | | 4.96 | % | | $ | 1,685,293 | | | | 0.32 | % | | | 0.31 | % | | | 2.32 | % | | | 130.37 | %(g) |
| | (0.07 | ) | | | 1.31 | | | | 7.16 | | | | 1,485,430 | | | | - | | | | 0.30 | | | | 3.10 | | | | 139.34 | (g) |
| | (0.05 | ) | | | 1.29 | | | | 6.59 | | | | 1,362,096 | | | | - | | | | 0.30 | | | | 3.51 | | | | 112.85 | (g) |
| | (0.06 | ) | | | 1.26 | | | | 9.37 | | | | 1,200,071 | | | | - | | | | 0.30 | | | | 4.42 | | | | 66.49 | (g) |
| | (0.06 | ) | | | 1.21 | | | | 3.26 | | | | 1,088,647 | | | | - | | | | 0.30 | | | | 5.06 | | | | 85.39 | (g) |
| | | | | | | | | | | | | | | | | | | | | | | | | | | | | | |
| $ | (0.11 | ) | | $ | 1.07 | | | | 3.75 | % | | $ | 113,136 | | | | 0.66 | %(s) | | | 0.65 | %(s) | | | 2.35 | % | | | 164.63 | %(g) (t) |
| | (0.15 | ) | | | 1.13 | | | | 28.92 | | | | 147,149 | | | | - | | | | 0.59 | | | | 2.32 | | | | 665.73 | (g) |
| | (0.11 | ) | | | 1.00 | | | | 10.62 | | | | 103,380 | | | | - | | | | 0.60 | | | | 2.76 | | | | 525.61 | (g) |
| | (0.14 | ) | | | 1.00 | | | | (6.98 | ) | | | 82,888 | | | | - | | | | 0.60 | | | | 2.75 | | | | 589.06 | (g) |
| | (0.04 | ) | | | 1.22 | | | | 20.76 | | | | 90,206 | | | | - | | | | 0.62 | | | | 2.51 | | | | 272.80 | (g) |
| | | | | | | | | | | | | | | | | | | | | | | | | | | | | | |
| $ | (0.04 | ) | | $ | 1.22 | | | | 7.35 | % | | $ | 254,176 | | | | 0.63 | % | | | 0.62 | % | | | 1.92 | % | | | 77.11 | % |
| | (0.01 | ) | | | 1.18 | | | | 11.93 | | | | 178,375 | | | | - | | | | 0.61 | | | | 3.74 | | | | 52.72 | |
| | (0.06 | ) | | | 1.06 | | | | 5.60 | | | | 116,078 | | | | - | | | | 0.61 | | | | 2.43 | | | | 68.09 | |
| | (0.02 | ) | | | 1.06 | | | | 9.98 | | | | 105,670 | | | | - | | | | 0.61 | | | | 2.35 | | | | 63.47 | |
| | (0.04 | ) | | | 0.99 | | | | (1.38 | ) | | | 69,140 | | | | - | | | | 0.62 | | | | 4.34 | | | | 48.63 | (g) |
| (d) | Total Return includes deductions for management and other fund expenses; excludes deductions for sales loads and account fees, not annualized for periods less than one year. |
| (f) | For the International Equity Portfolio, expense ratios reflect total expenses before a management fee waiver in effect from November 15, 2006, (“Gross Expense Ratio”) and after such waiver (“Net Expense Ratio”). |
| (g) | Portfolio Turnover Rate excludes the impact of mortgage dollar roll transactions. |
| (l) | For the Money Market Portfolio, expense ratios reflect total expenses before a management fee waiver in effect December 31, 2008, (“Gross Expense Ratio”) and after such waiver (“Net Expense Ratio”). |
| (m) | Reflects fee paid by the Portfolio to participate in the U.S. Department of Treasury’s Temporary Guarantee Program for Money Market Funds. |
| (o) | Total return reflects the effect of a one-time class action settlement received on June 18, 2009. Absent the payment, returns would have been lower. |
| (s) | The ratios of gross expenses to average net assets and net expenses to average net assets include interest expense. Excluding interest expense, the ratios would be 0.63% and 0.62% respectively. |
| (t) | Due to a change in accounting standards effective for 2012, certain treasury roll transactions which were previously accounted for as a sale and subsequent repurchase are now accounted for as a secured borrowing. Had the change in standards not occurred, the portfolio turnover rate would have been 504.73%. |
The Accompanying Notes are an Integral Part of the Financial Statements.
Financial Highlights
(For a share outstanding throughout the period)
| | | | | | | | | | | | | | | | | | | | | | | | |
| | | Net Asset Value, Beginning of Period | | | Net Investment Income (Loss) | | | Net Realized and Unrealized Gain (Loss) on Investments | | | Total from Investment Operations | | | Distributions from Net Investment Income | | | Distributions from Realized Gains on Investments | |
High Yield Bond Portfolio | |
2012 | | $ | 0.70 | | | $ | 0.05 | | | $ | 0.05 | | | $ | 0.10 | | | $ | (0.05 | ) | | $ | - | |
2011 | | | 0.72 | | | | 0.05 | | | | (0.02 | ) | | | 0.03 | | | | (0.05 | ) | | | - | |
2010 | | | 0.68 | | | | 0.06 | | | | 0.03 | | | | 0.09 | | | | (0.05 | ) | | | - | |
2009 | | | 0.51 | | | | 0.05 | | | | 0.18 | | | | 0.23 | | | | (0.06 | ) | | | - | |
2008 | | | 0.70 | | | | 0.05 | | | | (0.19 | ) | | | (0.14 | ) | | | (0.05 | ) | | | - | |
Multi-Sector Bond Portfolio | |
2012 | | $ | 1.00 | | | $ | 0.04 | | | $ | 0.11 | | | $ | 0.15 | | | $ | (0.01 | ) | | $ | 0.00 | (e) |
2011 | | | 1.03 | | | | 0.05 | | | | (0.01 | ) | | | 0.04 | | | | (0.05 | ) | | | (0.02 | ) |
2010 | | | 0.99 | | | | 0.06 | | | | 0.08 | | | | 0.14 | | | | (0.08 | ) | | | (0.02 | ) |
2009 | | | 0.85 | | | | 0.04 | | | | 0.15 | | | | 0.19 | | | | (0.03 | ) | | | (0.02 | ) |
2008 | | | 0.98 | | | | 0.04 | | | | (0.11 | ) | | | (0.07 | ) | | | (0.06 | ) | | | - | |
Commodities Return Strategy Portfolio | |
2012 | | $ | 0.81 | | | $ | (0.01 | ) | �� | $ | (0.01 | ) | | $ | (0.02 | ) | | $ | - | | | $ | 0.00 | (e) |
2011(h) | | | 1.00 | | | | 0.00 | (e) | | | (0.19 | ) | | | (0.19 | ) | | | - | | | | 0.00 | (e) |
Balanced Portfolio | |
2012 | | $ | 1.39 | | | $ | 0.03 | | | $ | 0.11 | | | $ | 0.14 | | | $ | (0.02 | ) | | $ | - | |
2011 | | | 1.40 | | | | 0.03 | | | | 0.00 | (e) | | | 0.03 | | | | (0.04 | ) | | | - | |
2010 | | | 1.28 | | | | 0.03 | | | | 0.12 | | | | 0.15 | | | | (0.03 | ) | | | - | |
2009 | | | 1.10 | | | | 0.04 | | | | 0.19 | | | | 0.23 | | | | (0.05 | ) | | | - | |
2008 | | | 1.99 | | | | 0.05 | | | | (0.41 | ) | | | (0.36 | ) | | | (0.02 | ) | | | (0.51 | ) |
Asset Allocation Portfolio | |
2012 | | $ | 1.02 | | | $ | 0.02 | | | $ | 0.09 | | | $ | 0.11 | | | $ | 0.00 | (e) | | $ | - | |
2011 | | | 1.05 | | | | 0.02 | | | | (0.02 | ) | | | 0.00 | (e) | | | (0.03 | ) | | | - | |
2010 | | | 0.96 | | | | 0.02 | | | | 0.10 | | | | 0.12 | | | | (0.03 | ) | | | - | |
2009 | | | 0.77 | | | | 0.02 | | | | 0.20 | | | | 0.22 | | | | (0.03 | ) | | | - | |
2008 | | | 1.24 | | | | 0.03 | | | | (0.38 | ) | | | (0.35 | ) | | | (0.03 | ) | | | (0.09 | ) |
| (e) | Amount is less than $0.005. |
| (h) | For the period April 29,2011 (commencement of operations) through December 31,2011. |
The Accompanying Notes are an Integral Part of the Financial Statements.
| | | | | | | | | | | | | | | | | | | | | | | | | | | | | | |
Total Distributions | | | Net Asset Value,
End of Period | | | Total Return(d) | | | Net Assets, End
of Period
(thousands) | | | Ratio of Gross
Expenses to
Average Net
Assets | | | Ratio of Net
Expenses to
Average Net
Assets | | | Ratio of Net
Investment
Income (Loss) to
Average Net
Assets | | | Portfolio
Turnover Rate | |
| | | | | | | | | | | | | | | | | | | | | | | | | | | | | | |
| $ | (0.05 | ) | | $ | 0.75 | | | | 13.89 | % | | $ | 460,942 | | | | 0.48 | % | | | 0.47 | % | | | 6.50 | % | | | 45.66 | % |
| | (0.05 | ) | | | 0.70 | | | | 4.59 | | | | 376,289 | | | | - | | | | 0.46 | | | | 7.33 | | | | 44.40 | |
| | (0.05 | ) | | | 0.72 | | | | 14.56 | | | | 343,549 | | | | - | | | | 0.47 | | | | 7.99 | | | | 71.62 | |
| | (0.06 | ) | | | 0.68 | | | | 45.39 | | | | 299,022 | | | | - | | | | 0.48 | | | | 8.74 | | | | 75.30 | |
| | (0.05 | ) | | | 0.51 | | | | (21.35 | ) | | | 212,003 | | | | - | | | | 0.47 | | | | 8.55 | | | | 43.30 | |
| | | | | | | | | | | | | | | | | | | | | | | | | | | | | | |
| $ | (0.01 | ) | | $ | 1.14 | | | | 14.94 | % | | $ | 372,656 | | | | 0.86 | % | | | 0.85 | % | | | 4.11 | % | | | 41.31 | %(g) |
| | (0.07 | ) | | | 1.00 | | | | 4.99 | | | | 234,872 | | | | - | | | | 0.83 | | | | 5.15 | | | | 59.18 | (g) |
| | (0.10 | ) | | | 1.03 | | | | 13.19 | | | | 182,453 | | | | - | | | | 0.84 | | | | 5.41 | | | | 102.10 | (g) |
| | (0.05 | ) | | | 0.99 | | | | 22.08 | | | | 145,720 | | | | - | | | | 0.85 | | | | 4.43 | | | | 93.70 | (g) |
| | (0.06 | ) | | | 0.85 | | | | (6.86 | ) | | | 94,121 | | | | - | | | | 0.88 | | | | 4.40 | | | | 23.40 | (g) |
| | | | | | | | | | | | | | | | | | | | | | | | | | | | | | |
| $ | 0.00 | (e) | | $ | 0.79 | | | | (2.35 | )% | | $ | 153,208 | | | | 0.89 | % | | | 0.89 | % | | | (0.67 | )% | | | 109.06 | %(g) |
| | 0.00 | (e) | | | 0.81 | | | | (19.30 | ) | | | 90,899 | | | | - | (c) | | | 0.91 | (c) | | | (0.51 | )(c) | | | 81.69 | (g) |
| | | | | | | | | | | | | | | | | | | | | | | | | | | | | | |
| $ | (0.02 | ) | | $ | 1.51 | | | | 9.69 | % | | $ | 2,240,232 | | | | 0.31 | % | | | 0.30 | % | | | 2.18 | % | | | 121.91 | %(g) |
| | (0.04 | ) | | | 1.39 | | | | 2.11 | | | | 2,188,140 | | | | - | | | | 0.30 | | | | 2.27 | | | | 114.17 | (g) |
| | (0.03 | ) | | | 1.40 | | | | 11.96 | | | | 2,295,102 | | | | - | | | | 0.30 | | | | 2.58 | | | | 81.33 | (g) |
| | (0.05 | ) | | | 1.28 | | | | 21.43 | | | | 2,202,539 | | | | - | | | | 0.30 | | | | 3.07 | | | | 73.12 | (g) |
| | (0.53 | ) | | | 1.10 | | | | (22.72 | ) | | | 1,994,701 | | | | - | | | | 0.30 | | | | 3.26 | | | | 68.34 | (g) |
| | | | | | | | | | | | | | | | | | | | | | | | | | | | | | |
| $ | 0.00 | (e) | | $ | 1.13 | | | | 11.02 | % | | $ | 235,762 | | | | 0.63 | % | | | 0.54 | % | | | 1.84 | % | | | 119.01 | %(g) |
| | (0.03 | ) | | | 1.02 | | | | (0.08 | ) | | | 230,257 | | | | 0.58 | | | | 0.53 | | | | 1.74 | | | | 95.15 | (g) |
| | (0.03 | ) | | | 1.05 | | | | 13.01 | | | | 248,166 | | | | 0.58 | | | | 0.53 | | | | 2.01 | | | | 73.04 | (g) |
| | (0.03 | ) | | | 0.96 | | | | 27.09 | | | | 232,454 | | | | 0.60 | | | | 0.55 | | | | 2.44 | | | | 78.15 | (g) |
| | (0.12 | ) | | | 0.77 | | | | (30.13 | ) | | | 199,640 | | | | 0.60 | | | | 0.54 | | | | 2.59 | | | | 74.22 | (g) |
| (c) | Computed on an annualized basis. |
| (d) | Total Return includes deductions for management and other fund expenses; excludes deductions for sales loads and account fees, not annualized for periods less than one year. |
| (g) | Portfolio Turnover Rate excludes the impact of mortgage dollar roll transactions. |
The Accompanying Notes are an Integral Part of the Financial Statements.
Notes to Financial Statements
Note 1. Organization
Northwestern Mutual Series Fund, Inc. (the “Series Fund”) is registered as an open-end management investment company under the Investment Company Act of 1940. The Series Fund consists of the Growth Stock Portfolio, Focused Appreciation Portfolio, Large Cap Core Stock Portfolio, Large Cap Blend Portfolio, Index 500 Stock Portfolio, Large Company Value Portfolio, Domestic Equity Portfolio, Equity Income Portfolio, Mid Cap Growth Stock Portfolio, Index 400 Stock Portfolio, Mid Cap Value Portfolio, Small Cap Growth Stock Portfolio, Index 600 Stock Portfolio, Small Cap Value Portfolio, International Growth Portfolio, Research International Core Portfolio, International Equity Portfolio, Emerging Markets Equity Portfolio, Money Market Portfolio, Short-Term Bond Portfolio, Select Bond Portfolio, Long-Term U.S. Government Bond Portfolio, Inflation Protection Portfolio, High Yield Bond Portfolio, Multi-Sector Bond Portfolio, Commodities Return Strategy Portfolio, Balanced Portfolio and Asset Allocation Portfolio (each, a “Portfolio” or collectively, the “Portfolios”). All of the outstanding shares of each Portfolio are held by The Northwestern Mutual Life Insurance Company (“Northwestern Mutual”) for its general account and/or for its segregated asset accounts (either directly or indirectly through one or more underlying Portfolios operating as affiliated fund of funds).
During the period ended December 31, 2012, Northwestern Mutual made redemptions from the following Portfolios totaling:
| | | | |
Portfolio | | Redemption
Amount | |
Research International Core | | $ | 27,365,772 | |
Short-Term Bond | | | 59,636,963 | |
Long-Term U.S. Government Bond | | | 43,771,615 | |
Note 2. Significant Accounting Policies
The following is a summary of significant accounting policies consistently followed by the Series Fund in the preparation of its financial statements.
A. Use of Estimates — The preparation of financial statements in conformity with accounting principles generally accepted in the United States of America requires management to make estimates and assumptions that affect the reported amounts of assets and liabilities at the date of the financial statements and the reported amounts of revenues and expenses during the reporting period. Actual results could differ from those estimates.
B. Foreign Income and Capital Gains Taxes — The Portfolios may be subject to dividend income taxes imposed by certain countries in which they invest. Foreign withholding taxes on dividends are netted against dividend income and separately disclosed in the Statements of Operations.
Some of the Portfolios may be subject to capital gains taxes and repatriation taxes imposed by certain countries in which they invest. The Portfolios may record a deferred tax liability in respect of unrealized appreciation on foreign securities for capital gains net of losses, if applicable, and repatriation taxes.
C. Federal Income Taxes — The Portfolios’ policy is to continue to comply with the requirements of the Internal Revenue Code that are applicable to regulated investment companies and to distribute all of its taxable income to its shareholders. The Portfolios also intend to distribute sufficient net investment income and net capital gains, if any, so that they will not be subject to excise tax on distributable income and gains. Therefore, no federal income tax or excise provision is required.
In accordance with the authoritative guidance for uncertainty in income taxes, management of the Portfolios has reviewed all open tax years (2008 to 2012) for major jurisdictions and concluded there was no material impact to the Portfolios’ net assets or results of operations. There is no material tax liability resulting from unrecognized tax benefits relating to uncertain income tax positions taken or expected to be taken in future tax returns. The Portfolios are also not aware of any tax positions for which it is reasonably possible that the total amounts of unrecognized tax benefits will significantly change in the next 12 months.
D. Distributions — Dividends from net investment income and net realized capital gains are declared each business day for the Money Market Portfolio and at least annually for the remaining Portfolios of the Series Fund, when applicable.
E. Other — The Portfolios record security transactions on trade date. The basis for determining cost on sale of securities is identified cost. Interest income is recorded daily on the accrual basis and dividend income is recorded on the ex-dividend date
| | | | |
| 244 | | Notes to Financial Statements | | |
Notes to Financial Statements
or as soon as information from foreign issuers is available. Where applicable, dividends are recorded net of foreign withholding tax. Discounts and premiums on securities purchased are amortized over the life of the respective securities using the effective interest method.
F. New Accounting Pronouncements —In December 2011, the Financial Accounting Standards Board (“FASB”) issued an Accounting Standards Update (“ASU”) to enhance disclosures about financial instruments and derivative instruments that are subject to offsetting (“netting”) on the Statements of Assets and Liabilities. This information will enable users of the entity’s financial statements to evaluate the effect or potential effect of netting arrangements on the entity’s financial position. The ASU is effective prospectively during interim or annual periods beginning on or after January 1, 2013. At this time, management is evaluating the implications of these changes on the financial statements.
Note 3. Security Valuation
For purposes of calculating a net asset value, portfolio securities and other assets are valued as of the close of trading on the New York Stock Exchange (“Exchange”) on each day during which the Exchange is open for trading.
The Fair Value Measurements and Disclosures Topic of the Financial Accounting Standards Codification defines fair value as the price that a fund would receive to sell an asset or pay to transfer a liability in an orderly transaction between market participants at the measurement date. It establishes and requires disclosure of a fair value hierarchy, separately for each major category of asset and liability, which segregates fair value measurements into levels. A summary of the fair value hierarchy is described below:
| | • | | Level 1 — fair value is determined by unadjusted quoted prices in active markets for identical securities or derivatives |
| | • | | Level 2 — fair value is determined by other significant observable inputs (including quoted prices for similar securities, interest rates, prepayment speeds, credit risk, and other data used in fair valuation) |
| | • | | Level 3 — fair value is determined by significant unobservable inputs (including the Portfolios’ own assumptions in determining fair value) |
The categorization of a value determined for a financial instrument within the hierarchy is based upon the pricing transparency of the instrument and does not necessarily correspond to the Portfolios’ perceived risk of that instrument.
The following is a description of the valuation techniques and significant inputs used in determining the value of the Portfolios’ investments classified as Level 1 and Level 2 in the fair value hierarchy:
| | • | | Equity securities (common and preferred stock) for which market quotations are readily available are valued at the last sale or official closing price as reported by an independent pricing service on the primary market or exchange on which they are traded. In the event there were no sales during the day or closing prices are not available, securities are valued at the last quoted bid price. Equity securities traded only in the over-the-counter market and not on a securities exchange are valued at the last sale price or closing bid price, if no sales have occurred. To the extent these securities are actively traded and valuation adjustments are not applied, they are categorized as Level 1 of the fair value hierarchy. Additionally, for foreign securities, fair value procedures are used if a significant event occurs between the close of the foreign market and the U.S. market close. The fair value price is reflected as Level 2 in the fair value hierarchy. |
| | • | | Fixed income securities including corporate, convertible and municipal bonds and notes, U.S. government agencies, U.S. treasury obligations, sovereign issues, and non-U.S. bonds are generally valued on the basis of service provider prices that use broker dealer quotations or valuation estimates from internal pricing models. The service providers’ internal models use inputs that are observable such as issuer details, interest rates, yield curves, call features, maturities, credit risks/spreads and default rates. Securities that use similar valuation techniques and inputs as described above are categorized as Level 2 in the fair value hierarchy. |
| | • | | Fixed income securities purchased on a delayed delivery basis are marked to market daily until settlement at the forward settlement date and are categorized as Level 2 in the fair value hierarchy. |
| | | | | | |
| | Notes to Financial Statements | | | 245 | |
Notes to Financial Statements
| | • | | Mortgage related and asset backed securities are generally issued as separate tranches, or classes, of securities within each deal. These securities are normally valued by pricing service providers that use broker dealer quotations or valuation estimates from their internal pricing models. The pricing models for these securities usually consider tranche level attributes, current market data, estimated cash flows and market based yield spreads for each tranche, and incorporate deal collateral performance, as available. Mortgage related and asset backed securities that use similar valuation techniques and inputs as described above are categorized as Level 2 in the fair value hierarchy. |
| | • | | Investments in open-end mutual funds (including other Portfolios) are valued at the mutual fund’s closing net asset value per share and are categorized as Level 1 in the fair value hierarchy. Investments in privately held mutual funds are valued at the mutual fund’s closing net asset value per share and are categorized as Level 2 in the fair value hierarchy. |
| | • | | Money market investments, other than in the Money Market Portfolio, with maturities exceeding 60 days are generally valued by a pricing service. Money market investments with maturities of 60 days or less and all securities in the Money Market Portfolio are valued using amortized cost, unless the current market value differs substantially from the amortized cost, at which time the securities are marked to market. Because the value is not obtained from a quoted price in an active market, such securities are reflected as Level 2 in the fair value hierarchy. |
| | • | | Listed derivatives, such as futures or option contracts, that are actively traded on a national securities exchange, are stated at the last reported sale or settlement price on the day of valuation and are categorized as Level 1 in the fair value hierarchy. |
| | • | | Over-the-counter financial derivatives, such as foreign currency contracts, futures contracts, options contracts, or swap agreements derive their value from underlying asset prices, indices, reference rates, and other inputs or a combination of these factors. These derivatives are normally valued on the basis of quotes obtained from brokers and dealers or pricing services. Depending on the product and the terms of the transaction, the value of the derivatives can be estimated using a series of techniques, including simulation pricing models. The pricing models use inputs that are observed from actively quoted markets such as issuer details, indices, spreads, interest rates, curves, dividends and exchange rates. Financial derivatives that use similar valuation techniques and inputs as described above are categorized as Level 2 in the fair value hierarchy. |
The following is a description of the valuation techniques and significant inputs used in determining the value the Portfolios’ investments classified as Level 3 in the fair value hierarchy:
| | • | | Securities and other assets for which market quotes are not readily available are valued at fair market value as determined in good faith in accordance with procedures adopted by the Series Fund’s Board of Directors. Market quotes are considered not readily available in circumstances where there is an absence of current or reliable market-based data (e.g. trade information or broker quotes). The factors considered in reaching these values at December 31, 2012 included, but were not limited to, broker quotes, analysis of the likely outcome of pending litigation, liquidity, prepayment speed, duration and recoverability. |
A table summarizing each Portfolio’s investments under this hierarchy is included following each Portfolio’s Schedule of Investments. Transfers between investment levels may occur as markets fluctuate and/or the availability of data used in investments’ valuation changes. The Portfolios recognize transfers between levels as of the end of the period.
At December 31, 2012, the fair market value of certain securities was adjusted, resulting in their level 2 classification, due to developments that occurred between the time of the close of the foreign markets on which they trade and the close of regular session trading on the NYSE. The following table summarizes security transfers from Level 1 to Level 2 for each Portfolio as of December 31, 2012 (amounts in thousands):
| | | | |
Portfolio | | Amount | |
Equity Income Portfolio | | $ | 3,170 | |
Mid Cap Value Portfolio | | | 1,546 | |
International Growth Portfolio | | $ | 208,282 | |
Research International Core Portfolio | | | 207,720 | |
International Equity Portfolio | | | 1,144,581 | |
Emerging Markets Equity Portfolio | | | 144,778 | |
| | | | |
| 246 | | Notes to Financial Statements | | |
Notes to Financial Statements
In addition, management concluded that investments in open end money market mutual funds should be classified as Level 1, resulting in transfers from Level 2 to Level 1. Additionally, preferred securities were transferred from level 2 to level 1 due to availability of closing market price. The following table summarizes security transfers from Level 2 to Level 1 for each Portfolio as of December 31, 2012 (amounts in thousands):
| | | | |
Portfolio | | Amount | |
Large Company Value Portfolio | | $ | 1,295 | |
Equity Income Portfolio | | | 19,021 | |
Mid Cap Value Portfolio | | | 2,926 | |
Small Cap Value Portfolio | | | 8,950 | |
Long-Term US Government Bond Portfolio | | | 113 | |
High Yield Bond Portfolio | | | 3,106 | |
Balanced Portfolio | | | 1,146 | |
Asset Allocation Portfolio | | | 166 | |
In addition, certain securities no longer were valued based on significant observable inputs resulting in transfers from Level 2 to Level 3. The following table summarizes security transfers from Level 2 to Level 3 for each Portfolio as of December 31, 2012 (amounts in thousands):
| | | | |
Portfolio | | Amount | |
Short-Term Bond Portfolio | | $ | 550 | |
Select Bond Portfolio | | | 6,467 | |
Multi-Sector Portfolio | | | 1,228 | |
Balanced Portfolio | | | 4,066 | |
Asset Allocation Portfolio | | | 203 | |
The Series Fund has adopted policies and procedures which govern the pricing of Portfolio securities. The Series Fund’s Board of Directors has delegated the day-to-day responsibility for pricing Portfolio securities and other investments to Mason Street Advisors, LLC (“MSA”), the Portfolios’ investment adviser and Northwestern Mutual in its capacity as fund accountant, subject to the oversight of a Pricing Committee appointed by the Board. The Pricing Committee is charged with the primary and day-to-day operational responsibility for executing the valuation process. The Pricing Committee has been delegated the authority to approve the override of any prices as permitted under the pricing procedures approved by the Board of Directors and any variances from these pricing procedures when appropriate. All such actions are subject to further review and approval by the Board of Directors at its next regular meeting.
Note 4. Securities and Other Investments
A. Delayed Delivery Transactions and When-Issued Securities — Certain Portfolios may engage in securities transactions on a when-issued or delayed delivery basis. In these transactions, the securities’ prices and yields are fixed on the date of the commitment, with payment and delivery scheduled for a future date. During this period, the securities are subject to market fluctuations. When delayed delivery purchases are outstanding, a Portfolio will earmark liquid assets on their records in amounts sufficient to meet the purchase price. A Portfolio may dispose of or renegotiate a delayed delivery transaction, which may result in a capital gain or loss.
B. Repurchase Agreements — Certain Portfolios may engage in repurchase transactions. Under the terms of a typical repurchase agreement, a Portfolio takes possession of an underlying debt obligation subject to an obligation of the seller to repurchase, and a Portfolio to resell, the obligation at an agreed upon price and time. The underlying securities for all repurchase agreements are held in safekeeping at the Portfolio’s custodian or designated sub-custodians under tri-party repurchase agreements. The market value of the collateral must be equal to or exceed at all times the total amount of the repurchase obligations, including interest. Securities purchased under repurchase agreements are reflected as an asset on the Statements of Assets and Liabilities. Generally, in the event of counterparty default, a Portfolio has the right to use the collateral to offset losses incurred. If the counterparty should default, a Portfolio will seek to sell the securities which it holds as collateral. This could involve procedural costs or delays in addition to a loss on the securities if their value should fall below their repurchase price.
C. Restricted Securities — Certain Portfolios may invest in securities that are subject to legal or contractual restrictions on resale. These securities may be sold privately, but are required to be registered or exempted from registration before being sold to the public. Disposal of these securities may involve time-consuming negotiations and expense, and prompt sale at an acceptable price may be difficult.
| | | | | | |
| | Notes to Financial Statements | | | 247 | |
Notes to Financial Statements
D. Foreign Currency Transactions — Certain Portfolios may have securities and other assets and liabilities denominated in foreign currencies which are translated into U.S. dollar amounts on the date of valuation. Purchases and sales of securities and income items denominated in foreign currencies are translated into U.S. dollar amounts on the respective dates of such transactions. When the Portfolios purchase or sell a foreign security they may enter into a foreign currency exchange contract to minimize exchange rate risk from the trade date to the settlement date of such transaction. Such foreign currency exchange contracts are marked to market daily.
The Portfolios do not separately report the results of operations due to fluctuations in foreign exchange rates on investments from the changes arising from changes in market prices of securities held. Such fluctuations are included with the net realized or unrealized gain or loss from investments.
Net realized foreign exchange gains or losses arise from sales of foreign currencies, currency gains or losses realized between the trade date and the settlement date on security transactions, and the differences between the amounts of dividends and foreign withholding taxes recorded on the Portfolios’ books and the U.S. dollar equivalent of the amounts actually received or paid.
E. Mortgage Backed and Asset Backed Securities — Certain Portfolios may invest in mortgage backed securities, including collateralized mortgage obligations, and asset backed securities. Mortgage backed securities are interests in pools of residential or commercial mortgage loans and asset backed securities are interests in pools of other assets, including various types of loans and credit card receivables. These securities provide a monthly payment, consisting of both a principal and interest component. Interest payments may be based on either fixed rates or adjustable rates. Receipt of principal payment reduces the outstanding par amount of the security and may generate realized gains or losses. Yields on mortgage backed securities are affected by interest and prepayment rates, which, in turn, are influenced by a variety of economic, geographical, social and other factors. Maturities on mortgage backed securities represent stated maturity dates. Actual maturity dates may differ based on prepayment rates. Unlike mortgage backed securities issued or guaranteed by the U.S. government or one of its sponsored entities, mortgage backed securities and asset backed securities issued by private issuers do not have a government or government sponsored entity guarantee. These issuers may provide credit enhancements through external entities such as financial institutions or through the structuring of the transaction itself. There is no guarantee that credit enhancements, if any, will be sufficient to prevent losses.
F. Inflation-Indexed Bonds — Certain Portfolios may invest in inflation-indexed bonds. Inflation-indexed bonds are fixed income securities whose principal value is periodically adjusted to the rate of inflation. The interest rate on these bonds is generally fixed at issuance at a rate lower than typical bonds. Over the life of an inflation-indexed bond, interest will be paid based on a principal value, which is adjusted for inflation. Any increase in the principal amount of an inflation indexed bond will be included as interest income in the Statements of Operations even though investors do not receive their principal until maturity.
G. Securities Lending — Each Portfolio is authorized to participate in securities lending, however, only the Select Bond and Balanced Portfolios currently have an established securities lending program that enables each to loan securities to approved broker-dealers. The Portfolios receive cash (U.S. currency), U.S. government or U.S. government agency obligations as collateral against the loaned securities. To the extent that a loan is collateralized by cash, such collateral is invested by the Portfolios in commercial paper to earn interest in accordance with the Portfolios’ investment policies. For the period ended December 31, 2012, the Select Bond and Balanced Portfolios earned $471,151 and $482,111, respectively, in interest from securities lending activity, which is included as interest income in the Statements of Operations. The collateral received under the securities lending program is recorded on each Portfolio’s Statement of Assets and Liabilities along with the related obligation to return the collateral.
Income generated from the investment of cash collateral, less negotiated rebate fees paid to participating brokers and transaction costs, is recorded as income for the Portfolios. All collateral received will be in an amount at least equal to 102% (for loans of U.S. securities) or 105% (for non-U.S. securities) of the market value of the loaned securities at the inception of each loan. Thereafter, each loan must be continuously secured by collateral at least equal at all times to the value of the securities on loan. In addition, the Portfolios are entitled to terminate a securities loan at any time. As of December 31, 2012, the value of outstanding securities on loan and the value of collateral amounted to the following:
| | | | | | | | |
Portfolio | | Values of
Securities on
Loan | | | Value of
Collateral | |
Select Bond Portfolio | | $ | 65,469,505 | | | $ | 67,068,750 | |
Balanced Portfolio | | | 49,500,820 | | | | 50,495,625 | |
| | | | |
| 248 | | Notes to Financial Statements | | |
Notes to Financial Statements
As of December 31, 2012, collateral received for securities on loan was invested in money market instruments and included in Investments on each Portfolio’s Statement of Assets and Liabilities.
H. Short Sales — Certain Portfolios may enter into short sale transactions. A short sale is a transaction in which a Portfolio sells a security it does not own in anticipation of a decline in the market price of the security. Securities sold in short sale transactions and the interest payable on such securities, if any, are reflected as a liability on the Statements of Assets and Liabilities. A Portfolio is obligated to deliver the security at the market price at the time the short position is closed. The risk of loss on a short sale transaction is theoretically unlimited, because there is no limit to the cost of replacing the security sold short, whereas losses from purchase transactions cannot exceed the total amount invested. As of December 31, 2012, short positions were held by the Large Company Value Portfolio and Multi-Sector Bond Portfolio.
I. Treasury Roll Transactions — In April 2011, the FASB issued an ASU related to accounting for repurchase agreements and similar agreements that both entitle and obligate a transferor to repurchase or redeem financial assets before their maturity. The ASU modified the criteria for determining effective control of transferred assets and as a result certain treasury roll transactions are now accounted for as secured borrowings. Certain Portfolios may enter into treasury roll transactions. In a treasury roll transaction, the Portfolio transfers a treasury security to a counterparty with a simultaneous agreement to repurchase the same security at an agreed upon price and future settlement date. For U.S. GAAP purposes, a treasury roll transaction is accounted for as a secured borrowing and not as a purchase or sale. During the term of the borrowing, the Portfolio is entitled to the interest on the treasury security. The difference between the sale price and repurchase price is included in net investment income with the cost of the secured borrowing transaction being recorded in interest expense over the term of the borrowing. The Portfolio will benefit from the transaction if the income earned on the investment purchased with the cash received in the treasury roll transaction exceeds the investment income and dividends to shareholders may be adversely impacted. Treasury roll transactions involve the risk that the market value of the securities that the Portfolio is required to repurchase may decline below the agreed upon repurchase price of those securities.
J. Loan Participation and Assignments — Certain Portfolios may invest in direct debt instruments which are interests in amounts owed to lenders or lending syndicates by corporate, governmental, or other borrowers. The Portfolios investments in a loan may be in the form of either actual participation in loans or assignments of all or part of the loans from third parties. A loan is often administered by a bank or other financial institution that acts as an agent for all holders. The agent administers the terms of the loan which are specified in the loan agreement. The Portfolios may invest in multiple series or tranches of a loan, each of which can have different terms and associated risks. The Portfolios generally do not have a right to enforce compliance with the terms of the loan agreement and as a result, the Portfolios may be subject to the credit risk of the borrower and lender that is selling the loan agreement. When the Portfolios purchase assignments from lenders they acquire direct rights against the borrower of the loan. The Portfolios may also enter into unfunded loan commitments, which are contractual obligations for future funding. Unfunded loan commitments can include lines of credit, which may require the Portfolios to grant additional cash to the borrower upon demand from the borrower. These unfunded loan commitments are in fact a future obligation in full, although a percentage of the loan amount may not be utilized by the borrower. When investing in a loan, the Portfolios have the right to receive principal, interest and any fees from the lender selling the loan agreement and only when the payments are received by the lender from the borrower. There may also be a commitment fee due to the Portfolios based on the unused portion of the line of credit of the floating rate loan. In certain cases, the Portfolios may be entitled to a penalty fee if there was a prepayment of a floating rate loan by the borrower. Fees that are earned or paid will be reflected as interest income or interest expense on the Statements of Operations. For the period ended December 31, 2012, only the High Yield Bond Portfolio invested in loan participations and assignments. At December 31, 2012 there were no unfunded loan commitments outstanding.
| | | | | | |
| | Notes to Financial Statements | | | 249 | |
Notes to Financial Statements
Note 5. Derivative Instruments
The Portfolios may use derivative instruments for various purposes, including as a cash management strategy, to earn income and enhance returns, to increase or decrease exposure to a particular market, to manage or adjust the risk profile of the Portfolio, to hedge exposure to a foreign currency, to earn income and enhance returns, or as an alternative to direct investments. The Portfolios have adopted amendments to authoritative guidance regarding disclosures of derivatives and hedging activity. This guidance requires qualitative disclosures about objectives and strategies for using derivatives and quantitative disclosures about fair value amounts of, and gains and losses on, derivative instruments. The disclosure requirements distinguish between derivatives which are accounted for as “hedges” and those that do not qualify for such accounting. Because the Portfolios are required to account for derivative instruments at fair value and recognize changes in fair value through the Statements of Operations, the Portfolios’ derivatives do not qualify for hedge accounting treatment under the guidance.
Certain Portfolios segregate cash to cover margin requirements for derivative positions. These amounts are denoted as “Cash Collateral for Derivative Positions” on the Statements of Assets and Liabilities.
A. Futures Contracts — Certain Portfolios invest in futures contracts as an alternative to investing in individual securities and could be exposed to market risk due to changes in the value of the underlying securities or due to an illiquid secondary market. Futures contracts are marked to market daily based upon quoted settlement prices. The Portfolios receive from or pay to brokers an amount of cash equal to the daily fluctuation in the value of the contracts. Such receipts or payments, known as the “variation margin,” are recorded by the Portfolios as unrealized gains or losses. When a contract is closed, the Portfolios record a realized gain or loss equal to the difference between the value of the contract at the time it was opened and the value at the time it was closed.
B. Forward Foreign Currency Contracts — The Portfolios may enter into forward foreign currency contracts to hedge against exchange rate risk arising from investments in securities denominated in foreign currencies or as part of an investment strategy. Contracts are valued at the contractual forward rate and are marked to market daily, with the change in market value recorded as an unrealized gain or loss. When the contracts are closed, a realized gain or loss is recorded. Risks may arise from changes in market value of the underlying instruments and from the possible inability of counterparties to meet the terms of their contracts.
C. Options — Certain Portfolios may write call and put options on futures, swaps, securities or currencies they own or in which they may invest. Writing put options tends to increase a Portfolio’s exposure to the underlying instrument. Writing call options tends to decrease a Portfolio’s exposure to the underlying instrument. The Portfolio receives a premium on the sale of a call option but gives up the opportunity to profit from any increase in the value of the security above the exercise price of the option. When a Portfolio writes a put option, it is exposed to a decline in the price of the underlying security. When a Portfolio writes a call or put option, an amount equal to the premium received is recorded as a liability and subsequently marked to market to reflect the current value of the option written. These liabilities are reflected as written options outstanding in the Statements of Assets and Liabilities. Payments received or made, if any, from writing options with premiums to be determined on a future date are reflected as such on the Statements of Assets and Liabilities. Premiums received from writing options which expire are treated as realized gains. Premiums received from writing options which are exercised or closed are added to the proceeds or offset against amounts paid on the underlying future, swap, security or currency transaction to determine the realized gain or loss. A Portfolio as a writer of an option has no control over whether the underlying future, swap, security or currency may be sold (call) or purchased (put) and as a result bears the market risk of an unfavorable change in the price of the future, swap, security or currency underlying the written option. There is a risk a Portfolio may not be able to enter into a closing transaction because of an illiquid market.
| | | | |
| 250 | | Notes to Financial Statements | | |
Notes to Financial Statements
Transactions in written call and put options for the period ended December 31, 2012 were as follows (amounts in thousands, except number of contracts):
| | | | | | | | | | | | | | | | | | | | | | | | |
| | | Balance at
12/31/2011 | | | Sales | | | Closing
Buys | | | Expirations | | | Exercised | | | Balance at
12/31/2012 | |
Growth Stock Portfolio | | | | | | | | | | | | | | | | | | | | | | | | |
# of Contracts | | | - | | | | 1,448 | | | | (50 | ) | | | (1,293 | ) | | | (105 | ) | | | - | |
Notional Amount | | | - | | | | 145 | | | | (5 | ) | | | (129 | ) | | | (11 | ) | | | - | |
Premium | | $ | - | | | | 243 | | | | (37 | ) | | | (128 | ) | | | (78 | ) | | $ | - | |
Large Cap Core Stock Portfolio | | | | | | | | | | | | | | | | | | | | | | | | |
# of Contracts | | | - | | | | 261 | | | | (30 | ) | | | (231 | ) | | | - | | | | - | |
Notional Amount | | | - | | | | 26 | | | | (3 | ) | | | (23 | ) | | | - | | | | - | |
Premium | | $ | - | | | | 47 | | | | (22 | ) | | | (25 | ) | | | - | | | $ | - | |
Small Cap Growth Stock Portfolio | | | | | | | | | | | | | | | | | | | | | | | | |
# of Contracts | | | - | | | | 7,979 | | | | - | | | | (5,031 | ) | | | (2,948 | ) | | | - | |
Notional Amount | | | - | | | | 798 | | | | - | | | | (503 | ) | | | (295 | ) | | | - | |
Premium | | $ | - | | | | 257 | | | | - | | | | (157 | ) | | | (100 | ) | | $ | - | |
Long-Term U.S. Government Bond Portfolio | | | | | | | | | | | | | | | | | | | | | | | | |
# of Contracts | | | - | | | | 20 | | | | (10 | ) | | | (10 | ) | | | - | | | | - | |
Notional Amount | | | - | | | | 20 | | | | (10 | ) | | | (10 | ) | | | - | | | | - | |
Premium | | $ | - | | | | 11 | | | | (6 | ) | | | (5 | ) | | | - | | | $ | - | |
Multi-Sector Bond Portfolio | | | | | | | | | | | | | | | | | | | | | | | | |
# of Contracts | | | 565 | | | | 1,480 | | | | (180 | ) | | | (715 | ) | | | (330 | ) | | | 820 | |
Notional Amount | | | 5,538 | | | | 14,800 | | | | (1,800 | ) | | | (7,038 | ) | | | (3,300 | ) | | | 8,200 | |
Premium | | $ | 54 | | | | 78 | | | | (13 | ) | | | (57 | ) | | | (17 | ) | | $ | 45 | |
Balanced Portfolio | | | | | | | | | | | | | | | | | | | | | | | | |
# of Contracts | | | - | | | | 395 | | | | (47 | ) | | | (300 | ) | | | (48 | ) | | | - | |
Notional Amount | | | - | | | | 40 | | | | (5 | ) | | | (30 | ) | | | (5 | ) | | | - | |
Premium | | $ | - | | | | 78 | | | | (35 | ) | | | (7 | ) | | | (36 | ) | | $ | - | |
Asset Allocation Portfolio | | | | | | | | | | | | | | | | | | | | | | | | |
# of Contracts | | | - | | | | 52 | | | | (6 | ) | | | (40 | ) | | | (6 | ) | | | - | |
Notional Amount | | | - | | | | 5 | | | | (1 | ) | | | (4 | ) | | | - | | | | - | |
Premium | | $ | - | | | | 10 | | | | (5 | ) | | | (1 | ) | | | (4 | ) | | $ | - | |
Certain Portfolios may also purchase call and put options on futures, swaps, securities or currencies they own or in which they may invest. Purchasing call options tends to increase a Portfolio’s exposure to the underlying instrument. Purchasing put options tends to decrease a Portfolio’s exposure to the underlying instrument. The Portfolio pays a premium on the purchase of a put option but receives the opportunity to profit from any increase in the value of the security above the exercise price of the option. When a Portfolio purchases a call option, it is exposed to a decline in the price of the underlying security. Premiums paid are reflected in the Statements of Assets and Liabilities as an investment and are subsequently marked to market to reflect the current value of the option. Premiums paid from purchasing options which expire are treated as realized losses. Premiums paid for purchasing options which are exercised or closed are added to the amount paid or offset against the proceeds on the underlying future, swap, security or currency transaction to determine realized gain or loss. The risk associated with a Portfolio purchasing call or put options is limited to the premium paid.
D. Swap Agreements — The Portfolios may enter into swap agreements on interest rate, total return and credit default to manage their exposure to interest rates, foreign currencies, investment style risk and credit risk or as an alternative to direct investing. In connection with these agreements, securities may be identified as collateral in accordance with the terms of the respective swap agreements. Swap agreements are privately negotiated in the over-the-counter market (“OTC swaps”) and may be executed in a multilateral or other trade facility platform, such as a registered commodities exchange (“centrally cleared swaps”).
Swaps are marked to market daily based upon quotations from market makers or values from third party vendors, which may include a registered commodities exchange, and the change in value, if any, is recorded as unrealized gain or loss in the Statements of Operations. Daily changes in valuation of centrally cleared swaps, if any, are recorded as a receivable or payable for the change in value as appropriate (“variation margin”) on the Statements of Assets and Liabilities. OTC swap payments received or made at the beginning of the measurement period of the swap are reflected on the Statements of Assets and Liabilities. Upfront payments are amortized to realized gain or loss. Upon termination of the swap, unamortized upfront payments are recorded as realized gain or loss in the Statements of Operations. A liquidation payment received or made at the termination of the swap is recorded as realized gain or loss in the Statements of Operations. Net periodic payments received by the Portfolios are included as part of realized gain (loss) on the Statements of Operations. Entering into these agreements involves, to varying degrees, elements of credit and market risk in excess of the amounts recognized on the Statements of
| | | | | | |
| | Notes to Financial Statements | | | 251 | |
Notes to Financial Statements
Assets and Liabilities. Such risks involve the possibility that there will be no liquid market for these agreements, that the counterparty to the agreements may default on its obligation to perform and that there may be unfavorable changes in interest rates.
Interest Rate Swaps — Interest rate swap agreements involve the exchange by a Portfolio with another party to pay or receive a set of cash flows, e.g., an exchange of floating rate payments for fixed rate payments based on a notional amount of principal.
Total Return Swaps — Total return swap agreements involve commitments to pay or receive a financing rate in exchange for the total return of an underlying reference entity, both based on notional amounts. To the extent the total return of the security or index underlying the transaction exceeds or falls short of the offsetting interest rate obligation, a Portfolio will receive a payment from or make a payment to the counterparty.
Credit Default Swaps — Credit default swap agreements involve one party making a series of payments to another party in exchange for the right to receive a cash payment equal to the notional value of the swap in the event of a default by a third party, typically corporate issues or sovereign issues of an emerging market country. A Portfolio may use credit default swaps to provide a measure of protection against defaults of the issuers where the Portfolio owns or has exposure to the corporate or sovereign issue or to take an active long or short position on the likelihood of a particular issuer’s default.
As a seller of protection, the Portfolio generally receives an upfront payment and/or a fixed rate of income throughout the term of the swap provided that there is no credit event. As the seller, the Portfolio adds leverage to its investments because the Portfolio has investment exposure on the notional amount of the swap. As a buyer of protection, the Portfolio generally makes an upfront payment or pays a fixed rate of interest throughout the term of the swap provided that there is no credit event. The Portfolio generally receives an amount up to the notional value of the swap if a credit event occurs.
Implied credit spreads, represented in absolute terms, utilized in determining the market value of credit default swap agreements on corporate issues or sovereign issues of an emerging market country serve as an indicator of the current status of the payment/performance risk and represent the likelihood of a credit event occurring. The implied credit spread of a particular referenced entity reflects the cost of selling protection and may include upfront payments required to be made to enter into the agreement. For credit default swap agreements on credit indices, the quoted market prices and resulting values serve as the indicator of the current status of the payment/performance risk. Wider credit spreads and increasing market values, in absolute terms when compared to the notional amount of the swap, represent a deterioration of the referenced entity’s credit soundness and indicate a greater likelihood a credit event could occur as defined under the terms of the agreement. Open credit default swaps on corporate or sovereign issues and credit indices are disclosed in the Schedules of Investments.
If the Portfolio is a seller of protection and a credit event occurs, the Portfolio will either pay to the buyer of the protection an amount equal to the notional value of the swap and may take delivery of the obligation or pay a net settlement amount in the form of cash or securities equal to the notional amount of the swap less the recovery value of the referenced obligation. The maximum potential amount of future payments (undiscounted) that a Portfolio as a seller of protection could be required to make under a credit default swap agreement would be equal to the notional amount of the agreement. Notional amounts and fair market value of all credit default swap agreements outstanding as of December 31, 2012 for each Portfolio are disclosed in the footnotes to the Schedules of Investments. These maximum potential amounts would be partially offset by any recovery values of the referenced obligations, upfront payments received upon entering into the agreement, or net amounts received by the Portfolio from the settlement of credit default swap agreements purchasing protection for the same referenced obligation.
E. Commodity-Linked Derivatives — The Commodities Portfolio invests in commodity-linked derivative instruments that provide exposure to the investment returns of the commodities market or a commodity index without investing directly in physical commodities. Such instruments may include swap agreements, options, futures and options on futures. The prices of commodity-linked instruments may move in different directions than investments in traditional equity and debt securities. However, there can be no guarantee that the Portfolio’s commodity linked investments would not be correlated with traditional financial assets under any particular market conditions. The value of commodity linked derivative instruments may be affected by changes in overall market movements, commodity index volatility, changes in interest rates, or factors affecting a particular industry or commodity, such as drought, floods, weather, livestock disease, embargoes, tariffs and international economic, political and regulatory developments.
| | | | |
| 252 | | Notes to Financial Statements | | |
Notes to Financial Statements
F. Derivative Disclosures — Derivative positions held by the Portfolios by contract type and primary risk exposure, including location on the Statement of Assets and Liabilities and value as of December 31, 2012, are (amounts in thousands):
| | | | | | | | | | | | |
| | | Asset Derivatives - December 31, 2012 | | | Liability Derivatives - December 31, 2012 | |
| Portfolio | | Statement of Assets and Liabilities Location | | Value | | | Statement of Assets and Liabilities Location | | Value | |
Growth Stock | | | | | | | | | | | | |
Equity contracts | | Receivables - Futures Variation Margin | | $ | 428 | | | Payables - Futures Variation Margin | | $ | - | |
Large Cap Core Stock | | | | | | | | | | | | |
Equity contracts | | Receivables - Futures Variation Margin | | | 123 | | | Payables - Futures Variation Margin | | | - | |
Index 500 Stock | | | | | | | | | | | | |
Equity contracts | | Receivables - Futures Variation Margin | | | 531 | | | Payables - Futures Variation Margin | | | - | |
Mid Cap Growth Stock | | | | | | | | | | | | |
Equity contracts | | Receivables - Futures Variation Margin | | | 1,347 | | | Payables - Futures Variation Margin | | | - | |
Index 400 Stock | | | | | | | | | | | | |
Equity contracts | | Receivables - Futures Variation Margin | | | 240 | | | Payables - Futures Variation Margin | | | - | |
Mid Cap Value | | | | | | | | | | | | |
Foreign exchange contracts | | Receivables - Foreign Currency Sold | | | - | | | Payables - Foreign Currency Purchased | | | 1 | |
Small Cap Growth Stock | | | | | | | | | | | | |
Equity contracts | | Receivables - Futures Variation Margin | | | 574 | | | Payables - Futures Variation Margin | | | - | |
Short-Term Bond | | | | | | | | | | | | |
Interest rate contracts | | Receivables - Futures Variation Margin | | | 20 | | | Payables - Futures Variation Margin | | | - | |
Select Bond | | | | | | | | | | | | |
Interest rate contracts | | Receivables - Futures Variation Margin | | | 258 | | | Payables - Futures Variation Margin | | | - | |
Long-Term U.S. Government Bond | | | | | | | | | | | | |
Interest rate contracts | | Receivables - Futures Variation Margin | | | - | | | Payables - Futures Variation Margin | | | 5 | |
Inflation Protection | | | | | | | | | | | | |
Foreign exchange contracts | | Receivables - Foreign Currency Sold | | | 203 | | | Payables - Foreign Currency Purchased | | | 663 | |
Interest rate contracts | | Receivables - Outstanding Swaps Contracts, at Value | | | 252 | | | Payables - Outstanding Swaps Contracts, at Value | | | 634 | |
Multi-Sector Bond | | | | | | | | | | | | |
Credit contracts | | Receivables - Outstanding Swaps Contracts, at Value | | | 4,680 | | | Payables - Outstanding Swaps Contracts, at Value | | | 1,388 | |
Foreign exchange contracts | | Receivables - Foreign Currency Sold | | | 238 | | | Payables - Foreign Currency Purchased | | | 1,120 | |
Interest rate contracts | | Receivables - Futures Variation Margin | | | - | | | Payables - Futures Variation Margin | | | 17 | |
Interest rate contracts | | Receivables - Outstanding Options Written, at Value | | | - | | | Payables - Outstanding Options Written, at Value | | | 54 | |
Interest rate contracts | | Receivables - Outstanding Swaps Contracts, at Value | | | 1.181 | | | Payables - Outstanding Swaps Contracts, at Value | | | 216 | |
Balanced | | | | | | | | | | | | |
Equity contracts | | Receivables - Futures Variation Margin | | | 1,861 | | | Payables - Futures Variation Margin | | | - | |
Equity contracts | | Receivables - Outstanding Swaps Contracts, at Value | | | 9,020 | | | Payables - Outstanding Swaps Contracts, at Value | | | 4,927 | |
Foreign exchange contracts | | Receivables - Foreign Currency Sold | | | - | | | Payables - Foreign Currency Purchased | | | 738 | |
Interest rate contracts | | Receivables - Futures Variation Margin | | | 211 | | | Payables - Futures Variation Margin | | | 137 | |
Asset Allocation | | | | | | | | | | | | |
Equity contracts | | Receivables - Futures Variation Margin | | | 166 | | | Payables - Futures Variation Margin | | | - | |
Equity contracts | | Receivables - Outstanding Swaps Contracts, at Value | | | 958 | | | Payables - Outstanding Swaps Contracts, at Value | | | 417 | |
Foreign exchange contracts | | Receivables - Foreign Currency Sold | | | - | | | Payables - Foreign Currency Purchased | | | 117 | |
Interest rate contracts | | Receivables - Futures Variation Margin | | | 14 | | | Payables - Futures Variation Margin | | | 20 | |
Commodities Return Strategy | | | | | | | | | | | | |
Other contracts | | Receivables - Outstanding Swaps Contracts, at Value | | | 109 | | | Payables - Outstanding Swaps Contracts, at Value | | | 7 | |
Realized gains and losses on derivative instruments, by contract type and primary risk exposure, for the period ended December 31, 2012 are (amounts in thousands):
| | | | | | | | | | | | | | | | | | | | |
| | | Realized Gain (Loss) on Derivatives Instruments | |
| Portfolio | | Options | | | Futures | | | Forward Currency Contracts | | | Swaps | | | Total | |
Growth Stock | | | | | | | | | | | | | | | | | | | | |
Equity contracts | | $ | 99 | | | $ | 2,517 | | | $ | - | | | $ | - | | | $ | 2,616 | |
Large Cap Core Stock | | | | | | | | | | | | | | | | | | | | |
Equity contracts | | | 7 | | | | 2,566 | | | | - | | | | - | | | | 2,573 | |
| | | | | | |
| | Notes to Financial Statements | | | 253 | |
Notes to Financial Statements
| | | | | | | | | | | | | | | | | | | | |
| | | Realized Gain (Loss) on Derivatives Instruments | |
| Portfolio | | Options | | | Futures | | | Forward
Currency
Contracts | | | Swaps | | | Total | |
Index 500 Stock | | | | | | | | | | | | | | | | | | | | |
Equity contracts | | $ | - | | | $ | 3,560 | | | $ | - | | | $ | - | | | $ | 3,560 | |
Foreign currency exchange contracts | | | - | | | | - | | | | 182 | | | | - | | | | 182 | |
Large Company Value | | | | | | | | | | | | | | | | | | | | |
Equity contracts | | | - | | | | 15 | | | | - | | | | - | | | | 15 | |
Foreign currency exchange contracts | | | - | | | | - | | | | (51 | ) | | | - | | | | (51 | ) |
Equity Income | | | | | | | | | | | | | | | | | | | | |
Foreign currency exchange contracts | | | - | | | | - | | | | (1 | ) | | | - | | | | (1 | ) |
Mid Cap Growth Stock | | | | | | | | | | | | | | | | | | | | |
Equity contracts | | | - | | | | 7,728 | | | | - | | | | - | | | | 7,728 | |
Index 400 Stock | | | | | | | | | | | | | | | | | | | | |
Equity contracts | | | - | | | | 5,308 | | | | - | | | | - | | | | 5,308 | |
Mid Cap Value | | | | | | | | | | | | | | | | | | | | |
Foreign currency exchange contracts | | | - | | | | - | | | | (140 | ) | | | - | | | | (140 | ) |
Small Cap Growth Stock | | | | | | | | | | | | | | | | | | | | |
Equity contracts | | | 72 | | | | 688 | | | | - | | | | 1,438 | | | | 2,198 | |
Index 600 Stock | | | | | | | | | | | | | | | | | | | | |
Equity contracts | | | - | | | | - | | | | - | | | | 891 | | | | 891 | |
Short-Term Bond | | | | | | | | | | | | | | | | | | | | |
Foreign currency exchange contracts | | | - | | | | - | | | | 19 | | | | - | | | | 19 | |
Interest rate contracts | | | - | | | | (924 | ) | | | - | | | | - | | | | (924 | ) |
Select Bond | | | | | | | | | | | | | | | | | | | | |
Foreign currency exchange contracts | | | - | | | | - | | | | 331 | | | | - | | | | 331 | |
Interest rate contracts | | | - | | | | (3,291 | ) | | | - | | | | - | | | | (3,291 | ) |
Long-Term U.S. Government Bond | | | | | | | | | | | | | | | | | | | | |
Interest rate contracts | | | (1 | ) | | | 305 | | | | - | | | | - | | | | 304 | |
Inflation Protection | | | | | | | | | | | | | | | | | | | | |
Foreign currency exchange contracts | | | - | | | | - | | | | 524 | | | | - | | | | 524 | |
Interest rate contracts | | | - | | | | 33 | | | | - | | | | (29 | ) | | | 4 | |
Multi-Sector Bond | | | | | | | | | | | | | | | | | | | | |
Credit contracts | | | - | | | | - | | | | - | | | | 1,317 | | | | 1,317 | |
Foreign currency exchange contracts | | | - | | | | - | | | | 76 | | | | - | | | | 76 | |
Interest rate contracts | | | 70 | | | | 1,026 | | | | - | | | | 1,497 | | | | 2,593 | |
Balanced | | | | | | | | | | | | | | | | | | | | |
Equity contracts | | | (93 | ) | | | 19,691 | | | | - | | | | 9,773 | | | | 29,371 | |
Foreign currency exchange contracts | | | - | | | | - | | | | 1,829 | | | | - | | | | 1,829 | |
Interest rate contracts | | | - | | | | (3,014 | ) | | | - | | | | - | | | | (3,014 | ) |
Asset Allocation | | | | | | | | | | | | | | | | | | | | |
Equity contracts | | | (11 | ) | | | 2,066 | | | | - | | | | 1,153 | | | | 3,208 | |
Foreign currency exchange contracts | | | - | | | | - | | | | 223 | | | | - | | | | 223 | |
Interest rate contracts | | | - | | | | (66 | ) | | | - | | | | - | | | | (66 | ) |
Commodities Return Strategy | | | | | | | | | | | | | | | | | | | | |
Other contracts | | | - | | | | - | | | | - | | | | (3,140 | ) | | | (3,140 | ) |
| | | | | | | | | | | | | | | | | | | | |
| | | Change in Unrealized Appreciation (Depreciation) on
Derivative Instruments | |
| Portfolio | | Options | | | Futures | | | Forward
Currency
Contracts | | | Swaps | | | Total | |
Growth Stock | | | | | | | | | | | | | | | | | | | | |
Equity contracts | | $ | - | | | $ | (232 | ) | | $ | - | | | $ | - | | | $ | (232 | ) |
Large Cap Core Stock | | | | | | | | | | | | | | | | | | | | |
Equity contracts | | | - | | | | (443 | ) | | | - | | | | - | | | | (443 | ) |
Index 500 Stock | | | | | | | | | | | | | | | | | | | | |
Equity contracts | | | - | | | | (695 | ) | | | - | | | | - | | | | (695 | ) |
Large Company Value | | | | | | | | | | | | | | | | | | | | |
Equity contracts | | | - | | | | 1 | | | | - | | | | - | | | | 1 | |
Foreign currency exchange contracts | | | - | | | | - | | | | (4 | ) | | | - | | | | (4 | ) |
Equity Income | | | | | | | | | | | | | | | | | | | | |
Foreign currency exchange contracts | | | - | | | | - | | | | 1 | | | | - | | | | 1 | |
Mid Cap Growth Stock | | | | | | | | | | | | | | | | | | | | |
Equity contracts | | | - | | | | (23 | ) | | | - | | | | - | | | | (23 | ) |
Index 400 Stock Portfolio | | | | | | | | | | | | | | | | | | | | |
Equity contracts | | | - | | | | (1,064 | ) | | | - | | | | - | | | | (1,064 | ) |
| | | | |
| 254 | | Notes to Financial Statements | | |
Notes to Financial Statements
| | | | | | | | | | | | | | | | | | | | |
| | | Change in Unrealized Appreciation (Depreciation) on
Derivative Instruments | |
Portfolio | | Options | | | Futures | | | Forward
Currency
Contracts | | | Swaps | | | Total | |
Mid Cap Value Portfolio | | | | | | | | | | | | | | | | | | | | |
Foreign currency exchange contracts | | $ | - | | | $ | - | | | $ | (18 | ) | | $ | - | | | $ | (18 | ) |
Small Cap Growth Stock Portfolio | | | | | | | | | | | | | | | | | | | | |
Equity contracts | | | - | | | | 309 | | | | - | | | | 33 | | | | 342 | |
Short-Term Bond | | | | | | | | | | | | | | | | | | | | |
Foreign currency exchange contracts | | | - | | | | - | | | | (56 | ) | | | - | | | | (56 | ) |
Interest rate contracts | | | - | | | | 207 | | | | - | | | | - | | | | 207 | |
Select Bond | | | | | | | | | | | | | | | | | | | | |
Foreign currency exchange contracts | | | - | | | | - | | | | (568 | ) | | | - | | | | (568 | ) |
Interest rate contracts | | | - | | | | 765 | | | | - | | | | - | | | | 765 | |
Long-Term U.S. Government Bond | | | | | | | | | | | | | | | | | | | | |
Interest rate contracts | | | - | | | | (53 | ) | | | - | | | | - | | | | (53 | ) |
Inflation Protection | | | | | | | | | | | | | | | | | | | | |
Foreign currency exchange contracts | | | - | | | | - | | | | (1,466 | ) | | | - | | | | (1,466 | ) |
Interest rate contracts | | | - | | | | - | | | | - | | | | 964 | | | | 964 | |
Multi-Sector Bond | | | | | | | | | | | | | | | | | | | | |
Credit contracts | | | - | | | | - | | | | - | | | | 2,176 | | | | 2,176 | |
Foreign currency exchange contracts | | | - | | | | - | | | | (1,881 | ) | | | - | | | | (1,881 | ) |
Interest rate contracts | | | (61 | ) | | | (901 | ) | | | - | | | | 499 | | | | (463 | ) |
Balanced | | | | | | | | | | | | | | | | | | | | |
Equity contracts | | | - | | | | (2,492 | ) | | | - | | | | (10,701 | ) | | | (13,193 | ) |
Foreign currency exchange contracts | | | - | | | | - | | | | (2,739 | ) | | | - | | | | (2,739 | ) |
Interest rate contracts | | | - | | | | 303 | | | | - | | | | - | | | | 303 | |
Asset Allocation | | | | | | | | | | | | | | | | | | | | |
Equity contracts | | | - | | | | (261 | ) | | | - | | | | (1,363 | ) | | | (1,624 | ) |
Foreign currency exchange contracts | | | - | | | | - | | | | (372 | ) | | | - | | | | (372 | ) |
Interest rate contracts | | | - | | | | 11 | | | | - | | | | - | | | | 11 | |
Commodities Return Strategy | | | | | | | | | | | | | | | | | | | | |
Other contracts | | | - | | | | - | | | | - | | | | 331 | | | | 331 | |
The volumes indicated in the open futures contracts, transactions in written options and swap agreements outstanding tables are indicative of the amounts throughout the period.
Note 6. Portfolio Risk
In the normal course of business the Portfolios trade financial instruments and enter into financial transactions where risk of potential loss exists. Security values fluctuate (market risk) and may decline due to factors affecting securities markets in general, particular industries represented in the securities markets or conditions specifically related to a particular company. Failure of the other party to a transaction to perform (credit risk), for example by not making principal and interest payments when due, reduces the value of the issuer’s debt and could reduce the Portfolios’ income.
Similar to credit risk, the Portfolios may be exposed to counterparty risk, or the risk that an institution or other entity with which the Portfolios have unsettled or open transactions will default. The potential loss could exceed the value of the financial assets recorded in the financial statements. Financial assets, which potentially expose the Portfolios to credit risk, consist principally of cash due from counterparties and investments. The extent of the Portfolios’ exposure to credit and counterparty risks in respect to these financial assets approximates their carrying value as recorded in the Statements of Assets and Liabilities.
Some of the Portfolios’ investments may be illiquid and the Portfolios may not be able to vary the portfolio investments in response to changes in economic and other conditions. If a Portfolio is required to liquidate all or a portion of its investments quickly, the Portfolio may realize significantly less than the value at which it previously recorded those investments.
| | | | | | |
| | Notes to Financial Statements | | | 255 | |
Notes to Financial Statements
Note 7. Investment Advisory and Sub-Advisory Fees
The Series Fund and its Portfolios are parties to annually renewable contracts pursuant to which each Portfolio pays a charge for investment management and administrative services to MSA, a wholly owned subsidiary of Northwestern Mutual. Certain Portfolios, listed below, pay at a fixed annual rate based on the average daily net asset values of the Portfolio.
| | | | |
Portfolio | | Fee | |
Index 500 Stock | | | 0.20% | |
Index 400 Stock | | | 0.25% | |
Mid Cap Value | | | 0.85% | |
Small Cap Value | | | 0.85% | |
Money Market | | | 0.30% | |
Select Bond | | | 0.30% | |
Commodities Return Strategy | | | 0.80% | |
Balanced | | | 0.30% | |
For the other Portfolios, the rate for the investment advisory fee is graded by the asset size of the Portfolio according to the following schedules:
| | | | | | | | | | | | | | | | |
Portfolio | | First
$50
Million | | | Next
$50
Million | | | Excess Over
$100
Million | | | | |
Growth Stock | | | 0.60% | | | | 0.50% | | | | 0.40% | | | | | |
Large Cap Core Stock | | | 0.60% | | | | 0.50% | | | | 0.40% | | | | | |
Mid Cap Growth Stock | | | 0.80% | | | | 0.65% | | | | 0.50% | | | | | |
Small Cap Growth Stock | | | 0.80% | | | | 0.65% | | | | 0.50% | | | | | |
High Yield Bond | | | 0.60% | | | | 0.50% | | | | 0.40% | | | | | |
Portfolio | | First
$100
Million | | | Next
$400
Million | | | Excess Over
$500
Million | | | | |
Focused Appreciation | | | 0.80% | | | | 0.75% | | | | 0.70% | | | | | |
| | | | |
Portfolio | | First
$100
Million | | | Next
$150
Million | | | Excess
Over $250
Million | | | | |
Domestic Equity | | | 0.65% | | | | 0.55% | | | | 0.50% | | | | | |
Large Company Value | | | 0.72% | | | | 0.67% | | | | 0.62% | | | | | |
International Growth | | | 0.75% | | | | 0.65% | | | | 0.55% | | | | | |
Short-Term Bond | | | 0.35% | | | | 0.33% | | | | 0.30% | | | | | |
Long-Term U.S. Government Bond | | | 0.555% | | | | 0.515% | | | | 0.495% | | | | | |
Inflation Protection | | | 0.58% | | | | 0.55% | | | | 0.49% | | | | | |
Multi-Sector Bond | | | 0.79% | | | | 0.78% | | | | 0.77% | | | | | |
Asset Allocation | | | 0.60% | | | | 0.50% | | | | 0.40% | | | | | |
Portfolio | | First
$150
Million | | | Next
$150
Million | | | Next
$200
Million | | | Excess
Over $500
Million | |
Large Cap Blend | | | 0.77% | | | | 0.70% | | | | 0.62% | | | | 0.56% | |
Research International Core | | | 0.88% | | | | 0.82% | | | | 0.75% | | | | 0.68% | |
| | | | |
Portfolio | | First
$500
Million | | | Excess
Over $500
Million | | | | | | | |
Equity Income | | | 0.65% | | | | 0.60% | | | | | | | | | |
| | | | |
Portfolio | | First
$200
Million | | | Excess
Over $200
Million | | | | | | | |
Index 600 Stock | | | 0.25% | | | | 0.20% | | | | | | | | | |
| | | | |
Portfolio | | First
$50
Million | | | Excess
Over $50
Million | | | | | | | |
International Equity | | | 0.85% | | | | 0.65% | | | | | | | | | |
| | | | |
| 256 | | Notes to Financial Statements | | |
Notes to Financial Statements
| | | | | | | | | | | | | | | | |
Portfolio | | First
$250
Million | | | Next
$250
Million | | | Next
$500
Million | | | Excess
Over $1.0
Billion | |
Emerging Markets Equity | | | 1.14% | | | | 1.08% | | | | 0.96% | | | | 0.78% | |
MSA, which is the manager and investment adviser of the Series Fund, contractually agreed to waive the management fee and absorb certain other operating expenses to the extent necessary so that Total Operating Expenses (excluding taxes, brokerage, other investment-related costs, interest and dividend expenses and charges and extraordinary expenses) will not exceed the following amounts:
| | | | | | | | |
Portfolio | | | | | Expiration | |
Focused Appreciation | | | 0.90 | % | | | April 30, 2013 | |
Large Cap Blend | | | 0.85 | % | | | April 30, 2013 | |
Large Company Value | | | 0.80 | % | | | April 30, 2013 | |
Domestic Equity | | | 0.75 | % | | | April 30, 2013 | |
Equity Income | | | 0.75 | % | | | April 30, 2013 | |
Mid Cap Value | | | 1.00 | % | | | April 30, 2013 | |
Index 600 Stock | | | 0.35 | % | | | April 30, 2013 | |
Small Cap Value | | | 1.00 | % | | | April 30, 2013 | |
International Growth | | | 1.10 | % | | | April 30, 2013 | |
Research International Core | | | 1.15 | % | | | April 30, 2013 | |
Emerging Markets Equity | | | 1.50 | % | | | April 30, 2013 | |
Short-Term Bond | | | 0.45 | % | | | April 30, 2013 | |
Long-Term U.S. Government Bond | | | 0.65 | % | | | April 30, 2013 | |
Inflation Protection | | | 0.65 | % | | | April 30, 2013 | |
Multi-Sector Bond | | | 0.90 | % | | | April 30, 2013 | |
Commodities Return Strategy | | | 0.95 | % | | | April 30, 2013 | |
Asset Allocation | | | 0.75 | % | | | April 30, 2013 | |
Growth Stock Portfolio — MSA has agreed to waive a portion of its management fee on assets over $500 million such that the management fee is 0.60% on the Portfolio’s first $50 million of assets, 0.50% on the next $50 million, 0.40% on the next $400 million and 0.35% on assets in excess of $500 million. MSA may terminate this fee waiver agreement at any time after April 30, 2013.
Focused Appreciation Portfolio — MSA has agreed to waive a portion of its management fee such that the management fee is 0.75% on the Portfolio’s first $100 million of assets, 0.70% on the next $200 million, 0.65% on the next $200 million and 0.60% on assets in excess of $500 million. MSA may terminate this fee waiver agreement at any time after April 30, 2013.
Large Cap Core Stock Portfolio — MSA has agreed to waive a portion of its management fee on assets over $500 million such that the management fee is 0.60% on the Portfolio’s first $50 million of assets, 0.50% on the next $50 million, 0.40% on the next $400 million and 0.35% on assets in excess of $500 million. MSA may terminate this fee waiver agreement at any time after April 30, 2013.
Mid Cap Growth Portfolio — MSA has agreed to waive a portion of its management fee on assets over $500 million such that the management fee is 0.80% on the Portfolio’s first $50 million of assets, 0.65% on the next $50 million, 0.50% on the next $400 million and 0.45% on assets in excess of $500 million. MSA may terminate this fee waiver agreement at any time after April 30, 2013.
Index 400 Stock Portfolio — MSA has agreed to waive a portion of its management fee on assets over $500 million such that the management fee is 0.25% on the Portfolio’s first $500 million of assets and 0.20% on assets in excess of $500 million. MSA may terminate this fee waiver agreement at any time after April 30, 2013.
Mid Cap Value Portfolio — MSA has agreed to waive a portion of its management fee on assets over $150 million such that the management fee is 0.85% on the Portfolio’s first $150 million of assets, 0.80% on the next $150 million and 0.75% on assets in excess of $300 million. MSA may terminate this fee waiver agreement at any time after April 30, 2013.
Small Cap Growth Portfolio — MSA has agreed to waive a portion of its management fee on assets over $500 million such that the management fee is 0.80% on the Portfolio’s first $50 million of assets, 0.65% on the next $50 million, 0.50% on the next $400 million and 0.45% on assets in excess of $500 million. MSA may terminate this fee waiver agreement at any time after April 30, 2013.
| | | | | | |
| | Notes to Financial Statements | | | 257 | |
Notes to Financial Statements
Small Cap Value Portfolio — MSA has agreed to waive a portion of its management fee on assets over $500 million such that the management fee is 0.85% on the Portfolio’s first $500 million of assets and 0.80% on assets in excess of $500 million. MSA may terminate this fee waiver agreement at any time after April 30, 2013.
International Equity Portfolio — MSA has agreed to waive a portion of its management fee such that the management fee for the Portfolio is 0.80% on the Portfolio’s first $50 million of assets, 0.60% on the next $950 million, 0.58% on the next $500 million and 0.51% on assets in excess of $1.5 billion. MSA may terminate this fee waiver agreement at any time after April 30, 2013.
Money Market Portfolio — For the period from January 1, 2012 to June 30, 2012; MSA voluntarily agreed to waive its entire management fee on a temporary basis. Effective July 1, 2012 and continuing for a period of time to be determined by MSA, MSA voluntarily agreed to waive a portion of the investment advisory fee such that the investment advisory fee is 0.15% of the Portfolio’s average net assets. This voluntary waiver will be reviewed periodically by MSA in light of market and economic developments and may be revised or discontinued at any time without advance notice.
Short-Term Bond Portfolio — MSA has agreed to waive a portion of its management fee on assets over $500 million such that the management fee is 0.35% on the Portfolio’s first $100 million of assets, 0.33% on the next $150 million, 0.30% on the next $250 million and 0.28% on assets in excess of $500 million. MSA may terminate this fee waiver agreement at any time after April 30, 2013.
High Yield Bond Portfolio — MSA has agreed to waive a portion of its management fee on assets over $1 billion such that the management fee is 0.60% on the Portfolio’s first $50 million of assets, 0.50% on the next $50 million, 0.40% on the next $900 million and 0.35% on assets in excess of $1 billion. MSA may terminate this fee waiver agreement at any time after April 30, 2013.
Commodities Return Strategy Portfolio — MSA has agreed to waive its management fee in an amount equal to the management fee paid to it by the Portfolio’s wholly owned Cayman Islands subsidiary fund. The fee waiver agreement will remain in effect for as long as the Portfolio remains invested in the subsidiary fund.
Balanced Portfolio — MSA has agreed to waive a portion of its management fee such that its management fee on assets invested in the International Growth Portfolio, Research International Core Portfolio, International Equity Portfolio and Emerging Markets Portfolio (“Underlying Portfolios”) is 0.05%. MSA may terminate this fee waiver agreement at any time after April 30, 2013.
Asset Allocation Portfolio — MSA has agreed to waive a portion of its management fee such that the management fee is 0.55% on the Portfolio’s first $100 million of assets, 0.45% on the next $150 million, and 0.35% on assets in excess of $250 million. In addition, MSA has agreed to waive a portion of its management fee such that its management fee on assets invested in Underlying Portfolios is 0.05%. MSA may terminate these fee waiver agreements at any time after April 30, 2013.
The investment advisory fee is paid to MSA. For the period January 1, 2012 to April 30, 2012, all of the Portfolios, except for the Balanced, Select Bond and Money Market Portfolios, paid custodian fees, audit expenses and certain other expenses. Effective May 1, 2012, the shareholders of the Series Fund approved an amendment and restatement of three previously existing investment advisory agreements into one Amended and Restated Advisory Agreement (“New Agreement”) which shifted, among other things, the responsibility to pay for certain of the Portfolios’ administrative and operating expenses not already assumed by the Portfolios from MSA to the Portfolios. Prior to May 1, 2012, the Balanced, Select Bond and Money Market Portfolios paid only limited operating expenses whereas the remaining Portfolios paid those and certain additional expenses. Under the new structure, these three Portfolios assumed responsibility for the additional expenses already paid by the other Portfolios, and all Portfolios assumed responsibility for additional day-to-day operating expenses. These additional expenses include the compensation of the Series Fund’s independent directors, compensation, benefits and expenses of the Series Fund’s chief compliance officer and his or her staff relating to their duties and functions for the Series Fund, expenses associated with the pricing of the shares of the Portfolios, and non-recurring or extraordinary expenses as they may arise. For the period May 1, 2012 through June 30, 2012, these additional expenses that were incurred as a result of the New Agreement were waived. MSA pays certain other costs in connection with the management of the investment of the assets of the Portfolios and the administration of the affairs of the Portfolios.
| | | | |
| 258 | | Notes to Financial Statements | | |
Notes to Financial Statements
Certain Portfolios, listed below, pay a portion of their custodian fees indirectly through expense offset arrangements. Custodian fees are reduced for Portfolios that maintain compensating balances in non-interest bearing accounts. These Portfolios could have invested the assets used to pay for the custodian fees, had the assets not been used in the expense offset arrangements. For the period ended December 31, 2012, the amounts paid through expense offset arrangements were as follows:
| | | | |
Portfolio | | Amount | |
Growth Stock Portfolio | | $ | 113 | |
Focused Appreciation Portfolio | | | 157 | |
Large Cap Core Stock Portfolio | | | 102 | |
Large Cap Blend Portfolio | | | 92 | |
Index 500 Stock Portfolio | | | 135 | |
Domestic Equity Portfolio | | | 117 | |
Equity Income Portfolio | | | 88 | |
Mid Cap Growth Stock Portfolio | | | 106 | |
Index 400 Stock Portfolio | | | 110 | |
Small Cap Growth Stock Portfolio | | | 131 | |
Index 600 Stock Portfolio | | | 139 | |
Small Cap Value Portfolio | | | 124 | |
Short-Term Bond Portfolio | | | 135 | |
High Yield Bond Portfolio | | | 161 | |
Asset Allocation Portfolio | | | 102 | |
With respect to certain Portfolios, MSA has engaged and oversees sub-advisers who manage the day- to- day investment operations of such Portfolios. MSA pays each sub-adviser a fee based on the average daily net assets of each such Portfolio out of its investment management fee.
Note 8. Federal Income Tax Matters
Taxable distributions from net investment income and realized capital gains in the Portfolios may differ from book amounts earned during the period due to differences in the timing of capital gains recognition and due to the reclassification of certain gains or losses between capital and income. The differences between cost amounts for book purposes and tax purposes are primarily due to the tax treatment of deferred losses, corporate actions and interest only securities.
It is the policy of the Portfolios to reclassify the net effect of permanent differences between book and taxable income to capital accounts on the Statements of Assets and Liabilities. Permanent differences primarily relate to character differences with respect to income on swaps, foreign currency transactions and paydowns on structured product investments.
Certain losses incurred by the Portfolios after October 31 are deferred and deemed to have occurred in the next fiscal year for income tax purposes. Deferred late year losses for federal income tax purposes are carried forward to offset future income or net realized gains. A summary of the Portfolios’ late year losses and capital loss carryovers as of December 31, 2012 is provided below:
| | | | | | | | | | | | | | | | | | | | | | | | |
| | | Late
Year
Capital
Losses | | | Late
Year
Ordinary
Losses | | | Capital Loss Carryover | |
| | | | | Amount
Subject to
Expiration | | | Expiration | | | Utilized in
2012 | | | Amount Not
Subject to
Expiration | |
| | | (Amounts in thousands) | |
Growth Stock Portfolio | | $ | - | | | $ | - | | | $ | - | | | | - | | | $ | 9,537 | | | $ | - | |
Focused Appreciation Portfolio | | | - | | | | - | | | | 1,071 | | | | 2017 | | | | 176 | | | | - | |
Large Cap Core Stock Portfolio | | | - | | | | - | | | | 9,207 | | | | 2017 | | | | 35,931 | | | | - | |
Large Cap Blend Portfolio | | | - | | | | - | | | | - | | | | - | | | | 12,340 | | | | - | |
Index 500 Stock Portfolio | | | - | | | | - | | | | - | | | | - | | | | - | | | | - | |
Large Company Value Portfolio | | | 106 | | | | 24 | | | | 3,453 | | | | 2017-2018 | | | | 3,107 | | | | - | |
Domestic Equity Portfolio | | | - | | | | - | | | | 56,245 | | | | 2016-2017 | | | | 72,493 | | | | - | |
Equity Income Portfolio | | | - | | | | - | | | | 1,372 | | | | 2017-2018 | | | | 12,421 | | | | - | |
Mid Cap Growth Stock Portfolio | | | - | | | | - | | | | - | | | | - | | | | 42,790 | | | | - | |
Index 400 Stock Portfolio | | | - | | | | - | | | | - | | | | - | | | | - | | | | - | |
Mid Cap Value Portfolio | | | - | | | | - | | | | - | | | | - | | | | 5,016 | | | | - | |
Small Cap Growth Stock Portfolio | | | - | | | | - | | | | 41,627 | | | | 2017 | | | | 40,135 | | | | - | |
Index 600 Stock Portfolio | | | - | | | | - | | | | - | | | | - | | | | - | | | | - | |
Small Cap Value Portfolio | | | - | | | | - | | | | - | | | | - | | | | - | | | | - | |
International Growth Portfolio | | | - | | | | - | | | | 61,099 | | | | 2017 | | | | - | | | | 6,529 | |
Research International Core Portfolio | | | - | | | | 36 | | | | 10,028 | | | | 2016-2018 | | | | 1,830 | | | | - | |
International Equity Portfolio | | | - | | | | - | | | | - | | | | - | | | | 18,962 | | | | - | |
| | | | | | |
| | Notes to Financial Statements | | | 259 | |
Notes to Financial Statements
| | | | | | | | | | | | | | | | | | | | | | | | |
| | | Late
Year
Capital
Losses | | | Late
Year
Ordinary
Losses | | | Capital Loss Carryover | |
| | | | | Amount
Subject to
Expiration | | | Expiration | | | Utilized in
2012 | | | Amount Not
Subject to
Expiration | |
| | | (Amounts in thousands) | |
Emerging Markets Equity Portfolio | | $ | - | | | $ | - | | | $ | - | | | $ | - | | | $ | - | | | $ | - | |
Money Market Portfolio | | | - | | | | - | | | | - | | | | - | | | | - | | | | 3 | |
Short-Term Bond Portfolio | | | 98 | | | | - | | | | - | | | | - | | | | - | | | | 524 | |
Select Bond Portfolio | | | - | | | | - | | | | - | | | | - | | | | - | | | | - | |
Long-Term U.S. Government Bond Portfolio | | | - | | | | - | | | | - | | | | - | | | | - | | | | - | |
Inflation Protection Portfolio | | | - | | | | - | | | | - | | | | - | | | | - | | | | - | |
High Yield Bond Portfolio | | | - | | | | - | | | | 32,411 | | | | 2016-2017 | | | | - | | | | 732 | |
Multi-Sector Bond Portfolio | | | - | | | | - | | | | - | | | | - | | | | - | | | | - | |
Commodities Return Strategy Portfolio | | | - | | | | - | | | | - | | | | - | | | | - | | | | - | |
Balanced Portfolio | | | - | | | | - | | | | - | | | | - | | | | 26,787 | | | | - | |
Asset Allocation Portfolio | | | - | | | | - | | | | 3,179 | | | | 2017 | | | | 18,288 | | | | - | |
Under the Regulated Investment Company Modernization Act of 2010 (“Modernization Act”), capital losses incurred during fiscal years after 2010 are carried forward indefinitely and retain the character of the original loss. In addition, such losses must be utilized prior to the losses incurred in the years preceding enactment.
When applicable, each of the Portfolios made distributions during the year of ordinary income and long-term capital gains. The tax character of distributions paid for the periods ended December 31, 2012 and 2011 was as follows:
| | | | | | | | |
| | | 2012 Distributions Paid From: | |
Portfolio | | Ordinary Income | | | Long-term
Capital Gain | |
| | | (Amounts in thousands) | |
Growth Stock Portfolio | | $ | 3,139 | | | $ | - | |
Focused Appreciation Portfolio | | | 1,010 | | | | - | |
Large Cap Core Stock Portfolio | | | 4,738 | | | | - | |
Large Cap Blend Portfolio | | | 736 | | | | 3,145 | |
Index 500 Stock Portfolio | | | 30,164 | | | | 30,165 | |
Large Company Value Portfolio | | | 1,609 | | | | - | |
Domestic Equity Portfolio | | | 8,652 | | | | - | |
Equity Income Portfolio | | | 5,715 | | | | - | |
Mid Cap Growth Stock Portfolio | | | 1,047 | | | | - | |
Index 400 Stock Portfolio | | | 4,436 | | | | 20,231 | |
Mid Cap Value Portfolio | | | 2,021 | | | | - | |
Small Cap Growth Stock Portfolio | | | - | | | | - | |
Index 600 Stock Portfolio | | | 2,285 | | | | 1,194 | |
Small Cap Value Portfolio | | | 1,466 | | | | 4,508 | |
International Growth Portfolio | | | 4,070 | | | | - | |
Research International Core Portfolio | | | 3,294 | | | | - | |
International Equity Portfolio | | | 35,832 | | | | - | |
Emerging Markets Equity Portfolio | | | 309 | | | | 93 | |
Money Market Portfolio | | | 676 | | | | - | |
Short-Term Bond Portfolio | | | 1,769 | | | | - | |
Select Bond Portfolio | | | 68,063 | | | | 10,069 | |
Long-Term U.S. Government Bond Portfolio | | | 8,953 | | | | 1,356 | |
Inflation Protection Portfolio | | | 6,029 | | | | 1,827 | |
High Yield Bond Portfolio | | | 26,613 | | | | - | |
Multi-Sector Bond Portfolio | | | 1,801 | | | | 659 | |
Commodities Return Strategy Portfolio | | | - | | | | 3 | |
Balanced Portfolio | | | 26,176 | | | | - | |
Asset Allocation Portfolio | | | 545 | | | | - | |
| | | | |
| 260 | | Notes to Financial Statements | | |
Notes to Financial Statements
| | | | | | | | |
| | | 2011 Distributions
Paid From: | |
Portfolio | | Ordinary Income | | | Long-term
Capital Gain | |
| | | (Amounts in thousands) | |
Growth Stock Portfolio | | $ | 4,271 | | | $ | - | |
Focused Appreciation Portfolio | | | 572 | | | | - | |
Large Cap Core Stock Portfolio | | | 4,523 | | | | - | |
Large Cap Blend Portfolio | | | 550 | | | | - | |
Index 500 Stock Portfolio | | | 28,570 | | | | 34,671 | |
Large Company Value Portfolio | | | 1,205 | | | | - | |
Domestic Equity Portfolio | | | 8,356 | | | | - | |
Equity Income Portfolio | | | 4,374 | | | | - | |
Mid Cap Growth Stock Portfolio | | | 2,086 | | | | - | |
Index 400 Stock Portfolio | | | 7,351 | | | | 22,879 | |
Mid Cap Value Portfolio | | | 2,135 | | | | - | |
Small Cap Growth Stock Portfolio | | | 1,448 | | | | - | |
Index 600 Stock Portfolio | | | 662 | | | | 1,245 | |
Small Cap Value Portfolio | | | 2,251 | | | | - | |
International Growth Portfolio | | | 3,374 | | | | - | |
Research International Core Portfolio | | | 1,332 | | | | - | |
International Equity Portfolio | | | 28,606 | | | | - | |
Emerging Markets Equity Portfolio | | | 1,340 | | | | - | |
Money Market Portfolio | | | 645 | | | | - | |
Short-Term Bond Portfolio | | | 2,493 | | | | - | |
Select Bond Portfolio | | | 68,303 | | | | 8,195 | |
Long-Term U.S. Government Bond Portfolio | | | 14,173 | | | | 3,014 | |
Inflation Protection Portfolio | | | 515 | | | | 737 | |
High Yield Bond Portfolio | | | 25,673 | | | | - | |
Multi-Sector Bond Portfolio | | | 13,385 | | | | 2,442 | |
Commodities Return Strategy Portfolio | | | - | | | | 3 | |
Balanced Portfolio | | | 62,036 | | | | - | |
Asset Allocation Portfolio | | | 5,767 | | | | - | |
As of December 31, 2012, the components of distributable earnings on a tax basis were as follows:
| | | | | | | | | | | | | | | | |
Portfolio | | Undistributed
Ordinary
Income | | | Undistributed
Long-Term
Gains | | | Accumulated
Losses | | | Unrealized
Appreciation
(Depreciation) | |
| | | (Amounts in thousands) | |
Growth Stock Portfolio | | $ | 5,017 | | | $ | 52,317 | | | $ | - | | | $ | 64,988 | |
Focused Appreciation Portfolio | | | 2,567 | | | | - | | | | (1,071 | ) | | | 88,826 | |
Large Cap Core Stock Portfolio | | | 5,721 | | | | - | | | | (9,207 | ) | | | 37,410 | |
Large Cap Blend Portfolio | | | 54 | | | | 13 | | | | - | | | | 547 | |
Index 500 Stock Portfolio | | | 37,338 | | | | 37,546 | | | | - | | | | 419,403 | |
Large Company Value Portfolio | | | 101 | | | | - | | | | (3,583 | ) | | | 7,499 | |
Domestic Equity Portfolio | | | 8,767 | | | | - | | | | (56,245 | ) | | | 13,238 | |
Equity Income Portfolio | | | 7,979 | | | | - | | | | (1,372 | ) | | | 33,884 | |
Mid Cap Growth Stock Portfolio | | | 3,305 | | | | 39,481 | | | | - | | | | 113,459 | |
Index 400 Stock Portfolio | | | 8,271 | | | | 16,975 | | | | - | | | | 76,888 | |
Mid Cap Value Portfolio | | | 2,889 | | | | 1,673 | | | | - | | | | 8,142 | |
Small Cap Growth Stock Portfolio | | | 2,247 | | | | - | | | | (41,627 | ) | | | 28,956 | |
Index 600 Stock Portfolio | | | 96 | | | | 101 | | | | - | | | | 7,123 | |
Small Cap Value Portfolio | | | 5,972 | | | | 2,290 | | | | - | | | | 107,936 | |
International Growth Portfolio | | | 5,271 | | | | - | | | | (67,628 | ) | | | 33,845 | |
Research International Core Portfolio | | | 458 | | | | - | | | | (10,064 | ) | | | 23,971 | |
International Equity Portfolio | | | 35,539 | | | | 421 | | | | - | | | | 190,141 | |
Emerging Markets Equity Portfolio | | | 2,345 | | | | 589 | | | | - | | | | 19,829 | |
Money Market Portfolio | | | 415 | | | | - | | | | (3 | ) | | | - | |
Short-Term Bond Portfolio | | | 273 | | | | - | | | | (621 | ) | | | 1,398 | |
Select Bond Portfolio | | | 62,323 | | | | 4,531 | | | | - | | | | 58,856 | |
Long-Term U.S. Government Bond Portfolio | | | 209 | | | | 15 | | | | - | | | | 747 | |
Inflation Protection Portfolio | | | 5,309 | | | | 2,509 | | | | - | | | | 17,949 | |
High Yield Bond Portfolio | | | 27,656 | | | | - | | | | (33,143 | ) | | | 28,708 | |
Multi-Sector Bond Portfolio | | | 16,562 | | | | 1,400 | | | | - | | | | 22,159 | |
Commodities Return Strategy Portfolio | | | - | | | | - | | | | - | | | | 66 | |
Balanced Portfolio | | | 78,088 | | | | 93,746 | | | | - | | | | 143,251 | |
Asset Allocation Portfolio | | | 7,353 | | | | - | | | | (3,179 | ) | | | 18,164 | |
| | | | | | | | | | | | | | | | |
| | | | | | |
| | Notes to Financial Statements | | | 261 | |
Notes to Financial Statements
Note 9. Voluntary Reimbursements
Northwestern Mutual voluntarily reimburses foreign equity portfolios for the benefit Northwestern Mutual receives from foreign dividend taxes charged against the Portfolios. The amounts reimbursed represent approximately 65% of the foreign dividend taxes withheld attributable to the portion of the Portfolio owned by Northwestern Mutual. Reimbursements are recorded when foreign dividend taxes are accrued.
Voluntary reimbursements for the periods ended December 31, 2012 and 2011 are summarized below:
| | | | | | | | |
Portfolio | | 2012
Reimbursements | | | 2011
Reimbursements | |
International Growth Portfolio | | $ | 330,126 | | | $ | 316,188 | |
International Equity Portfolio | | | 2,261,710 | | | | 2,789,589 | |
Research International Core Portfolio | | | 124,547 | | | | 134,488 | |
Emerging Markets Equity Portfolio | | | 305,832 | | | | 213,969 | |
Note 10. Guarantees
In the normal course of business the Portfolios enter into contracts that contain a variety of representations which provide general indemnifications. The Portfolios’ maximum exposure under these arrangements is unknown as this would involve future claims that may be made against the Portfolios that have not yet occurred. However, the Portfolios expect the risk of loss to be remote.
Note 11. Basis of Consolidation
The NMSF Cayman Commodity Fund, Ltd. (“Subsidiary”), a Cayman Islands exempted company, was incorporated on March 8, 2011 and is a wholly owned subsidiary of the Commodities Return Strategy Portfolio (“Commodities Portfolio”). Investing in the Subsidiary allows the Commodities Portfolio to achieve greater exposure to commodities-related investments in pursuit of its investment objectives as outlined in the prospectus and statement of additional information. The Commodities Portfolio is the sole shareholder of the Subsidiary with the intent that the Commodities Portfolio will retain all rights to the Subsidiary. The Commodities Portfolio may invest up to 25% of its total assets in the Subsidiary, which may invest without limitation in commodity index linked and commodity linked derivative instruments and other derivatives such as swap agreements and futures contracts that provide exposure to the performance of the commodities markets. The Subsidiary also may invest in fixed income securities. The Commodities Portfolio’s Schedule of Investments and related financial statements have been consolidated and includes the accounts of both the Commodities Portfolio and the Subsidiary. All inter-company transactions and balances have been eliminated.
Note 12. Investment Income and Securities Transactions
For the period ended December 31, 2012, transactions in securities other than money market investments were (amounts in thousands):
| | | | |
| 262 | | Notes to Financial Statements | | |
Notes to Financial Statements
| | | | | | | | | | | | | | | | |
Portfolio | | Total
Security
Purchases | | | U.S. Govt.
Security
Purchases | | | Total Security
Sales/Maturities | | | U.S. Govt.
Security
Sales/Maturities | |
Growth Stock Portfolio | | $ | 354,347 | | | $ | - | | | $ | 386,781 | | | $ | - | |
Focused Appreciation Portfolio | | | 66,457 | | | | - | | | | 51,646 | | | | - | |
Large Cap Core Stock Portfolio | | | 278,237 | | | | - | | | | 288,200 | | | | - | |
Large Cap Blend Portfolio | | | 94,641 | | | | - | | | | 95,847 | | | | - | |
Index 500 Stock Portfolio | | | 46,172 | | | | - | | | | 109,505 | | | | - | |
Large Company Value Portfolio | | | 34,523 | | | | - | | | | 27,547 | | | | - | |
Domestic Equity Portfolio | | | 513,789 | | | | - | | | | 534,931 | | | | - | |
Equity Income Portfolio | | | 103,698 | | | | - | | | | 56,066 | | | | - | |
Mid Cap Growth Stock Portfolio | | | 499,159 | | | | - | | | | 611,175 | | | | - | |
Index 400 Stock Portfolio (a) | | | 52,916 | | | | - | | | | 49,152 | | | | - | |
Mid Cap Value Portfolio | | | 127,439 | | | | - | | | | 108,405 | | | | - | |
Small Cap Growth Stock Portfolio | | | 275,233 | | | | - | | | | 320,556 | | | | - | |
Index 600 Stock Portfolio (b) | | | 34,605 | | | | - | | | | 23,244 | | | | - | |
Small Cap Value Portfolio | | | 22,145 | | | | - | | | | 30,404 | | | | - | |
International Growth Portfolio | | | 202,860 | | | | - | | | | 188,161 | | | | - | |
Research International Core Portfolio | | | 212,815 | | | | - | | | | 75,173 | | | | - | |
International Equity Portfolio | | | 543,656 | | | | - | | | | 525,170 | | | | - | |
Emerging Markets Equity Portfolio | | | 132,161 | | | | - | | | | 54,593 | | | | - | |
Money Market Portfolio | | | - | | | | - | | | | - | | | | - | |
Short-Term Bond Portfolio | | | 77,626 | | | | 306,610 | | | | 85,244 | | | | 309,664 | |
Select Bond Portfolio (c) | | | 733,924 | | | | 1,703,274 | | | | 638,301 | | | | 1,438,548 | |
Long-Term U.S. Government Bond Portfolio | | | 5,942 | | | | 199,212 | | | | 17,906 | | | | 225,511 | |
Inflation Protection Portfolio | | | 93,757 | | | | 126,833 | | | | 68,686 | | | | 96,386 | |
High Yield Bond Portfolio | | | 236,374 | | | | - | | | | 176,567 | | | | - | |
Multi-Sector Bond Portfolio | | | 169,111 | | | | 70,568 | | | | 60,023 | | | | 54,407 | |
Commodities Return Strategy Portfolio | | | 116,556 | | | | 42,284 | | | | 74,482 | | | | 34,070 | |
Balanced Portfolio (d) | | | 1,561,053 | | | | 932,776 | | | | 1,641,353 | | | | 794,750 | |
Asset Allocation Portfolio (e) | | | 193,583 | | | | 57,471 | | | | 197,081 | | | | 48,209 | |
| (a) | Includes (in thousands) $36 of sales directly with affliliates |
| (b) | Includes (in thousands) $36 of purchases directly with affiliates |
| (c) | Includes (in thousands) $4,183 of purchases directly with affliliates |
| (d) | Includes (in thousands) $4,215 of sales directly with affiliates |
| (e) | Includes (in thousands) $32 of purchases directly with affiliates |
| | | | | | |
| | Notes to Financial Statements | | | 263 | |
Notes to Financial Statements
Transactions with Affiliated Companies
An affiliated company is a company in which a Portfolio has ownership of at least 5% of the voting securities or which the Portfolio controls, is controlled by or with which the Portfolio is under common control. Transactions with affiliated companies during the period ended December 31, 2012 are as follows:
| | | | | | | | | | | | | | | | | | | | | | | | | | | | | | | | |
Portfolio | | Value at
12/31/2011 | | | Purchases | | | Sales | | | Value at
12/31/2012 | | | Realized
Gain
(Loss) | | | Income
Dividends | | | Capital Gain
Distributions | | | % Ownership,
12/31/2012 | |
| | | (Amounts in thousands) | |
Balanced | | | | | | | | | | | | | | | | | | | | | | | | | | | | | | | | |
Research International Core | | $ | – | | | $ | 92,361 | | | $ | – | | | $ | 106,843 | | | $ | – | | | $ | 1,361 | | | $ | – | | | | 40.9 | % |
International Equity | | | – | | | | 40,114 | | | | – | | | | 47,329 | | | | – | | | | 1,114 | | | | – | | | | 3.2 | |
Emerging Markets Equity | | | – | | | | 5,009 | | | | – | | | | 5,273 | | | | – | | | | 7 | | | | 2 | | | | 2.1 | |
| | | | | | | | | | | | | | | | | | | | | | | | | | | | | | | | |
| | $ | – | | | $ | 137,484 | | | $ | – | | | $ | 159,445 | | | $ | – | | | $ | 2,482 | | | $ | 2 | | | | | |
| | | | | | | | | | | | | | | | | | | | | | | | | | | | | | | | |
Asset Allocation | | | | | | | | | | | | | | | | | | | | | | | | | | | | | | | | |
Research International Core | | $ | – | | | $ | 14,209 | | | $ | – | | | $ | 16,437 | | | $ | – | | | $ | 209 | | | $ | – | | | | 6.3 | % |
International Equity | | | – | | | | 6,171 | | | | – | | | | 7,281 | | | | – | | | | 171 | | | | – | | | | 0.5 | |
Emerging Markets Equity | | | – | | | | 1,002 | | | | – | | | | 1,055 | | | | – | | | | 2 | | | | – | | | | 0.4 | |
| | | | | | | | | | | | | | | | | | | | | | | | | | | | | | | | |
| | $ | – | | | $ | 21,382 | | | $ | – | | | $ | 24,773 | | | $ | – | | | $ | 382 | | | $ | – | | | | | |
| | | | | | | | | | | | | | | | | | | | | | | | | | | | | | | | |
Note 13. Litigation
The Index 400 Stock, Index 500 Stock, Small Cap Value and Equity Income Portfolios are among the defendants in lawsuits and/or adversary proceedings (the “Actions”) in bankruptcy proceedings arising out of investments made by those Portfolios in two separate companies. These Actions seek to recover all payments made to beneficial owners of common stock in 2007 in connection with leveraged buy-out transactions involving each company. The Actions allege no misconduct by the Portfolios or management, and management intends to vigorously defend these Actions. The defendant shareholders have filed motions to dismiss both lawsuits. The value of the proceeds received by these Portfolios in 2007, and the percentage the proceeds represent of each Portfolio’s net assets as of December 31, 2012, were: Index 400 Stock Portfolio $5,600,000 (1.17% of net assets); Index 500 Stock Portfolio $977,000 (0.06% of net assets); Small Cap Value Portfolio $618,000 (0.15% of net assets); and Equity Income Portfolio $2,873,000 (0.70% of net assets).
Note 14. Subsequent Events
Effective January 1, 2013, with respect to the Money Market Portfolio, MSA voluntarily agreed to waive its entire investment advisory fee commencing on January 1, 2013 and continuing for a period of time to be determinded by MSA.
Northwestern Mutual is requesting approval of the Securities and Exchange Commission (“SEC”) to substitute an unaffiliated mutual fund for the Commodities Return Strategy Portfolio (“Commodities Portfolio”) as an investment option under the variable annuity and variable life insurance contracts issued by Northwestern Mutual. Subject to the SEC’s approval of such request, the Commodities Portfolio is expected to dissolve immediately following the effectiveness of such substitution (“Substitution”). The date for completing the Substitution is subject to SEC approval, which has not yet been received. Northwestern Mutual or its affiliates will bear all expenses incurred in connection with the Substitution. As of December 31, 2012, Northwestern Mutual (a related party) owned 50,003,499.32 shares in the Commodities Portfolio with a value of $39,402,757 which represented 25.8% of the Commodities Portfolio’s net assets. Northwestern Mutual intends to redeem those shares prior to the Substitution.
| | | | |
| 264 | | Notes to Financial Statements | | |
Report of Independent Registered Public Accounting Firm
To the Board of Directors and Shareholders of
Northwestern Mutual Series Fund, Inc.
In our opinion, the accompanying statements of assets and liabilities, including the schedules of investments, and the related statements of assets and liabilities, of operations, of changes in net assets, of cash flows for the Long-Term U.S. Government Bond Portfolio and the financial highlights present fairly, in all material respects, the financial position of Growth Stock Portfolio, Focused Appreciation Portfolio, Large Cap Core Stock Portfolio, Large Cap Blend Portfolio, Index 500 Stock Portfolio, Large Company Value Portfolio, Domestic Equity Portfolio, Equity Income Portfolio, Mid Cap Growth Stock Portfolio, Index 400 Stock Portfolio, Mid Cap Value Portfolio, Small Cap Growth Stock Portfolio, Index 600 Stock Portfolio, Small Cap Value Portfolio, International Growth Portfolio, Research International Core Portfolio, International Equity Portfolio, Emerging Markets Equity Portfolio, Money Market Portfolio, Short-Term Bond Portfolio, Select Bond Portfolio, Long-Term U.S. Government Bond Portfolio, Inflation Protection Portfolio, High Yield Bond Portfolio, Multi-Sector Bond Portfolio, Commodities Return Strategy Portfolio, Balanced Portfolio and Asset Allocation Portfolio (constituting Northwestern Mutual Series Fund, Inc., hereafter referred to as the “Fund”) at December 31, 2012, the results of each of their operations for the year then ended, the changes in each of their net assets for each of the two years in the period then ended, the cash flows for Long-Term U.S. Government Bond Portfolio for the year then ended and the financial highlights for each of the periods presented, in conformity with accounting principles generally accepted in the United States of America. These financial statements and financial highlights (hereafter referred to as “financial statements”) are the responsibility of the Fund’s management; our responsibility is to express an opinion on these financial statements based on our audits. We conducted our audits of these financial statements in accordance with the standards of the Public Company Accounting Oversight Board (United States). Those standards require that we plan and perform the audit to obtain reasonable assurance about whether the financial statements are free of material misstatement. An audit includes examining, on a test basis, evidence supporting the amounts and disclosures in the financial statements, assessing the accounting principles used and significant estimates made by management, and evaluating the overall financial statement presentation. We believe that our audits, which included confirmation of securities at December 31, 2012 by correspondence with the custodians and brokers, provide a reasonable basis for our opinion.
February 28, 2013
| | | | | | |
| | Report of Independent Registered Public Accounting Firm | | | 265 | |
Proxy Voting and Portfolio Holdings
Proxy Voting Guidelines
A description of the policies and procedures that the Portfolios use to determine how to vote proxies relating to portfolio securities is available without charge, upon request, by calling toll free 1-888-455-2232. It is also available on the Securities and Exchange Commission’s website at http://www.sec.gov.
Information regarding how the Portfolios voted proxies relating to portfolio securities during the most recent twelve-month period ended June 30 is available without charge, upon request, by calling toll free 1-888-455-2232. It is also available on the Securities and Exchange Commission’s website at http://www.sec.gov.
Quarterly Filing of Portfolio Holdings
Each Portfolio files its complete schedule of portfolio holdings with the Securities and Exchange Commission (SEC) for the first and third quarters of each fiscal year on Form N-Q. The Portfolio’s Form N-Q filings are available (i) on the SEC website at http://www.sec.gov, and may be reviewed and copied at the SEC’s Public Reference Room in Washington, DC. Information on the Public Reference Room may be obtained by calling 1-800-SEC-0330. The Portfolios also make their complete schedule of portfolio holdings for the most recent quarter of their fiscal year available on the Internet at www.northwesternmutual.com.
| | | | |
| 266 | | Proxy Voting and Portfolio Holdings | | |
Director and Officer Information (Unaudited)
Northwestern Mutual Series Fund, Inc.
The name, address and year of birth of the directors, as well as their affiliations, positions held with the Series Fund, principal occupations during the past five years and the number of portfolios overseen in the Northwestern Mutual fund complex, are shown below as of December 31, 2012. Each director (whenever elected) shall hold office until the next annual meeting of shareholders and until his or her successor is elected and qualifies or until his or her earlier death, resignation or removal, provided no director shall serve a term or successive terms totaling more than twelve (12) years. The twelve-year service limitation commences for all directors on the later of May 1, 2003, or the date of his or her election or appointment to the Board. Notwithstanding the foregoing, the Series Fund’s By-Laws provide that a director who has attained the age of seventy (70) on or before the first quarterly Board meeting in a calendar year shall retire effective at the end of the meeting. If a director attains age seventy (70) after the first quarterly Board meeting in a calendar year, he or she shall retire effective at the end of the first quarterly Board meeting in the following calendar year. The statement of additional information contains additional information about Series Fund directors and is available without charge, upon request, by calling 1-888-455-2232.
Independent Directors
| | | | | | | | |
Name, Address, and
Year of Birth | | Position | | Length of
Time Served | | Number of Portfolios
in Fund Complex
Overseen by Director | | Other Directorships
Held |
| | | | |
Michael G. Smith
720 East Wisconsin Avenue Milwaukee, WI 53202 1944 | | Director | | Since
2003 | | 28 | | Trustee of The Ivy Family of
Funds (2 registered
investment companies - 29
portfolios), Director of the
TDX Independence Funds,
Inc. (5 portfolios), Director
of CTMG, Inc. and Cox
Business School, Southern
Methodist University |
|
| Principal Occupation During Past 5 Years: Private investor; retired since 1999. |
| | | | |
Miriam M. Allison
720 East Wisconsin Avenue Milwaukee, WI 53202 1947 | | Director | | Since
2006 | | 28 | | Director of Wasatch Funds,
Inc. (18 portfolios) |
|
| Principal Occupation During Past 5 Years: Rancher since 2004. From 2001 to 2005, Chairman of UMB Fund Services, Inc. (formerly Sunstone Financial Group, Inc.), a mutual fund service provider. |
| | | | |
Robert H. Huffman III
720 East Wisconsin Avenue Milwaukee, WI 53202 1959 | | Director | | Since
2007 | | 28 | | None |
|
| Principal Occupation During Past 5 Years: Co-Founder and Managing Partner of Relative Value Partners, LLC, a registered investment adviser since 2004. |
| | | | |
Christy L. Brown
720 East Wisconsin Avenue Milwaukee, WI 53202 1965 | | Director | | Since
2012 | | 28 | | None |
|
| Principal Occupation During Past 5 Years: Since October 2012, Chief Executive Officer, Girl Scouts of Wisconsin Southeast. From 2007 to 2012, Vice Chancellor, Finance and Administrative Affairs, University of Wisconsin, Milwaukee. Prior thereto, Executive Vice President and General Counsel, Milwaukee Area Technical College. |
| | | | | | |
| | Director and Officer Information | | | 267 | |
Director and Officer Information (Unaudited)
| | | | | | | | |
Name, Address, and
Year of Birth | | Position | | Length of
Time Served | | Number of Portfolios
in Fund Complex Overseen by Director | | Other Directorships Held |
| | | | |
Gail L. Hanson 720 East Wisconsin Avenue Milwaukee, WI 53202 1955 | | Director | | Since 2012 | | 28 | | Director of Artisan
Funds, Inc. (12
portfolios) |
|
| Principal Occupation During Past 5 Years: Since February 2011, Chief Financial Officer, Aurora Health Care. Prior thereto, Deputy Executive Director, State of Wisconsin Investment Board. |
| | | | |
| Other Directors | | | | | | | | |
Name, Address, and
Year of Birth | | Position | | Length of
Time Served | | Number of Portfolios
in Fund Complex Overseen by Director | | Other Directorships Held |
| | | | |
| Jefferson V. DeAngelis 720 East Wisconsin Avenue Milwaukee, WI 53202 1958 | | Chairman of the Board | | Since 2012 | | 28 | | None |
|
| Principal Occupation During Past 5 Years: President of Mason Street Advisors, LLC (MSA) since 2008. Senior Vice President – Public Markets since 2009 of Northwestern Mutual and Chief Investment Officer of Northwestern Mutual Wealth Management since November, 2012. Prior thereto, Managing Director of Fixed Income of MSA from 1992 to 2008. |
Northwestern Mutual Series Fund, Inc.
Executive Officers
| | | | |
Name, Address, and
Year of Birth | | Position | | Length of
Time Served |
| | |
| R. David Ells 720 East Wisconsin Avenue Milwaukee, WI 53202 1968 | | President | | Since 2010 |
|
| Principal Occupation During Past 5 Years: Managing Director of Mason Street Advisors, LLC (MSA) since 2010. Prior thereto, Director of MSA from 2004 to 2010. |
| | |
Walter M. Givler
720 East Wisconsin Avenue
Milwaukee, WI 53202
1957 | | Vice President;
Chief Financial Officer & Treasurer | | Since 2003 |
|
| Principal Occupation During Past 5 Years: Vice President – Accounting Policy of Northwestern Mutual since 2007. |
| | |
| Kate M. Fleming 720 East Wisconsin Avenue Milwaukee, WI 53202 1962 | | Vice President - Operations | | Since 2004 |
|
| Principal Occupation During Past 5 Years: Vice President – Operations since 2004 and Treasurer since 2008 of Mason Street Advisors, LLC |
| | |
| Barbara E. Courtney 720 East Wisconsin Avenue Milwaukee, WI 53202 1957 | | Controller & Chief Accounting Officer | | Since 1996 |
|
| Principal Occupation During Past 5 Years: Director of Mutual Fund Accounting of Northwestern Mutual since 2002. |
| | | | |
| 268 | | Director and Officer Information | | |
Director and Officer Information (Unaudited)
| | | | |
Name, Address, and
Year of Birth | | Position | | Length of
Time Served |
| | |
| Michael W. Zielinski 720 East Wisconsin Avenue Milwaukee, WI 53202 1974 | | Chief Compliance Officer | | Since 2006 |
|
| Principal Occupation During Past 5 Years: Chief Compliance Officer of Mason Street Advisors, LLC since 2006. |
| | |
| Randy M. Pavlick 720 East Wisconsin Avenue Milwaukee, WI 53202 1959 | | Secretary | | Since 2006 |
|
| Principal Occupation During Past 5 Years: Assistant General Counsel of Northwestern Mutual and Assistant Secretary of Mason Street Advisors, LLC, each since 2004. |
| | | | | | |
| | Director and Officer Information | | | 269 | |
Approval and Continuance of Investment
Sub-Advisory Agreements
Northwestern Mutual Series Fund, Inc.
Annual Contract Review Process
Under Section 15(c) of the Investment Company Act of 1940, as amended (the “1940 Act”) contracts for investment advisory services are required to be reviewed, evaluated and approved by a majority of an investment company’s independent directors each year. In addition, each investment company is required to disclose in its annual or semi-annual report, as applicable, the material factors and conclusions that formed the basis for the board’s approval or renewal of any investment advisory agreements, including sub-advisory agreements, within the investment company’s most recently completed fiscal half-year period.
At least annually, the Board of Directors (the “Board”) of Northwestern Mutual Series Fund, Inc. (the “Series Fund”) considers and votes upon the renewal of the investment sub-advisory agreements between Mason Street Advisors, LLC (“Mason Street Advisors”) and each of the sub-advisers of those portfolios of the Series Fund (each, a “Portfolio” and collectively, the “Portfolios”) for which Mason Street Advisors has appointed a sub-adviser. In order to afford the Board the opportunity to focus on a smaller number of relationships at any one meeting, the Board considers the annual continuation of the sub-advisory agreements on a staggered basis during the course of the year.
Board Approvals During the Six-Month Period Ended December 31, 2012
At its August 9, 2012 meeting, the Series Fund Board, including the directors who are not “interested persons” (as that term is defined in the 1940 Act) of the Series Fund or Mason Street Advisors (“Independent Directors”), unanimously approved the continuance of (1) the Amended and Restated Investment Sub-Advisory Agreement between Mason Street Advisors and Janus Capital Management LLC (“Janus”) relating to the Series Fund’s Focused Appreciation Portfolio; (2) the Investment Sub-Advisory Agreement between Mason Street Advisors and Janus relating to the Series Fund’s International Growth Portfolio and (3) the Investment Sub-Advisory Agreement between Mason Street Advisors and American Century Investment Management, Inc. (“ACI”) relating to the Series Fund’s Large Company Value Portfolio, Inflation Protection Portfolio and Mid Cap Value Portfolio.
At its August 9, 2012 meeting, the Series Fund Board, including the Independent Directors, also unanimously approved a new Investment Sub-Advisory Agreement between Mason Street Advisors and Delaware Management Company, a Series of Delaware Management Business Trust (“Delaware”) relating to the Domestic Equity Portfolio (the “Delaware Sub-Advisory Agreement”) and a new Investment Sub-Advisory Agreement between Mason Street Advisors and Fiduciary Management, Inc. (“FMI”) relating to the Large Cap Blend Portfolio (the “FMI Sub-Advisory Agreement” and, together with the Delaware Sub-Advisory Agreement, the “New Sub-Advisory Agreements”). Delaware and FMI are sometimes collectively referred to hereinafter as the “New Sub-Advisers.”
At its November 15, 2012 meeting, the Series Fund Board, including the Independent Directors, unanimously approved the continuance of (1) the Second Amended and Restated Investment Sub-Advisory Agreement between Mason Street Advisors and T. Rowe Price Associates, Inc. (“T. Rowe Price”) relating to the Series Fund’s Small Cap Value Portfolio and Equity Income Portfolio; (2) the Amended and Restated Investment Sub-Advisory Agreement between Mason Street Advisors and Pacific Investment Management Company LLC (“PIMCO”) relating to the Series Fund’s Long-Term U.S. Government Bond Portfolio and Multi-Sector Bond Portfolio and (3) the Amended and Restated Investment Sub-Advisory Agreement between Mason Street Advisors and Credit Suisse Asset Management, LLC (“Credit Suisse”) relating to the Series Fund’s Commodities Return Strategy Portfolio. The Board also approved a related Amended and Restated Investment Sub-Advisory Agreement between Mason Street Advisors and Credit Suisse covering the NMSF Cayman Commodity Fund Ltd., a wholly-owned Cayman Islands subsidiary of the Commodities Return Strategy Portfolio. Janus, ACI, T. Rowe Price, PIMCO and Credit Suisse are sometimes collectively referred to hereinafter as the “Sub-Advisers,” their respective sub-advised Portfolios are collectively referred to herein as the “Sub-Advised Portfolios” and the respective Investment Sub-Advisory Agreements with such Sub-Advisers are collectively referred to herein as the “Existing Sub-Advisory Agreements.”
Approval of New Sub-Advisory Agreements Relating to Domestic Equity and Large Cap Blend Portfolios
In determining whether to approve the New Sub-Advisory Agreements on behalf of the Domestic Equity and Large Cap Blend Portfolios, the directors requested and received detailed information from Mason Street Advisors and the New Sub-Advisers to
| | | | |
| 270 | | Approval and Continuance of Investment Sub-Advisory Agreements | | |
Approval and Continuance of Investment
Sub-Advisory Agreements
assist them in their evaluation, including information compiled by certain independent providers of evaluative data. The Independent Directors also received a memorandum from their counsel advising them of their responsibilities in connection with the approval of the New Sub-Advisory Agreements and summarizing the legal standards governing the review of the Agreements. In addition, during the course of their deliberations, the Independent Directors had the opportunity to meet privately without representatives of Mason Street Advisors and the New Sub-Advisers present, and were represented throughout the process by legal counsel to the Independent Directors.
The material factors and conclusions that formed the basis for the Board’s determination to approve the New Sub-Advisory Agreements include those discussed below. The Board’s decision was reached after extensive research and qualitative and quantitative analysis of numerous candidate firms and their respective organizational structures, investment processes and long-term performance records. In addition to the information provided to them in anticipation of and at the May 10, 2012 and August 9, 2012 meetings, the directors considered the in-person presentations from Delaware and FMI at the August 9, 2012 meeting and Delaware’s and FMI’s respective responses to the directors’ questions during that meeting. The directors also considered the detailed analysis conducted by Mason Street Advisors and provided to the directors, which was based on Mason Street Advisors’ due diligence visit to, and interview of, each of the New Sub-Advisers. The directors were provided with, and considered an analysis that included details regarding each New Sub-Adviser’s investment performance, investment process, investment professionals and firm and operational and enterprise issues. The directors evaluated a variety of information they deemed relevant. No one particular factor was identified as controlling, but rather it was a combination of all the factors and conclusions that formed the basis for the determinations made by the directors.
Nature, Extent and Quality of Services. The directors evaluated the nature, scope, extent and quality of services to be provided by Delaware with respect to the Domestic Equity Portfolio and by FMI with respect to the Large Cap Blend Portfolio. The directors considered the process followed to identify potential sub-advisers for each Portfolio, and the rationale for the recommendation of Delaware as sub-adviser for the Domestic Equity Portfolio and FMI as sub-adviser for the Large Cap Blend Portfolio. The directors also considered the breadth and depth of experience of each of the New Sub-Advisers in managing other accounts using similar investment strategies, including other mutual funds using substantially similar strategies. The directors’ considerations included information about each New Sub-Adviser’s organization and the tenure, experience and performance of the New Sub-Advisers’ respective investment management teams. With respect to Delaware, the directors considered Delaware’s portfolio management team structure and the investment decision-making process among the members of the team. The directors also took into consideration Delaware’s consistent, understandable and disciplined investment approach and Delaware’s apparent commitment to the large cap value mandate. The directors also considered Delaware’s high conviction investment process and their favorable impression of the construction of similarly managed portfolios. With respect to FMI, the directors considered FMI’s investment management team structure and the continuity of the team. The directors also took into consideration FMI’s focused investment approach and its low turnover investment process. In connection with the foregoing, the directors noted that FMI’s focused approach provided a contrast to the offerings available to owners of variable annuity and variable life insurance products in the large cap blend space. The directors also considered FMI’s demonstrated attention to asset size. The directors took into consideration FMI’s private, employee-owned structure. The directors noted that the portfolio managers’ retirement plan assets were invested in the same manner as the client mandates managed by FMI, and observed that this created an alignment with the interests of FMI’s clients. Finally, the directors took into consideration each New Sub-Adviser’s general reputation and the resources available to be committed in managing the Portfolios. Based on their review of these factors and other factors deemed relevant, the directors concluded that they were satisfied with the nature, extent and quality of services to be provided by the New Sub-Advisers with respect to the Portfolios, and the resources to be committed by the New Sub-Advisers in providing such services.
Investment Performance. Because Delaware and FMI were newly appointed sub-advisers, the directors, at the meeting, could not consider the New Sub-Advisers’ respective investment performance in managing the Domestic Equity and Large Cap Blend Portfolios as a factor in evaluating the New Sub-Advisory Agreements. However, the directors considered each new Sub-Adviser’s performance record for other accounts, including other mutual funds, with investment objectives, investment policies and investment strategies substantially similar to the Portfolio to be managed by such New Sub-Adviser. In addition to absolute performance and risk adjusted performance for these similar accounts for both short and long-term periods, the directors considered a comparison of the performance to the returns of a peer group and universe of comparable funds underlying variable insurance products as compiled by an independent research firm, and to the performance averages of the respective Morningstar and Lipper categories for the same periods. The directors evaluated the similar accounts’ relative performance, and considered independent rankings and ratings where applicable, to provide an objective comparative benchmark against which they could assess the experience and ability of the New Sub-Advisers in managing similar accounts. The directors specifically noted the strong performance of such accounts over both the short and long-term periods, including,
| | | | | | |
| | Approval and Continuance of Investment Sub-Advisory Agreements | | | 271 | |
Approval and Continuance of Investment
Sub-Advisory Agreements
with respect to FMI, in down markets. Based on these and other factors deemed relevant, the directors concluded that they were satisfied with the experience and capabilities of each New Sub-Adviser and the personnel to be associated with the Portfolios.
Management Fees and Other Expenses. In evaluating the management fees paid by the Domestic Equity and Large Cap Blend Portfolios, the directors considered the actual and contractual fees paid by each Portfolio under the Amended and Restated Advisory Agreement dated April 30, 2012, between Mason Street Advisors and the Series Fund with respect to each Portfolio (the “Advisory Agreement”). The directors also considered the sub-advisory fees to be paid by Mason Street Advisors to each New Sub-Adviser out of its management fee, including a comparison of those fees with fees charged by each New Sub-Adviser for similarly managed accounts, including other mutual funds. The directors considered a comparison of the actual and contractual management fees of each Portfolio and those of an independently selected peer group of mutual funds for each Portfolio. The directors considered the comparative data as a guide to help assess the reasonableness of each Portfolio’s advisory fee, although they acknowledged that it was difficult to make precise comparisons with other funds since the exact nature of services provided by peers is often not apparent. The directors also separately considered the allocation between Mason Street Advisors and each New Sub-Adviser of the respective Portfolio’s investment advisory fee (i.e. the amount of the advisory fee retained by Mason Street Advisors relative to that paid to each New Sub-Adviser as a sub-advisory fee). They determined that the allocation was reasonable and the product of arm’s length negotiation between Mason Street Advisors and each new Sub-Adviser.
The directors did not consider the management fees charged to other Mason Street Advisors’ clients as particularly relevant, because substantially all of those accounts were managed for affiliates of Mason Street Advisors and, as such, those accounts were priced based on different factors and considerations and, in some instances, had investment objectives and policies different than those of the Portfolios.
The directors further considered the total operating expenses of each Portfolio and a comparison of those expenses with such Portfolio’s peer group. The directors noted that the Domestic Equity Portfolio was projected to continue to be in the top Lipper quartile (meaning lowest) and the Large Cap Blend Portfolio was projected to continue to be in the second Lipper quartile (meaning second lowest), with respect to total operating expenses. In considering the level of management fees, the directors also considered the structure and size of each Portfolio, the expenses assumed by Mason Street Advisors, the existing expense cap arrangement agreed to by Mason Street Advisors for each Portfolio and the amounts waived or reimbursed by Mason Street Advisors under such agreements. Based on their review of the management and other expenses, the comparative data, and other factors deemed relevant by the directors, the directors concluded that the management fees and total operating expenses of each Portfolio were reasonable in relation to the nature, scope and quality of services to be provided.
Costs and Profitability. The directors also considered Mason Street Advisors’ pricing methodology for its services as investment adviser and for the products of which the Portfolios were investment options. Also considered was the financial condition of Mason Street Advisors and information concerning Mason Street Advisors’ costs and profitability with respect to its relationship with the Portfolios in general as well as in light of the sub-advisory fees negotiated with each New Sub-Adviser. Mason Street Advisors provided a profitability analysis for each Portfolio that included the expense allocation methodology used, net income for the Portfolio and net and gross profit margins for the Portfolio. In connection with its review of the profitability of Mason Street Advisors’ services to the Portfolios, the directors also considered services provided by affiliates of Mason Street Advisors. The directors also received information on soft dollar arrangements, including its policies for allocating brokerage and research services, and any other benefits to Mason Street Advisors or its affiliates arising from the Portfolios.
The directors recognized that there are limitations inherent in allocating costs and calculating profitability for an organization such as Mason Street Advisors, and that it is difficult to make comparisons of profitability among investment advisers and clients because comparative information is not generally publicly available and, when available, such information has been developed using a variety of assumptions and other factors. Based on their review of the profitability analysis for each Portfolio, the directors concluded that they were satisfied that Mason Street Advisors’ level of profitability from its relationship with the Portfolios was not excessive.
Economies of Scale. The directors also considered whether each Portfolio’s expense structure permitted economies of scale to be shared with such Portfolio’s investors. The directors considered that the fee schedule for each Portfolio contained breakpoints and the extent to which the Portfolios may benefit from economies of scale through those breakpoints. The directors also took into consideration the expense cap agreement that was in place with respect to each Portfolio. The directors
| | | | |
| 272 | | Approval and Continuance of Investment Sub-Advisory Agreements | | |
Approval and Continuance of Investment
Sub-Advisory Agreements
also considered the total assets of each Portfolio and the expense ratios of the Portfolios. Based on this information, the Board concluded that the fee schedule and breakpoints evidenced an appropriate sharing of economies of scale between each Portfolio and Mason Street Advisors.
Other Information. The directors were presented with other information intended to assist them in their consideration of the approval of the New Sub-Advisory Agreements, including information about each New Sub-Adviser’s risk management infrastructure, compliance structure, compliance policies and procedures, brokerage practices and use of soft dollars. The directors also received information regarding pending or recent litigation or regulatory actions to which each New Sub-Adviser or its respective affiliates may have been a party, and responses to those actions, information regarding portfolio turnover, business continuity, succession planning, portfolio manager compensation, codes of ethics, and proxy voting policies and procedures.
Conclusions of the Directors. Based on a consideration of all information they deemed relevant in its totality, the Board, including the Independent Directors, and assisted by the advice of legal counsel independent of Mason Street Advisors, in the exercise of its business judgment concluded that it was in the best interest of the Domestic Equity Portfolio to approve the New Sub-Advisory Agreement between Mason Street Advisors and Delaware and in the best interest of the Large Cap Blend Portfolio to approve the New Sub-Advisory Agreement between Mason Street Advisors and FMI.
Restatement and Continuation of Existing Sub-Advisory Agreements Between Mason Street Advisors and Certain Sub-Advisers
In determining whether to approve the continuance of the Existing Sub-Advisory Agreements on behalf of the Series Fund, the Board requested and received detailed information from Mason Street Advisors and the Sub-Advisers to assist them in their evaluation, including information compiled by certain independent providers of evaluative data. The Board also had available Mason Street Advisors’ Executive Summary and Overview regarding each of the Sub-Advisers and other materials prepared by Mason Street Advisors, which contained detailed information concerning the expenses, performance, brokerage commissions, portfolio turnover, style consistency and other factors with respect to each of the Sub-Advised Portfolios, as well as a recap of the Sub-Advisers’ responses to the compliance questions contained in each Sub-Adviser’s Section 15(c) Report and the observations of Mason Street Advisors’ compliance group regarding the compliance structure and practices of each of the Sub-Advisers. While particular focus is given to an evaluation of the services, performance, fees, expenses and certain other relevant information under such Agreements at the meeting at which their continuation is formally considered, the evaluation process with respect to the Sub-Advisers and the nature, extent and quality of the services they provide to the Sub-Advised Portfolios, together with related information, is an ongoing one. As a result, the Board’s consideration of the nature, extent and quality of services, and the performance, fees, expenses and other relevant factors was informed by information provided and deliberations that occurred at other meetings throughout the year.
The Independent Directors also received a memorandum from their counsel advising them of their responsibilities in connection with the annual review of the Existing Sub-Advisory Agreements and summarizing the legal standards governing the renewal of such Agreements. The Independent Directors reviewed these standards with their counsel during the course of these meetings, including how these standards should be applied to the review of information relating to the Sub-Advisers under the Series Fund’s manager of managers structure. During the course of their deliberations, the Independent Directors had the opportunity to meet privately without representatives of Mason Street Advisors and the Sub-Advisers present, and were represented throughout the process by legal counsel.
The material factors and conclusions that formed the basis for the Board’s approval of the continuance of each of the Existing Sub-Advisory Agreements with respect to each Sub-Advised Portfolio include those discussed below. In addition to the information provided to them at the meetings by Mason Street Advisers and the Sub-Advisers, the directors considered their experience with and knowledge of the nature and quality of the services provided by the Sub-Advisers and their discussions with representatives of Mason Street Advisers, its affiliates and each Sub-Adviser. The directors received a presentation from representatives of each Sub-Adviser involved in the management of the respective Sub-Advised Portfolios. The directors evaluated a variety of information they deemed relevant on a Portfolio by Portfolio basis. No one particular factor was identified as determinative, but rather it was a combination of all the factors and conclusions that formed the basis for the determinations made by the directors, and different directors may have placed greater weight on certain factors than did other directors.
| | | | | | |
| Approval and Continuance of Investment Sub-Advisory Agreements | | | 273 | |
Approval and Continuance of Investment
Sub-Advisory Agreements
Nature, Extent and Quality of Services. In considering the nature, extent and quality of each Sub-Adviser’s services, factors considered by the directors included the Sub-Adviser’s overall business, organization and management structure, the tenure and experience of the Sub-Adviser’s investment personnel in general and the experience of the portfolio managers of each of the Sub-Advised Portfolios in particular, and changes in key personnel. The directors also received information provided by each Sub-Adviser with respect to its financial condition and assets under management, and noted in particular T. Rowe Price’s strong earnings and positive asset flows. The directors were provided with information regarding a recent workforce reduction implemented by Credit Suisse, but concluded that the reduction was not likely to impact services provided to the Commodities Return Strategy Portfolio based on Credit Suisse’s stated intention to continue to support and grow its commodities business. In connection with the renewal of the Existing Sub-Advisory Agreement with PIMCO, the directors considered recent changes to the organizational structure for the asset management business of PIMCO’s parent company, and concluded that the changes should not have an adverse effect on services provided to the Portfolios sub-advised by PIMCO. In connection with the renewal of the Existing Sub-Advisory Agreement with ACI, the Board considered ACI’s private ownership structure, which seems to afford ACI the flexibility to take a long term view, and its focus on money management as its sole line of business.
The directors also considered each Sub-Adviser’s investment philosophy and process and the scope of the services provided by the Sub-Advisers, noting in particular T. Rowe Price’s consistent, understandable investment strategy. The Board concluded that generally there were no changes in the services provided. The directors also considered the succession plans with respect to the management of the Sub-Advised Portfolios. The directors evaluated information provided by T. Rowe Price regarding its succession plan for the Small Cap Value Portfolio in light of the upcoming retirement of the Portfolio’s named portfolio manager, and concluded that in light of T. Rowe Price’s investment advisory committee structure and the qualifications of the named portfolio manager’s successor, professional coverage should be uninterrupted because the remaining professionals on the team had extensive knowledge of the mandate’s process and the Portfolio’s current holdings. Consideration was also given to each Sub-Adviser’s reputation in the industry in providing investment management services, each Sub-Adviser’s experience and the performance of each Sub-Advised Portfolio. Based on their review of these factors, their discussions with the Sub-Advisers and their experience with the services provided by the Sub-Advisers for the respective Sub-Advised Portfolios, the directors concluded, within the context of their overall determinations regarding the Existing Sub-Advisory Agreements, that they were satisfied with the nature, extent and quality of services provided by each Sub-Adviser on behalf of the respective Sub-Advised Portfolio, and the resources committed by each Sub-Adviser in providing those services.
Management Fees and Other Expenses. The directors evaluated the reasonableness of management fees and total expenses paid by the Sub-Advised Portfolios under the Existing Sub-Advisory Agreements. The directors considered the actual and contractual fees paid by each Sub-Advised Portfolio. The directors also considered the sub-advisory fees, which fees are paid by Mason Street Advisers out of its management fee, including a comparison of those fees with fees charged by the Sub-Advisers for similarly managed accounts. In considering the level of management fees, the directors also considered the size of each Sub-Advised Portfolio, expenses assumed by Mason Street Advisors, and the existing expense cap arrangements agreed to by Mason Street Advisors with respect to each Sub-Advised Portfolio.
As part of its evaluation, the directors received and reviewed an independent analysis prepared by Lipper of comparative expense and performance data for each Sub-Advised Portfolio. Lipper provided data comparing each Portfolio’s net and total expenses with those of a peer group of funds underlying variable insurance products, as well as a universe of funds underlying variable insurance products across each fund’s investment classification and objective, each as selected by Lipper. The directors considered the comparative data as a guide to help assess the reasonableness of each Portfolio’s net and total expense ratios. The directors noted that all but two of the Sub-Advised Portfolios were in the top two Lipper quartiles (meaning lowest expenses) of their respective peer groups for both gross and net expenses, for the period ended December 31, 2011. With respect to the Portfolios that were in the third Lipper quartile with respect to expenses, the directors considered that expense cap agreements were in place for each such Portfolio, that an advisory fee waiver had been implemented with respect to one of the Portfolios and that the other Portfolio was in Lipper’s top quartile (meaning lowest fees) for advisory fees. Expense information considered by the directors for the period ended December 31, 2011 was based on actual expenses plus estimated expenses that were shifted to the Portfolios pursuant to the Advisory Agreement, after giving effect to expense caps and breakpoints.
Based on their review of the above information and other factors deemed relevant by the directors, the directors concluded that the management fees and total expenses of each of the Sub-Advised Portfolios were reasonable in relation to the nature, scope and quality of services provided and the performance of the Sub-Advised Portfolios over time.
| | | | |
| 274 | | Approval and Continuance of Investment Sub-Advisory Agreements | | |
Approval and Continuance of Investment
Sub-Advisory Agreements
Investment Performance of the Sub-Advised Portfolios. The directors reviewed the investment performance of each Sub-Advised Portfolio over a variety of time periods. In addition to absolute performance and risk adjusted performance for each Sub-Advised Portfolio for both short and long-term periods, the directors considered (i) a comparison of each Sub-Advised Portfolio’s one-, three- and five-year (as applicable) performance to the returns of appropriate benchmarks and indices, and to the performance averages of each Sub-Advised Portfolio’s respective Morningstar and Lipper categories for the same periods, (ii) the Morningstar overall star rating for each Portfolio (as applicable), and (iii) the Morningstar and the Lipper rankings for the one-, three- and five-year (as applicable) periods. The directors evaluated each Sub-Advised Portfolio’s performance against these peer groups and industry benchmarks and indices, and viewed this information as providing an objective comparative benchmark against which they could assess the performance of each Sub-Advised Portfolio. The directors also considered the performance of accounts managed in a similar manner by each of the Sub-Advisers, where available, and information from the Sub-Advisers regarding any significant differences in the performance of those accounts from that of the Sub-Advised Portfolio in question. In connection with their evaluation of the performance of the Sub-Advised Portfolios, the directors also took into consideration the risk profile for each Sub-Advised Portfolio over the short and long term relative to its performance. The performance was considered in light of each Sub-Advised Portfolio’s investment objective and strategies as well as market conditions. In addition to performance information presented at the meeting, the directors considered the detailed performance information, market commentary, portfolio analysis and portfolio manager presentations they received periodically throughout the year. Generally speaking, while attentive to short term performance and what it might indicate, the directors gave greater weight to longer term performance.
The directors noted in particular their satisfaction with improving investment performance of the Portfolios sub-advised by ACI that seemed related to ACI’s revisions to investment process. The directors also noted that the short term performance of the Focused Appreciation Portfolio had improved, and observed that the Portfolio continued to maintain a strong long term track record. The directors noted favorably the strong investment results of the Portfolios sub-advised by T. Rowe Price and PIMCO as well as the low portfolio turnover rates of the Portfolios sub-advised by T. Rowe Price. The directors considered that the current portfolio management team for the International Growth Portfolio had been in place for less than two years, and thus its three year performance record continued to be negatively impacted by performance prior to the time Janus had been appointed as sub-adviser. Finally, with respect to the Commodities Return Strategy Portfolio, which had underperformed its benchmark since inception in 2011, the directors considered the role of the Portfolio in the variable annuity and variable life products for which it was an investment option, which was to provide pure exposure to a commodities return through an enhanced index strategy for purposes of diversification. The directors concluded that the Portfolio’s performance relative to this goal was sufficient to warrant approval of the continuation of the Existing Sub-Advisory Agreement with Credit Suisse.
The Board concluded that, in the totality of the circumstances and within the context of its overall determinations regarding the Existing Sub-Advisory Agreements, the performance of each Sub-Advised Portfolio was within an acceptable range compared to benchmarks and/or peers to support the continuation of each Existing Sub-Advisory Agreement.
Costs and Profitability. The directors reviewed information provided by Mason Street Advisors regarding the profitability realized by Mason Street Advisors due to its relationship with the Sub-Advised Portfolios. The directors considered Mason Street Advisors’ quarterly presentation to the directors regarding Mason Street Advisors’ revenues, expenses, income and profit margins allocable to its services to the Sub-Advised Portfolios on an aggregate and a per Portfolio basis, and Mason Street Advisors’ allocation methodology with respect to the revenues and expenses. The profitability information presented for the directors’ consideration was supplemented by the aforementioned information regarding the range of peer expenses in each Sub-Advised Portfolio’s respective Lipper category and the ranking of each Sub-Advised Portfolio within the categories. The directors also considered the profitability information related to certain of the Sub-Advised Portfolios where such information had been provided and the financial statements of certain Sub-Advisers or their affiliates who had not provided specific profitability information. In all instances, including in those cases where profitability information had not been provided, the directors noted that the sub-advisory fees were the result of arm’s-length negotiations between Mason Street Advisors and the Sub-Advisers. The directors also recognized that there are limitations inherent in allocating costs and calculating profitability for organizations such as the Sub-Advisers, and that it is difficult to make comparisons of profitability among investment advisers because comparative information is not generally publicly available and, when available, such information had been developed using a variety of assumptions and other factors.
The directors considered certain fall-out benefits that may be realized by Mason Street Advisors and its affiliates due to their relationship with the Sub-Advised Portfolios, including the participation of fund families advised by certain Sub-Advisers to the Sub-Advised Portfolios in affinity fund or select fund programs offered by an affiliate of Mason Street Advisors and the payment of fees by those entities to affiliates of Mason Street Advisors. The directors also reviewed information concerning
| | | | | | |
| Approval and Continuance of Investment Sub-Advisory Agreements | | | 275 | |
Approval and Continuance of Investment
Sub-Advisory Agreements
the Sub-Advisers’ soft dollar arrangements and any other benefits to the Sub-Advisers arising from their relationships with the Sub-Advised Portfolios.
The Board concluded, within the context of its overall determinations regarding the Existing Sub-Advisory Agreements, that the fees paid by each of the Sub-Advised Portfolios, and the profits realized by Mason Street Advisors and the Sub-Advisers due to their relationships with the Sub-Advised Portfolios, were not excessive.
Economics of Scale. The directors also considered whether each Sub-Advised Portfolio’s expense structure permitted economies of scale to be shared with such Portfolio’s investors. The directors considered the breakpoints contained in the advisory fee schedules for all but one of the Sub-Advised Portfolios and the extent to which the Sub-Advised Portfolios may benefit from economies of scale through those breakpoints. With respect to the Sub-Advised Portfolio for which breakpoints had not been established, the directors also took into account the expense cap agreement that was in place with respect to such Portfolio. The directors considered that the fee schedules for all but two of the Sub-Advised Portfolios contained breakpoints, and that the fee schedules and breakpoints evidenced an appropriate sharing of economies of scale between each Sub-Advised Portfolio and Mason Street Advisors. The directors also considered the total assets of each Sub-Advised Portfolio and the expense ratios of the Sub-Advised Portfolios.
Based on this information, the Board concluded, within the context of its overall determinations regarding the Existing Sub-Advisory Agreements, that each Sub-Advised Portfolio’s fee structure reflected appropriate economies of scale for the benefit of such Portfolio’s investors.
Other Information. The directors were presented with other information intended to assist them in their consideration of the continuation of the Existing Sub-Advisory Agreements, including information about the services provided by affiliates of Mason Street Advisors to the Sub-Advised Portfolios. The directors considered reports from Mason Street Advisors on its review of the respective compliance programs of the Sub-Advisers, recent compliance exceptions noted, pending or recent litigation or regulatory actions to which a Sub-Adviser or its affiliates may have been a party, and the applicable Sub-Adviser’s response. Their review further included information relating to each Sub-Adviser’s risk management infrastructure, information regarding portfolio manager compensation, brokerage and proxy voting practices, codes of ethics, business continuity and other matters.
Conclusions of the Directors. Based on a consideration of all information they deemed relevant in its totality, the directors, including the Independent Directors, and assisted by the advice of legal counsel independent of Mason Street Advisors, in the exercise of their reasonable business judgment concluded that it was in the best interest of each Portfolio to approve the continuation of each of the Existing Sub-Advisory Agreements between Mason Street Advisors and the Sub-Advisers.
| | | | |
| 276 | | Approval and Continuance of Investment Sub-Advisory Agreements | | |
REPORT ON FORM N-CSR
RESPONSES FOR NORTHWESTERN MUTUAL SERIES FUND, INC.
As of the end of the period covered by this report, the Registrant has adopted a code of ethics that applies to the Registrant’s principal executive officer, principal financial officer and principal accounting officer or controller.
| Item 3. | Audit Committee Financial Expert |
The Registrant’s board of directors has determined that the Registrant has three audit committee financial experts serving on its audit committee. The names of the audit committee financial experts are Miriam M. Allison, Gail L. Hanson and Michael G. Smith. Each of the audit committee financial experts is independent.
| Item 4. | Principal Accountant Fees and Services |
| | | | | | | | |
(a) Audit Fees | | | | | | | | |
| | |
Audit Fees and Expenses of Registrant | | | | | | | | |
| | |
| | | 2011
| | | 2012
| |
| | | $ | 562,000 | | | $ | 584,340 | |
| | |
(b) Audit Related Fees | | | | | | | | |
| | |
Audit-Related Fees and Expenses of Registrant | | | | | | | | |
| | |
| | | 2011
| | | 2012
| |
| | | $ | 0 | | | $ | 0 | |
| | |
(c) Tax Fees | | | | | | | | |
| | |
| | | 2011
| | | 2012
| |
| | | $ | 99,200 | | | $ | 95,765 | |
| | |
Review of dividend declarations | | | | | | | | |
Review of excise tax calculations | | | | | | | | |
Non-U.S. tax compliance | | | | | | | | |
| | |
(d) All Other Fees | | | | | | | | |
| | |
| | | 2011
| | | 2012
| |
| | | $ | 0 | | | $ | 0 | |
(e)(1) It is the audit committee’s policy to pre-approve all audit and non-audit service engagements for the Registrant; and any non-audit service engagement of the Registrant’s auditor by (1) the Registrant’s investment adviser and (2) any other entity in a control relationship with the investment adviser that provides ongoing services to the Registrant if, in each of (1) and (2) above, the non-audit service engagement relates directly to the operations and financial reporting of the Registrant. (2) Not applicable.
(f) Not applicable.
| | | | | | | | |
(g) Aggregate non-audit fees of Registrant and related service providers | | | | | | | | |
| | |
| | | 2011
| | | 2012
| |
| | | $ | 136,700 | | | $ | 154,715 | |
| | |
|
|
| |
|
|
|
(h) The Registrant’s audit committee has considered whether the auditor’s provision of non-audit services to the Registrant’s related service providers is compatible with the auditor’s independence.
| Item 5. | Audit Committee of Listed Registrants |
Not applicable.
| Item 6. | Schedule of Investments |
Full Schedule of Investments is included in Item 1.
| Item 7. | Disclosure of Proxy Voting Policies and Procedures for Closed-End Management Investment Companies |
Not applicable.
| Item 8. | Portfolio Managers of Closed-End Management Investment Companies |
Not applicable.
| Item 9. | Purchases of Equity Securities by Closed-End Management Investment Company and Affiliated Purchasers |
Not applicable.
| Item 10. | Submission of Matters to a Vote of Security Holders |
Not applicable.
| Item 11. | Disclosure Controls and Procedures |
(a) The Registrant’s Principal Executive Officer and Principal Financial Officer have evaluated the Registrant’s disclosure controls and procedures within 90 days of this filing and have concluded that the Registrant’s disclosure controls and procedures were effective, as of that date, in ensuring that information required to be disclosed by the Registrant in this filing was recorded, processed, summarized, and reported timely.
(b) There was no change in the Registrant’s internal control over financial reporting (as defined in Rule 30a-3(d) under the Investment Company Act of 1940) that occurred during the Registrant’s last fiscal half-year that has materially affected, or is reasonably likely to materially affect, the Registrant’s internal control over financial reporting.
(a)(1) The code of ethics referred to in the response to Item 2 above is attached as exhibit EX-99.12(a)(1).
(a)(2) Separate certifications for the Registrant’s principal executive officer and principal financial officer, as required by Section 302 of the Sarbanes-Oxley Act of 2002 and Rule 30a-2(a) under the Investment Company Act of 1940, are attached as exhibit EX-99.CERT.
(b) Separate certifications for the Registrant’s principal executive officer and principal financial officer, as required by 18 U.S.C. Section 1350, as adopted pursuant to Section 906 of the Sarbanes-Oxley Act of 2002, and Rule 30a-2(b) under the Investment Company Act of 1940, are attached as exhibit EX-99.906CERT. The certifications furnished pursuant to this paragraph are not deemed to be “filed” for purposes of Section 18 of the Securities Exchange Act of 1934, or otherwise subject to the liability of that section. Such certifications are not deemed to be incorporated by reference into any filing under the Securities Act of 1933 or the Securities Exchange Act of 1934, except to the extent that the Registrant specifically incorporates them by reference.
Pursuant to the requirements of the Securities Exchange Act of 1934 and the Investment Company Act of 1940, the Registrant has duly caused this report to be signed on its behalf by the undersigned, thereunto duly authorized.
NORTHWESTERN MUTUAL SERIES FUND, INC.
| | |
| By: | | /s/ R. David Ells
|
| | | R. David Ells, President |
|
| Date: February 14, 2013 |
| | |
| |
| By: | | /s/ Walter M. Givler
|
| | | Walter M. Givler, Vice-President, |
| | | Chief Financial Officer and |
| | | Treasurer |
|
| Date: February 14, 2013 |