UNITED STATES
SECURITIES AND EXCHANGE COMMISSION
Washington, D.C. 20549
FORM N-CSR
CERTIFIED SHAREHOLDER REPORT OF REGISTERED
MANAGEMENT INVESTMENT COMPANIES
Investment Company Act file number 811-3990
Northwestern Mutual Series Fund, Inc.
(Exact name of registrant as specified in charter)
720 East Wisconsin Avenue,
Milwaukee Wisconsin 53202
(Address of principal executive offices) (Zip code)
Barbara E. Courtney, Controller and Chief Accounting Officer Northwestern Mutual Series Fund, Inc.
(Name and address of agent for service)
Registrant’s telephone number, including area code: 414-271-1444
Date of fiscal year end: December 31
Date of reporting period: December 31, 2014
Form N-CSR is to be used by management investment companies to file reports with the Commission not later than 10 days after the transmission to stockholders of any report that is required to be transmitted to stockholders under Rule 30e-1 under the Investment Company Act of 1940 (17 CFR 270.30e-1). The Commission may use the information provided on Form N-CSR in its regulatory, disclosure review, inspection, and policymaking roles.
A registrant is required to disclose the information specified by Form N-CSR, and the Commission will make this information public. A registrant is not required to respond to the collection of information contained in Form N-CSR unless the Form displays a currently valid Office of Management and Budget (“OMB”) control number. Please direct comments concerning the accuracy of the information collection burden estimate and any suggestions for reducing the burden to Secretary, Securities and Exchange Commission, 450 Fifth Street, NW, Washington, DC 20549-0609. The OMB has reviewed this collection of information under the clearance requirements of 44 U.S.C. § 3507.
| Item 1. | Reports to Stockholders |
[Attached EDGARIZED ANNUAL REPORT]
Annual Report December 31, 2014
Northwestern Mutual Series Fund, Inc.
A Series Fund Offering 27 Portfolios
| | · | | Focused Appreciation Portfolio |
| | · | | Large Cap Core Stock Portfolio |
| | · | | Large Cap Blend Portfolio |
| | · | | Index 500 Stock Portfolio |
| | · | | Large Company Value Portfolio |
| | · | | Domestic Equity Portfolio |
| | · | | Equity Income Portfolio |
| | · | | Mid Cap Growth Stock Portfolio |
| | · | | Index 400 Stock Portfolio |
| | · | | Mid Cap Value Portfolio |
| | · | | Small Cap Growth Stock Portfolio |
| | · | | Index 600 Stock Portfolio |
| | · | | Small Cap Value Portfolio |
| | · | | International Growth Portfolio |
| | · | | Research International Core Portfolio |
| | · | | International Equity Portfolio |
| | · | | Emerging Markets Equity Portfolio |
| | · | | Short-Term Bond Portfolio |
| | · | | Long-Term U.S. Government Bond Portfolio |
| | · | | Inflation Protection Portfolio |
| | · | | High Yield Bond Portfolio |
| | · | | Multi-Sector Bond Portfolio |
| | · | | Asset Allocation Portfolio |
Letter to Contract Holders
December 31, 2014
In last year’s letter to contract holders, we discussed how investment markets for the past several years had been driven by broad economic themes, as opposed to individual, company specific factors. Economic themes continued to influence market performance during 2014, but investors demonstrated a greater appreciation for the fundamental drivers of different asset classes, countries and types of securities. For example, U.S. stocks and the U.S. dollar posted strong gains, as investors rewarded the U.S. economy’s strength relative to most major nations. With unsteady growth and political uncertainty throughout the world in 2014, investors embraced the U.S. economy’s improving growth and steady reduction in monetary stimulus.
Despite the overall strength of the U.S. market in 2014, the path for the market was uneven, as stocks fell sharply at the beginning of the year when global growth concerns dampened the outlook. Stocks rebounded thereafter, as improving economic growth in the U.S. led to optimism. The Federal Reserve (the “Fed”) steadily decreased its unprecedented stimulus program during the year, finishing its final bond purchasing program in October 2014. In September, the stock market dropped sharply again, as investors reduced risk in light of the Fed’s impending policy shift. Investors quickly returned to the U.S., as the Fed reaffirmed its commitment to a zero interest rate policy and the U.S. economy delivered solid growth, propelling the S&P 500® Index to an all-time high.
The U.S. stock market outperformed most foreign markets, while most major stock indices outperformed bonds. In general, emerging markets lagged during China’s economic slowdown, while the European Union continued to experience stagnant economic growth, sparking deflationary fears. A relatively new global theme emerged during the final months of the year when the U.S. dollar rallied relative to other major currencies due to rising economic prospects in the U.S. and the Fed’s termination of bond purchases. Subsequently, the rising dollar and record U.S. oil and gas production helped drive oil prices to a five-year low.
In that environment, investors were somewhat more discerning than in years past, as they developed a nuanced taste for risk assets. At the highest level, investors continued to embrace risk in stocks over the relative safety of bonds, although some clear risk-reduction themes emerged within both asset classes.
In the U.S., investors preferred the stability of larger-capitalization stocks, as the S&P 500® Index delivered a double-digit gain. Mid- and small-sized companies, on the other hand, produced more modest returns. Investors’ clear preference for large, liquid stocks was a notable divergence from the risk preference of prior years.
Similarly, within fixed income markets, bonds that offered more stability and lower yields—Treasurys and mortgage-backed securities—posted solid performance, while the higher yielding and higher risk corporate bond market
delivered mediocre returns. Here again, markets expressed a subtle shift toward risk reduction.
The U.S. economy grew at a moderate pace with contained inflation in 2014. An unseasonably cold winter led to a sharp economic contraction at the beginning of the year. Nevertheless, economic growth improved in each subsequent quarter with a strong finish in the latter half of the year. As a result, the U.S. unemployment rate dipped to 5.6% in December 2014. The improving job market and rising home prices led to relatively steady consumer spending, while solid profit growth and healthy balance sheets continued to propel Corporate America.
Despite the many strong and improving stories of 2014, we still find reasons to proceed with caution. Europe is struggling with stagnant economic growth and the risk of deflation, Japanese economic growth remains sluggish despite large amounts of economic stimulus, and declining oil prices could be a harbinger of weak demand. The Fed’s policy trajectory is tilting toward less economic stimulus, but the Fed’s interest rate policy remains uncertain, which may contribute to market volatility.
Although myriad economic, political and business events during 2015 may cause the investment markets to be volatile, this can serve as a reminder for investors to assess whether their portfolios remain adequately diversified in accordance with their long-term investment goals and risk tolerance. Portfolios tend to become unbalanced over time, as the outperformance of a certain asset class can lead to a higher concentration of that asset class in an investor’s portfolio. In light of this, an investor might consider whether it would be appropriate to return to his or her previously established asset class allocation levels by reallocating the gains of higher performing classes.1
Similar to all financial decisions, an investor should approach rebalancing with the guidance of a financial professional to pinpoint the appropriate allocation for his or her individual portfolio, current financial situation and overall financial plan. As always, we encourage you to work closely with your financial professional through the ups and downs of the financial markets in 2015, as they can help you develop and adhere to a plan that will be guided by your long-term goals, rather than the short-term fluctuations of the market.

Kate M. Fleming
President of Northwestern Mutual Series Fund, Inc.
1 A strategy involving portfolio rebalancing cannot assure a profit or protect against loss in a declining market. Not intended to be investment advice.
Northwestern Mutual Series Fund, Inc.
Table of Contents
| | | | |
Expense Examples | | | i | |
Series Fund Overviews and Schedules of Investments: | | | | |
Growth Stock Portfolio | | | 1 | |
Focused Appreciation Portfolio | | | 4 | |
Large Cap Core Stock Portfolio | | | 8 | |
Large Cap Blend Portfolio | | | 11 | |
Index 500 Stock Portfolio | | | 14 | |
Large Company Value Portfolio | | | 21 | |
Domestic Equity Portfolio | | | 25 | |
Equity Income Portfolio | | | 28 | |
Mid Cap Growth Stock Portfolio | | | 33 | |
Index 400 Stock Portfolio | | | 36 | |
Mid Cap Value Portfolio | | | 42 | |
Small Cap Growth Stock Portfolio | | | 47 | |
Index 600 Stock Portfolio | | | 51 | |
Small Cap Value Portfolio | | | 59 | |
International Growth Portfolio | | | 63 | |
Research International Core Portfolio | | | 67 | |
International Equity Portfolio | | | 72 | |
Emerging Markets Equity Portfolio | | | 77 | |
Money Market Portfolio | | | 82 | |
Short-Term Bond Portfolio | | | 86 | |
Select Bond Portfolio | | | 98 | |
Long-Term U.S. Government Bond Portfolio | | | 110 | |
Inflation Protection Portfolio | | | 116 | |
High Yield Bond Portfolio | | | 128 | |
Multi-Sector Bond Portfolio | | | 138 | |
Balanced Portfolio | | | 158 | |
Asset Allocation Portfolio | | | 163 | |
Benchmark Definitions | | | 168 | |
Statements of Assets and Liabilities | | | 170 | |
Statements of Operations | | | 174 | |
Statements of Changes in Net Assets | | | 178 | |
Statement of Cash Flows | | | 186 | |
Financial Highlights | | | 188 | |
Notes to Financial Statements | | | 196 | |
Report of Independent Registered Public Accounting Firm | | | 218 | |
Proxy Voting and Portfolio Holdings | | | 219 | |
Director and Officer Information | | | 220 | |
Approval and Continuance of Investment Sub-Advisory Agreements | | | 223 | |
Mason Street Advisors, LLC (“Mason Street Advisors”), adviser to the Northwestern Mutual Series Fund, Inc., is a wholly owned subsidiary of The Northwestern Mutual Life Insurance Company. Mason Street Advisors is the principal investment adviser for all the Portfolios of the Northwestern Mutual Series Fund, Inc., and has engaged and oversees sub-advisers who provide day-to-day management for certain of the Portfolios. Each sub-adviser may be replaced without the approval of shareholders. Please see the Series Fund prospectus for more information.
The views expressed in the portfolio manager commentaries set forth in the following pages reflect those of the portfolio managers only through the end of the period covered by this report and do not necessarily represent the views of any affiliated organization. The views expressed are not guarantees of future performance or economic results and involve certain risks, uncertainties and assumptions that could cause actual outcomes and results to differ materially from the views expressed herein. These views are subject to change at any time based upon market conditions or other events and should not be relied upon as investment advice. Mason Street Advisors disclaims any responsibility to update these views.
Expense Examples (unaudited)
Example
As a shareholder of each Portfolio, you incur two types of costs: (1) transaction costs and (2) ongoing costs, including management fees and other Portfolio expenses. This Example is intended to help you understand your ongoing costs (in dollars) of investing in the Portfolios and to compare these costs with the ongoing costs of investing in other mutual funds.
The Example is based on an investment of $1,000 invested at the beginning of the period and held for the entire period (July 1, 2014 to December 31, 2014).
Actual Expenses
The first line of the table below provides information about actual account values and actual expenses. You may use the information in this line, together with the amount you invested, to estimate the expenses that you paid over the period. Simply divide your account value by $1,000 (for example, an $8,600 account value divided by $1,000 = 8.6), then multiply the result by the number in the first line under the heading entitled “Expenses Paid During Period” to estimate the expenses you paid on your account during this period.
Hypothetical Example for Comparison Purposes
The second line of the table below for each Portfolio provides information about hypothetical account values and hypothetical expenses based on each Portfolio’s actual expense ratio and an assumed rate of return of 5% per year before expenses, which is not the Portfolio’s actual return. The hypothetical account values and expenses may not be used to estimate the actual ending account balance or expenses you paid for the period. You may use this information to compare the ongoing costs of investing in a Portfolio and other funds. To do so, compare this 5% hypothetical example with the 5% hypothetical examples that appear in the shareholder reports of the other funds.
Please note that the expenses shown in the table are meant to highlight your ongoing costs only and do not reflect any transactional costs or separate account charges. Therefore, the second line of the table is useful in comparing ongoing costs only, and will not help you determine the relative total costs of owning different funds. In addition, if these transactional costs or separate account charges were included, your costs would have been higher.
| | | | | | | | | | | | | | | | |
| | | Beginning Account Value
July 1, 2014 | | | Ending Account Value
December 31, 2014 | | | Expenses Paid During
Period July 1, 2014 to
December 31, 2014* | | | Annualized
Expense Ratio | |
| | | | |
Growth Stock Portfolio | | | | | | | | | | | | | | | | |
Actual | | | $1,000.00 | | | | $1,045.13 | | | | $2.11 | | | | 0.41 | % |
Hypothetical (5% return before expenses) | | | 1,000.00 | | | | 1,023.14 | | | | 2.09 | | | | 0.41 | |
| | | | |
Focused Appreciation Portfolio | | | | | | | | | | | | | | | | |
Actual | | | 1,000.00 | | | | 1,085.46 | | | | 3.36 | | | | 0.64 | |
Hypothetical (5% return before expenses) | | | 1,000.00 | | | | 1,021.98 | | | | 3.26 | | | | 0.64 | |
| | | | |
Large Cap Core Stock Portfolio | | | | | | | | | | | | | | | | |
Actual | | | 1,000.00 | | | | 1,010.77 | | | | 2.23 | | | | 0.44 | |
Hypothetical (5% return before expenses) | | | 1,000.00 | | | | 1,022.99 | | | | 2.24 | | | | 0.44 | |
| | | | |
Large Cap Blend Portfolio | | | | | | | | | | | | | | | | |
Actual | | | 1,000.00 | | | | 1,038.71 | | | | 4.16 | | | | 0.81 | |
Hypothetical (5% return before expenses) | | | 1,000.00 | | | | 1,021.12 | | | | 4.13 | | | | 0.81 | |
| | | | |
Index 500 Stock Portfolio | | | | | | | | | | | | | | | | |
Actual | | | 1,000.00 | | | | 1,060.23 | | | | 1.09 | | | | 0.21 | |
Hypothetical (5% return before expenses) | | | 1,000.00 | | | | 1,024.15 | | | | 1.07 | | | | 0.21 | |
Expense Examples (unaudited)
| | | | | | | | | | | | | | | | |
| | | Beginning Account Value
July 1, 2014 | | | Ending Account Value
December 31, 2014 | | | Expenses Paid During
Period July 1, 2014 to
December 31, 2014* | | | Annualized
Expense Ratio | |
| | | | |
Large Company Value Portfolio | | | | | | | | | | | | | | | | |
Actual | | | 1,000.00 | | | | 1,047.05 | | | | 3.66 | | | | 0.71 | |
Hypothetical (5% return before expenses) | | | 1,000.00 | | | | 1,021.63 | | | | 3.62 | | | | 0.71 | |
| | | | |
Domestic Equity Portfolio | | | | | | | | | | | | | | | | |
Actual | | | 1,000.00 | | | | 1,049.13 | | | | 2.84 | | | | 0.55 | |
Hypothetical (5% return before expenses) | | | 1,000.00 | | | | 1,022.43 | | | | 2.80 | | | | 0.55 | |
| | | | |
Equity Income Portfolio | | | | | | | | | | | | | | | | |
Actual | | | 1,000.00 | | | | 1,012.57 | | | | 3.35 | | | | 0.66 | |
Hypothetical (5% return before expenses) | | | 1,000.00 | | | | 1,021.88 | | | | 3.36 | | | | 0.66 | |
| | | | |
Mid Cap Growth Stock Portfolio | | | | | | | | | | | | | | | | |
Actual | | | 1,000.00 | | | | 1,057.44 | | | | 2.64 | | | | 0.51 | |
Hypothetical (5% return before expenses) | | | 1,000.00 | | | | 1,022.63 | | | | 2.60 | | | | 0.51 | |
| | | | |
Index 400 Stock Portfolio | | | | | | | | | | | | | | | | |
Actual | | | 1,000.00 | | | | 1,019.61 | | | | 1.37 | | | | 0.27 | |
Hypothetical (5% return before expenses) | | | 1,000.00 | | | | 1,023.84 | | | | 1.38 | | | | 0.27 | |
| | | | |
Mid Cap Value Portfolio | | | | | | | | | | | | | | | | |
Actual | | | 1,000.00 | | | | 1,059.22 | | | | 4.05 | | | | 0.78 | |
Hypothetical (5% return before expenses) | | | 1,000.00 | | | | 1,021.27 | | | | 3.97 | | | | 0.78 | |
| | | | |
Small Cap Growth Stock Portfolio | | | | | | | | | | | | | | | | |
Actual | | | 1,000.00 | | | | 1,038.16 | | | | 2.93 | | | | 0.57 | |
Hypothetical (5% return before expenses) | | | 1,000.00 | | | | 1,022.33 | | | | 2.91 | | | | 0.57 | |
| | | | |
Index 600 Stock Portfolio | | | | | | | | | | | | | | | | |
Actual | | | 1,000.00 | | | | 1,022.68 | | | | 1.89 | | | | 0.35 | |
Hypothetical (5% return before expenses) | | | 1,000.00 | | | | 1,023.34 | | | | 1.89 | | | | 0.35 | |
| | | | |
Small Cap Value Portfolio | | | | | | | | | | | | | | | | |
Actual | | | 1,000.00 | | | | 972.84 | | | | 4.38 | | | | 0.88 | |
Hypothetical (5% return before expenses) | | | 1,000.00 | | | | 1,020.77 | | | | 4.48 | | | | 0.88 | |
| | | | |
International Growth Portfolio | | | | | | | | | | | | | | | | |
Actual | | | 1,000.00 | | | | 913.19 | | | | 3.62 | | | | 0.75 | |
Hypothetical (5% return before expenses) | | | 1,000.00 | | | | 1,021.42 | | | | 3.82 | | | | 0.75 | |
| | | | |
Research International Core Portfolio | | | | | | | | | | | | | | | | |
Actual | | | 1,000.00 | | | | 905.35 | | | | 4.51 | | | | 0.94 | |
Hypothetical (5% return before expenses) | | | 1,000.00 | | | | 1,020.47 | | | | 4.79 | | | | 0.94 | |
| | | | |
International Equity Portfolio | | | | | | | | | | | | | | | | |
Actual | | | 1,000.00 | | | | 887.78 | | | | 3.14 | | | | 0.66 | |
Hypothetical (5% return before expenses) | | | 1,000.00 | | | | 1,021.88 | | | | 3.36 | | | | 0.66 | |
Expense Examples (unaudited)
| | | | | | | | | | | | | | | | |
| | | Beginning Account Value
July 1, 2014 | | | Ending Account Value
December 31, 2014 | | | Expenses Paid During
Period July 1, 2014 to
December 31, 2014* | | | Annualized
Expense Ratio | |
| | | | |
Emerging Markets Equity Portfolio | | | | | | | | | | | | | | | | |
Actual | | | 1,000.00 | | | | 894.31 | | | | 6.45 | | | | 1.35 | |
Hypothetical (5% return before expenses) | | | 1,000.00 | | | | 1,018.40 | | | | 6.87 | | | | 1.35 | |
| | | | |
Money Market Portfolio | | | | | | | | | | | | | | | | |
Actual | | | 1,000.00 | | | | 1,000.17 | | | | 0.55 | | | | 0.11 | |
Hypothetical (5% return before expenses) | | | 1,000.00 | | | | 1,024.65 | | | | 0.56 | | | | 0.11 | |
| | | | |
Short-Term Bond Portfolio | | | | | | | | | | | | | | | | |
Actual | | | 1,000.00 | | | | 997.98 | | | | 2.06 | | | | 0.41 | |
Hypothetical (5% return before expenses) | | | 1,000.00 | | | | 1,023.14 | | | | 2.09 | | | | 0.41 | |
| | | | |
Select Bond Portfolio | | | | | | | | | | | | | | | | |
Actual | | | 1,000.00 | | | | 1,016.63 | | | | 1.63 | | | | 0.32 | |
Hypothetical (5% return before expenses) | | | 1,000.00 | | | | 1,023.59 | | | | 1.63 | | | | 0.32 | |
| | | | |
Long-Term U.S. Government Bond Portfolio | | | | | | | | | | | | | | | | |
Actual | | | 1,000.00 | | | | 1,104.62 | | | | 3.40 | | | | 0.65 | |
Hypothetical (5% return before expenses) | | | 1,000.00 | | | | 1,021.98 | | | | 3.26 | | | | 0.65 | |
| | | | |
Inflation Protection Portfolio | | | | | | | | | | | | | | | | |
Actual | | | 1,000.00 | | | | 978.94 | | | | 2.94 | | | | 0.59 | |
Hypothetical (5% return before expenses) | | | 1,000.00 | | | | 1,022.23 | | | | 3.01 | | | | 0.59 | |
| | | | |
High Yield Bond Portfolio | | | | | | | | | | | | | | | | |
Actual | | | 1,000.00 | | | | 965.41 | | | | 2.33 | | | | 0.47 | |
Hypothetical (5% return before expenses) | | | 1,000.00 | | | | 1,022.84 | | | | 2.40 | | | | 0.47 | |
| | | | |
Multi-Sector Bond Portfolio | | | | | | | | | | | | | | | | |
Actual | | | 1,000.00 | | | | 971.28 | | | | 3.97 | | | | 0.80 | |
Hypothetical (5% return before expenses) | | | 1,000.00 | | | | 1,021.17 | | | | 4.08 | | | | 0.80 | |
| | | | |
Balanced Portfolio | | | | | | | | | | | | | | | | |
Actual | | | 1,000.00 | | | | 1,012.88 | | | | 0.56 | | | | 0.11 | |
Hypothetical (5% return before expenses) | | | 1,000.00 | | | | 1,024.65 | | | | 0.56 | | | | 0.11 | |
| | | | |
Asset Allocation Portfolio | | | | | | | | | | | | | | | | |
Actual | | | 1,000.00 | | | | 1,006.57 | | | | 0.81 | | | | 0.16 | |
Hypothetical (5% return before expenses) | | | 1,000.00 | | | | 1,024.40 | | | | 0.82 | | | | 0.16 | |
| * | Expenses are equal to the Portfolio’s annualized expense ratio, multiplied by the average account value over the period, multiplied by 184/365 (to reflect the one-half year period). |
Growth Stock Portfolio (unaudited)
| | | | |
| Objective: | | Portfolio Strategy: | | Net Assets: |
| Long-term growth of capital. Current income is a secondary objective. | | Invest in the equity securities of medium and large capitalization companies exhibiting the potential for earnings growth or share price appreciation. | | $886 million |
Portfolio Overview
Mason Street Advisors, LLC (“Mason Street Advisors”), the investment adviser for the Growth Stock Portfolio (the “Portfolio”), has engaged The Boston Company Asset Management, LLC (“The Boston Company”) to act as sub-adviser for the Portfolio. The Portfolio invests in the equity securities of medium and large capitalization companies. The Portfolio invests in stocks selected by a team of core research analysts, with each analyst responsible for investments in his or her area of expertise. These analysts use a fundamental, bottom-up research process to identify investments for the Portfolio. The Portfolio invests in those companies in which the analysts have the highest degree of conviction or have identified the potential for a strong near-term catalyst for earnings growth or share price appreciation.
Market Overview
Global equities produced mixed returns for 2014, according to various global indexes, as investors digested a medley of encouraging U.S. data, increasing volatility and rising geopolitical risk. Positive economic data helped U.S. stocks, as measured by the Russell 3000® Index, during the first quarter despite an unseasonably harsh winter that threatened consumer sentiment. By the second quarter, U.S. investors largely shrugged off reports that the economy shrank during the first three months of the year, while the U.S. Federal Reserve (the “Fed”) underlined an improving economy by announcing it would wind down its monthly bond purchases. U.S. stocks logged third-quarter gains, as investors cheered better-than-expected growth indicators, which included improvements in consumer spending, tourism and manufacturing. In the final quarter of 2014, U.S. stocks tallied another solid quarterly gain, as the Fed offered a mostly upbeat assessment of the country’s economic prospects.
Portfolio Results
The Portfolio returned 9.02% for the twelve months ended December 31, 2014. By comparison, the Portfolio’s benchmark, the Russell 1000® Growth Index (the “Index”), returned 13.05%. (This Index is unmanaged, cannot be invested in directly and does not include administrative expenses or sales charges.) According to Lipper® Analytical Services, Inc., an independent mutual fund ranking agency, the average return of the Large Cap Growth Funds peer group was 10.04% for 2014.
The Portfolio delivered solid performance in January and February, but in March, the markets began a correction, rotating away from the momentum stocks that had been 2013’s market leaders. This caused significant relative underperformance in March and April. From May through December, the Portfolio trailed the Index, but much less so relative to March/April. For the year, Industrials, Consumer Staples, Information Technology and Consumer Discretionary were the worst relative performers by sector, partially offset by outperformance in Health Care and a lack of exposure to Telecommunication Services.
The Healthcare sector delivered the best performance in both the Portfolio and the Index. The Portfolio’s outperformance was driven primarily by holdings in the biotechnology and life sciences tools & services segments. Within biotechnology, a position in Alexion Pharmaceuticals, Inc. moved higher, as the company’s Soliris treatment continued to generate improving earnings.
The Portfolio’s relative performance in the Industrials sector was hurt primarily by holdings in the construction & engineering and aerospace & defense segments. Shares of global construction & engineering firm Fluor Corp. fell despite several strong earnings reports, largely on concerns that lower oil prices may impact its backlog due to postponed projects.
The Portfolio’s relative underperformance in the Consumer Staples sector was mostly due to holdings in food & staples retailing and food products. Shares of specialty food retailer Whole Foods Market, Inc. dropped after disappointing earnings reports, demonstrating decelerating sales and margin compression.
Underperformance in the Consumer Discretionary sector was attributable to holdings in Internet & catalog retail and media. A position in television and media streaming service Netflix, Inc. fell amid weak subscriber growth with lackluster reviews for recent original content. As a result, the portfolio managers sold the position.
Portfolio Manager Outlook
The following forward looking comments are the opinion of The Boston Company, the Portfolio’s sub-adviser.
The U.S. economy continues to improve in key areas such as employment and manufacturing, and overall, we believe the economy remains well positioned for continued expansion in 2015. Lower oil prices could serve as a tailwind for the broader economy, as businesses realize lower input costs and consumers benefit from a boost to disposable income, which may drive retail spending in 2015. Coupled with early signs of rising wages and multi-year highs in consumer confidence, the consumer could be a particular source of economic strength.
Growth Stock Portfolio (unaudited)
Inflation remains subdued, and a strong dollar is likely to weigh on commodity prices for some time. The direction of interest rates and a potential rate hike by the Fed remain notable market uncertainties. While rates are widely expected to rise, we have yet to see that materialize. Market volatility could be further influenced by concerns about the new political mix in Washington, slow growth in Europe and Asia and extended weakness in oil, which could emerge as a source of instability. Overall, we continue to believe a healthier U.S. economy, strong corporate underpinnings and secular tailwinds will remain supportive of U.S. equities.
Relative Performance

| | | | | | | | | | | | |
Average Annual Total Returns
For Periods Ended December 31, 2014 | |
| | | 1 Year | | | 5 Years | | | 10 Years | |
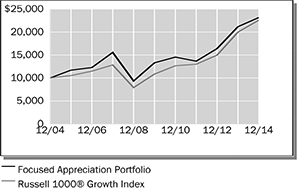
Growth Stock Portfolio | | | 9.02 | % | | | 13.16 | % | | | 7.21 | % |
Russell 1000® Growth Index | | | 13.05 | % | | | 15.81 | % | | | 8.49 | % |
Lipper® Variable Insurance Products (VIP) Large Cap Growth Funds Average | | | 10.04 | % | | | 14.09 | % | | | 7.73 | % |
The performance data quoted represents past performance. Past performance is historical and does not guarantee future performance. Investment return and principal value will fluctuate, so that shares, when redeemed, may be worth more or less than their original cost. Current performance may be lower or higher than the performance data quoted. For the most recent month-end performance information visit www.northwesternmutual.com.
This chart assumes an initial investment of $10,000 made on 12/31/04. Returns shown include deductions for management and other portfolio expenses, and reinvestment of all dividends. Returns exclude deductions for separate account sale loads and account fees. Please refer to the Benchmark Definitions section of this report for information about the indices cited in the above chart and graph.
Top 10 Equity Holdings 12/31/14
| | | | |
Security Description | | | % of Net Assets | |
Apple, Inc. | | | 6.9 | % |
Microsoft Corp. | | | 2.8 | % |
PepsiCo, Inc. | | | 2.8 | % |
Facebook, Inc. - Class A | | | 2.8 | % |
Visa, Inc. - Class A | | | 2.7 | % |
The Home Depot, Inc. | | | 2.4 | % |
Gilead Sciences, Inc. | | | 2.1 | % |
Honeywell International, Inc. | | | 2.1 | % |
Comcast Corp. - Class A | | | 2.0 | % |
Schlumberger, Ltd. | | | 2.0 | % |
Sector Allocation 12/31/14
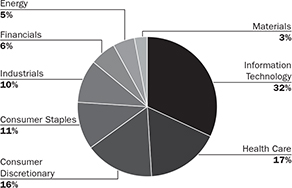
Sector Allocation is based on Net Assets.
Sector Allocation and Top 10 Holdings are subject to change.
Growth Stock Portfolio
Schedule of Investments
December 31, 2014
| | | | | | | | | | |
| | | Common Stocks (99.5%) | | Shares/
$ Par | | | Value
$ (000’s) | |
| |
| | Consumer Discretionary (16.3%) | |
| * | | AMC Networks, Inc. - Class A | | | 100,486 | | | | 6,408 | |
| | Comcast Corp. - Class A | | | 312,294 | | | | 18,116 | |
| | Delphi Automotive PLC | | | 97,960 | | | | 7,124 | |
| * | | Dollar General Corp. | | | 113,400 | | | | 8,017 | |
| | The Home Depot, Inc. | | | 202,260 | | | | 21,231 | |
| | The Interpublic Group of Cos., Inc. | | | 429,810 | | | | 8,927 | |
| * | | Michael Kors Holdings, Ltd. | | | 137,645 | | | | 10,337 | |
| | NIKE, Inc. - Class B | | | 146,070 | | | | 14,045 | |
| * | | Priceline.com, Inc. | | | 13,111 | | | | 14,949 | |
| | PVH Corp. | | | 89,830 | | | | 11,514 | |
| * | | Ulta Salon, Cosmetics & Fragrance, Inc. | | | 69,980 | | | | 8,946 | |
| * | | Under Armour, Inc. | | | 71,510 | | | | 4,856 | |
| | Viacom, Inc. - Class B | | | 127,530 | | | | 9,597 | |
| | | | | | | | | | |
| | Total | | | | | | | 144,067 | |
| | | | | | | | | | |
| |
| | Consumer Staples (10.8%) | |
| | Coca-Cola Enterprises, Inc. | | | 253,410 | | | | 11,206 | |
| | Colgate-Palmolive Co. | | | 207,980 | | | | 14,390 | |
| | Costco Wholesale Corp. | | | 79,456 | | | | 11,263 | |
| | CVS Caremark Corp. | | | 124,790 | | | | 12,018 | |
| | The Estee Lauder Cos., Inc. - Class A | | | 163,800 | | | | 12,482 | |
| | Mondelez International, Inc. | | | 281,670 | | | | 10,232 | |
| | PepsiCo, Inc. | | | 258,560 | | | | 24,449 | |
| | | | | | | | | | |
| | Total | | | | | | | 96,040 | |
| | | | | | | | | | |
| |
| | Energy (4.5%) | |
| | EOG Resources, Inc. | | | 142,900 | | | | 13,157 | |
| | Kinder Morgan, Inc. | | | 213,291 | | | | 9,024 | |
| | Schlumberger, Ltd. | | | 209,360 | | | | 17,882 | |
| | | | | | | | | | |
| | Total | | | | | | | 40,063 | |
| | | | | | | | | | |
| | | | | | | | | | |
| | | Common Stocks (99.5%) | | Shares/
$ Par | | | Value
$ (000’s) | |
| |
| | Financials (6.0%) | |
| | Ameriprise Financial, Inc. | | | 86,660 | | | | 11,461 | |
| | BlackRock, Inc. | | | 30,910 | | | | 11,052 | |
| | Discover Financial Services | | | 115,530 | | | | 7,566 | |
| | Intercontinental Exchange, Inc. | | | 52,540 | | | | 11,521 | |
| | Marsh & McLennan Cos., Inc. | | | 204,835 | | | | 11,725 | |
| | | | | | | | | | |
| | Total | | | | | | | 53,325 | |
| | | | | | | | | | |
| |
| | Health Care (16.7%) | |
| * | | Actavis PLC | | | 57,783 | | | | 14,874 | |
| * | | Alexion Pharmaceuticals, Inc. | | | 62,990 | | | | 11,655 | |
| * | | Biogen Idec, Inc. | | | 38,440 | | | | 13,049 | |
| | Bristol-Myers Squibb Co. | | | 144,090 | | | | 8,506 | |
| * | | Celgene Corp. | | | 144,040 | | | | 16,112 | |
| * | | Gilead Sciences, Inc. | | | 198,590 | | | | 18,719 | |
| * | | Illumina, Inc. | | | 49,638 | | | | 9,162 | |
| | McKesson Corp. | | | 68,710 | | | | 14,263 | |
| | Perrigo Co. PLC | | | 61,101 | | | | 10,214 | |
| * | | Regeneron Pharmaceuticals, Inc. | | | 20,780 | | | | 8,525 | |
| | UnitedHealth Group, Inc. | | | 104,960 | | | | 10,610 | |
| * | | Vertex Pharmaceuticals, Inc. | | | 102,520 | | | | 12,179 | |
| | | | | | | | | | |
| | Total | | | | | | | 147,868 | |
| | | | | | | | | | |
| |
| | Industrials (10.4%) | |
| | Cummins, Inc. | | | 76,890 | | | | 11,085 | |
| | Danaher Corp. | | | 129,240 | | | | 11,077 | |
| | FedEx Corp. | | | 58,430 | | | | 10,147 | |
| | Fluor Corp. | | | 142,268 | | | | 8,626 | |
| | Honeywell International, Inc. | | | 181,930 | | | | 18,178 | |
| | Precision Castparts Corp. | | | 54,720 | | | | 13,181 | |
| | Raytheon Co. | | | 86,320 | | | | 9,337 | |
| | Tyco Interntional PLC | | | 234,990 | | | | 10,307 | |
| | | | | | | | | | |
| | Total | | | | | | | 91,938 | |
| | | | | | | | | | |
| | | | | | | | | | |
| | | Common Stocks (99.5%) | | Shares/
$ Par | | | Value
$ (000’s) | |
| |
| | Information Technology (31.9%) | |
| | Accenture PLC - Class A | | | 93,590 | | | | 8,359 | |
| * | | Adobe Systems, Inc. | | | 130,390 | | | | 9,479 | |
| * | | Akamai Technologies, Inc. | | | 117,250 | | | | 7,382 | |
| | Apple, Inc. | | | 554,980 | | | | 61,259 | |
| * | | Cognizant Technology Solutions Corp. - Class A | | | 175,590 | | | | 9,247 | |
| | EMC Corp. | | | 390,970 | | | | 11,627 | |
| * | | Facebook, Inc. - Class A | | | 313,271 | | | | 24,441 | |
| * | | Fortinet, Inc. | | | 230,984 | | | | 7,082 | |
| * | | Google, Inc. - Class A | | | 31,610 | | | | 16,774 | |
| * | | Google, Inc. - Class C | | | 31,610 | | | | 16,640 | |
| | Intuit, Inc. | | | 160,490 | | | | 14,796 | |
| * | | LinkedIn Corp. - Class A | | | 39,950 | | | | 9,177 | |
| | Microsoft Corp. | | | 533,082 | | | | 24,762 | |
| | Oracle Corp. | | | 293,248 | | | | 13,187 | |
| * | | Salesforce.com, Inc. | | | 215,550 | | | | 12,784 | |
| | SanDisk Corp. | | | 115,130 | | | | 11,280 | |
| | Visa, Inc. - Class A | | | 92,830 | | | | 24,340 | |
| | | | | | | | | | |
| | Total | | | | | | | 282,616 | |
| | | | | | | | | | |
| |
| | Materials (2.9%) | |
| | The Dow Chemical Co. | | | 188,630 | | | | 8,603 | |
| | Martin Marietta Materials, Inc. | | | 66,060 | | | | 7,288 | |
| | Praxair, Inc. | | | 74,670 | | | | 9,674 | |
| | | | | | | | | | |
| | Total | | | | | | | 25,565 | |
| | | | | | | | | | |
| | Total Common Stocks | | | | | | | | |
| | (Cost: $683,284) | | | | | | | 881,482 | |
| | | | | | | | | | |
| | Total Investments (99.5%) | | | | | | | | |
| | (Cost: $683,284)(a) | | | | | | | 881,482 | |
| | | | | | | | | | |
| | Other Assets, Less | | | | | | | | |
| | Liabilities (0.5%) | | | | | | | 4,398 | |
| | | | | | | | | | |
| | Net Assets (100.0%) | | | | | | | 885,880 | |
| | | | | | | | | | |
| (a) | At December 31, 2014, the aggregate cost of securities for federal tax purposes (in thousands) was $684,921 and the net unrealized appreciation of investments based on that cost was $196,561 which is comprised of $199,956 aggregate gross unrealized appreciation and $3,395 aggregate gross unrealized depreciation. |
The following is a summary of the inputs used in valuing the Portfolio’s assets and liabilities at December 31, 2014. See Note 3 for additional information on portfolio valuation.
| | | | | | | | | | | | | | |
| | | Valuation Inputs | | | |
| Description | | Level 1 –
Quoted Prices | | | Level 2 –
Other Significant
Observable Inputs | | | Level 3 – Significant
Unobservable Inputs | | | |
| | | (Amounts in thousands) | | | |
Assets: | | | | | | | | | | | | | | |
Domestic Common Stocks | | $ | 881,482 | | | $ | - | | | $ | - | | | |
Total | | $ | 881,482 | | | $ | - | | | $ | - | | | |
The Accompanying Notes are an Integral Part of the Financial Statements.
Focused Appreciation Portfolio (unaudited)
| | | | |
| Objective: | | Portfolio Strategy: | | Net Assets: |
| Long-term growth of capital. | | Invest in equity securities selected for their growth potential. | | $722 million |
Portfolio Overview
Mason Street Advisors, LLC (“Mason Street Advisors”), the investment adviser for the Focused Appreciation Portfolio (the “Portfolio”), has engaged Janus Capital Management LLC (“Janus”) to act as sub-adviser for the Portfolio. In seeking to implement its growth strategy, the Portfolio employs a “bottom up” approach in choosing investments for the Portfolio. That is, the Portfolio looks at companies one at a time to determine if a company is an attractive investment opportunity and is consistent with the Portfolio’s investment policies. The Portfolio may invest in companies of any size, from larger, well established companies to smaller, emerging growth companies. As a non-diversified fund, the Portfolio may hold larger positions in a smaller number of companies and, in anticipation of such investments, may hold a correspondingly larger position in cash pending investment. The Portfolio invests primarily in a core group of 20-40 common stocks.
Market Overview
U.S. large-cap equities, as measured by the Russell 1000® Index, enjoyed another year of strong gains. Generally positive corporate earnings reports, a declining unemployment rate and a pickup in economic growth later in the year provided evidence the U.S. economy was strengthening. Low interest rates in most developed regions also provided a supportive backdrop for equities. While the U.S. equity market, measured by the Russell 3000® Index, enjoyed strong gains, volatility increased considerably in the final months of the year.
Portfolio Results
The Portfolio returned 9.43% for the twelve months ended December 31, 2014. By comparison, the Portfolio’s benchmark, the Russell 1000® Growth Index (the “Index”), returned 13.05%. (This Index is unmanaged, cannot be invested in directly and does not include administrative expenses or sales charges.) According to Lipper® Analytical Services, Inc., an independent mutual fund ranking agency, the average return of the Large Cap Growth Funds peer group was 10.04% for 2014.
As part of the Portfolio’s investment strategy, the portfolio managers seek companies that have clear, sustainable competitive moats around their businesses based on their view that sustainable competitive advantages should help grow market share within their respective industries over time. Important competitive advantages could include a strong brand, network effects from a product or service that would be hard for a competitor to replicate, a lower cost structure than competitors in the industry, a distribution advantage or patent protection over valuable intellectual property.
For the majority of companies in the Portfolio, the portfolio managers continued to see confirmation of their views on the strength of their competitive advantages, and the portfolio managers’ view of the long-term growth potential of these companies remained unchanged. However, the Portfolio did hold some stocks that produced disappointing results, and played a large role in the Portfolio’s underperformance relative to the Index.
Stock selection in the Technology and Financial sectors were the largest detractors from performance relative to the Index. The Portfolio’s relative underperformance in both sectors was stock specific, rather than the result of a broad underlying trend. Within the Information Technology sector, the Portfolio’s decision to not own Apple, Inc. was a significant detractor. The Portfolio’s position in Citigroup, Inc. held back results in the Financials sector.
The Portfolio’s underweight to the Energy sector and overweight to the Healthcare sector were the largest contributors to relative results. Within the Healthcare sector, the Portfolio held several biotechnology companies that announced encouraging results about innovative therapies under development, which was a large driver of performance. The Portfolio had a longstanding underweight to the Energy sector due to the sensitivity many businesses in the sector have to commodity prices. The decision to be underweight the sector was beneficial in the fourth quarter, when energy stocks generally declined as oil prices sank.
Portfolio Manager Outlook
The following forward looking comments are the opinion of Janus, the Portfolio’s sub-adviser.
Heading into 2015, we have a positive outlook for both the U.S. economy and domestic equities. In our view, the U.S. is clearly showing economic strength relative to the rest of the world. While declining commodity prices may create some short-term uncertainty, lower oil prices ultimately represent a tax cut for most consumers around the world. In a country such as the U.S., where such a large portion of the economy is driven by consumer spending, the tailwind from a sharp drop in oil prices can be considerable.
Looking at equity markets, we believe valuations are reasonable. However, after rising valuations in 2013 and the first half of 2014, we believe further stock price appreciation will need to be accompanied by earnings growth. If earnings growth again becomes the primary driver of stock returns next year, we believe such an environment could be favorable for our investment process.
| | | | |
| 4 | | Focused Appreciation Portfolio | | |
Focused Appreciation Portfolio (unaudited)
Relative Performance
| | | | | | | | | | | | |
Average Annual Total Returns
For Periods Ended December 31, 2014 | |
| | | 1 Year | | | 5 Years | | | 10 Years | |
Focused Appreciation Portfolio | | | 9.43 | % | | | 11.73 | % | | | 8.76 | % |
Russell 1000® Growth Index | | | 13.05 | % | | | 15.81 | % | | | 8.49 | % |
Lipper® Variable Insurance Products (VIP) Large Cap Growth Funds Average | | | 10.04 | % | | | 14.09 | % | | | 7.73 | % |
The performance data quoted represents past performance. Past performance is historical and does not guarantee future performance. Investment return and principal value will fluctuate, so that shares, when redeemed, may be worth more or less than their original cost. Current performance may be lower or higher than the performance data quoted. For the most recent month-end performance information visit www.northwesternmutual.com.
This chart assumes an initial investment of $10,000 made on 12/31/04. Returns shown include deductions for management and other portfolio expenses, and reinvestment of all dividends. Returns exclude deductions for separate account sale loads and account fees. Please refer to the Benchmark Definitions section of this report for information about the indices cited in the above chart and graph.
As a non-diversified portfolio, the Portfolio may hold fewer securities because of its focused investment strategy. Holding fewer securities increases the risk that the value of the Portfolio could go down because of the poor performance of a single investment.
Top 10 Equity Holdings 12/31/14
| | | | |
Security Description | | | % of Net Assets | |
Precision Castparts Corp. | | | 4.5 | % |
Lowe’s Cos., Inc. | | | 4.4 | % |
Celgene Corp. | | | 4.1 | % |
Google, Inc. - Class C | | | 3.9 | % |
Endo International PLC | | | 3.9 | % |
Valeant Pharmaceuticals International, Inc. | | | 3.6 | % |
Salesforce.com, Inc. | | | 3.4 | % |
Delphi Automotive PLC | | | 3.4 | % |
Zoetis, Inc. | | | 3.3 | % |
Canadian Pacific Railway, Ltd. | | | 3.3 | % |
Sector Allocation 12/31/14
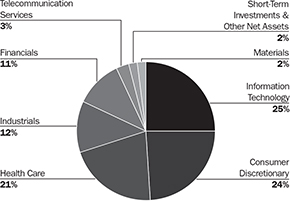
Sector Allocation is based on Net Assets.
Sector Allocation and Top 10 Holdings are subject to change.
| | | | | | |
| | Focused Appreciation Portfolio | | | 5 | |
Focused Appreciation Portfolio
Schedule of Investments
December 31, 2014
| | | | | | | | | | |
| | | Common Stocks (94.5%) | | Shares/
$ Par | | | Value
$ (000’s) | |
| | | |
| | Consumer Discretionary (23.5%) | | | | | | | | |
| * | | Amazon.com, Inc. | | | 65,404 | | | | 20,298 | |
| | Comcast Corp. - Class A | | | 310,420 | | | | 18,007 | |
| | Delphi Automotive PLC | | | 336,260 | | | | 24,453 | |
| | Las Vegas Sands Corp. | | | 137,682 | | | | 8,008 | |
| | Lowe’s Cos., Inc. | | | 465,229 | | | | 32,008 | |
| | Marriott International, Inc. - Class A | | | 193,305 | | | | 15,084 | |
| * | | Priceline.com, Inc. | | | 16,236 | | | | 18,512 | |
| | Starbucks Corp. | | | 215,092 | | | | 17,648 | |
| | The TJX Cos., Inc. | | | 230,328 | | | | 15,796 | |
| | | | | | | | | | |
| | Total | | | | | | | 169,814 | |
| | | | | | | | | | |
| | | |
| | Energy (0.5%) | | | | | | | | |
| | Baker Hughes, Inc. | | | 64,164 | | | | 3,598 | |
| | | | | | | | | | |
| | Total | | | | | | | 3,598 | |
| | | | | | | | | | |
| | | |
| | Financials (10.8%) | | | | | | | | |
| | Aon PLC | | | 194,316 | | | | 18,427 | |
| | Crown Castle International Corp. | | | 213,534 | | | | 16,805 | |
| * | | E*TRADE Financial Corp. | | | 462,625 | | | | 11,221 | |
| | Intercontinental Exchange, Inc. | | | 63,477 | | | | 13,920 | |
| | U.S. Bancorp | | | 395,744 | | | | 17,789 | |
| | | | | | | | | | |
| | Total | | | | | | | 78,162 | |
| | | | | | | | | | |
| | | |
| | Health Care (21.0%) | | | | | | | | |
| * | | athenahealth, Inc. | | | 32,461 | | | | 4,729 | |
| * | | Biogen Idec, Inc. | | | 48,369 | | | | 16,419 | |
| * | | Boston Scientific Corp. | | | 552,602 | | | | 7,322 | |
| * | | Celgene Corp. | | | 262,388 | | | | 29,351 | |
| * | | Endo International PLC | | | 390,387 | | | | 28,155 | |
| * | | Pharmacyclics, Inc. | | | 91,561 | | | | 11,194 | |
| * | | Salix Pharmaceuticals, Ltd. | | | 43,782 | | | | 5,032 | |
| * | | Valeant Pharmaceuticals International, Inc. | | | 179,421 | | | | 25,677 | |
| | Zoetis, Inc. | | | 551,482 | | | | 23,730 | |
| | | | | | | | | | |
| | Total | | | | | | | 151,609 | |
| | | | | | | | | | |
| | | |
| | Industrials (12.0%) | | | | | | | | |
| | Canadian Pacific Railway, Ltd. | | | 122,793 | | | | 23,661 | |
| | Kansas City Southern | | | 81,989 | | | | 10,005 | |
| | Nielsen NV | | | 447,052 | | | | 19,997 | |
| | Precision Castparts Corp. | | | 136,144 | | | | 32,794 | |
| | | | | | | | | | |
| | Total | | | | | | | 86,457 | |
| | | | | | | | | | |
| | | |
| | Information Technology (23.7%) | | | | | | | | |
| * | | Adobe Systems, Inc. | | | 198,691 | | | | 14,445 | |
| * | | Alibaba Group Holding, Ltd., ADR | | | 166,832 | | | | 17,340 | |
| | Amphenol Corp. - Class A | | | 166,915 | | | | 8,982 | |
| | ARM Holdings PLC, ADR | | | 313,413 | | | | 14,511 | |
| * | | CoStar Group, Inc. | | | 75,290 | | | | 13,825 | |
| * | | Google, Inc. - Class C | | | 53,499 | | | | 28,162 | |
| * | | LinkedIn Corp. - Class A | | | 43,979 | | | | 10,102 | |
| | | | | | | | | | | | |
| | | Common Stocks (94.5%) | | | | Shares/
$ Par | | | Value
$ (000’s) | |
| | |
| | Information Technology continued | | | | | |
| | MasterCard, Inc. - Class A | | | | | 274,266 | | | | 23,631 | |
| * | | NetSuite, Inc. | | | | | 58,318 | | | | 6,367 | |
| * | | Salesforce.com, Inc. | | | | | 413,357 | | | | 24,516 | |
| * | | Yahoo!, Inc. | | | | | 179,111 | | | | 9,047 | |
| | | | | | | | | | | | |
| | Total | | | | | | | | | 170,928 | |
| | | | | | | | | | | | |
| | | | |
| | Materials (2.0%) | | | | | | | | | | |
| | Monsanto Co. | | | | | 119,970 | | | | 14,333 | |
| | | | | | | | | | | | |
| | Total | | | | | | | | | 14,333 | |
| | | | | | | | | | | | |
| | | |
| | Telecommunication Services (1.0%) | | | | | | | | |
| * | | T-Mobile US, Inc. | | | | | 271,298 | | | | 7,309 | |
| | | | | | | | | | | | |
| | Total | | | | | | | | | 7,309 | |
| | | | | | | | | | | | |
| | | |
| | Total Common Stocks | | | | | | | | |
| | (Cost: $549,916) | | | | | | | | | 682,210 | |
| | | | | | | | | | | | |
| | | | |
| | | Foreign Common Stocks (3.3%) | | Country | | | | | | | | |
| | | |
| | Information Technology (1.4%) | | | | | | | | |
| | Tencent Holdings, Ltd. | | Cayman Islands | | | 717,000 | | | | 10,288 | |
| | | | | | | | | | | | |
| | Total | | | | | | | | | 10,288 | |
| | | | | | | | | | | | |
| | | | |
| | Telecommunication Services (1.9%) | | | | | | | | | | |
| | Iliad SA | | France | | | 57,416 | | | | 13,771 | |
| | | | | | | | | | | | |
| | Total | | | | | | | | | 13,771 | |
| | | | | | | | | | | | |
| | | |
| | Total Foreign Common Stocks | | | | | | | | |
| | (Cost: $23,485) | | | | | | | 24,059 | |
| | | | | | | | | | | | |
| | | |
| | Total Investments (97.8%) | | | | | | | | |
| | (Cost: $573,401)(a) | | | | | | | 706,269 | |
| | | | | | | | | | | | |
| | Other Assets, Less | | | | | | | | | | |
| | Liabilities (2.2%) | | | | | | | | | 16,110 | |
| | | | | | | | | | | | |
| | Net Assets (100.0%) | | | | | | | | | 722,379 | |
| | | | | | | | | | | | |
The Accompanying Notes are an Integral Part of the Financial Statements.
| | | | |
| 6 | | Focused Appreciation Portfolio | | |
Focused Appreciation Portfolio
ADR after the name of a security represents—American Depositary Receipt.
| (a) | At December 31, 2014, the aggregate cost of securities for federal tax purposes (in thousands) was $573,986 and the net unrealized appreciation of investments based on that cost was $132,283 which is comprised of $133,202 aggregate gross unrealized appreciation and $919 aggregate gross unrealized depreciation. |
The following is a summary of the inputs used in valuing the Portfolio’s assets and liabilities at December 31, 2014. See Note 3 for additional information on portfolio valuation.
| | | | | | | | | | | | | | |
| | | Valuation Inputs | | | |
| Description | | Level 1 – Quoted Prices | | | Level 2 –
Other Significant
Observable Inputs | | | Level 3 –
Significant
Unobservable Inputs | | | |
| | | (Amounts in thousands) | | | |
Assets: | | | | | | | | | | | | | | |
Domestic Common Stocks | | $ | 682,210 | | | $ | - | | | $ | - | | | |
Foreign Common Stocks | | | - | | | | 24,059 | | | | - | | | |
Total | | $ | 682,210 | | | $ | 24,059 | | | $ | - | | | |
For the period ended December 31, 2014, there were transfers from a Level 1 to a Level 2 in the amount of $24,059 thousand. These transfers were the result of the use of fair value procedures on certain foreign securities in the portfolio on December 31, 2014. These securities did not require the use of fair value procedures on December 31, 2013.
The Accompanying Notes are an Integral Part of the Financial Statements.
| | | | | | |
| | Focused Appreciation Portfolio | | | 7 | |
Large Cap Core Stock Portfolio (unaudited)
| | | | |
| Objective: | | Portfolio Strategy: | | Net Assets: |
| Long-term growth of capital and income. | | Invest primarily in common stocks of large capitalization U.S. and foreign based companies listed on U.S. exchanges. | | $556 million |
Portfolio Overview
Mason Street Advisors, LLC (“Mason Street Advisors”), the investment adviser for the Large Cap Core Stock Portfolio (the “Portfolio”), has engaged Fayez Sarofim & Co. (“Sarofim & Co.”) to act as sub-adviser for the Portfolio. In choosing securities, the Portfolio’s portfolio managers first identify structurally attractive economic sectors they believe can support longer term profit growth. Using fundamental analysis, the Portfolio’s portfolio managers then seek companies within these sectors that have dominant positions and sustainable competitive advantages in their industries, superior management that productively redeploys cash flow, sustained patterns of profitability, strong balance sheets, expanding global presence and the potential to achieve predictable, above-average earnings and dividend growth over the next three to five years or longer. The Portfolio may also invest in companies which the portfolio managers consider undervalued in terms of earnings, assets or growth prospects.
Market Overview
The S&P 500® Index recorded a series of successive new highs in 2014, despite five short-lived sell-offs, and has now more than tripled from its March 2009 low. The S&P 500® Index outpaced other developed market indices, as domestic economic growth gained traction and the U.S. Federal Reserve (the “Fed”) ended quantitative easing. In contrast, economic weakness and financial strains resurfaced abroad, and foreign central banks generally stepped up stimulative efforts. The U.S. dollar strengthened against nearly every major currency in 2014, while oil prices plunged 50%. Concerns about global growth intensified in the second half prompting increased market volatility. The relative performance of large cap stocks (S&P 500® Index) versus small caps (S&P SmallCap 600® Index) began to strengthen over the last six months, reversing the trend that has persisted through most of this liquidity-driven recovery. Utilities, Health Care, and Information Technology were the leading sectors in the S&P 500® Index for the year, while Energy was the only sector with a negative return.
Portfolio Results
The Portfolio returned 8.56% for the twelve months ended December 31, 2014. By comparison, the S&P 500® Index (the “Index”) returned 13.69%. (This Index is unmanaged, cannot be invested in directly and does not include administrative expenses or sales charges.) According to Lipper® Analytical Services, Inc., an independent mutual fund ranking agency, the average return of the Large Cap Core Funds peer group was 11.51% for 2014.
The Portfolio’s overweight allocation to the weak Energy sector was a primary factor weighing on results relative to Index. This impact, however, was mitigated by advantageous stock selection within the sector, reflecting the emphasis on the major integrated oil companies and the avoidance of the more volatile oilfield service and equipment stocks. The portfolio managers believed that the Portfolio’s Energy sector holdings offered compelling valuations, strong balance sheets, established records of returning capital to shareholders and disciplined cost controls.
Another factor impeding relative performance was stock selection in the Consumer Staples sector. Weakening demand in international markets, particularly in Europe, and the strength of the U.S. dollar detracted from the Portfolio’s holdings in the Consumer Staples sector, which included several global companies. Stock selection ultimately weighed on performance relative to the Index, although an overweight in the rallying sector limited the negative impact.
Stock selection in the Financials and Health Care sectors also detracted from relative performance.
On the upside, factors that supported results relative to the Index included the limited and selectively focused representations in the Consumer Discretionary and Materials sectors, two lagging sectors. The underweighted allocation to the Industrials sector and the lack of exposure to the Telecommunication Services sector also added value relative to the Index.
Turning to the performance of individual holdings, Portfolio holdings that delivered the largest contributions to absolute return were Apple, Inc., Altria Group, Inc., Walgreen Boots Alliance, Inc., Johnson & Johnson, AbbVie, Inc., Texas Instruments, Inc., Intel Corp. and The Walt Disney Co. Holdings that detracted from absolute performance were International Business Machines Corp., Exxon Mobil Corp., Chevron Corp., Occidental Petroleum Corp., Total Sponsored ADR, General Electric Co., Diageo PLC Sponsored ADR and Philip Morris International, Inc.
Portfolio Manager Outlook
The following forward looking comments are the opinion of Sarofim & Co., the Portfolio’s sub-adviser.
Although the U.S. economy seems to be gaining self-sustaining momentum, the global backdrop has grown less supportive. We expect the relative performance of the larger cap issues in the Portfolio to strengthen in the year ahead as equity markets adjust to desynchronized global trends and the potential shift in Fed policy. We believe the industry leaders that are the focus of the Portfolio’s investment strategy have the financial resources, operational discipline and competitive advantages to sustain
| | | | |
| 8 | | Large Cap Core Stock Portfolio | | |
Large Cap Core Stock Portfolio (unaudited)
longer-term earnings growth if interest rates begin to rise. Our strategic stock selection emphasizes structurally attractive industries with less cyclical attributes where pricing power is stronger and margins are more stable. We also continue to focus on companies with established records of returning capital to shareholders in the form of dividends and share repurchases, providing investors a degree of downside protection if market conditions continue to shift and volatility increases.
Relative Performance
| | | | | | | | | | | | |
Average Annual Total Returns
For Periods Ended December 31, 2014 | |
| | | 1 Year | | | 5 Years | | | 10 Years | |
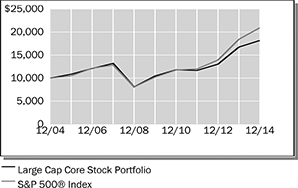
Large Cap Core Stock Portfolio | | | 8.56 | % | | | 11.69 | % | | | 6.15 | % |
S&P 500® Index | | | 13.69 | % | | | 15.45 | % | | | 7.67 | % |
Lipper® Variable Insurance Products (VIP) Large Cap Core Funds Average | | | 11.51 | % | | | 13.87 | % | | | 7.21 | % |
The performance data quoted represents past performance. Past performance is historical and does not guarantee future performance. Investment return and principal value will fluctuate, so that shares, when redeemed, may be worth more or less than their original cost. Current performance may be lower or higher than the performance data quoted. For the most recent month-end performance information visit www.northwesternmutual.com.
This chart assumes an initial investment of $10,000 made on 12/31/04. Returns shown include deductions for management and other portfolio expenses, and reinvestment of all dividends. Returns exclude deductions for separate account sale loads and account fees. Please refer to the Benchmark Definitions section of this report for information about the indices cited in the above chart and graph.
Top 10 Equity Holdings 12/31/14
| | | | |
Security Description | | | % of Net Assets | |
Apple, Inc. | | | 4.9 | % |
Exxon Mobil Corp. | | | 4.5 | % |
Philip Morris International, Inc. | | | 4.2 | % |
The Coca-Cola Co. | | | 4.0 | % |
Chevron Corp. | | | 3.5 | % |
Nestle SA, ADR | | | 2.9 | % |
JPMorgan Chase & Co. | | | 2.5 | % |
Altria Group, Inc. | | | 2.5 | % |
Johnson & Johnson | | | 2.5 | % |
The Procter & Gamble Co. | | | 2.4 | % |
Sector Allocation 12/31/14

Sector Allocation is based on Net Assets.
Sector Allocation and Top 10 Holdings are subject to change.
| | | | | | |
| | Large Cap Core Stock Portfolio | | | 9 | |
Large Cap Core Stock Portfolio
Schedule of Investments
December 31, 2014
| | | | | | | | | | |
| | | Common Stocks (99.8%) | | Shares/
$ Par | | | Value
$ (000’s) | |
| |
| | Consumer Discretionary (8.0%) | |
| | Comcast Corp. - Class A | | | 119,152 | | | | 6,912 | |
| | McDonald’s Corp. | | | 89,278 | | | | 8,365 | |
| | Target Corp. | | | 92,553 | | | | 7,026 | |
| | Time Warner Cable, Inc. | | | 22,288 | | | | 3,389 | |
| | Twenty-First Century Fox, Inc. | | | 238,510 | | | | 9,160 | |
| | Twenty-First Century Fox, Inc. - Class B | | | 20,000 | | | | 738 | |
| | The Walt Disney Co. | | | 94,133 | | | | 8,866 | |
| | | | | | | | | | |
| | Total | | | | | | | 44,456 | |
| | | | | | | | | | |
| |
| | Consumer Staples (26.2%) | |
| | Altria Group, Inc. | | | 286,708 | | | | 14,126 | |
| | Anheuser-Busch InBev NV, ADR | | | 50,000 | | | | 5,616 | |
| | The Coca-Cola Co. | | | 529,535 | | | | 22,357 | |
| | Diageo PLC | | | 41,833 | | | | 4,773 | |
| | The Estee Lauder Cos., Inc. - Class A | | | 115,311 | | | | 8,787 | |
| | Mondelez International, Inc. | | | 74,689 | | | | 2,713 | |
| | Nestle SA, ADR | | | 221,932 | | | | 16,190 | |
| | PepsiCo, Inc. | | | 103,025 | | | | 9,742 | |
| | Philip Morris International, Inc. | | | 286,328 | | | | 23,321 | |
| | The Procter & Gamble Co. | | | 148,522 | | | | 13,529 | |
| | SABMiller PLC, ADR | | | 107,053 | | | | 5,519 | |
| | Walgreens Boots Alliance, Inc. | | | 142,358 | | | | 10,848 | |
| | Wal-Mart Stores, Inc. | | | 90,647 | | | | 7,785 | |
| | | | | | | | | | |
| | Total | | | | | | | 145,306 | |
| | | | | | | | | | |
| |
| | Energy (16.9%) | |
| * | | California Resources Corp. | | | 59,116 | | | | 326 | |
| | Chevron Corp. | | | 174,747 | | | | 19,603 | |
| | ConocoPhillips | | | 154,170 | | | | 10,647 | |
| | | | | | | | | | |
| | | Common Stocks (99.8%) | | Shares/
$ Par | | | Value
$ (000’s) | |
| |
| | Energy continued | |
| | EOG Resources, Inc. | | | 36,822 | | | | 3,390 | |
| | Exxon Mobil Corp. | | | 269,581 | | | | 24,923 | |
| | Imperial Oil, Ltd. | | | 125,732 | | | | 5,410 | |
| | Occidental Petroleum Corp. | | | 147,790 | | | | 11,913 | |
| | Phillips 66 | | | 43,579 | | | | 3,125 | |
| | Royal Dutch Shell PLC - Class A, ADR | | | 115,227 | | | | 7,714 | |
| | Total SA, ADR | | | 138,507 | | | | 7,092 | |
| | | | | | | | | | |
| | Total | | | | | | | 94,143 | |
| | | | | | | | | | |
| |
| | Financials (11.3%) | |
| | ACE, Ltd. | | | 56,944 | | | | 6,541 | |
| | American Express Co. | | | 109,017 | | | | 10,143 | |
| | BlackRock, Inc. | | | 28,303 | | | | 10,120 | |
| | Franklin Resources, Inc. | | | 158,502 | | | | 8,776 | |
| | JPMorgan Chase & Co. | | | 225,755 | | | | 14,128 | |
| | State Street Corp. | | | 85,500 | | | | 6,712 | |
| | Wells Fargo & Co. | | | 120,523 | | | | 6,607 | |
| | | | | | | | | | |
| | Total | | | | | | | 63,027 | |
| | | | | | | | | | |
| |
| | Health Care (13.2%) | |
| | Abbott Laboratories | | | 210,638 | | | | 9,483 | |
| | AbbVie, Inc. | | | 171,972 | | | | 11,254 | |
| * | | Celgene Corp. | | | 50,000 | | | | 5,593 | |
| * | | Gilead Sciences, Inc. | | | 64,000 | | | | 6,033 | |
| | Johnson & Johnson | | | 132,101 | | | | 13,814 | |
| | Novartis AG, ADR | | | 88,303 | | | | 8,182 | |
| | Novo Nordisk A/S, ADR | | | 233,235 | | | | 9,870 | |
| | Roche Holding AG, ADR | | | 262,964 | | | | 8,938 | |
| | | | | | | | | | |
| | Total | | | | | | | 73,167 | |
| | | | | | | | | | |
| |
| | Industrials (5.6%) | |
| | Canadian Pacific Railway, Ltd. | | | 39,854 | | | | 7,679 | |
| | Caterpillar, Inc. | | | 58,273 | | | | 5,334 | |
| | | | | | | | | | |
| | | Common Stocks (99.8%) | | Shares/
$ Par | | | Value
$ (000’s) | |
| |
| | Industrials continued | |
| | General Electric Co. | | | 110,792 | | | | 2,800 | |
| | Union Pacific Corp. | | | 30,000 | | | | 3,574 | |
| | United Technologies Corp. | | | 102,676 | | | | 11,808 | |
| | | | | | | | | | |
| | Total | | | | | | | 31,195 | |
| | | | | | | | | | |
| |
| | Information Technology (15.6%) | |
| | Apple, Inc. | | | 248,089 | | | | 27,384 | |
| | ASML Holding N.V. | | | 30,000 | | | | 3,235 | |
| | Automatic Data Processing, Inc. | | | 86,475 | | | | 7,209 | |
| | Intel Corp. | | | 160,564 | | | | 5,827 | |
| | International Business Machines Corp. | | | 73,519 | | | | 11,795 | |
| | Oracle Corp. | | | 162,624 | | | | 7,313 | |
| | Qualcomm, Inc. | | | 122,918 | | | | 9,137 | |
| | Texas Instruments, Inc. | | | 206,633 | | | | 11,048 | |
| | Xilinx, Inc. | | | 83,444 | | | | 3,612 | |
| | | | | | | | | | |
| | Total | | | | | | | 86,560 | |
| | | | | | | | | | |
| |
| | Materials (3.0%) | |
| | Air Products and Chemicals, Inc. | | | 35,897 | | | | 5,177 | |
| | Praxair, Inc. | | | 88,526 | | | | 11,470 | |
| | | | | | | | | | |
| | Total | | | | | | | 16,647 | |
| | | | | | | | | | |
| | | |
| | Total Common Stocks | | | | | | | | |
| | (Cost: $443,372) | | | | | | | 554,501 | |
| | | | | | | | | | |
| | | |
| | Total Investments (99.8%) | | | | | | | | |
| | (Cost: $443,372)(a) | | | | | | | 554,501 | |
| | | | | | | | | | |
| | Other Assets, Less | | | | | | | | |
| | Liabilities (0.2%) | | | | | | | 1,138 | |
| | | | | | | | | | |
| | Net Assets (100.0%) | | | | | | | 555,639 | |
| | | | | | | | | | |
ADR after the name of a security represents—American Depositary Receipt.
| (a) | At December 31, 2014, the aggregate cost of securities for federal tax purposes (in thousands) was $443,396 and the net unrealized appreciation of investments based on that cost was $111,105 which is comprised of $114,229 aggregate gross unrealized appreciation and $3,124 aggregate gross unrealized depreciation. |
The following is a summary of the inputs used in valuing the Portfolio’s assets and liabilities at December 31, 2014. See Note 3 for additional information on portfolio valuation.
| | | | | | | | | | | | | | |
| | | Valuation Inputs | | | |
| Description | | Level 1 – Quoted Prices | | | Level 2 – Other Significant
Observable Inputs | | | Level 3 – Significant
Unobservable Inputs | | | |
| | | (Amounts in thousands) | | | |
Assets: | | | | | | | | | | | | | | |
Domestic Common Stocks | | $ | 554,501 | | | $ | - | | | $ | - | | | |
Total | | $ | 554,501 | | | $ | - | | | $ | - | | | |
The Accompanying Notes are an Integral Part of the Financial Statements.
| | | | |
| 10 | | Large Cap Core Stock Portfolio | | |
Large Cap Blend Portfolio (unaudited)
| | | | |
| Objective: | | Portfolio Strategy: | | Net Assets: |
| Long-term growth of capital and income. | | Invest primarily in equity securities of U.S. large capitalization companies listed or traded on U.S. securities exchanges. | | $167 million |
Portfolio Overview
Mason Street Advisors, LLC (“Mason Street Advisors”), the investment adviser for the Large Cap Blend Portfolio (the “Portfolio”), has engaged Fiduciary Management, Inc. (“FMI”) to act as sub-adviser for the Portfolio. Normally, the Portfolio invests in equity securities of large capitalization companies listed or traded on U.S. securities exchanges or U.S. securities associations. In selecting investments, greater consideration is given to potential appreciation and future dividends than to current income. The Portfolio uses fundamental analysis to look for stocks of good businesses that are selling at value prices. The Portfolio employs a focused investment strategy, typically investing in a core group of 20-30 large capitalization stocks and ADRs.
Market Overview
The U.S. stock market rally completed its 69th month since the market bottomed on March 9, 2009. Since then, large cap stocks, as measured by the S&P 500® Index, gained 244%, while small cap stocks, measured by the Russell 2000® Index, appreciated 280%. Improving economic growth with mild inflation prompted the U.S. Federal Reserve (the “Fed”) to gradually complete its bond purchasing program and maintain its zero interest rate policy during 2014, though Fed policy contributed to uncertainty during the second half of the year. Throughout the year, the Fed decreased its bond purchasing at a measured $10 billion monthly pace. Market volatility preceded the Fed’s last bond purchase in October, as investors became concerned that the Fed’s zero interest rate policy might be the next tightening of monetary stimulus. The Fed reaffirmed its commitment to zero interest rate policy for a considerable period, which reassured investors. Markets rallied on the news, while improving economic growth late in the year also increased investors’ optimism.
Portfolio Results
The Portfolio returned 12.58% for the twelve months ended December 31, 2014. By comparison, the S&P 500® Index (the “Index”) returned 13.69%. (This Index is unmanaged, cannot be invested in directly and does not include administrative expenses or sales charges.) According to Lipper® Analytical Services, Inc., an independent mutual fund ranking agency, the average return of the Large Cap Core Funds peer group was 11.51% for 2014.
Overall, stock selection was solid, particularly in Healthcare. UnitedHealth Group, Inc., AmerisourceBergen Corp. and Covidien PLC (sold in June after the buyout announcement by Medtronic) were among the top contributors relative to the Index in Healthcare. Other stock picks that helped performance relative to the Index were Ross Stores, Inc., Cintas Corp. and Berkshire Hathaway, Inc.
The Energy sector of the Portfolio delivered solid relative performance. The Portfolio’s positions in Devon Energy Corp. and Schlumberger, Ltd. both declined in the fourth quarter during the energy selloff, but still performed much better relative to the Index’s energy holdings.
The detractors in 2014 were the Portfolio’s elevated cash level (approximately 9%) and American Depository Receipts (ADR) exposure, including Danone SA, Nestle SA, and Unilever PLC. In those three investments, the depreciation in the Euro, Swiss Franc, and British Pound also detracted from the Portfolio’s return. The portfolio managers believed all three companies had strong franchises with above average growth prospects, relative to their U.S. counterparts. The portfolio managers added to positions in Danone SA and Unilever PLC during the year.
Portfolio Manager Outlook
The following forward looking comments are the opinion of FMI, the Portfolio’s sub-adviser.
Given the stock market’s significant appreciation in recent years, we would be surprised if returns over the next five years are anywhere close to returns of the past five years. The increased volatility in the fourth quarter may be a harbinger of future volatility. We believe volatile markets could give us more opportunities to maneuver in 2015. A recent investment letter that was discussing the rapid and steep drop in oil prices, quoted the renowned German economist, Rudiger Dornbusch; “In economics, things take longer to happen than you think they will, and then happen much quicker than you thought they could.” We believe this observation also applies to stock markets. Until good businesses are offered again at relatively inexpensive prices, we will focus on owning good businesses at somewhat elevated prices. The Portfolio trades at a significant discount to the Index, which we believe has the potential to help the Portfolio’s performance relative to the Index in 2015.
| | | | | | |
| | Large Cap Blend Portfolio | | | 11 | |
Large Cap Blend Portfolio (unaudited)
Relative Performance
| | | | | | | | | | | | |
Average Annual Total Returns
For Periods Ended December 31, 2014 | |
| | | 1 Year | | | 5 Years | | | Since Inception* | |
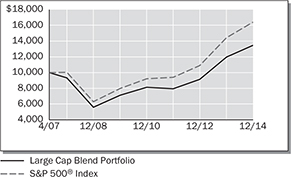
Large Cap Blend Portfolio | | | 12.58 | % | | | 13.64 | % | | | 3.98 | % |
S&P 500® Index | | | 13.69 | % | | | 15.45 | % | | | 6.66 | % |
Lipper® Variable Insurance Products (VIP) Large Cap Core Funds Average | | | 11.51 | % | | | 13.87 | % | | | - | |
| * | Inception date of 4/30/07 |
The performance data quoted represents past performance. Past performance is historical and does not guarantee future performance. Investment return and principal value will fluctuate, so that shares, when redeemed, may be worth more or less than their original cost. Current performance may be lower or higher than the performance data quoted. For the most recent month-end performance information visit www.northwesternmutual.com.
This chart assumes an initial investment of $10,000 made on 4/30/07 (commencement of the Portfolio’s operations). Returns shown reflect fee waivers, deductions for management and other portfolio expenses, and reinvestment of all dividends. In the absence of fee waivers, total return would be reduced. Returns exclude deductions for separate account sale loads and account fees. Please refer to the Benchmark Definitions section of this report for information about the indices cited in the above chart and graph.
The Portfolio may hold fewer securities than other diversified portfolios because of its more focused investment strategy. Holding fewer securities increases the risk that the value of the Portfolio could go down because of the poor performance of a single investment.
Top 10 Equity Holdings 12/31/14
| | | | |
Security Description | | | % of Net Assets | |
Potash Corp. of Saskatchewan, Inc. | | | 5.7 | % |
UnitedHealth Group, Inc. | | | 5.6 | % |
Accenture PLC - Class A | | | 5.4 | % |
Berkshire Hathaway, Inc. - Class B | | | 5.2 | % |
The Bank of New York Mellon Corp. | | | 5.0 | % |
AmerisourceBergen Corp. | | | 4.5 | % |
Devon Energy Corp. | | | 3.7 | % |
American Express Co. | | | 3.7 | % |
DANONE SA, ADR | | | 3.7 | % |
The Progressive Corp. | | | 3.6 | % |
Sector Allocation 12/31/14
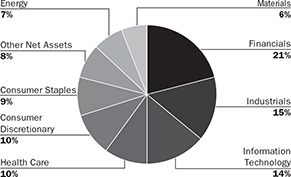
Sector Allocation is based on Net Assets.
Sector Allocation and Top 10 Holdings are subject to change.
| | | | |
| 12 | | Large Cap Blend Portfolio | | |
Large Cap Blend Portfolio
Schedule of Investments
December 31, 2014
| | | | | | | | | | |
| | | Common Stocks (92.2%) | | Shares/
$ Par | | | Value
$ (000’s) | |
| |
| | Consumer Discretionary (9.7%) | |
| | Comcast Corp. - Class A | | | 90,350 | | | | 5,241 | |
| | Omnicom Group, Inc. | | | 70,125 | | | | 5,432 | |
| | Ross Stores, Inc. | | | 58,950 | | | | 5,557 | |
| | | | | | | | | | |
| | Total | | | | | | | 16,230 | |
| | | | | | | | | | |
| |
| | Consumer Staples (9.0%) | |
| | DANONE SA, ADR | | | 471,250 | | | | 6,134 | |
| | Nestle SA, ADR | | | 70,925 | | | | 5,174 | |
| | Unilever PLC, ADR | | | 91,025 | | | | 3,685 | |
| | | | | | | | | | |
| | Total | | | | | | | 14,993 | |
| | | | | | | | | | |
| |
| | Energy (7.2%) | |
| | Devon Energy Corp. | | | 102,200 | | | | 6,255 | |
| | Schlumberger, Ltd. | | | 68,350 | | | | 5,838 | |
| | | | | | | | | | |
| | Total | | | | | | | 12,093 | |
| | | | | | | | | | |
| |
| | Financials (20.8%) | |
| | American Express Co. | | | 67,025 | | | | 6,236 | |
| | The Bank of New York Mellon Corp. | | | 205,100 | | | | 8,321 | |
| | | | | | | | | | |
| | | Common Stocks (92.2%) | | Shares/
$ Par | | | Value
$ (000’s) | |
| |
| | Financials continued | |
| * | | Berkshire Hathaway, Inc. - Class B | | | 57,625 | | | | 8,652 | |
| | Comerica, Inc. | | | 119,050 | | | | 5,576 | |
| | The Progressive Corp. | | | 220,175 | | | | 5,943 | |
| | | | | | | | | | |
| | Total | | | | | | | 34,728 | |
| | | | | | | | | | |
| |
| | Health Care (10.1%) | |
| | AmerisourceBergen Corp. | | | 82,475 | | | | 7,436 | |
| | UnitedHealth Group, Inc. | | | 92,775 | | | | 9,379 | |
| | | | | | | | | | |
| | Total | | | | | | | 16,815 | |
| | | | | | | | | | |
| |
| | Industrials (15.0%) | |
| | 3M Co. | | | 31,775 | | | | 5,221 | |
| | Cintas Corp. | | | 44,700 | | | | 3,506 | |
| | Expeditors International of Washington, Inc. | | | 104,550 | | | | 4,664 | |
| | Honeywell International, Inc. | | | 58,800 | | | | 5,875 | |
| | PACCAR, Inc. | | | 85,125 | | | | 5,790 | |
| | | | | | | | | | |
| | Total | | | | | | | 25,056 | |
| | | | | | | | | | |
| | | | | | | | | | |
| | | Common Stocks (92.2%) | | Shares/
$ Par | | | Value
$ (000’s) | |
| |
| | Information Technology (14.7%) | |
| | Accenture PLC - Class A | | | 101,175 | | | | 9,036 | |
| * | | eBay, Inc. | | | 79,225 | | | | 4,446 | |
| | Microsoft Corp. | | | 127,825 | | | | 5,938 | |
| | TE Connectivity, Ltd. | | | 79,925 | | | | 5,055 | |
| | | | | | | | | | |
| | Total | | | | | | | 24,475 | |
| | | | | | | | | | |
| |
| | Materials (5.7%) | |
| | Potash Corp. of Saskatchewan, Inc. | | | 268,475 | | | | 9,483 | |
| | | | | | | | | | |
| | Total | | | | | | | 9,483 | |
| | | | | | | | | | |
| | | |
| | Total Common Stocks | | | | | | | | |
| | (Cost: $124,982) | | | | | | | 153,873 | |
| | | | | | | | | | |
| | | |
| | Total Investments (92.2%) | | | | | | | | |
| | (Cost: $124,982)(a) | | | | | | | 153,873 | |
| | | | | | | | | | |
| | | |
| | Other Assets, Less | | | | | | | | |
| | Liabilities (7.8%) | | | | | | | 13,075 | |
| | | | | | | | | | |
| | Net Assets (100.0%) | | | | | | | 166,948 | |
| | | | | | | | | | |
ADR after the name of a security represents—American Depositary Receipt.
| (a) | At December 31, 2014, the aggregate cost of securities for federal tax purposes (in thousands) was $125,384 and the net unrealized appreciation of investments based on that cost was $28,489 which is comprised of $29,677 aggregate gross unrealized appreciation and $1,188 aggregate gross unrealized depreciation. |
The following is a summary of the inputs used in valuing the Portfolio’s assets and liabilities at December 31, 2014. See Note 3 for additional information on portfolio valuation.
| | | | | | | | | | | | | | |
| | | Valuation Inputs | | | |
| Description | | Level 1 – Quoted Prices | | | Level 2 – Other Significant
Observable Inputs | | | Level 3 – Significant
Unobservable Inputs | | | |
| | | (Amounts in thousands) | | | |
Assets: | | | | | | | | | | | | | | |
Domestic Common Stocks | | $ | 153,873 | | | $ | - | | | $ | - | | | |
Total | | $ | 153,873 | | | $ | - | | | $ | - | | | |
The Accompanying Notes are an Integral Part of the Financial Statements.
| | | | | | | | |
| | | | Large Cap Blend Portfolio | | | 13 | |
Index 500 Stock Portfolio (unaudited)
| | | | |
| Objective: | | Portfolio Strategy: | | Net Assets: |
| Investment results that approximate the performance of the S&P 500® Index. | | Invest in stocks that make up the S&P 500® Index, holding each stock in approximately the same proportion as its weighting in the Index. | | $2.4 billion |
Portfolio Overview
Mason Street Advisors is the investment adviser for the Index 500 Stock Portfolio (the “Portfolio”). The S&P 500® Index is composed of the stocks of primarily large capitalization companies that represent a broad spectrum of the U.S. economy and a substantial part of the U.S. stock market’s total capitalization. The Portfolio attempts to achieve its objective by investing all, or substantially all, of its assets in the stocks that make up the Index, holding each stock in approximately the same proportion as its weighting in the Index. This is known as a full replication strategy. The Portfolio may also invest in S&P 500® Index stock futures and, to a lesser extent, swap agreements to help achieve full replication.
Market Overview
The equity markets posted solid gains during 2014, as markets adjusted to changing monetary policy. Improving economic growth with mild inflation prompted the U.S. Federal Reserve (the “Fed”) to gradually complete its bond purchasing program and maintain its zero interest rate policy during 2014, though Fed policy contributed to uncertainty during the second half of the year. Throughout the year, the Fed decreased its bond purchasing at a measured $10 billion monthly pace. Market volatility preceded the Fed’s last bond purchase in October, as investors became concerned that the Fed’s zero interest rate policy might be the next tightening of monetary stimulus. The Fed reaffirmed its commitment to zero interest rate policy for a considerable period, which reassured investors. Markets rallied on the news, while improving economic growth late in the year also increased investors’ optimism. In that environment, small cap stocks led the market, followed by shares of mid and large sized companies. For the year, returns for the S&P 500®, MidCap 400®, and SmallCap 600® Indices were 13.69%, 9.77%, and 5.76%, respectively.
Portfolio Results
The Index 500 Stock Portfolio had a total return of 13.46% for the twelve months ended December 31, 2014. That was in line with the S&P 500® Index (the “Index”), which returned 13.69%. (The Index is unmanaged, cannot be invested in directly, and does not include administrative expenses or sales charges.) Portfolio performance slightly lagged the Index due to transaction costs, administrative expenses, cash flow effects and costs associated with the use of stock index futures contracts. The Portfolio outperformed the 13.21% average return for its peer group, S&P 500 Index Objective Funds, according to Lipper® Analytical Services, Inc.
Within the Portfolio, nine of the ten economic sectors posted positive returns. The Technology sector generated the largest contribution to the Portfolio’s return, as solid consumer spending on technology offset relatively slow business spending. The Health Care sector also generated solid performance, as health care companies continued to grow while adapting to the Affordable Care Act. The Financials sector delivered a solid contribution to the Portfolio’s return, driven by improving balance sheets and solid earnings. The Consumer Staples sector also posted solid results. Lower gas prices and declining interest rates buoyed the Utilities sector during 2014.
At the other end of the spectrum, the Energy sector declined due to falling oil and gas prices, as global oil producers increased supply amid modest demand for oil. The Telecommunications sector also detracted from the Portfolio’s performance, although its impact was limited by a weighting of less than 3% on average during 2014. The Industrials and Materials sectors posted modest returns while lagging the overall Portfolio, as manufacturing and industrial activity remained restrained in international markets, particularly in China.
As the Portfolio seeks to track the performance and weightings of stocks in the Index, the portfolio managers make adjustments to the Portfolio’s holdings as the Index changes. Standard & Poor’s modifies the composition of the Index as companies go public or private, merge, divest or have major changes in market capitalization. Additionally, Standard & Poor’s adjusts the Index to better reflect the companies that are most representative of the composition of the U.S. economy. The portfolio managers try to make these adjustments in a way that minimizes the cost and market impact of trading.
| | | | |
| 14 | | Index 500 Stock Portfolio | | |
Index 500 Stock Portfolio (unaudited)
Relative Performance
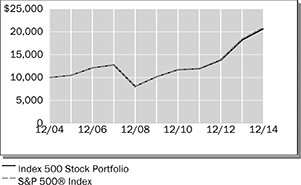
| | | | | | | | | | | | |
Average Annual Total Returns
For Periods Ended December 31, 2014 | |
| | | 1 Year | | | 5 Years | | | 10 Years | |
Index 500 Stock Portfolio | | | 13.46 | % | | | 15.23 | % | | | 7.53 | % |
S&P 500® Index | | | 13.69 | % | | | 15.45 | % | | | 7.67 | % |
Lipper® Variable Insurance Products (VIP) S&P 500 Index Objective Funds Average | | | 13.21 | % | | | 15.01 | % | | | 7.32 | % |
The performance data quoted represents past performance. Past performance is historical and does not guarantee future performance. Investment return and principal value will fluctuate, so that shares, when redeemed, may be worth more or less than their original cost. Current performance may be lower or higher than the performance data quoted. For the most recent month-end performance information visit www.northwesternmutual.com.
This chart assumes an initial investment of $10,000 made on 12/31/04. Returns shown include deductions for management and other portfolio expenses, and reinvestment of all dividends. Returns exclude deductions for separate account sale loads and account fees. Please refer to the Benchmark Definitions section of this report for information about the indices cited in the above chart and graph.
“Standard & Poor’s®”, “S&P®”, “S&P 500” and “Standard & Poor’s 500” are trademarks of The McGraw-Hill Companies, Inc. and have been licensed for use by Northwestern Mutual Life Insurance Company. The Portfolio is not sponsored, endorsed, sold or promoted by Standard & Poor’s, and Standard & Poor’s makes no representation regarding the advisability of investing in the Portfolio.
The Portfolio may invest in derivative instruments for cash management purposes or to hedge foreign currency exposure. Use of these instruments may involve certain costs and imposes certain risks such as liquidity risk, market risk, credit risk, management risk and the risk of mispricing or improper valuation. Certain derivatives involve leverage, which could magnify losses, and portfolios investing in derivatives could lose more than the principal amount invested in those instruments.
Top 10 Equity Holdings 12/31/14
| | | | |
Security Description | | | % of Net Assets | |
Apple, Inc. | | | 3.5 | % |
Exxon Mobil Corp. | | | 2.1 | % |
Microsoft Corp. | | | 2.1 | % |
Johnson & Johnson | | | 1.6 | % |
Berkshire Hathaway, Inc. - Class B | | | 1.5 | % |
Wells Fargo & Co. | | | 1.4 | % |
General Electric Co. | | | 1.4 | % |
The Procter & Gamble Co. | | | 1.3 | % |
JPMorgan Chase & Co. | | | 1.3 | % |
Chevron Corp. | | | 1.1 | % |
Sector Allocation 12/31/14
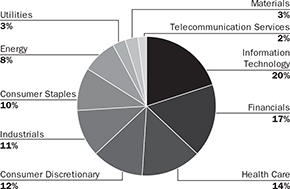
Sector Allocation is based on equities.
Sector Allocation and Top 10 Holdings are subject to change.
| | | | | | |
| | Index 500 Stock Portfolio | | | 15 | |
Index 500 Stock Portfolio
Schedule of Investments
December 31, 2014
| | | | | | | | | | |
| | | Common Stocks (98.7%) | | Shares/
$ Par | | | Value
$ (000’s) | |
| | |
| | Consumer Discretionary (12.0%) | | | | | |
| * | | Amazon.com, Inc. | | | 48,703 | | | | 15,115 | |
| * | | AutoNation, Inc. | | | 9,579 | | | | 579 | |
| * | | AutoZone, Inc. | | | 4,110 | | | | 2,544 | |
| * | | Bed Bath & Beyond, Inc. | | | 23,762 | | | | 1,810 | |
| | Best Buy Co., Inc. | | | 37,346 | | | | 1,456 | |
| | BorgWarner, Inc. | | | 29,167 | | | | 1,603 | |
| | Cablevision Systems Corp. - Class A | | | 28,081 | | | | 580 | |
| * | | CarMax, Inc. | | | 27,631 | | | | 1,840 | |
| | Carnival Corp. | | | 57,779 | | | | 2,619 | |
| | CBS Corp. - Class B | | | 61,165 | | | | 3,385 | |
| * | | Chipotle Mexican Grill, Inc. | | | 3,978 | | | | 2,723 | |
| | Coach, Inc. | | | 35,352 | | | | 1,328 | |
| | Comcast Corp. - Class A | | | 330,485 | | | | 19,171 | |
| | D.R. Horton, Inc. | | | 42,560 | | | | 1,076 | |
| | Darden Restaurants, Inc. | | | 17,016 | | | | 998 | |
| | Delphi Automotive PLC | | | 37,981 | | | | 2,762 | |
| * | | DIRECTV | | | 64,426 | | | | 5,586 | |
| * | | Discovery Communications, Inc. | | | 35,056 | | | | 1,182 | |
| * | | Discovery Communications, Inc. - Class A | | | 19,048 | | | | 656 | |
| * | | Dollar General Corp. | | | 38,923 | | | | 2,752 | |
| * | | Dollar Tree, Inc. | | | 26,381 | | | | 1,857 | |
| | Expedia, Inc. | | | 12,662 | | | | 1,081 | |
| | Family Dollar Stores, Inc. | | | 12,322 | | | | 976 | |
| | Ford Motor Co. | | | 493,706 | | | | 7,652 | |
| * | | Fossil Group, Inc. | | | 5,767 | | | | 639 | |
| | GameStop Corp. - Class A | | | 13,921 | | | | 470 | |
| | Gannett Co., Inc. | | | 28,969 | | | | 925 | |
| | The Gap, Inc. | | | 34,231 | | | | 1,441 | |
| | Garmin, Ltd. | | | 15,454 | | | | 816 | |
| | General Motors Co. | | | 173,129 | | | | 6,044 | |
| | Genuine Parts Co. | | | 19,608 | | | | 2,090 | |
| | The Goodyear Tire & Rubber Co. | | | 35,221 | | | | 1,006 | |
| | H&R Block, Inc. | | | 35,298 | | | | 1,189 | |
| | Harley-Davidson, Inc. | | | 27,486 | | | | 1,812 | |
| | Harman International Industries, Inc. | | | 8,789 | | | | 938 | |
| | Hasbro, Inc. | | | 14,510 | | | | 798 | |
| | The Home Depot, Inc. | | | 169,050 | | | | 17,745 | |
| | The Interpublic Group of Cos., Inc. | | | 53,650 | | | | 1,114 | |
| | Johnson Controls, Inc. | | | 85,458 | | | | 4,131 | |
| | Kohl’s Corp. | | | 25,914 | | | | 1,582 | |
| | L Brands, Inc. | | | 31,538 | | | | 2,730 | |
| | Leggett & Platt, Inc. | | | 17,654 | | | | 752 | |
| | Lennar Corp. - Class A | | | 22,906 | | | | 1,026 | |
| | Lowe’s Cos., Inc. | | | 124,804 | | | | 8,586 | |
| | Macy’s, Inc. | | | 44,293 | | | | 2,912 | |
| | Marriott International, Inc. - Class A | | | 27,262 | | | | 2,127 | |
| | | | | | | | | | |
| | | Common Stocks (98.7%) | | Shares/
$ Par | | | Value
$ (000’s) | |
| | |
| | Consumer Discretionary continued | | | | | |
| | Mattel, Inc. | | | 43,464 | | | | 1,345 | |
| | McDonald’s Corp. | | | 124,842 | | | | 11,698 | |
| * | | Michael Kors Holdings, Ltd. | | | 26,414 | | | | 1,984 | |
| * | | Mohawk Industries, Inc. | | | 7,948 | | | | 1,235 | |
| * | | Netflix, Inc. | | | 7,728 | | | | 2,640 | |
| | Newell Rubbermaid, Inc. | | | 34,776 | | | | 1,325 | |
| * | | News Corp. - Class A | | | 63,994 | | | | 1,004 | |
| | NIKE, Inc. - Class B | | | 89,516 | | | | 8,607 | |
| | Nordstrom, Inc. | | | 18,059 | | | | 1,434 | |
| | Omnicom Group, Inc. | | | 31,836 | | | | 2,466 | |
| * | | O’Reilly Automotive, Inc. | | | 13,013 | | | | 2,506 | |
| | PetSmart, Inc. | | | 12,752 | | | | 1,037 | |
| * | | Priceline.com, Inc. | | | 6,716 | | | | 7,658 | |
| | PulteGroup, Inc. | | | 42,806 | | | | 919 | |
| | PVH Corp. | | | 10,569 | | | | 1,355 | |
| | Ralph Lauren Corp. | | | 7,763 | | | | 1,437 | |
| | Ross Stores, Inc. | | | 26,917 | | | | 2,537 | |
| | Royal Caribbean Cruises, Ltd. | | | 21,423 | | | | 1,766 | |
| | Scripps Networks Interactive - Class A | | | 13,015 | | | | 980 | |
| | Staples, Inc. | | | 82,073 | | | | 1,487 | |
| | Starbucks Corp. | | | 95,991 | | | | 7,876 | |
| | Starwood Hotels & Resorts Worldwide, Inc. | | | 22,907 | | | | 1,857 | |
| | Target Corp. | | | 81,709 | | | | 6,202 | |
| | Tiffany & Co. | | | 14,436 | | | | 1,543 | |
| | Time Warner Cable, Inc. | | | 35,982 | | | | 5,471 | |
| | Time Warner, Inc. | | | 107,560 | | | | 9,188 | |
| | The TJX Cos., Inc. | | | 88,371 | | | | 6,060 | |
| | Tractor Supply Co. | | | 17,438 | | | | 1,374 | |
| * | | TripAdvisor, Inc. | | | 14,301 | | | | 1,068 | |
| | Twenty-First Century Fox, Inc. | | | 237,864 | | | | 9,135 | |
| * | | Under Armour, Inc. | | | 21,382 | | | | 1,452 | |
| * | | Urban Outfitters, Inc. | | | 12,834 | | | | 451 | |
| | VF Corp. | | | 44,320 | | | | 3,320 | |
| | Viacom, Inc. - Class B | | | 47,389 | | | | 3,566 | |
| | The Walt Disney Co. | | | 200,122 | | | | 18,849 | |
| | Whirlpool Corp. | | | 9,989 | | | | 1,935 | |
| | Wyndham Worldwide Corp. | | | 15,812 | | | | 1,356 | |
| | Wynn Resorts, Ltd. | | | 10,391 | | | | 1,546 | |
| | Yum! Brands, Inc. | | | 56,121 | | | | 4,088 | |
| | | | | | | | | | |
| | Total | | | | | | | 283,961 | |
| | | | | | | | | | |
| | | |
| | Consumer Staples (9.7%) | | | | | | | | |
| | Altria Group, Inc. | | | 253,540 | | | | 12,492 | |
| | Archer-Daniels-Midland Co. | | | 82,585 | | | | 4,294 | |
| | Avon Products, Inc. | | | 55,757 | | | | 524 | |
| | Brown-Forman Corp. - Class B | | | 20,070 | | | | 1,763 | |
| | Campbell Soup Co. | | | 22,981 | | | | 1,011 | |
| | The Clorox Co. | | | 16,600 | | | | 1,730 | |
| | | | | | | | | | |
| | | Common Stocks (98.7%) | | Shares/
$ Par | | | Value
$ (000’s) | |
| | |
| | Consumer Staples continued | | | | | |
| | The Coca-Cola Co. | | | 505,690 | | | | 21,350 | |
| | Coca-Cola Enterprises, Inc. | | | 28,529 | | | | 1,261 | |
| | Colgate-Palmolive Co. | | | 109,899 | | | | 7,604 | |
| | ConAgra Foods, Inc. | | | 54,496 | | | | 1,977 | |
| * | | Constellation Brands, Inc. - Class A | | | 21,525 | | | | 2,113 | |
| | Costco Wholesale Corp. | | | 56,156 | | | | 7,960 | |
| | CVS Health Corp. | | | 147,057 | | | | 14,163 | |
| | Dr. Pepper Snapple Group, Inc. | | | 24,939 | | | | 1,788 | |
| | The Estee Lauder Cos., Inc. - Class A | | | 28,731 | | | | 2,189 | |
| | General Mills, Inc. | | | 77,448 | | | | 4,130 | |
| | The Hershey Co. | | | 18,983 | | | | 1,973 | |
| | Hormel Foods Corp. | | | 17,236 | | | | 898 | |
| | The J.M. Smucker Co. | | | 13,061 | | | | 1,319 | |
| | Kellogg Co. | | | 32,336 | | | | 2,116 | |
| | Keurig Green Mountain, Inc. | | | 15,587 | | | | 2,064 | |
| | Kimberly-Clark Corp. | | | 47,778 | | | | 5,520 | |
| | Kraft Foods Group, Inc. | | | 75,534 | | | | 4,733 | |
| | The Kroger Co. | | | 62,997 | | | | 4,045 | |
| | Lorillard, Inc. | | | 46,183 | | | | 2,907 | |
| | McCormick & Co., Inc. | | | 16,567 | | | | 1,231 | |
| | Mead Johnson Nutrition Co. | | | 25,916 | | | | 2,606 | |
| | Molson Coors Brewing Co. - Class B | | | 20,441 | | | | 1,523 | |
| | Mondelez International, Inc. | | | 215,499 | | | | 7,828 | |
| * | | Monster Beverage Corp. | | | 18,494 | | | | 2,004 | |
| | PepsiCo, Inc. | | | 191,983 | | | | 18,154 | |
| | Philip Morris International, Inc. | | | 199,309 | | | | 16,234 | |
| | The Procter & Gamble Co. | | | 346,626 | | | | 31,574 | |
| | Reynolds American, Inc. | | | 39,529 | | | | 2,540 | |
| | Safeway, Inc. | | | 29,556 | | | | 1,038 | |
| | Sysco Corp. | | | 75,413 | | | | 2,993 | |
| | Tyson Foods, Inc. – Class A | | | 37,588 | | | | 1,507 | |
| | Walgreens Boots Alliance, Inc. | | | 111,584 | | | | 8,503 | |
| | Wal-Mart Stores, Inc. | | | 202,599 | | | | 17,399 | |
| | Whole Foods Market, Inc. | | | 46,148 | | | | 2,327 | |
| | | | | | | | | | |
| | Total | | | | | | | 229,385 | |
| | | | | | | | | | |
| | | |
| | Energy (8.3%) | | | | | | | | |
| | Anadarko Petroleum Corp. | | | 64,967 | | | | 5,360 | |
| | Apache Corp. | | | 48,295 | | | | 3,027 | |
| | Baker Hughes, Inc. | | | 55,504 | | | | 3,112 | |
| | Cabot Oil & Gas Corp. | | | 52,982 | | | | 1,569 | |
| * | | Cameron International Corp. | | | 25,328 | | | | 1,265 | |
| | Chesapeake Energy Corp. | | | 66,549 | | | | 1,302 | |
| | Chevron Corp. | | | 242,502 | | | | 27,204 | |
The Accompanying Notes are an Integral Part of the Financial Statements.
| | | | |
| 16 | | Index 500 Stock Portfolio | | |
Index 500 Stock Portfolio
| | | | | | | | | | |
| | | Common Stocks (98.7%) | | Shares/
$ Par | | | Value
$ (000’s) | |
| | |
| | Energy continued | | | | | |
| | Cimarex Energy Co. | | | 11,192 | | | | 1,186 | |
| | ConocoPhillips | | | 157,901 | | | | 10,905 | |
| | CONSOL Energy, Inc. | | | 29,527 | | | | 998 | |
| | Denbury Resources, Inc. | | | 45,227 | | | | 368 | |
| | Devon Energy Corp. | | | 49,330 | | | | 3,020 | |
| | Diamond Offshore Drilling, Inc. | | | 8,621 | | | | 316 | |
| | Ensco PLC - Class A | | | 30,057 | | | | 900 | |
| | EOG Resources, Inc. | | | 70,298 | | | | 6,472 | |
| | EQT Corp. | | | 19,435 | | | | 1,471 | |
| | Exxon Mobil Corp. | | | 543,202 | | | | 50,219 | |
| * | | FMC Technologies, Inc. | | | 29,998 | | | | 1,405 | |
| | Halliburton Co. | | | 108,711 | | | | 4,276 | |
| | Helmerich & Payne, Inc. | | | 13,887 | | | | 936 | |
| | Hess Corp. | | | 32,599 | | | | 2,406 | |
| | Kinder Morgan, Inc. | | | 217,962 | | | | 9,222 | |
| | Marathon Oil Corp. | | | 86,575 | | | | 2,449 | |
| | Marathon Petroleum Corp. | | | 35,943 | | | | 3,244 | |
| | Murphy Oil Corp. | | | 21,403 | | | | 1,081 | |
| | Nabors Industries, Ltd. | | | 37,128 | | | | 482 | |
| | National Oilwell Varco, Inc. | | | 55,234 | | | | 3,619 | |
| * | | Newfield Exploration Co. | | | 17,604 | | | | 477 | |
| | Noble Corp. PLC | | | 32,322 | | | | 536 | |
| | Noble Energy, Inc. | | | 46,228 | | | | 2,193 | |
| | Occidental Petroleum Corp. | | | 99,471 | | | | 8,018 | |
| | ONEOK, Inc. | | | 26,707 | | | | 1,330 | |
| | Phillips 66 | | | 71,004 | | | | 5,091 | |
| | Pioneer Natural Resources Co. | | | 19,100 | | | | 2,843 | |
| | QEP Resources, Inc. | | | 21,260 | | | | 430 | |
| | Range Resources Corp. | | | 21,641 | | | | 1,157 | |
| | Schlumberger, Ltd. | | | 165,069 | | | | 14,099 | |
| * | | Southwestern Energy Co. | | | 45,298 | | | | 1,236 | |
| | Spectra Energy Corp. | | | 86,075 | | | | 3,125 | |
| | Tesoro Corp. | | | 16,195 | | | | 1,204 | |
| | Transocean, Ltd. | | | 43,680 | | | | 801 | |
| | Valero Energy Corp. | | | 66,865 | | | | 3,310 | |
| | The Williams Companies, Inc. | | | 86,296 | | | | 3,878 | |
| | | | | | | | | | |
| | Total | | | | | | | 197,542 | |
| | | | | | | | | | |
| | | |
| | Financials (16.4%) | | | | | | | | |
| | ACE, Ltd. | | | 42,555 | | | | 4,889 | |
| * | | Affiliated Managers Group, Inc. | | | 7,129 | | | | 1,513 | |
| | Aflac, Inc. | | | 57,801 | | | | 3,531 | |
| | The Allstate Corp. | | | 53,805 | | | | 3,780 | |
| | American Express Co. | | | 114,146 | | | | 10,620 | |
| | American International Group, Inc. | | | 179,580 | | | | 10,058 | |
| | American Tower Corp. | | | 50,858 | | | | 5,027 | |
| | Ameriprise Financial, Inc. | | | 23,672 | | | | 3,131 | |
| | Aon PLC | | | 36,577 | | | | 3,469 | |
| | Apartment Investment & Management Co. – Class A | | | 18,755 | | | | 697 | |
| | Assurant, Inc. | | | 9,012 | | | | 617 | |
| | AvalonBay Communities, Inc. | | | 16,934 | | | | 2,767 | |
| | | | | | | | | | |
| | | Common Stocks (98.7%) | | Shares/
$ Par | | | Value
$ (000’s) | |
| | |
| | Financials continued | | | | | |
| | Bank of America Corp. | | | 1,349,042 | | | | 24,134 | |
| | The Bank of New York Mellon Corp. | | | 144,405 | | | | 5,858 | |
| | BB&T Corp. | | | 92,400 | | | | 3,593 | |
| * | | Berkshire Hathaway, Inc. - Class B | | | 233,923 | | | | 35,124 | |
| | BlackRock, Inc. | | | 16,341 | | | | 5,843 | |
| | Boston Properties, Inc. | | | 19,639 | | | | 2,527 | |
| | Capital One Financial Corp. | | | 71,320 | | | | 5,887 | |
| * | | CBRE Group, Inc. | | | 35,868 | | | | 1,228 | |
| | The Charles Schwab Corp. | | | 147,403 | | | | 4,450 | |
| | The Chubb Corp. | | | 30,250 | | | | 3,130 | |
| | Cincinnati Financial Corp. | | | 18,875 | | | | 978 | |
| | Citigroup, Inc. | | | 388,620 | | | | 21,028 | |
| | CME Group, Inc. | | | 40,617 | | | | 3,601 | |
| | Comerica, Inc. | | | 23,050 | | | | 1,080 | |
| | Crown Castle International Corp. | | | 42,827 | | | | 3,370 | |
| | Discover Financial Services | | | 58,172 | | | | 3,810 | |
| * | | E*TRADE Financial Corp. | | | 37,049 | | | | 899 | |
| | Equity Residential | | | 46,484 | | | | 3,339 | |
| | Essex Property Trust, Inc. | | | 8,202 | | | | 1,695 | |
| | Fifth Third Bancorp | | | 105,703 | | | | 2,154 | |
| | Franklin Resources, Inc. | | | 50,298 | | | | 2,785 | |
| | General Growth Properties, Inc. | | | 80,497 | | | | 2,264 | |
| * | | Genworth Financial, Inc. - Class A | | | 63,711 | | | | 542 | |
| | The Goldman Sachs Group, Inc. | | | 51,961 | | | | 10,072 | |
| | The Hartford Financial Services Group, Inc. | | | 55,350 | | | | 2,308 | |
| | HCP, Inc. | | | 58,914 | | | | 2,594 | |
| | Health Care REIT, Inc. | | | 42,034 | | | | 3,181 | |
| | Host Hotels & Resorts, Inc. | | | 97,148 | | | | 2,309 | |
| | Hudson City Bancorp, Inc. | | | 61,724 | | | | 625 | |
| | Huntington Bancshares, Inc. | | | 104,477 | | | | 1,099 | |
| | Intercontinental Exchange, Inc. | | | 14,458 | | | | 3,170 | |
| | Invesco, Ltd. | | | 55,266 | | | | 2,184 | |
| | JPMorgan Chase & Co. | | | 479,532 | | | | 30,009 | |
| | KeyCorp | | | 111,132 | | | | 1,545 | |
| | Kimco Realty Corp. | | | 52,777 | | | | 1,327 | |
| | Legg Mason, Inc. | | | 12,881 | | | | 687 | |
| | Leucadia National Corp. | | | 40,645 | | | | 911 | |
| | Lincoln National Corp. | | | 33,325 | | | | 1,922 | |
| | Loews Corp. | | | 38,396 | | | | 1,613 | |
| | M&T Bank Corp. | | | 16,947 | | | | 2,129 | |
| | The Macerich Co. | | | 18,051 | | | | 1,506 | |
| | Marsh & McLennan Cos., Inc. | | | 69,386 | | | | 3,972 | |
| | McGraw Hill Financial, Inc. | | | 34,828 | | | | 3,099 | |
| | MetLife, Inc. | | | 145,731 | | | | 7,883 | |
| | Moody’s Corp. | | | 23,548 | | | | 2,256 | |
| | Morgan Stanley | | | 195,853 | | | | 7,599 | |
| | | | | | | | | | |
| | | Common Stocks (98.7%) | | Shares/
$ Par | | | Value
$ (000’s) | |
| | |
| | Financials continued | | | | | |
| | The NASDAQ OMX Group, Inc. | | | 15,056 | | | | 722 | |
| | Navient Corp. | | | 52,623 | | | | 1,137 | |
| | Northern Trust Corp. | | | 28,398 | | | | 1,914 | |
| | People’s United Financial, Inc. | | | 39,506 | | | | 600 | |
| | Plum Creek Timber Co., Inc. | | | 22,563 | | | | 965 | |
| | PNC Financial Services Group, Inc. | | | 67,502 | | | | 6,158 | |
| | Principal Financial Group, Inc. | | | 35,034 | | | | 1,820 | |
| | The Progressive Corp. | | | 68,616 | | | | 1,852 | |
| | Prologis, Inc. | | | 64,138 | | | | 2,760 | |
| | Prudential Financial, Inc. | | | 58,752 | | | | 5,315 | |
| | Public Storage | | | 18,612 | | | | 3,440 | |
| | Regions Financial Corp. | | | 176,573 | | | | 1,865 | |
| | Simon Property Group, Inc. | | | 39,867 | | | | 7,260 | |
| | State Street Corp. | | | 53,556 | | | | 4,204 | |
| | SunTrust Banks, Inc. | | | 66,892 | | | | 2,803 | |
| | T. Rowe Price Group, Inc. | | | 33,274 | | | | 2,857 | |
| | Torchmark Corp. | | | 16,502 | | | | 894 | |
| | The Travelers Cos., Inc. | | | 42,511 | | | | 4,500 | |
| | U.S. Bancorp | | | 229,541 | | | | 10,318 | |
| | Unum Group | | | 32,325 | | | | 1,127 | |
| | Ventas, Inc. | | | 37,755 | | | | 2,707 | |
| | Vornado Realty Trust | | | 22,397 | | | | 2,636 | |
| | Wells Fargo & Co. | | | 605,572 | | | | 33,197 | |
| | Weyerhaeuser Co. | | | 67,265 | | | | 2,414 | |
| | XL Group PLC | | | 33,103 | | | | 1,138 | |
| | Zions Bancorporation | | | 26,032 | | | | 742 | |
| | | | | | | | | | |
| | Total | | | | | | | 388,763 | |
| | | | | | | | | | |
| | | |
| | Health Care (14.0%) | | | | | | | | |
| | Abbott Laboratories | | | 193,162 | | | | 8,696 | |
| | AbbVie, Inc. | | | 204,383 | | | | 13,375 | |
| * | | Actavis PLC | | | 34,002 | | | | 8,752 | |
| | Aetna, Inc. | | | 45,116 | | | | 4,008 | |
| | Agilent Technologies, Inc. | | | 42,783 | | | | 1,752 | |
| * | | Alexion Pharmaceuticals, Inc. | | | 25,436 | | | | 4,706 | |
| | Allergan, Inc. | | | 38,214 | | | | 8,124 | |
| | AmerisourceBergen Corp. | | | 26,651 | | | | 2,403 | |
| | Amgen, Inc. | | | 97,578 | | | | 15,543 | |
| | Anthem, Inc. | | | 34,628 | | | | 4,352 | |
| | Baxter International, Inc. | | | 69,524 | | | | 5,095 | |
| | Becton, Dickinson and Co. | | | 24,627 | | | | 3,427 | |
| * | | Biogen Idec, Inc. | | | 30,294 | | | | 10,283 | |
| * | | Boston Scientific Corp. | | | 170,160 | | | | 2,255 | |
| | Bristol-Myers Squibb Co. | | | 212,786 | | | | 12,561 | |
| | C.R. Bard, Inc. | | | 9,608 | | | | 1,601 | |
| | Cardinal Health, Inc. | | | 42,456 | | | | 3,427 | |
| * | | CareFusion Corp. | | | 26,158 | | | | 1,552 | |
| * | | Celgene Corp. | | | 102,457 | | | | 11,461 | |
| * | | Cerner Corp. | | | 38,986 | | | | 2,521 | |
| | Cigna Corp. | | | 33,555 | | | | 3,453 | |
| | Covidien PLC | | | 58,083 | | | | 5,941 | |
| * | | DaVita HealthCare Partners, Inc. | | | 22,054 | | | | 1,670 | |
The Accompanying Notes are an Integral Part of the Financial Statements.
| | | | | | |
| | Index 500 Stock Portfolio | | | 17 | |
Index 500 Stock Portfolio
| | | | | | | | | | |
| | | Common Stocks (98.7%) | | Shares/
$ Par | | | Value
$ (000’s) | |
| |
| | Health Care continued | |
| | DENTSPLY International, Inc. | | | 18,155 | | | | 967 | |
| * | | Edwards Lifesciences Corp. | | | 13,723 | | | | 1,748 | |
| | Eli Lilly and Co. | | | 125,690 | | | | 8,671 | |
| * | | Express Scripts Holding Co. | | | 94,145 | | | | 7,971 | |
| * | | Gilead Sciences, Inc. | | | 193,530 | | | | 18,242 | |
| * | | Hospira, Inc. | | | 21,705 | | | | 1,329 | |
| | Humana, Inc. | | | 19,670 | | | | 2,825 | |
| * | | Intuitive Surgical, Inc. | | | 4,650 | | | | 2,460 | |
| | Johnson & Johnson | | | 359,068 | | | | 37,548 | |
| * | | Laboratory Corp. of America Holdings | | | 10,840 | | | | 1,170 | |
| * | | Mallinckrodt PLC | | | 14,916 | | | | 1,477 | |
| | McKesson Corp. | | | 29,746 | | | | 6,175 | |
| | Medtronic, Inc. | | | 126,267 | | | | 9,117 | |
| | Merck & Co., Inc. | | | 365,708 | | | | 20,769 | |
| * | | Mylan, Inc. | | | 48,011 | | | | 2,706 | |
| | Patterson Cos., Inc. | | | 10,979 | | | | 528 | |
| | PerkinElmer, Inc. | | | 14,491 | | | | 634 | |
| | Perrigo Co. PLC | | | 18,057 | | | | 3,018 | |
| | Pfizer, Inc. | | | 808,244 | | | | 25,177 | |
| | Quest Diagnostics, Inc. | | | 18,541 | | | | 1,243 | |
| * | | Regeneron Pharmaceuticals, Inc. | | | 9,520 | | | | 3,906 | |
| | St. Jude Medical, Inc. | | | 36,677 | | | | 2,385 | |
| | Stryker Corp. | | | 38,339 | | | | 3,617 | |
| * | | Tenet Heathcare Corp. | | | 12,607 | | | | 639 | |
| | Thermo Fisher Scientific, Inc. | | | 51,315 | | | | 6,429 | |
| | UnitedHealth Group, Inc. | | | 123,121 | | | | 12,446 | |
| | Universal Health Services, Inc. - Class B | | | 11,680 | | | | 1,300 | |
| * | | Varian Medical Systems, Inc. | | | 12,825 | | | | 1,110 | |
| * | | Vertex Pharmaceuticals, Inc. | | | 30,854 | | | | 3,665 | |
| * | | Waters Corp. | | | 10,683 | | | | 1,204 | |
| | Zimmer Holdings, Inc. | | | 21,725 | | | | 2,464 | |
| * | | Zoetis, Inc. | | | 64,310 | | | | 2,767 | |
| | | | | | | | | | |
| | Total | | | | | | | 332,665 | |
| | | | | | | | | | |
| |
| | Industrials (10.3%) | |
| | 3M Co. | | | 82,204 | | | | 13,508 | |
| | The ADT Corp. | | | 22,388 | | | | 811 | |
| | Allegion PLC | | | 12,280 | | | | 681 | |
| | AMETEK, Inc. | | | 31,548 | | | | 1,660 | |
| | The Boeing Co. | | | 85,052 | | | | 11,055 | |
| | C.H. Robinson Worldwide, Inc. | | | 18,765 | | | | 1,405 | |
| | Caterpillar, Inc. | | | 77,660 | | | | 7,108 | |
| | Cintas Corp. | | | 12,455 | | | | 977 | |
| | CSX Corp. | | | 127,689 | | | | 4,626 | |
| | Cummins, Inc. | | | 21,795 | | | | 3,142 | |
| | Danaher Corp. | | | 78,423 | | | | 6,722 | |
| | Deere & Co. | | | 45,978 | | | | 4,068 | |
| | Delta Air Lines, Inc. | | | 107,362 | | | | 5,281 | |
| | Dover Corp. | | | 21,212 | | | | 1,521 | |
| | The Dun & Bradstreet Corp. | | | 4,607 | | | | 557 | |
| | | | | | | | | | |
| | | Common Stocks (98.7%) | | Shares/
$ Par | | | Value
$ (000’s) | |
| | |
| | Industrials continued | | | | | |
| | Eaton Corp. PLC | | | 60,881 | | | | 4,137 | |
| | Emerson Electric Co. | | | 88,979 | | | | 5,493 | |
| | Equifax, Inc. | | | 15,469 | | | | 1,251 | |
| | Expeditors International of Washington, Inc. | | | 24,762 | | | | 1,105 | |
| | Fastenal Co. | | | 34,985 | | | | 1,664 | |
| | FedEx Corp. | | | 33,791 | | | | 5,868 | |
| | Flowserve Corp. | | | 17,485 | | | | 1,046 | |
| | Fluor Corp. | | | 20,040 | | | | 1,215 | |
| | General Dynamics Corp. | | | 40,385 | | | | 5,558 | |
| | General Electric Co. | | | 1,288,205 | | | | 32,553 | |
| | Honeywell International, Inc. | | | 100,418 | | | | 10,034 | |
| | Illinois Tool Works, Inc. | | | 46,137 | | | | 4,369 | |
| | Ingersoll-Rand PLC | | | 34,054 | | | | 2,159 | |
| | Iron Mountain, Inc. | | | 23,919 | | | | 925 | |
| * | | Jacobs Engineering Group, Inc. | | | 16,747 | | | | 748 | |
| | Joy Global, Inc. | | | 12,594 | | | | 586 | |
| | Kansas City Southern | | | 14,157 | | | | 1,728 | |
| | L-3 Communications Holdings, Inc. | | | 10,921 | | | | 1,378 | |
| | Lockheed Martin Corp. | | | 34,448 | | | | 6,634 | |
| | Masco Corp. | | | 45,701 | | | | 1,152 | |
| | Nielsen NV | | | 41,551 | | | | 1,859 | |
| | Norfolk Southern Corp. | | | 39,695 | | | | 4,351 | |
| | Northrop Grumman Corp. | | | 25,912 | | | | 3,819 | |
| | PACCAR, Inc. | | | 45,424 | | | | 3,089 | |
| | Pall Corp. | | | 13,666 | | | | 1,383 | |
| | Parker Hannifin Corp. | | | 19,068 | | | | 2,459 | |
| | Pentair PLC | | | 23,962 | | | | 1,592 | |
| | Pitney Bowes, Inc. | | | 25,783 | | | | 628 | |
| | Precision Castparts Corp. | | | 18,284 | | | | 4,404 | |
| * | | Quanta Services, Inc. | | | 27,924 | | | | 793 | |
| | Raytheon Co. | | | 39,557 | | | | 4,279 | |
| | Republic Services, Inc. | | | 32,382 | | | | 1,303 | |
| | Robert Half International, Inc. | | | 17,436 | | | | 1,018 | |
| | Rockwell Automation, Inc. | | | 17,417 | | | | 1,937 | |
| | Rockwell Collins, Inc. | | | 17,054 | | | | 1,441 | |
| | Roper Industries, Inc. | | | 12,848 | | | | 2,009 | |
| | Ryder System, Inc. | | | 6,804 | | | | 632 | |
| | Snap-on, Inc. | | | 7,454 | | | | 1,019 | |
| | Southwest Airlines Co. | | | 87,069 | | | | 3,685 | |
| | Stanley Black & Decker, Inc. | | | 20,095 | | | | 1,931 | |
| * | | Stericycle, Inc. | | | 10,894 | | | | 1,428 | |
| | Textron, Inc. | | | 35,411 | | | | 1,491 | |
| | Tyco Interntional PLC | | | 53,680 | | | | 2,354 | |
| | Union Pacific Corp. | | | 114,053 | | | | 13,587 | |
| | United Parcel Service, Inc. - Class B | | | 89,414 | | | | 9,940 | |
| * | | United Rentals, Inc. | | | 12,803 | | | | 1,306 | |
| | United Technologies Corp. | | | 108,761 | | | | 12,507 | |
| | W.W. Grainger, Inc. | | | 7,784 | | | | 1,984 | |
| | Waste Management, Inc. | | | 54,630 | | | | 2,804 | |
| | Xylem, Inc. | | | 23,331 | | | | 888 | |
| | | | | | | | | | |
| | Total | | | | | | | 244,645 | |
| | | | | | | | | | |
| | | | | | | | | | |
| | | Common Stocks (98.7%) | | Shares/
$ Par | | | Value
$ (000’s) | |
| | |
| | Information Technology (19.4%) | | | | | |
| | Accenture PLC - Class A | | | 80,496 | | | | 7,189 | |
| * | | Adobe Systems, Inc. | | | 60,779 | | | | 4,419 | |
| * | | Akamai Technologies, Inc. | | | 22,833 | | | | 1,438 | |
| * | | Alliance Data Systems Corp. | | | 8,200 | | | | 2,346 | |
| | Altera Corp. | | | 39,102 | | | | 1,444 | |
| | Amphenol Corp. - Class A | | | 39,698 | | | | 2,136 | |
| | Analog Devices, Inc. | | | 39,921 | | | | 2,216 | |
| | Apple, Inc. | | | 752,337 | | | | 83,043 | |
| | Applied Materials, Inc. | | | 156,295 | | | | 3,895 | |
| * | | Autodesk, Inc. | | | 29,186 | | | | 1,753 | |
| | Automatic Data Processing, Inc. | | | 61,838 | | | | 5,155 | |
| | Avago Technologies, Ltd. | | | 32,442 | | | | 3,263 | |
| | Broadcom Corp. - Class A | | | 69,106 | | | | 2,994 | |
| | CA, Inc. | | | 41,092 | | | | 1,251 | |
| | Cisco Systems, Inc. | | | 655,967 | | | | 18,246 | |
| * | | Citrix Systems, Inc. | | | 20,649 | | | | 1,317 | |
| * | | Cognizant Technology Solutions Corp. - Class A | | | 78,111 | | | | 4,113 | |
| | Computer Sciences Corp. | | | 18,022 | | | | 1,136 | |
| | Corning, Inc. | | | 164,435 | | | | 3,770 | |
| * | | eBay, Inc. | | | 145,027 | | | | 8,139 | |
| * | | Electronic Arts, Inc. | | | 39,887 | | | | 1,875 | |
| | EMC Corp. | | | 261,037 | | | | 7,763 | |
| * | | F5 Networks, Inc. | | | 9,465 | | | | 1,235 | |
| * | | Facebook, Inc. - Class A | | | 268,217 | | | | 20,926 | |
| | Fidelity National Information Services, Inc. | | | 36,399 | | | | 2,264 | |
| * | | First Solar, Inc. | | | 9,641 | | | | 430 | |
| * | | Fiserv, Inc. | | | 31,296 | | | | 2,221 | |
| | FLIR Systems, Inc. | | | 18,074 | | | | 584 | |
| * | | Google, Inc. - Class A | | | 36,565 | | | | 19,404 | |
| * | | Google, Inc. - Class C | | | 36,532 | | | | 19,230 | |
| | Harris Corp. | | | 13,417 | | | | 964 | |
| | Hewlett-Packard Co. | | | 239,404 | | | | 9,607 | |
| | Intel Corp. | | | 620,230 | | | | 22,508 | |
| | International Business Machines Corp. | | | 118,066 | | | | 18,942 | |
| | Intuit, Inc. | | | 36,627 | | | | 3,377 | |
| | Juniper Networks, Inc. | | | 49,386 | | | | 1,102 | |
| | KLA-Tencor Corp. | | | 21,099 | | | | 1,484 | |
| | Lam Research Corp. | | | 20,391 | | | | 1,618 | |
| | Linear Technology Corp. | | | 30,598 | | | | 1,395 | |
| | MasterCard, Inc. - Class A | | | 125,704 | | | | 10,831 | |
| | Microchip Technology, Inc. | | | 25,780 | | | | 1,163 | |
| * | | Micron Technology, Inc. | | | 137,702 | | | | 4,821 | |
| | Microsoft Corp. | | | 1,057,387 | | | | 49,116 | |
| | Motorola Solutions, Inc. | | | 27,174 | | | | 1,823 | |
| | NetApp, Inc. | | | 39,984 | | | | 1,657 | |
| | NVIDIA Corp. | | | 66,238 | | | | 1,328 | |
| | Oracle Corp. | | | 414,964 | | | | 18,661 | |
| | Paychex, Inc. | | | 41,889 | | | | 1,934 | |
| | Qualcomm, Inc. | | | 213,277 | | | | 15,853 | |
| * | | Red Hat, Inc. | | | 24,094 | | | | 1,666 | |
| * | | Salesforce.com, Inc. | | | 75,278 | | | | 4,465 | |
| | SanDisk Corp. | | | 28,305 | | | | 2,773 | |
The Accompanying Notes are an Integral Part of the Financial Statements.
| | | | |
| 18 | | Index 500 Stock Portfolio | | |
Index 500 Stock Portfolio
| | | | | | | | | | |
| | | Common Stocks (98.7%) | | Shares/
$ Par | | | Value
$ (000’s) | |
| |
| | Information Technology continued | |
| | Seagate Technology PLC | | | 41,978 | | | | 2,792 | |
| | Symantec Corp. | | | 88,532 | | | | 2,271 | |
| | TE Connectivity, Ltd. | | | 52,168 | | | | 3,300 | |
| * | | Teradata Corp. | | | 19,627 | | | | 857 | |
| | Texas Instruments, Inc. | | | 135,502 | | | | 7,245 | |
| | Total System Services, Inc. | | | 21,224 | | | | 721 | |
| * | | VeriSign, Inc. | | | 13,980 | | | | 797 | |
| | Visa, Inc. - Class A | | | 62,654 | | | | 16,428 | |
| | Western Digital Corp. | | | 28,003 | | | | 3,100 | |
| | Western Union Co. | | | 67,043 | | | | 1,201 | |
| | Xerox Corp. | | | 137,651 | | | | 1,908 | |
| | Xilinx, Inc. | | | 33,924 | | | | 1,469 | |
| * | | Yahoo!, Inc. | | | 113,019 | | | | 5,709 | |
| | | | | | | | | | |
| | Total | | | | | | | 460,081 | |
| | | | | | | | | | |
| |
| | Materials (3.1%) | |
| | Air Products and Chemicals, Inc. | | | 24,673 | | | | 3,559 | |
| | Airgas, Inc. | | | 8,624 | | | | 993 | |
| | Alcoa, Inc. | | | 151,219 | | | | 2,388 | |
| | Allegheny Technologies, Inc. | | | 13,944 | | | | 485 | |
| | Avery Dennison Corp. | | | 11,686 | | | | 606 | |
| | Ball Corp. | | | 17,564 | | | | 1,197 | |
| | CF Industries Holdings, Inc. | | | 6,380 | | | | 1,739 | |
| | The Dow Chemical Co. | | | 142,114 | | | | 6,482 | |
| | E.I. du Pont de Nemours and Co. | | | 116,214 | | | | 8,593 | |
| | Eastman Chemical Co. | | | 19,053 | | | | 1,445 | |
| | Ecolab, Inc. | | | 34,649 | | | | 3,622 | |
| | FMC Corp. | | | 17,095 | | | | 975 | |
| | Freeport-McMoRan, Inc. | | | 133,298 | | | | 3,114 | |
| | International Flavors & Fragrances, Inc. | | | 10,387 | | | | 1,053 | |
| | International Paper Co. | | | 54,341 | | | | 2,912 | |
| | LyondellBasell Industries NV - Class A | | | 53,307 | | | | 4,232 | |
| | Martin Marietta Materials, Inc. | | | 7,939 | | | | 876 | |
| | MeadWestvaco Corp. | | | 21,387 | | | | 949 | |
| | Monsanto Co. | | | 62,097 | | | | 7,419 | |
| | The Mosaic Co. | | | 40,487 | | | | 1,848 | |
| | Newmont Mining Corp. | | | 63,985 | | | | 1,209 | |
| | | | | | | | | | |
| | | Common Stocks (98.7%) | | Shares/
$ Par | | | Value
$ (000’s) | |
| |
| | Materials continued | |
| | Nucor Corp. | | | 40,921 | | | | 2,007 | |
| * | | Owens-Illinois, Inc. | | | 21,155 | | | | 571 | |
| | PPG Industries, Inc. | | | 17,604 | | | | 4,069 | |
| | Praxair, Inc. | | | 37,377 | | | | 4,843 | |
| | Sealed Air Corp. | | | 27,087 | | | | 1,149 | |
| | The Sherwin-Williams Co. | | | 10,467 | | | | 2,753 | |
| | Sigma-Aldrich Corp. | | | 15,278 | | | | 2,097 | |
| | Vulcan Materials Co. | | | 16,895 | | | | 1,110 | |
| | | | | | | | | | |
| | Total | | | | | | | 74,295 | |
| | | | | | | | | | |
| |
| | Telecommunication Services (2.3%) | |
| | AT&T, Inc. | | | 665,384 | | | | 22,350 | |
| | CenturyLink, Inc. | | | 73,210 | | | | 2,898 | |
| | Frontier Communications Corp. | | | 128,547 | | | | 858 | |
| * | | Level 3 Communications, Inc. | | | 35,770 | | | | 1,766 | |
| | Verizon Communications, Inc. | | | 532,323 | | | | 24,902 | |
| | Windstream Holdings, Inc. | | | 77,323 | | | | 637 | |
| | | | | | | | | | |
| | Total | | | | | | | 53,411 | |
| | | | | | | | | | |
| |
| | Utilities (3.2%) | |
| | The AES Corp. | | | 84,152 | | | | 1,159 | |
| | AGL Resources, Inc. | | | 15,339 | | | | 836 | |
| | Ameren Corp. | | | 31,125 | | | | 1,436 | |
| | American Electric Power Co., Inc. | | | 62,759 | | | | 3,811 | |
| | CenterPoint Energy, Inc. | | | 55,134 | | | | 1,292 | |
| | CMS Energy Corp. | | | 35,284 | | | | 1,226 | |
| | Consolidated Edison, Inc. | | | 37,572 | | | | 2,480 | |
| | Dominion Resources, Inc. | | | 74,904 | | | | 5,760 | |
| | DTE Energy Co. | | | 22,704 | | | | 1,961 | |
| | Duke Energy Corp. | | | 90,731 | | | | 7,580 | |
| | Edison International | | | 41,795 | | | | 2,737 | |
| | Entergy Corp. | | | 23,152 | | | | 2,025 | |
| | Exelon Corp. | | | 110,252 | | | | 4,088 | |
| | FirstEnergy Corp. | | | 53,979 | | | | 2,105 | |
| | Integrys Energy Group, Inc. | | | 10,258 | | | | 798 | |
| | NextEra Energy, Inc. | | | 55,991 | | | | 5,951 | |
| | NiSource, Inc. | | | 40,498 | | | | 1,718 | |
| | Northeast Utilities | | | 40,639 | | | | 2,175 | |
| | NRG Energy, Inc. | | | 43,373 | | | | 1,169 | |
| | | | | | | | | | |
| | | Common Stocks (98.7%) | | Shares/
$ Par | | | Value
$ (000’s) | |
| |
| | Utilities continued | |
| | Pepco Holdings, Inc. | | | 32,315 | | | | 870 | |
| | PG&E Corp. | | | 60,944 | | | | 3,245 | |
| | Pinnacle West Capital Corp. | | | 14,168 | | | | 968 | |
| | PPL Corp. | | | 85,315 | | | | 3,099 | |
| | Public Service Enterprise Group, Inc. | | | 64,915 | | | | 2,688 | |
| | SCANA Corp. | | | 18,286 | | | | 1,104 | |
| | Sempra Energy | | | 29,650 | | | | 3,302 | |
| | The Southern Co. | | | 115,428 | | | | 5,669 | |
| | TECO Energy, Inc. | | | 30,106 | | | | 617 | |
| | Wisconsin Energy Corp. | | | 28,929 | | | | 1,526 | |
| | Xcel Energy, Inc. | | | 64,869 | | | | 2,330 | |
| | | | | | | | | | |
| | Total | | | | | | | 75,725 | |
| | | | | | | | | | |
| | |
| | Total Common Stocks | | | | | |
| | (Cost: $1,244,646) | | | | 2,340,473 | |
| | | | | | | | | | |
| | |
| | | Short-Term Investments (0.5%) | | | | |
| |
| | Commercial Paper (0.5%) | |
| (b) | | Federal Home Loan Bank, 0.07%, 1/14/15 | | | 3,200,000 | | | | 3,200 | |
| | Federal Home Loan Bank, 0.00%, 1/21/15 | | | 2,000,000 | | | | 2,000 | |
| | Federal Home Loan Bank, 0.04%, 1/9/15 | | | 4,800,000 | | | | 4,800 | |
| | Federal Home Loan Bank, 0.08%, 2/11/15 | | | 2,000,000 | | | | 2,000 | |
| | | | | | | | | | |
| | Total | | | | | | | 12,000 | |
| | | | | | | | | | |
| | | |
| | Total Short-Term Investments | | | | | | | | |
| | (Cost: $12,000) | | | | | | | 12,000 | |
| | | | | | | | | | |
| | | |
| | Total Investments (99.2%) | | | | | | | | |
| | (Cost: $1,256,646)(a) | | | | | | | 2,352,473 | |
| | | | | | | | | | |
| | Other Assets, Less | | | | | | | | |
| | Liabilities (0.8%) | | | | | | | 17,825 | |
| | | | | | | | | | |
| | Net Assets (100.0%) | | | | | | | 2,370,298 | |
| | | | | | | | | | |
The Accompanying Notes are an Integral Part of the Financial Statements.
| | | | | | |
| | Index 500 Stock Portfolio | | | 19 | |
Index 500 Stock Portfolio
| (a) | At December 31, 2014, the aggregate cost of securities for federal tax purposes (in thousands) was $1,259,756 and the net unrealized appreciation of investments based on that cost was $1,092,717 which is comprised of $1,148,568 aggregate gross unrealized appreciation and $55,851 aggregate gross unrealized depreciation. |
| (b) | All or a portion of the securities have been pledged as collateral for open futures positions or when-issued securities. Information regarding open futures contracts as of period end is summarized below. |
| | | | | | | | |
| Issuer (000’s) | | Number of
Contracts | | Expiration Date | | Unrealized
Appreciation/
(Depreciation)
(000’s) | |
S&P 500 Mini Index Futures (Long) (Total Notional Value at December 31, 2014, $27,333) | | 271 | | 3/15 | | $ | 476 | |
The following is a summary of the inputs used in valuing the Portfolio’s assets and liabilities at December 31, 2014. See Note 3 for additional information on portfolio valuation.
| | | | | | | | | | | | | | |
| | | Valuation Inputs | | | |
| Description | | Level 1 –
Quoted Prices | | | Level 2 – Other Significant
Observable Inputs | | | Level 3 –
Significant
Unobservable
Inputs | | | |
| | | (Amounts in thousands) | | | |
Assets: | | | | | | | | | | | | | | |
Domestic Common Stocks | | $ | 2,340,473 | | | $ | - | | | $ | - | | | |
Short-Term Investments | | | - | | | | 12,000 | | | | - | | | |
Other Financial Instruments^ | | | | | | | | | | | | | | |
Futures | | | 476 | | | | - | | | | - | | | |
Total | | $ | 2,340,949 | | | $ | 12,000 | | | $ | - | | | |
^ Other financial instruments are derivative instruments such as futures, forwards, written options and swaps contracts, which are valued at the unrealized appreciation (depreciation) on the instrument and short sales, which are valued at market value.
The Accompanying Notes are an Integral Part of the Financial Statements.
| | | | |
| 20 | | Index 500 Stock Portfolio | | |
Large Company Value Portfolio (unaudited)
| | | | |
| Objective: | | Portfolio Strategy: | | Net Assets: |
Long-term of capital growth. Income is a secondary objective. | | Invest primarily in equity securities of larger companies considered to be undervalued. | | $191 million |
Portfolio Overview
Mason Street Advisors, LLC (“Mason Street Advisors”), the investment adviser for the Large Company Value Portfolio (the “Portfolio”), has engaged American Century Investment Management, Inc. (“American Century”) to act as sub-adviser for the Portfolio. The Portfolio looks for stocks of companies that it believes are undervalued at the time of purchase. The Portfolio attempts to purchase the stocks of these undervalued companies and hold each stock until it has returned to favor in the market and the price has increased to, or is higher than, a level the Portfolio believes more accurately reflects the fair value of the company. Companies may be undervalued due to market declines, poor economic conditions, actual or anticipated bad news regarding the issuer or its industry, or because they have been overlooked by the market.
Market Overview
U.S. stocks posted solid gains for the year despite ending with a volatile fourth quarter. During the second half of the year, oil prices dropped dramatically, hurting energy stocks, but leaving consumers with more discretionary income. Economic growth in the U.S. continued at a moderate pace and inflation remained below the U.S. Federal Reserve’s (the “Fed”) target for raising interest rates. For 2014 overall, large cap value stocks posted returns similar to those of their large cap growth peers, while outpacing mid and small cap value stocks, according to various Russell® Indices.
Portfolio Results
The Portfolio returned 13.03% for the twelve months ended December 31, 2014. By comparison, its benchmark, the Russell 1000® Value Index (the “Index”), returned 13.45%. (This Index is unmanaged, cannot be invested in directly and does not include administrative expenses or sales charges.) According to Lipper® Analytical Services, Inc., an independent mutual fund ranking agency, the average return of the Large Cap Value Funds peer group for 2014 was 10.79%.
In the Consumer Discretionary sector, security selection and an overweight position relative to the Index contributed to relative results. Against a backdrop of a recovering housing market and an improving economy, Lowe’s Cos, Inc. exceeded consensus earnings estimates and shares advanced on the good news. Solid sales growth and improved merchandising led to better-than-expected operating margins. The Portfolio initiated a position in Whirlpool Corp. during the period, and the stock helped results.
An overweight in the Information Technology sector gave an additional boost to relative returns, and the sector was the source of one of the Portfolio’s top contributors, Electronic Arts, Inc. The gaming software company generated strong top line sales and substantially improved margins. This, along with robust earnings growth, drove an appreciation in the stock price. The portfolio managers believed the company’s outlook remained favorable for continued margin improvement and promising game launches.
In the Industrials sector, security selection added value to relative returns in the machinery industry, although an overweight to the group offset some of the gain.
Selection among Consumer Staples names enhanced results. CVS Health Corp. outperformed its peers with strong execution in both its pharmacy benefit manager and retail segments, despite the headwinds of generic drug inflation for the former and the company’s decision to cease tobacco sales for the latter. Revenue growth exceeded consensus expectations, driving earnings that were also better than expected. The portfolio managers believed the company was well-positioned in an evolving health care landscape.
In the Energy sector, security selection and an overweight position detracted from relative returns. In particular, Halliburton Co. was negatively impacted by the substantial decline in energy prices. Additionally, investors were concerned about the company’s proposed acquisition of Baker Hughes, Inc. Other Portfolio energy holdings, including Oasis Petroleum, Inc., Chevron Corp., and Total SA, were also dragged down by the falling price of crude oil.
An underweight to the Utilities sector also hampered relative results, particularly in the multi-utilities industry. Security selection in the Financials sector weighed on relative performance. The Portfolio was significantly underweight real estate investment trusts (REITs), as the portfolio managers believed the asset class was overvalued in general.
Derivatives did not play a substantial role in the investment process. The Portfolio did not hold any exchange traded fund (ETF) positions, but the Portfolio utilized forward currency contracts to help reduce risk that can result from currency fluctuations in foreign equity investments. The total impact of derivatives to the Portfolio over the year ended December 31, 2014 was positive, contributing 0.18% to return.
| | | | | | |
| | Large Company Value Portfolio | | | 21 | |
Large Company Value Portfolio (unaudited)
Portfolio Manager Outlook
The following forward looking comments are the opinion of American Century, the Portfolio’s sub-adviser.
We continue to be bottom-up investment managers, evaluating each company individually and building our Portfolio one stock at a time. As of December 31, 2014, the Portfolio was broadly diversified, with ongoing overweight positions in the Consumer Discretionary and Financials sectors. Our valuation work contributed to our smaller relative weightings in Utilities stocks. We are still finding greater value opportunities among mega-cap stocks and have maintained our bias toward these firms.
Relative Performance

| | | | | | | | | | | | |
Average Annual Total Returns
For Periods Ended December 31, 2014 | |
| | | 1 Year | | | 5 Years | | | Since
Inception* | |
Large Company Value Portfolio | | | 13.03 | % | | | 14.25 | % | | | 4.35 | % |
Russell 1000® Value Index | | | 13.45 | % | | | 15.42 | % | | | 5.17 | % |
Lipper® Variable Insurance Products (VIP) Large Cap Value Funds Average | | | 10.79 | % | | | 13.85 | % | | | - | |
| | | |
* Inception date of 4/30/07 | | | | | | | | | | | | |
The performance data quoted represents past performance. Past performance is historical and does not guarantee future performance. Investment return and principal value will fluctuate, so that shares, when redeemed, may be worth more or less than their original cost. Current performance may be lower or higher than the performance data quoted. For the most recent month-end performance information visit www.northwesternmutual.com.
This chart assumes an initial investment of $10,000 made on 4/30/07 (commencement of the Portfolio’s operations). Returns shown reflect fee waivers, deductions for management and other portfolio expenses, and reinvestment of all dividends. In the absence of fee waivers, total return would be reduced. Returns exclude deductions for separate account sale loads and account fees. Please refer to the Benchmark Definitions section of this report for information about the indices cited in the above chart and graph.
The Portfolio may invest in derivative instruments for cash management purposes or to hedge foreign currency exposure. Use of these instruments may involve certain costs and imposes certain risks such as liquidity risk, market risk, credit risk, management risk and the risk of mispricing or improper valuation. Certain derivatives involve leverage, which could magnify losses, and portfolios investing in derivatives could lose more than the principal amount invested in those instruments.
Top 10 Equity Holdings 12/31/14
| | | | |
Security Description | | | % of Net Assets | |
Chevron Corp. | | | 3.9 | % |
JPMorgan Chase & Co. | | | 3.9 | % |
Johnson & Johnson | | | 3.4 | % |
Wells Fargo & Co. | | | 3.4 | % |
CVS Health Corp. | | | 2.5 | % |
United Technologies Corp. | | | 2.5 | % |
Medtronic, Inc. | | | 2.4 | % |
U.S. Bancorp | | | 2.2 | % |
Ingersoll-Rand PLC | | | 2.1 | % |
Applied Materials, Inc. | | | 2.0 | % |
Sector Allocation 12/31/14
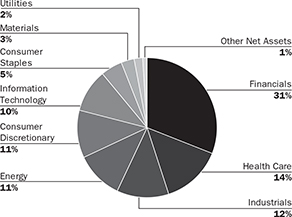
Sector Allocation is based on Net Assets.
Sector Allocation and Top 10 Holdings are subject to change.
| | | | |
| 22 | | Large Company Value Portfolio | | |
Large Company Value Portfolio
Schedule of Investments
December 31, 2014
| | | | | | | | | | |
| | | Common Stocks (97.4%) | | Shares/
$ Par | | | Value
$ (000’s) | |
| |
| | Consumer Discretionary (10.8%) | |
| | Comcast Corp. - Class A | | | 27,670 | | | | 1,605 | |
| | Delphi Automotive PLC | | | 26,330 | | | | 1,915 | |
| | Ford Motor Co. | | | 133,720 | | | | 2,072 | |
| | Lowe’s Cos., Inc. | | | 28,330 | | | | 1,949 | |
| | Macy’s, Inc. | | | 44,850 | | | | 2,949 | |
| | Marriott International, Inc. - Class A | | | 14,160 | | | | 1,105 | |
| | Target Corp. | | | 7,760 | | | | 589 | |
| | Time Warner Cable, Inc. | | | 18,000 | | | | 2,737 | |
| | Time Warner, Inc. | | | 36,990 | | | | 3,160 | |
| | Whirlpool Corp. | | | 13,400 | | | | 2,596 | |
| | | | | | | | | | |
| | Total | | | | | | | 20,677 | |
| | | | | | | | | | |
| |
| | Consumer Staples (4.5%) | |
| | Altria Group, Inc. | | | 16,550 | | | | 816 | |
| | CVS Health Corp. | | | 49,900 | | | | 4,806 | |
| | The Kroger Co. | | | 17,320 | | | | 1,112 | |
| | Philip Morris International, Inc. | | | 22,730 | | | | 1,851 | |
| | | | | | | | | | |
| | Total | | | | | | | 8,585 | |
| | | | | | | | | | |
| |
| | Energy (10.3%) | |
| | Baker Hughes, Inc. | | | 20,300 | | | | 1,138 | |
| | Chevron Corp. | | | 66,140 | | | | 7,420 | |
| | Exxon Mobil Corp. | | | 19,600 | | | | 1,812 | |
| | Halliburton Co. | | | 54,670 | | | | 2,150 | |
| | National Oilwell Varco, Inc. | | | 26,120 | | | | 1,712 | |
| * | | Oasis Petroleum, Inc. | | | 28,830 | | | | 477 | |
| | Occidental Petroleum Corp. | | | 29,230 | | | | 2,356 | |
| | Total SA, ADR | | | 52,410 | | | | 2,683 | |
| | | | | | | | | | |
| | Total | | | | | | | 19,748 | |
| | | | | | | | | | |
| |
| | Financials (31.3%) | |
| | The Allstate Corp. | | | 36,080 | | | | 2,535 | |
| | American International Group, Inc. | | | 37,680 | | | | 2,110 | |
| | Ameriprise Financial, Inc. | | | 23,560 | | | | 3,116 | |
| | Bank of America Corp. | | | 83,760 | | | | 1,498 | |
| * | | Berkshire Hathaway, Inc. - Class B | | | 11,420 | | | | 1,715 | |
| | BlackRock, Inc. | | | 3,090 | | | | 1,105 | |
| | Brixmor Property Group, Inc. | | | 39,340 | | | | 977 | |
| | Capital One Financial Corp. | | | 44,860 | | | | 3,703 | |
| | Citigroup, Inc. | | | 31,250 | | | | 1,691 | |
| | Fifth Third Bancorp | | | 98,660 | | | | 2,010 | |
| | The Goldman Sachs Group, Inc. | | | 13,500 | | | | 2,617 | |
| | Invesco, Ltd. | | | 77,440 | | | | 3,060 | |
| | JPMorgan Chase & Co. | | | 118,110 | | | | 7,391 | |
| | KeyCorp | | | 139,720 | | | | 1,942 | |
| | MetLife, Inc. | | | 43,080 | | | | 2,330 | |
| | PNC Financial Services Group, Inc. | | | 35,930 | | | | 3,278 | |
| | Principal Financial Group, Inc. | | | 15,220 | | | | 791 | |
| | Prudential Financial, Inc. | | | 37,170 | | | | 3,362 | |
| | | | | | | | | | |
| | | Common Stocks (97.4%) | | Shares/
$ Par | | | Value
$ (000’s) | |
| |
| | Financials continued | |
| | State Street Corp. | | | 21,200 | | | | 1,664 | |
| * | | Synchrony Financial | | | 13,530 | | | | 403 | |
| | The Travelers Cos., Inc. | | | 17,410 | | | | 1,843 | |
| | U.S. Bancorp | | | 93,130 | | | | 4,186 | |
| | Wells Fargo & Co. | | | 117,250 | | | | 6,428 | |
| | | | | | | | | | |
| | Total | | | | | | | 59,755 | |
| | | | | | | | | | |
| |
| | Health Care (13.9%) | |
| | Abbott Laboratories | | | 81,010 | | | | 3,647 | |
| | Aetna, Inc. | | | 18,800 | | | | 1,670 | |
| | Amgen, Inc. | | | 9,440 | | | | 1,504 | |
| | Anthem, Inc. | | | 19,990 | | | | 2,512 | |
| * | | Catalent, Inc. | | | 32,300 | | | | 901 | |
| * | | Gilead Sciences, Inc. | | | 18,800 | | | | 1,772 | |
| | Johnson & Johnson | | | 61,490 | | | | 6,430 | |
| | Medtronic, Inc. | | | 62,440 | | | | 4,508 | |
| | Merck & Co., Inc. | | | 63,230 | | | | 3,591 | |
| | | | | | | | | | |
| | Total | | | | | | | 26,535 | |
| | | | | | | | | | |
| |
| | Industrials (12.0%) | |
| | Eaton Corp. PLC | | | 26,840 | | | | 1,824 | |
| | Honeywell International, Inc. | | | 29,800 | | | | 2,978 | |
| | Huntington Ingalls Industries, Inc. | | | 16,010 | | | | 1,800 | |
| | Ingersoll-Rand PLC | | | 63,090 | | | | 3,999 | |
| | Masco Corp. | | | 59,440 | | | | 1,498 | |
| | Raytheon Co. | | | 21,340 | | | | 2,308 | |
| | Stanley Black & Decker, Inc. | | | 19,050 | | | | 1,830 | |
| | Textron, Inc. | | | 22,810 | | | | 961 | |
| * | | United Rentals, Inc. | | | 9,720 | | | | 992 | |
| | United Technologies Corp. | | | 40,720 | | | | 4,683 | |
| | | | | | | | | | |
| | Total | | | | | | | 22,873 | |
| | | | | | | | | | |
| |
| | Information Technology (9.7%) | |
| | Applied Materials, Inc. | | | 152,310 | | | | 3,795 | |
| | Cisco Systems, Inc. | | | 33,900 | | | | 943 | |
| * | | Electronic Arts, Inc. | | | 52,570 | | | | 2,471 | |
| | Microchip Technology, Inc. | | | 54,570 | | | | 2,462 | |
| | Microsoft Corp. | | | 54,360 | | | | 2,525 | |
| | Oracle Corp. | | | 78,940 | | | | 3,550 | |
| | Qualcomm, Inc. | | | 10,300 | | | | 766 | |
| | Western Digital Corp. | | | 17,480 | | | | 1,935 | |
| | | | | | | | | | |
| | Total | | | | | | | 18,447 | |
| | | | | | | | | | |
| |
| | Materials (2.6%) | |
| * | | Axalta Coating Systems, Ltd. | | | 3,940 | | | | 103 | |
| | The Dow Chemical Co. | | | 55,320 | | | | 2,523 | |
| | International Paper Co. | | | 20,440 | | | | 1,095 | |
| | LyondellBasell Industries NV - Class A | | | 16,220 | | | | 1,288 | |
| | | | | | | | | | |
| | Total | | | | | | | 5,009 | |
| | | | | | | | | | |
The Accompanying Notes are an Integral Part of the Financial Statements.
| | | | | | |
| | Large Company Value Portfolio | | | 23 | |
Large Company Value Portfolio
| | | | | | | | | | | | | | |
| | | Common Stocks (97.4%) | | | | | Shares/ $ Par | | | Value $ (000’s) | |
| |
| | Utilities (2.3%) | |
| | PPL Corp. | | | | | | | 53,670 | | | | 1,950 | |
| | Westar Energy, Inc. | | | | | | | 21,130 | | | | 871 | |
| | Xcel Energy, Inc. | | | | | | | 44,650 | | | | 1,604 | |
| | | | | | | | | | | | | | |
| | Total | | | | 4,425 | |
| | | | | | | | | | | | | | |
| | Total Common Stocks | | | | | |
| | (Cost: $156,862) | | | | 186,054 | |
| | | | | | | | | | | | | | |
| | | | |
| | | Foreign Common Stocks (1.2%) | | Country | | | | | | | |
| | | | |
| | Energy (1.2%) | | | | | | | | | | | | |
| | Imperial Oil, Ltd. | | | Canada | | | | 50,630 | | | | 2,181 | |
| | | | | | | | | | | | | | |
| | Total | | | | 2,181 | |
| | | | | | | | | | | | | | |
| | Total Foreign Common Stocks | | | | | |
| | (Cost: $2,464) | | | | 2,181 | |
| | | | | | | | | | | | | | |
| | | | | | | | | | |
| | | Short-Term Investments (1.3%) | | | | | | |
| |
| | Commercial Paper (1.3%) | |
| | Federal Farm Credit Bank, 0.01%, 1/2/15 | | | 931,000 | | | | 931 | |
| | Federal Home Loan Bank, 0.01%, 1/2/15 | | | 1,621,000 | | | | 1,621 | |
| | | | | | | | | | |
| | Total | | | | | | | 2,552 | |
| | | | | | | | | | |
| | | |
| | Total Short-Term Investments | | | | | | | | |
| | (Cost: $2,552) | | | | | | | 2,552 | |
| | | | | | | | | | |
| | | |
| | Total Investments (99.9%) | | | | | | | | |
| | (Cost: $161,878)(a) | | | | | | | 190,787 | |
| | | | | | | | | | |
| | Other Assets, Less | | | | | | | | |
| | Liabilities (0.1%) | | | | | | | 167 | |
| | | | | | | | | | |
| | Net Assets (100.0%) | | | | | | | 190,954 | |
| | | | | | | | | | |
ADR after the name of a security represents—American Depositary Receipt.
| (a) | At December 31, 2014, the aggregate cost of securities for federal tax purposes (in thousands) was $162,654 and the net unrealized appreciation of investments based on that cost was $28,133 which is comprised of $32,028 aggregate gross unrealized appreciation and $3,895 aggregate gross unrealized depreciation. |
| (h) | Forward foreign currency contracts outstanding on December 31, 2014. |
| | | | | | | | | | | | | | | | | | | | |
| Type | | Counterparty | | Currency | | Principal
Amount
Covered by
Contract (000’s) | | Settlement
Month | | Unrealized
Appreciation
(000’s) | | | Unrealized
(Depreciation)
(000’s) | | | Net Unrealized
Appreciation/
(Depreciation)
(000’s) | |
Sell | | HSBC Bank USA | | CAD | | 2,073 | | 1/15 | | $ | - | | | $ | - | | | $ | - | (m) |
Sell | | HSBC Bank USA | | EUR | | 1,922 | | 1/15 | | | 31 | | | | - | | | | 31 | |
| | | | | | | | | | | | | | | | | | | | |
| | | | | | | | | | $ | 31 | | | $ | - | | | $ | 31 | |
| | | | | | | | | | | | | | | | | | | | |
CAD — Canadian Dollar
EUR — Euro
| (m) | Amount is less than one thousand. |
The following is a summary of the inputs used in valuing the Portfolio’s assets and liabilities at December 31, 2014. See Note 3 for additional information on portfolio valuation.
| | | | | | | | | | | | | | |
| | | Valuation Inputs | | | |
| Description | | Level 1 –
Quoted Prices | | | Level 2 –
Other Significant
Observable Inputs | | | Level 3 – Significant
Unobservable Inputs | | | |
| | | (Amounts in thousands) | | | |
Assets: | | | | | | | | | | | | | | |
Domestic Common Stocks | | $ | 186,054 | | | $ | - | | | $ | - | | | |
Foreign Common Stocks | | | 2,181 | | | | - | | | | - | | | |
Short-Term Investments | | | - | | | | 2,552 | | | | - | | | |
Other Financial Instruments^ | | | | | | | | | | | | | | |
Forward Currency Contracts | | | - | | | | 31 | | | | - | | | |
Total Assets | | $ | 188,235 | | | $ | 2,583 | | | $ | - | | | |
Liabilities: | | | | | | | | | | | | | | |
Other Financial Instruments^ | | | | | | | | | | | | | | |
Forward Currency Contracts | | | - | | | | - | (m) | | | - | | | |
Total Liabilities | | $ | - | | | $ | - | (m) | | $ | - | | | |
^ Other financial instruments are derivative instruments such as futures, forwards, written options and swaps contracts, which are valued at the unrealized appreciation (depreciation) on the instrument and short sales, which are valued at market value.
The Accompanying Notes are an Integral Part of the Financial Statements.
| | | | |
| 24 | | Large Company Value Portfolio | | |
Domestic Equity Portfolio (unaudited)
| | | | |
| Objective: | | Portfolio Strategy: | | Net Assets: |
| Long-term growth of capital and income. | | Invest primarily in equity securities of U.S. issuers that are selling at attractive prices relative to their intrinsic value. | | $620 million |
Portfolio Overview
Mason Street Advisors, LLC (“Mason Street Advisors”), the investment adviser for the Domestic Equity Portfolio (the “Portfolio”), has engaged Delaware Investments Fund Advisers, a series of Delaware Management Business Trust (“Delaware”), to act as sub-adviser for the Portfolio. The Portfolio primarily invests in equity securities of large-capitalization companies that are believed to have long-term capital appreciation potential. Typically, the Portfolio seeks securities that are undervalued in relation to their intrinsic value, as indicated by multiple factors, including the earnings and cash flow potential or the asset valuation of the respective issuers.
Market Overview
U.S. equities were broadly higher in 2014. The S&P 500® Index advanced 13.7%, marking the third consecutive year of double-digit gains. Meanwhile, non-U.S. stocks generally remained under pressure amid signs of slowing economic growth and, in some cases, economic stagnation.
Late in the year, the U.S. Department of Commerce reported a 5.0% increase in third quarter real gross domestic product, which marked the second consecutive quarter of above trend growth. As in the prior quarter, there were notable improvements in capital expenditures by businesses and spending by consumers.
The U.S. Federal Reserve concluded its bond buying stimulus program, though it reiterated plans to maintain short-term interest rates near zero for some time longer. This commitment helped boost stock prices despite a variety of challenges, including the slumping European economy, growing geopolitical tensions in Russia and the Middle East and a sharp decline in oil prices that weighed heavily on energy stocks.
Portfolio Results
The Portfolio returned 13.87% for the twelve months ended December 31, 2014. By comparison, the Portfolio’s benchmark, the Russell 1000® Value Index (the “Index”), returned 13.45%. (This Index is unmanaged, cannot be invested in directly and does not include administrative expenses or sales charges.) According to Lipper® Analytical Services, Inc., an independent mutual fund ranking agency, the average return of the Large Cap Value Funds peer group for 2014 was 10.79%.
Investments in the Industrials and Information Technology sectors contributed most to relative returns. Stock selection was strong in the Industrials sector. As a group, the return of the Portfolio’s three Industrials stocks far exceeded the return of the Index’s Industrial constituents. Defense contractor Northrop Grumman Corp. was the strongest performer. The company continued to execute well despite downward pressure on defense spending, and has been buying back shares and increasing dividends.
In Technology, the Portfolio benefited most from an overweight allocation, but stock selection was also a positive contributor. Semiconductor manufacturer Broadcom Corporation (“Broadcom”) was the top performer. Its shares rose sharply after the company announced plans to abandon its unprofitable cellular baseband business. The move boosted Broadcom’s earnings and cash flow.
Energy sector investments caused the largest drag on the Portfolio’s return during the year. As a group, the Portfolio’s five holdings declined more than the Energy sector in the Index. The Portfolio’s modest overweight in the sector also hurt performance. Energy services provider Halliburton Company (“Halliburton”) had the largest decline of any stock in the Portfolio. The company’s businesses are sensitive to the price of oil, a key determinant in the level of oil field activity and, consequently, demand for its products and services. The shares also took a hit after Halliburton announced it would be acquiring rival and next-largest services provider, Baker Hughes, Inc.
Security selection in the Health Care sector was a notable source of weakness. The Portfolio’s six Health Care stocks lagged the Index’s Health Care constituents. In particular, Pfizer, Inc. (“Pfizer”) lagged the group, as various factors weighed on Pfizer’s shares, including a series of revenue declines and a failed effort to acquire U.K.-based competitor AstraZeneca PLC.
Portfolio Manager Outlook
The following forward looking comments are the opinion of Delaware, the Portfolio’s sub-adviser.
Over our three- to five-year investment horizon, we are cautious about the prospects for equities but optimistic about shares of higher quality companies trading below their long-term average valuation multiples. While we think annualized total returns for U.S. equities could be below average, we believe equity returns will be competitive versus other asset classes. Chief among our concerns is the valuation of the U.S. stock market. It appears fully valued across a range of price multiples including those based on earnings, sales, cash flows and book value. While none of these is approaching the extreme levels seen in
| | | | | | |
| | Domestic Equity Portfolio | | | 25 | |
Domestic Equity Portfolio (unaudited)
March 2000, price to book, price to ten-year average earnings, and price to sales are all near their 2007 highs. As a result, we expect to retain a defensive bias in the Portfolio, staying focused on higher quality businesses with relatively low price multiples and attractive risk and return profiles.
Relative Performance
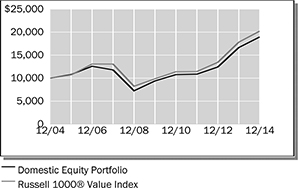
| | | | | | | | | | | | |
Average Annual Total Returns
For Periods Ended December 31, 2014 | |
| | | 1 Year | | | 5 Years | | | 10 Years | |
Domestic Equity Portfolio | | | 13.87 | % | | | 15.08 | % | | | 6.61 | % |
Russell 1000® Value Index | | | 13.45 | % | | | 15.42 | % | | | 7.30 | % |
Lipper® Variable Insurance Products (VIP) Large Cap Value Funds Average | | | 10.79 | % | | | 13.85 | % | | | 6.79 | % |
The performance data quoted represents past performance. Past performance is historical and does not guarantee future performance. Investment return and principal value will fluctuate, so that shares, when redeemed, may be worth more or less than their original cost. Current performance may be lower or higher than the performance data quoted. For the most recent month-end performance information visit www.northwesternmutual.com.
This chart assumes an initial investment of $10,000 made on 12/31/04. Returns shown include deductions for management and other portfolio expenses, and reinvestment of all dividends. Returns exclude deductions for separate account sale loads and account fees. Please refer to the Benchmark Definitions section of this report for information about the indices cited in the above chart and graph.
The Portfolio may hold fewer securities than other diversified portfolios because of its more focused investment strategy. Holding fewer securities increases the risk that the value of the Portfolio could go down because of the poor performance of a single investment.
Top 10 Equity Holdings 12/31/14
| | | | |
| Security Description | | % of Net Assets | |
Edison International | | | 3.4 | % |
Quest Diagnostics, Inc. | | | 3.3 | % |
Lowe’s Cos., Inc. | | | 3.3 | % |
Marsh & McLennan Cos., Inc. | | | 3.2 | % |
Kraft Foods Group, Inc. | | | 3.2 | % |
Broadcom Corp. - Class A | | | 3.2 | % |
CVS Caremark Corp. | | | 3.2 | % |
Raytheon Co. | | | 3.2 | % |
E.I. du Pont de Nemours and Co. | | | 3.2 | % |
Pfizer, Inc. | | | 3.2 | % |
Sector Allocation 12/31/14
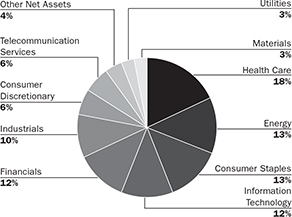
Sector Allocation is based on Net Assets.
Sector Allocation and Top 10 Holdings are subject to change.
| | | | |
| 26 | | Domestic Equity Portfolio | | |
Domestic Equity Portfolio
Schedule of Investments
December 31, 2014
| | | | | | | | | | |
| | | Common Stocks (95.9%) | | Shares/
$ Par | | | Value
$ (000’s) | |
| |
| | Consumer Discretionary (6.2%) | |
| | Johnson Controls, Inc. | | | 373,300 | | | | 18,046 | |
| | Lowe’s Cos., Inc. | | | 295,600 | | | | 20,337 | |
| | | | | | | | | | |
| | Total | | | | | | | 38,383 | |
| | | | | | | | | | |
| |
| | Consumer Staples (12.5%) | |
| | Archer-Daniels-Midland Co. | | | 370,700 | | | | 19,276 | |
| | CVS Caremark Corp. | | | 206,100 | | | | 19,849 | |
| | Kraft Foods Group, Inc. | | | 317,566 | | | | 19,899 | |
| | Mondelez International, Inc. | | | 505,900 | | | | 18,377 | |
| | | | | | | | | | |
| | Total | | | | | | | 77,401 | |
| | | | | | | | | | |
| |
| | Energy (13.0%) | |
| | Chevron Corp. | | | 146,046 | | | | 16,383 | |
| | ConocoPhillips | | | 230,700 | | | | 15,932 | |
| | Halliburton Co. | | | 385,600 | | | | 15,166 | |
| | Marathon Oil Corp. | | | 558,100 | | | | 15,789 | |
| | Occidental Petroleum Corp. | | | 213,300 | | | | 17,194 | |
| | | | | | | | | | |
| | Total | | | | | | | 80,464 | |
| | | | | | | | | | |
| |
| | Financials (12.3%) | |
| | The Allstate Corp. | | | 275,600 | | | | 19,361 | |
| | The Bank of New York Mellon Corp. | | | 466,100 | | | | 18,910 | |
| | BB&T Corp. | | | 462,200 | | | | 17,975 | |
| | | | | | | | | | |
| | | Common Stocks (95.9%) | | Shares/
$ Par | | | Value
$ (000’s) | |
| |
| | Financials continued | |
| | Marsh & McLennan Cos., Inc. | | | 348,100 | | | | 19,925 | |
| | | | | | | | | | |
| | Total | | | | | | | 76,171 | |
| | | | | | | | | | |
| |
| | Health Care (18.2%) | |
| | Baxter International, Inc. | | | 249,500 | | | | 18,286 | |
| | Cardinal Health, Inc. | | | 242,300 | | | | 19,561 | |
| | Johnson & Johnson | | | 171,600 | | | | 17,944 | |
| | Merck & Co., Inc. | | | 298,700 | | | | 16,963 | |
| | Pfizer, Inc. | | | 629,000 | | | | 19,594 | |
| | Quest Diagnostics, Inc. | | | 306,400 | | | | 20,547 | |
| | | | | | | | | | |
| | Total | | | | | | | 112,895 | |
| | | | | | | | | | |
| |
| | Industrials (9.4%) | |
| | Northrop Grumman Corp. | | | 131,500 | | | | 19,382 | |
| | Raytheon Co. | | | 182,300 | | | | 19,719 | |
| | Waste Management, Inc. | | | 377,900 | | | | 19,394 | |
| | | | | | | | | | |
| | Total | | | | | | | 58,495 | |
| | | | | | | | | | |
| |
| | Information Technology (12.3%) | |
| | Broadcom Corp. - Class A | | | 459,200 | | | | 19,897 | |
| | Cisco Systems, Inc. | | | 682,200 | | | | 18,975 | |
| | Intel Corp. | | | 524,500 | | | | 19,034 | |
| | Xerox Corp. | | | 1,338,500 | | | | 18,552 | |
| | | | | | | | | | |
| | Total | | | | | | | 76,458 | |
| | | | | | | | | | |
| | | | | | | | | | |
| | | Common Stocks (95.9%) | | Shares/
$ Par | | | Value
$ (000’s) | |
| |
| | Materials (3.2%) | |
| | E.I. du Pont de Nemours and Co. | | | 265,600 | | | | 19,639 | |
| | | | | | | | | | |
| | Total | | | | | | | 19,639 | |
| | | | | | | | | | |
| |
| | Telecommunication Services (5.4%) | |
| | AT&T, Inc. | | | 524,200 | | | | 17,608 | |
| | Verizon Communications, Inc. | | | 344,600 | | | | 16,120 | |
| | | | | | | | | | |
| | Total | | | | | | | 33,728 | |
| | | | | | | | | | |
| |
| | Utilities (3.4%) | |
| | Edison International | | | 317,400 | | | | 20,783 | |
| | | | | | | | | | |
| | Total | | | | | | | 20,783 | |
| | | | | | | | | | |
| | | |
| | Total Common Stocks | | | | | | | | |
| | (Cost: $433,043) | | | | | | | 594,417 | |
| | | | | | | | | | |
| | | |
| | Total Investments (95.9%) | | | | | | | | |
| | (Cost: $433,043)(a) | | | | | | | 594,417 | |
| | | | | | | | | | |
| | Other Assets, Less | | | | | | | | |
| | Liabilities (4.1%) | | | | | | | 25,604 | |
| | | | | | | | | | |
| | Net Assets (100.0%) | | | | | | | 620,021 | |
| | | | | | | | | | |
| (a) | At December 31, 2014, the aggregate cost of securities for federal tax purposes (in thousands) was $432,823 and the net unrealized appreciation of investments based on that cost was $161,594 which is comprised of $164,512 aggregate gross unrealized appreciation and $2,918 aggregate gross unrealized depreciation. |
The following is a summary of the inputs used in valuing the Portfolio’s assets and liabilities at December 31, 2014. See Note 3 for additional information on portfolio valuation.
| | | | | | | | | | | | | | |
| | | Valuation Inputs | | | |
| Description | | Level 1 –
Quoted Prices | | | Level 2 –
Other Significant
Observable Inputs | | | Level 3 - Significant
Unobservable Inputs | | | |
| | | (Amounts in thousands) | | | |
Assets: | | | | | | | | | | | | | | |
Domestic Common Stocks | | $ | 594,417 | | | $ | - | | | $ | - | | | |
Total | | $ | 594,417 | | | $ | - | | | $ | - | | | |
The Accompanying Notes are an Integral Part of the Financial Statements.
| | | | | | |
| | Domestic Equity Portfolio | | | 27 | |
Equity Income Portfolio (unaudited)
| | | | |
| Objective: | | Portfolio Strategy: | | Net Assets: |
| Long-term growth of capital and income. | | Invest in common stocks with a focus on larger capitalization stocks with a strong track record of paying dividends, or that are believed to be undervalued. | | $782 million |
Portfolio Overview
Mason Street Advisors, LLC (“Mason Street Advisors”), the investment adviser for the Equity Income Portfolio (the “Portfolio”), has engaged T. Rowe Price Associates, Inc. (“T. Rowe Price”) to act as sub-adviser for the Portfolio. Normally, the Portfolio invests in common stocks, with an emphasis on larger capitalization stocks with a strong track record of paying dividends, or that are believed to be undervalued. Under normal market conditions, the Portfolio’s yield, which reflects the level of dividends paid by the Portfolio, would be expected to generally exceed the dividend yield of the S&P 500® Index. The Portfolio will typically employ a value approach in selecting investments, with an effort made to identify companies that appear to be undervalued by various measures and may be temporarily out of favor, but that have good prospects for capital appreciation and dividend growth.
Market Overview
U.S. equities rose in 2014 for the sixth consecutive year, as the economy recovered strongly from a first-quarter weather-related contraction. Falling long-term interest rates, solid employment growth, favorable corporate earnings, and expanded stimulus measures by major non-U.S. central banks boosted returns.
The Russell 1000® Value Index posted a double-digit positive return during the period. As measured by the various Russell® Indices, large cap shares reached new highs in December, significantly outpacing small- and mid-caps in 2014. Within the large cap space, value stocks outperformed their growth peers. Within the Russell 1000® Value Index, nearly all sectors posted a positive return. Information Technology led performance, followed by Utilities and Health Care. The only sector to end in negative territory was Energy.
Portfolio Results
The Portfolio returned 7.43% for the twelve months ended December 31, 2014. By comparison, the Portfolio’s benchmark, the Russell 1000® Value Index (the “Index”), returned 13.45%. (This Index is unmanaged, cannot be invested in directly and does not include administrative expenses or sales charges.) According to Lipper® Analytical Services, Inc., an independent mutual fund ranking agency, the average return of the Equity Income Funds peer group for 2014 was 9.48%.
Overall, stock selection and sector allocation both detracted from relative performance. The Healthcare and Energy sectors hurt relative results, while the Utilities and Materials sectors contributed positively.
The Health Care sector was the most notable detractor, owing to stock choices and a detrimental underweight. In particular, GlaxoSmithKline PLC hurt returns. This U.K.-based pharmaceutical company experienced ongoing difficulty getting its respiratory treatments reimbursed by insurance plans, but the company expected the problem to be resolved going forward.
In the Energy sector, our overweight position and stock selection both proved disadvantageous. Among the underperforming names was Apache Corp. Despite continuing to sell off its weaker non-core assets, Apache Corp. declined sharply amid falling commodity prices. The Portfolio maintained its position as the portfolio managers expected the company to improve performance by focusing on U.S. onshore oil and natural gas production.
On the positive side, the Utilities sector outperformed due to stock selection. A leading name here was Entergy Corp., which surged due to colder weather earlier in the year, as well as stricter Environmental Protection Agency guidelines that reinforced the need for the company’s nuclear power plants.
Stock selection in the Materials sector was another area of relative strength, most notably International Paper Co. The firm benefited from strong operational performance in a highly consolidated market, led by a skilled new chief executive officer. The portfolio managers selectively trimmed the position on strength during the year, but the portfolio managers also saw further upside potential due to the company’s strong balance sheet and management’s ability to raise dividends or buy back shares.
Portfolio Manager Outlook
The following forward looking comments are the opinion of T. Rowe Price, the Portfolio’s sub-adviser.
Overall, we remain optimistic about the environment for equities, as valuations still look attractive despite last year’s strong performance. While overall inflation has remained tame, we expect that rising wage costs in the U.S. will squeeze record profit margins. Nevertheless, we think the pace of labor cost increases will be manageable, as companies may also enjoy modest sales gains. We note that fourth-quarter earnings reports should provide greater clarity on the overall impact on profits of the decline in oil prices, as some firms benefit from increased discretionary spending, particularly on the part of lower-income consumers.
| | | | |
| 28 | | Equity Income Portfolio | | |
Equity Income Portfolio (unaudited)
We are currently finding opportunities more in specific companies rather than in larger themes, highlighting the importance of fundamental research and effective stock selection. In the current environment, we will trim our holdings to our best ideas. We remain disciplined in our valuation-based approach and stand ready to take advantage of opportunities should valuations become more attractive.
Relative Performance

| | | | | | | | | | | | |
Average Annual Total Returns
For Periods Ended December 31, 2014 | |
| | | 1 Year | | | 5 Years | | | 10 Years | |
Equity Income Portfolio | | | 7.43 | % | | | 13.34 | % | | | 6.72 | % |
Russell 1000® Value Index | | | 13.45 | % | | | 15.42 | % | | | 7.30 | % |
Lipper® Variable Insurance Products (VIP) Equity Income Funds Average | | | 9.48 | % | | | 13.71 | % | | | 6.77 | % |
The performance data quoted represents past performance. Past performance is historical and does not guarantee future performance. Investment return and principal value will fluctuate, so that shares, when redeemed, may be worth more or less than their original cost. Current performance may be lower or higher than the performance data quoted. For the most recent month-end performance information visit www.northwesternmutual.com.
This chart assumes an initial investment of $10,000 made on 12/31/04. Returns shown include deductions for management and other portfolio expenses, and reinvestment of all dividends. Returns exclude deductions for separate account sale loads and account fees. Please refer to the Benchmark Definitions section of this report for information about the indices cited in the above chart and graph.
A portion of the Portfolio’s assets may be invested in lower quality debt securities, which may present a significant risk for loss of principal and interest. High yield bonds generally have greater price swings and higher default risks than investment grade bonds.
Currently, interest rates are at unprecedented historically low levels. A significant rise in interest rates over a short period of time could cause significant losses in the market value of the Portfolio’s fixed income investments.
Top 10 Equity Holdings 12/31/14
| | |
| Security Description | | % of Net Assets |
JPMorgan Chase & Co. | | 2.7% |
General Electric Co. | | 2.7% |
Wells Fargo & Co. | | 2.2% |
Chevron Corp. | | 1.9% |
U.S. Bancorp | | 1.8% |
Exxon Mobil Corp. | | 1.8% |
Bank of America Corp. | | 1.8% |
Johnson & Johnson | | 1.6% |
Illinois Tool Works, Inc. | | 1.6% |
PNC Financial Services Group, Inc. | | 1.5% |
Sector Allocation 12/31/14

Sector Allocation is based on Net Assets.
Sector Allocation and Top 10 Holdings are subject to change.
| | | | | | |
| | Equity Income Portfolio | | | 29 | |
Equity Income Portfolio
Schedule of Investments
December 31, 2014
| | | | | | | | | | |
| | | Common Stocks (91.7%) | | Shares/
$ Par | | | Value
$ (000’s) | |
| | | |
| | Consumer Discretionary (11.5%) | | | | | | | | |
| | Cablevision Systems Corp. - Class A | | | 194,800 | | | | 4,021 | |
| | Carnival Corp. | | | 170,100 | | | | 7,711 | |
| | Coach, Inc. | | | 51,400 | | | | 1,931 | |
| | Comcast Corp. - Class A | | | 67,000 | | | | 3,887 | |
| | Ford Motor Co. | | | 260,400 | | | | 4,036 | |
| | General Motors Co. | | | 119,733 | | | | 4,180 | |
| | Genuine Parts Co. | | | 51,100 | | | | 5,446 | |
| | Johnson Controls, Inc. | | | 104,500 | | | | 5,052 | |
| | Kohl’s Corp. | | | 144,000 | | | | 8,790 | |
| | Macy’s, Inc. | | | 97,300 | | | | 6,397 | |
| * | | Madison Square Garden, Inc. - Class A | | | 13,850 | | | | 1,042 | |
| | Mattel, Inc. | | | 259,500 | | | | 8,030 | |
| | McDonald’s Corp. | | | 20,800 | | | | 1,949 | |
| | The New York Times Co. - Class A | | | 178,700 | | | | 2,362 | |
| * | | News Corp. - Class A | | | 153,800 | | | | 2,413 | |
| | Staples, Inc. | | | 374,300 | | | | 6,782 | |
| | Tiffany & Co. | | | 5,900 | | | | 630 | |
| | Time Warner, Inc. | | | 118,300 | | | | 10,105 | |
| | The Walt Disney Co. | | | 43,900 | | | | 4,135 | |
| | Whirlpool Corp. | | | 5,700 | | | | 1,104 | |
| | | | | | | | | | |
| | Total | | | | | | | 90,003 | |
| | | | | | | | | | |
| | | |
| | Consumer Staples (4.2%) | | | | | | | | |
| | Archer-Daniels-Midland Co. | | | 166,400 | | | | 8,653 | |
| | Avon Products, Inc. | | | 270,500 | | | | 2,540 | |
| | Campbell Soup Co. | | | 89,300 | | | | 3,929 | |
| | The Clorox Co. | | | 60,800 | | | | 6,336 | |
| | ConAgra Foods, Inc. | | | 24,800 | | | | 900 | |
| | Kellogg Co. | | | 19,000 | | | | 1,243 | |
| | McCormick & Co., Inc. | | | 43,100 | | | | 3,202 | |
| | PepsiCo, Inc. | | | 65,600 | | | | 6,203 | |
| | | | | | | | | | |
| | Total | | | | | | | 33,006 | |
| | | | | | | | | | |
| | | |
| | Energy (12.2%) | | | | | | | | |
| | Anadarko Petroleum Corp. | | | 57,500 | | | | 4,744 | |
| | Apache Corp. | | | 183,900 | | | | 11,525 | |
| | BP PLC, ADR | | | 90,400 | | | | 3,446 | |
| | Chevron Corp. | | | 129,100 | | | | 14,482 | |
| | ConocoPhillips | | | 43,100 | | | | 2,976 | |
| | CONSOL Energy, Inc. | | | 161,000 | | | | 5,443 | |
| | Diamond Offshore Drilling, Inc. | | | 97,400 | | | | 3,576 | |
| | Exxon Mobil Corp. | | | 148,800 | | | | 13,757 | |
| | Hess Corp. | | | 137,900 | | | | 10,180 | |
| | Murphy Oil Corp. | | | 129,000 | | | | 6,517 | |
| | Royal Dutch Shell PLC - Class A, ADR | | | 152,900 | | | | 10,237 | |
| | Schlumberger, Ltd. | | | 61,100 | | | | 5,218 | |
| | Talisman Energy, Inc. | | | 393,100 | | | | 3,078 | |
| | | | | | | | | | |
| | Total | | | | | | | 95,179 | |
| | | | | | | | | | |
| | | | | | | | | | |
| | | Common Stocks (91.7%) | | Shares/
$ Par | | | Value
$ (000’s) | |
| | | |
| | Financials (19.3%) | | | | | | | | |
| | American Express Co. | | | 88,000 | | | | 8,188 | |
| | Bank of America Corp. | | | 767,023 | | | | 13,722 | |
| | The Bank of New York Mellon Corp. | | | 5,500 | | | | 223 | |
| | The Chubb Corp. | | | 38,300 | | | | 3,963 | |
| | Digital Realty Trust, Inc. | | | 55,100 | | | | 3,653 | |
| | JPMorgan Chase & Co. | | | 335,788 | | | | 21,014 | |
| | Loews Corp. | | | 123,000 | | | | 5,168 | |
| | Marsh & McLennan Cos., Inc. | | | 200,200 | | | | 11,459 | |
| | MetLife, Inc. | | | 97,100 | | | | 5,252 | |
| | Northern Trust Corp. | | | 116,700 | | | | 7,866 | |
| | Och-Ziff Capital Management Group - Class A | | | 65,500 | | | | 765 | |
| | PNC Financial Services Group, Inc. | | | 131,300 | | | | 11,978 | |
| | Rayonier, Inc. | | | 103,600 | | | | 2,895 | |
| | Regions Financial Corp. | | | 269,000 | | | | 2,841 | |
| | Sun Life Financial, Inc. | | | 86,000 | | | | 3,101 | |
| | SunTrust Banks, Inc. | | | 200,100 | | | | 8,384 | |
| | U.S. Bancorp | | | 321,600 | | | | 14,456 | |
| | Wells Fargo & Co. | | | 317,000 | | | | 17,378 | |
| | Weyerhaeuser Co. | | | 182,935 | | | | 6,566 | |
| | Willis Group Holdings PLC | | | 51,800 | | | | 2,321 | |
| | | | | | | | | | |
| | Total | | | | | | | 151,193 | |
| | | | | | | | | | |
| | | |
| | Health Care (6.1%) | | | | | | | | |
| | Bristol-Myers Squibb Co. | | | 164,200 | | | | 9,693 | |
| | Johnson & Johnson | | | 121,700 | | | | 12,726 | |
| | Merck & Co., Inc. | | | 175,000 | | | | 9,938 | |
| | Pfizer, Inc. | | | 334,626 | | | | 10,424 | |
| | Quest Diagnostics, Inc. | | | 77,100 | | | | 5,170 | |
| | | | | | | | | | |
| | Total | | | | | | | 47,951 | |
| | | | | | | | | | |
| | | |
| | Industrials (13.1%) | | | | | | | | |
| | The Boeing Co. | | | 66,400 | | | | 8,631 | |
| | Deere & Co. | | | 66,900 | | | | 5,919 | |
| | Eaton Corp. PLC | | | 59,270 | | | | 4,028 | |
| | Emerson Electric Co. | | | 133,600 | | | | 8,247 | |
| | Flowserve Corp. | | | 6,500 | | | | 389 | |
| | General Electric Co. | | | 828,400 | | | | 20,934 | |
| | Honeywell International, Inc. | | | 91,300 | | | | 9,123 | |
| | Illinois Tool Works, Inc. | | | 131,000 | | | | 12,406 | |
| | Joy Global, Inc. | | | 84,300 | | | | 3,922 | |
| | Masco Corp. | | | 189,700 | | | | 4,780 | |
| | Stanley Black & Decker, Inc. | | | 70,000 | | | | 6,725 | |
| | United Parcel Service, Inc. - Class B | | | 82,300 | | | | 9,149 | |
| * | | USG Corp. | | | 104,600 | | | | 2,928 | |
| | Xylem, Inc. | | | 135,500 | | | | 5,158 | |
| | | | | | | | | | |
| | Total | | | | | | | 102,339 | |
| | | | | | | | | | |
| | | |
| | Information Technology (11.0%) | | | | | | | | |
| | Analog Devices, Inc. | | | 94,100 | | | | 5,224 | |
| | Apple, Inc. | | | 48,900 | | | | 5,398 | |
The Accompanying Notes are an Integral Part of the Financial Statements.
| | | | |
| 30 | | Equity Income Portfolio | | |
Equity Income Portfolio
| | | | | | | | | | |
| | | Common Stocks (91.7%) | | Shares/
$ Par | | | Value
$ (000’s) | |
| | | |
| | Information Technology continued | | | | | | | | |
| | Applied Materials, Inc. | | | 330,800 | | | | 8,243 | |
| | CA, Inc. | | | 73,800 | | | | 2,247 | |
| | Cisco Systems, Inc. | | | 277,500 | | | | 7,719 | |
| | Computer Sciences Corp. | | | 61,200 | | | | 3,859 | |
| | Corning, Inc. | | | 321,800 | | | | 7,379 | |
| (p)* | | Dell Appraisal Rights Action | | | 347,300 | | | | 4,775 | |
| | Harris Corp. | | | 107,200 | | | | 7,699 | |
| | International Business Machines Corp. | | | 39,900 | | | | 6,402 | |
| | Microsoft Corp. | | | 159,400 | | | | 7,404 | |
| | Motorola Solutions, Inc. | | | 19,400 | | | | 1,301 | |
| | Qualcomm, Inc. | | | 112,700 | | | | 8,377 | |
| | Texas Instruments, Inc. | | | 120,800 | | | | 6,459 | |
| | Western Union Co. | | | 179,300 | | | | 3,211 | |
| | | | | | | | | | |
| | Total | | | | | | | 85,697 | |
| | | | | | | | | | |
| | | |
| | Materials (5.0%) | | | | | | | | |
| | E.I. du Pont de Nemours and Co. | | | 68,300 | | | | 5,050 | |
| | International Paper Co. | | | 194,500 | | | | 10,421 | |
| | MeadWestvaco Corp. | | | 103,200 | | | | 4,581 | |
| | Newmont Mining Corp. | | | 160,200 | | | | 3,028 | |
| | Nucor Corp. | | | 131,600 | | | | 6,455 | |
| | Potash Corp. of Saskatchewan, Inc. | | | 95,800 | | | | 3,384 | |
| | Vulcan Materials Co. | | | 88,600 | | | | 5,824 | |
| | | | | | | | | | |
| | Total | | | | | | | 38,743 | |
| | | | | | | | | | |
| | | |
| | Telecommunication Services (2.9%) | | | | | | | | |
| | AT&T, Inc. | | | 316,235 | | | | 10,622 | |
| | CenturyLink, Inc. | | | 117,090 | | | | 4,635 | |
| | Verizon Communications, Inc. | | | 160,708 | | | | 7,518 | |
| | | | | | | | | | |
| | Total | | | | | | | 22,775 | |
| | | | | | | | | | |
| | | |
| | Utilities (6.4%) | | | | | | | | |
| | The AES Corp. | | | 198,300 | | | | 2,731 | |
| | Duke Energy Corp. | | | 122,600 | | | | 10,242 | |
| | Entergy Corp. | | | 102,600 | | | | 8,975 | |
| | Exelon Corp. | | | 179,900 | | | | 6,671 | |
| | FirstEnergy Corp. | | | 139,600 | | | | 5,443 | |
| | NiSource, Inc. | | | 243,300 | | | | 10,321 | |
| | Xcel Energy, Inc. | | | 152,100 | | | | 5,463 | |
| | | | | | | | | | |
| | Total | | | | | | | 49,846 | |
| | | | | | | | | | |
| | | |
| | Total Common Stocks | | | | | | | | |
| | (Cost: $565,319) | | | | | | | 716,732 | |
| | | | | | | | | | |
| | | | | | | | | | |
| | | Foreign Common Stocks (1.3%) | | Country | | | | | |
| | | | |
| | Consumer Discretionary (0.3%) | | | | | | | | |
| | Pearson PLC | | United Kingdom | | 116,707 | | | 2,147 | |
| | | | | | | | | | |
| | Total | | | | | | | 2,147 | |
| | | | | | | | | | |
| | | |
| | Health Care (0.4%) | | | | | | |
| | GlaxoSmithKline PLC | | United Kingdom | | 162,092 | | | 3,468 | |
| | | | | | | | | | |
| | Total | | | | | | | 3,468 | |
| | | | | | | | | | |
| | | | | | | | | | | | |
| | | Foreign Common Stocks (1.3%) | | Country | | Shares/
$ Par | | | Value
$ (000’s) | |
| |
| | Telecommunication Services (0.6%) | |
| | Telefonica SA | | Spain | | | 229,045 | | | | 3,276 | |
| | Vodafone Group PLC | | United Kingdom | | | 442,817 | | | | 1,517 | |
| | | | | | | | | | | | |
| | Total | | | | | | | | | 4,793 | |
| | | | | | | | | | | | |
| | |
| | Total Foreign Common Stocks | | | | | |
| | (Cost: $12,081) | | | | | | | | | 10,408 | |
| | | | | | | | | | | | |
| | | Short-Term Investments (7.8%) | | | | | | | | |
| | | |
| | Money Market Funds (7.8%) | | | | | | | | |
| | T. Rowe Price Reserve Investment Fund | | | | | 60,958,660 | | | | 60,959 | |
| | | | | | | | | | | | |
| | Total | | | | | | | | | 60,959 | |
| | | | | | | | | | | | |
| | | |
| | Total Short-Term Investments | | | | | | | | |
| | (Cost: $60,959) | | | | | | | | | 60,959 | |
| | | | | | | | | | | | |
| | |
| | Total Investments (100.8%) | | | | | |
| | (Cost: $638,359)(a) | | | | | | | | | 788,099 | |
| | | | | | | |
| | Other Assets, Less | | | | | |
| | Liabilities (-0.8%) | | | | | | | | | (6,364 | ) |
| | | | | | | |
| | Net Assets (100.0%) | | | | 781,735 | |
| | | | | | | | | | | | |
The Accompanying Notes are an Integral Part of the Financial Statements.
| | | | | | |
| | Equity Income Portfolio | | | 31 | |
Equity Income Portfolio
ADR after the name of a security represents—American Depositary Receipt.
| (a) | At December 31, 2014, the aggregate cost of securities for federal tax purposes (in thousands) was $638,374 and the net unrealized appreciation of investments based on that cost was $149,725 which is comprised of $167,724 aggregate gross unrealized appreciation and $17,999 aggregate gross unrealized depreciation. |
| (p) | Restricted securities (excluding 144A issues) on December 31, 2014. |
The following is a summary of the inputs used in valuing the Portfolio’s assets and liabilities at December 31, 2014. See Note 3 for additional information on portfolio valuation.
| | | | | | | | | | | | | | |
| | | Valuation Inputs | | | |
| Description | | Level 1 –
Quoted Prices | | | Level 2 – Other Significant
Observable Inputs | | | Level 3 – Significant
Unobservable Inputs | | | |
| (Amounts in thousands) | | | | | |
Assets: | | | | | | | | | | | | | | |
Domestic Common Stocks | | | | | | | | | | | | | | |
Information Technology | | $ | 80,922 | | | $ | - | | | $ | 4,775 | | | |
All Others | | | 631,035 | | | | - | | | | - | | | |
Foreign Common Stocks | | | - | | | | 10,408 | | | | - | | | |
Short-Term Investments | | | 60,959 | | | | - | | | | - | | | |
Total | | $ | 772,916 | | | $ | 10,408 | | | $ | 4,775 | | | |
For the period ended December 31, 2014, there were transfers from a Level 1 to a Level 2 in the amount of $10,408 thousand. These transfers were the result of the use of fair value procedures on certain foreign securities in the portfolio on December 31, 2014. These securities did not require the use of fair value procedures on December 31, 2013.
The Accompanying Notes are an Integral Part of the Financial Statements.
| | | | |
| 32 | | Equity Income Portfolio | | |
Mid Cap Growth Stock Portfolio (unaudited)
| | | | |
| Objective: | | Portfolio Strategy: | | Net Assets: |
| Long-term growth of capital. | | Invest primarily in common stocks of mid cap domestic companies that are expected to experience solid growth in earnings. | | $1.1 billion |
Portfolio Overview
Mason Street Advisors, LLC (“Mason Street Advisors”), the investment adviser for the Mid Cap Growth Stock Portfolio (the “Portfolio”), has engaged William Blair & Company, L.L.C. (“William Blair”) to act as sub-adviser for the Portfolio. The Portfolio invests primarily in common stocks of mid cap domestic companies that are expected to experience solid growth in earnings. In choosing investments, the Portfolio evaluates the extent to which a company meets one or more of the following criteria, relative to the valuation of the security: (a) the company should have or should have the expectation of becoming, a significant provider in the primary markets it serves, (b) the company should have some distinctive attribute relative to present or potential competitors, (c) the prices of the company’s products or services should be based to some degree upon their value to the customer, rather than their production cost, (d) the company should participate in an industry expected to grow rapidly due to economic factors or technological change or grow through market share gains in its industry and (e) the company should have a strong management team.
Market Overview
The market’s advance in 2014 was fueled by positive domestic economic data, strong corporate earnings, continued accommodative policy from global central banks and increased merger and acquisition activity. The U.S. economy strengthened over the course of the year in marked contrast to many other leading economies. With this backdrop, the U.S. stock market moved steadily higher through much of the year and selloffs were relatively short-lived.
In contrast to the subdued volatility environment that preceded it, volatility spiked higher in the fourth quarter. This was the result of two conflicting views of the economic, and therefore, equity market outlook. On one hand, substantial parts of the global economy, including Europe, Japan and China, appeared to be slowing. Slow growth and collapsing commodity prices led to fears around deflation and the sustainability of economic growth and corporate earnings. On the other hand, the U.S. economy appeared to be quite healthy, as evidenced by robust economic growth in the second and third quarters of 2014 which was supported by a strengthened U.S. consumer. Improvement in the labor and housing markets, as well as the recent drop in energy prices, bolstered consumer confidence. Heightened fourth quarter volatility was reflective of these divergent dynamics.
Portfolio Results
The Portfolio returned 8.49% for the twelve months ended December 31, 2014. By comparison, the Portfolio’s benchmark, the Russell® Midcap Growth Index (the “Index”), returned 11.90%. (This Index is unmanaged, cannot be invested in directly and does not include administrative expenses or sales charges.) According to Lipper® Analytical Services, Inc., an independent mutual fund ranking agency, the average return of the Mid Cap Growth Funds peer group for 2014 was 6.81%.
The Portfolio’s underperformance was driven by a mix of stock selection and style headwinds. Most notably from a style perspective, some of our typical industry biases, including our underweights to airlines, semiconductors and REITs, worked against us. The Portfolio’s exposure to higher valuation stocks, as a result of our biases to higher quality and higher growth companies, as well as our smaller market cap profile, were more modest headwinds. In terms of stock selection, Information Technology, including positions in Pandora Media, Inc. and NeuStar, Inc., was an area of weakness. Other top detractors included Dick’s Sporting Goods, Inc. (Consumer Discretionary), Lululemon Athletica, Inc. (Consumer Discretionary) and SM Energy Company (Energy).
Our top contributors for the year came from a variety of sectors and included Keurig Green Mountain, Inc. (Consumer Staples), O’Reilly Automotive, Inc. (Consumer Discretionary), IDEXX Laboratories, Inc. (Health Care), Old Dominion Freight Line, Inc. (Industrials) and Akamai Technologies, Inc. (Information Technology).
Portfolio Manager Outlook
The following forward looking comments are the opinion of William Blair, the Portfolio’s sub-adviser.
Moving into 2015, the U.S. economy and stock market have several tailwinds including positive trends in employment and housing data and lower gas prices to boost consumer spending. Robust demand dynamics within the U.S. should provide support for the earnings of U.S. companies. However, there is considerable uncertainty as to how insulated the U.S. will be from the rest of the globe where the outlook is more challenged. China continues to slow, despite monetary easing, and eurozone growth remains sluggish, in part due to the drag caused by the Russian recession. Together with the implications of a strengthening U.S. dollar, these factors pose a threat to U.S. economic growth. Additionally, the timing of monetary policy implementation within the U.S. remains a notable risk. Though U.S. economic data has been solid, low inflation, reinforced by weak commodity prices, has enabled the U.S. Federal Reserve (the “Fed”) to keep interest rate hikes on hold. A weak global outlook, to the extent it challenges U.S. growth, could further slow the pace of tightening. We expect the market to remain highly sensitive to incremental guidance from the Fed.
| | | | | | |
| | Mid Cap Growth Stock Portfolio | | | 33 | |
Mid Cap Growth Stock Portfolio (unaudited)
Relative Performance
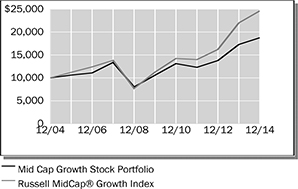
| | | | | | | | | | | | |
Average Annual Total Returns
For Periods Ended December 31, 2014 | |
| | | 1 Year | | | 5 Years | | | 10 Years | |
Mid Cap Growth Stock Portfolio | | | 8.49 | % | | | 12.12 | % | | | 6.49 | % |
Russell MidCap® Growth Index | | | 11.90 | % | | | 16.94 | % | | | 9.43 | % |
Lipper® Variable Insurance Products (VIP) Mid Cap Growth Funds Average | | | 6.81 | % | | | 15.00 | % | | | 8.41 | % |
The performance data quoted represents past performance. Past performance is historical and does not guarantee future performance. Investment return and principal value will fluctuate, so that shares, when redeemed, may be worth more or less than their original cost. Current performance may be lower or higher than the performance data quoted. For the most recent month-end performance information visit www.northwesternmutual.com.
This chart assumes an initial investment of $10,000 made on 12/31/04. Returns shown include deductions for management and other portfolio expenses, and reinvestment of all dividends. Returns exclude deductions for separate account sale loads and account fees. Please refer to the Benchmark Definitions section of this report for information about the indices cited in the above chart and graph.
Investing in small and medium-sized companies involves a greater degree of risk than investing in large company stocks.
Top 10 Equity Holdings 12/31/14
| | |
| Security Description | | % of Net Assets |
Affiliated Managers Group, Inc. | | 3.3% |
Stericycle, Inc. | | 3.2% |
O’Reilly Automotive, Inc. | | 3.0% |
Vantiv, Inc. - Class A | | 2.9% |
Dollar General Corp. | | 2.7% |
Williams-Sonoma, Inc. | | 2.7% |
Equifax, Inc. | | 2.6% |
Gartner, Inc. | | 2.5% |
SBA Communications Corp. - Class A | | 2.5% |
Mead Johnson Nutrition Co. | | 2.4% |
Sector Allocation 12/31/14
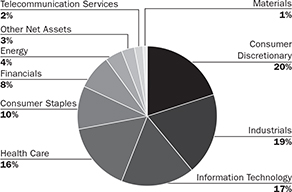
Sector Allocation is based on Net Assets.
Sector Allocation and Top 10 Holdings are subject to change.
| | | | |
| 34 | | Mid Cap Growth Stock Portfolio | | |
Mid Cap Growth Stock Portfolio
Schedule of Investments
December 31, 2014
| | | | | | | | | | |
| | | Common Stocks (97.2%) | | Shares/
$ Par | | | Value
$ (000’s) | |
| |
| | Consumer Discretionary (20.0%) | |
| | BorgWarner, Inc. | | | 407,990 | | | | 22,419 | |
| * | | Dollar General Corp. | | | 425,453 | | | | 30,080 | |
| | L Brands, Inc. | | | 162,754 | | | | 14,086 | |
| | Marriott International, Inc. - Class A | | | 275,473 | | | | 21,495 | |
| * | | Michael Kors Holdings, Ltd. | | | 147,874 | | | | 11,105 | |
| * | | O’Reilly Automotive, Inc. | | | 171,122 | | | | 32,962 | |
| | Polaris Industries, Inc. | | | 156,612 | | | | 23,686 | |
| | Ross Stores, Inc. | | | 219,052 | | | | 20,648 | |
| | Six Flags Entertainment Corp. | | | 332,890 | | | | 14,364 | |
| | Williams-Sonoma, Inc. | | | 386,924 | | | | 29,282 | |
| | | | | | | | | | |
| | Total | | | | | | | 220,127 | |
| | | | | | | | | | |
| |
| | Consumer Staples (9.5%) | |
| | Church & Dwight Co., Inc. | | | 229,288 | | | | 18,070 | |
| | Keurig Green Mountain, Inc. | | | 141,996 | | | | 18,799 | |
| | Mead Johnson Nutrition Co. | | | 265,115 | | | | 26,655 | |
| * | | Monster Beverage Corp. | | | 193,462 | | | | 20,962 | |
| * | | Sprouts Farmers Market, Inc. | | | 583,969 | | | | 19,843 | |
| | | | | | | | | | |
| | Total | | | | | | | 104,329 | |
| | | | | | | | | | |
| |
| | Energy (3.7%) | |
| * | | Concho Resources, Inc. | | | 103,384 | | | | 10,313 | |
| * | | FMC Technologies, Inc. | | | 209,840 | | | | 9,829 | |
| | Pioneer Natural Resources Co. | | | 59,369 | | | | 8,837 | |
| | Range Resources Corp. | | | 158,864 | | | | 8,491 | |
| * | | Whiting Petroleum Corp. | | | 109,526 | | | | 3,614 | |
| | | | | | | | | | |
| | Total | | | | | | | 41,084 | |
| | | | | | | | | | |
| |
| | Financials (8.2%) | |
| * | | Affiliated Managers Group, Inc. | | | 172,171 | | | | 36,542 | |
| | | | | | | | | | |
| | | Common Stocks (97.2%) | | Shares/
$ Par | | | Value
$ (000’s) | |
| |
| | Financials continued | |
| | LPL Financial Holdings, Inc. | | | 429,260 | | | | 19,123 | |
| * | | PRA Group, Inc. | | | 272,827 | | | | 15,805 | |
| * | | Signature Bank | | | 143,909 | | | | 18,127 | |
| | | | | | | | | | |
| | Total | | | | | | | 89,597 | |
| | | | | | | | | | |
| |
| | Health Care (15.9%) | |
| * | | Align Technology, Inc. | | | 258,973 | | | | 14,479 | |
| * | | BioMarin Pharmaceutical, Inc. | | | 272,487 | | | | 24,633 | |
| | Bio-Techne Corp. | | | 119,527 | | | | 11,044 | |
| * | | HMS Holdings Corp. | | | 841,691 | | | | 17,793 | |
| * | | IDEXX Laboratories, Inc. | | | 95,775 | | | | 14,201 | |
| * | | Mallinckrodt PLC | | | 129,998 | | | | 12,874 | |
| * | | Medivation, Inc. | | | 129,720 | | | | 12,921 | |
| * | | MEDNAX, Inc. | | | 315,662 | | | | 20,869 | |
| * | | Mettler-Toledo International, Inc. | | | 37,836 | | | | 11,444 | |
| * | | Sirona Dental Systems, Inc. | | | 205,745 | | | | 17,976 | |
| | Zoetis, Inc. | | | 387,854 | | | | 16,689 | |
| | | | | | | | | | |
| | Total | | | | | | | 174,923 | |
| | | | | | | | | | |
| |
| | Industrials (19.2%) | |
| | AMETEK, Inc. | | | 414,561 | | | | 21,818 | |
| | Equifax, Inc. | | | 359,586 | | | | 29,080 | |
| | Fortune Brands Home & Security, Inc. | | | 401,254 | | | | 18,165 | |
| | Manpowergroup, Inc. | | | 175,037 | | | | 11,932 | |
| * | | The Middleby Corp. | | | 129,998 | | | | 12,883 | |
| * | | Old Dominion Freight Line, Inc. | | | 331,649 | | | | 25,749 | |
| | Rockwell Collins, Inc. | | | 128,887 | | | | 10,888 | |
| * | | Stericycle, Inc. | | | 265,749 | | | | 34,834 | |
| | Towers Watson & Co. - Class A | | | 111,573 | | | | 12,627 | |
| | TransDigm Group, Inc. | | | 55,384 | | | | 10,875 | |
| | | | | | | | | | |
| | | Common Stocks (97.2%) | | Shares/
$ Par | | | Value
$ (000’s) | |
| |
| | Industrials continued | |
| * | | Verisk Analytics, Inc. - Class A | | | 339,909 | | | | 21,771 | |
| | | | | | | | | | |
| | Total | | | | | | | 210,622 | |
| | | | | | | | | | |
| |
| | Information Technology (17.1%) | |
| * | | Akamai Technologies, Inc. | | | 350,769 | | | | 22,084 | |
| * | | CoStar Group, Inc. | | | 91,767 | | | | 16,851 | |
| * | | Gartner, Inc. | | | 331,158 | | | | 27,887 | |
| * | | Genpact, Ltd. | | | 858,876 | | | | 16,259 | |
| * | | Guidewire Software, Inc. | | | 402,114 | | | | 20,359 | |
| * | | IPG Photonics Corp. | | | 167,972 | | | | 12,585 | |
| * | | NeuStar, Inc. - Class A | | | 412,763 | | | | 11,475 | |
| * | | Pandora Media, Inc. | | | 547,690 | | | | 9,765 | |
| * | | Red Hat, Inc. | | | 271,923 | | | | 18,801 | |
| * | | Vantiv, Inc. - Class A | | | 935,619 | | | | 31,736 | |
| | | | | | | | | | |
| | Total | | | | | | | 187,802 | |
| | | | | | | | | | |
| |
| | Materials (1.1%) | |
| | International Flavors & Fragrances, Inc. | | | 117,543 | | | | 11,914 | |
| | | | | | | | | | |
| | Total | | | | | | | 11,914 | |
| | | | | | | | | | |
| |
| | Telecommunication Services (2.5%) | |
| * | | SBA Communications Corp. - Class A | | | 247,713 | | | | 27,437 | |
| | | | | | | | | | |
| | Total | | | | | | | 27,437 | |
| | | | | | | | | | |
| | |
| | Total Common Stocks | | | | | |
| | (Cost: $961,751) | | | | 1,067,835 | |
| | | | | | | | | | |
| | |
| | Total Investments (97.2%) | | | | | |
| | (Cost: $961,751)(a) | | | | 1,067,835 | |
| | | | | | | | | | |
| | |
| | Other Assets, Less | | | | | |
| | Liabilities (2.8%) | | | | 30,320 | |
| | | | | | | | | | |
| | Net Assets (100.0%) | | | | 1,098,155 | |
| | | | | | | | | | |
| (a) | At December 31, 2014, the aggregate cost of securities for federal tax purposes (in thousands) was $961,333 and the net unrealized appreciation of investments based on that cost was $106,502 which is comprised of $136,904 aggregate gross unrealized appreciation and $30,402 aggregate gross unrealized depreciation. |
The following is a summary of the inputs used in valuing the Portfolio’s assets and liabilities at December 31, 2014. See Note 3 for additional information on portfolio valuation.
| | | | | | | | | | | | | | |
| | | Valuation Inputs | | | |
| Description | | Level 1 –
Quoted Prices | | | Level 2 –
Other Significant
Observable Inputs | | | Level 3 –
Significant
Unobservable Inputs | | | |
| | | (Amounts in thousands) | | | |
Assets: | | | | | | | | | | | | | | |
Domestic Common Stocks | | $ | 1,067,835 | | | $ | - | | | $ | - | | | |
Total | | $ | 1,067,835 | | | $ | - | | | $ | - | | | |
The Accompanying Notes are an Integral Part of the Financial Statements.
| | | | | | |
| | Mid Cap Growth Stock Portfolio | | | 35 | |
Index 400 Stock Portfolio (unaudited)
| | | | |
| Objective: | | Portfolio Strategy: | | Net Assets: |
| Investment results that approximate the performance of the S&P MidCap 400® Index. | | Invest in stocks that make up the S&P MidCap 400® Index, holding each stock in approximately the same proportion as its weighting in the Index. | | $652 million |
Portfolio Overview
Mason Street Advisors is the investment adviser for the Index 400 Stock Portfolio (the “Portfolio”). The Portfolio seeks investment results that approximate the performance of the S&P MidCap 400® Index (the “Index”), which is composed of the stocks of companies whose capitalizations generally are smaller than those of companies that comprise the S&P 500® Index. The Index does not include the very large issues that account for most of the weighting in the S&P 500® Index. The Portfolio attempts to achieve its objective by investing all, or substantially all, of its assets in the stocks that make up the Index, holding each stock in approximately the same proportion as its weighting in the Index. This is known as a full replication strategy. The Portfolio may also invest in S&P MidCap 400® Index stock futures and, to a lesser extent, swap agreements to help achieve full replication.
Market Overview
The equity markets posted solid gains during 2014, as markets adjusted to changing monetary policy. Improving economic growth with mild inflation prompted the U.S. Federal Reserve (the “Fed”) to gradually complete its bond purchasing program and maintain its zero interest rate policy during 2014, though Fed policy contributed to uncertainty during the second half of the year. Throughout the year, the Fed decreased its bond purchasing at a measured $10 billion monthly pace. Market volatility preceded the Fed’s last bond purchase in October, as investors became concerned that the Fed’s zero interest rate policy might be the next tightening of monetary stimulus. The Fed reaffirmed its commitment to zero interest rate policy for a considerable period, which reassured investors. Markets rallied on the news, while improving economic growth late in the year also increased investors’ optimism. In that environment, small cap stocks led the market, followed by shares of mid and large sized companies. For the year, returns for the S&P 500®, MidCap 400®, and SmallCap 600® Indices were 13.69%, 9.77%, and 5.76%, respectively.
Portfolio Results
The Index 400 Stock Portfolio had a total return of 9.42% in the twelve months ended December 31, 2014. That was in line with the 9.77% return of the Index. (The Index is unmanaged, cannot be invested in directly and does not include administrative expenses or sales charges.) Portfolio performance slightly lagged the Index due to transaction costs, administrative expenses, cash flow effects and costs associated with the use of stock index futures contracts. The average return for the Portfolio’s peer group, Mid Cap Core Funds, was 9.29%, according to Lipper® Analytical Services, Inc., an independent mutual fund ranking agency. However, the Mid Cap Core Funds peer group is not strictly comparable to the Portfolio because many of the funds in the group are actively managed.
Within the Portfolio, nine of the ten economic sectors posted positive returns. The Financials sector delivered the largest contribution to the Portfolio’s return, driven by improving balance sheets and solid earnings. The Health Care sector also generated solid performance, as health care companies continued to grow while adapting to the Affordable Care Act. The Consumer Discretionary sector was another large contributor, as the improving job market and declining oil prices late in the reporting period helped consumer spending. The Technology sector generated a solid return while lagging other sectors of the Portfolio due to slow business spending.
At the other end of the spectrum, the energy sector declined due to falling oil and gas prices, as global oil producers increased supply amid modest demand for oil. The Industrials and Materials sectors posted modest returns while lagging the overall Portfolio, as manufacturing and industrial activity remained restrained in international markets, particularly in China.
As the Portfolio seeks to track the performance and weightings of stocks in the Index, the portfolio managers make adjustments to the Portfolio’s holdings as the Index changes. Standard & Poor’s modifies the composition of the Index as companies go public or private, merge, divest or have major changes in market capitalization. Additionally, Standard & Poor’s adjusts the Index to better reflect the companies that are most representative of the composition of the U.S. economy. The portfolio managers try to make these adjustments in a way that minimizes the cost and market impact of trading.
| | | | |
| 36 | | Index 400 Stock Portfolio | | |
Index 400 Stock Portfolio (unaudited)
Relative Performance
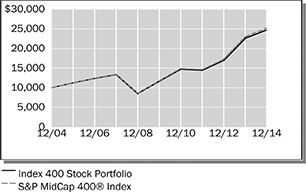
| | | | | | | | | | | | |
Average Annual Total Returns For Periods Ended December 31, 2014 | |
| | | 1 Year | | | 5 Years | | | 10 Years | |
Index 400 Stock Portfolio | | | 9.42 | % | | | 16.25 | % | | | 9.48 | % |
S&P MidCap 400® Index | | | 9.77 | % | | | 16.54 | % | | | 9.71 | % |
Lipper® Variable Insurance Products (VIP) Mid Cap Core Funds Average | | | 9.29 | % | | | 15.39 | % | | | 8.48 | % |
The performance data quoted represents past performance. Past performance is historical and does not guarantee future performance. Investment return and principal value will fluctuate, so that shares, when redeemed, may be worth more or less than their original cost. Current performance may be lower or higher than the performance data quoted. For the most recent month-end performance information visit www.northwesternmutual.com.
This chart assumes an initial investment of $10,000 made on 12/31/04. Returns shown include deductions for management and other portfolio expenses, and reinvestment of all dividends. Returns exclude deductions for separate account sale loads and account fees. Please refer to the Benchmark Definitions section of this report for information about the indices cited in the above chart and graph.
“Standard & Poor’s®”, “S&P®”, “S&P MidCap 400 Index” and “Standard & Poor’s MidCap 400 Index” are trademarks of The McGraw-Hill Companies, Inc. and have been licensed for use by Northwestern Mutual Life Insurance Company. The Portfolio is not sponsored, endorsed, sold or promoted by Standard & Poor’s, and Standard & Poor’s makes no representation regarding the advisability of investing in the Portfolio.
Investing in small and medium-sized companies involves a greater degree of risk than investing in large company stocks.
The Portfolio may invest in derivative instruments such as futures and, to a lesser extent, swap agreements to help achieve full replication. Use of these instruments may involve certain costs and imposes certain risks such as liquidity risk, market risk, credit risk, management risk and the risk of mispricing or improper valuation. Certain derivatives involve leverage, which could magnify losses, and portfolios investing in derivatives could lose more than the principal amount invested in those instruments.
Top 10 Equity Holdings 12/31/14
| | | | |
Security Description | | | % of Net Assets | |
Skyworks Solutions, Inc. | | | 0.8 | % |
Equinix, Inc. | | | 0.7 | % |
Advance Auto Parts, Inc. | | | 0.7 | % |
SL Green Realty Corp. | | | 0.7 | % |
Henry Schein, Inc. | | | 0.7 | % |
Hanesbrands, Inc. | | | 0.7 | % |
Endo International PLC | | | 0.7 | % |
Realty Income Corp. | | | 0.6 | % |
Signet Jewelers, Ltd. | | | 0.6 | % |
Church & Dwight Co., Inc. | | | 0.6 | % |
Sector Allocation 12/31/14
Sector Allocation is based on equities.
Sector Allocation and Top 10 Holdings are subject to change.
| | | | | | |
| | Index 400 Stock Portfolio | | | 37 | |
Index 400 Stock Portfolio
Schedule of Investments
December 31, 2014
| | | | | | | | | | |
| | | Common Stocks (97.7%) | | Shares/ $ Par | | | Value $ (000’s) | |
| |
| | Consumer Discretionary (13.6%) | |
| | Aaron’s, Inc. | | | 25,224 | | | | 771 | |
| | Abercrombie & Fitch Co. - Class A | | | 27,909 | | | | 799 | |
| | Advance Auto Parts, Inc. | | | 28,545 | | | | 4,547 | |
* | | AMC Networks, Inc. - Class A | | | 23,124 | | | | 1,475 | |
| | American Eagle Outfitters, Inc. | | | 68,453 | | | | 950 | |
* | | Ann, Inc. | | | 17,878 | | | | 652 | |
* | | Apollo Group, Inc. - Class A | | | 37,772 | | | | 1,288 | |
* | | Ascena Retail Group, Inc. | | | 51,506 | | | | 647 | |
| | Big Lots, Inc. | | | 20,903 | | | | 837 | |
| | Brinker International, Inc. | | | 24,855 | | | | 1,459 | |
| | Brunswick Corp. | | | 36,351 | | | | 1,863 | |
* | | Cabela’s, Inc. | | | 18,626 | | | | 982 | |
| | Carter’s, Inc. | | | 20,690 | | | | 1,806 | |
| | The Cheesecake Factory, Inc. | | | 18,001 | | | | 906 | |
| | Chico’s FAS, Inc. | | | 59,808 | | | | 970 | |
| | Cinemark Holdings, Inc. | | | 40,724 | | | | 1,449 | |
| | CST Brands, Inc. | | | 30,371 | | | | 1,325 | |
* | | Deckers Outdoor Corp. | | | 13,545 | | | | 1,233 | |
| | DeVry, Inc. | | | 22,483 | | | | 1,067 | |
| | Dick’s Sporting Goods, Inc. | | | 38,366 | | | | 1,905 | |
| | Domino’s Pizza, Inc. | | | 21,511 | | | | 2,026 | |
* | | DreamWorks Animation SKG, Inc. - Class A | | | 28,328 | | | | 633 | |
| | Foot Locker, Inc. | | | 55,565 | | | | 3,122 | |
| | Gentex Corp. | | | 57,249 | | | | 2,068 | |
| | Graham Holdings Co. | | | 1,722 | | | | 1,487 | |
| | Guess?, Inc. | | | 24,998 | | | | 527 | |
| | Hanesbrands, Inc. | | | 39,064 | | | | 4,360 | |
| | HSN, Inc. | | | 12,698 | | | | 965 | |
| | International Game Technology | | | 96,750 | | | | 1,669 | |
| | International Speedway Corp. - Class A | | | 10,933 | | | | 346 | |
* | | J.C. Penney Co., Inc. | | | 119,217 | | | | 773 | |
* | | Jarden Corp. | | | 69,966 | | | | 3,350 | |
| | John Wiley & Sons, Inc. - Class A | | | 18,348 | | | | 1,087 | |
* | | Kate Spade & Co. | | | 49,709 | | | | 1,591 | |
| | KB Home | | | 35,608 | | | | 589 | |
| | Lamar Advertising Co. - Class A | | | 31,349 | | | | 1,682 | |
* | | Life Time Fitness, Inc. | | | 14,076 | | | | 797 | |
* | | Live Nation Entertainment, Inc. | | | 56,499 | | | | 1,475 | |
* | | LKQ Corp. | | | 118,507 | | | | 3,332 | |
| | M.D.C. Holdings, Inc. | | | 15,272 | | | | 404 | |
| | Meredith Corp. | | | 14,254 | | | | 774 | |
* | | Murphy USA, Inc. | | | 16,810 | | | | 1,158 | |
| | The New York Times Co. - Class A | | | 51,138 | | | | 676 | |
| | | | | | | | | | |
| | | Common Stocks (97.7%) | | Shares/ $ Par | | | Value $ (000’s) | |
| |
| | Consumer Discretionary continued | |
* | | NVR, Inc. | | | 1,522 | | | | 1,941 | |
* | | Office Depot, Inc. | | | 189,573 | | | | 1,626 | |
* | | Panera Bread Co. - Class A | | | 10,019 | | | | 1,751 | |
| | Polaris Industries, Inc. | | | 23,888 | | | | 3,613 | |
| | Rent-A-Center, Inc. | | | 20,688 | | | | 751 | |
| | Service Corp. International | | | 81,203 | | | | 1,843 | |
| | Signet Jewelers, Ltd. | | | 31,355 | | | | 4,125 | |
| | Sotheby’s | | | 24,012 | | | | 1,037 | |
* | | Tempur-Pedic International, Inc. | | | 23,820 | | | | 1,308 | |
| | Thor Industries, Inc. | | | 18,164 | | | | 1,015 | |
| | Time, Inc. | | | 42,637 | | | | 1,049 | |
* | | Toll Brothers, Inc. | | | 63,314 | | | | 2,170 | |
| | Tupperware Brands Corp. | | | 19,698 | | | | 1,241 | |
| | The Wendy’s Co. | | | 107,133 | | | | 967 | |
| | Williams-Sonoma, Inc. | | | 33,492 | | | | 2,535 | |
| | | | | | | | | | |
| | Total | | | | | | | 88,794 | |
| | | | | | | | | | |
| |
| | Consumer Staples (3.3%) | |
| | Church & Dwight Co., Inc. | | | 52,315 | | | | 4,123 | |
| | Dean Foods Co. | | | 36,691 | | | | 711 | |
| | Energizer Holdings, Inc. | | | 24,284 | | | | 3,122 | |
| | Flowers Foods, Inc. | | | 72,244 | | | | 1,386 | |
* | | The Hain Celestial Group, Inc. | | | 39,466 | | | | 2,300 | |
| | Ingredion, Inc. | | | 28,103 | | | | 2,384 | |
| | Lancaster Colony Corp. | | | 7,592 | | | | 711 | |
* | | Post Holdings, Inc. | | | 17,543 | | | | 735 | |
* | | SUPERVALU, INC. | | | 80,670 | | | | 782 | |
| | Tootsie Roll Industries, Inc. | | | 7,802 | | | | 239 | |
* | | TreeHouse Foods, Inc. | | | 16,553 | | | | 1,416 | |
* | | United Natural Foods, Inc. | | | 19,509 | | | | 1,509 | |
* | | The WhiteWave Foods Co. | | | 68,185 | | | | 2,386 | |
| | | | | | | | | | |
| | Total | | | | | | | 21,804 | |
| | | | | | | | | | |
| |
| | Energy (4.0%) | |
* | | Atwood Oceanics, Inc. | | | 23,406 | | | | 664 | |
* | | California Resources Corp. | | | 119,407 | | | | 658 | |
| | CARBO Ceramics, Inc. | | | 7,676 | | | | 307 | |
* | | Dresser-Rand Group, Inc. | | | 29,976 | | | | 2,452 | |
* | | Dril-Quip, Inc. | | | 15,437 | | | | 1,184 | |
| | Energen Corp. | | | 28,628 | | | | 1,825 | |
* | | Gulfport Energy Corp. | | | 33,449 | | | | 1,396 | |
* | | Helix Energy Solutions Group, Inc. | | | 38,383 | | | | 833 | |
| | HollyFrontier Corp. | | | 76,546 | | | | 2,869 | |
| | Oceaneering International, Inc. | | | 41,066 | | | | 2,415 | |
* | | Oil States International, Inc. | | | 20,794 | | | | 1,017 | |
| | | | | | | | | | |
| | | Common Stocks (97.7%) | | Shares/
$ Par | | | Value
$ (000’s) | |
| |
| | Energy continued | |
| | Patterson-UTI Energy, Inc. | | | 57,257 | | | | 950 | |
| | Peabody Energy Corp. | | | 106,153 | | | | 822 | |
| * | | Rosetta Resources, Inc. | | | 24,047 | | | | 537 | |
| | Rowan Cos., PLC - Class A | | | 48,703 | | | | 1,136 | |
| | SM Energy Co. | | | 26,360 | | | | 1,017 | |
| | Superior Energy Services, Inc. | | | 59,509 | | | | 1,199 | |
| | Tidewater, Inc. | | | 19,447 | | | | 630 | |
| * | | Unit Corp. | | | 18,030 | | | | 615 | |
| | Western Refining, Inc. | | | 28,538 | | | | 1,078 | |
| | World Fuel Services Corp. | | | 28,182 | | | | 1,323 | |
| * | | WPX Energy, Inc. | | | 79,531 | | | | 925 | |
| | | | | | | | | | |
| | Total | | | | | | | 25,852 | |
| | | | | | | | | | |
| |
| | Financials (22.7%) | |
| | Alexander & Baldwin, Inc. | | | 17,732 | | | | 696 | |
| | Alexandria Real Estate Equities, Inc. | | | 28,160 | | | | 2,499 | |
| | | |
| * | | Alleghany Corp. | | | 6,299 | | | | 2,920 | |
| | American Campus Communities, Inc. | | | 41,108 | | | | 1,700 | |
| | American Financial Group, Inc. | | | 28,865 | | | | 1,753 | |
| | Arthur J. Gallagher & Co. | | | 63,108 | | | | 2,971 | |
| | Aspen Insurance Holdings, Ltd. | | | 24,337 | | | | 1,065 | |
| | Associated Banc-Corp. | | | 59,436 | | | | 1,107 | |
| | Astoria Financial Corp. | | | 34,343 | | | | 459 | |
| | BancorpSouth, Inc. | | | 33,445 | | | | 753 | |
| | Bank of Hawaii Corp. | | | 17,158 | | | | 1,018 | |
| | BioMed Realty Trust, Inc. | | | 77,213 | | | | 1,663 | |
| | Brown & Brown, Inc. | | | 46,102 | | | | 1,517 | |
| | Camden Property Trust | | | 33,787 | | | | 2,495 | |
| | Cathay General Bancorp | | | 28,988 | | | | 742 | |
| | CBOE Holdings, Inc. | | | 33,006 | | | | 2,093 | |
| | City National Corp. | | | 18,752 | | | | 1,515 | |
| | Commerce Bancshares, Inc. | | | 32,384 | | | | 1,408 | |
| | Corporate Office Properties Trust | | | 36,182 | | | | 1,026 | |
| | Corrections Corp. of America | | | 45,550 | | | | 1,655 | |
| | Cullen/Frost Bankers, Inc. | | | 21,454 | | | | 1,516 | |
| | Duke Realty Corp. | | | 133,633 | | | | 2,699 | |
| | East West Bancorp, Inc. | | | 56,139 | | | | 2,173 | |
| | Eaton Vance Corp. | | | 46,248 | | | | 1,893 | |
| | Equity One, Inc. | | | 30,023 | | | | 761 | |
| | Everest Re Group, Ltd. | | | 17,695 | | | | 3,013 | |
| | Extra Space Storage, Inc. | | | 43,218 | | | | 2,534 | |
| | Federal Realty Investment Trust | | | 26,644 | | | | 3,556 | |
| | Federated Investors, Inc. - Class B | | | 37,224 | | | | 1,226 | |
The Accompanying Notes are an Integral Part of the Financial Statements.
| | | | |
| 38 | | Index 400 Stock Portfolio | | |
Index 400 Stock Portfolio
| | | | | | | | | | |
| | | Common Stocks (97.7%) | | Shares/ $ Par | | | Value $ (000’s) | |
| |
| | | Financials continued | |
| | First American Financial Corp. | | | 41,948 | | | | 1,422 | |
| | First Horizon National Corp. | | | 91,998 | | | | 1,249 | |
| | First Niagara Financial Group, Inc. | | | 138,414 | | | | 1,167 | |
| | FirstMerit Corp. | | | 64,681 | | | | 1,222 | |
| | Fulton Financial Corp. | | | 72,451 | | | | 896 | |
| | Hancock Holding Co. | | | 31,899 | | | | 979 | |
| | Hanover Insurance Group, Inc. | | | 17,219 | | | | 1,228 | |
| | HCC Insurance Holdings, Inc. | | | 37,855 | | | | 2,026 | |
| | Highwoods Properties, Inc. | | | 35,693 | | | | 1,581 | |
| | Home Properties, Inc. | | | 22,434 | | | | 1,472 | |
| | Hospitality Properties Trust | | | 58,620 | | | | 1,817 | |
| | International Bancshares Corp. | | | 22,658 | | | | 601 | |
| | Janus Capital Group, Inc. | | | 57,461 | | | | 927 | |
| | Jones Lang LaSalle, Inc. | | | 17,528 | | | | 2,628 | |
| | Kemper Corp. | | | 19,566 | | | | 707 | |
| | Kilroy Realty Corp. | | | 32,833 | | | | 2,268 | |
| | LaSalle Hotel Properties | | | 43,670 | | | | 1,767 | |
| | Liberty Property Trust | | | 58,091 | | | | 2,186 | |
| | Mack-Cali Realty Corp. | | | 32,728 | | | | 624 | |
| | Mercury General Corp. | | | 14,205 | | | | 805 | |
| | Mid-America Apartment Communities, Inc. | | | 29,429 | | | | 2,198 | |
| | MSCI, Inc. | | | 43,811 | | | | 2,078 | |
| | National Retail Properties, Inc. | | | 51,577 | | | | 2,031 | |
| | New York Community Bancorp, Inc. | | | 173,104 | | | | 2,770 | |
| | Old Republic International Corp. | | | 94,883 | | | | 1,388 | |
| | OMEGA Healthcare Investors, Inc. | | | 49,832 | | | | 1,947 | |
| | PacWest Bancorp | | | 37,862 | | | | 1,721 | |
| | Potlatch Corp. | | | 15,876 | | | | 665 | |
| | Primerica, Inc. | | | 20,781 | | | | 1,128 | |
| | Prosperity Bancshares, Inc. | | | 23,465 | | | | 1,299 | |
| | Protective Life Corp. | | | 30,840 | | | | 2,148 | |
| | Raymond James Financial, Inc. | | | 49,267 | | | | 2,823 | |
| | Rayonier, Inc. | | | 49,558 | | | | 1,385 | |
| | Realty Income Corp. | | | 87,085 | | | | 4,155 | |
| | Regency Centers Corp. | | | 36,465 | | | | 2,326 | |
| | Reinsurance Group of America, Inc. | | | 26,865 | | | | 2,354 | |
| | RenaissanceRe Holdings, Ltd. | | | 15,067 | | | | 1,465 | |
| | SEI Investments Co. | | | 51,012 | | | | 2,043 | |
| | Senior Housing Properties Trust | | | 79,732 | | | | 1,763 | |
| * | | Signature Bank | | | 19,676 | | | | 2,478 | |
| | SL Green Realty Corp. | | | 37,744 | | | | 4,492 | |
| | SLM Corp. | | | 165,485 | | | | 1,686 | |
| | | | | | | | | | |
| | | Common Stocks (97.7%) | | Shares/ $ Par | | | Value $ (000’s) | |
| |
| | Financials continued | |
| | StanCorp Financial Group, Inc. | | | 16,440 | | | | 1,149 | |
| * | | SVB Financial Group | | | 19,885 | | | | 2,308 | |
| | Synovus Financial Corp. | | | 53,408 | | | | 1,447 | |
| | Tanger Factory Outlet Centers, Inc. | | | 37,502 | | | | 1,386 | |
| | Taubman Centers, Inc. | | | 24,763 | | | | 1,892 | |
| | TCF Financial Corp. | | | 65,398 | | | | 1,039 | |
| | Trustmark Corp. | | | 26,373 | | | | 647 | |
| | UDR, Inc. | | | 99,807 | | | | 3,076 | |
| | Umpqua Holdings Corp. | | | 84,965 | | | | 1,445 | |
| | Valley National Bancorp | | | 86,002 | | | | 835 | |
| | W.R. Berkley Corp. | | | 39,704 | | | | 2,035 | |
| | Waddell & Reed Financial, Inc. - Class A | | | 32,699 | | | | 1,629 | |
| | Washington Federal, Inc. | | | 38,395 | | | | 850 | |
| | Washington Prime Group, Inc. | | | 60,679 | | | | 1,045 | |
| | Webster Financial Corp. | | | 35,292 | | | | 1,148 | |
| | Weingarten Realty Investors | | | 43,992 | | | | 1,536 | |
| | | | | | | | | | |
| | Total | | | | | | | 147,808 | |
| | | | | | | | | | |
| |
| | Health Care (10.1%) | |
| * | | Align Technology, Inc. | | | 28,259 | | | | 1,580 | |
| * | | Allscripts Healthcare Solutions, Inc. | | | 66,265 | | | | 846 | |
| * | | Bio-Rad Laboratories, Inc. - Class A | | | 8,041 | | | | 969 | |
| | Bio-Techne Corp. | | | 14,499 | | | | 1,340 | |
| * | | Centene Corp. | | | 22,943 | | | | 2,383 | |
| * | | Charles River Laboratories International, Inc. | | | 18,350 | | | | 1,168 | |
| * | | Community Health Systems, Inc. | | | 45,474 | | | | 2,452 | |
| | The Cooper Cos., Inc. | | | 18,881 | | | | 3,060 | |
| * | | Covance, Inc. | | | 22,128 | | | | 2,298 | |
| * | | Cubist Pharmaceuticals, Inc. | | | 29,836 | | | | 3,003 | |
| * | | Endo International PLC | | | 60,112 | | | | 4,335 | |
| * | | Halyard Health, Inc. | | | 18,199 | | | | 828 | |
| * | | Health Net, Inc. | | | 30,471 | | | | 1,631 | |
| * | | Henry Schein, Inc. | | | 32,934 | | | | 4,484 | |
| | Hill-Rom Holdings, Inc. | | | 22,494 | | | | 1,026 | |
| * | | HMS Holdings Corp. | | | 34,331 | | | | 726 | |
| * | | Hologic, Inc. | | | 94,809 | | | | 2,535 | |
| * | | IDEXX Laboratories, Inc. | | | 18,647 | | | | 2,765 | |
| * | | LifePoint Hospitals, Inc. | | | 17,705 | | | | 1,273 | |
| * | | MEDNAX, Inc. | | | 39,269 | | | | 2,596 | |
| * | | Mettler-Toledo International, Inc. | | | 11,164 | | | | 3,377 | |
| | Omnicare, Inc. | | | 38,279 | | | | 2,792 | |
| | Owens & Minor, Inc. | | | 24,668 | | | | 866 | |
| | ResMed, Inc. | | | 54,532 | | | | 3,057 | |
| * | | Salix Pharmaceuticals, Ltd. | | | 24,920 | | | | 2,864 | |
| * | | Sirona Dental Systems, Inc. | | | 21,654 | | | | 1,892 | |
| | STERIS Corp. | | | 23,238 | | | | 1,507 | |
| | | | | | | | | | |
| | | Common Stocks (97.7%) | | Shares/ $ Par | | | Value $ (000’s) | |
| |
| | Health Care continued | |
| | Teleflex, Inc. | | | 16,196 | | | | 1,860 | |
| * | | Thoratec Corp. | | | 21,509 | | | | 698 | |
| * | | United Therapeutics Corp. | | | 18,579 | | | | 2,406 | |
| * | | VCA, Inc. | | | 32,898 | | | | 1,604 | |
| * | | WellCare Health Plans, Inc. | | | 17,170 | | | | 1,409 | |
| | | | | | | | | | |
| | Total | | | | | | | 65,630 | |
| | | | | | | | | | |
| |
| | Industrials (14.8%) | |
| | A.O. Smith Corp. | | | 29,415 | | | | 1,659 | |
| | Acuity Brands, Inc. | | | 16,960 | | | | 2,376 | |
| * | | Aecom Technology Corp. | | | 60,154 | | | | 1,827 | |
| | AGCO Corp. | | | 32,732 | | | | 1,480 | |
| | Alaska Air Group, Inc. | | | 51,449 | | | | 3,075 | |
| | Alliant Techsystems, Inc. | | | 12,487 | | | | 1,452 | |
| * | | B/E Aerospace, Inc. | | | 41,182 | | | | 2,389 | |
| | Carlisle Cos., Inc. | | | 25,093 | | | | 2,264 | |
| | CLARCOR, Inc. | | | 19,602 | | | | 1,306 | |
| * | | Clean Harbors, Inc. | | | 21,334 | | | | 1,025 | |
| | Con-way, Inc. | | | 22,651 | | | | 1,114 | |
| * | | Copart, Inc. | | | 44,465 | | | | 1,623 | |
| | The Corporate Executive Board Co. | | | 13,155 | | | | 954 | |
| | Crane Co. | | | 19,376 | | | | 1,137 | |
| | Deluxe Corp. | | | 19,425 | | | | 1,209 | |
| | Donaldson Co., Inc. | | | 49,938 | | | | 1,929 | |
| * | | Esterline Technologies Corp. | | | 12,491 | | | | 1,370 | |
| | Exelis, Inc. | | | 73,031 | | | | 1,280 | |
| | Fortune Brands Home & Security, Inc. | | | 61,698 | | | | 2,793 | |
| * | | FTI Consulting, Inc. | | | 16,043 | | | | 620 | |
| | GATX Corp. | | | 17,285 | | | | 995 | |
| * | | Genesee & Wyoming, Inc. - Class A | | | 20,017 | | | | 1,800 | |
| | Graco, Inc. | | | 23,256 | | | | 1,865 | |
| | Granite Construction, Inc. | | | 14,087 | | | | 536 | |
| | Harsco Corp. | | | 31,602 | | | | 597 | |
| | Herman Miller, Inc. | | | 23,263 | | | | 685 | |
| | HNI Corp. | | | 17,361 | | | | 886 | |
| | Hubbell, Inc. - Class B | | | 21,243 | | | | 2,269 | |
| | Huntington Ingalls Industries, Inc. | | | 18,884 | | | | 2,124 | |
| | IDEX Corp. | | | 31,049 | | | | 2,417 | |
| | ITT Corp. | | | 35,822 | | | | 1,449 | |
| | J.B. Hunt Transport Services, Inc. | | | 36,194 | | | | 3,049 | |
| * | | JetBlue Airways Corp. | | | 95,859 | | | | 1,520 | |
| | KBR, Inc. | | | 56,736 | | | | 962 | |
| | Kennametal, Inc. | | | 30,936 | | | | 1,107 | |
| * | | Kirby Corp. | | | 22,314 | | | | 1,802 | |
| * | | KLX, Inc. | | | 20,591 | | | | 849 | |
| | Landstar System, Inc. | | | 17,495 | | | | 1,269 | |
| | Lennox International, Inc. | | | 17,284 | | | | 1,643 | |
| | Lincoln Electric Holdings, Inc. | | | 30,378 | | | | 2,099 | |
| | Manpowergroup, Inc. | | | 30,949 | | | | 2,110 | |
| | MSA Safety, Inc. | | | 12,299 | | | | 653 | |
| | MSC Industrial Direct Co., Inc. - Class A | | | 19,755 | | | | 1,605 | |
The Accompanying Notes are an Integral Part of the Financial Statements.
| | | | | | |
| | Index 400 Stock Portfolio | | | 39 | |
Index 400 Stock Portfolio
| | | | | | | | | | |
| | | Common Stocks (97.7%) | | Shares/ $ Par | | | Value $ (000’s) | |
| |
| | Industrials continued | |
| | Nordson Corp. | | | 22,948 | | | | 1,789 | |
| * | | NOW, Inc. | | | 41,870 | | | | 1,077 | |
| * | | Old Dominion Freight Line, Inc. | | | 26,620 | | | | 2,067 | |
| | Oshkosh Corp. | | | 31,208 | | | | 1,518 | |
| | R.R. Donnelley & Sons Co. | | | 78,135 | | | | 1,313 | |
| | Regal-Beloit Corp. | | | 17,476 | | | | 1,314 | |
| | Rollins, Inc. | | | 25,041 | | | | 829 | |
| | SPX Corp. | | | 16,062 | | | | 1,380 | |
| | Terex Corp. | | | 42,391 | | | | 1,182 | |
| | The Timken Co. | | | 29,133 | | | | 1,243 | |
| | Towers Watson & Co. - Class A | | | 27,350 | | | | 3,095 | |
| | Trinity Industries, Inc. | | | 60,864 | | | | 1,705 | |
| | Triumph Group, Inc. | | | 19,861 | | | | 1,335 | |
| | Valmont Industries, Inc. | | | 9,623 | | | | 1,222 | |
| | Wabtec Corp. | | | 37,642 | | | | 3,271 | |
| | Waste Connections, Inc. | | | 48,539 | | | | 2,135 | |
| | Watsco, Inc. | | | 10,674 | | | | 1,142 | |
| | Werner Enterprises, Inc. | | | 17,424 | | | | 543 | |
| | Woodward, Inc. | | | 22,828 | | | | 1,124 | |
| | | | | | | | | | |
| | Total | | | | | | | 96,457 | |
| | | | | | | | | | |
| |
| | Information Technology (17.1%) | |
| * | | 3D Systems Corp. | | | 40,884 | | | | 1,344 | |
| * | | ACI Worldwide, Inc. | | | 44,948 | | | | 907 | |
| * | | Acxiom Corp. | | | 30,116 | | | | 610 | |
| * | | Advanced Micro Devices, Inc. | | | 245,599 | | | | 656 | |
| | Advent Software, Inc. | | | 17,387 | | | | 533 | |
| * | | ANSYS, Inc. | | | 35,942 | | | | 2,947 | |
| * | | AOL, Inc. | | | 30,459 | | | | 1,406 | |
| * | | ARRIS Group, Inc. | | | 51,522 | | | | 1,555 | |
| * | | Arrow Electronics, Inc. | | | 37,897 | | | | 2,194 | |
| * | | Atmel Corp. | | | 163,214 | | | | 1,370 | |
| | Avnet, Inc. | | | 53,595 | | | | 2,306 | |
| | Belden, Inc. | | | 16,744 | | | | 1,320 | |
| | Broadridge Financial Solutions, Inc. | | | 46,934 | | | | 2,167 | |
| * | | Cadence Design Systems, Inc. | | | 114,473 | | | | 2,172 | |
| | CDK Global, Inc. | | | 62,817 | | | | 2,560 | |
| * | | Ciena Corp. | | | 41,674 | | | | 809 | |
| * | | Cognex Corp. | | | 34,040 | | | | 1,407 | |
| * | | CommVault Systems, Inc. | | | 16,823 | | | | 870 | |
| | Convergys Corp. | | | 39,241 | | | | 799 | |
| * | | CoreLogic, Inc. | | | 35,094 | | | | 1,109 | |
| * | | Cree, Inc. | | | 46,711 | | | | 1,505 | |
| | Cypress Semiconductor Corp. | | | 58,011 | | | | 828 | |
| | Diebold, Inc. | | | 25,274 | | | | 875 | |
| | DST Systems, Inc. | | | 11,460 | | | | 1,079 | |
| | Equinix, Inc. | | | 21,431 | | | | 4,859 | |
| | FactSet Research Systems, Inc. | | | 15,183 | | | | 2,137 | |
| | Fair Isaac Corp. | | | 12,556 | | | | 908 | |
| * | | Fairchild Semiconductor International, Inc. | | | 46,448 | | | | 784 | |
| | FEI Co. | | | 16,249 | | | | 1,468 | |
| | | | | | | | | | |
| | | Common Stocks (97.7%) | | Shares/ $ Par | | | Value $ (000’s) | |
| |
| | Information Technology continued | |
| * | | Fortinet, Inc. | | | 54,154 | | | | 1,660 | |
| * | | Gartner, Inc. | | | 34,425 | | | | 2,899 | |
| | Global Payments, Inc. | | | 26,451 | | | | 2,135 | |
| * | | Informatica Corp. | | | 42,498 | | | | 1,621 | |
| * | | Ingram Micro, Inc. - Class A | | | 60,981 | | | | 1,685 | |
| * | | Integrated Device Technology, Inc. | | | 58,132 | | | | 1,139 | |
| | InterDigital, Inc. | | | 14,534 | | | | 769 | |
| * | | International Rectifier Corp. | | | 27,975 | | | | 1,116 | |
| | Intersil Corp. - Class A | | | 50,649 | | | | 733 | |
| * | | IPG Photonics Corp. | | | 13,877 | | | | 1,040 | |
| * | | Itron, Inc. | | | 15,275 | | | | 646 | |
| | Jabil Circuit, Inc. | | | 75,630 | | | | 1,651 | |
| | Jack Henry & Associates, Inc. | | | 31,980 | | | | 1,987 | |
| * | | JDS Uniphase Corp. | | | 90,670 | | | | 1,244 | |
| * | | Keysight Technologies, Inc. | | | 65,504 | | | | 2,212 | |
| * | | Knowles Corp. | | | 33,257 | | | | 783 | |
| | Leidos Holdings, Inc. | | | 24,331 | | | | 1,059 | |
| | Lexmark International, Inc. - Class A | | | 24,166 | | | | 997 | |
| | Mentor Graphics Corp. | | | 38,261 | | | | 839 | |
| | National Instruments Corp. | | | 39,417 | | | | 1,225 | |
| * | | NCR Corp. | | | 65,855 | | | | 1,919 | |
| * | | NeuStar, Inc. - Class A | | | 21,461 | | | | 597 | |
| | Plantronics, Inc. | | | 16,787 | | | | 890 | |
| * | | Polycom, Inc. | | | 53,374 | | | | 721 | |
| * | | PTC, Inc. | | | 45,362 | | | | 1,662 | |
| * | | Rackspace Hosting, Inc. | | | 46,595 | | | | 2,181 | |
| * | | RF Micro Devices, Inc. | | | 113,693 | | | | 1,886 | |
| * | | Riverbed Technology, Inc. | | | 60,658 | | | | 1,238 | |
| * | | Rovi Corp. | | | 37,046 | | | | 837 | |
| | Science Applications International Corp. | | | 15,814 | | | | 783 | |
| * | | Semtech Corp. | | | 26,105 | | | | 720 | |
| * | | Silicon Laboratories, Inc. | | | 15,414 | | | | 734 | |
| | Skyworks Solutions, Inc. | | | 74,558 | | | | 5,421 | |
| * | | Solarwinds, Inc. | | | 25,734 | | | | 1,282 | |
| | Solera Holdings, Inc. | | | 26,681 | | | | 1,366 | |
| * | | SunEdison, Inc. | | | 98,548 | | | | 1,923 | |
| * | | Synopsys, Inc. | | | 60,938 | | | | 2,649 | |
| * | | Tech Data Corp. | | | 14,960 | | | | 946 | |
| | Teradyne, Inc. | | | 84,663 | | | | 1,675 | |
| * | | Trimble Navigation, Ltd. | | | 101,288 | | | | 2,688 | |
| * | | Tyler Technologies, Inc. | | | 12,918 | | | | 1,414 | |
| * | | The Ultimate Software Group, Inc. | | | 11,095 | | | | 1,629 | |
| * | | VeriFone Systems, Inc. | | | 44,213 | | | | 1,645 | |
| | Vishay Intertechnology, Inc. | | | 53,051 | | | | 751 | |
| * | | WEX, Inc. | | | 15,161 | | | | 1,500 | |
| * | | Zebra Technologies Corp. - Class A | | | 19,914 | | | | 1,542 | |
| | | | | | | | | | |
| | Total | | | | | | | 111,523 | |
| | | | | | | | | | |
| | | | | | | | | | |
| | | Common Stocks (97.7%) | | Shares/ $ Par | | | Value $ (000’s) | |
| |
| | Materials (7.2%) | |
| | Albemarle Corp. | | | 30,600 | | | | 1,840 | |
| | AptarGroup, Inc. | | | 25,313 | | | | 1,692 | |
| | Ashland, Inc. | | | 24,957 | | | | 2,989 | |
| | Bemis Co., Inc. | | | 39,060 | | | | 1,766 | |
| | Cabot Corp. | | | 25,047 | | | | 1,099 | |
| | Carpenter Technology Corp. | | | 20,820 | | | | 1,025 | |
| | Cliffs Natural Resources, Inc. | | | 59,909 | | | | 428 | |
| | Commercial Metals Co. | | | 46,207 | | | | 753 | |
| | Compass Minerals International, Inc. | | | 13,135 | | | | 1,141 | |
| | Cytec Industries, Inc. | | | 28,186 | | | | 1,301 | |
| | Domtar Corp. | | | 25,212 | | | | 1,014 | |
| | Eagle Materials, Inc. | | | 19,656 | | | | 1,494 | |
| | Grief, Inc. - Class A | | | 13,255 | | | | 626 | |
| * | | Louisiana-Pacific Corp. | | | 55,614 | | | | 921 | |
| | Minerals Technologies, Inc. | | | 13,494 | | | | 937 | |
| | NewMarket Corp. | | | 4,165 | | | | 1,681 | |
| | Olin Corp. | | | 30,579 | | | | 696 | |
| | Packaging Corp. of America | | | 38,474 | | | | 3,003 | |
| | PolyOne Corp. | | | 35,552 | | | | 1,348 | |
| | Reliance Steel & Aluminum Co. | | | 30,533 | | | | 1,871 | |
| | Rock-Tenn Co. - Class A | | | 54,769 | | | | 3,340 | |
| | Royal Gold, Inc. | | | 25,496 | | | | 1,599 | |
| | RPM International, Inc. | | | 52,198 | | | | 2,647 | |
| | The Scotts Miracle-Gro Co. - Class A | | | 17,364 | | | | 1,082 | |
| | Sensient Technologies Corp. | | | 18,833 | | | | 1,136 | |
| | Silgan Holdings, Inc. | | | 17,054 | | | | 914 | |
| | Sonoco Products Co. | | | 39,599 | | | | 1,730 | |
| | Steel Dynamics, Inc. | | | 94,019 | | | | 1,856 | |
| | TimkenSteel Corp. | | | 14,992 | | | | 555 | |
| | United States Steel Corp. | | | 56,894 | | | | 1,521 | |
| | The Valspar Corp. | | | 29,811 | | | | 2,578 | |
| | Worthington Industries, Inc. | | | 19,817 | | | | 596 | |
| | | | | | | | | | |
| | Total | | | | | | | 47,179 | |
| | | | | | | | | | |
| |
| | Telecommunication Services (0.1%) | |
| | Telephone and Data Systems, Inc. | | | 38,400 | | | | 970 | |
| | | | | | | | | | |
| | Total | | | | | | | 970 | |
| | | | | | | | | | |
| |
| | Utilities (4.8%) | |
| | Alliant Energy Corp. | | | 43,383 | | | | 2,882 | |
| | Aqua America, Inc. | | | 69,075 | | | | 1,844 | |
| | Atmos Energy Corp. | | | 39,260 | | | | 2,188 | |
| | Black Hills Corp. | | | 17,463 | | | | 926 | |
| | Cleco Corp. | | | 23,612 | | | | 1,288 | |
| | Great Plains Energy, Inc. | | | 60,169 | | | | 1,709 | |
| | Hawaiian Electric Industries, Inc. | | | 40,109 | | | | 1,343 | |
| | IDACORP, Inc. | | | 19,658 | | | | 1,301 | |
| | MDU Resources Group, Inc. | | | 75,908 | | | | 1,784 | |
The Accompanying Notes are an Integral Part of the Financial Statements.
| | | | |
| 40 | | Index 400 Stock Portfolio | | |
Index 400 Stock Portfolio
| | | | | | | | | | |
| | | Common Stocks (97.7%) | | Shares/ $ Par | | | Value $ (000’s) | |
| |
| | Utilities continued | |
| | National Fuel Gas Co. | | | 32,924 | | | | 2,289 | |
| | OGE Energy Corp. | | | 77,947 | | | | 2,766 | |
| | ONE Gas, Inc. | | | 20,357 | | | | 839 | |
| | PNM Resources, Inc. | | | 31,150 | | | | 923 | |
| | Questar Corp. | | | 68,537 | | | | 1,733 | |
| | UGI Corp. | | | 67,430 | | | | 2,561 | |
| | Vectren Corp. | | | 32,278 | | | | 1,492 | |
| | Westar Energy, Inc. | | | 51,127 | | | | 2,108 | |
| | WGL Holdings, Inc. | | | 19,440 | | | | 1,062 | |
| | | | | | | | | | |
| | Total | | | | | | | 31,038 | |
| | | | | | | | | | |
| | | |
| | Total Common Stocks | | | | | | | | |
| | (Cost: $429,442) | | | | | | | 637,055 | |
| | | | | | | | | | |
| | | | | | | | | | |
| | | Short-Term Investments (0.3%) | | Shares/ $ Par | | | Value $ (000’s) | |
| |
| | Commercial Paper (0.3%) | |
| (b) | | Federal Home Loan Bank, 0.08%, 2/11/15 | | | 2,000,000 | | | | 2,000 | |
| | | | | | | | | | |
| | Total | | | | | | | 2,000 | |
| | | | | | | | | | |
| | | |
| | Total Short-Term Investments | | | | | | | | |
| | (Cost: $2,000) | | | | | | | 2,000 | |
| | | | | | | | | | |
| | | |
| | Total Investments (98.0%) | | | | | | | | |
| | (Cost: $431,442)(a) | | | | | | | 639,055 | |
| | | | | | | | | | |
| | Other Assets, Less | | | | | | | | |
| | Liabilities (2.0%) | | | | | | | 13,349 | |
| | | | | | | | | | |
| | Net Assets (100.0%) | | | | | | | 652,404 | |
| | | | | | | | | | |
| (a) | At December 31, 2014, the aggregate cost of securities for federal tax purposes (in thousands) was $431,976 and the net unrealized appreciation of investments based on that cost was $207,079 which is comprised of $228,826 aggregate gross unrealized appreciation and $21,747 aggregate gross unrealized depreciation. |
| (b) | All or a portion of the securities have been pledged as collateral for open futures positions or when-issued securities. Information regarding open futures contracts as of period end is summarized below. |
| | | | | | |
| Issuer (000’s) | | Number of
Contracts | | Expiration Date | | Unrealized
Appreciation/
(Depreciation)
(000’s) |
S&P 400 Mini Index Futures (Long) (Total Notional Value at December 31, 2014, $14,794) | | 105 | | 3/15 | | $417 |
The following is a summary of the inputs used in valuing the Portfolio’s assets and liabilities at December 31, 2014. See Note 3 for additional information on portfolio valuation.
| | | | | | | | | | | | | | |
| | | Valuation Inputs | | | |
| Description | | Level 1 – Quoted Prices | | | Level 2 – Other Significant Observable Inputs | | | Level 3 – Significant Unobservable Inputs | | | |
| | | (Amounts in thousands) | | | |
Assets: | | | | | | | | | | | | | | |
Domestic Common Stocks | | $ | 637,055 | | | $ | - | | | $ | - | | | |
Short-Term Investments | | | - | | | | 2,000 | | | | - | | | |
Other Financial Instruments^ | | | | | | | | | | | | | | |
Futures | | | 417 | | | | - | | | | - | | | |
Total | | $ | 637,472 | | | $ | 2,000 | | | $ | - | | | |
^ Other financial instruments are derivative instruments such as futures, forwards, written options and swaps contracts, which are valued at the unrealized appreciation (depreciation) on the instrument and short sales, which are valued at market value.
The Accompanying Notes are an Integral Part of the Financial Statements.
| | | | | | |
| | Index 400 Stock Portfolio | | | 41 | |
Mid Cap Value Portfolio (unaudited)
| | | | |
| Objective: | | Portfolio Strategy: | | Net Assets: |
| Long-term capital growth. Current income is a secondary objective. | | Invest primarily in equity securities of mid-sized companies that are determined to be undervalued. | | $428 million |
Portfolio Overview
Mason Street Advisors, LLC (“Mason Street Advisors”), the investment adviser for the Mid Cap Value Portfolio (the “Portfolio”), has engaged American Century Investment Management, Inc. (“American Century”) to act as sub-adviser for the Portfolio. The Portfolio invests primarily in a diversified portfolio of equity securities of mid-sized companies that are determined to be undervalued at the time of purchase. In selecting securities, the Portfolio attempts to identify companies whose long-term earnings, cash flows and/or assets are not reflected in the current market price of their securities and hold each security until it has returned to favor in the market and the price has increased to, or is higher than a level the adviser believes more accurately reflects the fair value of the company.
Market Overview
U.S. stocks posted solid gains for the year despite ending with a volatile fourth quarter. During the second half of the year, oil prices dropped dramatically, hurting energy stocks but leaving consumers with more discretionary income. Economic growth in the U.S. continued at a moderate pace and inflation remained below the U.S. Federal Reserve’s (the “Fed’s”) target for raising interest rates. According to various Russell® Indices, mid cap stocks outperformed small cap stocks but underperformed large cap stocks in 2014. Among mid cap stocks, mid cap value stocks outpaced mid cap growth stocks.
Portfolio Results
The Portfolio returned 16.69% for the twelve months ended December 31, 2014. By comparison, its benchmark, the Russell Midcap® Value Index (the “Index”), returned 14.75%. According to Lipper® Analytical Services, Inc., an independent mutual fund ranking agency, the average return of the Mid Cap Value Funds peer group for 2014 was 9.53%.
Security selection among Information Technology names contributed to performance relative to the Index. In the Information Technology sector, Applied Materials, Inc. enhanced relative results. The semiconductor equipment maker saw fundamentals improve across the industry in the wake of technology changes in semiconductor and memory manufacturing. The company continued to focus on improving its margins, market share, and research and development productivity. Additionally, the firm was working toward closing an acquisition that was expected to be highly accretive.
In the Industrials sector, security selection enhanced relative performance, although some of the gain was offset by a detrimental overweight position in the sector. Security selection and an underweight position in the machinery segment drove contribution from the sector.
The Energy sector was a contributor to performance relative to the Index. In particular, lack of exposure to Seadrill, Ltd. was helpful as crude oil plunged during the fourth quarter. However, many of the Portfolio’s energy holdings were also negatively impacted by falling oil prices, including Apache Corporation and Imperial Oil, Ltd. Weaker than expected demand from non-U.S. markets, higher than anticipated supply from North American shale formations, and the OPEC’s unwillingness to curtail production in the wake of falling prices all drove weakness in crude oil price.
Overweights in the Health Care and Consumer Staples sectors also contributed to relative performance. Merger and acquisition activity served as a tailwind for several of the Portfolio’s holdings. In the Consumer Staples sector, Hillshire Brands Co. was a top contributor for the Portfolio. Its share price appreciated when it announced it was being acquired by Tyson Foods, Inc. Health Care company CareFusion Corp. appreciated after accepting a buyout offer at a large premium from Becton, Dickinson and Company.
Security selection in the Financials sector was the greatest detractor from relative performance. The Portfolio remained significantly underweight in REITs, as the portfolio managers found valuations unattractive amid continued low interest rates.
In the Materials sector, security selection weighed on relative returns. Global aluminum fabricator Constellium NV detracted as an acquisition increased its debt burden. Additionally, the company announced its intent to increase capacity over the next three years, which could limit its free cash flow generation.
Derivatives did not play a substantial role in the investment process. Exchange traded funds (ETFs) and futures are occasionally used to equitize cash and temporarily gain sector exposure. The Portfolio had one ETF position, and the Portfolio also utilized forward currency contracts to help reduce risk that can result from currency fluctuations in foreign equity investments. The total impact of derivatives to the Portfolio for the twelve months ended December 31, 2014 was positive, contributing 0.75% to return.
Portfolio Manager Outlook
The following forward looking comments are the opinion of American Century, the Portfolio’s sub-adviser.
| | | | |
| 42 | | Mid Cap Value Portfolio | | |
Mid Cap Value Portfolio (unaudited)
We continue to follow our disciplined, bottom-up process, selecting companies one at a time for the Portfolio. As of December 31, 2014, we see opportunity in Industrials, Consumer Staples and Energy, as reflected by the Portfolio’s overweight positions in these sectors relative to the benchmark. Fundamental analysis and valuation work have led to smaller relative weightings in Financials, Consumer Discretionary and Materials stocks.
|
Relative Performance 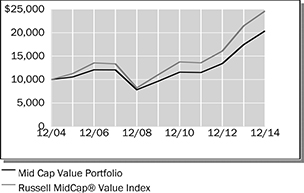
|
|
| | | | | | | | | | | | |
Average Annual Total Returns
For Periods Ended December 31, 2014 | |
| | | 1 Year | | | 5 Years | | | 10 Years | |
Mid Cap Value Portfolio | | | 16.69 | % | | | 16.13 | % | | | 7.37 | % |
Russell MidCap® Value Index | | | 14.75 | % | | | 17.43 | % | | | 9.43 | % |
Lipper® Variable Insurance Products (VIP) Mid Cap Value Funds Average | | | 9.53 | % | | | 15.22 | % | | | 8.08 | % |
|
| The performance data quoted represents past performance. Past performance is historical and does not guarantee future performance. Investment return and principal value will fluctuate, so that shares, when redeemed, may be worth more or less than their original cost. Current performance may be lower or higher than the performance data quoted. For the most recent month-end performance information visit www.northwesternmutual.com. |
This chart assumes an initial investment of $10,000 made on 12/31/04. Returns shown include deductions for management and other portfolio expenses, and reinvestment of all dividends. Returns exclude deductions for separate account sale loads and account fees. Please refer to the Benchmark Definitions section of this report for information about the indices cited in the above chart and graph. |
Investing in small and medium-sized companies involves a greater degree of risk than investing in large company stocks. The value of securities acquired in an IPO may rise or fall more rapidly than investments in more established issuers. |
|
| The Portfolio may invest in derivative instruments for cash management purposes or to hedge foreign currency exposure. Use of these instruments may involve certain costs and imposes certain risks such as liquidity risk, market risk, credit risk, management risk and the risk of mispricing or improper valuation. Certain derivatives involve leverage, which could magnify losses, and portfolios investing in derivatives could lose more than the principal amount invested in those instruments. |
Top 10 Equity Holdings 12/31/14
| | |
Security Description | | % of Net Assets |
Republic Services, Inc. | | 2.9% |
Northern Trust Corp. | | 2.8% |
iShares Russell Midcap Value Index Fund | | 2.6% |
Sysco Corp. | | 1.6% |
Royal Philips Electronics NV | | 1.6% |
LifePoint Hospitals, Inc. | | 1.5% |
The Laclede Group, Inc. | | 1.5% |
Westar Energy, Inc. | | 1.5% |
Imperial Oil, Ltd. | | 1.5% |
Edison International | | 1.4% |
Sector Allocation 12/31/14
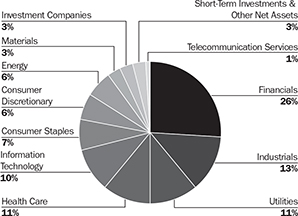
Sector Allocation is based on Net Assets.
Sector Allocation and Top 10 Holdings are subject to change.
| | | | | | |
| | Mid Cap Value Portfolio | | | 43 | |
Mid Cap Value Portfolio
Schedule of Investments
December 31, 2014
| | | | | | | | | | |
| | | Common Stocks (90.6%) | | Shares/ $ Par | | | Value $ (000’s) | |
| | | |
| | Consumer Discretionary (6.2%) | | | | | | | | |
| | Autoliv, Inc. | | | 15,635 | | | | 1,659 | |
| * | | Bed Bath & Beyond, Inc. | | | 32,425 | | | | 2,470 | |
| | Carnival Corp. | | | 56,656 | | | | 2,568 | |
| | Coach, Inc. | | | 29,953 | | | | 1,125 | |
| | International Game Technology | | | 116,650 | | | | 2,012 | |
| | Lowe’s Cos., Inc. | | | 61,203 | | | | 4,211 | |
| * | | Markit, Ltd. | | | 80,953 | | | | 2,140 | |
| | Mattel, Inc. | | | 92,128 | | | | 2,851 | |
| | Ralph Lauren Corp. | | | 12,781 | | | | 2,366 | |
| | Target Corp. | | | 41,519 | | | | 3,152 | |
| * | | Toll Brothers, Inc. | | | 62,260 | | | | 2,134 | |
| | | | | | | | | | |
| | Total | | | | | | | 26,688 | |
| | | | | | | | | | |
| | | |
| | Consumer Staples (6.9%) | | | | | | | | |
| | Campbell Soup Co. | | | 53,318 | | | | 2,346 | |
| | ConAgra Foods, Inc. | | | 152,344 | | | | 5,527 | |
| | General Mills, Inc. | | | 69,141 | | | | 3,687 | |
| | The J.M. Smucker Co. | | | 39,331 | | | | 3,972 | |
| | Kellogg Co. | | | 37,576 | | | | 2,459 | |
| | Kraft Foods Group, Inc. | | | 34,904 | | | | 2,187 | |
| | Mondelez International, Inc. | | | 75,594 | | | | 2,746 | |
| | Sysco Corp. | | | 169,924 | | | | 6,744 | |
| | | | | | | | | | |
| | Total | | | | | | | 29,668 | |
| | | | | | | | | | |
| | | |
| | Energy (4.6%) | | | | | | | | |
| * | | Antero Midstream Partners LP | | | 33,705 | | | | 927 | |
| | Apache Corp. | | | 68,797 | | | | 4,311 | |
| * | | Cameron International Corp. | | | 58,911 | | | | 2,943 | |
| | Devon Energy Corp. | | | 63,978 | | | | 3,916 | |
| | Noble Energy, Inc. | | | 38,370 | | | | 1,820 | |
| | Occidental Petroleum Corp. | | | 37,403 | | | | 3,015 | |
| * | | Southwestern Energy Co. | | | 33,676 | | | | 919 | |
| | Williams Partners LP | | | 38,460 | | | | 1,721 | |
| | | | | | | | | | |
| | Total | | | | | | | 19,572 | |
| | | | | | | | | | |
| | | |
| | Financials (25.7%) | | | | | | | | |
| | ACE, Ltd. | | | 31,984 | | | | 3,674 | |
| | Aflac, Inc. | | | 30,647 | | | | 1,872 | |
| | The Allstate Corp. | | | 20,557 | | | | 1,444 | |
| | Annaly Capital Management, Inc. | | | 103,185 | | | | 1,115 | |
| | Arthur J. Gallagher & Co. | | | 28,482 | | | | 1,341 | |
| | Bank of Hawaii Corp. | | | 45,165 | | | | 2,679 | |
| | BB&T Corp. | | | 53,809 | | | | 2,093 | |
| | BOK Financial Corp. | | | 37,406 | | | | 2,246 | |
| | Brown & Brown, Inc. | | | 70,388 | | | | 2,317 | |
| | Capitol Federal Financial, Inc. | | | 59,628 | | | | 762 | |
| | The Chubb Corp. | | | 24,756 | | | | 2,562 | |
| | Comerica, Inc. | | | 50,126 | | | | 2,348 | |
| | Commerce Bancshares, Inc. | | | 121,458 | | | | 5,282 | |
| | Corrections Corp. of America | | | 131,845 | | | | 4,791 | |
| | Cullen/Frost Bankers, Inc. | | | 33,670 | | | | 2,378 | |
| | | | | | | | | | |
| | | Common Stocks (90.6%) | | Shares/
$ Par | | | Value $ (000’s) | |
| | | |
| | Financials continued | | | | | | | | |
| | Empire State Realty Trust, Inc. | | | 120,796 | | | | 2,124 | |
| | Franklin Resources, Inc. | | | 41,140 | | | | 2,278 | |
| | HCC Insurance Holdings, Inc. | | | 78,971 | | | | 4,227 | |
| | LPL Financial Holdings, Inc. | | | 84,692 | | | | 3,773 | |
| | M&T Bank Corp. | | | 42,349 | | | | 5,320 | |
| | MetLife, Inc. | | | 34,069 | | | | 1,843 | |
| | Northern Trust Corp. | | | 179,138 | | | | 12,074 | |
| | People’s United Financial, Inc. | | | 236,750 | | | | 3,594 | |
| | Piedmont Office Realty Trust, Inc. - Class A | | | 247,679 | | | | 4,666 | |
| | PNC Financial Services Group, Inc. | | | 57,714 | | | | 5,265 | |
| | Reinsurance Group of America, Inc. | | | 45,985 | | | | 4,029 | |
| | State Street Corp. | | | 37,080 | | | | 2,911 | |
| | SunTrust Banks, Inc. | | | 63,638 | | | | 2,666 | |
| | T. Rowe Price Group, Inc. | | | 24,877 | | | | 2,136 | |
| | Torchmark Corp. | | | 28,377 | | | | 1,537 | |
| | The Travelers Cos., Inc. | | | 20,577 | | | | 2,178 | |
| | Unum Group | | | 91,727 | | | | 3,199 | |
| | Westamerica Bancorporation | | | 71,631 | | | | 3,511 | |
| | Weyerhaeuser Co. | | | 156,450 | | | | 5,615 | |
| | | | | | | | | | |
| | Total | | | | | | | 109,850 | |
| | | | | | | | | | |
| | | |
| | Health Care (10.7%) | | | | | | | | |
| | Agilent Technologies, Inc. | | | 35,145 | | | | 1,439 | |
| * | | Bio-Rad Laboratories, Inc. - Class A | | | 14,895 | | | | 1,796 | |
| * | | Boston Scientific Corp. | | | 165,811 | | | | 2,197 | |
| | Cardinal Health, Inc. | | | 45,132 | | | | 3,643 | |
| * | | CareFusion Corp. | | | 84,842 | | | | 5,035 | |
| | Cigna Corp. | | | 22,259 | | | | 2,291 | |
| * | | Hospira, Inc. | | | 24,311 | | | | 1,489 | |
| | Humana, Inc. | | | 21,937 | | | | 3,151 | |
| * | | LifePoint Hospitals, Inc. | | | 89,237 | | | | 6,417 | |
| | Medtronic, Inc. | | | 47,329 | | | | 3,417 | |
| | Patterson Cos., Inc. | | | 49,445 | | | | 2,378 | |
| | Quest Diagnostics, Inc. | | | 83,723 | | | | 5,614 | |
| | Stryker Corp. | | | 29,954 | | | | 2,826 | |
| * | | Waters Corp. | | | 13,938 | | | | 1,571 | |
| | Zimmer Holdings, Inc. | | | 20,693 | | | | 2,347 | |
| | | | | | | | | | |
| | Total | | | | | | | 45,611 | |
| | | | | | | | | | |
| | | |
| | Industrials (11.2%) | | | | | | | | |
| | The ADT Corp. | | | 141,718 | | | | 5,134 | |
| * | | Clean Harbors, Inc. | | | 70,823 | | | | 3,403 | |
| | Emerson Electric Co. | | | 69,122 | | | | 4,267 | |
| | Exelis, Inc. | | | 224,065 | | | | 3,928 | |
| | Heartland Express, Inc. | | | 85,772 | | | | 2,317 | |
| | Oshkosh Corp. | | | 102,975 | | | | 5,010 | |
| | Pentair PLC | | | 24,518 | | | | 1,628 | |
| | Republic Services, Inc. | | | 307,479 | | | | 12,376 | |
| | Textron, Inc. | | | 47,415 | | | | 1,997 | |
| | Tyco Interntional PLC | | | 85,198 | | | | 3,737 | |
| | Waste Management, Inc. | | | 21,163 | | | | 1,086 | |
The Accompanying Notes are an Integral Part of the Financial Statements.
| | | | |
| 44 | | Mid Cap Value Portfolio | | |
Mid Cap Value Portfolio
| | | | | | | | | | | | |
| | | Common Stocks (90.6%) | | | | Shares/
$ Par | | | Value
$ (000’s) | |
| | | | |
| | Industrials continued | | | | | | | | | | |
| | Werner Enterprises, Inc. | | | | | 91,393 | | | | 2,847 | |
| | | | | | | | | | | | |
| | Total | | | | | | | | | 47,730 | |
| | | | | | | | | | | | |
| | | | |
| | Information Technology (9.8%) | | | | | | | | | | |
| | Applied Materials, Inc. | | | | | 148,998 | | | | 3,713 | |
| | Broadcom Corp. - Class A | | | | | 94,023 | | | | 4,074 | |
| | Fidelity National Information Services, Inc. | | | | | 45,692 | | | | 2,842 | |
| | Harris Corp. | | | | | 29,914 | | | | 2,148 | |
| * | | Keysight Technologies, Inc. | | | | | 38,366 | | | | 1,296 | |
| | Lam Research Corp. | | | | | 49,764 | | | | 3,948 | |
| | Maxim Integrated Products, Inc. | | | | | 89,479 | | | | 2,852 | |
| | Microchip Technology, Inc. | | | | | 82,449 | | | | 3,719 | |
| | SanDisk Corp. | | | | | 34,474 | | | | 3,378 | |
| | TE Connectivity, Ltd. | | | | | 55,959 | | | | 3,539 | |
| | Teradyne, Inc. | | | | | 241,740 | | | | 4,784 | |
| | Western Digital Corp. | | | | | 52,067 | | | | 5,764 | |
| | | | | | | | | | | | |
| | Total | | | | | | | | | 42,057 | |
| | | | | | | | | | | | |
| | | | |
| | Materials (3.4%) | | | | | | | | | | |
| | Bemis Co., Inc. | | | | | 93,771 | | | | 4,240 | |
| | The Mosaic Co. | | | | | 73,346 | | | | 3,348 | |
| | Newmont Mining Corp. | | | | | 96,043 | | | | 1,815 | |
| | Nucor Corp. | | | | | 61,715 | | | | 3,027 | |
| | Sonoco Products Co. | | | | | 49,372 | | | | 2,158 | |
| | | | | | | | | | | | |
| | Total | | | | | | | | | 14,588 | |
| | | | | | | | | | | | |
| | | | |
| | Telecommunication Services (0.8%) | | | | | | | | | | |
| | CenturyLink, Inc. | | | | | 90,809 | | | | 3,594 | |
| | | | | | | | | | | | |
| | Total | | | | | | | | | 3,594 | |
| | | | | | | | | | | | |
| | | | |
| | Utilities (11.3%) | | | | | | | | | | |
| | Ameren Corp. | | | | | 45,588 | | | | 2,103 | |
| | Atmos Energy Corp. | | | | | 76,756 | | | | 4,278 | |
| | Consolidated Edison, Inc. | | | | | 31,284 | | | | 2,065 | |
| | Edison International | | | | | 93,521 | | | | 6,124 | |
| | Great Plains Energy, Inc. | | | | | 152,307 | | | | 4,327 | |
| | The Laclede Group, Inc. | | | | | 119,643 | | | | 6,365 | |
| | Northeast Utilities | | | | �� | 34,164 | | | | 1,828 | |
| | NorthWestern Corp. | | | | | 34,966 | | | | 1,978 | |
| | OGE Energy Corp. | | | | | 27,474 | | | | 975 | |
| | PG&E Corp. | | | | | 73,305 | | | | 3,903 | |
| | The Southern Co. | | | | | 42,694 | | | | 2,097 | |
| | Westar Energy, Inc. | | | | | 154,214 | | | | 6,360 | |
| | Xcel Energy, Inc. | | | | | 168,719 | | | | 6,060 | |
| | | | | | | | | | | | |
| | Total | | | | | | | | | 48,463 | |
| | | | | | | | | | | | |
| | Total Common Stocks | | | | | | | | | | |
| | (Cost: $340,195) | | | | | | | | | 387,821 | |
| | | | | | | | | | | | |
| | | Foreign Common Stocks (4.2%) | | Country | | | | | | |
| | | | |
| | Consumer Staples (0.3%) | | | | | | | | | | |
| | Danone SA | | France | | | 16,469 | | | | 1,083 | |
| | | | | | | | | | | | |
| | Total | | | | | | | | | 1,083 | |
| | | | | | | | | | | | |
| | | | | | | | | | | | |
| | | Foreign Common Stocks (4.2%) | | Country | | Shares/
$ Par | | | Value
$ (000’s) | |
| |
| | Energy (1.5%) | |
| | Imperial Oil, Ltd. | | Canada | | | 147,546 | | | | 6,356 | |
| | | | | | | | | | | | |
| | Total | | | | | | | | | 6,356 | |
| | | | | | | | | | | | |
| |
| | Industrials (1.9%) | |
| | BAE Systems PLC | | United
Kingdom | | | 223,917 | | | | 1,635 | |
| | Royal Philips Electronics NV | | Netherlands | | | 228,829 | | | | 6,644 | |
| | | | | | | | | | | | |
| | Total | | | | | | | | | 8,279 | |
| | | | | | | | | | | | |
| |
| | Telecommunication Services (0.5%) | |
| | Rogers Communications, Inc. - Class B | | Canada | | | 58,872 | | | | 2,289 | |
| | | | | | | | | | | | |
| | Total | | | | | | | | | 2,289 | |
| | | | | | | | | | | | |
| | |
| | Total Foreign Common Stocks | | | | | |
| | (Cost: $18,500) | | | | 18,007 | |
| | | | | | | | | | | | |
| | | | |
| | | Investment Companies (2.7%) | | | | | | | | |
| |
| | Investment Companies (2.7%) | |
| | iShares Russell Midcap Value Index Fund | | | | | 153,403 | | | | 11,317 | |
| | | | | | | | | | | | |
| | Total | | | | | | | | | 11,317 | |
| | | | | | | | | | | | |
| | Total Investment Companies | | | | | |
| | (Cost: $10,842) | | | | 11,317 | |
| | | | | | | | | | | | |
| | | | |
| | | Short-Term Investments (2.5%) | | | | | | | | |
| |
| | Commercial Paper (2.5%) | |
| | Federal Farm Credit Bank, 0.01%, 1/2/15 | | | | | 3,837,000 | | | | 3,837 | |
| | Federal Home Loan Bank, 0.01%, 1/2/15 | | | | | 6,683,000 | | | | 6,683 | |
| | | | | | | | | | | | |
| | Total | | | | | | | | | 10,520 | |
| | | | | | | | | | | | |
| | | |
| | Total Short-Term Investments (Cost: $10,520) | | | | | | | 10,520 | |
| | | | | | | | | | | | |
| | | |
| | Total Investments (100.0%) (Cost: $380,057)(a) | | | | | | | 427,665 | |
| | | | | | | | | | | | |
| | | |
| | Other Assets, Less Liabilities (0.0%) | | | | | | | 188 | |
| | | | | | | | | | | | |
| | | |
| | Net Assets (100.0%) | | | | | | | 427,853 | |
| | | | | | | | | | | | |
The Accompanying Notes are an Integral Part of the Financial Statements.
| | | | | | |
| | Mid Cap Value Portfolio | | | 45 | |
Mid Cap Value Portfolio
| (a) | At December 31, 2014, the aggregate cost of securities for federal tax purposes (in thousands) was $382,176 and the net unrealized appreciation of investments based on that cost was $45,489 which is comprised of $52,294 aggregate gross unrealized appreciation and $6,805 aggregate gross unrealized depreciation. |
| (h) | Forward foreign currency contracts outstanding on December 31, 2014. |
| | | | | | | | | | | | | | | | | | | | |
| Type | | Counterparty | | Currency | | Principal Amount Covered by Contract (000’s) | | Settlement
Month | | Unrealized
Appreciation
(000’s) | | | Unrealized
(Depreciation)
(000’s) | | | Net Unrealized Appreciation/ (Depreciation)
(000’s) | |
Sell | | HSBC Bank Usa Na | | CAD | | 8,730 | | 1/15 | | $ | - | (m) | | $ | - | | | $ | - | (m) |
Sell | | HSBC Bank Usa Na | | EUR | | 5,507 | | 1/15 | | | 87 | | | | - | | | | 87 | |
Sell | | HSBC Bank Usa Na | | GBP | | 901 | | 1/15 | | | 4 | | | | - | | | | 4 | |
| | | | | | | | | | | | | | | | | | | | |
| | | | | | | | | | $ | 91 | | | $ | - | | | $ | 91 | |
| | | | | | | | | | | | | | | | | | | | |
CAD — Canadian Dollar
EUR — Euro
GBP — British Pound
(m) Amount is less than one thousand.
The following is a summary of the inputs used in valuing the Portfolio’s assets and liabilities at December 31, 2014. See Note 3 for additional information on portfolio valuation.
| | | | | | | | | | | | | | |
| | | Valuation Inputs | | | |
| Description | | Level 1 – Quoted Prices | | | Level 2 – Other Significant Observable Inputs | | | Level 3 – Significant Unobservable Inputs | | | |
| | | (Amounts in thousands) | | | |
Assets: | | | | | | | | | | | | | | |
Domestic Common Stocks | | $ | 387,821 | | | $ | - | | | $ | - | | | |
Foreign Common Stocks | | | | | | | | | | | - | | | |
Consumer Staples | | | - | | | | 1,083 | | | | - | | | |
Energy | | | 6,356 | | | | - | | | | - | | | |
Industrials | | | - | | | | 8,279 | | | | - | | | |
Telecommunication Services | | | 2,289 | | | | - | | | | - | | | |
Investment Companies | | | 11,317 | | | | - | | | | - | | | |
Short-Term Investments | | | | | | | 10,520 | | | | - | | | |
Other Financial Instruments^ | | | | | | | | | | | | | | |
Forward Currency Contracts | | | - | | | | 91 | | | | - | | | |
Total Assets | | $ | 407,783 | | | $ | 19,973 | | | $ | - | | | |
Liabilities: | | | | | | | | | | | | | | |
Other Financial Instruments^ | | | | | | | | | | | | | | |
Forward Currency Contracts | | | - | | | | - | (m) | | | - | | | |
Total Liabilities | | $ | - | | | $ | - | (m) | | $ | - | | | |
^ Other financial instruments are derivative instruments such as futures, forwards, written options and swaps contracts, which are valued at the unrealized appreciation (depreciation) on the instrument and short sales, which are valued at market value.
For the period ended December 31, 2014, there were transfers from a Level 1 to a Level 2 in the amount of $9,362 thousand. These transfers were the result of the use of fair value procedures on certain foreign securities in the portfolio on December 31, 2014. These securities did not require the use of fair value procedures on December 31, 2013.
The Accompanying Notes are an Integral Part of the Financial Statements.
| | | | |
| 46 | | Mid Cap Value Portfolio | | |
Small Cap Growth Stock Portfolio (unaudited)
| | | | |
| Objective: | | Portfolio Strategy: | | Net Assets: |
| Long-term growth of capital. | | Invest primarily in common stocks of small capitalization companies. | | $530 million |
Portfolio Overview
Mason Street Advisors, LLC (“Mason Street Advisors”), the investment adviser for the Small Cap Growth Stock Portfolio (the “Portfolio”), has engaged Wellington Management Company, LLP (“Wellington”) to act as sub-adviser for the Portfolio. Normally, the Portfolio invests in common stocks of small capitalization companies. The Portfolio’s investment process is derived from the observation that the quality and persistence of a company’s business is often not reflected in its current stock price. Central to the investment process is intense, fundamental research focused on uncovering companies with improving quality metrics, business momentum, and attractive relative valuations.
Market Overview
U.S. stocks began 2014 with their worst month in nearly two years. Worries about a slowdown in China and general angst surrounding emerging markets overshadowed a fairly benign domestic environment. Despite negative weather-influenced economic data, the S&P 500® Index rebounded from January’s pullback and finished February at a new peak. By the end of the second quarter the S&P 500® Index was up 224.4% from its closing low on March 9, 2009. The second half of the year was also bumpy, with U.S. equities sinking in July, rebounding in August, and falling once again around mid-September before recovering in October. U.S. equities hit several all-time highs toward the end of the period, pulling back slightly on the final trading day of November and into December, led by weakness in the energy sector after OPEC’s decision to leave production unchanged.
Portfolio Results
The Portfolio returned 8.66% for the twelve months ended December 31, 2014. By comparison, the Portfolio’s benchmark, the Russell 2000® Growth Index (the “Index”), returned 5.60%. (This Index is unmanaged, cannot be invested in directly and does not include administrative expenses or sales charges.) According to Lipper® Analytical Services, Inc., an independent mutual fund ranking agency, the average return of the Small Cap Growth Funds peer group for 2014 was 3.41%.
The Portfolio’s outperformance during the period was primarily the result of strong stock selection, particularly in the Health Care, Materials and Industrials sectors. Weak selection within the Information Technology sector, as well as a modest cash position in a rising equity market detracted from relative returns during the period.
Top contributors to relative returns during the period included Agios Pharmaceuticals, Inc. (Healthcare), Core-Mark Holding Co., Inc. (Consumer Discretionary) and Athlon Energy, Inc. (Energy). Shares of Agios Pharmaceuticals, Inc., a biotech company focused on treating previously obtuse cancer mutations with highly specific drugs, rose during the period after company management reported strong enrollment trends and progress in reaching clinical trial and drug approval milestones. Shares of Core-Mark Holding Co., Inc., a provider of fresh and broad-line supply solutions to the convenience retail industry, outperformed during the period after the company signed a distribution agreement with Rite Aid Corp. Athlon Energy, Inc., a company focused on exploration and production within the Permian Basin, saw its shares surge after Encana Corp. announced that it would acquire the company at a significant premium. The portfolio managers eliminated the position on strength shortly after the announcement.
Top detractors from relative returns during the period included Energy XXI, Ltd. (Energy), Chart Industries, Inc. (Industrials) and Rosetta Resources, Inc. (Energy). Energy XXI, Ltd., an oil and gas exploration and production company, detracted from relative performance following the release of disappointing production results. Shares of Chart Industries, Inc., a maker of natural gas storage-related infrastructure equipment, fell during the period after the company reduced its sales and earnings guidance for the year based on a delay in shipments to China. Shares of Rosetta Resources, Inc., an energy exploration and production company, fell during the period. The primary cause of the decline was oil price weakness.
Portfolio Manager Outlook
The following forward looking comments are the opinion of Wellington, the Portfolio’s sub-adviser.
There are two key issues that have altered our outlook a little since last quarter—the precipitous drop in oil prices and the flattening of the yield curve. Without a supply response it’s hard to predict the near-term floor for oil prices. This worries us in terms of the multiplier effect from a slowdown in business spending in the energy complex, which could affect a broad swath of companies that could be involved in lending, hospitality or industrial goods in affected areas. At a high level, some of this will likely be offset by a boost to consumer demand from cheaper prices at the pump (serves as a tax break), although historically there has been a lagging effect between lower gas prices and a change in consumer behavior. Lower home heating costs due to a decline in heating oil prices should also serve as a tailwind to consumer spending trends. Thus, lower oil prices could be a net positive for the US economy. With respect to the flattening of the yield curve, this is likely to have a negative impact on banks and insurance companies’ investment and interest income, but low rates should be a boost to the consumer. The continued low rate environment should be good for housing and related areas as mortgage rates remain low and the ranks of the employed grow.
| | | | | | |
| | Small Cap Growth Stock Portfolio | | | 47 | |
Small Cap Growth Stock Portfolio (unaudited)
|
Relative Performance |
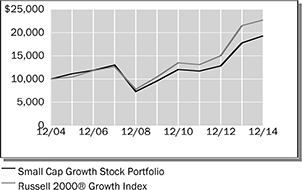 |
| | | | | | | | | | | | |
Average Annual Total Returns
For Periods Ended December 31, 2014 | |
| | | 1 Year | | | 5 Years | | | 10 Years | |
Small Cap Growth Stock Portfolio | | | 8.66 | % | | | 15.07 | % | | | 6.79 | % |
Russell 2000® Growth Index | | | 5.60 | % | | | 16.80 | % | | | 8.54 | % |
Lipper® Variable Insurance Products (VIP) Small Cap Growth Funds Average | | | 3.41 | % | | | 16.20 | % | | | 8.31 | % |
The performance data quoted represents past performance. Past performance is historical and does not guarantee future performance. Investment return and principal value will fluctuate, so that shares, when redeemed, may be worth more or less than their original cost. Current performance may be lower or higher than the performance data quoted. For the most recent month-end performance information visit www.northwesternmutual.com.
This chart assumes an initial investment of $10,000 made on 12/31/04. Returns shown include deductions for management and other portfolio expenses, and reinvestment of all dividends. Returns exclude deductions for separate account sale loads and account fees. Please refer to the Benchmark Definitions section of this report for information about the indices cited in the above chart and graph.
Stocks of smaller or newer companies, such as those held in this Portfolio, are more likely to realize more substantial growth as well as suffer more significant losses than larger or more established issuers. Investments in such companies can be both more volatile and more speculative. Investing in small company stocks involves a greater degree of risk than investing in medium or large company stocks.
The Portfolio may invest in exchange traded funds as a cash management strategy. Investing in ETFs may expose the Portfolio to greater risk of loss and price fluctuation than investing directly in a comparable portfolio of stocks due to lack of liquidity, the additional expenses incurred as a stockholder in another investment company, and tracking error.
Top 10 Equity Holdings 12/31/14
| | |
| Security Description | | % of Net Assets |
iShares Russell 2000 Growth Index Fund | | 2.5% |
DexCom, Inc. | | 1.4% |
Casey’s General Stores, Inc. | | 1.4% |
Tyler Technologies, Inc. | | 1.4% |
Bloomin’ Brands, Inc. | | 1.3% |
HSN, Inc. | | 1.2% |
Graphic Packaging Holding Co. | | 1.2% |
Manhattan Associates, Inc. | | 1.1% |
j2 Global, Inc. | | 1.1% |
Heartland Payment Systems, Inc. | | 1.1% |
|
Sector Allocation 12/31/14 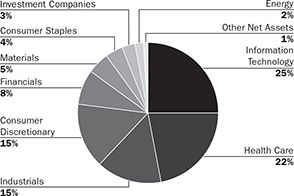
|
Sector Allocation is based on Net Assets.
Sector Allocation and Top 10 Holdings are subject to change.
| | | | |
| 48 | | Small Cap Growth Stock Portfolio | | |
Small Cap Growth Stock Portfolio
Schedule of Investments
December 31, 2014
| | | | | | | | | | |
| | | Common Stocks (96.9%) | | Shares/ $ Par | | | Value
$ (000’s) | |
| |
| | Consumer Discretionary (15.1%) | |
| | Arctic Cat, Inc. | | | 85,650 | | | | 3,041 | |
| * | | Bloomin’ Brands, Inc. | | | 274,590 | | | | 6,799 | |
| | Brinker International, Inc. | | | 64,390 | | | | 3,779 | |
| * | | Buffalo Wild Wings, Inc. | | | 24,230 | | | | 4,371 | |
| | Core-Mark Holding Co., Inc. | | | 75,796 | | | | 4,694 | |
| | Dana Holding Corp. | | | 156,713 | | | | 3,407 | |
| * | | Del Frisco’s Restaurant Group, Inc. | | | 122,570 | | | | 2,910 | |
| | DSW, Inc. - Class A | | | 112,124 | | | | 4,182 | |
| * | | Five Below, Inc. | | | 100,650 | | | | 4,110 | |
| | HSN, Inc. | | | 84,680 | | | | 6,436 | |
| * | | Ignite Restaurant Group, Inc. | | | 151,435 | | | | 1,192 | |
| * | | Kate Spade & Co. | | | 137,436 | | | | 4,399 | |
| | Marriott Vacations Worldwide Corp. | | | 59,020 | | | | 4,399 | |
| | Oxford Industries, Inc. | | | 43,310 | | | | 2,391 | |
| | Pier 1 Imports, Inc. | | | 290,666 | | | | 4,476 | |
| * | | Steven Madden, Ltd. | | | 131,765 | | | | 4,194 | |
| * | | Taylor Morrison Home Corp. - Class A | | | 104,100 | | | | 1,966 | |
| * | | Tenneco, Inc. | | | 98,740 | | | | 5,590 | |
| * | | Vince Holding Corp. | | | 150,416 | | | | 3,932 | |
| * | | Wayfair, Inc. | | | 92,605 | | | | 1,838 | |
| * | | Zulily, Inc. - Class A | | | 82,925 | | | | 1,940 | |
| | | | | | | | | | |
| | Total | | | | | | | 80,046 | |
| | | | | | | | | | |
| |
| | Consumer Staples (4.1%) | |
| | Casey’s General Stores, Inc. | | | 82,100 | | | | 7,415 | |
| * | | Diplomat Pharmacy, Inc. | | | 41,900 | | | | 1,147 | |
| * | | Natural Grocers by Vitamin Cottage, Inc. | | | 141,579 | | | | 3,989 | |
| | PriceSmart, Inc. | | | 38,908 | | | | 3,549 | |
| * | | TreeHouse Foods, Inc. | | | 63,895 | | | | 5,465 | |
| | | | | | | | | | |
| | Total | | | | | | | 21,565 | |
| | | | | | | | | | |
| |
| | Energy (2.3%) | |
| * | | Diamondback Energy, Inc. | | | 36,700 | | | | 2,194 | |
| * | | Forum Energy Technologies, Inc. | | | 82,619 | | | | 1,713 | |
| * | | Jones Energy, Inc. - Class A | | | 118,735 | | | | 1,355 | |
| | PBF Energy, Inc. | | | 68,585 | | | | 1,827 | |
| * | | Rosetta Resources, Inc. | | | 71,970 | | | | 1,606 | |
| * | | RSP Permian, Inc. | | | 142,740 | | | | 3,588 | |
| | | | | | | | | | |
| | Total | | | | | | | 12,283 | |
| | | | | | | | | | |
| |
| | Financials (7.9%) | |
| | Altisource Residential Corp. | | | 66,460 | | | | 1,289 | |
| | AMERISAFE, Inc. | | | 96,840 | | | | 4,102 | |
| | CoreSite Realty Corp. | | | 73,500 | | | | 2,870 | |
| | EverBank Financial Corp. | | | 198,280 | | | | 3,779 | |
| | Evercore Partners, Inc. | | | 55,080 | | | | 2,884 | |
| | First Merchants Corp. | | | 161,670 | | | | 3,678 | |
| | Flushing Financial Corp. | | | 82,500 | | | | 1,672 | |
| * | | Great Western Bancorp, Inc. | | | 69,600 | | | | 1,586 | |
| | | | | | | | | | |
| | | Common Stocks (96.9%) | | Shares/ $ Par | | | Value
$ (000’s) | |
| |
| | Financials continued | |
| | HFF, Inc. - Class A | | | 115,500 | | | | 4,149 | |
| * | | James River Group Holdings, Ltd. | | | 98,320 | | | | 2,238 | |
| * | | MGIC Investment Corp. | | | 291,500 | | | | 2,717 | |
| * | | PRA Group, Inc. | | | 26,370 | | | | 1,528 | |
| | Ramco-Gershenson Properties Trust | | | 110,800 | | | | 2,076 | |
| | Sandy Spring Bancorp, Inc. | | | 3,900 | | | | 102 | |
| | Sunstone Hotel Investors, Inc. | | | 246,260 | | | | 4,066 | |
| | Wintrust Financial Corp. | | | 65,200 | | | | 3,049 | |
| | | | | | | | | | |
| | Total | | | | | | | 41,785 | |
| | | | | | | | | | |
| |
| | Health Care (22.5%) | |
| * | | Acorda Therapeutics, Inc. | | | 111,700 | | | | 4,565 | |
| * | | Aerie Pharmaceuticals, Inc. | | | 104,330 | | | | 3,045 | |
| * | | Agios Pharmaceuticals, Inc. | | | 27,997 | | | | 3,137 | |
| * | | Alnylam Pharmaceuticals, Inc. | | | 52,540 | | | | 5,096 | |
| * | | Anacor Pharmaceuticals, Inc. | | | 134,646 | | | | 4,342 | |
| | Atrion Corp. | | | 8,954 | | | | 3,044 | |
| * | | BioCryst Pharmaceuticals, Inc. | | | 64,300 | | | | 782 | |
| * | | Bruker Corp. | | | 184,425 | | | | 3,618 | |
| * | | CorVel Corp. | | | 77,500 | | | | 2,885 | |
| * | | Cyberonics, Inc. | | | 52,180 | | | | 2,905 | |
| * | | DexCom, Inc. | | | 138,265 | | | | 7,612 | |
| * | | Five Prime Therapeutics, Inc. | | | 98,065 | | | | 2,648 | |
| * | | Globus Medical, Inc. - Class A | | | 218,430 | | | | 5,192 | |
| * | | GlycoMimetics, Inc. | | | 101,985 | | | | 734 | |
| | HEALTHSOUTH Corp. | | | 149,520 | | | | 5,751 | |
| * | | HeartWare International, Inc. | | | 25,500 | | | | 1,872 | |
| * | | Hyperion Therapeutics, Inc. | | | 84,500 | | | | 2,028 | |
| * | | ICU Medical, Inc. | | | 51,710 | | | | 4,235 | |
| * | | Ironwood Pharmaceuticals, Inc. | | | 25,900 | | | | 397 | |
| * | | The Medicines Co. | | | 148,710 | | | | 4,115 | |
| * | | NPS Pharmaceuticals, Inc. | | | 117,920 | | | | 4,218 | |
| * | | Omnicell, Inc. | | | 109,200 | | | | 3,617 | |
| * | | PAREXEL International Corp. | | | 89,000 | | | | 4,945 | |
| * | | Portola Pharmaceuticals, Inc. | | | 78,230 | | | | 2,216 | |
| * | | Prestige Brands Holdings, Inc. | | | 132,390 | | | | 4,597 | |
| * | | PTC Therapeutics, Inc. | | | 56,810 | | | | 2,941 | |
| * | | Puma Biotechnology, Inc. | | | 18,015 | | | | 3,410 | |
| * | | Team Health Holdings, Inc. | | | 98,510 | | | | 5,667 | |
| * | | Tesaro, Inc. | | | 68,400 | | | | 2,544 | |
| | U.S. Physical Therapy, Inc. | | | 105,860 | | | | 4,442 | |
| * | | Ultragenyx Pharmaceutical, Inc. | | | 44,630 | | | | 1,958 | |
| | | | | | | | | | |
| | | Common Stocks (96.9%) | | Shares/ $ Par | | | Value
$ (000’s) | |
| |
| | Health Care continued | |
| * | | Vascular Solutions, Inc. | | | 157,404 | | | | 4,275 | |
| * | | WellCare Health Plans, Inc. | | | 51,550 | | | | 4,230 | |
| * | | XenoPort, Inc. | | | 226,790 | | | | 1,989 | |
| | | | | | | | | | |
| | Total | | | | | | | 119,052 | |
| | | | | | | | | | |
| |
| | Industrials (15.2%) | |
| | A.O. Smith Corp. | | | 58,120 | | | | 3,279 | |
| | AAON, Inc. | | | 130,483 | | | | 2,922 | |
| | Altra Holdings, Inc. | | | 110,288 | | | | 3,131 | |
| | Applied Industrial Technologies, Inc. | | | 67,970 | | | | 3,099 | |
| | Astronics Corp. | | | 71,400 | | | | 3,949 | |
| | AZZ, Inc. | | | 67,583 | | | | 3,171 | |
| | Celadon Group, Inc. | | | 115,698 | | | | 2,625 | |
| * | | Chart Industries, Inc. | | | 65,066 | | | | 2,225 | |
| | Deluxe Corp. | | | 84,040 | | | | 5,231 | |
| * | | Esterline Technologies Corp. | | | 35,600 | | | | 3,905 | |
| | Exponent, Inc. | | | 54,888 | | | | 4,528 | |
| * | | Generac Holdings, Inc. | | | 103,154 | | | | 4,823 | |
| * | | GP Strategies Corp. | | | 109,700 | | | | 3,722 | |
| | Heico Corp. | | | 64,620 | | | | 3,903 | |
| | Lennox International, Inc. | | | 47,500 | | | | 4,516 | |
| | Marten Transport, Ltd. | | | 93,810 | | | | 2,051 | |
| * | | Moog, Inc. - Class A | | | 58,750 | | | | 4,349 | |
| * | | On Assignment, Inc. | | | 106,515 | | | | 3,535 | |
| * | | Swift Transportation Co. | | | 159,493 | | | | 4,566 | |
| * | | Teledyne Technologies, Inc. | | | 47,780 | | | | 4,909 | |
| | The Toro Co. | | | 55,739 | | | | 3,557 | |
| * | | WageWorks, Inc. | | | 35,200 | | | | 2,273 | |
| | | | | | | | | | |
| | Total | | | | | | | 80,269 | |
| | | | | | | | | | |
| |
| | Information Technology (24.9%) | |
| * | | Aruba Networks, Inc. | | | 158,580 | | | | 2,883 | |
| * | | Aspen Technology, Inc. | | | 120,370 | | | | 4,215 | |
| * | | Bankrate, Inc. | | | 127,650 | | | | 1,587 | |
| * | | CACI International, Inc. - Class A | | | 42,960 | | | | 3,702 | |
| * | | Carbonite, Inc. | | | 177,277 | | | | 2,530 | |
| | Cass Information Systems, Inc. | | | 73,290 | | | | 3,903 | |
| | CDW Corp. | | | 110,730 | | | | 3,894 | |
| * | | Ciena Corp. | | | 72,260 | | | | 1,402 | |
| * | | Cvent, Inc. | | | 52,130 | | | | 1,451 | |
| * | | Demandware, Inc. | | | 33,450 | | | | 1,925 | |
| * | | Ellie Mae, Inc. | | | 115,250 | | | | 4,647 | |
| * | | ePlus, Inc. | | | 60,574 | | | | 4,585 | |
| * | | Everyday Health, Inc. | | | 175,738 | | | | 2,592 | |
| * | | Exlservice Holdings, Inc. | | | 134,259 | | | | 3,855 | |
| | Fair Isaac Corp. | | | 74,990 | | | | 5,422 | |
| | FEI Co. | | | 61,625 | | | | 5,568 | |
| * | | Five9, Inc. | | | 348,389 | | | | 1,561 | |
| * | | Fleetmatics Group PLC | | | 149,390 | | | | 5,302 | |
| | Heartland Payment Systems, Inc. | | | 106,910 | | | | 5,768 | |
| | j2 Global, Inc. | | | 93,940 | | | | 5,824 | |
The Accompanying Notes are an Integral Part of the Financial Statements.
| | | | | | |
| | Small Cap Growth Stock Portfolio | | | 49 | |
Small Cap Growth Stock Portfolio
| | | | | | | | | | |
| | | Common Stocks (96.9%) | | Shares/ $ Par | | | Value
$ (000’s) | |
| |
| | Information Technology continued | |
| * | | Manhattan Associates, Inc. | | | 148,940 | | | | 6,065 | |
| * | | Marketo, Inc. | | | 87,700 | | | | 2,869 | |
| * | | Model N, Inc. | | | 245,150 | | | | 2,603 | |
| * | | Nanometrics, Inc. | | | 81,600 | | | | 1,372 | |
| * | | NetScout Systems, Inc. | | | 78,210 | | | | 2,858 | |
| * | | PTC, Inc. | | | 144,350 | | | | 5,290 | |
| * | | Q2 Holdings, Inc. | | | 39,430 | | | | 743 | |
| * | | Qualys, Inc. | | | 76,765 | | | | 2,898 | |
| * | | Sapient Corp. | | | 200,350 | | | | 4,985 | |
| | Solera Holdings, Inc. | | | 79,380 | | | | 4,063 | |
| * | | SunEdison Semiconductor, Ltd. | | | 87,180 | | | | 1,619 | |
| * | | SunEdison, Inc. | | | 221,874 | | | | 4,329 | |
| * | | SunPower Corp. | | | 101,215 | | | | 2,614 | |
| * | | Tyler Technologies, Inc. | | | 66,600 | | | | 7,289 | |
| | Ubiquiti Networks, Inc. | | | 73,990 | | | | 2,193 | |
| * | | Ultratech, Inc. | | | 69,960 | | | | 1,298 | |
| * | | WebMD Health Corp. | | | 78,285 | | | | 3,096 | |
| * | | WEX, Inc. | | | 29,890 | | | | 2,957 | |
| | | | | | | | | | |
| | Total | | | | | | | 131,757 | |
| | | | | | | | | | |
| | | | | | | | | | |
| | | Common Stocks (96.9%) | | Shares/ $ Par | | | Value
$ (000’s) | |
| |
| | Materials (4.9%) | |
| | Cabot Corp. | | | 61,995 | | | | 2,719 | |
| * | | Graphic Packaging Holding Co. | | | 452,500 | | | | 6,163 | |
| * | | Headwaters, Inc. | | | 299,345 | | | | 4,487 | |
| * | | Omnova Solutions, Inc. | | | 325,820 | | | | 2,652 | |
| | Orion Engineered Carbons SA | | | 68,600 | | | | 1,166 | |
| | PolyOne Corp. | | | 139,590 | | | | 5,292 | |
| | Silgan Holdings, Inc. | | | 68,600 | | | | 3,677 | |
| | | | | | | | | | |
| | Total | | | | | | | 26,156 | |
| | | | | | | | | | |
| | | |
| | Total Common Stocks | | | | | | | | |
| | (Cost: $422,689) | | | | | | | 512,913 | |
| | | | | | | | | | |
| | | | | | | | | | |
| | | Investment Companies (2.5%) | | Shares/ $ Par | | | Value
$ (000’s) | |
| |
| | Investment Companies (2.5%) | |
| | iShares Russell 2000 Growth Index Fund | | | 93,600 | | | | 13,327 | |
| | | | | | | | | | |
| | Total | | | | | | | 13,327 | |
| | | | | | | | | | |
| | Total Investment Companies | | | | | | | | |
| | (Cost: $12,415) | | | | | | | 13,327 | |
| | | | | | | | | | |
| | | |
| | Total Investments (99.4%) | | | | | | | | |
| | (Cost: $435,104)(a) | | | | | | | 526,240 | |
| | | | | | | | | | |
| | Other Assets, Less | | | | | | | | |
| | Liabilities (0.6%) | | | | | | | 3,308 | |
| | | | | | | | | | |
| | Net Assets (100.0%) | | | | | | | 529,548 | |
| | | | | | | | | | |
| (a) | At December 31, 2014, the aggregate cost of securities for federal tax purposes (in thousands) was $435,315 and the net unrealized appreciation of investments based on that cost was $90,925 which is comprised of $112,457 aggregate gross unrealized appreciation and $21,532 aggregate gross unrealized depreciation. |
The following is a summary of the inputs used in valuing the Portfolio’s assets and liabilities at December 31, 2014. See Note 3 for additional information on portfolio valuation.
| | | | | | | | | | | | | | |
| | | Valuation Inputs | | | |
| Description | | Level 1 – Quoted Prices | | | Level 2 – Other Significant Observable Inputs | | | Level 3 – Significant Unobservable Inputs | | | |
| | | (Amounts in thousands) | | | |
Assets: | | | | | | | | | | | | | | |
Domestic Common Stocks | | $ | 512,913 | | | $ | - | | | $ | - | | | |
Investment Companies | | | 13,327 | | | | - | | | | - | | | |
Total | | $ | 526,240 | | | $ | - | | | $ | - | | | |
The Accompanying Notes are an Integral Part of the Financial Statements.
| | | | | | |
| 50 | | Small Cap Growth Stock Portfolio | | | | |
Index 600 Stock Portfolio (unaudited)
| | | | |
| Objective: | | Portfolio Strategy: | | Net Assets: |
| Investment results that approximate the performance of the S&P SmallCap 600® Index. | | Invest in stocks that make up the S&P SmallCap 600® Index, holding each stock in approximately the same proportion as its weighting in the Index. | | $101 million |
Portfolio Overview
Mason Street Advisors is the investment adviser for the Index 600 Stock Portfolio (the “Portfolio”). The Portfolio attempts to achieve its objective by investing all, or substantially all, of its assets in stocks that make up the S&P SmallCap 600® Index, holding each stock in approximately the same proportion as its weighting in the Index. This is known as a full replication strategy. The Portfolio may also invest in exchange traded funds, swap agreements and, to a lesser extent, futures contracts for cash management purposes and to help achieve full replication.
Market Overview
The equity markets posted solid gains during 2014, as markets adjusted to changing monetary policy. Improving economic growth with mild inflation prompted the U.S. Federal Reserve (the “Fed”) to gradually complete its bond purchasing program and maintain its zero interest rate policy during 2014, though Fed policy contributed to uncertainty during the second half of the year. Throughout the year, the Fed decreased its bond purchasing at a measured $10 billion monthly pace. Market volatility preceded the Fed’s last bond purchase in October, as investors became concerned that the Fed’s zero interest rate policy might be the next tightening of monetary stimulus. The Fed reaffirmed its commitment to zero interest rate policy for a considerable period, which reassured investors. Markets rallied on the news, while improving economic growth late in the year also increased investors’ optimism. In that environment, small cap stocks led the market, followed by shares of mid and large sized companies. For the year, returns for the S&P 500®, MidCap 400®, and SmallCap 600® Indices were 13.69%, 9.77%, and 5.76%, respectively.
Portfolio Results
The Portfolio posted a total return of 5.34% in the twelve months ended December 31, 2014. That was in line with the 5.76% return of the S&P SmallCap 600® Index (“Index”). (The Index is unmanaged, cannot be invested in directly and does not include administrative expenses or sales charges.) Portfolio performance slightly lagged the Index due to transaction costs, administrative expenses, cash flow effects and the costs associated with the use of exchange traded funds and other derivative instruments used to achieve full replication. The Portfolio outperformed the 4.39% average return of its peer group, Small Cap Core Funds, according to Lipper® Analytical Services, Inc., an independent mutual fund ranking agency.
Within the Portfolio, nine of the ten economic sectors posted positive returns. The Technology sector generated the largest contribution to the Portfolio’s return, as solid consumer spending on technology offset relatively slow business spending. The Financials sector also delivered a solid contribution to the Portfolio’s return, driven by improving balance sheets and solid earnings. The Health Care sector generated solid performance, as health care companies continued to grow while adapting to the Affordable Care Act. Lower gas prices and declining interest rates buoyed the Utilities sector as well.
At the other end of the spectrum, the Energy sector sharply declined due to falling oil and gas prices, as global oil producers increased supply amid modest demand for oil. The Industrials and Materials sectors posted modest returns while lagging the overall Portfolio due to modest manufacturing and industrial activity.
As the Portfolio seeks to track the performance and weightings of stocks in the Index, the portfolio managers make adjustments to the Portfolio’s holdings as the Index changes. Standard & Poor’s modifies the composition of the Index as companies go public or private, merge, divest or have major changes in market capitalization. Additionally, Standard & Poor’s adjusts the Index to better reflect the companies that are most representative of the composition of the U.S. economy. The portfolio managers try to make these adjustments in a way that minimizes the cost and market impact of trading.
| | | | | | |
| | Index 600 Stock Portfolio | | | 51 | |
Index 600 Stock Portfolio (unaudited)
Relative Performance

| | | | | | | | | | | | |
Average Annual Total Returns
For Periods Ended December 31, 2014 | |
| | | 1 Year | | | 5 Years | | | Since
Inception* | |
Index 600 Stock Portfolio | | | 5.34 | % | | | 16.86 | % | | | 7.68 | % |
S&P SmallCap 600® Index | | | 5.76 | % | | | 17.27 | % | | | 8.07 | % |
Lipper® Variable Insurance Products (VIP) Small Cap Core Funds Average | | | 4.39 | % | | | 15.15 | % | | | – | |
* Inception date of 4/30/07 | | | | | |
The performance data quoted represents past performance. Past performance is historical and does not guarantee future performance. Investment return and principal value will fluctuate, so that shares, when redeemed, may be worth more or less than their original cost. Current performance may be lower or higher than the performance data quoted. For the most recent month-end performance information visit www.northwesternmutual.com.
This chart assumes an initial investment of $10,000 made on 4/30/07 (commencement of the Portfolio’s operations). Returns shown reflect fee waivers, deductions for management and other portfolio expenses, and reinvestment of all dividends. In the absence of fee waivers, total return would be reduced. Returns exclude deductions for separate account sale loads and account fees. Please refer to the Benchmark Definitions section of this report for information about the indices cited in the above chart and graph.
“Standard & Poor’s®”, “S&P®”, “S&P SmallCap 600” and “Standard & Poor’s SmallCap 600” are trademarks of The McGraw-Hill Companies, Inc. and have been licensed for use by Northwestern Mutual Life Insurance Company. The Portfolio is not sponsored, endorsed, sold or promoted by Standard & Poor’s, and Standard & Poor’s makes no representation regarding the advisability of investing in the Portfolio.
Stocks of smaller or newer companies, such as those held in this Portfolio, are more likely to realize more substantial growth as well as suffer more significant losses than larger or more established issuers. Investments in such companies can be both more volatile and more speculative. Investing in small company stocks involves a greater degree of risk than investing in medium or large company stocks.
The Portfolio may invest in exchange-traded funds and derivative instruments such as swap agreements and, to a lesser extent, futures contracts, for cash management purposes and to help achieve full replication. Use of these instruments may involve certain costs and imposes certain risks such as liquidity risk, market risk, credit risk, management risk and the risk of mispricing or improper valuation. Certain derivatives involve leverage, which could magnify losses, and portfolios investing in derivatives could lose more than the principal amount invested in those instruments.
Top 10 Equity Holdings 12/31/14
| | | | |
Security Description | | | % of Net Assets | |
iShares S&P SmallCap 600 Index Fund | | | 2.2 | % |
TriQuint Semiconductor, Inc. | | | 0.7 | % |
West Pharmaceutical Services, Inc. | | | 0.6 | % |
Teledyne Technologies, Inc. | | | 0.6 | % |
MAXIMUS, Inc. | | | 0.5 | % |
The Toro Co. | | | 0.5 | % |
Casey’s General Stores, Inc. | | | 0.5 | % |
Buffalo Wild Wings, Inc. | | | 0.5 | % |
Curtiss-Wright Corp. | | | 0.5 | % |
Stifel Financial Corp. | | | 0.5 | % |
Sector Allocation 12/31/14

Sector Allocation is based on equities.
Sector Allocation and Top 10 Holdings are subject to change.
| | | | |
| 52 | | Index 600 Stock Portfolio | | |
Index 600 Stock Portfolio
Schedule of Investments
December 31, 2014
| | | | | | | | | | |
| | | Common Stocks (88.8%) | | Shares/
$ Par | | | Value
$ (000’s) | |
| |
| | Consumer Discretionary (12.9%) | |
| * | | Aeropostale, Inc. | | | 10,179 | | | | 24 | |
| * | | American Public Education, Inc. | | | 2,221 | | | | 82 | |
| | Arctic Cat, Inc. | | | 1,664 | | | | 59 | |
| * | | Barnes & Noble, Inc. | | | 5,503 | | | | 128 | |
| | Big 5 Sporting Goods Corp. | | | 2,339 | | | | 34 | |
| * | | Biglari Holdings, Inc. | | | 221 | | | | 88 | |
| * | | BJ’s Restaurants, Inc. | | | 2,785 | | | | 140 | |
| * | | Blue Nile, Inc. | | | 1,524 | | | | 55 | |
| | Bob Evans Farms, Inc. | | | 3,036 | | | | 155 | |
| * | | Boyd Gaming Corp. | | | 10,043 | | | | 128 | |
| | Brown Shoe Co., Inc. | | | 5,630 | | | | 181 | |
| | The Buckle, Inc. | | | 3,609 | | | | 190 | |
| * | | Buffalo Wild Wings, Inc. | | | 2,435 | | | | 439 | |
| | Callaway Golf Co. | | | 9,979 | | | | 77 | |
| | Capella Education Co. | | | 1,400 | | | | 108 | |
| * | | Career Education Corp. | | | 7,703 | | | | 54 | |
| | The Cato Corp. - Class A | | | 3,303 | | | | 139 | |
| | The Children’s Place Retail Stores, Inc. | | | 2,727 | | | | 155 | |
| * | | Christopher & Banks Corp. | | | 4,751 | | | | 27 | |
| | Cracker Barrel Old Country Store, Inc. | | | 3,076 | | | | 433 | |
| * | | Crocs, Inc. | | | 10,613 | | | | 133 | |
| | DineEquity, Inc. | | | 2,121 | | | | 220 | |
| * | | Dorman Products, Inc. | | | 3,946 | | | | 190 | |
| * | | Drew Industries, Inc. | | | 3,042 | | | | 155 | |
| * | | The E.W. Scripps Co. - Class A | | | 3,861 | | | | 86 | |
| | Ethan Allen Interiors, Inc. | | | 3,349 | | | | 104 | |
| | The Finish Line, Inc. - Class A | | | 6,152 | | | | 150 | |
| * | | Francesca’s Holdings Corp. | | | 5,441 | | | | 91 | |
| | Fred’s, Inc. - Class A | | | 4,460 | | | | 78 | |
| * | | FTD Companies, Inc. | | | 2,443 | | | | 85 | |
| * | | Genesco, Inc. | | | 3,100 | | | | 238 | |
| * | | G-III Apparel Group, Ltd. | | | 2,457 | | | | 248 | |
| | Group 1 Automotive, Inc. | | | 2,751 | | | | 247 | |
| | Harte-Hanks, Inc. | | | 5,509 | | | | 43 | |
| | Haverty Furniture Cos., Inc. | | | 2,656 | | | | 58 | |
| * | | Helen of Troy, Ltd. | | | 3,435 | | | | 224 | |
| * | | Hibbett Sports, Inc. | | | 3,216 | | | | 156 | |
| * | | Iconix Brand Group, Inc. | | | 6,172 | | | | 209 | |
| | Interval Leisure Group, Inc. | | | 5,068 | | | | 106 | |
| * | | iRobot Corp. | | | 3,803 | | | | 132 | |
| | Jack in the Box, Inc. | | | 4,970 | | | | 397 | |
| * | | Kirkland’s, Inc. | | | 1,913 | | | | 45 | |
| | La-Z-Boy, Inc. | | | 6,660 | | | | 179 | |
| | Lithia Motors, Inc. - Class A | | | 2,938 | | | | 255 | |
| * | | Lumber Liquidators Holdings, Inc. | | | 3,481 | | | | 231 | |
| * | | M/I Homes, Inc. | | | 3,148 | | | | 72 | |
| | The Marcus Corp. | | | 2,361 | | | | 44 | |
| * | | MarineMax, Inc. | | | 3,197 | | | | 64 | |
| | | | | | | | | | |
| | | Common Stocks (88.8%) | | Shares/
$ Par | | | Value
$ (000’s) | |
| |
| | Consumer Discretionary continued | |
| | Marriott Vacations Worldwide Corp. | | | 3,650 | | | | 272 | |
| | The Men’s Wearhouse, Inc. | | | 5,873 | | | | 259 | |
| * | | Meritage Homes Corp. | | | 4,782 | | | | 172 | |
| * | | Monarch Casino & Resort, Inc. | | | 1,297 | | | | 22 | |
| | Monro Muffler Brake, Inc. | | | 4,062 | | | | 235 | |
| | Movado Group, Inc. | | | 2,332 | | | | 66 | |
| | Nutrisystem, Inc. | | | 3,702 | | | | 72 | |
| * | | Outerwall, Inc. | | | 2,433 | | | | 183 | |
| | Oxford Industries, Inc. | | | 1,864 | | | | 103 | |
| | Papa John’s International, Inc. | | | 3,823 | | | | 213 | |
| * | | The Pep Boys - Manny, Moe & Jack | | | 6,883 | | | | 68 | |
| * | | Perry Ellis International, Inc. | | | 1,547 | | | | 40 | |
| | PetMed Express, Inc. | | | 2,607 | | | | 37 | |
| * | | Pinnacle Entertainment, Inc. | | | 7,716 | | | | 172 | |
| | Pool Corp. | | | 5,586 | | | | 354 | |
| * | | Quiksilver, Inc. | | | 15,851 | | | | 35 | |
| * | | Red Robin Gourmet Burgers, Inc. | | | 1,803 | | | | 139 | |
| * | | Regis Corp. | | | 5,757 | | | | 97 | |
| * | | Ruby Tuesday, Inc. | | | 7,966 | | | | 55 | |
| | Ruth’s Hospitality Group, Inc. | | | 4,548 | | | | 68 | |
| | The Ryland Group, Inc. | | | 5,932 | | | | 229 | |
| | Scholastic Corp. | | | 3,452 | | | | 126 | |
| * | | Scientific Games Corp. - Class A | | | 6,329 | | | | 81 | |
| * | | Select Comfort Corp. | | | 6,855 | | | | 185 | |
| * | | Sizmek, Inc. | | | 2,855 | | | | 18 | |
| * | | Skechers U.S.A., Inc. - Class A | | | 5,275 | | | | 291 | |
| | Sonic Automotive, Inc. - Class A | | | 4,279 | | | | 116 | |
| | Sonic Corp. | | | 6,480 | | | | 176 | |
| | Stage Stores, Inc. | | | 4,090 | | | | 85 | |
| | Standard Motor Products, Inc. | | | 2,680 | | | | 102 | |
| * | | Standard Pacific Corp. | | | 19,456 | | | | 142 | |
| | Stein Mart, Inc. | | | 3,642 | | | | 53 | |
| * | | Steven Madden, Ltd. | | | 7,271 | | | | 231 | |
| * | | Strayer Education, Inc. | | | 1,403 | | | | 104 | |
| | Sturm, Ruger & Co., Inc. | | | 2,496 | | | | 86 | |
| | Superior Industries International, Inc. | | | 2,980 | | | | 59 | |
| | Texas Roadhouse, Inc. | | | 8,039 | | | | 271 | |
| * | | Tuesday Morning Corp. | | | 5,627 | | | | 122 | |
| * | | Unify, Inc. | | | 1,681 | | | | 50 | |
| * | | Universal Electronics, Inc. | | | 2,032 | | | | 132 | |
| | Universal Technical Institute, Inc. | | | 2,779 | | | | 27 | |
| * | | Vitamin Shoppe, Inc. | | | 3,972 | | | | 193 | |
| * | | VOXX International Corp. | | | 2,578 | | | | 23 | |
| | | | | | | | | | |
| | | Common Stocks (88.8%) | | Shares/
$ Par | | | Value
$ (000’s) | |
| |
| | Consumer Discretionary continued | |
| | Winnebago Industries, Inc. | | | 3,468 | | | | 75 | |
| | Wolverine World Wide, Inc. | | | 13,066 | | | | 385 | |
| * | | Zumiez, Inc. | | | 2,782 | | | | 107 | |
| | | | | | | | | | |
| | Total | | | | | | | 13,067 | |
| | | | | | | | | | |
| |
| | Consumer Staples (3.1%) | |
| * | | Alliance One International, Inc. | | | 10,577 | | | | 17 | |
| | The Andersons, Inc. | | | 3,458 | | | | 184 | |
| | B&G Foods, Inc. | | | 6,904 | | | | 206 | |
| * | | The Boston Beer Co., Inc. - Class A | | | 1,143 | | | | 331 | |
| | Calavo Growers, Inc. | | | 1,980 | | | | 94 | |
| | Cal-Maine Foods, Inc. | | | 3,859 | | | | 150 | |
| | Casey’s General Stores, Inc. | | | 4,969 | | | | 449 | |
| * | | Central Garden & Pet Co. - Class A | | | 5,515 | | | | 53 | |
| * | | Darling Ingredients, Inc. | | | 21,186 | | | | 385 | |
| * | | Diamond Foods, Inc. | | | 3,395 | | | | 96 | |
| | Inter Parfums, Inc. | | | 2,189 | | | | 60 | |
| | J & J Snack Foods Corp. | | | 1,921 | | | | 209 | |
| * | | Medifast, Inc. | | | 1,443 | | | | 48 | |
| | Sanderson Farms, Inc. | | | 2,641 | | | | 222 | |
| * | | Seneca Foods Corp. - Class A | | | 911 | | | | 25 | |
| | Snyder’s-Lance, Inc. | | | 6,690 | | | | 204 | |
| | SpartanNash Co. | | | 4,824 | | | | 126 | |
| | Universal Corp. | | | 2,982 | | | | 131 | |
| | WD-40 Co. | | | 1,769 | | | | 150 | |
| | | | | | | | | | |
| | | |
| | Total | | | | | | | 3,140 | |
| | | | | | | | | | |
| |
| | Energy (2.9%) | |
| * | | Approach Resources, Inc. | | | 4,681 | | | | 30 | |
| | Arch Coal, Inc. | | | 27,308 | | | | 49 | |
| * | | Basic Energy Services, Inc. | | | 4,500 | | | | 32 | |
| * | | Bill Barrett Corp. | | | 6,387 | | | | 73 | |
| * | | Bonanza Creek Energy, Inc. | | | 3,765 | | | | 90 | |
| | Bristow Group, Inc. | | | 4,523 | | | | 298 | |
| * | | C&J Energy Services, Inc. | | | 5,908 | | | | 78 | |
| * | | Carrizo Oil & Gas, Inc. | | | 5,456 | | | | 227 | |
| * | | Cloud Peak Energy, Inc. | | | 7,848 | | | | 72 | |
| | Comstock Resources, Inc. | | | 5,726 | | | | 39 | |
| * | | Contango Oil & Gas Co. | | | 2,044 | | | | 60 | |
| * | | ERA Group, Inc. | | | 2,490 | | | | 53 | |
| | Exterran Holdings, Inc. | | | 8,781 | | | | 286 | |
| * | | Geospace Technologies Corp. | | | 1,691 | | | | 45 | |
| | Green Plains, Inc. | | | 4,403 | | | | 109 | |
| | Gulf Island Fabrication, Inc. | | | 1,718 | | | | 33 | |
| | GulfMark Offshore, Inc. - Class A | | | 3,388 | | | | 83 | |
| * | | Hornbeck Offshore Services, Inc. | | | 4,160 | | | | 104 | |
| * | | ION Geophysical Corp. | | | 16,477 | | | | 45 | |
| * | | Matrix Service Co. | | | 3,413 | | | | 76 | |
The Accompanying Notes are an Integral Part of the Financial Statements.
| | | | | | |
| | Index 600 Stock Portfolio | | | 53 | |
Index 600 Stock Portfolio
| | | | | | | | | | |
| | | Common Stocks (88.8%) | | Shares/
$ Par | | | Value
$ (000’s) | |
| |
| | Energy continued | |
| * | | Newpark Resources, Inc. | | | 10,805 | | | | 103 | |
| * | | Northern Oil and Gas, Inc. | | | 7,373 | | | | 42 | |
| | Paragon Offshore PLC | | | 10,903 | | | | 30 | |
| * | | PDC Energy, Inc. | | | 4,615 | | | | 190 | |
| * | | Penn Virginia Corp. | | | 9,206 | | | | 61 | |
| * | | PetroQuest Energy, Inc. | | | 7,559 | | | | 28 | |
| * | | Pioneer Energy Services Corp. | | | 8,208 | | | | 45 | |
| * | | Rex Energy Corp. | | | 6,265 | | | | 32 | |
| * | | SEACOR Holdings, Inc. | | | 2,270 | | | | 168 | |
| * | | Stone Energy Corp. | | | 7,227 | | | | 122 | |
| * | | Swift Energy Co. | | | 5,642 | | | | 23 | |
| * | | Synergy Resources Corp. | | | 8,875 | | | | 111 | |
| | Tesco Corp. | | | 4,641 | | | | 60 | |
| * | | TETRA Technologies, Inc. | | | 10,240 | | | | 68 | |
| | | | | | | | | | |
| | Total | | | | | | | 2,965 | |
| | | | | | | | | | |
| |
| | Financials (20.9%) | |
| | Acadia Realty Trust | | | 8,696 | | | | 279 | |
| | Agree Realty Corp. | | | 2,214 | | | | 69 | |
| | American Assets Trust, Inc. | | | 4,769 | | | | 190 | |
| | American Equity Investment Life Holding Co. | | | 9,725 | | | | 284 | |
| | AMERISAFE, Inc. | | | 2,421 | | | | 103 | |
| | Associated Estates Realty Corp. | | | 7,416 | | | | 172 | |
| | Aviv REIT, Inc. | | | 3,161 | | | | 109 | |
| | Bank Mutual Corp. | | | 5,571 | | | | 38 | |
| | Bank of the Ozarks, Inc. | | | 8,305 | | | | 315 | |
| | Banner Corp. | | | 2,518 | | | | 108 | |
| | BBCN Bancorp, Inc. | | | 10,227 | | | | 147 | |
| * | | BofI Holding, Inc. | | | 1,677 | | | | 130 | |
| | Boston Private Financial Holdings, Inc. | | | 10,649 | | | | 143 | |
| | Brookline Bancorp, Inc. | | | 8,974 | | | | 90 | |
| | Calamos Asset Management, Inc. | | | 2,192 | | | | 29 | |
| | Capstead Mortgage Corp. | | | 12,325 | | | | 151 | |
| | Cardinal Financial Corp. | | | 4,120 | | | | 82 | |
| | CareTrust REIT, Inc. | | | 3,596 | | | | 44 | |
| | Cash America International, Inc. | | | 3,716 | | | | 84 | |
| | Cedar Realty Trust, Inc. | | | 8,865 | | | | 65 | |
| | Central Pacific Financial Corp. | | | 3,242 | | | | 70 | |
| | Chesapeake Lodging Trust | | | 7,060 | | | | 263 | |
| | City Holding Co. | | | 1,958 | | | | 91 | |
| | Columbia Banking System, Inc. | | | 6,867 | | | | 190 | |
| | Community Bank System, Inc. | | | 5,223 | | | | 199 | |
| | CoreSite Realty Corp. | | | 2,793 | | | | 109 | |
| | Cousins Properties, Inc. | | | 26,460 | | | | 302 | |
| | CVB Financial Corp. | | | 12,389 | | | | 198 | |
| | DiamondRock Hospitality Co. | | | 25,175 | | | | 374 | |
| | Dime Community Bancshares | | | 3,888 | | | | 63 | |
| | EastGroup Properties, Inc. | | | 4,108 | | | | 260 | |
| | | | | | | | | | |
| | | Common Stocks (88.8%) | | Shares/
$ Par | | | Value
$ (000’s) | |
| |
| | Financials continued | |
| | Education Realty Trust, Inc. | | | 6,110 | | | | 224 | |
| * | | eHealth, Inc. | | | 2,292 | | | | 57 | |
| | Employers Holdings, Inc. | | | 4,051 | | | | 95 | |
| * | | Encore Capital Group, Inc. | | | 3,077 | | | | 137 | |
| * | | Enova International, Inc. | | | 3,400 | | | | 76 | |
| | EPR Properties | | | 7,352 | | | | 424 | |
| | Evercore Partners, Inc. | | | 4,632 | | | | 243 | |
| * | | EZCORP, Inc. - Class A | | | 6,273 | | | | 74 | |
| | F.N.B. Corp. | | | 22,319 | | | | 297 | |
| | Financial Engines, Inc. | | | 6,684 | | | | 244 | |
| * | | First BanCorp/Puerto Rico | | | 13,427 | | | | 79 | |
| * | | First Cash Financial Services, Inc. | | | 3,642 | | | | 203 | |
| | First Commonwealth Financial Corp. | | | 11,800 | | | | 109 | |
| | First Financial Bancorp. | | | 7,895 | | | | 147 | |
| | First Financial Bankshares, Inc. | | | 8,242 | | | | 246 | |
| | First Midwest Bancorp, Inc. | | | 9,686 | | | | 166 | |
| * | | Forestar Group, Inc. | | | 4,491 | | | | 69 | |
| | Franklin Street Properties Corp. | | | 11,471 | | | | 141 | |
| | FXCM, Inc. - Class A | | | 5,460 | | | | 90 | |
| | The GEO Group, Inc. | | | 9,539 | | | | 385 | |
| | Getty Realty Corp. | | | 3,353 | | | | 61 | |
| | Glacier Bancorp, Inc. | | | 9,651 | | | | 268 | |
| | Government Properties Income Trust | | | 9,049 | | | | 208 | |
| * | | Green Dot Corp. - Class A | | | 4,658 | | | | 95 | |
| | Greenhill & Co., Inc. | | | 3,403 | | | | 148 | |
| | Hanmi Financial Corp. | | | 4,103 | | | | 89 | |
| | HCI Group, Inc. | | | 1,173 | | | | 51 | |
| | Healthcare Realty Trust, Inc. | | | 12,630 | | | | 345 | |
| | HFF, Inc. - Class A | | | 4,217 | | | | 151 | |
| | Home BancShares, Inc. | | | 7,558 | | | | 243 | |
| | Horace Mann Educators Corp. | | | 5,392 | | | | 179 | |
| | Independent Bank Corp. | | | 3,082 | | | | 132 | |
| | Infinity Property & Casualty Corp. | | | 1,479 | | | | 114 | |
| | Inland Real Estate Corp. | | | 11,334 | | | | 124 | |
| | Interactive Brokers Group, Inc. - Class A | | | 7,521 | | | | 219 | |
| * | | Investment Technology Group, Inc. | | | 4,475 | | | | 93 | |
| | Kite Realty Group Trust | | | 10,738 | | | | 309 | |
| | Lexington Realty Trust | | | 26,887 | | | | 295 | |
| | LTC Properties, Inc. | | | 4,483 | | | | 194 | |
| | MarketAxess Holdings, Inc. | | | 4,808 | | | | 345 | |
| | MB Financial, Inc. | | | 8,272 | | | | 272 | |
| | Meadowbrook Insurance Group, Inc. | | | 5,993 | | | | 51 | |
| | Medical Properties Trust, Inc. | | | 22,185 | | | | 306 | |
| | Montpelier Re Holdings, Ltd. | | | 4,741 | | | | 170 | |
| | National Penn Bancshares, Inc. | | | 15,923 | | | | 168 | |
| * | | The Navigators Group, Inc. | | | 1,396 | | | | 102 | |
| | NBT Bancorp, Inc. | | | 5,625 | | | | 148 | |
| | | | | | | | | | |
| | | Common Stocks (88.8%) | | Shares/
$ Par | | | Value
$ (000’s) | |
| |
| | Financials continued | |
| | Northwest Bancshares, Inc. | | | 12,214 | | | | 153 | |
| | OFG Bancorp | | | 5,748 | | | | 96 | |
| | Old National Bancorp | | | 13,760 | | | | 205 | |
| | Oritani Financial Corp. | | | 4,901 | | | | 75 | |
| | Parkway Properties, Inc. | | | 10,831 | | | | 199 | |
| | Pennsylvania Real Estate Investment Trust | | | 8,850 | | | | 208 | |
| | Pinnacle Financial Partners, Inc. | | | 4,266 | | | | 169 | |
| * | | Piper Jaffray Cos., Inc. | | | 2,095 | | | | 122 | |
| | Post Properties, Inc. | | | 7,006 | | | | 412 | |
| * | | PRA Group, Inc. | | | 6,442 | | | | 373 | |
| | PrivateBancorp, Inc. | | | 9,046 | | | | 302 | |
| | ProAssurance Corp. | | | 7,356 | | | | 332 | |
| | Provident Financial Services, Inc. | | | 6,928 | | | | 125 | |
| | PS Business Parks, Inc. | | | 2,493 | | | | 198 | |
| | Retail Opportunity Investments Corp. | | | 11,960 | | | | 201 | |
| | RLI Corp. | | | 4,760 | | | | 235 | |
| | S&T Bancorp, Inc. | | | 3,833 | | | | 114 | |
| | Sabra Health Care REIT, Inc. | | | 7,015 | | | | 213 | |
| | Safety Insurance Group, Inc. | | | 1,622 | | | | 104 | |
| | Saul Centers, Inc. | | | 1,452 | | | | 83 | |
| | Selective Insurance Group, Inc. | | | 7,259 | | | | 197 | |
| | Simmons First National Corp. - Class A | | | 2,040 | | | | 83 | |
| | Sovran Self Storage, Inc. | | | 4,343 | | | | 379 | |
| | Sterling Bancorp | | | 10,793 | | | | 155 | |
| | Stewart Information Services Corp. | | | 2,853 | | | | 106 | |
| * | | Stifel Financial Corp. | | | 8,492 | | | | 433 | |
| | Susquehanna Bancshares, Inc. | | | 23,319 | | | | 313 | |
| * | | Texas Capital Bancshares, Inc. | | | 5,880 | | | | 319 | |
| | Tompkins Financial Corp. | | | 1,519 | | | | 84 | |
| | TrustCo Bank Corp. NY | | | 12,207 | | | | 89 | |
| | UMB Financial Corp. | | | 4,857 | | | | 276 | |
| | United Bankshares, Inc. | | | 8,190 | | | | 307 | |
| | United Community Banks, Inc. | | | 5,813 | | | | 110 | |
| | United Fire Group, Inc. | | | 2,707 | | | | 80 | |
| | Universal Health Realty Income Trust | | | 1,663 | | | | 80 | |
| | Universal Insurance Holdings, Inc. | | | 3,746 | | | | 77 | |
| | Urstadt Biddle Properties, Inc. - Class A | | | 3,542 | | | | 78 | |
| | ViewPoint Financial Group | | | 4,683 | | | | 112 | |
| | Virtus Investment Partners, Inc. | | | 909 | | | | 155 | |
| | Westamerica Bancorporation | | | 3,330 | | | | 163 | |
| | Wilshire Bancorp, Inc. | | | 9,066 | | | | 92 | |
| | Wintrust Financial Corp. | | | 6,010 | | | | 281 | |
| * | | World Acceptance Corp. | | | 1,156 | | | | 92 | |
| | | | | | | | | | |
| | Total | | | | | | | 21,117 | |
| | | | | | | | | | |
The Accompanying Notes are an Integral Part of the Financial Statements.
| | | | |
| 54 | | Index 600 Stock Portfolio | | |
Index 600 Stock Portfolio
| | | | | | | | | | |
| | | Common Stocks (88.8%) | | Shares/
$ Par | | | Value
$ (000’s) | |
| |
| | Health Care (10.1%) | |
| | Abaxis, Inc. | | | 2,725 | | | | 155 | |
| * | | ABIOMED, Inc. | | | 4,735 | | | | 180 | |
| * | | Acorda Therapeutics, Inc. | | | 5,396 | | | | 221 | |
| * | | Affymetrix, Inc. | | | 9,466 | | | | 93 | |
| * | | Air Methods Corp. | | | 4,590 | | | | 202 | |
| * | | Akorn, Inc. | | | 9,572 | | | | 347 | |
| * | | Albany Molecular Research, Inc. | | | 3,062 | | | | 50 | |
| * | | Almost Family, Inc. | | | 1,012 | | | | 29 | |
| * | | Amedisys, Inc. | | | 4,294 | | | | 126 | |
| * | | AMN Healthcare Services, Inc. | | | 5,999 | | | | 118 | |
| * | | AmSurg Corp. | | | 6,191 | | | | 339 | |
| | Analogic Corp. | | | 1,592 | | | | 135 | |
| * | | AngioDynamics, Inc. | | | 3,289 | | | | 63 | |
| * | | Anika Therapeutics, Inc. | | | 1,866 | | | | 76 | |
| * | | Bio-Reference Laboratories, Inc. | | | 3,175 | | | | 102 | |
| * | | Cambrex Corp. | | | 3,987 | | | | 86 | |
| | Cantel Medical Corp. | | | 4,541 | | | | 196 | |
| | Chemed Corp. | | | 2,188 | | | | 231 | |
| | Computer Programs and Systems, Inc. | | | 1,341 | | | | 81 | |
| | CONMED Corp. | | | 3,541 | | | | 159 | |
| * | | CorVel Corp. | | | 1,142 | | | | 42 | |
| * | | Cross Country Healthcare, Inc. | | | 3,780 | | | | 47 | |
| | CryoLife, Inc. | | | 3,235 | | | | 37 | |
| * | | Cyberonics, Inc. | | | 3,385 | | | | 188 | |
| * | | Cynosure, Inc. - Class A | | | 2,785 | | | | 76 | |
| * | | DepoMed, Inc. | | | 7,557 | | | | 122 | |
| * | | Emergent Biosolutions, Inc. | | | 3,768 | | | | 103 | |
| | Ensign Group, Inc. | | | 2,603 | | | | 116 | |
| * | | ExamWorks Group, Inc. | | | 4,186 | | | | 174 | |
| * | | Gentiva Health Services, Inc. | | | 4,042 | | | | 77 | |
| * | | Greatbatch, Inc. | | | 3,215 | | | | 158 | |
| * | | Haemonetics Corp. | | | 6,604 | | | | 247 | |
| * | | Hanger, Inc. | | | 4,540 | | | | 99 | |
| * | | HealthStream, Inc. | | | 2,737 | | | | 81 | |
| * | | Healthways, Inc. | | | 4,553 | | | | 91 | |
| * | | ICU Medical, Inc. | | | 1,739 | | | | 142 | |
| * | | Impax Laboratories, Inc. | | | 8,524 | | | | 270 | |
| * | | Integra LifeSciences Holdings | | | 3,248 | | | | 176 | |
| | Invacare Corp. | | | 3,759 | | | | 63 | |
| * | | IPC The Hospitalist Co. | | | 2,216 | | | | 102 | |
| | Kindred Healthcare, Inc. | | | 8,955 | | | | 163 | |
| | Landauer, Inc. | | | 1,229 | | | | 42 | |
| * | | Lannett Co., Inc. | | | 3,404 | | | | 146 | |
| * | | LHC Group, Inc. | | | 1,580 | | | | 49 | |
| * | | Ligand Pharmaceuticals, Inc. - Class B | | | 2,344 | | | | 125 | |
| * | | Luminex Corp. | | | 4,904 | | | | 92 | |
| * | | Magellan Health, Inc. | | | 3,556 | | | | 213 | |
| * | | Masimo Corp. | | | 6,136 | | | | 162 | |
| * | | MedAssets, Inc. | | | 7,745 | | | | 153 | |
| * | | The Medicines Co. | | | 8,416 | | | | 233 | |
| * | | Medidata Solutions, Inc. | | | 6,979 | | | | 333 | |
| | | | | | | | | | |
| | | Common Stocks (88.8%) | | Shares/
$ Par | | | Value
$ (000’s) | |
| |
| | Health Care continued | |
| | Meridian Bioscience, Inc. | | | 5,357 | | | | 88 | |
| * | | Merit Medical Systems, Inc. | | | 5,584 | | | | 97 | |
| * | | Molina Healthcare, Inc. | | | 4,047 | | | | 217 | |
| * | | Momenta Pharmaceuticals, Inc. | | | 6,006 | | | | 72 | |
| * | | MWI Veterinary Supply, Inc. | | | 1,661 | | | | 282 | |
| * | | Natus Medical, Inc. | | | 4,187 | | | | 151 | |
| * | | Neogen Corp. | | | 4,750 | | | | 236 | |
| * | | NuVasive, Inc. | | | 6,052 | | | | 285 | |
| * | | Omnicell, Inc. | | | 4,580 | | | | 152 | |
| * | | PAREXEL International Corp. | | | 7,077 | | | | 393 | |
| * | | PharMerica Corp. | | | 3,874 | | | | 80 | |
| * | | Prestige Brands Holdings, Inc. | | | 6,712 | | | | 233 | |
| * | | The Providence Service Corp. | | | 1,530 | | | | 56 | |
| | Quality Systems, Inc. | | | 5,660 | | | | 88 | |
| * | | Repligen Corp. | | | 3,957 | | | | 78 | |
| * | | Sagent Pharmaceuticals, Inc. | | | 2,915 | | | | 73 | |
| * | | Spectrum Pharmaceuticals, Inc. | | | 7,441 | | | | 52 | |
| * | | SurModics, Inc. | | | 1,654 | | | | 37 | |
| | West Pharmaceutical Services, Inc. | | | 9,143 | | | | 487 | |
| | | | | | | | | | |
| | Total | | | | | | | 10,268 | |
| | | | | | | | | | |
| |
| | Industrials (14.6%) | |
| | AAON, Inc. | | | 5,396 | | | | 121 | |
| | AAR Corp. | | | 4,875 | | | | 135 | |
| | ABM Industries, Inc. | | | 6,670 | | | | 191 | |
| | Aceto Corp. | | | 3,515 | | | | 76 | |
| | Actuant Corp. - Class A | | | 8,358 | | | | 228 | |
| * | | Aegion Corp. | | | 4,809 | | | | 90 | |
| * | | Aerovironment, Inc. | | | 2,580 | | | | 70 | |
| | Albany International Corp. - Class A | | | 3,693 | | | | 140 | |
| | Allegiant Travel Co. | | | 1,754 | | | | 264 | |
| | American Science and Engineering, Inc. | | | 1,012 | | | | 53 | |
| * | | American Woodmark Corp. | | | 1,609 | | | | 65 | |
| | Apogee Enterprises, Inc. | | | 3,726 | | | | 158 | |
| | Applied Industrial Technologies, Inc. | | | 5,311 | | | | 242 | |
| | ArcBest Corp. | | | 3,115 | | | | 144 | |
| | Astec Industries, Inc. | | | 2,419 | | | | 95 | |
| * | | Atlas Air Worldwide Holdings, Inc. | | | 3,191 | | | | 157 | |
| | AZZ, Inc. | | | 3,302 | | | | 155 | |
| | Barnes Group, Inc. | | | 6,304 | | | | 233 | |
| | Brady Corp. - Class A | | | 6,133 | | | | 168 | |
| | Briggs & Stratton Corp. | | | 5,836 | | | | 119 | |
| | The Brink’s Co. | | | 6,249 | | | | 153 | |
| | CDI Corp. | | | 1,867 | | | | 33 | |
| | Celadon Group, Inc. | | | 2,829 | | | | 64 | |
| | CIRCOR International, Inc. | | | 2,274 | | | | 137 | |
| | Comfort Systems USA, Inc. | | | 4,793 | | | | 82 | |
| | Cubic Corp. | | | 2,799 | | | | 147 | |
| | Curtiss-Wright Corp. | | | 6,178 | | | | 436 | |
| | | | | | | | | | |
| | | Common Stocks (88.8%) | | Shares/
$ Par | | | Value
$ (000’s) | |
| |
| | Industrials continued | |
| * | | DXP Enterprises, Inc. | | | 1,656 | | | | 84 | |
| * | | Dycom Industries, Inc. | | | 4,381 | | | | 154 | |
| | EMCOR Group, Inc. | | | 8,329 | | | | 371 | |
| | Encore Wire Corp. | | | 2,399 | | | | 90 | |
| | EnerSys | | | 5,835 | | | | 360 | |
| * | | Engility Holdings, Inc. | | | 2,263 | | | | 97 | |
| * | | EnPro Industries, Inc. | | | 3,086 | | | | 194 | |
| | ESCO Technologies, Inc. | | | 3,385 | | | | 125 | |
| | Exponent, Inc. | | | 1,655 | | | | 137 | |
| | Federal Signal Corp. | | | 8,052 | | | | 124 | |
| | Forward Air Corp. | | | 3,917 | | | | 197 | |
| | Franklin Electric Co., Inc. | | | 5,076 | | | | 191 | |
| | G & K Services, Inc. - Class A | | | 2,564 | | | | 182 | |
| * | | GenCorp, Inc. | | | 7,573 | | | | 139 | |
| | General Cable Corp. | | | 6,261 | | | | 93 | |
| * | | Gibraltar Industries, Inc. | | | 3,725 | | | | 61 | |
| | Griffon Corp. | | | 5,419 | | | | 72 | |
| | Healthcare Services Group, Inc. | | | 9,091 | | | | 281 | |
| | Heartland Express, Inc. | | | 7,114 | | | | 192 | |
| | Heidrick & Struggles International, Inc. | | | 2,112 | | | | 49 | |
| | Hillenbrand, Inc. | | | 8,074 | | | | 279 | |
| * | | Hub Group, Inc. - Class A | | | 4,476 | | | | 170 | |
| | Insperity, Inc. | | | 2,900 | | | | 98 | |
| | Interface, Inc. | | | 8,522 | | | | 140 | |
| | John Bean Technologies Corp. | | | 3,746 | | | | 123 | |
| | Kaman Corp. | | | 3,488 | | | | 140 | |
| | Kelly Services, Inc. - Class A | | | 3,828 | | | | 65 | |
| | Knight Transportation, Inc. | | | 7,829 | | | | 264 | |
| * | | Korn/Ferry International | | | 6,471 | | | | 186 | |
| | Lindsay Corp. | | | 1,570 | | | | 135 | |
| * | | Lydall, Inc. | | | 2,207 | | | | 72 | |
| | Matson, Inc. | | | 5,537 | | | | 191 | |
| | Matthews International Corp. - Class A | | | 3,806 | | | | 185 | |
| | Mobile Mini, Inc. | | | 5,932 | | | | 240 | |
| * | | Moog, Inc. - Class A | | | 5,230 | | | | 387 | |
| | Mueller Industries, Inc. | | | 7,319 | | | | 250 | |
| | National Presto Industries, Inc. | | | 632 | | | | 37 | |
| * | | Navigant Consulting, Inc. | | | 6,238 | | | | 96 | |
| * | | On Assignment, Inc. | | | 6,061 | | | | 201 | |
| * | | Orbital Sciences Corp. | | | 7,832 | | | | 211 | |
| * | | Orion Marine Group, Inc. | | | 3,540 | | | | 39 | |
| * | | PGT, Inc. | | | 6,126 | | | | 59 | |
| | Powell Industries, Inc. | | | 1,192 | | | | 58 | |
| | Quanex Building Products Corp. | | | 4,829 | | | | 91 | |
| | Resources Connection, Inc. | | | 4,899 | | | | 81 | |
| * | | Roadrunner Transportation Systems, Inc. | | | 3,562 | | | | 83 | |
| * | | Saia, Inc. | | | 3,185 | | | | 176 | |
| | Simpson Manufacturing Co., Inc. | | | 5,352 | | | | 185 | |
| | SkyWest, Inc. | | | 6,584 | | | | 87 | |
| | Standex International Corp. | | | 1,641 | | | | 127 | |
The Accompanying Notes are an Integral Part of the Financial Statements.
| | | | | | |
| | Index 600 Stock Portfolio | | | 55 | |
Index 600 Stock Portfolio
| | | | | | | | | | |
| | | Common Stocks (88.8%) | | Shares/
$ Par | | | Value
$ (000’s) | |
| |
| | Industrials continued | |
| * | | TASER International, Inc. | | | 6,756 | | | | 179 | |
| * | | Teledyne Technologies, Inc. | | | 4,703 | | | | 483 | |
| | Tennant Co. | | | 2,367 | | | | 171 | |
| | Tetra Tech, Inc. | | | 8,054 | | | | 215 | |
| | Titan International, Inc. | | | 6,897 | | | | 73 | |
| | The Toro Co. | | | 7,161 | | | | 457 | |
| * | | TrueBlue, Inc. | | | 5,469 | | | | 122 | |
| | UniFirst Corp. | | | 2,012 | | | | 244 | |
| | United Stationers, Inc. | | | 5,004 | | | | 211 | |
| | Universal Forest Products, Inc. | | | 2,570 | | | | 137 | |
| | US Ecology, Inc. | | | 2,782 | | | | 112 | |
| * | | UTI Worldwide, Inc. | | | 11,803 | | | | 142 | |
| * | | Veritiv Corp. | | | 1,050 | | | | 54 | |
| | Viad Corp. | | | 2,582 | | | | 69 | |
| * | | Vicor Corp. | | | 2,133 | | | | 26 | |
| * | | WageWorks, Inc. | | | 4,229 | | | | 273 | |
| | Watts Water Technologies, Inc. - Class A | | | 3,661 | | | | 232 | |
| | | | | | | | | | |
| | Total | | | | | | | 14,805 | |
| | | | | | | | | | |
| |
| | Information Technology (15.2%) | |
| | ADTRAN, Inc. | | | 6,988 | | | | 152 | |
| * | | Advanced Energy Industries, Inc. | | | 4,849 | | | | 115 | |
| * | | Agilysys, Inc. | | | 1,908 | | | | 24 | |
| * | | Anixter International, Inc. | | | 3,506 | | | | 310 | |
| | Badger Meter, Inc. | | | 1,859 | | | | 110 | |
| | Bel Fuse, Inc. - Class B | | | 1,375 | | | | 38 | |
| * | | Benchmark Electronics, Inc. | | | 6,834 | | | | 174 | |
| | Black Box Corp. | | | 1,988 | | | | 48 | |
| | Blackbaud, Inc. | | | 5,955 | | | | 258 | |
| * | | Blucora, Inc. | | | 5,275 | | | | 73 | |
| * | | Bottomline Technologies, Inc. | | | 4,916 | | | | 124 | |
| | Brooks Automation, Inc. | | | 8,610 | | | | 110 | |
| * | | Cabot Microelectronics Corp. | | | 3,061 | | | | 145 | |
| * | | CACI International, Inc. - Class A | | | 3,061 | | | | 264 | |
| * | | CalAmp Corp. | | | 4,654 | | | | 85 | |
| * | | Cardtronics, Inc. | | | 5,728 | | | | 221 | |
| * | | CEVA, Inc. | | | 2,598 | | | | 47 | |
| * | | Checkpoint Systems, Inc. | | | 5,377 | | | | 74 | |
| * | | CIBER, Inc. | | | 9,082 | | | | 32 | |
| * | | Cirrus Logic, Inc. | | | 8,126 | | | | 192 | |
| * | | Coherent, Inc. | | | 3,231 | | | | 196 | |
| | Cohu, Inc. | | | 3,285 | | | | 39 | |
| * | | comScore, Inc. | | | 4,400 | | | | 204 | |
| | Comtech Telecommunications Corp. | | | 2,086 | | | | 66 | |
| | CSG Systems International, Inc. | | | 4,416 | | | | 111 | |
| | CTS Corp. | | | 4,306 | | | | 77 | |
| | Daktronics, Inc. | | | 5,043 | | | | 63 | |
| * | | Dealertrack Holdings, Inc. | | | 5,700 | | | | 253 | |
| * | | Dice Holdings, Inc. | | | 4,786 | | | | 48 | |
| * | | Digi International, Inc. | | | 3,197 | | | | 30 | |
| * | | Digital River, Inc. | | | 4,101 | | | | 101 | |
| | | | | | | | | | |
| | | Common Stocks (88.8%) | | Shares/
$ Par | | | Value
$ (000’s) | |
| |
| | Information Technology continued | |
| * | | Diodes, Inc. | | | 4,713 | | | | 130 | |
| * | | DSP Group, Inc. | | | 2,780 | | | | 30 | |
| * | | DTS, Inc. | | | 2,211 | | | | 68 | |
| | Ebix, Inc. | | | 3,775 | | | | 64 | |
| | Electro Scientific Industries, Inc. | | | 3,421 | | | | 27 | |
| * | | Electronics for Imaging, Inc. | | | 6,048 | | | | 259 | |
| * | | Entropic Communications, Inc. | | | 11,587 | | | | 29 | |
| | EPIQ Systems, Inc. | | | 4,028 | | | | 69 | |
| * | | Exar Corp. | | | 6,056 | | | | 62 | |
| * | | Exlservice Holdings, Inc. | | | 4,014 | | | | 115 | |
| * | | Fabrinet | | | 3,817 | | | | 68 | |
| * | | FARO Technologies, Inc. | | | 2,222 | | | | 139 | |
| | Forrester Research, Inc. | | | 1,405 | | | | 55 | |
| * | | Gerber Scientific, Inc. | | | 2,359 | | | | 0 | |
| * | | Harmonic, Inc. | | | 11,328 | | | | 79 | |
| | Heartland Payment Systems, Inc. | | | 4,660 | | | | 251 | |
| * | | iGATE Corp. | | | 4,572 | | | | 180 | |
| * | | II-VI, Inc. | | | 6,690 | | | | 91 | |
| * | | Insight Enterprises, Inc. | | | 5,271 | | | | 136 | |
| * | | Interactive Intelligence Group | | | 2,170 | | | | 104 | |
| * | | Ixia | | | 7,564 | | | | 85 | |
| | j2 Global, Inc. | | | 5,842 | | | | 362 | |
| * | | Kopin Corp. | | | 7,800 | | | | 28 | |
| * | | Kulicke and Soffa Industries, Inc. | | | 9,904 | | | | 143 | |
| * | | Liquidity Services, Inc. | | | 3,157 | | | | 26 | |
| | Littelfuse, Inc. | | | 2,893 | | | | 280 | |
| * | | LivePerson, Inc. | | | 6,398 | | | | 90 | |
| * | | LogMeIn, Inc. | | | 3,137 | | | | 155 | |
| * | | Manhattan Associates, Inc. | | | 9,601 | | | | 391 | |
| | ManTech International Corp. - Class A | | | 3,021 | | | | 91 | |
| | MAXIMUS, Inc. | | | 8,472 | | | | 465 | |
| * | | Mercury Systems, Inc. | | | 4,146 | | | | 58 | |
| | Methode Electronics, Inc. -Class A | | | 4,909 | | | | 179 | |
| | Micrel, Inc. | | | 5,758 | | | | 84 | |
| * | | Microsemi Corp. | | | 12,226 | | | | 347 | |
| * | | MicroStrategy, Inc. - Class A | | | 1,163 | | | | 189 | |
| | MKS Instruments, Inc. | | | 6,824 | | | | 250 | |
| | Monolithic Power Systems | | | 4,635 | | | | 231 | |
| | Monotype Imaging Holdings, Inc. | | | 5,039 | | | | 145 | |
| * | | Monster Worldwide, Inc. | | | 11,412 | | | | 53 | |
| | MTS Systems Corp. | | | 1,942 | | | | 146 | |
| * | | Nanometrics, Inc. | | | 3,108 | | | | 52 | |
| * | | NETGEAR, Inc. | | | 4,449 | | | | 158 | |
| * | | NetScout Systems, Inc. | | | 4,822 | | | | 176 | |
| * | | Newport Corp. | | | 5,126 | | | | 98 | |
| | NIC, Inc. | | | 7,812 | | | | 141 | |
| * | | OSI Systems, Inc. | | | 2,398 | | | | 170 | |
| | Park Electrochemical Corp. | | | 2,695 | | | | 67 | |
| * | | Perficient, Inc. | | | 4,428 | | | | 82 | |
| * | | Pericom Semiconductor Corp. | | | 2,557 | | | | 35 | |
| | | | | | | | | | |
| | | Common Stocks (88.8%) | | Shares/
$ Par | | | Value
$ (000’s) | |
| |
| | Information Technology continued | |
| * | | Plexus Corp. | | | 4,327 | | | | 178 | |
| | Power Integrations, Inc. | | | 3,798 | | | | 196 | |
| * | | Progress Software Corp. | | | 6,456 | | | | 174 | |
| * | | QLogic Corp. | | | 11,339 | | | | 151 | |
| * | | QuinStreet, Inc. | | | 4,454 | | | | 27 | |
| * | | Rofin-Sinar Technologies, Inc. | | | 3,608 | | | | 104 | |
| * | | Rogers Corp. | | | 2,353 | | | | 192 | |
| * | | Rudolph Technologies, Inc. | | | 4,269 | | | | 44 | |
| * | | Sanmina Corp. | | | 10,610 | | | | 250 | |
| * | | ScanSource, Inc. | | | 3,673 | | | | 147 | |
| * | | Stamps.com, Inc. | | | 1,883 | | | | 90 | |
| * | | Super Micro Computer, Inc. | | | 4,495 | | | | 157 | |
| * | | Sykes Enterprises, Inc. | | | 5,012 | | | | 118 | |
| * | | Synaptics, Inc. | | | 4,747 | | | | 327 | |
| * | | Synchronoss Technologies, Inc. | | | 4,630 | | | | 194 | |
| | SYNNEX Corp. | | | 3,593 | | | | 281 | |
| * | | Take-Two Interactive Software, Inc. | | | 10,822 | | | | 303 | |
| * | | Tangoe, Inc. | | | 4,697 | | | | 61 | |
| * | | TeleTech Holdings, Inc. | | | 2,257 | | | | 53 | |
| | Tessera Technologies, Inc. | | | 6,042 | | | | 216 | |
| * | | TriQuint Semiconductor, Inc. | | | 22,494 | | | | 620 | |
| * | | TTM Technologies, Inc. | | | 6,862 | | | | 52 | |
| * | | Ultratech, Inc. | | | 3,637 | | | | 67 | |
| * | | VASCO Data Security International, Inc. | | | 3,776 | | | | 107 | |
| * | | Veeco Instruments, Inc. | | | 5,174 | | | | 180 | |
| * | | ViaSat, Inc. | | | 5,544 | | | | 349 | |
| * | | Virtusa Corp. | | | 3,453 | | | | 144 | |
| * | | XO Group, Inc. | | | 3,113 | | | | 57 | |
| | | | | | | | | | |
| | Total | | | | | | | 15,356 | |
| | | | | | | | | | |
| |
| | Materials (5.1%) | |
| | A. Schulman, Inc. | | | 3,749 | | | | 152 | |
| * | | A.M. Castle & Co. | | | 2,237 | | | | 18 | |
| * | | AK Steel Holding Corp. | | | 22,780 | | | | 135 | |
| | American Vanguard Corp. | | | 3,258 | | | | 38 | |
| | Balchem Corp. | | | 3,955 | | | | 264 | |
| * | | Boise Cascade Co. | | | 5,070 | | | | 188 | |
| * | | Calgon Carbon Corp. | | | 6,846 | | | | 142 | |
| * | | Century Aluminum Co. | | | 6,637 | | | | 162 | |
| * | | Clearwater Paper Corp. | | | 2,513 | | | | 172 | |
| | Deltic Timber Corp. | | | 1,424 | | | | 97 | |
| * | | Flotek Industries, Inc. | | | 6,453 | | | | 121 | |
| | FutureFuel Corp. | | | 2,869 | | | | 37 | |
| | Globe Specialty Metals, Inc. | | | 8,254 | | | | 142 | |
| | H.B. Fuller Co. | | | 6,470 | | | | 288 | |
| | Hawkins, Inc. | | | 1,216 | | | | 53 | |
| | Haynes International, Inc. | | | 1,597 | | | | 77 | |
| * | | Headwaters, Inc. | | | 9,457 | | | | 142 | |
| | Innophos Holdings, Inc. | | | 2,797 | | | | 164 | |
| * | | Intrepid Potash, Inc. | | | 7,236 | | | | 100 | |
| | Kaiser Aluminum Corp. | | | 2,289 | | | | 164 | |
| | KapStone Paper & Packaging Corp. | | | 10,868 | | | | 319 | |
| | Koppers Holdings, Inc. | | | 2,637 | | | | 69 | |
The Accompanying Notes are an Integral Part of the Financial Statements.
| | | | |
| 56 | | Index 600 Stock Portfolio | | |
Index 600 Stock Portfolio
| | | | | | | | | | |
| | | Common Stocks (88.8%) | | Shares/
$ Par | | | Value
$ (000’s) | |
| |
| | Materials continued | |
| * | | Kraton Performance Polymers, Inc. | | | 4,223 | | | | 88 | |
| * | | LSB Industries, Inc. | | | 2,502 | | | | 79 | |
| | Materion Corp. | | | 2,593 | | | | 91 | |
| | Myers Industries, Inc. | | | 3,203 | | | | 56 | |
| | Neenah Paper, Inc. | | | 2,139 | | | | 129 | |
| | Olympic Steel, Inc. | | | 1,173 | | | | 21 | |
| | OM Group, Inc. | | | 3,964 | | | | 118 | |
| | P.H. Glatfelter Co. | | | 5,524 | | | | 141 | |
| | Quaker Chemical Corp. | | | 1,707 | | | | 157 | |
| | Rayonier Advanced Materials, Inc. | | | 5,487 | | | | 122 | |
| * | | RTI International Metals, Inc. | | | 3,952 | | | | 100 | |
| | Schweitzer-Mauduit International, Inc. | | | 3,919 | | | | 166 | |
| | Stepan Co. | | | 2,461 | | | | 99 | |
| * | | Stillwater Mining Co. | | | 15,460 | | | | 228 | |
| | SunCoke Energy, Inc. | | | 8,518 | | | | 165 | |
| | Tredegar Corp. | | | 3,292 | | | | 74 | |
| | US Silica Holdings, Inc. | | | 6,936 | | | | 178 | |
| | Wausau Paper Corp. | | | 6,432 | | | | 73 | |
| | Zep, Inc. | | | 2,970 | | | | 45 | |
| | | | | | | | | | |
| | Total | | | | | | | 5,174 | |
| | | | | | | | | | |
| | | | | | | | | | |
| | | Common Stocks (88.8%) | | Shares/
$ Par | | | Value
$ (000’s) | |
| |
| | Telecommunication Services (0.6%) | |
| * | | 8x8, Inc. | | | 11,509 | | | | 106 | |
| | Atlantic Tele-Network, Inc. | | | 1,290 | | | | 87 | |
| * | | Cincinnati Bell, Inc. | | | 26,917 | | | | 86 | |
| | Consolidated Communications Holdings, Inc. | | | 6,034 | | | | 168 | |
| * | | General Communication, Inc. - Class A | | | 3,923 | | | | 54 | |
| | Lumos Networks Corp. | | | 2,428 | | | | 41 | |
| | NTELOS Holdings Corp. | | | 2,168 | | | | 9 | |
| | Spok Holdings, Inc. | | | 2,789 | | | | 48 | |
| | | | | | | | | | |
| | Total | | | | | | | 599 | |
| | | | | | | | | | |
| |
| | Utilities (3.4%) | |
| | ALLETE, Inc. | | | 4,935 | | | | 272 | |
| | American States Water Co. | | | 4,940 | | | | 186 | |
| | Avista Corp. | | | 7,366 | | | | 260 | |
| | El Paso Electric Co. | | | 5,192 | | | | 208 | |
| | The Laclede Group, Inc. | | | 5,559 | | | | 296 | |
| | New Jersey Resources Corp. | | | 5,435 | | | | 332 | |
| | Northwest Natural Gas Co. | | | 3,500 | | | | 175 | |
| | NorthWestern Corp. | | | 5,906 | | | | 334 | |
| | Piedmont Natural Gas Co., Inc. | | | 10,078 | | | | 397 | |
| | | | | | | | | | |
| | | Common Stocks (88.8%) | | Shares/
$ Par | | | Value
$ (000’s) | |
| | | |
| | Utilities continued | | | | | | | | |
| | South Jersey Industries, Inc. | | | 4,328 | | | | 255 | |
| | Southwest Gas Corp. | | | 5,984 | | | | 370 | |
| | UIL Holdings Corp. | | | 7,274 | | | | 317 | |
| | | | | | | | | | |
| | Total | | | | | | | 3,402 | |
| | | | | | | | | | |
| | | |
| | Total Common Stocks | | | | | | | | |
| | (Cost: $69,937) | | | | | | | 89,893 | |
| | | | | | | | | | |
| | | |
| | | Investment Companies (1.9%) | | | | | | |
| | |
| | Investment Companies (1.9%) | | | | | |
| | iShares S&P SmallCap 600 Index Fund | | | 16,869 | | | | 1,924 | |
| | | | | | | | | | |
| | Total | | | | | | | 1,924 | |
| | | | | | | | | | |
| | |
| | Total Investment Companies | | | | | |
| | (Cost: $1,896) | | | | | | | 1,924 | |
| | | | | | | | | | |
| | |
| | Total Investments (90.7%) | | | | | |
| | (Cost: $71,833)(a) | | | | | | | 91,817 | |
| | | | | | | | | | |
| | Other Assets, Less | | | | | | | | |
| | Liabilities (9.3%) | | | | | | | 9,469 | |
| | | | | | | | | | |
| | Net Assets (100.0%) | | | | | | | 101,286 | |
| | | | | | | | | | |
| (a) | At December 31, 2014, the aggregate cost of securities for federal tax purposes (in thousands) was $72,254 and the net unrealized appreciation of investments based on that cost was $19,563 which is comprised of $22,924 aggregate gross unrealized appreciation and $3,361 aggregate gross unrealized depreciation. |
| (j) | Swap agreements outstanding on December 31, 2014. |
Total Return Swaps
| | | | | | | | | | | | | | |
| Reference Entity | | Counterparty | | Payment Made
by the Fund | | Payment
Received by the
Fund | | Expiration Date | | Notional
Amount (000’s) | | Unrealized
Appreciation/
(Depreciation)
(000’s) | |
S&P SmallCap 600 Index | | JPMorgan Chase London | | 1-Month USD Libor + 15 Basis Points (Bps) | | S&P SmallCap 600 Index | | 5/15 | | 9,574 | | $ | - | |
| | | | | | | | | | | | | | |
| | | | | | | | | | | | $ | - | |
| | | | | | | | | | | | | | |
The Accompanying Notes are an Integral Part of the Financial Statements.
| | | | | | |
| | Index 600 Stock Portfolio | | | 57 | |
Index 600 Stock Portfolio
The following is a summary of the inputs used in valuing the Portfolio’s assets and liabilities at December 31, 2014. See Note 3 for additional information on portfolio valuation.
| | | | | | | | | | | | | | |
| | | Valuation Inputs | | | |
| Description | | Level 1 –
Quoted Prices | | | Level 2 –
Other Significant
Observable Inputs | | | Level 3 – Significant
Unobservable Inputs | | | |
| | | (Amounts in thousands) | | | |
Assets: | | | | | | | | | | | | | | |
Domestic Common Stocks | | $ | 89,893 | | | $ | - | | | $ | - | | | |
Investment Companies | | | 1,924 | | | | - | | | | - | | | |
Other Financial Instruments^ | | | | | | | | | | | | | | |
Total Return Swaps | | | - | | | | - | | | | - | | | |
Total | | $ | 91,817 | | | $ | - | | | $ | - | | | |
^ Other financial instruments are derivative instruments such as futures, forwards, written options and swaps contracts, which are valued at the unrealized appreciation (depreciation) on the instrument and short sales, which are valued at market value.
The Accompanying Notes are an Integral Part of the Financial Statements.
| | | | |
| 58 | | Index 600 Stock Portfolio | | |
Small Cap Value Portfolio (unaudited)
| | | | |
| Objective: | | Portfolio Strategy: | | Net Assets: |
| Long-term growth of capital. | | Invest primarily in common stocks of small-sized companies believed to be undervalued. | | $583 million |
Portfolio Overview
Mason Street Advisors, LLC the investment adviser for the Small Cap Value Portfolio (“the Portfolio”), has engaged T. Rowe Price Associates, Inc. (“T. Rowe Price”) to act as sub-adviser for the Portfolio. Normally, the Portfolio primarily invests in common stocks of companies with market capitalizations that do not exceed the maximum market capitalization of any security in the Russell 2000® Index at the time of purchase. Reflecting a value approach to investing, the Portfolio will seek the stocks of companies whose current stock prices do not appear to adequately reflect their underlying value as measured by assets, earnings, cash flow or business franchises.
Market Overview
U.S. equities rose in 2014 for the sixth consecutive year. Falling long-term interest rates, solid employment growth, favorable corporate earnings and expanded stimulus measures by major non-U.S. central banks propelled equities in 2014. Stagnant global growth, heightened geopolitical tensions due to U.S. and European Union sanctions against Russia for its actions in Ukraine and unrest in the Middle East periodically weighed on stock prices, as did concerns that the Federal Reserve would soon start raising short-term interest rates. However, interest rate reductions in the eurozone, as well as aggressive monetary easing in Japan, boosted investor sentiment.
A sharp decline in the price of oil was positive for U.S. consumers and oil-importing nations but contributed to steep declines in the currencies and assets of major oil-producing and -exporting countries. Large-cap stocks significantly outpaced small- and mid-cap stocks for the twelve months ended December 31, 2014, according to various Russell® Indices. In the small cap universe, the Russell 2000® Value Index underperformed the Russell 2000® Growth Index.
Portfolio Results
The Portfolio returned 0.22% for the twelve months ended December 31, 2014. By comparison, the Portfolio’s benchmark, the Russell 2000® Value Index (the “Index”), returned 4.22%. (This Index is unmanaged, cannot be invested in directly and does not include administrative expenses or sales charges.) According to Lipper® Analytical Services, Inc., an independent mutual fund ranking agency, the average return of the Small Cap Value Funds peer group for 2014 was 4.25%.
The Portfolio’s underperformance relative to the Index was primarily due to sector weightings. Stock selection also detracted but to a much lesser degree. A substantially underweight position in the Financials sector and a substantially overweight position in the Industrials and Business Services sector hindered performance relative to the Index. In Industrials and Business Services, stock selection more than offset the detrimental effect of the overweight position. In the Energy sector, stock selection hurt performance, but being underweight compared to the Index in the weakest performing sector mitigated part of the blow to relative performance.
The Portfolio’s Consumer Discretionary stocks significantly lagged their Index counterparts. Meritage Homes Corp. (“Meritage”) was a notable detractor. Meritage is the ninth-largest U.S. homebuilder with a large presence in Florida, Texas, California, and Arizona. Despite measured growth in new home sales, months with anemic growth weighed heavily on homebuilders, and housing volumes remained at low levels for the size of the population.
Stock selection in Health Care also hampered the Portfolio’s relative performance, especially Momenta Pharmaceuticals, Inc. (“Momenta”), a biotechnology company with a diversified pipeline of complex generic, follow-on biologic, and novel drugs. Early in the year, the firm’s share price tumbled after rival Teva Pharmaceutical Industries, Ltd. benefited from the Supreme Court’s decision to review an appeal, which indefinitely delayed the sale of Momenta’s generic version of Copaxone, a multiple sclerosis drug.
The Industrials and Business Services sector was a bright spot for the Portfolio, helped by Alaska Air Group, Inc. The Seattle-based airline serves primarily the West Coast region, Alaska, Hawaii, and Mexico. The portfolio managers believed the company’s management followed a carefully articulated strategy with good capital discipline, including cautious expansion, while ensuring that demand was in place. Despite recent focus on increased competition in the northwestern U.S., particularly from Delta Air Lines, Inc., the firm continued to show strong revenues. In addition, the recent decline in oil prices improved the cost structure for the industry.
Portfolio Manager Outlook
The following forward looking comments are the opinion of T. Rowe Price, the Portfolio’s sub-adviser.
Although energy stocks are a small part of the small cap value universe, the recent decline in oil prices has weighed particularly heavily on small cap producers, while also punishing stocks in related industries, such as rail and barge transportation, that rely on energy industry spending. Upcoming earnings reports should provide greater clarity on the broader effects of falling oil prices on small caps. Clearly, energy-using firms and consumer-based companies stand to benefit from lower oil prices. In addition, the equally surprising decline in long-term interest rates has had a large, positive effect on small cap value stocks, especially financials. As always, our focus remains on long-term performance, and we believe a contrarian approach will ultimately best serve shareholders’ interests.
| | | | | | |
| | Small Cap Value Portfolio | | | 59 | |
Small Cap Value Portfolio (unaudited)
Relative Performance
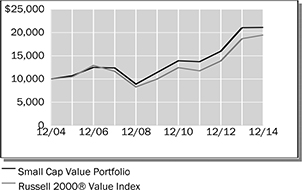
| | | | | | | | | | | | |
Average Annual Total Returns
For Periods Ended December 31, 2014 | |
| | | 1 Year | | | 5 Years | | | 10 Years | |
Small Cap Value Portfolio | | | 0.22 | % | | | 13.07 | % | | | 7.75 | % |
Russell 2000® Value Index | | | 4.22 | % | | | 14.26 | % | | | 6.89 | % |
Lipper® Variable Insurance Products (VIP) Small Cap Value Funds Average | | | 4.25 | % | | | 14.51 | % | | | 7.89 | % |
The performance data quoted represents past performance. Past performance is historical and does not guarantee future performance. Investment return and principal value will fluctuate, so that shares, when redeemed, may be worth more or less than their original cost. Current performance may be lower or higher than the performance data quoted. For the most recent month-end performance information visit www.northwesternmutual.com.
This chart assumes an initial investment of $10,000 made on 12/31/04. Returns shown include deductions for management and other portfolio expenses, and reinvestment of all dividends. Returns exclude deductions for separate account sale loads and account fees. Please refer to the Benchmark Definitions section of this report for information about the indices cited in the above chart and graph.
Stocks of smaller or newer companies, such as those held in this Portfolio, are more likely to realize more substantial growth as well as suffer more significant losses than larger or more established issuers. Investments in such companies can be both more volatile and more speculative. Investing in small company stocks involves a greater degree of risk than investing in medium or large company stocks.
The Portfolio may invest in exchange traded funds as a cash management strategy. Investing in ETFs may expose the Portfolio to greater risk of loss and price fluctuation than investing directly in a comparable portfolio of stocks due to lack of liquidity, the additional expenses incurred as a stockholder in another investment company, and tracking error.
Top 10 Equity Holdings 12/31/14
| | |
Security Description | | % of Net Assets |
Landstar System, Inc. | | 2.0% |
Alaska Air Group, Inc. | | 1.9% |
East West Bancorp, Inc. | | 1.7% |
Aaron’s, Inc. | | 1.7% |
ProAssurance Corp. | | 1.7% |
Genesee & Wyoming, Inc. - Class A | | 1.6% |
Home BancShares, Inc. | | 1.5% |
West Pharmaceutical Services, Inc. | | 1.4% |
SVB Financial Group | | 1.4% |
AptarGroup, Inc. | | 1.3% |
Sector Allocation 12/31/14

Sector Allocation is based on Net Assets.
Sector Allocation and Top 10 Holdings are subject to change.
| | | | |
| 60 | | Small Cap Value Portfolio | | |
Small Cap Value Portfolio
Schedule of Investments
December 31, 2014
| | | | | | | | | | |
| | | Common Stocks (95.9%) | | Shares/
$ Par | | | Value
$ (000’s) | |
| |
| | Consumer Discretionary (12.6%) | |
| | Aaron’s, Inc. | | | 330,000 | | | | 10,088 | |
| * | | American Public Education, Inc. | | | 58,500 | | | | 2,157 | |
| * | | Ascent Capital Group LLC - Class A | | | 36,200 | | | | 1,916 | |
| * | | Belmond, Ltd. | | | 84,900 | | | | 1,050 | |
| | Brunswick Corp. | | | 67,500 | | | | 3,460 | |
| * | | Crocs, Inc. | | | 100,900 | | | | 1,260 | |
| | CSS Industries, Inc. | | | 90,000 | | | | 2,488 | |
| | Culp, Inc. | | | 105,600 | | | | 2,289 | |
| * | | Dorman Products, Inc. | | | 21,280 | | | | 1,027 | |
| | Drew Industries, Inc. | | | 126,000 | | | | 6,435 | |
| | Ethan Allen Interiors, Inc. | | | 91,000 | | | | 2,818 | |
| | Fred’s, Inc. - Class A | | | 130,659 | | | | 2,275 | |
| | Haverty Furniture Cos., Inc. | | | 152,700 | | | | 3,361 | |
| | Interval Leisure Group, Inc. | | | 13,500 | | | | 282 | |
| * | | M/I Homes, Inc. | | | 79,400 | | | | 1,823 | |
| * | | Meritage Homes Corp. | | | 125,200 | | | | 4,506 | |
| * | | Modine Manufacturing Co. | | | 213,500 | | | | 2,904 | |
| | National CineMedia, Inc. | | | 25,200 | | | | 362 | |
| | New Media Investment Group, Inc. | | | 132,500 | | | | 3,131 | |
| | Pier 1 Imports, Inc. | | | 244,200 | | | | 3,761 | |
| | Pool Corp. | | | 90,600 | | | | 5,748 | |
| * | | Red Robin Gourmet Burgers, Inc. | | | 27,000 | | | | 2,078 | |
| | Saga Communications, Inc. - Class A | | | 71,298 | | | | 3,100 | |
| * | | Sportsman’s Warehouse Holdings, Inc. | | | 198,300 | | | | 1,451 | |
| | Stein Mart, Inc. | | | 253,000 | | | | 3,699 | |
| | | | | | | | | | |
| | Total | | | | | | | 73,469 | |
| | | | | | | | | | |
| |
| | Consumer Staples (1.0%) | |
| * | | Alliance One International, Inc. | | | 294,600 | | | | 466 | |
| | Pinnacle Foods, Inc. | | | 44,400 | | | | 1,567 | |
| | SpartanNash Co. | | | 146,000 | | | | 3,816 | |
| | | | | | | | | | |
| | Total | | | | | | | 5,849 | |
| | | | | | | | | | |
| |
| | Energy (3.9%) | |
| * | | Atwood Oceanics, Inc. | | | 56,900 | | | | 1,614 | |
| | Bristow Group, Inc. | | | 18,300 | | | | 1,204 | |
| | CARBO Ceramics, Inc. | | | 36,700 | | | | 1,470 | |
| * | | Clayton Williams Energy, Inc. | | | 23,400 | | | | 1,493 | |
| * | | Cloud Peak Energy, Inc. | | | 182,400 | | | | 1,674 | |
| | GasLog, Ltd. | | | 167,400 | | | | 3,407 | |
| * | | Matador Resources Co. | | | 108,200 | | | | 2,189 | |
| * | | Northern Oil and Gas, Inc. | | | 205,000 | | | | 1,158 | |
| * | | Oasis Petroleum, Inc. | | | 109,600 | | | | 1,813 | |
| * | | PDC Energy, Inc. | | | 45,100 | | | | 1,861 | |
| | Teekay Tankers, Ltd. - Class A | | | 374,000 | | | | 1,893 | |
| | | | | | | | | | |
| | | Common Stocks (95.9%) | | Shares/
$ Par | | | Value
$ (000’s) | |
| |
| | Energy continued | |
| | Tesco Corp. | | | 139,400 | | | | 1,787 | |
| * | | TETRA Technologies, Inc. | | | 214,200 | | | | 1,431 | |
| | | | | | | | | | |
| | Total | | | | | | | 22,994 | |
| | | | | | | | | | |
| |
| | Financials (26.4%) | |
| | Acadia Realty Trust | | | 152,600 | | | | 4,888 | |
| | Ares Capital Corp. | | | 222,800 | | | | 3,477 | |
| | Associated Estates Realty Corp. | | | 112,300 | | | | 2,607 | |
| | Assured Guaranty, Ltd. | | | 94,300 | | | | 2,451 | |
| | BBCN Bancorp, Inc. | | | 163,500 | | | | 2,351 | |
| | CatchMark Timber Trust, Inc. - Class A | | | 96,570 | | | | 1,093 | |
| | CBL & Associates Properties, Inc. | | | 206,800 | | | | 4,016 | |
| | Cedar Realty Trust, Inc. | | | 318,400 | | | | 2,337 | |
| | Columbia Banking System, Inc. | | | 133,900 | | | | 3,697 | |
| | Compass Diversified Holdings | | | 151,000 | | | | 2,454 | |
| | East West Bancorp, Inc. | | | 263,098 | | | | 10,185 | |
| | Employers Holdings, Inc. | | | 148,000 | | | | 3,479 | |
| * | | Enstar Group, Ltd. | | | 5,300 | | | | 810 | |
| | First Potomac Realty Trust | | | 256,300 | | | | 3,168 | |
| * | | Forestar Group, Inc. | | | 36,600 | | | | 564 | |
| | Glacier Bancorp, Inc. | | | 205,800 | | | | 5,715 | |
| | Hatteras Financial Corp. | | | 188,000 | | | | 3,465 | |
| | Hercules Technology Growth Capital, Inc. | | | 265,000 | | | | 3,943 | |
| | Home BancShares, Inc. | | | 279,400 | | | | 8,986 | |
| | Home Properties, Inc. | | | 39,700 | | | | 2,604 | |
| | Janus Capital Group, Inc. | | | 135,000 | | | | 2,178 | |
| | JMP Group, Inc. | | | 107,000 | | | | 815 | |
| | Kilroy Realty Corp. | | | 73,800 | | | | 5,097 | |
| | Kite Realty Group Trust | | | 89,525 | | | | 2,573 | |
| | LaSalle Hotel Properties | | | 142,600 | | | | 5,771 | |
| | Main Street Capital Corp. | | | 44,800 | | | | 1,310 | |
| | Meadowbrook Insurance Group, Inc. | | | 321,000 | | | | 2,716 | |
| | National Bank Holding Corp. | | | 119,000 | | | | 2,310 | |
| | National Interstate Corp. | | | 110,400 | | | | 3,290 | |
| * | | Piper Jaffray Cos., Inc. | | | 35,900 | | | | 2,085 | |
| | Potlatch Corp. | | | 94,200 | | | | 3,944 | |
| | ProAssurance Corp. | | | 219,000 | | | | 9,888 | |
| | PS Business Parks, Inc. | | | 21,600 | | | | 1,718 | |
| | Radian Group, Inc. | | | 206,100 | | | | 3,446 | |
| | Redwood Trust, Inc. | | | 200,000 | | | | 3,940 | |
| * | | Safeguard Scientifics, Inc. | | | 92,000 | | | | 1,823 | |
| | Safety Insurance Group, Inc. | | | 9,500 | | | | 608 | |
| | Sandy Spring Bancorp, Inc. | | | 4,000 | | | | 104 | |
| | Saul Centers, Inc. | | | 59,500 | | | | 3,403 | |
| * | | Signature Bank | | | 40,800 | | | | 5,139 | |
| | | | | | | | | | |
| | | Common Stocks (95.9%) | | Shares/
$ Par | | | Value
$ (000’s) | |
| |
| | Financials continued | |
| * | | Strategic Hotels & Resorts, Inc. | | | 193,700 | | | | 2,563 | |
| * | | SVB Financial Group | | | 71,400 | | | | 8,287 | |
| | Washington Real Estate Investment Trust | | | 107,100 | | | | 2,962 | |
| | Wintrust Financial Corp. | | | 127,900 | | | | 5,981 | |
| | | | | | | | | | |
| | Total | | | | | | | 154,241 | |
| | | | | | | | | | |
| |
| | Health Care (5.2%) | |
| | Analogic Corp. | | | 36,000 | | | | 3,046 | |
| | Atrion Corp. | | | 3,600 | | | | 1,224 | |
| * | | Halyard Health, Inc. | | | 107,600 | | | | 4,893 | |
| | Landauer, Inc. | | | 34,100 | | | | 1,164 | |
| * | | Momenta Pharmaceuticals, Inc. | | | 129,000 | | | | 1,553 | |
| | National Healthcare Corp. | | | 67,000 | | | | 4,210 | |
| * | | Quidel Corp. | | | 106,000 | | | | 3,065 | |
| * | | Triple-S Management Corp. - Class B | | | 93,000 | | | | 2,224 | |
| * | | WellCare Health Plans, Inc. | | | 4,407 | | | | 362 | |
| | West Pharmaceutical Services, Inc. | | | 162,000 | | | | 8,625 | |
| | | | | | | | | | |
| | Total | | | | | | | 30,366 | |
| | | | | | | | | | |
| |
| | Industrials (23.1%) | |
| * | | Aegion Corp. | | | 152,100 | | | | 2,831 | |
| | Alaska Air Group, Inc. | | | 185,600 | | | | 11,091 | |
| | Astec Industries, Inc. | | | 73,900 | | | | 2,905 | |
| * | | Beacon Roofing Supply, Inc. | | | 241,100 | | | | 6,703 | |
| | CIRCOR International, Inc. | | | 64,400 | | | | 3,882 | |
| | Comfort Systems USA, Inc. | | | 161,400 | | | | 2,763 | |
| | ESCO Technologies, Inc. | | | 118,300 | | | | 4,365 | |
| | Franklin Electric Co., Inc. | | | 88,500 | | | | 3,321 | |
| * | | FTI Consulting, Inc. | | | 75,000 | | | | 2,897 | |
| | G & K Services, Inc. - Class A | | | 92,000 | | | | 6,518 | |
| * | | Genesee & Wyoming, Inc. - Class A | | | 105,700 | | | | 9,505 | |
| * | | Gibraltar Industries, Inc. | | | 183,000 | | | | 2,976 | |
| | Hillenbrand, Inc. | | | 34,790 | | | | 1,200 | |
| * | | Hub Group, Inc. - Class A | | | 83,900 | | | | 3,195 | |
| | Kaman Corp. | | | 94,000 | | | | 3,768 | |
| * | | Kirby Corp. | | | 56,300 | | | | 4,546 | |
| * | | Kratos Defense & Security Solutions, Inc. | | | 21,500 | | | | 108 | |
| | Landstar System, Inc. | | | 159,100 | | | | 11,540 | |
| | Luxfer Holdings PLC, ADR | | | 75,100 | | | | 1,121 | |
| | Matthews International Corp. - Class A | | | 117,800 | | | | 5,733 | |
| | McGrath RentCorp | | | 187,500 | | | | 6,724 | |
| | MSA Safety, Inc. | | | 91,000 | | | | 4,831 | |
| * | | Navigant Consulting, Inc. | | | 197,000 | | | | 3,028 | |
The Accompanying Notes are an Integral Part of the Financial Statements.
| | | | | | |
| | Small Cap Value Portfolio | | | 61 | |
Small Cap Value Portfolio
| | | | | | | | | | |
| | | Common Stocks (95.9%) | | Shares/
$ Par | | | Value
$ (000’s) | |
| |
| | Industrials continued | |
| | Nordson Corp. | | | 82,600 | | | | 6,440 | |
| * | | On Assignment, Inc. | | | 66,100 | | | | 2,194 | |
| | Quanex Building Products Corp. | | | 41,700 | | | | 783 | |
| | RBC Bearings, Inc. | | | 27,000 | | | | 1,742 | |
| | Sun Hydraulics Corp. | | | 60,000 | | | | 2,363 | |
| | Universal Forest Products, Inc. | | | 73,800 | | | | 3,926 | |
| | Universal Truckload Services, Inc. | | | 96,594 | | | | 2,754 | |
| | US Ecology, Inc. | | | 83,900 | | | | 3,366 | |
| * | | UTI Worldwide, Inc. | | | 164,700 | | | | 1,988 | |
| | Woodward, Inc. | | | 70,100 | | | | 3,451 | |
| | | | | | | | | | |
| | Total | | | | | | | 134,558 | |
| | | | | | | | | | |
| |
| | Information Technology (10.5%) | |
| * | | Advanced Energy Industries, Inc. | | | 171,000 | | | | 4,053 | |
| | Badger Meter, Inc. | | | 14,900 | | | | 884 | |
| | Belden, Inc. | | | 93,500 | | | | 7,369 | |
| | Brooks Automation, Inc. | | | 154,000 | | | | 1,963 | |
| * | | Cabot Microelectronics Corp. | | | 104,000 | | | | 4,921 | |
| * | | Cognex Corp. | | | 33,100 | | | | 1,368 | |
| | Electro Rent Corp. | | | 215,000 | | | | 3,019 | |
| | Electro Scientific Industries, Inc. | | | 200,000 | | | | 1,552 | |
| * | | Entegris, Inc. | | | 170,800 | | | | 2,256 | |
| * | | Fabrinet | | | 153,000 | | | | 2,714 | |
| | Intersil Corp. - Class A | | | 61,500 | | | | 890 | |
| * | | Ixia | | | 259,500 | | | | 2,919 | |
| | Littelfuse, Inc. | | | 70,600 | | | | 6,825 | |
| | Methode Electronics, Inc. | | | 66,000 | | | | 2,410 | |
| | | | | | | | | | |
| | | Common Stocks (95.9%) | | Shares/
$ Par | | | Value
$ (000’s) | |
| * | | Newport Corp. | | | 97,000 | | | | 1,854 | |
| * | | Progress Software Corp. | | | 121,400 | | | | 3,280 | |
| * | | Sonus Networks, Inc. | | | 508,300 | | | | 2,018 | |
| | SYNNEX Corp. | | | 94,800 | | | | 7,410 | |
| | Teradyne, Inc. | | | 188,500 | | | | 3,730 | |
| | | | | | | | | | |
| | Total | | | | | | | 61,435 | |
| | | | | | | | | | |
| |
| | Materials (8.5%) | |
| | American Vanguard Corp. | | | 135,000 | | | | 1,569 | |
| | AptarGroup, Inc. | | | 116,500 | | | | 7,787 | |
| | Carpenter Technology Corp. | | | 66,400 | | | | 3,270 | |
| * | | Clearwater Paper Corp. | | | 76,600 | | | | 5,251 | |
| | Deltic Timber Corp. | | | 60,900 | | | | 4,166 | |
| | Innospec, Inc. | | | 174,500 | | | | 7,451 | |
| | Minerals Technologies, Inc. | | | 84,000 | | | | 5,834 | |
| | Myers Industries, Inc. | | | 196,000 | | | | 3,450 | |
| | Royal Gold, Inc. | | | 36,400 | | | | 2,282 | |
| * | | Ryerson Holding Corp. | | | 67,400 | | | | 669 | |
| | Schnitzer Steel Industries, Inc. | | | 69,300 | | | | 1,563 | |
| * | | Stillwater Mining Co. | | | 167,100 | | | | 2,463 | |
| | Wausau Paper Corp. | | | 324,000 | | | | 3,684 | |
| | | | | | | | | | |
| | Total | | | | | | | 49,439 | |
| | | | | | | | | | |
| |
| | Telecommunication Services (0.1%) | |
| * | | Premiere Global Services, Inc. | | | 42,330 | | | | 450 | |
| | | | | | | | | | |
| | Total | | | | | | | 450 | |
| | | | | | | | | | |
| |
| | Utilities (4.6%) | |
| | Black Hills Corp. | | | 54,600 | | | | 2,896 | |
| | | | | | | | | | |
| | | Common Stocks (95.9%) | | Shares/
$ Par | | | Value
$ (000’s) | |
| |
| | Utilities continued | |
| | Cleco Corp. | | | 115,100 | | | | 6,277 | |
| | El Paso Electric Co. | | | 106,000 | | | | 4,246 | |
| | NorthWestern Corp. | | | 89,300 | | | | 5,053 | |
| | PNM Resources, Inc. | | | 117,100 | | | | 3,470 | |
| | Southwest Gas Corp. | | | 80,300 | | | | 4,963 | |
| | | | | | | | | | |
| | Total | | | | | | | 26,905 | |
| | | | | | | | | | |
| | | |
| | Total Common Stocks | | | | | | | | |
| | (Cost: $369,196) | | | | | | | 559,706 | |
| | | | | | | | | | |
| |
| | | Investment Companies (0.6%) | |
| |
| | Domestic Equity (0.6%) | |
| | iShares Russell 2000 Value Index Fund | | | 32,300 | | | | 3,284 | |
| | | | | | | | | | |
| | Total | | | | | | | 3,284 | |
| | | | | | | | | | |
| | Total Investment Companies | | | | | | | | |
| | (Cost: $1,822) | | | | | | | 3,284 | |
| | | | | | | | | | |
| |
| | | Short-Term Investments (4.5%) | |
| |
| | Money Market Funds (4.5%) | |
| | T. Rowe Price Reserve Investment Fund | | | 26,073,802 | | | | 26,074 | |
| | | | | | | | | | |
| | Total | | | | | | | 26,074 | |
| | | | | | | | | | |
| | Total Short-Term Investments | | | | | | | | |
| | (Cost: $26,074) | | | | | | | 26,074 | |
| | | | | | | | | | |
| | Total Investments (101.0%) | | | | | | | | |
| | (Cost: $397,092) (a) | | | | | | | 589,064 | |
| | | | | | | | | | |
| | Other Assets, Less | | | | | | | | |
| | Liabilities (-1.0%) | | | | | | | (5,697 | ) |
| | | | | | | | | | |
| | Net Assets (100.0%) | | | | | | | 583,367 | |
| | | | | | | | | | |
ADR after the name of a security represents - American Depositary Receipt.
| (a) | At December 31, 2014, the aggregate cost of securities for federal tax purposes (in thousands) was $397,480 and the net unrealized appreciation of investments based on that cost was $191,584 which is comprised of $206,966 aggregate gross unrealized appreciation and $15,382 aggregate gross unrealized depreciation. |
The following is a summary of the inputs used in valuing the Portfolio’s assets and liabilities at December 31, 2014. See Note 3 for additional information on portfolio valuation.
| | | | | | | | | | | | | | |
| | | Valuation Inputs | | | |
| Description | | Level 1 –
Quoted Prices | | | Level 2 –
Other Significant
Observable Inputs | | | Level 3 – Significant
Unobservable Inputs | | | |
| | | (Amounts in thousands) | | | |
Assets: | | | | | | | | | | | | | | |
Domestic Common Stocks | | $ | 559,706 | | | $ | - | | | $ | - | | | |
Investment Companies | | | 3,284 | | | | - | | | | - | | | |
Short-Term Investments | | | 26,074 | | | | - | | | | - | | | |
Total | | $ | 589,064 | | | $ | - | | | $ | - | | | |
The Accompanying Notes are an Integral Part of the Financial Statements.
| | | | |
| 62 | | Small Cap Value Portfolio | | |
International Growth Portfolio (unaudited)
| | | | |
| Objective: | | Portfolio Strategy: | | Net Assets: |
| Long-term growth of capital. | | Invest in securities of issuers from countries outside the U.S. that have above average growth potential. | | $437 million |
Portfolio Overview
Mason Street Advisors, LLC (“Mason Street Advisors”), the investment adviser for the International Growth Portfolio (the “Portfolio”), has engaged Janus Capital Management LLC (“Janus”) to act as sub-adviser for the Portfolio. The Portfolio normally invests in a core group of equity securities of 60–100 issuers from countries outside the United States, including emerging markets. The Portfolio’s investments in equity securities may include small, medium and large capitalization issues. The Portfolio applies a “bottom up” approach in choosing investments and assesses companies for their growth potential. In other words, the Portfolio looks at companies one at a time to determine if a company is an attractive investment opportunity and if it is consistent with the Portfolio’s investment policies.
Market Overview
Geopolitical risks and tepid global growth set the stage for volatile markets that lasted for most of 2014. Early in the period, the Ukraine conflict and a deceleration in Europe contributed to negative sentiment. The European Central Bank (the “ECB”) responded by introducing measures to combat low inflation and stimulate growth. A slowdown in China and a weak Brazilian economy also soured markets.
U.S. stocks rose for much of the year, driven by steady employment gains. Japanese markets had to deal with a weaker yen relative to the U.S. dollar and other major currencies.
Volatility in the fourth quarter was partially mollified by a series of measures by major central banks. The ECB announced that it would raise the level of its balance sheet; the Bank of Japan enacted unprecedented easing and the People’s Bank of China lowered a key interest rate. Falling crude prices fueled volatility as investors considered the possibility that the slide was a consequence of declining global growth.
Portfolio Results
The Portfolio returned (4.52%) for the twelve months ended December 31, 2014. By comparison, the Portfolio’s benchmark, the MSCI® All Country World (ex-US) Growth Index (the “Index”), returned (2.29%). (This Index is unmanaged, cannot be invested in directly and does not include administrative expenses or sales charges.) According to Lipper® Analytical Services, Inc., an independent mutual fund ranking agency, the average return of the International Multi-Cap Growth Funds peer group for 2014 was (3.77%).
The Portfolio’s Consumer Discretionary and Financial holdings detracted most from relative performance, while stock selection in the Health Care and Information Technology sectors contributed to relative results. On a country basis, Canadian and Japanese holdings were relative detractors while selection of U.K. stocks and holdings in India were relative contributors.
Sega Sammy Holdings, Inc. was a top detractor. The gaming device maker suffered from a delay in legislation in Japan that would allow the construction of the country’s first casino. The company was also negatively impacted by new stricter testing standards for its games.
Melco International Development, Ltd. (“Melco”) was negatively impacted following a larger-than-expected slowdown in revenue in Macau, China. The portfolio managers believed growth in Macau’s mass market business was enough to offset weakness in other business segments. The portfolio managers also continued to appreciate Melco’s exposure to the growth in Asian travel and gaming.
French lender Societe Generale SA detracted due to lingering weakness within its home market and its exposure to Russia and Ukraine, which experienced diminishing growth prospects and declining investment during the year.
Shire PLC (“Shire”) and NGK Spark Plug Co., Ltd. (“NGK Spark Plug”) were the top contributors. Shire’s stock rose in anticipation of its purchase by AbbVie, Inc. Following the deal’s collapse, the company’s stock fell, yet the portfolio managers still favored Shire as a stand-alone company due to its dominant position in the ADHD market, as well as its portfolio of drugs for rare diseases. The portfolio managers also believed NGK Spark Plug’s core business could benefit from limited competition and steady growth due to tightening emissions standards and increased use by motorcycle manufacturers.
Portfolio Manager Outlook
The following forward looking comments are the opinion of Janus, the Portfolio’s sub-adviser.
Entering 2015, we are not finding equity valuations extreme in the context of low interest rates and inflation, but they are hardly cheap. Lower oil prices are generally good for the global economy, but it creates winners and losers. In addition, Europe still has structural problems. China remains attractive despite slowing growth. India could perform well if government reforms live up to the market’s enthusiasm. While these countries benefit from lower oil prices, Russia has been punished. Brazil remains the most uncertain, as the country is sorting through a corruption probe related to its largest oil company.
Against this backdrop, we remain positive on global equities. With global growth rates constrained, the challenge for stock pickers will be to find companies that can generate growth through superior business models, restructuring or acquisitions. We expect higher volatility in 2015, but we think stocks with high valuations and underappreciated risks will be the most vulnerable.
| | | | | | |
| | International Growth Portfolio | | | 63 | |
International Growth Portfolio (unaudited)
Relative Performance
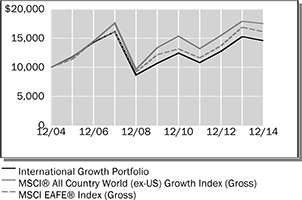
| | | | | | | | | | | | |
Average Annual Total Returns
For Periods Ended December 31, 2014 | |
| | | 1 Year | | | 5 Years | | | 10 Years | |
International Growth Portfolio | | | -4.52 | % | | | 6.41 | % | | | 3.86 | % |
MSCI® All Country World (ex-US) Growth Index (Gross) | | | -2.29 | % | | | 5.54 | % | | | 5.77 | % |
MSCI EAFE® Index (Gross) | | | -4.48 | % | | | 5.81 | % | | | 4.91 | % |
Lipper® Variable Insurance Products (VIP) International Multi-Cap Growth Funds Average | | | -3.77 | % | | | 5.92 | % | | | 5.30 | % |
The performance data quoted represents past performance. Past performance is historical and does not guarantee future performance. Investment return and principal value will fluctuate, so that shares, when redeemed, may be worth more or less than their original cost. Current performance may be lower or higher than the performance data quoted. For the most recent month-end performance information visit www.northwesternmutual.com.
This chart assumes an initial investment of $10,000 made on 12/31/04. Returns shown include deductions for management and other portfolio expenses, and reinvestment of all dividends. Returns exclude deductions for separate account sale loads and account fees. Please refer to the Benchmark Definitions section of this report for information about the indices cited in the above chart and graph.
Investors should be aware of the risks of investments in foreign securities, particularly investments in securities of companies in developing nations. These include the risks of currency fluctuation, of political and economic instability and of less well-developed government supervision and regulation of business and industry practices, as well as differences in accounting standards.
Investments in the securities of companies in developing nations impose risks different from, and greater than, risks of investing in developed countries.
The Portfolio may invest a relatively large percentage of its assets in issuers located in a single country, a small number of countries, or a particular geographic region. The Portfolio’s performance may be more volatile than that of a more geographically diversified fund, and may be tied more closely to the performance of a single country or region.
Top 10 Equity Holdings 12/31/14
| | |
| Security Description | | % of Net Assets |
AIA Group, Ltd. | | 3.3% |
NGK Spark Plug Co., Ltd. | | 3.1% |
Volkswagen AG | | 2.6% |
SABMiller PLC | | 2.4% |
ARM Holdings PLC | | 2.4% |
Prudential PLC | | 2.3% |
Panalpina Welttransport Holding AG | | 2.3% |
Taiwan Semiconductor Manufacturing Co., Ltd. | | 2.3% |
Cie Financiere Richemont SA | | 2.3% |
Glencore PLC | | 2.3% |
Sector Allocation 12/31/14

Sector Allocation is based on Net Assets.
Sector Allocation and Top 10 Holdings are subject to change.
| | | | |
| 64 | | International Growth Portfolio | | |
International Growth Portfolio
Schedule of Investments
December 31, 2014
| | | | | | | | | | | | |
| | | Foreign Common Stocks (95.9%) | | Country | | Shares/ $ Par | | | Value $ (000’s) | |
| | |
| | Consumer Discretionary (14.8%) | | | | | |
| | Cie Financiere Richemont SA | | Switzerland | | | 112,053 | | | | 9,925 | |
| * | | Hella KGaA Hueck & Co. | | Germany | | | 24,693 | | | | 1,060 | |
| * | | Liberty Global PLC | | United
Kingdom | | | 172,030 | | | | 8,637 | |
| | L’Occitane International SA | | Luxembourg | | | 2,165,250 | | | | 5,460 | |
| | Melco International Development, Ltd. | | Hong Kong | | | 3,891,000 | | | | 8,529 | |
| | NGK Spark Plug Co., Ltd. | | Japan | | | 451,700 | | | | 13,640 | |
| | Samsonite International SA | | Luxembourg | | | 1,976,000 | | | | 5,849 | |
| | Volkswagen AG | | Germany | | | 51,240 | | | | 11,446 | |
| | | | | | | | | | | | |
| | Total | | | | 64,546 | |
| | | | | | | | | | | | |
| | |
| | Consumer Staples (9.7%) | | | | | |
| | AMBEV SA | | Brazil | | | 885,400 | | | | 5,446 | |
| | Diageo PLC | | United
Kingdom | | | 299,835 | | | | 8,599 | |
| | ITC, Ltd. | | India | | | 797,929 | | | | 4,646 | |
| | Reckitt Benckiser Group PLC | | United
Kingdom | | | 103,689 | | | | 8,365 | |
| | SABMiller PLC | | United
Kingdom | | | 201,425 | | | | 10,424 | |
| | Unilever NV | | Netherlands | | | 125,035 | | | | 4,912 | |
| | | | | | | | | | | | |
| | Total | | | | 42,392 | |
| | | | | | | | | | | | |
| | |
| | Energy (5.3%) | | | | | |
| | Inpex Corp. | | Japan | | | 750,700 | | | | 8,329 | |
| | Koninklijke Vopak NV | | Netherlands | | | 32,251 | | | | 1,671 | |
| * | | MEG Energy Corp. | | Canada | | | 92,502 | | | | 1,556 | |
| | PrairieSky Royalty, Ltd. | | Canada | | | 112,849 | | | | 2,972 | |
| | Royal Dutch Shell PLC | | Netherlands | | | 133,522 | | | | 4,466 | |
| | Total SA | | France | | | 85,024 | | | | 4,384 | |
| | | | | | | | | | | | |
| | Total | | | | 23,378 | |
| | | | | | | | | | | | |
| | |
| | Financials (26.4%) | | | | | |
| | AIA Group, Ltd. | | Hong Kong | | | 2,606,800 | | | | 14,304 | |
| | Banco Bilbao Vizcaya Argentaria SA | | Spain | | | 1,460,664 | | | | 6,943 | |
| | Bangkok Bank PCL | | Thailand | | | 701,600 | | | | 4,118 | |
| | BB Seguridade Participacoes SA | | Brazil | | | 172,300 | | | | 2,085 | |
| | BNP Paribas SA | | France | | | 127,656 | | | | 7,502 | |
| | Countrywide PLC | | United
Kingdom | | | 624,385 | | | | 4,247 | |
| * | | Dalian Wanda Commercial Properties Co., Ltd. | | China | | | 572,402 | | | | 3,643 | |
| | Deutsche Bank AG | | Germany | | | 197,767 | | | | 5,978 | |
| | Housing Development Finance Corp., Ltd. | | India | | | 130,221 | | | | 2,330 | |
| | HSBC Holdings PLC | | United
Kingdom | | | 835,002 | | | | 7,891 | |
| | ICICI Bank, Ltd. | | India | | | 723,199 | | | | 4,017 | |
| | Kennedy Wilson Europe Real Estate PLC | | United
Kingdom | | | 556,209 | | | | 9,137 | |
| | Mitsubishi Estate Co., Ltd. | | Japan | | | 206,000 | | | | 4,360 | |
| | Mori Hills REIT Investment Corp. | | Japan | | | 3,164 | | | | 4,527 | |
| * | | National Bank of Greece SA | | Greece | | | 905,222 | | | | 1,608 | |
| | Prudential PLC | | United
Kingdom | | | 440,033 | | | | 10,126 | |
| | Seven Bank, Ltd. | | Japan | | | 2,340,397 | | | | 9,850 | |
| | Societe Generale SA | | France | | | 95,151 | | | | 3,998 | |
| | Turkiye Halk Bankasi A.S. | | Turkey | | | 377,096 | | | | 2,227 | |
| | | | | | | | | | | | |
| | | Foreign Common Stocks (95.9%) | | Country | | Shares/ $ Par | | | Value $ (000’s) | |
| | |
| | Financials continued | | | | | |
| | UniCredit SpA | | Italy | | | 1,033,286 | | | | 6,586 | |
| | | | | | | | | | | | |
| | Total | | | | 115,477 | |
| | | | | | | | | | | | |
| | | | |
| | Health Care (10.6%) | | | | | | | | | | |
| | Bayer AG | | Germany | | | 48,695 | | | | 6,657 | |
| * | | Catamaran Corp. | | Canada | | | 186,321 | | | | 9,642 | |
| | Essilor International SA | | France | | | 78,983 | | | | 8,792 | |
| * | | Indivior PLC | | United
Kingdom | | | 103,689 | | | | 241 | |
| | Novo Nordisk A/S | | Denmark | | | 151,832 | | | | 6,424 | |
| | Roche Holding AG | | Switzerland | | | 31,720 | | | | 8,597 | |
| | Shire PLC | | Ireland | | | 36,304 | | | | 2,569 | |
| * | | Swedish Orphan Biovitrum AB | | Sweden | | | 314,623 | | | | 3,202 | |
| | | | | | | | | | | | |
| | Total | | | | 46,124 | |
| | | | | | | | | | | | |
| | | | |
| | Industrials (5.9%) | | | | | | | | | | |
| | Brenntag AG | | Germany | | | 159,105 | | | | 8,953 | |
| | Panalpina Welttransport Holding AG | | Switzerland | | | 74,643 | | | | 10,021 | |
| | TNT Express NV | | Netherlands | | | 1,006,908 | | | | 6,690 | |
| | | | | | | | | | | | |
| | Total | | | | 25,664 | |
| | | | | | | | | | | | |
| | |
| | Information Technology (11.3%) | | | | | |
| * | | Alibaba Group Holding, Ltd., ADR | | China | | | 57,324 | | | | 5,958 | |
| | ARM Holdings PLC | | United
Kingdom | | | 666,008 | | | | 10,255 | |
| | Hexagon AB - Class B | | Sweden | | | 154,754 | | | | 4,786 | |
| | Keyence Corp. | | Japan | | | 11,700 | | | | 5,183 | |
| | Sumco Corp. | | Japan | | | 360,600 | | | | 5,185 | |
| | Taiwan Semiconductor Manufacturing Co., Ltd. | | Taiwan | | | 2,253,000 | | | | 9,942 | |
| | Tencent Holdings, Ltd. | | China | | | 311,800 | | | | 4,474 | |
| | TravelSky Technology, Ltd. | | China | | | 3,371,000 | | | | 3,622 | |
| | | | | | | | | | | | |
| | Total | | | | 49,405 | |
| | | | | | | | | | | | |
| | |
| | Materials (10.6%) | | | | | |
| | Acerinox SA | | Spain | | | 164,083 | | | | 2,453 | |
| | Alent PLC | | United
Kingdom | | | 1,179,833 | | | | 5,887 | |
| * | | APERAM SA | | Luxembourg | | | 78,457 | | | | 2,297 | |
| | Glencore PLC | | United
Kingdom | | | 2,154,552 | | | | 9,917 | |
| | LyondellBasell Industries NV | | Netherlands | | | 71,897 | | | | 5,708 | |
| * | | Outokumpu OYJ | | Finland | | | 534,900 | | | | 3,039 | |
| | Shin-Etsu Chemical Co., Ltd. | | Japan | | | 147,000 | | | | 9,563 | |
| * | | ThyssenKrupp AG | | Germany | | | 285,999 | | | | 7,356 | |
| | | | | | | | | | | | |
| | Total | | | | 46,220 | |
| | | | | | | | | | | | |
The Accompanying Notes are an Integral Part of the Financial Statements.
| | | | | | |
| | International Growth Portfolio | | | 65 | |
International Growth Portfolio
| | | | | | | | | | | | |
| | | Foreign Common Stocks (95.9%) | | Country | | Shares/
$ Par | | | Value
$ (000’s) | |
| | |
| | Telecommunication Services (1.3%) | | | | | |
| | Vodafone Group PLC | | United Kingdom | | | 1,696,133 | | | | 5,812 | |
| | | | | | | | | | | | |
| | Total | | | | | | | | | 5,812 | |
| | | | | | | | | | | | |
| | Total Foreign Common Stocks
(Cost: $410,928) | | | | 419,018 | |
| | | | | | | | | | | | |
| | Total Investments (95.9%) | | | | | | | | | | |
| | (Cost: $410,928)(a) | | | | | | | | | 419,018 | |
| | | | | | | | | | | | |
| | Other Assets, Less | | | | | | | | | | |
| | Liabilities (4.1%) | | | | | | | | | 17,913 | |
| | | | | | | | | | | | |
| | Net Assets (100.0%) | | | | | | | | | 436,931 | |
| | | | | | | | | | | | |
ADR after the name of a security represents—American Depositary Receipt.
| (a) | At December 31, 2014, the aggregate cost of securities for federal tax purposes (in thousands) was $411,685 and the net unrealized appreciation of investments based on that cost was $7,333 which is comprised of $38,946 aggregate gross unrealized appreciation and $31,613 aggregate gross unrealized depreciation. |
| | | | | | |
Investments Percentage by Country is based on Net Assets: | | | | | | |
United Kingdom | | | 22.8% | | | |
Japan | | | 13.9% | | | |
Germany | | | 9.5% | | | |
Switzerland | | | 6.5% | | | |
France | | | 5.6% | | | |
Netherlands | | | 5.4% | | | |
Hong Kong | | | 5.2% | | | |
Other | | | 27.0% | | | |
Total | | | 95.9% | | | |
The following is a summary of the inputs used in valuing the Portfolio’s assets and liabilities at December 31, 2014. See Note 3 for additional information on portfolio valuation.
| | | | | | | | | | | | | | |
| | | Valuation Inputs | | | |
| Description | | Level 1 –
Quoted Prices | | | Level 2 –
Other Significant
Observable Inputs | | | Level 3 – Significant Unobservable Inputs | | | |
| | | (Amounts in thousands) | | | |
Assets: | | | | | | | | | | | | | | |
Foreign Common Stocks | | | | | | | | | | | | | | |
Consumer Discretionary | | $ | 8,637 | | | $ | 55,909 | | | $ | - | | | |
Consumer Staples | | | 5,446 | | | | 36,946 | | | $ | - | | | |
Energy | | | 4,528 | | | | 18,850 | | | $ | - | | | |
Financials | | | 2,085 | | | | 113,392 | | | $ | - | | | |
Health Care | | | 9,642 | | | | 36,482 | | | $ | - | | | |
Information Technology | | | 5,958 | | | | 43,447 | | | $ | - | | | |
Materials | | | 5,708 | | | | 40,512 | | | $ | - | | | |
All Others | | | - | | | | 31,476 | | | $ | - | | | |
Total | | $ | 42,004 | | | $ | 377,014 | | | $ | - | | | |
During the year ended December 31, 2014 there were transfers from Level 1 to Level 2 in the amount of $377,014 thousand. These transfers were the result of the use of fair value procedures on certain foreign securities in the portfolio on December 31, 2014.
The Accompanying Notes are an Integral Part of the Financial Statements.
| | | | |
| 66 | | International Growth Portfolio | | |
Research International Core Portfolio (unaudited)
| | | | |
| Objective: | | Portfolio Strategy: | | Net Assets: |
| Capital appreciation. | | Invest primarily in foreign equity securities, including emerging markets. | | $457 million |
Portfolio Overview
Mason Street Advisors, LLC (“Mason Street Advisors”), the investment adviser for the Research International Core Portfolio (the “Portfolio”), has engaged Massachusetts Financial Services Company (“MFS®”) to act as sub-adviser for the Portfolio. The Portfolio normally invests in foreign equity securities, including emerging market equity securities. A team of research analysts selects investments for the Portfolio using a “bottom up” investment approach. MFS® allocates the Portfolio’s assets to analysts by broad market sectors, which generally approximate the sector weightings in the MSCI EAFE® Index. The adviser may invest the Portfolio’s assets in stocks of companies it believes to have above average earnings growth potential compared to other companies (growth companies), and in the stocks of companies it believes are undervalued compared to their perceived worth (value companies), or in a combination of growth and value companies. The Portfolio also may invest in companies of any size.
Market Overview
Early in 2014, U.S. equities suffered what proved to be a temporary setback due to concerns over emerging markets, as well as a pause in U.S. economic growth, partially caused by extreme weather events. Markets soon recovered as the economic pause concluded and investors appeared to have become increasingly comfortable that newly-installed US Federal Reserve (the “Fed”) Chair Janet Yellen would not make any substantial changes to the trajectory of the Fed’s monetary policy.
A generally risk-friendly environment persisted from February 2014 until mid-year. While geopolitical tensions flared in the Middle East and Ukraine, any market setbacks were short-lived, as improving economic growth in the U.S., coupled with prospects for easier monetary policy in regions with slowing growth, such as Japan, Europe and China, supported risk assets. For example, the European Central Bank (the “ECB”) cut policy interest rates into negative territory. By the end of the year, expectations were for additional rate cuts and the announcement for non-conventional easing measures by the ECB. Similarly, the Bank of Japan surprised markets late in the year with fresh stimulus measures given lackluster growth trends. The related decline in developed market interest rates was also supportive for equity markets.
At the end of the year, the U.S. equity market was trading close to all-time highs and U.S. Treasury yields were close to their lows for the year. However, credit markets did not fare as well in the second half of 2014, particularly U.S. high yield and emerging market debt. The higher weightings of oil and gas credits in these asset classes resulted in widening spreads and increased volatility, as oil prices began to decline in an accelerated fashion in the fourth quarter.
Portfolio Results
For the twelve months ended December 31, 2014, the Portfolio returned (6.71%). By comparison, its primary and secondary benchmarks, the MSCI® All Country World (ex-US) Index and MSCI EAFE® Index, returned (3.44%) and (4.48%), respectively. (These Indices are unmanaged, cannot be invested in directly, and do not include administrative expenses or sales charges.) The Portfolio underperformed the average return of its peer group, International Multi-Cap Core Funds, which was (5.02%) for 2014, according to Lipper® Analytical Services, Inc., an independent mutual fund ranking agency. The performance attribution commentary is presented against the MSCI EAFE® Index (the “Index”).
Stock selection within the Financials sector detracted from performance relative to the Index, led by overweight positions in banking and financial services firms Sumitomo Mitsui Financial Group, Inc. (Japan), Erste Group Bank AG (Austria) and Mitsubishi Estate Co., Ltd. (Japan).
Weak stock selection in both the Industrials sector also weakened relative returns. Within the sector, an overweight position in global engineering company JGC Corp. (Japan) weighed on relative results.
Individual holdings in various sectors of the Portfolio also detracted from relative performance. Overweight positions in automotive company Honda Motor Co., Ltd. (Japan), steel producer Gerdau SA (Brazil), mining company Iluka Resources, Ltd. (Australia), casino resort operator Sands China, Ltd. (Macau) and oil and gas company BG Group PLC (United Kingdom) held back relative performance, as all five stocks underperformed the Index.
Generally strong stock selection in the Energy and Information Technology sectors contributed to relative performance. In addition, stock selection in the Telecommunication Services sector aided relative returns. Within Telecommunication Services, an overweight position in telecommunications company KDDI Corp. (Japan) boosted relative returns.
Elsewhere, overweight positions in pharmaceutical companies Novartis AG (Switzerland) and Santen Pharmaceuticals Co., Ltd. (Japan), banking and financial services firms HDFC Bank, Ltd. (India), DBS Group Holdings, Ltd. (Singapore) and Kasikornbank PCL (Thailand), hotel and restaurant chain operator Whitbread PLC (United Kingdom) and automotive safety systems manufacturer Autoliv, Inc. (Sweden) strengthened relative performance.
Portfolio Manager Outlook
The following forward looking comments are the opinion of MFS®, the Portfolio’s sub-adviser.
| | | | | | |
| | Research International Core Portfolio | | | 67 | |
Research International Core Portfolio (unaudited)
The Research International Core Portfolio is a sector-neutral portfolio that emphasizes bottom-up fundamental research. Because of this approach, the Portfolio’s sector weightings vary only modestly from those of the Index. Instead, we attempt to outperform the Index by holding what we believe to be the most attractive opportunities among growth and value companies within each sector of the Index without regard to market capitalization.
Relative Performance

| | | | | | | | | | | | |
Average Annual Total Returns
For Periods Ended December 31, 2014 | |
| | | 1 Year | | | 5 Years | | | Since
Inception* | |
Research International Core Portfolio | | | -6.71 | % | | | 5.19 | % | | | 0.27 | % |
MSCI® All Country World (ex-US) Index (Gross) | | | -3.44 | % | | | 4.89 | % | | | 0.83 | % |
MSCI EAFE® Index (Gross) | | | -4.48 | % | | | 5.81 | % | | | 0.33 | % |
Lipper® Variable Insurance Products (VIP) International Mulit-Cap Core Funds Average | | | -5.02 | % | | | 5.62 | % | | | – | |
* Inception date of 4/30/07
The performance data quoted represents past performance. Past performance is historical and does not guarantee future performance. Investment return and principal value will fluctuate, so that shares, when redeemed, may be worth more or less than their original cost. Current performance may be lower or higher than the performance data quoted. For the most recent month-end performance information visit www.northwesternmutual.com.
This chart assumes an initial investment of $10,000 made on 4/30/07 (commencement of the Portfolio’s operations). Returns shown reflect fee waivers, deductions for management and other portfolio expenses, and reinvestment of all dividends. In the absence of fee waivers, total return would be reduced. Returns exclude deductions for separate account sale loads and account fees. Please refer to the Benchmark Definitions section of this report for information about the indices cited in the above chart and graph.
Investors should be aware of the risks of investments in foreign securities, particularly investments in securities of companies in developing nations. These include the
risks of currency fluctuation, of political and economic instability and of less well-developed government supervision and regulation of business and industry practices, as well as differences in accounting standards.
Investments in the securities of companies in developing nations impose risks different from, and greater than, risks of investing in developed countries.
The Portfolio may invest a relatively large percentage of its assets in issuers located in a single country, a small number of countries, or a particular geographic region. The Portfolio’s performance may be more volatile than that of a more geographically diversified fund, and may be tied more closely to the performance of a single country or region.
Top 10 Equity Holdings 12/31/14
| | |
| Security Description | | % of Net Assets |
Roche Holding AG | | 3.3% |
Novartis AG | | 3.0% |
Royal Dutch Shell PLC - Class A | | 3.0% |
Nestle SA | | 2.7% |
HSBC Holdings PLC | | 2.3% |
Bayer AG | | 2.2% |
Rio Tinto PLC | | 2.0% |
Denso Corp. | | 2.0% |
KDDI Corp. | | 1.9% |
Schneider Electric SE | | 1.8% |
Sector Allocation 12/31/14

Sector Allocation is based on Net Assets.
Sector Allocation and Top 10 Holdings are subject to change.
| | | | |
| 68 | | Research International Core Portfolio | | |
Research International Core Portfolio
Schedule of Investments
December 31, 2014
| | | | | | | | | | | | |
| | | Foreign Common Stocks (97.9%) | | Country | | Shares/
$ Par | | | Value
$ (000’s) | |
| | | |
| | Consumer Discretionary (12.8%) | | | | | | | | |
| | Autoliv, Inc. | | United
States | | | 46,427 | | | | 4,927 | |
| | Compass Group PLC | | United
Kingdom | | | 205,687 | | | | 3,506 | |
| | Denso Corp. | | Japan | | | 191,300 | | | | 8,916 | |
| | Esprit Holdings, Ltd. | | Hong Kong | | | 1,007,000 | | | | 1,203 | |
| * | | Global Brands Group Holding, Ltd. | | Bermuda | | | 5,772,000 | | | | 1,128 | |
| | Hennes & Mauritz AB - B Shares | | Sweden | | | 24,105 | | | | 1,000 | |
| | Honda Motor Co., Ltd. | | Japan | | | 219,700 | | | | 6,389 | |
| | Li & Fung, Ltd. | | Hong Kong | | | 898,000 | | | | 840 | |
| | Lojas Renner SA | | Brazil | | | 48,823 | | | | 1,404 | |
| | LVMH Moet Hennessy Louis Vuitton SA | | France | | | 29,131 | | | | 4,607 | |
| | ProSiebenSat.1 Media AG | | Germany | | | 46,686 | | | | 1,967 | |
| | Reed Elsevier NV | | Netherlands | | | 164,190 | | | | 3,924 | |
| | Ryohin Keikaku Co., Ltd. | | Japan | | | 11,700 | | | | 1,446 | |
| | Sands China, Ltd. | | Macau | | | 468,400 | | | | 2,281 | |
| | Whitbread PLC | | United
Kingdom | | | 80,453 | | | | 5,937 | |
| | WPP PLC | | Jersey
Channel
Islands | | | 244,449 | | | | 5,071 | |
| | Yum! Brands, Inc. | | United
States | | | 52,870 | | | | 3,851 | |
| | | | | | | | | | | | |
| | Total | | | | 58,397 | |
| | | | | | | | | | | | |
| | Consumer Staples (9.7%) | | | | | | | | |
| | Danone SA | | France | | | 110,752 | | | | 7,286 | |
| | Japan Tobacco, Inc. | | Japan | | | 169,800 | | | | 4,662 | |
| | L’Oreal SA | | France | | | 28,756 | | | | 4,828 | |
| | M Dias Branco SA | | Brazil | | | 59,016 | | | | 2,020 | |
| | Nestle SA | | Switzerland | | | 165,542 | | | | 12,134 | |
| | Pernod Ricard SA | | France | | | 54,225 | | | | 6,012 | |
| | Reckitt Benckiser Group PLC | | United
Kingdom | | | 61,493 | | | | 4,961 | |
| | Sundrug Co., Ltd. | | Japan | | | 58,000 | | | | 2,348 | |
| | | | | | | | | | | | |
| | Total | | | | 44,251 | |
| | | | | | | | | | | | |
| | |
| | Energy (5.7%) | | | | | |
| | BG Group PLC | | United
Kingdom | | | 251,557 | | | | 3,348 | |
| * | | Cairn Energy PLC | | United
Kingdom | | | 224,961 | | | | 617 | |
| | Cenovus Energy, Inc. | | Canada | | | 53,269 | | | | 1,099 | |
| | Galp Energia SGPS SA | | Portugal | | | 109,310 | | | | 1,106 | |
| | INPEX Corp. | | Japan | | | 174,200 | | | | 1,933 | |
| | Oil Search, Ltd. | | Australia | | | 168,235 | | | | 1,087 | |
| | Reliance Industries, Ltd. | | India | | | 111,042 | | | | 1,562 | |
| | Royal Dutch Shell PLC – Class A | | Netherlands | | | 413,678 | | | | 13,712 | |
| | Technip SA | | France | | | 23,002 | | | | 1,374 | |
| | | | | | | | | | | | |
| | Total | | | | 25,838 | |
| | | | | | | | | | | | |
| | |
| | Financials (24.5%) | | | | | |
| | AEON Financial Service Co., Ltd. | | Japan | | | 96,700 | | | | 1,890 | |
| | AIA Group, Ltd. | | Hong Kong | | | 1,399,600 | | | | 7,680 | |
| | BNP Paribas SA | | France | | | 106,284 | | | | 6,246 | |
| | BOC Hong Kong Holdings, Ltd. | | Hong Kong | | | 403,500 | | |
| 1,341
|
|
| | | | | | | | | | | | |
| | | Foreign Common Stocks (97.9%) | | Country | | Shares/
$ Par | | | Value
$ (000’s) | |
| | | |
| | Financials continued | | | | | | | | |
| | DBS Group Holdings, Ltd. | | Singapore | | | 331,000 | | | | 5,111 | |
| | Deutsche Wohnen AG | | Germany | | | 91,951 | | | | 2,185 | |
| | Erste Group Bank AG | | Austria | | | 109,398 | | | | 2,508 | |
| | HDFC Bank, Ltd., ADR | | India | | | 35,084 | | | | 1,781 | |
| | Hiscox, Ltd. | | Bermuda | | | 164,457 | | | | 1,847 | |
| | HSBC Holdings PLC | | United
Kingdom | | | 1,089,523 | | | | 10,297 | |
| * | | ING Groep NV | | Netherlands | | | 514,947 | | | | 6,667 | |
| | Intu Properties PLC | | United
Kingdom | | | 382,614 | | | | 1,979 | |
| * | | Julius Baer Group, Ltd. | | Switzerland | | | 69,645 | | | | 3,178 | |
| | Kasikornbank PCL | | Thailand | | | 253,700 | | | | 1,752 | |
| * | | KBC Groep NV | | Belgium | | | 98,673 | | | | 5,476 | |
| | Mitsubishi UFJ Financial Group, Inc. | | Japan | | | 1,047,900 | | | | 5,744 | |
| | Prudential PLC | | United
Kingdom | | | 178,403 | | | | 4,105 | |
| * | | Royal Bank of Scotland Group PLC | | United
Kingdom | | | 906,954 | | | | 5,506 | |
| | Sberbank of Russia, ADR | | Russia | | | 186,840 | | | | 757 | |
| | Sony Financial Holdings, Inc. | | Japan | | | 106,700 | | | | 1,573 | |
| | Standard Chartered PLC | | United
Kingdom | | | 246,143 | | | | 3,691 | |
| | Sumitomo Mitsui Financial Group, Inc. | | Japan | | | 133,200 | | | | 4,813 | |
| * | | UBS Group AG | | Switzerland | | | 457,033 | | | | 7,856 | |
| | UniCredit SpA | | Italy | | | 507,348 | | | | 3,234 | |
| | Westpac Banking Corp. | | Australia | | | 297,483 | | | | 7,997 | |
| * | | Zurich Insurance Group AG | | Switzerland | | | 22,326 | | | | 6,991 | |
| | | | | | | | | | | | |
| | Total | | | | 112,205 | |
| | | | | | | | | | | | |
| | |
| | Health Care (11.0%) | | | | | |
| | Bayer AG | | Germany | | | 71,979 | | | | 9,840 | |
| * | | Indivior PLC | | United
Kingdom | | | 54,370 | | | | 127 | |
| | Novartis AG | | Switzerland | | | 150,939 | | | | 13,882 | |
| | Odontoprev SA | | Brazil | | | 284,755 | | | | 1,056 | |
| | Roche Holding AG | | Switzerland | | | 54,712 | | | | 14,829 | |
| | Santen Pharmaceutical Co., Ltd. | | Japan | | | 124,600 | | | | 6,668 | |
| | Sonova Holding AG | | Switzerland | | | 8,584 | | | | 1,258 | |
| | Terumo Corp. | | Japan | | | 112,600 | | | | 2,565 | |
| | | | | | | | | | | | |
| | Total | | | | 50,225 | |
| | | | | | | | | | | | |
| | |
| | Industrials (10.9%) | | | | | |
| | Atlas Copco AB | | Sweden | | | 262,146 | | | | 7,297 | |
| | Brenntag AG | | Germany | | | 28,872 | | | | 1,625 | |
| | Hutchison Whampoa, Ltd. | | Hong Kong | | | 334,000 | | | | 3,828 | |
| | JGC Corp. | | Japan | | | 132,000 | | | | 2,720 | |
| | Joy Global, Inc. | | United
States | | | 65,171 | | | | 3,032 | |
| | Legrand SA | | France | | | 27,021 | | | | 1,415 | |
| | Mitsubishi Corp. | | Japan | | | 138,400 | | | | 2,538 | |
| | Schindler Holding AG | | Switzerland | | | 34,999 | | | | 5,050 | |
| | Schneider Electric SE | | France | | | 114,730 | | | | 8,337 | |
| | Siemens AG | | Germany | | | 65,640 | | | | 7,444 | |
| | Yamato Holdings Co., Ltd. | | Japan | | | 336,700 | | | | 6,630 | |
| | | | | | | | | | | | |
| | Total | | | | 49,916 | |
| | | | | | | | | | | | |
The Accompanying Notes are an Integral Part of the Financial Statements.
| | | | | | |
| | Research International Core Portfolio | | | 69 | |
Research International Core Portfolio
| | | | | | | | | | | | |
| | | Foreign Common Stocks (97.9%) | | Country | | Shares/
$ Par | | | Value
$ (000’s) | |
| | | |
| | Information Technology (6.6%) | | | | | | | | |
| * | | Cognizant Technology Solutions Corp. - Class A | | United
States | | | 83,505 | | | | 4,397 | |
| | Computershare, Ltd. | | Australia | | | 236,945 | | | | 2,266 | |
| | Dassault Systemes SA | | France | | | 39,409 | | | | 2,398 | |
| | Infineon Technologies AG | | Germany | | | 270,514 | | | | 2,900 | |
| | MediaTek, Inc. | | Taiwan | | | 396,000 | | | | 5,765 | |
| | Nomura Research Institute, Ltd. | | Japan | | | 73,200 | | | | 2,248 | |
| | Taiwan Semiconductor Manufacturing Co., Ltd. | | Taiwan | | | 1,242,189 | | | | 5,482 | |
| | Telefonaktiebolaget LM Ericsson - Class B | | Sweden | | | 394,486 | | | | 4,778 | |
| | | | | | | | | | | | |
| | Total | | | | | | | | | 30,234 | |
| | | | | | | | | | | | |
| | |
| | Materials (7.7%) | | | | | |
| | Akzo Nobel NV | | Netherlands | | | 102,304 | | | | 7,094 | |
| | Gerdau SA, ADR | | Brazil | | | 311,970 | | | | 1,108 | |
| | Iluka Resources, Ltd. | | Australia | | | 430,007 | | | | 2,067 | |
| | JSR Corp. | | Japan | | | 324,600 | | | | 5,574 | |
| | Linde AG | | Germany | | | 39,178 | | | | 7,308 | |
| | Rio Tinto PLC | | United
Kingdom | | | 196,127 | | | | 9,036 | |
| | Symrise AG | | Germany | | | 48,123 | | | | 2,918 | |
| | | | | | | | | | | | |
| | Total | | | | | | | | | 35,105 | |
| | | | | | | | | | | | |
| | |
| | Telecommunication Services (5.2%) | | | | | |
| | BT Group PLC | | United
Kingdom | | | 337,774 | | | | 2,097 | |
| * | | Hellenic Telecommunications Organization SA | | Greece | | | 125,000 | | | | 1,364 | |
| | KDDI Corp. | | Japan | | | 139,700 | | | | 8,741 | |
| | Koninklijke KPN NV | | Netherlands | | | 625,955 | | | | 1,974 | |
| * | | Mobile TeleSystems OJSC | | Russia | | | 193,472 | | | | 538 | |
| | Philippine Long Distance Telephone Co. | | Philippines | | | 19,850 | | | | 1,281 | |
| | Telecom Italia S.p.A. - Rights | | Italy | | | 2,017,527 | | | | 1,686 | |
| | Telefonica Brasil SA, ADR | | Brazil | | | 54,245 | | | | 959 | |
| | Vodafone Group PLC | | United
Kingdom | | | 1,436,969 | | | | 4,924 | |
| | | | | | | | | | | | |
| | Total | | | | | | | | | 23,564 | |
| | | | | | | | | | | | |
| | |
| | Utilities (3.8%) | | | | | |
| | APA Group | | Australia | | | 398,195 | | | | 2,425 | |
| | Canadian Utilities, Ltd. | | Canada | | | 68,510 | | | | 2,412 | |
| | Centrica PLC | | United
Kingdom | | | 541,977 | | | | 2,333 | |
| | China Resources Gas Group, Ltd. | | Hong Kong | | | 806,000 | | | | 2,085 | |
| | GDF Suez | | France | | | 193,249 | | | | 4,513 | |
| | Tokyo Gas Co., Ltd. | | Japan | | | 677,000 | | | | 3,653 | |
| | | | | | | | | | | | |
| | Total | | | | | | | | | 17,421 | |
| | | | | | | | | | | | |
| | |
| | Total Foreign Common Stocks | | | | | |
| | (Cost: $434,843) | | | | | | | | | 447,156 | |
| | | | | | | | | | | | |
| | | | | | | | | | | | |
| | | Short-Term Investments (0.4%) | | Country | | Shares/
$ Par | | | Value
$ (000’s) | |
| | | | |
| | Commercial Paper continued | | | | | | | | | | |
| | HSBC Americas, 0.02%, 1/2/15 | | United States | | | 1,981,000 | | | | 1,981 | |
| | | | | | | | | | | | |
| | Total | | | | | | | | | 1,981 | |
| | | | | | | | | | | | |
| | | |
| | Total Short-Term Investments | | | | | | | | |
| | (Cost: $1,981) | | | | | | | 1,981 | |
| | | | | | | | | | | | |
| | | |
| | Total Investments (98.3%) | | | | | | | | |
| | (Cost: $436,824)(a) | | | | | | | 449,137 | |
| | | | | | | | | | | | |
| | Other Assets, Less Liabilities (1.7%) | | | | | | | | | 7,871 | |
| | | | | | | | | | | | |
| | Net Assets (100.0%) | | | | | | | | | 457,008 | |
| | | | | | | | | | | | |
The Accompanying Notes are an Integral Part of the Financial Statements.
| | | | |
| 70 | | Research International Core Portfolio | | |
Research International Core Portfolio
| | ADR after the name of a security represents—American Depositary Receipt. |
| (a) | At December 31, 2014, the aggregate cost of securities for federal tax purposes (in thousands) was $440,169 and the net unrealized appreciation of investments based on that cost was $8,968 which is comprised of $40,717 aggregate gross unrealized appreciation and $31,749 aggregate gross unrealized depreciation. |
| | | | | | |
Investments Percentage by Country is based on Net Assets: | | | | | | |
Japan | | | 17.7% | | | |
Switzerland | | | 14.3% | | | |
United Kingdom | | | 13.7% | | | |
France | | | 10.3% | | | |
Germany | | | 7.9% | | | |
Netherlands | | | 7.3% | | | |
Other | | | 27.1% | | | |
Total | | | 98.3% | | | |
The following is a summary of the inputs used in valuing the Portfolio’s assets and liabilities at December 31, 2014. See Note 3 for additional information on portfolio valuation.
| | | | | | | | | | | | | | |
| | | Valuation Inputs | | | |
| Description | | Level 1 – Quoted Prices | | | Level 2 – Other Significant Observable Inputs | | | Level 3 – Significant Unobservable Inputs | | | |
| | | (Amounts in thousands) | | | |
Assets: | | | | | | | | | | | | | | |
Foreign Common Stocks | | | | | | | | | | | | | | |
Consumer Discretionary | | $ | 10,182 | | | $ | 48,215 | | | $ | - | | | |
Consumer Staples | | | 2,020 | | | | 42,231 | | | | - | | | |
Energy | | | 1,099 | | | | 24,739 | | | | - | | | |
Financials | | | 2,537 | | | | 109,668 | | | | - | | | |
Health Care | | | 1,056 | | | | 49,169 | | | | - | | | |
Industrials | | | 3,032 | | | | 46,884 | | | | - | | | |
Information Technology | | | 4,397 | | | | 25,837 | | | | - | | | |
Materials | | | 1,108 | | | | 33,997 | | | | - | | | |
Telecommunication Services | | | 959 | | | | 22,605 | | | | - | | | |
Utilities | | | 2,412 | | | | 15,009 | | | | - | | | |
Short-Term Investments | | | - | | | | 1,981 | | | | - | | | |
Total | | $ | 28,802 | | | $ | 420,335 | | | $ | - | | | |
During the year ended December 31, 2014 there were transfers from Level 1 to Level 2 in the amount of $417,813 thousand. These transfers were the result of the use of fair value procedures on certain foreign securities in the portfolio on December 31,2014.
The Accompanying Notes are an Integral Part of the Financial Statements.
| | | | | | |
| | Research International Core Portfolio | | | 71 | |
International Equity Portfolio (unaudited)
| | | | |
| Objective: | | Portfolio Strategy: | | Net Assets: |
| Long-term growth of capital. Any income realized will be incidental. | | Invests primarily in equity securities of issuers outside of the U.S. with favorable long-term potential relative to current market values. | | $1.6 billion |
Portfolio Overview
Mason Street Advisors, LLC (“Mason Street Advisors”), the investment adviser for the International Equity Portfolio (“the Portfolio”), has engaged Templeton Investment Counsel, LLC (“Templeton”) to act as sub-adviser for the Portfolio. The Portfolio may purchase securities in any foreign country, developed or undeveloped. The Portfolio’s investments in equity securities may include small, medium and large capitalization issues that the Portfolio’s sub-adviser believes are undervalued. The Portfolio’s strategy reflects a “bottom up”, value oriented and long-term investment philosophy. In choosing equity investments, the Portfolio will focus on the market price of a company’s securities in relation to its long-term earnings, asset value and cash flow potential. A company’s historical value measures, including price/earnings ratio, profit margins and liquidation value, will also be considered.
Market Overview
The global economy grew moderately during 2014. U.S. economic growth accelerated while growth rates in much of the rest of the world declined. The U.S. Federal Reserve ended its asset purchase program in October while keeping interest rates low. The U.K. economy grew relatively well, but eurozone economic growth remained subdued. The European Central Bank reduced its main interest rate and implemented an asset purchase program. Japan’s economy entered a recession, and the Bank of Japan expanded its stimulus measures. Global developed market stocks advanced overall during the twelve-month period amid a generally accommodative monetary policy environment and continued strength in corporate earnings. Emerging market stocks overall fell for the year, amid headwinds such as soft domestic demand, weak exports, plummeting crude oil prices, regional geopolitical tensions and concerns about possible U.S. interest rate increases.
Portfolio Results
For the twelve months ended December 31, 2014, the Portfolio returned (8.80%). By comparison, the Portfolio’s benchmark, the MSCI® All Country World (ex-US) Index (the “Index”), returned (3.44%). (The Index is unmanaged, cannot be invested in directly and does not include administrative expenses or sales charges.) The average return for the Portfolio’s peer group, International Multi-Cap Value Funds, was (6.40%) for 2014, according to Lipper® Analytical Services, Inc., an independent mutual fund rating agency.
From a sector standpoint, underperformance relative to the Index during the period came from stock selection in the Portfolio’s overweighted Energy position. The portfolio managers did not know when or at what price equilibrium would be restored to oil markets, and instead focused on the long-term fundamental prospects of individual energy companies. As energy companies improved capital allocation and refocused on shareholder returns, the portfolio managers continued to find what they considered were long-term bargains in the sector.
Underweighted Consumer Staples holdings also detracted, pressured by U.K. grocer Tesco PLC’s (“Tesco”) share price, which declined toward year-end, as the firm issued three profit warnings in five months. Although Tesco’s turnaround has been more difficult than expected, the portfolio managers remained positive toward the company’s strategy to revive sales and regain market share by improving the quality of its products and offering a stronger, clearer price message.
Stock selection supported relative performance in the Materials and Industrials sectors. The latter accounted for several of the Portfolio’s top contributors, led by Australian airline Qantas Airways Limited. Qantas shares nearly doubled in the final two months of the year as the price of oil declined and the firm benefited from improving fundamentals in international and domestic markets.
From a regional standpoint, stock selection and an overweighting in Europe detracted from relative performance, as the delicate progress that had been made towards stabilizing the banking system, enacting necessary budget reforms and preparing for further monetary stimulus failed to restore corporate confidence or revive lending activity. Concerns about Europe, along with worries about a slowing China and destabilized Russia, have made European equities cheap according to the portfolio managers. In contrast, stock selection buoyed the Portfolio’s underweighted Asian holdings.
Portfolio Manager Outlook
The following forward looking comments are the opinion of Templeton, the Portfolio’s sub-adviser.
In recent years, we feel that stocks have traded more on macroeconomic and policy expectations than on business fundamentals. This trend has, in our view, resulted in an increasingly bifurcated market in which the winners (U.S. stocks, consumer cyclicals, health care) kept surging farther ahead and the losers (international stocks, industrial cyclicals) kept falling farther behind. Throughout this challenging period, we have tried to use the market’s distraction to our advantage by focusing on what we determined to be overlooked value. In doing so, we have continued to build portfolios based on our long-term assumptions about company-level business fundamentals. We believe outperformance comes from value recognition, and it has been our experience that price and value have the potential to intersect over time. Going into 2015, we continue to believe that our portfolios contain far more value than their prices seem to reflect.
| | | | |
| 72 | | International Equity Portfolio | | |
International Equity Portfolio (unaudited)
Relative Performance
| | | | | | | | | | | | |
Average Annual Total Returns For Periods Ended December 31, 2014 | |
| | | 1 Year | | | 5 Years | | | 10 Years | |
International Equity Portfolio | | | -8.80% | | | | 5.42% | | | | 5.32% | |
MSCI® All Country World (ex-US) Index (Gross) | | | -3.44% | | | | 4.89% | | | | 5.59% | |
MSCI EAFE® Index (Gross) | | | -4.48% | | | | 5.81% | | | | 4.91% | |
Lipper® Variable Insurance Products (VIP) International Multi-Cap Value Funds Average | | | -6.40% | | | | 4.51% | | | | 3.40% | |
The performance data quoted represents past performance. Past performance is historical and does not guarantee future performance. Investment return and principal value will fluctuate, so that shares, when redeemed, may be worth more or less than their original cost. Current performance may be lower or higher than the performance data quoted. For the most recent month-end performance information visit www.northwesternmutual.com.
This chart assumes an initial investment of $10,000 made on 12/31/04. Returns shown include deductions for management and other portfolio expenses, and reinvestment of all dividends. Returns exclude deductions for separate account sale loads and account fees. Please refer to the Benchmark Definitions section of this report for information about the indices cited in the above chart and graph.
Investors should be aware of the risks of investments in foreign securities, particularly investments in securities of companies in developing nations. These include the risks of currency fluctuation, of political and economic instability and of less well-developed government supervision and regulation of business and industry practices, as well as differences in accounting standards.
Investments in the securities of companies in developing nations impose risks different from, and greater than, risks of investing in developed countries.
The Portfolio may invest a relatively large percentage of its assets in issuers located in a single country, a small number of countries, or a particular geographic region. The Portfolio’s performance may be more volatile than that of a more geographically diversified fund, and may be tied more closely to the performance of a single country or region.
Top 10 Equity Holdings 12/31/14
| | |
| Security Description | | % of Net Assets |
Samsung Electronics Co., Ltd. | | 2.2% |
Telenor ASA | | 2.1% |
Qantas Airways, Ltd. | | 2.1% |
DBS Group Holdings, Ltd. | | 2.1% |
Teva Pharmaceutical Industries, Ltd., ADR | | 2.0% |
China Telecom Corp., Ltd. - Class H | | 2.0% |
Credit Agricole SA | | 1.9% |
Singapore Telecommunications, Ltd. | | 1.9% |
Royal Dutch Shell PLC - Class B | | 1.8% |
Bayer AG | | 1.8% |
Sector Allocation 12/31/14

Sector Allocation is based on Net Assets.
Sector Allocation and Top 10 Holdings are subject to change.
| | | | | | |
| | International Equity Portfolio | | | 73 | |
International Equity Portfolio
Schedule of Investments
December 31, 2014
| | | | | | | | | | | | |
| | | Foreign Common Stocks (97.1%) | | Country | | Shares/
$ Par | | | Value
$ (000’s) | |
| |
| | Consumer Discretionary (10.4%) | |
| | Cie Generale des Etablissements Michelin | | France | | | 157,858 | | | | 14,312 | |
| | Haier Electronics Group Co., Ltd. | | Hong Kong | | | 11,224,550 | | | | 26,671 | |
| * | | Hyundai Mobis Co., Ltd. | | South Korea | | | 66,060 | | | | 14,060 | |
| * | | Hyundai Motor Co. | | South Korea | | | 53,030 | | | | 8,051 | |
| | Kingfisher PLC | | United Kingdom | | | 4,233,390 | | | | 22,308 | |
| | Nikon Corp. | | Japan | | | 311,500 | | | | 4,136 | |
| | Nissan Motor Co., Ltd. | | Japan | | | 2,477,990 | | | | 21,584 | |
| | SEB SA | | France | | | 195,270 | | | | 14,532 | |
| | Sky PLC | | United Kingdom | | | 1,290,860 | | | | 17,966 | |
| | Toyota Motor Corp. | | Japan | | | 414,280 | | | | 25,835 | |
| | | | | | | | | | | | |
| | Total | | | | | | | | | 169,455 | |
| | | | | | | | | | | | |
| |
| | Consumer Staples (2.3%) | |
| * | | METRO AG | | Germany | | | 302,910 | | | | 9,274 | |
| | Suntory Beverage & Food, Ltd. | | Japan | | | 401,300 | | | | 13,856 | |
| | Tesco PLC | | United Kingdom | | | 4,916,610 | | | | 14,307 | |
| | | | | | | | | | | | |
| | Total | | | | | | | | | 37,437 | |
| | | | | | | | | | | | |
| |
| | Energy (9.4%) | |
| | BP PLC | | United Kingdom | | | 2,335,890 | | | | 14,832 | |
| | China Shenhua Energy Co., Ltd. | | China | | | 4,099,940 | | | | 12,048 | |
| | Eni SpA | | Italy | | | 1,116,505 | | | | 19,500 | |
| | Galp Energia SGPS SA | | Portugal | | | 1,849,900 | | | | 18,715 | |
| | Kunlun Energy Co., Ltd. | | Bermuda | | | 9,531,920 | | | | 9,063 | |
| | Petrofac, Ltd. | | United Kingdom | | | 304,149 | | | | 3,299 | |
| | Petroleo Brasileiro SA, ADR | | Brazil | | | 654,340 | | | | 4,777 | |
| | Royal Dutch Shell PLC - Class B | | United Kingdom | | | 849,205 | | | | 29,174 | |
| * | | Saipem SpA | | Italy | | | 124,300 | | | | 1,305 | |
| | Statoil ASA | | Norway | | | 197,050 | | | | 3,453 | |
| | Talisman Energy, Inc. | | Canada | | | 1,011,970 | | | | 7,926 | |
| | Technip SA | | France | | | 162,980 | | | | 9,732 | |
| | Total SA | | France | | | 347,570 | | | | 17,921 | |
| | Trican Well Service, Ltd. | | Canada | | | 526,500 | | | | 2,524 | |
| | | | | | | | | | | | |
| | Total | | | | | | | | | 154,269 | |
| | | | | | | | | | | | |
| |
| | Financials (24.9%) | |
| | Aegon NV | | Netherlands | | | 931,090 | | | | 6,986 | |
| | AIA Group, Ltd. | | Hong Kong | | | 2,679,820 | | | | 14,705 | |
| | Aviva PLC | | United Kingdom | | | 2,395,180 | | | | 17,947 | |
| | AXA SA | | France | | | 744,155 | | | | 17,187 | |
| | Bangkok Bank PCL | | Thailand | | | 2,911,000 | | | | 17,088 | |
| | Barclays PLC | | United Kingdom | | | 2,967,820 | | | | 11,157 | |
| | BNP Paribas SA | | France | | | 446,500 | | | | 26,238 | |
| | Cheung Kong Holdings, Ltd. | | Hong Kong | | | 741,850 | | | | 12,398 | |
| | China Life Insurance Co., Ltd. | | China | | | 6,621,000 | | | | 25,844 | |
| | Credit Agricole SA | | France | | | 2,406,300 | | | | 30,935 | |
| * | | Credit Suisse Group AG | | Switzerland | | | 974,615 | | | | 24,432 | |
| | DBS Group Holdings, Ltd. | | Singapore | | | 2,175,000 | | | | 33,587 | |
| | | | | | | | | | | | |
| | | Foreign Common Stocks (97.1%) | | Country | | Shares/
$ Par | | | Value
$ (000’s) | |
| |
| | Financials continued | |
| | Deutsche Boerse AG | | Germany | | | 324,180 | | | | 23,232 | |
| | Hana Financial Group, Inc. | | South Korea | | | 344,710 | | | | 9,958 | |
| | Housing Development Finance Corp., Ltd. | | India | | | 47,610 | | | | 852 | |
| | HSBC Holdings PLC | | United Kingdom | | | 2,956,937 | | | | 28,113 | |
| * | | ING Groep NV | | Netherlands | | | 1,199,292 | | | | 15,528 | |
| | Intesa Sanpaolo SpA | | Italy | | | 624,420 | | | | 1,806 | |
| * | | NN Group NV | | Netherlands | | | 679,540 | | | | 20,249 | |
| | Standard Chartered PLC | | United Kingdom | | | 1,335,740 | | | | 20,032 | |
| * | | Swiss Re AG | | Switzerland | | | 200,752 | | | | 16,798 | |
| | UniCredit SpA | | Italy | | | 3,147,550 | | | | 20,061 | |
| | UNIQA Insurance Group AG | | Austria | | | 1,268,484 | | | | 11,875 | |
| | | | | | | | | | | | |
| | Total | | | | | | | | | 407,008 | |
| | | | | | | | | | | | |
| |
| | Health Care (16.3%) | |
| * | | Basilea Pharmaceutica AG | | Switzerland | | | 87,430 | | | | 8,086 | |
| | Bayer AG | | Germany | | | 209,050 | | | | 28,579 | |
| | Draegerwerk AG & Co. KGaA | | Germany | | | 92,710 | | | | 9,407 | |
| | Gerresheimer AG | | Germany | | | 134,790 | | | | 7,290 | |
| | Getinge AB - Class B | | Sweden | | | 591,650 | | | | 13,439 | |
| | GlaxoSmithKline PLC | | United Kingdom | | | 909,640 | | | | 19,462 | |
| | H Lundbeck A/S | | Denmark | | | 398,070 | | | | 7,916 | |
| | Ipsen SA | | France | | | 282,440 | | | | 14,689 | |
| | Merck KGaA | | Germany | | | 292,250 | | | | 27,724 | |
| * | | MorphoSys AG | | Germany | | | 168,120 | | | | 15,566 | |
| * | | QIAGEN NV | | Netherlands | | | 393,320 | | | | 9,211 | |
| | Roche Holding AG | | Switzerland | | | 96,190 | | | | 26,071 | |
| | Sanofi | | France | | | 55,425 | | | | 5,051 | |
| | Shanghai Pharmaceuticals Holding Co., Ltd. | | China | | | 7,792,400 | | | | 17,516 | |
| | Sinopharm Group Co., Ltd. | | China | | | 2,023,200 | | | | 7,134 | |
| * | | Sorin SpA | | Italy | | | 1,547,340 | | | | 3,606 | |
| | Teva Pharmaceutical Industries, Ltd., ADR | | Israel | | | 570,080 | | | | 32,785 | |
| | UCB SA | | Belgium | | | 177,210 | | | | 13,449 | |
| | | | | | | | | | | | |
| | Total | | | | | | | | | 266,981 | |
| | | | | | | | | | | | |
| |
| | Industrials (10.0%) | |
| * | | ABB, Ltd. | | Switzerland | | | 643,060 | | | | 13,602 | |
| * | | China CNR Corp., Ltd. | | China | | | 10,215,000 | | | | 14,622 | |
| | Cie de Saint-Gobain | | France | | | 341,910 | | | | 14,394 | |
| | CSR Corp., Ltd. | | China | | | 11,290,000 | | | | 15,200 | |
| | Deutsche Lufthansa AG | | Germany | | | 491,830 | | | | 8,237 | |
| | FLSmidth & Co. A/S | | Denmark | | | 68,780 | | | | 3,017 | |
| | Hutchison Whampoa, Ltd. | | Hong Kong | | | 1,897,983 | | | | 21,754 | |
| * | | Qantas Airways, Ltd. | | Australia | | | 17,523,680 | | | | 33,978 | |
| | Serco Group PLC | | United Kingdom | | | 1,766,090 | | | | 4,392 | |
| | Siemens AG, ADR | | Germany | | | 27,290 | | | | 3,056 | |
| | TNT Express NV | | Netherlands | | | 3,846,610 | | | | 25,556 | |
| | Weichai Power Co., Ltd. | | China | | | 1,170,000 | | | | 4,895 | |
| | | | | | | | | | | | |
| | Total | | | | | | | | | 162,703 | |
| | | | | | | | | | | | |
The Accompanying Notes are an Integral Part of the Financial Statements.
| | |
| 74 | | International Equity Portfolio |
International Equity Portfolio
| | | | | | | | | | | | |
| | | Foreign Common Stocks (97.1%) | | Country | | Shares/
$ Par | | | Value
$ (000’s) | |
| |
| | Information Technology (6.5%) | |
| | Capcom Co., Ltd. | | Japan | | | 468,400 | | | | 7,060 | |
| | Infineon Technologies AG | | Germany | | | 1,580,200 | | | | 16,941 | |
| | Konica Minolta, Inc. | | Japan | | | 819,800 | | | | 8,843 | |
| | Samsung Electronics Co., Ltd. | | South Korea | | | 30,140 | | | | 36,230 | |
| | Software AG | | Germany | | | 519,740 | | | | 12,699 | |
| | Taiwan Semiconductor Manufacturing Co., Ltd. | | Taiwan | | | 5,624,945 | | | | 24,821 | |
| | | | | | | | | | | | |
| | Total | | | | | | | | | 106,594 | |
| | | | | | | | | | | | |
| |
| | Materials (7.4%) | |
| | Akzo Nobel NV | | Netherlands | | | 336,140 | | | | 23,309 | |
| | CRH PLC | | Ireland | | | 558,050 | | | | 13,255 | |
| | HeidelbergCement AG | | Germany | | | 303,280 | | | | 21,575 | |
| | LANXESS AG | | Germany | | | 175,080 | | | | 8,145 | |
| | MMC Norilsk Nickel OJSC, ADR | | Russia | | | 1,671,710 | | | | 23,772 | |
| | POSCO | | South Korea | | | 37,010 | | | | 9,338 | |
| | POSCO, ADR | | South Korea | | | 92,600 | | | | 5,909 | |
| | Rexam PLC | | United Kingdom | | | 2,173,720 | | | | 15,282 | |
| | | | | | | | | | | | |
| | Total | | | | | | | | | 120,585 | |
| | | | | | | | | | | | |
| |
| | Telecommunication Services (8.8%) | |
| | China Mobile, Ltd. | | Hong Kong | | | 478,700 | | | | 5,636 | |
| | China Telecom Corp., Ltd. - Class H | | China | | | 54,694,000 | | | | 31,859 | |
| | Mobile TeleSystems OJSC, ADR | | Russia | | | 737,210 | | | | 5,293 | |
| | Singapore Telecommunications, Ltd. | | Singapore | | | 10,531,850 | | | | 30,915 | |
| | Telefonica SA | | Spain | | | 1,740,805 | | | | 24,900 | |
| | Telenor ASA | | Norway | | | 1,699,790 | | | | 34,274 | |
| * | | Vivendi SA | | France | | | 201,800 | | | | 5,034 | |
| | Vodafone Group PLC | | United Kingdom | | | 1,697,694 | | | | 5,817 | |
| | | | | | | | | | | | |
| | Total | | | | | | | | | 143,728 | |
| | | | | | | | | | | | |
| |
| | Utilities (1.1%) | |
| | Power Grid Corp. of India, Ltd. | | India | | | 8,352,110 | | | | 18,208 | |
| | | | | | | | | | | | |
| | Total | | | | | | | | | 18,208 | |
| | | | | | | | | | | | |
| | | |
| | Total Foreign Common Stocks | | | | | | | | |
| | (Cost: $1,506,219) | | | | | | | 1,586,968 | |
| | | | | | | | | | | | |
| | | | | | | | | | | | |
| | | | |
| | | Short-Term Investments (1.2%) | | Country | | Shares/ $ Par | | | Value $ (000’s) | |
| |
| | Commercial Paper (1.2%) | |
| | Federal Farm Credit Bank, 0.01%, 1/2/15 | | United States | | | 20,000,000 | | | | 20,000 | |
| | | | | | | | | | | | |
| | Total | | | | | | | | | 20,000 | |
| | | | | | | | | | | | |
| | | |
| | Total Short-Term Investments | | | | | | | | |
| | (Cost: $20,000) | | | | | | | 20,000 | |
| | | | | | | | | | | | |
| | | |
| | Total Investments (98.3%) | | | | | | | | |
| | (Cost: $1,526,219)(a) | | | | | | | 1,606,968 | |
| | | | | | | | | | | | |
| | Other Assets, Less | | | | | | | | | | |
| | Liabilities (1.7%) | | | | | | | | | 28,410 | |
| | | | | | | | | | | | |
| | Net Assets (100.0%) | | | | | | | | | 1,635,378 | |
| | | | | | | | | | | | |
The Accompanying Notes are an Integral Part of the Financial Statements.
| | | | | | |
| | International Equity Portfolio | | | 75 | |
International Equity Portfolio
| | ADR after the name of a security represents—American Depositary Receipt. |
| (a) | At December 31, 2014, the aggregate cost of securities for federal tax purposes (in thousands) was $1,526,219 and the net unrealized appreciation of investments based on that cost was $80,749 which is comprised of $256,568 aggregate gross unrealized appreciation and $175,819 aggregate gross unrealized depreciation. |
| | | | | | |
Investments Percentage by Country is based on Net Assets: | | | | | | |
United Kingdom | | | 13.7% | | | |
Germany | | | 11.7% | | | |
France | | | 10.4% | | | |
China | | | 7.9% | | | |
Netherlands | | | 6.2% | | | |
Switzerland | | | 5.4% | | | |
South Korea | | | 5.1% | | | |
Other | | | 37.9% | | | |
Total | | | 98.3% | | | |
The following is a summary of the inputs used in valuing the Portfolio’s assets and liabilities at December 31, 2014. See Note 3 for additional information on portfolio valuation.
| | | | | | | | | | | | | | |
| | | Valuation Inputs | | | |
| Description | | Level 1 – Quoted Prices | | | Level 2 – Other Significant Observable Inputs | | | Level 3 – Significant Unobservable Inputs | | | |
| | | (Amounts in thousands) | | | |
Assets: | | | | | | | | | | | | | | |
Foreign Common Stocks | | | | | | | | | | | | | | |
Energy | | $ | 15,227 | | | $ | 139,042 | | | $ | - | | | |
Health Care | | | 32,785 | | | | 234,196 | | | | - | | | |
Industrials | | | 3,056 | | | | 159,647 | | | | - | | | |
Materials | | | 29,681 | | | | 90,904 | | | | - | | | |
Telecommunication Services | | | 5,293 | | | | 138,435 | | | | - | | | |
All Others | | | - | | | | 738,702 | | | | - | | | |
Short-Term Investments | | | - | | | | 20,000 | | | | - | | | |
Total | | $ | 86,042 | | | $ | 1,520,926 | | | $ | - | | | |
During the year ended December 31, 2014 there were transfers from Level 1 to Level 2 in the amount of $1,500,926 thousand. These transfers were the result of the use of fair value procedures on certain foreign securities in the portfolio on December 31, 2014.
The Accompanying Notes are an Integral Part of the Financial Statements.
| | | | |
| 76 | | International Equity Portfolio | | |
Emerging Markets Equity Portfolio (unaudited)
| | | | |
| Objective: | | Portfolio Strategy: | | Net Assets: |
| Capital Appreciation. | | Invest in equity securities of issuers that are tied economically to emerging market countries. | | $417 million |
Portfolio Overview
Mason Street Advisors, LLC (“Mason Street Advisors”), the investment adviser for the Emerging Markets Equity Portfolio (“the Portfolio”), has engaged Massachusetts Financial Services Company (“MFS®”) to act as sub-adviser for the Portfolio. The Portfolio normally invests in equity securities of issuers that are tied economically to emerging market countries. Emerging market countries include countries determined by the Portfolio’s adviser to have emerging market economies, taking into account a number of factors, including whether a particular country has a low- to middle-income economy according to the International Bank for Reconstruction and Development (the World Bank), the country’s designation by the International Monetary Fund as an emerging market, the country’s inclusion in an emerging market index and other factors that demonstrate that the country’s financial and capital markets are in the development phase. The Portfolio may invest in companies of any size. Investments are selected primarily based on fundamental analysis of individual issuers and their potential in light of their current financial condition and market, economic, political and regulatory conditions.
Market Overview
Early in 2014, U.S. equities suffered what proved to be a temporary setback due to concerns over emerging markets, as well as a pause in U.S. economic growth, partially caused by extreme weather events. Markets soon recovered as the economic pause concluded and investors appeared to have become increasingly comfortable that newly-installed U.S. Federal Reserve (the “Fed”) Chair Janet Yellen would not make any substantial changes to the trajectory of the Fed’s monetary policy.
A generally risk-friendly environment persisted from February 2014 until mid-year. While geopolitical tensions flared in the Middle East and Ukraine, any market setbacks were short-lived, as improving economic growth in the U.S., coupled with prospects for easier monetary policy in regions with slowing growth, such as Japan, Europe and China, supported risk assets. For example, the European Central Bank (the “ECB”) cut policy interest rates into negative territory. By the end of the year, expectations were for additional rate cuts and the announcement for non-conventional easing measures by the ECB. Similarly, the Bank of Japan surprised markets late in the year with fresh stimulus measures given lackluster growth trends. The related decline in developed market interest rates was also supportive for equity markets.
At the end of the year, the U.S. equity market was trading close to all-time highs and U.S. Treasury yields were close to their lows for the period. However, credit markets did not fare as well in the second half of 2014, particularly U.S. high yield and emerging market debt. The higher weightings of oil and gas credits in these asset classes resulted in widening spreads and increased volatility, as oil prices began to decline in an accelerated fashion in the fourth quarter.
Portfolio Results
For the twelve months ended December 31, 2014, the Portfolio returned (6.25%). This compares with a return of (1.82%) for the Portfolio’s benchmark, the MSCI® Emerging Markets Index (the “Index”). (This Index is unmanaged, cannot be invested in directly and does not include administrative expenses or sales charges.) The average return of its peer group, Emerging Markets Funds, was (4.78%) for 2014, according to Lipper® Analytical Services, Inc., an independent mutual fund ranking agency.
Weak stock selection within the Industrials sector detracted from performance relative to the Index, led by the Portfolio’s positions in Brazilian specialty engineering services company Mills Estruturas e Servicos de Engenharia SA and shipping company Diana Shipping, Inc. (Greece).
Stock selection in both the Telecommunication Services and Health Care sectors also hampered relative returns. Within the Telecommunication Services sector, an overweight position in Russian telecommunications company Mobile TeleSystems held back relative results. There were no individual stocks within the Health Care sector that were among the Portfolio’s top relative detractors during the period. Stocks in other sectors that detracted from relative performance included holdings of insurance and brokerage services provider Brasil Insurance Participacoes e Administracao SA (Brazil), pipe manufacturer TMK OAO (Russia), oil and gas exploration company Gran Tierra Energy, Inc. (United States), banking group Standard Chartered PLC (United Kingdom) and South Korean LED devices manufacturer Seoul Semiconductor Co., Ltd.
On the upside, an underweight allocation to the Energy sector helped relative results. In addition, an underweight position in poor-performing Russian natural gas producer Gazprom OAO boosted relative returns.
Favorable stock selection in the Consumer Staples sector also aided relative performance. Within this sector, an overweight position in ayurvedic and natural health care products maker Dabur India, Ltd. (India) boosted relative returns, as the stock turned in strong performance in 2014.
Stocks in other sectors that contributed to relative performance included overweight positions in financial services company Housing Development Finance (India), banking group Kasikornbank PCL (Thailand), semiconductor manufacturer Taiwan Semiconductor (Taiwan), and banking services providers, Kotak Mahindra Bank (India) and BDO Unibank, Inc. (Philippines).
| | | | | | |
| | Emerging Markets Equity Portfolio | | | 77 | |
Emerging Markets Equity Portfolio (unaudited)
Portfolio Manager Outlook
The following forward looking comments are the opinion of MFS®, the Portfolio’s sub-adviser.
Regardless of changing economic and market conditions, we will continue to adhere to our investment process, basing our investment decisions primarily on fundamental analysis and our view of their potential in light of the broader market environment, including economic, political and regulatory conditions. As a result, the Portfolio’s sector and industry allocations will reflect where we are finding what we believe to be the best investment opportunities at any given time.
Relative Performance

| | | | | | | | | | | | |
Average Annual Total Returns For Periods Ended December 31, 2014 | |
| | | 1 Year | | | 5 Years | | | Since Inception* | |
Emerging Markets Equity Portfolio | | | -6.25 | % | | | 1.30 | % | | | 0.14 | % |
MSCI® Emerging Markets Index (Gross) | | | -1.82 | % | | | 2.11 | % | | | 2.56 | % |
Lipper® Variable Insurance Products (VIP) Emerging Markets Funds Average | | | -4.78 | % | | | 1.78 | % | | | – | |
| * | Inception date of 4/30/07 |
The performance data quoted represents past performance. Past performance is historical and does not guarantee future performance. Investment return and principal value will fluctuate, so that shares, when redeemed, may be worth more or less than their original cost. Current performance may be lower or higher than the performance data quoted. For the most recent month-end performance information visit www.northwesternmutual.com.
This chart assumes an initial investment of $10,000 made on 4/30/07 (commencement of the Portfolio’s operations). Returns shown reflect fee waivers, deductions for management and other portfolio expenses, and reinvestment of all dividends. In the absence of fee waivers, total return would be reduced. Returns exclude deductions for separate account sale loads and account fees. Please refer to the Benchmark Definitions section of this report for information about the indices cited in the above chart and graph.
Investors should be aware of the risks of investments in foreign securities, particularly investments in securities of companies in developing nations. These include the
risks of currency fluctuation, of political and economic instability and of less well-developed government supervision and regulation of business and industry practices, as well as differences in accounting standards.
Investments in the securities of companies in developing nations impose risks different from, and greater than, risks of investing in developed countries.
The Portfolio may invest a relatively large percentage of its assets in issuers located in a single country, a small number of countries, or a particular geographic region. The Portfolio’s performance may be more volatile than that of a more geographically diversified fund, and may be tied more closely to the performance of a single country or region.
Top 10 Equity Holdings 12/31/14
| | |
| Security Description | | % of Net Assets |
Taiwan Semiconductor Manufacturing Co., Ltd. | | 5.5% |
Naspers, Ltd. - Class N | | 3.6% |
Samsung Electronics Co., Ltd. | | 3.6% |
China Construction Bank Corp. - Class H | | 3.1% |
MediaTek, Inc. | | 2.7% |
Housing Development Finance Corp., Ltd. | | 2.4% |
Cognizant Technology Solutions Corp. | | 2.4% |
Techtronic Industries Co., Ltd. | | 1.9% |
Kia Motors Corp. | | 1.9% |
LG Household & Health Care, Ltd. | | 1.9% |
Sector Allocation 12/31/14

Sector Allocation is based on Net Assets.
Sector Allocation and Top 10 Holdings are subject to change.
| | | | |
| 78 | | Emerging Markets Equity Portfolio | | |
Emerging Markets Equity Portfolio
Schedule of Investments
December 31, 2014
| | | | | | | | | | | | |
| | | Foreign Common Stocks (97.8%) | | Country | | Shares/ $ Par | | | Value $ (000’s) | |
| |
| | Consumer Discretionary (18.2%) | |
| | Ajisen China Holdings, Ltd. | | Hong Kong | | | 2,566,000 | | | | 1,953 | |
| | Astro Malaysia Holdings Bhd | | Malaysia | | | 3,445,600 | | | | 2,976 | |
| | Estacio Participacoes SA | | Brazil | | | 399,745 | | | | 3,582 | |
| * | | Global Brands Group Holding, Ltd. | | Bermuda | | | 16,952,000 | | | | 3,314 | |
| | Guangzhou Automobile Group Co., Ltd. | | China | | | 8,220,000 | | | | 7,419 | |
| | Imperial Holdings, Ltd. | | South Africa | | | 122,513 | | | | 1,942 | |
| | Kia Motors Corp. | | South Korea | | | 166,688 | | | | 7,876 | |
| | Kroton Educacional SA | | Brazil | | | 203,304 | | | | 1,185 | |
| | Li & Fung, Ltd. | | Hong Kong | | | 2,890,000 | | | | 2,703 | |
| | Minor International PCL | | Thailand | | | 2,783,310 | | | | 2,749 | |
| | Mitra Adiperkasa Tbk PT | | Indonesia | | | 540,000 | | | | 220 | |
| | Naspers, Ltd. - Class N | | South Africa | | | 116,753 | | | | 15,032 | |
| | SACI Falabella | | Chile | | | 264,251 | | | | 1,773 | |
| | Samsonite International SA | | Luxembourg | | | 647,700 | | | | 1,917 | |
| | Sands China, Ltd. | | Macau | | | 356,000 | | | | 1,734 | |
| | Stella International Holdings, Ltd. | | Hong Kong | | | 2,194,500 | | | | 5,758 | |
| | Techtronic Industries Co., Ltd. | | Hong Kong | | | 2,467,000 | | | | 7,906 | |
| | Woolworths Holdings, Ltd. | | South Africa | | | 881,742 | | | | 5,829 | |
| | | | | | | | | | | | |
| | Total | | | | | | | | | 75,868 | |
| | | | | | | | | | | | |
| |
| | Consumer Staples (12.6%) | |
| | AMBEV SA, ADR | | Brazil | | | 759,933 | | | | 4,727 | |
| | AVI, Ltd. | | South Africa | | | 324,120 | | | | 2,172 | |
| | BRF SA | | Brazil | | | 68,956 | | | | 1,646 | |
| | Dabur India, Ltd. | | India | | | 1,540,378 | | | | 5,695 | |
| | Dairy Farm International Holdings, Ltd. | | Hong Kong | | | 252,000 | | | | 2,268 | |
| | E-Mart Co., Ltd. | | South Korea | | | 20,567 | | | | 3,789 | |
| * | | Grupo Lala SAB de CV | | Mexico | | | 648,703 | | | | 1,254 | |
| | Gudang Garam Tbk PT | | Indonesia | | | 376,500 | | | | 1,847 | |
| | ITC, Ltd. | | India | | | 319,684 | | | | 1,861 | |
| | LG Household & Health Care, Ltd. | | South Korea | | | 13,894 | | | | 7,873 | |
| | M Dias Branco SA | | Brazil | | | 64,987 | | | | 2,225 | |
| * | | Magnit PJSC | | Russia | | | 22,903 | | | | 3,657 | |
| | SABMiller PLC | | United Kingdom | | | 140,576 | | | | 7,275 | |
| | Want Want China Holdings, Ltd. | | Cayman Islands | | | 2,995,000 | | | | 3,929 | |
| | Wumart Stores, Inc. | | China | | | 2,715,000 | | | | 2,322 | |
| | | | | | | | | | | | |
| | Total | | | | | | | | | 52,540 | |
| | | | | | | | | | | | |
| |
| | Energy (5.7%) | |
| | China Shenhua Energy Co., Ltd. - Class H | | China | | | 2,176,000 | | | | 6,394 | |
| * | | Gran Tierra Energy, Inc. | | United States | | | 953,232 | | | | 3,659 | |
| | INPEX Corp. | | Japan | | | 330,700 | | | | 3,669 | |
| * | | Lamprell PLC | | United Arab
Emirates | | | 1,312,539 | | | | 2,439 | |
| | NovaTek OAO-GDR | | Russia | | | 49,198 | | | | 3,857 | |
| | Petroleo Brasileiro SA, ADR | | Brazil | | | 234,301 | | | | 1,711 | |
| | | | | | | | | | | | |
| | | Foreign Common Stocks (97.8%) | | Country | | Shares/ $ Par | | | Value $ (000’s) | |
| |
| | Energy continued | |
| | Reliance Industries, Ltd. | | India | | | 137,824 | | | | 1,939 | |
| | | | | | | | | | | | |
| | Total | | | | | | | | | 23,668 | |
| | | | | | | | | | | | |
| |
| | Financials (29.4%) | |
| | Bancolombia SA, ADR | | Colombia | | | 32,704 | | | | 1,566 | |
| | Bangkok Bank PCL | | Thailand | | | 174,600 | | | | 1,036 | |
| | Bank Mandiri Persero Tbk PT | | Indonesia | | | 2,120,000 | | | | 1,830 | |
| | BDO Unibank, Inc. | | Philippines | | | 2,300,920 | | | | 5,628 | |
| | BM&FBOVESPA SA | | Brazil | | | 1,006,476 | | | | 3,729 | |
| | BOC Hong Kong Holdings, Ltd. | | Hong Kong | | | 1,232,000 | | | | 4,094 | |
| | Bolsa Mexicana de Valores SAB de CV | | Mexico | | | 887,236 | | | | 1,607 | |
| | Brasil Insurance Participacoes e Administracao SA | | Brazil | | | 558,560 | | | | 714 | |
| | Cathay Financial Holding Co., Ltd. | | Taiwan | | | 3,155,800 | | | | 4,643 | |
| | China Construction Bank Corp. - Class H | | China | | | 15,842,020 | | | | 12,853 | |
| | China Pacific Insurance Group Co., Ltd. - Class H | | China | | | 1,574,000 | | | | 7,838 | |
| * | | Compartamos SAB de CV | | Mexico | | | 690,179 | | | | 1,387 | |
| | Concentradora Fibra Danhos SA de CV | | Mexico | | | 677,908 | | | | 1,654 | |
| | Concentradora Fibra Hotelera Mexicana SA de CV | | Mexico | | | 1,328,261 | | | | 2,035 | |
| | Credicorp, Ltd. | | Bermuda | | | 29,810 | | | | 4,775 | |
| | E.Sun Financial Holding Co., Ltd. | | Taiwan | | | 10,798,979 | | | | 6,695 | |
| | First Pacific Co., Ltd. | | Hong Kong | | | 3,914,750 | | | | 3,859 | |
| | Grupo Financiero Banorte SAB de CV | | Mexico | | | 473,685 | | | | 2,617 | |
| | Hang Lung Properties, Ltd. | | Hong Kong | | | 1,368,000 | | | | 3,812 | |
| | Housing Development Finance Corp., Ltd. | | India | | | 559,252 | | | | 10,005 | |
| | Iguatemi Empresa de Shopping Centers SA | | Brazil | | | 173,962 | | | | 1,610 | |
| | Itau Unibanco Holding SA, ADR | | Brazil | | | 220,120 | | | | 2,864 | |
| | Kasikornbank PCL-NVDR | | Thailand | | | 1,044,600 | | | | 7,213 | |
| | Kasikornbank PCL | | Thailand | | | 343,400 | | | | 2,386 | |
| | Komercni Banka AS | | Czech Republic | | | 19,470 | | | | 4,011 | |
| | Kotak Mahindra Bank, Ltd. | | India | | | 275,006 | | | | 5,476 | |
| * | | Prologis Property Mexico SA de CV | | Mexico | | | 1,000,175 | | | | 1,842 | |
| | Samsung Fire & Marine Insurance Co., Ltd. | | South Korea | | | 8,345 | | | | 2,138 | |
| * | | Sberbank of Russia | | Russia | | | 2,686,463 | | | | 2,428 | |
| | Standard Chartered PLC | | United
Kingdom | | | 237,525 | | | | 3,536 | |
| | Turkiye Garanti Bankasi AS | | Turkey | | | 1,282,073 | | | | 5,137 | |
| | Turkiye Sinai Kalkinma Bankasi AS | | Turkey | | | 1,949,810 | | | | 1,680 | |
| | | | | | | | | | | | |
| | Total | | | | | | | | | 122,698 | |
| | | | | | | | | | | | |
The Accompanying Notes are an Integral Part of the Financial Statements.
| | | | | | |
| | Emerging Markets Equity Portfolio | | | 79 | |
Emerging Markets Equity Portfolio
| | | | | | | | | | | | |
| | | Foreign Common Stocks (97.8%) | | Country | | Shares/ $ Par | | | Value $ (000’s) | |
| |
| | Health Care (2.0%) | |
| * | | Genomma Lab Internacional SAB de CV - Class B | | Mexico | | | 1,098,500 | | | | 2,093 | |
| | OdontoPrev SA | | Brazil | | | 793,457 | | | | 2,943 | |
| * | | Qualicorp SA | | Brazil | | | 115,107 | | | | 1,204 | |
| | Top Glove Corp. Bhd | | Malaysia | | | 1,451,400 | | | | 1,877 | |
| | | | | | | | | | | | |
| | Total | | | | | | | | | 8,117 | |
| | | | | | | | | | | | |
| |
| | Industrials (4.4%) | |
| * | | 51job, Inc., ADR | | China | | | 92,397 | | | | 3,312 | |
| | Copa Holdings SA | | Panama | | | 21,893 | | | | 2,269 | |
| * | | Diana Shipping, Inc. | | Marshall
Islands | | | 371,162 | | | | 2,491 | |
| | Glory, Ltd. | | Japan | | | 106,900 | | | | 2,857 | |
| | Haitian International Holdings, Ltd. | | Cayman Islands | | | 256,000 | | | | 538 | |
| | Localiza Rent a Car SA | | Brazil | | | 114,405 | | | | 1,537 | |
| | Mills Estruturas e Servicos de Engenharia SA | | Brazil | | | 374,408 | | | | 1,345 | |
| | Pacific Basin Shipping, Ltd. | | Bermuda | | | 3,769,614 | | | | 1,515 | |
| * | | Promotora y Operadora de Infraestructura SAB de CV | | Mexico | | | 106,710 | | | | 1,287 | |
| * | | TK Corp. | | South Korea | | | 128,231 | | | | 1,333 | |
| | | | | | | | | | | | |
| | Total | | | | | | | | | 18,484 | |
| | | | | | | | | | | | |
| |
| | Information Technology (15.9%) | |
| * | | Cognizant Technology Solutions Corp. | | United States | | | 187,605 | | | | 9,879 | |
| | Hon Hai Precision Industry Co., Ltd. | | Taiwan | | | 70,109 | | | | 194 | |
| | MediaTek, Inc. | | Taiwan | | | 785,000 | | | | 11,428 | |
| | NAVER Corp. | | South Korea | | | 5,766 | | | | 3,725 | |
| | Samsung Electronics Co., Ltd. | | South Korea | | | 12,347 | | | | 14,842 | |
| * | | Seoul Semiconductor Co., Ltd. | | South Korea | | | 70,468 | | | | 1,281 | |
| | Siliconware Precision Industries Co., Ltd. | | Taiwan | | | 1,444,000 | | | | 2,177 | |
| | Taiwan Semiconductor Manufacturing Co., Ltd. | | Taiwan | | | 5,175,290 | | | | 22,837 | |
| | | | | | | | | | | | |
| | Total | | | | | | | | | 66,363 | |
| | | | | | | | | | | | |
| |
| | Materials (3.5%) | |
| * | | Cemex SAB de CV, ADR | | Mexico | | | 236,659 | | | | 2,411 | |
| * | | Fibria Celulose SA | | Brazil | | | 156,177 | | | | 1,910 | |
| | Gerdau SA, ADR | | Brazil | | | 455,910 | | | | 1,618 | |
| | Grupo Mexico SAB de CV - Series B | | Mexico | | | 616,385 | | | | 1,788 | |
| | Iluka Resources, Ltd. | | Australia | | | 289,293 | | | | 1,391 | |
| | LG Chem, Ltd. | | South Korea | | | 12,743 | | | | 2,080 | |
| | PTT Global Chemical PCL | | Thailand | | | 896,000 | | | | 1,396 | |
| | Vale SA, ADR | | Brazil | | | 244,276 | | | | 1,998 | |
| | | | | | | | | | | | |
| | Total | | | | | | | | | 14,592 | |
| | | | | | | | | | | | |
| |
| | Telecommunication Services (4.4%) | |
| | America Movil SAB de CV - Series L, ADR | | Mexico | | | 128,386 | | | | 2,848 | |
| | China Mobile, Ltd. | | Hong Kong | | | 464,500 | | | | 5,469 | |
| * | | Hellenic Telecommunications Organization SA | | Greece | | | 170,415 | | | | 1,860 | |
| | MTN Group, Ltd. | | South Africa | | | 272,354 | | | | 5,168 | |
| | Orange Polska SA | | Poland | | | 739,943 | | | | 1,733 | |
| | | | | | | | | | | | |
| | | Foreign Common Stocks (97.8%) | | Country | | Shares/ $ Par | | | Value $ (000’s) | |
| |
| | Telecommunication Services continued | |
| | PT XL Axiata Tbk | | Indonesia | | | 3,209,500 | | | | 1,251 | |
| | | | | | | | | | | | |
| | Total | | | | | | | | | 18,329 | |
| | | | | | | | | | | | |
| |
| | Utilities (1.7%) | |
| | Alupar Investimento SA | | Brazil | | | 208,977 | | | | 1,387 | |
| | CESC, Ltd. | | India | | | 381,656 | | | | 4,028 | |
| | China Resources Gas Group, Ltd. | | Hong Kong | | | 666,000 | | | | 1,723 | |
| | | | | | | | | | | | |
| | Total | | | | | | | | | 7,138 | |
| | | | | | | | | | | | |
| | | |
| | Total Foreign Common Stocks | | | | | | | | |
| | (Cost: $422,043) | | | | | | | 407,797 | |
| | | | | | | | | | | | |
| | | | |
| | | Warrants (0.1%) | | | | | | | | |
| |
| | Consumer Discretionary (0.0%) | |
| * | | Minor International PCL | | Thailand | | | 252,460 | | | | 37 | |
| |
| | Financials (0.1%) | |
| * | | Emaar Malls Group PJSC | | Luxembourg | | | 603,822 | | | | 435 | |
| | | | | | | | | | | | |
| | | |
| | Total Warrants | | | | | | | | |
| | (Cost: $519) | | | | | | | 472 | |
| | | | | | | | | | | | |
| | | | |
| | | Short-Term Investments (0.4%) | | | | | | | | |
| |
| | Commercial Paper (0.4%) | |
| | HSBC Americas, 0.02%, 1/2/15 | | United States | | | 1,800,000 | | | | 1,800 | |
| | | | | | | | | | | | |
| | Total | | | | | | | | | 1,800 | |
| | | | | | | | | | | | |
| | | |
| | Total Short-Term Investments | | | | | | | | |
| | (Cost: $1,800) | | | | | | | 1,800 | |
| | | | | | | | | | | | |
| | | |
| | Total Investments (98.3%) | | | | | | | | |
| | (Cost: $424,362)(a) | | | | | | | 410,069 | |
| | | | | | | | | | | | |
| | Other Assets, Less | | | | | | | | | | |
| | Liabilities (1.7%) | | | | | | | | | 6,928 | |
| | | | | | | | | | | | |
| | Net Assets (100.0%) | | | | | | | | | 416,997 | |
| | | | | | | | | | | | |
The Accompanying Notes are an Integral Part of the Financial Statements.
| | | | |
| 80 | | Emerging Markets Equity Portfolio | | |
Emerging Markets Equity Portfolio
| | ADR after the name of a security represents—American Depositary Receipt. |
| (a) | At December 31, 2014, the aggregate cost of securities for federal tax purposes (in thousands) was $427,925 and the net unrealized depreciation of investments based on that cost was $17,856 which is comprised of $35,832 aggregate gross unrealized appreciation and $53,688 aggregate gross unrealized depreciation. |
| | | | | | |
Investments Percentage by Country is based on Net Assets: | | | | | | |
Taiwan | | | 11.5% | | | |
South Korea | | | 10.8% | | | |
China | | | 9.6% | | | |
Hong Kong | | | 9.5% | | | |
Brazil | | | 9.1% | | | |
South Africa | | | 7.2% | | | |
India | | | 7.0% | | | |
Mexico | | | 5.5% | | | |
Other | | | 28.1% | | | |
Total | | | 98.3% | | | |
| (h) | Forward foreign currency contracts outstanding on December 31, 2014. |
| | | | | | | | | | | | | | | | | | | | | | |
| Type | | Counterparty | | Currency | | Principal Amount Covered by Contract (000’s) | | Settlement Month | | | Unrealized Appreciation (000’s) | | | Unrealized (Depreciation) (000’s) | | | Net Unrealized Appreciation/ (Depreciation) (000’s) | |
| |
Sell | | Brown Brothers Harriman and Co. | | PHP | | 33,485 | | | 1/15 | | | $ | - | | | $ | - | | | $ | - (m) | |
| | | | | | | | | | | | | | | | | | | | | | |
| | | | | | | | | | | | $ | - | | | $ | - | | | $ | - | |
| | | | | | | | | | | | | | | | | | | | | | |
PHP — Philippines Peso
| (m) | Amount is less than one thousand. |
The following is a summary of the inputs used in valuing the Portfolio’s assets and liabilities at December 31, 2014. See Note 3 for additional information on portfolio valuation.
| | | | | | | | | | | | | | |
| | | Valuation Inputs | | | |
| Description | | Level 1 – Quoted Prices | | | Level 2 – Other Significant Observable Inputs | | | Level 3 – Significant Unobservable Inputs | | | |
| | | (Amounts in thousands) | | | |
Assets: | | | | | | | | | | | | | | |
Foreign Common Stocks | | | | | | | | | | | | | | |
Consumer Discretionary | | $ | 6,540 | | | $ | 69,365 | | | $ | - | | | |
Consumer Staples | | | 12,120 | | | | 40,420 | | | | - | | | |
Energy | | | 9,227 | | | | 14,441 | | | | - | | | |
Financials | | | 26,400 | | | | 96,733 | | | | - | | | |
Health Care | | | 6,240 | | | | 1,877 | | | | - | | | |
Industrials | | | 12,241 | | | | 6,243 | | | | - | | | |
Information Technology | | | 9,879 | | | | 56,484 | | | | - | | | |
Materials | | | 9,726 | | | | 4,866 | | | | - | | | |
Telecommunication Services | | | 2,848 | | | | 15,481 | | | | - | | | |
Utilities | | | 1,387 | | | | 5,751 | | | | - | | | |
Short-Term Investments | | | - | | | | 1,800 | | | | - | | | |
Total Assets | | $ | 96,608 | | | $ | 313,461 | | | $ | - | | | |
Liabilities: | | | | | | | | | | | | | | |
Other Financial Instruments^ | | | | | | | | | | | | | | |
Forward Currency Contracts | | | - | | | | - (m) | | | | - | | | |
Total Liabilities | | $ | - | | | $ | - (m) | | | $ | - | | | |
^ Other financial instruments are derivative instruments such as futures, forwards, written options and swaps contracts, which are valued at the unrealized appreciation (depreciation) on the instrument and short sales, which are valued at market value.
During the year ended December 31, 2014 there were transfers from Level 1 to Level 2 in the amount of $302,355 thousand. These transfers were the result of the use of fair value procedures on certain foreign securities in the portfolio on December 31, 2014.
The Accompanying Notes are an Integral Part of the Financial Statements.
| | | | | | |
| | Emerging Markets Equity Portfolio | | | 81 | |
Money Market Portfolio (unaudited)
| | | | |
| Objective: | | Portfolio Strategy: | | Net Assets: |
| Maximum current income to the extent consistent with liquidity and stability of capital. | | Invest in high quality, short-term, dollar-denominated money market instruments that present minimal credit risks. | | $439 million |
Portfolio Overview
Mason Street Advisors, LLC (“Mason Street Advisors”), the investment adviser for the Money Market Portfolio (the “Portfolio”), has engaged BlackRock Advisors, LLC (“BlackRock”) to act as sub-adviser for the Portfolio. BlackRock was appointed sub-adviser to the Portfolio effective October 31, 2014. Prior to that time, the Portfolio was managed directly by Mason Street Advisors. The Portfolio invests only in high quality, short term, dollar-denominated money market instruments that present minimal credit risks, as determined by management. The Portfolio may invest more than 25% of its total assets in domestic or dollar-denominated foreign bank obligations. The Portfolio’s investments will comply with applicable rules governing the quality, maturity, liquidity and diversification of securities held by money market funds under Rule 2a-7 under the Investment Company Act of 1940. The Portfolio seeks to maintain a net asset value of $1.00 per share.
Market Overview
The U.S. money market industry navigated the year in an environment with growing structural and regulatory constraints while the Federal Open Market Committee (“FOMC”) maintained the federal funds rate in the target range of 0.00% to 0.25% during the twelve-month period ended December 31, 2014. In July, the SEC approved final rules on money market reform that will have significant implications on the market once they become effective in late 2016. Front-end credit markets experienced slowing demand in the second half of the year, primarily driven by higher yields in the repo market. During the final months of the year money markets experienced moderate volatility as the New York Federal Reserve Bank adjusted the size and terms of the reverse repo program. These factors, combined with increasing T-bill and agency discount note supply, placed upward pressure on commercial paper and certificate of deposit rates into the close of the year.
Portfolio Results
The Portfolio returned 0.07% for the twelve months ended December 31, 2014; by comparison, the Portfolio’s benchmark, the Merrill Lynch® 3-Month Treasury Bill (T-Bill) Index (the “Index”), returned 0.03%. (This Index is unmanaged, cannot be invested in directly and does not include administrative expenses or sales charges.) The Portfolio outperformed the (0.04%) average return of the Money Market Funds peer group tracked by Lipper® Analytical Services, an independent mutual fund ranking agency.
The Portfolio’s absolute return reflects the historically low yields currently available on money market instruments. Relative to the peer group and Index, performance benefited from the management fee waiver that was in place during the period. The Portfolio’s investment adviser waived the entire management fee (30 basis points) through the first eight months of 2014. During the final four months of the year, the adviser voluntarily agreed to waive its advisory fee and /or reimburse expenses in excess of the Portfolio’s daily yield so as to maintain a zero or positive yield for the Portfolio. In the absence of the fee waiver, the Portfolio’s return would have been lower. With respect to Portfolio positioning, the Portfolio maintained a conservative bias, with high standards for liquidity and credit quality throughout the period.
| | | | |
| 82 | | Money Market Portfolio | | |
Money Market Portfolio (unaudited)
Portfolio Manager Outlook
The following forward looking comments are the opinion of BlackRock, the Portfolio’s sub-adviser.
With tepid wage growth and core inflation trending below target, we believe the Federal Reserve will be measured in the pursuit of higher rates. Given improvements in the economy and the labor market, and consistent with public remarks from prominent members of the FOMC, policy normalization could begin as early as the middle of 2015. That said, an increase in rates could occur at a later date should the impact of declines in energy prices on inflation prove other than transitory. Economic weakness overseas, particularly in Europe, also remains a threat if not properly addressed by relevant policy makers. Nevertheless, we expect an increase in rate volatility as the market continues to build in risk premiums in anticipation of the first Federal Reserve rate move in more than six years. While supply of eligible money market securities will remain constrained, the extension of the New York Federal Reserve Bank’s reverse repo program for another year should continue to support the lower boundary of interest rates.
Because the Portfolio may invest a significant portion of its assets in securities of companies in the banking related or Financial Services industry, developments affecting that industry may have a disproportionate impact on the Portfolio, including interest rate risk, credit risk, and risks associated with regulatory changes.
Recent amendments to regulations governing money market funds change the manner in which certain money market funds will be required to operate. The effect of these amendments on the Portfolio are still uncertain but may impact the Portfolio’s operations and return potential.
AN INVESTMENT IN THE MONEY MARKET PORTFOLIO IS NOT INSURED OR GUARANTEED
BY THE FEDERAL DEPOSIT INSURANCE CORPORATION OR ANY OTHER GOVERNMENT
AGENCY. ALTHOUGH THE MONEY MARKET PORTFOLIO SEEKS TO PRESERVE THE VALUE
OF YOUR INVESTMENT AT $1.00 PER SHARE, IT IS POSSIBLE TO LOSE MONEY BY INVESTING
IN THE MONEY MARKET PORTFOLIO.
| | | | | | |
| | Money Market Portfolio | | | 83 | |
Money Market Portfolio
Schedule of Investments
December 31, 2014
| | | | | | | | | | |
| | | Money Market Investments
(102.1%) | | Shares/
$ Par | | | Value
$ (000’s) | |
| |
| | Autos (2.8%) | |
| | American Honda Finance Corp.,
0.12%, 1/12/15 | | | 4,500,000 | | | | 4,500 | |
| | Toyota Motor Credit Corp., 0.12%, 1/16/15 | | | 7,900,000 | | | | 7,899 | |
| | | | | | | | | | |
| | Total | | | | | | | 12,399 | |
| | | | | | | | | | |
| |
| | Commercial Banks Non-US (21.7%) | |
| | Australia & New Zealand Banking Group, Ltd., 1.393%, 3/16/15 144A | | | 5,000,000 | | | | 5,012 | |
| | Bank of Tokyo-Mitsubishi UFJ, Ltd., 3.85%, 1/22/15 144A | | | 6,825,000 | | | | 6,838 | |
| | Ing Bank NV, 0.12%, 1/5/15 | | | 4,000,000 | | | | 4,000 | |
| | Nieuw Amsterdam Rec, 0.22%, 3/12/15 144A | | | 10,332,000 | | | | 10,328 | |
| | Rabobank Nederland of NY, 0.261%, 1/13/15 | | | 10,000,000 | | | | 10,000 | |
| | Rabobank Nederland of NY, 0.283%, 2/25/15 | | | 8,000,000 | | | | 8,000 | |
| | Royal Bank of Canada NY, 0.30%, 2/4/15 | | | 15,000,000 | | | | 15,000 | |
| | Skandinviska Enskilda, 0.05%, 1/2/15 | | | 18,000,000 | | | | 18,000 | |
| | Svenska Handelsbanken, 0.05%, 1/2/15 | | | 17,800,000 | | | | 17,800 | |
| | | | | | | | | | |
| | Total | | | | | | | 94,978 | |
| | | | | | | | | | |
| |
| | Commercial Banks US (4.0%) | |
| | Bank of America NA, 0.20%, 2/6/15 | | | 17,500,000 | | | | 17,500 | |
| | | | | | | | | | |
| | Total | | | | | | | 17,500 | |
| | | | | | | | | | |
| |
| | Finance Services (48.7%) | |
| | Antalis US Funding Corp., 0.12%, 1/7/15 | | | 18,000,000 | | | | 18,000 | |
| | Aspen Funding Corp., 0.28%, 1/5/15 144A | | | 14,000,000 | | | | 14,000 | |
| | Australia & New Zealand, 0.263%, 11/25/15 144A | | | 4,000,000 | | | | 4,000 | |
| | Bank of Tokyo Misubishi, 0.16%, 1/12/15 | | | 10,000,000 | | | | 10,000 | |
| | BNP Paribas SA, 0.25%, 3/2/15 | | | 5,000,000 | | | | 5,000 | |
| | Caisse Centrale, 0.13%, 1/5/15 | | | 4,000,000 | | | | 4,000 | |
| | Caisse Centrale, 0.16%, 1/26/15 | | | 10,000,000 | | | | 9,999 | |
| | Caisse Centrale, 0.17%, 2/5/15 | | | 6,500,000 | | | | 6,499 | |
| | Chariot Funding LLC, 0.26%, 8/13/15 144A | | | 3,000,000 | | | | 2,995 | |
| | Charta LLC, 0.25%, 5/12/15 144A | | | 4,534,000 | | | | 4,530 | |
| | Charta LLC, 0.25%, 5/20/15 144A | | | 4,000,000 | | | | 3,996 | |
| | | | | | | | | | |
| | | Money Market Investments
(102.1%) | | Shares/
$ Par | | | Value
$ (000’s) | |
| |
| | Finance Services continued | |
| | CRC Funding LLC, 0.25%, 6/4/15 144A | | | 4,000,000 | | | | 3,996 | |
| | Dbs Bank, Ltd., 0.23%, 5/26/15 144A | | | 4,000,000 | | | | 3,996 | |
| | Ing US Funding LLC, 0.21%, 2/27/15 | | | 5,000,000 | | | | 4,998 | |
| | Kellls Funding LLC, 0.242%, 4/16/15 144A | | | 5,000,000 | | | | 5,000 | |
| | Lloyds Bank PLC, 0.49%, 1/7/15 | | | 12,300,000 | | | | 12,301 | |
| | LMA Americas LLC, 0.25%, 3/2/15 144A | | | 14,000,000 | | | | 13,994 | |
| | Macquarie Bank, Ltd., 0.405%, 3/3/15 144A | | | 8,600,000 | | | | 8,600 | |
| | Manhattan Asset Funding, 0.17%, 1/16/15 144A | | | 8,700,000 | | | | 8,699 | |
| | Mizuho Funding LLC, 0.21%, 2/17/15 144A | | | 12,500,000 | | | | 12,497 | |
| | Natixis,
0.10%, 1/2/15 | | | 16,800,000 | | | | 16,800 | |
| | Oversea-chinese Banking, 0.23%, 1/27/15 | | | 7,000,000 | | | | 7,000 | |
| | Royal Bank of Canada, 0.252%, 11/10/15 | | | 2,000,000 | | | | 2,000 | |
| | Sumitomo Mitsui Banking, 0.17%, 1/23/15 144A | | | 900,000 | | | | 900 | |
| | Sumitomo Mitsui Banking, 0.22%, 3/4/15 144A | | | 7,000,000 | | | | 6,997 | |
| | Sumitomo Mitsui Trust, 0.16%, 1/2/15 144A | | | 15,000,000 | | | | 15,000 | |
| | Working Capital Management, 0.13%, 1/5/15 144A | | | 3,000,000 | | | | 3,000 | |
| | Working Capital Management, 0.17%, 1/8/15 144A | | | 5,000,000 | | | | 5,000 | |
| | | | | | | | | | |
| | Total | | | | | | | 213,797 | |
| | | | | | | | | | |
| |
| | Government (12.4%) | |
| | Cash Management Bill, 0.11%, 7/2/15 | | | 10,000,000 | | | | 9,995 | |
| | US Treasury, 0.25%, 3/31/15 | | | 9,000,000 | | | | 9,004 | |
| | US Treasury, 1.75%, 7/31/15 | | | 10,000,000 | | | | 10,096 | |
| | US Treasury, 1.875%, 6/30/15 | | | 10,000,000 | | | | 10,090 | |
| | US Treasury Floating Rate Note,
0.085%, 1/31/16 | | | 15,000,000 | | | | 14,995 | |
| | | | | | | | | | |
| | Total | | | | | | | 54,180 | |
| | | | | | | | | | |
| |
| | Information Technology (2.1%) | |
| | Google, Inc., 0.10%, 2/24/15 144A | | | 5,000,000 | | | | 4,999 | |
| | | | | | | | | | |
| | | Money Market Investments
(102.1%) | | Shares/
$ Par | | | Value
$ (000’s) | |
| |
| | Information Technology continued | |
| | Google, Inc., 0.11%, 3/18/15 144A | | | 4,300,000 | | | | 4,299 | |
| | | | | | | | | | |
| | Total | | | | | | | 9,298 | |
| | | | | | | | | | |
| |
| | Miscellaneous Business Credit Institutions (3.6%) | |
| | General Electric Capital, 0.22%, 6/4/15 | | | 10,000,000 | | | | 9,991 | |
| | General Electric Capital, 0.24%, 6/16/15 | | | 6,000,000 | | | | 5,993 | |
| | | | | | | | | | |
| | Total | | | | | | | 15,984 | |
| | | | | | | | | | |
| |
| | Municipal Bonds (3.9%) | |
| | Wheaton College/IL, 0.17%, 1/7/15 | | | 17,000,000 | | | | 17,000 | |
| | | | | | | | | | |
| | Total | | | | | | | 17,000 | |
| | | | | | | | | | |
| |
| | Personal Credit Institutions (1.9%) | |
| | Old Line Funding LLC, 0.15%, 1/7/15 144A | | | 8,500,000 | | | | 8,500 | |
| | | | | | | | | | |
| | Total | | | | | | | 8,500 | |
| | | | | | | | | | |
| |
| | Short Term Business Credit (1.0%) | |
| | Atlantic Asset Securitization LLC, 0.20%, 1/6/15 144A | | | 4,500,000 | | | | 4,500 | |
| | | | | | | | | | |
| | Total | | | | | | | 4,500 | |
| | | | | | | | | | |
| | Total Money Market Investments | | | | | | | | |
| | (Cost: $448,136) | | | | | | | 448,136 | |
| | | | | | | | | | |
| | Total Investments (102.1%) | | | | | | | | |
| | (Cost: $448,136)(a) | | | | | | | 448,136 | |
| | | | | | | | | | |
| | Other Assets, Less Liabilities (-2.1%) | | | | | | | (9,384 | ) |
| | | | | | | | | | |
| | Net Assets (100.0%) | | | | | | | 438,752 | |
| | | | | | | | | | |
The Accompanying Notes are an Integral Part of the Financial Statements.
| | | | |
| 84 | | Money Market Portfolio | | |
Money Market Portfolio
144A after the name of a security represents a security exempt from registration under Rule 144A of the Securities Act of 1933. These securities may be resold as transactions exempt from registration, normally to qualified institutional buyers. At December 31, 2014 the value of these securities (in thousands) was $161,676 representing 36.9% of the net assets.
The following is a summary of the inputs used in valuing the Portfolio’s assets and liabilities at December 31, 2014. See Note 3 for additional information on portfolio valuation.
| | | | | | | | | | | | | | |
| | | Valuation Inputs | | | |
| Description | | Level 1 –
Quoted Prices | | | Level 2 –
Other Significant
Observable Inputs | | | Level 3 – Significant
Unobservable Inputs | | | |
| | | (Amounts in thousands) | | | |
Assets: | | | | | | | | | | | | | | |
Short-Term Investments | | $ | - | | | $ | 448,136 | | | $ | - | | | |
Total | | $ | - | | | $ | 448,136 | | | $ | - | | | |
See above Schedule of Investments for values of each security.
The Accompanying Notes are an Integral Part of the Financial Statements.
| | | | | | |
| | Money Market Portfolio | | | 85 | |
Short-Term Bond Portfolio (unaudited)
| | | | |
| Objective: | | Portfolio Strategy: | | Net Assets: |
Provide as high a level of current income as is consistent with prudent investment risk. | | Invest in a diversified portfolio of investment grade debt securities. | | $234 million |
Portfolio Overview
Mason Street Advisors, LLC (“Mason Street Advisors”), the investment adviser for the Short-Term Bond Portfolio (the “Portfolio”), has engaged T. Rowe Price Associates, Inc. (“T. Rowe Price”) to act as sub-adviser for the Portfolio. T. Rowe Price was appointed sub-adviser to the Portfolio effective October 31, 2014. Prior to that time, the Portfolio was managed directly by Mason Street Advisors. Normally, the Portfolio invests in a diversified portfolio of investment grade debt securities. The Portfolio may invest up to 20% of net assets in non-investment grade, high yield/high risk bonds (so called “junk bonds”). Also, the Portfolio may invest up to 30% of net assets in foreign securities. Debt securities may be of any maturity, but under normal market conditions, the Portfolio’s average effective maturity will not exceed three years. The Portfolio may invest in mortgage- and asset-backed securities. The adviser uses both a “top down” and “bottom up” investment approach to construct the portfolio of investments.
Market Overview
Generally, bond markets posted positive returns in 2014, as most interest rates declined, pushing bond prices higher. The year began with the broadly held consensus view that interest rates would rise, but low inflation, modest economic growth and no unexpected changes to monetary policy led to lower interest rates. Although rates experienced some short-term volatility, investors largely favored the relative safety of U.S. Treasurys over the higher yields of corporate bonds. As a result, bonds experienced a relatively wide range of returns, as the Barclays® Long Term Treasury Index returned 25.07%, while the Barclays® Corporate U.S. High Yield Index returned only 2.45%. Overall, the broad bond market, as measured by the Barclays® U.S. Aggregate Index, posted a solid 5.97% return for 2014. Short-term fixed income markets, as measured by the Barclays® 1-3 Year U.S. Government/Credit Bond Index, posted a positive total return for the year of 0.77%, with positive absolute and excess returns across all sectors.
Portfolio Results
The Portfolio returned 0.38% for the twelve months ended December 31, 2014. By comparison, the Portfolio’s benchmark, the Barclays® 1-3 Year Government/Credit Bond Index, returned 0.77%. (The Index is unmanaged, cannot be invested in directly and does not include administrative expenses or sales charges.) The Portfolio’s benchmark prior to October 31, 2014 was the Barclays® U.S. Aggregate 1-3 Year Index, which had a return of 0.82% in 2014. The Portfolio underperformed the 1.28% average return of its Short Investment Grade Debt Funds peer group, according to Lipper® Analytical Services, Inc., an independent mutual fund ranking agency.
As noted above, prior to October 31, 2014, the Portfolio was managed by Mason Street Advisors. With respect to the period prior to October 31, 2014, the Portfolio underperformed the Barclays® U.S. Aggregate 1-3 Year Index primarily due to duration positioning, which was partially implemented through the use of Treasury futures contracts. When compared to the Barclays® U.S. Aggregate 1-3 Year Index, the Portfolio was short duration while interest rates dropped.
On a positive note, security selection, particularly among corporate and structured securities, contributed to relative results during the period.
The following attribution comments relate to the period October 31, 2014 through December 31, 2014, during which T. Rowe Price acted as the Portfolio’s sub-adviser.
The Portfolio performed in line with the Barclays® 1-3 Year Government/Credit Bond Index during the October 31, 2014 through December 31, 2014 period. Yield curve positioning contributed to relative performance, while sector allocation weighed on returns.
Shorter-dated Treasury yields rose amid anticipation of a rising Federal Funds rate, while yields on longer-dated bonds fell due to global economic weakness and geopolitical uncertainties. As the yield curve flattened, the Portfolio’s strategic positioning contributed to relative returns. The Portfolio was overweight the intermediate part of the curve and had modest out-of-benchmark exposure to longer maturities. The overweight allocation to the investment-grade corporate sector modestly detracted from returns, particularly for an energy-related name as oil prices continued to fall over the period. The Portfolio’s out-of-benchmark allocation to commercial-backed securities (CMBS) and a local Mexican government bond contributed modestly to relative performance.
Portfolio Manager Outlook
The following forward looking comments are the opinion of T. Rowe Price, the Portfolio’s sub-adviser.
The U.S. economy continues to experience steady improvement and an upwardly trending dollar while other major economies, such as Europe, Japan, and China, are showing signs of slower growth or concerns for deflation.
| | | | |
| 86 | | Short-Term Bond Portfolio | | |
Short-Term Bond Portfolio (unaudited)
U.S. labor market reports continue to improve while inflation remains low. We expect rates to trend upward, with greater volatility toward the front of the curve, as the market assesses the timing and trajectory of the tightening cycle. In short-duration credit markets, spreads have continued to tighten amid low volatility. In this environment, we expect interest rate management and security selection to play a greater role in alpha generation. U.S. credit fundamentals remain solid, and our analysts continue to find select opportunities for risk-adjusted returns within their respective sectors.
Relative Performance
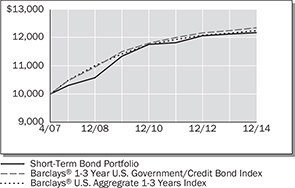
| | | | | | | | | | | | |
Average Annual Total Returns
For Periods Ended December 31, 2014 | |
| | | 1 Year | | | 5 Years | | | Since
Inception* | |
Short-Term Bond Portfolio | | | 0.38 | % | | | 1.43 | % | | | 2.61 | % |
Barclays® 1-3 Year U.S. Government/Credit Bond Index** | | | 0.77 | % | | | 1.41 | % | | | 2.70 | % |
Barclays® U.S. Aggregate 1-3 Years Index | | | 0.82 | % | | | 1.43 | % | | | 2.80 | % |
Lipper® Variable Insurance Products (VIP) Short-Intermediate Investment Grade Debt Funds Average | | | 1.28 | % | | | 1.95 | % | | | – | |
| *Inception | date of 4/30/07 |
The performance data quoted represents past performance. Past performance is historical and does not guarantee future performance. Investment return and principal value will fluctuate, so that shares, when redeemed, may be worth more or less than their original cost. Current performance may be lower or higher than the performance data quoted. For the most recent month-end performance information visit www.northwesternmutual.com.
This chart assumes an initial investment of $10,000 made on 4/30/07 (commencement of the Portfolio’s operations). Returns shown reflect fee waivers, deductions for management and other portfolio expenses, and reinvestment of all dividends. In the absence of fee waivers, total return would be reduced. Returns exclude deductions for separate account sale loads and account fees. Please refer to the Benchmark Definitions section of this report for information about the indices cited in the above chart and graph.
** The Barclays 1-3 Year U.S. Government/Credit Bond Index replaced the Barclays U.S. Aggregrate 1-3 Years Index as the Portfolio’s primary benchmark in connection with the appointment of the Portfolio’s sub-adviser effective October 31, 2014, based on the view that it would better align with the sub-adviser’s intended investment strategies.
Return of principal is not guaranteed. Bond funds have the same interest rate, inflation and credit risks that are associated with the underlying bonds owned by the Portfolio. When interest rates rise, bond prices fall. With a fixed income fund, when interest rates rise, the value of the fund’s existing bonds drops, which could negatively affect overall fund performance. A portion of the Portfolio’s assets may be invested in lower quality debt securities which may present a significant risk for loss of principal and interest. High yield bonds generally have greater price swings and higher default risks than investment grade bonds.
Currently, interest rates are at unprecedented historically low levels. A significant rise in interest rates over a short period of time could cause significant losses in the market value of the Portfolio’s fixed income investments.
Investing in bonds issued by foreign corporations and governments carries additional risk, including foreign currency risk, and may increase the volatility of the Portfolio’s performance.
The Portfolio may invest in derivative instruments to adjust the Portfolio’s duration and yield curve exposure, to hedge foreign currency exposure or for any other permissible purporse keeping with its investment objective. Use of these instruments may involve certain costs and imposes certain risks such as liquidity risk, market risk, credit risk, management risk and the risk of mispricing or improper valuation. Certain derivatives involve leverage, which could magnify losses, and portfolios investing in derivatives could lose more than the principal amount invested in those instruments.
| | | | | | |
| | Short-Term Bond Portfolio | | | 87 | |
Short-Term Bond Portfolio (unaudited)
Top 10 Fixed Income Holdings 12/31/14
| | | | |
Security Description | | | % of Net Assets | |
Federal National Mortgage Association, Various | | | 8.6 | % |
US Treasury, 1.75%, 7/31/15 | | | 7.4 | % |
Federal Home Loan Mortgage Corp., Various | | | 2.3 | % |
Federal Home Loan Bank, 0.50%, 9/28/16 | | | 2.0 | % |
Mexican Bonos, 7.75%, 12/14/17, MXN | | | 1.2 | % |
Bank of America Corp., Various | | | 1.0 | % |
Morgan Stanley, Various | | | 0.9 | % |
Government National Mortgage Association Pass-Through, Various | | | 0.9 | % |
DBRR Trust, Series 2013-EZ3, Class A, 1.636%, 12/18/49 | | | 0.8 | % |
Citigroup, Inc., Various | | | 0.8 | % |
Sector Allocation 12/31/14

Sector Allocation is based on Net Assets.
Sector Allocation and Top 10 Holdings are subject to change.
The Corporate Bonds sector includes bonds of companies and governments headquartered outside the United States.
The Government and Structured Product categories include domestic taxable bonds.
Consistent with the Portfolio’s stated parameters, no more than 30% of the Portfolio is invested in foreign securities, and no more than 20% is invested in high yield securities.
| | | | |
| 88 | | Short-Term Bond Portfolio | | |
Short-Term Bond Portfolio
Schedule of Investments
December 31, 2014
| | | | | | | | | | |
| | | Corporate Bonds (47.6%) | | Shares/ $ Par | | | Value $ (000’s) | |
| |
| | Aerospace & Defense (0.2%) | |
| | L-3 Communications Corp.,
1.50%, 5/28/17 | | | 250,000 | | | | 248 | |
| | L-3 Communications Corp., 3.95%, 11/15/16 | | | 300,000 | | | | 313 | |
| | | | | | | | | | |
| | Total | | | | | | | 561 | |
| | | | | | | | | | |
| |
| | Autos & Vehicle Parts (4.0%) | |
| | American Honda Finance Corp.,
1.20%, 7/14/17 | | | 750,000 | | | | 747 | |
| | American Honda Finance Corp., 2.125%, 10/10/18 | | | 250,000 | | | | 252 | |
| | Daimler Finance North America LLC, 1.092%, 8/1/18 144A | | | 850,000 | | | | 861 | |
| | Daimler Finance North America LLC, 2.375%, 8/1/18 144A | | | 125,000 | | | | 127 | |
| | Delphi Corp., 6.125%, 5/15/21 | | | 550,000 | | | | 599 | |
| | Ford Motor Credit Co. LLC,
1.684%, 9/8/17 | | | 900,000 | | | | 893 | |
| | Ford Motor Credit Co. LLC,
2.375%, 1/16/18 | | | 250,000 | | | | 251 | |
| | Ford Motor Credit Co. LLC,
3.00%, 6/12/17 | | | 250,000 | | | | 257 | |
| | General Motors Financial Co.,
3.50%, 7/10/19 | | | 140,000 | | | | 143 | |
| | General Motors Financial Co.,
4.75%, 8/15/17 | | | 300,000 | | | | 316 | |
| | The Goodyear Tire & Rubber Co., 8.25%, 8/15/20 | | | 500,000 | | | | 530 | |
| | Harley-Davidson Financial Services, Inc., 1.15%, 9/15/15 144A | | | 500,000 | | | | 501 | |
| | Hyundai Capital America, 1.45%, 2/6/17 144A | | | 1,000,000 | | | | 996 | |
| | Hyundai Capital Services, Inc., 3.50%, 9/13/17 144A | | | 600,000 | | | | 621 | |
| | Nissan Motor Acceptance Corp., 1.95%, 9/12/17 144A | | | 550,000 | | | | 554 | |
| | Nissan Motor Acceptance Corp., 4.50%, 1/30/15 144A | | | 30,000 | | | | 30 | |
| | Toyota Motor Credit Corp., 2.05%, 1/12/17 | | | 750,000 | | | | 764 | |
| | Volkswagen Group of America Finance LLC, 1.25%, 5/23/17 144A | | | 850,000 | | | | 846 | |
| | | | | | | | | | |
| | Total | | | | | | | 9,288 | |
| | | | | | | | | | |
| | | | | | | | | | |
| | | Corporate Bonds (47.6%) | | Shares/ $ Par | | | Value $ (000’s) | |
| |
| | Banking (9.8%) | |
| | Abbey National Treasury Services PLC/Stamford CT,
1.375%, 3/13/17 | | | 500,000 | | | | 499 | |
| | Ally Financial, Inc., 2.75%, 1/30/17 | | | 250,000 | | | | 249 | |
| | American Express Credit Corp.,
2.375%, 3/24/17 | | | 250,000 | | | | 256 | |
| | Bank of America Corp., 2.00%, 1/11/18 | | | 600,000 | | | | 600 | |
| | Bank of America Corp., 2.60%, 1/15/19 | | | 765,000 | | | | 771 | |
| | Bank of America Corp., 2.65%, 4/1/19 | | | 190,000 | | | | 191 | |
| | Bank of America Corp., 3.625%, 3/17/16 | | | 125,000 | | | | 129 | |
| | Bank of America Corp., 6.00%, 9/1/17 | | | 500,000 | | | | 551 | |
| | The Bank of New York Mellon Corp., 1.35%, 3/6/18 | | | 250,000 | | | | 248 | |
| | The Bank of New York Mellon Corp., 2.20%, 3/4/19 | | | 125,000 | | | | 126 | |
| | Barclays Bank PLC, 6.05%, 12/4/17 144A | | | 250,000 | | | | 275 | |
| | BB&T Corp., 1.094%, 6/15/18 | | | 450,000 | | | | 454 | |
| | BNP Paribas SA, 2.40%, 12/12/18 | | | 250,000 | | | | 252 | |
| | BPCE SA,
2.50%, 12/10/18 | | | 550,000 | | | | 558 | |
| | Canadian Imperial Bank of Commerce, 1.55%, 1/23/18 | | | 415,000 | | | | 413 | |
| | Canadian Imperial Bank of Commerce, 2.35%, 12/11/15 | | | 30,000 | | | | 30 | |
| | Capital One Bank USA NA, 1.15%, 11/21/16 | | | 500,000 | | | | 498 | |
| | Citigroup, Inc., 1.55%, 8/14/17 | | | 650,000 | | | | 648 | |
| | Citigroup, Inc., 1.75%, 5/1/18 | | | 350,000 | | | | 346 | |
| | Citigroup, Inc., 1.85%, 11/24/17 | | | 860,000 | | | | 859 | |
| | Credit Suisse/New York NY,
1.375%, 5/26/17 | | | 650,000 | | | | 648 | |
| | Discover Bank of Greenwood Delaware, 2.00%, 2/21/18 | | | 250,000 | | | | 249 | |
| | Fifth Third Bank, 4.75%, 2/1/15 | | | 600,000 | | | | 602 | |
| | The Goldman Sachs Group, Inc.,
2.90%, 7/19/18 | | | 250,000 | | | | 257 | |
| | The Goldman Sachs Group, Inc.,
6.15%, 4/1/18 | | | 750,000 | | | | 842 | |
| | | | | | | | | | |
| | | Corporate Bonds (47.6%) | | Shares/ $ Par | | | Value $ (000’s) | |
| |
| | Banking continued | |
| | The Goldman Sachs Group, Inc.,
6.25%, 9/1/17 | | | 500,000 | | | | 556 | |
| | HBOS PLC,
6.75%, 5/21/18 144A | | | 650,000 | | | | 724 | |
| | HSBC Bank NA/New York NY,
6.00%, 8/9/17 | | | 250,000 | | | | 276 | |
| | HSBC USA, Inc., 1.50%, 11/13/17 | | | 900,000 | | | | 898 | |
| | JPMorgan Chase & Co., 1.625%, 5/15/18 | | | 250,000 | | | | 247 | |
| | JPMorgan Chase & Co., 1.80%, 1/25/18 | | | 850,000 | | | | 849 | |
| | JPMorgan Chase & Co., 2.35%, 1/28/19 | | | 250,000 | | | | 252 | |
| | KeyBank NA/Cleveland OH, 7.413%, 5/6/15 | | | 250,000 | | | | 256 | |
| | Lloyds Bank PLC, 2.30%, 11/27/18 | | | 300,000 | | | | 303 | |
| | Morgan Stanley, 2.125%, 4/25/18 | | | 1,650,000 | | | | 1,651 | |
| | Morgan Stanley, 3.80%, 4/29/16 | | | 250,000 | | | | 258 | |
| | Morgan Stanley, 7.30%, 5/13/19 | | | 250,000 | | | | 297 | |
| | Nordea Bank AB, 0.875%, 5/13/16 144A | | | 800,000 | | | | 799 | |
| | Nordea Bank AB, 3.125%, 3/20/17 144A | | | 325,000 | | | | 337 | |
| | PNC Bank NA, 4.875%, 9/21/17 | | | 250,000 | | | | 271 | |
| | Regions Bank, 7.50%, 5/15/20 | | | 300,000 | | | | 348 | |
| | The Royal Bank of Scotland Group PLC, 2.55%, 9/18/15 | | | 400,000 | | | | 404 | |
| | Standard Chartered PLC, 3.20%, 5/12/16 144A | | | 270,000 | | | | 277 | |
| | Standard Chartered PLC, 3.85%, 4/27/15 144A | | | 160,000 | | | | 162 | |
| | SunTrust Banks, Inc., 2.35%, 11/1/18 | | | 465,000 | | | | 468 | |
| | Swedbank AB, 1.75%, 3/12/18 144A | | | 1,100,000 | | | | 1,098 | |
| | The Toronto-Dominion Bank,
1.40%, 4/30/18 | | | 170,000 | | | | 169 | |
| | The Toronto-Dominion Bank,
2.625%, 9/10/18 | | | 350,000 | | | | 359 | |
| | U.S. Bancorp, 3.442%, 2/1/16 | | | 450,000 | | | | 461 | |
| | Wells Fargo & Co., 5.625%, 12/11/17 | | | 600,000 | | | | 667 | |
| | | | | | | | | | |
| | Total | | | | | | | 22,938 | |
| | | | | | | | | | |
The Accompanying Notes are an Integral Part of the Financial Statements.
| | | | | | |
| | Short-Term Bond Portfolio | | | 89 | |
Short-Term Bond Portfolio
| | | | | | | | | | |
| | | Corporate Bonds (47.6%) | | Shares/ $ Par | | | Value $ (000’s) | |
| |
| | Basic Materials (0.7%) | |
| | Hutchinson Whampoa International 14, Ltd., 1.625%, 10/31/17 144A | | | 1,100,000 | | | | 1,091 | |
| | Rock-Tenn Co., 3.50%, 3/1/20 | | | 450,000 | | | | 457 | |
| | | | | | | | | | |
| | Total | | | | | | | 1,548 | |
| | | | | | | | | | |
| |
| | Builders & Building Materials (0.2%) | |
| | Mohawk Industries, Inc., 6.125%, 1/15/16 | | | 350,000 | | | | 367 | |
| | | | | | | | | | |
| | Total | | | | | | | 367 | |
| | | | | | | | | | |
| |
| | Capital Goods (0.3%) | |
| | Caterpillar Financial Services Corp., 2.65%, 4/1/16 | | | 200,000 | | | | 205 | |
| | CNH Capital LLC, 3.875%, 11/1/15 | | | 575,000 | | | | 578 | |
| | | | | | | | | | |
| | Total | | | | | | | 783 | |
| | | | | | | | | | |
| |
| | Chemicals (0.8%) | |
| | The Dow Chemical Co., 2.50%, 2/15/16 | | | 600,000 | | | | 610 | |
| | Eastman Chemical Co., 3.00%, 12/15/15 | | | 729,000 | | | | 743 | |
| | LyondellBasell Industries NV,
5.00%, 4/15/19 | | | 400,000 | | | | 436 | |
| | | | | | | | | | |
| | Total | | | | | | | 1,789 | |
| | | | | | | | | | |
| |
| | Conglomerate & Diversified Manufacturing (0.2%) | |
| | Eaton Corp., 1.50%, 11/2/17 | | | 335,000 | | | | 333 | |
| | Roper Industries, Inc., 2.05%, 10/1/18 | | | 180,000 | | | | 179 | |
| | | | | | | | | | |
| | Total | | | | | | | 512 | |
| | | | | | | | | | |
| |
| | Consumer Products & Retailing (2.7%) | |
| | AutoZone, Inc., 1.30%, 1/13/17 | | | 375,000 | | | | 374 | |
| | AutoZone, Inc., 5.50%, 11/15/15 | | | 250,000 | | | | 260 | |
| | Brinker International, Inc., 2.60%, 5/15/18 | | | 200,000 | | | | 200 | |
| | Colgate-Palmolive Co., 0.90%, 5/1/18 | | | 175,000 | | | | 171 | |
| | CVS Caremark Corp., 1.20%, 12/5/16 | | | 250,000 | | | | 251 | |
| | CVS Caremark Corp., 2.25%, 12/5/18 | | | 250,000 | | | | 252 | |
| | Delhaize Group, 6.50%, 6/15/17 | | | 250,000 | | | | 276 | |
| | Dollar General Corp., 4.125%, 7/15/17 | | | 550,000 | | | | 567 | |
| | The Home Depot, Inc., 2.25%, 9/10/18 | | | 500,000 | | | | 510 | |
| | Imperial Tobacco Finance PLC, 2.05%, 2/11/18 144A | | | 650,000 | | | | 646 | |
| | Newell Rubbermaid, Inc., 2.05%, 12/1/17 | | | 200,000 | | | | 199 | |
| | | | | | | | | | |
| | | Corporate Bonds (47.6%) | | Shares/ $ Par | | | Value $ (000’s) | |
| |
| | Consumer Products & Retailing continued | |
| | Philip Morris International, Inc.,
1.25%, 11/9/17 | | | 1,110,000 | | | | 1,104 | |
| | Target Corp., 2.30%, 6/26/19 | | | 185,000 | | | | 187 | |
| | Unilever Capital Corp., 2.75%, 2/10/16 | | | 250,000 | | | | 256 | |
| | Walgreens Boots Alliance, Inc., 1.75%, 11/17/17 | | | 150,000 | | | | 150 | |
| | | | | | | | | | |
| | Wal-Mart Stores, Inc., 1.125%, 4/11/18 | | | 500,000 | | | | 494 | |
| | Whirlpool Corp., 1.35%, 3/1/17 | | | 350,000 | | | | 349 | |
| | | | | | | | | | |
| | Total | | | | | | | 6,246 | |
| | | | | | | | | | |
| |
| | Electric Utilities (3.2%) | |
| | Arizona Public Service Co.,
4.65%, 5/15/15 | | | 262,000 | | | | 266 | |
| | Commonwealth Edison Co.,
2.15%, 1/15/19 | | | 250,000 | | | | 252 | |
| | Commonwealth Edison Co., 6.15%, 9/15/17 | | | 250,000 | | | | 280 | |
| | Consumers Energy Co., 5.50%, 8/15/16 | | | 247,000 | | | | 265 | |
| | Dayton Power & Light Co., 1.875%, 9/15/16 | | | 465,000 | | | | 470 | |
| | Dominion Resources, Inc., 5.20%, 8/15/19 | | | 150,000 | | | | 167 | |
| | Duke Energy Corp., 2.10%, 6/15/18 | | | 115,000 | | | | 116 | |
| | Duke Energy Indiana, Inc., 0.579%, 7/11/16 | | | 500,000 | | | | 501 | |
| | Entergy Mississippi, Inc., 3.25%, 6/1/16 | | | 500,000 | | | | 515 | |
| | Exelon Corp., 4.90%, 6/15/15 | | | 250,000 | | | | 254 | |
| | FirstEnergy Corp., 2.75%, 3/15/18 | | | 250,000 | | | | 252 | |
| | MidAmerican Energy Co., 2.40%, 3/15/19 | | | 500,000 | | | | 508 | |
| | Nevada Power Co., 5.95%, 3/15/16 | | | 250,000 | | | | 265 | |
| | NextEra Energy Capital Holdings, Inc., 1.20%, 6/1/15 | | | 250,000 | | | | 250 | |
| | NextEra Energy Capital Holdings, Inc., 2.40%, 9/15/19 | | | 250,000 | | | | 250 | |
| | Northeast Utilities, 1.45%, 5/1/18 | | | 105,000 | | | | 103 | |
| | NSTAR Electric Co., 0.472%, 5/17/16 | | | 440,000 | | | | 440 | |
| | Peco Energy Co., 1.20%, 10/15/16 | | | 250,000 | | | | 251 | |
| | Public Service Co. of Colorado,
5.80%, 8/1/18 | | | 500,000 | | | | 568 | |
| | Public Service Electric & Gas Co., 2.30%, 9/15/18 | | | 400,000 | | | | 406 | |
| | | | | | | | | | |
| | | Corporate Bonds (47.6%) | | Shares/ $ Par | | | Value $ (000’s) | |
| |
| | Electric Utilities continued | |
| | RJS Power Holdings LLC, 5.125%, 7/15/19 144A | | | 140,000 | | | | 138 | |
| | Southern Electric Generating Co., 2.20%, 12/1/18 144A | | | 140,000 | | | | 141 | |
| | Westar Energy, Inc., 8.625%, 12/1/18 | | | 300,000 | | | | 372 | |
| | Zhejiang Energy Group Hong Kong, Ltd., 2.30%, 9/30/17 | | | 550,000 | | | | 544 | |
| | | | | | | | | | |
| | Total | | | | | | | 7,574 | |
| | | | | | | | | | |
| |
| | Energy (2.4%) | |
| | Anadarko Petroleum Corp., 5.95%, 9/15/16 | | | 500,000 | | | | 535 | |
| | Apache Corp., 5.625%, 1/15/17 | | | 300,000 | | | | 324 | |
| | Cameron International Corp.,
1.40%, 6/15/17 | | | 300,000 | | | | 295 | |
| | Canadian Natural Resources, Ltd., 1.75%, 1/15/18 | | | 155,000 | | | | 154 | |
| | Canadian Natural Resources, Ltd., 5.70%, 5/15/17 | | | 250,000 | | | | 271 | |
| | Marathon Oil Corp., 0.90%, 11/1/15 | | | 575,000 | | | | 573 | |
| | National Oilwell Varco, Inc.,
1.35%, 12/1/17 | | | 105,000 | | | | 104 | |
| | Noble Energy, Inc., 8.25%, 3/1/19 | | | 250,000 | | | | 300 | |
| | Noble Holding International, Ltd., 2.50%, 3/15/17 | | | 250,000 | | | | 239 | |
| | Pioneer Natural Resources Co.,
5.875%, 7/15/16 | | | 800,000 | | | | 850 | |
| | Rowan Cos., 5.00%, 9/1/17 | | | 350,000 | | | | 365 | |
| | Sempra Energy, 6.15%, 6/15/18 | | | 250,000 | | | | 283 | |
| | SESI LLC,
6.375%, 5/1/19 | | | 1,000,000 | | | | 970 | |
| | Talisman Energy, Inc., 5.125%, 5/15/15 | | | 245,000 | | | | 249 | |
| | Transocean, Inc., 2.50%, 10/15/17 | | | 75,000 | | | | 66 | |
| | | | | | | | | | |
| | Total | | | | | | | 5,578 | |
| | | | | | | | | | |
| |
| | Entertainment (0.1%) | |
| | Carnival Corp., 1.20%, 2/5/16 | | | 275,000 | | | | 275 | |
| | | | | | | | | | |
| | Total | | | | | | | 275 | |
| | | | | | | | | | |
| |
| | Finance (0.9%) | |
| | GATX Corp., 3.50%, 7/15/16 | | | 586,000 | | | | 605 | |
| | General Electric Capital Corp.,
2.30%, 4/27/17 | | | 900,000 | | | | 922 | |
| | General Electric Capital Corp.,
6.00%, 8/7/19 | | | 250,000 | | | | 291 | |
The Accompanying Notes are an Integral Part of the Financial Statements.
| | | | |
| 90 | | Short-Term Bond Portfolio | | |
Short-Term Bond Portfolio
| | | | | | | | | | |
| | | Corporate Bonds (47.6%) | | Shares/
$ Par | | | Value
$ (000’s) | |
| |
| | Finance continued | |
| | International Lease Finance Corp.,
2.184%, 6/15/16 | | | 350,000 | | | | 349 | |
| | | | | | | | | | |
| | Total | | | | | | | 2,167 | |
| | | | | | | | | | |
| |
| | Food & Beverage (1.6%) | |
| | Bunge, Ltd. Finance Corp., 3.20%, 6/15/17 | | | 900,000 | | | | 925 | |
| | Coca-Cola Femsa SAB de CV, 2.375%, 11/26/18 | | | 325,000 | | | | 331 | |
| | ConAgra Foods, Inc., 1.90%, 1/25/18 | | | 285,000 | | | | 283 | |
| | General Mills, Inc., 2.20%, 10/21/19 | | | 250,000 | | | | 248 | |
| | Heineken NV, 1.40%, 10/1/17 144A | | | 280,000 | | | | 278 | |
| | Mondelez International, Inc.,
4.125%, 2/9/16 | | | 400,000 | | | | 415 | |
| | Pernod Ricard SA, 2.95%, 1/15/17 144A | | | 250,000 | | | | 256 | |
| | SABMiller Holdings, Inc., 2.45%, 1/15/17 144A | | | 250,000 | | | | 255 | |
| | Tyson Foods, Inc., 2.65%, 8/15/19 | | | 200,000 | | | | 202 | |
| | WM Wrigley Jr. Co., 1.40%, 10/21/16 144A | | | 60,000 | | | | 60 | |
| | WM Wrigley Jr. Co., 2.00%, 10/20/17 144A | | | 380,000 | | | | 383 | |
| | WM Wrigley Jr. Co., 2.40%, 10/21/18 144A | | | 65,000 | | | | 65 | |
| | | | | | | | | | |
| | Total | | | | | | | 3,701 | |
| | | | | | | | | | |
| |
| | Foreign Agencies (0.9%) | |
| | CNOOC Nexen Finance 2014 ULC, 1.625%, 4/30/17 | | | 350,000 | | | | 348 | |
| | Ecopetrol SA, 4.25%, 9/18/18 | | | 400,000 | | | | 416 | |
| | Eksportfinans ASA, 2.00%, 9/15/15 | | | 1,000,000 | | | | 1,001 | |
| | Electricite de France SA, 1.15%, 1/20/17 144A | | | 450,000 | | | | 450 | |
| | | | | | | | | | |
| | Total | | | | | | | 2,215 | |
| | | | | | | | | | |
| |
| | Gaming/Leisure/Lodging (0.2%) | |
| | GLP Capital LP/GLP Financing II, Inc., 4.375%, 11/1/18 | | | 450,000 | | | | 460 | |
| | | | | | | | | | |
| | Total | | | | | | | 460 | |
| | | | | | | | | | |
| |
| | Healthcare (1.3%) | |
| | AmerisourceBergen Corp., 1.15%, 5/15/17 | | | 250,000 | | | | 248 | |
| | Baxter International, Inc., 0.95%, 6/1/16 | | | 250,000 | | | | 250 | |
| | Express Scripts Holding Co.,
1.25%, 6/2/17 | | | 400,000 | | | | 396 | |
| | Express Scripts Holding Co.,
2.65%, 2/15/17 | | | 355,000 | | | | 363 | |
| | | | | | | | | | |
| | | Corporate Bonds (47.6%) | | Shares/
$ Par | | | Value
$ (000’s) | |
| |
| | Healthcare continued | |
| | Express Scripts Holding Co.,
3.125%, 5/15/16 | | | 60,000 | | | | 62 | |
| | McKesson Corp., 1.40%, 3/15/18 | | | 275,000 | | | | 272 | |
| | McKesson Corp., 3.25%, 3/1/16 | | | 400,000 | | | | 409 | |
| | Thermo Fisher Scientific, Inc.,
2.25%, 8/15/16 | | | 900,000 | | | | 914 | |
| | Thermo Fisher Scientific, Inc.,
2.40%, 2/1/19 | | | 65,000 | | | | 65 | |
| | | | | | | | | | |
| | Total | | | | | | | 2,979 | |
| | | | | | | | | | |
| |
| | Insurance (1.5%) | |
| | ACE INA Holdings, Inc., 5.80%, 3/15/18 | | | 250,000 | | | | 281 | |
| | Aetna, Inc., 1.50%, 11/15/17 | | | 110,000 | | | | 109 | |
| | AIA Group, Ltd., 2.25%, 3/11/19 144A | | | 200,000 | | | | 199 | |
| | American International Group, Inc., 5.85%, 1/16/18 | | | 445,000 | | | | 498 | |
| | Berkshire Hathaway Finance Corp., 1.30%, 5/15/18 | | | 250,000 | | | | 248 | |
| | CNA Financial Corp., 6.50%, 8/15/16 | | | 250,000 | | | | 270 | |
| | Humana, Inc., 2.625%, 10/1/19 | | | 190,000 | | | | 190 | |
| | Marsh & McLennan Cos., Inc.,
2.55%, 10/15/18 | | | 160,000 | | | | 163 | |
| | Metropolitan Life Global Funding I, 1.50%, 1/10/18 144A | | | 250,000 | | | | 248 | |
| | Metropolitan Life Global Funding I, 3.125%, 1/11/16 144A | | | 250,000 | | | | 257 | |
| | Prudential Covered Trust 2012-1, 2.997%, 9/30/15 144A | | | 262,502 | | | | 266 | |
| | UnitedHealth Group, Inc., 1.40%, 10/15/17 | | | 320,000 | | | | 320 | |
| | WellPoint, Inc., 1.875%, 1/15/18 | | | 100,000 | | | | 100 | |
| | WellPoint, Inc., 2.25%, 8/15/19 | | | 500,000 | | | | 495 | |
| | | | | | | | | | |
| | Total | | | | | | | 3,644 | |
| | | | | | | | | | |
| |
| | Media (2.3%) | |
| | British Sky Broadcasting Group PLC, 2.625%, 9/16/19 144A | | | 515,000 | | | | 515 | |
| | Comcast Corp., 4.95%, 6/15/16 | | | 250,000 | | | | 265 | |
| | Cox Communications, Inc., 5.50%, 10/1/15 | | | 1,000,000 | | | | 1,034 | |
| | DIRECTV Holdings LLC/DIRECTV Financing Co., Inc., 1.75%, 1/15/18 | | | 250,000 | | | | 248 | |
| | | | | | | | | | |
| | | Corporate Bonds (47.6%) | | Shares/
$ Par | | | Value
$ (000’s) | |
| |
| | Media continued | |
| | DIRECTV Holdings LLC/DIRECTV Financing Co., Inc., 2.40%, 3/15/17 | | | 750,000 | | | | 764 | |
| | Discovery Communications LLC, 3.70%, 6/1/15 | | | 180,000 | | | | 182 | |
| | Omnicom Group, Inc., 5.90%, 4/15/16 | | | 600,000 | | | | 635 | |
| | SES Global Americas Holdings GP, 2.50%, 3/25/19 144A | | | 50,000 | | | | 50 | |
| | Thomson Reuters Corp., 0.875%, 5/23/16 | | | 600,000 | | | | 597 | |
| | Time Warner, Inc., 2.10%, 6/1/19 | | | 250,000 | | | | 246 | |
| | Time Warner, Inc., 3.15%, 7/15/15 | | | 135,000 | | | | 137 | |
| | UPCB Finance III, Ltd., 6.625%, 7/1/20 144A | | | 400,000 | | | | 420 | |
| | Viacom, Inc.,
2.20%, 4/1/19 | | | 145,000 | | | | 143 | |
| | Viacom, Inc.,
2.50%, 9/1/18 | | | 250,000 | | | | 252 | |
| | | | | | | | | | |
| | Total | | | | | | | 5,488 | |
| | | | | | | | | | |
| |
| | Metals & Mining (0.7%) | |
| | Goldcorp, Inc., 2.125%, 3/15/18 | | | 450,000 | | | | 445 | |
| | Plains Exploration & Production Co., 6.50%, 11/15/20 | | | 640,000 | | | | 693 | |
| | Rio Tinto Finance USA PLC, 2.25%, 12/14/18 | | | 250,000 | | | | 250 | |
| | Vale Overseas, Ltd., 6.25%, 1/23/17 | | | 200,000 | | | | 213 | |
| | | | | | | | | | |
| | Total | | | | | | | 1,601 | |
| | | | | | | | | | |
| |
| | Oil & Gas (1.2%) | |
| | BG Energy Capital PLC, 2.875%, 10/15/16 144A | | | 500,000 | | | | 513 | |
| | BP Capital Markets PLC, 1.846%, 5/5/17 | | | 500,000 | | | | 504 | |
| | Chevron Corp., 1.718%, 6/24/18 | | | 250,000 | | | | 251 | |
| | Murphy Oil Corp., 2.50%, 12/1/17 | | | 500,000 | | | | 497 | |
| | Petro-Canada, 6.05%, 5/15/18 | | | 236,000 | | | | 265 | |
| | Shell International Finance BV,
1.90%, 8/10/18 | | | 250,000 | | | | 251 | |
| | Total Capital Canada, Ltd., 1.45%, 1/15/18 | | | 250,000 | | | | 248 | |
| | Total Capital SA, 2.125%, 8/10/18 | | | 250,000 | | | | 252 | |
| | | | | | | | | | |
| | Total | | | | | | | 2,781 | |
| | | | | | | | | | |
| |
| | Pharmaceuticals (1.6%) | |
| | AbbVie, Inc.,
1.75%, 11/6/17 | | | 750,000 | | | | 752 | |
The Accompanying Notes are an Integral Part of the Financial Statements.
| | | | | | |
| | Short-Term Bond Portfolio | | | 91 | |
Short-Term Bond Portfolio
| | | | | | | | | | |
| | | Corporate Bonds (47.6%) | | Shares/ $ Par | | | Value $ (000’s) | |
| |
| | Pharmaceuticals continued | |
| | Actavis Funding SCS, 2.45%, 6/15/19 | | | 100,000 | | | | 98 | |
| | Actavis, Inc., 1.875%, 10/1/17 | | | 115,000 | | | | 114 | |
| | Bayer US Finance LLC, 2.375%, 10/8/19 144A | | | 440,000 | | | | 442 | |
| | Celgene Corp., 1.90%, 8/15/17 | | | 500,000 | | | | 502 | |
| | Celgene Corp., 2.25%, 5/15/19 | | | 340,000 | | | | 338 | |
| | Gilead Sciences, Inc., 2.05%, 4/1/19 | | | 120,000 | | | | 120 | |
| | Merck & Co., Inc., 1.30%, 5/18/18 | | | 250,000 | | | | 248 | |
| | Perrigo Co. PLC, 1.30%, 11/8/16 | | | 180,000 | | | | 179 | |
| | Perrigo Co. PLC, 2.30%, 11/8/18 | | | 125,000 | | | | 125 | |
| | Takeda Pharmaceutical Co., Ltd., 1.625%, 3/17/17 144A | | | 750,000 | | | | 752 | |
| | | | | | | | | | |
| | Total | | | | | | | 3,670 | |
| | | | | | | | | | |
| |
| | Pipelines (3.7%) | |
| | Atlas Pipeline Partners LP/Atlas Pipeline Finance Corp., 6.625%, 10/1/20 | | | 600,000 | | | | 611 | |
| | CenterPoint Energy Resources Corp., 6.00%, 5/15/18 | | | 250,000 | | | | 282 | |
| | CenterPoint Energy Resources Corp., 6.15%, 5/1/16 | | | 250,000 | | | | 267 | |
| | DCP Midstream
Operating LP,
3.25%, 10/1/15 | | | 520,000 | | | | 528 | |
| | Enable Midstream
Partners LP,
2.40%, 5/15/19 144A | | | 250,000 | | | | 243 | |
| | Energy Transfer Partners LP, 5.95%, 2/1/15 | | | 400,000 | | | | 401 | |
| | EnLink Midstream
Partners LP,
2.70%, 4/1/19 | | | 85,000 | | | | 84 | |
| | Enterprise Products Operating LLC, 1.25%, 8/13/15 | | | 800,000 | | | | 802 | |
| | Enterprise Products Operating LLC, 3.20%, 2/1/16 | | | 100,000 | | | | 102 | |
| | Enterprise Products Operating LLC, 6.50%, 1/31/19 | | | 250,000 | | | | 287 | |
| | Florida Gas
Transmission Co.,
4.00%, 7/15/15 144A | | | 1,000,000 | | | | 1,014 | |
| | Kinder Morgan, Inc., 2.00%, 12/1/17 | | | 105,000 | | | | 104 | |
| | NiSource Finance Corp., 5.25%, 9/15/17 | | | 250,000 | | | | 273 | |
| | | | | | | | | | |
| | | Corporate Bonds (47.6%) | | Shares/ $ Par | | | Value $ (000’s) | |
| |
| | Pipelines continued | |
| | ONEOK Partners LP, 3.20%, 9/15/18 | | | 250,000 | | | | 253 | |
| | ONEOK Partners LP, 3.25%, 2/1/16 | | | 230,000 | | | | 235 | |
| | Plains All American Pipeline LP/PAA Finance Corp., 3.95%, 9/15/15 | | | 750,000 | | | | 765 | |
| | Regency Energy
Partners LP, 8.375%, 6/1/19 144A | | | 400,000 | | | | 419 | |
| | Spectra Energy Partners LP, 2.95%, 6/15/16 | | | 521,000 | | | | 534 | |
| | Tennessee Gas Pipeline Co., 8.00%, 2/1/16 | | | 500,000 | | | | 533 | |
| | TransCanada PipeLines, Ltd., 0.75%, 1/15/16 | | | 575,000 | | | | 573 | |
| | Williams Partners LP/Williams Partners Financial Corp., 7.25%, 2/1/17 | | | 275,000 | | | | 303 | |
| | | | | | | | | | |
| | Total | | | | | | | 8,613 | |
| | | | | | | | | | |
| |
| | Real Estate Investment Trusts (1.2%) | |
| | DDR Corp.,
4.75%, 4/15/18 | | | 250,000 | | | | 267 | |
| | ERP Operating LP, 6.584%, 4/13/15 | | | 275,000 | | | | 276 | |
| | Health Care REIT, Inc., 3.625%, 3/15/16 | | | 290,000 | | | | 299 | |
| | Kilroy Realty LP, 5.00%, 11/3/15 | | | 450,000 | | | | 464 | |
| | Simon Property Group LP, 1.50%, 2/1/18 144A | | | 250,000 | | | | 248 | |
| | Ventas Realty LP, 1.25%, 4/17/17 | | | 500,000 | | | | 495 | |
| | Ventas Realty LP, 1.55%, 9/26/16 | | | 450,000 | | | | 452 | |
| | WEA Finance LLC / Westfield UK & Europe Finance PLC, 1.75%, 9/15/17 144A | | | 300,000 | | | | 298 | |
| | | | | | | | | | |
| | Total | | | | | | | 2,799 | |
| | | | | | | | | | |
| |
| | Services (0.2%) | |
| | QVC, Inc.,
3.125%, 4/1/19 | | | 55,000 | | | | 55 | |
| | Republic Services, Inc., 5.50%, 9/15/19 | | | 250,000 | | | | 282 | |
| | Waste Management, Inc., 2.60%, 9/1/16 | | | 200,000 | | | | 204 | |
| | | | | | | | | | |
| | Total | | | | | | | 541 | |
| | | | | | | | | | |
| |
| | Technology (2.4%) | |
| | Adobe Systems, Inc., 3.25%, 2/1/15 | | | 250,000 | | | | 250 | |
| | Anstock II, Ltd., 2.125%, 7/24/17 | | | 300,000 | | | | 296 | |
| | Apple, Inc.,
1.00%, 5/3/18 | | | 200,000 | | | | 197 | |
| | Arrow Electronics, Inc., 3.375%, 11/1/15 | | | 275,000 | | | | 280 | |
| | | | | | | | | | |
| | | Corporate Bonds (47.6%) | | Shares/ $ Par | | | Value $ (000’s) | |
| |
| | Technology continued | |
| | Avnet, Inc.,
6.00%, 9/1/20 | | | 1,000,000 | | | | 1,031 | |
| | Baidu, Inc.,
2.75%, 6/9/19 | | | 200,000 | | | | 199 | |
| | Cisco Systems, Inc., 2.125%, 3/1/19 | | | 250,000 | | | | 251 | |
| | Fidelity National Information Services, Inc., 1.45%, 6/5/17 | | | 250,000 | | | | 249 | |
| | Hewlett-Packard Co., 2.75%, 1/14/19 | | | 275,000 | | | | 275 | |
| | International Business Machines Corp., 5.70%, 9/14/17 | | | 500,000 | | | | 557 | |
| | Keysight Technologies, Inc., 3.30%, 10/30/19 144A | | | 850,000 | | | | 845 | |
| | Oracle Corp., 2.375%, 1/15/19 | | | 250,000 | | | | 254 | |
| | Oracle Corp., 5.75%, 4/15/18 | | | 250,000 | | | | 283 | |
| | Tencent Holdings, Ltd., 2.00%, 5/2/17 144A | | | 350,000 | | | | 349 | |
| | Xerox Corp., 4.25%, 2/15/15 | | | 250,000 | | | | 251 | |
| | | | | | | | | | |
| | Total | | | | | | | 5,567 | |
| | | | | | | | | | |
| |
| | Telecommunications (1.4%) | |
| | America Movil SAB de CV, 2.375%, 9/8/16 | | | 425,000 | | | | 431 | |
| | America Movil SAB de CV, 3.625%, 3/30/15 | | | 140,000 | | | | 141 | |
| | American Tower Corp., 4.50%, 1/15/18 | | | 250,000 | | | | 265 | |
| | American Tower Corp., 4.625%, 4/1/15 | | | 1,250,000 | | | | 1,261 | |
| | British Telecommunications PLC, 2.35%, 2/14/19 | | | 250,000 | | | | 250 | |
| | CC Holdings GS V LLC/Crown Castle GS III Corp., 2.381%, 12/15/17 | | | 230,000 | | | | 232 | |
| | Verizon Communications, Inc., 1.10%, 11/1/17 | | | 200,000 | | | | 197 | |
| | Verizon Communications, Inc., 2.50%, 9/15/16 | | | 240,000 | | | | 245 | |
| | Verizon Communications, Inc., 3.65%, 9/14/18 | | | 335,000 | | | | 354 | |
| | | | | | | | | | |
| | Total | | | | | | | 3,376 | |
| | | | | | | | | | |
| |
| | Transportation (1.9%) | |
| | A.P. Moeller-Maersk A/S, 2.55%, 9/22/19 144A | | | 500,000 | | | | 501 | |
| | Burlington Northern Santa Fe LLC, 5.75%, 3/15/18 | | | 750,000 | | | | 841 | |
The Accompanying Notes are an Integral Part of the Financial Statements.
| | | | |
| 92 | | Short-Term Bond Portfolio | | |
Short-Term Bond Portfolio
| | | | | | | | | | | | |
| | | | Corporate Bonds (47.6%) | | Shares/
$ Par | | | Value
$ (000’s) | |
| |
| | | | Transportation continued | |
| | | | ERAC USA
Finance LLC, 1.40%, 4/15/16 144A | | | 750,000 | | | | 752 | |
| | | | ERAC USA
Finance LLC, 5.90%, 11/15/15 144A | | | 500,000 | | | | 522 | |
| | | | Kansas City Southern de Mexico SA de CV, 2.35%, 5/15/20 | | | 450,000 | | | | 432 | |
| | | | Penske Truck Leasing Co. LP/PTL
Finance Corp., 2.875%, 7/17/18 144A | | | 750,000 | | | | 763 | |
| | | | Southwest Airlines Co., 2.75%, 11/6/19 | | | 280,000 | | | | 281 | |
| | | | Southwest Airlines Co., 5.75%, 12/15/16 | | | 230,000 | | | | 248 | |
| | | | Union Pacific Corp., 2.25%, 2/15/19 | | | 85,000 | | | | 86 | |
| | | | | | | | | | | | |
| | | | Total | | | | | | | 4,426 | |
| | | | | | | | | | | | |
| | | |
| | | | Total Corporate Bonds | | | | | | | | |
| | | | (Cost: $111,488) | | | | | | | 111,487 | |
| | | | | | | | | | | | |
| | | |
| | | | Governments (13.2%) | | Shares/ Par | | | | |
| |
| | | | Governments (12.7%) | |
| | (b) | | | Federal Home Loan Bank, 0.50%, 9/28/16 | | | 4,680,000 | | | | 4,668 | |
| | | | Federal National Mortgage Association, 0.625%, 8/26/16 | | | 5,000,000 | | | | 4,999 | |
| | (f) | | | Mexican Bonos, 7.75%, 12/14/17, MXN | | | 37,260,000 | | | | 2,758 | |
| | | | US Treasury, 1.75%, 7/31/15 | | | 17,250,000 | | | | 17,408 | |
| | | | | | | | | | | | |
| | | | Total | | | | | | | 29,833 | |
| | | | | | | | | | | | |
| |
| | | | Yankee Sovereign (0.5%) | |
| | | | Hazine Mustesarligi Varlik Kiralama AS, 4.557%, 10/10/18 144A | | | 325,000 | | | | 340 | |
| | | | Iceland Government International Bond, 4.875%, 6/16/16 144A | | | 750,000 | | | | 785 | |
| | | | | | | | | | | | |
| | | | Total | | | | | | | 1,125 | |
| | | | | | | | | | | | |
| | | |
| | | | Total Governments | | | | | | | | |
| | | | (Cost: $30,962) | | | | | | | 30,958 | |
| | | | | | | | | | | | |
| | | | | | | | | | |
| | | Municipal Bonds (0.9%) | | Shares/
$ Par | | | Value
$ (000’s) | |
| |
| | Municipal Bonds (0.9%) | |
| | Florida Hurricane Catastrophe Fund Finance Corp.,
Series 2013A, 1.298%, 7/1/16 RB | | | 200,000 | | | | 201 | |
| | Florida Hurricane Catastrophe Fund Finance Corp.,
Series 2013A, 2.107%, 7/1/18 RB | | | 190,000 | | | | 0191 | |
| | Province of Ontario Canada, 2.00%,
9/27/18 GO | | | 1,000,000 | | | | 1,012 | |
| | State of Illinois,
Series 2010-3, 4.79%, 4/1/16 GO | | | 300,000 | | | | 312 | |
| | State of Illinois,
Series 2011, 4.961%, 3/1/16 GO | | | 195,000 | | | | 203 | |
| | University of California, Series 2011Y-1, 0.655%, 7/1/41 RB | | | 270,000 | | | | 270 | |
| | | | | | | | | | |
| | | |
| | Total Municipal Bonds | | | | | | | | |
| | (Cost: $2,161) | | | | | | | 2,189 | |
| | | | | | | | | | |
| | | |
| | | Structured Products (36.8%) | | | | | | |
| |
| | Structured Products (36.8%) | |
| | AEP Texas Central Transition Funding LLC, 5.17%, 1/1/18 | | | 700,000 | | | | 749 | |
| | Ally Auto Receivables Trust, Series 2012-2, Class B, 1.76%, 2/15/17 144A | | | 750,000 | | | | 755 | |
| | Ally Master Owner Trust, Series 2013-1, Class A2, 1.00%, 2/15/18 | | | 1,200,000 | | | | 1,201 | |
| | Ally Master Owner Trust, Series 2014-4, Class A2, 1.43%, 6/17/19 | | | 1,045,000 | | | | 1,043 | |
| | American Express Credit Account Master Trust, Series 2014-2, Class A, 1.26%, 1/15/20 | | | 1,000,000 | | | | 998 | |
| | American Express Credit Account Master Trust, Series 2014-3, Class A, 1.49%, 4/15/20 | | | 1,775,000 | | | | 1,777 | |
| | Banc of America Commercial Mortgage Trust, Series 2006-4, Class AM, 5.675%, 7/10/46 | | | 650,000 | | | | 692 | |
| | | | | | | | | | |
| | | Structured Products (36.8%) | | Shares/
$ Par | | | Value
$ (000’s) | |
| |
| | Structured Products continued | |
| | Banc of America Commercial Mortgage Trust, Series 2008-1, Class AM, 6.29%, 2/10/51 | | | 440,000 | | | | 485 | |
| | Bear Stearns Commercial Mortgage Securities, Series 2006-T24, Class A4, 5.537%, 10/12/41 | | | 315,480 | | | | 333 | |
| | Bear Stearns Commercial Mortgage Securities Trust, Series 2006-PW13, Class AM, 5.582%, 9/11/41 | | | 500,000 | | | | 528 | |
| | Bear Stearns Commercial Mortgage Securities Trust, Series 2007-PWR18, Class AM, 6.048%, 6/11/50 | | | 500,000 | | | | 550 | |
| | Bear Stearns Commercial Mortgage Securities Trust, Inc., Series 2007-PWR17, Class AAB, 5.703%, 6/11/50 | | | 395,977 | | | | 398 | |
| | BMW Vehicle Lease Trust, Series 2014-1, Class A3, 0.73%, 2/21/17 | | | 365,000 | | | | 365 | |
| | BMW Vehicle Lease Trust, Series 2014-1, Class A4, 0.99%, 8/21/17 | | | 295,000 | | | | 295 | |
| | Capital Auto Receivables Asset Trust, Series 2014-1, Class A2, 0.96%, 4/20/17 | | | 325,000 | | | | 325 | |
| | Capital Auto Receivables Asset Trust, Series 2013-3, Class A3, 1.31%, 12/20/17 | | | 1,370,000 | | | | 1,376 | |
| | Capital One Multi-Asset Execution Trust, Series 2013-A3, Class A3, 0.96%, 9/16/19 | | | 500,000 | | | | 498 | |
| | Capital One Multi-Asset Execution Trust, Series 2014-A2, Class A2, 1.26%, 1/15/20 | | | 470,000 | | | | 469 | |
| | Carmax Auto Owner Trust, Series 2013-2, Class A4, 0.84%, 11/15/18 | | | 420,000 | | | | 416 | |
| | CarMax Auto Owner Trust, Series 2014-4, Class A3, 1.25%, 11/15/19 | | | 440,000 | | | | 439 | |
| | CarMax Auto Owner Trust, Series 2014-4, Class A4, 1.81%, 7/15/20 | | | 250,000 | | | | 250 | |
The Accompanying Notes are an Integral Part of the Financial Statements.
| | | | | | |
| | Short-Term Bond Portfolio | |
| 93
|
|
Short-Term Bond Portfolio
| | | | | | | | | | |
| | | Structured Products (36.8%) | | Shares/
$ Par | | | Value
$ (000’s) | |
| |
| | Structured Products continued | |
| | CD Commerical Mortgage Trust, Series 2007-CD5, Class AMA, 6.12%, 11/15/44 | | | 565,000 | | | | 619 | |
| | Chase Issuance Trust, Series 2013-A8, Class A8, 1.01%, 10/15/18 | | | 145,000 | | | | 145 | |
| | Chase Issuance Trust, Series 2014-A1, Class A, 1.15%, 1/15/19 | | | 400,000 | | | | 400 | |
| | Citibank Credit Card Issuance Trust, Series 2014-A9, Class A9, 0.40525%, 11/23/18 | | | 695,000 | | | | 695 | |
| | Citibank Credit Card Issuance Trust, Series 2013-A6, Class A6, 1.32%, 9/7/18 | | | 1,150,000 | | | | 1,156 | |
| | Citigroup Commercial Mortgage Trust, Series 2014-GC25, Class A1, 1.485%, 10/10/47 | | | 338,096 | | | | 337 | |
| | CNH Equipment Trust, Series 2013-B, Class A4, 0.99%, 11/15/18 | | | 845,000 | | | | 838 | |
| | CNH Equipment Trust, Series 2014-B, Class A4, 1.61%, 5/17/21 | | | 1,150,000 | | | | 1,144 | |
| | Comm Mortgage Trust, Series 2014-CR21, Class A1, 1.494%, 12/10/47 | | | 92,165 | | | | 92 | |
| | Commercial Mortgage Pass Through Certificates, Series 2014-UBS6, Class A1, 1.445%, 12/10/47 | | | 180,000 | | | | 179 | |
| | Commercial Mortgage Trust, Series 2006-GG7, Class AM, 5.82%, 7/10/38 | | | 500,000 | | | | 527 | |
| | Commercial Mortgage Trust, Series 2001-J2A, Class C, 6.586%,
7/16/34 144A | | | 457,756 | | | | 490 | |
| | Connecticut
Avenue Securities, 2.105%, 11/25/24 | | | 306,587 | | | | 307 | |
| | Connecticut
Avenue Securities, 2.255%, 11/25/24 | | | 160,597 | | | | 161 | |
| | Credit Suisse First Boston Mortgage Securities Corp., Series 2005-C5, Class AM, 5.10%, 8/15/38 | | | 285,000 | | | | 291 | |
| | DBRR Trust, Series 2013-EZ3,
Class A, 1.636%,
12/18/49 144A | | | 1,904,142 | | | | 1,914 | |
| | | | | | | | | | |
| | | Structured Products (36.8%) | | Shares/
$ Par | | | Value
$ (000’s) | |
| |
| | Structured Products continued | |
| | Diamond Resorts Owner Trust, Series 2014-1, Class A, 2.54%, 5/20/27 144A | | | 386,296 | | | | 385 | |
| | Discover Card Execution Note Trust, Series 2013-A5, Class A5, 1.04%, 4/15/19 | | | 1,150,000 | | | | 1,149 | |
| | Discover Card Master Trust I, Series 2012-B3, Class B3, 0.61%, 5/15/18 | | | 1,000,000 | | | | 999 | |
| | FDIC Structured Sale Guaranteed Notes, Series 2010-S2,
Class 2A, 2.57%, 7/29/47 144A | | | 363,824 | | | | 367 | |
| | Federal Home Loan Mortgage Corp., Series 4092, Class CL, 1.25%, 6/15/27 | | | 2,784,450 | | | | 2,682 | |
| | Federal Home Loan Mortgage Corp., Series 3718, Class BC, 2.00%, 2/15/25 | | | 1,038,313 | | | | 1,045 | |
| | Federal Home Loan Mortgage Corp., 2.50%, 1/1/24 | | | 2,230,455 | | | | 2,292 | |
| | Federal Home Loan Mortgage Corp., 5.00%, 4/1/18 | | | 61,814 | | | | 65 | |
| | Federal Home Loan Mortgage Corp., 5.50%, 5/1/22 | | | 348,014 | | | | 379 | |
| | Federal National Mortgage Association, Series 2010-95, Class BK, 1.50%, 2/25/20 | | | 852,040 | | | | 859 | |
| | Federal National Mortgage Association, Series 2013-74, Class AD, 2.00%, 7/25/23 | | | 908,530 | | | | 919 | |
| | Federal National Mortgage Association, 2.50%, 10/1/22 | | | 1,552,816 | | | | 1,597 | |
| | Federal National Mortgage Association, 2.50%, 12/1/22 | | | 382,785 | | | | 394 | |
| | Federal National Mortgage Association, Series 2011-113, Class AG, 2.50%, 11/25/26 | | | 515,302 | | | | 527 | |
| | Federal National Mortgage Association, 3.00%, 6/1/22 | | | 479,317 | | | | 500 | |
| | Federal National Mortgage Association, 3.00%, 4/1/24 | | | 938,047 | | | | 980 | |
| | Federal National Mortgage Association, 3.50%, 5/1/27 | | | 1,765,196 | | | | 1,868 | |
| | | | | | | | | | |
| | | Structured Products (36.8%) | | Shares/
$ Par | | | Value
$ (000’s) | |
| |
| | Structured Products continued | |
| | Federal National Mortgage Association, 3.50%, 11/1/44 | | | 2,040,887 | | | | 2,136 | |
| | Federal National Mortgage Association, 4.00%, 2/1/29 | | | 2,310,447 | | | | 2,473 | |
| | Federal National Mortgage Association, 4.00%, 3/1/41 | | | 100,507 | | | | 107 | |
| | Federal National Mortgage Association, 4.00%, 3/1/42 | | | 994,407 | | | | 1,063 | |
| | Federal National Mortgage Association, 4.50%, 5/1/40 | | | 352,184 | | | | 383 | |
| | Federal National Mortgage Association, 4.50%, 9/1/40 | | | 349,553 | | | | 380 | |
| | Federal National Mortgage Association, 5.50%, 8/1/37 | | | 252,614 | | | | 284 | |
| | Federal National Mortgage Association, 5.5%, 2/1/38 | | | 972,816 | | | | 1,093 | |
| | Federal National Mortgage Association, 6.00%, 8/1/22 | | | 183,739 | | | | 198 | |
| | Federal National Mortgage Association, 6.00%, 8/1/34 | | | 556,286 | | | | 635 | |
| | Federal National Mortgage Association, 6.00%, 10/1/40 | | | 572,911 | | | | 650 | |
| | Fifth Third Auto Trust, Series 2014-2, Class A4, 1.38%, 12/15/20 | | | 500,000 | | | | 499 | |
| | Ford Credit Auto Lease Trust, Series 2014-A, Class A3, 0.68%, 4/15/17 | | | 260,000 | | | | 260 | |
| | Ford Credit Auto Lease Trust, Series 2014-A, Class A4, 0.90%, 6/15/17 | | | 220,000 | | | | 219 | |
| | Ford Credit Auto Lease Trust, Series 2013-B, Class A4, 0.96%, 10/15/16 | | | 1,000,000 | | | | 1,001 | |
| | Ford Credit Auto Owner Trust, Series 2014-A, Class A3, 0.79%, 5/15/18 | | | 350,000 | | | | 350 | |
| | Ford Credit Auto Owner Trust, Series 2014-A, Class A4, 1.29%, 4/15/19 | | | 425,000 | | | | 425 | |
| | Ford Credit Auto Owner Trust, Series 2014-B, Class A4, 1.42%, 8/15/19 | | | 400,000 | | | | 400 | |
The Accompanying Notes are an Integral Part of the Financial Statements.
| | | | |
| 94 | | Short-Term Bond Portfolio | | |
Short-Term Bond Portfolio
| | | | | | | | | | |
| | | Structured Products (36.8%) | | Shares/
$ Par | | | Value
$ (000’s) | |
| |
| | Structured Products continued | |
| | Ford Credit Auto Owner Trust, Series 2011-B, Class B,
2.27%, 1/15/17 | | | 200,000 | | | | 202 | |
| | Ford Credit Auto Owner Trust, Series 2013-C, Class D,
2.50%, 1/15/20 | | | 575,000 | | | | 584 | |
| | Ford Credit Auto Owner Trust, Series 2011-A, Class D,
3.21%, 7/15/17 | | | 110,000 | | | | 111 | |
| | Ford Credit Floorplan Master Owner Trust, Series 2014-1,
Class A1,
1.20%, 2/15/19 | | | 500,000 | | | | 499 | |
| | Ford Credit Floorplan Master Owner Trust, Series 2014-4, Class A1, 1.40%, 8/15/19 | | | 1,150,000 | | | | 1,148 | |
| | GE Equipment Small Ticket LLC, Series 2014-1A, Class A4, 1.44%, 10/25/21 144A | | | 300,000 | | | | 300 | |
| | General Electric Capital Credit Card Master Note Trust, Series
2013-1, Class B, 1.69%, 3/15/21 | | | 465,000 | | | | 460 | |
| | Government National Mortgage Association, 3.50%, 9/20/44 | | | 503,975 | | | | 530 | |
| | Government National Mortgage Association, 5.00%, 3/20/34 | | | 1,117,456 | | | | 1,236 | |
| | Government National Mortgage Association, 5.50%, 6/20/37 | | | 292,711 | | | | 329 | |
| | GS Mortgage Securities Trust, Series 2011-GC5, Class A1, 1.468%, 8/10/44 | | | 363,065 | | | | 365 | |
| | Honda Auto Receivables Owner Trust, Series 2013-1, Class A3, 0.48%, 11/21/16 | | | 1,349,736 | | | | 1,350 | |
| | Honda Auto Receivables Owner Trust, Series 2012-2, Class A4, 0.91%, 5/15/18 | | | 150,000 | | | | 150 | |
| | Honda Auto Receivables Owner Trust, Series 2013-4, Class A4, 1.04%, 2/18/20 | | | 85,000 | | | | 85 | |
| | Honda Auto Receivables Owner Trust, Series 2013-3, Class A4, 1.13%, 9/16/19 | | | 165,000 | | | | 165 | |
| | Honda Auto Receiveables Owner Trust, Series 2014-4, Class A3, 0.99%, 9/17/18 | | | 845,000 | | | | 843 | |
| | | | | | | | | | |
| | | Structured Products (36.8%) | | Shares/
$ Par | | | Value
$ (000’s) | |
| |
| | Structured Products continued | |
| | Hyundai Auto Receivables Trust, Series 2011-B, Class D, 3.51%, 11/15/17 | | | 445,000 | | | | 456 | |
| | J.P. Morgan Chase Commercial Mortgage Securities Trust, Series 2006-CB14, Class AM, 5.43%, 12/12/44 | | | 600,000 | | | | 622 | |
| | John Deere Owner Trust, Series 2014-A, Class A3, 0.92%, 4/16/18 | | | 600,000 | | | | 600 | |
| | JP Morgan Chase Commercial Mortgage Securities Trust, Series 2006-LDP8, Class AM, 5.44%, 5/15/45 | | | 485,000 | | | | 514 | |
| | JP Morgan Chase Commercial Mortgage Securities Trust, Series 2006-LDP7, Class AM, 5.87%, 4/15/45 | | | 730,000 | | | | 775 | |
| | JP Morgan Chase Commercial Mortgage Securities Trust, Series 2007-CB20, Class AM, 5.88%, 2/12/51 | | | 350,000 | | | | 384 | |
| | JP Morgan Chase Commerical Mortgage Securities Trust, Series 2007-C1, Class AM, 5.96%, 2/15/51 | | | 680,000 | | | | 729 | |
| | JPMBB Commercial Mortgage Securities Trust, Series 2014-C26, Class A1, 1.5962%, 1/15/48 | | | 505,000 | | | | 504 | |
| | Kubota Credit Owner Trust, Series 2014-1A, Class A4,
1.67%, 7/15/20 144A | | | 1,500,000 | | | | 1,495 | |
| | LB-UBS Commercial Mortgage Trust, Series 2006-C6, Class AM, 5.413%, 9/15/39 | | | 400,000 | | | | 425 | |
| | MASTR Asset Securitization Trust, Series 2003-10,
Class 1A1,
5.25%, 11/25/23 | | | 20,995 | | | | 21 | |
| | Mercedes-Benz Auto Lease Trust, Series 2014-A, Class A4, 0.90%, 12/16/19 | | | 470,000 | | | | 470 | |
| | Merrill Lynch Mortgage Trust, Series 2005-CKI1, Class AM, 5.29%, 11/12/37 | | | 360,000 | | | | 370 | |
| | ML-CFC Commercial Mortgage Trust, Series 2007-5, Class AM, 5.419%, 8/12/48 | | | 350,000 | | | | 367 | |
| | | | | | | | | | |
| | | Structured Products (36.8%) | | Shares/
$ Par | | | Value
$ (000’s) | |
| |
| | Structured Products continued | |
| | ML-CFC Commerical Mortgage Trust, Series 2006-4, Class AM, 5.204%, 12/12/49 | | | 210,000 | | | | 224 | |
| | Morgan Stanely Capital I Trust, Series 2006-T21, Class A4, 5.162%, 10/12/52 | | | 1,120,000 | | | | 1,148 | |
| | Morgan Stanley Bank of American Merrill Lynch Trust, Series 2014-C19, Class A1, 1.573%, 12/15/47 | | | 345,000 | | | | 345 | |
| | Morgan Stanley Capital I Trust, Series 2005-HQ6, Class AJ, 5.073%, 8/13/42 | | | 600,000 | | | | 609 | |
| | Nissan Auto Lease Trust, Series 2013-A,
Class A3,
0.61%, 4/15/16 | | | 1,000,000 | | | | 1,000 | |
| | Nissan Auto Lease Trust, Series 2014-A,
Class A4,
1.04%, 10/15/19 | | | 1,150,000 | | | | 1,148 | |
| | Nissan Auto Receivables Owner Trust, Series 2014-B, Class A3, 1.11%, 5/15/19 | | | 475,000 | | | | 474 | |
| | Residential Asset Securities Corp., Series 2006-KS4, Class A3, 0.319%, 6/25/36 | | | 667,380 | | | | 663 | |
| | Santander Drive Auto Receivables Trust, Series 2013-1, Class B, 1.16%, 1/15/16 | | | 665,000 | | | | 667 | |
| | Santander Drive Auto Receivables Trust, Series 2013-5, Class B, 1.55%, 10/15/18 | | | 925,000 | | | | 928 | |
| | Santander Drive Auto Receivables Trust, Series 2011-3, Class C, 3.09%, 5/15/17 | | | 90,621 | | | | 91 | |
| | Santander Drive Auto Receivables Trust, Series 2011-4, Class C, 3.82%, 8/15/17 | | | 332,275 | | | | 336 | |
| | Sierra Receivables Funding Co. LLC, Series 2013-3A, Class A,
2.20%, 10/20/30 144A | | | 662,580 | | | | 659 | |
| | Sierra Receivables Funding Co. LLC, Series 2013-2A, Class A,
2.28%, 11/20/25 144A | | | 547,752 | | | | 552 | |
| | Synchrony Credit Card Master Note Trust, Series 2012-6, Class A, 1.36%, 8/17/20 | | | 1,145,000 | | | | 1,138 | |
The Accompanying Notes are an Integral Part of the Financial Statements.
| | | | | | |
| | Short-Term Bond Portfolio | | | 95 | |
Short-Term Bond Portfolio
| | | | | | | | | | |
| | | Structured Products (36.8%) | | Shares/
$ Par | | | Value
$ (000’s) | |
| |
| | Structured Products continued | |
| | Synchrony Credit Card Master Note Trust, Series 2014-1, Class A, 1.61%, 11/16/20 | | | 1,155,000 | | | | 1,151 | |
| | TIAA Seasoned Commerical Mortgage Trust, Series 2007-C4, Class AJ, 5.56%, 8/15/39 | | | 491,000 | | | | 504 | |
| | Toyota Auto Receivables Owners Trust, Series 2014-B, Class A4, 1.31%, 9/16/19 | | | 1,500,000 | | | | 1,496 | |
| | Volkswagen Auto Loan Enhanced Trust, Series 2014-1, Class A3, 0.91%, 10/22/18 | | | 85,000 | | | | 85 | |
| | | | | | | | | | |
| | | Structured Products (36.8%) | | Shares/
$ Par | | | Value
$ (000’s) | |
| | Volkswagen Auto Loan Enhanced Trust, Series 2013-2, Class A4, 1.16%, 3/20/20 | | | 1,150,000 | | | | 1,141 | |
| | Volkswagen Auto Loan Enhanced Trust, Series 2014-1, Class A4, 1.45%, 9/21/20 | | | 425,000 | | | | 422 | |
| | Wachovia Bank Commercial Mortgage Trust, Series 2006-C29, Class AM, 5.339%, 11/15/48 | | | 916,000 | | | | 976 | |
| | | | | | | | | | |
| | | Structured Products (36.8%) | | Shares/
$ Par | | | Value
$ (000’s) | |
| | Wachovia Bank Commercial Mortgage Trust, Series 2006-C25, Class AM, 5.72%, 5/15/43 | | | 496,000 | | | | 522 | |
| | Wells Fargo Commercial Mortgage Trust, Series 2014-LC18, Class A1, 1.437%, 12/15/47 | | | 435,000 | | | | 434 | |
| | Wells Fargo Mortgage Backed Securities Trust, Series 2004-EE, Class 2A2, 2.611%, 12/25/34 | | | 648,364 | | | | 659 | |
| | | | | | | | | | |
| | | |
| | Total Structured Products | | | | | | | | |
| | (Cost: $86,327) | | | | | | | 86,261 | |
| | | | | | | | | | |
| | | |
| | Total Investments (98.5%) | | | | | | | | |
| | (Cost: $230,938)(a) | | | | | | | 230,895 | |
| | | | | | | | | | |
| | Other Assets, Less Liabilities (1.5%) | | | | | | | 3,592 | |
| | | | | | | | | | |
| | Net Assets (100.0%) | | | | | | | 234,487 | |
| | | | | | | | | | |
144A after the name of a security represents a security exempt from registration under Rule 144A of the Securities Act of 1933. These securities may be resold as transactions exempt from registration, normally to qualified institutional buyers. At December 31, 2014 the value of these securities (in thousands) was $29,629 representing 12.6% of the net assets.
GO — General Obligation
RB — Revenue Bond
| (a) | At December 31, 2014, the aggregate cost of securities for federal tax purposes (in thousands) was $230,941 and the net unrealized depreciation of investments based on that cost was $46 which is comprised of $745 aggregate gross unrealized appreciation and $791 aggregate gross unrealized depreciation. |
| (b) | All or a portion of the securities have been pledged as collateral for open futures positions or when-issued securities. Information regarding open futures contracts as of period end is summarized below. |
| | | | | | | | |
| Issuer (000’s) | | Number of
Contracts | | Expiration Date | | Unrealized
Appreciation/
(Depreciation)
(000’s) | |
US Five Year Treasury Note Futures (Short) (Total Notional Value at December 31, 2014, $12,960) | | 109 | | 3/15 | | $ | (4) | |
US Ten Year Treasury Note Futures (Short) (Total Notional Value at December 31, 2014, $2,268) | | 18 | | 3/15 | | | (14) | |
| (f) | Foreign Bond — par value is foreign denominated |
MXN – Mexican New Peso
The Accompanying Notes are an Integral Part of the Financial Statements.
| | | | |
| 96 | | Short-Term Bond Portfolio | | |
Short-Term Bond Portfolio
The following is a summary of the inputs used in valuing the Portfolio’s assets and liabilities at December 31, 2014. See Note 3 for additional information on portfolio valuation.
| | | | | | | | | | | | | | |
| | | Valuation Inputs | | | |
| Description | | Level 1 -
Quoted Prices | | | Level 2 -
Other Significant
Observable Inputs | | | Level 3 - Significant
Unobservable Inputs | | | |
| | | (Amounts in thousands) | | | |
Assets: | | | | | | | | | | | | | | |
Government & Agency Bonds | | $ | - | | | $ | 30,958 | | | $ | - | | | |
Municipal Bonds | | | - | | | | 2,189 | | | | - | | | |
Corporate Bonds | | | - | | | | 111,487 | | | | - | | | |
Structured Products | | | - | | | | 84,347 | | | | 1,914 | | | |
Total Assets | | $ | - | | | $ | 228,981 | | | $ | 1,914 | | | |
Liabilities: | | | | | | | | | | | | | | |
Other Financial Instruments^ | | | | | | | | | | | | | | |
Futures | | | (18 | ) | | | - | | | | - | | | |
Total Liabilities | | $ | (18 | ) | | $ | - | | | $ | - | | | |
^ Other financial instruments are derivative instruments such as futures, forwards, written options and swaps contracts, which are valued at the unrealized appreciation (depreciation) on the instrument and short sales, which are valued at market value.
For the period December 31, 2014, there were transfers from a Level 3 to a Level 2 in the amount of $367 thousand. These transfers were the result of an increase in the availability of observable inputs for a security that was previously priced by a third party utilizing a broker quote.
The following is a reconciliation of the fair valuations using significant unobservable inputs (Level 3) for the Portfolio during the period ended December 31, 2014. (Amounts in thousands)
| | | | | | | | | | | | | | | | | | | | | | | | | | | | | | | | | | | | | | | | |
| Category | | Market
Value
12/31/13 | | | Net
Purchases | | | Net
Sales | | | Accrued
Discounts/
(Premiums) | | | Realized
Gain/
(Loss) | | | Change in
Unrealized
Appreciation
(Depreciation) | | | Transfers
in at
Market
Value | | | Transfers
out at
Market
Value | | | Market
Value
12/31/14 | | | Net Change in
Unrealized
Appreciation/
(Depreciation)
on Invetments
Held at
12/31/14 | |
Structured Products | | $ | 5,798 | | | $ | 155 | | | $ | 3,665 | | | $ | — | | | $ | 1 | | | $ | (8 | ) | | $ | — | | | $ | 367 | | | $ | 1,914 | | | $ | 5 | |
The Accompanying Notes are an Integral Part of the Financial Statements.
| | | | | | |
| | Short-Term Bond Portfolio | | | 97 | |
Select Bond Portfolio (unaudited)
| | | | |
| Objective: | | Portfolio Strategy: | | Net Assets: |
Provide as high a level of total return as is consistent with prudent investment risk. A secondary objective is to seek preservation of shareholders’ capital. | | Invest in a diversified portfolio of investment grade debt securities with maturities exceeding one year. | | $2.8 billion |
Portfolio Overview
Mason Street Advisors, LLC (“Mason Street Advisors”), the investment adviser for the Select Bond Portfolio (the “Portfolio”), has engaged Wells Capital Management, Inc. (“Wells Capital”) to act as sub-adviser for the Portfolio. Wells Capital was appointed sub-adviser to the Portfolio effective October 31, 2014. Prior to that time, the Portfolio was managed directly by Mason Street Advisors. Normally, the Portfolio invests in a diversified portfolio of investment grade debt securities with maturities exceeding one year. The Portfolio may invest up to 20% of net assets in non-investment grade, high yield/high risk bonds (so called “junk bonds”) and up to 30% of net assets in foreign securities. Debt securities may be of any maturity or duration, but under normal market conditions, the Portfolio attempts to maintain an overall dollar-weighted average effective duration (an aggregate measure of the sensitivity of the Portfolio’s fixed income portfolio securities to changes in interest rates) that is within 10% of the Barclays® U.S. Aggregate Index. The Portfolio uses a “bottom up,” fundamental, relative value investment approach to construct the portfolio of investments. The Portfolio invests in debt securities that it believes offer competitive returns and are undervalued, offering additional income and/or price appreciation potential relative to other debt securities of similar credit quality and interest rate sensitivity. The Portfolio may engage in active and frequent trading of portfolio securities to achieve its investment objectives.
Market Overview
Higher risk assets began 2014 with mixed performance as the markets reacted to concerns about U.S and Chinese growth and geopolitical turmoil. Then risk premiums compressed while volatility edged toward all-time lows over the course of the second quarter. In the third quarter, volatility in markets returned. Concerns included uncertainty around monetary policy, geopolitical tensions and technical factors related to fixed-income flows.
A “flash rally” in Treasurys in October produced the most volatile month for rates since mid-2013. The Fed reaffirmed that a rate hike remains likely but data-dependent in 2015. Tumbling oil prices, weakening commodities, all-time lows in European bond yields, and highs in U.S. equities reflected the disparity between a strengthening U.S. economy and significant softness globally.
The Barclays® U.S. Aggregate Index posted a positive total return for the year, with positive returns across all sectors, on a relative basis led by tightening in commercial mortgage-backed securities, asset-backed securities, agencies, and agency mortgages, while credit was the sole sector that underperformed.
Portfolio Results
The Portfolio returned 5.56% for the twelve months ended December 31, 2014. By comparison, the Portfolio’s benchmark, the Barclays® U.S. Aggregate Index (the “Index”), returned 5.97%. (The Index is unmanaged, cannot be invested in directly and does not include administrative expenses or sales charges.) The Portfolio underperformed the 6.12% average return of its Corporate Debt Funds A-Rated peer group, according to Lipper® Analytical Services, Inc., an independent mutual fund ranking agency.
As noted above, prior to October 31, 2014, the Portfolio was managed by Mason Street Advisors. With respect to the period prior to October 31, 2014, the Portfolio underperformed the Index primarily due to duration and yield curve positioning. When compared to the Index, the Portfolio was short duration while interest rates dropped.
On a positive note, the Portfolio experienced positive security selection mainly within mortgage-backed securities and the credit sector.
The following attribution comments relate to the period October 31, 2014 through December 31, 2014, during which Wells Capital acted as the Portfolio’s sub-adviser.
The Portfolio underperformed the Index during the October 31, 2014 through December 31, 2014 period. Detractors to Portfolio performance included positions in the energy and pipelines sectors, due mainly to falling oil prices and supply pressure. Security selection within collateralized mortgage obligations, specifically positioning in lower coupons, detracted from performance as well. A sector overweight to commercial mortgage-backed securities and positions in credit cards asset-backed securities were also modest detractors from performance.
Security selection overall was a positive contributor to performance. In credit, contributors were concentrated in the health care, local government, and insurance segments. Security selection within hybrid adjustable-rate mortgages, fixed-rate mortgages and commercial mortgage-backed securities also contributed to performance.
Select Bond Portfolio (unaudited)
Portfolio Manager Outlook
The following forward looking comments are the opinion of Wells Capital, the Portfolio’s sub-adviser.
Consistent with our bottom-up security selection process, we maintain a neutral duration. We maintain a modest underweight to mortgages, reflecting stretched valuations in some securities and potentially worsening supply/demand technicals. We maintain a small overweight to credit, navigating a choppy environment with diverse subsector impacts. We are modestly overweight the asset-backed securities and commercial mortgage-backed securities sectors on favorable dynamics versus agency mortgages. We believe we are well positioned and stand ready to take advantage of relative value trading opportunities as they arise.
Relative Performance
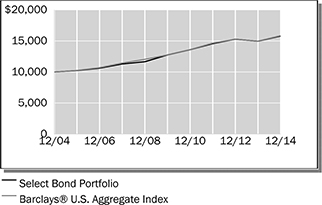
| | | | | | | | | | | | |
Average Annual Total Returns For Periods Ended December 31, 2014 | |
| | | 1 Year | | | 5 Years | | | 10 Years | |
Select Bond Portfolio | | | 5.56% | | | | 4.37% | | | | 4.67% | |
Barclays® U.S. Aggregate Index | | | 5.97% | | | | 4.45% | | | | 4.71% | |
Lipper® Variable Insurance Products (VIP) Corporate Debt Funds A-Rated Average | | | 6.12% | | | | 5.21% | | | | 4.44% | |
The performance data quoted represents past performance. Past performance is historical and does not guarantee future performance. Investment return and principal value will fluctuate, so that shares, when redeemed, may be worth more or less than their original cost. Current performance may be lower or higher than the performance data quoted. For the most recent month-end performance information visit www.northwesternmutual.com.
This chart assumes an initial investment of $10,000 made on 12/31/04. Returns shown include deductions for management and other portfolio expenses, and reinvestment of all dividends. Returns exclude deductions for separate account sale loads and account fees. Please refer to the Benchmark Definitions section of this report for information about the indices cited in the above chart and graph.
Return of principal is not guaranteed. Bond funds have the same interest rate, inflation and credit risks that are associated with the underlying bonds owned by the Portfolio. When interest rates rise, bond prices fall. With a fixed income fund, when interest rates rise, the value of the fund’s existing bonds drops, which could negatively affect overall fund performance. A portion of the Portfolio’s assets may be invested in lower quality debt securities which may present a significant risk for loss of principal and interest. High yield bonds generally have greater price swings and higher default risks than investment grade bonds.
Investing in bonds issued by foreign corporations and governments carries additional risk, including foreign currency risk, and may increase the volatility of the Portfolio’s performance.
The Portfolio may invest in derivative instruments to adjust the Portfolio’s duration and yield curve exposure, to hedge foreign currency exposure or for any other permissible purporse keeping with its investment objective. Use of these instruments may involve certain costs and imposes certain risks such as liquidity risk, market risk, credit risk, management risk and the risk of mispricing or improper valuation. Certain derivatives involve leverage, which could magnify losses, and portfolios investing in derivatives could lose more than the principal amount invested in those instruments.
Currently, interest rates are at unprecedented historically low levels. A significant rise in interest rates over a short period of time could cause significant losses in the market value of the Portfolio’s fixed income investments.
Select Bond Portfolio (unaudited)
Top 10 Fixed Income Holdings 12/31/14
| | | | |
Security Description | | | % of Market Value | |
US Treasury, Various | | | 33.1% | |
Federal National Mortgage Association, Various | | | 12.1% | |
Government National Mortgage Association, Various | | | 4.9% | |
Federal Home Loan Mortgage Corp, Various | | | 3.1% | |
Citibank Credit Card Issuance Trust, Series 2014-A6, Class A6, 2.15%, 7/15/21 | | | 1.3% | |
Federal National Mortgage Association TBA, 4.00%, 2/1/43 | | | 1.2% | |
JPMBB Commercial Mortgage Securities Trust, Series 2014-C25, Class ASB, 3.407%, 11/15/47 | | | 1.1% | |
Verizon Communications, Inc., Various | | | 1.0% | |
Federal National Mortgage Association Stripped, 3.00%, 8/25/42 | | | 0.9% | |
Federal National Mortgage Association, 4.00%, 6/25/39 | | | 0.8% | |
Sector Allocation 12/31/14
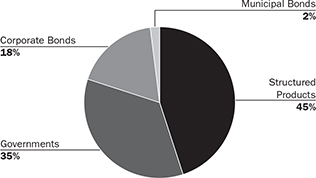
Sector Allocation is based on fixed income investments. Sector Allocation and Top 10 Holdings are subject to change.
The Corporate Bonds sector includes bonds of companies and governments headquartered outside the United States. The Government and Structured Product categories include domestic taxable bonds.
Consistent with the Portfolio’s stated parameters, no more than 30% of the Portfolio is invested in foreign securities, and no more than 20% is invested in high yield securities.
| | | | |
| 100 | | Select Bond Portfolio | | |
Select Bond Portfolio
Schedule of Investments
December 31, 2014
| | | | | | | | | | |
| | | Corporate Bonds (19.6%) | | Shares/
$ Par | | | Value
$ (000’s) | |
| |
| | Aerospace & Defense (0.4%) | |
| | L-3 Communications Corp.,
3.95%, 5/28/24 | | | 2,505,000 | | | | 2,526 | |
| | Litton Industries, Inc., 6.75%, 4/15/18 | | | 1,000,000 | | | | 1,144 | |
| | Northrop Grumman Corp.,
3.25%, 8/1/23 | | | 4,160,000 | | | | 4,191 | |
| | Northrop Grumman Corp.,
4.75%, 6/1/43 | | | 3,160,000 | | | | 3,528 | |
| | | | | | | | | | |
| | Total | | | | | | | 11,389 | |
| | | | | | | | | | |
| |
| | Autos & Vehicle Parts (0.6%) | |
| | Daimler Finance North America LLC, 2.25%, 9/3/19 144A | | | 170,000 | | | | 169 | |
| | Daimler Finance North America LLC, 2.875%, 3/10/21 144A | | | 2,105,000 | | | | 2,124 | |
| | Daimler Finance North America LLC, 3.25%, 8/1/24 144A | | | 565,000 | | | | 569 | |
| | Ford Motor Credit Co. LLC,
3.664%, 9/8/24 | | | 3,300,000 | | | | 3,307 | |
| | General Motors Co., 3.50%, 10/2/18 | | | 3,635,000 | | | | 3,708 | |
| | General Motors Co., 5.00%, 4/1/35 | | | 320,000 | | | | 333 | |
| | General Motors Co., 5.20%, 4/1/45 | | | 480,000 | | | | 506 | |
| | General Motors Financial Co., Inc., 3.50%, 7/10/19 | | | 1,860,000 | | | | 1,899 | |
| | Johnson Controls, Inc., 4.625%, 7/2/44 | | | 955,000 | | | | 983 | |
| | Johnson Controls, Inc., 4.95%, 7/2/64 | | | 955,000 | | | | 985 | |
| | Toyota Motor Credit Corp.,
3.30%, 1/12/22 | | | 2,900,000 | | | | 3,019 | |
| | | | | | | | | | |
| | Total | | | | | | | 17,602 | |
| | | | | | | | | | |
| |
| | Banking (5.0%) | |
| | American Express Co., 3.625%, 12/5/24 | | | 1,780,000 | | | | 1,795 | |
| | Australia & New Zealand Banking Group, Ltd., 4.50%, 3/19/24 144A | | | 3,310,000 | | | | 3,379 | |
| | Bank of America Corp., 4.00%, 4/1/24 | | | 5,755,000 | | | | 5,992 | |
| | Bank of America Corp., 4.25%, 10/22/26 | | | 3,080,000 | | | | 3,073 | |
| | Bank of America Corp., 6.00%, 9/1/17 | | | 3,500,000 | | | | 3,859 | |
| | The Bank of Tokyo-Mitsubishi UFJ, Ltd., 2.35%, 9/8/19 144A | | | 10,000,000 | | | | 9,933 | |
| | BB&T Corp., 2.45%, 1/15/20 | | | 5,745,000 | | | | 5,722 | |
| | BPCE SA, 5.70%, 10/22/23 144A | | | 1,800,000 | | | | 1,933 | |
| | | | | | | | | | |
| | | Corporate Bonds (19.6%) | | Shares/
$ Par | | | Value
$ (000’s) | |
| |
| | Banking continued | |
| | Citigroup, Inc., 1.55%, 8/14/17 | | | 5,185,000 | | | | 5,170 | |
| | Citigroup, Inc., 1.70%, 7/25/16 | | | 3,000,000 | | | | 3,021 | |
| | Citigroup, Inc., 3.75%, 6/16/24 | | | 2,290,000 | | | | 2,339 | |
| | Citigroup, Inc., 4.30%, 11/20/26 | | | 1,165,000 | | | | 1,162 | |
| | Credit Suisse of New York, 3.625%, 9/9/24 | | | 4,250,000 | | | | 4,323 | |
| | Fifth Third Bank, 4.75%, 2/1/15 | | | 2,000,000 | | | | 2,006 | |
| | The Goldman Sachs Group, Inc., 6.25%, 2/1/41 | | | 1,300,000 | | | | 1,643 | |
| | The Goldman Sachs Group, Inc., 6.75%, 10/1/37 | | | 1,300,000 | | | | 1,635 | |
| | HSBC Holdings PLC, 4.25%, 3/14/24 | | | 1,200,000 | | | | 1,249 | |
| | HSBC Holdings PLC, 5.25%, 3/14/44 | | | 2,000,000 | | | | 2,240 | |
| | HSBC USA, Inc., 2.375%, 11/13/19 | | | 6,395,000 | | | | 6,393 | |
| | ING Bank NV, 2.50%, 10/1/19 144A | | | 7,000,000 | | | | 7,045 | |
| | ING Bank NV, 5.80%, 9/25/23 144A | | | 2,800,000 | | | | 3,106 | |
| | Inter-American Development Bank, 4.375%, 1/24/44 | | | 1,045,000 | | | | 1,289 | |
| | Intesa Sanpaolo S.p.A, 2.375%, 1/13/17 | | | 4,000,000 | | | | 4,035 | |
| | JPMorgan Chase & Co., 2.20%, 10/22/19 | | | 4,155,000 | | | | 4,119 | |
| | JPMorgan Chase & Co., 4.125%, 12/15/26 | | | 5,000,000 | | | | 5,005 | |
| | JPMorgan Chase & Co., 4.85%, 2/1/44 | | | 2,000,000 | | | | 2,219 | |
| | Lazard Group LLC, 4.25%, 11/14/20 | | | 2,955,000 | | | | 3,114 | |
| | Lazard Group LLC, 6.85%, 6/15/17 | | | 4,000,000 | | | | 4,453 | |
| | Lloyds Banking Group PLC,
4.50%, 11/4/24 | | | 3,200,000 | | | | 3,229 | |
| | Morgan Stanley, 2.375%, 7/23/19 | | | 6,300,000 | | | | 6,277 | |
| | Morgan Stanley, 3.70%, 10/23/24 | | | 6,225,000 | | | | 6,310 | |
| | Morgan Stanley, 4.35%, 9/8/26 | | | 2,700,000 | | | | 2,716 | |
| | Murray Street Investment Trust I,
4.647%, 3/9/17 | | | 5,750,000 | | | | 6,068 | |
| | Royal Bank of Scotland Group PLC, 5.125%, 5/28/24 | | | 1,195,000 | | | | 1,216 | |
| | State Street Corp., 3.30%, 12/16/24 | | | 4,425,000 | | | | 4,491 | |
| | | | | | | | | | |
| | | Corporate Bonds (19.6%) | | Shares/
$ Par | | | Value
$ (000’s) | |
| |
| | Banking continued | |
| | Sumitomo Mitsui Banking Corp.,
1.35%, 7/11/17 | | | 5,000,000 | | | | 4,953 | |
| | Sumitomo Mitsui Financial Group, Inc., 4.436%, 4/2/24 144A | | | 1,775,000 | | | | 1,838 | |
| | Synchrony Financial, 4.25%, 8/15/24 | | | 2,895,000 | | | | 2,971 | |
| (d) | | Washington Mutual Bank, 6.75%, 5/20/36 | | | 1,100,000 | | | | - | |
| (d) | | Washington Mutual Bank, 6.875%, 6/15/11 | | | 1,620,000 | | | | - | |
| | | | | | | | | | |
| | Total | | | | | | | 141,321 | |
| | | | | | | | | | |
| |
| | Chemicals (0.4%) | |
| | Albemarle Corp., 4.15%, 12/1/24 | | | 1,425,000 | | | | 1,448 | |
| | Albemarle Corp., 5.45%, 12/1/44 | | | 1,350,000 | | | | 1,453 | |
| | Eastman Chemical Co., 3.80%, 3/15/25 | | | 2,865,000 | | | | 2,916 | |
| | Eastman Chemical Co., 4.65%, 10/15/44 | | | 1,315,000 | | | | 1,346 | |
| | LYB International Finance BV,
4.875%, 3/15/44 | | | 1,255,000 | | | | 1,291 | |
| | The Mosaic Co.,
5.625%, 11/15/43 | | | 1,200,000 | | | | 1,375 | |
| | Praxair, Inc., 3.55%, 11/7/42 | | | 2,000,000 | | | | 1,947 | |
| | | | | | | | | | |
| | Total | | | | | | | 11,776 | |
| | | | | | | | | | |
| |
| | Consumer Products & Retailing (0.7%) | |
| | Altria Group, Inc., 2.625%, 1/14/20 | | | 3,520,000 | | | | 3,530 | |
| | Altria Group, Inc., 4.50%, 5/2/43 | | | 1,855,000 | | | | 1,868 | |
| | Bed Bath & Beyond, Inc., 5.165%, 8/1/44 | | | 1,800,000 | | | | 1,883 | |
| | LVMH Moet Hennessy Louis Vuitton SA, 1.625%, 6/29/17 144A | | | 4,460,000 | | | | 4,463 | |
| | Philip Morris International, Inc., 3.25%, 11/10/24 | | | 1,415,000 | | | | 1,416 | |
| | Philip Morris International, Inc., 4.25%, 11/10/44 | | | 1,360,000 | | | | 1,383 | |
| | Signet UK Finance PLC, 4.70%, 6/15/24 | | | 4,000,000 | | | | 3,860 | |
| | | | | | | | | | |
| | Total | | | | | | | 18,403 | |
| | | | | | | | | | |
| |
| | Electric Utilities (1.2%) | |
| | AEP Texas Central Co., 6.65%, 2/15/33 | | | 575,000 | | | | 758 | |
| | Alabama Power Co., 3.95%, 6/1/21 | | | 2,000,000 | | | | 2,179 | |
| | Alabama Power Co., 4.15%, 8/15/44 | | | 1,300,000 | | | | 1,365 | |
The Accompanying Notes are an Integral Part of the Financial Statements.
| | | | | | |
| | Select Bond Portfolio | | | 101 | |
Select Bond Portfolio
| | | | | | | | | | |
| | | Corporate Bonds (19.6%) | | Shares/
$ Par | | | Value
$ (000’s) | |
| |
| | Electric Utilities continued | |
| | Ameren Illinois Co., 4.30%, 7/1/44 | | | 1,550,000 | | | | 1,659 | |
| | Appalachian Power Co., 4.60%, 3/30/21 | | | 1,000,000 | | | | 1,109 | |
| | Berkshire Hathaway, 4.50%, 2/1/45 144A | | | 1,875,000 | | | | 1,962 | |
| | Bruce Mansfield Unit, 6.85%, 6/1/34 | | | 776,290 | | | | 847 | |
| | CenterPoint Energy, Inc., 6.50%, 5/1/18 | | | 775,000 | | | | 886 | |
| | Commonwealth Edison Co., 5.875%, 2/1/33 | | | 215,000 | | | | 270 | |
| | Connecticut Light & Power Co., 5.65%, 5/1/18 | | | 320,000 | | | | 359 | |
| | Consolidated Edison Co. of New York, Inc., 4.625%, 12/1/54 | | | 1,195,000 | | | | 1,309 | |
| | Dayton Power & Light Co., 1.875%, 9/15/16 | | | 1,870,000 | | | | 1,891 | |
| | The Detroit Edison Co., 3.45%, 10/1/20 | | | 1,070,000 | | | | 1,122 | |
| | The Detroit Edison Co., 5.45%, 2/15/35 | | | 105,000 | | | | 129 | |
| | Dominion Resources, Inc., 4.70%, 12/1/44 | | | 1,925,000 | | | | 2,049 | |
| | Duke Energy Corp., 6.25%, 6/15/18 | | | 95,000 | | | | 108 | |
| | Duke Energy Ohio, Inc., 3.80%, 9/1/23 | | | 365,000 | | | | 388 | |
| | Entergy Gulf States Louisiana LLC, 3.78%, 4/1/25 | | | 2,000,000 | | | | 2,082 | |
| | Mississippi Power Co., 4.75%, 10/15/41 | | | 1,600,000 | | | | 1,766 | |
| | Northeast Utilities, 2.80%, 5/1/23 | | | 1,430,000 | | | | 1,384 | |
| | Northeast Utilities, 4.50%, 11/15/19 | | | 105,000 | | | | 114 | |
| | NV Energy, Inc., 6.25%, 11/15/20 | | | 900,000 | | | | 1,057 | |
| | Ohio Power Co., 5.375%, 10/1/21 | | | 1,000,000 | | | | 1,157 | |
| | Pacific Gas & Electric Co., 5.625%, 11/30/17 | | | 535,000 | | | | 595 | |
| | Public Service Electric & Gas Co., 3.05%, 11/15/24 | | | 1,545,000 | | | | 1,551 | |
| | Puget Energy, Inc., 5.625%, 7/15/22 | | | 1,000,000 | | | | 1,157 | |
| | Puget Sound Energy, Inc., 6.274%, 3/15/37 | | | 950,000 | | | | 1,284 | |
| | Southern Electric Generating Co., 2.20%, 12/1/18 144A | | | 1,715,000 | | | | 1,728 | |
| | Southwestern Electric Power Co., 3.55%, 2/15/22 | | | 1,300,000 | | | | 1,333 | |
| | Tampa Electric Co., 5.40%, 5/15/21 | | | 630,000 | | | | 736 | |
| | | | | | | | | | |
| | | Corporate Bonds (19.6%) | | Shares/
$ Par | | | Value
$ (000’s) | |
| |
| | Electric Utilities continued | |
| | Virginia Electric & Power Co.,
5.40%, 4/30/18 | | | 115,000 | | | | 129 | |
| | | | | | | | | | |
| | Total | | | | | | | 34,463 | |
| | | | | | | | | | |
| |
| | Energy (0.7%) | |
| | Canadian Oil Sands, Ltd., 6.00%, 4/1/42 144A | | | 1,635,000 | | | | 1,476 | |
| | ConocoPhillips Co., 2.875%, 11/15/21 | | | 2,285,000 | | | | 2,308 | |
| | ConocoPhillips Co., 4.15%, 11/15/34 | | | 555,000 | | | | 570 | |
| | ConocoPhillips Co., 4.30%, 11/15/44 | | | 2,710,000 | | | | 2,835 | |
| | Continental Resources, Inc., 4.50%, 4/15/23 | | | 4,045,000 | | | | 3,847 | |
| | Diamond Offshore Drilling, Inc.,
4.875%, 11/1/43 | | | 900,000 | | | | 767 | |
| | Rowan Cos., 5.40%, 12/1/42 | | | 1,590,000 | | | | 1,385 | |
| | Talisman Energy, Inc., 3.75%, 2/1/21 | | | 2,350,000 | | | | 2,273 | |
| | Weatherford International, Ltd.,
4.50%, 4/15/22 | | | 1,500,000 | | | | 1,335 | |
| | Weatherford International, Ltd.,
5.95%, 4/15/42 | | | 2,000,000 | | | | 1,693 | |
| | | | | | | | | | |
| | Total | | | | | | | 18,489 | |
| | | | | | | | | | |
| |
| | Finance (0.1%) | |
| | General Electric Capital Corp.,
5.875%, 1/14/38 | | | 2,475,000 | | | | 3,132 | |
| | | | | | | | | | |
| | Total | | | | | | | 3,132 | |
| | | | | | | | | | |
| |
| | Food & Beverage (0.8%) | |
| | Anheuser-Busch InBev Finance, Inc., 2.15%, 2/1/19 | | | 4,500,000 | | | | 4,518 | |
| | Anheuser-Busch InBev Finance, Inc., 2.625%, 1/17/23 | | | 2,180,000 | | | | 2,116 | |
| | Pernod-Ricard SA, 5.75%, 4/7/21 144A | | | 4,050,000 | | | | 4,652 | |
| | Tyson Foods, Inc., 4.50%, 6/15/22 | | | 4,510,000 | | | | 4,883 | |
| | WM Wrigley Jr. Co., 2.00%, 10/20/17 144A | | | 1,145,000 | | | | 1,154 | |
| | WM Wrigley Jr. Co., 2.40%, 10/21/18 144A | | | 320,000 | | | | 322 | |
| | WM Wrigley Jr. Co., 2.90%, 10/21/19 144A | | | 760,000 | | | | 770 | |
| | WM Wrigley Jr. Co., 3.375%, 10/21/20 144A | | | 3,490,000 | | | | 3,567 | |
| | | | | | | | | | |
| | Total | | | | | | | 21,982 | |
| | | | | | | | | | |
| |
| | Foreign Agencies (0.2%) | |
| | Pemex Project Funding Master Trust, 6.625%, 6/15/35 | | | 460,000 | | | | 531 | |
| | Statoil ASA,
2.25%, 11/8/19 | | | 2,575,000 | | | | 2,576 | |
| | | | | | | | | | |
| | | Corporate Bonds (19.6%) | | Shares/
$ Par | | | Value
$ (000’s) | |
| |
| | Foreign Agencies continued | |
| | Statoil ASA,
2.90%, 11/8/20 | | | 3,000,000 | | | | 3,069 | |
| | | | | | | | | | |
| | Total | | | | | | | 6,176 | |
| | | | | | | | | | |
| |
| | Healthcare (0.5%) | |
| | McKesson Corp., 3.796%, 3/15/24 | | | 1,900,000 | | | | 1,952 | |
| | Medtronic, Inc., 2.50%, 3/15/20 144A | | | 1,975,000 | | | | 1,980 | |
| | Medtronic, Inc., 3
.15%, 3/15/22 144A | | | 3,030,000 | | | | 3,069 | |
| | Medtronic, Inc., 4
.375%, 3/15/35 144A | | | 1,349,000 | | | | 1,431 | |
| | Thermo Fisher Scientific, Inc.,
1.30%, 2/1/17 | | | 3,680,000 | | | | 3,659 | |
| | Thermo Fisher Scientific, Inc.,
3.30%, 2/15/22 | | | 1,900,000 | | | | 1,903 | |
| | Thermo Fisher Scientific, Inc.,
3.60%, 8/15/21 | | | 1,500,000 | | | | 1,549 | |
| | | | | | | | | | |
| | Total | | | | | | | 15,543 | |
| | | | | | | | | | |
| |
| | Insurance (0.8%) | |
| | ACE INA Holdings, Inc., 3.35%, 5/15/24 | | | 895,000 | | | | 904 | |
| | Alleghany Corp., 4.90%, 9/15/44 | | | 390,000 | | | | 409 | |
| | American International Group, Inc., 3.375%, 8/15/20 | | | 2,180,000 | | | | 2,265 | |
| | American International Group, Inc., 4.50%, 7/16/44 | | | 1,385,000 | | | | 1,463 | |
| | American International Group, Inc., 8.175%, 5/15/58 | | | 800,000 | | | | 1,084 | |
| | Anthem, Inc., 5.10%, 1/15/44 | | | 1,000,000 | | | | 1,124 | |
| | Liberty Mutual Group, Inc., 4.85%, 8/1/44 144A | | | 2,015,000 | | | | 2,048 | |
| | Markel Corp., 3.625%, 3/30/23 | | | 805,000 | | | | 810 | |
| | Markel Corp., 4.90%, 7/1/22 | | | 20,000 | | | | 22 | |
| | MetLife, Inc., 1.903%, 12/15/17 | | | 1,650,000 | | | | 1,654 | |
| | Nationwide Financial Services, Inc., 5.30%, 11/18/44 144A | | | 3,100,000 | | | | 3,270 | |
| | Prudential Financial, Inc., 4.60%, 5/15/44 | | | 690,000 | | | | 727 | |
| | Teachers Insurance & Annuity Association of America, 4.90%, 9/15/44 144A | | | 1,435,000 | | | | 1,599 | |
| | WellPoint, Inc., 3.125%, 5/15/22 | | | 3,770,000 | | | | 3,768 | |
| | WellPoint, Inc., 3.50%, 8/15/24 | | | 2,010,000 | | | | 2,025 | |
| | WellPoint, Inc., 3.70%, 8/15/21 | | | 75,000 | | | | 78 | |
The Accompanying Notes are an Integral Part of the Financial Statements.
| | | | |
| 102 | | Select Bond Portfolio | �� | |
Select Bond Portfolio
| | | | | | | | | | |
| | | Corporate Bonds (19.6%) | | Shares/
$ Par | | | Value
$ (000’s) | |
| |
| | Insurance continued | |
| | WellPoint, Inc., 4.35%, 8/15/20 | | | 35,000 | | | | 38 | |
| | | | | | | | | | |
| | Total | | | | | | | 23,288 | |
| | | | | | | | | | |
| |
| | Media (1.2%) | |
| | British Sky Broadcasting Group PLC, 3.75%, 9/16/24 144A | | | 3,240,000 | | | | 3,260 | |
| | Cox Enterprise, Inc., 4.80%, 2/1/35 144A | | | 2,260,000 | | | | 2,355 | |
| | DIRECTV Holdings LLC/DIRECTV Financing Co., Inc., 3.80%, 3/15/22 | | | 3,000,000 | | | | 3,052 | |
| | DIRECTV Holdings LLC/DIRECTV Financing Co., Inc., 3.95%, 1/15/25 | | | 4,090,000 | | | | 4,122 | |
| | DIRECTV Holdings LLC/DIRECTV Financing Co., Inc., 4.45%, 4/1/24 | | | 3,100,000 | | | | 3,243 | |
| | DIRECTV Holdings LLC/DIRECTV Financing Co., Inc., 4.60%, 2/15/21 | | | 245,000 | | | | 262 | |
| | Grupo Televisa SAB, 5.00%, 5/13/45 | | | 1,505,000 | | | | 1,531 | |
| | Outerwall, Inc., 5.875%, 6/15/21 144A | | | 1,325,000 | | | | 1,236 | |
| | Scripps Networks Interactive, Inc., 2.75%, 11/15/19 | | | 1,875,000 | | | | 1,883 | |
| | Scripps Networks Interactive, Inc., 3.90%, 11/15/24 | | | 3,400,000 | | | | 3,462 | |
| | Thomson Reuters Corp., 3.85%, 9/29/24 | | | 3,300,000 | | | | 3,336 | |
| | Viacom, Inc., 4.85%, 12/15/34 | | | 4,390,000 | | | | 4,493 | |
| | Viacom, Inc., 5.25%, 4/1/44 | | | 1,140,000 | | | | 1,205 | |
| | | | | | | | | | |
| | Total | | | | | | | 33,440 | |
| | | | | | | | | | |
| |
| | Metals & Mining (0.2%) | |
| | Barrick Gold Corp., 4.10%, 5/1/23 | | | 1,355,000 | | | | 1,319 | |
| | BHP Hilliton Finance USA, Ltd.,
5.00%, 9/30/43 | | | 1,140,000 | | | | 1,292 | |
| | Freeport-McMoRan, Inc., 4.55%, 11/14/24 | | | 2,860,000 | | | | 2,777 | |
| | Freeport-McMoRan, Inc., 5.40%, 11/14/34 | | | 905,000 | | | | 882 | |
| | | | | | | | | | |
| | Total | | | | | | | 6,270 | |
| | | | | | | | | | |
| |
| | Oil & Gas (0.6%) | |
| | BP Capital Markets PLC, 3.535%, 11/4/24 | | | 1,260,000 | | | | 1,253 | |
| | BP Capital Markets PLC, 3.814%, 2/10/24 | | | 380,000 | | | | 382 | |
| | | | | | | | | | |
| | | Corporate Bonds (19.6%) | | Shares/
$ Par | | | Value
$ (000’s) | |
| |
| | Oil & Gas continued | |
| | Chevron Corp., 2.193%, 11/15/19 | | | 2,845,000 | | | | 2,856 | |
| | Kerr-McGee Corp., 6.95%, 7/1/24 | | | 5,125,000 | | | | 6,264 | |
| | Phillips 66, 4.875%, 11/15/44 | | | 3,735,000 | | | | 3,823 | |
| | Total Capital International SA,
1.50%, 2/17/17 | | | 600,000 | | | | 604 | |
| | Total Capital International SA,
2.75%, 6/19/21 | | | 1,625,000 | | | | 1,631 | |
| | Total Capital SA, 2.125%, 8/10/18 | | | 1,500,000 | | | | 1,512 | |
| | | | | | | | | | |
| | Total | | | | | | | 18,325 | |
| | | | | | | | | | |
| |
| | Pharmaceuticals (0.9%) | |
| | AbbVie, Inc., 4.40%, 11/6/42 | | | 1,835,000 | | | | 1,893 | |
| | Actavis Funding SCS, 3.85%, 6/15/24 | | | 700,000 | | | | 704 | |
| | Actavis Funding SCS, 4.85%, 6/15/44 | | | 2,040,000 | | | | 2,070 | |
| | Amgen, Inc., 1.25%, 5/22/17 | | | 6,255,000 | | | | 6,206 | |
| | Amgen, Inc., 3.625%, 5/22/24 | | | 2,345,000 | | | | 2,383 | |
| | Amgen, Inc., 5.375%, 5/15/43 | | | 515,000 | | | | 598 | |
| | Celgene Corp., 3.625%, 5/15/24 | | | 2,585,000 | | | | 2,640 | |
| | Celgene Corp., 5.25%, 8/15/43 | | | 1,395,000 | | | | 1,576 | |
| | Forest Laboratories, Inc., 4.375%, 2/1/19 144A | | | 3,365,000 | | | | 3,555 | |
| | Merck & Co., Inc., 4.75%, 3/1/15 | | | 500,000 | | | | 503 | |
| | Mylan, Inc., 5.40%, 11/29/43 | | | 1,265,000 | | | | 1,404 | |
| | Perrigo Finance PLC, 3.90%, 12/15/24 | | | 2,970,000 | | | | 3,024 | |
| | | | | | | | | | |
| | Total | | | | | | | 26,556 | |
| | | | | | | | | | |
| |
| | Pipelines (1.1%) | |
| | CenterPoint Energy Resources Corp., 6.125%, 11/1/17 | | | 270,000 | | | | 302 | |
| | Dominion Gas
Holdings LLC,
4.60%, 12/15/44 | | | 1,865,000 | | | | 1,954 | |
| | El Paso Pipeline Partners Operating Co. LLC,
4.30%, 5/1/24 | | | 3,200,000 | | | | 3,206 | |
| | El Paso Pipeline Partners Operating Co. LLC, 5.00%, 10/1/21 | | | 4,370,000 | | | | 4,596 | |
| | Energy Transfer Partners LP, 6.50%, 2/1/42 | | | 890,000 | | | | 1,023 | |
| | EnLink Midstream Partners, 5.05%, 4/1/45 | | | 2,265,000 | | | | 2,188 | |
| | Enterprise Products Operating LLC, 3.75%, 2/15/25 | | | 1,915,000 | | | | 1,922 | |
| | | | | | | | | | |
| | | Corporate Bonds (19.6%) | | Shares/
$ Par | | | Value
$ (000’s) | |
| |
| | Pipelines continued | |
| | Enterprise Products Operating LLC, 4.85%, 3/15/44 | | | 2,135,000 | | | | 2,226 | |
| | Kinder Morgan Energy Partners LP, 3.50%, 3/1/21 | | | 1,665,000 | | | | 1,638 | |
| | Kinder Morgan Energy Partners LP, 4.15%, 2/1/24 | | | 1,650,000 | | | | 1,646 | |
| | Kinder Morgan, Inc., 4.30%, 6/1/25 | | | 250,000 | | | | 250 | |
| | Kinder Morgan, Inc., 5.30%, 12/1/34 | | | 880,000 | | | | 893 | |
| | Kinder Morgan, Inc., 5.55%, 6/1/45 | | | 2,140,000 | | | | 2,192 | |
| | NiSource Finance Corp., 6.125%, 3/1/22 | | | 1,000,000 | | | | 1,186 | |
| | Oneok Partners LP, 5.00%, 9/15/23 | | | 1,005,000 | | | | 1,050 | |
| | Plains All American Pipeline,
4.90%, 2/15/45 | | | 2,195,000 | | | | 2,231 | |
| | Sunoco Logistics Partners Operations LP, 5.35%, 5/15/45 | | | 3,435,000 | | | | 3,473 | |
| | | | | | | | | | |
| | Total | | | | | | | 31,976 | |
| | | | | | | | | | |
| |
| | Real Estate Investment Trusts (0.7%) | |
| | DDR Corp., 3.375%, 5/15/23 | | | 3,705,000 | | | | 3,592 | |
| | DDR Corp., 4.625%, 7/15/22 | | | 3,847,000 | | | | 4,107 | |
| | Federal Realty Investment Trust,
2.75%, 6/1/23 | | | 2,500,000 | | | | 2,408 | |
| | Healthcare Trust of America Holdings LP, 3.70%, 4/15/23 | | | 1,511,000 | | | | 1,495 | |
| | Mid-America
Apartments LP,
4.30%, 10/15/23 | | | 2,440,000 | | | | 2,567 | |
| | Tanger Properties LP, 3.75%, 12/1/24 | | | 1,445,000 | | | | 1,456 | |
| | WEA Finance LLC/Westfield UK & Europe Finance PLC, 2.70%, 9/17/19 144A | | | 1,500,000 | | | | 1,500 | |
| | WEA Finance LLC/Westfield UK & Europe Finance PLC, 3.75%, 9/17/24 144A | | | 2,165,000 | | | | 2,197 | |
| | | | | | | | | | |
| | Total | | | | | | | 19,322 | |
| | | | | | | | | | |
| |
| | Services (0.4%) | |
| | Alibaba Group Holding, Ltd., 2.50%, 11/28/19 144A | | | 3,695,000 | | | | 3,645 | |
| | Alibaba Group Holding, Ltd., 3.60%, 11/28/24 144A | | | 2,795,000 | | | | 2,772 | |
| | Amazon.com, Inc., 4.95%, 12/5/44 | | | 1,355,000 | | | | 1,400 | |
The Accompanying Notes are an Integral Part of the Financial Statements.
| | | | | | |
| | Select Bond Portfolio | | | 103 | |
Select Bond Portfolio
| | | | | | | | | | |
| | | Corporate Bonds (19.6%) | | Shares/
$ Par | | | Value
$ (000’s) | |
| |
| | Services continued | |
| | MasterCard, Inc., 3.375%, 4/1/24 | | | 2,915,000 | | | | 2,992 | |
| | | | | | | | | | |
| | Total | | | | | | | 10,809 | |
| | | | | | | | | | |
| |
| | Technology (0.9%) | |
| | Anixter, Inc., 5.125%, 10/1/21 | | | 1,500,000 | | | | 1,500 | |
| | Apple, Inc., 2.85%, 5/6/21 | | | 6,765,000 | | | | 6,920 | |
| | Apple, Inc., 3.45%, 5/6/24 | | | 2,945,000 | | | | 3,084 | |
| | Apple, Inc., 4.45%, 5/6/44 | | | 1,755,000 | | | | 1,934 | |
| | Broadcom Corp., 4.50%, 8/1/34 | | | 665,000 | | | | 697 | |
| | NCR Corp., 4.625%, 2/15/21 | | | 1,200,000 | | | | 1,164 | |
| | NCR Corp., 5.875%, 12/15/21 | | | 400,000 | | | | 411 | |
| | Oracle Corp., 2.50%, 10/15/22 | | | 1,500,000 | | | | 1,461 | |
| | Oracle Corp., 3.40%, 7/8/24 | | | 2,645,000 | | | | 2,704 | |
| | Oracle Corp., 4.30%, 7/8/34 | | | 3,240,000 | | | | 3,469 | |
| | Oracle Corp., 4.50%, 7/8/44 | | | 780,000 | | | | 847 | |
| | | | | | | | | | |
| | Total | | | | | | | 24,191 | |
| | | | | | | | | | |
| |
| | Telecommunications (1.7%) | |
| | America Movil SAB de CV, 5.00%, 3/30/20 | | | 1,330,000 | | | | 1,467 | |
| | American Tower Corp., 3.45%, 9/15/21 | | | 3,000,000 | | | | 2,949 | |
| | American Tower Corp., 3.50%, 1/31/23 | | | 3,040,000 | | | | 2,937 | |
| | AT&T, Inc., 3.00%, 2/15/22 | | | 1,000,000 | | | | 981 | |
| | AT&T, Inc., 4.30%, 12/15/42 | | | 1,475,000 | | | | 1,402 | |
| | AT&T, Inc., 4.35%, 6/15/45 | | | 2,495,000 | | | | 2,352 | |
| | AT&T, Inc., 4.80%, 6/15/44 | | | 1,475,000 | | | | 1,503 | |
| | AT&T, Inc., 5.55%, 8/15/41 | | | 1,260,000 | | | | 1,404 | |
| | CenturyLink, Inc., 5.15%, 6/15/17 | | | 1,200,000 | | | | 1,257 | |
| | Rogers Communications, Inc., 5.45%, 10/1/43 | | | 1,115,000 | | | | 1,280 | |
| | Verizon Communications, Inc., 2.50%, 9/15/16 | | | 3,185,000 | | | | 3,256 | |
| | Verizon Communications, Inc., 3.50%, 11/1/24 | | | 3,125,000 | | | | 3,070 | |
| | Verizon Communications, Inc., 4.40%, 11/1/34 | | | 9,084,000 | | | | 9,029 | |
| | Verizon Communications, Inc., 4.50%, 9/15/20 | | | 3,000,000 | | | | 3,257 | |
| | Verizon Communications, Inc., 4.862%, 8/21/46 144A | | | 1,315,000 | | | | 1,351 | |
| | Verizon Communications, Inc., 5.15%, 9/15/23 | | | 5,895,000 | | | | 6,510 | |
| | | | | | | | | | |
| | | Corporate Bonds (19.6%) | | Shares/
$ Par | | | Value
$ (000’s) | |
| |
| | Telecommunications continued | |
| | Verizon Communications, Inc., 6.25%, 4/1/37 | | | 855,000 | | | | 1,049 | |
| | Verizon Communications, Inc., 6.35%, 4/1/19 | | | 2,000,000 | | | | 2,318 | |
| | Verizon Communications, Inc., 6.40%, 9/15/33 | | | 1,578,000 | | | | 1,944 | |
| | | | | | | | | | |
| | Total | | | | | | | 49,316 | |
| | | | | | | | | | |
| |
| | Transportation (0.5%) | |
| | A.P. Moeller-Maersk A/S, 3.75%, 9/22/24 144A | | | 675,000 | | | | 693 | |
| | Canadian National Railway Co., 5.85%, 11/15/17 | | | 265,000 | | | | 297 | |
| | CSX Corp., 5.60%, 5/1/17 | | | 1,245,000 | | | | 1,362 | |
| | ERAC USA Finance LLC, 3.85%, 11/15/24 144A | | | 1,235,000 | | | | 1,253 | |
| | ERAC USA Finance LLC, 5.625%, 3/15/42 144A | | | 4,410,000 | | | | 5,148 | |
| | Penske Truck Leasing Co. LP/PTL Finance Corp., 3.05%, 1/9/20 144A | | | 4,865,000 | | | | 4,861 | |
| | | | | | | | | | |
| | Total | | | | | | | 13,614 | |
| | | | | | | | | | |
| | | |
| | Total Corporate Bonds | | | | | | | | |
| | (Cost: $551,555) | | | | | | | 557,383 | |
| | | | | | | | | | |
| | | |
| | | Governments (37.7%) | | | | | | |
| |
| | Governments (36.1%) | |
| | Federal Home Loan Bank, 0.50%, 9/28/16 | | | 3,440,000 | | | | 3,431 | |
| | Federal National Mortgage Association, 0.00%, 10/9/19 | | | 7,000,000 | | | | 6,294 | |
| | US Treasury, 0.375%, 10/31/16 | | | 443,745,000 | | | | 441,907 | |
| | US Treasury,
0.50%, 9/30/16 | | | 23,670,000 | | | | 23,642 | |
| | US Treasury, 0.625%, 12/31/16 | | | 38,976,000 | | | | 38,924 | |
| | US Treasury, 0.875%, 11/15/17 | | | 28,559,000 | | | | 28,423 | |
| | US Treasury, 1.00%, 12/15/17 | | | 11,941,000 | | | | 11,913 | |
| | US Treasury,
1.50%, 5/31/19 | | | 12,714,000 | | | | 12,682 | |
| | US Treasury, 1.50%, 10/31/19 | | | 148,125,000 | | | | 147,222 | |
| | US Treasury, 1.50%, 11/30/19 | | | 753,000 | | | | 748 | |
| | US Treasury, 1.625%, 12/31/19 | | | 49,303,000 | | | | 49,230 | |
| | US Treasury,
1.75%, 9/30/19 | | | 118,031,000 | | | | 118,723 | |
| | US Treasury, 1.875%, 11/30/21 | | | 7,718,000 | | | | 7,673 | |
| | US Treasury, 2.25%, 11/15/24 | | | 40,454,000 | | | | 40,726 | |
| | US Treasury, 3.00%, 11/15/44 | | | 1,851,000 | | | | 1,945 | |
| | | | | | | | | | |
| | | Governments (37.7%) | | Shares/
$ Par | | | Value
$ (000’s) | |
| |
| | Governments continued | |
| | US Treasury, 3.125%, 8/15/44 | | | 18,269,000 | | | | 19,668 | |
| | US Treasury, 3.375%, 5/15/44 | | | 31,492,000 | | | | 35,453 | |
| | US Treasury Stripped, 0.00%, 5/15/34 | | | 61,400,000 | | | | 36,323 | |
| | Yankee Sovereign (1.6%) | |
| | Federative Republic of Brazil, 5.00%, 1/27/45 | | | 720,000 | | | | 706 | |
| | Israel Government AID Bond, 5.50%, 4/26/24 | | | 11,750,000 | | | | 14,568 | |
| | Mexico Government International Bond, 3.60%, 1/30/25 | | | 1,645,000 | | | | 1,639 | |
| | Republic of Paraguay, 6.10%, 8/11/44 144A | | | 3,005,000 | | | | 3,200 | |
| | Slovakia Government International Bond, 4.375%, 5/21/22 144A | | | 7,300,000 | | | | 7,895 | |
| | Slovenia Government International Bond, 5.25%, 2/18/24 144A | | | 5,350,000 | | | | 5,878 | |
| | Slovenia Government International Bond, 5.50%, 10/26/22 144A | | | 3,500,000 | | | | 3,881 | |
| | Slovenia Government International Bond, 5.85%, 5/10/23 144A | | | 1,500,000 | | | | 1,696 | |
| | United Mexican States, 5.75%, 10/12/10 | | | 6,565,000 | | | | 7,057 | |
| | | | | | | | | | |
| | | |
| | Total Governments | | | | | | | | |
| | (Cost: $1,065,893) | | | | | | | 1,071,447 | |
| | | | | | | | | | |
| | |
| | | Municipal Bonds (2.4%) | | | | |
| |
| | Municipal Bonds (2.4%) | |
| | American Municipal Power, Inc., Series 2010, 5.939%, 2/15/47 RB | | | 3,330,000 | | | | 4,187 | |
| | Bay Area Toll Authority San Francisco Bay Area Toll Bridge, Series 2009-F, 6.263%, 4/1/49 RB | | | 175,000 | | | | 247 | |
| | Board of Regents of the University of Texas System, Series 2010C, 4.794%, 8/15/46 RB | | | 2,625,000 | | | | 3,117 | |
| | Board of Regents of the University of Texas System, Series 2009B, 6.276%, 8/15/41 RB | | | 910,000 | | | | 1,052 | |
| | The City of New York, Series C-1, 5.517%, 10/1/37 GO | | | 1,500,000 | | | | 1,832 | |
| | County of Clark Department of Aviation, , 6.82%, 7/1/45 RB | | | 2,900,000 | | | | 4,253 | |
| | Dallas Area Rapid Transit, Series 2010B, 5.022%, 12/1/48 RB | | | 3,000,000 | | | | 3,700 | |
The Accompanying Notes are an Integral Part of the Financial Statements.
| | | | |
| 104 | | Select Bond Portfolio | | |
Select Bond Portfolio
| | | | | | | | | | |
| | | Municipal Bonds (2.4%) | | Shares/
$ Par | | | Value
$ (000’s) | |
| |
| | Municipal Bonds continued | |
| | Dallas Independent School District, Series 2010C, 6.45%, 2/15/35 GO, PSF | | | 3,000,000 | | | | 3,593 | |
| | Dormitory Authority of the State of New York, Series 2010H, 5.389%, 3/15/40 RB | | | 505,000 | | | | 642 | |
| | Energy Northwest, Series E, 2.197%, 7/1/19 RB | | | 2,680,000 | | | | 2,677 | |
| | Florida Hurricane Catastrophe Fund Finance Corp., Series 2013A, 1.298%, 7/1/16 RB | | | 20,000 | | | | 20 | |
| | Florida Hurricane Catastrophe Fund Finance Corp., Series 2013A, 2.107%, 7/1/18 RB | | | 90,000 | | | | 91 | |
| | The Illinois State Toll Highway Authority, Series A, 6.184%, 1/1/34 RB | | | 280,000 | | | | 362 | |
| | Los Angeles Community College District, Series 2010-E, 6.75%, 8/1/49 GO | | | 2,785,000 | | | | 4,151 | |
| | Los Angeles Unified School District, Series RY, 6.758%, 7/1/34 GO | | | 1,500,000 | | | | 2,090 | |
| | Louisiana Public Facilities Authority, Series 2008, 6.55%, 8/1/20 RB | | | 4,800,000 | | | | 5,395 | |
| | Metropolitan Transportation Authority, Series 2010C-1, 6.687%, 11/15/40 RB | | | 500,000 | | | | 683 | |
| | Metropolitan Transportation Authority, Series 2009C, 7.336%, 11/15/39 RB | | | 1,000,000 | | | | 1,526 | |
| | Montana Facility Finance Authority, Series 2010A, 4.75%, 5/20/37 RB, GNMA, FHA | | | 3,830,000 | | | | 4,213 | |
| | New Jersey Turnpike Authority, Series 2010, 7.102%, 1/1/41 RB | | | 3,295,000 | | | | 4,779 | |
| | New Jersey Turnpike Authority, Series 2009F, 7.414%, 1/1/40 RB | | | 800,000 | | | | 1,202 | |
| | New York City Municipal Water Finance Authority, Series AA, 5.44%, 6/15/43 RB | | | 1,102,000 | | | | 1,401 | |
| | New York City Municipal Water Finance Authority, Series AA-1, 5.75%, 6/15/41 RB | | | 295,000 | | | | 389 | |
| | North Texas Tollway Authority, Series
2009-B,
6.718%, 1/1/49 RB | | | 3,285,000 | | | | 4,756 | |
| | | | | | | | | | |
| | | Municipal Bonds (2.4%) | | Shares/
$ Par | | | Value
$ (000’s) | |
| |
| | Municipal Bonds continued | |
| | Port Authority New York & New Jersey, Series 168, 4.926%, 10/1/51 RB, GO OF AUTH | | | 2,500,000 | | | | 2,828 | |
| | State of California,
Series A,
4.988%, 4/1/39 GO | | | 2,280,000 | | | | 2,465 | |
| | State of California,
Series 2010,
5.70%, 11/1/21 GO | | | 2,000,000 | | | | 2,369 | |
| | Texas Transportation Commission,
Series 2010A,
4.681%, 4/1/40 GO | | | 900,000 | | | | 1,053 | |
| | University of California Regents Medical Center, Series H, 6.548%, 5/15/48 RB | | | 2,100,000 | | | | 2,871 | |
| | | | | | | | | | |
| | | |
| | Total Municipal Bonds | | | | | | | | |
| | (Cost: $62,332) | | | | | | | 67,944 | |
| | | | | | | | | | |
| | |
| | | Structured Products (48.4%) | | | | |
| |
| | Structured Products (48.4%) | |
| | Ally Auto Receivables Trust, Series 2013-1, Class A3, 0.63%, 5/15/17 | | | 5,045,976 | | | | 5,047 | |
| | Ally Auto Receivables Trust, Series 2012-2, Class C, 2.26%, 7/16/18 144A | | | 990,000 | | | | 999 | |
| | Ally Master Owner Trust, Series 2014-5,
Class A1,
0.651%, 10/15/19 | | | 18,542,000 | | | | 18,542 | |
| | Ally Master Owner Trust, Series 2012-5, Class A, 1.54%, 9/15/19 | | | 10,000,000 | | | | 9,924 | |
| | American Express Credit Account Master Trust, Series 2012-1, Class A, 0.431%, 1/15/20 | | | 10,000,000 | | | | 9,994 | |
| | American Express Credit Account Master Trust, Series 2013-2, Class A, 0.581%, 5/17/21 | | | 1,626,000 | | | | 1,630 | |
| | American Express Credit Account Master Trust, Series 2012-2, Class A, 0.68%, 3/15/18 | | | 16,264,000 | | | | 16,276 | |
| | American Express Credit Account Master Trust, Series 2014-3,
Class A,
1.49%, 4/15/20 | | | 6,575,000 | | | | 6,581 | |
| | Asset Securitization Corp., Series 1997-D5, Class PS1, 1.43%, 2/14/43 IO | | | 5,592,952 | | | | 106 | |
| | | | | | | | | | |
| | | Structured Products (48.4%) | | Shares/
$ Par | | | Value
$ (000’s) | |
| |
| | Structured Products continued | |
| | Avis Budget Rental Car Funding AESOP LLC, Series 2013-1A, Class A, 1.92%, 9/20/19 144A | | | 3,422,000 | | | | 3,386 | |
| | Avis Budget Rental Car Funding AESOP LLC, Series 2012-3A, Class A, 2.10%, 3/20/19 144A | | | 2,329,000 | | | | 2,330 | |
| | BA Credit Card Trust, Series 2014-A3, Class A, 0.451%, 1/15/20 | | | 5,000,000 | | | | 4,999 | |
| | Banc of America Merrill Lynch Commercial Mortgage, Inc., Series 2005-4, Class A5A, 4.933%, 7/10/45 | | | 3,897,000 | | | | 3,934 | |
| | Bank of America Credit Card Trust, Series 2014-A2, Class A, 0.431%, 9/16/19 | | | 11,531,000 | | | | 11,510 | |
| | Bank of the West Auto Trust, Series 2014-1, Class A3, 1.09%, 3/15/19 144A | | | 2,384,000 | | | | 2,385 | |
| | Bank of the West Auto Trust, Series 2014-1, Class A4, 1.65%, 3/16/20 144A | | | 3,164,000 | | | | 3,158 | |
| | Capital Auto Receivables Asset Trust, Series 2013-4, Class A2, 0.85%, 2/21/17 | | | 750,000 | | | | 750 | |
| | Capital Auto Receivables Asset Trust, Series 2014-1, Class A, 0.96%, 4/20/17 | | | 3,675,000 | | | | 3,679 | |
| | Capital Auto Receivables Asset Trust, Series 2013-1, Class A4, 0.97%, 1/22/18 | | | 17,250,000 | | | | 17,241 | |
| | Capital Auto Receivables Asset Trust, Series 2014-3, Class A2, 1.18%, 12/20/17 | | | 9,740,000 | | | | 9,740 | |
| | Capital Auto Receivables Asset Trust, Series 2014-1, Class A3, 1.32%, 6/20/18 | | | 9,528,000 | | | | 9,564 | |
| | Capital One Multi-Asset Execution Trust, Series 2014-A2, Class A2, 1.26%, 1/15/20 | | | 1,530,000 | | | | 1,528 | |
| | Chase Issuance Trust, Series 2007-A2, Class A2, 0.211%, 4/15/19 | | | 10,815,000 | | | | 10,755 | |
| | Chase Issuance Trust, Series 2013-A3,
Class A3,
0.441%, 4/15/20 | | | 5,328,000 | | | | 5,310 | |
| | Chase Issuance Trust, Series 2012-A8,
Class A8,
0.54%, 10/16/17 | | | 5,000,000 | | | | 4,998 | |
The Accompanying Notes are an Integral Part of the Financial Statements.
| | | | | | |
| | Select Bond Portfolio | | | 105 | |
Select Bond Portfolio
| | | | | | | | | | |
| | | Structured Products (48.4%) | | Shares/
$ Par | | | Value
$ (000’s) | |
| |
| | Structured Products continued | |
| | Chase Issuance Trust, Series 2013-A6, Class A6, 0.581%, 7/15/20 | | | 9,800,000 | | | | 9,816 | |
| | Chase Issuance Trust, Series 2013-A9, Class A, 0.581%, 11/16/20 | | | 4,400,000 | | | | 4,409 | |
| | Chase Issuance Trust, Series 2013-A7, Class A, 0.591%, 9/15/20 | | | 11,246,000 | | | | 11,278 | |
| | Chase Issuance Trust, Series 2013-A8, Class A8, 1.01%, 10/15/18 | | | 6,265,000 | | | | 6,265 | |
| | Chase Issuance Trust, Series 2014-A1, Class A, 1.15%, 1/15/19 | | | 4,600,000 | | | | 4,598 | |
| | Chase Issuance Trust, Series 2012-A4, Class A4, 1.58%, 8/16/21 | | | 3,235,000 | | | | 3,166 | |
| | Citibank Credit Card Issuance Trust, Series 2014-A3, Class A3, 0.358%, 5/9/18 | | | 22,764,000 | | | | 22,764 | |
| | Citibank Credit Card Issuance Trust, Series 2013-A7, Class A7, 0.592%, 9/10/20 | | | 6,545,000 | | | | 6,544 | |
| | Citibank Credit Card Issuance Trust, Series 2014-A6, Class A6, 2.15%, 7/15/21 | | | 40,602,000 | | | | 40,630 | |
| | Citigroup Commercial Mortgage Trust, Series 2013-GC17, Class A4, 4.131%, 11/10/46 | | | 475,000 | | | | 516 | |
| | Citigroup Mortgage Loan Trust, Inc., Series 2005-1, Class 3A1, 6.50%, 4/25/35 | | | 329,749 | | | | 334 | |
| | Commercial Mortgage Trust Pass-Through Certificates, Series 2014-UBS6, Class ASB, 3.387%, 12/10/47 | | | 3,518,000 | | | | 3,631 | |
| | Commercial Mortgage Trust Pass-Through Certificates, Series 2014-UBS4, Class A5, 3.694%, 8/10/47 | | | 6,410,000 | | | | 6,676 | |
| | Commercial Mortgage Trust Pass-Through Certificates, Series 2014-CR19, Class A5, 3.796%, 8/10/47 | | | 3,055,000 | | | | 3,225 | |
| | Commercial Mortgage Trust Pass-Through Certificates, Series 2014-LC15, Class A4, 4.006%, 4/10/47 | | | 8,000,000 | | | | 8,598 | |
| | | | | | | | | | |
| | | Structured Products (48.4%) | | Shares/
$ Par | | | Value
$ (000’s) | |
| |
| | Structured Products continued | |
| | Commercial Mortgage Trust Pass-Through Certificates, Series 2014-UBS6, Class AM, 4.048%, 12/10/47 | | | 3,411,000 | | | | 3,547 | |
| | Credit Suisse Mortgage Capital Certificates, Series 2013-IVR4,
Class A6,
2.50%, 7/25/43 144A | | | 7,142,650 | | | | 7,017 | |
| | Credit Suisse Mortgage Capital Certificates, Series 2009-RR1,
Class A3A,
5.383%, 2/15/40 144A | | | 1,995,149 | | | | 2,077 | |
| | DBUBS Mortgage Trust, Series 2011-LC1A,
Class A3,
5.002%, 11/10/46 144A | | | 9,675,000 | | | | 10,910 | |
| | Discover Card Execution Note Trust, Series 2013-A5, Class A5, 1.04%, 4/15/19 | | | 9,000,000 | | | | 8,991 | |
| | DLJ Commercial Mortgage Corp., Series 1998-CF1, Class S, 1.36%, 2/15/31 IO | | | 6,709,082 | | | | 56 | |
| | DLJ Mortgage Acceptance Corp., Series 1997-CF2, Class S,
0.688%, 10/15/30
IO 144A | | | 57,248 | | | | - | |
| | Federal Home Loan Mortgage Corp., 2.873%, 11/1/44 | | | 2,522,000 | | | | 2,600 | |
| | Federal Home Loan Mortgage Corp., 2.88%, 12/1/44 | | | 2,109,071 | | | | 2,175 | |
| | Federal Home Loan Mortgage Corp., 2.91%, 11/1/44 | | | 683,000 | | | | 705 | |
| | Federal Home Loan Mortgage Corp., 3.00%, 7/15/43 | | | 19,172,652 | | | | 19,444 | |
| | Federal Home Loan Mortgage Corp., 3.50%, 12/1/29 | | | 897,000 | | | | 955 | |
| | Federal Home Loan Mortgage Corp., 3.50%, 11/1/42 | | | 43,915,876 | | | | 45,836 | |
| | Federal Home Loan Mortgage Corp., 4.00%, 10/1/29 | | | 14,874,607 | | | | 16,033 | |
| | Federal Home Loan Mortgage Corp., 4.00%, 8/1/31 | | | 595,593 | | | | 642 | |
| | Federal Home Loan Mortgage Corp., 4.50%, 5/1/19 | | | 612,140 | | | | 647 | |
| | Federal Home Loan Mortgage Corp., 5.00%, 11/1/35 | | | 5,132,283 | | | | 5,719 | |
| | | | | | | | | | |
| | | Structured Products (48.4%) | | Shares/
$ Par | | | Value
$ (000’s) | |
| |
| | Structured Products continued | |
| | Federal Home Loan Mortgage Corp., Series 2439, Class LH, 6.00%, 4/15/32 | | | 1,004,776 | | | | 1,095 | |
| | Federal Home Loan Mortgage Corp., 7.00%, 12/1/35 | | | 107,369 | | | | 125 | |
| (n) | | Federal Home Loan Mortgage Corp., 2.63%, 1/1/45 | | | 5,152,000 | | | | 5,271 | |
| (n) | | Federal Home Loan Mortgage Corp., 2.70%, 2/1/45 | | | 3,808,000 | | | | 3,924 | |
| (n) | | Federal Home Loan Mortgage Corp., 2.73%, 1/1/45 | | | 30,000,000 | | | | 30,788 | |
| (n) | | Federal Home Loan Mortgage Corp., 2.73%, 2/1/45 | | | 3,810,000 | | | | 3,933 | |
| (n) | | Federal Home Loan Mortgage Corp., 2.75%, 2/1/45 | | | 3,938,000 | | | | 4,072 | |
| (n) | | Federal Home Loan Mortgage Corp., 2.80%, 2/1/45 | | | 3,810,000 | | | | 3,940 | |
| | Federal National Mortgage Association, 2.516%, 1/1/43 | | | 9,267,867 | | | | 9,350 | |
| | Federal National Mortgage Association, 2.70%, 1/1/45 | | | 3,938,000 | | | | 4,047 | |
| | Federal National Mortgage Association, 2.76%, 12/1/44 | | | 4,789,000 | | | | 4,935 | |
| | Federal National Mortgage Association, 2.799%, 12/1/44 | | | 2,000,000 | | | | 2,063 | |
| | Federal National Mortgage Association, 2.815%, 11/1/44 | | | 11,062,412 | | | | 11,411 | |
| | Federal National Mortgage Association, 2.99%, 11/1/43 | | | 26,378,735 | | | | 27,225 | |
| | Federal National Mortgage Association, 3.50%, 12/1/29 | | | 3,075,000 | | | | 3,272 | |
| | Federal National Mortgage Association, 3.50%, 1/1/30 | | | 6,237,000 | | | | 6,647 | |
| | Federal National Mortgage Association, 3.50%, 7/1/42 | | | 1,133,808 | | | | 1,184 | |
| | Federal National Mortgage Association, 3.50%, 9/1/42 | | | 2,112,203 | | | | 2,205 | |
| | Federal National Mortgage Association, 3.50%, 4/1/43 | | | 1,541,985 | | | | 1,610 | |
| | Federal National Mortgage Association, 3.50%, 7/1/43 | | | 1,972,951 | | | | 2,060 | |
The Accompanying Notes are an Integral Part of the Financial Statements.
| | | | |
| 106 | | Select Bond Portfolio | | |
Select Bond Portfolio
| | | | | | | | | | |
| | | Structured Products (48.4%) | | Shares/
$ Par | | | Value
$ (000’s) | |
| |
| | Structured Products continued | |
| | Federal National Mortgage Association, 4.00%, 8/1/33 | | | 6,594,850 | | | | 7,115 | |
| | Federal National Mortgage Association, 4.00%, 11/1/29 | | | 24,713,029 | | | | 26,456 | |
| | Federal National Mortgage Association, 4.00%, 5/1/34 | | | 56,570,184 | | | | 60,982 | |
| | Federal National Mortgage Association, Series 2013-91, Class CA, 4.00%, 4/25/39 | | | 22,144,918 | | | | 23,648 | |
| | Federal National Mortgage Association, Series 2013-133, Class AB, 4.00%, 6/25/39 | | | 22,238,804 | | | | 23,802 | |
| | Federal National Mortgage Association, 4.00%, 1/1/43 | | | 10,737,794 | | | | 11,582 | |
| | Federal National Mortgage Association, 4.50%, 6/1/19 | | | 3,350,131 | | | | 3,550 | |
| | Federal National Mortgage Association, 4.50%, 12/1/19 | | | 319,742 | | | | 337 | |
| | Federal National Mortgage Association, 4.50%, 11/1/44 | | | 8,328,018 | | | | 9,232 | |
| | Federal National Mortgage Association, 5.00%, 7/1/41 | | | 3,203,946 | | | | 3,616 | |
| | Federal National Mortgage Association, 5.50%, 11/1/35 | | | 5,436,427 | | | | 6,138 | |
| | Federal National Mortgage Association, 5.50%, 8/1/41 | | | 1,074,313 | | | | 1,203 | |
| | Federal National Mortgage Association, Series 2002-W4, Class A4, 6.25%, 5/25/42 | | | 5,395,442 | | | | 5,970 | |
| | Federal National Mortgage Association, 6.50%, 7/1/37 | | | 3,412,292 | | | | 3,886 | |
| | Federal National Mortgage Association, 6.50%, 9/1/37 | | | 1,218,576 | | | | 1,420 | |
| | Federal National Mortgage Association, 6.75%, 4/25/18 | | | 74,446 | | | | 77 | |
| | Federal National Mortgage Association Strip, Series 411,
Class A3,
3.00%, 8/25/42 | | | 27,490,290 | | | | 27,325 | |
| | Federal National Mortgage Association TBA, 2.50%, 1/1/28 | | | 1,000,000 | | | | 1,018 | |
| (n) | | Federal National Mortgage Association, 2.73%, 2/1/45 | | | 1,928,000 | | | | 1,987 | |
| | | | | | | | | | |
| | | Structured Products (48.4%) | | Shares/
$ Par | | | Value
$ (000’s) | |
| |
| | Structured Products continued | |
| (n) | | Federal National Mortgage Association, 2.75%, 2/1/45 | | | 3,823,000 | | | | 3,935 | |
| | Federal National Mortgage Association TBA, 3.00%, 6/4/18 | | | 10,800,000 | | | | 10,925 | |
| | Federal National Mortgage Association TBA, 3.00%, 2/1/28 | | | 14,000,000 | | | | 14,526 | |
| | Federal National Mortgage Association TBA, 3.00%, 1/1/30 | | | 27,900,000 | | | | 29,000 | |
| | Federal National Mortgage Association TBA, 3.50%, 1/1/43 | | | 13,100,000 | | | | 13,656 | |
| | Federal National Mortgage Association TBA, 3.50%, 2/1/43 | | | 21,700,000 | | | | 22,562 | |
| | Federal National Mortgage Association TBA, 4.00%, 2/1/43 | | | 34,600,000 | | | | 36,832 | |
| | Federal National Mortgage Association TBA, 4.00%, 11/1/44 | | | 8,300,000 | | | | 8,858 | |
| | Federal National Mortgage Association TBA, 4.50%, 1/1/44 | | | 50,100,000 | | | | 54,382 | |
| | Ford Credit Auto Owner Trust, Series 2013-B, Class A3, 0.57%, 10/15/17 | | | 4,088,535 | | | | 4,088 | |
| | Ford Credit Auto Owner Trust, Series 2014-A, Class A3, 0.79%, 5/15/18 | | | 4,150,000 | | | | 4,147 | |
| | Ford Credit Auto Owner Trust, Series 2013-D, Class A4, 1.11%, 2/15/19 | | | 3,500,000 | | | | 3,490 | |
| | Ford Credit Auto Owner Trust, Series 2014-A, Class A4, 1.29%, 4/15/19 | | | 5,075,000 | | | | 5,076 | |
| | Ford Credit Auto Owner Trust, Series 2014-1, Class A, 2.26%, 11/15/25 144A | | | 6,931,000 | | | | 6,968 | |
| | Ford Credit Auto Owner Trust, Series 2014-2, Class A, 2.31%, 4/15/26 | | | 6,260,000 | | | | 6,276 | |
| | Ford Credit Floorplan Master Owner Trust, Series 2014-1,
Class A1,
1.20%, 2/15/19 | | | 1,500,000 | | | | 1,496 | |
| | Government National Mortgage Association, 3.00%, 1/1/45 | | | 33,800,000 | | | | 34,565 | |
| | Government National Mortgage Association, 3.50%, 1/1/45 | | | 58,100,000 | | | | 60,987 | |
| | Government National Mortgage Association, 3.50%, 2/1/45 | | | 13,900,000 | | | | 14,556 | |
| | | | | | | | | | |
| | | Structured Products (48.4%) | | Shares/
$ Par | | | Value
$ (000’s) | |
| |
| | Structured Products continued | |
| | Government National Mortgage Association, 4.00%, 1/1/45 | | | 15,500,000 | | | | 16,619 | |
| | Government National Mortgage Association, 4.00%, 2/1/45 | | | 21,400,000 | | | | 22,899 | |
| | GS Mortgage Securities Corp. II, Series 2012-GCJ7, Class A1, 1.144%, 5/10/45 | | | 990,413 | | | | 993 | |
| | GS Mortgage Securities Corp. II, Series 2012-GC3, Class A2, 3.645%, 3/10/44 | | | 2,450,404 | | | | 2,509 | |
| | GS Mortgage Securities Trust, Series 2014-GC26, Class AAB, 3.365%, 11/10/47 | | | 2,187,000 | | | | 2,260 | |
| | GS Mortgage Securities Trust, Series 2014-GC18, Class AAB, 3.648%, 1/10/47 | | | 65,000 | | | | 68 | |
| | GS Mortgage Securities Trust, Series 2013-GC16, Class A4, 4.271%, 11/10/46 | | | 10,000,000 | | | | 10,961 | |
| | GS Mortgage Securities Trust, Series 2009-RR1, Class CSA, 5.286%, 12/17/39 144A | | | 1,119,752 | | | | 1,181 | |
| | Honda Auto Receivables Owner Trust, Series 2013-3, Class A3, 0.77%, 5/15/17 | | | 3,757,000 | | | | 3,760 | |
| | Honda Auto Receivables Owner Trust, Series 2012-2, Class A4, 0.91%, 5/15/18 | | | 1,450,000 | | | | 1,452 | |
| | Honda Auto Receivables Owner Trust, Series 2014-4, Class A4, 1.46%, 10/15/20 | | | 3,287,000 | | | | 3,279 | |
| | Hyundai Auto Receivables Trust, Series 2013-C, Class A3, 1.01%, 2/15/18 | | | 3,000,000 | | | | 3,009 | |
| | Hyundai Auto Receivables Trust, Series 2011-B, Class D, 3.51%, 11/15/17 | | | 2,455,000 | | | | 2,513 | |
| | Impact Funding Affordable Multifamily Housing Mortgage Loan Trust, Series 2010-1, Class A1, 5.314%, 1/25/51 144A | | | 6,384,682 | | | | 7,313 | |
| | JPMorgan Chase Commercial Mortgage Securities Trust, Series 2012-C6, Class A1, 1.031%, 5/15/45 | | | 3,300,987 | | | | 3,305 | |
The Accompanying Notes are an Integral Part of the Financial Statements.
| | | | | | |
| | Select Bond Portfolio | | | 107 | |
Select Bond Portfolio
| | | | | | | | | | |
| | | Structured Products (48.4%) | | Shares/
$ Par | | | Value
$ (000’s) | |
| |
| | Structured Products continued | |
| | JPMBB Commercial Mortgage Securities Trust, Series 2014-C25, Class ASB, 3.407%, 11/15/47 | | | 32,477,000 | | | | 33,749 | |
| | JPMorgan Chase Commercial Mortgage Securities Trust, Series 2007-CB18, Class A4, 5.44%, 6/12/47 | | | 1,902,361 | | | | 2,023 | |
| | JPMorgan Chase Commercial Mortgage Securities Trust, Series 2007-C1, Class ASB, 5.857%, 2/15/51 | | | 2,596,439 | | | | 2,732 | |
| | MASTR Asset Securitization Trust, Series 2004-9,
Class 6A1,
5.00%, 9/25/19 | | | 122,625 | | | | 125 | |
| | MASTR Asset Securitization Trust, Series 2003-10,
Class 1A1,
5.25%, 11/25/23 | | | 391,839 | | | | 397 | |
| | MASTR Asset Securitization Trust, Series 2003-12,
Class 1A1,
5.25%, 12/25/24 | | | 327,216 | | | | 341 | |
| | MBNA Credit Card Master Note Trust, Series 2004-A3,
Class A3,
0.421%, 8/16/21 | | | 4,398,000 | | | | 4,377 | |
| | Merrill Lynch Mortgage Trust, Series 2005-CIP1, Class A4, 5.047%, 7/12/38 | | | 4,797,000 | | | | 4,838 | |
| | Merrill Lynch Mortgage Trust, Series 2005-CKI1, Class AM, 5.288%, 11/12/37 | | | 3,330,000 | | | | 3,419 | |
| | Mid-State Trust, Series 6,
Class A3,
7.54%, 7/1/35 | | | 191,588 | | | | 205 | |
| | Morgan Stanley Bank of America Merrill Lynch Trust, Series 2014-C15, Class ASB, 3.654%, 4/15/47 | | | 65,000 | | | | 68 | |
| | Navient Student Loan Trust, Series 2014-1,
Class A2,
0.465%, 3/27/23 | | | 1,350,000 | | | | 1,345 | |
| | Navient Student Loan Trust, Series 2014-8,
Class A2,
0.595%, 4/25/23 | | | 10,153,000 | | | | 10,158 | |
| | Navient Student Loan Trust, Series 2014-8, Class B, 1.655%, 7/26/49 | | | 2,092,000 | | | | 2,028 | |
| | Nelnet Student Loan Trust, Series 2004-4,
Class A5,
0.394%, 1/25/37 | | | 4,812,494 | | | | 4,760 | |
| | | | | | | | | | |
| | | Structured Products (48.4%) | | Shares/
$ Par | | | Value
$ (000’s) | |
| |
| | Structured Products continued | |
| | Oncor Electric Delivery Transition Bond Co., Series 2004-1,
Class A3,
5.29%, 5/15/18 | | | 2,591,249 | | | | 2,695 | |
| | Residential Funding Mortgage Securities I, Series 2003-S18,
Class A1,
4.50%, 10/25/18 | | | 104,883 | | | | 107 | |
| | Sequoia Mortgage Trust, Series 2013-5,
Class A2,
3.00%, 5/25/43 144A | | | 3,754,968 | | | | 3,705 | |
| | Sequoia Mortgage Trust, Series 2011-2, Class A1, 3.90%, 9/25/41 | | | 1,698,671 | | | | 1,733 | |
| | SLM Private Education Loan Trust, Series 2014-A, Class A1, 0.761%, 7/15/22 144A | | | 2,905,501 | | | | 2,904 | |
| | SLM Private Education Loan Trust, Series 2011-C, Class A1, 1.561%, 12/15/23 144A | | | 5,559,444 | | | | 5,589 | |
| | SLM Private Education Loan Trust, Series 2012-D, Class A2,
2.95%, 2/15/46 | | | 4,356,000 | | | | 4,476 | |
| | SLM Private Education Loan Trust, Series 2011-B, Class A2,
3.74%, 2/15/29 | | | 3,590,000 | | | | 3,764 | |
| | SLM Private Education Loan Trust, Series 2012-A, Class A2,
3.83%, 1/17/45 | | | 1,945,000 | | | | 2,045 | |
| | SLM Private Education Loan Trust, Series 2011-A, Class A2,
4.37%, 4/17/28 | | | 1,400,000 | | | | 1,492 | |
| | SLM Student Loan Trust, Series 2006-9,
Class A4,
0.304%, 10/25/22 | | | 3,303,752 | | | | 3,298 | |
| | SLM Student Loan Trust, Series 2005-5,
Class A3,
0.334%, 4/25/25 | | | 1,721,145 | | | | 1,714 | |
| | SLM Student Loan Trust, Series 2007-2,
Class B,
0.404%, 7/25/25 | | | 1,426,000 | | | | 1,287 | |
| | SLM Student Loan Trust, Series 2013-6,
Class A1,
0.435%, 2/25/19 | | | 3,566,235 | | | | 3,566 | |
| | SLM Student Loan Trust, Series 2012-5,
Class A2,
0.47%, 6/25/19 | | | 19,083,820 | | | | 19,080 | |
| | SLM Student Loan Trust, Series 2014-2,
Class A2,
0.519%, 10/25/21 | | | 5,367,000 | | | | 5,346 | |
| | SLM Student Loan Trust, Series 2014-1,
Class A2,
0.549%, 7/26/21 | | | 950,000 | | | | 950 | |
| | SLM Student Loan Trust, Series 2012-6,
Class A3,
0.919%, 5/26/26 | | | 20,950,000 | | | | 21,056 | |
| | | | | | | | | | |
| | | Structured Products (48.4%) | | Shares/
$ Par | | | Value
$ (000’s) | |
| |
| | Structured Products continued | |
| | SLM Student Loan Trust, Series 2012-6, Class B, 1.17%, 4/27/43 | | | 3,000,000 | | | | 2,803 | |
| | SLM Student Loan Trust, Series 2012-7, Class B, 1.969%, 9/25/43 | | | 4,250,000 | | | | 4,257 | |
| | Toyota Auto Receivables Owner Trust, Series 2014-B, Class A4, 1.31%, 9/16/19 | | | 3,750,000 | | | | 3,740 | |
| | Toyota Auto Receivables Owner Trust, Series 2013-B, Class A4, 1.46%, 1/15/19 | | | 5,000,000 | | | | 5,042 | |
| | Trade MAPS, Ltd., Series 2013-1A, Class A, 0.862%, 12/10/18 144A | | | 9,100,000 | | | | 9,112 | |
| | World Financial Network Credit Card Master Trust, Series 2014-B, Class A, 0.61%, 7/15/19 | | | 3,063,000 | | | | 3,062 | |
| | | | | | | | | | |
| | | |
| | Total Structured Products | | | | | | | | |
| | (Cost: $1,370,270) | | | | | | | 1,374,505 | |
| | | | | | | | | | |
| | | |
| | Total Investments (108.1%) | | | | | | | | |
| | (Cost: $3,050,050)(a) | | | | | | | 3,071,279 | |
| | | | | | | | | | |
| | Other Assets, Less Liabilities (-8.1%) | | | | | | | (230,123 | ) |
| | | | | | | | | | |
| | Net Assets (100.0%) | | | | | | | 2,841,156 | |
| | | | | | | | | | |
The Accompanying Notes are an Integral Part of the Financial Statements.
| | | | |
| 108 | | Select Bond Portfolio | | |
Select Bond Portfolio
144A after the name of a security represents a security exempt from registration under Rule 144A of the Securities Act of 1933. These securities may be resold as transactions exempt from registration, normally to qualified institutional buyers. At December 31, 2014 the value of these securities (in thousands) was $188,997 representing 6.7% of the net assets.
IO — Interest Only Security
GO — General Obligation
RB — Revenue Bond
FHA — Federal Housing Authority
GNMA — Government National Mortgage Association
PSF — Permanent School Fund
| (a) | At December 31, 2014, the aggregate cost of securities for federal tax purposes (in thousands) was $3,051,350 and the net unrealized appreciation of investments based on that cost was $19,929 which is comprised of $26,186 aggregate gross unrealized appreciation and $6,257 aggregate gross unrealized depreciation. |
| (n) | Security issued on a when-issued basis |
The following is a summary of the inputs used in valuing the Portfolio’s assets and liabilities at December 31, 2014. See Note 3 for additional information on portfolio valuation.
| | | | | | | | | | | | | | |
| | | Valuation Inputs | | | |
| Description | | Level 1 –
Quoted Prices | | | Level 2 –
Other Significant
Observable Inputs | | | Level 3 –
Significant
Unobservable Inputs | | | |
| | | (Amounts in thousands) | | | |
Assets: | | | | | | | | | | | | | | |
Government & Agency Bonds | | $ | - | | | $ | 1,071,447 | | | $ | - | | | |
Municipal Bonds | | | - | | | | 67,944 | | | | - | | | |
Corporate Bonds | | | - | | | | 557,383 | | | | - | | | |
Structured Products | | | - | | | | 1,374,505 | | | | - | | | |
Total | | $ | - | | | $ | 3,071,279 | | | $ | - | | | |
For the period ended December 31, 2014, there were transfers from a Level 3 to a Level 2 in the amount of $9,112 thousand. These transfers were the result of an increase in the quantity of observable inputs for a security that was previously priced by a third party utilizing a broker quote.
The following is a reconciliation of the fair valuations using significant unobservable inputs (Level 3) for the Portfolio during the period ended December 31, 2014. (Amounts in thousands)
| | | | | | | | | | | | | | | | | | | | | | | | | | | | | | | | | | | | | | | | |
| Category | | Market
Value
12/31/13 | | | Net
Purchases | | | Net
Sales | | | Accrued
Discounts/
(Premiums) | | | Realized
Gain/
(Loss) | | | Change in
Unrealized
Appreciation
(Depreciation) | | | Transfers
in at
Market
Value | | | Transfers
out at
Market
Value | | | Market
Value
12/31/14 | | | Net Change in
Unrealized
Appreciation/
(Depreciation)
on Invetments
Held at
12/31/14 | |
Structured Products | | $ | 18,660 | | | $ | 9,376 | | | $ | 18,844 | | | $ | - | | | $ | 87 | | | $ | (167 | ) | | $ | - | | | $ | 9,112 | | | $ | - | | | $ | - | |
The Accompanying Notes are an Integral Part of the Financial Statements.
| | | | | | |
| | Select Bond Portfolio | | | 109 | |
Long-Term U.S. Government Bond Portfolio (unaudited)
| | | | |
| Objective: | | Portfolio Strategy: | | Net Assets: |
Maximum total return, consistent with preservation of capital and prudent investment management. | | Invest in a diversified portfolio of fixed income securities that are issued or guaranteed by the U.S. Government, its agencies or government sponsored enterprises, and in derivatives designed to replicate such securities. | | $109 million |
Portfolio Overview
Mason Street Advisors, LLC (“Mason Street Advisors”), the investment adviser for the Long-Term U.S. Government Bond Portfolio (the “Portfolio”), has engaged Pacific Investment Management Company LLC (“PIMCO”) to act as sub-adviser for the Portfolio. The Portfolio invests in a diversified portfolio of fixed income securities that are issued or guaranteed by the U.S. Government, its agencies or government sponsored enterprises (“U.S. Government Securities”), which may be represented by forwards or derivatives, such as options, futures contracts or interest rate swap agreements. Assets not invested in U.S. Government Securities may be invested in other types of non-government related investment grade fixed income instruments, such as corporate debt securities of U.S. issuers and mortgage- and asset-backed securities, or in preferred stocks. The Portfolio’s investments in fixed income securities are limited to investment grade U.S. dollar denominated securities of U.S. issuers that are rated at least A by Moody’s or equivalently rated by S&P or Fitch, or, if unrated, determined by PIMCO to be of comparable quality.
Market Overview
Both uncertainty and volatility increased in the first quarter of 2014. Bond markets rallied early in the quarter due to the somewhat uncertain pace of economic expansion and mostly held on to gains as the crisis in Ukraine led a general flight to quality. European economies continued to stabilize but concerns rose in Asia, especially over China’s economic health.
The second quarter of 2014 saw the return of risk appetite and an easing of global political risks. Bond markets rallied as central banks remained accommodative. Emerging markets (“EM”) led gains, and developed market yields fell to twelve-month lows during the quarter.
The third quarter was marked by geopolitical tension and diverging markets. Most developed market government yields moved lower, while credit markets backed up. Given the improvement in the outlook for growth, the Federal Reserve (the “Fed”) policy rate projections increased modestly and the U.S. dollar surged versus its major trading partners. Further east, growth concerns developed in China and Japan, and in EM tensions over Ukraine pushed the U.S. and European Union to expand sanctions on Russia.
The final quarter of 2014 saw continued global growth divergence, but the most defining event was the sharp decline in oil prices and accompanying market volatility, which dissipated quickly but still managed to leave certain risk sectors bruised. Growth in the U.S. exceeded expectations and handily outpaced its peers in the developed world, especially Japan and Europe, which continued to struggle.
Portfolio Results
The Portfolio returned 23.73% for the twelve months ended December 31, 2014. By comparison, the Portfolio’s benchmark, the Barclays® Long-Term U.S. Treasury Index (the “Index”), returned 25.07%. (This Index is unmanaged, cannot be invested in directly and does not include administrative expenses or sales charges.) According to Morningstar® Inc., an independent mutual fund ranking agency, the average return of the Long Government peer group for 2014 was 18.58%.
The Portfolio’s allocation along the range of bond maturities was the primary detractor from performance. An underweight in longer-term bonds was negative for returns as rates fell for these maturities. An allocation to Treasury Inflation-Protected Securities was also negative for performance as inflation expectations fell. Holdings of agency debentures and agency mortgages contributed to returns during the period.
As a tool in managing the Portfolio’s Treasury exposure and yield curve positioning, Treasury futures were used during the period.
Portfolio Manager Outlook
The following forward looking comments are the opinion of PIMCO, the Portfolio’s sub-adviser.
We expect global growth to accelerate from around 2.5% this year to 2.75% next year. This incremental improvement comes from our view that lower oil prices will be a positive shock for a majority of global economies, as petrodollars are redirected from producers to consumers. Declining oil prices will also have a clear downside impact on global inflation, allowing many countries to sustain or increase growth-supportive monetary policy measures.
We believe the U.S. economy will continue to be the growth leader in the developed world, with average growth around 3.0%. Our favorable outlook reflects improving household finances and confidence, as well as solid corporate profits and rising utilization rates, which could coalesce to underpin a self-reinforcing economic cycle. With business expansion plans likely to
| | | | |
| 110 | | Long-Term U.S. Government Bond Portfolio | | |
Long-Term U.S. Government Bond Portfolio (unaudited)
support a healthy pace of payroll gains, wage pressures are expected to gradually rise as the unemployment rate falls further. While falling oil prices should keep headline inflation subdued, we expect the Fed will take its policy signals from marginal wage gains and begin to gradually raise policy interest rates in mid-2015. As a result of the stronger growth outlook and likelihood for policy normalization, we expect the strength of the U.S. dollar versus other currencies to persist.
Relative Performance
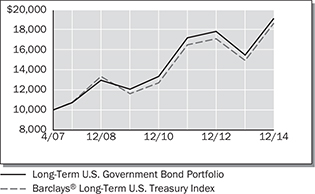
| | | | | | | | | | | | |
Average Annual Total Returns
For Periods Ended December 31, 2014 | |
| | | 1 Year | | | 5 Years | | | Since
Inception* | |
Long-Term U.S. Government Bond Portfolio | | | 23.73 | % | | | 9.69% | | | | 8.86% | |
Barclays® Long-Term U.S. Treasury Index | | | 25.07 | % | | | 9.96% | | | | 8.51% | |
Morningstar® US Insurance Fund Long Government Average | | | 18.58 | % | | | 8.27% | | | | – | |
| *Inception | date of 4/30/07 |
The performance data quoted represents past performance. Past performance is historical and does not guarantee future performance. Investment return and principal value will fluctuate, so that shares, when redeemed, may be worth more or less than their original cost. Current performance may be lower or higher than the performance data quoted. For the most recent month-end performance information visit www.northwesternmutual.com.
This chart assumes an initial investment of $10,000 made on 4/30/07 (commencement of the Portfolio’s operations). Returns shown reflect fee waivers, deductions for management and other portfolio expenses, and reinvestment of all dividends. In the absence of fee waivers, total return would be reduced. Returns exclude deductions for separate account sale loads and account fees. Please refer to the Benchmark Definitions section of this report for information about the indices cited in the above chart and graph.
Return of principal is not guaranteed. Bond funds have the same interest rate, inflation and credit risks that are associated with the underlying bonds owned by the Portfolio. When interest rates rise, bond prices fall. With a fixed income fund, when interest rates rise, the value of the fund’s existing bonds drops, which could negatively affect overall fund performance.
The Portfolio may invest in securities that are issued or guaranteed by the U.S. Government or its agencies, and in derivatives designed to replicate such securities. This guarantee is to timely repayment of the principal and interest if held to maturity, and does not apply to derivative securities held by the Portfolio. Guarantee does not eliminate market risk. The Portfolio may use derivative instruments for hedging or other purposes as part of its investment strategy. Use of these instruments may involve certain costs and risks such as liquidity risk, interest rate risk, market risk, credit risk, management risk and the risk that the Portfolio could not close out a position when it would be most advantageous to do so. The potential leverage created by use of derivatives may cause the Portfolio to be more sensitive to interest rate movements and thus more volatile than other long-term U.S. Government bond funds that do not use derivatives. Portfolios investing in derivatives could lose more than the principal amount invested in those instruments.
Currently, interest rates are at unprecedented historically low levels. A significant rise in interest rates over a short period of time could cause significant losses in the market value of the Portfolio’s fixed income investments.
| | | | | | |
| | Long-Term U.S. Government Bond Portfolio | | | 111 | |
Long-Term U.S. Government Bond Portfolio (unaudited)
Top 10 Fixed Income Holdings 12/31/14
| | | | |
| Security Description | | % of Market Value | |
US Treasury, Various | | | 73.4 | % |
Residual Funding Stripped, Various | | | 4.9 | % |
Federal National Mortgage Association, Various | | | 4.6 | % |
Financing Corp., Various | | | 2.2 | % |
Federal Home Loan Mortgage Corp., Series 4092, Class AY, 3.00%, 8/15/32 | | | 1.9 | % |
Freddie Mac Remics, , , 4.00%, 9/15/44 | | | 1.8 | % |
Israel Government AID Bond, Various | | | 1.7 | % |
Federal Home Loan Mortgage Corp., Series 2752, Class EZ, 5.50%, 2/15/34 | | | 0.6 | % |
Tennessee Valley Authority, Various | | | 0.6 | % |
Vessel Management Services, Inc., 3.432%, 8/15/36 | | | 0.5 | % |
Sector Allocation 12/31/14

Sector Allocation is based on fixed income investments.
Sector Allocation and Top 10 Holdings are subject to change.
The Corporate Bonds sector includes bonds of companies and governments headquartered outside the United States.
The Government and Structured Product categories include domestic taxable bonds.
Consistent with the Portfolio’s stated parameters, no more than 10% of the Portfolio is invested in securities rated A by Moody’s or S&P and no more than 25% of the Portfolio is invested in securities rated Aa by Moody’s or AA by S&P.
| | | | |
| 112 | | Long-Term U.S. Government Bond Portfolio | | |
Long-Term U.S. Government Bond Portfolio
Schedule of Investments
December 31, 2014
| | | | | | | | |
| | | Governments (93.1%) | | Shares/
$ Par | | | Value
$ (000’s) |
| |
| | Governments (93.1%) |
| | Federal National Mortgage Association, 5.625%, 4/17/28 | | | 100,000 | | | 128 |
| | Federal National Mortgage Association, 6.25%, 5/15/29 | | | 2,000,000 | | | 2,786 |
| | Federal National Mortgage Association, 7.125%, 1/15/30 | | | 700,000 | | | 1,067 |
| | Financing Corp., 8.60%, 9/26/19 | | | 700,000 | | | 911 |
| | Financing Corp. Stripped, 0.00%, 12/27/18 | | | 500,000 | | | 466 |
| | Financing Corp. Stripped, 0.00%, 9/26/19 | | | 1,300,000 | | | 1,186 |
| | Israel Government AID Bond,
0.00%, 2/15/23 | | | 100,000 | | | 81 |
| | Israel Government AID Bond,
0.00%, 5/15/23 | | | 500,000 | | | 402 |
| | Israel Government AID Bond,
5.50%, 9/18/33 | | | 300,000 | | | 403 |
| | Israel Government AID Bond,
5.50%, 9/18/23 | | | 800,000 | | | 985 |
| | Israel Government AID Bond,
5.50%, 4/26/24 | | | 100,000 | | | 124 |
| | Residual Funding Corp. Stripped, 0.00%, 4/15/30 | �� | | 4,800,000 | | | 3,045 |
| | Residual Funding Corp. Stripped, 0.00%, 10/15/20 | | | 2,000,000 | | | 1,768 |
| | Resolution Funding Corp. Stripped, 0.00%, 1/15/20 | | | 700,000 | | | 635 |
| | Resolution Funding Corp. Stripped, 0.00%, 4/15/28 | | | 400,000 | | | 273 |
| | Tennessee Valley Authority, 4.625%, 9/15/60 | | | 300,000 | | | 341 |
| | Tennessee Valley Authority Stripped, 0.00%, 5/1/30 | | | 500,000 | | | 301 |
| | US Treasury, 2.00%, 11/15/21 | | | 112,000 | | | 112 |
| | US Treasury, 2.50%, 5/15/24 | | | 1,600,000 | | | 1,648 |
| | US Treasury, 3.125%, 11/15/41 | | | 3,250,000 | | | 3,507 |
| (b) | | US Treasury, 3.125%, 2/15/42 | | | 14,000,000 | | | 15,071 |
| | US Treasury, 3.125%, 2/15/43 | | | 2,050,000 | | | 2,201 |
| | US Treasury, 3.125%, 8/15/44 | | | 4,000,000 | | | 4,306 |
| | | | | | | | |
| | | Governments (93.1%) | | Shares/
$ Par | | Value
$ (000’s) | |
| |
| | Governments continued | |
| (b) | | US Treasury, 3.375%, 5/15/44 | | 11,100,000 | | | 12,496 | |
| | US Treasury, 3.75%, 11/15/43 | | 4,000,000 | | | 4,808 | |
| (b) | | US Treasury, 4.375%, 11/15/39 | | 19,000,000 | | | 24,914 | |
| | US Treasury, 4.50%, 8/15/39 | | 3,800,000 | | | 5,064 | |
| | US Treasury, 6.25%, 5/15/30 | | 1,500,000 | | | 2,241 | |
| | US Treasury Inflation Index Bond, 1.375%, 2/15/44 | | 1,120,735 | | | 1,268 | |
| | US Treasury Inflation Index Bond, 2.00%, 1/15/26 | | 119,637 | | | 137 | |
| | US Treasury Inflation Index Bond, 3.625%, 4/15/28 | | 146,811 | | | 202 | |
| | US Treasury Stripped, 0.00%, 5/15/33 | | 1,000,000 | | | 609 | |
| | US Treasury Stripped, 0.00%, 8/15/39 | | 1,400,000 | | | 712 | |
| | US Treasury Stripped, 0.00%, 5/15/40 | | 11,400,000 | | | 5,660 | |
| | US Treasury Stripped, 0.00%, 5/15/42 | | 800,000 | | | 369 | |
| | US Treasury Stripped, 0.00%, 8/15/42 | | 1,400,000 | | | 638 | |
| | US Treasury Stripped, 0.00%, 11/15/42 | | 600,000 | | | 271 | |
| | Vessel Management Services, Inc., 3.432%, 8/15/36 | | 613,000 | | | 629 | |
| | | | | | | | |
| | |
| | Total Governments | | | | |
| | (Cost: $94,132) | | | | | 101,765 | |
| | | | | | | | |
| | | |
| | | Municipal Bonds (0.3%) | | | | | |
| |
| | Municipal Bonds (0.3%) | |
| | Massachusetts Educational Financing Authority,
Series 2008-1, 1.184%, 4/25/38 RB | | 144,219 | | | 145 | |
| | Poway Unified Public School District, Series 2007, 4.50%, 9/15/37 RB, AMBAC | | 200,000 | | | 204 | |
| | South Carolina Student Loan Corp.,
Series 2008-1, 0.784%, 3/1/18 RB | | 13,411 | | | 13 | |
| | | | | | | | |
| | |
| | Total Municipal Bonds | | | | |
| | (Cost: $350) | | | | | 362 | |
| | | | | | | | |
| | | | | | | | | | |
| | | Structured Products (7.4%) | | Shares/
$ Par | | | Value
$ (000’s) | |
| |
| | Structured Products (7.4%) | |
| | Credit Suisse First Boston Mortgage Securities Corp., Series 2003-AR18, Class 2A3, 2.248%, 7/25/33 | | | 2,989 | | | | 3 | |
| | Credit Suisse First Boston Mortgage Securities Corp., Series 2003-AR20, Class 2A1, 2.472%, 8/25/33 | | | 2,888 | | | | 3 | |
| | Federal Home Loan Mortgage Corp., Series 3346, Class FA, 0.391%, 2/15/19 | | | 13,797 | | | | 14 | |
| | Federal Home Loan Mortgage Corp.,
Series T61,
Class 1A1, 1.515%, 7/25/44 | | | 20,383 | | | | 21 | |
| | Federal Home Loan Mortgage Corp.,
Series 4092,
Class AY, 3.00%, 8/15/32 | | | 2,200,000 | | | | 2,192 | |
| | Federal Home Loan Mortgage Corp.,
Series 4387,
Class AZ, 4.00%, 9/15/44 | | | 2,020,067 | | | | 2,145 | |
| | Federal Home Loan Mortgage Corp.,
Series 3203,
Class ZW, 5.00%, 11/15/35 | | | 454,675 | | | | 502 | |
| | Federal Home Loan Mortgage Corp.,
Series 2752,
Class EZ, 5.50%, 2/15/34 | | | 665,048 | | | | 717 | |
| | Federal National Mortgage Association,
Series 2007-114, Class A6, 0.370%, 10/27/37 | | | 100,000 | | | | 99 | |
| | Federal National Mortgage Association, 3.765%, 12/1/25 | | | 900,000 | | | | 975 | |
| | Federal National Mortgage Association, Series
2007-39, Class NZ, 4.250%, 5/25/37 | | | 276,877 | | | | 294 | |
| | Federal National Mortgage Association, 5.00%, 6/1/35 | | | 151,213 | | | | 167 | |
| | Federal National Mortgage Association, 5.00%, 2/1/36 | | | 245,151 | | | | 271 | |
| | Merrill Lynch Mortgage Investors, Inc., Series 2003-A4, Class 3A, 2.791%, 5/25/33 | | | 2,768 | | | | 3 | |
| | SLM Student Loan Trust, Series 2007-2, Class A2, 0.234%, 7/25/17 | | | 66,921 | | | | 67 | |
The Accompanying Notes are an Integral Part of the Financial Statements.
| | | | | | |
| | Long-Term U.S. Government Bond Portfolio | | | 113 | |
Long-Term U.S. Government Bond Portfolio
| | | | | | | | | | |
| | | Structured Products (7.4%) | | Shares/
$ Par | | | Value
$ (000’s) | |
| |
| | Structured Products continued | |
| | SLM Student Loan Trust, Series 2008-7,
Class A2,
0.734%, 10/25/17 | | | 51,320 | | | | 51 | |
| | SLM Student Loan Trust, Series 2003-7A,
Class A5A,
1.441%, 12/15/33 144A | | | 194,911 | | | | 193 | |
| | SLM Student Loan Trust, Series 2008-9, Class A, 1.734%, 4/25/23 | | | 302,493 | | | | 311 | |
| | Structured Asset Mortgage Investments, Inc., Series 2004-AR5, Class 1A1,
0.824%, 10/19/34 | | | 9,679 | | | | 9 | |
| | Washington Mutual Mortgage Pass-Through Certificates, Series 2004-AR1, Class A, 2.419%, 3/25/34 | | | 26,046 | | | | 26 | |
| | | | | | | | | | |
| | | |
| | Total Structured Products | | | | | | | | |
| | (Cost: $7,800) | | | | | | | 8,063 | |
| | | | | | | | | | |
| | |
| | | Short-Term Investments (6.7%) | | | | |
| |
| | Commercial Paper (1.3%) | |
| (b) | | Federal Home Loan Bank, 0.00%, 1/28/15 | | | 300,000 | | | | 300 | |
| (b) | | Federal Home Loan Bank, 0.00%, 2/12/15 | | | 400,000 | | | | 400 | |
| (b) | | Federal Home Loan Bank, 0.08%, 4/17/15 | | | 200,000 | | | | 200 | |
| (b) | | Federal Home Loan Bank, 0.09%, 3/11/15 | | | 100,000 | | | | 100 | |
| (b) | | Federal Home Loan Mortgage Corp., 0.10%, 3/19/15 | | | 100,000 | | | | 100 | |
| (b) | | Federal Home Loan Mortgage Corp., 0.12%, 5/27/15 | | | 100,000 | | | | 100 | |
| (b) | | Federal National Mortgage Association, 0.09%, 4/13/15 | | | 200,000 | | | | 200 | |
| | | | | | | | | | |
| | Total | | | | | | | 1,400 | |
| | | | | | | | | | |
| | | | | | | | | | |
| | | Short-Term Investments
(6.7%) | | Shares/
$ Par | | | Value
$ (000’s) | |
| |
| | Repurchase Agreements (5.4%) | |
| (b) | | US Treasury Repurchase, 0.15%, dated 12/31/14, due 1/2/15, (collateralized by US Treasury Bond, 3.75%, 11/15/43, valued at $5,997,277, repurchase proceeds of $5,900,000) | | | 5,900,000 | | | | 5,900 | |
| | | | | | | | | | |
| | Total | | | | | | | 5,900 | |
| | | | | | | | | | |
| | Total Short-Term Investments | | | | | | | | |
| | (Cost: $7,300) | | | | | | | 7,300 | |
| | | | | | | | | | |
| | | |
| | Total Investments (107.5%) | | | | | | | | |
| | (Cost: $109,582)(a) | | | | | | | 117,490 | |
| | | | | | | | | | |
| | Other Assets, Less Liabilities (-7.5%) | | | | | | | (8,240 | ) |
| | | | | | | | | | |
| | Net Assets (100.0%) | | | | | | | 109,250 | |
| | | | | | | | | | |
The Accompanying Notes are an Integral Part of the Financial Statements.
| | | | |
| 114 | | Long-Term U.S. Government Bond Portfolio | | |
Long-Term U.S. Government Bond Portfolio
144A after the name of a security represents a security exempt from registration under Rule 144A of the Securities Act of 1933. These securities may be resold as transactions exempt from registration, normally to qualified institutional buyers. At December 31, 2014 the value of these securities (in thousands) was $193 representing 0.2% of the net assets.
RB — Revenue Bond
AMBAC — American Municipal Bond Assurance Corp.
| (a) | At December 31, 2014, the aggregate cost of securities for federal tax purposes (in thousands) was $113,623 and the net unrealized appreciation of investments based on that cost was $3,867 which is comprised of $7,978 aggregate gross unrealized appreciation and $4,111 aggregate gross unrealized depreciation. |
| (b) | All or a portion of the securities have been pledged as collateral for open futures positions or when-issued securities. Information regarding open futures contracts as of period end is summarized below. |
| | | | | | | | |
| Issuer (000’s) | | Number of
Contracts | | Expiration Date | | Unrealized
Appreciation/
(Depreciation)
(000’s) | |
90 Day Euro $ Commodity Future (Short) (Total Notional Value at December 31, 2014, $24,671) | | 101 | | 6/17 | | $ | (28 | ) |
90 Day Euro $ Commodity Future (Long) (Total Notional Value at December 31, 2014, $24,880) | | 101 | | 6/16 | | | 9 | |
US Long Treasury Bond Futures (Long) (Total Notional Value at December 31, 2014, $1,266) | | 9 | | 3/15 | | | 35 | |
The following is a summary of the inputs used in valuing the Portfolio’s assets and liabilities at December 31, 2014. See Note 3 for additional information on portfolio valuation.
| | | | | | | | | | | | | | |
| | | Valuation Inputs | | | |
| Description | | Level 1 – Quoted Prices | | | Level 2 – Other Significant
Observable Inputs | | | Level 3 – Significant
Unobservable Inputs | | | |
| | | (Amounts in thousands) | | | |
Assets: | | | | | | | | | | | | | | |
Government & Agency Bonds | | $ | - | | | $ | 101,765 | | | $ | - | | | |
Municipal Bonds | | | - | | | | 362 | | | | - | | | |
Structured Products | | | - | | | | 8,063 | | | | - | | | |
Short-Term Investments | | | - | | | | 7,300 | | | | - | | | |
Other Financial Instruments^ | | | | | | | | | | | | | | |
Futures | | | 44 | | | | - | | | | - | | | |
Total Assets | | $ | 44 | | | $ | 117,490 | | | $ | - | | | |
Liabilities: | | | | | | | | | | | | | | |
Other Financial Instruments^ | | | | | | | | | | | | | | |
Futures | | | (28 | ) | | | - | | | | - | | | |
Total Liabilities | | $ | (28 | ) | | $ | - | | | $ | - | | | |
^ Other financial instruments are derivative instruments such as futures, forwards, written options and swaps contracts, which are valued at the unrealized appreciation (depreciation) on the instrument and short sales, which are valued at market value.
The Accompanying Notes are an Integral Part of the Financial Statements.
| | | | | | |
| | Long-Term U.S. Government Bond Portfolio | | | 115 | |
Inflation Protection Portfolio (unaudited)
| | | | |
| Objective: | | Portfolio Strategy: | | Net Assets: |
| Total return using a strategy that seeks to protect against U.S. inflation. | | Invest substantially all assets in investment grade debt securities, with a majority in inflation-indexed debt securities. | | $286 million |
Portfolio Overview
Mason Street Advisors, LLC (“Mason Street Advisors”), the investment adviser for the Inflation Protection Portfolio (the “Portfolio”), has engaged American Century Investment Management, Inc. (“American Century”) to act as sub-adviser for the Portfolio. The Portfolio invests substantially all of its assets in investment grade debt securities. To help protect against U.S. inflation, under normal conditions, the Portfolio will invest over 50% of its net assets in inflation-indexed debt securities. These securities include inflation-indexed U.S. Treasury Securities, inflation-indexed securities issued by U.S. government agencies and instrumentalities other than the U.S. Treasury, and inflation-indexed securities issued by other entities such as domestic and foreign corporations and governments. The Portfolio also may invest in fixed income securities that are not inflation-indexed, including mortgage- and asset-backed securities. The Portfolio invests primarily in investment grade securities, but may also invest in high yield securities (so called “junk bonds”) up to a limit of 10% of Portfolio assets. Due to Internal Revenue Code provisions governing insurance product funds, no more than 55% of the Portfolio’s assets may be invested in securities issued by the same entity, such as the U.S. Treasury.
Market Overview
Most investors entered 2014 expecting U.S. interest rates to rise and the U.S. economy to gain ground, and, indeed, U.S. economic activity steadily improved after the first quarter. By the third quarter of 2014 (the latest data available as of year-end), the U.S. economy expanded at an annual rate of 5%, its fastest pace in more than a decade. Yet, these gains proved to have little effect on interest rates or inflation. Instead, longer-maturity rates declined more than 1% and inflation remained tame, providing a backdrop that supported broad fixed income gains.
Tame inflation and demand for perceived “safe-haven” Treasurys, which was triggered largely by geopolitical tensions (primarily in Russia/Ukraine and throughout the Middle East) and the relative attractiveness of U.S. fixed income securities versus those of other regions, generally helped drive down Treasury yields. Although Treasury inflation-protected securities (“TIPS”) returns remained positive, largely due to the strong rally among longer-maturity Treasurys, they lagged nominal Treasury returns and the broad investment grade fixed income benchmark average, according to various Barclays® Indices. The lagging results for TIPS were due to weak current inflation and declining longer-term inflation expectations.
At the end of December 2014, the annual headline inflation rate, as measured by CPI, was only 0.8%. Global commodity prices, which influence the inflation rate, declined sharply during the year, driven largely by a steep drop in oil prices. Brent crude plunged 50%, while West Texas Intermediate (WTI) crude futures declined 46%. Similarly, long-term expectations for inflation remained subdued due to subpar global growth, a rallying U.S. dollar and muted current inflation.
Portfolio Results
For the twelve months ended December 31, 2014, the Portfolio advanced 3.14%, compared with the gain of 3.64% for the Barclays U.S. TIPS Index, the Portfolio’s benchmark. (This Index is unmanaged, cannot be invested in directly and does not include administrative expenses or sales charges.) According to Lipper® Inc., an independent mutual fund ranking agency, the average return of the Inflation Protected Bond Funds peer group for 2014 was 3.88%.
The Portfolio’s duration strategy detracted from relative performance. Anticipating a gradual “normalization” in interest rates, the Portfolio maintained a shorter-than-benchmark duration. However, interest rates continued to decline in 2014. With global and technical factors, rather than the U.S. economic backdrop, driving the rate environment, the portfolio managers reduced the Portfolio’s short duration position late in the period.
The Portfolio’s relative performance benefited from exposure to certain non-benchmark securities that outperformed TIPS. The Portfolio was nearly as fully invested in TIPS as allowed by IRS portfolio diversification regulations for insurance products (54% of assets versus the IRS maximum of 55%). The remainder of the Portfolio included positions in investment grade corporate, mortgage and agency securities, which outperformed the all-TIPS benchmark. The Portfolio also held non-dollar inflation-linked bonds (hedged against currency fluctuations), which weighed on Portfolio performance. Most of the exposure in this allocation was to Europe, where inflation was even weaker than it was in the U.S.
In an effort to maintain maximum inflation protection and provide TIPS-like performance without investing further in TIPS, the Portfolio used inflation swaps to create an inflation-linked overlay for the non-inflation-linked securities. The swaps outperformed and aided Portfolio performance for the year, primarily because of the use of corporate and mortgage securities as the counterparts to the swap agreements.
Portfolio Manager Outlook
The following forward looking comments are the opinion of American Century, the Portfolio’s sub-adviser.
| | | | |
| 116 | | Inflation Protection Portfolio | | |
Inflation Protection Portfolio (unaudited)
We believe falling oil prices and global factors will keep U.S. inflation relatively low and contained in the near term. Longer term, we believe the large amount of monetary stimulus and an improving U.S. economy may trigger higher inflation, underscoring the importance of TIPS. In addition, with inflation expectations near seven-year lows, we believe TIPS currently represent an attractive buying opportunity.
Relative Performance
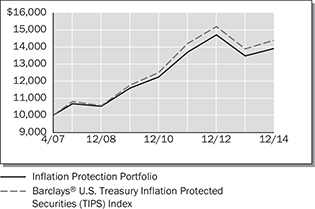
| | | | | | | | | | | | |
Average Annual Total Returns For Periods Ended December 31, 2014 | |
| | | 1 Year | | | 5 Years | | | Since
Inception* | |
Inflation Protection Portfolio | | | 3.14 | % | | | 3.71 | % | | | 4.39 | % |
Barclays® U.S. Treasury Inflation Protected Securities (TIPS) Index | | | 3.64 | % | | | 4.11 | % | | | 4.86 | % |
Lipper® Variable Insurance Products (VIP) Inflation Protected Bonds Funds Average | | | 3.88 | % | | | 4.02 | % | | | - | |
| * | Inception date of 4/30/07 |
The performance data quoted represents past performance. Past performance is historical and does not guarantee future performance. Investment return and principal value will fluctuate, so that shares, when redeemed, may be worth more or less than their original cost. Current performance may be lower or higher than the performance data quoted. For the most recent month-end performance information visit www.northwesternmutual.com.
This chart assumes an initial investment of $10,000 made on 4/30/07 (commencement of the Portfolio’s operations). Returns shown reflect fee waivers, deductions for management and other portfolio expenses, and reinvestment of all dividends. In the absence of fee waivers, total return would be reduced. Returns exclude deductions for separate account sale loads and account fees. Please refer to the Benchmark Definitions section of this report for information about the indices cited in the above chart and graph.
Return of principal is not guaranteed. Bond funds have the same interest rate, inflation and credit risks that are associated with the underlying bonds owned by the Portfolio. When interest rates rise, bond prices fall. With a fixed income fund, when interest rates rise, the value of the fund’s existing bonds drops, which could negatively affect overall fund performance.
Investing in bonds issued by foreign corporations and governments carries additional risk, including foreign currency risk, and may increase the volatility of the Portfolio’s performance.
As a non-diversified portfolio, the Portfolio may hold fewer securities because of its focused investment strategy. Holding fewer securities increases the risk that the value of the Portfolio could go down because of the poor performance of a single investment.
This Portfolio invests over 50% of its assets in inflation-linked bonds. Inflation-linked bonds issued by the U.S. Government, known as TIPs, are fixed income securities whose principal value is periodically adjusted according to the rate of inflation. Neither the current market value of the inflation-linked bonds nor the share value of the fund that invests in them is guaranteed, and either or both may fluctuate. Those portions of the Portfolio which are not invested in inflation linked securities will not be automatically protected from inflation. The Portfolio may use derivative instruments for hedging or other purposes as part of its investment strategy. Use of these instruments may involve certain costs and risks such as liquidity risk, interest rate risk, market risk, credit risk, management risk and the risk that the Portfolio could not close out a position when it would be most advantageous to do so. Portfolios investing in derivatives could lose more than the principal amount invested in those instruments.
Currently, interest rates are at unprecedented historically low levels. A significant rise in interest rates over a short period of time could cause significant losses in the market value of the Portfolio’s fixed income investments.
| | | | | | |
| | Inflation Protection Portfolio | | | 117 | |
Inflation Protection Portfolio (unaudited)
Top 10 Fixed Income Holdings 12/31/14
| | |
| Security Description | | % of Net Assets |
US Treasury Inflation Index Bond, Various | | 54.1% |
United Kingdom Gilt Inflation Linked, Various | | 7.7% |
Federal Home Loan Mortgage Corp., Various | | 4.5% |
France Government Bond OAT, Various | | 4.4% |
Bundesrepublik Deutschland Bundesobligation Inflation Linked Bond, Various | | 1.6% |
Canadian Government Bond, Various | | 0.7% |
Wells Fargo Mortgage Backed Securities Trust, Series 2005-AR10, Class 2A15, 2.614%, 6/25/35 | | 0.6% |
Bank of America Corp., Various | | 0.5% |
General Electric Capital Corp., Various | | 0.5% |
Comcast Corp., Various | | 0.4% |
Sector Allocation 12/31/14
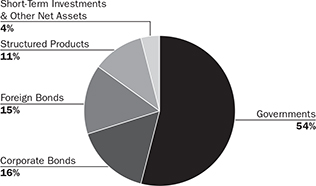
Sector Allocation is based on Net Assets.
Sector Allocation and Top 10 Holdings are subject to change.
The Corporate Bonds sector includes bonds of companies and governments headquartered outside the United States.
The Government and Structured Product categories include domestic taxable bonds.
Consistent with the Portfolio’s stated parameters, no more than 20% of the Portfolio is invested in foreign securities, and no more than 10% is invested in high yield securities.
| | | | |
| 118 | | Inflation Protection Portfolio | | |
Inflation Protection Portfolio
Schedule of Investments
December 31, 2014
| | | | | | | | | | |
| | | Corporate Bonds (15.7%) | | Shares/
$ Par | | | Value
$ (000’s) | |
| |
| | Aerospace & Defense (0.2%) | |
| | L-3 Communications Corp., 5.20%, 10/15/19 | | | 50,000 | | | | 55 | |
| | Lockheed Martin Corp., 2.125%, 9/15/16 | | | 100,000 | | | | 102 | |
| | Lockheed Martin Corp., 4.25%, 11/15/19 | | | 200,000 | | | | 218 | |
| | Raytheon Co., 2.50%, 12/15/22 | | | 300,000 | | | | 292 | |
| | | | | | | | | | |
| | Total | | | | | | | 667 | |
| | | | | | | | | | |
| | Autos & Vehicle Parts (0.3%) | | | | | | | | |
| | Daimler Finance North America LLC, 1.875%, 1/11/18 144A | | | 200,000 | | | | 201 | |
| | Ford Motor Credit Co. LLC, 2.375%, 1/16/18 | | | 200,000 | | | | 201 | |
| | Ford Motor Credit Co. LLC, 5.00%, 5/15/18 | | | 100,000 | | | | 109 | |
| | Toyota Motor Credit Corp., 3.30%, 1/12/22 | | | 350,000 | | | | 364 | |
| | | | | | | | | | |
| | Total | | | | | | | 875 | |
| | | | | | | | | | |
| |
| | Banking (3.3%) | |
| | American Express Co., 1.55%, 5/22/18 | | | 350,000 | | | | 347 | |
| | American Express Credit Corp., 1.30%, 7/29/16 | | | 70,000 | | | | 70 | |
| | Ameriprise Financial, Inc., 4.00%, 10/15/23 | | | 100,000 | | | | 106 | |
| | Bank of America Corp., 3.30%, 1/11/23 | | | 350,000 | | | | 350 | |
| | Bank of America Corp., 5.75%, 12/1/17 | | | 650,000 | | | | 718 | |
| | Barclays Bank PLC, 3.75%, 5/15/24 | | | 100,000 | | | | 103 | |
| | BB&T Corp., 2.05%, 6/19/18 | | | 100,000 | | | | 101 | |
| | BNP Paribas SA, 2.40%, 12/12/18 | | | 150,000 | | | | 152 | |
| | Branch Banking & Trust Co., 3.80%, 10/30/26 | | | 200,000 | | | | 204 | |
| | Capital One Bank USA NA, 2.30%, 6/5/19 | | | 250,000 | | | | 248 | |
| | Capital One Financial Corp., 2.45%, 4/24/19 | | | 100,000 | | | | 100 | |
| | Capital One Financial Corp., 3.15%, 7/15/16 | | | 100,000 | | | | 103 | |
| | Citigroup, Inc., 1.75%, 5/1/18 | | | 200,000 | | | | 198 | |
| | Citigroup, Inc., 3.75%, 6/16/24 | | | 150,000 | | | | 153 | |
| | Citigroup, Inc., 4.00%, 8/5/24 | | | 250,000 | | | | 251 | |
| | Citigroup, Inc., 4.05%, 7/30/22 | | | 300,000 | | | | 310 | |
| | Citigroup, Inc., 5.50%, 2/15/17 | | | 150,000 | | | | 161 | |
| | | | | | | | | | |
| | | Corporate Bonds (15.7%) | | Shares/
$ Par | | | Value
$ (000’s) | |
| |
| | Banking continued | |
| | Cooperatieve Centrale Raiffeisen-Boerenleenbank BA/Netherlands, 3.875%, 2/8/22 | | | 200,000 | | | | 213 | |
| | Credit Suisse of New York, 3.625%, 9/9/24 | | | 250,000 | | | | 254 | |
| | Fifth Third Bancorp, 4.30%, 1/16/24 | | | 60,000 | | | | 63 | |
| | Fifth Third Bank, 2.875%, 10/1/21 | | | 250,000 | | | | 250 | |
| | The Goldman Sachs Group, Inc., 2.375%, 1/22/18 | | | 200,000 | | | | 202 | |
| | The Goldman Sachs Group, Inc., 2.90%, 7/19/18 | | | 100,000 | | | | 103 | |
| | The Goldman Sachs Group, Inc., 3.625%, 1/22/23 | | | 500,000 | | | | 506 | |
| | The Goldman Sachs Group, Inc., 3.85%, 7/8/24 | | | 150,000 | | | | 154 | |
| | The Goldman Sachs Group, Inc., 5.75%, 1/24/22 | | | 230,000 | | | | 266 | |
| | HSBC Holdings PLC, 5.10%, 4/5/21 | | | 200,000 | | | | 226 | |
| | JPMorgan Chase & Co., 3.875%, 9/10/24 | | | 250,000 | | | | 250 | |
| | JPMorgan Chase & Co., 4.50%, 1/24/22 | | | 500,000 | | | | 546 | |
| | JPMorgan Chase & Co., 4.625%, 5/10/21 | | | 250,000 | | | | 275 | |
| | Morgan Stanley, 5.00%, 11/24/25 | | | 670,000 | | | | 715 | |
| | Morgan Stanley, 5.95%, 12/28/17 | | | 200,000 | | | | 222 | |
| | PNC Bank, N.A., 6.00%, 12/7/17 | | | 200,000 | | | | 223 | |
| | Standard Chartered PLC, 3.95%, 1/11/23 144A | | | 60,000 | | | | 58 | |
| | Synchrony Financial, 3.00%, 8/15/19 | | | 250,000 | | | | 253 | |
| | U.S. Bancorp, 2.95%, 7/15/22 | | | 200,000 | | | | 197 | |
| | U.S. Bancorp, 3.60%, 9/11/24 | | | 200,000 | | | | 203 | |
| | Wells Fargo & Co., 4.125%, 8/15/23 | | | 100,000 | | | | 105 | |
| | Wells Fargo & Co., 5.625%, 12/11/17 | | | 400,000 | | | | 445 | |
| | | | | | | | | | |
| | Total | | | | | | | 9,404 | |
| | | | | | | | | | |
| |
| | Basic Materials (0.1%) | |
| | Georgia-Pacific LLC, 2.539%, 11/15/19 144A | | | 100,000 | | | | 100 | |
| | | | | | | | | | |
| | | Corporate Bonds (15.7%) | | Shares/
$ Par | | | Value
$ (000’s) | |
| |
| | Basic Materials continued | |
| | Georgia-Pacific LLC, 5.40%, 11/1/20 144A | | | 140,000 | | | | 157 | |
| | International Paper Co., 6.00%, 11/15/41 | | | 75,000 | | | | 88 | |
| | | | | | | | | | |
| | Total | | | | | | | 345 | |
| | | | | | | | | | |
| |
| | Capital Goods (0.2%) | |
| | Caterpillar Financial Services Corp., 1.25%, 11/6/17 | | | 60,000 | | | | 60 | |
| | Deere & Co., 2.60%, 6/8/22 | | | 60,000 | | | | 59 | |
| | Deere & Co., 5.375%, 10/16/29 | | | 100,000 | | | | 121 | |
| | John Deere Capital Corp., 3.15%, 10/15/21 | | | 290,000 | | | | 301 | |
| | | | | | | | | | |
| | Total | | | | | | | 541 | |
| | | | | | | | | | |
| |
| | Chemicals (0.5%) | |
| | The Dow Chemical Co., 2.50%, 2/15/16 | | | 130,000 | | | | 132 | |
| | The Dow Chemical Co., 3.50%, 10/1/24 | | | 200,000 | | | | 198 | |
| | E.I. du Pont de Nemours & Co., 4.15%, 2/15/43 | | | 200,000 | | | | 201 | |
| | Eastman Chemical Co., 3.60%, 8/15/22 | | | 140,000 | | | | 142 | |
| | Ecolab, Inc., 4.35%, 12/8/21 | | | 360,000 | | | | 392 | |
| | LYB International Finance BV, 4.875%, 3/15/44 | | | 100,000 | | | | 103 | |
| | LyondellBasell Industries NV, 5.00%, 4/15/19 | | | 75,000 | | | | 82 | |
| | The Mosaic Co., 5.625%, 11/15/43 | | | 100,000 | | | | 115 | |
| | | | | | | | | | |
| | Total | | | | | | | 1,365 | |
| | | | | | | | | | |
| |
| | Conglomerate & Diversified Manufacturing (0.2%) | |
| | General Electric Co., 5.25%, 12/6/17 | | | 210,000 | | | | 233 | |
| | Ingersoll-Rand Luxembourg Finance SA, 3.55%, 11/1/24 | | | 200,000 | | | | 199 | |
| | United Technologies Corp., 4.50%, 6/1/42 | | | 80,000 | | | | 87 | |
| | | | | | | | | | |
| | Totalaea | | | | | | | 519 | |
| | | | | | | | | | |
| |
| | Consumer Products & Retailing (0.8%) | |
| | Colgate-Palmolive Co., 3.25%, 3/15/24 | | | 200,000 | | | | 207 | |
| | CVS Caremark Corp., 2.75%, 12/1/22 | | | 500,000 | | | | 487 | |
| | The Home Depot, Inc., 4.20%, 4/1/43 | | | 200,000 | | | | 208 | |
The Accompanying Notes are an Integral Part of the Financial Statements.
| | | | | | |
| | Inflation Protection Portfolio | | | 119 | |
Inflation Protection Portfolio
| | | | | | | | | | |
| | | Corporate Bonds (15.7%) | | Shares/
$ Par | | | Value
$ (000’s) | |
| |
| | Consumer Products & Retailing continued | |
| | Macy’s Retail Holdings, Inc., 3.625%, 6/1/24 | | | 150,000 | | | | 152 | |
| | McDonald’s Corp., 3.25%, 6/10/24 | | | 150,000 | | | | 153 | |
| | NIKE, Inc.,
2.25%, 5/1/23 | | | 250,000 | | | | 243 | |
| | Unilever Capital Corp., 2.20%, 3/6/19 | | | 200,000 | | | | 202 | |
| | Wal-Mart Stores, Inc., 3.25%, 10/25/20 | | | 400,000 | | | | 418 | |
| | Wal-Mart Stores, Inc., 5.625%, 4/15/41 | | | 300,000 | | | | 383 | |
| | | | | | | | | | |
| | Total | | | | | | | 2,453 | |
| | | | | | | | | | |
| |
| | Electric Utilities (0.5%) | |
| | CMS Energy Corp., 6.25%, 2/1/20 | | | 100,000 | | | | 116 | |
| | Constellation Energy Group, Inc.,
5.15%, 12/1/20 | | | 260,000 | | | | 288 | |
| | Dominion Resources, Inc., 3.625%, 12/1/24 | | | 200,000 | | | | 202 | |
| | Dominion Resources, Inc., 6.40%, 6/15/18 | | | 340,000 | | | | 388 | |
| | Duke Energy Corp., 3.55%, 9/15/21 | | | 150,000 | | | | 157 | |
| | Georgia Power Co., 4.30%, 3/15/42 | | | 100,000 | | | | 105 | |
| | Potomac Electric Power Co., 3.60%, 3/15/24 | | | 80,000 | | | | 84 | |
| | Virginia Electric and
Power Co.,
3.45%, 2/15/24 | | | 50,000 | | | | 51 | |
| | | | | | | | | | |
| | Total | | | | | | | 1,391 | |
| | | | | | | | | | |
| |
| | Energy (0.8%) | |
| | Anadarko Petroleum Corp., 5.95%, 9/15/16 | | | 100,000 | | | | 107 | |
| | Apache Corp., 4.75%, 4/15/43 | | | 225,000 | | | | 211 | |
| | ConocoPhillips, Co., 2.40%, 12/15/22 | | | 280,000 | | | | 268 | |
| | Ensco PLC,
4.70%, 3/15/21 | | | 250,000 | | | | 251 | |
| | EOG Resources, Inc., 2.50%, 2/1/16 | | | 300,000 | | | | 305 | |
| | Noble Energy, Inc., 4.15%, 12/15/21 | | | 330,000 | | | | 337 | |
| | Occidental Petroleum Corp., 1.75%, 2/15/17 | | | 370,000 | | | | 372 | |
| | Sempra Energy, 6.50%, 6/1/16 | | | 50,000 | | | | 54 | |
| | Talisman Energy, Inc., 3.75%, 2/1/21 | | | 150,000 | | | | 145 | |
| | Transocean, Inc., 3.80%, 10/15/22 | | | 100,000 | | | | 81 | |
| | Transocean, Inc., 5.05%, 12/15/16 | | | 100,000 | | | | 100 | |
| | | | | | | | | | |
| | Total | | | | | | | 2,231 | |
| | | | | | | | | | |
| | | | | | | | | | |
| | | Corporate Bonds (15.7%) | | Shares/
$ Par | | | Value
$ (000’s) | |
| |
| | Finance (0.4%) | |
| | General Electric Capital Corp.,
2.10%, 12/11/19 | | | 250,000 | | | | 249 | |
| | General Electric Capital Corp.,
4.65%, 10/17/21 | | | 100,000 | | | | 113 | |
| | General Electric Capital Corp.,
5.625%, 9/15/17 | | | 500,000 | | | | 555 | |
| | General Electric Capital Corp.,
6.00%, 8/7/19 | | | 110,000 | | | | 128 | |
| | | | | | | | | | |
| | Total | | | | | | | 1,045 | |
| | | | | | | | | | |
| |
| | Food & Beverage (0.6%) | |
| | Anheuser-Busch InBev Worldwide, Inc.,
5.375%, 1/15/20 | | | 525,000 | | | | 595 | |
| | Anheuser-Busch InBev Worldwide, Inc.,
7.75%, 1/15/19 | | | 120,000 | | | | 145 | |
| | Diageo Capital PLC,
2.625%, 4/29/23 | | | 200,000 | | | | 194 | |
| | General Mills, Inc., 3.15%, 12/15/21 | | | 450,000 | | | | 465 | |
| | Mondelez International, Inc.,
4.00%, 2/1/24 | | | 100,000 | | | | 105 | |
| | Sysco Corp.,
3.00%, 10/2/21 | | | 200,000 | | | | 203 | |
| | | | | | | | | | |
| | Total | | | | | | | 1,707 | |
| | | | | | | | | | |
| |
| | Foreign Agencies (0.2%) | |
| | CNOOC Nexen Finance 2014 ULC,
1.625%, 4/30/17 | | | 100,000 | | | | 100 | |
| | Petrobras Global Finance BV,
4.375%, 5/20/23 144A | | | 240,000 | | | | 206 | |
| | Statoil ASA,
2.45%, 1/17/23 | | | 250,000 | | | | 238 | |
| | | | | | | | | | |
| | Total | | | | | | | 544 | |
| | | | | | | | | | |
| |
| | Healthcare (0.5%) | |
| | Baxter International, Inc.,
1.85%, 1/15/17 | | | 200,000 | | | | 203 | |
| | Baxter International, Inc.,
3.20%, 6/15/23 | | | 150,000 | | | | 151 | |
| | Catholic Health Initiatives,
2.95%, 11/1/22 | | | 100,000 | | | | 98 | |
| | Dignity Health,
2.637%, 11/1/19 | | | 200,000 | | | | 202 | |
| | Express Scripts Holding Co., 3.125%, 5/15/16 | | | 150,000 | | | | 154 | |
| | Express Scripts Holding Co., 7.25%, 6/15/19 | | | 100,000 | | | | 120 | |
| | Medtronic, Inc., 2.50%, 3/15/20 144A | | | 100,000 | | | | 100 | |
| | Medtronic, Inc., 2.75%, 4/1/23 | | | 100,000 | | | | 97 | |
| | Medtronic, Inc., 3.50%, 3/15/25 144A | | | 80,000 | | | | 82 | |
| | Thermo Fisher Scientific, Inc.,
3.20%, 3/1/16 | | | 300,000 | | | | 307 | |
| | | | | | | | | | |
| | Total | | | | | | | 1,514 | |
| | | | | | | | | | |
| | | | | | | | | | |
| | | Corporate Bonds (15.7%) | | Shares/
$ Par | | | Value
$ (000’s) | |
| |
| | Insurance (1.0%) | |
| | Aetna, Inc.,
2.75%, 11/15/22 | | | 100,000 | | | | 97 | |
| | The Allstate Corp., 4.50%, 6/15/43 | | | 150,000 | | | | 166 | |
| | American International Group, Inc., 4.50%, 7/16/44 | | | 150,000 | | | | 158 | |
| | American International Group, Inc., 4.875%, 6/1/22 | | | 250,000 | | | | 281 | |
| | American International Group, Inc., 5.85%, 1/16/18 | | | 100,000 | | | | 112 | |
| | Berkshire Hathaway, Inc., 4.50%, 2/11/43 | | | 250,000 | | | | 273 | |
| | The Hartford Financial Services Group, Inc., 5.125%, 4/15/22 | | | 150,000 | | | | 169 | |
| | Liberty Mutual Group, Inc., 4.25%, 6/15/23 144A | | | 100,000 | | | | 103 | |
| | Metropolitan Life Global Funding I, 3.00%, 1/10/23 144A | | | 400,000 | | | | 398 | |
| | Prudential Financial, Inc., 2.30%, 8/15/18 | | | 100,000 | | | | 101 | |
| | Prudential Financial, Inc., 3.57%, 3/10/15 | | | 240,000 | | | | 240 | |
| | Prudential Financial, Inc., 5.625%, 5/12/41 | | | 150,000 | | | | 176 | |
| | TIAA Asset Management Finance Co. LLC, 4.125%, 11/1/24 144A | | | 200,000 | | | | 205 | |
| | UnitedHealth Group, Inc., 4.25%, 3/15/43 | | | 150,000 | | | | 157 | |
| | Voya Financial, Inc., 2.90%, 2/15/18 | | | 200,000 | | | | 205 | |
| | XLIT ltd.,
2.30%, 12/15/18 | | | 100,000 | | | | 100 | |
| | | | | | | | | | |
| | Total | | | | | | | 2,941 | |
| | | | | | | | | | |
| |
| | Media (1.1%) | |
| | 21st Century Fox America, Inc.,
6.90%, 8/15/39 | | | 235,000 | | | | 319 | |
| | Comcast Corp., 6.50%, 11/15/35 | | | 200,000 | | | | 267 | |
| | DIRECTV Holdings LLC/DIRECTV Financing Co., Inc.,
3.55%, 3/15/15 | | | 400,000 | | | | 402 | |
| | DIRECTV Holdings LLC/DIRECTV Financing Co., Inc.,
4.45%, 4/1/24 | | | 100,000 | | | | 105 | |
| | NBCUniversal Media LLC, 4.375%, 4/1/21 | | | 340,000 | | | | 374 | |
| | NBCUniversal Media LLC, 5.15%, 4/30/20 | | | 540,000 | | | | 613 | |
The Accompanying Notes are an Integral Part of the Financial Statements.
| | | | |
| 120 | | Inflation Protection Portfolio | | |
Inflation Protection Portfolio
| | | | | | | | | | |
| | | Corporate Bonds (15.7%) | | Shares/
$ Par | | | Value
$ (000’s) | |
| | |
| | Media continued | | | | | |
| | Time Warner, Inc., 4.05%, 12/15/23 | | | 150,000 | | | | 157 | |
| | Time Warner, Inc., 4.70%, 1/15/21 | | | 100,000 | | | | 110 | |
| | Viacom, Inc.,
4.50%, 3/1/21 | | | 250,000 | | | | 268 | |
| | The Walt Disney Co., 2.35%, 12/1/22 | | | 500,000 | | | | 490 | |
| | | | | | | | | | |
| | Total | | | | | | | 3,105 | |
| | | | | | | | | | |
| | |
| | Metals & Mining (0.3%) | | | | | |
| | Barrick North America Finance LLC, 4.40%, 5/30/21 | | | 80,000 | | | | 81 | |
| | BHP Billiton Finance USA, Ltd.,
3.25%, 11/21/21 | | | 330,000 | | | | 341 | |
| | Newmont Mining Corp., 6.25%, 10/1/39 | | | 120,000 | | | | 121 | |
| | Rio Tinto Finance USA, Ltd., 3.75%, 9/20/21 | | | 280,000 | | | | 288 | |
| | | | | | | | | | |
| | Total | | | | | | | 831 | |
| | | | | | | | | | |
| | |
| | Oil & Gas (0.7%) | | | | | |
| | BP Capital Markets PLC, 2.50%, 11/6/22 | | | 60,000 | | | | 56 | |
| | BP Capital Markets PLC, 2.75%, 5/10/23 | | | 200,000 | | | | 187 | |
| | Chevron Corp., 2.427%, 6/24/20 | | | 100,000 | | | | 101 | |
| | Marathon Petroleum Corp., 3.625%, 9/15/24 | | | 250,000 | | | | 245 | |
| | Petro-Canada, 6.80%, 5/15/38 | | | 80,000 | | | | 101 | |
| | Petroleos Mexicanos, 3.50%, 1/30/23 | | | 130,000 | | | | 124 | |
| | Phillips 66,
4.65%, 11/15/34 | | | 200,000 | | | | 205 | |
| | Shell International Finance BV,
2.375%, 8/21/22 | | | 900,000 | | | | 875 | |
| | Total Capital SA, 2.125%, 8/10/18 | | | 100,000 | | | | 101 | |
| | | | | | | | | | |
| | Total | | | | | | | 1,995 | |
| | | | | | | | | | |
| | |
| | Pharmaceuticals (0.9%) | | | | | |
| | AbbVie, Inc.,
2.90%, 11/6/22 | | | 200,000 | | | | 197 | |
| | Actavis Funding SCS, 3.85%, 6/15/24 | | | 150,000 | | | | 151 | |
| | Amgen, Inc., 3.625%, 5/22/24 | | | 140,000 | | | | 142 | |
| | Amgen, Inc.,
5.85%, 6/1/17 | | | 90,000 | | | | 99 | |
| | Celgene Corp., 3.625%, 5/15/24 | | | 50,000 | | | | 51 | |
| | Gilead Sciences, Inc., 4.40%, 12/1/21 | | | 260,000 | | | | 287 | |
| | GlaxoSmithKline Capital, Inc.,
2.85%, 5/8/22 | | | 200,000 | | | | 200 | |
| | | | | | | | | | |
| | | Corporate Bonds (15.7%) | | Shares/
$ Par | | | Value
$ (000’s) | |
| | |
| | Pharmaceuticals continued | | | | | |
| | Merck & Co., Inc., 2.40%, 9/15/22 | | | 200,000 | | | | 195 | |
| | Mylan, Inc.,
2.55%, 3/28/19 | | | 100,000 | | | | 99 | |
| | Mylan, Inc.,
2.60%, 6/24/18 | | | 70,000 | | | | 71 | |
| | Perrigo Finance PLC, 3.90%, 12/15/24 | | | 200,000 | | | | 204 | |
| | Roche Holdings, Inc., 3.35%, 9/30/24 144A | | | 400,000 | | | | 412 | |
| | Roche Holdings, Inc., 6.00%, 3/1/19 144A | | | 254,000 | | | | 293 | |
| | Teva Pharmaceutical Finance IV LLC,
2.25%, 3/18/20 | | | 170,000 | | | | 167 | |
| | | | | | | | | | |
| | Total | | | | | | | 2,568 | |
| | | | | | | | | | |
| | |
| | Pipelines (0.8%) | | | | | |
| | Enable Midstream Partners LP,
3.90%, 5/15/24 144A | | | 150,000 | | | | 145 | |
| | Enbridge, Inc., 3.50%, 6/10/24 | | | 150,000 | | | | 141 | |
| | Energy Transfer Partners LP, 3.60%, 2/1/23 | | | 100,000 | | | | 97 | |
| | Energy Transfer Partners LP, 4.15%, 10/1/20 | | | 100,000 | | | | 102 | |
| | Enterprise Products Operating LLC,
3.70%, 6/1/15 | | | 80,000 | | | | 81 | |
| | Enterprise Products Operating LLC,
3.75%, 2/15/25 | | | 200,000 | | | | 201 | |
| | Enterprise Products Operating LLC,
4.85%, 3/15/44 | | | 100,000 | | | | 104 | |
| | Kinder Morgan Energy Partners LP, 5.30%, 9/15/20 | | | 270,000 | | | | 291 | |
| | Magellan Midstream Partners LP,
5.15%, 10/15/43 | | | 150,000 | | | | 159 | |
| | Plains All American Pipeline LP/PAA Finance Corp., 3.65%, 6/1/22 | | | 200,000 | | | | 201 | |
| | Sunoco Logistics Partners Operations LP, 3.45%, 1/15/23 | | | 200,000 | | | | 192 | |
| | TransCanada PipeLines, Ltd., 2.50%, 8/1/22 | | | 100,000 | | | | 94 | |
| | The Williams Cos., Inc., 4.55%, 6/24/24 | | | 150,000 | | | | 139 | |
| | Williams Partners LP, 3.80%, 2/15/15 | | | 150,000 | | | | 150 | |
| | Williams Partners LP, 4.125%, 11/15/20 | | | 80,000 | | | | 82 | |
| | Williams Partners LP, 4.30%, 3/4/24 | | | 200,000 | | | | 200 | |
| | | | | | | | | | |
| | Total | | | | | | | 2,379 | |
| | | | | | | | | | |
| | | | | | | | | | |
| | | Corporate Bonds (15.7%) | | Shares/
$ Par | | | Value
$ (000’s) | |
| |
| | Real Estate Investment Trusts (0.3%) | |
| | Boston Properties LP, 3.80%, 2/1/24 | | | 70,000 | | | | 72 | |
| | DDR Corp.,
4.75%, 4/15/18 | | | 60,000 | | | | 64 | |
| | Essex Portfolio LP, 3.625%, 8/15/22 | | | 100,000 | | | | 101 | |
| | Health Care REIT, Inc., 3.75%, 3/15/23 | | | 300,000 | | | | 303 | |
| | Host Hotels & Resorts LP, 3.75%, 10/15/23 | | | 100,000 | | | | 100 | |
| | Kilroy Realty LP, 3.80%, 1/15/23 | | | 130,000 | | | | 131 | |
| | Ventas Realty LP/Ventas Capital Corp., 3.25%, 8/15/22 | | | 250,000 | | | | 247 | |
| | | | | | | | | | |
| | Total | | | | | | | 1,018 | |
| | | | | | | | | | |
| | |
| | Services (0.1%) | | | | | |
| | Republic Services, Inc., 3.80%, 5/15/18 | | | 100,000 | | | | 106 | |
| | Waste Management, Inc., 3.50%, 5/15/24 | | | 100,000 | | | | 101 | |
| | | | | | | | | | |
| | Total | | | | | | | 207 | |
| | | | | | | | | | |
| | |
| | Technology (0.9%) | | | | | |
| | Adobe Systems, Inc., 3.25%, 2/1/15 | | | 300,000 | | | | 301 | |
| | Apple, Inc.,
1.00%, 5/3/18 | | | 100,000 | | | | 99 | |
| | Apple, Inc.,
4.45%, 5/6/44 | | | 100,000 | | | | 110 | |
| | Cisco Systems, Inc., 5.90%, 2/15/39 | | | 165,000 | | | | 208 | |
| | Fidelity National Information Services, Inc., 3.50%, 4/15/23 | | | 100,000 | | | | 99 | |
| | Hewlett-Packard Co., 4.30%, 6/1/21 | | | 150,000 | | | | 158 | |
| | Intel Corp.,
2.70%, 12/15/22 | | | 260,000 | | | | 258 | |
| | Intuit, Inc.,
5.75%, 3/15/17 | | | 140,000 | | | | 154 | |
| | Microsoft Corp., 2.125%, 11/15/22 | | | 180,000 | | | | 175 | |
| | Oracle Corp.,
2.50%, 10/15/22 | | | 300,000 | | | | 292 | |
| | Oracle Corp.,
3.40%, 7/8/24 | | | 150,000 | | | | 153 | |
| | Oracle Corp.,
5.75%, 4/15/18 | | | 300,000 | | | | 339 | |
| | Seagate HDD Cayman, 4.75%, 1/1/25 144A | | | 150,000 | | | | 155 | |
| | | | | | | | | | |
| | Total | | | | | | | 2,501 | |
| | | | | | | | | | |
| | |
| | Telecommunications (0.6%) | | | | | |
| | AT&T, Inc.,
2.625%, 12/1/22 | | | 250,000 | | | | 238 | |
| | AT&T, Inc.,
4.80%, 6/15/44 | | | 150,000 | | | | 153 | |
| | AT&T, Inc.,
6.55%, 2/15/39 | | | 77,000 | | | | 95 | |
The Accompanying Notes are an Integral Part of the Financial Statements.
| | | | | | |
| | Inflation Protection Portfolio | | | 121 | |
Inflation Protection Portfolio
| | | | | | | | | | |
| | | Corporate Bonds (15.7%) | | Shares/
$ Par | | | Value
$ (000’s) | |
| |
| | Telecommunications continued | |
| | British Telecommunications PLC,
5.95%, 1/15/18 | | | 100,000 | | | | 112 | |
| | CC Holdings GS V LLC/Crown Castle GS III Corp., 3.849%, 4/15/23 | | | 90,000 | | | | 89 | |
| | Deutsche Telekom International Finance BV,
6.75%, 8/20/18 | | | 130,000 | | | | 151 | |
| | Orange SA,
2.75%, 2/6/19 | | | 100,000 | | | | 102 | |
| | Verizon Communications, Inc.,
3.50%, 11/1/24 | | | 200,000 | | | | 196 | |
| | Verizon Communications, Inc.,
4.15%, 3/15/24 | | | 150,000 | | | | 155 | |
| | Verizon Communications, Inc.,
4.40%, 11/1/34 | | | 150,000 | | | | 149 | |
| | Verizon Communications, Inc.,
5.15%, 9/15/23 | | | 250,000 | | | | 276 | |
| | | | | | | | | | |
| | Total | | | | | | | 1,716 | |
| | | | | | | | | | |
| |
| | Transportation (0.4%) | |
| | Burlington Northern Santa Fe LLC,
3.75%, 4/1/24 | | | 200,000 | | | | 208 | |
| | Burlington Northern Santa Fe LLC,
4.95%, 9/15/41 | | | 100,000 | | | | 111 | |
| | Canadian National Railway Co.,
4.50%, 11/7/43 | | | 125,000 | | | | 138 | |
| | CSX Corp.,
4.25%, 6/1/21 | | | 200,000 | | | | 217 | |
| | Norfolk Southern Corp., 3.85%, 1/15/24 | | | 75,000 | | | | 79 | |
| | Norfolk Southern Corp., 5.75%, 4/1/18 | | | 100,000 | | | | 112 | |
| | Penske Truck Leasing Co. LP/PTL Finance Corp., 2.875%, 7/17/18 144A | | | 100,000 | | | | 102 | |
| | Union Pacific Corp., 2.75%, 4/15/23 | | | 100,000 | | | | 99 | |
| | | | | | | | | | |
| | Total | | | | | | | 1,066 | |
| | | | | | | | | | |
| | Total Corporate Bonds | | | | | |
| | (Cost: $44,447) | | | | | | | 44,928 | |
| | | | | | | | | | |
| | | | | | | | | | |
| | | Governments (69.2%) | | Shares/
Par | | | Value
$ (000’s) | |
| |
| | Foreign Governments (15.0%) | |
| (f) | | Bundesrepublik Deutschland Bundesobligation Inflation Linked Bond, 0.75%, 4/15/18 EUR | | | 936,082 | | | | 1,163 | |
| (f) | | Canadian Government Bond,
4.25%, 12/1/21 CAD | | | 727,382 | | | | 805 | |
| (f) | | Canadian Government Bond,
4.25%, 12/1/26 CAD | | | 860,070 | | | | 1,073 | |
| (f) | | Commonwealth of Australia Treasury Indexed Bonds, 4.00%, 8/20/20 AUD | | | 715,000 | | | | 1,124 | |
| (f) | | Deutsche Bundesrepublik Inflation Linked Bond,
0.10%, 4/15/23 EUR | | | 875,741 | | | | 1,107 | |
| (f) | | Deutsche Bundesrepublik Inflation Linked Bond,
1.75%, 4/15/20 EUR | | | 1,798,293 | | | | 2,426 | |
| (f) | | France Government Bond OAT, 1.10%, 7/25/22 EUR | | | 3,756,695 | | | | 5,016 | |
| (f) | | France Government Bond OAT, 1.30%, 7/25/19 EUR | | | 1,156,436 | | | | 1,508 | |
| (f) | | France Government Bond OAT, 1.85%, 7/25/27 EUR | | | 1,107,419 | | | | 1,652 | |
| (f) | | France Government Bond OAT, 2.25%, 7/25/20 EUR | | | 3,236,604 | | | | 4,477 | |
| (f) | | Japanese Government CPI Linked Bond, 1.10%, 12/10/16 JPY | | | 54,075,000 | | | | 483 | |
| (f) | | United Kingdom Gilt Inflation Linked, 0.25%, 3/22/52 GBP | | | 132,014 | | | | 286 | |
| (f) | | United Kingdom Gilt Inflation Linked, 1.875%, 11/22/22 GBP | | | 2,368,208 | | | | 4,590 | |
| (f) | | United Kingdom Gilt Inflation Linked, 2.50%, 4/16/20 GBP | | | 975,000 | | | | 5,606 | |
| (f) | | United Kingdom Gilt Inflation Linked, 2.50%, 7/17/24 GBP | | | 2,100,000 | | | | 11,409 | |
| | | | | | | | | | |
| | Total | | | | | | | 42,725 | |
| | | | | | | | | | |
| |
| | US Governments (54.1%) | |
| | US Treasury Inflation Index Bond, 0.125%, 4/15/16 | | | 1,613,640 | | | | 1,609 | |
| | | | | | | | | | |
| | | Governments (69.2%) | | Shares/
$ Par | | | Value
$ (000’s) | |
| |
| | US Governments continued | |
| | US Treasury Inflation Index Bond, 0.125%, 4/15/18 | | | 8,731,370 | | | | 8,699 | |
| | US Treasury Inflation Index Bond, 0.125%, 4/15/19 | | | 9,069,662 | | | | 8,970 | |
| | US Treasury Inflation Index Bond, 0.125%, 1/15/22 | | | 3,042,448 | | | | 2,959 | |
| | US Treasury Inflation Index Bond, 0.125%, 7/15/22 | | | 9,809,415 | | | | 9,557 | |
| | US Treasury Inflation Index Bond, 0.125%, 1/15/23 | | | 3,600,520 | | | | 3,481 | |
| | US Treasury Inflation Index Bond, 0.375%, 7/15/23 | | | 2,550,850 | | | | 2,522 | |
| | US Treasury Inflation Index Bond, 0.625%, 2/15/43 | | | 5,422,200 | | | | 5,098 | |
| | US Treasury Inflation Index Bond, 0.625%, 7/15/21 | | | 10,229,971 | | | | 10,359 | |
| (b) | | US Treasury Inflation Index Bond, 0.625%, 1/15/24 | | | 12,873,399 | | | | 12,929 | |
| | US Treasury Inflation Index Bond, 0.75%, 2/15/42 | | | 6,147,531 | | | | 5,973 | |
| (k) | | US Treasury Inflation Index Bond, 1.125%, 1/15/21 | | | 6,825,498 | | | | 7,090 | |
| | US Treasury Inflation Index Bond, 1.25%, 7/15/20 | | | 1,524,335 | | | | 1,600 | |
| | US Treasury Inflation Index Bond, 1.375%, 2/15/44 | | | 6,775,353 | | | | 7,668 | |
| | US Treasury Inflation Index Bond, 1.375%, 7/15/18 | | | 3,138,278 | | | | 3,287 | |
| | US Treasury Inflation Index Bond, 1.375%, 1/15/20 | | | 1,756,896 | | | | 1,844 | |
| | US Treasury Inflation Index Bond, 1.75%, 1/15/28 | | | 4,528,093 | | | | 5,126 | |
| | US Treasury Inflation Index Bond, 1.875%, 7/15/19 | | | 2,780,225 | | | | 2,984 | |
| | US Treasury Inflation Index Bond, 2.00%, 1/15/26 | | | 4,665,843 | | | | 5,347 | |
| | US Treasury Inflation Index Bond, 2.125%, 2/15/40 | | | 2,675,115 | | | | 3,468 | |
| | US Treasury Inflation Index Bond, 2.125%, 2/15/41 | | | 2,586,056 | | | | 3,376 | |
The Accompanying Notes are an Integral Part of the Financial Statements.
| | | | |
| 122 | | Inflation Protection Portfolio | | |
Inflation Protection Portfolio
| | | | | | | | | | |
| | | Governments (69.2%) | | Shares/
$ Par | | | Value
$ (000’s) | |
| |
| | Governments continued | |
| | US Treasury Inflation Index Bond, 2.125%, 1/15/19 | | | 4,285,634 | | | | 4,605 | |
| (k) | | US Treasury Inflation Index Bond, 2.375%, 1/15/25 | | | 4,283,048 | | | | 5,028 | |
| | US Treasury Inflation Index Bond, 2.375%, 1/15/27 | | | 3,208,579 | | | | 3,840 | |
| | US Treasury Inflation Index Bond, 2.50%, 1/15/29 | | | 8,256,066 | | | | 10,245 | |
| | US Treasury Inflation Index Bond, 3.375%, 4/15/32 | | | 4,100,234 | | | | 5,815 | |
| | US Treasury Inflation Index Bond, 3.625%, 4/15/28 | | | 2,202,165 | | | | 3,027 | |
| | US Treasury Inflation Index Bond, 3.875%, 4/15/29 | | | 5,633,238 | | | | 8,063 | |
| | | | | | | | | | |
| | Total | | | | 154,569 | |
| | | | | | | | | | |
| | |
| | Yankee Sovereign (0.1%) | | | | | |
| | Mexico Government International Bond, 4.75%, 3/8/44 | | | 200,000 | | | | 209 | |
| | | | | | | | | | |
| | Total | | | | | | | 209 | |
| | | | | | | | | | |
| | Total Governments (Cost: $200,266) | | | | 197,503 | |
| | | | | | | | | | |
| |
| | | Municipal Bonds (0.0%) | |
| |
| | Municipal Bonds (0.0%) | |
| | Bay Area Toll Authority, Series S-1, 6.918%, 4/1/40 RB | | | 15,000 | | | | 21 | |
| | Los Angeles Department of Water and Power, 5.716%, 7/1/39 RB | | | 15,000 | | | | 19 | |
| | State of Texas, Series 2009A, 5.517%, 4/1/39 GO | | | 30,000 | | | | 40 | |
| | | | | | | | | | |
| | Total Municipal Bonds (Cost: $60) | | | | 80 | |
| | | | | | | | | | |
| |
| | | Structured Products (11.2%) | |
| |
| | Structured Products (11.2%) | |
| | Avis Budget Rental Car Funding AESOP LLC, Series 2012-3A, Class A, 2.10%, 3/20/19 144A | | | 750,000 | | | | 750 | |
| | | | | | | | | | |
| | | Structured Products (11.2%) | | Shares/
$ Par | | | Value
$ (000’s) | |
| |
| | Structured Products continued | |
| | BAMLL Commercial Mortgage Securities Trust, Series 2012-PARK, Class A, 2.959%, 12/10/30 144A | | | 1,050,000 | | | | 1,051 | |
| | Banc of America Merrill Lynch Commercial Mortgage, Inc., Series 2005-5, Class A4, 5.115%, 10/10/45 | | | 217,267 | | | | 221 | |
| | Banc of America Merrill Lynch Commercial Mortgage, Inc., Series 2005-5, Class AM, 5.176%, 10/10/45 | | | 200,000 | | | | 206 | |
| | Banc of America Mortgage Trust, Series 2004-7, Class 7A1, 5.00%, 8/25/19 | | | 38,587 | | | | 39 | |
| | BB-UBS Trust, Series 2012, Class A,
3.43%, 11/5/36 | | | 850,000 | | | | 865 | |
| | Chesapeake Funding LLC, Series 2014-1A, Class A,
.576%, 3/7/26 | | | 775,000 | | | | 775 | |
| | Citicorp Mortgage Securities, Inc., Series 2007-8, Class 1A3, 6.00%, 9/25/37 | | | 80,784 | | | | 84 | |
| | Commercial Mortgage Pass-Through Certificates, Series 2014-UBS5, Class AM,
4.193%, 9/10/47 | | | 850,000 | | | | 896 | |
| | Commercial Mortgage Pass-Through Certificates, Series 2014-CR15, Class AM,
4.426%, 2/10/47 | | | 550,000 | | | | 598 | |
| | Federal Home Loan Mortgage Corp., 4.00%, 5/1/42 | | | 6,445,027 | | | | 6,907 | |
| | Federal Home Loan Mortgage Corp., 4.50%, 4/1/41 | | | 5,442,675 | | | | 5,959 | |
| | GS Mortgage Securities Corp. II, Series 2012-ALOH, Class A, 3.551%, 4/10/34 | | | 1,000,000 | | | | 1,042 | |
| | GS Mortgage Securities Corp. II, Series 2005-GG4, Class A4A, 4.751%, 7/10/39 | | | 397,069 | | | | 397 | |
| | Hilton Grand Vacations Trust, Series 2014-AA, Class A, 1.77%, 11/25/26 144A | | | 710,033 | | | | 703 | |
| | Irvine Core Office Trust, Series 2013-IRV,
Class A2, 3.279%, 5/15/48 144A | | | 950,000 | | | | 965 | |
| | | | | | | | | | |
| | | Structured Products (11.2%) | | Shares/
$ Par | | | Value
$ (000’s) | |
| |
| | Structured Products continued | |
| | JPMorgan Mortgage Trust, Series 2014-5, Class A1, 3.00%, 10/1/29 144A | | | 678,219 | | | | 696 | |
| | JPMorgan Chase Commercial Mortgage Securities Trust, Series 2013-C16, Class A4, 4.166%, 12/15/46 | | | 600,000 | | | | 655 | |
| | JPMorgan Chase Commercial Mortgage Securities Trust, Series 2013-C16, Class AS, 4.517%, 12/15/46 | | | 375,000 | | | | 410 | |
| | LB-UBS Commercial Mortgage Trust, Series 2004-C1, Class A4, 4.568%, 1/15/31 | | | 16,670 | | | | 17 | |
| | LB-UBS Commercial Mortgage Trust, Series 2005-C5, Class AM, 5.017%, 9/15/40 | | | 300,000 | | | | 306 | |
| | LB-UBS Commercial Mortgage Trust, Series 2005-C7, Class AM, 5.263%, 11/15/40 | | | 175,000 | | | | 180 | |
| | Morgan Stanley Capital I Trust, Series 2014-CPT, Class C,
3.56%, 7/13/29 | | | 600,000 | | | | 609 | |
| | PHHMC Mortgage Pass-Through Certificates, Series 2007-6, Class A1,
5.558%, 12/18/37 | | | 61,882 | | | | 62 | |
| | Sequoia Mortgage Trust, Series 2014-3, Class A14,
3.00%, 10/25/44 | | | 773,974 | | | | 784 | |
| | Sequoia Mortgage Trust, Series 2013-12, Class A1,
4.00%, 12/25/43 | | | 503,054 | | | | 521 | |
| | Sequoia Mortgage Trust, Series 2011-1, Class A1,
4.125%, 2/25/41 | | | 56,464 | | | | 57 | |
| | Sequoia Mortgage Trust, Series 2014-4, Class A2, 3.50%, 11/25/44 | | | 546,350 | | | | 563 | |
| | Structured Adjustable Rate Mortgage Loan Trust, Series 2004-6, Class 3A2,
2.386%, 6/25/34 | | | 815,638 | | | | 830 | |
| | TAL Advantage LLC, Series 2014-1A, Class A, 3.51%, 2/22/39 144A | | | 458,333 | | | | 460 | |
| | Thornburg Morgage Securities Trust, Series 2004-3, Class A, 0.894%, 9/25/44 | | | 655,205 | | | | 635 | |
The Accompanying Notes are an Integral Part of the Financial Statements.
| | | | | | |
| | Inflation Protection Portfolio | | | 123 | |
Inflation Protection Portfolio
| | | | | | | | | | |
| | | Structured Products
(11.2%) | | Shares/
$ Par | | | Value
$ (000’s) | |
| |
| | Structured Products continued | |
| | Wells Fargo Mortgage Backed Securities Trust, Series 2005-AR16,
Class 1A1, 2.597%, 8/25/33 | | | 240,609 | | | | 245 | |
| | Wells Fargo Mortgage Backed Securities Trust, Series 2005-AR10,
Class 1A1,
2.614%, 6/25/35 | | | 534,856 | | | | 543 | |
| | Wells Fargo Mortgage Backed Securities Trust, Series 2005-AR10,
Class 2A15,
2.614%, 6/25/35 | | | 1,680,936 | | | | 1,709 | |
| | Wells Fargo Mortgage Backed Securities Trust, Series 2005-AR14, Class A1, 5.353%, 8/25/35 | | | 94,727 | | | | 95 | |
| | | | | | | | | | |
| | | Structured Products
(11.2%) | | Shares/
$ Par | | | Value
$ (000’s) | |
| |
| | Structured Products continued | |
| | Wells Fargo Mortgage Backed Securities Trust, Series 2005-17, Class 1A1,
5.50%, 1/25/36 | | | 108,318 | | | | 110 | |
| | Wells Fargo Mortgage Backed Securities Trust, Series 2007-3, Class 3A1,
5.50%, 4/25/22 | | | 25,688 | | | | 26 | |
| | Wells Fargo Mortgage Backed Securities Trust, Series 2006-10, Class A4, 6.00%, 8/25/36 | | | 120,687 | | | | 124 | |
| | Wells Fargo Mortgage Backed Securities Trust, Series 2007-AR10, Class 1A1, 6.107%, 1/25/38 | | | 106,735 | | | | 106 | |
| | WinWater Mortgage Loan Trust, Series 2014-1, Class A4,
3.50%, 6/20/44 144A | | | 845,996 | | | | 864 | |
| | | | | | | | | | |
| | Total Structured Products | | | | | |
| | (Cost: $31,339) | | | | 32,065 | |
| | | | | | | | | | |
| | | | | | | | | | |
| | | Short-Term Investments (4.9%) | |
| |
| | Commercial Paper (4.9%) | |
| (b) | | Bnp Paribas Finance, Inc.,
0.02%, 1/2/15 | | | 14,000,000 | | | | 14,000 | |
| | | | | | | | | | |
| | Total | | | | | | | 14,000 | |
| | | | | | | | | | |
| | Total Short-Term Investments | | | | | |
| | (Cost: $14,000) | | | | 14,000 | |
| | | | | | | | | | |
| | Total Investments (101.0%) | | | | | |
| | (Cost: $290,112)(a) | | | | 288,576 | |
| | | | | | | | | | |
| | Other Assets, Less Liabilities (-1.0%) | | | | (2,891 | ) |
| | | | | | | | | | |
| | Net Assets (100.0%) | | | | 285,685 | |
| | | | | | | | | | |
The Accompanying Notes are an Integral Part of the Financial Statements.
| | | | |
| 124 | | Inflation Protection Portfolio | | |
Inflation Protection Portfolio
144A after the name of a security represents a security exempt from registration under Rule 144A of the Securities Act of 1933. These securities may be resold as transactions exempt from registration, normally to qualified institutional buyers. At December 31, 2014 the value of these securities (in thousands) was $8,206 representing 2.9% of the net assets.
GO — General Obligation
RB — Revenue Bond
| (a) | At December 31, 2014, the aggregate cost of securities for federal tax purposes (in thousands) was $290,169 and the net unrealized depreciation of investments based on that cost was $1,593 which is comprised of $7,241 aggregate gross unrealized appreciation and $8,834 aggregate gross unrealized depreciation. |
| (b) | All or a portion of the securities have been pledged as collateral for open futures positions or when-issued securities. Information regarding open futures contracts as of period end is summarized below. |
| | | | | | | | |
| Issuer (000’s) | | Number of
Contracts | | Expiration Date | | Unrealized
Appreciation/
(Depreciation)
(000’s) | |
US Long Treasury Bond Futures (Short) (Total Notional Value at December 31, 2014, $3,250) | | 23 | | 3/15 | | $ | (75 | ) |
US Ten Year Treasury Note Futures (Short) (Total Notional Value at December 31, 2014, $5,176) | | 41 | | 3/15 | | | (23 | ) |
US Ultra Long Treasury Bond Futures (Short) (Total Notional Value at December 31, 2014, $7,749) | | 49 | | 3/15 | | | (345 | ) |
| (f) | Foreign Bond — par value is foreign denominated |
| (h) | Forward foreign currency contracts outstanding on December 31, 2014. |
| | | | | | | | | | | | | | | | | | | | |
| Type | | Counterparty | | Currency | | Principal
Amount
Covered by
Contract (000’s) | | Settlement
Month | | Unrealized
Appreciation
(000’s) | | | Unrealized
(Depreciation)
(000’s) | | | Net Unrealized
Appreciation/
(Depreciation)
(000’s) | |
Sell | | HSBC Bank USA NA | | AUD | | 1,251 | | 2/15 | | $ | 67 | | | $ | - | | | | 67 | |
Sell | | HSBC Bank USA NA | | CAD | | 2,114 | | 2/15 | | | 41 | | | | - | | | | 41 | |
Buy | | HSBC Bank USA NA | | EUR | | 330 | | 2/15 | | | - | | | | (10 | ) | | | (10 | ) |
Sell | | HSBC Bank USA NA | | EUR | | 14,349 | | 2/15 | | | 542 | | | | - | | | | 542 | |
Sell | | HSBC Bank USA NA | | GBP | | 13,955 | | 2/15 | | | 173 | | | | - | | | | 173 | |
Sell | | HSBC Bank USA NA | | JPY | | 50,521 | | 2/15 | | | 16 | | | | - | | | | 16 | |
| | | | | | | | | | | | | | | | | | | | |
| | | | | | | | | | $ | 839 | | | $ | (10 | ) | | $ | 829 | |
| | | | | | | | | | | | | | | | | | | | |
AUD — Australian Dollar
CAD — Canadian Dollar
EUR — Euro
GBP — British Pound
JPY — Japanese Yen
| (j) | Swap agreements outstanding on December 31, 2014. |
Total Return Swaps
| | | | | | | | | | | | | | |
| Reference Entity | | Counterparty | | Payment Made by the Fund | | Payment Received by the
Fund | | Expiration Date | | Notional
Amount (000’s) | | Unrealized
Appreciation/
(Depreciation)
(000’s) | |
U.S. Consumer Price Index - All Urban Consumers - Not Seasonally Adjusted (CPURNSA) | | Bank of America, N.A | | 2.528% | | CPURNSA Index Total Return at Maturity | | 8/24 | | 2,750 | | $ | (185 | ) |
U.S. Consumer Price Index - All Urban Consumers - Not Seasonally Adjusted (CPURNSA) | | Bank of America, N.A. | | 1.870% | | CPURNSA Index Total Return at Maturity | | 9/16 | | 6,000 | | | (179 | ) |
U.S. Consumer Price Index - All Urban Consumers - Not Seasonally Adjusted (CPURNSA) | | Bank of America, N.A. | | 2.420% | | CPURNSA Index Total Return at Maturity | | 4/18 | | 2,000 | | | (143 | ) |
U.S. Consumer Price Index - All Urban Consumers - Not Seasonally Adjusted (CPURNSA) | | Bank of America, N.A. | | 2.223% | | CPURNSA Index Total Return at Maturity | | 5/18 | | 2,500 | | | (121 | ) |
The Accompanying Notes are an Integral Part of the Financial Statements.
| | | | | | |
| | Inflation Protection Portfolio | | | 125 | |
Inflation Protection Portfolio
| | | | | | | | | | | | | | |
| Reference Entity | | Counterparty | | Payment Made
by the Fund | | Payment
Received
by the
Fund | | Expiration Date | | Notional Amount
(000’s) | | Unrealized Appreciation/ (Depreciation) (000’s) | |
U.S. Consumer Price Index - All Urban Consumers - Not Seasonally Adjusted (CPURNSA) | | Bank of America, N.A. | | 2.210% | | CPURNSA Index Total Return at Maturity | | 3/19 | | 6,500 | | | (255 | ) |
U.S. Consumer Price Index - All Urban Consumers - Not Seasonally Adjusted (CPURNSA) | | Bank of America, N.A. | | 2.640% | | CPURNSA Index Total Return at Maturity | | 3/19 | | 4,500 | | $ | (334 | ) |
U.S. Consumer Price Index - All Urban Consumers - Not Seasonally Adjusted (CPURNSA) | | Bank of America, N.A. | | 2.510% | | CPURNSA Index Total Return at Maturity | | 3/19 | | 2,000 | | | (172 | ) |
U.S. Consumer Price Index - All Urban Consumers - Not Seasonally Adjusted (CPURNSA) | | Bank of America, N.A. | | 2.640% | | CPURNSA Index Total Return at Maturity | | 2/20 | | 2,800 | | | (298 | ) |
U.S. Consumer Price Index - All Urban Consumers - Not Seasonally Adjusted (CPURNSA) | | Bank of America, N.A. | | 2.670% | | CPURNSA Index Total Return at Maturity | | 4/22 | | 3,000 | | | (356 | ) |
U.S. Consumer Price Index - All Urban Consumers - Not Seasonally Adjusted (CPURNSA) | | Bank of America, N.A. | | 2.763% | | CPURNSA Index Total Return at Maturity | | 3/23 | | 700 | | | (73 | ) |
U.S. Consumer Price Index - All Urban Consumers - Not Seasonally Adjusted (CPURNSA) | | Barclays Bank PLC | | 2.589% | | CPURNSA Index Total Return at Maturity | | 7/24 | | 1,400 | | | (103 | ) |
U.S. Consumer Price Index - All Urban Consumers - Not Seasonally Adjusted (CPURNSA) | | Barclays Bank PLC | | 2.095% | | CPURNSA Index Total Return at Maturity | | 10/15 | | 2,500 | | | (99 | ) |
U.S. Consumer Price Index - All Urban Consumers - Not Seasonally Adjusted (CPURNSA) | | Barclays Bank PLC | | 2.303% | | CPURNSA Index Total Return at Maturity | | 1/16 | | 1,700 | | | (62 | ) |
U.S. Consumer Price Index - All Urban Consumers - Not Seasonally Adjusted (CPURNSA) | | Barclays Bank PLC | | 2.520% | | CPURNSA Index Total Return at Maturity | | 5/16 | | 5,400 | | | (315 | ) |
U.S. Consumer Price Index - All Urban Consumers - Not Seasonally Adjusted (CPURNSA) | | Barclays Bank PLC | | 2.720% | | CPURNSA Index Total Return at Maturity | | 8/17 | | 2,000 | | | (254 | ) |
U.S. Consumer Price Index - All Urban Consumers - Not Seasonally Adjusted (CPURNSA) | | Barclays Bank PLC | | 2.345% | | CPURNSA Index Total Return at Maturity | | 9/17 | | 13,000 | | | (650 | ) |
U.S. Consumer Price Index - All Urban Consumers - Not Seasonally Adjusted (CPURNSA) | | Barclays Bank PLC | | 2.526% | | CPURNSA Index Total Return at Maturity | | 5/23 | | 5,500 | | | (444 | ) |
U.S. Consumer Price Index - All Urban Consumers - Not Seasonally Adjusted (CPURNSA) | | Barclays Bank PLC | | 2.535% | | CPURNSA Index Total Return at Maturity | | 5/23 | | 1,000 | | | (81 | ) |
U.S. Consumer Price Index - All Urban Consumers - Not Seasonally Adjusted (CPURNSA) | | Barclays Bank PLC | | 2.895% | | CPURNSA Index Total Return at Maturity | | 12/27 | | 1,700 | | | (372 | ) |
U.S. Consumer Price Index - All Urban Consumers - Not Seasonally Adjusted (CPURNSA) | | Barclays Bank PLC | | 2.784% | | CPURNSA Index Total Return at Maturity | | 7/44 | | 1,400 | | | (229 | ) |
The Accompanying Notes are an Integral Part of the Financial Statements.
| | | | |
| 126 | | Inflation Protection Portfolio | | |
Inflation Protection Portfolio
| | | | | | | | | | | | | | |
| Reference Entity | | Counterparty | | Payment Made
by the Fund | | Payment
Received by the
Fund | | Expiration
Date | | Notional
Amount (000’s) | | Unrealized
Appreciation/
(Depreciation)
(000’s) | |
U.S. Consumer Price Index - All Urban Consumers - Not Seasonally Adjusted (CPURNSA) | | Barclays Bank PLC | | 2.385% | | CPURNSA
Index Total
Return at
Maturity | | 9/24 | | 4,000 | | | (207 | ) |
U.S. Consumer Price Index - All Urban Consumers - Not Seasonally Adjusted (CPURNSA) | | Barclays Bank PLC | | 2.363% | | CPURNSA
Index Total
Return at
Maturity | | 9/24 | | 3,500 | | | (172 | ) |
U.S. Consumer Price Index - All Urban Consumers - Not Seasonally Adjusted (CPURNSA) | | Barclays Bank PLC | | 2.310% | | CPURNSA
Index Total
Return at
Maturity | | 9/24 | | 1,400 | | | (61 | ) |
| | | | | | | | | | | | | | |
| | | | | | | | | | | | $ | (5,165 | ) |
| | | | | | | | | | | | | | |
| (k) | Cash or securities with an aggregate value of $12,118 (in thousands) has been pledged as collateral for swap contracts outstanding, short sales or written options on December 31, 2014. |
The following is a summary of the inputs used in valuing the Portfolio’s assets and liabilities at December 31, 2014. See Note 3 for additional information on portfolio valuation.
| | | | | | | | | | | | | | |
| | | Valuation Inputs | | | |
| Description | | Level 1 -
Quoted Prices | | | Level 2 -
Other Significant
Observable Inputs | | | Level 3 - Significant Unobservable Inputs | | | |
| | | (Amounts in thousands) | | | |
Assets: | | | | | | | | | | | | | | |
Government & Agency Bonds | | $ | - | | | $ | 197,503 | | | $ | - | | | |
Municipal Bonds | | | - | | | | 80 | | | | - | | | |
Corporate Bonds | | | - | | | | 44,928 | | | | - | | | |
Structured Products | | | - | | | | 32,065 | | | | - | | | |
Short-Term Investments | | | - | | | | 14,000 | | | | - | | | |
Other Financial Instruments^ | | | | | | | | | | | | | | |
Forward Currency Contracts | | | - | | | | 839 | | | | - | | | |
Total Assets | | $ | - | | | $ | 289,415 | | | | - | | | |
Liabilities: | | | | | | | | | | | | | | |
Other Financial Instruments^ | | | | | | | | | | | | | | |
Futures | | | (443 | ) | | | - | | | | - | | | |
Forward Currency Contracts | | | - | | | | (10 | ) | | | - | | | |
Total Return Swaps | | | - | | | | (5,165 | ) | | | - | | | |
Total | | $ | (443 | ) | | $ | (5,175 | ) | | $ | - | | | |
^ Other financial instruments are derivative instruments such as futures, forwards, written options and swaps contracts, which are valued at the unrealized appreciation (depreciation) on the instrument and short sales, which are valued at market value.
The Accompanying Notes are an Integral Part of the Financial Statements.
| | | | | | |
| | Inflation Protection Portfolio | | | 127 | |
High Yield Bond Portfolio (unaudited)
| | | | |
| Objective: | | Portfolio Strategy: | | Net Assets: |
High current income and capital appreciation. | | Invest in non-investment grade debt securities. | | $702 million |
Portfolio Overview
Mason Street Advisors, LLC (“Mason Street Advisors”), the investment adviser for the High Yield Bond Portfolio (the “Portfolio”), has engaged Federated Investment Management Company (“Federated”) to act as sub-adviser for the Portfolio. Federated was appointed sub-adviser to the Portfolio effective October 31, 2014. Prior to that time, the Portfolio was managed directly by Mason Street Advisors. Normally, the Portfolio invests in non-investment grade debt securities, which are securities rated below investment grade by at least one major rating agency or, if unrated, determined by Federated to be of comparable quality. The Portfolio may invest up to 30% of net assets in foreign securities. The securities in which the Portfolio primarily invests are considered speculative and are sometimes known as “junk bonds.” These securities tend to offer higher yields than higher rated securities of comparable maturities because the historical financial condition of the issuers of these securities is usually not as strong as that of other issuers. Federated selects securities that it believes have attractive risk-return characteristics and seeks to minimize default risk and other risks through careful security selection and diversification. Federated’s securities selection process consists of a credit-intensive, fundamental analysis of the issuer. Federated does not limit the Portfolio’s investments to securities of a particular maturity range.
Market Overview
The total return for the high yield market for the twelve-month reporting period was modest on an absolute basis but weak on a relative basis. For example, the Barclays® U.S. Corporate High-Yield 2% Issuer Capped Index returned 2.46%, underperforming the Barclays® U.S. Aggregate Index, a measure of high quality bond performance, which returned 5.97% for the period. The main factor negatively impacting the high yield market during the period was the roughly 42% decline in the price of oil and its impact on the performance of the Energy sector in the Barclays® U.S. Corporate High-Yield 2% Issuer Capped Index. At the beginning of the period, the Energy component made up 14.27% of the Barclays® U.S. Corporate High-Yield 2% Issuer Capped Index. The two subsectors of the total Energy sector most directly impacted by the fall in the price of oil were Independents and Oil Field Services, which generated total returns of (12.01%) and (16.08%), respectively, for the twelve-month period. The oil price decline was so dominant that it offset factors that would have normally supported very strong performance for high yield securities – strong economic growth, surging stock prices, strong employment growth and rising consumer confidence to name a few.
Portfolio Results
The Portfolio returned 1.18% for the twelve months ended December 31, 2014. By comparison, the Portfolio’s benchmark, the Barclays® U.S. Corporate High-Yield 2% Issuer Capped Index (the “Index”), returned 2.46%. (The Index is unmanaged, cannot be invested in directly and does not include administrative expenses or sales charges.) The Portfolio underperformed the 1.59% average return of its High Yield Funds peer group, according to Lipper® Analytical Services, Inc., an independent mutual fund ranking agency.
As noted above, prior to October 31, 2014, the Portfolio was managed by Mason Street Advisors. With respect to the period prior to October 31, 2014, the Portfolio’s underperformance relative to the Index was mainly attributable to an overweight to the Energy sector and energy related credits. Issue selection among these credits also held back relative results during the period. Issue selection among lower quality credits, CCC-rated credits, helped performance relative to the Index during the period.
The following attribution comments relate to the period October 31, 2014 through December 31, 2014, during which Federated acted as the Portfolio’s sub-adviser.
The Portfolio was being repositioned during the October 31, 2014 through December 31, 2014 period. The Portfolio entered the period with overweight positions in the independent energy and oil field services subsectors of the Energy sector, as well as an overweight position in the Metals and Mining sector. These sector overweights were substantially altered by the end of November with the Energy and Metals and Mining exposures substantially reduced to below benchmark positions. Despite the exposure reduction in these sectors, the generally weak performance of these sectors within the Index in November held back the Portfolio’s relative results over the full two-month period.
Portfolio Manager Outlook
The following forward looking comments are the opinion of Federated, the Portfolio’s sub-adviser.
As 2015 begins, the high yield market is really a tale of two markets. First, the Independent Energy and Oil Field Services industry subsectors will continue to be impacted by the rise and fall of oil prices. While the sector substantially underperformed late in 2014, deteriorating financial results will lead to further problems for the weaker players in the sector should oil prices not rebound by late 2015. Of course if oil prices rise at some point in 2015, these subsectors have the potential to outperform the overall market. The other roughly 85% of the market should benefit from the decline in oil prices
| | | | |
| 128 | | High Yield Bond Portfolio | | |
High Yield Bond Portfolio (unaudited)
in addition to the strong domestic economy, rising employment, improving consumer confidence and rising corporate valuations. Overall, we would expect spreads ex Energy to move tighter in 2015 with overall market total returns, both relative and absolute, to be heavily influenced by the price of oil and returns in the Energy sector. As we begin 2015, the Portfolio will remain underweight in the Energy sector as a result of both the credit risk related to the rising volatility of commodity prices and our near-term expectation that oil prices will not move materially higher anytime soon.
Relative Performance
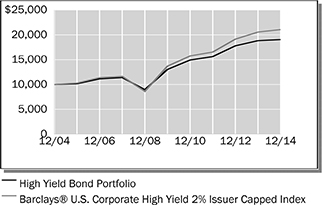
| | | | | | | | | | | | |
Average Annual Total Returns
For Periods Ended December 31, 2014 | |
| | | 1 Year | | | 5 Years | | | 10 Years | |
High Yield Bond Portfolio | | | 1.18 | % | | | 7.88 | % | | | 6.65 | % |
Barclays® U.S. Corporate High Yield 2% Issuer Capped Index | | | 2.46 | % | | | 8.98 | % | | | 7.73 | % |
Lipper® Variable Insurance Products (VIP) High Yield Funds Average | | | 1.59 | % | | | 7.91 | % | | | 6.47 | % |
The performance data quoted represents past performance. Past performance is historical and does not guarantee future performance. Investment return and principal value will fluctuate, so that shares, when redeemed, may be worth more or less than their original cost. Current performance may be lower or higher than the performance data quoted. For the most recent month-end performance information visit www.northwesternmutual.com.
This chart assumes an initial investment of $10,000 made on 12/31/04. Returns shown include deductions for management and other portfolio expenses, and reinvestment of all dividends. Returns exclude deductions for separate account sale loads and account fees. Please refer to the Benchmark Definitions section of this report for information about the indices cited in the above chart and graph.
The Portfolio invests in lower quality securities, which may represent a significant risk for loss of principal and interest. Bonds and other debt obligations are affected by changes in interest rates, inflation risk and the creditworthiness of their issuers. High yield bonds generally have greater price swings and higher default risks than investment grade bonds. Return of principal is
not guaranteed. When interest rates rise, bond prices fall. With a fixed income fund, when interest rates rise, the value of the fund’s existing bonds drops, which could negatively affect overall fund performance.
Investing in bonds issued by foreign corporations and governments carries additional risk, including foreign currency risk, and may increase the volatility of the Portfolio’s performance.
The Portfolio’s investments in convertible securities are subject to the risks associated with investments in equity securities, including market risk.
Currently, interest rates are at unprecedented historically low levels. A significant rise in interest rates over a short period of time could cause significant losses in the market value of the Portfolio’s fixed income investments. Certain fixed income investments, including Rule 144A securities, may be difficult to purchase or sell at an advantageous time or price, if at all.
| | | | | | |
| | High Yield Bond Portfolio | | | 129 | |
High Yield Bond Portfolio (unaudited)
Top 10 Fixed Income Holdings 12/31/14
| | | | |
Security Description | | | % of Net Assets | |
HCA, Inc., Various | | | 2.2 | % |
Sprint Nextel Corp., Various | | | 1.8 | % |
Ally Financial, Inc. Various | | | 1.6 | % |
Reynolds Group Issuer, Inc./Reynolds Group Issuer LLC/Reynolds Group Issuer LU, Various | | | 1.5 | % |
T-Mobile USA, Inc., Various | | | 1.2 | % |
First Data Corp., Various | | | 1.2 | % |
CCO Holdings LLC/CCO Holdings Capital Corp., Various | | | 1.1 | % |
Tenet Healthcare Corp., Various | | | 1.0 | % |
Intelsat Jackson Holdings SA, Various | | | 1.0 | % |
MGM Resorts International, Various | | | 1.0 | % |
Sector Allocation 12/31/14
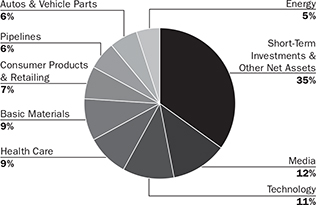
Sector Allocation is based on Net Assets.
Sector Allocation and Top 10 Holdings are subject to change.
| | | | |
| 130 | | High Yield Bond Portfolio | | |
High Yield Bond Portfolio
Schedule of Investments
December 31, 2014
| | | | | | | | | | |
| | | Bonds (96.4%) | | Shares/
$ Par | | | Value
$ (000’s) | |
| |
| | Aerospace & Defense (1.1%) | |
| | KLX, Inc.,
5.875%, 12/1/22 144A | | | 2,100,000 | | | | 2,121 | |
| | TransDigm, Inc., 6.00%, 7/15/22 | | | 520,000 | | | | 519 | |
| | TransDigm, Inc., 6.50%, 7/15/24 | | | 4,725,000 | | | | 4,748 | |
| | | | | | | | | | |
| | Total | | | | | | | 7,388 | |
| | | | | | | | | | |
| |
| | Autos & Vehicle Parts (5.6%) | |
| | Affinia Group, Inc., 7.75%, 5/1/21 | | | 2,350,000 | | | | 2,420 | |
| | American Axle & Manufacturing, Inc., 5.125%, 2/15/19 | | | 325,000 | | | | 332 | |
| | American Axle & Manufacturing, Inc., 6.25%, 3/15/21 | | | 2,335,000 | | | | 2,452 | |
| | American Axle & Manufacturing, Inc., 6.625%, 10/15/22 | | | 950,000 | | | | 1,007 | |
| | Chrysler Group LLC/CG Co-Issuer, Inc., 8.25%, 6/15/21 | | | 3,230,000 | | | | 3,577 | |
| | Gates Global LLC / Gates Global Co., 6.00%, 7/15/22 144A | | | 2,780,000 | | | | 2,662 | |
| | General Motors Co., 4.00%, 4/1/25 | | | 1,900,000 | | | | 1,905 | |
| | General Motors Financial Co., Inc., 3.50%, 7/10/19 | | | 1,035,000 | | | | 1,057 | |
| | General Motors Financial Co., Inc., 4.75%, 8/15/17 | | | 840,000 | | | | 886 | |
| | The Goodyear Tire & Rubber Co., 6.50%, 3/1/21 | | | 1,645,000 | | | | 1,744 | |
| | The Goodyear Tire & Rubber Co., 8.25%, 8/15/20 | | | 1,235,000 | | | | 1,309 | |
| | International Automotive Components Group S.L., 9.125%, 6/1/18 144A | | | 1,975,000 | | | | 2,059 | |
| | Jaguar Land Rover Automotive PLC, 4.125%, 12/15/18 144A | | | 1,020,000 | | | | 1,025 | |
| | JB Poindexter & Co., 9.00%, 4/1/22 144A | | | 1,275,000 | | | | 1,377 | |
| | Lear Corp., 5.25%, 1/15/25 | | | 2,950,000 | | | | 2,987 | |
| | Lear Corp., 5.375%, 3/15/24 | | | 655,000 | | | | 670 | |
| | MPG Holdco I, Inc., 7.375%, 10/15/22 144A | | | 3,075,000 | | | | 3,167 | |
| | Schaeffler Finance BV, 4.75%, 5/15/21 144A | | | 1,070,000 | | | | 1,070 | |
| (c) | | Schaeffler Finance BV, 6.25%, 11/15/19 144A | | | 440,000 | | | | 453 | |
| | | | | | | | | | |
| | | Bonds (96.4%) | | Shares/
$ Par | | | Value
$ (000’s) | |
| |
| | Autos & Vehicle Parts continued | |
| (c) | | Schaeffler Finance BV, 6.75%, 11/15/22 144A | | | 2,700,000 | | | | 2,822 | |
| | Schaeffler Holding Finance BV, 6.875%, 8/15/18 144A | | | 785,000 | | | | 818 | |
| | Stackpole International Intermediate Co. SA/Stackpole International Powder Meta l, 7.75%, 10/15/21 144A | | | 1,350,000 | | | | 1,350 | |
| | Tenneco, Inc., 5.375%, 12/15/24 | | | 2,400,000 | | | | 2,460 | |
| | | | | | | | | | |
| | Total | | | | | | | 39,609 | |
| | | | | | | | | | |
| |
| | Banking (1.6%) | |
| | Ally Financial, Inc., 2.75%, 1/30/17 | | | 500,000 | | | | 498 | |
| | Ally Financial, Inc., 3.50%, 1/27/19 | | | 895,000 | | | | 884 | |
| | Ally Financial, Inc., 3.75%, 11/18/19 | | | 4,950,000 | | | | 4,876 | |
| | Ally Financial, Inc., 5.50%, 2/15/17 | | | 990,000 | | | | 1,040 | |
| | Ally Financial, Inc., 7.50%, 9/15/20 | | | 1,114,000 | | | | 1,306 | |
| | Ally Financial, Inc., 8.00%, 3/15/20 | | | 1,996,000 | | | | 2,355 | |
| | | | | | | | | | |
| | Total | | | | | | | 10,959 | |
| | | | | | | | | | |
| |
| | Basic Materials (8.9%) | |
| | Ardagh Finance Holdings SA, 8.625%, 6/15/19 144A | | | 542,798 | | | | 535 | |
| | Ardagh Packaging Finance PLC, 9.125%, 10/15/20 144A | | | 665,000 | | | | 708 | |
| | Ardagh Packaging Finance PLC/Ardagh Holdings USA, Inc., 6.00%, 6/30/21 144A | | | 1,000,000 | | | | 955 | |
| | Ardagh Packaging Finance PLC/Ardagh MP Holdings USA, Inc., 6.25%, 1/31/19 144A | | | 1,640,000 | | | | 1,603 | |
| | Ardagh Packaging Finance PLC/Ardagh MP Holdings USA, Inc., 7.00%, 11/15/20 144A | | | 302,647 | | | | 306 | |
| | Ardagh Packaging Finance PLC/Ardagh MP Holdings USA, Inc., 9.125%, 10/15/20 144A | | | 590,000 | | | | 625 | |
| | Ball Corp., 4.00%, 11/15/23 | | | 2,625,000 | | | | 2,533 | |
| | Belden, Inc., 5.25%, 7/15/24 144A | | | 325,000 | | | | 312 | |
| | | | | | | | | | |
| | | Bonds (96.4%) | | Shares/
$ Par | | | Value
$ (000’s) | |
| |
| | Basic Materials continued | |
| | Belden, Inc., 5.50%, 9/1/22 144A | | | 3,450,000 | | | | 3,424 | |
| | Berry Plastics Corp., 5.50%, 5/15/22 | | | 4,205,000 | | | | 4,268 | |
| | Beverage Packaging Holdings Luxembourg II SA/Beverage Packaging Holdings II, 6.00%, 6/15/17 144A | | | 1,365,000 | | | | 1,331 | |
| | BWAY Holding Co., 9.125%, 8/15/21 144A | | | 2,440,000 | | | | 2,440 | |
| | Clearwater Paper Corp., 5.375%, 2/1/25 144A | | | 2,500,000 | | | | 2,462 | |
| | Cleaver-Brooks, Inc., 8.75%, 12/15/19 144A | | | 1,700,000 | | | | 1,789 | |
| | Crown Americas LLC/Crown Americas Capital Corp. IV, 4.50%, 1/15/23 | | | 3,250,000 | | | | 3,152 | |
| | Dematic SA / DH Services Luxembourg Sarl, 7.75%, 12/15/20 144A | | | 2,350,000 | | | | 2,462 | |
| | Garda World Security Corp., 7.25%, 11/15/21 144A | | | 520,000 | | | | 515 | |
| | Graphic Packaging International, Inc., 4.75%, 4/15/21 | | | 820,000 | | | | 826 | |
| | Graphic Packaging International, Inc., 4.875%, 11/15/22 | | | 1,925,000 | | | | 1,935 | |
| | The Hillman Group, Inc., 6.375%, 7/15/22 144A | | | 2,475,000 | | | | 2,376 | |
| | Interline Brands, Inc., 10.00%, 11/15/18 | | | 1,561,000 | | | | 1,631 | |
| | Mustang Merger Corp., 8.50%, 8/15/21 144A | | | 1,750,000 | | | | 1,662 | |
| | Owens-Brockway Glass Container, Inc., 5.00%, 1/15/22 144A | | | 425,000 | | | | 434 | |
| | Owens-Brockway Glass Container, Inc., 5.375%, 1/15/25 144A | | | 2,350,000 | | | | 2,374 | |
| | Reynolds Group Issuer, Inc./Reynolds Group Issuer LLC/Reynolds Group Issuer LU, 5.75%, 10/15/20 | | | 2,405,000 | | | | 2,465 | |
| | Reynolds Group Issuer, Inc./Reynolds Group Issuer LLC/Reynolds Group Issuer LU, 6.875%, 2/15/21 | | | 775,000 | | | | 809 | |
| | Reynolds Group Issuer, Inc./Reynolds Group Issuer LLC/Reynolds Group Issuer LU, 8.25%, 2/15/21 | | | 3,835,000 | | | | 3,931 | |
The Accompanying Notes are an Integral Part of the Financial Statements.
| | | | | | |
| | High Yield Bond Portfolio | | | 131 | |
High Yield Bond Portfolio
| | | | | | | | | | |
| | | Bonds (96.4%) | | Shares/
$ Par | | | Value
$ (000’s) | |
| |
| | Basic Materials continued | |
| | Reynolds Group Issuer, Inc./Reynolds Group Issuer LLC/Reynolds Group Issuer LU, 9.00%, 4/15/19 | | | 1,510,000 | | | | 1,563 | |
| | Reynolds Group Issuer, Inc./Reynolds Group Issuer LLC/Reynolds Group Issuer LU, 9.875%, 8/15/19 | | | 1,555,000 | | | | 1,648 | |
| | Sealed Air Corp., 4.875%, 12/1/22 144A | | | 1,675,000 | | | | 1,662 | |
| | Sealed Air Corp., 5.125%, 12/1/24 144A | | | 1,675,000 | | | | 1,692 | |
| | Sealed Air Corp., 6.50%, 12/1/20 144A | | | 505,000 | | | | 553 | |
| | Sealed Air Corp., 8.375%, 9/15/21 144A | | | 1,100,000 | | | | 1,229 | |
| | Signode Industrial Group US, Inc., 6.375%, 5/1/22 144A | | | 3,575,000 | | | | 3,486 | |
| | Truven Health Analytics, Inc., 10.625%, 6/1/20 144A | | | 1,375,000 | | | | 1,341 | |
| | Unifrax I LLC/Unifrax Holding Co., 7.50%, 2/15/19 144A | | | 1,750,000 | | | | 1,724 | |
| | | | | | | | | | |
| | Total | | | | | | | 62,761 | |
| | | | | | | | | | |
| |
| | Builders & Building Materials (2.2%) | |
| | American Builders & Contractors Supply Co., 5.625%, 4/15/21 144A | | | 2,800,000 | | | | 2,814 | |
| | CPG Merger Sub LLC, 8.00%, 10/1/21 144A | | | 1,525,000 | | | | 1,559 | |
| | HD Supply, Inc., 5.25%, 12/15/21 144A | | | 1,700,000 | | | | 1,730 | |
| | Masonite International Corp., 8.25%, 4/15/21 144A | | | 2,000,000 | | | | 2,135 | |
| | Nortek, Inc., 8.50%, 4/15/21 | | | 2,550,000 | | | | 2,729 | |
| | Nortek, Inc., 10.00%, 12/1/18 | | | 1,300,000 | | | | 1,362 | |
| | USG Corp., 5.875%, 11/1/21 144A | | | 2,500,000 | | | | 2,525 | |
| | USG Corp., 7.875%, 3/30/20 144A | | | 835,000 | | | | 893 | |
| | | | | | | | | | |
| | Total | | | | | | | 15,747 | |
| | | | | | | | | | |
| |
| | Capital Goods (0.8%) | |
| | Jurassic Holdings III, 6.875%, 2/15/21 144A | | | 2,695,000 | | | | 2,506 | |
| | United Rentals North America, Inc., 5.75%, 7/15/18 | | | 420,000 | | | | 438 | |
| | United Rentals North America, Inc., 5.75%, 11/15/24 | | | 1,300,000 | | | | 1,339 | |
| | United Rentals North America, Inc., 6.125%, 6/15/23 | | | 525,000 | | | | 551 | |
| | | | | | | | | | |
| | | Bonds (96.4%) | | Shares/
$ Par | | | Value
$ (000’s) | |
| |
| | Capital Goods continued | |
| | United Rentals North America, Inc., 7.375%, 5/15/20 | | | 585,000 | | | | 632 | |
| | | | | | | | | | |
| | Total | | | | | | | 5,466 | |
| | | | | | | | | | |
| |
| | Chemicals (2.4%) | |
| | Ashland, Inc., 4.75%, 8/15/22 | | | 1,400,000 | | | | 1,400 | |
| | Axalta Coating Systems US Holdings, Inc./Axalta Coating Systems Dutch Holding B BV, 7.375%, 5/1/21 144A | | | 3,150,000 | | | | 3,339 | |
| | Axiall Corp., 4.875%, 5/15/23 | | | 1,500,000 | | | | 1,416 | |
| | Celanese US Holdings LLC,
4.625%, 11/15/22 | | | 1,425,000 | | | | 1,411 | |
| | Eco Services Operations LLC/Eco Finance Corp., 8.50%, 11/1/22 144A | | | 1,000,000 | | | | 1,015 | |
| | Hexion US Finance Corp., 6.625%, 4/15/20 | | | 2,650,000 | | | | 2,597 | |
| | Hexion US Finance Corp./Hexion Nova Scotia Finance ULC, 8.875%, 2/1/18 | | | 2,290,000 | | | | 2,038 | |
| | Huntsman International LLC,
4.875%, 11/15/20 | | | 1,905,000 | | | | 1,891 | |
| | W.R. Grace & Co., 5.125%, 10/1/21 144A | | | 775,000 | | | | 794 | |
| | W.R. Grace & Co., 5.625%, 10/1/24 144A | | | 855,000 | | | | 891 | |
| | | | | | | | | | |
| | Total | | | | | | | 16,792 | |
| | | | | | | | | | |
| |
| | Conglomerate & Diversified Manufacturing (1.8%) | |
| | Entegris, Inc., 6.00%, 4/1/22 144A | | | 2,675,000 | | | | 2,709 | |
| | Gardner Denver, Inc., 6.875%, 8/15/21 144A | | | 2,320,000 | | | | 2,227 | |
| | Milacron LLC, 8.375%, 5/15/19 144A | | | 1,550,000 | | | | 1,643 | |
| | Rexel SA, 5.25%, 6/15/20 144A | | | 2,845,000 | | | | 2,866 | |
| | WESCO Distribution, Inc., 5.375%, 12/15/21 | | | 3,505,000 | | | | 3,536 | |
| | | | | | | | | | |
| | Total | | | | | | | 12,981 | |
| | | | | | | | | | |
| | | |
| | Consumer Products & Retailing (6.7%) | | | | | | | | |
| | 101178 B.C. ULC/New Red Finance, Inc., 6.00%, 4/1/22 144A | | | 4,050,000 | | | | 4,151 | |
| | FGI Operating Co. LLC/FGI Finance, Inc., 7.875%, 5/1/20 | | | 1,825,000 | | | | 1,642 | |
| | First Quality Finance Co., Inc., 4.625%, 5/15/21 144A | | | 2,285,000 | | | | 2,091 | |
| | L Brands, Inc., 5.625%, 10/15/23 | | | 1,250,000 | | | | 1,350 | |
| | Limited Brands, Inc., 5.625%, 2/15/22 | | | 620,000 | | | | 666 | |
| | | | | | | | | | |
| | | Bonds (96.4%) | | Shares/
$ Par | | | Value
$ (000’s) | |
| |
| | Consumer Products & Retailing continued | |
| | Limited Brands, Inc., 8.50%, 6/15/19 | | | 705,000 | | | | 835 | |
| | Michaels Stores, Inc., 5.875%, 12/15/20 144A | | | 3,500,000 | | | | 3,535 | |
| | Needle Merger Sub Corp., 8.125%, 3/15/19 144A | | | 2,000,000 | | | | 1,860 | |
| | Neiman Marcus Group LTD, Inc., 8.00%, 10/15/21 144A | | | 585,000 | | | | 619 | |
| | Neiman Marcus Group, Ltd. LLC, 8.75%, 10/15/21 144A | | | 2,000,000 | | | | 2,120 | |
| | New Academy Finance Co. LLC/New Academy Finance Corp., 8.00%, 6/15/18 144A | | | 4,600,000 | | | | 4,554 | |
| | NPC International, Inc./NPC Operating Co. A, Inc./NPC Operating Co. B, Inc., 10.50%, 1/15/20 | | | 1,500,000 | | | | 1,556 | |
| | Party City Holdings, Inc., 8.875%, 8/1/20 | | | 1,225,000 | | | | 1,308 | |
| | PC Nextco Holdings LLC/ PC Nextco Finance, Inc., 8.75%, 8/15/19 | | | 3,500,000 | | | | 3,517 | |
| | Petco Holdings, Inc., 8.50%, 10/15/17 144A | | | 3,500,000 | | | | 3,553 | |
| | Prestige Brands, Inc., 5.375%, 12/15/21 144A | | | 2,850,000 | | | | 2,800 | |
| | Sally Holdings LLC/Sally Capital, Inc., 6.875%, 11/15/19 | | | 1,165,000 | | | | 1,238 | |
| | Serta Simmons Holdings LLC, 8.125%, 10/1/20 144A | | | 3,975,000 | | | | 4,204 | |
| | Spectrum Brands, Inc., 6.125%, 12/15/24 144A | | | 3,450,000 | | | | 3,502 | |
| | Springs Industries, Inc., 6.25%, 6/1/21 | | | 1,700,000 | | | | 1,692 | |
| | | | | | | | | | |
| | Total | | | | | | | 46,793 | |
| | | | | | | | | | |
| |
| | Electric Utilities (1.2%) | |
| | Calpine Corp., 5.375%, 1/15/23 | | | 2,600,000 | | | | 2,626 | |
| | Calpine Corp., 6.00%, 1/15/22 144A | | | 455,000 | | | | 484 | |
| | NRG Energy, Inc., 6.25%, 7/15/22 | | | 1,450,000 | | | | 1,483 | |
| | NRG Energy, Inc., 6.25%, 5/1/24 144A | | | 1,300,000 | | | | 1,323 | |
| | NRG Energy, Inc., 7.625%, 1/15/18 | | | 1,710,000 | | | | 1,877 | |
| | NRG Energy, Inc., 8.25%, 9/1/20 | | | 270,000 | | | | 288 | |
| | | | | | | | | | |
| | Total | | | | | | | 8,081 | |
| | | | | | | | | | |
| |
| | Energy (5.3%) | |
| | Antero Resources Finance Corp.,
5.375%, 11/1/21 | | | 1,305,000 | | | | 1,263 | |
The Accompanying Notes are an Integral Part of the Financial Statements.
| | | | |
| 132 | | High Yield Bond Portfolio | | |
High Yield Bond Portfolio
| | | | | | | | | | |
| | | Bonds (96.4%) | | Shares/
$ Par | | | Value
$ (000’s) | |
| |
| | Energy continued | |
| | Antero Resources Investment LLC, 5.125%, 12/1/22 144A | | | 1,290,000 | | | | 1,216 | |
| | Berry Petroleum Co., 6.375%, 9/15/22 | | | 1,000,000 | | | | 760 | |
| | BreitBurn Energy Partners LP/BreitBurn Finance Corp.,
7.875%, 4/15/22 | | | 655,000 | | | | 506 | |
| | California Resources Corp., 5.00%, 1/15/20 144A | | | 645,000 | | | | 560 | |
| | California Resources Corp., 5.50%, 9/15/21 144A | | | 970,000 | | | | 829 | |
| | California Resources Corp., 6.00%, 11/15/24 144A | | | 1,615,000 | | | | 1,365 | |
| | Carrizo Oil & Gas, Inc., 7.50%, 9/15/20 | | | 620,000 | | | | 595 | |
| | CGG SA,
6.875%, 1/15/22 | | | 1,765,000 | | | | 1,341 | |
| | Chesapeake Energy Corp., 5.375%, 6/15/21 | | | 1,140,000 | | | | 1,139 | |
| | Chesapeake Energy Corp., 6.125%, 2/15/21 | | | 950,000 | | | | 997 | |
| | Chesapeake Energy Corp.,
6.875%, 11/15/20 | | | 1,635,000 | | | | 1,758 | |
| | Chesapeake Energy Corp., 7.25%, 12/15/18 | | | 920,000 | | | | 1,007 | |
| | Energy XXI Gulf Coast, Inc.,
7.50%, 12/15/21 | | | 1,180,000 | | | | 637 | |
| | EP Energy LLC/EP Energy Finance, Inc., 9.375%, 5/1/20 | | | 700,000 | | | | 707 | |
| | Gulfport Energy Corp., 7.75%, 11/1/20 144A | | | 1,375,000 | | | | 1,344 | |
| | Kodiak Oil & Gas Corp., 5.50%, 1/15/21 | | | 620,000 | | | | 622 | |
| | Kodiak Oil & Gas Corp., 5.50%, 2/1/22 | | | 785,000 | | | | 787 | |
| | Kodiak Oil & Gas Corp., 8.125%, 12/1/19 | | | 1,265,000 | | | | 1,287 | |
| | Laredo Petroleum, Inc., 5.625%, 1/15/22 | | | 675,000 | | | | 591 | |
| | Legacy Reserves LP / Legacy Reserves Finance Corp., 6.625%, 12/1/21 144A | | | 980,000 | | | | 799 | |
| | Legacy Reserves LP / Legacy Reserves Finance Corp., 6.625%, 12/1/21 | | | 805,000 | | | | 656 | |
| | Linn Energy LLC/Linn Energy Finance Corp., 6.25%, 11/1/19 | | | 1,495,000 | | | | 1,263 | |
| | Linn Energy LLC/Linn Energy Finance Corp., 6.50%, 9/15/21 | | | 1,290,000 | | | | 1,045 | |
| | Linn Energy LLC/Linn Energy Finance Corp., 7.75%, 2/1/21 | | | 1,215,000 | | | | 1,024 | |
| | Northern Oil and Gas, Inc., 8.00%, 6/1/20 | | | 1,905,000 | | | | 1,443 | |
| | | | | | | | | | |
| | | Bonds (96.4%) | | Shares/
$ Par | | | Value
$ (000’s) | |
| |
| | Energy continued | |
| | Oasis Petroleum, Inc., 6.50%, 11/1/21 | | | 1,645,000 | | | | 1,497 | |
| | Oasis Petroleum, Inc., 6.875%, 3/15/22 | | | 1,020,000 | | | | 928 | |
| | Range Resources Corp., 5.75%, 6/1/21 | | | 955,000 | | | | 986 | |
| | Rice Energy, Inc., 6.25%, 5/1/22 144A | | | 1,850,000 | | | | 1,721 | |
| | SandRidge Energy, Inc., 7.50%, 3/15/21 | | | 2,285,000 | | | | 1,462 | |
| | SandRidge Energy, Inc., 7.50%, 2/15/23 | | | 810,000 | | | | 510 | |
| | SandRidge Energy, Inc., 8.125%, 10/15/22 | | | 1,040,000 | | | | 655 | |
| | SM Energy Co., 6.50%, 11/15/21 | | | 1,205,000 | | | | 1,169 | |
| | SM Energy Co., 6.50%, 1/1/23 | | | 490,000 | | | | 470 | |
| | Whiting Petroleum Corp., 5.00%, 3/15/19 | | | 1,310,000 | | | | 1,225 | |
| | Whiting Petroleum Corp., 5.75%, 3/15/21 | | | 785,000 | | | | 728 | |
| | | | | | | | | | |
| | Total | | | | | | | 36,892 | |
| | | | | | | | | | |
| | | |
| | Entertainment (1.2%) | | | | | | | | |
| | Activision Blizzard, Inc., 5.625%, 9/15/21 144A | | | 785,000 | | | | 824 | |
| | Cedar Fair LP/Canada’s Wonderland Co./Magnum Management Corp., 5.375%, 6/1/24 144A | | | 2,680,000 | | | | 2,667 | |
| | NCL Corp., Ltd., 5.00%, 2/15/18 | | | 415,000 | | | | 415 | |
| | NCL Corp., Ltd., 5.25%, 11/15/19 144A | | | 975,000 | | | | 982 | |
| | Regal Entertainment Group, 5.75%, 3/15/22 | | | 660,000 | | | | 630 | |
| | Royal Caribbean Cruises, Ltd., 5.25%, 11/15/22 | | | 590,000 | | | | 620 | |
| | Six Flags Entertainment Corp., 5.25%, 1/15/21 144A | | | 2,500,000 | | | | 2,500 | |
| | | | | | | | | | |
| | Total | | | | | | | 8,638 | |
| | | | | | | | | | |
| |
| | Finance (1.9%) | |
| | AerCap Aviation Solutions BV,
6.375%, 5/30/17 | | | 1,005,000 | | | | 1,063 | |
| | AerCap Ireland Capital, Ltd., 5.00%, 10/1/21 144A | | | 2,400,000 | | | | 2,484 | |
| | CIT Group, Inc., 5.00%, 5/15/17 | | | 455,000 | | | | 472 | |
| | CIT Group, Inc., 5.00%, 8/15/22 | | | 1,215,000 | | | | 1,249 | |
| | CIT Group, Inc., 5.25%, 3/15/18 | | | 1,680,000 | | | | 1,751 | |
| | CIT Group, Inc., 5.375%, 5/15/20 | | | 515,000 | | | | 544 | |
| | | | | | | | | | |
| | | Bonds (96.4%) | | Shares/
$ Par | | | Value
$ (000’s) | |
| |
| | Finance continued | |
| | CIT Group, Inc., 5.50%, 2/15/19 144A | | | 815,000 | | | | 860 | |
| | International Lease Finance Corp., 7.125%, 9/1/18 144A | | | 1,550,000 | | | | 1,736 | |
| | International Lease Finance Corp.,
8.75%, 3/15/17 | | | 2,180,000 | | | | 2,414 | |
| | International Lease Finance Corp.,
8.875%, 9/1/17 | | | 965,000 | | | | 1,088 | |
| | | | | | | | | | |
| | Total | | | | | | | 13,661 | |
| | | | | | | | | | |
| |
| | Food & Beverage (3.5%) | |
| | Anna Merger Sub, Inc., 7.75%, 10/1/22 144A | | | 4,100,000 | | | | 4,151 | |
| | ARAMARK Corp., 5.75%, 3/15/20 | | | 4,585,000 | | | | 4,734 | |
| | B&G Foods, Inc., 4.625%, 6/1/21 | | | 2,150,000 | | | | 2,099 | |
| | Constellation Brands, Inc., 4.75%, 11/15/24 | | | 1,500,000 | | | | 1,519 | |
| | Darling Ingredients, Inc., 5.375%, 1/15/22 | | | 285,000 | | | | 281 | |
| | Del Monte Corp., 7.625%, 2/15/19 | | | 2,575,000 | | | | 2,530 | |
| | H.J. Heinz Co., 4.25%, 10/15/20 | | | 1,000,000 | | | | 1,010 | |
| | Pinnacle Foods Finance LLC / Pinnacle Foods Finance Corp., 4.875%, 5/1/21 | | | 3,000,000 | | | | 2,925 | |
| | Smithfield Foods, Inc., 6.625%, 8/15/22 | | | 1,095,000 | | | | 1,144 | |
| | Sun Merger Sub, Inc., 5.25%, 8/1/18 144A | | | 785,000 | | | | 799 | |
| | Sun Merger Sub, Inc., 5.875%, 8/1/21 144A | | | 390,000 | | | | 398 | |
| | US Foods, Inc., 8.50%, 6/30/19 | | | 2,625,000 | | | | 2,782 | |
| | Whitewave Foods Co., 5.375%, 10/1/22 | | | 515,000 | | | | 530 | |
| | | | | | | | | | |
| | Total | | | | | | | 24,902 | |
| | | | | | | | | | |
| |
| | Gaming/Leisure/Lodging (3.8%) | |
| | Ameristar Casinos, Inc., 7.50%, 4/15/21 | | | 2,625,000 | | | | 2,737 | |
| | Chester Downs & Marina LLC, 9.25%, 2/1/20 144A | | | 1,300,000 | | | | 949 | |
| | Churchill Downs, Inc., 5.375%, 12/15/21 | | | 1,550,000 | | | | 1,550 | |
| | GLP Capital LP / GLP Financing II, Inc., 5.375%, 11/1/23 | | | 2,000,000 | | | | 2,070 | |
| | Hilton Worldwide Finance LLC/Hilton Worldwide Finance Corp., 5.625%, 10/15/21 | | | 1,800,000 | | | | 1,881 | |
| | MGM Resorts International, 6.00%, 3/15/23 | | | 2,350,000 | | | | 2,362 | |
The Accompanying Notes are an Integral Part of the Financial Statements.
| | | | | | |
| | High Yield Bond Portfolio | | | 133 | |
High Yield Bond Portfolio
| | | | | | | | | | |
| | | Bonds (96.4%) | | Shares/
$ Par | | | Value
$ (000’s) | |
| |
| | Gaming/Leisure/Lodging continued | |
| | MGM Resorts International, 6.625%, 12/15/21 | | | 1,040,000 | | | | 1,092 | |
| | MGM Resorts International, 6.75%, 10/1/20 | | | 835,000 | | | | 877 | |
| | MGM Resorts International, 7.75%, 3/15/22 | | | 820,000 | | | | 908 | |
| | MGM Resorts International, 8.625%, 2/1/19 | | | 1,265,000 | | | | 1,434 | |
| | Penn National Gaming, Inc., 5.875%, 11/1/21 | | | 2,675,000 | | | | 2,488 | |
| | Seminole Hard Rock Entertainment, Inc./Seminole Hard Rock International LLC, 5.875%, 5/15/21 144A | | | 3,865,000 | | | | 3,826 | |
| | Seminole Tribe of Florida, Inc., 7.804%, 10/1/20 144A | | | 2,405,000 | | | | 2,549 | |
| | Station Casinos LLC, 7.50%, 3/1/21 | | | 2,000,000 | | | | 2,050 | |
| | | | | | | | | | |
| | Total | | | | | | | 26,773 | |
| | | | | | | | | | |
| |
| | Healthcare (9.0%) | |
| | AmSurg Corp., 5.625%, 7/15/22 144A | | | 2,325,000 | | | | 2,383 | |
| | Biomet, Inc., 6.50%, 8/1/20 | | | 725,000 | | | | 776 | |
| | Catamaran Corp., 4.75%, 3/15/21 | | | 1,715,000 | | | | 1,715 | |
| | CHS/Community Health Systems, Inc., 5.125%, 8/15/18 | | | 805,000 | | | | 833 | |
| | CHS/Community Health Systems, Inc., 6.875%, 2/1/22 | | | 1,185,000 | | | | 1,255 | |
| | CHS/Community Health Systems, Inc., 7.125%, 7/15/20 | | | 715,000 | | | | 762 | |
| | CHS/Community Health Systems, Inc., 8.00%, 11/15/19 | | | 2,615,000 | | | | 2,792 | |
| | Davita, Inc., 5.75%, 8/15/22 | | | 2,250,000 | | | | 2,385 | |
| | DJO Finance LLC/DJO Finance Corp., 9.875%, 4/15/18 | | | 1,500,000 | | | | 1,522 | |
| | Emdeon, Inc., 11.00%, 12/31/19 | | | 1,500,000 | | | | 1,631 | |
| | Envision Healthcare Corp., 5.125%, 7/1/22 144A | | | 3,330,000 | | | | 3,305 | |
| | HCA Holdings, Inc., 6.25%, 2/15/21 | | | 1,460,000 | | | | 1,555 | |
| | HCA Holdings, Inc., 7.75%, 5/15/21 | | | 1,505,000 | | | | 1,603 | |
| | HCA, Inc., 4.25%, 10/15/19 | | | 900,000 | | | | 913 | |
| | | | | | | | | | |
| | | Bonds (96.4%) | | Shares/
$ Par | | | Value
$ (000’s) | |
| |
| | Healthcare continued | |
| | HCA, Inc.,
5.00%, 3/15/24 | | | 2,575,000 | | | | 2,646 | |
| | HCA, Inc., 5.875%, 3/15/22 | | | 3,525,000 | | | | 3,860 | |
| | HCA, Inc.,
5.875%, 5/1/23 | | | 2,020,000 | | | | 2,129 | |
| | HCA, Inc.,
6.50%, 2/15/20 | | | 1,935,000 | | | | 2,168 | |
| | HCA, Inc.,
8.00%, 10/1/18 | | | 580,000 | | | | 664 | |
| | LifePoint Hospitals, Inc., 5.50%, 12/1/21 | | | 2,390,000 | | | | 2,444 | |
| | MPH Acquisition Holdings LLC, 6.625%, 4/1/22 144A | | | 4,125,000 | | | | 4,218 | |
| | Omnicare, Inc., 4.75%, 12/1/22 | | | 1,975,000 | | | | 2,000 | |
| | Omnicare, Inc., 5.00%, 12/1/24 | | | 900,000 | | | | 922 | |
| | Ortho-Clinical Diagnostics, Inc., 6.625%, 5/15/22 144A | | | 4,750,000 | | | | 4,269 | |
| | Teleflex, Inc., 5.25%, 6/15/24 144A | | | 1,750,000 | | | | 1,750 | |
| | Tenet Healthcare Corp., 4.50%, 4/1/21 | | | 830,000 | | | | 832 | |
| | Tenet Healthcare Corp., 5.00%, 3/1/19 144A | | | 655,000 | | | | 656 | |
| | Tenet Healthcare Corp., 6.00%, 10/1/20 | | | 1,285,000 | | | | 1,380 | |
| | Tenet Healthcare Corp., 6.25%, 11/1/18 | | | 860,000 | | | | 933 | |
| | Tenet Healthcare Corp., 6.75%, 2/1/20 | | | 1,045,000 | | | | 1,100 | |
| | Tenet Healthcare Corp., 8.125%, 4/1/22 | | | 2,180,000 | | | | 2,436 | |
| | United Surgical Partners International, Inc., 9.00%, 4/1/20 | | | 1,575,000 | | | | 1,691 | |
| | VWR Funding, Inc., 7.25%, 9/15/17 | | | 3,500,000 | | | | 3,658 | |
| | | | | | | | | | |
| | Total | | | | | | | 63,186 | |
| | | | | | | | | | |
| |
| | Insurance (0.9%) | |
| | Hockey Merger Sub 2, Inc., 7.875%, 10/1/21 144A | | | 4,370,000 | | | | 4,348 | |
| | Hub Holdings LLC/Hub Holdings Finance, Inc., 8.125%, 7/15/19 144A | | | 485,000 | | | | 480 | |
| | York Risk Services Holding Corp., 8.50%, 10/1/22 144A | | | 1,650,000 | | | | 1,650 | |
| | | | | | | | | | |
| | Total | | | | | | | 6,478 | |
| | | | | | | | | | |
| |
| | Media (12.0%) | |
| | AMC Networks, Inc., 7.75%, 7/15/21 | | | 2,200,000 | | | | 2,354 | |
| | | | | | | | | | |
| | | Bonds (96.4%) | | Shares/
$ Par | | | Value
$ (000’s) | |
| |
| | Media continued | |
| | CBS Outdoor Americas Capital LLC/CBS Outdoor Americas Capital Corp., 5.25%, 2/15/22 144A | | | 795,000 | | | | 801 | |
| | CBS Outdoor Americas Capital LLC/CBS Outdoor Americas Capital Corp., 5.875%, 3/15/25 144A | | | 1,950,000 | | | | 1,965 | |
| | CCO Holdings LLC/CCO Holdings Capital Corp., 5.25%, 3/15/21 | | | 1,350,000 | | | | 1,360 | |
| | CCO Holdings LLC/CCO Holdings Capital Corp., 5.75%, 9/1/23 | | | 1,000,000 | | | | 1,012 | |
| | CCO Holdings LLC/CCO Holdings Capital Corp., 5.75%, 1/15/24 | | | 3,050,000 | | | | 3,080 | |
| | CCO Holdings LLC/CCO Holdings Capital Corp., 6.50%, 4/30/21 | | | 1,285,000 | | | | 1,349 | |
| | CCO Holdings LLC/CCO Holdings Capital Corp., 7.375%, 6/1/20 | | | 870,000 | | | | 922 | |
| | Cequel Communications Holdings I LLC/Cequel Capital Corp., 5.125%, 12/15/21 144A | | | 2,460,000 | | | | 2,386 | |
| | Cequel Communications Holdings I LLC/Cequel Capital Corp., 6.375%, 9/15/20 144A | | | 1,685,000 | | | | 1,744 | |
| | Clear Channel Communications, Inc., 9.00%, 9/15/22 144A | | | 1,515,000 | | | | 1,485 | |
| | Clear Channel Worldwide Holdings, Inc., 6.50%, 11/15/22 | | | 2,700,000 | | | | 2,781 | |
| | Cumulus Media Holdings, Inc.,
7.75%, 5/1/19 | | | 1,750,000 | | | | 1,767 | |
| | DISH DBS Corp., 5.00%, 3/15/23 | | | 1,110,000 | | | | 1,074 | |
| | DISH DBS Corp., 5.875%, 7/15/22 | | | 1,080,000 | | | | 1,107 | |
| | DISH DBS Corp., 5.875%, 11/15/24 144A | | | 900,000 | | | | 904 | |
| | DISH DBS Corp., 6.75%, 6/1/21 | | | 1,810,000 | | | | 1,946 | |
| | Expo Event Transco, Inc., 9.00%, 6/15/21 144A | | | 2,400,000 | | | | 2,448 | |
| | Gannett Co., 4.875%, 9/15/21 144A | | | 195,000 | | | | 194 | |
| | Gannett Co., 5.125%, 10/15/19 | | | 785,000 | | | | 803 | |
| | Gannett Co., 5.125%, 7/15/20 | | | 980,000 | | | | 1,000 | |
| | Gannett Co., 5.50%, 9/15/24 144A | | | 195,000 | | | | 195 | |
| | Gannett Co., 6.375%, 10/15/23 | | | 700,000 | | | | 742 | |
The Accompanying Notes are an Integral Part of the Financial Statements.
| | | | |
| 134 | | High Yield Bond Portfolio | | |
High Yield Bond Portfolio
| | | | | | | | | | |
| | | Bonds (96.4%) | | Shares/
$ Par | | | Value
$ (000’s) | |
| |
| | Media continued | |
| | Gray Television, Inc., 7.50%, 10/1/20 | | | 2,730,000 | | | | 2,812 | |
| | IAC/InterActiveCorp, 4.75%, 12/15/22 | | | 2,500,000 | | | | 2,431 | |
| | IAC/InterActiveCorp., 4.875%, 11/30/18 | | | 655,000 | | | | 666 | |
| | Inmarsat Finance PLC, 4.875%, 5/15/22 144A | | | 1,305,000 | | | | 1,292 | |
| | Intelsat Jackson Holdings SA, 5.50%, 8/1/23 | | | 2,800,000 | | | | 2,783 | |
| | Intelsat Jackson Holdings SA, 6.625%, 12/15/22 | | | 1,200,000 | | | | 1,233 | |
| | Intelsat Jackson Holdings SA, 7.25%, 4/1/19 | | | 1,460,000 | | | | 1,524 | |
| | Intelsat Jackson Holdings SA, 7.25%, 10/15/20 | | | 1,115,000 | | | | 1,178 | |
| | Intelsat Luxembourg SA, 7.75%, 6/1/21 | | | 1,860,000 | | | | 1,865 | |
| | Lamar Media Corp., 5.875%, 2/1/22 | | | 2,600,000 | | | | 2,697 | |
| | LIN Television Corp., 6.375%, 1/15/21 | | | 840,000 | | | | 838 | |
| | Media General Financing Sub, Inc., 5.875%, 11/15/22 144A | | | 2,000,000 | | | | 1,980 | |
| | Nielsen Finance LLC, 4.50%, 10/1/20 | | | 3,000,000 | | | | 3,015 | |
| | Nielsen Finance LLC/Nielsen Finance Co., 5.00%, 4/15/22 144A | | | 2,000,000 | | | | 2,010 | |
| | Numericable Group SA, 4.875%, 5/15/19 144A | | | 2,535,000 | | | | 2,513 | |
| | Numericable Group SA, 6.00%, 5/15/22 144A | | | 1,295,000 | | | | 1,302 | |
| | Numericable Group SA, 6.25%, 5/15/24 144A | | | 650,000 | | | | 655 | |
| | Radio One, Inc., 9.25%, 2/15/20 144A | | | 1,000,000 | | | | 870 | |
| | Sinclair Television Group, Inc.,
5.375%, 4/1/21 | | | 1,370,000 | | | | 1,360 | |
| | Sinclair Television Group, Inc.,
6.125%, 10/1/22 | | | 990,000 | | | | 1,007 | |
| | Sinclair Television Group, Inc.,
6.375%, 11/1/21 | | | 550,000 | | | | 567 | |
| | Sirius XM Holdings, Inc., 4.25%, 5/15/20 144A | | | 645,000 | | | | 635 | |
| | Sirius XM Holdings, Inc., 4.625%, 5/15/23 144A | | | 550,000 | | | | 514 | |
| | Sirius XM Holdings, Inc., 5.75%, 8/1/21 144A | | | 1,045,000 | | | | 1,069 | |
| | Sirius XM Holdings, Inc., 5.875%, 10/1/20 144A | | | 1,180,000 | | | | 1,215 | |
| | Sirius XM Radio, Inc., 6.00%, 7/15/24 144A | | | 2,185,000 | | | | 2,240 | |
| | Southern Graphics, Inc., 8.375%, 10/15/20 144A | | | 2,375,000 | | | | 2,381 | |
| | Time, Inc., 5.75%, 4/15/22 144A | | | 1,575,000 | | | | 1,524 | |
| | | | | | | | | | |
| | | Bonds (96.4%) | | Shares/
$ Par | | | Value
$ (000’s) | |
| |
| | Media continued | |
| | Unitymedia Hessen GmbH & Co., 5.00%, 1/15/25 144A | | | 1,525,000 | | | | 1,529 | |
| | Unitymedia KabelBW GmbH, 6.125%, 1/15/25 144A | | | 3,250,000 | | | | 3,356 | |
| | Virgin Media Secured Finance PLC, 5.375%, 4/15/21 144A | | | 1,380,000 | | | | 1,425 | |
| | | | | | | | | | |
| | Total | | | | | | | 83,905 | |
| | | | | | | | | | |
| |
| | Metals & Mining (0.4%) | |
| | Steel Dynamics, Inc., 5.125%, 10/1/21 144A | | | 620,000 | | | | 632 | |
| | Steel Dynamics, Inc., 5.50%, 10/1/24 144A | | | 930,000 | | | | 953 | |
| | Steel Dynamics, Inc., 6.125%, 8/15/19 | | | 540,000 | | | | 567 | |
| | Steel Dynamics, Inc., 6.375%, 8/15/22 | | | 540,000 | | | | 572 | |
| | | | | | | | | | |
| | Total | | | | | | | 2,724 | |
| | | | | | | | | | |
| |
| | Oil & Gas (0.3%) | |
| | Tesoro Corp., 5.125%, 4/1/24 | | | 1,725,000 | | | | 1,712 | |
| | Tesoro Corp., 5.375%, 10/1/22 | | | 555,000 | | | | 562 | |
| | | | | | | | | | |
| | Total | | | | | | | 2,274 | |
| | | | | | | | | | |
| |
| | Other Holdings (–%) | |
| (d) | | General Motors Co. Escrow, 7.20%, 1/15/15 | | | 610,000 | | | | — | |
| (d) | | General Motors Co. Escrow, 8.375%, 7/15/33 | | | 4,865,000 | | | | — | |
| | | | | | | | | | |
| | Total | | | | | | | — | |
| | | | | | | | | | |
| |
| | Pharmaceuticals (1.4%) | |
| | Grifols Worldwide Operations, Ltd., 5.25%, 4/1/22 144A | | | 2,800,000 | | | | 2,863 | |
| | Jaguar Holding Co. I, 9.375%, 10/15/17 144A | | | 2,410,000 | | | | 2,463 | |
| | Jaguar Holding Co. II/ Jaguar Merger Sub, Inc., 9.50%, 12/1/19 144A | | | 1,600,000 | | | | 1,716 | |
| | Valeant Pharmaceuticals International, Inc., 5.625%, 12/1/21 144A | | | 655,000 | | | | 660 | |
| | Valeant Pharmaceuticals International, Inc., 6.375%, 10/15/20 144A | | | 750,000 | | | | 784 | |
| | Valeant Pharmaceuticals International, Inc., 6.75%, 8/15/18 144A | | | 1,571,000 | | | | 1,671 | |
| | | | | | | | | | |
| | Total | | | | | | | 10,157 | |
| | | | | | | | | | |
| |
| | Pipelines (5.7%) | |
| | Access Midstream Partners LP/ACMP Finance Corp., 4.875%, 3/15/24 | | | 1,600,000 | | | | 1,624 | |
| | | | | | | | | | |
| | | Bonds (96.4%) | | Shares/
$ Par | | | Value
$ (000’s) | |
| |
| | Pipelines continued | |
| | Access Midstream Partners LP/ACMP Finance Corp.,
6.125%, 7/15/22 | | | 890,000 | | | | 946 | |
| | Atlas Pipeline Partners LP/Atlas Pipeline Finance Corp., 6.625%, 10/1/20 | | | 1,095,000 | | | | 1,114 | |
| | Blue Racer Midstream LLC / Blue Racer Finance Corp., 6.125%, 11/15/22 144A | | | 1,000,000 | | | | 965 | |
| | Crestwood Midstream Partners LP/Crestwood Midstream Finance Corp.,
6.00%, 12/15/20 | | | 1,175,000 | | | | 1,125 | |
| | Crestwood Midstream Partners LP/Crestwood Midstream Finance Corp.,
6.125%, 3/1/22 | | | 520,000 | | | | 497 | |
| | El Paso LLC, 6.50%, 9/15/20 | | | 500,000 | | | | 566 | |
| | El Paso LLC, 7.25%, 6/1/18 | | | 500,000 | | | | 567 | |
| | Energy Transfer Equity LP, 5.875%, 1/15/24 | | | 2,500,000 | | | | 2,538 | |
| | Energy Transfer Equity LP, 7.50%, 10/15/20 | | | 2,020,000 | | | | 2,242 | |
| | Ferrellgas LP / Ferrellgas Finance Corp., 6.50%, 5/1/21 | | | 850,000 | | | | 829 | |
| | Ferrellgas LP/Ferrellgas Finance Corp., 6.75%, 1/15/22 | | | 2,350,000 | | | | 2,297 | |
| | Hiland Partners LP/Hiland Partners Finance Corp., 5.50%, 5/15/22 144A | | | 1,050,000 | | | | 924 | |
| | Hiland Partners LP/Hiland Partners Finance Corp., 7.25%, 10/1/20 144A | | | 1,075,000 | | | | 1,021 | |
| | Kinder Morgan, Inc., 5.00%, 2/15/21 144A | | | 730,000 | | | | 759 | |
| | Kinder Morgan, Inc., 5.625%, 11/15/23 144A | | | 625,000 | | | | 669 | |
| | MarkWest Energy Partners LP/MarkWest Energy Finance Corp., 4.875%, 12/1/24 | | | 1,850,000 | | | | 1,808 | |
| | MarkWest Energy Partners LP/MarkWest Energy Finance Corp., 6.25%, 6/15/22 | | | 603,000 | | | | 624 | |
| | MarkWest Energy Partners LP/MarkWest Energy Finance Corp., 6.75%, 11/1/20 | | | 780,000 | | | | 811 | |
| | Penn Virginia Resource Partners LP/Penn Virginia Resource Finance Corp. II, 6.50%, 5/15/21 | | | 405,000 | | | | 409 | |
The Accompanying Notes are an Integral Part of the Financial Statements.
| | | | | | |
| | High Yield Bond Portfolio | | | 135 | |
High Yield Bond Portfolio
| | | | | | | | | | |
| | | Bonds (96.4%) | | Shares/
$ Par | | | Value
$ (000’s) | |
| |
| | Pipelines continued | |
| | Penn Virginia Resource Partners LP/Penn Virginia Resource Finance Corp. II, 8.375%, 6/1/20 | | | 811,000 | | | | 866 | |
| | Regency Energy Partners LP/Regency Energy Finance Corp., 4.50%, 11/1/23 | | | 655,000 | | | | 601 | |
| | Regency Energy Partners LP/Regency Energy Finance Corp., 5.00%, 10/1/22 | | | 205,000 | | | | 194 | |
| | Regency Energy Partners LP/Regency Energy Finance Corp., 5.75%, 9/1/20 | | | 1,310,000 | | | | 1,313 | |
| | Regency Energy Partners LP/Regency Energy Finance Corp., 5.875%, 3/1/22 | | | 525,000 | | | | 524 | |
| | Rose Rock Midstream LP., 5.625%, 7/15/22 | | | 2,100,000 | | | | 1,964 | |
| | Sabine Pass Liquefaction LLC,
5.625%, 2/1/21 | | | 1,650,000 | | | | 1,621 | |
| | Sabine Pass Liquefaction LLC,
5.625%, 4/15/23 | | | 1,230,000 | | | | 1,202 | |
| | Sabine Pass Liquefaction LLC,
6.25%, 3/15/22 | | | 2,285,000 | | | | 2,319 | |
| | Suburban Propane Partners LP/Suburban Energy Finance Corp., 5.50%, 6/1/24 | | | 3,075,000 | | | | 2,967 | |
| | Summit Midstream Holdings LLC/Summit Midstream Finance Corp.,
5.50%, 8/15/22 | | | 455,000 | | | | 432 | |
| | Targa Resources Partners LP/Targa Resources Partners Finance Corp., 6.375%, 8/1/22 | | | 547,000 | | | | 554 | |
| | Tesoro Logistics LP/Tesoro Logistics Finance Corp., 5.875%, 10/1/20 | | | 967,000 | | | | 969 | |
| | Tesoro Logistics LP/Tesoro Logistics Finance Corp., 6.125%, 10/15/21 | | | 940,000 | | | | 938 | |
| | Tesoro Logistics LP/Tesoro Logistics Finance Corp., 6.25%, 10/15/22 144A | | | 1,125,000 | | | | 1,122 | |
| | | | | | | | | | |
| | Total | | | | | | | 39,921 | |
| | | | | | | | | | |
| |
| | Services (2.2%) | |
| | Garda World Security Corp., 7.25%, 11/15/21 144A | | | 2,000,000 | | | | 1,980 | |
| | | | | | | | | | |
| | | Bonds (96.4%) | | Shares/
$ Par | | | Value
$ (000’s) | |
| |
| | Services continued | |
| | Hearthside Group Holdings LLC/Hearthside Finance Co.,
6.50%, 5/1/22 144A | | | 3,175,000 | | | | 3,096 | |
| | IHS, Inc.,
5.00%, 11/1/22 14A | | | 2,100,000 | | | | 2,079 | |
| | Multi-Color Corp., 6.125%, 12/1/22 144A | | | 3,125,000 | | | | 3,125 | |
| | The ServiceMaster Co., 7.00%, 8/15/20 | | | 4,750,000 | | | | 4,916 | |
| | The ServiceMaster Co., 8.00%, 2/15/20 | | | 400,000 | | | | 421 | |
| | | | | | | | | | |
| | Total | | | | | | | 15,617 | |
| | | | | | | | | | |
| |
| | Technology (11.4%) | |
| | ACI Worldwide, Inc., 6.375%, 8/15/20 144A | | | 395,000 | | | | 413 | |
| | Advanced Micro Devices, Inc., 6.75%, 3/1/19 | | | 785,000 | | | | 738 | |
| | Advanced Micro Devices, Inc., 7.00%, 7/1/24 | | | 1,655,000 | | | | 1,403 | |
| | Anixter, Inc., 5.125%, 10/1/21 | | | 3,125,000 | | | | 3,125 | |
| | Audatex North America, Inc., 6.00%, 6/15/21 144A | | | 3,140,000 | | | | 3,234 | |
| | Audatex North America, Inc., 6.125%, 11/1/23 144A | | | 1,605,000 | | | | 1,657 | |
| | Blackboard, Inc., 7.75%, 11/15/19 144A | | | 1,450,000 | | | | 1,454 | |
| | BMC Software Finance, Inc., 8.125%, 7/15/21 144A | | | 2,200,000 | | | | 2,068 | |
| | Boxer Parent Co., 9.00%, 10/15/19 144A | | | 1,385,000 | | | | 1,177 | |
| | CDW LLC/CDW Finance Corp., 5.50%, 12/1/24 | | | 2,250,000 | | | | 2,253 | |
| | CDW LLC/CDW Finance Corp., 6.00%, 8/15/22 | | | 2,250,000 | | | | 2,323 | |
| | CommScope, Inc., 5.00%, 6/15/21 144A | | | 460,000 | | | | 453 | |
| | CommScope, Inc., 5.50%, 6/15/24 144A | | | 3,825,000 | | | | 3,768 | |
| | Compiler Finance Sub, Inc., 7.00%, 5/1/20 144A | | | 1,500,000 | | | | 1,290 | |
| | CoreLogic, Inc., 7.25%, 6/1/21 | | | 2,500,000 | | | | 2,625 | |
| | Eagle Midco, Inc., 9.00%, 6/15/18 144A | | | 1,650,000 | | | | 1,687 | |
| | First Data Corp., 6.75%, 11/1/20 144A | | | 1,185,000 | | | | 1,265 | |
| | First Data Corp., 7.375%, 6/15/19 144A | | | 820,000 | | | | 863 | |
| | First Data Corp., 8.25%, 1/15/21 144A | | | 935,000 | | | | 1,000 | |
| (c) | | First Data Corp., 8.75%, 1/15/22 144A | | | 1,875,000 | | | | 2,016 | |
| | First Data Corp., 11.25%, 1/15/21 | | | 1,012,000 | | | | 1,149 | |
| | | | | | | | | | |
| | | Bonds (96.4%) | | Shares/
$ Par | | | Value
$ (000’s) | |
| |
| | Technology continued | |
| | First Data Corp., 11.75%, 8/15/21 | | | 1,639,000 | | | | 1,881 | |
| | Freescale Semiconductor, Inc., 5.00%, 5/15/21 144A | | | 2,150,000 | | | | 2,150 | |
| | Freescale Semiconductor, Inc., 6.00%, 1/15/22 144A | | | 655,000 | | | | 684 | |
| (c) | | Igloo Holdings Corp., 8.25%, 12/15/17 144A | | | 3,625,000 | | | | 3,661 | |
| (c) | | Infor Software Parent LLC/Infor Software Parent, Inc., 7.125%, 5/1/21 144A | | | 5,560,000 | | | | 5,449 | |
| | Infor, Inc., 9.375%, 4/1/19 | | | 1,000,000 | | | | 1,070 | |
| | Interactive Data Corp., 5
.875%, 4/15/19 144A | | | 1,525,000 | | | | 1,514 | |
| | Iron Mountain, Inc., 7.75%, 10/1/19 | | | 1,360,000 | | | | 1,455 | |
| | Magnachip Semiconductor Corp., 6.625%, 7/15/21 | | | 1,500,000 | | | | 1,361 | |
| | MSCI, Inc., 5.25%, 11/15/24 144A | | | 500,000 | | | | 517 | |
| | NCR Corp., 4.625%, 2/15/21 | | | 675,000 | | | | 655 | |
| | NCR Corp., 5.00%, 7/15/22 | | | 335,000 | | | | 327 | |
| | NCR Corp., 5.875%, 12/15/21 | | | 2,000,000 | | | | 2,055 | |
| | NCR Corp., 6.375%, 12/15/23 | | | 520,000 | | | | 541 | |
| | Nuance Communications, Inc., 5.375%, 8/15/20 144A | | | 2,500,000 | | | | 2,506 | |
| | Sensata Technologies BV,
5.625%, 11/1/24 144A | | | 1,625,000 | | | | 1,686 | |
| | Sophia Holding Finance LP/Sophia Holding Finance, Inc.,
9.625%, 12/1/18 144A | | | 3,500,000 | | | | 3,518 | |
| | Sophia LP/Sophia Finance, Inc., 9.75%, 1/15/19 144A | | | 625,000 | | | | 667 | |
| | SunGard Data Systems, Inc.,
6.625%, 11/1/19 | | | 2,525,000 | | | | 2,550 | |
| | SunGard Data Systems, Inc., 7.625%, 11/15/20 | | | 1,230,000 | | | | 1,304 | |
| | TransUnion Holding Co., 8.125%, 6/15/18 | | | 1,000,000 | | | | 1,025 | |
| | TransUnion Holding Co., 9.625%, 6/15/18 | | | 3,000,000 | | | | 3,068 | |
| | VeriSign, Inc., 4.625%, 5/1/23 | | | 1,500,000 | | | | 1,470 | |
| | Zebra Technologies Corp., 7.25%, 10/15/22 144A | | | 2,725,000 | | | | 2,861 | |
| | | | | | | | | | |
| | Total | | | | | | | 79,936 | |
| | | | | | | | | | |
| |
| | Telecommunications (4.4%) | |
| | Altice SA, 7.75%, 5/15/22 144A | | | 1,150,000 | | | | 1,152 | |
The Accompanying Notes are an Integral Part of the Financial Statements.
| | | | |
| 136 | | High Yield Bond Portfolio | | |
High Yield Bond Portfolio
| | | | | | | | | | |
| | | Bonds (96.4%) | | Shares/
$ Par | | | Value
$ (000’s) | |
| |
| | Telecommunications continued | |
| | Digicel Group, Ltd., 7.125%, 4/1/22 144A | | | 525,000 | | | | 488 | |
| | Digicel Group, Ltd., 8.25%, 9/30/20 144A | | | 1,200,000 | | | | 1,164 | |
| | Digicel, Ltd., 6.00%, 4/15/21 144A | | | 1,260,000 | | | | 1,178 | |
| | Level 3 Communications, Inc., 5.75%, 12/1/22 144A | | | 4,250,000 | | | | 4,277 | |
| | MetroPCS Wireless, Inc., 6.625%, 11/15/20 | | | 1,410,000 | | | | 1,435 | |
| | Sprint Communications, Inc., 6.00%, 11/15/22 | | | 1,000,000 | | | | 920 | |
| | Sprint Communications, Inc., 7.00%, 8/15/20 | | | 2,740,000 | | | | 2,740 | |
| | Sprint Communications, Inc., 9.00%, 11/15/18 144A | | | 1,630,000 | | | | 1,854 | |
| | Sprint Communications, Inc., 11.50%, 11/15/21 | | | 1,485,000 | | | | 1,786 | |
| | Sprint Corp., 7.125%, 6/15/24 | | | 650,000 | | | | 604 | |
| | | | | | | | | | |
| | | Bonds (96.4%) | | Shares/
$ Par | | | Value
$ (000’s) | |
| |
| | Telecommunications continued | |
| | Sprint Corp.,
7.25%, 9/15/21 | | | 2,610,000 | | | | 2,587 | |
| | Sprint Corp., 7.875%, 9/15/23 | | | 1,965,000 | | | | 1,940 | |
| | T-Mobile USA, Inc., 6.00%, 3/1/23 | | | 775,000 | | | | 777 | |
| | T-Mobile USA, Inc., 6.125%, 1/15/22 | | | 575,000 | | | | 584 | |
| | T-Mobile USA, Inc., 6.25%, 4/1/21 | | | 2,740,000 | | | | 2,804 | |
| | T-Mobile USA, Inc., 6.375%, 3/1/25 | | | 1,035,000 | | | | 1,051 | |
| | T-Mobile USA, Inc., 6.542%, 4/28/20 | | | 1,045,000 | | | | 1,079 | |
| | T-Mobile USA, Inc., 6.625%, 4/1/23 | | | 1,000,000 | | | | 1,024 | |
| | T-Mobile USA, Inc., 6.633%, 4/28/21 | | | 785,000 | | | | 806 | |
| | T-Mobile USA, Inc., 6.731%, 4/28/22 | | | 365,000 | | | | 376 | |
| | | | | | | | | | |
| | Total | | | | | | | 30,626 | |
| | | | | | | | | | |
| | | | | | | | | | |
| | | Bonds (96.4%) | | Shares/
$ Par | | | Value
$ (000’s) | |
| |
| | Transportation (0.7%) | |
| | HDTFS, Inc., 6.25%, 10/15/22 | | | 4,100,000 | | | | 4,141 | |
| | The Hertz Corp., 5.875%, 10/15/20 | | | 420,000 | | | | 423 | |
| | | | | | | | | | |
| | Total | | | | | | | 4,564 | |
| | | | | | | | | | |
| | |
| | Total Bonds | | | | | |
| | (Cost: $683,753) | | | | 676,831 | |
| | | | | | | | | | |
| |
| | | Common Stocks & Warrants (0.0%) | |
| | Metals & Mining (0.0%) | |
| * | | Patriot Coal Corp. Warrants | | | 17,358 | | | | 38 | |
| | | | | | | | | | |
| | |
| | Total Common Stocks & Warrants | | | | | |
| | (Cost: $95) | | | | | | | 38 | |
| | | | | | | | | | |
| | |
| | Total Investments (96.4%) | | | | | |
| | (Cost: $683,848)(a) | | | | 676,869 | |
| | | | | | | | | | |
| | Other Assets, Less | | | | | |
| | Liabilities (3.6%) | | | | 25,119 | |
| | | | | | | | | | |
| | Net Assets (100.0%) | | | | 701,988 | |
| | | | | | | | | | |
144A after the name of a security represents a security exempt from registration under Rule 144A of the Securities Act of 1933. These securities may be resold as transactions exempt from registration, normally to qualified institutional buyers. At December 31, 2014 the value of these securities (in thousands) was $300,769 representing 42.8% of the net assets.
| (a) | At December 31, 2014, the aggregate cost of securities for federal tax purposes (in thousands) was $683,852 and the net unrealized depreciation of investments based on that cost was $6,983 which is comprised of $6,948 aggregate gross unrealized appreciation and $13,931 aggregate gross unrealized depreciation. |
The following is a summary of the inputs used in valuing the Portfolio’s assets and liabilities at December 31, 2014. See Note 3 for additional information on portfolio valuation.
| | | | | | | | | | | | | | |
| | | Valuation Inputs | | | |
| Description | | Level 1 –
Quoted Prices | | | Level 2 – Other Significant
Observable Inputs | | | Level 3 - Significant
Unobservable Inputs | | | |
| | | (Amounts in thousands) | | | |
Assets: | | | | | | | | | | | | | | |
Common Stocks & Warrants | | $ | - | | | $ | - | | | $ | 38 | | | |
Corporate Bonds | | | - | | | | 676,831 | | | | - | | | |
Total | | $ | - | | | $ | 676,831 | | | $ | 38 | | | |
The Accompanying Notes are an Integral Part of the Financial Statements.
| | | | | | |
| | High Yield Bond Portfolio | | | 137 | |
Multi-Sector Bond Portfolio (unaudited)
| | | | |
| Objective: | | Portfolio Strategy: | | Net Assets: |
| Maximum total return, consistent with prudent investment management. | | Invest in a diversified portfolio of fixed income instruments of varying maturities and quality, and in derivatives designed to replicate such securities. | | $546 million |
Portfolio Overview
Mason Street Advisors, LLC (“Mason Street Advisors”), the investment adviser for the Multi-Sector Bond Portfolio (the “Portfolio”), has engaged Pacific Investment Management Company LLC (“PIMCO”) to act as sub-adviser for the Portfolio. Normally, the Portfolio invests in a diversified portfolio of fixed income instruments of varying maturities, which may be represented by forwards or derivatives such as options, futures contracts or swap agreements. The Portfolio may invest all of its assets in high yield securities subject to a maximum of 10% of its total assets in securities rated below B by Moody’s or equivalently rated by S&P or Fitch or, if unrated, determined by PIMCO to be of comparable quality (so called “junk bonds”). The Portfolio may invest, without limitation, in securities denominated in foreign currencies and U.S. dollar denominated securities of foreign issuers. In addition, the Portfolio may invest without limit in fixed income securities of issuers that are economically tied to emerging securities markets.
Market Overview
Both uncertainty and volatility increased in the first quarter of 2014. Bond markets rallied early in the quarter due to the somewhat uncertain pace of economic expansion and mostly held on to gains as the crisis in Ukraine led a general flight to quality. European economies continued to stabilize but concerns rose in Asia, especially over China’s economic health.
The second quarter of 2014 saw the return of risk appetite and an easing of global political risks. Bond markets rallied as central banks remained accommodative. Emerging markets (“EM”) led gains, and developed market yields fell to twelve-month lows during the quarter.
The third quarter was marked by geopolitical tension and diverging markets. Most developed market government yields moved lower, while credit markets backed up. Given this improvement in the outlook for growth, the Federal Reserve (the “Fed”) policy rate projections increased modestly and the U.S. dollar surged more than 7.5% versus its major trading partners. Further east, growth concerns developed in China and Japan, and in EM tensions over Ukraine pushed the U.S. and European Union to expand sanctions on Russia.
The final quarter of 2014 saw continued global growth divergence, but the most defining event was the sharp decline in oil prices and accompanying market volatility, which dissipated quickly but still managed to leave certain risk sectors bruised. Growth in the U.S. exceeded expectations and handily outpaced its peers in the developed world, particularly in Japan and Europe, which continued to struggle.
Portfolio Results
The Portfolio returned 3.25% for the twelve months ended December 31, 2014. By comparison, the Portfolio’s benchmark, the Barclays® Global Credit Hedged USD Index returned 6.64%. The Portfolio’s custom benchmark, comprised of 1/3 Barclays® Global Aggregate Credit component, 1/3 Merrill Lynch Global High Yield BB-B rated constrained and 1/3 J.P. Morgan EMBI Global, all U.S. dollar Hedged Index, returned 5.48%. (These Indices are unmanaged, cannot be invested in directly and does not include administrative expenses or sales charges.) According to Morningstar® Inc., an independent mutual fund ranking agency, the average return of the Multisector Bond peer group was 3.43% in 2014.
During the period, exposure to Russian external debt was the primary detractor amid concerns over geopolitical tensions, oil prices and currency weakness. An underweight to long-term U.S. government bonds detracted from returns as rates fell during the period. An underweight to longer-term bonds in the U.K., partially implemented through the use of interest rate swaps, also detracted as rates fell across most parts of the curve. Within spread sectors, an overweight to EM external debt was negative for returns as spreads widened.
An overweight to European rates implemented through euro denominated external debt contributed to returns as rates fell across the maturity spectrum, particular in longer dated maturities. Additionally, an overweight to longer-term Australian government bonds contributed to returns as rates fell. Within the corporate sector, an underweight to high yield and investment grade industrials was positive for returns as spreads widened.
Portfolio Manager Outlook
The following forward looking comments are the opinion of PIMCO, the Portfolio’s sub-adviser.
We expect global growth to accelerate from around 2.5% this year to 2.75% next year. This incremental improvement comes from our view that lower oil prices will be a positive shock for a majority of global economies as petrodollars are redirected from producers to consumers. Declining oil prices will also have a clear downside impact on global inflation, allowing many countries to sustain or increase growth-supportive monetary policy measures.
| | | | |
| 138 | | Multi-Sector Bond Portfolio | | |
Multi-Sector Bond Portfolio (unaudited)
We believe the U.S. economy will continue to be the growth leader in the developed world, with average growth around 3.0%. Our favorable outlook reflects improving household finances and confidence, as well as solid corporate profits and rising utilization rates, which should coalesce to underpin a self-reinforcing economic cycle. With business expansion plans likely to support a healthy pace of payroll gains, wage pressures are expected to gradually rise as the unemployment rate falls further. While falling oil prices should keep headline inflation subdued, we expect the Fed will take its policy signals from marginal wage gains and begin to gradually raise policy interest rates in mid-2015. As a result of the stronger growth outlook and likelihood for policy normalization, we expect the strength of the U.S. dollar versus other currencies to persist.
Relative Performance
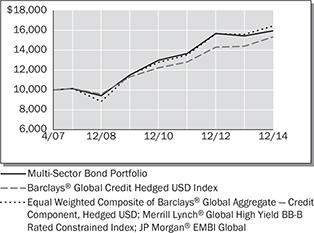
| | | | | | | | | | | | |
Average Annual Total Returns For Periods Ended December 31, 2014 | |
| | | 1 Year | | | 5 Years | | | Since Inception* | |
Multi-Sector Bond Portfolio | | | 3.25% | | | | 6.78% | | | | 6.28% | |
Barclays® Global Credit Hedged USD Index | | | 6.64% | | | | 6.30% | | | | 5.75% | |
Equal Weighted Composite of Barclays® Global Aggregate — Credit Component, Hedged USD; Merrill Lynch® Global High Yield BB-B Rated Constrained Index; JP Morgan® EMBI Global | | | 5.48% | | | | 7.42% | | | | 6.71% | |
Morningstar® US Insurance Fund Multisector Bond Average | | | 3.43% | | | | 6.40% | | | | – | |
| * | Inception date of 4/30/07 |
The performance data quoted represents past performance. Past performance is historical and does not guarantee future performance. Investment return and principal value will fluctuate, so that shares, when redeemed, may be worth more or less than their original cost. Current performance may be lower or higher than the performance data quoted. For the most recent month-end performance information visit www.northwesternmutual.com.
This chart assumes an initial investment of $10,000 made on 4/30/07 (commencement of the Portfolio’s operations). Returns shown reflect fee waivers, deductions for management and other portfolio expenses, and reinvestment of all dividends. In the absence of fee waivers, total return would be reduced. Returns exclude deductions for separate account sale loads and account fees. Please refer to the Benchmark Definitions section of this report for information about the indices cited in the above chart and graph.
The Portfolio invests in lower-quality securities, which may present a significant risk for loss of principal and interest. Bonds and other debt obligations are affected by changes in interest rates, inflation risk and the creditworthiness of their issuers. High yield bonds generally have greater price swings and higher default risks than investment grade bonds. Return of principal is not guaranteed. When interest rates rise, bond prices fall. With a fixed income fund, when interest rates rise, the value of the fund’s existing bonds drops, which could negatively affect overall fund performance.
Investing in bonds issued by foreign corporations and governments carries additional risk, including foreign currency risk, and may increase the volatility of the Portfolio’s performance.
The Portfolio may use derivative instruments for hedging purposes or as alternatives to direct investments. Use of these instruments may involve certain costs and risks such as liquidity risk, interest rate risk, market risk, credit risk, management risk and the risk of mispricing or improper valuation. Certain derivatives involve leverage, which could magnify losses, and portfolios investing in derivatives could lose more than the principal amount invested in those instruments.
The Portfolio may also invest in municipal securities, which may be more sensitive to certain adverse conditions than other fixed income securities, may be or become illiquid, and may have yields which move differently and adversely compared to the yields of the overall debt securities markets.
Currently, interest rates are at unprecedented historically low levels. A significant rise in interest rates over a short period of time could cause significant losses in the market value of the Portfolio’s fixed income investments.
| | | | | | |
| | Multi-Sector Bond Portfolio | | | 139 | |
Multi-Sector Bond Portfolio (unaudited)
Top 10 Fixed Income Holdings 12/31/14
| | | | |
| Security Description | | % of Net Assets | |
US Treasury, Various | | | 3.2% | |
Mexico Government International Bond, 4.00%, 10/2/23 | | | 2.2% | |
Barclays Bank PLC, Various | | | 2.1% | |
Brazil, Various | | | 1.4% | |
Russian Federation, Various | | | 1.4% | |
Gazprom OAO, Various | | | 1.4% | |
Credit Agricole SA, 8.125%, 9/19/33 | | | 1.3% | |
Ally Financial, Inc., Various | | | 1.3% | |
Republic of Italy EUR, 3.75%, 9/1/24 | | | 1.3% | |
UBS AG, Various | | | 1.3% | |
Sector Allocation 12/31/14
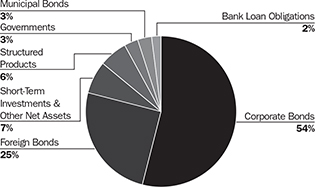
Sector Allocation is based on Net Assets.
Sector Allocation and Top 10 Holdings are subject to change.
| | | | |
| 140 | | Multi-Sector Bond Portfolio | | |
Multi-Sector Bond Portfolio
Schedule of Investments
December 31, 2014
| | | | | | | | | | |
| | | Corporate Bonds (42.3%) | | Shares/
$ Par | | | Value
$ (000’s) | |
| |
| | Autos & Vehicle Parts (0.6%) | |
| | Banque PSA Finance SA, 4.375%, 4/4/16 144A | | | 500,000 | | | | 515 | |
| (b) | | General Motors Financial Co., Inc., 2.625%, 7/10/17 | | | 800,000 | | | | 803 | |
| (b) | | Magna International, Inc., 3.625%, 6/15/24 | | | 700,000 | | | | 701 | |
| | RCI Banque SA, 3.50%, 4/3/18 144A | | | 300,000 | | | | 311 | |
| | Schaeffler Finance BV, 7.75%, 2/15/17 144A | | | 300,000 | | | | 329 | |
| (c) | | Schaeffler Holding Finance BV, 6.25%, 11/15/19 144A | | | 300,000 | | | | 309 | |
| (c) | | Schaeffler Holding Finance BV, 6.75%, 11/15/22 144A | | | 400,000 | | | | 418 | |
| | | | | | | | | | |
| | Total | | | | | | | 3,386 | |
| | | | | | | | | | |
| |
| | Banking (14.2%) | |
| (b) | | Ally Financial, Inc., 3.50%, 7/18/16 | | | 700,000 | | | | 708 | |
| (b) | | Ally Financial, Inc., 3.75%, 11/18/19 | | | 5,200,000 | | | | 5,122 | |
| (b) | | Ally Financial, Inc., 4.625%, 6/26/15 | | | 300,000 | | | | 302 | |
| (b) | | Ally Financial, Inc., 5.125%, 9/30/24 | | | 800,000 | | | | 812 | |
| | Banco Continental SA via Continental Senior Trustee II Cayman, Ltd., 5.75%, 1/18/17 144A | | | 600,000 | | | | 633 | |
| (b) | | Banco Santander Brasil SA, 4.625%, 2/13/17 | | | 400,000 | | | | 415 | |
| | Banco Santander Chile, 3.875%, 9/20/22 144A | | | 1,000,000 | | | | 989 | |
| | Banco Santander Mexico SA Institucion de Banca Multiple Grupo Financiero Santander, 4.125%, 11/9/22 144A | | | 2,350,000 | | | | 2,327 | |
| | Banco Votorantim SA, 5.25%, 2/11/16 144A | | | 800,000 | | | | 815 | |
| (b) | | Bank of America Corp., 2.60%, 1/15/19 | | | 3,300,000 | | | | 3,326 | |
| (b) | | Barclays Bank PLC, 7.625%, 11/21/22 | | | 2,000,000 | | | | 2,187 | |
| (b) | | Barclays Bank PLC, 7.75%, 4/10/23 | | | 3,200,000 | | | | 3,488 | |
| (b) | | BPCE SA, 4.00%, 4/15/24 | | | 2,000,000 | | | | 2,090 | |
| | BPCE SA, 4.50%, 3/15/25 144A | | | 1,600,000 | | | | 1,563 | |
| | | | | | | | | | |
| | | Corporate Bonds (42.3%) | | Shares/
$ Par | | | Value
$ (000’s) | |
| |
| | Banking continued | |
| | BPCE SA, 4.625%, 7/11/24 144A | | | 1,400,000 | | | | 1,359 | |
| | Cantor Fitzgerald LP, 7.875%, 10/15/19
144A | | | 1,500,000 | | | | 1,639 | |
| | Cooperatieve Centrale Raiffeisen-Boerenleenbank BA, 11.00%, 12/29/49 144A | | | 200,000 | | | | 257 | |
| | Corpbanca SA, 3.875%, 9/22/19 144A | | | 1,400,000 | | | | 1,404 | |
| | Credit Agricole SA, 8.125%, 9/19/33 | | | 6,500,000 | | | | 7,252 | |
| | Credit Suisse AG, 6.50%, 8/8/23 144A | | | 2,200,000 | | | | 2,415 | |
| | Credit Suisse AG, 6.50%, 8/8/23 | | | 1,700,000 | | | | 1,866 | |
| (b) | | The Goldman Sachs Group, Inc., 4.00%, 3/3/24 | | | 400,000 | | | | 415 | |
| (b) | | The Goldman Sachs Group, Inc., 5.75%, 1/24/22 | | | 400,000 | | | | 463 | |
| (b) | | The Goldman Sachs Group, Inc., 6.75%, 10/1/37 | | | 850,000 | | | | 1,069 | |
| (b) | | The Goldman Sachs Group, Inc., 7.50%, 2/15/19 | | | 400,000 | | | | 476 | |
| | ING Bank NV, 5.80%, 9/25/23 144A | | | 3,000,000 | | | | 3,328 | |
| (b) | | Intesa Sanpaolo SpA, 2.375%, 1/13/17 | | | 800,000 | | | | 807 | |
| | Intesa Sanpaolo SpA, 5.017%, 6/26/24 144A | | | 500,000 | | | | 485 | |
| | Intesa Sanpaolo SpA, 6.50%, 2/24/21 144A | | | 4,100,000 | | | | 4,743 | |
| (b) | | JPMorgan Chase & Co., 7.90%, 4/29/49 | | | 2,200,000 | | | | 2,368 | |
| | KBC Bank NV, 8.00%, 1/25/23 | | | 4,600,000 | | | | 5,176 | |
| | LBG Capital No.1 PLC, 8.50%, 12/29/49 144A | | | 660,000 | | | | 714 | |
| | Macquarie Group, Ltd., 6.25%, 1/14/21 144A | | | 300,000 | | | | 343 | |
| (b) | | Morgan Stanley, 5.50%, 1/26/20 | | | 500,000 | | | | 563 | |
| (b) | | Morgan Stanley, 7.30%, 5/13/19 | | | 400,000 | | | | 474 | |
| (b) | | Royal Bank of Scotland Group PLC, 6.40%, 10/21/19 | | | 1,200,000 | | | | 1,394 | |
| | Royal Bank of Scotland PLC,
9.50%, 3/16/22 | | | 3,200,000 | | | | 3,637 | |
| | UBS AG,
4.75%, 5/22/23 | | | 2,300,000 | | | | 2,321 | |
| | | | | | | | | | |
| | | Corporate Bonds (42.3%) | | Shares/
$ Par | | | Value
$ (000’s) | |
| |
| | Banking continued | |
| | UBS AG of Stamford Connecticut, 7.625%, 8/17/22 | | | 1,400,000 | | | | 1,648 | |
| | UBS AG/Jersey, 7.25%, 2/22/22 | | | 2,700,000 | | | | 2,896 | |
| | Wells Fargo & Co., 7.98%, 3/29/49 | | | 3,100,000 | | | | 3,422 | |
| | | | | | | | | | |
| | Total | | | | | | | 77,711 | |
| | | | | | | | | | |
| |
| | Basic Materials (0.3%) | |
| (b) | | Georgia-Pacific LLC, 8.875%, 5/15/31 | | | 200,000 | | | | 310 | |
| (b) | | Hamilton College, 4.75%, 7/1/13 | | | 100,000 | | | | 90 | |
| (b) | | Reynolds Group Issuer, Inc./Reynolds Group Issuer LLC/Reynolds Group Issuer LU, 7.875%, 8/15/19 | | | 200,000 | | | | 211 | |
| | Sappi Papier Holding GmbH, 7.75%, 7/15/17 144A | | | 400,000 | | | | 428 | |
| (b) | | Weyerhaeuser Co., 7.375%, 10/1/19 | | | 400,000 | | | | 477 | |
| | | | | | | | | | |
| | Total | | | | | | | 1,516 | |
| | | | | | | | | | |
| |
| | Builders & Building Materials (0.4%) | |
| (b) | | Associated Materials LLC/AMH New Finance, Inc., 9.125%, 11/1/17 | | | 600,000 | | | | 495 | |
| | Cemex SAB de CV, 9.50%, 6/15/18 144A | | | 1,300,000 | | | | 1,417 | |
| (b) | | Owens Corning, Inc., 4.20%, 12/1/24 | | | 400,000 | | | | 395 | |
| | | | | | | | | | |
| | Total | | | | | | | 2,307 | |
| | | | | | | | | | |
| |
| | Capital Goods (0.2%) | |
| | NCSG Crane & Heavy Haul Services, 9.50%, 8/15/19 144A | | | 1,000,000 | | | | 850 | |
| | | | | | | | | | |
| | Total | | | | | | | 850 | |
| | | | | | | | | | |
| |
| | Chemicals (0.5%) | |
| (b) | | Ashland, Inc., 3.875%, 4/15/18 | | | 500,000 | | | | 505 | |
| | Braskem Finance, Ltd., 5.75%, 4/15/21 | | | 700,000 | | | | 705 | |
| | EuroChem Mineral & Chemical Co. OJSC via EuroChem GI, Ltd., 5.125%, 12/12/17 144A | | | 900,000 | | | | 772 | |
| | Ineos Finance PLC, 7.50%, 5/1/20 144A | | | 200,000 | | | | 210 | |
| | Ineos Finance PLC, 8.375%, 2/15/19 144A | | | 200,000 | | | | 213 | |
The Accompanying Notes are an Integral Part of the Financial Statements.
| | | | | | |
| | Multi-Sector Bond Portfolio | | | 141 | |
Multi-Sector Bond Portfolio
| | | | | | | | | | |
| | | Corporate Bonds (42.3%) | | Shares/
$ Par | | | Value
$ (000’s) | |
| |
| | Chemicals continued | |
| | Phosagro OAO via Phosagro Bond Funding, Ltd., 4.204%, 2/13/18 144A | | | 200,000 | | | | 172 | |
| | | | | | | | | | |
| | Total | | | | | | | 2,577 | |
| | | | | | | | | | |
| |
| | Consumer Products & Retailing (0.4%) | |
| (b) | | Altria Group, Inc., 10.20%, 2/6/39 | | | 418,000 | | | | 728 | |
| | CVS Pass-Through Trust, 4.704%, 1/10/36 144A | | | 487,846 | | | | 521 | |
| | CVS Pass-Through Trust, 5.926%, 1/10/34 144A | | | 836,541 | | | | 973 | |
| | CVS Pass-Through Trust, 7.507%, 1/10/32 144A | | | 89,305 | | | | 114 | |
| | Sally Holdings LLC/Sally Capital, Inc., 6.875%, 11/15/19 | | | 100,000 | | | | 106 | |
| | | | | | | | | | |
| | Total | | | | | | | 2,442 | |
| | | | | | | | | | |
| |
| | Electric Utilities (1.9%) | |
| (k) | | The AES Corp., 8.00%, 10/15/17 | | | 13,000 | | | | 15 | |
| (k) | | The AES Corp., 8.00%, 6/1/20 | | | 300,000 | | | | 343 | |
| | ContourGlobal Power Holdings SA, 7.125%, 6/1/19 144A | | | 300,000 | | | | 300 | |
| | Dynegy Finance I, Inc./Dynegy Finance II, Inc., 7.625%, 11/1/24 144A | | | 1,875,000 | | | | 1,912 | |
| (k) | | Exelon Generation Co. LLC, 4.25%, 6/15/22 | | | 500,000 | | | | 520 | |
| (k) | | FirstEnergy Corp., 7.375%, 11/15/31 | | | 800,000 | | | | 968 | |
| (k) | | NRG Energy, Inc., 7.625%, 1/15/18 | | | 3,400,000 | | | | 3,732 | |
| (k) | | Puget Energy, Inc., 5.625%, 7/15/22 | | | 200,000 | | | | 231 | |
| | RWE AG, 7.00%, 10/12/72 | | | 800,000 | | | | 856 | |
| | SSE PLC, 5.625%, 9/29/49 | | | 1,600,000 | | | | 1,687 | |
| | | | | | | | | | |
| | Total | | | | | | | 10,564 | |
| | | | | | | | | | |
| |
| | Energy (2.6%) | |
| | Afren PLC, 6.625%, 12/9/20 | | | 2,600,000 | | | | 1,456 | |
| | Borets Finance, Ltd., 7.625%, 9/26/18 144A | | | 1,600,000 | | | | 1,136 | |
| | California Resources Corp., 5.00%, 1/15/20 144A | | | 700,000 | | | | 607 | |
| | California Resources Corp., 5.50%, 9/15/21 144A | | | 600,000 | | | | 513 | |
| | | | | | | | | | |
| | | Corporate Bonds (42.3%) | | Shares/
$ Par | | | Value
$ (000’s) | |
| |
| | Energy continued | |
| | California Resources Corp., 6.00%, 11/15/24 144A | | | 600,000 | | | | 507 | |
| (k) | | CGG SA, 7.75%, 5/15/17 | | | 34,000 | | | | 29 | |
| (k) | | Chesapeake Energy Corp., 3.481%, 4/15/19 | | | 1,500,000 | | | | 1,470 | |
| (k) | | EP Energy LLC/Everest Acquisition Finance, Inc.,
7.75%, 9/1/22 | | | 100,000 | | | | 93 | |
| | Gazprom OAO Via Gaz Capital SA, 6.51%, 3/7/22 144A | | | 200,000 | | | | 179 | |
| (k) | | Harvest Operations Corp., 6.875%, 10/1/17 | | | 100,000 | | | | 96 | |
| | Nakilat, Inc., 6.067%, 12/31/33 | | | 200,000 | | | | 223 | |
| | Novatek OAO via Novatek Finance, Ltd., 4.422%, 12/13/22 144A | | | 3,590,000 | | | | 2,657 | |
| | Novatek OAO via Novatek Finance, Ltd., 6.604%, 2/3/21 144A | | | 1,600,000 | | | | 1,368 | |
| | Odebrecht Drilling Norbe VIII/IX, Ltd., 6.35%, 6/30/21 | | | 1,275,000 | | | | 1,202 | |
| | Petrofac, Ltd., 3.40%, 10/10/18 144A | | | 100,000 | | | | 99 | |
| (k) | | Pride International, Inc., 8.50%, 6/15/19 | | | 500,000 | | | | 599 | |
| | Tullow Oil PLC, 6.25%, 4/15/22 144A | | | 2,600,000 | | | | 2,184 | |
| | | | | | | | | | |
| | Total | | | | | | | 14,418 | |
| | | | | | | | | | |
| |
| | Finance (4.8%) | |
| | AerCap Ireland Capital, Ltd./AerCap Global Aviation Trust, 5.00%, 10/1/21 144A | | | 1,500,000 | | | | 1,552 | |
| | Aviation Capital Group Corp., 3.875%, 9/27/16 144A | | | 1,000,000 | | | | 1,025 | |
| | AWAS Aviation Capital, Ltd., 7.00%, 10/17/16 144A | | | 616,000 | | | | 630 | |
| (k) | | CIT Group, Inc., 3.875%, 2/19/19 | | | 800,000 | | | | 798 | |
| (k) | | CIT Group, Inc., 4.25%, 8/15/17 | | | 100,000 | | | | 102 | |
| (k) | | CIT Group, Inc., 5.25%, 3/15/18 | | | 2,700,000 | | | | 2,815 | |
| (k) | | GATX Corp., 4.75%, 6/15/22 | | | 200,000 | | | | 220 | |
| (k) | | General Electric Capital Corp., 6.25%, 12/29/49 | | | 2,300,000 | | | | 2,504 | |
| | | | | | | | | | |
| | | Corporate Bonds (42.3%) | | Shares/
$ Par | | | Value
$ (000’s) | |
| |
| | Finance continued | |
| (k) | | International Lease Finance Corp., 5.875%, 4/1/19 | | | 1,400,000 | | | | 1,509 | |
| | International Lease Finance Corp., 6.75%, 9/1/16 144A | | | 1,200,000 | | | | 1,278 | |
| | Navient Corp., 4.875%, 6/17/19 | | | 1,200,000 | | | | 1,203 | |
| | Navient Corp., 6.00%, 1/25/17 | | | 100,000 | | | | 105 | |
| | Navient Corp., 6.25%, 1/25/16 | | | 3,200,000 | | | | 3,328 | |
| (k) | | Navient Corp., 8.45%, 6/15/18 | | | 1,100,000 | | | | 1,227 | |
| | OneMain Financial Holdings, Inc., 6.75%, 12/15/19 144A | | | 600,000 | | | | 612 | |
| | OneMain Financial Holdings, Inc., 7.25%, 12/15/21 144A | | | 600,000 | | | | 615 | |
| (k) | | PHH Corp., 6.375%, 8/15/21 | | | 1,100,000 | | | | 1,008 | |
| | SCF Capital, Ltd., 5.375%, 10/27/17 144A | | | 2,500,000 | | | | 2,047 | |
| (k) | | Springleaf Finance Corp., 5.75%, 9/15/16 | | | 300,000 | | | | 310 | |
| (k) | | Springleaf Finance Corp., 6.50%, 9/15/17 | | | 700,000 | | | | 735 | |
| | Springleaf Finance Corp., 6.90%, 12/15/17 | | | 2,200,000 | | | | 2,343 | |
| | | | | | | | | | |
| | Total | | | | | | | 25,966 | |
| | | | | | | | | | |
| |
| | Healthcare (0.8%) | |
| (k) | | Boston Scientific Corp., 6.00%, 1/15/20 | | | 1,200,000 | | | | 1,352 | |
| (k) | | CHS/Community Health Systems, Inc., 5.125%, 8/1/21 | | | 200,000 | | | | 208 | |
| (k) | | HCA, Inc., 6.50%, 2/15/20 | | | 2,000,000 | | | | 2,241 | |
| | Tenet Healthcare Corp., 4.50%, 4/1/21 | | | 300,000 | | | | 301 | |
| | | | | | | | | | |
| | Total | | | | | | | 4,102 | |
| | | | | | | | | | |
| |
| | Insurance (0.6%) | |
| (k) | | AXA SA, 8.60%, 12/15/30 | | | 2,000,000 | | | | 2,717 | |
| | The Doctors Co., 6.50%, 10/15/23 144A | | | 300,000 | | | | 330 | |
| | | | | | | | | | |
| | Total | | | | | | | 3,047 | |
| | | | | | | | | | |
| |
| | Media (1.9%) | |
| (k) | | CSC Holdings LLC, 7.625%, 7/15/18 | | | 800,000 | | | | 899 | |
| (k) | | CSC Holdings LLC, 8.625%, 2/15/19 | | | 200,000 | | | | 232 | |
| (k) | | DISH DBS Corp., 5.125%, 5/1/20 | | | 3,800,000 | | | | 3,828 | |
| | Numericable Group SA, 4.875%, 5/15/19 144A | | | 400,000 | | | | 397 | |
The Accompanying Notes are an Integral Part of the Financial Statements.
| | | | |
| 142 | | Multi-Sector Bond Portfolio | | |
Multi-Sector Bond Portfolio
| | | | | | | | | | |
| | | Corporate Bonds (42.3%) | | Shares/
$ Par | | | Value
$ (000’s) | |
| |
| | Media continued | |
| | Numericable Group SA, 6.00%, 5/15/22 144A | | | 900,000 | | | | 905 | |
| | Numericable Group SA, 6.25%, 5/15/24 144A | | | 2,400,000 | | | | 2,418 | |
| | UPCB Finance III, Ltd., 6.625%, 7/1/20 144A | | | 400,000 | | | | 420 | |
| | UPCB Finance V, Ltd., 7.25%, 11/15/21 144A | | | 200,000 | | | | 219 | |
| | UPCB Finance VI, Ltd., 6.875%, 1/15/22 144A | | | 150,000 | | | | 163 | |
| | Viacom, Inc., 5.85%, 9/1/43 | | | 100,000 | | | | 111 | |
| | Virgin Media Secured Finance PLC, 5.25%, 1/15/21 | | | 700,000 | | | | 732 | |
| | | | | | | | | | |
| | Total | | | | | | | 10,324 | |
| | | | | | | | | | |
| |
| | Metals & Mining (4.6%) | |
| | ALROSA Finance SA, 7.75%, 11/3/20 144A | | | 1,500,000 | | | | 1,410 | |
| | ALROSA Finance SA, 7.75%, 11/3/20 | | | 900,000 | | | | 846 | |
| | Anglo American Capital PLC, 4.125%, 4/15/21 144A | | | 200,000 | | | | 201 | |
| | Anglo American Capital PLC, 4.125%, 9/27/22 144A | | | 1,100,000 | | | | 1,089 | |
| (k) | | AngloGold Ashanti Holdings PLC, 5.375%, 4/15/20 | | | 100,000 | | | | 96 | |
| (k) | | AngloGold Ashanti Holdings PLC, 6.50%, 4/15/40 | | | 1,000,000 | | | | 881 | |
| (k) | | ArcelorMittal, 4.25%, 8/5/15 | | | 1,500,000 | | | | 1,522 | |
| | CONSOL Energy, Inc., 5.875%, 4/15/22 144A | | | 400,000 | | | | 372 | |
| | CSN Resources SA, 6.50%, 7/21/20 | | | 100,000 | | | | 92 | |
| | Glencore Finance Canada, Ltd., 2.70%, 10/25/17 144A | | | 5,300,000 | | | | 5,362 | |
| | Gold Fields Orogen Holding BVI, Ltd., 4.875%, 10/7/20 | | | 3,400,000 | | | | 2,856 | |
| | GTL Trade Finance, Inc., 5.893%, 4/29/24 144A | | | 2,490,000 | | | | 2,403 | |
| | Metalloinvest Finance, Ltd., 6.50%, 7/21/16 | | | 200,000 | | | | 189 | |
| | OAO Novolipetsk Steel via Steel Funding, Ltd., 4.45%, 2/19/18 144A | | | 1,500,000 | | | | 1,327 | |
| | Severstal OAO Via Steel Capital SA, 4.45%, 3/19/18 144A | | | 1,000,000 | | | | 860 | |
| | Severstal OAO Via Steel Capital SA, 6.70%, 10/25/17 144A | | | 700,000 | | | | 646 | |
| | | | | | | | | | |
| | | Corporate Bonds (42.3%) | | Shares/
$ Par | | | Value
$ (000’s) | |
| |
| | Metals & Mining continued | |
| | Southern Copper Corp., 5.25%, 11/8/42 | | | 1,700,000 | | | | 1,519 | |
| | Southern Copper Corp., 6.75%, 4/16/40 | | | 800,000 | | | | 839 | |
| | Southern Copper Corp., 7.50%, 7/27/35 | | | 200,000 | | | | 225 | |
| | Steel Dynamics, Inc., 7.625%, 3/15/20 | | | 300,000 | | | | 313 | |
| | Vale Overseas, Ltd., 4.375%, 1/11/22 | | | 800,000 | | | | 767 | |
| | Vale Overseas, Ltd., 4.625%, 9/15/20 | | | 400,000 | | | | 404 | |
| | Vale Overseas, Ltd., 6.875%, 11/21/36 | | | 700,000 | | | | 738 | |
| | Vale Overseas, Ltd., 6.875%, 11/10/39 | | | 300,000 | | | | 319 | |
| | | | | | | | | | |
| | Total | | | | | | | 25,276 | |
| | | | | | | | | | |
| |
| | Oil & Gas (0.5%) | |
| | BG Energy Capital PLC, 6.50%, 11/30/72 | | | 700,000 | | | | 750 | |
| | Borets Finance, Ltd., 7.625%, 9/26/18 | | | 1,100,000 | | | | 781 | |
| | EDC Finance, Ltd., 4.875%, 4/17/20 | | | 400,000 | | | | 258 | |
| | Reliance Holdings USA, Inc., 4.50%, 10/19/20 | | | 300,000 | | | | 313 | |
| | Rosneft Finance SA, 7.25%, 2/2/20 144A | | | 400,000 | | | | 346 | |
| | Rosneft Finance SA, 7.875%, 3/13/18 144A | | | 100,000 | | | | 92 | |
| | | | | | | | | | |
| | Total | | | | | | | 2,540 | |
| | | | | | | | | | |
| |
| | Pharmaceuticals (0.5%) | |
| (k) | | Amgen, Inc., 5.375%, 5/15/43 | | | 900,000 | | | | 1,045 | |
| | Endo Finance LLC, 5.75%, 1/15/22 144A | | | 300,000 | | | | 300 | |
| | Endo Finance LLC & Endo Finco, Inc., 5.375%, 1/15/23 144A | | | 900,000 | | | | 882 | |
| (k) | | Hospira, Inc., 5.80%, 8/12/23 | | | 200,000 | | | | 224 | |
| | Mallinckrodt International Finance SA/Mallinckrodt CB LLC, 5.75%, 8/1/22 144A | | | 400,000 | | | | 411 | |
| | | | | | | | | | |
| | Total | | | | | | | 2,862 | |
| | | | | | | | | | |
| |
| | Pipelines (1.8%) | |
| | Hiland Partners LP/Hiland Partners Finance Corp., 5.50%, 5/15/22 144A | | | 100,000 | | | | 88 | |
| | Hiland Partners LP/Hiland Partners Finance Corp., 7.25%, 10/1/20 144A | | | 100,000 | | | | 95 | |
| | | | | | | | | | |
| | | Corporate Bonds (42.3%) | | Shares/
$ Par | | | Value
$ (000’s) | |
| |
| | Pipelines continued | |
| (k) | | Kinder Morgan, Inc., 7.75%, 1/15/32 | | | 916,000 | | | | 1,127 | |
| (k) | | Kinder Morgan, Inc., 8.25%, 2/15/16 | | | 100,000 | | | | 106 | |
| | Midcontinent Express Pipeline LLC, 6.70%, 9/15/19 144A | | | 1,700,000 | | | | 1,861 | |
| (k) | | Regency Energy Partners LP/Regency Energy Finance Corp., 5.00%, 10/1/22 | | | 1,100,000 | | | | 1,039 | |
| (k) | | Regency Energy Partners LP/Regency Energy Finance Corp., 5.75%, 9/1/20 | | | 300,000 | | | | 301 | |
| | Rockies Express Pipeline LLC, 5.625%, 4/15/20 144A | | | 1,000,000 | | | | 983 | |
| | Rockies Express Pipeline LLC, 6.85%, 7/15/18 144A | | | 2,900,000 | | | | 2,987 | |
| | Sabine Pass Liquefaction LLC, 5.75%, 5/15/24 | | | 300,000 | | | | 294 | |
| | Sabine Pass LNG LP, 7.50%, 11/30/16 144A | | | 100,000 | | | | 104 | |
| | Sabine Pass LNG LP, 7.50%, 11/30/16 | | | 100,000 | | | | 104 | |
| (d) | | Selectica, 8.75%, 11/15/15 | | | 500,000 | | | | — | |
| | Tesoro Logistics LP/Tesoro Logistics Finance Corp., 5.875%, 10/1/20 | | | 469,000 | | | | 470 | |
| | Tesoro Logistics LP/Tesoro Logistics Finance Corp., 6.25%, 10/15/22 144A | | | 100,000 | | | | 100 | |
| | | | | | | | | | |
| | Total | | | | | | | 9,659 | |
| | | | | | | | | | |
| |
| | Real Estate Investment Trusts (0.5%) | |
| | Deutsche Annington Finance BV, 5.00%, 10/2/23 144A | | | 300,000 | | | | 314 | |
| | Goodman Funding Pty., Ltd., 6.375%, 4/15/21 144A | | | 1,000,000 | | | | 1,151 | |
| | OMEGA Healthcare Investors, Inc., 4.50%, 1/15/25 144A | | | 100,000 | | | | 99 | |
| (k) | | OMEGA Healthcare Investors, Inc., 4.95%, 4/1/24 | | | 100,000 | | | | 104 | |
| (k) | | SL Green Realty Corp., 5.00%, 8/15/18 | | | 1,100,000 | | | | 1,180 | |
| | | | | | | | | | |
| | Total | | | | | | | 2,848 | |
| | | | | | | | | | |
| |
| | Services (0.1%) | |
| (k) | | QVC, Inc., 4.375%, 3/15/23 | | | 500,000 | | | | 502 | |
The Accompanying Notes are an Integral Part of the Financial Statements.
| | | | | | |
| | Multi-Sector Bond Portfolio | | | 143 | |
Multi-Sector Bond Portfolio
| | | | | | | | | | |
| | | Corporate Bonds (42.3%) | | Shares/
$ Par | | | Value
$ (000’s) | |
| |
| | Services continued | |
| (k) | | QVC, Inc., 4.85%, 4/1/24 | | | 100,000 | | | | 102 | |
| | | | | | | | | | |
| | Total | | | | | | | 604 | |
| | | | | | | | | | |
| |
| | Technology (0.4%) | |
| | Alliance Data Systems Corp., 5.25%, 12/1/17 144A | | | 600,000 | | | | 618 | |
| | Denali Borrower LLC/Denali Finance Corp., 5.625%, 10/15/20 144A | | | 800,000 | | | | 832 | |
| (k) | | Flextronics International, Ltd.,
4.625%, 2/15/20 | | | 200,000 | | | | 203 | |
| | NXP BV/NXP Funding LLC, 3.50%, 9/15/16 144A | | | 400,000 | | | | 404 | |
| | | | | | | | | | |
| | Total | | | | | | | 2,057 | |
| | | | | | | | | | |
| |
| | Telecommunications (3.6%) | |
| (k) | | American Tower Corp., 7.25%, 5/15/19 | | | 1,500,000 | | | | 1,752 | |
| (k) | | Deutsche Telekom International Finance BV,
8.75%, 6/15/30 | | | 700,000 | | | | 1,034 | |
| | Digicel Group, Ltd., 8.25%, 9/30/20 144A | | | 600,000 | | | | 582 | |
| | Eileme 2 AB, 11.625%, 1/31/20 144A | | | 600,000 | | | | 672 | |
| | Millicom International Cellular SA, 6.625%, 10/15/21 144A | | | 200,000 | | | | 208 | |
| | Qwest Corp., 7.25%, 9/15/25 | | | 500,000 | | | | 595 | |
| | Sprint Communications, Inc.,
7.00%, 8/15/20 | | | 700,000 | | | | 700 | |
| | Sprint Corp., 7.125%, 6/15/24 | | | 2,300,000 | | | | 2,139 | |
| | Sprint Corp., 7.875%, 9/15/23 | | | 2,500,000 | | | | 2,468 | |
| | T-Mobile USA, Inc., 6.00%, 3/1/23 | | | 400,000 | | | | 401 | |
| | T-Mobile USA, Inc., 6.25%, 4/1/21 | | | 600,000 | | | | 614 | |
| | T-Mobile USA, Inc., 6.542%, 4/28/20 | | | 600,000 | | | | 620 | |
| | Verizon Communications, Inc.,
6.55%, 9/15/43 | | | 1,565,000 | | | | 2,005 | |
| | Vimpel Communications Via VIP Finance Ireland, Ltd., 7.748%, 2/2/21 144A | | | 1,200,000 | | | | 997 | |
| | Vimpel Communications Via VIP Finance Ireland, Ltd., 9.125%, 4/30/18 144A | | | 900,000 | | | | 846 | |
| | | | | | | | | | |
| | | Corporate Bonds (42.3%) | | Shares/
$ Par | | | Value
$ (000’s) | |
| |
| | Telecommunications continued | |
| | VimpelCom Holdings BV, 7.504%, 3/1/22 144A | | | 3,700,000 | | | | 2,997 | |
| | Wind Acquisition
Finance SA,
7.375%, 4/23/21 144A | | | 1,000,000 | | | | 944 | |
| | | | | | | | | | |
| | Total | | | | | | | 19,574 | |
| | | | | | | | | | |
| |
| | Transportation (1.1%) | |
| (k) | | American Airlines Pass
Through Trust,
3.70%, 10/1/26 | | | 600,000 | | | | 603 | |
| (k) | | American Airlines Pass
Through Trust,
5.25%, 1/31/21 | | | 153,409 | | | | 165 | |
| | Asciano Finance, Ltd.,
4.625%, 9/23/20 144A | | | 500,000 | | | | 522 | |
| (k) | | Asciano Finance, Ltd.,
5.00%,
4/7/18 144A | | | 800,000 | | | | 860 | |
| | Brunswick Rail Finance, Ltd., 6.50%,
11/1/17 144A | | | 2,700,000 | | | | 1,107 | |
| (k) | | Continental Airlines
Pass Through Trust,
4.75%, 1/12/21 | | | 82,978 | | | | 88 | |
| (k) | | Continental Airlines Pass Through Trust,
7.25%, 11/10/19 | | | 232,395 | | | | 269 | |
| | DP World Sukuk, Ltd.,
6.25%, 7/2/17 | | | 200,000 | | | | 217 | |
| | DP World, Ltd.,
6.85%, 7/2/37 | | | 500,000 | | | | 564 | |
| | United Airlines Pass
Through Trust,
4.30%, 8/15/25 | | | 100,000 | | | | 104 | |
| | US Airways Pass-Through Trust,
5.90%, 10/1/24 | | | 1,341,471 | | | | 1,496 | |
| | The Virgin
Australia Trust,
5.00%, 10/23/23 144A | | | 89,501 | | | | 92 | |
| | | | | | | | | | |
| | Total | | | | | | | 6,087 | |
| | | | | | | | | | |
| | |
| | Total Corporate Bonds | | | | | |
| | (Cost: $235,084) | | | | 230,717 | |
| | | | | | | | | | |
| | | |
| | | Foreign Bonds (19.4%) | | Par | | | Value
$ (000’s) | |
| |
| | Aerospace & Defense (0.6%) | |
| (f) | | Finmeccanica SpA,
8.00%, 12/16/19 GBP | | | 1,900,000 | | | | 3,451 | |
| | | | | | | | | | |
| | Total | | | | | | | 3,451 | |
| | | | | | | | | | |
| |
| | Autos & Vehicle Parts (1.0%) | |
| (f) | | Fiat Chrysler
Finance Europe,
7.00%, 3/23/17 EUR | | | 2,900,000 | | | | 3,829 | |
| (c),(f) | | Schaeffler Holding
Finance BV,
5.75%, 11/15/21 144A EUR | | | 1,100,000 | | | | 1,418 | |
| | | | | | | | | | |
| | | Foreign Bonds (19.4%) | | Par | | | Value
$ (000’s) | |
| |
| | Autos & Vehicle Parts continued | |
| (c),(f) | | Schaeffler Holding
Finance BV,
6.875%, 8/15/18 EUR | | | 200,000 | | | | 252 | |
| | | | | | | | | | |
| | Total | | | | | | | 5,499 | |
| | | | | | | | | | |
| |
| | Banking (6.9%) | |
| (f) | | Alpha Credit Group PLC, 3.375%, 6/17/17 EUR | | | 2,400,000 | | | | 2,485 | |
| (f) | | Banco Nacional de Desenvolvimento Economico e Social, 4.125%, 9/15/17 144A EUR | | | 300,000 | | | | 365 | |
| (f) | | Banco Popolare SC, 2.375%, 1/22/18 EUR | | | 900,000 | | | | 1,097 | |
| (f) | | Banco Popolare SC, 3.50%, 3/14/19 EUR | | | 3,800,000 | | | | 4,794 | |
| (f) | | Banco Popular Espanol SA, 11.50%, 10/29/49 EUR | | | 1,500,000 | | | | 2,066 | |
| (f) | | Bank of Scotland PLC, 6.375%, 8/16/19 GBP | | | 100,000 | | | | 178 | |
| (f) | | Bankia SA, 4.00%, 5/22/24 EUR | | | 2,000,000 | | | | 2,364 | |
| (f) | | Barclays Bank PLC, 10.00%, 5/21/21 GBP | | | 2,050,000 | | | | 4,230 | |
| (f) | | Barclays Bank PLC, 14.00%, 11/29/49 GBP | | | 800,000 | | | | 1,637 | |
| (f) | | Cooperatieve Centrale Raiffeisen-Boerenleenbank BA of Netherlands, 6.875%, 3/19/20 EUR | | | 3,000,000 | | | | 4,302 | |
| (f) | | Credit Suisse AG, 5.75%, 9/18/25 EUR | | | 300,000 | | | | 410 | |
| (f) | | ERB Hellas PLC, 4.25%, 6/26/18 EUR | | | 800,000 | | | | 801 | |
| (f) | | HBOS PLC, 5.374%, 6/30/21 EUR | | | 600,000 | | | | 813 | |
| (f) | | LBG Capital No.1 PLC, 7.869%, 8/25/20 GBP | | | 800,000 | | | | 1,259 | |
| (f) | | LBG Capital No.2 PLC, 15.00%, 12/21/19 EUR | | | 700,000 | | | | 1,252 | |
| (f) | | LBG Capital No.2 PLC, 15.00%, 12/21/19 GBP | | | 400,000 | | | | 855 | |
| (f) | | Lloyds Bank PLC, 7.625%, 4/22/25 GBP | | | 1,200,000 | | | | 2,413 | |
| (f) | | Nationwide Building Society, 10.25%, 6/29/49 GBP | | | 1,200,000 | | | | 2,357 | |
| (f) | | Novo Banco SA, 3.875%, 1/21/15 EUR | | | 100,000 | | | | 120 | |
| (f) | | Novo Banco SA, 5.00%, 4/23/19 EUR | | | 500,000 | | | | 579 | |
| (f) | | Novo Banco SA, 5.00%, 5/14/19 EUR | | | 300,000 | | | | 355 | |
The Accompanying Notes are an Integral Part of the Financial Statements.
| | | | |
| 144 | | Multi-Sector Bond Portfolio | | |
Multi-Sector Bond Portfolio
| | | | | | | | | | |
| | | Foreign Bonds (19.4%) | | Par | | | Value
$ (000’s) | |
| |
| | Banking continued | |
| (f) | | Novo Banco SA, 5.00%, 5/21/19 EUR | | | 100,000 | | | | 118 | |
| (f) | | Novo Banco SA, 5.00%, 5/23/19 EUR | | | 700,000 | | | | 827 | |
| (f) | | Novo Banco SA, 5.875%, 11/9/15 EUR | | | 200,000 | | | | 244 | |
| (f) | | Novo Banco SA, 7.00%, 3/4/16 EUR | | | 200,000 | | | | 242 | |
| (f) | | Piraeus Group Finance PLC, 5.00%, 3/27/17 EUR | | | 1,200,000 | | | | 1,239 | |
| | | | | | | | | | |
| | Total | | | | | | | 37,402 | |
| | | | | | | | | | |
| |
| | Basic Materials (0.3%) | |
| (f) | | KP Germany Erste GmbH, 11.625%, 7/15/17 EUR | | | 200,000 | | | | 259 | |
| (f) | | OI European Group BV, 6.75%, 9/15/20 EUR | | | 200,000 | | | | 287 | |
| (f) | | Smurfit Kappa Acquisitions, 4.125%, 1/30/20 144A EUR | | | 300,000 | | | | 392 | |
| (c),(f) | | Xella Holdco Finance SA, 9.125%, 9/15/18 EUR | | | 400,000 | | | | 494 | |
| | | | | | | | | | |
| | Total | | | | | | | 1,432 | |
| | | | | | | | | | |
| |
| | Builders & Building Materials (1.0%) | |
| (f) | | HeidelbergCement Finance Luxembourg SA, 8.50%, 10/31/19 EUR | | | 1,400,000 | | | | 2,234 | |
| (f) | | HeidelbergCement Finance Luxembourg SA, 9.50%, 12/15/18 EUR | | | 300,000 | | | | 475 | |
| (f) | | Lafarge SA, 6.25%, 4/13/18 EUR | | | 700,000 | | | | 962 | |
| (f) | | Lafarge SA, 6.625%, 11/29/18 EUR | | | 1,000,000 | | | | 1,413 | |
| (f) | | Lafarge SA, 6.75%, 12/16/19 EUR | | | 400,000 | | | | 588 | |
| | | | | | | | | | |
| | Total | | | | | | | 5,672 | |
| | | | | | | | | | |
| |
| | Capital Goods (0.4%) | |
| (f) | | Obrascon Huarte Lain SA, 7.625%, 3/15/20 EUR | | | 600,000 | | | | 755 | |
| (f) | | Obrascon Huarte Lain SA, 8.75%, 3/15/18 EUR | | | 1,200,000 | | | | 1,519 | |
| | | | | | | | | | |
| | Total | | | | | | | 2,274 | |
| | | | | | | | | | |
| |
| | Chemicals (0.7%) | |
| (f) | | Algeco Scotsman Global Finance PLC, 9.00%, 10/15/18 EUR | | | 1,950,000 | | | | 2,402 | |
| (f) | | Ineos Group Holdings SA,
6.50%, 8/15/18 EUR | | | 1,200,000 | | | | 1,426 | |
| | | | | | | | | | |
| | Total | | | | | | | 3,828 | |
| | | | | | | | | | |
| | | | | | | | | | |
| | | Foreign Bonds (19.4%) | | Par | | | Value
$ (000’s) | |
| |
| | Consumer Products & Retailing (2.2%) | |
| (e),(f) | | Co-operative Group Holdings, Ltd., 6.875%, 7/8/20 GBP | | | 2,400,000 | | | | 3,862 | |
| (f) | | DFS Furniture Holdings PLC, 7.625%, 8/15/18 GBP | | | 100,000 | | | | 161 | |
| (f) | | Indesit Co. SPA, 4.50%, 4/26/18 EUR | | | 1,800,000 | | | | 2,370 | |
| (f) | | Marks & Spencer PLC, 6.125%, 12/6/21 GBP | | | 300,000 | | | | 551 | |
| (f) | | Safeway, Ltd., 6.125%, 12/17/18 GBP | | | 300,000 | | | | 519 | |
| (f) | | Spirit Issuer PLC, 6.582%, 12/28/27 GBP | | | 900,000 | | | | 1,459 | |
| (f) | | Stretford 79 PLC, 6.25%, 7/15/21 GBP | | | 400,000 | | | | 490 | |
| (f) | | TeamSystem Holding SPA, 7.375%, 5/15/20 EUR | | | 2,000,000 | | | | 2,525 | |
| | | | | | | | | | |
| | Total | | | | | | | 11,937 | |
| | | | | | | | | | |
| |
| | Electric Utilities (0.4%) | |
| (f) | | SSE PLC, 5.625%, 9/29/49 EUR | | | 1,500,000 | | | | 1,967 | |
| | | | | | | | | | |
| | Total | | | | | | | 1,967 | |
| | | | | | | | | | |
| |
| | Finance (0.0%) | |
| (f) | | Stonegate Pub Co. Financing PLC, 5.31%, 4/15/19 144A GBP | | | 100,000 | | | | 154 | |
| | | | | | | | | | |
| | Total | | | | | | | 154 | |
| | | | | | | | | | |
| |
| | Insurance (0.4%) | |
| (f) | | CNP Assurances, 6.00%, 9/14/40 EUR | | | 100,000 | | | | 140 | |
| (f) | | CNP Assurances, 6.875%, 9/30/41 EUR | | | 200,000 | | | | 295 | |
| (f) | | CNP Assurances, 7.375%, 9/30/41 GBP | | | 1,000,000 | | | | 1,787 | |
| | | | | | | | | | |
| | Total | | | | | | | 2,222 | |
| | | | | | | | | | |
| |
| | Media (1.4%) | |
| (f) | | LGE HoldCo VI BV, 7.125%, 5/15/24 EUR | | | 1,600,000 | | | | 2,131 | |
| (f) | | Numericable Group SA, 5.375%, 5/15/22 EUR | | | 100,000 | | | | 125 | |
| (f) | | Numericable Group SA, 5.625%, 5/15/24 EUR | | | 100,000 | | | | 125 | |
| (f) | | Telenet Finance V Luxembourg SCA, 6.75%, 8/15/24 EUR | | | 1,100,000 | | | | 1,491 | |
| (e),(f) | | Unitymedia Hessen GmbH & Co. KG/Unitymedia NRW GmbH, 5.625%, 4/15/23 144A EUR | | | 300,000 | | | | 393 | |
| | | | | | | | | | |
| | | Foreign Bonds (19.4%) | | Par | | | Value
$ (000’s) | |
| |
| | Media continued | |
| (f) | | Unitymedia Hessen GmbH & Co. KG/Unitymedia NRW GmbH, 5.625%, 4/15/23 EUR | | | 200,000 | | | | 262 | |
| (f) | | Unitymedia Hessen GmbH & Co. KG/Unitymedia NRW GmbH, 5.75%, 1/15/23 EUR | | | 100,000 | | | | 131 | |
| (f) | | Unitymedia KabelBW GmbH, 9.50%, 3/15/21 EUR | | | 100,000 | | | | 135 | |
| (f) | | UPCB Finance II, Ltd., 6.375%, 7/1/20 EUR | | | 400,000 | | | | 507 | |
| (f) | | Virgin Media Secured Finance PLC, 5.50%, 1/15/21 GBP | | | 1,300,000 | | | | 2,170 | |
| | | | | | | | | | |
| | Total | | | | | | | 7,470 | |
| | | | | | | | | | |
| |
| | Municipal Bonds (1.4%) | |
| (f) | | The Autonomous Community of Catalonia, 4.95%, 2/11/20 EUR | | | 1,500,000 | | | | 2,012 | |
| (f) | | Heta Asset Resolution AG,
4.25%, 10/31/16 EUR | | | 1,600,000 | | | | 1,346 | |
| (f) | | Heta Asset Resolution AG,
4.375%, 1/24/17 EUR | | | 4,850,000 | | | | 4,049 | |
| | | | | | | | | | |
| | Total | | | | | | | 7,407 | |
| | | | | | | | | | |
| |
| | Oil & Gas (0.2%) | |
| (f) | | BG Energy Capital PLC, 6.50%, 11/30/72 GBP | | | 800,000 | | | | 1,322 | |
| | | | | | | | | | |
| | Total | | | | | | | 1,322 | |
| | | | | | | | | | |
| |
| | Structured Products (0.5%) | |
| (f) | | EMF-NL BV, 0.881%, 4/17/41 EUR | | | 266,568 | | | | 306 | |
| (f) | | Eurosail-NL BV, 1.581%, 10/17/40 EUR | | | 185,034 | | | | 223 | |
| (f) | | Mitchells & Butlers Finance PLC, 1.01%, 12/15/30 GBP | | | 83,780 | | | | 121 | |
| (f) | | Tesco Property Finance 2 PLC, 6.052%, 10/13/39 GBP | | | 653,506 | | | | 1,065 | |
| (f) | | The Unique Pub Finance Co. PLC, 6.542%, 3/30/21 GBP | | | 691,840 | | | | 1,115 | |
| | | | | | | | | | |
| | Total | | | | | | | 2,830 | |
| | | | | | | | | | |
| |
| | Telecommunications (1.8%) | |
| (f) | | Altice SA,
7.25%, 5/15/22 EUR | | | 200,000 | | | | 245 | |
| (f) | | Koninklijke KPN NV, 6.125%, 3/29/49 EUR | | | 1,500,000 | | | | 1,940 | |
The Accompanying Notes are an Integral Part of the Financial Statements.
| | | | | | |
| | Multi-Sector Bond Portfolio | | | 145 | |
Multi-Sector Bond Portfolio
| | | | | | | | | | |
| | | Foreign Bonds (19.4%) | | Par | | | Value
$ (000’s) | |
| |
| | Telecommunications continued | |
| (f) | | Telecom Italia SpA, 5.375%, 1/29/19 EUR | | | 2,000,000 | | | | 2,700 | |
| (f) | | Telecom Italia SpA, 6.375%, 6/24/19 GBP | | | 700,000 | | | | 1,199 | |
| (f) | | Telefonica Europe BV, 6.50%, 9/29/49 EUR | | | 200,000 | | | | 265 | |
| (f) | | Telenet Finance III Luxembourg SCA, 6.625%, 2/15/21 144A EUR | | | 100,000 | | | | 128 | |
| (f) | | Telenet Finance V Luxembourg SCA, 6.25%, 8/15/22 144A EUR | | | 100,000 | | | | 132 | |
| (f) | | Wind Acquisition Finance SA, 4.00%, 7/15/20 EUR | | | 1,000,000 | | | | 1,187 | |
| (f) | | Wind Acquisition Finance SA, 7.00%, 4/23/21 EUR | | | 1,900,000 | | | | 2,248 | |
| | | | | | | | | | |
| | Total | | | | | | | 10,044 | |
| | | | | | | | | | |
| |
| | Transportation (0.2%) | |
| (f) | | Europcar Groupe SA, 11.50%, 5/15/17 EUR | | | 700,000 | | | | 949 | |
| | | | | | | | | | |
| | Total | | | | | | | 949 | |
| | | | | | | | | | |
| | |
| | Total Foreign Bonds | | | | | |
| | (Cost: $115,802) | | | | 105,860 | |
| | | | | | | | | | |
| | | |
| | | Governments (20.0%) | | | | | | |
| | |
| | Foreign Agencies (11.4%) | | | | | |
| | AK Transneft OJSC Via TransCapitalInvest, Ltd., 8.70%, 8/7/18 144A | | | 1,000,000 | | | | 1,030 | |
| (k) | | Banco do Brasil SA, 3.875%, 10/10/22 | | | 4,300,000 | | | | 3,945 | |
| | Banco do Brasil SA, 6.00%, 1/22/20 144A | | | 200,000 | | | | 212 | |
| (f) | | Banco do Brasil SA, 3.75%, 7/25/18 144A EUR | | | 300,000 | | | | 364 | |
| | Banco Nacional de Desenvolvimento Economico e Social, 3.375%, 9/26/16 144A | | | 700,000 | | | | 702 | |
| | Banco Nacional de Desenvolvimento Economico e Social, 4.00%, 4/14/19 144A | | | 2,100,000 | | | | 2,068 | |
| (k) | | Banco Nacional de Desenvolvimento Economico e Social, 6.50%, 6/10/19 | | | 2,000,000 | | | | 2,120 | |
| (k) | | Centrais Eletricas Brasileiras SA, 6.875%, 7/30/19 | | | 600,000 | | | | 612 | |
| | Dolphin Energy, Ltd., 5.50%, 12/15/21 144A | | | 1,500,000 | | | | 1,688 | |
| | | | | | | | | | |
| | | Governments (20.0%) | | Par | | | Value
$ (000’s) | |
| | |
| | Foreign Agencies continued | | | | | |
| | DP World, Ltd., 6.85%, 7/2/37 144A | | | 200,000 | | | | 226 | |
| (k) | | Ecopetrol SA, 7.375%, 9/18/43 | | | 1,400,000 | | | | 1,512 | |
| (k) | | Ecopetrol SA, 7.625%, 7/23/19 | | | 720,000 | | | | 824 | |
| (k) | | Eksportfinans ASA, 2.00%, 9/15/15 | | | 1,500,000 | | | | 1,502 | |
| (k) | | Eksportfinans ASA, 2.375%, 5/25/16 | | | 1,900,000 | | | | 1,904 | |
| (k) | | Eksportfinans ASA, 5.50%, 5/25/16 | | | 200,000 | | | | 209 | |
| (k) | | Eksportfinans ASA, 5.50%, 6/26/17 | | | 100,000 | | | | 107 | |
| (k) | | Electricite de France SA, 5.25%, 1/29/49 | | | 2,200,000 | | | | 2,255 | |
| | Electricite de France SA, 5.625%, 12/29/49 144A | | | 500,000 | | | | 527 | |
| (k),(f) | | EnBW Energie Baden-Wuerttemberg AG, 7.375%, 4/2/72 EUR | | | 764,000 | | | | 1,030 | |
| | Gazprom Neft OAO Via GPN Capital SA, 6.00%, 11/27/23 144A | | | 3,000,000 | | | | 2,385 | |
| | Gazprom OAO Via Gaz Capital SA, 3.85%, 2/6/20 144A | | | 1,400,000 | | | | 1,148 | |
| (k) | | Gazprom OAO Via Gaz Capital SA, 6.51%, 3/7/22 | | | 1,000,000 | | | | 895 | |
| | Gazprom OAO Via Gaz Capital SA, 8.625%, 4/28/34 | | | 3,100,000 | | | | 3,108 | |
| | Israel Electric Corp., Ltd., 7.25%, 1/15/19 144A | | | 200,000 | | | | 223 | |
| | Majapahit Holding BV, 7.25%, 6/28/17 | | | 100,000 | | | | 110 | |
| | Majapahit Holding BV, 7.75%, 1/20/20 144A | | | 900,000 | | | | 1,042 | |
| | Majapahit Holding BV, 8.00%, 8/7/19 144A | | | 700,000 | | | | 811 | |
| | Nakilat, Inc., 6.267%, 12/31/33 144A | | | 631,214 | | | | 714 | |
| | Ooredoo International Finance, Ltd., 4.75%, 2/16/21 144A | | | 1,300,000 | | | | 1,399 | |
| | Pertamina Persero PT, 4.30%, 5/20/23 144A | | | 600,000 | | | | 573 | |
| | Peru Enhanced Pass-Through Finance, Ltd., 0.00%, 5/31/18 144A | | | 94,137 | | | | 89 | |
| | Perusahaan Listrik Negara PT, 5.50%, 11/22/21 144A | | | 600,000 | | | | 625 | |
| (k) | | Petrobras Global Finance BV, 6.25%, 3/17/24 | | | 1,400,000 | | | | 1,332 | |
| | | | | | | | | | |
| | | Governments (20.0%) | | Par | | | Value
$ (000’s) | |
| | |
| | Foreign Agencies continued | | | | | |
| (k) | | Petrobras International Finance Co. SA, 5.375%, 1/27/21 | | | 5,100,000 | | | | 4,726 | |
| (k) | | Petrobras International Finance Co. SA, 5.75%, 1/20/20 | | | 300,000 | | | | 290 | |
| | Petroleos de Venezuela SA,
5.375%, 4/12/27 | | | 3,600,000 | | | | 1,261 | |
| | Petroleos de Venezuela SA,
5.50%, 4/12/37 | | | 5,200,000 | | | | 1,789 | |
| (k) | | Petroleos Mexicanos, 8.00%, 5/3/19 | | | 1,200,000 | | | | 1,419 | |
| | Rosneft Finance SA, 7.25%, 2/2/20 | | | 400,000 | | | | 346 | |
| | Rosneft Oil Co. via Rosneft International Finance, Ltd., 3.149%, 3/6/17 144A | | | 1,700,000 | | | | 1,519 | |
| | Russian Agricultural Bank OJSC Via RSHB Capital SA, 5.10%, 7/25/18 144A | | | 2,400,000 | | | | 1,974 | |
| | Russian Agricultural Bank OJSC Via RSHB Capital SA, 5.298%, 12/27/17 144A | | | 2,000,000 | | | | 1,707 | |
| (f) | | Russian Railways via RZD Capital PLC, 7.487%, 3/25/31 GBP | | | 800,000 | | | | 1,068 | |
| | Russian Railways via RZD Capital, Ltd., 5.739%, 4/3/17 | | | 1,600,000 | | | | 1,507 | |
| (f) | | Sberbank Capital SA, 3.352%, 11/15/19 EUR | | | 1,000,000 | | | | 998 | |
| | Sberbank of Russia Via SB Capital SA, 4.95%, 2/7/17 144A | | | 2,800,000 | | | | 2,633 | |
| | Sberbank of Russia Via SB Capital SA, 5.18%, 6/28/19 | | | 400,000 | | | | 354 | |
| | Sberbank of Russia Via SB Capital SA, 5.717%, 6/16/21 | | | 200,000 | | | | 173 | |
| | Vnesheconombank Via VEB Finance PLC, 5.942%, 11/21/23 | | | 2,700,000 | | | | 2,092 | |
| | Vnesheconombank Via VEB Finance PLC, 6.025%, 7/5/22 144A | | | 1,100,000 | | | | 834 | |
| | Vnesheconombank Via VEB Finance PLC, 6.902%, 7/9/20 144A | | | 600,000 | | | | 481 | |
| | | | | | | | | | |
| | Total | | | | | | | 62,462 | |
| | | | | | | | | | |
| |
| | Foreign Governments (1.8%) | |
| (f) | | Brazil Notas do Tesouro Nacional, 10.00%, 1/1/25 BRL | | | 3,600,000 | | | | 1,186 | |
The Accompanying Notes are an Integral Part of the Financial Statements.
| | | | |
| 146 | | Multi-Sector Bond Portfolio | | |
Multi-Sector Bond Portfolio
| | | | | | | | | | |
| | | Governments (20.0%) | | Par | | | Value
$ (000’s) | |
| | |
| | Foreign Governments continued | | | | | |
| (f) | | Brazil Notas do Tesouro Nacional Serie F, 10.00%, 1/1/17 BRL | | | 3,344,000 | | | | 1,198 | |
| (f) | | Brazil Notas do Tesouro Nacional Serie F, 10.00%, 1/1/21 BRL | | | 650,000 | | | | 221 | |
| (f) | | Brazil Notas do Tesouro Nacional Serie F, 10.00%, 1/1/23 BRL | | | 47,000 | | | | 15 | |
| (e),(f) | | Hellenic Republic Government Bond, 2.00%, 2/24/32 EUR | | | 200,000 | | | | 124 | |
| (f) | | Republic of Italy, 3.75%, 9/1/24 EUR | | | 4,900,000 | | | | 6,919 | |
| (f) | | Republic of South Africa, 3.75%, 7/24/26 EUR | | | 200,000 | | | | 258 | |
| | | | | | | | | | |
| | Total | | | | | | | 9,921 | |
| | | | | | | | | | |
| |
| | US Government (3.2%) | |
| (b) | | US Treasury, 0.125%, 4/30/15 | | | 5,000,000 | | | | 5,001 | |
| (b) | | US Treasury, 0.25%, 2/28/15 | | | 909,000 | | | | 910 | |
| (b) | | US Treasury, 0.25%, 3/31/15 | | | 11,330,000 | | | | 11,334 | |
| | | | | | | | | | |
| | Total | | | | | | | 17,245 | |
| | | | | | | | | | |
| |
| | Yankee Sovereign (3.6%) | |
| | Indonesia Government International Bond, 6.875%, 1/17/18 | | | 5,300,000 | | | | 5,989 | |
| | Mexico Government International Bond, 4.00%, 10/2/23 | | | 11,300,000 | | | | 11,724 | |
| | Venezuela Government International Bond, 7.65%, 4/21/25 | | | 800,000 | | | | 339 | |
| | Venezuela Government International Bond, 7.75%, 10/13/19 | | | 1,100,000 | | | | 488 | |
| | Venezuela Government International Bond, 8.25%, 10/13/24 | | | 200,000 | | | | 87 | |
| | Venezuela Government International Bond, 9.25%, 5/7/28 | | | 1,100,000 | | | | 483 | |
| | Venezuela Government International Bond, 9.375%, 1/13/34 | | | 1,400,000 | | | | 608 | |
| | | | | | | | | | |
| | Total | | | | | | | 19,718 | |
| | | | | | | | | | |
| | | |
| | Total Governments | | | | | | | | |
| | (Cost: $119,197) | | | | | | | 109,346 | |
| | | | | | | | | | |
| | | | | | | | | | |
| | | Municipal Bonds (2.5%) | | Shares/
$ Par | | | Value
$ (000’s) | |
| |
| | Municipal Bonds (2.5%) | |
| | Alameda County Joint Powers Authority, Series 2010-A, 7.046%, 12/1/44 RB | | | 100,000 | | | | 138 | |
| | American Municipal Power, Inc., Series 2010-B, 7.834%, 2/15/41 RB | | | 100,000 | | | | 151 | |
| | Bay Area Toll Authority, Series 2010-S1,
6.918%, 4/1/40 RB | | | 200,000 | | | | 284 | |
| | Buckeye Tobacco Settlement Financing Authority, Series 2007-A2, 5.875%, 6/1/30 RB | | | 100,000 | | | | 83 | |
| | Buckeye Tobacco Settlement Financing Authority, Series 2007-A2, 5.875%, 6/1/47 RB | | | 900,000 | | | | 732 | |
| | Buckeye Tobacco Settlement Financing Authority, Series 2007-A2,
6.50%, 6/1/47 RB | | | 300,000 | | | | 263 | |
| | California State, Series 2010, 7.30%, 10/1/39 GO | | | 200,000 | | | | 295 | |
| | California State, Series 2010, 7.70%, 11/1/30 GO | | | 200,000 | | | | 252 | |
| | California State, Series 2010, 7.95%, 3/1/36 GO | | | 1,100,000 | | | | 1,360 | |
| | City of Riverside, Series 2010-A,
7.605%, 10/1/40 RB | | | 200,000 | | | | 284 | |
| | Golden State Tobacco Securitization Corp., Series 2007-A2,
5.30%, 6/1/37 RB | | | 100,000 | | | | 81 | |
| | Golden State Tobacco Securitization Corp., Series 2007-A1,
5.75%, 6/1/47 RB | | | 100,000 | | | | 82 | |
| | Indiana Finance Authority, Series 2009-B, 6.596%, 2/1/39 RB | | | 300,000 | | | | 400 | |
| | Irvine Ranch California Water District, Series 2010-B, 6.622%, 5/1/40 GO | | | 100,000 | | | | 133 | |
| | Los Angeles County California Public Works Financing Authority, Series 2010-B, 7.488%, 8/1/33 RB | | | 100,000 | | | | 133 | |
| | | | | | | | | | |
| | | Municipal Bonds (2.5%) | | Shares/
$ Par | | | Value
$ (000’s) | |
| |
| | Municipal Bonds continued | |
| | Los Angeles County California Public Works Financing Authority, Series 2010-B, 7.618%, 8/1/40 RB | | | 200,000 | | | | 292 | |
| | Metropolitan Government of Nashville & Davidson County Tennessee,
Series 2010-B,
6.568%, 7/1/37 RB | | | 100,000 | | | | 132 | |
| | Municipal Electric Authority of Georgia, , 6.655%, 4/1/57 RB | | | 200,000 | | | | 264 | |
| | New York City Municipal Water Finance Authority, Series 2011-CC, 5.882%, 6/15/44 RB | | | 100,000 | | | | 135 | |
| | New York City Transitional Finance Authority, Series 2011-A1, 5.508%, 8/1/37 RB | | | 300,000 | | | | 374 | |
| | New York Metropolitan Transportation Authority, Series 2010-A2, 6.089%, 11/15/40 RB | | | 500,000 | | | | 666 | |
| | New York State Urban Development Corp.,
Series 2009-E,
5.77%, 3/15/39 RB | | | 100,000 | | | | 123 | |
| | Orange County California Local Transportation Authority, Series 2010-A, 6.908%, 2/15/41 RB | | | 200,000 | | | | 284 | |
| | Port Authority New York & New Jersey, Series 168, 4.926%, 10/1/51 RB, GO | | | 200,000 | | | | 226 | |
| | Port Authority New York & New Jersey, Series 2010, 5.647%, 11/1/40 RB, GO | | | 1,100,000 | | | | 1,349 | |
| | San Diego County Regional Airport Authority,
Series 2010-C,
6.628%, 7/1/40 RB | | | 100,000 | | | | 113 | |
| | San Diego Redevelopment Agency, Series 2010-A, 7.625%, 9/1/30 TRAN | | | 100,000 | | | | 112 | |
The Accompanying Notes are an Integral Part of the Financial Statements.
| | | | | | |
| | Multi-Sector Bond Portfolio | | | 147 | |
Multi-Sector Bond Portfolio
| | | | | | | | | | |
| | | Municipal Bonds (2.5%) | | Shares/
$ Par | | | Value
$ (000’s) | |
| |
| | Municipal Bonds continued | |
| | Tobacco Securitization Authority of Southern California,
Series 2006-A,
5.00%, 6/1/37 RB | | | 100,000 | | | | 81 | |
| | Tobacco Settlement Finance Authority of West Virginia, Series 2007-A, 7.467%, 6/1/47 RB | | | 1,180,000 | | | | 1,012 | |
| | Tobacco Settlement Financing Corp., Series 2007A, 6.706%, 6/1/46 RB | | | 3,340,000 | | | | 2,509 | |
| | Triborough Bridge & Tunnel Authority,
Series 2010-A2,
5.55%, 11/15/40 RB | | | 800,000 | | | | 989 | |
| | University of California Regents Medical Center, Series 2010-H, 6.548%, 5/15/48 RB | | | 100,000 | | | | 137 | |
| | | | | | | | | | |
| | | |
| | Total Municipal Bonds | | | | | | | | |
| | (Cost: $11,366) | | | | | | | 13,469 | |
| | | | | | | | | | |
| | | |
| | | Structured Products (6.1%) | | | | | | |
| | | |
| | Structured Products (6.1%) | | | | | | | | |
| | ACE Securities Corp. Home Equity Loan Trust, Series 2005-HE4,
Class M4,
0.82%, 7/25/35 | | | 100,000 | | | | 85 | |
| | ACE Securities Corp. Home Equity Loan Trust, Series 2004-RM2,
Class M2,
0.964%, 1/25/35 | | | 86,893 | | | | 83 | |
| | ACE Securities Corp. Home Equity Loan Trust, Series 2004-HE4,
Class M1,
1.069%, 12/25/34 | | | 94,900 | | | | 86 | |
| | Aegis Asset Backed Securities Trust, Series 2004-6, Class M2, 1.17%, 3/25/35 | | | 300,000 | | | | 266 | |
| | Aircraft Certificate Owner Trust, Series 2003-1A, Class E, 7.001%, 9/20/22 144A | | | 349,432 | | | | 367 | |
| | American Home Mortgage Investment Trust, Series 2005-2, Class 4A1, 1.832%, 9/25/45 | | | 9,168 | | | | 9 | |
| | Ameriquest Mortgage Securities, Inc., Series 2004-R5, Class M1, 1.039%, 7/25/34 | | | 50,944 | | | | 45 | |
| | | | | | | | | | |
| | | Structured Products (6.1%) | | Shares/
$ Par | | | Value
$ (000’s) | |
| |
| | Structured Products continued | |
| | Asset Backed Securities Corp. Home Equity Loan Trust, Series WMC20-HE5, Class M4,
1.069%, 6/25/35 | | | 200,000 | | | | 164 | |
| | Asset Backed Securities Corp. Home Equity Loan Trust, Series 2003-HE4, Class M1, 1.40%, 8/15/33 | | | 50,323 | | | | 48 | |
| | Banc of America Commercial Mortgage Trust, Series 2007-3, Class A4, 5.547%, 6/10/49 | | | 100,000 | | | | 107 | |
| | Banc of America Commercial Mortgage Trust, Series 2007-4, Class A4, 5.754%, 2/10/51 | | | 77,756 | | | | 85 | |
| | Banc of America Funding Trust, Series 2007-D, Class 1A4, 0.395%, 6/20/47 | | | 204,320 | | | | 194 | |
| | Banc of America Funding Trust, Series 2007-6, Class A1, 0.46%, 7/25/37 | | | 154,610 | | | | 134 | |
| | Banc of America Funding Trust, Series 2005-H, Class 5A1, 2.62%, 11/20/35 | | | 270,823 | | | | 239 | |
| | Barclays Capital LLC, Series 2009-RR14,
Class 2A2,
4.979%, 7/26/36 144A | | | 86,001 | | | | 68 | |
| | Bear Stearns Adjustable Rate Mortgage Trust, Series 2004-3, Class 4A, 2.61%, 7/25/34 | | | 25,929 | | | | 25 | |
| | Bear Stearns ALT-A Trust, Series 2006-6,
Class 2A1,
4.334%, 11/25/36 | | | 389,738 | | | | 298 | |
| | Bear Stearns Asset Backed Securities I Trust, Series 07-AQ1, Class A1, 0.265%, 11/25/36 | | | 23,931 | | | | 23 | |
| | Bear Stearns Asset Backed Securities I Trust, Series 2006-HE10, Class 1A2, 0.37%, 12/25/36 | | | 83,180 | | | | 77 | |
| | Bear Stearns Asset Backed Securities I Trust, Series 2007-HE3, Class 1A2, 0.37%, 4/25/37 | | | 516,006 | | | | 466 | |
| | | | | | | | | | |
| | | Structured Products (6.1%) | | Shares/
$ Par | | | Value
$ (000’s) | |
| |
| | Structured Products continued | |
| | Bear Stearns Asset Backed Securities I Trust, Series 2005-HE11, Class M1, 0.585%, 11/25/35 | | | 100,000 | | | | 97 | |
| | Bear Stearns Asset Backed Securities I Trust, Series 2007-HE6,
Class 1A1,
1.419%, 8/25/37 | | | 369,742 | | | | 338 | |
| | Bear Stearns Asset Backed Securities Trust, Series 2005-SD3, Class 1A, 0.659%, 7/25/35 | | | 79,843 | | | | 78 | |
| | Bear Stearns Commercial Mortgage Securities Trust, Series 2007-PW16, Class A2, 5.655%, 6/11/40 | | | 28,448 | | | | 29 | |
| | CD Commercial Mortgage Trust, Series 2006-CD2, Class A1B, 5.30%, 1/15/46 | | | 1,110,204 | | | | 1,147 | |
| | Citicorp Mortgage Securities Trust, Series 2007-8, Class 1A3, 6.00%, 9/25/37 | | | 13,464 | | | | 14 | |
| | Citigroup Mortgage Loan Trust, Series 2007-AHL1, Class A2C, 0.38%, 12/25/36 | | | 100,000 | | | | 74 | |
| | Citigroup Mortgage Loan Trust, Series 2007-10, Class 22AA, 2.745%, 9/25/37 | | | 38,605 | | | | 34 | |
| | Citigroup Mortgage Loan Trust, Series 2007-10, Class 2A3A, 2.917%, 9/25/37 | | | 186,135 | | | | 155 | |
| | Citigroup Mortgage Loan Trust, Inc., Series 05-HE3, Class M2, 0.649%, 9/25/35 | | | 300,000 | | | | 282 | |
| | Countrywide Alternative Loan Trust, Series 2007-0A3, Class 1A1, 0.31%, 4/25/47 | | | 81,032 | | | | 68 | |
| | Countrywide Alternative Loan Trust, Series 2006-OC9, Class A2A, 0.33%, 12/25/46 | | | 43,409 | | | | 43 | |
| | Countrywide Alternative Loan Trust, Series 2006-0A12, Class A1B, 0.355%, 9/20/46 | | | 53,787 | | | | 43 | |
The Accompanying Notes are an Integral Part of the Financial Statements.
| | | | |
| 148 | | Multi-Sector Bond Portfolio | | |
Multi-Sector Bond Portfolio
| | | | | | | | | | |
| | | Structured Products (6.1%) | | Shares/
$ Par | | | Value
$ (000’s) | |
| |
| | Structured Products continued | |
| | Countrywide Alternative Loan Trust, Series
2006-0A17, Class 1A1A,
0.36%, 12/20/46 | | | 76,610 | | | | 58 | |
| | Countrywide Alternative Loan Trust, Series
2006-0A9, Class 2A1A,
0.375%, 7/20/46 | | | 24,232 | | | | 17 | |
| | Countrywide Alternative Loan Trust, Series
2005-59, Class 1A1,
0.487%, 11/20/35 | | | 16,738 | | | | 13 | |
| | Countrywide Alternative Loan Trust, Series
2005-76, Class 1A1,
1.593%, 1/25/36 | | | 42,212 | | | | 39 | |
| | Countrywide Alternative Loan Trust, Series
2006-OA6, Class 2A,
3.254%, 7/25/46 | | | 24,702 | | | | 21 | |
| | Countrywide Alternative Loan Trust, Series
2003-19CB, Class 2A1,
4.50%, 9/25/18 | | | 7,079 | | | | 7 | |
| | Countrywide Alternative Loan Trust, Series
2006-HY10, Class 2A1,
5.445%, 5/25/36 | | | 36,328 | | | | 31 | |
| | Countrywide Alternative Loan Trust, Series
2005-79CB, Class A3,
5.50%, 1/25/36 | | | 589,977 | | | | 524 | |
| | Countrywide Alternative Loan Trust, Series
2004-28CB, Class 5A1,
5.75%, 1/25/35 | | | 53,832 | | | | 55 | |
| | Countrywide Alternative Loan Trust, Series
2007-9T1, Class 2A2,
6.00%, 5/25/37 | | | 478,289 | | | | 389 | |
| | Countrywide Alternative Loan Trust, Series
2005-J1, Class 3A1,
6.50%, 8/25/32 | | | 37,680 | | | | 40 | |
| | Countrywide Asset-Backed Certificates, Series
2007-2, Class 2A2,
0.27%, 8/25/37 | | | 144,462 | | | | 143 | |
| | Countrywide Asset-Backed Certificates, Series
2007-1, Class 2A3,
0.31%, 7/25/37 | | | 100,000 | | | | 79 | |
| | | | | | | | | | |
| | | Structured Products (6.1%) | | Shares/
$ Par | | | Value
$ (000’s) | |
| |
| | Structured Products continued | |
| | Countrywide Asset-Backed Certificates, Series 2006-7, Class 2A3, 0.32%, 4/25/46 | | | 318,069 | | | | 296 | |
| | Countrywide Asset-Backed Certificates, Series 2006-23, Class 2A3, 0.339%, 5/25/37 | | | 564,140 | | | | 500 | |
| | Countrywide Asset-Backed Certificates, Series 2006-5, Class 2A2, 0.349%, 8/25/36 | | | 652,437 | | | | 638 | |
| | Countrywide Asset-Backed Certificates, Series 2005-17, Class 4A2A, 0.415%, 5/25/36 | | | 15,632 | | | | 16 | |
| | Countrywide Asset-Backed Certificates, Series 2006-4, Class 2A3, 0.46%, 7/25/36 | | | 100,000 | | | | 86 | |
| | Countrywide Asset-Backed Certificates, Series 2006-5, Class 2A3, 0.46%, 8/25/36 | | | 200,000 | | | | 169 | |
| | Countrywide Asset-Backed Certificates, Series 2005-AB, Class 2A4, 0.519%, 3/25/36 | | | 129,082 | | | | 113 | |
| | Countrywide Asset-Backed Certificates, Series 2005-14, Class 3A3, 0.519%, 4/25/36 | | | 157,179 | | | | 154 | |
| | Countrywide Asset-Backed Certificates, Series 2005-4, Class AF6, 4.74%, 10/25/35 | | | 96,823 | | | | 96 | |
| | Countrywide Asset-Backed Certificates, Series 2006-1, Class AF5, 5.157%, 7/25/36 | | | 100,000 | | | | 67 | |
| | Countrywide Home Loan Mortgage Pass Through Trust, Series 2006-OA4, Class A1, 1.073%, 4/25/46 | | | 63,299 | | | | 36 | |
| | Countrywide Home Loan Mortgage Pass Through Trust, Series 2005-HYB8, Class 1A1X, 2.47%, 12/20/35 | | | 21,712 | | | | 18 | |
| | Countrywide Home Loan Mortgage Pass Through Trust, Series 2005-22, Class 3A1, 4.826%, 10/25/35 | | | 46,772 | | | | 40 | |
| | | | | | | | | | |
| | | Structured Products (6.1%) | | Shares/
$ Par | | | Value
$ (000’s) | |
| |
| | Structured Products continued | |
| | Countrywide Home Loan Mortgage Pass Through Trust, Series 2006-9, Class A1, 6.00%, 5/25/36 | | | 358,021 | | | | 330 | |
| | Countrywide Home Loan Mortgage Pass Through Trust, Series 06-16, Class 2A1, 6.50%, 11/25/36 | | | 49,751 | | | | 45 | |
| | Credit Suisse Commercial Mortgage Trust, Series 2007-C4, Class A4, 5.898%, 9/15/39 | | | 166,106 | | | | 179 | |
| | Dryden Senior Loan Fund, Series 2011-22A, , 1.401%, 1/15/22 144A | | | 500,000 | | | | 499 | |
| | Federal National Mortgage Association, Series 2003-W6, Class F, 0.519%, 9/25/42 | | | 41,813 | | | | 42 | |
| | First Franklin Mortgage Loan Trust, Series
2006-FF12, Class A4,
0.31%, 9/25/36 | | | 186,780 | | | | 167 | |
| | First Franklin Mortgage Loan Trust, Series
2006-FF10, Class A4,
0.32%, 7/25/36 | | | 47,799 | | | | 45 | |
| | First Horizon Mortgage Pass Through Trust, Series 2007-2, Class 1A5, 5.75%, 5/25/37 | | | 768,988 | | | | 661 | |
| | First Horizon Mortgage Pass-Through Trust, Series 2005-5, Class 2A1, 5.00%, 10/25/20 | | | 21,113 | | | | 21 | |
| | GE Commercial Mortgage Corp. Trust, Series 2007-C1, Class A4, 5.543%, 12/10/49 | | | 100,000 | | | | 106 | |
| | GSAA Home Equity Trust, Series 2006-4, Class 4A2, 0.40%, 3/25/36 | | | 34,014 | | | | 31 | |
| | GSAMP Trust, Series
2007-NC1, Class A2A,
0.22%, 12/25/46 | | | 22,374 | | | | 13 | |
| | GSAMP Trust, Series
2007-FM2, Class A2B,
0.26%, 1/25/37 | | | 268,974 | | | | 162 | |
| | GSAMP Trust, Series
04-WF, Class M2,
1.819%, 10/25/34 | | | 140,747 | | | | 123 | |
| | GSR Mortgage Loan Trust, Series 2007-AR1, Class 2A1, 2.614%, 3/25/47 | | | 32,884 | | | | 29 | |
The Accompanying Notes are an Integral Part of the Financial Statements.
| | | | | | |
| | Multi-Sector Bond Portfolio | | | 149 | |
Multi-Sector Bond Portfolio
| | | | | | | | | | |
| | | Structured Products (6.1%) | | Shares/
$ Par | | | Value
$ (000’s) | |
| |
| | Structured Products continued | |
| | GSR Mortgage Loan Trust, Series 2006-AR1, Class 2A1, 2.629%, 1/25/36 | | | 7,515 | | | | 7 | |
| | GSR Mortgage Loan Trust, Series 2005-AR6, Class 1A1, 2.655%, 9/25/35 | | | 29,722 | | | | 30 | |
| | GSR Mortgage Loan Trust, Series 2006-2F, Class 3A6, 6.00%, 2/25/36 | | | 299,437 | | | | 245 | |
| | Harborview Mortgage Loan Trust, Series 2005-3, Class 2A1A, 0.404%, 6/19/35 | | | 57,322 | | | | 50 | |
| | Harborview Mortgage Loan Trust, Series 2005-10, Class 2A1A, 0.474%, 11/19/35 | | | 25,073 | | | | 21 | |
| | Home Equity Loan Trust, Series 2007-FRE1, Class 2AV4, 0.509%, 4/25/37 | | | 500,000 | | | | 300 | |
| | HomeBanc Mortgage Trust, Series 2005-1, Class A1, 0.42%, 3/25/35 | | | 21,193 | | | | 19 | |
| | HSI Asset Securitization Corp. Trust, Series 2005-I1, Class 2A4, 0.56%, 11/25/35 | | | 300,000 | | | | 217 | |
| | IndyMac Index Mortgage Loan Trust, Series 2005-AR12, Class 2A1A, 0.41%, 7/25/35 | | | 4,744 | | | | 4 | |
| | IndyMac Index Mortgage Loan Trust, Series 2005-AR14, Class 2A1A, 0.47%, 7/25/35 | | | 25,877 | | | | 23 | |
| | IndyMac Index Mortgage Loan Trust, Series 2004-AR6, Class 5A1, 2.519%, 10/25/34 | | | 56,934 | | | | 54 | |
| | ING Investment Management CLO, Ltd., Series 2006-3A,
Class A1,
0.479%, 12/13/20 144A | | | 631,487 | | | | 625 | |
| | IXIS Real Estate Capital Trust, Series 2005-HE1, Class M3, 0.95%, 6/25/35 | | | 56,076 | | | | 55 | |
| | JP Morgan Mortgage Trust, Series 2005-ALT1, Class 2A1, 2.424%, 10/25/35 | | | 29,719 | | | | 26 | |
| | | | | | | | | | |
| | | Structured Products (6.1%) | | Shares/
$ Par | | | Value
$ (000’s) | |
| |
| | Structured Products continued | |
| | JP Morgan Mortgage Trust, Series 2007-A1,
Class 6A1,
2.51%, 7/25/35 | | | 45,311 | | | | 45 | |
| | JP Morgan Mortgage Trust, Series 2007-A4, Class 3A1,
5.189%, 6/25/37 | | | 190,225 | | | | 174 | |
| | JP Morgan Resecuritization Trust, Series 2009-10, Class 4A1, 0.669%, 3/26/37 144A | | | 224,120 | | | | 217 | |
| | Landmark VII CDO, Ltd., Series 2006-7A,
Class A1L,
0.506%, 7/15/18 144A | | | 1,374 | | | | 1 | |
| | Lehman XS Trust, Series 2005-4, Class 1A3, 0.955%, 10/25/35 | | | 49,074 | | | | 46 | |
| | Merrill Lynch Alternative Note Asset Trust, Series 2007-OAR1, Class A1, 0.339%, 2/25/37 | | | 33,023 | | | | 31 | |
| | Merrill Lynch Mortgage Investors Trust, Series 2005-A6, Class 2A3, 0.549%, 8/25/35 | | | 100,000 | | | | 92 | |
| | Merrill Lynch Mortgage Investors Trust, Series 2007-SD1, Class A1, 0.619%, 2/25/47 | | | 1,384,514 | | | | 1,017 | |
| | Merrill Lynch Mortgage Investors Trust, Series 2006-1, Class 1A, 2.475%, 2/25/36 | | | 16,663 | | | | 16 | |
| | Merrill Lynch Mortgage Investors Trust, Series 2006-A3, Class 6A1, 5.337%, 5/25/36 | | | 52,263 | | | | 51 | |
| | Merrill Lynch Mortgage Investors Trust, Series 2005-A9, Class 5A1, 5.401%, 12/25/35 | | | 594,413 | | | | 551 | |
| | Morgan Stanley ABS Capital I, Inc., Series 2006-HE8, Class A2C, 0.31%, 10/25/36 | | | 91,634 | | | | 56 | |
| | Morgan Stanley ABS Capital I, Inc., Series 2007-HE5, Class A2C, 0.42%, 3/25/37 | | | 89,444 | | | | 51 | |
| | Morgan Stanley ABS Capital I, Inc. Trust, Series 2005-HE7, Class A2C, 0.49%, 11/25/35 | | | 50,584 | | | | 50 | |
| | | | | | | | | | |
| | | Structured Products (6.1%) | | Shares/
$ Par | | | Value
$ (000’s) | |
| |
| | Structured Products continued | |
| | Morgan Stanley ABS Capital I, Inc. Trust, Series 2005-WMC5, Class M5, 1.16%, 6/25/35 | | | 300,000 | | | | 269 | |
| | Morgan Stanley Capital I Trust, Series 2007-HQ11, Class A31, 5.439%, 2/12/44 | | | 17,218 | | | | 17 | |
| | Morgan Stanley Dean Witter Capital I, Inc., Series 2002-HE1, Class M1, 1.069%, 7/25/32 | | | 21,229 | | | | 20 | |
| | Morgan Stanley Dean Witter Capital I, Inc., Series 2003-NC2, Class M1, 1.519%, 2/25/33 | | | 65,175 | | | | 62 | |
| | Morgan Stanley Mortgage Loan Trust, Series
2005-5AR, Class 1A1,
0.44%, 9/25/35 | | | 8,484 | | | | 8 | |
| | Morgan Stanley Mortgage Loan Trust, Series
2005-3AR, Class 4A,
2.362%, 7/25/35 | | | 680,931 | | | | 586 | |
| | Nomura Asset Acceptance Corp. Alternative Loan Trust, Series 2005-AR4, Class 3A1, 2.87%, 8/25/35 | | | 38,687 | | | | 37 | |
| | Park Place Securities, Inc. Asset-Backed Pass-Through Certificates, Series 2005-WCW2, Class M1, 0.669%, 7/25/35 | | | 100,000 | | | | 99 | |
| | People’s Choice Home Loan Securities Trust, Series 2005-3, Class M2, 0.95%, 8/25/35 | | | 400,000 | | | | 370 | |
| | Residential Accredit Loans, Inc., Series 2007-QA1, Class A1, 0.31%, 1/25/37 | | | 52,599 | | | | 43 | |
| | Residential Accredit Loans, Inc., Series 2006-QA7, Class 1A1, 0.359%, 8/25/36 | | | 23,483 | | | | 17 | |
| | Residential Accredit Loans, Inc., Series 2006-QA8, Class A1, 0.359%, 9/25/36 | | | 51,942 | | | | 40 | |
| | Residential Accredit Loans, Inc., Series 2005-QA3, Class NB2, 3.053%, 3/25/35 | | | 451,119 | | | | 375 | |
The Accompanying Notes are an Integral Part of the Financial Statements.
| | | | |
| 150 | | Multi-Sector Bond Portfolio | | |
Multi-Sector Bond Portfolio
| | | | | | | | | | |
| | | Structured Products (6.1%) | | Shares/
$ Par | | | Value
$ (000’s) | |
| |
| | Structured Products continued | |
| | Residential Accredit Loans, Inc., Series 2005-QR1, Class A, 6.00%, 10/25/34 | | | 505,342 | | | | 528 | |
| | Residential Asset Mortgage Products, Series 2006-NC2, Class A2, 0.359%, 2/25/36 | | | 31,043 | | | | 30 | |
| | Residential Asset Mortgage Products, Series 2007-RP4, Class A, 0.519%, 11/25/46 144A | | | 404,120 | | | | 349 | |
| | Residential Asset Mortgage Products, Series 2005-EFC4, Class M3, 0.649%, 9/25/35 | | | 300,000 | | | | 258 | |
| | Residential Asset Securities Corp., Series 2007-KS1, Class A3, 0.32%, 1/25/37 | | | 460,319 | | | | 427 | |
| | Residential Asset Securities Corp., Series 2007-KS3, Class AI4, 0.509%, 4/25/37 | | | 1,600,000 | | | | 1,124 | |
| | Residential Asset Securities Corp., Series 06-EMX1, Class M1, 0.58%, 1/25/36 | | | 200,000 | | | | 173 | |
| | Rio Oil Finance Trust, 6.25%, 7/6/24 144A | | | 1,200,000 | | | | 1,148 | |
| | Securitized Asset Backed Receivables LLC Trust, Series 2005-FR4, Class M2, 1.129%, 1/25/36 | | | 181,799 | | | | 159 | |
| | SLM Private Education Loan Trust, Series 2012-D, Class A1, 1.211%, 6/15/23 144A | | | 38,103 | | | | 38 | |
| | SLM Private Education Loan Trust, Series 2011-B, Class A3, 2.411%, 6/16/42 144A | | | 100,000 | | | | 106 | |
| | SLM Private Education Loan Trust, Series 2010-A, Class 1A, 3.20%, 5/16/44 144A | | | 52,707 | | | | 55 | |
| | SLM Private Education Loan Trust, Series 2012-B, Class A2, 3.48%, 10/15/30 144A | | | 400,000 | | | | 416 | |
| | Soundview Home Loan Trust, Series 06-3,
Class A3,
0.33%, 11/25/36 | | | 631,218 | | | | 534 | |
| | Soundview Home Loan Trust, Series 06-OPT2, Class A4, 0.45%, 5/25/36 | | | 200,000 | | | | 158 | |
| | | | | | | | | | |
| | | Structured Products (6.1%) | | Shares/
$ Par | | | Value
$ (000’s) | |
| |
| | Structured Products continued | |
| | Soundview Home Loan Trust, Series 06-2, Class M2, 0.519%, 3/25/36 | | | 400,000 | | | | 325 | |
| | Soundview Home Loan Trust, Series 2005-3, Class M3, 0.994%, 6/25/35 | | | 300,000 | | | | 268 | |
| | Specialty Underwriting & Residential Finance Trust, Series 05-BC2, Class M3,
0.82%, 12/25/35 | | | 600,000 | | | | 551 | |
| | Structured Adjustable Rate Mortgage Loan Trust, Series 05-19XS,
Class 1A1,
0.49%, 10/25/35 | | | 153,761 | | | | 130 | |
| | Structured Asset Investment Loan Trust, Series 2006-BNC3, Class A3, 0.32%, 9/25/36 | | | 59,757 | | | | 47 | |
| | Structured Asset Investment Loan Trust, Series 05-7, Class M2, 0.679%, 8/25/35 | | | 500,000 | | | | 374 | |
| | Structured Asset Investment Loan Trust, Series 2005-5, Class M2, 0.86%, 6/25/35 | | | 100,000 | | | | 96 | |
| | Structured Asset Mortgage Investments II Trust, Series 2006-AR6, Class 1A1, 0.349%, 7/25/46 | | | 515,980 | | | | 419 | |
| | Structured Asset Mortgage Investments II Trust, Series 05-AR8,
Class A2,
1.614%, 2/25/36 | | | 1,073,490 | | | | 937 | |
| | Structured Asset Securities Corp. Mortgage Loan Trust, Series 2007-BC3, Class 2A2, 0.31%, 5/25/47 | | | 300,000 | | | | 288 | |
| | Structured Asset Securities Corp. Mortgage Loan Trust, Series 06-BC4, Class A4, 0.339%, 12/25/36 | | | 835,427 | | | | 696 | |
| | Structured Asset Securities Corp. Mortgage Loan Trust, Series 07-WF1, Class A6, 0.38%, 2/25/37 | | | 227,853 | | | | 200 | |
| | Structured Asset Securities Corp. Mortgage Loan Trust, Series 2006-GEL2, Class M1, 0.539%, 4/25/36 144A | | | 100,000 | | | | 85 | |
| | | | | | | | | | |
| | | Structured Products (6.1%) | | Shares/
$ Par | | | Value
$ (000’s) | |
| |
| | Structured Products continued | |
| | Structured Asset Securities Corp. Trust, Series 2005-1, Class 1A1, 0.519%, 2/25/35 | | | 98,286 | | | | 91 | |
| | Structured Asset Securitization Corp. Mortgage Pass Through Certificates, Series 2004-3,
Class 4A1,
5.667%, 3/25/34 | | | 15,439 | | | | 16 | |
| | Suntrust Alternative Loan Trust, Series 2005-1F, Class 1A1, 0.82%, 12/25/35 | | | 48,892 | | | | 38 | |
| | Truman Capital Mortgage Loan Trust, Series 2006-1, Class A, 0.43%, 3/25/36 144A | | | 3,023,605 | | | | 2,796 | |
| | Wachovia Bank Commercial Mortgage Trust, Series 2007-WHL8, Class A1, 0.241%, 6/15/20 144A | | | 13,700 | | | | 14 | |
| | Wachovia Bank Commercial Mortgage Trust, Series 2006-C24, Class A1A, 5.557%, 3/15/45 | | | 996,179 | | | | 1,038 | |
| | WaMu Mortgage Pass Through Certificates, Series 06-AR8,
Class 2A1,
2.225%, 8/25/36 | | | 31,002 | | | | 27 | |
| | WaMu Mortgage Pass Through Certificates, Series 2006-AR2, Class 1A1, 2.329%, 3/25/36 | | | 620,424 | | | | 574 | |
| | WaMu Mortgage Pass Through Certificates, Series 2002-AR19, Class A6, 2.402%, 2/25/33 | | | 3,608 | | | | 4 | |
| | WaMu Mortgage Pass Through Certificates, Series 2007-HY1, Class 3A1, 4.462%, 2/25/37 | | | 11,265 | | | | 10 | |
| | WaMu Mortgage Pass Through Certificates, Series 2006-AR12, Class 3A3, 6.047%, 10/25/36 | | | 63,522 | | | | 53 | |
| | Washington Mutual Mortgage Pass-Through Certificates, Series 2007-OA3, Class 4A2, 0.813%, 4/25/47 | | | 696,196 | | | | 555 | |
| | Wells Fargo Alternative Loan Trust, Series 2007-PA4, Class 2A1, 2.59%, 7/25/37 | | | 163,850 | | | | 138 | |
The Accompanying Notes are an Integral Part of the Financial Statements.
| | | | | | |
| | Multi-Sector Bond Portfolio | | | 151 | |
Multi-Sector Bond Portfolio
| | | | | | | | | | |
| | | Structured Products (6.1%) | | Shares/
$ Par | | | Value
$ (000’s) | |
| | |
| | Structured Products continued | | | | | |
| | Wells Fargo Mortgage Backed Securities Trust, Series 2007-AR8, Class A1, 2.608%, 11/25/37 | | | 183,680 | | | | 161 | |
| | Wells Fargo Mortgage Backed Securities Trust, Series 2006-AR10, Class 4A1, 2.61%, 7/25/36 | | | 475,004 | | | | 447 | |
| | Wells Fargo Mortgage Backed Securities Trust, Series 2006-AR5, Class 2A1, 2.615%, 4/25/36 | | | 251,089 | | | | 240 | |
| | Wells Fargo Mortgage Backed Securities Trust, Series 2005-AR2, Class 1A1, 2.616%, 3/25/35 | | | 62,275 | | | | 63 | |
| | | | | | | | | | |
| | | |
| | Total Structured Products | | | | | | | | |
| | (Cost: $33,580) | | | | | | | 33,570 | |
| | | | | | | | | | |
| | | |
| | | Bank Loan Obligations
(2.3%) | | Par | | | | |
| | Bank Loan Obligations (2.3%) | | | | | | | | |
| | Albertson’s Holdings LLC,
5.00%, 8/8/19 | | | 1,200,000 | | | | 1,196 | |
| | Avago Technologies Cayman, Ltd.,
3.75%, 5/6/21 | | | 100,000 | | | | 100 | |
| | Burger King, 4.50%, 12/12/21 | | | 300,000 | | | | 299 | |
| | Charter Communications Operating LLC, 3.00%, 7/1/20 | | | 698,228 | | | | 683 | |
| | Crown Castle Operating Co.,
3.00%, 1/31/21 | | | 498,741 | | | | 489 | |
| | Dell, Inc.,
4.50%, 4/29/20 | | | 3,384,810 | | | | 3,371 | |
| | Grifols Worldwide Operations USA, Inc., 3.00%, 3/27/21 | | | 694,750 | | | | 684 | |
| | H.J. Heinz Co.,
3.50%, 6/5/20 | | | 3,441,759 | | | | 3,415 | |
| | Hilton Worldwide Finance LLC,
3.50%, 10/25/20 | | | 328,947 | | | | 325 | |
| | Las Vegas Sands LLC, 3.25%, 12/19/20 | | | 99,748 | | | | 99 | |
| | Rise, Ltd., 4.75%, 2/15/39 | | | 758,315 | | | | 766 | |
| (f) | | Ziggo BV, 3.50%, 1/15/22 EUR | | | 1,000,000 | | | | 1,190 | |
| | | | | | | | | | |
| | | |
| | Total Bank Loan Obligations | | | | | | | | |
| | (Cost: $12,810) | | | | | | | 12,617 | |
| | | | | | | | | | |
| | | | | | | | | | |
| | | Short-Term Investments
(7.7%) | | Shares/
$ Par | | | Value
$ (000’s) | |
| |
| | Commercial Paper (7.7%) | |
| (b) | | US Treasury Bill, 0.01%, 1/22/15 | | | 4,000,000 | | | | 4,000 | |
| (b) | | US Treasury Bill, 0.015%, 1/29/15 | | | 4,000,000 | | | | 4,000 | |
| (b) | | US Treasury Bill, 0.02%, 1/15/15 | | | 4,000,000 | | | | 4,000 | |
| (b) | | US Treasury Bill, 0.02%, 2/26/15 | | | 454,000 | | | | 454 | |
| (b) | | US Treasury Bill, 0.05%, 4/23/15 | | | 6,900,000 | | | | 6,899 | |
| (b) | | US Treasury Bill, 0.06%, 5/7/15 | | | 100,000 | | | | 100 | |
| (b) | | US Treasury Bill, 0.06%, 5/14/15 | | | 4,400,000 | | | | 4,399 | |
| (b) | | US Treasury Bill, 0.07%, 5/21/15 | | | 8,000,000 | | | | 7,999 | |
| (b) | | US Treasury Bill, 0.07%, 6/4/15 | | | 10,000,000 | | | | 9,997 | |
| | | | | | | | | | |
| | Total | | | | | | | 41,848 | |
| | | | | | | | | | |
| | | |
| | Total Short-Term Investments | | | | | | | | |
| | (Cost: $41,847) | | | | | | | 41,848 | |
| | | | | | | | | | |
| | | |
| | Total Investments (100.3%) | | | | | | | | |
| | (Cost: $569,686)(a) | | | | | | | 547,427 | |
| | | | | | | | | | |
| | Other Assets, Less | | | | | | | | |
| | Liabilities (-0.3%) | | | | | | | (1,368 | ) |
| | | | | | | | | | |
| | Net Assets (100.0%) | | | | | | | 546,059 | |
| | | | | | | | | | |
The Accompanying Notes are an Integral Part of the Financial Statements.
| | | | |
| 152 | | Multi-Sector Bond Portfolio | | |
Multi-Sector Bond Portfolio
144A after the name of a security represents a security exempt from registration under Rule 144A of the Securities Act of 1933. These securities may be resold as transactions exempt from registration, normally to qualified institutional buyers. At December 31, 2014 the value of these securities (in thousands) was $124,543 representing 22.6% of the net assets.
GO — General Obligation
RB — Revenue Bond
TRAN — Tax Allocation Bond
AUD — Australian Dollar
BRL — Brazilian Real
EUR — Euro
GBP — British Pound
INR — Indian Rupee
JPY — Japanese Yen
MXN — Mexican New Peso
| (a) | At December 31, 2014, the aggregate cost of securities for federal tax purposes (in thousands) was $569,798 and the net unrealized depreciation of investments based on that cost was $22,371 which is comprised of $10,060 aggregate gross unrealized appreciation and $32,431 aggregate gross unrealized depreciation. |
| (b) | All or a portion of the securities have been pledged as collateral for open futures positions or when-issued securities. Information regarding open futures contracts as of period end is summarized below. |
| | | | | | | | |
| Issuer (000’s) | | Number of
Contracts | | Expiration Date | | Unrealized
Appreciation/
(Depreciation)
(000’s) | |
Euro Bund Future (Long) (Total Notional Value at December 31, 2014, $4,973) | | 26 | | 3/15 | | $ | 65 | |
US Long Treasury Bond Futures (Long) (Total Notional Value at December 31, 2014, $46,168) | | 322 | | 3/15 | | | 381 | |
US Ten Year Treasury Note Futures (Long) (Total Notional Value at December 31, 2014, $17,331) | | 137 | | 3/15 | | | 40 | |
US Ultra Long Treasury Bond Futures (Long) (Total Notional Value at December 31, 2014, $21,583) | | 134 | | 3/15 | | | 552 | |
| (e) | Step bond security that presently receives no coupon payments. At the predetermined date the stated coupon rate becomes effective. |
| (f) | Foreign Bond — par value is foreign denominated |
| (h) | Forward foreign currency contracts outstanding on December 31, 2014. |
| | | | | | | | | | | | | | | | | | | | |
| Type | | Counterparty | | Currency | | Principal
Amount
Covered by
Contract (000’s) | | Settlement
Month | | Unrealized
Appreciation
(000’s) | | | Unrealized
(Depreciation)
(000’s) | | | Net Unrealized
Appreciation/
(Depreciation)
(000’s) | |
Sell | | HSBC Bank USA | | AUD | | 521 | | 2/15 | | $ | - | | | $ | (1 | ) | | $ | (1 | ) |
Buy | | BNP Paribas SA | | BRL | | 2,426 | | 1/15 | | | - | | | | (2 | ) | | | (2 | ) |
Buy | | JP Morgan Chase Bank, N.A. | | BRL | | 7,054 | | 1/15 | | | - | | | | (90 | ) | | | (90 | ) |
Buy | | UBS AG | | BRL | | 4,628 | | 1/15 | | | - | | | | (3 | ) | | | (3 | ) |
Sell | | BNP Paribas SA | | BRL | | 2,426 | | 1/15 | | | 22 | | | | - | | | | 22 | |
Sell | | JP Morgan Chase Bank, N.A. | | BRL | | 7,054 | | 1/15 | | | 5 | | | | - | | | | 5 | |
Sell | | UBS AG | | BRL | | 4,628 | | 1/15 | | | 208 | | | | - | | | | 208 | |
Sell | | JP Morgan Chase Bank, N.A. | | BRL | | 7,054 | | 7/15 | | | 77 | | | | - | | | | 77 | |
Buy | | BNP Paribas SA | | EUR | | 76,673 | | 1/15 | | | - | | | | (665 | ) | | | (665 | ) |
Buy | | Goldman Sachs International | | EUR | | 439 | | 1/15 | | | - | | | | (15 | ) | | | (15 | ) |
Sell | | Goldman Sachs International | | EUR | | 76,709 | | 1/15 | | | 2,950 | | | | - | | | | 2,950 | |
Sell | | JP Morgan Chase Bank, N.A. | | EUR | | 403 | | 1/15 | | | 15 | | | | - | | | | 15 | |
Sell | | BNP Paribas SA | | EUR | | 76,673 | | 2/15 | | | 667 | | | | - | | | | 667 | |
Buy | | Bank of America, N.A. | | GBP | | 22,324 | | 1/15 | | | - | | | | (85 | ) | | | (85 | ) |
Buy | | Royal Bank of Canada | | GBP | | 384 | | 1/15 | | | - | | | | (5 | ) | | | (5 | ) |
Buy | | UBS AG | | GBP | | 486 | | 1/15 | | | - | | | | (1 | ) | | | (1 | ) |
Sell | | Goldman Sachs International | | GBP | | 22,278 | | 1/15 | | | 215 | | | | - | | | | 215 | |
Sell | | UBS AG | | GBP | | 430 | | 1/15 | | | 1 | | | | - | | | | 1 | |
The Accompanying Notes are an Integral Part of the Financial Statements.
| | | | | | |
| | Multi-Sector Bond Portfolio | | | 153 | |
Multi-Sector Bond Portfolio
| | | | | | | | | | | | | | | | | | | | |
| Type | | Counterparty | | Currency | | Principal
Amount
Covered by
Contract (000’s) | | Settlement
Month | | Unrealized
Appreciation
(000’s) | | | Unrealized
(Depreciation)
(000’s) | | | Net Unrealized
Appreciation/
(Depreciation)
(000’s) | |
Sell | | Bank of America, N.A. | | GBP | | 22,324 | | 2/15 | | $ | 85 | | | $ | - | | | $ | 85 | |
Buy | | Citibank, N.A. | | INR | | 49,584 | | 1/15 | | | - | | | | (15 | ) | | | (15 | ) |
Buy | | JP Morgan Chase Bank, N.A. | | INR | | 113,369 | | 1/15 | | | - | | | | (34 | ) | | | (34 | ) |
Buy | | JP Morgan Chase Bank, N.A. | | JPY | | 669,100 | | 1/15 | | | 28 | | | | - | | | | 28 | |
Sell | | Bank of America, N.A. | | JPY | | 651,900 | | 1/15 | | | 85 | | | | - | | | | 85 | |
Sell | | BNP Paribas SA. | | JPY | | 17,200 | | 1/15 | | | 4 | | | | - | | | | 4 | |
Sell | | JP Morgan Chase Bank, N.A. | | JPY | | 669,100 | | 2/15 | | | - | | | | (27 | ) | | | (27 | ) |
| | | | | | | | | | | | | | | | | | | | |
| | | | | | | | | | $ | 4,362 | | | $ | (943 | ) | | $ | 3,419 | |
| | | | | | | | | | | | | | | | | | | | |
| (j) | Swap agreements outstanding on December 31, 2014. |
Interest Rate Swaps - Pay Floating Rate
| | | | | | | | | | | | | | | | | | | | | | |
| Floating Rate Index | | Counterparty | | Fixed
Rate | | Expiration
Date | | Notional
Amount
(000’s) | | Currency | | Upfront
Premium Paid/
(Received)
(000’s) | | | Unrealized
Appreciation/
(Depreciation)
(000’s) | | | Market
Value
(000’s) | |
6-Month Australian Bank Bill | | Citibank, N.A. | | 3.50% | | 3/18 | | 7,900 | | AUD | | $ | 2 | | | $ | 213 | | | $ | 215 | |
| | | | | | | | | | | | | | | | | | | | | | |
| | | | | | | | | | | | $ | 2 | | | $ | 213 | | | $ | 215 | |
| | | | | | | | | | | | | | | | | | | | | | |
Credit Default Swaps on Corporate or Sovereign Issues - Sell Protection
| | | | | | | | | | | | | | | | | | | | | | | | |
| Reference Entity | | Counterparty | | Receive
Fixed
Rate | | Expiration
Date | | Implied
Credit
Spread | | Notional
Amount
(000’s) | | | | Upfront
Premium Paid/
(Received)
(000’s) | | | Unrealized
Appreciation/
(Depreciation)
(000’s) | | | Market
Value
(000’s) | |
Alcoa, Inc., 5.72%, 2/23/19 | | BNP Paribas SA | | 1.00% | | 6/21 | | 2.267% | | 300 | | USD | | $ | (20 | ) | | $ | (2 | ) | | $ | (22 | ) |
Anglo American Capital PLC, 5.875%, 4/17/15 | | Citibank, N.A. | | 1.00% | | 3/19 | | 1.242% | | 100 | | EUR | | | (4 | ) | | | 3 | | | | (1 | ) |
Federal Republic of Brazil, 12.25%, 3/6/30 | | Barclays Bank PLC | | 1.00% | | 6/18 | | 1.523% | | 400 | | USD | | | (5 | ) | | | (2 | ) | | | (7 | ) |
Federal Republic of Brazil, 12.25%, 3/6/30 | | Barclays Bank PLC | | 1.00% | | 9/21 | | 2.243% | | 1,200 | | USD | | | (37 | ) | | | (52 | ) | | | (89 | ) |
Federal Republic of Brazil, 12.25%, 3/6/30 | | BNP Paribas SA | | 1.00% | | 6/18 | | 1.523% | | 800 | | USD | | | (7 | ) | | | (6 | ) | | | (13 | ) |
Federal Republic of Brazil, 12.25%, 3/6/30 | | Citibank, N.A. | | 1.00% | | 9/17 | | 1.367% | | 2,000 | | USD | | | (25 | ) | | | 6 | | | | (19 | ) |
Federal Republic of Brazil, 12.25%, 3/6/30 | | Citibank, N.A. | | 1.00% | | 6/18 | | 1.523% | | 1,100 | | USD | | | (11 | ) | | | (8 | ) | | | (19 | ) |
Federal Republic of Brazil, 12.25%, 3/6/30 | | Citibank, N.A. | | 1.00% | | 9/21 | | 2.243% | | 300 | | USD | | | (9 | ) | | | (13 | ) | | | (22 | ) |
Federal Republic of Brazil, 12.25%, 3/6/30 | | Goldman Sachs International | | 1.00% | | 9/17 | | 1.367% | | 80 | | USD | | | (1 | ) | | | - | (m) | | | (1 | ) |
Federal Republic of Brazil, 12.25%, 3/6/30 | | Goldman Sachs International | | 1.00% | | 6/18 | | 1.523% | | 1,100 | | USD | | | (14 | ) | | | (5 | ) | | | (19 | ) |
Federal Republic of Brazil, 12.25%, 3/6/30 | | Goldman Sachs International | | 1.00% | | 9/21 | | 2.243% | | 400 | | USD | | | (12 | ) | | | (17 | ) | | | (29 | ) |
Federal Republic of Brazil, 12.25%, 3/6/30 | | HSBC Bank USA | | 1.00% | | 6/17 | | 1.311% | | 200 | | USD | | | (1 | ) | | | - | (m) | | | (1 | ) |
Federal Republic of Brazil, 12.25%, 3/6/30 | | HSBC Bank USA | | 1.00% | | 6/18 | | 1.523% | | 2,300 | | USD | | | (22 | ) | | | (17 | ) | | | (39 | ) |
Federal Republic of Brazil, 12.25%, 3/6/30 | | HSBC Bank USA | | 1.00% | | 9/22 | | 2.352% | | 1,200 | | USD | | | (63 | ) | | | (44 | ) | | | (107 | ) |
Federal Republic of Brazil, 12.25%, 3/6/30 | | Morgan Stanley Capital Services LLC | | 1.00% | | 3/17 | | 1.242% | | 1,100 | | USD | | | (9 | ) | | | 3 | | | | (6 | ) |
Federal Republic of Brazil, 12.25%, 3/6/30 | | Morgan Stanley Capital Services LLC | | 1.00% | | 6/18 | | 1.523% | | 900 | | USD | | | (12 | ) | | | (4 | ) | | | (16 | ) |
Frontier Communications, 5.00%, 9/20/17 | | Goldman Sachs International | | 5.00% | | 9/17 | | 1.186% | | 125 | | USD | | | (2 | ) | | | 14 | | | | 12 | |
The Accompanying Notes are an Integral Part of the Financial Statements.
| | | | |
| 154 | | Multi-Sector Bond Portfolio | | |
Multi-Sector Bond Portfolio
Credit Default Swaps on Corporate or Sovereign Issues - Sell Protection (continued)
| | | | | | | | | | | | | | | | | | | | | | | | |
| Reference Entity | | Counterparty | | Receive
Fixed
Rate | | Expiration
Date | | Implied
Credit
Spread | | Notional
Amount
(000’s) | | | | Upfront
Premium Paid/(Received) (000’s) | | | Unrealized
Appreciation/ (Depreciation)
(000’s) | | | Market
Value
(000’s) | |
Heidelbergcement Finance Luxembourg Sa, 5.625%, 1/4/18 | | Citibank, N.A. | | 5.00% | | 9/21 | | 1.409% | | 100 | | EUR | | $ | 12 | | | $ | 16 | | | $ | 28 | |
HeidelbergCement Finance Luxembourg SA, 5.625%, 1/4/18 | | Goldman Sachs International | | 5.00% | | 12/18 | | 0.803% | | 200 | | EUR | | | 31 | | | | 10 | | | | 41 | |
Hellenic Republic Government Bond, 2.00%, 2/24/23 | | Goldman Sachs International | | 1.00% | | 9/15 | | 13.930% | | 1,400 | | EUR | | | (39 | ) | | | (126 | ) | | | (165 | ) |
Hellenic Republic Government Bond, 2.00%, 2/24/23 | | Goldman Sachs International | | 1.00% | | 9/15 | | 17.097% | | 2,500 | | USD | | | (47 | ) | | | (217 | ) | | | (264 | ) |
Hellenic Republic Government Bond, 2.00%, 2/24/23 | | Goldman Sachs International | | 1.00% | | 12/15 | | 16.350% | | 1,500 | | EUR | | | (59 | ) | | | (171 | ) | | | (230 | ) |
Marks & Spencer PLC, 6.125%, 12/2/19 | | BNP Paribas SA | | 1.00% | | 6/21 | | 1.325% | | 3,100 | | EUR | | | (131 | ) | | | 57 | | | | (74 | ) |
Marks & Spencer PLC, 6.125%, 12/2/19 | | Citibank, N.A. | | 1.00% | | 6/21 | | 1.325% | | 300 | | EUR | | | (13 | ) | | | 5 | | | | (8 | ) |
Petrobras International Finance Co., 8.375%, 12/10/18 | | Morgan Stanley Capital Services LLC | | 1.00% | | 9/15 | | 5.662% | | 200 | | USD | | | (1 | ) | | | (5 | ) | | | (6 | ) |
Renault SA, 5.625%, 3/22/17 | | Citibank, N.A. | | 1.00% | | 12/18 | | 0.760% | | 600 | | EUR | | | (31 | ) | | | 38 | | | | 7 | |
Renault SA, 5.625%, 3/22/17 | | Goldman Sachs International | | 1.00% | | 12/18 | | 0.760% | | 200 | | EUR | | | (10 | ) | | | 12 | | | | 2 | |
Republic of Indonesia, 6.875%, 3/9/17 | | Barclays Bank Plc | | 1.00% | | 12/19 | | 1.516% | | 1,100 | | USD | | | (32 | ) | | | 6 | | | | (26 | ) |
Republic of Indonesia, 6.875%, 3/9/17 | | Citibank N.A. | | 1.00% | | 12/19 | | 1.516% | | 2,300 | | USD | | | (79 | ) | | | 24 | | | | (55 | ) |
Republic of Indonesia, 6.875%, 3/9/17 | | Morgan Stanley Capital Services LLC | | 1.00% | | 12/19 | | 1.516% | | 600 | | USD | | | (12 | ) | | | (3 | ) | | | (15 | ) |
Republic of Peru, 8.75%, 11/21/33 | | Barclays Bank PLC | | 1.00% | | 3/23 | | 1.535% | | 1,100 | | USD | | | (25 | ) | | | (18 | ) | | | (43 | ) |
Republic of Venezuela, 9.25%, 9/15/27 | | HSBC Bank USA | | 5.00% | | 6/17 | | 51.641% | | 200 | | USD | | | (11 | ) | | | (94 | ) | | | (105 | ) |
Republic of Venezuela, 9.25%, 9/15/27 | | HSBC Bank USA | | 5.00% | | 9/17 | | 50.044% | | 120 | | USD | | | (10 | ) | | | (53 | ) | | | (63 | ) |
Safeway, Ltd., 6.125%, 12/17/18 | | Citibank, N.A. | | 1.00% | | 9/19 | | 1.531% | | 300 | | EUR | | | (7 | ) | | | (2 | ) | | | (9 | ) |
Safeway, Ltd., 6.125%, 12/17/18 | | Goldman Sachs International | | 1.00% | | 9/19 | | 1.531% | | 500 | | EUR | | | (12 | ) | | | (2 | ) | | | (14 | ) |
Safeway, Ltd., 6.125%, 12/17/18 | | Goldman Sachs International | | 1.00% | | 9/19 | | 1.531% | | 600 | | EUR | | | (14 | ) | | | (4 | ) | | | (18 | ) |
Safeway, Ltd., 6.125%, 12/17/18 | | JPMorgan Chase Bank, N.A. | | 1.00% | | 12/19 | | 1.602% | | 300 | | EUR | | | (6 | ) | | | (4 | ) | | | (10 | ) |
Schaeffler Finance BV, 5.00%, 6/20/19 | | Barclays Bank PLC | | 5.00% | | 6/19 | | 1.566% | | 400 | | EUR | | | 75 | | | | (2 | ) | | | 73 | |
Sprint Communications, Inc., 8.375%, 8/15/17 | | Citibank N.A. | | 5.00% | | 12/19 | | 4.563% | | 300 | | USD | | | 15 | | | | (9 | ) | | | 6 | |
Teck Resources, Ltd., 3.15%, 1/15/17 | | BNP Paribas SA | | 1.00% | | 3/19 | | 2.109% | | 800 | | USD | | | (19 | ) | | | (16 | ) | | | (35 | ) |
Telefonica Emisiones Sau, 4.375%, 2/2/16 | | Citibank, N.A. | | 1.00% | | 6/19 | | 0.661% | | 4,000 | | EUR | | | 56 | | | | 18 | | | | 74 | |
Telefonica Emisiones Sau, 4.375%, 2/2/16 | | Goldman Sachs International | | 1.00% | | 6/21 | | 0.955% | | 600 | | EUR | | | (31 | ) | | | 34 | | | | 3 | |
Tesco PLC, 6.00%, 12/14/29 | | Barclays Bank PLC | | 1.00% | | 9/19 | | 1.804% | | 700 | | EUR | | | 3 | | | | (33 | ) | | | (30 | ) |
Tesco PLC, 6.00%, 12/14/29 | | Barclays Bank PLC | | 1.00% | | 12/19 | | 1.872% | | 100 | | EUR | | | (2 | ) | | | (3 | ) | | | (5 | ) |
Tesco PLC, 6.00%, 12/14/29 | | Barclays Bank PLC | | 1.00% | | 12/19 | | 1.872% | | 300 | | EUR | | | (6 | ) | | | (9 | ) | | | (15 | ) |
Tesco PLC, 6.00%, 12/14/29 | | Citibank, N.A | | 1.00% | | 12/19 | | 1.872% | | 100 | | EUR | | | (1 | ) | | | (4 | ) | | | (5 | ) |
The Accompanying Notes are an Integral Part of the Financial Statements.
| | | | | | |
| | Multi-Sector Bond Portfolio | | | 155 | |
Multi-Sector Bond Portfolio
Credit Default Swaps on Corporate or Sovereign Issues - Sell Protection (continued)
| | | | | | | | | | | | | | | | | | | | | | |
| Reference Entity | | Counterparty | | Receive
Fixed
Rate | | Expiration
Date | | Implied
Credit
Spread | | Notional
Amount
(000’s) | | Upfront
Premium Paid/(Received)
(000’s) | | | Unrealized
Appreciation/
(Depreciation)
(000’s) | | | Market
Value
(000’s) | |
Tesco PLC, 6.00%, 12/14/29 | | Citibank, N.A. | | 1.00% | | 12/19 | | 1.872% | | 100 EUR | | $ | (2 | ) | | $ | (3 | ) | | $ | (5 | ) |
Tesco PLC, 6.00%, 12/14/29 | | Citibank, N.A. | | 1.00% | | 12/19 | | 1.872% | | 800 EUR | | | (13 | ) | | | (26 | ) | | | (39 | ) |
Tesco PLC, 6.00%, 12/14/29 | | Goldman Sachs International | | 1.00% | | 12/19 | | 1.872% | | 100 EUR | | | — | | | | (4 | ) | | | (4 | ) |
Tesco PLC, 6.00%, 12/14/29 | | Morgan Stanley Capital Services LLC | | 1.00% | | 9/19 | | 1.804% | | 600 EUR | | | 2 | | | | (28 | ) | | | (26 | ) |
Ukraine Government International Bond, 6.75%, 11/14/17 | | Citibank, N.A. | | 5.00% | | 3/19 | | 28.150% | | 900 USD | | | (135 | ) | | | (249 | ) | | | (384 | ) |
Valeant Pharmaceuticals, 6.875%, 12/1/18 | | Goldman Sachs International | | 5.00% | | 6/16 | | 0.870% | | 200 USD | | | (1 | ) | | | 14 | | | | 13 | |
Volvo Treasury AB, 5.00%, 5/31/17 | | BNP Paribas SA | | 1.00% | | 9/19 | | 0.709% | | 600 EUR | | | 5 | | | | 5 | | | | 10 | |
Volvo Treasury AB, 5.00%, 5/31/17 | | Citibank, N.A. | | 1.00% | | 9/19 | | 0.709% | | 300 EUR | | | 2 | | | | 3 | | | | 5 | |
Volvo Treasury AB, 5.00%, 5/31/17 | | JPMorgan Chase Bank, N.A. | | 1.00% | | 9/19 | | 0.709% | | 400 EUR | | | 3 | | | | 4 | | | | 7 | |
Wendel SA, 4.875%, 5/26/16 | | Barclays Bank PLC | | 5.00% | | 6/21 | | 1.177% | | 100 EUR | | | 26 | | | | 3 | | | | 29 | |
| | | | | | | | | | | | | | | | | | | | | | |
| | | | | | | | | | | | $ | (773 | ) | | $ | (980 | ) | | $ | (1,753 | ) |
| | | | | | | | | | | | | | | | | | | | | | |
Credit Default Swaps on Corporate or Sovereign Issues - Buy Protection
| | | | | | | | | | | | | | | | | | | | | | | | |
| Reference Entity | | Counterparty | | Pay
Fixed
Rate | | Expiration
Date | | Implied
Credit
Spread | | Notional
Amount
(000’s) | | | | Upfront
Premium
Paid/
(Received)
(000’s) | | | Unrealized
Appreciation/
(Depreciation)
(000’s) | | | Market
Value
(000’s) | |
Russian Federation, 7.50%, 3/31/30 | | JPMorgan Chase Bank N.A. | | 1.00% | | 12/19 | | 4.779% | | 2,500 | | USD | | $ | 178 | | | $ | 214 | | | $ | 392 | |
| | | | | | | | | | | | | | | | | | | | | | | | |
| | | | | | | | | | | | | | $ | 178 | | | $ | 214 | | | $ | 392 | |
| | | | | | | | | | | | | | | | | | | | | | | | |
Centrally Cleared Interest Rate Swaps - Pay Floating Rate
| | | | | | | | | | | | | | | | |
| Floating Rate Index | | | | Fixed
Rate | | Expiration
Date | | Notional
Amount
(000’s) | | Currency | | | Unrealized
Appreciation/
(Depreciation)
(000’s) | |
28 Day Mexico Interbank TIIE Banxico | | | | 5.84% | | 9/21 | | 9,900 | | | MXN | | | $ | 5 | |
6-Month Australian Bank Bill | | | | 4.00% | | 6/19 | | 34,100 | | | AUD | | | | 1,292 | |
| | | | | | | | | | | | | | | | |
| | | | | | | | | | | | | | $ | 1,297 | |
| | | | | | | | | | | | | | | | |
Centrally Cleared Interest Rate Swaps - Receive Floating Rate
| | | | | | | | | | | | | | | | |
| Floating Rate Index | | | | Fixed
Rate | | Expiration
Date | | Notional
Amount
(000’s) | | Currency | | | Unrealized
Appreciation/
(Depreciation)
(000’s) | |
3-Month USD-LIBOR | | | | 2.25% | | 12/19 | | 18,000 | | | USD | | | $ | 21 | |
3-Month USD-LIBOR | | | | 1.50% | | 12/17 | | 20,000 | | | USD | | | | 8 | |
3-Month USD-LIBOR | | | | 1.25% | | 6/17 | | 40,000 | | | USD | | | | 103 | |
6-Month Euribor | �� | | | 0.50% | | 3/20 | | 2,300 | | | EUR | | | | (33 | ) |
6-Month GBP-LIBOR | | | | 2.75% | | 3/25 | | 3,400 | | | GBP | | | | (250 | ) |
6-Month JPY-LIBOR | | | | 1.00% | | 3/24 | | 510,000 | | | JPY | | | | (45 | ) |
6-Month JPY-LIBOR | | | | 1.00% | | 9/23 | | 1,120,000 | | | JPY | | | | (337 | ) |
| | | | | | | | | | | | | | | | |
| | | | | | | | | | | | | | $ | (533 | ) |
| | | | | | | | | | | | | | | | |
The Accompanying Notes are an Integral Part of the Financial Statements.
| | | | |
| 156 | | Multi-Sector Bond Portfolio | | |
Multi-Sector Bond Portfolio
Centrally Cleared Credit Default Swaps on Credit Indices - Sell Protection
| | | | | | | | | | | | | | | | |
| Reference Entity | | | | Receive Fixed
Rate | | Expiration Date | | Implied Credit Spread | | Notional
Amount
(000’s) | | Currency | | Unrealized
Appreciation/
(Depreciation)
(000’s) | |
Markit CDX Emerging Markets Index, Series 21 | | | | 5.00% | | 6/19 | | 3.757% | | 7,334 | | USD | | $ | (250 | ) |
Markit CDX Emerging Markets Index, Series 22 | | | | 1.00% | | 12/19 | | 3.394% | | 15,700 | | USD | | | (489 | ) |
| | | | | | | | | | | | | | | | |
| | | | | | | | | | | | | | $ | (739 | ) |
| | | | | | | | | | | | | | | | |
| (k) | Cash or securities with an aggregate value of $68,686 (in thousands) has been pledged as collateral for swap contracts outstanding, short sales or written options on December 31, 2014. |
| (m) | Amount is less than one thousand. |
The following is a summary of the inputs used in valuing the Portfolio’s assets and liabilities at December 31, 2014. See Note 3 for additional information on portfolio valuation.
| | | | | | | | | | | | | | |
| | | Valuation Inputs | | | |
| Description | | Level 1 –
Quoted Prices | | | Level 2 –
Other Significant
Observable Inputs | | | Level 3 –
Significant
Unobservable Inputs | | | |
| | | (Amounts in thousands) | | | |
Assets: | | | | | | | | | | | | | | |
Bank Loan Obligations | | $ | - | | | $ | 11,851 | | | $ | 766 | | | |
Government & Agency Bonds | | | - | | | | 109,346 | | | | - | | | |
Foreign Bonds | | | - | | | | 105,860 | | | | - | | | |
Municipal Bonds | | | - | | | | 13,469 | | | | - | | | |
Corporate Bonds | | | - | | | | 229,845 | | | | 872 | | | |
Structured Products | | | - | | | | 33,203 | | | | 367 | | | |
Short-Term Investments | | | - | | | | 41,848 | | | | - | | | |
Other Financial Instruments^ | | | | | | | | | | | | | | |
Futures | | | 1,038 | | | | - | | | | - | | | |
Forward Currency Contracts | | | - | | | | 4,362 | | | | - | | | |
Interest Rate Swaps | | | - | | | | 1,642 | | | | - | | | |
Credit Default Swaps | | | - | | | | 489 | | | | - | | | |
Total Assets | | $ | 1,038 | | | $ | 551,915 | | | $ | 2,005 | | | |
Liabilities: | | | | | | | | | | | | | | |
Other Financial Instruments^ | | | | | | | | | | | | | | |
Forward Currency Contracts | | $ | - | | | $ | (943 | ) | | $ | - | | | |
Interest Rate Swaps | | | - | | | | (665 | ) | | | - | | | |
Credit Default Swaps | | | - | | | | (1,994 | ) | | | - | | | |
Total Liabilities | | $ | - | | | $ | (3,602 | ) | | $ | - | | | |
^ Other financial instruments are derivative instruments such as futures, forwards, written options and swaps contracts, which are valued at the unrealized appreciation (depreciation) on the instrument and short sales, which are valued at market value.
The Accompanying Notes are an Integral Part of the Financial Statements.
| | | | | | |
| | Multi-Sector Bond Portfolio | | | 157 | |
Balanced Portfolio (unaudited)
| | | | |
| Objective: | | Portfolio Strategy: | | Net Assets: |
Realize as high a level of total return as is consistent with prudent investment risk, through income and capital appreciation. | | Invest in the stock, bond and money market sectors, attempting to capitalize on the variation in return potential produced by the interaction of changing financial markets and economic conditions. | | $2.4 billion |
Portfolio Overview
Mason Street Advisors, LLC is the investment adviser for the Balanced Portfolio (the “Portfolio”). The Portfolio is tactically and strategically managed to capitalize on changing financial markets and economic conditions following a flexible policy of allocating assets across the stock, bond and money market sectors. The Portfolio operates as a “fund of funds” to gain the Portfolio’s equity and fixed income exposure by investing in one or more of the portfolios of the Northwestern Mutual Series Fund, Inc. (each an “Underlying Portfolio”). The adviser will allocate the Portfolio’s assets among the Underlying Portfolios based on the adviser’s economic and market outlook and the investment objectives and strategies of the Underlying Portfolios. Under normal market conditions, the Portfolio’s equity exposure will typically range between 35-55% of assets.
Market Overview
The equity markets posted solid gains during 2014, as markets adjusted to changing monetary policy. Improving economic growth with mild inflation prompted the U.S. Federal Reserve (the “Fed”) to gradually complete its bond purchasing program and maintain its zero interest rate policy during 2014, though Fed policy contributed to uncertainty during the second half of the year. Throughout the year, the Fed decreased its bond purchasing at a measured $10 billion monthly pace. Market volatility preceded the Fed’s last bond purchase in October, as investors became concerned that the Fed’s zero interest rate policy might be the next tightening of monetary stimulus. The Fed reaffirmed its commitment to zero interest rate policy for a considerable period, which reassured investors. Markets rallied on the news, while improving economic growth late in the year also increased investors’ optimism. In that environment, small cap stocks led the market, followed by shares of mid and large sized companies. For the year, returns for the S&P 500®, MidCap 400®, and SmallCap 600® Indices were 13.69%, 9.77%, and 5.76%, respectively.
The bond market also posted positive returns, as most interest rates declined during 2014, pushing bond prices higher. The year began with the broadly held consensus view that interest rates would rise, but low inflation, modest economic growth and no unexpected changes to monetary policy led to lower interest rates. Although rates experienced some short-term volatility, investors largely favored the relative safety of U.S. Treasurys over the higher yields of corporate bonds. As a result, bonds experienced a relatively wide range of returns, as the Barclays® Long Term Treasury Index returned 25.07%, while the Barclays® Corporate U.S. High Yield Index returned only 2.45%. Overall, the broad bond market, as measured by the Barclays® U.S. Aggregate Index, posted a solid 5.97% return for 2014.
Portfolio Results
The Portfolio returned 5.56% for the twelve months ended December 31, 2014, trailing the 13.69% return of the broad stock market, as measured by the S&P 500® Index. The Portfolio also trailed the Balanced Portfolio Blended Composite Benchmark return of 7.47%. (The benchmark weights are detailed in the “Benchmark Definitions” section of this annual report.) The Mixed-Asset Target Allocation Moderate Funds peer group had an average return of 5.76% in 2014, according to Lipper® Analytical Services, Inc., an independent mutual fund ranking agency.
The Portfolio’s underperformance relative to the blended benchmark reflects the performance of the Portfolio’s Underlying Portfolios, as most of the Underlying Portfolios underperformed their respective benchmarks during a difficult year for active management.
Overall allocation decisions were modestly positive for the full year. The Portfolio’s additions to equities in the fourth quarter, particularly during market corrections, were the driver of the positive attribution. The Portfolio’s overweight to emerging markets during the early months of the year partially offset the positive allocation effects for the full year.
During the year, equity futures contracts and fixed income futures contracts were used for cash management purposes. The Portfolio’s use of derivatives did not have a significant effect on the Portfolio’s relative results during 2014.
Portfolio Manager Outlook
As we enter 2015, we expect volatility to continue to rise from historically low levels witnessed for much of 2014. Both equity and fixed income markets saw volatility pick up in the last quarter of 2014. Credit spreads widened as the year came to a close, implying some near term risk aversion. We will be closely following the financial markets’ reaction to the Fed’s exit from extraordinary monetary policy. Just as quantitative easing was a contributing factor to the reduction of volatility, the return to a more normal monetary policy and tighter liquidity conditions could lead to increased volatility. With interest rates low and earnings growth expected to continue in the U.S., we think equities look relatively attractive despite potential volatility.
Balanced Portfolio (unaudited)
Relative Performance

| | | | | | | | | | | | |
Average Annual Total Returns
For Periods Ended December 31, 2014 | |
| | | 1 Year | | | 5 Years | | | 10 Years | |
Balanced Portfolio | | | 5.56% | | | | 8.21% | | | | 5.39% | |
S&P 500® Index | | | 13.69% | | | | 15.45% | | | | 7.67% | |
Barclays® U.S. Aggregate Index | | | 5.97% | | | | 4.45% | | | | 4.71% | |
Balanced Portfolio Blended Composite Benchmark | | | 7.47% | | | | 9.39% | | | | 6.60% | |
Lipper® Variable Insurance Products (VIP) Mixed Asset Target Allocation Moderate Funds Average | | | 5.76% | | | | 8.76% | | | | 5.94% | |
The performance data quoted represents past performance. Past performance is historical and does not guarantee future performance. Investment return and principal value will fluctuate, so that shares, when redeemed, may be worth more or less than their original cost. Current performance may be lower or higher than the performance data quoted. For the most recent month-end performance information visit www.northwesternmutual.com.
This chart assumes an initial investment of $10,000 made on 12/31/04. Returns shown include deductions for management and other portfolio expenses, and reinvestment of all dividends. Returns exclude deductions for separate account sale loads and account fees. Please refer to the Benchmark Definitions section of this report for information about the indices cited in the above chart and graph.
Investors should be aware of the risks of investments in foreign securities, particularly investments in securities of companies in developing nations. These include the risks of currency fluctuation, of political and economic instability and of less well-developed government supervision and regulation of business and industry practices, as well as differences in accounting standards. Small cap stocks also may carry additional risk. Smaller or newer issuers are more likely to realize more substantial growth as well as suffer more significant losses than larger or more established issuers. Investments in such companies can be both volatile and more speculative. Bonds and other debt obligations are affected by changes in interest rates, inflation risk and the creditworthiness of their issuers. High yield bonds generally have greater price swings and higher default risks than investment grade bonds.
The Portfolio obtains its exposure to equity and fixed income securities by investing in other Series Fund portfolios (Underlying Portfolios). Each of the Underlying Portfolios has its own investment risks, and the Portfolio is indirectly exposed to all the risks of the Underlying Portfolios in which it invests, including that risk that an Underlying Portfolio will not perform as expected. To the extent that the Portfolio invests a significant portion of its assets in a single Underlying Portfolio, it will be particularly sensitive to the risks associated with that Underlying Portfolio may have a significant effect on the Portfolio’s net asset value. The Portfolio will bear a pro rata share of the Underlying Portfolio’s expenses.
The Portfolio may use derivative instruments to gain exposure to certain markets, sectors or regions as alternatives to direct investments, to adjust the Portfolio duration, to provide increased flexibility in asset allocation, to earn income and to otherwise seek to enhance returns or to hedge foreign currency exposure. Use of these instruments may involve certain costs and risks such as liquidity risk, interest rate risk, mispricing or improper valuation. Certain derivatives involve leverage, which could magnify losses, and portfolios investing in derivatives could lose more than the principal amount invested in those investments.
Currently, interest rates are at unprecedented historically low levels. A significant rise in interest rates over a short period of time could cause significant losses in the market value of the Portfolio’s fixed income investments.
Balanced Portfolio (unaudited)
Top 10 Equity Holdings 12/31/14
| | | | |
| Security Description | | % of Net Assets | |
Northwestern Mutual Series Fund, Inc., Select Bond Portfolio | | | 38.8% | |
Northwestern Mutual Series Fund, Inc., Growth Stock Portfolio | | | 6.8% | |
Northwestern Mutual Series Fund, Inc., Research International Core Portfolio | | | 6.3% | |
Northwestern Mutual Series Fund, Inc., High Yield Bond Portfolio | | | 5.3% | |
Northwestern Mutual Series Fund, Inc., Mid Cap Value Portfolio | | | 4.5% | |
Northwestern Mutual Series Fund, Inc., Mid Cap Growth Stock Portfolio | | | 4.5% | |
Northwestern Mutual Series Fund, Inc., Focused Appreciation Portfolio | | | 3.4% | |
Northwestern Mutual Series Fund, Inc., Domestic Equity Portfolio | | | 3.3% | |
Northwestern Mutual Series Fund, Inc., Large Company Value Portfolio | | | 3.3% | |
Northwestern Mutual Series Fund, Inc., Large Cap Blend Portfolio | | | 3.3% | |
Sector Allocation 12/31/14

Sector Allocation is based on Net Assets.
Sector Allocation and Top 10 Holdings are subject to change.
The Investment Grade Segment includes bonds of companies and governments headquarteed outside the United States.
Balanced Portfolio
Schedule of Investments
December 31, 2014
| | | | | | | | | | |
| | | Investment Companies (94.6%) | | Shares/
$ Par | | | Value
$ (000’s) | |
| | | |
| | Domestic Equity (39.0%) | | | | | | | | |
| | iShares Russell 2000 ETF | | | 63,980 | | | | 7,656 | |
| | iShares Russell Mid-Cap ETF | | | 41,662 | | | | 6,959 | |
| (q) | | Northwestern Mutual Series Fund, Inc., Domestic Equity Portfolio | | | 54,602,360 | | | | 78,737 | |
| (q) | | Northwestern Mutual Series Fund, Inc., Equity Income Portfolio | | | 41,537,698 | | | | 73,605 | |
| (q) | | Northwestern Mutual Series Fund, Inc., Focused Appreciation Portfolio | | | 30,126,661 | | | | 79,354 | |
| (q) | | Northwestern Mutual Series Fund, Inc., Growth Stock Portfolio | | | 56,014,610 | | | | 161,042 | |
| (q) | | Northwestern Mutual Series Fund, Inc., Large Cap Blend Portfolio | | | 68,646,796 | | | | 77,159 | |
| (q) | | Northwestern Mutual Series Fund, Inc., Large Cap Core Stock Portfolio | | | 44,846,678 | | | | 74,132 | |
| (q) | | Northwestern Mutual Series Fund, Inc., Large Company Value Portfolio | | | 67,293,480 | | | | 77,186 | |
| (q) | | Northwestern Mutual Series Fund, Inc., Mid Cap Growth Stock Portfolio | | | 31,490,889 | | | | 107,037 | |
| (q) | | Northwestern Mutual Series Fund, Inc., Mid Cap Value Portfolio | | | 60,619,286 | | | | 107,357 | |
| (q) | | Northwestern Mutual Series Fund, Inc., Small Cap Growth Stock Portfolio | | | 13,588,571 | | | | 33,903 | |
| (q) | | Northwestern Mutual Series Fund, Inc., Small Cap Value Portfolio | | | 14,260,608 | | | | 33,997 | |
| | SPDR S&P MidCap 400 ETF Trust | | | 15,573 | | | | 4,111 | |
| | | | | | | | | | |
| | Total | | | | | | | 922,235 | |
| | | | | | | | | | |
| | | |
| | Fixed Income (44.7%) | | | | | | | | |
| | iShares iBoxx $ High Yield Corporate Bond ETF | | | 127,375 | | | | 11,413 | |
| (q) | | Northwestern Mutual Series Fund, Inc., High Yield Bond Portfolio | | | 175,438,215 | | | | 126,491 | |
| (q) | | Northwestern Mutual Series Fund, Inc., Select Bond Portfolio | | | 725,572,167 | | | | 919,300 | |
| | | | | | | | | | |
| | Total | | | | | | | 1,057,204 | |
| | | | | | | | | | |
| | | |
| | Foreign Equity (10.9%) | | | | | | | | |
| | iShares MSCI EAFE ETF | | | 165,000 | | | | 10,039 | |
| | iShares MSCI Emerging Markets ETF | | | 212,675 | | | | 8,356 | |
| | iShares MSCI Japan ETF | | | 998,000 | | | | 11,217 | |
| | | | | | | | | | |
| | | Investment Companies (94.6%) | | Shares/
$ Par | | | Value
$ (000’s) | |
| | | |
| | Foreign Equity continued | | | | | | | | |
| (q) | | Northwestern Mutual Series Fund, Inc., Emerging Markets Portfolio | | | 10,256,634 | | | | 9,498 | |
| (q) | | Northwestern Mutual Series Fund, Inc., International Equity Portfolio | | | 36,737,411 | | | | 65,172 | |
| (q) | | Northwestern Mutual Series Fund, Inc., Research International Core Portfolio | | | 164,552,753 | | | | 148,426 | |
| | Vanguard FTSE Developed Markets ETF | | | 171,615 | | | | 6,501 | |
| | | | | | | | | | |
| | Total | | | | | | | 259,209 | |
| | | | | | | | | | |
| | | |
| | Total Investment Companies (Cost: $2,113,878) | | | | | | | 2,238,648 | |
| | | | | | | | | | |
| | | |
| | | Short-Term Investments (4.6%) | | | | | | | | |
| | Autos (0.4%) | |
| | Toyota Motor Credit Corp., 0.331%, 1/15/15 | | | 10,000,000 | | | | 10,000 | |
| | | | | | | | | | |
| | Total | | | | | | | 10,000 | |
| | | | | | | | | | |
| | | |
| | Commercial Paper (4.2%) | | | | | | | | |
| | Alpine Securitization Corp., 0.22%, 2/19/15 144A | | | 10,000,000 | | | | 9,997 | |
| | Federal Home Loan Banks, 0.005%, 1/21/15 | | | 4,000,000 | | | | 4,000 | |
| | Federal Home Loan Banks, 0.04%, 2/10/15 | | | 13,000,000 | | | | 12,999 | |
| | Federal Home Loan Banks, 0.05%, 1/7/15 | | | 10,000,000 | | | | 10,000 | |
| | Federal Home Loan Banks, 0.07%, 1/14/15 | | | 11,200,000 | | | | 11,200 | |
| | Federal Home Loan Banks, 0.07%, 1/23/15 | | | 18,100,000 | | | | 18,099 | |
| | Federal Home Loan Banks, 0.07%, 2/5/15 | | | 5,000,000 | | | | 5,000 | |
| | Federal Home Loan Banks, 0.08%, 1/20/15 | | | 10,000,000 | | | | 10,000 | |
| | Federal Home Loan Banks, 0.08%, 2/11/15 | | | 5,000,000 | | | | 4,999 | |
| | Federal Home Loan Banks, 0.09%, 1/28/15 | | | 12,700,000 | | | | 12,699 | |
| (b) | | Federal Home Loan Mortgage Corp., 0.10%, 3/16/15 | | | 1,300,000 | | | | 1,300 | |
| | | | | | | | | | |
| | Total | | | | | | | 100,293 | |
| | | | | | | | | | |
| | | |
| | Total Short-Term Investments (Cost: $110,293) | | | | | | | 110,293 | |
| | | | | | | | | | |
| | | |
| | Total Investments (99.2%) (Cost: $2,224,171)(a) | | | | | | | 2,348,941 | |
| | | | | | | | | | |
| | | |
| | Other Assets, Less Liabilities (0.8%) | | | | | | | 18,186 | |
| | | | | | | | | | |
| | Net Assets (100.0%) | | | | | | | 2,367,127 | |
| | | | | | | | | | |
The Accompanying Notes are an Integral Part of the Financial Statements.
Balanced Portfolio
144A after the name of a security represents a security exempt from registration under Rule 144A of the Securities Act of 1933. These securities may be resold as transactions exempt from registration, normally to qualified institutional buyers. At December 31, 2014 the value of these securities (in thousands) was $9,997 representing 0.4% of the net assets.
| (a) | At December 31, 2014, the aggregate cost of securities for federal tax purposes (in thousands) was $2,224,215 and the net unrealized appreciation of investments based on that cost was $124,726 which is comprised of $136,287 aggregate gross unrealized appreciation and $11,561 aggregate gross unrealized depreciation. |
| (b) | All or a portion of the securities have been pledged as collateral for open futures positions or when-issued securities. Information regarding open futures contracts as of period end is summarized below. |
| | | | | | | | |
| Issuer (000’s) | | Number of
Contracts | | Expiration Date | | Unrealized
Appreciation/
(Depreciation)
(000’s) | |
S&P 500 Mini Index Futures (Long) (Total Notional Value at December 31, 2014, $28,821) | | 287 | | 3/15 | | $ | 630 | |
The following is a summary of the inputs used in valuing the Portfolio’s assets and liabilities at December 31, 2014. See Note 3 for additional information on portfolio valuation.
| | | | | | | | | | | | | | |
| | | Valuation Inputs | | | |
| Description | | Level 1 - Quoted Prices | | | Level 2 -
Other Significant
Observable Inputs | | | Level 3 - Significant Unobservable Inputs | | | |
| | | (Amounts in thousands) | | | |
Assets: | | | | | | | | | | | | | | |
Investment Companies | | $ | 2,238,648 | | | $ | - | | | $ | - | | | |
Short-Term Investments | | | - | | | | 110,293 | | | | - | | | |
Other Financial Instruments^ | | | | | | | | | | | | | | |
Futures | | | 630 | | | | - | | | | - | | | |
Total | | $ | 2,239,278 | | | $ | 110,293 | | | $ | - | | | |
^ Other financial instruments are derivative instruments such as futures, forwards, written options and swaps contracts, which are valued at the unrealized appreciation (depreciation) on the instrument and short sales, which are valued at market value.
The Accompanying Notes are an Integral Part of the Financial Statements.
Asset Allocation Portfolio (unaudited)
| | | | |
| Objective: | | Portfolio Strategy: | | Net Assets: |
Realize as high a level of total return as is consistent with reasonable investment risk. | | Invest in the stock, bond and money market sectors, attempting to capitalize on the variation in return potential produced by the interaction of changing financial markets and economic conditions. | | $266 million |
Portfolio Overview
Mason Street Advisors, LLC is the investment adviser for the Asset Allocation Portfolio (the “Portfolio”). The Portfolio invests in the stock, bond and money market sectors. The Portfolio is tactically and strategically managed to capitalize on changing financial markets and economic conditions following a flexible policy of allocating assets across the stock, bond and money market sectors. The Portfolio operates as a “fund of funds” to gain the Portfolio’s equity and fixed income exposure by investing in one or more of the portfolios of Northwestern Mutual Series Fund, Inc. (each an “Underlying Portfolio”). The adviser will allocate the Portfolio’s assets among the Underlying Portfolios based on the adviser’s economic and market outlook and the investment objectives and strategies of the Underlying Portfolios. Under normal market conditions, the Portfolio’s equity exposure will typically range between 55-75% of assets.
Market Overview
The equity markets posted solid gains during 2014, as markets adjusted to changing monetary policy. Improving economic growth with mild inflation prompted the U.S. Federal Reserve (the “Fed”) to gradually complete its bond purchasing program and maintain its zero interest rate policy during 2014, though Fed policy contributed to uncertainty during the second half of the year. Throughout the year, the Fed decreased its bond purchasing at a measured $10 billion monthly pace. Market volatility preceded the Fed’s last bond purchase in October, as investors became concerned that the Fed’s zero interest rate policy might be the next tightening of monetary stimulus. The Fed reaffirmed its commitment to zero interest rate policy for a considerable period, which reassured investors. Markets rallied on the news, while improving economic growth late in the year also increased investors’ optimism. In that environment, small cap stocks led the market, followed by shares of mid and large sized companies. For the year, returns for the S&P 500®, MidCap 400®, and SmallCap 600® Indices were 13.69%, 9.77%, and 5.76%, respectively.
The bond market also posted positive returns, as most interest rates declined during 2014, pushing bond prices higher. The year began with the broadly held consensus view that interest rates would rise, but low inflation, modest economic growth and no unexpected changes to monetary policy led to lower interest rates. Although rates experienced some short-term volatility, investors largely favored the relative safety of U.S. Treasurys over the higher yields of corporate bonds. As a result, bonds experienced a relatively wide range of returns, as the Barclays® Long Term Treasury Index returned 25.07%, while the Barclays® Corporate U.S. High Yield Index returned only 2.45%. Overall, the broad bond market, as measured by the Barclays® U.S. Aggregate Index, posted a solid 5.97% return for 2014.
Portfolio Results
The Portfolio returned 5.15% for the twelve months ended December 31, 2014, trailing the 13.69% return of the broad stock market, as measured by the S&P 500® Index. The Portfolio also trailed the Asset Allocation Portfolio Blended Composite Benchmark return of 7.43%. (The benchmark weights are detailed in the “Benchmark Definitions” section of this annual report.) The Mixed-Asset Target Allocation Growth Funds peer group had an average return of 6.05% in 2014, according to Lipper® Analytical Services, Inc., an independent mutual fund ranking agency.
The Portfolio’s underperformance relative to the blended benchmark reflects the performance of the Portfolio’s Underlying Portfolios, as most of the Underlying Portfolios underperformed their respective benchmarks during a difficult year for active management.
Overall allocation decisions were modestly positive for the full year. The Portfolio’s additions to equities in the fourth quarter, particularly during market corrections, were the driver of the positive attribution. The Portfolio’s overweight to emerging markets during the early months of the year partially offset the positive allocation effects for the full year.
During the year, equity futures contracts and fixed income futures contracts were used for cash management purposes. The Portfolio’s use of derivatives did not have a significant effect on the Portfolio’s relative results during 2014.
Portfolio Manager Outlook
As we enter 2015, we volatility to continue to rise from historically low levels witnessed for much of 2014. Both equity and fixed income markets saw volatility pick up in the last quarter of 2014. Credit spreads widened as the year came to a close, implying some near term risk aversion. We will be closely following the financial markets’ reaction to the Fed’s exit from extraordinary monetary policy. Just as quantitative easing was a contributing factor to the reduction of volatility, the return to a more normal monetary policy and tighter liquidity conditions could lead to increased volatility. With interest rates low and earnings growth expected to continue in the U.S., we think equities look relatively attractive despite potential volatility.
| | | | | | |
| | Asset Allocation Portfolio | | | 163 | |
Asset Allocation Portfolio (unaudited)
Relative Performance
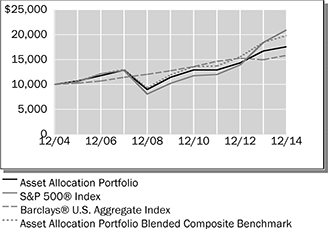
| | | | | | | | | | | | |
Average Annual Total Returns
For Periods Ended December 31, 2014 | |
| | | 1 Year | | | 5 Years | | | 10 Years | |
Asset Allocation Portfolio | | | 5.15% | | | | 8.99% | | | | 5.80% | |
S&P 500® Index | | | 13.69% | | | | 15.45% | | | | 7.67% | |
Barclays® U.S. Aggregate Index | | | 5.97% | | | | 4.45% | | | | 4.71% | |
Asset Allocation Portfolio Blended Composite Benchmark | | | 7.43% | | | | 10.71% | | | | 7.07% | |
Lipper® Variable Insurance Products (VIP) Mixed Asset Target Allocation Growth Funds Average | | | 6.05% | | | | 10.17% | | | | 6.61% | |
The performance data quoted represents past performance. Past performance is historical and does not guarantee future performance. Investment return and principal value will fluctuate, so that shares, when redeemed, may be worth more or less than their original cost. Current performance may be lower or higher than the performance data quoted. For the most recent month-end performance information visit www.northwesternmutual.com.
This chart assumes an initial investment of $10,000 made on 12/31/04. Returns shown include deductions for management and other portfolio expenses, and reinvestment of all dividends. Returns exclude deductions for separate account sale loads and account fees. Please refer to the Benchmark Definitions section of this report for information about the indices cited in the above chart and graph.
Investors should be aware of the risks of investments in foreign securities, particularly investments in securities of companies in developing nations. These include the risks of currency fluctuation, of political and economic instability and of less well-developed government supervision and regulation of business and industry practices, as well as differences in accounting standards. Small cap stocks also may carry additional risk. Smaller or newer issuers are more likely to realize more substantial growth as well as suffer more significant losses than larger or more established issuers. Investments in such companies can be both volatile and more speculative. Bonds and other debt obligations are affected by changes in interest rates, inflation risk and the creditworthiness of their issuers. High yield bonds generally have greater price swings and higher default risks than investment grade bonds.
The Portfolio obtains its exposure to equity and fixed income securities by investing in other Series Fund portfolios (Underlying Portfolios). Each of the Underlying Portfolios has its own investment risks, and the Portfolio is indirectly exposed to all the risks of the Underlying Portfolios in which it invests, including that risk that an Underlying Portfolio will not perform as expected. To the extent that the Portfolio invests a significant portion of its assets in a single Underlying Portfolio, it will be particularly sensitive to the risks associated with that Underlying Portfolio may have a significant effect on the Portfolio’s net asset value. The Portfolio will bear a pro rata share of the Underlying Portfolio’s expenses.
The Portfolio may use derivative instruments to gain exposure to certain markets, sectors or regions as alternatives to direct investments, to adjust the Portfolio duration, to provide increased flexibility in asset allocation, to earn income and to otherwise seek to enhance returns or to hedge foreign currency exposure. Use of these instruments may involve certain costs and risks such as liquidity risk, interest rate risk, mispricing or improper valuation. Certain derivatives involve leverage, which could magnify losses, and portfolios investing in derivatives could lose more than the principal amount invested in those investments.
Currently, interest rates are at unprecedented historically low levels. A significant rise in interest rates over a short period of time could cause significant losses in the market value of the Portfolio’s fixed income investments.
| | | | |
| 164 | | Asset Allocation Portfolio | | |
Asset Allocation Portfolio
Top 10 Equity Holdings 12/31/14
| | |
| Security Description | | % of Net Assets |
Northwestern Mutual Series Fund, Inc., Select Bond Portfolio | | 22.0% |
Northwestern Mutual Series Fund, Inc., Research International Core Portfolio | | 8.4% |
Northwestern Mutual Series Fund, Inc., Growth Stock Portfolio | | 8.2% |
Northwestern Mutual Series Fund, Inc., High Yield Bond Portfolio | | 7.1% |
Northwestern Mutual Series Fund, Inc., Mid Cap Growth Stock Portfolio | | 5.4% |
Northwestern Mutual Series Fund, Inc., Mid
Cap Value Portfolio | | 5.4% |
Northwestern Mutual Series Fund, Inc., Large Cap Blend Portfolio | | 4.4% |
Northwestern Mutual Series Fund, Inc., Large Cap Core Stock Portfolio | | 4.3% |
Northwestern Mutual Series Fund, Inc., Focused Appreciation Portfolio | | 4.0% |
Northwestern Mutual Series Fund, Inc., Domestic Equity Portfolio | | 4.0% |
Sector Allocation 12/31/14
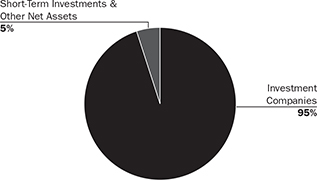
Sector Allocation is based on Net Assets.
Sector Allocation and Top 10 Holdings are subject to change.
| | | | | | |
| | Asset Allocation Portfolio | | | 165 | |
Asset Allocation Portfolio
Schedule of Investments
December 31, 2014
| | | | | | | | | | |
| | | Investment Companies (95.1%) | | Shares/
$ Par | | | Value
$ (000’s) | |
| | | |
| | Domestic Equity (49.6%) | | | | | | | | |
| | iShares Russell 2000 ETF | | | 15,775 | | | | 1,888 | |
| | iShares Russell Midcap ETF | | | 10,303 | | | | 1,721 | |
| (q) | | Northwestern Mutual Series Fund, Inc., Domestic Equity Portfolio | | | 7,420,074 | | | | 10,700 | |
| (q) | | Northwestern Mutual Series Fund, Inc., Equity Income Portfolio | | | 5,643,992 | | | | 10,001 | |
| (q) | | Northwestern Mutual Series Fund, Inc., Focused Appreciation Portfolio | | | 4,092,270 | | | | 10,779 | |
| (q) | | Northwestern Mutual Series Fund, Inc., Growth Stock Portfolio | | | 7,611,778 | | | | 21,884 | |
| (q) | | Northwestern Mutual Series Fund, Inc., Large Cap Blend Portfolio | | | 10,492,644 | | | | 11,794 | |
| (q) | | Northwestern Mutual Series Fund, Inc., Large Cap Core Stock Portfolio | | | 6,853,802 | | | | 11,329 | |
| (q) | | Northwestern Mutual Series Fund, Inc., Large Company Value Portfolio | | | 9,144,637 | | | | 10,489 | |
| (q) | | Northwestern Mutual Series Fund, Inc., Mid Cap Growth Stock Portfolio | | | 4,251,313 | | | | 14,450 | |
| (q) | | Northwestern Mutual Series Fund, Inc., Mid Cap Value Portfolio | | | 8,139,655 | | | | 14,415 | |
| (q) | | Northwestern Mutual Series Fund, Inc., Small Cap Growth Stock Portfolio | | | 2,428,753 | | | | 6,060 | |
| (q) | | Northwestern Mutual Series Fund, Inc., Small Cap Value Portfolio | | | 2,583,520 | | | | 6,159 | |
| | SPDR S&P MidCap 400 ETF Trust | | | 1,289 | | | | 340 | |
| | | | | | | | | | |
| | Total | | | | | | | 132,009 | |
| | | | | | | | | | |
| | | |
| | Fixed Income (29.5%) | | | | | | | | |
| | iShares iBoxx $ High Yield Corporate Bond Fund | | | 14,350 | | | | 1,286 | |
| (q) | | Northwestern Mutual Series Fund, Inc., High Yield Bond Portfolio | | | 26,098,184 | | | | 18,817 | |
| (q) | | Northwestern Mutual Series Fund, Inc., Select Bond Portfolio | | | 46,263,600 | | | | 58,616 | |
| | | | | | | | | | |
| | Total | | | | | | | 78,719 | |
| | | | | | | | | | |
| | | |
| | Foreign Equity (16.0%) | | | | | | | | |
| | iShares MSCI EAFE ETF | | | 66,775 | | | | 4,063 | |
| | iShares MSCI Emerging Markets ETF | | | 50,875 | | | | 1,999 | |
| | iShares MSCI Japan ETF | | | 130,000 | | | | 1,461 | |
| | | | | | | | | | |
| | | Investment Companies (95.1%) | | Shares/
$ Par | | | Value
$ (000’s) | |
| | | |
| | Foreign Equity continued | | | | | | | | |
| (q) | | Northwestern Mutual Series Fund, Inc., Emerging Markets Portfolio | | | 1,692,795 | | | | 1,567 | |
| (q) | | Northwestern Mutual Series Fund, Inc., International Equity Portfolio | | | 5,572,318 | | | | 9,885 | |
| (q) | | Northwestern Mutual Series Fund, Inc., Research International Core Portfolio | | | 24,945,237 | | | | 22,501 | |
| | Vanguard FTSE Developed Markets ETF | | | 28,070 | | | | 1,063 | |
| | | | | | | | | | |
| | Total | | | | | | | 42,539 | |
| | | | | | | | | | |
| | Total Investment Companies (Cost: $235,426) | | | | 253,267 | |
| | | | | | | | | | |
| | | |
| | | Short-Term Investments (2.5%) | | | | | | |
| |
| | Commercial Paper (2.5%) | |
| | Federal Home Loan Banks, 0.07%, 1/14/15 | | | 3,900,000 | | | | 3,900 | |
| | Federal Home Loan Banks, 0.07%, 1/23/15 | | | 1,700,000 | | | | 1,700 | |
| (b) | | Federal Home Loan Banks, 0.08%, 2/11/15 | | | 1,000,000 | | | | 1,000 | |
| | | | | | | | | | |
| | Total | | | | | | | 6,600 | |
| | | | | | | | | | |
| | | |
| | Total Short-Term Investments (Cost: $6,600) | | | | | | | 6,600 | |
| | | | | | | | | | |
| | | |
| | Total Investments (97.6%) (Cost: $242,026)(a) | | | | | | | 259,867 | |
| | | | | | | | | | |
| | Other Assets, Less Liabilities (2.4%) | | | | | | | 6,542 | |
| | | | | | | | | | |
| | Net Assets (100.0%) | | | | | | | 266,409 | |
| | | | | | | | | | |
The Accompanying Notes are an Integral Part of the Financial Statements.
| | | | |
| 166 | | Asset Allocation Portfolio | | |
Asset Allocation Portfolio
| (a) | At December 31, 2014, the aggregate cost of securities for federal tax purposes (in thousands) was $242,093 and the net unrealized appreciation of investments based on that cost was $17,774 which is comprised of $19,535 aggregate gross unrealized appreciation and $1,761 aggregate gross unrealized depreciation. |
| (b) | All or a portion of the securities have been pledged as collateral for open futures positions or when-issued securities. Information regarding open futures contracts as of period end is summarized below. |
| | | | | | | | |
| Issuer (000’s) | | Number of
Contracts | | Expiration Date | | Unrealized
Appreciation/
(Depreciation)
(000’s) | |
S&P 500 Mini Index Futures (Long) (Total Notional Value at December 31, 2014, $5,725) | | 57 | | 3/15 | | $ | 125 | |
The following is a summary of the inputs used in valuing the Portfolio’s assets and liabilities at December 31, 2014. See Note 3 for additional information on portfolio valuation.
| | | | | | | | | | | | | | |
| | | Valuation Inputs | | | |
| Description | | Level 1 - Quoted Prices | | | Level 2 -
Other Significant
Observable Inputs | | | Level 3 - Significant Unobservable Inputs | | | |
| | | (Amounts in thousands) | | | |
Assets: | | | | | | | | | | | | | | |
Investment Companies | | $ | 253,267 | | | $ | - | | | $ | - | | | |
Short-Term Investments | | | - | | | | 6,600 | | | | - | | | |
Other Financial Instruments^ | | | | | | | | | | | | | | |
Futures | | | 125 | | | | - | | | | - | | | |
Total | | $ | 253,392 | | | $ | 6,600 | | | $ | - | | | |
^ Other financial instruments are derivative instruments such as futures, forwards, written options and swaps contracts, which are valued at the unrealized appreciation (depreciation) on the instrument and short sales, which are valued at market value.
The Accompanying Notes are an Integral Part of the Financial Statements.
| | | | | | |
| | Asset Allocation Portfolio | | | 167 | |
Benchmark Definitions (unaudited)
The following indices are used to illustrate investment market, sector or style performance or to serve as Portfolio performance comparisons. Unlike the Portfolios, the indices are not professionally managed and do not incur fees or expenses. It is not possible to invest directly in an index.
33%: Barclays® Global Aggregate — Credit Component, Hedged USD, Merrill Lynch® Global High- Yield BB-B Rated Constrained Index and JPMorgan® EMBI Global — The benchmark is an equally weighted blend of the following three indices: Barclays® Global Aggregate —Credit Component, Hedged USD, Merrill Lynch® Global High Yield BB-B Rated Constrained Index and JPMorgan® EMBI Global. The Barclays® Global Aggregate — Credit Component, Hedged USD Index provides a broad-based measure of the global investment-grade fixed income markets. The Merrill Lynch® Global High Yield BB-B Rated Constrained Index tracks the performance of below investment-grade bonds of corporate issuers domiciled in countries having an investment-grade foreign currency long term debt rating (based on a composite of Moody’s, S&P, and Fitch). The Index includes bonds denominated in U.S. dollars, Canadian dollars, sterling, and euro (or euro legacy currency), but excludes all multi-currency denominated bonds. Bonds must be rated below investment-grade but at least B3 based on a composite of Moody’s, S&P, and Fitch. Qualifying bonds are capitalization-weighted provided the total allocation to an individual issuer (defined by Bloomberg tickers) does not exceed 2%. Issuers that exceed the limit are reduced to 2% and the face value of each of their bonds is adjusted on a pro-rata basis. Similarly, the face value of bonds of all other issuers that fall below the 2% cap are increased on a pro-basis. The index is re-balanced on the last calendar day of the month. JPMorgan® EMBI Global tracks total returns for United States Dollar-denominated debt instruments issued by emerging market sovereign and quasi-sovereign entities, Brady bonds, loans, Eurobonds and local market instruments. This index only tracks the particular region or country.
Asset Allocation Portfolio Blended Composite — The Asset Allocation Portfolio Blended Composite Benchmark is an unmanaged, hypothetical combination of unmanaged indices that correspond to the Asset Allocation Portfolio’s model allocation and consists of the Russell 3000® Index (50%), the MSCI® All Country World (ex-US) Index (15%), the Barclays® U.S. Aggregate Index (25%), and the Barclays® U.S. Corporate High Yield 2% Issuer Capped Index (10%).
Balanced Portfolio Blended Composite — The Balanced Portfolio Blended Composite Benchmark is an unmanaged, hypothetical combination of unmanaged indices that correspond to the Balanced Portfolio’s model allocation and consists of the Russell 3000® Index (40%), the MSCI® All Country World (ex-US) Index (10%), the Barclays® U.S. Aggregate Index (45%) and the Barclays® U.S. Corporate High Yield 2% Issuer Capped Index (5%).
Barclays® 1-3 Year U.S. Government/Credit Bond Index — The Barclays® 1-3 Year U.S. Government/Credit Bond Index is an unmanaged index of publicly issued medium and larger issues of U.S. Government, investment-grade corporate and investment-grade international dollar denominated bonds that have maturities of between one and three years.
Barclays® U.S. Aggregate 1-3 Years Index — The Barclays® U.S. Aggregate 1-3 Years Index is an unmanaged index of publicly issued investment-grade fixed-rate debt securities including corporate, U.S. Treasury and government agency securities, mortgage pass-through and asset-backed securities with remaining maturities of one to three years.
Barclays® U.S. Aggregate Index — The Barclays® U.S. Aggregate Index is an unmanaged index of publicly issued investment-grade fixed-rate debt securities including corporate, U.S. Treasury and government agency securities, mortgage pass-through and asset-backed securities with remaining maturities of at least one year regardless of call features.
Barclays® U.S. Corporate High Yield 2% Issuer Capped Index — The Barclays® U. S. Corporate High Yield 2% Issuer Capped Index is an unmanaged index of U.S. Dollar-denominated, non-convertible, fixed-rate, noninvestment-grade debt. Issuers are capped at 2% of the Index. Index holdings must have at least one year to final maturity, at least $150 million par amount outstanding, and be publicly issued with a rating of Ba1 or lower.
Barclays® Global Credit Hedged USD Index — The Barclays® Global Credit Hedged USD Index is an unmanaged index composed of investment-grade and high yield credit securities from the Multiverse represented in U.S. dollars on a hedged basis (Multiverse is the merger of two groups: the Global Aggregate and the Global High Yield).
Barclays® Long-Term U.S. Treasury Index — The Barclays® Long-Term U.S. Treasury Index is an unmanaged index comprised of fixed-income securities with various maturities greater than 10 years.
Barclays® U.S. Treasury Inflation Protected Securities (TIPS) Index — The Barclays® U.S. Treasury Inflation Protected Securities (TIPS) Index is an unmanaged index of inflation-protected public obligations of the U.S. Treasury. The index is market capitalization weighted and includes all publicly-issued U.S. Treasury Inflation-Protected Securities that have at least one year remaining to maturity and have $250 million or more of outstanding face value.
| | | | |
| 168 | | Benchmark Definitions | | |
Benchmark Definitions (unaudited)
Lipper® Variable Insurance Products (VIP) Average — Each Lipper® Variable Insurance Products (VIP) Average is calculated by Lipper® Analytical Services, Inc. and reflects the investment return of certain portfolios underlying variable life and annuity products. Source: Lipper®, Inc.
Morningstar® Insurance Fund Category Averages — Each Morningstar® category average is an equal-weighted category return. The calculation is simply the average of the returns at the end of the period for all the underlying variable insurance funds in a given category. Source: Morningstar®, Inc.
MSCI EAFE® (Europe-Australasia-Far-East) Index — The MSCI EAFE® (“Europe-Australasia-Far East”) Index is an unmanaged, free float-adjusted, market capitalization-weighted index that is designed to measure developed market equity performance, excluding the U.S. & Canada.
MSCI® All Country World (ex-US) Index — The MSCI® All Country World (ex-US) Index is an unmanaged, free float-adjusted market capitalization-weighted index that is designed to measure equity performance of companies in the developed and emerging markets, excluding the U.S.
MSCI® All Country World (ex-US) Growth Index — The MSCI® All Country World (ex-US) Growth Index is an unmanaged, free float-adjusted market capitalization-weighted index that is designed to measure equity performance of companies in the developed and emerging markets, excluding the U.S., with higher historical and forecasted growth characteristics.
MSCI® Emerging Markets Index — The MSCI® Emerging Markets Index is an unmanaged, free float-adjusted, market capitalization-weighted index that is designed to measure equity market performance in the global emerging markets.
Russell 1000® Growth Index — The Russell 1000® Growth Index is an unmanaged index that measures the performance of those companies in the Russell 1000® Index with higher price-to-book ratios and higher forecasted growth values. The Russell 1000® Index is an unmanaged, market capitalization-weighted, large cap index that measures the performance of the 1000 largest companies in the Russell 3000® Index.
Russell 1000® Value Index — The Russell 1000® Value Index is an unmanaged index that measures the performance of those companies in the Russell 1000® Index with lower price-to-book ratios and lower forecasted growth values. The Russell 1000® Index is an unmanaged, market capitalization-weighted, large cap index that measures the performance of the 1000 largest companies in the Russell 3000® Index.
Russell 2000® Growth Index — The Russell 2000® Growth Index is an unmanaged index that measures the performance of those companies in the Russell 2000® Index with higher price-to-book ratios and higher forecasted growth values. The Russell 2000® Index is an unmanaged, market capitalization-weighted index that measures the performance of the 2000 smallest of the 3000 largest publicly traded U.S. companies, based on total market capitalization.
Russell 2000® Value Index — The Russell 2000® Value Index is an unmanaged index measures the performance of those companies in the Russell 2000® Index with lower price-to-book ratios and lower forecasted growth values. The Russell 2000® Index is an unmanaged, market-capitalization weighted index that measures the performance of the 2000 smallest of the 3000 largest publicly traded U.S. companies, based on total market capitalization.
Russell 3000® Index — The Russell 3000® Index measures the performance of the largest 3000 U.S. companies representing approximately 98% of the investable U.S. equity market.
Russell MidCap® Growth Index — The Russell MidCap® Growth Index is an unmanaged index that measures the performance of the Russell MidCap® companies with higher price-to-book ratios and higher forecasted growth values. The Russell MidCap® Index is an unmanaged index that measures the performance of the 800 smallest companies in the Russell 1000® Index, which represents approximately 25% of the total market capitalization of the Russell 1000® Index.
Russell MidCap® Value Index — The Russell MidCap® Value Index is an unmanaged index that measures the performance of the Russell MidCap® companies with lower price-to-book and lower forecasted growth values. The Russell MidCap® Index is an unmanaged index that measures the performance of the 800 smallest companies in the Russell 1000® Index, which represents approximately 25% of the total market capitalization of the Russell 1000® Index.
S&P 500® Index — The S&P 500® Composite Stock Price Index is an unmanaged, capitalization-weighted index of 500 selected common stocks designed to measure the performance of the broad domestic economy.
S&P MidCap 400® Index — The S&P MidCap 400® Index is an unmanaged, capitalization-weighted index that measures the performance of the mid-range sector of the U.S. stock market.
S&P SmallCap 600® Index — The S&P SmallCap 600® Index is an unmanaged index of 600 selected common stocks of U.S.-based companies with small market capitalizations.
| | | | | | |
| | Benchmark Definitions | | | 169 | |
Statements of Assets and Liabilities
Northwestern Mutual Series Fund, Inc.
December 31, 2014 (in thousands)
| | | | | | | | | | | | | | | | | | | | |
| | | Growth Stock
Portfolio | | | Focused
Appreciation
Portfolio | | | Large Cap Core Stock
Portfolio | | | Large Cap
Blend Portfolio | | | Index 500 Stock
Portfolio | |
Assets | | | | | | | | | | | | | | | | | | | | |
Unaffiliated Investments, at Value (1) | | $ | 881,482 | | | $ | 706,269 | | | $ | 554,501 | | | $ | 153,873 | | | $ | 2,352,473 | |
Affiliated Investments, at Value (2) | | | - | | | | - | | | | - | | | | - | | | | - | |
Cash & Cash Equivalents | | | 4,335 | | | | 20,848 | | | | 413 | | | | 13,055 | | | | 16,171 | |
Foreign Currency, at Value (3) | | | - | | | | - | | | | - | | | | - | | | | - | |
Cash Collateral for Derivative Positions | | | - | | | | - | | | | - | | | | - | | | | - | |
Receivable for Portfolio Shares Sold | | | 93 | | | | 258 | | | | 114 | | | | 19 | | | | 603 | |
Receivable for Investment Securities Sold | | | - | | | | 674 | | | | - | | | | - | | | | - | |
Receivable for Financing Transactions | | | - | | | | - | | | | - | | | | - | | | | - | |
Futures Variation Margin | | | - | | | | - | | | | - | | | | - | | | | - | |
Outstanding Swap Contracts, at Value (4) | | | - | | | | - | | | | - | | | | - | | | | - | |
Receivable for Foreign Currency | | | - | | | | - | | | | - | | | | - | | | | - | |
Prepaid Expenses and Other Assets | | | 8 | | | | 6 | | | | 5 | | | | 2 | | | | 30 | |
Dividends and Interest Receivable | | | 627 | | | | 181 | | | | 1,164 | | | | 167 | | | | 3,133 | |
| | | | | | | | | | | | | | | | | | | | |
Total Assets | | | 886,545 | | | | 728,236 | | | | 556,197 | | | | 167,116 | | | | 2,372,410 | |
| | | | | | | | | | | | | | | | | | | | |
Liabilities | | | | | | | | | | | | | | | | | | | | |
Payable for Portfolio Shares Redeemed | | | 313 | | | | 227 | | | | 316 | | | | 38 | | | | 1,238 | |
Payable for Investment Securities Purchased | | | - | | | | 5,192 | | | | - | | | | - | | | | - | |
Payable for Financing Transactions | | | - | | | | - | | | | - | | | | - | | | | - | |
Futures Variation Margin | | | - | | | | - | | | | - | | | | - | | | | 329 | |
Outstanding Swap Contracts, at Value (5) | | | - | | | | - | | | | - | | | | - | | | | - | |
Payable for Foreign Currency | | | - | | | | - | | | | - | | | | - | | | | - | |
Collateral from Counterparty | | | - | | | | - | | | | - | | | | - | | | | - | |
Investment Advisory Fees | | | 318 | | | | 398 | | | | 213 | | | | 115 | | | | 428 | |
Compliance Fees Payable | | | - | | | | - | | | | - | | | | - | | | | - | |
Deferred Income for Financing Transactions | | | - | | | | - | | | | - | | | | - | | | | - | |
Accrued Expenses | | | 34 | | | | 40 | | | | 29 | | | | 15 | | | | 117 | |
| | | | | | | | | | | | | | | | | | | | |
Total Liabilities | | | 665 | | | | 5,857 | | | | 558 | | | | 168 | | | | 2,112 | |
| | | | | | | | | | | | | | | | | | | | |
Net Assets | | $ | 885,880 | | | $ | 722,379 | | | $ | 555,639 | | | $ | 166,948 | | | $ | 2,370,298 | |
| | | | | | | | | | | | | | | | | | | | |
Represented By: | | | | | | | | | | | | | | | | | | | | |
Aggregate Paid in Capital (6) (7) | | $ | 620,148 | | | $ | 507,588 | | | $ | 425,211 | | | $ | 128,288 | | | $ | 1,195,122 | |
Undistributed Net Investment Income (Loss) | | | 6,518 | | | | - | | | | 11,360 | | | | 1,436 | | | | 40,235 | |
Undistributed Accumulated Net Realized Gain (Loss) | | | 61,016 | | | | 81,923 | | | | 7,939 | | | | 8,334 | | | | 38,637 | |
Net Unrealized Appreciation (Depreciation) | | | 198,198 | | | | 132,868 | | | | 111,129 | | | | 28,890 | | | | 1,096,304 | |
| | | | | | | | | | | | | | | | | | | | |
Net Assets for Shares Outstanding (6) (7) | | $ | 885,880 | | | $ | 722,379 | | | $ | 555,639 | | | $ | 166,948 | | | $ | 2,370,298 | |
| | | | | | | | | | | | | | | | | | | | |
Net Asset Value, Offering and Redemption Price per Share | | $ | 2.87 | | | $ | 2.63 | | | $ | 1.65 | | | $ | 1.12 | | | $ | 3.98 | |
| | | | | | | | | | | | | | | | | | | | |
(1) Unaffiliated Investments, at Cost | | $ | 683,284 | | | $ | 573,401 | | | $ | 443,372 | | | $ | 124,982 | | | $ | 1,256,646 | |
(2) Affiliated Investments, at Cost | | | - | | | | - | | | | - | | | | - | | | | - | |
(3) Foreign Currency, at Cost | | | - | | | | - | | | | - | | | | - | | | | - | |
(4) Premiums Paid on Swap Contracts | | | - | | | | - | | | | - | | | | - | | | | - | |
(5) Premiums Received from Swap Contracts | | | - | | | | - | | | | - | | | | - | | | | - | |
(6) Shares Outstanding | | | 308,184 | | | | 274,255 | | | | 336,207 | | | | 148,531 | | | | 596,197 | |
(7) Shares Authorized, $.01 Par Value | | | 2,000,000 | | | | 2,000,000 | | | | 2,000,000 | | | | 2,000,000 | | | | 2,000,000 | |
The Accompanying Notes are an Integral Part of the Financial Statements.
| | | | |
| 170 | | Statements of Assets and Liabilities | | |
| | | | | | | | | | | | | | | | | | | | | | | | | | | | | | | | | | |
Large Company Value
Portfolio | | | Domestic
Equity Portfolio | | | Equity Income Portfolio | | | Mid Cap
Growth Stock Portfolio | | | Index 400 Stock
Portfolio | | | Mid Cap Value
Portfolio | | | Small Cap
Growth Stock
Portfolio | | | Index 600 Stock
Portfolio | | | Small Cap
Value Portfolio | |
| | | | | | | | | | | | | | | | | | | | | | | | | | | | | | | | | | |
| $ | 190,787 | | | $ | 594,417 | | | $ | 788,099 | | | $ | 1,067,835 | | | $ | 639,055 | | | $ | 427,665 | | | $ | 526,240 | | | $ | 91,817 | | | $ | 589,064 | |
| | - | | | | - | | | | - | | | | - | | | | - | | | | - | | | | - | | | | - | | | | - | |
| | 2 | | | | 25,001 | | | | 198 | | | | 31,298 | | | | 13,484 | | | | 15 | | | | 2,592 | | | | 9,377 | | | | 323 | |
| | 10 | | | | - | | | | - | | | | - | | | | - | | | | 35 | | | | - | | | | - | | | | - | |
| | - | | | | - | | | | - | | | | - | | | | - | | | | - | | | | - | | | | - | | | | - | |
| | 81 | | | | 88 | | | | 274 | | | | 156 | | | | 58 | | | | 121 | | | | 86 | | | | 42 | | | | 180 | |
| | 192 | | | | - | | | | 593 | | | | 1,438 | | | | - | | | | 1,037 | | | | 1,581 | | | | 290 | | | | 1,849 | |
| | - | | | | - | | | | - | | | | - | | | | - | | | | - | | | | - | | | | - | | | | - | |
| | - | | | | - | | | | - | | | | - | | | | - | | | | - | | | | - | | | | - | | | | - | |
| | - | | | | - | | | | - | | | | - | | | | - | | | | - | | | | - | | | | - | | | | - | |
| | 31 | | | | - | | | | - | | | | - | | | | - | | | | 91 | | | | - | | | | - | | | | - | |
| | 2 | | | | 5 | | | | 7 | | | | 10 | | | | 23 | | | | 4 | | | | 5 | | | | 6 | | | | 5 | |
| | 277 | | | | 1,142 | | | | 1,079 | | | | 179 | | | | 567 | | | | 878 | | | | 233 | | | | 115 | | | | 1,209 | |
| | | | | | | | | | | | | | | | | | | | | | | | | | | | | | | | | | |
| | 191,382 | | | | 620,653 | | | | 790,250 | | | | 1,100,916 | | | | 653,187 | | | | 429,846 | | | | 530,737 | | | | 101,647 | | | | 592,630 | |
| | | | | | | | | | | | | | | | | | | | | | | | | | | | | | | | | | |
| | | | | | | | | | | | | | | | | | | | | | | | | | | | | | | | | | | |
| | 14 | | | | 306 | | | | 107 | | | | 685 | | | | 402 | | | | 155 | | | | 125 | | | | 7 | | | | 351 | |
| | 283 | | | | - | | | | 7,925 | | | | 1,547 | | | | - | | | | 1,522 | | | | 772 | | | | 189 | | | | 8,425 | |
| | - | | | | - | | | | - | | | | - | | | | - | | | | - | | | | - | | | | - | | | | - | |
| | - | | | | - | | | | - | | | | - | | | | 196 | | | | - | | | | - | | | | - | | | | - | |
| | - | | | | - | | | | - | | | | - | | | | - | | | | - | | | | - | | | | - | | | | - | |
| | - | | | | - | | | | - | | | | - | | | | - | | | | - | | | | - | | | | - | | | | - | |
| | - | | | | - | | | | - | | | | - | | | | - | | | | - | | | | - | | | | 120 | | | | - | |
| | 114 | | | | 300 | | | | 443 | | | | 488 | | | | 140 | | | | 280 | | | | 256 | | | | 22 | | | | 436 | |
| | - | | | | - | | | | - | | | | - | | | | - | | | | - | | | | - | | | | - | | | | - | |
| | - | | | | - | | | | - | | | | - | | | | - | | | | - | | | | - | | | | - | | | | - | |
| | 17 | | | | 26 | | | | 40 | | | | 41 | | | | 45 | | | | 36 | | | | 36 | | | | 23 | | | | 51 | |
| | | | | | | | | | | | | | | | | | | | | | | | | | | | | | | | | | |
| | 428 | | | | 632 | | | | 8,515 | | | | 2,761 | | | | 783 | | | | 1,993 | | | | 1,189 | | | | 361 | | | | 9,263 | |
| | | | | | | | | | | | | | | | | | | | | | | | | | | | | | | | | | |
| $ | 190,954 | | | $ | 620,021 | | | $ | 781,735 | | | $ | 1,098,155 | | | $ | 652,404 | | | $ | 427,853 | | | $ | 529,548 | | | $ | 101,286 | | | $ | 583,367 | |
| | | | | | | | | | | | | | | | | | | | | | | | | | | | | | | | | | |
| | | | | | | | | | | | | | | | | | | | | | | | | | | | | | | | | | | |
| $ | 143,493 | | | $ | 455,776 | | | $ | 588,691 | | | $ | 892,331 | | | $ | 398,188 | | | $ | 332,688 | | | $ | 411,615 | | | $ | 81,439 | | | $ | 355,313 | |
| | 2,937 | | | | 11,101 | | | | 13,177 | | | | 412 | | | | 7,337 | | | | 7,271 | | | | 615 | | | | - | | | | 4,055 | |
| | 15,584 | | | | (8,230 | ) | | | 30,129 | | | | 99,328 | | | | 38,849 | | | | 40,194 | | | | 26,182 | | | | (137 | ) | | | 32,027 | |
| | 28,940 | | | | 161,374 | | | | 149,738 | | | | 106,084 | | | | 208,030 | | | | 47,700 | | | | 91,136 | | | | 19,984 | | | | 191,972 | |
| | | | | | | | | | | | | | | | | | | | | | | | | | | | | | | | | | |
| $ | 190,954 | | | $ | 620,021 | | | $ | 781,735 | | | $ | 1,098,155 | | | $ | 652,404 | | | $ | 427,853 | | | $ | 529,548 | | | $ | 101,286 | | | $ | 583,367 | |
| | | | | | | | | | | | | | | | | | | | | | | | | | | | | | | | | | |
| $ | 1 .15 | | | $ | 1 .44 | | | $ | 1 .77 | | | $ | 3 .40 | | | $ | 1 .96 | | | $ | 1 .77 | | | $ | 2 .50 | | | $ | 1 .16 | | | $ | 2 .38 | |
| | | | | | | | | | | | | | | | | | | | | | | | | | | | | | | | | | |
| $ | 161,878 | | | $ | 433,043 | | | $ | 638,359 | | | $ | 961,751 | | | $ | 431,442 | | | $ | 380,057 | | | $ | 435,104 | | | $ | 71,833 | | | $ | 397,092 | |
| | - | | | | - | | | | - | | | | - | | | | - | | | | - | | | | - | | | | - | | | | - | |
| | 10 | | | | - | | | | - | | | | - | | | | - | | | | 35 | | | | - | | | | - | | | | - | |
| | - | | | | - | | | | - | | | | - | | | | - | | | | - | | | | - | | | | - | | | | - | |
| | - | | | | - | | | | - | | | | - | | | | - | | | | - | | | | - | | | | - | | | | - | |
| | 166,461 | | | | 429,855 | | | | 441,268 | | | | 323,070 | | | | 332,829 | | | | 241,542 | | | | 212,216 | | | | 86,961 | | | | 244,745 | |
| | 2,000,000 | | | | 2,000,000 | | | | 2,000,000 | | | | 2,000,000 | | | | 2,000,000 | | | | 2,000,000 | | | | 2,000,000 | | | | 2,000,000 | | | | 2,000,000 | |
The Accompanying Notes are an Integral Part of the Financial Statements.
| | | | | | |
| | Statements of Assets and Liabilities | | | 171 | |
Statements of Assets and Liabilities
Northwestern Mutual Series Fund, Inc.
December 31, 2014 (in thousands)
| | | | | | | | | | | | | | | | | | | | |
| | | International
Growth
Portfolio | | | Research
International
Core Portfolio | | | International
Equity Portfolio | | | Emerging
Markets Equity
Portfolio | | | Money Market
Portfolio | |
Assets | | | | | | | | | | | | | | | | | | | | |
Unaffiliated Investments, at Value (1) | | $ | 419,018 | | | $ | 449,137 | | | $ | 1,606,968 | | | $ | 410,069 | | | $ | 448,136 | |
Affiliated Investments, at Value (2) | | | - | | | | - | | | | - | | | | - | | | | - | |
Cash & Cash Equivalents | | | 17,692 | | | | 7,099 | | | | 21,824 | | | | 5,347 | | | | 133 | |
Foreign Currency, at Value (3) | | | - | | | | 191 | | | | 3,657 | | | | 2,037 | | | | - | |
Cash Collateral for Derivative Positions | | | - | | | | - | | | | - | | | | - | | | | - | |
Receivable for Portfolio Shares Sold | | | 201 | | | | 216 | | | | 447 | | | | 230 | | | | 632 | |
Receivable for Investment Securities Sold | | | 322 | | | | - | | | | - | | | | 930 | | | | - | |
Receivable for Financing Transactions | | | - | | | | - | | | | - | | | | - | | | | - | |
Futures Variation Margin | | | - | | | | - | | | | - | | | | - | | | | - | |
Outstanding Swap Contracts, at Value (4) | | | - | | | | - | | | | - | | | | - | | | | - | |
Receivable for Foreign Currency | | | - | | | | - | | | | 1 | | | | 2 | | | | - | |
Prepaid Expenses and Other Assets | | | 5 | | | | 4 | | | | 17 | | | | 4 | | | | 4 | |
Dividends and Interest Receivable | | | 581 | | | | 972 | | | | 5,471 | | | | 151 | | | | 297 | |
| | | | | | | | | | | | | | | | | | | | |
Total Assets | | | 437,819 | | | | 457,619 | | | | 1,638,385 | | | | 418,770 | | | | 449,202 | |
| | | | | | | | | | | | | | | | | | | | |
Liabilities | | | | | | | | | | | | | | | | | | | | |
Payable for Portfolio Shares Redeemed | | | 123 | | | | 105 | | | | 691 | | | | 95 | | | | 369 | |
Payable for Investment Securities Purchased | | | - | | | | 13 | | | | 995 | | | | 645 | | | | 9,995 | |
Payable for Financing Transactions | | | - | | | | - | | | | - | | | | - | | | | - | |
Futures Variation Margin | | | - | | | | - | | | | - | | | | - | | | | - | |
Outstanding Swap Contracts, at Value (5) | | | - | | | | - | | | | - | | | | - | | | | - | |
Payable for Foreign Currency | | | 3 | | | | - | | | | - | | | | - | | | | - | |
Collateral from Counterparty | | | - | | | | - | | | | - | | | | - | | | | - | |
Investment Advisory Fees | | | 251 | | | | 338 | | | | 884 | | | | 419 | | | | 63 | |
Compliance Fees Payable | | | - | | | | - | | | | - | | | | - | | | | - | |
Deferred Income for Financing Transactions | | | - | | | | - | | | | - | | | | - | | | | - | |
Accrued Expenses | | | 511 | | | | 155 | | | | 437 | | | | 614 | | | | 23 | |
| | | | | | | | | | | | | | | | | | | | |
Total Liabilities | | | 888 | | | | 611 | | | | 3,007 | | | | 1,773 | | | | 10,450 | |
| | | | | | | | | | | | | | | | | | | | |
Net Assets | | $ | 436,931 | | | $ | 457,008 | | | $ | 1,635,378 | | | $ | 416,997 | | | $ | 438,752 | |
| | | | | | | | | | | | | | | | | | | | |
Represented By: | | | | | | | | | | | | | | | | | | | | |
Aggregate Paid in Capital (6) (7) | | $ | 429,397 | | | $ | 426,679 | | | $ | 1,437,698 | | | $ | 439,805 | | | $ | 438,729 | |
Undistributed Net Investment Income (Loss) | | | 7,745 | | | | 10,472 | | | | 49,800 | | | | 3,893 | | | | 28 | |
Undistributed Accumulated Net Realized Gain (Loss) | | | (7,867 | ) | | | 7,617 | | | | 67,504 | | | | (11,905 | ) | | | (5 | ) |
Net Unrealized Appreciation (Depreciation) | | | 7,656 | | | | 12,240 | | | | 80,376 | | | | (14,796 | ) | | | – | |
| | | | | | | | | | | | | | | | | | | | |
Net Assets for Shares Outstanding (6) (7) | | $ | 436,931 | | | $ | 457,008 | | | $ | 1,635,378 | | | $ | 416,997 | | | $ | 438,752 | |
| | | | | | | | | | | | | | | | | | | | |
Net Asset Value, Offering and Redemption Price per Share | | $ | 1 .34 | | | $ | 0 .90 | | | $ | 1 .77 | | | $ | 0 .93 | | | $ | 1 .00 | |
| | | | | | | | | | | | | | | | | | | | |
(1) Unaffiliated Investments, at Cost | | $ | 410,928 | | | $ | 436,824 | | | $ | 1,526,219 | | | $ | 424,362 | | | $ | 448,136 | |
(2) Affiliated Investments, at Cost | | | - | | | | - | | | | - | | | | - | | | | - | |
(3) Foreign Currency, at Cost | | | - | | | | 195 | | | | 3,851 | | | | 2,029 | | | | - | |
(4) Premiums Paid on Swap Contracts | | | - | | | | - | | | | - | | | | - | | | | - | |
(5) Premiums Received from Swap Contracts | | | - | | | | - | | | | - | | | | - | | | | - | |
(6) Shares Outstanding | | | 324,978 | | | | 506,674 | | | | 921,656 | | | | 450,565 | | | | 438,757 | |
(7) Shares Authorized, $.01 Par Value | | | 2,000,000 | | | | 2,000,000 | | | | 3,000,000 | | | | 2,000,000 | | | | 2,000,000 | |
The Accompanying Notes are an Integral Part of the Financial Statements.
| | | | |
| 172 | | Statements of Assets and Liabilities | | |
| | | | | | | | | | | | | | | | | | | | | | | | | | | | | | |
Short-Term
Bond Portfolio | | | Select Bond
Portfolio | | | Long-Term U.S.
Government
Bond Portfolio | | | Inflation
Protection
Portfolio | | | High Yield
Bond Portfolio | | | Multi-Sector
Bond Portfolio | | | Balanced
Portfolio | | | Asset
Allocation
Portfolio | |
| | | | | | | | | | | | | | | | | | | | | | | | | | | | | | | |
| $ | 230,895 | | | $ | 3,071,279 | | | $ | 117,490 | | | $ | 288,576 | | | $ | 676,869 | | | $ | 547,427 | | | $ | 176,545 | | | $ | 20,421 | |
| | - | | | | - | | | | - | | | | - | | | | - | | | | - | | | | 2,172,396 | | | | 239,446 | |
| | 2,561 | | | | 169,565 | | | | 205 | | | | 174 | | | | 9,762 | | | | 8,745 | | | | 7,080 | | | | 6,375 | |
| | - | | | | - | | | | - | | | | 66 | | | | - | | | | 4,221 | | | | - | | | | - | |
| | - | | | | - | | | | - | | | | - | | | | - | | | | 1,578 | | | | - | | | | - | |
| | 48 | | | | 725 | | | | 22 | | | | 204 | | | | 169 | | | | 220 | | | | 605 | | | | 25 | |
| | - | | | | 411,675 | | | | 44,711 | | | | - | | | | 5,683 | | | | 6 | | | | 17,590 | | | | 1,444 | |
| | - | | | | - | | | | 19 | | | | - | | | | - | | | | 22 | | | | - | | | | - | |
| | - | | | | - | | | | 5 | | | | - | | | | - | | | | 189 | | | | - | | | | - | |
| | - | | | | - | | | | - | | | | - | | | | - | | | | 1,084 | | | | - | | | | - | |
| | - | | | | - | | | | - | | | | 839 | | | | - | | | | 4,362 | | | | - | | | | - | |
| | 2 | | | | 17 | | | | 1 | | | | 80 | | | | 5 | | | | 170 | | | | 22 | | | | 2 | |
| | 1,259 | | | | 10,853 | | | | 653 | | | | 1,351 | | | | 10,603 | | | | 8,447 | | | | 88 | | | | 6 | |
| | | | | | | | | | | | | | | | | | | | | | | | | | | | | | |
| | 234,765 | | | | 3,664,114 | | | | 163,106 | | | | 291,290 | | | | 703,091 | | | | 576,471 | | | | 2,374,326 | | | | 267,719 | |
| | | | | | | | | | | | | | | | | | | | | | | | | | | | | | |
| | | | | | | | | | | | | | | | | | | | | | | | | | | | | | | |
| | 152 | | | | 734 | | | | 76 | | | | 216 | | | | 278 | | | | 349 | | | | 879 | | | | 67 | |
| | - | | | | 821,370 | | | | - | | | | - | | | | 488 | | | | 15,530 | | | | 5,710 | | | | 1,127 | |
| | - | | | | - | | | | 53,678 | | | | - | | | | - | | | | 7,343 | | | | - | | | | - | |
| | 21 | | | | - | | | | 5 | | | | 32 | | | | - | | | | - | | | | 433 | | | | 84 | |
| | - | | | | - | | | | - | | | | 5,165 | | | | - | | | | 2,305 | | | | - | | | | - | |
| | - | | | | - | | | | - | | | | 10 | | | | - | | | | 943 | | | | - | | | | - | |
| | - | | | | - | | | | - | | | | - | | | | - | | | | 3,464 | | | | - | | | | - | |
| | 71 | | | | 768 | | | | 54 | | | | 132 | | | | 266 | | | | 352 | | | | 152 | | | | 12 | |
| | - | | | | - | | | | - | | | | - | | | | - | | | | - | | | | - | | | | - | |
| | - | | | | - | | | | 18 | | | | - | | | | - | | | | 21 | | | | - | | | | - | |
| | 34 | | | | 86 | | | | 25 | | | | 50 | | | | 71 | | | | 105 | | | | 25 | | | | 20 | |
| | | | | | | | | | | | | | | | | | | | | | | | | | | | | | |
| | 278 | | | | 822,958 | | | | 53,856 | | | | 5,605 | | | | 1,103 | | | | 30,412 | | | | 7,199 | | | | 1,310 | |
| | | | | | | | | | | | | | | | | | | | | | | | | | | | | | |
| $ | 234,487 | | | $ | 2,841,156 | | | $ | 109,250 | | | $ | 285,685 | | | $ | 701,988 | | | $ | 546,059 | | | $ | 2,367,127 | | | $ | 266,409 | |
| | | | | | | | | | | | | | | | | | | | | | | | | | | | | | |
| | | | | | | | | | | | | | | | | | | | | | | | | | | | | | | |
| $ | 233,852 | | | $ | 2,767,895 | | | $ | 104,305 | | | $ | 287,855 | | | $ | 707,173 | | | $ | 530,191 | | | $ | 2,091,948 | | | $ | 230,687 | |
| | 1,717 | | | | 42,378 | | | | 2,211 | | | | 6,063 | | | | 32,590 | | | | 27,511 | | | | 45,681 | | | | 5,056 | |
| | (1,022 | ) | | | 9,654 | | | | (5,190 | ) | | | (1,906 | ) | | | (30,796 | ) | | | 6,899 | | | | 104,098 | | | | 12,701 | |
| | (60 | ) | | | 21,229 | | | | 7,924 | | | | (6,327 | ) | | | (6,979 | ) | | | (18,542 | ) | | | 125,400 | | | | 17,965 | |
| | | | | | | | | | | | | | | | | | | | | | | | | | | | | | |
| $ | 234,487 | | | $ | 2,841,156 | | | $ | 109,250 | | | $ | 285,685 | | | $ | 701,988 | | | $ | 546,059 | | | $ | 2,367,127 | | | $ | 266,409 | |
| | | | | | | | | | | | | | | | | | | | | | | | | | | | | | |
$ |
1 .03 |
| | $ | 1 .27 | | | $ | 1 .12 | | | $ | 1 .10 | | | $ | 0 .72 | | | $ | 1 .08 | | | $ | 1 .48 | | | $ | 1 .20 | |
| | | | | | | | | | | | | | | | | | | | | | | | | | | | | | |
| $ | 230,938 | | | $ | 3,050,050 | | | $ | 109,582 | | | $ | 290,112 | | | $ | 683,848 | | | $ | 569,686 | | | $ | 174,823 | | | $ | 19,755 | |
| | - | | | | - | | | | - | | | | - | | | | - | | | | - | | | | 2,049,348 | | | | 222,271 | |
| | - | | | | - | | | | - | | | | 69 | | | | - | | | | 4,412 | | | | - | | | | - | |
| | - | | | | - | | | | - | | | | - | | | | - | | | | 409 | | | | - | | | | - | |
| | - | | | | - | | | | - | | | | - | | | | - | | | | 1,003 | | | | - | | | | - | |
| | 228,043 | | | | 2,243,109 | | | | 97,672 | | | | 259,713 | | | | 974,159 | | | | 503,409 | | | | 1,598,701 | | | | 222,847 | |
| | 2,000,000 | | | | 3,000,000 | | | | 2,000,000 | | | | 2,000,000 | | | | 3,000,000 | | | | 2,000,000 | | | | 4,000,000 | | | | 2,000,000 | |
The Accompanying Notes are an Integral Part of the Financial Statements.
| | | | | | |
| | Statements of Assets and Liabilities | | | 173 | |
Statements of Operations
Northwestern Mutual Series Fund, Inc.
For the Year Ended December 31, 2014 (in thousands)
| | | | | | | | | | | | | | | | | | | | | | | | |
| | | Growth Stock
Portfolio | | | Focused
Appreciation
Portfolio | | | Large Cap
Core Stock
Portfolio | | | Large Cap
Blend
Portfolio | | | Index 500
Stock Portfolio | | | Large
Company
Value
Portfolio | |
Investment Income | | | | | | | | | | | | | | | | | | | | | | | | |
Income | | | | | | | | | | | | | | | | | | | | | | | | |
Interest (1) | | $ | - | | | $ | 13 | | | $ | - | | | $ | 1 | | | $ | 40 | | | $ | - | |
Unaffiliated Dividends (1) | | | 10,063 | | | | 4,062 | | | | 13,792 | | | | 2,722 | | | | 46,047 | | | | 4,040 | |
| | | | | | | | | | | | | | | | | | | | | | | | |
Total Income | | | 10,063 | | | | 4,075 | | | | 13,792 | | | | 2,723 | | | | 46,087 | | | | 4,040 | |
| | | | | | | | | | | | | | | | | | | | | | | | |
Expenses | | | | | | | | | | | | | | | | | | | | | | | | |
Investment Advisory Fees | | | 3,585 | | | | 4,875 | | | | 2,338 | | | | 1,207 | | | | 4,477 | | | | 1,241 | |
Custodian Fees | | | 7 | | | | 33 | | | | 4 | | | | 7 | | | | 31 | | | | 18 | |
Shareholder Reporting Fees | | | 44 | | | | 60 | | | | 34 | | | | 8 | | | | 85 | | | | 10 | |
Audit Fees | | | 24 | | | | 23 | | | | 23 | | | | 22 | | | | 30 | | | | 22 | |
Valuation Services | | | 1 | | | | 2 | | | | 1 | | | | - | | | | 2 | | | | 1 | |
Compliance Fees | | | 16 | | | | 15 | | | | 14 | | | | 12 | | | | 24 | | | | 12 | |
Directors Fees | | | 30 | | | | 28 | | | | 27 | | | | 24 | | | | 46 | | | | 24 | |
Professional Fees | | | 7 | | | | 7 | | | | 7 | | | | 6 | | | | 10 | | | | 6 | |
Trade Name Fees | | | - | | | | - | | | | - | | | | - | | | | 99 | | | | - | |
Other Expenses | | | 13 | | | | 9 | | | | 8 | | | | 3 | | | | 33 | | | | 3 | |
| | | | | | | | | | | | | | | | | | | | | | | | |
Total Expenses | | | 3,727 | | | | 5,052 | | | | 2,456 | | | | 1,289 | | | | 4,837 | | | | 1,337 | |
| | | | | | | | | | | | | | | | | | | | | | | | |
Less Waived Fees: | | | | | | | | | | | | | | | | | | | | | | | | |
Paid by Affiliate | | | (179 | ) | | | (854 | ) | | | (24 | ) | | | - | | | | - | | | | (55 | ) |
Paid Indirectly | | | (3 | ) | | | (3 | ) | | | - | | | | (2 | ) | | | (1 | ) | | | - | |
| | | | | | | | | | | | | | | | | | | | | | | | |
Net Expenses | | | 3,545 | | | | 4,195 | | | | 2,432 | | | | 1,287 | | | | 4,836 | | | | 1,282 | |
| | | | | | | | | | | | | | | | | | | | | | | | |
Net Investment Income (Loss) | | | 6,518 | | | | (120 | ) | | | 11,360 | | | | 1,436 | | | | 41,251 | | | | 2,758 | |
Realized and Unrealized Gain (Loss) on Investments | | | | | | | | | | | | | | | | | | | | | | | | |
Net Realized Gain (Loss) on: | | | | | | | | | | | | | | | | | | | | | | | | |
Unaffiliated Investment Securities | | | 61,731 | | | | 82,077 | | | | 8,124 | | | | 8,735 | | | | 38,717 | | | | 17,226 | |
Affiliated Investment Securities | | | - | | | | - | | | | - | | | | - | | | | - | | | | - | |
Futures Contracts | | | - | | | | - | | | | - | | | | - | | | | 3,446 | | | | - | |
Options Written | | | - | | | | - | | | | - | | | | - | | | | - | | | | - | |
Swap Contracts | | | - | | | | - | | | | - | | | | - | | | | - | | | | - | |
Foreign Currency Transactions | | | - | | | | (24 | ) | | | - | | | | - | | | | - | | | | 291 | |
| | | | | | | | | | | | | | | | | | | | | | | | |
Net Realized Gain (Loss) on Investments | | | 61,731 | | | | 82,053 | | | | 8,124 | | | | 8,735 | | | | 42,163 | | | | 17,517 | |
| | | | | | | | | | | | | | | | | | | | | | | | |
Net Unrealized Appreciation (Depreciation) of: | | | | | | | | | | | | | | | | | | | | | | | | |
Investment Securities | | | 6,191 | | | | (19,479 | ) | | | 25,294 | | | | 8,588 | | | | 201,902 | | | | 1,667 | |
Futures Contracts | | | - | | | | - | | | | - | | | | - | | | | (230 | ) | | | - | |
Options Written | | | - | | | | - | | | | - | | | | - | | | | - | | | | - | |
Swap Contracts | | | - | | | | - | | | | - | | | | - | | | | - | | | | - | |
Foreign Currency Transactions | | | - | | | | - | | | | - | | | | - | | | | - | | | | 43 | |
| | | | | | | | | | | | | | | | | | | | | | | | |
Net Change in Unrealized Appreciation (Depreciation) of Investments | | | 6,191 | | | | (19,479 | ) | | | 25,294 | | | | 8,588 | | | | 201,672 | | | | 1,710 | |
| | | | | | | | | | | | | | | | | | | | | | | | |
Net Gain (Loss) on Investments | | | 67,922 | | | | 62,574 | | | | 33,418 | | | | 17,323 | | | | 243,835 | | | | 19,227 | |
| | | | | | | | | | | | | | | | | | | | | | | | |
Net Increase (Decrease) in Net Assets Resulting from Operations | | $ | 74,440 | | | $ | 62,454 | | | $ | 44,778 | | | $ | 18,759 | | | $ | 285,086 | | | $ | 21,985 | |
| | | | | | | | | | | | | | | | | | | | | | | | |
(1) Net of Foreign Tax | | $ | - | | | $ | 62 | | | $ | 647 | | | $ | 183 | | | $ | 4 | | | $ | 20 | |
The Accompanying Notes are an Integral Part of the Financial Statements.
| | | | |
| 174 | | Statements of Operations | | |
| | | | | | | | | | | | | | | | | | | | | | | | | | | | | | |
Domestic
Equity
Portfolio | | | Equity Income
Portfolio | | | Mid Cap
Growth Stock
Portfolio | | | Index 400
Stock Portfolio | | | Mid Cap Value
Portfolio | | | Small Cap
Growth Stock
Portfolio | | | Index 600
Stock Portfolio | | | Small Cap
Value
Portfolio | |
| | | | | | | | | | | | | | | | | | | | | | | | | | | | | | | |
| | | | | | | | | | | | | | | | | | | | | | | | | | | | | | | |
| $ | - | | | $ | 35 | | | $ | - | | | $ | 27 | | | $ | 1 | | | $ | - | | | $ | 10 | | | $ | 8 | |
| | 14,657 | | | | 18,606 | | | | 7,981 | | | | 9,092 | | | | 8,771 | | | | 3,539 | | | | 1,105 | | | | 9,034 | |
| | 14,657 | | | | 18,641 | | | | 7,981 | | | | 9,119 | | | | 8,772 | | | | 3,539 | | | | 1,115 | | | | 9,042 | |
| | | | | | | | | | | | | | | | | | | | | | | | | | | | | | | |
| | 3,181 | | | | 4,604 | | | | 5,504 | | | | 1,588 | | | | 3,255 | | | | 2,772 | | | | 236 | | | | 4,834 | |
| | 7 | | | | 24 | | | | 11 | | | | 25 | | | | 51 | | | | 7 | | | | 37 | | | | 17 | |
| | 33 | | | | 59 | | | | 61 | | | | 44 | | | | 52 | | | | 53 | | | | 16 | | | | 87 | |
| | 23 | | | | 24 | | | | 27 | | | | 22 | | | | 22 | | | | 23 | | | | 20 | | | | 23 | |
| | - | | | | 2 | | | | - | | | | 2 | | | | 3 | | | | 1 | | | | 2 | | | | 1 | |
| | 15 | | | | 15 | | | | 17 | | | | 15 | | | | 14 | | | | 14 | | | | 12 | | | | 14 | |
| | 28 | | | | 29 | | | | 33 | | | | 28 | | | | 25 | | | | 27 | | | | 23 | | | | 27 | |
| | 7 | | | | 7 | | | | 7 | | | | 7 | | | | 6 | | | | 8 | | | | 9 | | | | 7 | |
| | - | | | | - | | | | - | | | | 62 | | | | - | | | | - | | | | 15 | | | | - | |
| | 8 | | | | 10 | | | | 17 | | | | 10 | | | | 5 | | | | 7 | | | | 1 | | | | 8 | |
| | 3,302 | | | | 4,774 | | | | 5,677 | | | | 1,803 | | | | 3,433 | | | | 2,912 | | | | 371 | | | | 5,018 | |
| | | | | | | | | | | | | | | | | | | | | | | | | | | | | | | |
| | - | | | | - | | | | (278 | ) | | | (68 | ) | | | (440 | ) | | | (6 | ) | | | (42 | ) | | | (34 | ) |
| | (3 | ) | | | - | | | | (8 | ) | | | (1 | ) | | | - | | | | (1 | ) | | | (1 | ) | | | - | |
| | 3,299 | | | | 4,774 | | | | 5,391 | | | | 1,734 | | | | 2,993 | | | | 2,905 | | | | 328 | | | | 4,984 | |
| | 11,358 | | | | 13,867 | | | | 2,590 | | | | 7,385 | | | | 5,779 | | | | 634 | | | | 787 | | | | 4,058 | |
| | | | | | | | | | | | | | | | | | | | | | | | | | | | | | | |
| | | | | | | | | | | | | | | | | | | | | | | | | | | | | | | |
| | 23,327 | | | | 30,308 | | | | 97,910 | | | | 40,773 | | | | 42,179 | | | | 26,408 | | | | 14,635 | | | | 33,068 | |
| | - | | | | - | | | | - | | | | - | | | | - | | | | - | | | | - | | | | - | |
| | - | | | | - | | | | - | | | | 454 | | | | - | | | | - | | | | - | | | | - | |
| | - | | | | - | | | | - | | | | - | | | | - | | | | - | | | | - | | | | - | |
| | - | | | | - | | | | - | | | | - | | | | - | | | | - | | | | 499 | | | | - | |
| | - | | | | (1 | ) | | | - | | | | - | | | | 1,500 | | | | - | | | | - | | | | - | |
| | 23,327 | | | | 30,307 | | | | 97,910 | | | | 41,227 | | | | 43,679 | | | | 26,408 | | | | 15,134 | | | | 33,068 | |
| | 42,579 | | | | 8,516 | | | | (13,904 | ) | | | 8,948 | | | | 10,258 | | | | 15,494 | | | | (11,036 | ) | | | (35,544 | ) |
| | | | | | | | | | | | | | | | | | | | | | | | | | | | | | | |
| | - | | | | - | | | | - | | | | 104 | | | | - | | | | - | | | | - | | | | - | |
| | - | | | | - | | | | - | | | | - | | | | - | | | | - | | | | - | | | | - | |
| | - | | | | - | | | | - | | | | - | | | | - | | | | - | | | | - | | | | - | |
| | - | | | | (5 | ) | | | - | | | | - | | | | 178 | | | | - | | | | - | | | | - | |
|
42,579 |
| | | 8,511 | | | | (13,904 | ) | | | 9,052 | | | | 10,436 | | | | 15,494 | | | | (11,036 | ) | | | (35,544 | ) |
| | 65,906 | | | | 38,818 | | | | 84,006 | | | | 50,279 | | | | 54,115 | | | | 41,902 | | | | 4,098 | | | | (2,476 | ) |
$ |
77,264 |
| | $ | 52,685 | | | $ | 86,596 | | | $ | 57,664 | | | $ | 59,894 | | | $ | 42,536 | | | $ | 4,885 | | | $ | 1,582 | |
| $ | - | | | $ | 180 | | | $ | - | | | $ | - | | | $ | 60 | | | $ | 9 | | | $ | - | | | $ | 3 | |
The Accompanying Notes are an Integral Part of the Financial Statements.
| | | | | | |
| | Statements of Operations | | | 175 | |
Statements of Operations
Northwestern Mutual Series Fund, Inc.
For the Year Ended December 31, 2014 (in thousands)
| | | | | | | | | | | | | | | | | | | | | | | | |
| | | International
Growth
Portfolio | | | Research
International
Core Portfolio | | | International
Equity
Portfolio | | | Emerging
Markets
Equity
Portfolio | | | Money Market
Portfolio | | | Short-Term
Bond Portfolio | |
Investment Income | | | | | | | | | | | | | | | | | | | | | | | | |
Income | | | | | | | | | | | | | | | | | | | | | | | | |
Interest (1) | | $ | 7 | | | $ | 6 | | | $ | 15 | | | $ | 6 | | | $ | 627 | | | $ | 2,558 | |
Unaffiliated Dividends (1) | | | 10,842 | | | | 15,062 | | | | 62,309 | | | | 9,427 | | | | - | | | | - | |
Affiliated Dividends | | | - | | | | - | | | | - | | | | - | | | | - | | | | - | |
| | | | | | | | | | | | | | | | | | | | | | | | |
Total Income | | | 10,849 | | | | 15,068 | | | | 62,324 | | | | 9,433 | | | | 627 | | | | 2,558 | |
| | | | | | | | | | | | | | | | | | | | | | | | |
Expenses | | | | | | | | | | | | | | | | | | | | | | | | |
Investment Advisory Fees | | | 2,748 | | | | 3,629 | | | | 11,458 | | | | 4,460 | | | | 1,364 | | | | 741 | |
Custodian Fees | | | 336 | | | | 420 | | | | 938 | | | | 760 | | | | 18 | | | | 25 | |
Shareholder Reporting Fees | | | 64 | | | | 42 | | | | 133 | | | | 61 | | | | 26 | | | | 27 | |
Audit Fees | | | 24 | | | | 24 | | | | 30 | | | | 24 | | | | 22 | | | | 27 | |
Valuation Services | | | - | | | | - | | | | - | | | | - | | | | 1 | | | | 32 | |
Compliance Fees | | | 16 | | | | 14 | | | | 18 | | | | 13 | | | | 14 | | | | 13 | |
Directors Fees | | | 26 | | | | 25 | | | | 39 | | | | 25 | | | | 27 | | | | 24 | |
Professional Fees | | | 20 | | | | 15 | | | | 17 | | | | 18 | | | | 5 | | | | 6 | |
Interest Expense | | | - | | | | - | | | | - | | | | - | | | | - | | | | - | |
Other Expenses | | | 6 | | | | 6 | | | | 27 | | | | 5 | | | | 7 | | | | 3 | |
| | | | | | | | | | | | | | | | | | | | | | | | |
Total Expenses | | | 3,240 | | | | 4,175 | | | | 12,660 | | | | 5,366 | | | | 1,484 | | | | 898 | |
| | | | | | | | | | | | | | | | | | | | | | | | |
Less Waived Fees: | | | | | | | | | | | | | | | | | | | | | | | | |
Paid by Affiliate | | | - | | | | - | | | | (1,196 | ) | | | - | | | | (1,185 | ) | | | - | |
Paid Indirectly | | | - | | | | - | | | | - | | | | - | | | | - | | | | (2 | ) |
| | | | | | | | | | | | | | | | | | | | | | | | |
Net Expenses | | | 3,240 | | | | 4,175 | | | | 11,464 | | | | 5,366 | | | | 299 | | | | 896 | |
| | | | | | | | | | | | | | | | | | | | | | | | |
Net Investment Income (Loss) | | | 7,609 | | | | 10,893 | | | | 50,860 | | | | 4,067 | | | | 328 | | | | 1,662 | |
Realized and Unrealized Gain (Loss) on Investments | | | | | | | | | | | | | | | | | | | | | | | | |
Net Realized Gain (Loss) on: | | | | | | | | | | | | | | | | | | | | | | | | |
Unaffiliated Investment Securities | | | 21,116 | | | | 12,092 | | | | 67,503 | | | | (9,867 | ) | | | (1 | ) | | | 761 | |
Affiliated Investment Securities | | | - | | | | - | | | | - | | | | - | | | | - | | | | - | |
Futures Contracts | | | - | | | | - | | | | - | | | | - | | | | - | | | | (760 | ) |
Options Written | | | - | | | | - | | | | - | | | | - | | | | - | | | | - | |
Swap Contracts | | | - | | | | - | | | | - | | | | - | | | | - | | | | - | |
Foreign Currency Transactions | | | (115 | ) | | | (95 | ) | | | (655 | ) | | | (68 | ) | | | - | | | | (7 | ) |
| | | | | | | | | | | | | | | | | | | | | | | | |
Net Realized Gain (Loss) on Investments | | | 21,001 | | | | 11,997 | | | | 66,848 | | | | (9,935 | ) | | | (1 | ) | | | (6 | ) |
| | | | | | | | | | | | | | | | | | | | | | | | |
Net Unrealized Appreciation (Depreciation) of: | | | | | | | | | | | | | | | | | | | | | | | | |
Investment Securities | | | (48,957 | ) | | | (54,517 | ) | | | (273,164 | ) | | | (20,797 | ) | | | - | | | | (472 | ) |
Futures Contracts | | | - | | | | - | | | | - | | | | - | | | | - | | | | (373 | ) |
Options Written | | | - | | | | - | | | | - | | | | - | | | | - | | | | - | |
Swap Contracts | | | - | | | | - | | | | - | | | | - | | | | - | | | | - | |
Foreign Currency Transactions | | | (72 | ) | | | (95 | ) | | | (344 | ) | | | 3 | | | | - | | | | - | |
| | | | | | | | | | | | | | | | | | | | | | | | |
Net Change in Unrealized Appreciation (Depreciation) of Investments | | | (49,029 | ) | | | (54,612 | ) | | | (273,508 | ) | | | (20,794 | ) | | | - | | | | (845 | ) |
| | | | | | | | | | | | | | | | | | | | | | | | |
Net Gain (Loss) on Investments | | | (28,028 | ) | | | (42,615 | ) | | | (206,660 | ) | | | (30,729 | ) | | | (1 | ) | | | (851 | ) |
| | | | | | | | | | | | | | | | | | | | | | | | |
Net Increase (Decrease) in Net Assets Resulting from Operations | | $ | (20,419 | ) | | $ | (31,722 | ) | | $ | (155,800 | ) | | $ | (26,662 | ) | | $ | 327 | | | $ | 811 | |
| | | | | | | | | | | | | | | | | | | | | | | | |
(1) Net of Foreign Tax | | $ | 268 | | | $ | 675 | | | $ | 1,768 | | | $ | 379 | | | $ | - | | | $ | - | |
The Accompanying Notes are an Integral Part of the Financial Statements.
| | | | |
| 176 | | Statements of Operations | | |
| | | | | | | | | | | | | | | | | | | | | | | | | | |
Select Bond
Portfolio | | | Long-Term
U.S.
Government
Bond Portfolio | | | Inflation
Protection
Portfolio | | | High Yield
Bond Portfolio | | | Multi-Sector
Bond Portfolio | | | Balanced
Portfolio | | | Asset
Allocation
Portfolio | |
| | | | | | | | | | | | | | | | | | | | | | | | | | | |
| | | | | | | | | | | | | | | | | | | | | | | | | | | |
| $ | 48,612 | | | $ | 3,253 | | | $ | 5,079 | | | $ | 34,729 | | | $ | 24,139 | | | $ | 23,672 | | | $ | 1,925 | |
| | - | | | | - | | | | - | | | | 702 | | | | - | | | | 1,412 | | | | 335 | |
| | - | | | | - | | | | - | | | | - | | | | - | | | | 9,307 | | | | 1,346 | |
| | | | | | | | | | | | | | | | | | | | | | | | | | |
| | 48,612 | | | | 3,253 | | | | 5,079 | | | | 35,431 | | | | 24,139 | | | | 34,391 | | | | 3,606 | |
| | | | | | | | | | | | | | | | | | | | | | | | | | |
| | | | | | | | | | | | | | | | | | | | | | | | | | | |
| | 6,373 | | | | 541 | | | | 1,522 | | | | 2,550 | | | | 3,996 | | | | 7,100 | | | | 1,410 | |
| | 70 | | | | 11 | | | | 44 | | | | 36 | | | | 142 | | | | 93 | | | | 59 | |
| | 93 | | | | 10 | | | | 46 | | | | 82 | | | | 53 | | | | 30 | | | | 9 | |
| | 35 | | | | 38 | | | | 26 | | | | 34 | | | | 37 | | | | 28 | | | | 26 | |
| | 106 | | | | 8 | | | | 49 | | | | 67 | | | | 149 | | | | 87 | | | | 81 | |
| | 22 | | | | 12 | | | | 13 | | | | 15 | | | | 14 | | | | 24 | | | | 13 | |
| | 42 | | | | 23 | | | | 25 | | | | 27 | | | | 27 | | | | 48 | | | | 25 | |
| | 13 | | | | 6 | | | | 6 | | | | 10 | | | | 11 | | | | 14 | | | | 9 | |
| | - | | | | 15 | | | | - | | | | - | | | | 2 | | | | - | | | | - | |
| | 28 | | | | 2 | | | | 4 | | | | 8 | | | | 7 | | | | 38 | | | | 4 | |
| | | | | | | | | | | | | | | | | | | | | | | | | | |
| | 6,782 | | | | 666 | | | | 1,735 | | | | 2,829 | | | | 4,438 | | | | 7,462 | | | | 1,636 | |
| | | | | | | | | | | | | | | | | | | | | | | | | | |
| | | | | | | | | | | | | | | | | | | | | | | | | | | |
| | - | | | | (17 | ) | | | (112 | ) | | | - | | | | (285 | ) | | | (3,687 | ) | | | (1,025 | ) |
| | (27) | | | | - | | | | - | | | | (3 | ) | | | - | | | | (1 | ) | | | (1 | ) |
| | | | | | | | | | | | | | | | | | | | | | | | | | |
| | 6,755 | | | | 649 | | | | 1,623 | | | | 2,826 | | | | 4,153 | | | | 3,774 | | | | 609 | |
| | | | | | | | | | | | | | | | | | | | | | | | | | |
| | 41,857 | | | | 2,604 | | | | 3,456 | | | | 32,605 | | | | 19,986 | | | | 30,617 | | | | 2,997 | |
| | | | | | | | | | | | | | | | | | | | | | | | | | | |
| | | | | | | | | | | | | | | | | | | | | | | | | | | |
| | 50,609 | | | | 2,290 | | | | 103 | | | | (2,184 | ) | | | 2,609 | | | | 54,423 | | | | 4,011 | |
| | - | | | | - | | | | - | | | | - | | | | - | | | | 76,714 | | | | 10,811 | |
| | (4,730) | | | | 364 | | | | (1,741 | ) | | | - | | | | 3,692 | | | | 5,068 | | | | 1,111 | |
| | - | | | | 18 | | | | - | | | | - | | | | 45 | | | | - | | | | - | |
| | - | | | | - | | | | (60 | ) | | | - | | | | (960 | ) | | | - | | | | - | |
| | 69 | | | | - | | | | 2,381 | | | | - | | | | 11,677 | | | | 41 | | | | - | |
| | | | | | | | | | | | | | | | | | | | | | | | | | |
| | 45,948 | | | | 2,672 | | | | 683 | | | | (2,184 | ) | | | 17,063 | | | | 136,246 | | | | 15,953 | |
| | | | | | | | | | | | | | | | | | | | | | | | | | |
| | | | | | | | | | | | | | | | | | | | | | | | | | | |
| | 16,148 | | | | 15,421 | | | | 5,965 | | | | (30,635 | ) | | | (28,365 | ) | | | (37,466 | ) | | | (5,456 | ) |
| | 48 | | | | 19 | | | | (543 | ) | | | - | | | | 2,360 | | | | (1,067 | ) | | | (97 | ) |
| | - | | | | - | | | | - | | | | - | | | | 19 | | | | - | | | | - | |
| | - | | | | - | | | | (3,371 | ) | | | - | | | | (1,140 | ) | | | - | | | | - | |
| | (32) | | | | - | | | | 1,588 | | | | - | | | | 4,413 | | | | (19 | ) | | | - | |
| | | | | | | | | | | | | | | | | | | | | | | | | | |
|
16,164 |
| | | 15,440 | | | | 3,639 | | | | (30,635 | ) | | | (22,713 | ) | | | (38,552 | ) | | | (5,553 | ) |
| | | | | | | | | | | | | | | | | | | | | | | | | | |
| | 62,112 | | | | 18,112 | | | | 4,322 | | | | (32,819 | ) | | | (5,650 | ) | | | 97,694 | | | | 10,400 | |
| | | | | | | | | | | | | | | | | | | | | | | | | | |
$ |
103,969 |
| | $ | 20,716 | | | $ | 7,778 | | | $ | (214 | ) | | $ | 14,336 | | | $ | 128,311 | | | $ | 13,397 | |
| | | | | | | | | | | | | | | | | | | | | | | | | | |
| $ | - | | | $ | - | | | $ | - | | | $ | - | | | $ | 16 | | | $ | - | | | $ | - | |
The Accompanying Notes are an Integral Part of the Financial Statements.
| | | | | | |
| | Statements of Operations | | | 177 | |
Statements of Changes in Net Assets
Northwestern Mutual Series Fund, Inc.
(Amounts in thousands)
| | | | | | | | | | | | | | | | | | | | | | | | |
| | | Growth Stock Portfolio | | | Focused Appreciation
Portfolio | | | Large Cap Core Stock
Portfolio | |
| | | For the Year
Ended
December 31,
2014 | | | For the Year
Ended
December 31,
2013 | | | For the Year
Ended
December 31,
2014 | | | For the Year
Ended
December 31,
2013 | | | For the Year
Ended
December 31,
2014 | | | For the Year
Ended
December 31,
2013 | |
Change in Net Assets | | | | | | | | | | | | | | | | | | | | | | | | |
Operations | | | | | | | | | | | | | | | | | | | | | | | | |
Net Investment Income (Loss) | | $ | 6,518 | | | $ | 5,254 | | | $ | (120 | ) | | $ | 177 | | | $ | 11,360 | | | $ | 8,237 | |
Net Realized Gain (Loss) on Investments | | | 61,731 | | | | 81,957 | | | | 82,053 | | | | 70,607 | | | | 8,124 | | | | 58,703 | |
Net Change in Unrealized Appreciation (Depreciation) of Investments | | | 6,191 | | | | 126,505 | | | | (19,479 | ) | | | 61,665 | | | | 25,294 | | | | 47,966 | |
| | | | | | | | | | | | | | | | | | | | | | | | |
Net Increase (Decrease) in Net Assets Resulting from Operations | | | 74,440 | | | | 213,716 | | | | 62,454 | | | | 132,449 | | | | 44,778 | | | | 114,906 | |
| | | | | | | | | | | | | | | | | | | | | | | | |
Distributions to Shareholders from: | | | | | | | | | | | | | | | | | | | | | | | | |
Net Investment Income | | | (5,089 | ) | | | (5,017 | ) | | | (131 | ) | | | (2,567 | ) | | | (8,198 | ) | | | (5,721 | ) |
Net Realized Gain on Investments | | | (82,323 | ) | | | (52,317 | ) | | | (67,736 | ) | | | - | | | | (49,261 | ) | | | - | |
Tax Return of Capital | | | - | | | | - | | | | - | | | | - | | | | - | | | | - | |
| | | | | | | | | | | | | | | | | | | | | | | | |
Net Decrease in Net Assets Resulting from Distributions to Shareholders | | | (87,412 | ) | | | (57,334 | ) | | | (67,867 | ) | | | (2,567 | ) | | | (57,459 | ) | | | (5,721 | ) |
| | | | | | | | | | | | | | | | | | | | | | | | |
Capital Transactions: | | | | | | | | | | | | | | | | | | | | | | | | |
Shares Sold | | | 27,204 | | | | 163,438 | | | | 95,788 | | | | 152,149 | | | | 18,370 | | | | 85,840 | |
Reinvestment of Distributions Paid | | | 87,412 | | | | 57,334 | | | | 67,867 | | | | 2,567 | | | | 57,459 | | | | 5,721 | |
Shares Redeemed | | | (63,148 | ) | | | (63,585 | ) | | | (60,375 | ) | | | (48,706 | ) | | | (45,877 | ) | | | (47,057 | ) |
| | | | | | | | | | | | | | | | | | | | | | | | |
Net Increase (Decrease) in Net Assets Resulting from Capital Transactions | | | 51,468 | | | | 157,187 | | | | 103,280 | | | | 106,010 | | | | 29,952 | | | | 44,504 | |
| | | | | | | | | | | | | | | | | | | | | | | | |
Total Increase (Decrease) in Net Assets | | | 38,496 | | | | 313,569 | | | | 97,867 | | | | 235,892 | | | | 17,271 | | | | 153,689 | |
Net Assets | | | | | | | | | | | | | | | | | | | | | | | | |
Beginning of Period | | | 847,384 | | | | 533,815 | | | | 624,512 | | | | 388,620 | | | | 538,368 | | | | 384,679 | |
| | | | | | | | | | | | | | | | | | | | | | | | |
End of Period | | $ | 885,880 | | | $ | 847,384 | | | $ | 722,379 | | | $ | 624,512 | | | $ | 555,639 | | | $ | 538,368 | |
| | | | | | | | | | | | | | | | | | | | | | | | |
Undistributed Net Investment Income (Loss) | | $ | 6,518 | | | $ | 5,254 | | | $ | - | | | $ | 131 | | | $ | 11,360 | | | $ | 8,237 | |
| | | | | | | | | | | | | | | | | | | | | | | | |
Portfolio Share Transactions: | | | | | | | | | | | | | | | | | | | | | | | | |
Shares Sold | | | 9,307 | | | | 62,328 | | | | 36,806 | | | | 66,405 | | | | 10,785 | | | | 56,114 | |
Reinvestment of Distributions Paid | | | 32,423 | | | | 22,501 | | | | 28,231 | | | | 1,079 | | | | 35,979 | | | | 3,656 | |
Shares Redeemed | | | (21,578 | ) | | | (24,367 | ) | | | (23,252 | ) | | | (20,822 | ) | | | (27,046 | ) | | | (30,789 | ) |
| | | | | | | | | | | | | | | | | | | | | | | | |
Net Increase (Decrease) in Shares Resulting from Portfolio Share Transactions | | | 20,152 | | | | 60,462 | | | | 41,785 | | | | 46,662 | | | | 19,718 | | | | 28,981 | |
| | | | | | | | | | | | | | | | | | | | | | | | |
The Accompanying Notes are an Integral Part of the Financial Statements.
| | | | |
| 178 | | Statements of Changes in Net Assets | | |
| | | | | | | | | | | | | | | | | | | | | | | | | | | | | | |
| Large Cap Blend Portfolio | | | Index 500 Stock Portfolio | | | Large Company Value Portfolio | | | Domestic Equity Portfolio | |
For the Year
Ended
December 31,
2014 | | | For the Year
Ended
December 31,
2013 | | | For the Year
Ended
December 31,
2014 | | | For the Year
Ended
December 31,
2013 | | | For the Year
Ended
December 31,
2014 | | | For the Year
Ended
December 31,
2013 | | | For the Year
Ended
December 31,
2014 | | | For the Year
Ended
December 31,
2013 | |
| | | | | | | | | | | | | | | | | | | | | | | | | | | | | | | |
| | | | | | | | | | | | | | | | | | | | | | | | | | | | | | | |
| $ | 1,436 | | | $ | 1,252 | | | $ | 41,251 | | | $ | 36,862 | | | $ | 2,758 | | | $ | 2,400 | | | $ | 11,358 | | | $ | 10,231 | |
| | 8,735 | | | | 10,868 | | | | 42,163 | | | | 29,321 | | | | 17,517 | | | | 16,058 | | | | 23,327 | | | | 24,432 | |
|
8,588 |
| | | 19,755 | | | | 201,672 | | | | 468,624 | | | | 1,710 | | | | 17,092 | | | | 42,579 | | | | 105,425 | |
| | | | | | | | | | | | | | | | | | | | | | | | | | | | | | |
|
18,759 |
| | | 31,875 | | | | 285,086 | | | | 534,807 | | | | 21,985 | | | | 35,550 | | | | 77,264 | | | | 140,088 | |
| | | | | | | | | | | | | | | | | | | | | | | | | | | | | | |
| | | | | | | | | | | | | | | | | | | | | | | | | | | | | | | |
| | (59 | ) | | | (1,247 | ) | | | (36,099 | ) | | | (35,405 | ) | | | - | | | | (2,362 | ) | | | (10,099 | ) | | | (8,767 | ) |
| | (6,023 | ) | | | (5,260 | ) | | | (28,128 | ) | | | (39,372 | ) | | | (9,080 | ) | | | (2,653 | ) | | | - | | | | - | |
| | - | | | | - | | | | - | | | | - | | | | - | | | | - | | | | - | | | | - | |
| | | | | | | | | | | | | | | | | | | | | | | | | | | | | | |
|
(6,082 |
) | | | (6,507 | ) | | | (64,227 | ) | | | (74,777 | ) | | | (9,080 | ) | | | (5,015 | ) | | | (10,099 | ) | | | (8,767 | ) |
| | | | | | | | | | | | | | | | | | | | | | | | | | | | | | |
| | | | | | | | | | | | | | | | | | | | | | | | | | | | | | |
| | 7,570 | | | | 79,206 | | | | 123,029 | | | | 103,969 | | | | 13,592 | | | | 87,261 | | | | 27,775 | | | | 92,289 | |
| | 6,082 | | | | 6,507 | | | | 64,227 | | | | 74,777 | | | | 9,080 | | | | 5,015 | | | | 10,099 | | | | 8,767 | |
| | (10,480 | ) | | | (38,682 | ) | | | (202,318 | ) | | | (178,746 | ) | | | (14,685 | ) | | | (39,664 | ) | | | (55,666 | ) | | | (61,787 | ) |
| | | | | | | | | | | | | | | | | | | | | | | | | | | | | | |
|
3,172 |
| | | 47,031 | | | | (15,062 | ) | | | - | | | | 7,987 | | | | 52,612 | | | | (17,792 | ) | | | 39,269 | |
| | | | | | | | | | | | | | | | | | | | | | | | | | | | | | |
| | 15,849 | | | | 72,399 | | | | 205,797 | | | | 460,030 | | | | 20,892 | | | | 83,147 | | | | 49,373 | | | | 170,590 | |
| | | | | | | | | | | | | | | | | | | | | | | | | | | | | | | |
| | 151,099 | | | | 78,700 | | | | 2,164,501 | | | | 1,704,471 | | | | 170,062 | | | | 86,915 | | | | 570,648 | | | | 400,058 | |
| | | | | | | | | | | | | | | | | | | | | | | | | | | | | | |
| $ | 166,948 | | | $ | 151,099 | | | $ | 2,370,298 | | | $ | 2,164,501 | | | $ | 190,954 | | | $ | 170,062 | | | $ | 620,021 | | | $ | 570,648 | |
| | | | | | | | | | | | | | | | | | | | | | | | | | | | | | |
| $ | 1,436 | | | $ | 59 | | | $ | 40,235 | | | $ | 36,421 | | | $ | 2,937 | | | $ | 17 | | | $ | 11,101 | | | $ | 10,230 | |
| | | | | | | | | | | | | | | | | | | | | | | | | | | | | | |
| | | | | | | | | | | | | | | | | | | | | | | | | | | | | | | |
| | 7,052 | | | | 82,410 | | | | 32,735 | | | | 32,130 | | | | 12,303 | | | | 89,007 | | | | 20,371 | | | | 80,248 | |
| | 5,743 | | | | 6,296 | | | | 17,326 | | | | 22,881 | | | | 8,431 | | | | 4,713 | | | | 7,344 | | | | 7,417 | |
| | (9,815 | ) | | | (38,039 | ) | | | (53,823 | ) | | | (55,321 | ) | | | (13,385 | ) | | | (38,166 | ) | | | (40,959 | ) | | | (54,239 | ) |
| | | | | | | | | | | | | | | | | | | | | | | | | | | | | | |
|
2,980 |
| | | 50,667 | | | | (3,762 | ) | | | (310 | ) | | | 7,349 | | | | 55,554 | | | | (13,244 | ) | | | 33,426 | |
| | | | | | | | | | | | | | | | | | | | | | | | | | | | | | |
The Accompanying Notes are an Integral Part of the Financial Statements.
| | | | | | |
| | Statements of Changes in Net Assets | | | 179 | |
Statements of Changes in Net Assets
Northwestern Mutual Series Fund, Inc.
(Amounts in thousands)
| | | | | | | | | | | | | | | | | | | | | | | | |
| | | Equity Income Portfolio | | | Mid Cap Growth Stock
Portfolio | | | Index 400 Stock Portfolio | |
| | | For the Year
Ended
December 31,
2014 | | | For the Year
Ended
December 31,
2013 | | | For the Year
Ended
December 31,
2014 | | | For the Year
Ended
December 31,
2013 | | | For the Year
Ended
December 31,
2014 | | | For the Year
Ended
December 31,
2013 | |
Change in Net Assets | | | | | | | | | | | | | | | | | | | | | | | | |
Operations | | | | | | | | | | | | | | | | | | | | | | | | |
Net Investment Income (Loss) | | $ | 13,867 | | | $ | 9,630 | | | $ | 2,590 | | | $ | 4,221 | | | $ | 7,385 | | | $ | 6,414 | |
Net Realized Gain (Loss) on Investments | | | 30,307 | | | | 23,116 | | | | 97,910 | | | | 208,116 | | | | 41,227 | | | | 29,756 | |
Net Change in Unrealized Appreciation
(Depreciation) of Investments | | | 8,511 | | | | 106,019 | | | | (13,904 | ) | | | 4,077 | | | | 9,052 | | | | 121,031 | |
| | | | | | | | | | | | | | | | | | | | | | | | |
Net Increase (Decrease) in Net Assets
Resulting from Operations | | | 52,685 | | | | 138,765 | | | | 86,596 | | | | 216,414 | | | | 57,664 | | | | 157,201 | |
| | | | | | | | | | | | | | | | | | | | | | | | |
Distributions to Shareholders from: | | | | | | | | | | | | | | | | | | | | | | | | |
Net Investment Income | | | (9,121 | ) | | | (7,946 | ) | | | (3,769 | ) | | | (3,093 | ) | | | (6,280 | ) | | | (5,972 | ) |
Net Realized Gain on Investments | | | (21,833 | ) | | | - | | | | (207,085 | ) | | | (39,484 | ) | | | (30,105 | ) | | | (19,282 | ) |
Tax Return of Capital | | | - | | | | - | | | | - | | | | - | | | | - | | | | - | |
| | | | | | | | | | | | | | | | | | | | | | | | |
Net Decrease in Net Assets Resulting from Distributions to Shareholders | | | (30,954 | ) | | | (7,946 | ) | | | (210,854 | ) | | | (42,577 | ) | | | (36,385 | ) | | | (25,254 | ) |
| | | | | | | | | | | | | | | | | | | | | | | | |
Capital Transactions: | | | | | | | | | | | | | | | | | | | | | | | | |
Shares Sold | | | 111,040 | | | | 174,190 | | | | 32,194 | | | | 124,108 | | | | 38,212 | | | | 41,007 | |
Reinvestment of Distributions Paid | | | 30,954 | | | | 7,946 | | | | 210,854 | | | | 42,577 | | | | 36,385 | | | | 25,254 | |
Shares Redeemed | | | (58,021 | ) | | | (46,021 | ) | | | (93,967 | ) | | | (96,143 | ) | | | (67,564 | ) | | | (53,157 | ) |
| | | | | | | | | | | | | | | | | | | | | | | | |
Net Increase (Decrease) in Net Assets
Resulting from Capital Transactions | | | 83,973 | | | | 136,115 | | | | 149,081 | | | | 70,542 | | | | 7,033 | | | | 13,104 | |
| | | | | | | | | | | | | | | | | | | | | | | | |
Total Increase (Decrease) in Net Assets | | | 105,704 | | | | 266,934 | | | | 24,823 | | | | 244,379 | | | | 28,312 | | | | 145,051 | |
Net Assets | | | | | | | | | | | | | | | | | | | | | | | | |
Beginning of Period | | | 676,031 | | | | 409,097 | | | | 1,073,332 | | | | 828,953 | | | | 624,092 | | | | 479,041 | |
| | | | | | | | | | | | | | | | | | | | | | | | |
End of Period | | $ | 781,735 | | | $ | 676,031 | | | $ | 1,098,155 | | | $ | 1,073,332 | | | $ | 652,404 | | | $ | 624,092 | |
| | | | | | | | | | | | | | | | | | | | | | | | |
Undistributed Net Investment Income (Loss) | | $ | 13,177 | | | $ | 9,519 | | | $ | 412 | | | $ | 4,036 | | | $ | 7,337 | | | $ | 6,338 | |
| | | | | | | | | | | | | | | | | | | | | | | | |
Portfolio Share Transactions: | | | | | | | | | | | | | | | | | | | | | | | | |
Shares Sold | | | 63,727 | | | | 112,602 | | | | 8,824 | | | | 34,116 | | | | 19,878 | | | | 23,841 | |
Reinvestment of Distributions Paid | | | 18,155 | | | | 5,013 | | | | 66,578 | | | | 11,684 | | | | 19,636 | | | | 14,564 | |
Shares Redeemed | | | (33,227 | ) | | | (29,531 | ) | | | (25,832 | ) | | | (26,449 | ) | | | (35,067 | ) | | | (30,940 | ) |
| | | | | | | | | | | | | | | | | | | | | | | | |
Net Increase (Decrease) in Shares Resulting from Portfolio Share Transactions | | | 48,655 | | | | 88,084 | | | | 49,570 | | | | 19,351 | | | | 4,447 | | | | 7,465 | |
| | | | | | | | | | | | | | | | | | | | | | | | |
The Accompanying Notes are an Integral Part of the Financial Statements.
| | | | |
| 180 | | Statements of Changes in Net Assets | | |
| | | | | | | | | | | | | | | | | | | | | | | | | | | | | | |
| Mid Cap Value Portfolio | | | Small Cap Growth Stock
Portfolio | | | Index 600 Stock Portfolio | | | Small Cap Value Portfolio | |
For the Year
Ended
December 31,
2014 | | | For the Year
Ended
December 31,
2013 | | | For the Year
Ended
December 31,
2014 | | | For the Year
Ended
December 31,
2013 | | | For the Year
Ended
December 31,
2014 | | | For the Year
Ended
December 31,
2013 | | | For the Year
Ended
December 31,
2014 | | | For the Year
Ended
December 31,
2013 | |
| | |
| | | | | | | | | | | | | | | | | | | | | | | | | | | | | | | |
| | | | | | | | | | | | | | | | | | | | | | | | | | | | | | | |
| $ | 5,779 | | | $ | 3,866 | | | $ | 634 | | | $ | (6 | ) | | $ | 787 | | | $ | 729 | | | $ | 4,058 | | | $ | 2,251 | |
| | 43,679 | | | | 32,255 | | | | 26,408 | | | | 100,940 | | | | 15,134 | | | | 8,219 | | | | 33,068 | | | | 14,024 | |
|
10,436 |
| | | 27,111 | | | | 15,494 | | | | 44,401 | | | | (11,036 | ) | | | 23,413 | | | | (35,544 | ) | | | 118,945 | |
| | | | | | | | | | | | | | | | | | | | | | | | | | | | | | |
|
59,894 |
| | | 63,232 | | | | 42,536 | | | | 145,335 | | | | 4,885 | | | | 32,361 | | | | 1,582 | | | | 135,220 | |
| | | | | | | | | | | | | | | | | | | | | | | | | | | | | | |
| | | | | | | | | | | | | | | | | | | | | | | | | | | | | | |
| | (3,829) | | | | (2,886 | ) | | | - | | | | (2,246 | ) | | | (1,419 | ) | | | (3,587 | ) | | | (2,032 | ) | | | (5,874 | ) |
| | (32,278 | ) | | | (1,673 | ) | | | (57,515 | ) | | | - | | | | (15,897 | ) | | | (3,748 | ) | | | (14,657 | ) | | | (2,384 | ) |
| | - | | | | - | | | | - | | | | - | | | | - | | | | - | | | | - | | | | - | |
| | | | | | | | | | | | | | | | | | | | | | | | | | | | | | |
|
(36,107 |
) | | | (4,559 | ) | | | (57,515 | ) | | | (2,246 | ) | | | (17,316 | ) | | | (7,335 | ) | | | (16,689 | ) | | | (8,258 | ) |
| | | | | | | | | | | | | | | | | | | | | | | | | | | | | | |
| | | | | | | | | | | | | | | | | | | | | | | | | | | | | | |
| | 54,015 | | | | 138,159 | | | | 22,235 | | | | 51,425 | | | | 19,952 | | | | 25,514 | | | | 57,330 | | | | 82,527 | |
| | 36,107 | | | | 4,559 | | | | 57,515 | | | | 2,246 | | | | 17,316 | | | | 7,335 | | | | 16,689 | | | | 8,258 | |
| | (29,989 | ) | | | (20,681 | ) | | | (55,715 | ) | | | (52,494 | ) | | | (47,038 | ) | | | (8,110 | ) | | | (52,375 | ) | | | (50,565 | ) |
| | | | | | | | | | | | | | | | | | | | | | | | | | | | | | |
|
60,133 |
| | | 122,037 | | | | 24,035 | | | | 1,177 | | | | (9,770 | ) | | | 24,739 | | | | 21,644 | | | | 40,220 | |
| | | | | | | | | | | | | | | | | | | | | | | | | | | | | | |
| | 83,920 | | | | 180,710 | | | | 9,056 | | | | 144,266 | | | | (22,201 | ) | | | 49,765 | | | | 6,537 | | | | 167,182 | |
| | | | | | | | | | | | | | | | | | | | | | | | | | | | | | |
| | 343,933 | | | | 163,223 | | | | 520,492 | | | | 376,226 | | | | 123,487 | | | | 73,722 | | | | 576,830 | | | | 409,648 | |
| | | | | | | | | | | | | | | | | | | | | | | | | | | | | | |
| $ | 427,853 | | | $ | 343,933 | | | $ | 529,548 | | | $ | 520,492 | | | $ | 101,286 | | | $ | 123,487 | | | $ | 583,367 | | | $ | 576,830 | |
| | | | | | | | | | | | | | | | | | | | | | | | | | | | | | |
| $ | 7,271 | | | $ | 4,065 | | | $ | 615 | | | $ | - | | | $ | - | | | $ | (129 | ) | | $ | 4,055 | | | $ | 2,251 | |
| | | | | | | | | | | | | | | | | | | | | | | | | | | | | | |
| | | | | | | | | | | | | | | | | | | | | | | | | | | | | | | |
| | 31,296 | | | | 91,143 | | | | 8,882 | | | | 23,479 | | | | 15,146 | | | | 20,797 | | | | 24,160 | | | | 38,061 | |
| | 21,923 | | | | 2,951 | | | | 25,237 | | | | 977 | | | | 14,726 | | | | 5,515 | | | | 7,249 | | | | 3,745 | |
| | (17,366 | ) | | | (13,694 | ) | | | (22,374 | ) | | | (23,916 | ) | | | (35,645 | ) | | | (6,800 | ) | | | (21,956 | ) | | | (23,194 | ) |
| | | | | | | | | | | | | | | | | | | | | | | | | | | | | | |
|
35,853 |
| | | 80,400 | | | | 11,745 | | | | 540 | | | | (5,773 | ) | | | 19,512 | | | | 9,453 | | | | 18,612 | |
| | | | | | | | | | | | | | | | | | | | | | | | | | | | | | |
The Accompanying Notes are an Integral Part of the Financial Statements.
| | | | | | |
| | Statements of Changes in Net Assets | | | 181 | |
Statements of Changes in Net Assets
Northwestern Mutual Series Fund, Inc.
(Amounts in thousands)
| | | | | | | | | | | | | | | | | | | | | | | | |
| | | International Growth
Portfolio | | | Research International Core
Portfolio | | | International Equity
Portfolio | |
| | | For the Year
Ended
December 31,
2014 | | | For the Year
Ended
December 31,
2013 | | | For the Year
Ended
December 31,
2014 | | | For the Year
Ended
December 31,
2013 | | | For the Year
Ended
December 31,
2014 | | | For the Year
Ended
December 31,
2013 | |
Change in Net Assets | | | | | | | | | | | | | | | | | | | | | | | | |
Operations | | | | | | | | | | | | | | | | | | | | | | | | |
Net Investment Income (Loss) | | $ | 7,609 | | | $ | 4,446 | | | $ | 10,893 | | | $ | 5,431 | | | $ | 50,860 | | | $ | 33,694 | |
Net Realized Gain (Loss) on Investments | | | 21,001 | | | | 42,529 | | | | 11,997 | | | | 14,390 | | | | 66,848 | | | | 116,746 | |
Net Change in Unrealized Appreciation (Depreciation) of Investments | | | (49,029 | ) | | | 20,520 | | | | (54,612 | ) | | | 37,591 | | | | (273,508 | ) | | | 163,724 | |
| | | | | | | | | | | | | | | | | | | | | | | | |
Net Increase (Decrease) in Net Assets Resulting from Operations | | | (20,419 | ) | | | 67,495 | | | | (31,722 | ) | | | 57,412 | | | | (155,800 | ) | | | 314,164 | |
| | | | | | | | | | | | | | | | | | | | | | | | |
Distributions to Shareholders from: | | | | | | | | | | | | | | | | | | | | | | | | |
Net Investment Income | | | (5,721 | ) | | | (5,267 | ) | | | (6,491 | ) | | | (452 | ) | | | (33,309 | ) | | | (35,590 | ) |
Net Realized Gain on Investments | | | - | | | | - | | | | (2,772 | ) | | | - | | | | (117,385 | ) | | | (421 | ) |
Tax Return of Capital | | | - | | | | - | | | | - | | | | - | | | | - | | | | - | |
| | | | | | | | | | | | | | | | | | | | | | | | |
Net Decrease in Net Assets Resulting from Distributions to Shareholders | | | (5,721 | ) | | | (5,267 | ) | | | (9,263 | ) | | | (452 | ) | | | (150,694 | ) | | | (36,011 | ) |
| | | | | | | | | | | | | | | | | | | | | | | | |
Capital Transactions: | | | | | | | | | | | | | | | | | | | | | | | | |
Shares Sold | | | 73,592 | | | | 58,279 | | | | 94,736 | | | | 108,059 | | | | 149,226 | | | | 128,805 | |
Reinvestment of Distributions Paid | | | 5,721 | | | | 5,267 | | | | 9,263 | | | | 452 | | | | 150,694 | | | | 36,011 | |
Shares Redeemed | | | (36,460 | ) | | | (35,274 | ) | | | (18,419 | ) | | | (14,326 | ) | | | (136,250 | ) | | | (150,463 | ) |
| | | | | | | | | | | | | | | | | | | | | | | | |
Net Increase (Decrease) in Net Assets Resulting from Capital Transactions | | | 42,853 | | | | 28,272 | | | | 85,580 | | | | 94,185 | | | | 163,670 | | | | 14,353 | |
| | | | | | | | | | | | | | | | | | | | | | | | |
Total Increase (Decrease) in Net Assets | | | 16,713 | | | | 90,500 | | | | 44,595 | | | | 151,145 | | | | (142,824 | ) | | | 292,506 | |
Net Assets | | | | | | | | | | | | | | | | | | | | | | | | |
Beginning of Period | | | 420,218 | | | | 329,718 | | | | 412,413 | | | | 261,268 | | | | 1,778,202 | | | | 1,485,696 | |
| | | | | | | | | | | | | | | | | | | | | | | | |
End of Period | | $ | 436,931 | | | $ | 420,218 | | | $ | 457,008 | | | $ | 412,413 | | | $ | 1,635,378 | | | $ | 1,778,202 | |
| | | | | | | | | | | | | | | | | | | | | | | | |
Undistributed Net Investment Income (Loss) | | $ | 7,745 | | | $ | 5,384 | | | $ | 10,472 | | | $ | 6,463 | | | $ | 49,800 | | | $ | 32,904 | |
| | | | | | | | | | | | | | | | | | | | | | | | |
Portfolio Share Transactions: | | | | | | | | | | | | | | | | | | | | | | | | |
Shares Sold | | | 52,238 | | | | 44,422 | | | | 98,267 | | | | 118,573 | | | | 74,795 | | | | 66,344 | |
Reinvestment of Distributions Paid | | | 4,009 | | | | 4,015 | | | | 9,599 | | | | 487 | | | | 78,938 | | | | 18,344 | |
Shares Redeemed | | | (25,723 | ) | | | (26,925 | ) | | | (18,981 | ) | | | (15,759 | ) | | | (67,068 | ) | | | (77,894 | ) |
| | | | | | | | | | | | | | | | | | | | | | | | |
Net Increase (Decrease) in Shares Resulting from Portfolio Share Transactions | | | 30,524 | | | | 21,512 | | | | 88,885 | | | | 103,301 | | | | 86,665 | | | | 6,794 | |
| | | | | | | | | | | | | | | | | | | | | | | | |
The Accompanying Notes are an Integral Part of the Financial Statements.
| | | | |
| 182 | | Statements of Changes in Net Assets | | |
| | | | | | | | | | | | | | | | | | | | | | | | | | | | | | |
Emerging Markets Equity
Portfolio | | | Money Market Portfolio | | | Short-Term Bond Portfolio | | | Select Bond Portfolio | |
For the Year
Ended
December 31,
2014 | | | For the Year
Ended
December 31,
2013 | | | For the Year
Ended
December 31,
2014 | | | For the Year
Ended
December 31,
2013 | | | For the Year
Ended
December 31,
2014 | | | For the Year
Ended
December 31,
2013 | | | For the Year
Ended
December 31,
2014 | | | For the Year
Ended
December 31,
2013 | |
| | | | | | | | | | | | | | | | | | | | | | | | | | | | | | | |
| | | | | | | | | | | | | | | | | | | | | | | | | | | | | | | |
| $ | 4,067 | | | $ | 2,423 | | | $ | 328 | | | $ | 467 | | | $ | 1,662 | | | $ | 1,274 | | | $ | 41,857 | | | $ | 33,682 | |
| | (9,935 | ) | | | (369 | ) | | | (1 | ) | | | (1 | ) | | | (6 | ) | | | 294 | | | | 45,948 | | | | (14,511 | ) |
|
(20,794 |
) | | | (15,266 | ) | | | - | | | | - | | | | (845 | ) | | | (664 | ) | | | 16,164 | | | | (55,403 | ) |
| | | | | | | | | | | | | | | | | | | | | | | | | | | | | | |
|
(26,662 |
) | | | (13,212 | ) | | | 327 | | | | 466 | | | | 811 | | | | 904 | | | | 103,969 | | | | (36,232 | ) |
| | | | | | | | | | | | | | | | | | | | | | | | | | | | | | |
| | | | | | | | | | | | | | | | | | | | | | | | | | | | | | | |
| | (2,542 | ) | | | (2,364 | ) | | | (328 | ) | | | (467 | ) | | | (1,286 | ) | | | (273 | ) | | | (36,871 | ) | | | (39,702 | ) |
| | (142 | ) | | | (589 | ) | | | - | | | | - | | | | - | | | | - | | | | - | | | | (27,152 | ) |
| | - | | | | - | | | | - | | | | - | | | | - | | | | - | | | | - | | | | - | |
| | | | | | | | | | | | | | | | | | | | | | | | | | | | | | |
|
(2,684 |
) | | | (2,953 | ) | | | (328 | ) | | | (467 | ) | | | (1,286 | ) | | | (273 | ) | | | (36,871 | ) | | | (66,854 | ) |
| | | | | | | | | | | | | | | | | | | | | | | | | | | | | | |
| | | | | | | | | | | | | | | | | | | | | | | | | | | | | | |
| | 124,956 | | | | 135,105 | | | | 241,263 | | | | 320,665 | | | | 64,591 | | | | 73,102 | | | | 1,261,633 | | | | 258,343 | |
| | 2,684 | | | | 2,953 | | | | 328 | | | | 467 | | | | 1,286 | | | | 273 | | | | 36,871 | | | | 66,854 | |
| | (38,550 | ) | | | (21,116 | ) | | | (286,020 | ) | | | (321,386 | ) | | | (27,113 | ) | | | (22,844 | ) | | | (237,342 | ) | | | (194,507 | ) |
| | | | | | | | | | | | | | | | | | | | | | | | | | | | | | |
|
89,090 |
| | | 116,942 | | | | (44,429 | ) | | | (254 | ) | | | 38,764 | | | | 50,531 | | | | 1,061,162 | | | | 130,690 | |
| | | | | | | | | | | | | | | | | | | | | | | | | | | | | | |
| | 59,744 | | | | 100,777 | | | | (44,430 | ) | | | (255 | ) | | | 38,289 | | | | 51,162 | | | | 1,128,260 | | | | 27,603 | |
| | | | | | | | | | | | | | | | | | | | | | | | | | | | | | |
| | 357,253 | | | | 256,476 | | | | 483,182 | | | | 483,437 | | | | 196,198 | | | | 145,036 | | | | 1,712,896 | | | | 1,685,293 | |
| | | | | | | | | | | | | | | | | | | | | | | | | | | | | | |
| $ | 416,997 | | | $ | 357,253 | | | $ | 438,752 | | | $ | 483,182 | | | $ | 234,487 | | | $ | 196,198 | | | $ | 2,841,156 | | | $ | 1,712,896 | |
| | | | | | | | | | | | | | | | | | | | | | | | | | | | | | |
| $ | 3,893 | | | $ | 2,541 | | | $ | 28 | | | $ | 415 | | | $ | 1,717 | | | $ | 1,286 | | | $ | 42,378 | | | $ | 36,042 | |
| | | | | | | | | | | | | | | | | | | | | | | | | | | | | | |
| | | | | | | | | | | | | | | | | | | | | | | | | | | | | | |
| | 128,009 | | | | 134,834 | | | | 241,263 | | | | 320,665 | | | | 62,562 | | | | 71,172 | | | | 1,004,526 | | | | 203,671 | |
| | 2,590 | | | | 3,057 | | | | 328 | | | | 467 | | | | 1,249 | | | | 266 | | | | 29,567 | | | | 54,931 | |
| | (39,394 | ) | | | (20,861 | ) | | | (286,020 | ) | | | (321,386 | ) | | | (26,267 | ) | | | (22,238 | ) | | | (188,797 | ) | | | (153,632 | ) |
| | | | | | | | | | | | | | | | | | | | | | | | | | | | | | |
|
91,205 |
| | | 117,030 | | | | (44,429 | ) | | | (254 | ) | | | 37,544 | | | | 49,200 | | | | 845,296 | | | | 104,970 | |
| | | | | | | | | | | | | | | | | | | | | | | | | | | | | | |
The Accompanying Notes are an Integral Part of the Financial Statements.
| | | | | | |
| | Statements of Changes in Net Assets | | | 183 | |
Statements of Changes in Net Assets
Northwestern Mutual Series Fund, Inc.
(Amounts in thousands)
| | | | | | | | | | | | | | | | | | | | | | | | |
| | | Long-Term U.S.
Government Bond Portfolio | | | Inflation Protection
Portfolio | | | High Yield Bond Portfolio | |
| | | For the Year
Ended
December 31,
2014 | | | For the Year
Ended
December 31,
2013(1) | | | For the Year
Ended
December 31,
2014 | | | For the Year
Ended
December 31,
2013 | | | For the Year
Ended
December 31,
2014 | | | For the Year
Ended
December 31,
2013 | |
Change in Net Assets | | | | | | | | | | | | | | | | | | | | | | | | |
Operations | | | | | | | | | | | | | | | | | | | | | | | | |
Net Investment Income (Loss) | | $ | 2,604 | | | $ | 2,666 | | | $ | 3,456 | | | $ | 2,346 | | | $ | 32,605 | | | $ | 27,908 | |
Net Realized Gain (Loss) on Investments | | | 2,672 | | | | (5,754 | ) | | | 683 | | | | 2,190 | | | | (2,184 | ) | | | 4,853 | |
Net Change in Unrealized Appreciation (Depreciation) of Investments | | | 15,440 | | | | (11,214 | ) | | | 3,639 | | | | (27,128 | ) | | | (30,635 | ) | | | (5,267 | ) |
| | | | | | | | | | | | | | | | | | | | | | | | |
Net Increase (Decrease) in Net Assets Resulting from Operations | | | 20,716 | | | | (14,302 | ) | | | 7,778 | | | | (22,592 | ) | | | (214 | ) | | | 27,494 | |
| | | | | | | | | | | | | | | | | | | | | | | | |
Distributions to Shareholders from: | | | | | | | | | | | | | | | | | | | | | | | | |
Net Investment Income | | | (2,087 | ) | | | (23 | ) | | | (1,520 | ) | | | (2,808 | ) | | | (27,964 | ) | | | (27,656 | ) |
Net Realized Gain on Investments | | | - | | | | (201 | ) | | | (2,767 | ) | | | (5,010 | ) | | | - | | | | - | |
Tax Return of Capital | | | - | | | | - | | | | - | | | | - | | | | - | | | | - | |
| | | | | | | | | | | | | | | | | | | | | | | | |
Net Decrease in Net Assets Resulting from Distributions to Shareholders | | | (2,087 | ) | | | (224 | ) | | | (4,287 | ) | | | (7,818 | ) | | | (27,964 | ) | | | (27,656 | ) |
| | | | | | | | | | | | | | | | | | | | | | | | |
Capital Transactions: | | | | | | | | | | | | | | | | | | | | | | | | |
Shares Sold | | | 22,576 | | | | 15,783 | | | | 58,499 | | | | 62,744 | | | | 240,372 | | | | 81,708 | |
Reinvestment of Distributions Paid | | | 2,087 | | | | 224 | | | | 4,287 | | | | 7,818 | | | | 27,964 | | | | 27,656 | |
Shares Redeemed | | | (21,669 | ) | | | (26,990 | ) | | | (33,300 | ) | | | (41,620 | ) | | | (56,557 | ) | | | (51,757 | ) |
| | | | | | | | | | | | | | | | | | | | | | | | |
Net Increase (Decrease) in Net Assets Resulting from Capital Transactions | | | 2,994 | | | | (10,983 | ) | | | 29,486 | | | | 28,942 | | | | 211,779 | | | | 57,607 | |
| | | | | | | | | | | | | | | | | | | | | | | | |
Total Increase (Decrease) in Net Assets | | | 21,623 | | | | (25,509 | ) | | | 32,977 | | | | (1,468 | ) | | | 183,601 | | | | 57,445 | |
Net Assets | | | | | | | | | | | | | | | | | | | | | | | | |
Beginning of Period | | | 87,627 | | | | 113,136 | | | | 252,708 | | | | 254,176 | | | | 518,387 | | | | 460,942 | |
| | | | | | | | | | | | | | | | | | | | | | | | |
End of Period | | $ | 109,250 | | | $ | 87,627 | | | $ | 285,685 | | | $ | 252,708 | | | $ | 701,988 | | | $ | 518,387 | |
| | | | | | | | | | | | | | | | | | | | | | | | |
Undistributed Net Investment Income (Loss) | | $ | 2,211 | | | $ | 2,086 | | | $ | 6,063 | | | $ | 1,656 | | | $ | 32,590 | | | $ | 27,821 | |
| | | | | | | | | | | | | | | | | | | | | | | | |
Portfolio Share Transactions: | | | | | | | | | | | | | | | | | | | | | | | | |
Shares Sold | | | 21,701 | | | | 15,814 | | | | 52,462 | | | | 54,134 | | | | 320,273 | | | | 108,063 | |
Reinvestment of Distributions Paid | | | 2,036 | | | | 238 | | | | 3,807 | | | | 7,133 | | | | 37,840 | | | | 38,147 | |
Shares Redeemed | | | (20,904 | ) | | | (27,148 | ) | | | (29,868 | ) | | | (36,540 | ) | | | (75,003 | ) | | | (68,628 | ) |
| | | | | | | | | | | | | | | | | | | | | | | | |
Net Increase (Decrease) in Shares Resulting from Portfolio Share Transactions | | | 2,833 | | | | (11,096 | ) | | | 26,401 | | | | 24,727 | | | | 283,110 | | | | 77,582 | |
| | | | | | | | | | | | | | | | | | | | | | | | |
| (1) | During the 2014 fiscal year, a calculation error was identified in the December 31, 2013 annual report of the Long-Term U.S. Government Bond Portfolio. The calculation error resulted in a $3,958,000 reclassification increasing the Net Realized Loss on Investments and decreasing the Net Change in Unrealized Depreciation on Investments. The cost of investments were overstated by $2,171,000 at December 31, 2013. The error had no impact on the Portfolio’s net assets or NAV at December 31, 2013, and had no impact on the Net Gain on Investments, the Net Increase in Net Assets Resulting from Operations in the Statement of Operations or the Fund’s Financial Highlights for the year ended December 31, 2013. Because the errors are not material to the Portfolio’s financial statements, the error was corrected in these financial statements. |
The Accompanying Notes are an Integral Part of the Financial Statements.
| | | | |
| 184 | | Statements of Changes in Net Assets | | |
| | | | | | | | | | | | | | | | | | | | | | |
| Multi-Sector Bond Portfolio | | | Balanced Portfolio | | | Asset Allocation Portfolio | |
For the Year
Ended
December 31,
2014 | | | For the Year
Ended
December 31,
2013 | | | For the Year
Ended
December 31,
2014 | | | For the Year
Ended
December 31,
2013 | | | For the Year
Ended
December 31,
2014 | | | For the Year
Ended
December 31,
2013 | |
| | | | | | | | | | | | | | | | | | | | | | | |
| | | | | | | | | | | | | | | | | | | | | | | |
| $ | 19,986 | | | $ | 16,350 | | | $ | 30,617 | | | $ | 44,237 | | | $ | 2,997 | | | $ | 4,095 | |
| | 17,063 | | | | (3,076 | ) | | | 136,246 | | | | 205,515 | | | | 15,953 | | | | 29,697 | |
|
(22,713 |
) | | | (19,872 | ) | | | (38,552 | ) | | | 13,160 | | | | (5,553 | ) | | | 4,516 | |
| | | | | | | | | | | | | | | | | | | | | | |
|
14,336 |
| | | (6,598 | ) | | | 128,311 | | | | 262,912 | | | | 13,397 | | | | 38,308 | |
| | | | | | | | | | | | | | | | | | | | | | |
| | | | | | | | | | | | | | | | | | | | | | | |
| | (13,804 | ) | | | (14,770 | ) | | | (54,943 | ) | | | (78,038 | ) | | | (5,717 | ) | | | (8,268 | ) |
| | - | | | | (3,192 | ) | | | (188,495 | ) | | | (93,485 | ) | | | (23,506 | ) | | | - | |
| | - | | | | - | | | | - | | | | - | | | | - | | | | - | |
| | | | | | | | | | | | | | | | | | | | | | |
|
(13,804 |
) | | | (17,962 | ) | | | (243,438 | ) | | | (171,523 | ) | | | (29,223 | ) | | | (8,268 | ) |
| | | | | | | | | | | | | | | | | | | | | | |
| | | | | | | | | | | | | | | | | | | | | | | |
| | 116,438 | | | | 130,657 | | | | 130,614 | | | | 122,826 | | | | 25,628 | | | | 22,823 | |
| | 13,804 | | | | 17,962 | | | | 243,438 | | | | 171,523 | | | | 29,223 | | | | 8,268 | |
| | (43,973 | ) | | | (37,457 | ) | | | (258,083 | ) | | | (259,685 | ) | | | (33,192 | ) | | | (36,317 | ) |
| | | | | | | | | | | | | | | | | | | | | | |
|
86,269 |
| | | 111,162 | | | | 115,969 | | | | 34,664 | | | | 21,659 | | | | (5,226 | ) |
| | | | | | | | | | | | | | | | | | | | | | |
| | 86,801 | | | | 86,602 | | | | 842 | | | | 126,053 | | | | 5,833 | | | | 24,814 | |
| | | | | | | | | | | | | | | | | | | | | | | |
| | 459,258 | | | | 372,656 | | | | 2,366,285 | | | | 2,240,232 | | | | 260,576 | | | | 235,762 | |
| | | | | | | | | | | | | | | | | | | | | | |
| $ | 546,059 | | | $ | 459,258 | | | $ | 2,367,127 | | | $ | 2,366,285 | | | $ | 266,409 | | | $ | 260,576 | |
| | | | | | | | | | | | | | | | | | | | | | |
| $ | 27,511 | | | $ | 11,520 | | | $ | 45,681 | | | $ | 53,637 | | | $ | 5,056 | | | $ | 5,695 | |
| | | | | | | | | | | | | | | | | | | | | | |
| | | | | | | | | | | | | | | | | | | | | | | |
| | 104,857 | | | | 116,936 | | | | 84,604 | | | | 79,052 | | | | 20,353 | | | | 18,757 | |
| | 12,503 | | | | 16,993 | | | | 168,469 | | | | 115,115 | | | | 25,041 | | | | 6,878 | |
| | (39,600 | ) | | | (33,795 | ) | | | (167,826 | ) | | | (167,498 | ) | | | (26,550 | ) | | | (29,971 | ) |
| | | | | | | | | | | | | | | | | | | | | | |
|
77,760 |
| | | 100,134 | | | | 85,247 | | | | 26,669 | | | | 18,844 | | | | (4,336 | ) |
| | | | | | | | | | | | | | | | | | | | | | |
The Accompanying Notes are an Integral Part of the Financial Statements.
| | | | | | |
| | Statements of Changes in Net Assets | | | 185 | |
Statement of Cash Flows
Northwestern Mutual Series Fund, Inc.
For the Year Ended December 31, 2014 (in thousands)
| | | | |
| | | Long-Term U.S.
Government
Bond Portfolio | |
Cash Flows from Operating Activities | | | | |
Net Increase (Decrease) in Net Assets Resulting from Operations | | $ | 20,716 | |
Adjustments to Reconcile Net Increase (Decrease) in Net Assets Resulting from Operations to Net Cash from Operating Activities | | | | |
Purchase of Investment Securities | | | (114,631 | ) |
Proceeds from Disposition of Investment Securities | | | 115,562 | |
Proceeds from Disposition (Purchase) of Short-Term Investments, net | | | 36,262 | |
Proceeds from (Payments for) Closed Futures Contracts | | | 383 | |
Premiums Received for Options Written | | | 17 | |
Amortization (Accretion) of Premium/Discount, net | | | (220 | ) |
(Increase) Decrease in: | | | | |
Cash Collateral for Derivative Positions | | | (520 | ) |
Receivable for Investment Securities Sold | | | (44,711 | ) |
Prepaid Expenses and Other Assets | | | 1 | |
Dividends and Interest Receivable | | | 34 | |
Increase (Decrease) in: | | | | |
Payable for Investment Securities Purchased | | | - | |
Payable for Investment Advisory Fees | | | 16 | |
Accrued Expenses | | | - | |
Change in Net Unrealized (Appreciation) Depreciation of: | | | | |
Investment Securities | | | (15,421 | ) |
Futures Contracts | | | (19 | ) |
Net Realized (Gain) Loss from: | | | | |
Investment Securities | | | (2,290 | ) |
Futures Contracts | | | (364 | ) |
Options Written | | | (18 | ) |
Paydowns | | | (8 | ) |
| | | | |
Total Adjustments | | | (25,927 | ) |
| | | | |
Net Cash (Used in) Provided by Operating Activities | | | (5,211 | ) |
| | | | |
Cash Flows from Financing Activities | | | | |
Cash Received from (Used for) Financing Transactions | | | 4,000 | |
Proceeds from Capital Shares Sold | | | 22,565 | |
Payment on Capital Shares Redeemed | | | (21,608 | ) |
| | | | |
Net Cash (Used in) Provided by Financing Activities | | | 4,957 | |
| | | | |
Net Increase (Decrease) in Cash | | | (254 | ) |
Cash: Beginning of Period | | | 459 | |
| | | | |
Cash: End of Period | | $ | 205 | |
| | | | |
Supplemental disclosure of cash flow information:
Noncash financing activities not included herein consist of reinvestment of dividends and distributions of $2,087.
Interest paid was $15 for the year ended December 31, 2014.
The Accompanying Notes are an Integral Part of the Financial Statements.
| | | | |
| 186 | | Statement of Cash Flows | | |
[THIS PAGE INTENTIONALLY LEFT BLANK]
Financial Highlights
(For a share outstanding throughout the period)
| | | | | | | | | | | | | | | | | | | | | | | | | | | | | | | | |
| | | Net Asset Value,
Beginning
of Period | | | Net Investment
Income (Loss) | | | Net Realized and
Unrealized Gain
(Loss) on
Investments | | | Total from
Investment
Operations | | | Distributions
from Net
Investment
Income | | | Distributions
from Realized
Gains on
Investments | | | Total
Distributions | | | Net Asset Value,
End of Period | |
Growth Stock Portfolio | |
2014 | | $ | 2.94 | | | $ | 0.02 | | | $ | 0.22 | | | $ | 0.24 | | | $ | (0.02 | ) | | $ | (0.29 | ) | | $ | (0.31 | ) | | $ | 2.87 | |
2013 | | | 2.35 | | | | 0.02 | | | | 0.78 | | | | 0.80 | | | | (0.02 | ) | | | (0.19 | ) | | | (0.21 | ) | | | 2.94 | |
2012 | | | 2.09 | | | | 0.02 | | | | 0.25 | | | | 0.27 | | | | (0.01 | ) | | | - | | | | (0.01 | ) | | | 2.35 | |
2011 | | | 2.13 | | | | 0.01 | | | | (0.03 | ) | | | (0.02 | ) | | | (0.02 | ) | | | - | | | | (0.02 | ) | | | 2.09 | |
2010 | | | 1.92 | | | | 0.02 | | | | 0.21 | | | | 0.23 | | | | (0.02 | ) | | | - | | | | (0.02 | ) | | | 2.13 | |
Focused Appreciation Portfolio | |
2014 | | $ | 2.69 | | | $ | 0.00 | (e) | | $ | 0.22 | | | $ | 0.22 | | | $ | 0.00 | (e) | | $ | (0.28 | ) | | $ | (0.28 | ) | | $ | 2.63 | |
2013 | | | 2.09 | | | | 0.00 | (e) | | | 0.61 | | | | 0.61 | | | | (0.01 | ) | | | - | | | | (0.01 | ) | | | 2.69 | |
2012 | | | 1.75 | | | | 0.01 | | | | 0.34 | | | | 0.35 | | | | (0.01 | ) | | | - | | | | (0.01 | ) | | | 2.09 | |
2011 | | | 1.86 | | | | 0.01 | | | | (0.12 | ) | | | (0.11 | ) | | | 0.00 | (e) | | | - | | | | 0.00 | (e) | | | 1.75 | |
2010 | | | 1.70 | | | | 0.00 | (e) | | | 0.16 | | | | 0.16 | | | | - | | | | - | | | | - | | | | 1.86 | |
Large Cap Core Stock Portfolio | |
2014 | | $ | 1.70 | | | $ | 0.04 | | | $ | 0.10 | | | $ | 0.14 | | | $ | (0.03 | ) | | $ | (0.16 | ) | | $ | (0.19 | ) | | $ | 1.65 | |
2013 | | | 1.34 | | | | 0.03 | | | | 0.35 | | | | 0.38 | | | | (0.02 | ) | | | - | | | | (0.02 | ) | | | 1.70 | |
2012 | | | 1.21 | | | | 0.02 | | | | 0.13 | | | | 0.15 | | | | (0.02 | ) | | | - | | | | (0.02 | ) | | | 1.34 | |
2011 | | | 1.24 | | | | 0.02 | | | | (0.04 | ) | | | (0.02 | ) | | | (0.01 | ) | | | - | | | | (0.01 | ) | | | 1.21 | |
2010 | | | 1.12 | | | | 0.01 | | | | 0.12 | | | | 0.13 | | | | (0.01 | ) | | | - | | | | (0.01 | ) | | | 1.24 | |
Large Cap Blend Portfolio | |
2014 | | $ | 1.04 | | | $ | 0.01 | | | $ | 0.11 | | | $ | 0.12 | | | $ | 0.00 | (e) | | $ | (0.04 | ) | | $ | (0.04 | ) | | $ | 1.12 | |
2013 | | | 0.83 | | | | 0.01 | | | | 0.25 | | | | 0.26 | | | | (0.01 | ) | | | (0.04 | ) | | | (0.05 | ) | | | 1.04 | |
2012 | | | 0.76 | | | | 0.01 | | | | 0.10 | | | | 0.11 | | | | (0.01 | ) | | | (0.03 | ) | | | (0.04 | ) | | | 0.83 | |
2011 | | | 0.78 | | | | 0.01 | | | | (0.02 | ) | | | (0.01 | ) | | | (0.01 | ) | | | - | | | | (0.01 | ) | | | 0.76 | |
2010 | | | 0.69 | | | | 0.01 | | | | 0.09 | | | | 0.10 | | | | (0.01 | ) | | | - | | | | (0.01 | ) | | | 0.78 | |
Index 500 Stock Portfolio | |
2014 | | $ | 3.61 | | | $ | 0.07 | | | $ | 0.41 | | | $ | 0.48 | | | $ | (0.06 | ) | | $ | (0.05 | ) | | $ | (0.11 | ) | | $ | 3.98 | |
2013 | | | 2.84 | | | | 0.06 | | | | 0.84 | | | | 0.90 | | | | (0.06 | ) | | | (0.07 | ) | | | (0.13 | ) | | | 3.61 | |
2012 | | | 2.54 | | | | 0.06 | | | | 0.34 | | | | 0.40 | | | | (0.05 | ) | | | (0.05 | ) | | | (0.10 | ) | | | 2.84 | |
2011 | | | 2.60 | | | | 0.05 | | | | (0.01 | ) | | | 0.04 | | | | (0.04 | ) | | | (0.06 | ) | | | (0.10 | ) | | | 2.54 | |
2010 | | | 2.33 | | | | 0.04 | | | | 0.30 | | | | 0.34 | | | | (0.05 | ) | | | (0.02 | ) | | | (0.07 | ) | | | 2.60 | |
Large Company Value Portfolio | |
2014 | | $ | 1.07 | | | $ | 0.02 | | | $ | 0.12 | | | $ | 0.14 | | | $ | - | | | $ | (0.06 | ) | | $ | (0.06 | ) | | $ | 1.15 | |
2013 | | | 0.84 | | | | 0.02 | | | | 0.24 | | | | 0.26 | | | | (0.01 | ) | | | (0.02 | ) | | | (0.03 | ) | | | 1.07 | |
2012 | | | 0.73 | | | | 0.02 | | | | 0.11 | | | | 0.13 | | | | (0.02 | ) | | | - | | | | (0.02 | ) | | | 0.84 | |
2011 | | | 0.74 | | | | 0.01 | | | | (0.01 | ) | | | 0.00 | (e) | | | (0.01 | ) | | | - | | | | (0.01 | ) | | | 0.73 | |
2010 | | | 0.67 | | | | 0.01 | | | | 0.07 | | | | 0.08 | | | | (0.01 | ) | | | - | | | | (0.01 | ) | | | 0.74 | |
Domestic Equity Portfolio | |
2014 | | $ | 1.29 | | | $ | 0.03 | | | $ | 0.14 | | | $ | 0.17 | | | $ | (0.02 | ) | | $ | - | | | $ | (0.02 | ) | | $ | 1.44 | |
2013 | | | 0.98 | | | | 0.02 | | | | 0.31 | | | | 0.33 | | | | (0.02 | ) | | | - | | | | (0.02 | ) | | | 1.29 | |
2012 | | | 0.87 | | | | 0.02 | | | | 0.11 | | | | 0.13 | | | | (0.02 | ) | | | - | | | | (0.02 | ) | | | 0.98 | |
2011 | | | 0.89 | | | | 0.02 | | | | (0.02 | ) | | | 0.00 | (e) | | | (0.02 | ) | | | - | | | | (0.02 | ) | | | 0.87 | |
2010 | | | 0.79 | | | | 0.02 | | | | 0.10 | | | | 0.12 | | | | (0.02 | ) | | | - | | | | (0.02 | ) | | | 0.89 | |
Equity Income Portfolio | |
2014 | | $ | 1.72 | | | $ | 0.03 | | | $ | 0.10 | | | $ | 0.13 | | | $ | (0.02 | ) | | $ | (0.06 | ) | | $ | (0.08 | ) | | $ | 1.77 | |
2013 | | | 1.34 | | | | 0.03 | | | | 0.37 | | | | 0.40 | | | | (0.02 | ) | | | - | | | | (0.02 | ) | | | 1.72 | |
2012 | | | 1.16 | | | | 0.03 | | | | 0.17 | | | | 0.20 | | | | (0.02 | ) | | | - | | | | (0.02 | ) | | | 1.34 | |
2011 | | | 1.19 | | | | 0.02 | | | | (0.03 | ) | | | (0.01 | ) | | | (0.02 | ) | | | - | | | | (0.02 | ) | | | 1.16 | |
2010 | | | 1.05 | | | | 0.02 | | | | 0.14 | | | | 0.16 | | | | (0.02 | ) | | | - | | | | (0.02 | ) | | | 1.19 | |
| (e) | Amount is less than $0.005. |
The Accompanying Notes are an Integral Part of the Financial Statements.
| | | | | | | | | | | | | | | | | | | | | | |
| Total Return(d) | | | Net Assets, End
of Period
(thousands) | | | Ratio of Gross
Expenses to
Average Net
Assets | | | Ratio of Net
Expenses to
Average Net
Assets | | | Ratio of Net
Investment
Income (Loss) to
Average Net
Assets | | | Portfolio
Turnover Rate | |
| | | | | | | | | | | | | | | | | | | | | | |
| | 9.02 | % | | $ | 885,880 | | | | 0.43 | % | | | 0.41 | % | | | 0.76 | % | | | 42.36 | % |
| | 35.86 | | | | 847,384 | | | | 0.44 | | | | 0.43 | | | | 0.79 | | | | 85.54 | |
| | 12.94 | | | | 533,815 | | | | 0.45 | | | | 0.44 | | | | 0.90 | | | | 68.40 | |
| | (1.30 | ) | | | 514,007 | | | | - | | | | 0.44 | | | | 0.65 | | | | 47.15 | |
| | 12.37 | | | | 556,872 | | | | - | | | | 0.44 | | | | 0.83 | | | | 48.90 | |
| | | | | | | | | | | | | | | | | | | | | | |
| | 9.43 | % | | $ | 722,379 | | | | 0.77 | % | | | 0.64 | % | | | (0.02 | )% | | | 54.58 | % |
| | 29.01 | | | | 624,512 | | | | 0.79 | | | | 0.71 | | | | 0.04 | | | | 63.90 | |
| | 20.14 | | | | 388,620 | | | | 0.79 | | | | 0.74 | | | | 0.71 | | | | 15.65 | |
| | (6.10 | ) | | | 305,120 | | | | 0.79 | | | | 0.74 | | | | 0.32 | | | | 45.98 | |
| | 9.33 | | | | 311,197 | | | | 0.79 | | | | 0.77 | | | | 0.21 | | | | 40.65 | |
| | | | | | | | | | | | | | | | | | | | | | |
| | 8.56 | % | | $ | 555,639 | | | | 0.45 | % | | | 0.44 | % | | | 2.08 | % | | | 5.92 | % |
| | 28.58 | | | | 538,368 | | | | 0.46 | | | | 0.46 | | | | 1.78 | | | | 72.60 | |
| | 11.63 | | | | 384,679 | | | | 0.46 | | | | 0.46 | | | | 1.43 | | | | 74.09 | |
| | (1.21 | ) | | | 377,069 | | | | - | | | | 0.45 | | | | 1.26 | | | | 51.46 | |
| | 12.91 | | | | 408,330 | | | | - | | | | 0.46 | | | | 1.21 | | | | 43.16 | |
| | | | | | | | | | | | | | | | | | | | | | |
| | 12.58 | % | | $ | 166,948 | | | | 0.82 | % | | | 0.82 | % | | | 0.91 | % | | | 27.31 | % |
| | 30.86 | | | | 151,099 | | | | - | | | | 0.83 | | | | 1.00 | | | | 55.43 | |
| | 15.20 | | | | 78,700 | | | | 0.87 | | | | 0.84 | | | | 1.05 | | | | 132.66 | |
| | (2.29 | ) | | | 69,268 | | | | - | | | | 0.82 | | | | 0.82 | | | | 35.91 | |
| | 14.29 | | | | 63,777 | | | | - | | | | 0.84 | | | | 0.83 | | | | 34.89 | |
| | | | | | | | | | | | | | | | | | | | | | |
| | 13.46 | % | | $ | 2,370,298 | | | | 0.22 | % | | | 0.22 | % | | | 1.84 | % | | | 2.65 | % |
| | 32.05 | | | | 2,164,501 | | | | - | | | | 0.22 | | | | 1.90 | | | | 3.76 | |
| | 15.76 | | | | 1,704,471 | | | | 0.22 | | | | 0.21 | | | | 2.12 | | | | 2.77 | |
| | 1.95 | | | | 1,569,801 | | | | - | | | | 0.21 | | | | 1.86 | | | | 3.21 | |
| | 14.89 | | | | 1,625,787 | | | | - | | | | 0.21 | | | | 1.84 | | | | 4.14 | |
| | | | | | | | | | | | | | | | | | | | | | |
| | 13.03 | % | | $ | 190,954 | | | | 0.75 | % | | | 0.72 | % | | | 1.55 | % | | | 55.92 | % |
| | 31.29 | | | | 170,062 | | | | 0.78 | | | | 0.76 | | | | 1.73 | | | | 49.12 | |
| | 16.47 | | | | 86,915 | | | | 0.82 | | | | 0.79 | | | | 1.99 | | | | 34.71 | |
| | 1.49 | | | | 69,674 | | | | - | | | | 0.78 | | | | 1.84 | | | | 47.30 | |
| | 10.95 | | | | 61,011 | | | | - | | | | 0.80 | | | | 1.67 | | | | 29.84 | |
| | | | | | | | | | | | | | | | | | | | | | |
| | 13.87 | % | | $ | 620,021 | | | | 0.56 | % | | | 0.56 | % | | | 1.92 | % | | | 7.97 | % |
| | 34.03 | | | | 570,648 | | | | - | | | | 0.57 | | | | 2.10 | | | | 17.09 | |
| | 14.35 | | | | 400,058 | | | | 0.58 | | | | 0.58 | | | | 2.23 | | | | 134.18 | |
| | 0.91 | | | | 385,811 | | | | - | | | | 0.57 | | | | 2.26 | | | | 40.73 | |
| | 14.62 | | | | 408,437 | | | | - | | | | 0.58 | | | | 2.29 | | | | 48.18 | |
| | | | | | | | | | | | | | | | | | | | | | |
| | 7.43 | % | | $ | 781,735 | | | | 0.66 | % | | | 0.66 | % | | | 1.94 | % | | | 13.56 | % |
| | 29.94 | | | | 676,031 | | | | - | | | | 0.67 | | | | 1.77 | | | | 15.98 | |
| | 17.23 | | | | 409,097 | | | | 0.68 | | | | 0.68 | | | | 2.21 | | | | 16.21 | |
| | (0.92 | ) | | | 306,921 | | | | - | | | | 0.67 | | | | 2.05 | | | | 13.79 | |
| | 15.33 | | | | 259,307 | | | | - | | | | 0.67 | | | | 2.00 | | | | 11.14 | |
| (d) | Total Return includes deductions for management and other fund expenses; excludes deductions for sales loads and account fees, not annualized for periods less than one year. |
The Accompanying Notes are an Integral Part of the Financial Statements.
Financial Highlights
(For a share outstanding throughout the period)
| | | | | | | | | | | | | | | | | | | | | | | | | | | | | | | | |
| | | Net Asset Value,
Beginning
of Period | | | Net Investment
Income (Loss) | | | Net Realized and
Unrealized Gain
(Loss) on
Investments | | | Total from
Investment
Operations | | | Distributions
from Net
Investment
Income | | | Distributions
from Realized
Gains on
Investments | | | Total
Distributions | | | Net Asset Value,
End of Period | |
Mid Cap Growth Stock Portfolio | |
2014 | | $ | 3.92 | | | $ | 0.01 | | | $ | 0.27 | | | $ | 0.28 | | | $ | (0.01 | ) | | $ | (0.79 | ) | | $ | (0.80 | ) | | $ | 3.40 | |
2013 | | | 3.26 | | | | 0.02 | | | | 0.80 | | | | 0.82 | | | | (0.01 | ) | | | (0.15 | ) | | | (0.16 | ) | | | 3.92 | |
2012 | | | 2.92 | | | | 0.01 | | | | 0.33 | | | | 0.34 | | | | 0.00 | (e) | | | - | | | | 0.00 | (e) | | | 3.26 | |
2011 | | | 3.12 | | | | 0.00 | (e) | | | (0.19 | ) | | | (0.19 | ) | | | (0.01 | ) | | | - | | | | (0.01 | ) | | | 2.92 | |
2010 | | | 2.52 | | | | 0.01 | | | | 0.60 | | | | 0.61 | | | | (0.01 | ) | | | - | | | | (0.01 | ) | | | 3.12 | |
Index 400 Stock Portfolio | |
2014 | | $ | 1.90 | | | $ | 0.02 | | | $ | 0.15 | | | $ | 0.17 | | | $ | (0.02 | ) | | $ | (0.09 | ) | | $ | (0.11 | ) | | $ | 1.96 | |
2013 | | | 1.49 | | | | 0.02 | | | | 0.47 | | | | 0.49 | | | | (0.02 | ) | | | (0.06 | ) | | | (0.08 | ) | | | 1.90 | |
2012 | | | 1.34 | | | | 0.02 | | | | 0.21 | | | | 0.23 | | | | (0.01 | ) | | | (0.07 | ) | | | (0.08 | ) | | | 1.49 | |
2011 | | | 1.47 | | | | 0.01 | | | | (0.04 | ) | | | (0.03 | ) | | | (0.01 | ) | | | (0.09 | ) | | | (0.10 | ) | | | 1.34 | |
2010 | | | 1.18 | | | | 0.01 | | | | 0.30 | | | | 0.31 | | | | (0.01 | ) | | | (0.01 | ) | | | (0.02 | ) | | | 1.47 | |
Mid Cap Value Portfolio | |
2014 | | $ | 1.67 | | | $ | 0.03 | | | $ | 0.24 | | | $ | 0.27 | | | $ | (0.02 | ) | | $ | (0.15 | ) | | $ | (0.17 | ) | | $ | 1.77 | |
2013 | | | 1.30 | | | | 0.02 | | | | 0.37 | | | | 0.39 | | | | (0.01 | ) | | | (0.01 | ) | | | (0.02 | ) | | | 1.67 | |
2012 | | | 1.13 | | | | 0.03 | | | | 0.16 | | | | 0.19 | | | | (0.02 | ) | | | - | | | | (0.02 | ) | | | 1.30 | |
2011 | | | 1.16 | | | | 0.02 | | | | (0.03 | ) | | | (0.01 | ) | | | (0.02 | ) | | | - | | | | (0.02 | ) | | | 1.13 | |
2010 | | | 0.98 | | | | 0.02 | | | | 0.17 | | | | 0.19 | | | | (0.01 | ) | | | - | | | | (0.01 | ) | | | 1.16 | |
Small Cap Growth Stock Portfolio | |
2014 | | $ | 2.60 | | | $ | 0.00 | (e) | | $ | 0.20 | | | $ | 0.20 | | | $ | - | | | $ | (0.30 | ) | | $ | (0.30 | ) | | $ | 2.50 | |
2013 | | | 1.88 | | | | 0.00 | (e) | | | 0.73 | | | | 0.73 | | | | (0.01 | ) | | | - | | | | (0.01 | ) | | | 2.60 | |
2012 | | | 1.72 | | | | 0.00 | (e) | | | 0.16 | | | | 0.16 | | | | - | | | | - | | | | - | | | | 1.88 | |
2011 | | | 1.77 | | | | 0.00 | (e) | | | (0.04 | ) | | | (0.04 | ) | | | (0.01 | ) | | | - | | | | (0.01 | ) | | | 1.72 | |
2010 | | | 1.42 | | | | 0.00 | (e) | | | 0.36 | | | | 0.36 | | | | (0.01 | ) | | | - | | | | (0.01 | ) | | | 1.77 | |
Index 600 Stock Portfolio | |
2014 | | $ | 1.33 | | | $ | 0.01 | | | $ | 0.06 | | | $ | 0.07 | | | $ | (0.02 | ) | | $ | (0.22 | ) | | $ | (0.24 | ) | | $ | 1.16 | |
2013 | | | 1.01 | | | | 0.01 | | | | 0.39 | | | | 0.40 | | | | (0.04 | ) | | | (0.04 | ) | | | (0.08 | ) | | | 1.33 | |
2012 | | | 0.91 | | | | 0.01 | | | | 0.14 | | | | 0.15 | | | | (0.03 | ) | | | (0.02 | ) | | | (0.05 | ) | | | 1.01 | |
2011 | | | 0.94 | | | | 0.01 | | | | (0.01 | ) | | | 0.00 | (e) | | | (0.01 | ) | | | (0.02 | ) | | | (0.03 | ) | | | 0.91 | |
2010 | | | 0.77 | | | | 0.01 | | | | 0.19 | | | | 0.20 | | | | (0.03 | ) | | | - | | | | (0.03 | ) | | | 0.94 | |
Small Cap Value Portfolio | |
2014 | | $ | 2.45 | | | $ | 0.02 | | | $ | (0.02 | ) | | $ | 0.00 | (e) | | $ | (0.01 | ) | | $ | (0.06 | ) | | $ | (0.07 | ) | | $ | 2.38 | |
2013 | | | 1.89 | | | | 0.01 | | | | 0.59 | | | | 0.60 | | | | (0.03 | ) | | | (0.01 | ) | | | (0.04 | ) | | | 2.45 | |
2012 | | | 1.65 | | | | 0.03 | | | | 0.24 | | | | 0.27 | | | | (0.01 | ) | | | (0.02 | ) | | | (0.03 | ) | | | 1.89 | |
2011 | | | 1.69 | | | | 0.01 | | | | (0.04 | ) | | | (0.03 | ) | | | (0.01 | ) | | | - | | | | (0.01 | ) | | | 1.65 | |
2010 | | | 1.40 | | | | 0.01 | | | | 0.30 | | | | 0.31 | | | | (0.02 | ) | | | - | | | | (0.02 | ) | | | 1.69 | |
International Growth Portfolio | |
2014 | | $ | 1.43 | | | $ | 0.02 | | | $ | (0.09 | ) | | $ | (0.07 | ) | | $ | (0.02 | ) | | $ | - | | | $ | (0.02 | ) | | $ | 1.34 | |
2013 | | | 1.21 | | | | 0.02 | | | | 0.22 | | | | 0.24 | | | | (0.02 | ) | | | - | | | | (0.02 | ) | | | 1.43 | |
2012 | | | 1.04 | | | | 0.02 | | | | 0.17 | | | | 0.19 | | | | (0.02 | ) | | | - | | | | (0.02 | ) | | | 1.21 | |
2011 | | | 1.21 | | | | 0.02 | | | | (0.18 | ) | | | (0.16 | ) | | | (0.01 | ) | | | - | | | | (0.01 | ) | | | 1.04 | |
2010 | | | 1.05 | | | | 0.02 | | | | 0.15 | | | | 0.17 | | | | (0.01 | ) | | | - | | | | (0.01 | ) | | | 1.21 | |
Research International Core Portfolio | |
2014 | | $ | 0.99 | | | $ | 0.02 | | | $ | (0.09 | ) | | $ | (0.07 | ) | | $ | (0.01 | ) | | $ | (0.01 | ) | | $ | (0.02 | ) | | $ | 0.90 | |
2013 | | | 0.83 | | | | 0.01 | | | | 0.15 | | | | 0.16 | | | | 0.00 | (e) | | | - | | | | 0.00 | (e) | | | 0.99 | |
2012 | | | 0.72 | | | | 0.01 | | | | 0.11 | | | | 0.12 | | | | (0.01 | ) | | | - | | | | (0.01 | ) | | | 0.83 | |
2011 | | | 0.82 | | | | 0.01 | | | | (0.10 | ) | | | (0.09 | ) | | | (0.01 | ) | | | - | | | | (0.01 | ) | | | 0.72 | |
2010 | | | 0.75 | | | | 0.01 | | | | 0.07 | | | | 0.08 | | | | (0.01 | ) | | | - | | | | (0.01 | ) | | | 0.82 | |
| (e) | Amount is less than $0.005. |
The Accompanying Notes are an Integral Part of the Financial Statements.
| | | | | | | | | | | | | | | | | | | | | | |
| Total Return(d) | | | Net Assets, End
of Period
(thousands) | | | Ratio of Gross
Expenses to
Average Net
Assets | | | Ratio of Net
Expenses to
Average Net
Assets | | | Ratio of Net
Investment
Income (Loss) to
Average Net
Assets | | | Portfolio
Turnover Rate | |
| | | | | | | | | | | | | | | | | | | | | | |
| | 8.49 | % | | $ | 1,098,155 | | | | 0.54 | % | | | 0.51 | % | | | 0.25 | % | | | 82.51 | % |
| | 25.53 | | | | 1,073,332 | | | | 0.54 | | | | 0.52 | | | | 0.44 | | | | 137.80 | |
| | 11.97 | | | | 828,953 | | | | 0.54 | | | | 0.52 | | | | 0.39 | | | | 63.30 | |
| | (6.18 | ) | | | 812,782 | | | | - | | | | 0.53 | | | | 0.12 | | | | 50.26 | |
| | 23.86 | | | | 941,928 | | | | - | | | | 0.54 | | | | 0.33 | | | | 41.04 | |
| | | | | | | | | | | | | | | | | | | | | | |
| | 9.42 | % | | $ | 652,404 | | | | 0.28 | % | | | 0.27 | % | | | 1.25 | % | | | 12.20 | % |
| | 33.16 | | | | 624,092 | | | | 0.29 | | | | 0.28 | | | | 1.15 | | | | 11.21 | |
| | 17.64 | | | | 479,041 | | | | 0.28 | | | | 0.28 | | | | 1.27 | | | | 10.91 | |
| | (1.92 | ) | | | 439,395 | | | | - | | | | 0.27 | | | | 1.04 | | | | 13.15 | |
| | 26.29 | | | | 471,012 | | | | - | | | | 0.27 | | | | 1.10 | | | | 9.93 | |
| | | | | | | | | | | | | | | | | | | | | | |
| | 16.69 | % | | $ | 427,853 | | | | 0.90 | % | | | 0.78 | % | | | 1.56 | % | | | 66.16 | % |
| | 30.24 | | | | 343,933 | | | | 0.91 | | | | 0.85 | | | | 1.54 | | | | 68.43 | |
| | 16.57 | | | | 163,223 | | | | 0.93 | | | | 0.93 | | | | 2.14 | | | | 75.97 | |
| | (0.61 | ) | | | 124,257 | | | | - | | | | 0.91 | | | | 1.66 | | | | 100.60 | |
| | 19.93 | | | | 118,130 | | | | - | | | | 0.92 | | | | 2.35 | | | | 121.65 | |
| | | | | | | | | | | | | | | | | | | | | | |
| | 8.66 | % | | $ | 529,548 | | | | 0.57 | % | | | 0.57 | % | | | 0.12 | % | | | 27.07 | % |
| | 38.60 | | | | 520,492 | | | | - | | | | 0.59 | | | | 0.00 | | | | 155.34 | |
| | 9.48 | | | | 376,226 | | | | 0.59 | | | | 0.59 | | | | (0.12 | ) | | | 76.49 | |
| | (2.78 | ) | | | 379,359 | | | | - | | | | 0.57 | | | | (0.20 | ) | | | 75.67 | |
| | 25.85 | | | | 418,965 | | | | - | | | | 0.59 | | | | 0.03 | | | | 74.54 | |
| | | | | | | | | | | | | | | | | | | | | | |
| | 5.34 | % | | $ | 101,286 | | | | 0.39 | % | | | 0.35 | % | | | 0.93 | % | | | 49.73 | % |
| | 40.67 | | | | 123,487 | | | | 0.38 | | | | 0.35 | | | | 0.76 | | | | 47.23 | |
| | 15.80 | | | | 73,722 | | | | 0.42 | | | | 0.35 | | | | 1.36 | | | | 38.47 | |
| | 0.90 | | | | 54,012 | | | | 0.37 | | | | 0.35 | | | | 0.72 | | | | 52.75 | |
| | 25.90 | | | | 45,991 | | | | 0.42 | | | | 0.35 | | | | 0.88 | | | | 46.88 | |
| | | | | | | | | | | | | | | | | | | | | | |
| | 0.22 | % | | $ | 583,367 | | | | 0.88 | % | | | 0.88 | % | | | 0.81 | % | | | 16.29 | % |
| | 31.76 | | | | 576,830 | | | | 0.88 | | | | 0.88 | | | | 0.46 | | | | 9.17 | |
| | 16.33 | | | | 409,648 | | | | 0.88 | | | | 0.88 | | | | 1.54 | | | | 5.82 | |
| | (1.36 | ) | | | 362,566 | | | | - | | | | 0.87 | | | | 0.63 | | | | 7.25 | |
| | 21.95 | | | | 374,259 | | | | - | | | | 0.87 | | | | 0.85 | | | | 11.51 | |
| | | | | | | | | | | | | | | | | | | | | | |
| | (4.52 | )% | | $ | 436,931 | | | | 0.74 | % | | | 0.74 | % | | | 1.75 | % | | | 64.20 | % |
| | 19.81 | | | | 420,218 | | | | - | | | | 0.76 | | | | 1.20 | | | | 77.33 | |
| | 17.99 | | | | 329,718 | | | | 0.80 | | | | 0.80 | | | | 1.92 | | | | 65.36 | |
| | (13.17 | ) | | | 266,215 | | | | - | | | | 0.78 | | | | 1.50 | | | | 82.02 | |
| | 16.43 | | | | 297,804 | | | | 0.81 | | | | 0.69 | | | | 1.40 | | | | 150.91 | |
| | | | | | | | | | | | | | | | | | | | | | |
| | (6.71 | )% | | $ | 457,008 | | | | 0.94 | % | | | 0.94 | % | | | 2.45 | % | | | 25.24 | % |
| | 18.92 | | | | 412,413 | | | | 0.98 | | | | 0.98 | | | | 1.65 | | | | 30.41 | |
| | 16.76 | | | | 261,268 | | | | 1.11 | | | | 1.11 | | | | 1.83 | | | | 42.10 | |
| | (10.48 | ) | | | 91,956 | | | | 1.37 | | | | 1.15 | | | | 1.79 | | | | 34.10 | |
| | 11.05 | | | | 65,711 | | | | 1.38 | | | | 1.15 | | | | 1.54 | | | | 47.90 | |
| (d) | Total Return includes deductions for management and other fund expenses; excludes deductions for sales loads and account fees, not annualized for periods less than one year. |
The Accompanying Notes are an Integral Part of the Financial Statements.
Financial Highlights
(For a share outstanding throughout the period)
| | | | | | | | | | | | | | | | | | | | | | | | | | | | | | |
| | | Net Asset Value,
Beginning
of Period | | Net Investment
Income (Loss) | | | Net Realized and
Unrealized Gain
(Loss) on
Investments | | | Total from
Investment
Operations | | | Distributions
from Net
Investment
Income | | | Distributions
from Realized
Gains on
Investments | | | Total
Distributions | | | Net Asset Value,
End of Period | |
International Equity Portfolio | |
2014 | | $2.13 | | $ | 0.06 | | | $ | (0.24 | ) | | $ | (0.18 | ) | | $ | (0.04 | ) | | $ | (0.14 | ) | | $ | (0.18 | ) | | $ | 1.77 | |
2013 | | 1.79 | | | 0.04 | | | | 0.34 | | | | 0.38 | | | | (0.04 | ) | | | 0.00 | (e) | | | (0.04 | ) | | | 2.13 | |
2012 | | 1.52 | | | 0.04 | | | | 0.27 | | | | 0.31 | | | | (0.04 | ) | | | - | | | | (0.04 | ) | | | 1.79 | |
2011 | | 1.73 | | | 0.05 | | | | (0.22 | ) | | | (0.17 | ) | | | (0.04 | ) | | | - | | | | (0.04 | ) | | | 1.52 | |
2010 | | 1.65 | | | 0.04 | | | | 0.09 | | | | 0.13 | | | | (0.05 | ) | | | - | | | | (0.05 | ) | | | 1.73 | |
Emerging Markets Equity Portfolio | |
2014 | | $0.99 | | $ | 0.01 | | | $ | (0.06 | ) | | $ | (0.05 | ) | | $ | (0.01 | ) | | $ | 0.00 | (e) | | $ | (0.01 | ) | | $ | 0.93 | |
2013 | | 1.06 | | | 0.01 | | | | (0.07 | ) | | | (0.06 | ) | | | (0.01 | ) | | | 0.00 | (e) | | | (0.01 | ) | | | 0.99 | |
2012 | | 0.89 | | | 0.01 | | | | 0.16 | | | | 0.17 | | | | 0.00 | (e) | | | 0.00 | (e) | | | 0.00 | (e) | | | 1.06 | |
2011 | | 1.11 | | | 0.01 | | | | (0.22 | ) | | | (0.21 | ) | | | (0.01 | ) | | | - | | | | (0.01 | ) | | | 0.89 | |
2010 | | 0.90 | | | 0.01 | | | | 0.21 | | | | 0.22 | | | | (0.01 | ) | | | - | | | | (0.01 | ) | | | 1.11 | |
Money Market Portfolio | |
2014 | | $1.00 | | $ | 0.00 | (e) | | $ | - | | | $ | 0.00 | (e) | | $ | 0.00 | (e) | | $ | - | | | $ | 0.00 | (e) | | $ | 1.00 | |
2013 | | 1.00 | | | 0.00 | (e) | | | - | | | | 0.00 | (e) | | | 0.00 | (e) | | | - | | | | 0.00 | (e) | | | 1.00 | |
2012 | | 1.00 | | | 0.00 | (e) | | | - | | | | 0.00 | (e) | | | 0.00 | (e) | | | - | | | | 0.00 | (e) | | | 1.00 | |
2011 | | 1.00 | | | 0.00 | (e) | | | - | | | | 0.00 | (e) | | | 0.00 | (e) | | | 0.00 | (e) | | | 0.00 | (e) | | | 1.00 | |
2010 | | 1.00 | | | 0.00 | (e) | | | - | | | | 0.00 | (e) | | | 0.00 | (e) | | | 0.00 | (e) | | | 0.00 | (e) | | | 1.00 | |
Short-Term Bond Portfolio | |
2014 | | $1.03 | | $ | 0.01 | | | $ | - | | | $ | 0.01 | | | $ | (0.01 | ) | | $ | - | | | $ | (0.01 | ) | | $ | 1.03 | |
2013 | | 1.03 | | | 0.01 | | | | (0.01 | ) | | | 0.00 | (e) | | | 0.00 | (e) | | | - | | | | 0.00 | (e) | | | 1.03 | |
2012 | | 1.02 | | | 0.01 | | | | 0.01 | | | | 0.02 | | | | (0.01 | ) | | | - | | | | (0.01 | ) | | | 1.03 | |
2011 | | 1.03 | | | 0.02 | | | | (0.01 | ) | | | 0.01 | | | | (0.02 | ) | | | 0.00 | (e) | | | (0.02 | ) | | | 1.02 | |
2010 | | 1.02 | | | 0.03 | | | | 0.02 | | | | 0.05 | | | | (0.03 | ) | | | (0.01 | ) | | | (0.04 | ) | | | 1.03 | |
Select Bond Portfolio | |
2014 | | $1.23 | | $ | 0.02 | | | $ | 0.05 | | | $ | 0.07 | | | $ | (0.03 | ) | | $ | - | | | $ | (0.03 | ) | | $ | 1.27 | |
2013 | | 1.30 | | | 0.03 | | | | (0.05 | ) | | | (0.02 | ) | | | (0.03 | ) | | | (0.02 | ) | | | (0.05 | ) | | | 1.23 | |
2012 | | 1.31 | | | 0.03 | | | | 0.03 | | | | 0.06 | | | | (0.04 | ) | | | (0.03 | ) | | | (0.07 | ) | | | 1.30 | |
2011 | | 1.29 | | | 0.04 | | | | 0.05 | | | | 0.09 | | | | (0.04 | ) | | | (0.03 | ) | | | (0.07 | ) | | | 1.31 | |
2010 | | 1.26 | | | 0.05 | | | | 0.03 | | | | 0.08 | | | | (0.05 | ) | | | 0.00 | (e) | | | (0.05 | ) | | | 1.29 | |
Long-Term U.S. Government Bond Portfolio | |
2014 | | $0.92 | | $ | 0.03 | | | $ | 0.19 | | | $ | 0.22 | | | $ | (0.02 | ) | | $ | - | | | $ | (0.02 | ) | | $ | 1.12 | |
2013 | | 1.07 | | | 0.03 | | | | (0.18 | ) | | | (0.15 | ) | | | 0.00 | (e) | | | 0.00 | (e) | | | 0.00 | (e) | | | 0.92 | |
2012 | | 1.13 | | | 0.03 | | | | 0.02 | | | | 0.05 | | | | (0.02 | ) | | | (0.09 | ) | | | (0.11 | ) | | | 1.07 | |
2011 | | 1.00 | | | 0.03 | | | | 0.25 | | | | 0.28 | | | | (0.02 | ) | | | (0.13 | ) | | | (0.15 | ) | | | 1.13 | |
2010 | | 1.00 | | | 0.03 | | | | 0.08 | | | | 0.11 | | | | (0.05 | ) | | | (0.06 | ) | | | (0.11 | ) | | | 1.00 | |
Inflation Protection Portfolio | |
2014 | | $1.08 | | $ | 0.01 | | | $ | 0.03 | | | $ | 0.04 | | | $ | (0.01 | ) | | $ | (0.01 | ) | | $ | (0.02 | ) | | $ | 1.10 | |
2013 | | 1.22 | | | 0.01 | | | | (0.12 | ) | | | (0.11 | ) | | | (0.01 | ) | | | (0.02 | ) | | | (0.03 | ) | | | 1.08 | |
2012 | | 1.18 | | | 0.02 | | | | 0.06 | | | | 0.08 | | | | (0.03 | ) | | | (0.01 | ) | | | (0.04 | ) | | | 1.22 | |
2011 | | 1.06 | | | 0.04 | | | | 0.09 | | | | 0.13 | | | | 0.00 | (e) | | | (0.01 | ) | | | (0.01 | ) | | | 1.18 | |
2010 | | 1.06 | | | 0.03 | | | | 0.03 | | | | 0.06 | | | | (0.04 | ) | | | (0.02 | ) | | | (0.06 | ) | | | 1.06 | |
| (e) | Amount is less than $0.005. |
The Accompanying Notes are an Integral Part of the Financial Statements.
| | | | | | | | | | | | | | | | | | | | | | |
Total
Return(d) | | | Net Assets, End
of Period
(thousands) | | | Ratio of Gross
Expenses to
Average Net
Assets | | | Ratio of Net
Expenses to
Average Net
Assets | | | Ratio of Net
Investment
Income (Loss) to
Average Net
Assets | | | Portfolio
Turnover Rate | |
| | | | | | | | | | | | | | | | | | | | | | |
| | (8.80 | )% | | $ | 1,635,378 | | | | 0.72 | % | | | 0.66 | % | | | 2.91 | % | | | 17.84 | % |
| | 21.38 | | | | 1,778,202 | | | | 0.73 | | | | 0.66 | | | | 2.10 | | | | 34.06 | |
| | 21.52 | | | | 1,485,696 | | | | 0.73 | | | | 0.68 | | | | 2.55 | | | | 41.34 | |
| | (10.10 | ) | | | 1,218,070 | | | | 0.72 | | | | 0.67 | | | | 2.75 | | | | 32.06 | |
| | 7.67 | | | | 1,376,593 | | | | 0.72 | | | | 0.67 | | | | 2.33 | | | | 28.57 | |
| | | | | | | | | | | | | | | | | | | | | | |
| | (6.25 | )% | | $ | 416,997 | | | | 1.34 | % | | | 1.34 | % | | | 1.02 | % | | | 45.75 | % |
| | (5.15 | ) | | | 357,253 | | | | - | | | | 1.40 | | | | 0.81 | | | | 31.60 | |
| | 18.83 | | | | 256,476 | | | | 1.49 | | | | 1.48 | | | | 1.17 | | | | 27.32 | |
| | (18.66 | ) | | | 146,836 | | | | 1.59 | | | | 1.50 | | | | 1.21 | | | | 45.56 | |
| | 24.08 | | | | 140,665 | | | | 1.57 | | | | 1.50 | | | | 0.98 | | | | 51.60 | |
| | | | | | | | | | | | | | | | | | | | | | |
| | 0.07 | % | | $ | 438,752 | | | | 0.33 | % | | | 0.07 | % | | | 0.07 | % | | | - | % |
| | 0.10 | | | | 483,182 | | | | 0.32 | | | | 0.07 | | | | 0.10 | | | | - | |
| | 0.15 | | | | 483,437 | | | | 0.32 | | | | 0.09 | | | | 0.15 | | | | - | |
| | 0.14 | | | | 496,563 | | | | 0.30 | | | | 0.08 | | | | 0.13 | | | | - | |
| | 0.29 | | | | 476,291 | | | | 0.30 | | | | 0.00 | (e) | | | 0.29 | | | | - | |
| | | | | | | | | | | | | | | | | | | | | | |
| | 0.38 | % | | $ | 234,487 | | | | 0.41 | % | | | 0.41 | % | | | 0.76 | % | | | 196.15 | % |
| | 0.55 | | | | 196,198 | | | | - | | | | 0.42 | | | | 0.76 | | | | 199.33 | |
| | 2.07 | | | | 145,036 | | | | 0.41 | | | | 0.40 | | | | 1.18 | | | | 267.65 | |
| | 0.55 | | | | 165,716 | | | | - | | | | 0.38 | | | | 1.79 | | | | 116.64 | |
| | 3.63 | | | | 130,420 | | | | - | | | | 0.39 | | | | 2.48 | | | | 115.08 | |
| | | | | | | | | | | | | | | | | | | | | | |
| | 5.56 | % | | $ | 2,841,156 | | | | 0.32 | % | | | 0.32 | % | | | 1.97 | % | | | 308.80 | %(g) |
| | (2.16 | ) | | | 1,712,896 | | | | - | | | | 0.32 | | | | 1.99 | | | | 131.49 | (g) |
| | 4.96 | | | | 1,685,293 | | | | 0.32 | | | | 0.31 | | | | 2.32 | | | | 130.37 | (g) |
| | 7.16 | | | | 1,485,430 | | | | - | | | | 0.30 | | | | 3.10 | | | | 139.34 | (g) |
| | 6.59 | | | | 1,362,096 | | | | - | | | | 0.30 | | | | 3.51 | | | | 112.85 | (g) |
| | | | | | | | | | | | | | | | | | | | | | |
| | 23.73 | % | | $ | 109,250 | | | | 0.68 | %(s) | | | 0.67 | %(s) | | | 2.67 | % | | | 116.62 | %(g),(t) |
| | (13.27 | ) | | | 87,627 | | | | 0.69 | (s) | | | 0.68 | (s) | | | 2.69 | | | | 125.96 | (g),(t) |
| | 3.75 | | | | 113,136 | | | | 0.66 | (s) | | | 0.65 | (s) | | | 2.35 | | | | 164.63 | (g),(t) |
| | 28.92 | | | | 147,149 | | | | - | | | | 0.59 | | | | 2.32 | | | | 665.73 | (g) |
| | 10.62 | | | | 103,380 | | | | - | | | | 0.60 | | | | 2.76 | | | | 525.61 | (g) |
| | | | | | | | | | | | | | | | | | | | | | |
| | 3.14 | % | | $ | 285,685 | | | | 0.63 | % | | | 0.59 | % | | | 1.26 | % | | | 20.25 | % |
| | (8.33 | ) | | | 252,708 | | | | 0.64 | | | | 0.62 | | | | 0.91 | | | | 31.82 | |
| | 7.35 | | | | 254,176 | | | | 0.63 | | | | 0.62 | | | | 1.92 | | | | 77.11 | |
| | 11.93 | | | | 178,375 | | | | - | | | | 0.61 | | | | 3.74 | | | | 52.72 | |
| | 5.60 | | | | 116,078 | | | | - | | | | 0.61 | | | | 2.43 | | | | 68.09 | |
| (d) | Total Return includes deductions for management and other fund expenses; excludes deductions for sales loads and account fees, not annualized for periods less than one year. |
| (g) | Portfolio Turnover Rate excludes the impact of mortgage dollar roll transactions. |
| (s) | The ratios of gross expenses to average net assets and net expenses to average net assets includes interest expense. Excluding interest expense, the ratios would be 0.67% and 0.65% respectively for the period ended December 31, 2014, 0.67% and 0.65% respectively in 2013 and 0.63% and 0.62% respectively in 2012. |
| (t) | Due to a change in accounting standards effective for 2012, certain treasury roll transactions which were previously accounted for as a sale and subsequent repurchase are now accounted for as a secured borrowing. |
The Accompanying Notes are an Integral Part of the Financial Statements.
Financial Highlights
(For a share outstanding throughout the period)
| | | | | | | | | | | | | | | | | | | | | | | | | | | | | | | | |
| | | Net Asset Value,
Beginning
of Period | | | Net Investment
Income (Loss) | | | Net Realized and
Unrealized Gain
(Loss) on
Investments | | | Total from
Investment
Operations | | | Distributions
from Net
Investment
Income | | | Distributions
from Realized
Gains on
Investments | | | Total
Distributions | | | Net Asset Value,
End of Period | |
High Yield Bond Portfolio | |
2014 | | $ | 0.75 | | | $ | 0.04 | | | $ | (0.03 | ) | | $ | 0.01 | | | $ | (0.04 | ) | | $ | - | | | $ | (0.04 | ) | | $ | 0.72 | |
2013 | | | 0.75 | | | | 0.04 | | | | - | | | | 0.04 | | | | (0.04 | ) | | | - | | | | (0.04 | ) | | | 0.75 | |
2012 | | | 0.70 | | | | 0.05 | | | | 0.05 | | | | 0.10 | | | | (0.05 | ) | | | - | | | | (0.05 | ) | | | 0.75 | |
2011 | | | 0.72 | | | | 0.05 | | | | (0.02 | ) | | | 0.03 | | | | (0.05 | ) | | | - | | | | (0.05 | ) | | | 0.70 | |
2010 | | | 0.68 | | | | 0.06 | | | | 0.03 | | | | 0.09 | | | | (0.05 | ) | | | - | | | | (0.05 | ) | | | 0.72 | |
Multi-Sector Bond Portfolio | |
2014 | | $ | 1.08 | | | $ | 0.04 | | | $ | (0.01 | ) | | $ | 0.03 | | | $ | (0.03 | ) | | $ | - | | | $ | (0.03 | ) | | $ | 1.08 | |
2013 | | | 1.14 | | | | 0.04 | | | | (0.05 | ) | | | (0.01 | ) | | | (0.04 | ) | | | (0.01 | ) | | | (0.05 | ) | | | 1.08 | |
2012 | | | 1.00 | | | | 0.04 | | | | 0.11 | | | | 0.15 | | | | (0.01 | ) | | | 0.00 | (e) | | | (0.01 | ) | | | 1.14 | |
2011 | | | 1.03 | | | | 0.05 | | | | (0.01 | ) | | | 0.04 | | | | (0.05 | ) | | | (0.02 | ) | | | (0.07 | ) | | | 1.00 | |
2010 | | | 0.99 | | | | 0.06 | | | | 0.08 | | | | 0.14 | | | | (0.08 | ) | | | (0.02 | ) | | | (0.10 | ) | | | 1.03 | |
Balanced Portfolio | |
2014 | | $ | 1.56 | | | $ | 0.02 | | | $ | 0.07 | | | $ | 0.09 | | | $ | (0.04 | ) | | $ | (0.13 | ) | | $ | (0.17 | ) | | $ | 1.48 | |
2013 | | | 1.51 | | | | 0.03 | | | | 0.14 | | | | 0.17 | | | | (0.05 | ) | | | (0.07 | ) | | | (0.12 | ) | | | 1.56 | |
2012 | | | 1.39 | | | | 0.03 | | | | 0.11 | | | | 0.14 | | | | (0.02 | ) | | | - | | | | (0.02 | ) | | | 1.51 | |
2011 | | | 1.40 | | | | 0.03 | | | | 0.00 | (e) | | | 0.03 | | | | (0.04 | ) | | | - | | | | (0.04 | ) | | | 1.39 | |
2010 | | | 1.28 | | | | 0.03 | | | | 0.12 | | | | 0.15 | | | | (0.03 | ) | | | - | | | | (0.03 | ) | | | 1.40 | |
Asset Allocation Portfolio | |
2014 | | $ | 1.28 | | | $ | 0.01 | | | $ | 0.05 | | | $ | 0.06 | | | $ | (0.03 | ) | | $ | (0.11 | ) | | $ | (0.14 | ) | | $ | 1.20 | |
2013 | | | 1.13 | | | | 0.02 | | | | 0.17 | | | | 0.19 | | | | (0.04 | ) | | | - | | | | (0.04 | ) | | | 1.28 | |
2012 | | | 1.02 | | | | 0.02 | | | | 0.09 | | | | 0.11 | | | | 0.00 | (e) | | | - | | | | 0.00 | (e) | | | 1.13 | |
2011 | | | 1.05 | | | | 0.02 | | | | (0.02 | ) | | | 0.00 | (e) | | | (0.03 | ) | | | - | | | | (0.03 | ) | | | 1.02 | |
2010 | | | 0.96 | | | | 0.02 | | | | 0.10 | | | | 0.12 | | | | (0.03 | ) | | | - | | | | (0.03 | ) | | | 1.05 | |
| (e) | Amount is less than $0.005. |
The Accompanying Notes are an Integral Part of the Financial Statements.
| | | | | | | | | | | | | | | | | | | | | | |
| Total Return(d) | | | Net Assets, End
of Period
(thousands) | | | Ratio of Gross
Expenses to
Average Net
Assets | | | Ratio of Net
Expenses to
Average Net
Assets | | | Ratio of Net
Investment
Income (Loss) to
Average Net
Assets | | | Portfolio
Turnover Rate | |
| | | | | | | | | | | | | | | | | | | | | | |
| | 1.18 | % | | $ | 701,988 | | | | 0.47 | % | | | 0.47 | % | | | 5.43 | % | | | 96.48 | % |
| | 5.84 | | | | 518,387 | | | | - | | | | 0.48 | | | | 5.70 | | | | 53.07 | |
| | 13.89 | | | | 460,942 | | | | 0.48 | | | | 0.47 | | | | 6.50 | | | | 45.66 | |
| | 4.59 | | | | 376,289 | | | | - | | | | 0.46 | | | | 7.33 | | | | 44.40 | |
| | 14.56 | | | | 343,549 | | | | - | | | | 0.47 | | | | 7.99 | | | | 71.62 | |
| | | | | | | | | | | | | | | | | | | | | | |
| | 3.25 | % | | $ | 546,059 | | | | 0.86 | % | | | 0.81 | % | | | 3.88 | % | | | 58.51 | %(g) |
| | (1.58 | ) | | | 459,258 | | | | - | | | | 0.88 | | | | 3.91 | | | | 65.10 | (g) |
| | 14.94 | | | | 372,656 | | | | 0.86 | | | | 0.85 | | | | 4.11 | | | | 41.31 | (g) |
| | 4.99 | | | | 234,872 | | | | - | | | | 0.83 | | | | 5.15 | | | | 59.18 | (g) |
| | 13.19 | | | | 182,453 | | | | - | | | | 0.84 | | | | 5.41 | | | | 102.10 | (g) |
| | | | | | | | | | | | | | | | | | | | | | |
| | 5.56 | % | | $ | 2,367,127 | | | | 0.32 | % | | | 0.16 | % | | | 1.29 | % | | | 56.83 | %(g),(h) |
| | 12.08 | | | | 2,366,285 | | | | 0.32 | | | | 0.26 | | | | 1.91 | | | | 112.58 | (g) |
| | 9.69 | | | | 2,240,232 | | | | 0.31 | | | | 0.30 | | | | 2.18 | | | | 121.91 | (g) |
| | 2.11 | | | | 2,188,140 | | | | - | | | | 0.30 | | | | 2.27 | | | | 114.17 | (g) |
| | 11.96 | | | | 2,295,102 | | | | - | | | | 0.30 | | | | 2.58 | | | | 81.33 | (g) |
| | | | | | | | | | | | | | | | | | | | | | |
| | 5.15 | % | | $ | 266,409 | | | | 0.62 | % | | | 0.23 | % | | | 1.13 | % | | | 39.50 | %(g),(h) |
| | 16.67 | | | | 260,576 | | | | 0.65 | | | | 0.43 | | | | 1.65 | | | | 105.28 | (g) |
| | 11.02 | | | | 235,762 | | | | 0.63 | | | | 0.54 | | | | 1.84 | | | | 119.01 | (g) |
| | (0.08 | ) | | | 230,257 | | | | 0.58 | | | | 0.53 | | | | 1.74 | | | | 95.15 | (g) |
| | 13.01 | | | | 248,166 | | | | 0.58 | | | | 0.53 | | | | 2.01 | | | | 73.04 | (g) |
| (d) | Total Return includes deductions for management and other fund expenses; excludes deductions for sales loads and account fees, not annualized for periods less than one year. |
| (g) | Portfolio Turnover Rate excludes the impact of mortgage dollar roll transactions. |
| (h) | Portfolio Turnover Rate excludes the impact of in kind transactions. |
The Accompanying Notes are an Integral Part of the Financial Statements.
Notes to Financial Statements
Note 1. Organization
Northwestern Mutual Series Fund, Inc. (the “Series Fund”) is registered as an open-end management investment company under the Investment Company Act of 1940. The Series Fund is also considered an investment company following the accounting and reporting guidance in Financial Accounting Standards Board (“FASB”) Accounting Standards Codification (“ASC”) Topic 946. The Series Fund consists of the Growth Stock Portfolio, Focused Appreciation Portfolio, Large Cap Core Stock Portfolio, Large Cap Blend Portfolio, Index 500 Stock Portfolio, Large Company Value Portfolio, Domestic Equity Portfolio, Equity Income Portfolio, Mid Cap Growth Stock Portfolio, Index 400 Stock Portfolio, Mid Cap Value Portfolio, Small Cap Growth Stock Portfolio, Index 600 Stock Portfolio, Small Cap Value Portfolio, International Growth Portfolio, Research International Core Portfolio, International Equity Portfolio, Emerging Markets Equity Portfolio, Money Market Portfolio, Short-Term Bond Portfolio, Select Bond Portfolio, Long-Term U.S. Government Bond Portfolio, Inflation Protection Portfolio, High Yield Bond Portfolio, Multi-Sector Bond Portfolio, Balanced Portfolio and Asset Allocation Portfolio (each, a “Portfolio” or collectively, the “Portfolios”). All of the outstanding shares of each Portfolio are held by The Northwestern Mutual Life Insurance Company (“Northwestern Mutual”) for its segregated asset accounts (either directly or indirectly through one or more underlying Portfolios operating as affiliated fund of funds).
During the period ended December 31, 2014, Northwestern Mutual made redemptions from the following Portfolios totaling:
| | | | |
Portfolio | | Redemption
Amount | |
Index 600 Portfolio | | $ | 33,212,995 | |
Note 2. Significant Accounting Policies
The following is a summary of significant accounting policies consistently followed by the Series Fund in the preparation of its financial statements.
A. Use of Estimates — The preparation of financial statements in conformity with accounting principles generally accepted in the United States of America requires management to make estimates and assumptions that affect the reported amounts of assets and liabilities at the date of the financial statements and the reported amounts of revenues and expenses during the reporting period. Actual results could differ from those estimates.
B. Foreign Income and Capital Gains Taxes — The Portfolios may be subject to dividend income taxes imposed by certain countries in which they invest. Foreign withholding taxes on dividends are netted against dividend income and separately disclosed in the Statements of Operations.
Some of the Portfolios may be subject to capital gains taxes and repatriation taxes imposed by certain countries in which they invest. The Portfolios may record a deferred tax liability in respect of unrealized appreciation on foreign securities for capital gains net of losses, if applicable, and repatriation taxes.
C. Federal Income Taxes — The Portfolios’ policy is to continue to comply with the requirements of the Internal Revenue Code that are applicable to regulated investment companies and to distribute all of their taxable income to their respective shareholders. The Portfolios also intend to distribute sufficient net investment income and net capital gains, if any, so that they will not be subject to excise tax, as applicable, on distributable income and gains.
In accordance with the authoritative guidance for uncertainty in income taxes, management of the Series Fund has reviewed all open tax years (2011 to 2014) for major jurisdictions and concluded there was no material impact to the Portfolios’ net assets or results of operations. There is no material tax liability relating to uncertain income tax positions taken or expected to be taken in future tax returns. The Portfolios are also not aware of any tax positions for which it is reasonably possible that the total amounts of unrecognized tax benefits will significantly change in the next 12 months.
D. Distributions — Dividends from net investment income and net realized capital gains are declared and paid each business day for the Money Market Portfolio and at least annually for the remaining Portfolios of the Series Fund, when applicable. During 2014, the Money Market Portfolio utilized earnings and profits distributions to shareholders on redemption of shares as part of the dividends paid deduction for income tax purposes.
| | | | |
| 196 | | Notes to Financial Statements | | |
Notes to Financial Statements
E. Other — The Portfolios record security transactions on trade date. The basis for determining cost on sale of securities is identified cost. Interest income is recorded daily on the accrual basis and dividend income is recorded on the ex-dividend date or as soon as information from issuers is available. Where applicable, dividends are recorded net of foreign withholding tax. Discounts and premiums on securities purchased are amortized using the effective interest method. Expenses directly attributable to a Portfolio are incurred by the respective Portfolio. Expenses that are not directly attributable to one or more Portfolios are allocated among applicable Portfolios on an equitable and consistent basis considering such things as the nature and type of expenses and the relative net assets of the Portfolios.
F. New Acounting Pronouncements — In June 2014, the FASB issued an Accounting Standards Update (ASU) that expands secured borrowing accounting for certain repurchase agreements. The ASU also sets forth additional disclosure requirements for certain transactions accounted for as sales in order to provide financial statement users with information to compare to similar transactions accounted for as secured borrowings. The ASU is effective prospectively during interim or annual periods beginning after December 15, 2014. At this time, management is evaluating the implications of these changes on the financial statements.
Note 3. Security Valuation
For purposes of calculating a net asset value, Portfolio securities and other assets are valued as of the close of trading on the New York Stock Exchange (“Exchange”) on each day during which the Exchange is open for trading.
The Fair Value Measurements and Disclosures Topic of the Financial Accounting Standards Codification defines fair value as the price that a fund would receive to sell an asset or pay to transfer a liability in an orderly transaction between market participants at the measurement date. It establishes and requires disclosure of a fair value hierarchy, separately for each major category of asset and liability, which segregates fair value measurements into levels. A summary of the fair value hierarchy is described below:
| | • | | Level 1 — fair value is determined by unadjusted quoted prices in active markets for identical securities or derivatives |
| | • | | Level 2 — fair value is determined by other significant observable inputs (including quoted prices for similar securities, interest rates, prepayment speeds, credit risk, and other data used in fair valuation) |
| | • | | Level 3 — fair value is determined by significant unobservable inputs (including the Portfolios’ own assumptions in determining fair value) |
The categorization of a value determined for a financial instrument within the hierarchy is based upon the pricing transparency of the instrument and does not necessarily correspond to the Portfolios’ perceived risk of that instrument.
The following is a description of the valuation techniques and significant inputs used in determining the value of the Portfolios’ investments classified as Level 1 and Level 2 in the fair value hierarchy:
| | • | | Equity securities (common and preferred stock) for which market quotations are readily available are valued at the last sale or official closing price as reported by an independent pricing service on the primary market or exchange on which they are traded. In the event there were no sales during the day or closing prices are not available, securities are valued at the last quoted bid price. Equity securities traded only in the over-the-counter market and not on a securities exchange are valued at the last sale price or closing bid price, if no sales have occurred. To the extent these securities are actively traded and valuation adjustments are not applied, they are categorized as Level 1 of the fair value hierarchy. Additionally, for foreign securities, fair value procedures are used if a significant event occurs between the close of the foreign market and the U.S. market close. The fair value price is reflected as Level 2 in the fair value hierarchy where applicable. |
| | • | | Fixed income securities, including corporate, convertible and municipal bonds and notes, U.S. government agencies, U.S. treasury obligations, sovereign issues, and non-U.S. bonds are generally valued on the basis of service provider prices that use broker dealer quotations or valuation estimates from internal pricing models. The service providers’ internal models use inputs that are observable such as issuer details, interest rates, yield curves, call features, maturities, credit risks/spreads and default rates. Securities that use similar valuation techniques and inputs as described above are categorized as Level 2 in the fair value hierarchy. |
| | | | | | |
| | Notes to Financial Statements | | | 197 | |
Notes to Financial Statements
| | • | | Fixed income securities purchased on a delayed delivery basis are marked to market daily until settlement at the forward settlement date and are categorized as Level 2 in the fair value hierarchy. |
| | • | | Mortgage related and asset backed securities are generally issued as separate tranches, or classes, of securities within each deal. These securities are normally valued by pricing service providers that use broker dealer quotations or valuation estimates from their internal pricing models. The pricing models for these securities usually consider tranche level attributes, current market data, estimated cash flows and market based yield spreads for each tranche, and incorporate deal collateral performance, as available. Mortgage related and asset backed securities that use similar valuation techniques and inputs as described above are categorized as Level 2 in the fair value hierarchy. |
| | • | | Investments in open-end mutual funds (including other Portfolios) are valued at the mutual fund’s closing net asset value per share and are categorized as Level 1 in the fair value hierarchy. Investments in privately held mutual funds are valued at the mutual fund’s closing net asset value per share and are categorized as Level 2 in the fair value hierarchy. |
| | • | | Money market investments, other than in the Money Market Portfolio, with maturities exceeding 60 days are generally valued by a pricing service. Money market investments with maturities of 60 days or less and all securities in the Money Market Portfolio are valued using amortized cost, unless the current market value differs substantially from the amortized cost, at which time the securities are marked to market. Because the value is not obtained from a quoted price in an active market, such securities are reflected as Level 2 in the fair value hierarchy. |
| | • | | Listed derivatives, such as futures or option contracts, which are actively traded on a national securities exchange, are stated at the last reported sale or settlement price on the day of valuation and are categorized as Level 1 in the fair value hierarchy. |
| | • | | Centrally cleared swaps are valued at the daily settlement price determined by the respective exchange. For centrally cleared credit default swaps the clearing facility requires its members to provide actionable levels across complete term structures. These levels along with external third party prices are used to produce daily settlement prices. These securities are categorized as Level 2 in the fair value hierarchy. Centrally cleared interest rate swaps are valued using a pricing model that references the underlying rates including the overnight index swap rate and London Interbank Offered Rate forward rate to produce the daily settlement price. These securities are categorized as Level 2 in the fair value hierarchy. |
| | • | | Over-the-counter financial derivatives, such as foreign currency contracts, futures contracts, options contracts, or swap agreements derive their value from underlying asset prices, indices, reference rates, and other inputs or a combination of these factors. These derivatives are normally valued on the basis of quotes obtained from brokers and dealers or pricing services. Depending on the product and the terms of the transaction, the value of the derivatives can be estimated using a series of techniques, including simulation pricing models. The pricing models use inputs that are observed from actively quoted markets such as issuer details, indices, spreads, interest rates, curves, dividends and exchange rates. Financial derivatives that use similar valuation techniques and inputs as described above are categorized as Level 2 in the fair value hierarchy. |
The following is a description of the valuation techniques and significant inputs used in determining the value the Portfolios’ investments classified as Level 3 in the fair value hierarchy:
| | • | | Securities and other assets for which market quotes are not readily available are valued at fair market value as determined in good faith in accordance with procedures adopted by the Series Fund’s Board of Directors. Market quotes are considered not readily available in circumstances where there is an absence of current or reliable market-based data (e.g. trade information or broker quotes). The factors considered in reaching these values at December 31, 2014 included, but were not limited to, broker quotes, analysis of the likely outcome of pending litigation, liquidity, prepayment speed, duration and recoverability. |
A table summarizing each Portfolio’s investments under this hierarchy is included following each Portfolio’s Schedule of Investments. Transfers between investment levels may occur as markets fluctuate and/or the availability of data used in investments’ valuation changes. The Portfolios recognize transfers between levels as of the end of the period. The amounts of
| | | | |
| 198 | | Notes to Financial Statements | | |
Notes to Financial Statements
transfers between Levels 1 and 2 are disclosed in the Notes to Schedules of Investments for the Portfolio. For fair valuations using significant unobservable inputs, U.S. Generally Accepted Accounting Principles (GAAP) requires a reconciliation of the beginning to ending balances for reported fair values that presents changes attributable to total realized and unrealized gains or losses, purchases and sales, and transfers in or out of the Level 3 category during the period. Additionally, U.S GAAP requires quantitative information regarding the significant unobservable inputs used in the determination of fair value of assets categorized as Level 3 in the fair value hierarchy. In accordance with the requirements, a Level 3 reconciliation and details of significant unobservable inputs have been included in the Notes to the Schedule of Investments for Portfolios that have a material amount of Level 3 investments.
The Series Fund has adopted policies and procedures which govern the pricing of Portfolio securities. The Series Fund’s Board of Directors (sometimes referred to hereinafter as “Board”) has delegated the day-to-day responsibility for pricing Portfolio securities and other investments to Mason Street Advisors, LLC (“MSA”), the Portfolios’ investment adviser and Northwestern Mutual in its capacity as fund accountant, subject to the oversight of a Pricing Committee appointed by the Board and comprised of representatives of MSA, Northwestern Mutual and Series Fund officers. The Pricing Committee is charged with the primary and day-to-day operational responsibility for executing the valuation process. The Pricing Committee has been delegated the authority to approve the override of any prices as permitted under the pricing procedures approved by the Board and any variances from these pricing procedures when appropriate. All such actions are subject to further review and approval by the Board at its next regular meeting.
Note 4. Securities and Other Investments
A. Delayed Delivery Transactions and When-Issued Securities — Certain Portfolios may engage in securities transactions on a when-issued or delayed delivery basis. In these transactions, the securities’ prices and yields are fixed on the date of the commitment, with payment and delivery scheduled for a future date. During this period, the securities are subject to market fluctuations. When delayed delivery purchases are outstanding, a Portfolio will earmark liquid assets on its records in amounts sufficient to meet the purchase price. A Portfolio may dispose of or renegotiate a delayed delivery transaction, which may result in a capital gain or loss.
B. Repurchase Agreements — Certain Portfolios may engage in repurchase transactions. Under the terms of a typical repurchase agreement, a Portfolio takes possession of an underlying debt obligation subject to an obligation of the seller to repurchase, and a Portfolio to resell, the obligation at an agreed upon price and time. The underlying securities for all repurchase agreements are held in safekeeping at the Portfolio’s custodian or designated sub-custodians under tri-party repurchase agreements. The market value of the collateral must be equal to or exceed at all times the total amount of the repurchase obligations, including interest. Securities purchased under repurchase agreements are reflected as an asset on the Statements of Assets and Liabilities. Generally, in the event of counterparty default, a Portfolio has the right to use the collateral to offset losses incurred. If the counterparty should default, a Portfolio will seek to sell the securities which it holds as collateral. This could involve procedural costs or delays in addition to a loss on the securities if their value should fall below their repurchase price.
C. Restricted Securities — Certain Portfolios may invest in securities that are subject to legal or contractual restrictions on resale. These securities may be sold privately, but are required to be registered or exempted from registration before being sold to the public. Disposal of these securities may involve time-consuming negotiations and expense, and prompt sale at an acceptable price may be difficult.
D. Foreign Currency Transactions — Certain Portfolios may have securities and other assets and liabilities denominated in foreign currencies which are translated into U.S. dollar amounts on the date of valuation. Purchases and sales of securities and income items denominated in foreign currencies are translated into U.S. dollar amounts on the respective dates of such transactions. When the Portfolios purchase or sell a foreign security they may enter into a foreign currency exchange contract to minimize exchange rate risk from the trade date to the settlement date of such transaction. Such foreign currency exchange contracts are marked to market daily.
The Portfolios do not separately report the results of operations due to fluctuations in foreign exchange rates on investments from the changes arising from changes in market prices of securities held. Such fluctuations are included with the net realized or unrealized gain or loss from investments.
| | | | | | |
| | Notes to Financial Statements | | | 199 | |
Notes to Financial Statements
Net realized foreign exchange gains or losses arise from sales of foreign currencies, currency gains or losses realized between the trade date and the settlement date on security transactions, and the differences between the amounts of dividends and foreign withholding taxes recorded on the Portfolios’ books and the U.S. dollar equivalent of the amounts actually received or paid.
E. Mortgage Backed and Asset Backed Securities — Certain Portfolios may invest in mortgage backed securities, including collateralized mortgage obligations, and asset backed securities. Mortgage backed securities are interests in pools of residential or commercial mortgage loans and asset backed securities are interests in pools of other assets, including various types of loans and credit card receivables. These securities provide a monthly payment, consisting of both a principal and interest component. Interest payments may be based on either fixed rates or adjustable rates. Receipt of principal payment reduces the outstanding par amount of the security and may generate realized gains or losses. Yields on mortgage backed securities are affected by interest and prepayment rates, which, in turn, are influenced by a variety of economic, geographical, social and other factors. Maturities on mortgage backed securities represent stated maturity dates. Actual maturity dates may differ based on prepayment rates. Unlike mortgage backed securities issued or guaranteed by the U.S. government or one of its sponsored entities, mortgage backed securities and asset backed securities issued by private issuers do not have a government or government sponsored entity guarantee. These issuers may provide credit enhancements through external entities such as financial institutions or through the structuring of the transaction itself. There is no guarantee that credit enhancements, if any, will be sufficient to prevent losses.
F. Inflation-Indexed Bonds — Certain Portfolios may invest in inflation-indexed bonds. Inflation-indexed bonds are fixed income securities whose principal value is periodically adjusted to the rate of inflation. The interest rate on these bonds is generally fixed at issuance at a rate lower than typical bonds. Over the life of an inflation-indexed bond, interest will be paid based on a principal value, which is adjusted for inflation. Any increase in the principal amount of an inflation indexed bond will be included as interest income in the applicable Portfolio’s Statement of Operations even though investors do not receive their principal until maturity.
G. Securities Lending — Each Portfolio is authorized to participate in securities lending; however, only the Select Bond and Balanced Portfolios had an established securities lending program that enabled each to loan securities to approved broker dealers during the period ended December 31, 2014. The Portfolios receive cash (U.S. currency), U.S. government or U.S. government agency obligations as collateral against the loaned securities. To the extent that a loan is collateralized by cash, such collateral is invested by the Portfolios in commercial paper to earn interest in accordance with the Portfolios’ investment policies. For the period ended December 31, 2014, the Select Bond and Balanced Portfolios earned $87,297 and $80,920 , respectively, in interest from securities lending activity, which is included as interest income in their respective Statements of Operations.
Income generated from the investment of cash collateral, less negotiated rebate fees paid to participating brokers and transaction costs, is recorded as income for the Portfolios. All collateral received will be in an amount at least equal to 102% (for loans of U.S. securities) or 105% (for non-U.S. securities) of the market value of the loaned securities at the inception of each loan. Thereafter, each loan must be continuously secured by collateral at least equal at all times to the value of the securities on loan. In addition, the Portfolios are entitled to terminate a securities loan at any time. As of December 31, 2014, none of the Portfolios had any outstanding securities on loan.
H. Short Sales — Certain Portfolios may enter into short sale transactions. A short sale is a transaction in which a Portfolio sells a security it does not own in anticipation of a decline in the market price of the security. Securities sold in short sale transactions and the interest payable on such securities, if any, are reflected as a liability on the Statements of Assets and Liabilities. A Portfolio is obligated to deliver the security at the market price at the time the short position is closed. The risk of loss on a short sale transaction is theoretically unlimited, because there is no limit to the cost of replacing the security sold short, whereas losses from purchase transactions cannot exceed the total amount invested. As of December 31, 2014 there were no short positions held by any Portfolio.
I. Treasury Roll Transactions — Certain Portfolios may enter into treasury roll transactions. In a treasury roll transaction, the Portfolio transfers a treasury security to a counterparty with a simultaneous agreement to repurchase the same security at an agreed upon price and future settlement date. For U.S. GAAP purposes, a treasury roll transaction is accounted for as a secured borrowing and not as a purchase or sale. During the term of the borrowing, the Portfolio is entitled to the interest on the treasury security. The difference between the sale price and repurchase price is included in net investment income with the cost of the secured borrowing transaction being recorded in interest expense over the term of the borrowing. The Portfolio will
| | | | |
| 200 | | Notes to Financial Statements | | |
Notes to Financial Statements
benefit from the transaction if the income earned on the investment purchased with the cash received in the treasury roll transaction exceeds the interest expense incurred by the Portfolio. If the interest expense exceeds the income earned, the Portfolio’s net investment income and dividends to shareholders may be adversely impacted. Treasury roll transactions involve the risk that the market value of the securities that the Portfolio is required to repurchase may decline below the agreed upon repurchase price of those securities.
J. Loan Participation and Assignments — Certain Portfolios may invest in direct debt instruments which are interests in amounts owed to lenders or lending syndicates by corporate, governmental, or other borrowers. The Portfolios’ investments in a loan may be in the form of either actual participation in loans or assignments of all or part of the loans from third parties. A loan is often administered by a bank or other financial institution that acts as an agent for all holders. The agent administers the terms of the loan which are specified in the loan agreement. The Portfolios may invest in multiple series or tranches of a loan, each of which can have different terms and associated risks. The Portfolios generally do not have a right to enforce compliance with the terms of the loan agreement and as a result, the Portfolios may be subject to the credit risk of the borrower and lender that is selling the loan agreement. When the Portfolios purchase assignments from lenders they acquire direct rights against the borrower of the loan. The Portfolios may also enter into unfunded loan commitments, which are contractual obligations for future funding. Unfunded loan commitments can include lines of credit, which may require the Portfolios to grant additional cash to the borrower upon demand from the borrower. These unfunded loan commitments are in fact a future obligation in full, although a percentage of the loan amount may not be utilized by the borrower. When investing in a loan, the Portfolios have the right to receive principal, interest and any fees from the lender selling the loan agreement and only when the payments are received by the lender from the borrower. There may also be a commitment fee due to the Portfolios based on the unused portion of the line of credit of the floating rate loan. In certain cases, the Portfolios may be entitled to a penalty fee if there was a prepayment of a floating rate loan by the borrower. Fees that are earned or paid will be reflected as interest income or interest expense on the Statements of Operations. For the period ended December 31, 2014, only the High Yield Bond Portfolio and Multi Sector Bond Portfolio invested in loan participations and assignments. At December 31, 2014 there were no unfunded loan commitments outstanding.
K. Reverse Repurchase Agreements — Certain Portfolios may enter into reverse repurchase agreements. In a reverse repurchase agreement, a Portfolio delivers a security in exchange for cash to a financial institution, the counterparty, with a simultaneous agreement to repurchase the same or substantially the same security at an agreed upon price and date. The Portfolio is entitled to receive principal and interest payments, if any, made on the security delivered to the counterparty during the term of the agreement. Cash received in exchange for securities delivered plus accrued interest payments to be made by the Portfolio to counterparties are reflected as a liability on the Statements of Assets and Liabilities. Interest payments made by a Portfolio to counterparties are recorded as a component of interest expense on the Statements of Operations. In periods of increased demand for the security, a Portfolio may receive a fee for use of the security by the counterparty, which may result in interest income to the Portfolio. When effecting reverse repurchase transactions, the Portfolio will hold securities of a dollar amount equal in value to the securities subject to the reverse repurchase agreement in a segregated account.
Note 5. Derivative Instruments
The Portfolios may use derivative instruments for various purposes, including as a cash management strategy, to earn income and enhance returns, to increase or decrease exposure to a particular market, to manage or adjust the risk profile of the Portfolio, to hedge exposure to a foreign currency, or as an alternative to direct investments. Because the Portfolios are required to account for derivative instruments at fair value and recognize changes in fair value through the Statements of Operations, the Portfolios’ derivatives do not qualify for hedge accounting treatment.
Certain Portfolios segregate cash to cover margin requirements for derivative positions. These amounts are denoted as “Cash Collateral for Derivative Positions” on the Statements of Assets and Liabilities.
A. Futures Contracts — Certain Portfolios invest in futures contracts as an alternative to investing in individual securities and could be exposed to market risk due to changes in the value of the underlying securities or due to an illiquid secondary market. Futures contracts are marked to market daily based upon quoted settlement prices. The Portfolios receive from or pay to brokers an amount of cash equal to the daily fluctuation in the value of the contracts. Such receipts or payments, known as the “variation margin,” are recorded by the Portfolios as unrealized gains or losses. When a contract is closed, the Portfolios record a realized gain or loss equal to the difference between the value of the contract at the time it was opened and the value at the time it was closed.
| | | | | | |
| | Notes to Financial Statements | | | 201 | |
Notes to Financial Statements
B. Forward Foreign Currency Contracts — The Portfolios may enter into forward foreign currency contracts to hedge against exchange rate risk arising from investments in securities denominated in foreign currencies or as part of an investment strategy. Contracts are valued at the contractual forward rate and are marked to market daily, with the change in market value recorded as an unrealized gain or loss. When the contracts are closed, a realized gain or loss is recorded. Risks may arise from changes in market value of the underlying instruments and from the possible inability of counterparties to meet the terms of their contracts.
C. Options — Certain Portfolios may write call and put options on futures, swaps, securities or currencies they own or in which they may invest. Writing put options tends to increase a Portfolio’s exposure to the underlying instrument. Writing call options tends to decrease a Portfolio’s exposure to the underlying instrument. The Portfolio receives a premium on the sale of a call option but gives up the opportunity to profit from any increase in the value of the security above the exercise price of the option. When a Portfolio writes a put option, it is exposed to a decline in the price of the underlying security. When a Portfolio writes a call or put option, an amount equal to the premium received is recorded as a liability and subsequently marked to market to reflect the current value of the option written. These liabilities are reflected as written options outstanding in the Statements of Assets and Liabilities. Payments received or made, if any, from writing options with premiums to be determined on a future date are reflected as such on the Statements of Assets and Liabilities. Premiums received from writing options which expire are treated as realized gains. Premiums received from writing options which are exercised or closed are added to the proceeds or offset against amounts paid on the underlying future, swap, security or currency transaction to determine the realized gain or loss. A Portfolio as a writer of an option has no control over whether the underlying future, swap, security or currency may be sold (called) or purchased (put) and as a result bears the market risk of an unfavorable change in the price of the future, swap, security or currency underlying the written option. There is a risk a Portfolio may not be able to enter into a closing transaction because of an illiquid market.
Transactions in written call and put options for the period ended December 31, 2014 were as follows (amounts in thousands, except number of contracts):
| | | | | | | | | | | | | | | | | | | | | | | | |
| | | Balance at
12/31/2013 | | | Sales | | | Closing
Buys | | | Expirations | | | Exercised | | | Balance at
12/31/2014 | |
Long-Term U.S. Government Bond Portfolio | | | | | | | | | | | | | | | | | | | | | | | | |
# of Contracts | | | 1 | | | | 40 | | | | - | | | | 21 | | | | 20 | | | | - | |
Premium | | $ | - | | | | 33 | | | | - | | | | 18 | | | | 15 | | | $ | - | |
Multi-Sector Bond Portfolio | | | | | | | | | | | | | | | | | | | | | | | | |
# of Contracts | | | 26 | | | | - | | | | - | | | | 26 | | | | - | | | | - | |
Notional Amount | | | 21,300 | | | | - | | | | - | | | | 9,200 | | | | 12,100 | | | | - | |
Premium | | $ | 51 | ) | | | 0 | | | | - | | | | 37 | | | | 14 | | | $ | - | |
Certain Portfolios may also purchase call and put options on futures, swaps, securities or currencies they own or in which they may invest. Purchasing call options tends to increase a Portfolio’s exposure to the underlying instrument. Purchasing put options tends to decrease a Portfolio’s exposure to the underlying instrument. The Portfolio pays a premium on the purchase of a put option but receives the opportunity to profit from any increase in the value of the security above the exercise price of the option. When a Portfolio purchases a call option, it is exposed to a decline in the price of the underlying security. Premiums paid are reflected in the Statements of Assets and Liabilities as an investment and are subsequently marked to market to reflect the current value of the option. Premiums paid from purchasing options which expire are treated as realized losses. Premiums paid for purchasing options which are exercised or closed are added to the amount paid or offset against the proceeds on the underlying future, swap, security or currency transaction to determine realized gain or loss. The risk associated with a Portfolio purchasing call or put options is limited to the premium paid.
D. Swap Agreements — The Portfolios may enter into swap agreements on interest rate, total return and credit default to manage their exposure to interest rates, foreign currencies, investment style risk and credit risk or as an alternative to direct investing. In connection with these agreements, securities may be identified as collateral in accordance with the terms of the respective swap agreements. Swap agreements are privately negotiated in the over-the-counter market (“OTC swaps”) and may be executed in a multilateral or other trade facility platform, such as a registered commodities exchange (“centrally cleared swaps”).
| | | | |
| 202 | | Notes to Financial Statements | | |
Notes to Financial Statements
Swaps are marked to market daily based upon quotations from market makers or values from third party vendors, which may include a registered commodities exchange, and the change in value, if any, is recorded as unrealized gain or loss in the Statements of Operations. Daily changes in the valuation of centrally cleared swaps, if any, are recorded as a receivable or payable for the change in value as appropriate (“variation margin”) on the Statements of Assets and Liabilities. OTC swap payments received or made at the beginning of the measurement period of the swap are reflected on the Statements of Assets and Liabilities. Upfront payments are amortized to realized gain or loss. Upon termination of the swap, unamortized upfront payments are recorded as realized gain or loss in the Statements of Operations. A liquidation payment received or made at the termination of the swap is recorded as realized gain or loss in the Statements of Operations. Net periodic payments received by the Portfolios are included as part of realized gain (loss) on the Statements of Operations. Entering into these agreements involves, to varying degrees, elements of credit and market risk in excess of the amounts recognized on the Statements of Assets and Liabilities. Such risks involve the possibility that there will be no liquid market for these agreements, that the counterparty to the agreements may default on its obligation to perform and that there may be unfavorable changes in interest rates.
Interest Rate Swaps — Interest rate swap agreements involve the exchange by a Portfolio with another party to pay or receive a set of cash flows, e.g., an exchange of floating rate payments for fixed rate payments based on a notional amount of principal.
Total Return Swaps — Total return swap agreements involve commitments to pay or receive a financing rate in exchange for the total return of an underlying reference entity, both based on notional amounts. To the extent the total return of the security or index underlying the transaction exceeds or falls short of the offsetting interest rate obligation, a Portfolio will receive a payment from or make a payment to the counterparty.
Credit Default Swaps — Credit default swap agreements involve one party making a series of payments to another party in exchange for the right to receive a cash payment equal to the notional value of the swap in the event of a default by a third party, typically corporate issues or sovereign issues of an emerging market country. A Portfolio may use credit default swaps to provide a measure of protection against defaults of the issuers where the Portfolio owns or has exposure to the corporate or sovereign issue or to take an active long or short position on the likelihood of a particular issuer’s default.
As a seller of protection, the Portfolio generally receives an upfront payment and/or a fixed rate of income throughout the term of the swap provided that there is no credit event. As the seller, the Portfolio adds leverage to its investments because the Portfolio has investment exposure on the notional amount of the swap. As a buyer of protection, the Portfolio generally makes an upfront payment or pays a fixed rate of interest throughout the term of the swap provided that there is no credit event. The Portfolio generally receives an amount up to the notional value of the swap if a credit event occurs.
Implied credit spreads, represented in absolute terms, utilized in determining the market value of credit default swap agreements on corporate issues or sovereign issues of an emerging market country serve as an indicator of the current status of the payment/performance risk and represent the likelihood of a credit event occurring. The implied credit spread of a particular referenced entity reflects the cost of selling protection and may include upfront payments required to be made to enter into the agreement. For credit default swap agreements on credit indices, the quoted market prices and resulting values serve as the indicator of the current status of the payment/performance risk. Wider credit spreads and increasing market values, in absolute terms when compared to the notional amount of the swap, represent a deterioration of the referenced entity’s credit soundness and indicate a greater likelihood a credit event could occur as defined under the terms of the agreement. Open credit default swaps on corporate or sovereign issues and credit indices are disclosed in the Schedules of Investments.
If the Portfolio is a seller of protection and a credit event occurs, the Portfolio will either pay to the buyer of the protection an amount equal to the notional value of the swap and may take delivery of the obligation or pay a net settlement amount in the form of cash or securities equal to the notional amount of the swap less the recovery value of the referenced obligation. The maximum potential amount of future payments (undiscounted) that a Portfolio as a seller of protection could be required to make under a credit default swap agreement would be equal to the notional amount of the agreement. Notional amounts and fair market value of all credit default swap agreements outstanding for each Portfolio are disclosed in the footnotes to the Schedules of Investments. These maximum potential amounts would be partially offset by any recovery values of the referenced obligations, upfront payments received upon entering into the agreement, or net amounts received by the Portfolio from the settlement of credit default swap agreements purchasing protection for the same referenced obligation.
| | | | | | |
| | Notes to Financial Statements | | | 203 | |
Notes to Financial Statements
E. Derivative Disclosures — Derivative positions held by the Portfolios by contract type and primary risk exposure, including location on the Statement of Assets and Liabilities and value as of December 31, 2014, are (amounts in thousands):
| | | | | | | | | | | | |
| | | Asset Derivatives – December 31, 2014 | | | Liability Derivatives – December 31, 2014 | |
| Portfolio | | Statement of Assets and Liabilities
Location | | Value | | | Statement of Assets and Liabilities
Location | | Value | |
Index 500 Stock Portfolio | | | | | | | | | | | | |
Equity contracts | | Receivables – Futures Variation Margin | | $ | - | | | Payables – Futures Variation Margin | | $ | 329 | |
Large Company Value Portfolio | | | | | | | | | | | | |
Foreign exchange contracts | | Receivables – Foreign Currency Sold | | | 31 | | | Payables – Foreign Currency Purchased | | | - | |
Index 400 Stock Portfolio | | | | | | | | | | | | |
Equity contracts | | Receivables – Futures Variation Margin | | | - | | | Payables – Futures Variation Margin | | | 196 | |
Mid Cap Value Portfolio | | | | | | | | | | | | |
Foreign exchange contracts | | Receivables – Foreign Currency Sold | | | 91 | | | Payables – Foreign Currency Purchased | | | - | |
International Growth Portfolio | | | | | | | | | | | | |
Foreign exchange contracts | | Receivables – Foreign Currency Sold | | | - | | | Payables – Foreign Currency Purchased | | | 3 | |
International Equity Portfolio | | | | | | | | | | | | |
Foreign exchange contracts | | Receivables – Foreign Currency Sold | | | 1 | | | Payables – Foreign Currency Purchased | | | - | |
Emerging Markets Equity Portfolio | | | | | | | | | | | | |
Foreign exchange contracts | | Receivables – Foreign Currency Sold | | | 2 | | | Payables – Foreign Currency Purchased | | | - | |
Short-Term Bond Portfolio | | | | | | | | | | | | |
Interest rate contracts | | Receivables – Futures Variation Margin | | | - | | | Payables – Futures Variation Margin | | | 21 | |
Long-Term U.S. Government Bond Portfolio | | | | | | | | | | | | |
Interest rate contracts | | Receivables – Futures Variation Margin | | | 5 | | | Payables – Futures Variation Margin | | | 5 | |
Inflation Protection Portfolio | | | | | | | | | | | | |
Foreign exchange contracts | | Receivables – Foreign Currency Sold | | | 839 | | | Payables – Foreign Currency Purchased | | | 10 | |
Interest rate contracts | | Receivables – Futures Variation Margin | | | - | | | Payables – Futures Variation Margin | | | 32 | |
Interest rate contracts | | Receivables – Outstanding Swaps Contracts, at Value | | | - | | | Payables – Outstanding Swaps Contracts, at Value | | | 5,165 | |
Multi-Sector Bond Portfolio | | | | | | | | | | | | |
Credit contracts | | Receivables – Outstanding Swaps Contracts, at Value | | | 702 | | | Payables – Outstanding Swaps Contracts, at Value | | | 2,164 | |
Foreign exchange contracts | | Receivables – Foreign Currency Sold | | | 4,363 | | | Payables – Foreign Currency Purchased | | | 944 | |
Interest rate contracts | | Receivables – Futures Variation Margin | | | 189 | | | Payables – Futures Variation Margin | | | - | |
Interest rate contracts | | Receivables – Outstanding Swaps Contracts, at Value | | | 382 | | | Payables – Outstanding Swaps Contracts, at Value | | | 141 | |
Balanced Portfolio | | | | | | | | | | | | |
Equity contracts | | Receivables – Futures Variation Margin | | | - | | | Payables – Futures Variation Margin | | | 433 | |
Asset Allocation Portfolio | | | | | | | | | | | | |
Equity contracts | | Receivables – Futures Variation Margin | | | - | | | Payables – Futures Variation Margin | | | 84 | |
Realized gains and losses on derivative instruments, by contract type and primary risk exposure, for the period ended December 31, 2014 are (amounts in thousands):
| | | | | | | | | | | | | | | | | | | | |
| | | Realized Gain (Loss) on Derivatives Instruments | |
| Portfolio | | Options | | | Futures | | | Forward
Currency
Contracts | | | Swaps | | | Total | |
Focused Appreciation Portfolio | | | | | | | | | | | | | | | | | | | | |
Foreign currency exchange contracts | | $ | - | | | $ | - | | | $ | (24 | ) | | $ | - | | | $ | (24 | ) |
Index 500 Stock Portfolio | | | | | | | | | | | | | | | | | | | | |
Equity contracts | | | - | | | | 3,446 | | | | - | | | | - | | | | 3,446 | |
Large Company Value Portfolio | | | | | | | | | | | | | | | | | | | | |
Foreign currency exchange contracts | | | - | | | | - | | | | 291 | | | | - | | | | 291 | |
Equity Income Portfolio | | | | | | | | | | | | | | | | | | | | |
Foreign currency exchange contracts | | | - | | | | - | | | | (1 | ) | | | - | | | | (1 | ) |
Index 400 Stock Portfolio | | | | | | | | | | | | | | | | | | | | |
Equity contracts | | | - | | | | 454 | | | | - | | | | - | | | | 454 | |
Mid Cap Value Portfolio | | | | | | | | | | | | | | | | | | | | |
Foreign currency exchange contracts | | | - | | | | - | | | | 1,500 | | | | - | | | | 1,500 | |
Index 600 Stock Portfolio | | | | | | | | | | | | | | | | | | | | |
Equity contracts | | | - | | | | - | | | | - | | | | 499 | | | | 499 | |
| | | | |
| 204 | | Notes to Financial Statements | | |
Notes to Financial Statements
| | | | | | | | | | | | | | | | | | | | |
| | | Realized Gain (Loss) on Derivatives Instruments | |
| Portfolio | | Options | | | Futures | | | Forward
Currency
Contracts | | | Swaps | | | Total | |
International Growth Portfolio | | | | | | | | | | | | | | | | | | | | |
Foreign currency exchange contracts | | $ | - | | | $ | - | | | $ | (115 | ) | | $ | - | | | $ | (115 | ) |
Research International Core Portfolio | | | | | | | | | | | | | | | | | | | | |
Foreign currency exchange contracts | | | - | | | | - | | | | (95 | ) | | | - | | | | (95 | ) |
International Equity Portfolio | | | | | | | | | | | | | | | | | | | | |
Foreign currency exchange contracts | | | - | | | | - | | | | (655 | ) | | | - | | | | (655 | ) |
Emerging Markets Equity Portfolio | | | | | | | | | | | | | | | | | | | | |
Foreign currency exchange contracts | | | - | | | | - | | | | (68 | ) | | | - | | | | (68 | ) |
Short-Term Bond Portfolio | | | | | | | | | | | | | | | | | | | | |
Foreign currency exchange contracts | | | - | | | | - | | | | (7 | ) | | | - | | | | (7 | ) |
Interest rate contracts | | | - | | | | (760 | ) | | | - | | | | - | | | | (760 | ) |
Select Bond Portfolio | | | | | | | | | | | | | | | | | | | | |
Foreign currency exchange contracts | | | - | | | | - | | | | 69 | | | | - | | | | 69 | |
Interest rate contracts | | | - | | | | (4,730 | ) | | | - | | | | - | | | | (4,730 | ) |
Long-Term U.S. Government Bond Portfolio | | | | | | | | | | | | | | | | | | | | |
Interest rate contracts | | | 18 | | | | 364 | | | | - | | | | - | | | | 382 | |
Inflation Protection Portfolio | | | | | | | | | | | | | | | | | | | | |
Foreign currency exchange contracts | | | - | | | | - | | | | 2,381 | | | | - | | | | 2,381 | |
Interest rate contracts | | | - | | | | (1,741 | ) | | | - | | | | (60 | ) | | | (1,801 | ) |
Multi-Sector Bond Portfolio | | | | | | | | | | | | | | | | | | | | |
Credit contracts | | | - | | | | - | | | | - | | | | (2,173 | ) | | | (2,173 | ) |
Foreign currency exchange contracts | | | - | | | | - | | | | 11,677 | | | | - | | | | 11,677 | |
Interest rate contracts | | | 45 | | | | 3,692 | | | | - | | | | 1,213 | | | | 4,950 | |
Balanced Portfolio | | | | | | | | | | | | | | | | | | | | |
Equity contracts | | | - | | | | 8,982 | | | | - | | | | - | | | | 8,982 | |
Foreign currency exchange contracts | | | - | | | | - | | | | 41 | | | | - | | | | 41 | |
Interest rate contracts | | | - | | | | (3,914 | ) | | | - | | | | - | | | | (3,914 | ) |
Asset Allocation Portfolio | | | | | | | | | | | | | | | | | | | | |
Equity contracts | | | - | | | | 1,268 | | | | - | | | | - | | | | 1,268 | |
Interest rate contracts | | | - | | | | (157 | ) | | | - | | | | - | | | | (157 | ) |
Change in unrealized appreciation and depreciation on derivative instruments, by contract type and primary risk exposure, for the period ended December 31, 2014 are (amounts in thousands):
| | | | | | | | | | | | | | | | | | | | |
| | | Change in Unrealized Appreciation (Depreciation) on
Derivative Instruments | |
| Portfolio | | Options | | | Futures | | | Forward
Currency
Contracts | | | Swaps | | | Total | |
Index 500 Stock Portfolio | | | | | | | | | | | | | | | | | | | | |
Equity contracts | | $ | - | | | $ | (230 | ) | | $ | - | | | $ | - | | | $ | (230 | ) |
Large Company Value Portfolio | | | | | | | | | | | | | | | | | | | | |
Foreign currency exchange contracts | | | - | | | | - | | | | 43 | | | | - | | | | 43 | |
Equity Income Portfolio | | | | | | | | | | | | | | | | | | | | |
Foreign currency exchange contracts | | | - | | | | - | | | | (6 | ) | | | - | | | | (6 | ) |
Index 400 Stock Portfolio | | | | | | | | | | | | | | | | | | | | |
Equity contracts | | | - | | | | 104 | | | | - | | | | - | | | | 104 | |
Mid Cap Value Portfolio | | | | | | | | | | | | | | | | | | | | |
Foreign currency exchange contracts | | | - | | | | - | | | | 178 | | | | - | | | | 178 | |
International Growth Portfolio | | | | | | | | | | | | | | | | | | | | |
Foreign currency exchange contracts | | | - | | | | - | | | | (72 | ) | | | - | | | | (72 | ) |
Research International Core Portfolio | | | | | | | | | | | | | | | | | | | | |
Foreign currency exchange contracts | | | - | | | | - | | | | (95 | ) | | | - | | | | (95 | ) |
International Equity Portfolio | | | | | | | | | | | | | | | | | | | | |
Foreign currency exchange contracts | | | - | | | | - | | | | (344 | ) | | | - | | | | (344 | ) |
Emerging Markets Equity Portfolio | | | | | | | | | | | | | | | | | | | | |
Foreign currency exchange contracts | | | - | | | | - | | | | 3 | | | | - | | | | 3 | |
| | | | | | |
| | Notes to Financial Statements | | | 205 | |
Notes to Financial Statements
| | | | | | | | | | | | | | | | | | | | |
| | | Change in Unrealized Appreciation (Depreciation) on Derivative Instruments | |
| Portfolio | | Options | | | Futures | | | Forward
Currency
Contracts | | | Swaps | | | Total | |
Short-Term Bond Portfolio | | | | | | | | | | | | | | | | | | | | |
Interest rate contracts | | $ | - | | | $ | (373 | ) | | $ | - | | | $ | - | | | $ | (373 | ) |
Select Bond Portfolio | | | | | | | | | | | | | | | | | | | | |
Foreign currency exchange contracts | | | - | | | | - | | | | (32 | ) | | | - | | | | (32 | ) |
Interest rate contracts | | | - | | | | 48 | | | | - | | | | - | | | | 48 | |
Long-Term U.S. Government Bond Portfolio | | | | | | | | | | | | | | | | | | | | |
Interest rate contracts | | | - | | | | 19 | | | | - | | | | - | | | | 19 | |
Inflation Protection Portfolio | | | | | | | | | | | | | | | | | | | | |
Foreign currency exchange contracts | | | - | | | | - | | | | 1,588 | | | | - | | | | 1,588 | |
Interest rate contracts | | | - | | | | (543 | ) | | | - | | | | (3,371 | ) | | | (3,914 | ) |
Multi-Sector Bond Portfolio | | | | | | | | | | | | | | | | | | | | |
Credit contracts | | | - | | | | - | | | | - | | | | (1,991 | ) | | | (1,991 | ) |
Foreign currency exchange contracts | | | - | | | | - | | | | 4,413 | | | | - | | | | 4,413 | |
Interest rate contracts | | | 19 | | | | 2,360 | | | | - | | | | 851 | | | | 3,230 | |
Balanced Portfolio | | | | | | | | | | | | | | | | | | | | |
Equity contracts | | | - | | | | (482 | ) | | | - | | | | - | | | | (482 | ) |
Foreign currency exchange contracts | | | - | | | | - | | | | (19 | ) | | | - | | | | (19 | ) |
Interest rate contracts | | | - | | | | (585 | ) | | | - | | | | - | | | | (585 | ) |
Asset Allocation Portfolio | | | | | | | | | | | | | | | | | | | | |
Equity contracts | | | - | | | | (66 | ) | | | - | | | | - | | | | (66 | ) |
Interest rate contracts | | | - | | | | (31 | ) | | | - | | | | - | | | | (31 | ) |
Volumes on derivative instruments by contract type and primary risk exposure, for the period ended December 31, 2014 are (amounts in thousands):
| | | | | | | | | | | | | | | | | | | | |
| | | Volume of Derivative Instruments Held | |
| | | Average Contracts | | | Average Notional | |
| Portfolio | | Exchange
Traded Options | | | Futures | | | Forward
Currency
Contracts | | | Swaps | | | Over the
Counter
Options | |
Focused Appreciation Portfolio | | | | | | | | | | | | | | | | | | | | |
Foreign currency exchange contracts | | | - | | | | - | | | | 84 | | | | - | | | | - | |
Index 500 Stock Portfolio | | | | | | | | | | | | | | | | | | | | |
Equity contracts | | | - | | | | 293 | | | | - | | | | - | | | | - | |
Large Company Value Portfolio | | | | | | | | | | | | | | | | | | | | |
Foreign currency exchange contracts | | | - | | | | - | | | | 6,844 | | | | - | | | | - | |
Equity Income Portfolio | | | | | | | | | | | | | | | | | | | | |
Foreign currency exchange contracts | | | - | | | | - | | | | 141 | | | | - | | | | - | |
Index 400 Stock Portfolio | | | | | | | | | | | | | | | | | | | | |
Equity contracts | | | - | | | | 125 | | | | - | | | | - | | | | - | |
Mid Cap Value Portfolio | | | | | | | | | | | | | | | | | | | | |
Foreign currency exchange contracts | | | - | | | | - | | | | 39,322 | | | | - | | | | - | |
Index 600 Stock Portfolio | | | | | | | | | | | | | | | | | | | | |
Interest rate contracts | | | - | | | | - | | | | - | | | | 9,168 | | | | - | |
Emerging Markets Equity Portfolio | | | | | | | | | | | | | | | | | | | | |
Foreign currency exchange contracts | | | - | | | | - | | | | 150 | | | | - | | | | - | |
Short-Term Bond Portfolio | | | | | | | | | | | | | | | | | | | | |
Interest rate contracts | | | - | | | | 329 | | | | - | | | | - | | | | - | |
Select Bond Portfolio | | | | | | | | | | | | | | | | | | | | |
Foreign currency exchange contracts | | | - | | | | - | | | | 221 | | | | - | | | | - | |
Interest rate contracts | | | - | | | | 768 | | | | - | | | | - | | | | - | |
Long-Term U.S. Government Bond Portfolio | | | | | | | | | | | | | | | | | | | | |
Interest rate contracts | | | 8 | | | | 59 | | | | - | | | | - | | | | - | |
| | | | |
| 206 | | Notes to Financial Statements | | |
Notes to Financial Statements
| | | | | | | | | | | | | | | | | | | | |
| | | Volume of Derivative Instruments Held | |
| | | Average Contracts | | | Average Notional | |
| Portfolio | | Exchange
Traded Options | | | Futures | | | Forward
Currency
Contracts | | | Swaps | | | Over the
Counter
Options | |
Inflation Protection Portfolio | | | | | | | | | | | | | | | | | | | | |
Foreign currency exchange contracts | | | - | | | | - | | | | 43,905 | | | | - | | | | - | |
Interest rate contracts | | | - | | | | 94 | | | | - | | | | 73,180 | | | | - | |
Multi-Sector Bond Portfolio | | | | | | | | | | | | | | | | | | | | |
Credit contracts | | | - | | | | - | | | | - | | | | 71,881 | | | | - | |
Foreign currency exchange contracts | | | - | | | | - | | | | 419,534 | | | | - | | | | - | |
Interest rate contracts | | | 5 | | | | 773 | | | | - | | | | 90,992 | | | | 4,260 | |
Balanced Portfolio | | | | | | | | | | | | | | | | | | | | |
Equity contracts | | | - | | | | 337 | | | | - | | | | - | | | | - | |
Foreign currency exchange contracts | | | - | | | | - | | | | 131 | | | | - | | | | - | |
Interest rate contracts | | | - | | | | 476 | | | | - | | | | - | | | | - | |
Asset Allocation Portfolio | | | | | | | | | | | | | | | | | | | | |
Equity contracts | | | - | | | | 64 | | | | - | | | | - | | | | - | |
Interest rate contracts | | | - | | | | 31 | | | | - | | | | - | | | | - | |
Note 6. Portfolio Risk
In the normal course of business the Portfolios trade financial instruments and enter into financial transactions where risk of potential loss exists. Security values fluctuate (market risk) and may decline due to factors affecting securities markets in general, particular industries represented in the securities markets or conditions specifically related to a particular company. Failure of the other party to a transaction to perform (credit risk), for example by not making principal and interest payments when due, reduces the value of the issuer’s debt and could reduce the Portfolios’ income. Similar to credit risk, the Portfolios may be exposed to counterparty risk, or the risk that an institution or other entity with which the Portfolios have unsettled or open transactions will fail to make required payments or otherwise comply with the terms of the instrument, transaction or contract. The potential loss could exceed the value of the financial assets recorded in the financial statements. Some of the Portfolios’ investments may be illiquid and the Portfolios may not be able to vary the portfolio investments in response to changes in economic and other conditions. If a Portfolio is required to liquidate all or a portion of its investments quickly, the Portfolio may realize significantly less than the value at which it previously recorded those investments.
Master Netting Arrangements
The Portfolios are subject to various Master Agreements that govern the terms of certain transactions. Master Repurchase Agreements and Global Master Repurchase Agreements are in place that govern repurchase, reverse repurchase, and sale-buyback financing transactions. Master Securities Forward Transaction Agreements are in place that govern the settlement of certain forward settling transactions including to-be-announced securities, delayed-delivery or sale-buyback financing transactions. Customer Account Agreements and related addenda are in place that govern certain cleared derivative transactions including futures and cleared OTC derivatives. International Swaps and Derivatives Association, Inc. Master Agreements and Credit Support Annexes (“ISDA agreements”) are in place that govern certain OTC financial derivative transactions. The terms of Master Agreements may reduce counterparty risk with respect to transactions governed by the Master Agreement under certain circumstances.
Offsetting Assets and Liabilities
Certain Portfolios are parties to enforceable master netting or similar agreements which provide for the right of offset under certain circumstances. The Portfolios have made an accounting policy election not to offset qualifying financial and derivative instruments on the Statements of Assets and Liabilities. As such, all financial and derivative instruments are presented on a gross basis on the Statements of Assets and Liabilities. The impacts of netting arrangements that provide the right to offset are detailed below (amounts in thousands). The net amount represents the net receivable or payable that would be due from or to the counterparty in the event of default. Exposure from borrowings and other financing transactions such as repurchase agreements and certain forward settling transactions can only be netted across transactions governed under the same Master Agreement with the same legal entity. For certain Portfolios, derivative amounts do not reconcile to the Statements of Assets and Liabilities due to the Statements of Assets and Liabilities including derivatives that are not covered under master netting or similar agreements. The amount of collateral presented below has been limited such that the net amount cannot be less than zero.
| | | | | | |
| | Notes to Financial Statements | | | 207 | |
Notes to Financial Statements
Inflation Protection Portfolio
| | | | | | | | | | | | | | | | |
| Offsetting of Financial Assets and Derivative Assets | |
| As of December 31, 2014 | | | | | (i) | | | (ii) | | | (iii) = (i) - (ii) | |
| Description | | | | | Gross Amounts of
Recognized
Assets | | | Gross Amounts
Offset in the
Statement of Assets
and Liabilities | | | Net Amounts of Assets
Presented in the Statement
of Assets and Liabilities | |
Foreign Currency | | | | | | $ | 839 | | | $ | - | | | $ | 839 | |
|
| Financial Assets, Derivative Assets, and Collateral Held | |
| As of December 31, 2014 | | (iii) | | | (iv) | | | (v) = (iii) - (iv) | |
| | | | | | Gross Amounts Not Offset in the Statement of
Assets and Liabilities | | | | |
| Counterparty | | Net Amounts of
Assets in the
Statement of Assets
and Liabilities | | | Financial Instruments | | | Cash Collateral
Received | | | Net Amount | |
HSBC Bank USA | | $ | 839 | | | $ | (839 | ) | | $ | - | | | $ | - | |
|
| Offsetting of Financial Liabilities and Derivative Liabilities | |
| As of December 31, 2014 | | | | | (i) | | | (ii) | | | (iii) = (i) - (ii) | |
| Description | | | | | Gross Amounts of
Recognized Liabilities | | | Gross Amounts
Offset in the
Statement of Assets
and Liabilities | | | Net Amounts of Liabilities
Presented in the Statement
of Assets and Liabilities | |
Foreign Currency | | | | | | $ | 10 | | | $ | - | | | $ | 10 | |
Swaps | | | | | | | 5,165 | | | | - | | | | 5,165 | |
| | | | | | | | | | | | | | | | |
Total | | | | | | $ | 5,175 | | | $ | - | | | $ | 5,175 | |
| | | | | | | | | | | | | | | | |
|
| Financial Liabilties, Derivative Liabilities, and Collateral Pledged | |
| As of December 31, 2014 | | (iii) | | | (iv) | | | (v) = (iii) - (iv) | |
| | | | | | Gross Amounts Not Offset in the Statement of
Assets and Liabilities | | | | |
| Counterparty | | Net Amounts of
Liabilities in the
Statement of Assets
and Liabilities | | | Financial Instruments | | | Cash Collateral
Pledged | | | Net Amount | |
Bank of America, N.A. | | $ | 2,116 | | | $ | (1,821 | ) | | $ | - | | | $ | 295 | |
Barclays Bank PLC | | | 3,049 | | | | (2,787 | ) | | | - | | | | 261 | |
HSBC Bank USA | | | 10 | | | | (10 | ) | | | - | | | | - | |
| | | | | | | | | | | | | | | | |
Total | | $ | 5,175 | | | $ | (4,618 | ) | | $ | - | | | $ | 556 | |
| | | | | | | | | | | | | | | | |
|
Long-Term Government Bond Portfolio | |
Offsetting of Financial Assets and Derivative Assets | |
As of December 31, 2014 | | | | | | | (i) | | | | (ii) | | | | (iii) = (i) - (ii) | |
| Description | | | | | Gross Amounts of
Recognized Assets | | | Gross Amounts
Offset in the
Statement of Assets
and Liabilities | | | Net Amounts of Assets
Presented in the Statement
of Assets and Liabilities | |
Repurchase Agreements | | | | | | $ | 5,900 | | | $ | - | | | $ | 5,900 | |
|
Financial Assets, Derivative Assets, and Collateral Held | |
| As of December 31, 2014 | | (iii) | | | (iv) | | | (v) = (iii) - (iv) | |
| | | | | | Gross Amounts Not Offset in the Statement of
Assets and Liabilities | | | | |
| Counterparty | | Net Amounts of
Assets in the
Statement of Assets
and Liabilities | | | Financial Instruments | | | Cash Collateral
Received | | | Net Amount | |
Morgan Stanley & Co. LLC | | $ | 5,900 | | | $ | (5,900 | ) | | $ | - | | | $ | - | |
| | | | |
| 208 | | Notes to Financial Statements | | |
Notes to Financial Statements
Long-Term Government Bond Portfolio continued
| | | | | | | | | | | | | | | | |
Offsetting of Financial Liabilities and Derivative Liabilities | |
As of December 31, 2014 | | | | | | | (i) | | | | (ii) | | | | (iii) = (i) - (ii) | |
| Description | | | | | Gross Amounts of
Recognized Liabilities | | | Gross Amounts
Offset in the
Statement of Assets
and Liabilities | | | Net Amounts of Liabilities
Presented in the Statement
of Assets and Liabilities | |
Financing Transactions | | | | | | $ | 53,678 | | | $ | - | | | $ | 53,678 | |
|
Financial Liabilties, Derivative Liabilities, and Collateral Pledged | |
| As of December 31, 2014 | | (iii) | | | (iv) | | | (v) = (iii) - (iv) | |
| | | | | | Gross Amounts Not Offset in the Statement
of Assets and Liabilities | | | | |
| Counterparty | | Net Amounts of Liabilities
in the Statement of
Assets and Liabilities | | | Financial Instruments | | | Cash Collateral
Pledged | | | Net Amount | |
Barclays Capital, Inc. | | $ | 6,248 | | | $ | (6,247 | ) | | $ | - | | | $ | 1 | |
Credit Suisse Securities LLC | | | 44,712 | | | | (44,711 | ) | | | - | | | | 1 | |
Goldman Sachs & Co. | | | 1,625 | | | | (1,625 | ) | | | - | | | | - | |
Morgan Stanley & Co. LLC | | | 1,093 | | | | (1,093 | ) | | | - | | | | - | |
| | | | | | | | | | | | | | | | |
Total | | $ | 53,678 | | | $ | (53,676 | ) | | $ | - | | | $ | 2 | |
| | | | | | | | | | | | | | | | |
Multi-Sector Bond Portfolio
| | | | | | | | | | | | | | | | |
| Offsetting of Financial Assets and Derivative Assets | |
| As of December 31, 2014 | | | | | (i) | | | (ii) | | | (iii) = (i) - (ii) | |
| Description | | | | | Gross Amounts of
Recognized Assets | | | Gross Amounts
Offset in the
Statement of Assets
and Liabilities | | | Net Amounts of Assets
Presented in the Statement
of Assets and Liabilities | |
Foreign Currency | | | | | | $ | 4,363 | | | $ | - | | | $ | 4,363 | |
Swaps | | | | | | | 917 | | | | - | | | | 917 | |
| | | | | | | | | | | | | | | | |
Total | | | | | | $ | 5,280 | | | $ | - | | | $ | 5,280 | |
| | | | | | | | | | | | | | | | |
|
| Financial Assets, Derivative Assets, and Collateral Held | |
| As of December 31, 2014 | | (iii) | | | (iv) | | | (v) = (iii) - (iv) | |
| | | | | | Gross Amounts Not Offset in the Statement
of Assets and Liabilities | | | | |
| Counterparty | | Net Amounts of Assets
in the Statement of
Assets and Liabilities | | | Financial Instruments | | | Cash Collateral
Received | | | Net Amount | |
Bank of America, N.A. | | $ | 169 | | | $ | (85 | ) | | $ | - | | | $ | 84 | |
Barclays Bank PLC | | | 102 | | | | (102 | ) | | | - | | | | - | |
BNP Paribas SA | | | 704 | | | | (704 | ) | | | - | | | | - | |
Citibank, N.A. | | | 336 | | | | (336 | ) | | | - | | | | - | |
Goldman Sachs International | | | 3,235 | | | | (759 | ) | | | (2,476 | ) | | | - | |
JPMorgan Chase Bank, N.A. | | | 524 | | | | (162 | ) | | | (180 | ) | | | 182 | |
UBS AG | | | 210 | | | | (5 | ) | | | (205 | ) | | | - | |
| | | | | | | | | | | | | | | | |
Total | | $ | 5,280 | | | $ | (2,153 | ) | | $ | (2,861 | ) | | $ | 267 | |
| | | | | | | | | | | | | | | | |
|
| Offsetting of Financial Liabilities and Derivative Liabilities | |
| As of December 31, 2014 | | | | | (i) | | | (ii) | | | (iii) = (i) - (ii) | |
| Description | | | | | Gross Amounts of
Recognized
Liabilities | | | Gross Amounts
Offset in the
Statement of Assets
and Liabilities | | | Net Amounts of Liabilities
Presented in the Statement
of Assets and Liabilities | |
Foreign Currency | | | | | | $ | 944 | | | $ | - | | | $ | 944 | |
Swaps | | | | | | | 2,064 | | | | - | | | | 2,064 | |
Financing Transactions | | | | | | | 7,343 | | | | - | | | | 7,343 | |
| | | | | | | | | | | | | | | | |
Total | | | | | | $ | 10,351 | | | $ | - | | | $ | 10,351 | |
| | | | | | | | | | | | | | | | |
| | | | | | |
| | Notes to Financial Statements | | | 209 | |
Notes to Financial Statements
Multi-Sector Bond Portfolio continued
| | | | | | | | | | | | | | | | |
|
| Financial Liabilties, Derivative Liabilities, and Collateral Pledged | |
| As of December 31, 2014 | | (iii) | | | (iv) | | | (v) = (iii) - (iv) | |
| | | | | | Gross Amounts Not Offset in the Statement of
Assets and Liabilities | | | | |
| Counterparty | | Net Amounts of
Liabilities in the
Statement of Assets
and Liabilities | | | Financial Instruments | | | Cash Collateral
Pledged | | | Net Amount | |
Bank of America, N.A. | | $ | 85 | | | $ | (85 | ) | | $ | - | | | $ | - | |
Barclays Bank PLC | | | 214 | | | | (102 | ) | | | - | | | | 113 | |
BNP Paribas SA | | | 812 | | | | (704 | ) | | | - | | | | 108 | |
Citibank, N.A. | | | 580 | | | | (336 | ) | | | - | | | | 244 | |
Credit Suisse Securities, Ltd. | | | 500 | | | | (489 | ) | | | - | | | | 11 | |
Goldman Sachs International | | | 759 | | | | (759 | ) | | | - | | | | - | |
HSBC Bank USA | | | 318 | | | | - | | | | - | | | | 318 | |
JPMorgan Chase Bank, N.A. | | | 162 | | | | (162 | ) | | | - | | | | - | |
Morgan Stanley Capital Services | | | 68 | | | | - | | | | - | | | | 68 | |
Morgan Stanley & Co. | | | 6,843 | | | | (6,840 | ) | | | - | | | | 3 | |
Royal Bank of Canada | | | 5 | | | | - | | | | - | | | | 5 | |
UBS AG | | | 5 | | | | (5 | ) | | | - | | | | - | |
| | | | | | | | | | | | | | | | |
Total | | $ | 10,351 | | | $ | (9,482 | ) | | $ | - | | | $ | 869 | |
| | | | | | | | | | | | | | | | |
Note 7. Investment Advisory and Sub-Advisory Fees
The Series Fund and its Portfolios are parties to annually renewable contracts pursuant to which each Portfolio pays a charge for investment management and administrative services to MSA, a wholly owned subsidiary of Northwestern Mutual. Certain Portfolios, listed below, pay at a fixed annual rate based on the average daily net asset values of the Portfolio.
| | | | |
Portfolio | | Fee | |
Index 500 Stock Portfolio | | | 0.20% | |
Index 400 Stock Portfolio | | | 0.25% | |
Mid Cap Value Portfolio | | | 0.85% | |
Small Cap Value Portfolio | | | 0.85% | |
Money Market Portfolio | | | 0.30% | |
Select Bond Portfolio | | | 0.30% | |
Balanced Portfolio | | | 0.30% | |
For the other Portfolios, the rate for the investment advisory fee is graded by the asset size of the Portfolio according to the following schedules:
| | | | | | | | | | | | | | |
Portfolio | | First
$50
Million | | | Next
$50
Million | | | Excess Over
$100
Million | | | |
Growth Stock Portfolio | | | 0.60% | | | | 0.50% | | | | 0.40% | | | |
Large Cap Core Stock Portfolio | | | 0.60% | | | | 0.50% | | | | 0.40% | | | |
Mid Cap Growth Stock Portfolio | | | 0.80% | | | | 0.65% | | | | 0.50% | | | |
Small Cap Growth Stock Portfolio | | | 0.80% | | | | 0.65% | | | | 0.50% | | | |
High Yield Bond Portfolio | | | 0.60% | | | | 0.50% | | | | 0.40% | | | |
| | | | |
Portfolio | | First
$100
Million | | | Next
$400
Million | | | Excess Over
$500
Million | | | |
Focused Appreciation Portfolio | | | 0.80% | | | | 0.75% | | | | 0.70% | | | |
| | | | |
| 210 | | Notes to Financial Statements | | |
Notes to Financial Statements
| | | | | | | | | | | | | | | | |
Portfolio | | First
$100
Million | | | Next
$150
Million | | | Excess Over
$250
Million | | | | |
Domestic Equity Portfolio | | | 0.65% | | | | 0.55% | | | | 0.50% | | | | | |
Large Company Value Portfolio | | | 0.72% | | | | 0.67% | | | | 0.62% | | | | | |
International Growth Portfolio | | | 0.75% | | | | 0.65% | | | | 0.55% | | | | | |
Short-Term Bond Portfolio | | | 0.35% | | | | 0.33% | | | | 0.30% | | | | | |
Long-Term U.S. Government Bond Portfolio | | | 0.555% | | | | 0.515% | | | | 0.495% | | | | | |
Inflation Protection Portfolio | | | 0.58% | | | | 0.55% | | | | 0.49% | | | | | |
Multi-Sector Bond Portfolio | | | 0.79% | | | | 0.78% | | | | 0.77% | | | | | |
Asset Allocation Portfolio | | | 0.60% | | | | 0.50% | | | | 0.40% | | | | | |
| | | | |
Portfolio | | First
$150
Million | | | Next
$150
Million | | | Next
$200
Million | | | Excess Over
$500
Million | |
Large Cap Blend Portfolio | | | 0.77% | | | | 0.70% | | | | 0.62% | | | | 0.56% | |
Research International Core Portfolio | | | 0.88% | | | | 0.82% | | | | 0.75% | | | | 0.68% | |
| | | | |
Portfolio | | First
$500
Million | | | Excess Over
$500
Million | | | | | | | |
Equity Income Portfolio | | | 0.65% | | | | 0.60% | | | | | | | | | |
| | | | |
Portfolio | | First
$200
Million | | | Excess Over
$200
Million | | | | | | | |
Index 600 Stock Portfolio | | | 0.25% | | | | 0.20% | | | | | | | | | |
| | | | |
Portfolio | | First
$50
Million | | | Excess Over
$50
Million | | | | | | | |
International Equity Portfolio | | | 0.85% | | | | 0.65% | | | | | | | | | |
| | | | |
Portfolio | | First
$250
Million | | | Next
$250 Million | | | Next
$500
Million | | | Excess Over
$1.0
Billion | |
Emerging Markets Equity Portfolio | | | 1.14% | | | | 1.08% | | | | 0.96% | | | | 0.78% | |
MSA, which is the manager and investment adviser of the Series Fund, contractually agreed to waive the management fee and absorb certain other operating expenses to the extent necessary so that Total Operating Expenses (excluding taxes, brokerage, other investment-related costs, interest and dividend expenses and charges, acquired fund fees and expenses and extraordinary expenses) will not exceed the following amounts:
| | | | | | | | |
Portfolio | | | | | Expiration | |
Focused Appreciation Portfolio | | | 0.90 | % | | | April 30, 2015 | |
Large Cap Blend Portfolio | | | 0.85 | % | | | April 30, 2015 | |
Large Company Value Portfolio | | | 0.80 | % | | | April 30, 2015 | |
Domestic Equity Portfolio | | | 0.75 | % | | | April 30, 2015 | |
Equity Income Portfolio | | | 0.75 | % | | | April 30, 2015 | |
Mid Cap Value Portfolio | | | 1.00 | % | | | April 30, 2015 | |
Index 600 Stock Portfolio | | | 0.35 | % | | | April 30, 2015 | |
Small Cap Value Portfolio | | | 1.00 | % | | | April 30, 2015 | |
International Growth Portfolio | | | 1.10 | % | | | April 30, 2015 | |
Research International Core Portfolio | | | 1.15 | % | | | April 30, 2015 | |
Emerging Markets Equity Portfolio | | | 1.50 | % | | | April 30, 2015 | |
Short-Term Bond Portfolio | | | 0.45 | % | | | April 30, 2015 | |
Long-Term U.S. Government Bond Portfolio | | | 0.65 | % | | | April 30, 2015 | |
Inflation Protection Portfolio | | | 0.65 | % | | | April 30, 2015 | |
Multi-Sector Bond Portfolio | | | 0.90 | % | | | April 30, 2015 | |
Asset Allocation Portfolio | | | 0.75 | % | | | April 30, 2015 | |
Growth Stock Portfolio – MSA has agreed to waive a portion of its management fee on average net assets over $500 million such that the management fee is 0.60% on the Portfolio’s first $50 million of average net assets, 0.50% on the next $50 million, 0.40% on the next $400 million and 0.35% on average net assets in excess of $500 million. MSA may terminate this fee waiver agreement at any time after April 30, 2015.
| | | | | | |
| | Notes to Financial Statements | | | 211 | |
Notes to Financial Statements
Focused Appreciation Portfolio — MSA has agreed to waive a portion of its management fee such that the management fee is 0.66% on the Portfolio’s first $100 million of average net assets, 0.61% on the next $400 million, and 0.60% on average net assets in excess of $500 million. MSA may terminate this fee waiver agreement at any time after April 30, 2015.
Large Cap Core Stock Portfolio — MSA has agreed to waive a portion of its management fee on average net assets over $500 million such that the management fee is 0.60% on the Portfolio’s first $50 million of average net assets, 0.50% on the next $50 million, 0.40% on the next $400 million and 0.35% on average net assets in excess of $500 million. MSA may terminate this fee waiver agreement at any time after April 30, 2015.
Large Company Value Portfolio — MSA has agreed to waive a portion of its management fee such that the management fee is 0.68% on the Portfolio’s first $100 million of average net assets, 0.65% on the next $150 million, and 0.59% on average net assets in excess of $250 million. MSA may terminate this fee waiver agreement at any time after April 30, 2015.
Mid Cap Growth Stock Portfolio — MSA has agreed to waive a portion of its management fee on average net assets over $500 million such that the management fee is 0.80% on the Portfolio’s first $50 million, 0.65% on the next $50 million, 0.50% on the next $400 million and 0.45% on average net assets in excess of $500 million. MSA may terminate this fee waiver agreement at any time after April 30, 2015.
Index 400 Stock Portfolio — MSA has agreed to waive a portion of its management fee on average net assets over $500 million such that the management fee is 0.25% on the Portfolio’s first $500 million and 0.20% on average net assets in excess of $500 million. MSA may terminate this fee waiver agreement at any time after April 30, 2015.
Mid Cap Value Portfolio — MSA has agreed to waive a portion of its management fee such that the management fee is 0.79% on the Portfolio’s first $150 million of average net assets, and 0.70% in excess of $150 million. MSA may terminate this fee waiver agreement at any time after April 30, 2015.
Small Cap Growth Stock Portfolio — MSA has agreed to waive a portion of its management fee on assets over $500 million such that the management fee is 0.80% on the Portfolio’s first $50 million of average net assets, 0.65% on the next $50 million, 0.50% on the next $400 million and 0.45% on average net assets in excess of $500 million. MSA may terminate this fee waiver agreement at any time after April 30, 2015.
Small Cap Value Portfolio — MSA has agreed to waive a portion of its management fee on assets over $500 million such that the management fee is 0.85% on the Portfolio’s first $500 million of average net assets and 0.80% on average net assets in excess of $500 million. MSA may terminate this fee waiver agreement at any time after April 30, 2015.
International Equity Portfolio — MSA has agreed to waive a portion of its management fee such that the management fee for the Portfolio is 0.80% on the Portfolio’s first $50 million of average net assets, 0.60% on the next $950 million, 0.58% on the next $500 million, 0.51% on the next $500 million, and 0.45% on average net assets in excess of $2 billion. MSA may terminate this fee waiver agreement at any time after April 30, 2015.
Money Market Portfolio — For the period from January 1, 2014 to August 29, 2014, MSA voluntarily agreed to waive its entire management fee on a temporary basis. Effective August 30, 2014, and continuing for a period of time to be determined by MSA, MSA voluntarily agreed to waive its advisory fee and/or reimburse expenses in excess of the Portfolio’s daily yield so as to maintain a zero or positive yield for the Portfolio.
Short-Term Bond Portfolio — MSA has agreed to waive a portion of its management fee on assets over $500 million such that the management fee is 0.35% on the Portfolio’s first $100 million of average net assets, 0.33% on the next $150 million, 0.30% on the next $250 million and 0.28% on average net assets in excess of $500 million. MSA may terminate this fee waiver agreement at any time after April 30, 2015.
Inflation Protection Portfolio — MSA has agreed to waive a portion of its management fee such that the management fee is 0.55% on the Portfolio’s first $100 million of average net assets, 0.50% on the next $150 million, and 0.46% on average net assets in excess of $250 million. MSA may terminate this fee waiver agreement at any time after April 30, 2015.
High Yield Bond Portfolio — MSA has agreed to waive a portion of its management fee on assets over $1 billion such that the management fee is 0.60% on the Portfolio’s first $50 million of average net assets, 0.50% on the next $50 million, 0.40% on the next $900 million and 0.35% on average net assets in excess of $1 billion. MSA may terminate this fee waiver agreement at any time after April 30, 2015.
| | | | |
| 212 | | Notes to Financial Statements | | |
Notes to Financial Statements
Multi-Sector Bond Portfolio — Effective February 4, 2014, MSA agreed to waive a portion of its management fee such that the management fee is 0.74% on the Portfolio’s first $100 million of average net assets, 0.73% on the next $150 million, and 0.70% on average net assets in excess of $250 million. MSA may terminate this fee waiver agreement at any time after April 30, 2015.
Balanced Portfolio — MSA has agreed to waive a portion of its management fee such that its management fee on assets invested in affiliated companies is 0.05%. MSA may terminate this fee waiver agreement at any time after April 30, 2015. For the period from August 30, 2014 through October 31, 2014, MSA voluntarily agreed to waive its entire investment advisory fee on all assets of the Balanced Portfolio invested in the Select Bond and High Yield Bond Portfolios.
Asset Allocation Portfolio — MSA has agreed to waive a portion of its management fee such that the management fee is 0.55% on the Portfolio’s first $100 million of average net assets, 0.45% on the next $150 million, and 0.35% on average net assets in excess of $250 million. In addition, MSA has agreed to waive a portion of its management fee such that its management fee on assets invested in affiliated companies is 0.05%. MSA may terminate these fee waiver agreements at any time after April 30, 2015. For the period from August 30, 2014 through October 31, 2014, MSA voluntarily agreed to waive its entire investment advisory fee on all assets of the Asset Allocation Portfolio invested in the Select Bond and High Yield Bond Portfolios.
Certain Portfolios, listed below, pay a portion of their custodian fees indirectly through expense offset arrangements. Custodian fees are reduced for Portfolios that maintain compensating balances in non-interest bearing accounts. These Portfolios could have invested the assets used to pay for the custodian fees, had the assets not been used in the expense offset arrangements. For the period ended December 31, 2014, the amounts paid through expense offset arrangements were as follows:
| | | | |
Portfolio | | Amount | |
Growth Stock Portfolio | | $ | 2,710 | |
Focused Appreciation Portfolio | | | 2,929 | |
Large Cap Core Stock Portfolio | | | 147 | |
Large Cap Blend Portfolio | | | 1,799 | |
Index 500 Stock Portfolio | | | 1,224 | |
Domestic Equity Portfolio | | | 3,320 | |
Equity Income Portfolio | | | 150 | |
Mid Cap Growth Stock Portfolio | | | 7,584 | |
Index 400 Stock Portfolio | | | 822 | |
Mid Cap Value Portfolio | | | 2 | |
Small Cap Growth Stock Portfolio | | | 1,417 | |
Index 600 Stock Portfolio | | | 795 | |
Small Cap Value Portfolio | | | 380 | |
Money Market Portfolio | | | 522 | |
Short-Term Bond Portfolio | | | 1,726 | |
Select Bond Portfolio | | | 26,804 | |
Long-Term U.S. Government Bond Portfolio | | | 70 | |
Inflation Protection Portfolio | | | 9 | |
High Yield Bond Portfolio | | | 3,267 | |
Balanced Portfolio | | | 1,503 | |
Asset Allocation Portfolio | | | 1,316 | |
With respect to certain Portfolios, MSA has engaged and oversees sub-advisers who manage the day-to-day investment operations of such Portfolios. MSA pays each sub-adviser a fee based on the average daily net assets of each such Portfolio out of its investment management fee.
Note 8. Federal Income Tax Matters
Taxable distributions from net investment income and realized capital gains in the Portfolios may differ from book amounts earned during the period due to differences in the timing of capital gains recognition and due to the reclassification of certain gains or losses between capital and income. The differences between cost amounts for book purposes and tax purposes are primarily due to the tax treatment of deferred losses, corporate actions, passive foreign investment companies, interest only securities and financing transactions.
| | | | | | |
| | Notes to Financial Statements | | | 213 | |
Notes to Financial Statements
It is the policy of the Portfolios to reclassify the net effect of permanent differences between book and taxable income to capital accounts on the Statements of Assets and Liabilities. Permanent differences primarily relate to character differences with respect to income on swaps, foreign currency transactions, foreign bond sales, passive foreign investment companies and paydowns on structured product investments.
A summary of the Portfolios’ capital loss carryovers as of December 31, 2014 is provided below:
| | | | | | | | | | | | | | | | |
| | | Amount
Subject to
Expiration | | | Expiration
Dates | | | Utilized in
2014 | | | Amount Not
Subject to
Expiration | |
| | | (Amounts in Thousands) | |
Domestic Equity Portfolio | | $ | 8,450 | | | | 2017 | | | $ | 23,363 | | | $ | - | |
International Growth Portfolio | | | 7,111 | | | | 2017 | | | | 19,349 | | | | - | |
Emerging Markets Equity Portfolio | | | - | | | | - | | | | - | | | | 8,342 | |
Money Market Portfolio | | | - | | | | - | | | | - | | | | 5 | |
Short-Term Bond Portfolio | | | - | | | | - | | | | - | | | | 572 | |
Select Bond Portfolio | | | - | | | | - | | | | 20,629 | | | | - | |
Long-Term U.S. Government Bond Portfolio | | | - | | | | - | | | | 484 | | | | 1,011 | |
Inflation Protection Portfolio | | | - | | | | - | | | | - | | | | 239 | |
High Yield Bond Portfolio | | | 28,315 | | | | 2016-2017 | | | | - | | | | 2,477 | |
Multi-Sector Bond Portfolio | | | - | | | | - | | | | 943 | | | | - | |
Capital losses incurred during fiscal years after 2010 are carried forward indefinitely and retain the character of the original loss. These losses are deferred to the first day of the next fiscal year and must be utilized prior to the losses incurred prior to 2011.
When applicable, each of the Portfolios made distributions during the year of ordinary income and long-term capital gains. The tax character of distributions paid for the periods ended December 31, 2014 and 2013 was as follows:
| | | | | | | | | | | | | | | | |
| | | 2014 Distributions
Paid From: | | | 2013 Distributions Paid From: | |
| Portfolio | | Ordinary
Income | | | Long-term
Capital Gain | | | Ordinary
Income | | | Long-term
Capital Gain | |
| | | (Amounts in Thousands) | |
Growth Stock Portfolio | | $ | 27,171 | | | $ | 60,242 | | | $ | 5,017 | | | $ | 52,317 | |
Focused Appreciation Portfolio | | | 131 | | | | 67,736 | | | | 2,567 | | | | - | |
Large Cap Core Stock Portfolio | | | 17,975 | | | | 39,484 | | | | 5,721 | | | | - | |
Large Cap Blend Portfolio | | | 106 | | | | 5,976 | | | | 5,447 | | | | 1,060 | |
Index 500 Stock Portfolio | | | 38,463 | | | | 25,764 | | | | 37,227 | | | | 37,550 | |
Large Company Value Portfolio | | | - | | | | 9,080 | | | | 2,362 | | | | 2,653 | |
Domestic Equity Portfolio | | | 10,099 | | | | - | | | | 8,767 | | | | - | |
Equity Income Portfolio | | | 11,149 | | | | 19,806 | | | | 7,946 | | | | - | |
Mid Cap Growth Stock Portfolio | | | 57,787 | | | | 153,067 | | | | 3,093 | | | | 39,484 | |
Index 400 Stock Portfolio | | | 8,640 | | | | 27,745 | | | | 8,276 | | | | 16,978 | |
Mid Cap Value Portfolio | | | 18,475 | | | | 17,632 | | | | 2,886 | | | | 1,673 | |
Small Cap Growth Stock Portfolio | | | - | | | | 57,514 | | | | 2,247 | | | | - | |
Index 600 Stock Portfolio | | | 2,227 | | | | 15,089 | | | | 4,606 | | | | 2,729 | |
Small Cap Value Portfolio | | | 2,436 | | | | 14,253 | | | | 5,874 | | | | 2,384 | |
International Growth Portfolio | | | 5,721 | | | | - | | | | 5,267 | | | | - | |
Research International Core Portfolio | | | 6,491 | | | | 2,773 | | | | 452 | | | | - | |
International Equity Portfolio | | | 48,726 | | | | 101,968 | | | | 35,590 | | | | 421 | |
Emerging Markets Equity Portfolio | | | 2,542 | | | | 142 | | | | 2,364 | | | | 589 | |
Money Market Portfolio | | | 347 | | | | - | | | | 467 | | | | - | |
Short-Term Bond Portfolio | | | 1,286 | | | | - | | | | 273 | | | | - | |
Select Bond Portfolio | | | 36,871 | | | | - | | | | 62,323 | | | | 4,531 | |
Long-Term U.S. Government Bond Portfolio | | | 2,087 | | | | - | | | | 209 | | | | 15 | |
Inflation Protection Portfolio | | | 1,837 | | | | 2,450 | | | | 5,309 | | | | 2,509 | |
High Yield Bond Portfolio | | | 27,964 | | | | - | | | | 27,656 | | | | - | |
Multi-Sector Bond Portfolio | | | 13,804 | | | | - | | | | 16,562 | | | | 1,400 | |
Balanced Portfolio | | | 111,042 | | | | 132,396 | | | | 78,038 | | | | 93,484 | |
Asset Allocation Portfolio | | | 9,473 | | | | 19,751 | | | | 8,268 | | | | - | |
| | | | |
| 214 | | Notes to Financial Statements | | |
Notes to Financial Statements
As of December 31, 2014, the components of distributable earnings on a tax basis were as follows:
| | | | | | | | | | | | | | | | |
Portfolio | | Undistributed
Ordinary
Income | | | Undistributed
Long-Term
Gains | | | Accumulated
Losses | | | Unrealized
Appreciation
(Depreciation) | |
| | | (Amounts in Thousands) | |
Growth Stock Portfolio | | $ | 20,753 | | | $ | 49,004 | | | $ | - | | | $ | 196,561 | |
Focused Appreciation Portfolio | | | 6,918 | | | | 75,590 | | | | - | | | | 132,283 | |
Large Cap Core Stock Portfolio | | | 11,360 | | | | 8,027 | | | | - | | | | 111,105 | |
Large Cap Blend Portfolio | | | 3,963 | | | | 6,208 | | | | - | | | | 28,489 | |
Index 500 Stock Portfolio | | | 41,699 | | | | 40,759 | | | | - | | | | 1,092,717 | |
Large Company Value Portfolio | | | 7,419 | | | | 11,909 | | | | - | | | | 28,133 | |
Domestic Equity Portfolio | | | 11,101 | | | | - | | | | (8,450 | ) | | | 161,594 | |
Equity Income Portfolio | | | 13,821 | | | | 29,500 | | | | - | | | | 149,725 | |
Mid Cap Growth Stock Portfolio | | | 25,193 | | | | 74,443 | | | | - | | | | 106,503 | |
Index 400 Stock Portfolio | | | 8,258 | | | | 39,365 | | | | - | | | | 207,079 | |
Mid Cap Value Portfolio | | | 23,362 | | | | 26,314 | | | | - | | | | 45,490 | |
Small Cap Growth Stock Portfolio | | | 12,131 | | | | 14,877 | | | | - | | | | 90,925 | |
Index 600 Stock Portfolio | | | - | | | | 349 | | | | - | | | | 19,563 | |
Small Cap Value Portfolio | | | 4,055 | | | | 32,415 | | | | - | | | | 191,584 | |
International Growth Portfolio | | | 7,805 | | | | - | | | | (7,111 | ) | | | 7,333 | |
Research International Core Portfolio | | | 10,557 | | | | 10,963 | | | | - | | | | 8,968 | |
International Equity Portfolio | | | 50,078 | | | | 67,503 | | | | - | | | | 80,749 | |
Emerging Markets Equity Portfolio | | | 3,897 | | | | - | | | | (8,342 | ) | | | (17,856 | ) |
Money Market Portfolio | | | 28 | | | | - | | | | (5 | ) | | | - | |
Short-Term Bond Portfolio | | | 1,717 | | | | - | | | | (572 | ) | | | (46 | ) |
Select Bond Portfolio | | | 55,277 | | | | 1,029 | | | | - | | | | 19,929 | |
Long-Term U.S. Government Bond Portfolio | | | 2,212 | | | | - | | | | (1,011 | ) | | | 3,867 | |
Inflation Protection Portfolio | | | 6,986 | | | | - | | | | (239 | ) | | | (1,593 | ) |
High Yield Bond Portfolio | | | 32,590 | | | | - | | | | (30,792 | ) | | | (6,983 | ) |
Multi-Sector Bond Portfolio | | | 35,421 | | | | 4,734 | | | | - | | | | (22,371 | ) |
Balanced Portfolio | | | 66,615 | | | | 86,487 | | | | - | | | | 124,726 | |
Asset Allocation Portfolio | | | 6,708 | | | | 11,422 | | | | - | | | | 17,774 | |
Note 9. Voluntary Reimbursements
Northwestern Mutual voluntarily reimburses foreign equity portfolios for the benefit Northwestern Mutual receives from foreign dividend taxes charged against the Portfolios. The amounts reimbursed represent approximately 65% of the foreign dividend taxes withheld attributable to the portion of the Portfolio owned by Northwestern Mutual. Reimbursements are recorded when foreign dividend taxes are accrued.
Voluntary reimbursements for the periods ended December 31, 2014 and 2013 are summarized below:
| | | | | | | | |
Portfolio | | 2014
Reimbursements | | | 2013
Reimbursements | |
International Growth Portfolio | | $ | 401,626 | | | $ | 370,045 | |
International Equity Portfolio | | | 3,145,179 | | | | 1,797,491 | |
Research International Core Portfolio | | | 423,715 | | | | 210,374 | |
Emerging Markets Equity Portfolio | | | 554,965 | | | | 349,091 | |
Note 10. Guarantees
In the normal course of business the Portfolios enter into contracts that contain a variety of representations which provide general indemnifications. The Portfolios’ maximum exposure under these arrangements is unknown as this would involve future claims that may be made against the Portfolios that have not yet occurred. However, the Portfolios expect the risk of loss to be remote.
| | | | | | |
| | Notes to Financial Statements | | | 215 | |
Notes to Financial Statements
Note 11. Investment Income and Securities Transactions
For the period ended December 31, 2014, transactions in securities other than short term investments were:
| | | | | | | | | | | | | | | | |
Portfolios | | Non U.S. Govt
Security
Purchases | | | U.S. Govt.
Security
Purchases | | | Non U.S. Govt.
Security
Sales/Maturities | | | U.S. Govt.
Security
Sales/Maturities | |
| | | (Amounts in Thousands) | |
Growth Stock Portfolio | | $ | 361,057 | | | $ | - | | | $ | 385,259 | | | $ | - | |
Focused Appreciation Portfolio | | | 382,563 | | | | - | | | | 349,479 | | | | - | |
Large Cap Core Stock Portfolio | | | 32,362 | | | | - | | | | 47,336 | | | | - | |
Large Cap Blend Portfolio | | | 39,354 | | | | - | | | | 39,995 | | | | - | |
Index 500 Stock Portfolio | | | 58,700 | | | | - | | | | 95,279 | | | | - | |
Large Company Value Portfolio | | | 100,261 | | | | - | | | | 98,738 | | | | - | |
Domestic Equity Portfolio | | | 46,070 | | | | - | | | | 82,861 | | | | - | |
Equity Income Portfolio | | | 151,244 | | | | - | | | | 90,570 | | | | - | |
Mid Cap Growth Stock Portfolio | | | 853,386 | | | | - | | | | 915,984 | | | | - | |
Index 400 Stock Portfolio (a) | | | 75,510 | | | | - | | | | 95,334 | | | | - | |
Mid Cap Value Portfolio | | | 278,811 | | | | - | | | | 247,724 | | | | - | |
Small Cap Growth Stock Portfolio | | | 137,387 | | | | - | | | | 168,282 | | | | - | |
Index 600 Stock Portfolio (b) | | | 43,611 | | | | - | | | | 69,468 | | | | - | |
Small Cap Value Portfolio | | | 94,240 | | | | - | | | | 90,528 | | | | - | |
International Growth Portfolio | | | 308,451 | | | | - | | | | 274,099 | | | | - | |
Research International Core Portfolio (c) | | | 189,592 | | | | - | | | | 110,052 | | | | - | |
International Equity Portfolio | | | 423,730 | | | | - | | | | 298,882 | | | | - | |
Emerging Markets Equity Portfolio (d) | | | 262,567 | | | | - | | | | 178,892 | | | | - | |
Short-Term Bond Portfolio | | | 198,960 | | | | 270,772 | | | | 108,627 | | | | 307,834 | |
Select Bond Portfolio | | | 7,649,350 | | | | 92,344 | | | | 6,400,255 | | | | 92,339 | |
Long-Term U.S. Government Bond Portfolio | | | 2,164 | | | | 112,380 | | | | 665 | | | | 113,910 | |
Inflation Protection Portfolio | | | 30,267 | | | | 61,581 | | | | 8,556 | | | | 44,547 | |
High Yield Bond Portfolio | | | 765,449 | | | | - | | | | 541,705 | | | | - | |
Multi-Sector Bond Portfolio | | | 361,114 | | | | 39,536 | | | | 255,433 | | | | 31,301 | |
Balanced Portfolio | | | 1,549,518 | | | | 848,341 | | | | 1,242,276 | | | | 1,128,347 | |
Asset Allocation Portfolio | | | 128,391 | | | | 62,295 | | | | 99,639 | | | | 80,302 | |
| (a) | Includes $890 (in thousands) of purchases and $279 (in thousands) of sales directly with affliliates. |
| (b) | Includes $279 (in thousands) of purchases and $890 (in thousands) of sales directly with affliliates. |
| (c) | Includes $7 (in thousands) of sales directly with affliliates. |
| (d) | Includes $7 (in thousands) of purchases directly with affiliates. |
| | | | |
| 216 | | Notes to Financial Statements | | |
Notes to Financial Statements
Transactions with Affiliated Companies
An affiliated company is a company in which a Portfolio has ownership of at least 5% of the voting securities or which the Portfolio controls, is controlled by or with which the Portfolio is under common control. Transactions with affiliated companies during the period ended December 31, 2014 are as follows:
| | | | | | | | | | | | | | | | | | | | | | | | | | | | | | | | |
Portfolio | | Value at
12/31/2013 | | | Purchases | | | Sales | | | Value at
12/31/2014 | | | Realized
Gain
(Loss) | | | Income
Dividends | | | Capital Gain
Distributions | | | % Ownership,
12/31/2014 | |
| | | | | | | | | | | | (Amounts in thousands) | | | | | | | | | | |
Balanced | | | | | | | | | | | | | | | | | | | | | | | | | | | | | | | | |
Growth Stock | | $ | 147,712 | | | $ | 15,655 | | | $ | - | | | $ | 161,042 | | | $ | - | | | $ | 911 | | | $ | 14,743 | | | | 18.2 | % |
Focused Appreciation | | | 72,512 | | | | 7,525 | | | | - | | | | 79,354 | | | | - | | | | 14 | | | | 7,511 | | | | 11.0 | % |
Large Cap Core Stock | | | 68,283 | | | | 7,512 | | | | - | | | | 74,132 | | | | - | | | | 1,072 | | | | 6,440 | | | | 13.3 | % |
Large Cap Blend | | | 68,539 | | | | 2,772 | | | | - | | | | 77,159 | | | | - | | | | 27 | | | | 2,745 | | | | 46.2 | % |
Large Company Value | | | 68,288 | | | | 3,677 | | | | - | | | | 77,186 | | | | - | | | | - | | | | 3,677 | | | | 40.4 | % |
Domestic Equity | | | 69,144 | | | | 1,263 | | | | - | | | | 78,737 | | | | - | | | | 1,263 | | | | - | | | | 12.7 | % |
Equity Income | | | 68,513 | | | | 2,985 | | | | - | | | | 73,605 | | | | - | | | | 880 | | | | 2,105 | | | | 9.4 | % |
Mid Cap Growth Stock | | | 93,952 | | | | 24,463 | | | | - | | | | 107,037 | | | | - | | | | 348 | | | | 19,115 | | | | 9.7 | % |
Mid Cap Value | | | 93,373 | | | | 11,109 | | | | 3,400 | | | | 107,357 | | | | 474 | | | | 1,008 | | | | 8,501 | | | | 25.1 | % |
Small Cap Growth Stock | | | 33,065 | | | | 3,789 | | | | 2,000 | | | | 33,903 | | | | 230 | | | | - | | | | 3,789 | | | | 6.4 | % |
Small Cap Value | | | 31,892 | | | | 2,922 | | | | - | | | | 33,997 | | | | - | | | | 112 | | | | 810 | | | | 5.8 | % |
Research International Core | | | 159,107 | | | | 3,233 | | | | - | | | | 148,426 | | | | - | | | | 2,265 | | | | 968 | | | | 32.5 | % |
International Equity | | | 71,464 | | | | 6,082 | | | | - | | | | 65,172 | | | | - | | | | 1,344 | | | | 4,738 | | | | 4.0 | % |
Emerging Markets Equity | | | 19,638 | | | | 67 | | | | 9,000 | | | | 9,498 | | | | 424 | | | | 63 | | | | 4 | | | | 2.3 | % |
Select Bond | | | - | | | | 962,493 | (a) | | | 51,500 | | | | 919,300 | | | | 326 | | | | - | | | | - | | | | 32.3 | % |
High Yield Bond | | | - | | | | 138,167 | (a) | | | 7,000 | | | | 126,491 | | | | 114 | | | | - | | | | - | | | | 18.0 | % |
| | | | | | | | | | | | | | | | | | | | | | | | | | | | | | | | |
| | $ | 1,065,482 | | | $ | 1,193,714 | | | $ | 72,900 | | | $ | 2,172,396 | | | $ | 1,568 | | | $ | 9,307 | | | $ | 75,146 | | | | | |
| | | | | | | | | | | | | | | | | | | | | | | | | | | | | | | | |
Asset Allocation | | | | | | | | | | | | | | | | | | | | | | | | | | | | | | | | |
Growth Stock | | $ | 20,072 | | | $ | 2,127 | | | $ | - | | | $ | 21,884 | | | $ | - | | | $ | 124 | | | $ | 2,003 | | | | 2.5 | % |
Focused Appreciation | | | 9,850 | | | | 1,022 | | | | - | | | | 10,779 | | | | - | | | | 2 | | | | 1,020 | | | | 1.5 | % |
Large Cap Core Stock | | | 10,436 | | | | 1,148 | | | | - | | | | 11,329 | | | | - | | | | 164 | | | | 984 | | | | 2.0 | % |
Large Cap Blend | | | 10,476 | | | | 424 | | | | - | | | | 11,794 | | | | - | | | | 4 | | | | 420 | | | | 7.1 | % |
Large Company Value | | | 9,280 | | | | 500 | | | | - | | | | 10,489 | | | | - | | | | - | | | | 500 | | | | 5.5 | % |
Domestic Equity | | | 9,396 | | | | 172 | | | | - | | | | 10,700 | | | | - | | | | 172 | | | | - | | | | 1.7 | % |
Equity Income | | | 9,309 | | | | 406 | | | | - | | | | 10,001 | | | | - | | | | 120 | | | | 286 | | | | 1.3 | % |
Mid Cap Growth Stock | | | 12,467 | | | | 3,520 | | | | - | | | | 14,450 | | | | - | | | | 47 | | | | 2,573 | | | | 1.3 | % |
Mid Cap Value | | | 12,394 | | | | 1,681 | | | | 500 | | | | 14,415 | | | | 70 | | | | 136 | | | | 1,145 | | | | 3.4 | % |
Small Cap Growth Stock | | | 5,950 | | | | 682 | | | | 400 | | | | 6,060 | | | | 46 | | | | - | | | | 682 | | | | 1.1 | % |
Small Cap Value | | | 5,739 | | | | 566 | | | | - | | | | 6,159 | | | | - | | | | 20 | | | | 146 | | | | 1.1 | % |
Research International Core | | | 24,120 | | | | 490 | | | | - | | | | 22,501 | | | | - | | | | 343 | | | | 147 | | | | 4.9 | % |
International Equity | | | 10,840 | | | | 923 | | | | - | | | | 9,885 | | | | - | | | | 204 | | | | 719 | | | | 0.6 | % |
Emerging Markets Equity | | | 2,728 | | | | 11 | | | | 1,000 | | | | 1,568 | | | | 65 | | | | 10 | | | | 1 | | | | 0.4 | % |
Select Bond | | | - | | | | 62,181 | (a) | | | 4,100 | | | | 58,616 | | | | 26 | | | | - | | | | - | | | | 2.1 | % |
High Yield Bond | | | - | | | | 19,495 | (a) | | | - | | | | 18,817 | | | | - | | | | - | | | | - | | | | 2.7 | % |
| | | | | | | | | | | | | | | | | | | | | | | | | | | | | | | | |
| | $ | 153,057 | | | $ | 95,348 | | | $ | 6,000 | | | $ | 239,446 | | | $ | 207 | | | $ | 1,346 | | | $ | 10,626 | | | | | |
| | | | | | | | | | | | | | | | | | | | | | | | | | | | | | | | |
| (a) | Purchase was made by contributing securities to the affiliated portfolio on August 29, 2014. |
Note 12. Litigation
The Index 400 Stock, Index 500 Stock, Small Cap Value and Equity Income Portfolios are among the defendants in lawsuits and/or adversary proceedings (the “Actions”) arising out of investments made by those Portfolios in two separate companies. These Actions seek to recover all payments made to beneficial owners of common stock in 2007 in connection with leveraged buy-out transactions involving each company. The Actions allege no misconduct by the Portfolios or management, and management intends to vigorously defend these Actions. One of the lawsuits has been dismissed and is on appeal, and the remaining lawsuits are in the pleadings stage. The value of the proceeds received by these Portfolios in 2007, and the percentage the proceeds represent of each Portfolio’s net assets as of December 31, 2014, were: Index 400 Stock Portfolio $5,600,000 (0.86% of net assets); Index 500 Stock Portfolio $977,000 (0.05% of net assets); Small Cap Value Portfolio $618,000 (0.11% of net assets); and Equity Income Portfolio $2,873,000 (0.37% of net assets).
| | | | | | |
| | Notes to Financial Statements | | | 217 | |
Report of Independent Registered Public Accounting Firm
To the Board of Directors and Shareholders of
Northwestern Mutual Series Fund, Inc.
In our opinion, the accompanying statements of assets and liabilities, including the schedules of investments, and the related statements of operations, of changes in net assets, and of cash flows for the Long-Term U.S. Government Bond Portfolio and the financial highlights present fairly, in all material respects, the financial position of Growth Stock Portfolio, Focused Appreciation Portfolio, Large Cap Core Stock Portfolio, Large Cap Blend Portfolio, Index 500 Stock Portfolio, Large Company Value Portfolio, Domestic Equity Portfolio, Equity Income Portfolio, Mid Cap Growth Stock Portfolio, Index 400 Stock Portfolio, Mid Cap Value Portfolio, Small Cap Growth Stock Portfolio, Index 600 Stock Portfolio, Small Cap Value Portfolio, International Growth Portfolio, Research International Core Portfolio, International Equity Portfolio, Emerging Markets Equity Portfolio, Money Market Portfolio, Short-Term Bond Portfolio, Select Bond Portfolio, Long-Term U.S. Government Bond Portfolio, Inflation Protection Portfolio, High Yield Bond Portfolio, Multi-Sector Bond Portfolio, Balanced Portfolio and Asset Allocation Portfolio (constituting Northwestern Mutual Series Fund, Inc., hereafter referred to as the “Fund”) at December 31, 2014, the results of each of their operations for the year then ended, the changes in each of their net assets for each of the two years in the period then ended, the cash flows for the Long-Term U.S. Government Bond Portfolio for the year then ended and the financial highlights for each of the five years in the period then ended, in conformity with accounting principles generally accepted in the United States of America. These financial statements and financial highlights (hereafter referred to as “financial statements”) are the responsibility of the Fund’s management; our responsibility is to express an opinion on these financial statements based on our audits. We conducted our audits of these financial statements in accordance with the standards of the Public Company Accounting Oversight Board (United States). Those standards require that we plan and perform the audit to obtain reasonable assurance about whether the financial statements are free of material misstatement. An audit includes examining, on a test basis, evidence supporting the amounts and disclosures in the financial statements, assessing the accounting principles used and significant estimates made by management, and evaluating the overall financial statement presentation. We believe that our audits, which included confirmation of securities at December 31, 2014 by correspondence with the custodians and brokers, provide a reasonable basis for our opinion.

Milwaukee, WI
February 26, 2015
| | | | |
| 218 | | Report of Independent Registered Public Accounting Firm | | |
Proxy Voting and Portfolio Holdings
Proxy Voting Guidelines
A description of the policies and procedures that the Portfolios use to determine how to vote proxies relating to portfolio securities is available without charge, upon request, by calling toll free 1-888-455-2232. It is also available on the Securities and Exchange Commission’s website at http://www.sec.gov.
Information regarding how the Portfolios voted proxies relating to portfolio securities during the most recent twelve-month period ended June 30 is available without charge, upon request, by calling toll free 1-888-455-2232. It is also available on the Securities and Exchange Commission’s website at http://www.sec.gov.
Quarterly Filing of Portfolio Holdings
Each Portfolio files its complete schedule of portfolio holdings with the Securities and Exchange Commission (SEC) for the first and third quarters of each fiscal year on Form N-Q. The Portfolio’s Form N-Q filings are available (i) on the SEC website at http://www.sec.gov, and may be reviewed and copied at the SEC’s Public Reference Room in Washington, DC. Information on the Public Reference Room may be obtained by calling 1-800-SEC-0330. The Portfolios also make their complete schedule of portfolio holdings for the most recent quarter of their fiscal year available on the Internet at www.northwesternmutual.com.
| | | | | | |
| | Proxy Voting and Portfolio Holdings | | | 219 | |
Director and Officer Information (Unaudited)
Northwestern Mutual Series Fund, Inc.
The name, address and year of birth of the directors, as well as their affiliations, positions held with the Series Fund, principal occupations during the past five years and the number of portfolios overseen in the Northwestern Mutual fund complex, are shown below as of December 31, 2014. Each director (whenever elected) shall hold office until the next annual meeting of shareholders and until his or her successor is elected and qualifies or until his or her earlier death, resignation or removal. A director shall retire at the end of the calendar year in which the first of the two events occurs: (i) he or she attains the age of seventy-three (73), or (ii) he or she has served a term or successive terms totaling thirteen (13) years, commencing on the date of his or her election or appointment to the Board. The statement of additional information contains additional information about Series Fund directors and is available without charge, upon request, by calling 1-888-455-2232.
Independent Directors
| | | | | | | | |
Name, Address, and
Year of Birth | | Position | | Length of
Time Served | | Number of Portfolios
in Fund Complex
Overseen by Director | | Other Directorships Held |
| | | | |
Michael G. Smith 720 East Wisconsin Avenue Milwaukee, WI 53202 1944 | | Director | | Since 2003 | | 27 | | Trustee of The Ivy Family of Funds (2 registered investment companies – 35 portfolios), Director of the DBX Independence Funds, Inc. (5 portfolios), Director of CTMG, Inc. and Cox Business School, Southern Methodist University |
|
| Principal Occupation During Past 5 Years: Private investor; retired since 1999. |
| | | | |
Miriam M. Allison 720 East Wisconsin Avenue Milwaukee, WI 53202 1947 | | Director | | Since 2006 | | 27 | | Director of Wasatch Funds, Inc. (20 portfolios) |
|
Principal Occupation During Past 5 Years: Rancher since 2004. From 2001 to 2005, Chairman of UMB Fund Services, Inc. (formerly Sunstone Financial Group, Inc.), a mutual fund service provider. |
| | | | |
Robert H. Huffman III 720 East Wisconsin Avenue Milwaukee, WI 53202 1959 | | Director | | Since 2007 | | 27 | | None |
|
| Principal Occupation During Past 5 Years: Co-Founder and Managing Partner of Relative Value Partners, LLC, a registered investment adviser since 2004. |
| | | | |
Christy L. Brown 720 East Wisconsin Avenue Milwaukee, WI 53202 1965 | | Director | | Since 2012 | | 27 | | None |
|
Principal Occupation During Past 5 Years: Since October 2012, Chief Executive Officer, Girl Scouts of Wisconsin Southeast. From 2007 to 2012, Vice Chancellor, Finance and Administrative Affairs, University of Wisconsin, Milwaukee. |
| | | | |
| 220 | | Director and Officer Information | | |
Director and Officer Information (Unaudited)
| | | | | | | | |
Name, Address, and Year of Birth | | Position | | Length of
Time Served | | Number of Portfolios
in Fund Complex
Overseen by Director | | Other Directorships
Held |
| | | | |
Gail L. Hanson 720 East Wisconsin Avenue Milwaukee, WI 53202 1955 | | Director | | Since 2012 | | 27 | | Director of Artisan
Funds, Inc. (13
portfolios) |
|
Principal Occupation During Past 5 Years: Since February 2011, Senior Vice President and Chief Financial Officer, Aurora Health Care. Prior thereto, Deputy Executive Director, State of Wisconsin Investment Board. |
Other Directors
| | | | | | | | |
Name, Address, and
Year of Birth | | Position | | Length of
Time Served | | Number of Portfolios
in Fund Complex
Overseen by Director | | Other Directorships Held |
| | | | |
R. David Ells 720 East Wisconsin Avenue Milwaukee, WI 53202 1968 | | Chairman of the Board | | Since 2013 | | 27 | | None |
Principal Occupation During Past 5 Years: Since February 2013, Vice President of Northwestern Mutual and head of
Northwestern Mutual’s Investment Strategy Department. Prior thereto, Managing Director of Mason Street Advisors, LLC
(MSA) from 2010 to February 2013 and Director of MSA from 2004 to 2010.
Northwestern Mutual Series Fund, Inc.
Executive Officers
| | | | |
Name, Address, and
Year of Birth | | Position | | Length of
Time Served |
| | |
Kate M. Fleming 720 East Wisconsin Avenue Milwaukee, WI 53202 1962 | | President | | Since 2013 |
Principal Occupation During Past 5 Years: Vice President – Operations since 2004 and Treasurer since 2008 of Mason Street
Advisors, LLC. Effective January 1, 2015, President of Mason Street Advisors, LLC.
| | | | |
| | |
John C. Kelly
720 East Wisconsin Avenue
Milwaukee, WI 53202 1959 | | Vice President;
Chief Financial Officer & Treasurer | | Since 2014 |
Principal Occupation During Past 5 Years: Vice President and Controller of Northwestern Mutual since 2004.
| | | | |
| | |
Barbara E. Courtney
720 East Wisconsin Avenue
Milwaukee, WI 53202
1957 | | Controller &
Chief Accounting Officer | | Since 1996 |
Principal Occupation During Past 5 Years: Director of Mutual Fund Accounting of Northwestern Mutual since 2002.
| | | | | | |
| | Director and Officer Information | | | 221 | |
Director and Officer Information (Unaudited)
| | | | |
Name, Address, and
Year of Birth | | Position | | Length of
Time Served |
| | |
Randy M. Pavlick 720 East Wisconsin Avenue Milwaukee, WI 53202 1959 | | Chief Compliance Officer | | Since 2014 |
Principal Occupation During Past 5 Years: Chief Compliance Officer of Mason Street Advisors, LLC since 2014; from
2004 to 2014, Assistant General Counsel of Northwestern Mutual, Secretary of the Fund and Assistant Secretary of Mason Street Advisors, LLC.
| | | | |
| | |
Leslie H. McLinden
720 East Wisconsin Avenue
Milwaukee, WI 53202 1962 | | Secretary | | Since 2014 |
Principal Occupation During Past 5 Years: Assistant General Counsel of Northwestern Mutual since 2007, Secretary of the
Fund and Assistant Secretary of Mason Street Advisors, LLC, each since 2014.
| | | | |
| 222 | | Director and Officer Information | | |
Approval and Continuance of Investment
Sub-Advisory Agreements
Northwestern Mutual Series Fund, Inc.
Annual Contract Review Process
Under Section 15(c) of the Investment Company Act of 1940, as amended (the “1940 Act”), contracts for investment advisory services are required to be reviewed, evaluated and approved by a majority of an investment company’s independent directors each year. In addition, each investment company is required to disclose in its annual or semi-annual report, as applicable, the material factors and conclusions that formed the basis for the board’s approval or renewal of any investment advisory agreements within the investment company’s most recently completed fiscal half-year period.
At least annually, the Board of Directors (the “Board”) of Northwestern Mutual Series Fund, Inc. (the “Series Fund”) considers and votes upon the renewal of the investment sub-advisory agreements between Mason Street Advisors, LLC (“Mason Street Advisors”) and each of the sub-advisers of those portfolios of the Series Fund (each, a “Portfolio” and collectively, the “Portfolios”) for which Mason Street Advisors has appointed a sub-adviser. In order to afford the Board the opportunity to focus on a smaller number of relationships at any one meeting, the Board considers the annual continuation of the sub-advisory agreements on a staggered basis during the course of the year.
Board Approvals During the Six-Month Period Ended December 31, 2014
At its August 6, 2014 meeting, the Board, including the directors who are not “interested persons” (as that term is defined in the 1940 Act) of the Series Fund or Mason Street Advisors (“Independent Directors”), unanimously approved Investment Sub-Advisory Agreements between Mason Street Advisors and (1) Wells Capital Management, Inc. (“WellsCap”) relating to the Series Fund’s Select Bond Portfolio, (2) Federated Investment Management Company (“Federated”) relating to the Series Fund’s High Yield Bond Portfolio, (3) T. Rowe Price Associates, Inc. (“T. Rowe Price”) relating to the Series Fund’s Short-Term Bond Portfolio, and (4) BlackRock Advisors, LLC (“BlackRock”) relating to the Series Fund’s Money Market Portfolio (each, a “New Sub-Advisory Agreement” and collectively, the “New Sub-Advisory Agreements”). WellsCap, Federated, BlackRock and T. Rowe Price (with respect to the Short-Term Bond Portfolio) are sometimes collectively referred to hereinafter as the “New Sub-Advisers.”
Also at its August 6, 2014 meeting, the Board, including the Independent Directors), unanimously approved the continuance of (1) the Amended and Restated Investment Sub-Advisory Agreement between Mason Street Advisors and American Century Investment Management, Inc. (“ACI”) relating to the Series Fund’s Large Company Value, Inflation Protection and Mid Cap Value Portfolios and (2) the Restated Investment Sub-Advisory Agreement between Mason Street Advisors and Delaware Investments Fund Advisers, a series of Delaware Management Business Trust (“Delaware”) relating to the Series Fund’s Domestic Equity Portfolio. The Series Fund Board, including the Independent Directors, also unanimously approved the continuance, subject to the limitations discussed below, of the Second Amended and Restated Investment Sub-Advisory Agreement between Mason Street Advisors and Janus Capital Management LLC (“Janus”) relating to the Series Fund’s Focused Appreciation and International Growth Portfolios. At its November 20, 2014 meeting, the Board, including the Independent Directors, unanimously approved the continuance of (1) the Second Amended and Restated Investment Sub-Advisory Agreement between Mason Street Advisors and T. Rowe Price relating to the Series Fund’s Small Cap Value and Equity Income Portfolios and (2) the Amended and Restated Investment Sub-Advisory Agreement between Mason Street Advisors and Pacific Investment Management Company LLC (“PIMCO”) relating to the Series Fund’s Long-Term U.S. Government Bond and Multi-Sector Bond Portfolios. Janus, ACI, Delaware, PIMCO and T. Rowe Price (with respect to the Equity Income and Small Cap Value Portfolios) are sometimes collectively referred to hereinafter as the “Existing Sub-Advisers,” their respective sub-advised Portfolios are collectively referred to herein as the “Sub-Advised Portfolios” and the respective Investment Sub-Advisory Agreements with the Existing Sub-Advisers are collectively referred to herein as the “Existing Sub-Advisory Agreements.”
In determining whether to approve the New Sub-Advisory Agreements and the continuance of the Existing Sub-Advisory Agreements on behalf of the Series Fund, the Board requested and received detailed information from Mason Street Advisors, the New Sub-Advisers and the Existing Sub-Advisers in advance of each meeting to assist them in their evaluation, including information compiled by certain independent providers of evaluative data. With respect to the continuation of the Existing Sub-Advisory Agreements, while particular focus was given to an evaluation of the services, performance, fees, costs, and certain other relevant information under such Existing Sub-Advisory Agreements at the meeting at which their continuation is formally considered, the evaluation process with respect to the Existing Sub-Advisers and the nature, extent and quality of the
| | |
Approval and Continuance of Investment Sub-Advisory Agreements | | 223 |
Approval and Continuance of Investment
Sub-Advisory Agreements
services they provide to the Sub-Advised Portfolios, together with related information, is an ongoing one. As a result, the Board’s consideration of the nature, extent and quality of the services, and the performance, fees, expenses and other relevant factors was informed by information provided and deliberations that occurred at other meetings throughout the year.
The Independent Directors also received a memorandum from their counsel advising them of their responsibilities in connection with the approval of the New Sub-Advisory Agreements and the continuance of the Existing Sub-Advisory Agreements, and summarizing the legal standards governing the review and approval of these Agreements. The Independent Directors reviewed these standards with their counsel during the course of the meetings, including how these standards should be applied to the review of information relating to sub-advisers under the Series Fund’s manager of managers structure. During the course of their deliberations, the Independent Directors had the opportunity to meet privately without representatives of Mason Street Advisors and the Existing and New Sub-Advisers present, and were represented throughout the process by legal counsel.
Continuation of Existing Sub-Advisory Agreements
At its August 6, 2014 and November 20, 2014 meetings, the Series Fund Board, including the Independent Directors, unanimously approved the continuance of the Existing Sub-Advisory Agreements with respect to the Sub-Advised Portfolios. At the August 6, 2014 and November 20, 2014 meetings, the directors received a presentation from representatives of each Existing Sub-Adviser involved in the management of the respective Sub-Advised Portfolios. In addition to the information presented by and about the Existing Sub-Advisers during the course of the August 6, 2014 and November 20, 2014 meetings, the directors also had available for consideration each Existing Sub-Adviser’s Section 15(c) Report, which contained responses to the information request letter prepared by counsel to the Independent Directors requesting certain information from the Existing Sub-Advisers designed to assist the directors in fulfilling their responsibilities when considering the continuation of the Existing Sub-Advisory Agreements. The directors also had available Mason Street Advisors’ Executive Summary and Overview regarding each of the Existing Sub-Advisers and other materials prepared by Mason Street Advisors, which contained detailed information concerning the expenses, performance, brokerage commissions, portfolio turnover, style consistency and other factors with respect to each of the Sub-Advised Portfolios, as well as a recap of the Existing Sub-Advisers’ responses to the compliance questions contained in each of the Existing Sub-Adviser’s Section 15(c) Report and the observations of the Series Fund’s Chief Compliance Officer regarding the compliance structure and practices of each of the Existing Sub-Advisers. In addition to the information provided to them at the meetings by Mason Street Advisors and the Existing Sub-Advisers, the directors considered their experience with and knowledge of the nature and quality of the services provided by the Existing Sub-Advisers and their discussions with representatives of Mason Street Advisors, its affiliates and each Existing Sub-Adviser.
The material factors and conclusions that formed the basis for the Board’s approval of the continuance of each of the Existing Sub-Advisory Agreements with respect to each Existing Sub-Advised Portfolio include those discussed below. The directors evaluated a variety of information they deemed relevant on a Portfolio-by-Portfolio basis. No one particular factor was identified as determinative, but rather it was a combination of all the factors and conclusions that formed the basis for the determinations made by the directors, and different directors may have placed greater weight on certain factors than did other directors.
Nature, Extent and Quality of Services. In considering the nature, extent and quality of each Existing Sub-Adviser’s services, factors considered by the directors included the Existing Sub-Adviser’s overall business, organization and management structure. The directors also reviewed information provided by each Existing Sub-Adviser with respect to its financial condition and assets under management. Included in the directors’ consideration was an evaluation of the services provided by each Existing Sub-Adviser and the tenure and experience of the Existing Sub-Adviser’s investment personnel in general and the experience of the portfolio managers of each of the Sub-Advised Portfolios in particular, as well as changes in key personnel. In particular, the Board considered T. Rowe Price’s smooth transition to a new portfolio manager for the Small Cap Value Portfolio. The Board also considered T. Rowe Price’s succession plans with respect to the management of the Equity Income Portfolio in light of the upcoming retirement of the portfolio manager as well as the experience and qualifications of the retiring portfolio manager’s successor and his familiarity with the mandate. The Board noted favorably T. Rowe Price as an organization and its culture and the Series Fund’s long relationship with T. Rowe Price. The directors also considered each Existing Sub-Adviser’s investment philosophy and process and the scope of services provided by the Existing Sub-Advisers, and concluded that generally there had been no changes in the level of service provided. The directors considered information provided by ACI regarding the departure of a mid-cap analyst as well as ACI’s statement that the departure would not impact the services provided to the Mid Cap Value Portfolio. The directors also considered the investment strategies employed by the
| | | | |
| 224 | | Approval and Continuance of Investment Sub-Advisory Agreements | | |
Approval and Continuance of Investment
Sub-Advisory Agreements
Existing Sub-Advisers with respect to the Sub-Advised Portfolios, and in particular noted favorably the low portfolio turnover rate that resulted from Delaware’s investment strategy. Consideration was also given to each Existing Sub-Adviser’s reputation and experience in providing investment management services and the performance of each Sub-Advised Portfolio. Additionally, the directors considered other recent organizational and firm developments. In particular, the Board considered favorably the clarity of PIMCO’s presentation regarding internal changes at PIMCO and discussed positive developments as a result, including the return of certain investment personnel. The directors also considered that recent outflows at PIMCO were primarily related to strategies different from those used to manage the Long-Term U.S. Government and Multi-Sector Bond Portfolios.
Based on their review of these factors, their discussions with the Existing Sub-Advisers and their experience with the services provided by the Existing Sub-Advisers for the respective Sub-Advised Portfolios, other than as discussed below with respect to Janus under “Investment Performance”, the directors concluded, within the context of their overall determinations regarding the Existing Sub-Advisory Agreements, that they were satisfied with the nature, extent and quality of services provided by each Existing Sub-Adviser on behalf of the respective Sub-Advised Portfolio, and the resources committed by each Existing Sub-Adviser in providing those services.
Investment Performance. The directors reviewed the investment performance of each Existing Sub-Advised Portfolio over a variety of time periods. In addition to absolute performance and risk adjusted performance for each Existing Sub-Advised Portfolio for both short and long-term periods, the directors considered (i) a comparison of each Existing Sub-Advised Portfolio’s one-, three- and five-year (as applicable) performance to the returns of appropriate benchmarks and indices, and to the performance averages of each Existing Sub-Advised Portfolio’s respective Morningstar and Lipper categories for the same periods, (ii) the Morningstar overall star rating for each Portfolio (as applicable), and (iii) the Morningstar and the Lipper rankings for the one-, three- and five-year (as applicable) periods. The directors evaluated each Existing Sub-Advised Portfolio’s performance against these peer groups and industry benchmarks and indices, and viewed this information as providing an objective comparative benchmark against which they could assess the performance of each Sub-Advised Portfolio. The directors also considered the performance of accounts managed in a similar manner by each of the Existing Sub-Advisers, where available, and information from the Existing Sub-Advisers regarding any significant differences in the performance of those accounts from that of the Sub-Advised Portfolio in question. In connection with their evaluation of the performance of the Sub-Advised Portfolios, the directors also took into consideration the risk profile for each Sub-Advised Portfolio over the short and long term relative to its performance. The performance was considered in light of each Sub-Advised Portfolio’s investment objective and strategies as well as market conditions. In addition to performance information presented at the meeting, the directors considered the detailed performance information, market commentary, portfolio analysis and portfolio manager presentations they received periodically throughout the year. Generally speaking, while attentive to short term performance and what it might indicate, the directors gave greater weight to longer term performance.
With respect to the Portfolios sub-advised by ACI, the directors considered favorably the improved performance of the Large Cap Value Portfolio and the consistent performance of the Mid Cap Value and Inflation Protection Portfolios. With respect to the Domestic Equity Portfolio, the directors noted the strong performance under Delaware’s tenure as sub-adviser, as well as the low turnover rate that resulted from Delaware’s investment strategy. The directors also acknowledged the improved performance of the International Growth Portfolio. With respect to the Equity Income Portfolio and the Small Cap Value Portfolio, the Board acknowledged T. Rowe Price’s near-term underperformance but considered the Portfolio’s stronger long-term performance and expressed confidence in T. Rowe Price’s resources and ability as a firm, and their capability to improve performance going forward. With respect to the Portfolios sub-advised by PIMCO, the Board was satisfied with PIMCO’s performance in light of the recent major internal changes at the firm. With respect to the Board’s consideration of the continuation of the Existing Sub-Advisory Agreement with Janus relating to the Focused Appreciation, the Board considered the Portfolio’s lagging performance over a variety of periods, the frequent portfolio manager and investment process changes that the Portfolio had experienced during that time, as well as the investment style employed by the current portfolio manager. The Board expressed concern that Janus’ approach to improving the Portfolio’s performance was not likely to be successful. The Board also considered changes that had occurred at the management level of Janus and the potential impact of those changes on further service levels to the Portfolios sub-advised by Janus. Based on the foregoing considerations, the Board concluded that the Existing Sub-Advisory Agreement with Janus relating to the Focused Appreciation Portfolio should be continued only until such time as an orderly transition to a new sub-adviser could be accomplished.
The Board concluded that, in the totality of the circumstances and within the context of its overall determinations regarding the Existing Sub-Advisory Agreements, except as stated above with respect to Janus, the performance of each Sub-Advised Portfolio was within an acceptable range compared to benchmarks and/or peers to support the continuation of each Existing Sub-Advisory Agreement.
| | | | | | |
| | Approval and Continuance of Investment Sub-Advisory Agreements | | | 225 | |
Approval and Continuance of Investment
Sub-Advisory Agreements
Management Fees and Other Expenses. The directors evaluated the reasonableness of management fees and total expenses paid by the Sub-Advised Portfolios under the Existing Sub-Advisory Agreements. The directors considered the actual and contractual fees paid by each Sub-Advised Portfolio. The directors also considered the sub-advisory fees paid by Mason Street Advisers out of its management fee, including a comparison of those fees with fees charged by the Existing Sub-Advisers for similarly managed accounts. In considering the level of management fees, the directors also considered the size of each Sub-Advised Portfolio, expenses assumed by Mason Street Advisors, and the existing expense cap arrangements and/or advisory fee waivers agreed to by Mason Street Advisors with respect to each Sub-Advised Portfolio.
As part of their evaluation, the directors received and reviewed an independent analysis prepared by Lipper of comparative expense and performance data for each Sub-Advised Portfolio. Lipper provided data comparing each Portfolio’s net and total expenses and actual and contractual management expenses with those of a peer group of funds underlying variable insurance products, as well as a universe of funds underlying variable insurance products across each fund’s investment classification and objective, each as selected by Lipper. The directors considered the comparative data as a guide to help assess the reasonableness of each Portfolio’s expense ratio and management expenses. The directors noted that five of the ten Sub-Advised Portfolios were in the top two Lipper quartiles (meaning lowest expenses) of their respective peer universe for total expenses, for the period ended December 31, 2013. With respect to the Portfolios in Lipper’s third and fourth quartiles with respect to total expenses, the directors considered the nature of the expenses that had contributed to the total operating expenses and that an expense cap agreement was in place for each such Portfolio.
In evaluating the management fees paid by each Sub-Advised Portfolio on a stand-alone basis, and the fact that six of the Sub-Advised Portfolios were ranked in Lipper’s third or fourth quartile for actual management fees within their respective peer universe for the period ended December 31, 2013, the Board took into consideration that the management fees compensated Mason Street Advisors for a broader range of services than would often be the case under a typical investment management contract, in that Mason Street Advisors and its affiliates provided certain other administrative services necessary for the operation of the Sub-Advised Portfolios and the servicing of the Series Fund’s investors, including mutual fund accounting, legal and middle and back office investment operations services, corporate and regulatory reporting, service provider oversight and overall risk management. The directors concluded that as a result of these additional services, a comparison of Mason Street Advisors’ management fees to Lipper averages might not provide a complete frame of reference.
Based on their review of the above information and other factors deemed relevant by the directors, the directors concluded that the management fees and total expenses of each of the Sub-Advised Portfolios were reasonable in relation to the nature, scope and quality of services provided and the performance of the Sub-Advised Portfolios over time.
Costs and Profitability. The directors reviewed information provided by Mason Street Advisors regarding the profitability realized by Mason Street Advisors due to its relationship with the Sub-Advised Portfolios. The directors considered Mason Street Advisors’ quarterly presentation to the directors regarding Mason Street Advisors’ revenues, expenses, income and profit margins allocable to its services to the Sub-Advised Portfolios on an aggregate and a per Portfolio basis, and Mason Street Advisors’ allocation methodology with respect to the revenues and expenses. The profitability information presented for the directors’ consideration was supplemented by the aforementioned information regarding the range of peer expenses in each Sub-Advised Portfolio’s respective Lipper category and the ranking of each Sub-Advised Portfolio within the categories. The directors also considered the profitability information related to certain of the Sub-Advised Portfolios where such information had been provided. In all instances, including in those cases where profitability information had not been provided, the directors noted that the sub-advisory fees were the result of arm’s-length negotiations between Mason Street Advisors and the Existing Sub-Advisers. The directors also recognized that there are limitations inherent in allocating costs and calculating profitability for organizations such as the Existing Sub-Advisers, and that it is difficult to make comparisons of profitability among investment advisers because comparative information is not generally publicly available and, when available, such information had been developed using a variety of assumptions and other factors.
The directors considered certain fall-out benefits that may be realized by Mason Street Advisors and its affiliates due to their relationship with the Sub-Advised Portfolios, including the participation of fund families advised by certain Existing Sub-Advisers to the Sub-Advised Portfolios in affinity fund or select fund programs offered by an affiliate of Mason Street Advisors and the payment of fees by those entities to affiliates of Mason Street Advisors. The directors also reviewed information concerning the Sub-Advisers’ soft dollar arrangements and any other benefits to the Existing Sub-Advisers arising from their relationships with the Sub-Advised Portfolios.
| | | | |
| 226 | | Approval and Continuance of Investment Sub-Advisory Agreements | | |
Approval and Continuance of Investment
Sub-Advisory Agreements
The Board concluded, within the context of its overall determinations regarding the Existing Sub-Advisory Agreements, that the fees paid by each of the Sub-Advised Portfolios, and the profits realized by Mason Street Advisors and the Existing Sub-Advisers due to their relationships with the Sub-Advised Portfolios, were not excessive.
Economies of Scale. The directors also considered whether each Sub-Advised Portfolio’s expense structure permitted economies of scale to be shared with such Portfolio’s investors. The directors considered the breakpoints contained in all but two of the advisory fee schedules of the Sub-Advised Portfolios and the extent to which the Sub-Advised Portfolios may benefit from economies of scale through those breakpoints. With respect to the two Sub-Advised Portfolios for which breakpoints had not been established, the directors considered the investment advisory fee waiver agreement in place with respect to each such Portfolio which contained breakpoints as well as the expense limitation agreement that was in place with respect to each such Portfolio. The Board also acknowledged Mason Street Advisors’ ongoing efforts to seek fee concessions from each Existing Sub-Adviser, in particular with respect to the Multi-Sector Bond Portfolio, and the fee waiver agreement for the Multi-Sector Bond Portfolio that was put in place earlier in the year. The directors also considered the total assets of each Sub-Advised Portfolio and the expense ratios of the Sub-Advised Portfolios. Based on this information, the Board concluded, within the context of its overall determinations regarding the Existing Sub-Advisory Agreements, that each Sub-Advised Portfolio’s fee structure reflected appropriate economies of scale for the benefit of such Portfolio’s investors.
Other Information. The directors were presented with other information intended to assist them in their consideration of the continuation of the Existing Sub-Advisory Agreements, including information about the services provided by affiliates of Mason Street Advisors to the Sub-Advised Portfolios. The directors considered reports from Mason Street Advisors on its review of the respective compliance programs of the Existing Sub-Advisers, recent compliance exceptions noted, pending or recent litigation or regulatory actions to which a Existing Sub-Adviser or its affiliates may have been a party, and the applicable Existing Sub-Adviser’s response. Also considered were key affiliations and business relationships between the Existing Sub-Advisers and their affiliates and Mason Street Advisors’ parent company and its affiliates. Their review further included information relating to each Existing Sub-Adviser’s risk management infrastructure, information regarding portfolio manager compensation, brokerage and proxy voting practices, codes of ethics, business continuity and other matters.
Conclusions of the Directors. Based on a consideration of all information they deemed relevant in its totality, the Board, including the Independent Directors, and assisted by the advice of legal counsel independent of Mason Street Advisors, in the exercise of their reasonable business judgment concluded that it was in the best interest of each Sub-Advised Portfolio to approve the continuation of each of the Existing Sub-Advisory Agreements between Mason Street Advisors and the Existing Sub-Advisers for another year.
Approval of New Investment Sub-Advisory Agreements
At its August 6, 2014 meetings, the Board, including the Independent Directors, unanimously approved each of the New Sub-Advisory Agreements between Mason Street Advisors and the New Sub-Advisers, pursuant to which, respectively, WellsCap was appointed to serve as the sub-adviser for the Select Bond Portfolio, Federated was appointed to serve as the sub-adviser for the High Yield Bond Portfolio, T. Rowe Price was appointed to serve as the sub-adviser for the Short-Term Bond Portfolio and BlackRock was appointed to serve as the sub-adviser for the Money Market Portfolio, beginning October 31, 2014. Prior to that time, Mason Street Advisors managed the assets of each such Portfolio.
The material factors and conclusions that formed the basis for the Board’s determination to approve the New Sub-Advisory Agreements include those discussed below. In addition to the information provided to them in anticipation of and at the February 20, 2014, May 16, 2014 and August 5-6, 2014 meetings, the directors considered the in-person presentation from the New Sub-Advisers at the meeting on August 5-6, 2014, and the New Sub-Advisers’ responses to the directors’ questions during the meeting. The in-person presentation with the New Sub-Advisers and the other candidates considered by the Board were the culmination of an extensive process that began a number of months prior to the meeting at which the New Sub-Advisers were selected with the creation of a significant universe of prospects that all of the directors narrowed down over several meetings and a number of months to 2-3 finalists per mandate. The screening criteria used to select potential candidates for the mandate was extensive. In addition to the analysis and information compiled by Mason Street Advisors and presented at the Board’s meetings in February and May, the directors considered a detailed analysis conducted by Mason Street Advisors and provided to the directors at the August Board meeting. The analysis was designed to facilitate the Board’s review of the
| | | | | | |
| | Approval and Continuance of Investment Sub-Advisory Agreements | | | 227 | |
Approval and Continuance of Investment
Sub-Advisory Agreements
substantial amount of material that was available, and was based on Mason Street Advisor’s due diligence visits and interviews of, and review of the detailed information provided by, the candidates. Among other factors, the Board considered details of each candidate’s investment performance and risk/return profiles over various time periods, peer group ratings and rankings, representative holdings, key points of differentiation and competitive advantages, portfolio characteristics, mandate assets under management, investment personnel, process and strategies, proposed sub-advisory fees and breakpoints, the impact on Mason Street Advisors’ profitability, and other operational and enterprise issues. Also available for the directors’ consideration was Portfolio information regularly provided at Board meetings, including net expense ratio information, certain comparative peer group data, and other Portfolio information.
Also considered were reports received from Mason Street Advisors regarding its due diligence visits with each candidate, including the New Sub-Advisers. The due diligence reports were based on the candidate’s responses to the requests for proposals as well as interviews with compliance and/or legal representatives of each candidate. The proposals included information about each candidate’s compliance structure, compliance policies and procedures, trade execution practices and receipt of research or other benefits, trading policies and procedures, codes of ethics and proxy voting procedures, recent SEC exams, pricing practices, derivatives practices, to the extent applicable, information about material business relationships with Northwestern Mutual, if any, and other matters. The directors also had available for consideration each candidate’s responses to the investment, compliance and operations requests for proposals. In addition to written materials, the directors considered in-person interviews with each candidate to have been of particular assistance in gaining an understanding of the candidates’ investment philosophies and portfolio construction processes. No one particular factor was identified as controlling, but rather it was a combination of all the factors and conclusions that formed the basis for the determinations made by the directors.
Nature, Extent and Quality of Services. The directors evaluated the nature, scope, extent and quality of services to be provided by WellsCap with respect to the Select Bond Portfolio, Federated with respect to the High Yield Bond Portfolio, T. Rowe with respect to the Short-Term Bond Portfolio, and BlackRock with respect to the Money Market Portfolio. The directors considered the extensive process followed to identify potential sub-advisers for each Portfolio, as well as observations and analysis of the candidates provided by Mason Street Advisors. The directors also considered the breadth and depth of experience of the New Sub-Advisers in managing accounts, including accounts for other mutual funds, using similar investment strategies. The directors’ consideration included information about each of the New Sub-Adviser’s organization and ownership structure, and the tenure, experience and performance of the firm’s investment management team. In addition, the directors considered the in-person presentation by the New Sub-Advisers, including the firm’s description of its investment process.
In particular, with respect to WellsCap, the directors considered whether the various investment strategies employed by the candidates for the Select Bond Portfolio’s mandate were consistent with the current core investment strategy of the Portfolio. The directors noted that while each of the potential sub-advisers were strong candidates, each employed a different strategy. The Board considered favorably WellsCap’s consistent and straight-forward investment process and long-tenured investment management team. Some concern was also expressed over the apparent reliance by one candidate on a single, long tenured manager for the mandate. The relative sizes of the candidates’ respective mandates was specifically considered by the directors, including possibly that mandate size might impact liquidity and portfolio turnover. While the directors considered the investment strategy employed by WellsCap to be most favorable compared to the other candidates, they noted and discussed the elevated portfolio turnover rate that the strategy seemed to produce and weighed that factor against other factors, such as performance.
With respect to Federated, the directors considered Federated and another candidate for the High Yield Bond Portfolio to be particularly strong and noted that their respective investment styles shared a number of similar qualities. However, the directors observed the particularly strong fundamental research aspect of Federated’s investment strategy and noted the mandate’s high Morningstar ranking. The relative merits of each candidate’s investment personnel were also discussed. The directors considered Federated’s strong investment team and also observed that Federated had a strong transition plan in place with respect to its portfolio management team. The directors also considered the role of the high yield mandate within Northwestern Mutual’s asset allocation models in evaluating the candidates.
With respect to T. Rowe Price, the directors compared and contrasted the investment strategies employed by T. Rowe Price and the other candidate, and considered information about each candidate’s standard deviation, beta and duration contained in the materials. It was observed that the investment parameters employed by T. Rowe Price most closely resembled those currently in place for the Portfolio. The directors observed that consistency of performance and protection of principal were particularly important for this Portfolio, and concluded that T. Rowe Price’s strategy was more likely to result in consistent performance with lower volatility. The directors also commented favorably on the amount invested by T. Rowe Price’s portfolio managers in its mandate.
| | | | |
| 228 | | Approval and Continuance of Investment Sub-Advisory Agreements | | |
Approval and Continuance of Investment
Sub-Advisory Agreements
With respect to BlackRock, the directors viewed favorably the depth of BlackRock’s credit research capabilities and the strength of its compliance function and, particularly, its use of internally developed infrastructure and systems. In addition, the directors considered favorably BlackRock’s expressed willingness to support the Series Fund’s extensive pricing efforts and its robust stress testing procedures. The directors considered and discussed concerns they had with the other candidate based on the candidate’s recent presentation to the Board and certain directors’ past experience with the candidate.
Finally, the directors took into consideration each of the New Sub-Adviser’s general reputation and the resources available to be committed in managing the respective Portfolio, and in particular with respect to the Money Market Portfolio, BlackRock’s commitment to the money market fund product line. Based on their review of these factors and other factors deemed relevant, the directors concluded that they were satisfied with the nature, extent and quality of the services to be provided by the New Sub-Advisers with respect to the Portfolios, and the resources to be committed by each New Sub-Adviser in providing such services.
Investment Performance. Because the New Sub-Advisers are newly appointed sub-advisers, the directors, at the meeting, could not consider the New Sub-Advisers’ respective investment performance in managing the Portfolios as a factor in evaluating the New Sub-Advisory Agreements. However, the directors considered each New Sub-Adviser’s performance record for a composite of other accounts, including mutual fund accounts, with investment objectives, investment policies and investment strategies substantially similar to the Portfolio to be managed by the New Sub-Adviser. The directors considered absolute performance and risk adjusted performance (based on, among other things, standard deviation, information ratio and tracking errors) for these similar accounts for both short and long-term periods. The directors also evaluated the similar accounts’ relative performance versus the appropriate index and considered independent Morningstar rankings and ratings of the candidates to provide an objective comparative benchmark against which they could assess the experience and ability of the candidates in managing similar accounts. The directors also took into consideration information presented to them regarding the composition of porfolios managed by the candidates in a similar mandate, including (as applicable) sector and industry allocation, portfolio turnover, maturity, duration, credit quality, weighted average maturity and weighted average life, among other things.
With respect to the consideration of candidates for the Select Bond Portfolio, the directors noted favorably the consistency of WellsCap’s long term performance in contrast to the performance volatility of other candidates. With respect to the consideration of candidates for the High Yield Bond Portfolio, the directors observed that Federated and one of the other candidates experienced a negative information ratio over the longer term, but observed that Federated’s strategy appeared to provide superior protection in down markets. With respect to another candidate for the High Yield Bond Portfolio, the directors noted that candidate’s mandate had higher beta and performance volatility as compared to Federated. With respect to the consideration of candidates for the Short-Term Bond Portfolio, the directors considered at length the performance of T. Rowe Price and the other candidate, focusing in particular on performance during the 2008-2009 period and what under- or over-performance during that period suggested about each candidate’s strategy. The directors noted that while the other candidate achieved strong performance results, a portion of its performance was achieved through investments in lower rated securities. The directors expressed concern about the additional risk and volatility that could result from that strategy, particularly for a short-term fund. They viewed more favorably the consistent performance with lower volatility that would likely result from T. Rowe Price’s strategy. With respect to the consideration of candidates for the Money Market Portfolio, while the directors considered the performance information provided throughout the selection process, they focused more heavily on the candidates’ respective investment processes and other services in light of the nature of money market portfolios in the current economic environment.
Based on these and other factors deemed relevant, the directors concluded that they were satisfied with the experience and capabilities of each New Sub-Adviser and the personnel to be associated with the Portfolios.
Management Fees and Other Expenses. In evaluating the management fees paid by each Portfolio, the directors considered the contractual fees and applicable breakpoints, if any, paid by the Portfolio under the Advisory Agreement between Mason Street Advisors and the Series Fund with respect to the Portfolios. The directors also considered the sub-advisory fees and applicable breakpoints to be paid by Mason Street Advisors to each New Sub-Adviser out of its management fee. The directors also separately considered the proposed allocation between Mason Street Advisors and each New Sub-Adviser of the respective Portfolio’s investment advisory fee (i.e., the amount of the advisory fee retained by Mason Street Advisors relative to that paid to the New Sub-Adviser as a sub-advisory fee). They determined that the allocation was reasonable in light of the nature, scope and quality of services to be provided and was the product of an arm’s length negotiation between Mason Street Advisors and each New Sub-Adviser.
| | | | | | |
| | Approval and Continuance of Investment Sub-Advisory Agreements | | | 229 | |
Approval and Continuance of Investment
Sub-Advisory Agreements
The directors did not consider the management fees charged to other Mason Street Advisors’ clients as particularly relevant, because substantially all of those accounts were managed for affiliates of Mason Street Advisors and, as such, those accounts were priced based on different factors and considerations and, generally, had investment objectives and policies different than those of the Portfolio.
In considering the level of management fees, the directors also considered the structure, size, and total operating expenses of each Portfolio. With respect to the Money Market, Short-Term Bond and High Yield Bond Portfolios, the directors also considered the existing fee waiver arrangements in place for each such Portfolio as well as the expense limitation agreement in place for the Short-Term Bond Portfolio. With respect to the Select Bond Portfolio, the directors considered information about how the Portfolio’s expenses compared to the range of Lipper expense breakpoint levels. Based on their review of the management and other expenses, comparative data and other factors deemed relevant by the directors, the directors concluded that the management fees and total operating expenses of each Portfolio were reasonable in relation to the nature, scope and quality of the services to be provided.
Costs and Profitability. The directors also considered Mason Street Advisors’ pricing methodology for its services as investment adviser for the products of which the Portfolios were an investment option. Also considered was the financial condition of Mason Street Advisors and information concerning Mason Street Advisors’ costs and profitability with respect to its relationship with the Portfolios in general as well as in light of the sub-advisory fees negotiated with each New Sub-Adviser. Mason Street Advisors provided a profitability analysis for each Portfolio that included the expense allocation methodology used, net income for the Portfolio and net and gross profit margins for the Portfolio. In connection with its review of the profitability of Mason Street Advisors’ services to the Portfolios, the directors also considered services provided by affiliates of Mason Street Advisors.
The directors recognized that there are limitations inherent in allocating costs and calculating profitability for an organization such as Mason Street Advisors, and that it is difficult to make comparisons of profitability among investment advisers and clients because comparative information is not generally publicly available and, when available, such information has been developed using a variety of assumptions and other factors. Based on their review of the profitability analysis for each Portfolio, the directors concluded that they were satisfied that Mason Street Advisors’ level of profitability from its relationship with the Portfolios was not excessive.
Economies of Scale. The directors considered whether each Portfolio’s expense structure permitted economies of scale to be shared with the Portfolio’s investors. They also took into consideration the total assets and expense ratios of each Portfolio. With respect to the Select Bond Portfolio in particular, information provided to the directors showed that the Portfolio’s total expenses are close to the lowest relative to the total expenses of the Portfolio’s peer group as determined by Lipper. With respect to the Short-Term Bond and High Yield Bond Portfolios, the directors considered the breakpoints contained in the fee schedules for each Portfolio and the extent to which those Portfolios may benefit from economies of scale through those breakpoints. The directors also considered the fee waiver agreements in place for the Short-Term Bond, High Yield Bond, and Money Market Portfolios, as well as the expense limitation agreement in place for the Short-Term Bond Portfolio. Based on this information, the Board concluded that each Portfolio’s fee structure reflected appropriate economies of scale between the Portfolio and Mason Street Advisors.
Other Information. The directors were presented with other information intended to assist them in their consideration of the approval of the New Sub-Advisory Agreements, including information regarding each New Sub-Adviser’s risk management structure, any pending or recent litigation or regulatory actions to which the New Sub-Adviser or its affiliates may have been a party, and responses to those actions. The directors also received information regarding business continuity and portfolio manager compensation.
Conclusions of the Directors. Based on a consideration of all information they deemed relevant in its totality, the Board, including the Independent Directors, and assisted by the advice of legal counsel independent of Mason Street Advisors, in the exercise of its business judgment concluded that it was in the best interest of the Select Bond Portfolio to approve the New Sub-Advisory Agreement between Mason Street Advisors and WellsCap, it was in the best interest of the High Yield Bond Portfolio to approve the New Sub-Advisory Agreement between Mason Street Advisors and Federated, it was in the best interest of the Short-Term Bond Portfolio to approve the New Sub-Advisory Agreement between Mason Street Advisors and T. Rowe Price, and it was in the best interest of the Money Market Portfolio to approve the New Sub-Advisory Agreement between Mason Street Advisors and BlackRock.
| | | | |
| 230 | | Approval and Continuance of Investment Sub-Advisory Agreements | | |
REPORT ON FORM N-CSR
RESPONSES FOR NORTHWESTERN MUTUAL SERIES FUND, INC.
As of the end of the period covered by this report, the Registrant has adopted a code of ethics that applies to the Registrant’s principal executive officer, principal financial officer and principal accounting officer or controller.
| Item 3. | Audit Committee Financial Expert |
The Registrant’s board of directors has determined that the Registrant has three audit committee financial experts serving on its audit committee. The names of the audit committee financial experts are Miriam M. Allison, Gail L. Hanson and Michael G. Smith. Each of the audit committee financial experts is independent.
| Item 4. | Principal Accountant Fees and Services |
| | | | | | | | |
(a) Audit Fees | | | | | | | | |
| | |
Audit Fees and Expenses of Registrant | | | | | | | | |
| | |
| | | 2013
| | | 2014
| |
| | | $ | 661,770 | | | $ | 688,000 | |
| | |
(b) Audit Related Fees | | | | | | | | |
| | |
Audit-Related Fees and Expenses of Registrant | | | | | | | | |
| | |
| | | 2013
| | | 2014
| |
| | | $ | 0 | | | $ | 0 | |
| | |
(c) Tax Fees | | | | | | | | |
| | |
| | | 2013
| | | 2014
| |
| | | $ | 82,965 | | | $ | 75,955 | |
| | |
Review of dividend declarations | | | | | | | | |
Review of excise tax calculations | | | | | | | | |
Non-U.S. tax compliance | | | | | | | | |
| | |
(d) All Other Fees | | | | | | | | |
| | |
| | | 2013
| | | 2014
| |
| | | $ | 0 | | | $ | 0 | |
(e)(1) It is the audit committee’s policy to pre-approve all audit and non-audit service engagements for the Registrant; and any non-audit service engagement of the Registrant’s auditor by (1) the Registrant’s investment adviser and (2) any other entity in a control relationship with the investment adviser that provides ongoing services to the Registrant if, in each of (1) and (2) above, the non-audit service engagement relates directly to the operations and financial reporting of the Registrant. (2) Not applicable.
(f) Not applicable.
| | | | | | | | |
(g) Aggregate non-audit fees of Registrant and related service providers | | | | | | | | |
| | |
| | | 2013
| | | 2014
| |
| | | $ | 193,305 | | | $ | 145,105 | |
(h) The Registrant’s audit committee has considered whether the auditor’s provision of non-audit services to the Registrant’s related service providers is compatible with the auditor’s independence.
| Item 5. | Audit Committee of Listed Registrants |
Not applicable.
| Item 6. | Schedule of Investments |
Full Schedule of Investments is included in Item 1.
| Item 7. | Disclosure of Proxy Voting Policies and Procedures for Closed-End Management Investment Companies |
Not applicable.
| Item 8. | Portfolio Managers of Closed-End Management Investment Companies |
Not applicable.
| Item 9. | Purchases of Equity Securities by Closed-End Management Investment Company and Affiliated Purchasers |
Not applicable.
| Item 10. | Submission of Matters to a Vote of Security Holders |
Not applicable.
| Item 11. | Disclosure Controls and Procedures |
(a) The Registrant’s Principal Executive Officer and Principal Financial Officer have evaluated the Registrant’s disclosure controls and procedures within 90 days of this filing and have concluded that the Registrant’s disclosure controls and procedures were effective, as of that date, in ensuring that information required to be disclosed by the Registrant in this filing was recorded, processed, summarized, and reported timely.
(b) There was no change in the Registrant’s internal control over financial reporting (as defined in Rule 30a-3(d) under the Investment Company Act of 1940) that occurred during the Registrant’s last fiscal half-year that has materially affected, or is reasonably likely to materially affect, the Registrant’s internal control over financial reporting.
(a)(1) The code of ethics referred to in the response to Item 2 above is attached as exhibit EX-99.12(a)(1).
(a)(2) Separate certifications for the Registrant’s principal executive officer and principal financial officer, as required by Section 302 of the Sarbanes-Oxley Act of 2002 and Rule 30a-2(a) under the Investment Company Act of 1940, are attached as exhibit EX-99.CERT.
(b) Separate certifications for the Registrant’s principal executive officer and principal financial officer, as required by 18 U.S.C. Section 1350, as adopted pursuant to Section 906 of the Sarbanes-Oxley Act of 2002, and Rule 30a-2(b) under the Investment Company Act of 1940, are attached as exhibit EX-99.906CERT. The certifications furnished pursuant to this paragraph are not deemed to be “filed” for purposes of Section 18 of the Securities Exchange Act of 1934, or otherwise subject to the liability of that section. Such certifications are not deemed to be incorporated by reference into any filing under the Securities Act of 1933 or the Securities Exchange Act of 1934, except to the extent that the Registrant specifically incorporates them by reference.
Pursuant to the requirements of the Securities Exchange Act of 1934 and the Investment Company Act of 1940, the Registrant has duly caused this report to be signed on its behalf by the undersigned, thereunto duly authorized.
NORTHWESTERN MUTUAL SERIES FUND, INC.
| | |
| By: | | /s/ Kate M. Fleming
|
| | | Kate M. Fleming, President |
|
| Date: February 17, 2015 |
| | |
| |
| By: | | /s/ John C. Kelly
|
| | | John C. Kelly, Vice-President, |
| | | Chief Financial Officer and |
| | | Treasurer |
|
| Date: February 17, 2015 |
