UNITED STATES
SECURITIES AND EXCHANGE COMMISSION
Washington, D.C. 20549
FORM N-CSR
CERTIFIED SHAREHOLDER REPORT OF REGISTERED
MANAGEMENT INVESTMENT COMPANIES
Investment Company Act file number 811-3990
Northwestern Mutual Series Fund, Inc.
(Exact name of registrant as specified in charter)
720 East Wisconsin Avenue,
Milwaukee Wisconsin 53202
(Address of principal executive offices) (Zip code)
Barbara E. Courtney, Controller and Chief Accounting Officer Northwestern Mutual Series Fund, Inc.
(Name and address of agent for service)
Registrant’s telephone number, including area code: 414-271-1444
Date of fiscal year end: December 31
Date of reporting period: December 31, 2017
Form N-CSR is to be used by management investment companies to file reports with the Commission not later than 10 days after the transmission to stockholders of any report that is required to be transmitted to stockholders under Rule 30e-1 under the Investment Company Act of 1940 (17 CFR 270.30e-1). The Commission may use the information provided on Form N-CSR in its regulatory, disclosure review, inspection, and policymaking roles.
A registrant is required to disclose the information specified by Form N-CSR, and the Commission will make this information public. A registrant is not required to respond to the collection of information contained in Form N-CSR unless the Form displays a currently valid Office of Management and Budget (“OMB”) control number. Please direct comments concerning the accuracy of the information collection burden estimate and any suggestions for reducing the burden to Secretary, Securities and Exchange Commission, 450 Fifth Street, NW, Washington, DC 20549-0609. The OMB has reviewed this collection of information under the clearance requirements of 44 U.S.C. § 3507.
| Item 1. | Reports to Stockholders |
Annual Report December 31, 2017
Northwestern Mutual Series Fund, Inc.
A Series Fund Offering 27 Portfolios
| | · | | Focused Appreciation Portfolio |
| | · | | Large Cap Core Stock Portfolio |
| | · | | Large Cap Blend Portfolio |
| | · | | Index 500 Stock Portfolio |
| | · | | Large Company Value Portfolio |
| | · | | Domestic Equity Portfolio |
| | · | | Equity Income Portfolio |
| | · | | Mid Cap Growth Stock Portfolio |
| | · | | Index 400 Stock Portfolio |
| | · | | Mid Cap Value Portfolio |
| | · | | Small Cap Growth Stock Portfolio |
| | · | | Index 600 Stock Portfolio |
| | · | | Small Cap Value Portfolio |
| | · | | International Growth Portfolio |
| | · | | Research International Core Portfolio |
| | · | | International Equity Portfolio |
| | · | | Emerging Markets Equity Portfolio |
| | · | | Government Money Market Portfolio |
| | · | | Short-Term Bond Portfolio |
| | · | | Long-Term U.S. Government Bond Portfolio |
| | · | | Inflation Protection Portfolio |
| | · | | High Yield Bond Portfolio |
| | · | | Multi-Sector Bond Portfolio |
| | · | | Asset Allocation Portfolio |
Letter to Contract Holders
December 31, 2017
As 2017 came to a close, the second longest U.S. bull market since 1929 approached its ninth year. The S&P 500 reached all-time highs and posted a positive return in every single month of the year. Volatility remained muted, as business and consumer confidence showed continued improvement throughout the year.
Within the U.S. equity market, the largest of the large capitalization stocks led the broader market, which helped the large cap S&P 500® Index1 outperform the MidCap 400® Index and SmallCap S&P 600® Index. International stocks outperformed domestic stocks, driven by improving global trade and solid economic growth in most nations. In particular, emerging markets posted robust returns, as increased business activity encouraged investors to embrace risk in developing nations.
The bond market, as defined by various Barclays® Indices, delivered a relatively modest positive return by historical standards. In 2017, intermediate and longer-term interest rates remained constrained due to accommodating monetary policies of the world’s central banks and a benign inflation outlook throughout the year.
High yield corporate bonds led the bond market once again, followed by strong performance from high quality corporate bonds. Lower risk and lower yield government debt lagged the higher yielding sectors of the bond market. Nevertheless, all of the major sectors of the bond market managed to post positive returns in 2017.
The U.S. dollar declined steadily during the year, which helped international investment returns, as well as exporters in the U.S. For U.S. investors, a rising dollar decreases the return of foreign investments, while a declining dollar increases the return of foreign investments.
The U.S. economy grew at a 3% pace during the second half of the year, its fastest pace in more than three years. Virtually every segment of the economy, from the manufacturing and industrial sectors to science and technology, experienced sustained growth. The uptick in U.S. economic growth began in early 2016, paused during the election season, and continued to strengthen thereafter, buoyed by improving global growth and hopes that the new administration would enact market-friendly policies.
Synchronized and sustained global growth for the first time since the financial crisis underpinned the optimistic outlook during the year. China’s growth stabilized after a six-year decline, which boosted economies throughout Asia, while Europe and Japan displayed green shoots after several years of weak growth and unprecedented monetary stimulus. Tensions between the U.S. and North Korea raised concerns, while the election results in France, the Netherlands and Australia were generally positive for markets.
In the strong economic environment of 2017, the U.S. Federal Reserve (the “Fed”) sought to normalize monetary policy by reversing some of the extraordinary measures taken over the last several years in response to the 2008 financial crisis. The Fed increased interest rates by 0.25% three times during 2017, to a range of 1.25% to 1.50%, as inflation approached the Fed’s target of 2.0%. In October, the Fed began to reduce its $4 trillion dollar balance sheet by announcing $10 billion in monthly bond sales and plans to gradually increase sales going forward. While the Fed’s announcement was highly anticipated, it marked the end of a ten-year battle against deflation and the beginning of a challenging new era of normalizing monetary policy.
Consumer prices rose approximately 2.0% for the year, putting inflation well below its long-term average. Nevertheless, the annual inflation rate increased from -0.1% in April 2015 to a recent high of 2.7% in February 2017, and inflationary pressures continue to build in the labor market. The U.S. economy created more than 2 million jobs in each of the last six years, which drove the unemployment rate down to 4.1% at the end of 2017. With wages already growing at a 3% annual pace, the strong demand for labor has the potential to drive wages and inflation higher as we move into 2018.
Nine years of strong equity returns and the potential for rising inflation are good reminders for investors to review their financial plans and make sure the risks and potential returns of their investment portfolio are consistent with those plans. Similar to all financial decisions, an investor should approach the reallocating or rebalancing of their investment portfolio with the guidance of a financial professional, to pinpoint the appropriate allocation for their current financial situation and overall financial plan. As always, we encourage you to work closely with your Northwestern Mutual financial professional to navigate the financial markets in 2018, as they can help you develop and adhere to a plan that will be guided by your long-term goals, rather than the short-term fluctuations of the market.

Kate M. Fleming
President of Northwestern Mutual Series Fund, Inc.
1 All indices and/or benchmarks referenced are unmanaged and cannot be invested in directly.
2 A strategy involving portfolio rebalancing cannot assure a profit or protect against loss in a declining market. Not intended to be investment advice.
Northwestern Mutual Series Fund, Inc.
Table of Contents
Mason Street Advisors, LLC (“Mason Street Advisors”), adviser to the Northwestern Mutual Series Fund, Inc., is a wholly owned subsidiary of The Northwestern Mutual Life Insurance Company. Mason Street Advisors is the principal investment adviser for all the Portfolios of the Northwestern Mutual Series Fund, Inc., and has engaged and oversees sub-advisers who provide day-to-day management for certain of the Portfolios. Each sub-adviser may be replaced without the approval of shareholders. Please see the Series Fund prospectus for more information.
The views expressed in the portfolio manager commentaries set forth in the following pages reflect those of the portfolio managers only through the end of the period covered by this report and do not necessarily represent the views of any affiliated organization. The views expressed are not guarantees of future performance or economic results and involve certain risks, uncertainties and assumptions that could cause actual outcomes and results to differ materially from the views expressed herein. These views are subject to change at any time based upon market conditions or other events and should not be relied upon as investment advice. Mason Street Advisors disclaims any responsibility to update these views.
Expense Examples (unaudited)
Example
As a shareholder of each Portfolio, you incur two types of costs: (1) transaction costs and (2) ongoing costs, including management fees and other Portfolio expenses. This Example is intended to help you understand your ongoing costs (in dollars) of investing in the Portfolios and to compare these costs with the ongoing costs of investing in other mutual funds.
The Example is based on an investment of $1,000 invested at the beginning of the period and held for the entire period (July 1, 2017 to December 31, 2017).
Actual Expenses
The first line of the table below provides information about actual account values and actual expenses. You may use the information in this line, together with the amount you invested, to estimate the expenses that you paid over the period. Simply divide your account value by $1,000 (for example, an $8,600 account value divided by $1,000 = 8.6), then multiply the result by the number in the first line under the heading entitled “Expenses Paid During Period” to estimate the expenses you paid on your account during this period.
Hypothetical Example for Comparison Purposes
The second line of the table below for each Portfolio provides information about hypothetical account values and hypothetical expenses based on each Portfolio’s actual expense ratio and an assumed rate of return of 5% per year before expenses, which is not the Portfolio’s actual return. The hypothetical account values and expenses may not be used to estimate the actual ending account balance or expenses you paid for the period. You may use this information to compare the ongoing costs of investing in a Portfolio and other funds. To do so, compare this 5% hypothetical example with the 5% hypothetical examples that appear in the shareholder reports of the other funds.
Please note that the expenses shown in the table are meant to highlight your ongoing costs only and do not reflect any transactional costs or separate account charges. Therefore, the second line of the table is useful in comparing ongoing costs only, and will not help you determine the relative total costs of owning different funds. In addition, if these transactional costs or separate account charges were included, your costs would have been higher.
| | | | | | | | | | | | | | | | |
| | | Beginning Account Value
July 1, 2017 | | | Ending Account Value
December 31, 2017 | | | Expenses Paid During
Period July 1, 2017 to
December 31, 2017* | | | Annualized
Expense Ratio | |
| | | | |
Growth Stock Portfolio | | | | | | | | | | | | | | | | |
Actual | | | $1,000.00 | | | | $1,109.79 | | | | $2.23 | | | | 0.42 | % |
Hypothetical (5% return before expenses) | | | 1,000.00 | | | | 1,023.09 | | | | 2.14 | | | | 0.42 | |
| | | | |
Focused Appreciation Portfolio | | | | | | | | | | | | | | | | |
Actual | | | 1,000.00 | | | | 1,131.28 | | | | 3.38 | | | | 0.63 | |
Hypothetical (5% return before expenses) | | | 1,000.00 | | | | 1,022.03 | | | | 3.21 | | | | 0.63 | |
| | | | |
Large Cap Core Stock Portfolio | | | | | | | | | | | | | | | | |
Actual | | | 1,000.00 | | | | 1,109.56 | | | | 2.34 | | | | 0.44 | |
Hypothetical (5% return before expenses) | | | 1,000.00 | | | | 1,022.99 | | | | 2.24 | | | | 0.44 | |
| | | | |
Large Cap Blend Portfolio | | | | | | | | | | | | | | | | |
Actual | | | 1,000.00 | | | | 1,097.27 | | | | 4.28 | | | | 0.81 | |
Hypothetical (5% return before expenses) | | | 1,000.00 | | | | 1,021.12 | | | | 4.13 | | | | 0.81 | |
| | | | |
Index 500 Stock Portfolio | | | | | | | | | | | | | | | | |
Actual | | | 1,000.00 | | | | 1,112.96 | | | | 1.12 | | | | 0.21 | |
Hypothetical (5% return before expenses) | | | 1,000.00 | | | | 1,024.15 | | | | 1.07 | | | | 0.21 | |
Expense Examples (unaudited)
| | | | | | | | | | | | | | | | |
| | | Beginning Account Value
July 1, 2017 | | | Ending Account Value
December 31, 2017 | | | Expenses Paid During
Period July 1, 2017 to
December 31, 2017* | | | Annualized
Expense Ratio | |
| | | | |
Large Company Value Portfolio | | | | | | | | | | | | | | | | |
Actual | | | 1,000.00 | | | | 1,061.95 | | | | 3.85 | | | | 0.74 | |
Hypothetical (5% return before expenses) | | | 1,000.00 | | | | 1,021.48 | | | | 3.77 | | | | 0.74 | |
| | | | |
Domestic Equity Portfolio | | | | | | | | | | | | | | | | |
Actual | | | 1,000.00 | | | | 1,106.09 | | | | 2.87 | | | | 0.54 | |
Hypothetical (5% return before expenses) | | | 1,000.00 | | | | 1,022.48 | | | | 2.75 | | | | 0.54 | |
| | | | |
Equity Income Portfolio | | | | | | | | | | | | | | | | |
Actual | | | 1,000.00 | | | | 1,101.12 | | | | 3.28 | | | | 0.62 | |
Hypothetical (5% return before expenses) | | | 1,000.00 | | | | 1,022.08 | | | | 3.16 | | | | 0.62 | |
| | | | |
Mid Cap Growth Stock Portfolio | | | | | | | | | | | | | | | | |
Actual | | | 1,000.00 | | | | 1,087.05 | | | | 2.84 | | | | 0.54 | |
Hypothetical (5% return before expenses) | | | 1,000.00 | | | | 1,022.48 | | | | 2.75 | | | | 0.54 | |
| | | | |
Index 400 Stock Portfolio | | | | | | | | | | | | | | | | |
Actual | | | 1,000.00 | | | | 1,095.16 | | | | 1.37 | | | | 0.26 | |
Hypothetical (5% return before expenses) | | | 1,000.00 | | | | 1,023.89 | | | | 1.33 | | | | 0.26 | |
| | | | |
Mid Cap Value Portfolio | | | | | | | | | | | | | | | | |
Actual | | | 1,000.00 | | | | 1,073.94 | | | | 3.97 | | | | 0.76 | |
Hypothetical (5% return before expenses) | | | 1,000.00 | | | | 1,021.37 | | | | 3.87 | | | | 0.76 | |
| | | | |
Small Cap Growth Stock Portfolio | | | | | | | | | | | | | | | | |
Actual | | | 1,000.00 | | | | 1,092.82 | | | | 2.95 | | | | 0.56 | |
Hypothetical (5% return before expenses) | | | 1,000.00 | | | | 1,022.38 | | | | 2.85 | | | | 0.56 | |
| | | | |
Index 600 Stock Portfolio | | | | | | | | | | | | | | | | |
Actual | | | 1,000.00 | | | | 1,099.37 | | | | 1.75 | | | | 0.33 | |
Hypothetical (5% return before expenses) | | | 1,000.00 | | | | 1,023.54 | | | | 1.68 | | | | 0.33 | |
| | | | |
Small Cap Value Portfolio | | | | | | | | | | | | | | | | |
Actual | | | 1,000.00 | | | | 1,099.72 | | | | 4.55 | | | | 0.86 | |
Hypothetical (5% return before expenses) | | | 1,000.00 | | | | 1,020.87 | | | | 4.38 | | | | 0.86 | |
| | | | |
International Growth Portfolio | | | | | | | | | | | | | | | | |
Actual | | | 1,000.00 | | | | 1,088.84 | | | | 3.47 | | | | 0.66 | |
Hypothetical (5% return before expenses) | | | 1,000.00 | | | | 1,021.88 | | | | 3.36 | | | | 0.66 | |
| | | | |
Research International Core Portfolio | | | | | | | | | | | | | | | | |
Actual | | | 1,000.00 | | | | 1,103.73 | | | | 4.19 | | | | 0.79 | |
Hypothetical (5% return before expenses) | | | 1,000.00 | | | | 1,021.22 | | | | 4.02 | | | | 0.79 | |
| | | | |
International Equity Portfolio | | | | | | | | | | | | | | | | |
Actual | | | 1,000.00 | | | | 1,075.96 | | | | 2.88 | | | | 0.55 | |
Hypothetical (5% return before expenses) | | | 1,000.00 | | | | 1,022.43 | | | | 2.80 | | | | 0.55 | |
Expense Examples (unaudited)
| | | | | | | | | | | | | | | | |
| | | Beginning Account Value
July 1, 2017 | | | Ending Account Value
December 31, 2017 | | | Expenses Paid During
Period July 1, 2017 to
December 31, 2017* | | | Annualized
Expense Ratio | |
| | | | |
Emerging Markets Equity Portfolio | | | | | | | | | | | | | | | | |
Actual | | | 1,000.00 | | | | 1,089.70 | | | | 5.53 | | | | 1.05 | |
Hypothetical (5% return before expenses) | | | 1,000.00 | | | | 1,019.91 | | | | 5.35 | | | | 1.05 | |
| | | | |
Government Money Market Portfolio | | | | | | | | | | | | | | | | |
Actual | | | 1,000.00 | | | | 1,003.89 | | | | 1.67 | | | | 0.33 | |
Hypothetical (5% return before expenses) | | | 1,000.00 | | | | 1,023.54 | | | | 1.68 | | | | 0.33 | |
| | | | |
Short-Term Bond Portfolio | | | | | | | | | | | | | | | | |
Actual | | | 1,000.00 | | | | 1,003.56 | | | | 2.07 | | | | 0.41 | |
Hypothetical (5% return before expenses) | | | 1,000.00 | | | | 1,023.14 | | | | 2.09 | | | | 0.41 | |
| | | | |
Select Bond Portfolio | | | | | | | | | | | | | | | | |
Actual | | | 1,000.00 | | | | 1,012.46 | | | | 1.57 | | | | 0.31 | |
Hypothetical (5% return before expenses) | | | 1,000.00 | | | | 1,023.64 | | | | 1.58 | | | | 0.31 | |
| | | | |
Long-Term U.S. Government Bond Portfolio | | | | | | | | | | | | | | | | |
Actual | | | 1,000.00 | | | | 1,027.31 | | | | 4.85 | | | | 0.95 | |
Hypothetical (5% return before expenses) | | | 1,000.00 | | | | 1,020.42 | | | | 4.84 | | | | 0.95 | |
| | | | |
Inflation Protection Portfolio | | | | | | | | | | | | | | | | |
Actual | | | 1,000.00 | | | | 1,026.32 | | | | 2.86 | | | | 0.56 | |
Hypothetical (5% return before expenses) | | | 1,000.00 | | | | 1,022.38 | | | | 2.85 | | | | 0.56 | |
| | | | |
High Yield Bond Portfolio | | | | | | | | | | | | | | | | |
Actual | | | 1,000.00 | | | | 1,019.11 | | | | 2.29 | | | | 0.45 | |
Hypothetical (5% return before expenses) | | | 1,000.00 | | | | 1,022.94 | | | | 2.29 | | | | 0.45 | |
| | | | |
Multi-Sector Bond Portfolio | | | | | | | | | | | | | | | | |
Actual | | | 1,000.00 | | | | 1,027.04 | | | | 3.83 | | | | 0.75 | |
Hypothetical (5% return before expenses) | | | 1,000.00 | | | | 1,021.42 | | | | 3.82 | | | | 0.75 | |
| | | | |
Balanced Portfolio | | | | | | | | | | | | | | | | |
Actual | | | 1,000.00 | | | | 1,054.28 | | | | 0.31 | | | | 0.06 | |
Hypothetical (5% return before expenses) | | | 1,000.00 | | | | 1,024.90 | | | | 0.31 | | | | 0.06 | |
| | | | |
Asset Allocation Portfolio | | | | | | | | | | | | | | | | |
Actual | | | 1,000.00 | | | | 1,067.85 | | | | 0.47 | | | | 0.09 | |
Hypothetical (5% return before expenses) | | | 1,000.00 | | | | 1,024.75 | | | | 0.46 | | | | 0.09 | |
| * | Expenses are equal to the Portfolio’s annualized expense ratio, multiplied by the average account value over the period, multiplied by 184/365 (to reflect the one-half year period). |
Growth Stock Portfolio (unaudited)
| | | | |
| Objective: | | Portfolio Strategy: | | Net Assets: |
| Long-term growth of capital. Current income is a secondary objective. | | Invest in the equity securities of medium and large capitalization companies exhibiting the potential for earnings growth or share price appreciation. | | $960 million |
Portfolio Overview
Mason Street Advisors, LLC (“Mason Street Advisors”), the investment adviser for the Growth Stock Portfolio (the “Portfolio”), has engaged The Boston Company Asset Management, LLC (“The Boston Company”) to act as sub-adviser for the Portfolio. The Portfolio invests in the equity securities of medium and large capitalization companies. The Portfolio invests in stocks selected by a team of global research analysts, with each analyst responsible for investments in his or her area of expertise. These analysts use a fundamental research process to identify investments for the Portfolio. The Portfolio invests in those companies in which the analysts have the highest degree of conviction or have identified the potential for strong earnings growth or share price appreciation in the near-term.
Market Overview
Global equities posted robust results in 2017 as leading economic indicators in both developed and emerging markets beat expectations. The U.S. Federal Reserve’s (the “Fed”) 2% inflation target remained elusive despite better than expected GDP numbers and improving job growth. Consumer confidence nearly reached a two-decade high during the year. As expected, the Fed raised interest rates three times during the year. President Trump appointed Jerome Powell to replace outgoing Fed chair Janet Yellen. At the end of the period, the Trump administration passed sweeping tax reform, lifting sentiment weighed down by delays in policy reforms and fiscal stimulus during the first half of the year.
Portfolio Results
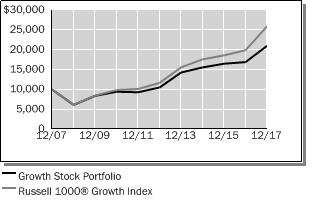
The Portfolio returned 24.27% for the twelve months ended December 31, 2017. By comparison, the Portfolio’s benchmark, the Russell 1000® Growth Index (the “Index”), returned 30.21%. (The Index is unmanaged, cannot be invested in directly and does not include administrative expenses.) According to Lipper® Analytical Services, Inc., an independent mutual fund ranking agency, the average return of the Large Cap Growth Funds peer group was 30.84% for 2017.
Overall, Portfolio positioning in the Health Care and Consumer Discretionary sectors detracted the most from performance versus the Index, while Information Technology, Real Estate and Telecommunication Services contributed to performance during the reporting period.
In the Health Care sector, the health care equipment and supplies and biotechnology industries weighed on relative results. An investment in Dentsply Sirona, Inc., declined on disappointing second quarter results, as operational execution did not meet management’s expectations. An investment in Danaher Corporation also declined following mixed second quarter results, as its dental segment and organic growth remained soft. A position in Celgene Corporation fell on weak third quarter results, missing revenue estimates with sales below expectations.
In the Consumer Discretionary sector, household durables company Newell Brands, Inc., detracted from Portfolio performance as brick-and-mortar retailers continued to see market share loss to e-commerce. Within the hotels, restaurants and leisure industry, an investment in Starbucks Corporation weighed on performance.
In the Information Technology sector, stock selection in the IT services and semiconductors and semiconductor equipment industries primarily drove outperformance. Shares of Square, Inc. rose after posting positive first and second quarter results, driving estimates and the stock higher. The company also increased full-year guidance. Shares of Teradata Corporation also rose following solid third quarter results. Its strategy was gaining momentum as it transitioned to cloud-based offerings. An investment in NVIDIA Corporation also moved higher following solid fiscal second and third quarter results.
The Portfolio’s lack of exposure to the Real Estate sector positively impacted relative returns, as the sector was one of the worst performers in the Index during the year. Elsewhere, the Telecommunication Services sector benefited from positioning in the diversified telecommunication services industry. Specifically, an investment in Verizon Communications, Inc., aided Portfolio returns.
Growth Stock Portfolio (unaudited)
Portfolio Manager Outlook
The following forward-looking comments are the opinion of The Boston Company, the Portfolio’s sub-adviser.
As we look to 2018, synchronized global economic growth appears to be gaining momentum, led by the U.S. and the recent passage of sweeping tax reform, which slashed the corporate tax rate from 35% to 21%. Even before the tax bill passed, U.S. economic data had been encouraging, with positive trends in hours worked, retail sales, housing starts, home prices and unemployment. The consensus estimate for fourth quarter U.S. GDP hovers around 2.7%. However, the Atlanta Fed recently raised estimates to 3.2% from 2.8%, citing stronger U.S. manufacturing PMI and nominal construction spending.
The foregoing growth estimates do not reflect the projected benefits flowing from the recently passed tax bill, which has likely already begun to increase optimism as evidenced by the equity markets’ increase after the passage of the bill. The bottom-up earnings consensus for the S&P 500® Index in the fourth quarter remains steady at $136, a gain of 12% year over year. The consensus number for first quarter 2018 moved higher to $140, an approximately 12% gain, but the tax cut could now increase that number by almost $8 to $148, representing an increase of almost 18%.
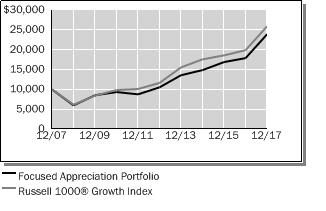
Relative Performance
| | | | | | | | | | | | |
Average Annual Total Returns
For Periods Ended December 31, 2017 | |
| | | 1 Year | | | 5 Years | | | 10 Years | |
Growth Stock Portfolio | | | 24.27 | % | | | 14.86 | % | | | 7.70 | % |
Russell 1000® Growth Index | | | 30.21 | % | | | 17.33 | % | | | 10.00 | % |
Lipper® Variable Insurance Products (VIP) Large Cap Growth Funds Average | | | 30.84 | % | | | 16.28 | % | | | 8.72 | % |
The performance data quoted represents past performance. Past performance is historical and does not guarantee future performance. Investment return and principal value will fluctuate, so that shares, when redeemed, may be worth more or less than their original cost. Current performance may be lower or higher than the performance data quoted. For the most recent month-end performance information visit www.northwesternmutual.com.
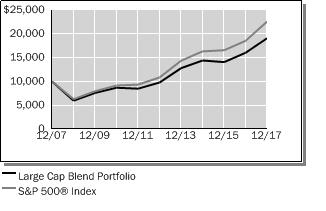
This chart assumes an initial investment of $10,000 made on 12/31/07. Returns shown reflect fee waivers, deductions for management and other portfolio expenses, and reinvestment of all dividends. In the absence of fee waivers, total return would be reduced. Returns exclude deductions for separate account sale
loads and account fees. Please refer to the Benchmark Definitions section of this report for information about the indices cited in the above chart and graph.
The Portfolio may invest a relatively high percentage of its assets in a particular sector. The Portfolio will have greater exposure to the risks associated with that sector and its performance will be tied more closely to the performance of the sector.
Top 10 Equity Holdings 12/31/17
| | | | |
Security Description | | | % of Net Assets | |
Apple, Inc. | | | 6.6 | % |
Microsoft Corp. | | | 5.6 | % |
Amazon.com, Inc. | | | 4.2 | % |
Facebook, Inc. - Class A | | | 4.0 | % |
Alphabet, Inc. - Class C | | | 3.9 | % |
UnitedHealth Group, Inc. | | | 3.0 | % |
Visa, Inc. - Class A | | | 2.8 | % |
Broadcom, Ltd. | | | 2.6 | % |
The Home Depot, Inc. | | | 2.5 | % |
PepsiCo, Inc. | | | 2.4 | % |
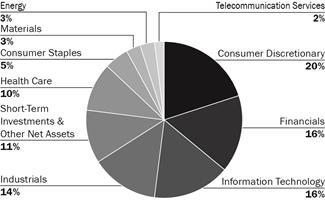
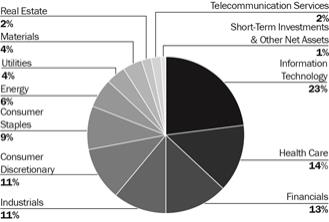
Sector Allocation 12/31/17
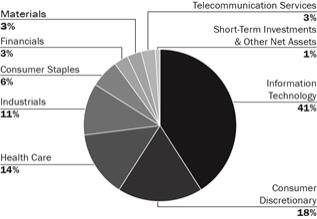
Sector Allocation is based on Net Assets.
Sector Allocation and Top 10 Holdings are subject to change.
Growth Stock Portfolio
Schedule of Investments
December 31, 2017
| | | | | | | | |
| Common Stocks (99.5%) | | Shares/
$ Par | | | Value
$ (000’s) | |
| |
Consumer Discretionary (17.9%) | | | | | |
Amazon.com, Inc.* | | | 34,742 | | | | 40,630 | |
Aptiv PLC | | | 100,992 | | | | 8,567 | |
Charter Communications, Inc. - Class A* | | | 22,030 | | | | 7,401 | |
Comcast Corp. - Class A | | | 444,808 | | | | 17,815 | |
Dollar Tree, Inc.* | | | 107,591 | | | | 11,546 | |
The Home Depot, Inc. | | | 125,661 | | | | 23,816 | |
Las Vegas Sands Corp. | | | 175,155 | | | | 12,171 | |
Nordstrom, Inc. | | | 136,300 | | | | 6,458 | |
The Priceline Group, Inc.* | | | 10,415 | | | | 18,099 | |
PVH Corp. | | | 53,964 | | | | 7,404 | |
Tesla Motors, Inc.* | | | 34,480 | | | | 10,735 | |
Wayfair, Inc.* | | | 88,225 | | | | 7,082 | |
| | | | | | | | |
Total | | | | | | | 171,724 | |
| | | | | | | | |
| |
Consumer Staples (6.0%) | | | | | |
Costco Wholesale Corp. | | | 85,594 | | | | 15,931 | |
The Kraft Heinz Co. | | | 103,478 | | | | 8,046 | |
Monster Beverage Corp.* | | | 172,074 | | | | 10,890 | |
PepsiCo, Inc. | | | 189,798 | | | | 22,761 | |
| | | | | | | | |
Total | | | | | | | 57,628 | |
| | | | | | | | |
| |
Financials (3.4%) | | | | | |
Ameriprise Financial, Inc. | | | 92,244 | | | | 15,633 | |
The Progressive Corp. | | | 295,151 | | | | 16,623 | |
| | | | | | | | |
Total | | | | | | | 32,256 | |
| | | | | | | | |
| |
Health Care (13.7%) | | | | | |
Biogen, Inc.* | | | 54,510 | | | | 17,365 | |
BioMarin Pharmaceutical, Inc.* | | | 64,079 | | | | 5,714 | |
Boston Scientific Corp.* | | | 447,145 | | | | 11,085 | |
Bristol-Myers Squibb Co. | | | 174,489 | | | | 10,693 | |
Celgene Corp.* | | | 137,870 | | | | 14,388 | |
IDEXX Laboratories, Inc.* | | | 61,201 | | | | 9,571 | |
Merck & Co., Inc. | | | 113,877 | | | | 6,408 | |
| | | | | | | | |
| Common Stocks (99.5%) | | Shares/
$ Par | | | Value
$ (000’s) | |
| |
Health Care continued | | | | | |
Neurocrine Biosciences, Inc.* | | | 99,137 | | | | 7,692 | |
UnitedHealth Group, Inc. | | | 128,998 | | | | 28,439 | |
WellCare Health Plans, Inc.* | | | 45,484 | | | | 9,147 | |
Zoetis, Inc. | | | 152,659 | | | | 10,997 | |
| | | | | | | | |
Total | | | | | | | 131,499 | |
| | | | | | | | |
| |
Industrials (10.6%) | | | | | |
Fortive Corp. | | | 205,409 | | | | 14,861 | |
Honeywell International, Inc. | | | 134,560 | | | | 20,636 | |
PACCAR, Inc. | | | 167,229 | | | | 11,887 | |
Quanta Services, Inc.* | | | 236,148 | | | | 9,236 | |
Raytheon Co. | | | 66,168 | | | | 12,430 | |
Union Pacific Corp. | | | 143,634 | | | | 19,261 | |
United Technologies Corp. | | | 106,566 | | | | 13,594 | |
| | | | | | | | |
Total | | | | | | | 101,905 | |
| | | | | | | | |
| |
Information Technology (41.6%) | | | | | |
Activision Blizzard, Inc. | | | 217,981 | | | | 13,803 | |
Alphabet, Inc. - Class C* | | | 35,823 | | | | 37,485 | |
Apple, Inc. | | | 373,507 | | | | 63,209 | |
Arista Networks, Inc.* | | | 27,675 | | | | 6,520 | |
Broadcom, Ltd. | | | 98,056 | | | | 25,191 | |
Facebook, Inc. - Class A* | | | 215,513 | | | | 38,029 | |
First Data Corp.* | | | 486,383 | | | | 8,127 | |
Fortinet, Inc.* | | | 226,386 | | | | 9,891 | |
HubSpot, Inc.* | | | 99,616 | | | | 8,806 | |
Microsoft Corp. | | | 632,403 | | | | 54,096 | |
NVIDIA Corp. | | | 89,954 | | | | 17,406 | |
PayPal Holdings, Inc.* | | | 249,900 | | | | 18,398 | |
Salesforce.com, Inc.* | | | 156,146 | | | | 15,963 | |
ServiceNow, Inc.* | | | 81,759 | | | | 10,660 | |
Splunk, Inc.* | | | 104,668 | | | | 8,671 | |
Square, Inc.* | | | 192,115 | | | | 6,661 | |
Teradata Corp.* | | | 201,615 | | | | 7,754 | |
Texas Instruments, Inc. | | | 171,557 | | | | 17,917 | |
| | | | | | | | |
| Common Stocks (99.5%) | | Shares/
$ Par | | | Value
$ (000’s) | |
| |
Information Technology continued | | | | | |
Twilio, Inc.* | | | 174,081 | | | | 4,108 | |
Visa, Inc. - Class A | | | 233,548 | | | | 26,629 | |
| | | | | | | | |
Total | | | | | | | 399,324 | |
| | | | | | | | |
| | |
Materials (3.3%) | | | | | | | | |
DowDuPont, Inc. | | | 192,666 | | | | 13,722 | |
Praxair, Inc. | | | 65,364 | | | | 10,110 | |
Vulcan Materials Co. | | | 65,522 | | | | 8,411 | |
| | | | | | | | |
Total | | | | | | | 32,243 | |
| | | | | | | | |
| |
Telecommunication Services (3.0%) | | | | | |
T-Mobile US, Inc.* | | | 133,394 | | | | 8,472 | |
Verizon Communications, Inc. | | | 380,923 | | | | 20,162 | |
| | | | | | | | |
Total | | | | | | | 28,634 | |
| | | | | | | | |
| | |
Total Common Stocks | | | | | | | | |
(Cost: $739,354) | | | | | | | 955,213 | |
| | | | | |
| |
| Short-Term Investments (1.2%) | | | | |
| |
Money Market Funds (1.2%) | | | | | |
State Street Institutional U.S. Government Money Market Fund - Premier Class, 1.209% # | | | 11,091,855 | | | | 11,092 | |
| | | | | | | | |
Total | | | | | | | 11,092 | |
| | | | | | | | |
| | |
Total Short-Term Investments
| | | | | | | | |
(Cost: $11,092) | | | | | | | 11,092 | |
| | | | | | | | |
| | |
Total Investments (100.7%) | | | | | | | | |
(Cost: $750,446)(a) | | | | | | | 966,305 | |
| | | | | |
Other Assets, Less | | | | | | | | |
Liabilities (-0.7%) | | | | | | | (6,451 | ) |
| | | | | |
Net Assets (100.0%) | | | | | | | 959,854 | |
| | | | | |
| # | 7-Day yield as of December 31, 2017. |
| (a) | At December 31, 2017, the aggregate cost of investments, including derivatives, for federal tax purposes (in thousands) was $750,453 and the net unrealized appreciation of investments based on that cost was $215,853 which is comprised of $223,799 aggregate gross unrealized appreciation and $7,946 aggregate gross unrealized depreciation. |
The Accompanying Notes are an Integral Part of the Financial Statements.
Growth Stock Portfolio
The following is a summary of the inputs used in valuing the Portfolio’s assets and liabilities at December 31, 2017. See Note 3 for additional information on portfolio valuation.
| | | | | | | | | | | | | | |
| | | Valuation Inputs | | | |
| Description | | Level 1 –
Quoted Prices | | | Level 2 –
Other Significant
Observable Inputs | | | Level 3 – Significant
Unobservable Inputs | | | |
| | | (Amounts in thousands) | | | |
Assets: | | | | | | | | | | | | | | |
Common Stocks | | $ | 955,213 | | | $ | - | | | $ | - | | | |
Short-Term Investments | | | 11,092 | | | | - | | | | - | | | |
Total Assets: | | $ | 966,305 | | | $ | - | | | $ | - | | | |
The Accompanying Notes are an Integral Part of the Financial Statements.
Focused Appreciation Portfolio (unaudited)
| | | | |
| Objective: | | Portfolio Strategy: | | Net Assets: |
| Long-term growth of capital. | | Invest in equity securities selected for their growth potential. | | $945 million |
Portfolio Overview
Mason Street Advisors, LLC (“Mason Street Advisors”), the investment adviser for the Focused Appreciation Portfolio (the “Portfolio”), has engaged Loomis, Sayles & Co., L.P. (“Loomis Sayles”) to act as sub-adviser for the Portfolio. The Portfolio invests primarily in the equity securities of companies selected for their growth potential. The Portfolio focuses on equity securities of large capitalization companies, but may invest in companies of any size. The Portfolio employs a growth style of equity management that emphasizes companies with sustainable competitive advantages, long-term structural growth drivers, profitable cash flow returns, and management teams focused on creating long-term value for shareholders. The Portfolio invests primarily in a core group of 30-40 securities.
Market Overview
U.S. equity markets staged a strong rally in 2017. Volatility generally remained low as investors responded favorably to signs of a continued improvement in global economic conditions and stable central bank policy. The pickup in global growth fed through to corporate results, with companies around the world reporting gains in both revenues and bottom-line profits. Corporate earnings experienced a synchronized, worldwide upturn for the first time since 2006, providing support for somewhat elevated stock market valuations. Growth stocks, particularly those in the Information Technology sector, were key beneficiaries of this trend. In December, the passage of U.S. tax reform propelled U.S. equities to new highs as investors anticipated further earnings growth in 2018 due to lower corporate tax rates, in addition to healthy underlying global growth.
Portfolio Results
The Portfolio returned 33.62% for the twelve months ended December 31, 2017. By comparison, the Portfolio’s benchmark, the Russell 1000® Growth Index (the “Index”), returned 30.21%. According to Lipper® Analytical Services, Inc., an independent mutual fund ranking agency, the average return in 2017 of the Large Cap Growth Funds peer group was 30.84%.
Alibaba Group Holding, Ltd., Amazon.com, Inc. and Facebook, Inc. were among the top contributors to the Portfolio’s performance for the reporting period. Schlumberger N.V., QUALCOMM, Inc., and Merck & Co., Inc., were among the largest detractors to performance. During the period, the portfolio manager took advantage of price weakness to add to several high quality growth companies, including Schlumberger N.V., Oracle Corp. and Regeneron Pharmaceuticals, Inc. The purchases were funded by trimming Portfolio positions in Amazon.com, Inc., Facebook, Inc. and Alibaba Group Holding, Ltd., as each position approached the Portfolio’s maximum allowable position size.
Stock selection in the Consumer Discretionary, Consumer Staples, Healthcare and Financials sectors, as well as the allocation effect to Information Technology and Consumer Discretionary sectors, contributed to relative performance. Stock selection in the Energy, Industrials and Information Technology sectors, as well as the allocation effect to the Consumer Staples, Energy, Industrials and Healthcare sectors detracted from relative performance.
Portfolio Manager Outlook
The following forward-looking comments are the opinion of Loomis Sayles, the Portfolio’s sub-adviser.
Our investment process is characterized by bottom-up fundamental research and a long-term investment time horizon. All aspects of our quality-growth-valuation investment thesis must be present simultaneously for us to make an investment. Often, our research is completed well in advance of the opportunity to invest. We are patient investors and maintain coverage of high quality businesses in order to take advantage of meaningful price dislocations if and when they occur. The nature of the process leads to a lower turnover Portfolio where sector positioning is the result of stock selection. In comparison to the Index, we are currently overweight in the Information Technology, Consumer Staples, Financials, Energy and Healthcare sectors. We are underweight in the Consumer Discretionary and Industrials sectors. We hold no positions in the Materials, Real Estate, Telecommunication Services and Utilities sectors.
| | | | | | |
| | Focused Appreciation Portfolio | | | 5 | |
Focused Appreciation Portfolio (unaudited)
Relative Performance
| | | | | | | | | | | | |
Average Annual Total Returns
For Periods Ended December 31, 2017 | |
| | | 1 Year | | | 5 Years | | | 10 Years | |
Focused Appreciation Portfolio | | | 33.62 | % | | | 17.81 | % | | | 9.12 | % |
Russell 1000® Growth Index | | | 30.21 | % | | | 17.33 | % | | | 10.00 | % |
Lipper® Variable Insurance Products (VIP) Large Cap Growth Funds Average | | | 30.84 | % | | | 16.28 | % | | | 8.72 | % |
The performance data quoted represents past performance. Past performance is historical and does not guarantee future performance. Investment return and principal value will fluctuate, so that shares, when redeemed, may be worth more or less than their original cost. Current performance may be lower or higher than the performance data quoted. For the most recent month-end performance information visit www.northwesternmutual.com.
This chart assumes an initial investment of $10,000 made on 12/31/07. Returns shown reflect fee waivers, deductions for management and other portfolio expenses, and reinvestment of all dividends. In the absence of fee waivers, total return would be reduced. Returns exclude deductions for separate account sale loads and account fees. Please refer to the Benchmark Definitions section of this report for information about the indices cited in the above chart and graph.
As a non-diversified portfolio, the Portfolio may hold fewer securities because of its focused investment strategy. Holding fewer securities increases the risk that the value of the Portfolio could go down because of the poor performance of a single investment.
The Portfolio may invest a relatively high percentage of its assets in a particular sector. The Portfolio will have greater exposure to the risks associated with that sector and its performance will be tied more closely to the performance of the sector.
Top 10 Equity Holdings 12/31/17
| | | | |
Security Description | | | % of Net Assets | |
Amazon.com, Inc. | | | 7.3 | % |
Facebook, Inc. - Class A | | | 6.6 | % |
Alibaba Group Holding, Ltd., ADR | | | 6.4 | % |
Alphabet, Inc., Various | | | 5.9 | % |
Visa, Inc. - Class A | | | 5.5 | % |
Oracle Corp. | | | 4.9 | % |
Cisco Systems, Inc. | | | 4.8 | % |
Monster Beverage Corp. | | | 4.1 | % |
Novo Nordisk A/S, ADR | | | 3.5 | % |
QUALCOMM, Inc. | | | 3.3 | % |
Sector Allocation 12/31/17
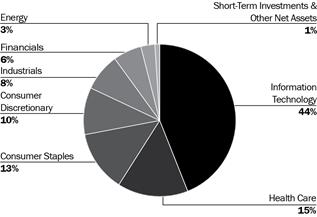
Sector Allocation is based on Net Assets.
Sector Allocation and Top 10 Holdings are subject to change.
| | | | |
| 6 | | Focused Appreciation Portfolio | | |
Focused Appreciation Portfolio
Schedule of Investments
December 31, 2017
| | | | | | | | |
| Common Stocks (99.8%) | | Shares/
$ Par | | | Value
$ (000’s) | |
Consumer Discretionary (10.4%) | | | | | |
Amazon.com, Inc.* | | | 58,861 | | | | 68,836 | |
Yum China Holdings, Inc. | | | 307,560 | | | | 12,309 | |
Yum! Brands, Inc. | | | 207,535 | | | | 16,937 | |
| | | | | | | | |
Total | | | | | | | 98,082 | |
| | | | | | | | |
| |
Consumer Staples (12.7%) | | | | | |
The Coca-Cola Co. | | | 556,360 | | | | 25,526 | |
Danone SA, ADR | | | 1,805,359 | | | | 30,276 | |
Monster Beverage Corp.* | | | 608,065 | | | | 38,484 | |
The Procter & Gamble Co. | | | 279,200 | | | | 25,653 | |
| | | | | | | | |
Total | | | | | | | 119,939 | |
| | | | | | | | |
| |
Energy (3.2%) | | | | | |
Schlumberger, Ltd. | | | 442,915 | | | | 29,848 | |
| | | | | | | | |
Total | | | | | | | 29,848 | |
| | | | | | | | |
| |
Financials (6.4%) | | | | | |
American Express Co. | | | 142,271 | | | | 14,129 | |
FactSet Research Systems, Inc. | | | 81,848 | | | | 15,777 | |
SEI Investments Co. | | | 425,575 | | | | 30,582 | |
| | | | | | | | |
Total | | | | | | | 60,488 | |
| | | | | | | | |
| |
Health Care (14.6%) | | | | | |
Amgen, Inc. | | | 93,159 | | | | 16,200 | |
Cerner Corp.* | | | 305,377 | | | | 20,580 | |
| | | | | | | | |
| Common Stocks (99.8%) | | Shares/
$ Par | | | Value
$ (000’s) | |
| |
Health Care continued | | | | | |
Merck & Co., Inc. | | | 160,390 | | | | 9,025 | |
Novartis AG, ADR | | | 197,248 | | | | 16,561 | |
Novo Nordisk A/S, ADR | | | 607,971 | | | | 32,630 | |
Regeneron Pharmaceuticals, Inc.* | | | 60,501 | | | | 22,746 | |
Varian Medical Systems, Inc.* | | | 183,043 | | | | 20,345 | |
| | | | | | | | |
Total | | | | | | | 138,087 | |
| | | | | | | | |
| |
Industrials (8.0%) | | | | | |
Deere & Co. | | | 181,653 | | | | 28,430 | |
Expeditors International of Washington, Inc. | | | 410,120 | | | | 26,531 | |
United Parcel Service, Inc. - Class B | | | 175,071 | | | | 20,860 | |
| | | | | | | | |
Total | | | | | | | 75,821 | |
| | | | | | | | |
| |
Information Technology (44.5%) | | | | | |
Alibaba Group Holding, Ltd., ADR* | | | 350,382 | | | | 60,416 | |
Alphabet, Inc. - Class A* | | | 26,291 | | | | 27,695 | |
Alphabet, Inc. - Class C* | | | 26,349 | | | | 27,572 | |
Analog Devices, Inc. | | | 45,439 | | | | 4,045 | |
Autodesk, Inc.* | | | 290,361 | | | | 30,438 | |
Automatic Data Processing, Inc. | | | 67,323 | | | | 7,890 | |
Cisco Systems, Inc. | | | 1,187,926 | | | | 45,498 | |
Facebook, Inc. - Class A* | | | 351,133 | | | | 61,961 | |
| | | | | | | | |
| Common Stocks (99.8%) | | Shares/
$ Par | | | Value
$ (000’s) | |
Information Technology continued | | | | | |
Microsoft Corp. | | | 313,243 | | | | 26,795 | |
Oracle Corp. | | | 979,876 | | | | 46,328 | |
QUALCOMM, Inc. | | | 479,345 | | | | 30,688 | |
Visa, Inc. - Class A | | | 453,737 | | | | 51,735 | |
| | | | | | | | |
Total | | | | | | | 421,061 | |
| | | | | | | | |
Total Common Stocks | | | | | | | | |
(Cost: $687,454) | | | | | | | 943,326 | |
| | | | | | | | |
|
| Short-Term Investments (0.7%) | |
| |
Money Market Funds (0.7%) | | | | | |
State Street Institutional U.S. Government Money Market Fund - Premier Class, 1.209% # | | | 6,385,434 | | | | 6,385 | |
| | | | | | | | |
Total | | | | | | | 6,385 | |
| | | | | | | | |
| | |
Total Short-Term Investments | | | | | | | | |
(Cost: $6,385) | | | | | | | 6,385 | |
| | | | | | | | |
| | |
Total Investments (100.5%) | | | | | | | | |
(Cost: $693,839)(a) | | | | | | | 949,711 | |
| | | | | | | | |
Other Assets, Less | | | | | | | | |
Liabilities (-0.5%) | | | | | | | (4,326 | ) |
| | | | | | | | |
Net Assets (100.0%) | | | | | | | 945,385 | |
| | | | | | | | |
| # | 7-Day yield as of December 31, 2017. |
| | ADR after the name of a security represents—American Depositary Receipt. |
| (a) | At December 31, 2017, the aggregate cost of investments, including derivatives, for federal tax purposes (in thousands) was $694,637 and the net unrealized appreciation of investments based on that cost was $255,073 which is comprised of $265,594 aggregate gross unrealized appreciation and $10,521 aggregate gross unrealized depreciation. |
The following is a summary of the inputs used in valuing the Portfolio’s assets and liabilities at December 31, 2017. See Note 3 for additional information on portfolio valuation.
| | | | | | | | | | | | | | |
| | | Valuation Inputs | | | |
| Description | | Level 1 –
Quoted Prices | | | Level 2 –
Other Significant Observable Inputs | | | Level 3 – Significant Unobservable Inputs | | | |
| | | (Amounts in thousands) | | | |
Assets: | | | | | | | | | | | | | | |
Common Stocks | | $ | 943,326 | | | $ | - | | | $ | - | | | |
Short-Term Investments | | | 6,385 | | | | - | | | | - | | | |
Total Assets: | | $ | 949,711 | | | $ | - | | | $ | - | | | |
The Accompanying Notes are an Integral Part of the Financial Statements.
| | | | | | |
| | Focused Appreciation Portfolio | | | 7 | |
Large Cap Core Stock Portfolio (unaudited)
| | | | |
| Objective: | | Portfolio Strategy: | | Net Assets: |
| Long-term growth of capital and income. | | Invest primarily in common stocks of large capitalization U.S. and foreign based companies listed on U.S. exchanges. | | $593 Million |
Portfolio Overview
Mason Street Advisors, LLC (“Mason Street Advisors”), the investment adviser for the Large Cap Core Stock Portfolio (the “Portfolio”), has engaged Wellington Management Company LLP (“Wellington”) to act as sub-adviser for the Portfolio. Wellington was appointed sub-adviser to the Portfolio effective October 27, 2017. Prior to that time, the Portfolio was sub-advised by Fayez Sarofim & Co. (“Sarofim & Co.”). The Portfolio allocates its assets across a variety of industries, selecting companies in each industry based on the research of a team of global industry analysts. The Portfolio typically seeks to maintain representation in each major industry represented by broad-based, large cap U.S. equity indices. The Portfolio utilizes a “bottom-up” approach, which is the use of fundamental analysis to identify specific securities for purchase or sale. Fundamental analysis of a company involves the assessment of a variety of factors, including the company’s business environment, management quality, balance sheet, income statement, anticipated earnings, revenues and dividends, and other related measures or indicators of valuation and growth potential. The Portfolio’s sector exposures generally conform with the sector weights present in the Portfolio’s benchmark index.
Market Overview
U.S. equities rose for the fourteenth consecutive month, as measured by the S&P 500® Index, to finish the twelve-month period ending December 31, 2017. The stock market soared following Donald Trump’s victory on hopes of increased fiscal stimulus, reduced regulatory restrictions and lower corporate taxes. The reflation trading theme dominated the narrative heading into 2017, leading to significant equity inflows and the largest exodus from bonds since the “taper tantrum” in 2013. Despite many investors voicing concerns about stretched valuations, heightened U.S. tensions with Russia and North Korea, and overly optimistic policy expectations, the market hit a series of record highs during the year on the back of strong employment data and strong corporate earnings.
In a well-telegraphed move, the U.S. Federal Reserve (the “Fed”) hiked the policy interest rates three times during the period. In August, the Fed announced that its balance sheet normalization program would begin in October, reiterating that the process would be gradual and predictable. In November, Jerome Powell’s nomination as the chair of the Fed provided markets with reasonable assurance that current central bank policies would be maintained in the near term.
Tax reform was a key area of focus during the period, culminating with a $1.5 trillion tax reform bill signed into law by Donald Trump at the end of December. The legislation included the most sweeping changes to the tax code since 1986 and represented a major victory for Republicans.
Returns during the period varied by market cap. Large cap stocks, as measured by the S&P 500® Index outperformed mid and small cap stocks, as measured by the S&P MidCap 400® Index and the S&P SmallCap 600® Index.
Portfolio Results
The Large Cap Core Stock Portfolio returned 24.87% for the twelve months ended December 31, 2017. By comparison, the S&P 500® Index (the “Index”) returned 21.83% for the year. (The Index is unmanaged, cannot be invested in directly, and does not include administrative expenses.) According to Lipper® Analytical Services, Inc., an independent mutual fund ranking company, the average return in 2017 for the Large Cap Core Funds peer group was 20.69%.
As noted above, prior to October 27, 2017, the Portfolio was managed by Sarofim & Co. With respect to the period prior to October 27, 2017, the Portfolio’s outperformance relative to the Index was primarily attributable to stock selection in the Consumer Staples, Information Technology and Health Care sectors. In the Consumer Staples sector, positioning within the food products and personal products industries was advantageous. The Portfolio’s emphasis on Apple and Facebook produced the largest positive effects in the Information Technology sector. Positive stock selection in Health Care was driven by strong returns from key health care equipment holdings such as Intuitive Surgical and Abbott Laboratories.
The following performance attribution comments relate to the period October 27, 2017 through December 31, 2017, during which Wellington acted as the Portfolio’s sub-adviser.
The Portfolio’s underperformance during the period was due to both stock selection and sector allocation, a residual of the bottom-up stock selection process. Weak stock selection within the Financials, Utilities and Materials sectors was partially offset by strong stock selection within the Consumer Staples and Energy sectors. The Portfolio’s overweight to Utilities and underweight to Consumer Discretionary also detracted from performance during the period.
| | | | |
| 8 | | Large Cap Core Stock Portfolio | | |
Large Cap Core Stock Portfolio (unaudited)
Top individual security detractors from relative returns during the period included Edison International and PG&E. The Portfolio’s underweight to Amazon also held back relative results. Top individual security contributors to relative performance during the period included Coty and Microsoft. Not holding benchmark constituent Merck & Co. also aided performance.
Portfolio Manager Outlook
The following forward-looking comments are the opinion of Wellington, the Portfolio’s sub-adviser.
Our U.S. macro team expects the U.S. economy to expand at a steady clip and believes growth in 2018 could be bolstered by an expansionary fiscal stance. Consumer confidence is high as the job market is strong, wage gains are reasonable, and home prices are rising. Business investment is starting to rebound and projected capital expenditures are robust. Against this backdrop, some combination of tax relief and hurricane-recovery spending is likely to add to growth in 2018. Further, deregulation is likely to be a tailwind for investment spending and growth.
In terms of potential risks, inflation is the wild card. While not our base case, an unexpected rise in inflation could force central banks’ hands toward more aggressive tightening and raise the risk of recession. If the U.S. yield curve flattens further, it would signal tighter financial conditions. Global trade is another risk for markets. The U.S. administration could set off a stagflationary dynamic if it enacts severe trade restrictions. Geopolitics is also a concern, but we think any market disruptions are likely to be temporary.
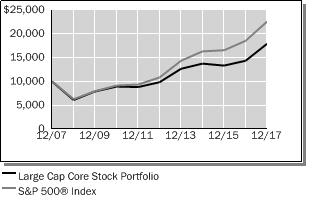
Relative Performance
| | | | | | | | | | | | |
Average Annual Total Returns
For Periods Ended December 31, 2017 | |
| | | 1 Year | | | 5 Years | | | 10 Years | |
Large Cap Core Stock Portfolio | | | 24.87 | % | | | 12.69 | % | | | 6.01 | % |
S&P 500® Index | | | 21.83 | % | | | 15.79 | % | | | 8.50 | % |
Lipper® Variable Insurance Products (VIP) Large Cap Core Funds Average | | | 20.69 | % | | | 14.51 | % | | | 7.48 | % |
The performance data quoted represents past performance. Past performance is historical and does not guarantee future performance. Investment return and principal value will fluctuate, so that shares, when redeemed, may be worth more or less than their original cost. Current performance may be lower or higher than the performance data quoted. For the most recent month-end performance information visit www.northwesternmutual.com.
This chart assumes an initial investment of $10,000 made on 12/31/07. Returns shown reflect fee waivers, deductions for management and other portfolio expenses, and reinvestment of all dividends. In the absence of fee waivers, total return would be reduced. Returns exclude deductions for separate account sale loads and account fees. Please refer to the Benchmark Definitions section of this report for information about the indices cited in the above chart and graph.
The Portfolio may invest a relatively high percentage of its assets in a particular sector. The Portfolio will have greater exposure to the risks associated with that sector and its performance will be tied more closely to the performance of the sector.
| | | | | | |
| | Large Cap Core Stock Portfolio | | | 9 | |
Large Cap Core Stock Portfolio (unaudited)
Top 10 Equity Holdings 12/31/17
| | | | | | |
| Security Description | | % of Net Assets | | | |
Bank of America Corp. | | | 2.5 | % | | |
Apple, Inc. | | | 2.4 | % | | |
Alphabet, Inc. - Class A | | | 2.4 | % | | |
Facebook, Inc. - Class A | | | 2.3 | % | | |
Microsoft Corp. | | | 2.2 | % | | |
Amazon.com, Inc. | | | 2.2 | % | | |
Verizon Communications, Inc. | | | 2.0 | % | | |
UnitedHealth Group, Inc. | | | 1.7 | % | | |
The Boeing Co. | | | 1.7 | % | | |
Coty, Inc. - Class A | | | 1.6 | % | | |
Sector Allocation 12/31/17
Sector Allocation is based on Net Assets.
Sector Allocation and Top 10 Holdings are subject to change.
| | | | |
| 10 | | Large Cap Core Stock Portfolio | | |
Large Cap Core Stock Portfolio
Schedule of Investments
December 31, 2017
| | | | | | | | |
| Common Stocks (99.6%) | | Shares/
$ Par | | | Value
$ (000’s) | |
| | |
Consumer Discretionary (11.0%) | | | | | | | | |
Amazon.com, Inc.* | | | 11,035 | | | | 12,905 | |
Charter Communications, Inc. - Class A* | | | 12,269 | | | | 4,122 | |
Comcast Corp. - Class A | | | 240,381 | | | | 9,627 | |
Dollar Tree, Inc.* | | | 17,929 | | | | 1,924 | |
Expedia, Inc. | | | 19,835 | | | | 2,376 | |
Harley-Davidson, Inc. | | | 41,751 | | | | 2,124 | |
Hilton Worldwide Holdings, Inc. | | | 25,328 | | | | 2,023 | |
L Brands, Inc. | | | 7,269 | | | | 438 | |
Lennar Corp. - Class A | | | 38,868 | | | | 2,458 | |
Liberty Media Corp. - Liberty Formula One* | | | 24,196 | | | | 827 | |
McDonald’s Corp. | | | 23,540 | | | | 4,052 | |
Mohawk Industries, Inc.* | | | 15,835 | | | | 4,369 | |
Netflix, Inc.* | | | 12,024 | | | | 2,308 | |
NIKE, Inc. - Class B | | | 66,446 | | | | 4,156 | |
Tapestry, Inc. | | | 19,239 | | | | 851 | |
The TJX Cos., Inc. | | | 52,958 | | | | 4,049 | |
Twenty-First Century Fox, Inc. - Class A | | | 71,771 | | | | 2,478 | |
Viacom, Inc. - Class B | | | 95,462 | | | | 2,941 | |
Wynn Resorts, Ltd. | | | 8,234 | | | | 1,388 | |
| | | | | | | | |
Total | | | | | | | 65,416 | |
| | | | | | | | |
| | |
Consumer Staples (9.5%) | | | | | | | | |
Altria Group, Inc. | | | 96,700 | | | | 6,905 | |
Anheuser-Busch InBev NV, ADR | | | 14,250 | | | | 1,590 | |
British American Tobacco PLC, ADR | | | 103,048 | | | | 6,903 | |
Campbell Soup Co. | | | 106,391 | | | | 5,118 | |
Constellation Brands, Inc. - Class A | | | 17,620 | | | | 4,027 | |
Costco Wholesale Corp. | | | 14,963 | | | | 2,785 | |
Coty, Inc. - Class A | | | 485,315 | | | | 9,653 | |
Monster Beverage Corp.* | | | 104,926 | | | | 6,641 | |
PepsiCo, Inc. | | | 52,765 | | | | 6,328 | |
Sysco Corp. | | | 27,930 | | | | 1,696 | |
Unilever NV | | | 78,988 | | | | 4,449 | |
| | | | | | | | |
Total | | | | | | | 56,095 | |
| | | | | | | | |
| | |
Energy (5.7%) | | | | | | | | |
Andeavor | | | 17,898 | | | | 2,047 | |
Antero Resources Corp.* | | | 65,806 | | | | 1,250 | |
BP PLC, ADR | | | 54,685 | | | | 2,299 | |
Chevron Corp. | | | 23,663 | | | | 2,962 | |
Concho Resources, Inc.* | | | 5,633 | | | | 846 | |
Diamondback Energy, Inc.* | | | 21,639 | | | | 2,732 | |
Encana Corp. | | | 37,985 | | | | 506 | |
| | | | | | | | |
| Common Stocks (99.6%) | | Shares/
$ Par | | | Value
$ (000’s) | |
| | |
Energy continued | | | | | | | | |
Exxon Mobil Corp. | | | 19,240 | | | | 1,609 | |
Hess Corp. | | | 25,600 | | | | 1,215 | |
Kinder Morgan, Inc. | | | 150,825 | | | | 2,725 | |
Marathon Petroleum Corp. | | | 46,162 | | | | 3,046 | |
Newfield Exploration Co.* | | | 179,960 | | | | 5,674 | |
Parsley Energy, Inc. - Class A* | | | 8,584 | | | | 253 | |
Pioneer Natural Resources Co. | | | 1,026 | | | | 177 | |
Suncor Energy, Inc. | | | 56,538 | | | | 2,076 | |
TransCanada Corp. | | | 94,213 | | | | 4,583 | |
| | | | | | | | |
Total | | | | | | | 34,000 | |
| | | | | | | | |
| | |
Financials (12.8%) | | | | | | | | |
The Allstate Corp. | | | 20,232 | | | | 2,118 | |
American Express Co. | | | 44,160 | | | | 4,385 | |
American International Group, Inc. | | | 95,209 | | | | 5,673 | |
Athene Holding, Ltd. - Class A* | | | 21,326 | | | | 1,103 | |
Bank of America Corp. | | | 500,536 | | | | 14,776 | |
BlackRock, Inc. | | | 1,990 | | | | 1,022 | |
Boston Properties, Inc. | | | 20,959 | | | | 2,725 | |
Capital One Financial Corp. | | | 44,748 | | | | 4,456 | |
Citigroup, Inc. | | | 81,983 | | | | 6,100 | |
The Hartford Financial Services Group, Inc. | | | 40,844 | | | | 2,299 | |
Huntington Bancshares, Inc. | | | 192,215 | | | | 2,799 | |
Intercontinental Exchange, Inc. | | | 17,632 | | | | 1,244 | |
Marsh & McLennan Cos., Inc. | | | 64,111 | | | | 5,218 | |
MetLife, Inc. | | | 61,034 | | | | 3,086 | |
Morgan Stanley | | | 28,657 | | | | 1,504 | |
Northern Trust Corp. | | | 10,619 | | | | 1,061 | |
PNC Financial Services Group, Inc. | | | 53,761 | | | | 7,757 | |
Prudential Financial, Inc. | | | 14,550 | | | | 1,673 | |
Simon Property Group, Inc. | | | 12,290 | | | | 2,111 | |
TD Ameritrade Holding Corp. | | | 26,735 | | | | 1,367 | |
XL Group, Ltd. | | | 96,988 | | | | 3,410 | |
| | | | | | | | |
Total | | | | | | | 75,887 | |
| | | | | | | | |
| | |
Health Care (14.4%) | | | | | | | | |
Abbott Laboratories | | | 62,440 | | | | 3,563 | |
Allergan PLC | | | 39,784 | | | | 6,508 | |
Alnylam Pharmaceuticals, Inc.* | | | 7,069 | | | | 898 | |
AstraZeneca PLC, ADR | | | 151,404 | | | | 5,254 | |
Baxter International, Inc. | | | 32,196 | | | | 2,081 | |
| | | | | | | | |
| Common Stocks (99.6%) | | Shares/
$ Par | | | Value
$ (000’s) | |
| | |
Health Care continued | | | | | | | | |
Biogen, Inc.* | | | 2,771 | | | | 883 | |
Boston Scientific Corp.* | | | 223,886 | | | | 5,550 | |
Bristol-Myers Squibb Co. | | | 127,809 | | | | 7,832 | |
Cardinal Health, Inc. | | | 39,228 | | | | 2,404 | |
Celgene Corp.* | | | 30,882 | | | | 3,223 | |
Cigna Corp. | | | 22,083 | | | | 4,485 | |
Danaher Corp. | | | 19,923 | | | | 1,849 | |
Eli Lilly and Co. | | | 32,575 | | | | 2,751 | |
HCA Healthcare, Inc.* | | | 20,853 | | | | 1,832 | |
Incyte Corp.* | | | 10,894 | | | | 1,032 | |
McKesson Corp. | | | 20,028 | | | | 3,123 | |
Medtronic PLC | | | 90,909 | | | | 7,341 | |
Mylan NV* | | | 82,285 | | | | 3,481 | |
Regeneron Pharmaceuticals, Inc.* | | | 3,141 | | | | 1,181 | |
Stryker Corp. | | | 19,822 | | | | 3,069 | |
Teva Pharmaceutical Industries, Ltd., ADR | | | 56,444 | | | | 1,070 | |
Thermo Fisher Scientific, Inc. | | | 14,654 | | | | 2,783 | |
UnitedHealth Group, Inc. | | | 46,323 | | | | 10,212 | |
Vertex Pharmaceuticals, Inc.* | | | 18,937 | | | | 2,838 | |
| | | | | | | | |
Total | | | | | | | 85,243 | |
| | | | | | | | |
| | |
Industrials (11.4%) | | | | | | | | |
AMETEK, Inc. | | | 43,230 | | | | 3,133 | |
The Boeing Co. | | | 34,297 | | | | 10,114 | |
Caterpillar, Inc. | | | 16,017 | | | | 2,524 | |
Deere & Co. | | | 11,078 | | | | 1,734 | |
Eaton Corp. PLC | | | 36,773 | | | | 2,905 | |
Equifax, Inc. | | | 10,986 | | | | 1,295 | |
FedEx Corp. | | | 12,478 | | | | 3,114 | |
Fortive Corp. | | | 42,944 | | | | 3,107 | |
General Electric Co. | | | 227,871 | | | | 3,976 | |
IHS Markit, Ltd.* | | | 18,704 | | | | 844 | |
Illinois Tool Works, Inc. | | | 15,681 | | | | 2,616 | |
J.B. Hunt Transport Services, Inc. | | | 20,140 | | | | 2,316 | |
Lockheed Martin Corp. | | | 22,964 | | | | 7,373 | |
Masco Corp. | | | 41,951 | | | | 1,843 | |
Norfolk Southern Corp. | | | 27,779 | | | | 4,025 | |
Northrop Grumman Corp. | | | 20,791 | | | | 6,381 | |
PACCAR, Inc. | | | 27,091 | | | | 1,926 | |
Pentair PLC | | | 44,571 | | | | 3,148 | |
Southwest Airlines Co. | | | 15,129 | | | | 990 | |
Union Pacific Corp. | | | 16,552 | | | | 2,220 | |
United Continental Holdings, Inc.* | | | 24,817 | | | | 1,673 | |
| | | | | | | | |
Total | | | | | | | 67,257 | |
| | | | | | | | |
The Accompanying Notes are an Integral Part of the Financial Statements.
| | | | | | |
| | Large Cap Core Stock Portfolio | | | 11 | |
Large Cap Core Stock Portfolio
| | | | | | | | |
| Common Stocks (99.6%) | | Shares/
$ Par | | | Value
$ (000’s) | |
| | |
Information Technology (22.5%) | | | | | | | | |
Accenture PLC - Class A | | | 8,821 | | | | 1,350 | |
Adobe Systems, Inc.* | | | 18,251 | | | | 3,198 | |
Advanced Micro Devices, Inc.* | | | 151,219 | | | | 1,555 | |
Alliance Data Systems Corp. | | | 9,134 | | | | 2,315 | |
Alphabet, Inc. - Class A* | | | 13,497 | | | | 14,218 | |
Apple, Inc. | | | 84,301 | | | | 14,266 | |
Applied Materials, Inc. | | | 42,804 | | | | 2,188 | |
Autodesk, Inc.* | | | 14,055 | | | | 1,473 | |
Cognizant Technology Solutions Corp. - Class A | | | 7,381 | | | | 524 | |
CoStar Group, Inc.* | | | 1,925 | | | | 572 | |
eBay, Inc.* | | | 98,635 | | | | 3,722 | |
Facebook, Inc. - Class A* | | | 77,862 | | | | 13,740 | |
FleetCor Technologies, Inc.* | | | 15,597 | | | | 3,001 | |
Flex, Ltd.* | | | 170,445 | | | | 3,066 | |
Global Payments, Inc. | | | 47,560 | | | | 4,767 | |
KLA-Tencor Corp. | | | 22,172 | | | | 2,330 | |
Marvell Technology Group, Ltd. | | | 180,838 | | | | 3,883 | |
Microchip Technology, Inc. | | | 43,891 | | | | 3,857 | |
Micron Technology, Inc.* | | | 125,134 | | | | 5,146 | |
Microsoft Corp. | | | 151,204 | | | | 12,934 | |
NetApp, Inc. | | | 48,221 | | | | 2,668 | |
NVIDIA Corp. | | | 21,551 | | | | 4,170 | |
PayPal Holdings, Inc.* | | | 47,533 | | | | 3,499 | |
QUALCOMM, Inc. | | | 77,377 | | | | 4,954 | |
Salesforce.com, Inc.* | | | 44,114 | | | | 4,510 | |
ServiceNow, Inc.* | | | 22,363 | | | | 2,916 | |
Total System Services, Inc. | | | 11,605 | | | | 918 | |
| | | | | | | | |
| Common Stocks (99.6%) | | Shares/
$ Par | | | Value
$ (000’s) | |
| | |
Information Technology continued | | | | | | | | |
Visa, Inc. - Class A | | | 75,060 | | | | 8,558 | |
Workday, Inc. - Class A* | | | 29,926 | | | | 3,045 | |
| | | | | | | | |
Total | | | | | | | 133,343 | |
| | | | | | | | |
| | |
Materials (3.7%) | | | | | | | | |
ArcelorMittal* | | | 21,938 | | | | 709 | |
Ball Corp. | | | 46,000 | | | | 1,741 | |
Celanese Corp. - Class A | | | 27,929 | | | | 2,991 | |
Crown Holdings, Inc.* | | | 29,698 | | | | 1,671 | |
DowDuPont, Inc. | | | 87,164 | | | | 6,208 | |
International Paper Co. | | | 37,353 | | | | 2,164 | |
Martin Marietta Materials, Inc. | | | 1,521 | | | | 336 | |
Monsanto Co. | | | 8,015 | | | | 936 | |
Nucor Corp. | | | 6,563 | | | | 417 | |
PPG Industries, Inc. | | | 18,748 | | | | 2,190 | |
Praxair, Inc. | | | 9,750 | | | | 1,508 | |
Southern Copper Corp. | | | 7,939 | | | | 377 | |
Vulcan Materials Co. | | | 3,377 | | | | 433 | |
| | | | | | | | |
Total | | | | | | | 21,681 | |
| | | | | | | | |
| | |
Real Estate (2.2%) | | | | | | | | |
American Tower Corp. | | | 42,669 | | | | 6,088 | |
Equinix, Inc. | | | 4,767 | | | | 2,161 | |
Invitation Homes, Inc. | | | 127,841 | | | | 3,013 | |
Prologis, Inc. | | | 29,597 | | | | 1,909 | |
| | | | | | | | |
Total | | | | | | | 13,171 | |
| | | | | | | | |
| | |
Telecommunication Services (2.0%) | | | | | | | | |
Verizon Communications, Inc. | | | 227,927 | | | | 12,064 | |
| | | | | | | | |
Total | | | | | | | 12,064 | |
| | | | | | | | |
| | | | | | | | |
| Common Stocks (99.6%) | | Shares/
$ Par | | | Value
$ (000’s) | |
| | |
Utilities (4.4%) | | | | | | | | |
Avangrid, Inc. | | | 28,050 | | | | 1,419 | |
Edison International | | | 83,120 | | | | 5,257 | |
Exelon Corp. | | | 71,757 | | | | 2,828 | |
NextEra Energy, Inc. | | | 41,612 | | | | 6,499 | |
NRG Energy, Inc. | | | 140,065 | | | | 3,989 | |
PG&E Corp. | | | 66,429 | | | | 2,978 | |
Sempra Energy | | | 31,215 | | | | 3,337 | |
| | | | | | | | |
Total | | | | | | | 26,307 | |
| | | | | | | | |
| | |
Total Common Stocks
(Cost: $540,257) | | | | | | | 590,464 | |
| | | | | | | | |
| |
| Short-Term Investments (0.5%) | | | | |
| | |
Money Market Funds (0.5%) | | | | | | | | |
State Street Institutional U.S. Government Money Market Fund - Premier Class, 1.209% # | | | 2,906,799 | | | | 2,907 | |
| | | | | | | | |
Total | | | | | | | 2,907 | |
| | | | | | | | |
| | |
Total Short-Term Investments | | | | | | | | |
(Cost: $2,907) | | | | | | | 2,907 | |
| | | | | | | | |
| | |
Total Investments (100.1%)
| | | | | | | | |
(Cost: $543,164)(a) | | | | | | | 593,371 | |
| | | | | | | | |
Other Assets, Less | | | | | | | | |
Liabilities (-0.1%) | | | | | | | (794 | ) |
| | | | | | | | |
Net Assets (100.0%) | | | | | | | 592,577 | |
| | | | | | | | |
| # | 7-Day yield as of December 31, 2017. |
| | ADR after the name of a security represents—American Depositary Receipt. |
| (a) | At December 31, 2017, the aggregate cost of investments, including derivatives, for federal tax purposes (in thousands) was $543,397 and the net unrealized appreciation of investments based on that cost was $49,974 which is comprised of $58,772 aggregate gross unrealized appreciation and $8,798 aggregate gross unrealized depreciation. |
| | The following is a summary of the inputs used in valuing the Portfolio’s assets and liabilities at December 31, 2017. See Note 3 for additional information on portfolio valuation. |
| | | | | | | | | | | | | | |
| | | Valuation Inputs | | | |
| Description | | Level 1 –
Quoted Prices | | | Level 2 –
Other Significant
Observable Inputs | | | Level 3 – Significant
Unobservable Inputs | | | |
| | | (Amounts in thousands) | | | |
Assets: | | | | | | | | | | | | | | |
Common Stocks | | $ | 590,464 | | | $ | - | | | $ | - | | | |
Short-Term Investments | | | 2,907 | | | | - | | | | - | | | |
Total Assets: | | $ | 593,371 | | | $ | - | | | $ | - | | | |
The Accompanying Notes are an Integral Part of the Financial Statements.
| | | | |
| 12 | | Large Cap Core Stock Portfolio | | |
Large Cap Blend Portfolio (unaudited)
| | | | |
| Objective: | | Portfolio Strategy: | | Net Assets: |
| Long-term growth of capital and income. | | Invest primarily in equity securities of U.S. large capitalization companies listed or traded on U.S. securities exchanges. | | $176 million |
Portfolio Overview
Mason Street Advisors, LLC (“Mason Street Advisors”), the investment adviser for the Large Cap Blend Portfolio (the “Portfolio”), has engaged Fiduciary Management, Inc. (“FMI”) to act as sub-adviser for the Portfolio. Normally, the Portfolio invests in equity securities of large capitalization companies listed or traded on U.S. securities exchanges. In selecting investments, greater consideration is given to potential appreciation and future dividends than to current income. The Portfolio uses fundamental analysis to look for stocks of good businesses that are selling at value prices. The Portfolio employs a focused investment strategy, typically investing in a core group of 20-30 large capitalization common stocks and ADRs.
Market Overview
We are now 106 months into this bull market that started in March 2009. Over that time period, the S&P 500® Index has gained more than 295%, which makes this the second longest, and second highest bull market recovery on record. For the year, large cap stocks, as represented by the S&P 500® Index, posted a return of 21.83%, outperforming the S&P SmallCap 600® and the S&P MidCap 400® Indices, which returned 13.23% and 16.24%, respectively. Meanwhile, the broader bond market, as represented by the Bloomberg Barclays® U.S. Aggregate Index returned 3.54%, while the Bloomberg Barclays® U.S. Corporate High Yield Index advanced 7.50%.
Portfolio Results
The Portfolio returned 19.02% for the twelve months ended December 31, 2017. By comparison, the Portfolio’s benchmark, the S&P 500® Index (the “Index”) returned 21.83%. (The Index is unmanaged, cannot be invested in directly, and does not include administrative expenses.) According to Lipper® Analytical Services, Inc., an independent mutual fund ranking agency, the average return in 2017 of the Large Cap Core Funds peer group was 20.69%.
During the year, the market was driven by a handful of growth and momentum stocks, and a primary detractor from Portfolio performance, relative to the Index, was the Portfolio’s failure to own certain key companies. For example, in 2017 not owning the five FAANG stocks (Facebook, Amazon, Apple, Netflix, and Google, now Alphabet) caused the Portfolio to lag the Index by more than 2.0% for the reporting period.
The Portfolio’s investments in the Energy sector, which included Devon Energy and Schlumberger, were detractors for the year. At the end of the year, the Portfolio sold Devon Energy and added to its position in Schlumberger. While Devon Energy operated its business well over the Portfolio’s holding period, the exploration and production industry is highly competitive, with too many highly indebted and undisciplined drillers. Schlumberger, a supplier to the energy industry, was seen as a better business going forward.
The Health Care sector contributed most to the Portfolio’s return for the reporting period, led by insurance company UnitedHealth Group and Cerner Corporation, a provider of electronic patient records. UnitedHealth Group is the largest health insurance provider in the world, measured by revenue, and it has a strong position in each of the core-managed care business segments, including commercial, Medicare and Medicaid. The company also has investments in ancillary health care services such as Pharmacy Benefit Management (PBM), health care IT, and patient and data management. Cerner Corp. is one of three main companies working with hospitals and clinics in implementing and maintaining electronic patient records.
Auto and home insurer Progressive Corporation was the Portfolio’s top individual security performer for the reporting period. Insurance company Progressive continued to grow its market presence and the company’s earnings are expected to benefit from a more disciplined pricing environment following recent insurance industry losses from two major U.S. hurricanes in 2017. Stanley Black & Decker, a provider of building materials, was also a positive contributor to the Portfolio due to continued strength in the home construction and remodeling industry.
Portfolio Manager Outlook
The following forward-looking comments are the opinion of FMI, the Portfolio’s sub-adviser.
Over time, FMI has added the most value by protecting client portfolios in challenging markets. This is accomplished by being sensitive to the valuation paid for a company, and focusing on what could potentially go wrong with each investment, rather
| | | | | | |
| | Large Cap Blend Portfolio | | | 13 | |
Large Cap Blend Portfolio (unaudited)
than what can go right. Today, the Portfolio owns 26 strong business franchises, with solid balance sheets, that over a business cycle should earn a return more than their cost of capital. Businesses with those characteristics have generally held up better when the market corrects.
We continue to believe that valuations are critical, and at some point, investors will lose confidence and money will flow out, rather than into the stock market. That is human nature and from time-eternal, that is how markets have behaved. While we remain strong believers in equities for the long run, we are being as cautious and prudent as possible in the short run. The market will eventually give us the opportunity to reposition and upgrade a handful of existing holdings to even better businesses. We continue to build our idea inventory with high quality businesses that are just too rich to own today.
Relative Performance
| | | | | | | | | | | | |
Average Annual Total Returns
For Periods Ended December 31, 2017 | |
| | | 1 Year | | | 5 Years | | | 10 Years | |
Large Cap Blend Portfolio | | | 19.02 | % | | | 14.29 | % | | | 6.69 | % |
S&P 500® Index | | | 21.83 | % | | | 15.79 | % | | | 8.50 | % |
Lipper® Variable Insurance Products (VIP) Large Cap Core Funds Average | | | 20.69 | % | | | 14.51 | % | | | 7.48 | % |
The performance data quoted represents past performance. Past performance is historical and does not guarantee future performance. Investment return and principal value will fluctuate, so that shares, when redeemed, may be worth more or less than their original cost. Current performance may be lower or higher than the performance data quoted. For the most recent month-end performance information visit www.northwesternmutual.com.
This chart assumes an initial investment of $10,000 made on 12/31/07. Returns shown reflect fee waivers, deductions for management and other portfolio expenses, and reinvestment of all dividends. In the absence of fee waivers, total return would be reduced. Returns exclude deductions for separate account sale loads and account fees. Please refer to the Benchmark Definitions section of this report for
information about the indices cited in the above chart and graph.
The Portfolio may hold fewer securities than other diversified portfolios because of its more focused investment strategy. Holding fewer securities increases the risk that the value of the Portfolio could go down because of the poor performance of a single investment.
Top 10 Equity Holdings 12/31/17
| | | | |
Security Description | | | % of Net Assets | |
Berkshire Hathaway, Inc. - Class B | | | 5.1 | % |
UnitedHealth Group, Inc. | | | 5.1 | % |
Comcast Corp. - Class A | | | 4.7 | % |
Honeywell International, Inc. | | | 4.6 | % |
Dollar General Corp. | | | 4.5 | % |
The TJX Cos., Inc. | | | 4.3 | % |
Accenture PLC - Class A | | | 4.3 | % |
The Progressive Corp. | | | 4.1 | % |
JPMorgan Chase & Co. | | | 4.0 | % |
Stanley Black & Decker, Inc. | | | 3.7 | % |
Sector Allocation 12/31/17
Sector Allocation is based on Net Assets.
Sector Allocation and Top 10 Holdings are subject to change.
| | | | |
| 14 | | Large Cap Blend Portfolio | | |
Large Cap Blend Portfolio
Schedule of Investments
December 31, 2017
| | | | | | | | |
| Common Stocks (88.7%) | | Shares/
$ Par | | | Value
$ (000’s) | |
|
| Consumer Discretionary (19.7%) | |
Comcast Corp. - Class A | | | 207,700 | | | | 8,318 | |
Dollar General Corp. | | | 84,625 | | | | 7,871 | |
Omnicom Group, Inc. | | | 65,500 | | | | 4,770 | |
The TJX Cos., Inc. | | | 99,700 | | | | 7,623 | |
Twenty-First Century Fox, Inc. - Class A | | | 31,175 | | | | 1,077 | |
Twenty-First Century Fox, Inc. - Class B | | | 150,750 | | | | 5,144 | |
| | | | | | | | |
Total | | | | | | | 34,803 | |
| | | | | | | | |
|
Consumer Staples (4.7%) | |
Nestle SA, ADR | | | 58,425 | | | | 5,023 | |
Unilever PLC, ADR | | | 57,800 | | | | 3,199 | |
| | | | | | | | |
Total | | | | | | | 8,222 | |
| | | | | | | | |
|
Energy (3.1%) | |
Schlumberger, Ltd. | | | 79,825 | | | | 5,379 | |
| | | | | | | | |
Total | | | | | | | 5,379 | |
| | | | | | | | |
|
Financials (16.3%) | |
The Bank of New York Mellon Corp. | | | 101,950 | | | | 5,491 | |
Berkshire Hathaway, Inc. - Class B* | | | 45,300 | | | | 8,980 | |
JPMorgan Chase & Co. | | | 66,150 | | | | 7,074 | |
The Progressive Corp. | | | 126,850 | | | | 7,144 | |
| | | | | | | | |
Total | | | | | | | 28,689 | |
| | | | | | | | |
| | | | | | | | |
| Common Stocks (88.7%) | | Shares/
$ Par | | | Value
$ (000’s) | |
|
Health Care (9.8%) | |
Cerner Corp.* | | | 88,075 | | | | 5,936 | |
Quest Diagnostics, Inc. | | | 25,395 | | | | 2,501 | |
UnitedHealth Group, Inc. | | | 40,475 | | | | 8,923 | |
| | | | | | | | |
Total | | | | | | | 17,360 | |
| | | | | | | | |
|
Industrials (13.9%) | |
Expeditors International of Washington, Inc. | | | 69,600 | | | | 4,502 | |
Honeywell International, Inc. | | | 52,375 | | | | 8,032 | |
PACCAR, Inc. | | | 76,850 | | | | 5,463 | |
Stanley Black & Decker, Inc. | | | 38,800 | | | | 6,584 | |
| | | | | | | | |
Total | | | | | | | 24,581 | |
| | | | | | | | |
|
Information Technology (15.9%) | |
Accenture PLC - Class A | | | 49,575 | | | | 7,590 | |
eBay, Inc.* | | | 168,900 | | | | 6,374 | |
Microsoft Corp. | | | 49,575 | | | | 4,241 | |
Oracle Corp. | | | 82,450 | | | | 3,898 | |
TE Connectivity, Ltd. | | | 61,925 | | | | 5,885 | |
| | | | | | | | |
Total | | | | | | | 27,988 | |
| | | | | | | | |
|
Materials (3.1%) | |
Potash Corp. of Saskatchewan, Inc. | | | 262,050 | | | | 5,411 | |
| | | | | | | | |
Total | | | | | | | 5,411 | |
| | | | | | | | |
| | | | | | | | |
| Common Stocks (88.7%) | | Shares/
$ Par | | | Value
$ (000’s) | |
| |
Telecommunication Services (2.2%) | | | | | |
CenturyLink, Inc. | | | 227,584 | | | | 3,796 | |
| | | | | | | | |
Total | | | | | | | 3,796 | |
| | | | | | | | |
| | |
Total Common Stocks | | | | | | | | |
(Cost: $112,840) | | | | | | | 156,229 | |
| | | | | |
| | |
| Short-Term Investments (12.1%) | | | | | | |
| |
Money Market Funds (12.1%) | | | | | |
State Street Institutional U.S. Government Money Market Fund - Premier Class, 1.209% # | | | 21,322,403 | | | | 21,322 | |
| | | | | | | | |
Total | | | | | | | 21,322 | |
| | | | | | | | |
| | |
Total Short-Term Investments | | | | | | | | |
(Cost: $21,322) | | | | | | | 21,322 | |
| | | | | | | | |
| | |
Total Investments (100.8%) | | | | | | | | |
(Cost: $134,162)(a) | | | | | | | 177,551 | |
| | | | | |
Other Assets, Less | | | | | | | | |
Liabilities (-0.8%) | | | | | | | (1,330 | ) |
| | | | | |
Net Assets (100.0%) | | | | | | | 176,221 | |
| | | | | |
| # | 7-Day yield as of December 31, 2017. |
ADR after the name of a security represents—American Depositary Receipt.
| (a) | At December 31, 2017, the aggregate cost of investments, including derivatives, for federal tax purposes (in thousands) was $134,789 and the net unrealized appreciation of investments based on that cost was $42,762 which is comprised of $47,412 aggregate gross unrealized appreciation and $4,650 aggregate gross unrealized depreciation. |
The following is a summary of the inputs used in valuing the Portfolio’s assets and liabilities at December 31, 2017. See Note 3 for additional information on portfolio valuation.
| | | | | | | | | | | | | | |
| | | Valuation Inputs | | | |
| Description | | Level 1 –
Quoted Prices | | | Level 2 –
Other Significant
Observable Inputs | | | Level 3 –
Significant
Unobservable Inputs | | | |
| | | (Amounts in thousands) | | | |
Assets: | | | | | | | | | | | | | | |
Common Stocks | | $ | 156,229 | | | $ | - | | | $ | - | | | |
Short-Term Investments | | | 21,322 | | | | - | | | | - | | | |
Total Assets: | | $ | 177,551 | | | $ | - | | | $ | - | | | |
The Accompanying Notes are an Integral Part of the Financial Statements.
| | | | | | |
| | Large Cap Blend Portfolio | | | 15 | |
Index 500 Stock Portfolio (unaudited)
| | | | |
| Objective: | | Portfolio Strategy: | | Net Assets: |
| Investment results that approximate the performance of the S&P 500® Index. | | Invest in stocks that make up the S&P 500® Index, holding each stock in approximately the same proportion as its weighting in the Index. | | $3.2 billion |
Portfolio Overview
Mason Street Advisors is the investment adviser for the Index 500 Stock Portfolio (the “Portfolio”). The Portfolio seeks investment results that approximate the performance of the S&P 500® Index, which is composed of the stocks of primarily large capitalization companies that represent a broad spectrum of the U.S. economy and a substantial part of the U.S. stock market’s total capitalization. The Portfolio attempts to achieve its objective by investing all, or substantially all, of its assets in the stocks that make up the S&P 500® Index, holding each stock in approximately the same proportion as its weighting in the Index. This is known as a full replication strategy. The Portfolio may also invest in S&P 500® Index stock futures and, to a lesser extent, purchase (long) total return equity swap agreements to help achieve full replication.
Market Overview
U.S. equities delivered another year of strong performance. The sharp gains in business and consumer confidence following the U.S. election and improving global economic growth were among the catalysts for equities, as investors anticipated market-friendly policies from the new administration. That confidence was generally well placed—corporate earnings finally improved after three flat years and Congress passed one of the largest tax cuts in U.S. history. The improving economy favored equities over bonds; although, fixed income sectors still posted positive returns.
The U.S. economy expanded at a pace of approximately 3% during the second half of the year. The strong growth prompted the U.S. Federal Reserve (the “Fed”) to raise rates and begin reducing its $4 trillion balance sheet. In that environment, large cap stocks, as represented by the S&P 500® Index, posted a return of 21.83%, outperforming the S&P SmallCap 600® and the S&P MidCap 400® Indices, which returned 13.23% and 16.24%, respectively. Meanwhile, the broader bond market, as represented by the Bloomberg Barclays® U.S. Aggregate Index returned 3.54%, while the Bloomberg Barclays® U.S. Corporate High Yield Index advanced 7.50%.
Portfolio Results
The Index 500 Stock Portfolio delivered a total return of 21.52% for the twelve months ended December 31, 2017, trailing the S&P 500® Index (the “Index”), which returned 21.83%. (The Index is unmanaged, cannot be invested in directly and does not include administrative expenses.) Portfolio performance slightly lagged the Index due to transaction costs, administrative expenses, cash flow effects and costs associated with the use of stock index futures contracts. The Portfolio outperformed the 21.13% average return for its peer group, S&P 500® Index Funds, according to Lipper® Analytical Services, Inc.
Nine of the Index’s eleven sectors posted positive returns for the year. The largest contributor to the Index’s return was the Information Technology sector, which delivered strong revenue and earnings growth throughout the year. Within the sector, the communications equipment industry was the strongest performer, led by Apple Inc., which saw gains after the successful launch of a new iPhone. Other industries within the Information Technology sector that contributed substantially to the Index’s return include internet software and services, software and semiconductors and semiconductor equipment. The Financials sector also performed well, led by banks as the Fed’s interest rate increases boosted net interest margins (the difference between the interest charged to borrowers and that paid to depositors). The Consumer Discretionary sector also posted gains, reflecting steady economic growth, low inflation and declining unemployment, which led to an increase in consumer spending. Ongoing demographic trends and tax reform helped the Health Care sector post gains despite continued uncertainty surrounding governmental reform efforts and regulatory changes. The pharmaceuticals industry led performance in the sector, reflecting rising sales for new products.
At the other end of the spectrum, the Energy sector suffered losses. Worries over the impact of supply growth on oil prices weighed on oil and gas exploration companies. The Telecommunication Services sector also struggled with pricing pressure from intense competition between new entrants and legacy carriers.
| | | | |
| 16 | | Index 500 Stock Portfolio | | |
Index 500 Stock Portfolio (unaudited)
Relative Performance
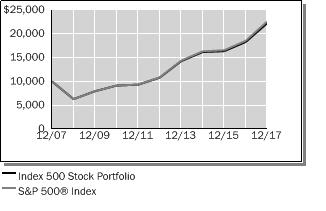
| | | | | | | | | | | | |
Average Annual Total Returns
For Periods Ended December 31, 2017 | |
| | | 1 Year | | | 5 Years | | | 10 Years | |
Index 500 Stock Portfolio | | | 21.52 | % | | | 15.53 | % | | | 8.32 | % |
S&P 500® Index | | | 21.83 | % | | | 15.79 | % | | | 8.50 | % |
Lipper® Variable Insurance Products (VIP) S&P 500 Index Objective Funds Average | | | 21.13 | % | | | 15.31 | % | | | 8.11 | % |
The performance data quoted represents past performance. Past performance is historical and does not guarantee future performance. Investment return and principal value will fluctuate, so that shares, when redeemed, may be worth more or less than their original cost. Current performance may be lower or higher than the performance data quoted. For the most recent month-end performance information visit www.northwesternmutual.com.
This chart assumes an initial investment of $10,000 made on 12/31/07. Returns shown reflect fee waivers, deductions for management and other portfolio expenses, and reinvestment of all dividends. In the absence of fee waivers, total return would be reduced. Returns exclude deductions for separate account sale loads and account fees. Please refer to the Benchmark Definitions section of this report for information about the indices cited in the above chart and graph.
“Standard & Poor’s®”, “S&P®”, “S&P 500” and “Standard & Poor’s 500” are trademarks of The McGraw-Hill Companies, Inc. and have been licensed for use by Northwestern Mutual Life Insurance Company. The Portfolio is not sponsored, endorsed, sold or promoted by Standard & Poor’s, and Standard & Poor’s makes no representation regarding the advisability of investing in the Portfolio.
The Portfolio may invest in derivative instruments, such as futures and, to a lesser extent, swap agreements, to help achieve full replication. Use of these instruments may involve certain costs and imposes certain risks such as liquidity risk, market risk, credit risk, management risk and the risk of mispricing or improper valuation. Certain derivatives involve leverage, which could magnify losses, and portfolios investing in derivatives could lose more than the principal amount invested in those instruments.
Top 10 Equity Holdings 12/31/17
| | | | |
Security Description | | | % of Net Assets | |
Apple, Inc. | | | 3.8 | % |
Microsoft Corp. | | | 2.9 | % |
Alphabet, Inc., various | | | 2.7 | % |
Amazon.com, Inc. | | | 2.0 | % |
Facebook, Inc. - Class A | | | 1.8 | % |
Berkshire Hathaway, Inc. - Class B | | | 1.7 | % |
Johnson & Johnson | | | 1.6 | % |
JPMorgan Chase & Co. | | | 1.6 | % |
Exxon Mobil Corp. | | | 1.5 | % |
Bank of America Corp. | | | 1.2 | % |
Sector Allocation 12/31/17
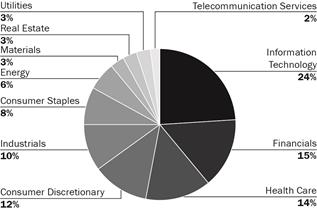
Sector Allocation is based on Net Assets.
Sector Allocation and Top 10 Holdings are subject to change.
| | | | | | |
| | Index 500 Stock Portfolio | | | 17 | |
Index 500 Stock Portfolio
Schedule of Investments
December 31, 2017
| | | | | | | | |
| Common Stocks (98.6%) | | Shares/
$ Par | | | Value
$ (000’s) | |
| |
Consumer Discretionary (12.0%) | | | | | |
Advance Auto Parts, Inc. | | | 10,293 | | | | 1,026 | |
Amazon.com, Inc.* | | | 55,710 | | | | 65,151 | |
Aptiv PLC | | | 37,029 | | | | 3,141 | |
AutoZone, Inc.* | | | 3,830 | | | | 2,725 | |
Best Buy Co., Inc. | | | 35,425 | | | | 2,426 | |
BorgWarner, Inc. | | | 27,606 | | | | 1,410 | |
CarMax, Inc.* | | | 25,397 | | | | 1,629 | |
Carnival Corp. | | | 56,807 | | | | 3,770 | |
CBS Corp. - Class B | | | 50,505 | | | | 2,980 | |
Charter Communications, Inc. - Class A* | | | 27,011 | | | | 9,075 | |
Chipotle Mexican Grill, Inc.* | | | 3,461 | | | | 1,000 | |
Comcast Corp. - Class A | | | 649,702 | | | | 26,021 | |
D.R. Horton, Inc. | | | 47,538 | | | | 2,428 | |
Darden Restaurants, Inc. | | | 17,227 | | | | 1,654 | |
Discovery Communications, Inc. - Class A* | | | 21,452 | | | | 480 | |
Discovery Communications, Inc. - Class C* | | | 28,308 | | | | 599 | |
DISH Network Corp. - Class A* | | | 31,747 | | | | 1,516 | |
Dollar General Corp. | | | 36,287 | | | | 3,375 | |
Dollar Tree, Inc.* | | | 33,026 | | | | 3,544 | |
Expedia, Inc. | | | 17,123 | | | | 2,051 | |
Foot Locker, Inc. | | | 17,272 | | | | 810 | |
Ford Motor Co. | | | 543,440 | | | | 6,788 | |
The Gap, Inc. | | | 30,332 | | | | 1,033 | |
Garmin, Ltd. | | | 15,456 | | | | 921 | |
General Motors Co. | | | 178,066 | | | | 7,299 | |
Genuine Parts Co. | | | 20,422 | | | | 1,940 | |
The Goodyear Tire & Rubber Co. | | | 34,311 | | | | 1,109 | |
H&R Block, Inc. | | | 29,119 | | | | 764 | |
Hanesbrands, Inc. | | | 50,784 | | | | 1,062 | |
Harley-Davidson, Inc. | | | 23,442 | | | | 1,193 | |
Hasbro, Inc. | | | 15,788 | | | | 1,435 | |
Hilton Worldwide Holdings, Inc. | | | 28,167 | | | | 2,249 | |
The Home Depot, Inc. | | | 162,658 | | | | 30,829 | |
The Interpublic Group of Cos., Inc. | | | 54,131 | | | | 1,091 | |
Kohl’s Corp. | | | 23,482 | | | | 1,273 | |
L Brands, Inc. | | | 34,398 | | | | 2,071 | |
Leggett & Platt, Inc. | | | 18,361 | | | | 876 | |
Lennar Corp. - Class A | | | 28,485 | | | | 1,801 | |
LKQ Corp.* | | | 43,048 | | | | 1,751 | |
Lowe’s Cos., Inc. | | | 116,004 | | | | 10,781 | |
Macy’s, Inc. | | | 42,428 | | | | 1,069 | |
| | | | | | | | |
| Common Stocks (98.6%) | | Shares/
$ Par | | | Value
$ (000’s) | |
| |
Consumer Discretionary continued | | | | | |
Marriott International, Inc. - Class A | | | 42,658 | | | | 5,790 | |
Mattel, Inc. | | | 47,879 | | | | 736 | |
McDonald’s Corp. | | | 111,042 | | | | 19,113 | |
MGM Resorts International | | | 70,973 | | | | 2,370 | |
Michael Kors Holdings, Ltd.* | | | 21,183 | | | | 1,333 | |
Mohawk Industries, Inc.* | | | 8,802 | | | | 2,428 | |
Netflix, Inc.* | | | 60,276 | | | | 11,571 | |
Newell Brands, Inc. | | | 68,267 | | | | 2,109 | |
News Corp. - Class A | | | 53,347 | | | | 865 | |
News Corp. - Class B | | | 16,961 | | | | 282 | |
NIKE, Inc. - Class B | | | 183,022 | | | | 11,448 | |
Nordstrom, Inc. | | | 16,244 | | | | 770 | |
Norwegian Cruise Line Holdings, Ltd.* | | | 24,822 | | | | 1,322 | |
Omnicom Group, Inc. | | | 32,111 | | | | 2,339 | |
O’Reilly Automotive, Inc.* | | | 11,844 | | | | 2,849 | |
The Priceline Group, Inc.* | | | 6,793 | | | | 11,804 | |
PulteGroup, Inc. | | | 37,671 | | | | 1,253 | |
PVH Corp. | | | 10,784 | | | | 1,480 | |
Ralph Lauren Corp. | | | 7,716 | | | | 800 | |
Ross Stores, Inc. | | | 53,710 | | | | 4,310 | |
Royal Caribbean Cruises, Ltd. | | | 23,857 | | | | 2,846 | |
Scripps Networks Interactive - Class A | | | 13,381 | | | | 1,142 | |
Signet Jewelers, Ltd. | | | 8,422 | | | | 476 | |
Starbucks Corp. | | | 198,184 | | | | 11,382 | |
Tapestry, Inc. | | | 39,611 | | | | 1,752 | |
Target Corp. | | | 75,715 | | | | 4,940 | |
Tiffany & Co. | | | 14,222 | | | | 1,478 | |
Time Warner, Inc. | | | 108,452 | | | | 9,920 | |
The TJX Cos., Inc. | | | 88,628 | | | | 6,777 | |
Tractor Supply Co. | | | 17,490 | | | | 1,307 | |
TripAdvisor, Inc.* | | | 15,103 | | | | 520 | |
Twenty-First Century Fox, Inc. - Class A | | | 146,814 | | | | 5,070 | |
Twenty-First Century Fox, Inc. - Class B | | | 61,175 | | | | 2,087 | |
Ulta Beauty, Inc.* | | | 8,129 | | | | 1,818 | |
Under Armour, Inc. - Class A* | | | 25,788 | | | | 372 | |
Under Armour, Inc. - Class C* | | | 25,677 | | | | 342 | |
VF Corp. | | | 45,684 | | | | 3,381 | |
Viacom, Inc. - Class B | | | 49,146 | | | | 1,514 | |
The Walt Disney Co. | | | 210,374 | | | | 22,617 | |
Whirlpool Corp. | | | 10,010 | | | | 1,688 | |
Wyndham Worldwide Corp. | | | 14,114 | | | | 1,635 | |
| | | | | | | | |
| Common Stocks (98.6%) | | Shares/
$ Par | | | Value
$ (000’s) | |
| |
Consumer Discretionary continued | | | | | |
Wynn Resorts, Ltd. | | | 11,167 | | | | 1,883 | |
Yum! Brands, Inc. | | | 46,941 | | | | 3,831 | |
| | | | | | | | |
Total | | | | | | | 387,896 | |
| | | | | | | | |
| |
Consumer Staples (8.1%) | | | | | |
Altria Group, Inc. | | | 265,795 | | | | 18,980 | |
Archer-Daniels-Midland Co. | | | 77,899 | | | | 3,122 | |
Brown-Forman Corp. - Class B | | | 27,276 | | | | 1,873 | |
Campbell Soup Co. | | | 26,791 | | | | 1,289 | |
Casa Ley SA de CV (l),(p),* | | | 29,556 | | | | 30 | |
Church & Dwight Co., Inc. | | | 34,812 | | | | 1,747 | |
The Clorox Co. | | | 17,960 | | | | 2,671 | |
The Coca-Cola Co. | | | 534,128 | | | | 24,506 | |
Colgate-Palmolive Co. | | | 122,313 | | | | 9,229 | |
Conagra Brands, Inc. | | | 56,901 | | | | 2,143 | |
Constellation Brands, Inc. - Class A | | | 23,996 | | | | 5,485 | |
Costco Wholesale Corp. | | | 60,869 | | | | 11,329 | |
Coty, Inc. - Class A | | | 65,770 | | | | 1,308 | |
CVS Health Corp. | | | 141,102 | | | | 10,230 | |
Dr. Pepper Snapple Group, Inc. | | | 25,148 | | | | 2,441 | |
The Estee Lauder Cos., Inc. - Class A | | | 31,183 | | | | 3,968 | |
General Mills, Inc. | | | 79,165 | | | | 4,694 | |
The Hershey Co. | | | 19,650 | | | | 2,230 | |
Hormel Foods Corp. | | | 37,497 | | | | 1,365 | |
The J.M. Smucker Co. | | | 15,822 | | | | 1,966 | |
Kellogg Co. | | | 34,648 | | | | 2,355 | |
Kimberly-Clark Corp. | | | 48,997 | | | | 5,912 | |
The Kraft Heinz Co. | | | 83,164 | | | | 6,467 | |
The Kroger Co. | | | 123,903 | | | | 3,401 | |
McCormick & Co., Inc. | | | 16,679 | | | | 1,700 | |
Molson Coors Brewing Co. - Class B | | | 25,736 | | | | 2,112 | |
Mondelez International, Inc. | | | 208,156 | | | | 8,909 | |
Monster Beverage Corp.* | | | 57,346 | | | | 3,629 | |
PepsiCo, Inc. | | | 198,093 | | | | 23,755 | |
Philip Morris International, Inc. | | | 216,340 | | | | 22,856 | |
The Procter & Gamble Co. | | | 354,931 | | | | 32,611 | |
Property Development Centers
LLC (l),(p),* | | | 29,556 | | | | – | |
Sysco Corp. | | | 66,773 | | | | 4,055 | |
Tyson Foods, Inc. - Class A | | | 41,453 | | | | 3,361 | |
Walgreens Boots Alliance, Inc. | | | 120,935 | | | | 8,782 | |
The Accompanying Notes are an Integral Part of the Financial Statements.
| | | | |
| 18 | | Index 500 Stock Portfolio | | |
Index 500 Stock Portfolio
| | | | | | | | |
| Common Stocks (98.6%) | | Shares/
$ Par | | | Value
$ (000’s) | |
| |
Consumer Staples continued | | | | | |
Wal-Mart Stores, Inc. | | | 203,885 | | | | 20,134 | |
| | | | | | | | |
Total | | | | | | | 260,645 | |
| | | | | | | | |
| |
Energy (6.0%) | | | | | |
Anadarko Petroleum Corp. | | | 76,215 | | | | 4,088 | |
Andeavor | | | 19,991 | | | | 2,286 | |
Apache Corp. | | | 53,061 | | | | 2,240 | |
Baker Hughes | | | 59,641 | | | | 1,887 | |
Cabot Oil & Gas Corp. | | | 64,422 | | | | 1,842 | |
Chesapeake Energy Corp.* | | | 126,576 | | | | 501 | |
Chevron Corp. | | | 264,567 | | | | 33,121 | |
Cimarex Energy Co. | | | 13,269 | | | | 1,619 | |
Concho Resources, Inc.* | | | 20,714 | | | | 3,112 | |
ConocoPhillips | | | 166,525 | | | | 9,141 | |
Devon Energy Corp. | | | 73,200 | | | | 3,030 | |
EOG Resources, Inc. | | | 80,541 | | | | 8,691 | |
EQT Corp. | | | 34,103 | | | | 1,941 | |
Exxon Mobil Corp. | | | 590,216 | | | | 49,366 | |
Halliburton Co. | | | 121,538 | | | | 5,940 | |
Helmerich & Payne, Inc. | | | 15,128 | | | | 978 | |
Hess Corp. | | | 37,622 | | | | 1,786 | |
Kinder Morgan, Inc. | | | 267,523 | | | | 4,834 | |
Marathon Oil Corp. | | | 118,352 | | | | 2,004 | |
Marathon Petroleum Corp. | | | 68,032 | | | | 4,489 | |
National Oilwell Varco, Inc. | | | 52,937 | | | | 1,907 | |
Newfield Exploration Co.* | | | 27,746 | | | | 875 | |
Noble Energy, Inc. | | | 67,780 | | | | 1,975 | |
Occidental Petroleum Corp. | | | 106,592 | | | | 7,852 | |
ONEOK, Inc. | | | 53,410 | | | | 2,855 | |
Phillips 66 | | | 59,850 | | | | 6,054 | |
Pioneer Natural Resources Co. | | | 23,703 | | | | 4,097 | |
Range Resources Corp. | | | 31,451 | | | | 536 | |
Schlumberger, Ltd. | | | 192,955 | | | | 13,003 | |
TechnipFMC PLC | | | 61,071 | | | | 1,912 | |
Valero Energy Corp. | | | 60,952 | | | | 5,602 | |
The Williams Companies, Inc. | | | 115,159 | | | | 3,511 | |
| | | | | | | | |
Total | | | | | | | 193,075 | |
| | | | | | | | |
| |
Financials (14.6%) | | | | | |
Affiliated Managers Group, Inc. | | | 7,742 | | | | 1,589 | |
Aflac, Inc. | | | 54,762 | | | | 4,807 | |
The Allstate Corp. | | | 49,981 | | | | 5,234 | |
American Express Co. | | | 100,351 | | | | 9,966 | |
American International Group, Inc. | | | 125,218 | | | | 7,460 | |
Ameriprise Financial, Inc. | | | 20,606 | | | | 3,492 | |
Aon PLC | | | 34,809 | | | | 4,664 | |
Arthur J. Gallagher & Co. | | | 25,184 | | | | 1,594 | |
Assurant, Inc. | | | 7,495 | | | | 756 | |
Bank of America Corp. | | | 1,351,196 | | | | 39,887 | |
| | | | | | | | |
| Common Stocks (98.6%) | | Shares/
$ Par | | | Value
$ (000’s) | |
| |
Financials continued | | | | | |
The Bank of New York Mellon Corp. | | | 142,638 | | | | 7,682 | |
BB&T Corp. | | | 109,890 | | | | 5,464 | |
Berkshire Hathaway, Inc. - Class B* | | | 268,054 | | | | 53,134 | |
BlackRock, Inc. | | | 17,196 | | | | 8,834 | |
Brighthouse Financial, Inc.* | | | 13,347 | | | | 783 | |
Capital One Financial Corp. | | | 67,521 | | | | 6,724 | |
CBOE Holdings, Inc. | | | 15,804 | | | | 1,969 | |
The Charles Schwab Corp. | | | 166,191 | | | | 8,537 | |
Chubb, Ltd. | | | 64,662 | | | | 9,449 | |
Cincinnati Financial Corp. | | | 20,797 | | | | 1,559 | |
Citigroup, Inc. | | | 368,288 | | | | 27,404 | |
Citizens Financial Group, Inc. | | | 68,530 | | | | 2,877 | |
CME Group, Inc. | | | 47,400 | | | | 6,923 | |
Comerica, Inc. | | | 24,225 | | | | 2,103 | |
Discover Financial Services | | | 50,616 | | | | 3,893 | |
E*TRADE Financial Corp.* | | | 37,705 | | | | 1,869 | |
Everest Re Group, Ltd. | | | 5,721 | | | | 1,266 | |
Fifth Third Bancorp | | | 98,282 | | | | 2,982 | |
Franklin Resources, Inc. | | | 45,522 | | | | 1,972 | |
The Goldman Sachs Group, Inc. | | | 48,863 | | | | 12,448 | |
The Hartford Financial Services Group, Inc. | | | 49,688 | | | | 2,796 | |
Huntington Bancshares, Inc. | | | 150,567 | | | | 2,192 | |
Intercontinental Exchange, Inc. | | | 81,489 | | | | 5,750 | |
Invesco, Ltd. | | | 56,703 | | | | 2,072 | |
JPMorgan Chase & Co. | | | 483,304 | | | | 51,685 | |
KeyCorp | | | 149,794 | | | | 3,021 | |
Leucadia National Corp. | | | 43,671 | | | | 1,157 | |
Lincoln National Corp. | | | 30,481 | | | | 2,343 | |
Loews Corp. | | | 38,446 | | | | 1,923 | |
M&T Bank Corp. | | | 20,966 | | | | 3,585 | |
Marsh & McLennan Cos., Inc. | | | 71,089 | | | | 5,786 | |
MetLife, Inc. | | | 146,576 | | | | 7,411 | |
Moody’s Corp. | | | 23,158 | | | | 3,418 | |
Morgan Stanley | | | 193,905 | | | | 10,174 | |
Nasdaq, Inc. | | | 16,208 | | | | 1,245 | |
Navient Corp. | | | 36,636 | | | | 488 | |
Northern Trust Corp. | | | 29,917 | | | | 2,988 | |
People’s United Financial, Inc. | | | 48,230 | | | | 902 | |
PNC Financial Services Group, Inc. | | | 66,275 | | | | 9,563 | |
Principal Financial Group, Inc. | | | 37,406 | | | | 2,639 | |
| | | | | | | | |
| Common Stocks (98.6%) | | Shares/
$ Par | | | Value
$ (000’s) | |
| |
Financials continued | | | | | |
The Progressive Corp. | | | 81,012 | | | | 4,563 | |
Prudential Financial, Inc. | | | 59,060 | | | | 6,791 | |
Raymond James Financial, Inc. | | | 17,901 | | | | 1,599 | |
Regions Financial Corp. | | | 161,574 | | | | 2,792 | |
S&P Global, Inc. | | | 35,519 | | | | 6,017 | |
State Street Corp. | | | 51,655 | | | | 5,042 | |
SunTrust Banks, Inc. | | | 66,307 | | | | 4,283 | |
Synchrony Financial | | | 102,468 | | | | 3,956 | |
T. Rowe Price Group, Inc. | | | 33,752 | | | | 3,542 | |
Torchmark Corp. | | | 14,955 | | | | 1,357 | |
The Travelers Cos., Inc. | | | 38,124 | | | | 5,171 | |
U.S. Bancorp | | | 219,596 | | | | 11,766 | |
Unum Group | | | 31,256 | | | | 1,716 | |
Wells Fargo & Co. | | | 617,318 | | | | 37,453 | |
Willis Towers Watson PLC | | | 18,392 | | | | 2,771 | |
XL Group, Ltd. | | | 35,661 | | | | 1,254 | |
Zions Bancorporation | | | 27,823 | | | | 1,414 | |
| | | | | | | | |
Total | | | | | | | 469,946 | |
| | | | | | | | |
| |
Health Care (13.6%) | | | | | |
Abbott Laboratories | | | 242,451 | | | | 13,837 | |
AbbVie, Inc. | | | 222,044 | | | | 21,474 | |
Aetna, Inc. | | | 45,423 | | | | 8,194 | |
Agilent Technologies, Inc. | | | 44,828 | | | | 3,002 | |
Alexion Pharmaceuticals, Inc.* | | | 31,119 | | | | 3,722 | |
Align Technology, Inc.* | | | 10,051 | | | | 2,233 | |
Allergan PLC | | | 46,326 | | | | 7,578 | |
AmerisourceBergen Corp. | | | 22,479 | | | | 2,064 | |
Amgen, Inc. | | | 101,113 | | | | 17,584 | |
Anthem, Inc. | | | 35,765 | | | | 8,047 | |
Baxter International, Inc. | | | 69,824 | | | | 4,513 | |
Becton, Dickinson and Co. | | | 36,910 | | | | 7,901 | |
Biogen, Inc.* | | | 29,451 | | | | 9,382 | |
Boston Scientific Corp.* | | | 191,275 | | | | 4,742 | |
Bristol-Myers Squibb Co. | | | 227,979 | | | | 13,971 | |
Cardinal Health, Inc. | | | 43,822 | | | | 2,685 | |
Celgene Corp.* | | | 109,667 | | | | 11,445 | |
Centene Corp.* | | | 24,025 | | | | 2,424 | |
Cerner Corp.* | | | 43,988 | | | | 2,964 | |
Cigna Corp. | | | 34,342 | | | | 6,974 | |
The Cooper Cos., Inc. | | | 6,818 | | | | 1,485 | |
Danaher Corp. | | | 85,265 | | | | 7,914 | |
DaVita, Inc.* | | | 21,087 | | | | 1,524 | |
Dentsply Sirona, Inc. | | | 31,993 | | | | 2,106 | |
Edwards Lifesciences Corp.* | | | 29,477 | | | | 3,322 | |
Eli Lilly and Co. | | | 134,956 | | | | 11,398 | |
Envision Healthcare Corp.* | | | 16,853 | | | | 582 | |
Express Scripts Holding Co.* | | | 78,891 | | | | 5,888 | |
Gilead Sciences, Inc. | | | 181,952 | | | | 13,035 | |
The Accompanying Notes are an Integral Part of the Financial Statements.
| | | | | | |
| | Index 500 Stock Portfolio | | | 19 | |
Index 500 Stock Portfolio
| | | | | | | | |
| Common Stocks (98.6%) | | Shares/
$ Par | | | Value
$ (000’s) | |
| |
Health Care continued | | | | | |
HCA Healthcare, Inc.* | | | 39,453 | | | | 3,466 | |
Henry Schein, Inc.* | | | 21,862 | | | | 1,528 | |
Hologic, Inc.* | | | 38,400 | | | | 1,642 | |
Humana, Inc. | | | 19,899 | | | | 4,936 | |
IDEXX Laboratories, Inc.* | | | 12,149 | | | | 1,900 | |
Illumina, Inc.* | | | 20,337 | | | | 4,443 | |
Incyte Corp.* | | | 24,398 | | | | 2,311 | |
Intuitive Surgical, Inc.* | | | 15,607 | | | | 5,696 | |
IQVIA Holdings, Inc.* | | | 20,280 | | | | 1,985 | |
Johnson & Johnson | | | 374,210 | | | | 52,285 | |
Laboratory Corp. of America Holdings* | | | 14,180 | | | | 2,262 | |
McKesson Corp. | | | 29,039 | | | | 4,529 | |
Medtronic PLC | | | 188,544 | | | | 15,225 | |
Merck & Co., Inc. | | | 380,986 | | | | 21,438 | |
Mettler-Toledo International, Inc.* | | | 3,563 | | | | 2,207 | |
Mylan NV* | | | 74,700 | | | | 3,161 | |
Patterson Cos., Inc. | | | 11,473 | | | | 415 | |
PerkinElmer, Inc. | | | 15,352 | | | | 1,123 | |
Perrigo Co. PLC | | | 18,245 | | | | 1,590 | |
Pfizer, Inc. | | | 830,278 | | | | 30,073 | |
Quest Diagnostics, Inc. | | | 18,985 | | | | 1,870 | |
Regeneron Pharmaceuticals, Inc.* | | | 10,730 | | | | 4,034 | |
ResMed, Inc. | | | 19,766 | | | | 1,674 | |
Stryker Corp. | | | 44,830 | | | | 6,941 | |
Thermo Fisher Scientific, Inc. | | | 55,855 | | | | 10,606 | |
UnitedHealth Group, Inc. | | | 134,983 | | | | 29,758 | |
Universal Health Services, Inc. - Class B | | | 12,206 | | | | 1,384 | |
Varian Medical Systems, Inc.* | | | 12,762 | | | | 1,418 | |
Vertex Pharmaceuticals, Inc.* | | | 35,227 | | | | 5,279 | |
Waters Corp.* | | | 11,078 | | | | 2,140 | |
Zimmer Biomet Holdings, Inc. | | | 28,203 | | | | 3,403 | |
Zoetis, Inc. | | | 67,875 | | | | 4,890 | |
| | | | | | | | |
Total | | | | | | | 437,602 | |
| | | | | | | | |
| |
Industrials (10.0%) | | | | | |
3M Co. | | | 83,125 | | | | 19,565 | |
A.O. Smith Corp. | | | 20,311 | | | | 1,245 | |
Acuity Brands, Inc. | | | 5,872 | | | | 1,033 | |
Alaska Air Group, Inc. | | | 17,139 | | | | 1,260 | |
Allegion PLC | | | 13,231 | | | | 1,053 | |
American Airlines Group, Inc. | | | 59,319 | | | | 3,086 | |
AMETEK, Inc. | | | 32,193 | | | | 2,333 | |
Arconic, Inc. | | | 58,999 | | | | 1,608 | |
The Boeing Co. | | | 77,982 | | | | 22,998 | |
C.H. Robinson Worldwide, Inc. | | | 19,418 | | | | 1,730 | |
| | | | | | | | |
| Common Stocks (98.6%) | | Shares/
$ Par | | | Value
$ (000’s) | |
| |
Industrials continued | | | | | |
Caterpillar, Inc. | | | 82,869 | | | | 13,059 | |
Cintas Corp. | | | 11,994 | | | | 1,869 | |
CSX Corp. | | | 124,488 | | | | 6,848 | |
Cummins, Inc. | | | 21,731 | | | | 3,839 | |
Deere & Co. | | | 44,554 | | | | 6,973 | |
Delta Air Lines, Inc. | | | 91,366 | | | | 5,117 | |
Dover Corp. | | | 21,700 | | | | 2,191 | |
Eaton Corp. PLC | | | 61,372 | | | | 4,849 | |
Emerson Electric Co. | | | 89,400 | | | | 6,230 | |
Equifax, Inc. | | | 16,726 | | | | 1,972 | |
Expeditors International of Washington, Inc. | | | 24,753 | | | | 1,601 | |
Fastenal Co. | | | 40,031 | | | | 2,189 | |
FedEx Corp. | | | 34,363 | | | | 8,575 | |
Flowserve Corp. | | | 18,196 | | | | 767 | |
Fluor Corp. | | | 19,484 | | | | 1,006 | |
Fortive Corp. | | | 42,603 | | | | 3,082 | |
Fortune Brands Home & Security, Inc. | | | 21,452 | | | | 1,468 | |
General Dynamics Corp. | | | 38,679 | | | | 7,869 | |
General Electric Co. | | | 1,207,951 | | | | 21,079 | |
Honeywell International, Inc. | | | 106,116 | | | | 16,274 | |
IHS Markit, Ltd.* | | | 50,601 | | | | 2,285 | |
Illinois Tool Works, Inc. | | | 42,949 | | | | 7,166 | |
Ingersoll-Rand PLC | | | 34,805 | | | | 3,104 | |
J.B. Hunt Transport Services, Inc. | | | 11,924 | | | | 1,371 | |
Jacobs Engineering Group, Inc. | | | 16,780 | | | | 1,107 | |
Johnson Controls International PLC | | | 128,905 | | | | 4,913 | |
Kansas City Southern | | | 14,423 | | | | 1,518 | |
L3 Technologies, Inc. | | | 10,884 | | | | 2,153 | |
Lockheed Martin Corp. | | | 34,748 | | | | 11,156 | |
Masco Corp. | | | 43,816 | | | | 1,925 | |
Nielsen Holdings PLC | | | 46,635 | | | | 1,698 | |
Norfolk Southern Corp. | | | 39,858 | | | | 5,775 | |
Northrop Grumman Corp. | | | 24,248 | | | | 7,442 | |
PACCAR, Inc. | | | 48,977 | | | | 3,481 | |
Parker Hannifin Corp. | | | 18,557 | | | | 3,704 | |
Pentair PLC | | | 23,004 | | | | 1,625 | |
Quanta Services, Inc.* | | | 21,551 | | | | 843 | |
Raytheon Co. | | | 40,268 | | | | 7,564 | |
Republic Services, Inc. | | | 31,657 | | | | 2,140 | |
Robert Half International, Inc. | | | 17,460 | | | | 970 | |
Rockwell Automation, Inc. | | | 17,899 | | | | 3,514 | |
Rockwell Collins, Inc. | | | 22,677 | | | | 3,075 | |
Roper Technologies, Inc. | | | 14,258 | | | | 3,693 | |
Snap-on, Inc. | | | 7,941 | | | | 1,384 | |
Southwest Airlines Co. | | | 76,042 | | | | 4,977 | |
Stanley Black & Decker, Inc. | | | 21,361 | | | | 3,625 | |
| | | | | | | | |
| Common Stocks (98.6%) | | Shares/
$ Par | | | Value
$ (000’s) | |
| |
Industrials continued | | | | | |
Stericycle, Inc.* | | | 11,892 | | | | 809 | |
Textron, Inc. | | | 36,692 | | | | 2,076 | |
TransDigm Group, Inc. | | | 6,731 | | | | 1,848 | |
Union Pacific Corp. | | | 109,646 | | | | 14,704 | |
United Continental Holdings, Inc.* | | | 35,076 | | | | 2,364 | |
United Parcel Service, Inc. - Class B | | | 95,701 | | | | 11,403 | |
United Rentals, Inc.* | | | 11,772 | | | | 2,024 | |
United Technologies Corp. | | | 103,448 | | | | 13,197 | |
Verisk Analytics, Inc.* | | | 21,649 | | | | 2,078 | |
W.W. Grainger, Inc. | | | 7,223 | | | | 1,706 | |
Waste Management, Inc. | | | 55,644 | | | | 4,802 | |
Xylem, Inc. | | | 25,017 | | | | 1,706 | |
| | | | | | | | |
Total | | | | | | | 323,693 | |
| | | | | | | | |
| |
Information Technology (23.5%) | | | | | |
Accenture PLC - Class A | | | 86,080 | | | | 13,178 | |
Activision Blizzard, Inc. | | | 105,319 | | | | 6,669 | |
Adobe Systems, Inc.* | | | 68,663 | | | | 12,032 | |
Advanced Micro Devices, Inc.* | | | 114,231 | | | | 1,174 | |
Akamai Technologies, Inc.* | | | 23,562 | | | | 1,532 | |
Alliance Data Systems Corp. | | | 6,695 | | | | 1,697 | |
Alphabet, Inc. - Class A* | | | 41,515 | | | | 43,732 | |
Alphabet, Inc. - Class C* | | | 42,047 | | | | 43,998 | |
Amphenol Corp. - Class A | | | 42,531 | | | | 3,734 | |
Analog Devices, Inc. | | | 51,348 | | | | 4,572 | |
ANSYS, Inc.* | | | 11,820 | | | | 1,745 | |
Apple, Inc. | | | 715,168 | | | | 121,028 | |
Applied Materials, Inc. | | | 148,553 | | | | 7,594 | |
Autodesk, Inc.* | | | 30,532 | | | | 3,201 | |
Automatic Data Processing, Inc. | | | 61,775 | | | | 7,239 | |
Broadcom, Ltd. | | | 56,635 | | | | 14,550 | |
CA, Inc. | | | 43,725 | | | | 1,455 | |
Cadence Design Systems, Inc.* | | | 39,330 | | | | 1,645 | |
Cisco Systems, Inc. | | | 688,606 | | | | 26,374 | |
Citrix Systems, Inc.* | | | 19,938 | | | | 1,755 | |
Cognizant Technology Solutions Corp. - Class A | | | 82,133 | | | | 5,833 | |
Corning, Inc. | | | 121,053 | | | | 3,872 | |
CSRA, Inc. | | | 22,813 | | | | 683 | |
DXC Technology Co. | | | 39,736 | | | | 3,771 | |
eBay, Inc.* | | | 135,315 | | | | 5,107 | |
Electronic Arts, Inc.* | | | 42,891 | | | | 4,506 | |
F5 Networks, Inc.* | | | 8,719 | | | | 1,144 | |
Facebook, Inc. - Class A* | | | 332,183 | | | | 58,617 | |
Fidelity National Information Services, Inc. | | | 46,505 | | | | 4,376 | |
Fiserv, Inc.* | | | 29,028 | | | | 3,806 | |
FLIR Systems, Inc. | | | 19,302 | | | | 900 | |
The Accompanying Notes are an Integral Part of the Financial Statements.
| | | | |
| 20 | | Index 500 Stock Portfolio | | |
Index 500 Stock Portfolio
| | | | | | | | |
| Common Stocks (98.6%) | | Shares/
$ Par | | | Value
$ (000’s) | |
| |
Information Technology continued | | | | | |
Gartner, Inc.* | | | 12,627 | | | | 1,555 | |
Global Payments, Inc. | | | 22,167 | | | | 2,222 | |
Harris Corp. | | | 16,604 | | | | 2,352 | |
Hewlett Packard Enterprise Co. | | | 222,170 | | | | 3,190 | |
HP, Inc. | | | 232,652 | | | | 4,888 | |
Intel Corp. | | | 651,885 | | | | 30,091 | |
International Business Machines Corp. | | | 119,928 | | | | 18,399 | |
Intuit, Inc. | | | 33,829 | | | | 5,338 | |
Juniper Networks, Inc. | | | 52,225 | | | | 1,488 | |
KLA-Tencor Corp. | | | 21,828 | | | | 2,293 | |
Lam Research Corp. | | | 22,558 | | | | 4,152 | |
Mastercard, Inc. - Class A | | | 129,375 | | | | 19,582 | |
Microchip Technology, Inc. | | | 32,581 | | | | 2,863 | |
Micron Technology, Inc.* | | | 160,639 | | | | 6,605 | |
Microsoft Corp. | | | 1,074,579 | | | | 91,919 | |
Motorola Solutions, Inc. | | | 22,565 | | | | 2,039 | |
NetApp, Inc. | | | 37,575 | | | | 2,079 | |
NVIDIA Corp. | | | 84,411 | | | | 16,334 | |
Oracle Corp. | | | 424,373 | | | | 20,064 | |
Paychex, Inc. | | | 44,546 | | | | 3,033 | |
PayPal Holdings, Inc.* | | | 157,371 | | | | 11,586 | |
Qorvo, Inc.* | | | 17,727 | | | | 1,181 | |
QUALCOMM, Inc. | | | 205,339 | | | | 13,146 | |
Red Hat, Inc.* | | | 24,647 | | | | 2,960 | |
Salesforce.com, Inc.* | | | 95,580 | | | | 9,771 | |
Seagate Technology PLC | | | 40,300 | | | | 1,686 | |
Skyworks Solutions, Inc. | | | 25,593 | | | | 2,430 | |
Symantec Corp. | | | 86,358 | | | | 2,423 | |
Synopsys, Inc.* | | | 20,927 | | | | 1,784 | |
TE Connectivity, Ltd. | | | 48,980 | | | | 4,655 | |
Texas Instruments, Inc. | | | 137,281 | | | | 14,338 | |
Total System Services, Inc. | | | 23,303 | | | | 1,843 | |
VeriSign, Inc.* | | | 11,808 | | | | 1,351 | |
Visa, Inc. - Class A | | | 252,600 | | | | 28,801 | |
Western Digital Corp. | | | 41,201 | | | | 3,277 | |
Western Union Co. | | | 63,975 | | | | 1,216 | |
Xerox Corp. | | | 29,737 | | | | 867 | |
Xilinx, Inc. | | | 34,956 | | | | 2,357 | |
| | | | | | | | |
Total | | | | | | | 757,677 | |
| | | | | | | | |
| |
Materials (3.0%) | | | | | |
Air Products and Chemicals, Inc. | | | 30,360 | | | | 4,982 | |
Albemarle Corp. | | | 15,391 | | | | 1,968 | |
Avery Dennison Corp. | | | 12,312 | | | | 1,414 | |
Ball Corp. | | | 48,760 | | | | 1,846 | |
CF Industries Holdings, Inc. | | | 32,490 | | | | 1,382 | |
DowDuPont, Inc. | | | 325,941 | | | | 23,214 | |
Eastman Chemical Co. | | | 20,021 | | | | 1,855 | |
Ecolab, Inc. | | | 36,219 | | | | 4,860 | |
| | | | | | | | |
| Common Stocks (98.6%) | | Shares/
$ Par | | | Value
$ (000’s) | |
| |
Materials continued | | | | | |
FMC Corp. | | | 18,702 | | | | 1,770 | |
Freeport-McMoRan, Inc.* | | | 187,523 | | | | 3,555 | |
International Flavors & Fragrances, Inc. | | | 11,000 | | | | 1,679 | |
International Paper Co. | | | 57,513 | | | | 3,332 | |
LyondellBasell Industries NV - Class A | | | 45,055 | | | | 4,970 | |
Martin Marietta Materials, Inc. | | | 8,756 | | | | 1,935 | |
Monsanto Co. | | | 61,194 | | | | 7,146 | |
The Mosaic Co. | | | 48,894 | | | | 1,255 | |
Newmont Mining Corp. | | | 74,290 | | | | 2,787 | |
Nucor Corp. | | | 44,283 | | | | 2,816 | |
Packaging Corp. of America | | | 13,142 | | | | 1,584 | |
PPG Industries, Inc. | | | 35,446 | | | | 4,141 | |
Praxair, Inc. | | | 39,880 | | | | 6,169 | |
Sealed Air Corp. | | | 25,127 | | | | 1,239 | |
The Sherwin-Williams Co. | | | 11,463 | | | | 4,700 | |
Vulcan Materials Co. | | | 18,425 | | | | 2,365 | |
WestRock Co. | | | 35,466 | | | | 2,242 | |
| | | | | | | | |
Total | | | | | | | 95,206 | |
| | | | | | | | |
| |
Real Estate (2.9%) | | | | | |
Alexandria Real Estate Equities, Inc. | | | 13,333 | | | | 1,741 | |
American Tower Corp. | | | 59,736 | | | | 8,522 | |
Apartment Investment & Management Co. - Class A | | | 21,872 | | | | 956 | |
AvalonBay Communities, Inc. | | | 19,234 | | | | 3,431 | |
Boston Properties, Inc. | | | 21,495 | | | | 2,795 | |
CBRE Group, Inc.* | | | 42,082 | | | | 1,823 | |
Crown Castle International Corp. | | | 56,590 | | | | 6,282 | |
Digital Realty Trust, Inc. | | | 28,616 | | | | 3,259 | |
Duke Realty Corp. | | | 49,607 | | | | 1,350 | |
Equinix, Inc. | | | 10,897 | | | | 4,939 | |
Equity Residential | | | 51,188 | | | | 3,264 | |
Essex Property Trust, Inc. | | | 9,198 | | | | 2,220 | |
Extra Space Storage, Inc. | | | 17,538 | | | | 1,534 | |
Federal Realty Investment Trust | | | 10,105 | | | | 1,342 | |
GGP, Inc. | | | 86,966 | | | | 2,034 | |
HCP, Inc. | | | 65,343 | | | | 1,704 | |
Host Hotels & Resorts, Inc. | | | 103,083 | | | | 2,046 | |
Iron Mountain, Inc. | | | 39,244 | | | | 1,481 | |
Kimco Realty Corp. | | | 59,290 | | | | 1,076 | |
The Macerich Co. | | | 15,098 | | | | 992 | |
Mid-America Apartment Communities, Inc. | | | 15,827 | | | | 1,592 | |
Prologis, Inc. | | | 74,115 | | | | 4,781 | |
Public Storage | | | 20,849 | | | | 4,357 | |
| | | | | | | | |
| Common Stocks (98.6%) | | Shares/
$ Par | | | Value
$ (000’s) | |
| |
Real Estate continued | | | | | |
Realty Income Corp. | | | 39,250 | | | | 2,238 | |
Regency Centers Corp. | | | 20,611 | | | | 1,426 | |
SBA Communications Corp.* | | | 16,373 | | | | 2,675 | |
Simon Property Group, Inc. | | | 43,297 | | | | 7,436 | |
SL Green Realty Corp. | | | 13,688 | | | | 1,381 | |
UDR, Inc. | | | 37,270 | | | | 1,436 | |
Ventas, Inc. | | | 49,609 | | | | 2,977 | |
Vornado Realty Trust | | | 24,016 | | | | 1,878 | |
Welltower, Inc. | | | 51,588 | | | | 3,290 | |
Weyerhaeuser Co. | | | 105,142 | | | | 3,707 | |
| | | | | | | | |
Total | | | | | | | 91,965 | |
| | | | | | | | |
| |
Telecommunication Services (2.0%) | | | | | |
AT&T, Inc. | | | 855,252 | | | | 33,253 | |
CenturyLink, Inc. | | | 135,503 | | | | 2,260 | |
Verizon Communications, Inc. | | | 568,223 | | | | 30,076 | |
| | | | | | | | |
Total | | | | | | | 65,589 | |
| | | | | | | | |
| |
Utilities (2.9%) | | | | | |
The AES Corp. | | | 91,986 | | | | 996 | |
Alliant Energy Corp. | | | 32,205 | | | | 1,372 | |
Ameren Corp. | | | 33,797 | | | | 1,994 | |
American Electric Power Co., Inc. | | | 68,509 | | | | 5,040 | |
American Water Works Co., Inc. | | | 24,846 | | | | 2,273 | |
CenterPoint Energy, Inc. | | | 60,038 | | | | 1,703 | |
CMS Energy Corp. | | | 39,282 | | | | 1,858 | |
Consolidated Edison, Inc. | | | 43,190 | | | | 3,669 | |
Dominion Resources, Inc. | | | 89,638 | | | | 7,266 | |
DTE Energy Co. | | | 24,987 | | | | 2,735 | |
Duke Energy Corp. | | | 97,488 | | | | 8,200 | |
Edison International | | | 45,383 | | | | 2,870 | |
Entergy Corp. | | | 25,107 | | | | 2,044 | |
Eversource Energy | | | 44,140 | | | | 2,789 | |
Exelon Corp. | | | 133,732 | | | | 5,271 | |
FirstEnergy Corp. | | | 61,965 | | | | 1,897 | |
NextEra Energy, Inc. | | | 65,523 | | | | 10,234 | |
NiSource, Inc. | | | 46,913 | | | | 1,204 | |
NRG Energy, Inc. | | | 41,901 | | | | 1,193 | |
PG&E Corp. | | | 71,432 | | | | 3,202 | |
Pinnacle West Capital Corp. | | | 15,563 | | | | 1,326 | |
PPL Corp. | | | 95,161 | | | | 2,945 | |
Public Service Enterprise Group, Inc. | | | 70,487 | | | | 3,630 | |
SCANA Corp. | | | 19,865 | | | | 790 | |
Sempra Energy | | | 34,973 | | | | 3,739 | |
The Southern Co. | | | 139,797 | | | | 6,723 | |
WEC Energy Group, Inc. | | | 43,958 | | | | 2,920 | |
The Accompanying Notes are an Integral Part of the Financial Statements.
| | | | | | |
| | Index 500 Stock Portfolio | | | 21 | |
Index 500 Stock Portfolio
| | | | | | | | |
| Common Stocks (98.6%) | | Shares/
$ Par | | | Value
$ (000’s) | |
| |
Utilities continued | | | | | |
Xcel Energy, Inc. | | | 70,727 | | | | 3,403 | |
| | | | | | | | |
Total | | | | | | | 93,286 | |
| | | | | | | | |
| | |
Total Common Stocks | | | | | | | | |
(Cost: $1,456,017) | | | | | | | 3,176,580 | |
| | | | | | | | |
| | |
| Short-Term Investments (1.3%) | | | | | | | | |
| | |
Commercial Paper (0.9%) | | | | | | | | |
Apple, Inc., 0.000%, 1/8/18 144A | | | 3,000,000 | | | | 2,999 | |
Bank of America Corp., 1.400%, 1/8/18 | | | 5,000,000 | | | | 5,000 | |
General Mills, Inc., 0.000%, 1/8/18 144A | | | 1,000,000 | | | | 1,000 | |
General Mills, Inc., 0.000%, 1/17/18 144A | | | 2,000,000 | | | | 1,998 | |
Microsoft Corp., 0.000%, 1/11/18 144A | | | 1,500,000 | | | | 1,499 | |
Microsoft Corp., 0.000%, 2/12/18 144A | | | 3,000,000 | | | | 2,995 | |
| | | | | | | | |
| Short-Term Investments (1.3%) | | Shares/
$ Par | | | Value
$ (000’s) | |
| |
Commercial Paper continued | | | | | |
Mondelez International, Inc., 0.000%, 1/16/18 144A | | | 1,500,000 | | | | 1,499 | |
Pfizer, Inc., 0.000%, 1/31/18 144A | | | 3,000,000 | | | | 2,996 | |
Societe Generale SA, 0.000%, 2/14/18 144A | | | 1,000,000 | | | | 998 | |
Societe Generale SA, 0.000%, 3/5/18 144A | | | 2,000,000 | | | | 1,994 | |
United Parcel Service, Inc., 0.000%, 3/5/18 144A | | | 2,000,000 | | | | 1,994 | |
The Walt Disney Co., 0.000%, 1/19/18 144A | | | 3,000,000 | | | | 2,997 | |
| | | | | | | | |
Total | | | | | | | 27,969 | |
| | | | | | | | |
| | |
Money Market Funds (0.2%) | | | | | | | | |
State Street Institutional U.S. Government Money Market Fund - Premier Class,
1.209% # | | | 5,809,953 | | | | 5,810 | |
| | | | | | | | |
Total | | | | | | | 5,810 | |
| | | | | | | | |
| | | | | | | | |
| Short-Term Investments (1.3%) | | Shares/
$ Par | | | Value
$ (000’s) | |
| |
US Government & Agencies (0.2%) | | | | | |
Federal Home Loan Bank, 0.000%, 1/12/18 | | | 1,000,000 | | | | 1,000 | |
Federal Home Loan Bank, 0.000%, 1/23/18 | | | 2,000,000 | | | | 1,998 | |
Federal Home Loan Bank, 0.000%, 2/9/18 | | | 1,000,000 | | | | 998 | |
Federal Home Loan Bank, 0.000%, 3/15/18 (b) | | | 3,000,000 | | | | 2,992 | |
| | | | | | | | |
Total | | | | | | �� | 6,988 | |
| | | | | | | | |
| | |
Total Short-Term Investments | | | | | | | | |
(Cost: $40,774) | | | | | | | 40,767 | |
| | | | | | | | |
| | |
Total Investments (99.9%) | | | | | | | | |
(Cost: $1,496,791)(a) | | | | | | | 3,217,347 | |
| | | | | | | | |
Other Assets, Less | | | | | | | | |
Liabilities (0.1%) | | | | | | | 4,790 | |
| | | | | | | | |
Net Assets (100.0%) | | | | | | | 3,222,137 | |
| | | | | | | | |
| # | 7-day yield as of December 31, 2017. |
| | 144A after the name of a security represents a security exempt from registration under Rule 144A of the Securities Act of 1933. These securities may be resold as transactions exempt from registration, normally to qualified institutional buyers. At December 31, 2017 the value of these securities (in thousands) was $22,969 representing 0.7% of the net assets. |
| (a) | At December 31, 2017, the aggregate cost of investments, including derivatives, for federal tax purposes (in thousands) was $1,506,561 and the net unrealized appreciation of investments based on that cost was $1,710,942 which is comprised of $1,768,894 aggregate gross unrealized appreciation and $57,952 aggregate gross unrealized depreciation. |
| (b) | All or a portion of the securities have been pledged as collateral for open futures positions. Information regarding open futures contracts as of period end is summarized below. |
| | | | | | | | | | | | | | | | | | | | |
| Issuer | | Long/Short | | Currency | | Notional Par
(000’s) | | | Number of
Contracts | | Expiration
Date | | Notional
Value
(000’s) | | | Unrealized
Appreciation/
(Depreciation)
(000’s) | |
E-Mini S&P 500 Future | | Long | | USD | | $ | 15 | | | 303 | | 3/18 | | $ | 40,541 | | | $ | 156 | |
| (l) | Security valued using significant unobservable inputs. |
| (p) | Restricted securities (excluding 144A issues) on December 31, 2017. |
| | | | | | | | | | | | | | |
| Description | | Acquisition
Date | | Cost (000’s) | | | Value (000’s) | | | Value as a
Percentage of
Net Assets | |
Casa Ley SA de CV | | 2/2/2015 | | $ | 30 | | | $ | 30 | | | | 0.00 | % |
Property Development Centers LLC | | 2/2/2015 | | | - | | | | - | | | | 0.00 | % |
The Accompanying Notes are an Integral Part of the Financial Statements.
| | | | |
| 22 | | Index 500 Stock Portfolio | | |
Index 500 Stock Portfolio
The following is a summary of the inputs used in valuing the Portfolio’s assets and liabilities at December 31, 2017. See Note 3 for additional information on portfolio valuation.
| | | | | | | | | | | | | | |
| | | Valuation Inputs | | | |
| Description | | Level 1 –
Quoted Prices | | | Level 2 –
Other Significant
Observable Inputs | | | Level 3 –
Significant
Unobservable Inputs | | | |
| | | (Amounts in thousands) | | | |
Assets: | | | | | | | | | | | | | | |
Common Stocks | | | | | | | | | | | | | | |
Consumer Staples | | $ | 260,615 | | | $ | - | | | $ | 30 | | | |
All Others | | | 2,915,935 | | | | | | | | - | | | |
Short-Term Investments | | | | | | | | | | | | | | |
Money Market Funds | | | 5,810 | | | | - | | | | | | | |
All Others | | | - | | | | 34,957 | | | | - | | | |
Other Financial Instruments^ | | | | | | | | | | | | | | |
Futures | | | 156 | | | | - | | | | - | | | |
Total Assets: | | $ | 3,182,516 | | | $ | 34,957 | | | $ | 30 | | | |
^ Other financial instruments are derivative instruments such as futures and forwards, which are valued at the unrealized appreciation (depreciation) on the instrument, and short sales, written options and swaps contracts, which are valued at market value.
The Accompanying Notes are an Integral Part of the Financial Statements.
| | | | | | |
| | Index 500 Stock Portfolio | | | 23 | |
Large Company Value Portfolio (unaudited)
| | | | |
| Objective: | | Portfolio Strategy: | | Net Assets: |
| Long-term growth of capital. Current income is a secondary objective. | | Invest primarily in equity securities of larger companies considered to be undervalued. | | $200 million |
Portfolio Overview
Mason Street Advisors, LLC (“Mason Street Advisors”), the investment adviser for the Large Company Value Portfolio (the “Portfolio”), has engaged American Century Investment Management, Inc. (“American Century”) to act as sub-adviser for the Portfolio. The Portfolio looks for stocks of companies that it believes are undervalued at the time of purchase. The Portfolio attempts to purchase the stocks of these undervalued companies and hold each stock until it has returned to favor in the market and the price has increased to, or is higher than, a level the Portfolio believes more accurately reflects the fair value of the company. Companies may be undervalued due to market declines, poor economic conditions, actual or anticipated bad news regarding the issuer or its industry, or because they have been overlooked by the market.
Market Overview
Major U.S. stock market benchmarks climbed to record highs in 2017, with large cap stocks outperforming mid cap and small cap stocks, according to the S&P Indices. Market gains were fueled by positive economic and earnings news, moderate inflation and passage of the largest corporate tax cut in decades. Moreover, the U.S. Federal Reserve (the “Fed”) raised the federal funds rate by 25 basis points in December, to a range of 1.25% to 1.50%. This constituted the third rate hike in 2017, and the Fed is expected to continue raising rates at a gradual pace through 2018 given relatively moderate inflation. The outperformance of growth versus value was pronounced in 2017. This created headwinds for the investment team’s approach to value investing as quality and value factors are key determinants of the Portfolio’s performance over time.
Portfolio Results
The Portfolio returned 11.10% for the twelve months ended December 31, 2017. By comparison, the Portfolio’s benchmark, the Russell 1000® Value Index (the “Index”), returned 13.66%. (The Index is unmanaged, cannot be invested in directly and does not include administrative expenses.) According to Lipper® Analytical Services, Inc., an independent mutual fund ranking agency, the average return of the Large Cap Value Funds peer group for 2017 was 15.11%.
The Industrials sector weighed on performance for the reporting period. Industrial conglomerate General Electric was a top detractor, as the company reported weak financial results, cut its dividend by 50%, lowered earnings expectations for 2018 and replaced its CEO.
In the Consumer Discretionary sector, Advance Auto Parts detracted from relative performance. Its stock fell on reports that Amazon was increasing its focus on the aftermarket automotive parts sector. The company also reported first quarter and second quarter earnings that missed estimates, and it materially lowered guidance for its fiscal 2017 year. The investment team’s longer-term investment thesis, however, remained intact. Mattel was another notable detractor in the Consumer Discretionary sector. On the new CEO’s first investor day, she reduced guidance and announced a larger-than-expected dividend cut. Later in the year, the toy company missed second quarter and third quarter earnings estimates and announced the need to renegotiate the financial leverage covenants of its credit facility. Mattel’s weak financial results were negatively impacted by the bankruptcy of Toys”R”Us, one of Mattel’s largest customers, and by continued inventory reductions at other large customers.
Stocks in the Energy sector weighed on returns, including Schlumberger, which is the largest oilfield services company in the world with top market positions across the globe. In the first half of 2017, the stock was pressured by weakening oil prices, as well as exposure to the relatively weak non-U.S. markets. Later in the year, Schlumberger reported solid third quarter earnings, but investors became concerned that the company’s oil production business would raise the overall risk profile of the company.
On the other hand, several companies in the Portfolio’s Information Technology sector outperformed for the reporting period, including Applied Materials and Lam Research. These semiconductor stocks reported better-than-expected earnings and raised guidance results as they benefited from strong orders and a backlog. Lack of exposure to AT&T was also beneficial, as the stock was pressured by increased competition in wireless and from merger arbitrage related to its pending acquisition of Time Warner.
Portfolio Manager Outlook
The following forward-looking comments are the opinion of American Century, the Portfolio’s sub-adviser.
| | | | |
| 24 | | Large Company Value Portfolio | | |
Large Company Value Portfolio (unaudited)
We see value in the Health Care sector, where we hold higher quality companies with compelling valuations and strong fundamentals. For example, in the fourth quarter, we initiated a position in biotechnology company Celgene. The stock fell to an attractive level after one of its drugs failed in a phase 3 study, and the company lowered its 2020 guidance. Celgene offers solid cash flow generation, an attractive drug pipeline and a compelling risk/reward profile.
The Portfolio is also overweight Energy. During the first half of 2017, the Energy sector declined as the price of oil fell and energy companies faced a rising service cost environment. This provided us with the opportunity to add to some of the Portfolio’s Energy stocks that continue to offer compelling risk/reward profiles.
Our valuation methodology shows that many Real Estate and Utilities stocks remain overvalued, leading to the Portfolio’s continued underweight in those sectors.
Relative Performance

| | | | | | | | | | | | |
Average Annual Total Returns
For Periods Ended December 31, 2017 | |
| | | 1 Year | | | 5 Years | | | 10 Years | |
Large Company Value Portfolio | | | 11.10 | % | | | 12.83 | % | | | 6.15 | % |
Russell 1000® Value Index | | | 13.66 | % | | | 14.04 | % | | | 7.10 | % |
Lipper® Variable Insurance Products (VIP) Large Cap Value Funds Average | | | 15.11 | % | | | 13.46 | % | | | 6.83 | % |
The performance data quoted represents past performance. Past performance is historical and does not guarantee future performance. Investment return and principal value will fluctuate, so that shares, when redeemed, may be worth more or less than their original cost. Current performance may be lower or higher than the performance data quoted. For the most recent month-end performance information visit www.northwesternmutual.com.
This chart assumes an initial investment of $10,000 made on 12/31/07. Returns shown reflect fee waivers, deductions for management and other portfolio expenses, and reinvestment of all dividends. In the absence of fee waivers, total return would be reduced.
Returns exclude deductions for separate account sale loads and account fees. Please refer to the Benchmark
Definitions section of this report for information about the indices cited in the above chart and graph.
The Portfolio may invest in derivative instruments for cash management purposes or to hedge foreign currency exposure. Use of these instruments may involve certain costs and imposes certain risks such as liquidity risk, market risk, credit risk, management risk and the risk of mispricing or improper valuation. Certain derivatives involve leverage, which could magnify losses, and portfolios investing in derivatives could lose more than the principal amount invested in those instruments.
Top 10 Equity Holdings 12/31/17
| | | | |
Security Description | | | % of Net Assets | |
Schlumberger, Ltd. | | | 3.8 | % |
Pfizer, Inc. | | | 3.3 | % |
iShares Russell 1000 Value Index Fund | | | 3.0 | % |
The Procter & Gamble Co. | | | 2.9 | % |
Verizon Communications, Inc. | | | 2.9 | % |
Cisco Systems, Inc. | | | 2.7 | % |
Total SA, ADR | | | 2.6 | % |
Bank of America Corp. | | | 2.6 | % |
U.S. Bancorp | | | 2.5 | % |
BB&T Corp. | | | 2.5 | % |
Sector Allocation 12/31/17
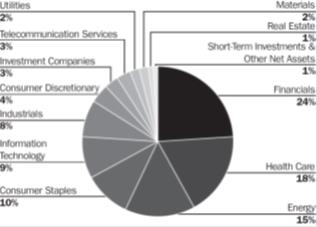
Sector Allocation is based on Net Assets.
Sector Allocation and Top 10 Holdings are subject to change.
| | | | | | |
| | Large Company Value Portfolio | | | 25 | |
Large Company Value Portfolio
Schedule of Investments
December 31, 2017
| | | | | | | | |
| Common Stocks (96.6%) | | Shares/
$ Par | | | Value
$ (000’s) | |
|
Consumer Discretionary (4.3%) | |
Advance Auto Parts, Inc. | | | 20,720 | | | | 2,066 | |
Aptiv PLC | | | 8,140 | | | | 691 | |
Carnival Corp. | | | 10,180 | | | | 676 | |
Honda Motor Co., Ltd., ADR* | | | 54,380 | | | | 1,853 | |
L Brands, Inc. | | | 12,130 | | | | 730 | |
Mattel, Inc. | | | 32,020 | | | | 492 | |
Target Corp. | | | 17,610 | | | | 1,149 | |
Time Warner, Inc. | | | 11,010 | | | | 1,007 | |
| | | | | | | | |
Total | | | | | | | 8,664 | |
| | | | | | | | |
|
Consumer Staples (10.3%) | |
Conagra Brands, Inc. | | | 47,850 | | | | 1,803 | |
General Mills, Inc. | | | 16,680 | | | | 989 | |
Mondelez International, Inc. | | | 92,570 | | | | 3,962 | |
PepsiCo, Inc. | | | 8,470 | | | | 1,016 | |
The Procter & Gamble Co. | | | 62,360 | | | | 5,730 | |
Sysco Corp. | | | 31,030 | | | | 1,884 | |
Unilever NV | | | 28,870 | | | | 1,622 | |
Wal-Mart Stores, Inc. | | | 35,750 | | | | 3,530 | |
| | | | | | | | |
Total | | | | | | | 20,536 | |
| | | | | | | | |
|
Energy (15.5%) | |
Anadarko Petroleum Corp. | | | 44,740 | | | | 2,400 | |
Baker Hughes | | | 65,880 | | | | 2,084 | |
Chevron Corp. | | | 32,630 | | | | 4,085 | |
Exxon Mobil Corp. | | | 18,910 | | | | 1,582 | |
Imperial Oil, Ltd. | | | 49,450 | | | | 1,543 | |
Occidental Petroleum Corp. | | | 57,090 | | | | 4,205 | |
Royal Dutch Shell PLC - Class B, ADR | | | 34,930 | | | | 2,385 | |
Schlumberger, Ltd. | | | 111,700 | | | | 7,528 | |
Total SA, ADR | | | 92,540 | | | | 5,116 | |
| | | | | | | | |
Total | | | | | | | 30,928 | |
| | | | | | | | |
|
Financials (23.6%) | |
AFLAC, Inc. | | | 23,650 | | | | 2,076 | |
Ameriprise Financial, Inc. | | | 9,480 | | | | 1,607 | |
Bank of America Corp. | | | 172,560 | | | | 5,094 | |
The Bank of New York Mellon Corp. | | | 82,780 | | | | 4,459 | |
BB&T Corp. | | | 100,380 | | | | 4,991 | |
BlackRock, Inc. | | | 970 | | | | 498 | |
Chubb, Ltd. | | | 26,650 | | | | 3,894 | |
Invesco, Ltd. | | | 89,310 | | | | 3,264 | |
| | | | | | | | |
| Common Stocks (96.6%) | | Shares/
$ Par | | | Value
$ (000’s) | |
|
Financials continued | |
JPMorgan Chase & Co. | | | 34,630 | | | | 3,703 | |
M&T Bank Corp. | | | 17,050 | | | | 2,915 | |
MetLife, Inc. | | | 23,460 | | | | 1,186 | |
PNC Financial Services Group, Inc. | | | 27,580 | | | | 3,980 | |
U.S. Bancorp | | | 94,800 | | | | 5,079 | |
Wells Fargo & Co. | | | 73,940 | | | | 4,486 | |
| | | | | | | | |
Total | | | | | | | 47,232 | |
| | | | | | | | |
|
Health Care (18.3%) | |
Abbott Laboratories | | | 42,270 | | | | 2,412 | |
Allergan PLC | | | 14,190 | | | | 2,321 | |
Celgene Corp.* | | | 9,710 | | | | 1,013 | |
HCA Healthcare, Inc.* | | | 28,140 | | | | 2,472 | |
Johnson & Johnson | | | 33,500 | | | | 4,681 | |
McKesson Corp. | | | 10,450 | | | | 1,630 | |
Medtronic PLC | | | 61,410 | | | | 4,959 | |
Merck & Co., Inc. | | | 60,080 | | | | 3,381 | |
Pfizer, Inc. | | | 180,410 | | | | 6,534 | |
Roche Holding AG | | | 14,570 | | | | 3,685 | |
Zimmer Biomet Holdings, Inc. | | | 29,130 | | | | 3,515 | |
| | | | | | | | |
Total | | | | | | | 36,603 | |
| | | | | | | | |
|
Industrials (7.6%) | |
Eaton Corp. PLC | | | 22,880 | | | | 1,808 | |
General Electric Co. | | | 202,850 | | | | 3,540 | |
Ingersoll-Rand PLC | | | 11,560 | | | | 1,031 | |
Johnson Controls International PLC | | | 114,090 | | | | 4,348 | |
Textron, Inc. | | | 27,230 | | | | 1,541 | |
Union Pacific Corp. | | | 6,960 | | | | 933 | |
United Technologies Corp. | | | 16,040 | | | | 2,046 | |
| | | | | | | | |
Total | | | | | | | 15,247 | |
| | | | | | | | |
|
Information Technology (9.5%) | |
Apple, Inc. | | | 4,170 | | | | 706 | |
Applied Materials, Inc. | | | 29,780 | | | | 1,522 | |
Cisco Systems, Inc. | | | 139,110 | | | | 5,328 | |
Intel Corp. | | | 38,790 | | | | 1,791 | |
Lam Research Corp. | | | 5,460 | | | | 1,005 | |
Oracle Corp. | | | 88,270 | | | | 4,173 | |
QUALCOMM, Inc. | | | 28,950 | | | | 1,853 | |
TE Connectivity, Ltd. | | | 28,200 | | | | 2,680 | |
| | | | | | | | |
Total | | | | | | | 19,058 | |
| | | | | | | | |
| | | | | | | | |
| Common Stocks (96.6%) | | Shares/
$ Par | | | Value
$ (000’s) | |
| | |
Materials (1.7%) | | | | | | | | |
DowDuPont, Inc. | | | 28,850 | | | | 2,055 | |
WestRock Co. | | | 21,650 | | | | 1,368 | |
| | | | | | | | |
Total | | | | | | | 3,423 | |
| | | | | | | | |
| | |
Real Estate (0.5%) | | | | | | | | |
Boston Properties, Inc. | | | 7,200 | | | | 936 | |
| | | | | | | | |
Total | | | | | | | 936 | |
| | | | | | | | |
| | |
Telecommunication Services (2.9%) | | | | | | | | |
Verizon Communications, Inc. | | | 107,570 | | | | 5,694 | |
| | | | | | | | |
Total | | | | | | | 5,694 | |
| | | | | | | | |
|
Utilities (2.4%) | |
Edison International | | | 16,030 | | | | 1,014 | |
PG&E Corp. | | | 17,800 | | | | 798 | |
PPL Corp. | | | 32,400 | | | | 1,003 | |
Xcel Energy, Inc. | | | 42,000 | | | | 2,020 | |
| | | | | | | | |
Total | �� | | | | | | 4,835 | |
| | | | | | | | |
| | |
Total Common Stocks | | | | | | | | |
(Cost: $172,414) | | | | | | | 193,156 | |
| | | | | | | | |
| |
| Investment Companies (3.0%) | | | | | |
|
Investment Companies (3.0%) | |
iShares Russell 1000 Value Index Fund | | | 47,810 | | | | 5,945 | |
| | | | | | | | |
| | |
Total Investment Companies | | | | | | | | |
(Cost: $5,755) | | | | | | | 5,945 | |
| | | | | | | | |
| |
| Short-Term Investments (1.5%) | | | | | |
|
Money Market Funds (1.5%) | |
State Street Institutional U.S. Government Money Market Fund - Premier Class, 1.209% # | | | 2,962,142 | | | | 2,962 | |
| | | | | | | | |
| | |
Total Short-Term Investments | | | | | | | | |
(Cost: $2,962) | | | | | | | 2,962 | |
| | | | | | | | |
Total Investments (101.1%) | | | | | | | | |
(Cost: $181,131)(a) | | | | | | | 202,063 | |
| | | | | | | | |
Other Assets, Less | | | | | | | | |
Liabilities (-1.1%) | | | | | | | (2,227 | ) |
| | | | | | | | |
Net Assets (100.0%) | | | | | | | 199,836 | |
| | | | | | | | |
| # | 7-day yield as of December 31, 2017. |
| | ADR after the name of a security represents—American Depositary Receipt. |
CAD — Canadian Dollar
CHF — Swiss Franc
The Accompanying Notes are an Integral Part of the Financial Statements.
| | | | |
| 26 | | Large Company Value Portfolio | | |
Large Company Value Portfolio
EUR — Euro
GBP — British Pound
JPY — Japanese Yen
| (a) | At December 31, 2017, the aggregate cost of investments, including derivatives, for federal tax purposes (in thousands) was $183,141 and the net unrealized appreciation of investments based on that cost was $18,729 which is comprised of $27,756 aggregate gross unrealized appreciation and $9,027 aggregate gross unrealized depreciation. |
| (h) | Forward foreign currency contracts outstanding on December 31, 2017. |
| | | | | | | | | | | | | | | | | | | | | | |
| Type | | Counterparty | | Currency | | Foreign
Principal
Amount
Covered by
Contract (000s) | | USD Principal
Amount
Covered by
Contract (000’s) | | Settlement
Month | | Unrealized
Appreciation
(000’s) | | | Unrealized
(Depreciation)
(000’s) | | | Net Unrealized
Appreciation/
(Depreciation)
(000’s) | |
Buy | | Morgan Stanley Capital Services, Inc. | | CAD | | 114 | | 91 | | 3/18 | | $ | 2 | | | $ | - | | | $ | 2 | |
Sell | | Morgan Stanley Capital Services, Inc. | | CAD | | 1,762 | | 1,403 | | 3/18 | | | - | | | | (32 | ) | | | (32 | ) |
Sell | | Morgan Stanley Capital Services, Inc. | | CHF | | 2,993 | | 3,091 | | 3/18 | | | - | | | | (42 | ) | | | (42 | ) |
Sell | | Morgan Stanley Capital Services, Inc. | | EUR | | 4,848 | | 5,848 | | 3/18 | | | - | | | | (102 | ) | | | (102 | ) |
Sell | | Morgan Stanley Capital Services, Inc. | | GBP | | 1,506 | | 2,040 | | 3/18 | | | - | | | | (22 | ) | | | (22 | ) |
Sell | | Morgan Stanley Capital Services, Inc. | | JPY | | 178,979 | | 1,595 | | 3/18 | | | 3 | | | | - | | | | 3 | |
| | | | | | | | | | | | | | | | | | | | | | |
| | | | | | | | | | | | $ | 5 | | | $ | (198 | ) | | $ | (193 | ) |
| | | | | | | | | | | | | | | | | | | | | | |
The following is a summary of the inputs used in valuing the Portfolio’s assets and liabilities at December 31, 2017. See Note 3 for additional information on portfolio valuation.
| | | | | | | | | | | | | | |
| | | Valuation Inputs | | | |
| Description | | Level 1 –
Quoted Prices | | | Level 2 –
Other Significant
Observable Inputs | | | Level 3 –
Significant
Unobservable Inputs | | | |
| | | (Amounts in thousands) | | | |
Assets: | | | | | | | | | | | | | | |
Common Stocks | | | | | | | | | | | | | | |
Consumer Staples | | $ | 18,914 | | | $ | 1,622 | | | $ | - | | | |
Health Care | | | 32,918 | | | | 3,685 | | | | - | | | |
All Others | | | 136,017 | | | | - | | | | - | | | |
Investment Companies | | | 5,945 | | | | - | | | | - | | | |
Short-Term Investments | | | 2,962 | | | | - | | | | - | | | |
Other Financial Instruments^ | | | | | | | | | | | | | | |
Forward Currency Contracts | | | - | | | | 5 | | | | - | | | |
Total Assets: | | $ | 196,756 | | | $ | 5,312 | | | $ | - | | | |
Liabilities: | | | | | | | | | | | | | | |
Other Financial Instruments^ | | | | | | | | | | | | | | |
Forward Currency Contracts | | | - | | | | (198 | ) | | | - | | | |
Total Liabilities: | | $ | - | | | $ | (198 | ) | | $ | - | | | |
^ Other financial instruments are derivative instruments such as futures, forwards, written options and swaps contracts, which are valued at the unrealized appreciation (depreciation) on the instrument and short sales, which are valued at market value.
The Accompanying Notes are an Integral Part of the Financial Statements.
| | | | | | |
| | Large Company Value Portfolio | | | 27 | |
Domestic Equity Portfolio (unaudited)
| | | | |
| Objective: | | Portfolio Strategy: | | Net Assets: |
| Long-term growth of capital and income. | | Invest primarily in equity securities of U.S. issuers that are selling at attractive prices relative to their intrinsic value. | | $819 million |
Portfolio Overview
Mason Street Advisors, LLC (“Mason Street Advisors”), the investment adviser for the Domestic Equity Portfolio (the “Portfolio”), has engaged Delaware Investments Fund Advisers, a series of Macquarie Investment Management Business Trust (“Delaware”), to act as sub-adviser for the Portfolio. The Portfolio primarily invests in common stocks of large-capitalization companies that are believed to have long-term capital appreciation potential. Typically, the Portfolio seeks securities that are believed to be undervalued in relation to their intrinsic value, as indicated by multiple factors, including the earnings and cash flow potential or the asset valuation of the respective issuers. The Portfolio invests in a core group of 30-40 securities.
Market Overview
In a year of nearly uninterrupted stock market gains, major stock market indices attained new highs throughout 2017. Late in the year, the U.S. Congress debated and then passed a tax reform bill, which was signed into law on Dec. 22. U.S. equity markets reacted positively to the legislation, as investors appeared to discount a boost in corporate earnings resulting from a lower corporate tax rate. At its December meeting, the U.S. Federal Reserve (the “Fed”) increased its benchmark short-term interest rate 0.25 percentage points, to a range between 1.25% and 1.50%. It was the third increase in 2017 and the fifth since December 2015, when the current, gradual tightening cycle began. Longer-term interest rates moved in a fairly tight range. The yield on the 10-year Treasury note closed 2017 at 2.41%, down from 2.48% at the beginning of the year.
Portfolio Results
The Portfolio returned 13.78% for the twelve months ended December 31, 2017. By comparison, the Portfolio’s benchmark, the Russell 1000® Value Index (the “Index”), returned 13.66%. (The Index is unmanaged, cannot be invested in directly and does not include administrative expenses.) According to Lipper® Analytical Services, Inc., an independent mutual fund ranking agency, the average return of the Large Cap Value Funds peer group was 15.11%.
At the Portfolio level, positive performance attribution versus the Index was driven by stock selection. The Industrials and Consumer Discretionary sectors contributed most to relative performance for the reporting period. The Industrials sector benefited most from a positive performance by defense contractor Raytheon Company, which delivered strong sales and earnings throughout the period. The company was also helped by the expectation that geopolitical instability could boost military spending. In the Consumer Discretionary sector, discount retailer Dollar Tree, Inc., led the way. The company’s stock was first added to the Portfolio in August 2017, and its shares rose sharply thereafter, following the release of stronger-than-expected second quarter financial results. More recently, Dollar Tree posted solid third quarter results and raised its full-year guidance for sales and earnings. Another strong contributor was Abbott Laboratories in the Health Care sector. The company launched numerous products during the year and completed acquisitions of both St. Jude Medical and Alere.
Investments in the Consumer Staples and Financials sectors detracted most from relative returns for the reporting period. In the Consumer Staples sector, agricultural commodity firm Archer-Daniels-Midland Company was the biggest detractor. Several years of robust grain harvests led to a weak pricing environment, putting pressure on the company’s revenues. The steady growth of grain stocks has also led to low price volatility, further tempering Archer-Daniels-Midland’s earnings potential. In the Financials sector, the Portfolio’s underweight allocation detracted from relative returns. Regional bank BB&T Corporation was the laggard in the group, in part because of sluggish loan growth and higher-than-anticipated expenses.
Another significant detractor was healthcare products distributor Cardinal Health, Inc. During the year, the company reduced its earnings guidance for fiscal 2018, citing several one-time items including integration expenses associated with a recent acquisition. The stock was also pressured by talk of Amazon’s potential entry into the medical products supply chain.
Portfolio Manager Outlook
The following forward-looking comments are the opinion of Delaware, the Portfolio’s sub-adviser.
We believe the newly-enacted tax legislation is likely to boost corporate earnings and, possibly, consumer spending in the coming quarters. Prospects for higher levels of employment growth and wage gains seem more uncertain. In general, U.S. companies have already been experiencing high profitability and easy access to capital for a number of years. We also see a number of impediments that may temper the robust economic growth anticipated by the markets. These include high debt, the aging population, a shrinking Fed balance sheet and the potential for higher interest rates. As we think about the stock market, high valuations, other signs of excess and investors’ apparent complacency toward risk are concerning. We continue to opt for defensiveness in the Portfolio’s sector weights, with the exception of Energy, and remain focused on quality and relative value in our stock selection.
| | | | |
| 28 | | Domestic Equity Portfolio | | |
Domestic Equity Portfolio (unaudited)
Relative Performance
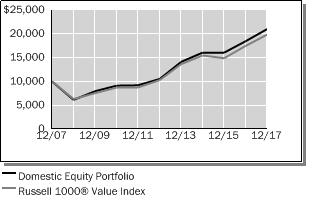
| | | | | | | | | | | | |
Average Annual Total Returns
For Periods Ended December 31, 2017 | |
| | | 1 Year | | | 5 Years | | | 10 Years | |
Domestic Equity Portfolio | | | 13.78 | % | | | 14.81 | % | | | 7.71 | % |
Russell 1000® Value Index | | | 13.66 | % | | | 14.04 | % | | | 7.10 | % |
Lipper® Variable Insurance Products (VIP) Large Cap Value Funds Average | | | 15.11 | % | | | 13.46 | % | | | 6.83 | % |
The performance data quoted represents past performance. Past performance is historical and does not guarantee future performance. Investment return and principal value will fluctuate, so that shares, when redeemed, may be worth more or less than their original cost. Current performance may be lower or higher than the performance data quoted. For the most recent month-end performance information visit www.northwesternmutual.com.
This chart assumes an initial investment of $10,000 made on 12/31/07. Returns shown reflect fee waivers, deductions for management and other portfolio expenses, and reinvestment of all dividends. In the absence of fee waivers, total return would be reduced. Returns exclude deductions for separate account sale loads and account fees. Please refer to the Benchmark Definitions section of this report for information about the indices cited in the above chart and graph.
The Portfolio may hold fewer securities than other diversified portfolios because of its more focused investment strategy. Holding fewer securities increases the risk that the value of the Portfolio could go down because of the poor performance of a single investment.
Top 10 Equity Holdings 12/31/17
| | | | |
Security Description | | | % of Net Assets | |
Express Scripts Holding Co. | | | 3.3 | % |
Occidental Petroleum Corp. | | | 3.3 | % |
Intel Corp. | | | 3.3 | % |
Marathon Oil Corp. | | | 3.2 | % |
Cisco Systems, Inc. | | | 3.2 | % |
Lowe’s Cos., Inc. | | | 3.2 | % |
The Allstate Corp. | | | 3.2 | % |
Waste Management, Inc. | | | 3.2 | % |
Dollar Tree, Inc. | | | 3.2 | % |
Chevron Corp. | | | 3.2 | % |
Sector Allocation 12/31/17
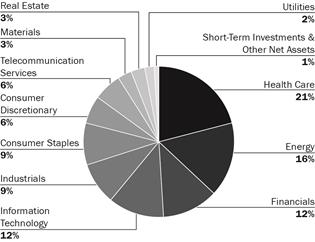
Sector Allocation is based on Net Assets.
Sector Allocation and Top 10 Holdings are subject to change.
| | | | | | |
| | Domestic Equity Portfolio | | | 29 | |
Domestic Equity Portfolio
Schedule of Investments
December 31, 2017
| | | | | | | | |
| Common Stocks (98.8%) | | Shares/
$ Par | | | Value
$ (000’s) | |
| |
Consumer Discretionary (6.4%) | | | | | |
Dollar Tree, Inc.* | | | 244,700 | | | | 26,259 | |
Lowe’s Cos., Inc. | | | 283,600 | | | | 26,358 | |
| | | | | | | | |
Total | | | | | | | 52,617 | |
| | | | | | | | |
| |
Consumer Staples (8.4%) | | | | | |
Archer-Daniels-Midland Co. | | | 566,600 | | | | 22,709 | |
CVS Health Corp. | | | 308,400 | | | | 22,359 | |
Mondelez International, Inc. | | | 559,300 | | | | 23,938 | |
| | | | | | | | |
Total | | | | | | | 69,006 | |
| | | | | | | | |
| |
Energy (15.9%) | | | | | |
Chevron Corp. | | | 208,246 | | | | 26,070 | |
ConocoPhillips | | | 464,200 | | | | 25,480 | |
Halliburton Co. | | | 529,000 | | | | 25,852 | |
Marathon Oil Corp. | | | 1,567,145 | | | | 26,532 | |
Occidental Petroleum Corp. | | | 361,500 | | | | 26,628 | |
| | | | | | | | |
Total | | | | | | | 130,562 | |
| | | | | | | | |
| |
Financials (12.2%) | | | | | |
The Allstate Corp. | | | 251,600 | | | | 26,345 | |
The Bank of New York Mellon Corp. | | | 442,800 | | | | 23,849 | |
BB&T Corp. | | | 512,300 | | | | 25,472 | |
Marsh & McLennan Cos., Inc. | | | 301,900 | | | | 24,572 | |
| | | | | | | | |
Total | | | | | | | 100,238 | |
| | | | | | | | |
| | | | | | | | |
| Common Stocks (98.8%) | | Shares/
$ Par | | | Value
$ (000’s) | |
| |
Health Care (20.8%) | | | | | |
Abbott Laboratories | | | 443,500 | | | | 25,311 | |
Cardinal Health, Inc. | | | 381,800 | | | | 23,393 | |
Express Scripts Holding Co.* | | | 356,784 | | | | 26,630 | |
Johnson & Johnson | | | 180,300 | | | | 25,191 | |
Merck & Co., Inc. | | | 408,800 | | | | 23,003 | |
Pfizer, Inc. | | | 650,200 | | | | 23,550 | |
Quest Diagnostics, Inc. | | | 232,000 | | | | 22,850 | |
| | | | | | | | |
Total | | | | | | | 169,928 | |
| | | | | | | | |
| |
Industrials (9.3%) | | | | | |
Northrop Grumman Corp. | | | 84,700 | | | | 25,995 | |
Raytheon Co. | | | 126,000 | | | | 23,669 | |
Waste Management, Inc. | | | 304,600 | | | | 26,287 | |
| | | | | | | | |
Total | | | | | | | 75,951 | |
| | | | | | | | |
| |
Information Technology (11.9%) | | | | | |
CA, Inc. | | | 661,487 | | | | 22,014 | |
Cisco Systems, Inc. | | | 689,200 | | | | 26,396 | |
Intel Corp. | | | 575,900 | | | | 26,584 | |
Oracle Corp. | | | 473,700 | | | | 22,397 | |
| | | | | | | | |
Total | | | | | | | 97,391 | |
| | | | | | | | |
| |
Materials (3.1%) | | | | | |
DowDuPont, Inc. | | | 356,267 | | | | 25,373 | |
| | | | | | | | |
Total | | | | | | | 25,373 | |
| | | | | | | | |
| |
Real Estate (2.7%) | | | | | |
Equity Residential | | | 350,095 | | | | 22,326 | |
| | | | | | | | |
Total | | | | | | | 22,326 | |
| | | | | | | | |
| | | | | | | | |
| Common Stocks (98.8%) | | Shares/
$ Par | | | Value
$ (000’s) | |
| |
Telecommunication Services (5.9%) | | | | | |
AT&T, Inc. | | | 620,800 | | | | 24,137 | |
Verizon Communications, Inc. | | | 462,600 | | | | 24,485 | |
| | | | | | | | |
Total | | | | | | | 48,622 | |
| | | | | | | | |
| | |
Utilities (2.2%) | | | | | | | | |
Edison International | | | 276,900 | | | | 17,511 | |
| | | | | | | | |
Total | | | | | | | 17,511 | |
| | | | | | | | |
| | |
Total Common Stocks | | | | | | | | |
(Cost: $575,667) | | | | | | | 809,525 | |
| | | | | | | | |
| |
| Short-Term Investments (1.1%) | | | | |
| |
Money Market Funds (1.1%) | | | | | |
State Street Institutional U.S. Government Money Market Fund - Premier Class,
1.209% # | | | 9,210,804 | | | | 9,211 | |
| | | | | | | | |
Total | | | | | | | 9,211 | |
| | | | | | | | |
| | |
Total Short-Term Investments | | | | | | | | |
(Cost: $9,211) | | | | | | | 9,211 | |
| | | | | | | | |
| | |
Total Investments (99.9%) | | | | | | | | |
(Cost: $584,878)(a) | | | | | | | 818,736 | |
| | | | | | | | |
Other Assets, Less | | | | | | | | |
Liabilities (0.1%) | | | | | | | 478 | |
| | | | | | | | |
Net Assets (100.0%) | | | | | | | 819,214 | |
| | | | | | | | |
| # | 7-Day yield as of December 31, 2017. |
| (a) | At December 31, 2017, the aggregate cost of investments, including derivatives, for federal tax purposes (in thousands) was $584,878 and the net unrealized appreciation of investments based on that cost was $233,858 which is comprised of $236,284 aggregate gross unrealized appreciation and $2,426 aggregate gross unrealized depreciation. |
The following is a summary of the inputs used in valuing the Portfolio’s assets and liabilities at December 31, 2017. See Note 3 for additional information on portfolio valuation.
| | | | | | | | | | | | | | |
| | | Valuation Inputs | | | |
| Description | | Level 1 –
Quoted Prices | | | Level 2 –
Other Significant
Observable Inputs | | | Level 3 –
Significant
Unobservable Inputs | | | |
| | | (Amounts in thousands) | | | |
Assets: | | | | | | | | | | | | | | |
Common Stocks | | $ | 809,525 | | | $ | - | | | $ | - | | | |
Short-Term Investments | | $ | 9,211 | | | $ | - | | | $ | - | | | |
Total Assets: | | $ | 818,736 | | | $ | - | | | $ | - | | | |
The Accompanying Notes are an Integral Part of the Financial Statements.
| | | | |
| 30 | | Domestic Equity Portfolio | | |
Equity Income Portfolio (unaudited)
| | | | |
| Objective: | | Portfolio Strategy: | | Net Assets: |
| Long-term growth of capital and income. | | Invest in common stocks with a focus on larger capitalization stocks with a strong track record of paying dividends, or that are believed to be undervalued. | | $844 million |
Portfolio Overview
Mason Street Advisors, LLC (“Mason Street Advisors”), the investment adviser for the Equity Income Portfolio (the “Portfolio”), has engaged T. Rowe Price Associates, Inc. (“T. Rowe Price”) to act as sub-adviser for the Portfolio. Normally, the Portfolio invests in common stocks, with an emphasis on larger capitalization stocks with a strong track record of paying dividends or that are believed to be undervalued. The Portfolio’s yield, which reflects the level of dividends paid by the Portfolio, is expected to normally exceed the yield of the S&P 500® Stock Index. The Portfolio will typically employ a value approach in selecting investments. The Portfolio’s in-house research team seeks to identify companies that appear to be undervalued, as measured by price to earnings ratio, dividend yield and enterprise value to sales, among other metrics and may be temporarily out of favor, but have good prospects for capital appreciation and dividend growth.
Market Overview
U.S. stocks posted strong returns in 2017, buoyed by solid corporate earnings and economic growth. Throughout the year, hopes that President Trump’s proposals for lower tax rates, reduced regulation and increased infrastructure spending benefited the market. In December, the Trump administration signed legislation that reduces tax rates for corporations and closely held businesses, reduces marginal tax rates for individuals at most income levels, and changes the limits for various individual tax deductions. Most major stock indices finished the year near record levels amid expectations that the new tax law would add to economic growth in 2018.
The Russell 1000® Value Index posted a double-digit positive return during the period. As measured by various Russell Indices, large cap shares outperformed mid and small caps. Growth stocks soundly outperformed value across all market capitalizations, most notably among large caps. Within the Russell 1000® Value Index, nearly all sectors posted positive returns. Information Technology led performance, followed by the Materials and Financials sectors. The only detractors were the Telecommunication Services and Energy sectors.
Portfolio Results
The Portfolio returned 16.24% for the twelve months ended December 31, 2017. By comparison, the Portfolio’s benchmark, the Russell 1000® Value Index (the “Index”), returned 13.66%. (The Index is unmanaged, cannot be invested in directly and does not include administrative expenses.) According to Lipper® Analytical Services, Inc., an independent mutual fund ranking agency, the average return of the Equity Income Funds peer group was 15.23% for 2017.
Stock selection in the Industrials and Business Services sector was the largest contributor to relative results for the reporting period, largely due to a position in Boeing. The company continued to benefit from cost reductions and productivity gains, which translated into increased earnings and cash flow. The portfolio managers trimmed the Portfolio’s position but continued to like Boeing because it operates in a duopoly market that is expected to experience steady long-term global airline passenger growth.
The Information Technology sector also bolstered relative returns, driven by stock selection, particularly an investment in Applied Materials. The company produces manufacturing equipment for the semiconductor industry, as well as supplies for flat-panel displays. Both segments benefited from smartphones transitioning to the next generation of memory and display technology, as well as growth in demand from China.
At the other end of the spectrum, stock selection in Utilities detracted from relative performance for the reporting period. Amid extensive wildfires in southern California, shares of both PG&E and Edison International suffered due to concerns that the electric utilities could be found liable for fire damage. PG&E suspended its dividend in light of this potential headwind, which further weighed on the share price. While the portfolio managers continued to like both companies’ exposure to the California market, they sold shares of PG&E due to the uncertainty and are closely monitoring Edison International’s potential legal responsibility.
Portfolio Manager Outlook
The following forward-looking comments are the opinion of T. Rowe Price, the Portfolio’s sub-adviser.
| | | | | | |
| | Equity Income Portfolio | | | 31 | |
Equity Income Portfolio (unaudited)
We expect increased volatility and modest equity returns in the coming months, as investors assess the impact of tax reform on the economy and individual companies. The level of complacency in the market is slightly concerning, and as a result, we believe a more thoughtful approach to balancing cyclical and defensive exposure is warranted. Valuations have remained elevated, making it challenging to identify areas of the market that will outperform over the long term. Given the higher potential for a choppy market environment, we believe a cautious approach that takes advantage of market gyrations is appropriate.
|
Relative Performance |
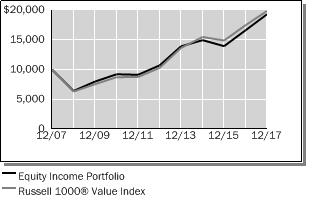 |
| | | | | | | | | | | | |
Average Annual Total Returns
For Periods Ended December 31, 2017 | |
| | | 1 Year | | | 5 Years | | | 10 Years | |
Equity Income Portfolio | | | 16.24 | % | | | 12.52 | % | | | 6.81 | % |
Russell 1000® Value Index | | | 13.66 | % | | | 14.04 | % | | | 7.10 | % |
Lipper® Variable Insurance Products (VIP) Equity Income Funds Average | | | 15.23 | % | | | 12.62 | % | | | 6.88 | % |
The performance data quoted represents past performance. Past performance is historical and does not guarantee future performance. Investment return and principal value will fluctuate, so that shares, when redeemed, may be worth more or less than their original cost. Current performance may be lower or higher than the performance data quoted. For the most recent month-end performance information visit www.northwesternmutual.com.
This chart assumes an initial investment of $10,000 made on 12/31/07. Returns shown reflect fee waivers, deductions for management and other portfolio expenses, and reinvestment of all dividends. In the absence of fee waivers, total return would be reduced. Returns exclude deductions for separate account sale loads and account fees. Please refer to the Benchmark Definitions section of this report for information about the indices cited in the above chart and graph.
The Portfolio invests with an emphasis on larger capitalization stocks with a strong track record of paying dividends or that are believed to be undervalued. The Portfolio may underperform similar funds that invest without an emphasis on dividend-paying stocks. Dividend-paying stocks may not participate in a broad market advance to the same degree as other stocks.
Currently, interest rates remain at historically low levels on a relative basis, although the U.S. federal funds rate has been subject to modest increases over the course of the last two years. A significant rise in interest rates or economic downturn could cause a company to unexpectedly reduce or eliminate its dividend.
Top 10 Equity Holdings 12/31/17
| | | | | | |
| Security Description | | % of Net Assets | | | |
JPMorgan Chase & Co. | | | 3.9 | % | | |
Wells Fargo & Co. | | | 2.9 | % | | |
Exxon Mobil Corp. | | | 2.7 | % | | |
Morgan Stanley | | | 2.2 | % | | |
Microsoft Corp. | | | 2.1 | % | | |
Verizon Communications, Inc. | | | 2.1 | % | | |
Johnson & Johnson | | | 1.9 | % | | |
Total SA, ADR | | | 1.9 | % | | |
DowDuPont, Inc. | | | 1.9 | % | | |
QUALCOMM, Inc. | | | 1.9 | % | | |
Sector Allocation 12/31/17
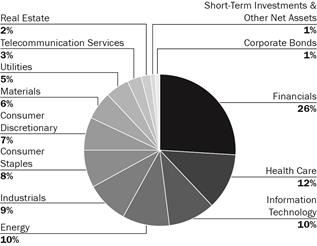
Sector Allocation is based on Net Assets.
Sector Allocation and Top 10 Holdings are subject to change.
| | | | |
| 32 | | Equity Income Portfolio | | |
Equity Income Portfolio
Schedule of Investments
December 31, 2017
| | | | | | | | | | |
| | | Common Stocks (96.3%) | | Shares/ $ Par | | | Value $ (000’s) | |
| | |
| | Consumer Discretionary (7.6%) | | | | | |
| | Adient PLC | | | 69,745 | | | | 5,489 | |
| | Comcast Corp. - Class A | | | 248,190 | | | | 9,940 | |
| | Ford Motor Co. | | | 165,100 | | | | 2,062 | |
| | Kohl’s Corp. | | | 119,400 | | | | 6,475 | |
| | L Brands, Inc. | | | 35,500 | | | | 2,138 | |
| | Las Vegas Sands Corp. | | | 115,900 | | | | 8,054 | |
| | Macy’s, Inc. | | | 48,200 | | | | 1,214 | |
| | Mattel, Inc. | | | 270,200 | | | | 4,155 | |
| | News Corp. - Class A | | | 445,200 | | | | 7,217 | |
| | Twenty-First Century Fox, Inc. - Class B | | | 428,100 | | | | 14,607 | |
| | The Walt Disney Co. | | | 25,600 | | | | 2,752 | |
| | | | | | | | | | |
| | Total | | | | | | | 64,103 | |
| | | | | | | | | | |
| | |
| | Consumer Staples (7.9%) | | | | | |
| | Archer-Daniels-Midland Co. | | | 170,300 | | | | 6,826 | |
| | Coty, Inc. - Class A | | | 177,297 | | | | 3,526 | |
| | CVS Health Corp. | | | 36,642 | | | | 2,656 | |
| | Diageo PLC | | | 56,426 | | | | 2,065 | |
| | Kellogg Co. | | | 52,200 | | | | 3,549 | |
| | Kimberly-Clark Corp. | | | 80,000 | | | | 9,653 | |
| | PepsiCo, Inc. | | | 71,100 | | | | 8,526 | |
| | Philip Morris International, Inc. | | | 72,400 | | | | 7,649 | |
| | Tyson Foods, Inc. - Class A | | | 143,700 | | | | 11,650 | |
| | Wal-Mart Stores, Inc. | | | 103,300 | | | | 10,201 | |
| | | | | | | | | | |
| | Total | | | | | | | 66,301 | |
| | | | | | | | | | |
| | |
| | Energy (9.7%) | | | | | |
| | Apache Corp. | | | 167,456 | | | | 7,070 | |
| | Canadian Natural Resources, Ltd. | | | 21,400 | | | | 764 | |
| | Chevron Corp. | | | 79,300 | | | | 9,928 | |
| | EQT Corp. | | | 17,690 | | | | 1,007 | |
| | Exxon Mobil Corp. | | | 267,600 | | | | 22,382 | |
| | Hess Corp. | | | 180,300 | | | | 8,559 | |
| | Occidental Petroleum Corp. | | | 137,400 | | | | 10,121 | |
| | Total SA, ADR | | | 292,700 | | | | 16,181 | |
| | TransCanada Corp. | | | 118,800 | | | | 5,778 | |
| | | | | | | | | | |
| | Total | | | | | | | 81,790 | |
| | | | | | | | | | |
| | |
| | Financials (26.4%) | | | | | |
| | American International Group, Inc. | | | 166,400 | | | | 9,914 | |
| | Ameriprise Financial, Inc. | | | 45,500 | | | | 7,711 | |
| | Bank of America Corp. | | | 52,623 | | | | 1,553 | |
| | The Bank of New York Mellon Corp. | | | 130,200 | | | | 7,013 | |
| | Brighthouse Financial, Inc.* | | | 106,227 | | | | 6,229 | |
| | | | | | | | | | |
| | | Common Stocks (96.3%) | | Shares/ $ Par | | | Value $ (000’s) | |
| | |
| | Financials continued | | | | | |
| | Chubb, Ltd. | | | 59,875 | | | | 8,750 | |
| | Citigroup, Inc. | | | 172,600 | | | | 12,843 | |
| | Fifth Third Bancorp | | | 376,600 | | | | 11,426 | |
| | Franklin Resources, Inc. | | | 50,700 | | | | 2,197 | |
| | JPMorgan Chase & Co. | | | 305,988 | | | | 32,722 | |
| | KeyCorp | | | 342,500 | | | | 6,908 | |
| | Loews Corp. | | | 241,900 | | | | 12,102 | |
| | Marsh & McLennan Cos., Inc. | | | 54,000 | | | | 4,395 | |
| | MetLife, Inc. | | | 201,400 | | | | 10,183 | |
| | Morgan Stanley | | | 352,000 | | | | 18,469 | |
| | Northern Trust Corp. | | | 57,100 | | | | 5,704 | |
| | PNC Financial Services Group, Inc. | | | 56,600 | | | | 8,167 | |
| | State Street Corp. | | | 149,000 | | | | 14,544 | |
| | U.S. Bancorp | | | 223,400 | | | | 11,970 | |
| | Wells Fargo & Co. | | | 399,900 | | | | 24,262 | |
| | Willis Towers Watson PLC | | | 17,716 | | | | 2,670 | |
| | XL Group, Ltd. | | | 99,100 | | | | 3,484 | |
| | | | | | | | | | |
| | Total | | | | | | | 223,216 | |
| | | | | | | | | | |
| | |
| | Health Care (10.9%) | | | | | |
| | Anthem, Inc. | | | 68,149 | | | | 15,334 | |
| | Becton, Dickinson and Co. | | | 29,700 | | | | 6,358 | |
| | Bristol-Myers Squibb Co. | | | 114,000 | | | | 6,986 | |
| | Gilead Sciences, Inc. | | | 128,500 | | | | 9,206 | |
| | GlaxoSmithKline PLC | | | 281,433 | | | | 4,978 | |
| | GlaxoSmithKline PLC, ADR | | | 93,600 | | | | 3,320 | |
| | Johnson & Johnson | | | 116,800 | | | | 16,319 | |
| | Medtronic PLC | | | 123,035 | | | | 9,935 | |
| | Merck & Co., Inc. | | | 145,400 | | | | 8,182 | |
| | Pfizer, Inc. | | | 319,726 | | | | 11,580 | |
| | | | | | | | | | |
| | Total | | | | | | | 92,198 | |
| | | | | | | | | | |
| | |
| | Industrials (8.6%) | | | | | |
| | The Boeing Co. | | | 45,700 | | | | 13,477 | |
| | Delta Air Lines, Inc. | | | 63,400 | | | | 3,550 | |
| | Emerson Electric Co. | | | 114,000 | | | | 7,945 | |
| | Flowserve Corp. | | | 101,921 | | | | 4,294 | |
| | General Electric Co. | | | 236,600 | | | | 4,129 | |
| | Illinois Tool Works, Inc. | | | 30,200 | | | | 5,039 | |
| | Johnson Controls International PLC | | | 338,059 | | | | 12,883 | |
| | Pentair PLC | | | 65,000 | | | | 4,590 | |
| | Southwest Airlines Co. | | | 54,300 | | | | 3,554 | |
| | Stericycle, Inc.* | | | 28,303 | | | | 1,924 | |
| | United Parcel Service, Inc. - Class B | | | 86,300 | | | | 10,283 | |
| | United Technologies Corp. | | | 9,200 | | | | 1,174 | |
| | | | | | | | | | |
| | Total | | | | | | | 72,842 | |
| | | | | | | | | | |
| | | | | | | | | | |
| | | Common Stocks (96.3%) | | Shares/ $ Par | | | Value $ (000’s) | |
| | |
| | Information Technology (10.0%) | | | | | |
| | Analog Devices, Inc. | | | 24,800 | | | | 2,208 | |
| | Apple, Inc. | | | 8,800 | | | | 1,489 | |
| | Applied Materials, Inc. | | | 127,700 | | | | 6,528 | |
| | CA, Inc. | | | 45,200 | | | | 1,504 | |
| | Cisco Systems, Inc. | | | 320,100 | | | | 12,260 | |
| | Harris Corp. | | | 99,773 | | | | 14,133 | |
| | Hewlett Packard Enterprise Co. | | | 132,800 | | | | 1,907 | |
| | Microsoft Corp. | | | 208,500 | | | | 17,835 | |
| | QUALCOMM, Inc. | | | 243,700 | | | | 15,602 | |
| | TE Connectivity, Ltd. | | | 39,800 | | | | 3,783 | |
| | Texas Instruments, Inc. | | | 51,600 | | | | 5,389 | |
| | Western Digital Corp. | | | 27,300 | | | | 2,171 | |
| | | | | | | | | | |
| | Total | | | | | | | 84,809 | |
| | | | | | | | | | |
| | |
| | Materials (5.5%) | | | | | |
| | Akzo Nobel NV | | | 53,200 | | | | 1,550 | |
| | CF Industries Holdings, Inc. | | | 216,700 | | | | 9,218 | |
| | DowDuPont, Inc. | | | 223,204 | | | | 15,897 | |
| | International Paper Co. | | | 139,700 | | | | 8,094 | |
| | Nucor Corp. | | | 84,000 | | | | 5,341 | |
| | Vulcan Materials Co. | | | 47,800 | | | | 6,136 | |
| | | | | | | | | | |
| | Total | | | | | | | 46,236 | |
| | | | | | | | | | |
| | |
| | Real Estate (2.1%) | | | | | |
| | Equity Residential | | | 78,200 | | | | 4,987 | |
| | Rayonier, Inc. | | | 225,906 | | | | 7,146 | |
| | Weyerhaeuser Co. | | | 152,535 | | | | 5,378 | |
| | | | | | | | | | |
| | Total | | | | | | | 17,511 | |
| | | | | | | | | | |
| | | |
| | Telecommunication Services (3.0%) | | | | | | | | |
| | CenturyLink, Inc. | | | 140,290 | | | | 2,340 | |
| | Telefonica SA | | | 444,165 | | | | 4,325 | |
| | Verizon Communications, Inc. | | | 327,008 | | | | 17,308 | |
| | Vodafone Group PLC | | | 367,781 | | | | 1,162 | |
| | | | | | | | | | |
| | Total | | | | | | | 25,135 | |
| | | | | | | | | | |
| | |
| | Utilities (4.6%) | | | | | |
| | Edison International | | | 100,188 | | | | 6,336 | |
| | Exelon Corp. | | | 76,962 | | | | 3,033 | |
| | NiSource, Inc. | | | 323,400 | | | | 8,301 | |
| | PG&E Corp. | | | 104,322 | | | | 4,677 | |
| | Sempra Energy | | | 6,856 | | | | 733 | |
| | The Southern Co. | | | 283,636 | | | | 13,640 | |
| | Westar Energy, Inc. | | | 42,100 | | | | 2,223 | |
| | | | | | | | | | |
| | Total | | | | | | | 38,943 | |
| | | | | | | | | | |
| | | |
| | Total Common Stocks | | | | | | | | |
| | (Cost: $649,270) | | | | | | | 813,084 | |
| | | | | | | | | | |
The Accompanying Notes are an Integral Part of the Financial Statements.
| | | | | | |
| | Equity Income Portfolio | | | 33 | |
Equity Income Portfolio
| | | | | | | | | | |
| | | Convertible Preferred Stocks (1.6%) | | Shares/
$ Par | | | Value
$ (000’s) | |
| | |
| | Health Care (0.7%) | | | | | |
| | Becton, Dickinson and Co., 6.125%, 5/1/20 | | | 100,450 | | | | 5,816 | |
| | | | | | | | | | |
| | Total | | | | | | | 5,816 | |
| | | | | | | | | | |
| | | |
| | Utilities (0.9%) | | | | | | | | |
| | DTE Energy Co., 6.500%, 10/1/19 | | | 25,217 | | | | 1,361 | |
| | NextEra Energy, Inc., 6.123%, 9/1/19 | | | 105,113 | | | | 5,907 | |
| | | | | | | | | | |
| | Total | | | | | | | 7,268 | |
| | | | | | | | | | |
| | | |
| | Total Convertible Preferred Stocks | | | | | | | | |
| | (Cost: $11,427) | | | | | | | 13,084 | |
| | | | | | | | | | |
| | | | | | | | | | |
| | | Corporate Bonds (0.5%) | | Shares/
$ Par | | | Value
$ (000’s) | |
| | |
| | Consumer, Cyclical (0.3%) | | | | | |
| | Mattel, Inc., 6.750%, 12/31/25, 144A | | | 2,540,000 | | | | 2,574 | |
| | | | | | | | | | |
| | Total | | | | | | | 2,574 | |
| | | | | | | | | | |
| | | |
| | Technology (0.2%) | | | | | | | | |
| | Western Digital Corp., 10.500%, 4/1/24, 144A | | | 1,150,000 | | | | 1,333 | |
| | | | | | | | | | |
| | Total | | | | | | | 1,333 | |
| | | | | | | | | | |
| | | |
| | Total Corporate Bonds | | | | | | | | |
| | (Cost: $3,671) | | | | | | | 3,907 | |
| | | | | | | | | | |
| | | | | | | | | | |
| | | Short-Term Investments (1.3%) | | Shares/
$ Par | | | Value
$ (000’s) | |
| | |
| | Money Market Funds (1.3%) | | | | | |
| | State Street Institutional U.S. Government Money Market Fund - Premier Class, 1.209% # | | | 11,398,487 | | | | 11,398 | |
| | | | | | | | | | |
| | Total | | | | | | | 11,398 | |
| | | | | | | | | | |
| | | |
| | Total Short-Term
Investments | | | | | | | | |
| | (Cost: $11,398) | | | | | | | 11,398 | |
| | | | | | | | | | |
| | | |
| | Total Investments
(99.7%) | | | | | | | | |
| | (Cost: $675,766)(a) | | | | | | | 841,473 | |
| | | | | | | | | | |
| | Other Assets, Less | | | | | | | | |
| | Liabilities (0.3%) | | | | | | | 2,925 | |
| | | | | | | | | | |
| | Net Assets (100.0%) | | | | | | | 844,398 | |
| | | | | | | | | | |
| # | 7-Day yield as of December 31, 2017. |
| | ADR after the name of a security represents—American Depositary Receipt. |
| | 144A after the name of a security represents a security exempt from registration under Rule 144A of the Securities Act of 1933. These securities may be resold as transactions exempt from registration, normally to qualified institutional buyers. At December 31, 2017 the value of these securities (in thousands) was $3,907 representing 0.5% of the net assets. |
| (a) | At December 31, 2017, the aggregate cost of investments, including derivatives, for federal tax purposes (in thousands) was $677,377 and the net unrealized appreciation of investments based on that cost was $164,096 which is comprised of $186,573 aggregate gross unrealized appreciation and $22,477 aggregate gross unrealized depreciation. |
The following is a summary of the inputs used in valuing the Portfolio’s assets and liabilities at December 31, 2017. See Note 3 for additional information on portfolio valuation.
| | | | | | | | | | | | | | |
| | | Valuation Inputs | | | |
| Description | | Level 1 – Quoted Prices | | | Level 2 – Other Significant Observable Inputs | | | Level 3 – Significant Unobservable Inputs | | | |
| | | (Amounts in thousands) | | | |
| Assets: | | | | | |
Common Stocks | | | | | | | | | | | | | | |
Consumer Staples | | $ | 64,236 | | | $ | 2,065 | | | $ | - | | | |
Health Care | | | 87,220 | | | | 4,978 | | | | - | | | |
Telecommunication Services | | | 19,648 | | | | 5,487 | | | | - | | | |
All Others | | | 629,450 | | | | - | | | | - | | | |
Convertible Preferred Stocks | | | 13,084 | | | | - | | | | - | | | |
Corporate Bonds | | | - | | | | 3,907 | | | | - | | | |
Short-Term Investments | | | 11,398 | | | | - | | | | - | | | |
Total Assets: | | $ | 825,036 | | | $ | 16,437 | | | $ | - | | | |
For the period ended December 31, 2017, there were transfers from Level 1 to Level 2 in the amount of $12,530 (in thousands). These transfers were the result of the use of fair value procedures on certain foreign securities in the portfolio on December 31, 2017.
The Accompanying Notes are an Integral Part of the Financial Statements.
| | | | |
| 34 | | Equity Income Portfolio | | |
Mid Cap Growth Stock Portfolio (unaudited)
| | | | |
| Objective: | | Portfolio Strategy: | | Net Assets: |
| Long-term growth of capital. | | Invest primarily in common stocks of mid cap domestic companies selected on the basis of their potential for capital appreciation. | | $1.1 billion |
Portfolio Overview
Mason Street Advisors, LLC (“Mason Street Advisors”), the investment adviser for the Mid Cap Growth Stock Portfolio (the “Portfolio”), has engaged Wellington Management Company LLP (“Wellington”) to act as sub-adviser for the Portfolio. Wellington was appointed sub-adviser to the Portfolio effective October 27, 2017. Prior to that time, the Portfolio was sub-advised by William Blair Investment Management, LLC (“William Blair”). The Portfolio invests primarily in common stocks of mid cap companies selected on the basis of their potential for capital appreciation. The Portfolio focuses on companies that are determined to be of high quality. The key characteristics of high quality companies include a leadership position within an industry, a strong balance sheet, a high return on equity, and/or a strong management team. The Portfolio seeks to reduce overall risk by diversifying across sectors, industry groups and companies. The Portfolio’s sector exposure relative to its benchmark is driven by an investment process which relies on fundamental company analysis and individual stock selection. The Portfolio invests primarily in U.S. common stocks. The Portfolio may also invest up to 20% of net assets in American Depositary Receipts (ADRs) and other securities of foreign issuers, including non-U.S. dollar denominated securities.
Market Overview
U.S. equities rose for the fourteenth consecutive month, as measured by the S&P 500® Index, to finish the twelve-month period ending December 31, 2017. The stock market soared following Donald Trump’s victory on hopes of increased fiscal stimulus, reduced regulatory restrictions, and lower corporate taxes. The reflation trading theme dominated the narrative heading into 2017, leading to significant equity inflows and the largest exodus from bonds since the “taper tantrum” in 2013. Despite many investors voicing concerns about stretched valuations, heightened U.S. tensions with Russia and North Korea, and overly optimistic policy expectations, the market hit a series of record highs during the year on the back of strong employment data and strong corporate earnings.
In a well-telegraphed move, the U.S. Federal Reserve (the “Fed”) hiked the policy interest rates three times during the period. In August, the Fed announced that its balance sheet normalization program would begin in October, reiterating that the process would be gradual and predictable. In November, Jerome Powell’s nomination as the chair of the Fed provided markets with reasonable assurance that current central bank policies would be maintained in the near term.
Tax reform was a key area of focus during the period, culminating with a $1.5 trillion tax reform bill signed into law by Donald Trump at the end of December. The legislation included the most sweeping changes to the tax code since 1986 and represented a major victory for Republicans.
Returns during the period varied by market cap. Large cap stocks, as measured by the S&P 500® Index outperformed mid and small cap stocks, as measured by the S&P MidCap 400® Index and S&P SmallCap 600® Index.
Portfolio Results
The Portfolio returned 20.29% for the twelve months ended December 31, 2017. By comparison, the Portfolio’s benchmark, the Russell Midcap® Growth Index (the “Index”), returned 25.27%. (The Index is unmanaged, cannot be invested in directly, and does not include administrative expenses.) According to Lipper® Analytical Services Inc., an independent mutual fund ranking agency, the average return in 2017 of the Mid Cap Growth Funds peer group was 25.71%.
As noted above, prior to October 27, 2017, the Portfolio was managed by William Blair. With respect to the period prior to October 27, 2017, the Portfolio’s underperformance relative to the Index was primarily attributable to stock selection in the Consumer Discretionary and Industrials sectors. Significant individual security detractors in the Consumer Discretionary sector included O’Reilly Automotive and Tractor Supply, which both declined in part due to the risk of potential competition from ecommerce. Stock selection in the machinery industry held back results in the Industrials sector. The Portfolio’s decision to not hold NVIDIA, a large benchmark constituent, also hurt relative results during the period.
The following performance attribution comments relate to the period October 27, 2017 through December 31, 2017, during which Wellington acted as the Portfolio’s sub-adviser.
| | | | | | |
| | Mid Cap Growth Stock Portfolio | | | 35 | |
Mid Cap Growth Stock Portfolio (unaudited)
The Portfolio’s relative underperformance during the period was due to both sector allocation and stock selection. Sector allocation, a residual of the team’s bottom-up stock selection process, was the primary driver of underperformance, primarily the Portfolio’s underweights within the Consumer Discretionary and Consumer Staples sectors. Negative stock selection for the period was also a factor, driven by weak selection within the Financials, Consumer Discretionary, and Utilities sectors.
Top individual security detractors from relative returns during the period included TESARO, CarMax and First Republic Bank. Top individual security contributors to relative performance during the period included Sage Therapeutics, Neurocrine Biosciences and Bluebird Bio.
Portfolio Manager Outlook
The following forward-looking comments are the opinion of Wellington, the Portfolio’s sub-adviser.
As we enter 2018, we expect strong fundamentals and gradual monetary tightening to support equity markets during the year. Despite a favorable economic environment, investors are worried about valuations and complacency as the Fed moves forward with the removal of unprecedented monetary accommodation. While this sounds like the end of the party, we believe that the Fed will be quite gradual in their withdrawal of support and that the economy is strong enough to withstand a bit less stimulus.
The U.S. economy continues to expand at a steady clip and we think growth in 2018 could be bolstered by an expansionary fiscal stance. Consumer confidence is high as the job market is strong, wage gains are reasonable, and home prices are rising. Business investment is starting to rebound and projected capital expenditures are robust. Against this backdrop, some combination of tax relief and hurricane-recovery spending is likely to add to growth in 2018. Further, deregulation is likely to be a tailwind for investment spending and growth. That said, uncertainties and risks related to Washington politics as well as potential international developments (North Korea, Iran) could possibly increase market volatility, which should be partly mitigated by the Portfolio’s diversification and exposure to market leading companies.
Relative Performance
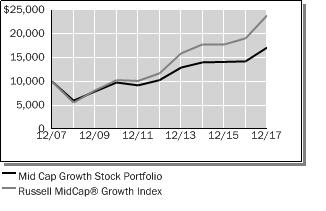
| | | | | | | | | | | | |
Average Annual Total Returns
For Periods Ended December 31, 2017 | |
| | | 1 Year | | | 5 Years | | | 10 Years | |
Mid Cap Growth Stock Portfolio | | | 20.29 | % | | | 10.72 | % | | | 5.53 | % |
Russell MidCap® Growth Index | | | 25.27 | % | | | 15.30 | % | | | 9.10 | % |
Lipper® Variable Insurance Products (VIP) Mid Cap Growth Funds Average | | | 25.71 | % | | | 14.17 | % | | | 7.84 | % |
The performance data quoted represents past performance. Past performance is historical and does not guarantee future performance. Investment return and principal value will fluctuate, so that shares, when redeemed, may be worth more or less than their original cost. Current performance may be lower or higher than the performance data quoted. For the most recent month-end performance information visit www.northwesternmutual.com.
This chart assumes an initial investment of $10,000 made on 12/31/07. Returns shown reflect fee waivers, deductions for management and other portfolio expenses, and reinvestment of all dividends. In the absence of fee waivers, total return would be reduced. Returns exclude deductions for separate account sale loads and account fees. Please refer to the Benchmark Definitions section of this report for information about the indices cited in the above chart and graph.
Investing in small and medium-sized companies involves a greater degree of risk than investing in large company stocks.
The Portfolio may invest a relatively high percentage of its assets in a particular sector. The Portfolio will have greater exposure to the risks associated with that sector and its performance will be tied more closely to the performance of the sector.
| | | | |
| 36 | | Mid Cap Growth Stock Portfolio | | |
Mid Cap Growth Stock Portfolio (unaudited)
Top 10 Equity Holdings 12/31/17
| | | | | | |
| Security Description | | % of Net Assets | | | |
Genpact, Ltd. | | | 2.2 | % | | |
TransUnion | | | 2.2 | % | | |
VeriSign, Inc. | | | 2.1 | % | | |
Global Payments, Inc. | | | 2.0 | % | | |
Markel Corp. | | | 2.0 | % | | |
Lennox International, Inc. | | | 2.0 | % | | |
IDEX Corp. | | | 2.0 | % | | |
NVR, Inc. | | | 1.9 | % | | |
CDW Corp. | | | 1.7 | % | | |
Sage Therapeutics, Inc. | | | 1.7 | % | | |
Sector Allocation 12/31/17
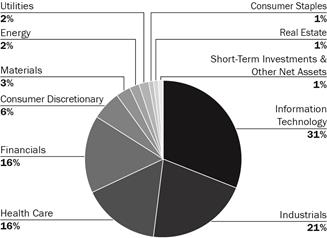
Sector Allocation is based on Net Assets.
Sector Allocation and Top 10 Holdings are subject to change.
| | | | | | |
| | Mid Cap Growth Stock Portfolio | | | 37 | |
Mid Cap Growth Stock Portfolio
Schedule of Investments
December 31, 2017
| | | | | | | | |
| Common Stocks (99.8%) | | Shares/
$ Par | | | Value
$ (000’s) | |
| |
Consumer Discretionary (6.6%) | | | | | |
CarMax, Inc.* | | | 207,870 | | | | 13,331 | |
Choice Hotels International, Inc. | | | 164,727 | | | | 12,783 | |
Harley-Davidson, Inc. | | | 227,921 | | | | 11,597 | |
NVR, Inc.* | | | 6,018 | | | | 21,112 | |
TripAdvisor, Inc.* | | | 105,237 | | | | 3,626 | |
Under Armour, Inc. - Class C* | | | 315,235 | | | | 4,199 | |
UniFirst Corp. | | | 35,024 | | | | 5,775 | |
| | | | | | | | |
Total | | | | | | | 72,423 | |
| | | | | | | | |
| |
Consumer Staples (0.7%) | | | | | |
PriceSmart, Inc. | | | 88,821 | | | | 7,648 | |
| | | | | | | | |
Total | | | | | | | 7,648 | |
| | | | | | | | |
| |
Energy (2.2%) | | | | | |
Diamondback Energy, Inc.* | | | 50,259 | | | | 6,345 | |
Newfield Exploration Co.* | | | 179,424 | | | | 5,657 | |
WPX Energy, Inc.* | | | 852,555 | | | | 11,996 | |
| | | | | | | | |
Total | | | | | | | 23,998 | |
| | | | | | | | |
| |
Financials (16.1%) | | | | | |
Alleghany Corp.* | | | 16,156 | | | | 9,630 | |
Credit Acceptance Corp.* | | | 33,781 | | | | 10,928 | |
Cullen / Frost Bankers, Inc. | | | 55,461 | | | | 5,249 | |
East West Bancorp, Inc. | | | 82,600 | | | | 5,025 | |
FactSet Research Systems, Inc. | | | 67,071 | | | | 12,929 | |
Fairfax Financial Holdings, Ltd. | | | 18,534 | | | | 9,869 | |
First Citizens BancShares, Inc. - Class A | | | 20,037 | | | | 8,075 | |
First Republic Bank | | | 142,625 | | | | 12,357 | |
FNF Group | | | 214,191 | | | | 8,405 | |
M&T Bank Corp. | | | 109,704 | | | | 18,758 | |
Markel Corp.* | | | 18,984 | | | | 21,625 | |
Moody’s Corp. | | | 21,876 | | | | 3,229 | |
MSCI, Inc. | | | 84,734 | | | | 10,722 | |
Northern Trust Corp. | | | 120,313 | | | | 12,018 | |
Prosperity Bancshares, Inc. | | | 88,988 | | | | 6,235 | |
South State Corp. | | | 71,560 | | | | 6,237 | |
W.R. Berkley Corp. | | | 108,810 | | | | 7,796 | |
White Mountains Insurance Group, Ltd. | | | 8,610 | | | | 7,330 | |
| | | | | | | | |
Total | | | | | | | 176,417 | |
| | | | | | | | |
| |
Health Care (16.5%) | | | | | |
Aerie Pharmaceuticals, Inc.* | | | 159,144 | | | | 9,509 | |
| | | | | | | | |
| Common Stocks (99.8%) | | Shares/
$ Par | | | Value
$ (000’s) | |
| |
Health Care continued | | | | | |
Agios Pharmaceuticals, Inc.* | | | 53,885 | | | | 3,081 | |
Alkermes PLC* | | | 265,438 | | | | 14,527 | |
BeiGene, Ltd., ADR* | | | 57,271 | | | | 5,597 | |
Bluebird Bio, Inc.* | | | 52,292 | | | | 9,313 | |
Integra LifeSciences Holdings Corp.* | | | 84,098 | | | | 4,025 | |
Ionis Pharmaceuticals, Inc.* | | | 290,883 | | | | 14,631 | |
Ironwood Pharmaceuticals, Inc.* | | | 20,781 | | | | 312 | |
Mettler-Toledo International, Inc.* | | | 20,348 | | | | 12,606 | |
Neurocrine Biosciences, Inc.* | | | 170,086 | | | | 13,197 | |
Sage Therapeutics, Inc.* | | | 114,282 | | | | 18,823 | |
Spark Therapeutics, Inc.* | | | 76,634 | | | | 3,941 | |
Steris PLC | | | 138,939 | | | | 12,153 | |
Teleflex, Inc. | | | 53,615 | | | | 13,340 | |
Tesaro, Inc.* | | | 118,716 | | | | 9,838 | |
Ultragenyx Pharmaceutical, Inc.* | | | 172,675 | | | | 8,009 | |
Varian Medical Systems, Inc.* | | | 103,992 | | | | 11,559 | |
Veeva Systems, Inc. - Class A* | | | 123,923 | | | | 6,850 | |
Waters Corp.* | | | 54,212 | | | | 10,473 | |
| | | | | | | | |
Total | | | | | | | 181,784 | |
| | | | | | | | |
| |
Industrials (21.3%) | | | | | |
Alaska Air Group, Inc. | | | 162,139 | | | | 11,919 | |
Allison Transmission Holdings, Inc. | | | 248,159 | | | | 10,688 | |
AMERCO | | | 27,958 | | | | 10,566 | |
Cintas Corp. | | | 66,011 | | | | 10,286 | |
The Dun & Bradstreet Corp. | | | 101,357 | | | | 12,002 | |
Equifax, Inc. | | | 63,775 | | | | 7,520 | |
Fastenal Co. | | | 158,617 | | | | 8,675 | |
Genesee & Wyoming, Inc. - Class A* | | | 194,737 | | | | 15,332 | |
HEICO Corp. - Class A | | | 131,529 | | | | 10,397 | |
IDEX Corp. | | | 162,117 | | | | 21,395 | |
JetBlue Airways Corp.* | | | 592,344 | | | | 13,233 | |
KAR Auction Services, Inc. | | | 160,602 | | | | 8,112 | |
Lennox International, Inc. | | | 102,827 | | | | 21,415 | |
The Middleby Corp.* | | | 59,233 | | | | 7,993 | |
PACCAR, Inc. | | | 119,589 | | | | 8,500 | |
Robert Half International, Inc. | | | 224,340 | | | | 12,460 | |
| | | | | | | | |
| Common Stocks (99.8%) | | Shares/
$ Par | | | Value
$ (000’s) | |
| |
Industrials continued | | | | | |
Spirit Airlines, Inc.* | | | 197,834 | | | | 8,873 | |
TransUnion* | | | 438,394 | | | | 24,094 | |
Waste Connections, Inc. | | | 154,207 | | | | 10,939 | |
| | | | | | | | |
Total | | | | | | | 234,399 | |
| | | | | | | | |
| |
Information Technology (31.2%) | | | | | |
Akamai Technologies, Inc.* | | | 266,390 | | | | 17,326 | |
Black Knight, Inc.* | | | 169,972 | | | | 7,504 | |
Blackbaud, Inc. | | | 129,246 | | | | 12,212 | |
Blackhawk Network Holdings, Inc.* | | | 127,851 | | | | 4,558 | |
Cadence Design Systems, Inc.* | | | 223,319 | | | | 9,339 | |
CDW Corp. | | | 275,123 | | | | 19,118 | |
Cimpress NV* | | | 35,418 | | | | 4,246 | |
CommScope Holding Co., Inc.* | | | 284,269 | | | | 10,754 | |
CoStar Group, Inc.* | | | 46,415 | | | | 13,783 | |
Finisar Corp.* | | | 397,609 | | | | 8,091 | |
Genpact, Ltd. | | | 769,774 | | | | 24,433 | |
Global Payments, Inc. | | | 218,780 | | | | 21,931 | |
GrubHub, Inc.* | | | 58,117 | | | | 4,173 | |
Guidewire Software, Inc.* | | | 147,920 | | | | 10,985 | |
II-VI, Inc.* | | | 268,743 | | | | 12,617 | |
Keysight Technologies, Inc.* | | | 268,128 | | | | 11,154 | |
MKS Instruments, Inc. | | | 129,244 | | | | 12,214 | |
National Instruments Corp. | | | 409,526 | | | | 17,049 | |
ServiceNow, Inc.* | | | 90,416 | | | | 11,789 | |
Silicon Laboratories, Inc.* | | | 122,361 | | | | 10,804 | |
Teradata Corp.* | | | 357,416 | | | | 13,746 | |
Total System Services, Inc. | | | 198,728 | | | | 15,717 | |
Trimble Navigation, Ltd.* | | | 358,357 | | | | 14,564 | |
VeriSign, Inc.* | | | 196,557 | | | | 22,494 | |
WEX, Inc.* | | | 118,539 | | | | 16,741 | |
Zillow Group, Inc. - Class A* | | | 131,733 | | | | 5,367 | |
Zillow Group, Inc. - Class C* | | | 233,427 | | | | 9,552 | |
| | | | | | | | |
Total | | | | | | | 342,261 | |
| | | | | | | | |
| |
Materials (3.1%) | | | | | |
Ball Corp. | | | 280,358 | | | | 10,612 | |
Packaging Corp. of America | | | 141,707 | | | | 17,083 | |
Silgan Holdings, Inc. | | | 207,701 | | | | 6,104 | |
| | | | | | | | |
Total | | | | | | | 33,799 | |
| | | | | | | | |
The Accompanying Notes are an Integral Part of the Financial Statements.
| | | | |
| 38 | | Mid Cap Growth Stock Portfolio | | |
Mid Cap Growth Stock Portfolio
| | | | | | | | |
| Common Stocks (99.8%) | | Shares/
$ Par | | | Value
$ (000’s) | |
| |
Real Estate (0.2%) | | | | | |
Equity Commonwealth* | | | 76,611 | | | | 2,337 | |
| | | | | | | | |
Total | | | | | | | 2,337 | |
| | | | | | | | |
| |
Utilities (1.9%) | | | | | |
Black Hills Corp. | | | 69,321 | | | | 4,167 | |
NiSource, Inc. | | | 125,525 | | | | 3,222 | |
UGI Corp. | | | 287,835 | | | | 13,514 | |
| | | | | | | | |
Total | | | | | | | 20,903 | |
| | | | | | | | |
| | |
Total Common Stocks | | | | | | | | |
(Cost: $1,045,980) | | | | | | | 1,095,969 | |
| | | | | | | | |
| | | | | | | | |
Short-Term Investments
(0.7%) | | Shares/
$ Par | | | Value
$ (000’s) | |
|
Money Market Funds (0.7%) | |
State Street Institutional U.S. Government Money Market Fund - Premier Class, 1.209%# | | | 7,364,632 | | | | 7,365 | |
| | | | | | | | |
Total | | | | | | | 7,365 | |
| | | | | | | | |
| | |
Total Short-Term
Investments | | | | | | | | |
(Cost: $7,365) | | | | | | | 7,365 | |
| | | | | | | | |
| | | | | | | | |
| | | Shares/
$ Par | | | Value
$ (000’s) | |
| | |
Total Investments (100.5%) | | | | | | | | |
(Cost: $1,053,345)(a) | | | | | | | 1,103,334 | |
| | | | | | | | |
Other Assets, Less | | | | | | | | |
Liabilities (-0.5%) | | | | | | | (5,901 | ) |
| | | | | | | | |
Net Assets (100.0%) | | | | | | | 1,097,433 | |
| | | | | | | | |
Non-Income Producing
| # | 7-Day yield as of December 31, 2017 |
ADR after the name of a security represents—American Depositary Receipt.
| (a) | At December 31, 2017, the aggregate cost of investments, including derivatives, for federal tax purposes (in thousands) was $1,055,356 and the net unrealized appreciation of investments based on that cost was $47,978 which is comprised of $68,519 aggregate gross unrealized appreciation and $20,541 aggregate gross unrealized depreciation. |
The following is a summary of the inputs used in valuing the Portfolio’s assets and liabilities at December 31, 2017. See Note 3 for additional information on portfolio valuation.
| | | | | | | | | | | | | | |
| | | Valuation Inputs | | | |
| Description | | Level 1 –
Quoted Prices | | | Level 2 – Other Significant
Observable Inputs | | | Level 3 – Significant
Unobservable Inputs | | | |
| | | (Amounts in thousands) | | | |
Assets: | | | | | | | | | | | | | | |
Common Stocks | | $ | 1,095,969 | | | $ | - | | | $ | - | | | |
Short-Term Investments | | | 7,365 | | | | - | | | | - | | | |
Total Assets: | | $ | 1,103,334 | | | $ | - | | | $ | - | | | |
The Accompanying Notes are an Integral Part of the Financial Statements.
| | | | | | |
| | Mid Cap Growth Stock Portfolio | | | 39 | |
Index 400 Stock Portfolio (unaudited)
| | | | |
| Objective: | | Portfolio Strategy: | | Net Assets: |
| Investment results that approximate the performance of the S&P MidCap 400® Index. | | Invest in stocks that make up the S&P MidCap 400® Index, holding each stock in approximately the same proportion as its weighting in the Index. | | $ 897 Million |
Portfolio Overview
Mason Street Advisors is the investment adviser for the Index 400 Stock Portfolio (the “Portfolio”). The Portfolio seeks investment results that approximate the performance of the S&P MidCap 400® Index, which is composed of the stocks of companies whose capitalizations generally are smaller than those of companies that comprise the S&P 500® Index. The S&P MidCap 400® Index does not include the stocks of the very large companies that account for most of the weighting in the S&P 500® Index. The Portfolio attempts to achieve its objective by investing all, or substantially all, of its assets in the stocks that make up the S&P MidCap 400® Index, holding each stock in approximately the same proportion as its weighting in the Index. This is known as a full replication strategy. The Portfolio may also invest in S&P MidCap 400® Index stock futures and, to a lesser extent, purchase (long) total return equity swap agreements to help achieve full replication.
Market Overview
U.S. equities delivered another year of strong performance. The sharp gains in business and consumer confidence following the U.S. election and improving global economic growth were among the catalysts for equities, as investors anticipated market-friendly policies from the new administration. That confidence was generally well placed—corporate earnings finally improved after three flat years and Congress passed one of the largest tax cuts in U.S. history. The improving economy favored equities over bonds; although, fixed income sectors still posted positive returns.
The U.S. economy expanded at a pace of approximately 3% during the second half of the year. The strong growth prompted the U.S. Federal Reserve (the “Fed”) to raise rates and begin reducing its $4 trillion balance sheet. In that environment, large cap stocks, as represented by the S&P 500® Index, posted a return of 21.83%, outperforming the S&P SmallCap 600® and the S&P MidCap 400® Indices, which returned 13.23% and 16.24%, respectively. Meanwhile, the broader bond market, as represented by the Bloomberg Barclays® U.S. Aggregate Index returned 3.54%, while the Bloomberg Barclays® U.S. Corporate High Yield Index advanced 7.50%.
Portfolio Results
The Index 400 Stock Portfolio delivered a total return of 15.96% for the twelve months ended December 31, 2017, trailing the S&P MidCap 400® Index (the “Index”), which returned 16.24%. (The Index is unmanaged, cannot be invested in directly, and does not include administrative expenses.) Portfolio performance slightly lagged the Index due to transaction costs, administrative expenses, cash flow effects and costs associated with the use of stock index futures contracts. The Portfolio outperformed the 14.84% average return for its peer group, Mid Cap Core Funds, according to Lipper® Analytical Services, Inc. However, the Mid Cap Core Funds peer group is not strictly comparable to the Portfolio because many of the funds in the group are actively managed.
Nine of the Index’s eleven sectors delivered positive returns for the year. The largest contributor to the Index’s return was the Information Technology sector, which delivered outstanding revenue and earnings growth throughout the year. Within the sector, the semiconductors and semiconductor equipment industry experienced strong sales and high profitability. The Industrials sector had strong returns, as mid cap machinery stocks benefited from increases in industrial production and capital expenditure. Steady economic growth, low inflation, and declining unemployment led to an increase in consumer spending, which helped performance in the Consumer Discretionary sector. The Financials sector was another solid contributor, as mid cap insurance companies benefited from several interest rate increases by the Fed. Ongoing demographic trends and tax reform helped the Health Care sector post gains despite continued uncertainty surrounding governmental reform efforts and regulatory changes. The Materials sector posted solid returns, buoyed by continued economic growth and output, as well as anticipation of future governmental infrastructure spending.
At the other end of the spectrum, the Energy sector suffered losses, as worries over the impact of supply growth on oil prices weighed on oil and gas exploration companies. The Telecommunication Services sector also struggled as intense competition kept prices low, and new entrants to the market put pressure on legacy carriers.
| | | | |
| 40 | | Index 400 Stock Portfolio | | |
Index 400 Stock Portfolio (unaudited)
Relative Performance
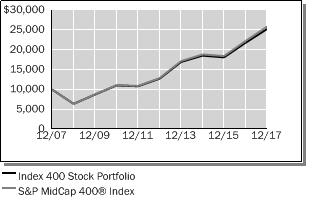
| | | | | | | | | | | | |
Average Annual Total Returns
For Periods Ended December 31, 2017 | |
| | | 1 Year | | | 5 Years | | | 10 Years | |
Index 400 Stock Portfolio | | | 15.96 | % | | | 14.70 | % | | | 9.71 | % |
S&P MidCap 400® Index | | | 16.24 | % | | | 15.01 | % | | | 9.97 | % |
Lipper® Variable Insurance Products (VIP) Mid Cap Core Funds Average | | | 14.84 | % | | | 13.66 | % | | | 8.28 | % |
The performance data quoted represents past performance. Past performance is historical and does not guarantee future performance. Investment return and principal value will fluctuate, so that shares, when redeemed, may be worth more or less than their original cost. Current performance may be lower or higher than the performance data quoted. For the most recent month-end performance information visit www.northwesternmutual.com.
This chart assumes an initial investment of $10,000 made on 12/31/07. Returns shown reflect fee waivers, deductions for management and other portfolio expenses, and reinvestment of all dividends. In the absence of fee waivers, total return would be reduced. Returns exclude deductions for separate account sale loads and account fees. Please refer to the Benchmark Definitions section of this report for information about the indices cited in the above chart and graph.
“Standard & Poor’s®”, “S&P®”, “S&P MidCap 400 Index” and “Standard & Poor’s MidCap 400 Index” are trademarks of The McGraw-Hill Companies, Inc. and have been licensed for use by Northwestern Mutual Life Insurance Company. The Portfolio is not sponsored, endorsed, sold or promoted by Standard & Poor’s, and Standard & Poor’s makes no representation regarding the advisability of investing in the Portfolio.
Investing in small and medium-sized companies involves a greater degree of risk than investing in large company stocks.
The Portfolio may invest in derivative instruments such as futures and, to a lesser extent, swap agreements to help achieve full replication. Use of these instruments may involve certain costs and imposes certain risks such as liquidity risk, market risk, credit risk, management risk and the risk of mispricing or improper valuation. Certain derivatives involve leverage, which could magnify losses, and portfolios investing in derivatives could lose more than the principal amount invested in those instruments.
Top 10 Equity Holdings 12/31/17
| | | | |
Security Description | | | % of Net Assets | |
Take-Two Interactive Software, Inc. | | | 0.7 | % |
SVB Financial Group | | | 0.7 | % |
NVR, Inc. | | | 0.7 | % |
MSCI, Inc. | | | 0.6 | % |
Teleflex, Inc. | | | 0.6 | % |
Huntington Ingalls Industries, Inc. | | | 0.6 | % |
Cognex Corp. | | | 0.6 | % |
Broadridge Financial Solutions, Inc. | | | 0.6 | % |
Trimble Navigation, Ltd. | | | 0.6 | % |
Steel Dynamics, Inc. | | | 0.6 | % |
Sector Allocation 12/31/17
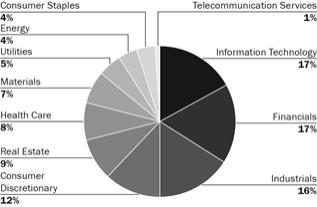
Sector Allocation is based on Net Assets.
Sector Allocation and Top 10 Holdings are subject to change.
| | | | | | |
| | Index 400 Stock Portfolio | | | 41 | |
Index 400 Stock Portfolio
Schedule of Investments
December 31, 2017
| | | | | | | | |
| Common Stocks (98.1%) | | Shares/
$ Par | | | Value
$ (000’s) | |
| |
Consumer Discretionary (11.9%) | | | | | |
Aaron’s, Inc. | | | 30,679 | | | | 1,223 | |
Adtalem Global Education, Inc.* | | | 29,888 | | | | 1,257 | |
AMC Networks, Inc. - Class A* | | | 24,820 | | | | 1,342 | |
American Eagle Outfitters, Inc. | | | 82,865 | | | | 1,558 | |
AutoNation, Inc.* | | | 29,219 | | | | 1,500 | |
Bed Bath & Beyond, Inc. | | | 70,571 | | | | 1,552 | |
Big Lots, Inc. | | | 20,915 | | | | 1,174 | |
Brinker International, Inc. | | | 22,805 | | | | 886 | |
Brunswick Corp. | | | 43,202 | | | | 2,386 | |
Buffalo Wild Wings, Inc.* | | | 7,642 | | | | 1,195 | |
Cable One, Inc. | | | 2,311 | | | | 1,625 | |
CalAtlantic Group, Inc. | | | 37,507 | | | | 2,115 | |
Carter’s, Inc. | | | 23,314 | | | | 2,739 | |
The Cheesecake Factory, Inc. | | | 20,978 | | | | 1,011 | |
Churchill Downs, Inc. | | | 6,384 | | | | 1,486 | |
Cinemark Holdings, Inc. | | | 52,216 | | | | 1,818 | |
Cooper Tire & Rubber Co. | | | 25,261 | | | | 893 | |
Cracker Barrel Old Country Store, Inc. | | | 11,822 | | | | 1,878 | |
Dana, Inc. | | | 71,373 | | | | 2,285 | |
Deckers Outdoor Corp.* | | | 15,746 | | | | 1,264 | |
Delphi Technologies PLC* | | | 43,822 | | | | 2,299 | |
Dick’s Sporting Goods, Inc. | | | 40,741 | | | | 1,171 | |
Dillard’s, Inc. - Class A | | | 10,351 | | | | 622 | |
Domino’s Pizza, Inc. | | | 21,546 | | | | 4,071 | |
Dunkin’ Brands Group, Inc. | | | 44,499 | | | | 2,869 | |
GameStop Corp. - Class A | | | 49,911 | | | | 896 | |
Gentex Corp. | | | 139,869 | | | | 2,930 | |
Graham Holdings Co. | | | 2,280 | | | | 1,273 | |
Helen of Troy, Ltd.* | | | 13,434 | | | | 1,294 | |
ILG, Inc. | | | 51,947 | | | | 1,479 | |
International Speedway Corp. - Class A | | | 12,049 | | | | 480 | |
Jack in the Box, Inc. | | | 14,496 | | | | 1,422 | |
John Wiley & Sons, Inc. - Class A | | | 21,957 | | | | 1,444 | |
KB Home | | | 41,470 | | | | 1,325 | |
Live Nation Entertainment, Inc.* | | | 66,012 | | | | 2,810 | |
Meredith Corp. | | | 19,488 | | | | 1,287 | |
The Michaels Cos., Inc.* | | | 54,391 | | | | 1,316 | |
Murphy USA, Inc.* | | | 15,943 | | | | 1,281 | |
The New York Times Co. - Class A | | | 62,020 | | | | 1,147 | |
NVR, Inc.* | | | 1,714 | | | | 6,013 | |
Office Depot, Inc. | | | 253,513 | | | | 897 | |
Papa John’s International, Inc. | | | 12,603 | | | | 707 | |
| | | | | | | | |
| Common Stocks (98.1%) | | Shares/
$ Par | | | Value
$ (000’s) | |
| |
Consumer Discretionary continued | | | | | |
Polaris Industries, Inc. | | | 28,656 | | | | 3,553 | |
Pool Corp. | | | 19,789 | | | | 2,566 | |
Sally Beauty Holdings, Inc.* | | | 63,275 | | | | 1,187 | |
Service Corp. International | | | 92,360 | | | | 3,447 | |
Six Flags Entertainment Corp. | | | 38,389 | | | | 2,555 | |
Skechers U.S.A., Inc. - Class A* | | | 65,981 | | | | 2,497 | |
Sotheby’s* | | | 18,365 | | | | 948 | |
TEGNA, Inc. | | | 105,980 | | | | 1,492 | |
Tempur Sealy International, Inc.* | | | 22,689 | | | | 1,422 | |
Texas Roadhouse, Inc. | | | 32,229 | | | | 1,698 | |
Thor Industries, Inc. | | | 24,143 | | | | 3,639 | |
Toll Brothers, Inc. | | | 72,509 | | | | 3,482 | |
TRI Pointe Homes, Inc.* | | | 74,113 | | | | 1,328 | |
Tupperware Brands Corp. | | | 25,070 | | | | 1,572 | |
Urban Outfitters, Inc.* | | | 39,464 | | | | 1,384 | |
The Wendy’s Co. | | | 89,492 | | | | 1,469 | |
Williams-Sonoma, Inc. | | | 38,290 | | | | 1,980 | |
| | | | | | | | |
Total | | | | | | | 106,439 | |
| | | | | | | | |
| |
Consumer Staples (3.7%) | | | | | |
Avon Products, Inc.* | | | 216,773 | | | | 466 | |
The Boston Beer Co., Inc. - Class A* | | | 4,268 | | | | 816 | |
Casey’s General Stores, Inc. | | | 18,839 | | | | 2,109 | |
Dean Foods Co. | | | 44,868 | | | | 519 | |
Edgewell Personal Care Co.* | | | 27,598 | | | | 1,639 | |
Energizer Holdings, Inc. | | | 29,924 | | | | 1,436 | |
Flowers Foods, Inc. | | | 90,876 | | | | 1,755 | |
The Hain Celestial Group, Inc.* | | | 51,135 | | | | 2,167 | |
Ingredion, Inc. | | | 35,405 | | | | 4,950 | |
Lamb Weston Holdings, Inc. | | | 72,014 | | | | 4,065 | |
Lancaster Colony Corp. | | | 9,599 | | | | 1,240 | |
Nu Skin Enterprises, Inc. | | | 24,383 | | | | 1,664 | |
Post Holdings, Inc.* | | | 32,575 | | | | 2,581 | |
Sanderson Farms, Inc. | | | 9,860 | | | | 1,368 | |
Snyder’s-Lance, Inc. | | | 42,251 | | | | 2,116 | |
Sprouts Farmers Market, Inc.* | | | 60,971 | | | | 1,485 | |
Tootsie Roll Industries, Inc. | | | 9,372 | | | | 341 | |
TreeHouse Foods, Inc.* | | | 28,188 | | | | 1,394 | |
United Natural Foods, Inc.* | | | 25,035 | | | | 1,233 | |
| | | | | | | | |
Total | | | | | | | 33,344 | |
| | | | | | | | |
| |
Energy (4.2%) | | | | | |
Callon Petroleum Co.* | | | 99,438 | | | | 1,208 | |
| | | | | | | | |
| Common Stocks (98.1%) | | Shares/
$ Par | | | Value
$ (000’s) | |
| |
Energy continued | | | | | |
CNX Resources Corp.* | | | 102,028 | | | | 1,493 | |
Core Laboratories N.V. | | | 21,732 | | | | 2,381 | |
Diamond Offshore Drilling, Inc.* | | | 31,775 | | | | 591 | |
Dril-Quip, Inc.* | | | 18,653 | | | | 890 | |
Energen Corp.* | | | 47,886 | | | | 2,757 | |
Ensco PLC - Class A | | | 214,812 | | | | 1,269 | |
Gulfport Energy Corp.* | | | 81,179 | | | | 1,036 | |
HollyFrontier Corp. | | | 87,340 | | | | 4,473 | |
Matador Resources Co.* | | | 47,551 | | | | 1,480 | |
Murphy Oil Corp. | | | 79,920 | | | | 2,481 | |
Nabors Industries, Ltd. | | | 156,468 | | | | 1,069 | |
Oceaneering International, Inc. | | | 48,414 | | | | 1,023 | |
Patterson-UTI Energy, Inc. | | | 109,591 | | | | 2,522 | |
PBF Energy, Inc. | | | 54,212 | | | | 1,922 | |
QEP Resources, Inc.* | | | 118,700 | | | | 1,136 | |
Rowan Cos., PLC - Class A* | | | 55,975 | | | | 877 | |
SM Energy Co. | | | 50,594 | | | | 1,117 | |
Southwestern Energy Co.* | | | 252,456 | | | | 1,409 | |
Superior Energy Services, Inc.* | | | 75,419 | | | | 726 | |
Transocean, Ltd.* | | | 192,722 | | | | 2,058 | |
World Fuel Services Corp. | | | 33,314 | | | | 937 | |
WPX Energy, Inc.* | | | 196,009 | | | | 2,758 | |
| | | | | | | | |
Total | | | | | | | 37,613 | |
| | | | | | | | |
| |
Financials (17.0%) | | | | | |
Alleghany Corp.* | | | 7,606 | | | | 4,534 | |
American Financial Group, Inc. | | | 33,860 | | | | 3,675 | |
Aspen Insurance Holdings, Ltd. | | | 29,268 | | | | 1,188 | |
Associated Banc-Corp. | | | 74,474 | | | | 1,892 | |
BancorpSouth Bank | | | 41,387 | | | | 1,302 | |
Bank of Hawaii Corp. | | | 20,928 | | | | 1,794 | |
Bank of the Ozarks | | | 59,825 | | | | 2,899 | |
Brown & Brown, Inc. | | | 57,004 | | | | 2,933 | |
Cathay General Bancorp | | | 37,428 | | | | 1,578 | |
Chemical Financial Corp. | | | 35,063 | | | | 1,875 | |
CNO Financial Group, Inc. | | | 82,651 | | | | 2,041 | |
Commerce Bancshares, Inc. | | | 46,266 | | | | 2,584 | |
Cullen/Frost Bankers, Inc. | | | 28,318 | | | | 2,680 | |
East West Bancorp, Inc. | | | 71,212 | | | | 4,332 | |
Eaton Vance Corp. | | | 58,173 | | | | 3,280 | |
F.N.B. Corp. | | | 159,244 | | | | 2,201 | |
FactSet Research Systems, Inc. | | | 19,268 | | | | 3,714 | |
Federated Investors, Inc. - Class B | | | 46,725 | | | | 1,686 | |
The Accompanying Notes are an Integral Part of the Financial Statements.
| | | | |
| 42 | | Index 400 Stock Portfolio | | |
Index 400 Stock Portfolio
| | | | | | | | |
| Common Stocks (98.1%) | | Shares/
$ Par | | | Value
$ (000’s) | |
| |
Financials continued | | | | | |
First American Financial Corp. | | | 54,549 | | | | 3,057 | |
First Horizon National Corp. | | | 159,914 | | | | 3,197 | |
Fulton Financial Corp. | | | 86,277 | | | | 1,544 | |
Genworth Financial, Inc. - Class A* | | | 245,910 | | | | 765 | |
Hancock Holding Co. | | | 41,966 | | | | 2,077 | |
Hanover Insurance Group, Inc. | | | 20,881 | | | | 2,257 | |
Home BancShares, Inc. | | | 77,881 | | | | 1,811 | |
Interactive Brokers Group, Inc. - Class A | | | 34,920 | | | | 2,068 | |
International Bancshares Corp. | | | 26,693 | | | | 1,060 | |
Janus Henderson Group PLC | | | 88,864 | | | | 3,400 | |
Kemper Corp. | | | 24,081 | | | | 1,659 | |
Legg Mason, Inc. | | | 42,124 | | | | 1,768 | |
MarketAxess Holdings, Inc. | | | 18,517 | | | | 3,736 | |
MB Financial, Inc. | | | 41,302 | | | | 1,839 | |
Mercury General Corp. | | | 17,992 | | | | 962 | |
MSCI, Inc. | | | 44,369 | | | | 5,614 | |
New York Community Bancorp, Inc. | | | 240,941 | | | | 3,137 | |
Old Republic International Corp. | | | 120,871 | | | | 2,584 | |
PacWest Bancorp | | | 63,522 | | | | 3,202 | |
Pinnacle Financial Partners, Inc. | | | 36,341 | | | | 2,409 | |
Primerica, Inc. | | | 21,800 | | | | 2,214 | |
Prosperity Bancshares, Inc. | | | 34,235 | | | | 2,399 | |
Reinsurance Group of America, Inc. | | | 31,730 | | | | 4,948 | |
RenaissanceRe Holdings, Ltd. | | | 19,721 | | | | 2,477 | |
SEI Investments Co. | | | 64,393 | | | | 4,627 | |
Signature Bank* | | | 26,448 | | | | 3,630 | |
SLM Corp.* | | | 212,778 | | | | 2,404 | |
Sterling Bancorp | | | 110,706 | | | | 2,723 | |
Stifel Financial Corp. | | | 33,731 | | | | 2,009 | |
SVB Financial Group* | | | 25,984 | | | | 6,074 | |
Synovus Financial Corp. | | | 58,907 | | | | 2,824 | |
TCF Financial Corp. | | | 84,705 | | | | 1,736 | |
Texas Capital Bancshares, Inc.* | | | 24,450 | | | | 2,174 | |
Trustmark Corp. | | | 33,374 | | | | 1,063 | |
UMB Financial Corp. | | | 21,620 | | | | 1,555 | |
Umpqua Holdings Corp. | | | 108,490 | | | | 2,257 | |
United Bankshares, Inc. | | | 51,726 | | | | 1,797 | |
Valley National Bancorp | | | 130,161 | | | | 1,460 | |
W.R. Berkley Corp. | | | 47,403 | | | | 3,396 | |
Washington Federal, Inc. | | | 42,957 | | | | 1,471 | |
Webster Financial Corp. | | | 45,362 | | | | 2,548 | |
Wintrust Financial Corp. | | | 27,551 | | | | 2,269 | |
| | | | | | | | |
Total | | | | | | | 152,389 | |
| | | | | | | | |
| | | | | | | | |
| Common Stocks (98.1%) | | Shares/
$ Par | | | Value
$ (000’s) | |
| |
Health Care (7.4%) | | | | | |
ABIOMED, Inc.* | | | 20,695 | | | | 3,878 | |
Acadia Healthcare Co., Inc.* | | | 40,241 | | | | 1,313 | |
Akorn, Inc.* | | | 46,214 | | | | 1,490 | |
Allscripts Healthcare Solutions, Inc.* | | | 89,015 | | | | 1,295 | |
Bio-Rad Laboratories, Inc. - Class A* | | | 9,959 | | | | 2,377 | |
Bio-Techne Corp. | | | 18,456 | | | | 2,391 | |
Bioverativ, Inc.* | | | 53,287 | | | | 2,873 | |
Catalent, Inc.* | | | 65,456 | | | | 2,689 | |
Charles River Laboratories International, Inc.* | | | 23,334 | | | | 2,554 | |
Encompass Health Corp. | | | 48,643 | | | | 2,403 | |
Endo International PLC* | | | 99,007 | | | | 767 | |
Globus Medical, Inc. - Class A* | | | 35,713 | | | | 1,468 | |
Halyard Health, Inc.* | | | 23,053 | | | | 1,065 | |
Hill-Rom Holdings, Inc. | | | 32,428 | | | | 2,733 | |
INC Research Holdings, Inc. - Class A* | | | 27,760 | | | | 1,210 | |
LifePoint Health, Inc.* | | | 19,419 | | | | 967 | |
LivaNova PLC* | | | 21,362 | | | | 1,707 | |
Mallinckrodt PLC* | | | 46,806 | | | | 1,056 | |
Masimo Corp.* | | | 23,420 | | | | 1,986 | |
Medidata Solutions, Inc.* | | | 28,802 | | | | 1,825 | |
MEDNAX, Inc.* | | | 46,141 | | | | 2,466 | |
Molina Healthcare, Inc.* | | | 21,659 | | | | 1,661 | |
NuVasive, Inc.* | | | 25,110 | | | | 1,469 | |
Owens & Minor, Inc. | | | 30,176 | | | | 570 | |
Prestige Brands Holdings, Inc.* | | | 26,131 | | | | 1,161 | |
Steris PLC | | | 41,902 | | | | 3,665 | |
Teleflex, Inc. | | | 22,194 | | | | 5,522 | |
Tenet Heathcare Corp.* | | | 39,783 | | | | 603 | |
United Therapeutics Corp.* | | | 21,289 | | | | 3,150 | |
WellCare Health Plans, Inc.* | | | 21,935 | | | | 4,411 | |
West Pharmaceutical Services, Inc. | | | 36,582 | | | | 3,610 | |
| | | | | | | | |
Total | | | | | | | 66,335 | |
| | | | | | | | |
| |
Industrials (15.5%) | | | | | |
AECOM* | | | 77,656 | | | | 2,885 | |
AGCO Corp. | | | 32,488 | | | | 2,321 | |
Avis Budget Group, Inc.* | | | 35,300 | | | | 1,549 | |
The Brink’s Co. | | | 24,870 | | | | 1,957 | |
Carlisle Cos., Inc. | | | 30,541 | | | | 3,471 | |
Clean Harbors, Inc.* | | | 25,525 | | | | 1,383 | |
Copart, Inc.* | | | 99,077 | | | | 4,279 | |
Crane Co. | | | 24,854 | | | | 2,217 | |
Curtiss-Wright Corp. | | | 21,741 | | | | 2,649 | |
Deluxe Corp. | | | 23,708 | | | | 1,822 | |
Donaldson Co., Inc. | | | 64,000 | | | | 3,133 | |
The Dun & Bradstreet Corp. | | | 18,207 | | | | 2,156 | |
| | | | | | | | |
| Common Stocks (98.1%) | | Shares/
$ Par | | | Value
$ (000’s) | |
| |
Industrials continued | | | | | |
Dycom Industries, Inc.* | | | 15,243 | | | | 1,699 | |
EMCOR Group, Inc. | | | 28,976 | | | | 2,369 | |
EnerSys | | | 20,754 | | | | 1,445 | |
Esterline Technologies Corp.* | | | 12,999 | | | | 971 | |
GATX Corp. | | | 18,869 | | | | 1,173 | |
Genesee & Wyoming, Inc. - Class A* | | | 30,384 | | | | 2,392 | |
Graco, Inc. | | | 82,959 | | | | 3,751 | |
Granite Construction, Inc. | | | 19,633 | | | | 1,245 | |
Herman Miller, Inc. | | | 29,451 | | | | 1,180 | |
HNI Corp. | | | 21,395 | | | | 825 | |
Hubbell, Inc. | | | 26,950 | | | | 3,647 | |
Huntington Ingalls Industries, Inc. | | | 22,371 | | | | 5,273 | |
IDEX Corp. | | | 37,641 | | | | 4,968 | |
ITT, Inc. | | | 43,355 | | | | 2,314 | |
JetBlue Airways Corp.* | | | 157,972 | | | | 3,529 | |
KBR, Inc. | | | 69,013 | | | | 1,369 | |
Kennametal, Inc. | | | 39,930 | | | | 1,933 | |
Kirby Corp.* | | | 26,470 | | | | 1,768 | |
KLX, Inc.* | | | 25,335 | | | | 1,729 | |
Knight-Swift Transportation Holdings, Inc. | | | 63,117 | | | | 2,759 | |
Landstar System, Inc. | | | 20,655 | | | | 2,150 | |
Lennox International, Inc. | | | 18,523 | | | | 3,858 | |
Lincoln Electric Holdings, Inc. | | | 30,452 | | | | 2,789 | |
Manpowergroup, Inc. | | | 32,649 | | | | 4,117 | |
MSA Safety, Inc. | | | 16,676 | | | | 1,293 | |
MSC Industrial Direct Co., Inc. - Class A | | | 21,944 | | | | 2,121 | |
Nordson Corp. | | | 25,012 | | | | 3,662 | |
NOW, Inc.* | | | 53,044 | | | | 585 | |
Old Dominion Freight Line, Inc. | | | 33,685 | | | | 4,431 | |
Orbital ATK, Inc. | | | 28,420 | | | | 3,737 | |
Oshkosh Corp. | | | 37,034 | | | | 3,366 | |
Pitney Bowes, Inc. | | | 91,995 | | | | 1,029 | |
Regal Beloit Corp. | | | 21,827 | | | | 1,672 | |
Rollins, Inc. | | | 47,251 | | | | 2,199 | |
Ryder System, Inc. | | | 26,086 | | | | 2,196 | |
Teledyne Technologies, Inc.* | | | 17,458 | | | | 3,163 | |
Terex Corp. | | | 39,362 | | | | 1,898 | |
The Timken Co. | | | 33,651 | | | | 1,654 | |
The Toro Co. | | | 53,094 | | | | 3,463 | |
Trinity Industries, Inc. | | | 74,779 | | | | 2,801 | |
Valmont Industries, Inc. | | | 11,138 | | | | 1,847 | |
Wabtec Corp. | | | 42,093 | | | | 3,428 | |
Watsco, Inc. | | | 15,033 | | | | 2,556 | |
Werner Enterprises, Inc. | | | 22,096 | | | | 854 | |
Woodward, Inc. | | | 27,153 | | | | 2,078 | |
| | | | | | | | |
Total | | | | | | | 139,108 | |
| | | | | | | | |
The Accompanying Notes are an Integral Part of the Financial Statements.
| | | | | | |
| | Index 400 Stock Portfolio | | | 43 | |
Index 400 Stock Portfolio
| | | | | | | | |
| Common Stocks (98.1%) | | Shares/
$ Par | | | Value
$ (000’s) | |
| |
Information Technology (17.1%) | | | | | |
3D Systems Corp.* | | | 56,096 | | | | 485 | |
ACI Worldwide, Inc.* | | | 58,420 | | | | 1,324 | |
Acxiom Corp.* | | | 39,027 | | | | 1,076 | |
ARRIS International PLC* | | | 86,963 | | | | 2,234 | |
Arrow Electronics, Inc.* | | | 43,341 | | | | 3,485 | |
Avnet, Inc. | | | 59,577 | | | | 2,360 | |
Belden, Inc. | | | 20,778 | | | | 1,603 | |
Blackbaud, Inc. | | | 23,692 | | | | 2,239 | |
Broadridge Financial Solutions, Inc. | | | 57,421 | | | | 5,201 | |
Cars.com, Inc.* | | | 35,261 | | | | 1,017 | |
CDK Global, Inc. | | | 64,710 | | | | 4,613 | |
Ciena Corp.* | | | 70,298 | | | | 1,471 | |
Cirrus Logic, Inc.* | | | 31,366 | | | | 1,627 | |
Cognex Corp. | | | 85,317 | | | | 5,218 | |
Coherent, Inc.* | | | 12,135 | | | | 3,425 | |
CommVault Systems, Inc.* | | | 21,161 | | | | 1,111 | |
Convergys Corp. | | | 45,528 | | | | 1,070 | |
CoreLogic, Inc.* | | | 40,583 | | | | 1,875 | |
Cree, Inc.* | | | 48,348 | | | | 1,796 | |
Cypress Semiconductor Corp. | | | 164,386 | | | | 2,505 | |
Diebold, Inc. | | | 37,213 | | | | 608 | |
DST Systems, Inc. | | | 29,668 | | | | 1,841 | |
Fair Isaac Corp. | | | 14,775 | | | | 2,264 | |
First Solar, Inc.* | | | 40,132 | | | | 2,710 | |
Fortinet, Inc.* | | | 73,680 | | | | 3,219 | |
Integrated Device Technology, Inc.* | | | 65,443 | | | | 1,946 | |
InterDigital, Inc. | | | 17,101 | | | | 1,302 | |
IPG Photonics Corp.* | | | 18,490 | | | | 3,959 | |
j2 Global, Inc. | | | 23,850 | | | | 1,789 | |
Jabil Circuit, Inc. | | | 87,026 | | | | 2,284 | |
Jack Henry & Associates, Inc. | | | 38,051 | | | | 4,450 | |
Keysight Technologies, Inc.* | | | 91,325 | | | | 3,799 | |
Knowles Corp.* | | | 44,051 | | | | 646 | |
Leidos Holdings, Inc. | | | 70,060 | | | | 4,524 | |
Littelfuse, Inc. | | | 11,190 | | | | 2,214 | |
LogMeIn, Inc. | | | 25,955 | | | | 2,972 | |
Manhattan Associates, Inc.* | | | 33,958 | | | | 1,682 | |
MAXIMUS, Inc. | | | 32,091 | | | | 2,297 | |
Microsemi Corp.* | | | 57,935 | | | | 2,992 | |
MKS Instruments, Inc. | | | 26,749 | | | | 2,528 | |
Monolithic Power Systems | | | 18,818 | | | | 2,114 | |
National Instruments Corp. | | | 52,819 | | | | 2,199 | |
NCR Corp.* | | | 60,007 | | | | 2,040 | |
NetScout Systems, Inc.* | | | 42,931 | | | | 1,307 | |
Plantronics, Inc. | | | 16,291 | | | | 821 | |
PTC, Inc.* | | | 56,956 | | | | 3,461 | |
Sabre Corp. | | | 102,755 | | | | 2,106 | |
Science Applications International Corp. | | | 21,303 | | | | 1,631 | |
| | | | | | | | |
| Common Stocks (98.1%) | | Shares/
$ Par | | | Value
$ (000’s) | |
| |
Information Technology continued | | | | | |
Silicon Laboratories, Inc.* | | | 20,970 | | | | 1,852 | |
Synaptics, Inc.* | | | 16,766 | | | | 670 | |
SYNNEX Corp. | | | 14,373 | | | | 1,954 | |
Take-Two Interactive Software, Inc.* | | | 56,190 | | | | 6,169 | |
Tech Data Corp.* | | | 17,103 | | | | 1,676 | |
Teradata Corp.* | | | 59,613 | | | | 2,293 | |
Teradyne, Inc. | | | 96,641 | | | | 4,046 | |
Trimble Navigation, Ltd.* | | | 124,034 | | | | 5,041 | |
Tyler Technologies, Inc.* | | | 17,213 | | | | 3,048 | |
The Ultimate Software Group, Inc.* | | | 13,983 | | | | 3,051 | |
VeriFone Systems, Inc.* | | | 55,278 | | | | 979 | |
Versum Materials, Inc. | | | 53,600 | | | | 2,029 | |
ViaSat, Inc.* | | | 26,683 | | | | 1,997 | |
Vishay Intertechnology, Inc. | | | 64,971 | | | | 1,348 | |
WEX, Inc.* | | | 19,661 | | | | 2,777 | |
Zebra Technologies Corp. - Class A* | | | 26,204 | | | | 2,720 | |
| | | | | | | | |
Total | | | | | | | 153,090 | |
| | | | | | | | |
| |
Materials (7.0%) | | | | | |
Allegheny Technologies, Inc.* | | | 62,009 | | | | 1,497 | |
AptarGroup, Inc. | | | 30,690 | | | | 2,648 | |
Ashland Global Holdings, Inc. | | | 30,616 | | | | 2,180 | |
Bemis Co., Inc. | | | 44,737 | | | | 2,138 | |
Cabot Corp. | | | 30,521 | | | | 1,880 | |
Carpenter Technology Corp. | | | 23,065 | | | | 1,176 | |
The Chemours Co. | | | 91,224 | | | | 4,567 | |
Commercial Metals Co. | | | 57,070 | | | | 1,217 | |
Compass Minerals International, Inc. | | | 16,666 | | | | 1,204 | |
Domtar Corp. | | | 30,887 | | | | 1,529 | |
Eagle Materials, Inc. | | | 23,956 | | | | 2,714 | |
Grief, Inc. - Class A | | | 12,728 | | | | 771 | |
Louisiana-Pacific Corp.* | | | 71,374 | | | | 1,874 | |
Minerals Technologies, Inc. | | | 17,424 | | | | 1,200 | |
NewMarket Corp. | | | 4,555 | | | | 1,810 | |
Olin Corp. | | | 81,910 | | | | 2,914 | |
Owens-Illinois, Inc.* | | | 80,300 | | | | 1,780 | |
PolyOne Corp. | | | 39,809 | | | | 1,732 | |
Reliance Steel & Aluminum Co. | | | 35,923 | | | | 3,082 | |
Royal Gold, Inc. | | | 32,247 | | | | 2,648 | |
RPM International, Inc. | | | 65,789 | | | | 3,449 | |
The Scotts Miracle-Gro Co. - Class A | | | 20,144 | | | | 2,155 | |
Sensient Technologies Corp. | | | 21,419 | | | | 1,567 | |
Silgan Holdings, Inc. | | | 36,433 | | | | 1,071 | |
Sonoco Products Co. | | | 48,969 | | | | 2,602 | |
Steel Dynamics, Inc. | | | 116,738 | | | | 5,035 | |
United States Steel Corp. | | | 86,049 | | | | 3,028 | |
| | | | | | | | |
| Common Stocks (98.1%) | | Shares/
$ Par | | | Value
$ (000’s) | |
| |
Materials continued | | | | | |
Valvoline, Inc. | | | 99,827 | | | | 2,502 | |
Worthington Industries, Inc. | | | 22,027 | | | | 970 | |
| | | | | | | | |
Total | | | | | | | 62,940 | |
| | | | | | | | |
| |
Real Estate (9.0%) | | | | | |
Alexander & Baldwin, Inc. | | | 22,774 | | | | 632 | |
American Campus Communities, Inc. | | | 67,213 | | | | 2,758 | |
Camden Property Trust | | | 45,653 | | | | 4,203 | |
CoreCivic, Inc. | | | 58,235 | | | | 1,310 | |
CoreSite Realty Corp. | | | 16,845 | | | | 1,919 | |
Corporate Office Properties Trust | | | 49,074 | | | | 1,433 | |
Cousins Properties, Inc. | | | 206,917 | | | | 1,914 | |
CyrusOne, Inc. | | | 44,976 | | | | 2,677 | |
DCT Industrial Trust, Inc. | | | 45,884 | | | | 2,697 | |
Douglas Emmett, Inc. | | | 78,508 | | | | 3,224 | |
Education Realty Trust, Inc. | | | 37,321 | | | | 1,303 | |
EPR Properties | | | 31,573 | | | | 2,067 | |
First Industrial Realty Trust, Inc. | | | 59,044 | | | | 1,858 | |
The GEO Group, Inc. | | | 61,106 | | | | 1,442 | |
Healthcare Realty Trust, Inc. | | | 61,529 | | | | 1,976 | |
Highwoods Properties, Inc. | | | 50,867 | | | | 2,590 | |
Hospitality Properties Trust | | | 80,969 | | | | 2,417 | |
JBG SMITH Properties | | | 46,005 | | | | 1,598 | |
Jones Lang LaSalle, Inc. | | | 22,350 | | | | 3,329 | |
Kilroy Realty Corp. | | | 48,470 | | | | 3,618 | |
Lamar Advertising Co. - Class A | | | 41,390 | | | | 3,073 | |
LaSalle Hotel Properties | | | 55,779 | | | | 1,566 | |
Liberty Property Trust | | | 72,628 | | | | 3,124 | |
Life Storage, Inc. | | | 22,927 | | | | 2,042 | |
Mack-Cali Realty Corp. | | | 44,264 | | | | 954 | |
Medical Properties Trust, Inc. | | | 179,408 | | | | 2,472 | |
National Retail Properties, Inc. | | | 74,911 | | | | 3,231 | |
OMEGA Healthcare Investors, Inc. | | | 97,584 | | | | 2,687 | |
Potlatch Corp. | | | 20,007 | | | | 998 | |
Quality Care Properties, Inc.* | | | 46,217 | | | | 638 | |
Rayonier, Inc. | | | 63,520 | | | | 2,009 | |
Sabra Health Care REIT, Inc. | | | 87,809 | | | | 1,648 | |
Senior Housing Properties Trust | | | 117,073 | | | | 2,242 | |
Tanger Factory Outlet Centers, Inc. | | | 46,571 | | | | 1,235 | |
Taubman Centers, Inc. | | | 29,911 | | | | 1,957 | |
Uniti Group, Inc. | | | 81,251 | | | | 1,445 | |
Urban Edge Properties | | | 52,148 | | | | 1,329 | |
The Accompanying Notes are an Integral Part of the Financial Statements.
| | | | |
| 44 | | Index 400 Stock Portfolio | | |
Index 400 Stock Portfolio
| | | | | | | | |
| Common Stocks (98.1%) | | Shares/
$ Par | | | Value
$ (000’s) | |
| |
Real Estate continued | | | | | |
Washington Prime Group, Inc. | | | 91,520 | | | | 652 | |
Weingarten Realty Investors | | | 58,839 | | | | 1,934 | |
| | | | | | | | |
Total | | | | | | | 80,201 | |
| | | | | | | | |
| |
Telecommunication Services (0.1%) | | | | | |
Telephone and Data Systems, Inc. | | | 45,196 | | | | 1,256 | |
| | | | | | | | |
Total | | | | | | | 1,256 | |
| | | | | | | | |
| |
Utilities (5.2%) | | | | | |
Aqua America, Inc. | | | 87,543 | | | | 3,434 | |
Atmos Energy Corp. | | | 54,597 | | | | 4,689 | |
Black Hills Corp. | | | 26,350 | | | | 1,584 | |
Great Plains Energy, Inc. | | | 106,247 | | | | 3,426 | |
Hawaiian Electric Industries, Inc. | | | 53,595 | | | | 1,938 | |
IDACORP, Inc. | | | 24,826 | | | | 2,268 | |
MDU Resources Group, Inc. | | | 96,220 | | | | 2,586 | |
National Fuel Gas Co. | | | 42,163 | | | | 2,315 | |
New Jersey Resources Corp. | | | 42,796 | | | | 1,720 | |
NorthWestern Corp. | | | 23,941 | | | | 1,429 | |
OGE Energy Corp. | | | 98,388 | | | | 3,238 | |
ONE Gas, Inc. | | | 25,751 | | | | 1,887 | |
PNM Resources, Inc. | | | 39,243 | | | | 1,587 | |
| | | | | | | | |
| Common Stocks (98.1%) | | Shares/
$ Par | | | Value
$ (000’s) | |
| |
Utilities continued | | | | | |
Southwest Gas Holdings, Inc. | | | 23,516 | | | | 1,893 | |
UGI Corp. | | | 85,306 | | | | 4,005 | |
Vectren Corp. | | | 40,892 | | | | 2,659 | |
Westar Energy, Inc. | | | 69,981 | | | | 3,695 | |
WGL Holdings, Inc. | | | 25,300 | | | | 2,172 | |
| | | | | | | | |
Total | | | | | | | 46,525 | |
| | | | | | | | |
| | |
Total Common Stocks | | | | | | | | |
(Cost: $618,130) | | | | | | | 879,240 | |
| | | | | |
| |
| Short-Term Investments (1.9%) | | | | | |
| |
Commercial Paper (1.1%) | | | | | |
Apple, Inc., 0.000%, 2/6/18 144A | | | 1,500,000 | | | | 1,498 | |
Bank of America Corp., 1.400%, 1/8/18 | | | 1,500,000 | | | | 1,500 | |
General Mills, Inc., 0.000%, 1/4/18 144A | | | 1,500,000 | | | | 1,500 | |
Microsoft Corp., 0.000%, 1/24/18 144A | | | 500,000 | | | | 499 | |
Mondelez International, Inc., 0.000%, 1/10/18 144A | | | 1,500,000 | | | | 1,499 | |
Pfizer, Inc., 0.0000%, 3/1/18 144A | | | 1,500,000 | | | | 1,496 | |
Roche Holdings, Inc., 0.000%, 1/12/18 144A | | | 1,500,000 | | | | 1,499 | |
| | | | | | | | |
| Short-Term Investments (1.9%) | | Shares/
$ Par | | | Value
$ (000’s) | |
| |
Commercial Paper continued | | | | | |
Societe Generale SA, 0.000%, 3/5/18 144A | | | 500,000 | | | | 499 | |
| | | | | | | | |
Total | | | | | | | 9,990 | |
| | | | | | | | |
| |
Money Market Funds (0.4%) | | | | | |
State Street Institutional U.S. Government Money Market Fund - Premier Class, 1.209%, # | | | 3,317,384 | | | | 3,317 | |
| | | | | | | | |
Total | | | | | | | 3,317 | |
| | | | | | | | |
| |
US Government & Agencies (0.4%) | | | | | |
Federal Home Loan Bank, 0.000%, 1/23/18 | | | 1,500,000 | | | | 1,499 | |
Federal Home Loan Bank, 0.000%, 3/15/18(b) | | | 1,500,000 | | | | 1,496 | |
Federal Home Loan Bank, 0.000%, 2/22/18 | | | 1,200,000 | | | | 1,197 | |
| | | | | | | | |
Total | | | | | | | 4,192 | |
| | | | | | | | |
| | |
Total Short-Term Investments | | | | | | | | |
(Cost: $17,501) | | | | | | | 17,499 | |
| | | | | | | | |
| | |
Total Investments (100.0%) | | | | | | | | |
(Cost: $635,631)(a) | | | | | | | 896,739 | |
| | | | | | | | |
Other Assets, Less | | | | | | | | |
Liabilities (0.0%) | | | | | | | (180 | ) |
| | | | | | | | |
Net Assets (100.0%) | | | | | | | 896,559 | |
| | | | | | | | |
| # | 7-day yield as of December 31, 2017. |
| | 144A after the name of a security represents a security exempt from registration under Rule 144A of the Securities Act of 1933. These securities may be resold as transactions exempt from registration, normally to qualified institutional buyers. At December 31, 2017 the value of these securities (in thousands) was $8,490 representing 0.9% of the net assets. |
| (a) | At December 31, 2017, the aggregate cost of investments, including derivatives, for federal tax purposes (in thousands) was $636,059 and the net unrealized appreciation of investments based on that cost was $260,802 which is comprised of $297,560 aggregate gross unrealized appreciation and $36,758 aggregate gross unrealized depreciation. |
| (b) | All or a portion of the securities have been pledged as collateral for open futures positions. Information regarding open futures contracts as of period end is summarized below. |
| | | | | | | | | | | | | | |
| Issuer | | Long/Short | | Currency | | Notional Par
(000’s) | | Number of
Contracts | | Expiration Date | | Notional
Value
(000’s) | | Unrealized
Appreciation/
(Depreciation)
(000’s) |
S&P 400 Mini Index Futures | | Long | | USD | | $9 | | 89 | | 3/18 | | $16,931 | | $122 |
The Accompanying Notes are an Integral Part of the Financial Statements.
| | | | | | |
| | Index 400 Stock Portfolio | | | 45 | |
Index 400 Stock Portfolio
The following is a summary of the inputs used in valuing the Portfolio’s assets and liabilities at December 31, 2017. See Note 3 for additional information on portfolio valuation.
| | | | | | | | | | | | | | |
| | | Valuation Inputs | | | |
| Description | | Level 1 –
Quoted Prices | | | Level 2 –
Other Significant
Observable Inputs | | | Level 3 – Significant
Unobservable Inputs | | | |
| | | (Amounts in thousands) | | | |
Assets: | | | | | | | | | | | | | | |
Common Stocks | | $ | 879,240 | | | $ | - | | | $ | - | | | |
Short-Term Investments | | | | | | | | | | | | | | |
Money Market Funds | | | 3,317 | | | | - | | | | - | | | |
All Others | | | - | | | | 14,182 | | | | - | | | |
Other Financial Instruments^ | | | | | | | | | | | | | | |
Futures | | | 122 | | | | - | | | | - | | | |
Total Assets: | | $ | 882,679 | | | $ | 14,182 | | | $ | - | | | |
^ Other financial instruments are derivative instruments such as futures, forwards, written options and swaps contracts, which are valued at the unrealized appreciation (depreciation) on the instrument and short sales, which are valued at market value.
The Accompanying Notes are an Integral Part of the Financial Statements.
| | | | |
| 46 | | Index 400 Stock Portfolio | | |
Mid Cap Value Portfolio (unaudited)
| | | | |
| Objective: | | Portfolio Strategy: | | Net Assets: |
| Long-term capital growth. Current income is a secondary objective. | | Invest primarily in equity securities of mid-sized companies that are determined to be undervalued. | | $565 million |
Portfolio Overview
Mason Street Advisors, LLC (“Mason Street Advisors”), the investment adviser for the Mid Cap Value Portfolio (the “Portfolio”), has engaged American Century Investment Management, Inc. (“American Century”) to act as sub-adviser for the Portfolio. The Portfolio invests primarily in a diversified portfolio of equity securities of mid-sized companies that are determined to be undervalued at the time of purchase. In selecting securities, the Portfolio attempts to identify companies whose long-term earnings, cash flows and/or assets are not reflected in the current market price of their securities and hold each security until it has returned to favor in the market and the price has increased to, or is higher than a level believed to more accurately reflect the fair value of the company.
Market Overview
Upbeat earnings reports, improving growth prospects and prospects for tax reform drove most U.S. equity indices higher during 2017. Mid cap stocks, as measured by the Russell® Indices, outperformed small caps but underperformed large caps. The outperformance of growth versus value was also pronounced in 2017. This created headwinds for the Portfolio’s approach to value investing, as quality and value factors are key determinants of the Portfolio’s performance over time.
Robust earnings growth and a positive cycle for semiconductor stocks helped fuel gains in the Information Technology sector of the Russell Midcap® Value Index. Materials was another leading sector, boosted by optimism over the economic outlook. On the other hand, Telecommunication Services and Energy stocks declined.
Portfolio Results
The Portfolio returned 11.81% for the twelve months ended December 31, 2017. By comparison, the Portfolio’s benchmark, the Russell Midcap® Value Index (the “Index”), returned 13.34%. (The Index is unmanaged, cannot be invested in directly and does not include administrative expenses.) According to Lipper® Analytical Services, Inc., an independent mutual fund ranking agency, the average return of the Mid Cap Value Funds peer group was 12.52% for 2017.
Underperformance relative to the Index was driven in part by a Portfolio overweight and stock selection in the Energy sector, where Anadarko Petroleum was a top detractor. The stock declined in the first half of the year, when weaker oil prices and a rising service cost environment led to concerns about lower margins/returns on capital. The Portfolio held onto the position given the diversification in Anadarko Petroleum’s production profile, and the stock recovered some ground in the fourth quarter as oil prices improved.
The Consumer Discretionary sector also weighed on relative performance, due largely to an overweight position in automotive and accessories retailer Advance Auto Parts. The retailer’s stock declined due to weaker-than-expected earnings growth and concerns that Amazon could take market share away from its brick-and-mortar stores. Despite these headwinds, the portfolio managers believed margins would improve and that the investment thesis remained intact.
The Portfolio remained underweight in Real Estate due to high valuations throughout the sector. This underweight aided relative performance as the sector underperformed the broader market. Security selection also benefited the Real Estate sector. American Tower, an owner and operator of wireless communications towers, performed particularly well.
Portfolio stocks in the Information Technology sector also outperformed. Stocks in the semiconductors and semiconductor industry, including those of Applied Materials, Lam Research and Teradyne, turned in particularly strong performance due to continued robust demand trends.
Portfolio Manager Outlook
The following forward-looking comments are the opinion of American Century, the Portfolio’s sub-adviser.
We continue to build the Portfolio bottom-up through our fundamental research, seeking higher quality, midsize companies temporarily selling at a discount to fair value. We also continue to favor value opportunities in the Consumer Staples sector. When Amazon announced its plan to acquire Whole Foods Market in the second quarter, many food companies fell on fears of increased competition. This decline continued into the third quarter, providing us with the opportunity to add to select names as their valuations became more attractive.
| | | | | | |
| | Mid Cap Value Portfolio | | | 47 | |
Mid Cap Value Portfolio (unaudited)
Energy also remains an overweight in the Portfolio, as valuations remain attractive. Earlier this year, the decline in Energy stocks provided us with the opportunity to add to some of the Portfolio’s stocks in the sector that offer compelling risk/reward profiles. The Portfolio has a sizable underweight in Real Estate because the sector has generally been overvalued for some time. We have identified some Real Estate stocks with attractive valuations, however, including Weyerhaeuser, a timber REIT, and American Tower, a REIT that owns and operates wireless communications towers.
Additionally, the Portfolio is underweight in the Consumer Discretionary sector because it is difficult to find higher quality companies with sustainable business models in the sector.
Relative Performance
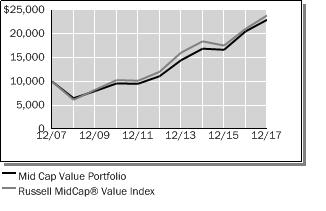
| | | | | | | | | | | | |
Average Annual Total Returns
For Periods Ended December 31, 2017 | |
| | | 1 Year | | | 5 Years | | | 10 Years | |
Mid Cap Value Portfolio | | | 11.81% | | | | 15.62% | | | | 8.67% | |
Russell MidCap® Value Index | | | 13.34% | | | | 14.68% | | | | 9.10% | |
Lipper® Variable Insurance Products (VIP) Mid Cap Value Funds Average | | | 12.52% | | | | 13.14% | | | | 7.37% | |
The performance data quoted represents past performance. Past performance is historical and does not guarantee future performance. Investment return and principal value will fluctuate, so that shares, when redeemed, may be worth more or less than their original cost. Current performance may be lower or higher than the performance data quoted. For the most recent month-end performance information visit www.northwesternmutual.com.
This chart assumes an initial investment of $10,000 made on 12/31/07. Returns shown reflect fee waivers, deductions for management and other portfolio expenses, and reinvestment of all dividends. In the absence of fee waivers, total return would be reduced. Returns exclude deductions for separate account sale loads and account fees. Please refer to the Benchmark Definitions section of this report for information about the indices cited in the above chart and graph.
Investing in small and medium-sized companies involves a greater degree of risk than investing in large company stocks. The value of securities acquired in an IPO may rise or fall more rapidly than investments in more established issuers.
The Portfolio may invest in derivative instruments for cash management purposes or to hedge foreign currency exposure. Use of these instruments may involve certain costs and imposes certain risks such as liquidity risk, market risk, credit risk, management risk and the risk of mispricing or improper valuation. Certain derivatives involve leverage, which could magnify losses, and portfolios investing in derivatives could lose more than the principal amount invested in those instruments.
Top 10 Equity Holdings 12/31/17
| | |
Security Description | | % of Net Assets |
Johnson Controls International PLC | | 2.6% |
Northern Trust Corp. | | 2.6% |
Zimmer Biomet Holdings, Inc. | | 2.5% |
Weyerhaeuser Co. | | 2.2% |
iShares Russell Midcap Value Index Fund | | 2.0% |
Invesco, Ltd. | | 1.8% |
Conagra Brands, Inc. | | 1.8% |
WestRock Co. | | 1.8% |
BB&T Corp. | | 1.7% |
Exxon Mobil Corp. | | 1.7% |
Sector Allocation 12/31/17
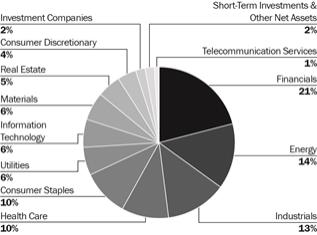
Sector Allocation is based on Net Assets.
Sector Allocation and Top 10 Holdings are subject to change.
| | | | |
| 48 | | Mid Cap Value Portfolio | | |
Mid Cap Value Portfolio
Schedule of Investments
December 31, 2017
| | | | | | | | |
| Common Stocks (95.9%) | | Shares/
$ Par | | | Value
$ (000’s) | |
| | |
Consumer Discretionary (3.9%) | | | | | | | | |
Advance Auto Parts, Inc. | | | 62,694 | | | | 6,250 | |
Aptiv PLC | | | 16,712 | | | | 1,418 | |
Honda Motor Co., Ltd., ADR | | | 168,094 | | | | 5,729 | |
PulteGroup, Inc. | | | 127,560 | | | | 4,241 | |
Target Corp. | | | 69,142 | | | | 4,511 | |
| | | | | | | | |
Total | | | | | | | 22,149 | |
| | | | | | | | |
| | |
Consumer Staples (9.5%) | | | | | | | | |
Conagra Brands, Inc. | | | 275,565 | | | | 10,380 | |
Dr. Pepper Snapple Group, Inc. | | | 54,431 | | | | 5,283 | |
General Mills, Inc. | | | 149,761 | | | | 8,879 | |
The J.M. Smucker Co. | | | 39,905 | | | | 4,958 | |
Kellogg Co. | | | 109,115 | | | | 7,418 | |
Mondelez International, Inc. | | | 211,584 | | | | 9,056 | |
Sysco Corp. | | | 130,821 | | | | 7,945 | |
| | | | | | | | |
Total | | | | | | | 53,919 | |
| | | | | | | | |
| | |
Energy (13.8%) | | | | | | | | |
Anadarko Petroleum Corp. | | | 109,172 | | | | 5,856 | |
Baker Hughes | | | 233,334 | | | | 7,383 | |
Cimarex Energy Co. | | | 26,326 | | | | 3,212 | |
Devon Energy Corp. | | | 129,392 | | | | 5,357 | |
EQT Corp. | | | 132,225 | | | | 7,526 | |
Exxon Mobil Corp. | | | 305,003 | | | | 9,519 | |
Halliburton Co. | | | 74,159 | | | | 3,624 | |
Helmerich & Payne, Inc. | | | 63,835 | | | | 4,126 | |
Marathon Petroleum Corp. | | | 72,274 | | | | 4,769 | |
National Oilwell Varco, Inc. | | | 209,822 | | | | 7,558 | |
Noble Energy, Inc. | | | 264,045 | | | | 7,694 | |
Occidental Petroleum Corp. | | | 110,173 | | | | 8,115 | |
Spectra Energy Partners LP | | | 79,320 | | | | 3,136 | |
| | | | | | | | |
Total | | | | | | | 77,875 | |
| | | | | | | | |
| | |
Financials (20.6%) | | | | | | | | |
AFLAC, Inc. | | | 39,266 | | | | 3,447 | |
Ameriprise Financial, Inc. | | | 46,684 | | | | 7,912 | |
Arthur J. Gallagher & Co. | | | 59,005 | | | | 3,734 | |
Bank of Hawaii Corp. | | | 50,461 | | | | 4,325 | |
BB&T Corp. | | | 196,103 | | | | 9,750 | |
Brown & Brown, Inc. | | | 52,423 | | | | 2,698 | |
Capitol Federal Financial, Inc. | | | 337,164 | | | | 4,521 | |
Chubb, Ltd. | | | 59,087 | | | | 8,634 | |
Comerica, Inc. | | | 18,241 | | | | 1,583 | |
Commerce Bancshares, Inc. | | | 91,898 | | | | 5,132 | |
| | | | | | | | |
| Common Stocks (95.9%) | | Shares/
$ Par | | | Value
$ (000’s) | |
| | |
Financials continued | | | | | | | | |
Invesco, Ltd. | | | 284,829 | | | | 10,408 | |
M&T Bank Corp. | | | 42,800 | | | | 7,318 | |
Northern Trust Corp. | | | 146,705 | | | | 14,654 | |
PNC Financial Services Group, Inc. | | | 27,736 | | | | 4,002 | |
ProAssurance Corp. | | | 42,336 | | | | 2,420 | |
Reinsurance Group of America, Inc. | | | 27,060 | | | | 4,219 | |
SunTrust Banks, Inc. | | | 74,816 | | | | 4,832 | |
T. Rowe Price Group, Inc. | | | 28,533 | | | | 2,994 | |
Torchmark Corp. | | | 21,947 | | | | 1,991 | |
The Travelers Cos., Inc. | | | 11,617 | | | | 1,576 | |
UMB Financial Corp. | | | 26,494 | | | | 1,905 | |
Unum Group | | | 42,021 | | | | 2,307 | |
Westamerica Bancorporation | | | 95,621 | | | | 5,694 | |
| | | | | | | | |
Total | | | | | | | 116,056 | |
| | | | | | | | |
| | |
Health Care (10.1%) | | | | | | | | |
Cardinal Health, Inc. | | | 120,166 | | | | 7,363 | |
Express Scripts Holding Co.* | | | 72,979 | | | | 5,447 | |
HCA Healthcare, Inc.* | | | 69,798 | | | | 6,131 | |
Henry Schein, Inc.* | | | 40,225 | | | | 2,811 | |
Koninklijke Philips NV | | | 26,391 | | | | 998 | |
LifePoint Health, Inc.* | | | 130,138 | | | | 6,481 | |
McKesson Corp. | | | 31,842 | | | | 4,966 | |
Quest Diagnostics, Inc. | | | 48,180 | | | | 4,745 | |
Steris PLC | | | 49,765 | | | | 4,353 | |
Zimmer Biomet Holdings, Inc. | | | 116,022 | | | | 14,000 | |
| | | | | | | | |
Total | | | | | | | 57,295 | |
| | | | | | | | |
| | |
Industrials (13.5%) | | | | | | | | |
Cummins, Inc. | | | 23,616 | | | | 4,172 | |
Eaton Corp. PLC | | | 69,284 | | | | 5,474 | |
Emerson Electric Co. | | | 116,334 | | | | 8,107 | |
Heartland Express, Inc. | | | 244,171 | | | | 5,699 | |
Hubbell, Inc. | | | 65,614 | | | | 8,880 | |
Ingersoll-Rand PLC | | | 59,508 | | | | 5,308 | |
Johnson Controls International PLC | | | 384,818 | | | | 14,666 | |
MSC Industrial Direct Co., Inc. - Class A | | | 63,401 | | | | 6,128 | |
Norfolk Southern Corp. | | | 21,471 | | | | 3,111 | |
PACCAR, Inc. | | | 35,739 | | | | 2,540 | |
Parker Hannifin Corp. | | | 8,161 | | | | 1,629 | |
Republic Services, Inc. | | | 62,548 | | | | 4,229 | |
Textron, Inc. | | | 113,962 | | | | 6,449 | |
| | | | | | | | |
Total | | | | | | | 76,392 | |
| | | | | | | | |
| | | | | | | | |
| Common Stocks (95.9%) | | Shares/
$ Par | | | Value
$ (000’s) | |
| | |
Information Technology (6.4%) | | | | | | | | |
Applied Materials, Inc. | | | 125,481 | | | | 6,414 | |
Keysight Technologies, Inc.* | | | 163,118 | | | | 6,786 | |
Lam Research Corp. | | | 20,208 | | | | 3,720 | |
Maxim Integrated Products, Inc. | | | 151,439 | | | | 7,917 | |
TE Connectivity, Ltd. | | | 59,762 | | | | 5,680 | |
Teradyne, Inc. | | | 132,882 | | | | 5,564 | |
| | | | | | | | |
Total | | | | | | | 36,081 | |
| | | | | | | | |
| | |
Materials (5.8%) | | | | | | | | |
Bemis Co., Inc. | | | 82,965 | | | | 3,965 | |
Graphic Packaging Holding Co. | | | 477,030 | | | | 7,370 | |
Orkla ASA | | | 562,249 | | | | 5,960 | |
Sonoco Products Co. | | | 106,611 | | | | 5,665 | |
WestRock Co. | | | 157,773 | | | | 9,973 | |
| | | | | | | | |
Total | | | | | | | 32,933 | |
| | | | | | | | |
| | |
Real Estate (5.5%) | | | | | | | | |
American Tower Corp. | | | 37,401 | | | | 5,336 | |
Boston Properties, Inc. | | | 25,527 | | | | 3,320 | |
Empire State Realty Trust, Inc. | | | 91,780 | | | | 1,884 | |
MGM Growth Properties LLC - Class A | | | 124,020 | | | | 3,615 | |
Piedmont Office Realty Trust, Inc. - Class A | | | 213,625 | | | | 4,189 | |
Weyerhaeuser Co. | | | 355,101 | | | | 12,521 | |
| | | | | | | | |
Total | | | | | | | 30,865 | |
| | | | | | | | |
| | |
Telecommunication Services (0.2%) | | | | | | | | |
CenturyLink, Inc. | | | 81,626 | | | | 1,362 | |
| | | | | | | | |
Total | | | | | | | 1,362 | |
| | | | | | | | |
| | |
Utilities (6.5%) | | | | | | | | |
Ameren Corp. | | | 47,096 | | | | 2,778 | |
Atmos Energy Corp. | | | 39,726 | | | | 3,412 | |
Edison International | | | 65,783 | | | | 4,160 | |
Eversource Energy | | | 40,869 | | | | 2,582 | |
NorthWestern Corp. | | | 94,620 | | | | 5,649 | |
PG&E Corp. | | | 32,992 | | | | 1,479 | |
Pinnacle West Capital Corp. | | | 48,899 | | | | 4,166 | |
Spire, Inc. | | | 56,423 | | | | 4,240 | |
Xcel Energy, Inc. | | | 172,669 | | | | 8,307 | |
| | | | | | | | |
Total | | | | | | | 36,773 | |
| | | | | | | | |
| | |
Total Common Stocks | | | | | | | | |
(Cost: $469,583) | | | | | | | 541,700 | |
| | | | | | | | |
The Accompanying Notes are an Integral Part of the Financial Statements.
| | | | | | |
| | Mid Cap Value Portfolio | | | 49 | |
Mid Cap Value Portfolio
| | | | | | | | |
| Investment Companies (2.0%) | | Shares/
$ Par | | | Value
$ (000’s) | |
| | |
Investment Companies (2.0%) | | | | | | | | |
iShares Russell Midcap Value Index Fund | | | 124,846 | | | | 11,130 | |
| | | | | | | | |
| | |
Total Investment Companies | | | | | | | | |
(Cost: $10,631) | | | | | | | 11,130 | |
| | | | | | | | |
| Short-Term Investments (3.0%) | | | | | | |
| | |
Commercial Paper (0.3%) | | | | | | | | |
Credit Agricole, 0.000%, 1/2/18 | | | 1,372,000 | | | | 1,371 | |
| | | | | | | | |
Total | | | | | | | 1,371 | |
| | | | | | | | |
| | | | | | | | |
| Short-Term Investments (3.0%) | | Shares/
$ Par | | | Value
$ (000’s) | |
| | |
Money Market Funds (2.7%) | | | | | | | | |
State Street Institutional U.S. Government Money Market Fund - Premier Class, 1.209%# | | | 15,303,587 | | | | 15,304 | |
| | | | | | | | |
Total | | | | | | | 15,304 | |
| | | | | | | | |
| | |
Total Short-Term Investments | | | | | | | | |
(Cost: $16,675) | | | | | | | 16,675 | |
| | | | | | | | |
| | |
Total Investments (100.9%) | | | | | | | | |
(Cost: $496,889)(a) | | | | | | | 569,505 | |
| | | | | | | | |
Other Assets, Less | | | | | | | | |
Liabilities (-0.9%) | | | | | | | (4,881 | ) |
| | | | | | | | |
Net Assets (100.0%) | | | | | | | 564,624 | |
| | | | | | | | |
| # | 7-Day yield as of December 31, 2017. |
ADR after the name of a security represents—American Depositary Receipt.
CAD — Canadian Dollar
EUR — Euro
JPY — Japanese Yen
NOK — Norwegian Krone
| (a) | At December 31, 2017, the aggregate cost of investments, including derivatives, for federal tax purposes (in thousands) was $500,482 and the net unrealized appreciation of investments based on that cost was $68,739 which is comprised of $86,223 aggregate gross unrealized appreciation and $17,484 aggregate gross unrealized depreciation. |
| (h) | Forward foreign currency contracts outstanding on December 31, 2017. |
| | | | | | | | | | | | | | | | | | | | | | |
| Type | | Counterparty | | Currency | | Foreign
Principal
Amount
Covered by
Contract (000s) | | USD Principal
Amount
Covered by
Contract (000’s) | | Settlement
Month | | Unrealized
Appreciation
(000’s) | | | Unrealized
(Depreciation)
(000’s) | | | Net Unrealized
Appreciation/
(Depreciation)
(000’s) | |
Sell | | Morgan Stanley Capital Services Inc. | | CAD | | 9,914 | | 7,896 | | 3/18 | | $ | - | | | $ | (182 | ) | | $ | (182 | ) |
Sell | | Morgan Stanley Capital Services Inc. | | EUR | | 730 | | 880 | | 3/18 | | | - | | | | (15 | ) | | | (15 | ) |
Sell | | Morgan Stanley Capital Services Inc. | | JPY | | 384,904 | | 3,431 | | 3/18 | | | 8 | | | | - | | | | 8 | |
Sell | | Morgan Stanley Capital Services Inc. | | NOK | | 41,140 | | 5,022 | | 3/18 | | | - | | | | (95 | ) | | | (95 | ) |
| | | | | | | | | | | | | | | | | | | | | | |
| | | | | | | | | | | | $ | 8 | | | $ | (292 | ) | | $ | (284 | ) |
| | | | | | | | | | | | | | | | | | | | | | |
The Accompanying Notes are an Integral Part of the Financial Statements.
| | | | |
| 50 | | Mid Cap Value Portfolio | | |
Mid Cap Value Portfolio
The following is a summary of the inputs used in valuing the Portfolio’s assets and liabilities at December 31, 2017. See Note 3 for additional information on portfolio valuation.
| | | | | | | | | | | | | | |
| | | Valuation Inputs | | | |
| Description | | Level 1 –
Quoted Prices | | | Level 2 –
Other Significant
Observable Inputs | | | Level 3 –Significant
Unobservable Inputs | | | |
| | | (Amounts in thousands) | | | |
Assets: | | | | | | | | | | | | | | |
Common Stocks | | | | | | | | | | | | | | |
Healthcare | | $ | 56,297 | | | $ | 998 | | | $ | - | | | |
Materials | | | 26,973 | | | | 5,960 | | | | - | | | |
All Others | | | 451,472 | | | | - | | | | - | | | |
Investment Companies | | | 11,130 | | | | - | | | | - | | | |
Short-Term Investments | | | | | | | | | | | | | | |
Commercial Paper | | | - | | | | 1,371 | | | | - | | | |
Money Market Funds | | | 15,304 | | | | - | | | | - | | | |
Other Financial Instruments^ | | | | | | | | | | | | | | |
Forward Currency Contracts | | | - | | | | 8 | | | | - | | | |
Total Assets: | | $ | 561,176 | | | $ | 8,337 | | | $ | - | | | |
Liabilities: | | | | | | | | | | | | | | |
Other Financial Instruments^ | | | | | | | | | | | | | | |
Forward Currency Contracts | | | - | | | | (292 | ) | | | - | | | |
Total Liabilities: | | $ | - | | | $ | (292 | ) | | $ | - | | | |
^ Other financial instruments are derivative instruments such as futures, forwards, written options and swaps contracts, which are valued at the unrealized appreciation (depreciation) on the instrument and short sales, which are valued at market value.
The Accompanying Notes are an Integral Part of the Financial Statements.
| | | | | | |
| | Mid Cap Value Portfolio | | | 51 | |
Small Cap Growth Stock Portfolio (unaudited)
| | | | |
| Objective: | | Portfolio Strategy: | | Net Assets: |
| Long-term growth of capital. | | Invest primarily in common stocks of small capitalization companies. | | $628 million |
Portfolio Overview
Mason Street Advisors, LLC (“Mason Street Advisors”), the investment adviser for the Small Cap Growth Stock Portfolio (the “Portfolio”), has engaged Wellington Management Company LLP (“Wellington”) to act as sub-adviser for the Portfolio. Normally, the Portfolio invests in common stocks of small capitalization companies. The Portfolio’s investment process is derived from the observation that the quality and persistence of a company’s business is often not reflected in its current stock price. Central to the investment process is intense, fundamental research focused on uncovering companies with improving quality metrics, business momentum and attractive relative valuations.
Market Overview
U.S. equities rose for the fourteenth consecutive month, as measured by the S&P 500® Index, to finish the year ending December 31, 2017. The stock market soared following Donald Trump’s victory on hopes of increased fiscal stimulus, reduced regulatory restrictions and lower corporate taxes. The reflation trading theme dominated the narrative heading into 2017, leading to significant equity inflows and the largest exodus from bonds since the “taper tantrum” in 2013. Despite many investors voicing concerns about stretched valuations, heightened U.S. tensions with Russia and North Korea, and overly optimistic policy expectations, the market hit a series of record highs during the year on the back of strong employment data and rising corporate earnings.
In a well-telegraphed move, the U.S. Federal Reserve (the “Fed”) hiked their policy interest rate three times during the period. In August, it announced that its balance sheet normalization program would begin in October, reiterating that the process would be gradual and predictable. In November, Jerome Powell’s nomination as the chair of the Fed provided markets with reasonable assurance that current central bank policies would be maintained in the near term.
Tax reform was a key area of focus during the period, culminating with a $1.5 trillion tax reform bill signed into law by President Trump at the end of December. The legislation included the most sweeping changes to the tax code since 1986 and represented a major victory for Republicans.
Returns varied by market cap during the period, with large cap stocks, as measured by the S&P 500® Index, outperforming mid and small cap stocks, as measured by the S&P MidCap 400® Index and the S&P SmallCap 600® Index.
Portfolio Results
The Portfolio returned 21.61% for the twelve months ended December 31, 2017. By comparison, the Portfolio’s benchmark, the Russell 2000® Growth Index (the “Index”) returned 22.17%. (The Index is unmanaged, cannot be invested in directly, and does not include administrative expenses.) According to Lipper® Analytical Services, Inc., an independent mutual fund ranking agency, the average return in 2017 of the Small Cap Growth Funds peer group was 24.34%.
Strong stock selection within the Consumer Discretionary, Industrials and Information Technology sectors was partially offset by negative selection in the Health Care, Financials and Consumer Staples sectors. Sector allocation, a residual of the Portfolio’s bottom-up stock selection process, detracted from performance. Overweight positions in the Energy and Financials sectors were the top relative detractors.
Nektar Therapeutics (Health Care), Cardtronics (Information Technology) and Five Prime Therapeutics (Health Care) were among the top detractors from relative performance during the period. Cardtronics, a provider of ATMs and automated financial services kiosks, underperformed as the company reported slower transaction volumes in their core ATM business in the U.S. and U.K. Five Prime Therapeutics, a small cap biopharmaceutical company focused on immuno-oncology therapies, fell sharply in November after the company announced low response rates during a trial for one of its key pancreatic cancer drugs. Not holding benchmark constituent Nektar Therapeutics detracted from relative performance.
Top contributors to relative performance during the period included TopBuild (Consumer Discretionary), Wayfair (Consumer Discretionary) and Rogers (Information Technology). TopBuild, which installs and distributes insulation products, is heavily tied to new housing construction and housing refurbishment (upgrading insulation). The stock rose sharply following a strong earnings release at the beginning of the year. Wayfair, an e-commerce provider of home furnishing products, contributed to performance by delivering positive revenue guidance early in the year. Rogers, a maker of specialty advanced materials including printed circuit materials and high-end specialty foams used in smartphones, tablets and electric vehicles, also outperformed during the period. The stock price rose in the second quarter after the company released strong earnings and provided guidance above consensus expectations.
| | | | |
| 52 | | Small Cap Growth Stock Portfolio | | |
Small Cap Growth Stock Portfolio (unaudited)
Portfolio Manager Outlook
The following forward-looking comments are the opinion of Wellington, the Portfolio’s sub-adviser.
With the significant changes to tax law, corporate profits are set to rise materially in 2018. It is likely that some of these tax savings are competed away or reinvested in the business for various reasons, including employee retention, competitive pricing or marketing support. In the near term, some of the windfalls will fall to the bottom line but we expect to spend more time this year evaluating the sustainability of margins and changes to the competitive intensity, as some of the improved profitability may be eroded.
We continue to find attractively valued stocks with the characteristics we seek. We remain consistent in adhering to our disciplined portfolio construction process that allows us to assess risk, weight individual positions accordingly, and in the process, build a portfolio largely focusing on stock selection for generating returns.
Relative Performance
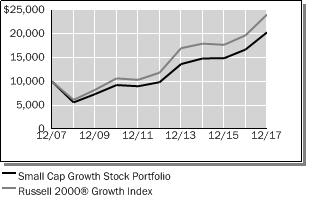
| | | | | | | | | | | | |
Average Annual Total Returns
For Periods Ended December 31, 2017 | |
| | | 1 Year | | | 5 Years | | | 10 Years | |
Small Cap Growth Stock Portfolio | | | 21.61 | % | | | 15.58 | % | | | 7.36 | % |
Russell 2000® Growth Index | | | 22.17 | % | | | 15.21 | % | | | 9.19 | % |
Lipper® Variable Insurance Products (VIP) Small Cap Growth Funds Average | | | 24.34 | % | | | 14.40 | % | | | 8.69 | % |
The performance data quoted represents past performance. Past performance is historical and does not guarantee future performance. Investment return and principal value will fluctuate, so that shares, when redeemed, may be worth more or less than their original cost. Current performance may be lower or higher than the performance data quoted. For the most recent month-end performance information visit www.northwesternmutual.com.
This chart assumes an initial investment of $10,000 made on 12/31/07. Returns shown reflect fee waivers, deductions for management and other portfolio expenses, and reinvestment of all dividends. In the absence of fee waivers, total return would be reduced. Returns exclude deductions for separate account sale loads and account fees. Please refer to the Benchmark Definitions section of this report for information about the indices cited in the above chart and graph.
Stocks of smaller or newer companies, such as those held in this Portfolio, are more likely to realize more substantial growth as well as suffer more significant losses than larger or more established issuers. Investments in such companies can be both more volatile and more speculative. Investing in small company stocks involves a greater degree of risk than investing in medium or large company stocks.
The Portfolio may invest in exchange-traded funds (“ETFs”) for cash management purposes. Investing in ETFs may expose the Portfolio to greater risk of loss and price fluctuation than investing directly in an equity security. The market prices of ETFs may trade at a premium or discount to their net asset value and may be subject to trading halts by the applicable exchange, which may negatively impact the Portfolio.
The Portfolio may invest a relatively high percentage of its assets in a particular sector. The Portfolio will have greater exposure to the risks associated with that sector and its performance will be tied more closely to the performance of the sector.
| | | | | | |
| | Small Cap Growth Stock Portfolio | | | 53 | |
Small Cap Growth Stock Portfolio (unaudited)
Top 10 Equity Holdings 12/31/17
| | | | | | | | |
Security Description | | | % of Net Assets | | | | | |
iShares Russell 2000 Growth Index Fund | | | 2.9 | % | | | | |
EPAM Systems, Inc. | | | 1.3 | % | | | | |
Steven Madden, Ltd. | | | 1.2 | % | | | | |
TopBuild Corp. | | | 1.2 | % | | | | |
Knight-Swift Transportation Holdings, Inc. | | | 1.1 | % | | | | |
Carter’s, Inc. | | | 1.1 | % | | | | |
Teledyne Technologies, Inc. | | | 1.1 | % | | | | |
PolyOne Corp. | | | 1.0 | % | | | | |
HFF, Inc. - Class A | | | 1.0 | % | | | | |
WEX, Inc. | | | 1.0 | % | | | | |
Sector Allocation 12/31/17
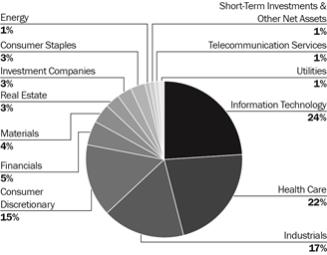
Sector Allocation is based on Net Assets.
Sector Allocation and Top 10 Holdings are subject to change.
| | | | |
| 54 | | Small Cap Growth Stock Portfolio | | |
Small Cap Growth Stock Portfolio
Schedule of Investments
December 31, 2017
| | | | | | | | |
| Common Stocks (96.1%) | | Shares/
$ Par | | | Value
$ (000’s) | |
| |
Consumer Discretionary (14.8%) | | | | | |
Burlington Stores, Inc.* | | | 26,809 | | | | 3,298 | |
Caleres, Inc. | | | 114,433 | | | | 3,831 | |
Carter’s, Inc. | | | 56,710 | | | | 6,663 | |
Cooper Tire & Rubber Co. | | | 90,503 | | | | 3,199 | |
Core-Mark Holding Co., Inc. | | | 116,172 | | | | 3,669 | |
Dunkin’ Brands Group, Inc. | | | 93,546 | | | | 6,031 | |
Five Below, Inc.* | | | 79,114 | | | | 5,247 | |
Floor & Decor Holdings, Inc.* | | | 9,900 | | | | 482 | |
La Quinta Holdings, Inc.* | | | 154,099 | | | | 2,845 | |
Marriott Vacations Worldwide Corp. | | | 42,124 | | | | 5,696 | |
The Michaels Cos., Inc.* | | | 146,492 | | | | 3,544 | |
National Vision Holdings, Inc.* | | | 12,400 | | | | 503 | |
Oxford Industries, Inc. | | | 60,625 | | | | 4,558 | |
Papa John’s International, Inc. | | | 63,978 | | | | 3,590 | |
Steven Madden, Ltd.* | | | 162,924 | | | | 7,608 | |
Tenneco, Inc. | | | 102,796 | | | | 6,018 | |
TopBuild Corp.* | | | 95,319 | | | | 7,219 | |
Visteon Corp.* | | | 33,320 | | | | 4,170 | |
Wayfair, Inc.* | | | 35,071 | | | | 2,815 | |
Wingstop, Inc. | | | 138,760 | | | | 5,409 | |
Wolverine World Wide, Inc. | | | 195,585 | | | | 6,235 | |
| | | | | | | | |
Total | | | | | | | 92,630 | |
| | | | | | | | |
| |
Consumer Staples (2.8%) | | | | | |
Casey’s General Stores, Inc. | | | 32,463 | | | | 3,634 | |
Hostess Brands, Inc.* | | | 264,243 | | | | 3,913 | |
Performance Food Group Co.* | | | 82,717 | | | | 2,738 | |
Post Holdings, Inc.* | | | 36,277 | | | | 2,874 | |
PriceSmart, Inc. | | | 52,063 | | | | 4,483 | |
| | | | | | | | |
Total | | | | | | | 17,642 | |
| | | | | | | | |
| |
Energy (1.5%) | | | | | |
PDC Energy, Inc.* | | | 61,194 | | | | 3,154 | |
ProPetro Holding Corp.* | | | 160,700 | | | | 3,240 | |
WildHorse Resource Development Corp.* | | | 159,100 | | | | 2,929 | |
| | | | | | | | |
Total | | | | | | | 9,323 | |
| | | | | | | | |
| |
Financials (5.5%) | | | | | |
Evercore Partners, Inc. | | | 58,895 | | | | 5,301 | |
FCB Financial Holdings, Inc. - Class A* | | | 57,967 | | | | 2,945 | |
First Busey Corp. | | | 80,983 | | | | 2,425 | |
| | | | | | | | |
| Common Stocks (96.1%) | | Shares/
$ Par | | | Value
$ (000’s) | |
| |
Financials continued | | | | | |
First Hawaiian, Inc. | | | 79,767 | | | | 2,328 | |
Great Western Bancorp, Inc. | | | 71,793 | | | | 2,857 | |
IBERIABANK Corp. | | | 54,617 | | | | 4,233 | |
James River Group Holdings, Ltd. | | | 85,536 | | | | 3,422 | |
MGIC Investment Corp.* | | | 277,390 | | | | 3,914 | |
NMI Holdings, Inc. - Class A* | | | 46,483 | | | | 790 | |
OneMain Holdings, Inc.* | | | 64,387 | | | | 1,673 | |
Sterling Bancorp | | | 177,740 | | | | 4,372 | |
| | | | | | | | |
Total | | | | | | | 34,260 | |
| | | | | | | | |
| |
Health Care (22.3%) | | | | | |
Abeona Therapeutics, Inc.* | | | 73,616 | | | | 1,167 | |
Aerie Pharmaceuticals, Inc.* | | | 54,855 | | | | 3,278 | |
Agios Pharmaceuticals, Inc.* | | | 27,997 | | | | 1,601 | |
Amicus Therapeutics, Inc.* | | | 286,626 | | | | 4,125 | |
Anika Therapeutics, Inc.* | | | 80,603 | | | | 4,345 | |
Aratana Therapeutics, Inc.* | | | 193,000 | | | | 1,015 | |
Arena Pharmaceuticals, Inc.* | | | 69,200 | | | | 2,351 | |
AtriCure, Inc.* | | | 133,874 | | | | 2,442 | |
Atrion Corp. | | | 5,827 | | | | 3,675 | |
Bluebird Bio, Inc.* | | | 26,487 | | | | 4,717 | |
Blueprint Medicines Corp.* | | | 67,579 | | | | 5,096 | |
Calithera Biosciences, Inc.* | | | 105,756 | | | | 883 | |
Cardiovascular Systems, Inc.* | | | 118,010 | | | | 2,796 | |
Catalent, Inc.* | | | 137,434 | | | | 5,646 | |
Coherus Biosciences, Inc.* | | | 94,374 | | | | 830 | |
Cytokinetics, Inc.* | | | 136,187 | | | | 1,110 | |
Dermira, Inc.* | | | 106,939 | | | | 2,974 | |
Exact Sciences Corp.* | | | 42,749 | | | | 2,246 | |
Five Prime Therapeutics, Inc.* | | | 97,224 | | | | 2,131 | |
Flexion Therapeutics, Inc.* | | | 61,334 | | | | 1,536 | |
Globus Medical, Inc. - Class A* | | | 138,331 | | | | 5,685 | |
GlycoMimetics, Inc.* | | | 83,630 | | | | 1,404 | |
HMS Holdings Corp.* | | | 119,823 | | | | 2,031 | |
ICU Medical, Inc.* | | | 28,400 | | | | 6,134 | |
Impax Laboratories, Inc.* | | | 139,701 | | | | 2,326 | |
INC Research Holdings, Inc. - Class A* | | | 65,827 | | | | 2,870 | |
Integra LifeSciences Holdings Corp.* | | | 83,964 | | | | 4,019 | |
Intersect ENT, Inc.* | | | 155,696 | | | | 5,045 | |
| | | | | | | | |
| Common Stocks (96.1%) | | Shares/
$ Par | | | Value
$ (000’s) | |
| |
Health Care continued | | | | | |
Ionis Pharmaceuticals, Inc.* | | | 66,428 | | | | 3,341 | |
Ironwood Pharmaceuticals, Inc.* | | | 44,991 | | | | 674 | |
Jounce Therapeutics, Inc.* | | | 55,295 | | | | 705 | |
Kala Pharmaceuticals, Inc.* | | | 22,200 | | | | 410 | |
Loxo Oncology, Inc.* | | | 41,307 | | | | 3,477 | |
The Medicines Co.* | | | 89,770 | | | | 2,454 | |
Medidata Solutions, Inc.* | | | 37,919 | | | | 2,403 | |
Nanostring Technologies, Inc.* | | | 142,990 | | | | 1,068 | |
Natus Medical, Inc.* | | | 138,889 | | | | 5,306 | |
Neurocrine Biosciences, Inc.* | | | 48,453 | | | | 3,759 | |
Omnicell, Inc.* | | | 109,050 | | | | 5,289 | |
OraSure Technologies, Inc.* | | | 132,300 | | | | 2,495 | |
Orthofix International* | | | 79,789 | | | | 4,364 | |
Otonomy, Inc.* | | | 138,409 | | | | 768 | |
Portola Pharmaceuticals, Inc.* | | | 82,335 | | | | 4,008 | |
Revance Therapeutics, Inc.* | | | 44,100 | | | | 1,577 | |
Rigel Pharmaceuticals, Inc.* | | | 265,592 | | | | 1,031 | |
Sage Therapeutics, Inc.* | | | 30,059 | | | | 4,951 | |
Spark Therapeutics, Inc.* | | | 51,163 | | | | 2,631 | |
U.S. Physical Therapy, Inc. | | | 42,966 | | | | 3,102 | |
Ultragenyx Pharmaceutical, Inc.* | | | 61,124 | | | | 2,835 | |
| | | | | | | | |
Total | | | | | | | 140,126 | |
| | | | | | | | |
| |
Industrials (16.8%) | | | | | |
AAON, Inc. | | | 120,661 | | | | 4,428 | |
Advanced Disposal Services, Inc.* | | | 106,858 | | | | 2,558 | |
Altra Industrial Motion Corp. | | | 115,319 | | | | 5,812 | |
American Woodmark Corp.* | | | 33,668 | | | | 4,385 | |
Armstrong World Industries, Inc.* | | | 76,733 | | | | 4,646 | |
AZZ, Inc. | | | 69,113 | | | | 3,532 | |
The Brink’s Co. | | | 44,073 | | | | 3,469 | |
Deluxe Corp. | | | 62,590 | | | | 4,809 | |
Exponent, Inc. | | | 65,396 | | | | 4,650 | |
Generac Holdings, Inc.* | | | 109,919 | | | | 5,443 | |
Genesee & Wyoming, Inc. - Class A* | | | 52,449 | | | | 4,129 | |
HEICO Corp. - Class A | | | 39,049 | | | | 3,087 | |
Huron Consulting Group, Inc.* | | | 58,580 | | | | 2,370 | |
The Accompanying Notes are an Integral Part of the Financial Statements.
| | | | | | |
| | Small Cap Growth Stock Portfolio | | | 55 | |
Small Cap Growth Stock Portfolio
| | | | | | | | |
| Common Stocks (96.1%) | | Shares/
$ Par | | | Value
$ (000’s) | |
| |
Industrials continued | | | | | |
ITT, Inc. | | | 98,247 | | | | 5,244 | |
JELD-WEN Holding, Inc.* | | | 151,155 | | | | 5,951 | |
Knight-Swift Transportation Holdings, Inc. | | | 161,125 | | | | 7,044 | |
Marten Transport, Ltd. | | | 153,300 | | | | 3,112 | |
Milacron Holdings Corp.* | | | 148,106 | | | | 2,835 | |
On Assignment, Inc.* | | | 88,920 | | | | 5,715 | |
Rexnord Corp.* | | | 150,366 | | | | 3,913 | |
SiteOne Landscape Supply, Inc.* | | | 38,138 | | | | 2,925 | |
Teledyne Technologies, Inc.* | | | 36,460 | | | | 6,605 | |
Viad Corp. | | | 64,465 | | | | 3,571 | |
WageWorks, Inc.* | | | 45,431 | | | | 2,817 | |
Welbilt, Inc.* | | | 104,866 | | | | 2,465 | |
| | | | | | | | |
Total | | | | | | | 105,515 | |
| | | | | | | | |
| |
Information Technology (24.2%) | | | | | |
Aspen Technology, Inc.* | | | 63,418 | | | | 4,198 | |
Axcelis Technologies, Inc.* | | | 107,900 | | | | 3,097 | |
Blackbaud, Inc. | | | 34,330 | | | | 3,244 | |
Blackhawk Network Holdings, Inc.* | | | 153,210 | | | | 5,462 | |
Blucora, Inc.* | | | 100,380 | | | | 2,218 | |
CACI International, Inc. - Class A* | | | 35,319 | | | | 4,675 | |
Ciena Corp.* | | | 127,355 | | | | 2,666 | |
Cloudera, Inc.* | | | 215,238 | | | | 3,556 | |
Cohu, Inc. | | | 106,052 | | | | 2,328 | |
Entegris, Inc. | | | 142,208 | | | | 4,330 | |
EPAM Systems, Inc.* | | | 77,203 | | | | 8,294 | |
ePlus, Inc.* | | | 65,420 | | | | 4,920 | |
Etsy, Inc.* | | | 134,203 | | | | 2,745 | |
Exlservice Holdings, Inc.* | | | 66,485 | | | | 4,012 | |
Fabrinet* | | | 106,770 | | | | 3,064 | |
Fair Isaac Corp. | | | 34,232 | | | | 5,244 | |
Five9, Inc.* | | | 143,997 | | | | 3,583 | |
ForeScout Technologies, Inc.* | | | 5,500 | | | | 175 | |
GrubHub, Inc.* | | | 84,020 | | | | 6,033 | |
Guidewire Software, Inc.* | | | 43,444 | | | | 3,226 | |
HubSpot, Inc.* | | | 61,914 | | | | 5,473 | |
| | | | | | | | |
| Common Stocks (96.1%) | | Shares/
$ Par | | | Value
$ (000’s) | |
| |
Information Technology continued | | | | | |
Integrated Device Technology, Inc.* | | | 168,004 | | | | 4,995 | |
Itron, Inc.* | | | 66,626 | | | | 4,544 | |
j2 Global, Inc. | | | 53,819 | | | | 4,038 | |
LogMeIn, Inc. | | | 44,074 | | | | 5,047 | |
MACOM Technology Solutions Holdings, Inc.* | | | 70,712 | | | | 2,301 | |
MAXIMUS, Inc. | | | 50,782 | | | | 3,635 | |
MaxLinear, Inc. - Class A* | | | 116,212 | | | | 3,070 | |
MKS Instruments, Inc. | | | 49,851 | | | | 4,711 | |
Nutanix, Inc. - Class A* | | | 66,792 | | | | 2,356 | |
Okta, Inc.* | | | 94,893 | | | | 2,430 | |
Paylocity Holding Corp.* | | | 68,114 | | | | 3,212 | |
Pegasystems, Inc. | | | 54,346 | | | | 2,562 | |
PTC, Inc.* | | | 40,519 | | | | 2,462 | |
Q2 Holdings, Inc.* | | | 44,105 | | | | 1,625 | |
Rogers Corp.* | | | 34,286 | | | | 5,552 | |
Science Applications International Corp. | | | 49,086 | | | | 3,759 | |
Tyler Technologies, Inc.* | | | 16,139 | | | | 2,857 | |
WEX, Inc.* | | | 44,366 | | | | 6,266 | |
Zendesk, Inc.* | | | 126,955 | | | | 4,296 | |
| | | | | | | | |
Total | | | | | | | 152,261 | |
| | | | | | | | |
| |
Materials (4.0%) | | | | | |
Boise Cascade Co. | | | 95,062 | | | | 3,793 | |
Graphic Packaging Holding Co. | | | 297,173 | | | | 4,591 | |
Louisiana-Pacific Corp.* | | | 148,741 | | | | 3,906 | |
Omnova Solutions, Inc.* | | | 281,628 | | | | 2,816 | |
PolyOne Corp. | | | 146,734 | | | | 6,383 | |
Summit Materials, Inc. - Class A* | | | 121,361 | | | | 3,816 | |
| | | | | | | | |
Total | | | | | | | 25,305 | |
| | | | | | | | |
| |
Real Estate (3.0%) | | | | | |
CoreSite Realty Corp. | | | 22,671 | | | | 2,582 | |
Corporate Office Properties Trust | | | 85,509 | | | | 2,497 | |
HFF, Inc. - Class A | | | 129,593 | | | | 6,303 | |
LaSalle Hotel Properties | | | 123,068 | | | | 3,455 | |
| | | | | | | | |
| Common Stocks (96.1%) | | Shares/
$ Par | | | Value
$ (000’s) | |
| |
Real Estate continued | | | | | |
Sunstone Hotel Investors, Inc. | | | 242,184 | | | | 4,003 | |
| | | | | | | | |
Total | | | | | | | 18,840 | |
| | | | | | | | |
| |
Telecommunication Services (0.8%) | | | | | |
ORBCOMM, Inc.* | | | 195,103 | | | | 1,986 | |
Vonage Holdings Corp.* | | | 292,300 | | | | 2,973 | |
| | | | | | | | |
Total | | | | | | | 4,959 | |
| | | | | | | | |
| | |
Utilities (0.4%) | | | | | | | | |
Evoqua Water Technologies Corp.* | | | 108,900 | | | | 2,582 | |
| | | | | | | | |
Total | | | | | | | 2,582 | |
| | | | | | | | |
| | |
Total Common Stocks
| | | | | | | | |
(Cost: $447,744) | | | | | | | 603,443 | |
| | | | | | | | |
| |
Investment Companies (3.0%) | | | | | |
| |
Investment Companies (3.0%) | | | | | |
iShares Russell 2000 Growth Index Fund | | | 98,101 | | | | 18,316 | |
| | | | | | | | |
Total | | | | | | | 18,316 | |
| | | | | | | | |
| | |
Total Investment Companies
| | | | | | | | |
(Cost: $16,267) | | | | | | | 18,316 | |
| | | | | | | | |
| |
Short-Term Investments (1.0%) | | | | | |
| |
Money Market Funds (1.0%) | | | | | |
State Street Institutional U.S. Government Money Market Fund - Premier Class, 1.209%# | | | 6,478,364 | | | | 6,478 | |
| | | | | | | | |
Total | | | | | | | 6,478 | |
| | | | | | | | |
| | |
Total Short-Term Investments
| | | | | | | | |
(Cost: $6,478) | | | | | | | 6,478 | |
| | | | | | | | |
| | |
Total Investments (100.1%)
| | | | | | | | |
(Cost: $470,489)(a) | | | | | | | 628,237 | |
| | | | | | | | |
Other Assets, Less | | | | | | | | |
Liabilities (-0.1%) | | | | | | | (336 | ) |
| | | | | | | | |
Net Assets (100.0%) | | | | | | | 627,901 | |
| | | | | | | | |
| # | 7-Day yield as of December 31, 2017. |
| (a) | At December 31, 2017, the aggregate cost of investments, including derivatives, for federal tax purposes (in thousands) was $470,770 and the net unrealized appreciation of investments based on that cost was $157,467 which is comprised of $176,619 aggregate gross unrealized appreciation and $19,152 aggregate gross unrealized depreciation. |
The Accompanying Notes are an Integral Part of the Financial Statements.
| | | | |
| 56 | | Small Cap Growth Stock Portfolio | | |
Small Cap Growth Stock Portfolio
The following is a summary of the inputs used in valuing the Portfolio’s assets and liabilities at December 31, 2017. See Note 3 for additional information on portfolio valuation.
| | | | | | | | | | | | | | |
| | | Valuation Inputs | | | |
| Description | | Level 1 –
Quoted Prices | | | Level 2 –
Other Significant
Observable Inputs | | | Level 3 – Significant
Unobservable Inputs | | | |
| | | (Amounts in thousands) | | | |
Assets: | | | | | | | | | | | | | | |
Common Stocks | | $ | 603,443 | | | $ | - | | | $ | - | | | |
Investment Companies | | | 18,316 | | | | - | | | | - | | | |
Short-Term Investments | | | 6,478 | | | | - | | | | - | | | |
Total Assets: | | $ | 628,237 | | | $ | - | | | $ | - | | | |
The Accompanying Notes are an Integral Part of the Financial Statements.
| | | | | | |
| | Small Cap Growth Stock Portfolio | | | 57 | |
Index 600 Stock Portfolio (unaudited)
| | | | |
| Objective: | | Portfolio Strategy: | | Net Assets: |
| Investment results that approximate the performance of the S&P SmallCap 600® Index. | | Invest in stocks that make up the S&P SmallCap 600® Index, holding each stock in approximately the same proportion as its weighting in the Index. | | $222 million |
Portfolio Overview
Mason Street Advisors is the investment adviser for the Index 600 Stock Portfolio (the “Portfolio”). The Portfolio seeks investment results that approximate the performance of the S&P SmallCap 600® Index. The Portfolio attempts to achieve its objective by investing all, or substantially all, of its assets in stocks that make up the S&P SmallCap 600® Index, holding each stock in approximately the same proportion as its weighting in the Index. This is known as a full replication strategy. The Portfolio may also purchase (long) total return equity swap agreements and invest in exchange traded funds and, to a lesser extent, futures contracts, for cash management purposes and to help achieve full replication.
Market Overview
U.S. equities delivered another year of strong performance. The sharp gains in business and consumer confidence following the U.S. election and improving global economic growth were among the catalysts for equities, as investors anticipated market-friendly policies from the new administration. That confidence was generally well placed—corporate earnings finally improved after three flat years and Congress passed one of the largest tax cuts in U.S. history. The improving economy favored equities over bonds; although, fixed income sectors still posted positive returns.
The U.S. economy expanded at a pace of approximately 3% during the second half of the year. The strong growth prompted the U.S. Federal Reserve (the “Fed”) to raise rates and begin reducing its $4 trillion balance sheet. In that environment, large cap stocks, as represented by the S&P 500® Index, posted a return of 21.83%, outperforming the S&P SmallCap 600® and the S&P MidCap 400® Indices, which returned 13.23% and 16.24%, respectively. Meanwhile, the broader bond market, as represented by the Bloomberg Barclays® U.S. Aggregate Index returned 3.54%, while the Bloomberg Barclays® U.S. Corporate High Yield Index advanced 7.50%.
Portfolio Results
The Index 600 Stock Portfolio delivered a total return of 12.93% for the twelve months ended December 31, 2017, trailing the S&P SmallCap 600® Index (the “Index”), which returned 13.23%. (The Index is unmanaged, cannot be invested in directly, and does not include administrative expenses.) Portfolio performance slightly lagged the Index due to transaction costs, administrative expenses, cash flow effects and costs associated with the use of total return equity swap agreements and exchange traded funds. The Portfolio underperformed the 13.17% average return for its peer group, Small Cap Core Funds, according to Lipper® Analytical Services, Inc. However, the Small Cap Core Funds peer group is not strictly comparable to the Portfolio because many of the funds in the group are actively managed.
Ten of the Index’s eleven sectors posted positive returns for the year. Ongoing demographic trends and tax reform helped the Health Care sector post the largest contribution to the Index’s return despite continued uncertainty surrounding governmental reform efforts and regulatory changes. Biotechnology was the leading industry within the Health Care sector, as worries over pricing regulation eased and investor sentiment for small cap stocks in the industry remained optimistic. In the Industrials sector, increases in industrial production and capital expenditure boosted small cap machinery stocks, benefiting Index performance. Outstanding revenue and earnings growth helped the Information Technology sector post solid contributions to the Index’s performance. The Consumer Discretionary sector also posted gains, reflecting steady economic growth, low inflation and declining unemployment, which led to an increase in consumer spending. Other significant contributors to the Index’s return included the Financials sector and the Utilities sector. Within these sectors, the consumer finance industry was a leading source of strength for Financials, while the Utilities sector saw positive results from the electric, water and gas utilities industries. The Materials sector also posted solid gains, buoyed by continued economic growth and output, as well as anticipation of future governmental infrastructure spending.
At the other end of the spectrum, the Energy sector suffered losses, as worries over the impact of supply growth on oil prices weighed on oil and gas exploration companies.
| | | | |
| 58 | | Index 600 Stock Portfolio | | |
Index 600 Stock Portfolio (unaudited)
Relative Performance
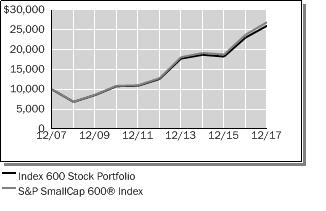
| | | | | | | | | | | | |
Average Annual Total Returns
For Periods Ended December 31, 2017 | |
| | | 1 Year | | | 5 Years | | | 10 Years | |
Index 600 Stock Portfolio | | | 12.93 | % | | | 15.56 | % | | | 10.06 | % |
S&P SmallCap 600® Index | | | 13.23 | % | | | 15.99 | % | | | 10.43 | % |
Lipper® Variable Insurance Products (VIP) Small Cap Core Funds Average | | | 13.17 | % | | | 13.84 | % | | | 8.62 | % |
The performance data quoted represents past performance. Past performance is historical and does not guarantee future performance. Investment return and principal value will fluctuate, so that shares, when redeemed, may be worth more or less than their original cost. Current performance may be lower or higher than the performance data quoted. For the most recent month-end performance information visit www.northwesternmutual.com.
This chart assumes an initial investment of $10,000 made on 12/31/07. Returns shown reflect fee waivers, deductions for management and other portfolio expenses, and reinvestment of all dividends. In the absence of fee waivers, total return would be reduced. Returns exclude deductions for separate account sale loads and account fees. Please refer to the Benchmark Definitions section of this report for information about the indices cited in the above chart and graph.
“Standard & Poor’s®”, “S&P®”, “S&P SmallCap 600” and “Standard & Poor’s SmallCap 600” are trademarks of The McGraw-Hill Companies, Inc. and have been licensed for use by Northwestern Mutual Life Insurance Company. The Portfolio is not sponsored, endorsed, sold or promoted by Standard & Poor’s, and Standard & Poor’s makes no representation regarding the advisability of investing in the Portfolio.
Stocks of smaller or newer companies, such as those held in this Portfolio, are more likely to realize more substantial growth as well as suffer more significant losses than larger or more established issuers. Investments in such companies can be both more volatile and more speculative. Investing in small company stocks involves a greater degree of risk than investing in medium or large company stocks.
The Portfolio may invest in exchange-traded funds and derivative instruments such as swap agreements and, to a lesser extent, futures contracts, for cash management purposes and to help achieve full replication. Use of these instruments may involve certain costs and imposes certain risks such as liquidity risk, market risk, credit risk, management risk and the risk of mispricing or improper valuation. Certain derivatives involve leverage, which could magnify losses, and portfolios investing in derivatives could lose more than the principal amount invested in those instruments.
Top 10 Equity Holdings 12/31/17
| | | | |
Security Description | | | % of Net Assets | |
iShares Core S&P Small-Cap ETF | | | 2.1 | % |
Nektar Therapeutics | | | 1.1 | % |
Chemed Corp. | | | 0.5 | % |
Healthcare Services Group, Inc. | | | 0.5 | % |
ALLETE, Inc. | | | 0.4 | % |
Cantel Medical Corp. | | | 0.4 | % |
Five Below, Inc. | | | 0.4 | % |
Spire, Inc. | | | 0.4 | % |
John Bean Technologies Corp. | | | 0.4 | % |
Evercore Partners, Inc. | | | 0.4 | % |
Sector Allocation 12/31/17
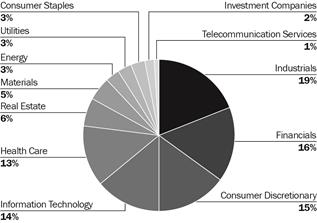
Sector Allocation is based on Net Assets.
Sector Allocation and Top 10 Holdings are subject to change.
| | | | | | |
| | Index 600 Stock Portfolio | | | 59 | |
Index 600 Stock Portfolio
Schedule of Investments
December 31, 2017
| | | | | | | | |
| Common Stocks (91.4%) | | Shares/
$ Par | | | Value
$ (000’s) | |
| |
Consumer Discretionary (14.6%) | | | | | |
Abercrombie & Fitch Co. - Class A | | | 17,690 | | | | 308 | |
American Axle & Manufacturing Holdings, Inc.* | | | 25,761 | | | | 439 | |
American Public Education, Inc.* | | | 4,231 | | | | 106 | |
Asbury Automotive Group, Inc.* | | | 4,823 | | | | 309 | |
Ascena Retail Group, Inc.* | | | 44,353 | | | | 104 | |
Barnes & Noble Education, Inc.* | | | 9,665 | | | | 80 | |
Barnes & Noble, Inc. | | | 14,745 | | | | 99 | |
Belmond, Ltd.* | | | 21,826 | | | | 267 | |
Big 5 Sporting Goods Corp. | | | 5,238 | | | | 40 | |
Biglari Holdings, Inc.* | | | 263 | | | | 109 | |
BJ’s Restaurants, Inc. | | | 4,669 | | | | 170 | |
Bob Evans Farms, Inc. | | | 5,214 | | | | 411 | |
Boyd Gaming Corp. | | | 21,355 | | | | 749 | |
The Buckle, Inc. | | | 7,369 | | | | 175 | |
Caleres, Inc. | | | 11,175 | | | | 374 | |
Callaway Golf Co. | | | 24,588 | | | | 343 | |
Capella Education Co. | | | 3,036 | | | | 235 | |
Career Education Corp.* | | | 17,072 | | | | 206 | |
The Cato Corp. - Class A | | | 6,054 | | | | 96 | |
Cavco Industries, Inc.* | | | 2,207 | | | | 337 | |
Chico’s FAS, Inc. | | | 33,241 | | | | 293 | |
The Children’s Place, Inc. | | | 4,525 | | | | 658 | |
Chuy’s Holdings, Inc.* | | | 4,399 | | | | 123 | |
Cooper-Standard Holding, Inc.* | | | 4,104 | | | | 503 | |
Core-Mark Holding Co., Inc. | | | 12,014 | | | | 379 | |
Crocs, Inc.* | | | 18,120 | | | | 229 | |
Dave & Buster’s Entertainment, Inc.* | | | 10,690 | | | | 590 | |
DineEquity, Inc. | | | 4,678 | | | | 237 | |
Dorman Products, Inc.* | | | 7,806 | | | | 477 | |
DSW, Inc. - Class A | | | 18,795 | | | | 402 | |
The E.W. Scripps Co. - Class A* | | | 14,376 | | | | 225 | |
El Pollo Loco Holdings, Inc.* | | | 5,630 | | | | 56 | |
Ethan Allen Interiors, Inc. | | | 6,573 | | | | 188 | |
Express, Inc.* | | | 20,496 | | | | 208 | |
Fiesta Restaurant Group, Inc.* | | | 7,039 | | | | 134 | |
The Finish Line, Inc. - Class A | | | 10,454 | | | | 152 | |
Five Below, Inc.* | | | 14,357 | | | | 952 | |
Fossil Group, Inc.* | | | 11,233 | | | | 87 | |
Fox Factory Holding Corp.* | | | 9,764 | | | | 379 | |
| | | | | | | | |
| Common Stocks (91.4%) | | Shares/
$ Par | | | Value
$ (000’s) | |
| |
Consumer Discretionary continued | | | | | |
Francesca’s Holdings Corp.* | | | 9,554 | | | | 70 | |
Fred’s, Inc. - Class A | | | 9,309 | | | | 38 | |
FTD Companies, Inc.* | | | 4,370 | | | | 31 | |
Gannett Co., Inc. | | | 29,070 | | | | 337 | |
Genesco, Inc.* | | | 5,181 | | | | 168 | |
Gentherm, Inc.* | | | 9,540 | | | | 303 | |
G-III Apparel Group, Ltd.* | | | 10,779 | | | | 398 | |
Group 1 Automotive, Inc. | | | 5,100 | | | | 362 | |
Guess?, Inc. | | | 15,593 | | | | 263 | |
Haverty Furniture Cos., Inc. | | | 5,052 | | | | 114 | |
Hibbett Sports, Inc.* | | | 4,949 | | | | 101 | |
Installed Building Products, Inc.* | | | 5,470 | | | | 415 | |
iRobot Corp.* | | | 7,250 | | | | 556 | |
J.C. Penney Co., Inc.* | | | 80,914 | | | | 256 | |
Kirkland’s, Inc.* | | | 4,164 | | | | 50 | |
La-Z-Boy, Inc. | | | 12,547 | | | | 392 | |
LCI Industries | | | 6,487 | | | | 843 | |
LGI Homes, Inc.* | | | 4,523 | | | | 339 | |
Lithia Motors, Inc. - Class A | | | 6,248 | | | | 710 | |
Lumber Liquidators Holdings, Inc.* | | | 7,409 | | | | 233 | |
M.D.C. Holdings, Inc. | | | 11,673 | | | | 372 | |
M/I Homes, Inc.* | | | 7,158 | | | | 246 | |
The Marcus Corp. | | | 5,005 | | | | 137 | |
MarineMax, Inc.* | | | 5,713 | | | | 108 | |
Marriott Vacations Worldwide Corp. | | | 6,133 | | | | 829 | |
Meritage Homes Corp.* | | | 9,859 | | | | 505 | |
Monarch Casino & Resort, Inc.* | | | 2,946 | | | | 132 | |
Monro Muffler Brake, Inc. | | | 8,524 | | | | 485 | |
Motorcar Parts of America, Inc.* | | | 4,960 | | | | 124 | |
Movado Group, Inc. | | | 4,027 | | | | 130 | |
Nautilus, Inc.* | | | 7,987 | | | | 107 | |
New Media Investment Group, Inc. | | | 13,847 | | | | 232 | |
Nutrisystem, Inc. | | | 7,813 | | | | 411 | |
Ollie’s Bargain Outlet Holdings, Inc.* | | | 12,778 | | | | 680 | |
Oxford Industries, Inc. | | | 4,377 | | | | 329 | |
Penn National Gaming, Inc.* | | | 21,798 | | | | 683 | |
Perry Ellis International, Inc.* | | | 3,269 | | | | 82 | |
PetMed Express, Inc. | | | 5,359 | | | | 244 | |
Red Robin Gourmet Burgers, Inc.* | | | 3,365 | | | | 190 | |
Regis Corp.* | | | 9,087 | | | | 140 | |
Rent-A-Center, Inc. | | | 13,866 | | | | 154 | |
| | | | | | | | |
| Common Stocks (91.4%) | | Shares/
$ Par | | | Value
$ (000’s) | |
| |
Consumer Discretionary continued | | | | | |
Restoration Hardware, Inc.* | | | 4,889 | | | | 422 | |
Ruth’s Hospitality Group, Inc. | | | 7,566 | | | | 164 | |
Scholastic Corp. | | | 7,201 | | | | 289 | |
Scientific Games Corp. - Class A* | | | 13,756 | | | | 706 | |
Shake Shack, Inc. - Class A* | | | 4,769 | | | | 206 | |
Shoe Carnival, Inc. | | | 2,966 | | | | 79 | |
Shutterfly, Inc.* | | | 8,540 | | | | 425 | |
Sleep Number Corp.* | | | 10,357 | | | | 389 | |
Sonic Automotive, Inc. - Class A | | | 6,404 | | | | 118 | |
Sonic Corp. | | | 10,469 | | | | 288 | |
Standard Motor Products, Inc. | | | 5,294 | | | | 238 | |
Steven Madden, Ltd.* | | | 13,835 | | | | 646 | |
Strayer Education, Inc. | | | 2,759 | | | | 247 | |
Sturm, Ruger & Co., Inc. | | | 4,533 | | | | 253 | |
Superior Industries International, Inc. | | | 6,025 | | | | 90 | |
Tailored Brands, Inc. | | | 12,795 | | | | 279 | |
The Tile Shop Holdings, Inc. | | | 8,953 | | | | 86 | |
Time, Inc. | | | 25,900 | | | | 478 | |
TopBuild Corp.* | | | 9,244 | | | | 700 | |
Unifi, Inc.* | | | 4,419 | | | | 159 | |
Universal Electronics, Inc.* | | | 3,721 | | | | 176 | |
Vera Bradley, Inc.* | | | 4,958 | | | | 60 | |
Vista Outdoor, Inc.* | | | 14,909 | | | | 217 | |
Vitamin Shoppe, Inc.* | | | 6,236 | | | | 27 | |
William Lyon Homes* | | | 7,250 | | | | 211 | |
Wingstop, Inc. | | | 7,567 | | | | 295 | |
Winnebago Industries, Inc. | | | 7,528 | | | | 419 | |
Wolverine World Wide, Inc. | | | 24,886 | | | | 793 | |
World Wrestling Entertainment, Inc. - Class A | | | 10,185 | | | | 311 | |
Zumiez, Inc.* | | | 4,725 | | | | 98 | |
| | | | | | | | |
Total | | | | | | | 32,397 | |
| | | | | | | | |
| |
Consumer Staples (2.4%) | | | | | |
The Andersons, Inc. | | | 6,859 | | | | 214 | |
B&G Foods, Inc. | | | 17,295 | | | | 608 | |
Calavo Growers, Inc. | | | 4,104 | | | | 346 | |
Cal-Maine Foods, Inc.* | | | 7,742 | | | | 344 | |
Central Garden & Pet Co.* | | | 2,688 | | | | 105 | |
Central Garden & Pet Co. - Class A* | | | 9,084 | | | | 343 | |
Coca-Cola Bottling Co. Consolidated | | | 1,207 | | | | 260 | |
Darling Ingredients, Inc.* | | | 42,841 | | | | 777 | |
The Accompanying Notes are an Integral Part of the Financial Statements.
| | | | |
| 60 | | Index 600 Stock Portfolio | | |
Index 600 Stock Portfolio
| | | | | | | | |
| Common Stocks (91.4%) | | Shares/
$ Par | | | Value
$ (000’s) | |
| |
Consumer Staples continued | | | | | |
Inter Parfums, Inc. | | | 4,461 | | | | 194 | |
J & J Snack Foods Corp. | | | 3,883 | | | | 589 | |
John B. Sanfilippo & Son, Inc. | | | 2,263 | | | | 143 | |
Medifast, Inc. | | | 2,731 | | | | 191 | |
Seneca Foods Corp. - Class A* | | | 1,761 | | | | 54 | |
SpartanNash Co. | | | 9,616 | | | | 256 | |
SUPERVALU, Inc.* | | | 9,976 | | | | 215 | |
Universal Corp. | | | 6,532 | | | | 343 | |
WD-40 Co. | | | 3,632 | | | | 429 | |
| | | | | | | | |
Total | | | | | | | 5,411 | |
| | | | | | | | |
| |
Energy (3.1%) | | | | | |
Archrock, Inc. | | | 18,461 | | | | 194 | |
Bill Barrett Corp.* | | | 25,185 | | | | 129 | |
Bristow Group, Inc. | | | 8,370 | | | | 113 | |
CARBO Ceramics, Inc.* | | | 5,717 | | | | 58 | |
Carrizo Oil & Gas, Inc.* | | | 20,123 | | | | 428 | |
Cloud Peak Energy, Inc.* | | | 19,521 | | | | 87 | |
CONSOL Energy, Inc.* | | | 6,733 | | | | 266 | |
Denbury Resources, Inc.* | | | 104,600 | | | | 231 | |
ERA Group, Inc.* | | | 5,256 | | | | 56 | |
Exterran Corp.* | | | 8,286 | | | | 261 | |
Geospace Technologies Corp.* | | | 3,496 | | | | 45 | |
Green Plains, Inc. | | | 10,063 | | | | 170 | |
Gulf Island Fabrication, Inc. | | | 3,526 | | | | 47 | |
Helix Energy Solutions Group, Inc.* | | | 36,115 | | | | 272 | |
Matrix Service Co.* | | | 6,957 | | | | 124 | |
McDermott International, Inc.* | | | 73,868 | | | | 486 | |
Newpark Resources, Inc.* | | | 22,325 | | | | 192 | |
Noble Corp. PLC* | | | 63,713 | | | | 288 | |
Oil States International, Inc.* | | | 13,288 | | | | 376 | |
Par Pacific Holdings, Inc.* | | | 6,552 | | | | 126 | |
PDC Energy, Inc.* | | | 17,133 | | | | 883 | |
Pioneer Energy Services Corp.* | | | 20,214 | | | | 62 | |
REX American Resources Corp.* | | | 1,503 | | | | 124 | |
SEACOR Holdings, Inc.* | | | 4,366 | | | | 202 | |
SRC Energy, Inc.* | | | 62,770 | | | | 535 | |
TETRA Technologies, Inc.* | | | 30,144 | | | | 129 | |
Unit Corp.* | | | 13,754 | | | | 303 | |
US Silica Holdings, Inc. | | | 21,123 | | | | 688 | |
| | | | | | | | |
Total | | | | | | | 6,875 | |
| | | | | | | | |
| |
Financials (14.9%) | | | | | |
American Equity Investment Life Holding Co. | | | 23,180 | | | | 712 | |
Ameris Bancorp | | | 9,683 | | | | 467 | |
| | | | | | | | |
| Common Stocks (91.4%) | | Shares/
$ Par | | | Value
$ (000’s) | |
| |
Financials continued | | | | | |
AMERISAFE, Inc. | | | 5,005 | | | | 308 | |
Appollo Commercial Real Estate Finance, Inc. | | | 25,353 | | | | 468 | |
ARMOUR Residential REIT, Inc. | | | 10,890 | | | | 280 | |
Banc of California, Inc. | | | 11,075 | | | | 229 | |
Bank Mutual Corp. | | | 11,009 | | | | 117 | |
Banner Corp. | | | 8,532 | | | | 470 | |
BofI Holding, Inc.* | | | 14,569 | | | | 436 | |
Boston Private Financial Holdings, Inc. | | | 21,910 | | | | 339 | |
Brookline Bancorp, Inc. | | | 19,936 | | | | 313 | |
Capstead Mortgage Corp. | | | 24,996 | | | | 216 | |
Central Pacific Financial Corp. | | | 7,836 | | | | 234 | |
City Holding Co. | | | 4,062 | | | | 274 | |
Columbia Banking System, Inc. | | | 18,993 | | | | 825 | |
Community Bank System, Inc. | | | 13,163 | | | | 708 | |
Customers Bancorp, Inc.* | | | 7,527 | | | | 196 | |
CVB Financial Corp. | | | 26,644 | | | | 628 | |
Dime Community Bancshares | | | 7,981 | | | | 167 | |
Donnelley Financial Solutions, Inc.* | | | 8,765 | | | | 171 | |
eHealth, Inc.* | | | 4,262 | | | | 74 | |
Employers Holdings, Inc. | | | 8,435 | | | | 375 | |
Encore Capital Group, Inc.* | | | 6,160 | | | | 259 | |
Enova International, Inc.* | | | 8,704 | | | | 132 | |
Evercore Partners, Inc. | | | 10,044 | | | | 904 | |
EZCORP, Inc. - Class A* | | | 13,376 | | | | 163 | |
Fidelity Southern Corp. | | | 5,723 | | | | 125 | |
Financial Engines, Inc. | | | 16,468 | | | | 499 | |
First BanCorp* | | | 47,236 | | | | 241 | |
First Commonwealth Financial Corp. | | | 25,348 | | | | 363 | |
First Financial Bancorp. | | | 16,141 | | | | 425 | |
First Financial Bankshares, Inc. | | | 17,225 | | | | 776 | |
First Midwest Bancorp, Inc. | | | 26,721 | | | | 642 | |
FirstCash, Inc. | | | 12,273 | | | | 828 | |
Glacier Bancorp, Inc. | | | 20,287 | | | | 799 | |
Great Western Bancorp, Inc. | | | 15,302 | | | | 609 | |
Green Dot Corp. - Class A* | | | 11,896 | | | | 717 | |
Greenhill & Co., Inc. | | | 6,353 | | | | 124 | |
Hanmi Financial Corp. | | | 8,429 | | | | 256 | |
HCI Group, Inc. | | | 2,061 | | | | 62 | |
HomeStreet, Inc.* | | | 6,992 | | | | 202 | |
Hope Bancorp, Inc. | | | 33,480 | | | | 611 | |
Horace Mann Educators Corp. | | | 10,577 | | | | 466 | |
Independent Bank Corp. | | | 7,138 | | | | 499 | |
Infinity Property & Casualty Corp. | | | 2,842 | | | | 301 | |
| | | | | | | | |
| Common Stocks (91.4%) | | Shares/
$ Par | | | Value
$ (000’s) | |
| |
Financials continued | | | | | |
INTL FCStone, Inc.* | | | 4,041 | | | | 172 | |
Invesco Mortgage Capital, Inc. | | | 29,020 | | | | 517 | |
Investment Technology Group, Inc. | | | 8,599 | | | | 166 | |
LegacyTexas Financial Group, Inc. | | | 10,995 | | | | 464 | |
LendingTree, Inc.* | | | 1,961 | | | | 668 | |
Maiden Holdings, Ltd. | | | 18,048 | | | | 119 | |
Meta Financial Group, Inc. | | | 2,363 | | | | 219 | |
National Bank Holding Corp. - Class A | | | 6,949 | | | | 225 | |
The Navigators Group, Inc. | | | 5,832 | | | | 284 | |
NBT Bancorp, Inc. | | | 11,324 | | | | 417 | |
NMI Holdings, Inc. - Class A* | | | 13,896 | | | | 236 | |
Northfield Bancorp, Inc. | | | 12,078 | | | | 206 | |
Northwest Bancshares, Inc. | | | 26,690 | | | | 447 | |
OFG Bancorp | | | 11,430 | | | | 107 | |
Old National Bancorp | | | 34,799 | | | | 607 | |
Opus Bank* | | | 4,482 | | | | 122 | |
Oritani Financial Corp. | | | 10,231 | | | | 168 | |
Pacific Premier Bancorp, Inc.* | | | 10,090 | | | | 404 | |
Piper Jaffray Cos., Inc. | | | 3,694 | | | | 319 | |
PRA Group, Inc.* | | | 11,747 | | | | 390 | |
ProAssurance Corp. | | | 13,888 | | | | 794 | |
Provident Financial Services, Inc. | | | 15,734 | | | | 424 | |
RLI Corp. | | | 10,084 | | | | 612 | |
S&T Bancorp, Inc. | | | 9,098 | | | | 362 | |
Safety Insurance Group, Inc. | | | 3,958 | | | | 318 | |
Selective Insurance Group, Inc. | | | 15,187 | | | | 892 | |
ServisFirst Bancshares, Inc. | | | 11,712 | | | | 486 | |
Simmons First National Corp. - Class A | | | 10,146 | | | | 579 | |
Southside Bancshares, Inc. | | | 7,174 | | | | 242 | |
Stewart Information Services Corp. | | | 6,175 | | | | 261 | |
Third Point Reinsurance, Ltd.* | | | 22,623 | | | | 331 | |
Tompkins Financial Corp. | | | 3,214 | | | | 261 | |
TrustCo Bank Corp. | | | 24,995 | | | | 230 | |
United Community Banks, Inc. | | | 18,671 | | | | 525 | |
United Fire Group, Inc. | | | 5,500 | | | | 251 | |
United Insurance Holdings Corp. | | | 5,338 | | | | 92 | |
Universal Insurance Holdings, Inc. | | | 8,331 | | | | 228 | |
Virtus Investment Partners, Inc. | | | 1,862 | | | | 214 | |
The Accompanying Notes are an Integral Part of the Financial Statements.
| | | | | | |
| | Index 600 Stock Portfolio | | | 61 | |
Index 600 Stock Portfolio
| | | | | | | | |
| Common Stocks (91.4%) | | Shares/
$ Par | | | Value
$ (000’s) | |
| |
Financials continued | | | | | |
Waddell & Reed Financial, Inc. - Class A | | | 21,684 | | | | 484 | |
Walker & Dunlop, Inc.* | | | 7,353 | | | | 349 | |
Westamerica Bancorporation | | | 6,852 | | | | 408 | |
WisdomTree Investments, Inc. | | | 29,912 | | | | 375 | |
World Acceptance Corp.* | | | 1,532 | | | | 124 | |
| | | | | | | | |
Total | | | | | | | 33,109 | |
| | | | | | | | |
| |
Health Care (12.2%) | | | | | |
Abaxis, Inc. | | | 5,903 | | | | 292 | |
Aceto Corp. | | | 7,831 | | | | 81 | |
Acorda Therapeutics, Inc.* | | | 12,158 | | | | 261 | |
Almost Family, Inc.* | | | 3,269 | | | | 181 | |
AMAG Pharmaceuticals, Inc.* | | | 9,200 | | | | 122 | |
Amedisys, Inc.* | | | 7,414 | | | | 391 | |
AMN Healthcare Services, Inc.* | | | 12,425 | | | | 612 | |
Amphastar Pharmaceuticals, Inc.* | | | 9,208 | | | | 177 | |
Analogic Corp. | | | 3,247 | | | | 272 | |
AngioDynamics, Inc.* | | | 9,549 | | | | 159 | |
ANI Pharmaceuticals, Inc.* | | | 2,331 | | | | 150 | |
Anika Therapeutics, Inc.* | | | 3,813 | | | | 206 | |
BioTelemetry, Inc.* | | | 7,996 | | | | 239 | |
Cambrex Corp.* | | | 8,525 | | | | 409 | |
Cantel Medical Corp. | | | 9,271 | | | | 954 | |
Chemed Corp. | | | 4,153 | | | | 1,009 | |
Community Health Systems, Inc.* | | | 29,839 | | | | 127 | |
Computer Programs and Systems, Inc. | | | 2,898 | | | | 87 | |
CONMED Corp. | | | 6,466 | | | | 330 | |
Corcept Therapeutics, Inc.* | | | 21,779 | | | | 393 | |
CorVel Corp.* | | | 2,499 | | | | 132 | |
Cross Country Healthcare, Inc.* | | | 9,488 | | | | 121 | |
CryoLife, Inc.* | | | 8,699 | | | | 167 | |
Cutera, Inc.* | | | 3,604 | | | | 163 | |
Cytokinetics, Inc.* | | | 13,174 | | | | 107 | |
DepoMed, Inc.* | | | 16,376 | | | | 132 | |
Diplomat Pharmacy, Inc.* | | | 12,539 | | | | 252 | |
Eagle Pharmaceuticals, Inc.* | | | 2,173 | | | | 116 | |
Emergent Biosolutions, Inc.* | | | 9,151 | | | | 425 | |
Enanta Pharmaceuticals, Inc.* | | | 3,713 | | | | 218 | |
Ensign Group, Inc. | | | 12,511 | | | | 278 | |
Haemonetics Corp.* | | | 13,737 | | | | 798 | |
HealthEquity, Inc.* | | | 13,373 | | | | 624 | |
HealthStream, Inc.* | | | 6,637 | | | | 154 | |
Heska Corp.* | | | 1,696 | | | | 136 | |
| | | | | | | | |
| Common Stocks (91.4%) | | Shares/
$ Par | | | Value
$ (000’s) | |
| |
Health Care continued | | | | | |
HMS Holdings Corp.* | | | 21,869 | | | | 371 | |
ICU Medical, Inc.* | | | 3,927 | | | | 848 | |
Impax Laboratories, Inc.* | | | 19,276 | | | | 321 | |
Innoviva, Inc.* | | | 19,104 | | | | 271 | |
Inogen, Inc.* | | | 4,451 | | | | 530 | |
Integer Holdings Corp.* | | | 7,331 | | | | 332 | |
Integra LifeSciences Holdings Corp.* | | | 16,533 | | | | 791 | |
Invacare Corp. | | | 8,539 | | | | 144 | |
Kindred Healthcare, Inc. | | | 22,633 | | | | 220 | |
Lannett Co., Inc.* | | | 7,837 | | | | 182 | |
Lantheus Holdings, Inc.* | | | 7,706 | | | | 158 | |
LeMaitre Vascular, Inc. | | | 3,958 | | | | 126 | |
LHC Group, Inc.* | | | 4,231 | | | | 259 | |
Ligand Pharmaceuticals, Inc. - Class B* | | | 5,489 | | | | 752 | |
Luminex Corp. | | | 10,656 | | | | 210 | |
Magellan Health, Inc.* | | | 6,253 | | | | 604 | |
The Medicines Co.* | | | 16,685 | | | | 456 | |
Meridian Bioscience, Inc. | | | 10,977 | | | | 154 | |
Merit Medical Systems, Inc.* | | | 13,056 | | | | 564 | |
MiMedx Group, Inc.* | | | 26,569 | | | | 335 | |
Momenta Pharmaceuticals, Inc.* | | | 19,867 | | | | 277 | |
Myriad Genetics, Inc.* | | | 18,009 | | | | 619 | |
Natus Medical, Inc.* | | | 8,103 | | | | 310 | |
Nektar Therapeutics* | | | 40,956 | | | | 2,446 | |
Neogen Corp.* | | | 9,944 | | | | 817 | |
Omnicell, Inc.* | | | 9,866 | | | | 478 | |
OraSure Technologies, Inc.* | | | 15,774 | | | | 297 | |
Orthofix International* | | | 4,726 | | | | 258 | |
Phibro Animal Health Corp. - Class A | | | 5,093 | | | | 171 | |
Progenics Pharmaceuticals, Inc.* | | | 18,276 | | | | 109 | |
The Providence Service Corp.* | | | 2,907 | | | | 172 | |
Quality Systems, Inc.* | | | 12,255 | | | | 166 | |
Quorum Health Corp.* | | | 7,385 | | | | 46 | |
Repligen Corp.* | | | 9,744 | | | | 354 | |
Select Medical Holdings Corp.* | | | 27,845 | | | | 491 | |
Spectrum Pharmaceuticals, Inc.* | | | 23,563 | | | | 447 | |
Sucampo Pharmaceuticals, Inc.* | | | 6,550 | | | | 118 | |
Supernus Pharmaceuticals, Inc.* | | | 13,333 | | | | 531 | |
Surmodics, Inc.* | | | 3,410 | | | | 95 | |
Tactile Systems Technology, Inc.* | | | 3,775 | | | | 109 | |
Tivity Health, Inc.* | | | 8,861 | | | | 324 | |
U.S. Physical Therapy, Inc. | | | 3,272 | | | | 236 | |
| | | | | | | | |
| Common Stocks (91.4%) | | Shares/
$ Par | | | Value
$ (000’s) | |
| |
Health Care continued | | | | | |
Varex Imaging Corp.* | | | 9,763 | | | | 392 | |
| | | | | | | | |
Total | | | | | | | 27,166 | |
| | | | | | | | |
| |
Industrials (17.6%) | | | | | |
AAON, Inc. | | | 10,508 | | | | 386 | |
AAR Corp. | | | 8,374 | | | | 329 | |
ABM Industries, Inc. | | | 14,400 | | | | 543 | |
Actuant Corp. - Class A | | | 15,559 | | | | 394 | |
Aegion Corp.* | | | 8,460 | | | | 215 | |
Aerojet Rocketdyne Holdings, Inc.* | | | 19,533 | | | | 609 | |
Aerovironment, Inc.* | | | 5,518 | | | | 310 | |
Alamo Group, Inc. | | | 2,481 | | | | 280 | |
Albany International Corp. - Class A | | | 7,543 | | | | 464 | |
Allegiant Travel Co. | | | 3,262 | | | | 505 | |
American Woodmark Corp.* | | | 3,719 | | | | 484 | |
Apogee Enterprises, Inc. | | | 7,450 | | | | 341 | |
Applied Industrial Technologies, Inc. | | | 10,095 | | | | 687 | |
ArcBest Corp. | | | 6,668 | | | | 238 | |
Astec Industries, Inc. | | | 4,980 | | | | 291 | |
Atlas Air Worldwide Holdings, Inc.* | | | 6,576 | | | | 386 | |
Axon Enterprise, Inc.* | | | 13,762 | | | | 365 | |
AZZ, Inc. | | | 6,752 | | | | 345 | |
Barnes Group, Inc. | | | 12,828 | | | | 812 | |
Brady Corp. - Class A | | | 12,490 | | | | 473 | |
Briggs & Stratton Corp. | | | 11,148 | | | | 283 | |
Chart Industries, Inc.* | | | 8,003 | | | | 375 | |
CIRCOR International, Inc. | | | 4,291 | | | | 209 | |
Comfort Systems USA, Inc. | | | 9,658 | | | | 422 | |
Cubic Corp. | | | 6,510 | | | | 384 | |
DXP Enterprises, Inc.* | | | 4,116 | | | | 122 | |
Echo Global Logistics, Inc.* | | | 6,823 | | | | 191 | |
Encore Wire Corp. | | | 5,414 | | | | 263 | |
Engility Holdings, Inc.* | | | 4,591 | | | | 130 | |
EnPro Industries, Inc. | | | 5,547 | | | | 519 | |
ESCO Technologies, Inc. | | | 6,720 | | | | 405 | |
Essendant, Inc. | | | 9,783 | | | | 91 | |
Exponent, Inc. | | | 6,713 | | | | 477 | |
Federal Signal Corp. | | | 15,601 | | | | 313 | |
Forward Air Corp. | | | 7,743 | | | | 445 | |
Franklin Electric Co., Inc. | | | 10,059 | | | | 462 | |
FTI Consulting, Inc.* | | | 9,872 | | | | 424 | |
General Cable Corp. | | | 12,995 | | | | 385 | |
Gibraltar Industries, Inc.* | | | 8,242 | | | | 272 | |
The Greenbrier Cos., Inc. | | | 7,465 | | | | 398 | |
Griffon Corp. | | | 7,860 | | | | 160 | |
Harsco Corp.* | | | 20,923 | | | | 390 | |
Hawaiian Holdings, Inc. | | | 13,647 | | | | 544 | |
Healthcare Services Group, Inc. | | | 19,058 | | | | 1,005 | |
The Accompanying Notes are an Integral Part of the Financial Statements.
| | | | |
| 62 | | Index 600 Stock Portfolio | | |
Index 600 Stock Portfolio
| | | | | | | | |
| Common Stocks (91.4%) | | Shares/
$ Par | | | Value
$ (000’s) | |
| |
Industrials continued | | | | | |
Heartland Express, Inc. | | | 13,000 | | | | 303 | |
Heidrick & Struggles International, Inc. | | | 4,886 | | | | 120 | |
Hillenbrand, Inc. | | | 16,393 | | | | 733 | |
Hub Group, Inc. - Class A* | | | 8,700 | | | | 417 | |
Insperity, Inc. | | | 9,649 | | | | 553 | |
Insteel Industries, Inc. | | | 4,705 | | | | 133 | |
Interface, Inc. | | | 15,671 | | | | 394 | |
John Bean Technologies Corp. | | | 8,211 | | | | 910 | |
Kaman Corp. | | | 7,234 | | | | 426 | |
Kelly Services, Inc. - Class A | | | 7,918 | | | | 216 | |
Korn / Ferry International | | | 14,693 | | | | 608 | |
Lindsay Corp. | | | 2,765 | | | | 244 | |
LSC Communications, Inc. | | | 9,075 | | | | 137 | |
Lydall, Inc.* | | | 4,484 | | | | 228 | |
Marten Transport, Ltd. | | | 10,060 | | | | 204 | |
Matson, Inc. | | | 11,040 | | | | 329 | |
Matthews International Corp. - Class A | | | 8,362 | | | | 441 | |
Mercury Systems, Inc.* | | | 12,547 | | | | 644 | |
Mobile Mini, Inc. | | | 11,529 | | | | 398 | |
Moog, Inc. - Class A* | | | 8,416 | | | | 731 | |
Mueller Industries, Inc. | | | 15,034 | | | | 533 | |
Multi-Color Corp. | | | 3,615 | | | | 271 | |
MYR Group, Inc.* | | | 4,282 | | | | 153 | |
National Presto Industries, Inc. | | | 1,304 | | | | 130 | |
Navigant Consulting, Inc.* | | | 11,943 | | | | 232 | |
On Assignment, Inc.* | | | 12,717 | | | | 817 | |
Orion Group Holdings, Inc.* | | | 7,334 | | | | 57 | |
Patrick Industries, Inc.* | | | 6,211 | | | | 431 | |
PGT Innovations, Inc.* | | | 12,916 | | | | 218 | |
Powell Industries, Inc. | | | 2,259 | | | | 65 | |
Proto Labs, Inc.* | | | 6,445 | | | | 664 | |
Quanex Building Products Corp. | | | 9,036 | | | | 211 | |
Raven Industries, Inc. | | | 9,300 | | | | 319 | |
Resources Connection, Inc. | | | 7,366 | | | | 114 | |
Roadrunner Transportation Systems, Inc.* | | | 8,174 | | | | 63 | |
RR Donnelley & Sons Co. | | | 18,209 | | | | 169 | |
Saia, Inc.* | | | 6,630 | | | | 469 | |
Simpson Manufacturing Co., Inc. | | | 10,952 | | | | 629 | |
SkyWest, Inc. | | | 13,483 | | | | 716 | |
SPX Corp.* | | | 11,082 | | | | 348 | |
SPX Flow, Inc.* | | | 11,001 | | | | 523 | |
Standex International Corp. | | | 3,326 | | | | 339 | |
Team, Inc.* | | | 7,780 | | | | 116 | |
Tennant Co. | | | 4,643 | | | | 337 | |
Tetra Tech, Inc. | | | 14,493 | | | | 698 | |
Titan International, Inc. | | | 12,890 | | | | 166 | |
| | | | | | | | |
| Common Stocks (91.4%) | | Shares/
$ Par | | | Value
$ (000’s) | |
| |
Industrials continued | | | | | |
Trex Co., Inc.* | | | 7,653 | | | | 829 | |
Triumph Group, Inc. | | | 12,913 | | | | 351 | |
TrueBlue, Inc.* | | | 10,758 | | | | 296 | |
UniFirst Corp. | | | 4,021 | | | | 663 | |
Universal Forest Products, Inc. | | | 15,911 | | | | 599 | |
US Ecology, Inc. | | | 5,683 | | | | 290 | |
Veritiv Corp.* | | | 2,897 | | | | 84 | |
Viad Corp. | | | 5,308 | | | | 294 | |
Vicor Corp.* | | | 4,232 | | | | 88 | |
Wabash National Corp. | | | 15,340 | | | | 333 | |
WageWorks, Inc.* | | | 10,326 | | | | 640 | |
Watts Water Technologies, Inc. - Class A | | | 7,222 | | | | 548 | |
| | | | | | | | |
Total | | | | | | | 39,098 | |
| | | | | | | | |
| |
Information Technology (12.7%) | | | | | |
8x8, Inc.* | | | 23,916 | | | | 337 | |
ADTRAN, Inc. | | | 12,523 | | | | 242 | |
Advanced Energy Industries, Inc.* | | | 10,314 | | | | 696 | |
Agilysys, Inc.* | | | 3,983 | | | | 49 | |
Alarm.com Holdings, Inc.* | | | 6,511 | | | | 246 | |
Anixter International, Inc.* | | | 7,529 | | | | 572 | |
Applied Optoelectronics, Inc.* | | | 5,041 | | | | 191 | |
Axcelis Technologies, Inc.* | | | 8,170 | | | | 234 | |
Badger Meter, Inc. | | | 7,572 | | | | 362 | |
Barracuda Networks, Inc.* | | | 10,596 | | | | 291 | |
Bel Fuse, Inc. - Class B | | | 2,564 | | | | 65 | |
Benchmark Electronics, Inc.* | | | 12,932 | | | | 376 | |
Blucora, Inc.* | | | 11,997 | | | | 265 | |
Bottomline Technologies, Inc.* | | | 9,155 | | | | 317 | |
Brooks Automation, Inc. | | | 18,287 | | | | 436 | |
Cabot Microelectronics Corp. | | | 6,595 | | | | 620 | |
CACI International, Inc. - Class A* | | | 6,404 | | | | 848 | |
CalAmp Corp.* | | | 9,259 | | | | 198 | |
Cardtronics PLC* | | | 11,881 | | | | 220 | |
CEVA, Inc.* | | | 5,713 | | | | 264 | |
Cohu, Inc. | | | 7,357 | | | | 161 | |
Comtech Telecommunications Corp. | | | 6,142 | | | | 136 | |
Control4 Corp.* | | | 5,126 | | | | 153 | |
Cray, Inc.* | | | 10,517 | | | | 255 | |
CSG Systems International, Inc. | | | 8,719 | | | | 382 | |
CTS Corp. | | | 8,567 | | | | 221 | |
Daktronics, Inc. | | | 10,137 | | | | 93 | |
DHI Group, Inc.* | | | 12,284 | | | | 23 | |
Digi International, Inc.* | | | 6,935 | | | | 66 | |
Diodes, Inc.* | | | 10,020 | | | | 287 | |
| | | | | | | | |
| Common Stocks (91.4%) | | Shares/
$ Par | | | Value
$ (000’s) | |
| |
Information Technology continued | | | | | |
DSP Group, Inc.* | | | 5,806 | | | | 73 | |
Ebix, Inc. | | | 5,727 | | | | 454 | |
Electro Scientific Industries, Inc.* | | | 8,711 | | | | 187 | |
Electronics for Imaging, Inc.* | | | 11,884 | | | | 351 | |
ePlus, Inc.* | | | 3,686 | | | | 277 | |
Exlservice Holdings, Inc.* | | | 8,828 | | | | 533 | |
Fabrinet* | | | 9,777 | | | | 281 | |
FARO Technologies, Inc.* | | | 4,346 | | | | 204 | |
Forrester Research, Inc. | | | 2,571 | | | | 114 | |
Gerber Scientific, Inc.* (l) | | | 2,359 | | | | – | |
Harmonic, Inc.* | | | 21,228 | | | | 89 | |
II-VI, Inc.* | | | 14,275 | | | | 670 | |
Insight Enterprises, Inc.* | | | 9,309 | | | | 356 | |
Itron, Inc.* | | | 8,863 | | | | 604 | |
KEMET Corp.* | | | 12,758 | | | | 192 | |
Kopin Corp.* | | | 15,872 | | | | 51 | |
Kulicke and Soffa Industries, Inc.* | | | 18,363 | | | | 447 | |
Liquidity Services, Inc.* | | | 6,637 | | | | 32 | |
LivePerson, Inc.* | | | 14,243 | | | | 164 | |
Lumentum Holdings, Inc.* | | | 16,112 | | | | 788 | |
ManTech International Corp. - Class A | | | 6,712 | | | | 337 | |
MaxLinear, Inc. - Class A* | | | 15,848 | | | | 419 | |
Methode Electronics, Inc. - Class A | | | 9,574 | | | | 384 | |
MicroStrategy, Inc. - Class A* | | | 2,448 | | | | 321 | |
Monotype Imaging Holdings, Inc. | | | 10,855 | | | | 262 | |
MTS Systems Corp. | | | 4,624 | | | | 248 | |
Nanometrics, Inc.* | | | 6,657 | | | | 166 | |
NETGEAR, Inc.* | | | 8,185 | | | | 481 | |
NIC, Inc. | | | 17,235 | | | | 286 | |
Oclaro, Inc.* | | | 43,898 | | | | 296 | |
OSI Systems, Inc.* | | | 4,637 | | | | 299 | |
Park Electrochemical Corp. | | | 4,947 | | | | 97 | |
PDF Solutions, Inc.* | | | 7,146 | | | | 112 | |
Perficient, Inc.* | | | 9,079 | | | | 173 | |
Photronics, Inc.* | | | 17,930 | | | | 153 | |
Plexus Corp.* | | | 8,735 | | | | 530 | |
Power Integrations, Inc. | | | 7,729 | | | | 568 | |
Progress Software Corp. | | | 12,434 | | | | 529 | |
Qualys, Inc.* | | | 8,285 | | | | 492 | |
QuinStreet, Inc.* | | | 9,274 | | | | 78 | |
Rambus, Inc.* | | | 28,552 | | | | 406 | |
Rogers Corp.* | | | 4,745 | | | | 768 | |
Rudolph Technologies, Inc.* | | | 8,215 | | | | 196 | |
Sanmina Corp.* | | | 18,732 | | | | 618 | |
ScanSource, Inc.* | | | 6,630 | | | | 237 | |
Semtech Corp.* | | | 17,218 | | | | 589 | |
Shutterstock, Inc.* | | | 4,780 | | | | 206 | |
The Accompanying Notes are an Integral Part of the Financial Statements.
| | | | | | |
| | Index 600 Stock Portfolio | | | 63 | |
Index 600 Stock Portfolio
| | | | | | | | |
| Common Stocks (91.4%) | | Shares/
$ Par | | | Value
$ (000’s) | |
| |
Information Technology continued | | | | | |
SolarEdge Technologies, Inc.* | | | 9,397 | | | | 353 | |
SPS Commerce, Inc.* | | | 4,480 | | | | 218 | |
Stamps.com, Inc.* | | | 4,228 | | | | 795 | |
Super Micro Computer, Inc.* | | | 9,878 | | | | 207 | |
Sykes Enterprises, Inc.* | | | 10,376 | | | | 326 | |
Synchronoss Technologies, Inc.* | | | 11,370 | | | | 102 | |
TeleTech Holdings, Inc. | | | 3,697 | | | | 149 | |
TiVo Corp. | | | 31,745 | | | | 495 | |
TTM Technologies, Inc.* | | | 23,833 | | | | 373 | |
VASCO Data Security International, Inc.* | | | 7,835 | | | | 109 | |
Veeco Instruments, Inc.* | | | 12,563 | | | | 187 | |
Viavi Solutions, Inc.* | | | 59,150 | | | | 517 | |
Virtusa Corp.* | | | 7,103 | | | | 313 | |
XO Group, Inc.* | | | 6,283 | | | | 116 | |
Xperi Corp. | | | 12,826 | | | | 313 | |
| | | | | | | | |
Total | | | | | | | 28,297 | |
| | | | | | | | |
| |
Materials (4.9%) | | | | | |
A. Schulman, Inc. | | | 7,654 | | | | 285 | |
AdvanSix, Inc.* | | | 7,916 | | | | 333 | |
AK Steel Holding Corp.* | | | 81,873 | | | | 463 | |
American Vanguard Corp. | | | 6,819 | | | | 134 | |
Balchem Corp. | | | 8,324 | | | | 671 | |
Boise Cascade Co. | | | 10,023 | | | | 400 | |
Calgon Carbon Corp. | | | 13,215 | | | | 282 | |
Century Aluminum Co.* | | | 12,946 | | | | 254 | |
Clearwater Paper Corp.* | | | 4,274 | | | | 194 | |
Deltic Timber Corp. | | | 2,822 | | | | 258 | |
Flotek Industries, Inc.* | | | 14,780 | | | | 69 | |
FutureFuel Corp. | | | 6,599 | | | | 93 | |
H.B. Fuller Co. | | | 13,091 | | | | 705 | |
Hawkins, Inc. | | | 2,468 | | | | 87 | |
Haynes International, Inc. | | | 3,254 | | | | 104 | |
Ingevity Corp.* | | | 10,950 | | | | 772 | |
Innophos Holdings, Inc. | | | 5,079 | | | | 237 | |
Innospec, Inc. | | | 6,278 | | | | 443 | |
Kaiser Aluminum Corp. | | | 4,397 | | | | 470 | |
KapStone Paper & Packaging Corp. | | | 22,696 | | | | 515 | |
Koppers Holdings, Inc.* | | | 5,396 | | | | 275 | |
Kraton Corp.* | | | 8,140 | | | | 392 | |
LSB Industries, Inc.* | | | 5,245 | | | | 46 | |
Materion Corp. | | | 5,213 | | | | 253 | |
Myers Industries, Inc. | | | 5,700 | | | | 111 | |
Neenah Paper, Inc. | | | 4,374 | | | | 397 | |
Olympic Steel, Inc. | | | 2,369 | | | | 51 | |
P.H. Glatfelter | | | 11,336 | | | | 243 | |
Quaker Chemical Corp. | | | 3,459 | | | | 522 | |
Rayonier Advanced Materials, Inc. | | | 13,469 | | | | 275 | |
| | | | | | | | |
| Common Stocks (91.4%) | | Shares/
$ Par | | | Value
$ (000’s) | |
| |
Materials continued | | | | | |
Schweitzer-Mauduit International, Inc. | | | 7,990 | | | | 362 | |
Stepan Co. | | | 5,143 | | | | 406 | |
SunCoke Energy, Inc.* | | | 16,726 | | | | 201 | |
TimkenSteel Corp.* | | | 10,156 | | | | 154 | |
Tredegar Corp. | | | 6,614 | | | | 127 | |
US Concrete, Inc.* | | | 4,070 | | | | 341 | |
| | | | | | | | |
Total | | | | | | | 10,925 | |
| | | | | | | | |
| |
Real Estate (5.4%) | | | | | |
Acadia Realty Trust | | | 21,771 | | | | 596 | |
Agree Realty Corp. | | | 7,599 | | | | 391 | |
American Assets Trust, Inc. | | | 10,783 | | | | 412 | |
Armada Hoffler Properties, Inc. | | | 11,682 | | | | 181 | |
CareTrust REIT, Inc. | | | 19,741 | | | | 331 | |
CBL & Associates Properties, Inc. | | | 44,500 | | | | 252 | |
Cedar Realty Trust, Inc. | | | 21,138 | | | | 129 | |
Chatham Lodging Trust | | | 11,801 | | | | 269 | |
Chesapeake Lodging Trust | | | 15,630 | | | | 423 | |
Community Healthcare Trust, Inc. | | | 4,433 | | | | 125 | |
DiamondRock Hospitality Co. | | | 52,097 | | | | 588 | |
Easterly Government Properties, Inc. | | | 11,411 | | | | 244 | |
EastGroup Properties, Inc. | | | 8,954 | | | | 791 | |
Four Corners Property Trust, Inc. | | | 15,916 | | | | 409 | |
Franklin Street Properties Corp. | | | 27,890 | | | | 300 | |
Getty Realty Corp. | | | 8,551 | | | | 232 | |
Government Properties Income Trust | | | 25,787 | | | | 478 | |
Hersha Hospitality Trust | | | 10,173 | | | | 177 | |
HFF, Inc. - Class A | | | 9,531 | | | | 464 | |
Independence Realty Trust, Inc. | | | 21,722 | | | | 219 | |
Kite Realty Group Trust | | | 21,742 | | | | 426 | |
Lexington Realty Trust | | | 56,325 | | | | 544 | |
LTC Properties, Inc. | | | 10,292 | | | | 448 | |
National Storage Affiliates Trust | | | 12,913 | | | | 352 | |
Pennsylvania Real Estate Investment Trust | | | 18,183 | | | | 216 | |
PS Business Parks, Inc. | | | 5,174 | | | | 647 | |
Ramco-Gershenson Properties Trust | | | 20,641 | | | | 304 | |
RE/MAX Holdings, Inc. | | | 4,603 | | | | 223 | |
Retail Opportunity Investments Corp. | | | 28,540 | | | | 569 | |
Saul Centers, Inc. | | | 3,133 | | | | 193 | |
Summit Hotel Properties, Inc. | | | 27,109 | | | | 413 | |
| | | | | | | | |
| Common Stocks (91.4%) | | Shares/
$ Par | | | Value
$ (000’s) | |
| | |
Real Estate continued | | | | | | | | |
Universal Health Realty Income Trust | | | 3,287 | | | | 247 | |
Urstadt Biddle Properties, Inc. - Class A | | | 7,732 | | | | 168 | |
Whitestone REIT | | | 10,019 | | | | 144 | |
| | | | | | | | |
Total | | | | | | | 11,905 | |
| | | | | | | | |
| |
Telecommunication Services (1.1%) | | | | | |
ATN International, Inc. | | | 2,833 | | | | 157 | |
Cincinnati Bell, Inc.* | | | 10,972 | | | | 229 | |
Cogent Communications Holdings, Inc. | | | 10,757 | | | | 487 | |
Consolidated Communications Holdings, Inc. | | | 16,766 | | | | 204 | |
Frontier Communications Corp. | | | 20,427 | | | | 138 | |
General Communication, Inc. - Class A* | | | 6,877 | | | | 268 | |
Iridium Communications, Inc.* | | | 21,659 | | | | 256 | |
Spok Holdings, Inc. | | | 5,197 | | | | 81 | |
Vonage Holdings Corp.* | | | 54,122 | | | | 551 | |
| | | | | | | | |
Total | | | | | | | 2,371 | |
| | | | | | | | |
| | |
Utilities (2.5%) | | | | | | | | |
ALLETE, Inc. | | | 13,228 | | | | 984 | |
American States Water Co. | | | 9,540 | | | | 552 | |
Avista Corp. | | | 16,753 | | | | 863 | |
California Water Service Group | | | 12,478 | | | | 566 | |
El Paso Electric Co. | | | 10,558 | | | | 584 | |
Northwest Natural Gas Co. | | | 7,468 | | | | 445 | |
South Jersey Industries, Inc. | | | 20,671 | | | | 646 | |
Spire, Inc. | | | 12,554 | | | | 943 | |
| | | | | | | | |
Total | | | | | | | 5,583 | |
| | | | | | | | |
| | |
Total Common Stocks | | | | | | | | |
(Cost: $158,180) | | | | | | | 203,137 | |
| | | | | | | | |
| | |
| Investment Companies (2.1%) | | | | | | |
| | |
Investment Companies (2.1%) | | | | | | | | |
iShares Core S&P Small-Cap ETF | | | 61,245 | | | | 4,704 | |
| | | | | | | | |
Total | | | | | | | 4,704 | |
| | | | | | | | |
| | |
Total Investment Companies | | | | | | | | |
(Cost: $4,640) | | | | | | | 4,704 | |
| | | | | | | | |
| | |
| Short-Term Investments (6.2%) | | | | | | |
| | |
Commercial Paper (4.0%) | | | | | | | | |
Apple, Inc., 0.000%, 1/8/18 144A | | | 1,000,000 | | | | 1,000 | |
Bank of America Corp., 1.400%, 1/8/18 | | | 1,000,000 | | | | 1,000 | |
The Accompanying Notes are an Integral Part of the Financial Statements.
| | | | |
| 64 | | Index 600 Stock Portfolio | | |
Index 600 Stock Portfolio
| | | | | | | | |
| Short-Term Investments (6.2%) | | Shares/
$ Par | | | Value
$ (000’s) | |
| |
Commercial Paper continued | | | | | |
Microsoft Corp., 0.000%, 2/12/18 144A | | | 1,000,000 | | | | 998 | |
Mondelez International, Inc., 0.000%, 1/11/18 144A | | | 1,000,000 | | | | 1,000 | |
Pfizer, Inc., 0.000%, 1/31/18 144A | | | 500,000 | | | | 499 | |
Pfizer, Inc., 0.000%, 2/8/18 144A (k) | | | 500,000 | | | | 499 | |
Societe Generale SA, 0.000%, 3/5/18 144A | | | 1,000,000 | | | | 997 | |
United Parcel Service, Inc., 0.000%, 3/5/18 144A | | | 1,000,000 | | | | 997 | |
Wal-Mart Stores, Inc., 0.000%, 1/4/18 144A | | | 1,000,000 | | | | 1,000 | |
| | | | | | | | |
| Short-Term Investments (6.2%) | | Shares/
$ Par | | | Value
$ (000’s) | |
| |
Commercial Paper continued | | | | | |
The Walt Disney Co., 0.000%, 1/19/18 144A | | | 1,000,000 | | | | 999 | |
| | | | | | | | |
Total | | | | | | | 8,989 | |
| | | | | | | | |
| |
Money Market Funds (1.3%) | | | | | |
State Street Institutional U.S. Government Money Market Fund - Premier Class, 1.209% # | | | 2,830,814 | | | | 2,831 | |
| | | | | | | | |
Total | | | | | | | 2,831 | |
| | | | | | | | |
| |
US Government & Agencies (0.9%) | | | | | |
Federal Home Loan Bank, 0.000%, 1/23/18 | | | 1,000,000 | | | | 999 | |
| | | | | | | | |
| Short-Term Investments (6.2%) | | Shares/
$ Par | | | Value
$ (000’s) | |
| |
US Government & Agencies continued | | | | | |
Federal Home Loan Bank, 0.000%, 2/9/18 | | | 1,000,000 | | | | 999 | |
| | | | | | | | |
Total | | | | | | | 1,998 | |
| | | | | | | | |
| | |
Total Short-Term Investments | | | | | | | | |
(Cost: $13,820) | | | | | | | 13,818 | |
| | | | | | | | |
| | |
Total Investments (99.7%) | | | | | | | | |
(Cost: $176,640)(a) | | | | | | | 221,659 | |
| | | | | |
Other Assets, Less | | | | | | | | |
Liabilities (0.3%) | | | | | | | 689 | |
| | | | | |
Net Assets (100.0%) | | | | | | | 222,348 | |
| | | | | |
| # | 7-day yield as of December 31, 2017. |
| | 144A after the name of a security represents a security exempt from registration under Rule 144A of the Securities Act of 1933. These securities may be resold as transactions exempt from registration, normally to qualified institutional buyers. At December 31, 2017 the value of these securities (in thousands) was $7,989 representing 3.6% of the net assets. |
| (a) | At December 31, 2017, the aggregate cost of investments, including derivatives, for federal tax purposes (in thousands) was $176,833 and the net unrealized appreciation of investments based on that cost was $44,836 which is comprised of $54,895 aggregate gross unrealized appreciation and $10,059 aggregate gross unrealized depreciation. |
| (j) | Swap agreements outstanding on December 31, 2017. |
Total Return Swaps
| | | | | | | | | | | | | | | | | | |
| Reference Entity | | Counterparty | | Payment Made by the Fund | | Payment Received by the Fund | | Expiration Date | | Notional Amount (000’s) | | Unrealized
Appreciation/
(Depreciation)
(000’s) | | | Market Value
(000’s) | |
S&P SmallCap 600 Index | | JP Morgan Chase Bank NA | | 1-Month USD LIBOR +22 Basis Points | | S&P SmallCap 600 Index | | 5/18 | | 13,439 | | $ | 10 | | | $ | 10 | |
| (k) | Cash or securities with an aggregate value of $499 (in thousands) has been pledged as collateral for swap contracts outstanding, short sales or written options on December 31, 2017. |
| (l) | Security valued using significant unobservable inputs. |
The Accompanying Notes are an Integral Part of the Financial Statements.
| | | | | | |
| | Index 600 Stock Portfolio | | | 65 | |
Index 600 Stock Portfolio
The following is a summary of the inputs used in valuing the Portfolio’s assets and liabilities at December 31, 2017. See Note 3 for additional information on portfolio valuation.
| | | | | | | | | | | | | | |
| | | Valuation Inputs | | | |
| Description | | Level 1 – Quoted Prices | | | Level 2 – Other Significant Observable Inputs | | | Level 3 – Significant Unobservable Inputs | | | |
| | | (Amounts in thousands) | | | |
Assets: | | | | | | | | | | | | | | |
Common Stocks | | $ | 203,137 | | | $ | - | | | $ | - | | | |
Investment Companies | | | 4,704 | | | | - | | | | - | | | |
Short-Term Investments | | | | | | | | | | | | | | |
Money Market Funds | | | 2,831 | | | | - | | | | - | | | |
All Others | | | - | | | | 10,987 | | | | - | | | |
Other Financial Instruments^ | | | | | | | | | | | | | | |
Total Return Swaps | | | - | | | | 10 | | | | - | | | |
Total Assets: | | $ | 210,672 | | | $ | 10,997 | | | $ | - | | | |
^ Other financial instruments are derivative instruments such as futures, forwards, written options and swaps contracts, which are valued at the unrealized appreciation (depreciation) on the instrument and short sales, which are valued at market value.
The Accompanying Notes are an Integral Part of the Financial Statements.
| | | | |
| 66 | | Index 600 Stock Portfolio | | |
Small Cap Value Portfolio (unaudited)
| | | | |
| Objective: | | Portfolio Strategy: | | Net Assets: |
| Long-term growth of capital. | | Invest primarily in common stocks of small-sized companies believed to be undervalued. | | $673 million |
Portfolio Overview
Mason Street Advisors, LLC, the investment adviser for the Small Cap Value Portfolio (“the Portfolio”), has engaged T. Rowe Price Associates, Inc. (“T. Rowe Price”) to act as sub-adviser for the Portfolio. Normally, the Portfolio invests in common stocks of companies with market capitalizations that do not exceed the maximum market capitalization of any security in the Russell 2000® Index at the time of purchase. Reflecting a value approach to investing, the Portfolio will seek the stocks of companies whose current stock prices do not appear to adequately reflect their underlying value as measured by assets, earnings, cash flow or business franchises.
Market Overview
U.S. stocks posted strong returns in 2017, buoyed by solid corporate earnings and economic growth. Throughout the year, hopes that President Trump’s proposals for lower tax rates, reduced regulation and increased infrastructure spending would be enacted supported the market. While the the U.S. Federal Reserve (the “Fed”) raised its interest rate target three times in 2017, the central bank’s moves were widely expected and did not disrupt equity markets. In the closing weeks of the year, Congress passed and President Trump signed legislation that reduced tax rates for corporations and closely held businesses, reduced marginal tax rates for individuals at most income levels, and changed the limits for various individual tax deductions. Most major stock indices finished the year near record levels amid expectations that the new tax law would add to economic growth in 2018. As measured by various Russell® Indices, large cap shares outperformed mid and small caps. Growth stocks soundly outperformed value across all market capitalizations.
Portfolio Results
The Portfolio returned 11.65% for the twelve months ended December 31, 2017. By comparison, the Portfolio’s benchmark, the Russell 2000® Value Index (the “Index”), returned 7.84%. (The Index is unmanaged, cannot be invested in directly and does not include administrative expenses.) According to Lipper® Analytical Services, Inc., an independent mutual fund ranking agency, the average return of the Small Cap Value Funds peer group was 8.75% for 2017.
While the Portfolio’s outperformance of the Index was primarily due to stock selection, sector weightings also contributed to a much lesser degree. The Portfolio’s Financials sector holdings significantly outpaced their benchmark counterparts, led by Green Dot, a provider of general purpose reloadable (GPR) cards in the U.S. The firm has recently taken on activist investor involvement and made moves to focus on operational improvement, in order to address a significant market opportunity. Green Dot will work with Intuit to provide debit cards for tax refund payments and with Apple to enable its peer-to-peer payments functionality. Shares of SVB Financial were boosted by expectations for a pro-growth agenda, rising interest rates and a less onerous regulatory environment.
Stock choices in the Information Technology, Utilities and Energy sectors made notable contributions to relative performance, while an overweight to Health Care, the top-performing sector in the Index, also helped. Within Health Care, diagnostic testing solutions firm Quidel was a notable contributor, as the company’s shares surged in mid-summer and rose through much of late 2017. Price increases were driven by Quidel’s purchase of assets being divested from Abbott Labs at a favorable price.
On the negative side, only the Industrials and Business Services sector weighed substantially on results relative to the Index. Circor, an industrial valve manufacturer, was a detractor, as exposure to oil end markets continued to weigh on share prices during the period. A slight underweight in the Consumer Discretionary sector was also a modest detractor.
Portfolio Manager Outlook
The following forward-looking comments are the opinion of T. Rowe Price, the Portfolio’s sub-adviser.
Small cap shares as measured by various indices touched new highs in early December 2017 amid expectations that the U.S. tax reform legislation would become law. Now that it has, we expect smaller companies, and small cap value companies in particular, to benefit from the lower tax rates, as smaller companies generally pay a higher effective tax rate. We believe passage of the legislation improves the prospects of companies in a wide range of industries to book higher earnings, particularly as we expect the benefits of lower taxes to work their way through to consumers in many market segments. However, while the benefits of tax reform may prove stimulative for small cap value shares, it’s worth noting that longer-term benefits may prove fleeting. In our view, return on capital is determined primarily by industry competitive structure and pricing power, not tax policy.
| | | | | | |
| | Small Cap Value Portfolio | | | 67 | |
Small Cap Value Portfolio (unaudited)
Relative Performance
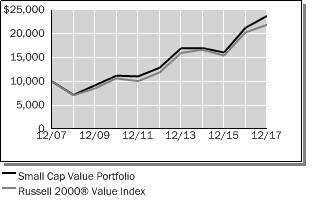
| | | | | | | | | | | | |
Average Annual Total Returns
For Periods Ended December 31, 2017 | |
| | | 1 Year | | | 5 Years | | | 10 Years | |
Small Cap Value Portfolio | | | 11.65 | % | | | 13.04 | % | | | 9.05 | % |
Russell 2000® Value Index | | | 7.84 | % | | | 13.01 | % | | | 8.17 | % |
Lipper® Variable Insurance Products (VIP) Small Cap Value Funds Average | | | 8.75 | % | | | 12.96 | % | | | 8.44 | % |
The performance data quoted represents past performance. Past performance is historical and does not guarantee future performance. Investment return and principal value will fluctuate, so that shares, when redeemed, may be worth more or less than their original cost. Current performance may be lower or higher than the performance data quoted. For the most recent month-end performance information visit www.northwesternmutual.com.
This chart assumes an initial investment of $10,000 made on 12/31/07. Returns shown reflect fee waivers, deductions for management and other portfolio expenses, and reinvestment of all dividends. In the absence of fee waivers, total return would be reduced. Returns exclude deductions for separate account sale loads and account fees. Please refer to the Benchmark Definitions section of this report for information about the indices cited in the above chart and graph.
Stocks of smaller or newer companies, such as those held in this Portfolio, are more likely to realize more substantial growth as well as suffer more significant losses than larger or more established issuers. Investments in such companies can be both more volatile and more speculative. Investing in small company stocks involves a greater degree of risk than investing in medium or large company stocks.
The Portfolio may invest a portion of its assets in other investment companies, including open-end and closed-end funds, exchange-traded funds (“ETFs”), and business development companies (“BDCs”), and will bear its pro rata portion of such expenses. The market prices of ETFs, closed-end funds and BDCs may trade at a premium or discount to their net asset values and may be subject to trading halts by the applicable exchange, which may negatively impact the Portfolio. BDCs in particular may be less liquid and more adversely affected by poor economic or market conditions.
The Portfolio may invest a relatively high percentage of its assets in a particular sector. The Portfolio will have greater exposure to the risks associated with that sector and its performance will be tied more closely to the performance of the sector.
Top 10 Equity Holdings 12/31/17
| | | | |
Security Description | | | % of Net Assets | |
Home BancShares, Inc. | | | 1.6 | % |
East West Bancorp, Inc. | | | 1.6 | % |
Littelfuse, Inc. | | | 1.6 | % |
Landstar System, Inc. | | | 1.5 | % |
SVB Financial Group | | | 1.3 | % |
Belden, Inc. | | | 1.3 | % |
BankUnited, Inc. | | | 1.2 | % |
Green Dot Corp. - Class A | | | 1.1 | % |
PNM Resources, Inc. | | | 1.1 | % |
Atrion Corp. | | | 1.1 | % |
Sector Allocation 12/31/17
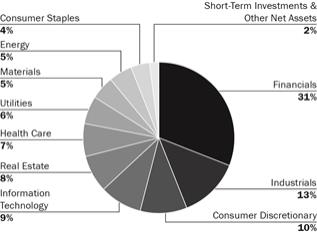
Sector Allocation is based on Net Assets.
Sector Allocation and Top 10 Holdings are subject to change.
| | | | |
| 68 | | Small Cap Value Portfolio | | |
Small Cap Value Portfolio
Schedule of Investments
December 31, 2017
| | | | | | | | |
| Common Stocks (98.2%) | | Shares/
$ Par | | | Value
$ (000’s) | |
| |
Consumer Discretionary (10.3%) | | | | | |
Aaron’s, Inc. | | | 150,500 | | | | 5,997 | |
American Public Education, Inc.* | | | 101,100 | | | | 2,533 | |
Cable One, Inc. | | | 5,921 | | | | 4,165 | |
Capella Education Co. | | | 63,200 | | | | 4,892 | |
Cavco Industries, Inc.* | | | 33,800 | | | | 5,158 | |
Crocs, Inc.* | | | 142,000 | | | | 1,795 | |
CSS Industries, Inc. | | | 81,000 | | | | 2,254 | |
Culp, Inc. | | | 87,700 | | | | 2,938 | |
Dorman Products, Inc.* | | | 66,400 | | | | 4,060 | |
Express, Inc.* | | | 215,000 | | | | 2,182 | |
ILG, Inc. | | | 128,200 | | | | 3,651 | |
LCI Industries | | | 52,800 | | | | 6,864 | |
Lumber Liquidators Holdings, Inc.* | | | 149,800 | | | | 4,702 | |
Party City Holdco, Inc.* | | | 185,461 | | | | 2,587 | |
Pool Corp. | | | 42,700 | | | | 5,536 | |
Red Robin Gourmet Burgers, Inc.* | | | 41,000 | | | | 2,312 | |
Scholastic Corp. | | | 48,300 | | | | 1,937 | |
Sportsman’s Warehouse Holdings, Inc.* | | | 242,468 | | | | 1,603 | |
Steven Madden, Ltd.* | | | 93,800 | | | | 4,381 | |
| | | | | | | | |
Total | | | | | | | 69,547 | |
| | | | | | | | |
| |
Consumer Staples (4.0%) | | | | | |
Energizer Holdings, Inc. | | | 66,000 | | | | 3,167 | |
Nomad Foods, Ltd.* | | | 441,000 | | | | 7,457 | |
Pinnacle Foods, Inc. | | | 51,700 | | | | 3,075 | |
Post Holdings, Inc.* | | | 40,400 | | | | 3,201 | |
PriceSmart, Inc. | | | 41,522 | | | | 3,575 | |
The Simply Good Foods Co.* | | | 142,000 | | | | 2,025 | |
SpartanNash Co. | | | 106,200 | | | | 2,833 | |
Vector Group, Ltd. | | | 83,255 | | | | 1,863 | |
| | | | | | | | |
Total | | | | | | | 27,196 | |
| | | | | | | | |
| |
Energy (5.1%) | | | | | |
Andeavor Logistics LP | | | 38,329 | | | | 4,383 | |
Centennial Resource Development, Inc.* | | | 228,100 | | | | 4,516 | |
Frank’s International NV | | | 349,700 | | | | 2,326 | |
Jagged Peak Energy, Inc.* | | | 154,400 | | | | 2,437 | |
Keane Group, Inc.* | | | 115,420 | | | | 2,194 | |
Matador Resources Co.* | | | 195,800 | | | | 6,095 | |
Oceaneering International, Inc. | | | 95,100 | | | | 2,011 | |
Parsley Energy, Inc. - Class A* | | | 106,500 | | | | 3,135 | |
TETRA Technologies, Inc.* | | | 583,700 | | | | 2,492 | |
WPX Energy, Inc.* | | | 323,900 | | | | 4,557 | |
| | | | | | | | |
| Common Stocks (98.2%) | | Shares/
$ Par | | | Value
$ (000’s) | |
| |
Energy continued | | | | | |
WPX Energy, Inc.* | | | 323,900 | | | | 4,557 | |
| | | | | | | | |
Total | | | | | | | 34,146 | |
| | | | | | | | |
| |
Financials (30.5%) | | | | | |
Assured Guaranty, Ltd. | | | 92,900 | | | | 3,146 | |
Atlantic Capital Bancshares, Inc.* | | | 109,356 | | | | 1,925 | |
BankUnited, Inc. | | | 203,500 | | | | 8,286 | |
Beneficial Bancorp, Inc. | | | 250,639 | | | | 4,123 | |
CBOE Holdings, Inc. | | | 48,188 | | | | 6,004 | |
CoBiz Financial, Inc. | | | 244,200 | | | | 4,882 | |
Columbia Banking System, Inc. | | | 169,500 | | | | 7,363 | |
East West Bancorp, Inc. | | | 181,398 | | | | 11,034 | |
Employers Holdings, Inc. | | | 84,500 | | | | 3,752 | |
First Hawaiian, Inc. | | | 80,585 | | | | 2,351 | |
Glacier Bancorp, Inc. | | | 158,600 | | | | 6,247 | |
Green Dot Corp. - Class A* | | | 127,700 | | | | 7,695 | |
Hannon Armstrong Sustainable Infrastructure Capital, Inc. | | | 177,800 | | | | 4,278 | |
Hercules Capital, Inc. | | | 289,200 | | | | 3,794 | |
Heritage Financial Corp. of Washington | | | 96,900 | | | | 2,984 | |
Home BancShares, Inc. | | | 476,100 | | | | 11,069 | |
Hope Bancorp, Inc. | | | 212,000 | | | | 3,869 | |
Houlihan Lokey, Inc. | | | 67,375 | | | | 3,061 | |
Howard Bancorp, Inc.* | | | 80,499 | | | | 1,771 | |
Janus Henderson Group, PLC | | | 81,252 | | | | 3,109 | |
Kinsale Capital Group, Inc. | | | 57,224 | | | | 2,575 | |
Live Oak Bancshares, Inc. | | | 83,026 | | | | 1,980 | |
Main Street Capital Corp. | | | 64,500 | | | | 2,563 | |
Meridian Bancorp, Inc. | | | 154,300 | | | | 3,179 | |
National Bank Holding Corp. - Class A | | | 163,200 | | | | 5,293 | |
PCSB Financial Corp.* | | | 91,594 | | | | 1,745 | |
PDL Community Bancorp* | | | 99,708 | | | | 1,514 | |
Pinnacle Financial Partners, Inc. | | | 44,000 | | | | 2,917 | |
Popular, Inc. | | | 144,200 | | | | 5,118 | |
ProAssurance Corp. | | | 113,800 | | | | 6,504 | |
Prosperity Bancshares, Inc. | | | 104,800 | | | | 7,343 | |
Radian Group, Inc. | | | 290,100 | | | | 5,979 | |
Redwood Trust, Inc. | | | 139,400 | | | | 2,066 | |
Safeguard Scientifics, Inc.* | | | 98,800 | | | | 1,107 | |
Safety Insurance Group, Inc. | | | 30,700 | | | | 2,468 | |
South State Corp. | | | 20,782 | | | | 1,811 | |
| | | | | | | | |
| Common Stocks (98.2%) | | Shares/
$ Par | | | Value
$ (000’s) | |
| |
Financials continued | | | | | |
State Auto Financial Corp. | | | 96,600 | | | | 2,813 | |
Sterling Bancorp, Inc.* | | | 56,183 | | | | 714 | |
Stifel Financial Corp. | | | 42,900 | | | | 2,555 | |
SVB Financial Group* | | | 37,000 | | | | 8,649 | |
Synovus Financial Corp. | | | 55,100 | | | | 2,641 | |
Texas Capital Bancshares, Inc.* | | | 60,000 | | | | 5,334 | |
TowneBank | | | 200,200 | | | | 6,156 | |
TPG Specialty Lending, Inc. | | | 120,000 | | | | 2,376 | |
United Financial Bancorp, Inc. | | | 246,600 | | | | 4,350 | |
Webster Financial Corp. | | | 92,233 | | | | 5,180 | |
Wintrust Financial Corp. | | | 66,800 | | | | 5,502 | |
WSFS Financial Corp. | | | 83,900 | | | | 4,015 | |
| | | | | | | | |
Total | | | | | | | 205,190 | |
| | | | | | | | |
| |
Health Care (7.2%) | | | | | |
Analogic Corp. | | | 30,000 | | | | 2,513 | |
Atrion Corp. | | | 12,100 | | | | 7,630 | |
Ensign Group, Inc. | | | 126,400 | | | | 2,806 | |
Haemonetics Corp.* | | | 68,110 | | | | 3,956 | |
Halyard Health, Inc.* | | | 124,940 | | | | 5,770 | |
Molina Healthcare, Inc.* | | | 36,300 | | | | 2,784 | |
Puma Biotechnology, Inc.* | | | 24,000 | | | | 2,372 | |
Quidel Corp.* | | | 143,100 | | | | 6,203 | |
Select Medical Holdings Corp.* | | | 176,400 | | | | 3,113 | |
WellCare Health Plans, Inc.* | | | 23,100 | | | | 4,646 | |
West Pharmaceutical Services, Inc. | | | 67,000 | | | | 6,611 | |
| | | | | | | | |
Total | | | | | | | 48,404 | |
| | | | | | | | |
| |
Industrials (12.9%) | | | | | |
Aegion Corp.* | | | 197,400 | | | | 5,020 | |
Beacon Roofing Supply, Inc.* | | | 96,200 | | | | 6,134 | |
Blue Bird Corp.* | | | 99,400 | | | | 1,978 | |
Brady Corp. - Class A | | | 71,200 | | | | 2,698 | |
CIRCOR International, Inc. | | | 61,000 | | | | 2,969 | |
Colfax Corp.* | | | 64,100 | | | | 2,540 | |
ESCO Technologies, Inc. | | | 99,200 | | | | 5,977 | |
FTI Consulting, Inc.* | | | 76,900 | | | | 3,304 | |
Genesee & Wyoming, Inc. - Class A* | | | 57,000 | | | | 4,488 | |
Hillenbrand, Inc. | | | 57,590 | | | | 2,574 | |
Kaman Corp. | | | 38,900 | | | | 2,289 | |
Kirby Corp.* | | | 35,400 | | | | 2,365 | |
Landstar System, Inc. | | | 96,400 | | | | 10,035 | |
The Accompanying Notes are an Integral Part of the Financial Statements.
| | | | | | |
| | Small Cap Value Portfolio | | | 69 | |
Small Cap Value Portfolio
| | | | | | | | |
| Common Stocks (98.2%) | | Shares/
$ Par | | | Value
$ (000’s) | |
| |
Industrials continued | | | | | |
Matthews International Corp. - Class A | | | 32,600 | | | | 1,721 | |
McGrath RentCorp | | | 85,908 | | | | 4,036 | |
MSA Safety, Inc. | | | 32,400 | | | | 2,512 | |
Navigant Consulting, Inc.* | | | 179,000 | | | | 3,474 | |
RBC Bearings, Inc.* | | | 33,700 | | | | 4,260 | |
Sun Hydraulics Corp. | | | 67,900 | | | | 4,392 | |
Thermon Group Holdings, Inc.* | | | 97,900 | | | | 2,317 | |
Triumph Group, Inc. | | | 189,450 | | | | 5,153 | |
Universal Forest Products, Inc. | | | 113,300 | | | | 4,262 | |
Universal Logistics Holdings, Inc. | | | 111,780 | | | | 2,655 | |
| | | | | | | | |
Total | | | | | | | 87,153 | |
| | | | | | | | |
| |
Information Technology (8.7%) | | | | | |
Badger Meter, Inc. | | | 74,600 | | | | 3,566 | |
Belden, Inc. | | | 111,800 | | | | 8,628 | |
Cabot Microelectronics Corp. | | | 36,700 | | | | 3,453 | |
Callidus Software, Inc.* | | | 142,000 | | | | 4,068 | |
CarGurus, Inc.* | | | 11,727 | | | | 352 | |
Conduent, Inc.* | | | 107,700 | | | | 1,740 | |
CSRA, Inc. | | | 116,000 | | | | 3,471 | |
GTT Communications, Inc.* | | | 44,700 | | | | 2,099 | |
Harmonic, Inc.* | | | 766,449 | | | | 3,219 | |
Knowles Corp.* | | | 279,600 | | | | 4,099 | |
Littelfuse, Inc. | | | 54,800 | | | | 10,840 | |
Lumentum Holdings, Inc.* | | | 14,100 | | | | 689 | |
MaxLinear, Inc. - Class A* | | | 68,300 | | | | 1,804 | |
Methode Electronics, Inc. - Class A | | | 77,300 | | | | 3,100 | |
Rudolph Technologies, Inc.* | | | 75,400 | | | | 1,802 | |
SYNNEX Corp. | | | 41,100 | | | | 5,588 | |
| | | | | | | | |
Total | | | | | | | 58,518 | |
| | | | | | | | |
| | | | | | | | |
| Common Stocks (98.2%) | | Shares/
$ Par | | | Value
$ (000’s) | |
| |
Materials (5.2%) | | | | | |
American Vanguard Corp. | | | 121,800 | | | | 2,393 | |
Carpenter Technology Corp. | | | 102,000 | | | | 5,201 | |
Clearwater Paper Corp.* | | | 99,500 | | | | 4,517 | |
Constellium NV - Class A* | | | 161,300 | | | | 1,798 | |
Innospec, Inc. | | | 27,995 | | | | 1,976 | |
KMG Chemicals, Inc. | | | 93,305 | | | | 6,166 | |
Minerals Technologies, Inc. | | | 54,100 | | | | 3,725 | |
Myers Industries, Inc. | | | 252,700 | | | | 4,928 | |
New Gold, Inc.* | | | 433,200 | | | | 1,425 | |
Reliance Steel & Aluminum Co. | | | 31,200 | | | | 2,677 | |
| | | | | | | | |
Total | | | | | | | 34,806 | |
| | | | | | | | |
| |
Real Estate (8.1%) | | | | | |
Acadia Realty Trust | | | 134,900 | | | | 3,691 | |
American Assets Trust, Inc. | | | 41,300 | | | | 1,579 | |
American Campus Communities, Inc. | | | 60,341 | | | | 2,476 | |
Cedar Realty Trust, Inc. | | | 917,100 | | | | 5,576 | |
Douglas Emmett, Inc. | | | 80,100 | | | | 3,289 | |
EastGroup Properties, Inc. | | | 60,300 | | | | 5,329 | |
Healthcare Realty Trust, Inc. | | | 102,800 | | | | 3,302 | |
JBG SMITH Properties | | | 115,159 | | | | 3,999 | |
Kilroy Realty Corp. | | | 50,000 | | | | 3,733 | |
Potlatch Corp. | | | 95,800 | | | | 4,780 | |
PS Business Parks, Inc. | | | 35,000 | | | | 4,378 | |
Retail Opportunity Investments Corp. | | | 105,000 | | | | 2,095 | |
Saul Centers, Inc. | | | 63,700 | | | | 3,934 | |
Sunstone Hotel Investors, Inc. | | | 163,000 | | | | 2,694 | |
Washington Real Estate Investment Trust | | | 119,900 | | | | 3,731 | |
| | | | | | | | |
Total | | | | | | | 54,586 | |
| | | | | | | | |
| | | | | | | | |
| Common Stocks (98.2%) | | Shares/
$ Par | | | Value
$ (000’s) | |
| |
Utilities (6.2%) | | | | | |
Atmos Energy Corp. | | | 43,000 | | | | 3,693 | |
California Water Service Group | | | 75,900 | | | | 3,442 | |
Chesapeake Utilities Corp. | | | 82,200 | | | | 6,457 | |
El Paso Electric Co. | | | 64,900 | | | | 3,592 | |
MGE Energy, Inc. | | | 17,000 | | | | 1,073 | |
NorthWestern Corp. | | | 84,700 | | | | 5,057 | |
ONE Gas, Inc. | | | 98,700 | | | | 7,231 | |
PNM Resources, Inc. | | | 189,100 | | | | 7,649 | |
Portland General Electric Co. | | | 76,600 | | | | 3,491 | |
| | | | | | | | |
Total | | | | | | | 41,685 | |
| | | | | | | | |
| | |
Total Common Stocks
(Cost: $431,125) | | | | | | | 661,231 | |
| | | | | | | | |
| |
| Warrants (0.0%) | | | | | |
| |
Consumer Staples (0.0%) | | | | | |
The Simply Good Foods Co. Warrants* | | | 31,700 | | | | 123 | |
| | | | | | | | |
Total | | | | | | | 123 | |
| | | | | | | | |
| | |
Total Warrants | | | | | | | | |
(Cost: $61) | | | | | | | 123 | |
| | | | | | | | |
| |
| Short-Term Investments (1.6%) | | | | | |
| |
Money Market Funds (1.6%) | | | | | |
State Street Institutional U.S. Government Money Market Fund - Premier Class, 1.209% # | | | 10,689,760 | | | | 10,690 | |
| | | | | | | | |
Total | | | | | | | 10,690 | |
| | | | | | | | |
| | |
Total Short-Term Investments | | | | | | | | |
(Cost: $10,690) | | | | | | | 10,690 | |
| | | | | | | | |
| | |
Total Investments (99.8%) | | | | | | | | |
(Cost: $441,876)(a) | | | | | | | 672,044 | |
| | | | | | | | |
Other Assets, Less | | | | | | | | |
Liabilities (0.2%) | | | | | | | 1,190 | |
| | | | | | | | |
Net Assets (100.0%) | | | | | | | 673,234 | |
| | | | | |
| # | 7-day yield as of December 31, 2017. |
| (a) | At December 31, 2017, the aggregate cost of investments, including derivatives, for federal tax purposes (in thousands) was $442,672 and the net unrealized appreciation of investments based on that cost was $229,373 which is comprised of $236,163 aggregate gross unrealized appreciation and $6,790 aggregate gross unrealized depreciation. |
The Accompanying Notes are an Integral Part of the Financial Statements.
| | | | |
| 70 | | Small Cap Value Portfolio | | |
Small Cap Value Portfolio
The following is a summary of the inputs used in valuing the Portfolio’s assets and liabilities at December 31, 2017. See Note 3 for additional information on portfolio valuation.
| | | | | | | | | | | | | | |
| | | Valuation Inputs | | | |
| Description | | Level 1 –
Quoted Prices | | | Level 2 – Other Significant
Observable Inputs | | | Level 3 – Significant
Unobservable Inputs | | | |
| | | (Amounts in thousands) | | | |
Assets: | | | | | | | | | | | | | | |
Common Stocks | | $ | 661,231 | | | $ | - | | | $ | - | | | |
Warrants | | | 123 | | | | - | | | | - | | | |
Short-Term Investments | | | 10,690 | | | | - | | | | - | | | |
Total Assets: | | $ | 672,044 | | | $ | - | | | $ | - | | | |
The Accompanying Notes are an Integral Part of the Financial Statements.
| | | | | | |
| | Small Cap Value Portfolio | | | 71 | |
International Growth Portfolio (unaudited)
| | | | |
| Objective: | | Portfolio Strategy: | | Net Assets: |
| Long-term growth of capital. | | Invest in securities of issuers from countries outside the U.S. that have above average growth potential. | | $698 million |
Portfolio Overview
Mason Street Advisors, LLC (“Mason Street Advisors”), the investment adviser for the International Growth Portfolio (the “Portfolio”), has engaged FIAM LLC (“FIAM”) to act as sub-adviser for the Portfolio. FIAM is an indirect, wholly-owned subsidiary of FMR LLC (along with its affiliates, “Fidelity Investments”). Normally, the Portfolio will invest in the securities of issuers from countries outside the United States. The Portfolio invests in companies it believes operate in a market environment, or with a competitive advantage, that make it difficult for competition to disrupt current and future profitability, in combination with growth drivers that may offer above-average growth potential measured by factors such as earnings or revenue. In buying and selling securities for the Portfolio, the portfolio manager relies on fundamental analysis, which involves a “bottom-up” assessment of a company’s potential for success in light of factors such as its financial condition, earnings outlook, strategy, management, industry position and economic and market conditions.
Market Overview
Persistent and synchronized global economic growth — along with low volatility, low inflation and accommodative monetary policies — continued to support asset markets in 2017, especially stocks. Credit spreads tightened amid the “risk on” tone, boosting emerging market (“EM”) and high yield bonds. Steady longer-term interest rates kept high quality bond returns positive, and all major asset categories, including commodity securities and inflation protected debt, posted gains.
EM equities led the global stock rally for the fourth quarter in a row, bolstered by a weaker U.S. dollar, as well as by rising import demand and manufacturing activity, particularly in China. Developed market equities also had a strong year, with large cap growth stocks outpacing their value counterparts again.
At the sector level, Information Technology stocks led the way in both developed and emerging markets. Materials and Industrial stocks also did well in developed markets. On the EM side, Real Estate and Consumer Discretionary stocks were big contributors. The biggest sector laggards were Telecommunication Services, Energy and Utilities across the board.
Portfolio Results
The Portfolio returned 30.03% for the twelve months ended December 31, 2017. By comparison, the Portfolio’s benchmark, the MSCI EAFE® Growth Index (the “Index”), returned 29.34%. (The Index is unmanaged, cannot be invested in directly and does not include administrative expenses.) According to Lipper® Analytical Services, Inc., an independent mutual fund ranking agency, the average return of the International Multi-Cap Growth Funds peer group was 30.01% for 2017.
A substantial overweight position and solid stock selection in the Information Technology sector accounted for the majority of the Portfolio’s outperformance, though stock selection in the Consumer Discretionary and Health Care sectors was also strong.
Within the Information Technology sector, long-time holdings drove most of the outperformance for the reporting period. Keyence, a Japan-based manufacturer of factory automation equipment, continued to benefit from manufacturers’ attempts to control labor costs, particularly in Asia. Alibaba Group continued to enjoy the benefits of its dominant competitive position and the tailwinds of Chinese consumer strength. Visa and Mastercard, while not “international” stocks in terms of country of domicile, both get more than half of their revenue and much of their growth outside the U.S. and are examples of companies benefiting from strong secular growth trends (online payments) and formidable barriers to entry that beget considerable pricing power.
Naspers, a media conglomerate headquartered in South Africa, was the Portfolio’s top individual performer for the reporting period and the main driver of outperformance in the Consumer Discretionary sector. The company’s minority investment in Chinese internet conglomerate Tencent fueled Nasper’s rise this year, though it is believed that its core businesses are being undervalued by the market.
In the Health Care sector, the Portfolio’s exposure to another secular growth theme, blood plasma, helped the Portfolio as a substantial overweighting in CSL Limited generated strong returns. The Portfolio also avoided most of the sector’s weaker performing pharmaceutical constituents due to concerns around drug pricing and regulation.
On the downside, stock selection in the Consumer Staples and Materials sectors detracted from relative performance. The Portfolio had trimmed many of the Consumer Staples positions early in the year as it became clear that distribution dominance
| | | | |
| 72 | | International Growth Portfolio | | |
International Growth Portfolio (unaudited)
of the “big brands” was becoming more challenged. Unfortunately, it was not enough to avoid poor relative performance in Anheuser-Busch Inbev and Reckitt Benckiser Group, among others. In the Materials sector, the Portfolio’s exposure to building materials at the expense of metals and mining stocks, a group that typically does not meet the Portfolio’s investment criteria, hurt performance.
On a geographic basis, out-of-benchmark positions in several aforementioned EM stocks accounted for much of the outperformance, while stock selection in Europe detracted this year.
Portfolio Manager Outlook
The following forward-looking comments are the opinion of FIAM, the Portfolio’s sub-adviser.
Regardless of the macro environment, the Portfolio Manager looks for companies with multiyear structural growth drivers, pricing power and attractive valuations. As the valuation of Japanese equities have risen over the past year, finding new ideas there, particularly among small cap stocks, has become much more difficult. As a result, comparatively more time will be spent examining potential opportunities in EM and peripheral European markets with improving economic prospects during the coming year.
Relative Performance
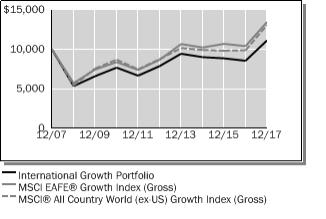
| | | | | | | | | | | | |
Average Annual Total Returns
For Periods Ended December 31, 2017 | |
| | | 1 Year | | | 5 Years | | | 10 Years | |
International Growth Portfolio | | | 30.03 | % | | | 7.14 | % | | | 1.11 | % |
MSCI EAFE® Growth Index (Gross) | | | 29.34 | % | | | 9.18 | % | | | 3.05 | % |
MSCI® All Country World (ex-US) Growth Index (Gross) | | | 32.47 | % | | | 8.36 | % | | | 2.76 | % |
Lipper® Variable Insurance Products (VIP) International Multi-Cap Growth Funds Average | | | 30.01 | % | | | 8.10 | % | | | 2.42 | % |
The performance data quoted represents past performance. Past performance is historical and does not guarantee future performance. Investment return and principal value will fluctuate, so that shares, when redeemed, may be worth more or less than their original cost. Current performance may be lower or higher than the performance data quoted. For the most recent month-end performance information visit www.northwesternmutual.com.
This chart assumes an initial investment of $10,000 made on 12/31/07. Returns shown include deductions for management and other portfolio expenses, and reinvestment of all dividends. Returns exclude deductions for separate account sale loads and account fees. Please refer to the Benchmark Definitions section of this report for information about the indices cited in the above chart and graph.
Investors should be aware of the risks of investments in foreign securities, particularly investments in securities of companies in developing nations. These include the the risks of currency fluctuation, of political and economic instability and of less well-developed government supervision and regulation of business and industry practices, as well as differences in accounting standards.
Investments in the securities of companies in developing nations impose risks different from, and greater than, risks of investing in developed countries.
The Portfolio may invest a relatively large percentage of its assets in issuers located in a single country, a small number of countries, or a particular geographic region. The Portfolio’s performance may be more volatile than that of a more geographically diversified fund, and may be tied more closely to the performance of a single country or region.
Top 10 Equity Holdings 12/31/17
| | | | |
Security Description | | | % of Net Assets | |
Nestle SA | | | 4.5 | % |
SAP SE | | | 3.0 | % |
CSL, Ltd. | | | 2.9 | % |
Keyence Corp. | | | 2.7 | % |
Roche Holding AG | | | 2.6 | % |
Visa, Inc. - Class A | | | 2.6 | % |
AIA Group, Ltd. | | | 2.5 | % |
British American Tobacco PLC | | | 2.4 | % |
ASML Holding NV | | | 2.3 | % |
Mastercard, Inc. - Class A | | | 2.2 | % |
| | | | | | |
| | International Growth Portfolio | | | 73 | |
International Growth Portfolio (unaudited)
Sector Allocation 12/31/17
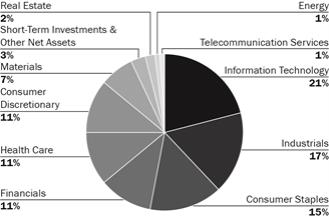
Sector Allocation is based on Net Assets.
Sector Allocation and Top 10 Holdings are subject to change.
| | | | |
| 74 | | International Growth Portfolio | | |
International Growth Portfolio
Schedule of Investments
December 31, 2017
| | | | | | | | | | |
| Common Stocks (96.2%) | | Country | | Shares/
$ Par | | | Value
$ (000’s) | |
| | |
Consumer Discretionary (10.6%) | | | | | | | | |
Autoliv, Inc. | | United
States | | | 59,000 | | | | 7,498 | |
Denso Corp. | | Japan | | | 128,600 | | | | 7,721 | |
Industria de Diseno Textil SA | | Spain | | | 185,081 | | | | 6,437 | |
Informa PLC | | United
Kingdom | | | 716,368 | | | | 6,969 | |
InterContinental Hotels Group PLC, ADR | | United
Kingdom | | | 194,089 | | | | 12,327 | |
Mohawk Industries, Inc.* | | United
States | | | 25,500 | | | | 7,035 | |
Naspers, Ltd. - Class N | | South
Africa | | | 50,600 | | | | 14,099 | |
Schibsted ASA - Class B | | Norway | | | 40,492 | | | | 1,074 | |
USS Co., Ltd. | | Japan | | | 510,000 | | | | 10,789 | |
| | | | | | | | | | |
Total | | | | | | | 73,949 | |
| | | | | | | | | | |
| | |
Consumer Staples (15.0%) | | | | | | | | |
Alimentation Couche-Tard, Inc. | | Canada | | | 59,000 | | | | 3,079 | |
Anheuser-Busch InBev SA/NV | | Belgium | | | 135,200 | | | | 15,080 | |
BGF Retail Co., Ltd. | | South
Korea | | | 20,767 | | | | 4,074 | |
British American Tobacco PLC | | United
Kingdom | | | 249,000 | | | | 16,805 | |
Clicks Group, Ltd. | | South
Africa | | | 304,571 | | | | 4,458 | |
Essity AB* | | Sweden | | | 121,800 | | | | 3,449 | |
Fomento Economico Mexicano SAB de CV, ADR | | Mexico | | | 32,500 | | | | 3,052 | |
Nestle SA | | Switzerland | | | 362,224 | | | | 31,127 | |
Philip Morris International, Inc. | | United
States | | | 81,600 | | | | 8,621 | |
PriceSmart, Inc. | | United
States | | | 30,000 | | | | 2,583 | |
Reckitt Benckiser Group PLC | | United
Kingdom | | | 131,533 | | | | 12,286 | |
| | | | | | | | | | |
Total | | | | | | | 104,614 | |
| | | | | | | | | | |
| | |
Energy (0.7%) | | | | | | | | |
Pason Systems, Inc. | | Canada | | | 91,400 | | | | 1,323 | |
PrairieSky Royalty, Ltd. | | Canada | | | 75,200 | | | | 1,918 | |
Tupras Turkiye Petrol Rafinerileri AS | | Turkey | | | 57,000 | | | | 1,827 | |
| | | | | | | | | | |
Total | | | | | | | 5,068 | |
| | | | | | | | | | |
| | |
Financials (11.2%) | | | | | | | | |
AIA Group, Ltd. | | Hong Kong | | | 2,051,088 | | | | 17,492 | |
Azimut Holding SpA | | Italy | | | 16,028 | | | | 307 | |
Berkshire Hathaway, Inc. - Class B* | | United
States | | | 44,100 | | | | 8,742 | |
Housing Development Finance Corp., Ltd. | | India | | | 270,858 | | | | 7,250 | |
Itau Unibanco Holding SA | | Brazil | | | 71,700 | | | | 811 | |
Jyske Bank A/S | | Denmark | | | 63,200 | | | | 3,587 | |
KBC Group NV | | Belgium | | | 65,032 | | | | 5,541 | |
Moody’s Corp. | | United
States | | | 29,600 | | | | 4,369 | |
MSCI, Inc. | | United
States | | | 46,700 | | | | 5,909 | |
Prudential PLC | | United
Kingdom | | | 492,921 | | | | 12,673 | |
S&P Global, Inc. | | United
States | | | 37,700 | | | | 6,386 | |
Svenska Handelsbanken AB | | Sweden | | | 363,600 | | | | 4,963 | |
| | | | | | | | | | |
Total | | | | | | | 78,030 | |
| | | | | | | | | | |
| | | | | | | | | | |
| Common Stocks (96.2%) | | Country | | Shares/
$ Par | | | Value
$ (000’s) | |
| | |
Health Care (11.6%) | | | | | | | | |
Bayer AG | | Germany | | | 102,905 | | | | 12,799 | |
CSL, Ltd. | | Australia | | | 186,476 | | | | 20,524 | |
Essilor International SA | | France | | | 43,421 | | | | 5,988 | |
Hoya Corp. | | Japan | | | 143,800 | | | | 7,185 | |
Novo Nordisk A/S, ADR | | Denmark | | | 103,299 | | | | 5,544 | |
Olympus Corp. | | Japan | | | 115,900 | | | | 4,438 | |
ResMed, Inc. | | United
States | | | 69,600 | | | | 5,894 | |
Roche Holding AG | | Switzerland | | | 72,540 | | | | 18,348 | |
| | | | | | | | | | |
Total | | | | | | | 80,720 | |
| | | | | | | | | | |
| | |
Industrials (16.8%) | | | | | | | | |
ANDRITZ AG | | Austria | | | 140,154 | | | | 7,914 | |
Assa Abloy AB | | Sweden | | | 647,400 | | | | 13,434 | |
Atlas Copco AB | | Sweden | | | 220,400 | | | | 9,493 | |
Auckland International Airport, Ltd. | | New
Zealand | | | 452,587 | | | | 2,077 | |
BAE Systems PLC | | United
Kingdom | | | 706,500 | | | | 5,434 | |
Canadian Pacific Railway, Ltd. | | Canada | | | 17,300 | | | | 3,161 | |
East Japan Railway Co. | | Japan | | | 70,200 | | | | 6,844 | |
Edenred | | France | | | 119,700 | | | | 3,468 | |
Elis SA | | France | | | 117,025 | | | | 3,231 | |
Fagerhult AB | | Sweden | | | 357,600 | | | | 4,378 | |
Howden Joinery Group PLC | | United
Kingdom | | | 213,100 | | | | 1,342 | |
Interpump Group SpA | | Italy | | | 177,700 | | | | 5,586 | |
Komatsu, Ltd. | | Japan | | | 262,200 | | | | 9,498 | |
MISUMI Group, Inc. | | Japan | | | 275,200 | | | | 7,974 | |
MTU Aero Engines AG | | Germany | | | 18,100 | | | | 3,237 | |
OSG Corp. | | Japan | | | 157,000 | | | | 3,396 | |
Prosegur Cia de Seguridad SA | | Spain | | | 460,900 | | | | 3,620 | |
Safran SA | | France | | | 60,100 | | | | 6,180 | |
Schindler Holding AG | | Switzerland | | | 32,557 | | | | 7,469 | |
SHO-BOND Holdings Co., Ltd. | | Japan | | | 60,400 | | | | 4,295 | |
Transurban Group | | Australia | | | 531,124 | | | | 5,141 | |
| | | | | | | | | | |
Total | | | | | | | 117,172 | |
| | | | | | | | | | |
| | |
Information Technology (21.0%) | | | | | | | | |
58.com, Inc., ADR* | | Cayman
Islands | | | 45,100 | | | | 3,228 | |
Alibaba Group Holding, Ltd., ADR* | | China | | | 50,279 | | | | 8,670 | |
Alphabet, Inc. - Class A* | | United
States | | | 11,200 | | | | 11,798 | |
Amadeus IT Group SA | | Spain | | | 168,900 | | | | 12,157 | |
ASML Holding NV | | Netherlands | | | 93,400 | | | | 16,204 | |
Keyence Corp. | | Japan | | | 34,000 | | | | 18,984 | |
Mastercard, Inc. - Class A | | United
States | | | 100,700 | | | | 15,242 | |
NAVER Corp.* | | South
Korea | | | 3,931 | | | | 3,192 | |
Nintendo Co., Ltd. | | Japan | | | 9,300 | | | | 3,386 | |
Playtech PLC | | Isle Of Man | | | 293,875 | | | | 3,404 | |
Rightmove PLC | | United
Kingdom | | | 28,400 | | | | 1,725 | |
SAP SE | | Germany | | | 184,995 | | | | 20,743 | |
Spectris PLC | | United
Kingdom | | | 80,700 | | | | 2,698 | |
| | | | | | |
| | International Growth Portfolio | | | 75 | |
International Growth Portfolio
| | | | | | | | | | |
| Common Stocks (96.2%) | | Country | | Shares/
$ Par | | | Value
$ (000’s) | |
| | |
Information Technology continued | | | | | | | | |
Taiwan Semiconductor Manufacturing Co., Ltd. | | Taiwan | | | 931,000 | | | | 7,154 | |
Visa, Inc. - Class A | | United
States | | | 158,125 | | | | 18,029 | |
| | | | | | | | | | |
Total | | | | | | | 146,614 | |
| | | | | | | | | | |
| | |
Materials (6.7%) | | | | | | | | |
CRH PLC, ADR | | Ireland | | | 350,400 | | | | 12,646 | |
Elementis PLC | | United
Kingdom | | | 469,100 | | | | 1,824 | |
Franco-Nevada Corp. | | Canada | | | 46,100 | | | | 3,684 | |
James Hardie Industries PLC | | Ireland | | | 593,671 | | | | 10,451 | |
Martin Marietta Materials, Inc. | | United
States | | | 29,000 | | | | 6,410 | |
The Sherwin-Williams Co. | | United
States | | | 21,500 | | | | 8,816 | |
Svenska Cellulosa AB SCA | | Sweden | | | 118,800 | | | | 1,222 | |
Tikkurila Oyj | | Finland | | | 84,300 | | | | 1,799 | |
| | | | | | | | | | |
Total | | | | | | | 46,852 | |
| | | | | | | | | | |
| | |
Real Estate (2.0%) | | | | | | | | |
BUWOG AG* | | Austria | | | 115,733 | | | | 3,984 | |
Hispania Activos Inmobiliarios SOCIMI SA | | Spain | | | 116,660 | | | | 2,195 | |
Merlin Properties Socimi SA | | Spain | | | 131,200 | | | | 1,776 | |
Mitsui Fudosan Co., Ltd. | | Japan | | | 170,200 | | | | 3,815 | |
Shaftesbury PLC | | United
Kingdom | | | 134,700 | | | | 1,899 | |
| | | | | | | | | | |
Total | | | | | | | 13,669 | |
| | | | | | | | | | |
| | | | | | | | | | |
| Common Stocks (96.2%) | | Country | | Shares/
$ Par | | | Value
$ (000’s) | |
| | |
Telecommunication Services (0.6%) | | | | | | | | |
Safaricom, Ltd. | | Kenya | | | 15,455,100 | | | | 4,044 | |
| | | | | | | | | | |
Total | | | | | | | | | 4,044 | |
| | | | | | | | | | |
| | |
Total Common Stocks | | | | | | | | |
(Cost: $532,301) | | | | | | | | | 670,732 | |
| | | | | | | | | | |
| | | |
| Preferred Stocks (0.4%) | | | | | | | | |
| | |
Financials (0.4%) | | | | | | | | |
Itau Unibanco Holding SA | | Brazil | | | 241,500 | | | | 3,128 | |
| | | | | | | | | | |
| | |
Total Preferred Stocks | | | | | | | | |
(Cost: $3,090) | | | | | | | | | 3,128 | |
| | | | | | | | | | |
| | | |
| Short-Term Investments (3.2%) | | | | | | | �� | |
| | |
Money Market Funds (3.2%) | | | | | | | | |
State Street Institutional U.S. Government Money Market Fund - Premier Class, 1.209% # | | United
States | | | 22,035,734 | | | | 22,036 | |
| | | | | | | | | | |
| | |
Total Short-Term Investments | | | | | | | | |
(Cost: $22,036) | | | | | | | 22,036 | |
| | | | | | | | | | |
| | |
Total Investments (99.8%) | | | | | | | | |
(Cost: $557,427)(a) | | | | | | | | | 695,896 | |
| | | | | | | | | | |
Other Assets, Less | | | | | | | | | | |
Liabilities (0.2%) | | | | | | | | | 1,685 | |
| | | | | | | | | | |
Net Assets (100.0%) | | | | | | | | | 697,581 | |
| | | | | | | | | | |
| # | 7-day yield as of December 31, 2017. |
| | ADR after the name of a security represents—American Depositary Receipt. |
| (a) | At December 31, 2017, the aggregate cost of investments, including derivatives, for federal tax purposes (in thousands) was $560,107 and the net unrealized appreciation of investments based on that cost was $135,731 which is comprised of $142,341 aggregate gross unrealized appreciation and $6,610 aggregate gross unrealized depreciation. |
| | | | | | |
Investments Percentage by Country is based on Net Assets: | | | | | | |
United States | | | 20.0% | | | |
Japan | | | 12.7% | | | |
United Kingdom | | | 10.9% | | | |
Switzerland | | | 8.2% | | | |
Sweden | | | 5.3% | | | |
Germany | | | 5.3% | | | |
Other | | | 37.4% | | | |
Total | | | 99.8% | | | |
The Accompanying Notes are an Integral Part of the Financial Statements.
| | | | |
| 76 | | International Growth Portfolio | | |
International Growth Portfolio
The following is a summary of the inputs used in valuing the Portfolio’s assets and liabilities at December 31, 2017. See Note 3 for additional information on portfolio valuation.
| | | | | | | | | | | | | | |
| | | Valuation Inputs | | | |
| Description | | Level 1 –
Quoted Prices | | | Level 2 –
Other Significant
Observable Inputs | | | Level 3 – Significant
Unobservable Inputs | | | |
| | | (Amounts in thousands) | | | |
| Assets: | | | | | |
Common Stocks | | | | | | | | | | | | | | |
Consumer Discretionary | | $ | 26,860 | | | $ | 47,089 | | | $ | - | | | |
Consumer Staples | | | 21,408 | | | | 83,206 | | | | - | | | |
Energy | | | 3,241 | | | | 1,827 | | | | - | | | |
Financials | | | 25,406 | | | | 52,624 | | | | - | | | |
Health Care | | | 11,438 | | | | 69,282 | | | | - | | | |
Industrials | | | 3,161 | | | | 114,011 | | | | - | | | |
Information Technology | | | 56,967 | | | | 89,647 | | | | - | | | |
Materials | | | 31,556 | | | | 15,296 | | | | - | | | |
All Others | | | - | | | | 17,713 | | | | - | | | |
Preferred Stocks | | | - | | | | 3,128 | | | | - | | | |
Short-Term Investments | | | 22,036 | | | | - | | | | - | | | |
Total Assets: | | $ | 202,073 | | | $ | 493,823 | | | $ | - | | | |
For the period ended December 31, 2017, there were transfers from Level 1 to Level 2 in the amount of $444,103 (in thousands). These transfers were the result of the use of fair value procedures on certain foreign securities in the portfolio on December 31, 2017.
The Accompanying Notes are an Integral Part of the Financial Statements.
| | | | | | |
| | International Growth Portfolio | | | 77 | |
Research International Core Portfolio (unaudited)
| | | | |
| Objective: | | Portfolio Strategy: | | Net Assets: |
| Capital appreciation. | | Invest primarily in foreign equity securities, including emerging markets. | | $658 million |
Portfolio Overview
Mason Street Advisors, LLC (“Mason Street Advisors”), the investment adviser for the Research International Core Portfolio (the “Portfolio”), has engaged Massachusetts Financial Services Company (“MFS®”) to act as sub-adviser for the Portfolio. The Portfolio normally invests in foreign equity securities, including emerging market equity securities. A team of investment research analysts selects investments for the Portfolio using a “bottom up” investment approach. The Portfolio allocates assets to analysts by broad market sectors, which generally approximate the sector weightings in the MSCI EAFE® Index. The Portfolio may invest in the stocks of companies it believes to have above average earnings growth potential compared to other companies (growth companies), in the stocks of companies it believes are undervalued compared to their perceived worth (value companies), or in a combination of growth and value companies. The Portfolio also may invest in companies of any size.
Market Overview
For the first time in many years, the global economy experienced a period of synchronized economic growth over the reporting period. The rebound in emerging markets (“EM”) economies was more pronounced, helped by larger economies, such as Brazil and Russia, emerging from recessions. At the same time, developed markets (“DM”) economies continued to grow at or above potential. Market confidence increased in the U.S. during the period, fueled in part by a more lenient U.S. regulatory backdrop and a significant cut in corporate tax rates.
Global markets benefited as commodity prices strengthened, growth prospects improved and inflation moved higher. As a result, DM central banks reduced monetary stimulus. The U.S. Federal Reserve increased interest rates by 25 basis points three times during the period. The European Central Bank continued its quantitative easing program at the end of the period but halved the amount of its monthly asset purchases. In addition, the Bank of England hiked its base rate for the first time in a decade. Markets were comforted, along with central banks, by the decline in fears of a populist surge in Europe after establishment candidates won the Dutch and French elections. Additionally, European economic growth reflected a generally calmer political economic backdrop.
Portfolio Results
The Portfolio returned 28.21% for the twelve months ended December 31, 2017. By comparison, the Portfolio’s primary and secondary benchmarks, the MSCI® All Country World (ex-U.S.) Index (the “Index”) and the MSCI EAFE® Index, returned 27.77% and 25.62%, respectively. (These Indices are unmanaged, cannot be invested in directly, and do not include administrative expenses.) According to Lipper® Analytical Services, Inc., an independent mutual fund ranking company, the average return of the International Multi-Cap Core Funds peer group was 25.27% for 2017.
Strong stock selection in the Materials sector contributed to performance relative to the MSCI All Country World ex-U.S. Index. Within this sector, overweight positions in paint and specialty chemicals manufacturer Akzo Nobel (Netherlands), specialty chemical products maker Sika (Switzerland), industrial gas supplier Linde (Germany) and specialty chemical products producer Croda International (U.K.) helped relative performance.
Stock selection in both the Financials and Health Care sectors also aided relative results. Within the Financials sector, an overweight position in insurance company AIA Group (Hong Kong) and the Portfolio’s holdings of banking firm HDFC Bank (India) supported relative returns. Within the Health Care sector there were no individual stocks among the Portfolio’s largest relative contributors during the reporting period.
Stocks in other sectors that contributed to relative performance included overweight positions in electrical and electronic products manufacturer Techtronic Industries (Hong Kong), household fixture manufacturer Toto (Japan) and luxury goods company LVMH (France). Additionally, holdings of real estate company Leg Immobilien (Germany) further supported relative results.
In contrast, stock selection in both the Information Technology and Energy sectors detracted from relative performance. Within the Information Technology sector, not owning shares of internet-based multiple services company Tencent (China) held back relative returns.
Stocks in other sectors that detracted from relative performance included overweight positions in supply chain support services and information management solutions provider Brambles (Australia), advertising and marketing firm WPP Group (U.K.), telecommunications company KDDI (Japan), tobacco company Japan Tobacco (Japan), pharmaceutical and diagnostic company Roche Holding (Switzerland), parcel delivery services company Yamato (Japan), financial services firm Barclays (U.K.) and global engineering company GKN (U.K.).
| | | | |
| 78 | | Research International Core Portfolio | | |
Research International Core Portfolio (unaudited)
Portfolio Manager Outlook
The following forward-looking comments are the opinion of MFS®, the Portfolio’s sub-adviser.
Regardless of changing economic and market conditions, we will continue to adhere to our investment process, building a Portfolio of fundamentally sound companies. The Portfolio is a sector-neutral portfolio that emphasizes bottom-up fundamental research. Because of this approach, the Portfolio’s sector weightings vary only modestly from those of the general foreign market. Instead, we attempt to outperform the Index by holding what we believe to be the most attractive opportunities among growth and value companies within each sector of the market without regard to market capitalization.
Relative Performance
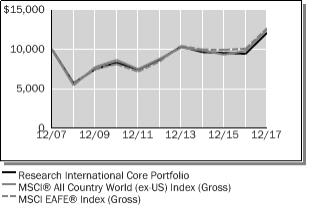
| | | | | | | | | | | | |
Average Annual Total Returns
For Periods Ended December 31, 2017 | |
| | | 1 Year | | | 5 Years | | | 10 Years | |
Research International Core Portfolio | | | 28.21 | % | | | 6.82 | % | | | 1.95 | % |
MSCI® All Country World (ex-US) Index (Gross) | | | 27.77 | % | | | 7.28 | % | | | 2.31 | % |
MSCI EAFE® Index (Gross) | | | 25.62 | % | | | 8.39 | % | | | 2.42 | % |
Lipper® Variable Insurance Products (VIP) International Mulit-Cap Core Funds Average | | | 25.27 | % | | | 7.03 | % | | | 1.71 | % |
The performance data quoted represents past performance. Past performance is historical and does not guarantee future performance. Investment return and principal value will fluctuate, so that shares, when redeemed, may be worth more or less than their original cost. Current performance may be lower or higher than the performance data quoted. For the most recent month-end performance information visit www.northwesternmutual.com.
This chart assumes an initial investment of $10,000 made on 12/31/07. Returns shown reflect fee waivers, deductions for management and other portfolio expenses, and reinvestment of all dividends. In the absence of fee waivers, total return would be reduced. Returns exclude deductions for separate account sale loads and account fees. Please refer to the Benchmark Definitions section of this report for information about the indices cited in the above chart and graph.
Investors should be aware of the risks of investments in foreign securities, particularly investments in securities of companies in developing nations. These include the risks of currency fluctuation, of political and economic instability and of less well-developed government supervision and regulation of business and industry practices, as well as differences in accounting standards.
Investments in the securities of companies in developing nations impose risks different from, and greater than, risks of investing in developed countries.
The Portfolio may invest a relatively large percentage of its assets in issuers located in a single country, a small number of countries, or a particular geographic region. The Portfolio’s performance may be more volatile than that of a more geographically diversified fund, and may be tied more closely to the performance of a single country or region.
The Portfolio may invest a relatively high percentage of its assets in a particular sector. The Portfolio will have greater exposure to the risks associated with that sector and its performance will be tied more closely to the performance of that sector.
| | | | | | |
| | Research International Core Portfolio | | | 79 | |
Research International Core Portfolio (unaudited)
Top 10 Equity Holdings 12/31/17
| | | | | | |
Security Description | | | % of Net Assets | | | |
Nestle SA | | | 3.2 | % | | |
Roche Holding AG | | | 2.7 | % | | |
Bayer AG | | | 2.4 | % | | |
Schneider Electric SE | | | 2.0 | % | | |
AIA Group, Ltd. | | | 1.9 | % | | |
UBS Group AG | | | 1.9 | % | | |
Linde AG | | | 1.8 | % | | |
Novo Nordisk A/S | | | 1.8 | % | | |
Reckitt Benckiser Group PLC | | | 1.8 | % | | |
Danone SA | | | 1.7 | % | | |
Sector Allocation 12/31/17
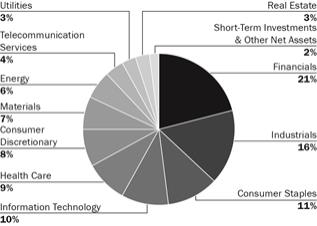
Sector Allocation is based on Net Assets.
Sector Allocation and Top 10 Holdings are subject to change.
| | | | |
| 80 | | Research International Core Portfolio | | |
Research International Core Portfolio
Schedule of Investments
December 31, 2017
| | | | | | | | | | |
| Common Stocks (98.0%) | | | | Shares/
$ Par | | | Value
$ (000’s) | |
| | |
Consumer Discretionary (8.2%) | | | | | | | | |
Ctrip.com International, Ltd.* | | Cayman Islands | | | 48,167 | | | | 2,124 | |
Dollarama, Inc. | | Canada | | | 26,661 | | | | 3,331 | |
Esprit Holdings, Ltd.* | | Bermuda | | | 330,300 | | | | 176 | |
GKN PLC | | United Kingdom | | | 1,440,837 | | | | 6,187 | |
JD.com, Inc., ADR* | | Cayman Islands | | | 72,467 | | | | 3,002 | |
Koito Manufacturing Co., Ltd. | | Japan | | | 99,600 | | | | 7,004 | |
LVMH Moet Hennessy Louis Vuitton SE | | France | | | 29,804 | | | | 8,755 | |
Paddy Power Betfair PLC | | Ireland | | | 30,417 | | | | 3,623 | |
Techtronic Industries Co., Ltd. | | Hong Kong | | | 1,049,500 | | | | 6,840 | |
USS Co., Ltd. | | Japan | | | 359,500 | | | | 7,605 | |
WPP PLC | | Jersey | | | 303,783 | | | | 5,505 | |
| | | | | | | | | | |
Total | | | | | | | | | 54,152 | |
| | | | | | | | | | |
| | | |
Consumer Staples (11.3%) | | | | | | | | | | |
Ambev SA, ADR | | Brazil | | | 484,550 | | | | 3,130 | |
Booker Group PLC | | United Kingdom | | | 1,244,894 | | | | 3,833 | |
Danone SA | | France | | | 133,682 | | | | 11,207 | |
Japan Tobacco, Inc. | | Japan | | | 251,200 | | | | 8,091 | |
L’Oreal SA | | France | | | 37,968 | | | | 8,411 | |
Nestle SA | | Switzerland | | | 246,702 | | | | 21,200 | |
Reckitt Benckiser Group PLC | | United Kingdom | | | 123,728 | | | | 11,557 | |
Sundrug Co., Ltd. | | Japan | | | 144,000 | | | | 6,698 | |
| | | | | | | | | | |
Total | | | | | | | | | 74,127 | |
| | | | | | | | | | |
| | | |
Energy (5.7%) | | | | | | | | | | |
BP PLC | | United Kingdom | | | 1,247,536 | | | | 8,798 | |
Cairn Energy PLC* | | United Kingdom | | | 794,016 | | | | 2,273 | |
Caltex Australia, Ltd. | | Australia | | | 149,765 | | | | 3,972 | |
Enbridge, Inc. | | Canada | | | 119,493 | | | | 4,673 | |
Eni SpA | | Italy | | | 327,464 | | | | 5,415 | |
Galp Energia SGPS SA | | Portugal | | | 243,946 | | | | 4,482 | |
Oil Search, Ltd. | | Papua New Guinea | | | 686,268 | | | | 4,175 | |
Schlumberger, Ltd. | | Curaçao | | | 53,054 | | | | 3,576 | |
| | | | | | | | | | |
Total | | | | | | | | | 37,364 | |
| | | | | | | | | | |
| | | |
Financials (21.3%) | | | | | | | | | | |
AEON Financial Service Co., Ltd. | | Japan | | | 349,300 | | | | 8,112 | |
AIA Group, Ltd. | | Hong Kong | | | 1,493,200 | | | | 12,735 | |
AIB Group PLC | | Ireland | | | 821,054 | | | | 5,418 | |
AMP, Ltd. | | Australia | | | 654,848 | | | | 2,646 | |
Aon PLC | | United Kingdom | | | 43,946 | | | | 5,889 | |
Barclays PLC | | United Kingdom | | | 2,638,212 | | | | 7,193 | |
BNP Paribas SA | | France | | | 138,341 | | | | 10,317 | |
Cerved Information Solutions SpA | | Italy | | | 151,291 | | | | 1,921 | |
DNB ASA | | Norway | | | 311,594 | | | | 5,761 | |
Erste Group Bank AG* | | Austria | | | 131,367 | | | | 5,665 | |
HDFC Bank, Ltd. | | India | | | 170,618 | | | | 5,002 | |
Hiscox, Ltd. | | Bermuda | | | 322,222 | | | | 6,351 | |
| | | | | | | | | | |
| Common Stocks (98.0%) | | | | Shares/
$ Par | | | Value
$ (000’s) | |
| | | |
Financials continued | | | | | | | | | | |
Intesa Sanpaolo SpA | | Italy | | | 2,199,004 | | | | 7,293 | |
Julius Baer Group, Ltd.* | | Switzerland | | | 116,090 | | | | 7,097 | |
Jyske Bank A/S | | Denmark | | | 87,783 | | | | 4,982 | |
KBC Group NV | | Belgium | | | 86,762 | | | | 7,392 | |
Mitsubishi UFJ Financial Group, Inc. | | Japan | | | 1,152,000 | | | | 8,453 | |
Swiss Re AG | | Switzerland | | | 48,153 | | | | 4,508 | |
TMX Group, Ltd. | | Canada | | | 59,503 | | | | 3,334 | |
UBS Group AG* | | Switzerland | | | 686,905 | | | | 12,621 | |
Zurich Insurance Group AG | | Switzerland | | | 25,287 | | | | 7,691 | |
| | | | | | | | | | |
Total | | | | | | | | | 140,381 | |
| | | | | | | | | | |
| | | |
Health Care (9.3%) | | | | | | | | | | |
Bayer AG | | Germany | | | 128,246 | | | | 15,950 | |
Novo Nordisk A/S | | Denmark | | | 220,366 | | | | 11,844 | |
Roche Holding AG | | Switzerland | | | 69,443 | | | | 17,565 | |
Santen Pharmaceutical Co., Ltd. | | Japan | | | 549,800 | | | | 8,632 | |
Terumo Corp. | | Japan | | | 157,100 | | | | 7,423 | |
| | | | | | | | | | |
Total | | | | | | | | | 61,414 | |
| | | | | | | | | | |
| | | |
Industrials (15.9%) | | | | | | | | | | |
Aena SA | | Spain | | | 17,321 | | | | 3,507 | |
Brambles, Ltd. | | Australia | | | 911,748 | | | | 7,148 | |
Daikin Industries, Ltd. | | Japan | | | 81,200 | | | | 9,613 | |
GEA Group AG | | Germany | | | 145,327 | | | | 6,968 | |
Hitachi, Ltd. | | Japan | | | 362,000 | | | | 2,816 | |
Kubota Corp. | | Japan | | | 487,400 | | | | 9,544 | |
Legrand SA | | France | | | 63,403 | | | | 4,875 | |
Linde AG* | | Germany | | | 51,371 | | | | 12,018 | |
Malaysia Airports Holdings Bhd | | Malaysia | | | 1,236,600 | | | | 2,693 | |
RELX NV | | Netherlands | | | 357,219 | | | | 8,212 | |
Ritchie Bros Auctioneers, Inc. | | Canada | | | 96,449 | | | | 2,888 | |
Schindler Holding AG | | Switzerland | | | 29,501 | | | | 6,789 | |
Schneider Electric SE * | | France | | | 151,712 | | | | 12,867 | |
TOTO, Ltd. | | Japan | | | 167,200 | | | | 9,857 | |
Yamato Holdings Co., Ltd. | | Japan | | | 243,000 | | | | 4,892 | |
| | | | | | | | | | |
Total | | | | | | | | | 104,687 | |
| | | | | | | | | | |
| | |
Information Technology (10.3%) | | | | | | | | |
Alibaba Group Holding, Ltd., ADR* | | Cayman Islands | | | 16,816 | | | | 2,900 | |
Amadeus IT Group SA | | Spain | | | 91,982 | | | | 6,621 | |
Broadcom, Ltd. | | Singapore | | | 12,007 | | | | 3,085 | |
Check Point Software Technologies, Ltd.* | | Israel | | | 36,895 | | | | 3,823 | |
Cognizant Technology Solutions Corp. - Class A | | United States | | | 127,003 | | | | 9,020 | |
EPAM Systems, Inc.* | | United States | | | 45,809 | | | | 4,921 | |
Just Eat PLC* | | United Kingdom | | | 343,475 | | | | 3,603 | |
Mastercard, Inc. - Class A | | United States | | | 31,568 | | | | 4,778 | |
Mellanox Technologies, Ltd.* | | Israel | | | 57,168 | | | | 3,699 | |
NAVER Corp. | | South Korea | | | 6,614 | | | | 5,370 | |
The Accompanying Notes are an Integral Part of the Financial Statements.
| | | | | | |
| | Research International Core Portfolio | | | 81 | |
Research International Core Portfolio
| | | | | | | | | | |
| Common Stocks (98.0%) | | | | Shares/
$ Par | | | Value
$ (000’s) | |
| | |
Information Technology continued | | | | | | | | |
Nomura Research Institute, Ltd. | | Japan | | | 97,700 | | | | 4,538 | |
Samsung Electronics Co., Ltd. | | South Korea | | | 1,247 | | | | 2,963 | |
Scout24 AG | | Germany | | | 46,385 | | | | 1,894 | |
Taiwan Semiconductor Manufacturing Co., Ltd. | | Taiwan | | | 880,189 | | | | 6,763 | |
Telefonaktiebolaget LM Ericsson - Class B | | Sweden | | | 603,950 | | | | 3,959 | |
| | | | | | | | | | |
Total | | | | | | | | | 67,937 | |
| | | | | | | | | | |
| | | |
Materials (6.8%) | | | | | | | | | | |
Akzo Nobel NV | | Netherlands | | | 112,964 | | | | 9,881 | |
Croda International PLC | | United Kingdom | | | 132,692 | | | | 7,923 | |
Nippon Paint Holdings Co., Ltd. | | Japan | | | 94,500 | | | | 2,978 | |
Orica, Ltd. | | Australia | | | 203,466 | | | | 2,871 | |
Rio Tinto PLC | | United Kingdom | | | 162,662 | | | | 8,585 | |
Sika AG | | Switzerland | | | 836 | | | | 6,627 | |
Symrise AG | | Germany | | | 67,619 | | | | 5,798 | |
| | | | | | | | | | |
Total | | | | | | | | | 44,663 | |
| | | | | | | | | | |
| | | |
Real Estate (2.5%) | | | | | | | | | | |
Grand City Properties SA | | Luxembourg | | | 285,194 | | | | 6,708 | |
LEG Immobilien AG | | Germany | | | 86,974 | | | | 9,927 | |
| | | | | | | | | | |
Total | | | | | | | | | 16,635 | |
| | | | | | | | | | |
| | | |
Telecommunication Services (4.0%) | | | | | | | | | | |
Advanced Info Service PCL | | Thailand | | | 681,800 | | | | 3,996 | |
Cellnex Telecom SA | | Spain | | | 217,701 | | | | 5,572 | |
| | | | | | | | | | | | |
| Common Stocks (98.0%) | | | | | Shares/
$ Par | | | Value
$ (000’s) | |
| | |
Telecommunication Services continued | | | | | | | | | |
Com Hem Holding AB | | | Sweden | | | | 163,262 | | | | 2,495 | |
KDDI Corp. | | | Japan | | | | 295,700 | | | | 7,362 | |
SoftBank Group Corp. | | | Japan | | | | 84,800 | | | | 6,700 | |
| | | | | | | | | | | | |
Total | | | | | | | | | | | 26,125 | |
| | | | | | | | | | | | |
| | | |
Utilities (2.7%) | | | | | | | | | | | | |
APA Group | | | Australia | | | | 597,865 | | | | 3,880 | |
China Resources Gas Group, Ltd. | | | Bermuda | | | | 1,188,000 | | | | 4,292 | |
CLP Holdings, Ltd. | | | Hong Kong | | | | 520,500 | | | | 5,326 | |
Iberdrola, SA | | | Spain | | | | 515,266 | | | | 3,988 | |
| | | | | | | | | | | | |
Total | | | | | | | | | | | 17,486 | |
| | | | | | | | | | | | |
| | | |
Total Common Stocks | | | | | | | | | | | | |
(Cost: $529,423) | | | | | | | | | | | 644,971 | |
| | | | | | | | | | | | |
| | | |
| Short-Term Investments (2.2%) | | | | | | | | | |
| | |
US Government & Agencies (2.2%) | | | | | | | | | |
Federal Home Loan Bank, 0.000%, 1/2/18 | | | | | | | 14,438,000 | | | | 14,438 | |
| | | | | | | | | | | | |
| | | |
Total Governments | | | | | | | | | | | | |
(Cost: $14,438) | | | | | | | | | | | 14,438 | |
| | | | | | | | | | | | |
| | | |
Total Investments (100.2%) | | | | | | | | | | | | |
(Cost: $543,861)(a) | | | | | | | | | | | 659,409 | |
| | | | | | | | | | �� | | |
Other Assets, Less | | | | | | | | | | | | |
Liabilities (-0.2%) | | | | | | | | | | | (1,404 | ) |
| | | | | | | | | | | | |
Net Assets (100.0%) | | | | | | | | | | | 658,005 | |
| | | | | | | | | | | | |
| | ADR after the name of a security represents—American Depositary Receipt. |
| (a) | At December 31, 2017, the aggregate cost of investments, including derivatives, for federal tax purposes (in thousands) was $547,271 and the net unrealized appreciation of investments based on that cost was $112,138 which is comprised of $123,108 aggregate gross unrealized appreciation and $10,970 aggregate gross unrealized depreciation. |
| | | | | | |
Investments Percentage by Country is based on Net Assets: | | | | | | |
Japan | | | 18.3% | | | |
Switzerland | | | 12.8% | | | |
United Kingdom | | | 10.0% | | | |
France | | | 8.6% | | | |
Germany | | | 8.0% | | | |
United States | | | 5.0% | | | |
Other | | | 37.5% | | | |
Total | | | 100.2% | | | |
The Accompanying Notes are an Integral Part of the Financial Statements.
| | | | |
| 82 | | Research International Core Portfolio | | |
Research International Core Portfolio
The following is a summary of the inputs used in valuing the Portfolio’s assets and liabilities at December 31, 2017. See Note 3 for additional information on portfolio valuation.
| | | | | | | | | | | | | | |
| | | Valuation Inputs | | | |
| Description | | Level 1 –
Quoted Prices | | | Level 2 –
Other Significant
Observable Inputs | | | Level 3 –
Significant
Unobservable Inputs | | | |
| | | (Amounts in thousands) | | | |
| Assets: | | | | | | |
Common Stocks | | | | | | | | | | | | | | |
Consumer Discretionary | | $ | 8,457 | | | $ | 45,696 | | | $ | - | | | |
Consumer Staples | | | 3,130 | | | | 70,997 | | | | - | | | |
Energy | | | 8,249 | | | | 29,115 | | | | - | | | |
Financials | | | 14,641 | | | | 125,739 | | | | - | | | |
Industrials | | | 2,888 | | | | 101,799 | | | | - | | | |
Information Technology | | | 32,225 | | | | 35,712 | | | | - | | | |
All Others | | | - | | | | 166,323 | | | | - | | | |
Short-Term Investments | | | - | | | | 14,438 | | | | - | | | |
Total Assets: | | $ | 69,590 | | | $ | 589,819 | | | $ | - | | | |
For the period ended December 31, 2017, there were transfers from Level 1 to Level 2 in the amount of $497,184 (in thousands). These transfers were the result of the use of fair value procedures on certain foreign securities in the portfolio on December 31, 2017.
The Accompanying Notes are an Integral Part of the Financial Statements.
| | | | | | |
| | Research International Core Portfolio | | | 83 | |
International Equity Portfolio (unaudited)
| | | | |
| Objective: | | Portfolio Strategy: | | Net Assets: |
Long-term growth of capital. Any income realized will be incidental. | | Invests primarily in equity securities of issuers outside of the U.S. with favorable long-term potential relative to current market values. | | $1.9 billion |
Portfolio Overview
Mason Street Advisors, LLC (“Mason Street Advisors”), the investment adviser for the International Equity Portfolio (“the Portfolio”), has engaged Templeton Investment Counsel, LLC (“Templeton”) to act as sub-adviser for the Portfolio. The Portfolio may purchase securities in any foreign country, including those with developed markets and emerging markets. The Portfolio’s investments in equity securities may include small, medium and large capitalization issues that are believed to be undervalued. The Portfolio’s strategy reflects a “bottom up”, value oriented and long-term investment philosophy. In choosing equity investments, the Portfolio will focus on the market price of a company’s securities in relation to the company’s long-term earnings (typically 5 years), asset value and cash flow potential. A company’s historical value measures, including price/earnings ratio, profit margins and liquidation value, will also be considered.
Market Overview
The global economy grew moderately during the reporting period. Global developed and emerging market stocks rose significantly, as measured by the MSCI® All Country World Index. Global markets reflected investor concerns about political uncertainty in the U.S. and the European Union (E.U.), the terms of the U.K.’s exit from the E.U., geopolitical tensions in various regions, global oil oversupply and hawkish comments from key central bankers around the world. However, global markets were aided by price gains in oil and other commodities, generally upbeat economic data across regions, the European Central Bank’s extension of its monetary easing program, and investor optimism about pro-growth and pro-business policies in the U.S. The prospect for reforms in the E.U. with the election of Emmanuel Macron as France’s president, encouraging corporate earnings reports and the passage of the U.S. tax reform bill also supported global stocks.
Portfolio Results
The Portfolio returned 22.30% for the twelve months ended December 31, 2017. By comparison, the Portfolio’s benchmark, the MSCI® All Country World (ex-US) Index (the “Index”), returned 27.77%. (The Index is unmanaged, cannot be invested in directly and does not include administrative expenses.) According to Lipper® Analytical Services, Inc., an independent mutual fund rating agency, the average return for the International Multi-Cap Value Funds peer group was 22.28% for 2017.
International equities rallied in 2017 as investors looked beyond political turmoil and nascent monetary policy tightening, focusing instead on global growth and fiscal stimulus that could potentially help earnings growth. The Portfolio delivered solid absolute gains but trailed the Index as a challenging environment for value investors contributed to stock-specific setbacks.
Health Care was the biggest sector detractor, pressured by stock selection and an overweighting. Israeli generic drug maker Teva Pharmaceutical Industries declined after reducing its guidance, leading to concerns about its debt profile. The portfolio manager’s analysis indicated that Teva did not have a liquidity problem and should be able to address balance sheet issues, cut costs and deliver on a more conservative outlook. The Health Care sector remained subject to concerns about generic competition, regulatory scrutiny and a consolidating payor sector, all of which were believed to be overstated and addressable.
The Portfolio’s overweight position and stock-specific weakness in Energy also hurt relative results. U.K.-based oilfield services company Petrofac Limited declined amid a regulatory investigation. The portfolio manager had been constructive on the stock given his view that it had a healthy backlog, strategic refocus on core assets and prudent balance sheet deleveraging, but the escalating fraud investigation seemed to be a thesis changer, and the position was divested to avoid further downside risk. More broadly, the decision to remain overweight in Energy despite fears of a supply glut proved beneficial as oil rallied and the sector outperformed in the second half.
Turning to contributors, stock selection and an underweight position worked well in the Financials sector, led by Asian and European lenders. Select European and Asian markets benefited from an economic upturn and the potential for incrementally tighter monetary policy. Stock selection and underweight allocations also drove Consumer Staples and Utilities outperformance relative to the benchmark; the portfolio manager remained cautious on these sectors, which he considered expensive bond proxies.
Regionally, stock-specific weakness among underweighted Asian and over-weighted European holdings detracted from relative results.
| | | | |
| 84 | | International Equity Portfolio | | |
International Equity Portfolio (unaudited)
Portfolio Manager Outlook
The following forward looking comments are the opinion of Templeton, the Portfolio’s sub-adviser.
After outperforming growth in 2016, value lagged in 2017 by the most in two decades, marking the tenth year out of the past eleven that global value has underperformed global growth. In our view, value’s headwinds stem largely from unconventional monetary policies, which, since the global financial crisis, have depressed interest rates and sent investors out the risk curve in search of growth and yield. We believe these policies are unsustainable for three reasons. First, they increase social inequality, which has political consequences; second, they inflate asset prices, which creates stability risks; and third, rising inflationary pressures and falling unemployment gives data-dependent central bankers cause to begin reversing such policies. As policies transition, we believe the mature cycle could eventually change and with it the conditions unfavorable to value. We would not want to own the leaders of the last cycle during this transition: the growth stocks and bond proxies trading at valuations we consider expensive. However, the stocks left behind—those of companies whose long-term fundamentals have been overlooked and undervalued by a myopic market—appear to us well positioned over a long-term investment horizon we believe is likely to include an inflection point in this mature cycle.
Relative Performance
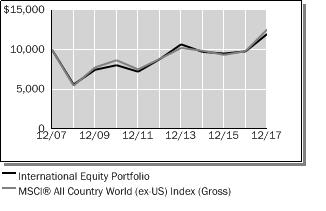
| | | | | | | | | | | | |
Average Annual Total Returns
For Periods Ended December 31, 2017 | |
| | | 1 Year | | | 5 Years | | | 10 Years | |
International Equity Portfolio | | | 22.30 | % | | | 6.37 | % | | | 1.83 | % |
MSCI® All Country World (ex-US) Index (Gross) | | | 27.77 | % | | | 7.28 | % | | | 2.31 | % |
MSCI EAFE® Index (Gross) | | | 25.62 | % | | | 8.39 | % | | | 2.42 | % |
Lipper® Variable Insurance Products (VIP) International Multi-Cap Value Funds Average | | | 22.28 | % | | | 7.22 | % | | | 1.29 | % |
The performance data quoted represents past performance. Past performance is historical and does not guarantee future performance. Investment return and principal value will fluctuate, so that shares, when redeemed, may be worth more or less than their original cost. Current performance may be lower or higher than the performance data quoted. For the most recent month-end performance information visit www.northwesternmutual.com.
This chart assumes an initial investment of $10,000 made on 12/31/07. Returns shown reflect fee waivers, deductions for management and other portfolio expenses, and reinvestment of all dividends. In the absence of fee waivers, total return would be reduced. Returns exclude deductions for separate account sale loads and account fees. Please refer to the Benchmark Definitions section of this report for information about the indices cited in the above chart and graph.
Investors should be aware of the risks of investments in foreign securities, particularly investments in securities of companies in developing nations. These include the risks of currency fluctuation, of political and economic instability and of less well-developed government supervision and regulation of business and industry practices, as well as differences in accounting standards.
Investments in the securities of companies in developing nations impose risks different from, and greater than, risks of investing in developed countries.
The Portfolio may invest a relatively large percentage of its assets in issuers located in a single country, a small number of countries, or a particular geographic region. The Portfolio’s performance may be more volatile than that of a more geographically diversified fund, and may be tied more closely to the performance of a single country or region.
The Portfolio may invest a relatively high percentage of its assets in a particular sector. The Portfolio will have greater exposure to the risks associated with that sector and its performance will be tied more closely to the performance of that sector.
| | | | | | |
| | International Equity Portfolio | | | 85 | |
International Equity Portfolio (unaudited)
Top 10 Equity Holdings 12/31/17
| | | | | | | | |
Security Description | | | % of Net Assets | | | | | |
Samsung Electronics Co., Ltd. | | | 3.3 | % | | | | |
BP PLC | | | 2.1 | % | | | | |
Standard Chartered PLC | | | 1.9 | % | | | | |
Royal Dutch Shell PLC - Class B | | | 1.9 | % | | | | |
Galp Energia SGPS SA | | | 1.8 | % | | | | |
HSBC Holdings PLC | | | 1.7 | % | | | | |
Telenor ASA | | | 1.6 | % | | | | |
TOTAL SA | | | 1.5 | % | | | | |
Vodafone Group PLC | | | 1.5 | % | | | | |
Baidu, Inc., ADR | | | 1.5 | % | | | | |
Sector Allocation 12/31/17
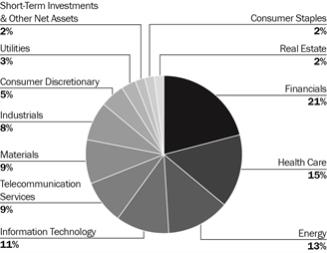
Sector Allocation is based on Net Assets.
Sector Allocation and Top 10 Holdings are subject to change.
| | | | |
| 86 | | International Equity Portfolio | | |
International Equity Portfolio
Schedule of Investments
December 31, 2017
| | �� | | | | | | | | |
| Common Stocks (97.1%) | | Country | | Shares/
$ Par | | | Value
$ (000’s) | |
| | | |
Consumer Discretionary (5.3%) | | | | | | | | | | |
Cie Generale des Etablissements Michelin | | France | | | 131,608 | | | | 18,852 | |
Kingfisher PLC | | United Kingdom | | | 5,779,010 | | | | 26,345 | |
Panasonic Corp. | | Japan | | | 1,075,080 | | | | 15,744 | |
Ryohin Keikaku Co., Ltd. | | Japan | | | 75,300 | | | | 23,445 | |
SES SA | | Luxembourg | | | 1,088,580 | | | | 16,963 | |
| | | | | | | | | | |
Total | | | | | | | | | 101,349 | |
| | | | | | | | | | |
| | | |
Consumer Staples (2.3%) | | | | | | | | | | |
Kirin Holdings Co., Ltd. | | Japan | | | 863,000 | | | | 21,713 | |
Seven & i Holdings Co., Ltd. | | Japan | | | 134,300 | | | | 5,578 | |
Suntory Beverage & Food, Ltd. | | Japan | | | 401,300 | | | | 17,846 | |
| | | | | | | | | | |
Total | | | | | | | | | 45,137 | |
| | | | | | | | | | |
| | | |
Energy (12.8%) | | | | | | | | | | |
BP PLC | | United Kingdom | | | 5,622,920 | | | | 39,656 | |
Eni SpA | | Italy | | | 1,605,485 | | | | 26,550 | |
Galp Energia SGPS SA | | Portugal | | | 1,849,900 | | | | 33,985 | |
Husky Energy, Inc.* | | Canada | | | 1,138,760 | | | | 16,080 | |
Inpex Corp. | | Japan | | | 952,120 | | | | 11,915 | |
Kunlun Energy Co., Ltd. | | Bermuda | | | 13,549,350 | | | | 14,120 | |
PTT Exploration & Production PCL | | Thailand | | | 1,876,300 | | | | 5,757 | |
Royal Dutch Shell PLC - Class B | | United Kingdom | | | 1,055,335 | | | | 35,593 | |
SBM Offshore NV | | Netherlands | | | 1,371,290 | | | | 24,130 | |
Suncor Energy, Inc. | | Canada | | | 255,440 | | | | 9,378 | |
TOTAL SA | | France | | | 535,650 | | | | 29,555 | |
| | | | | | | | | | |
Total | | | | | | | | | 246,719 | |
| | | | | | | | | | |
| | | |
Financials (20.6%) | | | | | | | | | | |
Aegon NV | | Netherlands | | | 3,999,610 | | | | 25,490 | |
AIA Group, Ltd. | | Hong Kong | | | 2,358,020 | | | | 20,110 | |
AXA SA | | France | | | 744,155 | | | | 22,055 | |
Bangkok Bank PCL | | Thailand | | | 4,208,000 | | | | 26,078 | |
Bank of Ireland Group PLC* | | Ireland | | | 966,600 | | | | 8,223 | |
Barclays PLC | | United Kingdom | | | 9,127,140 | | | | 24,886 | |
BNP Paribas SA | | France | | | 371,430 | | | | 27,699 | |
China Life Insurance Co., Ltd. | | China | | | 6,331,010 | | | | 19,764 | |
Credit Agricole SA | | France | | | 768,660 | | | | 12,698 | |
DBS Group Holdings, Ltd. | | Singapore | | | 1,447,180 | | | | 26,796 | |
Hana Financial Group, Inc. | | South Korea | | | 344,710 | | | | 16,039 | |
HSBC Holdings PLC | | United Kingdom | | | 3,236,027 | | | | 33,058 | |
ING Groep NV | | Netherlands | | | 1,283,032 | | | | 23,609 | |
KB Financial Group, Inc., ADR* | | South Korea | | | 237,530 | | | | 13,898 | |
Standard Chartered PLC* | | United Kingdom | | | 3,417,202 | | | | 35,960 | |
Swiss Re AG | | Switzerland | | | 182,382 | | | | 17,072 | |
UBS Group AG* | | Switzerland | | | 1,171,840 | | | | 21,532 | |
UNIQA Insurance Group AG | | Austria | | | 1,268,484 | | | | 13,419 | |
| | | | | | | | | | |
| Common Stocks (97.1%) | | Country | | Shares/
$ Par | | | Value
$ (000’s) | |
| | | |
Financials continued | | | | | | | | | | |
United Overseas Bank, Ltd. | | Singapore | | | 477,240 | | | | 9,415 | |
| | | | | | | | | | |
Total | | | | | | | | | 397,801 | |
| | | | | | | | | | |
| | | |
Health Care (14.4%) | | | | | | | | | | |
Astellas Pharma, Inc. | | Japan | | | 1,493,930 | | | | 18,975 | |
Bayer AG | | Germany | | | 209,050 | | | | 26,001 | |
Getinge AB - Class B | | Sweden | | | 676,171 | | | | 9,770 | |
GlaxoSmithKline PLC | | United Kingdom | | | 503,400 | | | | 8,904 | |
Merck KGaA | | Germany | | | 251,030 | | | | 27,033 | |
MorphoSys AG* | | Germany | | | 256,240 | | | | 23,456 | |
Qiagen NV* | | Netherlands | | | 378,752 | | | | 11,827 | |
Roche Holding AG | | Switzerland | | | 96,190 | | | | 24,331 | |
Sanofi | | France | | | 304,975 | | | | 26,259 | |
Shanghai Pharmaceuticals Holding Co., Ltd. | | China | | | 5,366,610 | | | | 14,492 | |
Shire PLC | | Jersey | | | 466,660 | | | | 24,205 | |
Sinopharm Group Co., Ltd. | | China | | | 2,825,200 | | | | 12,169 | |
Teva Pharmaceutical Industries, Ltd., ADR | | Israel | | | 1,501,760 | | | | 28,458 | |
UCB SA | | Belgium | | | 275,350 | | | | 21,820 | |
| | | | | | | | | | |
Total | | | | | | | | | 277,700 | |
| | | | | | | | | | |
| | | |
Industrials (8.2%) | | | | | | | | | | |
BAE Systems PLC | | United Kingdom | | | 2,968,690 | | | | 22,833 | |
Cie de Saint-Gobain | | France | | | 460,830 | | | | 25,362 | |
CK Hutchison Holdings, Ltd. | | Cayman Islands | | | 2,040,070 | | | | 25,613 | |
IHI Corp. | | Japan | | | 368,800 | | | | 12,277 | |
Rolls-Royce Holdings PLC* | | United Kingdom | | | 1,926,730 | | | | 21,928 | |
Siemens AG | | Germany | | | 159,550 | | | | 22,138 | |
Siemens AG, ADR | | Germany | | | 101,560 | | | | 7,035 | |
Travis Perkins PLC | | United Kingdom | | | 956,600 | | | | 20,226 | |
| | | | | | | | | | |
Total | | | | | | | | | 157,412 | |
| | | | | | | | | | |
| | | |
Information Technology (10.6%) | | | | | | | | | | |
Baidu, Inc., ADR* | | China | | | 122,680 | | | | 28,733 | |
Infineon Technologies AG | | Germany | | | 685,510 | | | | 18,723 | |
Konica Minolta, Inc. | | Japan | | | 2,077,820 | | | | 19,999 | |
NetEase, Inc. | | Cayman Islands | | | 23,770 | | | | 8,202 | |
Omron Corp. | | Japan | | | 229,700 | | | | 13,681 | |
Pegatron Corp. | | Taiwan | | | 585,330 | | | | 7,103 | |
Quanta Computer, Inc. | | Taiwan | | | 4,807,820 | | | | 9,983 | |
Samsung Electronics Co., Ltd.* | | South Korea | | | 26,820 | | | | 63,719 | |
SAP SE | | Germany | | | 84,650 | | | | 9,492 | |
Taiwan Semiconductor Manufacturing Co., Ltd. | | Taiwan | | | 3,188,135 | | | | 24,498 | |
| | | | | | | | | | |
Total | | | | | | | | | 204,133 | |
| | | | | | | | | | |
| | | |
Materials (9.1%) | | | | | | | | | | |
Akzo Nobel NV | | Netherlands | | | 256,360 | | | | 22,424 | |
CRH PLC | | Ireland | | | 558,050 | | | | 20,001 | |
HeidelbergCement AG | | Germany | | | 249,870 | | | | 27,049 | |
The Accompanying Notes are an Integral Part of the Financial Statements.
| | | | | | |
| | International Equity Portfolio | | | 87 | |
International Equity Portfolio
| | | | | | | | | | |
| Common Stocks (97.1%) | | Country | | Shares/
$ Par | | | Value
$ (000’s) | |
| | | |
Materials continued | | | | | | | | | | |
LANXESS AG | | Germany | | | 334,970 | | | | 26,634 | |
Novozymes A/S | | Denmark | | | 308,870 | | | | 17,645 | |
Sumitomo Metal Mining Co., Ltd. | | Japan | | | 517,350 | | | | 23,735 | |
Tahoe Resources, Inc. | | Canada | | | 667,970 | | | | 3,204 | |
thyssenkrupp AG | | Germany | | | 378,970 | | | | 11,004 | |
Wheaton Precious Metals Corp. | | Canada | | | 317,420 | | | | 7,018 | |
Yara International ASA | | Norway | | | 375,770 | | | | 17,200 | |
| | | | | | | | | | |
Total | | | | | | | | | 175,914 | |
| | | | | | | | | | |
| | | |
Real Estate (1.9%) | | | | | | | | | | |
CK Asset Holdings, Ltd. | | Cayman Islands | | | 2,040,070 | | | | 17,832 | |
Mitsui Fudosan Co., Ltd. | | Japan | | | 811,700 | | | | 18,197 | |
| | | | | | | | | | |
Total | | | | | | | | | 36,029 | |
| | | | | | | | | | |
| | | |
Telecommunication Services (9.4%) | | | | | | | | | | |
China Mobile, Ltd. | | China | | | 2,050,700 | | | | 20,758 | |
China Telecom Corp., Ltd. - Class H | | China | | | 50,940,160 | | | | 24,237 | |
Singapore Telecommunications, Ltd. | | Singapore | | | 10,531,850 | | | | 28,111 | |
SoftBank Group Corp. | | Japan | | | 362,440 | | | | 28,634 | |
Telefonica Deutschland Holding AG | | Germany | | | 3,793,460 | | | | 19,050 | |
Telenor ASA | | Norway | | | 1,440,340 | | | | 30,853 | |
Vodafone Group PLC | | United Kingdom | | | 9,251,794 | | | | 29,227 | |
| | | | | | | | | | |
Total | | | | | | | | | 180,870 | |
| | | | | | | | | | |
| | | |
Utilities (2.5%) | | | | | | | | | | |
Innogy SE | | Germany | | | 453,620 | | | | 17,678 | |
Orsted A/S | | Denmark | | | 171,790 | | | | 9,359 | |
| | | | | | | | | | | | |
| Common Stocks (97.1%) | | Country | | | Shares/
$ Par | | | Value
$ (000’s) | |
| | | |
Utilities continued | | | | | | | | | | | | |
Veolia Environnement SA | | | France | | | | 832,890 | | | | 21,250 | |
| | | | | | | | | | | | |
Total | | | | | | | | | | | 48,287 | |
| | | | | | | | | | | | |
| | | |
Total Common Stocks | | | | | | | | | | | | |
(Cost: $1,535,291) | | | | | | | | | | | 1,871,351 | |
| | | | | | | | | | | | |
| | | |
| Preferred Stocks (0.4%) | | | | | | | | | |
| | | |
Health Care (0.4%) | | | | | | | | | | | | |
Draegerwerk AG & Co. KGaA | | | Germany | | | | 92,710 | | | | 8,039 | |
| | | | | | | | | | | | |
| | | |
Total Preferred Stocks | | | | | | | | | | | | |
(Cost: $11,723) | | | | | | | | | | | 8,039 | |
| | | | | | | | | | | | |
| | | |
| Short-Term Investments (2.4%) | | | | | | | | | |
| | | |
Money Market Funds (2.0%) | | | | | | | | | | | | |
State Street Institutional U.S. Government Money Market Fund - Premier Class, 1.209% # | | | United States | | | | 38,877,938 | | | | 38,878 | |
| | | | | | | | | | | | |
Total | | | | | | | | | | | 38,878 | |
| | | | | | | | | | | | |
| | | |
US Government & Agencies (0.4%) | | | | | | | | | | | | |
Federal Home Loan Bank,
0.000%, 1/2/18 | | | United States | | | | 6,500,000 | | | | 6,500 | |
| | | | | | | | | | | | |
Total | | | | | | | | | | | 6,500 | |
| | | | | | | | | | | | |
| | | |
Total Short-Term Investments | | | | | | | | | | | | |
(Cost: $45,378) | | | | | | | | | | | 45,378 | |
| | | | | | | | | | | | |
| | | |
Total Investments (99.9%) | | | | | | | | | | | | |
(Cost: $1,592,392)(a) | | | | | | | | | | | 1,924,768 | |
| | | | | | | | | | | | |
Other Assets, Less | | | | | | | | | | | | |
Liabilities (0.1%) | | | | | | | | | | | 2,905 | |
| | | | | | | | | | | | |
Net Assets (100.0%) | | | | | | | | | | | 1,927,673 | |
| | | | | | | | | | | | |
| # | 7-day yield as of 12/31/2017 |
| | ADR after the name of a security represents—American Depositary Receipt. |
| | GDR after the name of a security represents—Global Depositary Receipt. |
| (a) | At December 31, 2017, the aggregate cost of investments, including derivatives, for federal tax purposes (in thousands) was $1,596,161 and the net unrealized appreciation of investments based on that cost was $328,607 which is comprised of $410,967 aggregate gross unrealized appreciation and $82,360 aggregate gross unrealized depreciation. |
| | | | | | |
Investments Percentage by Country is based on Net Assets: | | | | | | |
United Kingdom | | | 15.5% | | | |
Germany | | | 12.6% | | | |
Japan | | | 12.0% | | | |
France | | | 9.5% | | | |
China | | | 6.2% | | | |
Netherlands | | | 5.6% | | | |
Other | | | 38.4% | | | |
Total | | | 99.9% | | | |
The Accompanying Notes are an Integral Part of the Financial Statements.
| | | | |
| 88 | | International Equity Portfolio | | |
International Equity Portfolio
The following is a summary of the inputs used in valuing the Portfolio’s assets and liabilities at December 31, 2017. See Note 3 for additional information on portfolio valuation.
| | | | | | | | | | | | | | |
| | | Valuation Inputs | | | |
| Description | | Level 1 – Quoted Prices | | | Level 2 – Other Significant
Observable Inputs | | | Level 3 – Significant
Unobservable Inputs | | | |
| | | | | | (Amounts in thousands) | | | | | | |
Assets: | | | | | | | | | | | | | | |
Common Stocks | | | | | | | | | | | | | | |
Energy | | $ | 25,459 | | | $ | 221,260 | | | $ | - | | | |
Financials | | | 13,898 | | | | 383,903 | | | | - | | | |
Health Care | | | 28,458 | | | | 249,242 | | | | - | | | |
Industrials | | | 7,035 | | | | 150,377 | | | | - | | | |
Information Technology | | | 44,038 | | | | 160,095 | | | | - | | | |
Materials | | | 10,222 | | | | 165,692 | | | | - | | | |
All Others | | | - | | | | 411,672 | | | | - | | | |
Preferred Stocks | | | - | | | | 8,039 | | | | - | | | |
Short-Term Investments | | | 38,878 | | | | 6,500 | | | | - | | | |
Total Assets: | | $ | 167,988 | | | $ | 1,756,780 | | | $ | - | | | |
For the period ended December 31, 2017, there were transfers from Level 1 to Level 2 in the amount of $1,545,591 (in thousands). These transfers were the result of the use of fair value procedures on certain foreign securities in the portfolio on December 31, 2017.
The Accompanying Notes are an Integral Part of the Financial Statements.
| | | | | | |
| | International Equity Portfolio | | | 89 | |
Emerging Markets Equity Portfolio (unaudited)
| | | | |
| Objective: | | Portfolio Strategy: | | Net Assets: |
| Capital Appreciation. | | Invest in equity securities of issuers that are tied economically to emerging market countries. | | $718 million |
Portfolio Overview
Mason Street Advisors, LLC (“Mason Street Advisors”), the investment adviser for the Emerging Markets Equity Portfolio (“the Portfolio”), has engaged Aberdeen Asset Managers Limited (“Aberdeen”) to act as sub-adviser for the Portfolio. Aberdeen was appointed sub-adviser to the Portfolio effective March 24, 2017. Prior to that time, the Portfolio was sub-advised by Massachusetts Financial Services Company (“MFS®”). The Portfolio normally invests in equity securities of issuers that are tied economically to emerging market countries. Emerging market countries include countries determined by the Portfolio’s portfolio managers to have emerging market economies, taking into account a number of factors, such as the country’s credit rating, its political and economic stability and the development of its financial and capital markets. The Portfolio may invest in companies of any size. The Portfolio employs a fundamental “bottom up” equity investment style, which is characterized by intensive, first-hand research and disciplined company evaluation. Investments are identified for their long-term, fundamental value.
Market Overview
Emerging market equities rallied in 2017. While geopolitical tensions occasionally threatened global risk appetites, sentiment was boosted by improving corporate earnings, buoyant economic signals worldwide and stabilizing oil prices. Despite three U.S. Federal Reserve rate hikes, the U.S. dollar remained subdued against most emerging market currencies.
Chinese shares rose on resilient growth and a sharp rise in internet stocks, despite Beijing’s efforts to curb financial risks. Indian markets benefited from Prime Minister Narendra Modi’s progress on crucial reforms, though growth somewhat slowed. Central Europe outperformed, thanks to growing economic optimism in Poland, the Czech Republic and Hungary. South Africa enjoyed a year-end rally after Cyril Ramaphosa won the ANC Party leadership on hopes that he will implement reforms. In Latin America, Brazilian stocks were resilient amid encouraging economic signals and interest rate cuts. But Mexico was pressured by earthquakes in September and uncertainty over the North American Free Trade Agreement.
Portfolio Results
The Portfolio returned 27.84% for the twelve months ended December 31, 2017. By comparison, the Portfolio’s benchmark, the MSCI® Emerging Markets Index (the “Index”) returned 37.75%. (This Index is unmanaged, cannot be invested in directly and does not include administrative expenses.) According to Lipper® Analytical Services, Inc., an independent mutual fund ranking agency, the average return of the Emerging Markets Funds peer group was 37.62% for 2017.
As noted above, prior to March 24, 2017, the Portfolio was managed by MFS®. With respect to the period prior to March 24, 2017, the Portfolio’s underperformance relative to the Index was largely a result of weak stock selection in the Information Technology sector. Specifically, weakness in the internet software & services and communications equipment industries held back relative results in the sector.
The following attribution comments relate to the period March 24, 2017 through December 31, 2017, during which Aberdeen acted as the Portfolio’s sub-adviser.
The Portfolio’s underperformance during this portion of the year was largely due to its underweight to both China and the Information Technology sector. In 2017, Chinese internet heavyweights, including Tencent and Alibaba, advanced substantially, resulting in a narrow market rally. Not holding Tencent for much of the year, and the lack of exposure to Alibaba, magnified the Portfolio’s underperformance, and outweighed the positive contributions of other mainland holdings like Kweichow Moutai, Hangzhou Hikvision and Shanghai International Airport.
The overweight to consumer stocks also hurt relative performance. Notably, Russian retailer Magnit fell on disappointing earnings amid challenges in executing its turnaround strategy. Indonesian conglomerate Astra International dragged, as it reported below-par results and faced greater competition for its core automotive business. Nevertheless, the managers were confident that both companies’ weaknesses were temporary. Elsewhere, the underweight to Korea hurt, as the market rallied on perceptions of improved political stability.
More positively, the Portfolio’s underweight to Taiwan lifted relative performance. Markets there weakened in the second half, driven by components manufacturers’ production delays associated with the iPhone X. The lack of exposure to the Middle East was another bright spot, as markets were hampered by heightened geopolitical risks. Stock selection was also positive in Brazil, as retailer Lojas Renner rallied on expectations of improved consumer spending.
| | | | |
| 90 | | Emerging Markets Equity Portfolio | | |
Emerging Markets Equity Portfolio (unaudited)
Portfolio Manager Outlook
The following forward-looking comments are the opinion of Aberdeen, the Portfolio’s sub-adviser.
After a stellar year, emerging markets should continue to be supported by stable growth and expectations for improving earnings. A number of risks could present short-term challenges. Recent U.S. tax reform and quicker-than-expected rate hikes could strengthen the dollar and trigger outflows. Political uncertainty due to elections in key markets may also dampen sentiment. That said, the asset class continues to be buoyed by broadening global growth and moderate inflation. Company-level efforts to improve capital allocations and margins should underpin higher profits. Various long-run structural factors also seem favorable, such as a growing middle class with rising wealth, which should boost consumer and financial companies. Some holdings are also well-positioned to benefit from new secular themes, including the expansion of trends like cloud computing and the “Internet of Things” in the Information Technology sector. Overall, prospects are encouraging. But we remain committed to investing in well-managed companies with solid fundamentals, and engaging them consistently, to maintain the Portfolio’s quality.
Relative Performance
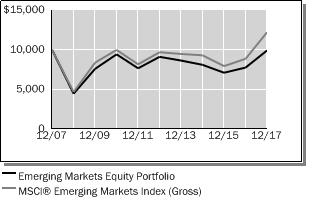
| | | | | | | | | | | | |
Average Annual Total Returns
For Periods Ended December 31, 2017 | |
| | | 1 Year | | | 5 Years | | | 10 Years | |
Emerging Markets Equity Portfolio | | | 27.84 | % | | | 1.70 | % | | | -0.08 | % |
MSCI® Emerging Markets Index (Gross) | | | 37.75 | % | | | 4.73 | % | | | 2.02 | % |
Lipper® Variable Insurance Products (VIP) Emerging Markets Funds Average | | | 37.62 | % | | | 4.51 | % | | | 1.31 | % |
The performance data quoted represents past performance. Past performance is historical and does not guarantee future performance. Investment return and principal value will fluctuate, so that shares, when redeemed, may be worth more or less than their original cost. Current performance may be lower or higher than the performance data quoted. For the most recent month-end performance information visit www.northwesternmutual.com
This chart assumes an initial investment of $10,000 made on 12/31/07. Returns shown reflect fee waivers, deductions for management and other portfolio expenses, and reinvestment of all dividends. In the absence of fee waivers, total return would be reduced. Returns exclude deductions for separate account sale loads and account fees. Please refer to the Benchmark Definitions section of this report for information about the indices cited in the above chart and graph.
Investors should be aware of the risks of investments in foreign securities, particularly investments in securities of companies in developing nations. These include the risks of currency fluctuation, of political and economic instability and of less well-developed government supervision and regulation of business and industry practices, as well as differences in accounting standards.
Investments in the securities of companies in developing nations impose risks different from, and greater than, risks of investing in developed countries.
| | | | | | |
| | Emerging Markets Equity Portfolio | | | 91 | |
Emerging Markets Equity Portfolio (unaudited)
The Portfolio may invest a relatively large percentage of its assets in issuers located in a single country, a small number of countries, or a particular geographic region. The Portfolio’s performance may be more volatile than that of a more geographically diversified fund, and may be tied more closely to the performance of a single country or region.
The Portfolio may invest a relatively high percentage of its assets in a particular sector. The Portfolio will have greater exposure to the risks associated with that sector and its performance will be tied more closely to the performance of that sector.
Top 10 Equity Holdings 12/31/17
| | | | | | | | |
Security Description | | | % of Net Assets | | | | | |
Samsung Electronics Co., Ltd. | | | 5.5 | % | | | | |
Taiwan Semiconductor Manufacturing Co., Ltd. | | | 4.5 | % | | | | |
Housing Development Finance Corp., Ltd. | | | 3.5 | % | | | | |
Tencent Holdings, Ltd. | | | 3.2 | % | | | | |
AIA Group, Ltd. | | | 3.0 | % | | | | |
Banco Bradesco SA, ADR | | | 2.8 | % | | | | |
China Mobile, Ltd. | | | 2.7 | % | | | | |
Ayala Land, Inc. | | | 2.5 | % | | | | |
Astra International Tbk PT | | | 2.4 | % | | | | |
Vale SA, ADR | | | 2.4 | % | | | | |
Sector Allocation 12/31/17
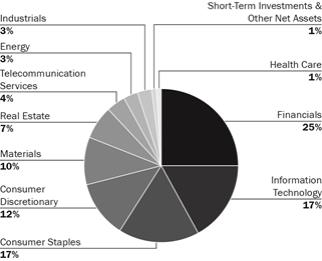
Sector Allocation is based on Net Assets.
Sector Allocation and Top 10 Holdings are subject to change.
| | | | |
| 92 | | Emerging Markets Equity Portfolio | | |
Emerging Markets Equity Portfolio
Schedule of Investments
December 31, 2017
| | | | | | | | | | |
| Common Stocks (97.9%) | | Country | | Shares/
$ Par | | | Value
$ (000’s) | |
| | |
Consumer Discretionary (12.2%) | | | | | | | | |
Astra International Tbk PT | | Indonesia | | | 28,044,600 | | | | 17,143 | |
China International Travel Service Corp., Ltd.* | | China | | | 1,080,795 | | | | 7,181 | |
Hero MotoCorp, Ltd. | | India | | | 160,100 | | | | 9,545 | |
Lojas Renner SA | | Brazil | | | 1,195,000 | | | | 12,742 | |
Midea Group Co., Ltd. | | China | | | 1,117,999 | | | | 9,504 | |
SACI Falabella | | Chile | | | 786,270 | | | | 7,851 | |
Truworths International, Ltd. | | South Africa | | | 1,274,000 | | | | 9,707 | |
Yum China Holdings, Inc. | | United States | | | 351,267 | | | | 14,058 | |
| | | | | | | | | | |
Total | | | | | | | 87,731 | |
| | | | | | | | | | |
| | |
Consumer Staples (16.4%) | | | | | | | | |
Ambev SA, ADR | | Brazil | | | 1,828,409 | | | | 11,812 | |
Amorepacific Group* | | South Korea | | | 27,500 | | | | 3,623 | |
BIM Birlesik Magazalar AS | | Turkey | | | 450,717 | | | | 9,286 | |
BRF SA* | | Brazil | | | 631,535 | | | | 7,108 | |
Fomento Economico Mexicano SAB de CV, ADR | | Mexico | | | 167,100 | | | | 15,691 | |
Hindustan Unilever, Ltd. | | India | | | 639,100 | | | | 13,613 | |
ITC, Ltd. | | India | | | 3,841,000 | | | | 15,818 | |
Jeronimo Martins SGPS SA | | Portugal | | | 390,000 | | | | 7,574 | |
Kweichow Moutai Co., Ltd. | | China | | | 150,680 | | | | 16,112 | |
Magnit PJSC | | Russia | | | 97,300 | | | | 10,694 | |
Massmart Holdings, Ltd. | | South Africa | | | 544,000 | | | | 6,133 | |
| | | | | | | | | | |
Total | | | | | | | 117,464 | |
| | | | | | | | | | |
| | |
Energy (3.0%) | | | | | | | | |
LUKOIL PJSC, ADR | | Russia | | | 127,700 | | | | 7,305 | |
Ultrapar Participacoes SA | | Brazil | | | 643,813 | | | | 14,586 | |
| | | | | | | | | | |
Total | | | | | | | 21,891 | |
| | | | | | | | | | |
| | |
Financials (25.1%) | | | | | | | | |
Aditya Birla Capital, Ltd.* | | India | | | 749,700 | | | | 2,155 | |
AIA Group, Ltd. | | Hong Kong | | | 2,540,600 | | | | 21,667 | |
Akbank TAS | | Turkey | | | 2,105,500 | | | | 5,471 | |
Banco Bradesco SA, ADR | | Brazil | | | 1,977,312 | | | | 20,248 | |
Banco Santander Chile, ADR | | Chile | | | 263,837 | | | | 8,250 | |
Bank Central Asia Tbk PT | | Indonesia | | | 6,142,300 | | | | 9,901 | |
Bank of the Philippine Islands | | Philippines | | | 4,217,500 | | | | 9,123 | |
Bank Pekao SA | | Poland | | | 192,900 | | | | 7,167 | |
Grupo Financiero Banorte SAB de CV | | Mexico | | | 2,102,660 | | | | 11,542 | |
Hong Kong Exchanges & Clearing, Ltd. | | Hong Kong | | | 308,670 | | | | 9,428 | |
Housing Development Finance Corp., Ltd. | | India | | | 949,103 | | | | 25,403 | |
Kotak Mahindra Bank, Ltd. | | India | | | 637,661 | | | | 10,077 | |
Ping An Insurance Group Co. of China, Ltd. | | China | | | 689,500 | | | | 7,176 | |
Public Bank Bhd | | Malaysia | | | 1,566,600 | | | | 8,040 | |
The Siam Commercial Bank PCL | | Thailand | | | 2,648,900 | | | | 12,192 | |
| | | | | | | | | | |
| Common Stocks (97.9%) | | Country | | Shares/
$ Par | | | Value
$ (000’s) | |
| | |
Financials continued | | | | | | | | |
Standard Chartered PLC* | | United Kingdom | | | 651,400 | | | | 6,855 | |
Turkiye Garanti Bankasi AS | | Turkey | | | 1,974,500 | | | | 5,593 | |
| | | | | | | | | | |
Total | | | | | | | 180,288 | |
| | | | | | | | | | |
| | |
Health Care (1.0%) | | | | | | | | |
Richter Gedeon Nyrt | | Hungary | | | 271,700 | | | | 7,113 | |
| | | | | | | | | | |
Total | | | | | | | 7,113 | |
| | | | | | | | | | |
| | |
Industrials (2.6%) | | | | | | | | |
Grupo Aeroportuario del Sureste SAB de CV, ADR | | Mexico | | | 51,408 | | | | 9,383 | |
Shanghai International Airport Co., Ltd. | | China | | | 1,321,982 | | | | 9,129 | |
| | | | | | | | | | |
Total | | | | | | | 18,512 | |
| | | | | | | | | | |
| | |
Information Technology (17.4%) | | | | | | | | |
Hangzhou Hikvision Digital Technology Co., Ltd. | | China | | | 2,016,662 | | | | 12,070 | |
NAVER Corp.* | | South Korea | | | 15,598 | | | | 12,665 | |
Samsung Electronics Co., Ltd. | | South Korea | | | 15,363 | | | | 36,500 | |
Taiwan Semiconductor Manufacturing Co., Ltd. | | Taiwan | | | 4,175,290 | | | | 32,083 | |
Tata Consultancy Services, Ltd. | | India | | | 192,630 | | | | 8,148 | |
Tencent Holdings, Ltd. | | Cayman Islands | | | 449,600 | | | | 23,242 | |
| | | | | | | | | | |
Total | | | | | | | 124,708 | |
| | | | | | | | | | |
| | |
Materials (9.4%) | | | | | | | | |
Grasim Industries, Ltd. | | India | | | 535,500 | | | | 9,749 | |
Indocement Tunggal Prakarsa Tbk PT | | Indonesia | | | 5,235,000 | | | | 8,481 | |
LG Chem, Ltd.* | | South Korea | | | 18,630 | | | | 7,040 | |
The Siam Cement PCL | | Thailand | | | 1,018,000 | | | | 15,282 | |
UltraTech Cement, Ltd. | | India | | | 145,700 | | | | 9,852 | |
Vale SA, ADR | | Brazil | | | 1,400,000 | | | | 17,122 | |
| | | | | | | | | | |
Total | | | | | | | 67,526 | |
| | | | | | | | | | |
| | |
Real Estate (6.5%) | | | | | | | | |
Ayala Land, Inc. | | Philippines | | | 20,202,000 | | | | 18,007 | |
China Resources Land, Ltd. | | Cayman Islands | | | 2,694,000 | | | | 7,912 | |
Hang Lung Group, Ltd. | | Hong Kong | | | 889,000 | | | | 3,270 | |
Hang Lung Properties, Ltd. | | Hong Kong | | | 3,033,000 | | | | 7,402 | |
Multiplan Empreendimentos Imobiliarios SA | | Brazil | | | 374,000 | | | | 7,982 | |
Swire Pacific, Ltd. | | Hong Kong | | | 249,000 | | | | 2,305 | |
| | | | | | | | | | |
Total | | | | | | | 46,878 | |
| | | | | | | | | | |
| | |
Telecommunication Services (4.3%) | | | | | | | | |
China Mobile, Ltd. | | China | | | 1,927,000 | | | | 19,506 | |
MTN Group, Ltd. | | South Africa | | | 902,000 | | | | 9,970 | |
Taiwan Mobile Co., Ltd. | | Taiwan | | | 394,000 | | | | 1,423 | |
| | | | | | | | | | |
Total | | | | | | | 30,899 | |
| | | | | | | | | | |
| | |
Total Common Stocks | | | | | | | | |
(Cost: $593,424) | | | | | | | 703,010 | |
| | | | | | | | | | |
The Accompanying Notes are an Integral Part of the Financial Statements.
| | | | | | |
| | Emerging Markets Equity Portfolio | | | 93 | |
Emerging Markets Equity Portfolio
| | | | | | | | | | |
| Preferred Stocks (0.8%) | | Country | | Shares/
$ Par | | | Value
$ (000’s) | |
| | |
Consumer Staples (0.4%) | | | | | | | | |
Amorepacific Corp.* | | South Korea | | | 20,400 | | | | 3,162 | |
| | | | | | | | | | |
Total | | | | | | | | | 3,162 | |
| | | | | | | | | | |
| | | |
Information Technology (0.4%) | | | | | | | | | | |
Samsung Electronics Co., Ltd. | | South Korea | | | 1,392 | | | | 2,713 | |
| | | | | | | | | | |
Total | | | | | | | | | 2,713 | |
| | | | | | | | | | |
| | | |
Total Preferred Stocks | | | | | | | | | | |
(Cost: $5,721) | | | | | | | | | 5,875 | |
| | | | | | | | | | |
| | | | | | | | | | |
| Short-Term Investments (2.3%) | | Country | | Shares/
$ Par | | | Value
$ (000’s) | |
| | |
Money Market Funds (2.3%) | | | | | | | | |
State Street Institutional U.S. Government Money Market Fund - Premier Class, 1.209% # | | United States | | | 16,299,647 | | | | 16,300 | |
| | | | | | | | | | |
Total | | | | | | | | | 16,300 | |
| | | | | | | | | | |
| | |
Total Short-Term Investments | | | | | | | | |
(Cost: $16,300) | | | | | | | | | 16,300 | |
| | | | | | | | | | |
| | | |
Total Investments (101.0%) | | | | | | | | | | |
(Cost: $615,445)(a) | | | | | | | | | 725,185 | |
| | | | | | | | | | |
Other Assets, Less | | | | | | | | | | |
Liabilities (-1.0%) | | | | | | | | | (6,904 | ) |
| | | | | | | | | | |
Net Assets (100.0%) | | | | | | | | | 718,281 | |
| | | | | | | | | | |
| # | 7-Day yield as of December 31, 2017. |
| | ADR after the name of a security represents—American Depositary Receipt. |
| (a) | At December 31, 2017, the aggregate cost of investments, including derivatives, for federal tax purposes (in thousands) was $616,089 and the net unrealized appreciation of investments based on that cost was $109,096 which is comprised of $124,678 aggregate gross unrealized appreciation and $15,582 aggregate gross unrealized depreciation. |
| | | | | | |
Investments Percentage by Country is based on Net Assets: | | | | | | |
India | | | 14.5% | | | |
Brazil | | | 12.8% | | | |
China | | | 11.2% | | | |
South Korea | | | 9.1% | | | |
Hong Kong | | | 6.1% | | | |
Mexico | | | 5.1% | | | |
Other | | | 42.2% | | | |
| | | | | | |
Total | | | 101.0% | | | |
The following is a summary of the inputs used in valuing the Portfolio’s assets and liabilities at December 31, 2017. See Note 3 for additional information on portfolio valuation.
| | | | | | | | | | | | | | |
| | | Valuation Inputs | | | |
| Description | | Level 1 –
Quoted Prices | | | Level 2 –
Other Significant
Observable Inputs | | | Level 3 –
Significant
Unobservable Inputs | | | |
| | | (Amounts in thousands) | | | |
Assets: | | | | | | | | | | | | | | |
Foreign Common Stocks | | | | | | | | | | | | | | |
Consumer Discretionary | | $ | 21,909 | | | $ | 65,822 | | | $ | - | | | |
Consumer Staples | | | 27,502 | | | | 89,962 | | | | - | | | |
Financials | | | 40,040 | | | | 140,249 | | | | - | | | |
Industrials | | | 9,382 | | | | 9,129 | | | | - | | | |
Materials | | | 17,122 | | | | 50,404 | | | | - | | | |
All Others | | | - | | | | 231,489 | | | | - | | | |
Preferred Stocks | | | - | | | | 5,875 | | | | - | | | |
Short-Term Investments | | | 16,300 | | | | - | | | | - | | | |
Total Assets: | | $ | 132,255 | | | $ | 592,930 | | | $ | - | | | |
For the period ended December 31, 2017, there were transfers from Level 1 to Level 2 in the amount of $231,796 (in thousands). These transfers were the result of the use of fair value procedures on certain foreign securities in the portfolio on December 31, 2017.
The Accompanying Notes are an Integral Part of the Financial Statements.
| | | | |
| 94 | | Emerging Markets Equity Portfolio | | |
Government Money Market Portfolio (unaudited)
| | | | |
| Objective: | | Portfolio Strategy: | | Net Assets: |
| Maximum current income to the extent consistent with liquidity and stability of capital. | | Invest in short-term fixed income obligations issued or guaranteed by the U.S Government, its agencies or instrumentalities. | | $439 million |
Portfolio Overview
Mason Street Advisors, LLC (“Mason Street Advisors”), the investment adviser for the Government Money Market Portfolio (the “Portfolio”), has engaged BlackRock Advisors, LLC (“BlackRock”) to act as sub-adviser for the Portfolio. The Portfolio invests at least 99.5% of its total assets in cash, U.S. Treasury bills, notes and other obligations issued or guaranteed as to principal and interest by the U.S. Government, its agencies or instrumentalities, and repurchase agreements secured by such obligations or cash. The Portfolio invests in a portfolio of securities maturing in 397 days or less (with certain exceptions) that will have a dollar-weighted average maturity of 60 days or less and a dollar-weighted average life of 120 days or less. The Portfolio seeks to maintain a net asset value of $1.00 per share.
Market Overview
Notable conditions during 2017 included the continued gradual removal of monetary accommodation by the U.S. Federal Reserve (the “Fed”), the nomination of a new chairman of the Fed, pronounced demand for U.S. dollar funding heading into year end, a series of short-term spending agreements to keep the government open, and the passage of U.S. tax reform. The U.S. debt ceiling was a focus during the summer months. Volatility was manifested via an earlier-than-usual back up in yields on Treasury bills deemed most at risk of a potential delay in payment by the U.S. Government. Fortunately, a respite was achieved in September, with two “stopgap” spending measures put in place during the fourth quarter. In September, as anticipated, the Fed announced the commencement of its balance sheet normalization program, which began in October. Jerome Powell was nominated as Chairman of the Fed in November to replace Janet Yellen following her term ending in February 2018. In December, the Fed delivered another 0.25% increase in the federal funds target range to 1.25% to 1.50%. The Fed upgraded its forecasts for growth and employment, while leaving its outlook for inflation unchanged.
Portfolio Results
The Portfolio returned 0.60% for the twelve months ended December 31, 2017. By comparison, the Portfolio’s benchmark, the Merrill Lynch® 3-Month Treasury Bill Index (the “Index”), returned 0.86%. (The Index is unmanaged, cannot be invested in directly and does not include administrative expenses.) The Portfolio outperformed the 0.39% average return of the Money Market Funds peer group tracked by Lipper® Analytical Services, Inc., an independent mutual fund ranking agency.
The Portfolio maintained a highly competitive yield throughout the year. In terms of sector allocation, exposure to floating rate notes in the first, second and third quarters and exposure to fixed rate Treasury securities in the fourth quarter contributed strongly to the Portfolio’s relative performance. The Portfolio’s allocation to floating rate notes straddled 20% of the Portfolio’s net asset value during the year. Ultra-short repurchase agreements were another major security type with a target allocation of 40% to 50% of net asset value. Tri-party repurchase agreements were well diversified across the largest, most systematically important banking organizations in their respective sovereigns. The large allocations to overnight repurchase agreements provided the Portfolio with significant liquidity provisioning that was not dependent on secondary liquidity conditions.
In terms of duration and yield curve management, the Portfolio’s duration exposure was modestly shorter than its peer group during the first quarter, which benefited the Portfolio as rates reset higher following the March Fed rate hike decision. The Portfolio’s duration profile was slightly longer than its peer group during the last three quarters of the year and contributed to performance given that the Fed Funds Futures market priced in a greater than 50% probability of a 0.25% rate hike numerous times during the period. During the fourth quarter, having to digest almost $150 billion in additional Treasury bill supply, the market participants began to price in term premiums for longer fixed rate Treasurys. This dynamic resulted in the Portfolio favoring fixed rate Treasury exposure in six-month and nine-month tenors (when an aggressive Fed rate hike was priced in) and being selective in adding floating rate exposure given the tight unattractive spreads.
Portfolio Manager Outlook
The following forward looking comments are the opinion of BlackRock, the Portfolio’s sub-adviser.
We expect the Fed to hike rates at least three times during 2018, subject to a resumption in progress toward the Fed’s inflation target and the persistence of accommodative financial conditions. While a level of uncertainty accompanies any outlook for the debt ceiling, we do anticipate a resolution, possibly during the first quarter of 2018. In turn, we would expect to see a
| | | | | | |
| | Government Money Market Portfolio | | | 95 | |
Government Money Market Portfolio (unaudited)
significant increase in Treasury-bill issuance as the Treasury restores its cash balance and over time finances an expected increase in the federal deficit. We are evaluating the impacts of tax reform, particularly the ‘deemed repatriation’ tax on earnings held offshore. Initial indications suggest the possibility of incremental outflows from U.S. dollar offshore money market funds over time, inflows into U.S. government money market funds, and modest upward pressure on financing levels for banks reliant on short-term wholesale funding.
Effective May 1, 2016 the Money Market Portfolio was renamed the Government Money Market Portfolio. Prior to May 1, 2016, the Government Money Market Portfolio operated as a “prime” money market fund, which allowed it to invest in certain types of securities that the Portfolio is no longer permitted to hold as a “government” money market fund. As a government money market portfolio, the Portfolio invests at least 99.5% of its total assets in cash, U.S. Treasury bills, notes and other obligations issued or guaranteed as to principal and interest by the U.S. Government, its agencies or instrumentalities, and repurchase agreements secured by such obligations or cash.
Not all obligations of the U.S. government, its agencies and instrumentalities are backed by the full faith and credit of the U.S. Treasury. Some obligations are backed only by the credit of the issuing agency or instrumentality, and in some cases there may be some risk of default by the issuer. Any guarantee by the U.S. government or its agencies or instrumentalities of a security held by the Portfolio does not apply to the market value of such security or to shares of the Portfolio itself.
If the other party to a repurchase agreement defaults on its obligation under the agreement, the Portfolio may suffer delays and incur costs or lose money in exercising its rights under the agreement. These risks may be heightened if the other party is located outside the U.S. If the seller fails to repurchase the security and the market value of the security declines, the Portfolio may lose money.
You could lose money investing in the Government Money Market Portfolio. Although the Portfolio seeks to preserve the value of your investment at $1.00 per share, it cannot guarantee it will do so. An investment in the Portfolio is not insured or guaranteed by the Federal Deposit Insurance Corporation or any other government agency. The Portfolio’s sponsor has no legal obligation to provide financial support to the Portfolio, and you should not expect that the sponsor will provide financial support to the Portfolio at any time.
| | | | |
| 96 | | Government Money Market Portfolio | | |
Government Money Market Portfolio
Schedule of Investments
December 31, 2017
| | | | | | | | | | |
| | | Money Market Investments (100.2%) | | Shares/
$ Par | | | Value
$ (000’s) | |
| | |
| | Money Market Funds (0.0%) | | | | | |
| | State Street Institutional U.S. Government Money Market Fund - Premier Class, 1.209% # | | | 137,083 | | | | 137 | |
| | | | | | | | | | |
| | Total | | | | | | | 137 | |
| | | | | | | | | | |
| | |
| | Repurchase Agreements (38.6%) | | | | | |
| | Tri-Party Bank of Nova Scotia, 1.350%, 1/2/18
(Purchased on 12/29/17, to be repurchased at $4,000,600, collateralized by various US Treasury obligations, 2.125% to 3.625%, due from 3/31/24 to 2/15/43, aggregate par and fair value of $4,123,035 and $4,087,513, respectively) | | | 4,000,000 | | | | 4,000 | |
| | Tri-Party BNP Paribas, 1.400%, 1/2/18
(Purchased on 12/29/17, to be repurchased at $11,001,711, collateralized by US Treasury Inflation Index Bond and various US government sponsored agency obligations, 0.625% to 3.125%, due from 1/15/24 to 5/20/41, aggregate par and fair value of $11,017,693 and $11,245,845, respectively) | | | 11,000,000 | | | | 11,000 | |
| | Tri-Party Citigroup Global Markets, Inc., 1.380%, 1/2/18
(Purchased on 12/29/17, to be repurchased at $5,000,767, collateralized by US Treasury Note, 1.375%, due 10/31/20, par and fair value of $5,187,789 and $5,104,110, respectively) | | | 5,000,000 | | | | 5,000 | |
| | Tri-Party Citigroup Global Markets, Inc., 1.400%, 1/2/18
(Purchased on 12/29/17, to be repurchased at $15,002,333, collateralized by various US government sponsored agency obligations, 1.308% to 4.500%, due from 5/4/18 to 9/15/46, aggregate par and fair value of $15,314,946 and $15,300,567, respectively) | | | 15,000,000 | | | | 15,000 | |
| | Tri-Party Credit Agricole, 1.400%, 1/2/18
(Purchased on 12/29/17, to be repurchased at $20,003,111, collateralized by US Treasury Bond and US government sponsored agency, 2.250% to 3.500%, due from 8/15/46 to 11/20/47, aggregate par and fair value of $19,734,280 and $20,425,716, respectively) | | | 20,000,000 | | | | 20,000 | |
| | Tri-Party Goldman Sachs, 1.350%, 1/2/18
(Purchased on 12/29/17, to be repurchased at $20,003,000, collateralized by various US government sponsored agency obligations, 3.000% to 5.000%, due from 5/20/41 to 9/20/47, aggregate par and fair value of $19,731,924 and $20,424,317, respectively) | | | 20,000,000 | | | | 20,000 | |
| | Tri-Party HSBC Securities, 1.350%, 1/2/18
(Purchased on 12/26/17, to be repurchased at $2,500,656, collateralized by US Treasury Inflation Index Bond, 0.375%, due 7/15/27, par and fair value of $2,572,864 and $2,560,463, respectively) | | | 2,500,000 | | | | 2,500 | |
| | | | | | | | | | |
| | | Money Market Investments (100.2%) | | Shares/
$ Par | | | Value
$ (000’s) | |
| | |
| | Repurchase Agreements continued | | | | | |
| | Tri-Party HSBC Securities, 1.380%, 1/2/18
(Purchased on 12/29/17, to be repurchased at $15,002,300, collateralized by various US government sponsored agency obligations, 1.500% to 2.750%, due from 9/18/18 to 12/13/24, aggregate par and fair value of $15,374,365 and $15,302,759, respectively) | | | 15,000,000 | | | | 15,000 | |
| | Tri-Party Mitsubishi UFJ, 1.350%, 1/2/18
(Purchased on 12/29/17, to be repurchased at $10,001,500, collateralized by various US government sponsored agency obligations, 2.359% to 5.000%, due from 6/1/20 to 11/1/47, aggregate par and fair value of $10,055,651 and $10,289,343, respectively) | | | 10,000,000 | | | | 10,000 | |
| | Tri-Party Mizuho Securities, 1.370%, 1/2/18
(Purchased on 12/29/17, to be repurchased at $15,002,283, collateralized by US Treasury Bond, 2.750%, due 11/15/47, par and fair value of $15,325,024 and $15,350,923, respectively) | | | 15,000,000 | | | | 15,000 | |
| | Tri-Party Natixis S.A., 1.330%, 1/2/18
(Purchased on 12/29/17, to be repurchased at $17,002,512, collateralized by various US Treasury obligations, 1.250% to 5.375%, due from 8/31/18 to 2/15/46, aggregate par and fair value of $18,271,553 and $17,393,536, respectively) | | | 17,000,000 | | | | 17,000 | |
| | Tri-Party Natixis S.A., 1.340%, 1/2/18
(Purchased on 12/29/17, to be repurchased at $5,000,744, collateralized by various US government sponsored agency obligations, 3.500% to 5.047%, due from 6/13/18 to 3/20/47, aggregate par and fair value of $4,945,146 and $5,116,127, respectively) | | | 5,000,000 | | | | 5,000 | |
| | Tri-Party RBC Capital Markets, 1.380%, 1/2/18
(Purchased on 12/29/17, to be repurchased at $10,001,533, collateralized by various US government sponsored agency obligations, 2.500% to 8.000%, due from 8/20/24 to 12/20/47, aggregate par and fair value of $9,854,625 and $10,201,123, respectively) | | | 10,000,000 | | | | 10,000 | |
| | Tri-Party TD Securities, 1.410%, 1/2/18
(Purchased on 12/29/17, to be repurchased at $20,003,133, collateralized by US Treasury Note and US government sponsored agency, 2.125% to 2.710%, due from 2/29/24 to 8/26/38, aggregate par and fair value of $20,787,601 and $20,430,609, respectively) | | | 20,000,000 | | | | 20,000 | |
| | | | | | | | | | |
| | Total | | | | | | | 169,500 | |
| | | | | | | | | | |
| | |
| | US Government & Agencies (61.6%) | | | | | |
| | Federal Farm Credit Bank, 0.000%, 1/11/18 | | | 3,195,000 | | | | 3,194 | |
| | Federal Farm Credit Bank, 0.000%, 8/10/18 | | | 355,000 | | | | 352 | |
| | Federal Farm Credit Bank, 0.750%, 4/18/18 | | | 5,500,000 | | | | 5,493 | |
| | Federal Farm Credit Bank, 1.000%, 1/19/18 | | | 2,500,000 | | | | 2,500 | |
| | Federal Farm Credit Bank, 1.552%, (ICE LIBOR USD 1 Month plus 0.18%), 4/4/18 | | | 2,065,000 | | | | 2,065 | |
| | Federal Home Loan Bank, 0.000%, 1/8/18 | | | 1,950,000 | | | | 1,950 | |
The Accompanying Notes are an Integral Part of the Financial Statements.
| | | | | | |
| | Government Money Market Portfolio | | | 97 | |
Government Money Market Portfolio
| | | | | | | | |
| Money Market Investments (100.2%) | | Shares/
$ Par | | | Value
$ (000’s) | |
US Government & Agencies continued | | | | | |
Federal Home Loan Bank, 0.000%, 1/19/18 | | | 6,000,000 | | | | 5,997 | |
Federal Home Loan Bank, 0.000%, 1/24/18 | | | 13,190,000 | | | | 13,180 | |
Federal Home Loan Bank, 0.000%, 1/29/18 | | | 1,610,000 | | | | 1,609 | |
Federal Home Loan Bank, 0.000%, 1/31/18 | | | 5,195,000 | | | | 5,190 | |
Federal Home Loan Bank, 0.000%, 2/2/18 | | | 10,000,000 | | | | 9,989 | |
Federal Home Loan Bank, 0.000%, 2/7/18 | | | 4,000,000 | | | | 3,995 | |
Federal Home Loan Bank, 0.000%, 3/7/18 | | | 4,215,000 | | | | 4,205 | |
Federal Home Loan Bank, 0.000%, 5/2/18 | | | 1,200,000 | | | | 1,195 | |
Federal Home Loan Bank, 0.000%, 6/6/18 | | | 2,000,000 | | | | 1,987 | |
Federal Home Loan Bank, 0.875%, 3/19/18 | | | 17,000,000 | | | | 16,989 | |
Federal Home Loan Bank, 1.233%, (3 Month LIBOR plus (0.33)%), 3/13/18 | | | 4,635,000 | | | | 4,635 | |
Federal Home Loan Bank, 1.244%, (ICE LIBOR USD 1 Month plus (0.14)%), 6/5/18 | | | 3,200,000 | | | | 3,200 | |
Federal Home Loan Bank, 1.257%, (ICE LIBOR USD 1 Month plus (0.12)%), 10/3/18 | | | 3,500,000 | | | | 3,500 | |
Federal Home Loan Bank, 1.272%, (ICE LIBOR USD 1 Month plus (0.10)%), 11/2/18 | | | 10,000,000 | | | | 10,000 | |
Federal Home Loan Bank, 1.281%, (3 Month LIBOR plus (0.11)%), 2/5/18 | | | 3,000,000 | | | | 3,000 | |
Federal Home Loan Bank, 1.320%, (ICE LIBOR USD 1 Month plus (0.14)%), 4/13/18 | | | 10,025,000 | | | | 10,025 | |
Federal Home Loan Bank, 1.346%, (ICE LIBOR USD 1 Month plus (0.15)%), 4/17/18 | | | 4,425,000 | | | | 4,425 | |
Federal Home Loan Bank, 1.353%, (ICE LIBOR USD 1 Month plus (0.14)%), 5/18/18 | | | 3,000,000 | | | | 3,000 | |
Federal Home Loan Bank, 1.361%, (1 Month LIBOR plus (0.13)%), 11/16/18 | | | 7,000,000 | | | | 7,000 | |
Federal Home Loan Bank, 1.362%, (1 Month LIBOR plus (0.07)%), 2/11/19 | | | 1,010,000 | | | | 1,010 | |
Federal Home Loan Bank, 1.372%, (ICE LIBOR USD 1 Month plus (0.06)%), 9/11/19 | | | 4,000,000 | | | | 4,000 | |
Federal Home Loan Bank, 1.375%, 3/9/18 | | | 3,500,000 | | | | 3,502 | |
Federal Home Loan Bank, 1.389%, (3 Month LIBOR plus (0.16)%), 6/12/19 | | | 1,390,000 | | | | 1,389 | |
Federal Home Loan Bank, 1.392%, (ICE LIBOR USD 1 Month plus (0.14)%), 5/22/18 | | | 5,000,000 | | | | 5,000 | |
Federal Home Loan Bank, 1.392%, (ICE LIBOR USD 1 Month plus (0.04)%), 7/9/18 | | | 5,000,000 | | | | 5,000 | |
Federal Home Loan Bank, 1.458%, (3 Month LIBOR plus (0.20)%), 3/22/18 | | | 2,500,000 | | | | 2,500 | |
Federal Home Loan Bank, 1.462%, (ICE LIBOR USD 1 Month plus (0.09)%), 1/25/19 | | | 3,650,000 | | | | 3,650 | |
Federal Home Loan Bank, 1.465%, (3 Month LIBOR plus (0.16)%), 6/20/19 | | | 1,600,000 | | | | 1,600 | |
Federal Home Loan Bank, 1.466%, (3 Month LIBOR plus (0.16)%), 6/20/19 | | | 1,950,000 | | | | 1,950 | |
| | | | | | | | |
| Money Market Investments (100.2%) | | Shares/
$ Par | | | Value
$ (000’s) | |
US Government & Agencies continued | | | | | |
Federal Home Loan Bank, 1.473%, (3 Month LIBOR plus (0.14)%), 12/19/19 | | | 1,770,000 | | | | 1,770 | |
Federal Home Loan Mortgage Corp., 0.000%, 2/16/18 | | | 1,015,000 | | | | 1,014 | |
Federal Home Loan Mortgage Corp., 0.875%, 10/12/18 | | | 2,785,000 | | | | 2,769 | |
Federal Home Loan Mortgage Corp., 1.053%, (3 Month LIBOR plus (0.35)%), 5/9/18 | | | 2,500,000 | | | | 2,500 | |
Federal Home Loan Mortgage Corp., 1.319%, (3 Month LIBOR plus (0.03)%), 1/8/18 | | | 2,145,000 | | | | 2,145 | |
Federal Home Loan Mortgage Corp., 1.327%, (3 Month LIBOR plus (0.03)%), 1/12/18 | | | 2,145,000 | | | | 2,145 | |
Federal Home Loan Mortgage Corp., 1.330%, 6/27/18 | | | 1,500,000 | | | | 1,500 | |
Federal Home Loan Mortgage Corp., 1.543%, (3 Month LIBOR plus 0.02%), 3/8/18 | | | 4,000,000 | | | | 4,000 | |
Federal National Mortgage Association, 0.875%, 2/8/18 | | | 2,500,000 | | | | 2,499 | |
Federal National Mortgage Association, 0.875%, 3/28/18 | | | 3,200,000 | | | | 3,198 | |
Federal National Mortgage Association, 0.875%, 5/21/18 | | | 2,955,000 | | | | 2,951 | |
US Treasury, 0.000%, 4/5/18 | | | 10,000,000 | | | | 9,969 | |
US Treasury, 0.000%, 5/3/18 | | | 5,000,000 | | | | 4,979 | |
US Treasury, 0.000%, 5/31/18 | | | 5,080,000 | | | | 5,050 | |
US Treasury, 0.000%, 6/7/18 | | | 6,740,000 | | | | 6,697 | |
US Treasury, 0.000%, 6/14/18 | | | 990,000 | | | | 983 | |
US Treasury, 0.000%, 6/21/18 | | | 320,000 | | | | 318 | |
US Treasury, 0.000%, 6/28/18 | | | 14,000,000 | | | | 13,894 | |
US Treasury, 1.375%, 7/31/18 | | | 2,005,000 | | | | 2,004 | |
US Treasury, 2.375%, 6/30/18 | | | 5,000,000 | | | | 5,022 | |
US Treasury Floating Rate Note, 1.722%, (US Treasury 3 Month Bill Money Market Yield plus 0.27%), 1/31/18 | | | 2,120,000 | | | | 2,120 | |
US Treasury Note, 0.000%, 3/22/18 | | | 3,375,000 | | | | 3,366 | |
US Treasury Note, 0.000%, 3/29/18 | | | 26,010,000 | | | | 25,931 | |
US Treasury Note, 0.750%, 2/28/18 | | | 5,670,000 | | | | 5,669 | |
| | | | | | | | |
Total | | | | | | | 270,769 | |
| | | | | | | | |
| | |
Total Money Market Investments | | | | | | | | |
(Cost: $440,406) | | | | | | | 440,406 | |
| | | | | | | | |
| | |
Total Investments (100.2%) | | | | | | | | |
(Cost: $440,406) | | | | | | | 440,406 | |
| | | | | | | | |
| | |
Other Assets, Less | | | | | | | | |
Liabilities (-0.2%) | | | | | | | (968 | ) |
| | | | | | | | |
Net Assets (100.0%) | | | | | | | 439,438 | |
| | | | | | | | |
| # | 7-Day yield as of December 31, 2017. |
The Accompanying Notes are an Integral Part of the Financial Statements.
| | | | |
| 98 | | Government Money Market Portfolio | | |
Government Money Market Portfolio
The following is a summary of the inputs used in valuing the Portfolio’s assets and liabilities at December 31, 2017. See Note 3 for additional information on portfolio valuation.
| | | | | | | | | | | | | | |
| | | Valuation Inputs | | | |
| Description | | Level 1 –
Quoted Prices | | | Level 2 –
Other Significant
Observable Inputs | | | Level 3 –
Significant
Unobservable Inputs | | | |
| | | (Amounts in thousands) | | | |
Assets: | | | | | | | | | | | | | | |
Short-Term Investments | | | | | | | | | | | | | | |
Money Market Funds | | $ | 137 | | | $ | - | | | $ | - | | | |
All Others | | | - | | | | 440,269 | | | | - | | | |
Total Assets: | | $ | 137 | | | $ | 440,269 | | | $ | - | | | |
The Accompanying Notes are an Integral Part of the Financial Statements.
| | | | | | |
| | Government Money Market Portfolio | | | 99 | |
Short-Term Bond Portfolio (unaudited)
| | | | |
| Objective: | | Portfolio Strategy: | | Net Assets: |
Provide as high a level of current income as is consistent with prudent investment risk. | | Invest in a diversified portfolio of investment grade debt securities. | | $294 million |
Portfolio Overview
Mason Street Advisors, LLC (“Mason Street Advisors”), the investment adviser for the Short-Term Bond Portfolio (the “Portfolio”), has engaged T. Rowe Price Associates, Inc. (“T. Rowe Price”) to act as sub-adviser for the Portfolio. Normally, the Portfolio invests in a diversified portfolio of investment grade debt securities. The Portfolio may also invest up to 10% of net assets in non-investment grade, high yield/high risk bonds (so called “junk bonds”). Also, the Portfolio may invest up to 20% of net assets in foreign securities. Debt securities may be of any maturity, but under normal market conditions the Portfolio’s average effective maturity will not exceed three years. The Portfolio primarily invests in corporate, government and mortgage- and asset-backed securities. The Portfolio uses both a “top-down” and “bottom-up” investment approach to construct the portfolio of investments. The top-down investment approach involves an evaluation of the overall macroeconomic environment and its potential impact on the level and direction of interest rates. The bottom-up investment approach focuses on fundamental research of individual issuers.
Market Overview
For most of 2017, the yield curve flattened amid expectations of further rate increases in line with stronger economic growth. Short-term Treasury yields rose as the U.S. Federal Reserve (the “Fed”) raised its federal funds target rate three times during the year, while yields further out on the curve remained relatively unchanged. Muted inflation pressures and demand for duration supported the long end of the curve. Companies issued debt at a record pace. However, technical conditions remained healthy with strong demand, especially from foreign buyers, absorbing the supply. Corporate bonds outpaced U.S. Treasurys of similar maturities as credit spreads compressed amid tax reform, sustained global growth and generally strong corporate earnings. Asset-backed securities (“ABS”) and mortgage-backed securities (“MBS”) gained modestly. The ABS sector was supported by strong consumer fundamentals, while MBS benefited from the rise in rates that helped mitigate prepayment risk.
Portfolio Results
The Portfolio returned 1.33% for the twelve months ended December 31, 2017. By comparison, the Portfolio’s benchmark, the Bloomberg Barclays® 1–3 Year U.S. Government/Credit Index (the “Index”), returned 0.84%. (The Index is unmanaged, cannot be invested in directly and does not include administrative expenses.) According to Lipper® Analytical Services, Inc., an independent mutual fund ranking agency, the average return of the Short Investment Grade Debt Funds peer group was 1.22% for 2017.
Sector allocation was the primary driver of the Portfolio’s relative performance. The Portfolio’s strategic overweight allocation to short-dated, investment grade corporate debt and corresponding underweight to U.S. Treasury securities added to relative returns as risk assets rallied and investors sought higher yields. Out-of-benchmark exposure to securitized sectors—ABS, MBS and commercial mortgage-backed securities (“CMBS”)—further supported results. Yield curve positioning also contributed to relative performance. The Portfolio’s overweight allocation to the intermediate portion of the curve and modest out-of-benchmark exposure to longer maturities outperformed as the yield curve flattened over the period amid increased short-term rates and an uptick in growth expectations.
Corporate bond allocations, both investment grade and crossover bonds, contributed to the Portfolio’s relative results for the year. Solid demand from investors looking for additional yield, along with solid fundamentals, benefited short-maturity corporate bonds. As a result, the Portfolio’s significant overweight to corporates provided a meaningful contribution to relative results. Security selection within investment grade corporates was a modest drag on performance. Select bonds within the health care and automotive industries underperformed amid competitive pressures within the pharmaceutical industry and slowing auto sales.
Portfolio Manager Outlook
The following forward-looking comments are the opinion of T. Rowe Price, the Portfolio’s sub-adviser.
While uncertainties surrounding monetary policy and geopolitical risks could add to market volatility, the solid macroeconomic backdrop should remain supportive of the short-term bond market. Global liquidity and supportive financial conditions persist despite signs from global central bank officials that years of ultra-loose monetary policy may be coming to an end.
We believe that the Fed will continue to tighten monetary policy at a gradual pace so as not to derail the economic expansion and that it will clearly telegraph its moves to investors. While future rate increases could pressure short-term securities, we expect that investor demand for higher-yielding securities with lower duration risk should support the Portfolio.
| | | | |
| 100 | | Short-Term Bond Portfolio | | |
Short-Term Bond Portfolio (unaudited)
While the backdrop for U.S. corporate bonds remains constructive—buoyed by decent earnings and expectations of economic growth—we will be on the lookout for potential events that challenge this thesis. As always, we strive to find value and seek out securities offering reasonable yields without taking on an inordinate level of risk. Our broad diversification and research-driven approach will help us identify segments of the asset class where valuations are disconnected from credit fundamentals while helping to limit exposure to sharp swings in the market.
Relative Performance
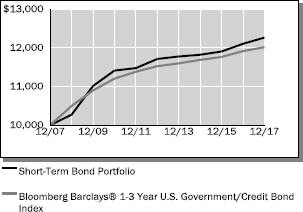
| | | | | | | | | | | | |
Average Annual Total Returns
For Periods Ended December 31, 2017 | |
| | | 1 Year | | | 5 Years | | | 10 Years | |
Short-Term Bond Portfolio | | | 1.33 | % | | | 0.93 | % | | | 2.06 | % |
Bloomberg Barclays® 1-3 Year U.S. Government/Credit Bond Index | | | 0.84 | % | | | 0.84 | % | | | 1.85 | % |
Lipper® Variable Insurance Products (VIP) Short Investment Grade Debt Funds Average | | | 1.22 | % | | | 0.58 | % | | | 1.42 | % |
The performance data quoted represents past performance. Past performance is historical and does not guarantee future performance. Investment return and principal value will fluctuate, so that shares, when redeemed, may be worth more or less than their original cost. Current performance may be lower or higher than the performance data quoted. For the most recent month-end performance information visit www.northwesternmutual.com
This chart assumes an initial investment of $10,000 made on 12/31/07. Returns shown reflect fee waivers, deductions for management and other portfolio expenses, and reinvestment of all dividends. In the absence of fee waivers, total return would be reduced. Returns exclude deductions for separate account sale loads and account fees. Please refer to the Benchmark Definitions section of this report for information about the indices cited in the above chart and graph.
Return of principal is not guaranteed. Bond funds have the same interest rate, inflation and credit risks that are associated with the underlying bonds owned by the Portfolio. When interest rates rise, bond prices fall. With a fixed income fund, when interest rates rise, the value of the fund’s existing bonds drops, which could negatively affect overall fund performance. A portion of the Portfolio’s assets may be invested in lower quality debt securities which may present a significant risk for loss of principal and interest. High yield bonds generally have greater price swings and higher default risks than investment grade bonds.
Investing in bonds issued by foreign corporations and governments carries additional risk, including foreign currency risk, and may increase the volatility of the Portfolio’s performance.
The Portfolio may invest in derivative instruments to adjust the Portfolio’s duration and yield curve exposure, to hedge foreign currency exposure or for any other permissible purpose keeping with its investment objective. Use of these instruments may involve certain costs and imposes certain risks such as liquidity risk, market risk, credit risk, management risk and the risk of mispricing or improper valuation. Certain derivatives involve leverage, which could magnify losses, and portfolios investing in derivatives could lose more than the principal amount invested in those instruments.
Currently, interest rates remain at historically low levels on a relative basis, although the U.S. federal funds rate has been subject to modest increases over the course of the last two years. A significant rise in interest rates over a short period of time could cause significant losses in the market value of the Portfolio’s fixed income investments.
| | | | | | |
| | Short-Term Bond Portfolio | | | 101 | |
Short-Term Bond Portfolio (unaudited)
Top 10 Fixed Income Holdings 12/31/17
| | | | | | |
Security Description | | | % of Net Assets | | | |
US Treasury, Various | | | 14.8 | % | | |
Federal National Mortgage Association, Various | | | 3.4 | % | | |
The Goldman Sachs Group, Inc., Various | | | 1.1 | % | | |
Morgan Stanley, Various | | | 1.0 | % | | |
JPMorgan Chase & Co., Various | | | 0.9 | % | | |
Bank of America Corp., Various | | | 0.8 | % | | |
Daimler Finance North America LLC, Various | | | 0.7 | % | | |
BellSouth Telecommunications LLC, 4.285%, 4/26/21 | | | 0.7 | % | | |
Penske Truck Leasing Co. LP / PTL Finance Corp., Various | | | 0.7 | % | | |
Citigroup, Inc., Various | | | 0.7 | % | | |
Sector Allocation 12/31/17
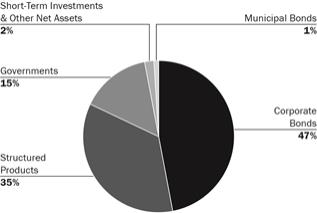
Sector Allocation is based on Net Assets.
Sector Allocation and Top 10 Holdings are subject to change.
Consistent with the Portfolio’s stated parameters, no more than 20% of the Portfolio is invested in foreign securities, and no more than 10% is invested in high yield securities.
| | | | |
| 102 | | Short-Term Bond Portfolio | | |
Short-Term Bond Portfolio
Schedule of Investments
December 31, 2017
| | | | | | | | |
| Corporate Bonds (47.2%) | | Shares/
$ Par | | | Value
$ (000’s) | |
| |
Basic Materials (1.9%) | | | | | |
Anglo American Capital PLC, 3.625%, 5/14/20 144A | | | 290,000 | | | | 295 | |
Anglo American Capital PLC, 9.375%, 4/8/19 144A | | | 725,000 | | | | 786 | |
Goldcorp, Inc., 2.125%, 3/15/18 (b) | | | 935,000 | | | | 936 | |
INVISTA Finance LLC, 4.250%, 10/15/19 144A | | | 515,000 | | | | 522 | |
LyondellBasell Industries NV, 5.000%, 4/15/19 | | | 199,000 | | | | 204 | |
LyondellBasell Industries NV, 6.000%, 11/15/21 | | | 280,000 | | | | 311 | |
Sherwin-Williams Co., 2.250%, 5/15/20 (b) | | | 1,395,000 | | | | 1,390 | |
Solvay Finance America LLC, 3.400%, 12/3/20 144A | | | 415,000 | | | | 424 | |
Westlake Chemical Corp., 4.625%, 2/15/21 | | | 575,000 | | | | 589 | |
| | | | | | | | |
Total | | | | | | | 5,457 | |
| | | | | | | | |
| |
Communications (4.0%) | | | | | |
Alibaba Group Holding, Ltd., 2.500%, 11/28/19 (b) | | | 870,000 | | | | 873 | |
AT&T, Inc., 2.300%, 3/11/19 (b) | | | 625,000 | | | | 626 | |
Baidu, Inc., 2.750%, 6/9/19 (b) | | | 590,000 | | | | 591 | |
BellSouth Telecommunications LLC, 4.285%, 4/26/21 144A(b) | | | 2,035,000 | | | | 2,049 | |
British Telecommunications PLC, 2.350%, 2/14/19 | | | 250,000 | | | | 250 | |
Charter Communications Operating LLC / Charter Communications Operating Capital Corp., 3.579%, 7/23/20 (b) | | | 630,000 | | | | 642 | |
Crown Castle Towers LLC, 6.113%, 1/15/40 144A(b) | | | 815,000 | | | | 859 | |
Discovery Communications LLC, 2.200%, 9/20/19 | | | 265,000 | | | | 264 | |
eBay, Inc., 2.150%, 6/5/20 | | | 375,000 | | | | 372 | |
The Interpublic Group of Cos., Inc., 4.000%, 3/15/22 | | | 155,000 | | | | 160 | |
JD.com, Inc., 3.125%, 4/29/21 (b) | | | 720,000 | | | | 718 | |
Neptune Finco Corp., 10.875%, 10/15/25 144A | | | 337,000 | | | | 400 | |
Omnicom Group, Inc., 4.450%, 8/15/20 | | | 55,000 | | | | 58 | |
Omnicom Group, Inc., 6.250%, 7/15/19 (b) | | | 615,000 | | | | 650 | |
The Priceline Group, Inc., 2.750%, 3/15/23 | | | 150,000 | | | | 149 | |
Telefonica Emisiones SAU, 3.192%, 4/27/18 | | | 400,000 | | | | 401 | |
Tencent Holdings, Ltd., 2.875%, 2/11/20 144A | | | 200,000 | | | | 201 | |
Tencent Holdings, Ltd., 3.375%, 5/2/19 144A | | | 520,000 | | | | 526 | |
Time Warner Cable, Inc., 2.100%, 6/1/19 | | | 250,000 | | | | 250 | |
Time Warner Cable, Inc., 8.250%, 4/1/19 | | | 445,000 | | | | 476 | |
Time Warner Cable, Inc., 8.750%, 2/14/19 | | | 490,000 | | | | 522 | |
Viacom, Inc., 2.750%, 12/15/19 | | | 553,000 | | | | 552 | |
Viacom, Inc., 5.625%, 9/15/19 | | | 245,000 | | | | 256 | |
| | | | | | | | |
Total | | | | | | | 11,845 | |
| | | | | | | | |
| |
Consumer, Cyclical (3.9%) | | | | | |
American Honda Finance Corp., 2.125%, 10/10/18 | | | 250,000 | | | | 250 | |
Aptiv PLC, 3.150%, 11/19/20 | | | 510,000 | | | | 518 | |
AutoZone, Inc., 1.625%, 4/21/19 | | | 65,000 | | | | 65 | |
Brinker International, Inc., 2.600%, 5/15/18 (b) | | | 735,000 | | | | 735 | |
CVS Health Corp., 1.900%, 7/20/18 | | | 460,000 | | | | 460 | |
CVS Health Corp., 2.250%, 12/5/18 | | | 250,000 | | | | 250 | |
D.R. Horton, Inc., 2.550%, 12/1/20 | | | 240,000 | | | | 240 | |
Daimler Finance North America LLC, 1.750%, 10/30/19 144A | | | 480,000 | | | | 474 | |
Daimler Finance North America LLC, 2.237%, (3 Month LIBOR plus 0.86%), 8/1/18 144A(b) | | | 850,000 | | | | 853 | |
| | | | | | | | |
| Corporate Bonds (47.2%) | | Shares/
$ Par | | | Value
$ (000’s) | |
| |
Consumer, Cyclical continued | | | | | |
Daimler Finance North America LLC, 2.300%, 2/12/21 144A(b) | | | 705,000 | | | | 699 | |
Daimler Finance North America LLC, 2.375%, 8/1/18 144A | | | 125,000 | | | | 125 | |
Delta Air Lines, Inc., 2.875%, 3/13/20 | | | 295,000 | | | | 297 | |
Ford Motor Credit Co. LLC, 2.021%, 5/3/19 | | | 455,000 | | | | 453 | |
Ford Motor Credit Co. LLC, 2.375%, 1/16/18 | | | 250,000 | | | | 250 | |
Ford Motor Credit Co. LLC, 2.551%, 10/5/18 (b) | | | 630,000 | | | | 632 | |
General Motors Financial Co., Inc., 3.100%, 1/15/19 | | | 580,000 | | | | 583 | |
GLP Capital LP / GLP Financing II, Inc., 4.375%, 11/1/18 (b) | | | 1,036,000 | | | | 1,044 | |
Hyundai Capital America, 2.000%, 7/1/19 144A | | | 215,000 | | | | 212 | |
Hyundai Capital America, 2.400%, 10/30/18 144A | | | 400,000 | | | | 400 | |
Hyundai Capital America, 2.500%, 3/18/19 144A(b) | | | 1,020,000 | | | | 1,017 | |
Newell Rubbermaid, Inc., 2.150%, 10/15/18 | | | 375,000 | | | | 375 | |
Newell Rubbermaid, Inc., 2.600%, 3/29/19 | | | 133,000 | | | | 134 | |
Nissan Motor Acceptance Corp., 1.550%, 9/13/19 144A | | | 340,000 | | | | 336 | |
QVC, Inc., 3.125%, 4/1/19 | | | 325,000 | | | | 326 | |
Royal Caribbean Cruises, Ltd., 2.650%, 11/28/20 | | | 125,000 | | | | 125 | |
Southwest Airlines Co., 2.750%, 11/6/19 | | | 280,000 | | | | 282 | |
Toyota Motor Credit Corp., 1.450%, 1/12/18 | | | 395,000 | | | | 395 | |
| | | | | | | | |
Total | | | | | | | 11,530 | |
| | | | | | | | |
| |
Consumer, Non-cyclical (6.1%) | | | | | |
Abbott Laboratories, 2.350%, 11/22/19 (b) | | | 1,115,000 | | | | 1,115 | |
Abbott Laboratories, 2.900%, 11/30/21 | | | 480,000 | | | | 486 | |
AbbVie, Inc., 1.800%, 5/14/18 | | | 575,000 | | | | 575 | |
AbbVie, Inc., 2.300%, 5/14/21 | | | 375,000 | | | | 372 | |
Allergan Funding SCS, 2.350%, 3/12/18 (b) | | | 625,000 | | | | 625 | |
Allergan Funding SCS, 2.450%, 6/15/19 | | | 100,000 | | | | 100 | |
Anthem, Inc., 1.875%, 1/15/18 | | | 100,000 | | | | 100 | |
Anthem, Inc., 2.250%, 8/15/19 | | | 500,000 | | | | 499 | |
Anthem, Inc., 2.300%, 7/15/18 | | | 435,000 | | | | 436 | |
Anthem, Inc., 2.500%, 11/21/20 | | | 105,000 | | | | 105 | |
BAT Capital Corp., 2.297%, 8/14/20 144A(b) | | | 750,000 | | | | 746 | |
Baxalta, Inc., 2.000%, 6/22/18 | | | 80,000 | | | | 80 | |
Baxalta, Inc., 2.438%, (3 Month LIBOR plus 0.78%), 6/22/18 | | | 225,000 | | | | 225 | |
Bayer US Finance LLC, 2.375%, 10/8/19 144A | | | 440,000 | | | | 440 | |
Becton, Dickinson and Co., 2.675%, 12/15/19 | | | 530,000 | | | | 532 | |
Biogen, Inc., 2.900%, 9/15/20 | | | 230,000 | | | | 233 | |
Boral Finance Pty, Ltd., 3.000%, 11/1/22 144A | | | 65,000 | | | | 64 | |
Bunge, Ltd. Finance Corp., 3.500%, 11/24/20 | | | 235,000 | | | | 240 | |
Bunge, Ltd. Finance Corp., 8.500%, 6/15/19 | | | 190,000 | | | | 206 | |
Celgene Corp., 2.250%, 5/15/19 | | | 340,000 | | | | 340 | |
Coca-Cola Femsa, SAB de CV, 2.375%, 11/26/18 | | | 145,000 | | | | 145 | |
Danone SA, 1.691%, 10/30/19 144A(b) | | | 1,070,000 | | | | 1,057 | |
Equifax, Inc., 2.300%, 6/1/21 | | | 150,000 | | | | 146 | |
ERAC USA Finance LLC, 2.350%, 10/15/19 144A | | | 50,000 | | | | 50 | |
ERAC USA Finance LLC, 2.800%, 11/1/18 144A | | | 325,000 | | | | 327 | |
Express Scripts Holding Co., 2.229%, (3 Month LIBOR plus 0.75%), 11/30/20 (b) | | | 750,000 | | | | 750 | |
The Accompanying Notes are an Integral Part of the Financial Statements.
| | | | | | |
| | Short-Term Bond Portfolio | | | 103 | |
Short-Term Bond Portfolio
| | | | | | | | |
| Corporate Bonds (47.2%) | | Shares/
$ Par | | | Value
$ (000’s) | |
| |
Consumer, Non-cyclical continued | | | | | |
Express Scripts Holding Co., 2.250%, 6/15/19 | | | 70,000 | | | | 70 | |
HCA, Inc., 3.750%, 3/15/19 | | | 290,000 | | | | 293 | |
HPHT Finance 15, Ltd., 2.250%, 3/17/18 144A(b) | | | 644,000 | | | | 644 | |
Humana, Inc., 2.625%, 10/1/19 | | | 190,000 | | | | 191 | |
Imperial Tobacco Finance PLC,
2.050%, 2/11/18 144A(b) | | | 1,335,000 | | | | 1,335 | |
Johnson & Johnson, 1.950%, 11/10/20 | | | 225,000 | | | | 224 | |
The Kroger Co., 1.500%, 9/30/19 | | | 212,000 | | | | 209 | |
The Kroger Co., 2.300%, 1/15/19 | | | 165,000 | | | | 165 | |
McKesson Corp., 1.400%, 3/15/18 | | | 275,000 | | | | 275 | |
Medco Health Solutions, Inc., 4.125%, 9/15/20 | | | 325,000 | | | | 337 | |
Reynolds American, Inc., 2.300%, 6/12/18 | | | 355,000 | | | | 355 | |
Reynolds American, Inc., 8.125%, 6/23/19 | | | 160,000 | | | | 173 | |
S&P Global, Inc., 2.500%, 8/15/18 | | | 105,000 | | | | 105 | |
Shire Acquisitions Investments Ireland Designated Activity Co., 1.900%, 9/23/19 (b) | | | 1,335,000 | | | | 1,323 | |
Teva Pharmaceutical Finance Netherlands III BV, 1.400%, 7/20/18 (b) | | | 860,000 | | | | 854 | |
Teva Pharmaceutical Finance Netherlands III BV, 1.700%, 7/19/19 (b) | | | 890,000 | | | | 865 | |
Thermo Fisher Scientific, Inc., 2.400%, 2/1/19 | | | 65,000 | | | | 65 | |
Tyson Foods, Inc., 2.250%, 8/23/21 | | | 280,000 | | | | 276 | |
| | | | | | | | |
Total | | | | | | | 17,753 | |
| | | | | | | | |
| |
Energy (3.8%) | | | | | |
Canadian Natural Resources, Ltd., 1.750%, 1/15/18 | | | 265,000 | | | | 265 | |
China Shenhua Overseas Capital Co., Ltd., 2.500%, 1/20/18 (b) | | | 1,005,000 | | | | 1,005 | |
China Shenhua Overseas Capital Co., Ltd., 3.125%, 1/20/20 (b) | | | 785,000 | | | | 787 | |
Columbia Pipeline Group, Inc., 2.450%, 6/1/18 | | | 210,000 | | | | 210 | |
EnCana Corp., 6.500%, 5/15/19 | | | 240,000 | | | | 252 | |
Enterprise Products Operating LLC, 6.500%, 1/31/19 | | | 250,000 | | | | 261 | |
Exxon Mobil Corp., 1.305%, 3/6/18 (b) | | | 780,000 | | | | 779 | |
Exxon Mobil Corp., 1.878%, (3 Month LIBOR plus 0.37%), 3/6/22 (b) | | | 1,110,000 | | | | 1,118 | |
Hess Corp., 8.125%, 2/15/19 | | | 105,000 | | | | 111 | |
Kinder Morgan Energy Partners LP, 5.950%, 2/15/18 | | | 305,000 | | | | 306 | |
Kinder Morgan Finance Co. LLC, 6.000%, 1/15/18 144A | | | 320,000 | | | | 321 | |
NuStar Logistics, LP, 8.400%, 4/15/18 (b) | | | 1,120,000 | | | | 1,138 | |
ONEOK Partners LP, 3.200%, 9/15/18 (b) | | | 955,000 | | | | 961 | |
Panhandle Eastern Pipe Line Co. LP, 7.000%, 6/15/18 | | | 460,000 | | | | 470 | |
Petroleos Mexicanos, 3.500%, 7/23/20 | | | 580,000 | | | | 588 | |
Phillips 66, 2.009%, (3 Month LIBOR plus 0.65%), 4/15/19 144A | | | 245,000 | | | | 245 | |
Plains All American Pipeline LP / PAA Finance Corp., 5.000%, 2/1/21 | | | 220,000 | | | | 231 | |
Plains All American Pipeline LP / PAA Finance Corp., 5.750%, 1/15/20 | | | 205,000 | | | | 216 | |
Sabine Pass Liquefaction LLC, 5.625%, 2/1/21 | | | 470,000 | | | | 504 | |
Spectra Energy Partners LP, 2.950%, 9/25/18 | | | 560,000 | | | | 563 | |
Total Capital Canada, Ltd., 1.450%, 1/15/18 | | | 250,000 | | | | 250 | |
Total Capital SA, 2.125%, 8/10/18 | | | 250,000 | | | | 251 | |
| | | | | | | | |
| Corporate Bonds (47.2%) | | Shares/
$ Par | | | Value
$ (000’s) | |
| |
Energy continued | | | | | |
Valero Energy Corp., 9.375%, 3/15/19 | | | 350,000 | | | | 379 | |
| | | | | | | | |
Total | | | | | | | 11,211 | |
| | | | | | | | |
| |
Financial (17.4%) | | | | | |
ABN AMRO Bank NV, 2.100%, 1/18/19 144A(b) | | | 805,000 | | | | 804 | |
AerCap Ireland Capital, Ltd. / AerCap Global Aviation Trust, 3.950%, 2/1/22 | | | 475,000 | | | | 489 | |
AIA Group, Ltd., 2.250%, 3/11/19 144A | | | 200,000 | | | | 199 | |
Air Lease Corp., 2.125%, 1/15/18 | | | 185,000 | | | | 185 | |
Air Lease Corp., 2.125%, 1/15/20 | | | 570,000 | | | | 566 | |
Ally Financial, Inc., 3.250%, 11/5/18 (b) | | | 610,000 | | | | 612 | |
Ally Financial, Inc., 3.500%, 1/27/19 (b) | | | 825,000 | | | | 829 | |
American Campus Communities Operating Partnership LP, 3.350%, 10/1/20 | | | 390,000 | | | | 398 | |
American Express Credit Corp., 2.200%, 3/3/20 (b) | | | 700,000 | | | | 698 | |
ANZ New Zealand International, Ltd., 2.200%, 7/17/20 144A | | | 380,000 | | | | 378 | |
Aon PLC, 2.800%, 3/15/21 | | | 570,000 | | | | 572 | |
Banco de Credito del Peru, 2.250%, 10/25/19 144A | | | 200,000 | | | | 200 | |
Banco Santander Chile, 2.500%, 12/15/20 144A(b) | | | 860,000 | | | | 858 | |
Bank of America Corp., 1.971%, (3 Month LIBOR plus 0.65%), 10/1/21 | | | 420,000 | | | | 422 | |
Bank of America Corp., 2.000%, 1/11/18 (b) | | | 600,000 | | | | 600 | |
Bank of America Corp., 2.503%, 10/21/22 | | | 280,000 | | | | 277 | |
Bank of America Corp., 2.523%, (3 Month LIBOR plus 1.16%), 1/20/23 (b) | | | 665,000 | | | | 679 | |
Bank of America Corp., 2.625%, 4/19/21 | | | 315,000 | | | | 317 | |
Bank of Montreal, 1.750%, 9/11/19 (b) | | | 1,100,000 | | | | 1,091 | |
The Bank of New York Mellon Corp., 1.350%, 3/6/18 | | | 250,000 | | | | 250 | |
The Bank of New York Mellon Corp., 2.200%, 3/4/19 | | | 125,000 | | | | 125 | |
The Bank of Tokyo-Mitsubishi UFJ, Ltd.,
1.700%, 3/5/18 144A(b) | | | 1,145,000 | | | | 1,145 | |
Banque Federative du Credit Mutuel SA,
2.000%, 4/12/19 144A(b) | | | 795,000 | | | | 792 | |
Barclays PLC, 2.975%, (3 Month LIBOR plus 1.63%), 1/10/23 (b) | | | 690,000 | | | | 709 | |
BB&T Corp., 2.150%, 2/1/21 | | | 550,000 | | | | 545 | |
Bestgain Real Estate, Ltd., 2.625%, 3/13/18 (b) | | | 1,655,000 | | | | 1,654 | |
BPCE SA, 2.500%, 12/10/18 (b) | | | 1,200,000 | | | | 1,203 | |
BPCE SA, 2.666%, (3 Month LIBOR plus 1.22%), 5/22/22 144A | | | 280,000 | | | | 284 | |
Brixmor Operating Partnership LP, 3.875%, 8/15/22 | | | 80,000 | | | | 82 | |
Capital One Financial Corp., 2.350%, 1/31/20 | | | 455,000 | | | | 454 | |
Capital One Financial Corp., 2.400%, 10/30/20 | | | 230,000 | | | | 229 | |
Capital One NA, 1.850%, 9/13/19 (b) | | | 655,000 | | | | 649 | |
Capital One NA, 2.350%, 8/17/18 | | | 260,000 | | | | 260 | |
Chicago Board Options Exchange, Inc., 1.950%, 6/28/19 | | | 285,000 | | | | 283 | |
Chubb INA Holdings, Inc., 5.800%, 3/15/18 | | | 250,000 | | | | 252 | |
Citibank NA, 2.125%, 10/20/20 | | | 405,000 | | | | 401 | |
Citigroup, Inc., 1.750%, 5/1/18 | | | 350,000 | | | | 350 | |
Citigroup, Inc., 2.050%, 6/7/19 | | | 235,000 | | | | 234 | |
Citigroup, Inc., 2.140%, (3 Month LIBOR plus 0.79%), 1/10/20 (b) | | | 680,000 | | | | 684 | |
Citigroup, Inc., 2.900%, 12/8/21 (b) | | | 675,000 | | | | 679 | |
Citizens Bank NA, 2.500%, 3/14/19 | | | 525,000 | | | | 526 | |
The Accompanying Notes are an Integral Part of the Financial Statements.
| | | | |
| 104 | | Short-Term Bond Portfolio | | |
Short-Term Bond Portfolio
| | | | | | | | |
| Corporate Bonds (47.2%) | | Shares/
$ Par | | | Value
$ (000’s) | |
| |
Financial continued | | | | | |
Citizens Bank NA, 2.550%, 5/13/21 | | | 250,000 | | | | 249 | |
Citizens Financial Group, Inc., 2.250%, 3/2/20 | | | 565,000 | | | | 562 | |
Citizens Financial Group, Inc., 2.375%, 7/28/21 | | | 35,000 | | | | 35 | |
CNA Financial Corp., 6.950%, 1/15/18 | | | 130,000 | | | | 130 | |
CNO Financial Group, Inc., 4.500%, 5/30/20 | | | 140,000 | | | | 144 | |
Commonwealth Bank of Australia, 1.750%, 11/2/18 (b) | | | 918,000 | | | | 916 | |
The Credit Mutuel-CM11 Group, 2.200%, 7/20/20 144A | | | 435,000 | | | | 432 | |
Crown Castle International Corp., 2.250%, 9/1/21 | | | 195,000 | | | | 192 | |
Crown Castle International Corp., 3.400%, 2/15/21 | | | 385,000 | | | | 393 | |
Danske Bank A/S, 2.200%, 3/2/20 144A(b) | | | 620,000 | | | | 617 | |
Discover Bank, 2.000%, 2/21/18 | | | 515,000 | | | | 515 | |
Discover Bank, 2.600%, 11/13/18 (b) | | | 590,000 | | | | 592 | |
First Niagara Financial Group, Inc., 7.250%, 12/15/21 | | | 155,000 | | | | 178 | |
The Goldman Sachs Group, Inc., 1.950%, 7/23/19 | | | 240,000 | | | | 239 | |
The Goldman Sachs Group, Inc., 2.160%, (3 Month LIBOR plus 0.78%), 10/31/22 | | | 330,000 | | | | 330 | |
The Goldman Sachs Group, Inc., 2.300%, 12/13/19 | | | 370,000 | | | | 370 | |
The Goldman Sachs Group, Inc., 2.481%, (3 Month LIBOR plus 1.11%), 4/26/22 | | | 520,000 | | | | 526 | |
The Goldman Sachs Group, Inc., 2.750%, 9/15/20 | | | 95,000 | | | | 95 | |
The Goldman Sachs Group, Inc., 5.375%, 3/15/20 | | | 195,000 | | | | 207 | |
The Goldman Sachs Group, Inc., 6.000%, 6/15/20 | | | 60,000 | | | | 65 | |
The Goldman Sachs Group, Inc., 6.150%, 4/1/18 (b) | | | 1,430,000 | | | | 1,445 | |
HBOS PLC, 6.750%, 5/21/18 144A | | | 300,000 | | | | 305 | |
The Huntington National Bank, 2.200%, 11/6/18 (b) | | | 1,175,000 | | | | 1,176 | |
ING Groep NV, 2.483%, (3 Month LIBOR plus 1.15%), 3/29/22 | | | 335,000 | | | | 341 | |
Intesa Sanpaolo, 3.875%, 1/15/19 | | | 425,000 | | | | 431 | |
JPMorgan Chase & Co., 1.625%, 5/15/18 | | | 250,000 | | | | 250 | |
JPMorgan Chase & Co., 1.800%, 1/25/18 (b) | | | 850,000 | | | | 850 | |
JPMorgan Chase & Co., 2.086%, (3 Month LIBOR plus 0.55%), 3/9/21 (b) | | | 675,000 | | | | 677 | |
JPMorgan Chase & Co., 2.350%, 1/28/19 | | | 250,000 | | | | 250 | |
JPMorgan Chase & Co., 4.250%, 10/15/20 | | | 200,000 | | | | 210 | |
JPMorgan Chase & Co., 4.400%, 7/22/20 | | | 105,000 | | | | 110 | |
JPMorgan Chase & Co., 4.950%, 3/25/20 | | | 150,000 | | | | 158 | |
Kimco Realty Corp., 6.875%, 10/1/19 | | | 215,000 | | | | 231 | |
Marsh & McLennan Cos., Inc., 2.550%, 10/15/18 | | | 160,000 | | | | 161 | |
Mitsubishi UFJ Financial Group, Inc., 2.366%,
(3 Month LIBOR plus 0.92%), 2/22/22 | | | 390,000 | | | | 393 | |
Mizuho Bank, 2.150%, 10/20/18 144A | | | 245,000 | | | | 245 | |
Morgan Stanley, 2.125%, 4/25/18 (b) | | | 1,890,000 | | | | 1,890 | |
Morgan Stanley, 5.500%, 1/26/20 | | | 240,000 | | | | 254 | |
Morgan Stanley, 5.500%, 7/24/20 | | | 235,000 | | | | 252 | |
Morgan Stanley, 6.625%, 4/1/18 | | | 325,000 | | | | 329 | |
Morgan Stanley, 7.300%, 5/13/19 | | | 250,000 | | | | 266 | |
Nationwide Building Society, 2.350%, 1/21/20 144A | | | 340,000 | | | | 340 | |
New York Life Global Funding, 1.550%, 11/2/18 144A | | | 525,000 | | | | 523 | |
PNC Bank NA, 2.450%, 11/5/20 | | | 425,000 | | | | 426 | |
Principal Life Global Funding II, 1.500%, 4/18/19 144A | | | 240,000 | | | | 238 | |
| | | | | | | | |
| Corporate Bonds (47.2%) | | Shares/
$ Par | | | Value
$ (000’s) | |
| |
Financial continued | | | | | |
Principal Life Global Funding II, 2.200%, 4/8/20 144A | | | 445,000 | | | | 443 | |
Principal Life Global Funding II, 2.250%, 10/15/18 144A | | | 250,000 | | | | 250 | |
Provident Cos., Inc., 7.000%, 7/15/18 | | | 125,000 | | | | 128 | |
Regions Bank, 2.250%, 9/14/18 | | | 270,000 | | | | 270 | |
Regions Bank, 7.500%, 5/15/18 | | | 250,000 | | | | 255 | |
Reinsurance Group of America, Inc., 6.450%, 11/15/19 | | | 540,000 | | | | 578 | |
Santander UK Group Holdings PLC., 2.875%, 10/16/20 | | | 145,000 | | | | 145 | |
Santander UK PLC, 2.125%, 11/3/20 | | | 430,000 | | | | 427 | |
Simon Property Group LP, 1.500%, 2/1/18 144A | | | 250,000 | | | | 250 | |
Skandinaviska Enskilda Banken AB, 1.500%, 9/13/19 (b) | | | 680,000 | | | | 671 | |
Standard Chartered PLC, 2.100%, 8/19/19 144A | | | 200,000 | | | | 199 | |
Sumitomo Mitsui Banking Corp., 1.762%, 10/19/18 | | | 250,000 | | | | 250 | |
Sumitomo Mitsui Banking Corp., 1.950%, 9/19/19 144A | | | 290,000 | | | | 288 | |
SunTrust Banks, Inc., 2.350%, 11/1/18 | | | 465,000 | | | | 466 | |
Swedbank AB, 1.750%, 3/12/18 144A(b) | | | 1,100,000 | | | | 1,099 | |
The Toronto-Dominion Bank, 2.625%, 9/10/18 | | | 350,000 | | | | 351 | |
Trininty Acquisition PLC, 3.500%, 9/15/21 | | | 145,000 | | | | 148 | |
UBS Group Funding AG, 2.682%, (3 Month LIBOR plus 1.22%), 5/23/23 144A | | | 415,000 | | | | 422 | |
UBS Group Funding Jersey, Ltd., 2.950%, 9/24/20 144A | | | 255,000 | | | | 258 | |
UBS Group Funding Jersey, Ltd., 3.000%, 4/15/21 144A | | | 385,000 | | | | 388 | |
UNUM Group, 3.000%, 5/15/21 (b) | | | 620,000 | | | | 624 | |
Ventas Realty LP / Ventas Capital Corp., 4.000%, 4/30/19 | | | 435,000 | | | | 443 | |
VEREIT Operating Partnership LP, 3.000%, 2/6/19 (b) | | | 1,205,000 | | | | 1,211 | |
WEA Finance LLC / Westfield UK & Europe Finance PLC, 2.700%, 9/17/19 144A | | | 405,000 | | | | 407 | |
WEA Finance LLC / Westfield UK & Europe Finance PLC, 3.250%, 10/5/20 144A | | | 240,000 | | | | 244 | |
XLIT, Ltd., 2.300%, 12/15/18 | | | 430,000 | | | | 430 | |
| | | | | | | | |
Total | | | | | | | 51,147 | |
| | | | | | | | |
| |
Industrial (4.8%) | | | | | |
Bohai Capital Holding Co., Ltd., 3.625%, 3/15/21 144A(b) | | | 690,000 | | | | 664 | |
Burlington Northern Santa Fe LLC, 5.750%, 3/15/18 (b) | | | 750,000 | | | | 756 | |
DAE Funding LLC, 4.000%, 8/1/20 144A | | | 360,000 | | | | 364 | |
Fortive Corp., 1.800%, 6/15/19 | | | 65,000 | | | | 65 | |
GATX Corp., 2.375%, 7/30/18 | | | 525,000 | | | | 525 | |
GATX Corp., 2.500%, 7/30/19 | | | 315,000 | | | | 314 | |
GATX Corp., 2.600%, 3/30/20 | | | 335,000 | | | | 335 | |
Harris Corp., 1.999%, 4/27/18 (b) | | | 755,000 | | | | 754 | |
Honeywell International, Inc., 1.800%, 10/30/19 | | | 505,000 | | | | 502 | |
Kansas City Southern, 2.350%, 5/15/20 (b) | | | 715,000 | | | | 712 | |
Keysight Technologies, Inc., 3.300%, 10/30/19 (b) | | | 1,220,000 | | | | 1,231 | |
Martin Marietta Materials, Inc., 2.096%, (3 Month LIBOR plus 0.65%), 5/22/20 | | | 150,000 | | | | 151 | |
The Accompanying Notes are an Integral Part of the Financial Statements.
| | | | | | |
| | Short-Term Bond Portfolio | | | 105 | |
Short-Term Bond Portfolio
| | | | | | | | |
| Corporate Bonds (47.2%) | | Shares/
$ Par | | | Value
$ (000’s) | |
| |
Industrial continued | | | | | |
Martin Marietta Materials, Inc., 2.125%, (3 Month LIBOR plus 0.50%), 12/20/19 | | | 295,000 | | | | 296 | |
Packaging Corp. of America, 2.450%, 12/15/20 | | | 270,000 | | | | 270 | |
Penske Truck Leasing Co. LP / PTL Finance Corp., 2.500%, 6/15/19 144A | | | 105,000 | | | | 105 | |
Penske Truck Leasing Co. LP / PTL Finance Corp., 2.875%, 7/17/18 144A(b) | | | 1,175,000 | | | | 1,180 | |
Penske Truck Leasing Co. LP / PTL Finance Corp., 3.375%, 3/15/18 144A(b) | | | 705,000 | | | | 707 | |
Republic Services, Inc., 5.500%, 9/15/19 | | | 250,000 | | | | 263 | |
Rockwell Collins, Inc., 1.950%, 7/15/19 | | | 205,000 | | | | 204 | |
Roper Industries, Inc., 2.050%, 10/1/18 (b) | | | 865,000 | | | | 865 | |
Roper Technologies, Inc., 3.000%, 12/15/20 | | | 90,000 | | | | 91 | |
SBA Tower Trust, 2.240%, 4/9/43 144A | | | 180,000 | | | | 180 | |
SBA Tower Trust, 2.877%, 7/10/46 144A | | | 155,000 | | | | 154 | |
SBA Tower Trust, 3.156%, 10/10/45 144A(b) | | | 635,000 | | | | 640 | |
SBA Tower Trust, 3.168%, 4/9/47 144A | | | 390,000 | | | | 388 | |
SBA Tower Trust, 3.598%, 4/9/43 144A | | | 115,000 | | | | 115 | |
Stanley Black & Decker, Inc., 1.622%, 11/17/18 | | | 65,000 | | | | 65 | |
Stanley Black & Decker, Inc., 2.451%, 11/17/18 (b) | | | 1,155,000 | | | | 1,159 | |
Union Pacific Corp., 2.250%, 2/15/19 | | | 85,000 | | | | 85 | |
United Parcel Service, Inc., 2.500%, 4/1/23 | | | 485,000 | | | | 482 | |
Vulcan Materials Co., 2.188%, (3 Month LIBOR plus 0.60%), 6/15/20 | | | 365,000 | | | | 365 | |
| | | | | | | | |
Total | | | | | | | 13,987 | |
| | | | | | | | |
| |
Technology (2.1%) | | | | | |
Apple, Inc., 1.800%, 11/13/19 (b) | | | 690,000 | | | | 687 | |
Broadcom Corp. / Broadcom Cayman Finance, Ltd., 2.375%, 1/15/20 144A(b) | | | 750,000 | | | | 745 | |
Broadcom Corp. / Broadcom Cayman Finance, Ltd., 3.000%, 1/15/22 144A(b) | | | 700,000 | | | | 694 | |
DXC Technology Co., 2.431%, (3 Month LIBOR plus 0.95%), 3/1/21 (b) | | | 880,000 | | | | 882 | |
DXC Technology Co., 2.875%, 3/27/20 | | | 445,000 | | | | 447 | |
Fidelity National Information Services, Inc., 2.250%, 8/15/21 | | | 490,000 | | | | 482 | |
Hewlett Packard Enterprise Co., 2.100%, 10/4/19 144A | | | 280,000 | | | | 278 | |
Hewlett Packard Enterprise Co., 2.850%, 10/5/18 | | | 425,000 | | | | 427 | |
QUALCOMM, Inc., 2.100%, 5/20/20 | | | 280,000 | | | | 279 | |
Seagate HDD Cayman, 3.750%, 11/15/18 | | | 410,000 | | | | 416 | |
Xerox Corp., 2.750%, 3/15/19 | | | 295,000 | | | | 295 | |
Xerox Corp., 5.625%, 12/15/19 | | | 525,000 | | | | 552 | |
| | | | | | | | |
Total | | | | | | | 6,184 | |
| | | | | | | | |
| |
Utilities (3.2%) | | | | | |
CMS Energy Corp., 8.750%, 6/15/19 | | | 117,000 | | | | 127 | |
Commonwealth Edison Co., 2.150%, 1/15/19 | | | 250,000 | | | | 250 | |
Dominion Energy, Inc., 2.579%, 7/1/20 | | | 185,000 | | | | 185 | |
Dominion Resources, Inc., 1.500%, 9/30/18 144A | | | 315,000 | | | | 314 | |
Dominion Resources, Inc., 1.875%, 1/15/19 | | | 225,000 | | | | 224 | |
Dominion Resources, Inc., 2.125%, 2/15/18 144A | | | 465,000 | | | | 465 | |
Dominion Resources, Inc., 2.962%, 7/1/19 | | | 145,000 | | | | 146 | |
Dominion Resources, Inc., 5.200%, 8/15/19 | | | 150,000 | | | | 157 | |
Duke Energy Corp., 2.100%, 6/15/18 | | | 115,000 | | | | 115 | |
| | | | | | | | |
| Corporate Bonds (47.2%) | | Shares/
$ Par | | | Value
$ (000’s) | |
| |
Utilities continued | | | | | |
Enel Finance International NV, 2.875%, 5/25/22 144A | | | 535,000 | | | | 534 | |
Eversource Energy, 1.450%, 5/1/18 | | | 105,000 | | | | 105 | |
Exelon Generation Co. LLC, 2.950%, 1/15/20 | | | 365,000 | | | | 369 | |
Exelon Generation Co. LLC, 5.200%, 10/1/19 | | | 21,000 | | | | 22 | |
FirstEnergy Corp., 2.850%, 7/15/22 | | | 320,000 | | | | 317 | |
MidAmerican Energy Co., 2.400%, 3/15/19 | | | 500,000 | | | | 502 | |
Municipality of Beijing China, 2.750%, 9/26/20 | | | 385,000 | | | | 382 | |
NextEra Energy Capital Holdings, Inc., 1.649%, 9/1/18 | | | 190,000 | | | | 189 | |
NextEra Energy Capital Holdings, Inc., 2.300%, 4/1/19 | | | 165,000 | | | | 165 | |
NiSource Finance Corp., 6.800%, 1/15/19 | | | 78,000 | | | | 82 | |
Origin Energy Finance, Ltd., 3.500%, 10/9/18 144A(b) | | | 790,000 | | | | 795 | |
PPL Capital Funding, Inc., 1.900%, 6/1/18 (b) | | | 590,000 | | | | 589 | |
Public Service Electric & Gas Co., 2.300%, 9/15/18 | | | 400,000 | | | | 400 | |
San Diego Gas & Electric Co., 1.914%, 2/1/22 | | | 138,215 | | | | 135 | |
Sempra Energy, 6.150%, 6/15/18 | | | 250,000 | | | | 255 | |
The Southern Co., 1.550%, 7/1/18 | | | 165,000 | | | | 165 | |
The Southern Co., 1.850%, 7/1/19 | | | 575,000 | | | | 571 | |
The Southern Co., 2.350%, 7/1/21 | | | 125,000 | | | | 124 | |
Southern Electric Generating Co., 2.200%, 12/1/18 144A | | | 140,000 | | | | 140 | |
State Grid Overseas Investment 2016, Ltd., 2.250%, 5/4/20 144A(b) | | | 1,030,000 | | | | 1,020 | |
TECO Finance, Inc., 1.950%, (3 Month LIBOR plus 0.60%), 4/10/18 (b) | | | 590,000 | | | | 590 | |
| | | | | | | | |
Total | | | | | | | 9,434 | |
| | | | | | | | |
| | |
Total Corporate Bonds | | | | | | | | |
(Cost: $138,577) | | | | | | | 138,548 | |
| | | | | | | | |
| | |
| Governments (15.3%) | | | | | | |
| |
Governments (15.3%) | | | | | |
Province of Ontario Canada, 2.000%, 9/27/18 | | | 1,000,000 | | | | 1,000 | |
State of Qatar, 2.099%, 1/18/18 | | | 420,000 | | | | 420 | |
US Treasury, 0.875%, 6/15/19 | | | 3,105,000 | | | | 3,061 | |
US Treasury, 1.000%, 11/15/19 | | | 16,780,000 | | | | 16,508 | |
US Treasury, 1.250%, 5/31/19 | | | 1,080,000 | | | | 1,071 | |
US Treasury, 1.250%, 1/31/20 | | | 2,900,000 | | | | 2,861 | |
US Treasury, 1.375%, 9/15/20 | | | 2,870,000 | | | | 2,829 | |
US Treasury, 1.375%, 5/31/21 | | | 1,000,000 | | | | 978 | |
US Treasury, 1.500%, 6/15/20 | | | 3,460,000 | | | | 3,425 | |
US Treasury, 1.625%, 11/30/20 | | | 5,605,000 | | | | 5,548 | |
US Treasury, 1.750%, 9/30/19 | | | 450,000 | | | | 449 | |
US Treasury Note, 1.875%, 12/15/20 | | | 6,845,000 | | | | 6,825 | |
| | | | | | | | |
| | |
Total Governments | | | | | | | | |
(Cost: $45,319) | | | | | | | 44,975 | |
| | | | | | | | |
| | |
| Municipal Bonds (0.2%) | | | | | | |
| |
Municipal Bonds (0.2%) | | | | | |
Florida State Board of Administration Finance Corp., 2.163%, 7/1/19 RB | | | 475,000 | | | | 474 | |
The Accompanying Notes are an Integral Part of the Financial Statements.
| | | | |
| 106 | | Short-Term Bond Portfolio | | |
Short-Term Bond Portfolio
| | | | | | | | |
| Municipal Bonds (0.2%) | | Shares/
$ Par | | | Value
$ (000’s) | |
| |
Municipal Bonds continued | | | | | |
State Board of Administration Finance Corp., Series 2013A, 2.107%, 7/1/18 RB | | | 190,000 | | | | 190 | |
| | | | | | | | |
Total Municipal Bonds | | | | | | | | |
(Cost: $665) | | | | | | | 664 | |
| | | | | | | | |
| | |
| Structured Products (35.3%) | | | | | | |
| |
Asset Backed Securities (21.0%) | | | | | |
AEP Texas Central Transition Funding LLC, Series 2006-A, Class A4, 5.170%, 1/1/18 | | | 112,067 | | | | 112 | |
Ally Auto Receivables Trust, Series 2014-1, Class C, 2.040%, 12/15/19 | | | 75,000 | | | | 75 | |
Ally Auto Receivables Trust, Series 2014-1, Class D, 2.480%, 2/15/21 | | | 75,000 | | | | 75 | |
Ally Auto Receivables Trust, Series 2015-2, Class C, 2.410%, 1/15/21 144A | | | 505,000 | | | | 506 | |
Ally Auto Receivables Trust, Series 2016-1, Class D, 2.840%, 9/15/22 | | | 180,000 | | | | 181 | |
Ally Auto Receivables Trust, Series 2017-2, Class C, 2.460%, 9/15/22 | | | 70,000 | | | | 70 | |
Ally Auto Receivables Trust, Series 2017-2, Class D, 2.930%, 11/15/23 | | | 95,000 | | | | 94 | |
Ally Master Owner Trust, Series 2015-3, Class A, 1.630%, 5/15/20 | | | 1,195,000 | | | | 1,194 | |
Ally Master Owner Trust, Series 2017-2, Class A, 1.817%, (ICE LIBOR USD 1 Month plus 0.34%), 6/15/21 | | | 95,000 | | | | 95 | |
Ally Master Owner Trust, Series 2017-3, Class A1, 1.907%, (ICE LIBOR USD 1 Month plus 0.43%), 6/15/22 | | | 75,000 | | | | 75 | |
AmeriCredit Automobile Receivables Trust, Series 14-3, Class D, 3.130%, 10/8/20 | | | 445,000 | | | | 449 | |
AmeriCredit Automobile Receivables Trust, Series 2014-1, Class E, 3.580%, 8/9/21 144A | | | 175,000 | | | | 177 | |
AmeriCredit Automobile Receivables Trust, Series 2014-2, Class E, 3.370%, 11/8/21 144A | | | 375,000 | | | | 378 | |
AmeriCredit Automobile Receivables Trust, Series 2014-3, Class C, 2.580%, 9/8/20 | | | 520,000 | | | | 522 | |
AmeriCredit Automobile Receivables Trust, Series 2014-3, Class E, 3.720%, 3/8/22 144A | | | 170,000 | | | | 172 | |
AmeriCredit Automobile Receivables Trust, Series 2014-4, Class C, 2.470%, 11/9/20 | | | 220,000 | | | | 221 | |
AmeriCredit Automobile Receivables Trust, Series 2014-4, Class E, 3.660%, 3/8/22 | | | 150,000 | | | | 151 | |
AmeriCredit Automobile Receivables Trust, Series 2015-1, Class A3, 1.260%, 11/8/19 | | | 12,459 | | | | 12 | |
AmeriCredit Automobile Receivables Trust, Series 2015-2, Class A3, 1.270%, 1/8/20 | | | 50,373 | | | | 50 | |
AmeriCredit Automobile Receivables Trust, Series 2015-2, Class D, 3.000%, 6/8/21 | | | 245,000 | | | | 247 | |
AmeriCredit Automobile Receivables Trust, Series 2015-3, Class D, 3.340%, 8/8/21 | | | 310,000 | | | | 314 | |
AmeriCredit Automobile Receivables Trust, Series 2015-4, Class A3, 1.700%, 7/8/20 | | | 143,260 | | | | 143 | |
AmeriCredit Automobile Receivables Trust, Series 2016-1, Class A3, 1.810%, 10/8/20 | | | 60,777 | | | | 61 | |
| | | | | | | | |
| Structured Products (35.3%) | | Shares/
$ Par | | | Value
$ (000’s) | |
| |
Asset Backed Securities continued | | | | | |
AmeriCredit Automobile Receivables Trust, Series 2016-1, Class C, 2.890%, 1/10/22 | | | 1,120,000 | | | | 1,128 | |
AmeriCredit Automobile Receivables Trust, Series 2016-3, Class D, 2.710%, 9/8/22 | | | 380,000 | | | | 377 | |
Americredit Automobile Receivables Trust, Series 2016-4, Class A3, 1.530%, 7/8/21 | | | 385,000 | | | | 382 | |
AmeriCredit Automobile Receivables Trust, Series 2017-1, Class C, 2.710%, 8/18/22 | | | 175,000 | | | | 175 | |
AmeriCredit Automobile Receivables Trust, Series 2017-3, Class B, 2.240%, 6/19/23 | | | 185,000 | | | | 183 | |
AmeriCredit Automobile Receivables Trust, Series 2017-3, Class C, 2.690%, 6/19/23 | | | 195,000 | | | | 195 | |
ARI Fleet Lease Trust, Series 2015-A, Class A2, 1.110%, 11/15/18 144A | | | 14,243 | | | | 14 | |
ARI Fleet Lease Trust, Series 2015-A, Class A3, 1.670%, 9/15/23 144A | | | 520,000 | | | | 518 | |
ARI Fleet Lease Trust, Series 2016-A, Class A2, 1.820%, 7/15/24 144A | | | 231,213 | | | | 231 | |
ARI Fleet Lease Trust, Series 2017-A, Class A2, 1.910%, 4/15/26 144A | | | 135,000 | | | | 135 | |
ARI Fleet Lease Trust, Series 2017-A, Class A3, 2.280%, 4/15/26 144A | | | 700,000 | | | | 696 | |
Ascentium Equipment Receivables Trust LLC, Series 2015-2A, Class A3, 1.930%, 3/11/19 144A | | | 182,411 | | | | 182 | |
Ascentium Equipment Receivables Trust LLC, Series 2016-1A, Class A2, 1.750%, 11/13/18 144A | | | 25,271 | | | | 25 | |
Ascentium Equipment Receivables Trust LLC, Series 2016-2A, Class A2, 1.460%, 4/10/19 144A | | | 74,347 | | | | 74 | |
Ascentium Equipment Receivables Trust LLC, Series 2017-1A, Class A2, 1.870%, 7/10/19 144A | | | 160,000 | | | | 160 | |
Ascentium Equipment Receivables Trust LLC, Series 2017-1A, Class A3, 2.290%, 6/10/21 144A | | | 160,000 | | | | 159 | |
Ascentium Equipment Receivables Trust LLC, Series 2017-2A, Class A3, 2.310%, 12/10/21 144A | | | 415,000 | | | | 412 | |
Avis Budget Rental Car Funding AESOP LLC, Series 2012-3A, Class A, 2.100%, 3/20/19 144A | | | 137,500 | | | | 138 | |
Avis Budget Rental Car Funding AESOP LLC, Series 2013-2A, Class A, 2.970%, 2/20/20 144A | | | 135,000 | | | | 136 | |
Avis Budget Rental Car Funding AESOP LLC, Series 2013-2A, Class B, 3.660%, 2/20/20 144A | | | 670,000 | | | | 677 | |
Avis Budget Rental Car Funding AESOP LLC, Series 2014-1A, Class A, 2.460%, 7/20/20 144A | | | 155,000 | | | | 155 | |
Avis Budget Rental Car Funding AESOP LLC, Series 2014-2A, Class A, 2.500%, 2/20/21 144A | | | 940,000 | | | | 940 | |
Avis Budget Rental Car Funding AESOP LLC, Series 2015-1A, Class A, 2.500%, 7/20/21 144A | | | 415,000 | | | | 415 | |
Avis Budget Rental Car Funding AESOP LLC, Series 2016-1A, Class A, 2.990%, 6/20/22 144A | | | 440,000 | | | | 443 | |
Babson CLO, Ltd., Series 2013-IA, Class AR, 2.315%, (3 Month LIBOR plus 0.80%), 1/20/28 144A | | | 730,000 | | | | 730 | |
Bayview Mortgage Fund IVc Trust, Series 2017-RT3, Class A, 3.500%, (AFC), 1/28/58 144A | | | 880,723 | | | | 898 | |
Bayview Opportunity Master Fund IVa Trust, Series 2017-SPL5, Class A, 3.500%, (AFC), 6/28/57 144A | | | 756,749 | | | | 767 | |
The Accompanying Notes are an Integral Part of the Financial Statements.
| | | | | | |
| | Short-Term Bond Portfolio | | | 107 | |
Short-Term Bond Portfolio
| | | | | | | | |
| Structured Products (35.3%) | | Shares/
$ Par | | | Value
$ (000’s) | |
| |
Asset Backed Securities continued | | | | | |
Bayview Opportunity Master Fund IVb Trust, Series 2017-SPL4,Class A, 3.500%, (AFC), 1/28/55 144A | | | 262,496 | | | | 266 | |
BMW Vehicle Lease Trust, Series 2016-2, Class A3, 1.430%, 9/20/19 | | | 215,000 | | | | 214 | |
BMW Vehicle Lease Trust, Series 2017-1, Class A3, 1.980%, 5/20/20 | | | 325,000 | | | | 325 | |
BMW Vehicle Lease Trust, Series 2017-2, Class A3, 2.070%, 10/20/20 | | | 205,000 | | | | 204 | |
California Republic Auto Receivables Trust, Series 2015-1, Class B, 2.510%, 2/16/21 | | | 130,000 | | | | 130 | |
Capital Auto Receivables Asset Trust, Series 2013-4, Class D, 3.220%, 5/20/19 | | | 172,264 | | | | 172 | |
Capital Auto Receivables Asset Trust, Series 2015-2, Class A3, 1.730%, 9/20/19 | | | 129,403 | | | | 129 | |
Capital Auto Receivables Asset Trust, Series 2015-4, Class A2, 1.620%, 3/20/19 | | | 30,096 | | | | 30 | |
Capital Auto Receivables Asset Trust, Series 2016-1, Class A3, 1.730%, 4/20/20 | | | 186,014 | | | | 186 | |
Capital Auto Receivables Asset Trust, Series 2016-2, Class A4, 1.630%, 1/20/21 | | | 175,000 | | | | 174 | |
Capital Auto Receivables Asset Trust, Series 2016-3, Class A3, 1.540%, 8/20/20 | | | 120,000 | | | | 120 | |
Capital Auto Receivables Asset Trust, Series 2017-1, Class B, 2.430%, 5/20/22 144A | | | 70,000 | | | | 70 | |
Capital Auto Receivables Asset Trust, Series 2017-1, Class C, 2.700%, 9/20/22 144A | | | 115,000 | | | | 115 | |
Carlyle Global Market Strategies, Series 2014-2A, Class AR, 2.666%, (3 Month LIBOR plus 1.25%), 5/15/25 144A | | | 575,000 | | | | 577 | |
Carlyle Global Market Strategies, Series 2015-1A, Class AR, 2.363%, (3 Month LIBOR plus 1.00%), 4/20/27 144A | | | 425,000 | | | | 426 | |
CarMax Auto Owner Trust, Series 2014-4, Class A4, 1.810%, 7/15/20 | | | 250,000 | | | | 250 | |
CarMax Auto Owner Trust, Series 2015-3, Class D, 3.270%, 3/15/22 | | | 220,000 | | | | 221 | |
CarMax Auto Owner Trust, Series 2016-2, Class A3, 1.520%, 2/16/21 | | | 315,000 | | | | 314 | |
CarMax Auto Owner Trust, Series 2016-4, Class A3, 1.400%, 8/15/21 | | | 400,000 | | | | 396 | |
CarMax Auto Owner Trust, Series 2017-4, Class C, 2.700%, 10/16/23 | | | 95,000 | | | | 94 | |
CCG Receivables Trust, Series 2015-1, Class A2, 1.460%, 11/14/18 144A | | | 8,255 | | | | 8 | |
CCG Receivables Trust, Series 2015-1, Class B, 2.600%, 1/17/23 144A | | | 370,000 | | | | 371 | |
CCG Receivables Trust, Series 2016-1, Class A2, 1.690%, 9/14/22 144A | | | 114,584 | | | | 114 | |
CCG Receivables Trust, Series 2017-1, Class A2, 1.840%, 11/14/23 144A | | | 265,000 | | | | 264 | |
Chrysler Capital Auto Receivables Trust, Series 2016-BA, Class A2, 1.360%, 1/15/20 144A | | | 46,245 | | | | 46 | |
Chrysler Capital Auto Receivables Trust, Series 2016-BA, Class A3, 1.640%, 7/15/21 144A | | | 125,000 | | | | 124 | |
| | | | | | | | |
| Structured Products (35.3%) | | Shares/
$ Par | | | Value
$ (000’s) | |
| |
Asset Backed Securities continued | | | | | |
CNH Equipment Trust, Series 2015-B, Class A3, 1.370%, 7/15/20 | | | 314,974 | | | | 314 | |
CNH Equipment Trust, Series 2015-C, Class B, 2.400%, 2/15/23 | | | 570,000 | | | | 569 | |
CNH Equipment Trust, Series 2016-C, Class A3, 1.440%, 12/15/21 | | | 260,000 | | | | 257 | |
Diamond Resorts Owner Trust, Series 2014-1, Class A, 2.540%, 5/20/27 144A | | | 94,975 | | | | 94 | |
Diamond Resorts Owner Trust, Series 2015-1, Class A, 2.730%, 7/20/27 144A | | | 73,173 | | | | 73 | |
Diamond Resorts Owner Trust, Series 2015-2, Class A, 2.990%, 5/22/28 144A | | | 78,970 | | | | 79 | |
Elara HGV Timeshare Issuer, Series 2017-A, Class A, 2.690%, 3/25/30 144A | | | 192,840 | | | | 191 | |
Enterprise Fleet Financing LLC, Series 2015-1, Class A2, 1.300%, 9/20/20 144A | | | 13,698 | | | | 14 | |
Enterprise Fleet Financing LLC, Series 2015-2, Class A2, 1.590%, 2/22/21 144A | | | 141,315 | | | | 141 | |
Enterprise Fleet Financing LLC, Series 2016-1, Class A2, 1.830%, 9/20/21 144A | | | 542,179 | | | | 542 | |
Enterprise Fleet Financing LLC, Series 2016-2, Class A2, 1.740%, 2/22/22 144A | | | 433,049 | | | | 432 | |
Enterprise Fleet Financing LLC, Series 2017-1, Class A2, 2.130%, 7/20/22 144A | | | 195,698 | | | | 196 | |
Enterprise Fleet Financing LLC, Series 2017-3, Class A2, 2.130%, 5/22/23 144A | | | 665,000 | | | | 664 | |
Enterprise Fleet Financing LLC., Series 2017-2, Class A2, 1.970%, 1/20/23 144A | | | 155,000 | | | | 155 | |
Ford Credit Auto Lease Trust, Series 2017-B, Class A3, 2.030%, 12/15/20 | | | 255,000 | | | | 254 | |
Ford Credit Floorplan Master Owner Trust A, Series 2013-4, Class C, 2.290%, 6/15/20 | | | 1,070,000 | | | | 1,070 | |
Ford Credit Floorplan Master Owner Trust A, Series 2016-3, Class A1, 1.550%, 7/15/21 | | | 490,000 | | | | 486 | |
Ford Credit Floorplan Master Owner Trust A, Series 2016-3, Class B, 1.750%, 7/15/21 | | | 190,000 | | | | 188 | |
Ford Credit Floorplan Master Owner Trust A, Series 2017-1, Class B, 2.250%, 5/15/22 | | | 480,000 | | | | 476 | |
Ford Credit Floorplan Master Owner Trust A, Series 2017-2, Class B, 2.340%, 9/15/22 | | | 1,265,000 | | | | 1,261 | |
Ford Credit Floorplan Master Owner Trust, Series 2016-5, Class B, 2.160%, 11/15/21 | | | 410,000 | | | | 408 | |
GM Financial Automobile Leasing Trust, Series 2015-1, Class D, 3.010%, 3/20/20 | | | 140,000 | | | | 140 | |
GM Financial Automobile Leasing Trust, Series 2016-2, Class A3, 1.620%, 9/20/19 | | | 415,000 | | | | 414 | |
GM Financial Automobile Leasing Trust, Series 2016-3, Class B, 1.970%, 5/20/20 | | | 225,000 | | | | 223 | |
GM Financial Automobile Leasing Trust, Series 2017-1, Class A4, 2.260%, 8/20/20 | | | 75,000 | | | | 75 | |
GM Financial Automobile Leasing Trust, Series 2017-2, Class A3, 2.020%, 9/21/20 | | | 325,000 | | | | 324 | |
GM Financial Automobile Leasing Trust, Series 2017-3, Class A4, 2.120%, 9/20/21 | | | 115,000 | | | | 114 | |
The Accompanying Notes are an Integral Part of the Financial Statements.
| | | | |
| 108 | | Short-Term Bond Portfolio | | |
Short-Term Bond Portfolio
| | | | | | | | |
| Structured Products (35.3%) | | Shares/
$ Par | | | Value
$ (000’s) | |
| |
Asset Backed Securities continued | | | | | |
GM Financial Automobile Leasing Trust, Series 2017-3, Class C, 2.730%, 9/20/21 | | | 140,000 | | | | 139 | |
GM Financial Securitized Term, Series 2017-3A, Class C, 2.520%, 3/16/23 144A | | | 475,000 | | | | 471 | |
GMF Floorplan Owner Revolving Trust, Series 2015-1, Class A1, 1.650%, 5/15/20 144A | | | 290,000 | | | | 290 | |
GMF Floorplan Owner Revolving Trust, Series 2016-1, Class B, 2.410%, 5/17/21 144A | | | 125,000 | | | | 125 | |
GMF Floorplan Owner Revolving Trust, Series 2016-1, Class C, 2.850%, 5/17/21 144A | | | 100,000 | | | | 100 | |
GMF Floorplan Owner Revolving Trust, Series 2017-1, Class C, 2.970%, 1/18/22 144A | | | 260,000 | | | | 260 | |
GMF Floorplan Owner Revolving Trust, Series 2017-2, Class C, 2.630%, 7/15/22 144A | | | 170,000 | | | | 168 | |
GMF Floorplan Owner Revolving Trust, Series 2017-3, Class B, 2.260%, 8/16/21 144A | | | 715,000 | | | | 710 | |
GMF Floorplan Owner Revolving Trust, Series 2017-3, Class C, 2.460%, 8/16/21 144A | | | 855,000 | | | | 849 | |
GreatAmerica Leasing Receivables Funding LLC, Series 2016-1, Class A3, 1.730%, 6/20/19 144A | | | 295,816 | | | | 296 | |
GreatAmerica Leasing Receivables Funding LLC, Series 2017-1, Class A2, 1.720%, 4/22/19 144A | | | 90,295 | | | | 90 | |
GreatAmerica Leasing Receivables Funding LLC, Series 2017-1, Class A3, 2.060%, 6/22/20 144A | | | 100,000 | | | | 100 | |
Halcyon Loan Advisors Funding, Ltd., Series 2014-3A, Class B1R0(3 Month LIBOR plus 1.70%), 10/22/25 144A | | | 345,000 | | | | 345 | |
Hilton Grand Vacations Trust, Series 2017-AA, Class A, 2.660%, 12/26/28 144A | | | 146,561 | | | | 146 | |
Hilton Grand Vacations Trust, Series 2017-AA, Class B, 2.960%, (EXE), 12/26/28 144A | | | 83,749 | | | | 83 | |
Huntington Auto Trust, Series 2016-1, Class A4, 1.930%, 4/15/22 | | | 325,000 | | | | 323 | |
Hyundai Auto Lease Securitization Trust, Series 2015-B, Class A3, 1.400%, 11/15/18 144A | | | 12,623 | | | | 13 | |
Hyundai Auto Lease Securitization Trust, Series 2016-A, Class A3, 1.600%, 7/15/19 144A | | | 132,101 | | | | 132 | |
Hyundai Auto Lease Securitization Trust, Series 2016-B, Class A4, 1.680%, 4/15/20 144A | | | 100,000 | | | | 100 | |
Hyundai Auto Lease Securitization Trust, Series 2016-C, Class A4, 1.650%, 7/15/20 144A | | | 290,000 | | | | 289 | |
Hyundai Auto Lease Securitization Trust, Series 2016-C, Class B, 1.860%, 5/17/21 144A | | | 320,000 | | | | 318 | |
Hyundai Auto Lease Securitization Trust, Series 2017-B, Class A3, 1.970%, 7/15/20 144A | | | 500,000 | | | | 499 | |
Hyundai Auto Receivables Trust, Series 2015-A, Class A3, 1.050%, 4/15/19 | | | 21,384 | | | | 21 | |
Hyundai Auto Receivables Trust, Series 2017-A, Class B, 2.380%, 4/17/23 | | | 150,000 | | | | 149 | |
John Deere Owner Trust, Series 2015-A, Class A3, 1.320%, 6/17/19 | | | 48,217 | | | | 48 | |
John Deere Owner Trust, Series 2016-A, Class A3, 1.360%, 4/15/20 | | | 318,683 | | | | 318 | |
| | | | | | | | |
| Structured Products (35.3%) | | Shares/
$ Par | | | Value
$ (000’s) | |
| |
Asset Backed Securities continued | | | | | |
KKR CLO 12, Ltd., 2.409%, (3 Month LIBOR plus 1.05%), 7/15/27 144A | | | 705,000 | | | | 706 | |
Kubota Credit Owner Trust, Series 2014-1A, Class A4, 1.670%, 7/15/20 144A | | | 732,221 | | | | 732 | |
Kubota Credit Owner Trust, Series 2016-1A, Class A3, 1.500%, 7/15/20 144A | | | 605,000 | | | | 601 | |
Madison Park Funding XVIII, Ltd., Series 2015-18A, Class A1R, 2.553%, (3 Month LIBOR plus 1.19%), 10/21/30 144A | | | 440,000 | | | | 443 | |
Mercedes-Benz Auto Lease Trust, Series 2016-A, Class A3, 1.520%, 3/15/19 | | | 323,463 | | | | 323 | |
Mill City Mortgage Loan Trust, Series 2016-1, Class A1, 2.500%, (AFC), 4/25/57 144A | | | 99,375 | | | | 99 | |
Mill City Mortgage Loan Trust, Series 2017-2, Class A1, 2.750%, (AFC), 7/25/59 144A | | | 573,851 | | | | 574 | |
MMAF Equipment Finance LLC, Series 2015-AA, Class A3, 1.390%, 10/16/19 144A | | | 42,505 | | | | 42 | |
MMAF Equipment Finance LLC, Series 2017-AA, Class A2, 1.730%, 5/18/20 144A | | | 338,772 | | | | 338 | |
MVW Owner Trust, Series 2015-1A, Class A, 2.520%, 12/20/32 144A | | | 295,873 | | | | 294 | |
MVW Owner Trust, Series 2017-1A, Class A, 2.420%, 12/20/34 144A | | | 115,355 | | | | 114 | |
MVW Owner Trust, Series 2017-1A, Class B, 2.750%, 12/20/34 144A | | | 96,129 | | | | 95 | |
MVW Owner Trust, Series 2017-1A, Class C, 2.990%, 12/20/34 144A | | | 105,742 | | | | 104 | |
Nationstar HECM Loan Trust, Series 2016-2A, Class A, 2.239%, (AFC), 6/25/26 144A(l) | | | 51,608 | | | | 52 | |
Nationstar HECM Loan Trust, Series 2016-3A, Class A, 2.012%, 8/25/26 144A(l) | | | 42,054 | | | | 42 | |
Neuberger Berman CLO XVI-S, Ltd., Series 16S, Class A, 1.625%, (3 Month LIBOR plus 0.85%), 1/15/28 144A(l) | | | 440,000 | | | | 440 | |
Nissan Auto Lease Trust, Series 2016-B, Class A4, 1.610%, 1/18/22 | | | 370,000 | | | | 368 | |
Nissan Auto Lease Trust, Series 2017-B, Class A4, 2.170%, 12/15/21 | | | 290,000 | | | | 289 | |
Nissan Master Owner Trust Receivables, Series 2015-A, Class A2, 1.440%, 1/15/20 | | | 400,000 | | | | 400 | |
Nissan Master Owner Trust Receivables, Series 2016-A, Class A2, 1.540%, 6/15/21 | | | 335,000 | | | | 332 | |
Nissan Master Owner Trust Receivables, Series 2017-B, Class A, 1.907%, (ICE LIBOR USD 1 Month plus 0.43%), 4/18/22 | | | 1,110,000 | | | | 1,116 | |
OCP CLO, Ltd., Series 2015-10A, Class A1R, 2.191%, (3 Month LIBOR plus 0.82%), 10/26/27 144A | | | 665,000 | | | | 666 | |
Santander Drive Auto Receivables Trust, Series 2014-3, Class D, 2.650%, 8/17/20 | | | 55,000 | | | | 55 | |
Santander Drive Auto Receivables Trust, Series 2015-3, Class D, 3.490%, 5/17/21 | | | 345,000 | | | | 350 | |
Santander Drive Auto Receivables Trust, Series 2015-4, Class D, 3.530%, 8/16/21 | | | 240,000 | | | | 244 | |
The Accompanying Notes are an Integral Part of the Financial Statements.
| | | | | | |
| | Short-Term Bond Portfolio | | | 109 | |
Short-Term Bond Portfolio
| | | | | | | | |
| Structured Products (35.3%) | | Shares/
$ Par | | | Value
$ (000’s) | |
| |
Asset Backed Securities continued | | | | | |
Santander Drive Auto Receivables Trust, Series 2015-5, Class C, 2.740%, 12/15/21 | | | 705,000 | | | | 708 | |
Santander Drive Auto Receivables Trust, Series 2015-5, Class D, 3.650%, 12/15/21 | | | 345,000 | | | | 350 | |
Santander Drive Auto Receivables Trust, Series 2016-1, Class B, 2.470%, 12/15/20 | | | 170,000 | | | | 170 | |
Santander Drive Auto Receivables Trust, Series 2016-1, Class D, 4.020%, 4/15/22 | | | 425,000 | | | | 436 | |
Santander Drive Auto Receivables Trust, Series 2016-3, Class C, 2.460%, 3/15/22 | | | 274,000 | | | | 274 | |
Santander Drive Auto Receivables Trust, Series 2017-1, Class B, 2.100%, 6/15/21 | | | 50,000 | | | | 50 | |
Santander Drive Auto Receivables Trust, Series 2017-1, Class C, 2.580%, 5/16/22 | | | 65,000 | | | | 65 | |
Santander Drive Auto Receivables Trust, Series 2017-3, Class B, 2.190%, 3/15/22 | | | 365,000 | | | | 363 | |
Santander Retail Auto Lease Trust, Series 2017-A, Class A3, 2.220%, 1/20/21 144A | | | 185,000 | | | | 184 | |
Santander Retail Auto Lease Trust, Series 2017-A, Class C, 2.960%, 11/21/22 144A | | | 155,000 | | | | 155 | |
Sierra Receivables Funding Co. LLC, Series 2015-1A, Class A, 2.400%, 3/22/32 144A | | | 248,670 | | | | 248 | |
Sierra Receivables Funding Co. LLC, Series 2015-3A, Class A, 2.580%, 9/20/32 144A | | | 234,273 | | | | 234 | |
Sierra Receivables Funding Co. LLC, Series 2016-3A, Class A, 2.430%, 10/20/33 144A | | | 315,434 | | | | 314 | |
Sierra Receivables Funding Co. LLC, Series 2017-1A, Class A, 2.910%, 3/20/34 144A | | | 96,871 | | | | 97 | |
Sierra Timeshare Receivables Funding LLC, Series 2015-2A, Class A, 2.430%, 6/20/32 144A | | | 123,615 | | | | 123 | |
Sierra Timeshare Receivables Funding LLC, Series 2016-1A, Class A, 3.080%, 3/21/33 144A | | | 349,033 | | | | 350 | |
Sierra Timeshare Receivables Funding LLC, Series 2016-2A, Class A, 2.330%, 7/20/33 144A | | | 99,563 | | | | 99 | |
SLM Private Education Loan Trust, Series 2013-A, Class B, 2.500%, 3/15/47 144A | | | 580,000 | | | | 576 | |
SLM Student Loan Trust, Series 2007-7, Class A4, 1.697%, (3 Month LIBOR plus 0.33%), 1/25/22 | | | 272,651 | | | | 269 | |
SLM Student Loan Trust, Series 2008-4, Class A4, 3.017%, (3 Month LIBOR plus 1.65%), 7/25/22 | | | 78,656 | | | | 81 | |
SLM Student Loan Trust, Series 2008-5, Class A4, 3.067%, (3 Month LIBOR plus 1.70%), 7/25/23 | | | 212,842 | | | | 220 | |
SLM Student Loan Trust, Series 2008-9, Class A, 2.867%, (3 Month LIBOR plus 1.50%), 4/25/23 | | | 153,144 | | | | 157 | |
SMART ABS Trust, Series 2015-3US, Class A3A, 1.660%, 8/14/19 | | | 308,884 | | | | 308 | |
SMART ABS Trust, Series 2016-2US, Class A2A, 1.450%, 8/14/19 | | | 379,455 | | | | 378 | |
SMB Private Education Loan Trust, Series 2015-A, Class A2B, 2.477%, (ICE LIBOR USD 1 Month plus 1.00%), 6/15/27 144A | | | 273,912 | | | | 278 | |
Springleaf Funding Trust, Series 2016-AA, Class A, 2.900%, 11/15/29 144A | | | 180,000 | | | | 180 | |
| | | | | | | | |
| Structured Products (35.3%) | | Shares/
$ Par | | | Value
$ (000’s) | |
| |
Asset Backed Securities continued | | | | | |
Synchrony Credit Card Master Note Trust, Series 2013-1, Class B, 1.690%, 3/15/21 | | | 465,000 | | | | 465 | |
Synchrony Credit Card Master Note Trust, Series 2015-1, Class B, 2.640%, 3/15/23 | | | 250,000 | | | | 250 | |
Synchrony Credit Card Master Note Trust, Series 2015-4, Class B, 2.620%, 9/15/23 | | | 305,000 | | | | 304 | |
Synchrony Credit Card Master Note Trust, Series 2016-2, Class C, 2.950%, 5/15/24 | | | 522,306 | | | | 522 | |
Towd Point Mortgage Trust, Series 2015-4, Class A1B, 2.750%, (AFC), 4/25/55 144A | | | 276,223 | | | | 276 | |
Towd Point Mortgage Trust, Series 2015-5, Class A1B, 2.750%, (AFC), 5/25/55 144A | | | 255,978 | | | | 256 | |
Towd Point Mortgage Trust, Series 2016-1, Class A1B, 2.750%, (AFC), 2/25/55 144A | | | 137,654 | | | | 138 | |
Towd Point Mortgage Trust, Series 2016-1, Class A3B, 3.000%, (AFC), 2/25/55 144A | | | 177,243 | | | | 178 | |
Towd Point Mortgage Trust, Series 2016-2, Class A1A, 2.750%, (AFC), 8/25/55 144A | | | 119,270 | | | | 119 | |
Towd Point Mortgage Trust, Series 2016-3, Class A1, 2.250%, (AFC), 4/25/56 144A | | | 95,423 | | | | 94 | |
Towd Point Mortgage Trust, Series 2017-1, Class A1, 2.750%, (AFC), 10/25/56 144A | | | 460,594 | | | | 460 | |
Towd Point Mortgage Trust, Series 2017-2, Class A1, 2.750%, (AFC), 4/25/57 144A | | | 305,565 | | | | 305 | |
Towd Point Mortgage Trust, Series 2017-3, Class A1, 2.750%, (AFC), 7/25/57 144A | | | 648,255 | | | | 647 | |
Towd Point Mortgage Trust, Series 2017-4, Class A1, 2.750%, (AFC), 6/25/57 144A | | | 318,228 | | | | 317 | |
Towd Point Mortgage Trust, Series 2017-6, Class A1, 2.750%, (AFC), 10/25/57 144A | | | 1,130,626 | | | | 1,127 | |
Verizon Owner Trust, Series 2016-2A, Class A, 1.680%, 5/20/21 144A | | | 500,000 | | | | 497 | |
Verizon Owner Trust, Series 2016-2A, Class B, 2.150%, 5/20/21 144A | | | 340,000 | | | | 338 | |
Verizon Owner Trust, Series 2016-2A, Class C, 2.360%, 5/20/21 144A | | | 270,000 | | | | 268 | |
Verizon Owner Trust, Series 2017-1A, Class B, 2.450%, 9/20/21 144A | | | 110,000 | | | | 110 | |
Verizon Owner Trust, Series 2017-1A, Class C, 2.650%, 9/20/21 144A | | | 150,000 | | | | 150 | |
Verizon Owner Trust, Series 2017-3A, Class C, 2.530%, 4/20/22 144A | | | 550,000 | | | | 547 | |
Volvo Financial Equipment LLC, Series 2014-1A, Class C, 1.940%, 11/15/21 144A | | | 265,000 | | | | 265 | |
Volvo Financial Equipment LLC, Series 2016-1A, Class A3, 1.670%, 2/18/20 144A | | | 175,000 | | | | 175 | |
Volvo Financial Equipment Master Owner Trust, Series 2017-A, Class A, 1.977%, (1 Month LIBOR plus 0.50%), 11/15/22 144A | | | 115,000 | | | | 115 | |
Wendys Funding LLC, Series 2015-1A, Class A2I, 3.371%, 6/15/45 144A | | | 855,313 | | | | 858 | |
Wheels SPV 2 LLC, Series 2015-1A, Class A2, 1.270%, 4/22/24 144A | | | 20,317 | | | | 20 | |
The Accompanying Notes are an Integral Part of the Financial Statements.
| | | | |
| 110 | | Short-Term Bond Portfolio | | |
Short-Term Bond Portfolio
| | | | | | | | |
| Structured Products (35.3%) | | Shares/
$ Par | | | Value
$ (000’s) | |
| |
Asset Backed Securities continued | | | | | |
Wheels SPV 2 LLC, Series 2016-1A, Class A2, 1.590%, 5/20/25 144A | | | 135,704 | | | | 135 | |
World Omni Automobile Lease Securitization Trust, Series 2016-A, Class A3, 1.450%, 8/15/19 | | | 480,000 | | | | 478 | |
| | | | | | | | |
Total | | | | | | | 61,495 | |
| | | | | | | | |
| |
Mortgage Securities (14.3%) | | | | | |
Allegro CLO III, Ltd., 2.482%, 7/25/27 144A(l) | | | 585,000 | | | | 585 | |
BAMLL Commercial Mortgage Securities Trust, Series 2014-IP, Class A, 2.717%, (CSTR), 6/15/28 144A | | | 475,000 | | | | 475 | |
Banc of America Commercial Mortgage Trust, Series 2017-BNK3, Class A1, 1.957%, 2/15/50 | | | 127,945 | | | | 127 | |
BANK, Series 2017-BNK4, Class A1, 2.002%, 5/15/50 | | | 525,423 | | | | 521 | |
BX Trust, Series 2017-IMC, Class D, 2.650%, (1 Month LIBOR plus 1.40%), 10/15/32 144A | | | 695,000 | | | | 695 | |
BX Trust, Series 2017-IMC, Class D, 3.500%, (1 Month LIBOR plus 2.25%), 10/15/32 144A | | | 225,000 | | | | 225 | |
CD Mortgage Trust, Series 2016-CD2, Class A1, 1.848%, 11/10/49 | | | 591,533 | | | | 585 | |
CD Mortgage Trust, Series 2017-CD3, Class A1, 1.965%, 2/10/50 | | | 134,491 | | | | 134 | |
Citigroup Commercial Mortgage Trust, Series 2014-GC25, Class A1, 1.485%, 10/10/47 | | | 114,077 | | | | 114 | |
Citigroup Commercial Mortgage Trust, Series 2015-GC27, Class A1, 1.353%, 2/10/48 | | | 105,396 | | | | 105 | |
Citigroup Commercial Mortgage Trust, Series 2015-GC31, Class A1, 1.637%, 6/10/48 | | | 305,759 | | | | 304 | |
Citigroup Commercial Mortgage Trust, Series 2015-GC33, Class A1, 1.643%, 9/10/58 | | | 292,574 | | | | 290 | |
Citigroup Commercial Mortgage Trust, Series 2015-P1, Class A1, 1.648%, 9/15/48 | | | 111,130 | | | | 110 | |
CLNS Trust, Series 2017-IKPR, Class A, 2.232%, (ICE LIBOR USD 1 Month plus 0.80%), 6/11/32 144A | | | 240,000 | | | | 240 | |
CLNS Trust, Series 2017-IKPR, Class B, 2.432%,
(1 Month LIBOR plus 1.00%), 6/11/32 144A | | | 365,000 | | | | 365 | |
COLT Funding LLC, Series 2017-1, Class A1, 2.614%, (AFC), 5/27/47 144A | | | 379,211 | | | | 379 | |
COLT Funding LLC, Series 2017-1, Class A3, 3.074%, (AFC), 5/27/47 144A | | | 66,528 | | | | 67 | |
COLT Funding LLC, Series 2017-2, Class A1A, 2.415%, (AFC), 10/25/47 144A | | | 628,926 | | | | 630 | |
COLT Funding LLC, Series 2017-2, Class A2A, 2.568%, (AFC), 10/25/47 144A | | | 266,261 | | | | 267 | |
COLT Funding LLC, Series 2017-2, Class A3A, 2.773%, (AFC), 10/25/47 144A | | | 114,768 | | | | 115 | |
Commercial Mortgage Pass Through Certificates, Series 2014-CR21, Class A1, 1.494%, 12/10/47 | | | 42,206 | | | | 42 | |
Commercial Mortgage Pass Through Certificates, Series 2014-UBS6, Class A1, 1.445%, 12/10/47 | | | 73,021 | | | | 73 | |
Commercial Mortgage Pass Through Certificates, Series 2015-CR22, Class A1, 1.569%, 3/10/48 | | | 37,177 | | | | 37 | |
| | | | | | | | |
| Structured Products (35.3%) | | Shares/
$ Par | | | Value
$ (000’s) | |
| |
Mortgage Securities continued | | | | | |
Commercial Mortgage Pass Through Certificates, Series 2015-CR25, Class A1, 1.737%, 8/10/48 | | | 234,272 | | | | 233 | |
Commercial Mortgage Pass Through Certificates, Series 2015-CR26, Class A1, 1.604%, 10/10/48 | | | 247,896 | | | | 246 | |
Commercial Mortgage Pass Through Certificates, Series 2015-LC23, Class A2, 3.221%, 10/10/48 | | | 605,000 | | | | 617 | |
Commercial Mortgage Pass Through Certificates, Series 2015-PC1, Class A1, 1.667%, 7/10/50 | | | 340,629 | | | | 340 | |
Commercial Mortgage Pass Through Certificates, Series 2016-CR28, Class A1, 1.770%, 2/10/49 | | | 26,860 | | | | 27 | |
Commercial Mortgage Pass Through Certificates, Series 2017-COR2, Class A1, 2.111%, 9/10/50 | | | 155,326 | | | | 154 | |
Connecticut Avenue Securities, Series 2016-C01, Class 2M1, 3.652%, (ICE LIBOR USD 1 Month plus 2.10%), 8/25/28 | | | 188,975 | | | | 190 | |
CSAIL Commercial Mortgage Trust, Series 2015-C1, Class A1, 1.684%, 4/15/50 | | | 41,307 | | | | 41 | |
CSAIL Commercial Mortgage Trust, Series 2015-C2, Class A1, 1.454%, 6/15/57 | | | 455,087 | | | | 452 | |
CSAIL Commercial Mortgage Trust, Series 2015-C3, Class A1, 1.716%, 8/15/48 | | | 219,104 | | | | 217 | |
CSAIL Commercial Mortgage Trust, Series 2016-C5, Class A1, 1.746%, 11/15/48 | | | 65,738 | | | | 65 | |
CSAIL Commercial Mortgage Trust, Series 2017-CX9, Class A1, 2.024%, 9/15/50 | | | 96,302 | | | | 95 | |
Deephaven Residential Mortgage Trust, Series 2017-3A, Class A1, 2.577%, (CSTR, AFC), 10/25/47 144A | | | 569,397 | | | | 569 | |
Deephaven Residential Mortgage Trust, Series 2017-3A, Class A2, 2.711%, (CSTR, AFC), 10/25/47 144A | | | 94,899 | | | | 95 | |
Deephaven Residential Mortgage Trust, Series 2017-3A, Class A3, 2.813%, (CSTR, AFC), 10/25/47 144A | | | 94,899 | | | | 95 | |
FDIC Guaranteed Notes Trust, Series 2010-S2, Class 2A, 2.570%, 7/29/47 144A | | | 148,601 | | | | 148 | |
Federal Home Loan Mortgage Corp., 3.500%, 3/1/46 | | | 103,306 | | | | 107 | |
Federal Home Loan Mortgage Corp., 5.000%, 4/1/18 | | | 2,618 | | | | 3 | |
Federal Home Loan Mortgage Corp., 5.500%, 5/1/22 | | | 118,318 | | | | 124 | |
Federal Home Loan Mortgage Corp., 6.000%, 12/1/28 | | | 9,722 | | | | 11 | |
Federal Home Loan Mortgage Corp., 6.000%, 9/1/34 | | | 3,640 | | | | 4 | |
Federal Home Loan Mortgage Corp., 6.000%, 2/1/35 | | | 59,484 | | | | 67 | |
Federal Home Loan Mortgage Corp., 6.000%, 9/1/35 | | | 20,292 | | | | 23 | |
Federal Home Loan Mortgage Corp., 6.000%, 1/1/38 | | | 3,641 | | | | 4 | |
Federal Home Loan Mortgage Corp., Series 2015-DNA1, Class M1, 2.452%, (ICE LIBOR USD 1 Month plus 0.90%), 10/25/27 | | | 42,575 | | | | 43 | |
Federal Home Loan Mortgage Corp., Series 2016-DNA1, Class M1, 3.002%, (ICE LIBOR USD 1 Month plus 1.45%), 7/25/28 | | | 71,861 | | | | 72 | |
Federal Home Loan Mortgage Corp., Series 2016-HQA1, Class M1, 3.302%, (ICE LIBOR USD 1 Month plus 1.75%), 9/25/28 | | | 36,835 | | | | 37 | |
The Accompanying Notes are an Integral Part of the Financial Statements.
| | | | | | |
| | Short-Term Bond Portfolio | | | 111 | |
Short-Term Bond Portfolio
| | | | | | | | |
| Structured Products (35.3%) | | Shares/
$ Par | | | Value
$ (000’s) | |
| |
Mortgage Securities continued | | | | | |
Federal Home Loan Mortgage Corp., Series 2017-DNA1, Class M1, 2.752%, (ICE LIBOR USD 1 Month plus 1.20%), 7/25/29 | | | 237,172 | | | | 240 | |
Federal Home Loan Mortgage Corp., Series 2017-DNA2, Class M1, 2.752%, (ICE LIBOR USD 1 Month plus 1.20%), 10/25/29 | | | 665,526 | | | | 676 | |
Federal Home Loan Mortgage Corp., Series 2017-HQA1, Class M1, 2.752%, (ICE LIBOR USD 1 Month plus 1.20%), 8/25/29 | | | 472,996 | | | | 478 | |
Federal Home Loan Mortgage Corp., Series 2017-HQA2, Class M1, 2.352%, (ICE LIBOR USD 1 Month plus 0.80%), 12/25/29 | | | 240,868 | | | | 242 | |
Federal Home Loan Mortgage Corp., Series 2017-SC02, Class M1, 3.890%, (CSTR), 5/25/47 144A | | | 133,144 | | | | 133 | |
Federal Home Loan Mortgage Corp., Series 2017-SPI1, Class M1, 3.991%, 9/25/47 144A | | | 57,290 | | | | 58 | |
Federal Home Loan Mortgage Corp., Series 3713, Class PA, 2.000%, 2/15/40 | | | 438,843 | | | | 435 | |
Federal Home Loan Mortgage Corp., Series 3718, Class BC, 2.000%, 2/15/25 | | | 426,357 | | | | 425 | |
Federal Home Loan Mortgage Corp., Series 4092, Class CL, 1.250%, 6/15/27 | | | 1,361,325 | | | | 1,306 | |
Federal Home Loan Mortgage Corp., Series DNA3, Class M1, 2.302%, (ICE LIBOR USD 1 Month plus 0.75%), 3/25/30 | | | 408,631 | | | | 410 | |
Federal National Mortgage Association, 1.500%, 7/30/20 | | | 1,310,000 | | | | 1,294 | |
Federal National Mortgage Association, 2.500%, 10/1/22 | | | 628,411 | | | | 628 | |
Federal National Mortgage Association, 2.500%, 12/1/22 | | | 159,900 | | | | 161 | |
Federal National Mortgage Association, 3.000%, 6/1/22 | | | 176,407 | | | | 180 | |
Federal National Mortgage Association, 3.000%, 4/1/24 | | | 432,647 | | | | 441 | |
Federal National Mortgage Association, 3.500%, 5/1/27 | | | 863,595 | | | | 892 | |
Federal National Mortgage Association, 3.500%, 4/1/46 | | | 1,067,302 | | | | 1,097 | |
Federal National Mortgage Association, 4.000%, 2/1/29 | | | 1,032,478 | | | | 1,081 | |
Federal National Mortgage Association, 4.000%, 8/1/47 | | | 1,384,522 | | | | 1,450 | |
Federal National Mortgage Association, 4.500%, 5/1/40 | | | 170,229 | | | | 182 | |
Federal National Mortgage Association, 4.500%, 9/1/40 | | | 155,552 | | | | 167 | |
Federal National Mortgage Association, 4.500%, 2/1/44 | | | 570,701 | | | | 608 | |
Federal National Mortgage Association, 5.000%, 10/1/33 | | | 210,768 | | | | 229 | |
Federal National Mortgage Association, 5.500%, 8/1/37 | | | 117,366 | | | | 130 | |
Federal National Mortgage Association, 5.500%, 2/1/38 | | | 441,863 | | | | 490 | |
| | | | | | | | |
| Structured Products (35.3%) | | Shares/
$ Par | | | Value
$ (000’s) | |
| |
Mortgage Securities continued | | | | | |
Federal National Mortgage Association, 6.000%, 8/1/22 | | | 48,980 | | | | 51 | |
Federal National Mortgage Association, 6.000%, 3/1/34 | | | 100,267 | | | | 112 | |
Federal National Mortgage Association, 6.000%, 8/1/34 | | | 278,130 | | | | 316 | |
Federal National Mortgage Association, 6.000%, 11/1/34 | | | 10,976 | | | | 12 | |
Federal National Mortgage Association, 6.000%, 12/1/34 | | | 3,473 | | | | 4 | |
Federal National Mortgage Association, 6.000%, 4/1/35 | | | 6,563 | | | | 7 | |
Federal National Mortgage Association, 6.000%, 5/1/38 | | | 4,641 | | | | 5 | |
Federal National Mortgage Association, 6.000%, 10/1/40 | | | 232,053 | | | | 262 | |
Federal National Mortgage Association, 6.500%, 7/1/32 | | | 33,071 | | | | 37 | |
Federal National Mortgage Association, 6.500%, 12/1/32 | | | 37,186 | | | | 42 | |
Federal National Mortgage Association, Series 2010-95, Class Bk, 1.500%, 2/25/20 | | | 183,921 | | | | 183 | |
Federal National Mortgage Association, Series 2011-113, Class AG, 2.500%, 11/25/26 | | | 259,827 | | | | 259 | |
Federal National Mortgage Association, Series 2013-74, Class AD, 2.000%, 7/25/23 | | | 374,137 | | | | 369 | |
Federal National Mortgage Association, Series 2016-83, Class FA, 2.052%, (ICE LIBOR USD 1 Month plus 0.50%), 11/25/46 | | | 275,393 | | | | 278 | |
Federal National Mortgage Association, Series 2016-85, Class FA, 2.052%, (ICE LIBOR USD 1 Month plus 0.50%), 11/25/46 | | | 498,701 | | | | 498 | |
Federal National Mortgage Association, Series 2016-85, Class FG, 2.052%, (ICE LIBOR USD 1 Month plus 0.50%), 11/25/46 | | | 501,460 | | | | 506 | |
Federal National Mortgage Association, Series 2016-C07, Class 2M1, 2.852%, (ICE LIBOR USD 1 Month plus 1.30%), 5/25/29 | | | 233,746 | | | | 235 | |
Federal National Mortgage Association, Series 2017-85, Class FC, 1.852%, (1 Month LIBOR plus 0.30%), 11/25/47 | | | 1,389,334 | | | | 1,388 | |
Federal National Mortgage Association, Series 2017-90, Class KA, 3.000%, 11/25/47 | | | 580,342 | | | | 585 | |
Federal National Mortgage Association, Series 2017-C01, Class 1M1, 2.852%, (ICE LIBOR USD 1 Month plus 1.30%), 7/25/29 | | | 338,283 | | | | 342 | |
Federal National Mortgage Association, Series 2017-C02, Class 2M1, 2.702%, (ICE LIBOR USD 1 Month plus 1.15%), 9/25/29 | | | 528,660 | | | | 533 | |
Federal National Mortgage Association, Series 2017-C03, Class 1M1, 2.502%, (ICE LIBOR USD 1 Month plus 0.95%), 10/25/29 | | | 584,721 | | | | 589 | |
Federal National Mortgage Association, Series 2017-C04, Class 2M1, 2.402%, (ICE LIBOR USD 1 Month plus 0.85%), 11/25/29 | | | 394,840 | | | | 397 | |
The Accompanying Notes are an Integral Part of the Financial Statements.
| | | | |
| 112 | | Short-Term Bond Portfolio | | |
Short-Term Bond Portfolio
| | | | | | | | |
| Structured Products (35.3%) | | Shares/
$ Par | | | Value
$ (000’s) | |
| |
Mortgage Securities continued | | | | | |
Federal National Mortgage Association, Series 2017-C05, Class 1M1, 2.102%, (ICE LIBOR USD 1 Month plus 0.55%), 1/25/30 | | | 736,523 | | | | 737 | |
Federal National Mortgage Association, Series 2017-C06, Class 1M1, 2.302%, (ICE LIBOR USD 1 Month plus 0.75%), 2/25/30 | | | 553,766 | | | | 556 | |
Federal National Mortgage Association, Series 2017-C06, Class 2M1, 2.302%, (ICE LIBOR USD 1 Month plus 0.75%), 2/25/30 | | | 237,639 | | | | 238 | |
GCCFC Commercial Mortgage Trust, Series 2006-GG7, Class AM, 5.767%, (CSTR), 7/10/38 | | | 206,562 | | | | 208 | |
GM Financial Securitized Term, Series 2017-3A, Class B, 2.330%, 3/16/23 144A | | | 400,000 | | | | 396 | |
Government National Mortgage Association, 3.500%, 8/20/32 | | | 462,460 | | | | 479 | |
Government National Mortgage Association, 3.500%, 9/20/32 | | | 221,551 | | | | 230 | |
Government National Mortgage Association, 3.500%, 12/20/42 | | | 10,610 | | | | 11 | |
Government National Mortgage Association, 3.500%, 9/20/43 | | | 155,226 | | | | 161 | |
Government National Mortgage Association, 5.000%, 3/20/34 | | | 569,014 | | | | 619 | |
Government National Mortgage Association, 5.500%, 6/20/37 | | | 131,799 | | | | 144 | |
Great Wolf Trust, Series 2017-Wolf, Class A, 2.477%, (ICE LIBOR USD 1 Month plus 0.85%), 9/15/34 144A | | | 310,000 | | | | 311 | |
Great Wolf Trust, Series 2017-Wolf, Class C, 2.947%, (ICE LIBOR USD 1 Month plus 1.32%), 9/15/34 144A | | | 455,000 | | | | 455 | |
GS Mortgage Securities Trust, Series 2014-EB1A, Class 2A1, 2.467%, (CSTR), 7/25/44 144A | | | 61,856 | | | | 61 | |
GS Mortgage Securities Trust, Series 2015-GC28, Class A1, 1.528%, 2/10/48 | | | 169,564 | | | | 169 | |
GS Mortgage Securities Trust, Series 2015-GC32, Class A1, 1.593%, 7/10/48 | | | 151,538 | | | | 151 | |
GS Mortgage Securities Trust, Series 2016-GS3, Class A1, 1.429%, 10/10/49 | | | 72,981 | | | | 72 | |
GS Mortgage Securities Trust, Series 2017-GS7, Class A1, 1.950%, 8/10/50 | | | 321,462 | | | | 318 | |
Hospitality Mortgage Trust, Series 2017-HIT, Class A, 2.094%, (ICE LIBOR USD 1 Month plus 0.85%), 5/8/30 144A | | | 235,000 | | | | 235 | |
JP Morgan Chase Commercial Mortgage Securities Trust, Series 2016-JP3, Class A1, 1.461%, 8/15/49 | | | 224,497 | | | | 220 | |
JPMBB Commercial Mortgage Securities Trust, Series 2014-C26, Class A1, 1.596%, 1/15/48 | | | 188,526 | | | | 188 | |
JPMBB Commercial Mortgage Securities Trust, Series 2015-C27, Class A1, 1.413%, 2/15/48 | | | 144,734 | | | | 144 | |
JPMBB Commercial Mortgage Securities Trust, Series 2015-C28, Class A1, 1.445%, 10/15/48 | | | 292,745 | | | | 291 | |
JPMBB Commercial Mortgage Securities Trust, Series 2015-C29, Class A1, 1.625%, 5/15/48 | | | 120,420 | | | | 120 | |
| | | | | | | | |
| Structured Products (35.3%) | | Shares/
$ Par | | | Value
$ (000’s) | |
| |
Mortgage Securities continued | | | | | |
JPMBB Commercial Mortgage Securities Trust, Series 2015-C30, Class A1, 1.738%, 7/15/48 | | | 496,861 | | | | 495 | |
MetLife Securitization Trust, Series 2017-1A, Class A, 3.000%, (AFC), 4/25/55 144A | | | 296,380 | | | | 299 | |
Morgan Stanley Bank of America Merrill Lynch Trust, Series 2014-C19, Class A1, 1.573%, 12/15/47 | | | 152,730 | | | | 152 | |
Morgan Stanley Bank of America Merrill Lynch Trust, Series 2015-C24, Class A1, 1.706%, 5/15/48 | | | 194,079 | | | | 193 | |
Morgan Stanley Bank of America Merrill Lynch Trust, Series 2016-C30, Class A1, 1.389%, 9/15/49 | | | 117,783 | | | | 116 | |
Morgan Stanley Capital I Trust, Series 2015-MS1, Class A1, 1.638%, 5/15/48 | | | 205,565 | | | | 204 | |
Morgan Stanley Capital I Trust, Series 2017-CLS, Class B, 2.100%, (1 Month LIBOR plus 0.85%), 11/15/34 144A | | | 365,000 | | | | 365 | |
Morgan Stanley Capital I Trust, Series 2017-CLS, Class C, 2.250%, (1 Month LIBOR plus 1.00%), 11/15/34 144A | | | 290,000 | | | | 290 | |
Neuberger Berman CLO XIX Ltd., Series 2015-19a, Class A1R, 2.409%, 7/15/27 144A | | | 250,000 | | | | 251 | |
TIAA Seasoned Commercial Mortgage Trust, Series 2007-C4, Class AJ, 5.476%, (CSTR), 8/15/39 | | | 63,494 | | | | 64 | |
Wells Fargo Commercial Mortgage Trust, Series 2014-LC18, Class A1, 1.437%, 12/15/47 | | | 199,231 | | | | 198 | |
Wells Fargo Commercial Mortgage Trust, Series 2015-C26, Class A1, 1.454%, 2/15/48 | | | 95,384 | | | | 95 | |
Wells Fargo Commercial Mortgage Trust, Series 2015-C27, Class A1, 1.730%, 2/15/48 | | | 40,265 | | | | 40 | |
Wells Fargo Commercial Mortgage Trust, Series 2015-C28, Class A1, 1.531%, 5/15/48 | | | 107,268 | | | | 107 | |
Wells Fargo Commercial Mortgage Trust, Series 2015-LC20, Class A1, 1.471%, 4/15/50 | | | 116,709 | | | | 116 | |
Wells Fargo Commercial Mortgage Trust, Series 2015-NXS2, Class A2, 3.020%, 7/15/58 | | | 530,000 | | | | 536 | |
Wells Fargo Commercial Mortgage Trust, Series 2016-C32, Class A1, 1.577%, 1/15/59 | | | 251,963 | | | | 250 | |
Wells Fargo Commercial Mortgage Trust, Series 2016-LC24, Class A1, 1.441%, 10/15/49 | | | 122,108 | | | | 121 | |
Wells Fargo Commercial Mortgage Trust, Series 2017-C38, Class A1, 1.968%, 7/15/50 | | | 265,590 | | | | 263 | |
Wells Fargo Commercial Mortgage Trust, Series 2017-C39, Class A1, 1.975%, 9/15/50 | | | 163,843 | | | | 162 | |
Wells Fargo Mortgage Backed Securities Trust, Series 2004-EE, Class 2A2, 3.425%, (CSTR), 12/25/34 | | | 267,170 | | | | 274 | |
| | | | | | | | |
Total | | | | | | | 42,112 | |
| | | | | | | | |
Total Structured Products | | | | | | | | |
(Cost: $103,769) | | | | | | | 103,607 | |
| | | | | | | | |
| | |
| Short-Term Investments (1.9%) | | | | | | |
| | |
Money Market Funds (1.9%) | | | | | | | | |
State Street Institutional U.S. Government Money Market Fund - Premier Class, 1.209% # | | | 5,434,995 | | | | 5,435 | |
| | | | | | | | |
| | |
Total Short-Term Investments | | | | | | | | |
(Cost: $5,435) | | | | | | | 5,435 | |
| | | | | | | | |
| | |
Total Investments (99.9%) | | | | | | | | |
(Cost: $293,765)(a) | | | | | | | 293,229 | |
| | | | | | | | |
Other Assets, Less | | | | | | | | |
Liabilities (0.1%) | | | | | | | 285 | |
| | | | | | | | |
Net Assets (100.0%) | | | | | | | 293,514 | |
| | | | | | | | |
The Accompanying Notes are an Integral Part of the Financial Statements.
| | | | | | |
| | Short-Term Bond Portfolio | | | 113 | |
Short-Term Bond Portfolio
144A after the name of a security represents a security exempt from registration under Rule 144A of the Securities Act of 1933. These securities may be resold as transactions exempt from registration, normally to qualified institutional buyers. At December 31, 2017 the value of these securities (in thousands) was $79,360 representing 27.0% of the net assets.
AFC — Available Funds Cap security - Security accrues interest at an assumed or uncapped rate. If the interest rate on the underlying loans is lower than the uncapped rate, then the security will pay at the lower rate.
CSTR — Collateral Strip Rate security - interest is based on the weighted net interest rate of the collateral.
RB — Revenue Bond
| # | 7-Day yield as of December 31, 2017. |
| (a) | At December 31, 2017, the aggregate cost of investments, including derivatives, for federal tax purposes (in thousands) was $293,659 and the net unrealized depreciation of investments based on that cost was $519 which is comprised of $656 aggregate gross unrealized appreciation and $1,175 aggregate gross unrealized depreciation. |
| (b) | All or a portion of the securities have been pledged as collateral for open futures positions or when-issued securities. Information regarding open futures contracts as of period end is summarized below. |
| | | | | | | | | | | | | | | | | | | | |
| Issuer | | Long/Short | | Currency | | Notional Par
(000’s) | | | Number of
Contracts | | Expiration
Date | | Notional
Value (000’s) | | | Unrealized
Appreciation/
(Depreciation)
(000’s) | |
US Ten Year Treasury Note Futures | | Short | | USD | | $ | 5,300 | | | 53 | | 3/18 | | $ | 6,575 | | | $ | 35 | |
US Two Year Treasury Note Futures | | Long | | USD | | | 58,600 | | | 293 | | 3/18 | | | 62,734 | | | | (124 | ) |
| (l) | Security valued using significant unobservable inputs. |
The following is a summary of the inputs used in valuing the Portfolio’s assets and liabilities at December 31, 2017. See Note 3 for additional information on portfolio valuation.
| | | | | | | | | | | | | | |
| | | Valuation Inputs | | | |
| Description | | Level 1 –
Quoted Prices | | | Level 2 –
Other Significant
Observable Inputs | | | Level 3 – Significant
Unobservable Inputs | | | |
| | | (Amounts in thousands) | | | |
Assets: | | | | | | | | | | | | | | |
Municipal Bonds | | $ | - | | | $ | 664 | | | $ | - | | | |
Corporate Bonds | | | - | | | | 138,548 | | | | - | | | |
Governments | | | - | | | | 44,975 | | | | - | | | |
Structured Products | | | | | | | | | | | | | | |
Asset Backed Securities | | | - | | | | 60,961 | | | | 534 | | | |
Mortgage Securities | | | - | | | | 41,527 | | | | 585 | | | |
Short-Term Investments | | | 5,435 | | | | - | | | | - | | | |
Other Financial Instruments | | | | | | | | | | | | | | |
Futures | | | 35 | | | | - | | | | - | | | |
Total Assets: | | $ | 5,470 | | | $ | 286,675 | | | $ | 1,119 | | | |
Liabilities: | | | | | | | | | | | | | | |
Other Financial Instruments | | | | | | | | | | | | | | |
Futures | | | (124 | ) | | | - | | | | - | | | |
Total Liabilities: | | $ | (124 | ) | | $ | - | | | $ | - | | | |
For the period ended December 31, 2017, there was a transfer from Level 2 to Level 3 in the amount of $42 (in thousands). This transfer was the result of a decrease in the quantity of observable inputs for the security that was previously priced by a third-party vendor utilizing a broker quote.
The Accompanying Notes are an Integral Part of the Financial Statements.
| | | | |
| 114 | | Short-Term Bond Portfolio | | |
Select Bond Portfolio (unaudited)
| | | | |
| Objective: | | Portfolio Strategy: | | Net Assets: |
Provide as high a level of total return as is consistent with prudent investment risk. A secondary objective is to seek preservation of shareholders’ capital. | | Invest in a diversified portfolio of investment grade debt securities with maturities exceeding one year. | | $2.9 billion |
Portfolio Overview
Mason Street Advisors, LLC (“Mason Street Advisors”), the investment adviser for the Select Bond Portfolio (the “Portfolio”), has engaged Wells Capital Management, Inc. (“Wells Capital”) to act as sub-adviser for the Portfolio. Normally, the Portfolio invests in a diversified portfolio of investment grade debt securities with maturities exceeding one year. The Portfolio may also invest up to 10% of net assets in non-investment grade, high yield/high risk bonds (so called “junk bonds”) and up to 20% of net assets in foreign securities. Debt securities may be of any maturity or duration, but under normal market conditions, the Portfolio attempts to maintain an overall dollar-weighted average effective duration (an aggregate measure of the sensitivity of the Portfolio’s fixed income securities to changes in interest rates) that is within 10% of the Bloomberg Barclays® U.S. Aggregate Index. The Portfolio uses a fundamental, relative value investment approach to construct the portfolio of investments. The Portfolio invests in debt securities that it believes offer competitive returns and are undervalued, offering additional income and/or price appreciation potential relative to other debt securities of similar credit quality and interest rate sensitivity. The Portfolio may engage in active and frequent trading of portfolio securities to achieve its investment objectives.
Market Overview
The year began with a dynamic and changing policy landscape as President Trump officially took office. On September 20, the U.S. Federal Reserve (the “Fed”) left rates unchanged—as expected—and formally announced the start of its balance sheet roll off. December saw rapidly evolving headlines around the exact structure and probability of successful tax legislation; ultimately, the final legislation passed just in time for Christmas. The Fed raised its benchmark rate by 0.25% to a range of 1.25% to 1.50%—as widely expected and telegraphed—and markets ended December expecting two or three further hikes for 2018. Within the components of the Bloomberg Barclays® U.S. Aggregate Index, all subsectors outperformed Treasurys. Credit led excess returns, followed by commercial mortgage-backed securities (“CMBS”) and asset-backed securities (“ABS”), which edged just ahead of Agencies and mortgage-backed securities (“MBS”).
Portfolio Results
The Portfolio returned 3.58% for the twelve months ended December 31, 2017. By comparison, the Portfolio’s benchmark, the Bloomberg Barclays® U.S. Aggregate Index (the “Index”), returned 3.54%. (The Index is unmanaged, cannot be invested in directly and does not include administrative expenses.) According to Lipper® Analytical Services, Inc., an independent mutual fund ranking agency, the average return of the Core Bond Funds peer group was 3.72% for 2017.
In credit, sector and security selection contributed to performance. Contributors were concentrated in names across the Sovereigns, Information Technology, Health Care and Foreign Agency sectors. Examples included Slovenia, United Mexican States, Oracle Corp., Petroleos Mexicanos and General Motors Co. Meanwhile, detractors were concentrated in names across the Banking, Telecommunications, Insurance and Energy sectors. Examples included Verizon Communications Inc., Charter Communications, Inc., Hess Corp., Anheuser-Busch InBev and Halliburton Co. In credit, the Portfolio decreased its risk-adjusted overweight from 2.7% to 0.7% during 2017. Early in the year, the Portfolio increased the overweight to credit as the portfolio managers saw attractive opportunities, particularly across names in the Sovereigns, Banking and Telecommunication sectors. Later in the year, the Portfolio reduced risk close to neutral by further tempering positions across names in Banks, Basic Industries and Utilities, while taking advantage of heavy new issuance in Information Technology and attractive opportunities in Real Estate Investment Trusts. Positioning was dynamic throughout the year, responding to the best bottom-up security selections as they arose.
In Agency mortgages, positioning in Ginnie Mae securities, hybrid adjustable rate mortgages (“ARMs”) and 20-years contributed to performance. A sector underweight that was in place for most of the year detracted from performance, as did positioning in 15-years and lower-coupon 30-years.
In consumer ABS, a sector overweight and positioning in FFELP (Federal Family Education Loan Program) and rental car ABS contributed to performance. A sector overweight in CMBS was also a modest contributor. Positioning in private student loans underperformed on a risk-adjusted basis. In consumer ABS, the Portfolio’s risk-adjusted overweight increased from 8.2% to 9.8% during 2017.
| | | | | | |
| | Select Bond Portfolio | | | 115 | |
Select Bond Portfolio (unaudited)
Portfolio Manager Outlook
The following forward-looking comments are the opinion of Wells Capital, the Portfolio’s sub-adviser.
Momentum in the U.S. economy is high heading into the new year. Recent passage of corporate tax rate reform should provide a meaningful boost to the corporate sector’s profitability. Measures of U.S. inflation have shown modest signs of firming after persistent softness throughout 2017. With inflation trending somewhat below the Fed’s target, officials continue to set expectations for gradual interest rate increases going forward, with the market pricing in two or three 25 basis point hikes during 2018.
Consistent with our bottom-up relative value process, we maintain a neutral duration. In December, we increased our overweight to credit, identifying additional security selection opportunities. We moved more underweight U.S. Agency MBS as mortgage valuations remain somewhat vulnerable, in our view, as market participants adjust to higher yields and volatility. We maintained an overweight to ABS on stable fundamentals in core sectors and attractive risk-adjusted valuations, while maintaining a tempered overweight in CMBS. We remain nimble and agile, and stand ready to take advantage of security selection opportunities as they arise.
Relative Performance
| | | | | | | | | | | | |
Average Annual Total Returns
For Periods Ended December 31, 2017 | |
| | | 1 Year | | | 5 Years | | | 10 Years | |
Select Bond Portfolio | | | 3.58 | % | | | 2.08 | % | | | 4.14 | % |
Bloomberg Barclays® U.S. Aggregate Index | | | 3.54 | % | | | 2.10 | % | | | 4.01 | % |
Lipper® Variable Insurance Products (VIP) Core Bond Funds Average | | | 3.72 | % | | | 2.05 | % | | | 3.87 | % |
The performance data quoted represents past performance. Past performance is historical and does not guarantee future performance. Investment return and principal value will fluctuate, so that shares, when redeemed, may be worth more or less than their original cost. Current performance may be lower or higher than the performance data quoted. For the most recent month-end performance information visit www.northwesternmutual.com.
This chart assumes an initial investment of $10,000 made on 12/31/07. Returns shown reflect fee waivers, deductions for management and other portfolio expenses, and reinvestment of all dividends. In the absence of fee waivers, total return would be reduced.
Returns exclude deductions for separate account sale loads and account fees. Please refer to the Benchmark Definitions section of this report for information about the indices cited in the above chart and graph.
Return of principal is not guaranteed. Bond funds have the same interest rate, inflation and credit risks that are associated with the underlying bonds owned by the Portfolio. When interest rates rise, bond prices fall. With a fixed income fund, when interest rates rise, the value of the fund’s existing bonds drops, which could negatively affect overall fund performance. A portion of the Portfolio’s assets may be invested in lower quality debt securities which may present a significant risk for loss of principal and interest. High yield bonds generally have greater price swings and higher default risks than investment grade bonds.
Investing in bonds issued by foreign corporations and governments carries additional risk, including foreign currency risk, and may increase the volatility of the Portfolio’s performance.
Currently, interest rates remain at historically low levels on a relative basis, although the U.S. federal funds rate has been subject to modest increases over the course of the last two years. A significant rise in interest rates over a short period of time could cause significant losses in the market value of the Portfolio’s fixed income investments.
The Portfolio may engage in active and frequent trading of portfolio securities to achieve its investment objectives. Active and frequent trading may cause higher brokerage expenses and other transaction costs, which may adversely affect performance.
| | | | |
| 116 | | Select Bond Portfolio | | |
Select Bond Portfolio (unaudited)
Top 10 Fixed Income Holdings 12/31/17
| | | | | | | | |
| Security Description | | % of Market Value | | | | |
US Treasury, Various | | | 33.7 | % | | | | |
Federal National Mortgage Association, Various | | | 17.7 | % | | | | |
Government National Mortgage Association, Various | | | 5.5 | % | | | | |
Federal Home Loan Mortgage Corp., Various | | | 4.2 | % | | | | |
Apple, Inc., Various | | | 0.8 | % | | | | |
Northrop Grumman Corp., Various | | | 0.8 | % | | | | |
AT&T, Inc., Various | | | 0.8 | % | | | | |
JPMorgan Chase & Co., Various | | | 0.6 | % | | | | |
Morgan Stanley, Various | | | 0.6 | % | | | | |
Oracle Corp., Various | | | 0.6 | % | | | | |
Sector Allocation 12/31/17
Sector Allocation is based on fixed income investments.
Sector Allocation and Top 10 Holdings are subject to change. Consistent with the Portfolio’s stated parameters, no more than 20% of the Portfolio is invested in foreign securities, and no more than 10% is invested in high yield securities.
| | | | | | |
| | Select Bond Portfolio | | | 117 | |
Select Bond Portfolio
Schedule of Investments
December 31, 2017
| | | | | | | | |
| Corporate Bonds (24.2%) | | Shares/
$ Par | | | Value
$ (000’s) | |
| |
Basic Materials (0.7%) | | | | | |
Barrick North America Finance LLC, 5.700%, 5/30/41 | | | 2,030,000 | | | | 2,493 | |
BHP Billiton Finance USA, Ltd., 5.000%, 9/30/43 | | | 1,040,000 | | | | 1,274 | |
CF Industries, Inc., 3.400%, 12/1/21 144A | | | 2,185,000 | | | | 2,207 | |
CF Industries, Inc., 4.500%, 12/1/26 144A | | | 2,213,000 | | | | 2,306 | |
Corp. Nacional del Cobre de Chile, 3.625%, 8/1/27 144A | | | 1,780,000 | | | | 1,782 | |
International Paper Co., 5.150%, 5/15/46 | | | 2,460,000 | | | | 2,846 | |
Sherwin-Williams Co., 2.750%, 6/1/22 | | | 2,680,000 | | | | 2,669 | |
Sherwin-Williams Co., 3.450%, 6/1/27 | | | 1,036,000 | | | | 1,052 | |
Sherwin-Williams Co., 4.500%, 6/1/47 | | | 980,000 | | | | 1,071 | |
Vale Overseas, Ltd., 6.250%, 8/10/26 | | | 1,745,000 | | | | 2,022 | |
| | | | | | | | |
Total | | | | | | | 19,722 | |
| | | | | | | | |
| |
Communications (2.8%) | | | | | |
21st Century Fox America, Inc., 4.750%, 11/15/46 | | | 850,000 | | | | 983 | |
21st Century Fox America, Inc., 4.950%, 10/15/45 | | | 615,000 | | | | 723 | |
Alibaba Group Holding, Ltd., 3.400%, 12/6/27 | | | 2,693,000 | | | | 2,692 | |
Alibaba Group Holding, Ltd., 4.000%, 12/6/37 | | | 648,000 | | | | 670 | |
Alibaba Group Holding, Ltd., 4.200%, 12/6/47 | | | 607,000 | | | | 631 | |
Alibaba Group Holding, Ltd., 4.400%, 12/6/57 | | | 1,483,000 | | | | 1,543 | |
Amazon.com, Inc., 2.400%, 2/22/23 144A | | | 3,976,000 | | | | 3,934 | |
Amazon.com, Inc., 2.800%, 8/22/24 144A | | | 626,000 | | | | 624 | |
Amazon.com, Inc., 3.150%, 8/22/27 144A | | | 2,075,000 | | | | 2,078 | |
Amazon.com, Inc., 3.875%, 8/22/37 144A | | | 1,106,000 | | | | 1,173 | |
Amazon.com, Inc., 4.050%, 8/22/47 144A | | | 1,540,000 | | | | 1,658 | |
Amazon.com, Inc., 4.250%, 8/22/57 144A | | | 625,000 | | | | 681 | |
AT&T, Inc., 3.400%, 5/15/25 | | | 8,181,000 | | | | 8,041 | |
AT&T, Inc., 3.900%, 8/14/27 | | | 3,309,000 | | | | 3,330 | |
AT&T, Inc., 4.450%, 4/1/24 | | | 1,427,000 | | | | 1,509 | |
AT&T, Inc., 4.900%, 8/14/37 | | | 666,000 | | | | 675 | |
AT&T, Inc., 5.150%, 2/14/50 | | | 1,068,000 | | | | 1,073 | |
AT&T, Inc., 5.250%, 3/1/37 | | | 4,874,000 | | | | 5,152 | |
AT&T, Inc., 5.450%, 3/1/47 | | | 2,681,000 | | | | 2,863 | |
CBS Corp., 2.500%, 2/15/23 | | | 3,560,000 | | | | 3,471 | |
CBS Corp., 3.375%, 2/15/28 | | | 1,785,000 | | | | 1,719 | |
Charter Communications Operating LLC / Charter Communications Operating Capital Corp., 4.464%, 7/23/22 | | | 1,060,000 | | | | 1,106 | |
Charter Communications Operating LLC / Charter Communications Operating Capital Corp., 4.908%, 7/23/25 | | | 2,790,000 | | | | 2,966 | |
Charter Communications Operating LLC / Charter Communications Operating Capital Corp., 5.375%, 5/1/47 | | | 1,058,000 | | | | 1,084 | |
Comcast Corp., 2.350%, 1/15/27 | | | 1,515,000 | | | | 1,430 | |
Comcast Corp., 3.150%, 2/15/28 | | | 4,277,000 | | | | 4,289 | |
Comcast Corp., 4.000%, 8/15/47 | | | 635,000 | | | | 662 | |
Discovery Communications LLC, 3.950%, 3/20/28 | | | 1,174,000 | | | | 1,167 | |
Discovery Communications LLC, 4.875%, 4/1/43 | | | 1,240,000 | | | | 1,231 | |
Discovery Communications LLC, 4.950%, 5/15/42 | | | 620,000 | | | | 614 | |
Discovery Communications LLC, 5.200%, 9/20/47 | | | 721,000 | | | | 752 | |
NBCUniversal Media LLC, 4.450%, 1/15/43 | | | 405,000 | | | | 442 | |
| | | | | | | | |
| Corporate Bonds (24.2%) | | Shares/
$ Par | | | Value
$ (000’s) | |
| |
Communications continued | | | | | |
Nokia OYJ, 3.375%, 6/12/22 | | | 3,027,000 | | | | 3,008 | |
Nokia OYJ, 4.375%, 6/12/27 | | | 640,000 | | | | 633 | |
Telefonica Emisiones SAU, 5.213%, 3/8/47 | | | 1,600,000 | | | | 1,814 | |
Time Warner Cable, Inc., 6.550%, 5/1/37 | | | 770,000 | | | | 905 | |
Time Warner, Inc., 3.800%, 2/15/27 | | | 1,560,000 | | | | 1,558 | |
Time Warner, Inc., 4.850%, 7/15/45 | | | 1,480,000 | | | | 1,553 | |
Verizon Communications, Inc., 2.946%, 3/15/22 | | | 1,570,000 | | | | 1,579 | |
Verizon Communications, Inc., 4.125%, 8/15/46 | | | 4,246,000 | | | | 3,919 | |
Verizon Communications, Inc., 4.400%, 11/1/34 | | | 3,904,000 | | | | 3,976 | |
Verizon Communications, Inc., 5.012%, 8/21/54 | | | 1,053,000 | | | | 1,073 | |
| | | | | | | | |
Total | | | | | | | 80,984 | |
| | | | | | | | |
| |
Consumer, Cyclical (1.4%) | | | | | |
Alimentation Couche-Tard, Inc., 2.700%, 7/26/22 144A | | | 3,670,000 | | | | 3,636 | |
Alimentation Couche-Tard, Inc., 3.550%, 7/26/27 144A | | | 2,190,000 | | | | 2,187 | |
Costco Wholesale Corp., 2.300%, 5/18/22 | | | 3,454,000 | | | | 3,425 | |
Costco Wholesale Corp., 2.750%, 5/18/24 | | | 2,390,000 | | | | 2,387 | |
Costco Wholesale Corp., 3.000%, 5/18/27 | | | 4,000,000 | | | | 4,005 | |
Ford Motor Co., 5.291%, 12/8/46 | | | 2,480,000 | | | | 2,697 | |
Ford Motor Credit Co. LLC, 2.343%, 11/2/20 | | | 3,296,000 | | | | 3,265 | |
Ford Motor Credit Co. LLC, 2.979%, 8/3/22 | | | 1,990,000 | | | | 1,983 | |
Ford Motor Credit Co. LLC, 3.339%, 3/28/22 | | | 2,815,000 | | | | 2,847 | |
Ford Motor Credit Co. LLC, 3.815%, 11/2/27 | | | 2,148,000 | | | | 2,148 | |
General Motors Co., 5.150%, 4/1/38 | | | 2,175,000 | | | | 2,317 | |
General Motors Co., 5.200%, 4/1/45 | | | 515,000 | | | | 544 | |
General Motors Co., 5.400%, 4/1/48 | | | 616,000 | | | | 671 | |
General Motors Financial Co., Inc., 3.500%, 11/7/24 | | | 2,926,000 | | | | 2,919 | |
General Motors Financial Co., Inc., 4.350%, 1/17/27 | | | 3,023,000 | | | | 3,143 | |
Lennar Corp., 4.750%, 11/29/27 144A | | | 2,790,000 | | | | 2,873 | |
| | | | | | | | |
Total | | | | | | | 41,047 | |
| | | | | | | | |
| |
Consumer, Non-cyclical (3.7%) | | | | | |
Abbott Laboratories, 3.750%, 11/30/26 | | | 4,520,000 | | | | 4,640 | |
Abbott Laboratories, 4.900%, 11/30/46 | | | 505,000 | | | | 578 | |
AbbVie, Inc., 2.500%, 5/14/20 | | | 4,165,000 | | | | 4,178 | |
AbbVie, Inc., 4.450%, 5/14/46 | | | 2,305,000 | | | | 2,503 | |
AbbVie, Inc., 4.500%, 5/14/35 | | | 1,020,000 | | | | 1,120 | |
AmerisourceBergen Corp., 4.300%, 12/15/47 | | | 2,029,000 | | | | 2,034 | |
Anheuser-Busch InBev Finance, Inc., 2.650%, 2/1/21 | | | 5,830,000 | | | | 5,859 | |
Anheuser-Busch InBev Finance, Inc., 3.300%, 2/1/23 | | | 2,089,000 | | | | 2,137 | |
Anheuser-Busch InBev Finance, Inc., 4.900%, 2/1/46 | | | 1,616,000 | | | | 1,871 | |
Anthem, Inc., 2.500%, 11/21/20 | | | 2,341,000 | | | | 2,336 | |
Anthem, Inc., 2.950%, 12/1/22 | | | 2,340,000 | | | | 2,341 | |
Anthem, Inc., 3.350%, 12/1/24 | | | 1,175,000 | | | | 1,192 | |
Anthem, Inc., 3.650%, 12/1/27 | | | 1,755,000 | | | | 1,788 | |
BAT Capital Corp., 2.297%, 8/14/20 144A | | | 1,645,000 | | | | 1,636 | |
BAT Capital Corp., 2.764%, 8/15/22 144A | | | 4,370,000 | | | | 4,346 | |
BAT Capital Corp., 3.222%, 8/15/24 144A | | | 2,182,000 | | | | 2,181 | |
BAT Capital Corp., 3.557%, 8/15/27 144A | | | 1,646,000 | | | | 1,648 | |
BAT Capital Corp., 4.540%, 8/15/47 144A | | | 1,095,000 | | | | 1,152 | |
Becton Dickinson and Co., 2.404%, 6/5/20 | | | 3,600,000 | | | | 3,580 | |
The Accompanying Notes are an Integral Part of the Financial Statements.
| | | | |
| 118 | | Select Bond Portfolio | | |
Select Bond Portfolio
| | | | | | | | |
| Corporate Bonds (24.2%) | | Shares/
$ Par | | | Value
$ (000’s) | |
| |
Consumer, Non-cyclical continued | | | | | |
Becton Dickinson and Co., 2.894%, 6/6/22 | | | 3,015,000 | | | | 2,996 | |
Becton Dickinson and Co., 3.700%, 6/6/27 | | | 2,420,000 | | | | 2,438 | |
Becton Dickinson and Co., 4.685%, 12/15/44 | | | 2,035,000 | | | | 2,223 | |
Celgene Corp., 2.750%, 2/15/23 | | | 3,898,000 | | | | 3,865 | |
Celgene Corp., 3.450%, 11/15/27 | | | 1,542,000 | | | | 1,540 | |
Celgene Corp., 4.350%, 11/15/47 | | | 2,766,000 | | | | 2,870 | |
Celgene Corp., 5.000%, 8/15/45 | | | 2,355,000 | | | | 2,670 | |
Church & Dwight Co., Inc., 2.450%, 8/1/22 | | | 835,000 | | | | 825 | |
Church & Dwight Co., Inc., 3.150%, 8/1/27 | | | 1,351,000 | | | | 1,331 | |
Church & Dwight Co., Inc., 3.950%, 8/1/47 | | | 835,000 | | | | 837 | |
Eli Lilly & Co., 2.350%, 5/15/22 | | | 995,000 | | | | 992 | |
Eli Lilly & Co., 3.100%, 5/15/27 | | | 1,765,000 | | | | 1,791 | |
Eli Lilly & Co., 3.950%, 5/15/47 | | | 905,000 | | | | 971 | |
ERAC USA Finance LLC, 2.700%, 11/1/23 144A | | | 725,000 | | | | 705 | |
ERAC USA Finance LLC, 3.300%, 12/1/26 144A | | | 2,630,000 | | | | 2,607 | |
ERAC USA Finance LLC, 4.500%, 2/15/45 144A | | | 520,000 | | | | 534 | |
Johnson & Johnson, 2.625%, 1/15/25 | | | 1,135,000 | | | | 1,129 | |
Johnson & Johnson, 2.900%, 1/15/28 | | | 4,555,000 | | | | 4,560 | |
Johnson & Johnson, 3.400%, 1/15/38 | | | 1,390,000 | | | | 1,423 | |
Johnson & Johnson, 3.500%, 1/15/48 | | | 1,750,000 | | | | 1,788 | |
Kraft Heinz Foods Co., 2.800%, 7/2/20 | | | 4,300,000 | | | | 4,325 | |
Kraft Heinz Foods Co., 3.000%, 6/1/26 | | | 2,665,000 | | | | 2,564 | |
Kraft Heinz Foods Co., 4.375%, 6/1/46 | | | 4,102,000 | | | | 4,060 | |
PepsiCo, Inc., 3.000%, 10/15/27 | | | 1,540,000 | | | | 1,534 | |
Perrigo Finance Unlimited Co., 4.375%, 3/15/26 | | | 2,870,000 | | | | 2,944 | |
Reynolds American, Inc., 5.850%, 8/15/45 | | | 2,996,000 | | | | 3,738 | |
Thermo Fisher Scientific, Inc., 2.950%, 9/19/26 | | | 1,540,000 | | | | 1,496 | |
Thermo Fisher Scientific, Inc., 3.200%, 8/15/27 | | | 2,950,000 | | | | 2,923 | |
| | | | | | | | |
Total | | | | | | | 108,799 | |
| | | | | | | | |
| |
Energy (2.8%) | | | | | |
Anadarko Petroleum Corp., 4.500%, 7/15/44 | | | 2,283,000 | | | | 2,273 | |
Anadarko Petroleum Corp., 4.850%, 3/15/21 | | | 1,232,000 | | | | 1,301 | |
Anadarko Petroleum Corp., 5.550%, 3/15/26 | | | 2,982,000 | | | | 3,345 | |
Andeavor Logistics LP / Tesoro Logistics Finance Corp., 3.500%, 12/1/22 | | | 1,249,000 | | | | 1,247 | |
Andeavor Logistics LP / Tesoro Logistics Finance Corp., 4.250%, 12/1/27 | | | 491,000 | | | | 495 | |
Andeavor Logistics LP / Tesoro Logistics Finance Corp., 5.200%, 12/1/47 | | | 1,120,000 | | | | 1,167 | |
Apache Corp., 4.250%, 1/15/44 | | | 995,000 | | | | 963 | |
Buckeye Partners LP, 4.125%, 12/1/27 | | | 2,052,000 | | | | 2,029 | |
Cenovus Energy, Inc., 5.400%, 6/15/47 | | | 1,640,000 | | | | 1,725 | |
Chevron Corp., 2.954%, 5/16/26 | | | 1,026,000 | | | | 1,025 | |
Cimarex Energy Co., 4.375%, 6/1/24 | | | 3,416,000 | | | | 3,624 | |
Concho Resources, Inc., 3.750%, 10/1/27 | | | 1,881,000 | | | | 1,905 | |
Concho Resources, Inc., 4.875%, 10/1/47 | | | 880,000 | | | | 964 | |
Enbridge Energy Partners LP, 5.500%, 9/15/40 | | | 754,000 | | | | 825 | |
Enbridge Energy Partners LP, 7.375%, 10/15/45 | | | 745,000 | | | | 989 | |
Enbridge, Inc., 2.900%, 7/15/22 | | | 2,598,000 | | | | 2,582 | |
Enbridge, Inc., 3.700%, 7/15/27 | | | 764,000 | | | | 767 | |
Encana Corp., 6.500%, 2/1/38 | | | 1,690,000 | | | | 2,131 | |
Energy Transfer Partners LP, 2.500%, 6/15/18 | | | 2,160,000 | | | | 2,163 | |
Energy Transfer Partners LP, 6.125%, 12/15/45 | | | 1,872,000 | | | | 2,031 | |
Enterprise Products Operating LLC, 3.350%, 3/15/23 | | | 1,025,000 | | | | 1,045 | |
| | | | | | | | |
| Corporate Bonds (24.2%) | | Shares/
$ Par | | | Value
$ (000’s) | |
| |
Energy continued | | | | | |
Enterprise Products Operating LLC, 3.700%, 2/15/26 | | | 1,027,000 | | | | 1,051 | |
Enterprise Products Operating LLC, 4.850%, 3/15/44 | | | 538,000 | | | | 589 | |
Hess Corp., 5.600%, 2/15/41 | | | 663,000 | | | | 715 | |
Kinder Morgan Energy Partners LP, 5.400%, 9/1/44 | | | 1,150,000 | | | | 1,215 | |
Kinder Morgan, Inc., 3.150%, 1/15/23 | | | 4,151,000 | | | | 4,125 | |
Kinder Morgan, Inc., 5.000%, 2/15/21 144A | | | 4,410,000 | | | | 4,679 | |
Kinder Morgan, Inc., 5.550%, 6/1/45 | | | 1,435,000 | | | | 1,569 | |
Marathon Petroleum Corp., 4.750%, 9/15/44 | | | 565,000 | | | | 590 | |
Marathon Petroleum Corp., 5.000%, 9/15/54 | | | 1,265,000 | | | | 1,280 | |
Petroleos Mexicanos, 2.460%, 12/15/25 | | | 5,135,200 | | | | 5,117 | |
Petroleos Mexicanos, 5.625%, 1/23/46 | | | 2,025,000 | | | | 1,874 | |
Petroleos Mexicanos, 6.500%, 3/13/27 144A | | | 1,770,000 | | | | 1,935 | |
Petroleos Mexicanos, 6.750%, 9/21/47 144A | | | 415,000 | | | | 433 | |
Petroleos Mexicanos, 6.750%, 9/21/47 | | | 1,660,000 | | | | 1,733 | |
Plains All American Pipeline LP, 4.500%, 12/15/26 | | | 515,000 | | | | 522 | |
Sabine Pass Liquefaction LLC, 5.000%, 3/15/27 | | | 2,489,000 | | | | 2,670 | |
Sabine Pass Liquefaction LLC, 5.875%, 6/30/26 | | | 1,130,000 | | | | 1,269 | |
Schlumberger Finance Canada, Ltd., 2.200%, 11/20/20 144A | | | 2,702,000 | | | | 2,686 | |
Schlumberger Finance Canada, Ltd., 2.650%, 11/20/22 144A | | | 4,297,000 | | | | 4,277 | |
Schlumberger Holdings Corp., 4.000%, 12/21/25 144A | | | 4,271,000 | | | | 4,487 | |
Shell International Finance BV, 4.000%, 5/10/46 | | | 1,891,000 | | | | 2,012 | |
TC Pipelines LP, 3.900%, 5/25/27 | | | 1,695,000 | | | | 1,703 | |
Williams Partners LP, 3.750%, 6/15/27 | | | 2,395,000 | | | | 2,399 | |
| | | | | | | | |
Total | | | | | | | 83,526 | |
| | | | | | | | |
| |
Financial (7.4%) | | | | | |
ACE INA Holdings, Inc., 4.350%, 11/3/45 | | | 1,690,000 | | | | 1,906 | |
AerCap Ireland Capital Designated Activity Co. / AerCap Global Aviation Trust, 3.500%, 1/15/25 | | | 3,360,000 | | | | 3,330 | |
Air Lease Corp., 3.625%, 4/1/27 | | | 2,670,000 | | | | 2,667 | |
Air Lease Corp., 3.625%, 12/1/27 | | | 2,460,000 | | | | 2,458 | |
American International Group, Inc., 4.375%, 1/15/55 | | | 820,000 | | | | 834 | |
American International Group, Inc., 4.800%, 7/10/45 | | | 453,000 | | | | 508 | |
American International Group, Inc., 6.250%, 5/1/36 | | | 1,675,000 | | | | 2,161 | |
American Tower Corp., 3.600%, 1/15/28 | | | 3,186,000 | | | | 3,166 | |
Banco Santander SA, 3.125%, 2/23/23 | | | 2,600,000 | | | | 2,586 | |
Banco Santander SA, 3.500%, 4/11/22 | | | 2,200,000 | | | | 2,243 | |
Banco Santander SA, 3.800%, 2/23/28 | | | 1,200,000 | | | | 1,200 | |
Banco Santander SA, 4.250%, 4/11/27 | | | 1,510,000 | | | | 1,565 | |
Bank of America Corp., 2.503%, 10/21/22 | | | 5,535,000 | | | | 5,475 | |
Bank of America Corp., 2.600%, 1/15/19 | | | 391,000 | | | | 392 | |
Bank of America Corp., 3.004%, 12/20/23 144A | | | 2,336,000 | | | | 2,342 | |
Bank of America Corp., 4.000%, 4/1/24 | | | 1,545,000 | | | | 1,633 | |
Bank of America Corp., 4.244%, (3 Month LIBOR plus 1.81%), 4/24/38 | | | 2,359,000 | | | | 2,556 | |
Bank of America Corp., 4.450%, 3/3/26 | | | 1,680,000 | | | | 1,793 | |
The Bank of New York Mellon Corp., 3.250%, 5/16/27 | | | 3,449,000 | | | | 3,485 | |
Boston Properties LP, 3.200%, 1/15/25 | | | 2,819,000 | | | | 2,809 | |
Brandywine Operating Partnership LP, 3.950%, 2/15/23 | | | 585,000 | | | | 597 | |
Brandywine Operating Partnership LP, 3.950%, 11/15/27 | | | 1,949,000 | | | | 1,934 | |
The Accompanying Notes are an Integral Part of the Financial Statements.
| | | | | | |
| | Select Bond Portfolio | | | 119 | |
Select Bond Portfolio
| | | | | | | | |
| Corporate Bonds (24.2%) | | Shares/
$ Par | | | Value
$ (000’s) | |
| |
Financial continued | | | | | |
Brighthouse Financial, Inc., 3.700%, 6/22/27 144A | | | 2,950,000 | | | | 2,900 | |
Brighthouse Financial, Inc., 4.700%, 6/22/47 144A | | | 1,060,000 | | | | 1,080 | |
Capital One Financial Corp., 2.400%, 10/30/20 | | | 2,060,000 | | | | 2,047 | |
Capital One Financial Corp., 3.300%, 10/30/24 | | | 2,060,000 | | | | 2,052 | |
Capital One Financial Corp., 4.200%, 10/29/25 | | | 756,000 | | | | 778 | |
Capital One NA, 2.650%, 8/8/22 | | | 4,714,000 | | | | 4,664 | |
Citigroup, Inc., 2.700%, 10/27/22 | | | 6,263,000 | | | | 6,195 | |
Citigroup, Inc., 4.125%, 7/25/28 | | | 2,766,000 | | | | 2,850 | |
Citigroup, Inc., 4.450%, 9/29/27 | | | 4,010,000 | | | | 4,244 | |
Credit Suisse Group AG, 2.997%, (3 Month LIBOR plus 1.20%), 12/14/23 144A | | | 4,680,000 | | | | 4,624 | |
Credit Suisse Group Funding Guernsey, Ltd., 3.800%, 6/9/23 | | | 1,105,000 | | | | 1,139 | |
Credit Suisse Group Funding, Ltd., 3.800%, 9/15/22 | | | 2,300,000 | | | | 2,372 | |
Credit Suisse Group Funding, Ltd., 4.550%, 4/17/26 | | | 2,755,000 | | | | 2,949 | |
DDR Corp., 3.375%, 5/15/23 | | | 2,770,000 | | | | 2,760 | |
DDR Corp., 4.250%, 2/1/26 | | | 770,000 | | | | 783 | |
DDR Corp., 4.625%, 7/15/22 | | | 3,037,000 | | | | 3,202 | |
DNB Bank ASA, 2.125%, 10/2/20 144A | | | 5,500,000 | | | | 5,447 | |
The Goldman Sachs Group, Inc., 2.750%, 9/15/20 | | | 2,590,000 | | | | 2,603 | |
The Goldman Sachs Group, Inc., 3.500%, 11/16/26 | | | 827,000 | | | | 832 | |
The Goldman Sachs Group, Inc., 4.017%, (3 Month LIBOR plus 1.37%), 10/31/38 | | | 1,032,000 | | | | 1,060 | |
The Goldman Sachs Group, Inc., 6.750%, 10/1/37 | | | 3,889,000 | | | | 5,202 | |
HSBC Holdings PLC, 2.650%, 1/5/22 | | | 6,380,000 | | | | 6,337 | |
HSBC Holdings PLC, 3.033%, (3 Month LIBOR plus 0.92%), 11/22/23 | | | 2,700,000 | | | | 2,705 | |
HSBC Holdings PLC, 4.375%, 11/23/26 | | | 1,797,000 | | | | 1,876 | |
ING Groep NV, 3.150%, 3/29/22 | | | 1,415,000 | | | | 1,432 | |
ING Groep NV, 3.950%, 3/29/27 | | | 1,230,000 | | | | 1,282 | |
Intesa Sanpaolo SpA, 3.125%, 7/14/22 144A | | | 4,095,000 | | | | 4,065 | |
Intesa Sanpaolo SpA, 3.875%, 7/14/27 144A | | | 3,220,000 | | | | 3,218 | |
JPMorgan Chase & Co., 2.295%, 8/15/21 | | | 4,885,000 | | | | 4,841 | |
JPMorgan Chase & Co., 2.950%, 10/1/26 | | | 5,947,000 | | | | 5,840 | |
JPMorgan Chase & Co., 2.972%, 1/15/23 | | | 762,000 | | | | 768 | |
JPMorgan Chase & Co., 3.882%, (3 Month LIBOR plus 1.36%), 7/24/38 | | | 3,690,000 | | | | 3,809 | |
JPMorgan Chase & Co., 4.260%, (3 Month LIBOR plus 1.58%), 2/22/48 | | | 3,025,000 | | | | 3,271 | |
Kilroy Realty LP, 3.450%, 12/15/24 | | | 1,755,000 | | | | 1,750 | |
Lazard Group LLC, 3.750%, 2/13/25 | | | 2,950,000 | | | | 3,008 | |
Markel Corp., 3.500%, 11/1/27 | | | 1,780,000 | | | | 1,770 | |
Markel Corp., 4.300%, 11/1/47 | | | 1,055,000 | | | | 1,083 | |
Mid-America Apartments LP, 3.600%, 6/1/27 | | | 1,075,000 | | | | 1,077 | |
Mid-America Apartments LP, 3.750%, 6/15/24 | | | 2,680,000 | | | | 2,754 | |
Mid-America Apartments LP, 4.000%, 11/15/25 | | | 1,380,000 | | | | 1,429 | |
Mid-America Apartments LP, 4.300%, 10/15/23 | | | 1,155,000 | | | | 1,212 | |
Morgan Stanley, 2.625%, 11/17/21 | | | 5,674,000 | | | | 5,647 | |
Morgan Stanley, 2.750%, 5/19/22 | | | 7,180,000 | | | | 7,153 | |
Morgan Stanley, 3.625%, 1/20/27 | | | 3,582,000 | | | | 3,665 | |
Morgan Stanley, 3.971%, (3 Month LIBOR plus 1.46%), 7/22/38 | | | 1,039,000 | | | | 1,075 | |
Public Storage, 2.370%, 9/15/22 | | | 2,979,000 | | | | 2,939 | |
Public Storage, 3.094%, 9/15/27 | | | 2,367,000 | | | | 2,351 | |
Realty Income Corp., 4.650%, 3/15/47 | | | 980,000 | | | | 1,074 | |
| | | | | | | | |
| Corporate Bonds (24.2%) | | Shares/
$ Par | | | Value
$ (000’s) | |
| |
Financial continued | | | | | |
Regency Centers, LP, 3.600%, 2/1/27 | | | 1,099,000 | | | | 1,100 | |
Santander Holdings USA, Inc., 3.400%, 1/18/23 144A | | | 4,810,000 | | | | 4,791 | |
Santander Holdings USA, Inc., 4.400%, 7/13/27 144A | | | 2,035,000 | | | | 2,080 | |
Synchrony Financial, 3.950%, 12/1/27 | | | 4,333,000 | | | | 4,313 | |
Tanger Properties LP, 3.750%, 12/1/24 | | | 1,330,000 | | | | 1,337 | |
Tanger Properties LP, 3.875%, 12/1/23 | | | 1,440,000 | | | | 1,468 | |
Teachers Insurance & Annuity Association of America, 4.270%, 5/15/47 144A | | | 620,000 | | | | 655 | |
Teachers Insurance & Annuity Association of America, 4.900%, 9/15/44 144A | | | 925,000 | | | | 1,057 | |
UBS Group Funding AG, 3.491%, 5/23/23 144A | | | 3,610,000 | | | | 3,667 | |
UBS Group Funding Jersey, Ltd., 2.650%, 2/1/22 144A | | | 5,000,000 | | | | 4,943 | |
Washington Prime Group LP, 5.950%, 8/15/24 | | | 1,040,000 | | | | 1,063 | |
WEA Finance LLC, 3.150%, 4/5/22 144A | | | 2,915,000 | | | | 2,942 | |
XLIT, Ltd., 5.250%, 12/15/43 | | | 660,000 | | | | 757 | |
XLIT, Ltd., 6.250%, 5/15/27 | | | 1,229,000 | | | | 1,454 | |
| | | | | | | | |
Total | | | | | | | 216,481 | |
| | | | | | | | |
| |
Industrial (1.5%) | | | | | |
FedEx Corp., 4.400%, 1/15/47 | | | 658,000 | | | | 701 | |
FedEx Corp., 4.550%, 4/1/46 | | | 1,775,000 | | | | 1,948 | |
General Electric Co., 5.875%, 1/14/38 | | | 970,000 | | | | 1,253 | |
John Deere Capital Corp., 2.150%, 9/8/22 | | | 2,055,000 | | | | 2,011 | |
John Deere Capital Corp., 2.650%, 6/24/24 | | | 2,575,000 | | | | 2,550 | |
John Deere Capital Corp., 2.800%, 9/8/27 | | | 2,575,000 | | | | 2,527 | |
Mexico City Airport Trust, 5.500%, 7/31/47 144A | | | 1,410,000 | | | | 1,392 | |
Northrop Grumman Corp., 2.080%, 10/15/20 | | | 3,535,000 | | | | 3,506 | |
Northrop Grumman Corp., 2.550%, 10/15/22 | | | 3,543,000 | | | | 3,517 | |
Northrop Grumman Corp., 2.930%, 1/15/25 | | | 2,334,000 | | | | 2,320 | |
Northrop Grumman Corp., 3.200%, 2/1/27 | | | 3,635,000 | | | | 3,648 | |
Northrop Grumman Corp., 3.250%, 8/1/23 | | | 3,270,000 | | | | 3,336 | |
Northrop Grumman Corp., 3.250%, 1/15/28 | | | 3,962,000 | | | | 3,967 | |
Northrop Grumman Corp., 4.030%, 10/15/47 | | | 2,380,000 | | | | 2,485 | |
Penske Truck Leasing Co. LP / PTL Finance Corp., 2.700%, 3/14/23 144A | | | 2,352,000 | | | | 2,311 | |
Penske Truck Leasing Co. LP / PTL Finance Corp., 3.375%, 2/1/22 144A | | | 1,940,000 | | | | 1,976 | |
Penske Truck Leasing Co. LP / PTL Finance Corp., 3.400%, 11/15/26 144A | | | 1,525,000 | | | | 1,505 | |
Valmont Industries, Inc., 5.250%, 10/1/54 | | | 1,560,000 | | | | 1,613 | |
Vulcan Materials Co., 4.500%, 6/15/47 | | | 1,205,000 | | | | 1,229 | |
Wabtec Corp., 3.450%, 11/15/26 | | | 1,062,000 | | | | 1,038 | |
| | | | | | | | |
Total | | | | | | | 44,833 | |
| | | | | | | | |
| |
Technology (2.2%) | | | | | |
Analog Devices, Inc., 2.500%, 12/5/21 | | | 2,275,000 | | | | 2,252 | |
Analog Devices, Inc., 3.125%, 12/5/23 | | | 2,435,000 | | | | 2,440 | |
Analog Devices, Inc., 3.500%, 12/5/26 | | | 828,000 | | | | 838 | |
Apple, Inc., 2.300%, 5/11/22 | | | 643,000 | | | | 638 | |
Apple, Inc., 2.750%, 1/13/25 | | | 2,563,000 | | | | 2,540 | |
Apple, Inc., 2.850%, 5/11/24 | | | 4,545,000 | | | | 4,564 | |
Apple, Inc., 3.000%, 2/9/24 | | | 4,025,000 | | | | 4,075 | |
Apple, Inc., 3.000%, 11/13/27 | | | 2,051,000 | | | | 2,038 | |
The Accompanying Notes are an Integral Part of the Financial Statements.
| | | | |
| 120 | | Select Bond Portfolio | | |
Select Bond Portfolio
| | | | | | | | |
| Corporate Bonds (24.2%) | | Shares/
$ Par | | | Value
$ (000’s) | |
| |
Technology continued | | | | | |
Apple, Inc., 3.200%, 5/11/27 | | | 3,020,000 | | | | 3,058 | |
Apple, Inc., 3.350%, 2/9/27 | | | 3,000,000 | | | | 3,072 | |
Apple, Inc., 3.750%, 11/13/47 | | | 1,641,000 | | | | 1,680 | |
Apple, Inc., 4.375%, 5/13/45 | | | 1,020,000 | | | | 1,148 | |
Hewlett Packard Enterprise Co., 6.350%, 10/15/45 | | | 1,629,000 | | | | 1,723 | |
Microsoft Corp., 2.000%, 8/8/23 | | | 2,725,000 | | | | 2,647 | |
Microsoft Corp., 2.400%, 2/6/22 | | | 1,975,000 | | | | 1,975 | |
Microsoft Corp., 2.875%, 2/6/24 | | | 3,540,000 | | | | 3,591 | |
Microsoft Corp., 4.100%, 2/6/37 | | | 1,799,000 | | | | 2,007 | |
Oracle Corp., 2.625%, 2/15/23 | | | 4,680,000 | | | | 4,690 | |
Oracle Corp., 2.950%, 11/15/24 | | | 2,925,000 | | | | 2,945 | |
Oracle Corp., 3.250%, 11/15/27 | | | 4,284,000 | | | | 4,355 | |
Oracle Corp., 3.800%, 11/15/37 | | | 2,458,000 | | | | 2,578 | |
Oracle Corp., 4.000%, 11/15/47 | | | 2,142,000 | | | | 2,279 | |
VMware, Inc., 2.300%, 8/21/20 | | | 3,555,000 | | | | 3,535 | |
VMware, Inc., 2.950%, 8/21/22 | | | 2,950,000 | | | | 2,941 | |
VMware, Inc., 3.900%, 8/21/27 | | | 1,760,000 | | | | 1,776 | |
| | | | | | | | |
Total | | | | | | | 65,385 | |
| | | | | | | | |
| |
Utilities (1.7%) | | | | | |
Alabama Power Co., 3.700%, 12/1/47 | | | 1,672,000 | | | | 1,705 | |
Appalachian Power Co., 3.300%, 6/1/27 | | | 1,690,000 | | | | 1,695 | |
Baltimore Gas & Electric Co., 3.750%, 8/15/47 | | | 1,044,000 | | | | 1,069 | |
Commonwealth Edison Co., 2.950%, 8/15/27 | | | 2,375,000 | | | | 2,347 | |
Commonwealth Edison Co., 3.750%, 8/15/47 | | | 695,000 | | | | 721 | |
Dominion Resources, Inc., 1.600%, 8/15/19 | | | 2,070,000 | | | | 2,047 | |
Dominion Resources, Inc., 2.000%, 8/15/21 | | | 1,555,000 | | | | 1,519 | |
Duke Energy Carolinas LLC, 2.500%, 3/15/23 | | | 1,745,000 | | | | 1,729 | |
Duke Energy Corp., 1.800%, 9/1/21 | | | 2,365,000 | | | | 2,300 | |
Duke Energy Corp., 3.150%, 8/15/27 | | | 518,000 | | | | 514 | |
Duke Energy Florida LLC, 3.400%, 10/1/46 | | | 1,015,000 | | | | 981 | |
Duquesne Light Holdings, Inc., 3.616%, 8/1/27 144A | | | 3,005,000 | | | | 3,003 | |
Electricite de France SA, 6.000%, 1/22/14 144A | | | 2,532,000 | | | | 2,827 | |
Enel Finance International NV, 2.750%, 4/6/23 144A | | | 2,464,000 | | | | 2,428 | |
Georgia Power Co., 4.300%, 3/15/42 | | | 530,000 | | | | 563 | |
Indiana Michigan Power Co., 4.550%, 3/15/46 | | | 1,105,000 | | | | 1,259 | |
IPALCO Enterprises, Inc., 3.700%, 9/1/24 144A | | | 2,635,000 | | | | 2,632 | |
ITC Holdings Corp., 3.350%, 11/15/27 144A | | | 4,354,000 | | | | 4,356 | |
New England Power Co., 3.800%, 12/5/47 144A | | | 1,536,000 | | | | 1,569 | |
Nisource Finance Corp., 3.950%, 3/30/48 | | | 619,000 | | | | 633 | |
Northern States Power Co., 3.600%, 9/15/47 | | | 2,583,000 | | | | 2,626 | |
Pacific Gas & Electric Co., 3.300%, 12/1/27 144A | | | 2,862,000 | | | | 2,837 | |
PECO Energy Co., 3.150%, 10/15/25 | | | 2,775,000 | | | | 2,794 | |
PPL Electric Utilities Corp., 4.150%, 10/1/45 | | | 1,010,000 | | | | 1,123 | |
South Carolina Electric & Gas Co., 5.100%, 6/1/65 | | | 377,000 | | | | 431 | |
The Southern Co., 4.400%, 7/1/46 | | | 1,445,000 | | | | 1,537 | |
Southern Co. Gas Capital Corp., 2.450%, 10/1/23 | | | 1,585,000 | | | | 1,534 | |
Southwestern Electric Power Co., 3.900%, 4/1/45 | | | 735,000 | | | | 753 | |
Southwestern Public Service Co., 3.700%, 8/15/47 | | | 1,559,000 | | | | 1,594 | |
| | | | | | | | |
Total | | | | | | | 51,126 | |
| | | | | | | | |
| | |
Total Corporate Bonds | | | | | | | | |
(Cost: $702,148) | | | | | | | 711,903 | |
| | | | | | | | |
| | | | | | | | |
| Governments (35.2%) | | Shares/
$ Par | | | Value
$ (000’s) | |
| |
Governments (35.2%) | | | | | |
Abu Dhabi Government, 2.500%, 10/11/22 144A | | | 3,940,000 | | | | 3,861 | |
Abu Dhabi Government, 3.125%, 10/11/27 144A | | | 2,195,000 | | | | 2,146 | |
Abu Dhabi Government, 4.125%, 10/11/47 144A | | | 2,175,000 | | | | 2,151 | |
Export-Import Bank of Korea, 2.500%, 11/1/20 | | | 1,940,000 | | | | 1,919 | |
Export-Import Bank of Korea, 3.000%, 11/1/22 | | | 4,113,000 | | | | 4,091 | |
Indonesia Government International Bond, 2.950%, 1/11/23 | | | 3,900,000 | | | | 3,870 | |
Indonesia Government International Bond, 3.500%, 1/11/28 | | | 1,095,000 | | | | 1,091 | |
Japan Bank for International Cooperation, 1.750%, 5/28/20 | | | 3,250,000 | | | | 3,202 | |
Japan Bank for International Cooperation, 1.875%, 4/20/21 | | | 1,392,000 | | | | 1,360 | |
Japan Bank for International Cooperation, 2.250%, 2/24/20 | | | 4,658,000 | | | | 4,637 | |
Republic of Chile, 3.860%, 6/21/47 | | | 2,370,000 | | | | 2,434 | |
Republic of Paraguay, 6.100%, 8/11/44 144A | | | 1,660,000 | | | | 1,892 | |
Saudi Government International Bond, 2.875%, 3/4/23 144A | | | 2,860,000 | | | | 2,811 | |
Saudi Government International Bond, 3.625%, 3/4/28 144A | | | 1,942,000 | | | | 1,924 | |
Saudi Government International Bond, 4.500%, 10/26/46 144A | | | 695,000 | | | | 694 | |
Saudi Government International Bond, 4.625%, 10/4/47 144A | | | 1,200,000 | | | | 1,226 | |
United Mexican States, 4.600%, 2/10/48 | | | 2,956,000 | | | | 2,919 | |
United Mexican States, 5.750%, 10/12/2110 | | | 1,630,000 | | | | 1,736 | |
US Treasury, 1.125%, 2/28/21 | | | 50,230,000 | | | | 48,843 | |
US Treasury, 1.125%, 7/31/21 | | | 36,287,000 | | | | 35,088 | |
US Treasury, 1.250%, 4/30/19 | | | 16,392,000 | | | | 16,261 | |
US Treasury, 1.250%, 8/31/19 | | | 3,319,000 | | | | 3,285 | |
US Treasury, 1.375%, 7/31/19 | | | 15,052,000 | | | | 14,937 | |
US Treasury, 1.375%, 9/30/19 | | | 15,928,000 | | | | 15,789 | |
US Treasury, 1.375%, 8/31/20 | | | 6,569,000 | | | | 6,472 | |
US Treasury, 1.375%, 9/30/20 | | | 11,704,000 | | | | 11,525 | |
US Treasury, 1.500%, 10/31/19 | | | 15,192,000 | | | | 15,086 | |
US Treasury, 1.500%, 5/31/20 | | | 34,382,000 | | | | 34,040 | |
US Treasury, 1.500%, 7/15/20 | | | 8,164,000 | | | | 8,076 | |
US Treasury, 1.500%, 8/15/20 | | | 25,081,000 | | | | 24,801 | |
US Treasury, 1.500%, 8/15/26 | | | 43,035,000 | | | | 40,028 | |
US Treasury, 1.625%, 3/31/19 | | | 11,739,000 | | | | 11,704 | |
US Treasury, 1.625%, 7/31/20 | | | 48,346,000 | | | | 47,969 | |
US Treasury, 1.625%, 10/15/20 | | | 29,726,000 | | | | 29,460 | |
US Treasury, 1.625%, 8/31/22 | | | 32,067,000 | | | | 31,270 | |
US Treasury, 1.750%, 11/30/19 | | | 24,638,000 | | | | 24,573 | |
US Treasury, 1.750%, 11/15/20 | | | 19,595,000 | | | | 19,481 | |
US Treasury, 1.750%, 12/31/20 | | | 5,464,000 | | | | 5,426 | |
US Treasury, 1.875%, 12/31/19 | | | 9,392,000 | | | | 9,388 | |
US Treasury, 1.875%, 12/15/20 | | | 56,206,000 | | | | 56,039 | |
US Treasury, 1.875%, 1/31/22 | | | 21,355,000 | | | | 21,132 | |
US Treasury, 1.875%, 3/31/22 | | | 29,714,000 | | | | 29,376 | |
US Treasury, 1.875%, 4/30/22 | | | 12,220,000 | | | | 12,073 | |
The Accompanying Notes are an Integral Part of the Financial Statements.
| | | | | | |
| | Select Bond Portfolio | | | 121 | |
Select Bond Portfolio
| | | | | | | | |
| Governments (35.2%) | | Shares/
$ Par | | | Value
$ (000’s) | |
| |
Governments continued | | | | | |
US Treasury, 1.875%, 7/31/22 | | | 25,024,000 | | | | 24,682 | |
US Treasury, 2.000%, 10/31/21 | | | 26,150,000 | | | | 26,036 | |
US Treasury, 2.000%, 12/31/21 | | | 44,186,000 | | | | 43,959 | |
US Treasury, 2.000%, 11/30/22 | | | 11,980,000 | | | | 11,869 | |
US Treasury, 2.000%, 11/15/26 | | | 24,891,000 | | | | 24,082 | |
US Treasury, 2.125%, 12/31/22(b) | | | 5,057,000 | | | | 5,035 | |
US Treasury, 2.125%, 11/30/24 | | | 4,312,000 | | | | 4,254 | |
US Treasury, 2.250%, 10/31/24 | | | 3,796,000 | | | | 3,778 | |
US Treasury, 2.250%, 2/15/27 | | | 45,910,000 | | | | 45,294 | |
US Treasury, 2.250%, 8/15/27 | | | 45,575,000 | | | | 44,920 | |
US Treasury, 2.250%, 11/15/27 | | | 27,511,000 | | | | 27,114 | |
US Treasury, 2.375%, 5/15/27 | | | 15,562,000 | | | | 15,513 | |
US Treasury, 2.500%, 2/15/46 | | | 19,549,000 | | | | 18,582 | |
US Treasury, 2.500%, 5/15/46 | | | 25,816,000 | | | | 24,530 | |
US Treasury, 2.750%, 8/15/47 | | | 29,726,000 | | | | 29,730 | |
US Treasury, 2.750%, 11/15/47 | | | 14,648,000 | | | | 14,656 | |
US Treasury, 2.875%, 11/15/46 | | | 10,029,000 | | | | 10,277 | |
US Treasury, 3.000%, 11/15/45 | | | 24,338,000 | | | | 25,532 | |
US Treasury, 3.000%, 2/15/47 | | | 17,248,000 | | | | 18,119 | |
US Treasury, 3.000%, 5/15/47 | | | 2,895,000 | | | | 3,040 | |
| | | | | | | | |
| | |
Total Governments | | | | | | | | |
(Cost: $1,048,067) | | | | | | | 1,037,088 | |
| | | | | | | | |
| |
| Municipal Bonds (0.6%) | | | | |
| |
Municipal Bonds (0.6%) | | | | | |
County of Clark Department of Aviation, 6.820%, 7/1/45 RB | | | 1,780,000 | | | | 2,776 | |
Los Angeles Community College District, Series 2010-E, 6.750%, 8/1/49 GO | | | 2,600,000 | | | | 4,036 | |
North Texas Tollway Authority, Series 2009-B, 6.718%, 1/1/49 RB | | | 2,445,000 | | | | 3,719 | |
The Ohio State University, 4.800%, 6/1/11 RB | | | 1,070,000 | | | | 1,202 | |
Port Authority of New York & New Jersey, 4.458%, 10/1/62 RB | | | 3,540,000 | | | | 4,088 | |
State of California, Series 2010, 7.600%, 11/1/40 GO | | | 1,870,000 | | | | 2,986 | |
| | | | | | | | |
| | |
Total Municipal Bonds | | | | | | | | |
(Cost: $17,519) | | | | | | | 18,807 | |
| | | | | | | | |
| |
| Structured Products (47.1%) | | | | |
| |
Asset Backed Securities (12.8%) | | | | | |
Ally Master Owner Trust, Series 2017-1, Class A, 1.877%, (ICE LIBOR USD 1 Month plus 0.40%), 2/15/21 | | | 1,729,000 | | | | 1,733 | |
Avis Budget Rental Car Funding AESOP LLC, Series 2017-2A, Class A, 2.970%, 3/20/24 144A | | | 4,744,000 | | | | 4,743 | |
California Republic Auto Receivables Trust, Series 2016-1, Class A4, 2.240%, 10/15/21 | | | 2,142,000 | | | | 2,143 | |
California Republic Auto Receivables Trust, Series 2017-1, Class A3, 1.900%, 3/15/21 | | | 2,569,000 | | | | 2,560 | |
California Republic Auto Receivables Trust, Series 2017-1, Class A4, 2.280%, 6/15/22 | | | 1,177,000 | | | | 1,173 | |
| | | | | | | | |
| Structured Products (47.1%) | | Shares/
$ Par | | | Value
$ (000’s) | |
| |
Asset Backed Securities continued | | | | | |
Capital Auto Receivables Asset Trust, Series 2015-3, Class A4, 2.130%, 5/20/20 | | | 250,000 | | | | 250 | |
Capital Auto Receivables Asset Trust, Series 2015-4, Class A2, 1.620%, 3/20/19 | | | 215,277 | | | | 215 | |
Capital Auto Receivables Asset Trust, Series 2015-4, Class A4, 2.010%, 7/20/20 | | | 2,266,000 | | | | 2,265 | |
Capital Auto Receivables Asset Trust, Series 2016-1, Class A4, 1.980%, 10/20/20 | | | 1,690,000 | | | | 1,688 | |
Capital Auto Receivables Asset Trust, Series 2016-3, Class A2A, 1.360%, 4/22/19 | | | 191,262 | | | | 191 | |
Capital Auto Receivables Asset Trust, Series 2016-3, Class A4, 1.690%, 3/20/21 | | | 1,365,000 | | | | 1,355 | |
Capital One Multi-Asset Execution Trust, Series 2015-A1, Class A, 1.390%, 1/15/21 | | | 340,000 | | | | 340 | |
Capital One Multi-Asset Execution Trust, Series 2016-A5, Class A5, 1.660%, 6/17/24 | | | 2,943,000 | | | | 2,869 | |
Capital One Multi-Asset Execution Trust, Series 2017-A6, Class A6, 2.290%, 7/15/25 | | | 758,000 | | | | 753 | |
College Ave Student Loans, Series 2017-A, Class A1, 2.978%, (ICE LIBOR USD 1 Month plus 1.65%), 11/26/46 144A | | | 2,457,231 | | | | 2,518 | |
Hertz Vehicle Financing II LP, Series 2015-1A, Class A, 2.730%, 3/25/21 144A | | | 5,476,000 | | | | 5,491 | |
Hertz Vehicle Financing II LP, Series 2015-3A, Class A, 2.670%, 9/25/21 144A | | | 5,403,000 | | | | 5,348 | |
Hertz Vehicle Financing LLC, Series 2016-2A, Class A, 2.950%, 3/25/22 144A | | | 2,766,000 | | | | 2,757 | |
Hertz Vehicle Financing LLC, Series 2016-3A, Class A, 2.270%, 7/25/20 144A | | | 3,577,000 | | | | 3,560 | |
Hertz Vehicle Financing LLC, Series 2016-3A, Class B, 3.110%, 7/25/20 144A | | | 1,173,000 | | | | 1,167 | |
Hertz Vehicle Financing LLC, Series 2016-4, Class A, 2.650%, 7/25/22 144A | | | 3,698,000 | | | | 3,630 | |
Hertz Vehicle Financing LLC, Series 2017-2A, Class A, 3.290%, 10/25/23 144A | | | 5,167,000 | | | | 5,175 | |
Naviant Student Loan Trust, Series 2016-1A, Class A, 2.252%, (ICE LIBOR USD 1 Month plus 0.70%), 2/25/70 144A | | | 10,002,085 | | | | 10,033 | |
Navient Private Education Loan Trust, Series 2014-AA, Class A3, 3.077%, (ICE LIBOR USD 1 Month plus 1.60%), 10/15/31 144A | | | 3,434,000 | | | | 3,504 | |
Navient Private Education Loan Trust, Series 2014-CTA, Class A, 2.177%, (ICE LIBOR USD 1 Month plus 0.70%), 9/16/24 144A | | | 1,656,469 | | | | 1,661 | |
Navient Private Education Loan Trust, Series 2015-CA, Class B, 3.250%, 5/15/40 144A | | | 2,181,000 | | | | 2,197 | |
Navient Student Loan Trust, Series 2014-1, Class A3, 1.838%, (ICE LIBOR USD 1 Month plus 0.51%), 6/25/31 | | | 2,840,000 | | | | 2,831 | |
Navient Student Loan Trust, Series 2015-AA, Class A2B, 2.677%, (ICE LIBOR USD 1 Month plus 1.20%), 12/15/28 144A | | | 1,023,069 | | | | 1,043 | |
Navient Student Loan Trust, Series 2016-5A, Class A, 2.802%, (ICE LIBOR USD 1 Month plus 1.25%), 6/25/65 144A | | | 1,539,454 | | | | 1,572 | |
The Accompanying Notes are an Integral Part of the Financial Statements.
| | | | |
| 122 | | Select Bond Portfolio | | |
Select Bond Portfolio
| | | | | | | | |
| Structured Products (47.1%) | | Shares/
$ Par | | | Value
$ (000’s) | |
| |
Asset Backed Securities continued | | | | | |
Navient Student Loan Trust, Series 2016-7A, Class A, 2.702%, (ICE LIBOR USD 1 Month plus 1.15%), 3/25/66 144A | | | 3,322,404 | | | | 3,400 | |
Navient Student Loan Trust, Series 2016-AA, Class A2A, 3.910%, 12/15/45 144A | | | 6,961,294 | | | | 7,152 | |
Navient Student Loan Trust, Series 2016-AA, Class A2B, 3.627%, (ICE LIBOR USD 1 Month plus 2.15%), 12/15/45 144A | | | 2,052,714 | | | | 2,141 | |
Navient Student Loan Trust, Series 2017-1A, Class A3, 2.702%, (ICE LIBOR USD 1 Month plus 1.15%), 7/26/66 144A | | | 11,939,000 | | | | 12,224 | |
Navient Student Loan Trust, Series 2017-2A, Class A, 2.602%, (ICE LIBOR USD 1 Month plus 1.05%), 12/27/66 144A | | | 7,610,301 | | | | 7,702 | |
Navient Student Loan Trust, Series 2017-3A, Class A3, 2.602%, (ICE LIBOR USD 1 Month plus 1.05%), 7/26/66 144A | | | 5,914,000 | | | | 6,070 | |
Navient Student Loan Trust, Series 2017-4A, Class A3, 2.552%, (ICE LIBOR USD 1 Month plus 1.00%), 9/27/66 144A | | | 8,793,000 | | | | 8,877 | |
Navient Student Loan Trust, Series 2017-5A, Class A, 2.352%, (ICE LIBOR USD 1 Month plus 0.80%), 7/26/66 144A | | | 11,195,022 | | | | 11,233 | |
Navient Student Loan Trust, Series 2017-A, Class A2A, 2.880%, 12/16/58 144A | | | 3,386,000 | | | | 3,356 | |
Navient Student Loan Trust, Series 2017-A, Class A2B, 2.377%, (1 Month LIBOR plus 0.90%), 12/16/58 144A | | | 3,441,000 | | | | 3,441 | |
Nelnet Student Loan Trust, Series 2004-3, Class A5, 1.547%, (3 Month LIBOR plus 0.18%), 10/27/36 | | | 647,866 | | | | 640 | |
Nelnet Student Loan Trust, Series 2004-4, Class A5, 1.527%, (3 Month LIBOR plus 0.16%), 1/25/37 | | | 3,205,480 | | | | 3,172 | |
Nelnet Student Loan Trust, Series 2005-1, Class, A5, 1.477%, (3 Month LIBOR plus 0.11%), 10/25/33 | | | 9,895,701 | | | | 9,712 | |
Nelnet Student Loan Trust, Series 2005-2, Class A5, 1.758%, (3 Month LIBOR plus 0.10%), 3/23/37 | | | 3,439,367 | | | | 3,402 | |
Nelnet Student Loan Trust, Series 2005-3, Class A5, 1.443%, (3 Month LIBOR plus 0.12%), 12/24/35 | | | 9,076,986 | | | | 8,972 | |
Nelnet Student Loan Trust, Series 2005-4, Clas A4, 1.503%, (3 Month LIBOR plus 0.18%), 3/22/32 | | | 1,731,000 | | | | 1,675 | |
Nelnet Student Loan Trust, Series 2006-2, Class A6, 1.487%, (3 Month LIBOR plus 0.12%), 4/25/31 | | | 7,268,000 | | | | 7,288 | |
Nelnet Student Loan Trust, Series 2010-4A, Series A, 2.128%, (1 Month LIBOR plus 0.80%), 4/25/46 144A | | | 1,151,745 | | | | 1,163 | |
Nelnet Student Loan Trust, Series 2016-1A, Class A, 2.128%, (ICE LIBOR USD 1 Month plus 0.80%), 9/25/65 144A | | | 3,589,360 | | | | 3,638 | |
Nelnet Student Loan Trust, Series 2017-2A, Class A, 2.322%, (ICE LIBOR USD 1 Month plus 0.77%), 9/25/65 144A | | | 5,500,867 | | | | 5,521 | |
Nelnet Student Loan Trust, Series 2017-3A, Class A, 2.322%, (1 Month LIBOR plus 0.85%), 2/25/66 144A | | | 3,195,000 | | | | 3,195 | |
| | | | | | | | |
| Structured Products (47.1%) | | Shares/
$ Par | | | Value
$ (000’s) | |
| |
Asset Backed Securities continued | | | | | |
Santander Drive Auto Receivables Trust, Series 2017-3, Class A3, 1.870%, 6/15/21 | | | 2,521,000 | | | | 2,511 | |
SLC Student Loan Trust, Series 2005-3, Class A3, 1.708%, (3 Month LIBOR plus 0.12%), 6/15/29 | | | 7,046,346 | | | | 6,990 | |
SLM Private Education Loan Trust, Series 2012-D, Class A2, 2.950%, 2/15/46 144A | | | 431,576 | | | | 432 | |
SLM Private Education Loan Trust, Series 2013-B, Class A2B, 2.577%, (ICE LIBOR USD 1 Month plus 1.10%), 6/17/30 144A | | | 555,118 | | | | 559 | |
SLM Student Loan Trust, Series 2003-1, Class A5C, 2.338%, (3 Month LIBOR plus 0.75%), 12/15/32 144A | | | 1,888,750 | | | | 1,873 | |
SLM Student Loan Trust, Series 2004-10, Class A7A, 2.117%, (3 Month LIBOR plus 0.75%), 10/25/29 144A | | | 5,602,000 | | | | 5,602 | |
SLM Student Loan Trust, Series 2005-8, Class A5, 1.537%, (3 Month LIBOR plus 0.17%), 1/25/40 | | | 2,728,000 | | | | 2,635 | |
SLM Student Loan Trust, Series 2006-3, Class A5, 1.467%, (3 Month LIBOR plus 0.10%), 1/25/21 | | | 4,955,407 | | | | 4,924 | |
SLM Student Loan Trust, Series 2007-2, Class A4, 1.427%, (3 Month LIBOR plus 0.06%), 7/25/22 | | | 6,060,000 | | | | 5,890 | |
SLM Student Loan Trust, Series 2012-1, Class A3, 2.278%, (ICE LIBOR USD 1 Month plus 0.95%), 9/25/28 | | | 8,876,203 | | | | 8,965 | |
SLM Student Loan Trust, Series 2012-2, Class A, 2.028%, (ICE LIBOR USD 1 Month plus 0.70%), 1/25/29 | | | 4,291,101 | | | | 4,307 | |
SLM Student Loan Trust, Series 2012-3, Class A, 1.978%, (ICE LIBOR USD 1 Month plus 0.65%), 12/27/38 | | | 2,101,902 | | | | 2,114 | |
SLM Student Loan Trust, Series 2012-6, Class A3, 2.078%, (ICE LIBOR USD 1 Month plus 0.75%), 5/26/26 | | | 3,385,171 | | | | 3,367 | |
SLM Student Loan Trust, Series 2012-6, Class B, 2.328%, (ICE LIBOR USD 1 Month plus 1.00%), 4/27/43 | | | 1,812,000 | | | | 1,659 | |
SLM Student Loan Trust, Series 2012-7, Class B, 3.128%, (ICE LIBOR USD 1 Month plus 1.80%), 9/25/43 | | | 4,250,000 | | | | 4,250 | |
SMB Private Education Loan Trust, Series 2015-A, Class A2A, 2.490%, 6/15/27 144A | | | 1,383,502 | | | | 1,380 | |
SMB Private Education Loan Trust, Series 2015-A, Class A2B, 2.477%, (ICE LIBOR USD 1 Month plus 1.00%), 6/15/27 144A | | | 3,737,149 | | | | 3,791 | |
SMB Private Education Loan Trust, Series 2015-B, Class A2A, 2.980%, 7/15/27 144A | | | 1,610,959 | | | | 1,620 | |
SMB Private Education Loan Trust, Series 2015-B, Class A2B, 2.677%, (ICE LIBOR USD 1 Month plus 1.20%), 7/15/27 144A | | | 5,324,715 | | | | 5,406 | |
SMB Private Education Loan Trust, Series 2015-C, Class A2A, 2.750%, 7/15/27 144A | | | 2,431,392 | | | | 2,435 | |
SMB Private Education Loan Trust, Series 2015-C, Class A2B, 2.877%, (ICE LIBOR USD 1 Month plus 1.40%), 7/15/27 144A | | | 1,782,209 | | | | 1,822 | |
The Accompanying Notes are an Integral Part of the Financial Statements.
| | | | | | |
| | Select Bond Portfolio | | | 123 | |
Select Bond Portfolio
| | | | | | | | |
| Structured Products (47.1%) | | Shares/
$ Par | | | Value
$ (000’s) | |
| |
Asset Backed Securities continued | | | | | |
SMB Private Education Loan Trust, Series 2016-A, Class A2A, 2.700%, 5/15/31 144A | | | 6,939,000 | | | | 6,903 | |
SMB Private Education Loan Trust, Series 2016-A, Class A2B, 2.977%, (ICE LIBOR USD 1 Month plus 1.50%), 5/15/31 144A | | | 8,920,000 | | | | 9,168 | |
SMB Private Education Loan Trust, Series 2016-B, Class A2A, 2.430%, 2/17/32 144A | | | 3,352,000 | | | | 3,294 | |
SMB Private Education Loan Trust, Series 2016-B, Class A2B, 2.927%, (ICE LIBOR USD 1 Month plus 1.45%), 2/17/32 144A | | | 8,058,000 | | | | 8,334 | |
SMB Private Education Loan Trust, Series 2016-C, Class A2A, 2.340%, 9/15/34 144A | | | 6,011,000 | | | | 5,883 | |
SMB Private Education Loan Trust, Series 2016-C, Class A2B, 2.577%, (ICE LIBOR USD 1 Month plus 1.10%), 9/15/34 144A | | | 5,766,000 | | | | 5,864 | |
SMB Private Education Loan Trust, Series 2017-A, Class A2A, 2.880%, 9/15/34 144A | | | 3,062,000 | | | | 3,067 | |
SMB Private Education Loan Trust, Series 2017-B, Class A2A, 2.820%, 10/15/35 144A | | | 4,200,000 | | | | 4,183 | |
SMB Private Education Loan Trust, Series 2017-B, Class A2B, 2.101%, (1 Month LIBOR plus 0.75%), 10/15/35 144A | | | 4,236,000 | | | | 4,252 | |
Social Professional Loan Program LLC, Series 2017-E, Class A1, 2.052%, (1 Month LIBOR plus 0.50%), 11/26/40 144A | | | 1,641,744 | | | | 1,644 | |
Social Professional Loan Program LLC, Series 2017-E, Class A2B, 2.720%, 11/26/40 144A | | | 5,282,000 | | | | 5,255 | |
SoFi Professional Loan Program LLC, Series 2016-A, Class A2, 2.760%, 12/26/36 144A | | | 3,405,666 | | | | 3,402 | |
SoFi Professional Loan Program LLC, Series 2016-D, Class A1, 2.502%, (ICE LIBOR USD 1 Month plus 0.95%), 1/25/39 144A | | | 749,463 | | | | 757 | |
SoFi Professional Loan Program LLC, Series 2017-B, Class A2F, 2.740%, 5/25/40 144A | | | 2,108,000 | | | | 2,101 | |
SoFi Professional Loan Program LLC, Series 2017-C, Class A2B, 2.630%, 7/25/40 144A | | | 3,127,000 | | | | 3,106 | |
SoFi Professional Loan Program LLC, Series 2017-F, Class A2FX, 2.840%, 1/25/41 144A | | | 5,457,000 | | | | 5,463 | |
SoFi Professional Loan Program, Series 2016-E, Class A1, 2.402%, (ICE LIBOR USD 1 Month plus 0.85%), 7/25/39 144A | | | 1,928,536 | | | | 1,946 | |
SoFi Professional Loan Program, Series 2017-A, Class A1, 2.252%, (ICE LIBOR USD 1 Month plus 0.70%), 3/26/40 144A | | | 1,721,055 | | | | 1,731 | |
SoFi Professional Loan Program, Series 2017-A, Class A2B, 2.400%, 3/26/40 144A | | | 1,877,000 | | | | 1,848 | |
SoFi Professional Loan Program, Series 2017-D, Class A2FX, 2.650%, 9/25/40 144A | | | 744,000 | | | | 739 | |
Synchrony Credit Card Master Note Trust, Series 2015-1, Class A, 2.370%, 3/15/23 | | | 1,621,000 | | | | 1,626 | |
Synchrony Credit Card Master Note Trust, Series 2016-2, Class A, 2.210%, 5/15/24 | | | 1,043,000 | | | | 1,037 | |
Synchrony Credit Card Master Note Trust, Series 2016-3, Class A, 1.580%, 9/15/22 | | | 6,523,000 | | | | 6,454 | |
| | | | | | | | |
| Structured Products (47.1%) | | Shares/
$ Par | | | Value
$ (000’s) | |
| |
Asset Backed Securities continued | | | | | |
Synchrony Credit Card Master Note Trust, Series 2017-2, Class A, 2.620%, 10/15/25 | | | 4,592,000 | | | | 4,590 | |
TCF Auto Receivables Owner Trust, Series 2016-1A, Class A4, 2.030%, 2/15/22 144A | | | 941,000 | | | | 934 | |
World Financial Network Credit Card Master Trust, Series 2015-B, Class A, 2.550%, 6/17/24 | | | 246,000 | | | | 247 | |
World Financial Network Credit Card Master Trust, Series 2016-A, Class A, 2.030%, 4/15/25 | | | 6,863,000 | | | | 6,739 | |
World Financial Network Credit Card Master Trust, Series 2016-C, Class A, 1.720%, 8/15/23 | | | 2,591,000 | | | | 2,568 | |
World Financial Network Credit Card Master Trust, Series 2017-A, Class A, 2.120%, 3/15/24 | | | 3,908,000 | | | | 3,892 | |
World Financial Network Credit Card Master Trust, Series 2017-C, Class A, 2.310%, 8/15/24 | | | 5,847,000 | | | | 5,822 | |
World Omni Auto Receiveables Trust, Series 2014-B, Class A4, 1.680%, 12/15/20 | | | 1,162,000 | | | | 1,160 | |
| | | | | | | | |
Total | | | | | | | 375,280 | |
| | | | | | | | |
| |
Mortgage Securities (34.3%) | | | | | |
Asset Securitization Corp., Series 1997-D5, Class PS1, 1.837%, (CSTR), 2/14/43 IO | | | 483,939 | | | | 8 | |
CD Commercial Mortgage Trust, Series 2017-CD6, Class ASB, 3.332%, 11/13/50 | | | 2,821,000 | | | | 2,892 | |
CFCRE Commercial Mortgage Trust, Series 2011-C1, Class A4, 4.961%, (CSTR, AFC), 4/15/44 144A | | | 2,166,341 | | | | 2,275 | |
CFCRE Commercial Mortgage Trust, Series 2016-C3, Class A1, 1.793%, (CSTR, AFC), 1/10/48 | | | 1,264,153 | | | | 1,254 | |
CFCRE Commercial Mortgage Trust, Series 2016-C4, Class A4, 3.283%, (EXE), 5/10/58 | | | 1,545,000 | | | | 1,552 | |
CFCRE Commercial Mortgage Trust, Series 2016-C4, Class ASB, 3.091%, 5/10/58 | | | 1,508,000 | | | | 1,524 | |
CFCRE Commercial Mortgage Trust, Series 2016-C7, Class A2, 3.585%, (CSTR), 12/10/54 | | | 1,536,000 | | | | 1,574 | |
CFCRE Commercial Mortgage Trust, Series 2016-C7, Class A3, 3.838%, (AFC, EXE), 12/10/54 | | | 1,179,000 | | | | 1,230 | |
CFCRE Commercial Mortgage Trust, Series 2017-C8, Class A1, 1.964%, 6/15/50 | | | 897,121 | | | | 889 | |
CFCRE Commercial Mortgage Trust, Series 2017-C8, Class A4, 3.571%, 6/15/50 | | | 907,000 | | | | 926 | |
CFCRE Commercial Mortgage Trust, Series 2017-C8, Class ASB, 3.367%, 6/15/50 | | | 1,226,000 | | | | 1,256 | |
Citigroup / Deutsche Bank Commercial Mortgage Trust, Series 2016-CD1, Class A1, 1.443%, 8/10/49 | | | 776,611 | | | | 763 | |
Citigroup / Deutsche Bank Commercial Mortgage Trust, Series 2017-C6, 3.121%, 6/10/50 | | | 694,000 | | | | 700 | |
Citigroup / Deutsche Bank Commercial Mortgage Trust, Series 2017-CD4, Class ASB, 3.317%, 5/10/50 | | | 1,173,000 | | | | 1,196 | |
Citigroup / Deutsche Bank Commercial Trust, Series 2016-CD1, Class ASB, 2.622%, 8/10/49 | | | 2,660,000 | | | | 2,627 | |
Citigroup Commercial Mortgage Trust, Series 2013-GC11, Class A2, 1.987%, 4/10/46 | | | 1,735,389 | | | | 1,735 | |
Citigroup Commercial Mortgage Trust, Series 2013-GC11, Class AAB, 2.690%, 4/10/46 | | | 1,047,000 | | | | 1,050 | |
The Accompanying Notes are an Integral Part of the Financial Statements.
| | | | |
| 124 | | Select Bond Portfolio | | |
Select Bond Portfolio
| | | | | | | | |
| Structured Products (47.1%) | | Shares/
$ Par | | | Value
$ (000’s) | |
| |
Mortgage Securities continued | | | | | |
Citigroup Commercial Mortgage Trust, Series 2014-GC25, Class A4, 3.635%, 10/10/47 | | | 2,716,000 | | | | 2,823 | |
Citigroup Commercial Mortgage Trust, Series 2015-GC29, Class A4, 3.192%, 4/10/48 | | | 1,383,000 | | | | 1,396 | |
Citigroup Mortgage Loan Trust, Inc., Series 2005-1, Class 3A1, 6.500%, 4/25/35 | | | 219,541 | | | | 225 | |
Commercial Mortgage Pass Through Certificates, Series 2012-CR3, Class A3, 2.822%, 10/15/45 | | | 1,231,000 | | | | 1,233 | |
Commercial Mortgage Pass Through Certificates, Series 2012-CR4, Class A2, 1.801%, 10/15/45 | | | 429,260 | | | | 429 | |
Commercial Mortgage Pass Through Certificates, Series 2013-Cr11, Class A1, 1.468%, 8/10/50 | | | 304,384 | | | | 304 | |
Commercial Mortgage Pass Through Certificates, Series 2013-CR12, Class A1, 1.295%, 10/10/46 | | | 46,709 | | | | 47 | |
Commercial Mortgage Pass Through Certificates, Series 2013-CR12, Class A3, 3.765%, 10/10/46 | | | 734,000 | | | | 770 | |
Commercial Mortgage Pass Through Certificates, Series 2013-CR12, Class A4, 4.046%, 10/10/46 | | | 1,225,000 | | | | 1,301 | |
Commercial Mortgage Pass Through Certificates, Series 2013-CR6, Class A2, 2.122%, 3/10/46 | | | 555,456 | | | | 555 | |
Commercial Mortgage Pass Through Certificates, Series 2014-UBS2, Class A5, 3.961%, 3/10/47 | | | 415,000 | | | | 438 | |
Commercial Mortgage Pass Through Certificates, Series 2014-UBS6, Class A5, 3.644%, 12/10/47 | | | 2,228,000 | | | | 2,314 | |
Commercial Mortgage Pass Through Certificates, Series 2014-UBS6, Class AM, 4.048%, 12/10/47 | | | 2,400,000 | | | | 2,503 | |
Commercial Mortgage Pass Through Certificates, Series 2016-C0R1, Class ASB, 2.972%, 10/10/49 | | | 1,155,000 | | | | 1,159 | |
Commercial Mortgage Pass Through Certificates, Series 2017-COR2, Class A3, 3.510%, 9/10/50 | | | 745,000 | | | | 768 | |
Commercial Mortgage Pass-Through Certificates, Series 2014-UBS4, Class A5, 3.694%, 8/10/47 | | | 893,000 | | | | 930 | |
Commerical Mortgage Pass Through Certificates, Series 2013-CR10, Class A2, 2.972%, 8/10/46 | | | 1,137,000 | | | | 1,144 | |
Credit Suisse Mortgage Trust, Series 2013-IVR4, Class A6, 2.500%, (AFC), 7/25/43 144A | | | 3,386,831 | | | | 3,330 | |
CSAIL Commercial Mortgage Trust, Series 2015-C3, Class A4, 3.718%, 8/15/48 | | | 1,597,000 | | | | 1,661 | |
CSAIL Commercial Mortgage Trust, Series 2015-C4, Class A4, 3.807%, 11/15/48 | | | 4,039,000 | | | | 4,221 | |
CSAIL Commercial Mortgage Trust, Series 2016-C5, Class ASB, 3.532%, 11/15/48 | | | 582,000 | | | | 600 | |
DLJ Commercial Mortgage Corp., Series 1998-CF1, Class S, 1.090%, (CSTR), 2/18/31 IO | | | 5,331 | | | | — | |
Federal Home Loan Bank, 3.500%, 12/1/32 | | | 561,000 | | | | 581 | |
Federal Home Loan Mortgage Corp., 3.000%, 10/15/47 | | | 19,417,527 | | | | 19,577 | |
Federal Home Loan Mortgage Corp., 3.085%, (ICE LIBOR USD 12 Month plus 1.62%), 2/1/45 | | | 1,623,697 | | | | 1,650 | |
Federal Home Loan Mortgage Corp., 3.500%, 9/1/26 | | | 543,707 | | | | 566 | |
Federal Home Loan Mortgage Corp., 3.500%, 12/1/29 | | | 15,666,814 | | | | 16,286 | |
Federal Home Loan Mortgage Corp., 3.500%, 4/1/30 | | | 5,404,189 | | | | 5,616 | |
Federal Home Loan Mortgage Corp., 3.500%, 6/1/30 | | | 1,587,658 | | | | 1,650 | |
Federal Home Loan Mortgage Corp., 3.500%, 7/1/30 | | | 3,786,551 | | | | 3,935 | |
| | | | | | | | |
| Structured Products (47.1%) | | Shares/
$ Par | | | Value
$ (000’s) | |
| |
Mortgage Securities continued | | | | | |
Federal Home Loan Mortgage Corp., 3.500%, 8/1/30 | | | 2,612,857 | | | | 2,716 | |
Federal Home Loan Mortgage Corp., 3.500%, 10/1/30 | | | 2,118,671 | | | | 2,201 | |
Federal Home Loan Mortgage Corp., 3.500%, 11/1/30 | | | 5,135,255 | | | | 5,339 | |
Federal Home Loan Mortgage Corp., 3.500%, 1/1/31 | | | 3,035,957 | | | | 3,157 | |
Federal Home Loan Mortgage Corp., 3.500%, 2/1/31 | | | 610,157 | | | | 635 | |
Federal Home Loan Mortgage Corp., 3.500%, 11/1/31 | | | 289,641 | | | | 302 | |
Federal Home Loan Mortgage Corp., 3.500%, 5/1/32 | | | 10,029,116 | | | | 10,386 | |
Federal Home Loan Mortgage Corp., 3.500%, 6/1/32 | | | 4,304,870 | | | | 4,461 | |
Federal Home Loan Mortgage Corp., 3.500%, 7/1/32 | | | 3,676,485 | | | | 3,842 | |
Federal Home Loan Mortgage Corp., 3.500%, 10/1/32 | | | 4,473,207 | | | | 4,629 | |
Federal Home Loan Mortgage Corp., 3.500%, 12/1/32 | | | 377,073 | | | | 390 | |
Federal Home Loan Mortgage Corp., 3.500%, 12/1/45 | | | 416,636 | | | | 431 | |
Federal Home Loan Mortgage Corp., 4.000%, 10/1/29 | | | 8,652,389 | | | | 9,169 | |
Federal Home Loan Mortgage Corp., 4.000%, 1/1/34 | | | 3,754,378 | | | | 3,971 | |
Federal Home Loan Mortgage Corp., 4.000%, 1/1/35 | | | 142,242 | | | | 152 | |
Federal Home Loan Mortgage Corp., 4.000%, 1/1/36 | | | 210,868 | | | | 224 | |
Federal Home Loan Mortgage Corp., 4.000%, 10/1/36 | | | 1,474,415 | | | | 1,563 | |
Federal Home Loan Mortgage Corp., 4.000%, 3/1/37 | | | 772,222 | | | | 823 | |
Federal Home Loan Mortgage Corp., 4.000%, 8/1/43 | | | 1,681,774 | | | | 1,779 | |
Federal Home Loan Mortgage Corp., 4.000%, 8/1/44 | | | 772,036 | | | | 817 | |
Federal Home Loan Mortgage Corp., 4.000%, 12/1/45 | | | 962,154 | | | | 1,014 | |
Federal Home Loan Mortgage Corp., 4.000%, 2/1/46 | | | 1,042,312 | | | | 1,099 | |
Federal Home Loan Mortgage Corp., 4.000%, 6/1/46 | | | 1,529,618 | | | | 1,614 | |
Federal Home Loan Mortgage Corp., 4.000%, 4/1/47 | | | 1,145,513 | | | | 1,216 | |
Federal Home Loan Mortgage Corp., 4.500%, 8/1/20 | | | 1,560,467 | | | | 1,583 | |
Federal Home Loan Mortgage Corp., 4.500%, 6/1/39 | | | 132,284 | | | | 143 | |
Federal Home Loan Mortgage Corp., 4.500%, 7/1/39 | | | 144,464 | | | | 156 | |
Federal Home Loan Mortgage Corp., 4.500%, 3/1/41 | | | 396,127 | | | | 430 | |
Federal Home Loan Mortgage Corp., 4.500%, 1/1/45 | | | 906,589 | | | | 985 | |
Federal Home Loan Mortgage Corp., 4.500%, 5/1/45 | | | 166,678 | | | | 180 | |
Federal Home Loan Mortgage Corp., 4.500%, 4/1/47 | | | 1,250,694 | | | | 1,361 | |
Federal Home Loan Mortgage Corp., 4.500%, 6/1/47 | | | 2,413,740 | | | | 2,600 | |
Federal Home Loan Mortgage Corp., 5.000%, 5/1/44 | | | 614,308 | | | | 670 | |
Federal Home Loan Mortgage Corp., 5.000%, 6/1/44 | | | 2,507,846 | | | | 2,774 | |
Federal Home Loan Mortgage Corp., 5.000%, 7/1/44 | | | 1,783,830 | | | | 1,946 | |
Federal Home Loan Mortgage Corp., Series 2439, Class LH, 6.000%, 4/15/32 | | | 505,128 | | | | 568 | |
Federal Home Loan Mortgage Corp., Series 3829, Class ED, 3.500%, 10/15/28 | | | 308,889 | | | | 310 | |
Federal Home Loan Mortgage Corp., Series 3838, Class QE, 3.500%, 1/15/29 | | | 737,824 | | | | 741 | |
Federal Home Loan Mortgage Corp., Series 4425, Class A, 4.000%, 9/15/40 | | | 2,940,423 | | | | 3,068 | |
Federal Home Loan Mortgage Corp., Series 4529, Class HC, 3.000%, 10/15/39 | | | 1,068,180 | | | | 1,072 | |
The Accompanying Notes are an Integral Part of the Financial Statements.
| | | | | | |
| | Select Bond Portfolio | | | 125 | |
Select Bond Portfolio
| | | | | | | | |
| Structured Products (47.1%) | | Shares/
$ Par | | | Value
$ (000’s) | |
| |
Mortgage Securities continued | | | | | |
Federal Home Loan Mortgage Corp., Series 4604, Class AB, 3.000%, 8/15/46 | | | 2,649,498 | | | | 2,672 | |
Federal Home Loan Mortgage Corp., Series 4640, Class LD, 4.000%, 9/15/43 | | | 9,600,222 | | | | 10,013 | |
Federal Home Loan Mortgage Corp., Series 4700, Class QJ, 4.000%, 7/15/44 | | | 6,839,110 | | | | 7,141 | |
Federal Home Loan Mortgage Corp., Series 4705, Class A, 4.500%, 9/15/42 | | | 4,558,051 | | | | 4,809 | |
Federal National Mortgage Association, 0.010%, 10/9/19 | | | 6,830,000 | | | | 6,577 | |
Federal National Mortgage Association, 2.689%, (US0012M plus 1.61%), 5/1/46 | | | 2,314,462 | | | | 2,345 | |
Federal National Mortgage Association, 2.950%, (US0012M plus 1.61%), 10/1/47 | | | 3,359,020 | | | | 3,419 | |
Federal National Mortgage Association, 2.990%, (US0012M plus 1.62%), 8/1/47 | | | 4,572,110 | | | | 4,662 | |
Federal National Mortgage Association, 3.000%, 12/1/32 | | | 1,092,277 | | | | 1,113 | |
Federal National Mortgage Association, 3.027%, (US0012M plus 1.61%), 12/1/47 | | | 2,952,000 | | | | 2,997 | |
Federal National Mortgage Association, 3.133%, (ICE LIBOR USD 12 Month plus 1.62%), 3/1/47 | | | 3,926,675 | | | | 4,019 | |
Federal National Mortgage Association, 3.168%, (US0012M plus 1.62%), 10/1/47 | | | 2,926,091 | | | | 2,987 | |
Federal National Mortgage Association, 3.235%, (ICE LIBOR USD 12 Month plus 1.62%), 6/1/47 | | | 3,841,977 | | | | 3,932 | |
Federal National Mortgage Association, 3.500%, 8/1/28 | | | 51,116 | | | | 53 | |
Federal National Mortgage Association, 3.500%, 10/1/28 | | | 2,000,501 | | | | 2,071 | |
Federal National Mortgage Association, 3.500%, 9/1/29 | | | 119,648 | | | | 124 | |
Federal National Mortgage Association, 3.500%, 10/1/29 | | | 568,725 | | | | 591 | |
Federal National Mortgage Association, 3.500%, 1/1/30 | | | 1,170,756 | | | | 1,217 | |
Federal National Mortgage Association, 3.500%, 2/1/30 | | | 346,135 | | | | 360 | |
Federal National Mortgage Association, 3.500%, 7/1/30 | | | 2,490,345 | | | | 2,587 | |
Federal National Mortgage Association, 3.500%, 8/1/30 | | | 1,654,067 | | | | 1,718 | |
Federal National Mortgage Association, 3.500%, 1/1/31 | | | 1,402,264 | | | | 1,457 | |
Federal National Mortgage Association, 3.500%, 2/1/31 | | | 1,410,490 | | | | 1,466 | |
Federal National Mortgage Association, 3.500%, 4/1/31 | | | 5,105,319 | | | | 5,306 | |
Federal National Mortgage Association, 3.500%, 5/1/31 | | | 871,248 | | | | 905 | |
Federal National Mortgage Association, 3.500%, 12/1/31 | | | 379,050 | | | | 394 | |
Federal National Mortgage Association, 3.500%, 1/1/32 | | | 2,701,894 | | | | 2,812 | |
Federal National Mortgage Association, 3.500%, 2/1/32 | | | 472,939 | | | | 491 | |
| | | | | | | | |
| Structured Products (47.1%) | | Shares/
$ Par | | | Value
$ (000’s) | |
| |
Mortgage Securities continued | | | | | |
Federal National Mortgage Association, 3.500%, 3/1/32 | | | 2,843,264 | | | | 2,940 | |
Federal National Mortgage Association, 3.500%, 4/1/32 | | | 5,256,962 | | | | 5,454 | |
Federal National Mortgage Association, 3.500%, 5/1/32 | | | 6,494,089 | | | | 6,749 | |
Federal National Mortgage Association, 3.500%, 6/1/32 | | | 5,688,034 | | | | 5,896 | |
Federal National Mortgage Association, 3.500%, 8/1/32 | | | 2,767,552 | | | | 2,874 | |
Federal National Mortgage Association, 3.500%, 6/1/43 | | | 689,364 | | | | 713 | |
Federal National Mortgage Association, 4.000%, 4/1/24 | | | 1,487,815 | | | | 1,545 | |
Federal National Mortgage Association, 4.000%, 7/1/24 | | | 1,037,338 | | | | 1,077 | |
Federal National Mortgage Association, 4.000%, 1/1/25 | | | 2,200,911 | | | | 2,286 | |
Federal National Mortgage Association, 4.000%, 4/1/25 | | | 1,300,188 | | | | 1,350 | |
Federal National Mortgage Association, 4.000%, 11/1/29 | | | 7,862,605 | | | | 8,327 | |
Federal National Mortgage Association, 4.000%, 2/1/32 | | | 58,223 | | | | 62 | |
Federal National Mortgage Association, 4.000%, 3/1/32 | | | 231,110 | | | | 243 | |
Federal National Mortgage Association, 4.000%, 5/1/32 | | | 429,976 | | | | 452 | |
Federal National Mortgage Association, 4.000%, 6/1/32 | | | 3,585,507 | | | | 3,804 | |
Federal National Mortgage Association, 4.000%, 12/1/33 | | | 330,247 | | | | 352 | |
Federal National Mortgage Association, 4.000%, 4/1/34 | | | 3,599,654 | | | | 3,824 | |
Federal National Mortgage Association, 4.000%, 7/1/35 | | | 6,182,579 | | | | 6,591 | |
Federal National Mortgage Association, 4.000%, 11/1/35 | | | 2,840,198 | | | | 3,029 | |
Federal National Mortgage Association, 4.000%, 1/1/36 | | | 4,156,432 | | | | 4,432 | |
Federal National Mortgage Association, 4.000%, 7/1/36 | | | 3,769,820 | | | | 4,006 | |
Federal National Mortgage Association, 4.000%, 9/1/36 | | | 1,606,687 | | | | 1,706 | |
Federal National Mortgage Association, 4.000%, 11/1/36 | | | 1,184,545 | | | | 1,259 | |
Federal National Mortgage Association, 4.000%, 12/1/36 | | | 4,308,642 | | | | 4,579 | |
Federal National Mortgage Association, 4.000%, 1/1/37 | | | 187,529 | | | | 197 | |
Federal National Mortgage Association, 4.000%, 2/1/37 | | | 581,434 | | | | 618 | |
Federal National Mortgage Association, 4.000%, 3/1/37 | | | 5,640,010 | | | | 5,996 | |
Federal National Mortgage Association, 4.000%, 4/1/37 | | | 3,373,917 | | | | 3,593 | |
The Accompanying Notes are an Integral Part of the Financial Statements.
| | | | |
| 126 | | Select Bond Portfolio | | |
Select Bond Portfolio
| | | | | | | | |
| Structured Products (47.1%) | | Shares/
$ Par | | | Value
$ (000’s) | |
| |
Mortgage Securities continued | | | | | |
Federal National Mortgage Association, 4.000%, 5/1/37 | | | 3,750,967 | | | | 3,992 | |
Federal National Mortgage Association, 4.000%, 6/1/37 | | | 3,655,308 | | | | 3,897 | |
Federal National Mortgage Association, 4.000%, 7/1/37 | | | 5,616,127 | | | | 5,963 | |
Federal National Mortgage Association, 4.000%, 9/1/37 | | | 4,379,056 | | | | 4,656 | |
Federal National Mortgage Association, 4.000%, 10/1/37 | | | 721,228 | | | | 768 | |
Federal National Mortgage Association, 4.000%, 11/1/37 | | | 4,903,009 | | | | 5,195 | |
Federal National Mortgage Association, 4.000%, 12/1/37 | | | 3,817,557 | | | | 4,065 | |
Federal National Mortgage Association, 4.000%, 11/1/40 | | | 3,088,823 | | | | 3,263 | |
Federal National Mortgage Association, 4.000%, 10/1/43 | | | 3,411,992 | | | | 3,618 | |
Federal National Mortgage Association, 4.000%, 4/1/44 | | | 3,068,155 | | | | 3,257 | |
Federal National Mortgage Association, 4.000%, 5/1/45 | | | 5,438,536 | | | | 5,722 | |
Federal National Mortgage Association, 4.000%, 8/1/45 | | | 1,996,978 | | | | 2,116 | |
Federal National Mortgage Association, 4.000%, 9/1/45 | | | 4,810,097 | | | | 5,103 | |
Federal National Mortgage Association, 4.000%, 10/1/45 | | | 901,245 | | | | 952 | |
Federal National Mortgage Association, 4.000%, 12/1/45 | | | 1,048,587 | | | | 1,105 | |
Federal National Mortgage Association, 4.000%, 1/1/46 | | | 1,854,081 | | | | 1,962 | |
Federal National Mortgage Association, 4.000%, 2/1/46 | | | 489,554 | | | | 520 | |
Federal National Mortgage Association, 4.000%, 5/1/46 | | | 1,760,832 | | | | 1,859 | |
Federal National Mortgage Association, 4.000%, 7/1/46 | | | 218,229 | | | | 231 | |
Federal National Mortgage Association, 4.000%, 11/1/46 | | | 4,373,528 | | | | 4,640 | |
Federal National Mortgage Association, 4.000%, 1/1/47 | | | 800,792 | | | | 846 | |
Federal National Mortgage Association, 4.000%, 2/1/47 | | | 4,638,043 | | | | 4,891 | |
Federal National Mortgage Association, 4.000%, 3/1/47 | | | 2,164,689 | | | | 2,288 | |
Federal National Mortgage Association, 4.000%, 4/1/47 | | | 13,120,082 | | | | 13,891 | |
Federal National Mortgage Association, 4.000%, 5/1/47 | | | 7,097,007 | | | | 7,475 | |
Federal National Mortgage Association, 4.000%, 6/1/47 | | | 622,776 | | | | 658 | |
Federal National Mortgage Association, 4.000%, 7/1/47 | | | 995,139 | | | | 1,057 | |
Federal National Mortgage Association, 4.000%, 8/1/47 | | | 17,478,009 | | | | 18,414 | |
| | | | | | | | |
| Structured Products (47.1%) | | Shares/
$ Par | | | Value
$ (000’s) | |
| |
Mortgage Securities continued | | | | | |
Federal National Mortgage Association, 4.000%, 10/1/47 | | | 2,526,788 | | | | 2,678 | |
Federal National Mortgage Association, 4.000%, 11/1/47 | | | 16,388,893 | | | | 17,233 | |
Federal National Mortgage Association, 4.000%, 12/1/47 | | | 20,192,232 | | | | 21,353 | |
Federal National Mortgage Association, 4.377%, (ICE LIBOR USD 12 Month plus 1.78%), 4/1/40 | | | 1,105,760 | | | | 1,158 | |
Federal National Mortgage Association, 4.500%, 1/1/20 | | | 734,530 | | | | 747 | |
Federal National Mortgage Association, 4.500%, 5/1/34 | | | 99,656 | | | | 108 | |
Federal National Mortgage Association, 4.500%, 1/1/39 | | | 3,268,821 | | | | 3,484 | |
Federal National Mortgage Association, 4.500%, 6/1/41 | | | 206,324 | | | | 223 | |
Federal National Mortgage Association, 4.500%, 3/1/43 | | | 2,505,827 | | | | 2,705 | |
Federal National Mortgage Association, 4.500%, 2/1/44 | | | 13,918,144 | | | | 15,045 | |
Federal National Mortgage Association, 4.500%, 3/1/44 | | | 1,875,253 | | | | 2,025 | |
Federal National Mortgage Association, 4.500%, 4/1/44 | | | 5,413,009 | | | | 5,852 | |
Federal National Mortgage Association, 4.500%, 6/1/44 | | | 2,316,969 | | | | 2,505 | |
Federal National Mortgage Association, 4.500%, 10/1/44 | | | 161,576 | | | | 173 | |
Federal National Mortgage Association, 4.500%, 10/1/45 | | | 4,288,533 | | | | 4,630 | |
Federal National Mortgage Association, 4.500%, 12/1/45 | | | 384,336 | | | | 416 | |
Federal National Mortgage Association, 4.500%, 2/1/46 | | | 479,839 | | | | 520 | |
Federal National Mortgage Association, 4.500%, 3/1/46 | | | 253,366 | | | | 275 | |
Federal National Mortgage Association, 4.500%, 4/1/46 | | | 348,305 | | | | 380 | |
Federal National Mortgage Association, 4.500%, 6/1/46 | | | 5,918,534 | | | | 6,433 | |
Federal National Mortgage Association, 4.500%, 3/1/47 | | | 143,960 | | | | 156 | |
Federal National Mortgage Association, 4.500%, 4/1/47 | | | 1,182,328 | | | | 1,282 | |
Federal National Mortgage Association, 4.500%, 5/1/47 | | | 6,459,919 | | | | 6,978 | |
Federal National Mortgage Association, 4.500%, 6/1/47 | | | 15,236,485 | | | | 16,461 | |
Federal National Mortgage Association, 4.500%, 9/1/47 | | | 3,839,071 | | | | 4,147 | |
Federal National Mortgage Association, 5.000%, 7/1/44 | | | 405,839 | | | | 442 | |
Federal National Mortgage Association, 5.000%, 8/1/56 | | | 14,219,460 | | | | 15,498 | |
Federal National Mortgage Association TBA, 3.000%, 1/1/47 | | | 5,000,000 | | | | 5,001 | |
The Accompanying Notes are an Integral Part of the Financial Statements.
| | | | | | |
| | Select Bond Portfolio | | | 127 | |
Select Bond Portfolio
| | | | | | | | |
| Structured Products (47.1%) | | Shares/
$ Par | | | Value
$ (000’s) | |
| |
Mortgage Securities continued | | | | | |
Federal National Mortgage Association TBA, 3.500%, 1/1/47 | | | 18,300,000 | | | | 18,800 | |
Federal National Mortgage Association TBA, 3.500%, 2/1/47 | | | 69,900,000 | | | | 71,694 | |
Federal National Mortgage Association TBA, 4.000%, 1/1/47 | | | 22,200,000 | | | | 23,228 | |
Federal National Mortgage Association TBA, 4.500%, 3/13/48 | | | 16,700,000 | | | | 17,723 | |
Federal National Mortgage Association, Series 2007-108, Class AN, 8.048%, 11/25/37 | | | 490,525 | | | | 563 | |
Federal National Mortgage Association, Series 2011-43, Class AN, 3.500%, 12/25/28 | | | 624,929 | | | | 626 | |
Federal National Mortgage Association, Series 2013-30, Class CA, 1.500%, 4/25/43 | | | 1,328,000 | | | | 1,215 | |
Federal National Mortgage Association, Series 2014-40, Class EP, 3.500%, 10/25/42 | | | 2,032,469 | | | | 2,093 | |
Federal National Mortgage Association, Series 2015-M3, Class FA, 1.458%, (ICE LIBOR USD 1 Month plus 0.22%), (AFC), 6/25/18 | | | 201,178 | | | | 201 | |
Federal National Mortgage Association, Series 2016-59, Class CA, 3.500%, 9/25/43 | | | 7,713,874 | | | | 7,973 | |
Federal National Mortgage Association, Series 2017-13, Class PA, 3.000%, 8/25/46 | | | 3,588,451 | | | | 3,609 | |
Federal National Mortgage Association, Series 2017-M13, Class A2, 2.939%, 9/25/27 | | | 2,257,000 | | | | 2,270 | |
Federal National Mortgage Association, Series 2017-M4, Class A2, 2.597%, 12/25/26 | | | 2,335,000 | | | | 2,287 | |
Federal National Mortgage Association, Series 2017-M7, Class A2, 2.961%, (AFC), 2/25/27 | | | 2,100,000 | | | | 2,111 | |
Government National Mortgage Association, 4.000%, 7/15/45 | | | 410,344 | | | | 434 | |
Government National Mortgage Association, 4.000%, 9/15/45 | | | 1,404,710 | | | | 1,485 | |
Government National Mortgage Association, 4.000%, 9/20/45 | | | 2,459,105 | | | | 2,605 | |
Government National Mortgage Association, 4.000%, 10/15/45 | | | 1,699,103 | | | | 1,799 | |
Government National Mortgage Association, 4.000%, 6/15/47 | | | 3,010,393 | | | | 3,173 | |
Government National Mortgage Association, 4.000%, 7/15/47 | | | 3,282,358 | | | | 3,460 | |
Government National Mortgage Association, 4.000%, 11/20/47 | | | 16,532,081 | | | | 17,332 | |
Government National Mortgage Association, 4.000%, 12/20/47 | | | 6,038,000 | | | | 6,368 | |
Government National Mortgage Association, 4.500%, 5/20/45 | | | 754,189 | | | | 808 | |
Government National Mortgage Association, 4.500%, 6/20/45 | | | 1,335,915 | | | | 1,437 | |
Government National Mortgage Association, 4.500%, 7/20/45 | | | 1,211,384 | | | | 1,297 | |
Government National Mortgage Association, 4.500%, 8/20/45 | | | 544,469 | | | | 582 | |
Government National Mortgage Association, 4.500%, 9/20/45 | | | 266,939 | | | | 290 | |
| | | | | | | | |
| Structured Products (47.1%) | | Shares/
$ Par | | | Value
$ (000’s) | |
| |
Mortgage Securities continued | | | | | |
Government National Mortgage Association, 4.500%, 4/15/47 | | | 1,535,303 | | | | 1,635 | |
Government National Mortgage Association, 4.500%, 8/15/47 | | | 616,237 | | | | 662 | |
Government National Mortgage Association, 4.500%, 9/15/47 | | | 652,523 | | | | 700 | |
Government National Mortgage Association, 4.500%, 10/20/47 | | | 4,516,681 | | | | 4,857 | |
Government National Mortgage Association, 4.500%, 11/20/47 | | | 20,473,406 | | | | 21,714 | |
Government National Mortgage Association, 5.000%, 12/20/39 | | | 180,929 | | | | 202 | |
Government National Mortgage Association, 5.000%, 11/20/45 | | | 326,905 | | | | 363 | |
Government National Mortgage Association TBA, 3.000%, 1/1/47 | | | 37,200,000 | | | | 37,527 | |
Government National Mortgage Association TBA, 3.500%, 1/1/47 | | | 46,800,000 | | | | 48,415 | |
Government National Mortgage Association TBA, 4.500%, 1/1/48 (l) | | | 4,515,000 | | | | 4,862 | |
GS Mortgage Securities Trust, Series 2012-GCJ7, Class AAB, 2.935%, 5/10/45 | | | 391,492 | | | | 396 | |
GS Mortgage Securities Trust, Series 2013-GC16, Class A2, 3.033%, 11/10/46 | | | 935,671 | | | | 941 | |
GS Mortgage Securities Trust, Series 2014-GC18, Class A3, 3.801%, 1/10/47 | | | 1,044,000 | | | | 1,093 | |
GS Mortgage Securities Trust, Series 2016-GS3, Class A4, 2.850%, 10/10/49 | | | 1,160,000 | | | | 1,138 | |
GS Mortgage Securities Trust, Series 2016-GS3, Class AAB, 2.777%, 10/10/49 | | | 1,740,000 | | | | 1,730 | |
Impact Funding Affordable Multifamily Housing Mortgage Loan Trust, Series 2010- 1, Class A1, 5.314%, 1/25/51 144A | | | 5,149,588 | | | | 5,607 | |
JP Morgan Chase Commercial Mortgage Securities Corp., Series 2010-C2, Class A2, 3.615%, 11/15/43 144A | | | 115,898 | | | | 117 | |
JP Morgan Chase Commercial Mortgage Securities Corp., Series 2012-CBX, Class A4, 3.483%, 6/15/45 | | | 1,917,000 | | | | 1,972 | |
JP Morgan Chase Commercial Mortgage Securities Corp., Series 2013-C13, Class A2, 2.665%, 1/15/46 | | | 3,596,165 | | | | 3,608 | |
JP Morgan Chase Commercial Mortgage Securities Corp., Series 2014-C20, Class A2, 2.871%, 7/15/47 | | | 1,052,000 | | | | 1,060 | |
JP Morgan Chase Commercial Mortgage Securities Corp., Series 2014-C20, Class A5, 3.804%, 7/15/47 | | | 124,000 | | | | 130 | |
JP Morgan Chase Commercial Mortgage Securities Corp., Series 2016-JP2, Class A1, 1.324%, 8/15/49 | | | 1,648,315 | | | | 1,623 | |
JP Morgan Chase Commercial Mortgage Securities Corp., Series 2016-JP2, Class AS B, 2.713%, 8/15/49 | | | 1,805,000 | | | | 1,785 | |
JP Morgan Chase Commercial Mortgage Securities Corp., Series 2017-JP5, Class AS B, 3.548%, 3/15/50 | | | 3,358,000 | | | | 3,470 | |
JP Morgan Chase Commercial Mortgage Securities Trust, Series 2010-CNTR, Class A 2, 4.311%, 8/5/32 144A | | | 2,996,249 | | | | 3,069 | |
The Accompanying Notes are an Integral Part of the Financial Statements.
| | | | |
| 128 | | Select Bond Portfolio | | |
Select Bond Portfolio
| | | | | | | | |
| Structured Products (47.1%) | | Shares/
$ Par | | | Value
$ (000’s) | |
| |
Mortgage Securities continued | | | | | |
JP Morgan Chase Commercial Mortgage Securities Trust, Series 2011-C4, Class A3, 4.106%, 7/15/46 144A | | | 4,784,031 | | | | 4,801 | |
JP Morgan Chase Commercial Mortgage Securities Trust, Series 2012-LC9, Class A5, 2.840%, 12/15/47 | | | 2,906,000 | | | | 2,921 | |
JP Morgan Chase Commercial Mortgage Securities Trust, Series 2015-JP1, Class ASB, 3.732%, 1/15/49 | | | 1,413,000 | | | | 1,474 | |
JP Morgan Chase Mortgage Trust, Series 2017-5, Class A1, 3.188%, (CSTR), 10/26/48 144A | | | 15,061,485 | | | | 15,186 | |
JPMBB Commercial Mortgage Securities Trust, Series 2013-C15, Class A2, 2.976%, 11/15/45 | | | 1,564,321 | | | | 1,572 | |
JPMBB Commercial Mortgage Securities Trust, Series 2014-C21, Class A5, 3.774%, 8/15/47 | | | 2,629,000 | | | | 2,752 | |
JPMBB Commercial Mortgage Securities Trust, Series 2014-C23, Class A4, 3.669%, 9/15/47 | | | 1,323,000 | | | | 1,376 | |
JPMBB Commercial Mortgage Securities Trust, Series 2015-C28, Class A2, 2.773%, 10/15/48 | | | 1,089,000 | | | | 1,096 | |
JPMBB Commercial Mortgage Securities Trust, Series 2015-C28, Class A3, 2.912%, 10/15/48 | | | 6,101,000 | | | | 6,061 | |
JPMBB Commercial Mortgage Securities Trust, Series 2015-C28, Class A4, 3.227%, 10/15/48 | | | 1,772,000 | | | | 1,793 | |
JPMBB Commercial Mortgage Securities Trust, Series 2015-C30, Class A5, 3.821%, 7/15/48 | | | 2,014,000 | | | | 2,115 | |
JPMBB Commercial Mortgage Securities Trust, Series 2015-C30, Class AS, 4.226%, (AFC), 7/15/48 | | | 1,597,000 | | | | 1,681 | |
JPMBB Commercial Mortgage Securities Trust, Series 2015-C30, Class ASB, 3.559%, 7/15/48 | | | 1,587,000 | | | | 1,642 | |
JPMBB Commercial Mortgage Securities Trust, Series 2016-C1, Class ASB, 3.315%, 3/15/49 | | | 2,819,000 | | | | 2,879 | |
JPMCC Commercial Mortgage Securities Trust, Series 2017-JP6, Class ASB, 3.282%, 7/15/50 | | | 1,306,000 | | | | 1,329 | |
JPMDB Commercial Mortgage Securities Trust, Series 2017-C5, Class ASB, 3.491%, 3/15/50 | | | 463,000 | | | | 477 | |
Mastr Asset Securitization Trust, Series 2003-12, Class 1A1, 5.250%, 12/25/24 | | | 189,633 | | | | 192 | |
Mastr Asset Securitization Trust, Series 2004-9, Class 6A1, 5.000%, 9/25/19 | | | 13,101 | | | | 13 | |
Morgan Stanley Bank of America Merrill Lynch Trust, Series 2013-C10, Class A2, 2.964%, 7/15/46 | | | 394,403 | | | | 395 | |
Morgan Stanley Bank of America Merrill Lynch Trust, Series 2013-C9, Class A2, 1.970%, 5/15/46 | | | 184,966 | | | | 185 | |
| | | | | | | | |
| Structured Products (47.1%) | | Shares/
$ Par | | | Value
$ (000’s) | |
| |
Mortgage Securities continued | | | | | |
Morgan Stanley Bank of America Merrill Lynch Trust, Series 2015-C27, Class A4, 3.753%, 12/15/47 | | | 2,069,000 | | | | 2,169 | |
Morgan Stanley Bank of America Merrill Lynch Trust, Series 2016-C28, Class A4, 3.544%, 1/15/49 | | | 774,000 | | | | 798 | |
Morgan Stanley Bank of America Merrill Lynch Trust, Series 2016-C30, Class ASB, 2.729%, 9/15/49 | | | 5,519,000 | | | | 5,398 | |
Morgan Stanley Capital I Trust, Series 2015-UBS8, Class A3, 3.540%, 12/15/48 | | | 1,115,000 | | | | 1,151 | |
Morgan Stanley Capital I Trust, Series 2016-UB11, Class A1, 1.445%, 8/15/49 | | | 2,187,515 | | | | 2,152 | |
Morgan Stanley Capital I Trust, Series 2016-UB11, Class ASB, 2.606%, 8/15/49 | | | 1,289,000 | | | | 1,264 | |
Morgan Stanley Capital I Trust, Series 2016-UBS9, Class A1, 1.711%, 3/15/49 | | | 1,300,223 | | | | 1,288 | |
Morgan Stanley Capital I, Inc., Series 2017-HR2, Class A4, 3.587%, 12/15/50 | | | 1,310,000 | | | | 1,351 | |
Residential Funding Mortgage Securities I, Series 2003-S18, Class A1, 4.500%, 10/25/18 | | | 12,588 | | | | 13 | |
Sequoia Mortgage Trust, Series 2013-5, Class A2, 3.000%, (CSTR, AFC), 5/25/43 144A | | | 2,532,891 | | | | 2,523 | |
UBS Commercial Mortgage Trust, 3.679%, 12/15/50 | | | 2,057,000 | | | | 2,136 | |
UBS-Barclays Commercial Mortgage Trust, Series 2012-C2, Class A4, 3.525%, 5/10/63 | | | 1,832,000 | | | | 1,892 | |
| | | | | | | | |
Total | | | | | | | 1,010,698 | |
| | | | | | | | |
| | |
Total Structured Products | | | | | | | | |
(Cost: $1,389,860) | | | | | | | 1,385,978 | |
| | | | | | | | |
| |
| Short-Term Investments (1.1%) | | | | |
| | |
Money Market Funds (1.1%) | | | | | | | | |
State Street Institutional U.S. Government Money Market Fund - Premier Class, 1.209% # | | | 32,073,579 | | | | 32,074 | |
| | | | | | | | |
Total | | | | | | | 32,074 | |
| | | | | | | | |
| | |
Total Short-Term Investments | | | | | | | | |
(Cost: $32,074) | | | | | | | 32,074 | |
| | | | | | | | |
| | |
Total Investments (108.2%) | | | | | | | | |
(Cost: $3,189,669)(a) | | | | | | | 3,185,850 | |
| | | | | | | | |
Other Assets, Less | | | | | | | | |
Liabilities (-8.2%) | | | | | | | (241,916 | ) |
| | | | | | | | |
Net Assets (100.0%) | | | | | | | 2,943,934 | |
| | | | | | | | |
| # | 7-day yield as of December 31, 2017. |
144A after the name of a security represents a security exempt from registration under Rule 144A of the Securities Act of 1933. These securities may be resold as transactions exempt from registration, normally to qualified institutional buyers. At December 31, 2017 the value of these securities (in thousands) was $421,011 representing 14.3% of the net assets.
The Accompanying Notes are an Integral Part of the Financial Statements.
| | | | | | |
| | Select Bond Portfolio | | | 129 | |
Select Bond Portfolio
AFC — Available Funds Cap security - Security accrues interest at an assumed or uncapped rate. If the interest rate on the underlying loans is lower than the uncapped rate, then the security will pay at the lower rate.
CSTR — Collateral Strip Rate security - interest is based on the weighted net interest rate of the collateral.
EXE — Security receives collateral principal and interest paid which exceeds the amount of principal and interest obligated to all bonds in the deal.
IO — Interest Only Security
GO — General Obligation
RB — Revenue Bond
| (a) | At December 31, 2017, the aggregate cost of investments, including derivatives, for federal tax purposes (in thousands) was $3,200,425 and the net unrealized depreciation of investments based on that cost was $14,575 which is comprised of $18,578 aggregate gross unrealized appreciation and $33,153 aggregate gross unrealized depreciation. |
| (b) | All or a portion of the securities have been pledged as collateral for when-issued securities. |
| (l) | Security valued using significant unobservable inputs. |
The following is a summary of the inputs used in valuing the Portfolio’s assets and liabilities at December 31, 2017. See Note 3 for additional information on portfolio valuation.
| | | | | | | | | | | | | | |
| | | Valuation Inputs | | | |
| Description | | Level 1 – Quoted Prices | | | Level 2 – Other Significant
Observable Inputs | | | Level 3 – Significant
Unobservable Inputs | | | |
| | | (Amounts in thousands) | | | |
Assets: | | | | | | | | | | | | | | |
Municipal Bonds | | $ | - | | | $ | 18,807 | | | $ | - | | | |
Corporate Bonds | | | - | | | | 711,903 | | | | - | | | |
Governments | | | - | | | | 1,037,088 | | | | - | | | |
Structured Products | | | | | | | | | | | | | | |
Asset Backed Securities | | | - | | | | 375,280 | | | | - | | | |
Mortgage Securities | | | - | | | | 1,005,836 | | | | 4,862 | | | |
Short-Term Investments | | | 32,074 | | | | - | | | | - | | | |
Total Assets: | | $ | 32,074 | | | $ | 3,148,914 | | | $ | 4,862 | | | |
The Accompanying Notes are an Integral Part of the Financial Statements.
| | | | |
| 130 | | Select Bond Portfolio | | |
Long-Term U.S. Government Bond Portfolio (unaudited)
| | | | |
| Objective: | | Portfolio Strategy: | | Net Assets: |
Maximum total return, consistent with preservation of capital and prudent investment management. | | Invest in a diversified portfolio of fixed income securities that are issued or guaranteed by the U.S. Government, its agencies or government sponsored enterprises, and in derivatives designed to replicate such securities. | | $116 million |
Portfolio Overview
Mason Street Advisors, LLC (“Mason Street Advisors”), the investment adviser for the Long-Term U.S. Government Bond Portfolio (the “Portfolio”), has engaged Pacific Investment Management Company LLC (“PIMCO”) to act as sub-adviser for the Portfolio. The Portfolio primarily invests in a diversified portfolio of fixed income securities that are issued or guaranteed by the U.S. Government, its agencies or government sponsored enterprises (“U.S. Government Securities”), which may be represented by forwards or derivatives such as options, futures contracts or interest rate swap agreements. Assets not invested in U.S. Government Securities may be invested in other types of non-government related investment grade fixed income instruments, such as corporate debt securities of U.S. issuers and mortgage- and asset-backed securities, or in preferred stocks. The Portfolio will normally have a minimum average portfolio duration (an aggregate measure of the sensitivity of the Portfolio’s fixed income portfolio securities to changes in interest rates) of eight years and, for point of reference, the dollar weighted average maturity of the Portfolio is expected to be more than ten years. The Portfolio’s investments in fixed income securities are limited to investment grade U.S. dollar denominated securities of U.S. issuers that are rated at least A by Moody’s or equivalently rated by S&P or Fitch, or, if unrated, determined by the Portfolio to be of comparable quality.
Market Overview
Headlines in 2017 were largely dominated by political developments, namely Donald Trump’s surprise victory in the U.S. presidential election, the U.S. Federal Reserve’s (the “Fed”) policy decisions and geopolitics. In the U.S., solid fundamental data, relatively easy financial conditions, and optimism among businesses and consumers provided an opportunity for the Fed to continue on its path towards policy normalization. As such, the Fed raised rates and unveiled details of its plan to gradually unwind its balance sheet. A perceived hawkish shift in tone from other major central banks spurred most developed market yields to rise. Still, the fundamental backdrop remained largely intact and the broader risk rally continued as equities marched higher, credit spreads tightened and emerging market assets strengthened.
Portfolio Results
The Portfolio returned 8.28% for the twelve months ended December 31, 2017. By comparison, the Portfolio’s benchmark, the Bloomberg Barclays® Long-Term U.S. Treasury Index (the “Index”), returned 8.53%. (This Index is unmanaged, cannot be invested in directly and does not include administrative expenses.) According to Morningstar® Inc., an independent mutual fund ranking agency, the average return of the Long Government peer group was 9.03% for 2017.
Yield curve positioning, particularly an underweight to the long end of the curve, was the main detractor over the period as rates rallied. The Portfolio’s duration positioning was partially implemented through the use of futures, interest rate swaps and options.
Within spread sectors, an allocation to Agency and commercial mortgage-backed securities, as well as investment grade corporate credit, contributed to performance given spread tightening and security selection. An allocation to government Agency debentures was also additive throughout the period.
Portfolio Manager Outlook
The following forward-looking comments are the opinion of PIMCO, the Portfolio’s sub-adviser.
We expect world GDP growth to remain above-trend at 3.0%–3.5% in 2018. Easier financial conditions, resulting in buoyant risk assets and low interest rates, and fiscal stimulus in several advanced economies imply near-term tailwinds.
In the U.S., we look for above-consensus growth of 2.25%–2.75% in 2018. Tax cuts and higher federal spending are expected to boost growth. With unemployment likely to drop below 4%, we expect some upward pressure on wages and consumer prices, and core inflation to rise above 2% over the course of 2018. Under new leadership, the Fed is expected to continue tightening gradually; our baseline forecast calls for three rate hikes this year.
| | | | | | |
| | Long-Term U.S. Government Bond Portfolio | | | 131 | |
Long-Term U.S. Government Bond Portfolio (unaudited)
Relative Performance
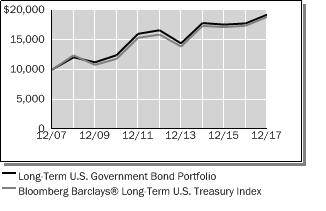
| | | | | | | | | | | | |
Average Annual Total Returns
For Periods Ended December 31, 2017 | |
| | | 1 Year | | | 5 Years | | | 10 Years | |
Long-Term U.S. Government Bond Portfolio | | | 8.28 | % | | | 2.96 | % | | | 6.76 | % |
Bloomberg Barclays® Long-Term U.S. Treasury Index | | | 8.53 | % | | | 3.48 | % | | | 6.55 | % |
Morningstar® US Insurance Fund Long Government Average | | | 9.03 | % | | | 2.95 | % | | | 6.65 | % |
The performance data quoted represents past performance. Past performance is historical and does not guarantee future performance. Investment return and principal value will fluctuate, so that shares, when redeemed, may be worth more or less than their original cost. Current performance may be lower or higher than the performance data quoted. For the most recent month-end performance information visit www.northwesternmutual.com.
This chart assumes an initial investment of $10,000 made on 12/31/07. Returns shown reflect fee waivers, deductions for management and other portfolio expenses, and reinvestment of all dividends. In the absence of fee waivers, total return would be reduced. Returns exclude deductions for separate account sale loads and account fees. Please refer to the Benchmark Definitions section of this report for information about the indices cited in the above chart and graph.
Return of principal is not guaranteed. Bond funds have the same interest rate, inflation and credit risks that are associated with the underlying bonds owned by the Portfolio. When interest rates rise, bond prices fall. With a fixed income fund, when interest rates rise, the value of the fund’s existing bonds drops, which could negatively affect overall fund performance.
The Portfolio may invest in securities that are issued or guaranteed by the U.S. Government or its agencies, and in derivatives designed to replicate such securities. This guarantee provides for the timely repayment of the principal and interest as applicable under the terms of the instrument, if it is held to maturity, and does not apply to derivative securities held by the Portfolio. A guarantee by the U.S. Government or its agencies does not eliminate market risk.
The Portfolio may also use derivative instruments for hedging or other purposes as part of its investment strategy. Use of these instruments may involve certain costs and risks such as liquidity risk, interest rate risk, market risk, credit risk, management risk and the risk that the Portfolio could not close out a position when it would be most advantageous to do so. The potential leverage created by use of derivatives may cause the Portfolio to be more sensitive to interest rate movements and thus more volatile than other long-term U.S. Government bond funds that do not use derivatives. Portfolios investing in derivatives could lose more than the principal amount invested in those instruments.
Currently, interest rates remain at historically low levels on a relative basis, although the U.S. federal funds rate has been subject to modest increases over the course of the last two years. A significant rise in interest rates over a short period of time could cause significant losses in the market value of the Portfolio’s fixed income investments.
The Portfolio may engage in active and frequent trading of portfolio securities to achieve its investment objectives. Active and frequent trading may cause higher brokerage expenses and other transaction costs, which may adversely affect performance.
| | | | |
| 132 | | Long-Term U.S. Government Bond Portfolio | | |
Long-Term U.S. Government Bond Portfolio (unaudited)
Top 10 Fixed Income Holdings 12/31/17
| | | | | | |
| Security Description | | % of Market Value | | | |
US Treasury, Various | | | 80.1 | % | | |
Federal National Mortgage Association, Various | | | 5.0 | % | | |
Resolution Funding Corp. Stripped, Various | | | 3.3 | % | | |
Federal Home Loan Mortgage Corp., Series 4387, Class AZ, 4%, 9/15/44 | | | 1.5 | % | | |
Federal Home Loan Mortgage Corp., Series 4092, Class AY, 3%, 8/15/32 | | | 1.4 | % | | |
Federal National Mortgage Association, Series 2016-61, Class ML, 3%, 9/25/46 | | | 0.6 | % | | |
DBWF Mortgage Trust, Series 2016-85T, Class A, 3.791%, 12/10/36 | | | 0.5 | % | | |
VNDO Trust, Series 2016-350P, Class A, 3.805%, 1/10/35 | | | 0.5 | % | | |
Federal Home Loan Mortgage Corp., Series 4398, Class ZX, 4%, 9/15/54 | | | 0.5 | % | | |
Morgan Stanley Bank of America Merrill Lynch Trust, Series 2016-C32, Class ASB, 3.514%, 12/15/49 | | | 0.5 | % | | |
Sector Allocation 12/31/17

Sector Allocation is based on fixed income investments.
Sector Allocation and Top 10 Holdings are subject to change.
Consistent with the Portfolio’s stated parameters, no more than 10% of the Portfolio is invested in securities rated A by Moody’s or S&P and no more than 25% of the Portfolio is invested in securities rated Aa by Moody’s or AA by S&P.
| | | | | | |
| | Long-Term U.S. Government Bond Portfolio | | | 133 | |
Long-Term U.S. Government Bond Portfolio
Schedule of Investments
December 31, 2017
| | | | | | | | |
| Corporate Bonds (0.8%) | | Shares/
$ Par | | | Value
$ (000’s) | |
| | |
Consumer, Cyclical (0.3%) | | | | | | | | |
United Airlines Pass Through Trust, Series 2016-2, Class A, 3.100%, 4/7/30 | | | 200,000 | | | | 197 | |
United Airlines Pass Through Trust, Series 2016-2, Class AA, 2.875%, 4/7/30 | | | 200,000 | | | | 196 | |
| | | | | | | | |
Total | | | | | | | 393 | |
| | | | | | | | |
| | |
Industrial (0.5%) | | | | | | | | |
Vessel Management Services, Inc., 3.432%, 8/15/36 | | | 529,000 | | | | 524 | |
| | | | | | | | |
Total | | | | | | | 524 | |
| | | | | | | | |
| | |
Total Corporate Bonds | | | | | | | | |
(Cost: $929) | | | | | | | 917 | |
| | | | | | | | |
| Purchased Options (0.0%) | | # of
Contracts | | | | |
| | |
Purchased Options (0.0%) | | | | | | | | |
US Two Year Bond Future Call Option, Strike Price $108.5, Exp. 2/23/18, Counterparty – Goldman Sachs International, Notional – 20,000 | | | 10 | | | | – | (m) |
| | | | | | | | |
| | |
Total Purchased Options | | | | | | | | |
(Cost: $0) | | | | | | | – | (m) |
| | |
| Governments (114.0%) | | Shares/
$ Par | | | | |
| | |
Governments (114.0%) | | | | | | | | |
Federal National Mortgage Association, 5.625%, 4/17/28 | | | 100,000 | | | | 125 | |
Resolution Funding Corp. Stripped, 0.000%, 10/15/20 | | | 2,000,000 | | | | 1,884 | |
Resolution Funding Corp. Stripped, 0.000%, 4/15/30 | | | 4,800,000 | | | | 3,371 | |
Resolution Funding Corp. Stripped, 0.000%, 4/15/28 | | | 400,000 | | | | 298 | |
Tennessee Valley Authority Stripped, 0.000%, 5/1/30 | | | 500,000 | | | | 342 | |
US Treasury, 1.875%, 7/31/22 | | | 8,000,000 | | | | 7,891 | |
US Treasury, 2.000%, 10/31/21 | | | 5,800,000 | | | | 5,775 | |
US Treasury, 2.125%, 8/15/21 | | | 400,000 | | | | 401 | |
US Treasury, 2.500%, 2/15/45 | | | 2,660,000 | | | | 2,533 | |
US Treasury, 2.750%, 8/15/42 | | | 2,000,000 | | | | 2,012 | |
US Treasury, 2.750%, 11/15/42 | | | 400,000 | | | | 402 | |
US Treasury, 2.750%, 8/15/47 | | | 3,210,000 | | | | 3,210 | |
US Treasury, 2.875%, 5/15/43 | | | 3,710,000 | | | | 3,811 | |
US Treasury, 2.875%, 8/15/45 | | | 5,180,000 | | | | 5,306 | |
US Treasury, 3.000%, 5/15/42 | | | 530,000 | | | | 557 | |
US Treasury, 3.000%, 11/15/45 | | | 370,000 | | | | 388 | |
US Treasury, 3.125%, 2/15/43 | | | 10,710,000 | | | | 11,494 | |
US Treasury, 3.375%, 5/15/44 | | | 9,300,000 | | | | 10,425 | |
US Treasury, 3.500%, 2/15/39 | | | 50,000 | | | | 57 | |
US Treasury, 3.625%, 8/15/43 | | | 8,750,000 | | | | 10,202 | |
US Treasury, 3.625%, 2/15/44 (k) | | | 11,920,000 | | | | 13,918 | |
US Treasury, 3.750%, 11/15/43 | | | 5,600,000 | | | | 6,666 | |
US Treasury, 3.875%, 8/15/40 | | | 850,000 | | | | 1,023 | |
US Treasury, 4.250%, 11/15/40 | | | 1,400,000 | | | | 1,776 | |
US Treasury, 4.375%, 2/15/38 | | | 2,240,000 | | | | 2,861 | |
US Treasury, 4.375%, 11/15/39 (b) | | | 19,030,000 | | | | 24,464 | |
US Treasury, 4.375%, 5/15/40 | | | 100,000 | | | | 129 | |
| | | | | | | | |
| Governments (114.0%) | | Shares/
$ Par | | | Value
$ (000’s) | |
| | |
Governments continued | | | | | | | | |
US Treasury, 4.500%, 5/15/38 | | | 1,440,000 | | | | 1,870 | |
US Treasury, 4.625%, 2/15/40 | | | 200,000 | | | | 266 | |
US Treasury Inflation Index Bond, 0.125%, 7/15/24 | | | 581,739 | | | | 575 | |
US Treasury Inflation Index Bond, 0.375%, 7/15/23 | | | 625,435 | | | | 630 | |
US Treasury Inflation Index Bond, 0.375%, 1/15/27 | | | 173,592 | | | | 172 | |
US Treasury Inflation Index Bond, 0.375%, 7/15/27 | | | 1,633,543 | | | | 1,626 | |
US Treasury Inflation Index Bond, 1.375%, 2/15/44 | | | 137,588 | | | | 159 | |
US Treasury Inflation Index Bond, 1.750%, 1/15/28 | | | 423,868 | | | | 477 | |
US Treasury Inflation Index Bond, 2.500%, 1/15/29 | | | 413,597 | | | | 502 | |
US Treasury Inflation Index Bond, 3.625%, 4/15/28 | | | 152,506 | | | | 200 | |
US Treasury Stripped, 0.000%, 2/15/30 | | | 900,000 | | | | 659 | |
US Treasury Stripped, 0.000%, 2/15/32 | | | 700,000 | | | | 483 | |
US Treasury Stripped, 0.000%, 5/15/33 | | | 1,000,000 | | | | 666 | |
US Treasury Stripped, 0.000%, 8/15/34 | | | 130,000 | | | | 83 | |
US Treasury Stripped, 0.000%, 5/15/36 | | | 1,200,000 | | | | 731 | |
US Treasury Stripped, 0.000%, 5/15/37 | | | 1,300,000 | | | | 766 | |
US Treasury Stripped, 0.000%, 8/15/43 | | | 900,000 | | | | 443 | |
US Treasury Stripped, 0.000%, 11/15/43 | | | 700,000 | | | | 342 | |
| | | | | | | | |
| | |
Total Governments | | | | | | | | |
(Cost: $132,449) | | | | | | | 131,971 | |
| | | | | | | | |
| | |
| Structured Products (19.3%) | | | | | | |
| | |
Asset Backed Securities (0.4%) | | | | | | | | |
Massachusetts Educational Financing Authority, Series 2008-1, Class A1, 2.317%, (3 Month LIBOR plus 0.95%), 4/25/38 | | | 70,279 | | | | 71 | |
SLM Student Loan Trust, Series 2003-7A, Class A5A, 2.788%, (3 Month LIBOR plus 1.20%), 12/15/33 144A | | | 139,774 | | | | 141 | |
SLM Student Loan Trust, Series 2008-9, Class A, 2.867%, (3 Month LIBOR plus 1.50%), 4/25/23 | | | 181,954 | | | | 186 | |
Sunset Mortgage Loan Co., Series 2015-NPL1, Class A, 4.459%, (AFC), 9/18/45 144A | | | 73,591 | | | | 74 | |
| | | | | | | | |
Total | | | | | | | 472 | |
| | | | | | | | |
| | |
Mortgage Securities (18.9%) | | | | | | | | |
CityLine Commercial Mortgage Trust, Series 2016-CLNE, Class A, 2.778%, (CSTR), 11/10/31 144A | | | 600,000 | | | | 593 | |
Commercial Mortgage Pass Through Certificates, Series 2016-667M, Class A, 3.140%, 10/10/36 144A | | | 700,000 | | | | 697 | |
Core Industrial Trust, Series 2015-West, Class C, 3.494%, 2/10/37 144A | | | 300,000 | | | | 301 | |
Credit Suisse First Boston Mortgage Securities Corp., Series 2003-AR18, Class 2A3, 3.080%, (CSTR), 7/25/33 | | | 1,002 | | | | 1 | |
Credit Suisse First Boston Mortgage Securities Corp., Series 2003-AR20, Class 2A1, 3.371%, (CSTR), 8/25/33 | | | 569 | | | | 1 | |
DBWF Mortgage Trust, Series 2016-85T, Class A, 3.791%, 12/10/36 144A | | | 800,000 | | | | 836 | |
The Accompanying Notes are an Integral Part of the Financial Statements.
| | | | |
| 134 | | Long-Term U.S. Government Bond Portfolio | | |
Long-Term U.S. Government Bond Portfolio
| | | | | | | | |
| Structured Products (19.3%) | | Shares/
$ Par | | | Value
$ (000’s) | |
| | |
Mortgage Securities continued | | | | | | | | |
Federal Home Loan Mortgage Corp. Multifamily Structured Pass Through Certificates, Series 2017-K071, Class A2, 3.286%, 11/25/27 | | | 500,000 | | | | 516 | |
Federal Home Loan Mortgage Corp., Series 2752, Class EZ, 5.500%, 2/15/34 | | | 341,621 | | | | 375 | |
Federal Home Loan Mortgage Corp., Series 3346, Class FA, 1.707%, (ICE LIBOR USD 1 Month plus 0.23%), 2/15/19 | | | 80 | | | | – | (m) |
Federal Home Loan Mortgage Corp., Series 4092, Class AY, 3.000%, 8/15/32 | | | 2,200,000 | | | | 2,176 | |
Federal Home Loan Mortgage Corp., Series 4387, Class AZ, 4.000%, 9/15/44 | | | 2,277,164 | | | | 2,416 | |
Federal Home Loan Mortgage Corp., Series 4398, Class ZX, 4.000%, 9/15/54 | | | 680,880 | | | | 726 | |
Federal Home Loan Mortgage Corp., Series 4830, Class ZG, 3.000%, 4/15/53 | | | 663,020 | | | | 589 | |
Federal Home Loan Mortgage Corp., Series T-61, Class 1A1, 2.402%, (Federal Reserve US 12 Month Cumulative Avg 1 year CMT plus 1.40%), 7/25/44 | | | 12,798 | | | | 13 | |
Federal National Mortgage Association, 2.750%, 11/1/31 | | | 295,100 | | | | 288 | |
Federal National Mortgage Association, 3.040%, 12/1/30 | | | 364,111 | | | | 355 | |
Federal National Mortgage Association, 3.090%, 12/1/36 | | | 600,000 | | | | 591 | |
Federal National Mortgage Association, 3.600%, 2/1/40 | | | 655,442 | | | | 673 | |
Federal National Mortgage Association, 3.700%, 9/1/34 | | | 663,593 | | | | 708 | |
Federal National Mortgage Association, 5.000%, 6/1/35 | | | 71,394 | | | | 77 | |
Federal National Mortgage Association, 5.000%, 2/1/36 | | | 109,103 | | | | 119 | |
Federal National Mortgage Association TBA,
3.000%, 2/13/48 | | | 1,500,000 | | | | 1,498 | |
Federal National Mortgage Association TBA,
3.500%, 3/15/33 | | | 800,000 | | | | 824 | |
Federal National Mortgage Association TBA,
4.000%, 2/1/48 | | | 2,400,000 | | | | 2,508 | |
Federal National Mortgage Association, Series 2007-39, Class NZ, 4.250%, 5/25/37 | | | 314,458 | | | | 328 | |
| | | | | | | | |
| Structured Products (19.3%) | | Shares/
$ Par | | | Value
$ (000’s) | |
| | |
Mortgage Securities continued | | | | | | | | |
Federal National Mortgage Association, Series 2016-61, Class ML, 3.000%, 9/25/46 | | | 900,000 | | | | 873 | |
GS Mortgage Securities Trust, Series 2015-590M, Class B, 3.805%, (CSTR), 10/10/35 144A | | | 300,000 | | | | 303 | |
Hilton USA Trust, Series 2016-HHV, Class A,
3.719%, 11/5/38 144A | | | 300,000 | | | | 309 | |
Hilton USA Trust, Series 2016-HHV, Class C,
4.194%, (CSTR), 11/5/38 144A | | | 400,000 | | | | 408 | |
Hudson’s Bay Simon JV Trust, Series 2015-HB10, Class C10, 5.447%, (CSTR), 8/5/34 144A | | | 300,000 | | | | 290 | |
Merrill Lynch Mortgage Investors, Inc., Series 2003-A4, Class 3A, 3.879%, (CSTR, AFC), 5/25/33 | | | 1,938 | | | | 2 | |
Morgan Stanley Bank of America Merrill Lynch Trust, Series 2016-C32, Class ASB, 3.514%, 12/15/49 | | | 700,000 | | | | 724 | |
MSSG Trust, Series 2017-237P, Class A,
3.397%, 9/13/39 144A | | | 700,000 | | | | 709 | |
Structured Asset Mortgage Investments, Inc.,
Series 2004-AR5, Class 1A1, 2.155%, (ICE LIBOR USD 1 Month plus 0.66%), (AFC), 10/19/34 | | | 6,043 | | | | 6 | |
VNDO Trust, Series 2016-350P, Class A,
3.805%, 1/10/35 144A | | | 800,000 | | | | 834 | |
WaMu Mortgage Pass-Through Certificates, Series 2004-AR1, Class A, 3.200%, (CSTR, AFC), 3/25/34 | | | 14,525 | | | | 15 | |
Worldwide Plaza Trust, Series 2017-WWP, Class A,
3.526%, 11/10/36 144A | | | 100,000 | | | | 103 | |
| | | | | | | | |
Total | | | | | | | 21,785 | |
| | | | | | | | |
| | |
Total Structured Products | | | | | | | | |
(Cost: $22,396) | | | | | | | 22,257 | |
| | | | | | | | |
| | |
| Short-Term Investments (1.1%) | | | | | | |
| | |
Money Market Funds (1.1%) | | | | | | | | |
State Street Institutional U.S. Government Money Market Fund - Premier Class, 1.209% # | | | 1,291,581 | | | | 1,292 | |
| | | | | | | | |
| | |
Total Short-Term Investments | | | | | | | | |
(Cost: $1,292) | | | | | | | 1,292 | |
| | | | | | | | |
| | |
Total Investments (135.2%) | | | | | | | | |
(Cost: $157,066)(a) | | | | | | | 156,437 | |
| | | | | | | | |
Other Assets, Less | | | | | | | | |
Liabilities (-35.2%) | | | | | | | (40,724 | ) |
| | | | | | | | |
Net Assets (100.0%) | | | | | | | 115,713 | |
| | | | | | | | |
| # | 7-day yield as of December 31, 2017. |
| | 144A after the name of a security represents a security exempt from registration under Rule 144A of the Securities Act of 1933. These securities may be resold as transactions exempt from registration, normally to qualified institutional buyers. At December 31, 2017 the value of these securities (in thousands) was $5,598 representing 4.8% of the net assets. |
AFC — Available Funds Cap security - Security accrues interest at an assumed or uncapped rate. If the interest rate on the underlying loans is lower than the uncapped rate, then the security will pay at the lower rate.
CSTR — Collateral Strip Rate security - interest is based on the weighted net interest rate of the collateral.
| (a) | At December 31, 2017, the aggregate cost of investments, including derivatives, for federal tax purposes (in thousands) was $162,219 and the net unrealized depreciation of investments based on that cost was $5,323 which is comprised of $3,461 aggregate gross unrealized appreciation and $8,784 aggregate gross unrealized depreciation. |
| (b) | All or a portion of the securities have been pledged as collateral for open futures positions or when-issued securities. Information regarding open futures contracts as of period end is summarized below. |
The Accompanying Notes are an Integral Part of the Financial Statements.
| | | | | | |
| | Long-Term U.S. Government Bond Portfolio | | | 135 | |
Long-Term U.S. Government Bond Portfolio
| | | | | | | | | | | | | | | | | | |
| Issuer | | Long/Short | | Currency | | Notional
Par
(000’s) | | | Number of
Contracts | | Expiration
Date | | Notional
Value
(000’s) | | Unrealized
Appreciation/
(Depreciation)
(000’s) |
US Five Year Treasury Note Future | | Short | | USD | | $ | 4,900 | | | 49 | | 3/18 | | $5,692 | | $28 |
US Ten Year Ultra Treasury Bond Future | | Short | | USD | | | 3,000 | | | 30 | | 3/18 | | 4,007 | | 13 |
US Two Year Treasury Note Future | | Short | | USD | | | 12,200 | | | 61 | | 3/18 | | 13,061 | | 30 |
US Ultra Long Treasury Bond Future | | Long | | USD | | | 200 | | | 2 | | 3/18 | | 335 | | 3 |
| (j) | Swap agreements outstanding on December 31, 2017. |
Centrally Cleared Interest Rate Swaps – Receive Floating Rate
| | | | | | | | | | | | | | | | | | | | | | |
| Floating Rate Index | | Fixed
Rate | | Expiration
Date | | Notional
Amount
(000’s) | | Currency | | Upfront
Premium
Paid/
(Received)
(000’s) | | | Unrealized
Appreciation/
(Depreciation)
(000’s) | | | Market
Value
(000’s) | |
3-Month USD-LIBOR | | 1.75% | | 12/26 | | 3,610 | | USD | | $ | 166 | | | $ | 16 | | | $ | 182 | |
3-Month USD-LIBOR | | 2.25% | | 6/28 | | 1,800 | | USD | | | 27 | | | | 4 | | | | 31 | |
3-Month USD-LIBOR | | 2.50% | | 6/46 | | 1,300 | | USD | | | 35 | | | | (15 | ) | | | 20 | |
3-Month USD-LIBOR | | 1.75% | | 6/47 | | 600 | | USD | | | 108 | | | | (1 | ) | | | 107 | |
3-Month USD-LIBOR | | 2.38% | | 9/47 | | 2,000 | | USD | | | 106 | | | | (24 | ) | | | 82 | |
3-Month USD-LIBOR | | 2.75% | | 12/47 | | 800 | | USD | | | (27 | ) | | | (10 | ) | | | (37 | ) |
| | | | | | | | | | | | | | | | | | | | |
| | | | $ | 415 | | | $ | (30 | ) | | | $385 | |
| | | | | | | | | | | | |
| (k) | Cash or securities with an aggregate value of $13,918 (in thousands) has been pledged as collateral for swap contracts |
| (m) | Amount is less than one thousand. |
The following is a summary of the inputs used in valuing the Portfolio’s assets and liabilities at December 31, 2017. See Note 3 for additional information on portfolio valuation.
| | | | | | | | | | | | | | |
| | | Valuation Inputs | | | |
| Description | | Level 1 –
Quoted Prices | | | Level 2 –
Other Significant
Observable Inputs | | | Level 3 – Significant
Unobservable Inputs | | | |
| | | (Amounts in thousands) | | | |
Assets: | | | | | | | | | | | | | | |
Corporate Bonds | | $ | - | | | $ | 917 | | | $ | - | | | |
Governments | | | - | | | | 131,971 | | | | - | | | |
Structured Products | | | - | | | | 22,257 | | | | - | | | |
Purchased Options | | | - | (m) | | | - | | | | - | | | |
Short-Term Investments | | | 1,292 | | | | - | | | | - | | | |
Other Financial Instruments^ | | | | | | | | | | | | | | |
Futures | | | 74 | | | | - | | | | - | | | |
Interest Rate Swaps | | | - | | | | 422 | | | | - | | | |
Total Assets: | | $ | 1,366 | | | $ | 155,567 | | | $ | - | | | |
Liabilities: | | | | | | | | | | | | | | |
Other Financial Instruments^ | | | | | | | | | | | | | | |
Interest Rate Swaps | | $ | - | | | $ | (37 | ) | | $ | - | | | |
Total Liabilities: | | $ | - | | | $ | (37 | ) | | $ | - | | | |
^ Other financial instruments are derivative instruments such as futures and forwards, which are valued at the unrealized appreciation (depreciation) on the instrument, and short sales, written options and swaps contracts, which are valued at market value.
The Accompanying Notes are an Integral Part of the Financial Statements.
| | | | |
| 136 | | Long-Term U.S. Government Bond Portfolio | | |
Inflation Protection Portfolio (unaudited)
| | | | |
| Objective: | | Portfolio Strategy: | | Net Assets: |
| Total return using a strategy that seeks to protect against U.S. inflation. | | Invest substantially all assets in investment grade debt securities, with a majority in inflation-indexed debt securities. | | $402 million |
Portfolio Overview
Mason Street Advisors, LLC (“Mason Street Advisors”), the investment adviser for the Inflation Protection Portfolio (the “Portfolio”), has engaged American Century Investment Management, Inc. (“American Century”) to act as sub-adviser for the Portfolio. The Portfolio invests substantially all of its assets in investment grade debt securities. To help protect against U.S. inflation, under normal conditions, the Portfolio will invest more than 50% of its net assets in inflation-indexed debt securities. These securities include inflation-indexed U.S. Treasury Securities, inflation-indexed securities issued by U.S. government agencies and instrumentalities other than the U.S. Treasury, and inflation-indexed securities issued by domestic and foreign corporations and governments. The Portfolio also may invest in fixed income securities that are not inflation-indexed, including mortgage- and asset-backed securities. Due to Internal Revenue Code provisions and regulations governing insurance product funds, no more than 55% of the Portfolio’s assets may be invested in securities issued by the same entity.
Market Overview
Continued economic growth, upbeat corporate fundamentals and earnings, and expectations for pro-growth tax reform legislation fueled bullish, “risk-on” investor sentiment in 2017. The U.S. economy grew at a 3.2% annual rate in the third quarter, which, combined with a 3.1% expansion in the second quarter, gave the U.S. economy the strongest back-to-back quarterly growth rates in three years. The U.S. Federal Reserve (the “Fed”) raised its interest rate target three times during the year, launched balance sheet normalization and signaled three additional rate increases were likely in 2018. In December, Congress passed sweeping tax reform legislation, reducing tax rates for corporate and individual taxpayers and implementing comprehensive changes to the tax code.
Against this backdrop, the broad U.S. investment grade bond market, as measured by the Bloomberg Barclays U.S. Aggregate Bond Index, posted positive returns. All index sectors generated gains, led by corporate bonds, which outperformed the index. Corporate securities benefited from the “risk-on” sentiment, improving corporate fundamentals and the tax reform package. Although the 30-year Treasury bond returned more than 9%, the broad U.S. Treasury sector underperformed the investment grade bond market. The Treasury yield curve flattened 74 bps during the year, according to Bloomberg Barclays, as yields on short-maturity Treasuries increased on Fed tightening, while yields on longer-maturity Treasuries declined on muted inflation.
Despite stronger economic growth, core inflation remained below the Fed’s 2% target rate. While higher gasoline prices helped push the headline inflation rate to 2.2% in November, core inflation retreated to a 1.7% year-over-year rate. The muted inflation backdrop, which prevailed throughout the year, helped push long-maturity Treasury yields lower, despite the year-end passage of the tax-cut bill.
As the year progressed, expectations for stronger economic growth—partly stemming from the anticipated effects of federal tax reform—pushed the 10-year breakeven rate higher. Although the breakeven rate ended 2017 close to its year end 2016 level (198 bps versus 197 bps), it dropped to 174 bps at the end of June and generally headed upward for the remainder of the year. This second-half rebound in inflation expectations helped Treasury Inflation Protected Securities (“TIPS”) outperform nominal Treasuries for the entire twelve-month period. However, TIPS underperformed the broad investment grade bond market.
Portfolio Results
The Portfolio returned 3.58% for the twelve months ended December 31, 2017. By comparison, the Portfolio’s benchmark, the Bloomberg Barclays® U.S. TIPS Index (the “Index”), returned 3.01%. (The Index is unmanaged, cannot be invested in directly, and does not include administrative expenses.) According to Lipper® Analytical Services, Inc., an independent mutual fund ranking company, the average return for the Inflation Protected Bonds Funds peer group was 3.36% for 2017.
The Portfolio was nearly as fully invested in TIPS as allowed by IRS portfolio diversification regulations for insurance products (53% of assets versus the IRS maximum of 55%). The remainder was primarily invested in investment grade corporate and securitized securities. Robust performance from these positions generally accounted for the Portfolio’s outperformance relative to the all-TIPS index. In addition, small, Portfolio-only positions in non-dollar inflation-linked securities and emerging market bonds aided Portfolio performance.
The portfolio managers also used inflation swaps to create an inflation overlay for the non-inflation-linked corporate and securitized securities. This strategy outperformed because of the relative strength of corporate and securitized securities during the year.
| | | | | | |
| | Inflation Protection Portfolio | | | 137 | |
Inflation Protection Portfolio (unaudited)
Portfolio Manager Outlook
The following forward-looking comments are the opinion of American Century, the Portfolio’s sub-adviser.
Although market-based inflation expectations, including the 10-year breakeven rate, have trended higher, they remain slightly below average, suggesting TIPS still offer value. The Portfolio’s positioning continues to reflect our expectations for solid, sustainable global growth, relatively low market volatility, stabilizing commodity prices, modest wage growth, and continued—albeit gradual—Fed tightening. We believe these influences eventually will create higher inflation than is currently priced into the bond market.
Relative Performance
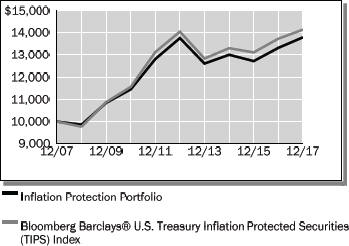
| | | | | | | | | | | | |
Average Annual Total Returns
For Periods Ended December 31, 2017 | |
| | | 1 Year | | | 5 Years | | | 10 Years | |
Inflation Protection Portfolio | | | 3.58 | % | | | 0.05 | % | | | 3.27 | % |
Bloomberg Barclays® U.S. Treasury Inflation Protected Securities (TIPS) Index | | | 3.01 | % | | | 0.13 | % | | | 3.53 | % |
Lipper® Variable Insurance Products (VIP) Inflation Protected Bonds Funds Average | | | 3.36 | % | | | 0.04 | % | | | 3.34 | % |
The performance data quoted represents past performance. Past performance is historical and does not guarantee future performance. Investment return and principal value will fluctuate, so that shares, when redeemed, may be worth more or less than their original cost. Current performance may be lower or higher than the performance data quoted. For the most recent month-end performance information visit www.northwesternmutual.com.
This chart assumes an initial investment of $10,000 made on 12/31/07. Returns shown reflect fee waivers, deductions for management and other portfolio expenses, and reinvestment of all dividends. In the absence of fee waivers, total return would be reduced. Returns exclude deductions for separate account sale loads and account fees. Please refer to the Benchmark Definitions section of this report for information about the indices cited in the above chart and graph.
Return of principal is not guaranteed. Bond funds have the same interest rate, inflation and credit risks that are associated with the underlying bonds owned by the Portfolio. When interest rates rise, bond prices fall. With a fixed income fund, when interest rates rise, the value of the fund’s existing bonds drops, which could negatively affect overall fund performance.
Currently, interest rates remain at historically low levels on a relative basis, although the U.S. federal funds rate has been subject to modest increases over the course of the last two years. A significant rise in interest rates over a short period of time could cause significant losses in the market value of the Portfolio’s fixed income investments.
Investing in bonds issued by foreign corporations and governments carries additional risk, including foreign currency risk, and may increase the volatility of the Portfolio’s performance.
As a non-diversified portfolio, the Portfolio may hold fewer securities because of its focused investment strategy. Holding fewer securities increases the risk that the value of the Portfolio could go down because of the poor performance of a single investment.
| | | | |
| 138 | | Inflation Protection Portfolio | | |
Inflation Protection Portfolio (unaudited)
This Portfolio invests over 50% of its assets in inflation-linked bonds. Inflation-linked bonds issued by the U.S. Government, known as TIPs, are fixed income securities whose principal value is periodically adjusted according to the rate of inflation. Neither the current market value of the inflation-linked bonds nor the share value of the fund that invests in them is guaranteed, and either or both may fluctuate. Those portions of the Portfolio which are not invested in inflation linked securities will not be automatically protected from inflation. The Portfolio may use derivative instruments for hedging or other purposes as part of its investment strategy. Use of these instruments may involve certain costs and risks such as liquidity risk, interest rate risk, market risk, credit risk, management risk and the risk that the Portfolio could not close out a position when it would be most advantageous to do so. Portfolios investing in derivatives could lose more than the principal amount invested in those instruments.
Top 10 Fixed Income Holdings 12/31/17
| | |
| Security Description | | % of Net Assets |
US Treasury, Various | | 52.0% |
Federal Home Loan Mortgage Corp., Various | | 1.8% |
Federal National Mortgage Association, 4.00%, 2/1/46 | | 1.4% |
JPMorgan Chase & Co., Various | | 0.7% |
The Goldman Sachs Group, Inc., Various | | 0.7% |
Citigroup, Inc., Various | | 0.6% |
Canadian Government Real Return Bond, Various | | 0.6% |
Sequoia Mortgage Trust, Series 2017-7, Class A7, 3.50%, 10/25/47 | | 0.6% |
AT&T, Inc., Various | | 0.5% |
Bank of America Corp., Various | | 0.5% |
Sector Allocation 12/31/17
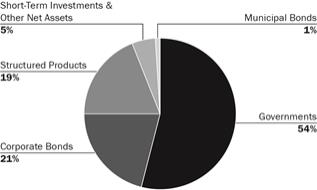
Sector Allocation is based on Net Assets.
Sector Allocation and Top 10 Holdings are subject to change.
Consistent with the Portfolio’s stated parameters, no more than 20% of the Portfolio is invested in foreign securities.
| | | | | | |
| | Inflation Protection Portfolio | | | 139 | |
Inflation Protection Portfolio
Schedule of Investments
December 31, 2017
| | | | | | | | |
| Corporate Bonds (20.7%) | | Shares/
$ Par | | | Value
$ (000’s) | |
| | |
Basic Materials (0.5%) | | | | | | | | |
The Dow Chemical Co., 3.500%, 10/1/24 | | | 200,000 | | | | 206 | |
The Dow Chemical Co., 4.375%, 11/15/42 | | | 200,000 | | | | 210 | |
E.I. du Pont de Nemours & Co., 4.150%, 2/15/43 | | | 200,000 | | | | 206 | |
Georgia-Pacific LLC, 5.400%, 11/1/20 144A | | | 140,000 | | | | 151 | |
International Paper Co., 4.400%, 8/15/47 | | | 200,000 | | | | 209 | |
LyondellBasell Industries NV, 4.625%, 2/26/55 | | | 100,000 | | | | 105 | |
LyondellBasell Industries NV, 5.000%, 4/15/19 | | | 37,000 | | | | 38 | |
The Mosaic Co., 4.050%, 11/15/27 | | | 180,000 | | | | 180 | |
Sherwin-Williams Co., 4.500%, 6/1/47 | | | 340,000 | | | | 371 | |
Westlake Chemical Corp., 4.375%, 11/15/47 | | | 200,000 | | | | 208 | |
| | | | | | | | |
Total | | | | | | | 1,884 | |
| | | | | | | | |
| | |
Communications (2.7%) | | | | | | | | |
21st Century Fox America, Inc., 4.750%, 9/15/44 | | | 150,000 | | | | 171 | |
21st Century Fox America, Inc., 6.900%, 8/15/39 | | | 385,000 | | | | 543 | |
AT&T, Inc., 3.400%, 5/15/25 | | | 450,000 | | | | 442 | |
AT&T, Inc., 3.600%, 2/17/23 | | | 250,000 | | | | 256 | |
AT&T, Inc., 4.450%, 4/1/24 | | | 100,000 | | | | 106 | |
AT&T, Inc., 4.750%, 5/15/46 | | | 300,000 | | | | 293 | |
AT&T, Inc., 4.800%, 6/15/44 | | | 280,000 | | | | 277 | |
AT&T, Inc., 5.150%, 11/15/46 144A | | | 77,000 | | | | 79 | |
AT&T, Inc., 5.150%, 2/14/50 | | | 700,000 | | | | 703 | |
British Telecommunications PLC, 5.950%, 1/15/18 | | | 100,000 | | | | 100 | |
CBS Corp., 3.500%, 1/15/25 | | | 200,000 | | | | 201 | |
CBS Corp., 3.700%, 6/1/28 144A | | | 170,000 | | | | 168 | |
Charter Communications Operating LLC / Charter Communications Operating Capital, 6.484%, 10/23/45 | | | 530,000 | | | | 617 | |
Cisco Systems, Inc., 5.900%, 2/15/39 | | | 335,000 | | | | 458 | |
Comcast Corp., 6.500%, 11/15/35 | | | 350,000 | | | | 473 | |
Deutsche Telekom International Finance BV, 3.600%, 1/19/27 144A | | | 450,000 | | | | 452 | |
Discovery Communications LLC, 3.950%, 3/20/28 | | | 350,000 | | | | 348 | |
NBCUniversal Media LLC, 4.375%, 4/1/21 | | | 340,000 | | | | 360 | |
Telefonica Emisiones SAU, 4.103%, 3/8/27 | | | 400,000 | | | | 413 | |
Telefonica Emisiones SAU, 5.213%, 3/8/47 | | | 200,000 | | | | 227 | |
Time Warner Cable LLC, 4.500%, 9/15/42 | | | 295,000 | | | | 276 | |
Time Warner, Inc., 3.600%, 7/15/25 | | | 200,000 | | | | 200 | |
Time Warner, Inc., 3.800%, 2/15/27 | | | 300,000 | | | | 300 | |
Time Warner, Inc., 4.050%, 12/15/23 | | | 150,000 | | | | 157 | |
Time Warner, Inc., 4.700%, 1/15/21 | | | 300,000 | | | | 317 | |
Verizon Communications, Inc., 2.625%, 8/15/26 | | | 300,000 | | | | 282 | |
Verizon Communications, Inc., 4.125%, 3/16/27 | | | 330,000 | | | | 344 | |
Verizon Communications, Inc., 4.125%, 8/15/46 | | | 400,000 | | | | 369 | |
Verizon Communications, Inc., 4.400%, 11/1/34 | | | 150,000 | | | | 153 | |
Verizon Communications, Inc., 4.862%, 8/21/46 | | | 300,000 | | | | 312 | |
Verizon Communications, Inc., 5.500%, 3/16/47 | | | 330,000 | | | | 376 | |
Viacom, Inc., 4.250%, 9/1/23 | | | 470,000 | | | | 480 | |
The Walt Disney Co., 2.350%, 12/1/22 | | | 500,000 | | | | 497 | |
The Walt Disney Co., 4.125%, 6/1/44 | | | 170,000 | | | | 183 | |
| | | | | | | | |
Total | | | | | | | 10,933 | |
| | | | | | | | |
| | | | | | | | |
| Corporate Bonds (20.7%) | | Shares/
$ Par | | | Value
$ (000’s) | |
| | |
Consumer, Cyclical (1.0%) | | | | | | | | |
CVS Health Corp., 2.750%, 12/1/22 | | | 700,000 | | | | 689 | |
Ford Motor Co., 4.346%, 12/8/26 | | | 120,000 | | | | 125 | |
Ford Motor Credit Co. LLC, 4.389%, 1/8/26 | | | 300,000 | | | | 315 | |
Ford Motor Credit Co. LLC, 5.000%, 5/15/18 | | | 100,000 | | | | 101 | |
General Motors Co., 5.150%, 4/1/38 | | | 1,000,000 | | | | 1,065 | |
General Motors Financial Co., Inc., 5.250%, 3/1/26 | | | 80,000 | | | | 88 | |
The Home Depot, Inc., 4.200%, 4/1/43 | | | 275,000 | | | | 303 | |
Lowe’s Companies, Inc., 4.050%, 5/3/47 | | | 120,000 | | | | 128 | |
Macy’s Retail Holdings, Inc., 2.875%, 2/15/23 | | | 60,000 | | | | 56 | |
McDonald’s Corp., 3.250%, 6/10/24 | | | 150,000 | | | | 154 | |
McDonald’s Corp., 4.450%, 3/1/47 | | | 330,000 | | | | 359 | |
NIKE, Inc., 3.375%, 11/1/46 | | | 315,000 | | | | 304 | |
Target Corp., 3.900%, 11/15/47 | | | 300,000 | | | | 305 | |
| | | | | | | | |
Total | | | | | | | 3,992 | |
| | | | | | | | |
| | |
Consumer, Non-cyclical (3.1%) | | | | | | | | |
Abbott Laboratories, 4.900%, 11/30/46 | | | 400,000 | | | | 458 | |
AbbVie, Inc., 2.900%, 11/6/22 | | | 325,000 | | | | 326 | |
AbbVie, Inc., 4.450%, 5/14/46 | | | 350,000 | | | | 380 | |
Actavis Funding SCS, 3.850%, 6/15/24 | | | 150,000 | | | | 154 | |
Actavis Funding SCS, 4.550%, 3/15/35 | | | 170,000 | | | | 180 | |
Aetna, Inc., 2.750%, 11/15/22 | | | 230,000 | | | | 228 | |
Aetna, Inc., 3.875%, 8/15/47 | | | 170,000 | | | | 167 | |
Amgen, Inc., 3.625%, 5/22/24 | | | 140,000 | | | | 145 | |
Anheuser-Busch InBev Finance, Inc., 3.650%, 2/1/26 | | | 1,420,000 | | | | 1,465 | |
Anheuser-Busch InBev Finance, Inc., 4.900%, 2/1/46 | | | 500,000 | | | | 579 | |
Anheuser-Busch InBev Worldwide, Inc., 7.750%, 1/15/19 | | | 100,000 | | | | 106 | |
Anthem, Inc., 4.650%, 1/15/43 | | | 200,000 | | | | 219 | |
Becton Dickinson and Co., 3.700%, 6/6/27 | | | 400,000 | | | | 403 | |
Catholic Health Initiatives, 2.950%, 11/1/22 | | | 100,000 | | | | 99 | |
Celgene Corp., 3.625%, 5/15/24 | | | 50,000 | | | | 51 | |
Celgene Corp., 5.000%, 8/15/45 | | | 170,000 | | | | 193 | |
Constellation Brands, Inc., 3.500%, 5/9/27 | | | 170,000 | | | | 173 | |
Constellation Brands, Inc., 3.700%, 12/6/26 | | | 340,000 | | | | 350 | |
Diageo Capital PLC, 2.625%, 4/29/23 | | | 200,000 | | | | 200 | |
Duke University Health System, Inc., 3.920%, 6/1/47 | | | 268,000 | | | | 280 | |
Ecolab, Inc., 4.350%, 12/8/21 | | | 294,000 | | | | 313 | |
Express Scripts Holding Co., 3.400%, 3/1/27 | | | 200,000 | | | | 196 | |
Express Scripts Holding Co., 4.500%, 2/25/26 | | | 200,000 | | | | 212 | |
General Mills, Inc., 3.150%, 12/15/21 | | | 670,000 | | | | 683 | |
Gilead Sciences, Inc., 3.650%, 3/1/26 | | | 200,000 | | | | 207 | |
Gilead Sciences, Inc., 4.150%, 3/1/47 | | | 165,000 | | | | 175 | |
Gilead Sciences, Inc., 4.400%, 12/1/21 | | | 485,000 | | | | 517 | |
Johnson & Johnson, 3.500%, 1/15/48 | | | 360,000 | | | | 368 | |
Kaiser Foundation Hospitals, 4.150%, 5/1/47 | | | 200,000 | | | | 216 | |
Kimberly-Clark Corp., 3.900%, 5/4/47 | | | 340,000 | | | | 360 | |
Kraft Heinz Foods Co., 4.375%, 6/1/46 | | | 300,000 | | | | 297 | |
The Kroger Co., 3.875%, 10/15/46 | | | 400,000 | | | | 366 | |
Medtronic, Inc., 2.500%, 3/15/20 | | | 100,000 | | | | 101 | |
Medtronic, Inc., 3.500%, 3/15/25 | | | 80,000 | | | | 83 | |
The Accompanying Notes are an Integral Part of the Financial Statements.
| | | | |
| 140 | | Inflation Protection Portfolio | | |
Inflation Protection Portfolio
| | | | | | | | |
| Corporate Bonds (20.7%) | | Shares/
$ Par | | | Value
$ (000’s) | |
| | |
Consumer, Non-cyclical continued | | | | | | | | |
Medtronic, Inc., 4.625%, 3/15/45 | | | 350,000 | | | | 407 | |
Mylan NV, 3.950%, 6/15/26 | | | 200,000 | | | | 202 | |
Northwell Health, Inc., 4.260%, 11/1/47 | | | 180,000 | | | | 184 | |
PepsiCo, Inc., 3.450%, 10/6/46 | | | 320,000 | | | | 310 | |
Shire Acquisitions Investments Ireland Designated Activity Co., 3.200%, 9/23/26 | | | 160,000 | | | | 156 | |
Thermo Fisher Scientific, Inc., 2.950%, 9/19/26 | | | 250,000 | | | | 243 | |
Unilever Capital Corp., 2.200%, 3/6/19 | | | 200,000 | | | | 200 | |
UnitedHealth Group, Inc., 3.750%, 10/15/47 | | | 350,000 | | | | 357 | |
UnitedHealth Group, Inc., 4.250%, 3/15/43 | | | 150,000 | | | | 164 | |
Zoetis, Inc., 3.000%, 9/12/27 | | | 60,000 | | | | 59 | |
| | | | | | | | |
Total | | | | | | | 12,532 | |
| | | | | | | | |
| | |
Energy (2.7%) | | | | | | | | |
Apache Corp., 4.750%, 4/15/43 | | | 325,000 | | | | 334 | |
BP Capital Markets PLC, 2.500%, 11/6/22 | | | 160,000 | | | | 159 | |
BP Capital Markets PLC, 2.750%, 5/10/23 | | | 200,000 | | | | 200 | |
Cenovus Energy, Inc., 4.250%, 4/15/27 | | | 200,000 | | | | 199 | |
Chevron Corp., 2.427%, 6/24/20 | | | 100,000 | | | | 101 | |
Cimarex Energy Co., 4.375%, 6/1/24 | | | 100,000 | | | | 106 | |
Concho Resources, Inc., 4.875%, 10/1/47 | | | 80,000 | | | | 88 | |
ConocoPhillips Co., 2.400%, 12/15/22 | | | 500,000 | | | | 494 | |
Enbridge, Inc., 3.500%, 6/10/24 | | | 150,000 | | | | 152 | |
Enbridge, Inc., 3.700%, 7/15/27 | | | 200,000 | | | | 201 | |
Energy Transfer Partners LP, 3.600%, 2/1/23 | | | 100,000 | | | | 100 | |
Energy Transfer Partners LP, 4.050%, 3/15/25 | | | 200,000 | | | | 200 | |
Energy Transfer Partners LP, 5.300%, 4/15/47 | | | 330,000 | | | | 328 | |
Enterprise Products Operating LLC, 3.750%, 2/15/25 | | | 200,000 | | | | 206 | |
Enterprise Products Operating LLC, 4.850%, 3/15/44 | | | 100,000 | | | | 110 | |
Exxon Mobil Corp., 3.043%, 3/1/26 | | | 200,000 | | | | 203 | |
Hess Corp., 6.000%, 1/15/40 | | | 300,000 | | | | 331 | |
Kinder Morgan Energy Partners LP, 5.300%, 9/15/20 | | | 270,000 | | | | 288 | |
Kinder Morgan, Inc., 5.550%, 6/1/45 | | | 500,000 | | | | 547 | |
Magellan Midstream Partners LP, 5.150%, 10/15/43 | | | 150,000 | | | | 170 | |
Marathon Oil Corp., 3.850%, 6/1/25 | | | 170,000 | | | | 173 | |
Marathon Oil Corp., 5.200%, 6/1/45 | | | 100,000 | | | | 111 | |
Marathon Petroleum Corp., 3.625%, 9/15/24 | | | 250,000 | | | | 255 | |
MPLX LP, 4.875%, 6/1/25 | | | 400,000 | | | | 429 | |
MPLX LP, 5.200%, 3/1/47 | | | 200,000 | | | | 219 | |
Noble Energy, Inc., 4.150%, 12/15/21 | | | 480,000 | | | | 500 | |
Occidental Petroleum Corp., 4.100%, 2/15/47 | | | 330,000 | | | | 350 | |
ONEOK, Inc., 4.000%, 7/13/27 | | | 225,000 | | | | 228 | |
Petroleos Mexicanos, 3.500%, 1/30/23 | | | 130,000 | | | | 127 | |
Petroleos Mexicanos, 4.625%, 9/21/23 | | | 200,000 | | | | 206 | |
Petroleos Mexicanos, 4.875%, 1/18/24 | | | 400,000 | | | | 414 | |
Phillips 66, 4.650%, 11/15/34 | | | 200,000 | | | | 219 | |
Plains All American Pipeline LP / PAA Finance Corp., 3.650%, 6/1/22 | | | 200,000 | | | | 201 | |
Sabine Pass Liquefaction LLC, 5.625%, 3/1/25 | | | 500,000 | | | | 551 | |
Shell International Finance BV, 2.375%, 8/21/22 | | | 1,170,000 | | | | 1,161 | |
Statoil ASA, 2.450%, 1/17/23 | | | 250,000 | | | | 248 | |
Suncor Energy, Inc., 6.500%, 6/15/38 | | | 170,000 | | | | 230 | |
Sunoco Logistics Partners Operations LP, 3.450%, 1/15/23 | | | 300,000 | | | | 298 | |
| | | | | | | | |
| Corporate Bonds (20.7%) | | Shares/
$ Par | | | Value
$ (000’s) | |
| | |
Energy continued | | | | | | | | |
TransCanada PipeLines, Ltd., 2.500%, 8/1/22 | | | 100,000 | | | | 99 | |
Williams Partners LP, 4.125%, 11/15/20 | | | 80,000 | | | | 83 | |
Williams Partners LP, 4.300%, 3/4/24 | | | 200,000 | | | | 209 | |
| | | | | | | | |
Total | | | | | | | 10,828 | |
| | | | | | | | |
| | |
Financial (6.0%) | | | | | | | | |
The Allstate Corp., 4.200%, 12/15/46 | | | 150,000 | | | | 163 | |
American Express Credit Corp., 3.300%, 5/3/27 | | | 450,000 | | | | 456 | |
American International Group, Inc., 4.125%, 2/15/24 | | | 250,000 | | | | 264 | |
American International Group, Inc., 4.500%, 7/16/44 | | | 150,000 | | | | 161 | |
American Tower Corp., 3.375%, 10/15/26 | | | 400,000 | | | | 393 | |
AvalonBay Communities, Inc., 3.200%, 1/15/28 | | | 280,000 | | | | 279 | |
Banco Inbursa SA Institucion de Banca Multiple, 4.375%, 4/11/27 144A | | | 200,000 | | | | 200 | |
Bank of America Corp., 3.248%, 10/21/27 | | | 1,625,000 | | | | 1,612 | |
Bank of America Corp., 3.300%, 1/11/23 | | | 350,000 | | | | 358 | |
Bank of America Corp., 4.443%, (3 Month LIBOR plus 1.99%), 1/20/48 | | | 80,000 | | | | 90 | |
Berkshire Hathaway, Inc., 4.500%, 2/11/43 | | | 335,000 | | | | 386 | |
Boston Properties LP, 3.650%, 2/1/26 | | | 150,000 | | | | 152 | |
BPCE SA, 3.500%, 10/23/27 | | | 250,000 | | | | 246 | |
Branch Banking & Trust Co., 3.800%, 10/30/26 | | | 200,000 | | | | 209 | |
Capital One Financial Corp., 3.750%, 3/9/27 | | | 330,000 | | | | 333 | |
Capital One Financial Corp., 4.200%, 10/29/25 | | | 150,000 | | | | 154 | |
Chubb INA Holdings, Inc., 3.150%, 3/15/25 | | | 200,000 | | | | 202 | |
Citigroup, Inc., 2.350%, 8/2/21 | | | 300,000 | | | | 297 | |
Citigroup, Inc., 3.200%, 10/21/26 | | | 500,000 | | | | 496 | |
Citigroup, Inc., 4.000%, 8/5/24 | | | 250,000 | | | | 261 | |
Citigroup, Inc., 4.050%, 7/30/22 | | | 450,000 | | | | 468 | |
Citigroup, Inc., 4.281%, (3 Month LIBOR plus 1.84%), 4/24/48 | | | 200,000 | | | | 217 | |
Citigroup, Inc., 4.450%, 9/29/27 | | | 775,000 | | | | 820 | |
Cooperatieve Rabobank UA, 3.875%, 2/8/22 | | | 200,000 | | | | 210 | |
Credit Suisse AG, 3.625%, 9/9/24 | | | 250,000 | | | | 259 | |
Crown Castle International Corp., 4.450%, 2/15/26 | | | 240,000 | | | | 252 | |
DDR Corp., 3.900%, 8/15/24 | | | 60,000 | | | | 60 | |
Discover Bank, 3.450%, 7/27/26 | | | 300,000 | | | | 296 | |
Discover Financial Services, 3.750%, 3/4/25 | | | 200,000 | | | | 201 | |
Essex Portfolio LP, 3.625%, 8/15/22 | | | 100,000 | | | | 103 | |
Fifth Third Bancorp, 4.300%, 1/16/24 | | | 60,000 | | | | 64 | |
GE Capital International Funding Co. Unlimited Co., 4.418%, 11/15/35 | | | 500,000 | | | | 541 | |
The Goldman Sachs Group, Inc., 2.300%, 12/13/19 | | | 300,000 | | | | 300 | |
The Goldman Sachs Group, Inc., 3.500%, 11/16/26 | | | 400,000 | | | | 402 | |
The Goldman Sachs Group, Inc., 3.750%, 5/22/25 | | | 850,000 | | | | 875 | |
The Goldman Sachs Group, Inc., 4.800%, 7/8/44 | | | 675,000 | | | | 769 | |
The Goldman Sachs Group, Inc., 5.750%, 1/24/22 | | | 330,000 | | | | 366 | |
The Hartford Financial Services Group, Inc., 5.125%, 4/15/22 | | | 150,000 | | | | 164 | |
HSBC Holdings PLC, 2.950%, 5/25/21 | | | 400,000 | | | | 403 | |
HSBC Holdings PLC, 4.041%, (3 Month LIBOR plus 1.55%), 3/13/28 | | | 230,000 | | | | 240 | |
HSBC Holdings PLC, 4.300%, 3/8/26 | | | 200,000 | | | | 213 | |
HSBC Holdings PLC, 4.375%, 11/23/26 | | | 200,000 | | | | 209 | |
The Accompanying Notes are an Integral Part of the Financial Statements.
| | | | | | |
| | Inflation Protection Portfolio | | | 141 | |
Inflation Protection Portfolio
| | | | | | | | |
| Corporate Bonds (20.7%) | | Shares/
$ Par | | | Value
$ (000’s) | |
| | |
Financial continued | | | | | | | | |
Huntington Bancshares, Inc., 2.300%, 1/14/22 | | | 200,000 | | | | 197 | |
International Lease Finance Corp., 5.875%, 8/15/22 | | | 200,000 | | | | 222 | |
Jefferies Group LLC, 4.850%, 1/15/27 | | | 330,000 | | | | 351 | |
JPMorgan Chase & Co., 3.875%, 9/10/24 | | | 1,250,000 | | | | 1,304 | |
JPMorgan Chase & Co., 3.964%, (3 Month LIBOR plus 1.38%), 11/15/48 | | | 835,000 | | | | 861 | |
JPMorgan Chase & Co., 4.500%, 1/24/22 | | | 500,000 | | | | 535 | |
JPMorgan Chase & Co., 4.625%, 5/10/21 | | | 250,000 | | | | 267 | |
KeyBank NA, 3.400%, 5/20/26 | | | 250,000 | | | | 249 | |
Kilroy Realty LP, 3.800%, 1/15/23 | | | 120,000 | | | | 123 | |
Kilroy Realty LP, 4.375%, 10/1/25 | | | 40,000 | | | | 42 | |
Liberty Mutual Group, Inc., 4.250%, 6/15/23 144A | | | 225,000 | | | | 237 | |
Markel Corp., 3.500%, 11/1/27 | | | 200,000 | | | | 199 | |
Morgan Stanley, 3.875%, 1/27/26 | | | 400,000 | | | | 417 | |
Morgan Stanley, 4.000%, 7/23/25 | | | 700,000 | | | | 733 | |
Morgan Stanley, 4.375%, 1/22/47 | | | 170,000 | | | | 186 | |
Prudential Financial, Inc., 3.935%, 12/7/49 144A | | | 251,000 | | | | 256 | |
Simon Property Group LP, 4.250%, 11/30/46 | | | 300,000 | | | | 316 | |
Suntrust Bank, 3.300%, 5/15/26 | | | 200,000 | | | | 198 | |
The Travelers Cos, Inc., 3.750%, 5/15/46 | | | 200,000 | | | | 204 | |
U.S. Bancorp, 3.600%, 9/11/24 | | | 400,000 | | | | 414 | |
Ventas Realty LP / Ventas Capital Corp., 3.250%, 8/15/22 | | | 250,000 | | | | 253 | |
Wells Fargo & Co., 3.000%, 4/22/26 | | | 200,000 | | | | 196 | |
Wells Fargo & Co., 3.550%, 9/29/25 | | | 175,000 | | | | 180 | |
Wells Fargo & Co., 4.100%, 6/3/26 | | | 330,000 | | | | 346 | |
Wells Fargo & Co., 4.125%, 8/15/23 | | | 220,000 | | | | 232 | |
Wells Fargo & Co., 4.400%, 6/14/46 | | | 600,000 | | | | 632 | |
Wells Fargo & Co., 4.750%, 12/7/46 | | | 300,000 | | | | 335 | |
Welltower, Inc., 3.750%, 3/15/23 | | | 300,000 | | | | 311 | |
| | | | | | | | |
Total | | | | | | | 23,940 | |
| | | | | | | | |
| | |
Industrial (1.6%) | | | | | | | | |
Burlington Northern Santa Fe LLC, 3.000%, 4/1/25 | | | 200,000 | | | | 201 | |
Burlington Northern Santa Fe LLC, 3.750%, 4/1/24 | | | 200,000 | | | | 212 | |
Burlington Northern Santa Fe LLC, 4.125%, 6/15/47 | | | 380,000 | | | | 416 | |
Burlington Northern Santa Fe LLC, 4.950%, 9/15/41 | | | 100,000 | | | | 119 | |
CSX Corp., 3.800%, 11/1/46 | | | 180,000 | | | | 179 | |
FedEx Corp., 4.400%, 1/15/47 | | | 200,000 | | | | 213 | |
General Electric Co., 2.100%, 12/11/19 | | | 250,000 | | | | 249 | |
General Electric Co., 4.125%, 10/9/42 | | | 770,000 | | | | 806 | |
General Electric Co., 4.375%, 9/16/20 | | | 100,000 | | | | 105 | |
John Deere Capital Corp., 3.150%, 10/15/21 | | | 290,000 | | | | 297 | |
Lockheed Martin Corp., 3.550%, 1/15/26 | | | 100,000 | | | | 104 | |
Lockheed Martin Corp., 3.800%, 3/1/45 | | | 200,000 | | | | 202 | |
Lockheed Martin Corp., 4.250%, 11/15/19 | | | 200,000 | | | | 208 | |
Norfolk Southern Corp., 3.150%, 6/1/27 | | | 150,000 | | | | 150 | |
Norfolk Southern Corp., 3.850%, 1/15/24 | | | 75,000 | | | | 79 | |
Norfolk Southern Corp., 5.750%, 4/1/18 | | | 100,000 | | | | 101 | |
Republic Services, Inc., 3.375%, 11/15/27 | | | 300,000 | | | | 302 | |
Republic Services, Inc., 3.800%, 5/15/18 | | | 100,000 | | | | 101 | |
Rockwell Collins, Inc., 4.350%, 4/15/47 | | | 300,000 | | | | 326 | |
Union Pacific Corp., 2.750%, 4/15/23 | | | 100,000 | | | | 100 | |
Union Pacific Corp., 3.350%, 8/15/46 | | | 165,000 | | | | 159 | |
| | | | | | | | |
| Corporate Bonds (20.7%) | | Shares/
$ Par | | | Value
$ (000’s) | |
| | |
Industrial continued | | | | | | | | |
Union Pacific Corp., 4.000%, 4/15/47 | | | 340,000 | | | | 367 | |
United Parcel Service, Inc., 3.400%, 11/15/46 | | | 300,000 | | | | 290 | |
United Technologies Corp., 3.750%, 11/1/46 | | | 525,000 | | | | 525 | |
Waste Management, Inc., 3.125%, 3/1/25 | | | 150,000 | | | | 151 | |
Waste Management, Inc., 3.150%, 11/15/27 | | | 200,000 | | | | 200 | |
Waste Management, Inc., 3.500%, 5/15/24 | | | 250,000 | | | | 259 | |
| | | | | | | | |
Total | | | | | | | 6,421 | |
| | | | | | | | |
| | |
Technology (1.4%) | | | | | | | | |
Apple, Inc., 2.900%, 9/12/27 | | | 650,000 | | | | 642 | |
Apple, Inc., 3.200%, 5/11/27 | | | 550,000 | | | | 557 | |
Apple, Inc., 4.250%, 2/9/47 | | | 370,000 | | | | 411 | |
Broadcom Corp. / Broadcom Cayman Finance, Ltd., 3.500%, 1/15/28 144A | | | 200,000 | | | | 191 | |
Dell International LLC / EMC Corp., 6.020%, 6/15/26 144A | | | 470,000 | | | | 518 | |
Fidelity National Information Services, Inc., 3.000%, 8/15/26 | | | 200,000 | | | | 193 | |
Intel Corp., 4.100%, 5/11/47 | | | 340,000 | | | | 374 | |
Microsoft Corp., 2.125%, 11/15/22 | | | 330,000 | | | | 326 | |
Microsoft Corp., 3.450%, 8/8/36 | | | 400,000 | | | | 412 | |
Microsoft Corp., 4.250%, 2/6/47 | | | 550,000 | | | | 628 | |
Oracle Corp., 2.500%, 10/15/22 | | | 300,000 | | | | 300 | |
Oracle Corp., 2.650%, 7/15/26 | | | 150,000 | | | | 146 | |
Oracle Corp., 4.000%, 7/15/46 | | | 500,000 | | | | 532 | |
Oracle Corp., 5.750%, 4/15/18 | | | 300,000 | | | | 303 | |
| | | | | | | | |
Total | | | | | | | 5,533 | |
| | | | | | | | |
| | |
Utilities (1.7%) | | | | | | | | |
AEP Transmission Co., LLC, 3.750%, 12/1/47 144A | | | 200,000 | | | | 205 | |
Alabama Power Co., 3.700%, 12/1/47 | | | 640,000 | | | | 653 | |
American Electric Power Co., Inc., 3.200%, 11/13/27 | | | 200,000 | | | | 198 | |
Consolidated Edison Co. of New York, Inc., 3.875%, 6/15/47 | | | 400,000 | | | | 418 | |
Dominion Resources, Inc., 3.625%, 12/1/24 | | | 200,000 | | | | 207 | |
Dominion Resources, Inc., 4.900%, 8/1/41 | | | 320,000 | | | | 369 | |
Dominion Resources, Inc., 6.400%, 6/15/18 | | | 340,000 | | | | 347 | |
Duke Energy Corp., 3.150%, 8/15/27 | | | 150,000 | | | | 149 | |
Duke Energy Corp., 3.550%, 9/15/21 | | | 150,000 | | | | 155 | |
Duke Energy Progress LLC, 3.700%, 10/15/46 | | | 720,000 | | | | 735 | |
Exelon Corp., 4.450%, 4/15/46 | | | 160,000 | | | | 174 | |
Exelon Generation Co. LLC, 5.600%, 6/15/42 | | | 480,000 | | | | 526 | |
FirstEnergy Corp., 4.850%, 7/15/47 | | | 300,000 | | | | 334 | |
Georgia Power Co., 4.300%, 3/15/42 | | | 100,000 | | | | 106 | |
MidAmerican Energy Co., 4.400%, 10/15/44 | | | 600,000 | | | | 682 | |
NextEra Energy Capital Holdings, Inc., 3.550%, 5/1/27 | | | 200,000 | | | | 204 | |
Pacific Gas & Electric Co., 4.000%, 12/1/46 | | | 570,000 | | | | 570 | |
Potomac Electric Power Co., 3.600%, 3/15/24 | | | 80,000 | | | | 84 | |
Sempra Energy, 3.250%, 6/15/27 | | | 250,000 | | | | 249 | |
Southern Co. Gas Capital Corp., 3.950%, 10/1/46 | | | 200,000 | | | | 198 | |
Southwestern Public Service Co., 3.700%, 8/15/47 | | | 250,000 | | | | 256 | |
Virginia Electric and Power Co., 3.450%, 2/15/24 | | | 50,000 | | | | 52 | |
| | | | | | | | |
Total | | | | | | | 6,871 | |
| | | | | | | | |
| | |
Total Corporate Bonds | | | | | | | | |
(Cost: $80,902) | | | | | | | 82,934 | |
| | | | | | | | |
The Accompanying Notes are an Integral Part of the Financial Statements.
| | | | |
| 142 | | Inflation Protection Portfolio | | |
Inflation Protection Portfolio
| | | | | | | | |
| Governments (52.4%) | | Shares/
Par | | | Value
$ (000’s) | |
| | |
Governments (52.4%) | | | | | | | | |
Australian Government Bond, 6.709%, 8/20/20 AUD (f) | | | 715,000 | | | | 1,025 | |
Canadian Government Real Return Bond, 4.250%, 12/1/21 CAD (f) | | | 756,293 | | | | 695 | |
Canadian Government Real Return Bond, 4.250%, 12/1/26 CAD (f) | | | 1,490,420 | | | | 1,589 | |
Mexico Government International Bond, 4.750%, 3/8/44 | | | 200,000 | | | | 202 | |
Saudi Government International Bond, 2.375%, 10/26/21 144A | | | 300,000 | | | | 293 | |
US Treasury Inflation Index Bond, 0.125%, 4/15/21 | | | 7,025,130 | | | | 6,998 | |
US Treasury Inflation Index Bond, 0.125%, 1/15/22 | | | 517,674 | | | | 516 | |
US Treasury Inflation Index Bond, 0.125%, 4/15/22 | | | 7,099,960 | | | | 7,052 | |
US Treasury Inflation Index Bond, 0.125%, 7/15/22 (b) | | | 10,190,080 | | | | 10,180 | |
US Treasury Inflation Index Bond, 0.125%, 1/15/23 | | | 3,740,275 | | | | 3,713 | |
US Treasury Inflation Index Bond, 0.125%, 7/15/24 | | | 1,817,970 | | | | 1,798 | |
US Treasury Inflation Index Bond, 0.125%, 7/15/26 | | | 13,171,968 | | | | 12,879 | |
US Treasury Inflation Index Bond, 0.250%, 1/15/25 | | | 7,290,010 | | | | 7,230 | |
US Treasury Inflation Index Bond, 0.375%, 7/15/23 | | | 2,649,850 | | | | 2,671 | |
US Treasury Inflation Index Bond, 0.375%, 7/15/25 (b) | | | 19,138,944 | | | | 19,180 | |
US Treasury Inflation Index Bond, 0.625%, 7/15/21 (b) | | | 9,849,960 | | | | 10,042 | |
US Treasury Inflation Index Bond, 0.625%, 1/15/24 (b) | | | 13,373,074 | | | | 13,614 | |
US Treasury Inflation Index Bond, 0.625%, 1/15/26 (k) | | | 4,463,916 | | | | 4,538 | |
US Treasury Inflation Index Bond, 0.625%, 2/15/43 | | | 7,134,652 | | | | 6,992 | |
US Treasury Inflation Index Bond, 0.750%, 2/15/42 (b) | | | 8,542,083 | | | | 8,638 | |
US Treasury Inflation Index Bond, 0.750%, 2/15/45 | | | 4,032,875 | | | | 4,060 | |
US Treasury Inflation Index Bond, 0.875%, 2/15/47 | | | 2,656,810 | | | | 2,766 | |
US Treasury Inflation Index Bond, 1.000%, 2/15/46 | | | 2,446,444 | | | | 2,618 | |
US Treasury Inflation Index Bond, 1.375%, 1/15/20 | | | 7,984,760 | | | | 8,195 | |
US Treasury Inflation Index Bond, 1.375%, 2/15/44 | | | 11,250,686 | | | | 13,008 | |
US Treasury Inflation Index Bond, 1.750%, 1/15/28 | | | 4,703,833 | | | | 5,291 | |
US Treasury Inflation Index Bond, 2.000%, 1/15/26 | | | 3,044,860 | | | | 3,427 | |
US Treasury Inflation Index Bond, 2.125%, 2/15/40 | | | 2,168,356 | | | | 2,825 | |
US Treasury Inflation Index Bond, 2.125%, 2/15/41 | | | 6,009,237 | | | | 7,884 | |
US Treasury Inflation Index Bond, 2.375%, 1/15/25 | | | 13,936,697 | | | | 15,890 | |
US Treasury Inflation Index Bond, 2.375%, 1/15/27 | | | 4,189,323 | | | | 4,904 | |
US Treasury Inflation Index Bond, 2.500%, 1/15/29 | | | 7,140,414 | | | | 8,668 | |
US Treasury Inflation Index Bond, 3.375%, 4/15/32 | | | 2,174,849 | | | | 3,011 | |
US Treasury Inflation Index Bond, 3.625%, 4/15/28 | | | 2,287,635 | | | | 3,003 | |
US Treasury Inflation Index Bond, 3.875%, 4/15/29 | | | 3,601,128 | | | | 4,913 | |
| | | | | | | | |
Total Governments | | | | | | | | |
(Cost: $208,600) | | | | | | | 210,308 | |
| | | | | | | | |
| | |
| Municipal Bonds (0.4%) | | | | | | |
| | |
Municipal Bonds (0.4%) | | | | | | | | |
Bay Area Toll Authority, California, Series 2010, 6.918%, 4/1/40 RB | | | 35,000 | | | | 51 | |
City of San Antonio TX Electric & Gas System Revenue, 5.985%, 2/1/39 RB | | | 150,000 | | | | 202 | |
City of San Francisco CA Public Utilities Commission Water Revenue, 6.950%, 11/1/50 RB | | | 25,000 | | | | 37 | |
Los Angeles Community College District, Series 2010-E, 6.750%, 8/1/49 GO | | | 95,000 | | | | 147 | |
| | | | | | | | |
| Municipal Bonds (0.4%) | | Shares/
$ Par | | | Value
$ (000’s) | |
| | |
Municipal Bonds continued | | | | | | | | |
Metropolitan Transportation Authority, 6.814%, 11/15/40 RB | | | 50,000 | | | | 72 | |
Missouri Highway & Transportation Commission, 5.445%, 5/1/33 RB | | | 100,000 | | | | 121 | |
New Jersey Turnpike Authority, Series 2010, 7.102%, 1/1/41 RB | | | 100,000 | | | | 149 | |
Port Authority of New York & New Jersey, Series 168, 4.926%, 10/1/51 RB | | | 50,000 | | | | 62 | |
Rutgers - The State University of New Jersey, 5.665%, 5/1/40 RB | | | 55,000 | | | | 68 | |
Santa Clara Valley Transportation Authority, 5.876%, 4/1/32 RB | | | 50,000 | | | | 61 | |
State of California, Series 2009, 7.550%, 4/1/39 GO | | | 250,000 | | | | 393 | |
State of Illinois, 5.100%, 6/1/33 GO | | | 150,000 | | | | 150 | |
State of Texas, Series 2009A, 5.517%, 4/1/39 GO | | | 30,000 | | | | 39 | |
| | | | | | | | |
Total Municipal Bonds | | | | | | | | |
(Cost: $1,500) | | | | | | | 1,552 | |
| | | | | | | | |
| | |
| Structured Products (18.6%) | | | | | | |
| | |
Asset Backed Securities (1.5%) | | | | | | | | |
Avis Budget Rental Car Funding AESOP LLC, Series 2012-3A, Class A, 2.100%, 3/20/19 144A | | | 375,000 | | | | 375 | |
Avis Budget Rental Car Funding AESOP LLC, Series 2013-1A, Class A, 1.920%, 9/20/19 144A | | | 625,000 | | | | 624 | |
BRE Grand Islander Timeshare Issuer, Series 2017-1A, Class A, 2.940%, 5/25/29 144A | | | 543,959 | | | | 540 | |
Hilton Grand Vacations Trust, Series 2014-AA, Class A, 1.770%, 11/25/26 144A | | | 255,062 | | | | 251 | |
MVW Owner Trust, Series 2015-1A, Class A, 2.520%, 12/20/32 144A | | | 503,842 | | | | 501 | |
MVW Owner Trust, Series 2016-1A, Class A, 2.250%, 12/20/33 144A | | | 445,491 | | | | 441 | |
Sierra Receivables Funding Co. LLC, Series 2015-1A, Class A, 2.400%, 3/22/32 144A | | | 140,651 | | | | 140 | |
Sierra Timeshare Receivables Funding LLC, Series 2016-1A, Class A, 3.080%, 3/21/33 144A | | | 406,904 | | | | 408 | |
Towd Point Mortgage Trust, Series 2016-1, Class A1, 3.500%, (AFC), 2/25/55 144A | | | 550,617 | | | | 559 | |
Towd Point Mortgage Trust, Series 2017-2, Class A1, 2.750%, (AFC), 4/25/57 144A | | | 982,175 | | | | 981 | |
VSE VOI Mortgage LLC, Series 2017-A, Class A, 2.330%, 3/20/35 | | | 1,124,560 | | | | 1,109 | |
| | | | | | | | |
Total | | | | | | | 5,929 | |
| | | | | | | | |
| | |
Mortgage Securities (17.1%) | | | | | | | | |
Agate Bay Mortgage Trust, Series 2014-1, Class 1A6, 3.500%, (AFC), 7/25/44 144A | | | 1,185,461 | | | | 1,199 | |
Agate Bay Mortgage Trust, Series 2014-3, Class A2, 3.500%, (AFC), 11/25/44 144A | | | 844,140 | | | | 845 | |
Agate Bay Mortgage Trust, Series 2015-7, Class A3, 3.500%, (AFC), 10/25/45 144A | | | 1,626,825 | | | | 1,653 | |
Agate Bay Mortgage Trust, Series 2016-1, Class A3, 3.500%, (AFC), 12/25/45 144A | | | 1,220,330 | | | | 1,234 | |
Agate Bay Mortgage Trust, Series 2016-2, Class A3, 3.500%, (AFC), 3/25/46 144A | | | 1,489,897 | | | | 1,514 | |
The Accompanying Notes are an Integral Part of the Financial Statements.
| | | | | | |
| | Inflation Protection Portfolio | | | 143 | |
Inflation Protection Portfolio
| | | | | | | | |
| Structured Products (18.6%) | | Shares/
$ Par | | | Value
$ (000’s) | |
| | |
Mortgage Securities continued | | | | | | | | |
Agate Bay Mortgage Trust, Series 2016-3, Class A3, 3.500%, (AFC), 8/25/46 144A | | | 784,045 | | | | 797 | |
BAMLL Commercial Mortgage Securities Trust, Series 2015-200P, Class A, 3.218%, 4/14/33 144A | | | 825,000 | | | | 834 | |
BAMLL Commercial Mortgage Securities Trust, Series 2015-200P, Class B, 3.490%, 4/14/33 | | | 1,110,000 | | | | 1,124 | |
BB-UBS Trust, Series 2012, Class A, 3.430%, 11/5/36 144A | | | 1,000,000 | | | | 1,013 | |
CD Mortgage Trust, Series 2016-CD2, Class A4, 3.526%, (AFC), 11/10/49 | | | 700,000 | | | | 722 | |
Citicorp Mortgage Securities Trust, Series 2007-8, Class 1A3, 6.000%, 9/25/37 | | | 40,015 | | | | 41 | |
Citigroup / Deutsche Bank Mortgage Trust, Series 2016-CD1, Class AM, 2.926%, 8/10/49 | | | 1,000,000 | | | | 968 | |
Commercial Mortgage Pass Through Certificates, Series 2014-CR15, Class AM, 4.426%, (AFC), 2/10/47 | | | 1,000,000 | | | | 1,065 | |
Commercial Mortgage Pass Through Certificates, Series 2014-UBS5, Class AM, 4.193%, (AFC), 9/10/47 | | | 850,000 | | | | 887 | |
Commercial Mortgage Pass Through Certificates, Series 2015-CR22, Class AM, 3.603%, (AFC), 3/10/48 | | | 900,000 | | | | 915 | |
Commercial Mortgage Pass Through Certificates, Series 2016-CR28, Class B, 4.647%, (CSTR), 2/10/49 | | | 880,000 | | | | 940 | |
Commercial Mortgage Pass Through Certificates, Series 2017-PANW, Class A, 3.244%, 11/10/34 | | | 850,000 | | | | 857 | |
Commercial Mortgage Pass Through Certificates, Series 2015-3BP, Class A, 3.178%, 2/10/35 144A | | | 875,000 | | | | 881 | |
Core Industrial Trust, Series 2015-CALW, Class C, 3.555%, 2/10/34 | | | 1,500,000 | | | | 1,523 | |
Core Industrial Trust, Series 2015-TEXW, Class B, 3.329%, 2/10/34 144A | | | 725,000 | | | | 736 | |
Core Industrial Trust, Series 2015-WEST, Class A, 3.292%, 2/10/37 144A | | | 950,000 | | | | 964 | |
Credit Suisse Mortgage Trust, Series 2015-WIN1, Class A10, 3.500%, (AFC), 12/25/44 144A | | | 300,000 | | | | 301 | |
Credit Suisse Mortgage Trust, Series 2017-HL1, Class A3, 3.500%, (AFC), 6/25/47 | | | 1,164,951 | | | | 1,179 | |
Federal Home Loan Mortgage Corp., 4.000%, 5/1/42 | | | 3,692,157 | | | | 3,887 | |
Federal Home Loan Mortgage Corp., 4.500%, 4/1/41 | | | 3,002,820 | | | | 3,232 | |
Federal Home Loan Mortgage Corp., Series DNA3, Class M1, 2.302%, (ICE LIBOR USD 1 Month plus 0.75%), 3/25/30 | | | 650,855 | | | | 653 | |
Federal National Mortgage Association, 4.000%, 2/1/46 | | | 5,531,258 | | | | 5,789 | |
Federal National Mortgage Association, Series 2017-C03, Class 1M1, 2.502%, (ICE LIBOR USD 1 Month plus 0.95%), 10/25/29 | | | 829,391 | | | | 836 | |
Flagstar Mortgage Trust, Series 2017-1, Class 1A5, 3.500%, (AFC), 3/25/47 | | | 1,628,164 | | | | 1,648 | |
GS Mortgage Securities Trust, Series 2015-GC28, Class A5, 3.396%, 2/10/48 | | | 1,000,000 | | | | 1,023 | |
| | | | | | | | |
| Structured Products (18.6%) | | Shares/
$ Par | | | Value
$ (000’s) | |
| | |
Mortgage Securities continued | | | | | | | | |
GS Mortgage Securities Trust, Series 2016-GS2, Class B, 3.759%, (AFC), 5/10/49 | | | 750,000 | | | | 764 | |
Hudson Yards Mortgage Trust, Series 2016-10HY, Class B, 3.076%, (CSTR), 8/10/38 144A | | | 1,175,000 | | | | 1,136 | |
Irvine Core Office Trust, Series 2013-IRV, Class A2, 3.173%, (CSTR), 5/15/48 144A | | | 800,000 | | | | 812 | |
JP Morgan Chase Commercial Mortgage Securities Trust, Series 2013-C16, Class A4, 4.166%, 12/15/46 | | | 600,000 | | | | 641 | |
JP Morgan Chase Commercial Mortgage Securities Trust, Series 2016-JP2, Class A4, 2.822%, 8/15/49 | | | 600,000 | | | | 587 | |
JP Morgan Chase Commercial Mortgage Securities Trust, Series 2016-JP3, Class AS, 3.144%, 8/15/49 | | | 675,000 | | | | 660 | |
JP Morgan Mortgage Trust, Series 2013-1, Class 2A2, 2.500%, (AFC), 3/25/43 144A | | | 830,434 | | | | 825 | |
JP Morgan Mortgage Trust, Series 2014-5, Class A1, 3.000%, (AFC), 10/25/29 144A | | | 914,257 | | | | 923 | |
JP Morgan Mortgage Trust, Series 2016-1, Class A7, 3.500%, 5/25/46 144A | | | 1,750,000 | | | | 1,734 | |
JP Morgan Mortgage Trust, Series 2017-1, Class A2, 3.500%, (AFC), 1/25/47 144A | | | 1,854,521 | | | | 1,880 | |
JPMBB Commercial Mortgage Securities Trust, Series 2014-C21, Class B, 4.341%, (AFC), 8/15/47 | | | 700,000 | | | | 718 | |
JPMDB Commercial Mortgage Securities Trust, Series 2017-C5, Class A4, 3.414%, 3/15/50 | | | 930,000 | | | | 952 | |
Morgan Stanley BAML Trust, Series 2017-C34, Class A3, 3.276%, 11/15/52 | | | 1,350,000 | | | | 1,361 | |
Morgan Stanley Capital I Trust, Series 2014-CPT, Class AM, 3.402%, 7/13/29 | | | 2,000,000 | | | | 2,038 | |
Morgan Stanley Capital I Trust, Series 2014-CPT, Class C, 3.446%, (CSTR), 7/13/29 144A | | | 600,000 | | | | 604 | |
Morgan Stanley Capital I Trust, Series 2016-UB11, Class A4, 2.782%, 8/15/49 | | | 1,575,000 | | | | 1,535 | |
New Residential Mortgage Loan Trust, Series 2017-2A, Class A3, 4.000%, (CSTR), 3/25/57 144A | | | 1,386,485 | | | | 1,433 | |
New Residential Mortgage Loan Trust, Series 2017-5A, Class A1, 3.052%, (ICE LIBOR USD 1 Month plus 1.50%), (AFC), 6/25/57 | | | 1,560,485 | | | | 1,599 | |
PHHMC Mortgage Pass-Through Certificates, Series 2007-6, Class A1, 5.897%, (CSTR), 12/18/37 | | | 5,953 | | | | 6 | |
Sequoia Mortgage Trust, Series 2013-12, Class A1, 4.000%, 12/25/43 144A | | | 194,301 | | | | 201 | |
Sequoia Mortgage Trust, Series 2014-3, Class A14, 3.000%, (AFC), 10/25/44 144A | | | 251,394 | | | | 253 | |
Sequoia Mortgage Trust, Series 2014-4, Class A2, 3.500%, (AFC), 11/25/44 144A | | | 227,603 | | | | 231 | |
Sequoia Mortgage Trust, Series 2017-5, Class A4, 3.500%, (AFC), 8/25/47 | | | 1,601,695 | | | | 1,624 | |
Sequoia Mortgage Trust, Series 2017-7, Class A7, 3.500%, 10/25/47 | | | 2,250,000 | | | | 2,231 | |
Sequoia Mortgage Trust, Series 2017-CH1, Class A1, 4.000%, (AFC), 10/25/47 | | | 1,876,452 | | | | 1,908 | |
Structured Adjustable Rate Mortgage Loan Trust, Series 2004-6, Class 3A2, 3.447%, (CSTR), 6/25/34 | | | 435,683 | | | | 453 | |
The Accompanying Notes are an Integral Part of the Financial Statements.
| | | | |
| 144 | | Inflation Protection Portfolio | | |
Inflation Protection Portfolio
| | | | | | | | |
| Structured Products (18.6%) | | Shares/
$ Par | | | Value
$ (000’s) | |
| | |
Mortgage Securities continued | | | | | | | | |
Thornburg Mortgage Securities Trust, Series 2004-3, Class A, 2.292%, (ICE LIBOR USD 1 Month plus 0.74%), (AFC), 9/25/44 | | | 329,335 | | | | 312 | |
USB Commercial Mortgage Trust, Series 2017-C1, Class A3, 3.196%, 6/15/50 | | | 700,000 | | | | 702 | |
Wells Fargo Mortgage Backed Securities Trust, Series 2005-17, Class 1A1, 5.500%, 1/25/36 | | | 37,833 | | | | 37 | |
Wells Fargo Mortgage Backed Securities Trust, Series 2005-AR10, Class 1A1, 3.473%, (CSTR), 6/25/35 | | | 270,812 | | | | 283 | |
Wells Fargo Mortgage Backed Securities Trust, Series 2005-AR10, Class 2A15, 3.473%, (CSTR), 6/25/35 | | | 782,896 | | | | 804 | |
Wells Fargo Mortgage Backed Securities Trust, Series 2006-10, Class A4, 6.000%, 8/25/36 | | | 53,168 | | | | 53 | |
Wells Fargo Mortgage Backed Securities Trust, Series 2007-AR10, Class 1A1, 3.806%, (CSTR), 1/25/38 | | | 53,918 | | | | 51 | |
WinWater Mortgage Loan Trust, Series 2014-1, Class A4, 3.500%, (AFC), 6/20/44 144A | | | 184,672 | | | | 186 | |
| | | | | | | | |
Total | | | | | | | 68,797 | |
| | | | | | | | |
| | |
Total Structured Products | | | | | | | | |
(Cost: $75,081) | | | | | | | 74,726 | |
| | | | | | | | |
| | | | | | | | |
| Short-Term Investments (5.3%) | | Shares/
$ Par | | | Value
$ (000’s) | |
| | |
Money Market Funds (4.7%) | | | | | | | | |
State Street Institutional U.S. Government Money Market Fund - Premier Class, 1.209% # | | | 18,971,973 | | | | 18,972 | |
| | | | | | | | |
Total | | | | | | | 18,972 | |
| | | | | | | | |
| | |
US Government & Agencies (0.6%) | | | | | | | | |
US Treasury, 0.000%, 5/3/18 | | | 2,500,000 | | | | 2,488 | |
| | | | | | | | |
Total | | | | | | | 2,488 | |
| | | | | | | | |
| | |
Total Short-Term Investments | | | | | | | | |
(Cost: $21,460) | | | | | | | 21,460 | |
| | | | | | | | |
| | |
Total Investments (97.4%) | | | | | | | | |
(Cost: $387,543)(a) | | | | | | | 390,980 | |
| | | | | | | | |
Other Assets, Less Liabilities (2.6%) | | | | | | | 10,731 | |
| | | | | | | | |
Net Assets (100.0%) | | | | | | | 401,711 | |
| | | | | | | | |
| # | 7-day yield as of December 31, 2017. |
144A after the name of a security represents a security exempt from registration under Rule 144A of the Securities Act of 1933. These securities may be resold as transactions exempt from registration, normally to qualified institutional buyers. At December 31, 2017 the value of these securities (in thousands) was $29,759 representing 7.4% of the net assets.
AFC — Available Funds Cap security—Security accrues interest at an assumed or uncapped rate. If the interest rate on the underlying loans is lower than the uncapped rate, then the security will pay at the lower rate.
CSTR — Collateral Strip Rate security—interest is based on the weighted net interest rate of the collateral.
GO — General Obligation
RB — Revenue Bond
| (a) | At December 31, 2017, the aggregate cost of investments, including derivatives, for federal tax purposes (in thousands) was $387,400 and the net unrealized appreciation of investments based on that cost was $647 which is comprised of $7,951 aggregate gross unrealized appreciation and $7,304 aggregate gross unrealized depreciation. |
| (b) | All or a portion of the securities have been pledged as collateral for open futures positions or when-issued securities. Information regarding open futures contracts as of period end is summarized below. |
| | | | | | | | | | | | | | | | | | |
| Issuer | | Long/Short | | Currency | | Notional Par
(000’s) | | Number of
Contracts | | Expiration
Date | | Notional Value
(000’s) | | | Unrealized
Appreciation/
(Depreciation)
(000’s) | |
US Long Treasury Bond Futures | | Short | | USD | | $8,700 | | 87 | | 3/18 | | $ | 13,311 | | | $ | 20 | |
US Ten Year Treasury Note Futures | | Short | | USD | | 4,800 | | 48 | | 3/18 | | | 5,954 | | | | 31 | |
US Ten Year Ultra Treasury Bond Futures | | Short | | USD | | 6,000 | | 60 | | 3/18 | | | 8,014 | | | | 36 | |
US Two Year Treasury Note Futures | | Long | | USD | | 41,200 | | 206 | | 3/18 | | | 44,107 | | | | (90 | ) |
US Ultra Long Treasury Bond Futures | | Short | | USD | | 1,900 | | 19 | | 3/18 | | | 3,185 | | | | (15 | ) |
| (f) | Foreign Bond — par value is foreign denominated |
The Accompanying Notes are an Integral Part of the Financial Statements.
| | | | | | |
| | Inflation Protection Portfolio | | | 145 | |
Inflation Protection Portfolio
| (h) | Forward foreign currency contracts outstanding on December 31, 2017. |
| | | | | | | | | | | | | | | | | | | | | | |
| Type | | Counterparty | | Currency | | Foreign
Principal
Amount
Covered by
Contract (000s) | | USD Principal
Amount
Covered by
Contract (000’s) | | Settlement
Month | | Unrealized
Appreciation
(000’s) | | | Unrealized
(Depreciation)
(000’s) | | | Net Unrealized
Appreciation/
(Depreciation)
(000’s) | |
Sell | | Morgan Stanley Capital Services, Inc. | | AUD | | 1,294 | | 1,009 | | 3/18 | | $ | - | | | $ | (26 | ) | | $ | (26 | ) |
Sell | | Morgan Stanley Capital Services, Inc. | | CAD | | 2,844 | | 2,265 | | 3/18 | | | - | | | | (50 | ) | | | (50 | ) |
| | | | | | | | | | | | | | | | | | | | | | |
| | | | | | | | | | | | $ | - | | | $ | (76 | ) | | $ | (76 | ) |
| | | | | | | | | | | | | | | | | | | | | | |
AUD — Australian Dollar
CAD — Canadian Dollar
CPURNSA — U.S. Consumer Price Index — All Urban Consumers — Not Seasonally Adjusted
| (j) | Swap agreements outstanding on December 31, 2017. |
Total Return Swaps
| | | | | | | | | | | | | | | | | | | | |
| Floating Rate Index | | Counterparty | | Pay/Receive
Floating
Rate | | Fixed
Rate | | Expiration
Date | | Notional
Amount
(000’s) | | | Unrealized
Appreciation/
(Depreciation)(000’s) | | | Market
Value
(000’s) | |
CPURNSA | | Bank of America, N.A. | | Receive | | 2.42% | | 4/18 | | | 2,000 | | | $ | (139 | ) | | $ | (139 | ) |
CPURNSA | | Bank of America, N.A. | | Receive | | 2.22% | | 5/18 | | | 2,500 | | | | (119 | ) | | | (119 | ) |
CPURNSA | | Bank of America, N.A. | | Receive | | 2.21% | | 3/19 | | | 6,500 | | | | (253 | ) | | | (253 | ) |
CPURNSA | | Bank of America, N.A. | | Receive | | 2.64% | | 3/19 | | | 4,500 | | | | (340 | ) | | | (340 | ) |
CPURNSA | | Bank of America, N.A. | | Receive | | 2.51% | | 3/19 | | | 2,000 | | | | (175 | ) | | | (175 | ) |
CPURNSA | | Barclays Bank PLC | | Receive | | 1.71% | | 2/20 | | | 1,000 | | | | (2 | ) | | | (2 | ) |
CPURNSA | | Bank of America, N.A. | | Receive | | 2.64% | | 2/20 | | | 2,800 | | | | (302 | ) | | | (302 | ) |
CPURNSA | | Bank of America, N.A. | | Receive | | 2.67% | | 4/22 | | | 3,000 | | | | (372 | ) | | | (372 | ) |
CPURNSA | | Barclays Bank PLC | | Receive | | 2.53% | | 5/23 | | | 5,500 | | | | (476 | ) | | | (476 | ) |
CPURNSA | | Barclays Bank PLC | | Receive | | 2.54% | | 5/23 | | | 1,000 | | | | (87 | ) | | | (87 | ) |
CPURNSA | | Barclays Bank PLC | | Receive | | 2.59% | | 7/24 | | | 1,400 | | | | (117 | ) | | | (117 | ) |
CPURNSA | | Bank of America, N.A. | | Receive | | 2.53% | | 8/24 | | | 2,750 | | | | (212 | ) | | | (212 | ) |
CPURNSA | | Barclays Bank PLC | | Receive | | 2.39% | | 9/24 | | | 4,000 | | | | (242 | ) | | | (242 | ) |
CPURNSA | | Barclays Bank PLC | | Receive | | 2.31% | | 9/24 | | | 1,400 | | | | (73 | ) | | | (73 | ) |
CPURNSA | | Bank of America, N.A. | | Receive | | 2.14% | | 7/25 | | | 2,900 | | | | (23 | ) | | | (23 | ) |
CPURNSA | | Bank of America, N.A. | | Receive | | 1.79% | | 8/25 | | | 1,500 | | | | 36 | | | | 36 | |
CPURNSA | | Goldman Sachs International | | Receive | | 1.87% | | 5/26 | | | 17,000 | | | | 562 | | | | 562 | |
CPURNSA | | Goldman Sachs International | | Receive | | 1.92% | | 5/26 | | | 7,000 | | | | 197 | | | | 197 | |
CPURNSA | | Goldman Sachs International | | Receive | | 1.77% | | 6/26 | | | 6,000 | | | | 255 | | | | 255 | |
CPURNSA | | Goldman Sachs International | | Receive | | 2.25% | | 11/26 | | | 3,000 | | | | (15 | ) | | | (15 | ) |
CPURNSA | | Goldman Sachs International | | Receive | | 2.28% | | 11/26 | | | 3,000 | | | | (26 | ) | | | (26 | ) |
CPURNSA | | Goldman Sachs International | | Receive | | 2.28% | | 11/26 | | | 4,000 | | | | (35 | ) | | | (35 | ) |
CPURNSA | | Bank of America, N.A. | | Receive | | 2.24% | | 4/27 | | | 3,500 | | | | (27 | ) | | | (27 | ) |
CPURNSA | | Bank of America, N.A. | | Receive | | 2.22% | | 4/27 | | | 2,000 | | | | (11 | ) | | | (11 | ) |
CPURNSA | | Bank of America, N.A. | | Receive | | 2.24% | | 4/27 | | | 2,000 | | | | (13 | ) | | | (13 | ) |
CPURNSA | | Bank of America, N.A. | | Receive | | 2.24% | | 5/27 | | | 5,000 | | | | (32 | ) | | | (32 | ) |
CPURNSA | | Barclays Bank PLC | | Receive | | 2.90% | | 12/27 | | | 1,700 | | | | (409 | ) | | | (409 | ) |
CPURNSA | | Barclays Bank PLC | | Receive | | 2.78% | | 7/44 | | | 1,400 | | | | (310 | ) | | | (310 | ) |
CPURNSA | | Bank of America, N.A. | | Receive | | 2.76% | | 3/23 | | | 700 | | | | (77 | ) | | | (77 | ) |
CPURNSA | | Barclays Bank PLC | | Receive | | 2.36% | | 9/24 | | | 3,500 | | | | (201 | ) | | | (201 | ) |
| | | | | | | | | | | | | | | | | | | | |
| | | $ | (3,038 | ) | | $ | (3,038 | ) |
| | | | | | | | | | | | | | | | | | | | |
Centrally Cleared Total Return Swaps
| | | | | | | | | | | | | | | | | | | | |
| Floating Rate Index | | Pay/Receive
Floating
Rate | | Fixed
Rate | | Expiration
Date | | Upfront
Premiums Paid/
Received
(000’s) | | | Notional
Amount
(000’s) | | Unrealized
Appreciation/
(Depreciation)(000’s) | | | Market
Value
(000’s) | |
U.S. Consumer Price Index – 3 Month USD LIBOR | | Receive | | 2.16% | | 9/27 | | $ | - | | | 9,000 | | $ | 94 | | | $ | 94 | |
U.S. Consumer Price Index – 3 Month USD LIBOR | | Receive | | 2.15% | | 11/27 | | | 1 | | | 5,000 | | | 44 | | | $ | 44 | |
U.S. Consumer Price Index – 3 Month USD LIBOR | | Receive | | 2.07% | | 8/27 | | | - | | | 3,500 | | | 61 | | | $ | 61 | |
| | | | | | | | | | | | | | | | | | | | |
| | $ | 199 | | | $ | 199 | |
| | | | | | | | |
The Accompanying Notes are an Integral Part of the Financial Statements.
| | | | |
| 146 | | Inflation Protection Portfolio | | |
Inflation Protection Portfolio
| (k) | Cash or securities with an aggregate value of $4,538 (in thousands) has been pledged as collateral for swap contracts outstanding, short sales or written options on December 31, 2017. |
The following is a summary of the inputs used in valuing the Portfolio’s assets and liabilities at December 31, 2017. See Note 3 for additional information on portfolio valuation.
| | | | | | | | | | | | | | |
| | | Valuation Inputs | | | |
| Description | | Level 1 –
Quoted Prices | | | Level 2 –
Other Significant
Observable Inputs | | | Level 3 –
Significant
Unobservable Inputs | | | |
| | | (Amounts in thousands) | | | |
Assets: | | | | | | | | | | | | | | |
Municipal Bonds | | $ | - | | | $ | 1,552 | | | $ | - | | | |
Corporate Bonds | | | - | | | | 82,934 | | | | - | | | |
Governments | | | - | | | | 210,308 | | | | - | | | |
Structured Products | | | - | | | | 74,726 | | | | - | | | |
Short-Term Investments | | | | | | | | | | | | | | |
Money Market Funds | | | 18,972 | | | | - | | | | - | | | |
US Government & Agencies | | | - | | | | 2,488 | | | | - | | | |
Other Financial Instruments^ | | | | | | | | | | | | | | |
Futures | | | 87 | | | | - | | | | - | | | |
Total Return Swaps | | | - | | | | 1,249 | | | | - | | | |
Total Assets: | | $ | 19,059 | | | $ | 373,257 | | | $ | - | | | |
Liabilities: | | | | | | | | | | | | | | |
Other Financial Instruments^ | | | | | | | | | | | | | | |
Futures | | | (105 | ) | | | - | | | | - | | | |
Forward Currency Contracts | | | - | | | | (76 | ) | | | - | | | |
Total Return Swaps | | | - | | | | (4,088 | ) | | | - | | | |
Total Liabilities: | | $ | (105 | ) | | $ | (4,164 | ) | | $ | - | | | |
^ Other financial instruments are derivative instruments such as futures and forwards, which are valued at the unrealized appreciation (depreciation) on the instrument and short sales, written options and swaps contracts, which are valued at market value.
The Accompanying Notes are an Integral Part of the Financial Statements.
| | | | | | |
| | Inflation Protection Portfolio | | | 147 | |
High Yield Bond Portfolio (unaudited)
| | | | |
| Objective: | | Portfolio Strategy: | | Net Assets: |
High current income and capital appreciation. | | Invest in non-investment grade debt securities. | | $812 million |
Portfolio Overview
Mason Street Advisors, LLC (“Mason Street Advisors”), the investment adviser for the High Yield Bond Portfolio (the “Portfolio”), has engaged Federated Investment Management Company (“Federated”) to act as sub-adviser for the Portfolio. Normally, the Portfolio invests in non-investment grade debt securities, which are securities rated below investment grade by major credit rating agencies, or if unrated, determined to be of comparable quality. The Portfolio may invest up to 30% of net assets in non-investment grade foreign securities. The securities in which the Portfolio primarily invests are considered speculative and are sometimes known as “junk bonds.” These securities tend to offer higher yields than higher rated securities of comparable maturities primarily because of the market’s greater uncertainty about the issuer’s ability to make all required interest and principal payments, and therefore about the returns that will in fact be realized by the Portfolio. The Portfolio invests in securities believed to have attractive investment characteristics and seeks to minimize default risk and other risks through careful security selection and diversification. The Portfolio’s security selection process consists of a credit-intensive, fundamental analysis of the issuer. The Portfolio does not limit the investments to securities of a particular maturity range.
Market Overview
The high yield market posted a solid return in 2017, benefiting from a synchronized global economic expansion. The market environment was characterized by a business-friendly administration in Washington, accommodative central bank policy outside the U.S., high levels of employment and strong levels of business and consumer confidence. These factors led to strong corporate earnings, high levels of cash generation by high yield companies and declining default rates, all of which supported high yield bonds. The impact of these factors can be seen in the narrowing spread between high yield bonds and U.S. Treasury securities with comparable maturities. According to the Bloomberg Barclays® U.S. Corporate High Yield 2% Issuer Capped Index, the aggregate high yield spread began the reporting period at 409 basis points and ended the reporting period at 343 basis points.
Within the high yield market, major industry sectors that substantially outperformed the overall market included Pharmaceuticals, Transportation Services, Banking, Electric Utilities and Diversified Manufacturing. Major industry sectors that substantially underperformed the overall market included Wireline Telecommunications, Retail, Consumer Products, Wireless Telecommunications and Media & Entertainment. From a credit quality perspective, lower quality bonds performed best, as the CCC-rated sector returned 10.38%, while the BB-rated and B-rated sectors returned 7.32% and 6.48%, respectively.
Portfolio Results
The Portfolio returned 6.88% for the twelve months ended December 31, 2017. By comparison, the Portfolio’s benchmark, the Bloomberg Barclays® U.S. Corporate High Yield 2% Issuer Capped Index (the “Index”), returned 7.50%. (The Index is unmanaged, cannot be invested in directly and does not include administrative expenses.) According to Lipper® Analytical Services, Inc., an independent mutual fund rating agency, the average return for the High Yield Funds peer group was 6.49% for 2017.
The Portfolio was negatively impacted by its security selection during the period. This was especially true in the Retail, Consumer Products, Pharmaceutical, Midstream and Chemicals industry sectors. Specific high yield issuers held by the Portfolio that negatively impacted performance relative to the Index included FGI Operating Co., PetSmart, Mallinckrodt, Team Health and Northern Oil & Gas.
The Portfolio was positively impacted by its sector allocation during the period under review. This was mainly a result of its substantial underweight to the poorly performing Wireline Telecommunications industry sector. This was partially offset by the Portfolio’s cash holdings and its underweight to the strong performing Banking sector. An overweight to the strong performing Pharmaceutical sector and an underweight to the poorly performing Retail sector helped to offset some of the poor security selection in these two sectors.
The Portfolio was positively impacted by security selection in the Healthcare, Cable & Satellite, Automotive, Wireless Telecommunications, Packaging, Metals and the Media & Entertainment industry sectors. Specific high yield issuers held by the Portfolio that positively impacted performance relative to the Index included Intelsat, Ortho-Clinical Diagnostics, Valeant Pharmaceutical, Tenet Healthcare and Freeport-McMoRan.
| | | | |
| 148 | | High Yield Bond Portfolio | | |
High Yield Bond Portfolio (unaudited)
Portfolio Manager Outlook
The following forward-looking comments are the opinion of Federated, the Portfolio’s sub-adviser.
We continue to believe that the lows in credit spreads for this cycle are yet to come as the synchronized global economic expansion, strong corporate earnings aided by tax reform and surging corporate valuations, as illustrated by rising stock markets, will push credit spreads to lows consistent with prior cycles. However, low absolute (and possible rising) interest rates and well below median starting yield spread levels will most likely temper both the absolute and relative returns expected for high yield bonds. In the short term, tax reform will benefit most high yield issuers; although, a subset may be negatively impacted by a limit on the deductibility of interest expense. Intermediate term, the limits on the deductibility of interest expense may lead those corporations negatively impacted to optimize their capital structures to reduce this negative impact.
Relative Performance
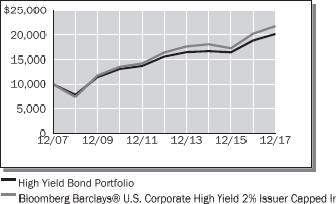
| | | | | | | | | | | | |
Average Annual Total Returns
For Periods Ended December 31, 2017 | |
| | | 1 Year | | | 5 Years | | | 10 Years | |
High Yield Bond Portfolio | | | 6.88 | % | | | 5.28 | % | | | 7.28 | % |
Bloomberg Barclays® U.S. Corporate High Yield 2% Issuer Capped Index | | | 7.50 | % | | | 5.78 | % | | | 8.09 | % |
Lipper® Variable Insurance Products (VIP) High Yield Funds Average | | | 6.49 | % | | | 4.74 | % | | | 6.46 | % |
The performance data quoted represents past performance. Past performance is historical and does not guarantee future performance. Investment return and principal value will fluctuate, so that shares, when redeemed, may be worth more or less than their original cost. Current performance may be lower or higher than the performance data quoted. For the most recent month-end performance information visit www.northwesternmutual.com.
This chart assumes an initial investment of $10,000 made on 12/31/07. Returns shown reflect fee waivers, deductions for management and other portfolio expenses, and reinvestment of all dividends. In the absence of fee waivers, total return would be reduced. Returns exclude deductions for separate account sale loads and account fees. Please refer to the Benchmark Definitions section of this report for information about the indices cited in the above chart and graph.
The Portfolio invests in lower quality securities, which may represent a significant risk for loss of principal and interest. Bonds and other debt obligations are affected by changes in interest rates, inflation risk and the creditworthiness of their issuers. High yield bonds generally have greater price swings and higher default risks than investment grade bonds. Return of principal is not guaranteed. When interest rates rise, bond prices fall. With a fixed income fund, when interest rates rise, the value of the fund’s existing bonds drops, which could negatively affect overall fund performance.
Investing in bonds issued by foreign corporations and governments carries additional risk, including foreign currency risk, and may increase the volatility of the Portfolio’s performance.
Currently, interest rates remain at historically low levels on a relative basis, although the U.S. federal funds rate has been subject to modest increases over the course of the last two years. A significant rise in interest rates over a short period of time could cause significant losses in the market value of the Portfolio’s fixed income investments.
| | | | | | |
| | High Yield Bond Portfolio | | | 149 | |
High Yield Bond Portfolio (unaudited)
Top 10 Fixed Income Holdings 12/31/17
| | | | | | | | |
Security Description | | | % of Net Assets | | | | | |
HCA, Inc., Various | | | 1.9 | % | | | | |
Valeant Pharmaceuticals International, Inc., Various | | | 1.8 | % | | | | |
CCO Holdings LLC / CCO Holdings Capital Corp., Various | | | 1.3 | % | | | | |
First Data Corp., Various | | | 1.2 | % | | | | |
T-Mobile USA, Inc., Various | | | 1.1 | % | | | | |
Sprint Corp., Various | | | 1.0 | % | | | | |
TransDigm, Inc., Various | | | 0.9 | % | | | | |
Post Holdings, Inc., Various | | | 0.9 | % | | | | |
Intelsat Jackson Holdings SA, Various | | | 0.9 | % | | | | |
BWAY Holding Co., Various | | | 0.9 | % | | | | |
Sector Allocation 12/31/17
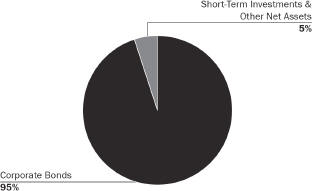
Sector Allocation is based on Net Assets.
Sector Allocation and Top 10 Holdings are subject to change.
| | | | |
| 150 | | High Yield Bond Portfolio | | |
High Yield Bond Portfolio
Schedule of Investments
December 31, 2017
| | | | | | | | |
| Corporate Bonds (95.4%) | | Shares/
$ Par | | | Value
$ (000’s) | |
| | |
Basic Materials (4.8%) | | | | | | | | |
Alpha 3 BV / Alpha US Bidco, Inc., 6.250%, 2/1/25 144A | | | 2,250,000 | | | | 2,306 | |
ArcelorMittal, 6.125%, 6/1/25 | | | 425,000 | | | | 489 | |
Clearwater Paper Corp., 5.375%, 2/1/25 144A | | | 3,350,000 | | | | 3,367 | |
Compass Minerals International, Inc., 4.875%, 7/15/24 144A | | | 2,225,000 | | | | 2,192 | |
Freeport-McMoRan, Inc., 3.550%, 3/1/22 | | | 175,000 | | | | 173 | |
Freeport-McMoRan, Inc., 3.875%, 3/15/23 | | | 2,775,000 | | | | 2,761 | |
Freeport-McMoRan, Inc., 5.400%, 11/14/34 | | | 3,425,000 | | | | 3,485 | |
Hexion, Inc., 6.625%, 4/15/20 | | | 3,000,000 | | | | 2,692 | |
HudBay Minerals, Inc., 7.250%, 1/15/23 144A | | | 600,000 | | | | 636 | |
HudBay Minerals, Inc., 7.625%, 1/15/25 144A | | | 1,050,000 | | | | 1,150 | |
Huntsman International LLC, 4.875%, 11/15/20 | | | 730,000 | | | | 759 | |
Platform Specialty Products Corp., 5.875%, 12/1/25 144A | | | 1,450,000 | | | | 1,439 | |
Platform Specialty Products Corp., 6.500%, 2/1/22 144A | | | 5,000,000 | | | | 5,169 | |
PQ Corp., 5.750%, 12/15/25 144A | | | 350,000 | | | | 356 | |
PQ Corp., 6.750%, 11/15/22 144A | | | 450,000 | | | | 480 | |
Signode Industrial Group Lux SA / Signode Industrial Group US, Inc., 6.375%, 5/1/22 144A | | | 4,175,000 | | | | 4,363 | |
Steel Dynamics, Inc., 5.000%, 12/15/26 | | | 525,000 | | | | 555 | |
Steel Dynamics, Inc., 5.125%, 10/1/21 | | | 620,000 | | | | 635 | |
Steel Dynamics, Inc., 5.500%, 10/1/24 | | | 930,000 | | | | 988 | |
Teck Resources, Ltd., 6.000%, 8/15/40 | | | 850,000 | | | | 946 | |
Teck Resources, Ltd., 6.125%, 10/1/35 | | | 1,075,000 | | | | 1,204 | |
Teck Resources, Ltd., 6.250%, 7/15/41 | | | 175,000 | | | | 200 | |
Teck Resources, Ltd., 8.500%, 6/1/24 144A | | | 1,175,000 | | | | 1,328 | |
Valvoline, Inc., 5.500%, 7/15/24 | | | 300,000 | | | | 319 | |
Versum Materials, Inc., 5.500%, 9/30/24 144A | | | 550,000 | | | | 589 | |
W.R. Grace & Co., 5.625%, 10/1/24 144A | | | 480,000 | | | | 518 | |
| | | | | | | | |
Total | | | | | | | 39,099 | |
| | | | | | | | |
| | |
Communications (17.8%) | | | | | | | | |
Acosta, Inc., 7.750%, 10/1/22 144A | | | 2,850,000 | | | | 2,080 | |
Altice Luxembourg SA, 7.625%, 2/15/25 144A | | | 3,875,000 | | | | 3,710 | |
Altice Luxembourg SA, 7.750%, 5/15/22 144A | | | 200,000 | | | | 196 | |
Altice US Finance I Corp., 5.375%, 7/15/23 144A | | | 1,100,000 | | | | 1,127 | |
Altice US Finance I Corp., 5.500%, 5/15/26 144A | | | 650,000 | | | | 662 | |
AMC Networks, Inc., 4.750%, 8/1/25 | | | 1,550,000 | | | | 1,536 | |
AMC Networks, Inc., 5.000%, 4/1/24 | | | 1,875,000 | | | | 1,898 | |
Anixter, Inc., 5.500%, 3/1/23 | | | 275,000 | | | | 296 | |
Cablevision Systems Corp., 5.875%, 9/15/22 | | | 2,225,000 | | | | 2,192 | |
CBS Radio, Inc., 7.250%, 11/1/24 144A | | | 1,675,000 | | | | 1,766 | |
CCO Holdings LLC, 5.000%, 2/1/28 144A | | | 2,450,000 | | | | 2,383 | |
CCO Holdings LLC / CCO Holdings Capital Corp., 5.125%, 5/1/27 144A | | | 1,475,000 | | | | 1,453 | |
CCO Holdings LLC / CCO Holdings Capital Corp., 5.250%, 9/30/22 | | | 1,350,000 | | | | 1,384 | |
CCO Holdings LLC / CCO Holdings Capital Corp., 5.375%, 5/1/25 144A | | | 650,000 | | | | 670 | |
CCO Holdings LLC / CCO Holdings Capital Corp., 5.500%, 5/1/26 144A | | | 550,000 | | | | 564 | |
| | | | | | | | |
| Corporate Bonds (95.4%) | | Shares/
$ Par | | | Value
$ (000’s) | |
| | |
Communications continued | | | | | | | | |
CCO Holdings LLC / CCO Holdings Capital Corp., 5.750%, 9/1/23 | | | 1,000,000 | | | | 1,025 | |
CCO Holdings LLC / CCO Holdings Capital Corp., 5.750%, 1/15/24 | | | 3,050,000 | | | | 3,142 | |
CCO Holdings LLC / CCO Holdings Capital Corp., 5.750%, 2/15/26 144A | | | 1,825,000 | | | | 1,896 | |
CCO Holdings LLC / CCO Holdings Capital Corp., 5.875%, 5/1/27 144A | | | 575,000 | | | | 591 | |
Cequel Communications Holdings I LLC / Cequel Capital Corp., 5.125%, 12/15/21 144A | | | 3,335,000 | | | | 3,335 | |
Cequel Communications Holdings I LLC / Cequel Capital Corp., 7.750%, 7/15/25 144A | | | 1,325,000 | | | | 1,418 | |
Clear Channel International BV, 8.750%, 12/15/20 144A | | | 375,000 | | | | 387 | |
Clear Channel Worldwide Holdings, Inc.,
6.500%, 11/15/22 | | | 2,925,000 | | | | 2,973 | |
CommScope Technologies LLC, 6.000%, 6/15/25 144A | | | 650,000 | | | | 691 | |
CommScope, Inc., 5.500%, 6/15/24 144A | | | 1,925,000 | | | | 2,002 | |
CSC Holdings LLC, 5.250%, 6/1/24 | | | 1,450,000 | | | | 1,421 | |
CSC Holdings LLC, 5.500%, 4/15/27 144A | | | 2,250,000 | | | | 2,295 | |
CSC Holdings LLC, 6.625%, 10/15/25 144A | | | 1,250,000 | | | | 1,353 | |
CSC Holdings LLC, 10.125%, 1/15/23 144A | | | 1,000,000 | | | | 1,126 | |
Digicel Group, Ltd., 7.125%, 4/1/22 144A | | | 525,000 | | | | 486 | |
Digicel Group, Ltd., 8.250%, 9/30/20 144A | | | 425,000 | | | | 418 | |
DISH DBS Corp., 5.000%, 3/15/23 | | | 1,810,000 | | | | 1,720 | |
DISH DBS Corp., 5.875%, 7/15/22 | | | 1,080,000 | | | | 1,085 | |
DISH DBS Corp., 5.875%, 11/15/24 | | | 3,075,000 | | | | 2,990 | |
DISH DBS Corp., 7.750%, 7/1/26 | | | 500,000 | | | | 526 | |
The EW Scripps Co., 5.125%, 5/15/25 144A | | | 400,000 | | | | 398 | |
Gray Television, Inc., 5.125%, 10/15/24 144A | | | 675,000 | | | | 673 | |
Gray Television, Inc., 5.875%, 7/15/26 144A | | | 2,150,000 | | | | 2,204 | |
iHeartCommunications, Inc., 9.000%, 3/1/21 | | | 600,000 | | | | 429 | |
iHeartCommunications, Inc., 9.000%, 9/15/22 | | | 1,515,000 | | | | 1,087 | |
Intelsat Jackson Holdings SA, 5.500%, 8/1/23 | | | 2,925,000 | | | | 2,391 | |
Intelsat Jackson Holdings SA, 7.250%, 10/15/20 | | | 1,490,000 | | | | 1,401 | |
Intelsat Jackson Holdings SA, 7.500%, 4/1/21 | | | 1,550,000 | | | | 1,411 | |
Intelsat Jackson Holdings SA, 8.000%, 2/15/24 144A | | | 1,125,000 | | | | 1,184 | |
Intelsat Jackson Holdings SA, 9.750%, 7/15/25 144A | | | 950,000 | | | | 914 | |
Lamar Media Corp., 5.875%, 2/1/22 | | | 1,725,000 | | | | 1,762 | |
LIN Television Corp., 5.875%, 11/15/22 | | | 2,000,000 | | | | 2,080 | |
Match Group, Inc., 5.000%, 12/15/27 144A | | | 1,150,000 | | | | 1,167 | |
Match Group, Inc., 6.375%, 6/1/24 | | | 725,000 | | | | 786 | |
Nexstar Broadcasting, Inc., 6.125%, 2/15/22 144A | | | 1,850,000 | | | | 1,915 | |
Nexstar Escrow Corp., 5.625%, 8/1/24 144A | | | 1,075,000 | | | | 1,110 | |
Outdoor Americas Capital LLC / Outfront Media Capital Corp., 5.875%, 3/15/25 | | | 1,850,000 | | | | 1,956 | |
Radio One, Inc., 7.375%, 4/15/22 144A | | | 1,825,000 | | | | 1,820 | |
Radio One, Inc., 9.250%, 2/15/20 144A | | | 1,450,000 | | | | 1,363 | |
SFR Group SA, 6.000%, 5/15/22 144A | | | 345,000 | | | | 349 | |
SFR Group SA, 6.250%, 5/15/24 144A | | | 850,000 | | | | 852 | |
SFR Group SA, 7.375%, 5/1/26 144A | | | 5,425,000 | | | | 5,588 | |
Sinclair Television Group, Inc., 5.125%, 2/15/27 144A | | | 1,150,000 | | | | 1,140 | |
Sinclair Television Group, Inc., 5.375%, 4/1/21 | | | 1,370,000 | | | | 1,394 | |
The Accompanying Notes are an Integral Part of the Financial Statements.
| | | | | | |
| | High Yield Bond Portfolio | | | 151 | |
High Yield Bond Portfolio
| | | | | | | | |
| Corporate Bonds (95.4%) | | Shares/
$ Par | | | Value
$ (000’s) | |
| | |
Communications continued | | | | | | | | |
Sinclair Television Group, Inc., 5.625%, 8/1/24 144A | | | 825,000 | | | | 851 | |
Sinclair Television Group, Inc., 5.875%, 3/15/26 144A | | | 325,000 | | | | 338 | |
Sinclair Television Group, Inc., 6.125%, 10/1/22 | | | 990,000 | | | | 1,020 | |
Sirius XM Radio, Inc., 4.625%, 5/15/23 144A | | | 550,000 | | | | 562 | |
Sirius XM Radio, Inc., 5.000%, 8/1/27 144A | | | 775,000 | | | | 777 | |
Sirius XM Radio, Inc., 5.375%, 4/15/25 144A | | | 1,100,000 | | | | 1,145 | |
Sirius XM Radio, Inc., 5.375%, 7/15/26 144A | | | 1,675,000 | | | | 1,736 | |
Sirius XM Radio, Inc., 6.000%, 7/15/24 144A | | | 2,185,000 | | | | 2,311 | |
Sprint Capital Corp., 6.875%, 11/15/28 | | | 4,375,000 | | | | 4,402 | |
Sprint Communications, Inc., 6.000%, 11/15/22 | | | 1,675,000 | | | | 1,675 | |
Sprint Corp., 7.125%, 6/15/24 | | | 1,150,000 | | | | 1,170 | |
Sprint Corp., 7.875%, 9/15/23 | | | 6,190,000 | | | | 6,592 | |
Symantec Corp., 5.000%, 4/15/25 144A | | | 1,075,000 | | | | 1,118 | |
TEGNA, Inc., 5.125%, 7/15/20 | | | 980,000 | | | | 1,003 | |
TEGNA, Inc., 5.500%, 9/15/24 144A | | | 495,000 | | | | 519 | |
TEGNA, Inc., 6.375%, 10/15/23 | | | 700,000 | | | | 733 | |
Telenet Finance Luxembourg Notes Sarl,
5.500%, 3/1/28 144A | | | 3,600,000 | | | | 3,591 | |
T-Mobile USA, Inc., 5.125%, 4/15/25 | | | 2,700,000 | | | | 2,805 | |
T-Mobile USA, Inc., 5.375%, 4/15/27 | | | 350,000 | | | | 373 | |
T-Mobile USA, Inc., 6.000%, 3/1/23 | | | 775,000 | | | | 811 | |
T-Mobile USA, Inc., 6.125%, 1/15/22 | | | 575,000 | | | | 593 | |
T-Mobile USA, Inc., 6.375%, 3/1/25 | | | 1,035,000 | | | | 1,107 | |
T-Mobile USA, Inc., 6.500%, 1/15/24 | | | 425,000 | | | | 451 | |
T-Mobile USA, Inc., 6.500%, 1/15/26 | | | 875,000 | | | | 955 | |
T-Mobile USA, Inc., 6.625%, 4/1/23 | | | 1,375,000 | | | | 1,433 | |
T-Mobile USA, Inc., 6.836%, 4/28/23 | | | 225,000 | | | | 236 | |
Tribune Media Co., 5.875%, 7/15/22 | | | 3,050,000 | | | | 3,134 | |
Unitymedia Hessen GmbH & Co., KG / Unitymedia NRW GmbH, 5.000%, 1/15/25 144A | | | 1,250,000 | | | | 1,278 | |
Unitymedia KabelBW GmbH, 6.125%, 1/15/25 144A | | | 2,525,000 | | | | 2,664 | |
VeriSign, Inc., 4.750%, 7/15/27 | | | 550,000 | | | | 562 | |
VeriSign, Inc., 5.250%, 4/1/25 | | | 350,000 | | | | 381 | |
Virgin Media Finance PLC, 5.750%, 1/15/25 144A | | | 2,350,000 | | | | 2,397 | |
Virgin Media Secured Finance PLC, 5.250%, 1/15/26 144A | | | 3,175,000 | | | | 3,207 | |
Virgin Media Secured Finance PLC, 5.500%, 8/15/26 144A | | | 425,000 | | | | 436 | |
Ziggo Bond Finance BV, 5.875%, 1/15/25 144A | | | 625,000 | | | | 616 | |
Ziggo Bond Finance BV, 6.000%, 1/15/27 144A | | | 1,225,000 | | | | 1,194 | |
Ziggo Secured Finance BV, 5.500%, 1/15/27 144A | | | 2,425,000 | | | | 2,422 | |
| | | | | | | | |
Total | | | | | | | 144,769 | |
| | | | | | | | |
| | |
Consumer, Cyclical (12.6%) | | | | | | | | |
1011778 BC Unlimited Liability Co. / New Red Finance, Inc., 4.250%, 5/15/24 144A | | | 475,000 | | | | 474 | |
1011778 BC Unlimited Liability Co. / New Red Finance, Inc., 5.000%, 10/15/25 144A | | | 4,075,000 | | | | 4,106 | |
Adient Global Holdings, Ltd., 4.875%, 8/15/26 144A | | | 2,050,000 | | | | 2,106 | |
Allison Transmission, Inc., 5.000%, 10/1/24 144A | | | 750,000 | | | | 773 | |
AMC Entertainment Holdings, Inc., 5.875%, 11/15/26 | | | 825,000 | | | | 815 | |
AMC Entertainment Holdings, Inc., 6.125%, 5/15/27 | | | 225,000 | | | | 223 | |
American Axle & Manufacturing, Inc.,
6.500%, 4/1/27 144A | | | 2,450,000 | | | | 2,594 | |
American Builders & Contractors Supply Co., Inc., 5.625%, 4/15/21 144A | | | 1,083,000 | | | | 1,102 | |
| | | | | | | | |
| Corporate Bonds (95.4%) | | Shares/
$ Par | | | Value
$ (000’s) | |
| | |
Consumer, Cyclical continued | | | | | | | | |
American Builders & Contractors Supply Co., Inc., 5.750%, 12/15/23 144A | | | 125,000 | | | | 132 | |
Aramark Services, Inc., 5.000%, 4/1/25 144A | | | 1,450,000 | | | | 1,532 | |
Aramark Services, Inc., 5.125%, 1/15/24 | | | 1,525,000 | | | | 1,600 | |
Argos Merger Sub, Inc., 7.125%, 3/15/23 144A | | | 3,975,000 | | | | 2,355 | |
BCD Acquisition, Inc., 9.625%, 9/15/23 144A | | | 1,750,000 | | | | 1,921 | |
Beacon Escrow Corp., 4.875%, 11/1/25 144A | | | 850,000 | | | | 853 | |
Beacon Roofing Supply, Inc., 6.375%, 10/1/23 | | | 625,000 | | | | 665 | |
Boyd Gaming Corp., 6.375%, 4/1/26 | | | 775,000 | | | | 835 | |
Boyd Gaming Corp., 6.875%, 5/15/23 | | | 2,050,000 | | | | 2,173 | |
Cedar Fair LP / Canada’s Wonderland Co. / Magnum Management Corp., 5.375%, 6/1/24 | | | 2,280,000 | | | | 2,383 | |
CRC Escrow Issuer LLC / CRC Finco, Inc., 5.250%, 10/15/25 144A | | | 4,300,000 | | | | 4,344 | |
Dana Financing Luxembourg Sarl, 5.750%, 4/15/25 144A | | | 400,000 | | | | 421 | |
Dana Financing Luxembourg Sarl, 6.500%, 6/1/26 144A | | | 2,025,000 | | | | 2,195 | |
Eldorado Resorts, Inc., 6.000%, 4/1/25 | | | 1,800,000 | | | | 1,881 | |
EMI Music Publishing Group North America Holdings, Inc., 7.625%, 6/15/24 144A | | | 2,100,000 | | | | 2,310 | |
Ferrellgas LP / Ferrellgas Finance Corp.,
6.500%, 5/1/21 | | | 850,000 | | | | 796 | |
Ferrellgas LP / Ferrellgas Finance Corp.,
6.750%, 1/15/22 | | | 2,350,000 | | | | 2,174 | |
Ferrellgas LP / Ferrellgas Finance Corp.,
6.750%, 6/15/23 | | | 1,400,000 | | | | 1,284 | |
GLP Capital LP / GLP Financing II, Inc.,
5.375%, 11/1/23 | | | 175,000 | | | | 187 | |
GLP Capital LP / GLP Financing II, Inc.,
5.375%, 4/15/26 | | | 500,000 | | | | 536 | |
The Goodyear Tire & Rubber Co., 4.875%, 3/15/27 | | | 375,000 | | | | 384 | |
The Goodyear Tire & Rubber Co., 5.000%, 5/31/26 | | | 1,150,000 | | | | 1,186 | |
The Goodyear Tire & Rubber Co., 5.125%, 11/15/23 | | | 350,000 | | | | 365 | |
Hanesbrands, Inc., 4.875%, 5/15/26 144A | | | 1,100,000 | | | | 1,127 | |
HD Supply, Inc., 5.750%, 4/15/24 144A | | | 375,000 | | | | 398 | |
Hilton Worldwide Finance LLC / Hilton Worldwide Finance Corp., 4.625%, 4/1/25 | | | 1,175,000 | | | | 1,207 | |
JB Poindexter & Co., Inc., 9.000%, 4/1/22 144A | | | 842,000 | | | | 874 | |
KFC Holding Co. / Pizza Hut Holdings LLC / Taco Bell of America LLC, 4.750%, 6/1/27 144A | | | 550,000 | | | | 562 | |
KFC Holding Co. / Pizza Hut Holdings LLC / Taco Bell of America LLC, 5.000%, 6/1/24 144A | | | 800,000 | | | | 825 | |
KFC Holding Co. / Pizza Hut Holdings LLC / Taco Bell of America LLC, 5.250%, 6/1/26 144A | | | 1,600,000 | | | | 1,684 | |
MGM Resorts International, 6.000%, 3/15/23 | | | 2,525,000 | | | | 2,727 | |
MGM Resorts International, 6.625%, 12/15/21 | | | 1,040,000 | | | | 1,141 | |
MGM Resorts International, 6.750%, 10/1/20 | | | 510,000 | | | | 551 | |
Michaels Stores, Inc., 5.875%, 12/15/20 144A | | | 1,875,000 | | | | 1,901 | |
Mohegan Tribal Gaming Authority, 7.875%, 10/15/24 144A | | | 2,250,000 | | | | 2,306 | |
Party City Holdings, Inc., 6.125%, 8/15/23 144A | | | 2,425,000 | | | | 2,504 | |
Penn National Gaming, Inc., 5.625%, 1/15/27 144A | | | 1,150,000 | | | | 1,193 | |
Performance Food Group, Inc., 5.500%, 6/1/24 144A | | | 325,000 | | | | 336 | |
PetSmart, Inc., 8.875%, 6/1/25 144A | | | 1,000,000 | | | | 602 | |
Pinnacle Entertainment, Inc., 5.625%, 5/1/24 | | | 2,225,000 | | | | 2,381 | |
The Accompanying Notes are an Integral Part of the Financial Statements.
| | | | |
| 152 | | High Yield Bond Portfolio | | |
High Yield Bond Portfolio
| | | | | | | | |
| Corporate Bonds (95.4%) | | Shares/
$ Par | | | Value
$ (000’s) | |
| | |
Consumer, Cyclical continued | | | | | | | | |
Red Rock Resorts, Inc., 5.000%, 10/1/25 144A | | | 1,675,000 | | | | 1,683 | |
Regal Entertainment Group, 5.750%, 3/15/22 | | | 310,000 | | | | 320 | |
Regal Entertainment Group, 5.750%, 2/1/25 | | | 1,025,000 | | | | 1,051 | |
Rite Aid Corp., 6.125%, 4/1/23 144A | | | 2,025,000 | | | | 1,828 | |
Rivers Pittsburgh Borrower LP / Rivers Pittsburgh Finance Corp., 6.125%, 8/15/21 144A | | | 1,950,000 | | | | 1,935 | |
Sabre GLBL, Inc., 5.375%, 4/15/23 144A | | | 1,275,000 | | | | 1,313 | |
Sally Holdings LLC / Sally Capital, Inc.,
5.625%, 12/1/25 | | | 2,225,000 | | | | 2,214 | |
Schaeffler Verwaltung Zwei GmbH, 4.500%, 9/15/23 144A | | | 375,000 | | | | 382 | |
Schaeffler Verwaltung Zwei GmbH, 4.750%, 9/15/26 144A | | | 3,325,000 | | | | 3,375 | |
The Scotts Miracle-Gro Co., 5.250%, 12/15/26 | | | 125,000 | | | | 131 | |
Seminole Hard Rock Entertainment, Inc. / Seminole Hard Rock International LLC, 5.875%, 5/15/21 144A | | | 3,865,000 | | | | 3,923 | |
Seminole Tribe of Florida, Inc., 7.804%, 10/1/20 144A | | | 1,320,000 | | | | 1,333 | |
Six Flags Entertainment Corp., 4.875%, 7/31/24 144A | | | 850,000 | | | | 863 | |
Six Flags Entertainment Corp., 5.500%, 4/15/27 144A | | | 3,725,000 | | | | 3,855 | |
Springs Industries, Inc., 6.250%, 6/1/21 | | | 980,000 | | | | 1,000 | |
Suburban Propane Partners LP / Suburban Energy Finance Corp., 5.500%, 6/1/24 | | | 3,425,000 | | | | 3,391 | |
Suburban Propane Partners LP / Suburban Energy Finance Corp., 5.750%, 3/1/25 | | | 275,000 | | | | 272 | |
Suburban Propane Partners LP / Suburban Energy Finance Corp., 5.875%, 3/1/27 | | | 900,000 | | | | 880 | |
Sugarhouse HSP Gaming Prop Mezz LP / Sugarhouse HSP Gaming Finance Corp., 5.875%, 5/15/25 144A | | | 1,675,000 | | | | 1,591 | |
Tenneco, Inc., 5.000%, 7/15/26 | | | 350,000 | | | | 359 | |
TI Group Automotive Systems LLC, 8.750%, 7/15/23 144A | | | 899,000 | | | | 964 | |
WMG Acquisition Corp., 4.875%, 11/1/24 144A | | | 450,000 | | | | 463 | |
WMG Acquisition Corp., 5.000%, 8/1/23 144A | | | 250,000 | | | | 259 | |
Wynn Las Vegas, LLC / Wynn Las Vegas Capital Corp., 5.250%, 5/15/27 144A | | | 1,200,000 | | | | 1,216 | |
ZF North America Capital, Inc., 4.750%, 4/29/25 144A | | | 531,000 | | | | 562 | |
| | | | | | | | |
Total | | | | | | | 102,187 | |
| | | | | | | | |
| | |
Consumer, Non-cyclical (20.9%) | | | | | | | | |
Acadia Healthcare Co., Inc., 5.625%, 2/15/23 | | | 575,000 | | | | 584 | |
Acadia Healthcare Co., Inc., 6.500%, 3/1/24 | | | 2,625,000 | | | | 2,730 | |
Air Medical Merger Sub Corp., 6.375%, 5/15/23 144A | | | 3,025,000 | | | | 2,904 | |
Albertsons Cos. LLC / Safeway, Inc. / New Albertson’s, Inc. / Albertsons’s LLC, 5.750%, 3/15/25 | | | 2,250,000 | | | | 2,031 | |
Albertsons Cos. LLC / Safeway, Inc. / New Albertson’s, Inc. / Albertsons’s LLC, 6.625%, 6/15/24 | | | 1,600,000 | | | | 1,528 | |
AmSurg Corp., 5.625%, 7/15/22 | | | 1,275,000 | | | | 1,288 | |
Avantor, Inc., 6.000%, 10/1/24 144A | | | 825,000 | | | | 822 | |
Avantor, Inc., 9.000%, 10/1/25 144A | | | 1,925,000 | | | | 1,896 | |
Avis Budget Car Rental LLC / Avis Budget Finance, Inc., 5.250%, 3/15/25 144A | | | 725,000 | | | | 718 | |
Avis Budget Car Rental LLC / Avis Budget Finance, Inc., 6.375%, 4/1/24 144A | | | 1,875,000 | | | | 1,951 | |
| | | | | | | | |
| Corporate Bonds (95.4%) | | Shares/
$ Par | | | Value
$��(000’s) | |
| | |
Consumer, Non-cyclical continued | | | | | | | | |
CHS / Community Health Systems, Inc.,
5.125%, 8/1/21 | | | 800,000 | | | | 720 | |
CHS / Community Health Systems, Inc.,
6.250%, 3/31/23 | | | 1,550,000 | | | | 1,395 | |
CHS / Community Health Systems, Inc.,
6.875%, 2/1/22 | | | 2,910,000 | | | | 1,673 | |
Crimson Merger Sub, Inc., 6.625%, 5/15/22 144A | | | 6,950,000 | | | | 6,985 | |
DaVita HealthCare Partners, Inc., 5.750%, 8/15/22 | | | 425,000 | | | | 437 | |
Eagle Holding Co. II LLC, 7.625%, 5/15/22 144A | | | 1,475,000 | | | | 1,501 | |
Endo Finance LLC / Endo Finco, Inc., 6.000%, 2/1/25 144A | | | 2,875,000 | | | | 2,228 | |
Endo Finance LLC / Endo, Ltd. / Endo Finco, Inc., 6.000%, 7/15/23 144A | | | 1,850,000 | | | | 1,452 | |
Envision Healthcare Corp., 5.125%, 7/1/22 144A | | | 2,280,000 | | | | 2,212 | |
First Quality Finance Co., Inc., 4.625%, 5/15/21 144A | | | 3,235,000 | | | | 3,259 | |
First Quality Finance Co., Inc., 5.000%, 7/1/25 144A | | | 425,000 | | | | 433 | |
Gartner, Inc., 5.125%, 4/1/25 144A | | | 850,000 | | | | 888 | |
GW Honos Security Corp., 8.750%, 5/15/25 144A | | | 1,750,000 | | | | 1,881 | |
HCA Healthcare, Inc., 6.250%, 2/15/21 | | | 1,385,000 | | | | 1,468 | |
HCA, Inc., 4.500%, 2/15/27 | | | 1,050,000 | | | | 1,055 | |
HCA, Inc., 5.000%, 3/15/24 | | | 2,575,000 | | | | 2,678 | |
HCA, Inc., 5.250%, 6/15/26 | | | 450,000 | | | | 477 | |
HCA, Inc., 5.375%, 2/1/25 | | | 2,250,000 | | | | 2,329 | |
HCA, Inc., 5.875%, 3/15/22 | | | 1,475,000 | | | | 1,578 | |
HCA, Inc., 5.875%, 5/1/23 | | | 2,520,000 | | | | 2,690 | |
HCA, Inc., 5.875%, 2/15/26 | | | 2,825,000 | | | | 2,987 | |
HCA, Inc., 6.500%, 2/15/20 | | | 1,485,000 | | | | 1,574 | |
Hearthside Group Holdings LLC / Hearthside Finance Co., 6.500%, 5/1/22 144A | | | 2,000,000 | | | | 2,042 | |
The Hertz Corp., 5.500%, 10/15/24 144A | | | 1,000,000 | | | | 902 | |
The Hertz Corp., 6.250%, 10/15/22 | | | 775,000 | | | | 748 | |
The Hertz Corp., 7.625%, 6/1/22 144A | | | 1,125,000 | | | | 1,178 | |
Hologic, Inc., 4.375%, 10/15/25 144A | | | 275,000 | | | | 279 | |
Jaguar Holding Co. II / Pharmaceutical Product Development LLC, 6.375%, 8/1/23 144A | | | 5,750,000 | | | | 5,807 | |
KAR Auction Services, Inc., 5.125%, 6/1/25 144A | | | 1,425,000 | | | | 1,461 | |
Lamb Weston Holdings, Inc., 4.875%, 11/1/26 144A | | | 1,225,000 | | | | 1,280 | |
LifePoint Health, Inc., 5.375%, 5/1/24 | | | 325,000 | | | | 323 | |
LifePoint Hospitals, Inc., 5.500%, 12/1/21 | | | 1,415,000 | | | | 1,443 | |
Live Nation Entertainment, Inc., 4.875%, 11/1/24 144A | | | 600,000 | | | | 615 | |
Mallinckrodt International Finance SA,
4.750%, 4/15/23 | | | 1,850,000 | | | | 1,452 | |
Mallinckrodt International Finance SA / Mallinckrodt CB LLC, 5.500%, 4/15/25 144A | | | 2,975,000 | | | | 2,425 | |
Mallinckrodt International Finance SA / Mallinckrodt CB LLC, 5.625%, 10/15/23 144A | | | 1,550,000 | | | | 1,317 | |
Matthews International Corp., 5.250%, 12/1/25 144A | | | 875,000 | | | | 884 | |
MEDNAX, Inc., 5.250%, 12/1/23 144A | | | 425,000 | | | | 432 | |
MPH Acquisition Holdings LLC, 7.125%, 6/1/24 144A | | | 5,525,000 | | | | 5,884 | |
New Amethyst Corp., 6.250%, 12/1/24 144A | | | 1,925,000 | | | | 1,983 | |
The Nielsen Co. (Luxembourg) Sarl,
5.000%, 2/1/25 144A | | | 1,175,000 | | | | 1,219 | |
Nielsen Finance LLC / Nielsen Finance Co., 5.000%, 4/15/22 144A | | | 4,000,000 | | | | 4,115 | |
The Accompanying Notes are an Integral Part of the Financial Statements.
| | | | | | |
| | High Yield Bond Portfolio | | | 153 | |
High Yield Bond Portfolio
| | | | | | | | |
| Corporate Bonds (95.4%) | | Shares/
$ Par | | | Value
$ (000’s) | |
| | |
Consumer, Non-cyclical continued | | | | | | | | |
Pinnacle Foods Finance LLC / Pinnacle Foods Finance Corp., 5.875%, 1/15/24 | | | 475,000 | | | | 502 | |
Polaris Intermediate Corp., 8.500%, 12/1/22 144A | | | 1,975,000 | | | | 2,049 | |
Post Holdings, Inc., 5.000%, 8/15/26 144A | | | 1,825,000 | | | | 1,795 | |
Post Holdings, Inc., 5.500%, 3/1/25 144A | | | 1,275,000 | | | | 1,320 | |
Post Holdings, Inc., 5.625%, 1/15/28 144A | | | 975,000 | | | | 979 | |
Post Holdings, Inc., 5.750%, 3/1/27 144A | | | 3,225,000 | | | | 3,281 | |
Prestige Brands, Inc., 5.375%, 12/15/21 144A | | | 3,475,000 | | | | 3,536 | |
Prestige Brands, Inc., 6.375%, 3/1/24 144A | | | 1,600,000 | | | | 1,658 | |
Ritchie Bros. Auctioneers, Inc., 5.375%, 1/15/25 144A | | | 575,000 | | | | 594 | |
The ServiceMaster Co. LLC, 5.125%, 11/15/24 144A | | | 2,525,000 | | | | 2,557 | |
Spectrum Brands, Inc., 5.750%, 7/15/25 | | | 725,000 | | | | 763 | |
Spectrum Brands, Inc., 6.125%, 12/15/24 | | | 2,975,000 | | | | 3,150 | |
Sterigenics-Nordion Holdings LLC, 6.500%, 5/15/23 144A | | | 3,500,000 | | | | 3,649 | |
Sterigenics-Nordion Topco LLC, 8.125%, 11/1/21 144A | | | 2,900,000 | | | | 2,929 | |
Surgery Center Holdings, 6.750%, 7/1/25 144A | | | 2,700,000 | | | | 2,551 | |
Team Health Holdings, Inc., 6.375%, 2/1/25 144A | | | 4,875,000 | | | | 4,351 | |
Teleflex, Inc., 4.625%, 11/15/27 | | | 450,000 | | | | 454 | |
Teleflex, Inc., 5.250%, 6/15/24 | | | 1,750,000 | | | | 1,824 | |
Tenet Healthcare Corp., 4.500%, 4/1/21 | | | 830,000 | | | | 834 | |
Tenet Healthcare Corp., 4.625%, 7/15/24 144A | | | 850,000 | | | | 829 | |
Tenet Healthcare Corp., 6.750%, 6/15/23 | | | 3,500,000 | | | | 3,395 | |
Tenet Healthcare Corp., 7.500%, 1/1/22 144A | | | 700,000 | | | | 735 | |
Tenet Healthcare Corp., 8.125%, 4/1/22 | | | 330,000 | | | | 336 | |
THC Escrow Corp. III, 5.125%, 5/1/25 144A | | | 2,400,000 | | | | 2,340 | |
THC Escrow Corp. III, 7.000%, 8/1/25 144A | | | 575,000 | | | | 541 | |
United Rentals North America, Inc., 4.875%, 1/15/28 | | | 2,075,000 | | | | 2,085 | |
United Rentals North America, Inc., 5.500%, 7/15/25 | | | 475,000 | | | | 504 | |
United Rentals North America, Inc., 5.500%, 5/15/27 | | | 1,750,000 | | | | 1,842 | |
United Rentals North America, Inc., 5.875%, 9/15/26 | | | 1,225,000 | | | | 1,311 | |
US Foods, Inc., 5.875%, 6/15/24 144A | | | 2,800,000 | | | | 2,940 | |
Valeant Pharmaceuticals International, Inc.,
5.500%, 3/1/23 144A | | | 2,700,000 | | | | 2,471 | |
Valeant Pharmaceuticals International, Inc.,
5.500%, 11/1/25 144A | | | 725,000 | | | | 738 | |
Valeant Pharmaceuticals International, Inc.,
5.625%, 12/1/21 144A | | | 1,055,000 | | | | 1,031 | |
Valeant Pharmaceuticals International, Inc.,
5.875%, 5/15/23 144A | | | 3,225,000 | | | | 2,987 | |
Valeant Pharmaceuticals International, Inc.,
6.125%, 4/15/25 144A | | | 5,425,000 | | | | 4,964 | |
Valeant Pharmaceuticals International, Inc.,
6.500%, 3/15/22 144A | | | 300,000 | | | | 315 | |
Valeant Pharmaceuticals International, Inc.,
7.000%, 3/15/24 144A | | | 875,000 | | | | 936 | |
Valeant Pharmaceuticals International, Inc.,
7.250%, 7/15/22 144A | | | 500,000 | | | | 506 | |
Valeant Pharmaceuticals International, Inc.,
9.000%, 12/15/25 144A | | | 800,000 | | | | 834 | |
Vizient, Inc., 10.375%, 3/1/24 144A | | | 2,775,000 | | | | 3,122 | |
West Street Merger Sub, Inc., 6.375%, 9/1/25 144A | | | 1,625,000 | | | | 1,629 | |
| | | | | | | | |
Total | | | | | | | 169,308 | |
| | | | | | | | |
| | | | | | | | |
| Corporate Bonds (95.4%) | | Shares/
$ Par | | | Value
$ (000’s) | |
| | |
Energy (12.4%) | | | | | | | | |
Alliance Resource Operating Partners LP / Alliance Resource Finance Corp., 7.500%, 5/1/25 144A | | | 1,525,000 | | | | 1,620 | |
Antero Midstream Partners LP / Antero Midstream Finance Corp., 5.375%, 9/15/24 | | | 2,000,000 | | | | 2,060 | |
Antero Resources Corp., 5.000%, 3/1/25 | | | 375,000 | | | | 382 | |
Antero Resources Corp., 5.125%, 12/1/22 | | | 465,000 | | | | 474 | |
Antero Resources Corp., 5.375%, 11/1/21 | | | 730,000 | | | | 748 | |
Antero Resources Corp., 5.625%, 6/1/23 | | | 1,225,000 | | | | 1,274 | |
Ascent Resources - Utica LLC / AEU Finance Corp., 1.000%, 4/1/22 144A | | | 2,075,000 | | | | 2,225 | |
Callon Petroleum Co., 6.125%, 10/1/24 | | | 1,502,000 | | | | 1,547 | |
Carrizo Oil & Gas, Inc., 6.250%, 4/15/23 | | | 1,725,000 | | | | 1,790 | |
Carrizo Oil & Gas, Inc., 7.500%, 9/15/20 | | | 127,000 | | | | 129 | |
Carrizo Oil & Gas, Inc., 8.250%, 7/15/25 | | | 425,000 | | | | 467 | |
Cheniere Corpus Christi Holdings LLC,
5.125%, 6/30/27 | | | 575,000 | | | | 595 | |
Cheniere Corpus Christi Holdings LLC,
5.875%, 3/31/25 | | | 1,725,000 | | | | 1,869 | |
Cheniere Corpus Christi Holdings LLC,
7.000%, 6/30/24 | | | 1,025,000 | | | | 1,167 | |
Cheniere Energy Partners LP, 5.250%, 10/1/25 144A | | | 2,850,000 | | | | 2,900 | |
Chesapeake Energy Corp., 5.375%, 6/15/21 | | | 625,000 | | | | 603 | |
Chesapeake Energy Corp., 5.750%, 3/15/23 | | | 225,000 | | | | 208 | |
Chesapeake Energy Corp., 8.000%, 12/15/22 144A | | | 805,000 | | | | 868 | |
Chesapeake Energy Corp., 8.000%, 1/15/25 144A | | | 425,000 | | | | 429 | |
Chesapeake Energy Corp., 8.000%, 6/15/27 144A | | | 2,000,000 | | | | 1,920 | |
Coeur Mining, Inc., 5.875%, 6/1/24 | | | 1,750,000 | | | | 1,728 | |
Continental Resources, Inc., 4.500%, 4/15/23 | | | 1,275,000 | | | | 1,300 | |
CrownRock LP / CrownRock Finance, Inc.,
5.625%, 10/15/25 144A | | | 2,600,000 | | | | 2,613 | |
CVR Refining LLC / Coffeyville Finance, Inc., 6.500%, 11/1/22 | | | 3,150,000 | | | | 3,244 | |
Diamondback Energy, Inc., 5.375%, 5/31/25 | | | 575,000 | | | | 592 | |
Endeavor Energy Resources LP / EER Finance, Inc., 5.500%, 1/30/26 144A | | | 125,000 | | | | 127 | |
Endeavor Energy Resources LP / EER Finance, Inc., 5.750%, 1/30/28 144A | | | 750,000 | | | | 770 | |
Energy Transfer Equity LP, 5.500%, 6/1/27 | | | 225,000 | | | | 229 | |
Energy Transfer Equity LP, 5.875%, 1/15/24 | | | 2,025,000 | | | | 2,131 | |
Enviva Partners LP / Enviva Partners Finance Corp., 8.500%, 11/1/21 | | | 2,750,000 | | | | 2,929 | |
EP Energy LLC / Everest Acquisition Finance, Inc., 6.375%, 6/15/23 | | | 350,000 | | | | 189 | |
EP Energy LLC / Everest Acquisition Finance, Inc., 8.000%, 11/29/24 144A | | | 1,275,000 | | | | 1,316 | |
Gulfport Energy Corp., 6.000%, 10/15/24 | | | 550,000 | | | | 550 | |
Gulfport Energy Corp., 6.375%, 5/15/25 | | | 1,025,000 | | | | 1,030 | |
Gulfport Energy Corp., 6.375%, 1/15/26 144A | | | 425,000 | | | | 428 | |
Gulfport Energy Corp., 6.625%, 5/1/23 | | | 875,000 | | | | 893 | |
Holly Energy Partners LP / Holly Energy Finance Corp., 6.000%, 8/1/24 144A | | | 2,725,000 | | | | 2,841 | |
Laredo Petroleum, Inc., 5.625%, 1/15/22 | | | 1,025,000 | | | | 1,035 | |
Laredo Petroleum, Inc., 6.250%, 3/15/23 | | | 400,000 | | | | 414 | |
NGPL PipeCo LLC, 4.875%, 8/15/27 144A | | | 150,000 | | | | 156 | |
NuStar Logistics LP, 5.625%, 4/28/27 | | | 2,400,000 | | | | 2,442 | |
Oasis Petroleum, Inc., 6.500%, 11/1/21 | | | 1,395,000 | | | | 1,425 | |
The Accompanying Notes are an Integral Part of the Financial Statements.
| | | | |
| 154 | | High Yield Bond Portfolio | | |
High Yield Bond Portfolio
| | | | | | | | |
| Corporate Bonds (95.4%) | | Shares/
$ Par | | | Value
$ (000’s) | |
| | |
Energy continued | | | | | | | | |
Oasis Petroleum, Inc., 6.875%, 3/15/22 | | | 645,000 | | | | 662 | |
Parsley Energy LLC / Parsley Finance Corp., 5.250%, 8/15/25 144A | | | 425,000 | | | | 426 | |
Parsley Energy LLC / Parsley Finance Corp., 5.375%, 1/15/25 144A | | | 450,000 | | | | 455 | |
Parsley Energy LLC / Parsley Finance Corp., 5.625%, 10/15/27 144A | | | 1,225,000 | | | | 1,253 | |
Parsley Energy LLC / Parsley Finance Corp., 6.250%, 6/1/24 144A | | | 300,000 | | | | 316 | |
PDC Energy, Inc., 5.750%, 5/15/26 144A | | | 800,000 | | | | 820 | |
PDC Energy, Inc., 6.125%, 9/15/24 | | | 575,000 | | | | 595 | |
Peabody Securities Finance Corp., 6.000%, 3/31/22 144A | | | 300,000 | | | | 311 | |
Peabody Securities Finance Corp., 6.375%, 3/31/25 144A | | | 1,325,000 | | | | 1,378 | |
Precision Drilling Corp., 6.500%, 12/15/21 | | | 254,000 | | | | 259 | |
Precision Drilling Corp., 7.125%, 1/15/26 144A | | | 700,000 | | | | 714 | |
Precision Drilling Corp., 7.750%, 12/15/23 | | | 1,000,000 | | | | 1,050 | |
QEP Resources, Inc., 5.250%, 5/1/23 | | | 575,000 | | | | 582 | |
QEP Resources, Inc., 5.625%, 3/1/26 | | | 525,000 | | | | 532 | |
Range Resources Corp., 4.875%, 5/15/25 | | | 1,000,000 | | | | 965 | |
Range Resources Corp., 5.000%, 3/15/23 | | | 225,000 | | | | 224 | |
Range Resources Corp., 5.750%, 6/1/21 | | | 955,000 | | | | 991 | |
RSP Permian, Inc., 5.250%, 1/15/25 | | | 750,000 | | | | 769 | |
RSP Permian, Inc., 6.625%, 10/1/22 | | | 750,000 | | | | 787 | |
SESI LLC, 7.125%, 12/15/21 | | | 325,000 | | | | 333 | |
SESI LLC, 7.750%, 9/15/24 144A | | | 2,075,000 | | | | 2,205 | |
SM Energy Co., 5.625%, 6/1/25 | | | 600,000 | | | | 582 | |
SM Energy Co., 6.500%, 1/1/23 | | | 665,000 | | | | 678 | |
SM Energy Co., 6.750%, 9/15/26 | | | 725,000 | | | | 747 | |
Southwestern Energy Co., 4.100%, 3/15/22 | | | 1,025,000 | | | | 1,010 | |
Southwestern Energy Co., 7.500%, 4/1/26 | | | 300,000 | | | | 319 | |
Southwestern Energy Co., 7.750%, 10/1/27 | | | 1,775,000 | | | | 1,895 | |
SRC Energy, Inc., 6.250%, 12/1/25 144A | | | 1,775,000 | | | | 1,815 | |
Summit Midstream Holdings LLC / Summit Midstream Finance Corp., 5.500%, 8/15/22 | | | 2,355,000 | | | | 2,355 | |
Summit Midstream Holdings, LLC / Summit Midstream Finance Corp., 5.750%, 4/15/25 | | | 2,275,000 | | | | 2,294 | |
Targa Resources Partners LP / Targa Resources Partners Finance Corp., 5.000%, 1/15/28 144A | | | 1,400,000 | | | | 1,397 | |
Targa Resources Partners LP / Targa Resources Partners Finance Corp., 5.125%, 2/1/25 | | | 1,025,000 | | | | 1,049 | |
Targa Resources Partners LP / Targa Resources Partners Finance Corp., 5.375%, 2/1/27 | | | 2,150,000 | | | | 2,206 | |
TerraForm Power Operating LLC, 4.250%, 1/31/23 144A | | | 175,000 | | | | 174 | |
TerraForm Power Operating LLC, 5.000%, 1/31/28 144A | | | 2,300,000 | | | | 2,277 | |
TerraForm Power Operating LLC, 6.625%, 6/15/25 144A | | | 950,000 | | | | 1,036 | |
Tesoro Corp., 5.125%, 4/1/24 | | | 325,000 | | | | 343 | |
Tesoro Corp., 5.375%, 10/1/22 | | | 555,000 | | | | 573 | |
Tesoro Logistics LP / Tesoro Finance Corp., 5.250%, 1/15/25 | | | 725,000 | | | | 762 | |
Tesoro Logistics LP / Tesoro Logistics Finance Corp., 6.250%, 10/15/22 | | | 503,000 | | | | 534 | |
| | | | | | | | |
| Corporate Bonds (95.4%) | | Shares/
$ Par | | | Value
$ (000’s) | |
| | |
Energy continued | | | | | | | | |
Tesoro Logistics LP / Tesoro Logistics Finance Corp., 6.375%, 5/1/24 | | | 825,000 | | | | 895 | |
Ultra Resources, Inc., 6.875%, 4/15/22 144A | | | 350,000 | | | | 351 | |
Ultra Resources, Inc., 7.125%, 4/15/25 144A | | | 1,325,000 | | | | 1,322 | |
Weatherford International LLC, 6.800%, 6/15/37 | | | 400,000 | | | | 332 | |
Weatherford International, Ltd., 7.000%, 3/15/38 | | | 1,400,000 | | | | 1,176 | |
Weatherford International, Ltd., 8.250%, 6/15/23 | | | 1,575,000 | | | | 1,591 | |
Whiting Petroleum Corp., 5.750%, 3/15/21 | | | 410,000 | | | | 421 | |
Whiting Petroleum Corp., 6.250%, 4/1/23 | | | 1,150,000 | | | | 1,180 | |
Whiting Petroleum Corp., 6.625%, 1/15/26 144A | | | 600,000 | | | | 612 | |
The Williams Cos., Inc., 4.550%, 6/24/24 | | | 900,000 | | | | 934 | |
Williams Partners LP / ACMP Finance Corp.,
4.875%, 3/15/24 | | | 475,000 | | | | 496 | |
WPX Energy, Inc., 5.250%, 9/15/24 | | | 1,125,000 | | | | 1,121 | |
WPX Energy, Inc., 6.000%, 1/15/22 | | | 375,000 | | | | 392 | |
WPX Energy, Inc., 7.500%, 8/1/20 | | | 84,000 | | | | 91 | |
WPX Energy, Inc., 8.250%, 8/1/23 | | | 350,000 | | | | 397 | |
| | | | | | | | |
Total | | | | | | | 100,641 | |
| | | | | | | | |
| | |
Financial (5.4%) | | | | | | | | |
Acrisure LLC / Acrisure Finance, Inc.,
7.000%, 11/15/25 144A | | | 2,000,000 | | | | 1,928 | |
Ally Financial, Inc., 3.750%, 11/18/19 | | | 1,950,000 | | | | 1,975 | |
Ally Financial, Inc., 4.125%, 2/13/22 | | | 400,000 | | | | 409 | |
Ally Financial, Inc., 5.750%, 11/20/25 | | | 3,725,000 | | | | 4,060 | |
AssuredPartners, Inc., 7.000%, 8/15/25 144A | | | 2,500,000 | | | | 2,487 | |
Hub Holdings LLC / Hub Holdings Finance, Inc., 8.125%, 7/15/19 144A(c) | | | 810,000 | | | | 811 | |
HUB International, Ltd., 7.875%, 10/1/21 144A | | | 5,615,000 | | | | 5,847 | |
Iron Mountain, Inc., 5.750%, 8/15/24 | | | 425,000 | | | | 430 | |
KIRS Midco 3 PLC, 8.625%, 7/15/23 144A | | | 2,150,000 | | | | 2,225 | |
MGM Growth Properties Operating Partnership LP / MGP Finance Co-Issuer, Inc., 5.625%, 5/1/24 | | | 475,000 | | | | 506 | |
National Financial Partners Corp., 6.875%, 7/15/25 144A | | | 2,650,000 | | | | 2,670 | |
Navient Corp., 5.500%, 1/25/23 | | | 500,000 | | | | 499 | |
Navient Corp., 5.875%, 10/25/24 | | | 2,200,000 | | | | 2,183 | |
Navient Corp., 6.125%, 3/25/24 | | | 1,725,000 | | | | 1,747 | |
Navient Corp., 6.500%, 6/15/22 | | | 200,000 | | | | 210 | |
Navient Corp., 6.750%, 6/25/25 | | | 325,000 | | | | 334 | |
Navient Corp., 7.250%, 9/25/23 | | | 1,150,000 | | | | 1,225 | |
Quicken Loans, Inc., 5.250%, 1/15/28 144A | | | 950,000 | | | | 938 | |
Quicken Loans, Inc., 5.750%, 5/1/25 144A | | | 4,150,000 | | | | 4,295 | |
RHP Hotel Properties LP / RHP Finance Corp., 5.000%, 4/15/23 | | | 325,000 | | | | 332 | |
Tempo Acquisition LLC / Tempo Acquisition Finance Corp., 6.750%, 6/1/25 144A | | | 3,625,000 | | | | 3,688 | |
Trident Merger Sub, Inc., 6.625%, 11/1/25 144A | | | 1,725,000 | | | | 1,721 | |
USIS Merger Sub, Inc., 6.875%, 5/1/25 144A | | | 2,775,000 | | | | 2,803 | |
Vantiv LLC, 4.375%, 11/15/25 144A | | | 325,000 | | | | 329 | |
| | | | | | | | |
Total | | | | | | | 43,652 | |
| | | | | | | | |
| | |
Industrial (11.5%) | | | | | | | | |
ARD Finance SA, 7.125%, 9/15/23 | | | 3,275,000 | | | | 3,422 | |
Ardagh Packaging Finance PLC / Ardagh Holdings USA, Inc., 4.625%, 5/15/23 144A | | | 525,000 | | | | 535 | |
The Accompanying Notes are an Integral Part of the Financial Statements.
| | | | | | |
| | High Yield Bond Portfolio | | | 155 | |
High Yield Bond Portfolio
| | | | | | | | |
| Corporate Bonds (95.4%) | | Shares/
$ Par | | | Value
$ (000’s) | |
| | |
Industrial continued | | | | | | | | |
Ardagh Packaging Finance PLC / Ardagh Holdings USA, Inc., 6.000%, 6/30/21 144A | | | 1,475,000 | | | | 1,514 | |
Ardagh Packaging Finance PLC / Ardagh Holdings USA, Inc., 6.000%, 2/15/25 144A | | | 2,100,000 | | | | 2,210 | |
Ardagh Packaging Finance PLC / Ardagh Holdings USA, Inc., 7.250%, 5/15/24 144A | | | 2,000,000 | | | | 2,178 | |
Ball Corp., 5.250%, 7/1/25 | | | 475,000 | | | | 517 | |
Belden, Inc., 5.250%, 7/15/24 144A | | | 325,000 | | | | 335 | |
Berry Plastics Corp., 5.125%, 7/15/23 | | | 1,150,000 | | | | 1,196 | |
Berry Plastics Corp., 5.500%, 5/15/22 | | | 4,205,000 | | | | 4,331 | |
Berry Plastics Corp., 6.000%, 10/15/22 | | | 275,000 | | | | 288 | |
BWAY Holding Co., 5.500%, 4/15/24 144A | | | 2,175,000 | | | | 2,262 | |
BWAY Holding Co., 7.250%, 4/15/25 144A | | | 4,775,000 | | | | 4,930 | |
CD&R Waterworks Merger Sub LLC, 6.125%, 8/15/25 144A | | | 1,050,000 | | | | 1,066 | |
Engility Corp., 8.875%, 9/1/24 | | | 1,475,000 | | | | 1,576 | |
FGI Operating Co. LLC / FGI Finance, Inc.,
7.875%, 5/1/20 | | | 1,200,000 | | | | 264 | |
Flex Acquisition Co., Inc., 6.875%, 1/15/25 144A | | | 4,700,000 | | | | 4,867 | |
Gates Global LLC / Gates Global Co.,
6.000%, 7/15/22 144A | | | 4,092,000 | | | | 4,184 | |
The Hillman Group, Inc., 6.375%, 7/15/22 144A | | | 3,200,000 | | | | 3,192 | |
JELD-WEN, Inc., 4.625%, 12/15/25 144A | | | 300,000 | | | | 302 | |
JELD-WEN, Inc., 4.875%, 12/15/27 144A | | | 275,000 | | | | 278 | |
JPW Industries Holding Corp., 9.000%, 10/1/24 144A | | | 1,150,000 | | | | 1,202 | |
Koppers, Inc., 6.000%, 2/15/25 144A | | | 1,150,000 | | | | 1,219 | |
Masonite International Corp., 5.625%, 3/15/23 144A | | | 800,000 | | | | 836 | |
Multi-Color Corp., 4.875%, 11/1/25 144A | | | 450,000 | | | | 452 | |
Multi-Color Corp., 6.125%, 12/1/22 144A | | | 3,125,000 | | | | 3,262 | |
NCI Building Systems, Inc., 8.250%, 1/15/23 144A | | | 1,200,000 | | | | 1,272 | |
Owens-Brockway Glass Container, Inc.,
5.375%, 1/15/25 144A | | | 2,350,000 | | | | 2,479 | |
Owens-Brockway Glass Container, Inc.,
5.875%, 8/15/23 144A | | | 500,000 | | | | 539 | |
Owens-Brockway Glass Container, Inc.,
6.375%, 8/15/25 144A | | | 325,000 | | | | 363 | |
Park Aerospace Holdings, Ltd., 4.500%, 3/15/23 144A | | | 550,000 | | | | 525 | |
Park Aerospace Holdings, Ltd., 5.250%, 8/15/22 144A | | | 425,000 | | | | 422 | |
Park Aerospace Holdings, Ltd., 5.500%, 2/15/24 144A | | | 5,050,000 | | | | 5,012 | |
Ply Gem Industries, Inc., 6.500%, 2/1/22 | | | 1,525,000 | | | | 1,575 | |
Reynolds Group Issuer, Inc. / Reynolds Group Issuer LLC / Reynolds Group Issuer LU,
5.750%, 10/15/20 | | | 2,815,258 | | | | 2,857 | |
Reynolds Group Issuer, Inc. / Reynolds Group Issuer LLC / Reynolds Group Issuer LU,
6.875%, 2/15/21 | | | 502,305 | | | | 509 | |
Reynolds Group Issuer, Inc. / Reynolds Group Issuer LLC / Reynolds Group Issuer LU,
7.000%, 7/15/24 144A | | | 2,575,000 | | | | 2,758 | |
RSI Home Products, Inc., 6.500%, 3/15/23 144A | | | 2,725,000 | | | | 2,854 | |
Sealed Air Corp., 4.875%, 12/1/22 144A | | | 1,375,000 | | | | 1,452 | |
Sealed Air Corp., 5.125%, 12/1/24 144A | | | 1,950,000 | | | | 2,087 | |
Standard Industries, Inc., 5.000%, 2/15/27 144A | | | 2,900,000 | | | | 2,965 | |
Standard Industries, Inc., 6.000%, 10/15/25 144A | | | 1,275,000 | | | | 1,361 | |
Tervita Escrow Corp., 7.625%, 12/1/21 144A | | | 1,900,000 | | | | 1,905 | |
TransDigm, Inc., 6.000%, 7/15/22 | | | 520,000 | | | | 532 | |
TransDigm, Inc., 6.375%, 6/15/26 | | | 1,575,000 | | | | 1,597 | |
TransDigm, Inc., 6.500%, 7/15/24 | | | 4,875,000 | | | | 4,997 | |
| | | | | | | | |
| Corporate Bonds (95.4%) | | Shares/
$ Par | | | Value
$ (000’s) | |
| | |
Industrial continued | | | | | | | | |
TransDigm, Inc., 6.500%, 5/15/25 | | | 300,000 | | | | 307 | |
TTM Technologies, Inc., 5.625%, 10/1/25 144A | | | 1,675,000 | | | | 1,717 | |
USG Corp., 4.875%, 6/1/27 144A | | | 1,525,000 | | | | 1,581 | |
WESCO Distribution, Inc., 5.375%, 12/15/21 | | | 2,780,000 | | | | 2,850 | |
WESCO Distribution, Inc., 5.375%, 6/15/24 | | | 1,750,000 | | | | 1,798 | |
Wrangler Buyer Corp., 6.000%, 10/1/25 144A | | | 1,000,000 | | | | 1,030 | |
| | | | | | | | |
Total | | | | | | | 93,762 | |
| | | | | | | | |
| | |
Other Holdings (–%) | | | | | | | | |
General Motors Co. Escrow, 7.200%, 1/15/15(d), (l),* | | | 610,000 | | | | — | |
General Motors Co. Escrow, 8.375%, 7/15/49(d), (l),* | | | 4,865,000 | | | | — | |
| | | | | | | | |
Total | | | | | | | — | |
| | | | | | | | |
| | |
Technology (8.1%) | | | | | | | | |
BMC Software Finance, Inc., 8.125%, 7/15/21 144A | | | 3,775,000 | | | | 3,799 | |
CDW LLC / CDW Finance Corp., 5.000%, 9/1/25 | | | 450,000 | | | | 466 | |
CDW LLC / CDW Finance Corp., 5.500%, 12/1/24 | | | 2,075,000 | | | | 2,256 | |
Diamond 1 Finance Corp. / Diamond 2 Finance Corp., 5.875%, 6/15/21 144A | | | 450,000 | | | | 467 | |
Diamond 1 Finance Corp. / Diamond 2 Finance Corp., 7.125%, 6/15/24 144A | | | 3,025,000 | | | | 3,312 | |
Entegris, Inc., 4.625%, 2/10/26 144A | | | 2,275,000 | | | | 2,309 | |
First Data Corp., 5.375%, 8/15/23 144A | | | 2,450,000 | | | | 2,550 | |
First Data Corp., 5.750%, 1/15/24 144A | | | 4,600,000 | | | | 4,777 | |
First Data Corp., 7.000%, 12/1/23 144A | | | 2,400,000 | | | | 2,538 | |
IMS Health, Inc., 5.000%, 10/15/26 144A | | | 1,625,000 | | | | 1,666 | |
Inception Merger Sub, Inc. / Rackspace Hosting, Inc., 8.625%, 11/15/24 144A | | | 3,675,000 | | | | 3,923 | |
Infor Software Parent LLC / Infor Software Parent, Inc., 7.125%, 5/1/21 144A(c) | | | 4,760,000 | | | | 4,867 | |
Infor US, Inc., 6.500%, 5/15/22 | | | 3,625,000 | | | | 3,752 | |
Informatica LLC, 7.125%, 7/15/23 144A | | | 2,775,000 | | | | 2,837 | |
JDA Escrow LLC / JDA Bond Finance, Inc.,
7.375%, 10/15/24 144A | | | 2,750,000 | | | | 2,881 | |
Micron Technology, Inc., 5.250%, 1/15/24 144A | | | 225,000 | | | | 234 | |
MSCI, Inc., 5.250%, 11/15/24 144A | | | 300,000 | | | | 316 | |
MSCI, Inc., 5.750%, 8/15/25 144A | | | 1,100,000 | | | | 1,181 | |
NCR Corp., 4.625%, 2/15/21 | | | 675,000 | | | | 681 | |
NCR Corp., 5.000%, 7/15/22 | | | 635,000 | | | | 646 | |
NCR Corp., 5.875%, 12/15/21 | | | 2,150,000 | | | | 2,204 | |
NCR Corp., 6.375%, 12/15/23 | | | 520,000 | | | | 545 | |
Nuance Communications, Inc., 5.375%, 8/15/20 144A | | | 1,072,000 | | | | 1,087 | |
Nuance Communications, Inc., 5.625%, 12/15/26 | | | 1,675,000 | | | | 1,744 | |
Nuance Communications, Inc., 6.000%, 7/1/24 | | | 1,375,000 | | | | 1,475 | |
Qorvo, Inc., 7.000%, 12/1/25 | | | 325,000 | | | | 363 | |
Riverbed Technology, Inc., 8.875%, 3/1/23 144A | | | 2,550,000 | | | | 2,406 | |
Sensata Technologies BV, 5.625%, 11/1/24 144A | | | 1,250,000 | | | | 1,373 | |
Sensata Technologies UK Financing Co. PLC, 6.250%, 2/15/26 144A | | | 425,000 | | | | 462 | |
Solera LLC / Solera Finance, Inc., 10.500%, 3/1/24 144A | | | 3,575,000 | | | | 4,022 | |
Sophia LP / Sophia Finance, Inc., 9.000%, 9/30/23 144A | | | 2,625,000 | | | | 2,776 | |
SS&C Technologies Holdings, Inc., 5.875%, 7/15/23 | | | 1,500,000 | | | | 1,582 | |
| | | | | | | | |
Total | | | | | | | 65,497 | |
| | | | | | | | |
The Accompanying Notes are an Integral Part of the Financial Statements.
| | | | |
| 156 | | High Yield Bond Portfolio | | |
High Yield Bond Portfolio
| | | | | | | | |
| Corporate Bonds (95.4%) | | Shares/
$ Par | | | Value
$ (000’s) | |
| | |
Utilities (1.9%) | | | | | | | | |
AmeriGas Partners LP / AmeriGas Finance Corp., 5.500%, 5/20/25 | | | 350,000 | | | | 353 | |
AmeriGas Partners LP / AmeriGas Finance Corp., 5.625%, 5/20/24 | | | 975,000 | | | | 1,014 | |
AmeriGas Partners LP / AmeriGas Finance Corp., 5.750%, 5/20/27 | | | 550,000 | | | | 556 | |
AmeriGas Partners LP / AmeriGas Finance Corp., 5.875%, 8/20/26 | | | 2,775,000 | | | | 2,858 | |
Calpine Corp., 5.250%, 6/1/26 144A | | | 550,000 | | | | 539 | |
Calpine Corp., 5.375%, 1/15/23 | | | 2,800,000 | | | | 2,727 | |
Calpine Corp., 5.750%, 1/15/25 | | | 1,375,000 | | | | 1,308 | |
Calpine Corp., 6.000%, 1/15/22 144A | | | 455,000 | | | | 469 | |
NRG Energy, Inc., 5.750%, 1/15/28 144A | | | 225,000 | | | | 227 | |
NRG Energy, Inc., 6.250%, 7/15/22 | | | 1,450,000 | | | | 1,508 | |
NRG Energy, Inc., 6.250%, 5/1/24 | | | 1,750,000 | | | | 1,833 | |
NRG Energy, Inc., 6.625%, 1/15/27 | | | 925,000 | | | | 978 | |
| | | | | | | | |
| Corporate Bonds (95.4%) | | Shares/
$ Par | | | Value
$ (000’s) | |
| | |
Utilities continued | | | | | | | | |
NRG Energy, Inc., 7.250%, 5/15/26 | | | 1,150,000 | | | | 1,252 | |
| | | | | | | | |
Total | | | | | | | 15,622 | |
| | | | | | | | |
| | |
Total Corporate Bonds | | | | | | | | |
(Cost: $762,315) | | | | | | | 774,537 | |
| | | | | | | | |
| | |
| Short-Term Investments (3.0%) | | | | | | |
| | |
Money Market Funds (3.0%) | | | | | | | | |
State Street Institutional U.S. Government Money
Market Fund - Premier Class, 1.209% # | | | 24,750,445 | | | | 24,750 | |
| | | | | | | | |
Total | | | | | | | 24,750 | |
| | | | | | | | |
| | |
Total Short-Term Investments | | | | | | | | |
(Cost: $24,750) | | | | | | | 24,750 | |
| | | | | | | | |
| | |
Total Investments (98.4%) | | | | | | | | |
(Cost: $787,065)(a) | | | | | | | 799,287 | |
| | | | | | | | |
Other Assets, | | | | | | | | |
Less Liabilities (1.6%) | | | | | | | 12,591 | |
| | | | | | | | |
Net Assets (100.0%) | | | | | | | 811,878 | |
| | | | | | | | |
| # | 7-Day yield as of December 31, 2017 |
144A after the name of a security represents a security exempt from registration under Rule 144A of the Securities Act of 1933. These securities may be resold as transactions exempt from registration, normally to qualified institutional buyers. At December 31, 2017 the value of these securities (in thousands) was $469,517 representing 57.8% of the net assets.
| (a) | At December 31, 2017, the aggregate cost of investments, including deriatives, for federal tax purposes (in thousands) was $787,065 and the net unrealized appreciation of investments based on that cost was $12,222 which is comprised of $24,729 aggregate gross unrealized appreciation and $12,507 aggregate gross unrealized depreciation. |
| (b) | All or a portion of the securities have been pledged as collateral for when-issued securities. |
| (c) | PIK — Payment In Kind. PIK rates of Hub Holdings LLC / Hub Holdings Finance, Inc. 8.875%, Infor Software Parent LLC / Infor Software Parent, Inc. 7.875% |
| (l) | This security is being valued using significant unobservable inputs. |
The following is a summary of the inputs used in valuing the Portfolio’s assets and liabilities at December 31, 2017. See Note 3 for additional information on portfolio valuation.
| | | | | | | | | | | | | | |
| | | Valuation Inputs | | | |
| Description | | Level 1 – Quoted Prices | | | Level 2 –
Other Significant
Observable Inputs | | | Level 3 –
Significant
Unobservable Inputs | | | |
| | | (Amounts in thousands) | | | |
Assets: | | | | | | | | | | | | | | |
Corporate Bonds | | $ | - | | | $ | 774,537 | | | $ | - | (m) | | |
Short-Term Investments | | | 24,750 | | | | - | | | | - | | | |
Total Assets: | | $ | 24,750 | | | $ | 774,537 | | | $ | - | | | |
^ Other financial instruments are derivative instruments such as futures, forwards, written options and swaps contracts, which are valued at the unrealized appreciation (depreciation) on the instrument and short sales, which are valued at market value. On December 31, 2017, this Portfolio did not hold any derivative instruments.
The Accompanying Notes are an Integral Part of the Financial Statements.
| | | | | | |
| | High Yield Bond Portfolio | | | 157 | |
Multi-Sector Bond Portfolio (unaudited)
| | | | |
| Objective: | | Portfolio Strategy: | | Net Assets: |
| Maximum total return, consistent with prudent investment management. | | Invest in a diversified portfolio of fixed income instruments of varying maturities and quality, and in derivatives designed to replicate such securities. | | $841 million |
Portfolio Overview
Mason Street Advisors, LLC (“Mason Street Advisors”), the investment adviser for the Multi-Sector Bond Portfolio (the “Portfolio”), has engaged Pacific Investment Management Company LLC (“PIMCO”) to act as sub-adviser for the Portfolio. Normally, the Portfolio invests in a diversified portfolio of fixed income instruments of varying maturities, which may be represented by forwards or derivatives such as options, futures contracts or swap agreements. The average portfolio duration (an aggregate measure of the sensitivity of the Portfolio’s fixed income portfolio securities to changes in interest rates) of the Portfolio normally varies from three to eight years, based on the Portfolio’s forecast for interest rates. The Portfolio may invest all of its assets in high yield securities subject to a maximum of 10% of its total assets in securities rated below B by Moody’s or equivalently rated by S&P or Fitch or, if unrated, determined to be of comparable quality (so called “junk bonds”). The Portfolio may invest, without limitation, in securities denominated in foreign currencies and U.S. dollar denominated securities of foreign issuers. In addition, the Portfolio may invest without limit in fixed income securities of issuers that are economically tied to emerging securities markets.
Market Overview
Headlines in 2017 were largely dominated by political developments, namely Donald Trump’s surprise victory in the U.S. presidential election, the U.S. Federal Reserve’s (the “Fed”) policy decisions and geopolitics. In the U.S., solid fundamental data, relatively easy financial conditions, and optimism among businesses and consumers provided an opportunity for the Fed to continue on its path towards policy normalization. As such, the Fed raised rates and unveiled details of its plan to gradually unwind its balance sheet. A perceived hawkish shift in tone from other major central banks spurred most developed market yields to rise. Still, the fundamental backdrop remained largely intact and the broader risk rally continued as equities marched higher, credit spreads tightened and emerging market assets strengthened.
Portfolio Results
The Portfolio returned 8.38% for the twelve months ended December 31, 2017. By comparison, the Portfolio’s benchmark, the Bloomberg Barclays® Global Credit Hedged USD Index returned 5.89%. The Portfolio’s custom benchmark, comprised of 1/3 each: Bloomberg Barclays® Global Aggregate - Credit Component ex Emerging Markets, Hedged USD; BofA Merrill Lynch® Global High Yield BB-B Rated Constrained Developed Markets Index, Hedged USD; J.P. Morgan® EMBI Global (the “Equal Weighted Composite Index”), returned 7.28%. (These Indices are unmanaged, cannot be invested in directly and does not include administrative expenses.) According to Morningstar® Inc., an independent mutual fund ranking agency, the average return of the Multisector Bond peer group was 6.50% for 2017.
When compared to the Equal Weighted Composite Index, the Portfolio’s corporate credit allocation benefited from strength in investment grade and high yield Financials and Utilities, given recent rallies in credit spreads. During the year, the Portfolio’s credit exposure was partially obtained through the use of credit default swaps. Tactical exposure to non-Agency mortgage-backed securities was additive to performance due to continued strength in the U.S. housing market. An overweight to taxable municipals contributed to performance. Additionally, positioning within European interest rates, partially implemented through the use of futures and option contracts, contributed to performance as rates sold off throughout the period. Currency positioning, which was partially facilitated through currency forward contracts, was neutral.
The primary detractor over the period was an underweight to investment grade and high yield industrials as spreads continued to rally. Additionally, an underweight to external emerging market credit detracted as spreads tightened.
Portfolio Manager Outlook
The following forward-looking comments are the opinion of PIMCO, the Portfolio’s sub-adviser.
We expect world GDP growth to remain above-trend at 3.0%–3.5% in 2018. Easier financial conditions, resulting in buoyant risk assets and low interest rates, and fiscal stimulus in several advanced economies imply near-term tailwinds.
In the U.S., we look for above-consensus growth of 2.25%–2.75% in 2018. Tax cuts and higher federal spending are expected to boost growth. With unemployment likely to drop below 4%, we expect some upward pressure on wages and consumer prices, and core inflation to rise above 2% over the course of 2018. Under new leadership, the Fed is expected to continue tightening gradually; our baseline forecast calls for three rate hikes this year.
| | | | |
| 158 | | Multi-Sector Bond Portfolio | | |
Multi-Sector Bond Portfolio (unaudited)
Relative Performance
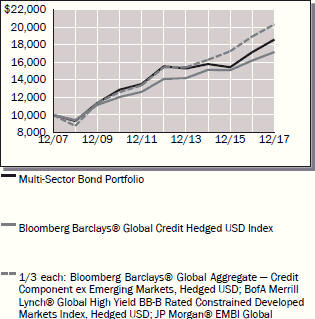
| | | | | | | | | | | | |
Average Annual Total Returns For Periods Ended December 31, 2017 | |
| | | 1 Year | | | 5 Years | | | 10 Years | |
Multi-Sector Bond Portfolio | | | 8.38 | % | | | 3.65 | % | | | 6.39 | % |
Bloomberg Barclays® Global Credit Hedged USD Index | | | 5.89 | % | | | 4.02 | % | | | 5.55 | % |
1/3 each: Bloomberg Barclays® Global Aggregate — Credit Component ex Emerging Markets, Hedged USD; BofA Merrill Lynch® Global High Yield BB-B Rated Constrained Developed Markets Index, Hedged USD; JP Morgan® EMBI Global | | | 7.28 | % | | | 4.40 | % | | | 6.72 | % |
Morningstar® US Insurance Fund Multisector Bond Average | | | 6.50 | % | | | 3.51 | % | | | 5.60 | % |
The performance data quoted represents past performance. Past performance is historical and does not guarantee future performance. Investment return and principal value will fluctuate, so that shares, when redeemed, may be worth more or less than their original cost. Current performance may be lower or higher than the performance data quoted. For the most recent month-end performance information visit www.northwesternmutual.com.
This chart assumes an initial investment of $10,000 made on 12/31/07. Returns shown reflect fee waivers, deductions for management and other portfolio expenses, and reinvestment of all dividends.
In the absence of fee waivers, total return would be reduced. Returns exclude deductions for separate account sale loads and account fees. Please refer to the Benchmark Definitions section of this report for information about the indices cited in the above chart and graph.
The Portfolio invests in lower-quality securities, which may present a significant risk for loss of principal and interest. Bonds and other debt obligations are affected by changes in interest rates, inflation risk and the creditworthiness of their issuers. High yield bonds generally have greater price swings and higher default risks than investment grade bonds. Return of principal is not guaranteed. When interest rates rise, bond prices fall. With a fixed income fund, when interest rates rise, the value of the fund’s existing bonds drops, which could negatively affect overall fund performance.
Investing in bonds issued by foreign corporations and governments carries additional risk, including foreign currency risk, and may increase the volatility of the Portfolio’s performance.
The Portfolio may use derivative instruments for hedging purposes or as alternatives to direct investments. Use of these instruments may involve certain costs and risks such as liquidity risk, interest rate risk, market risk, credit risk, management risk and the risk of mispricing or improper valuation. Certain derivatives involve leverage, which could magnify losses, and portfolios investing in derivatives could lose more than the principal amount invested in those instruments.
The Portfolio may invest a portion of its assets in fixed-and floating-rate loans, including senior loans, through loan participations and assignments. Investing in loans may expose the Portfolio to additional risks, including credit risk, interest rate risk, liquidity risk, call risk, settlement risk, and risks associated with being a lender.
The Portfolio may also invest in municipal securities, which may be more sensitive to certain adverse conditions than other fixed income securities, may be or become illiquid, and may have yields which move differently and adversely compared to the yields of the overall debt securities markets.
Currently, interest rates remain at historically low levels on a relative basis, although the U.S. federal funds rate has been subject to modest increases over the course of the last two years. A significant rise in interest rates over a short period of time could cause significant losses in the market value of the Portfolio’s fixed income investments.
| | | | | | |
| | Multi-Sector Bond Portfolio | | | 159 | |
Multi-Sector Bond Portfolio (unaudited)
Top 10 Fixed Income Holdings 12/31/17
| | |
| Security Description | | % of Net Assets |
US Treasury, Various | | 7.0% |
Spain Letras del Tesoro, 0.01%, 1/19/18 | | 4.1% |
Italy Buoni Poliennali Del Tesoro, 4.50%, 2/1/18 | | 3.6% |
Turkey Government International Bond, Various | | 2.4% |
Energy Future Intermediate Holding Co., LLC, 1.00%, 6/30/18 | | 1.9% |
Argentine Republic Government International Bond, Various | | 1.9% |
Petroleos Mexicanos, Various | | 1.7% |
Blackstone CQP Holdco LP, 6.50%, 3/20/21 | | 1.7% |
Master Asset Backed Securities Trust, Series 2006-FRE2, Class A1, 1.70%, 3/25/36 | | 1.6% |
Republic of Indonesia, Various | | 1.3% |
Sector Allocation 12/31/17
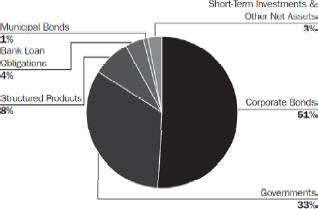
Sector Allocation is based on Net Assets.
Sector Allocation and Top 10 Holdings are subject to change.
| | | | |
| 160 | | Multi-Sector Bond Portfolio | | |
Multi-Sector Bond Portfolio
Schedule of Investments
December 31, 2017
| | | | | | | | |
| Corporate Bonds (50.6%) | | Shares/
Par | | | Value
$ (000’s) | |
| | |
Basic Materials (0.5%) | | | | | | | | |
FMG Resources August 2006 PTY, Ltd., 9.750%, 3/1/22 144A | | | 1,800,000 | | | | 1,992 | |
Georgia-Pacific LLC, 8.875%, 5/15/31 | | | 200,000 | | | | 310 | |
Ineos Finance PLC, 4.000%, 5/1/23 144A EUR (f) | | | 1,500,000 | | | | 1,847 | |
Solvay Finance America LLC, 4.450%, 12/3/25 144A | | | 200,000 | | | | 212 | |
Suzano Austria GmbH, 7.000%, 3/16/47 144A | | | 200,000 | | | | 229 | |
| | | | | | | | |
Total | | | | | | | 4,590 | |
| | | | | | | | |
| | |
Communications (8.7%) | | | | | | | | |
Altice Financing SA, 5.250%, 2/15/23 EUR (f) | | | 2,800,000 | | | | 3,494 | |
Altice Financing SA, 6.625%, 2/15/23 144A | | | 2,427,000 | | | | 2,541 | |
Altice Financing SA, 7.500%, 5/15/26 144A | | | 1,200,000 | | | | 1,278 | |
Altice Luxembourg SA,
6.250%, 2/15/25 EUR (f) | | | 1,500,000 | | | | 1,764 | |
Altice Luxembourg SA, 7.625%, 2/15/25 144A | | | 1,600,000 | | | | 1,532 | |
Altice SA, 7.250%, 5/15/22 EUR (f) | | | 4,900,000 | | | | 5,956 | |
AT&T, Inc., 3.400%, 5/15/25 (k) | | | 1,000,000 | | | | 983 | |
AT&T, Inc., 4.900%, 8/14/37 | | | 200,000 | | | | 203 | |
AT&T, Inc., 5.300%, 8/14/58 (b) | | | 6,200,000 | | | | 6,215 | |
Charter Communications Operating LLC / Charter Communications Operating Capital, 4.200%, 3/15/28 (k) | | | 1,700,000 | | | | 1,683 | |
Charter Communications Operating LLC / Charter Communications Operating Capital Corp., 4.464%, 7/23/22 (b) | | | 2,400,000 | | | | 2,504 | |
CommScope Technologies LLC,
5.000%, 3/15/27 144A | | | 100,000 | | | | 100 | |
Deutsche Telekom International Finance BV, 8.750%, 6/15/30 (k) | | | 700,000 | | | | 1,035 | |
DISH DBS Corp., 5.125%, 5/1/20 (k) | | | 1,342,000 | | | | 1,369 | |
Koninklijke KPN NV, 5.750%, 9/17/29 GBP (f) | | | 750,000 | | | | 1,296 | |
Qwest Corp., 7.250%, 9/15/25 | | | 500,000 | | | | 536 | |
SFR Group SA, 5.375%, 5/15/22 EUR (f) | | | 1,800,000 | | | | 2,222 | |
SFR Group SA, 6.250%, 5/15/24 144A | | | 2,400,000 | | | | 2,406 | |
SFR Group SA, 7.375%, 5/1/26 144A | | | 6,000,000 | | | | 6,180 | |
SoftBank Group Corp., 4.000%, 9/19/29 EUR (f) | | | 2,500,000 | | | | 2,944 | |
TDC A/S, 5.625%, 2/23/23 GBP (f) | | | 100,000 | | | | 157 | |
Telenet Finance Luxembourg Notes,
3.500%, 3/1/28 144A EUR (f) | | | 1,100,000 | | | | 1,313 | |
Time Warner Cable LLC, 5.875%, 11/15/40 | | | 300,000 | | | | 325 | |
Time Warner Cable LLC, 6.750%, 6/15/39 | | | 200,000 | | | | 240 | |
UPCB Finance IV, Ltd.,
4.000%, 1/15/27 EUR (f) | | | 350,000 | | | | 445 | |
UPCB Finance VII, Ltd.,
3.625%, 6/15/29 EUR (f) | | | 2,800,000 | | | | 3,345 | |
Verizon Communications, Inc., 3.125%, 3/16/22 | | | 200,000 | | | | 203 | |
Verizon Communications, Inc., 4.522%, 9/15/48 | | | 100,000 | | | | 98 | |
Verizon Communications, Inc.,
4.672%, 3/15/55 (k) | | | 2,150,000 | | | | 2,074 | |
Verizon Communications, Inc.,
5.012%, 4/15/49 (b) | | | 2,449,000 | | | | 2,566 | |
Verizon Communications, Inc., 5.250%, 3/16/37 | | | 200,000 | | | | 220 | |
Virgin Media Investment Holdings, Ltd.,
5.125%, 1/15/25 144A GBP (f) | | | 700,000 | | | | 983 | |
Virgin Media Secured Finance PLC,
4.875%, 1/15/27 GBP (f) | | | 3,100,000 | | | | 4,256 | |
Virgin Media Secured Finance PLC,
5.000%, 4/15/27 144A GBP (f) | | | 500,000 | | | | 686 | |
| | | | | | | | |
| Corporate Bonds (50.6%) | | Shares/
Par | | | Value
$ (000’s) | |
| | |
Communications continued | | | | | | | | |
Wind Tre SPA, 2.625%, 1/20/23 144A EUR (f) | | | 3,000,000 | | | | 3,523 | |
Wind Tre SPA, 2.750%, 1/20/24 144A EUR (f) | | | 600,000 | | | | 708 | |
Wind Tre SPA, 3.125%, 1/20/25 144A EUR (f) | | | 4,200,000 | | | | 4,905 | |
Ziggo Secured Finance BV, 4.250%, 1/15/27 144A EUR (f) | | | 500,000 | | | | 623 | |
Ziggo Secured Finance BV,
4.250%, 1/15/27 EUR (f) | | | 200,000 | | | | 249 | |
| | | | | | | | |
Total | | | | | | | 73,160 | |
| | | | | | | | |
| | |
Consumer, Cyclical (4.2%) | | | | | | | | |
American Airlines Pass Through Trust, Series 2011-1, Class A, 5.250%, 7/31/22 | | | 101,927 | | | | 107 | |
American Airlines Pass Through Trust, Series 2014-1, Class A, 3.700%, 4/1/28 | | | 498,420 | | | | 510 | |
Continental Airlines Pass Through Trust, Series 2009-2, Class A, 7.250%, 5/10/21 | | | 189,029 | | | | 204 | |
Continental Airlines Pass Through Trust, Series 2010, Class A, 4.750%, 7/12/22 | | | 61,074 | | | | 64 | |
CVS Pass-Through Trust, 4.704%, 1/10/36 144A | | | 444,206 | | | | 470 | |
CVS Pass-Through Trust, 5.926%, 1/10/34 144A | | | 758,790 | | | | 865 | |
CVS Pass-Through Trust, 7.507%, 1/10/32 144A | | | 80,431 | | | | 99 | |
DriveTime Automotive Group, Inc.,
8.000%, 6/1/21 144A | | | 1,500,000 | | | | 1,500 | |
Ford Motor Credit Co. LLC, 4.134%, 8/4/25 (k) | | | 800,000 | | | | 827 | |
General Motors Financial Co., Inc.,
3.450%, 4/10/22 | | | 300,000 | | | | 304 | |
The Goodyear Tire & Rubber Co.,
4.875%, 3/15/27 | | | 200,000 | | | | 205 | |
Hilton Worldwide Finance Corp.,
4.875%, 4/1/27 (k) | | | 700,000 | | | | 732 | |
INA-Holding Schaeffler GmbH & Co. KG, 3.750%, 9/15/26 EUR (c),(f) | | | 4,300,000 | | | | 5,520 | |
L Brands, Inc., 6.875%, 11/1/35 (k) | | | 2,040,000 | | | | 2,060 | |
Marks & Spencer PLC, 3.000%, 12/8/23 GBP (f) | | | 300,000 | | | | 420 | |
Melco Resorts Finance, Ltd., 4.875%, 6/6/25 144A | | | 700,000 | | | | 708 | |
Mitchells & Butlers Finance PLC, 0.966%, (ICE LIBOR GBP 3 Month plus 0.45%), 12/15/30 GBP (f) | | | 1,533,510 | | | | 1,905 | |
QVC, Inc., 4.375%, 3/15/23 (k) | | | 2,000,000 | | | | 2,051 | |
QVC, Inc., 5.450%, 8/15/34 (k) | | | 800,000 | | | | 803 | |
Spirit Issuer PLC, 6.582%, 12/28/27 GBP (f) | | | 1,100,000 | | | | 1,565 | |
Travis Perkins PLC, 4.375%, 9/15/21 GBP (f) | | | 200,000 | | | | 284 | |
Travis Perkins PLC, 4.500%, 9/7/23 GBP (f) | | | 200,000 | | | | 282 | |
The Unique Pub Finance Co. PLC,
5.659%, 6/30/27 GBP (f) | | | 155,045 | | | | 236 | |
The Unique Pub Finance Co. PLC,
6.542%, 3/30/21 GBP (f) | | | 640,120 | | | | 933 | |
The Unique Pub Finance Co. PLC,
7.395%, 3/28/24 GBP (f) | | | 400,000 | | | | 613 | |
United Airlines Pass Through Trust, Series 2013-1, Class A, 4.300%, 8/15/25 | | | 85,232 | | | | 90 | |
US Airways Pass-Through Trust, Series 2012-1, Class A, 5.900%, 4/1/26 (k) | | | 1,090,286 | | | | 1,210 | |
The Virgin Australia 2013-1A Pass Through Trust, 5.000%, 4/23/25 144A | | | 43,722 | | | | 45 | |
Volkswagen Group of America Finance LLC, 2.125%, 5/23/19 144A | | | 200,000 | | | | 199 | |
The Accompanying Notes are an Integral Part of the Financial Statements.
| | | | | | |
| | Multi-Sector Bond Portfolio | | | 161 | |
Multi-Sector Bond Portfolio
| | | | | | | | |
| Corporate Bonds (50.6%) | | Shares/
Par | | | Value
$ (000’s) | |
| | |
Consumer, Cyclical continued | | | | | | | | |
Wynn Las Vegas LLC / Wynn Las Vegas Capital Corp., 5.500%, 3/1/25 144A | | | 6,250,000 | | | | 6,437 | |
Wynn Las Vegas, LLC / Wynn Las Vegas Capital Corp., 5.250%, 5/15/27 144A | | | 800,000 | | | | 811 | |
ZF North America Capital, Inc.,
4.500%, 4/29/22 144A | | | 436,000 | | | | 458 | |
ZF North America Capital, Inc.,
4.750%, 4/29/25 144A | | | 2,232,000 | | | | 2,363 | |
| | | | | | | | |
Total | | | | | | | 34,880 | |
| | | | | | | | |
| | |
Consumer, Non-cyclical (2.4%) | | | | | | | | |
Amgen, Inc., 4.663%, 6/15/51 (k) | | | 1,041,000 | | | | 1,163 | |
CHS / Community Health Systems, Inc., 5.125%, 8/1/21 | | | 200,000 | | | | 180 | |
Endo Finance LLC, 5.750%, 1/15/22 144A | | | 2,900,000 | | | | 2,414 | |
Endo Finance LLC & Endo Finco, Inc., 5.375%, 1/15/23 144A | | | 3,200,000 | | | | 2,496 | |
Greene King Finance PLC, 2.596%, (ICE LIBOR GBP 3 Month plus 2.08%), 3/15/36 GBP (f) | | | 450,000 | | | | 510 | |
Hamilton College, 4.750%, 7/1/13 | | | 100,000 | | | | 103 | |
HCA, Inc., 4.500%, 2/15/27 | | | 100,000 | | | | 100 | |
HCA, Inc., 4.750%, 5/1/23 (b) | | | 2,655,000 | | | | 2,735 | |
HCA, Inc., 6.500%, 2/15/20 (k) | | | 2,000,000 | | | | 2,120 | |
Mallinckrodt International Finance SA, 4.750%, 4/15/23 | | | 700,000 | | | | 549 | |
Mallinckrodt International Finance SA / Mallinckrodt CB LLC, 5.750%, 8/1/22 144A | | | 400,000 | | | | 363 | |
Pfizer, Inc., 5.800%, 8/12/23 | | | 200,000 | | | | 232 | |
Tenet Healthcare Corp., 4.500%, 4/1/21 | | | 300,000 | | | | 302 | |
Teva Pharmaceutical Finance Co. BV, 2.950%, 12/18/22 | | | 120,000 | | | | 108 | |
Teva Pharmaceutical Finance Co. BV, 3.650%, 11/10/21 (k) | | | 1,000,000 | | | | 951 | |
Teva Pharmaceutical Finance IV BV, 3.650%, 11/10/21 | | | 400,000 | | | | 380 | |
Teva Pharmaceutical Finance Netherlands III BV, 2.200%, 7/21/21 | | | 200,000 | | | | 183 | |
Teva Pharmaceutical Finance Netherlands III BV, 2.800%, 7/21/23 (k) | | | 2,300,000 | | | | 2,003 | |
Valeant Pharmaceuticals International, Inc., 4.500%, 5/15/23 EUR (f) | | | 1,600,000 | | | | 1,717 | |
Valeant Pharmaceuticals International, Inc., 5.375%, 3/15/20 144A | | | 1,400,000 | | | | 1,404 | |
Valeant Pharmaceuticals International, Inc., 9.000%, 12/15/25 144A | | | 300,000 | | | | 313 | |
| | | | | | | | |
Total | | | | | | | 20,326 | |
| | | | | | | | |
| | |
Diversified (0.5%) | | | | | | | | |
Co-operative Group Holdings 2011, Ltd., 6.875%, 7/8/20 GBP (e),(f) | | | 700,000 | | | | 1,040 | |
Co-operative Group Holdings 2011, Ltd., 7.500%, 7/8/26 GBP (e),(f) | | | 1,700,000 | | | | 2,839 | |
| | | | | | | | |
Total | | | | | | | 3,879 | |
| | | | | | | | |
| | |
Energy (9.8%) | | | | | | | | |
Andeavor Logistics LP / Tesoro Logistics Finance Corp., 4.250%, 12/1/27 | | | 100,000 | | | | 101 | |
Borets Finance, Ltd., 7.625%, 9/26/18 (b) | | | 2,700,000 | | | | 2,785 | |
| | | | | | | | |
| Corporate Bonds (50.6%) | | Shares/
Par | | | Value
$ (000’s) | |
| | |
Energy continued | | | | | | | | |
Continental Resources, Inc., 4.375%, 1/15/28 144A | | | 1,400,000 | | | | 1,382 | |
Dolphin Energy, Ltd., 5.500%, 12/15/21 144A | | | 1,000,000 | | | | 1,085 | |
El Paso Natural Gas Co. LLC, 8.375%, 6/15/32 | | | 200,000 | | | | 263 | |
Energy Transfer LP, 3.600%, 2/1/23 | | | 100,000 | | | | 100 | |
Energy Transfer LP, 4.150%, 10/1/20 | | | 400,000 | | | | 413 | |
Energy Transfer LP, 4.650%, 6/1/21 | | | 200,000 | | | | 210 | |
Energy Transfer LP, 7.500%, 7/1/38 | | | 100,000 | | | | 124 | |
Ensco PLC, 5.750%, 10/1/44 | | | 200,000 | | | | 137 | |
Ensco PLC, 8.000%, 1/31/24 | | | 80,000 | | | | 80 | |
Harvest Operations Corp., 2.330%, 4/14/21 144A | | | 2,970,000 | | | | 2,879 | |
Kinder Morgan Energy Partners LP,
6.550%, 9/15/40 (b) | | | 2,382,000 | | | | 2,783 | |
Kinder Morgan, Inc., 7.750%, 1/15/32 (k) | | | 1,216,000 | | | | 1,570 | |
Midcontinent Express Pipeline LLC, 6.700%, 9/15/19 144A | | | 1,700,000 | | | | 1,776 | |
Newfield Exploration Co., 5.625%, 7/1/24 (k) | | | 2,100,000 | | | | 2,257 | |
Novatek OAO via Novatek Finance, Ltd.,
4.422%, 12/13/22 (k) | | | 1,690,000 | | | | 1,738 | |
Novatek OAO via Novatek Finance, Ltd.,
6.604%, 2/3/21 (k) | | | 1,600,000 | | | | 1,756 | |
Odebrecht Drilling Norbe VIII/IX, Ltd.,
6.350%, 12/1/21 (l) | | | 1,133,333 | | | | 1,113 | |
Odebrecht Drilling Norbe VIII/IX, Ltd.,
7.350%, 12/1/26 (l) | | | 1,339,260 | | | | 462 | |
Odebrecht Oil & Gas Finance, Ltd., 0.000%, 2/9/18 (l) | | | 782,000 | | | | 15 | |
Petrobras Global Finance BV, 5.999%, 1/27/28 144A | | | 4,403,000 | | | | 4,414 | |
Petrobras Global Finance BV, 6.125%, 1/17/22 (b) | | | 3,600,000 | | | | 3,820 | |
Petrobras Global Finance BV, 7.375%, 1/17/27 (k) | | | 500,000 | | | | 550 | |
Petrofac, Ltd., 3.400%, 10/10/18 144A | | | 2,510,000 | | | | 2,485 | |
Petroleos de Venezuela SA, 5.375%, 4/12/27 (k) | | | 6,500,000 | | | | 1,511 | |
Petroleos de Venezuela SA, 5.500%, 4/12/37 (k) | | | 4,300,000 | | | | 1,021 | |
Petroleos Mexicanos, 2.750%, 4/21/27 EUR (f) | | | 1,100,000 | | | | 1,265 | |
Petroleos Mexicanos, 3.750%, 2/21/24 EUR (f) | | | 400,000 | | | | 520 | |
Petroleos Mexicanos, 4.875%, 2/21/28 EUR (f) | | | 600,000 | | | | 799 | |
Petroleos Mexicanos, 5.625%, 1/23/46 (b) | | | 5,000,000 | | | | 4,627 | |
Petroleos Mexicanos, 6.500%, 3/13/27 144A | | | 1,700,000 | | | | 1,858 | |
Petroleos Mexicanos, 6.500%, 6/2/41 (k) | | | 2,000,000 | | | | 2,057 | |
Petroleos Mexicanos, 6.625%, 6/15/38 (k) | | | 1,800,000 | | | | 1,872 | |
Petroleos Mexicanos, 6.750%, 9/21/47 (k) | | | 1,400,000 | | | | 1,461 | |
QEP Resources, Inc., 5.625%, 3/1/26 (k) | | | 700,000 | | | | 710 | |
QGOG Constellation SA, 9.500%, 11/9/24 (c) | | | 200,000 | | | | 134 | |
Ras Laffan Liquefied Natural Gas Co., Ltd. III, 5.838%, 9/30/27 144A | | | 2,300,000 | | | | 2,576 | |
Regency Energy Partners LP / Regency Energy Finance Corp., 4.500%, 11/1/23 | | | 300,000 | | | | 311 | |
Regency Energy Partners LP / Regency Energy Finance Corp., 5.000%, 10/1/22 (k) | | | 1,100,000 | | | | 1,172 | |
Regency Energy Partners LP / Regency Energy Finance Corp., 5.750%, 9/1/20 | | | 300,000 | | | | 319 | |
Regency Energy Partners LP / Regency Energy Finance Corp., 5.875%, 3/1/22 (k) | | | 800,000 | | | | 875 | |
Reliance Holdings USA, Inc., 4.500%, 10/19/20 | | | 300,000 | | | | 314 | |
Rio Oil Finance Trust, Series 2014-3, 9.750%, 1/6/27 | | | 505,998 | | | | 546 | |
Rockies Express Pipeline LLC, 5.625%, 4/15/20 144A | | | 1,000,000 | | | | 1,048 | |
Rockies Express Pipeline LLC, 6.850%, 7/15/18 144A | | | 4,200,000 | | | | 4,274 | |
The Accompanying Notes are an Integral Part of the Financial Statements.
| | | | |
| 162 | | Multi-Sector Bond Portfolio | | |
Multi-Sector Bond Portfolio
| | | | | | | | |
| Corporate Bonds (50.6%) | | Shares/
Par | | | Value
$ (000’s) | |
| | |
Energy continued | | | | | | | | |
Sabine Pass Liquefaction LLC, 5.625%, 2/1/21 (k) | | | 1,100,000 | | | | 1,179 | |
Sabine Pass Liquefaction LLC, 5.625%, 4/15/23 | | | 100,000 | | | | 110 | |
Sabine Pass Liquefaction LLC, 5.625%, 3/1/25 (b) | | | 4,900,000 | | | | 5,404 | |
Sabine Pass Liquefaction LLC, 5.750%, 5/15/24 (k) | | | 700,000 | | | | 778 | |
Sabine Pass Liquefaction LLC, 5.875%, 6/30/26 | | | 200,000 | | | | 225 | |
Tallgrass Energy Partners LP, 5.500%, 1/15/28 144A | | | 8,400,000 | | | | 8,502 | |
Williams Partners LP, 3.600%, 3/15/22 (b) | | | 2,500,000 | | | | 2,557 | |
| | | | | | | | |
Total | | | | | | | 82,323 | |
| | | | | | | | |
| | |
Financial (21.3%) | | | | | | | | |
AerCap Ireland Capital DAC / AerCap Global Aviation Trust, 4.250%, 7/1/20 | | | 150,000 | | | | 156 | |
AerCap Ireland Capital DAC / AerCap Global Aviation Trust, 5.000%, 10/1/21 (k) | | | 1,500,000 | | | | 1,599 | |
Alliance Data Systems Corp., 5.875%, 11/1/21 144A | | | 2,900,000 | | | | 2,972 | |
Ally Financial, Inc., 3.250%, 2/13/18 (k) | | | 1,500,000 | | | | 1,501 | |
Ally Financial, Inc., 3.250%, 11/5/18 | | | 100,000 | | | | 100 | |
Ally Financial, Inc., 3.500%, 1/27/19 | | | 371,000 | | | | 373 | |
Ally Financial, Inc., 3.600%, 5/21/18 | | | 100,000 | | | | 100 | |
Ally Financial, Inc., 3.750%, 11/18/19 (b) | | | 5,290,000 | | | | 5,357 | |
Ally Financial, Inc., 4.125%, 3/30/20 | | | 537,000 | | | | 548 | |
Ally Financial, Inc., 4.250%, 4/15/21 | | | 246,000 | | | | 252 | |
Ally Financial, Inc., 4.750%, 9/10/18 | | | 100,000 | | | | 101 | |
Ally Financial, Inc., 8.000%, 12/31/18 | | | 30,000 | | | | 31 | |
Ally Financial, Inc., 8.000%, 11/1/31 (k) | | | 1,361,000 | | | | 1,769 | |
Banco Bilbao Vizcaya Argentaria SA, 7.000%, (Euro Swap Annual 5 Year plus 6.16%), 12/29/49 EUR (f) | | | 600,000 | | | | 757 | |
Banco Bilbao Vizcaya Argentina SA, 6.750%, 12/29/49 EUR (f) | | | 5,000,000 | | | | 6,486 | |
Banistmo SA, 3.650%, 9/19/22 144A | | | 200,000 | | | | 197 | |
Bank of America Corp., 3.419%, (3 Month Libor plus 1.04%), 12/20/28 144A | | | 973,000 | | | | 973 | |
Bank of America Corp., 4.000%, 4/1/24 (k) | | | 1,081,000 | | | | 1,143 | |
Bank of Ireland, 7.375%, (Euro Swap Annual 5 Year plus 6.96%), 12/29/49 EUR (f) | | | 400,000 | | | | 538 | |
Barclays Bank PLC, 7.625%, 11/21/22 (k) | | | 2,000,000 | | | | 2,265 | |
Barclays Bank PLC, 7.750%, (USD SWAP SEMI 30/360 (>2 - 10Y) 5Y plus 6.83%), 4/10/23 (b) | | | 3,200,000 | | | | 3,248 | |
Barclays Bank PLC, 14.000%, (ICE LIBOR GBP 3 Month plus 13.40%), 11/29/49 GBP (f) | | | 800,000 | | | | 1,266 | |
Barclays PLC, 2.375%, 10/6/23 GBP (f) | | | 200,000 | | | | 273 | |
Barclays PLC, 3.250%, 2/12/27 GBP (f) | | | 500,000 | | | | 705 | |
Barclays PLC, 3.650%, 3/16/25 (b) | | | 3,100,000 | | | | 3,094 | |
Barclays PLC, 6.500%, (Euro Swap Annual 5 Year plus 5.88%), 12/29/49 EUR (f) | | | 2,300,000 | | | | 2,946 | |
Barclays PLC, 7.000%, (GBP Swap Semi-Annual 5 Year plus 5.08%), 6/15/49 GBP (f) | | | 800,000 | | | | 1,135 | |
Barclays PLC, 8.000%, (Euro Swap Annual 5 Year plus 6.75%), 12/15/49 EUR (f) | | | 900,000 | | | | 1,242 | |
Blackstone CQP Holdco LP, 6.500%, 3/20/21 144A | | | 14,200,000 | | | | 14,413 | |
Cantor Fitzgerald LP, 6.500%, 6/17/22 144A | | | 200,000 | | | | 222 | |
Cantor Fitzgerald LP, 7.875%, 10/15/19 144A | | | 1,500,000 | | | | 1,623 | |
CIT Group, Inc., 3.875%, 2/19/19 (k) | | | 1,000,000 | | | | 1,010 | |
CIT Group, Inc., 5.000%, 8/15/22 | | | 272,000 | | | | 288 | |
CIT Group, Inc., 5.000%, 8/1/23 | | | 100,000 | | | | 106 | |
| | | | | | | | |
| Corporate Bonds (50.6%) | | Shares/
Par | | | Value
$ (000’s) | |
| | |
Financial continued | | | | | | | | |
Citigroup, Inc., 3.400%, 5/1/26 (k) | | | 600,000 | | | | 603 | |
Cooperatieve Rabobank UA, 6.625%, 12/29/49 EUR (f) | | | 1,000,000 | | | | 1,387 | |
Credit Agricole Assurances SA, 4.250%, (Euro Swap Annual 5 Year plus 4.50%), 12/31/49 EUR (f) | | | 2,000,000 | | | | 2,681 | |
Credit Suisse AG, 6.500%, 8/8/23 144A | | | 7,400,000 | | | | 8,281 | |
Credit Suisse AG, 6.500%, 8/8/23 (k) | | | 1,700,000 | | | | 1,902 | |
Deutsche Bank AG, 4.250%, 10/14/21 (b) | | | 4,500,000 | | | | 4,693 | |
The Doctors Co., 6.500%, 10/15/23 144A | | | 300,000 | | | | 332 | |
Emerald Bay SA, %, 10/15/20 144A EUR (f) | | | 3,796,000 | | | | 4,202 | |
Equinix, Inc., 2.875%, 2/1/26 EUR (f) | | | 1,200,000 | | | | 1,439 | |
Freedom Mortgage Corp., 8.125%, 11/15/24 144A | | | 190,000 | | | | 194 | |
The Goldman Sachs Group, Inc., 2.788%, (3 Month LIBOR plus 1.20%), 9/15/20 | | | 200,000 | | | | 204 | |
The Goldman Sachs Group, Inc., 3.232%, 2/25/21 | | | 200,000 | | | | 207 | |
The Goldman Sachs Group, Inc., 3.750%, 5/22/25 (b) | | | 2,700,000 | | | | 2,781 | |
The Goldman Sachs Group, Inc., 3.850%, 7/8/24 (k) | | | 1,000,000 | | | | 1,037 | |
The Goldman Sachs Group, Inc., 4.000%, 3/3/24 | | | 400,000 | | | | 420 | |
The Goldman Sachs Group, Inc., 5.750%, 1/24/22 | | | 400,000 | | | | 443 | |
HBOS PLC, 5.374%, 6/30/21 EUR (f) | | | 600,000 | | | | 842 | |
The Howard Hughes Corp., 5.375%, 3/15/25 144A | | | 300,000 | | | | 308 | |
HSBC Holdings PLC, 3.600%, 5/25/23 (k) | | | 2,100,000 | | | | 2,160 | |
ING Bank NV, 5.800%, 9/25/23 144A | | | 2,100,000 | | | | 2,356 | |
International Lease Finance Corp., 5.875%, 4/1/19 (k) | | | 1,400,000 | | | | 1,457 | |
International Lease Finance Corp., 5.875%, 8/15/22 | | | 400,000 | | | | 443 | |
International Lease Finance Corp., 6.250%, 5/15/19 | | | 450,000 | | | | 472 | |
International Lease Finance Corp., 8.250%, 12/15/20 (b) | | | 2,100,000 | | | | 2,412 | |
International Lease Finance Corp., 8.625%, 1/15/22 | | | 400,000 | | | | 482 | |
Intesa Sanpaolo SPA, 5.017%, 6/26/24 144A | | | 2,700,000 | | | | 2,764 | |
Intesa Sanpaolo SPA, 6.500%, 2/24/21 144A | | | 4,100,000 | | | | 4,517 | |
Jefferies Finance LLC / JFIN Co-Issuer Corp., 6.875%, 4/15/22 144A | | | 800,000 | | | | 810 | |
Jefferies Finance LLC / JFIN Co-Issuer Corp., 7.375%, 4/1/20 144A | | | 2,000,000 | | | | 2,058 | |
Jefferies Finance LLC / JFIN Co-Issuer Corp., 7.500%, 4/15/21 144A | | | 500,000 | | | | 518 | |
Kennedy Wilson Europe Real Estate PLC, 3.950%, 6/30/22 GBP (f) | | | 2,700,000 | | | | 3,830 | |
Lincoln Finance, Ltd., 6.875%, 4/15/21 EUR (f) | | | 4,000,000 | | | | 5,037 | |
Lloyds Bank PLC, Series EMTN, 7.625%, 4/22/25 GBP (f) | | | 1,200,000 | | | | 2,171 | |
Lloyds Banking Group PLC, 7.000%, 12/29/49 GBP (f) | | | 800,000 | | | | 1,137 | |
Macquarie Group, Ltd., 6.250%, 1/14/21 144A | | | 300,000 | | | | 329 | |
Morgan Stanley, 2.293%, 7/22/22 (k) | | | 1,000,000 | | | | 1,008 | |
Morgan Stanley, 4.000%, 7/23/25 (b) | | | 3,600,000 | | | | 3,768 | |
Navient Corp., 4.875%, 6/17/19 (b) | | | 3,648,000 | | | | 3,710 | |
Navient Corp., 5.000%, 10/26/20 | | | 100,000 | | | | 101 | |
Navient Corp., 5.875%, 3/25/21 | | | 200,000 | | | | 207 | |
Navient Corp., 6.500%, 6/15/22 (k) | | | 1,200,000 | | | | 1,259 | |
Navient Corp., 6.625%, 7/26/21 (k) | | | 1,100,000 | | | | 1,161 | |
Navient Corp., 7.250%, 1/25/22 (k) | | | 400,000 | | | | 429 | |
Navient Corp., 8.000%, 3/25/20 (k) | | | 763,000 | | | | 825 | |
NN Group NV, 4.500%, (Euribor 3 Month plus 4.00%), 7/15/49 EUR (f) | | | 2,600,000 | | | | 3,515 | |
The Accompanying Notes are an Integral Part of the Financial Statements.
| | | | | | |
| | Multi-Sector Bond Portfolio | | | 163 | |
Multi-Sector Bond Portfolio
| | | | | | | | |
| Corporate Bonds (50.6%) | | Shares/
Par | | | Value
$ (000’s) | |
| | |
Financial continued | | | | | | | | |
OMEGA Healthcare Investors, Inc., 4.500%, 1/15/25 | | | 100,000 | | | | 100 | |
OMEGA Healthcare Investors, Inc., 4.950%, 4/1/24 | | | 100,000 | | | | 104 | |
OneMain Financial Holdings LLC, 6.750%, 12/15/19 144A | | | 1,146,000 | | | | 1,184 | |
OneMain Financial Holdings LLC, 7.250%, 12/15/21 144A | | | 530,000 | | | | 551 | |
Oxford Finance LLC / Oxford Finance Co-Issuer II, Inc., 6.375%, 12/15/22 144A | | | 200,000 | | | | 207 | |
Peru Enhanced Pass-Through Finance, Ltd., 0.000%, 5/31/18 144A | | | 13,448 | | | | 13 | |
Quicken Loans, Inc., 5.250%, 1/15/28 144A | | | 1,500,000 | | | | 1,481 | |
Rio Oil Finance Trust, Series 2014-1, 9.250%, 7/6/24 144A | | | 1,700,187 | | | | 1,836 | |
Rio Oil Finance Trust, Series 2014-1, 9.250%, 7/6/24 (k) | | | 1,310,562 | | | | 1,415 | |
Royal Bank of Scotland Group PLC, 2.500%, 3/22/23 EUR (f) | | | 100,000 | | | | 129 | |
Royal Bank of Scotland Group PLC, 4.800%, 4/5/26 (b) | | | 2,800,000 | | | | 3,008 | |
Royal Bank of Scotland Group PLC, 7.500%, (USD SWAP SEMI 30/360 (>2 - 10Y) 5Y plus 5.80%), 12/29/49 | | | 200,000 | | | | 212 | |
Santander UK Group Holdings PLC, 3.125%, 1/8/21 (k) | | | 2,100,000 | | | | 2,120 | |
Santander UK Group Holdings PLC, 6.750%, (GBP Swap Semi-Annual 5 Year plus 5.79%), 12/31/99 GBP (f) | | | 1,390,000 | | | | 2,048 | |
Sberbank of Russia Via SB Capital SA, 3.080%, 3/7/19 EUR (f) | | | 1,400,000 | | | | 1,723 | |
SL Green Realty Corp., 5.000%, 8/15/18 (k) | | | 1,100,000 | | | | 1,113 | |
Societe Generale SA, 8.250%, (USD 5 Year Swap Rate plus 6.39%), 9/29/49 | | | 200,000 | | | | 209 | |
Springleaf Finance Corp., 5.250%, 12/15/19 | | | 311,000 | | | | 320 | |
Springleaf Finance Corp., 6.000%, 6/1/20 (k) | | | 418,000 | | | | 433 | |
Springleaf Finance Corp., 6.125%, 5/15/22 (b) | | | 2,900,000 | | | | 3,009 | |
Springleaf Finance Corp., 8.250%, 12/15/20 | | | 206,000 | | | | 227 | |
Tesco Property Finance 2 PLC, 6.051%, 10/13/39 GBP (f) | | | 1,138,804 | | | | 1,856 | |
Tesco Property Finance 3 PLC, 5.744%, 4/13/40 GBP (f) | | | 97,529 | | | | 156 | |
Tesco Property Finance 6 PLC, 5.411%, 7/13/44 GBP (f) | | | 2,733,666 | | | | 4,263 | |
UBS AG, 4.750%, (USD 5 Year Swap Rate plus 3.77%), 5/22/23 (k) | | | 2,300,000 | | | | 2,316 | |
UBS AG, 7.625%, 8/17/22 (b) | | | 4,400,000 | | | | 5,140 | |
UBS Group Funding AG, 4.125%, 9/24/25 144A | | | 700,000 | | | | 734 | |
UniCredit SPA, 3.750%, 4/12/22 144A | | | 200,000 | | | | 203 | |
VEREIT Operating Partnership LP, 4.125%, 6/1/21 | | | 100,000 | | | | 104 | |
VIVAT NV, 2.375%, 5/17/24 EUR (f) | | | 500,000 | | | | 594 | |
Vonovia Finance BV, 5.000%, 10/2/23 144A | | | 300,000 | | | | 318 | |
Weyerhaeuser Co., 7.375%, 10/1/19 | | | 400,000 | | | | 433 | |
Weyerhaeuser Co., 7.375%, 3/15/32 (k) | | | 1,500,000 | | | | 2,071 | |
| | | | | | | | |
Total | | | | | | | 179,311 | |
| | | | | | | | |
| | |
Industrial (1.7%) | | | | | | | | |
Asciano Finance, Ltd., 4.625%, 9/23/20 144A | | | 500,000 | | | | 517 | |
Asciano Finance, Ltd., 5.000%, 4/7/18 144A | | | 800,000 | | | | 805 | |
| | | | | | | | |
| Corporate Bonds (50.6%) | | Shares/
Par | | | Value
$ (000’s) | |
| | |
Industrial continued | | | | | | | | |
Aviation Capital Group Corp., 4.625%, 1/31/18 144A | | | 1,900,000 | | | | 1,904 | |
Cemex SAB de CV, 4.375%, 3/5/23 144A EUR (f) | | | 1,400,000 | | | | 1,772 | |
Crown European Holdings SA, 3.375%, 5/15/25 144A EUR (f) | | | 500,000 | | | | 627 | |
DAE Funding LLC, 4.000%, 8/1/20 144A | | | 2,920,000 | | | | 2,949 | |
Flex, Ltd., 4.625%, 2/15/20 | | | 200,000 | | | | 206 | |
Fortress Transportation & Infrastructure, 6.750%, 3/15/22 144A | | | 700,000 | | | | 725 | |
Lima Metro Line 2 Finance, Ltd., 5.875%, 7/5/34 144A | | | 600,000 | | | | 648 | |
Park Aerospace Holdings, Ltd., 4.500%, 3/15/23 144A | | | 3,800,000 | | | | 3,629 | |
Park Aerospace Holdings, Ltd., 5.500%, 2/15/24 144A | | | 400,000 | | | | 397 | |
| | | | | | | | |
Total | | | | | | | 14,179 | |
| | | | | | | | |
| | |
Technology (0.4%) | | | | | | | | |
Dell International LLC / EMC Corp, 5.450%, 6/15/23 144A | | | 1,400,000 | | | | 1,513 | |
Dell International LLC / EMC Corp, 8.100%, 7/15/36 144A | | | 300,000 | | | | 378 | |
Fidelity National Information Services, Inc., 4.500%, 10/15/22 | | | 395,000 | | | | 423 | |
Pitney Bowes, Inc., 3.625%, 9/15/20 | | | 100,000 | | | | 99 | |
Quintiles IMS, Inc., 3.250%, 3/15/25 144A EUR (f) | | | 500,000 | | | | 619 | |
| | | | | | | | |
Total | | | | | | | 3,032 | |
| | | | | | | | |
| | |
Telecommunications (0.0%) | | | | | | | | |
Sprint Communications, Inc., 7.000%, 8/15/20 | | | 110,000 | | | | 117 | |
| | | | | | | | |
Total | | | | | | | 117 | |
| | | | | | | | |
| | |
Utilities (1.1%) | | | | | | | | |
Calpine Corp., 5.250%, 6/1/26 144A | | | 650,000 | | | | 637 | |
Centrais Electricas Brasileiras SA, 6.875%, 7/30/19 (k) | | | 700,000 | | | | 732 | |
Dynegy, Inc., 7.375%, 11/1/22 (b) | | | 2,500,000 | | | | 2,637 | |
Dynegy, Inc., 7.625%, 11/1/24 (k) | | | 875,000 | | | | 938 | |
Dynegy, Inc., 8.000%, 1/15/25 144A | | | 100,000 | | | | 108 | |
Dynegy, Inc., 8.125%, 1/30/26 144A | | | 700,000 | | | | 765 | |
Exelon Generation Co. LLC, 4.250%, 6/15/22 | | | 500,000 | | | | 525 | |
FirstEnergy Corp., 7.375%, 11/15/31 (k) | | | 600,000 | | | | 809 | |
Nakilat, Inc., 6.067%, 12/31/33 (k) | | | 1,100,000 | | | | 1,282 | |
Nakilat, Inc., 6.267%, 12/31/33 144A | | | 573,554 | | | | 665 | |
National Fuel Gas Co., 5.200%, 7/15/25 | | | 300,000 | | | | 322 | |
Puget Energy, Inc., 5.625%, 7/15/22 | | | 200,000 | | | | 221 | |
| | | | | | | | |
Total | | | | | | | 9,641 | |
| | | | | | | | |
Total Corporate Bonds (Cost: $414,779) | | | | | | | 425,438 | |
| | | | | | | | |
| Governments (32.8%) | | | | | | |
| | |
Governments (32.8%) | | | | | | | | |
Argentina Treasury Bill, 0.010%, 6/15/18 | | | 400,000 | | | | 394 | |
Argentina Treasury Bill, 0.010%, 9/14/18 ARS (f) | | | 18,920,000 | | | | 859 | |
Argentina Treasury Bill, 0.010%, 11/16/18 | | | 500,000 | | | | 485 | |
Argentine Republic, 0.000%, 9/28/18 (b) | | | 3,800,000 | | | | 3,706 | |
Argentine Republic, 0.010%, 3/16/18 (k) | | | 1,400,000 | | | | 1,391 | |
Argentine Republic, 0.010%, 5/11/18 | | | 500,000 | | | | 494 | |
Argentine Republic, 0.010%, 5/24/18 | | | 400,000 | | | | 395 | |
The Accompanying Notes are an Integral Part of the Financial Statements.
| | | | |
| 164 | | Multi-Sector Bond Portfolio | | |
Multi-Sector Bond Portfolio
| | | | | | | | |
| Governments (32.8%) | | Shares/
Par | | | Value
$ (000’s) | |
| | |
Governments continued | | | | | | | | |
Argentine Republic, 0.010%, 10/26/18 (k) | | | 900,000 | | | | 875 | |
Argentine Republic, 0.010%, 10/12/18 (k) | | | 800,000 | | | | 779 | |
Argentine Republic, 7.820%, 12/31/33 EUR (f) | | | 4,953,973 | | | | 6,944 | |
Argentine Republic Government International Bond, 3.375%, 1/15/23 EUR (f) | | | 950,000 | | | | 1,162 | |
Argentine Republic Government International Bond, 3.875%, 1/15/22 EUR (f) | | | 600,000 | | | | 758 | |
Argentine Republic Government International Bond, 5.000%, 1/15/27 EUR (f) | | | 4,900,000 | | | | 6,092 | |
Argentine Republic Government International Bond, 5.250%, 1/15/28 EUR (f) | | | 950,000 | | | | 1,185 | |
Autonomous Community of Catalonia, 4.750%, 6/4/18 EUR (f) | | | 4,550,000 | | | | 5,529 | |
Autonomous Community of Catalonia, 4.900%, 9/15/21 EUR (f) | | | 700,000 | | | | 886 | |
Autonomous Community of Catalonia, 4.950%, 2/11/20 EUR (f) | | | 200,000 | | | | 253 | |
Columbia Government International Bond, 5.000%, 6/15/45(b) | | | 6,000,000 | | | | 6,345 | |
Commonwealth of Australia, 4.250%, 4/21/26 AUD (f) | | | 2,400,000 | | | | 2,104 | |
Dominican Republic, 6.850%, 1/27/45 (k) | | | 900,000 | | | | 1,010 | |
Dominican Republic, 6.875%, 1/29/26 | | | 500,000 | | | | 570 | |
Dominican Republic, 7.450%, 4/30/44 | | | 400,000 | | | | 477 | |
Ecuador Government International Bond, 9.650%, 12/13/26 144A | | | 600,000 | | | | 689 | |
Ecuador Government International Bond, 10.750%, 3/28/22 (k) | | | 1,300,000 | | | | 1,519 | |
Egypt Government International Bond, 8.500%, 1/31/47 144A | | | 1,100,000 | | | | 1,263 | |
Export-Import Bank of India, 3.375%, 8/5/26 144A | | | 600,000 | | | | 589 | |
Gazprom Neft OAO Via GPN Capital SA, 6.000%, 11/27/23(b) | | | 3,000,000 | | | | 3,313 | |
Hellenic Republic Treasury Bill, 0.010%, 3/9/18 EUR (f) | | | 3,400,000 | | | | 4,067 | |
Hellenic Republic Treasury Bill, 0.010%, 3/16/18 EUR (f) | | | 1,900,000 | | | | 2,272 | |
Hellenic Republic Treasury Bill, 0.010%, 6/8/18 EUR (f) | | | 1,800,000 | | | | 2,143 | |
Indonesia Government International Bond, 3.375%, 7/30/25 EUR (f) | | | 100,000 | | | | 136 | |
Indonesia Government International Bond, 3.750%, 6/14/28 EUR (f) | | | 3,600,000 | | | | 4,978 | |
Indonesia Government International Bond, 5.125%, 1/15/45(k) | | | 700,000 | | | | 774 | |
Italy Buoni Poliennali Del Tesoro, 4.500%, 2/1/18 EUR (f) | | | 25,000,000 | | | | 30,112 | |
Japan Treasury Discount Bill, 0.010%, 1/29/18 JPY (f) | | | 70,000,000 | | | | 621 | |
Mexico Government International Bond, 4.600%, 1/23/46 (b) | | | 4,700,000 | | | | 4,634 | |
Mexico Government International Bond, 4.750%, 3/8/44 (k) | | | 600,000 | | | | 607 | |
Nigeria Government International Bond, 7.875%, 2/16/32 144A | | | 200,000 | | | | 226 | |
| | | | | | | | |
| Governments (32.8%) | | Shares/
Par | | | Value
$ (000’s) | |
| | |
Governments continued | | | | | | | | |
Oman Government International Bond, 6.500%, 3/8/47 (k) | | | 1,800,000 | | | | 1,803 | |
Panama Government International Bond, 6.700%, 1/26/36 (b) | | | 1,900,000 | | | | 2,529 | |
Panama Government International Bond, 8.125%, 4/28/34 | | | 100,000 | | | | 139 | |
Perusahaan Penerbit SBSN Indonesia III, 3.400%, 3/29/22 144A | | | 600,000 | | | | 608 | |
Province of Ontario Canada, 2.400%, 6/2/26 CAD (f) | | | 2,800,000 | | | | 2,198 | |
Province of Ontario Canada, 2.600%, 6/2/25 CAD (f) | | | 600,000 | | | | 480 | |
Province of Quebec Canada, 2.750%, 9/1/25 CAD (f) | | | 3,000,000 | | | | 2,426 | |
Republic of Costa Rica, 7.000%, 4/4/44(k) | | | 700,000 | | | | 723 | |
Republic of Costa Rica, 7.158%, 3/12/45 | | | 500,000 | | | | 525 | |
Republic of Croatia, 6.625%, 7/14/20(b) | | | 5,000,000 | | | | 5,445 | |
Republic of Ecuador, 8.875%, 10/23/27 144A | | | 900,000 | | | | 990 | |
Republic of Ghana, 9.250%, 9/15/22 | | | 200,000 | | | | 227 | |
Republic of Indonesia, 3.375%, 7/30/25 144A EUR (f) | | | 3,300,000 | | | | 4,469 | |
Republic of Indonesia, 3.750%, 6/14/28 144A EUR (f) | | | 1,900,000 | | | | 2,627 | |
Republic of Indonesia, 6.750%, 1/15/44 (b) | | | 2,900,000 | | | | 3,854 | |
Republic of Kazakhstan, 5.125%, 7/21/25 (b) | | | 5,200,000 | | | | 5,790 | |
Republic of Kazakhstan, 6.500%, 7/21/45 (k) | | | 1,100,000 | | | | 1,411 | |
Republic of South Africa Government International Bond, 5.875%, 9/16/25 | | | 500,000 | | | | 544 | |
The Republic of Trinidad & Tobago, 4.500%, 8/4/26 | | | 400,000 | | | | 409 | |
Republic of Venezuela, 9.250%, 5/7/28 | | | 1,241,000 | | | | 251 | |
Romania, 2.375%, 4/19/27 EUR (f) | | | 1,600,000 | | | | 1,967 | |
Russian Federation, 5.625%, 4/4/42 (k) | | | 2,000,000 | | | | 2,240 | |
Saudi Government International Bond, 2.875%, 3/4/23 144A | | | 600,000 | | | | 590 | |
Senegal Government International Bond, 6.250%, 5/23/33 144A | | | 400,000 | | | | 422 | |
Spain Letras del Tesoro, 0.010%, 1/19/18 EUR (f) | | | 28,400,000 | | | | 34,085 | |
Turkey Government International Bond, 4.875%, 10/9/26 (b) | | | 4,000,000 | | | | 3,945 | |
Turkey Government International Bond, 5.125%, 3/25/22 (b) | | | 12,600,000 | | | | 13,060 | |
Turkey Government International Bond, 5.750%, 5/11/47 | | | 300,000 | | | | 293 | |
Turkey Government International Bond, 5.750%, 3/22/24 (b) | | | 2,400,000 | | | | 2,540 | |
Ukraine Government International Bond, 7.375%, 9/25/32 144A | | | 600,000 | | | | 590 | |
Ukraine Government International Bond, 7.750%, 9/1/19 (b) | | | 3,100,000 | | | | 3,255 | |
Ukraine Government International Bond, 7.750%, 9/1/20 (b) | | | 4,400,000 | | | | 4,659 | |
United Kingdom Treasury Bill, 0.010%, 1/15/18 GBP (f) | | | 6,200,000 | | | | 8,370 | |
Uruguay Government International Bond, 5.100%, 6/18/50 (k) | | | 2,100,000 | | | | 2,331 | |
US Treasury, 2.000%, 5/31/24 (b) | | | 50,500,000 | | | | 49,546 | |
US Treasury, 2.250%, 2/15/27 (b) | | | 150,000 | | | | 148 | |
US Treasury, 2.750%, 2/15/24 (b) | | | 8,700,000 | | | | 8,927 | |
The Accompanying Notes are an Integral Part of the Financial Statements.
| | | | | | |
| | Multi-Sector Bond Portfolio | | | 165 | |
Multi-Sector Bond Portfolio
| | | | | | | | |
| Governments (32.8%) | | Shares/
$ Par | | | Value
$ (000’s) | |
| | |
Governments continued | | | | | | | | |
Venezuela Government International Bond, 6.000%, 12/9/20 | | | 32,000 | | | | 7 | |
Venezuela Government International Bond, 7.000%, 3/31/38 | | | 204,000 | | | | 42 | |
Venezuela Government International Bond, 7.650%, 4/21/25 | | | 1,955,000 | | | | 391 | |
Venezuela Government International Bond, 8.250%, 10/13/24 | | | 356,000 | | | | 71 | |
Venezuela Government International Bond, 9.000%, 5/7/23 | | | 32,000 | | | | 7 | |
Venezuela Government International Bond, 9.375%, 1/13/34 | | | 1,400,000 | | | | 284 | |
| | | | | | | | |
Total Governments (Cost: $269,563) | | | | | | | 275,854 | |
| | | | | | | | |
| Municipal Bonds (1.5%) | | | | | | |
| | |
Municipal Bonds (1.5%) | | | | | | | | |
Alameda County Joint Powers Authority, 7.046%, 12/1/44 RB | | | 100,000 | | | | 151 | |
American Municipal Power, Inc., Series 2010B, 7.834%, 2/15/41 RB | | | 100,000 | | | | 156 | |
Bay Area Toll Authority, California, Series 2010, 6.918%, 4/1/40 RB | | | 200,000 | | | | 289 | |
City of Chicago, 7.750%, 1/1/42 GO (k) | | | 1,300,000 | | | | 1,444 | |
City of Riverside CA Electric Revenue, 7.605%, 10/1/40 RB | | | 200,000 | | | | 304 | |
Indiana Finance Authority, Series 2009-B, 6.596%, 2/1/39 RB | | | 300,000 | | | | 425 | |
Irvine Ranch California Water District, 6.622%, 5/1/40 RB | | | 100,000 | | | | 139 | |
Los Angeles County California Public Works Financing Authority, 7.618%, 8/1/40 RB | | | 200,000 | | | | 311 | |
Metropolitan Government of Nashville & Davidson County Tennessee, 6.568%, 7/1/37 RB | | | 100,000 | | | | 135 | |
Municipal Electric Authority of Georgia, 6.655%, 4/1/57 RB | | | 100,000 | | | | 126 | |
New York City Transitional Finance Authority, 5.508%, 8/1/37 RB | | | 300,000 | | | | 382 | |
New York State Urban Development Corp., 5.770%, 3/15/39 RB | | | 100,000 | | | | 122 | |
Port Authority of New York & New Jersey, 5.647%, 11/1/40 RB, GO OF AUTH (k) | | | 1,100,000 | | | | 1,443 | |
Port Authority of New York & New Jersey, Series 168, 4.926%, 10/1/51 RB, GO OF AUTH | | | 200,000 | | | | 247 | |
Regents of the University of California Medical Center Pooled Revenue, 6.548%, 5/15/48 RB | | | 100,000 | | | | 142 | |
San Diego County Regional Airport Authority, Series C, 6.628%, 7/1/40 RB | | | 100,000 | | | | 110 | |
San Diego Redevelopment Agency, Series A, 7.625%, 9/1/30 RB | | | 100,000 | | | | 114 | |
State of California, 7.950%, 3/1/36 GO (k) | | | 900,000 | | | | 1,005 | |
State of Illinois, 6.630%, 2/1/35 GO | | | 245,000 | | | | 272 | |
State of Illinois, 6.725%, 4/1/35 GO | | | 95,000 | | | | 105 | |
State of Illinois, 7.350%, 7/1/35 GO | | | 200,000 | | | | 231 | |
| | | | | | | | |
| Municipal Bonds (1.5%) | | Shares/
$ Par | | | Value
$ (000’s) | |
| | |
Municipal Bonds continued | | | | | | | | |
Texas Public Finance Authority, 8.250%, 7/1/24 RB | | | 200,000 | | | | 209 | |
Tobacco Settlement Finance Authority of West Virginia, Series A, 7.467%, 6/1/47 RB (k) | | | 1,110,000 | | | | 1,079 | |
Tobacco Settlement Financing Corp., Series 2007A, 6.706%, 6/1/46 RB (b) | | | 3,340,000 | | | | 3,012 | |
Triborough Bridge & Tunnel Authority, 5.550%, 11/15/40 RB, GO OF AUTH (k) | | | 800,000 | | | | 1,015 | |
| | | | | | | | |
Total Municipal Bonds (Cost: $10,463) | | | | | | | 12,968 | |
| | | | | | | | |
| Structured Products (8.3%) | | | | | | |
| | |
Asset Backed Securities (6.3%) | | | | | | | | |
Accredited Mortgage Loan Trust, Series 2005-3, Class M3, 1.810%, (ICE LIBOR USD 1 Month plus 0.48%), 9/25/35 | | | 50,000 | | | | 48 | |
ACE Securities Corp. Home Equity Loan Trust, Series 2004-HE4, Class M1, 2.452%, (ICE LIBOR USD 1 Month plus 0.90%), 12/25/34 | | | 89,592 | | | | 85 | |
ACE Securities Corp. Home Equity loan Trust, Series 2004-RM2, Class M2, 2.347%, (ICE LIBOR USD 1 Month plus 0.80%), 1/25/35 | | | 60,154 | | | | 60 | |
ACE Securities Corp. Home Equity Loan Trust, Series 2005-HE4, Class M4, 2.527%, (ICE LIBOR USD 1 Month plus 0.98%), 7/25/35 | | | 100,000 | | | | 101 | |
ACE Securities Corp. Home Equity Loan Trust, Series 2006-FM1, Class A2C, 1.702%, (ICE LIBOR USD 1 Month plus 0.15%), 7/25/36(b) | | | 8,249,998 | | | | 2,921 | |
Aegis Asset Backed Securities Trust, Series 2004-6, Class M2, 2.552%, (ICE LIBOR USD 1 Month plus 1.00%), (AFC), 3/25/35 | | | 199,437 | | | | 185 | |
Aircraft Certificate Owner Trust, Series 2003-1A, Class E, 7.001%, 9/20/22 144A (l) | | | 96,331 | | | | 102 | |
Ameriquest Mortgage Securities, Inc., Series 2004-R5, Class M1, 2.422%, (ICE LIBOR USD 1 Month plus 0.87%), 7/25/34 | | | 45,880 | | | | 46 | |
Asset Backed Securities Corp. Home Equity Loan Trust, Series 2003-HE4, Class M1, 2.722%, (ICE LIBOR USD 1 Month plus 1.25%), 8/15/33 | | | 35,112 | | | | 35 | |
Asset Backed Securities Corp. Home Equity Loan Trust, Series WMC 2005-HE5, Class M4, 2.452%, (ICE LIBOR USD 1 Month plus 0.90%), 6/25/35 | | | 200,000 | | | | 198 | |
Bayview Opportunity Master Fund IIIb Trust, Series 2017-RN2, Class A1, 3.475%, (AFC), 4/28/32 144A | | | 74,117 | | | | 74 | |
Bear Stearns Asset Backed Securities I Trust, Series 2005-HE11, Class M1, 1.973%, (ICE LIBOR USD 1 Month plus 0.65%), 11/25/35 | | | 33,040 | | | | 33 | |
Bear Stearns Asset Backed Securities I Trust, Series 2005-SD3, Class 1A, 2.042%, (ICE LIBOR USD 1 Month plus 0.49%), 7/25/35 | | | 26,152 | | | | 26 | |
Bear Stearns Asset Backed Securities I Trust, Series 2006-HE10, Class 1A2, 1.752%, (ICE LIBOR USD 1 Month plus 0.20%), 12/25/36 | | | 53,695 | | | | 53 | |
Bear Stearns Asset Backed Securities I Trust, Series 2007-AQ1, Class A1, 1.662%, (ICE LIBOR USD 1 Month plus 0.11%), 4/25/31 | | | 11,188 | | | | 14 | |
The Accompanying Notes are an Integral Part of the Financial Statements.
| | | | |
| 166 | | Multi-Sector Bond Portfolio | | |
Multi-Sector Bond Portfolio
| | | | | | | | |
| Structured Products (8.3%) | | Shares/
$ Par | | | Value
$ (000’s) | |
| | |
Asset Backed Securities continued | | | | | | | | |
Bear Stearns Asset Backed Securities I Trust, Series 2007-HE3, Class 1A2, 1.752%, (ICE LIBOR USD 1 Month plus 0.20%), 4/25/37 | | | 194,000 | | | | 235 | |
Bear Stearns Asset Backed Securities I Trust, Series 2007-HE6, Class 1A1, 2.802%, (ICE LIBOR USD 1 Month plus 1.25%), 8/25/37 | | | 272,302 | | | | 269 | |
Citi Held For Asset Issuance, Series 2016-PM1, Class A, 4.650%, 4/15/25 144A | | | 159,798 | | | | 160 | |
Citigroup Mortgage Loan Trust, Inc., Series 2005-HE3, Class M2, 2.272%, (ICE LIBOR USD 1 Month plus 0.72%), 9/25/35 | | | 145,314 | | | | 146 | |
Citigroup Mortgage Loan Trust, Series 2007-AHL1, Class A2C, 1.762%, (ICE LIBOR USD 1 Month plus 0.21%), 12/25/36 | | | 100,000 | | | | 92 | |
Countrywide Asset-Backed Certificates, Series 2004-9, Class MV4, 3.127%, (ICE LIBOR USD 1 Month plus 1.58%), 11/25/34 | | | 100,000 | | | | 87 | |
Countrywide Asset-Backed Certificates, Series 2004-AB2, Class M1, 2.332%, (ICE LIBOR USD 1 Month plus 0.78%), 5/25/36 | | | 141,819 | | | | 142 | |
Countrywide Asset-Backed Certificates, Series 2005-4, Class AF6, 4.740%, (AFC), 10/25/35 | | | 11,981 | | | | 12 | |
Countrywide Asset-Backed Certificates, Series 2005-AB, Class 2A4, 1.902%, (ICE LIBOR USD 1 Month plus 0.35%), 3/25/36 | | | 95,365 | | | | 86 | |
Countrywide Asset-Backed Certificates, Series 2006-1, Class AF5, 4.764%, (AFC), 7/25/36 (e) | | | 100,000 | | | | 83 | |
Countrywide Asset-Backed Certificates, Series 2006-23, Class 2A3, 1.722%, (ICE LIBOR USD 1 Month plus 0.17%), 5/25/37 | | | 142,278 | | | | 141 | |
Countrywide Asset-Backed Certificates, Series 2006-26, Class 1A, 1.692%, (ICE LIBOR USD 1 Month plus 0.14%), 6/25/37 (k) | | | 704,652 | | | | 638 | |
Countrywide Asset-Backed Certificates, Series 2006-4, Class 2A3, 1.842%, (ICE LIBOR USD 1 Month plus 0.29%), 7/25/36 | | | 75,645 | | | | 74 | |
Countrywide Asset-Backed Certificates, Series 2006-5, Class 2A3, 1.842%, (ICE LIBOR USD 1 Month plus 0.29%), 8/25/36 | | | 127,938 | | | | 125 | |
Countrywide Asset-Backed Certificates, Series 2006-BC3, Class M2, 1.872%, (ICE LIBOR USD 1 Month plus 0.32%), 2/25/37 (k) | | | 900,000 | | | | 613 | |
Countrywide Asset-Backed Certificates, Series 2007-1, Class 2A3, 1.692%, (ICE LIBOR USD 1 Month plus 0.14%), 7/25/37 | | | 54,904 | | | | 48 | |
Countrywide Asset-Backed Certificates, Series 2007-13, Class 1A, 2.392%, (ICE LIBOR USD 1 Month plus 0.84%), 10/25/47 (b) | | | 3,125,717 | | | | 3,084 | |
Countrywide Asset-Backed Certificates, Series 2007-9, Class 1A, 1.752%, (ICE LIBOR USD 1 Month plus 0.20%), 6/25/47 (k) | | | 1,246,036 | | | | 1,041 | |
Countrywide Asset-Backed Certificates, Series 2007-SEA1, Class 1A1, 2.102%, (ICE LIBOR USD 1 Month plus 0.55%), (AFC), 5/25/47 144A | | | 2,911,623 | | | | 2,038 | |
| | | | | | | | |
| Structured Products (8.3%) | | Shares/
Par | | | Value
$ (000’s) | |
| | |
Asset Backed Securities continued | | | | | | | | |
Credit Suisse First Boston Mortgage Securities Corp., Series 01-HE17, Class A1, 2.172%, (ICE LIBOR USD 1 Month plus 0.62%), 1/25/32 | | | 6,387 | | | | 6 | |
Ellington Loan Acquisition Trust, Series 2007-2, Class A1, 2.602%, (ICE LIBOR USD 1 Month plus 1.05%), 5/25/37 144A | | | 438,138 | | | | 417 | |
Enterprise Inns PLC, 6.875%, 5/9/25 GBP (f) | | | 1,600,000 | | | | 2,383 | |
First Franklin Mortgage Loan Trust, Series 2005-FF12, Class A2B, 1.812%, (ICE LIBOR USD 1 Month plus 0.26%), 11/25/36 | | | 145,912 | | | | 146 | |
First Franklin Mortgage Loan Trust, Series 2006-FF10, Class A4, 1.702%, (ICE LIBOR USD 1 Month plus 0.15%), 7/25/36 | | | 16,997 | | | | 17 | |
First Franklin Mortgage Loan Trust, Series 2006-FF12, Class A4, 1.692%, (ICE LIBOR USD 1 Month plus 0.14%), 9/25/36 | | | 94,804 | | | | 94 | |
First Franklin Mortgage Loan Trust, Series 2006-FF5, Class 2A504/25/36 | | | 200,000 | | | | 170 | |
Fremont Home Loan Trust, Series 2005-02, Class M4, 2.482%, (ICE LIBOR USD 1 Month plus 0.93%), 6/25/35 | | | 300,000 | | | | 281 | |
GSAA Home Equity Trust, Series 2006-17, Class A1, 1.612%, (ICE LIBOR USD 1 Month plus 0.06%), 11/25/36 | | | 68,545 | | | | 35 | |
GSAMP Trust, Series 2004-WF, Class M2, 3.202%, (ICE LIBOR USD 1 Month plus 1.65%), 10/25/34 | | | 74,829 | | | | 73 | |
GSAMP Trust, Series 2007-FM2, Class A2B, 1.642%, (ICE LIBOR USD 1 Month plus 0.09%), 1/25/37 | | | 230,562 | | | | 147 | |
GSAMP Trust, Series 2007-NC1, Class A2A, 1.602%, (ICE LIBOR USD 1 Month plus 0.05%), 12/25/46 | | | 18,176 | | | | 11 | |
Home Equity Loan Trust, Series 2007-FRE1, Class 2AV4, 1.892%, (ICE LIBOR USD 1 Month plus 0.34%), 4/25/37 | | | 500,000 | | | | 385 | |
Home Equity Mortgage Loan Asset-Backed Trust, Series 2007-B, Class 2A2, 1.712%, (ICE LIBOR USD 1 Month plus 0.16%), 7/25/37 | | | 439,237 | | | | 296 | |
HSI Asset Securitization Corp. Trust, Series 2005-I1, Class 2A4, 1.942%, (ICE LIBOR USD 1 Month plus 0.39%), 11/25/35 | | | 300,000 | | | | 286 | |
Lehman XS Trust, Series 2005-4, Class 1A3, 2.352%, (ICE LIBOR USD 1 Month plus 0.80%), 10/25/35 | | | 22,211 | | | | 22 | |
Lendmark Funding Trust, Series 2016-A2, Class A, 3.260%, 4/21/25 144A | | | 400,000 | | | | 402 | |
Long Beach Mortgage Loan Trust, Series 2006-1, Class 2A4, 1.852%, (ICE LIBOR USD 1 Month plus 0.30%), 2/25/36 | | | 86,292 | | | | 61 | |
Long Beach Mortgage Loan Trust, Series 2006-3, Class 2A4, 1.822%, (ICE LIBOR USD 1 Month plus 0.27%), 5/25/46 | | | 367,641 | | | | 174 | |
Long Beach Mortgage Loan Trust, Series 2006-4, Class 1A, 1.702%, (ICE LIBOR USD 1 Month plus 0.15%), 5/25/36(k) | | | 1,725,618 | | | | 1,213 | |
Mastr Asset Backed Securities Trust, Series 2004-WMC2, Class M1, 2.229%, (ICE LIBOR USD 1 Month plus 0.90%), 4/25/34 | | | 197,229 | | | | 195 | |
The Accompanying Notes are an Integral Part of the Financial Statements.
| | | | | | |
| | Multi-Sector Bond Portfolio | | | 167 | |
Multi-Sector Bond Portfolio
| | | | | | | | |
| Structured Products (8.3%) | | Shares/
Par | | | Value
$ (000’s) | |
| | |
Asset Backed Securities continued | | | | | | | | |
Mastr Asset Backed Securities Trust, Series 2006-FRE2, Class A1, 1.702%, (ICE LIBOR USD 1 Month plus 0.15%), 3/25/36 (b) | | | 16,330,255 | | | | 13,309 | |
Mastr Asset Backed Securities Trust, Series 2006-HE3, Class A2, 1.652%, (ICE LIBOR USD 1 Month plus 0.10%), 8/25/36 (k) | | | 2,458,493 | | | | 1,162 | |
Mastr Asset Backed Securities Trust, Series 2006-WMC4, Class A5, 1.702%, (ICE LIBOR USD 1 Month plus 0.15%), 10/25/36 | | | 1,056,752 | | | | 479 | |
Merrill Lynch Mortgage Investors Trust, Series 2007-SD1, Class A1, 2.002%, (ICE LIBOR USD 1 Month plus 0.45%), 2/25/47 (k) | | | 1,107,414 | | | | 837 | |
Morgan Stanley ABS Capital I, Inc. Trust, Series 2005-HE7, Class A2C, 1.872%, (ICE LIBOR USD 1 Month plus 0.32%), 11/25/35 | | | 9,515 | | | | 9 | |
Morgan Stanley ABS Capital I, Inc. Trust, Series 2005-NC1, Class A2MZ, 2.132%, (ICE LIBOR USD 1 Month plus 0.58%), 1/25/35 (k) | | | 784,058 | | | | 781 | |
Morgan Stanley ABS Capital I, Inc. Trust, Series 2005-NC1, Class M2, 2.257%, (ICE LIBOR USD 1 Month plus 0.71%), 1/25/35 | | | 162,120 | | | | 156 | |
Morgan Stanley ABS Capital I, Inc. Trust, Series 2005-WMC5, Class M5, 2.542%, (ICE LIBOR USD 1 Month plus 0.99%), 6/25/35 | | | 300,000 | | | | 303 | |
Morgan Stanley ABS Capital I, Inc., Series 2006-HE7, Class A2C, 1.712%, (ICE LIBOR USD 1 Month plus 0.16%), 9/25/36 | | | 81,463 | | | | 51 | |
Morgan Stanley ABS Capital I, Inc., Series 2006-HE8, Class A2C, 1.692%, (ICE LIBOR USD 1 Month plus 0.14%), 10/25/36 | | | 75,978 | | | | 44 | |
Morgan Stanley ABS Capital I, Inc., Series 2007-HE5, Class A2C, 1.802%, (ICE LIBOR USD 1 Month plus 0.25%), 3/25/37 | | | 74,541 | | | | 40 | |
Morgan Stanley Dean Witter Capital I, Inc., Series 2002-HE1, Class M1, 2.452%, (ICE LIBOR USD 1 Month plus 0.90%), 7/25/32 | | | 8,708 | | | | 9 | |
Morgan Stanley Dean Witter Capital I, Inc., Series 2003-NC1, Class M1, 3.127%, (ICE LIBOR USD 1 Month plus 1.58%), 11/25/32 | | | 111,245 | | | | 111 | |
Morgan Stanley Dean Witter Capital I, Inc., Series 2003-NC2, Class M1, 2.902%, (ICE LIBOR USD 1 Month plus 1.35%), 2/25/33 | | | 42,584 | | | | 42 | |
NovaStar Mortgage Funding Trust, Series 2007-2, Class A2B, 1.712%, (ICE LIBOR USD 1 Month plus 0.16%), (AFC), 9/25/37(k) | | | 846,306 | | | | 812 | |
OneMain Financial Issuance Trust, Series 2016-2A, Class A, 4.100%, 3/20/28 144A | | | 1,000,000 | | | | 1,013 | |
Park Place Securities, Inc. Asset-Backed Pass Through Certificates, Series 2005 -WCW2, Class M1, 2.302%, (ICE LIBOR USD 1 Month plus 0.75%), 7/25/35 | | | 48,108 | | | | 48 | |
People’s Choice Home Loan Securities Trust, Series 2005-3, Class M2, 2.123%, (ICE LIBOR USD 1 Month plus 0.80%), (AFC), 8/25/35 | | | 216,502 | | | | 213 | |
RAC Bond Co. PLC, 4.870%, 5/6/46 GBP (f) | | | 900,000 | | | | 1,337 | |
| | | | | | | | |
| Structured Products (8.3%) | | Shares/
$ Par | | | Value
$ (000’s) | |
| | |
Asset Backed Securities continued | | | | | | | | |
Residential Asset Mortgage Products, Inc., Series 2005-EFC4, Class M3, 2.032%, (ICE LIBOR USD 1 Month plus 0.48%), (AFC), 9/25/35 | | | 300,000 | | | | 300 | |
Residential Asset Mortgage Products, Inc., Series 2006-NC2, Class A2, 1.742%, (ICE LIBOR USD 1 Month plus 0.19%), (AFC), 2/25/36 | | | 5,474 | | | | 5 | |
Residential Asset Mortgage Products, Inc., Series 2007-RP4, Class A, 1.902%, (ICE LIBOR USD 1 Month plus 0.35%), (AFC), 11/25/46 144A | | | 329,953 | | | | 297 | |
Residential Asset Securities Corp., Series 2006-EMX1, Class M1, 1.962%, (ICE LIBOR USD 1 Month plus 0.41%), (AFC), 1/25/36 | | | 179,248 | | | | 178 | |
Residential Asset Securities Corp., Series 2007-KS1, Class A3, 1.702%, (ICE LIBOR USD 1 Month plus 0.15%), (AFC), 1/25/37 | | | 264,037 | | | | 257 | |
Residential Asset Securities Corp., Series 2007-KS3, Class AI4, 1.892%, (ICE LIBOR USD 1 Month plus 0.34%), (AFC), 4/25/37(k) | | | 1,600,000 | | | | 1,348 | |
Saxon Asset Securities Trust, Series 2006-1, Class M1, 2.017%, (ICE LIBOR USD 1 Month plus 0.47%), (AFC), 3/25/36 | | | 400,000 | | | | 350 | |
Securitized Asset Backed Receivables LLC Trust, Series 2005-FR4, Class M2, 2.512%, (ICE LIBOR USD 1 Month plus 0.96%), 1/25/36 | | | 122,327 | | | | 85 | |
SLM Private Education Loan Trust, Series 2010-A, Class 1A, 4.200%, (Prime Rate by County United States less 0.05%), 5/16/44 144A | | | 21,126 | | | | 21 | |
SLM Private Education Loan Trust, Series 2011-B, Class A3, 3.727%, (ICE LIBOR USD 1 Month plus 2.25%), 6/16/42 144A | | | 100,000 | | | | 104 | |
Soundview Home Loan Trust, Series 2005-3, Class M3, 2.377%, (ICE LIBOR USD 1 Month plus 0.83%), 6/25/35 | | | 163,542 | | | | 162 | |
Soundview Home Loan Trust, Series 2006-2, Class M2, 1.902%, (ICE LIBOR USD 1 Month plus 0.35%), 3/25/36 | | | 400,000 | | | | 379 | |
Soundview Home Loan Trust, Series 2006-3, Class A3, 1.712%, (ICE LIBOR USD 1 Month plus 0.16%), 11/25/36 | | | 328,510 | | | | 318 | |
Soundview Home Loan Trust, Series 2006-OPT2, Class A4, 1.832%, (ICE LIBOR USD 1 Month plus 0.28%), 5/25/36 | | | 200,000 | | | | 190 | |
Soundview Home Loan Trust, Series 2006-OPT3, Class M1, 1.862%, (ICE LIBOR USD 1 Month plus 0.31%), 6/25/36(b) | | | 7,088,368 | | | | 3,757 | |
Specialty Underwriting & Residential Finance Trust, Series 2005-BC2, Class M3, 2.527%, (ICE LIBOR USD 1 Month plus 0.98%), 12/25/35 | | | 400,372 | | | | 399 | |
Structured Asset Investment Loan Trust, Series 2003-BC11, Class M1, 2.527%, (ICE LIBOR USD 1 Month plus 0.98%), 10/25/33 | | | 290,474 | | | | 289 | |
Structured Asset Investment Loan Trust, Series 2005-5, 2.242%, (ICE LIBOR USD 1 Month plus 0.69%), 6/25/35 | | | 46,559 | | | | 47 | |
The Accompanying Notes are an Integral Part of the Financial Statements.
| | | | |
| 168 | | Multi-Sector Bond Portfolio | | |
Multi-Sector Bond Portfolio
| | | | | | | | |
| Structured Products (8.3%) | | Shares/
$ Par | | | Value
$ (000’s) | |
| | |
Asset Backed Securities continued | | | | | | | | |
Structured Asset Investment Loan Trust, Series 2005-7, Class M2, 2.317%, (ICE LIBOR USD 1 Month plus 0.77%), 8/25/35 | | | 500,000 | | | | 475 | |
Structured Asset Investment Loan Trust, Series 2006-BNC3, Class A3, 1.702%, (ICE LIBOR USD 1 Month plus 0.15%), 9/25/36 | | | 41,061 | | | | 39 | |
Structured Asset Securities Corp. Mortgage Loan Trust, Series 2001-WF1, Class A 6, 1.762%, (ICE LIBOR USD 1 Month plus 0.21%), 2/25/37 | | | 150,125 | | | | 142 | |
Structured Asset Securities Corp. Mortgage Loan Trust, Series 2006-BC4, Class A 4, 1.722%, (ICE LIBOR USD 1 Month plus 0.17%), 12/25/36 | | | 518,933 | | | | 502 | |
Structured Asset Securities Corp. Mortgage Loan Trust, Series 2006-GEL2, Class M1, 1.922%, (ICE LIBOR USD 1 Month plus 0.37%), 4/25/36 144A | | | 95,802 | | | | 89 | |
Structured Asset Securities Corp. Mortgage Loan Trust, Series 2007-BC3, Class 2 A2, 1.692%, (ICE LIBOR USD 1 Month plus 0.14%), 5/25/47 | | | 17,888 | | | | 18 | |
Truman Capital Mortgage Loan Trust, Series 2006-1, Class A, 1.812%, (ICE LIBOR USD 1 Month plus 0.26%), 3/25/36 144A | | | 1,839,304 | | | | 1,802 | |
Vericrest Opportunity Loan Transferee, Series 2015-NP14, Class A1, 4.375%, (AFC), 11/27/45 144A (e) | | | 554,617 | | | | 556 | |
Vericrest Opportunity Loan Transferee, Series 2017-NPL4, Class A1, 3.375%, (AFC), 4/25/47 144A (e) | | | 220,789 | | | | 222 | |
WaMu Asset-Backed Certificates, Series 2007-HE1, Class 1A, 1.702%, (ICE LIBOR USD 1 Month plus 0.15%), 1/25/37 | | | 211,172 | | | | 168 | |
| | | | | | | | |
Total | | | | | | | 53,164 | |
| | | | | | | | |
| | |
Mortgage Securities (2.0%) | | | | | | | | |
American Home Mortgage Investment Trust, Series 2005-2, Class 4A1, 3.152%, (ICE LIBOR USD 6 Month plus 1.50%), (AFC), 9/25/45 | | | 3,728 | | | | 4 | |
Banc of America Funding Trust, Series 2005-H, Class 5A1, 3.745%, (CSTR), 11/20/35 | | | 178,583 | | | | 167 | |
Banc of America Funding Trust, Series 2006-J, Class 4A1, 3.830%, (CSTR), 1/20/47 | | | 90,901 | | | | 87 | |
Banc of America Funding Trust, Series 2007-6, Class A1, 1.842%, (ICE LIBOR USD 1 Month plus 0.29%), 7/25/37 | | | 97,028 | | | | 93 | |
Banc of America Funding Trust, Series 2007-D, Class 14A, 1.731%, (ICE LIBOR USD 1 Month plus 0.23%), 6/20/47 | | | 34,757 | | | | 35 | |
Barclays Capital LLC, Series 2009-RR14, Class 2A2, 3.721%, (CSTR), 7/26/36 144A | | | 47,928 | | | | 40 | |
Barclays Capital LLC, Series 2009-RR5, Class 3A3, 5.954%, (CSTR), 8/26/36 144A | | | 3,169,939 | | | | 2,329 | |
Bear Stearns Adjustable Rate Mortgage Trust, Series 2004-3, Class 4A, 3.789%, (CSTR), 7/25/34 | | | 11,654 | | | | 12 | |
Bear Stearns ALT-A Trust, Series 2006-6, Class 2A1, 3.506%, (CSTR), 11/25/36 | | | 228,286 | | | | 208 | |
Citicorp Mortgage Securities Trust, Series 2007-8, Class 1A3, 6.000%, 9/25/37 | | | 6,669 | | | | 7 | |
Citigroup Mortgage Loan Trust, Series 2007-10, Class 22AA, 3.674%, (CSTR), 9/25/37 | | | 20,650 | | | | 19 | |
| | | | | | | | |
| Structured Products (8.3%) | | Shares/
$ Par | | | Value
$ (000’s) | |
| | |
Mortgage Securities continued | | | | | | | | |
Citigroup Mortgage Loan Trust, Series 2007-10, Class 2A3A, 3.830%, (CSTR), 9/25/37 | | | 99,942 | | | | 95 | |
Countrywide Alternative Loan Trust, Series 2004-28CB, Class 5A1, 5.750%, 1/25/35 | | | 30,583 | | | | 31 | |
Countrywide Alternative Loan Trust, Series 2005-59, Class 1A1, 1.831%, (ICE LIBOR USD 1 Month plus 0.33%), 11/20/35 | | | 9,469 | | | | 9 | |
Countrywide Alternative Loan Trust, Series 2005-76, Class 1A1, 2.543%, (Federal Reserve US 12 Month Cumulative Avg 1 year CMT plus 1.48%), 1/25/36 | | | 25,711 | | | | 25 | |
Countrywide Alternative Loan Trust, Series 2005-79CB, Class A3, 5.500%, 1/25/36 | | | 301,257 | | | | 256 | |
Countrywide Alternative Loan Trust, Series 2005-J1, Class 3A1, 6.500%, 8/25/32 | | | 15,834 | | | | 16 | |
Countrywide Alternative Loan Trust, Series 2006-0A12, Class A1B, 1.691%, (ICE LIBOR USD 1 Month plus 0.19%), 9/20/46 | | | 31,323 | | | | 26 | |
Countrywide Alternative Loan Trust, Series 2006-0A17, Class 1A1A, 1.696%, (ICE LIBOR USD 1 Month plus 0.20%), 12/20/46 | | | 47,745 | | | | 40 | |
Countrywide Alternative Loan Trust, Series 2006-0A9, Class 2A1A, 1.711%, (ICE LIBOR USD 1 Month plus 0.21%), 7/20/46 | | | 14,314 | | | | 10 | |
Countrywide Alternative Loan Trust, Series 2006-45T1, Class 1A13, 6.000%, 2/25/37 | | | 162,018 | | | | 112 | |
Countrywide Alternative Loan Trust, Series 2006-5T2, Class A1, 2.052%, (ICE LIBOR USD 1 Month plus 0.50%), 4/25/36 | | | 619,843 | | | | 364 | |
Countrywide Alternative Loan Trust, Series 2006-HY10, Class 2A1, 3.398%, (CSTR), 5/25/36 | | | 21,068 | | | | 18 | |
Countrywide Alternative Loan Trust, Series 2006-OA2, Class A1, 1.711%, (ICE LIBOR USD 1 Month plus 0.21%), 5/20/46 | | | 581,017 | | | | 488 | |
Countrywide Alternative Loan Trust, Series 2006-OA6, Class 2A, 2.902%, (CSTR), 7/25/46 | | | 600 | | | | 1 | |
Countrywide Alternative Loan Trust, Series 2006-OC9, Class A2A, 1.712%, (ICE LIBOR USD 1 Month plus 0.16%), 12/25/46 | | | 12,285 | | | | 12 | |
Countrywide Alternative Loan Trust, Series 2007-0A3, Class 1A1, 1.692%, (ICE LIBOR USD 1 Month plus 0.14%), 4/25/47 | | | 54,161 | | | | 48 | |
Countrywide Alternative Loan Trust, Series 2007-9T1, Class 2A2, 6.000%, 5/25/37 | | | 323,268 | | | | 241 | |
Countrywide Home Loan Mortgage Pass Through Trust, Series 2005-22, Class 3A1, 3.334%, (CSTR), 10/25/35 | | | 21,041 | | | | 18 | |
Countrywide Home Loan Mortgage Pass Through Trust, Series 2005-HYB8, 3.443%, (CSTR), 12/20/35 | | | 15,417 | | | | 13 | |
Countrywide Home Loan Mortgage Pass Through Trust, Series 2006-16, Class 2A1, 6.500%, 11/25/36 | | | 30,563 | | | | 25 | |
Countrywide Home Loan Mortgage Pass Through Trust, Series 2006-9, Class A1, 6.000%, 5/25/36 | | | 214,004 | | | | 180 | |
The Accompanying Notes are an Integral Part of the Financial Statements.
| | | | | | |
| | Multi-Sector Bond Portfolio | | | 169 | |
Multi-Sector Bond Portfolio
| | | | | | | | |
| Structured Products (8.3%) | | Shares/
Par | | | Value
$ (000’s) | |
| | |
Mortgage Securities continued | | | | | | | | |
Countrywide Home Loan Mortgage Pass Through Trust, Series 2006-OA4, Class A1, 2.023%, (Federal Reserve US 12 Month Cumulative Avg 1 year CMT plus 0.96%), 4/25/46 | | | 44,873 | | | | 24 | |
Countrywide Home Loan Mortgage Pass Through Trust, Series 2006-OA4, Class A2, 1.822%, (ICE LIBOR USD 1 Month plus 0.27%), 4/25/46 | | | 1,189,123 | | | | 570 | |
Countrywide Home Loan Mortgage Pass Through Trust, Series 2007-HYB1, Class 3A1, 3.263%, (CSTR), 3/25/37 | | | 16,469 | | | | 15 | |
Credit Suisse First Boston Mortgage Securities, Series 2003-8, Class 5A1, 6.500%, 4/25/33 | | | 2,322 | | | | 2 | |
Deutsche Alt-A Securities, Inc. Mortgage Loan Trust, Series 2005-6, Class 2A3, 5.500%, 12/25/35 (k) | | | 712,367 | | | | 635 | |
EMF-NL BV, Series 2008-APRX, Class A2, 0.471%, (Euribor 3 Month plus 0.80%), 4/17/41 EUR (f) | | | 208,977 | | | | 238 | |
Eurosail-NL BV, Series 2007-NL2X, Class A, 1.171%, (Euribor 3 Month plus 1.50%), 10/17/40 EUR(f) | | | 137,207 | | | | 165 | |
Federal National Mortgage Association, Series 2003-W6, Class F, 1.678%, (ICE LIBOR USD 1 Month plus 0.35%), 9/25/42 | | | 28,303 | | | | 28 | |
First Horizon Mortgage Pass-Through Trust, Series 2005-5, Class 2A1, 5.000%, 10/25/20 | | | 8,614 | | | | 9 | |
First Horizon Mortgage Pass-Through Trust, Series 2007-2, Class 1A5, 5.750%, 5/25/37 | | | 361,388 | | | | 279 | |
GSR Mortgage Loan Trust, Series 2005-AR6, Class 1A1, 3.506%, (CSTR), 9/25/35 | | | 13,165 | | | | 14 | |
GSR Mortgage Loan Trust, Series 2006-2F, Class 3A6, 6.000%, 2/25/36 | | | 154,583 | | | | 129 | |
GSR Mortgage Loan Trust, Series 2006-AR1, Class 2A1, 3.639%, (CSTR), 1/25/36 | | | 3,718 | | | | 4 | |
GSR Mortgage Loan Trust, Series 2007-AR1, Class 2A1, 3.537%, (CSTR), 3/25/47 | | | 17,723 | | | | 16 | |
Harborview Mortgage Loan Trust, Series 2005-10, Class 2A1A, 1.805%, (ICE LIBOR USD 1 Month plus 0.31%), (AFC), 11/19/35 | | | 16,812 | | | | 16 | |
Harborview Mortgage Loan Trust, Series 2005-3, Class 2A1A, 1.735%, (ICE LIBOR USD 1 Month plus 0.24%), (AFC), 6/19/35 | | | 35,081 | | | | 34 | |
HomeBanc Mortgage Trust, Series 2005-1, Class A1, 1.802%, (ICE LIBOR USD 1 Month plus 0.25%), 3/25/35 | | | 11,061 | | | | 10 | |
HSI Asset Securitization Corp. Trust, Series 2006-NC1, Class 2A, 1.772%, (ICE LIBOR USD 1 Month plus 0.22%), 11/25/35 (k) | | | 1,486,953 | | | | 1,230 | |
Impac Secured Assets Trust, Series 2007-1, Class A2, 1.712%, (ICE LIBOR USD 1 Month plus 0.16%), (AFC), 3/25/37 | | | 149,024 | | | | 135 | |
IndyMac INDX Mortgage Loan Trust, Series 2004-AR6, Class 5A1, 3.583%, (CSTR), 10/25/34 | | | 37,146 | | | | 37 | |
IndyMac INDX Mortgage Loan Trust, Series 2005-AR12, Class 2A1A, 1.792%, (ICE LIBOR USD 1 Month plus 0.24%), (AFC), 7/25/35 | | | 3,175 | | | | 3 | |
| | | | | | | | |
| Structured Products (8.3%) | | Shares/
$ Par | | | Value
$ (000’s) | |
| | |
Mortgage Securities continued | | | | | | | | |
IndyMac INDX Mortgage Loan Trust, Series 2005-AR14, Class 2A1A, 1.852%, (ICE LIBOR USD 1 Month plus 0.30%), 7/25/35 | | | 17,548 | | | | 17 | |
JP Morgan Mortgage Trust, Series 2005-ALT1, Class 2A1, 3.596%, (CSTR), 10/25/35 | | | 17,102 | | | | 16 | |
JP Morgan Mortgage Trust, Series 2007-A1, Class 6A1, 3.575%, (CSTR), 7/25/35 | | | 19,663 | | | | 20 | |
JP Morgan Mortgage Trust, Series 2007-A4, Class 3A1, 3.375%, (CSTR), 6/25/37 | | | 106,392 | | | | 96 | |
Merrill Lynch Alternative Note Asset Trust, Series 2007-OAR1, Class A1, 1.498%, (ICE LIBOR USD 1 Month plus 0.17%), 2/25/37 | | | 12,184 | | | | 12 | |
Merrill Lynch Mortgage Investors Trust, Series 2005-A6, Class 2A3, 1.932%, (ICE LIBOR USD 1 Month plus 0.38%), 8/25/35 | | | 41,931 | | | | 41 | |
Merrill Lynch Mortgage Investors Trust, Series 2005-A9, Class 5A1, 3.149%, (CSTR), 12/25/35 | | | 315,098 | | | | 291 | |
Merrill Lynch Mortgage Investors Trust, Series 2006-1, Class 1A, 3.260%, (CSTR), 2/25/36 | | | 8,348 | | | | 8 | |
Merrill Lynch Mortgage Investors Trust, Series 2006-A3, Class 6A1, 3.773%, (CSTR), 5/25/36 | | | 27,336 | | | | 26 | |
Morgan Stanley Mortgage Loan Trust, Series 2005-3AR, Class 4A, 3.330%, (CSTR), 7/25/35 | | | 99,679 | | | | 89 | |
Morgan Stanley Mortgage Loan Trust, Series 2005-5AR, Class 1A1, 1.822%, (ICE LIBOR USD 1 Month plus 0.27%), 9/25/35 | | | 799 | | | | 1 | |
Nomura Asset Acceptance Corp. Alternative Loan Trust, Series 2005-AR4, Class 3A 1, 3.906%, (CSTR), 8/25/35 | | | 17,256 | | | | 17 | |
Nomura Resecuritization Trust, Series 2014-1R, Class 2A1, 1.925%, (ICE LIBOR USD 1 Month plus 0.13%), 2/26/37 144A | | | 1,611,363 | | | | 1,610 | |
Residential Accredit Loans, Inc., Series 2005-QA3, Class NB2, 3.812%, (CSTR), 3/25/35 | | | 193,619 | | | | 176 | |
Residential Accredit Loans, Inc., Series 2005-QR1, Class A, 6.000%, 10/25/34 | | | 283,571 | | | | 289 | |
Residential Accredit Loans, Inc., Series 2006-QA7, Class 1A1, 1.742%, (ICE LIBOR USD 1 Month plus 0.19%), 8/25/36 | | | 15,674 | | | | 14 | |
Residential Accredit Loans, Inc., Series 2006-QA8, Class A1, 1.742%, (ICE LIBOR USD 1 Month plus 0.19%), 9/25/36 | | | 33,916 | | | | 31 | |
Residential Accredit Loans, Inc., Series 2007-QA1, Class A1, 1.692%, (ICE LIBOR USD 1 Month plus 0.14%), 1/25/37 | | | 30,783 | | | | 29 | |
Residential Asset Securitization Trust, Series 2007-A2, Class 2A2, 6.500%, 4/25/37 (k) | | | 3,903,493 | | | | 2,197 | |
Rise, Ltd., Series 2014-1, Class A, 4.750%, 2/15/39 (l) (p) | | | 482,701 | | | | 480 | |
Structured Adjustable Rate Mortgage Loan Trust, Series 2005-19XS, Class 1A1, 1.872%, (ICE LIBOR USD 1 Month plus 0.32%), 10/25/35 | | | 94,307 | | | | 92 | |
Structured Asset Mortgage Investments II Trust, Series 2005-AR8, Class A2, 2.076%, (Federal Reserve US 12 Month Cumulative Avg 1 year CMT plus 1.48%), 2/25/36(k) | | | 722,074 | | | | 717 | |
The Accompanying Notes are an Integral Part of the Financial Statements.
| | | | |
| 170 | | Multi-Sector Bond Portfolio | | |
Multi-Sector Bond Portfolio
| | | | | | | | |
| Structured Products (8.3%) | | Shares/
$ Par | | | Value
$ (000’s) | |
| | |
Mortgage Securities continued | | | | | | | | |
Structured Asset Mortgage Investments II Trust, Series 2006-AR6, Class 1A1, 1.732%, (ICE LIBOR USD 1 Month plus 0.18%), (AFC), 7/25/46 | | | 374,362 | | | | 338 | |
Structured Asset Securities Corp. Mortgage Loan Trust, Series 2005-1, Class 1A1, 1.902%, (ICE LIBOR USD 1 Month plus 0.35%), 2/25/35 | | | 34,984 | | | | 34 | |
Suntrust Alternative Loan Trust, Series 2005-1F, Class 1A1, 2.202%, (ICE LIBOR USD 1 Month plus 0.65%), 12/25/35 | | | 25,804 | | | | 21 | |
WaMu Mortgage Pass-Through Certificates, Series 2002-AR19, Class A6, 3.029%, (CSTR, AFC), 2/25/33 | | | 2,241 | | | | 2 | |
WaMu Mortgage Pass-Through Certificates, Series 2006-AR12, Class 3A3, 3.254%, (CSTR), 10/25/36 | | | 36,926 | | | | 34 | |
WaMu Mortgage Pass-Through Certificates, Series 2006-AR2, Class 1A1, 2.979%, (CSTR), 3/25/36 | | | 383,505 | | | | 366 | |
WaMu Mortgage Pass-Through Certificates, Series 2006-AR8, Class 2A1, 3.213%, (CSTR), 8/25/36 | | | 18,117 | | | | 18 | |
WaMu Mortgage Pass-Through Certificates, Series 2007-HY1, Class 3A1, 3.229%, (CSTR), 2/25/37 | | | 6,048 | | | | 6 | |
WaMu Mortgage Pass-Through Certificates, Series 2007-OA3, Class 4 A2, 1.763%, (Federal Reserve US 12 Month Cumulative Avg 1 year CMT plus 0.70%), 4/25/47 | | | 532,142 | | | | 406 | |
Wells Fargo Alternative Loan Trust, Series 2007-PA4, Class 2A1, 3.682%, (CSTR), 7/25/37 | | | 84,703 | | | | 78 | |
Wells Fargo Mortgage Backed Securities Trust, Series 2005-AR2, Class 1A1, 3.285%, (CSTR), 3/25/35 | | | 31,387 | | | | 32 | |
Wells Fargo Mortgage Backed Securities Trust, Series 2006-AR10, Class 4A1, 3.281%, (CSTR), 7/25/36 | | | 229,810 | | | | 232 | |
Wells Fargo Mortgage Backed Securities Trust, Series 2006-AR5, Class 2A1, 3.325%, (CSTR), 4/25/36 | | | 132,397 | | | | 125 | |
Wells Fargo Mortgage Backed Securities Trust, Series 2006-AR8, Class 1A3, 3.493%, (CSTR), 4/25/36 | | | 4,288 | | | | 4 | |
Wells Fargo Mortgage Backed Securities Trust, Series 2007-11, Class A81, 6.000%, 8/25/37 | | | 158,087 | | | | 158 | |
Wells Fargo Mortgage Backed Securities Trust, Series 2007-AR8, Class A1, 3.707%, (CSTR), 11/25/37 | | | 91,403 | | | | 87 | |
| | | | | | | | |
Total | | | | | | | 16,832 | |
| | | | | | | | |
| | |
Total Structured Products | | | | | | | | |
(Cost: $67,309) | | | | | | | 69,996 | |
| | | | | | | | |
| | |
| Bank Loan Obligations (4.3%) | | | | | | |
| | |
Bank Loan Obligations (4.3%) | | | | | | | | |
Albany Molecular Research, Inc., 4.566%, 8/30/24 | | | 99,750 | | | | 98 | |
Avolon TLK Borrower 1 US LLC, 4.097%, 4/3/22 | | | 1,990,249 | | | | 1,973 | |
CenturyLink, Inc., 4.076%, 1/31/25 | | | 1,900,000 | | | | 1,831 | |
| | | | | | | | |
| Bank Loan Obligations (4.3%) | | Shares/
Par | | | Value
$ (000’s) | |
| | |
Bank Loan Obligations continued | | | | | | | | |
Charter Communications Operating LLC, 3.329%, 1/15/22 | | | 3,520,610 | | | | 3,521 | |
Chesapeake Energy Corp., 8.817%, 8/23/21 | | | 700,000 | | | | 744 | |
CommScope, Inc., 3.810%, 12/29/22 | | | 141,800 | | | | 142 | |
Community Health Systems, Inc., 4.065%, 12/31/19 | | | 2,300,063 | | | | 2,208 | |
Dell International LLC, 3.350%, 9/7/23 | | | 1,554,693 | | | | 1,553 | |
Energy Future Intermediate Holding Co., LLC, 1.000%, 6/30/18 | | | 16,200,000 | | | | 16,228 | |
Grifols SA, 3.561%, 1/31/25 | | | 694,750 | | | | 696 | |
Hilton Worldwide Holdings, Inc., 3.324%, 10/25/23 | | | 1,411,171 | | | | 1,418 | |
INEOS Finance PLC, 1.000%, 3/31/24 EUR (f) | | | 1,000,000 | | | | 1,195 | |
Intelsat Jackson Holdings SA, 5.212%, 11/27/23 | | | 1,900,000 | | | | 1,858 | |
Las Vegas Sands, LLC, 3.334%, 3/29/24 | | | 681,740 | | | | 685 | |
Valeant Pharmaceuticals International, Inc., 6.078%, 4/1/22 | | | 430,792 | | | | 437 | |
Ziggo Secured Finance BV, 3.000%, 4/15/25 EUR (f) | | | 1,000,000 | | | | 1,193 | |
| | | | | | | | |
| | |
Total Bank Loan Obligations | | | | | | | | |
(Cost: $35,599) | | | | | | | 35,780 | |
| | | | | | | | |
| | |
| Short-Term Investments (1.0%) | | | | | | |
| | |
Money Market Funds (0.6%) | | | | | | | | |
State Street Institutional U.S. Government Money Market Fund - Premier Class, 1.209% # | | | 4,635,241 | | | | 4,635 | |
| | | | | | | | |
Total | | | | | | | 4,635 | |
| | | | | | | | |
| | |
Repurchase Agreements (0.4%) | | | | | | | | |
Tri-Party JP Morgan repurchase, 1.230%, 1/2/18 (Purchased 12/29/17, to be repurchased at $3,500,704, collateralized by Government National Mortgage Association, 3.500%, due 12/20/47, par and fair value of $3,482,587 and $3,605,974, respectively) | | | 3,500,000 | | | | 3,500 | |
| | | | | | | | |
Total | | | | | | | 3,500 | |
| | | | | | | | |
| | |
US Government & Agencies (0.0%) | | | | | | | | |
US Treasury Bill, 0.000%, 1/4/18 (b) | | | 6,000 | | | | 6 | |
| | | | | | | | |
Total | | | | | | | 6 | |
| | | | | | | | |
| | |
Total Short-Term Investments | | | | | | | | |
(Cost: $8,141) | | | | | | | 8,141 | |
| | | | | | | | |
| | |
Total Investments (98.5%) | | | | | | | | |
(Cost: $805,854)(a) | | | | | | | 828,177 | |
| | | | | | | | |
Other Assets, Less | | | | | | | | |
Liabilities (1.5%) | | | | | | | 12,804 | |
| | | | | | | | |
Net Assets (100.0%) | | | | | | | 840,981 | |
| | | | | | | | |
| # | 7-day yield as of December 31, 2017. |
| | 144A after the name of a security represents a security exempt from registration under Rule 144A of the Securities Act of 1933. These securities may be resold as transactions exempt from registration, normally to qualified institutional buyers. At December 31, 2017 the value of these securities (in thousands) was $180,875 representing 21.5% of the net assets. |
The Accompanying Notes are an Integral Part of the Financial Statements.
| | | | | | |
| | Multi-Sector Bond Portfolio | | | 171 | |
Multi-Sector Bond Portfolio
AFC — Available Funds Cap security — Security accrues interest at an assumed or uncapped rate. If the interest rate on the underlying loans is lower than the uncapped rate, then the security will pay at the lower rate.
CSTR — Collateral Strip Rate security — interest is based on the weighted net interest rate of the collateral.
GO — General Obligation
RB — Revenue Bond
ARS — Argentine Peso
AUD — Australian Dollar
BRL — Brazilian Real
CAD — Canadian Dollar
CNH — CNH
EUR — Euro
GBP — British Pound
INR — Indian Rupee
JPY — Japanese Yen
KRW — South Korean Won
MXN — Mexican New Peso
RUB — Russian Ruble
TRY — Turkish Lira
| (a) | At December 31, 2017, the aggregate cost of investments, including derivatives, for federal tax purposes (in thousands) was $800,371 and the net unrealized appreciation of investments based on that cost was $23,773 which is comprised of $38,225 aggregate gross unrealized appreciation and $14,452 aggregate gross unrealized depreciation. |
| (b) | All or a portion of the securities have been pledged as collateral for open futures positions or when-issued securities. Information regarding open futures contracts as of period end is summarized below. |
| | | | | | | | | | | | | | | | |
| Issuer | | Long/Short | | Currency | | Notional Par
(000’s) | | Number of
Contracts | | Expiration
Date | | Notional Value
(000’s) | | Unrealized
Appreciation/
(Depreciation)
(000’s) | |
Euro-Bobl Future | | Long | | EUR | | 3,300 | | 33 | | 3/18 | | $5,211 | | $ | (16 | ) |
Euro-Buxl Future | | Long | | EUR | | 1,500 | | 15 | | 3/18 | | 2,949 | | | (39 | ) |
Euro-Schatz Future | | Long | | EUR | | 5,900 | | 59 | | 3/18 | | 7,927 | | | (7 | ) |
US Five Year Treasury Note Future | | Long | | USD | | 24,000 | | 240 | | 3/18 | | 27,879 | | | (126 | ) |
US Ten Year Treasury Note Future | | Long | | USD | | 92,300 | | 923 | | 3/18 | | 114,495 | | | (300 | ) |
US Two Year Treasury Note Future | | Long | | USD | | 45,400 | | 227 | | 3/18 | | 48,603 | | | (113 | ) |
US Ultra Long Treasury Bond Future | | Long | | USD | | 10,100 | | 101 | | 3/18 | | 16,933 | | | 195 | |
| (c) | PIK — Payment In Kind. PIK rates of INA-Holding Schaeffler GmbH & Co. KG 4.50%, QGOG Constellation SA 0.50% |
| (e) | Step bond security that presently receives no coupon payments. At the predetermined date the stated coupon rate becomes effective. |
| (f) | Foreign Bond — par value is foreign denominated |
| (h) | Forward foreign currency contracts outstanding on December 31, 2017. |
| | | | | | | | | | | | | | | | | | | | | | |
| Type | | Counterparty | | Currency | | Foreign
Principal
Amount
Covered by
Contract (000s) | | USD Principal
Amount
Covered by
Contract (000’s) | | Settlement
Month | | Unrealized
Appreciation
(000’s) | | | Unrealized
(Depreciation)
(000’s) | | | Net Unrealized
Appreciation/
(Depreciation)
(000’s) | |
Buy | | UBS AG | | AUD | | 12,447 | | 9,712 | | 1/18 | | $ | 351 | | | $ | - | | | $ | 351 | |
Sell | | Bank of America NA | | AUD | | 20,447 | | 15,954 | | 1/18 | | | - | | | | (438 | ) | | | (438 | ) |
Buy | | Goldman Sachs International | | BRL | | 13,300 | | 4,010 | | 1/18 | | | 3 | | | | - | | | | 3 | |
Buy | | HSBC Bank USA NA | | BRL | | 6,746 | | 2,034 | | 1/18 | | | - | | | | (29 | ) | | | (29 | ) |
Buy | | Goldman Sachs International | | BRL | | 13,279 | | 3,990 | | 2/18 | | | - | | | | (22 | ) | | | (22 | ) |
Sell | | Goldman Sachs International | | BRL | | 13,300 | | 4,010 | | 1/18 | | | 185 | | | | - | | | | 185 | |
Sell | | HSBC Bank USA NA | | BRL | | 6,746 | | 2,034 | | 1/18 | | | 6 | | | | - | | | | 6 | |
Sell | | Goldman Sachs International | | BRL | | 6,554 | | 1,969 | | 2/18 | | | - | | | | (10 | ) | | | (10 | ) |
Sell | | Goldman Sachs International | | CAD | | 6,400 | | 5,092 | | 1/18 | | | - | | | | (91 | ) | | | (91 | ) |
Sell | | Goldman Sachs International | | CNH | | 26,081 | | 3,989 | | 3/18 | | | - | | | | (84 | ) | | | (84 | ) |
The Accompanying Notes are an Integral Part of the Financial Statements.
| | | | |
| 172 | | Multi-Sector Bond Portfolio | | |
Multi-Sector Bond Portfolio
| | | | | | | | | | | | | | | | | | | | | | |
| Type | | Counterparty | | Currency | | Foreign
Principal
Amount
Covered by
Contract (000s) | | USD
Principal
Amount
Covered by
Contract (000’s) | | Settlement
Month | | Unrealized
Appreciation
(000’s) | | | Unrealized
(Depreciation)
(000’s) | | | Net Unrealized
Appreciation/
(Depreciation)
(000’s) | |
Sell | | Goldman Sachs International | | EUR | | 93,382 | | 112,092 | | 1/18 | | | - | | | | (860 | ) | | | (860 | ) |
Sell | | HSBC Bank USA NA | | EUR | | 1,671 | | 2,005 | | 1/18 | | | - | | | | (27 | ) | | | (27 | ) |
Sell | | JP Morgan Chase Bank NA | | EUR | | 1,573 | | 1,888 | | 1/18 | | | - | | | | (28 | ) | | | (28 | ) |
Sell | | UBS AG | | EUR | | 2,620 | | 3,145 | | 1/18 | | | - | | | | (39 | ) | | | (39 | ) |
Sell | | Royal Bank Of Canada | | EUR | | 28,435 | | 34,149 | | 1/18 | | | - | | | | (449 | ) | | | (449 | ) |
Sell | | UBS AG | | EUR | | 25,000 | | 30,046 | | 2/18 | | | - | | | | (380 | ) | | | (380 | ) |
Sell | | JP Morgan Chase Bank NA | | EUR | | 3,385 | | 4,078 | | 3/18 | | | - | | | | (62 | ) | | | (62 | ) |
Sell | | Goldman Sachs International | | EUR | | 1,900 | | 2,290 | | 3/18 | | | - | | | | (40 | ) | | | (40 | ) |
Sell | | Bank of America NA | | EUR | | 400 | | 485 | | 6/18 | | | - | | | | (4 | ) | | | (4 | ) |
Sell | | UBS AG | | EUR | | 2,400 | | 2,908 | | 6/18 | | | - | | | | (51 | ) | | | (51 | ) |
Sell | | Royal Bank Of Canada | | EUR | | 1,782 | | 2,160 | | 6/18 | | | - | | | | (33 | ) | | | (33 | ) |
Sell | | HSBC Bank USA NA | | GBP | | 86 | | 116 | | 1/18 | | | - | (m) | | | - | | | | - | (m) |
Sell | | UBS AG | | GBP | | 30,691 | | 41,446 | | 1/18 | | | - | | | | (594 | ) | | | (594 | ) |
Sell | | Barclays Bank PLC | | GBP | | 3,100 | | 4,187 | | 1/18 | | | - | | | | (19 | ) | | | (19 | ) |
Sell | | Goldman Sachs International | | GBP | | 3,100 | | 4,187 | | 1/18 | | | - | | | | (20 | ) | | | (20 | ) |
Buy | | HSBC Bank USA NA | | INR | | 128,639 | | 1,999 | | 3/18 | | | 41 | | | | - | | | | 41 | |
Buy | | BNP Paribas | | JPY | | 460,200 | | 4,085 | | 1/18 | | | - | | | | (61 | ) | | | (61 | ) |
Sell | | Barclays Bank PLC | | JPY | | 22,400 | | 199 | | 1/18 | | | 1 | | | | - | | | | 1 | |
Sell | | BNP Paribas | | JPY | | 40,000 | | 355 | | 1/18 | | | - | | | | (2 | ) | | | (2 | ) |
Sell | | UBS AG | | JPY | | 30,000 | | 267 | | 1/18 | | | - | | | | (1 | ) | | | (1 | ) |
Sell | | UBS AG | | KRW | | 4,466,820 | | 4,177 | | 3/18 | | | - | | | | (164 | ) | | | (164 | ) |
Buy | | HSBC Bank USA NA | | MXN | | 79,390 | | 4,022 | | 1/18 | | | - | | | | (201 | ) | | | (201 | ) |
Buy | | HSBC Bank USA NA | | RUB | | 123,331 | | 2,123 | | 3/18 | | | 44 | | | | - | | | | 44 | |
Buy | | JP Morgan Chase Bank NA | | TRY | | 6,966 | | 1,827 | | 1/18 | | | 82 | | | | - | | | | 82 | |
| | | | | | | | | | | | | | | | | | | | | | |
| | | | | | | | | | | | $ | 713 | | | $ | (3,709 | ) | | $ | (2,996 | ) |
| | | | | | | | | | | | | | | | | | | | | | |
| (i) | Written options outstanding on December 31, 2017. |
| | | | | | | | | | | | | | | | |
| Description | | Counterparty | | Currency | | Notional Par
(000’s) | | Exercise
Price | | Expiration
Date | | Number of
Contracts | | Value
(000’s) | |
Call — US Ten Year Treasury Note | | Merrill Lynch Capital Services | | USD | | 80 | | $125.000 | | 1/18 | | 80 | | $ | (11 | ) |
Put — US Ten Year Treasury Note | | Merrill Lynch Capital Services | | USD | | 80 | | 123.500 | | 1/18 | | 80 | | | (19 | ) |
Put — US Ten Year Treasury Note | | Merrill Lynch Capital Services | | USD | | 83 | | 124.000 | | 1/18 | | 83 | | | (35 | ) |
| | | | | | | | | | | | | | | | |
(Premiums Received $66) | | $ | (65 | ) |
| | | | | | | | | | | | | | | | |
| (j) | Swap agreements outstanding on December 31, 2017. |
Credit Default Swaps on Corporate or Sovereign Issues - Sell Protection
| | | | | | | | | | | | | | | | | | | | | | | | | | |
| Reference Entity | | Counterparty | | Receive
Fixed
Rate | | Expiration
Date | | Implied
Credit
Spread | | Currency | | | Notional
Amount
(000’s) | | Upfront
Premium Paid/
(Received)
(000’s) | | | Unrealized
Appreciation/
(Depreciation)
(000’s) | | | Market
Value
(000’s) | |
Deutsche Bank AG,
0.763%, 12/20/21 | | BNP Paribas | | 1.00% | | 12/21 | | 1.226% | | | EUR | | | 700 | | $ | (89 | ) | | $ | 81 | | | $ | (8 | ) |
Deutsche Bank AG,
1.448%, 12/20/21 | | Goldman Sachs International | | 1.00% | | 12/21 | | 1.226% | | | EUR | | | 1,100 | | | (78 | ) | | | 66 | | | | (12 | ) |
Deutsche Bank AG,
1.448%, 12/20/21 | | JP Morgan Chase Bank NA | | 1.00% | | 12/21 | | 1.226% | | | EUR | | | 700 | | | (91 | ) | | | 84 | | | | (7 | ) |
Federative Republic of Brazil,
4.25%, 1/7/25 | | Goldman Sachs International | | 1.00% | | 6/22 | | 1.442% | | | USD | | | 500 | | | (27 | ) | | | 18 | | | | (9 | ) |
The Accompanying Notes are an Integral Part of the Financial Statements.
| | | | | | |
| | Multi-Sector Bond Portfolio | | | 173 | |
Multi-Sector Bond Portfolio
Credit Default Swaps on Corporate or Sovereign Issues - Sell Protection (continued)
| | | | | | | | | | | | | | | | | | | | | | | | | | |
| Reference Entity | | Counterparty | | Receive
Fixed
Rate | | Expiration
Date | | Implied
Credit
Spread | | Currency | | | Notional
Amount
(000’s) | | Upfront
Premium Paid/
(Received)
(000’s) | | | Unrealized
Appreciation/
(Depreciation)
(000’s) | | | Market
Value
(000’s) | |
Federative Republic of Brazil, 4.25%, 1/7/25 | | Goldman Sachs International | | 1.00% | | 12/22 | | 1.605% | | | USD | | | 1,000 | | $ | (46 | ) | | $ | 18 | | | $ | (28 | ) |
Federative Republic of Brazil, 4.25%, 1/7/25 | | HSBC Bank USA NA | | 1.00% | | 12/22 | | 1.605% | | | USD | | | 800 | | | (37 | ) | | | 15 | | | | (22 | ) |
Novo Banco,
5.00%, 12/20/21 | | Morgan Stanley Capital Services | | 5.00% | | 12/21 | | 7.576% | | | EUR | | | 100 | | | (21 | ) | | | 12 | | | | (9 | ) |
(l) Park Aerospace Holdings, Ltd.,
4.50%, 3/15/23 | | UBS AG | | 5.00% | | 7/20 | | 1.000% | | | USD | | | 200 | | | 10 | | | | (1 | ) | | | 9 | |
Republic of Brazil,
4.25%, 1/7/25 | | Barclays Bank PLC | | 1.00% | | 6/22 | | 1.442% | | | USD | | | 200 | | | (10 | ) | | | 6 | | | | (4 | ) |
Republic of Peru, 8.75%,11/21/33 | | Barclays Bank PLC | | 1.00% | | 3/23 | | 0.776% | | | USD | | | 1,100 | | | (16 | ) | | | 28 | | | | 12 | |
Republic of South Africa, 5.50%, 3/9/20 | | Barclays Bank PLC | | 1.00% | | 6/24 | | 1.959% | | | USD | | | 4,600 | | | (316 | ) | | | 61 | | | | (255 | ) |
Russian Federation,
7.50%, 3/31/30 | | Goldman Sachs International | | 1.00% | | 9/20 | | 0.583% | | | USD | | | 400 | | | (24 | ) | | | 28 | | | | 4 | |
Russian Federation,
7.50%, 3/31/30 | | Goldman Sachs International | | 1.00% | | 9/20 | | 0.583% | | | USD | | | 900 | | | (47 | ) | | | 57 | | | | 10 | |
Russian Federation,
7.50%, 3/31/30 | | Goldman Sachs International | | 1.00% | | 6/22 | | 1.054% | | | USD | | | 2,100 | | | (55 | ) | | | 50 | | | | (5 | ) |
Russian Federation,
7.50%, 3/31/30 | | HSBC Bank USA NA | | 1.00% | | 6/21 | | 0.780% | | | USD | | | 4,200 | | | (209 | ) | | | 240 | | | | 31 | |
Russian Federation,
7.50%, 3/31/30 | | JP Morgan Chase Bank NA | | 1.00% | | 9/20 | | 0.583% | | | USD | | | 1,500 | | | (89 | ) | | | 106 | | | | 17 | |
Russian Federation,
7.50%, 3/31/30 | | JP Morgan Chase Bank NA | | 1.00% | | 12/20 | | 0.620% | | | USD | | | 800 | | | (60 | ) | | | 68 | | | | 8 | |
Teva Pharmaceutical Finance Co. BV,
3.65%, 11/10/21 | | Goldman Sachs International | | 1.00% | | 6/22 | | 2.559% | | | USD | | | 1,600 | | | (69 | ) | | | (31 | ) | | | (100 | ) |
Unicredit Spa,
4.70%, 6/14/17 | | JP Morgan Chase Bank NA | | 1.00% | | 12/22 | | 1.872% | | | EUR | | | 900 | | | (58 | ) | | | 13 | | | | (45 | ) |
United Mexican States,
5.95%, 3/19/19 | | BNP Paribas | | 1.00% | | 12/22 | | 1.059% | | | USD | | | 1,500 | | | (49 | ) | | | 45 | | | | (4 | ) |
United Mexican States,
5.95%, 3/19/19 | | JP Morgan Chase Bank NA | | 1.00% | | 12/22 | | 1.059% | | | USD | | | 3,800 | | | (129 | ) | | | 119 | | | | (10 | ) |
| | | | | | | | | | | | | | | | | | | | | | | | | | |
| | | | | | | | | | | | | | | | $ | (1,510 | ) | | $ | 1,083 | | | $ | (427 | ) |
| | | | | | | | | | | | | | | | | | | | | | | | | | |
Centrally Cleared Interest Rate Swaps - Receive Floating Rate
| | | | | | | | | | | | | | | | | | | | |
| Floating Rate Index | | Fixed
Rate | | Expiration
Date | | Notional
Amount (000’s) | | Currency | | Upfront
Premium Paid/
(Received)
(000’s) | | | Unrealized
Appreciation/
(Depreciation)(000’s) | | | Market
Value
(000’s) | |
6-Month Euribor | | 1.00% | | 6/28 | | 8,800 | | EUR | | $ | (48 | ) | | $ | 30 | | | $ | (18 | ) |
6-Month Euribor | | 1.00% | | 3/28 | | 6,800 | | EUR | | | (79 | ) | | | 22 | | | | (57 | ) |
6-Month GBP-LIBOR | | 1.75% | | 3/48 | | 2,200 | | GBP | | | (183 | ) | | | (52 | ) | | | (235 | ) |
6-Month GBP-LIBOR | | 1.50% | | 3/28 | | 3,900 | | GBP | | | (69 | ) | | | (32 | ) | | | (101 | ) |
6-Month JPY-LIBOR | | 0.45% | | 3/29 | | 1,280,000 | | JPY | | | (68 | ) | | | 44 | | | | (24 | ) |
| | | | | | | | | | | | | | | | | | | | |
| | $ | (447 | ) | | $ | 12 | | | $ | (435 | ) |
| | | | | | | | | | | | | | | | | | | | |
The Accompanying Notes are an Integral Part of the Financial Statements.
| | | | |
| 174 | | Multi-Sector Bond Portfolio | | |
Multi-Sector Bond Portfolio
Centrally Cleared Credit Default Swaps on Corporate or Sovereign Issues - Sell Protection
| | | | | | | | | | | | | | | | | | | | | | |
| Reference Entity | | Receive
Fixed
Rate | | Expiration
Date | | Implied
Credit
Spread | | Notional
Amount
(000’s) | | Currency | | Upfront
Premium Paid/
(Received)
(000’s) | | | Unrealized
Appreciation/
(Depreciation)
(000’s) | | | Market
Value
(000’s) | |
Ally Financial, Inc, 7.50%, 9/15/20 | | 5.00% | | 6/22 | | 9.042% | | 1,300 | | USD | | $ | 227 | | | $ | (1 | ) | | $ | 226 | |
Berkshire Hathaway, Inc., 2.75%, 3/15/23 | | 1.00% | | 12/22 | | 0.524% | | 800 | | USD | | | 16 | | | | 2 | | | | 18 | |
Ford Motor Co., 6.50%, 8/1/18 | | 5.00% | | 12/23 | | 1.106% | | 200 | | USD | | | 44 | | | | (1 | ) | | | 43 | |
General Motors, Co., 3.50%, 10/2/18 | | 5.00% | | 6/22 | | 0.775% | | 200 | | USD | | | 37 | | | | (1 | ) | | | 36 | |
Marks & Spencer PLC, 6.125%, 12/2/19 | | 1.00% | | 12/22 | | 1.318% | | 2,900 | | EUR | | | (39 | ) | | | (14 | ) | | | (53 | ) |
Navient Corp., 5.50%, 1/25/23 | | 5.00% | | 12/21 | | 2.144% | | 650 | | USD | | | 74 | | | | (5 | ) | | | 69 | |
Navient Corp., 5.50%, 1/15/23 | | 5.00% | | 12/22 | | 2.895% | | 100 | | USD | | | 10 | | | | (1 | ) | | | 9 | |
Novo Banco SA, 5.00%, 4/23/19 | | 5.00% | | 12/21 | | 7.576% | | 600 | | EUR | | | (119 | ) | | | 62 | | | | (57 | ) |
Telefonica Emisiones SAU, 2.73%, 5/29/19 | | 1.00% | | 6/22 | | 0.670% | | 3,000 | | EUR | | | 62 | | | | (7 | ) | | | 55 | |
Telefonica Emisiones SAU, 2.736%, 5/19/19 | | 1.00% | | 12/22 | | 0.750% | | 1,500 | | EUR | | | 26 | | | | (4 | ) | | | 22 | |
Volkswagen International Finance NV,
5.375%, 5/22/18 | | 1.00% | | 6/22 | | 0.458% | | 500 | | EUR | | | 13 | | | | 2 | | | | 15 | |
Volkswagen International Finance NV,
5.375%, 5/22/18 | | 1.00% | | 12/21 | | 0.381% | | 700 | | EUR | | | 18 | | | | 2 | | | | 20 | |
| | | | | | | | | | | | | | | | | | | | | | |
| | $ | 369 | | | $ | 34 | | | $ | 403 | |
| | | | | | | | | | | | | | | | | | | | | | |
Centrally Cleared Credit Default Swaps on Credit Indices - Sell Protection
| | | | | | | | | | | | | | | | | | | | | | |
| Reference Entity | | Receive
Fixed
Rate | | Expiration
Date | | Implied
Credit
Spread | | Notional
Amount
(000’s) | | Currency | | Upfront
Premium Paid/
(Received)
(000’s) | | | Unrealized
Appreciation/
(Depreciation)
(000’s) | | | Market
Value
(000’s) | |
Markit Roll CDX | | 1.00% | | 12/22 | | 1.196% | | 8,342 | | USD | | $ | (353 | ) | | $ | 277 | | | $ | (76 | ) |
Markit CDX North America High Yield | | 5.00% | | 12/22 | | 3.070% | | 60,400 | | USD | | | 4,661 | | | | 443 | | | | 5,104 | |
| | | | | | | | | | | | | | | | | | | | | | |
| | $ | 4,308 | | | $ | 720 | | | $ | 5,028 | |
| | | | | | | | | | | | | | | | | | | | | | |
| (k) | Cash or securities with an aggregate value of $110,302 (in thousands) has been pledged as collateral for swap contracts outstanding, short sales or written options on December 31, 2017. |
| (l) | Security valued using significant unobservable inputs. |
| (m) | Amount is less than one thousand. |
| (p) | Restricted securities (excluding 144A issues) on December 31, 2017. |
| | | | | | | | | | | | |
| Description | | Coupon | | Maturity
Date | | Acquisition
Date | | Cost
(000’s) | | Value
(000’s) | | Value as a
Percentage
of Net
Assets |
Rise, Ltd., Series 2014-1, Class A | | 4.750% | | 2/15/39 | | 2/21/14 | | $484 | | $480 | | 0.06% |
The Accompanying Notes are an Integral Part of the Financial Statements.
| | | | | | |
| | Multi-Sector Bond Portfolio | | | 175 | |
Multi-Sector Bond Portfolio
The following is a summary of the inputs used in valuing the Portfolio’s assets and liabilities at December 31, 2017. See Note 3 for additional information on portfolio valuation.
| | | | | | | | | | | | | | |
| | | Valuation Inputs | | | |
| Description | | Level 1 –
Quoted Prices | | | Level 2 –
Other Significant
Observable Inputs | | | Level 3 –
Significant
Unobservable Inputs | | | |
| | | (Amounts in thousands) | | | |
Assets: | | | | | | | | | | | | | | |
Bank Loan Obligations | | $ | - | | | $ | 35,780 | | | $ | - | | | |
Municipal Bonds | | | - | | | | 12,968 | | | | - | | | |
Corporate Bonds | | | | | | | | | | | | | | |
Energy | | | - | | | | 80,733 | | | | 1,590 | | | |
All Others | | | - | | | | 343,115 | | | | - | | | |
Governments | | | - | | | | 275,854 | | | | - | | | |
Structured Products | | | - | | | | 69,414 | | | | 582 | | | |
Short-Term Investments | | | | | | | | | | | | | | |
Money Market Funds | | | 4,635 | | | | - | | | | - | | | |
All Others | | | - | | | | 3,506 | | | | - | | | |
Other Financial Instruments^ | | | | | | | | | | | | | | |
Futures | | | 195 | | | | - | | | | - | | | |
Forward Currency Contracts | | | - | | | | 713 | | | | - | | | |
Credit Default Swaps | | | - | | | | 5,702 | | | | 9 | | | |
Total Assets: | | $ | 4,830 | | | $ | 827,785 | | | $ | 2,181 | | | |
Liabilities: | | | | | | | | | | | | | | |
Other Financial Instruments^ | | | | | | | | | | | | | | |
Futures | | | (601 | ) | | | - | | | | - | | | |
Forward Currency Contracts | | | - | | | | (3,709 | ) | | | - | | | |
Written Options | | | (65 | ) | | | - | | | | - | | | |
Interest Rate Swaps | | | - | | | | (435 | ) | | | - | | | |
Credit Default Swaps | | | - | | | | (704 | ) | | | - | | | |
Total Liabilities: | | $ | (666 | ) | | $ | (4,848 | ) | | $ | - | | | |
^ Other financial instruments are derivative instruments such as futures and forwards, which are valued at the unrealized appreciation (depreciation) on the instrument, and short sales, written options and swaps contracts, which are valued at market value.
For the period ended December 31, 2017, there was a transfer from Level 2 to Level 3 in the amount of $102 (in thousands). This transfer was the result of a decrease in the quantity of observable inputs for the security that was previously priced by a third-party vendor utilizing a broker quote.
The Accompanying Notes are an Integral Part of the Financial Statements.
| | | | |
| 176 | | Multi-Sector Bond Portfolio | | |
Balanced Portfolio (unaudited)
| | | | |
| Objective: | | Portfolio Strategy: | | Net Assets: |
Realize as high a level of total return as is consistent with prudent investment risk, through income and capital appreciation. | | Invest in the stock, bond and money market sectors, attempting to capitalize on the variation in return potential produced by the interaction of changing financial markets and economic conditions. | | $2.3 billion |
Portfolio Overview
Mason Street Advisors, LLC is the investment adviser for the Balanced Portfolio (the “Portfolio”). The Portfolio invests in the stock, bond and money market sectors. The Portfolio is tactically and strategically managed to capitalize on changing financial markets and economic conditions following a flexible policy for allocating assets across the stock, bond and money market sectors. The Portfolio operates primarily as a “fund of funds” to gain the Portfolio’s equity and fixed income exposure by investing in one or more of the portfolios of Northwestern Mutual Series Fund, Inc. (each an “Underlying Portfolio”). The adviser allocates the Portfolio’s assets among the Underlying Portfolios based on the adviser’s economic and market outlook and the investment objectives and strategies of the Underlying Portfolios. Under normal market conditions, the Portfolio will typically hold between 35-55% of assets in equity investments, 40-60% of assets in fixed income investments, and 0-20% of assets in cash equivalent investments.
Market Overview
U.S. equities delivered another year of strong performance. The sharp gains in business and consumer confidence following the U.S. election and improving global economic growth were among the catalysts for equities, as investors anticipated market-friendly policies from the new administration. That confidence was generally well placed—corporate earnings finally improved after three flat years and Congress passed one of the largest tax cuts in U.S. history. The improving economy favored equities over bonds; although, fixed income sectors still posted positive returns.
The U.S. economy expanded at a pace of approximately 3% during the second half of the year. The strong growth prompted the U.S. Federal Reserve (the “Fed”) to raise rates and begin reducing its $4 trillion balance sheet. In that environment, large cap stocks, as represented by the S&P 500® Index, posted a return of 21.83%, outperforming the S&P SmallCap 600® and the S&P MidCap 400® Indices, which returned 13.23% and 16.24%, respectively. Meanwhile, the broader bond market, as represented by the Bloomberg Barclays® U.S. Aggregate Index returned 3.54%, while the Bloomberg Barclays® U.S. Corporate High Yield Index advanced 7.50%.
Portfolio Results
The Portfolio returned 11.98% for the twelve months ended December 31, 2017, trailing the 21.83% return of the broad stock market, as measured by the S&P 500® Index, but outstripping the Bloomberg Barclays® U.S. Aggregate Index return of 3.54%. The Portfolio underperformed the Balanced Portfolio Blended Composite Benchmark return of 12.71%. (The benchmark weights are detailed in the “Benchmark Definitions” section of this annual report.) When compared to peers in 2017, the Portfolio outperformed its Morningstar® Inc. Allocation – 30% to 50% Equity peer group average return of 10.84% but lagged its Lipper® Analytical Services, Inc. Mixed-Asset Target Allocation Moderate Funds peer group average return of 13.33%. Morningstar® Inc. and Lipper® Analytical Services, Inc. are independent mutual fund ranking agencies.
The Portfolio’s underperformance relative to the blended benchmark reflected the challenged performance of its Underlying Portfolios, as many of the Underlying Portfolios underperformed their respective benchmarks during the year. In particular, the Emerging Markets Equity Portfolio, the Growth Stock Portfolio and the International Equity Portfolio trailed their respective benchmarks by relatively wide margins.
Overall, asset allocation decisions were a positive contributor to relative performance. The Portfolio began the year with an overweight to U.S. equities and an underweight to fixed income, a favorable position that was maintained throughout the reporting period. As domestic equities outpaced fixed income by a wide margin and the global economy gained strength, the Portfolio added to the equity position during the second half of the year, funded by investment grade fixed income. Low rates, improving economic growth, and less central bank accommodation present difficulties for fixed income markets going forward.
During the year, equity futures contracts were used for cash management purposes. The Portfolio’s use of futures did not have a significant effect on the Portfolio’s relative results during 2017.
Portfolio Manager Outlook
Entering the new year, we will maintain our overweight in U.S. equities and an underweight in fixed income. We believe the global economy is picking up momentum, which should support earnings growth and equity prices. Valuations are relatively high across asset classes, but low inflation and strong growth are likely to continue to benefit risk assets. Business and
Balanced Portfolio (unaudited)
consumer confidence remain at elevated levels, pointing to persistent strength in the economy. The world is enjoying synchronized global growth for the first time since the Great Recession suggesting that we have entered another stage of the expansion. Moreover, the tax cuts in December 2017 are likely to boost near-term growth and improve equity valuations.
Our expectations for bonds are less sanguine. Treasury yields and the premiums on corporate bonds are already very low, leaving little room for error as the bond market faces stiff headwinds in 2018. The tax cuts are likely to lead to larger deficits and increased issuance, which will be concurrent with the Fed’s increasing bond sales. Also, there are some signs that inflation pressures are building due to the acceleration in economic growth and the increase in commodity prices, especially oil. We will minimize risks in the bond portfolio while closely monitoring geopolitical and economic developments during the year ahead. As always, we will seek an optimal mix of the most attractive asset classes from a risk and return perspective.
Relative Performance
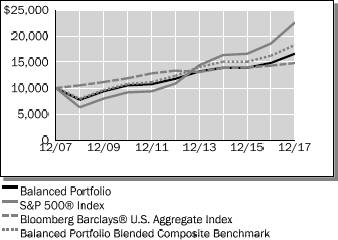
| | | | | | | | | | | | |
Average Annual Total Returns
For Periods Ended December 31, 2017 | |
| | | 1 Year | | | 5 Years | | | 10 Years | |
Balanced Portfolio | | | 11.98% | | | | 7.12% | | | | 5.20% | |
S&P 500® Index | | | 21.83% | | | | 15.79% | | | | 8.50% | |
Bloomberg Barclays® U.S. Aggregate Index | | | 3.54% | | | | 2.10% | | | | 4.01% | |
Balanced Portfolio Blended Composite Benchmark | | | 12.71% | | | | 8.16% | | | | 6.22% | |
Morningstar® US Insurance Fund Allocation - 30% to 50% Equity Index | | | 10.84% | | | | 5.95% | | | | 4.67% | |
Lipper® Variable Insurance Products (VIP) Mixed Asset Target Allocation Moderate Funds Average | | | 13.33% | | | | 7.61% | | | | 5.38% | |
The performance data quoted represents past performance. Past performance is historical and does not guarantee future performance. Investment return and principal value will fluctuate, so that shares, when redeemed, may be worth more or less than their original cost. Current performance may be lower or higher than the performance data quoted. For the most recent month-end performance information visit www.northwesternmutual.com.
This chart assumes an initial investment of $10,000 made on 12/31/07. Returns shown reflect fee waivers, deductions for management and other portfolio expenses, and reinvestment of all dividends. In the absence of fee waivers, total return would be reduced. Returns exclude deductions for separate account sale loads and account fees. Please refer to the Benchmark Definitions section of this report for information about the indices cited in the above chart and graph.
Investors should be aware of the risks of investments in foreign securities, particularly investments in securities of companies in developing nations. These include the risks of currency fluctuation, of political and economic instability and of less well-developed government supervision and regulation of business and industry practices, as well as differences in accounting standards. Small cap stocks also may carry additional risk. Smaller or newer issuers are more likely to realize more substantial growth as well as suffer more significant losses than larger or more established issuers. Investments in such companies can be both volatile and more speculative. Bonds and other debt obligations are affected by changes in interest rates, inflation risk and the creditworthiness of their issuers. High yield bonds generally have greater price swings and higher default risks than investment grade bonds.
Balanced Portfolio (unaudited)
The Portfolio may obtain its exposure to domestic and foreign equity securities by investing in other Series Fund portfolios (Underlying Portfolios). Each of the Underlying Portfolios has its own investment risks, and the Portfolio is indirectly exposed to all the risks of the Underlying Portfolios in which it invests, including that risk that an Underlying Portfolio will not perform as expected. To the extent that the Portfolio invests a significant portion of its assets in a single Underlying Portfolio, it will be particularly sensitive to the risks associated with that Underlying Portfolio may have a significant effect on the Portfolio’s net asset value. The Portfolio will bear a pro rata share of the Underlying Portfolio’s expenses.
The Portfolio may use derivative instruments to gain exposure to certain markets, sectors or regions as alternatives to direct investments, to adjust the Portfolio duration, to provide increased flexibility in asset allocation, to earn income and to otherwise seek to enhance returns or to hedge foreign currency exposure. Use of these instruments may involve certain costs and risks such as liquidity risk, interest rate risk, mispricing or improper valuation. Certain derivatives involve leverage, which could magnify losses, and portfolios investing in derivatives could lose more than the principal amount invested in those investments.
Currently, interest rates remain at historically low levels on a relative basis, although the U.S. federal funds rate has been subject to modest increases over the course of the last two years. A significant rise in interest rates over a short period of time could cause significant losses in the market value of the Portfolio’s fixed income investments.
Top 10 Equity Holdings 12/31/17
| | | | |
| Security Description | | % of Net Assets | |
Northwestern Mutual Series Fund, Inc., Select Bond Portfolio | | | 34.2 | % |
Northwestern Mutual Series Fund, Inc., Growth Stock Portfolio | | | 6.6 | % |
Northwestern Mutual Series Fund, Inc., High Yield Bond Portfolio | | | 6.0 | % |
Northwestern Mutual Series Fund, Inc., Research International Core Portfolio | | | 5.4 | % |
Northwestern Mutual Series Fund, Inc., Mid Cap Value Portfolio | | | 4.9 | % |
Northwestern Mutual Series Fund, Inc., Mid Cap Growth Stock Portfolio | | | 4.8 | % |
Northwestern Mutual Series Fund, Inc., Large Cap Blend Portfolio | | | 3.3 | % |
Northwestern Mutual Series Fund, Inc., Domestic Equity Portfolio | | | 3.3 | % |
Northwestern Mutual Series Fund, Inc., Large Company Value Portfolio | | | 3.3 | % |
Northwestern Mutual Series Fund, Inc., Equity Income Portfolio | | | 3.3 | % |
Sector Allocation 12/31/17
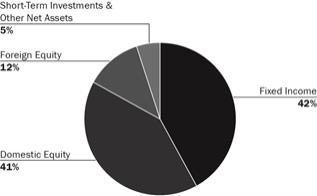
Sector Allocation is based on Net Assets.
Sector Allocation and Top 10 Holdings are subject to change.
Balanced Portfolio
Schedule of Investments
December 31, 2017
| | | | | | | | |
| Investment Companies (95.2%) | | Shares/
$ Par | | | Value
$ (000’s) | |
| | |
| Domestic Equity (40.6%) | | | | | | | | |
iShares Russell 2000 ETF | | | 122,600 | | | | 18,692 | |
iShares Russell Mid-Cap ETF | | | 2,000 | | | | 416 | |
Northwestern Mutual Series Fund, Inc., Domestic Equity Portfolio(q) | | | 45,137,221 | | | | 75,695 | |
Northwestern Mutual Series Fund, Inc., Equity Income Portfolio(q) | | | 40,577,249 | | | | 75,677 | |
Northwestern Mutual Series Fund, Inc., Focused Appreciation Portfolio(q) | | | 27,914,560 | | | | 75,676 | |
Northwestern Mutual Series Fund, Inc., Growth Stock Portfolio(q) | | | 49,798,067 | | | | 151,087 | |
Northwestern Mutual Series Fund, Inc., Large Cap Blend Portfolio(q) | | | 62,893,388 | | | | 75,787 | |
Northwestern Mutual Series Fund, Inc., Large Cap Core Stock Portfolio(q) | | | 38,649,047 | | | | 75,636 | |
Northwestern Mutual Series Fund, Inc., Large Company Value Portfolio(q) | | | 71,267,246 | | | | 75,686 | |
Northwestern Mutual Series Fund, Inc., Mid Cap Growth Stock Portfolio(q) | | | 32,256,388 | | | | 111,510 | |
Northwestern Mutual Series Fund, Inc., Mid Cap Value Portfolio(q) | | | 61,936,496 | | | | 113,530 | |
Northwestern Mutual Series Fund, Inc., Small Cap Growth Stock Portfolio(q) | | | 13,074,014 | | | | 37,601 | |
Northwestern Mutual Series Fund, Inc., Small Cap Value Portfolio(q) | | | 19,774,941 | | | | 50,129 | |
| | | | | | | | |
Total | | | | | | | 937,122 | |
| | | | | | | | |
| | |
| Fixed Income (42.3%) | | | | | | | | |
Northwestern Mutual Series Fund, Inc., High Yield Bond Portfolio(q) | | | 186,728,658 | | | | 139,300 | |
Northwestern Mutual Series Fund, Inc., Inflation Protection Portfolio(q) | | | 41,189,828 | | | | 45,885 | |
Northwestern Mutual Series Fund, Inc., Select Bond Portfolio(q) | | | 628,621,208 | | | | 790,177 | |
| | | | | | | | |
Total | | | | | | | 975,362 | |
| | | | | | | | |
| | |
| Foreign Equity (12.3%) | | | | | | | | |
iShares Core MSCI Emerging Markets ETF | | | 400,475 | | | | 22,787 | |
iShares MSCI EAFE ETF | | | 248,779 | | | | 17,492 | |
Northwestern Mutual Series Fund, Inc., Emerging Markets Equity Portfolio(q) | | | 12,187,543 | | | | 13,467 | |
Northwestern Mutual Series Fund, Inc., International Equity Portfolio(q) | | | 27,101,948 | | | | 51,900 | |
| | | | | | | | |
| Investment Companies (95.2%) | | Shares/
$ Par | | | Value
$ (000’s) | |
| | |
| Foreign Equity (12.3%) continued | | | | | | | | |
Northwestern Mutual Series Fund, Inc., International Growth Portfolio(q) | | | 33,312,588 | | | | 53,067 | |
Northwestern Mutual Series Fund, Inc., Research International Core Portfolio(q) | | | 121,020,593 | | | | 125,619 | |
| | | | | | | | |
Total | | | | | | | 284,332 | |
| | | | | | | | |
| | |
Total Investment Companies | | | | | | | | |
(Cost: $2,024,545) | | | | | | | 2,196,816 | |
| | | | | | | | |
| | |
| Short-Term Investments (3.5%) | | | | | | |
| | |
| Commercial Paper (3.2%) | | | | | | | | |
Apple, Inc., 0.000%, 2/22/18 144A | | | 5,000,000 | | | | 4,989 | |
Apple, Inc., 0.000%, 2/20/18 144A | | | 5,000,000 | | | | 4,989 | |
Bank of America Corp., 1.400%, 1/8/18 | | | 10,000,000 | | | | 10,000 | |
General Mills, Inc., 0.000%, 1/10/18 144A | | | 3,900,000 | | | | 3,898 | |
General Mills, Inc., 0.000%, 1/17/18 144A | | | 5,000,000 | | | | 4,996 | |
General Mills, Inc., 0.000%, 1/16/18 144A | | | 1,000,000 | | | | 999 | |
Mondelez International, Inc., 0.000%, 1/17/18 144A | | | 5,000,000 | | | | 4,995 | |
Pfizer, Inc., 0.000%, 1/16/18 144A | | | 2,000,000 | | | | 1,999 | |
Pfizer, Inc., 0.000%, 3/1/18 144A | | | 1,000,000 | | | | 997 | |
Pfizer, Inc., 0.000%, 3/15/18 144A | | | 7,000,000 | | | | 6,978 | |
Societe Generale SA, 0.000%, 2/8/18 144A | | | 6,000,000 | | | | 5,989 | |
Societe Generale SA, 0.000%, 2/15/18 144A | | | 4,000,000 | | | | 3,992 | |
United Parcel Service, Inc., 0.000%, 3/5/18 144A | | | 10,000,000 | | | | 9,972 | |
The Walt Disney Co., 0.000%, 3/23/18 144A | | | 10,000,000 | | | | 9,964 | |
| | | | | | | | |
Total | | | | | | | 74,757 | |
| | | | | | | | |
| | |
| Money Market Funds (0.1%) | | | | | | | | |
State Street Institutional U.S. Government Money Market Fund - Premier Class, 1.209% # | | | 3,361,136 | | | | 3,361 | |
| | | | | | | | |
Total | | | | | | | 3,361 | |
| | | | | | | | |
| | |
| U.S. Government & Agencies (0.2%) | | | | | | | | |
Federal Home Loan Bank, 0.000%, 1/12/18 | | | 1,500,000 | | | | 1,499 | |
Federal Home Loan Bank, 0.000%, 3/15/18 (b) | | | 2,000,000 | | | | 1,995 | |
| | | | | | | | |
Total | | | | | | | 3,494 | |
| | | | | | | | |
| | |
Total Short-Term Investments | | | | | | | | |
(Cost: $81,627) | | | | | | | 81,612 | |
| | | | | | | | |
| | |
Total Investments (98.7%) | | | | | | | | |
(Cost: $2,106,172)(a) | | | | | | | 2,278,428 | |
| | | | | | | | |
Other Assets, Less | | | | | | | | |
Liabilities (1.3%) | | | | | | | 29,042 | |
| | | | | | | | |
Net Assets (100.0%) | | | | | | | 2,307,470 | |
| | | | | | | | |
| # | 7-day yield as of December 31, 2017. |
| | 144A after the name of a security represents a security exempt from registration under Rule 144A of the Securities Act of 1933. These securities may be resold as transactions exempt from registration, normally to qualified institutional buyers. At December 31, 2017 the value of these securities (in thousands) was $64,757 representing 2.8% of the net assets. |
| (a) | At December 31, 2017, the aggregate cost of investments, including derivatives, for federal tax purposes (in thousands) was $2,106,541 and the net unrealized appreciation of investments based on that cost was $171,824 which is comprised of $174,641 aggregate gross unrealized appreciation and $2,817 aggregate gross unrealized depreciation. |
The Accompanying Notes are an Integral Part of the Financial Statements.
Balanced Portfolio
| (b) | All or a portion of the securities have been pledged as collateral for open futures positions. Information regarding open futures contracts as of period end is summarized below. |
| | | | | | | | | | | | | | | | | | |
| Issuer | | Long/Short | | Currency | | Notional Par
(000’s) | | Number of
Contracts | | Expiration
Date | | Notional
Value
(000’s) | | | Unrealized
Appreciation/
(Depreciation)
(000’s) | |
E-Mini S&P 500 Future | | Long | | USD | | $4 | | 85 | | 3/18 | | $ | 11,373 | | | $ | (63 | ) |
| | The following is a summary of the inputs used in valuing the Portfolio’s assets and liabilities at December 31, 2017. See Note 3 for additional information on portfolio valuation. |
| | | | | | | | | | | | | | |
| | | Valuation Inputs | | | |
| Description | | Level 1 –
Quoted Prices | | | Level 2 –
Other Significant
Observable Inputs | | | Level 3 –
Significant
Unobservable Inputs | | | |
| | | (Amounts in thousands) | | | |
Assets: | | | | | | | | | | | | | | |
Investment Companies | | $ | 2,196,816 | | | $ | - | | | $ | - | | | |
Short-Term Investments | | | | | | | | | | | | | | |
Money Market Funds | | | 3,361 | | | | - | | | | - | | | |
All Others | | | - | | | | 78,251 | | | | - | | | |
Total Assets: | | $ | 2,200,177 | | | $ | 78,251 | | | $ | - | | | |
Liabilities: | | | | | | | | | | | | | | |
Other Financial Instruments^ | | | | | | | | | | | | | | |
Futures | | $ | (63 | ) | | $ | - | | | $ | - | | | |
Total Liabilities: | | $ | (63 | ) | | $ | - | | | $ | - | | | |
^ Other financial instruments are derivative instruments such as futures, forwards, written options and swaps contracts, which are valued at the unrealized appreciation (depreciation) on the instrument and short sales, which are valued at market value.
The Accompanying Notes are an Integral Part of the Financial Statements.
Asset Allocation Portfolio (unaudited)
| | | | |
| Objective: | | Portfolio Strategy: | | Net Assets: |
Realize as high a level of total return as is consistent with reasonable investment risk. | | Invest in the stock, bond and money market sectors, attempting to capitalize on the variation in return potential produced by the interaction of changing financial markets and economic conditions. | | $277 million |
Portfolio Overview
Mason Street Advisors, LLC is the investment adviser for the Asset Allocation Portfolio (the “Portfolio”). The Portfolio invests in the stock, bond and money market sectors. The Portfolio is tactically and strategically managed to capitalize on changing financial markets and economic conditions following a flexible policy for allocating assets across the stock, bond and money market sectors. The Portfolio operates primarily as a “fund of funds” to gain the Portfolio’s equity and fixed income exposure by investing in one or more of the portfolios of Northwestern Mutual Series Fund, Inc. (each an “Underlying Portfolio”). The adviser allocates the Portfolio’s assets among the Underlying Portfolios based on the adviser’s economic and market outlook and the investment objectives and strategies of the Underlying Portfolios. Under normal market conditions, the Portfolio will typically hold between 55-75% of assets in equity investments, 25-45% of assets in fixed income investments, and 0-15% of assets in cash equivalent investments.
Market Overview
U.S. equities delivered another year of strong performance. The sharp gains in business and consumer confidence following the U.S. election and improving global economic growth were among the catalysts for equities, as investors anticipated market-friendly policies from the new administration. That confidence was generally well placed – corporate earnings finally improved after three flat years and Congress passed one of the largest tax cuts in U.S. history. The improving economy favored equities over bonds; although, fixed income sectors still posted positive returns.
The U.S. economy expanded at a pace of approximately 3% during the second half of the year. The strong growth prompted the U.S. Federal Reserve (the “Fed”) to raise rates and begin reducing its $4 trillion balance sheet. In that environment, large cap stocks, as represented by the S&P 500® Index, posted a return of 21.83%, outperforming the S&P SmallCap 600® and the S&P MidCap 400® Indices, which returned 13.23% and 16.24%, respectively. Meanwhile, the broader bond market, as represented by the Bloomberg Barclays® U.S. Aggregate Index returned 3.54%, while the Bloomberg Barclays® U.S. Corporate High Yield Index advanced 7.50%.
Portfolio Results
The Portfolio returned 14.87% for the twelve months ended December 31, 2017, trailing the 21.83% return of the broad stock market, as measured by the S&P 500® Index, but outstripping the Bloomberg Barclays® U.S. Aggregate Index return of 3.54%. The Portfolio underperformed the Asset Allocation Portfolio Blended Composite Benchmark return of 15.87%. (The benchmark weights are detailed in the “Benchmark Definitions” section of this annual report.) When compared to peers in 2017, the Portfolio outperformed its Morningstar® Inc. Allocation – 50% to 70% Equity peer group average return of 14.47% but lagged its Lipper® Analytical Services, Inc. Mixed-Asset Target Allocation Growth Funds peer group average return of 15.82%. Morningstar® Inc. and Lipper® Analytical Services, Inc. are independent mutual fund ranking agencies.
The Portfolio’s underperformance relative to the blended benchmark reflected the challenged performance of its Underlying Portfolios, as many of the Underlying Portfolios underperformed their respective benchmarks during the year. In particular, the Emerging Markets Equity Portfolio, the Growth Stock Portfolio and the International Equity Portfolio trailed their respective benchmarks by relatively wide margins.
Overall, asset allocation decisions were a positive contributor to relative performance. The Portfolio began the year with an overweight to U.S. equities and an underweight to fixed income, a favorable position that was maintained throughout the reporting period. As domestic equities outpaced fixed income by a wide margin and the global economy gained strength, the Portfolio added to the equity position during the second half of the year, funded by investment grade fixed income. Low rates, improving economic growth and less central bank accommodation present difficulties for fixed income markets going forward.
During the year, equity futures contracts were used for cash management purposes. The Portfolio’s use of futures did not have a significant effect on the Portfolio’s relative results during 2017.
Portfolio Manager Outlook
Entering the new year, we will maintain our overweight in U.S. equities and an underweight in fixed income. We believe the global economy is picking up momentum, which should support earnings growth and equity prices. Valuations are relatively
| | | | |
| 182 | | Asset Allocation Portfolio | | |
Asset Allocation Portfolio (unaudited)
high across asset classes, but low inflation and strong growth are likely to continue to benefit risk assets. Business and consumer confidence remain at elevated levels, pointing to persistent strength in the economy. The world is enjoying synchronized global growth for the first time since the Great Recession suggesting that we have entered another stage of the expansion. Moreover, the tax cuts in December 2017 are likely to boost near-term growth and improve equity valuations.
Our expectations for bonds are less sanguine. Treasury yields and the premiums on corporate bonds are already very low, leaving little room for error as the bond market faces stiff headwinds in 2018. The tax cuts are likely to lead to larger deficits and increased issuance, which will be concurrent with the Fed’s increasing bond sales. Also, there are some signs that inflation pressures are building due to the acceleration in economic growth and the increase in commodity prices, especially oil. We will minimize risks in the bond portfolio while closely monitoring geopolitical and economic developments during the year ahead. As always, we will seek an optimal mix of the most attractive asset classes from a risk and return perspective.
Relative Performance

| | | | | | | | | | | | |
Average Annual Total Returns
For Periods Ended December 31, 2017 | |
| | | 1 Year | | | 5 Years | | | 10 Years | |
Asset Allocation Portfolio | | | 14.87 | % | | | 8.63 | % | | | 5.35 | % |
S&P 500® Index | | | 21.83 | % | | | 15.79 | % | | | 8.50 | % |
Bloomberg Barclays® U.S. Aggregate Index | | | 3.54 | % | | | 2.10 | % | | | 4.01 | % |
Asset Allocation Portfolio Blended Composite Benchmark | | | 15.87 | % | | | 9.94 | % | | | 6.74 | % |
Morningstar® US Insurance Fund Allocation - 50% to 70% Equity Index | | | 14.47 | % | | | 8.57 | % | | | 5.72 | % |
Lipper® Variable Insurance Products (VIP) Mixed Asset Target Allocation Growth Funds Average | | | 15.82 | % | | | 9.25 | % | | | 5.77 | % |
The performance data quoted represents past performance. Past performance is historical and does not guarantee future performance. Investment return and principal value will fluctuate, so that shares, when redeemed, may be worth more or less than their original cost. Current performance may be lower or higher than the performance data quoted. For the most recent month-end performance information visit www.northwesternmutual.com.
This chart assumes an initial investment of $10,000 made on 12/31/07. Returns shown reflect fee waivers, deductions for management and other portfolio expenses, and reinvestment of all dividends. In the absence of fee waivers, total return would be reduced. Returns exclude deductions for separate account sale loads and account fees. In the graph and chart, the Portfolio is compared against various indices representing the three major components of the Portfolio: equities, fixed income and cash equivalent instruments. Please refer to the Benchmark Definitions section of this report for information about the indices cited in the above chart and graph.
Investors should be aware of the risks of investments in foreign securities, particularly investments in securities of companies in developing nations. These include the risks of currency fluctuation, of political and economic instability and of less well-developed government supervision and regulation of business and industry practices, as well as differences in accounting standards. Small cap stocks also may carry additional risk. Smaller or newer issuers are more likely to realize more substantial growth as well as suffer more significant losses than larger or more established issuers. Investments in such companies can be both volatile and more speculative. Bonds and other debt obligations are affected by changes in interest rates, inflation risk and the creditworthiness of their issuers. High yield bonds generally have greater price swings and higher default risks than investment grade bonds.
The Portfolio obtains its exposure to equity and fixed income securities by investing in other Series Fund portfolios (Underlying Portfolios). Each of the Underlying Portfolios has its own investment risks, and the Portfolio is indirectly exposed to all the risks of the Underlying Portfolios in which it invests, including that risk that an Underlying Portfolio will not perform as expected. To the extent that the Portfolio invests a significant portion of its assets in a single Underlying Portfolio, it will be particularly sensitive to the risks associated with that Underlying Portfolio may have a significant effect on the Portfolio’s net asset value. The Portfolio will bear a pro rata share of the Underlying Portfolio’s expenses.
| | | | | | |
| | Asset Allocation Portfolio | | | 183 | |
Asset Allocation Portfolio (unaudited)
The Portfolio may use derivative instruments to gain exposure to certain markets, sectors or regions as alternatives to direct investments, to adjust the Portfolio duration, to provide increased flexibility in asset allocation, to earn income and to otherwise seek to enhance returns or to hedge foreign currency exposure. Use of these instruments may involve certain costs and risks such as liquidity risk, interest rate risk, mispricing or improper valuation. Certain derivatives involve leverage, which could magnify losses, and portfolios investing in derivatives could lose more than the principal amount invested in those investments.
Currently, interest rates remain at historically low levels on a relative basis, although the U.S. federal funds rate has been subject to modest increases over the course of the last two years. A significant rise in interest rates over a short period of time could cause significant losses in the market value of the Portfolio’s fixed income investments.
Top 10 Equity Holdings 12/31/17
| | |
| Security Description | | % of Net Assets |
Northwestern Mutual Series Fund, Inc., Select Bond Portfolio | | 15.7% |
Northwestern Mutual Series Fund, Inc., High Yield Bond Portfolio | | 8.0% |
Northwestern Mutual Series Fund, Inc., Growth Stock Portfolio | | 7.9% |
Northwestern Mutual Series Fund, Inc., Research International Core Portfolio | | 7.5% |
Northwestern Mutual Series Fund, Inc., Mid Cap Value Portfolio | | 5.9% |
Northwestern Mutual Series Fund, Inc., Mid Cap Growth Stock Portfolio | | 5.8% |
Northwestern Mutual Series Fund, Inc., Large Cap Blend Portfolio | | 4.5% |
Northwestern Mutual Series Fund, Inc., Large Cap Core Stock Portfolio | | 4.5% |
Northwestern Mutual Series Fund, Inc., Focused Appreciation Portfolio | | 4.0% |
Northwestern Mutual Series Fund, Inc., Large Co. Value Portfolio | | 4.0% |
Sector Allocation 12/31/17

Sector Allocation is based on Net Assets.
Sector Allocation and Top 10 Holdings are subject to change.
| | | | |
| 184 | | Asset Allocation Portfolio | | |
Asset Allocation Portfolio
| | | | | | | | |
| Investment Companies (95.3%) | | Shares/
$ Par | | | Value
$ (000’s) | |
| |
Domestic Equity (51.5%) | | | | | |
iShares Russell 2000 ETF | | | 12,750 | | | | 1,944 | |
iShares Russell Mid-Cap ETF | | | 3,300 | | | | 687 | |
Northwestern Mutual Series Fund, Inc., Domestic Equity Portfolio (q) | | | 6,575,705 | | | | 11,027 | |
Northwestern Mutual Series Fund, Inc., Equity Income Portfolio (q) | | | 5,914,000 | | | | 11,030 | |
Northwestern Mutual Series Fund, Inc., Focused Appreciation Portfolio (q) | | | 4,070,284 | | | | 11,034 | |
Northwestern Mutual Series Fund, Inc., Growth Stock Portfolio (q) | | | 7,257,605 | | | | 22,019 | |
Northwestern Mutual Series Fund, Inc., Large Cap Blend Portfolio (q) | | | 10,313,394 | | | | 12,428 | |
Northwestern Mutual Series Fund, Inc., Large Cap Core Stock Portfolio (q) | | | 6,338,737 | | | | 12,405 | |
Northwestern Mutual Series Fund, Inc., Large Company Value Portfolio (q) | | | 10,386,302 | | | | 11,030 | |
Northwestern Mutual Series Fund, Inc., Mid Cap Growth Stock Portfolio (q) | | | 4,666,667 | | | | 16,133 | |
Northwestern Mutual Series Fund, Inc., Mid Cap Value Portfolio (q) | | | 8,918,646 | | | | 16,348 | |
Northwestern Mutual Series Fund, Inc., Small Cap Growth Stock Portfolio (q) | | | 2,588,259 | | | | 7,444 | |
Northwestern Mutual Series Fund, Inc., Small Cap Value Portfolio (q) | | | 3,643,850 | | | | 9,237 | |
| | | | | | | | |
Total | | | | | | | 142,766 | |
| | | | | | | | |
| |
Fixed Income (26.3%) | | | | | |
iShares Core U.S. Aggregate Bond ETF | | | 12,250 | | | | 1,339 | |
Northwestern Mutual Series Fund, Inc., High Yield Bond Portfolio (q) | | | 29,879,203 | | | | 22,290 | |
Northwestern Mutual Series Fund, Inc., Inflation Protection Portfolio (q) | | | 5,032,767 | | | | 5,607 | |
Northwestern Mutual Series Fund, Inc., Select Bond Portfolio (q) | | | 34,708,094 | | | | 43,628 | |
| | | | | | | | |
Total | | | | | | | 72,864 | |
| | | | | | | | |
| |
Foreign Equity (17.5%) | | | | | |
iShares Core MSCI Emerging Markets ETF | | | 15,075 | | | | 858 | |
iShares MSCI EAFE ETF | | | 31,597 | | | | 2,222 | |
Northwestern Mutual Series Fund, Inc., Emerging Markets Equity Portfolio (q) | | | 4,809,353 | | | | 5,314 | |
| | | | | | | | |
| Investment Companies (95.3%) | | Shares/
$ Par | | | Value
$ (000’s) | |
| |
Foreign Equity (17.5%) continued | | | | | |
Northwestern Mutual Series Fund, Inc., International Equity Portfolio (q) | | | 4,983,685 | | | | 9,544 | |
Northwestern Mutual Series Fund, Inc., International Growth Portfolio (q) | | | 6,098,866 | | | | 9,716 | |
Northwestern Mutual Series Fund, Inc., Research International Core Portfolio (q) | | | 20,117,041 | | | | 20,881 | |
| | | | | | | | |
Total | | | | | | | 48,535 | |
| | | | | | | | |
Total Investment Companies | | | | | | | | |
(Cost: $236,804) | | | | | | | 264,165 | |
| | | | | | | | |
| | |
| Short-Term Investments (3.5%) | | | | | | |
| |
Commercial Paper (2.2%) | | | | | |
Apple, Inc., 0.000%, 1/3/18 144A | | | 1,000,000 | | | | 1,000 | |
Bank of America Corp., 1.400%, 1/8/18 | | | 1,000,000 | | | | 1,000 | |
General Mills, Inc., 0.000%, 1/17/18 144A | | | 1,000,000 | | | | 999 | |
Pfizer, Inc., 0.000%, 3/1/18 144A | | | 600,000 | | | | 599 | |
Pfizer, Inc., 0.000%, 3/15/18 144A | | | 400,000 | | | | 399 | |
United Parcel Service, Inc.,0.000%, 3/5/18 144A | | | 1,000,000 | | | | 997 | |
The Walt Disney Co., 0.000%, 3/23/18 144A | | | 1,000,000 | | | | 996 | |
| | | | | | | | |
Total | | | | | | | 5,990 | |
| | | | | | | | |
| |
Money Market Funds (0.6%) | | | | | |
State Street Institutional U.S. Government Money Market Fund - Premier Class, 1.209% # | | | 1,737,140 | | | | 1,737 | |
| | | | | | | | |
Total | | | | | | | 1,737 | |
| | | | | | | | |
| |
US Government & Agencies (0.7%) | | | | | |
Federal Home Loan Bank, 0.000%, 1/3/18 | | | 1,000,000 | | | | 1,000 | |
Federal Home Loan Bank, 0.000%, 3/15/18 (b) | | | 1,000,000 | | | | 997 | |
| | | | | | | | |
Total | | | | | | | 1,997 | |
| | | | | | | | |
Total Short-Term Investments | | | | | | | | |
(Cost: $9,724) | | | | | | | 9,724 | |
| | | | | | | | |
Total Investments (98.8%) | | | | | | | | |
(Cost: $246,528)(a) | | | | | | | 273,889 | |
| | | | | | | | |
Other Assets, Less | | | | | | | | |
Liabilities (1.2%) | | | | | | | 3,324 | |
| | | | | | | | |
Net Assets (100.0%) | | | | | | | 277,213 | |
| | | | | | | | |
| # | 7-day yield as of December 31, 2017. |
144A after the name of a security represents a security exempt from registration under Rule 144A of the Securities Act of 1933. These securities may be resold as transactions exempt from registration, normally to qualified institutional buyers. At December 31, 2017 the value of these securities (in thousands) was $4,990 representing 1.8% of the net assets.
| (a) | At December 31, 2017, the aggregate cost of investments, including derivatives, for federal tax purposes (in thousands) was $246,573 and the net unrealized appreciation of investments based on that cost was $27,315 which is comprised of $27,704 aggregate gross unrealized appreciation and $389 aggregate gross unrealized depreciation. |
The Accompanying Notes are an Integral Part of the Financial Statements.
| | | | | | |
| | Asset Allocation Portfolio | | | 185 | |
Asset Allocation Portfolio
| (b) | All or a portion of the securities have been pledged as collateral for open futures positions. Information regarding open futures contracts as of period end is summarized below. |
| | | | | | | | | | | | | | | | | | | | |
| Issuer | | Long/Short | | Currency | | Notional
Par
(000’s) | | | Number of
Contracts | | Expiration Date | | Notional
Value
(000’s) | | | Unrealized
Appreciation/
(Depreciation)
(000’s) | |
E-Mini S&P 500 Future | | Long | | USD | | $ | 1 | | | 22 | | 3/18 | | $ | 2,944 | | | $ | - | (m) |
| (m) | Amount is less than one thousand. |
The following is a summary of the inputs used in valuing the Portfolio’s assets and liabilities at December 31, 2017. See Note 3 for additional information on portfolio valuation.
| | | | | | | | | | | | | | |
| | | Valuation Inputs | | | |
| Description | | Level 1 –
Quoted Prices | | | Level 2 –
Other Significant
Observable Inputs | | | Level 3 –
Significant
Unobservable Inputs | | | |
| | | (Amounts in thousands) | | | |
Assets: | | | | | | | | | | | | | | |
Investment Companies | | $ | 264,165 | | | $ | - | | | $ | - | | | |
Short-Term Investments | | | | | | | | | | | | | | |
Money Market Funds | | | 1,737 | | | | - | | | | - | | | |
All Others | | | - | | | | 7,987 | | | | - | | | |
Total Assets: | | $ | 265,902 | | | $ | 7,987 | | | $ | - | | | |
Liabilities: | | | | | | | | | | | | | | |
Other Financial Instruments^ | | | | | | | | | | | | | | |
Futures | | $ | - | (m) | | $ | - | | | $ | - | | | |
Total Liabilities: | | $ | - | (m) | | $ | - | | | $ | - | | | |
^ Other financial instruments are derivative instruments such as futures, forwards, written options and swaps contracts, which are valued at the unrealized appreciation (depreciation) on the instrument and short sales, which are valued at market value.
The Accompanying Notes are an Integral Part of the Financial Statements.
| | | | |
| 186 | | Asset Allocation Portfolio | | |
Benchmark Definitions (unaudited)
The following indices are used to illustrate investment market, sector or style performance or to serve as Portfolio performance comparisons. Unlike the Portfolios, the indices are not professionally managed and do not incur fees or expenses. It is not possible to invest directly in an index.
1/3 each: Bloomberg Barclays® Global Aggregate — Credit Component ex Emerging Markets , Hedged USD; BofA Merrill Lynch® Global High Yield BB-B Rated Constrained Developed Markets Index, Hedged USD; JPMorgan® EMBI Global — The Bloomberg Barclays Global Aggregate — Credit Component ex Emerging Markets, Hedged USD provides a broad-based measure of the global developed markets investment grade fixed income markets. The BofA Merrill Lynch Global High Yield BB-B Rated Constrained Developed Markets Index, Hedged USD tracks the performance of below investment grade bonds of corporate issuers domiciled in developed market countries rated BB1 through B3, based on an average of Moody’s, S&P and Fitch. Qualifying bonds are capitalization weighted provided the total allocation to an individual issuer (defined by Bloomberg tickers) does not exceed 2%. Issuers that exceed the limit are reduced to 2% and the face value of each of their bonds is adjusted on a pro-rata basis. Similarly, the face value of bonds of all other issuers that fall below the 2% cap are increased on a pro-rata basis. The index is rebalanced on the last calendar day of the month. The JPMorgan EMBI Global tracks total returns for U.S. dollar-denominated debt instruments issued by emerging market sovereign and quasi-sovereign entities, Brady bonds, loans, Eurobonds and local market instruments. It is not possible to invest in an unmanaged index.
Asset Allocation Portfolio Blended Composite — The Asset Allocation Portfolio Blended Composite Benchmark is an unmanaged, hypothetical combination of unmanaged indices that correspond to the Asset Allocation Portfolio’s model allocation and consists of the Russell 3000® Index (50%), the MSCI® All Country World (ex-US) Index (15%), the Bloomberg Barclays® U.S. Aggregate Index (25%), and the Bloomberg Barclays® U.S. Corporate High Yield 2% Issuer Capped Index (10%).
Balanced Portfolio Blended Composite — The Balanced Portfolio Blended Composite Benchmark is an unmanaged, hypothetical combination of unmanaged indices that correspond to the Balanced Portfolio’s model allocation and consists of the Russell 3000® Index (40%), the MSCI® All Country World (ex-US) Index (10%), the Bloomberg Barclays® U.S. Aggregate Index (45%) and the Bloomberg Barclays® U.S. Corporate High Yield 2% Issuer Capped Index (5%).
Bloomberg Barclays® 1-3 Year U.S. Government/Credit Bond Index — The Bloomberg Barclays® 1-3 Year U.S.
Government/Credit Bond Index is an unmanaged index of publicly issued medium and larger issues of U.S. Government, investment-grade corporate and investment-grade international dollar denominated bonds that have maturities of between one and three years.
Bloomberg Barclays® U.S. Aggregate Index — The Bloomberg Barclays® U.S. Aggregate Index is an unmanaged index of publicly issued investment-grade fixed-rate debt securities including corporate, U.S. Treasury and government agency securities, mortgage pass-through and asset-backed securities with remaining maturities of at least one year regardless of call features.
Bloomberg Barclays® U.S. Corporate High Yield 2% Issuer Capped Index — The Bloomberg Barclays® U. S. Corporate High Yield 2% Issuer Capped Index is an unmanaged index of U.S. Dollar-denominated, non-convertible, fixed-rate, noninvestment-grade debt. Issuers are capped at 2% of the Index. Index holdings must have at least one year to final maturity, at least $150 million par amount outstanding, and be publicly issued with a rating of Ba1 or lower.
Bloomberg Barclays® Global Credit Hedged USD Index — The Bloomberg Barclays® Global Credit Hedged USD Index is an unmanaged index composed of investment-grade and high yield credit securities from the Multiverse represented in U.S. dollars on a hedged basis (Multiverse is the merger of two groups: the Global Aggregate and the Global High Yield).
Bloomberg Barclays® Long-Term U.S. Treasury Index — The Bloomberg Barclays® Long-Term U.S. Treasury Index is an unmanaged index comprised of fixed-income securities with various maturities greater than 10 years.
Bloomberg Barclays® U.S. Treasury Inflation Protected Securities (TIPS) Index — The Bloomberg Barclays® U.S. Treasury Inflation Protected Securities (TIPS) Index is an unmanaged index of inflation-protected public obligations of the U.S. Treasury. The index is market capitalization weighted and includes all publicly-issued U.S. Treasury Inflation-Protected Securities that have at least one year remaining to maturity and have $250 million or more of outstanding face value.
Lipper® Variable Insurance Products (VIP) Average — Each Lipper® Variable Insurance Products (VIP) Average is calculated by Lipper® Analytical Services, Inc. and reflects the investment return of certain portfolios underlying variable life and annuity products. Source: Lipper®, Inc.
Morningstar® Insurance Fund Category Averages — Each Morningstar® category average is an equal-weighted category return. The calculation is simply the average of the returns at the end of the period for all the underlying variable insurance funds in a given category. Source: Morningstar®, Inc.
| | | | | | |
| | Benchmark Definitions | | | 187 | |
Benchmark Definitions (unaudited)
MSCI® All Country World (ex-US) Index — The MSCI® All Country World (ex-US) Index is an unmanaged, free float-adjusted market capitalization-weighted index that is designed to measure equity performance of companies in the developed and emerging markets, excluding the U.S.
MSCI® All Country World (ex-US) Growth Index — The MSCI® All Country World (ex-US) Growth Index is an unmanaged, free float-adjusted market capitalization-weighted index that is designed to measure equity performance of companies in the developed and emerging markets, excluding the U.S., with higher historical and forecasted growth characteristics.
MSCI EAFE® (Europe-Australasia-Far-East) Index — The MSCI EAFE® (“Europe-Australasia-Far East”) Index is an unmanaged, free float-adjusted, market capitalization-weighted index that is designed to measure equity performance of companies in the developed markets, excluding the U.S. & Canada.
MSCI EAFE® (Europe-Australasia-Far-East) Growth
Index — The MSCI EAFE® (“Europe-Australasia-Far East”) Index is an unmanaged, free float-adjusted, market capitalization-weighted index that is designed to measure equity performance of companies in the developed markets, excluding the U.S. & Canada, with higher historical and forecasted growth characteristics.
MSCI® Emerging Markets Index — The MSCI® Emerging Markets Index is an unmanaged, free float-adjusted, market capitalization-weighted index that is designed to measure equity market performance in the global emerging markets.
Russell 1000® Growth Index — The Russell 1000® Growth Index is an unmanaged index that measures the performance of those companies in the Russell 1000® Index with higher price-to-book ratios and higher forecasted growth values. The Russell 1000® Index is an unmanaged, market capitalization-weighted, large cap index that measures the performance of the 1000 largest companies in the Russell 3000® Index.
Russell 1000® Value Index — The Russell 1000® Value Index is an unmanaged index that measures the performance of those companies in the Russell 1000® Index with lower price-to-book ratios and lower forecasted growth values. The Russell 1000® Index is an unmanaged, market capitalization-weighted, large cap index that measures the performance of the 1000 largest companies in the Russell 3000® Index.
Russell 2000® Index — The Russell 2000® Index is an unmanaged, market capitalization-weighted index that measures the performance of the 2000 smallest of the 3000 largest publicly traded U.S. companies, based on total market capitalization.
Russell 2000® Growth Index — The Russell 2000® Growth Index is an unmanaged index that measures the performance of those companies in the Russell 2000® Index with higher price-to-book ratios and higher forecasted growth values. The Russell 2000® Index is an unmanaged, market capitalization-weighted index that measures the performance of the 2000 smallest of the 3000 largest publicly traded U.S. companies, based on total market capitalization.
Russell 2000® Value Index — The Russell 2000® Value Index is an unmanaged index measures the performance of those companies in the Russell 2000® Index with lower price-to-book ratios and lower forecasted growth values. The Russell 2000® Index is an unmanaged, market-capitalization weighted index that measures the performance of the 2000 smallest of the 3000 largest publicly traded U.S. companies, based on total market capitalization.
Russell 3000® Index — The Russell 3000® Index measures the performance of the largest 3000 U.S. companies representing approximately 98% of the investable U.S. equity market.
Russell MidCap® Growth Index — The Russell MidCap® Growth Index is an unmanaged index that measures the performance of the Russell MidCap® companies with higher price-to-book ratios and higher forecasted growth values. The Russell MidCap® Index is an unmanaged index that measures the performance of the 800 smallest companies in the Russell 1000® Index, which represents approximately 25% of the total market capitalization of the Russell 1000® Index.
Russell MidCap® Value Index — The Russell MidCap® Value Index is an unmanaged index that measures the performance of the Russell MidCap® companies with lower price-to-book and lower forecasted growth values. The Russell MidCap® Index is an unmanaged index that measures the performance of the 800 smallest companies in the Russell 1000® Index, which represents approximately 25% of the total market capitalization of the Russell 1000® Index.
S&P 500® Index — The S&P 500® Composite Stock Price Index is an unmanaged, capitalization-weighted index of 500 selected common stocks designed to measure the performance of the broad domestic economy.
S&P MidCap 400® Index — The S&P MidCap 400® Index is an unmanaged, capitalization-weighted index that measures the performance of the mid-range sector of the U.S. stock market.
S&P SmallCap 600® Index — The S&P SmallCap 600® Index is an unmanaged index of 600 selected common stocks of U.S.-based companies with small market capitalizations.
| | | | |
| 188 | | Benchmark Definitions | | |
Statements of Assets and Liabilities
Northwestern Mutual Series Fund, Inc.
December 31, 2017 (in thousands)
| | | | | | | | | | | | | | | | | | | | |
| | | Growth Stock Portfolio | | | Focused Appreciation Portfolio | | | Large Cap Core Stock Portfolio | | | Large Cap Blend Portfolio | | | Index 500 Stock Portfolio | |
Assets | | | | | | | | | | | | | | | | | | | | |
Unaffiliated Investments, at Value (1) | | $ | 966,305 | | | $ | 949,711 | | | $ | 593,371 | | | $ | 177,551 | | | $ | 3,217,347 | |
Cash | | | - | | | | - | | | | - | | | | - | | | | 18 | |
Foreign Currency, at Value (4) | | | - | | | | - | | | | - | | | | - | | | | - | |
Cash Collateral for Derivative Positions | | | - | | | | - | | | | - | | | | - | | | | - | |
Receivable for Portfolio Shares Sold | | | 97 | | | | 69 | | | | 63 | | | | 2 | | | | 737 | |
Receivable for Investment Securities Sold | | | - | | | | - | | | | 6,967 | | | | 2,194 | | | | 3,379 | |
Outstanding Swap Contracts, at Value | | | - | | | | - | | | | - | | | | - | | | | - | |
Receivable for Foreign Currency | | | - | | | | - | | | | - | | | | - | | | | - | |
Prepaid Expenses and Other Assets | | | 6 | | | | 7 | | | | 4 | | | | 1 | | | | 31 | |
Dividends and Interest Receivable | | | 382 | | | | 620 | | | | 679 | | | | 221 | | | | 3,254 | |
| | | | | | | | | | | | | | | | | | | | |
Total Assets | | | 966,790 | | | | 950,407 | | | | 601,084 | | | | 179,969 | | | | 3,224,766 | |
| | | | | | | | | | | | | | | | | | | | |
Liabilities | | | | | | | | | | | | | | | | | | | | |
Payable for Portfolio Shares Redeemed | | | 6,563 | | | | 4,484 | | | | 3,616 | | | | 3,607 | | | | 731 | |
Payable for Investment Securities Purchased | | | - | | | | - | | | | 4,644 | | | | - | | | | 1,115 | |
Payable to Custodian | | | - | | | | - | | | | - | | | | - | | | | - | |
Contingent Liability | | | - | | | | - | | | | - | | | | - | | | | - | |
Futures Variation Margin | | | - | | | | - | | | | - | | | | - | | | | 149 | |
Payable for Foreign Currency | | | - | | | | - | | | | - | | | | - | | | | - | |
Collateral from Counterparty | | | - | | | | - | | | | - | | | | - | | | | - | |
Investment Advisory Fees | | | 335 | | | | 496 | | | | 212 | | | | 117 | | | | 525 | |
Accrued Expenses | | | 38 | | | | 42 | | | | 35 | | | | 25 | | | | 109 | |
| | | | | | | | | | | | | | | | | | | | |
Total Liabilities | | | 6,936 | | | | 5,022 | | | | 8,507 | | | | 3,749 | | | | 2,629 | |
| | | | | | | | | | | | | | | | | | | | |
Net Assets | | $ | 959,854 | | | $ | 945,385 | | | $ | 592,577 | | | $ | 176,220 | | | $ | 3,222,137 | |
| | | | | | | | | | | | | | | | | | | | |
Represented By: | | | | | | | | | | | | | | | | | | | | |
Aggregate Paid in Capital (10) (11) | | $ | 632,023 | | | $ | 659,486 | | | $ | 366,604 | | | $ | 124,077 | | | $ | 1,426,928 | |
Undistributed Net Investment Income (Loss) | | | 6,853 | | | | 5,780 | | | | 8,722 | | | | 1,299 | | | | 53,108 | |
Undistributed Accumulated Net Realized Gain (Loss) | | | 105,119 | | | | 24,248 | | | | 167,044 | | | | 7,455 | | | | 21,389 | |
Net Unrealized Appreciation (Depreciation) | | | 215,859 | | | | 255,871 | | | | 50,207 | | | | 43,389 | | | | 1,720,712 | |
| | | | | | | | | | | | | | | | | | | | |
Net Assets for Shares Outstanding (10) (11) | | $ | 959,854 | | | $ | 945,385 | | | $ | 592,577 | | | $ | 176,220 | | | $ | 3,222,137 | |
| | | | | | | | | | | | | | | | | | | | |
Net Asset Value, Offering and Redemption Price per Share | | $ | 3.03 | | | $ | 2.71 | | | $ | 1.96 | | | $ | 1.20 | | | $ | 4.93 | |
| | | | | | | | | | | | | | | | | | | | |
(1) Unaffiliated Investments, at Cost | | $ | 750,446 | | | $ | 693,839 | | | $ | 543,164 | | | $ | 134,162 | | | $ | 1,496,791 | |
(4) Foreign Currency, at Cost | | | - | | | | - | | | | - | | | | - | | | | - | |
(10) Shares Outstanding | | | 316,319 | | | | 348,717 | | | | 302,834 | | | | 146,235 | | | | 653,973 | |
(11) Shares Authorized, $.01 Par Value | | | 2,000,000 | | | | 2,000,000 | | | | 2,000,000 | | | | 2,000,000 | | | | 2,000,000 | |
The Accompanying Notes are an Integral Part of the Financial Statements.
| | | | | | |
| | Statements of Assets and Liabilities | | | 189 | |
| | | | | | | | | | | | | | | | | | | | | | | | | | | | | | | | | | |
Large Company Value Portfolio | | | Domestic Equity Portfolio | | | Equity Income Portfolio | | | Mid Cap Growth Stock Portfolio | | | Index 400 Stock Portfolio | | | Mid Cap Value Portfolio | | | Small Cap Growth Stock
Portfolio | | | Index 600 Stock Portfolio | | | Small Cap
Value Portfolio | |
| | | | | | | | | | | | | | | | | | | | | | | | | | | | | | | | | | | |
| $ | 202,063 | | | $ | 818,736 | | | $ | 841,473 | | | $ | 1,103,334 | | | $ | 896,739 | | | $ | 569,505 | | | $ | 628,237 | | | $ | 221,659 | | | $ | 672,044 | |
| | - | | | | - | | | | - | | | | - | | | | 44 | | | | - | | | | - | | | | - | | | | 7 | |
| | 10,063 | | | | - | | | | - | | | | - | | | | - | | | | 5,738 | | | | - | | | | - | | | | - | |
| | 160 | | | | - | | | | - | | | | - | | | | - | | | | - | | | | - | | | | - | | | | - | |
| | 6 | | | | 123 | | | | 41 | | | | 60 | | | | 395 | | | | 71 | | | | 40 | | | | 97 | | | | 7,519 | |
| | 427 | | | | 3,382 | | | | 5,834 | | | | 477 | | | | 636 | | | | 918 | | | | 155 | | | | 1,101 | | | | - | |
| | - | | | | - | | | | - | | | | - | | | | - | | | | - | | | | - | | | | 10 | | | | - | |
| | 5 | | | | - | | | | - | | | | - | | | | - | | | | 8 | | | | - | | | | - | | | | - | |
| | 1 | | | | 5 | | | | 6 | | | | 8 | | | | 8 | | | | 5 | | | | 4 | | | | 6 | | | | 4 | |
| | 437 | | | | 1,222 | | | | 1,672 | | | | 588 | | | | 1,286 | | | | 1,244 | | | | 390 | | | | 265 | | | | 1,202 | |
| | | | | | | | | | | | | | | | | | | | | | | | | | | | | | | | | | |
| | 213,162 | | | | 823,468 | | | | 849,026 | | | | 1,104,467 | | | | 899,108 | | | | 577,489 | | | | 628,826 | | | | 223,138 | | | | 680,776 | |
| | | | | | | | | | | | | | | | | | | | | | | | | | | | | | | | | | |
| | | | | | | | | | | | | | | | | | | | | | | | | | | | | | | | | | | |
| | 1,609 | | | | 3,858 | | | | 3,362 | | | | 5,648 | | | | 139 | | | | 5,280 | | | | 412 | | | | 19 | | | | 218 | |
| | 1,013 | | | | - | | | | 138 | | | | 858 | | | | 2,068 | | | | 768 | | | | 185 | | | | 551 | | | | 6,802 | |
| | 10,219 | | | | - | | | | - | | | | - | | | | - | | | | 5,509 | | | | - | | | | - | | | | - | |
| | - | | | | - | | | | 649 | | | | - | | | | - | | | | - | | | | - | | | | - | | | | - | |
| | - | | | | - | | | | - | | | | - | | | | 103 | | | | - | | | | - | | | | - | | | | - | |
| | 199 | | | | - | | | | - | | | | - | | | | - | | | | 292 | | | | - | | | | - | | | | - | |
| | 140 | | | | - | | | | - | | | | - | | | | - | | | | 410 | | | | - | | | | 120 | | | | - | |
| | 116 | | | | 358 | | | | 432 | | | | 485 | | | | 173 | | | | 346 | | | | 284 | | | | 46 | | | | 472 | |
| | 30 | | | | 39 | | | | 47 | | | | 43 | | | | 66 | | | | 260 | | | | 44 | | | | 54 | | | | 50 | |
| | | | | | | | | | | | | | | | | | | | | | | | | | | | | | | | | | |
| | 13,326 | | | | 4,255 | | | | 4,628 | | | | 7,034 | | | | 2,549 | | | | 12,865 | | | | 925 | | | | 790 | | | | 7,542 | |
| | | | | | | | | | | | | | | | | | | | | | | | | | | | | | | | | | |
| $ | 199,836 | | | $ | 819,213 | | | $ | 844,398 | | | $ | 1,097,433 | | | $ | 896,559 | | | $ | 564,624 | | | $ | 627,901 | | | $ | 222,348 | | | $ | 673,234 | |
| | | | | | | | | | | | | | | | | | | | | | | | | | | | | | | | | | |
| | | | | | | | | | | | | | | | | | | | | | | | | | | | | | | | | | | |
| $ | 163,237 | | | $ | 542,218 | | | $ | 603,215 | | | $ | 864,867 | | | $ | 567,495 | | | $ | 437,687 | | | $ | 419,418 | | | $ | 164,153 | | | $ | 393,855 | |
| | 3,613 | | | | 14,479 | | | | 16,447 | | | | 2,294 | | | | 9,983 | | | | 9,027 | | | | - | | | | 3,400 | | | | 3,487 | |
| | 12,247 | | | | 28,658 | | | | 59,026 | | | | 180,283 | | | | 57,851 | | | | 45,578 | | | | 50,735 | | | | 9,766 | | | | 45,724 | |
| | 20,739 | | | | 233,858 | | | | 165,710 | | | | 49,989 | | | | 261,230 | | | | 72,332 | | | | 157,748 | | | | 45,029 | | | | 230,168 | |
| | | | | | | | | | | | | | | | | | | | | | | | | | | | | | | | | | |
| $ | 199,836 | | | $ | 819,213 | | | $ | 844,398 | | | $ | 1,097,433 | | | $ | 896,559 | | | $ | 564,624 | | | $ | 627,901 | | | $ | 222,348 | | | $ | 673,234 | |
| | | | | | | | | | | | | | | | | | | | | | | | | | | | | | | | | | |
| $ | 1.06 | | | $ | 1.68 | | | $ | 1.86 | | | $ | 3.46 | | | $ | 2.11 | | | $ | 1.83 | | | $ | 2.88 | | | $ | 1.45 | | | $ | 2.54 | |
| | | | | | | | | | | | | | | | | | | | | | | | | | | | | | | | | | |
| $ | 181,131 | | | $ | 584,878 | | | $ | 675,766 | | | $ | 1,053,345 | | | $ | 635,631 | | | $ | 496,889 | | | $ | 470,489 | | | $ | 176,640 | | | $ | 441,876 | |
| | 10,063 | | | | - | | | | - | | | | - | | | | - | | | | 5,738 | | | | - | | | | - | | | | - | |
| | 188,179 | | | | 488,366 | | | | 452,869 | | | | 317,428 | | | | 425,076 | | | | 308,077 | | | | 218,357 | | | | 153,369 | | | | 265,533 | |
| | 2,000,000 | | | | 2,000,000 | | | | 2,000,000 | | | | 2,000,000 | | | | 2,000,000 | | | | 2,000,000 | | | | 2,000,000 | | | | 2,000,000 | | | | 2,000,000 | |
The Accompanying Notes are an Integral Part of the Financial Statements.
| | | | |
| 190 | | Statements of Assets and Liabilities | | |
Statements of Assets and Liabilities
Northwestern Mutual Series Fund, Inc.
December 31, 2017 (in thousands)
| | | | | | | | | | | | | | | | | | | | |
| | | International
Growth
Portfolio | | | Research
International
Core Portfolio | | | International
Equity Portfolio | | | Emerging
Markets Equity
Portfolio | | | Government
Money Market
Portfolio | |
Assets | | | | | | | | | | | | | | | | | | | | |
Unaffiliated Investments, at Value (1) | | $ | 695,896 | | | $ | 659,409 | | | $ | 1,924,768 | | | $ | 725,185 | | | $ | 270,906 | |
Affiliated Investments, at Value (2) | | | – | | | | – | | | | – | | | | – | | | | – | |
Investments in Repurchase Agreements, at Value (3) | | | – | | | | – | | | | – | | | | – | | | | 169,500 | |
Cash | | | 55 | | | | – | | | | – | | | | – | | | | – | |
Foreign Currency, at Value (4) | | | 11 | | | | – | | | | – | | | | 890 | | | | – | |
Cash Collateral for Derivative Positions | | | – | | | | – | | | | – | | | | – | | | | – | |
Receivable for Portfolio Shares Sold | | | 141 | | | | 198 | | | | 222 | | | | 185 | | | | 206 | |
Receivable for Investment Securities Sold | | | – | | | | 2,971 | | | | 120 | | | | 1,277 | | | | – | |
Receivable for Financing Transactions | | | – | | | | – | | | | – | | | | – | | | | – | |
Futures / Cleared Swap Variation Margin | | | – | | | | – | | | | – | | | | – | | | | – | |
Outstanding Swap Contracts, at Value (8) | | | – | | | | – | | | | – | | | | – | | | | – | |
Receivable for Foreign Currency | | | – | | | | – | | | | – | | | | 1 | | | | – | |
Prepaid Expenses and Other Assets | | | 5 | | | | 4 | | | | 13 | | | | 5 | | | | 3 | |
Dividends and Interest Receivable | | | 2,153 | | | | 1,823 | | | | 4,343 | | | | 324 | | | | 295 | |
| | | | | | | | | | | | | | | | | | | | |
Total Assets | | | 698,261 | | | | 664,405 | | | | 1,929,466 | | | | 727,867 | | | | 440,910 | |
| | | | | | | | | | | | | | | | | | | | |
Liabilities | | | | | | | | | | | | | | | | | | | | |
Payable for Portfolio Shares Redeemed | | | 133 | | | | 109 | | | | 650 | | | | 130 | | | | 1,324 | |
Payable for Investment Securities Purchased | | | 113 | | | | 5,785 | | | | 181 | | | | 8,777 | | | | – | |
Payable for Financing Transactions | | | – | | | | – | | | | – | | | | – | | | | – | |
Futures / Cleared Swap Variation Margin | | | – | | | | – | | | | – | | | | – | | | | – | |
Outstanding Options Written, at Value (6) | | | – | | | | – | | | | – | | | | – | | | | – | |
Payable to Custodian | | | – | | | | 19 | | | | – | | | | – | | | | – | |
Outstanding Swap Contracts, at Value (9) | | | – | | | | – | | | | – | | | | – | | | | – | |
Payable for Foreign Currency | | | – | | | | 6 | | | | – | | | | 1 | | | | – | |
Collateral from Counterparty | | | – | | | | – | | | | – | | | | – | | | | – | |
Investment Advisory Fees | | | 349 | | | | 398 | | | | 821 | | | | 555 | | | | 112 | |
Deferred Income for Financing Transactions | | | – | | | | – | | | | – | | | | – | | | | – | |
Accrued Expenses | | | 85 | | | | 83 | | | | 141 | | | | 123 | | | | 36 | |
| | | | | | | | | | | | | | | | | | | | |
Total Liabilities | | | 680 | | | | 6,400 | | | | 1,793 | | | | 9,586 | | | | 1,472 | |
| | | | | | | | | | | | | | | | | | | | |
Net Assets | | $ | 697,581 | | | $ | 658,005 | | | $ | 1,927,673 | | | $ | 718,281 | | | $ | 439,438 | |
| | | | | | | | | | | | | | | | | | | | |
Represented By: | | | | | | | | | | | | | | | | | | | | |
Aggregate Paid in Capital (10) (11) | | $ | 571,330 | | | $ | 541,705 | | | $ | 1,575,554 | | | $ | 618,229 | | | $ | 439,438 | |
Undistributed Net Investment Income (Loss) | | | 9,025 | | | | 10,078 | | | | 45,322 | | | | 9,186 | | | | – | |
Undistributed Accumulated Net Realized Gain (Loss) | | | (21,257 | ) | | | (9,319 | ) | | | (25,639 | ) | | | (18,871 | ) | | | – | |
Net Unrealized Appreciation (Depreciation) | | | 138,483 | | | | 115,541 | | | | 332,436 | | | | 109,737 | | | | – | |
| | | | | | | | | | | | | | | | | | | | |
Net Assets for Shares Outstanding (10) (11) | | $ | 697,581 | | | $ | 658,005 | | | $ | 1,927,673 | | | $ | 718,281 | | | $ | 439,438 | |
| | | | | | | | | | | | | | | | | | | | |
Net Asset Value, Offering and Redemption Price per Share | | $ | 1.59 | | | $ | 1.04 | | | $ | 1.91 | | | $ | 1.10 | | | $ | 1.00 | |
| | | | | | | | | | | | | | | | | | | | |
(1) Unaffiliated Investments, at Cost | | $ | 557,427 | | | $ | 543,861 | | | $ | 1,592,392 | | | $ | 615,445 | | | $ | 270,906 | |
(2) Affiliated Investments, at Cost | | | – | | | | – | | | | – | | | | – | | | | – | |
(3) Investments in Repurchase Agreements, at Cost | | | – | | | | – | | | | – | | | | – | | | | 169,500 | |
(4) Foreign Currency, at Cost | | | 11 | | | | – | | | | – | | | | 890 | | | | – | |
(6) Premiums Received on Options Written | | | – | | | | – | | | | – | | | | – | | | | – | |
(8) Premiums Paid on Swap Contracts | | | – | | | | – | | | | – | | | | – | | | | – | |
(9) Premiums Received on Swap Contracts | | | – | | | | – | | | | – | | | | – | | | | – | |
(10) Shares Outstanding | | | 437,728 | | | | 633,878 | | | | 1,006,655 | | | | 650,179 | | | | 439,436 | |
(11) Shares Authorized, $.01 Par Value | | | 2,000,000 | | | | 2,000,000 | | | | 3,000,000 | | | | 2,000,000 | | | | 2,000,000 | |
The Accompanying Notes are an Integral Part of the Financial Statements.
| | | | | | |
| | Statements of Assets and Liabilities | | | 191 | |
| | | | | | | | | | | | | | | | | | | | | | | | | | | | | | |
Short-Term Bond Portfolio | | | Select Bond Portfolio | | | Long-Term U.S. Government Bond Portfolio | | | Inflation
Protection
Portfolio | | | High Yield
Bond
Portfolio | | | Multi-Sector
Bond
Portfolio | | | Balanced
Portfolio | | | Asset
Allocation
Portfolio | |
| | | | | | | | | | | | | | | | | | | | | | | | | | | | | | |
| $ | 293,229 | | | $ | 3,185,850 | | | $ | 156,437 | | | $ | 390,980 | | | $ | 799,287 | | | $ | 824,677 | | | $ | 140,999 | | | $ | 16,774 | |
| | – | | | | – | | | | – | | | | – | | | | – | | | | – | | | | 2,137,429 | | | | 257,115 | |
| | – | | | | – | | | | – | | | | – | | | | – | | | | 3,500 | | | | – | | | | – | |
| | – | | | | – | | | | – | | | | – | | | | – | | | | 172 | | | | – | | | | – | |
| | – | | | | – | | | | – | | | | – | | | | – | | | | 540 | | | | – | | | | – | |
| | – | | | | – | | | | 1,272 | | | | 11 | | | | – | | | | 10,172 | | | | – | | | | – | |
| | 169 | | | | 458 | | | | 17 | | | | 13,166 | | | | 815 | | | | 811 | | | | 139 | | | | 60 | |
| | 1 | | | | 246,334 | | | | 5,796 | | | | – | | | | – | | | | 1,736 | | | | 48,091 | | | | 6,511 | |
| | – | | | | – | | | | 88,344 | | | | – | | | | – | | | | – | | | | – | | | | – | |
| | 18 | | | | – | | | | 1 | | | | 26 | | | | – | | | | 151 | | | | – | | | | – | |
| | – | | | | – | | | | – | | | | 1,050 | | | | – | | | | 92 | | | | – | | | | – | |
| | – | | | | – | | | | – | | | | – | | | | – | | | | 719 | | | | – | | | | – | |
| | 4 | | | | 22 | | | | 1 | | | | 3 | | | | 6 | | | | 6 | | | | 17 | | | | 2 | |
| | 1,321 | | | | 14,876 | | | | 1,039 | | | | 1,855 | | | | 12,298 | | | | 10,461 | | | | 70 | | | | 7 | |
| | | | | | | | | | | | | | | | | | | | | | | | | | | | | | |
| | 294,742 | | | | 3,447,540 | | | | 252,907 | | | | 407,091 | | | | 812,406 | | | | 853,037 | | | | 2,326,745 | | | | 280,469 | |
| | | | | | | | | | | | | | | | | | | | | | | | | | | | | | |
| | | | | | | | | | | | | | | | | | | | | | | | | | | | | | |
| | 52 | | | | 564 | | | | 106 | | | | 78 | | | | 174 | | | | 346 | | | | 1,091 | | | | 5 | |
| | 1,025 | | | | 502,180 | | | | 10,630 | | | | – | | | | – | | | | 1,693 | | | | 18,000 | | | | 3,200 | |
| | – | | | | – | | | | 125,885 | | | | – | | | | – | | | | – | | | | – | | | | – | |
| | 11 | | | | – | | | | 40 | | | | 59 | | | | – | | | | 339 | | | | 41 | | | | 11 | |
| | – | | | | – | | | | – | | | | – | | | | – | | | | 65 | | | | – | | | | – | |
| | – | | | | 19 | | | | – | | | | – | | | | – | | | | – | | | | – | | | | – | |
| | – | | | | – | | | | – | | | | 4,088 | | | | – | | | | 518 | | | | – | | | | – | |
| | – | | | | – | | | | – | | | | 76 | | | | – | | | | 3,715 | | | | – | | | | – | |
| | – | | | | – | | | | 418 | | | | 860 | | | | – | | | | 4,785 | | | | – | | | | – | |
| | 83 | | | | 731 | | | | 46 | | | | 162 | | | | 287 | | | | 494 | | | | 98 | | | | 12 | |
| | – | | | | – | | | | 25 | | | | – | | | | – | | | | – | | | | – | | | | – | |
| | 57 | | | | 112 | | | | 44 | | | | 57 | | | | 67 | | | | 101 | | | | 45 | | | | 28 | |
| | | | | | | | | | | | | | | | | | | | | | | | | | | | | | |
| | 1,228 | | | | 503,606 | | | | 137,194 | | | | 5,380 | | | | 528 | | | | 12,056 | | | | 19,275 | | | | 3,256 | |
| | | | | | | | | | | | | | | | | | | | | | | | | | | | | | |
| $ | 293,514 | | | $ | 2,943,934 | | | $ | 115,713 | | | $ | 401,711 | | | $ | 811,878 | | | $ | 840,981 | | | $ | 2,307,470 | | | $ | 277,213 | |
| | | | | | | | | | | | | | | | | | | | | | | | | | | | | | |
| | | | | | | | | | | | | | | | | | | | | | | | | | | | | | |
| $ | 292,105 | | | $ | 2,893,298 | | | $ | 116,407 | | | $ | 398,393 | | | $ | 761,351 | | | $ | 812,642 | | | $ | 2,034,004 | | | $ | 237,227 | |
| | 4,647 | | | | 67,846 | | | | 2,221 | | | | 7,085 | | | | 43,280 | | | | 21,941 | | | | 52,700 | | | | 5,391 | |
| | (2,613 | ) | | | (13,391 | ) | | | (2,333 | ) | | | (4,330 | ) | | | (4,975 | ) | | | (14,529 | ) | | | 48,573 | | | | 7,234 | |
| | (625 | ) | | | (3,819 | ) | | | (582 | ) | | | 563 | | | | 12,222 | | | | 20,927 | | | | 172,193 | | | | 27,361 | |
| | | | | | | | | | | | | | | | | | | | | | | | | | | | | | |
| $ | 293,514 | | | $ | 2,943,934 | | | $ | 115,713 $ | | | | 401,711 | | | $ | 811,878 | | | $ | 840,981 | | | $ | 2,307,470 | | | $ | 277,213 | |
| | | | | | | | | | | | | | | | | | | | | | | | | | | | | | |
$ |
1.03 |
| | $ | 1.26 | | | $ | 1.08 $ | | | | 1.11 | | | $ | 0.75 | | | $ | 1.09 | | | $ | 1.47 | | | $ | 1.21 | |
| | | | | | | | | | | | | | | | | | | | | | | | | | | | | | |
| $ | 293,765 | | | $ | 3,189,669 | | | $ | 157,066 | | | $ | 387,543 | | | $ | 787,065 | | | $ | 802,355 | | | $ | 139,688 | | | $ | 16,656 | |
| | – | | | | – | | | | – | | | | – | | | | – | | | | – | | | | 1,966,484 | | | | 229,872 | |
| | – | | | | – | | | | – | | | | – | | | | – | | | | 3,500 | | | | – | | | | – | |
| | – | | | | – | | | | – | | | | – | | | | – | | | | 527 | | | | – | | | | – | |
| | – | | | | – | | | | – | | | | – | | | | – | | | | 65 | | | | – | | | | – | |
| | – | | | | – | | | | 442 | | | | 1 | | | | – | | | | 5,198 | | | | – | | | | – | |
| | – | | | | – | | | | 27 | | | | – | | | | – | | | | 2,478 | | | | – | | | | – | |
| | 284,254 | | | | 2,341,746 | | | | 107,336 | | | | 360,339 | | | | 1,087,909 | | | | 768,811 | | | | 1,564,464 | | | | 229,599 | |
| | 2,000,000 | | | | 6,000,000 | | | | 2,000,000 | | | | 2,000,000 | | | | 3,000,000 | | | | 2,000,000 | | | | 4,000,000 | | | | 2,000,000 | |
The Accompanying Notes are an Integral Part of the Financial Statements.
| | | | |
| 192 | | Statements of Assets and Liabilities | | |
Statement of Operations
Northwestern Mutual Series Fund, Inc.
For the Year Ended December 31, 2017 (in thousands)
| | | | | | | | | | | | | | | | | | | | | | | | |
| | | Growth Stock
Portfolio | | | Focused
Appreciation
Portfolio | | | Large Cap
Core Stock
Portfolio | | | Large Cap
Blend
Portfolio | | | Index 500
Stock Portfolio | | | Large
Company
Value
Portfolio | |
Investment Income | | | | | | | | | | | | | | | | | | | | | | | | |
Income | | | | | | | | | | | | | | | | | | | | | | | | |
Interest (1) | | $ | 113 | | | $ | 65 | | | $ | 5 | | | $ | 110 | | | $ | 395 | | | $ | 16 | |
Unaffiliated Dividends (1) | | | 10,853 | | | | 11,216 | | | | 11,243 | | | | 2,585 | | | | 59,167 | | | | 5,666 | |
| | | | | | | | | | | | | | | | | | | | | | | | |
Total Income | | | 10,966 | | | | 11,281 | | | | 11,248 | | | | 2,695 | | | | 59,562 | | | | 5,682 | |
| | | | | | | | | | | | | | | | | | | | | | | | |
Expenses | | | | | | | | | | | | | | | | | | | | | | | | |
Investment Advisory Fees | | | 3,808 | | | | 6,435 | | | | 2,395 | | | | 1,310 | | | | 5,891 | | | | 1,374 | |
Custodian Fees | | | 4 | | | | 3 | | | | 4 | | | | 3 | | | | 26 | | | | 26 | |
Shareholder Reporting Fees | | | 32 | | | | 43 | | | | 23 | | | | 7 | | | | 76 | | | | 7 | |
Audit Fees | | | 27 | | | | 27 | | | | 27 | | | | 24 | | | | 42 | | | | 28 | |
Valuation Services | | | 1 | | | | - | | | | 1 | | | | 1 | | | | 5 | | | | 1 | |
Compliance Fees | | | 8 | | | | 8 | | | | 7 | | | | 6 | | | | 13 | | | | 6 | |
Directors Fees | | | 43 | | | | 40 | | | | 39 | | | | 34 | | | | 72 | | | | 34 | |
Professional Fees | | | 10 | | | | 10 | | | | 11 | | | | 9 | | | | 15 | | | | 9 | |
Trade Name Fees | | | - | | | | - | | | | - | | | | - | | | | 132 | | | | - | |
Other Expenses | | | 11 | | | | 11 | | | | 7 | | | | 2 | | | | 33 | | | | 3 | |
| | | | | | | | | | | | | | | | | | | | | | | | |
Total Expenses | | | 3,944 | | | | 6,577 | | | | 2,514 | | | | 1,396 | | | | 6,305 | | | | 1,488 | |
| | | | | | | | | | | | | | | | | | | | | | | | |
Less Waived Fees: | | | | | | | | | | | | | | | | | | | | | | | | |
Paid by Affiliate | | | (96 | ) | | | (1,076 | ) | | | (31 | ) | | | - | | | | (189 | ) | | | (46 | ) |
Paid Indirectly | | | - | | | | - | | | | (1 | ) | | | - | | | | (1 | ) | | | (1 | ) |
| | | | | | | | | | | | | | | | | | | | | | | | |
Net Expenses | | | 3,848 | | | | 5,501 | | | | 2,482 | | | | 1,396 | | | | 6,115 | | | | 1,441 | |
| | | | | | | | | | | | | | | | | | | | | | | | |
Net Investment Income (Loss) | | | 7,118 | | | | 5,780 | | | | 8,766 | | | | 1,299 | | | | 53,447 | | | | 4,241 | |
Realized and Unrealized Gain (Loss) on Investments | | | | | | | | | | | | | | | | | | | | | | | | |
Net Realized Gain (Loss) on: | | | | | | | | | | | | | | | | | | | | | | | | |
Unaffiliated Investment Securities | | | 105,442 | | | | 25,025 | | | | 167,854 | | | | 8,073 | | | | 25,799 | | | | 14,406 | |
Futures Contracts | | | - | | | | - | | | | - | | | | - | | | | 6,699 | | | | - | |
Swap Contracts | | | - | | | | - | | | | - | | | | - | | | | - | | | | - | |
Foreign Currency Transactions | | | - | | | | - | | | | - | | | | - | | | | - | | | | (659 | ) |
| | | | | | | | | | | | | | | | | | | | | | | | |
Net Realized Gain (Loss) on Investments | | | 105,442 | | | | 25,025 | | | | 167,854 | | | | 8,073 | | | | 32,498 | | | | 13,747 | |
| | | | | | | | | | | | | | | | | | | | | | | | |
Net Unrealized Appreciation (Depreciation) of: | | | | | | | | | | | | | | | | | | | | | | | | |
Unaffiliated Investment Securities | | | 84,809 | | | | 219,761 | | | | (52,818 | ) | | | 20,698 | | | | 488,162 | | | | 3,111 | |
Affiliated Investment Securities | | | - | | | | - | | | | - | | | | - | | | | - | | | | - | |
Futures Contracts | | | - | | | | - | | | | - | | | | - | | | | 300 | | | | - | |
Swap Contracts | | | - | | | | - | | | | - | | | | - | | | | - | | | | - | |
Foreign Currency Transactions | | | - | | | | - | | | | - | | | | - | | | | - | | | | (148 | ) |
| | | | | | | | | | | | | | | | | | | | | | | | |
Net Change in Unrealized Appreciation (Depreciation) of Investments | | | 84,809 | | | | 219,761 | | | | (52,818 | ) | | | 20,698 | | | | 488,462 | | | | 2,963 | |
| | | | | | | | | | | | | | | | | | | | | | | | |
Net Gain (Loss) on Investments | | | 190,251 | | | | 244,786 | | | | 115,036 | | | | 28,771 | | | | 520,960 | | | | 16,710 | |
| | | | | | | | | | | | | | | | | | | | | | | | |
Net Increase (Decrease) in Net Assets Resulting from Operations | | $ | 197,369 | | | $ | 250,566 | | | $ | 123,802 | | | $ | 30,070 | | | $ | 574,407 | | | $ | 20,951 | |
| | | | | | | | | | | | | | | | | | | | | | | | |
(1) Net of Foreign Tax | | $ | - | | | $ | 371 | | | $ | 529 | | | $ | 82 | | | $ | - | | | $ | 68 | |
The Accompanying Notes are an Integral Part of the Financial Statements.
| | | | | | |
| | Statement of Operations | | | 193 | |
| | | | | | | | | | | | | | | | | | | | | | | | | | | | | | | | | | | | | | |
Domestic
Equity
Portfolio | | | Equity Income
Portfolio | | | Mid Cap
Growth Stock
Portfolio | | | Index 400
Stock Portfolio | | | Mid Cap
Value
Portfolio | | | Small Cap
Growth Stock
Portfolio | | | Index 600
Stock Portfolio | | | Small Cap
Value Portfolio | | | International
Growth
Portfolio | | | Research
International
Core
Portfolio | |
| | | | | | | | | | | | | | | | | | | | | | | | | | | | | | | | | | | | | | |
| | | | | | | | | | | | | | | | | | | | | | | | | | | | | | | | | | | | | | |
| $ | 68 | | | $ | 175 | | | $ | 133 | | | $ | 187 | | | $ | 138 | | | $ | 59 | | | $ | 126 | | | $ | 28 | | | $ | 81 | | | $ | 49 | |
| | 18,484 | | | | 21,399 | | | | 6,942 | | | | 11,983 | | | | 13,539 | | | | 3,159 | | | | 2,536 | | | | 9,049 | | | | 12,330 | | | | 14,817 | |
| | | | | | | | | | | | | | | | | | | | | | | | | | | | | | | | | | | | | | |
| | 18,552 | | | | 21,574 | | | | 7,075 | | | | 12,170 | | | | 13,677 | | | | 3,218 | | | | 2,662 | | | | 9,077 | | | | 12,411 | | | | 14,866 | |
| | | | | | | | | | | | | | | | | | | | | | | | | | | | | | | | | | | | | | |
| | | | | | | | | | | | | | | | | | | | | | | | | | | | | | | | | | | | | | |
| | 4,008 | | | | 5,108 | | | | 5,459 | | | | 2,063 | | | | 4,565 | | | | 3,159 | | | | 486 | | | | 5,414 | | | | 3,780 | | | | 4,612 | |
| | 2 | | | | 37 | | | | 8 | | | | 17 | | | | 35 | | | | 9 | | | | 36 | | | | 23 | | | | 220 | | | | 251 | |
| | 38 | | | | 41 | | | | 40 | | | | 48 | | | | 52 | | | | 43 | | | | 20 | | | | 59 | | | | 56 | | | | 43 | |
| | 28 | | | | 32 | | | | 29 | | | | 26 | | | | 28 | | | | 27 | | | | 24 | | | | 27 | | | | 29 | | | | 28 | |
| | - | | | | 5 | | | | 1 | | | | 4 | | | | 2 | | | | 1 | | | | 6 | | | | 1 | | | | - | | | | - | |
| | 8 | | | | 8 | | | | 9 | | | | 8 | | | | 7 | | | | 7 | | | | 6 | | | | 7 | | | | 7 | | | | 7 | |
| | 40 | | | | 41 | | | | 46 | | | | 40 | | | | 36 | | | | 38 | | | | 33 | | | | 39 | | | | 39 | | | | 38 | |
| | 9 | | | | 9 | | | | 11 | | | | 10 | | | | 9 | | | | 9 | | | | 10 | | | | 9 | | | | 28 | | | | 27 | |
| | - | | | | - | | | | - | | | | 84 | | | | - | | | | - | | | | 19 | | | | - | | | | - | | | | - | |
| | 9 | | | | 10 | | | | 13 | | | | 10 | | | | 7 | | | | 8 | | | | 2 | | | | 8 | | | | 7 | | | | 7 | |
| | | | | | | | | | | | | | | | | | | | | | | | | | | | | | | | | | | | | | |
| | 4,142 | | | | 5,291 | | | | 5,616 | | | | 2,310 | | | | 4,741 | | | | 3,301 | | | | 642 | | | | 5,587 | | | | 4,166 | | | | 5,013 | |
| | | | | | | | | | | | | | | | | | | | | | | | | | | | | | | | | | | | | | |
| | | | | | | | | | | | | | | | | | | | | | | | | | | | | | | | | | | | | | |
| | (69 | ) | | | (222 | ) | | | (10 | ) | | | (163 | ) | | | (681 | ) | | | - | | | | - | | | | (68 | ) | | | - | | | | (291 | ) |
| | - | | | | (29 | ) | | | - | | | | (1 | ) | | | - | | | | - | | | | (1 | ) | | | (20 | ) | | | - | | | | - | |
| | | | | | | | | | | | | | | | | | | | | | | | | | | | | | | | | | | | | | |
| | 4,073 | | | | 5,040 | | | | 5,606 | | | | 2,146 | | | | 4,060 | | | | 3,301 | | | | 641 | | | | 5,499 | | | | 4,166 | | | | 4,722 | |
| | | | | | | | | | | | | | | | | | | | | | | | | | | | | | | | | | | | | | |
| | 14,479 | | | | 16,534 | | | | 1,469 | | | | 10,024 | | | | 9,617 | | | | (83 | ) | | | 2,021 | | | | 3,578 | | | | 8,245 | | | | 10,144 | |
| | | | | | | | | | | | | | | | | | | | | | | | | | | | | | | | | | | | | | |
| | | | | | | | | | | | | | | | | | | | | | | | | | | | | | | | | | | | | | |
| | 28,658 | | | | 60,785 | | | | 199,647 | | | | 57,168 | | | | 49,681 | | | | 51,269 | | | | 9,989 | | | | 46,804 | | | | (472 | ) | | | 12,154 | |
| | - | | | | (5 | ) | | | - | | | | 1,126 | | | | - | | | | - | | | | - | | | | - | | | | - | | | | - | |
| | - | | | | - | | | | - | | | | - | | | | - | | | | - | | | | 1,359 | | | | - | | | | - | | | | - | |
| | - | | | | 39 | | | | (7 | ) | | | - | | | | (632 | ) | | | - | | | | - | | | | - | | | | (6 | ) | | | 84 | |
| | | | | | | | | | | | | | | | | | | | | | | | | | | | | | | | | | | | | | |
| | 28,658 | | | | 60,819 | | | | 199,640 | | | | 58,294 | | | | 49,049 | | | | 51,269 | | | | 11,348 | | | | 46,804 | | | | (478 | ) | | | 12,238 | |
| | | | | | | | | | | | | | | | | | | | | | | | | | | | | | | | | | | | | | |
| | | | | | | | | | | | | | | | | | | | | | | | | | | | | | | | | | | | | | |
| | 57,061 | | | | 45,349 | | | | (8,354 | ) | | | 54,777 | | | | 1,915 | | | | 63,084 | | | | 11,347 | | | | 20,016 | | | | 151,263 | | | | 119,890 | |
| | - | | | | - | | | | - | | | | - | | | | - | | | | - | | | | - | | | | - | | | | - | | | | - | |
| | - | | | | - | | | | - | | | | 424 | | | | - | | | | - | | | | - | | | | - | | | | - | | | | - | |
| | - | | | | - | | | | - | | | | - | | | | - | | | | - | | | | 60 | | | | - | | | | - | | | | - | |
| | - | | | | 5 | | | | - | | | | - | | | | (208 | ) | | | - | | | | - | | | | - | | | | 132 | | | | 124 | |
| | | | | | | | | | | | | | | | | | | | | | | | | | | | | | | �� | | | | | | | |
|
57,061 |
| | | 45,354 | | | | (8,354 | ) | | | 55,201 | | | | 1,707 | | | | 63,084 | | | | 11,407 | | | | 20,016 | | | | 151,395 | | | | 120,014 | |
| | | | | | | | | | | | | | | | | | | | | | | | | | | | | | | | | | | | | | |
| | 85,719 | | | | 106,173 | | | | 191,286 | | | | 113,495 | | | | 50,756 | | | | 114,353 | | | | 22,755 | | | | 66,820 | | | | 150,917 | | | | 132,252 | |
| | | | | | | | | | | | | | | | | | | | | | | | | | | | | | | | | | | | | | |
| $ | 100,198 | | | $ | 122,707 | | | $ | 192,755 | | | $ | 123,519 | | | $ | 60,373 | | | $ | 114,270 | | | $ | 24,776 | | | $ | 70,398 | | | $ | 159,162 | | | $ | 142,396 | |
| | | | | | | | | | | | | | | | | | | | | | | | | | | | | | | | | | | | | | |
| $ | - | | | $ | 314 | | | $ | 3 | | | $ | 8 | | | $ | 141 | | | $ | - | | | $ | - | | | $ | 18 | | | $ | 362 | | | $ | 417 | |
The Accompanying Notes are an Integral Part of the Financial Statements.
| | | | |
| 194 | | Statement of Operations | | |
Statement of Operations
Northwestern Mutual Series Fund, Inc.
For the Year Ended December 31, 2017 (in thousands)
| | | | | | | | | | | | | | | | | | | | | | | | |
| | | International
Equity
Portfolio | | | Emerging
Markets Equity
Portfolio | | | Government
Money Market
Portfolio | | | Short-Term
Bond Portfolio | | | Select Bond
Portfolio | | | Long-Term
U.S.
Government
Bond Portfolio | |
Investment Income | | | | | | | | | | | | | | | | | | | | | | | | |
Income | | | | | | | | | | | | | | | | | | | | | | | | |
Interest (1) | | $ | 344 | | | $ | 73 | | | $ | 4,297 | | | $ | 5,679 | | | $ | 71,194 | | | $ | 4,046 | |
Unaffiliated Dividends (1) | | | 53,218 | | | | 16,682 | | | | - | | | | - | | | | - | | | | 1 | |
Affiliated Dividends | | | - | | | | - | | | | - | | | | - | | | | - | | | | - | |
| | | | | | | | | | | | | | | | | | | | | | | | |
Total Income | | | 53,562 | | | | 16,755 | | | | 4,297 | | | | 5,679 | | | | 71,194 | | | | 4,047 | |
| | | | | | | | | | | | | | | | | | | | | | | | |
Expenses | | | | | | | | | | | | | | | | | | | | | | | | |
Investment Advisory Fees | | | 11,833 | | | | 6,794 | | | | 1,406 | | | | 942 | | | | 8,692 | | | | 625 | |
Custodian Fees | | | 522 | | | | 404 | | | | 14 | | | | 28 | | | | 69 | | | | 10 | |
Shareholder Reporting Fees | | | 100 | | | | 97 | | | | 18 | | | | 24 | | | | 72 | | | | 9 | |
Audit Fees | | | 32 | | | | 28 | | | | 26 | | | | 30 | | | | 39 | | | | 39 | |
Valuation Services | | | - | | | | - | | | | 3 | | | | 95 | | | | 129 | | | | 23 | |
Compliance Fees | | | 10 | | | | 7 | | | | 7 | | | | 7 | | | | 12 | | | | 6 | |
Directors Fees | | | 56 | | | | 38 | | | | 38 | | | | 34 | | | | 61 | | | | 33 | |
Professional Fees | | | 29 | | | | 46 | | | | 10 | | | | 10 | | | | 15 | | | | 14 | |
Trade Name Fees | | | - | | | | 2 | | | | - | | | | - | | | | - | | | | - | |
Interest Expense | | | - | | | | - | | | | - | | | | - | | | | - | | | | 304 | |
Other Expenses | | | 22 | | | | 3 | | | | 5 | | | | 3 | | | | 37 | | | | 3 | |
| | | | | | | | | | | | | | | | | | | | | | | | |
Total Expenses | | | 12,604 | | | | 7,419 | | | | 1,527 | | | | 1,173 | | | | 9,126 | | | | 1,066 | |
| | | | | | | | | | | | | | | | | | | | | | | | |
Less Waived Fees: | | | | | | | | | | | | | | | | | | | | | | | | |
Paid by Affiliate | | | (2,384 | ) | | | (765 | ) | | | - | | | | - | | | | (179 | ) | | | (21 | ) |
Paid Indirectly | | | - | | | | - | | | | - | | | | (4 | ) | | | - | | | | (1 | ) |
| | | | | | | | | | | | | | | | | | | | | | | | |
Net Expenses | | | 10,220 | | | | 6,654 | | | | 1,527 | | | | 1,169 | | | | 8,947 | | | | 1,044 | |
| | | | | | | | | | | | | | | | | | | | | | | | |
Net Investment Income (Loss) | | | 43,342 | | | | 10,101 | | | | 2,770 | | | | 4,510 | | | | 62,247 | | | | 3,003 | |
Realized and Unrealized Gain (Loss) on Investments | | | | | | | | | | | | | | | | | | | | | | | | |
Net Realized Gain (Loss) on: | | | | | | | | | | | | | | | | | | | | | | | | |
Unaffiliated Investment Securities | | | 44,879 | | | | 30,152 | | | | 5 | | | | 87 | | | | 9,220 | | | | (73 | ) |
Affiliated Investment Securities | | | - | | | | - | | | | - | | | | - | | | | - | | | | - | |
Futures Contracts | | | - | | | | - | | | | - | | | | (354 | ) | | | - | | | | 50 | |
Options Written | | | - | | | | - | | | | - | | | | - | | | | - | | | | - | |
Swap Contracts | | | - | | | | - | | | | - | | | | - | | | | - | | | | 816 | |
Foreign Currency Transactions | | | 93 | | | | (451 | ) | | | - | | | | 11 | | | | - | | | | - | |
| | | | | | | | | | | | | | | | | | | | | | | | |
Net Realized Gain (Loss) on Investments | | | 44,972 | | | | 29,701 | | | | 5 | | | | (256 | ) | | | 9,220 | | | | 793 | |
| | | | | | | | | | | | | | | | | | | | | | | | |
Net Unrealized Appreciation (Depreciation) of: | | | | | | | | | | | | | | | | | | | | | | | | |
Unaffiliated Investment Securities | | | 269,671 | | | | 109,971 | | | | - | | | | (577 | ) | | | 31,121 | | | | 6,265 | |
Affiliated Investment Securities | | | - | | | | - | | | | - | | | | - | | | | - | | | | - | |
Futures Contracts | | | - | | | | - | | | | - | | | | (92 | ) | | | - | | | | 76 | |
Options Written | | | - | | | | - | | | | - | | | | - | | | | - | | | | - | |
Swap Contracts | | | - | | | | - | | | | - | | | | - | | | | - | | | | (1,053 | ) |
Foreign Currency Transactions | | | 240 | | | | (2 | ) | | | - | | | | - | | | | - | | | | - | |
| | | | | | | | | | | | | | | | | | | | | | | | |
Net Change in Unrealized Appreciation (Depreciation) of Investments | | | 269,911 | | | | 109,969 | | | | - | | | | (669 | ) | | | 31,121 | | | | 5,288 | |
| | | | | | | | | | | | | | | | | | | | | | | | |
Net Gain (Loss) on Investments | | | 314,883 | | | | 139,670 | | | | 5 | | | | (925 | ) | | | 40,341 | | | | 6,081 | |
| | | | | | | | | | | | | | | | | | | | | | | | |
Net Increase (Decrease) in Net Assets Resulting from Operations | | $ | 358,225 | | | $ | 149,771 | | | $ | 2,775 | | | $ | 3,585 | | | $ | 102,588 | | | $ | 9,084 | |
| | | | | | | | | | | | | | | | | | | | | | | | |
(1) Net of Foreign Tax | | $ | 1,742 | | | $ | 532 | | | $ | - | | | $ | 3 | | | $ | 6 | | | $ | - | |
The Accompanying Notes are an Integral Part of the Financial Statements.
| | | | | | |
| | Statement of Operations | | | 195 | |
| | | | | | | | | | | | | | | | | | |
Inflation
Protection
Portfolio | | | High Yield
Bond
Portfolio | | | Multi-Sector
Bond
Portfolio | | | Balanced
Portfolio | | | Asset
Allocation
Portfolio | |
| | | | | | | | | | | | | | | | | | |
| | | | | | | | | | | | | | | | | | |
| $ | 9,270 | | | $ | 46,838 | | | $ | 37,112 | | | $ | 1,097 | | | $ | 129 | |
| | - | | | | - | | | | 7 | | | | 1,367 | | | | 294 | |
| | - | | | | - | | | | - | | | | 38,348 | | | | 4,256 | |
| | | | | | | | | | | | | | | | | | |
| | 9,270 | | | | 46,838 | | | | 37,119 | | | | 40,812 | | | | 4,679 | |
| | | | | | | | | | | | | | | | | | |
| | | | | | | | | | | | | | | | | | |
| | 1,915 | | | | 3,308 | | | | 5,971 | | | | 6,784 | | | | 1,409 | |
| | 28 | | | | 11 | | | | 86 | | | | 40 | | | | 18 | |
| | 44 | | | | 64 | | | | 49 | | | | 29 | | | | 9 | |
| | 28 | | | | 41 | | | | 45 | | | | 37 | | | | 28 | |
| | 71 | | | | 93 | | | | 131 | | | | 2 | | | | 2 | |
| | 7 | | | | 8 | | | | 8 | | | | 12 | | | | 7 | |
| | 35 | | | | 40 | | | | 38 | | | | 65 | | | | 35 | |
| | 11 | | | | 10 | | | | 14 | | | | 13 | | | | 9 | |
| | - | | | | - | | | | - | | | | - | | | | - | |
| | - | | | | - | | | | - | | | | - | | | | - | |
| | 3 | | | | 9 | | | | 9 | | | | 29 | | | | 3 | |
| | | | | | | | | | | | | | | | | | |
| | 2,142 | | | | 3,584 | | | | 6,351 | | | | 7,011 | | | | 1,520 | |
| | | | | | | | | | | | | | | | | | |
| | | | | | | | | | | | | | | | | | |
| | (136 | ) | | | - | | | | (571 | ) | | | (5,653 | ) | | | (1,276 | ) |
| | - | | | | - | | | | - | | | | (2 | ) | | | - | |
| | | | | | | | | | | | | | | | | | |
| | 2,006 | | | | 3,584 | | | | 5,780 | | | | 1,356 | | | | 244 | |
| | | | | | | | | | | | | | | | | | |
| | 7,264 | | | | 43,254 | | | | 31,339 | | | | 39,456 | | | | 4,435 | |
|
|
| | | | | | | | | | | | | | | | |
| | | | | | | | | | | | | | | | | | |
| | 1,104 | | | | 5,357 | | | | 2,234 | | | | 2,537 | | | | 769 | |
| | - | | | | - | | | | - | | | | 60,143 | | | | 7,297 | |
| | (1,636 | ) | | | - | | | | 2,677 | | | | 624 | | | | 278 | |
| | - | | | | - | | | | 720 | | | | - | | | | - | |
| | (975 | ) | | | - | | | | 1,771 | | | | - | | | | - | |
| | (553 | ) | | | - | | | | (10,008 | ) | | | - | | | | - | |
| | | | | | | | | | | | | | | | | | |
|
(2,060 |
) | | | 5,357 | | | | (2,606 | ) | | | 63,304 | | | | 8,344 | |
| | | | | | | | | | | | | | | | | | |
| | | | | | | | | | | | | | | | | | |
| | 7,601 | | | | 3,538 | | | | 34,030 | | | | 1,944 | | | | 149 | |
| | - | | | | - | | | | - | | | | 150,998 | | | | 23,774 | |
| | (8 | ) | | | - | | | | (266 | ) | | | (63 | ) | | | 2 | |
| | - | | | | - | | | | (152 | ) | | | - | | | | - | |
| | 232 | | | | - | | | | 1,629 | | | | - | | | | - | |
| | (245 | ) | | | - | | | | (3,366 | ) | | | - | | | | - | |
| | | | | | | | | | | | | | | | | | |
|
7,580 |
| | | 3,538 | | | | 31,875 | | | | 152,879 | | | | 23,925 | |
| | | | | | | | | | | | | | | | | | |
| | 5,520 | | | | 8,895 | | | | 29,269 | | | | 216,183 | | | | 32,269 | |
| | | | | | | | | | | | | | | | | | |
$ |
12,784 |
| | $ | 52,149 | | | $ | 60,608 | | | $ | 255,639 | | | $ | 36,704 | |
| | | | | | | | | | | | | | | | | | |
| $ | 3 | | | $ | - | | | $ | (3 | ) | | $ | - | | | $ | - | |
The Accompanying Notes are an Integral Part of the Financial Statements.
| | | | |
| 196 | | Statement of Operations | | |
Statement of Changes in Net Assets
Northwestern Mutual Series Fund, Inc.
(in thousands)
| | | | | | | | | | | | | | | | | | | | | | | | |
| | | Growth Stock Portfolio | | | Focused Appreciation
Portfolio | | | Large Cap Core Stock
Portfolio | |
| | | For the Year
Ended
December 31,
2017 | | | For the Year
Ended
December 31,
2016 | | | For the Year
Ended
December 31,
2017 | | | For the Year
Ended
December 31,
2016 | | | For the Year
Ended
December 31,
2017 | | | For the Year
Ended
December 31,
2016 | |
Change in Net Assets | | | | | | | | | | | | | | | | | | | | | | | | |
Operations | | | | | | | | | | | | | | | | | | | | | | | | |
Net Investment Income (Loss) | | $ | 7,118 | | | $ | 8,054 | | | $ | 5,780 | | | $ | 6,368 | | | $ | 8,766 | | | $ | 9,903 | |
Net Realized Gain (Loss) on Investments | | | 105,442 | | | | 41,844 | | | | 25,025 | | | | 16,541 | | | | 167,854 | | | | (830 | ) |
Net Change in Unrealized Appreciation (Depreciation) of Investments | | | 84,809 | | | | (29,832 | ) | | | 219,761 | | | | 21,209 | | | | (52,818 | ) | | | 28,134 | |
| | | | | | | | | | | | | | | | | | | | | | | | |
Net Increase (Decrease) in Net Assets Resulting from Operations | | | 197,369 | | | | 20,066 | | | | 250,566 | | | | 44,118 | | | | 123,802 | | | | 37,207 | |
| | | | | | | | | | | | | | | | | | | | | | | | |
Distributions to Shareholders from: | | | | | | | | | | | | | | | | | | | | | | | | |
Net Investment Income | | | (7,919 | ) | | | (7,202 | ) | | | (6,369 | ) | | | (1,814 | ) | | | (9,903 | ) | | | (10,934 | ) |
Net Realized Gain on Investments | | | (41,619 | ) | | | (80,811 | ) | | | (16,079 | ) | | | (214,229 | ) | | | - | | | | (9,149 | ) |
| | | | | | | | | | | | | | | | | | | | | | | | |
Net Decrease in Net Assets Resulting from Distributions to Shareholders | | | (49,538 | ) | | | (88,013 | ) | | | (22,448 | ) | | | (216,043 | ) | | | (9,903 | ) | | | (20,083 | ) |
| | | | | | | | | | | | | | | | | | | | | | | | |
Capital Transactions: | | | | | | | | | | | | | | | | | | | | | | | | |
Shares Sold | | | 23,840 | | | | 31,187 | | | | 42,642 | | | | 47,940 | | | | 15,135 | | | | 14,623 | |
Reinvestment of Distributions Paid | | | 49,538 | | | | 88,014 | | | | 22,448 | | | | 216,043 | | | | 9,903 | | | | 20,083 | |
Shares Redeemed | | | (99,335 | ) | | | (73,622 | ) | | | (119,623 | ) | | | (99,095 | ) | | | (60,855 | ) | | | (46,746 | ) |
| | | | | | | | | | | | | | | | | | | | | | | | |
Net Increase (Decrease) in Net Assets Resulting from Capital Transactions | | | (25,957 | ) | | | 45,579 | | | | (54,533 | ) | | | 164,888 | | | | (35,817 | ) | | | (12,040 | ) |
| | | | | | | | | | | | | | | | | | | | | | | | |
Total Increase (Decrease) in Net Assets | | | 121,874 | | | | (22,368 | ) | | | 173,585 | | | | (7,037 | ) | | | 78,082 | | | | 5,084 | |
Net Assets | | | | | | | | | | | | | | | | | | | | | | | | |
Beginning of Period | | | 837,980 | | | | 860,348 | | | | 771,800 | | | | 778,837 | | | | 514,495 | | | | 509,411 | |
| | | | | | | | | | | | | | | | | | | | | | | | |
End of Period | | $ | 959,854 | | | $ | 837,980 | | | $ | 945,385 | | | $ | 771,800 | | | $ | 592,577 | | | $ | 514,495 | |
| | | | | | | | | | | | | | | | | | | | | | | | |
Undistributed Net Investment Income (Loss) | | $ | 6,853 | | | $ | 8,019 | | | $ | 5,780 | | | $ | 6,369 | | | $ | 8,722 | | | $ | 9,903 | |
| | | | | | | | | | | | | | | | | | | | | | | | |
Portfolio Share Transactions: | | | | | | | | | | | | | | | | | | | | | | | | |
Shares Sold | | | 8,407 | | | | 11,811 | | | | 17,606 | | | | 20,183 | | | | 8,587 | | | | 9,409 | |
Reinvestment of Distributions Paid | | | 17,724 | | | | 33,503 | | | | 9,019 | | | | 99,881 | | | | 5,459 | | | | 12,663 | |
Shares Redeemed | | | (34,493 | ) | | | (27,288 | ) | | | (48,788 | ) | | | (40,065 | ) | | | (33,701 | ) | | | (29,869 | ) |
| | | | | | | | | | | | | | | | | | | | | | | | |
Net Increase (Decrease) in Shares Resulting from Portfolio Share Transactions | | | (8,362 | ) | | | 18,026 | | | | (22,163 | ) | | | 79,999 | | | | (19,655 | ) | | | (7,797 | ) |
| | | | | | | | | | | | | | | | | | | | | | | | |
The Accompanying Notes are an Integral Part of the Financial Statements.
| | | | | | |
| | Statement of Changes in Net Assets | | | 197 | |
| | | | | | | | | | | | | | | | | | | | | | | | | | | | | | | | | | | | | | |
| Large Cap Blend Portfolio | | | Index 500 Stock Portfolio | | | Large Company Value
Portfolio | | | Domestic Equity Portfolio | | | Equity Income Portfolio | |
For the Year
Ended
December 31,
2017 | | | For the Year
Ended
December 31,
2016 | | | For the Year
Ended
December 31,
2017 | | | For the Year
Ended
December 31,
2016 | | | For the Year
Ended
December 31,
2017 | | | For the Year
Ended
December 31,
2016 | | | For the Year
Ended
December 31,
2017 | | | For the Year
Ended
December 31,
2016 | | | For the Year
Ended
December 31,
2017 | | | For the Year
Ended
December 31,
2016 | |
| | | | | | | | | | | | | | | | | | | | | | | | | | | | | | | | | | | | | | | |
| | | | | | | | | | | | | | | | | | | | | | | | | | | | | | | | | | | | | | | |
| $ | 1,299 | | | $ | 1,520 | | | $ | 53,447 | | | $ | 48,788 | | | $ | 4,241 | | | $ | 3,738 | | | $ | 14,479 | | | $ | 13,252 | | | $ | 16,534 | | | $ | 18,046 | |
| | 8,073 | | | | 8,220 | | | | 32,498 | | | | 31,503 | | | | 13,747 | | | | 7,401 | | | | 28,658 | | | | 18,505 | | | | 60,819 | | | | 37,899 | |
|
20,698 |
| | | 10,948 | | | | 488,462 | | | | 200,667 | | | | 2,963 | | | | 15,211 | | | | 57,061 | | | | 61,502 | | | | 45,354 | | | | 76,955 | |
| | | | | | | | | | | | | | | | | | | | | | | | | | | | | | | | | | | | | | |
|
30,070 |
| | | 20,688 | | | | 574,407 | | | | 280,958 | | | | 20,951 | | | | 26,350 | | | | 100,198 | | | | 93,259 | | | | 122,707 | | | | 132,900 | |
| | | | | | | | | | | | | | | | | | | | | | | | | | | | | | | | | | | | | | |
| | | | | | | | | | | | | | | | | | | | | | | | | | | | | | | | | | | | | | |
| | (1,520 | ) | | | (1,635 | ) | | | (52,281 | ) | | | (46,095 | ) | | | (3,917 | ) | | | (3,178 | ) | | | (12,408 | ) | | | (12,521 | ) | | | (17,838 | ) | | | (15,268 | ) |
| | (8,213 | ) | | | (12,029 | ) | | | (30,749 | ) | | | (52,413 | ) | | | (7,833 | ) | | | (16,812 | ) | | | (18,505 | ) | | | (25,926 | ) | | | (37,935 | ) | | | (39,660 | ) |
| | | | | | | | | | | | | | | | | | | | | | | | | | | | | | | | | | | | | | |
|
(9,733 |
) | | | (13,664 | ) | | | (83,030 | ) | | | (98,508 | ) | | | (11,750 | ) | | | (19,990 | ) | | | (30,913 | ) | | | (38,447 | ) | | | (55,773 | ) | | | (54,928 | ) |
| | | | | | | | | | | | | | | | | | | | | | | | | | | | | | | | | | | | | | |
| | | | | | | | | | | | | | | | | | | | | | | | | | | | | | | | | | | | | | |
| | 7,134 | | | | 5,156 | | | | 217,672 | | | | 226,962 | | | | 10,861 | | | | 15,169 | | | | 73,348 | | | | 84,306 | | | | 29,597 | | | | 35,008 | |
| | 9,733 | | | | 13,664 | | | | 83,030 | | | | 98,507 | | | | 11,750 | | | | 19,989 | | | | 30,913 | | | | 38,447 | | | | 55,773 | | | | 54,929 | |
| | (25,736 | ) | | | (14,933 | ) | | | (248,856 | ) | | | (215,258 | ) | | | (27,749 | ) | | | (20,174 | ) | | | (75,273 | ) | | | (67,083 | ) | | | (106,073 | ) | | | (102,523 | ) |
| | | | | | | | | | | | | | | | | | | | | | | | | | | | | | | | | | | | | | |
| | (8,869 | ) | |
|
3,887 |
| | | 51,846 | | | | 110,211 | | | | (5,138 | ) | | | 14,984 | | | | 28,988 | | | | 55,670 | | | | (20,703 | ) | | | (12,586 | ) |
| | | | | | | | | | | | | | | | | | | | | | | | | | | | | | | | | | | | | | |
| | 11,468 | | | | 10,911 | | | | 543,223 | | | | 292,661 | | | | 4,063 | | | | 21,344 | | | | 98,273 | | | | 110,482 | | | | 46,231 | | | | 65,386 | |
| | | | | | | | | | | | | | | | | | | | | | | | | | | | | | | | | | | | | | |
| | 164,752 | | | | 153,841 | | | | 2,678,914 | | | | 2,386,253 | | | | 195,773 | | | | 174,429 | | | | 720,940 | | | | 610,458 | | | | 798,167 | | | | 732,781 | |
| | | | | | | | | | | | | | | | | | | | | | | | | | | | | | | | | | | | | | |
| $ | 176,220 | | | $ | 164,752 | | | $ | 3,222,137 | | | $ | 2,678,914 | | | $ | 199,836 | | | $ | 195,773 | | | $ | 819,213 | | | $ | 720,940 | | | $ | 844,398 | | | $ | 798,167 | |
| | | | | | | | | | | | | | | | | | | | | | | | | | | | | | | | | | | | | | |
| $ | 1,299 | | | $ | 1,520 | | | $ | 53,108 | | | $ | 52,559 | | | $ | 3,613 | | | $ | 3,987 | | | $ | 14,479 | | | $ | 12,655 | | | $ | 16,447 | | | $ | 18,215 | |
| | | | | | | | | | | | | | | | | | | | | | | | | | | | | | | | | | | | | | |
| | | | | | | | | | | | | | | | | | | | | | | | | | | | | | | | | | | | | | |
| | 6,254 | | | | 4,918 | | | | 48,043 | | | | 57,360 | | | | 10,382 | | | | 15,262 | | | | 46,374 | | | | 57,076 | | | | 16,579 | | | | 21,719 | |
| | 8,800 | | | | 13,126 | | | | 18,370 | | | | 24,401 | | | | 11,797 | | | | 20,909 | | | | 20,204 | | | | 25,563 | | | | 32,540 | | | | 34,309 | |
| | (22,159 | ) | | | (14,175 | ) | | | (54,718 | ) | | | (54,324 | ) | | | (26,318 | ) | | | (20,739 | ) | | | (47,254 | ) | | | (45,433 | ) | | | (59,237 | ) | | | (63,374 | ) |
| | | | | | | | | | | | | | | | | | | | | | | | | | | | | | | | | | | | | | |
| | (7,105 | ) | |
|
3,869 |
| | | 11,695 | | | | 27,437 | | | | (4,139 | ) | | | 15,432 | | | | 19,324 | | | | 37,206 | | | | (10,118 | ) | | | (7,346 | ) |
| | | | | | | | | | | | | | | | | | | | | | | | | | | | | | | | | | | | | | |
The Accompanying Notes are an Integral Part of the Financial Statements.
| | | | |
| 198 | | Statement of Changes in Net Assets | | |
Statement of Changes in Net Assets
Northwestern Mutual Series Fund, Inc.
(in thousands)
| | | | | | | | | | | | | | | | | | | | | | | | |
| | | Mid Cap Growth Stock
Portfolio | | | Index 400 Stock Portfolio | | | Mid Cap Value Portfolio | |
| | | For the Year
Ended
December 31,
2017 | | | For the Year
Ended
December 31,
2016 | | | For the Year
Ended
December 31,
2017 | | | For the Year
Ended
December 31,
2016 | | | For the Year
Ended
December 31,
2017 | | | For the Year
Ended
December 31,
2016 | |
Change in Net Assets | | | | | | | | | | | | | | | | | | | | | | | | |
Operations | | | | | | | | | | | | | | | | | | | | | | | | |
Net Investment Income (Loss) | | $ | 1,469 | | | $ | 2,845 | | | $ | 10,024 | | | $ | 9,004 | | | $ | 9,617 | | | $ | 7,787 | |
Net Realized Gain (Loss) on Investments | | | 199,640 | | | | (17,881 | ) | | | 58,294 | | | | 48,093 | | | | 49,049 | | | | 18,620 | |
Net Change in Unrealized Appreciation (Depreciation) of Investments | | | (8,354 | ) | | | 22,418 | | | | 55,201 | | | | 73,684 | | | | 1,707 | | | | 69,864 | |
| | | | | | | | | | | | | | | | | | | | | | | | |
Net Increase (Decrease) in Net Assets Resulting from Operations | | | 192,755 | | | | 7,382 | | | | 123,519 | | | | 130,781 | | | | 60,373 | | | | 96,271 | |
| | | | | | | | | | | | | | | | | | | | | | | | |
Distributions to Shareholders from: | | | | | | | | | | | | | | | | | | | | | | | | |
Net Investment Income | | | (2,583 | ) | | | (1,831 | ) | | | (8,964 | ) | | | (8,024 | ) | | | (7,902 | ) | | | (7,853 | ) |
Net Realized Gain on Investments | | | - | | | | (79,591 | ) | | | (47,765 | ) | | | (52,210 | ) | | | (19,110 | ) | | | (35,261 | ) |
| | | | | | | | | | | | | | | | | | | | | | | | |
Net Decrease in Net Assets Resulting from Distributions to Shareholders | | | (2,583 | ) | | | (81,422 | ) | | | (56,729 | ) | | | (60,234 | ) | | | (27,012 | ) | | | (43,114 | ) |
| | | | | | | | | | | | | | | | | | | | | | | | |
Capital Transactions: | | | | | | | | | | | | | | | | | | | | | | | | |
Shares Sold | | | 24,615 | | | | 44,302 | | | | 72,075 | | | | 68,624 | | | | 42,853 | | | | 61,280 | |
Reinvestment of Distributions Paid | | | 2,583 | | | | 81,422 | | | | 56,729 | | | | 60,234 | | | | 27,012 | | | | 43,114 | |
Shares Redeemed | | | (103,333 | ) | | | (93,440 | ) | | | (72,192 | ) | | | (60,649 | ) | | | (56,819 | ) | | | (49,567 | ) |
| | | | | | | | | | | | | | | | | | | | | | | | |
Net Increase (Decrease) in Net Assets Resulting from Capital Transactions | | | (76,135 | ) | | | 32,284 | | | | 56,612 | | | | 68,209 | | | | 13,046 | | | | 54,827 | |
| | | | | | | | | | | | | | | | | | | | | | | | |
Total Increase (Decrease) in Net Assets | | | 114,038 | | | | (41,756 | ) | | | 123,402 | | | | 138,756 | | | | 46,407 | | | | 107,984 | |
Net Assets | | | | | | | | | | | | | | | | | | | | | | | | |
Beginning of Period | | | 983,395 | | | | 1,025,151 | | | | 773,157 | | | | 634,401 | | | | 518,217 | | | | 410,233 | |
| | | | | | | | | | | | | | | | | | | | | | | | |
End of Period | | $ | 1,097,433 | | | $ | 983,395 | | | $ | 896,559 | | | $ | 773,157 | | | $ | 564,624 | | | $ | 518,217 | |
| | | | | | | | | | | | | | | | | | | | | | | | |
Undistributed Net Investment Income (Loss) | | $ | 2,294 | | | $ | 2,582 | | | $ | 9,983 | | | $ | 8,968 | | | $ | 9,027 | | | $ | 8,105 | |
| | | | | | | | | | | | | | | | | | | | | | | | |
Portfolio Share Transactions: | | | | | | | | | | | | | | | | | | | | | | | | |
Shares Sold | | | 7,810 | | | | 14,709 | | | | 35,541 | | | | 37,613 | | | | 24,158 | | | | 37,185 | |
Reinvestment of Distributions Paid | | | 809 | | | | 27,884 | | | | 29,779 | | | | 33,169 | | | | 15,974 | | | | 27,014 | |
Shares Redeemed | | | (32,507 | ) | | | (31,349 | ) | | | (35,640 | ) | | | (33,113 | ) | | | (32,153 | ) | | | (30,646 | ) |
| | | | | | | | | | | | | | | | | | | | | | | | |
Net Increase (Decrease) in Shares Resulting from Portfolio Share Transactions | | | (23,888 | ) | | | 11,244 | | | | 29,680 | | | | 37,669 | | | | 7,979 | | | | 33,553 | |
| | | | | | | | | | | | | | | | | | | | | | | | |
The Accompanying Notes are an Integral Part of the Financial Statements.
| | | | | | |
| | Statement of Changes in Net Assets | | | 199 | |
| | | | | | | | | | | | | | | | | | | | | | | | | | | | | | | | | | | | | | |
Small Cap Growth Stock
Portfolio | | | Index 600 Stock Portfolio | | | Small Cap Value Portfolio | | | International Growth
Portfolio | | | Research International Core
Portfolio | |
For the Year
Ended
December 31,
2017 | | | For the Year
Ended
December 31,
2016 | | | For the Year
Ended
December 31,
2017 | | | For the Year
Ended
December 31,
2016 | | | For the Year
Ended
December 31,
2017 | | | For the Year
Ended
December 31,
2016 | | | For the Year
Ended
December 31,
2017 | | | For the Year
Ended
December 31,
2016 | | | For the Year
Ended
December 31,
2017 | | | For the Year
Ended
December 31,
2016 | |
| | | | | | | | | | | | | | | | | | | | | | | | | | | | | | | | | | | | | | |
| | | | | | | | | | | | | | | | | | | | | | | | | | | | | | | | | | | | | | |
| $ | (83 | ) | | $ | 933 | | | $ | 2,021 | | | $ | 1,367 | | | $ | 3,578 | | | $ | 5,166 | | | $ | 8,245 | | | $ | 8,349 | | | $ | 10,144 | | | $ | 9,802 | |
| | 51,269 | | | | 5,988 | | | | 11,348 | | | | 9,451 | | | | 46,804 | | | | 32,549 | | | | (478 | ) | | | (16,270 | ) | | | 12,238 | | | | (18,551 | ) |
|
63,084 |
| | | 52,886 | | | | 11,407 | | | | 23,687 | | | | 20,016 | | | | 123,684 | | | | 151,395 | | | | (9,407 | ) | | | 120,014 | | | | 4,499 | |
| | | | | | | | | | | | | | | | | | | | | | | | | | | | | | | | | | | | | | |
|
114,270 |
| | | 59,807 | | | | 24,776 | | | | 34,505 | | | | 70,398 | | | | 161,399 | | | | 159,162 | | | | (17,328 | ) | | | 142,396 | | | | (4,250 | ) |
| | | | | | | | | | | | | | | | | | | | | | | | | | | | | | | | | | | | | | |
| | | | | | | | | | | | | | | | | | | | | | | | | | | | | | | | | | | | | | |
| | (625 | ) | | | (1,158 | ) | | | (3,771 | ) | | | (793 | ) | | | (4,984 | ) | | | (5,244 | ) | | | (8,203 | ) | | | (5,957 | ) | | | (9,827 | ) | | | (8,773 | ) |
| | (6,457 | ) | | | (51,660 | ) | | | (6,956 | ) | | | (6,350 | ) | | | (33,520 | ) | | | (70,226 | ) | | | - | | | | - | | | | - | | | | (4,342 | ) |
| | | | | | | | | | | | | | | | | | | | | | | | | | | | | | | | | | | | | | |
|
(7,082 |
) | | | (52,818 | ) | | | (10,727 | ) | | | (7,143 | ) | | | (38,504 | ) | | | (75,470 | ) | | | (8,203 | ) | | | (5,957 | ) | | | (9,827 | ) | | | (13,115 | ) |
| | | | | | | | | | | | | | | | | | | | | | | | | | | | | | | | | | | | | | |
| | | | | | | | | | | | | | | | | | | | | | | | | | | | | | | | | | | | | | |
| | 25,314 | | | | 40,765 | | | | 42,637 | | | | 40,201 | | | | 35,589 | | | | 39,601 | | | | 72,456 | | | | 96,384 | | | | 72,547 | | | | 79,725 | |
| | 7,082 | | | | 52,818 | | | | 10,727 | | | | 7,143 | | | | 38,504 | | | | 75,470 | | | | 8,203 | | | | 5,957 | | | | 9,827 | | | | 13,118 | |
| | (56,735 | ) | | | (50,452 | ) | | | (18,948 | ) | | | (14,816 | ) | | | (80,582 | ) | | | (68,140 | ) | | | (57,159 | ) | | | (41,247 | ) | | | (56,587 | ) | | | (74,224 | ) |
| | | | | | | | | | | | | | | | | | | | | | | | | | | | | | | | | | | | | | |
| | (24,339 | ) | |
|
43,131 |
| | | 34,416 | | | | 32,528 | | | | (6,489 | ) | | | 46,931 | | | | 23,500 | | | | 61,094 | | | | 25,787 | | | | 18,619 | |
| | | | | | | | | | | | | | | | | | | | | | | | | | | | | | | | | | | | | | |
| | 82,849 | | | | 50,120 | | | | 48,465 | | | | 59,890 | | | | 25,405 | | | | 132,860 | | | | 174,459 | | | | 37,809 | | | | 158,356 | | | | 1,254 | |
| | | | | | | | | | | | | | | | | | | | | | | | | | | | | | | | | | | | | | |
| | 545,052 | | | | 494,932 | | | | 173,883 | | | | 113,993 | | | | 647,830 | | | | 514,970 | | | | 523,122 | | | | 485,313 | | | | 499,649 | | | | 498,395 | |
| | | | | | | | | | | | | | | | | | | | | | | | | | | | | | | | | | | | | | |
| $ | 627,901 | | | $ | 545,052 | | | $ | 222,348 | | | $ | 173,883 | | | $ | 673,235 | | | $ | 647,830 | | | $ | 697,581 | | | $ | 523,122 | | | $ | 658,005 | | | $ | 499,649 | |
| | | | | | | | | | | | | | | | | | | | | | | | | | | | | | | | | | | | | | |
| $ | - | | | $ | 625 | | | $ | 3,400 | | | $ | 3,844 | | | $ | 3,487 | | | $ | 5,105 | | | $ | 9,025 | | | $ | 8,041 | | | $ | 10,078 | | | $ | 9,557 | |
| | | | | | | | | | | | | | | | | | | | | | | | | | | | | | | | | | | | | | |
| | | | | | | | | | | | | | | | | | | | | | | | | | | | | | | | | | | | | | |
| | 9,657 | | | | 17,728 | | | | 30,997 | | | | 33,773 | | | | 14,351 | | | | 17,863 | | | | 49,958 | | | | 75,878 | | | | 76,894 | | | | 97,427 | |
| | 2,722 | | | | 23,495 | | | | 8,329 | | | | 5,943 | | | | 16,858 | | | | 35,887 | | | | 5,520 | | | | 4,493 | | | | 10,173 | | | | 15,430 | |
| | (21,694 | ) | | | (22,126 | ) | | | (13,768 | ) | | | (12,440 | ) | | | (33,318 | ) | | | (30,845 | ) | | | (39,225 | ) | | | (32,466 | ) | | | (59,961 | ) | | | (89,855 | ) |
| | | | | | | | | | | | | | | | | | | | | | | | | | | | | | | | | | | | | | |
| | (9,315 | ) | |
|
19,097 |
| | | 25,558 | | | | 27,276 | | | | (2,109 | ) | | | 22,905 | | | | 16,253 | | | | 47,905 | | | | 27,106 | | | | 23,002 | |
| | | | | | | | | | | | | | | | | | | | | | | | | | | | | | | | | | | | | | |
The Accompanying Notes are an Integral Part of the Financial Statements.
| | | | |
| 200 | | Statement of Changes in Net Assets | | |
Statement of Changes in Net Assets
Northwestern Mutual Series Fund, Inc.
(in thousands)
| | | | | | | | | | | | | | | | | | | | | | | | |
| | | International Equity
Portfolio | | | Emerging Markets Equity
Portfolio | | | Government Money Market
Portfolio | |
| | | For the Year
Ended
December 31,
2017 | | | For the Year
Ended
December 31,
2016 | | | For the Year
Ended
December 31,
2017 | | | For the Year
Ended
December 31,
2016 | | | For the Year
Ended
December 31,
2017 | | | For the Year
Ended
December 31,
2016 | |
Change in Net Assets | | | | | | | | | | | | | | | | | | | | | | | | |
Operations | | | | | | | | | | | | | | | | | | | | | | | | |
Net Investment Income (Loss) | | $ | 43,342 | | | $ | 41,400 | | | $ | 10,101 | | | $ | 6,039 | | | $ | 2,770 | | | $ | 536 | |
Net Realized Gain (Loss) on Investments | | | 44,972 | | | | (67,233 | ) | | | 29,701 | | | | (21,156 | ) | | | 5 | | | | 39 | |
Net Change in Unrealized Appreciation (Depreciation) of Investments | | | 269,911 | | | | 72,238 | | | | 109,969 | | | | 59,470 | | | | - | | | | - | |
| | | | | | | | | | | | | | | | | | | | | | | | |
Net Increase (Decrease) in Net Assets Resulting from Operations | | | 358,225 | | | | 46,405 | | | | 149,771 | | | | 44,353 | | | | 2,775 | | | | 575 | |
| | | | | | | | | | | | | | | | | | | | | | | | |
Distributions to Shareholders from: | | | | | | | | | | | | | | | | | | | | | | | | |
Net Investment Income | | | (42,550 | ) | | | (33,744 | ) | | | (5,748 | ) | | | (3,683 | ) | | | (2,770 | ) | | | (562 | ) |
Net Realized Gain on Investments | | | - | | | | (20,770 | ) | | | - | | | | - | | | | (5 | ) | | | (39 | ) |
| | | | | | | | | | | | | | | | | | | | | | | | |
Net Decrease in Net Assets Resulting from Distributions to Shareholders | | | (42,550 | ) | | | (54,514 | ) | | | (5,748 | ) | | | (3,683 | ) | | | (2,775 | ) | | | (601 | ) |
| | | | | | | | | | | | | | | | | | | | | | | | |
Capital Transactions: | | | | | | | | | | | | | | | | | | | | | | | | |
Shares Sold | | | 108,920 | | | | 130,094 | | | | 101,162 | | | | 96,382 | | | | 198,453 | | | | 280,259 | |
Reinvestment of Distributions Paid | | | 42,550 | | | | 54,514 | | | | 5,748 | | | | 3,683 | | | | 2,774 | | | | 601 | |
Shares Redeemed | | | (167,739 | ) | | | (154,180 | ) | | | (54,452 | ) | | | (63,232 | ) | | | (263,423 | ) | | | (224,486 | ) |
| | | | | | | | | | | | | | | | | | | | | | | | |
Net Increase (Decrease) in Net Assets Resulting from Capital Transactions | | | (16,269 | ) | | | 30,428 | | | | 52,458 | | | | 36,833 | | | | (62,196 | ) | | | 56,374 | |
| | | | | | | | | | | | | | | | | | | | | | | | |
Total Increase (Decrease) in Net Assets | | | 299,406 | | | | 22,319 | | | | 196,481 | | | | 77,503 | | | | (62,196 | ) | | | 56,348 | |
Net Assets | | | | | | | | | | | | | | | | | | | | | | | | |
Beginning of Period | | | 1,628,267 | | | | 1,605,948 | | | | 521,800 | | | | 444,297 | | | | 501,635 | | | | 445,287 | |
| | | | | | | | | | | | | | | | | | | | | | | | |
End of Period | | $ | 1,927,673 | | | $ | 1,628,267 | | | $ | 718,281 | | | $ | 521,800 | | | $ | 439,439 | | | $ | 501,635 | |
| | | | | | | | | | | | | | | | | | | | | | | | |
Undistributed Net Investment Income (Loss) | | $ | 45,322 | | | $ | 42,171 | | | $ | 9,186 | | | $ | 5,746 | | | $ | - | | | $ | 3 | |
| | | | | | | | | | | | | | | | | | | | | | | | |
Portfolio Share Transactions: | | | | | | | | | | | | | | | | | | | | | | | | |
Shares Sold | | | 60,655 | | | | 84,805 | | | | 99,983 | | | | 116,570 | | | | 198,452 | | | | 280,259 | |
Reinvestment of Distributions Paid | | | 23,547 | | | | 34,678 | | | | 5,490 | | | | 4,084 | | | | 2,774 | | | | 601 | |
Shares Redeemed | | | (93,626 | ) | | | (99,670 | ) | | | (53,874 | ) | | | (74,182 | ) | | | (263,423 | ) | | | (224,486 | ) |
| | | | | | | | | | | | | | | | | | | | | | | | |
Net Increase (Decrease) in Shares Resulting from Portfolio Share Transactions | | | (9,424 | ) | | | 19,813 | | | | 51,599 | | | | 46,472 | | | | (62,197 | ) | | | 56,374 | |
| | | | | | | | | | | | | | | | | | | | | | | | |
The Accompanying Notes are an Integral Part of the Financial Statements.
| | | | | | |
| | Statement of Changes in Net Assets | | | 201 | |
| | | | | | | | | | | | | | | | | | | | | | | | | | | | | | | | | | | | | | |
| Short-Term Bond Portfolio | | | Select Bond Portfolio | | | Long-Term U.S.
Government Bond Portfolio | | | Inflation Protection
Portfolio | | | High Yield Bond Portfolio | |
For the Year
Ended
December 31,
2017 | | | For the Year
Ended
December 31,
2016 | | | For the Year
Ended
December 31,
2017 | | | For the Year
Ended
December 31,
2016 | | | For the Year
Ended
December 31,
2017 | | | For the Year
Ended
December 31,
2016 | | | For the Year
Ended
December 31,
2017 | | | For the Year
Ended
December 31,
2016 | | | For the Year
Ended
December 31,
2017 | | | For the Year
Ended
December 31,
2016 | |
| | | | | | | | | | | | | | | | | | | | | | | | | | | | | | | | | | | | | | |
| | | | | | | | | | | | | | | | | | | | | | | | | | | | | | | | | | | | | | |
| $ | 4,510 | | | $ | 3,390 | | | $ | 62,247 | | | $ | 54,899 | | | $ | 3,003 | | | $ | 2,670 | | | $ | 7,264 | | | $ | 4,658 | | | $ | 43,254 | | | $ | 43,038 | |
| | (256 | ) | | | (267 | ) | | | 9,220 | | | | 33,412 | | | | 793 | | | | 6,286 | | | | (2,060 | ) | | | (361 | ) | | | 5,357 | | | | (9,145 | ) |
| | (669 | ) | | | 1,009 | | |
|
31,121 |
| | | (4,066 | ) | | | 5,288 | | | | (8,770 | ) | | | 7,580 | | | | 9,070 | | | | 3,538 | | | | 66,202 | |
| | | | | | | | | | | | | | | | | | | | | | | | | | | | | | | | | | | | | | |
| | 3,585 | | | | 4,132 | | |
|
102,588 |
| | | 84,245 | | | | 9,084 | | | | 186 | | | | 12,784 | | | | 13,367 | | | | 52,149 | | | | 100,095 | |
| | | | | | | | | | | | | | | | | | | | | | | | | | | | | | | | | | | | | | |
| | | | | | | | | | | | | | | | | | | | | | | | | | | | | | | | | | | | | | |
| | (3,730 | ) | | | (3,014 | ) | | | (59,951 | ) | | | (54,600 | ) | | | (2,157 | ) | | | (2,240 | ) | | | (2,412 | ) | | | (3,649 | ) | | | (43,155 | ) | | | (39,861 | ) |
| | - | | | | - | | | | (38,818 | ) | | | (15,134 | ) | | | (4,416 | ) | | | (2,060 | ) | | | (1,002 | ) | | | - | | | | - | | | | - | |
| | | | | | | | | | | | | | | | | | | | | | | | | | | | | | | | | | | | | | |
|
(3,730 |
) | | | (3,014 | ) | | | (98,769 | ) | | | (69,734 | ) | | | (6,573 | ) | | | (4,300 | ) | | | (3,414 | ) | | | (3,649 | ) | | | (43,155 | ) | | | (39,861 | ) |
| | | | | | | | | | | | | | | | | | | | | | | | | | | | | | | | | | | | | | |
| | | | | | | | | | | | | | | | | | | | | | | | | | | | | | | | | | | | | | |
| | 52,650 | | | | 55,068 | | | | 261,713 | | | | 306,188 | | | | 16,641 | | | | 31,985 | | | | 90,861 | | | | 64,335 | | | | 61,646 | | | | 90,495 | |
| | 3,730 | | | | 3,014 | | | | 98,769 | | | | 69,734 | | | | 6,573 | | | | 4,300 | | | | 3,414 | | | | 3,649 | | | | 43,155 | | | | 39,861 | |
| | (32,554 | ) | | | (33,571 | ) | | | (259,412 | ) | | | (408,346 | ) | | | (20,403 | ) | | | (26,293 | ) | | | (28,861 | ) | | | (37,864 | ) | | | (58,863 | ) | | | (121,767 | ) |
| | | | | | | | | | | | | | | | | | | | | | | | | | | | | | | | | | | | | | |
|
23,826 |
| | | 24,511 | | | | 101,070 | | | | (32,424 | ) | | | 2,811 | | | | 9,992 | | | | 65,414 | | | | 30,120 | | | | 45,938 | | | | 8,589 | |
| | | | | | | | | | | | | | | | | | | | | | | | | | | | | | | | | | | | | | |
| | 23,681 | | | | 25,629 | | | | 104,889 | | | | (17,913 | ) | | | 5,322 | | | | 5,878 | | | | 74,784 | | | | 39,838 | | | | 54,931 | | | | 68,823 | |
| | | | | | | | | | | | | | | | | | | | | | | | | | | | | | | | | | | | | | |
| | 269,833 | | | | 244,204 | | | | 2,839,045 | | | | 2,856,958 | | | | 110,391 | | | | 104,513 | | | | 326,927 | | | | 287,089 | | | | 756,947 | | | | 688,124 | |
| | | | | | | | | | | | | | | | | | | | | | | | | | | | | | | | | | | | | | |
| $ | 293,514 | | | $ | 269,833 | | | $ | 2,943,934 | | | $ | 2,839,045 | | | $ | 115,713 | | | $ | 110,391 | | | $ | 401,711 | | | $ | 326,927 | | | $ | 811,878 | | | $ | 756,947 | |
| | | | | | | | | | | | | | | | | | | | | | | | | | | | | | | | | | | | | | |
| $ | 4,647 | | | $ | 3,730 | | | $ | 67,846 | | | $ | 59,282 | | | $ | 2,221 | | | $ | 2,138 | | | $ | 7,085 | | | $ | 2,241 | | | $ | 43,280 | | | $ | 43,156 | |
| | | | | | | | | | | | | | | | | | | | | | | | | | | | | | | | | | | | | | |
| | | | | | | | | | | | | | | | | | | | | | | | | | | | | | | | | | | | | | |
| | 50,772 | | | | 53,074 | | | | 206,659 | | | | 238,149 | | | | 15,440 | | | | 27,499 | | | | 82,521 | | | | 59,146 | | | | 81,679 | | | | 126,073 | |
| | 3,610 | | | | 2,912 | | | | 78,952 | | | | 54,056 | | | | 6,189 | | | | 3,571 | | | | 3,121 | | | | 3,314 | | | | 58,635 | | | | 55,133 | |
| | (31,382 | ) | | | (32,380 | ) | | | (204,707 | ) | | | (319,391 | ) | | | (18,859 | ) | | | (23,311 | ) | | | (26,253 | ) | | | (34,953 | ) | | | (77,840 | ) | | | (169,484 | ) |
| | | | | | | | | | | | | | | | | | | | | | | | | | | | | | | | | | | | | | |
|
23,000 |
| | | 23,606 | | | | 80,904 | | | | (27,186 | ) | | | 2,770 | | | | 7,759 | | | | 59,389 | | | | 27,507 | | | | 62,474 | | | | 11,722 | |
| | | | | | | | | | | | | | | | | | | | | | | | | | | | | | | | | | | | | | |
The Accompanying Notes are an Integral Part of the Financial Statements.
| | | | |
| 202 | | Statement of Changes in Net Assets | | |
Statement of Changes in Net Assets
Northwestern Mutual Series Fund, Inc.
(in thousands)
| | | | | | | | | | | | | | | | | | | | | | | | |
| | | Multi-Sector Bond Portfolio | | | Balanced Portfolio | | | Asset Allocation Portfolio | |
| | | For the Year
Ended
December 31,
2017 | | | For the Year
Ended
December 31,
2016 | | | For the Year
Ended
December 31,
2017 | | | For the Year
Ended
December 31,
2016 | | | For the Year
Ended
December 31,
2017 | | | For the Year
Ended
December 31,
2016 | |
Change in Net Assets | | | | | | | | | | | | | | | | | | | | | | | | |
Operations | | | | | | | | | | | | | | | | | | | | | | | | |
Net Investment Income (Loss) | | $ | 31,339 | | | $ | 24,620 | | | $ | 39,456 | | | $ | 38,101 | | | $ | 4,435 | | | $ | 4,178 | |
Net Realized Gain (Loss) on Investments | | | (2,606 | ) | | | 1,476 | | | | 63,304 | | | | 94,444 | | | | 8,344 | | | | 12,914 | |
Net Change in Unrealized Appreciation (Depreciation) of Investments | | | 31,875 | | | | 38,528 | | | | 152,879 | | | | 7,764 | | | | 23,925 | | | | 1,493 | |
| | | | | | | | | | | | | | | | | | | | | | | | |
Net Increase (Decrease) in Net Assets Resulting from Operations | | | 60,608 | | | | 64,624 | | | | 255,639 | | | | 140,309 | | | | 36,704 | | | | 18,585 | |
| | | | | | | | | | | | | | | | | | | | | | | | |
Distributions to Shareholders from: | | | | | | | | | | | | | | | | | | | | | | | | |
Net Investment Income | | | (30,040 | ) | | | (29,034 | ) | | | (49,621 | ) | | | (49,667 | ) | | | (5,486 | ) | | | (5,868 | ) |
Net Realized Gain on Investments | | | - | | | | - | | | | (82,890 | ) | | | (62,181 | ) | | | (11,468 | ) | | | (9,122 | ) |
Net Decrease in Net Assets Resulting from Distributions to Shareholders | | | (30,040 | ) | | | (29,034 | ) | | | (132,511 | ) | | | (111,848 | ) | | | (16,954 | ) | | | (14,990 | ) |
| | | | | | | | | | | | | | | | | | | | | | | | |
Capital Transactions: | | | | | | | | | | | | | | | | | | | | | | | | |
Shares Sold | | | 153,044 | | | | 124,597 | | | | 110,602 | | | | 112,327 | | | | 17,526 | | | | 12,710 | |
Reinvestment of Distributions Paid | | | 30,040 | | | | 29,034 | | | | 132,511 | | | | 111,848 | | | | 16,954 | | | | 14,990 | |
Shares Redeemed | | | (62,520 | ) | | | (80,006 | ) | | | (261,605 | ) | | | (269,268 | ) | | | (27,416 | ) | | | (30,309 | ) |
| | | | | | | | | | | | | | | | | | | | | | | | |
Net Increase (Decrease) in Net Assets Resulting from Capital Transactions | | | 120,564 | | | | 73,625 | | | | (18,492 | ) | | | (45,093 | ) | | | 7,064 | | | | (2,609 | ) |
| | | | | | | | | | | | | | | | | | | | | | | | |
Total Increase (Decrease) in Net Assets | | | 151,132 | | | | 109,215 | | | | 104,636 | | | | (16,632 | ) | | | 26,814 | | | | 986 | |
Net Assets | | | | | | | | | | | | | | | | | | | | | | | | |
Beginning of Period | | | 689,849 | | | | 580,634 | | | | 2,202,834 | | | | 2,219,466 | | | | 250,399 | | | | 249,413 | |
| | | | | | | | | | | | | | | | | | | | | | | | |
End of Period | | $ | 840,981 | | | $ | 689,849 | | | $ | 2,307,470 | | | $ | 2,202,834 | | | $ | 277,213 | | | $ | 250,399 | |
| | | | | | | | | | | | | | | | | | | | | | | | |
Undistributed Net Investment Income (Loss) | | $ | 21,941 | | | $ | 29,247 | | | $ | 52,700 | | | $ | 49,621 | | | $ | 5,391 | | | $ | 5,486 | |
| | | | | | | | | | | | | | | | | | | | | | | | |
Portfolio Share Transactions: | | | | | | | | | | | | | | | | | | | | | | | | |
Shares Sold | | | 140,652 | | | | 119,181 | | | | 76,125 | | | | 80,453 | | | | 14,931 | | | | 11,471 | |
Reinvestment of Distributions Paid | | | 27,866 | | | | 27,365 | | | | 93,913 | | | | 79,834 | | | | 14,858 | | | | 13,456 | |
Shares Redeemed | | | (57,521 | ) | | | (77,141 | ) | | | (180,257 | ) | | | (193,183 | ) | | | (23,360 | ) | | | (27,323 | ) |
| | | | | | | | | | | | | | | | | | | | | | | | |
Net Increase (Decrease) in Shares Resulting from Portfolio Share Transactions | | | 110,997 | | | | 69,405 | | | | (10,219 | ) | | | (32,896 | ) | | | 6,429 | | | | (2,396 | ) |
| | | | | | | | | | | | | | | | | | | | | | | | |
The Accompanying Notes are an Integral Part of the Financial Statements.
| | | | | | |
| | Statement of Changes in Net Assets | | | 203 | |
Statement of Cash Flows
Northwestern Mutual Series Fund, Inc.
For the Year Ended December 31, 2017 (in thousands)
| | | | |
| | | Long-Term U.S.
Government Bond
Portfolio | |
Cash Flows from Operating Activities | | | | |
Net Increase (Decrease) in Net Assets Resulting from Operations | | $ | 9,084 | |
Adjustments to Reconcile Net Increase (Decrease) in Net Assets Resulting from Operations to Net Cash from Operating Activities Purchase of Investment Securities | | | (112,543 | ) |
Proceeds from Disposition of Investment Securities | | | 102,275 | |
Proceeds from Disposition (Purchase) of Short-Term Investments, net | | | (1,291 | ) |
Proceeds from (Payments for) Closed Futures Contracts and Cleared Swaps | | | 165 | |
Proceeds from (Payments for) Swap Contracts | | | (315 | ) |
Premiums Received for Options Written | | | | |
Amortization (Accretion) of Premium/Discount, net | | | (88 | ) |
(Increase) Decrease in: | | | | |
Cash Collateral for Derivative Positions | | | 226 | |
Receivable for Investment Securities Sold | | | 8,546 | |
Dividends and Interest Receivable | | | (201 | ) |
Increase (Decrease) in: | | | | |
Payable for Investment Securities Purchased | | | (1,609 | ) |
Payable for Reverse Repurchase Agreement | | | (1,568 | ) |
Payable for Investment Advisory Fees | | | (6 | ) |
Accrued Expenses | | | 21 | |
Change in Net Unrealized (Appreciation) Depreciation of: | | | | |
Investment Securities | | | (6,265 | ) |
Futures Contracts | | | (76 | ) |
Swap Contracts | | | 1,053 | |
Net Realized (Gain) Loss from: | | | | |
Investment Securities | | | 73 | |
Futures Contracts | | | (50 | ) |
Options Written | | | | |
Paydowns | | | | |
Swap Contracts | | | (816 | ) |
| | | | |
Total Adjustments | | | (12,469 | ) |
| | | | |
Net Cash (Used in) Provided by Operating Activities | | | (3,385 | ) |
| | | | |
Cash Flows from Financing Activities | | | | |
Cash Received from Financing Transactions | | | 1,201,515 | |
Cash (Used for) Financing Transactions | | | (1,200,750 | ) |
Proceeds from Capital Shares Sold | | | 16,709 | |
Payment on Capital Shares Redeemed | | | (20,317 | ) |
| | | | |
Net Cash (Used in) Provided by Financing Activities | | | (2,843 | ) |
| | | | |
Net Increase (Decrease) in Cash and Cash Equivalents | | | (6,228 | ) |
Cash and Cash Equivalents, Beginning of Period | | | 6,228 | |
| | | | |
Cash and Cash Equivalents, End of Period | | $ | - | |
| | | | |
Supplemental disclosure of cash flow information:
Non-cash financing activities not included herein consist of reinvestment of dividends and distributions of $6,573.
Interest paid was $304 for the period ended December 31, 2017.
The Accompanying Notes are an Integral Part of the Financial Statements.
| | | | |
| 204 | | Statement of Cash Flows | | |
Financial Highlights
(For a share outstanding throughout the period)
| | | | | | | | | | | | | | | | | | | | | | | | | | | | | | | | |
| | | Net Asset Value,
Beginning
of Period | | | Net Investment
Income (Loss) | | | Net Realized and
Unrealized Gain
(Loss) on
Investments | | | Total from
Investment
Operations | | | Distributions
from Net
Investment
Income | | | Distributions
from Realized
Gains on
Investments | | | Total
Distributions | | | Net Asset Value,
End of Period | |
Growth Stock Portfolio | |
2017 | | $ | 2.58 | | | $ | 0.02 | | | $ | 0.59 | | | $ | 0.61 | | | $ | (0.03 | ) | | $ | (0.13 | ) | | $ | (0.16 | ) | | $ | 3.03 | |
2016 | | | 2.81 | | | | 0.03 | | | | 0.04 | | | | 0.07 | | | | (0.02 | ) | | | (0.28 | ) | | | (0.30 | ) | | | 2.58 | |
2015 | | | 2.87 | | | | 0.02 | | | | 0.15 | | | | 0.17 | | | | (0.02 | ) | | | (0.21 | ) | | | (0.23 | ) | | | 2.81 | |
2014 | | | 2.94 | | | | 0.02 | | | | 0.22 | | | | 0.24 | | | | (0.02 | ) | | | (0.29 | ) | | | (0.31 | ) | | | 2.87 | |
2013 | | | 2.35 | | | | 0.02 | | | | 0.78 | | | | 0.80 | | | | (0.02 | ) | | | (0.19 | ) | | | (0.21 | ) | | | 2.94 | |
Focused Appreciation Portfolio | | | | | | | | | | | | | | | | | |
2017 | | $ | 2.08 | | | $ | 0.02 | | | $ | 0.68 | | | $ | 0.70 | | | $ | (0.02 | ) | | $ | (0.05 | ) | | $ | (0.07 | ) | | $ | 2.71 | |
2016 | | | 2.68 | | | | 0.02 | | | | 0.17 | | | | 0.19 | | | | (0.01 | ) | | | (0.78 | ) | | | (0.79 | ) | | | 2.08 | |
2015 | | | 2.63 | | | | 0.01 | | | | 0.34 | | | | 0.35 | | | | – | | | | (0.30 | ) | | | (0.30 | ) | | | 2.68 | |
2014 | | | 2.69 | | | | 0.00 | (e) | | | 0.22 | | | | 0.22 | | | | (0.00 | )(e) | | | (0.28 | ) | | | (0.28 | ) | | | 2.63 | |
2013 | | | 2.09 | | | | 0.00 | (e) | | | 0.61 | | | | 0.61 | | | | (0.01 | ) | | | – | | | | (0.01 | ) | | | 2.69 | |
Large Cap Core Stock Portfolio | |
2017 | | $ | 1.60 | | | $ | 0.03 | | | $ | 0.36 | | | $ | 0.39 | | | $ | (0.03 | ) | | $ | – | | | $ | (0.03 | ) | | $ | 1.96 | |
2016 | | | 1.54 | | | | 0.03 | | | | 0.09 | | | | 0.12 | | | | (0.03 | ) | | | (0.03 | ) | | | (0.06 | ) | | | 1.60 | |
2015 | | | 1.65 | | | | 0.03 | | | | (0.08 | ) | | | (0.05 | ) | | | (0.04 | ) | | | (0.02 | ) | | | (0.06 | ) | | | 1.54 | |
2014 | | | 1.70 | | | | 0.04 | | | | 0.10 | | | | 0.14 | | | | (0.03 | ) | | | (0.16 | ) | | | (0.19 | ) | | | 1.65 | |
2013 | | | 1.34 | | | | 0.03 | | | | 0.35 | | | | 0.38 | | | | (0.02 | ) | | | – | | | | (0.02 | ) | | | 1.70 | |
Large Cap Blend Portfolio | |
2017 | | $ | 1.07 | | | $ | 0.01 | | | $ | 0.20 | | | $ | 0.21 | | | $ | (0.01 | ) | | $ | (0.06 | ) | | $ | (0.07 | ) | | $ | 1.21 | |
2016 | | | 1.03 | | | | 0.01 | | | | 0.12 | | | | 0.13 | | | | (0.01 | ) | | | (0.08 | ) | | | (0.09 | ) | | | 1.07 | |
2015 | | | 1.12 | | | | 0.01 | | | | (0.03 | ) | | | (0.02 | ) | | | (0.01 | ) | | | (0.06 | ) | | | (0.07 | ) | | | 1.03 | |
2014 | | | 1.04 | | | | 0.01 | | | | 0.11 | | | | 0.12 | | | | (0.00 | )(e) | | | (0.04 | ) | | | (0.04 | ) | | | 1.12 | |
2013 | | | 0.83 | | | | 0.01 | | | | 0.25 | | | | 0.26 | | | | (0.01 | ) | | | (0.04 | ) | | | (0.05 | ) | | | 1.04 | |
Index 500 Stock Portfolio | |
2017 | | $ | 4.17 | | | $ | 0.08 | | | $ | 0.81 | | | $ | 0.89 | | | $ | (0.08 | ) | | $ | (0.05 | ) | | $ | (0.13 | ) | | $ | 4.93 | |
2016 | | | 3.88 | | | | 0.08 | | | | 0.37 | | | | 0.45 | | | | (0.07 | ) | | | (0.09 | ) | | | (0.16 | ) | | | 4.17 | |
2015 | | | 3.98 | | | | 0.07 | | | | (0.03 | ) | | | 0.04 | | | | (0.07 | ) | | | (0.07 | ) | | | (0.14 | ) | | | 3.88 | |
2014 | | | 3.61 | | | | 0.07 | | | | 0.41 | | | | 0.48 | | | | (0.06 | ) | | | (0.05 | ) | | | (0.11 | ) | | | 3.98 | |
2013 | | | 2.84 | | | | 0.06 | | | | 0.84 | | | | 0.90 | | | | (0.06 | ) | | | (0.07 | ) | | | (0.13 | ) | | | 3.61 | |
Large Company Value Portfolio | |
2017 | | $ | 1.02 | | | $ | 0.02 | | | $ | 0.08 | | | $ | 0.10 | | | $ | (0.02 | ) | | $ | (0.04 | ) | | $ | (0.06 | ) | | $ | 1.06 | |
2016 | | | 0.99 | | | | 0.02 | | | | 0.12 | | | | 0.14 | | | | (0.02 | ) | | | (0.09 | ) | | | (0.11 | ) | | | 1.02 | |
2015 | | | 1.15 | | | | 0.02 | | | | (0.06 | ) | | | (0.04 | ) | | | (0.02 | ) | | | (0.10 | ) | | | (0.12 | ) | | | 0.99 | |
2014 | | | 1.07 | | | | 0.02 | | | | 0.12 | | | | 0.14 | | | | – | | | | (0.06 | ) | | | (0.06 | ) | | | 1.15 | |
2013 | | | 0.84 | | | | 0.02 | | | | 0.24 | | | | 0.26 | | | | (0.01 | ) | | | (0.02 | ) | | | (0.03 | ) | | | 1.07 | |
Domestic Equity Portfolio | |
2017 | | $ | 1.54 | | | $ | 0.03 | | | $ | 0.18 | | | $ | 0.21 | | | $ | (0.03 | ) | | $ | (0.04 | ) | | $ | (0.07 | ) | | $ | 1.68 | |
2016 | | | 1.41 | | | | 0.03 | | | | 0.19 | | | | 0.22 | | | | (0.03 | ) | | | (0.06 | ) | | | (0.09 | ) | | | 1.54 | |
2015 | | | 1.44 | | | | 0.03 | | | | (0.03 | ) | | | – | | | | (0.03 | ) | | | – | | | | (0.03 | ) | | | 1.41 | |
2014 | | | 1.29 | | | | 0.03 | | | | 0.14 | | | | 0.17 | | | | (0.02 | ) | | | – | | | | (0.02 | ) | | | 1.44 | |
2013 | | | 0.98 | | | | 0.02 | | | | 0.31 | | | | 0.33 | | | | (0.02 | ) | | | – | | | | (0.02 | ) | | | 1.29 | |
| (e) | Amount is less than $0.005. |
The Accompanying Notes are an Integral Part of the Financial Statements.
| | | | | | | | | | | | | | | | | | | | | | |
| Total Return(d) | | | Net Assets, End
of Period
(thousands) | | | Ratio of Gross
Expenses to
Average Net
Assets | | | Ratio of Net
Expenses to
Average Net
Assets | | | Ratio of Net
Investment
Income (Loss) to
Average Net
Assets | | | Portfolio
Turnover Rate | |
| | | | | | | | | | | | | | | | | | | | | | | |
| | 24.27 | % | | $ | 959,854 | | | | 0.43 | % | | | 0.42 | % | | | 0.78 | % | | | 57.70 | % |
| | 2.47 | | | | 837,980 | | | | 0.43 | | | | 0.43 | | | | 0.97 | | | | 65.66 | |
| | 6.01 | | | | 860,348 | | | | 0.43 | | | | 0.42 | | | | 0.82 | | | | 50.12 | |
| | 9.02 | | | | 885,880 | | | | 0.43 | | | | 0.41 | | | | 0.76 | | | | 42.36 | |
| | 35.86 | | | | 847,384 | | | | 0.44 | | | | 0.43 | | | | 0.79 | | | | 85.54 | |
| | | | | | | | | | | | | | | | | | | | | | | |
| | 33.62 | % | | $ | 945,385 | | | | 0.75 | % | | | 0.63 | % | | | 0.66 | % | | | 3.50 | % |
| | 5.87 | | | | 771,800 | | | | 0.76 | | | | 0.63 | | | | 0.83 | | | | 9.38 | |
| | 13.64 | | | | 778,837 | | | | 0.76 | | | | 0.63 | | | | 0.27 | | | | 131.33 | |
| | 9.43 | | | | 722,379 | | | | 0.77 | | | | 0.64 | | | | (0.02 | ) | | | 54.58 | |
| | 29.01 | | | | 624,512 | | | | 0.79 | | | | 0.71 | | | | 0.04 | | | | 63.90 | |
| | | | | | | | | | | | | | | | | | | | | | |
| | 24.87 | % | | $ | 592,577 | | | | 0.45 | % | | | 0.44 | % | | | 1.56 | % | | | 100.72 | % |
| | 7.57 | | | | 514,495 | | | | 0.45 | | | | 0.45 | | | | 1.96 | | | | 6.83 | |
| | (3.06 | ) | | | 509,411 | | | | 0.45 | | | | 0.44 | | | | 2.04 | | | | 13.36 | |
| | 8.56 | | | | 555,639 | | | | 0.45 | | | | 0.44 | | | | 2.08 | | | | 5.92 | |
| | 28.58 | | | | 538,368 | | | | 0.46 | | | | 0.46 | | | | 1.78 | | | | 72.60 | |
| | | | | | | | | | | | | | | | | | | | | | | |
| | 19.02 | % | | $ | 176,221 | | | | 0.81 | % | | | 0.81 | % | | | 0.75 | % | | | 16.09 | % |
| | 13.99 | | | | 164,752 | | | | 0.82 | | | | 0.81 | | | | 0.97 | | | | 21.12 | |
| | (2.42 | ) | | | 153,841 | | | | 0.81 | | | | 0.81 | | | | 0.99 | | | | 16.11 | |
| | 12.58 | | | | 166,948 | | | | 0.82 | | | | 0.82 | | | | 0.91 | | | | 27.31 | |
| | 30.86 | | | | 151,099 | | | | 0.83 | | | | 0.83 | | | | 1.01 | | | | 55.43 | |
| | | | | | | | | | | | | | | | | | | | | | |
| | 21.52 | % | | $ | 3,222,137 | | | | 0.21 | % | | | 0.21 | % | | | 1.82 | % | | | 2.92 | % |
| | 11.73 | | | | 2,678,914 | | | | 0.21 | | | | 0.21 | | | | 1.97 | | | | 3.28 | |
| | 1.17 | | | | 2,386,253 | | | | 0.21 | | | | 0.21 | | | | 1.87 | | | | 4.17 | |
| | 13.46 | | | | 2,370,298 | | | | 0.22 | | | | 0.22 | | | | 1.84 | | | | 2.65 | |
| | 32.05 | | | | 2,164,501 | | | | 0.22 | | | | 0.22 | | | | 1.90 | | | | 3.76 | |
| | | | | | | | | | | | | | | | | | | | | | | |
| | 11.10 | % | | $ | 199,836 | | | | 0.75 | % | | | 0.73 | % | | | 2.15 | % | | | 53.45 | % |
| | 15.36 | | | | 195,773 | | | | 0.75 | | | | 0.72 | | | | 2.07 | | | | 79.86 | |
| | (3.85 | ) | | | 174,429 | | | | 0.74 | | | | 0.71 | | | | 1.49 | | | | 52.53 | |
| | 13.03 | | | | 190,954 | | | | 0.75 | | | | 0.72 | | | | 1.55 | | | | 55.92 | |
| | 31.29 | | | | 170,062 | | | | 0.78 | | | | 0.76 | | | | 1.73 | | | | 49.12 | |
| | | | | | | | | | | | | | | | | | | | | | | |
| | 13.78 | % | | $ | 819,214 | | | | 0.55 | % | | | 0.54 | % | | | 1.93 | % | | | 12.37 | % |
| | 14.98 | | | | 720,940 | | | | 0.55 | | | | 0.55 | | | | 2.00 | | | | 12.24 | |
| | (0.09 | ) | | | 610,458 | | | | 0.56 | | | | 0.55 | | | | 2.06 | | | | 14.15 | |
| | 13.87 | | | | 620,021 | | | | 0.56 | | | | 0.56 | | | | 1.92 | | | | 7.97 | |
| | 34.03 | | | | 570,648 | | | | 0.57 | | | | 0.57 | | | | 2.10 | | | | 17.09 | |
| (d) | Total Return includes deductions for management and other fund expenses; excludes deductions for sales loads and account fees, not annualized for periods less than one year. |
The Accompanying Notes are an Integral Part of the Financial Statements.
Financial Highlights
(For a share outstanding throughout the period)
| | | | | | | | | | | | | | | | | | | | | | | | | | | | | | | | |
| | | Net Asset Value,
Beginning
of Period | | | Net Investment
Income (Loss) | | | Net Realized and
Unrealized Gain
(Loss) on
Investments | | | Total from
Investment
Operations | | | Distributions
from Net
Investment
Income | | | Distributions
from Realized
Gains on
Investments | | | Total
Distributions | | | Net Asset Value,
End of Period | |
Equity Income Portfolio | |
2017 | | $ | 1.72 | | | $ | 0.04 | | | $ | 0.23 | | | $ | 0.27 | | | $ | (0.04 | ) | | $ | (0.09 | ) | | $ | (0.13 | ) | | $ | 1.86 | |
2016 | | | 1.56 | | | | 0.04 | | | | 0.24 | | | | 0.28 | | | | (0.03 | ) | | | (0.09 | ) | | | (0.12 | ) | | | 1.72 | |
2015 | | | 1.77 | | | | 0.03 | | | | (0.14 | ) | | | (0.11 | ) | | | (0.03 | ) | | | (0.07 | ) | | | (0.10 | ) | | | 1.56 | |
2014 | | | 1.72 | | | | 0.03 | | | | 0.10 | | | | 0.13 | | | | (0.02 | ) | | | (0.06 | ) | | | (0.08 | ) | | | 1.77 | |
2013 | | | 1.34 | | | | 0.03 | | | | 0.37 | | | | 0.40 | | | | (0.02 | ) | | | – | | | | (0.02 | ) | | | 1.72 | |
Mid Cap Growth Stock Portfolio | |
2017 | | $ | 2.88 | | | $ | 0.00 | (e) | | $ | 0.59 | | | $ | 0.59 | | | $ | (0.01 | ) | | $ | – | | | $ | (0.01 | ) | | $ | 3.46 | |
2016 | | | 3.11 | | | | 0.01 | | | | 0.02 | | | | 0.03 | | | | (0.01 | ) | | | (0.25 | ) | | | (0.26 | ) | | | 2.88 | |
2015 | | | 3.40 | | | | 0.01 | | | | 0.02 | | | | 0.03 | | | | (0.00 | )(e) | | | (0.32 | ) | | | (0.32 | ) | | | 3.11 | |
2014 | | | 3.92 | | | | 0.01 | | | | 0.27 | | | | 0.28 | | | | (0.01 | ) | | | (0.79 | ) | | | (0.80 | ) | | | 3.40 | |
2013 | | | 3.26 | | | | 0.02 | | | | 0.80 | | | | 0.82 | | | | (0.01 | ) | | | (0.15 | ) | | | (0.16 | ) | | | 3.92 | |
Index 400 Stock Portfolio | |
2017 | | $ | 1.96 | | | $ | 0.02 | | | $ | 0.27 | | | $ | 0.29 | | | $ | (0.02 | ) | | $ | (0.12 | ) | | $ | (0.14 | ) | | $ | 2.11 | |
2016 | | | 1.77 | | | | 0.02 | | | | 0.33 | | | | 0.35 | | | | (0.02 | ) | | | (0.14 | ) | | | (0.16 | ) | | | 1.96 | |
2015 | | | 1.96 | | | | 0.02 | | | | (0.07 | ) | | | (0.05 | ) | | | (0.02 | ) | | | (0.12 | ) | | | (0.14 | ) | | | 1.77 | |
2014 | | | 1.90 | | | | 0.02 | | | | 0.15 | | | | 0.17 | | | | (0.02 | ) | | | (0.09 | ) | | | (0.11 | ) | | | 1.96 | |
2013 | | | 1.49 | | | | 0.02 | | | | 0.47 | | | | 0.49 | | | | (0.02 | ) | | | (0.06 | ) | | | (0.08 | ) | | | 1.90 | |
Mid Cap Value Portfolio | |
2017 | | $ | 1.73 | | | $ | 0.03 | | | $ | 0.16 | | | $ | 0.19 | | | $ | (0.03 | ) | | $ | (0.06 | ) | | $ | (0.09 | ) | | $ | 1.83 | |
2016 | | | 1.54 | | | | 0.03 | | | | 0.32 | | | | 0.35 | | | | (0.03 | ) | | | (0.13 | ) | | | (0.16 | ) | | | 1.73 | |
2015 | | | 1.77 | | | | 0.02 | | | | (0.04 | ) | | | (0.02 | ) | | | (0.03 | ) | | | (0.18 | ) | | | (0.21 | ) | | | 1.54 | |
2014 | | | 1.67 | | | | 0.03 | | | | 0.24 | | | | 0.27 | | | | (0.02 | ) | | | (0.15 | ) | | | (0.17 | ) | | | 1.77 | |
2013 | | | 1.30 | | | | 0.02 | | | | 0.37 | | | | 0.39 | | | | (0.01 | ) | | | (0.01 | ) | | | (0.02 | ) | | | 1.67 | |
Small Cap Growth Stock Portfolio | |
2017 | | $ | 2.39 | | | $ | 0.00 | (e) | | $ | 0.52 | | | $ | 0.52 | | | $ | (0.00 | )(e) | | $ | (0.03 | ) | | $ | (0.03 | ) | | $ | 2.88 | |
2016 | | | 2.37 | | | | 0.00 | (e) | | | 0.28 | | | | 0.28 | | | | (0.01 | ) | | | (0.25 | ) | | | (0.26 | ) | | | 2.39 | |
2015 | | | 2.50 | | | | 0.01 | | | | (0.01 | ) | | | – | | | | (0.00 | )(e) | | | (0.13 | ) | | | (0.13 | ) | | | 2.37 | |
2014 | | | 2.60 | | | | 0.00 | (e) | | | 0.20 | | | | 0.20 | | | | – | | | | (0.30 | ) | | | (0.30 | ) | | | 2.50 | |
2013 | | | 1.88 | | | | 0.00 | (e) | | | 0.73 | | | | 0.73 | | | | (0.01 | ) | | | – | | | | (0.01 | ) | | | 2.60 | |
Index 600 Stock Portfolio | |
2017 | | $ | 1.36 | | | $ | 0.01 | | | $ | 0.16 | | | $ | 0.17 | | | $ | (0.03 | ) | | $ | (0.05 | ) | | $ | (0.08 | ) | | $ | 1.45 | |
2016 | | | 1.13 | | | | 0.01 | | | | 0.29 | | | | 0.30 | | | | (0.01 | ) | | | (0.06 | ) | | | (0.07 | ) | | | 1.36 | |
2015 | | | 1.16 | | | | 0.01 | | | | (0.04 | ) | | | (0.03 | ) | | | – | | | | (0.00 | )(e) | | | (0.00 | )(e) | | | 1.13 | |
2014 | | | 1.33 | | | | 0.01 | | | | 0.06 | | | | 0.07 | | | | (0.02 | ) | | | (0.22 | ) | | | (0.24 | ) | | | 1.16 | |
2013 | | | 1.01 | | | | 0.01 | | | | 0.39 | | | | 0.40 | | | | (0.04 | ) | | | (0.04 | ) | | | (0.08 | ) | | | 1.33 | |
Small Cap Value Portfolio | |
2017 | | $ | 2.42 | | | $ | 0.02 | | | $ | 0.25 | | | $ | 0.27 | | | $ | (0.02 | ) | | $ | (0.13 | ) | | $ | (0.15 | ) | | $ | 2.54 | |
2016 | | | 2.10 | | | | 0.02 | | | | 0.61 | | | | 0.63 | | | | (0.02 | ) | | | (0.29 | ) | | | (0.31 | ) | | | 2.42 | |
2015 | | | 2.38 | | | | 0.02 | | | | (0.14 | ) | | | (0.12 | ) | | | (0.02 | ) | | | (0.14 | ) | | | (0.16 | ) | | | 2.10 | |
2014 | | | 2.45 | | | | 0.02 | | | | (0.02 | ) | | | 0.00 | (e) | | | (0.01 | ) | | | (0.06 | ) | | | (0.07 | ) | | | 2.38 | |
2013 | | | 1.89 | | | | 0.01 | | | | 0.59 | | | | 0.60 | | | | (0.03 | ) | | | (0.01 | ) | | | (0.04 | ) | | | 2.45 | |
| (e) | Amount is less than $0.005. |
The Accompanying Notes are an Integral Part of the Financial Statements.
| | | | | | | | | | | | | | | | | | | | | | |
| Total Return(d) | | | Net Assets, End
of Period
(thousands) | | | Ratio of Gross
Expenses to
Average Net
Assets | | | Ratio of Net
Expenses to
Average Net
Assets | | | Ratio of Net
Investment
Income (Loss) to
Average Net
Assets | | | Portfolio
Turnover Rate | |
| | | | | | | | | | | | | | | | | | | | | | | |
| | 16.24 | % | | $ | 844,398 | | | | 0.65 | % | | | 0.62 | % | | | 2.04 | % | | | 21.27 | % |
| | 19.17 | | | | 798,167 | | | | 0.66 | | | | 0.64 | | | | 2.42 | | | | 23.09 | |
| | (6.74 | ) | | | 732,781 | | | | 0.65 | | | | 0.65 | | | | 2.08 | | | | 37.97 | |
| | 7.43 | | | | 781,735 | | | | 0.66 | | | | 0.66 | | | | 1.94 | | | | 13.56 | |
| | 29.94 | | | | 676,031 | | | | 0.67 | | | | 0.67 | | | | 1.77 | | | | 15.98 | |
| | | | | | | | | | | | | | | | | | | | | | | |
| | 20.29 | % | | $ | 1,097,433 | | | | 0.54 | % | | | 0.54 | % | | | 0.14 | % | | | 148.03 | % |
| | 0.83 | | | | 983,395 | | | | 0.54 | | | | 0.54 | | | | 0.29 | | | | 57.23 | |
| | 0.71 | | | | 1,025,151 | | | | 0.53 | | | | 0.52 | | | | 0.17 | | | | 68.54 | |
| | 8.49 | | | | 1,098,155 | | | | 0.54 | | | | 0.51 | | | | 0.25 | | | | 82.51 | |
| | 25.53 | | | | 1,073,332 | | | | 0.54 | | | | 0.52 | | | | 0.44 | | | | 137.80 | |
| | | | | | | | | | | | | | | | | | | | | | |
| | 15.96 | % | | $ | 896,559 | | | | 0.28 | % | | | 0.26 | % | | | 1.22 | % | | | 18.08 | % |
| | 20.38 | | | | 773,157 | | | | 0.28 | | | | 0.27 | | | | 1.31 | | | | 19.44 | |
| | (2.38 | ) | | | 634,401 | | | | 0.28 | | | | 0.27 | | | | 1.23 | | | | 18.70 | |
| | 9.42 | | | | 652,404 | | | | 0.28 | | | | 0.27 | | | | 1.25 | | | | 12.20 | |
| | 33.16 | | | | 624,092 | | | | 0.29 | | | | 0.28 | | | | 1.15 | | | | 11.21 | |
| | | | | | | | | | | | | | | | | | | | | | | |
| | 11.81 | % | | $ | 564,624 | | | | 0.88 | % | | | 0.76 | % | | | 1.79 | % | | | 46.45 | % |
| | 23.23 | | | | 518,217 | | | | 0.89 | | | | 0.77 | | | | 1.71 | | | | 53.81 | |
| | (1.33 | ) | | | 410,233 | | | | 0.89 | | | | 0.77 | | | | 1.38 | | | | 71.46 | |
| | 16.69 | | | | 427,853 | | | | 0.90 | | | | 0.78 | | | | 1.56 | | | | 66.16 | |
| | 30.24 | | | | 343,933 | | | | 0.91 | | | | 0.85 | | | | 1.54 | | | | 68.43 | |
| | | | | | | | | | | | | | | | | | | | | | | |
| | 21.61 | % | | $ | 627,901 | | | | 0.56 | % | | | 0.56 | % | | | (0.01 | )% | | | 43.11 | % |
| | 12.25 | | | | 545,052 | | | | 0.58 | | | | 0.58 | | | | 0.19 | | | | 44.26 | |
| | 0.32 | | | | 494,932 | | | | 0.57 | | | | 0.56 | | | | 0.22 | | | | 48.21 | |
| | 8.66 | | | | 529,548 | | | | 0.57 | | | | 0.57 | | | | 0.12 | | | | 27.07 | |
| | 38.60 | | | | 520,492 | | | | 0.59 | | | | 0.59 | | | | 0.00 | | | | 155.34 | |
| | | | | | | | | | | | | | | | | | | | | | | |
| | 12.93 | % | | $ | 222,348 | | | | 0.33 | % | | | 0.33 | % | | | 1.04 | % | | | 36.46 | % |
| | 26.12 | | | | 173,883 | | | | 0.36 | | | | 0.35 | | | | 1.00 | | | | 52.14 | |
| | (2.35 | ) | | | 113,993 | | | | 0.36 | | | | 0.34 | | | | 0.95 | | | | 46.59 | |
| | 5.34 | | | | 101,286 | | | | 0.39 | | | | 0.35 | | | | 0.93 | | | | 49.73 | |
| | 40.67 | | | | 123,487 | | | | 0.38 | | | | 0.35 | | | | 0.76 | | | | 47.23 | |
| | | | | | | | | | | | | | | | | | | | | | | |
| | 11.65 | % | | $ | 673,234 | | | | 0.88 | % | | | 0.86 | % | | | 0.56 | % | | | 14.51 | % |
| | 32.39 | | | | 647,830 | | | | 0.89 | | | | 0.88 | | | | 0.93 | | | | 24.02 | |
| | (5.45 | ) | | | 514,970 | | | | 0.88 | | | | 0.88 | | | | 1.00 | | | | 35.53 | |
| | 0.22 | | | | 583,367 | | | | 0.88 | | | | 0.88 | | | | 0.81 | | | | 16.29 | |
| | 31.76 | | | | 576,830 | | | | 0.88 | | | | 0.88 | | | | 0.46 | | | | 9.17 | |
| (d) | Total Return includes deductions for management and other fund expenses; excludes deductions for sales loads and account fees, not annualized for periods less than one year. |
The Accompanying Notes are an Integral Part of the Financial Statements.
Financial Highlights
(For a share outstanding throughout the period)
| | | | | | | | | | | | | | | | | | | | | | | | | | | | | | | | |
| | | Net Asset Value,
Beginning
of Period | | | Net Investment
Income (Loss) | | | Net Realized and
Unrealized Gain
(Loss) on
Investments | | | Total from
Investment
Operations | | | Distributions
from Net
Investment
Income | | | Distributions
from Realized
Gains on
Investments | | | Total
Distributions | | | Net Asset Value,
End of Period | |
International Growth Portfolio | |
2017 | | $ | 1.24 | | | $ | 0.02 | | | $ | 0.35 | | | $ | 0.37 | | | $ | (0.02 | ) | | $ | – | | | $ | (0.02 | ) | | $ | 1.59 | |
2016 | | | 1.30 | | | | 0.02 | | | | (0.07 | ) | | | (0.05 | ) | | | (0.01 | ) | | | – | | | | (0.01 | ) | | | 1.24 | |
2015 | | | 1.34 | | | | 0.02 | | | | (0.04 | ) | | | (0.02 | ) | | | (0.02 | ) | | | – | | | | (0.02 | ) | | | 1.30 | |
2014 | | | 1.43 | | | | 0.02 | | | | (0.09 | ) | | | (0.07 | ) | | | (0.02 | ) | | | – | | | | (0.02 | ) | | | 1.34 | |
2013 | | | 1.21 | | | | 0.02 | | | | 0.22 | | | | 0.24 | | | | (0.02 | ) | | | – | | | | (0.02 | ) | | | 1.43 | |
Research International Core Portfolio | |
2017 | | $ | 0.82 | | | $ | 0.02 | | | $ | 0.22 | | | $ | 0.24 | | | $ | (0.02 | ) | | $ | – | | | $ | (0.02 | ) | | $ | 1.04 | |
2016 | | | 0.85 | | | | 0.02 | | | | (0.03 | ) | | | (0.01 | ) | | | (0.01 | ) | | | (0.01 | ) | | | (0.02 | ) | | | 0.82 | |
2015 | | | 0.90 | | | | 0.02 | | | | (0.03 | ) | | | (0.01 | ) | | | (0.02 | ) | | | (0.02 | ) | | | (0.04 | ) | | | 0.85 | |
2014 | | | 0.99 | | | | 0.02 | | | | (0.09 | ) | | | (0.07 | ) | | | (0.01 | ) | | | (0.01 | ) | | | (0.02 | ) | | | 0.90 | |
2013 | | | 0.83 | | | | 0.01 | | | | 0.15 | | | | 0.16 | | | | (0.00 | )(e) | | | – | | | | (0.00 | )(e) | | | 0.99 | |
International Equity Portfolio | |
2017 | | $ | 1.60 | | | $ | 0.04 | | | $ | 0.31 | | | $ | 0.35 | | | $ | (0.04 | ) | | $ | – | | | $ | (0.04 | ) | | $ | 1.91 | |
2016 | | | 1.61 | | | | 0.04 | | | | (0.00 | )(e) | | | 0.04 | | | | (0.03 | ) | | | (0.02 | ) | | | (0.05 | ) | | | 1.60 | |
2015 | | | 1.77 | | | | 0.04 | | | | (0.08 | ) | | | (0.04 | ) | | | (0.05 | ) | | | (0.07 | ) | | | (0.12 | ) | | | 1.61 | |
2014 | | | 2.13 | | | | 0.06 | | | | (0.24 | ) | | | (0.18 | ) | | | (0.04 | ) | | | (0.14 | ) | | | (0.18 | ) | | | 1.77 | |
2013 | | | 1.79 | | | | 0.04 | | | | 0.34 | | | | 0.38 | | | | (0.04 | ) | | | (0.00 | )(e) | | | (0.04 | ) | | | 2.13 | |
Emerging Markets Equity Portfolio | |
2017 | | $ | 0.87 | | | $ | 0.02 | | | $ | 0.22 | | | $ | 0.24 | | | $ | (0.01 | ) | | $ | – | | | $ | (0.01 | ) | | $ | 1.10 | |
2016 | | | 0.80 | | | | 0.01 | | | | 0.07 | | | | 0.08 | | | | (0.01 | ) | | | – | | | | (0.01 | ) | | | 0.87 | |
2015 | | | 0.93 | | | | 0.01 | | | | (0.13 | ) | | | (0.12 | ) | | | (0.01 | ) | | | – | | | | (0.01 | ) | | | 0.80 | |
2014 | | | 0.99 | | | | 0.01 | | | | (0.06 | ) | | | (0.05 | ) | | | (0.01 | ) | | | 0.00 | (e) | | | (0.01 | ) | | | 0.93 | |
2013 | | | 1.06 | | | | 0.01 | | | | (0.07 | ) | | | (0.06 | ) | | | (0.01 | ) | | | 0.00 | (e) | | | (0.01 | ) | | | 0.99 | |
Government Money Market Portfolio | |
2017 | | $ | 1.00 | | | $ | 0.01 | | | $ | 0.00 | (e) | | $ | 0.01 | | | $ | (0.01 | ) | | $ | (0.00 | )(e) | | $ | (0.01 | ) | | $ | 1.00 | |
2016 | | | 1.00 | | | | 0.00 | (e) | | | – | | | | 0.00 | (e) | | | (0.00 | )(e) | | | (0.00 | )(e) | | | (0.00 | )(e) | | | 1.00 | |
2015 | | | 1.00 | | | | 0.00 | (e) | | | – | | | | 0.00 | (e) | | | (0.00 | )(e) | | | (0.00 | )(e) | | | (0.00 | )(e) | | | 1.00 | |
2014 | | | 1.00 | | | | 0.00 | (e) | | | – | | | | 0.00 | (e) | | | (0.00 | )(e) | | | – | | | | (0.00 | )(e) | | | 1.00 | |
2013 | | | 1.00 | | | | 0.00 | (e) | | | – | | | | 0.00 | (e) | | | (0.00 | )(e) | | | – | | | | (0.00 | )(e) | | | 1.00 | |
Short-Term Bond Portfolio | |
2017 | | $ | 1.03 | | | $ | 0.02 | | | $ | (0.01 | ) | | $ | 0.01 | | | $ | (0.01 | ) | | $ | – | | | $ | (0.01 | ) | | $ | 1.03 | |
2016 | | | 1.03 | | | | 0.01 | | | | – | | | | 0.01 | | | | (0.01 | ) | | | – | | | | (0.01 | ) | | | 1.03 | |
2015 | | | 1.03 | | | | 0.01 | | | | (0.00 | )(e) | | | 0.01 | | | | (0.01 | ) | | | – | | | | (0.01 | ) | | | 1.03 | |
2014 | | | 1.03 | | | | 0.01 | | | | – | | | | 0.01 | | | | (0.01 | ) | | | – | | | | (0.01 | ) | | | 1.03 | |
2013 | | | 1.03 | | | | 0.01 | | | | (0.01 | ) | | | 0.00 | (e) | | | (0.00 | )(e) | | | – | | | | (0.00 | )(e) | | | 1.03 | |
Select Bond Portfolio | |
2017 | | $ | 1.26 | | | $ | 0.03 | | | $ | 0.02 | | | $ | 0.05 | | | $ | (0.03 | ) | | $ | (0.02 | ) | | $ | (0.05 | ) | | $ | 1.26 | |
2016 | | | 1.25 | | | | 0.02 | | | | 0.03 | | | | 0.05 | | | | (0.03 | ) | | | (0.01 | ) | | | (0.04 | ) | | | 1.26 | |
2015 | | | 1.27 | | | | 0.02 | | | | (0.01 | ) | | | 0.01 | | | | (0.02 | ) | | | (0.01 | ) | | | (0.03 | ) | | | 1.25 | |
2014 | | | 1.23 | | | | 0.02 | | | | 0.05 | | | | 0.07 | | | | (0.03 | ) | | | – | | | | (0.03 | ) | | | 1.27 | |
2013 | | | 1.30 | | | | 0.03 | | | | (0.05 | ) | | | (0.02 | ) | | | (0.03 | ) | | | (0.02 | ) | | | (0.05 | ) | | | 1.23 | |
| (e) | Amount is less than $0.005. |
The Accompanying Notes are an Integral Part of the Financial Statements.
| | | | | | | | | | | | | | | | | | | | | | |
| Total Return(d) | | | Net Assets, End
of Period
(thousands) | | | Ratio of Gross
Expenses to
Average Net
Assets | | | Ratio of Net
Expenses to
Average Net
Assets | | | Ratio of Net
Investment
Income (Loss) to
Average Net
Assets | | | Portfolio
Turnover Rate | |
| | | | | | | | | | | | | | | | | | | | | | | |
| | 30.03 | % | | $ | 697,581 | | | | 0.67 | % | | | 0.67 | % | | | 1.32 | % | | | 19.52 | % |
| | (3.41 | ) | | | 523,122 | | | | 0.71 | | | | 0.71 | | | | 1.67 | | | | 25.57 | |
| | (1.73 | ) | | | 485,313 | | | | 0.74 | | | | 0.74 | | | | 1.12 | | | | 134.92 | |
| | (4.52 | ) | | | 436,931 | | | | 0.74 | | | | 0.74 | | | | 1.75 | | | | 64.20 | |
| | 19.81 | | | | 420,218 | | | | 0.76 | | | | 0.76 | | | | 1.20 | | | | 77.33 | |
| | | | | | | | | | | | | | | | | | | | | | | |
| | 28.21 | % | | $ | 658,005 | | | | 0.86 | % | | | 0.81 | % | | | 1.74 | % | | | 27.88 | % |
| | (1.12 | ) | | | 499,649 | | | | 0.92 | | | | 0.88 | | | | 1.99 | | | | 40.80 | |
| | (1.11 | ) | | | 498,395 | | | | 0.91 | | | | 0.91 | | | | 1.78 | | | | 32.43 | |
| | (6.71 | ) | | | 457,008 | | | | 0.94 | | | | 0.94 | | | | 2.45 | | | | 25.24 | |
| | 18.92 | | | | 412,413 | | | | 0.98 | | | | 0.98 | | | | 1.65 | | | | 30.41 | |
| | | | | | | | | | | | | | | | | | | | | | | |
| | 22.30 | % | | $ | 1,927,673 | | | | 0.70 | % | | | 0.57 | % | | | 2.40 | % | | | 20.68 | % |
| | 2.89 | | | | 1,628,267 | | | | 0.71 | | | | 0.62 | | | | 2.65 | | | | 16.25 | |
| | (2.21 | ) | | | 1,605,948 | | | | 0.73 | | | | 0.64 | | | | 2.05 | | | | 18.80 | |
| | (8.80 | ) | | | 1,635,378 | | | | 0.72 | | | | 0.66 | | | | 2.91 | | | | 17.84 | |
| | 21.38 | | | | 1,778,202 | | | | 0.73 | | | | 0.66 | | | | 2.10 | | | | 34.06 | |
| | | | | | | | | | | | | | | | | | | | | | | |
| | 27.84 | % | | $ | 718,281 | | | | 1.18 | % | | | 1.06 | % | | | 1.61 | % | | | 98.21 | % |
| | 9.06 | | | | 521,800 | | | | 1.25 | | | | 1.16 | | | | 1.24 | | | | 47.33 | |
| | (12.24 | ) | | | 444,297 | | | | 1.32 | | | | 1.32 | | | | 0.91 | | | | 45.83 | |
| | (6.25 | ) | | | 416,997 | | | | 1.34 | | | | 1.35 | | | | 1.02 | | | | 45.75 | |
| | (5.15 | ) | | | 357,253 | | | | 1.40 | | | | 1.40 | | | | 0.81 | | | | 31.60 | |
| | | | | | | | | | | | | | | | | | | | | | | |
| | 0.60 | % | | $ | 439,438 | | | | 0.33 | % | | | 0.33 | % | | | 0.59 | % | | | – | % |
| | 0.13 | | | | 501,635 | | | | 0.32 | | | | 0.32 | | | | 0.11 | | | | – | |
| | 0.01 | | | | 445,287 | | | | 0.33 | | | | 0.26 | | | | 0.01 | | | | – | |
| | 0.07 | | | | 438,752 | | | | 0.33 | | | | 0.07 | | | | 0.07 | | | | – | |
| | 0.10 | | | | 483,182 | | | | 0.32 | | | | 0.07 | | | | 0.10 | | | | – | |
| | | | | | | | | | | | | | | | | | | | | | | |
| | 1.33 | % | | $ | 293,514 | | | | 0.42 | % | | | 0.41 | % | | | 1.60 | % | | | 45.77 | % |
| | 1.67 | | | | 269,833 | | | | 0.43 | | | | 0.43 | | | | 1.33 | | | | 36.61 | |
| | 0.72 | | | | 244,204 | | | | 0.43 | | | | 0.42 | | | | 1.17 | | | | 35.76 | |
| | 0.38 | | | | 234,487 | | | | 0.41 | | | | 0.41 | | | | 0.76 | | | | 196.15 | |
| | 0.55 | | | | 196,198 | | | | 0.42 | | | | 0.42 | | | | 0.76 | | | | 199.33 | |
| | | | | | | | | | | | | | | | | | | | | | | |
| | 3.58 | % | | $ | 2,943,934 | | | | 0.32 | % | | | 0.31 | % | | | 2.15 | % | | | 390.26 | %(g) |
| | 3.06 | | | | 2,839,045 | | | | 0.32 | | | | 0.31 | | | | 1.91 | | | | 524.79 | (g) |
| | 0.53 | | | | 2,856,958 | | | | 0.31 | | | | 0.31 | | | | 1.76 | | | | 476.41 | (g) |
| | 5.56 | | | | 2,841,156 | | | | 0.32 | | | | 0.32 | | | | 1.97 | | | | 308.80 | (g) |
| | (2.16 | ) | | | 1,712,896 | | | | 0.32 | | | | 0.32 | | | | 1.99 | | | | 131.49 | (g) |
| (d) | Total Return includes deductions for management and other fund expenses; excludes deductions for sales loads and account fees, not annualized for periods less than one year. |
| (g) | Portfolio Turnover Rate excludes the impact of mortgage dollar roll transactions. |
The Accompanying Notes are an Integral Part of the Financial Statements.
Financial Highlights
(For a share outstanding throughout the period)
| | | | | | | | | | | | | | | | | | | | | | | | | | | | | | | | |
| | | Net Asset Value,
Beginning
of Period | | | Net Investment
Income (Loss) | | | Net Realized and
Unrealized Gain
(Loss) on
Investments | | | Total from
Investment
Operations | | | Distributions
from Net
Investment
Income | | | Distributions
from Realized
Gains on
Investments | | | Total
Distributions | | | Net Asset Value,
End of Period | |
Long-Term U.S. Government Bond Portfolio | |
2017 | | $ | 1.06 | | | $ | 0.03 | | | $ | 0.05 | | | $ | 0.08 | | | $ | (0.02 | ) | | $ | (0.04 | ) | | $ | (0.06 | ) | | $ | 1.08 | |
2016 | | | 1.08 | | | | 0.03 | | | | (0.01 | ) | | | 0.02 | | | | (0.02 | ) | | | (0.02 | ) | | | (0.04 | ) | | | 1.06 | |
2015 | | | 1.12 | | | | 0.03 | | | | (0.05 | ) | | | (0.02 | ) | | | (0.02 | ) | | | – | | | | (0.02 | ) | | | 1.08 | |
2014 | | | 0.92 | | | | 0.03 | | | | 0.19 | | | | 0.22 | | | | (0.02 | ) | | | – | | | | (0.02 | ) | | | 1.12 | |
2013 | | | 1.07 | | | | 0.03 | | | | (0.18 | ) | | | (0.15 | ) | | | 0.00 | (e) | | | (0.00 | )(e) | | | (0.00 | )(e) | | | 0.92 | |
Inflation Protection Portfolio | |
2017 | �� | $ | 1.09 | | | $ | 0.02 | | | $ | 0.01 | | | $ | 0.03 | | | $ | (0.01 | ) | | $ | (0.00 | )(e) | | $ | (0.01 | ) | | $ | 1.11 | |
2016 | | | 1.05 | | | | 0.02 | | | | 0.03 | | | | 0.05 | | | | (0.01 | ) | | | – | | | | (0.01 | ) | | | 1.09 | |
2015 | | | 1.10 | | | | 0.01 | | | | (0.03 | ) | | | (0.02 | ) | | | (0.03 | ) | | | – | | | | (0.03 | ) | | | 1.05 | |
2014 | | | 1.08 | | | | 0.01 | | | | 0.03 | | | | 0.04 | | | | (0.01 | ) | | | (0.01 | ) | | | (0.02 | ) | | | 1.10 | |
2013 | | | 1.22 | | | | 0.01 | | | | (0.12 | ) | | | (0.11 | ) | | | (0.01 | ) | | | (0.02 | ) | | | (0.03 | ) | | | 1.08 | |
High Yield Bond Portfolio | |
2017 | | $ | 0.74 | | | $ | 0.04 | | | $ | 0.01 | | | $ | 0.05 | | | $ | (0.04 | ) | | $ | – | | | $ | (0.04 | ) | | $ | 0.75 | |
2016 | | | 0.68 | | | | 0.04 | | | | 0.06 | | | | 0.10 | | | | (0.04 | ) | | | – | | | | (0.04 | ) | | | 0.74 | |
2015 | | | 0.72 | | | | 0.04 | | | | (0.05 | ) | | | (0.01 | ) | | | (0.03 | ) | | | – | | | | (0.03 | ) | | | 0.68 | |
2014 | | | 0.75 | | | | 0.04 | | | | (0.03 | ) | | | 0.01 | | | | (0.04 | ) | | | – | | | | (0.04 | ) | | | 0.72 | |
2013 | | | 0.75 | | | | 0.04 | | | | – | | | | 0.04 | | | | (0.04 | ) | | | – | | | | (0.04 | ) | | | 0.75 | |
Multi-Sector Bond Portfolio | |
2017 | | $ | 1.05 | | | $ | 0.04 | | | $ | 0.04 | | | $ | 0.08 | | | $ | (0.04 | ) | | $ | – | | | $ | (0.04 | ) | | $ | 1.09 | |
2016 | | | 0.99 | | | | 0.04 | | | | 0.07 | | | | 0.11 | | | | (0.05 | ) | | | – | | | | (0.05 | ) | | | 1.05 | |
2015 | | | 1.08 | | | | 0.04 | | | | (0.05 | ) | | | (0.01 | ) | | | (0.06 | ) | | | (0.02 | ) | | | (0.08 | ) | | | 0.99 | |
2014 | | | 1.08 | | | | 0.04 | | | | (0.01 | ) | | | 0.03 | | | | (0.03 | ) | | | – | | | | (0.03 | ) | | | 1.08 | |
2013 | | | 1.14 | | | | 0.04 | | | | (0.05 | ) | | | (0.01 | ) | | | (0.04 | ) | | | (0.01 | ) | | | (0.05 | ) | | | 1.08 | |
Balanced Portfolio | |
2017 | | $ | 1.40 | | | $ | 0.03 | | | $ | 0.12 | | | $ | 0.15 | | | $ | (0.03 | ) | | $ | (0.05 | ) | | $ | (0.08 | ) | | $ | 1.47 | |
2016 | | | 1.38 | | | | 0.02 | | | | 0.07 | | | | 0.09 | | | | (0.03 | ) | | | (0.04 | ) | | | (0.07 | ) | | | 1.40 | |
2015 | | | 1.48 | | | | 0.02 | | | | (0.02 | ) | | | – | | | | (0.03 | ) | | | (0.07 | ) | | | (0.10 | ) | | | 1.38 | |
2014 | | | 1.56 | | | | 0.02 | | | | 0.07 | | | | 0.09 | | | | (0.04 | ) | | | (0.13 | ) | | | (0.17 | ) | | | 1.48 | |
2013 | | | 1.51 | | | | 0.03 | | | | 0.14 | | | | 0.17 | | | | (0.05 | ) | | | (0.07 | ) | | | (0.12 | ) | | | 1.56 | |
Asset Allocation Portfolio | |
2017 | | $ | 1.12 | | | $ | 0.02 | | | $ | 0.15 | | | $ | 0.17 | | | $ | (0.03 | ) | | $ | (0.05 | ) | | $ | (0.08 | ) | | $ | 1.21 | |
2016 | | | 1.11 | | | | 0.02 | | | | 0.06 | | | | 0.08 | | | | (0.03 | ) | | | (0.04 | ) | | | (0.07 | ) | | | 1.12 | |
2015 | | | 1.20 | | | | 0.02 | | | | (0.03 | ) | | | (0.01 | ) | | | (0.02 | ) | | | (0.06 | ) | | | (0.08 | ) | | | 1.11 | |
2014 | | | 1.28 | | | | 0.01 | | | | 0.05 | | | | 0.06 | | | | (0.03 | ) | | | (0.11 | ) | | | (0.14 | ) | | | 1.20 | |
2013 | | | 1.13 | | | | 0.02 | | | | 0.17 | | | | 0.19 | | | | (0.04 | ) | | | – | | | | (0.04 | ) | | | 1.28 | |
| (e) | Amount is less than $0.005. |
The Accompanying Notes are an Integral Part of the Financial Statements.
| | | | | | | | | | | | | | | | | | | | | | |
| Total Return(d) | | | Net Assets, End
of Period
(thousands) | | | Ratio of Gross
Expenses to
Average Net
Assets | | | Ratio of Net
Expenses to
Average Net
Assets | | | Ratio of Net
Investment
Income (Loss) to
Average Net
Assets | | | Portfolio
Turnover Rate | |
| | | | | | | | | | | | | | | | | | | | | | | |
| | 8.28 | % | | $ | 115,713 | | | | 0.94 | %(s) | | | 0.92 | %(s) | | | 2.64 | % | | | 50.94 | %(g) |
| | 1.09 | | | | 110,391 | | | | 0.77 | (s) | | | 0.77 | (s) | | | 2.19 | | | | 126.34 | (g |
| | (1.47 | ) | | | 104,513 | | | | 0.69 | (s) | | | 0.67 | (s) | | | 2.32 | | | | 32.93 | (g) |
| | 23.73 | | | | 109,250 | | | | 0.68 | (s) | | | 0.67 | (s) | | | 2.67 | | | | 116.62 | (g) |
| | – | | | | 87,627 | | | | 0.69 | (s) | | | 0.68 | (s) | | | 2.69 | | | | 125.96 | (g) |
| | | | | | | | | | | | | | | | | | | | | | | |
| | 3.58 | % | | $ | 401,711 | | | | 0.61 | % | | | 0.57 | % | | | 2.05 | % | | | 20.82 | % |
| | 4.68 | | | | 326,927 | | | | 0.64 | | | | 0.59 | | | | 1.54 | | | | 33.80 | |
| | (2.20 | ) | | | 287,089 | | | | 0.63 | | | | 0.59 | | | | 0.52 | | | | 17.29 | |
| | 3.14 | | | | 285,685 | | | | 0.63 | | | | 0.59 | | | | 1.26 | | | | 20.25 | |
| | (8.33 | ) | | | 252,708 | | | | 0.64 | | | | 0.62 | | | | 0.91 | | | | 31.82 | |
| | | | | | | | | | | | | | | | | | | | | | | |
| | 6.88 | % | | $ | 811,878 | | | | 0.45 | % | | | 0.45 | % | | | 5.48 | % | | | 31.59 | % |
| | 14.59 | | | | 756,947 | | | | 0.47 | | | | 0.46 | | | | 5.83 | | | | 35.58 | |
| | (1.36 | ) | | | 688,124 | | | | 0.46 | | | | 0.46 | | | | 5.55 | | | | 27.49 | |
| | 1.18 | | | | 701,988 | | | | 0.47 | | | | 0.47 | | | | 5.43 | | | | 96.48 | |
| | 5.84 | | | | 518,387 | | | | 0.48 | | | | 0.48 | | | | 5.70 | | | | 53.07 | |
| | | | | | | | | | | | | | | | | | | | | | |
| | 8.38 | % | | $ | 840,981 | | | | 0.82 | % | | | 0.75 | % | | | 4.06 | % | | | 48.84 | % |
| | 11.09 | | | | 689,849 | | | | 0.84 | | | | 0.78 | | | | 3.86 | | | | 42.81 | |
| | (2.22 | ) | | | 580,634 | | | | 0.85 | | | | 0.79 | | | | 4.13 | | | | 58.14 | (g) |
| | 3.25 | | | | 546,059 | | | | 0.86 | | | | 0.81 | | | | 3.89 | | | | 58.51 | (g) |
| | (1.58 | ) | | | 459,258 | | | | 0.88 | | | | 0.88 | | | | 3.91 | | | | 65.10 | (g) |
| | | | | | | | | | | | | | | | | | | | | | |
| | 11.98 | % | | $ | 2,307,470 | | | | 0.31 | %(v) | | | 0.06 | %(v) | | | 1.75 | % | | | 16.58 | % |
| | 6.58 | | | | 2,202,834 | | | | 0.31 | (v) | | | 0.07 | (v) | | | 1.73 | | | | 23.64 | |
| | (0.12 | ) | | | 2,219,466 | | | | 0.31 | (v) | | | 0.08 | (v) | | | 1.43 | | | | 13.53 | |
| | 5.56 | | | | 2,367,127 | | | | 0.32 | (v) | | | 0.16 | (v) | | | 1.29 | | | | 56.83 | (g)(h) |
| | 12.08 | | | | 2,366,285 | | | | 0.32 | | | | 0.32 | | | | 1.91 | | | | 112.58 | (g) |
| | | | | | | | | | | | | | | | | | | | | | |
| | 14.87 | % | | $ | 277,213 | | | | 0.57 | %(v) | | | 0.09 | %(v) | | | 1.68 | % | | | 22.05 | % |
| | 7.79 | | | | 250,399 | | | | 0.58 | (v) | | | 0.09 | (v) | | | 1.69 | | | | 25.59 | |
| | (0.43 | ) | | | 249,413 | | | | 0.58 | (v) | | | 0.08 | (v) | | | 1.47 | | | | 15.36 | |
| | 5.15 | | | | 266,409 | | | | 0.62 | (v) | | | 0.23 | (v) | | | 1.13 | | | | 39.50 | (g)(h) |
| | 16.67 | | | | 260,576 | | | | 0.65 | | | | 0.60 | | | | 1.65 | | | | 105.28 | (g) |
| (d) | Total Return includes deductions for management and other fund expenses; excludes deductions for sales loads and account fees, not annualized for periods less than one year. |
| (g) | Portfolio Turnover Rate excludes the impact of mortgage dollar roll transactions. |
| (h) | Portfolio Turnover Rate excludes the impact of in kind transactions. |
| (s) | The ratios of gross expenses to average net assets and net expenses to average net assets include interest expense. Excluding interest expense, the ratios would be 0.67% and 0.66% respectively for the period ended December 31, 2017, 0.64% and 0.64% respectively for the period ended December 31, 2016, 0.67% and 0.64% respectively in 2015, 0.67% and 0.65% respectively in 2014, and 0.67% and 0.65% respectively in 2013. |
| (v) | The ratios do not reflect the fund of fund’s proportionate share of income and expenses of the underlying investee funds. |
The Accompanying Notes are an Integral Part of the Financial Statements.
Notes to Financial Statements
Note 1. Organization
Northwestern Mutual Series Fund, Inc. (the “Series Fund”) is registered as an open-end management investment company under the Investment Company Act of 1940, as amended (“1940 Act”). The Series Fund is also considered an investment company following the accounting and reporting guidance in Financial Accounting Standards Board (“FASB”) Accounting Standards Codification (“ASC”) Topic 946. The Series Fund consists of the Growth Stock Portfolio, Focused Appreciation Portfolio, Large Cap Core Stock Portfolio, Large Cap Blend Portfolio, Index 500 Stock Portfolio, Large Company Value Portfolio, Domestic Equity Portfolio, Equity Income Portfolio, Mid Cap Growth Stock Portfolio, Index 400 Stock Portfolio, Mid Cap Value Portfolio, Small Cap Growth Stock Portfolio, Index 600 Stock Portfolio, Small Cap Value Portfolio, International Growth Portfolio, Research International Core Portfolio, International Equity Portfolio, Emerging Markets Equity Portfolio, Government Money Market Portfolio, Short-Term Bond Portfolio, Select Bond Portfolio, Long-Term U.S. Government Bond Portfolio, Inflation Protection Portfolio, High Yield Bond Portfolio, Multi-Sector Bond Portfolio, Balanced Portfolio and Asset Allocation Portfolio (each, a “Portfolio” or collectively, the “Portfolios”). All of the outstanding shares of each Portfolio are held by The Northwestern Mutual Life Insurance Company (“Northwestern Mutual”) for its segregated asset accounts (either directly or indirectly through one or more underlying Portfolios operating as affiliated fund of funds).
Note 2. Significant Accounting Policies
The following is a summary of significant accounting policies consistently followed by the Series Fund in the preparation of its financial statements.
A. Use of Estimates — The preparation of financial statements in conformity with accounting principles generally accepted in the United States of America (“U.S. GAAP”) requires management to make estimates and assumptions that affect the reported amounts of assets and liabilities at the date of the financial statements and the reported amounts of revenues and expenses during the reporting period. Actual results could differ from those estimates.
B. Foreign Income and Capital Gains Taxes — The Portfolios may be subject to income taxes imposed by certain countries in which they invest. Foreign withholding taxes on dividends and interest are netted against income and separately disclosed in the Statements of Operations.
Some of the Portfolios may be subject to capital gains taxes imposed by certain countries in which they invest. Any applicable foreign capital gains tax is accrued daily based upon net unrealized gains, and may be payable following the sale of any applicable investments.
C. Federal Income Taxes — The Portfolios’ policy is to continue to comply with the requirements of the Internal Revenue Code that are applicable to regulated investment companies and to distribute all of their taxable income to their respective shareholders. The Portfolios also intend to distribute sufficient net investment income and net capital gains, if any, so that they will not be subject to excise tax, as applicable, on distributable income and gains.
In accordance with the authoritative guidance for uncertainty in income taxes, management of the Series Fund has reviewed all open tax years (2014 to 2017) for major jurisdictions and concluded there was no material impact to the Portfolios’ net assets or results of operations. There is no material tax liability relating to uncertain income tax positions taken or expected to be taken in future tax returns. The Portfolios are also not aware of any tax positions for which it is reasonably possible that the total amounts of unrecognized tax benefits will significantly change in the next 12 months.
D. Distributions — Dividends from net investment income and net realized capital gains are declared and paid each business day for the Government Money Market Portfolio and at least annually for the remaining Portfolios, when applicable. During 2017 and 2016, the Government Money Market Portfolio utilized earnings and profits distributions to shareholders on redemption of shares as part of the dividends paid deduction for income tax purposes.
E. Other — The Portfolios record security transactions on trade date. The basis for determining cost on sale of securities is identified cost. Interest income is recorded daily on the accrual basis and dividend income is recorded on the ex-dividend date or as soon as information from issuers is available. Where applicable, dividends are recorded net of foreign withholding tax. Discounts and premiums on securities purchased are amortized using the effective interest method. Expenses directly attributable to a Portfolio are incurred by the respective Portfolio. Expenses that are not directly attributable to one or more Portfolios are allocated among applicable Portfolios on an equitable and consistent basis considering such things as the nature
| | | | | | |
| | Notes to Financial Statements | | | 213 | |
Notes to Financial Statements
and type of expenses and the relative net assets of the Portfolios. The Portfolios consider highly liquid temporary cash investments purchased with an original maturity of less than three months to be cash equivalents. Cash equivalents are included in the short-term investments on the Schedule of Investments as well as in investments on the Statement of Assets and Liabilities. Temporary cash overdrafts are reported as a payable to custodian.
F. New Accounting Pronouncements — In August 2016, the FASB issued an Accounting Standards Update (“ASU”) 2016-15 which amends ASC 230 to clarify guidance on the classification of certain cash receipts and cash payments in the statement of cash flows. The ASU is effective for annual periods beginning after December 15, 2017, and interim periods within those annual periods. In November 2016, the FASB issued ASU 2016-18 which amends ASC 230 to provide guidance on the classification and presentation of changes in restricted cash and restricted cash equivalents on the statement of cash flows. The ASU is effective for annual periods beginning after December 15, 2017, and interim periods within those annual periods. Management is currently evaluating the impact that adopting both ASU 2016-15 and ASU 2016-18 will have on the financial statements.
In March 2017, the FASB issued Accounting Standards Update No. 2017-08, “Receivables—Nonrefundable Fees and Other Costs (Subtopic 310-20), Premium Amortization on Purchased Callable Debt Securities” (ASU 2017-08). ASU 2017-08 amends the amortization period for certain purchased callable debt securities held at a premium, shortening such period to the earliest call date. The amendments are effective for fiscal years, and interim periods within those fiscal years, beginning after December 15, 2018. Management is currently evaluating the impact that adopting ASU 2017-08 will have on the financial statements.
Note 3. Security Valuation
For purposes of calculating a net asset value, Portfolio securities and other assets are valued as of the close of trading on the New York Stock Exchange (“Exchange”) on each day during which the Exchange is open for trading.
The Fair Value Measurements and Disclosures Topic of the Financial Accounting Standards Codification defines fair value as the price that a fund would receive to sell an asset or pay to transfer a liability in an orderly transaction between market participants at the measurement date. It establishes and requires disclosure of a fair value hierarchy, separately for each major category of asset and liability, which segregates fair value measurements into levels. A summary of the fair value hierarchy is described below:
| | • | | Level 1 — fair value is determined by unadjusted quoted prices in active markets for identical securities or derivatives |
| | • | | Level 2 — fair value is determined by other significant observable inputs (including quoted prices for similar securities, interest rates, prepayment speeds, credit risk, and other data used in fair valuation) |
| | • | | Level 3 — fair value is determined by significant unobservable inputs (including the Portfolios’ own assumptions in determining fair value) |
The categorization of a value determined for a financial instrument within the hierarchy is based upon the pricing transparency of the instrument and does not necessarily correspond to the Portfolios’ perceived risk of that instrument.
The following is a description of the valuation techniques and significant inputs used in determining the value of the Portfolios’ investments classified as Level 1 and Level 2 in the fair value hierarchy:
| | • | | Equity securities (common and preferred stock) for which market quotations are readily available are valued at the last sale or official closing price as reported by an independent pricing service on the primary market or exchange on which they are traded. In the event there were no sales during the day or closing prices are not available, securities are valued at the last quoted bid price. Equity securities traded only in the over-the-counter market and not on a securities exchange are valued at the last sale price or closing bid price, if no sales have occurred. To the extent these securities are actively traded and valuation adjustments are not applied, they are categorized as Level 1 of the fair value hierarchy. Additionally, for foreign securities, fair value procedures are used if a significant event occurs between the close of the foreign market and the U.S. market close. The fair value price is reflected as Level 2 in the fair value hierarchy where applicable. |
| | • | | Fixed income securities, including corporate, convertible and municipal bonds and notes, U.S. government agencies, U.S. treasury obligations, sovereign issues, and non-U.S. bonds are generally valued on the basis of service provider prices that use broker dealer quotations or valuation estimates from internal pricing models. The service providers’ |
| | | | |
| 214 | | Notes to Financial Statements | | |
Notes to Financial Statements
| | internal models use inputs that are observable such as issuer details, interest rates, yield curves, call features, maturities, credit risks/spreads and default rates. Securities that use similar valuation techniques and inputs as described above are categorized as Level 2 in the fair value hierarchy. |
| | • | | Fixed income securities purchased on a delayed delivery basis are marked to market daily until settlement at the forward settlement date and are categorized as Level 2 in the fair value hierarchy. |
| | • | | Mortgage related and asset backed securities are generally issued as separate tranches, or classes, of securities within each deal. These securities are normally valued by pricing service providers that use broker dealer quotations or valuation estimates from their internal pricing models. The pricing models for these securities usually consider tranche level attributes, current market data, estimated cash flows and market based yield spreads for each tranche, and incorporate deal collateral performance, as available. Mortgage related and asset backed securities that use similar valuation techniques and inputs as described above are categorized as Level 2 in the fair value hierarchy. |
| | • | | Investments in open-end mutual funds (including other Portfolios) are valued at the mutual fund’s closing net asset value per share and are categorized as Level 1 in the fair value hierarchy. Investments in privately held mutual funds are valued at the mutual fund’s closing net asset value per share and are categorized as Level 2 in the fair value hierarchy. |
| | • | | Money market investments, other than in the Government Money Market Portfolio, are generally valued by a pricing service. All securities in the Government Money Market Portfolio are valued using amortized cost, unless the current market value differs substantially from the amortized cost, at which time the securities are marked to market. Because the value is not obtained from a quoted price in an active market, such securities are reflected as Level 2 in the fair value hierarchy. |
| | • | | Listed derivatives, such as futures or option contracts, which are actively traded on a national securities exchange, are stated at the last reported sale or settlement price on the day of valuation and are categorized as Level 1 in the fair value hierarchy. |
| | • | | Centrally cleared swaps are valued at the daily settlement price determined by the respective exchange. For centrally cleared credit default swaps the clearing facility requires its members to provide actionable levels across complete term structures. These levels along with external third party prices are used to produce daily settlement prices. These securities are categorized as Level 2 in the fair value hierarchy. Centrally cleared interest rate swaps are valued using a pricing model that references the underlying rates including the overnight index swap rate and London Interbank Offered Rate forward rate to produce the daily settlement price. These securities are categorized as Level 2 in the fair value hierarchy. |
| | • | | Over-the-counter financial derivatives, such as foreign currency contracts, futures contracts, options contracts, or swap agreements derive their value from underlying asset prices, indices, reference rates, and other inputs or a combination of these factors. These derivatives are normally valued on the basis of quotes obtained from brokers and dealers or pricing services. Depending on the product and the terms of the transaction, the value of the derivatives can be estimated using a series of techniques, including simulation pricing models. The pricing models use inputs that are observed from actively quoted markets such as issuer details, indices, spreads, interest rates, curves, dividends and exchange rates. Financial derivatives that use similar valuation techniques and inputs as described above are categorized as Level 2 in the fair value hierarchy. |
The following is a description of the valuation techniques and significant inputs used in determining the value the Portfolios’ investments classified as Level 3 in the fair value hierarchy:
| | • | | Securities and other assets for which market quotes are not readily available are valued at fair market value as determined in good faith in accordance with procedures adopted by the Series Fund’s Board of Directors (“Board”). Market quotes are considered not readily available in circumstances where there is an absence of current or reliable market-based data (e.g. trade information or broker quotes). The factors considered in reaching these values at December 31, 2017 included, but were not limited to, broker quotes, analysis of the likely outcome of pending litigation, liquidity, prepayment speed, duration and recoverability. |
A table summarizing each Portfolio’s investments under this hierarchy is included following each Portfolio’s Schedule of Investments. Transfers between investment levels may occur as markets fluctuate and/or the availability of data used in
| | | | | | |
| | Notes to Financial Statements | | | 215 | |
Notes to Financial Statements
investments’ valuation changes. The Portfolios recognize transfers between levels as of the end of the period. The amounts of transfers between Levels 1 and 2 are disclosed in the Notes to Schedules of Investments for the Portfolio. For fair valuations using significant unobservable inputs, U.S. GAAP requires a reconciliation of the beginning to ending balances for reported fair values that presents changes attributable to total realized and unrealized gains or losses, purchases and sales, and transfers in or out of the Level 3 category during the period. Additionally, U.S GAAP requires quantitative information regarding the significant unobservable inputs used in the determination of fair value of assets categorized as Level 3 in the fair value hierarchy. In accordance with the requirements, a Level 3 reconciliation and details of significant unobservable inputs have been included in the notes to the Schedule of Investments for Portfolios that have a material amount of Level 3 investments.
The Series Fund has adopted policies and procedures which govern the pricing of Portfolio securities. The Board has delegated the day-to-day responsibility for pricing Portfolio securities and other investments to Mason Street Advisors, LLC (“MSA”), the Portfolios’ investment adviser, Northwestern Mutual in its capacity as fund administrator, and State Street Bank and Trust Company in its capacity as fund accountant, subject to the oversight of a Pricing Committee appointed by the Board and comprised of representatives of MSA, Northwestern Mutual and Series Fund officers. The Pricing Committee is charged with the primary and day-to-day operational responsibility for executing the valuation process. The Pricing Committee has been delegated the authority to approve the override of any prices as permitted under the pricing procedures approved by the Board and any variances from these pricing procedures when appropriate. All such actions are subject to further review and approval by the Board at its next regular meeting.
Note 4. Securities and Other Investments
A. Delayed Delivery Transactions and When-Issued Securities — Certain Portfolios may engage in securities transactions on a when-issued or delayed delivery basis. In these transactions, the securities’ prices and yields are fixed on the date of the commitment, with payment and delivery scheduled for a future date. During this period, the securities are subject to market fluctuations. When delayed delivery purchases are outstanding, a Portfolio will earmark liquid assets on its records in amounts sufficient to meet the purchase price. A Portfolio may dispose of or renegotiate a delayed delivery transaction, which may result in a capital gain or loss.
B. Repurchase Agreements — Certain Portfolios may engage in repurchase transactions. Under the terms of a typical repurchase agreement, a Portfolio takes possession of an underlying debt obligation subject to an obligation of the seller to repurchase, and a Portfolio to resell, the obligation at an agreed upon price and time. The underlying securities for all repurchase agreements are held in safekeeping at the Portfolio’s custodian or designated sub-custodians under tri-party repurchase agreements. The market value of the collateral must be equal to or exceed at all times the total amount of the repurchase obligations, including interest. Securities purchased under repurchase agreements are reflected as an asset on the Statements of Assets and Liabilities. Generally, in the event of counterparty default, a Portfolio has the right to use the collateral to offset losses incurred. If the counterparty should default, a Portfolio will seek to sell the securities which it holds as collateral. This could involve procedural costs or delays in addition to a loss on the securities if their value should fall below their repurchase price.
C. Restricted Securities — Certain Portfolios may invest in securities that are subject to legal or contractual restrictions on resale. These securities may be sold privately, but are required to be registered or exempted from registration before being sold to the public. Disposal of these securities may involve time-consuming negotiations and expense, and prompt sale at an acceptable price may be difficult.
D. Foreign Currency Transactions — Certain Portfolios may have securities and other assets and liabilities denominated in foreign currencies which are translated into U.S. dollar amounts on the date of valuation. Purchases and sales of securities and income items denominated in foreign currencies are translated into U.S. dollar amounts on the respective dates of such transactions. When the Portfolios purchase or sell a foreign security they may enter into a foreign currency exchange contract to minimize exchange rate risk from the trade date to the settlement date of such transaction. Such foreign currency exchange contracts are marked to market daily.
The Portfolios do not separately report the results of operations due to fluctuations in foreign exchange rates on investments from the changes arising from changes in market prices of securities held. Such fluctuations are included with the net realized or unrealized gain or loss from investments.
| | | | |
| 216 | | Notes to Financial Statements | | |
Notes to Financial Statements
Net realized foreign exchange gains or losses arise from sales of foreign currencies, currency gains or losses realized between the trade date and the settlement date on security transactions, and the differences between the amounts of dividends and foreign withholding taxes recorded on the Portfolios’ books and the U.S. dollar equivalent of the amounts actually received or paid.
E. Mortgage Backed and Asset Backed Securities — Certain Portfolios may invest in mortgage backed securities, including collateralized mortgage obligations, and asset backed securities. Mortgage backed securities are interests in pools of residential or commercial mortgage loans and asset backed securities are interests in pools of other assets, including various types of loans and credit card receivables. These securities provide a monthly payment, consisting of both a principal and interest component. Interest payments may be based on either fixed rates or adjustable rates. Receipt of principal payment reduces the outstanding par amount of the security and may generate realized gains or losses. Yields on mortgage backed securities are affected by interest and prepayment rates, which, in turn, are influenced by a variety of economic, geographical, social and other factors. Maturities on mortgage backed securities represent stated maturity dates. Actual maturity dates may differ based on prepayment rates. Unlike mortgage backed securities issued or guaranteed by the U.S. government or one of its sponsored entities, mortgage backed securities and asset backed securities issued by private issuers do not have a government or government sponsored entity guarantee. These issuers may provide credit enhancements through external entities such as financial institutions or through the structuring of the transaction itself. There is no guarantee that credit enhancements, if any, will be sufficient to prevent losses.
F. Inflation-Indexed Bonds — Certain Portfolios may invest in inflation-indexed bonds. Inflation-indexed bonds are fixed income securities whose principal value is periodically adjusted to the rate of inflation. The interest rate on these bonds is generally fixed at issuance at a rate lower than typical bonds. Over the life of an inflation-indexed bond, interest will be paid based on a principal value, which is adjusted for inflation. Any increase in the principal amount of an inflation-indexed bond will be included as interest income in the applicable Portfolio’s Statement of Operations even though investors do not receive their principal until maturity.
G. Short Sales — Certain Portfolios may enter into short sale transactions. A short sale is a transaction in which a Portfolio sells a security it does not own in anticipation of a decline in the market price of the security. Securities sold in short sale transactions and the interest payable on such securities, if any, are reflected as a liability on the Statements of Assets and Liabilities. A Portfolio is obligated to deliver the security at the market price at the time the short position is closed. The risk of loss on a short sale transaction is theoretically unlimited, because there is no limit to the cost of replacing the security sold short, whereas losses from purchase transactions cannot exceed the total amount invested. As of December 31, 2017, there were no short positions held by any Portfolio.
H. Financing Transactions — Certain Portfolios may enter into financing transactions. In a financing transaction, the Portfolio transfers a security to a counterparty with a simultaneous agreement to repurchase the same security at an agreed upon price and future settlement date. For U.S. GAAP purposes, a financing transaction is accounted for as a secured borrowing and not as a purchase or sale. During the term of the borrowing, the Portfolio is entitled to the interest on the security. The difference between the sale price and repurchase price is included in net investment income with the cost of the secured borrowing transaction being recorded in interest expense over the term of the borrowing. The Portfolio will benefit from the transaction if the income earned on the investment purchased with the cash received in the financing transaction exceeds the interest expense incurred by the Portfolio. If the interest expense exceeds the income earned, the Portfolio’s net investment income and dividends to shareholders may be adversely impacted. Financing transactions involve the risk that the market value of the securities that the Portfolio is required to repurchase may decline below the agreed upon repurchase price of those securities.
I. Loan Participation and Assignments — Certain Portfolios may invest in direct debt instruments which are interests in amounts owed to lenders or lending syndicates by corporate, governmental, or other borrowers. The Portfolios’ investments in a loan may be in the form of either actual participation in loans or assignments of all or part of the loans from third parties. A loan is often administered by a bank or other financial institution that acts as an agent for all holders. The agent administers the terms of the loan which are specified in the loan agreement. The Portfolios may invest in multiple series or tranches of a loan, each of which can have different terms and associated risks. The Portfolios generally do not have a right to enforce compliance with the terms of the loan agreement and as a result, the Portfolios may be subject to the credit risk of the borrower and lender that is selling the loan agreement. When the Portfolios purchase assignments from lenders they acquire direct rights against the borrower of the loan. The Portfolios may also enter into unfunded loan commitments, which are contractual obligations for future funding. Unfunded loan commitments can include lines of credit, which may require the Portfolios to grant additional cash to the borrower upon demand from the borrower. These unfunded loan commitments are in fact a future obligation in full,
| | | | | | |
| | Notes to Financial Statements | | | 217 | |
Notes to Financial Statements
although a percentage of the loan amount may not be utilized by the borrower. When investing in a loan, the Portfolios have the right to receive principal, interest and any fees from the lender selling the loan agreement and only when the payments are received by the lender from the borrower. There may also be a commitment fee due to the Portfolios based on the unused portion of the line of credit of the floating rate loan. In certain cases, the Portfolios may be entitled to a penalty fee if there was a prepayment of a floating rate loan by the borrower. Fees that are earned or paid will be reflected as interest income or interest expense on the Statements of Operations. For the period ended December 31, 2017, only the Multi Sector Bond Portfolio invested in loan participations and assignments. At December 31, 2017, there were no unfunded loan commitments outstanding.
J. Reverse Repurchase Agreements — Certain Portfolios may enter into reverse repurchase agreements. In a reverse repurchase agreement, a Portfolio delivers a security in exchange for cash to a financial institution, the counterparty, with a simultaneous agreement to repurchase the same or substantially the same security at an agreed upon price and date. The Portfolio is entitled to receive principal and interest payments, if any, made on the security delivered to the counterparty during the term of the agreement. Cash received in exchange for securities delivered plus accrued interest payments to be made by the Portfolio to counterparties are reflected as a liability on the Statements of Assets and Liabilities. Interest payments made by a Portfolio to counterparties are recorded as a component of interest expense on the Statements of Operations. In periods of increased demand for the security, a Portfolio may receive a fee for use of the security by the counterparty, which may result in interest income to the Portfolio. When effecting reverse repurchase transactions, the Portfolio will hold securities of a dollar amount equal in value to the securities subject to the reverse repurchase agreement in a segregated account. As of December 31, 2017, there were no reverse repurchase agreements held by any Portfolio.
K. Zero Strike Warrants — Certain Portfolios may invest in low exercise price call warrants (zero strike warrants). Zero strike warrants are issued by banks or broker-dealers and allow the Portfolio to gain exposure to common stocks in markets that place restrictions on direct investments by foreign investors and may or may not be traded on an exchange. Income received from zero strike warrants is recorded as dividend income in the Statement of Operations. To the extent a Portfolio invests in zero strike warrants whose returns correspond to the performance of a foreign stock, investing in zero strike warrants will involve risks similar to the risks of investing in foreign securities. Additional risks associated with zero strike warrants include the potential inability of the counterparty to fulfill their obligations under the warrant, inability to transfer or liquidate the warrants and potential delays or an inability to redeem before expiration under certain market conditions.
Note 5. Derivative Instruments
The Portfolios may use derivative instruments for various purposes, including as a cash management strategy, to earn income and enhance returns, to increase or decrease exposure to a particular market, to manage or adjust the risk profile of the Portfolio, to hedge exposure to a foreign currency, or as an alternative to direct investments. Because the Portfolios are required to account for derivative instruments at fair value and recognize changes in fair value through the Statements of Operations, the Portfolios’ derivatives do not qualify for hedge accounting treatment.
Certain Portfolios segregate cash to cover margin requirements for derivative positions. These amounts are denoted as “Cash Collateral for Derivative Positions” on the Statements of Assets and Liabilities.
A. Futures Contracts — Certain Portfolios invest in futures contracts as an alternative to investing in individual securities and could be exposed to market risk due to changes in the value of the underlying securities or due to an illiquid secondary market. Futures contracts are marked to market daily based upon quoted settlement prices. The Portfolios receive from or pay to brokers an amount of cash equal to the daily fluctuation in the value of the contracts. Such receipts or payments, known as the “variation margin,” are recorded by the Portfolios as unrealized gains or losses. When a contract is closed, the Portfolios record a realized gain or loss equal to the difference between the value of the contract at the time it was opened and the value at the time it was closed.
B. Forward Foreign Currency Contracts — The Portfolios may enter into forward foreign currency contracts to hedge against exchange rate risk arising from investments in securities denominated in foreign currencies or as part of an investment strategy. Contracts are valued at the contractual forward rate and are marked to market daily, with the change in market value recorded as an unrealized gain or loss. When the contracts are closed, a realized gain or loss is recorded. Risks may arise from changes in market value of the underlying instruments and from the possible inability of counterparties to meet the terms of their contracts.
| | | | |
| 218 | | Notes to Financial Statements | | |
Notes to Financial Statements
C. Options — Certain Portfolios may write call and put options on futures, swaps, securities or currencies they own or in which they may invest. Writing put options tends to increase a Portfolio’s exposure to the underlying instrument. Writing call options tends to decrease a Portfolio’s exposure to the underlying instrument. The Portfolio receives a premium on the sale of a call option but gives up the opportunity to profit from any increase in the value of the security above the exercise price of the option. When a Portfolio writes a put option, it is exposed to a decline in the price of the underlying security. When a Portfolio writes a call or put option, an amount equal to the premium received is recorded as a liability and subsequently marked to market to reflect the current value of the option written. These liabilities are reflected as written options outstanding in the Statements of Assets and Liabilities. Payments received or made, if any, from writing options with premiums to be determined on a future date are reflected as such on the Statements of Assets and Liabilities. Premiums received from writing options which expire are treated as realized gains. Premiums received from writing options which are exercised or closed are added to the proceeds or offset against amounts paid on the underlying future, swap, security or currency transaction to determine the realized gain or loss. A Portfolio as a writer of an option has no control over whether the underlying future, swap, security or currency may be sold (called) or purchased (put) and as a result bears the market risk of an unfavorable change in the price of the future, swap, security or currency underlying the written option. There is a risk a Portfolio may not be able to enter into a closing transaction because of an illiquid market.
Certain Portfolios may also purchase call and put options on futures, swaps, securities or currencies they own or in which they may invest. Purchasing call options tends to increase a Portfolio’s exposure to the underlying instrument. Purchasing put options tends to decrease a Portfolio’s exposure to the underlying instrument. The Portfolio pays a premium on the purchase of a put option but receives the opportunity to profit from any increase in the value of the security above the exercise price of the option. When a Portfolio purchases a call option, it is exposed to a decline in the price of the underlying security. Premiums paid are reflected in the Statements of Assets and Liabilities as an investment and are subsequently marked to market to reflect the current value of the option. Premiums paid from purchasing options which expire are treated as realized losses. Premiums paid for purchasing options which are exercised or closed are added to the amount paid or offset against the proceeds on the underlying future, swap, security or currency transaction to determine realized gain or loss. The risk associated with a Portfolio purchasing call or put options is limited to the premium paid.
D. Swap Agreements — The Portfolios may enter into swap agreements on interest rate, total return and credit default to manage their exposure to interest rates, foreign currencies, investment style risk and credit risk or as an alternative to direct investing. In connection with these agreements, securities may be identified as collateral in accordance with the terms of the respective swap agreements. Swap agreements are privately negotiated in the over-the-counter market (“OTC swaps”) and may be executed in a multilateral or other trade facility platform, such as a registered commodities exchange (“centrally cleared swaps”).
Swaps are marked to market daily based upon quotations from market makers or values from third party vendors, which may include a registered commodities exchange, and the change in value, if any, is recorded as unrealized gain or loss in the Statements of Operations. Daily changes in the valuation of centrally cleared swaps, if any, are recorded as a receivable or payable for the change in value as appropriate (“variation margin”) on the Statements of Assets and Liabilities. OTC swap payments received or made at the beginning of the measurement period of the swap are reflected on the Statements of Assets and Liabilities. Upfront payments are amortized to realized gain or loss. Upon termination of the swap, unamortized upfront payments are recorded as realized gain or loss in the Statements of Operations. A liquidation payment received or made at the termination of the swap is recorded as realized gain or loss in the Statements of Operations. Net periodic payments received by the Portfolios are included as part of realized gain (loss) on the Statements of Operations. Entering into these agreements involves, to varying degrees, elements of credit and market risk in excess of the amounts recognized on the Statements of Assets and Liabilities. Such risks involve the possibility that there will be no liquid market for these agreements, that the counterparty to the agreements may default on its obligation to perform and that there may be unfavorable changes in interest rates.
Interest Rate Swaps — Interest rate swap agreements involve the exchange by a Portfolio with another party to pay or receive a set of cash flows, e.g., an exchange of floating rate payments for fixed rate payments based on a notional amount of principal.
Total Return Swaps — Total return swap agreements involve commitments to pay or receive a financing rate in exchange for the total return of an underlying reference entity, both based on notional amounts. To the extent the total return of the security or index underlying the transaction exceeds or falls short of the offsetting interest rate obligation, a Portfolio will receive a payment from or make a payment to the counterparty.
| | | | | | |
| | Notes to Financial Statements | | | 219 | |
Notes to Financial Statements
Credit Default Swaps — Credit default swap agreements involve one party making a series of payments to another party in exchange for the right to receive a cash payment equal to the notional value of the swap in the event of a default by a third party, typically corporate issues or sovereign issues of an emerging market country. A Portfolio may use credit default swaps to provide a measure of protection against defaults of the issuers where the Portfolio owns or has exposure to the corporate or sovereign issue or to take an active long or short position on the likelihood of a particular issuer’s default.
As a seller of protection, the Portfolio generally receives an upfront payment and/or a fixed rate of income throughout the term of the swap provided that there is no credit event. As the seller, the Portfolio adds leverage to its investments because the Portfolio has investment exposure on the notional amount of the swap. As a buyer of protection, the Portfolio generally makes an upfront payment or pays a fixed rate of interest throughout the term of the swap provided that there is no credit event. The Portfolio generally receives an amount up to the notional value of the swap if a credit event occurs.
Implied credit spreads, represented in absolute terms, utilized in determining the market value of credit default swap agreements on corporate issues or sovereign issues of an emerging market country serve as an indicator of the current status of the payment/performance risk and represent the likelihood of a credit event occurring. The implied credit spread of a particular referenced entity reflects the cost of selling protection and may include upfront payments required to be made to enter into the agreement. For credit default swap agreements on credit indices, the quoted market prices and resulting values serve as the indicator of the current status of the payment/performance risk. Wider credit spreads and increasing market values, in absolute terms when compared to the notional amount of the swap, represent a deterioration of the referenced entity’s credit soundness and indicate a greater likelihood a credit event could occur as defined under the terms of the agreement. Open credit default swaps on corporate or sovereign issues and credit indices are disclosed in the Schedules of Investments.
If the Portfolio is a seller of protection and a credit event occurs, the Portfolio will either pay to the buyer of the protection an amount equal to the notional value of the swap and may take delivery of the obligation or pay a net settlement amount in the form of cash or securities equal to the notional amount of the swap less the recovery value of the referenced obligation. The maximum potential amount of future payments (undiscounted) that a Portfolio as a seller of protection could be required to make under a credit default swap agreement would be equal to the notional amount of the agreement. Notional amounts and fair market value of all credit default swap agreements outstanding for each Portfolio are disclosed in the footnotes to the Schedules of Investments. These maximum potential amounts would be partially offset by any recovery values of the referenced obligations, upfront payments received upon entering into the agreement, or net amounts received by the Portfolio from the settlement of credit default swap agreements purchasing protection for the same referenced obligation.
E. Derivative Disclosures – Derivative positions held by the Portfolios by contract type and primary risk exposure, including location on the Statement of Assets and Liabilities and value as of December 31, 2017, are (amounts in thousands):
| | | | | | | | | | | | |
| | | Asset Derivatives | | | Liability Derivatives | |
| Portfolio | | Statement of Assets and Liabilities Location | | Value | | | Statement of Assets and Liabilities Location | | Value | |
Index 500 Stock Portfolio | | | | | | | | | | | | |
Equity contracts | | Receivables – Futures Variation Margin | | $ | - | | | Payables – Futures Variation Margin | | $ | 149 | |
Large Company Value Portfolio | | | | | | | | | | | | |
Foreign exchange contracts | | Receivables – Foreign Currency Sold | | | 5 | | | Payables – Foreign Currency Purchased | | | 199 | |
Index 400 Stock Portfolio | | | | | | | | | | | | |
Equity contracts | | Receivables – Futures Variation Margin | | | - | | | Payables – Futures Variation Margin | | | 103 | |
Mid Cap Value Portfolio | | | | | | | | | | | | |
Foreign exchange contracts | | Receivables – Foreign Currency Sold | | | 8 | | | Payables – Foreign Currency Purchased | | | 292 | |
Index 600 Portfolio | | | | | | | | | | | | |
Total return contracts | | Receivables – Outstanding Swaps Contracts, at Value | | | 10 | | | Payables – Outstanding Swaps Contracts, at Value | | | - | |
Research International Core Portfolio | | | | | | | | | | | | |
Foreign exchange contracts | | Receivables – Foreign Currency Sold | | | - | | | Payables – Foreign Currency Purchased | | | 6 | |
Emerging Markets Equity Portfolio | | | | | | | | | | | | |
Foreign exchange contracts | | Receivables – Foreign Currency Sold | | | 1 | | | Payables – Foreign Currency Purchased | | | 1 | |
| | | | |
| 220 | | Notes to Financial Statements | | |
Notes to Financial Statements
| | | | | | | | | | | | |
| | | Asset Derivatives | | | Liability Derivatives | |
| Portfolio | | Statement of Assets and Liabilities Location | | Value | | | Statement of Assets and Liabilities Location | | Value | |
Short-Term Bond Portfolio | | | | | | | | | | | | |
Interest rate contracts | | Receivables – Futures Variation Margin | | $ | 18 | | | Payables – Futures Variation Margin | | $ | 11 | |
Long-Term U.S. Government Bond Portfolio | | | | | | | | | | | | |
Interest rate contracts | | Receivables – Futures Variation Margin | | | 1 | | | Payables – Futures Variation Margin | | | 17 | |
Interest rate contracts | | Receivables – Cleared Swap Variation Margin | | | - | | | Payables – Cleared Swap Variation Margin | | | 24 | |
Inflation Protection Portfolio | | | | | | | | | | | | |
Foreign exchange contracts | | Receivables – Foreign Currency Sold | | | - | | | Payables – Foreign Currency Purchased | | | 76 | |
Interest rate contracts | | Receivables – Futures Variation Margin | | | 13 | | | Payables – Futures Variation Margin | | | 59 | |
Other contracts | | Receivables – Cleared Swap Variation Margin | | | 13 | | | Payables – Cleared Swap Variation Margin | | | - | |
Other contracts | | Receivables – Outstanding Swaps Contracts, at Value | | | 1,050 | | | Payables – Outstanding Swaps Contracts, at Value | | | 4,088 | |
Multi-Sector Bond Portfolio | | | | | | | | | | | | |
Credit contracts | | Receivables – Outstanding Swaps Contracts, at Value | | | 92 | | | Payables – Outstanding Swaps Contracts, at Value | | | 518 | |
Credit contracts | | Receivables – Cleared Swap Variation Margin | | | 151 | | | Payables – Cleared Swap Variation Margin | | | 1 | |
Foreign exchange contracts | | Receivables – Foreign Currency Sold | | | 719 | | | Payables – Foreign Currency Purchased | | | 3,715 | |
Option contracts | | Receivables – Options | | | - | | | Payables – Options | | | 65 | |
Interest rate contracts | | Receivables – Futures Variation Margin | | | 82 | | | Payables – Futures Variation Margin | | | 311 | |
Interest rate contracts | | Receivables – Cleared Swap Variation Margin | | | - | | | Payables – Cleared Swap Variation Margin | | | 27 | |
Balanced Portfolio | | | | | | | | | | | | |
Equity contracts | | Receivables – Futures Variation Margin | | | - | | | Payables – Futures Variation Margin | | | 41 | |
Asset Allocation Portfolio | | | | | | | | | | | | |
Equity contracts | | Receivables – Futures Variation Margin | | | - | | | Payables – Futures Variation Margin | | | 11 | |
Realized gains and losses on derivative instruments, by contract type and primary risk exposure, for the period ended December 31, 2017 are (amounts in thousands):
| | | | | | | | | | | | | | | | | | | | |
| | | Realized Gain (Loss) on Derivatives Instruments | |
| Portfolio | | Options | | | Futures | | | Forward
Currency
Contracts | | | Swaps | | | Total | |
Index 500 Stock Portfolio | | | | | | | | | | | | | | | | | | | | |
Equity contracts | | $ | - | | | $ | 6,699 | | | $ | - | | | $ | - | | | $ | 6,699 | |
Large Company Value Portfolio | | | | | | | | | | | | | | | | | | | | |
Foreign currency exchange contracts | | | - | | | | - | | | | (659 | ) | | | - | | | | (659 | ) |
Equity Income Portfolio | | | | | | | | | | | | | | | | | | | | |
Equity contracts | | | - | | | | (5 | ) | | | - | | | | - | | | | (5 | ) |
Index 400 Stock Portfolio | | | | | | | | | | | | | | | | | | | | |
Equity contracts | | | - | | | | 1,126 | | | | - | | | | - | | | | 1,126 | |
Mid Cap Value Portfolio | | | | | | | | | | | | | | | | | | | | |
Foreign currency exchange contracts | | | - | | | | - | | | | (632 | ) | | | - | | | | (632 | ) |
Index 600 Stock Portfolio | | | | | | | | | | | | | | | | | | | | |
Equity contracts | | | - | | | | - | | | | - | | | | 1,359 | | | | 1,359 | |
International Growth Portfolio | | | | | | | | | | | | | | | | | | | | |
Foreign currency exchange contracts | | | - | | | | - | | | | (6 | ) | | | - | | | | (6 | ) |
Research International Core Portfolio | | | | | | | | | | | | | | | | | | | | |
Foreign currency exchange contracts | | | - | | | | - | | | | 84 | | | | - | | | | 84 | |
International Equity Portfolio | | | | | | | | | | | | | | | | | | | | |
Foreign currency exchange contracts | | | - | | | | - | | | �� | 93 | | | | - | | | | 93 | |
Emerging Markets Equity Portfolio | | | | | | | | | | | | | | | | | | | | |
Foreign currency exchange contracts | | | - | | | | - | | | | (451 | ) | | | - | | | | (451 | ) |
Short-Term Bond Portfolio | | | | | | | | | | | | | | | | | | | | |
Interest rate contracts | | | - | | | | (354 | ) | | | - | | | | - | | | | (354 | ) |
Long-Term U.S. Government Bond Portfolio | | | | | | | | | | | | | | | | | | | | |
Interest rate contracts | | | - | | | | 50 | | | | - | | | | 816 | | | | 866 | |
Inflation Protection Portfolio | | | | | | | | | | | | | | | | | | | | |
Foreign currency exchange contracts | | | - | | | | - | | | | (553 | ) | | | - | | | | (553 | ) |
Interest rate contracts | | | - | | | | (1,636 | ) | | | - | | | | - | | | | (1,636 | ) |
Other contracts | | | - | | | | - | | | | - | | | | (975 | ) | | | (975 | ) |
| | | | | | |
| | Notes to Financial Statements | | | 221 | |
Notes to Financial Statements
| | | | | | | | | | | | | | | | | | | | |
| | | Realized Gain (Loss) on Derivatives Instruments | |
| Portfolio | | Options | | | Futures | | | Forward
Currency
Contracts | | | Swaps | | | Total | |
Multi-Sector Bond Portfolio | | | | | | | | | | | | | | | | | | | | |
Credit contracts | | $ | - | | | $ | - | | | $ | - | | | $ | 1,759 | | | $ | 1,759 | |
Foreign currency exchange contracts | | | - | | | | - | | | | (10,008 | ) | | | - | | | | (10,008 | ) |
Interest rate contracts | | | 720 | | | | 2,677 | | | | - | | | | 12 | | | | 3,409 | |
Balanced Portfolio | | | | | | | | | | | | | | | | | | | | |
Equity contracts | | | - | | | | 624 | | | | - | | | | - | | | | 624 | |
Asset Allocation Portfolio | | | | | | | | | | | | | | | | | | | | |
Equity contracts | | | - | | | | 278 | | | | - | | | | - | | | | 278 | |
Change in unrealized appreciation and depreciation on derivative instruments, by contract type and primary risk exposure for the period ended December 31, 2017 are (amounts in thousands):
| | | | | | | | | | | | | | | | | | | | |
| | | Change in Unrealized Appreciation (Depreciation) on
Derivative Instruments | |
| Portfolio | | Options | | | Futures | | | Forward
Currency
Contracts | | | Swaps | | | Total | |
Index 500 Stock Portfolio | | | | | | | | | | | | | | | | | | | | |
Equity contracts | | $ | - | | | $ | 300 | | | $ | - | | | $ | - | | | $ | 300 | |
Large Company Value Portfolio | | | | | | | | | | | | | | | | | | | | |
Foreign currency exchange contracts | | | - | | | | - | | | | (148 | ) | | | - | | | | (148 | ) |
Equity Income Portfolio | | | | | | | | | | | | | | | | | | | | |
Foreign currency exchange contracts | | | - | | | | - | | | | 5 | | | | - | | | | 5 | |
Index 400 Stock Portfolio | | | | | | | | | | | | | | | | | | | | |
Equity contracts | | | - | | | | 424 | | | | - | | | | - | | | | 424 | |
Mid Cap Value Portfolio | | | | | | | | | | | | | | | | | | | | |
Foreign currency exchange contracts | | | - | | | | - | | | | (208 | ) | | | - | | | | (208 | ) |
Index 600 Stock Portfolio | | | | | | | | | | | | | | | | | | | | |
Interest Rate Contracts | | | - | | | | - | | | | - | | | | 60 | | | | 60 | |
International Growth Portfolio | | | | | | | | | | | | | | | | | | | | |
Foreign currency exchange contracts | | | - | | | | - | | | | 132 | | | | - | | | | 132 | |
Research International Core Portfolio | | | | | | | | | | | | | | | | | | | | |
Foreign currency exchange contracts | | | - | | | | - | | | | 124 | | | | - | | | | 124 | |
International Equity Portfolio | | | | | | | | | | | | | | | | | | | | |
Foreign currency exchange contracts | | | - | | | | - | | | | 240 | | | | - | | | | 240 | |
Emerging Markets Equity Portfolio | | | | | | | | | | | | | | | | | | | | |
Foreign currency exchange contracts | | | - | | | | - | | | | (2 | ) | | | - | | | | (2 | ) |
Short-Term Bond Portfolio | | | | | | | | | | | | | | | | | | | | |
Interest rate contracts | | | - | | | | (92 | ) | | | - | | | | - | | | | (92 | ) |
Long-Term U.S. Government Bond Portfolio | | | | | | | | | | | | | | | | | | | | |
Interest rate contracts | | | - | | | | 76 | | | | - | | | | (1,053 | ) | | | (977 | ) |
Inflation Protection Portfolio | | | | | | | | | | | | | | | | | | | | |
Foreign currency exchange contracts | | | - | | | | - | | | | (245 | ) | | | - | | | | (245 | ) |
Interest rate contracts | | | - | | | | (8 | ) | | | - | | | | - | | | | (8 | ) |
Other contracts | | | - | | | | - | | | | - | | | | 232 | | | | 232 | |
Multi-Sector Bond Portfolio | | | | | | | | | | | | | | | | | | | | |
Credit contracts | | | - | | | | - | | | | - | | | | 1,183 | | | | 1,183 | |
Foreign currency exchange contracts | | | - | | | | - | | | | (3,366 | ) | | | - | | | | (3,366 | ) |
Interest rate contracts | | | (152 | ) | | | (266 | ) | | | - | | | | 446 | | | | 28 | |
Balanced Portfolio | | | | | | | | | | | | | | | | | | | | |
Equity contracts | | | - | | | | (63 | ) | | | - | | | | - | | | | (63 | ) |
Asset Allocation Portfolio | | | | | | | | | | | | | | | | | | | | |
Equity contracts | | | - | | | | 2 | | | | - | | | | - | | | | 2 | |
| | | | |
| 222 | | Notes to Financial Statements | | |
Notes to Financial Statements
Volumes on derivative instruments by contract type and primary risk exposure, for the period ended December 31, 2017 are:
| | | | | | | | | | | | | | | | | | | | |
| | | Volume of Derivative Instruments Held | |
| | | Average Number of Contracts | | | Average Notional
(Amounts in Thousands) | |
| Portfolio | | Exchange Traded Options | | | Futures | | | Forward
Currency
Contracts | | | Swaps | | | Over the
Counter
Options | |
Index 500 Stock Portfolio | | | | | | | | | | | | | | | | | | | | |
Equity contracts | | $ | - | | | $ | 309 | | | $ | - | | | $ | - | | | $ | - | |
Large Company Value Portfolio | | | | | | | | | | | | | | | | | | | | |
Foreign currency exchange contracts | | | - | | | | - | | | | 11,923 | | | | - | | | | - | |
Equity Income Portfolio | | | | | | | | | | | | | | | | | | | | |
Foreign currency exchange contracts | | | - | | | | - | | | | 40 | | | | - | | | | - | |
Index 400 Stock Portfolio | | | | | | | | | | | | | | | | | | | | |
Equity contracts | | | - | | | | 87 | | | | - | | | | - | | | | - | |
Mid Cap Value Portfolio | | | | | | | | | | | | | | | | | | | | |
Foreign currency exchange contracts | | | - | | | | - | | | | 16,357 | | | | - | | | | - | |
Index 600 Stock Portfolio | | | | | | | | | | | | | | | | | | | | |
Interest rate contracts | | | - | | | | - | | | | - | | | | 12,278 | | | | - | |
Short-Term Bond Portfolio | | | | | | | | | | | | | | | | | | | | |
Interest rate contracts | | | - | | | | 300 | | | | - | | | | - | | | | - | |
Long-Term U.S. Government Bond Portfolio | | | | | | | | | | | | | | | | | | | | |
Interest rate contracts | | | - | | | | 58 | | | | - | | | | 12,790 | | | | - | |
Inflation Protection Portfolio | | | | | | | | | | | | | | | | | | | | |
Foreign currency exchange contracts | | | - | | | | - | | | | 8,533 | | | | - | | | | - | |
Interest rate contracts | | | - | | | | 502 | | | | - | | | | - | | | | - | |
Other contracts | | | - | | | | - | | | | - | | | | 112,750 | | | | - | |
Multi-Sector Bond Portfolio | | | | | | | | | | | | | | | | | | | | |
Credit contracts | | | - | | | | - | | | | - | | | | 98,149 | | | | - | |
Foreign currency exchange contracts | | | - | | | | - | | | | 380,610 | | | | - | | | | - | |
Interest rate contracts | | | 210 | | | | 1,326 | | | | - | | | | 305,320 | | | | 110 | |
Balanced Portfolio | | | | | | | | | | | | | | | | | | | | |
Equity contracts | | | - | | | | 73 | | | | - | | | | - | | | | - | |
Asset Allocation Portfolio | | | | | | | | | | | | | | | | | | | | |
Equity contracts | | | - | | | | 20 | | | | - | | | | - | | | | - | |
Note 6. Portfolio Risk
In the normal course of business the Portfolios trade financial instruments and enter into financial transactions where risk of potential loss exists. Security values fluctuate (market risk) and may decline due to factors affecting securities markets in general, particular industries represented in the securities markets or conditions specifically related to a particular company. Failure of the other party to a transaction to perform (credit risk), for example by not making principal and interest payments when due, reduces the value of the issuer’s debt and could reduce the Portfolios’ income. Similar to credit risk, the Portfolios may be exposed to counterparty risk, or the risk that an institution or other entity with which the Portfolios have unsettled or open transactions will fail to make required payments or otherwise comply with the terms of the instrument, transaction or contract. The potential loss could exceed the value of the financial assets recorded in the financial statements. Some of the Portfolios’ investments may be illiquid and the Portfolios may not be able to vary the portfolio investments in response to changes in economic and other conditions. If a Portfolio is required to liquidate all or a portion of its investments quickly, the Portfolio may realize significantly less than the value at which it previously recorded those investments.
Master Netting Arrangements
The Portfolios are subject to various Master Agreements that govern the terms of certain transactions. Master Repurchase Agreements and Global Master Repurchase Agreements are in place that govern repurchase, reverse repurchase, and sale-buyback financing transactions. Master Securities Forward Transaction Agreements are in place that govern the settlement of certain forward settling transactions, including to-be-announced securities, delayed-delivery or sale-buyback financing transactions. Customer Account Agreements and related addenda are in place that govern certain cleared derivative transactions, including futures and cleared OTC derivatives. International Swaps and Derivatives Association, Inc. Master Agreements and Credit Support Annexes (“ISDA agreements”) are in place that govern certain OTC financial derivative transactions. ISDA agreements maintain provisions for general obligations, representations, agreements, collateral and events of default or termination. Events of termination include conditions that may entitle counterparties to elect to terminate early and cause settlement of all outstanding transactions under the applicable ISDA agreement. The terms of Master Agreements may reduce counterparty risk with respect to transactions governed by the Master Agreement under certain circumstances.
| | | | | | |
| | Notes to Financial Statements | | | 223 | |
Notes to Financial Statements
Certain Portfolios have agreements with counterparties that contain provisions, or contingency features, that allow net settlement in the event of contract termination and permit termination by either party prior to maturity upon the occurrence of certain stated events, such as failure to pay or bankruptcy. In addition, certain agreements specify other events, the occurrence of which would allow one of the parties to terminate. For example, a downgrade in credit rating of a counterparty would allow the Portfolio to terminate while a decline in the Portfolio’s net assets of more than a certain percentage would allow the counterparty to terminate. In such a situation, the counterparty involved would have the option to waive the triggering event or liquidate the affected positions pursuant to the terms of the related agreement. The aggregate amount of derivatives in a liability position is disclosed in Note 5.
Offsetting Assets and Liabilities
Certain Portfolios are parties to enforceable master netting or similar agreements which provide for the right of offset under certain circumstances. The Portfolios have made an accounting policy election not to offset qualifying financial and derivative instruments on the Statements of Assets and Liabilities. As such, all financial and derivative instruments are presented on a gross basis on the Statements of Assets and Liabilities. The impacts of netting arrangements that provide the right to offset are detailed below (amounts in thousands). The net amount represents the net receivable or payable that would be due from or to the counterparty in the event of default. Exposure from borrowings and other financing transactions such as repurchase agreements and certain forward settling transactions can only be netted across transactions governed under the same Master Agreement with the same legal entity. For certain Portfolios, derivative amounts do not reconcile to the Statements of Assets and Liabilities due to the Statements of Assets and Liabilities including derivatives that are not covered under master netting or similar agreements. The amount of collateral, for the period ended December 31, 2017, has been limited such that the net amount cannot be less than zero.
Large Company Value Portfolio
| | | | | | | | | | | | | | | | |
| Offsetting of Financial Assets and Derivative Assets | |
| | | | | | (i) | | | (ii) | | | (iii) = (i) - (ii) | |
| Description | | | | | Gross Amounts of
Recognized Assets | | | Gross Amounts
Offset in the
Statement of Assets
and Liabilities | | | Net Amounts of Assets
Presented in the Statement
of Assets and Liabilities | |
Foreign Currency | | | | | | $ | 5 | | | $ | - | | | $ | 5 | |
|
| Financial Assets, Derivative Assets, and Collateral Held | |
| | | (iii) | | | (iv) | | | (v) = (iii) - (iv) | |
| | | | | | Gross Amounts Not Offset in the Statement of
Assets and Liabilities | | | | |
| Counterparty | | Net Amounts of
Assets in the
Statement of Assets
and Liabilities | | | Financial Instruments | | | Cash Collateral
Received | | | Net Amount | |
Morgan Stanley Capital Services | | $ | 5 | | | $ | (5 | ) | | $ | - | | | $ | - | |
| | | | |
| | | | | | (i) | | | (ii) | | | (iii) = (i) - (ii) | |
| Description | | | | | Gross Amounts of
Recognized Liabilities | | | Gross Amounts
Offset in the
Statement of Assets
and Liabilities | | | Net Amounts of Liabilities
Presented in the Statement
of Assets and Liabilities | |
Foreign Currency | | | | | | $ | 199 | | | $ | - | | | $ | 199 | |
|
| Financial Liabilities, Derivative Liabilities, and Collateral Pledged | |
| | | (iii) | | | (iv) | | | (v) = (iii) - (iv) | |
| | | | | | Gross Amounts Not Offset in the Statement of
Assets and Liabilities | | | | |
| Counterparty | | Net Amounts of
Liabilities in the
Statement of Assets
and Liabilities | | | Financial Instruments | | | Cash Collateral
Pledged | | | Net Amount | |
Morgan Stanley Capital Services | | $ | 199 | | | $ | (5) | | | $ | - | | | $ | 194 | |
| | | | |
| 224 | | Notes to Financial Statements | | |
Notes to Financial Statements
Mid Cap Value Portfolio
| | | | | | | | | | | | | | | | |
| Offsetting of Financial Assets and Derivative Assets | |
| | | | | | (i) | | | (ii) | | | (iii) = (i) - (ii) | |
| Description | | | | | Gross Amounts of
Recognized Assets | | | Gross Amounts
Offset in the
Statement of Assets
and Liabilities | | | Net Amounts of Assets
Presented in the Statement
of Assets and Liabilities | |
Foreign Currency | | | | | | $ | 8 | | | $ | - | | | $ | 8 | |
|
| Financial Assets, Derivative Assets, and Collateral Held | |
| | | (iii) | | | (iv) | | | (v) = (iii) - (iv) | |
| | | | | | Gross Amounts Not Offset in the Statement of
Assets and Liabilities | | | | |
| Counterparty | | Net Amounts of
Assets in the
Statement of Assets
and Liabilities | | | Financial Instruments | | | Cash Collateral
Received | | | Net Amount | |
Morgan Stanley Capital Services | | $ | 8 | | | $ | (8 | ) | | $ | - | | | $ | - | |
|
| Offsetting of Financial Liabilities and Derivative Liabilities | |
| | | | | | (i) | | | (ii) | | | (iii) = (i) - (ii) | |
| Description | | | | | Gross Amounts of
Recognized Liabilities | | | Gross Amounts
Offset in the
Statement of Assets
and Liabilities | | | Net Amounts of Liabilities
Presented in the Statement
of Assets and Liabilities | |
Foreign Currency | | | | | | $ | 292 | | | $ | - | | | $ | 292 | |
|
| Financial Liabilities, Derivative Liabilities, and Collateral Pledged | |
| | | (iii) | | | (iv) | | | (v) = (iii) - (iv) | |
| | | | | | Gross Amounts Not Offset in the Statement of
Assets and Liabilities | | | | |
| Counterparty | | Net Amounts of
Liabilities in the
Statement of Assets
and Liabilities | | | Financial Instruments | | | Cash Collateral
Pledged | | | Net Amount | |
Morgan Stanley Capital Services | | $ | 292 | | | $ | (8 | ) | | $ | - | | | $ | 285 | |
Government Money Market Portfolio
| | | | | | | | | | | | | | | | |
| Offsetting of Financial Assets and Derivative Assets | |
| | | | | | (i) | | | (ii) | | | (iii) = (i) - (ii) | |
| Description | | | | | Gross Amounts of
Recognized Assets | | | Gross Amounts
Offset in the
Statement of Assets
and Liabilities | | | Net Amounts of Assets
Presented in the Statement
of Assets and Liabilities | |
Repurchase Agreements | | | | | | $ | 169,500 | | | $ | - | | | $ | 169,500 | |
| | | | | | | | | | | | | | | | |
| Financial Assets, Derivative Assets, and Collateral Held | |
| | | (iii) | | | (iv) | | | (v) = (iii) - (iv) | |
| | | | | | Gross Amounts Not Offset in the Statement
of Assets and Liabilities | | | | |
| Counterparty | | Net Amounts of
Assets in the
Statement of Assets
and Liabilities | | | Financial Instruments | | | Cash Collateral
Received | | | Net Amount | |
Bank of Nova Scotia. | | $ | 4,000 | | | $ | (4,000 | ) | | $ | - | | | $ | - | |
BNP Paribas SA | | | 11,000 | | | | (11,000 | ) | | | - | | | | - | |
Citigroup Global Markets. | | | 20,000 | | | | (20,000 | ) | | | - | | | | - | |
Credit Agricole SA | | | 20,000 | | | | (20,000 | ) | | | - | | | | - | |
Goldman Sachs International | | | 20,000 | | | | (20,000 | ) | | | - | | | | - | |
HSBC Bank USA. | | | 17,500 | | | | (17,500 | ) | | | - | | | | - | |
Mitsubishi UFJ Securities USA | | | 10,000 | | | | (10,000 | ) | | | - | | | | - | |
Mizuho Bank | | | 15,000 | | | | (15,000 | ) | | | - | | | | - | |
Natixis SA | | | 22,000 | | | | (22,000 | ) | | | - | | | | - | |
| | | | | | |
| | Notes to Financial Statements | | | 225 | |
Notes to Financial Statements
Government Money Market Portfolio (continued)
| | | | | | | | | | | | | | | | |
| Financial Assets, Derivative Assets, and Collateral Held (continued) | |
| | | (iii) | | | (iv) | | | (v) = (iii) - (iv) | |
| | | | | | Gross Amounts Not Offset in the Statement of
Assets and Liabilities | | | | |
| Counterparty | | Net Amounts of
Assets in the
Statement of Assets
and Liabilities | | | Financial Instruments | | | Cash Collateral
Received | | | Net Amount | |
RBC Capital Markets | | $ | 10,000 | | | $ | (10,000 | ) | | $ | - | | | $ | - | |
TD Securities USA | | | 20,000 | | | | (20,000 | ) | | | - | | | | - | |
| | | | | | | | | | | | | | | | |
Total | | $ | 169,500 | | | $ | (169,500 | ) | | $ | - | | | $ | - | |
| | | | | | | | | | | | | | | | |
Long-Term U.S. Government Bond Portfolio
| | | | | | | | | | | | | | | | |
| Offsetting of Financial Liabilities and Derivative Liabilities | |
| | | | | | (i) | | | (ii) | | | (iii) = (i) - (ii) | |
| Description | | | | | Gross Amounts of
Recognized Liabilities | | | Gross Amounts
Offset in the
Statement of Assets
and Liabilities | | | Net Amounts of Liabilities
Presented in the Statement
of Assets and Liabilities | |
Financing Transactions | | | | | | $ | 125,885 | | | $ | - | | | $ | 125,885 | |
| | | | | | | | | | | | | | | | |
Total | | | | | | $ | 125,885 | | | $ | - | | | $ | 125,885 | |
| | | | | | | | | | | | | | | | |
|
| Financial Liabilities, Derivative Liabilities, and Collateral Pledged | |
| | | (iii) | | | (iv) | | | (v) = (iii) - (iv) | |
| | | | | | Gross Amounts Not Offset in the Statement of
Assets and Liabilities | | | | |
| Counterparty | | Net Amounts of Liabilities
in the Statement of
Assets and Liabilities | | | Financial Instruments | | | Cash Collateral
Pledged | | | Net Amount | |
Barclays Capital | | $ | 3,325 | | | $ | (3,323 | ) | | $ | - | | | $ | 2 | |
Goldman Sachs & Co. | | | 88,353 | | | | (88,344 | ) | | | - | | | | 9 | |
Morgan Stanley & Co. LLC | | | 34,207 | | | | (34,141 | ) | | | - | | | | 66 | |
| | | | | | | | | | | | | | | | |
Total | | $ | 125,885 | | | $ | (125,808 | ) | | $ | - | | | $ | 77 | |
| | | | | | | | | | | | | | | | |
Inflation Protection Portfolio
| | | | | | | | | | | | | | | | |
| Offsetting of Financial Assets and Derivative Assets | |
| | | | | | (i) | | | (ii) | | | (iii) = (i) - (ii) | |
| Description | | | | | Gross Amounts of
Recognized Assets | | | Gross Amounts
Offset in the
Statement of Assets
and Liabilities | | | Net Amounts of Assets
Presented in the Statement
of Assets and Liabilities | |
Swaps | | | | | | $ | 1,050 | | | $ | - | | | $ | 1,050 | |
| | | | | | | | | | | | | | | | |
Total | | | | | | $ | 1,050 | | | $ | - | | | $ | 1,050 | |
| | | | | | | | | | | | | | | | |
|
| Financial Assets, Derivative Assets, and Collateral Held | |
| | | (iii) | | | (iv) | | | (v) = (iii) - (iv) | |
| | | | | | Gross Amounts Not Offset in the Statement of
Assets and Liabilities | | | | |
| Counterparty | | Net Amounts of
Assets in the
Statement of Assets
and Liabilities | | | Financial Instruments | | | Cash Collateral
Received | | | Net Amount | |
Bank of America, N.A. | | $ | 36 | | | $ | (36 | ) | | $ | - | | | $ | - | |
Goldman Sachs International | | | 1,014 | | | | (75 | ) | | | (860 | ) | | | 79 | |
| | | | | | | | | | | | | | | | |
Total | | $ | 1,050 | | | $ | (111 | ) | | $ | (860 | ) | | $ | 79 | |
| | | | | | | | | | | | | | | | |
| | | | |
| 226 | | Notes to Financial Statements | | |
Notes to Financial Statements
Inflation Protection Portfolio (continued)
| | | | | | | | | | | | | | | | |
| Offsetting of Financial Liabilities and Derivative Liabilities | |
| | | | | | (i) | | | (ii) | | | (iii) = (i) - (ii) | |
| Description | | | | | Gross Amounts of
Recognized Liabilities | | | Gross Amounts
Offset in the
Statement of Assets
and Liabilities | | | Net Amounts of Liabilities
Presented in the Statement
of Assets and Liabilities | |
Foreign Currency | | | | | | $ | 76 | | | $ | - | | | $ | 76 | |
Swaps | | | | | | | 4,088 | | | | - | | | | 4,088 | |
| | | | | | | | | | | | | | | | |
Total | | | | | | $ | 4,163 | | | $ | - | | | $ | 4,163 | |
| | | | | | | | | | | | | | | | |
|
| Financial Liabilities, Derivative Liabilities, and Collateral Pledged | |
| | | (iii) | | | (iv) | | | (v) = (iii) - (iv) | |
| | | | | | Gross Amounts Not Offset in the Statement of
Assets and Liabilities | | | | |
| Counterparty | | Net Amounts of Liabilities
in the Statement of
Assets and Liabilities | | | Financial Instruments | | | Cash Collateral
Pledged | | | Net Amount | |
Bank of America, N.A. | | $ | 2,094 | | | $ | (2,094 | ) | | $ | - | | | $ | - | |
Barclays Bank PLC | | | 1,917 | | | | (1,684 | ) | | | - | | | | 233 | |
Goldman Sachs International | | | 75 | | | | (75 | ) | | | - | | | | - | |
Morgan Stanley Capital Services | | | 76 | | | | - | | | | - | | | | 76 | |
| | | | | | | | | | | | | | | | |
Total | | $ | 4,163 | | | $ | (3,853 | ) | | $ | - | | | $ | 309 | |
| | | | | | | | | | | | | | | | |
Multi-Sector Bond Portfolio
| | | | | | | | | | | | | | | | |
| Offsetting of Financial Assets and Derivative Assets | |
| | | | | | (i) | | | (ii) | | | (iii) = (i) - (ii) | |
| Description | | | | | Gross Amounts of
Recognized Assets | | | Gross Amounts
Offset in the
Statement of Assets
and Liabilities | | �� | Net Amounts of Assets
Presented in the Statement
of Assets and Liabilities | |
Foreign Currency | | | | | | $ | 719 | | | $
| -
|
| | $ | 719 | |
Repurchase Agreements | | | | | | | 3,500 | | | | - | | | | 3,500 | |
Swaps | | | | | | | 92 | | | | - | | | | 92 | |
| | | | | | | | | | | | | | | | |
Total | | | | | | $ | 4,311 | | | $ | - | | | $ | 4,311 | |
| | | | | | | | | | | | | | | | |
|
| Financial Assets, Derivative Assets, and Collateral Held | |
| | | (iii) | | | (iv) | | | (v) = (iii) - (iv) | |
| | | | | | Gross Amounts Not Offset in the Statement of
Assets and Liabilities | | | | |
| Counterparty | | Net Amounts of Assets
in the Statement of
Assets and Liabilities | | | Financial Instruments | | | Cash Collateral
Received | | | Net Amount | |
Barclays Bank PLC. | | $ | 13 | | | $ | (13 | ) | | $ | - | | | $ | - | |
Goldman Sachs International | | | 208 | | | | (208 | ) | | | - | | | | - | |
HSBC Bank USA | | | 122 | | | | (122 | ) | | | - | | | | - | |
JPMorgan Chase Bank, N.A. | | | 3,607 | | | | (3,607 | ) | | | - | | | | - | |
UBS AG | | | 360 | | | | (360 | ) | | | - | | | | - | |
| | | | | | | | | | | | | | | | |
Total | | $ | 4,310 | | | $ | (3,998 | ) | | $ | - | | | $ | - | |
| | | | | | | | | | | | | | | | |
|
| Offsetting of Financial Liabilities and Derivative Liabilities | |
| | | | | | (i) | | | (ii) | | | (iii) = (i) - (ii) | |
| Description | | | | | Gross Amounts of
Recognized Liabilities | | | Gross Amounts
Offset in the
Statement of Assets
and Liabilities | | | Net Amounts of Liabilities
Presented in the Statement
of Assets and Liabilities | |
Foreign Currency | | | | | | $ | 3,715 | | | $ | - | | | $ | 3,715 | |
Options | | | | | | | 65 | | | | - | | | | 65 | |
Swaps | | | | | | | 518 | | | | - | | | | 518 | |
| | | | | | | | | | | | | | | | |
Total | | | | | | $ | 4,298 | | | $ | - | | | $ | 4,298 | |
| | | | | | | | | | | | | | | | |
| | | | | | |
| | Notes to Financial Statements | | | 227 | |
Notes to Financial Statements
Multi-Sector Bond Portfolio (continued)
| | | | | | | | | | | | | | | | |
Financial Liabilities, Derivative Liabilities, and Collateral Pledged | |
| | | (iii) | | | (iv) | | | (v) = (iii) - (iv) | |
| | | | | | Gross Amounts Not Offset in the Statement
of Assets and Liabilities | | | | |
| Counterparty | | Net Amounts of
Liabilities in the
Statement of Assets
and Liabilities | | | Financial Instruments | | | Cash Collateral
Pledged | | | Net Amount | |
Bank of America, N.A. | | $ | 507 | | | $ | (263 | ) | | $ | - | | | $ | 244 | |
Barclays Bank PLC | | | 278 | | | | (278 | ) | | | - | | | | - | |
BNP Paribas SA | | | 74 | | | | (74 | ) | | | - | | | | - | |
Goldman Sachs International | | | 1,286 | | | | (487 | ) | | | - | | | | 799 | |
HSBC Bank USA | | | 279 | | | | (279 | ) | | | - | | | | - | |
JPMorgan Chase Bank, N.A. | | | 153 | | | | (153 | ) | | | - | | | | - | |
Morgan Stanley Capital Services | | | 9 | | | | - | | | | - | | | | 9 | |
Royal Bank of Canada | | | 482 | | | | - | | | | - | | | | 482 | |
UBS AG | | | 1,230 | | | | (900 | ) | | | - | | | | 330 | |
| | | | | | | | | | | | | | | | |
Total | | $ | 4,298 | | | $ | (2,434 | ) | | $ | - | | | $ | 1,864 | |
| | | | | | | | | | | | | | | | |
Note 7. Investment Advisory, Sub-Advisory, and Compliance Fees
The Series Fund and its Portfolios are parties to annually renewable contracts pursuant to which each Portfolio pays a charge for investment management and administrative services to MSA, a wholly owned subsidiary of Northwestern Mutual. Certain Portfolios, listed below, pay at a fixed annual rate based on the average daily net asset values of the Portfolio.
| | | | |
Portfolio | | Fee | |
Index 500 Stock Portfolio | | | 0.20% | |
Index 400 Stock Portfolio | | | 0.25% | |
Mid Cap Value Portfolio | | | 0.85% | |
Small Cap Value Portfolio | | | 0.85% | |
Government Money Market Portfolio | | | 0.30% | |
Select Bond Portfolio | | | 0.30% | |
Balanced Portfolio | | | 0.30% | |
For the other Portfolios, the rate for the investment advisory fee is graded by the asset size of the Portfolio according to the following schedules:
| | | | | | | | | | | | | | | | |
Portfolio | | First
$50
Million | | | Next
$50
Million | | | Excess Over
$100
Million | | | | |
Growth Stock Portfolio | | | 0.60% | | | | 0.50% | | | | 0.40% | | | | | |
Large Cap Core Stock Portfolio | | | 0.60% | | | | 0.50% | | | | 0.40% | | | | | |
Mid Cap Growth Stock Portfolio | | | 0.80% | | | | 0.65% | | | | 0.50% | | | | | |
Small Cap Growth Stock Portfolio | | | 0.80% | | | | 0.65% | | | | 0.50% | | | | | |
High Yield Bond Portfolio | | | 0.60% | | | | 0.50% | | | | 0.40% | | | | | |
| | | | |
Portfolio | | First
$100
Million | | | Next
$400
Million | | | Excess Over
$500
Million | | | | |
Focused Appreciation Portfolio | | | 0.80% | | | | 0.75% | | | | 0.70% | | | | | |
| | | | |
Portfolio | | First
$100
Million | | | Next
$150
Million | | | Excess Over
$250
Million | | | | |
Large Company Value Portfolio | | | 0.72% | | | | 0.67% | | | | 0.62% | | | | | |
Domestic Equity Portfolio | | | 0.65% | | | | 0.55% | | | | 0.50% | | | | | |
International Growth Portfolio | | | 0.75% | | | | 0.65% | | | | 0.55% | | | | | |
Short-Term Bond Portfolio | | | 0.35% | | | | 0.33% | | | | 0.30% | | | | | |
Long-Term U.S. Government Bond Portfolio | | | 0.555% | | | | 0.515% | | | | 0.495% | | | | | |
Inflation Protection Portfolio | | | 0.58% | | | | 0.55% | | | | 0.49% | | | | | |
Multi-Sector Bond Portfolio | | | 0.79% | | | | 0.78% | | | | 0.77% | | | | | |
Asset Allocation Portfolio | | | 0.60% | | | | 0.50% | | | | 0.40% | | | | | |
| | | | |
| 228 | | Notes to Financial Statements | | |
Notes to Financial Statements
| | | | | | | | | | | | | | | | |
Portfolio | | First
$150
Million | | | Next
$150
Million | | | Next
$200
Million | | | Excess Over
$500
Million | |
Large Cap Blend Portfolio | | | 0.77% | | | | 0.70% | | | | 0.62% | | | | 0.56% | |
Research International Core Portfolio | | | 0.88% | | | | 0.82% | | | | 0.75% | | | | 0.68% | |
| | | | |
Portfolio | | First
$500
Million | | | Excess Over
$500
Million | | | | | | | |
Equity Income Portfolio | | | 0.65% | | | | 0.60% | | | | | | | | | |
| | | | |
Portfolio | | First
$200
Million | | | Excess Over
$200
Million | | | | | | | |
Index 600 Stock Portfolio | | | 0.25% | | | | 0.20% | | | | | | | | | |
| | | | |
Portfolio | | First
$50
Million | | | Excess Over
$50
Million | | | | | | | |
International Equity Portfolio | | | 0.85% | | | | 0.65% | | | | | | | | | |
| | | | |
Portfolio | | First
$250
Million | | | Next
$250
Million | | | Next
$500
Million | | | Excess Over
$1.0
Billion | |
Emerging Markets Equity Portfolio | | | 1.14% | | | | 1.08% | | | | 0.96% | | | | 0.78% | |
MSA, which is the manager and investment adviser of the Series Fund, contractually agreed to waive the management fee and absorb certain other operating expenses to the extent necessary so that Total Operating Expenses (excluding taxes, brokerage, other investment-related costs, interest and dividend expenses and charges, acquired fund fees and expenses and such non-recurring and extraordinary expenses as they may arise) will not exceed the following amounts:
| | | | | | | | |
Portfolio | | | | | Expiration | |
Focused Appreciation Portfolio | | | 0.90 | % | | | April 30, 2018 | |
Large Cap Blend Portfolio | | | 0.85 | % | | | April 30, 2018 | |
Large Company Value Portfolio | | | 0.80 | % | | | April 30, 2018 | |
Domestic Equity Portfolio | | | 0.75 | % | | | April 30, 2018 | |
Equity Income Portfolio | | | 0.75 | % | | | April 30, 2018 | |
Mid Cap Value Portfolio | | | 1.00 | % | | | April 30, 2018 | |
Index 600 Stock Portfolio | | | 0.35 | % | | | April 30, 2018 | |
Small Cap Value Portfolio | | | 1.00 | % | | | April 30, 2018 | |
International Growth Portfolio | | | 1.10 | % | | | April 30, 2018 | |
Research International Core Portfolio | | | 1.15 | % | | | April 30, 2018 | |
Emerging Markets Equity Portfolio | | | 1.50 | % | | | April 30, 2018 | |
Short-Term Bond Portfolio | | | 0.45 | % | | | April 30, 2018 | |
Long-Term U.S. Government Bond Portfolio | | | 0.65 | % | | | April 30, 2018 | |
Inflation Protection Portfolio | | | 0.65 | % | | | April 30, 2018 | |
Multi-Sector Bond Portfolio | | | 0.90 | % | | | April 30, 2018 | |
Asset Allocation Portfolio | | | 0.75 | % | | | April 30, 2018 | |
Growth Stock Portfolio — MSA has agreed to waive a portion of its management fee such that the management fee is 0.60% on the Portfolio’s first $50 million of average net assets, 0.50% on the next $50 million, 0.40% on the next $400 million, and 0.38% on average net assets in excess of $500 million. MSA may terminate this fee waiver agreement at any time after April 30, 2018.
Focused Appreciation Portfolio — MSA has agreed to waive a portion of its management fee such that the management fee is 0.66% on the Portfolio’s first $100 million of average net assets, 0.61% on the next $400 million, 0.60% on the next $500 million, and 0.57% on average net assets in excess of $1 billion. MSA may terminate this fee waiver agreement at any time after April 30, 2018.
Large Cap Core Stock Portfolio — MSA has agreed to waive a portion of its management fee such that the management fee is 0.60% on the Portfolio’s first $50 million of average net assets, 0.50% on the next $50 million, 0.40% on the next $400 million, and 0.35% on average net assets in excess of $500 million. MSA may terminate this fee waiver agreement at any time after April 30, 2018.
| | | | | | |
| | Notes to Financial Statements | | | 229 | |
Notes to Financial Statements
Index 500 Stock Portfolio — MSA has agreed to waive a portion of its management fee such that the management fee is 0.20% on the Portfolio’s first $2 billion of average net assets, and 0.18% on average net assets in excess of $2 billion. MSA may terminate this fee waiver agreement at any time after April 30, 2018.
Large Company Value Portfolio — For the period from January 1, 2017 through April 30, 2017, MSA agreed to waive a portion of its management fee such that the management fee was 0.68% on the Portfolio’s first $100 million of average net assets, 0.65% on the next $150 million, 0.59% on the next $250 million, and 0.57% on the average net assets in excess of $500 million. Effective May 1, 2017, MSA has agreed to waive a portion of its management fee such that the management fee is 0.70% on the Portfolio’s first $100 million of average net assets, 0.65% on the next $150 million, 0.59% on the next $250 million, and 0.57% on the average net assets in excess of $500 million. MSA may terminate this fee waiver agreement at any time after April 30, 2018.
Domestic Equity Portfolio — For the period from January 1, 2017 through April 30, 2017, MSA agreed to waive a portion of its management fee such that the management fee was 0.65% on the Portfolio’s first $100 million of average net assets, 0.55% on the next $150 million, 0.50% on the next $250 million, and 0.48% on the average net assets in excess of $500 million. Effective May 1, 2017, MSA has agreed to waive a portion of its management fee such that the management fee is 0.65% on the Portfolio’s first $100 million of average net assets, 0.55% on the next $150 million, 0.50% on the next $250 million, and 0.47% on the average net assets in excess of $500 million. MSA may terminate this fee waiver agreement at any time after April 30, 2018.
Equity Income Portfolio — For the period from January 1, 2017 through April 30, 2017, MSA agreed to waive a portion of its management fee such that the management fee was 0.65% on the Portfolio’s first $500 million of average net assets, 0.55% on the next $1 billion, and 0.52% on average net assets in excess of $1.5 billion. Effective May 1, 2017, MSA has agreed to waive a portion of its management fee such that the management fee is 0.63% on the Portfolio’s first $500 million of average net assets, 0.55% on the next $1 billion, and 0.52% on the average net assets in excess of $1.5 billion. MSA may terminate this fee waiver agreement at any time after April 30, 2018.
Mid Cap Growth Stock Portfolio — MSA has agreed to waive a portion of its management fee such that the management fee is 0.80% on the Portfolio’s first $50 million, 0.65% on the next $50 million, 0.50% on the next $900 million, and 0.48% on average net assets in excess of $1 billion. MSA may terminate this fee waiver agreement at any time after April 30, 2018.
Index 400 Stock Portfolio — MSA has agreed to waive a portion of its management fee such that the management fee is 0.25% on the Portfolio’s first $500 million and 0.20% on average net assets in excess of $500 million. MSA may terminate this fee waiver agreement at any time after April 30, 2018.
Mid Cap Value Portfolio — For the period from January 1, 2017 through April 30, 2017, MSA agreed to waive a portion of its management fee such that the management fee was 0.79% on the Portfolio’s first $150 million of average net assets, 0.70% on the next $350 million, and 0.68% on average net assets in excess of $500 million. Effective May 1, 2017, MSA has agreed to waive a portion of its management fee such that the management fee is 0.79% on the Portfolio’s first $150 million of average net assets, 0.70% on the next $350 million, and 0.67% on the average net assets in excess of $500 million. MSA may terminate this fee waiver agreement at any time after April 30, 2018.
Small Cap Value Portfolio — MSA has agreed to waive a portion of its management fee such that the management fee is 0.85% on the Portfolio’s first $500 million of average net assets, and 0.80% on average net assets in excess of $500 million. MSA may terminate this fee waiver agreement at any time after April 30, 2018.
Research International Core Portfolio — MSA has agreed to waive a portion of its management fee such that the management fee is 0.83% on the Portfolio’s first $150 million of average net assets, 0.77% of the next $150 million, 0.70% on the next $200 million, and 0.63% on average net assets in excess of $500 million. MSA may terminate this fee waiver agreement at any time after April 30, 2018.
International Equity Portfolio — For the period from January 1, 2017 through April 30, 2017, MSA agreed to waive a portion of its management fee such that the management fee was 0.80% on the Portfolio’s first $50 million of average net assets, 0.60% on the next $450 million, 0.57% on the next $500 million, 0.50% on the next $500 million, and 0.45% on the average net assets in excess of $1.5 billion. Effective May 1, 2017, MSA has agreed to waive a portion of its management fee such that the management fee is 0.77% on the Portfolio’s first $50 million of average net assets, 0.57% on the next $450 million, 0.54% on the next $500 million, 0.47% on the next $500 million, and 0.42% on the average net assets in excess of $1.5 billion. MSA may terminate this fee waiver agreement at any time after April 30, 2018.
| | | | |
| 230 | | Notes to Financial Statements | | |
Notes to Financial Statements
Emerging Markets Equity Portfolio — MSA has agreed to waive a portion of its management fee such that its management fee is 1.01% on the Portfolio’s first $250 million of average net assets, 0.93% on the next $250 million, 0.91% on the next $500 million, and 0.78% on average net assets in excess of $1 billion. MSA may terminate this fee waiver agreement at any time after April 30, 2018.
Government Money Market Portfolio — MSA has agreed to waive a portion of its management fee such that the management fee is 0.30% on the Portfolio’s first $500 million of average net assets, 0.29% on the next $500 million, and 0.28% in excess of $1 billion. MSA may terminate this fee waiver agreement at any time after April 30, 2018. In addition, MSA has voluntarily agreed to waive its advisory fee and/or reimburse expenses in excess of the Portfolio’s daily yield so as to maintain a zero or positive yield for the Portfolio. This voluntary waiver will be reviewed periodically by MSA in light of market and economic developments and may be revised or discontinued at any time without advance notice.
Short-Term Bond Portfolio — MSA has agreed to waive a portion of its management fee such that the management fee is 0.35% on the Portfolio’s first $100 million of average net assets, 0.33% on the next $150 million, 0.30% on the next $250 million, and 0.28% on average net assets in excess of $500 million. MSA may terminate this fee waiver agreement at any time after April 30, 2018.
Select Bond Portfolio — MSA has agreed to waive a portion of its management fee such that the management fee is 0.30% on the Portfolio’s first $2 billion of average net assets, and 0.28% on average net assets in excess of $2 billion. MSA may terminate this fee waiver agreement at any time after April 30, 2018.
Long-Term U.S. Government Bond Portfolio — MSA has agreed to waive a portion of its management fee such that the management fee is 0.555% on the Portfolio’s first $100 million of average net assets, 0.515% on the next $150 million, 0.495% on the next $250 million, and 0.445% on average net assets in excess of $500 million. MSA may terminate this fee waiver agreement at any time after April 30, 2018.
Inflation Protection Portfolio — MSA agreed to waive a portion of its management fee such that the management fee is 0.55% on the Portfolio’s first $100 million of average net assets, 0.50% on the next $150 million, and 0.46% on average net assets in excess of $250 million. MSA may terminate this fee waiver agreement at any time after April 30, 2018.
High Yield Bond Portfolio — MSA agreed to waive a portion of its management fee such that the management fee is 0.60% on the Portfolio’s first $50 million of average net assets, 0.50% on the next $50 million, 0.40% on the next $900 million, and 0.30% on average net assets in excess of $1 billion. MSA may terminate this fee waiver agreement at any time after April 30, 2018.
Multi-Sector Bond Portfolio — MSA has agreed to waive a portion of its management fee such that the management fee is 0.74% on the Portfolio’s first $100 million of average net assets, 0.73% on the next $150 million, 0.70% on the next $250 million, and 0.67% on average net assets in excess of $500 million. MSA may terminate this fee waiver agreement at any time after April 30, 2018.
Balanced Portfolio — MSA has agreed to waive a portion of its management fee such that the management fee is 0.05% on all average net assets. MSA may terminate this fee waiver agreement at any time after April 30, 2018.
Asset Allocation Portfolio — MSA has agreed to waive a portion of its management fee such that the management fee is 0.05% on all average net assets. MSA may terminate this fee waiver agreement at any time after April 30, 2018.
Waivers are not recoupable in future periods.
Certain Portfolios pay a portion of their custodian fees indirectly through expense offset arrangements. Custodian fees are reduced for Portfolios that maintain compensating balances in non-interest bearing accounts. These Portfolios could have invested the assets used to pay for the custodian fees, had the assets not been used in the expense offset arrangements. Expense offset arrangements are reflected as Waived Fees Paid Indirectly on the Statements of Operations.
| | | | | | |
| | Notes to Financial Statements | | | 231 | |
Notes to Financial Statements
With respect to certain Portfolios, MSA has engaged and oversees sub-advisers who manage the day-to-day investment operations of such Portfolios. MSA pays each sub-adviser a fee based on the average daily net assets of each such Portfolio out of its investment management fee.
Compliance fees are paid to Northwestern Mutual, an affiliate of the Series Fund. The compliance fees paid are for the compensation, benefits and expenses of the Chief Compliance Officer and compliance staff. The amounts paid relate only to the Chief Compliance Officer and compliance staffs’ duties and functions performed for the Series Fund.
Note 8. Federal Income Tax Matters
Taxable distributions from net investment income and realized capital gains in the Portfolios may differ from book amounts earned during the period due to differences in the timing of capital gains recognition and due to the reclassification of certain gains or losses between capital and income. The differences between cost amounts for book purposes and tax purposes are primarily due to the tax treatment of deferred losses, corporate actions, passive foreign investment companies, and financing transactions.
It is the policy of the Portfolios to reclassify the net effect of permanent differences between book and taxable income to capital accounts on the Statements of Assets and Liabilities. Permanent differences primarily relate to character differences with respect to income on swaps, foreign currency transactions, foreign bond sales, passive foreign investment companies, corporate actions and paydowns on structured product investments.
A summary of the Portfolios’ capital loss carryovers as of December 31, 2017 is provided below:
| | | | | | | | | | | | | | | | |
| | | Short-Term
Loss
Carryover | | | Long-Term
Loss
Carryover | | | Losses
Utilized | | | Losses
Expired | |
| | | (Amounts in thousands) | |
Large Cap Core Stock Portfolio | | $ | - | | | $ | - | | | $ | 837 | | | $ | - | |
Mid Cap Growth Stock Portfolio | | | - | | | | - | | | | 16,965 | | | | - | |
International Growth Portfolio | | | 16,110 | | | | 2,426 | | | | - | | | | 7,111 | |
Research International Core Portfolio | | | - | | | | 5,832 | | | | 10,894 | | | | - | |
International Equity Portfolio | | | 13,732 | | | | 8,138 | | | | 44,876 | | | | - | |
Emerging Markets Equity Portfolio | | | - | | | | 17,231 | | | | 28,060 | | | | - | |
Short-Term Bond Portfolio | | | 1,179 | | | | 1,246 | | | | - | | | | - | |
Select Bond Portfolio | | | 2,235 | | | | 414 | | | | - | | | | - | |
Inflation Protection Portfolio | | | 725 | | | | 1,132 | | | | - | | | | - | |
High Yield Bond Portfolio | | | - | | | | 4,975 | | | | 5,331 | | | | 19,925 | |
Multi-Sector Bond Portfolio | | | 13,094 | | | | - | | | | 6,249 | | | | - | |
Capital losses are carried forward indefinitely and retain the character of the original loss. These losses are deferred to the first day of the next fiscal year.
When applicable, each of the Portfolios made distributions during the year of ordinary income and long-term capital gains. The tax character of distributions paid for the periods ended December 31, 2017 and 2016 was as follows:
| | | | | | | | | | | | | | | | |
| | | 2017 Distributions
Paid From: | | | 2016 Distributions
Paid From: | |
Portfolio | | Ordinary
Income | | | Long-term
Capital Gain | | | Ordinary
Income | | | Long-term
Capital Gain | |
| | | (Amounts in thousands) | |
Growth Stock Portfolio | | $ | 7,919 | | | $ | 41,619 | | | $ | 7,202 | | | $ | 80,811 | |
Focused Appreciation Portfolio | | | 7,447 | | | | 15,000 | | | | 50,577 | | | | 165,466 | |
Large Cap Core Stock Portfolio | | | 9,903 | | | | - | | | | 10,936 | | | | 9,147 | |
Large Cap Blend Portfolio | | | 1,572 | | | | 8,161 | | | | 3,122 | | | | 10,542 | |
Index 500 Stock Portfolio | | | 53,611 | | | | 29,420 | | | | 46,439 | | | | 52,069 | |
Large Company Value Portfolio | | | 6,519 | | | | 5,231 | | | | 3,858 | | | | 16,132 | |
Domestic Equity Portfolio | | | 16,927 | | | | 13,986 | | | | 12,521 | | | | 25,926 | |
Equity Income Portfolio | | | 19,168 | | | | 36,605 | | | | 15,268 | | | | 39,661 | |
Mid Cap Growth Stock Portfolio | | | 2,583 | | | | - | | | | 3,826 | | | | 77,596 | |
Index 400 Stock Portfolio | | | 9,365 | | | | 47,364 | | | | 8,024 | | | | 52,210 | |
Mid Cap Value Portfolio | | | 11,745 | | | | 15,266 | | | | 17,599 | | | | 25,515 | |
Small Cap Growth Stock Portfolio | | | 625 | | | | 6,457 | | | | 3,262 | | | | 49,556 | |
Index 600 Stock Portfolio | | | 5,210 | | | | 5,517 | | | | 1,140 | | | | 6,003 | |
Small Cap Value Portfolio | | | 4,984 | | | | 33,520 | | | | 5,244 | | | | 70,226 | |
International Growth Portfolio | | | 8,203 | | | | - | | | | 5,957 | | | | - | |
| | | | |
| 232 | | Notes to Financial Statements | | |
Notes to Financial Statements
| | | | | | | | | | | | | | | | |
| | | 2017 Distributions
Paid From: | | | 2016 Distributions
Paid From: | |
Portfolio | | Ordinary
Income | | | Long-term
Capital Gain | | | Ordinary
Income | | | Long-term
Capital Gain | |
| | | (Amounts in thousands) | |
Research International Core Portfolio | | $ | 9,827 | | | $ | - | | | | 9,199 | | | $ | 3,916 | |
International Equity Portfolio | | | 42,550 | | | | - | | | | 33,744 | | | | 20,770 | |
Emerging Markets Equity Portfolio | | | 5,748 | | | | - | | | | 3,683 | | | | - | |
Government Money Market Portfolio | | | 2,770 | | | | 5 | | | | 611 | | | | 2 | |
Short-Term Bond Portfolio | | | 3,730 | | | | - | | | | 3,014 | | | | - | |
Select Bond Portfolio | | | 98,769 | | | | - | | | | 67,490 | | | | 2,244 | |
Long-Term U.S. Government Bond Portfolio | | | 4,589 | | | | 1,984 | | | | 4,300 | | | | - | |
Inflation Protection Portfolio | | | 3,414 | | | | - | | | | 3,649 | | | | - | |
High Yield Bond Portfolio | | | 43,155 | | | | - | | | | 39,861 | | | | - | |
Multi-Sector Bond Portfolio | | | 30,040 | | | | - | | | | 29,034 | | | | - | |
Balanced Portfolio | | | 56,193 | | | | 76,318 | | | | 49,667 | | | | 62,181 | |
Asset Allocation Portfolio | | | 6,212 | | | | 10,741 | | | | 5,868 | | | | 9,122 | |
As of December 31, 2017, the components of distributable earnings on a tax basis were as follows:
| | | | | | | | | | | | | | | | |
Portfolio | | Undistributed
Ordinary
Income | | | Undistributed
Long-Term
Gains | | | Accumulated
Losses | | | Unrealized
Appreciation
(Depreciation) | |
| | | (Amounts in thousands) | |
Growth Stock Portfolio | | $ | 19,285 | | | $ | 92,900 | | | $ | - | | | $ | 215,852 | |
Focused Appreciation Portfolio | | | 6,290 | | | | 24,536 | | | | - | | | | 255,073 | |
Large Cap Core Stock Portfolio | | | 13,132 | | | | 162,866 | | | | - | | | | 49,974 | |
Large Cap Blend Portfolio | | | 1,436 | | | | 7,945 | | | | - | | | | 42,762 | |
Index 500 Stock Portfolio | | | 56,053 | | | | 28,215 | | | | - | | | | 1,710,942 | |
Large Company Value Portfolio | | | 6,624 | | | | 11,246 | | | | - | | | | 18,729 | |
Domestic Equity Portfolio | | | 16,392 | | | | 26,745 | | | | - | | | | 233,858 | |
Equity Income Portfolio | | | 18,673 | | | | 58,411 | | | | - | | | | 164,096 | |
Mid Cap Growth Stock Portfolio | | | 49,554 | | | | 135,034 | | | | - | | | | 47,978 | |
Index 400 Stock Portfolio | | | 11,288 | | | | 57,309 | | | | - | | | | 260,802 | |
Mid Cap Value Portfolio | | | 14,596 | | | | 43,616 | | | | - | | | | 68,739 | |
Small Cap Growth Stock Portfolio | | | 6,699 | | | | 44,317 | | | | - | | | | 157,467 | |
Index 600 Stock Portfolio | | | 5,864 | | | | 7,520 | | | | - | | | | 44,836 | |
Small Cap Value Portfolio | | | 4,946 | | | | 45,060 | | | | - | | | | 229,373 | |
International Growth Portfolio | | | 9,449 | | | | - | | | | (18,536 | ) | | | 135,731 | |
Research International Core Portfolio | | | 10,585 | | | | - | | | | (5,832 | ) | | | 112,138 | |
International Equity Portfolio | | | 45,977 | | | | - | | | | (21,870 | ) | | | 328,607 | |
Emerging Markets Equity Portfolio | | | 9,192 | | | | - | | | | (17,231 | ) | | | 109,096 | |
Short-Term Bond Portfolio | | | 4,647 | | | | - | | | | (2,426 | ) | | | (519 | ) |
Select Bond Portfolio | | | 67,892 | | | | - | | | | (2,649 | ) | | | (14,575 | ) |
Long-Term U.S. Government Bond Portfolio | | | 4,123 | | | | 671 | | | | - | | | | (5,323 | ) |
Inflation Protection Portfolio | | | 7,026 | | | | - | | | | (1,857 | ) | | | 647 | |
High Yield Bond Portfolio | | | 43,280 | | | | - | | | | (4,975 | ) | | | 12,222 | |
Multi-Sector Bond Portfolio | | | 26,934 | | | | - | | | | (13,094 | ) | | | 23,773 | |
Balanced Portfolio | | | 55,332 | | | | 46,465 | | | | - | | | | 171,824 | |
Asset Allocation Portfolio | | | 6,104 | | | | 6,578 | | | | - | | | | 27,315 | |
Note 9. Voluntary Reimbursements
Northwestern Mutual voluntarily reimburses foreign equity portfolios for the benefit Northwestern Mutual receives from foreign dividend taxes charged against the Portfolios. The amounts reimbursed represent approximately 65% of the foreign dividend taxes withheld attributable to the portion of the Portfolio owned by Northwestern Mutual. Reimbursements are recorded when foreign dividend taxes are accrued and are included in Unaffiliated Dividends on the Statement of Operations.
Voluntary reimbursements for the periods ended December 31, 2017 and 2016 are summarized below:
| | | | | | | | |
Portfolio | | 2017
Reimbursements | | | 2016
Reimbursements | |
International Growth Portfolio | | $ | 972,733 | | | $ | 552,098 | |
Research International Core Portfolio | | | 1,277,132 | | | | 726,889 | |
International Equity Portfolio | | | 3,938,457 | | | | 3,444,135 | |
Emerging Markets Equity Portfolio | | | 991,056 | | | | 736,438 | |
| | | | | | |
| | Notes to Financial Statements | | | 233 | |
Notes to Financial Statements
Note 10. Guarantees
In the normal course of business the Portfolios enter into contracts that contain a variety of representations which provide general indemnifications. The Portfolios’ maximum exposure under these arrangements is unknown as this would involve future claims that may be made against the Portfolios that have not yet occurred. However, the Portfolios expect the risk of loss to be remote.
Note 11. Investment Income and Securities Transactions
For the period ended December 31, 2017, transactions in securities other than short term investments were:
| | | | | | | | | | | | | | | | |
Portfolio | | Non U.S.
Govt.
Security
Purchases | | | U.S. Govt.
Security
Purchases | | | Non U.S.
Govt.
Security
Sales/
Maturities | | | U.S. Govt.
Security
Sales/
Maturities | |
| | | (Amount in thousands) | |
Growth Stock Portfolio | | $ | 517,252 | | | $ | - | | | $ | 583,214 | | | $ | - | |
Focused Appreciation Portfolio | | | 30,215 | | | | - | | | | 89,324 | | | | - | |
Large Cap Core Stock Portfolio | | | 561,919 | | | | - | | | | 599,285 | | | | - | |
Large Cap Blend Portfolio | | | 25,066 | | | | - | | | | 47,908 | | | | - | |
Index 500 Stock Portfolio | | | 112,465 | | | | - | | | | 84,962 | | | | - | |
Large Company Value Portfolio | | | 104,471 | | | | - | | | | 115,873 | | | | - | |
Domestic Equity Portfolio | | | 122,647 | | | | - | | | | 92,305 | | | | - | |
Equity Income Portfolio | | | 168,738 | | | | - | | | | 227,809 | | | | - | |
Mid Cap Growth Stock Portfolio | | | 1,521,633 | | | | - | | | | 1,592,442 | | | | - | |
Index 400 Stock Portfolio | | | 157,261 | | | | - | | | | 146,255 | | | | - | |
Mid Cap Value Portfolio | | | 243,627 | | | | - | | | | 249,723 | | | | - | |
Small Cap Growth Stock Portfolio | | | 249,918 | | | | - | | | | 275,985 | | | | - | |
Index 600 Stock Portfolio | | | 92,038 | | | | - | | | | 67,012 | | | | - | |
Small Cap Value Portfolio | | | 91,545 | | | | - | | | | 132,429 | | | | - | |
International Growth Portfolio | | | 141,928 | | | | - | | | | 118,978 | | | | - | |
Research International Core Portfolio | | | 179,396 | | | | - | | | | 159,797 | | | | - | |
International Equity Portfolio | | | 363,510 | | | | - | | | | 391,936 | | | | - | |
Emerging Markets Equity Portfolio | | | 626,462 | | | | - | | | | 603,516 | | | | - | |
Short-Term Bond Portfolio | | | 137,570 | | | | 40,263 | | | | 102,294 | | | | 23,378 | |
Select Bond Portfolio | | | 5,578,663 | | | | 6,962,470 | | | | 5,377,183 | | | | 6,868,878 | |
Long-Term U.S. Government Bond Portfolio | | | 103 | | | | 85,835 | | | | 623 | | | | 74,779 | |
Inflation Protection Portfolio | | | 68,089 | | | | 59,546 | | | | 41,977 | | | | 28,839 | |
High Yield Bond Portfolio | | | 273,981 | | | | - | | | | 239,896 | | | | - | |
Multi-Sector Bond Portfolio | | | 522,688 | | | | 61,918 | | | | 274,177 | | | | 59,317 | |
Balanced Portfolio | | | 357,747 | | | | - | | | | 404,921 | | | | - | |
Asset Allocation Portfolio | | | 58,312 | | | | - | | | | 55,679 | | | | - | |
Transactions with Affiliated Companies
An affiliated company is a company in which a Portfolio has ownership of at least 5% of the voting securities or which the Portfolio controls, is controlled by or with which the Portfolio is under common control. Transactions with affiliated companies during the period ended December 31, 2017 are as follows:
| | | | |
| 234 | | Notes to Financial Statements | | |
Notes to Financial Statements
| | | | | | | | | | | | | | | | | | | | | | | | | | | | | | | | | | | | |
Portfolio | | Value at
12/31/2016 | | | Purchases | | | Sales | | | Value at
12/31/2017 | | | Change in
Unrealized
Appreciation
/Depreciation | | | Realized
Gain
(Loss) | | | Income
Dividends | | | Capital Gain
Distributions | | | % Ownership,
12/31/2017 | |
| | | | | | | | | | | | (Amount in thousands) | | | | | | | | | | | | | |
Balanced: | | | | | | | | | | | | | | | | | | | | | | | | | | | | | | | | | | | | |
Growth Stock | | $ | 145,302 | | | $ | 8,100 | | | $ | 27,584 | | | $ | 151,087 | | | $ | 22,248 | | | $ | 3,021 | | | $ | 1,295 | | | $ | 6,805 | | | | 15.7 | % |
Focused Appreciation | | | 70,124 | | | | 1,923 | | | | 16,880 | | | | 75,676 | | | | 18,418 | | | | 2,092 | | | | 546 | | | | 1,378 | | | | 8.0 | % |
Large Cap Core Stock | | | 72,644 | | | | 1,318 | | | | 14,103 | | | | 75,636 | | | | 13,314 | | | | 2,464 | | | | 1,318 | | | | - | | | | 12.8 | % |
Large Cap Blend | | | 75,542 | | | | 4,285 | | | | 13,282 | | | | 75,787 | | | | 6,813 | | | | 2,428 | | | | 669 | | | | 3,616 | | | | 43.0 | % |
Large Company Value | | | 78,481 | | | | 4,486 | | | | 11,007 | | | | 75,686 | | | | 2,811 | | | | 915 | | | | 1,495 | | | | 2,990 | | | | 37.9 | % |
Domestic Equity | | | 78,011 | | | | 3,065 | | | | 12,472 | | | | 75,695 | | | | 3,361 | | | | 3,730 | | | | 1,230 | | | | 1,835 | | | | 9.2 | % |
Equity Income | | | 80,130 | | | | 5,186 | | | | 16,243 | | | | 75,677 | | | | 4,136 | | | | 2,467 | | | | 1,659 | | | | 3,528 | | | | 9.0 | % |
Mid Cap Growth Stock | | | 102,724 | | | | 281 | | | | 11,500 | | | | 111,510 | | | | 21,147 | | | | (1,141 | ) | | | 281 | | | | - | | | | 10.2 | % |
Mid Cap Value | | | 112,334 | | | | 5,877 | | | | 11,500 | | | | 113,530 | | | | 5,275 | | | | 1,543 | | | | 1,719 | | | | 4,158 | | | | 20.1 | % |
Small Cap Growth Stock | | | 36,493 | | | | 487 | | | | 6,000 | | | | 37,601 | | | | 5,766 | | | | 855 | | | | 43 | | | | 444 | | | | 6.0 | % |
Small Cap Value | | | 40,066 | | | | 14,757 | | | | 6,000 | | | | 50,129 | | | | 1,082 | | | | 224 | | | | 324 | | | | 2,182 | | | | 7.4 | % |
International Growth | | | 36,675 | | | | 5,598 | | | | - | | | | 53,067 | | | | 10,794 | | | | - | | | | 598 | | | | - | | | | 7.6 | % |
Research International Core | | | 101,555 | | | | 6,890 | | | | 8,500 | | | | 125,619 | | | | 23,747 | | | | 1,927 | | | | 1,890 | | | | - | | | | 19.1 | % |
International Equity | | | 45,218 | | | | 4,159 | | | | 6,000 | | | | 51,900 | | | | 7,561 | | | | 963 | | | | 1,159 | | | | - | | | | 2.7 | % |
Emerging Markets Equity | | | 5,356 | | | | 6,557 | | | | - | | | | 13,467 | | | | 1,554 | | | | - | | | | 57 | | | | - | | | | 1.9 | % |
Select Bond | | | 833,447 | | | | 27,175 | | | | 72,000 | | | | 790,177 | | | | 737 | | | | 817 | | | | 16,495 | | | | 10,680 | | | | 26.8 | % |
Inflation Protection | | | 16,561 | | | | 28,662 | | | | - | | | | 45,885 | | | | 662 | | | | - | | | | 115 | | | | 48 | | | | 11.4 | % |
High Yield Bond | | | 135,098 | | | | 7,455 | | | | 5,000 | | | | 139,300 | | | | 1,572 | | | | 174 | | | | 7,455 | | | | - | | | | 17.2 | % |
| | | | | | | | | | | | | | | | | | | | | | | | | | | | | | | | | | | | |
| | $ | 2,065,761 | | | $ | 136,261 | | | $ | 238,070 | | | $ | 2,137,429 | | | $ | 150,998 | | | $ | 22,479 | | | $ | 38,348 | | | $ | 37,664 | | | | | |
| | | | | | | | | | | | | | | | | | | | | | | | | | | | | | | | | | | | |
| | | | | | | | | |
Asset Allocation: | | | | | | | | | | | | | | | | | | | | | | | | | | | | | | | | | | | | |
Growth Stock | | $ | 19,888 | | | $ | 1,165 | | | $ | 2,541 | | | $ | 22,019 | | | $ | 3,227 | | | $ | 281 | | | $ | 186 | | | $ | 979 | | | | 2.3 | % |
Focused Appreciation | | | 9,569 | | | | 876 | | | | 2,273 | | | | 11,034 | | | | 2,628 | | | | 234 | | | | 78 | | | | 198 | | | | 1.2 | % |
Large Cap Core Stock | | | 11,259 | | | | 213 | | | | 1,554 | | | | 12,405 | | | | 2,212 | | | | 275 | | | | 213 | | | | - | | | | 2.1 | % |
Large Cap Blend | | | 11,708 | | | | 693 | | | | 1,434 | | | | 12,428 | | | | 1,191 | | | | 268 | | | | 108 | | | | 585 | | | | 7.1 | % |
Large Company Value | | | 11,091 | | | | 645 | | | | 1,233 | | | | 11,030 | | | | 424 | | | | 104 | | | | 215 | | | | 430 | | | | 5.5 | % |
Domestic Equity | | | 10,768 | | | | 428 | | | | 1,154 | | | | 11,027 | | | | 646 | | | | 340 | | | | 172 | | | | 256 | | | | 1.3 | % |
Equity Income | | | 11,152 | | | | 745 | | | | 1,803 | | | | 11,030 | | | | 659 | | | | 277 | | | | 238 | | | | 507 | | | | 1.3 | % |
Mid Cap Growth Stock | | | 13,907 | | | | 38 | | | | 600 | | | | 16,133 | | | | 2,813 | | | | (26 | ) | | | 38 | | | | - | | | | 1.5 | % |
Mid Cap Value | | | 15,156 | | | | 793 | | | | 600 | | | | 16,348 | | | | 892 | | | | 107 | | | | 232 | | | | 561 | | | | 2.9 | % |
Small Cap Growth Stock | | | 6,771 | | | | 90 | | | | 700 | | | | 7,444 | | | | 1,182 | | | | 100 | | | | 8 | | | | 82 | | | | 1.2 | % |
Small Cap Value | | | 7,424 | | | | 2,214 | | | | 700 | | | | 9,237 | | | | 272 | | | | 26 | | | | 60 | | | | 404 | | | | 1.4 | % |
International Growth | | | 5,706 | | | | 2,296 | | | | - | | | | 9,716 | | | | 1,714 | | | | - | | | | 96 | | | | - | | | | 1.4 | % |
Research International Core | | | 15,934 | | | | 2,400 | | | | 1,500 | | | | 20,881 | | | | 3,684 | | | | 364 | | | | 300 | | | | - | | | | 3.2 | % |
International Equity | | | 7,720 | | | | 1,894 | | | | 1,500 | | | | 9,544 | | | | 1,189 | | | | 241 | | | | 194 | | | | - | | | | 0.5 | % |
Emerging Markets Equity | | | 2,404 | | | | 2,225 | | | | - | | | | 5,314 | | | | 685 | | | | - | | | | 26 | | | | - | | | | 0.7 | % |
Select Bond | | | 50,467 | | | | 1,519 | | | | 8,500 | | | | 43,628 | | | | 41 | | | | 101 | | | | 922 | | | | 597 | | | | 1.5 | % |
Inflation Protection | | | 2,007 | | | | 3,520 | | | | - | | | | 5,607 | | | | 80 | | | | - | | | | 14 | | | | 6 | | | | 1.4 | % |
High Yield Bond | | | 20,200 | | | | 1,855 | | | | - | | | | 22,290 | | | | 235 | | | | - | | | | 1,156 | | | | - | | | | 2.7 | % |
| | | | | | | | | | | | | | | | | | | | | | | | | | | | | | | | | | | | |
| | $ | 233,131 | | | $ | 23,611 | | | $ | 26,092 | | | $ | 257,115 | | | $ | 23,774 | | | $ | 2,692 | | | $ | 4,256 | | | $ | 4,605 | | | | | |
| | | | | | | | | | | | | | | | | | | | | | | | | | | | | | | | | | | | |
The Series Fund and its Portfolios are permitted to purchase securities from, and sell securities to (so called “cross-trades”), (i) other Portfolios, (ii) any registered investment company which is an affiliate, or an affiliate of an affiliate, or (iii) any person which is an affiliate, or an affiliate of an affiliate, of the Series Fund or the Portfolio solely by reason of having a common investment adviser or sub-adviser (or affiliated investment advisers) or common directors and/or officers, pursuant to procedures adopted by the Board under Rule 17a-7 of the 1940 Act (“Procedures”). These Procedures have been designed to ensure that any cross-trade of securities by a Portfolio complies with Rule 17a-7 of the 1940 Act. Each cross-trade is effected at the current market price as defined under the Procedures. Pursuant to the Procedures, for the period ended December 31, 2017, the Series Fund Portfolios engaged in the following cross-trades (amounts in thousands):
| | | | |
| | | | |
Portfolio | | Cross Trade
Purchases | |
Large Cap Core Portfolio | | $ | 11,971 | |
Large Company Value Portfolio | | | 1,096 | |
Mid Cap Growth Stock Portfolio | | | 4,432 | |
Mid Cap Value Portfolio | | | 670 | |
International Growth Portfolio | | | 63,585 | |
Research International Core Portfolio | | | 4,922 | |
Emerging Markets Equity Portfolio | | | 6,462 | |
High Yield Bond Portfolio | | | 1,219 | |
| | | | | | | | |
| | | Cross Trade Sales | |
Portfolio | | Proceeds | | | Net Realized Gains
(Losses) on Sales | |
Large Company Value Portfolio | | $ | 482 | | | $ | (13 | ) |
Equity Income Portfolio | | | 73 | | | | 9 | |
Mid Cap Growth Stock Portfolio | | | 10,552 | | | | 847 | |
Mid Cap Value Portfolio | | | 534 | | | | 61 | |
Small Cap Value Portfolio | | | 780 | | | | (189 | ) |
International Growth Portfolio | | | 89,223 | | | | 110 | |
Research International Core Portfolio | | | 7,677 | | | | 125 | |
Emerging Markets Equity Portfolio | | | 6,776 | | | | 5 | |
| | | | | | |
| | Notes to Financial Statements | | | 235 | |
Notes to Financial Statements
Note 12. Litigation
The Index 500 Stock, Small Cap Value and Equity Income Portfolios are among the defendants in two lawsuits relating to their receipt of proceeds from the 2007 Tribune Co. leveraged buy-out (“Tribune LBO”) transaction. One lawsuit, filed in a U.S. Bankruptcy Court by a group of unsecured creditors, asserts that the directors and officers of Tribune Co. intentionally defrauded Tribune creditors because Tribune was either insolvent or rendered insolvent by the transactions. Counsel for the Series Fund and other institutional defendants filed a motion to dismiss the intentional fraudulent transfer case in the Southern District of New York and the district court judge granted the motion to dismiss without leave to amend. The trustee’s counsel has filed a motion to certify the dismissal for appeal to the U.S. Court of Appeals for the Second Circuit. The other set of lawsuits, filed by a group of secured creditors in various U.S. federal courts, asserts that the transfer of proceeds to the above-noted Portfolios (and other shareholders) as part of the Tribune LBO were constructively fraudulent. Following the grant of a motion to dismiss the secured creditors’ constructive fraud claim by the District Court, the affirmation of that dismissal by the U.S. Court of Appeals for the Second Circuit, followed by a denial of a motion for reconsideration, the Plaintiffs requested review of the decision by the U.S. Supreme Court. A decision from the U.S. Supreme Court on the request for review is pending. The lawsuits allege no misconduct by the Portfolios or management, and management intends to vigorously defend all claims and allegations. The plaintiffs in both lawsuits seek to recover amounts paid to Tribune shareholders in the leveraged buyout transaction, plus interest and attorneys’ fees and expenses. The value of the proceeds received by these Portfolios in 2007, and the percentage the proceeds represent of each Portfolio’s net assets as of December 31,2017, were: Index 500 Stock Portfolio $977,000 (0.03%) of net assets; Small Cap Value Portfolio $618,000 (0.09% of net assets); and Equity Income Portfolio $2,873,000 (0.34% of net assets). Management has not concluded that a loss is reasonably likely to occur, and therefore no loss accrual has been recorded.
In 2016, the Series Fund was a participant in an appraisal action relating to the share of Dell, Inc. (“Dell”) held by the Equity Income Portfolio. In consultation with T. Rowe Price Associates, Inc. (“T. Rowe Price”), the sub-adviser for the Equity Income Portfolio, the Equity Income Portfolio declined to receive consideration of $13.75 per share, plus a special dividend of $0.13 per share, in connection with a going private transaction approved by Dell shareholders in September 2013. Instead, the Portfolio was seeking an appraisal of the fair value of its Dell shares in the Delaware Chancery Court. Ultimately, the Chancery Court issued a finding that the correct value of the Dell shares at the time of the merger was $17.62 per share, or $3.87 over the merger price of $13.75. However, due to an inadvertent error in the voting process by T. Rowe Price, the Equity Income Portfolio lost the right to seek appraisal and benefit from the higher share valuation as determined by the Court, and was therefore only entitled to receive the consideration offered by Dell.
T. Rowe Price subsequently informed the Series Fund that they intended to reimburse the Equity Income Portfolio by an amount designed to put the Portfolio in the same position it would have been in had its valuation rights not been lost due to the voting error, and payment to the Portfolio was made in the amount of $2,084,801.77. The Series Fund also entered into a settlement agreement with Dell, under which it received the merger share price for the Dell Shares held by the Portfolio. Pursuant to the settlement agreement with T. Rowe Price, the Equity Income Portfolio is required to repay T. Rowe Price if the valuation decision is reversed or reduced on appeal. On December 14, 2017, the Delaware Supreme Court issued an opinion reversing the trial court’s judgment and remanding the case to the trial court for further proceedings. Although it is not clear how the trial court will eventually rule or what the ultimate valuation would be, the Supreme Court’s opinion strongly suggested that the trial court’s valuation of $17.62 would be reduced. Accordingly, a contingent liability has been recorded for $648,550 (the estimated amount of the reduction in value).
| | | | |
| 236 | | Notes to Financial Statements | | |
Report of Independent Registered Public Accounting Firm
To the Board of Directors and Shareholders of
Northwestern Mutual Series Fund, Inc.
Opinion on the Financial Statements
We have audited the accompanying statement of assets and liabilities, including the schedule of investments, of the Growth Stock Portfolio, Focused Appreciation Portfolio, Large Cap Core Stock Portfolio, Large Cap Blend Portfolio, Index 500 Stock Portfolio, Large Company Value Portfolio, Domestic Equity Portfolio, Equity Income Portfolio, Mid Cap Growth Stock Portfolio, Index 400 Stock Portfolio, Mid Cap Value Portfolio, Small Cap Growth Stock Portfolio, Index 600 Stock Portfolio, Small Cap Value Portfolio, International Growth Portfolio, Research International Core Portfolio, International Equity Portfolio, Emerging Markets Equity Portfolio, Government Money Market Portfolio, Short-Term Bond Portfolio, Select Bond Portfolio, Long-Term U.S. Government Bond Portfolio, Inflation Protection Portfolio, High Yield Bond Portfolio, Multi-Sector Bond Portfolio, Balanced Portfolio and Asset Allocation Portfolio (constituting Northwestern Mutual Series Fund, Inc., hereafter referred to as the “Fund”) as of December 31, 2017, the related statements of operations for the year ended December 31, 2017, cash flows for the Long-Term U.S. Government Bond Portfolio for the year ended December 31, 2017, the statement of changes in net assets for each of the two years in the period ended December 31, 2017, including the related notes, and the financial highlights for each of the five years in the period ended December 31, 2017 (collectively referred to as the “financial statements”). In our opinion, the financial statements present fairly, in all material respects, the financial position of the Fund as of December 31, 2017, the results of its operations for the year then ended, its cash flows for the Long-Term U.S. Government Bond Portfolio for the year then ended, the changes in its net assets for each of the two years in the period ended December 31, 2017 and the financial highlights for each of the five years in the period ended December 31, 2017 in conformity with accounting principles generally accepted in the United States of America.
Basis for Opinion
These financial statements are the responsibility of the Fund’s management. Our responsibility is to express an opinion on the Fund’s financial statements based on our audits. We are a public accounting firm registered with the Public Company Accounting Oversight Board (United States) (“PCAOB”) and are required to be independent with respect to the Fund in accordance with the U.S. federal securities laws and the applicable rules and regulations of the Securities and Exchange Commission and the PCAOB.
We conducted our audits of these financial statements in accordance with the standards of the PCAOB. Those standards require that we plan and perform the audit to obtain reasonable assurance about whether the financial statements are free of material misstatement, whether due to error or fraud.
Our audits included performing procedures to assess the risks of material misstatement of the financial statements, whether due to error or fraud, and performing procedures that respond to those risks. Such procedures included examining, on a test basis, evidence regarding the amounts and disclosures in the financial statements. Our audits also included evaluating the accounting principles used and significant estimates made by management, as well as evaluating the overall presentation of the financial statements. Our procedures included confirmation of securities owned as of December 31, 2017 by correspondence with the custodian, transfer agent and brokers. We believe that our audits provide a reasonable basis for our opinion.

Milwaukee, WI
February 23, 2018
We have served as the auditor of one or more Portfolios in Northwestern Mutual Series Fund, Inc. since 1984.
The Accompanying Notes are an Integral Part of the Financial Statements.
| | | | | | |
| | Report of Independent Registered Public Accounting Firm | | | 237 | |
Proxy Voting and Portfolio Holdings (unaudited)
Proxy Voting Guidelines
A description of the policies and procedures that the Portfolios use to determine how to vote proxies relating to portfolio securities is available without charge, upon request, by calling toll free 1-888-455-2232. It is also available on the Securities and Exchange Commission’s website at http://www.sec.gov.
Information regarding how the Portfolios voted proxies relating to portfolio securities during the most recent twelve-month period ended June 30 is available without charge, upon request, by calling toll free 1-888-455-2232. It is also available on the Securities and Exchange Commission’s website at http://www.sec.gov.
Quarterly Filing of Portfolio Holdings
Each Portfolio files its complete schedule of portfolio holdings with the Securities and Exchange Commission (SEC) for the first and third quarters of each fiscal year on Form N-Q. The Portfolio’s Form N-Q filings are available (i) on the SEC website at http://www.sec.gov, and may be reviewed and copied at the SEC’s Public Reference Room in Washington, DC. Information on the Public Reference Room may be obtained by calling 1-800-SEC-0330. The Portfolios also make their complete schedule of portfolio holdings for the most recent quarter of their fiscal year available on the Internet at www.northwesternmutual.com.
| | | | |
| 238 | | Proxy Voting and Portfolio Holdings | | |
Director and Officer Information (unaudited)
Northwestern Mutual Series Fund, Inc.
The name, address and year of birth of the directors, as well as their affiliations, positions held with the Series Fund, principal occupations during the past five years and the number of portfolios overseen in the Northwestern Mutual fund complex, are shown below as of December 31, 2017, except as otherwise noted. Each director (whenever elected) shall hold office until the next annual meeting of shareholders and until his or her successor is elected and qualifies or until his or her earlier death, resignation or removal. A director shall retire at the end of the calendar year in which the first of the two events occurs: (i) he or she attains the age of seventy-three (73), or (ii) he or she has served a term or successive terms totaling thirteen (13) years, commencing on the date of his or her election or appointment to the Board. The statement of additional information contains additional information about Series Fund directors and is available without charge, upon request, by calling 1-888-455-2232.
Independent Directors1
| | | | | | | | |
Name, Address, and
Year of Birth | | Position | | Length of
Time Served | | Number of Portfolios
in Fund Complex
Overseen by Director | | Other Directorships Held1 |
Miriam M. Allison 720 East Wisconsin Avenue Milwaukee, WI 53202 1947 | | Director | | Since 2006 | | 27 | | Director of Wasatch Funds, Inc. (19 portfolios) |
|
| Principal Occupation During Past 5 Years: Rancher since 2004. From 2001 to 2005, Chairman of UMB Fund Services, Inc. (formerly Sunstone Financial Group, Inc.), a mutual fund service provider. |
Robert H. Huffman III 720 East Wisconsin Avenue Milwaukee, WI 53202 1959 | | Director | | Since 2007 | | 27 | | None |
|
| Principal Occupation During Past 5 Years: Since 2004, Co-Founder and Managing Partner of Relative Value Group, LLC, a registered investment adviser. |
Christy L. Brown 720 East Wisconsin Avenue Milwaukee, WI 53202 1965 | | Director | | Since 2012 | | 27 | | None |
|
| Principal Occupation During Past 5 Years: Since October 2012, Chief Executive Officer, Girl Scouts of Wisconsin Southeast. From 2007 to 2012, Vice Chancellor, Finance and Administrative Affairs, University of Wisconsin, Milwaukee. |
Gail L. Hanson 720 East Wisconsin Avenue Milwaukee, WI 53202 1955 | | Director | | Since 2012 | | 27 | | Director of Artisan Funds, Inc. (15 portfolios) |
|
| Principal Occupation During Past 5 Years: Since February 2011, Chief Financial Officer, Aurora Health Care. Prior thereto, Deputy Executive Director, State of Wisconsin Investment Board. |
| | | | | | |
| | Director and Officer Information | | | 239 | |
Director and Officer Information (unaudited)
| | | | | | | | |
Name, Address, and
Year of Birth | | Position | | Length of
Time Served | | Number of Portfolios
in Fund Complex
Overseen by Director | | Other Directorships Held |
William Gerber 720 East Wisconsin Avenue Milwaukee, WI 53202 1958 | | Director | | Since 2017 | | 27 | | Director of Ballantyne Strong, Inc., a developer of technology solutions for digital applications (2015 to present) |
|
| Principal Occupation During Past 5 Years: Retired. From 2006 to 2015, Chief Financial Officer, and from 2007 to 2015, Executive Vice President, of TD Ameritrade Holdings Corporation. |
| | | | | |
David Ribbens 720 East Wisconsin Avenue Milwaukee, WI 53202 1961 | | Director | | Since 2017 | | 27 | | None |
|
| Principal Occupation During Past 5 Years: Founder and President of Distribution Team Alpha LLC, founded in 2016. From 2015 to 2016, President, Managing Partner, and Director of Heartland Advisors, Inc. From 2008 to 2015, Executive Vice President and Head of Distribution, Managing Partner, and Director of Heartland Advisors, Inc. |
| | | | | |
Donald M. Ullmann 720 East Wisconsin Avenue Milwaukee, WI 53202 1957 | | Director | | Since 2017 | | 27 | | None |
|
| Principal Occupation During Past 5 Years: Since 2015, Principal of DMU Financial Consulting, LLC. From 2013 to 2015, Managing Director, Head of Product Development, Fixed Income at Guggenheim Securities. From 2012 to 2013, Executive Managing Director, Co-head, MBS and Rates Division at Gleacher & Co. From 2009 to 2011, Executive Vice President, Head of Fixed Income Trading and Co-Head of Fixed Income Sales at Keefe, Bruyette and Woods, Inc. |
| 1. | This column includes only directorships of companies required to report to the Securities and Exchange Commission (SEC) under the Securities Exchange Act of 1934, as amended (i.e., “public companies”) or other investment companies registered under the Investment Company Act of 1940, as amended. |
Other Directors
| | | | | | | | |
Name, Address, and
Year of Birth | | Position | | Length of
Time Served | | Number of Portfolios
in Fund Complex
Overseen by Director | | Other Directorships Held |
| | | | |
| Ronald P. Joelson 720 East Wisconsin Avenue Milwaukee, WI 53202 1958 | | Chairman of the Board | | Since 2015 | | 27 | | None |
|
| Principal Occupation During Past 5 Years: Since 2012, Executive Vice President of The Northwestern Mutual Life Insurance Company (NM) and Chief Investment Officer of NM. Prior thereto, Chief Investment Officer of Genworth Financial from 2009 to 2012. |
| | | | |
| 240 | | Director and Officer Information | | |
Director and Officer Information (unaudited)
Northwestern Mutual Series Fund, Inc.
Executive Officers
| | | | |
Name, Address, and
Year of Birth | | Position | | Length of
Time Served |
| | |
Kate M. Fleming 720 East Wisconsin Avenue Milwaukee, WI 53202 1962 | | President | | Since 2013 |
|
| Principal Occupation During Past 5 Years: Since January 2015, President of Mason Street Advisors. Since 2014, a member of the Board of Directors of Mason Street Advisors. Prior thereto, Vice President – Operations of Mason Street Advisors from 2004-December 2014 and Treasurer of Mason Street Advisors from 2008-December 2014. |
| | |
Todd M Jones 720 East Wisconsin Avenue Milwaukee, WI 53202 1968 | | Vice President; Chief Financial Officer & Treasurer | | Since 2015 |
|
| Principal Occupation During Past 5 Years: Since April 2015, Vice President and Controller of Northwestern Mutual. From November 2012 to April 2015, Vice President and Chief Risk Officer of Northwestern Mutual. From April 2012 to October 2012, Vice President of Product Finance for Northwestern Mutual and Treasurer and Financial and Operations Principal (FINOP) of Northwestern Mutual Investment Services, LLC. |
| | |
Barbara E. Courtney 720 East Wisconsin Avenue Milwaukee, WI 53202 1957 | | Controller & Chief Accounting Officer | | Since 1996 |
|
| Principal Occupation During Past 5 Years: Director of Mutual Fund Accounting of Northwestern Mutual since 2002. |
| | |
Randy M. Pavlick 720 East Wisconsin Avenue Milwaukee, WI 53202 1959 | | Chief Compliance Officer | | Since 2014 |
|
| Principal Occupation During Past 5 Years: Chief Compliance Officer of Mason Street Advisors since 2014; from 2004 to 2014, Assistant General Counsel of Northwestern Mutual, Secretary of the Fund and Assistant Secretary of Mason Street Advisors. |
| | |
Leslie H. McLinden 720 East Wisconsin Avenue Milwaukee, WI 53202 1962 | | Secretary | | Since 2014 |
|
| Principal Occupation During Past 5 Years: Assistant General Counsel of Northwestern Mutual since 2007, Secretary of the Fund and Assistant Secretary of Mason Street Advisors, each since 2014. |
| | | | | | |
| | Director and Officer Information | | | 241 | |
Approval and Continuance of Investment Advisory and Sub-Advisory Agreements (unaudited)
Northwestern Mutual Series Fund, Inc.
Annual Contract Review Process
Under Section 15(c) of the Investment Company Act of 1940, as amended (the “1940 Act”), contracts for investment advisory services are required to be reviewed, evaluated and approved by a majority of an investment company’s independent directors each year. In addition, each investment company is required to disclose in its annual or semi-annual report, as applicable, the material factors and conclusions that formed the basis for the board’s approval or renewal of any investment advisory agreements within the investment company’s most recently completed fiscal half-year period.
At least annually, the Board of Directors (the “Board”) of Northwestern Mutual Series Fund, Inc. (the “Series Fund”) considers and votes upon the renewal of the investment sub-advisory agreements between Mason Street Advisors, LLC (“Mason Street Advisors”) and each of the sub-advisers of those portfolios of the Series Fund (each, a “Portfolio” and collectively, the “Portfolios”) for which Mason Street Advisors and the Board have appointed a sub-adviser. In order to afford the Board the opportunity to focus on a smaller number of relationships at any one meeting, the Board considers the annual continuation of the sub-advisory agreements on a staggered basis during the course of the year.
Board Approvals During the Six-Month Period Ended December 31, 2017
At its August 15, 2017 meeting, the Board, including the directors who are not “interested persons” (as that term is defined in the 1940 Act) of the Series Fund or Mason Street Advisors (“Independent Directors”), unanimously approved two new Investment Sub-Advisory Agreements between Mason Street Advisors and Wellington Management Company LLP (“Wellington”) relating to the Series Fund’s Mid Cap Growth Stock and Large Cap Core Stock Portfolios (the “New Sub-Advisory Agreements”).
Also at its August 15, 2017 meeting, the Board, including the Independent Directors, unanimously approved the continuance of (1) the Second Amended and Restated Investment Sub-Advisory Agreement between Mason Street Advisors and American Century Investment Management, Inc. (“ACI”) relating to the Series Fund’s Mid Cap Value, Large Company Value and Inflation Protection Portfolios, (2) the Amended and Restated Investment Sub-Advisory Agreement between Mason Street Advisors and Delaware Investments Fund Advisers, a series of Macquarie Investment Management Business Trust (“Delaware”) relating to the Series Fund’s Domestic Equity Portfolio, (3) the Amended and Restated Investment Sub-Advisory Agreement between Mason Street Advisors and Federated Investment Management Company (“Federated”) relating to the Series Fund’s High Yield Bond Portfolio, and (4) the Amended and Restated Investment Sub-Advisory Agreement between Mason Street Advisors and Loomis, Sayles & Company, L.P. (“Loomis Sayles”) relating to the Series Fund’s Focused Appreciation Portfolio. Each of the foregoing Investment Sub-Advisory Agreements with the above-named Sub-Advisers was, in connection with their continuance, modified to incorporate certain updated terms and conditions which resulted in the Investment Sub-Advisory Agreements being amended and restated.
At its November 17, 2017 meeting, the Board, including the Independent Directors, unanimously approved the continuance of (1) the Third Amended and Restated Investment Sub-Advisory Agreement between Mason Street Advisors and T. Rowe Price Associates, Inc. (“T. Rowe Price”) relating to the Series Fund’s Short Term Bond, Small Cap Value and Equity Income Portfolios, (2) the Amended and Restated Investment Sub-Advisory Agreement between Mason Street Advisors and Wells Capital Management, Incorporated (“Wells”) relating to the Series Fund’s Select Bond Portfolio, (3) the Second Amended and Restated Investment Sub-Advisory Agreement between Mason Street Advisors and Pacific Investment Management Company LLC (“PIMCO”) relating to the Series Fund’s Long-Term U.S. Government Bond and Multi-Sector Bond Portfolios, and (4) the Amended and Restated Investment Sub-Advisory Agreement between Mason Street Advisors and BlackRock Advisors, LLC (“BlackRock”) relating to the Series Fund’s Government Money Market Portfolio. In addition, the Board, including the Independent Directors, unanimously approved an Amendment to the Amended and Restated Agreement between Mason Street Advisors and BlackRock incorporating a modification to the fee schedule.
ACI, Delaware, Federated, Loomis Sayles, T. Rowe Price, Wells, PIMCO and BlackRock are sometimes collectively referred to hereinafter as the “Existing Sub-Advisers,” and their respective sub-advised Portfolios are collectively referred to herein as the “Sub-Advised Portfolios.” The respective Investment Sub-Advisory Agreements with the Existing Sub-Advisers are collectively referred to herein as the “Existing Sub-Advisory Agreements.”
| | | | |
| 242 | | XApproval and Continuance of Investment Advisory and Sub-Advisory Agreements | | |
Approval and Continuance of Investment Advisory and Sub-Advisory Agreements (unaudited)
In determining whether to approve the New Sub-Advisory Agreements and the Existing Sub-Advisory Agreements on behalf of the Series Fund, the Board requested and received detailed information from Mason Street Advisors, Wellington and the Existing Sub-Advisers in advance of each meeting at which such Agreements were considered, to assist them in their evaluation, including information compiled by certain independent providers of evaluative data. With respect to the continuation of the Existing Sub-Advisory Agreements, while particular focus was given to an evaluation of the services, performance, fees, costs, and certain other relevant information under such Agreements at the meeting at which their continuation is formally considered, the evaluation process with respect to the Existing Sub-Advisers and the nature, extent and quality of the services they provide to the Portfolios, together with related information, is an ongoing one. As a result, the Board’s consideration of such services, and the performance, fees, costs and other relevant factors was informed by information provided and deliberations that occurred at other meetings throughout the year.
The Independent Directors also received a memorandum from their counsel advising them of their responsibilities in connection with the approval of the New Sub-Advisory Agreements and the continuance of the Existing Sub-Advisory Agreements, and summarizing the legal standards governing the review and approval of these Agreements. The Independent Directors reviewed these standards with their counsel during the course of the meetings, including how these standards should be applied to the review of information relating to sub-advisers under the Series Fund’s manager of managers structure. In addition, during the course of their deliberations, the Independent Directors had the opportunity to meet privately without representatives of Mason Street Advisors, the Existing Sub-Advisers, and Wellington present, and were represented throughout the process by legal counsel.
Continuation of Existing Sub-Advisory Agreements
At its August 15, 2017 and November 17, 2017 meetings, the Board, including the Independent Directors, unanimously approved the continuance of the Existing Sub-Advisory Agreements with respect to the Sub-Advised Portfolios. In connection with those meetings, the directors received a presentation from representatives of each Existing Sub-Adviser involved in the management of the respective Sub-Advised Portfolios. In addition to the information presented by and about the Existing Sub-Advisers during the course of those meetings, the directors also had available for consideration each Existing Sub-Adviser’s Section 15(c) Report, which contained responses to the information request letter prepared by counsel to the Independent Directors requesting certain information from the Existing Sub-Advisers designed to assist the directors in fulfilling their responsibilities when considering the continuation of the Existing Sub-Advisory Agreements. The directors also had available Mason Street Advisors’ Executive Summary and Overview regarding each of the Existing Sub-Advisers and other materials prepared by Mason Street Advisors. The materials contained detailed information concerning management and personnel, expenses, performance, brokerage commissions, portfolio turnover, portfolio construction and investment processes and other factors with respect to each of the Sub-Advised Portfolios, as well as a recap of the Existing Sub-Advisers’ responses to the compliance questions contained in the Section 15(c) Report and the observations of the Series Fund’s Chief Compliance Officer regarding the compliance structure and practices of each of the Existing Sub-Advisers. The directors also considered their experience with and knowledge of the nature and quality of the services provided by the Existing Sub-Advisers and their ongoing discussions with representatives of Mason Street Advisors, its affiliates and each Existing Sub-Adviser.
The material factors and conclusions that formed the basis for the Board’s approval of the continuance of each of the Existing Sub-Advisory Agreements include those discussed below. The directors evaluated a variety of information they deemed relevant on a Portfolio-by-Portfolio basis. No one particular factor was identified as determinative, but rather it was a combination of all the factors and conclusions that formed the basis for the determinations made by the Board. Further, different directors may have placed greater weight on certain factors than did other directors.
Nature, Extent and Quality of Services. In considering the nature, extent and quality of each Existing Sub-Adviser’s services, factors considered by the directors included each Existing Sub-Adviser’s financial strength, assets under management, overall business, organization and management structure. Also included in the directors’ consideration was an evaluation of the services provided, and investment strategies employed, by each of the Existing Sub-Advisers, as well as the personnel providing such services with respect to the Sub-Advised Portfolios. The directors considered firm updates given by the portfolio managers and how the Sub-Advised Portfolios were being positioned in the current market environment. With respect to Federated, the directors noted the continuity with respect to the personnel on the investment team, and commented favorably on the firm’s succession plan. With respect to ACI, the directors expressed satisfaction with the quality of the presentation provided by the portfolio manager for the Inflation Protection Portfolio, and considered the stability and tenure of the Portfolio’s investment team. In addition, the directors viewed favorably the successful implementation of strategies to help manage position size limitations imposed by the Internal Revenue Code on the Portfolio. The directors considered the recent
| | | | | | |
| | Approval and Continuance of Investment Advisory and Sub-Advisory Agreements | | | 243 | |
Approval and Continuance of Investment Advisory and Sub-Advisory Agreements (unaudited)
merger of ACI’s large company value team with its value team, and observed that the combined investment team for value-focused management helped increase the amount and quality of information available to the portfolio managers and provide greater depth in underlying research capabilities, thereby helping to facilitate improved efficiency. The directors also viewed positively the depth of investment talent and resources at ACI, noting that this provided the firm with a competitive advantage. With respect to Delaware, the directors commented positively on the quality of the presentation delivered to the Board by the portfolio manager for the Domestic Equity Portfolio. The directors considered the potential favorable impact of the addition of a dedicated information technology analyst to the Delaware portfolio management team. The directors considered the departure of a portfolio management team member in 2016 and its impact to the delivery of services. The directors also considered the heightened level of involvement by Delaware’s parent company in Delaware’s operations. The directors commented favorably on the stability of Delaware’s assets under management. With respect to Loomis Sayles, the directors considered the investment process as employed for the Focused Appreciation Portfolio and the stability of its portfolio management team. The directors expressed satisfaction with the level of service provided to the Portfolio. With respect to T. Rowe Price, the directors commented favorably on the quality of the presentations provided by the portfolio managers. The directors considered the additional resources that had been added by T. Rowe Price to its team serving the Short-Term Bond Portfolio. With respect to the Small Cap Value Portfolio, the directors noted that the close working relationship between the portfolio manager and the supporting analysts had resulted in strong stock selection, and expressed satisfaction regarding the Portfolio’s sector neutral strategy. The directors considered the multi-CIO management structure that had been put into place by T. Rowe Price. With respect to Wells, the directors considered the additional resources that had been added to its fixed income investment team. The directors expressed a high degree of comfort with the succession plan that Wells had put in place for its fixed income investment team. The directors considered certain internal restructuring that had occurred with respect to Wells and its related asset management entities. The directors also commented favorably on the strong credit discipline exercised by the portfolio managers at Wells. With respect to PIMCO, the directors considered the recent retirement of PIMCO’s president and the associated appointment of co-chief operating officers. The directors also considered and expressed satisfaction with each Existing Sub-Adviser’s investment philosophy and process and the scope of services provided by the Existing Sub-Advisers. Consideration was also given to the Existing Sub-Advisers’ respective reputations and experience in providing investment management services and the performance of each Sub-Advised Portfolio. Also considered were recent organizational and other firm developments. Based on their review of these factors, their discussions with the Existing Sub-Advisers and their experience with the services provided by the Existing Sub-Advisers for the respective Sub-Advised Portfolios, the Board concluded, within the context of their overall determinations regarding the Existing Sub-Advisory Agreements, that they were satisfied with the nature, extent and quality of services, and the resources committed by each Existing Sub-Adviser in providing those services.
Investment Performance. The directors reviewed the investment performance of each of the Sub-Advised Portfolios over a variety of time periods. In addition to reviewing the performance of each Sub-Advised Portfolio for both short-term and long-term periods, the directors considered (i) a comparison of each Sub-Advised Portfolio’s one-, three- and five-year (as applicable) performance to the returns of appropriate benchmarks and indices, and to the performance averages of each Sub-Advised Portfolio’s respective Morningstar and Lipper categories for the same periods, (ii) the Morningstar overall star rating for each Sub-Advised Portfolio and (iii) the Morningstar and the Lipper rankings for the one-, three- and five-year periods. The directors evaluated each Sub-Advised Portfolio’s performance against these peer groups and industry benchmarks and indices, and viewed this information as providing an objective comparative benchmark against which they could assess the performance of the Sub-Advised Portfolios. The directors also considered the performance of accounts managed in a similar manner by each of the Existing Sub-Advisers and information from the Existing Sub-Advisers regarding any significant differences in the performance of those accounts from that of the Sub-Advised Portfolios. In connection with the review of investment performance of the Sub-Advised Portfolios over the time periods identified herein, the directors also considered investment performance since the date on which each Existing Sub-Adviser began managing their respective Sub-Advised Portfolio.
The directors commented favorably on the overall strong performance of Federated with respect to the High Yield Bond Portfolio, Delaware with respect to the Domestic Equity Portfolio, Loomis Sayles with respect to the Focused Appreciation Portfolio, and ACI with respect to the Mid Cap Value and the Inflation Protection Portfolios. With respect to the Large Company Value Portfolio managed by ACI, the directors noted that the involvement of ACI’s chief investment officer in the portfolio construction process for the Portfolio was a positive development. The directors considered the performance of the Large Company Value Portfolio, observing that the Portfolio tended to perform more favorably in difficult markets. The directors also noted that the Large Company Value Portfolio retained a model-based investment approach following the combination of the internal ACI large company value and value investment teams, and that this model-based process differed from the approach utilized by the Mid Cap Value Portfolio, which was grounded in fundamental analysis. The directors
| | | | |
| 244 | | Approval and Continuance of Investment Advisory and Sub-Advisory Agreements | | |
Approval and Continuance of Investment Advisory and Sub-Advisory Agreements (unaudited)
considered how the use of a model as part of a portfolio construction process for the Large Company Value Portfolio’s holdings produced differentiation in terms of performance results when compared with the Mid Cap Value Portfolio. The directors expressed satisfaction with the downside protection provided by the Portfolios sub-advised by ACI. With respect to T. Rowe Price, the directors noted the strong performance of each of the Portfolios sub-advised by the firm and commented favorably on the performance results achieved for the Equity Income and the Small Cap Value Portfolios during the tenures of the current portfolio managers. In considering the Short-Term Bond Portfolio, the directors noted the cyclical nature of performance, and expressed continued confidence in the investment strategy employed for the Portfolio. With respect to Wells, the directors considered favorably the consistency of performance achieved for the Select Bond Portfolio during its tenure as sub-adviser. The directors commented with approval on the continued strong performance of PIMCO with respect to the Long-Term U.S. Government Bond and Multi-Sector Bond Portfolios, and BlackRock with respect to the Government Money Market Portfolio.
In addition to performance information presented at the meeting, the directors considered the detailed performance information, market commentary, portfolio analysis and portfolio manager presentations they received periodically throughout the year. Generally speaking, while attentive to the short-term performance results, the directors accorded greater weight to longer term performance. For the reasons and based on the discussion summarized above, the Board concluded that, in the totality of circumstances and within the context of its overall determinations regarding the Existing Sub-Advisory Agreements, it was satisfied with the relative investment performance of the Sub-Advised Portfolios.
Management Fees and Other Expenses. The directors evaluated the reasonableness of the management fees and total expenses paid by the Sub-Advised Portfolios under the Existing Sub-Advisory Agreements. The directors considered the actual and contractual fees paid by each Sub-Advised Portfolio. The directors also considered the sub-advisory fees paid by Mason Street Advisors out of its management fee, including a comparison of those fees with fees charged by the respective Existing Sub-Advisers for similarly managed accounts. In considering the level of management fees, the directors also considered the size of the Sub-Advised Portfolios, expenses assumed by Mason Street Advisors, and the existing expense limitation and/or fee waiver arrangements agreed to by Mason Street Advisors with respect to each Sub-Advised Portfolio.
As part of their evaluation, the directors received and reviewed an independent analysis prepared by Morningstar of comparative expense data for each Sub-Advised Portfolio. Morningstar provided data as of December 31, 2016 comparing each Sub-Advised Portfolio’s net and total expenses with those of a peer group of funds underlying variable insurance products, as well as a universe of funds underlying variable insurance products across each fund’s investment classification and objective, each as selected by Morningstar. The directors considered the comparative data as a guide to help assess the reasonableness of each Sub-Advised Portfolio’s net and total expense ratios. The directors considered that the Morningstar expense rankings of the Portfolios sub-advised by ACI (with respect to the Mid Cap Value Portfolio), Delaware (Domestic Equity Portfolio), Federated (High Yield Bond Portfolio), Loomis Sayles (Focused Apprecation Portfolio), T. Rowe Price (with respect to the Short-Term Bond, Small Cap Value and Equity Income Portfolios), Wells (Select Bond Portfolio) and BlackRock (Government Money Market Portfolio) were in the top Morningstar quartiles (meaning lowest net expenses) of their respective peer groups. The directors considered that the rankings of the remaining Portfolios, i.e., the Large Company Value and the Inflation Protection Portfolios sub-advised by ACI, and the Long-Term U.S. Government Bond and the Multi-Sector Bond Portfolios sub-advised by PIMCO, were within the second quartile of their respective peer groups. The directors also considered BlackRock’s agreement to provide a sub-advisory fee reduction for services provided to the Government Money Market Portfolio.
Based on their review of the above information and other factors deemed relevant by the directors, the Board concluded that the management fees and total operating expenses of each of the Sub-Advised Portfolios were reasonable in relation to the nature, scope and quality of services provided and the performance of the Sub-Advised Portfolios over time and the expense limitation and fee waivers that are in place.
Costs and Profitability. The directors reviewed information provided by Mason Street Advisors regarding the profitability realized by Mason Street Advisors due to its relationship with the Sub-Advised Portfolios. The directors considered Mason Street Advisors’ quarterly presentation to the directors regarding Mason Street Advisors’ revenues, expenses, income and profit margins allocable to its services to the Sub-Advised Portfolios on an aggregate and a per Portfolio basis, and Mason Street Advisors’ allocation methodology with respect to the revenues and expenses. The profitability information presented for the directors’ consideration was supplemented by the aforementioned information regarding the ranking of each Sub-Advised Portfolio within the Portfolio’s respective Morningstar category. The directors also considered the profitability information related to certain of the Sub-Advised Portfolios where such information had been provided and the financial statements of
| | | | | | |
| | Approval and Continuance of Investment Advisory and Sub-Advisory Agreements | | | 245 | |
Approval and Continuance of Investment Advisory and Sub-Advisory Agreements (unaudited)
certain Existing Sub-Advisers or their affiliates who had not provided specific profitability information. In all instances, including those where profitability information had not been provided, the sub-advisory fees were the result of arm’s-length negotiations between Mason Street Advisors and such Existing Sub-Advisers. The directors also recognized that there are limitations inherent in allocating costs and calculating profitability for organizations such as the Existing Sub-Advisers, and that it is difficult to make comparisons of profitability among investment advisers because comparative information is not generally publicly available and, when available, such information had been developed using a variety of assumptions and other factors. The directors concluded that they had received sufficient information to evaluate the Existing Sub-Advisers’ costs and profitability.
The directors considered certain fall-out benefits that may be realized by Mason Street Advisors and its affiliates due to their relationship with the Sub-Advised Portfolios, including the participation of mutual fund families advised by certain Existing Sub-Advisers to the Sub-Advised Portfolios in the brokerage platform and/or mutual fund partner programs offered by an affiliate of Mason Street Advisors and the payment of fees by those entities to affiliates of Mason Street Advisors related to such participation. The directors also reviewed information concerning certain of the Existing Sub-Advisers’ soft dollar arrangements and any other benefits to the Existing Sub-Advisers arising from their relationships with the Sub-Advised Portfolios. Based on their review, the Board concluded, within the context of their overall determinations regarding the Existing Sub-Advisory Agreements, that they were satisfied that the fees paid by each of the Sub-Advised Portfolios, and the profits realized by Mason Street Advisors and the Existing Sub-Advisers due to their relationship with the Sub-Advised Portfolios, were not excessive.
Economies of Scale. The directors also considered whether each Sub-Advised Portfolio’s expense structure permitted economies of scale to be shared with the Sub-Advised Portfolio’s investors. The directors considered the breakpoints contained in the advisory fee schedules for the Sub-Advised Portfolios and the extent to which each Sub-Advised Portfolio may benefit from economies of scale through those breakpoints. The directors also took into account the expense limitation arrangements in place for the Large Company Value, Inflation Protection, Mid Cap Value, Domestic Equity, Focused Appreciation, Equity Income, Small Cap Value, Short-Term Bond, Long-Term U.S. Government Bond and Multi-Sector Bond Portfolios, and the fee waiver arrangements in place with respect to the High Yield Bond, Large Company Value, Inflation Protection, Mid Cap Value, Domestic Equity, Focused Appreciation, Equity Income, Small Cap Value, Short-Term Bond, Select Bond, Long-Term U.S. Government Bond, Multi-Sector Bond and Government Money Market Portfolios. The directors also considered the total assets of each Sub-Advised Portfolio and the expense ratios of the Sub-Advised Portfolios. Based on this information, the Board concluded, within the context of its overall determinations regarding the Existing Sub-Advisory Agreements, that each Sub-Advised Portfolio’s fee structure reflected appropriate economies of scale for the benefit of such Portfolio’s investors.
Other Information. The directors were presented with other information intended to assist them in their consideration of the continuation of the Existing Sub-Advisory Agreements, including information about the services provided by affiliates of Mason Street Advisors to the Portfolios and information regarding Mason Street Advisors’ and the Existing Sub-Advisers’ brokerage practices and commissions. The directors took into consideration reports from Mason Street Advisors on its review of the respective compliance programs of the Existing Sub-Advisers, including any recent compliance exceptions noted and the applicable Sub-Adviser’s response. Also considered were key affiliations and business relationships between the Existing Sub-Advisers and their affiliates and Mason Street Advisors’ parent company and affiliates. Their review further included information relating to each Existing Sub-Adviser’s risk management infrastructure, pending or recent litigation or regulatory actions to which an Existing Sub-Adviser or its affiliates may have been a party, and the applicable Sub-Adviser’s responses to those actions. The directors also considered information regarding each Existing Sub-Adviser’s code of ethics, cybersecurity program and business continuity plan, portfolio manager compensation, portfolio turnover, succession planning and other matters they deemed relevant.
Conclusions of the Directors. Based on a consideration of all information deemed relevant in its totality, the Board, including the Independent Directors, and assisted by the advice of legal counsel independent of Mason Street Advisors, in the exercise of their reasonable business judgment concluded that the terms of the Existing Sub-Advisory Agreements were fair and reasonable and approved the continuation of each Agreement for another year as being in the best interests of each Portfolio.
Approval of New Investment Sub-Advisory Agreements
At its August 15, 2017 meeting, the Board, including the Independent Directors, unanimously approved two New Sub-Advisory Agreements between Mason Street Advisors and Wellington, pursuant to which Wellington was appointed to serve as sub-adviser to the Large Cap Core Stock Portfolio (“LCCS Portfolio”) and the Mid Cap Growth Stock Portfolio (“MCGS
| | | | |
| 246 | | Approval and Continuance of Investment Advisory and Sub-Advisory Agreements | | |
Approval and Continuance of Investment Advisory and Sub-Advisory Agreements (unaudited)
Portfolio”) effective on or about October 27, 2017 (hereinafter, collectively, the “Portfolios”). The Board’s decision to retain Wellington as sub-adviser for both the LCCS Portfolio and the MCGS Portfolio was reached after extensive research and qualitative and quantitative analysis of numerous candidate firms and their respective organizational structures, investment processes and long-term performance records.
The material factors and conclusions that formed the basis for the Board’s determination to approve the New Sub-Advisory Agreements include those discussed below. In addition to the information provided to them in anticipation of and at the August, 2017 Board meeting, the directors considered the in-person presentations of Wellington related to both the LCCS Portfolio and the MCGS Portfolio at a meeting of the Investment Oversight Committee of the Board held on August 15, 2017, and Wellington’s responses to the directors’ questions during the presentation sessions at the Investment Oversight Committee meeting.
The process that culminated with the directors determining to engage Wellington as the replacement investment sub-adviser for the LCCS Portfolio and the MCGS Portfolio had been initiated by the Board of Directors several months earlier. At its February, 2017 meeting, the directors instructed Mason Street Advisors to identify potential replacement candidates for both the LCCS Portfolio and MCGS Portfolio mandates. At its May, 2017 meeting the Board was presented with a list of qualifying sub-advisory firms for both mandates, along with a detailed review of the assessment criteria and comparative information regarding each of the candidates. The directors evaluated a compilation of information with respect to each of the candidates for the LCCS Portfolio and MCGS Portfolio mandates, including historical performance returns over multiple periods compared with applicable benchmark returns and peer group performance returns for similar periods. The directors also reviewed performance characteristics (including excess return, information ratio, beta and standard deviation data), portfolio characteristics (including cash levels, holdings, market cap and portfolio turnover data), a summary of the investment strategy, philosophy and process, and portfolio management team credentials and experience associated with each mandate under consideration, and the strengths and key points of differentiation for each firm in the candidate pool. Based upon a review of the list of qualified sub-advisers, and an evaluation and assessment of the comparative information provided regarding the candidates, the directors narrowed down the list of candidates to three final candidates for the LCCS Portfolio mandate and four final candidates for the MCGS Portfolio mandate.
With respect to the final candidates for each mandate that were reviewed and considered at the Board’s August, 2017 meeting, background information and assessment data used to evaluate, compare and contrast the potential candidates for each mandate was extensive. The information compiled for purposes of facilitating the Board’s review of the candidates was a combination of independent assessment data developed by Mason Street Advisors as well as data provided by the candidates, which was formatted in a manner to permit the Board to effectively conduct its due diligence review of the information and engage in a thorough comparative analysis. Among other factors, the Board considered details of each candidate’s investment performance and risk/return profiles over various time periods, peer group ratings and rankings, representative holdings, key points of differentiation and competitive advantages, portfolio characteristics, mandate assets under management, investment personnel, processes and strategies, proposed sub-advisory fees and breakpoints, the impact on Mason Street Advisors’ profitability, and other operational and enterprise issues. Also available for the directors’ consideration was information related to both the LCCS Portfolio and the MCGS Portfolio regularly provided at Board meetings, including net expense ratio information and certain comparative peer group data.
Also considered were reports received from Mason Street Advisors regarding its due diligence visits with each candidate for the LCCS Portfolio and the MCGS Portfolio, including Wellington. The due diligence reports were based on the candidates’ responses to the requests for proposals as well as interviews with compliance and/or legal representatives of each candidate. The reports included information about each candidate’s compliance structure, compliance policies and procedures, brokerage practices and use of soft dollars, trading policies and procedures, codes of ethics and proxy voting procedures, recent SEC exams, pricing practices, information about material business relationships with Northwestern Mutual, if any, and other matters. The directors also had available for consideration each candidate’s responses to the investment, compliance and operations sections of the requests for proposals. In addition to the written materials that were provided, the directors considered in-person interviews with each candidate to have been of particular assistance in gaining an understanding of the candidates’ investment philosophies and portfolio construction processes and the background and experience of each candidate’s key investment personnel. No one particular factor was identified as controlling, but rather it was a combination of all the factors and conclusions that formed the basis for the determinations made by the Board.
| | | | | | |
| | Approval and Continuance of Investment Advisory and Sub-Advisory Agreements | | | 247 | |
Approval and Continuance of Investment Advisory and Sub-Advisory Agreements (unaudited)
Nature, Extent and Quality of Services. The directors evaluated the nature, scope, extent and quality of services to be provided by Wellington with respect to the Portfolios. The directors considered the information developed from the extensive process utilized to identify qualified sub-advisers for the Portfolios, as well as the analysis and assessment provided by Mason Street Advisors with respect to the sub-advisory candidates. The directors also considered the depth of experience of Wellington in managing accounts, including particularly its well-established business in serving as a sub-adviser to accounts for third-party mutual funds, using investment strategies similar to those employed for the Portfolios. The directors’ consideration included information about Wellington’s organization and ownership structure, and the tenure, experience and performance of the firm’s investment management team, including particularly the qualifications and experience of the investment personnel who would be providing services to each of the Portfolios. In addition, the directors considered the in-person presentations by Wellington associated with both the LCCS Portfolio and the MCGS Portfolio mandates.
The directors considered Mason Street Advisors’ positive assessment of Wellington, based upon the strength of the investment processes in place at the firm. The directors considered the substantial resources in place at Wellington and the size and breadth of its investment business, and cited positively the compensation structure in place, which incented a team-based approach. The directors noted favorably the well-developed compliance structure that was operating at Wellington. The directors also considered that the firm culture in place at Wellington was very positive, and was a culture that appeared to create a career-promoting environment fostering retention and growth of investment professionals. Wellington was also noted as being a recognized brand with a positive reputation which would be well received by the Northwestern Mutual field force.
With respect to the LCCS Portfolio, the directors cited favorably the clarity of the firm’s investment strategy and the analyst-centered portfolio management model employed by Wellington. The directors noted with approval that the Wellington investment style utilized for the LCCS Portfolio would provide differentiation from the styles employed across other Series Fund portfolios. The directors also cited favorably the significant experience of the members of the firm’s investment analyst team. The directors were positively impressed with the firm’s performance record as it related to the LCCS Portfolio mandate.
With respect to the MCGS Portfolio, the directors cited Wellington’s positive longer-term performance record, and favorable comparative performance figures versus peers and other mandate candidates. The directors also considered Masons Street Advisors’ positive assessment of the firm’s mid cap growth investment team and the substantial experience of the portfolio managers.
The directors considered the different investment approaches utilized by each of the candidates for the LCCS Portfolio and the MCGS Portfolio mandates, and the positive and negative considerations of each. The directors also took into consideration the suitability of each candidate’s respective investment mandate with respect to Northwestern Mutual’s variable products. Finally, the directors took into consideration Wellington’s general reputation and the strength of the investment-related resources available to be committed in managing both of the Portfolios. Based on their review of these factors and other factors deemed relevant, the Board concluded that they were satisfied with the nature, extent and quality of the services to be provided by Wellington with respect to both the LCCS Portfolio and the MCGS Portfolio, and the resources to be committed by Wellington in providing such services.
Investment Performance. As a newly appointed sub-adviser, the directors could not consider Wellington’s investment performance in managing the Portfolios as a factor in evaluating the New Sub-Advisory Agreements, but did consider Wellington’s performance record for a composite of other accounts, including mutual fund accounts, with investment objectives, investment policies and strategies substantially similar to the both the LCCS Portfolio and the MCGS Portfolio. The directors considered performance returns (including performance analytics reports evaluating, among other things, standard deviation, information ratio and tracking errors) for these similar accounts for both short- and long-term periods. The directors also evaluated the similar accounts’ relative performance versus the appropriate index and considered independent Morningstar rankings and ratings of the candidates to provide an objective comparative benchmark against which they could assess the experience and ability of the candidates in managing similar accounts. The directors also took into consideration information presented regarding the composition of portfolios managed by the candidates in a mandate similar to the LCCS Portfolio and the MCGS Portfolio, including (as applicable) sector and industry weightings, number of holdings, portfolio turnover, total firm ownership, and top ten holdings percentage, among other things.
Management Fees and Other Expenses. In evaluating the management fees paid by the Portfolios, the directors considered the contractual fees and applicable breakpoints paid by the Portfolios under the Advisory Agreement between Mason Street Advisors and the Series Fund with respect to each Portfolio. The directors also considered the sub-advisory fees and applicable breakpoints to be paid by Mason Street Advisors to Wellington for services provided to each of the Portfolios out of its
| | | | |
| 248 | | Approval and Continuance of Investment Advisory and Sub-Advisory Agreements | | |
Approval and Continuance of Investment Advisory and Sub-Advisory Agreements (unaudited)
management fee. The directors also separately considered the proposed allocation between Mason Street Advisors and Wellington of each Portfolio’s investment advisory fee (i.e., the amount of the advisory fee retained by Mason Street Advisors relative to that paid to Wellington as a sub-advisory fee). They determined that the allocation in each case was reasonable in light of the nature, scope and quality of services to be provided and was the product of an arm’s length negotiation between Mason Street Advisors and Wellington. In evaluating Wellington’s proposed fees relative to both the LCCS Portfolio and the MCGS Portfolio, the directors considered information relating to amounts Wellington charged under other advisory contracts involving similar investment mandates.
The directors considered the existing structure, size, and total operating expenses of each Portfolio. They also considered existing expense limitation agreements in place for each of the Portfolios as well as the advisory fee waiver arrangements that were in place.
Based on their review of the management and other expenses, comparative data and other factors deemed relevant by the directors, the Board concluded that the management fees, proposed sub-advisory fees and total operating expenses of the Portfolios were reasonable in relation to the nature, scope and quality of the services to be provided and the experience of Wellington.
Costs and Profitability. The directors considered Mason Street Advisors’ pricing methodology for its services as investment adviser for the products of which the Portfolios are an investment option. Also considered was the financial condition of Mason Street Advisors and information concerning Mason Street Advisors’ costs and profitability with respect to its relationship with the Portfolios in general as well as in light of the sub-advisory fees negotiated with Wellington for each of the Portfolios. Mason Street Advisors provided comparative information regarding the proposed sub-advisory fees of each of the candidates, and projections regarding Mason Street Advisors’ advisory fee spread. Mason Street Advisors also provided a profitability analysis for the Portfolios based on certain assumptions and metrics. In connection with its review of the profitability of Mason Street Advisors’ services to each Portfolio, the directors also considered services provided by affiliates of Mason Street Advisors.
The directors recognized that there are limitations inherent in allocating costs and calculating profitability for an organization such as Mason Street Advisors, and that it is difficult to make comparisons of profitability among investment advisers and clients because comparative information is not generally publicly available and, when available, such information has been developed using a variety of assumptions and other factors. Based on their review of the profitability analysis for each of the Portfolios, the Board concluded that they were satisfied that Mason Street Advisors’ level of profitability from its relationship with the Portfolios was not excessive.
Economies of Scale. The directors considered whether the expense structure of each of the Portfolios permitted economies of scale to be shared with investors in the Portfolios. They also took into consideration the total assets and expense ratios of each Portfolio. The directors considered the breakpoints contained in the management fee schedules applicable to each Portfolio, as well as the breakpoints contained in the proposed sub-advisory fee schedules negotiated with the final candidates for each Portfolio, and the extent to which a Portfolio may benefit from economies of scale through those breakpoints. The directors also considered the expense limitation and fee waiver agreements in place for the Portfolios. Based on this information, the Board concluded that the fee structure for each of the Portfolios reflected appropriate economies of scale between the particular Portfolio and Mason Street Advisors.
Other Information. The directors were presented with other information intended to assist them in their consideration of the approval of the New Sub-Advisory Agreements, including information regarding Wellington’s risk management structure, any pending or recent litigation or regulatory actions to which Wellington or its affiliates may have been a party, and responses to those actions. The directors also received information regarding Wellington’s cybersecurity program and business continuity plan, as well as information regarding portfolio manager compensation practices as they may apply to those portfolio managers proposed to provide services to each of the Portfolios.
Conclusions of the Directors. Based on a consideration of all information deemed relevant in its totality, the Board, including the Independent Directors, and assisted by the advice of legal counsel independent of Mason Street Advisors, in the exercise of its business judgment concluded that it was in the best interest of the LCCS Portfolio and the MCGS Portfolio to approve the New Sub-Advisory Agreements between Mason Street Advisors and Wellington.
| | | | | | |
| | Approval and Continuance of Investment Advisory and Sub-Advisory Agreements | | | 249 | |
REPORT ON FORM N-CSR
RESPONSES FOR NORTHWESTERN MUTUAL SERIES FUND, INC.
As of the end of the period covered by this report, the Registrant has adopted a code of ethics that applies to the Registrant’s principal executive officer, principal financial officer and principal accounting officer or controller.
| Item 3. | Audit Committee Financial Expert |
The Registrant’s board of directors has determined that the Registrant has two audit committee financial experts serving on its audit committee. The names of the audit committee financial experts are Miriam M. Allison, Gail L. Hanson, and William Gerber. Each of the audit committee financial experts is independent.
| Item 4. | Principal Accountant Fees and Services |
| | | | | | | | |
(a) Audit Fees | | | | | | | | |
| | |
Audit Fees and Expenses of Registrant | | | | | | | | |
| | |
| | | 2016 | | | 2017 | |
| | $ | 738,730 | | | $ | 852,730 | |
| | |
(b) Audit Related Fees | | | | | | | | |
| | |
Audit-Related Fees and Expenses of Registrant | | | | | | | | |
| | |
| | | 2016 | | | 2017 | |
| | $ | 0 | | | $ | 0 | |
| | |
(c) Tax Fees | | | | | | | | |
| | |
| | | 2016 | | | 2017 | |
| | $ | 75,720 | | | $ | 102,720 | |
| | |
Review of dividend declarations | | | | | | | | |
Review of excise tax calculations | | | | | | | | |
Non-U.S. tax compliance | | | | | | | | |
| | |
(d) All Other Fees | | | | | | | | |
| | |
| | | 2016 | | | 2017 | |
| | $ | 0 | | | $ | 0 | |
(e)(1) It is the audit committee’s policy to pre-approve all audit and non-audit service engagements for the Registrant; and any non-audit service engagement of the Registrant’s auditor by (1) the Registrant’s investment adviser and (2) any other entity in a control relationship with the investment adviser that provides ongoing services to the Registrant if, in each of (1) and (2) above, the non-audit service engagement relates directly to the operations and financial reporting of the Registrant. (2) Not applicable.
(f) Not applicable.
| | | | | | | | |
(g) Aggregate non-audit fees of Registrant and related service providers | | | | | | | | |
| | |
| | | 2016 | | | 2017 | |
| | $ | 375,220 | | | $ | 161,720 | |
(h) The Registrant’s audit committee has considered whether the auditor’s provision of non-audit services to the Registrant’s related service providers is compatible with the auditor’s independence.
| Item 5. | Audit Committee of Listed Registrants |
Not applicable.
| Item 6. | Schedule of Investments |
Full Schedule of Investments is included in Item 1.
| Item 7. | Disclosure of Proxy Voting Policies and Procedures for Closed-End Management Investment Companies |
Not applicable.
| Item 8. | Portfolio Managers of Closed-End Management Investment Companies |
Not applicable.
| Item 9. | Purchases of Equity Securities by Closed-End Management Investment Company and Affiliated Purchasers |
Not applicable.
| Item 10. | Submission of Matters to a Vote of Security Holders |
Not applicable.
| Item 11. | Disclosure Controls and Procedures |
(a) The Registrant’s Principal Executive Officer and Principal Financial Officer have evaluated the Registrant’s disclosure controls and procedures within 90 days of this filing and have concluded that the Registrant’s disclosure controls and procedures were effective, as of that date, in ensuring that information required to be disclosed by the Registrant in this filing was recorded, processed, summarized, and reported timely.
(b) There was no change in the Registrant’s internal control over financial reporting (as defined in Rule 30a-3(d) under the Investment Company Act of 1940) that occurred during the Registrant’s fourth fiscal quarter of the period covered by this report that has materially affected, or is reasonably likely to materially affect, the Registrant’s internal control over financial reporting.
(a)(1) The code of ethics referred to in the response to Item 2 above is attached as exhibit EX-99.12(a)(1).
(a)(2) Separate certifications for the Registrant’s principal executive officer and principal financial officer, as required by Section 302 of the Sarbanes-Oxley Act of 2002 and Rule 30a-2(a) under the Investment Company Act of 1940, are attached as exhibit EX-99.CERT.
(a)(3) Not applicable.
(a)(4) Not applicable.
(b) Separate certifications for the Registrant’s principal executive officer and principal financial officer, as required by 18 U.S.C. Section 1350, as adopted pursuant to Section 906 of the Sarbanes-Oxley Act of 2002, and Rule 30a-2(b) under the Investment Company Act of 1940, are attached as exhibit EX-99.906CERT. The certifications furnished pursuant to this paragraph are not deemed to be “filed” for purposes of Section 18 of the Securities Exchange Act of 1934, or otherwise subject to the liability of that section. Such certifications are not deemed to be incorporated by reference into any filing under the Securities Act of 1933 or the Securities Exchange Act of 1934, except to the extent that the Registrant specifically incorporates them by reference.
Pursuant to the requirements of the Securities Exchange Act of 1934 and the Investment Company Act of 1940, the Registrant has duly caused this report to be signed on its behalf by the undersigned, thereunto duly authorized.
NORTHWESTERN MUTUAL SERIES FUND, INC.
| | |
| By: | | /s/ Kate M. Fleming |
| | Kate M. Fleming, President |
|
| Date: February 15, 2018 |
Pursuant to the requirements of the Securities Exchange Act of 1934 and the Investment Company Act of 1940, this report has been signed below by the following persons on behalf of the registrant and in the capacities and on the dates indicated.
| | |
| |
| By: | | /s/ Kate M. Fleming |
| | Kate M. Fleming, President |
|
| Date: February 15, 2018 |
| | |
| |
| By: | | /s/ Todd M. Jones |
| | Todd M. Jones, Vice President, |
| | Chief Financial Officer and Treasurer |
|
| Date: February 15, 2018 |