UNITED STATES
SECURITIES AND EXCHANGE COMMISSION
Washington, D.C. 20549
FORM N-CSR
CERTIFIED SHAREHOLDER REPORT OF REGISTERED
MANAGEMENT INVESTMENT COMPANIES
Investment Company Act file number 811-3990
Northwestern Mutual Series Fund, Inc.
(Exact name of registrant as specified in charter)
720 East Wisconsin Avenue,
Milwaukee Wisconsin 53202
(Address of principal executive offices) (Zip code)
Barbara E. Courtney, Controller and Chief Accounting Officer Northwestern Mutual Series Fund, Inc.
(Name and address of agent for service)
Registrant’s telephone number, including area code: 414-271-1444
Date of fiscal year end: December 31
Date of reporting period: December 31, 2018
Form N-CSR is to be used by management investment companies to file reports with the Commission not later than 10 days after the transmission to stockholders of any report that is required to be transmitted to stockholders under Rule 30e-1 under the Investment Company Act of 1940 (17 CFR 270.30e-1). The Commission may use the information provided on Form N-CSR in its regulatory, disclosure review, inspection, and policymaking roles.
A registrant is required to disclose the information specified by Form N-CSR, and the Commission will make this information public. A registrant is not required to respond to the collection of information contained in Form N-CSR unless the Form displays a currently valid Office of Management and Budget (“OMB”) control number. Please direct comments concerning the accuracy of the information collection burden estimate and any suggestions for reducing the burden to Secretary, Securities and Exchange Commission, 450 Fifth Street, NW, Washington, DC 20549-0609. The OMB has reviewed this collection of information under the clearance requirements of 44 U.S.C. § 3507.
| Item 1. | Reports to Stockholders |
Annual Report December 31, 2018
Northwestern Mutual Series Fund, Inc.
A Series Fund Offering 27 Portfolios
| | · | | Focused Appreciation Portfolio |
| | · | | Large Cap Core Stock Portfolio |
| | · | | Large Cap Blend Portfolio |
| | · | | Index 500 Stock Portfolio |
| | · | | Large Company Value Portfolio |
| | · | | Domestic Equity Portfolio |
| | · | | Equity Income Portfolio |
| | · | | Mid Cap Growth Stock Portfolio |
| | · | | Index 400 Stock Portfolio |
| | · | | Mid Cap Value Portfolio |
| | · | | Small Cap Growth Stock Portfolio |
| | · | | Index 600 Stock Portfolio |
| | · | | Small Cap Value Portfolio |
| | · | | International Growth Portfolio |
| | · | | Research International Core Portfolio |
| | · | | International Equity Portfolio |
| | · | | Emerging Markets Equity Portfolio |
| | · | | Government Money Market Portfolio |
| | · | | Short-Term Bond Portfolio |
| | · | | Long-Term U.S. Government Bond Portfolio |
| | · | | Inflation Protection Portfolio |
| | · | | High Yield Bond Portfolio |
| | · | | Multi-Sector Bond Portfolio |
| | · | | Asset Allocation Portfolio |
Beginning on or after January 1, 2021 as permitted by regulations adopted by the Securities and Exchange Commission, paper copies of the Fund’s shareholder reports like this one will no longer be sent by mail unless you specifically request paper copies of the reports from us at (888)455-2232, free of charge. Instead, your Fund annual and semi- annual reports will be made available on a website and you will be notified by mail each time a report is posted and provided with a website link to access the report.
If you already elected to receive shareholder reports electronically, you will not be affected by this change, will continue to receive reports electronically, and you need not take any action. You may elect to receive shareholder reports (and other communications) electronically by signing up for eDelivery at NorthwesternMutal.com/Paperless.
You may elect to receive all future reports in paper free of charge. You can inform the Fund that you wish to continue receiving paper copies of your shareholder reports by contacting us at (888)455-2232. Your election to receive reports in paper will apply to all future shareholder reports.
Letter to Contract Holders
December 31, 2018
One of the longest bull markets in U.S. history continued to charge ahead for most of the year, but ground to a halt in late 2018, as volatility emerged and the S&P 500® Index1 briefly dipped into bear market territory by falling 20% from itsall-time high. Gains early in the year were offset by the sharp decline late in the year, precipitated by a number of lingering concerns that resulted in broad-based selling of riskier assets.
Despite steady economic growth in the U.S., many investors began to anticipate slower global growth, additional rate hikes by the U.S. Federal Reserve (the “Fed”) and continued economic disruption from trade clashes between the U.S. and China. With no signs of moderation, investors saw signs that these themes would likely continue, choosing to sell first and ask questions later.
On balance for the year, the large cap S&P 500® Index returned-4.38%, while the S&P MidCap 400® Index and the S&P SmallCap 600® Index returned-11.08% and-8.48%, respectively. Similarly, risk aversion prevailed across the globe, as the riskiest equities in both developed and emerging markets fell sharply.
By contrast, the overall bond market, as defined by the Bloomberg Barclays® U.S. Aggregate Index, was relatively unchanged with a return of 0.01%, as the various sectors of the bond market delivered mixed returns. Short-term U.S. Treasurys, which are often seen as a safe haven during tumultuous times, posted positive returns, while long-term U.S. Treasurys declined with rising interest rates. Riskier bonds, such as high yield corporates, posted negative returns despite the relatively healthy credit environment.
Despite the shifting winds in financial markets, U.S. economic growth accelerated to above 4% during the first half of the year, buoyed by the sweeping tax reform legislation passed in late 2017. Various measures of inflation, as well as inflation expectations, all approximately converged on the Fed’s target of 2.0% during the year. Faster growth and modest inflation led to a booming labor market, the lowest unemployment rate in more than 50 years (3.7% in November of 2018) and rising wages.
The Fed continued to reduce monetary stimulus at a steady pace by raising interest rates four times in 2018. The Fed also made significant progress on reducing the size of its balance sheet, which quadrupled in the years following the 2008 financial crisis. At the time of the writing of this letter, the Fed’s balance sheet was approximately $4 trillion, down from its high of $4.5 trillion in January of 2015. In December of 2018, the Fed also reset expectations for a slower pace of rate hikes in 2019.
The U.S. dollar appreciated against most foreign currencies, as the Fed’s higher interest rate policy stood in sharp contrast to the ongoing low interest rate policy of other major central banks like the European Central Bank and the Bank of Japan. Higher interest rates amid steady growth in the U.S. made American investments more attractive than comparable foreign investments, which meant international capital flowed to dollar-based assets during the year, boosting the value of the U.S. dollar in foreign exchange markets. The rising dollar proved to be especially challenging for emerging market nations, whose economies heavily rely on international capital inflows. Currency crises in Turkey and Argentina led to economic turmoil in those countries and their surrounding regions.
As we look ahead to 2019, the economy is facing many crosscurrents, which are likely to result in more volatility, as investors navigate the shifting economic waters. On the upside, the U.S. economy has shown positive momentum, and the overall business environment has remained strong through many challenges, persevering with solid growth, low inflation, and strong corporate profits. On the downside, trade wars and political turmoil at home and abroad, as well as the trajectory of the Fed’s monetary policy and international growth, are likely to contribute to an uncertain environment for markets. With so many unresolved themes, markets are likely to alternate between recognizing the potential for further growth and positioning for the end of the business cycle. The headlines are likely to highlight and accentuate the news at the extremes, which will add to the challenge of remaining resolute with your financial plan.
Good financial planning assumes that markets will experience volatility during the investor’s financial life cycle, so when volatility actually arrives, it can be an opportunity to rebalance2 a portfolio or put cash to work in other assets.
As always, we encourage you to work closely with your financial professional to navigate the financial markets in 2019 as they can help you develop and adhere to a plan that will be guided by your long-term goals, rather than the short-term fluctuations of the market.
Kate M. Fleming
President of Northwestern Mutual Series Fund, Inc.
1 All indices and/or benchmarks referenced are unmanaged and cannot be invested in directly.
2 A strategy involving portfolio rebalancing cannot assure a profit or protect against loss in a declining market. Not intended to be investment advice.
Northwestern Mutual Series Fund, Inc.
Table of Contents
| | |
Mason Street Advisors, LLC (“Mason Street Advisors”), adviser to the Northwestern Mutual Series Fund, Inc., is a wholly owned subsidiary of The Northwestern Mutual Life Insurance Company. Mason Street Advisors is the principal investment adviser for all the Portfolios of the Northwestern Mutual Series Fund, Inc., and has engaged and overseessub-advisers who provideday-to-day management for certain of the Portfolios. Eachsub-adviser may be replaced without the approval of shareholders. Please see the Series Fund prospectus for more information. The views expressed in the portfolio manager commentaries set forth in the following pages reflect those of the portfolio managers only through the end of the period covered by this report and do not necessarily represent the views of any affiliated organization. The views expressed are not guarantees of future performance or economic results and involve certain risks, uncertainties and assumptions that could cause actual outcomes and results to differ materially from the views expressed herein. These views are subject to change at any time based upon market conditions or other events and should not be relied upon as investment advice. Mason Street Advisors disclaims any responsibility to update these views. | | |
Expense Examples (unaudited)
EXAMPLE
As a shareholder of each Portfolio, you incur two types of costs: (1) transaction costs and (2) ongoing costs, including management fees and other Portfolio expenses. This Example is intended to help you understand your ongoing costs (in dollars) of investing in the Portfolios and to compare these costs with the ongoing costs of investing in other mutual funds.
The Example is based on an investment of $1,000 invested at the beginning of the period and held for the entire period (July 1, 2018 to December 31, 2018).
ACTUAL EXPENSES
The first line of the table below provides information about actual account values and actual expenses. You may use the information in this line, together with the amount you invested, to estimate the expenses that you paid over the period. Simply divide your account value by $1,000 (for example, an $8,600 account value divided by $1,000 = 8.6), then multiply the result by the number in the first line under the heading entitled “Expenses Paid During Period” to estimate the expenses you paid on your account during this period.
HYPOTHETICAL EXAMPLE FOR COMPARISON PURPOSES
The second line of the table below for each Portfolio provides information about hypothetical account values and hypothetical expenses based on each Portfolio’s actual expense ratio and an assumed rate of return of 5% per year before expenses, which is not the Portfolio’s actual return. The hypothetical account values and expenses may not be used to estimate the actual ending account balance or expenses you paid for the period. You may use this information to compare the ongoing costs of investing in a Portfolio and other funds. To do so, compare this 5% hypothetical example with the 5% hypothetical examples that appear in the shareholder reports of the other funds.
Please note that the expenses shown in the table are meant to highlight your ongoing costs only and do not reflect any transactional costs or separate account charges. Therefore, the second line of the table is useful in comparing ongoing costs only, and will not help you determine the relative total costs of owning different funds. In addition, if these transactional costs or separate account charges were included, your costs would have been higher.
| | | | | | | | | | | | | | | | |
| | | Beginning Account Value
July 1, 2018 | | | Ending Account Value
December 31, 2018 | | | Expenses Paid During
Period July 1, 2018 to
December 31, 2018* | | | Annualized
Expense Ratio | |
| | | | |
Growth Stock Portfolio | | | | | | | | | | | | | | | | |
Actual | | | $1,000.00 | | | | $918.44 | | | | $1.98 | | | | 0.41 | % |
Hypothetical (5% return before expenses) | | | 1,000.00 | | | | 1,023.14 | | | | 2.09 | | | | 0.41 | |
| | | | |
Focused Appreciation Portfolio | | | | | | | | | | | | | | | | |
Actual | | | 1,000.00 | | | | 943.21 | | | | 3.04 | | | | 0.62 | |
Hypothetical (5% return before expenses) | | | 1,000.00 | | | | 1,022.08 | | | | 3.16 | | | | 0.62 | |
| | | | |
Large Cap Core Stock Portfolio | | | | | | | | | | | | | | | | |
Actual | | | 1,000.00 | | | | 920.80 | | | | 2.13 | | | | 0.44 | |
Hypothetical (5% return before expenses) | | | 1,000.00 | | | | 1,022.99 | | | | 2.24 | | | | 0.44 | |
| | | | |
Large Cap Blend Portfolio | | | | | | | | | | | | | | | | |
Actual | | | 1,000.00 | | | | 941.20 | | | | 3.91 | | | | 0.80 | |
Hypothetical (5% return before expenses) | | | 1,000.00 | | | | 1,021.17 | | | | 4.08 | | | | 0.80 | |
| | | | |
Index 500 Stock Portfolio | | | | | | | | | | | | | | | | |
Actual | | | 1,000.00 | | | | 930.64 | | | | 0.97 | | | | 0.20 | |
Hypothetical (5% return before expenses) | | | 1,000.00 | | | | 1,024.20 | | | | 1.02 | | | | 0.20 | |
1
Expense Examples (unaudited)
| | | | | | | | | | | | | | | | |
| | | Beginning Account Value
July 1, 2018 | | | Ending Account Value
December 31, 2018 | | | Expenses Paid During
Period July 1, 2018 to
December 31, 2018* | | | Annualized
Expense Ratio | |
| | | | |
Large Company Value Portfolio | | | | | | | | | | | | | | | | |
Actual | | | $1,000.00 | | | | $934.84 | | | | $3.61 | | | | 0.74 | % |
Hypothetical (5% return before expenses) | | | 1,000.00 | | | | 1,021.48 | | | | 3.77 | | | | 0.74 | |
| | | | |
Domestic Equity Portfolio | | | | | | | | | | | | | | | | |
Actual | | | 1,000.00 | | | | 959.29 | | | | 2.62 | | | | 0.53 | |
Hypothetical (5% return before expenses) | | | 1,000.00 | | | | 1,022.53 | | | | 2.70 | | | | 0.53 | |
| | | | |
Equity Income Portfolio | | | | | | | | | | | | | | | | |
Actual | | | 1,000.00 | | | | 910.91 | | | | 2.94 | | | | 0.61 | |
Hypothetical (5% return before expenses) | | | 1,000.00 | | | | 1,022.13 | | | | 3.11 | | | | 0.61 | |
| | | | |
Mid Cap Growth Stock Portfolio | | | | | | | | | | | | | | | | |
Actual | | | 1,000.00 | | | | 862.11 | | | | 2.49 | | | | 0.53 | |
Hypothetical (5% return before expenses) | | | 1,000.00 | | | | 1,022.53 | | | | 2.70 | | | | 0.53 | |
| | | | |
Index 400 Stock Portfolio | | | | | | | | | | | | | | | | |
Actual | | | 1,000.00 | | | | 857.79 | | | | 1.17 | | | | 0.25 | |
Hypothetical (5% return before expenses) | | | 1,000.00 | | | | 1,023.95 | | | | 1.28 | | | | 0.25 | |
| | | | |
Mid Cap Value Portfolio | | | | | | | | | | | | | | | | |
Actual | | | 1,000.00 | | | | 878.68 | | | | 3.55 | | | | 0.75 | |
Hypothetical (5% return before expenses) | | | 1,000.00 | | | | 1,021.42 | | | | 3.82 | | | | 0.75 | |
| | | | |
Small Cap Growth Stock Portfolio | | | | | | | | | | | | | | | | |
Actual | | | 1,000.00 | | | | 812.85 | | | | 2.56 | | | | 0.56 | |
Hypothetical (5% return before expenses) | | | 1,000.00 | | | | 1,022.38 | | | | 2.85 | | | | 0.56 | |
| | | | |
Index 600 Stock Portfolio | | | | | | | | | | | | | | | | |
Actual | | | 1,000.00 | | | | 835.55 | | | | 1.39 | | | | 0.30 | |
Hypothetical (5% return before expenses) | | | 1,000.00 | | | | 1,023.69 | | | | 1.53 | | | | 0.30 | |
| | | | |
Small Cap Value Portfolio | | | | | | | | | | | | | | | | |
Actual | | | 1,000.00 | | | | 843.43 | | | | 4.00 | | | | 0.86 | |
Hypothetical (5% return before expenses) | | | 1,000.00 | | | | 1,020.87 | | | | 4.38 | | | | 0.86 | |
| | | | |
International Growth Portfolio | | | | | | | | | | | | | | | | |
Actual | | | 1,000.00 | | | | 891.69 | | | | 3.10 | | | | 0.65 | |
Hypothetical (5% return before expenses) | | | 1,000.00 | | | | 1,021.93 | | | | 3.31 | | | | 0.65 | |
| | | | |
Research International Core | | | | | | | | | | | | | | | | |
Portfolio | | | | | | | | | | | | | | | | |
Actual | | | 1,000.00 | | | | 874.32 | | | | 3.64 | | | | 0.77 | |
Hypothetical (5% return before expenses) | | | 1,000.00 | | | | 1,021.32 | | | | 3.92 | | | | 0.77 | |
| | | | |
International Equity Portfolio | | | | | | | | | | | | | | | | |
Actual | | | 1,000.00 | | | | 871.42 | | | | 2.55 | | | | 0.54 | |
Hypothetical (5% return before expenses) | | | 1,000.00 | | | | 1,022.48 | | | | 2.75 | | | | 0.54 | |
| | | | |
Emerging Markets Equity Portfolio | | | | | | | | | | | | | | | | |
Actual | | | 1,000.00 | | | | 961.67 | | | | 4.85 | | | | 0.98 | |
Hypothetical (5% return before expenses) | | | 1,000.00 | | | | 1,020.27 | | | | 4.99 | | | | 0.98 | |
2
Expense Examples (unaudited)
| | | | | | | | | | | | | | | | |
| | | Beginning Account Value
July 1, 2018 | | | Ending Account Value
December 31, 2018 | | | Expenses Paid During
Period July 1, 2018 to
December 31, 2018* | | | Annualized
Expense Ratio | |
| | | | |
Government Money Market | | | | | | | | | | | | | | | | |
Portfolio | | | | | | | | | | | | | | | | |
Actual | | | $1,000.00 | | | | $1,009.09 | | | | $1.72 | | | | 0.34 | % |
Hypothetical (5% return before expenses) | | | 1,000.00 | | | | 1,023.49 | | | | 1.73 | | | | 0.34 | |
| | | | |
Short-Term Bond Portfolio | | | | | | | | | | | | | | | | |
Actual | | | 1,000.00 | | | | 1,011.59 | | | | 1.93 | | | | 0.38 | |
Hypothetical (5% return before expenses) | | | 1,000.00 | | | | 1,023.29 | | | | 1.94 | | | | 0.38 | |
| | | | |
Select Bond Portfolio | | | | | | | | | | | | | | | | |
Actual | | | 1,000.00 | | | | 1,014.82 | | | | 1.52 | | | | 0.30 | |
Hypothetical (5% return before expenses) | | | 1,000.00 | | | | 1,023.69 | | | | 1.53 | | | | 0.30 | |
| | | | |
Long-Term U.S. Government Bond Portfolio | | | | | | | | | | | | | | | | |
Actual | | | 1,000.00 | | | | 1,012.43 | | | | 4.06 | | | | 0.80 | |
Hypothetical (5% return before expenses) | | | 1,000.00 | | | | 1,021.17 | | | | 4.08 | | | | 0.80 | |
| | | | |
Inflation Protection Portfolio | | | | | | | | | | | | | | | | |
Actual | | | 1,000.00 | | | | 983.60 | | | | 2.70 | | | | 0.54 | |
Hypothetical (5% return before expenses) | | | 1,000.00 | | | | 1,022.48 | | | | 2.75 | | | | 0.54 | |
| | | | |
High Yield Bond Portfolio | | | | | | | | | | | | | | | | |
Actual | | | 1,000.00 | | | | 976.86 | | | | 2.19 | | | | 0.44 | |
Hypothetical (5% return before expenses) | | | 1,000.00 | | | | 1,022.99 | | | | 2.24 | | | | 0.44 | |
| | | | |
Multi-Sector Bond Portfolio | | | | | | | | | | | | | | | | |
Actual | | | 1,000.00 | | | | 1,006.30 | | | | 3.79 | | | | 0.75 | |
Hypothetical (5% return before expenses) | | | 1,000.00 | | | | 1,021.42 | | | | 3.82 | | | | 0.75 | |
| | | | |
Balanced Portfolio | | | | | | | | | | | | | | | | |
Actual | | | 1,000.00 | | | | 957.69 | | | | 0.30 | | | | 0.06 | |
Hypothetical (5% return before expenses) | | | 1,000.00 | | | | 1,024.90 | | | | 0.31 | | | | 0.06 | |
| | | | |
Asset Allocation Portfolio | | | | | | | | | | | | | | | | |
Actual | | | 1,000.00 | | | | 938.03 | | | | 0.39 | | | | 0.08 | |
Hypothetical (5% return before expenses) | | | 1,000.00 | | | | 1,024.80 | | | | 0.41 | | | | 0.08 | |
| * | Expenses are equal to the Portfolio’s annualized expense ratio, multiplied by the average account value over the period, multiplied by 184/365 (to reflect theone-half year period). Expenses are based on the direct expenses of the Portfolio and do not include the effect of the underlying Portfolios’ expenses which are disclosed in the Fee and Expense table and described more fully in a footnote to that table in the Prospectus. |
3
Growth Stock Portfolio (unaudited)
| | | | |
| Objective: | | Portfolio Strategy: | | Net Assets: |
| Long-term growth of capital. Current income is a secondary objective. | | Invest in the equity securities of medium and large capitalization companies exhibiting the potential for earnings growth or share price appreciation. | | $899 million |
PORTFOLIO OVERVIEW
Mason Street Advisors, LLC (“Mason Street Advisors”), the investment adviser for the Growth Stock Portfolio (the “Portfolio”), has engaged BNY Mellon Asset Management North America Corporation (“BNY Mellon”) to act assub-adviser for the Portfolio. The Portfolio invests in the equity securities of medium and large capitalization companies. The Portfolio invests in stocks selected by a team of global research analysts, with each analyst responsible for investments in his or her area of expertise. These analysts use a fundamental research process to identify investments for the Portfolio. The Portfolio invests in those companies in which the analysts have the highest degree of conviction or have identified the potential for strong earnings growth or share price appreciation in the near-term.
MARKET OVERVIEW
Markets declined overall in 2018 as the ongoing U.S.-China trade dispute, rising interest rates, weakening corporate profit growth, uncertainty related to Brexit and Italian budget negotiations and a partial U.S. government shutdown all weighed on equity markets. In the U.S., the U.S. Federal Reserve (the “Fed”) voted to raise short-term interest rates four times during the period. Fed Chairman Jerome Powell struck a dovish tone at theyear-end meeting, however, revising next year’s growth forecasts downward and triggering a selloff in U.S. equity markets. Unemployment ended the period at the lowest level in nearly 50 years, and consumer confidence was consistently strong. The U.S. dollar strengthened against a basket of major currencies.
PORTFOLIO RESULTS
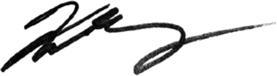
The Portfolio returned 1.26% for the twelve months ended December 31, 2018. By comparison, the Portfolio’s benchmark, the Russell 1000® Growth Index (the “Index”), returned (1.51%). (The Index is unmanaged, cannot be invested in directly and does not incur expenses.) According to Lipper® Analytical Services, Inc., an independent mutual fund ranking agency, the average return in 2018 of the Large Cap Growth Funds peer group was (0.60%).
In the Information Technology sector, stock selection in the software and IT services industries contributed to relative performance. Shares of Fortinet, Inc. climbed after reporting robust earnings results with an upside in nearly every key metric, in addition to an increase in fiscal year 2018 guidance. Firewall demand was generally improving due to rising IT spending. An investment in Twilio, Inc. also helped the Portfolio’s relative return.
The Healthcare sector was also a key contributor. Shares of Boston Scientific Corporation climbed after the Wall Street Journal reported that Stryker Corporation had approached the medical device company with a takeover offer in the second quarter. Although the deal was ultimately scrapped, it would have put two high-growth medical-surgical assets together with very little overlap. WellCare Health Plans, Inc. also gained after it acquired Meridian Health Plans of Michigan and Illinois and MeridianRx, a pharmacy benefit management company.
On the downside, several stocks in the Communication Services sector worked against the Portfolio’s relative return. Activision Blizzard, Inc. declined after reporting fourth-quarter guidance below expectations, despite reporting earnings slightly above expectations. While performance related to the game “Call of Duty Black Ops IV” remains strong, “Destiny 2: Forsaken” was a source of weakness and performed below management expectations. Charter Communications, Inc. also fell after reporting mixed quarterly results.
The Financials sector was also a source of weakness for the year. Positioning in the capital markets segment and a lack of exposure to diversified financial services were the primary culprits for lagging results. Ameriprise Financial, Inc. fell due to questions about the company’s long-term care business sale, which became a significant drag on the stock. While Ameriprise is considering selling its property and casualty business, its core business – advice and wealth management – remains robust.
PORTFOLIO MANAGER OUTLOOK
The following forward-looking comments are the opinion of BNY Mellon, the Portfolio’ssub-adviser.
4
Growth Stock Portfolio (unaudited)
As 2019 begins, a number of issues could impact U.S. economic and corporate profit growth, including protracted U.S.-China trade tensions, the continuing effects of last year’s rise in interest rates and a reduction in the economic effect of tax reform. Tariff-inducedpre-buying appears to have inflated demand and inventories, which could ultimately result in reduced orders and demand in the near term. China reported weak manufacturing data and U.S. manufacturing sentiment dropped in December with weak new orders. Brexit is also nearing its final stages.
Despite these headwinds, we believe the odds of a recession-driven bear market remain low due to continued job growth, the recent decline in longer-term interest rates and the under-levered positions of the consumer balance sheet and the U.S. financial system. While the path to a resolution remains unclear, any meaningful breakthrough on U.S.-China tariffs would be well received across equity markets. We should see some type of fiscal stimulus in China, a U.S.-China trade deal, a pause in interest rate increases and oil price stability, all of which would help markets continue to recover.
Relative Performance
| | | | | | | | | | | | |
Average Annual Total Returns
For Periods Ended December 31, 2018 | |
| | | 1 Year | | | 5 Years | | | 10 Years | |
Growth Stock Portfolio | | | 1.26 | % | | | 8.31 | % | | | 13.28 | % |
Russell 1000® Growth Index | | | -1.51 | % | | | 10.40 | % | | | 15.29 | % |
Lipper® Variable Insurance Products (VIP) Large Cap Growth Funds Average | | | -0.60 | % | | | 9.46 | % | | | 14.64 | % |
The performance data quoted represents past performance. Past performance is historical and does not guarantee future performance. Investment return and principal value will fluctuate, so that shares, when redeemed, may be worth more or less than their original cost. Current performance may be lower or higher than the performance data quoted. For the most recentmonth-end performance information visitwww.northwesternmutual.com.
This chart assumes an initial investment of $10,000 made on 12/31/08. Returns shown reflect fee waivers, deductions for management and other portfolio expenses, and reinvestment of all dividends. In the absence of fee waivers, total return would be reduced. Returns exclude deductions for separate account sale loads and account fees. Please refer to the Benchmark Definitions section ofthis report for information about the indices cited in the above chart and graph.
The Portfolio may invest a relatively high percentage of its assets in a particular sector. The Portfolio will have greater exposure to the risks associated with that sector and its performance will be tied more closely to the performance of the sector.
Top 10 Equity Holdings 12/31/18
| | | | |
Security Description | | | % of Net Assets | |
Alphabet, Inc., Various | | | 7.6 | % |
Amazon.com, Inc. | | | 6.5 | % |
Microsoft Corp. | | | 5.2 | % |
Apple, Inc. | | | 4.5 | % |
UnitedHealth Group, Inc. | | | 3.6 | % |
Visa, Inc. - Class A | | | 3.2 | % |
Verizon Communications, Inc. | | | 2.2 | % |
Union Pacific Corp. | | | 2.1 | % |
O’Reilly Automotive, Inc. | | | 2.0 | % |
Honeywell International, Inc. | | | 2.0 | % |
Sector Allocation 12/31/18
| | | | |
Sector | | | % of Net Assets | |
Information Technology | | | 31.2 | % |
Health Care | | | 16.6 | % |
Consumer Discretionary | | | 13.8 | % |
Communication Services | | | 12.6 | % |
Industrials | | | 11.3 | % |
Consumer Staples | | | 5.8 | % |
Short-Term Investments & Other Net Assets | | | 3.1 | % |
Financials | | | 3.0 | % |
Materials | | | 1.8 | % |
Energy | | | 0.8 | % |
Sector Allocation and Top 10 Holdings are subject to change.
5
Growth Stock Portfolio
SCHEDULE OF INVESTMENTS
December 31, 2018
| | | | | | | | |
| Common Stocks (96.9%) | | Shares/
Par+ | | | Value
$ (000’s) | |
| |
Communication Services (12.6%) | | | | | |
Activision Blizzard, Inc. | | | 199,181 | | | | 9,276 | |
Alphabet, Inc. - Class A* | | | 16,526 | | | | 17,269 | |
Alphabet, Inc. - Class C* | | | 49,208 | | | | 50,960 | |
T-Mobile US, Inc.* | | | 242,679 | | | | 15,437 | |
Verizon Communications, Inc. | | | 352,620 | | | | 19,824 | |
| | | | | | | | |
Total | | | | | | | 112,766 | |
| | | | | | | | |
| |
Consumer Discretionary (13.8%) | | | | | |
Amazon.com, Inc.* | | | 38,774 | | | | 58,237 | |
Chipotle Mexican Grill, Inc.* | | | 24,768 | | | | 10,695 | |
GrubHub, Inc.* | | | 61,444 | | | | 4,719 | |
Las Vegas Sands Corp. | | | 105,839 | | | | 5,509 | |
McDonald’s Corp. | | | 92,244 | | | | 16,380 | |
O’Reilly Automotive, Inc.* | | | 52,734 | | | | 18,158 | |
PVH Corp. | | | 49,956 | | | | 4,643 | |
Wayfair, Inc. - Class A* | | | 58,178 | | | | 5,241 | |
| | | | | | | | |
Total | | | | | | | 123,582 | |
| | | | | | | | |
| |
Consumer Staples (5.8%) | | | | | |
Costco Wholesale Corp. | | | 51,598 | | | | 10,511 | |
Monster Beverage Corp.* | | | 140,432 | | | | 6,912 | |
PepsiCo, Inc. | | | 158,966 | | | | 17,563 | |
The Procter & Gamble Co. | | | 82,522 | | | | 7,585 | |
Walmart, Inc. | | | 106,709 | | | | 9,940 | |
| | | | | | | | |
Total | | | | | | | 52,511 | |
| | | | | | | | |
| |
Energy (0.8%) | | | | | |
Marathon Petroleum Corp. | | | 127,737 | | | | 7,538 | |
| | | | | | | | |
Total | | | | | | | 7,538 | |
| | | | | | | | |
| |
Financials (3.0%) | | | | | |
Ameriprise Financial, Inc. | | | 103,218 | | | | 10,773 | |
The Progressive Corp. | | | 273,252 | | | | 16,485 | |
| | | | | | | | |
Total | | | | | | | 27,258 | |
| | | | | | | | |
| |
Health Care (16.6%) | | | | | |
Align Technology, Inc.* | | | 39,532 | | | | 8,279 | |
Becton Dickinson and Co. | | | 51,028 | | | | 11,498 | |
Biogen, Inc.* | | | 22,370 | | | | 6,732 | |
BioMarin Pharmaceutical, Inc.* | | | 82,904 | | | | 7,059 | |
Boston Scientific Corp.* | | | 452,499 | | | | 15,991 | |
Danaher Corp. | | | 93,465 | | | | 9,638 | |
| | | | | | | | |
| Common Stocks (96.9%) | | Shares/
Par+ | | | Value
$ (000’s) | |
| |
Health Care continued | | | | | |
Edwards Lifesciences Corp.* | | | 50,443 | | | | 7,726 | |
Eli Lilly & Co. | | | 152,615 | | | | 17,661 | |
Illumina, Inc.* | | | 33,904 | | | | 10,169 | |
Neurocrine Biosciences, Inc.* | | | 61,142 | | | | 4,366 | |
UnitedHealth Group, Inc. | | | 128,456 | | | | 32,001 | |
Vertex Pharmaceuticals, Inc.* | | | 45,205 | | | | 7,491 | |
WellCare Health Plans, Inc.* | | | 44,486 | | | | 10,503 | |
| | | | | | | | |
Total | | | | | | | 149,114 | |
| | | | | | | | |
| |
Industrials (11.3%) | | | | | |
Cintas Corp. | | | 55,812 | | | | 9,376 | |
CoStar Group, Inc.* | | | 25,748 | | | | 8,686 | |
Fortive Corp. | | | 224,251 | | | | 15,173 | |
Honeywell International, Inc. | | | 136,720 | | | | 18,064 | |
Quanta Services, Inc.* | | | 218,578 | | | | 6,579 | |
Raytheon Co. | | | 84,272 | | | | 12,923 | |
Union Pacific Corp. | | | 132,904 | | | | 18,371 | |
United Technologies Corp. | | | 116,776 | | | | 12,434 | |
| | | | | | | | |
Total | | | | | | | 101,606 | |
| | | | | | | | |
| |
Information Technology (31.2%) | | | | | |
Apple, Inc. | | | 255,316 | | | | 40,273 | |
Broadcom, Inc. | | | 47,218 | | | | 12,007 | |
FleetCor Technologies, Inc.* | | | 46,401 | | | | 8,618 | |
HubSpot, Inc.* | | | 51,322 | | | | 6,453 | |
International Business Machines Corp. | | | 150,326 | | | | 17,087 | |
Microsoft Corp. | | | 458,805 | | | | 46,601 | |
Palo Alto Networks, Inc.* | | | 54,653 | | | | 10,294 | |
PayPal Holdings, Inc.* | | | 201,247 | | | | 16,923 | |
QUALCOMM, Inc. | | | 217,834 | | | | 12,397 | |
salesforce.com, Inc.* | | | 125,282 | | | | 17,160 | |
ServiceNow, Inc.* | | | 61,424 | | | | 10,936 | |
Splunk, Inc.* | | | 73,688 | | | | 7,726 | |
SS&C Technologies Holdings, Inc. | | | 189,361 | | | | 8,542 | |
Teradata Corp.* | | | 186,621 | | | | 7,159 | |
Texas Instruments, Inc. | | | 102,940 | | | | 9,728 | |
Twilio, Inc. - Class A* | | | 62,437 | | | | 5,576 | |
Visa, Inc. - Class A | | | 220,603 | | | | 29,106 | |
Xilinx, Inc. | | | 164,181 | | | | 13,983 | |
| | | | | | | | |
Total | | | | | | | 280,569 | |
| | | | | | | | |
| | | | | | | | |
| Common Stocks (96.9%) | | Shares/
Par+ | | | Value
$ (000’s) | |
Materials (1.8%) | | | | | | | | |
Linde PLC | | | 104,486 | | | | 16,304 | |
| | | | | | | | |
Total | | | | | | | 16,304 | |
| | | | | | | | |
| | |
Total Common Stocks | | | | | | | | |
(Cost: $750,415) | | | | | | | 871,248 | |
| | | | | |
| |
| Short-Term Investments (3.1%) | | | | |
| |
Money Market Funds (3.1%) | | | | | |
State Street Institutional U.S. Government Money Market Fund - Premier Class 2.270% # | | | 27,687,596 | | | | 27,688 | |
| | | | | | | | |
Total | | | | | | | 27,688 | |
| | | | | | | | |
| | |
Total Short-Term Investments | | | | | | | | |
(Cost: $27,688) | | | | | | | 27,688 | |
| | | | | | | | |
| | |
Total Investments (100.0%) | | | | | | | | |
(Cost: $778,103)@ | | | | | | | 898,936 | |
| | | | | |
Other Assets, Less | | | | | | | | |
Liabilities (0.0%) | | | | | | | (310 | ) |
| | | | | |
Net Assets (100.0%) | | | | | | | 898,626 | |
| | | | | |
The Accompanying Notes are an Integral Part of the Financial Statements.
6
Growth Stock Portfolio
| + | All par is stated in U.S Dollar unless otherwise noted. |
| # | 7-Day yield as of 12/31/2018. |
| @ | At December 31, 2018, the aggregate cost of investments, including derivatives, for federal tax purposes (in thousands) was $778,142 and the net unrealized appreciation of investments based on that cost was $120,793 which is comprised of $158,273 aggregate gross unrealized appreciation and $37,480 aggregate gross unrealized depreciation. |
The following is a summary of the inputs used in valuing the Portfolio’s assets and liabilities at December 31, 2018. See Note 3 for additional information on portfolio valuation.
| | | | | | | | | | | | | | |
| | | Valuation Inputs | | | |
| Description | | Level 1 –
Quoted Prices | | | Level 2 –
Other Significant
Observable Inputs | | | Level 3 –
Significant
Unobservable Inputs | | | |
| | | (Amounts in thousands) | | | |
Assets: | | | | | | | | | | | | | | |
Common Stocks | | $ | 871,248 | | | $ | - | | | $ | - | | | |
Short-Term Investments | | | 27,688 | | | | - | | | | - | | | |
Total Assets: | | $ | 898,936 | | | $ | - | | | $ | - | | | |
The Accompanying Notes are an Integral Part of the Financial Statements.
7
Focused Appreciation Portfolio (unaudited)
| | | | |
| Objective: | | Portfolio Strategy: | | Net Assets: |
| Long-term growth of capital. | | Invest in equity securities selected for their growth potential. | | $849 million |
PORTFOLIO OVERVIEW
Mason Street Advisors, LLC (“Mason Street Advisors”), the investment adviser for the Focused Appreciation Portfolio (the “Portfolio”), has engaged Loomis, Sayles & Company, L.P. (“Loomis Sayles”) to act assub-adviser for the Portfolio. The Portfolio invests primarily in the equity securities of companies selected for their growth potential. The Portfolio focuses on equity securities of large capitalization companies but may invest in companies of any size. The Portfolio employs a growth style of equity management that emphasizes companies with sustainable competitive advantages, long-term structural growth drivers, profitable cash flow returns, and management teams focused on creating long-term value for shareholders. The Portfolio invests primarily in a core group of30-40 securities, but may exceed this range.
MARKET OVERVIEW
Enthusiasm over corporate tax cuts, deregulation and accelerating global growth led U.S. equities toall-time highs in January 2018, but the advance eventually reversed due to fears over trade wars, slowing growth outside the U.S. and U.S. Federal Reserve (the “Fed”) interest rate hikes. When the dust settled after the first quarter selloff, U.S. equities established an uptrend and headed higher, reaching fresh52-week highs in September and early October. Earnings remained strong throughout the first three quarters of the year, butprice-to-earnings valuations contracted. As the fourth quarter began, macroeconomic risksre-emerged and shook equity risk appetite once more, wiping outyear-to-date gains. Sectors with steady earnings outperformed the growth-oriented Information Technology and Consumer Discretionary sectors.
PORTFOLIO RESULTS
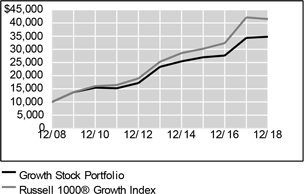
The Portfolio returned (2.34%) for the twelve months ended December 31, 2018. By comparison, the Portfolio’s benchmark, the Russell 1000® Growth Index (the “Index”), returned (1.51%). (The Index is unmanaged, cannot be invested in directly and does not incur expenses.) According to Lipper® Analytical Services, Inc., an independent mutual fund ranking agency, the average return in 2018 of the Large Cap Growth Funds peer group was (0.60%).
Amazon.com, Inc., Visa Inc. and Autodesk, Inc. were among the top contributors to Portfolio performance. Facebook, Inc., Schlumberger N.V. and SEI Investments Company were among the largest detractors from performance. During the period, the portfolio manager took advantage of price weakness to initiate positions in Colgate-Palmolive Company and Starbucks Corporation and added to holdings of several of the high quality growth companies in the Portfolio, including Cerner Corporation, Oracle Corporation, Procter & Gamble Company, Regeneron Pharmaceuticals, Inc., Schlumberger N.V. and Yum China Holdings, Inc. The purchases were funded by trimming Portfolio positions in American Express Company, Cisco Systems, Inc., United Parcel Service, Inc. and Varian Medical Systems, Inc. The portfolio manager also reduced the Portfolio position in Amazon.com, Inc. as it approached the Portfolio’s maximum allowable position size, and sold Analog Devices, Inc. as it approached the portfolio manager’s estimate of intrinsic value.
Stock selection in the Consumer Discretionary and Industrials sectors, as well as the allocations to the Industrials and Information Technology sectors, contributed to relative performance. Stock selection in the Information Technology, Financials and Consumer Staples sectors, as well as the allocations to the Energy and Consumer Discretionary sectors, detracted from relative performance.
PORTFOLIO MANAGER OUTLOOK
The following forward-looking comments are the opinion of Loomis Sayles, the Portfolio’ssub-adviser.
Our investment process is characterized bybottom-up fundamental research and a long-term investment time horizon. All aspects of our quality-growth-valuation investment thesis must be present simultaneously for us to make an investment. Often our research is completed well in advance of the opportunity to invest. We are patient investors and maintain coverage of high quality businesses in order to take advantage of meaningful price dislocations when they occur. The nature of the process leads to lower portfolio turnover based on stock selection. Relative to the Russell 1000® Growth Index, we are currently overweight in the Consumer Staples, Consumer Discretionary, Health Care, Energy and Financials sectors. We are underweight in the Information Technology, Industrials and Communication Services sectors. We hold no positions in the Real Estate or Materials sectors.
8
Focused Appreciation Portfolio (unaudited)
Relative Performance
| | | | | | | | | | | | |
Average Annual Total Returns
For Periods Ended December 31, 2018 | |
| | | 1 Year | | | 5 Years | | | 10 Years | |
Focused Appreciation Portfolio | | | -2.34 | % | | | 11.43 | % | | | 14.57 | % |
Russell 1000® Growth Index | | | -1.51 | % | | | 10.40 | % | | | 15.29 | % |
Lipper® Variable Insurance Products (VIP) Large Cap Growth Funds Average | | | -0.60 | % | | | 9.46 | % | | | 14.64 | % |
The performance data quoted represents past performance. Past performance is historical and does not guarantee future performance. Investment return and principal value will fluctuate, so that shares, when redeemed, may be worth more or less than their original cost. Current performance may be lower or higher than the performance data quoted. For the most recentmonth-end performance information visitwww.northwesternmutual.com.
This chart assumes an initial investment of $10,000 made on 12/31/08. Returns shown reflect fee waivers, deductions for management and other portfolio expenses, and reinvestment of all dividends. In the absence of fee waivers, total return would be reduced. Returns exclude deductions for separate account sale loads and account fees. Please refer to the Benchmark Definitions section of this report for information about the indices cited in the above chart and graph.
As anon-diversified portfolio, the Portfolio may hold fewer securities because of its focused investment strategy. Holding fewer securities increases the riskthat the value of the Portfolio could go down because of the poor performance of a single investment.
The Portfolio may invest a relatively high percentage of its assets in a particular sector. The Portfolio will have greater exposure to the risks associated with that sector and its performance will be tied more closely to the performance of the sector.
Top 10 Equity Holdings 12/31/18
| | | | |
Security Description | | | % of Net Assets | |
Amazon.com, Inc. | | | 6.6 | % |
Visa, Inc. - Class A | | | 6.4 | % |
Alphabet, Inc., Various | | | 6.0 | % |
Oracle Corp. | | | 5.2 | % |
Alibaba Group Holding, Ltd., ADR | | | 5.1 | % |
Facebook, Inc. - Class A | | | 5.0 | % |
Autodesk, Inc. | | | 4.0 | % |
Regeneron Pharmaceuticals, Inc. | | | 3.7 | % |
Microsoft Corp. | | | 3.4 | % |
Starbucks Corp. | | | 3.3 | % |
Sector Allocation 12/31/18
| | | | |
Sector | | | % of Net Assets | |
Information Technology | | | 25.7 | % |
Consumer Discretionary | | | 18.3 | % |
Health Care | | | 15.6 | % |
Consumer Staples | | | 13.8 | % |
Communication Services | | | 11.0 | % |
Industrials | | | 6.8 | % |
Financials | | | 5.0 | % |
Short-Term Investments & Other Net Assets | | | 2.1 | % |
Energy | | | 1.7 | % |
Sector Allocation and Top 10 Holdings are subject to change.
9
Focused Appreciation Portfolio
SCHEDULE OF INVESTMENTS
December 31, 2018
| | | | | | | | |
| Common Stocks (97.9%) | | Shares/
Par+ | | | Value
$ (000’s) | |
Communication Services (11.0%) | | | | | |
Alphabet, Inc. - Class A* | | | 24,373 | | | | 25,469 | |
Alphabet, Inc. - Class C* | | | 24,422 | | | | 25,292 | |
Facebook, Inc. - Class A* | | | 325,831 | | | | 42,713 | |
| | | | | | | | |
Total | | | | | | | 93,474 | |
| | | | | | | | |
| |
Consumer Discretionary (18.3%) | | | | | |
Alibaba Group Holding, Ltd., ADR* | | | 317,218 | | | | 43,481 | |
Amazon.com, Inc.* | | | 37,145 | | | | 55,790 | |
Starbucks Corp. | | | 436,895 | | | | 28,136 | |
Yum China Holdings, Inc. | | | 324,330 | | | | 10,875 | |
Yum! Brands, Inc. | | | 187,954 | | | | 17,277 | |
| | | | | | | | |
Total | | | | | | | 155,559 | |
| | | | | | | | |
| |
Consumer Staples (13.8%) | | | | | |
The Coca-Cola Co. | | | 503,866 | | | | 23,858 | |
Colgate-Palmolive Co. | | | 278,152 | | | | 16,555 | |
Danone SA, ADR | | | 1,681,767 | | | | 23,511 | |
Monster Beverage Corp.* | | | 551,703 | | | | 27,155 | |
The Procter & Gamble Co. | | | 284,450 | | | | 26,147 | |
| | | | | | | | |
Total | | | | | | | 117,226 | |
| | | | | | | | |
Energy (1.7%) | | | | | |
Schlumberger, Ltd. | | | 402,609 | | | | 14,526 | |
| | | | | | | | |
Total | | | | | | | 14,526 | |
| | | | | | | | |
| | | | | | | | |
| Common Stocks (97.9%) | | Shares/
Par+ | | | Value
$ (000’s) | |
Financials (5.0%) | | | | | |
American Express Co. | | | 102,107 | | | | 9,733 | |
FactSet Research Systems, Inc. | | | 74,124 | | | | 14,834 | |
SEI Investments Co. | | | 385,423 | | | | 17,807 | |
| | | | | | | | |
Total | | | | | | | 42,374 | |
| | | | | | | | |
| |
Health Care (15.6%) | | | | | |
Amgen, Inc. | | | 84,368 | | | | 16,424 | |
Cerner Corp.* | | | 337,766 | | | | 17,712 | |
Merck & Co., Inc. | | | 145,256 | | | | 11,099 | |
Novartis AG, ADR | | | 178,636 | | | | 15,329 | |
Novo Nordisk A/S, ADR | | | 550,609 | | | | 25,366 | |
Regeneron Pharmaceuticals, Inc.* | | | 84,224 | | | | 31,458 | |
Varian Medical Systems, Inc.* | | | 131,885 | | | | 14,944 | |
| | | | | | | | |
Total | | | | | | | 132,332 | |
| | | | | | | | |
| |
Industrials (6.8%) | | | | | |
Deere & Co. | | | 164,512 | | | | 24,540 | |
Expeditors International of Washington, Inc. | | | 371,428 | | | | 25,290 | |
United Parcel Service, Inc. - Class B | | | 82,372 | | | | 8,034 | |
| | | | | | | | |
Total | | | | | | | 57,864 | |
| | | | | | | | |
| | | | | | | | |
| Common Stocks (97.9%) | | Shares/
Par+ | | | Value
$ (000’s) | |
Information Technology (25.7%) | | | | | |
Autodesk, Inc.* | | | 263,561 | | | | 33,897 | |
Automatic Data Processing, Inc. | | | 60,968 | | | | 7,994 | |
Cisco Systems, Inc. | | | 581,514 | | | | 25,197 | |
Microsoft Corp. | | | 283,692 | | | | 28,815 | |
Oracle Corp. | | | 967,492 | | | | 43,682 | |
QUALCOMM, Inc. | | | 434,115 | | | | 24,705 | |
Visa, Inc. - Class A | | | 411,866 | | | | 54,342 | |
| | | | | | | | |
Total | | | | | | | 218,632 | |
| | | | | | | | |
Total Common Stocks | | | | | | | | |
(Cost: $651,208) | | | | | | | 831,987 | |
| | | | | | | | |
| |
| Short-Term Investments (2.0%) | | | | |
| |
Money Market Funds (2.0%) | | | | | |
State Street Institutional U.S. Government Money Market Fund - Premier Class 2.270% # | | | 16,715,801 | | | | 16,716 | |
| | | | | | | | |
Total | | | | | | | 16,716 | |
| | | | | | | | |
| | |
Total Short-Term Investments | | | | | | | | |
(Cost: $16,716) | | | | | | | 16,716 | |
| | | | | | | | |
| | |
Total Investments (99.9%) | | | | | | | | |
(Cost: $667,924)@ | | | | | | | 848,703 | |
| | | | | | | | |
Other Assets, Less | | | | | | | | |
Liabilities (0.1%) | | | | | | | 466 | |
| | | | | | | | |
Net Assets (100.0%) | | | | | | | 849,169 | |
| | | | | | | | |
| + | All par is stated in U.S Dollar unless otherwise noted. |
| # | 7-Day yield as of 12/31/2018. |
| @ | At December 31, 2018, the aggregate cost of investments, including derivatives, for federal tax purposes (in thousands) was $668,699 and the net unrealized appreciation of investments based on that cost was $180,004 which is comprised of $214,675 aggregate gross unrealized appreciation and $34,671 aggregate gross unrealized depreciation. |
The following is a summary of the inputs used in valuing the Portfolio’s assets and liabilities at December 31, 2018. See Note 3 for additional information on portfolio valuation.
| | | | | | | | | | | | | | |
| | | Valuation Inputs | | | |
| Description | | Level 1 –
Quoted Prices | | | Level 2 –
Other Significant
Observable Inputs | | | Level 3 –
Significant
Unobservable Inputs | | | |
| | | (Amounts in thousands) | | | |
Assets: | | | | | | | | | | | | | | |
Common Stocks | | $ | 831,987 | | | $ | - | | | $ | - | | | |
Short-Term Investments | | | 16,716 | | | | - | | | | - | | | |
Total Assets: | | $ | 848,703 | | | $ | - | | | $ | - | | | |
The Accompanying Notes are an Integral Part of the Financial Statements.
10
Large Cap Core Stock Portfolio (unaudited)
| | | | |
| Objective: | | Portfolio Strategy: | | Net Assets: |
| Long-term growth of capital and income. | | Invest primarily in common stocks of large capitalization U.S. companies. | | $519 million |
PORTFOLIO OVERVIEW
Mason Street Advisors, LLC (“Mason Street Advisors”), the investment adviser for the Large Cap Core Stock Portfolio (the “Portfolio”), has engaged Wellington Management Company LLP (“Wellington”) to act assub-adviser for the Portfolio. The Portfolio allocates its assets across a variety of industries, selecting companies in each industry based on the research of a team of global industry analysts. The Portfolio typically seeks to maintain representation in each major industry represented by broad-based, large cap U.S. equity indices. The Portfolio utilizes a“bottom-up” approach, which is the use of fundamental analysis to identify specific securities for purchase or sale. Fundamental analysis of a company involves the assessment of a variety of factors, including the company’s business environment, management quality, balance sheet, income statement, anticipated earnings, revenues and dividends, and other related measures or indicators of valuation and growth potential. The Portfolio’s sector exposures generally conform with the sector weights present in the Portfolio’s benchmark index.
MARKET OVERVIEW
U.S. equities, as measured by the S&P 500® Index, posted negative results over the twelve-month period ending December 31, 2018. The U.S. Federal Reserve (the “Fed”) raised its benchmark interest rate by 25 basis points four times during the year, although it signaled a slower pace of interest rate increases heading into 2019. Bullish sentiment was exceptionally strong to start the year, as better-than-expected corporate profits helped drive U.S. equities higher. By the summer of 2018, however, talk of tariffs and trade wars had progressed to implementation, raising concerns in an otherwise strong economy. In the final months of 2018, worries surrounding slowing global growth, rich valuations, rising interest rates and heightened U.S. and Chinese trade tensions were at the forefront of investors’ minds. Returns in October and December were sharply negative, with the latter representing the largest monthly decline in a decade, which culminated in the first year of negative U.S. equity returns since 2008. Large cap stocks, as measured by the S&P 500® Index, outperformed mid and small cap stocks, as measured by the S&P MidCap 400® Index and Russell 2000® Index.
PORTFOLIO RESULTS
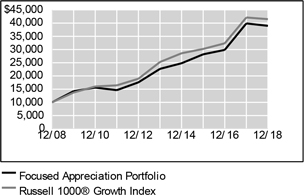
The Large Cap Core Stock Portfolio returned (6.04%) for the twelve months ended December 31, 2018. By comparison, the S&P 500® Index (the “Index”) returned (4.38%) for the year. (The Index is unmanaged, cannot be invested in directly and does not incur expenses.) According to Lipper® Analytical Services, Inc., an independent mutual fund ranking company, the average return in 2018 for the Large Cap Core Funds peer group was (5.07%).
The Portfolio’s underperformance during the period was driven by stock selection within the Consumer Staples and Health Care sectors. This was partially offset by stock selection within the Communication Services and Industrials sectors.
Top detractors from relative return during the period included Coty, British-American Tobacco and Flex. The Portfolio’s overweight to Coty, an emerging beauty franchise, was the top detractor from relative results during the period. Shares of Coty fell after the company reported mixed quarterly results in May. The Portfolio’s position in Coty was eliminated prior to year end. British American Tobacco, the world’s second largest cigarette maker, underperformed as a challenging regulatory environment weighed on tobacco stocks. A position in Flex, a provider of manufacturing and supply chain services solutions to manufacturers, also detracted from relative performance for the period. Shares fell sharply after the company missed estimates for revenue, announced the wind-down of its Nike footwear operations and disclosed the CEO’s retirement.
Top contributors to relative performance included Advanced Micro Devices, Boston Scientific and NRG Energy. The Portfolio’s overweight position in Advanced Micro Devices, a semiconductor company, was the largest contributor to relative performance during the period, driven by the success of the Ryzen line of notebooks and the general strength of the PC market. The Portfolio’s overweight position in Boston Scientific, a U.S.-based medical device developer and manufacturer, benefited relative performance as the company reported favorable earnings and revenue growth across most business segments in the third quarter of 2018. NRG Energy, a U.S.-based power producer with a mix of nuclear, coal and gas capacity, contributed to relative returns, as the company reported favorable financial results throughout the year and announced two large repurchase programs in 2018.
11
Large Cap Core Stock Portfolio (unaudited)
PORTFOLIO MANAGER OUTLOOK
The following forward-looking comments are the opinion of Wellington, the Portfolio’ssub-adviser.
We expect the U.S. economy to continue outpacing its developed-market peers while slowing somewhat as earnings growth plateaus and higher interest rates dampen demand for housing. However, U.S. consumers continue to power the economy and are supported by a strong job market and higher nominal wages. Despite falling in the wake of the fourth quarter’s stock marketsell-off, consumer confidence remains at healthy levels.
Capital expenditures may remain relatively subdued despite last year’s tax cut, as trade concerns increase uncertainty for businesses, but business spending should still add to economic growth in coming quarters. Also, the U.S. presidential administration could soften its most severe trade threats given slower growth and declining stock prices.
Relative Performance
| | | | | | | | | | | | |
Average Annual Total Returns
For Periods Ended December 31, 2018 | |
| | | 1 Year | | | 5 Years | | | 10 Years | |
Large Cap Core Stock Portfolio | | | -6.04 | % | | | 5.84 | % | | | 10.65 | % |
S&P 500® Index | | | -4.38 | % | | | 8.49 | % | | | 13.11 | % |
Lipper® Variable Insurance Products (VIP) Large Cap Core Funds Average | | | -5.07 | % | | | 7.10 | % | | | 12.11 | % |
The performance data quoted represents past performance. Past performance is historical and does not guarantee future performance. Investment return and principal value will fluctuate, so that shares, when redeemed, may be worth more or less than their original cost. Current performance may be lower or higher than the performance data quoted. For the most recentmonth-end performance information visitwww.northwesternmutual.com.
This chart assumes an initial investment of $10,000 made on 12/31/08. Returns shown reflect fee waivers, deductions for management and other portfolio expenses, and reinvestment of all dividends. In the absence of fee waivers, total return would be reduced. Returns exclude deductions for separate account sale loads and account fees. Please refer to the Benchmark Definitions section of this report for information about the indices cited in the above chart and graph.
The Portfolio may invest a relatively high percentage of its assets in a particular sector. The Portfolio will have greater exposure to the risks associated with that sector and its performance will be tied more closely to the performance of the sector.
Top 10 Equity Holdings 12/31/18
| | | | | | |
| Security Description | | % of Net Assets | | | |
Amazon.com, Inc. | | | 4.3 | % | | |
Microsoft Corp. | | | 3.6 | % | | |
Alphabet, Inc. - Class A | | | 3.5 | % | | |
Bank of America Corp. | | | 3.2 | % | | |
Apple, Inc. | | | 2.5 | % | | |
UnitedHealth Group, Inc. | | | 2.5 | % | | |
Verizon Communications, Inc. | | | 2.1 | % | | |
Exxon Mobil Corp. | | | 1.9 | % | | |
Comcast Corp. - Class A | | | 1.7 | % | | |
The Boeing Co. | | | 1.6 | % | | |
Sector Allocation 12/31/18
| | | | | | |
| Sector | | % of Net Assets | | | |
Information Technology | | | 17.7 | % | | |
Health Care | | | 14.9 | % | | |
Financials | | | 12.1 | % | | |
Industrials | | | 11.0 | % | | |
Consumer Discretionary | | | 10.6 | % | | |
Communication Services | | | 10.2 | % | | |
Consumer Staples | | | 6.7 | % | | |
Energy | | | 5.2 | % | | |
Utilities | | | 4.4 | % | | |
Materials | | | 3.3 | % | | |
Real Estate | | | 2.5 | % | | |
Short-Term Investments & Other Net Assets | | | 0.7 | % | | |
Investment Companies | | | 0.7 | % | | |
Sector Allocation and Top 10 Holdings are subject to change.
12
Large Cap Core Stock Portfolio
SCHEDULE OF INVESTMENTS
December 31, 2018
| | | | | | | | |
| Common Stocks (98.6%) | | Shares/
Par+ | | | Value
$ (000’s) | |
| |
Communication Services (10.2%) | | | | | |
Alphabet, Inc. - Class A* | | | 17,276 | | | | 18,053 | |
Charter Communications, Inc. - Class A* | | | 11,119 | | | | 3,168 | |
Comcast Corp. - Class A | | | 257,911 | | | | 8,782 | |
Facebook, Inc. - Class A* | | | 57,942 | | | | 7,596 | |
Liberty Media Corp. - Liberty Formula One - Class C* | | | 38,512 | | | | 1,182 | |
Spotify Technology SA* | | | 4,781 | | | | 543 | |
Twenty-First Century Fox, Inc. - Class A | | | 35,912 | | | | 1,728 | |
Verizon Communications, Inc. | | | 191,558 | | | | 10,769 | |
The Walt Disney Co. | | | 12,286 | | | | 1,347 | |
| | | | | | | | |
Total | | | | | | | 53,168 | |
| | | | | | | | |
| |
Consumer Discretionary (10.6%) | | | | | |
Amazon.com, Inc.* | | | 14,693 | | | | 22,068 | |
Booking Holdings, Inc.* | | | 1,158 | | | | 1,995 | |
Expedia, Inc. | | | 32,309 | | | | 3,640 | |
Hilton Worldwide Holdings, Inc. | | | 27,147 | | | | 1,949 | |
The Interpublic Group of Companies, Inc. | | | 61,649 | | | | 1,272 | |
Lowe’s Companies, Inc. | | | 61,563 | | | | 5,686 | |
McDonald’s Corp. | | | 30,004 | | | | 5,328 | |
MGM Resorts International | | | 53,407 | | | | 1,296 | |
Netflix, Inc.* | | | 7,179 | | | | 1,921 | |
NIKE, Inc. - Class B | | | 40,638 | | | | 3,013 | |
Ross Stores, Inc. | | | 17,232 | | | | 1,434 | |
Tapestry, Inc. | | | 27,205 | | | | 918 | |
The TJX Cos., Inc. | | | 84,826 | | | | 3,795 | |
Viacom, Inc. - Class B | | | 29,905 | | | | 768 | |
| | | | | | | | |
Total | | | | | | | 55,083 | |
| | | | | | | | |
| |
Consumer Staples (6.7%) | | | | | |
Altria Group, Inc. | | | 100,275 | | | | 4,953 | |
Archer-Daniels-Midland Co. | | | 33,430 | | | | 1,370 | |
British American Tobacco PLC, ADR | | | 132,540 | | | | 4,223 | |
The Coca-Cola Co. | | | 170,713 | | | | 8,083 | |
Costco Wholesale Corp. | | | 2,631 | | | | 536 | |
Hormel Foods Corp. | | | 32,737 | | | | 1,397 | |
McCormick & Co., Inc. | | | 12,619 | | | | 1,757 | |
Monster Beverage Corp.* | | | 53,033 | | | | 2,610 | |
Sysco Corp. | | | 55,313 | | | | 3,466 | |
| | | | | | | | |
| Common Stocks (98.6%) | | Shares/
Par+ | | | Value
$ (000’s) | |
| |
Consumer Staples continued | | | | | |
Unilever NV | | | 120,716 | | | | 6,494 | |
| | | | | | | | |
Total | | | | | | | 34,889 | |
| | | | | | | | |
| |
Energy (5.2%) | | | | | |
Baker Hughes | | | 69,804 | | | | 1,501 | |
Chevron Corp. | | | 38,754 | | | | 4,216 | |
Concho Resources, Inc.* | | | 10,392 | | | | 1,068 | |
Diamondback Energy, Inc. | | | 7,682 | | | | 712 | |
Encana Corp. | | | 142,270 | | | | 822 | |
Exxon Mobil Corp. | | | 145,627 | | | | 9,930 | |
Halliburton Co. | | | 67,176 | | | | 1,786 | |
Marathon Petroleum Corp. | | | 49,680 | | | | 2,932 | |
Noble Energy, Inc. | | | 20,796 | | | | 390 | |
Pioneer Natural Resources Co. | | | 6,548 | | | | 861 | |
TransCanada Corp. | | | 78,120 | | �� | | 2,789 | |
| | | | | | | | |
Total | | | | | | | 27,007 | |
| | | | | | | | |
| |
Financials (12.1%) | | | | | |
The Allstate Corp. | | | 18,591 | | | | 1,536 | |
American Express Co. | | | 29,142 | | | | 2,778 | |
American International Group, Inc. | | | 104,664 | | | | 4,125 | |
Athene Holding, Ltd. - Class A* | | | 78,438 | | | | 3,124 | |
AXA Equitable Holdings, Inc. | | | 84,310 | | | | 1,402 | |
Bank of America Corp. | | | 680,887 | | | | 16,777 | |
Berkshire Hathaway, Inc. - Class B* | | | 21,423 | | | | 4,374 | |
The Hartford Financial Services Group, Inc. | | | 63,110 | | | | 2,805 | |
Marsh & McLennan Cos., Inc. | | | 47,412 | | | | 3,781 | |
Northern Trust Corp. | | | 42,772 | | | | 3,575 | |
The Progressive Corp. | | | 26,166 | | | | 1,579 | |
Prudential Financial, Inc. | | | 36,845 | | | | 3,005 | |
Public Storage | | | 7,135 | | | | 1,444 | |
Raymond James Financial, Inc. | | | 33,565 | | | | 2,498 | |
Simon Property Group, Inc. | | | 13,422 | | | | 2,255 | |
TD Ameritrade Holding Corp. | | | 126,361 | | | | 6,187 | |
Zions Bancorporation | | | 36,440 | | | | 1,484 | |
| | | | | | | | |
Total | | | | | | | 62,729 | |
| | | | | | | | |
| |
Health Care (14.9%) | | | | | |
Abbott Laboratories | | | 67,695 | | | | 4,896 | |
Allergan PLC | | | 45,582 | | | | 6,093 | |
Alnylam Pharmaceuticals, Inc.* | | | 5,447 | | | | 397 | |
| | | | | | | | |
| Common Stocks (98.6%) | | Shares/
Par+ | | | Value
$ (000’s) | |
| |
Health Care continued | | | | | |
AstraZeneca PLC, ADR | | | 154,517 | | | | 5,869 | |
Baxter International, Inc. | | | 30,400 | | | | 2,001 | |
Biogen, Inc.* | | | 3,803 | | | | 1,144 | |
Boston Scientific Corp.* | | | 183,723 | | | | 6,493 | |
Bristol-Myers Squibb Co. | | | 148,879 | | | | 7,739 | |
Celgene Corp.* | | | 14,592 | | | | 935 | |
Danaher Corp. | | | 33,444 | | | | 3,449 | |
Eli Lilly & Co. | | | 10,540 | | | | 1,220 | |
HCA Healthcare, Inc. | | | 19,600 | | | | 2,439 | |
Incyte Corp.* | | | 10,894 | | | | 693 | |
Medtronic PLC | | | 85,129 | | | | 7,743 | |
Mylan NV* | | | 75,638 | | | | 2,073 | |
Regeneron Pharmaceuticals, Inc.* | | | 2,562 | | | | 957 | |
Seattle Genetics, Inc.* | | | 18,995 | | | | 1,076 | |
Teva Pharmaceutical Industries, Ltd., ADR* | | | | | | | | |
Thermo Fisher Scientific, Inc. | | | 23,826 | | | | 5,332 | |
UnitedHealth Group, Inc. | | | 51,201 | | | | 12,755 | |
Vertex Pharmaceuticals, Inc.* | | | 15,263 | | | | 2,529 | |
| | | | | | | | |
Total | | | | | | | 77,323 | |
| | | | | | | | |
| |
Industrials (11.0%) | | | | | |
3M Co. | | | 13,702 | | | | 2,611 | |
AMETEK, Inc. | | | 14,830 | | | | 1,004 | |
The Boeing Co. | | | 25,346 | | | | 8,174 | |
Caterpillar, Inc. | | | 14,798 | | | | 1,880 | |
Deere & Co. | | | 10,376 | | | | 1,548 | |
Eaton Corp. PLC | | | 21,590 | | | | 1,482 | |
Equifax, Inc. | | | 11,677 | | | | 1,087 | |
FedEx Corp. | | | 5,602 | | | | 904 | |
Fortive Corp. | | | 18,818 | | | | 1,273 | |
General Dynamics Corp. | | | 23,432 | | | | 3,684 | |
General Electric Co. | | | 212,479 | | | | 1,608 | |
Harris Corp. | | | 20,005 | | | | 2,694 | |
IHS Markit, Ltd.* | | | 87,381 | | | | 4,192 | |
Illinois Tool Works, Inc. | | | 10,717 | | | | 1,358 | |
J.B. Hunt Transport Services, Inc. | | | 11,911 | | | | 1,108 | |
Jacobs Engineering Group, Inc. | | | 9,041 | | | | 529 | |
Lockheed Martin Corp. | | | 21,065 | | | | 5,516 | |
Norfolk Southern Corp. | | | 35,224 | | | | 5,267 | |
Pentair PLC | | | 26,388 | | | | 997 | |
Southwest Airlines Co. | | | 37,638 | | | | 1,749 | |
Union Pacific Corp. | | | 30,328 | | | | 4,192 | |
The Accompanying Notes are an Integral Part of the Financial Statements.
13
Large Cap Core Stock Portfolio
| | | | | | | | |
| Common Stocks (98.6%) | | Shares/
Par+ | | | Value
$ (000’s) | |
| |
Industrials continued | | | | | |
Waste Management, Inc. | | | 44,642 | | | | 3,973 | |
| | | | | | | | |
Total | | | | | | | 56,830 | |
| | | | | | | | |
Information Technology (17.7%) | | | | | |
Adobe Systems, Inc.* | | | 9,435 | | | | 2,135 | |
Advanced Micro | | | | | | | | |
Devices, Inc.* | | | 122,051 | | | | 2,253 | |
Apple, Inc. | | | 81,620 | | | | 12,875 | |
Autodesk, Inc.* | | | 5,975 | | | | 768 | |
Broadcom, Inc. | | | 1,961 | | | | 499 | |
FleetCor Technologies, Inc.* | | | 18,584 | | | | 3,451 | |
Flex, Ltd.* | | | 290,489 | | | | 2,211 | |
Global Payments, Inc. | | | 47,193 | | | | 4,867 | |
GoDaddy, Inc.* | | | 38,920 | | | | 2,554 | |
Intel Corp. | | | 74,825 | | | | 3,512 | |
KLA-Tencor Corp. | | | 11,800 | | | | 1,056 | |
Marvell Technology Group, Ltd. | | | 68,717 | | | | 1,112 | |
Micron Technology, Inc.* | | | 46,127 | | | | 1,464 | |
Microsoft Corp. | | | 181,497 | | | | 18,435 | |
NVIDIA Corp. | | | 7,429 | | | | 992 | |
PayPal Holdings, Inc.* | | | 47,510 | | | | 3,995 | |
PTC, Inc.* | | | 5,958 | | | | 494 | |
salesforce.com, Inc.* | | | 27,247 | | | | 3,732 | |
ServiceNow, Inc.* | | | 6,164 | | | | 1,097 | |
Splunk, Inc.* | | | 5,200 | | | | 545 | |
SS&C Technologies Holdings, Inc. | | | 135,631 | | | | 6,118 | |
Texas Instruments, Inc. | | | 29,153 | | | | 2,755 | |
Total System Services, Inc. | | | 15,584 | | | | 1,267 | |
VeriSign, Inc.* | | | 16,121 | | | | 2,391 | |
Visa, Inc. - Class A | | | 59,787 | | | | 7,888 | |
Workday, Inc. - Class A* | | | 11,649 | | | | 1,860 | |
Xilinx, Inc. | | | 18,340 | | | | 1,562 | |
| | | | | | | | |
Total | | | | | | | 91,888 | |
| | | | | | | | |
| | |
Materials (3.3%) | | | | | | | | |
Alcoa Corp.* | | | 4,353 | | | | 116 | |
Ball Corp. | | | 41,109 | | | | 1,890 | |
Celanese Corp. - Class A | | | 26,043 | | | | 2,343 | |
Crown Holdings, Inc.* | | | 25,737 | | | | 1,070 | |
DowDuPont, Inc. | | | 76,975 | | | | 4,116 | |
FMC Corp. | | | 16,409 | | | | 1,213 | |
Freeport-McMoRan, Inc. | | | 16,392 | | | | 169 | |
International Paper Co. | | | 34,830 | | | | 1,406 | |
Linde PLC | | | 10,529 | | | | 1,643 | |
Nucor Corp. | | | 11,615 | | | | 602 | |
PPG Industries, Inc. | | | 17,703 | | | | 1,810 | |
Southern Copper Corp. | | | 7,939 | | | | 244 | |
Vulcan Materials Co. | | | 3,377 | | | | 334 | |
| | | | | | | | |
Total | | | | | | | 16,956 | |
| | | | | | | | |
| | | | | | | | |
| Common Stocks (98.6%) | | Shares/
Par+ | | | Value
$ (000’s) | |
| |
Real Estate (2.5%) | | | | | |
Alexandria Real Estate Equities, Inc. | | | 14,992 | | | | 1,728 | |
American Tower Corp. | | | 45,106 | | | | 7,135 | |
Equinix, Inc. | | | 4,965 | | | | 1,751 | |
Essex Property Trust, Inc. | | | 9,993 | | | | 2,450 | |
| | | | | | | | |
Total | | | | | | | 13,064 | |
| | | | | | | | |
| | |
Utilities (4.4%) | | | | | | | | |
Edison International | | | 57,887 | | | | 3,286 | |
Exelon Corp. | | | 82,369 | | | | 3,715 | |
NextEra Energy, Inc. | | | 24,377 | | | | 4,237 | |
NRG Energy, Inc. | | | 110,302 | | | | 4,368 | |
ONEOK, Inc. | | | 21,908 | | | | 1,182 | |
PG&E Corp.* | | | 14,887 | | | | 354 | |
Sempra Energy | | | 50,170 | | | | 5,428 | |
| | | | | | | | |
Total | | | | | | | 22,570 | |
| | | | | | | | |
| | |
Total Common Stocks | | | | | | | | |
(Cost: $528,828) | | | | | | | 511,507 | |
| | | | | | | | |
| |
| Investment Companies (0.7%) | | | | |
| |
Investment Companies (0.7%) | | | | | |
SPDR S&P 500 ETF Trust | | | 14,124 | | | | 3,530 | |
| | | | | | | | |
Total | | | | | | | 3,530 | |
| | | | | | | | |
Total Investment Companies | | | | | |
(Cost: $3,679) | | | | | | | 3,530 | |
| | | | | | | | |
| |
| Short-Term Investments (0.5%) | | | | |
| |
Money Market Funds (0.5%) | | | | | |
State Street Institutional U.S. Government Money Market Fund - Premier Class 2.270%# | | | 2,664,462 | | | | 2,664 | |
| | | | | | | | |
Total | | | | | | | 2,664 | |
| | | | | | | | |
Total Short-Term Investments | | | | | |
(Cost: $2,664) | | | | | | | 2,664 | |
| | | | | | | | |
| |
Total Investments (99.8%) | | | | | |
(Cost: $535,171)@ | | | | | | | 517,701 | |
| | | | | | | | |
Other Assets, Less | | | | | | | | |
Liabilities (0.2%) | | | | | | | 1,270 | |
| | | | | | | | |
Net Assets (100.0%) | | | | | | | 518,971 | |
| | | | | | | | |
The Accompanying Notes are an Integral Part of the Financial Statements.
14
Large Cap Core Stock Portfolio
| + | All par is stated in U.S Dollar unless otherwise noted. |
| # | 7-Day yield as of 12/31/2018. |
| @ | At December 31, 2018, the aggregate cost of investments, including derivatives, for federal tax purposes (in thousands) was $535,713 and the net unrealized depreciation of investments based on that cost was $18,012 which is comprised of $39,480 aggregate gross unrealized appreciation and $57,492 aggregate gross unrealized depreciation. |
The following is a summary of the inputs used in valuing the Portfolio’s assets and liabilities at December 31, 2018. See Note 3 for additional information on portfolio valuation.
| | | | | | | | | | | | | | |
| | | Valuation Inputs | | | |
| Description | | Level 1 –
Quoted Prices | | | Level 2 –
Other Significant
Observable Inputs | | | Level 3 –
Significant
Unobservable Inputs | | | |
| | | (Amounts in thousands) | | | |
Assets: | | | | | | | | | | | | | | |
Common Stocks | | $ | 511,507 | | | $ | - | | | $ | - | | | |
Investment Companies | | | 3,530 | | | | - | | | | - | | | |
Short-Term Investments | | | 2,664 | | | | - | | | | - | | | |
Total Assets: | | $ | 517,701 | | | $ | - | | | $ | - | | | |
The Accompanying Notes are an Integral Part of the Financial Statements.
15
Large Cap Blend Portfolio (unaudited)
| | | | |
| Objective: | | Portfolio Strategy: | | Net Assets: |
| Long-term growth of capital and income. | | Invest primarily in equity securities of U.S. large capitalization companies listed or traded on U.S. securities exchanges. | | $154 million |
PORTFOLIO OVERVIEW
Mason Street Advisors, LLC (“Mason Street Advisors”), the investment adviser for the Large Cap Blend Portfolio (the “Portfolio”), has engaged Fiduciary Management, Inc. (“FMI”) to act assub-adviser for the Portfolio. Normally, the Portfolio invests in equity securities of large capitalization companies listed or traded on U.S. securities exchanges. In selecting investments, greater consideration is given to potential appreciation and future dividends than to current income. The Portfolio uses fundamental analysis to look for stocks of good businesses that are selling at value prices. The Portfolio employs a focused investment strategy, typically investing in a core group of20-30 large capitalization common stocks and American Depository Receipts.
MARKET OVERVIEW
U.S. equity markets hit record highs until a sharpsell-off in the fourth quarter drove stocks lower for the year. Early gains were driven by strong economic fundamentals, high consumer spending and stimulus from tax reform. Markets peaked in October, however, as investors became increasingly concerned that the pace of the U.S. Federal Reserve’s (the “Fed”) interest rate hikes could slow economic growth and hurt corporate earnings.
Markets were further rattled by several developments late in the year, including lower international growth forecasts, an escalation of the trade dispute between the U.S. and China and a partial U.S. government shutdown. Following the confluence of negative news, market sentiment turned negative, and investors began to consider the possibility of a recession in 2019.
PORTFOLIO RESULTS
The Portfolio returned (4.00%) for the twelve months ended December 31, 2018. By comparison, the Portfolio’s benchmark, the S&P 500® Index (the “Index”) returned (4.38%). (The Index is unmanaged, cannot be invested in directly and does not incur expenses.) According to Lipper® Analytical Services, Inc., an independent mutual fund ranking agency, the average return in 2018 of the Large Cap Core Funds peer group was (5.07%).
Top performers for the Portfolio were in the communications (21st Century Fox) and consumer retail industries (TJ Maxx and Dollar General). 21st Century Fox was the top contributor as a substantial part of its media networks were in the process of being purchased by the Walt Disney Company. FOX possessed a set of undervalued and under-appreciated U.S. and international cable networks, and Disney unlocked that value. TJ Maxx and Dollar General are both involved in discount retail. While many brick and mortar retailers continued to struggle due to the growth of online shopping, the portfolio managers believed both of these companies were less impacted by changes in consumer habits.
Stock selection in the Financials sector also helped performance for the year. Berkshire Hathaway stock performance was up modestly for the year, and the Portfolio’s investments in JP Morgan, Chubb Limited and Franklin Resources declined considerably less than the broader Financials sector of the S&P 500® Index.
In the Information Technology and Health Care sectors, performance was hurt by benchmark stocks that the Portfolio avoided. In 2018, these were the only sectors in the S&P 500® Index that posted positive returns. While some high-flying growth stocks underperformed in the fourth quarter, they still had big gains for the year. The Portfolio’s downstream tech investments such as TE Connectivity and Accenture underperformed. While the Portfolio’s investment in UnitedHealth Group outperformed, some of the Portfolio’s newer Health Care sector investments (Smith & Nephew and Quest Diagnostics) lagged. The portfolio managers added to both of these new positions during the year.
PORTFOLIO MANAGER OUTLOOK
The following forward-looking comments are the opinion of FMI, the Portfolio’ssub-adviser.
One of the most important ways we provide value is by protecting client portfolios in challenging markets. This is accomplished by being sensitive to the valuation paid for a company, and staying focused on what could potentially go wrong with each investment, rather than what could go right. The rapid change in market sentiment over the past year has
16
Large Cap Blend Portfolio (unaudited)
put many more interesting ideas into view, and the FMI research team is excited for the first time in several years. Over the course of the year, we made ten new purchases for the Portfolio across a variety of industries. For a Portfolio of 30 stocks, that is considerable activity.
The Portfolio owns 30 strong business franchises with solid balance sheets, which over a business cycle should earn a return over their cost of capital. Businesses with those characteristics have generally held up better when the market corrects (whereas many expensive growth stocks do not). Careful, discerning, value-oriented investors should beat the market that has heretofore benefited from years of nonfundamental money flow, causing it to betop-heavy with expensive stocks. The memory of a10-year growth-driven bull market doesn’t change in one quarter, however, so we expect sharp growth-stock rallies within the context of a return to normal in valuations. Our working thesis is that investors will support the good growth companies at lower multiples and abandon the rickety companies, both of which should work in our favor.
Relative Performance
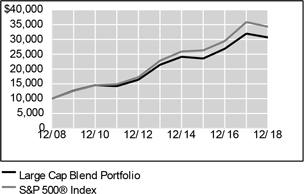
| | | | | | | | | | | | |
Average Annual Total Returns For Periods Ended December 31, 2018 | |
| | | 1 Year | | | 5 Years | | | 10 Years | |
Large Cap Blend Portfolio | | | -4.00 | % | | | 7.43 | % | | | 11.86 | % |
S&P 500® Index | | | -4.38 | % | | | 8.49 | % | | | 13.11 | % |
Lipper® Variable Insurance Products (VIP) Large Cap Core Funds Average | | | -5.07 | % | | | 7.10 | % | | | 12.11 | % |
The performance data quoted represents past performance. Past performance is historical and does not guarantee future performance. Investment return and principal value will fluctuate, so that shares, when redeemed, may be worth more or less than their original cost. Current performance may be lower or higher than the performance data quoted. For the most recentmonth-end performance information visitwww.northwesternmutual.com.
This chart assumes an initial investment of $10,000 made on 12/31/08. Returns shown reflect fee waivers, deductions for management and other portfolio expenses, and reinvestment of all dividends. In the absence of fee waivers, total return would be reduced. Returns exclude deductions for separate account sale loads and account fees. Please refer to the Benchmark Definitions section of this report for information about the indices cited in the above chart and graph.
The Portfolio may hold fewer securities than other diversified portfolios because of its more focused investment strategy. Holding fewer securities increases therisk that the value of the Portfolio could go down because of the poor performance of a single investment.
Top 10 Equity Holdings 12/31/18
| | | | | | |
| Security Description | | % of Net Assets | | | |
Dollar General Corp. | | | 5.6 | % | | |
Berkshire Hathaway, Inc. - Class B | | | 5.6 | % | | |
Twenty-First Century Fox, Inc. -Class B | | | 5.3 | % | | |
UnitedHealth Group, Inc. | | | 4.9 | % | | |
Honeywell International, Inc. | | | 4.2 | % | | |
JPMorgan Chase & Co. | | | 4.0 | % | | |
Accenture PLC - Class A | | | 3.4 | % | | |
PepsiCo, Inc. | | | 3.4 | % | | |
Nestle SA, ADR | | | 3.3 | % | | |
The TJX Cos., Inc. | | | 3.2 | % | | |
Sector Allocation 12/31/18
| | | | | | |
| Sector | | % of Net Assets | | | |
Financials | | | 16.3 | % | | |
Industrials | | | 14.9 | % | | |
Consumer Discretionary | | | 14.5 | % | | |
Health Care | | | 13.6 | % | | |
Communication Services | | | 10.4 | % | | |
Consumer Staples | | | 9.7 | % | | |
Information Technology | | | 7.9 | % | | |
Short-Term Investments & Other Net Assets | | | 5.9 | % | | |
Materials | | | 4.5 | % | | |
Energy | | | 2.3 | % | | |
Sector Allocation and Top 10 Holdings are subject to change.
17
Large Cap Blend Portfolio
SCHEDULE OF INVESTMENTS
December 31, 2018
| | | | | | | | |
| Common Stocks (94.1%) | | Shares/
Par+ | | | Value
$ (000’s) | |
|
| Communication Services (10.4%) | |
CenturyLink, Inc. | | | 219,984 | | | | 3,333 | |
Omnicom Group, Inc. | | | 61,625 | | | | 4,513 | |
Twenty-First Century Fox, Inc. - Class B | | | 172,000 | | | | 8,218 | |
| | | | | | | | |
Total | | | | | | | 16,064 | |
| | | | | | | | |
| |
Consumer Discretionary (14.5%) | | | | | |
Dollar General Corp. | | | 80,250 | | | | 8,673 | |
Dollar Tree, Inc.* | | | 42,945 | | | | 3,879 | |
eBay, Inc.* | | | 173,775 | | | | 4,878 | |
The TJX Cos., Inc. | | | 112,000 | | | | 5,011 | |
| | | | | | | | |
Total | | | | | | | 22,441 | |
| | | | | | | | |
| | | | | | | | |
| |
Consumer Staples (9.7%) | | | | | |
Nestle SA, ADR | | | 63,725 | | | | 5,159 | |
PepsiCo, Inc. | | | 46,760 | | | | 5,166 | |
Unilever PLC, ADR | | | 88,475 | | | | 4,623 | |
| | | | | | | | |
Total | | | | | | | 14,948 | |
| | | | | | | | |
| |
Energy (2.3%) | | | | | |
Schlumberger, Ltd. | | | 97,700 | | | | 3,525 | |
| | | | | | | | |
Total | | | | | | | 3,525 | |
| | | | | | | | |
| |
Financials (16.3%) | | | | | |
The Bank of New York Mellon Corp. | | | 98,575 | | | | 4,640 | |
Berkshire Hathaway, Inc. - Class B* | | | 42,250 | | | | 8,627 | |
Chubb, Ltd. | | | 32,330 | | | | 4,176 | |
| | | | | | | | |
| Common Stocks (94.1%) | | Shares/
Par+ | | | Value
$ (000’s) | |
|
| Financials continued | |
Franklin Resources, Inc. | | | 54,950 | | | | 1,630 | |
JPMorgan Chase & Co. | | | 63,175 | | | | 6,167 | |
| | | | | | | | |
Total | | | | | | | 25,240 | |
| | | | | | | | |
| |
Health Care (13.6%) | | | | | |
Cerner Corp.* | | | 81,375 | | | | 4,267 | |
Quest Diagnostics, Inc. | | | 57,205 | | | | 4,764 | |
Smith & Nephew PLC, ADR | | | 114,300 | | | | 4,273 | |
UnitedHealth Group, Inc. | | | 30,605 | | | | 7,624 | |
| | | | | | | | |
Total | | | | | | | 20,928 | |
| | | | | | | | |
| |
Industrials (14.9%) | | | | | |
Expeditors International of Washington, Inc. | | | 65,575 | | | | 4,465 | |
Honeywell International, Inc. | | | 49,025 | | | | 6,477 | |
Masco Corp. | | | 155,520 | | | | 4,547 | |
PACCAR, Inc. | | | 57,350 | | | | 3,277 | |
Stanley Black & Decker, Inc. | | | 35,875 | | | | 4,296 | |
| | | | | | | | |
Total | | | | | | | 23,062 | |
| | | | | | | | |
| |
Information Technology (7.9%) | | | | | |
Accenture PLC - Class A | | | 36,855 | | | | 5,197 | |
Oracle Corp. | | | 94,850 | | | | 4,283 | |
TE Connectivity, Ltd. | | | 35,450 | | | | 2,681 | |
| | | | | | | | |
Total | | | | | | | 12,161 | |
| | | | | | | | |
| | | | | | | | |
| Common Stocks (94.1%) | | Shares/
Par+ | | | Value $ (000’s) | |
|
| Materials (4.5%) | |
Nutrien, Ltd. | | | 95,000 | | | | 4,465 | |
PPG Industries, Inc. | | | 24,260 | | | | 2,480 | |
| | | | | | | | |
Total | | | | | | | 6,945 | |
| | | | | | | | |
| | |
Total Common Stocks | | | | | | | | |
(Cost: $125,487) | | | | | | | 145,314 | |
| | | | | |
| | |
| Short-Term Investments (5.7%) | | | | | | |
| |
Money Market Funds (5.7%) | | | | | |
State Street Institutional U.S. Government Money Market Fund - Premier Class 2.270%# | | | 8,837,252 | | | | 8,837 | |
| | | | | | | | |
Total | | | | | | | 8,837 | |
| | | | | | | | |
| | |
Total Short-Term Investments | | | | | | | | |
(Cost: $8,837) | | | | | | | 8,837 | |
| | | | | | | | |
| | |
Total Investments (99.8%) | | | | | | | | |
(Cost: $134,324)@ | | | | | | | 154,151 | |
| | | | | |
Other Assets, Less | | | | | | | | |
Liabilities (0.2%) | | | | | | | 284 | |
| | | | | |
Net Assets (100.0%) | | | | | | | 154,435 | |
| | | | | | | | |
| + | All par is stated in U.S Dollar unless otherwise noted. |
| # | 7-Day yield as of 12/31/2018. |
| @ | At December 31, 2018, the aggregate cost of investments, including derivatives, for federal tax purposes (in thousands) was $134,942 and the net unrealized appreciation of investments based on that cost was $19,209 which is comprised of $29,227 aggregate gross unrealized appreciation and $10,018 aggregate gross unrealized depreciation. |
The following is a summary of the inputs used in valuing the Portfolio’s assets and liabilities at December 31, 2018. See Note 3 for additional information on portfolio valuation.
| | | | | | | | | | | | | | |
| | | Valuation Inputs | | | |
| Description | | Level 1 –
Quoted Prices | | | Level 2 –
Other Significant
Observable Inputs | | | Level 3 –
Significant
Unobservable Inputs | | | |
| | | (Amounts in thousands) | | | |
Assets: | | | | | | | | | | | | | | |
Common Stocks | | $ | 145,314 | | | $ | - | | | $ | - | | | |
Short-Term Investments | | | 8,837 | | | | - | | | | - | | | |
Total Assets: | | $ | 154,151 | | | $ | - | | | $ | - | | | |
The Accompanying Notes are an Integral Part of the Financial Statements.
18
Index 500 Stock Portfolio (unaudited)
| | | | |
| Objective: | | Portfolio Strategy: | | Net Assets: |
| Investment results that approximate the performance of the S&P 500® Index. | | Invest in stocks that make up the S&P 500® Index, holding each stock in approximately the same proportion as its weighting in the Index. | | $3.0 billion |
PORTFOLIO OVERVIEW
Mason Street Advisors is the investment adviser for the Index 500 Stock Portfolio (the “Portfolio”). The Portfolio seeks investment results that approximate the performance of the S&P 500® Index, which is composed of the stocks of primarily large capitalization companies that represent a broad spectrum of the U.S. economy and a substantial part of the U.S. stock market’s total capitalization. The Portfolio attempts to achieve its objective by investing all, or substantially all, of its assets in the stocks that make up the S&P 500® Index, holding each stock in approximately the same proportion as its weighting in the Index. This is known as a full replication strategy. The Portfolio may also invest in S&P 500® Index stock futures and, to a lesser extent, purchase (long) total return equity swap agreements to help achieve full replication.
MARKET OVERVIEW
U.S. equity markets hit record highs until a sharpsell-off in the fourth quarter drove stocks lower for the year. Early gains were driven by strong economic fundamentals, high consumer spending and stimulus from tax reform. Markets peaked in October, however, as investors became increasingly concerned that the pace of the U.S. Federal Reserve’s (the “Fed”) interest rate hikes could hurt economic growth and corporate earnings.
Markets were further rattled by several developments late in the year, including lower international growth forecasts, an escalation of the trade dispute between the U.S. and China and a partial U.S. government shutdown. Following the confluence of negative news, market sentiment turned negative, and investors began to consider the possibility of a recession in 2019.
In this environment, large cap stocks, as represented by the S&P 500® Index, posted a return of (4.38%), outperforming the S&P SmallCap 600® and the S&P MidCap 400® Indices, which returned (8.48%) and (11.08%), respectively. Meanwhile, the broader bond market, as represented by the Bloomberg Barclays® U.S. Aggregate Index, was relatively unchanged, while the Bloomberg Barclays® U.S. Corporate High Yield Index declined (2.08%).
PORTFOLIO RESULTS
The Index 500 Stock Portfolio delivered a total return of (4.58%) for the twelve months ended December 31, 2018, trailing the S&P 500® Index (the “Index”), which returned (4.38%). (The Index is unmanaged, cannot be invested in directly and does not incur expenses.) Portfolio performance slightly lagged the Index due to transaction costs, administrative expenses, cash flow effects and costs associated with the use of stock index futures contracts. According to Lipper® Analytical Services, Inc., an independent mutual fund ranking agency, the average return in 2018 of the S&P 500® Index Objective Funds peer group was (4.73%).
Seven of the Index’s eleven sectors posted negative returns for the year. The largest detractor from the Index’s return was the Financials sector, where bank stocks were particularly affected by fears of an economic slowdown. Banks tend to be sensitive to economic downturns, which reduce demand for credit products and increase the risk of loan defaults. Stiff competition for deposits also hindered bank profitability, as customers began to demand higher rates of return. Industrials companies were major detractors from the Index’s return, with increased tariffs taking a toll on the sector. Tariffs increased input costs and disrupted supply chains, while a slowdown in international demand put pressure on profit margins.
Energy companies detracted from the Index’s return, as lower estimates of energy demand amid ample supply led to a sharp decline in oil prices late in the year. Profitability in the sector was also lower than expected as producers struggled to contain extraction costs. Despite high levels of consumer spending, Consumer Staples stocks posted a negative return, driven by intense competitive pressure, the rising U.S. dollar and shrinking profit margins. The Communication Services sector also detracted from the Index’s return, which was primarily the result of declines in the interactive media and services industry. Materials stocks also fell due to lower prices for many commodities and weakness in the chemicals industry.
19
Index 500 Stock Portfolio (unaudited)
At the other end of the spectrum, Health Care stocks performed well, benefiting from ongoing demographic shifts and faster drug approvals from the Food and Drug Administration. Information Technology companies also posted a solid return, driven by the growth of cloud computing and subscription-based products that helped boost earnings.
Relative Performance
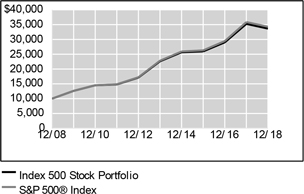
| | | | | | | | | | | | |
Average Annual Total Returns
For Periods Ended December 31, 2018 | |
| | | 1 Year | | | 5 Years | | | 10 Years | |
Index 500 Stock Portfolio | | | -4.58 | % | | | 8.26 | % | | | 12.90 | % |
S&P 500® Index | | | -4.38 | % | | | 8.49 | % | | | 13.11 | % |
Lipper® Variable Insurance Products (VIP) S&P 500 Index Objective Funds Average | | | -4.73 | % | | | 8.03 | % | | | 12.71 | % |
The performance data quoted represents past performance. Past performance is historical and does not guarantee future performance. Investment return and principal value will fluctuate, so that shares, when redeemed, may be worth more or less than their original cost. Current performance may be lower or higher than the performance data quoted. For the most recentmonth-end performance information visitwww.northwesternmutual.com.
This chart assumes an initial investment of $10,000 made on 12/31/08. Returns shown reflect fee waivers, deductions for management and other portfolio expenses, and reinvestment of all dividends. In the absence of fee waivers, total return would be reduced. Returns exclude deductions for separate account sale loads and account fees. Please refer to the Benchmark Definitions section of this report for information about the indices cited in the above chart and graph.
“Standard & Poor’s®”, “S&P®”, “S&P 500” and “Standard & Poor’s 500” are trademarks of The McGraw-Hill Companies, Inc. and have been licensed for use by Northwestern Mutual Life Insurance Company. The Portfolio is not sponsored, endorsed, sold or promoted by Standard & Poor’s, and Standard & Poor’s makes no representation regarding the advisability of investing in the Portfolio.
The Portfolio may invest in derivative instruments, such as futures and, to a lesser extent, swap agreements, to help achieve full replication. Use of these instruments may involve certain costs and imposes certain risks such as liquidity risk, market risk, credit risk, management risk and the risk of mispricing or improper valuation. Certain derivatives involve leverage, which could magnify losses, and portfolios investing in derivatives could lose more than the principal amount invested in those instruments.
Top 10 Equity Holdings 12/31/18
| | | | |
Security Description | | | % of Net Assets | |
Microsoft Corp. | | | 3.7 | % |
Apple, Inc. | | | 3.3 | % |
Alphabet, Inc., Various | | | 3.0 | % |
Amazon.com, Inc. | | | 2.9 | % |
Berkshire Hathaway, Inc. - Class B | | | 1.9 | % |
Johnson & Johnson | | | 1.6 | % |
JPMorgan Chase & Co. | | | 1.5 | % |
Facebook, Inc. - Class A | | | 1.5 | % |
Exxon Mobil Corp. | | | 1.4 | % |
Pfizer, Inc. | | | 1.2 | % |
Sector Allocation 12/31/18
| | | | |
Sector | | | % of Net Assets | |
Information Technology | | | 19.8 | % |
Health Care | | | 15.3 | % |
Financials | | | 13.2 | % |
Communication Services | | | 10.0 | % |
Consumer Discretionary | | | 9.8 | % |
Industrials | | | 9.1 | % |
Consumer Staples | | | 7.3 | % |
Energy | | | 5.2 | % |
Utilities | | | 3.3 | % |
Real Estate | | | 2.9 | % |
Materials | | | 2.7 | % |
Short-Term Investments & Other Net Assets | | | 1.4 | % |
Sector Allocation and Top 10 Holdings are subject to change.
20
Index 500 Stock Portfolio
Schedule of Investments
December 31, 2018
| | | | | | | | |
| Common Stocks (98.6%) | | Shares/
Par+ | | | Value
$ (000’s) | |
| |
Communication Services (10.0%) | | | | | |
Activision Blizzard, Inc. | | | 107,579 | | | | 5,010 | |
Alphabet, Inc. - Class A* | | | 42,151 | | | | 44,046 | |
Alphabet, Inc. - Class C* | | | 43,376 | | | | 44,921 | |
AT&T, Inc. | | | 1,026,092 | | | | 29,285 | |
CBS Corp. - Class B | | | 47,470 | | | | 2,075 | |
CenturyLink, Inc. | | | 134,074 | | | | 2,031 | |
Charter Communications, Inc. - Class A* | | | 24,851 | | | | 7,082 | |
Comcast Corp. - Class A | | | 640,082 | | | | 21,795 | |
Discovery Communications, Inc. - Class A* | | | 22,098 | | | | 547 | |
Discovery Communications, Inc. - Class C* | | | 50,790 | | | | 1,172 | |
DISH Network Corp. - Class A* | | | 32,320 | | | | 807 | |
Electronic Arts, Inc.* | | | 42,596 | | | | 3,361 | |
Facebook, Inc. - Class A* | | | 338,713 | | | | 44,402 | |
The Interpublic Group of Companies, Inc. | | | 54,188 | | | | 1,118 | |
Netflix, Inc.* | | | 61,482 | | | | 16,456 | |
News Corp. - Class A | | | 54,311 | | | | 616 | |
News Corp. - Class B | | | 17,449 | | | | 202 | |
Omnicom Group, Inc. | | | 31,596 | | | | 2,314 | |
Take-Two Interactive Software, Inc.* | | | 16,054 | | | | 1,653 | |
TripAdvisor, Inc.* | | | 14,435 | | | | 779 | |
Twenty-First Century Fox, Inc. - Class A | | | 149,018 | | | | 7,171 | |
Twenty-First Century Fox, Inc. - Class B | | | 68,674 | | | | 3,281 | |
Twitter, Inc.* | | | 101,958 | | | | 2,930 | |
Verizon Communications, Inc. | | | 582,554 | | | | 32,751 | |
Viacom, Inc. - Class B | | | 49,829 | | | | 1,281 | |
The Walt Disney Co. | | | 209,881 | | | | 23,013 | |
| | | | | | | | |
Total | | | | | | | 300,099 | |
| | | | | | | | |
| |
Consumer Discretionary (9.8%) | | | | | |
Advance Auto Parts, Inc. | | | 10,277 | | | | 1,618 | |
Amazon.com, Inc.* | | | 57,907 | | | | 86,975 | |
Aptiv PLC | | | 37,146 | | | | 2,287 | |
AutoZone, Inc.* | | | 3,555 | | | | 2,980 | |
Best Buy Co., Inc. | | | 33,007 | | | | 1,748 | |
Booking Holdings, Inc.* | | | 6,532 | | | | 11,251 | |
BorgWarner, Inc. | | | 29,364 | | | | 1,020 | |
CarMax, Inc.* | | | 24,619 | | | | 1,544 | |
Carnival Corp. | | | 56,451 | | | | 2,783 | |
| | | | | | | | |
| Common Stocks (98.6%) | | Shares/
Par+ | | | Value
$ (000’s) | |
| |
Consumer Discretionary continued | | | | | |
Chipotle Mexican Grill, Inc.* | | | 3,447 | | | | 1,488 | |
D.R. Horton, Inc. | | | 48,274 | | | | 1,673 | |
Darden Restaurants, Inc. | | | 17,498 | | | | 1,747 | |
Dollar General Corp. | | | 37,063 | | | | 4,006 | |
Dollar Tree, Inc.* | | | 33,550 | | | | 3,030 | |
eBay, Inc.* | | | 127,600 | | | | 3,582 | |
Expedia, Inc. | | | 16,703 | | | | 1,882 | |
Foot Locker, Inc. | | | 16,199 | | | | 862 | |
Ford Motor Co. | | | 550,836 | | | | 4,214 | |
The Gap, Inc. | | | 30,115 | | | | 776 | |
Garmin, Ltd. | | | 17,036 | | | | 1,079 | |
General Motors Co. | | | 185,058 | | | | 6,190 | |
Genuine Parts Co. | | | 20,691 | | | | 1,987 | |
The Goodyear Tire & Rubber Co. | | | 32,851 | | | | 670 | |
H&R Block, Inc. | | | 28,977 | | | | 735 | |
Hanesbrands, Inc. | | | 50,858 | | | | 637 | |
Harley-Davidson, Inc. | | | 22,957 | | | | 783 | |
Hasbro, Inc. | | | 16,409 | | | | 1,333 | |
Hilton Worldwide Holdings, Inc. | | | 41,812 | | | | 3,002 | |
The Home Depot, Inc. | | | 159,247 | | | | 27,362 | |
Kohl’s Corp. | | | 23,281 | | | | 1,544 | |
L Brands, Inc. | | | 32,194 | | | | 826 | |
Leggett & Platt, Inc. | | | 18,387 | | | | 659 | |
Lennar Corp. - Class A | | | 41,244 | | | | 1,615 | |
LKQ Corp.* | | | 44,862 | | | | 1,065 | |
Lowe’s Companies, Inc. | | | 113,205 | | | | 10,456 | |
Macy’s, Inc. | | | 43,348 | | | | 1,291 | |
Marriott International, Inc. - Class A | | | 39,918 | | | | 4,333 | |
Mattel, Inc.* | | | 48,661 | | | | 486 | |
McDonald’s Corp. | | | 108,687 | | | | 19,300 | |
MGM Resorts International | | | 70,611 | | | | 1,713 | |
Michael Kors Holdings, Ltd.* | | | 21,181 | | | | 803 | |
Mohawk Industries, Inc.* | | | 8,892 | | | | 1,040 | |
Newell Brands, Inc. | | | 60,547 | | | | 1,126 | |
NIKE, Inc. - Class B | | | 179,484 | | | | 13,307 | |
Nordstrom, Inc. | | | 16,041 | | | | 748 | |
Norwegian Cruise Line Holdings, Ltd.* | | | 31,013 | | | | 1,315 | |
O’Reilly Automotive, Inc.* | | | 11,293 | | | | 3,889 | |
PulteGroup, Inc. | | | 36,430 | | | | 947 | |
PVH Corp. | | | 10,677 | | | | 992 | |
Ralph Lauren Corp. | | | 7,692 | | | | 796 | |
Ross Stores, Inc. | | | 52,639 | | | | 4,380 | |
Royal Caribbean Cruises, Ltd. | | | 24,162 | | | | 2,363 | |
Starbucks Corp. | | | 174,906 | | | | 11,264 | |
| | | | | | | | |
| Common Stocks (98.6%) | | Shares/
Par+ | | | Value
$ (000’s) | |
| |
Consumer Discretionary continued | | | | | |
Tapestry, Inc. | | | 40,857 | | | | 1,379 | |
Target Corp. | | | 73,571 | | | | 4,862 | |
Tiffany & Co. | | | 15,295 | | | | 1,231 | |
The TJX Cos., Inc. | | | 174,473 | | | | 7,806 | |
Tractor Supply Co. | | | 17,210 | | | | 1,436 | |
Ulta Beauty, Inc.* | | | 7,944 | | | | 1,945 | |
Under Armour, Inc. - Class A* | | | 26,452 | | | | 467 | |
Under Armour, Inc. - Class C* | | | 27,119 | | | | 438 | |
VF Corp. | | | 45,874 | | | | 3,273 | |
Whirlpool Corp. | | | 8,996 | | | | 961 | |
Wynn Resorts, Ltd. | | | 13,798 | | | | 1,365 | |
Yum! Brands, Inc. | | | 44,030 | | | | 4,047 | |
| | | | | | | | |
Total | | | | | | | 294,712 | |
| | | | | | | | |
| |
Consumer Staples (7.3%) | | | | | |
Altria Group, Inc. | | | 264,918 | | | | 13,084 | |
Archer-Daniels-Midland Co. | | | 79,042 | | | | 3,238 | |
Brown-Forman Corp. - Class B | | | 23,445 | | | | 1,116 | |
Campbell Soup Co. | | | 27,162 | | | | 896 | |
Church & Dwight Co., Inc. | | | 34,715 | | | | 2,283 | |
The Clorox Co. | | | 17,997 | | | | 2,774 | |
The Coca-Cola Co. | | | 540,095 | | | | 25,574 | |
Colgate-Palmolive Co. | | | 122,279 | | | | 7,278 | |
Conagra Brands, Inc. | | | 68,465 | | | | 1,462 | |
Constellation Brands, Inc. - Class A | | | 23,423 | | | | 3,767 | |
Costco Wholesale Corp. | | | 61,781 | | | | 12,585 | |
Coty, Inc. - Class A | | | 63,534 | | | | 417 | |
The Estee Lauder Cos., Inc. - Class A | | | 31,003 | | | | 4,033 | |
General Mills, Inc. | | | 84,060 | | | | 3,273 | |
The Hershey Co. | | | 19,771 | | | | 2,119 | |
Hormel Foods Corp. | | | 38,439 | | | | 1,641 | |
The J.M. Smucker Co. | | | 16,038 | | | | 1,499 | |
Kellogg Co. | | | 35,715 | | | | 2,036 | |
Kimberly-Clark Corp. | | | 48,823 | | | | 5,563 | |
The Kraft Heinz Co. | | | 87,680 | | | | 3,774 | |
The Kroger Co. | | | 112,506 | | | | 3,094 | |
Lamb Weston Holdings, Inc. | | | 20,648 | | | | 1,519 | |
McCormick & Co., Inc. | | | 17,167 | | | | 2,390 | |
Molson Coors Brewing Co. - Class B | | | 26,407 | | | | 1,483 | |
Mondelez International, Inc. | | | 204,969 | | | | 8,205 | |
Monster Beverage Corp.* | | | 56,131 | | | | 2,763 | |
PepsiCo, Inc. | | | 199,010 | | | | 21,987 | |
Philip Morris International, Inc. | | | 219,165 | | | | 14,631 | |
The Accompanying Notes are an Integral Part of the Financial Statements.
21
Index 500 Stock Portfolio
| | | | | | | | |
| Common Stocks (98.6%) | | Shares/
Par+ | | | Value
$ (000’s) | |
| |
Consumer Staples continued | | | | | |
The Procter & Gamble Co. | | | 351,252 | | | | 32,287 | |
Sysco Corp. | | | 67,420 | | | | 4,225 | |
Tyson Foods, Inc. - Class A | | | 41,605 | | | | 2,222 | |
Walgreens Boots Alliance, Inc. | | | 113,341 | | | | 7,745 | |
Walmart, Inc. | | | 200,703 | | | | 18,695 | |
| | | | | | | | |
Total | | | | | | | 219,658 | |
| | | | | | | | |
| |
Energy (5.2%) | | | | | |
Anadarko Petroleum Corp. | | | 71,096 | | | | 3,117 | |
Apache Corp. | | | 53,510 | | | | 1,405 | |
Baker Hughes | | | 72,381 | | | | 1,556 | |
Cabot Oil & Gas Corp. | | | 60,790 | | | | 1,359 | |
Chevron Corp. | | | 269,391 | | | | 29,307 | |
Cimarex Energy Co. | | | 13,481 | | | | 831 | |
Concho Resources, Inc.* | | | 28,232 | | | | 2,902 | |
ConocoPhillips | | | 162,308 | | | | 10,120 | |
Devon Energy Corp. | | | 66,009 | | | | 1,488 | |
Diamondback Energy, Inc. | | | 21,746 | | | | 2,016 | |
EOG Resources, Inc. | | | 81,758 | | | | 7,130 | |
Exxon Mobil Corp. | | | 596,905 | | | | 40,703 | |
Halliburton Co. | | | 123,510 | | | | 3,283 | |
Helmerich & Payne, Inc. | | | 15,373 | | | | 737 | |
Hess Corp. | | | 35,085 | | | | 1,421 | |
HollyFrontier Corp. | | | 22,475 | | | | 1,149 | |
Kinder Morgan, Inc. | | | 267,596 | | | | 4,116 | |
Marathon Oil Corp. | | | 117,197 | | | | 1,680 | |
Marathon Petroleum Corp. | | | 97,400 | | | | 5,747 | |
National Oilwell Varco, Inc. | | | 54,049 | | | | 1,389 | |
Newfield Exploration Co.* | | | 28,246 | | | | 414 | |
Noble Energy, Inc. | | | 67,645 | | | | 1,269 | |
Occidental Petroleum Corp. | | | 106,447 | | | | 6,534 | |
ONEOK, Inc. | | | 57,996 | | | | 3,129 | |
Phillips 66 | | | 59,811 | | | | 5,153 | |
Pioneer Natural Resources Co. | | | 24,033 | | | | 3,161 | |
Schlumberger, Ltd. | | | 195,237 | | | | 7,044 | |
TechnipFMC PLC | | | 59,985 | | | | 1,174 | |
Valero Energy Corp. | | | 59,821 | | | | 4,485 | |
The Williams Cos., Inc. | | | 170,669 | | | | 3,763 | |
| | | | | | | | |
Total | | | | | | | 157,582 | |
| | | | | | | | |
| |
Financials (13.2%) | | | | | |
Affiliated Managers Group, Inc. | | | 7,426 | | | | 724 | |
AFLAC, Inc. | | | 107,329 | | | | 4,890 | |
The Allstate Corp. | | | 48,561 | | | | 4,013 | |
American Express Co. | | | 98,759 | | | | 9,414 | |
American International Group, Inc. | | | 124,723 | | | | 4,915 | |
| | | | | | | | |
| Common Stocks (98.6%) | | Shares/
Par+ | | | Value
$ (000’s) | |
| |
Financials continued | | | | | |
Ameriprise Financial, Inc. | | | 19,647 | | | | 2,051 | |
Aon PLC | | | 33,955 | | | | 4,936 | |
Arthur J. Gallagher & Co. | | | 25,892 | | | | 1,908 | |
Assurant, Inc. | | | 7,349 | | | | 657 | |
Bank of America Corp. | | | 1,286,802 | | | | 31,707 | |
The Bank of New York Mellon Corp. | | | 128,251 | | | | 6,037 | |
BB&T Corp. | | | 108,646 | | | | 4,706 | |
Berkshire Hathaway, Inc. - Class B* | | | 274,272 | | | | 56,001 | |
BlackRock, Inc. | | | 17,121 | | | | 6,725 | |
Brighthouse Financial, Inc.* | | | 16,721 | | | | 510 | |
Capital One Financial Corp. | | | 66,779 | | | | 5,048 | |
CBOE Holdings, Inc. | | | 15,819 | | | | 1,548 | |
The Charles Schwab Corp. | | | 169,451 | | | | 7,037 | |
Chubb, Ltd. | | | 64,967 | | | | 8,392 | |
Cincinnati Financial Corp. | | | 21,338 | | | | 1,652 | |
Citigroup, Inc. | | | 344,306 | | | | 17,925 | |
Citizens Financial Group, Inc. | | | 65,968 | | | | 1,961 | |
CME Group, Inc. | | | 50,441 | | | | 9,489 | |
Comerica, Inc. | | | 22,797 | | | | 1,566 | |
Discover Financial Services | | | 47,366 | | | | 2,794 | |
E*TRADE Financial Corp. | | | 35,844 | | | | 1,573 | |
Everest Re Group, Ltd. | | | 5,731 | | | | 1,248 | |
Fifth Third Bancorp | | | 92,432 | | | | 2,175 | |
First Republic Bank | | | 23,045 | | | | 2,003 | |
Franklin Resources, Inc. | | | 41,957 | | | | 1,244 | |
The Goldman Sachs Group, Inc. | | | 48,772 | | | | 8,147 | |
The Hartford Financial Services Group, Inc. | | | 50,577 | | | | 2,248 | |
Huntington Bancshares, Inc. | | | 149,660 | | | | 1,784 | |
Intercontinental Exchange, Inc. | | | 80,303 | | | | 6,049 | |
Invesco, Ltd. | | | 57,992 | | | | 971 | |
Jefferies Financial Group, Inc. | | | 39,627 | | | | 688 | |
JPMorgan Chase & Co. | | | 468,834 | | | | 45,768 | |
KeyCorp | | | 145,854 | | | | 2,156 | |
Lincoln National Corp. | | | 30,115 | | | | 1,545 | |
Loews Corp. | | | 38,981 | | | | 1,774 | |
M&T Bank Corp. | | | 19,789 | | | | 2,832 | |
Marsh & McLennan Cos., Inc. | | | 71,016 | | | | 5,663 | |
MetLife, Inc. | | | 139,130 | | | | 5,713 | |
Moody’s Corp. | | | 23,501 | | | | 3,291 | |
Morgan Stanley | | | 184,313 | | | | 7,308 | |
MSCI, Inc. | | | 12,411 | | | | 1,830 | |
Nasdaq, Inc. | | | 16,181 | | | | 1,320 | |
Northern Trust Corp. | | | 31,214 | | | | 2,609 | |
| | | | | | | | |
| Common Stocks (98.6%) | | Shares/
Par+ | | | Value
$ (000’s) | |
| |
Financials continued | | | | | |
People’s United Financial, Inc. | | | 53,215 | | | | 768 | |
PNC Financial Services Group, Inc. | | | 65,054 | | | | 7,605 | |
Principal Financial Group, Inc. | | | 37,112 | | | | 1,639 | |
The Progressive Corp. | | | 82,208 | | | | 4,960 | |
Prudential Financial, Inc. | | | 58,227 | | | | 4,748 | |
Raymond James Financial, Inc. | | | 18,181 | | | | 1,353 | |
Regions Financial Corp. | | | 145,762 | | | | 1,950 | |
S&P Global, Inc. | | | 35,373 | | | | 6,011 | |
State Street Corp. | | | 53,509 | | | | 3,375 | |
SunTrust Banks, Inc. | | | 63,343 | | | | 3,195 | |
SVB Financial Group* | | | 7,508 | | | | 1,426 | |
Synchrony Financial | | | 93,224 | | | | 2,187 | |
T. Rowe Price Group, Inc. | | | 33,929 | | | | 3,132 | |
Torchmark Corp. | | | 14,467 | | | | 1,078 | |
The Travelers Cos., Inc. | | | 37,345 | | | | 4,472 | |
U.S. Bancorp | | | 214,175 | | | | 9,788 | |
Unum Group | | | 30,840 | | | | 906 | |
Wells Fargo & Co. | | | 597,287 | | | | 27,523 | |
Willis Towers Watson PLC | | | 18,319 | | | | 2,782 | |
Zions Bancorporation | | | 27,095 | | | | 1,104 | |
| | | | | | | | |
Total | | | | | | | 396,547 | |
| | | | | | | | |
| |
Health Care (15.3%) | | | | | |
Abbott Laboratories | | | 247,617 | | | | 17,910 | |
AbbVie, Inc. | | | 212,072 | | | | 19,551 | |
ABIOMED, Inc.* | | | 6,350 | | | | 2,064 | |
Agilent Technologies, Inc. | | | 44,942 | | | | 3,032 | |
Alexion Pharmaceuticals, Inc.* | | | 31,453 | | | | 3,062 | |
Align Technology, Inc.* | | | 10,262 | | | | 2,149 | |
Allergan PLC | | | 44,699 | | | | 5,974 | |
AmerisourceBergen Corp. | | | 22,111 | | | | 1,645 | |
Amgen, Inc. | | | 89,839 | | | | 17,489 | |
Anthem, Inc. | | | 36,465 | | | | 9,577 | |
Baxter International, Inc. | | | 69,772 | | | | 4,592 | |
Becton Dickinson and Co. | | | 37,820 | | | | 8,522 | |
Biogen, Inc.* | | | 28,406 | | | | 8,548 | |
Boston Scientific Corp.* | | | 195,095 | | | | 6,895 | |
Bristol-Myers Squibb Co. | | | 230,116 | | | | 11,961 | |
Cardinal Health, Inc. | | | 42,006 | | | | 1,873 | |
Celgene Corp.* | | | 98,584 | | | | 6,318 | |
Centene Corp.* | | | 28,952 | | | | 3,338 | |
Cerner Corp.* | | | 46,453 | | | | 2,436 | |
Cigna Corp. | | | 53,685 | | | | 10,196 | |
The Cooper Cos., Inc. | | | 6,928 | | | | 1,763 | |
The Accompanying Notes are an Integral Part of the Financial Statements.
22
Index 500 Stock Portfolio
| | | | | | | | |
| Common Stocks (98.6%) | | Shares/
Par+ | | | Value
$ (000’s) | |
| |
Health Care continued | | | | | |
CVS Health Corp. | | | 182,322 | | | | 11,946 | |
Danaher Corp. | | | 86,959 | | | | 8,967 | |
DaVita, Inc.* | | | 17,785 | | | | 915 | |
Dentsply Sirona, Inc. | | | 31,376 | | | | 1,168 | |
Edwards Lifesciences Corp.* | | | 29,473 | | | | 4,514 | |
Eli Lilly & Co. | | | 132,921 | | | | 15,382 | |
Gilead Sciences, Inc. | | | 182,381 | | | | 11,408 | |
HCA Healthcare, Inc. | | | 37,847 | | | | 4,710 | |
Henry Schein, Inc.* | | | 21,491 | | | | 1,688 | |
Hologic, Inc.* | | | 37,982 | | | | 1,561 | |
Humana, Inc. | | | 19,341 | | | | 5,541 | |
IDEXX Laboratories, Inc.* | | | 12,158 | | | | 2,262 | |
Illumina, Inc.* | | | 20,725 | | | | 6,216 | |
Incyte Corp.* | | | 24,902 | | | | 1,584 | |
Intuitive Surgical, Inc.* | | | 16,101 | | | | 7,711 | |
IQVIA Holdings, Inc.* | | | 22,337 | | | | 2,595 | |
Johnson & Johnson | | | 378,120 | | | | 48,796 | |
Laboratory Corp. of America Holdings* | | | 14,225 | | | | 1,797 | |
McKesson Corp. | | | 27,545 | | | | 3,043 | |
Medtronic PLC | | | 189,350 | | | | 17,223 | |
Merck & Co., Inc. | | | 366,615 | | | | 28,013 | |
Mettler-Toledo International, Inc.* | | | 3,531 | | | | 1,997 | |
Mylan NV* | | | 72,696 | | | | 1,992 | |
Nektar Therapeutics* | | | 24,402 | | | | 802 | |
PerkinElmer, Inc. | | | 15,683 | | | | 1,232 | |
Perrigo Co. PLC | | | 17,622 | | | | 683 | |
Pfizer, Inc. | | | 814,962 | | | | 35,573 | |
Quest Diagnostics, Inc. | | | 19,184 | | | | 1,597 | |
Regeneron Pharmaceuticals,Inc.* | | | 10,943 | | | | 4,087 | |
ResMed, Inc. | | | 20,090 | | | | 2,288 | |
Stryker Corp. | | | 43,786 | | | | 6,863 | |
Thermo Fisher Scientific, Inc. | | | 56,757 | | | | 12,702 | |
UnitedHealth Group, Inc. | | | 135,633 | | | | 33,789 | |
Universal Health Services, Inc. - Class B | | | 12,020 | | | | 1,401 | |
Varian Medical Systems, Inc.* | | | 12,846 | | | | 1,456 | |
Vertex Pharmaceuticals, Inc.* | | | 36,030 | | | | 5,971 | |
Waters Corp.* | | | 10,679 | | | | 2,015 | |
WellCare Health Plans, Inc.* | | | 7,048 | | | | 1,664 | |
Zimmer Biomet Holdings, Inc. | | | 28,758 | | | | 2,983 | |
Zoetis, Inc. | | | 67,737 | | | | 5,794 | |
| | | | | | | | |
Total | | | | | | | 460,824 | |
| | | | | | | | |
| |
Industrials (9.1%) | | | | | |
3M Co. | | | 82,094 | | | | 15,642 | |
A.O. Smith Corp. | | | 20,286 | | | | 866 | |
Alaska Air Group, Inc. | | | 17,383 | | | | 1,058 | |
| | | | | | | | |
| Common Stocks (98.6%) | | Shares/
Par+ | | | Value
$ (000’s) | |
| |
Industrials continued | | | | | |
Allegion PLC | | | 13,402 | | | | 1,068 | |
American Airlines Group, Inc. | | | 57,792 | | | | 1,856 | |
AMETEK, Inc. | | | 32,725 | | | | 2,215 | |
Arconic, Inc. | | | 60,636 | | | | 1,022 | |
The Boeing Co. | | | 74,459 | | | | 24,013 | |
C.H. Robinson Worldwide, Inc. | | | 19,386 | | | | 1,630 | |
Caterpillar, Inc. | | | 83,197 | | | | 10,572 | |
Cintas Corp. | | | 12,207 | | | | 2,051 | |
Copart, Inc.* | | | 29,034 | | | | 1,387 | |
CSX Corp. | | | 113,098 | | | | 7,027 | |
Cummins, Inc. | | | 20,826 | | | | 2,783 | |
Deere & Co. | | | 45,351 | | | | 6,765 | |
Delta Air Lines, Inc. | | | 87,962 | | | | 4,389 | |
Dover Corp. | | | 20,631 | | | | 1,464 | |
Eaton Corp. PLC | | | 61,103 | | | | 4,195 | |
Emerson Electric Co. | | | 88,279 | | | | 5,275 | |
Equifax, Inc. | | | 16,999 | | | | 1,583 | |
Expeditors International of Washington, Inc. | | | 24,333 | | | | 1,657 | |
Fastenal Co. | | | 40,471 | | | | 2,116 | |
FedEx Corp. | | | 34,180 | | | | 5,514 | |
Flowserve Corp. | | | 18,449 | | | | 701 | |
Fluor Corp. | | | 19,833 | | | | 639 | |
Fortive Corp. | | | 41,434 | | | | 2,803 | |
Fortune Brands Home & Security, Inc. | | | 19,936 | | | | 757 | |
General Dynamics Corp. | | | 39,248 | | | | 6,170 | |
General Electric Co. | | | 1,226,307 | | | | 9,283 | |
Harris Corp. | | | 16,588 | | | | 2,234 | |
Honeywell International, Inc. | | | 104,370 | | | | 13,789 | |
Huntington Ingalls Industries, Inc. | | | 6,056 | | | | 1,153 | |
IHS Markit, Ltd.* | | | 50,570 | | | | 2,426 | |
Illinois Tool Works, Inc. | | | 43,037 | | | | 5,452 | |
Ingersoll-Rand PLC | | | 34,634 | | | | 3,160 | |
J.B. Hunt Transport Services, Inc. | | | 12,314 | | | | 1,146 | |
Jacobs Engineering Group, Inc. | | | 16,857 | | | | 985 | |
Johnson Controls International PLC | | | 130,279 | | | | 3,863 | |
Kansas City Southern | | | 14,338 | | | | 1,369 | |
L3 Technologies, Inc. | | | 11,095 | | | | 1,927 | |
Lockheed Martin Corp. | | | 34,887 | | | | 9,135 | |
Masco Corp. | | | 43,070 | | | | 1,259 | |
Nielsen Holdings PLC | | | 50,047 | | | | 1,168 | |
Norfolk Southern Corp. | | | 38,397 | | | | 5,742 | |
Northrop Grumman Corp. | | | 24,478 | | | | 5,995 | |
PACCAR, Inc. | | | 49,265 | | | | 2,815 | |
Parker Hannifin Corp. | | | 18,659 | | | | 2,783 | |
Pentair PLC | | | 22,517 | | | | 851 | |
Quanta Services, Inc. | | | 20,588 | | | | 620 | |
Raytheon Co. | | | 40,121 | | | | 6,153 | |
Republic Services, Inc. | | | 30,659 | | | | 2,210 | |
Robert Half International, Inc. | | | 17,126 | | | | 980 | |
| | | | | | | | |
| Common Stocks (98.6%) | | Shares/
Par+ | | | Value
$ (000’s) | |
| |
Industrials continued | | | | | |
Rockwell Automation, Inc. | | | 17,015 | | | | 2,560 | |
Rollins, Inc. | | | 20,766 | | | | 750 | |
Roper Technologies, Inc. | | | 14,582 | | | | 3,886 | |
Snap-on, Inc. | | | 7,850 | | | | 1,141 | |
Southwest Airlines Co. | | | 71,349 | | | | 3,316 | |
Stanley Black & Decker, Inc. | | | 21,297 | | | | 2,550 | |
Textron, Inc. | | | 34,254 | | | | 1,575 | |
TransDigm Group, Inc.* | | | 6,842 | | | | 2,327 | |
Union Pacific Corp. | | | 103,877 | | | | 14,359 | |
United Continental Holdings, Inc.* | | | 32,267 | | | | 2,702 | |
United Parcel Service, Inc. - Class B | | | 98,015 | | | | 9,559 | |
United Rentals, Inc.* | | | 11,434 | | | | 1,172 | |
United Technologies Corp. | | | 114,421 | | | | 12,184 | |
Verisk Analytics, Inc.* | | | 23,209 | | | | 2,531 | |
W.W. Grainger, Inc. | | | 6,432 | | | | 1,816 | |
Waste Management, Inc. | | | 55,300 | | | | 4,921 | |
Xylem, Inc. | | | 25,337 | | | | 1,690 | |
| | | | | | | | |
Total | | | | | | | 272,755 | |
| | | | | | | | |
| |
Information Technology (19.8%) | | | | | |
Accenture PLC - Class A | | | 89,871 | | | | 12,673 | |
Adobe Systems, Inc.* | | | 68,820 | | | | 15,570 | |
Advanced Micro Devices, Inc.* | | | 123,994 | | | | 2,289 | |
Akamai Technologies, Inc.* | | | 22,962 | | | | 1,403 | |
Alliance Data Systems Corp. | | | 6,605 | | | | 991 | |
Amphenol Corp. - Class A | | | 42,483 | | | | 3,442 | |
Analog Devices, Inc. | | | 52,187 | | | | 4,479 | |
ANSYS, Inc.* | | | 11,781 | | | | 1,684 | |
Apple, Inc. | | | 635,580 | | | | 100,256 | |
Applied Materials, Inc. | | | 138,588 | | | | 4,537 | |
Arista Networks, Inc.* | | | 7,338 | | | | 1,546 | |
Autodesk, Inc.* | | | 30,877 | | | | 3,971 | |
Automatic Data Processing, Inc. | | | 61,714 | | | | 8,092 | |
Broadcom, Inc. | | | 58,290 | | | | 14,822 | |
Broadridge Financial Solutions, Inc. | | | 16,460 | | | | 1,584 | |
Cadence Design Systems, Inc.* | | | 39,778 | | | | 1,730 | |
Cisco Systems, Inc. | | | 633,865 | | | | 27,465 | |
Citrix Systems, Inc. | | | 18,049 | | | | 1,849 | |
Cognizant Technology Solutions Corp. - Class A | | | 81,634 | | | | 5,182 | |
Corning, Inc. | | | 112,845 | | | | 3,409 | |
DXC Technology Co. | | | 39,492 | | | | 2,100 | |
F5 Networks, Inc.* | | | 8,548 | | | | 1,385 | |
The Accompanying Notes are an Integral Part of the Financial Statements.
23
Index 500 Stock Portfolio
| | | | | | | | |
| Common Stocks (98.6%) | | Shares/
Par+ | | | Value
$ (000’s) | |
| |
Information Technology continued | | | | | |
Fidelity National Information Services, Inc. | | | 46,171 | | | | 4,735 | |
Fiserv, Inc.* | | | 56,178 | | | | 4,129 | |
FleetCor Technologies, Inc.* | | | 12,502 | | | | 2,322 | |
FLIR Systems, Inc. | | | 19,505 | | | | 849 | |
Fortinet, Inc.* | | | 20,417 | | | | 1,438 | |
Gartner, Inc.* | | | 12,815 | | | | 1,638 | |
Global Payments, Inc. | | | 22,306 | | | | 2,300 | |
Hewlett Packard Enterprise Co. | | | 200,622 | | | | 2,650 | |
HP, Inc. | | | 223,096 | | | | 4,565 | |
Intel Corp. | | | 643,457 | | | | 30,197 | |
International Business Machines Corp. | | | 128,127 | | | | 14,564 | |
Intuit, Inc. | | | 36,591 | | | | 7,203 | |
IPG Photonics Corp.* | | | 5,044 | | | | 571 | |
Jack Henry & Associates, Inc. | | | 10,898 | | | | 1,379 | |
Juniper Networks, Inc. | | | 48,661 | | | | 1,310 | |
Keysight Technologies, Inc.* | | | 26,424 | | | | 1,640 | |
KLA-Tencor Corp. | | | 21,581 | | | | 1,931 | |
Lam Research Corp. | | | 21,879 | | | | 2,979 | |
Mastercard, Inc. - Class A | | | 128,103 | | | | 24,167 | |
Maxim Integrated Products, Inc. | | | 39,062 | | | | 1,986 | |
Microchip Technology, Inc. | | | 33,345 | | | | 2,398 | |
Micron Technology, Inc.* | | | 157,917 | | | | 5,011 | |
Microsoft Corp. | | | 1,089,664 | | | | 110,677 | |
Motorola Solutions, Inc. | | | 23,055 | | | | 2,652 | |
NetApp, Inc. | | | 35,512 | | | | 2,119 | |
NVIDIA Corp. | | | 86,001 | | | | 11,481 | |
Oracle Corp. | | | 359,351 | | | | 16,225 | |
Paychex, Inc. | | | 45,057 | | | | 2,936 | |
PayPal Holdings, Inc.* | | | 166,131 | | | | 13,970 | |
Qorvo, Inc.* | | | 17,610 | | | | 1,069 | |
QUALCOMM, Inc. | | | 170,897 | | | | 9,726 | |
Red Hat, Inc.* | | | 24,921 | | | | 4,377 | |
salesforce.com, Inc.* | | | 107,854 | | | | 14,773 | |
Seagate Technology PLC | | | 36,718 | | | | 1,417 | |
Skyworks Solutions, Inc. | | | 25,029 | | | | 1,677 | |
Symantec Corp. | | | 90,073 | | | | 1,702 | |
Synopsys, Inc.* | | | 21,044 | | | | 1,773 | |
TE Connectivity, Ltd. | | | 48,363 | | | | 3,658 | |
Texas Instruments, Inc. | | | 135,422 | | | | 12,797 | |
Total System Services, Inc. | | | 23,664 | | | | 1,924 | |
VeriSign, Inc.* | | | 14,998 | | | | 2,224 | |
Visa, Inc. - Class A | | | 247,745 | | | | 32,688 | |
Western Digital Corp. | | | 40,805 | | | | 1,509 | |
Western Union Co. | | | 62,429 | | | | 1,065 | |
Xerox Corp. | | | 29,227 | | | | 578 | |
| | | | | | | | |
| Common Stocks (98.6%) | | Shares/
Par+ | | | Value
$ (000’s) | |
| |
Information Technology continued | | | | | |
Xilinx, Inc. | | | 35,675 | | | | 3,038 | |
| | | | | | | | |
Total | | | | | | | 596,476 | |
| | | | | | | | |
| |
Materials (2.7%) | | | | | |
Air Products and Chemicals, Inc. | | | 30,951 | | | | 4,954 | |
Albemarle Corp. | | | 14,974 | | | | 1,154 | |
Avery Dennison Corp. | | | 12,225 | | | | 1,098 | |
Ball Corp. | | | 47,821 | | | | 2,199 | |
Celanese Corp. - Class A | | | 18,858 | | | | 1,697 | |
CF Industries Holdings, Inc. | | | 32,538 | | | | 1,416 | |
DowDuPont, Inc. | | | 323,455 | | | | 17,298 | |
Eastman Chemical Co. | | | 19,744 | | | | 1,444 | |
Ecolab, Inc. | | | 35,840 | | | | 5,281 | |
FMC Corp. | | | 18,985 | | | | 1,404 | |
Freeport-McMoRan, Inc. | | | 204,292 | | | | 2,106 | |
International Flavors & Fragrances, Inc. | | | 14,280 | | | | 1,917 | |
International Paper Co. | | | 57,103 | | | | 2,305 | |
Linde PLC | | | 77,691 | | | | 12,123 | |
LyondellBasell Industries NV - Class A | | | 44,354 | | | | 3,689 | |
Martin Marietta Materials, Inc. | | | 8,841 | | | | 1,520 | |
The Mosaic Co. | | | 49,998 | | | | 1,460 | |
Newmont Mining Corp. | | | 75,098 | | | | 2,602 | |
Nucor Corp. | | | 44,260 | | | | 2,293 | |
Packaging Corp. of America | | | 13,323 | | | | 1,112 | |
PPG Industries, Inc. | | | 33,820 | | | | 3,457 | |
Sealed Air Corp. | | | 22,125 | | | | 771 | |
The Sherwin-Williams Co. | | | 11,616 | | | | 4,570 | |
Vulcan Materials Co. | | | 18,617 | | | | 1,839 | |
WestRock Co. | | | 35,747 | | | | 1,350 | |
| | | | | | | | |
Total | | | | | | | 81,059 | |
| | | | | | | | |
| |
Real Estate (2.9%) | | | | | |
Alexandria Real Estate Equities, Inc. | | | 15,160 | | | | 1,747 | |
American Tower Corp. | | | 62,102 | | | | 9,824 | |
Apartment Investment & Management Co. - Class A | | | 21,944 | | | | 963 | |
AvalonBay Communities, Inc. | | | 19,487 | | | | 3,392 | |
Boston Properties, Inc. | | | 21,774 | | | | 2,451 | |
CBRE Group, Inc.* | | | 44,695 | | | | 1,790 | |
Crown Castle International Corp. | | | 58,488 | | | | 6,353 | |
Digital Realty Trust, Inc. | | | 29,083 | | | | 3,099 | |
Duke Realty Corp. | | | 50,518 | | | | 1,308 | |
Equinix, Inc. | | | 11,334 | | | | 3,996 | |
Equity Residential | | | 51,945 | | | | 3,429 | |
Essex Property Trust, Inc. | | | 9,314 | | | | 2,284 | |
| | | | | | | | |
| Common Stocks (98.6%) | | Shares/
Par+ | | | Value
$ (000’s) | |
| |
Real Estate continued | | | | | |
Extra Space Storage, Inc. | | | 17,837 | | | | 1,614 | |
Federal Realty Investment Trust | | | 10,414 | | | | 1,229 | |
HCP, Inc. | | | 67,318 | | | | 1,880 | |
Host Hotels & Resorts, Inc. | | | 104,619 | | | | 1,744 | |
Iron Mountain, Inc. | | | 40,353 | | | | 1,308 | |
Kimco Realty Corp. | | | 59,409 | | | | 870 | |
The Macerich Co. | | | 14,914 | | | | 645 | |
Mid-America Apartment Communities, Inc. | | | 16,049 | | | | 1,536 | |
Prologis, Inc. | | | 88,754 | | | | 5,212 | |
Public Storage | | | 21,141 | | | | 4,279 | |
Realty Income Corp. | | | 41,607 | | | | 2,623 | |
Regency Centers Corp. | | | 23,889 | | | | 1,402 | |
SBA Communications Corp.* | | | 15,977 | | | | 2,586 | |
Simon Property Group, Inc. | | | 43,606 | | | | 7,325 | |
SL Green Realty Corp. | | | 12,022 | | | | 951 | |
UDR, Inc. | | | 38,848 | | | | 1,539 | |
Ventas, Inc. | | | 50,257 | | | | 2,945 | |
Vornado Realty Trust | | | 24,413 | | | | 1,514 | |
Welltower, Inc. | | | 52,960 | | | | 3,676 | |
Weyerhaeuser Co. | | | 105,626 | | | | 2,309 | |
| | | | | | | | |
Total | | | | | | | 87,823 | |
| | | | | | | | |
| |
Utilities (3.3%) | | | | | |
The AES Corp. | | | 93,374 | | | | 1,350 | |
Alliant Energy Corp. | | | 33,264 | | | | 1,405 | |
Ameren Corp. | | | 34,442 | | | | 2,247 | |
American Electric Power Co., Inc. | | | 69,521 | | | | 5,196 | |
American Water Works Co., Inc. | | | 25,462 | | | | 2,311 | |
CenterPoint Energy, Inc. | | | 70,661 | | | | 1,995 | |
CMS Energy Corp. | | | 39,945 | | | | 1,983 | |
Consolidated Edison, Inc. | | | 43,914 | | | | 3,358 | |
Dominion Resources, Inc. | | | 92,553 | | | | 6,614 | |
DTE Energy Co. | | | 25,649 | | | | 2,829 | |
Duke Energy Corp. | | | 100,505 | | | | 8,673 | |
Edison International | | | 45,935 | | | | 2,608 | |
Entergy Corp. | | | 25,538 | | | | 2,198 | |
Evergy, Inc. | | | 37,143 | | | | 2,109 | |
Eversource Energy | | | 44,676 | | | | 2,906 | |
Exelon Corp. | | | 136,334 | | | | 6,149 | |
FirstEnergy Corp. | | | 68,501 | | | | 2,572 | |
NextEra Energy, Inc. | | | 67,383 | | | | 11,712 | |
NiSource, Inc. | | | 51,218 | | | | 1,298 | |
NRG Energy, Inc. | | | 40,876 | | | | 1,619 | |
PG&E Corp.* | | | 73,126 | | | | 1,737 | |
Pinnacle West Capital Corp. | | | 15,802 | | | | 1,346 | |
PPL Corp. | | | 101,538 | | | | 2,876 | |
Public Service Enterprise Group, Inc. | | | 71,261 | | | | 3,709 | |
The Accompanying Notes are an Integral Part of the Financial Statements.
24
Index 500 Stock Portfolio
| | | | | | | | |
| Common Stocks (98.6%) | | Shares/
Par+ | | | Value
$ (000’s) | |
| |
Utilities continued | | | | | |
SCANA Corp. | | | 20,107 | | | | 961 | |
Sempra Energy | | | 38,582 | | | | 4,174 | |
The Southern Co. | | | 145,058 | | | | 6,371 | |
WEC Energy Group, Inc. | | | 44,484 | | | | 3,081 | |
Xcel Energy, Inc. | | | 72,470 | | | | 3,571 | |
| | | | | | | | |
Total | | | | | | | 98,958 | |
| | | | | | | | |
| | |
Total Common Stocks | | | | | | | | |
(Cost: $1,533,504) | | | | | | | 2,966,493 | |
| | | | | | | | |
| |
| Short-Term Investments (1.3%) | | | | |
| | |
Commercial Paper (0.6%) | | | | | | | | |
Apple, Inc. 0.000%, 1/22/19 144A | | | 500,000 | | | | 499 | |
0.000%, 3/18/19 144A | | | 1,900,000 | | | | 1,890 | |
The Coca-Cola Co. 0.000%, 2/11/19 144A | | | 1,000,000 | | | | 997 | |
0.000%, 2/12/19 144A | | | 1,000,000 | | | | 997 | |
Exxon Mobil Corp. 0.000%, 1/23/19 | | | 1,300,000 | | | | 1,298 | |
General Mills, Inc. 0.000%, 1/10/19 144A | | | 1,000,000 | | | | 999 | |
Marriott International, Inc. 0.000%, 1/7/19 144A | | | 1,000,000 | | | | 999 | |
0.000%, 1/25/19 144A | | | 2,000,000 | | | | 1,996 | |
Mondelez International, Inc. 0.000%, 2/6/19 144A | | | 3,000,000 | | | | 2,991 | |
Pfizer, Inc. 0.000%, 1/17/19 144A | | | 1,000,000 | | | | 999 | |
0.000%, 3/11/19 144A | | | 2,000,000 | | | | 1,990 | |
Societe Generale SA
0.000%, 1/17/19 144A | | | 1,500,000 | | | | 1,498 | |
0.000%, 2/12/19 144A | | | 1,500,000 | | | | 1,496 | |
Walgreens Boots Alliance, Inc. 0.000%, 1/4/19 | | | 1,500,000 | | | | 1,500 | |
| | | | | | | | |
Total | | | | | | | 20,149 | |
| | | | | | | | |
| | |
Money Market Funds (0.4%) | | | | | | | | |
State Street Institutional U.S. Government Money Market Fund - Premier Class 2.270%# | | | 10,579,730 | | | | 10,580 | |
| | | | | | | | |
Total | | | | | | | 10,580 | |
| | | | | | | | |
| | | | | | | | |
| Short-Term Investments (1.3%) | | Shares/
Par+ | | | Value
$ (000’s) | |
| |
US Government & Agencies (0.3%) | | | | | |
Federal Home Loan Bank | | | | | | | | |
0.000%, 1/14/19 | | | 3,000,000 | | | | 2,997 | |
0.000%, 4/2/19 | | | 3,000,000 | | | | 2,982 | |
0.000%, 4/15/19b | | | 3,000,000 | | | | 2,979 | |
| | | | | | | | |
Total | | | | | | | 8,958 | |
| | | | | | | | |
| |
Total Short-Term Investments | | | | | |
(Cost: $39,689) | | | | | | | 39,687 | |
| | | | | | | | |
| |
Total Investments (99.9%) | | | | | |
(Cost: $1,573,193)@ | | | | | | | 3,006,180 | |
| | | | | | | | |
Other Assets, Less | | | | | | | | |
Liabilities (0.1%) | | | | | | | 2,961 | |
| | | | | | | | |
Net Assets (100.0%) | | | | | | | 3,009,141 | |
| | | | | | | | |
The Accompanying Notes are an Integral Part of the Financial Statements.
25
Index 500 Stock Portfolio
Exchange Traded or Centrally Cleared Derivatives Futures
| | | | | | | | | | | | | | | | | | | | | | | | |
| Issuer | | Long/Short | | Currency | | Notional Par
(000’s) | | | Number of
Contracts | | Expiration
Date | | Notional
Value
(000’s) | | | Unrealized
Appreciation/
(Depreciation)
(000’s) | | | Variation Margin (000’s) | |
E-Mini S&P 500 Future | | Long | | USD | | | 15 | | | 309 | | 3/19 | | $ | 38,705 | | | $ | (955 | ) | | $ | 297 | |
| | | | | | | | | | | | | | | | | | | | | | | | |
| | | | | | | | | | | | | | | | | | $ | (955 | ) | | $ | 297 | |
| | | | | | | | | | | | | | | | | | | | | | | | |
| | | | | | | | | | | | | | | | | | | | | | | | | | | | | | | | | | | | |
| | | Financial Derivative Assets | | | Financial Derivative Liabilities | | | | | | | |
| | | Variation Margin (000’s) | | | Variation Margin (000’s) | | | Market Value
(000’s) | | | | |
| | | Swaps | | | Futures | | | Total | | | Swaps | | | Futures | | | Total | | | Options | | | | |
Total Exchange-Traded or | | $ | | | | | - | | | $ | 297 | | | $ | 297 | | | $ | - | | | $ | - | | | $ | - | | | $ | - | | | | | |
Centrally Cleared Derivatives | | | | | | | | | | | | | | | | | | | | | | | | | | | | | | | | | | | | |
| + | All par is stated in U.S Dollar unless otherwise noted. |
| # | 7-Day yield as of 12/31/2018. |
| b | Cash or securities with an aggregate value of $2,979 (in thousands) has been pledged as collateral for futures, swap contracts outstanding, short sales, when issued securities or written options on 12/31/2018. |
| 144A | Security exempt from registration under Rule 144A of the Securities Act of 1933. These securities may be resold as transactions exempt from registration, normally to qualified institutional buyers. At December 31, 2018 the value of these securities (in thousands) was $17,351 representing 0.6% of the net assets. |
| @ | At December 31, 2018, the aggregate cost of investments, including derivatives, for federal tax purposes (in thousands) was $1,574,195 and the net unrealized appreciation of investments based on that cost was $1,431,031 which is comprised of $1,539,432 aggregate gross unrealized appreciation and $108,401 aggregate gross unrealized depreciation. |
The following is a summary of the inputs used in valuing the Portfolio’s assets and liabilities at December 31, 2018. See Note 3 for additional information on portfolio valuation.
| | | | | | | | | | | | | | |
| | | Valuation Inputs | | | |
| Description | | Level 1 –
Quoted Prices | | | Level 2 –
Other Significant
Observable Inputs | | | Level 3 –
Significant
Unobservable Inputs | | | |
| | | (Amounts in thousands) | | | |
Assets: | | | | | | | | | | | | | | |
Common Stocks | | $ | 2,966,493 | | | $ | - | | | $ | - | | | |
Short-Term Investments | | | | | | | | | | | | | | |
Money Market Funds | | | 10,580 | | | | - | | | | - | | | |
All Others | | | - | | | | 29,107 | | | | - | | | |
Total Assets: | | $ | 2,977,073 | | | $ | 29,107 | | | $ | - | | | |
Liabilities: | | | | | | | | | | | | | | |
Other Financial Instruments^ | | | | | | | | | | | | | | |
Futures | | | (955 | ) | | | - | | | | - | | | |
Total Liabilities: | | $ | (955 | ) | | $ | - | | | $ | - | | | |
^ Other financial instruments are derivative instruments such as futures and forwards, which are valued at the unrealized appreciation (depreciation) on the instrument, and securities sold short, reverse repurchase agreements, written options and swaps contracts, which are valued at market value.
The Accompanying Notes are an Integral Part of the Financial Statements.
26
Large Company Value Portfolio (unaudited)
| | | | |
| Objective: | | Portfolio Strategy: | | Net Assets: |
| Long-term growth of capital. Current income is a secondary objective. | | Invest primarily in equity securities of larger companies considered to be undervalued. | | $173 million |
PORTFOLIO OVERVIEW
Mason Street Advisors, LLC (“Mason Street Advisors”), the investment adviser for the Large Company Value Portfolio (the “Portfolio”), has engaged American Century Investment Management, Inc. (“American Century”) to act assub-adviser for the Portfolio. The Portfolio looks for stocks of companies that it believes are undervalued at the time of purchase. The Portfolio attempts to purchase the stocks of these undervalued companies and hold each stock until it has returned to favor in the market and the price has increased to, or is higher than, a level the Portfolio believes more accurately reflects the fair value of the company. Companies may be undervalued due to market declines, poor economic conditions, actual or anticipated bad news regarding the issuer or its industry, or because they have been overlooked by the market.
MARKET OVERVIEW
The U.S. equity market experienced heightened volatility in 2018 as concerns about slowing global growth, falling oil prices, less accommodative monetary policy, trade tensions and a partial U.S. government shutdown triggered a sharp fourth-quarter decline in stock prices. As a result, most market Indices ended lower for the calendar year.
According to the Russell® Indices, growth stocks outperformed value stocks by a significant margin during 2018. Large cap stocks outperformed mid cap stocks, and both categories outperformed small cap stocks. Furthermore, stocks of companies with higher credit ratings (rated B+ or better) generally outperformed companies with lower credit ratings (rated B or worse).
PORTFOLIO RESULTS
The Portfolio returned (7.92%) for the twelve months ended December 31, 2018. By comparison, the Portfolio’s benchmark, the Russell 1000® Value Index (the “Index”), returned (8.27%). (The Index is unmanaged, cannot be invested in directly and does not incur expenses.) According to Lipper® Analytical Services, Inc., an independent mutual fund ranking agency, the average return in 2018 of the Large Cap Value Funds peer group was (9.78%).
Security selection in the Consumer Discretionary sector positively impacted performance relative to the Index. Advance Auto Parts was a top contributor. During the third quarter of 2018, the company reported better-than-expected quarterly results. It also raised its full-year guidance due to margin improvement and stronger-than-expected same-store sales trends. This indicated to investors that the company’s turnaround plan was starting to show signs of effectiveness.
Consumer Staples was another area of relative strength. The Portfolio benefited from not owning Philip Morris International. The stock’s decline was driven by slowing demand in Japan for Philip Morris’ IQOS product. The American Century investment team avoided the stock due to its longer-term concerns about the sustainability of the company’s core business. The Portfolio’s position in The Procter & Gamble Co. also contributed to relative performance. Procter & Gamble benefited from stabilizing and improving market share in many key areas.
A few of the Portfolio’s Health Care holdings were top individual contributors, including Medtronic, which outperformed after reporting quarterly revenue, earnings and free cash flow results that were better than expected. Pfizer, a pharmaceutical company, was another key contributor. Its stock was supported by solid data on Tafamidis, its cardiomyopathy drug, and by its relatively strong drug pipeline.
On the other hand, a decline in oil prices pressured the Portfolio’s Energy holdings. Schlumberger, the world’s largest oil field services company, was a key detractor. Its stock fell substantially during the fourth quarter as lower oil and gas prices reduced the market’s expectations for normalization in oil and gas markets. The company also preannounced worse-than-expected quarterly results due to weakness in the North American hydraulic fracturing market.
A few holdings in the Financials sector also weighed on relative performance, including Invesco, which experienced an acceleration of net outflows and announced an expensive acquisition of OppenheimerFunds.
PORTFOLIO MANAGER OUTLOOK
The following forward-looking comments are the opinion of American Century, the Portfolio’ssub-adviser.
27
Large Company Value Portfolio (unaudited)
According to our metrics, the Portfolio’s Energy stocks are attractively priced and offer compelling risk/reward profiles. We favor Energy companies that we believe are higher quality and well managed.
The Portfolio is overweight in Consumer Staples. This sector is composed of companies with diverging strategies and fundamental outlooks. We believe we have identified some of the more diversified, stronger companies which can navigate a tougher competitive environment.
While we generally remain concerned about extended valuations in the Real Estate sector, we initiated a position in Weyerhaeuser toward the end of the year after its stock declined to an attractive level.
As of the end of 2018, our only position in the newly created Communication Services sector was Verizon Communications. We believe Verizon offers relative stability and balance sheet strength. Our analysis shows that many other Communication Services stocks have volatile business models and higher levels of leverage, leading to our underweight position in the sector.
Relative Performance
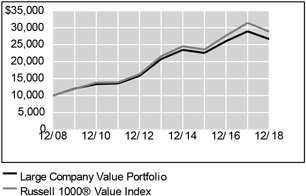
| | | | | | | | | | | | |
Average Annual Total Returns
For Periods Ended December 31, 2018 | |
| | | 1 Year | | | 5 Years | | | 10 Years | |
Large Company Value Portfolio | | | -7.92 | % | | | 5.10 | % | | | 10.30 | % |
Russell 1000® Value Index | | | -8.27 | % | | | 5.95 | % | | | 11.18 | % |
Lipper® Variable Insurance Products (VIP) Large Cap Value Funds Average | | | -9.78 | % | | | 5.04 | % | | | 10.77 | % |
The performance data quoted represents past performance. Past performance is historical and does not guarantee future performance. Investment return and principal value will fluctuate, so that shares, when redeemed, may be worth more or less than their original cost. Current performance may be lower or higher than the performance data quoted. For the most recentmonth-end performance information visitwww.northwesternmutual.com.
This chart assumes an initial investment of $10,000 made on 12/31/08. Returns shown reflect fee waivers, deductions for management and other portfolio expenses, and reinvestment of all dividends. In the absence of fee waivers, total return would be reduced. Returns exclude
deductions for separate account sale loads and account fees. Please refer to the Benchmark Definitions section of this report for information about the indices cited in the above chart and graph.
The Portfolio may invest in derivative instruments for cash management purposes or to hedge foreign currency exposure. Use of these instruments may involve certain costs and imposes certain risks such as liquidity risk, market risk, credit risk, management risk and the risk of mispricing or improper valuation. Certain derivatives involve leverage, which could magnify losses, and portfolios investing in derivatives could lose more than the principal amount invested in those instruments.
Top 10 Equity Holdings 12/31/18
| | | | |
Security Description | | | % of Net Assets | |
JPMorgan Chase & Co. | | | 3.3 | % |
Johnson & Johnson | | | 3.3 | % |
U.S. Bancorp | | | 3.3 | % |
Medtronic PLC | | | 3.0 | % |
Verizon Communications, Inc. | | | 3.0 | % |
Total SA, ADR | | | 3.0 | % |
Schlumberger, Ltd. | | | 2.9 | % |
Chevron Corp. | | | 2.8 | % |
The Procter & Gamble Co. | | | 2.8 | % |
iShares Russell 1000 Value Index Fund | | | 2.7 | % |
28
Large Company Value Portfolio (unaudited)
Sector Allocation 12/31/18
| | | | | | |
| Sector | | % of Net Assets | | | |
Financials | | | 23.0 | % | | |
Health Care | | | 17.4 | % | | |
Energy | | | 12.4 | % | | |
Consumer Staples | | | 10.5 | % | | |
Industrials | | | 9.3 | % | | |
Information Technology | | | 8.7 | % | | |
Consumer Discretionary | | | 3.9 | % | | |
Utilities | | | 3.0 | % | | |
Communication Services | | | 3.0 | % | | |
Investment Companies | | | 2.7 | % | | |
Short-Term Investments & Other Net Assets | | | 2.7 | % | | |
Materials | | | 2.3 | % | | |
Real Estate | | | 1.1 | % | | |
Sector Allocation and Top 10 Holdings are subject to change.
29
Large Company Value Portfolio
SCHEDULE OF INVESTMENTS
December 31, 2018
| | | | | | | | |
| Common Stocks (94.6%) | | Shares/ Par+ | | | Value
$ (000’s) | |
|
Communication Services (3.0%) | |
Verizon Communications, Inc. | | | 92,880 | | | | 5,222 | |
| | | | | | | | |
Total | | | | | | | 5,222 | |
| | | | | | | | |
| | |
Consumer Discretionary (3.9%) | | | | | | | | |
Advance Auto Parts, Inc. | | | 8,670 | | | | 1,365 | |
BorgWarner, Inc. | | | 45,450 | | | | 1,579 | |
Carnival Corp. | | | 19,750 | | | | 974 | |
Honda Motor Co., Ltd., ADR | | | 70,900 | | | | 1,875 | |
Target Corp. | | | 14,150 | | | | 935 | |
| | | | | | | | |
Total | | | | | | | 6,728 | |
| | | | | | | | |
| | |
Consumer Staples (10.5%) | | | | | | | | |
Colgate-Palmolive Co. | | | 27,800 | | | | 1,655 | |
Conagra Brands, Inc. | | | 61,530 | | | | 1,314 | |
Kellogg Co. | | | 15,500 | | | | 884 | |
Mondelez International, Inc. | | | 91,190 | | | | 3,650 | |
PepsiCo, Inc. | | | 17,060 | | | | 1,885 | |
The Procter & Gamble Co. | | | 51,870 | | | | 4,768 | |
Sysco Corp. | | | 14,060 | | | | 881 | |
Unilever NV | | | 16,300 | | | | 885 | |
Walgreens Boots Alliance, Inc. | | | 12,700 | | | | 868 | |
Walmart, Inc. | | | 15,580 | | | | 1,451 | |
| | | | | | | | |
Total | | | | | | | 18,241 | |
| | | | | | | | |
| | |
Energy (12.4%) | | | | | | | | |
Anadarko Petroleum Corp. | | | 27,980 | | | | 1,227 | |
Baker Hughes | | | 87,320 | | | | 1,877 | |
Chevron Corp. | | | 44,870 | | | | 4,881 | |
EQT Corp. | | | 36,440 | | | | 688 | |
Equitrans Midstream Corp.* | | | 29,152 | | | | 584 | |
Noble Energy, Inc. | | | 53,500 | | | | 1,004 | |
Royal Dutch Shell PLC - Class B, ADR | | | 18,540 | | | | 1,111 | |
Schlumberger, Ltd. | | | 139,150 | | | | 5,021 | |
Total SA, ADR | | | 98,750 | | | | 5,153 | |
| | | | | | | | |
Total | | | | | | | 21,546 | |
| | | | | | | | |
| | |
Financials (23.0%) | | | | | | | | |
AFLAC, Inc. | | | 40,350 | | | | 1,838 | |
Ameriprise Financial, Inc. | | | 25,520 | | | | 2,664 | |
Bank of America Corp. | | | 117,740 | | | | 2,901 | |
The Bank of New York Mellon Corp. | | | 88,920 | | | | 4,186 | |
BB&T Corp. | | | 96,340 | | | | 4,174 | |
Chubb, Ltd. | | | 34,770 | | | | 4,492 | |
Invesco, Ltd. | | | 148,040 | | | | 2,478 | |
JPMorgan Chase & Co. | | | 59,130 | | | | 5,772 | |
| | | | | | | | |
| Common Stocks (94.6%) | | Shares/
Par+ | | | Value
$ (000’s) | |
|
Financials continued | |
PNC Financial Services Group, Inc. | | | 28,290 | | | | 3,307 | |
U.S. Bancorp | | | 123,510 | | | | 5,644 | |
Wells Fargo & Co. | | | 50,040 | | | | 2,306 | |
| | | | | | | | |
Total | | | | | | | 39,762 | |
| | | | | | | | |
| | |
Health Care (17.4%) | | | | | | | | |
Allergan PLC | | | 11,010 | | | | 1,472 | |
Cerner Corp.* | | | 31,440 | | | | 1,649 | |
Hologic, Inc.* | | | 38,110 | | | | 1,566 | |
Johnson & Johnson | | | 43,870 | | | | 5,661 | |
McKesson Corp. | | | 14,520 | | | | 1,604 | |
Medtronic PLC | | | 57,750 | | | | 5,253 | |
Merck & Co., Inc. | | | 42,250 | | | | 3,228 | |
Pfizer, Inc. | | | 97,400 | | | | 4,252 | |
Roche Holding AG | | | 5,270 | | | | 1,303 | |
Zimmer Biomet Holdings, Inc. | | | 40,650 | | | | 4,216 | |
| | | | | | | | |
Total | | | | | | | 30,204 | |
| | | | | | | | |
| | |
Industrials (9.3%) | | | | | | | | |
Atlas Copco AB | | | 133,370 | | | | 2,924 | |
Cummins, Inc. | | | 17,150 | | | | 2,292 | |
Eaton Corp. PLC | | | 26,550 | | | | 1,823 | |
General Electric Co. | | | 123,120 | | | | 932 | |
Johnson Controls International PLC | | | 57,720 | | | | 1,711 | |
Siemens AG | | | 16,590 | | | | 1,850 | |
Southwest Airlines Co. | | | 41,770 | | | | 1,942 | |
Union Pacific Corp. | | | 7,060 | | | | 976 | |
United Parcel Service, Inc. - Class B | | | 16,310 | | | | 1,591 | |
| | | | | | | | |
Total | | | | | | | 16,041 | |
| | | | | | | | |
| | |
Information Technology (8.7%) | | | | | | | | |
Apple, Inc. | | | 5,700 | | | | 899 | |
Applied Materials, Inc. | | | 71,210 | | | | 2,331 | |
Cisco Systems, Inc. | | | 63,430 | | | | 2,749 | |
Intel Corp. | | | 90,880 | | | | 4,265 | |
Oracle Corp. | | | 55,860 | | | | 2,522 | |
TE Connectivity, Ltd. | | | 30,710 | | | | 2,323 | |
| | | | | | | | |
Total | | | | | | | 15,089 | |
| | | | | | | | |
| | |
Materials (2.3%) | | | | | | | | |
DowDuPont, Inc. | | | 34,290 | | | | 1,834 | |
WestRock Co. | | | 56,730 | | | | 2,142 | |
| | | | | | | | |
Total | | | | | | | 3,976 | |
| | | | | | | | |
| | |
Real Estate (1.1%) | | | | | | | | |
Weyerhaeuser Co. | | | 88,910 | | | | 1,943 | |
| | | | | | | | |
Total | | | | | | | 1,943 | |
| | | | | | | | |
| | | | | | | | |
| Common Stocks (94.6%) | | Shares/
Par+ | | | Value $ (000’s) | |
|
Utilities (3.0%) | |
Edison International | | | 15,980 | | | | 907 | |
Eversource Energy | | | 29,310 | | | | 1,906 | |
Xcel Energy, Inc. | | | 49,380 | | | | 2,433 | |
| | | | | | | | |
Total | | | | | | | 5,246 | |
| | | | | | | | |
| | |
Total Common Stocks | | | | | | | | |
(Cost: $175,332) | | | | | | | 163,998 | |
| | | | | | | | |
| |
| Investment Companies (2.7%) | | | | | |
|
Investment Companies (2.7%) | |
iShares Russell 1000 Value Index Fund | | | 42,680 | | | | 4,739 | |
| | | | | | | | |
Total | | | | | | | 4,739 | |
| | | | | | | | |
| | |
Total Investment Companies | | | | | | | | |
(Cost: $5,252) | | | | | | | 4,739 | |
| | | | | | | | |
| |
| Short-Term Investments (2.9%) | | | | | |
|
Money Market Funds (2.9%) | |
State Street Institutional U.S. Government Money Market Fund - Premier Class 2.270%# | | | 4,944,656 | | | | 4,945 | |
| | | | | | | | |
Total | | | | | | | 4,945 | |
| | | | | | | | |
| | |
Total Short-Term Investments | | | | | | | | |
(Cost: $4,945) | | | | | | | 4,945 | |
| | | | | | | | |
Total Investments (100.2%) | | | | | | | | |
(Cost: $185,529)@ | | | | | | | 173,682 | |
| | | | | | | | |
Other Assets, Less | | | | | | | | |
Liabilities(-0.2%) | | | | | | | (332 | ) |
| | | | | | | | |
Net Assets (100.0%) | | | | | | | 173,350 | |
| | | | | | | | |
The Accompanying Notes are an Integral Part of the Financial Statements.
30
Large Company Value Portfolio
Over the Counter Derivatives
Forward Contracts
| | | | | | | | | | | | | | | | | | | | | | |
| Type | | Counterparty | | Currency | | Foreign
Principal
Amount
Covered by
Contract (000s) | | USD Principal
Amount
Covered by
Contract (000’s) | | Settlement
Month | | Unrealized
Appreciation
(000’s) | | | Unrealized
(Depreciation)
(000’s) | | | Net Unrealized
Appreciation/
(Depreciation)
(000’s) | |
Buy | | Morgan Stanley Capital Services, Inc. | | CHF | | 83 | | 85 | | 3/19 | | $ | - | p | | $ | - | p | | $ | - | p |
Sell | | Morgan Stanley Capital Services, Inc. | | CHF | | 1,174 | | 1,203 | | 3/19 | | | - | | | | (9 | ) | | | (9 | ) |
Buy | | Morgan Stanley Capital Services, Inc. | | EUR | | 290 | | 334 | | 3/19 | | | 2 | | | | - | | | | 2 | |
Sell | | Morgan Stanley Capital Services, Inc. | | EUR | | 6,059 | | 6,993 | | 3/19 | | | - | | | | (53 | ) | | | (53 | ) |
Buy | | Morgan Stanley Capital Services, Inc. | | GBP | | 18 | | 23 | | 3/19 | | | - | p | | | - | | | | - | p |
Sell | | Morgan Stanley Capital Services, Inc. | | GBP | | 754 | | 964 | | 3/19 | | | - | | | | (7 | ) | | | (7 | ) |
Buy | | Morgan Stanley Capital Services, Inc. | | JPY | | 10,909 | | 101 | | 3/19 | | | - | p | | | - | | | | - | p |
Sell | | Morgan Stanley Capital Services, Inc. | | JPY | | 186,030 | | 1,708 | | 3/19 | | | - | | | | (40 | ) | | | (40 | ) |
Buy | | Goldman Sachs International | | SEK | | 546 | | 62 | | 3/19 | | | 1 | | | | - | | | | 1 | |
Sell | | Goldman Sachs International | | SEK | | 20,857 | | 2,370 | | 3/19 | | | - | | | | (52 | ) | | | (52 | ) |
| | | | | | | | | | | | | | | | | | | | | | |
| | | | | | | | | | | | $ | 3 | | | $ | (161 | ) | | $ | (158 | ) |
| | | | | | | | | | | | | | | | | | | | | | |
| | | | | | | | | | | | | | | | | | | | | | |
| | | Financial Derivative Assets (000’s) | | | | | Financial Derivative Liabilities (000’s) | | | |
| | | Forward
Contracts | | | Swaps | | Total | | | Forward
Contracts | | | Options | | Swaps | | Total | |
Total Over the Counter Derivatives | | $ | 3 | | | - | | $ | 3 | | | $ | | (161) | | - | | - | | $ | (161) | |
| + | All par is stated in U.S Dollar unless otherwise noted. |
| # | 7-Day yield as of 12/31/2018. |
| @ | At December 31, 2018, the aggregate cost of investments, including derivatives, for federal tax purposes (in thousands) was $187,524 and the net unrealized depreciation of investments based on that cost was $13,998 which is comprised of $7,599 aggregate gross unrealized appreciation and $21,597 aggregate gross unrealized depreciation. |
| p | Amount is less than one thousand. |
The Accompanying Notes are an Integral Part of the Financial Statements.
31
Large Company Value Portfolio
The following is a summary of the inputs used in valuing the Portfolio’s assets and liabilities at December 31, 2018. See Note 3 for additional information on portfolio valuation.
| | | | | | | | | | | | | | |
| | | Valuation Inputs | | | |
| Description | | Level 1 –
Quoted Prices | | | Level 2 –
Other Significant
Observable Inputs | | | Level 3 –
Significant
Unobservable Inputs | | | |
| | | (Amounts in thousands) | | | |
Assets: | | | | | | | | | | | | | | |
Common Stocks | | | | | | | | | | | | | | |
Health Care | | $ | 28,901 | | | $ | 1,303 | | | $ | - | | | |
Industrials | | | 11,267 | | | | 4,774 | | | | - | | | |
All Others | | | 117,753 | | | | - | | | | - | | | |
Investment Companies | | | 4,739 | | | | - | | | | - | | | |
Short-Term Investments | | | 4,945 | | | | - | | | | - | | | |
Other Financial Instruments^ | | | | | | | | | | | | | | |
Forward Currency Contracts | | | - | | | | 3 | | | | - | | | |
Total Assets: | | $ | 167,605 | | | $ | 6,080 | | | $ | - | | | |
Liabilities: | | | | | | | | | | | | | | |
Other Financial Instruments^ | | | | | | | | | | | | | | |
Forward Currency Contracts | | | - | | | | (161 | ) | | | - | | | |
Total Liabilities: | | $ | - | | | $ | (161 | ) | | $ | - | | | |
^ Other financial instruments are derivative instruments such as futures and forwards, which are valued at the unrealized appreciation (depreciation) on the instrument, and securities sold short, reverse repurchase agreements, written options and swaps contracts, which are valued at market value.
The Accompanying Notes are an Integral Part of the Financial Statements.
32
Domestic Equity Portfolio (unaudited)
| | | | |
| Objective: | | Portfolio Strategy: | | Net Assets: |
| Long-term growth of capital and | | Invest primarily in equity securities of U.S. issuers that are | | $772 million |
| income. | | selling at attractive prices relative to their intrinsic value. | | |
PORTFOLIO OVERVIEW
Mason Street Advisors, LLC (“Mason Street Advisors”), the investment adviser for the Domestic Equity Portfolio (the “Portfolio”), has engaged Delaware Investments Fund Advisers, a series of Macquarie Investment Management Business Trust (“Delaware”), to act assub-adviser for the Portfolio. The Portfolio primarily invests in common stocks of large capitalization companies that are believed to have long-term capital appreciation potential. Typically, the Portfolio seeks securities that are believed to be undervalued in relation to their intrinsic value, as indicated by multiple factors, including the earnings and cash flow potential or the asset valuation of the respective issuers. The Portfolio invests in a core group of30-40 securities.
MARKET OVERVIEW
The broad market S&P 500® Index posted its weakest yearly return since 2008 following a big sell off in the fourth quarter that included some of the largest, most popular growth stocks. A number of developments appeared to contribute to growing unease among investors, such as slowing global growth, stalled tariff negotiations, higher interest rates and, in the final weeks of December, the federal government shutdown. Following through on its plan to continue “normalizing” short-term interest rates, the Federal Open Market Committee implemented four rate hikes during 2018 and has now raised rates nine times since December 2015. On the employment front,non-farm payrolls continued growing at a healthy pace, averaging 220,000 a month in 2018. The unemployment rate ended the year at 3.9%, slightly above the 3.7% reading for both October and November—the lowest rate in 49 years.
PORTFOLIO RESULTS
The Portfolio returned (2.81%) for the twelve months ended December 31, 2018. By comparison, the Portfolio’s benchmark, the Russell 1000® Value Index (the “Index”), returned (8.27%). (The Index is unmanaged, cannot be invested in directly and does not incur expenses.) According to Lipper® Analytical Services, Inc., an independent mutual fund ranking agency, the average return in 2018 of the Large Cap Value Funds peer group was (9.78%).
Investments in the Information Technology and Health Care sectors contributed the most to relative performance during 2018. In Information Technology, the Portfolio benefited most from a position in CA Technologies, a provider of IT management software and solutions. In July, the company agreed to be acquired by semiconductor developer Broadcom Inc. in anall-cash deal worth $18.9 billion — a premium over CA’s share price at the time. In Health Care, global pharmaceutical maker Merck & Co., Inc., was the top contributor. The company has seen solid demand for its cancer drug, Keytruda. This market-leading immunotherapy treatment continued to show efficacy across a range of studies and gained approvals from the FDA and international regulatory bodies. Another strong contributor was Abbott Laboratories, a diversified medical products manufacturer. The company continued to execute well, particularly in its medical devices business, and announced positive clinical trial results for an important cardiovascular device.
Investments in the Utilities and Communication Services sectors caused the largest drags on relative returns. The Portfolio’s single Utilities holding, Edison International, trailed the Index’s Utilities return for the year. Edison’s shares fell in response to investors’ concerns about liabilities associated with the wildfires in Southern California. Despite the scale and destruction of the Woolsey fire, the Delaware investment team believed the market had overly discounted Edison’s current and future wildfire liability risk. In the Communication Services sector, diversified telecommunications provider AT&T Inc., was a notable detractor. A federal judge approved AT&T’s acquisition of Time Warner despite attempts by the Department of Justice (“DOJ”) to block the deal. The DOJ has since appealed the decision, leading to some uncertainty about the timing of integration. Another significant detractor was Halliburton Company, a provider of energy services. The company’s operations remained under pressure as weakness in international demand caused reductions in exploration and production budgets in the U.S.
PORTFOLIO MANAGER OUTLOOK
The following forward-looking comments are the opinion of Delaware, the Portfolio’ssub-adviser.
The recent market downturn, in combination with robust earnings growth, have improved the valuation backdrop for U.S. stocks. At the end of 2018, the price/earnings ratio of the S&P 500® Index (based on12-month trailing earnings) was 20.5x,
33
Domestic Equity Portfolio (unaudited)
down from 24.3x a year ago and a cycle high of 25.7x at the end of January 2018. Still, stock market valuation levels seem elevated, especially in light of slowing global economic growth and the waning effects of tax reform, which had given a sizable boost to corporate earnings growth. We believe that the economic and earnings cycles are in their later stages. Because our expectations are for modest returns over the five-year investment horizon, we remain defensively oriented with a focus on higher quality businesses that offer attractive relative value. Currently, we have research projects underway in the Consumer Staples and Information Technology sectors.
Relative Performance
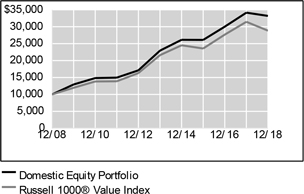
| | | | | | | | | | | | |
Average Annual Total Returns For Periods Ended December 31, 2018 | |
| | | 1 Year | | | 5 Years | | | 10 Years | |
Domestic Equity Portfolio | | | -2.81 | % | | | 7.66 | % | | | 12.75 | % |
Russell 1000® Value Index | | | -8.27 | % | | | 5.95 | % | | | 11.18 | % |
Lipper® Variable Insurance Products (VIP) Large Cap Value Funds Average | | | -9.78 | % | | | 5.04 | % | | | 10.77 | % |
The performance data quoted represents past performance. Past performance is historical and does not guarantee future performance. Investment return and principal value will fluctuate, so that shares, when redeemed, may be worth more or less than their original cost. Current performance may be lower or higher than the performance data quoted. For the most recentmonth-end performance information visitwww.northwesternmutual.com.
This chart assumes an initial investment of $10,000 made on 12/31/08. Returns shown reflect fee waivers, deductions for management and other portfolio expenses, and reinvestment of all dividends. In the absence of fee waivers, total return would be reduced. Returns exclude deductionsfor separateaccount sale loads and account fees. Please refer to the Benchmark Definitions section of this report for information about the indices cited in the above chart and graph.
The Portfolio may hold fewer securities than other diversified portfolios because of its more focused investment strategy. Holding fewer securities increases therisk that the value of the Portfolio could go down because of the poor performance of a single investment.
Top 10 Equity Holdings 12/31/18
| | | | |
Security Description | | | % of Net Assets | |
Merck & Co., Inc. | | | 3.5 | % |
Pfizer, Inc. | | | 3.5 | % |
Abbott Laboratories | | | 3.4 | % |
Verizon Communications, Inc. | | | 3.4 | % |
Dollar Tree, Inc. | | | 3.3 | % |
Waste Management, Inc. | | | 3.3 | % |
Equity Residential | | | 3.2 | % |
Cisco Systems, Inc. | | | 3.2 | % |
Mondelez International, Inc. | | | 3.2 | % |
Marsh & McLennan Cos., Inc. | | | 3.1 | % |
Sector Allocation 12/31/18
| | | | |
Sector | | | % of Net Assets | |
Health Care | | | 21.9 | % |
Financials | | | 14.6 | % |
Energy | | | 10.8 | % |
Information Technology | | | 9.3 | % |
Industrials | | | 8.9 | % |
Consumer Staples | | | 8.8 | % |
Consumer Discretionary | | | 6.2 | % |
Communication Services | | | 6.2 | % |
Short-Term Investments & Other Net Assets | | | 4.2 | % |
Real Estate | | | 3.2 | % |
Utilities | | | 3.1 | % |
Materials | | | 2.8 | % |
Sector Allocation and Top 10 Holdings are subject to change.
34
Domestic Equity Portfolio
SCHEDULE OF INVESTMENTS
December 31, 2018
| | | | | | | | |
| Common Stocks (95.8%) | | Shares/
Par+ | | | Value
$ (000’s) | |
| |
Communication Services (6.2%) | | | | | |
AT&T, Inc. | | | 774,500 | | | | 22,104 | |
Verizon Communications, Inc. | | | 462,600 | | | | 26,008 | |
| | | | | | | | |
Total | | | | | | | 48,112 | |
| | | | | | | | |
| |
Consumer Discretionary (6.2%) | | | | | |
Dollar Tree, Inc.* | | | 284,600 | | | | 25,705 | |
Lowe’s Companies, Inc. | | | 243,500 | | | | 22,490 | |
| | | | | | | | |
Total | | | | | | | 48,195 | |
| | | | | | | | |
| |
Consumer Staples (8.8%) | | | | | |
Archer-Daniels-Midland Co. | | | 524,300 | | | | 21,481 | |
CVS Health Corp. | | | 335,000 | | | | 21,949 | |
Mondelez International, Inc. | | | 611,100 | | | | 24,462 | |
| | | | | | | | |
Total | | | | | | | 67,892 | |
| | | | | | | | |
| |
Energy (10.8%) | | | | | |
ConocoPhillips | | | 373,900 | | | | 23,312 | |
Halliburton Co. | | | 732,500 | | | | 19,470 | |
Marathon Oil Corp. | | | 1,429,145 | | | | 20,494 | |
Occidental Petroleum Corp. | | | 322,300 | | | | 19,783 | |
| | | | | | | | |
Total | | | | | | | 83,059 | |
| | | | | | | | |
| | | | | | | | |
| Common Stocks (95.8%) | | Shares/
Par+ | | | Value
$ (000’s) | |
| |
Financials (14.6%) | | | | | |
The Allstate Corp. | | | 270,300 | | | | 22,335 | |
American International Group, Inc. | | | 546,000 | | | | 21,518 | |
The Bank of New York Mellon Corp. | | | 489,500 | | | | 23,041 | |
BB&T Corp. | | | 493,500 | | | | 21,378 | |
Marsh & McLennan Cos., Inc. | | | 301,900 | | | | 24,076 | |
| | | | | | | | |
Total | | | | | | | 112,348 | |
| | | | | | | | |
| |
Health Care (21.9%) | | | | | |
Abbott Laboratories | | | 366,600 | | | | 26,516 | |
Cardinal Health, Inc. | | | 479,100 | | | | 21,368 | |
Cigna Corp. | | | 121,460 | | | | 23,068 | |
Johnson & Johnson | | | 182,300 | | | | 23,526 | |
Merck & Co., Inc. | | | 358,200 | | | | 27,370 | |
Pfizer, Inc. | | | 616,900 | | | | 26,927 | |
Quest Diagnostics, Inc. | | | 248,300 | | | | 20,676 | |
| | | | | | | | |
Total | | | | | | | 169,451 | |
| | | | | | | | |
| |
Industrials (8.9%) | | | | | |
Northrop Grumman Corp. | | | 86,500 | | | | 21,184 | |
Raytheon Co. | | | 146,800 | | | | 22,512 | |
Waste Management, Inc. | | | 283,600 | | | | 25,237 | |
| | | | | | | | |
Total | | | | | | | 68,933 | |
| | | | | | | | |
| |
Information Technology (9.3%) | | | | | |
Cisco Systems, Inc. | | | 568,800 | | | | 24,646 | |
Intel Corp. | | | 493,000 | | | | 23,137 | |
Oracle Corp. | | | 526,600 | | | | 23,776 | |
| | | | | | | | |
Total | | | | | | | 71,559 | |
| | | | | | | | |
| | | | | | | | |
| Common Stocks (95.8%) | | Shares/ Par+ | | | Value
$ (000’s) | |
| |
Materials (2.8%) | | | | | |
DowDuPont, Inc. | | | 401,867 | | | | 21,492 | |
| | | | | | | | |
Total | | | | | | | 21,492 | |
| | | | | | | | |
Real Estate (3.2%) | | | | | | | | |
| | |
Equity Residential | | | 377,195 | | | | 24,899 | |
| | | | | | | | |
Total | | | | | | | 24,899 | |
| | | | | | | | |
| |
Utilities (3.1%) | | | | | |
Edison International | | | 421,500 | | | | 23,928 | |
| | | | | | | | |
Total | | | | | | | 23,928 | |
| | | | | | | | |
| | |
Total Common Stocks | | | | | | | | |
(Cost: $583,729) | | | | | | | 739,868 | |
| | | | | | | | |
| |
| Short-Term Investments (4.4%) | | | | |
| |
Money Market Funds (4.4%) | | | | | |
State Street Institutional U.S. Government Money Market Fund - Premier Class 2.270%# | | | 33,791,227 | | | | 33,791 | |
| | | | | | | | |
Total | | | | | | | 33,791 | |
| | | | | | | | |
| | |
Total Short-Term Investments | | | | | | | | |
(Cost: $33,791) | | | | | | | 33,791 | |
| | | | | | | | |
| | |
Total Investments (100.2%) | | | | | | | | |
(Cost: $617,520)@ | | | | | | | 773,659 | |
| | | | | | | | |
Other Assets, Less | | | | | | | | |
Liabilities(-0.2%) | | | | | | | (1,194 | ) |
| | | | | | | | |
Net Assets (100.0%) | | | | | | | 772,465 | |
| | | | | | | | |
| + | All par is stated in U.S Dollar unless otherwise noted. |
| # | 7-Day yield as of 12/31/2018. |
| @ | At December 31, 2018, the aggregate cost of investments, including derivatives, for federal tax purposes (in thousands) was $617,520 and the net unrealized appreciation of investments based on that cost was $156,140 which is comprised of $188,221 aggregate gross unrealized appreciation and $32,081 aggregate gross unrealized depreciation. |
The following is a summary of the inputs used in valuing the Portfolio’s assets and liabilities at December 31, 2018. See Note 3 for additional information on portfolio valuation.
| | | | | | | | | | | | | | |
| | | Valuation Inputs | | | |
| Description | | Level 1 –
Quoted Prices | | | Level 2 –
Other Significant
Observable Inputs | | | Level 3 –
Significant
Unobservable Inputs | | | |
| | | | | | (Amounts in thousands)
| | | | | | |
Assets: | | | | | | | | | | | | | | |
Common Stocks | | $ | 739,868 | | | $ | - | | | $ | - | | | |
Short-Term Investments | | | 33,791 | | | | - | | | | - | | | |
Total Assets: | | $ | 773,659 | | | $ | - | | | $ | - | | | |
The Accompanying Notes are an Integral Part of the Financial Statements.
35
Equity Income Portfolio (unaudited)
| | | | |
| Objective: | | Portfolio Strategy: | | Net Assets: |
| Long-term growth of capital and | | Invest in common stocks with a focus on larger | | $705 million |
income. | | capitalization stocks with a strong track record of paying | | |
| | dividends, or that are believed to be undervalued. | | |
PORTFOLIO OVERVIEW
Mason Street Advisors, LLC (“Mason Street Advisors”), the investment adviser for the Equity Income Portfolio (the “Portfolio”), has engaged T. Rowe Price Associates, Inc. (“T. Rowe Price”) to act assub-adviser for the Portfolio. Normally, the Portfolio invests in common stocks, with an emphasis on larger capitalization stocks with a strong track record of paying dividends or that are believed to be undervalued. The Portfolio’s yield, which reflects the level of dividends paid by the Portfolio, is expected to normally exceed the yield of the S&P 500® Index. The Portfolio will typically employ a value approach in selecting investments. The Portfolio’sin-house research team seeks to identify companies that appear to be undervalued, as measured by price to earnings ratio, dividend yield and enterprise value to sales, among other metrics and may be temporarily out of favor, but have good prospects for capital appreciation and dividend growth.
MARKET OVERVIEW
In 2018, U.S. stocks experienced their worst calendar year losses in a decade, pressured by rising interest rates, global trade tensions and worries about slowing global growth. Most major U.S. stock indices reachedall-time highs near the end of the third quarter but plunged in the final months of the year, with several indices down at least 20% from recent highs. Market volatility was elevated throughout the year, thanks in part to rising interest rates as the U.S. Federal Reserve (the “Fed”) continued its normalization of monetary policy with four short-term interest rate hikes in 2018. Expectations that the Fed would raise rates two more times in 2019 also weighed on stocks, along with concerns that corporate earnings growth would slow as the tailwinds from the late-2017 tax reform subside.
As measured by various Russell® Indices, large cap stocks held up much better than theirsmaller-cap peers. Growth outperformed value stocks across all market capitalizations. Within the Russell 1000® Value Index, nearly all sectors posted negative returns. The Industrials sector was the largest detractor, followed by Energy and Materials. Health Care and Utilities were the only sectors to advance over the period.
PORTFOLIO RESULTS
The Portfolio returned (9.35%) for the twelve months ended December 31, 2018. By comparison, the Portfolio’s benchmark, the Russell 1000® Value Index (the “Index”), returned (8.27%). (The Index is unmanaged, cannot be invested in directly and does not incur expenses.) According to Lipper® Analytical Services, Inc., an independent mutual fund ranking agency, the average return in 2018 of the Equity Income Funds peer group was (7.90%).
Stock selection in the Financials sector detracted from relative results. State Street, a leading detractor within Financials, suffered from disappointing growth in core servicing fees, driven by higher compensation costs, as well as its announced plan to buy Charles River Development for $2.6 billion, a price that many investors deemed excessive.
The Consumer Staples sector also hindered relative returns, mainly due to stock selection. Tyson Foods detracted from performance due to the unexpected resignation of its CEO, as well as heightened trade tensions with China, which created a glut in the domestic supply of chicken, beef and pork, resulting in lower meat prices. Despite these headwinds, the Portfolio continued to maintain its investment in Tyson Foods due to growth in the prepared foods market, strong long-term earnings prospects and management’s focus on the transition into a globally-branded protein company.
At the other end of the spectrum, stock selection in the Industrials sector contributed to relative performance. Boeing benefited from strong demand for its commercial aircraft, increased defense spending and lower production costs due to automation. The Portfolio remains invested in Boeing due to its position as a part of a duopoly in global commercial aerospace, its superior product offering and shareholder friendly policies such as increasing dividends and repurchasing stock.
PORTFOLIO MANAGER OUTLOOK
The following forward-looking comments are the opinion of T. Rowe Price, the Portfolio’ssub-adviser.
36
Equity Income Portfolio (unaudited)
Equity markets in 2018 fell sharply, as monetary policy developments, trade tensions, worries about slowing global growth and macroeconomic concerns sparked volatility in the previously sanguine markets and drove stretches of sharp declines. Continued trade disputes between the U.S. and China periodically depressed equities and raised the level of uncertainty in markets.
We believe the recent market volatility may persist until there is more clarity into how the U.S.-China trade situation will be resolved. We also remain mindful of potential headwinds from increased political tensions in the U.S., as well as rising interest rates. That said, we believe the U.S. economy, although slowing, remains reasonably strong. The marketsell-off during the fourth quarter led to more compelling valuations, and we purchased attractively priced shares of solid companies, including some in more cyclical sectors. As always, we are maintaining our disciplined, longer-term approach while also taking advantage of market volatility to buy shares of high quality companies at compelling valuations.
Relative Performance

| | | | | | | | | | | | |
Average Annual Total Returns For Periods Ended December 31, 2018 | |
| | | 1 Year | | | 5 Years | | | 10 Years | |
Equity Income Portfolio | | | -9.35 | % | | | 4.70 | % | | | 10.56 | % |
Russell 1000® Value Index | | | -8.27 | % | | | 5.95 | % | | | 11.18 | % |
Lipper® Variable Insurance Products (VIP) Equity Income Funds Average | | | -7.90 | % | | | 5.27 | % | | | 10.72 | % |
The performance data quoted represents past performance. Past performance is historical and does not guarantee future performance. Investment return and principal value will fluctuate, so that shares, when redeemed, may be worth more or less than their original cost. Current performance may be lower or higher than the performance data quoted. For the most recentmonth-end performance information visit www.northwesternmutual. com.
This chart assumes an initial investment of $10,000 made on 12/31/08. Returns shown reflect fee waivers, deductions for management and other portfolio expenses, and reinvestment of all dividends. In the absence of fee waivers, total return would bereduced. Returns exclude deductions for separate account sale loads and account fees. Please refer to the Benchmark Definitions section of this report for information about the indices cited in the above chart and graph.
The Portfolio invests with an emphasis on larger capitalization stocks with a strong track record of paying dividends or that are believed to be undervalued. The Portfolio may underperform similar funds that invest without an emphasis on dividend-paying stocks. Dividend-paying stocks may not participate in a broad market advance to the same degree as other stocks. The U.S. federal funds rate has been subject to moderate and steady increases over the course of the last three years. A significant rise in interest rates or economic downturn could cause a company to unexpectedly reduce or eliminate its dividend.
The Portfolio may invest a relatively high percentage of its assets in a particular sector. The Portfolio will have greater exposure to the risks associated with that sector and its performance will be tied more closely to the performance of the sector.
Top 10 Equity Holdings 12/31/18
| | | | | | |
| Security Description | | % of Net Assets | | | |
JPMorgan Chase & Co. | | | 3.4 | % | | |
Wells Fargo & Co. | | | 3.3 | % | | |
Twenty-First Century Fox, Inc. - Class B | | | 2.5 | % | | |
Exxon Mobil Corp. | | | 2.4 | % | | |
Verizon Communications, Inc. | | | 2.2 | % | | |
DowDuPont, Inc. | | | 2.1 | % | | |
Pfizer, Inc. | | | 2.1 | % | | |
Total SA, ADR | | | 2.1 | % | | |
Johnson & Johnson | | | 2.1 | % | | |
The Southern Co. | | | 2.0 | % | | |
37
Equity Income Portfolio (unaudited)
Sector Allocation 12/31/18
| | | | | | |
| Sector | | % of Net Assets | | | |
Financials | | | 23.4 | % | | |
Health Care | | | 13.0 | % | | |
Industrials | | | 10.8 | % | | |
Energy | | | 9.2 | % | | |
Communication Services | | | 8.1 | % | | |
Consumer Staples | | | 7.9 | % | | |
Utilities | | | 7.6 | % | | |
Information Technology | | | 7.5 | % | | |
Materials | | | 5.1 | % | | |
Real Estate | | | 2.6 | % | | |
Consumer Discretionary | | | 2.4 | % | | |
Short-Term Investments & Other Net Assets | | | 1.8 | % | | |
Corporate Bonds | | | 0.4 | % | | |
Convertible Corporate Bonds | | | 0.2 | % | | |
Sector Allocation and Top 10 Holdings are subject to change.
38
Equity Income Portfolio
SCHEDULE OF INVESTMENTS
December 31, 2018
| | | | | | | | | | |
| | | Common Stocks (95.1%) | | Shares/
Par+ | | | Value
$ (000’s) | |
| | |
| | Communication Services (8.1%) | | | | | |
| | AT&T, Inc. | | | 114,262 | | | | 3,261 | |
| | CenturyLink, Inc. | | | 85,013 | | | | 1,288 | |
| | Comcast Corp. - Class A | | | 221,085 | | | | 7,528 | |
| | News Corp. - Class A | | | 424,945 | | | | 4,823 | |
| | Telefonica SA | | | 494,823 | | | | 4,161 | |
| | Twenty-First Century | | | | | | | | |
| | Fox, Inc. - Class B | | | 365,704 | | | | 17,473 | |
| | Verizon | | | | | | | | |
| | Communications, Inc. | | | 279,908 | | | | 15,737 | |
| | The Walt Disney Co. | | | 23,100 | | | | 2,533 | |
| | | | | | | | | | |
| | Total | | | | | | | 56,804 | |
| | | | | | | | | | |
| | |
| | Consumer Discretionary (2.4%) | | | | | |
| | Adient PLC | | | 53,045 | | | | 799 | |
| | Kohl’s Corp. | | | 56,859 | | | | 3,772 | |
| | L Brands, Inc. | | | 114,300 | | | | 2,934 | |
| | Las Vegas Sands Corp. | | | 124,915 | | | | 6,502 | |
| | Mattel, Inc.* | | | 281,603 | | | | 2,813 | |
| | | | | | | | | | |
| | Total | | | | | | | 16,820 | |
| | | | | | | | | | |
| | |
| | Consumer Staples (7.9%) | | | | |
| | Archer-Daniels-Midland Co. | | | 82,036 | | | | 3,361 | |
| | Conagra Brands, Inc. | | | 159,458 | | | | 3,406 | |
| | Coty, Inc. - Class A | | | 124,197 | | | | 815 | |
| | CVS Health Corp. | | | 105,442 | | | | 6,908 | |
| | Kellogg Co. | | | 24,800 | | | | 1,414 | |
| | Kimberly-Clark Corp. | | | 103,800 | | | | 11,827 | |
| | PepsiCo, Inc. | | | 31,336 | | | | 3,462 | |
| | Philip Morris International, Inc. | | | 113,689 | | | | 7,590 | |
| | Tyson Foods, Inc. - Class A | | | 166,693 | | | | 8,901 | |
| | Walmart, Inc. | | | 85,000 | | | | 7,918 | |
| | | | | | | | | | |
| | Total | | | | | | | 55,602 | |
| | | | | | | | | | |
| | |
| | Energy (9.2%) | | | | |
| | Apache Corp. | | | 107,756 | | | | 2,829 | |
| | Chevron Corp. | | | 61,700 | | | | 6,712 | |
| | EQT Corp. | | | 17,690 | | | | 334 | |
| | Equitrans Midstream Corp.* | | | 40,852 | | | | 818 | |
| | Exxon Mobil Corp. | | | 251,700 | | | | 17,163 | |
| | Hess Corp. | | | 139,800 | | | | 5,662 | |
| | Occidental Petroleum Corp. | | | 110,700 | | | | 6,795 | |
| | Total SA, ADR | | | 281,512 | | | | 14,689 | |
| | TransCanada Corp. | | | 274,956 | | | | 9,816 | |
| | | | | | | | | | |
| | Total | | | | | | | 64,818 | |
| | | | | | | | | | |
| | |
| | Financials (23.4%) | | | | |
| | American International Group, Inc. | | | 218,060 | | | | 8,594 | |
| | Ameriprise Financial, Inc. | | | 10,737 | | | | 1,121 | |
| | Bank of America Corp. | | | 24,123 | | | | 594 | |
| | | | | | | | | | |
| | | Common Stocks (95.1%) | | Shares/
Par+ | | | Value
$ (000’s) | |
| | |
| | Financials continued | | | | | |
| | The Bank of New York Mellon Corp. | | | 104,300 | | | | 4,909 | |
| | Brighthouse Financial, Inc.* | | | 117,178 | | | | 3,572 | |
| | Chubb, Ltd. | | | 93,600 | | | | 12,091 | |
| | Citigroup, Inc. | | | 102,787 | | | | 5,351 | |
| | Fifth Third Bancorp | | | 377,187 | | | | 8,875 | |
| | Franklin Resources, Inc. | | | 212,600 | | | | 6,306 | |
| | JPMorgan Chase & Co. | | | 246,846 | | | | 24,097 | |
| | KeyCorp | | | 158,991 | | | | 2,350 | |
| | Loews Corp. | | | 175,161 | | | | 7,973 | |
| | Marsh & McLennan Cos., Inc. | | | 37,947 | | | | 3,026 | |
| | MetLife, Inc. | | | 233,900 | | | | 9,604 | |
| | Morgan Stanley | | | 287,591 | | | | 11,403 | |
| | Northern Trust Corp. | | | 24,100 | | | | 2,015 | |
| | PNC Financial Services Group, Inc. | | | 60,200 | | | | 7,038 | |
| | State Street Corp. | | | 137,100 | | | | 8,647 | |
| | U.S. Bancorp | | | 220,700 | | | | 10,086 | |
| | Wells Fargo & Co. | | | 496,473 | | | | 22,877 | |
| | Willis Towers Watson PLC | | | 26,616 | | | | 4,042 | |
| | | | | | | | | | |
| | Total | | | | | | | 164,571 | |
| | | | | | | | | | |
| | |
| | Health Care (12.2%) | | | | |
| | Anthem, Inc. | | | 51,349 | | | | 13,486 | |
| | Becton Dickinson and Co. | | | 11,464 | | | | 2,583 | |
| | Bristol-Myers Squibb Co. | | | 85,100 | | | | 4,423 | |
| | Gilead Sciences, Inc. | | | 138,500 | | | | 8,663 | |
| | GlaxoSmithKline PLC | | | 253,152 | | | | 4,812 | |
| | GlaxoSmithKline PLC, ADR | | | 64,100 | | | | 2,449 | |
| | Johnson & Johnson | | | 112,346 | | | | 14,498 | |
| | Medtronic PLC | | | 110,945 | | | | 10,092 | |
| | Merck & Co., Inc. | | | 125,730 | | | | 9,607 | |
| | Pfizer, Inc. | | | 343,526 | | | | 14,995 | |
| | Zimmer Biomet Holdings, Inc. | | | 6,500 | | | | 674 | |
| | | | | | | | | | |
| | Total | | | | | | | 86,282 | |
| | | | | | | | | | |
| | |
| | Industrials (10.8%) | | | | |
| | Alaska Air Group, Inc. | | | 69,500 | | | | 4,229 | |
| | The Boeing Co. | | | 40,200 | | | | 12,964 | |
| | Delta Air Lines, Inc. | | | 63,693 | | | | 3,178 | |
| | Emerson Electric Co. | | | 68,600 | | | | 4,099 | |
| | Flowserve Corp. | | | 9,881 | | | | 376 | |
| | General Electric Co. | | | 531,900 | | | | 4,026 | |
| | Harris Corp. | | | 79,252 | | | | 10,671 | |
| | Illinois Tool Works, Inc. | | | 7,300 | | | | 925 | |
| | Johnson Controls International PLC | | | 332,098 | | | | 9,847 | |
| | Nielsen Holdings PLC | | | 278,956 | | | | 6,508 | |
| | | | | | | | | | |
| | | Common Stocks (95.1%) | | Shares/
Par+ | | | Value
$ (000’s) | |
| | |
| | Industrials continued | | | | |
| | Northrop Grumman Corp. | | | 1,456 | | | | 357 | |
| | nVent Electric PLC | | | 56,500 | | | | 1,269 | |
| | PACCAR, Inc. | | | 32,100 | | | | 1,834 | |
| | Pentair PLC | | | 43,900 | | | | 1,659 | |
| | Southwest Airlines Co. | | | 55,700 | | | | 2,589 | |
| | Stericycle, Inc.* | | | 79,399 | | | | 2,913 | |
| | United Parcel Service, Inc. - Class B | | | 92,500 | | | | 9,022 | |
| | | | | | | | | | |
| | Total | | | | | | | 76,466 | |
| | | | | | | | | | |
| |
| | Information Technology (7.5%) | |
| | Applied Materials, Inc. | | | 105,500 | | | | 3,454 | |
| | Cisco Systems, Inc. | | | 269,787 | | | | 11,690 | |
| | Hewlett Packard Enterprise Co. | | | 98,400 | | | | 1,300 | |
| | Microsoft Corp. | | | 137,222 | | | | 13,938 | |
| | NXP Semiconductors NV | | | 17,186 | | | | 1,259 | |
| | QUALCOMM, Inc. | | | 242,500 | | | | 13,801 | |
| | TE Connectivity, Ltd. | | | 15,200 | | | | 1,150 | |
| | Texas Instruments, Inc. | | | 55,000 | | | | 5,197 | |
| | Western Digital Corp. | | | 29,300 | | | | 1,083 | |
| | | | | | | | | | |
| | Total | | | | | | | 52,872 | |
| | | | | | | | | | |
| | |
| | Materials (5.1%) | | | | |
| | Akzo Nobel NV, ADR | | | 45,200 | | | | 1,204 | |
| | CF Industries Holdings, | | | | | | | | |
| | Inc. | | | 158,884 | | | | 6,913 | |
| | DowDuPont, Inc. | | | 280,804 | | | | 15,017 | |
| | International Paper Co. | | | 155,437 | | | | 6,274 | |
| | Nucor Corp. | | | 39,300 | | | | 2,036 | |
| | PPG Industries, Inc. | | | 8,200 | | | | 838 | |
| | Vulcan Materials Co. | | | 35,300 | | | | 3,488 | |
| | | | | | | | | | |
| | Total | | | | | | | 35,770 | |
| | | | | | | | | | |
| | |
| | Real Estate (2.6%) | | | | |
| | Equity Residential | | | 99,500 | | | | 6,568 | |
| | Rayonier, Inc. | | | 146,906 | | | | 4,068 | |
| | SL Green Realty Corp. | | | 48,444 | | | | 3,831 | |
| | Weyerhaeuser Co. | | | 188,944 | | | | 4,130 | |
| | | | | | | | | | |
| | Total | | | | | | | 18,597 | |
| | | | | | | | | | |
| | |
| | Utilities (5.9%) | | | | | |
| | Duke Energy Corp. | | | 49,500 | | | | 4,272 | |
| | Edison International | | | 83,688 | | | | 4,751 | |
| | Evergy, Inc. | | | 63,477 | | | | 3,603 | |
| | NiSource, Inc. | | | 400,952 | | | | 10,164 | |
| | PG&E Corp.* | | | 110,222 | | | | 2,618 | |
| | Sempra Energy | | | 16,107 | | | | 1,743 | |
| | The Southern Co. | | | 325,779 | | | | 14,308 | |
| | | | | | | | | | |
| | Total | | | | | | | 41,459 | |
| | | | | | | | | | |
| | | |
| | Total Common Stocks | | | | | | | | |
| | (Cost: $642,604) | | | | | | | 670,061 | |
| | | | | | | | | | |
The Accompanying Notes are an Integral Part of the Financial Statements.
39
Equity Income Portfolio
| | | | | | | | | | |
| | | Corporate Bonds (0.4%) | | Shares/
Par+ | | | Value
$ (000’s) | |
| |
| | Consumer, Cyclical (0.4%) | |
| | Mattel, Inc., 6.750%, | | | | | | | | |
| | 12/31/25 144A | | | 2,780,000 | | | | 2,481 | |
| | Total | | | | | | | 2,481 | |
| | | | | | | | | | |
| | Total Corporate Bonds | | | | | | | | |
| | (Cost: $2,738) | | | | | | | 2,481 | |
| | | | | | | | | | |
| | Convertible Corporate Bonds (0.2%) | | | | | | | | |
| | |
| | Financial (0.2%) | | | | |
| | AXA SA, 7.250%, | | | | | | | | |
| | 5/15/21 144A | | | 1,460,000 | | | | 1,273 | |
| | | | | | | | | | |
| | Total | | | | | | | 1,273 | |
| | | | | | | | | | |
| | Total Convertible Corporate Bonds | | | | | | | | |
| | (Cost: $1,460) | | | | | | | 1,273 | |
| | | | | | | | | | |
| | | | | | | | | | |
| | | Convertible Preferred Stocks (2.5%) | | Shares/
Par+ | | | Value
$ (000’s) | |
| | |
| | Health Care (0.8%) | | | | |
| | Becton Dickinson and Co., 6.125%, 5/1/20 | | | 100,450 | | | | 5,793 | |
| | | | | | | | | | |
| | Total | | | | | | | 5,793 | |
| | | | | | | | | | |
| | |
| | Utilities (1.7%) | | | | |
| | DTE Energy Co.,
6.500%, 10/1/19 | | | 25,217 | | | | 1,303 | |
| | NextEra Energy, Inc.,
6.123%, 9/1/19 | | | 108,213 | | | | 6,237 | |
| | Sempra Energy,
6.750%, 7/15/21 | | | 11,107 | | | | 1,066 | |
| | Sempra Energy,
6.000%, 1/15/21 | | | 36,037 | | | | 3,428 | |
| | | | | | | | | | |
| | Total | | | | | | | 12,034 | |
| | | | | | | | | | |
| | Total Convertible Preferred Stocks | | | | | | | | |
| | (Cost: $16,321) | | | | | | | 17,827 | |
| | | | | | | | | | |
| | | | | | | | | | |
| | | Short-Term Investments (1.6%) | | Shares/
Par+ | | | Value
$ (000’s) | |
| |
| | Money Market Funds (1.6%) | |
| | State Street Institutional U.S. Government Money Market Fund - Premier Class 2.270%# | | | 11,301,494 | | | | 11,301 | |
| | | | | | | | | | |
| | Total | | | | | | | 11,301 | |
| | | | | | | | | | |
| | Total Short-Term Investments | | | | | | | | |
| | (Cost: $11,301) | | | | | | | 11,301 | |
| | | | | | | | | | |
| | Total Investments (99.8%) | | | | | | | | |
| | (Cost: $674,424)@ | | | | | | | 702,943 | |
| | | | | | | | | | |
| | Other Assets, Less | | | | | | | | |
| | Liabilities (0.2%) | | | | | | | 1,731 | |
| | | | | | | | | | |
| | Net Assets (100.0%) | | | | | | | 704,674 | |
| | | | | | | | | | |
| + | All par is stated in U.S Dollar unless otherwise noted. |
| | 144A Security exempt from registration under Rule 144A of the Securities Act of 1933. These securities may be resold as transactions exempt from registration, normally to qualified institutional buyers. At December 31, 2018 the value of these securities (in thousands) was $3,754 representing 0.6% of the net assets. |
| # | 7-Day yield as of 12/31/2018. |
| @ | At December 31, 2018, the aggregate cost of investments, including derivatives, for federal tax purposes (in thousands) was $675,492 and the net unrealized appreciation of investments based on that cost was $27,451 which is comprised of $101,228 aggregate gross unrealized appreciation and $73,777 aggregate gross unrealized depreciation. |
The following is a summary of the inputs used in valuing the Portfolio’s assets and liabilities at December 31, 2018. See Note 3 for additional information on portfolio valuation.
| | | | | | | | | | | | | | |
| | | Valuation Inputs | | | |
| Description | | Level 1 –
Quoted Prices | | | Level 2 –
Other Significant
Observable Inputs | | | Level 3 –
Significant
Unobservable Inputs | | | |
| | | | | | (Amounts in thousands) | | | | | | |
| Assets: | | | | | |
Common Stocks | | $ | 670,061 | | | $ | - | | | $ | - | | | |
Convertible Corporate Bonds | | | - | | | | 1,273 | | | | - | | | |
Convertible Preferred Stocks | | | 17,827 | | | | - | | | | - | | | |
Corporate Bonds | | | - | | | | 2,481 | | | | - | | | |
Short-Term Investments | | | 11,301 | | | | - | | | | - | | | |
Total Assets: | | $ | 699,189 | | | $ | 3,754 | | | $ | - | | | |
The Accompanying Notes are an Integral Part of the Financial Statements.
40
Mid Cap Growth Stock Portfolio (unaudited)
| | | | |
| Objective: | | Portfolio Strategy: | | Net Assets: |
| Long-term growth of capital. | | Invest primarily in common stocks of mid cap domestic companies selected on the basis of their potential for capital appreciation. | | $943 million |
PORTFOLIO OVERVIEW
Mason Street Advisors, LLC (“Mason Street Advisors”), the investment adviser for the Mid Cap Growth Stock Portfolio (the “Portfolio”), has engaged Wellington Management Company LLP (“Wellington”) to act assub-adviser for the Portfolio. The Portfolio invests primarily in common stocks of mid cap companies selected on the basis of their potential for capital appreciation. The Portfolio focuses on companies that are determined to be of high quality. The key characteristics of high quality companies include a leadership position within an industry, a strong balance sheet, a high return on equity, and/or a strong management team. The Portfolio seeks to reduce overall risk by diversifying across sectors, industry groups and companies. The Portfolio’s sector exposure relative to its benchmark is driven by an investment process which relies on fundamental company analysis and individual stock selection. The Portfolio invests primarily in U.S. common stocks. The Portfolio may also invest up to 20% of net assets in American Depositary Receipts and other securities of foreign issuers, includingnon-U.S. dollar denominated securities.
MARKET OVERVIEW
U.S. equities, as measured by the S&P 500® Index, posted negative results over the twelve-month period ending December 31, 2018. The U.S. Federal Reserve (the “Fed”) raised its benchmark interest rate by 25 basis points four times during the year, although it signaled a slower pace of interest rate increases heading into 2019. Bullish sentiment was exceptionally strong to start the year, as better-than-expected corporate profits helped drive U.S. equities higher. By the summer of 2018, however, talk of tariffs and trade wars had progressed to implementation, raising concerns in an otherwise strong economy. In the final months of 2018, worries surrounding slowing global growth, rich valuations, rising interest rates and heightened U.S. and Chinese trade tensions were at the forefront of investors’ minds. Returns in October and December were sharply negative, with the latter representing the largest U.S. equity market monthly decline seen this decade, culminating in the first year of negative U.S. equity returns since 2008. Returns varied by market capitalization. Large cap stocks, as measured by the S&P 500® Index, outperformed mid and small cap stocks, as measured by the S&P MidCap 400® Index and Russell 2000® Index.
PORTFOLIO RESULTS
The Portfolio returned (7.38%) for the twelve months ended December 31, 2018. By comparison, the Portfolio’s benchmark, the Russell Midcap® Growth Index (the “Index”), returned (4.75%). (The Index is unmanaged, cannot be invested in directly, and does not incur expenses.) According to Lipper® Analytical Services Inc., an independent mutual fund ranking agency, the average return in 2018 of the Mid Cap Growth Funds peer group was (4.27%).
Stock selection within the Health Care, Information Technology and Energy sectors drove relative underperformance during the period. In contrast, stock selection in the Industrials and Financials sectors partially offset the negative results. Sector allocation, a residual of the team’sbottom-up stock selection process, modestly contributed to relative performance results, mainly due to the Portfolio’s underweight allocation to Materials and overweight to Utilities.
Top detractors from relative return during the period included Information Technology company CommScope and Newfield Exploration in the Energy sector. CommScope reported earnings below expectations and announced that it was acquiring Arris, a telecommunications equipment manufacturer. The portfolio managers believed the deal will ultimately be beneficial and added modestly to the position. Newfield Exploration, a petroleum and natural gas exploration and production company, underperformed during the period as oil prices fell dramatically during the fourth quarter of 2018 amid ongoing concerns about excess supply and lower demand growth. Health Care company Alkermes also detracted due to a setback in approval of an important drug to treat depression.
Top contributors to relative performance included Keysight Technologies in the Information Technology sector and GrubHub, a Consumer Discretionary company. Keysight Technologies, a maker of electronic test and measurement equipment, was a strong performer throughout the period. The company’s revenue was bolstered by customer demand in Keysight’s key focus areas, including 5G, automotive and energy, and aerospace and defense. Grubhub, the online food ordering service, was also a strong performer as their quarterly results beat expectations and showed solid year-over-year revenue growth. The Portfolio’s position was eliminated during the period to take profits after shares rose substantially in
41
Mid Cap Growth Stock Portfolio (unaudited)
the past year. VeriSign, an Information Technology company, also contributed after a regulator allowed them to raise future prices.
PORTFOLIO MANAGER OUTLOOK
The following forward-looking comments are the opinion of Wellington, the Portfolio’ssub-adviser.
Based on ourbottom-up, company-specific research and stock selection, as of the end of the period, the Portfolio had overweight positions in the Financials, Health Care, Industrials, Utilities and Energy sectors. The Portfolio was underweight in the Consumer Discretionary, Information Technology, Consumer Staples, Communication Services, Real Estate and Materials sectors.
Despite the recent market selloff, we believe the fundamentals of the U.S. economy are sound, and we continue to find attractive company-specific opportunities to add to the Portfolio. Higher levels of volatility may persist as the market absorbs the effects of higher interest rates, trade policy, slower growth and political uncertainty, but we believe our diversified Portfolio of blue-chip, market-leading companies should outperform over the long term.
Relative Performance
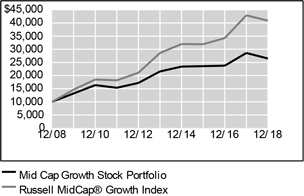
| | | | | | | | | | | | |
Average Annual Total Returns For Periods Ended December 31, 2018 | |
| | | 1 Year | | | 5 Years | | | 10 Years | |
Mid Cap Growth Stock Portfolio | | | -7.38 | % | | | 4.18 | % | | | 10.23 | % |
Russell MidCap® Growth Index | | | -4.75 | % | | | 7.42 | % | | | 15.12 | % |
Lipper® Variable Insurance Products (VIP) Mid Cap Growth Funds Average | | | -4.27 | % | | | 6.22 | % | | | 13.75 | % |
The performance data quoted represents past performance. Past performance is historical and does not guarantee future performance. Investment return and principal value will fluctuate, so that shares, when redeemed, may be worth more or less than their original cost. Current performance may be lower or higher than the performance data quoted. For the most recentmonth-end performance information visitwww.northwesternmutual.com.
This chart assumes an initial investment of $10,000 made on 12/31/08. Returns shown reflect fee waivers, deductions for management and other portfolio expenses, and reinvestment of all dividends. In the absence of fee
waivers, total return would be reduced. Returns exclude deductions for separate account sale loads and account fees. Please refer to the Benchmark Definitions section of this report for information about the indices cited in the above chart and graph.
Investing in small andmedium-sized companies involves a greater degree of risk than investing in large company stocks.
The Portfolio may invest a relatively high percentage of its assets in a particular sector. The Portfolio will have greater exposure to the risks associated with that sector and its performance will be tied more closely to the performance of the sector.
Top 10 Equity Holdings12/31/18
| | | | | | |
| Security Description | | % of Net Assets | | | |
Genpact, Ltd. | | | 2.4 | % | | |
WEX, Inc. | | | 2.1 | % | | |
Lennox International, Inc. | | | 2.1 | % | | |
VeriSign, Inc. | | | 2.0 | % | | |
Markel Corp. | | | 2.0 | % | | |
CDW Corp. | | | 1.7 | % | | |
IDEX Corp. | | | 1.7 | % | | |
TransUnion | | | 1.6 | % | | |
Teradata Corp. | | | 1.6 | % | | |
Ball Corp. | | | 1.6 | % | | |
42
Mid Cap Growth Stock Portfolio (unaudited)
Sector Allocation12/31/18
| | | | | | |
| Sector | | % of Net Assets | | | |
Information Technology | | | 27.5 | % | | |
Health Care | | | 19.2 | % | | |
Industrials | | | 19.0 | % | | |
Financials | | | 14.5 | % | | |
Consumer Discretionary | | | 7.0 | % | | |
Energy | | | 3.1 | % | | |
Materials | | | 2.8 | % | | |
Utilities | | | 2.6 | % | | |
Communication Services | | | 2.5 | % | | |
Real Estate | | | 1.4 | % | | |
Short-Term Investments & Other Net Assets | | | 0.4 | % | | |
Sector Allocation and Top 10 Holdings are subject to change.
43
Mid Cap Growth Stock Portfolio
SCHEDULE OF INVESTMENTS
December 31, 2018
| | | | | | | | |
| Common Stocks (99.6%) | | Shares/
Par+ | | | Value
$ (000’s) | |
| |
Communication Services (2.5%) | | | | | |
CarGurus, Inc.* | | | 112,935 | | | | 3,809 | |
TripAdvisor, Inc.* | | | 227,167 | | | | 12,253 | |
Zillow Group, Inc. - Class A* | | | 63,905 | | | | 2,009 | |
Zillow Group, Inc. - Class C* | | | 174,857 | | | | 5,522 | |
| | | | | | | | |
Total | | | | | | | 23,593 | |
| | | | | | | | |
| |
Consumer Discretionary (7.0%) | | | | | |
Aramark | | | 294,431 | | | | 8,530 | |
CarMax, Inc.* | | | 159,069 | | | | 9,978 | |
Carter’s, Inc. | | | 102,368 | | | | 8,355 | |
Choice Hotels International, Inc. | | | 148,689 | | | | 10,643 | |
Etsy, Inc.* | | | 150,300 | | | | 7,150 | |
NVR, Inc.* | | | 5,675 | | | | 13,830 | |
Service Corp. International | | | 27,273 | | | | 1,098 | |
Under Armour, Inc. - Class C* | | | 384,608 | | | | 6,219 | |
| | | | | | | | |
Total | | | | | | | 65,803 | |
| | | | | | | | |
| |
Energy (3.1%) | | | | | |
Diamondback Energy, Inc. | | | 91,832 | | | | 8,513 | |
Newfield Exploration Co.* | | | 468,622 | | | | 6,870 | |
WPX Energy, Inc.* | | | 1,249,442 | | | | 14,181 | |
| | | | | | | | |
Total | | | | | | | 29,564 | |
| | | | | | | | |
| |
Financials (14.5%) | | | | | |
Alleghany Corp. | | | 13,088 | | | | 8,158 | |
Credit Acceptance Corp.* | | | 28,347 | | | | 10,822 | |
Cullen / Frost Bankers, Inc. | | | 98,770 | | | | 8,686 | |
FactSet Research Systems, Inc. | | | 51,061 | | | | 10,219 | |
Fairfax Financial Holdings, Ltd. | | | 14,118 | | | | 6,215 | |
First Citizens BancShares, Inc. - Class A | | | 18,794 | | | | 7,086 | |
First Republic Bank | | | 133,884 | | | | 11,634 | |
FNF Group | | | 166,663 | | | | 5,240 | |
M&T Bank Corp. | | | 75,591 | | | | 10,819 | |
Markel Corp.* | | | 17,677 | | | | 18,350 | |
Northern Trust Corp. | | | 94,958 | | | | 7,937 | |
Pinnacle Financial Partners, Inc. | | | 78,640 | | | | 3,625 | |
Prosperity Bancshares, Inc. | | | 123,590 | | | | 7,700 | |
South State Corp. | | | 89,839 | | | | 5,386 | |
W.R. Berkley Corp. | | | 95,641 | | | | 7,069 | |
| | | | | | | | |
| Common Stocks (99.6%) | | Shares/
Par+ | | | Value
$ (000’s) | |
| |
Financials continued | | | | | |
White Mountains Insurance Group, Ltd. | | | 9,238 | | | | 7,923 | |
| | | | | | | | |
Total | | | | | | | 136,869 | |
| | | | | | | | |
| |
Health Care (19.2%) | | | | | |
Aerie Pharmaceuticals, Inc.* | | | 195,022 | | | | 7,040 | |
Agios Pharmaceuticals, Inc.* | | | 137,180 | | | | 6,325 | |
Alkermes PLC* | | | 268,986 | | | | 7,938 | |
Alnylam Pharmaceuticals, Inc.* | | | 103,609 | | | | 7,554 | |
Bio-Techne Corp. | | | 59,400 | | | | 8,596 | |
Bluebird Bio, Inc.* | | | 74,112 | | | | 7,352 | |
Hill-Rom Holdings, Inc. | | | 114,519 | | | | 10,141 | |
Integra LifeSciences Holdings Corp.* | | | 194,529 | | | | 8,773 | |
Ionis Pharmaceuticals, Inc.* | | | 179,123 | | | | 9,684 | |
Ironwood Pharmaceuticals, Inc.* | | | 369,995 | | | | 3,833 | |
Mettler-Toledo International, Inc.* | | | 16,549 | | | | 9,360 | |
NuVasive, Inc.* | | | 131,074 | | | | 6,496 | |
PRA Health Sciences, Inc.* | | | 102,043 | | | | 9,384 | |
Repligen Corp.* | | | 97,205 | | | | 5,127 | |
Sage Therapeutics, Inc.* | | | 83,258 | | | | 7,975 | |
Seattle Genetics, Inc.* | | | 202,139 | | | | 11,453 | |
Steris PLC | | | 98,810 | | | | 10,558 | |
Teleflex, Inc. | | | 56,163 | | | | 14,517 | |
Ultragenyx Pharmaceutical, Inc.* | | | 159,962 | | | | 6,955 | |
Varian Medical | | | | | | | | |
Systems, Inc.* | | | 100,990 | | | | 11,443 | |
Veeva Systems, Inc.- Class A* | | | 116,285 | | | | 10,387 | |
| | | | | | | | |
Total | | | | | | | 180,891 | |
| | | | | | | | |
| |
Industrials (19.0%) | | | | | |
AMERCO | | | 29,291 | | | | 9,611 | |
Cimpress NV* | | | 62,004 | | | | 6,412 | |
Cintas Corp. | | | 53,405 | | | | 8,972 | |
CoStar Group, Inc.* | | | 28,593 | | | | 9,646 | |
Fastenal Co. | | | 180,766 | | | | 9,452 | |
Genesee & Wyoming, Inc. - Class A* | | | 174,392 | | | | 12,909 | |
HEICO Corp. - Class A | | | 119,433 | | | | 7,524 | |
IDEX Corp. | | | 124,087 | | | | 15,667 | |
JetBlue Airways Corp.* | | | 471,414 | | | | 7,571 | |
KAR Auction Services, Inc. | | | 218,134 | | | | 10,409 | |
| | | | | | | | |
| Common Stocks (99.6%) | | Shares/
Par+ | | | Value
$ (000’s) | |
| |
Industrials continued | | | | | |
Lennox International, Inc. | | | 89,315 | | | | 19,547 | |
Lincoln Electric Holdings, Inc. | | | 121,799 | | | | 9,604 | |
The Middleby Corp.* | | | 60,553 | | | | 6,221 | |
PACCAR, Inc. | | | 126,361 | | | | 7,220 | |
Spirit Airlines, Inc.* | | | 140,246 | | | | 8,123 | |
TransUnion | | | 270,615 | | | | 15,371 | |
UniFirst Corp. | | | 29,797 | | | | 4,263 | |
Waste Connections, Inc. | | | 138,476 | | | | 10,282 | |
| | | | | | | | |
Total | | | | | | | 178,804 | |
| | | | | | | | |
| |
Information Technology (27.5%) | | | | | |
2U, Inc.* | | | 115,958 | | | | 5,765 | |
Akamai Technologies, Inc.* | | | 147,543 | | | | 9,012 | |
Black Knight, Inc.* | | | 154,289 | | | | 6,952 | |
Blackbaud, Inc. | | | 167,403 | | | | 10,530 | |
CDW Corp. | | | 198,865 | | | | 16,118 | |
CommScope Holding Co., Inc.* | | | 464,974 | | | | 7,621 | |
EPAM Systems, Inc.* | | | 62,163 | | | | 7,212 | |
F5 Networks, Inc.* | | | 60,218 | | | | 9,757 | |
Fair Isaac Corp.* | | | 54,484 | | | | 10,189 | |
Genpact, Ltd. | | | 829,579 | | | | 22,390 | |
Global Payments, Inc. | | | 129,084 | | | | 13,312 | |
Guidewire Software, Inc.* | | | 136,600 | | | | 10,959 | |
II-VI, Inc.* | | | 341,178 | | | | 11,075 | |
Keysight Technologies, Inc.* | | | 163,680 | | | | 10,161 | |
MKS Instruments, Inc. | | | 125,179 | | | | 8,088 | |
Monolithic Power Systems | | | 68,716 | | | | 7,988 | |
National Instruments Corp. | | | 248,347 | | | | 11,270 | |
PTC, Inc.* | | | 129,297 | | | | 10,719 | |
Silicon Laboratories, Inc.* | | | 106,320 | | | | 8,379 | |
Teradata Corp.* | | | 399,705 | | | | 15,333 | |
Total System Services, Inc. | | | 109,102 | | | | 8,869 | |
VeriSign, Inc.* | | | 124,955 | | | | 18,530 | |
WEX, Inc.* | | | 140,419 | | | | 19,667 | |
| | | | | | | | |
Total | | | | | | | 259,896 | |
| | | | | | | | |
| |
Materials (2.8%) | | | | | |
Ball Corp. | | | 323,407 | | | | 14,870 | |
Packaging Corp. of America | | | 83,344 | | | | 6,956 | |
Silgan Holdings, Inc. | | | 192,769 | | | | 4,553 | |
| | | | | | | | |
Total | | | | | | | 26,379 | |
| | | | | | | | |
The Accompanying Notes are an Integral Part of the Financial Statements.
44
Mid Cap Growth Stock Portfolio
| | | | | | | | |
| Common Stocks (99.6%) | | Shares/
Par+ | | | Value
$ (000’s) | |
| |
Real Estate (1.4%) | | | | | |
Equity Commonwealth | | | 280,575 | | | | 8,420 | |
Redfin Corp.* | | | 357,326 | | | | 5,146 | |
| | | | | | | | |
Total | | | | | | | 13,566 | |
| | | | | | | | |
| |
Utilities (2.6%) | | | | | |
Black Hills Corp. | | | 88,938 | | | | 5,584 | |
NiSource, Inc. | | | 172,837 | | | | 4,381 | |
UGI Corp. | | | 268,559 | | | | 14,328 | |
| | | | | | | | |
Total | | | | | | | 24,293 | |
| | | | | | | | |
| | |
Total Common Stocks
| | | | | | | | |
(Cost: $1,009,325) | | | | | | | 939,658 | |
| | | | | | | | |
| | | | | | | | |
| Short-Term Investments (0.0%) | | Shares/
Par+ | | | Value
$ (000’s) | |
| |
Money Market Funds (0.0%) | | | | | |
State Street Institutional U.S. Government Money Market Fund - Premier Class 2.270%# | | | 183,993 | | | | 184 | |
| | | | | | | | |
Total | | | | | | | 184 | |
| | | | | | | | |
| | |
Total Short-Term
Investments | | | | | | | | |
(Cost: $184) | | | | | | | 184 | |
| | | | | | | | |
| | | | | | | | |
| | | Shares/
Par+ | | | Value
$ (000’s) | |
| | |
Total Investments (99.6%) | | | | | | | | |
(Cost: $1,009,509)@ | | | | | | | 939,842 | |
| | | | | | | | |
Other Assets, Less | | | | | | | | |
Liabilities (0.4%) | | | | | | | 3,528 | |
| | | | | | | | |
Net Assets (100.0%) | | | | | | | 943,370 | |
| | | | | | | | |
| + | All par is stated in U.S Dollar unless otherwise noted. |
| # | 7-Day yield as of 12/31/2018. |
| @ | At December 31, 2018, the aggregate cost of investments, including derivatives, for federal tax purposes (in thousands) was $1,010,263 and the net unrealized depreciation of investments based on that cost was $70,421 which is comprised of $53,738 aggregate gross unrealized appreciation and $124,159 aggregate gross unrealized depreciation. |
The following is a summary of the inputs used in valuing the Portfolio’s assets and liabilities at December 31, 2018. See Note 3 for additional information on portfolio valuation.
| | | | | | | | | | | | | | |
| | | Valuation Inputs | | | |
| Description | | Level 1 – Quoted Prices | | | Level 2 –
Other Significant
Observable Inputs | | | Level 3 –
Significant
Unobservable Inputs | | | |
| | | (Amounts in thousands) | | | |
Assets: | | | | | | | | | | | | | | |
Common Stocks | | $ | 939,658 | | | $ | - | | | $ | - | | | |
Short-Term Investments | | | 184 | | | | - | | | | - | | | |
Total Assets: | | $ | 939,842 | | | $ | - | | | $ | - | | | |
The Accompanying Notes are an Integral Part of the Financial Statements.
45
Index 400 Stock Portfolio (unaudited)
| | | | |
| Objective: | | Portfolio Strategy: | | Net Assets: |
| Investment results that approximate the performance of the S&P MidCap 400® Index. | | Invest in stocks that make up the S&P MidCap 400® Index, holding each stock in approximately the same proportion as its weighting in the Index. | | $793 million |
PORTFOLIO OVERVIEW
Mason Street Advisors is the investment adviser for the Index 400 Stock Portfolio (the “Portfolio”). The Portfolio seeks investment results that approximate the performance of the S&P MidCap 400® Index, which is composed of the stocks of companies whose capitalizations generally are smaller than those of companies that comprise the S&P 500® Index. The S&P MidCap 400® Index does not include the stocks of the very large companies that account for most of the weighting in the S&P 500® Index. The Portfolio attempts to achieve its objective by investing all, or substantially all, of its assets in the stocks that make up the S&P MidCap 400® Index, holding each stock in approximately the same proportion as its weighting in the Index. This is known as a full replication strategy. The Portfolio may also invest in S&P MidCap 400® Index stock futures and, to a lesser extent, purchase (long) total return equity swap agreements to help achieve full replication.
MARKET OVERVIEW
U.S. equity markets hit record highs until a sharpsell-off in the fourth quarter drove stocks lower for the year. Early gains were driven by strong economic fundamentals, high consumer spending and stimulus from tax reform. Markets peaked in October, however, as investors became increasingly concerned that the pace of the U.S. Federal Reserve’s (the “Fed”) interest rate hikes could hurt economic growth and corporate earnings.
Markets were further rattled by several developments late in the year, including lower international growth forecasts, an escalation of the trade dispute between the U.S. and China and a partial U.S. government shutdown. Following the confluence of negative news, market sentiment turned negative, and investors began to consider the possibility of a recession in 2019.
In this environment, large cap stocks, as represented by the S&P 500® Index, posted a return of (4.38%), outperforming the S&P SmallCap 600® and the S&P MidCap 400® Indices, which returned (8.48%) and (11.08%), respectively. Meanwhile, the broader bond market, as represented by the Bloomberg Barclays® U.S. Aggregate Index, was relatively unchanged, while the Bloomberg Barclays® U.S. Corporate High Yield Index declined (2.08%).
PORTFOLIO RESULTS
The Index 400 Stock Portfolio delivered a total return of (11.33%) for the twelve months ended December 31, 2018, trailing the S&P MidCap 400® Index (the “Index”), which returned (11.08%). (The Index is unmanaged, cannot be invested in directly, and does not incur expenses.) Portfolio performance slightly lagged the Index due to transaction costs, administrative expenses, cash flow effects and costs associated with the use of stock index futures contracts. According to Lipper® Analytical Services, Inc., an independent mutual fund ranking agency, the average return in 2018 of the Mid Cap Core Funds peer group was (10.83%). However, the Mid Cap Core Funds peer group is not strictly comparable to the Portfolio because many of the funds in the group are actively managed.
Nine of the Index’s eleven sectors posted negative returns for the year. The largest detractor from the Index’s return was the Financials sector, where bank stocks were particularly affected by fears of an economic slowdown. Banks tend to be sensitive to economic downturns, which reduce demand for credit products and increase the risk of loan defaults. Stiff competition for deposits also hindered bank profitability, as customers began to demand higher rates of return. Industrials companies were major detractors from the Index’s return, with increased tariffs taking a toll on the sector. Tariffs increased input costs and disrupted supply chains, while a slowdown in international demand put pressure on profit margins.
Consumer Discretionary stocks were hurt by a worsening sentiment about the economy, as every industry group declined despite solid consumer spending. Energy companies also detracted from the Index’s return. Lower estimates of energy demand amid ample supply led to a sharp decline in oil prices late in the year. Materials stocks fell due to lower prices for many commodities and weakness in the chemicals industry. Real Estate companies were hurt by higher interest rates, which increased borrowing costs for the highly leveraged sector.
46
Index 400 Stock Portfolio (unaudited)
At the other end of the spectrum, Utilities stocks performed well, as investors sought out stocks with relatively stable revenue in a volatile market environment. Health Care companies added modestly to the Index’s return, benefiting from ongoing demographic shifts and faster drug approvals from the Food and Drug Administration.
Relative Performance
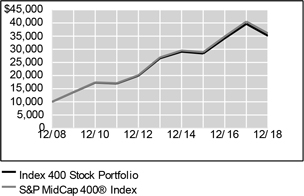
| | | | | | | | | | | | |
Average Annual Total Returns
For Periods Ended December 31, 2018 | |
| | | 1 Year | | | 5 Years | | | 10 Years | |
Index 400 Stock Portfolio | | | -11.33 | % | | | 5.74 | % | | | 13.39 | % |
S&P MidCap 400® Index | | | -11.08 | % | | | 6.03 | % | | | 13.68 | % |
Lipper® Variable Insurance Products (VIP) Mid Cap Core Funds Average | | | -10.83 | % | | | 4.61 | % | | | 12.25 | % |
The performance data quoted represents past performance. Past performance is historical and does not guarantee future performance. Investment return and principal value will fluctuate, so that shares, when redeemed, may be worth more or less than their original cost. Current performance may be lower or higher than the performance data quoted. For the most recentmonth-end performance information visitwww.northwesternmutual.com.
This chart assumes an initial investment of $10,000 made on 12/31/08. Returns shown reflect fee waivers, deductions for management and other portfolio expenses, and reinvestment of all dividends. In the absence of fee waivers, total return would be reduced. Returns exclude deductions for separate account sale loads and account fees. Please refer to the Benchmark Definitions section of this report for information about the indices cited in the above chart and graph.
“Standard & Poor’s®”, “S&P®”, “S&P MidCap 400 Index” and “Standard & Poor’s MidCap 400 Index” are trademarks of The McGraw-Hill Companies, Inc. and have been licensed for use by Northwestern MutualLife Insurance Company. The Portfolio is not sponsored, endorsed, sold or promoted by Standard & Poor’s, and Standard & Poor’s
makes no representation regarding the advisability of investing in the Portfolio.
Investing in small andmedium-sized companies involves a greater degree of risk than investing in large company stocks.
The Portfolio may invest in derivative instruments such as futures and, to a lesser extent, swap agreements to help achieve full replication. Use of these instruments may involve certain costs and imposes certain risks such as liquidity risk, market risk, credit risk, management risk and the risk of mispricing or improper valuation. Certain derivatives involve leverage, which could magnify losses, and portfolios investing in derivatives could lose more than the principal amount invested in those instruments.
Top 10 Equity Holdings12/31/18
| | | | |
Security Description | | | % of Net Assets | |
Teleflex, Inc. | | | 0.8% | |
Atmos Energy Corp. | | | 0.7% | |
Domino’s Pizza, Inc. | | | 0.7% | |
IDEX Corp. | | | 0.6% | |
UGI Corp. | | | 0.6% | |
Alleghany Corp. | | | 0.6% | |
Steris PLC | | | 0.6% | |
PTC, Inc. | | | 0.6% | |
Reinsurance Group of America, Inc. | | | 0.6% | |
Zebra Technologies Corp. - Class A | | | 0.6% | |
Sector Allocation12/31/18
| | | | |
Sector | | | % of Net Assets | |
Financials | | | 16.1% | |
Industrials | | | 15.0% | |
Information Technology | | | 14.9% | |
Consumer Discretionary | | | 11.5% | |
Health Care | | | 9.8% | |
Real Estate | | | 9.5% | |
Materials | | | 6.5% | |
Utilities | | | 5.5% | |
Energy | | | 3.7% | |
Consumer Staples | | | 2.9% | |
Communication Services | | | 2.4% | |
Short-Term Investments & Other Net Assets | | | 2.2% | |
Sector Allocation and Top 10 Holdings are subject to change.
47
Index 400 Stock Portfolio
SCHEDULE OF INVESTMENTS
December 31, 2018
| | | | | | | | |
| Common Stocks (97.8%) | | Shares/
Par+ | | | Value
$ (000’s) | |
|
Communication Services (2.4%) | |
AMC Networks, Inc. - Class A* | | | 23,595 | | | | 1,295 | |
Cable One, Inc. | | | 2,599 | | | | 2,132 | |
Cars.com, Inc.* | | | 33,043 | | | | 710 | |
Cinemark Holdings, Inc. | | | 55,685 | | | | 1,994 | |
John Wiley & Sons, Inc. - Class A | | | 23,694 | | | | 1,113 | |
Live Nation Entertainment, Inc.* | | | 72,442 | | | | 3,568 | |
Meredith Corp. | | | 20,889 | | | | 1,085 | |
The New York Times Co. -Class A | | | 73,943 | | | | 1,648 | |
TEGNA, Inc. | | | 112,775 | | | | 1,226 | |
Telephone and Data Systems, Inc. | | | 48,691 | | | | 1,584 | |
World Wrestling Entertainment, Inc. Class A | | | 22,741 | | | | 1,699 | |
Yelp, Inc.* | | | 40,038 | | | | 1,401 | |
| | | | | | | | |
Total | | | | | | | 19,455 | |
| | | | | | | | |
| |
Consumer Discretionary (11.5%) | | | | | |
Aaron’s, Inc. | | | 35,930 | | | | 1,511 | |
Adient PLC | | | 45,496 | | | | 685 | |
Adtalem Global Education, Inc.* | | | 30,771 | | | | 1,456 | |
American Eagle Outfitters, Inc. | | | 88,259 | | | | 1,706 | |
AutoNation, Inc.* | | | 30,146 | | | | 1,076 | |
Bed Bath & Beyond, Inc. | | | 72,311 | | | | 819 | |
Big Lots, Inc. | | | 21,131 | | | | 611 | |
Boyd Gaming Corp. | | | 42,317 | | | | 879 | |
Brinker International, Inc. | | | 20,219 | | | | 889 | |
Brunswick Corp. | | | 45,435 | | | | 2,110 | |
Carter’s, Inc. | | | 24,016 | | | | 1,960 | |
The Cheesecake Factory, Inc. | | | 21,847 | | | | 951 | |
Churchill Downs, Inc. | | | 6,256 | | | | 1,526 | |
Cracker Barrel Old Country Store, Inc. | | | 12,589 | | | | 2,013 | |
Dana Holding Corp. | | | 75,775 | | | | 1,033 | |
Deckers Outdoor Corp.* | | | 15,254 | | | | 1,952 | |
Delphi Technologies PLC | | | 46,352 | | | | 664 | |
Dick’s Sporting Goods, Inc. | | | 38,637 | | | | 1,205 | |
Dillard’s, Inc. - Class A | | | 9,679 | | | | 584 | |
Domino’s Pizza, Inc. | | | 21,788 | | | | 5,403 | |
Dunkin’ Brands Group, Inc. | | | 43,265 | | | | 2,774 | |
Eldorado Resorts, Inc.* | | | 34,051 | | | | 1,233 | |
Five Below, Inc.* | | | 29,207 | | | | 2,988 | |
| | | | | | | | |
| Common Stocks (97.8%) | | Shares/
Par+ | | | Value
$ (000’s) | |
| |
Consumer Discretionary continued | | | | | |
Gentex Corp. | | | 137,297 | | | | 2,775 | |
Graham Holdings Co. Class B | | | 2,272 | | | | 1,455 | |
Helen of Troy, Ltd.* | | | 13,829 | | | | 1,814 | |
International Speedway Corp. - Class A | | | 12,803 | | | | 562 | |
Jack in the Box, Inc. | | | 13,484 | | | | 1,047 | |
KB Home | | | 45,149 | | | | 862 | |
Marriott Vacations Worldwide Corp. | | | 21,435 | | | | 1,511 | |
The Michaels Cos., Inc.* | | | 47,082 | | | | 638 | |
Murphy USA, Inc.* | | | 15,706 | | | | 1,204 | |
NVR, Inc.* | | | 1,780 | | | | 4,338 | |
Ollie’s Bargain Outlet Holdings, Inc.* | | | 27,009 | | | | 1,796 | |
Papa John’s International, Inc. | | | 11,730 | | | | 467 | |
Penn National Gaming, Inc.* | | | 56,654 | | | | 1,067 | |
Polaris Industries, Inc. | | | 30,419 | | | | 2,333 | |
Pool Corp. | | | 21,090 | | | | 3,135 | |
Sally Beauty Holdings, Inc.* | | | 62,932 | | | | 1,073 | |
Scientific Games Corp. - Class A* | | | 28,821 | | | | 515 | |
Service Corp. International | | | 94,783 | | | | 3,816 | |
Signet Jewelers, Ltd. | | | 27,192 | | | | 864 | |
Six Flags Entertainment Corp. | | | 37,586 | | | | 2,091 | |
Skechers U.S.A., Inc. - Class A* | | | 70,127 | | | | 1,605 | |
Sotheby’s* | | | 18,229 | | | | 724 | |
Tempur Sealy International, Inc.* | | | 23,979 | | | | 993 | |
Texas Roadhouse, Inc. | | | 34,855 | | | | 2,081 | |
Thor Industries, Inc. | | | 26,277 | | | | 1,366 | |
Toll Brothers, Inc. | | | 71,014 | | | | 2,339 | |
TRI Pointe Homes, Inc.* | | | 74,486 | | | | 814 | |
Tupperware Brands Corp. | | | 25,447 | | | | 803 | |
Urban Outfitters, Inc.* | | | 39,468 | | | | 1,310 | |
Visteon Corp.* | | | 15,143 | | | | 913 | |
Weight Watchers International, Inc.* | | | 20,305 | | | | 783 | |
The Wendy’s Co. | | | 97,976 | | | | 1,529 | |
Williams-Sonoma, Inc. | | | 41,985 | | | | 2,118 | |
Wyndham Destinations, Inc. | | | 51,046 | | | | 1,830 | |
Wyndham Hotels & Resorts, Inc. | | | 51,953 | | | | 2,357 | |
| | | | | | | | |
Total | | | | | | | 90,956 | |
| | | | | | | | |
| | | | | | | | |
| Common Stocks (97.8%) | | Shares/
Par+ | | | Value
$ (000’s) | |
| |
Consumer Staples (2.9%) | | | | | |
The Boston Beer Co., Inc. - Class A* | | | 4,506 | | | | 1,085 | |
Casey’s General Stores, Inc. | | | 19,174 | | | | 2,457 | |
Edgewell Personal Care Co.* | | | 28,307 | | | | 1,057 | |
Energizer Holdings, Inc. | | | 31,223 | | | | 1,410 | |
Flowers Foods, Inc. | | | 96,107 | | | | 1,775 | |
The Hain Celestial Group, Inc.* | | | 46,877 | | | | 744 | |
Ingredion, Inc. | | | 37,035 | | | | 3,385 | |
Lancaster Colony Corp. | | | 10,223 | | | | 1,808 | |
Nu Skin Enterprises, Inc. | | | 29,097 | | | | 1,785 | |
Post Holdings, Inc.* | | | 34,928 | | | | 3,113 | |
Sanderson Farms, Inc. | | | 10,527 | | | | 1,045 | |
Sprouts Farmers Market, Inc.* | | | 66,839 | | | | 1,572 | |
Tootsie Roll Industries, Inc. | | | 9,710 | | | | 324 | |
TreeHouse Foods, Inc.* | | | 29,331 | | | | 1,487 | |
| | | | | | | | |
Total | | | | | | | 23,047 | |
| | | | | | | | |
| |
Energy (3.7%) | | | | | |
Apergy Corp.* | | | 40,511 | | | | 1,097 | |
Callon Petroleum Co.* | | | 119,207 | | | | 774 | |
Chesapeake Energy Corp.* | | | 478,605 | | | | 1,005 | |
CNX Resources Corp. * | | | 106,646 | | | | 1,218 | |
Core Laboratories N.V. | | | 23,159 | | | | 1,382 | |
Diamond Offshore Drilling, Inc.* | | | 33,834 | | | | 319 | |
Dril-Quip, Inc.* | | | 18,740 | | | | 563 | |
Ensco PLC - Class A | | | 228,955 | | | | 815 | |
EQT Corp. | | | 133,269 | | | | 2,517 | |
Equitrans Midstream Corp.* | | | 106,549 | | | | 2,133 | |
Matador Resources Co.* | | | 54,233 | | | | 842 | |
McDermott International, Inc.* | | | 94,590 | | | | 619 | |
Murphy Oil Corp. | | | 85,208 | | | | 1,993 | |
Oasis Petroleum, Inc.* | | | 140,109 | | | | 775 | |
Oceaneering International, Inc.* | | | 51,612 | | | | 624 | |
Patterson-UTI Energy, Inc. | | | 113,882 | | | | 1,179 | |
PBF Energy, Inc. | | | 62,799 | | | | 2,052 | |
QEP Resources, Inc.* | | | 124,022 | | | | 698 | |
Range Resources Corp. | | | 108,474 | | | | 1,038 | |
Rowan Cos., PLC - Class A* | | | 66,559 | | | | 558 | |
SM Energy Co. | | | 54,041 | | | | 837 | |
The Accompanying Notes are an Integral Part of the Financial Statements.
48
Index 400 Stock Portfolio
| | | | | | | | |
| Common Stocks (97.8%) | | Shares/
Par+ | | | Value
$ (000’s) | |
| |
Energy continued | | | | | |
Southwestern Energy Co.* | | | 304,474 | | | | 1,038 | |
Transocean, Ltd.* | | | 265,014 | | | | 1,839 | |
World Fuel Services Corp. | | | 35,216 | | | | 754 | |
WPX Energy, Inc.* | | | 206,941 | | | | 2,349 | |
| | | | | | | | |
Total | | | | | | | 29,018 | |
| | | | | | | | |
| |
Financials (16.1%) | | | | | |
Alleghany Corp. | | | 7,772 | | | | 4,844 | |
American Financial Group, Inc. | | | 36,933 | | | | 3,344 | |
Aspen Insurance Holdings, Ltd. | | | 31,271 | | | | 1,313 | |
Associated Banc-Corp. | | | 86,837 | | | | 1,719 | |
BancorpSouth Bank | | | 47,511 | | | | 1,242 | |
Bank of Hawaii Corp. | | | 21,870 | | | | 1,472 | |
Bank OZK | | | 63,320 | | | | 1,446 | |
Brown & Brown, Inc. | | | 122,856 | | | | 3,386 | |
Cathay General Bancorp | | | 40,344 | | | | 1,353 | |
Chemical Financial Corp. | | | 37,423 | | | | 1,370 | |
CNO Financial Group, Inc. | | | 86,243 | | | | 1,283 | |
Commerce Bancshares, Inc. | | | 51,998 | | | | 2,931 | |
Cullen / Frost Bankers, Inc. | | | 33,494 | | | | 2,945 | |
East West Bancorp, Inc. | | | 75,930 | | | | 3,305 | |
Eaton Vance Corp. | | | 61,038 | | | | 2,147 | |
Evercore, Inc. - Class A | | | 21,199 | | | | 1,517 | |
F.N.B. Corp. | | | 169,867 | | | | 1,672 | |
FactSet Research Systems, Inc. | | | 19,924 | | | | 3,987 | |
Federated Investors, Inc. - Class B | | | 50,006 | | | | 1,328 | |
First American Financial Corp. | | | 58,555 | | | | 2,614 | |
First Horizon National Corp. | | | 169,682 | | | | 2,233 | |
Fulton Financial Corp. | | | 92,239 | | | | 1,428 | |
Genworth Financial, Inc. - Class A* | | | 262,298 | | | | 1,222 | |
Hancock Holding Co. | | | 44,610 | | | | 1,546 | |
Hanover Insurance Group, Inc. | | | 22,174 | | | | 2,589 | |
Home BancShares, Inc. | | | 83,336 | | | | 1,362 | |
Interactive Brokers Group, Inc. - Class A | | | 39,329 | | | | 2,149 | |
International Bancshares Corp. | | | 28,761 | | | | 989 | |
Janus Henderson Group, PLC | | | 87,397 | | | | 1,811 | |
Kemper Corp. | | | 31,880 | | | | 2,116 | |
Legg Mason, Inc. | | | 44,800 | | | | 1,143 | |
LendingTree, Inc.* | | | 3,897 | | | | 856 | |
MarketAxess Holdings, Inc. | | | 19,691 | | | | 4,161 | |
| | | | | | | | |
| Common Stocks (97.8%) | | Shares/
Par+ | | | Value
$ (000’s) | |
| |
Financials continued | | | | | |
MB Financial, Inc. | | | 44,123 | | | | 1,749 | |
Mercury General Corp. | | | 14,204 | | | | 735 | |
Navient Corp. | | | 120,259 | | | | 1,059 | |
New York Community Bancorp, Inc. | | | 256,841 | | | | 2,417 | |
Old Republic International Corp. | | | 149,014 | | | | 3,065 | |
PacWest Bancorp | | | 63,783 | | | | 2,123 | |
Pinnacle Financial Partners, Inc. | | | 38,351 | | | | 1,768 | |
Primerica, Inc. | | | 22,491 | | | | 2,198 | |
Prosperity Bancshares, Inc. | | | 34,753 | | | | 2,165 | |
Reinsurance Group of America, Inc. | | | 32,882 | | | | 4,611 | |
RenaissanceRe Holdings, Ltd. | | | 21,091 | | | | 2,820 | |
SEI Investments Co. | | | 68,437 | | | | 3,162 | |
Signature Bank | | | 27,962 | | | | 2,875 | |
SLM Corp.* | | | 228,200 | | | | 1,896 | |
Sterling Bancorp | | | 117,556 | | | | 1,941 | |
Stifel Financial Corp. | | | 37,720 | | | | 1,562 | |
Synovus Financial Corp. | | | 86,750 | | | | 2,775 | |
TCF Financial Corp. | | | 87,373 | | | | 1,703 | |
Texas Capital Bancshares, Inc.* | | | 26,285 | | | | 1,343 | |
Trustmark Corp. | | | 35,141 | | | | 999 | |
UMB Financial Corp. | | | 23,513 | | | | 1,434 | |
Umpqua Holdings Corp. | | | 115,362 | | | | 1,834 | |
United Bankshares, Inc. | | | 54,048 | | | | 1,681 | |
Valley National Bancorp | | | 173,636 | | | | 1,542 | |
W.R. Berkley Corp. | | | 50,535 | | | | 3,735 | |
Washington Federal, Inc. | | | 42,688 | | | | 1,140 | |
Webster Financial Corp. | | | 48,314 | | | | 2,381 | |
Wintrust Financial Corp. | | | 29,538 | | | | 1,964 | |
| | | | | | | | |
Total | | | | | | | 127,500 | |
| | | | | | | | |
| |
Health Care (9.8%) | | | | | |
Acadia Healthcare Co., Inc.* | | | 46,229 | | | | 1,189 | |
Allscripts Healthcare Solutions, Inc.* | | | 91,516 | | | | 882 | |
Avanos Medical, Inc.* | | | 24,843 | | | | 1,113 | |
Bio-Rad Laboratories, Inc. - Class A* | | | 10,548 | | | | 2,449 | |
Bio-Techne Corp. | | | 19,782 | | | | 2,863 | |
Cantel Medical Corp. | | | 19,013 | | | | 1,416 | |
Catalent, Inc.* | | | 76,146 | | | | 2,374 | |
Charles River Laboratories International, Inc.* | | | 25,193 | | | | 2,851 | |
Chemed Corp. | | | 8,387 | | | | 2,376 | |
Encompass Health Corp. | | | 51,819 | | | | 3,197 | |
| | | | | | | | |
| Common Stocks (97.8%) | | Shares/
Par+ | | | Value
$ (000’s) | |
| |
Health Care continued | | | | | |
Exelixis, Inc.* | | | 156,608 | | | | 3,080 | |
Globus Medical, Inc. - Class A* | | | 39,819 | | | | 1,723 | |
Haemonetics Corp.* | | | 27,072 | | | | 2,709 | |
HealthEquity, Inc.* | | | 28,431 | | | | 1,696 | |
Hill-Rom Holdings, Inc. | | | 35,243 | | | | 3,121 | |
ICU Medical, Inc.* | | | 8,693 | | | | 1,996 | |
Inogen, Inc.* | | | 9,245 | | | | 1,148 | |
Integra LifeSciences Holdings Corp.* | | | 37,033 | | | | 1,670 | |
Ligand Pharmaceuticals, Inc. - Class B* | | | 11,133 | | | | 1,511 | |
LivaNova PLC* | | | 25,501 | | | | 2,333 | |
Mallinckrodt PLC* | | | 43,640 | | | | 690 | |
Masimo Corp.* | | | 25,539 | | | | 2,742 | |
Medidata Solutions, Inc.* | | | 32,051 | | | | 2,161 | |
MEDNAX, Inc.* | | | 46,839 | | | | 1,546 | |
Molina Healthcare, Inc.* | | | 32,680 | | | | 3,798 | |
NuVasive, Inc.* | | | 26,935 | | | | 1,335 | |
Patterson Cos., Inc. | | | 43,271 | | | | 851 | |
PRA Health Sciences, Inc.* | | | 30,631 | | | | 2,817 | |
Prestige Brands Holdings, Inc.* | | | 27,100 | | | | 837 | |
Steris PLC | | | 44,261 | | | | 4,729 | |
Syneos Health, Inc.* | | | 31,901 | | | | 1,255 | |
Teleflex, Inc. | | | 24,085 | | | | 6,225 | |
Tenet Healthcare Corp.* | | | 43,488 | | | | 745 | |
United Therapeutics Corp.* | | | 22,831 | | | | 2,486 | |
West Pharmaceutical Services, Inc. | | | 38,803 | | | | 3,804 | |
| | | | | | | | |
Total | | | | | | | 77,718 | |
| | | | | | | | |
| |
Industrials (15.0%) | | | | | |
Acuity Brands, Inc. | | | 20,999 | | | | 2,414 | |
AECOM* | | | 81,898 | | | | 2,170 | |
AGCO Corp. | | | 34,445 | | | | 1,918 | |
ASGN, Inc.* | | | 27,488 | | | | 1,498 | |
Avis Budget Group, Inc.* | | | 34,032 | | | | 765 | |
The Brink’s Co. | | | 26,513 | | | | 1,714 | |
Carlisle Cos., Inc. | | | 31,190 | | | | 3,135 | |
Clean Harbors, Inc. * | | | 26,695 | | | | 1,317 | |
Crane Co. | | | 26,469 | | | | 1,911 | |
Curtiss-Wright Corp. | | | 22,937 | | | | 2,342 | |
Deluxe Corp. | | | 24,256 | | | | 932 | |
Donaldson Co., Inc. | | | 66,990 | | | | 2,907 | |
The Dun & Bradstreet Corp. | | | 19,449 | | | | 2,776 | |
Dycom Industries, Inc.* | | | 16,393 | | | | 886 | |
EMCOR Group, Inc. | | | 30,150 | | | | 1,800 | |
EnerSys | | | 22,077 | | | | 1,713 | |
Esterline Technologies Corp.* | | | 13,915 | | | | 1,690 | |
GATX Corp. | | | 19,695 | | | | 1,395 | |
The Accompanying Notes are an Integral Part of the Financial Statements.
49
Index 400 Stock Portfolio
| | | | | | | | |
| Common Stocks (97.8%) | | Shares/
Par+ | | | Value
$ (000’s) | |
| |
Industrials continued | | | | | |
Genesee & Wyoming, Inc. - Class A* | | | 30,585 | | | | 2,264 | |
Graco, Inc. | | | 87,180 | | | | 3,649 | |
Granite Construction, Inc. | | | 24,565 | | | | 989 | |
Healthcare Services Group, Inc. | | | 38,656 | | | | 1,553 | |
Herman Miller, Inc. | | | 31,080 | | | | 940 | |
HNI Corp. | | | 22,953 | | | | 813 | |
Hubbell, Inc. | | | 28,656 | | | | 2,847 | |
IDEX Corp. | | | 40,181 | | | | 5,073 | |
Insperity, Inc. | | | 19,929 | | | | 1,861 | |
ITT, Inc. | | | 45,885 | | | | 2,215 | |
JetBlue Airways Corp.* | | | 159,647 | | | | 2,564 | |
KBR, Inc. | | | 73,792 | | | | 1,120 | |
Kennametal, Inc. | | | 43,006 | | | | 1,431 | |
Kirby Corp.* | | | 28,222 | | | | 1,901 | |
Knight-Swift Transportation Holdings | | | 65,826 | | | | 1,650 | |
Landstar System, Inc. | | | 21,536 | | | | 2,060 | |
Lennox International, Inc. | | | 18,990 | | | | 4,156 | |
Lincoln Electric Holdings, Inc. | | | 33,757 | | | | 2,662 | |
Manpowergroup, Inc. | | | 32,388 | | | | 2,099 | |
MasTec, Inc.* | | | 33,382 | | | | 1,354 | |
MSA Safety, Inc. | | | 18,335 | | | | 1,728 | |
MSC Industrial Direct Co., Inc. - Class A | | | 23,784 | | | | 1,829 | |
Nordson Corp. | | | 27,413 | | | | 3,272 | |
NOW, Inc.* | | | 56,792 | | | | 661 | |
nVent Electric PLC | | | 85,525 | | | | 1,921 | |
Old Dominion Freight Line, Inc. | | | 34,257 | | | | 4,230 | |
Oshkosh Corp. | | | 37,658 | | | | 2,309 | |
Pitney Bowes, Inc. | | | 98,276 | | | | 581 | |
Regal Beloit Corp. | | | 22,598 | | | | 1,583 | |
Resideo Technologies, Inc.* | | | 64,410 | | | | 1,324 | |
Ryder System, Inc. | | | 27,808 | | | | 1,339 | |
Stericycle, Inc.* | | | 44,607 | | | | 1,637 | |
Teledyne Technologies, Inc.* | | | 18,898 | | | | 3,913 | |
Terex Corp. | | | 33,972 | | | | 937 | |
The Timken Co. | | | 36,234 | | | | 1,352 | |
The Toro Co. | | | 55,101 | | | | 3,079 | |
Trinity Industries, Inc. | | | 76,632 | | | | 1,578 | |
Valmont Industries, Inc. | | | 11,570 | | | | 1,284 | |
Wabtec Corp. | | | 45,040 | | | | 3,164 | |
Watsco, Inc. | | | 16,823 | | | | 2,341 | |
Werner Enterprises, Inc. | | | 23,121 | | | | 683 | |
Woodward, Inc. | | | 29,125 | | | | 2,164 | |
| | | | | | | | |
Total | | | | | | | 119,393 | |
| | | | | | | | |
| | | | | | | | |
| Common Stocks (97.8%) | | Shares/
Par+ | | | Value
$ (000’s) | |
| |
Information Technology (14.9%) | | | | | |
ACI Worldwide, Inc.* | | | 60,751 | | | | 1,681 | |
ARRIS International PLC* | | | 85,603 | | | | 2,617 | |
Arrow Electronics, Inc.* | | | 45,661 | | | | 3,148 | |
Avnet, Inc. | | | 58,260 | | | | 2,103 | |
Belden, Inc. | | | 21,112 | | | | 882 | |
Blackbaud, Inc. | | | 25,441 | | | | 1,600 | |
CACI International, Inc. - Class A* | | | 13,016 | | | | 1,875 | |
CDK Global, Inc. | | | 67,452 | | | | 3,230 | |
Ciena Corp.* | | | 74,387 | | | | 2,522 | |
Cirrus Logic, Inc.* | | | 31,346 | | | | 1,040 | |
Cognex Corp. | | | 90,194 | | | | 3,488 | |
Coherent, Inc.* | | | 12,770 | | | | 1,350 | |
CommVault Systems, Inc.* | | | 20,366 | | | | 1,203 | |
CoreLogic, Inc.* | | | 42,198 | | | | 1,410 | |
Cree, Inc.* | | | 53,721 | | | | 2,298 | |
Cypress Semiconductor Corp. | | | 189,590 | | | | 2,412 | |
Fair Isaac Corp.* | | | 15,167 | | | | 2,836 | |
First Solar, Inc.* | | | 39,530 | | | | 1,678 | |
Integrated Device Technology, Inc.* | | | 67,589 | | | | 3,273 | |
InterDigital, Inc. | | | 17,726 | | | | 1,177 | |
j2 Global, Inc. | | | 24,526 | | | | 1,702 | |
Jabil Circuit, Inc. | | | 75,306 | | | | 1,867 | |
Leidos Holdings, Inc. | | | 78,445 | | | | 4,136 | |
Littelfuse, Inc. | | | 13,177 | | | | 2,260 | |
LiveRamp Holdings, Inc.* | | | 35,628 | | | | 1,376 | |
LogMeIn, Inc. | | | 26,799 | | | | 2,186 | |
Lumentum Holdings, Inc.* | | | 38,576 | | | | 1,621 | |
Manhattan Associates, Inc.* | | | 34,245 | | | | 1,451 | |
MAXIMUS, Inc. | | | 33,593 | | | | 2,186 | |
MKS Instruments, Inc. | | | 28,278 | | | | 1,827 | |
Monolithic Power Systems | | | 20,438 | | | | 2,376 | |
National Instruments Corp. | | | 58,963 | | | | 2,676 | |
NCR Corp.* | | | 61,913 | | | | 1,429 | |
NetScout Systems, Inc.* | | | 36,632 | | | | 866 | |
Perspecta, Inc. | | | 74,087 | | | | 1,276 | |
Plantronics, Inc. | | | 17,305 | | | | 573 | |
PTC, Inc.* | | | 55,946 | | | | 4,638 | |
Sabre Corp. | | | 144,210 | | | | 3,121 | |
Science Applications International Corp. | | | 22,285 | | | | 1,419 | |
Silicon Laboratories, Inc.* | | | 22,601 | | | | 1,781 | |
Synaptics, Inc.* | | | 18,134 | | | | 675 | |
SYNNEX Corp. | | | 21,707 | | | | 1,755 | |
Tech Data Corp.* | | | 19,547 | | | | 1,599 | |
Teradata Corp.* | | | 61,913 | | | | 2,375 | |
Teradyne, Inc. | | | 93,892 | | | | 2,946 | |
Trimble Navigation, Ltd.* | | | 131,551 | | | | 4,329 | |
| | | | | | | | |
| Common Stocks (97.8%) | | Shares/
Par+ | | | Value $
(000’s) | |
| |
Information Technology continued | | | | | |
Tyler Technologies, Inc.* | | | 20,336 | | | | 3,779 | |
The Ultimate Software Group, Inc.* | | | 16,379 | | | | 4,011 | |
Universal Display Corp. | | | 22,204 | | | | 2,078 | |
Versum Materials, Inc. | | | 57,112 | | | | 1,583 | |
ViaSat, Inc.* | | | 29,370 | | | | 1,731 | |
Vishay Intertechnology, Inc. | | | 69,204 | | | | 1,246 | |
WEX, Inc.* | | | 22,577 | | | | 3,162 | |
Zebra Technologies Corp. - Class A* | | | 28,183 | | | | 4,488 | |
| | | | | | | | |
Total | | | | | | | 118,347 | |
| | | | | | | | |
| |
Materials (6.5%) | | | | | |
Allegheny Technologies, Inc.* | | | 65,833 | | | | 1,433 | |
AptarGroup, Inc. | | | 32,902 | | | | 3,095 | |
Ashland Global Holdings, Inc. | | | 32,731 | | | | 2,323 | |
Bemis Co., Inc. | | | 47,675 | | | | 2,188 | |
Cabot Corp. | | | 31,443 | | | | 1,350 | |
Carpenter Technology Corp. | | | 24,812 | | | | 884 | |
The Chemours Co. | | | 89,615 | | | | 2,529 | |
Commercial Metals Co. | | | 61,615 | | | | 987 | |
Compass Minerals International, Inc. | | | 17,732 | | | | 739 | |
Domtar Corp. | | | 32,948 | | | | 1,157 | |
Eagle Materials, Inc. | | | 24,561 | | | | 1,499 | |
Grief, Inc. - Class A | | | 13,588 | | | | 504 | |
Louisiana-Pacific Corp. | | | 73,949 | | | | 1,643 | |
Minerals Technologies, Inc. | | | 18,470 | | | | 948 | |
NewMarket Corp. | | | 4,659 | | | | 1,920 | |
Olin Corp. | | | 87,389 | | | | 1,757 | |
Owens-Illinois, Inc.* | | | 83,127 | | | | 1,433 | |
PolyOne Corp. | | | 41,810 | | | | 1,196 | |
Reliance Steel & Aluminum Co. | | | 36,892 | | | | 2,626 | |
Royal Gold, Inc. | | | 34,314 | | | | 2,939 | |
RPM International, Inc. | | | 69,518 | | | | 4,086 | |
The ScottsMiracle-Gro Co. - Class A | | | 20,576 | | | | 1,265 | |
Sensient Technologies Corp. | | | 22,144 | | | | 1,237 | |
Silgan Holdings, Inc. | | | 40,559 | | | | 958 | |
Sonoco Products Co. | | | 52,280 | | | | 2,778 | |
Steel Dynamics, Inc. | | | 120,240 | | | | 3,612 | |
United States Steel Corp. | | | 92,854 | | | | 1,694 | |
Valvoline, Inc. | | | 98,560 | | | | 1,907 | |
Worthington Industries, Inc. | | | 21,074 | | | | 734 | |
| | | | | | | | |
Total | | | | | | | 51,421 | |
| | | | | | | | |
The Accompanying Notes are an Integral Part of the Financial Statements.
50
Index 400 Stock Portfolio
| | | | | | | | |
| Common Stocks (97.8%) | | Shares/
Par+ | | | Value
$ (000’s) | |
| |
Real Estate (9.5%) | | | | | |
Alexander & Baldwin, Inc.* | | | 35,464 | | | | 652 | |
American Campus Communities, Inc. | | | 71,777 | | | | 2,971 | |
Camden Property Trust | | | 48,784 | | | | 4,295 | |
CoreCivic, Inc. | | | 62,166 | | | | 1,108 | |
CoreSite Realty Corp. | | | 19,223 | | | | 1,677 | |
Corporate Office Properties Trust | | | 57,019 | | | | 1,199 | |
Cousins Properties, Inc. | | | 220,199 | | | | 1,740 | |
CyrusOne, Inc. | | | 55,436 | | | | 2,931 | |
Douglas Emmett, Inc. | | | 84,564 | | | | 2,886 | |
EPR Properties | | | 38,938 | | | | 2,493 | |
First Industrial Realty Trust, Inc. | | | 66,161 | | | | 1,909 | |
The GEO Group, Inc. | | | 63,797 | | | | 1,257 | |
Healthcare Realty Trust, Inc. | | | 65,599 | | | | 1,866 | |
Highwoods Properties, Inc. | | | 54,208 | | | | 2,097 | |
Hospitality Properties Trust | | | 86,135 | | | | 2,057 | |
JBG SMITH Properties | | | 57,003 | | | | 1,984 | |
Jones Lang LaSalle, Inc. | | | 23,868 | | | | 3,022 | |
Kilroy Realty Corp. | | | 52,771 | | | | 3,318 | |
Lamar Advertising Co. - Class A | | | 44,568 | | | | 3,083 | |
Liberty Property Trust | | | 77,429 | | | | 3,243 | |
Life Storage, Inc. | | | 24,410 | | | | 2,270 | |
Mack-Cali Realty Corp. | | | 47,310 | | | | 927 | |
Medical Properties Trust, Inc. | | | 191,157 | | | | 3,074 | |
National Retail Properties, Inc. | | | 83,358 | | | | 4,044 | |
OMEGA Healthcare Investors, Inc. | | | 105,126 | | | | 3,695 | |
Pebblebrook Hotel Trust | | | 67,055 | | | | 1,898 | |
Potlatch Corp. | | | 35,396 | | | | 1,120 | |
Rayonier, Inc. | | | 67,816 | | | | 1,878 | |
Realogy Holdings Corp. | | | 61,890 | | | | 909 | |
Sabra Health Care REIT, Inc. | | | 93,386 | | | | 1,539 | |
Senior Housing Properties Trust | | | 124,524 | | | | 1,459 | |
Tanger Factory Outlet Centers, Inc. | | | 49,189 | | | | 995 | |
Taubman Centers, Inc. | | | 31,986 | | | | 1,455 | |
Uniti Group, Inc. | | | 93,751 | | | | 1,460 | |
Urban Edge Properties | | | 59,874 | | | | 995 | |
Weingarten Realty Investors | | | 62,512 | | | | 1,551 | |
| | | | | | | | |
Total | | | | | | | 75,057 | |
| | | | | | | | |
| |
Utilities (5.5%) | | | | | |
ALLETE, Inc. | | | 26,937 | | | | 2,053 | |
Aqua America, Inc. | | | 93,205 | | | | 3,187 | |
Atmos Energy Corp. | | | 61,211 | | | | 5,676 | |
| | | | | | | | |
| Common Stocks (97.8%) | | Shares/
Par+ | | | Value
$ (000’s) | |
| |
Utilities continued | | | | | |
Black Hills Corp. | | | 28,274 | | | | 1,775 | |
Hawaiian Electric Industries, Inc. | | | 57,031 | | | | 2,088 | |
IDACORP, Inc. | | | 26,396 | | | | 2,456 | |
MDU Resources Group, Inc. | | | 102,675 | | | | 2,448 | |
National Fuel Gas Co. | | | 45,028 | | | | 2,305 | |
New Jersey Resources Corp. | | | 46,359 | | | | 2,117 | |
NorthWestern Corp. | | | 26,358 | | | | 1,567 | |
OGE Energy Corp. | | | 104,620 | | | | 4,100 | |
ONE Gas, Inc. | | | 27,513 | | | | 2,190 | |
PNM Resources, Inc. | | | 41,723 | | | | 1,714 | |
Southwest Gas Holdings, Inc. | | | 27,761 | | | | 2,124 | |
UGI Corp. | | | 91,061 | | | | 4,858 | |
Vectren Corp. | | | 43,518 | | | | 3,132 | |
| | | | | | | | |
Total | | | | | | | 43,790 | |
| | | | | | | | |
| |
Total Common Stocks
(Cost: $686,567) | | | | 775,702 | |
| |
| Short-Term Investments (2.1%) | | | | | |
| |
Commercial Paper (1.4%) | | | | | |
Apple, Inc.
0.000%, 1/23/19 144A | | | 700,000 | | | | 699 | |
0.000%, 3/11/19 144A | | | 800,000 | | | | 796 | |
Exxon Mobil Corp.
0.000%, 1/10/19 | | | 500,000 | | | | 500 | |
0.000%, 1/23/19 | | | 1,000,000 | | | | 998 | |
Marriott International, Inc. 0.000%, 1/25/19 144A | | | 2,052,000 | | | | 2,048 | |
Mondelez International, Inc. 0.000%, 1/14/19 144A | | | 1,500,000 | | | | 1,498 | |
Pfizer, Inc.
0.000%, 1/15/19 144A | | | 1,500,000 | | | | 1,498 | |
Societe Generale SA
0.000%, 3/1/19 144A | | | 1,000,000 | | | | 996 | |
United Parcel Service, Inc. 0.000%, 2/1/19 144A | | | 1,500,000 | | | | 1,497 | |
| | | | | | | | |
Total | | | | | | | 10,530 | |
| | | | | | | | |
| |
Money Market Funds (0.2%) | | | | | |
State Street Institutional U.S. Government Money Market Fund - Premier Class 2.270% # | | | 1,923,286 | | | | 1,923 | |
| | | | | | | | |
Total | | | | | | | 1,923 | |
| | | | | | | | |
| | | | | | | | |
| Short-Term Investments (2.1%) | | Shares/
Par+ | | | Value
$ (000’s) | |
| |
US Government & Agencies (0.5%) | | | | | |
Federal Home Loan Bank 0.000%, 1/11/19 | | | 2,000,000 | | | | 1,999 | |
0.000%, 4/15/19 ß | | | 2,000,000 | | | | 1,986 | |
| | | | | | | | |
Total | | | | | | | 3,985 | |
| | | | | | | | |
| | |
Total Short-Term Investments | | | | | | | | |
(Cost: $16,440) | | | | | | | 16,438 | |
| | | | | | | | |
| | |
Total Investments (99.9%) | | | | | | | | |
(Cost: $703,007)@ | | | | | | | 792,140 | |
| | | | | | | | |
Other Assets, Less | | | | | | | | |
Liabilities (0.1%) | | | | | | | 640 | |
| | | | | | | | |
Net Assets (100.0%) | | | | | | | 792,780 | |
| | | | | | | | |
The Accompanying Notes are an Integral Part of the Financial Statements.
51
Index 400 Stock Portfolio
Exchange Traded or Centrally Cleared Derivatives Futures
| | | | | | | | | | | | | | | | |
| Issuer | | Long/Short | | Currency | | Notional Par
(000’s) | | Number
of
Contracts | | Expiration
Date | | Notional
Value
(000’s) | | Unrealized Appreciation/
(Depreciation)
(000’s) | | Variation Margin
(000’s) |
S&P 400 Mini Index Futures | | Long | | USD | | 10 | | 98 | | 3/19 | | $16,290 | | $(975) | | $160 |
| | | | | | | | | | | | | | $(975) | | $160 |
| | | | | | | | | | | | | | |
| | | Financial Derivative Assets | | Financial Derivative Liabilities | | |
| | | Variation Margin (000’s) | | Variation Margin (000’s) | | Market Value
(000’s) |
| | | Swaps | | Futures | | Total | | Swaps | | Futures | | Total | | Options |
Total Exchange-Traded or Centrally Cleared Derivatives | | $– | | $160 | | $160 | | $- | | $– | | $– | | $– |
| + | All par is stated in U.S Dollar unless otherwise noted. |
| # | 7-Day yield as of 12/31/2018. |
| ß | Cash or securities with an aggregate value of $1,986 (in thousands) has been pledged as collateral for futures, swap contracts outstanding, short sales, when issued securities or written options on 12/31/2018. |
| 144A | Security exempt from registration under Rule 144A of the Securities Act of 1933. These securities may be resold as transactions exempt from registration, normally to qualified institutional buyers. At December 31, 2018 the value of these securities (in thousands) was $9,032 representing 1.2% of the net assets. |
| @ | At December 31, 2018, the aggregate cost of investments, including derivatives, for federal tax purposes (in thousands) was $702,275 and the net unrealized appreciation of investments based on that cost was $88,889 which is comprised of $180,580 aggregate gross unrealized appreciation and $91,691 aggregate gross unrealized depreciation. |
The following is a summary of the inputs used in valuing the Portfolio’s assets and liabilities at December 31, 2018. See Note 3 for additional information on portfolio valuation.
| | | | | | | | | | | | | | |
| | | Valuation Inputs | | | |
| Description | | Level 1 – Quoted Prices | | | Level 2 – Other Significant
Observable Inputs | | | Level 3 – Significant
Unobservable Inputs | | | |
| | | (Amounts in thousands) | | | |
Assets: | | | | | | | | | | | | | | |
Common Stocks | | $ | 775,702 | | | $ | - | | | $ | - | | | |
Short-Term Investments | | | | | | | | | | | | | | |
Money Market Funds | | | 1,923 | | | | - | | | | - | | | |
All Others | | | — | | | | 14,515 | | | | - | | | |
Total Assets: | | $ | 777,625 | | | $ | 14,515 | | | $ | - | | | |
Liabilities: | | | | | | | | | | | | | | |
Other Financial Instruments^ | | | | | | | | | | | | | | |
Futures | | | (975 | ) | | | - | | | | - | | | |
Total Liabilities: | | $ | (975 | ) | | $ | - | | | $ | - | | | |
^ Other financial instruments are derivative instruments such as futures and forwards, which are valued at the unrealized appreciation (depreciation) on the instrument, and securities sold short, reverse repurchase agreements, written options and swaps contracts, which are valued at market value.
The Accompanying Notes are an Integral Part of the Financial Statements.
52
Mid Cap Value Portfolio (unaudited)
| | | | |
| Objective: | | Portfolio Strategy: | | Net Assets: |
| Long-term capital growth. Current | | Invest primarily in equity securities ofmid-sized companies | | $472 million |
| income is a secondary objective. | | that are determined to be undervalued. | | |
PORTFOLIO OVERVIEW
Mason Street Advisors, LLC (“Mason Street Advisors”), the investment adviser for the Mid Cap Value Portfolio (the “Portfolio”), has engaged American Century Investment Management, Inc. (“American Century”) to act assub-adviser for the Portfolio. The Portfolio invests primarily in a diversified portfolio of equity securities ofmid-sized companies that are determined to be undervalued at the time of purchase. In selecting securities, the Portfolio attempts to identify companies whose long-term earnings, cash flows and/or assets are not reflected in the current market price of their securities and hold each security until it has returned to favor in the market and the price has increased to or is higher than a level believed to more accurately reflect the fair value of the company.
MARKET OVERVIEW
The U.S. equity market experienced heightened volatility in 2018 as concerns about slowing global growth, falling oil prices, less accommodative monetary policy, trade tensions and a partial U.S. government shutdown triggered a sharp fourth-quarter decline in stock prices. As a result, most market indices ended lower for the calendar year.
According to the Russell® Indices, growth stocks outperformed value stocks by a significant margin during 2018. Large cap stocks outperformed mid cap stocks, and both categories outperformed small cap stocks. Furthermore, stocks of companies with higher credit ratings (rated B+ or better) generally outperformed companies with lower credit ratings (rated B or worse).
PORTFOLIO RESULTS
The Portfolio returned (12.85%) for the twelve months ended December 31, 2018. By comparison, the Portfolio’s benchmark, the Russell Midcap® Value Index (the “Index”), returned (12.29%). (The Index is unmanaged, cannot be invested in directly and does not incur expenses.) According to Lipper® Analytical Services, Inc., an independent mutual fund ranking agency, the average return in 2018 of the Mid Cap Value Funds peer group was (13.68%). The Portfolio delivered a negative return and underperformed the Index, due in part to both stock selection and an underweight position in Real Estate. Weyerhaeuser was a notable detractor within the Real Estate sector. The stock of this timber REIT fell considerably in the fourth quarter due to a decline in timber prices, driven in part by a weaker construction outlook and worries regarding export trade.
Stock selection and an overweight allocation to the Energy sector also weighed on relative performance, as several of the Portfolio’s Energy stocks declined in the fourth quarter along with crude oil prices. Detractors included oil and gas exploration company Cimarex Energy and EQT, a natural gas and pipeline company.
Elsewhere in the Portfolio, asset manager Invesco was one of the largest relative detractors. Asset managers trailed the market during much of the year as relative valuations compressed. Disappointing fund flows (Invesco lost both a large sovereign wealth mandate and large subadvisory engagement) and lower fee rates reduced Invesco’s earnings estimates and magnified its underperformance. News that Invesco is acquiring OppenheimerFunds also weighed on the stock price. The portfolio manager trimmed the position in Invesco.
Stock selection and an underweight position in the Consumer Discretionary sector supported relative outperformance. Advance Auto Parts was a notable sector contributor. This retailer of aftermarket replacement parts is a market share leader in a higher quality industry. It reported several quarters of strong results and raised its full-year guidance due to profit margin improvement and stronger-than-expected same-store sales trends. This news indicated to investors that the company’s turnaround plan was starting to show signs of effectiveness.
Stock selection and an overweight position in Health Care also aided relative performance. Hospital company LifePoint Health was a key contributor. This provider of health services outperformed on news that it would be acquired at a significant premium by Apollo Global Management, a private equity firm. This was a cash offer, and the investment team eliminated the position after the stock appreciated.
53
Mid Cap Value Portfolio (unaudited)
PORTFOLIO MANAGER OUTLOOK
The following forward-looking comments are the opinion of American Century, the Portfolio’ssub-adviser. We continue to invest in companies where valuation does not reflect the quality and normal earnings power of the company. Our process is based on individual security selection, but broad themes emerged. We ended the period with an overweight position in the Financials sector. Ourbottom-up investment approach identified stocks we believe offer attractive risk/reward profiles, particularly in the capital markets and banking industries. We maintained our sizable underweight position in Real Estate because our metrics show that valuations in the sector generally remain inflated. We believe that rising interest rates also pose a threat to the sector.
Relative Performance
[GRAPHIC]
| | | | | | | | | | | | |
| Average Annual Total Returns For Periods Ended December 31, 2018 | |
| | | 1 Year | | | 5 Years | | | 10 Years | |
Mid Cap Value Portfolio | | | -12.85% | | | | 6.69% | | | | 11.92% | |
Russell MidCap® Value Index | | | -12.29% | | | | 5.44% | | | | 13.03% | |
Lipper® Variable Insurance Products | | | | | | | | | | | | |
(VIP) Mid Cap Value Funds Average | | | -13.68% | | | | 3.81% | | | | 11.72% | |
The performance data quoted represents past performance. Past performance is historical and does not guarantee future performance. Investment return and principal value will fluctuate, so that shares, when redeemed, may be worth more or less than their
original cost. Current performance may be lower or higher than the performance data quoted. For the most recentmonth-end performance information visitwww.northwesternmutual.com.
This chart assumes an initial investment of $10,000 made on 12/31/08. Returns shown reflect fee waivers, deductions for management and other portfolio expenses, and reinvestment of all dividends. In the absence of fee waivers, total return would be reduced. Returns exclude deductions for separate account sale loads and account fees. Please refer to the Benchmark Definitions section of this report for information about the indices cited in the above chart and graph.
Investing in small andmedium-sized companies involves a greater degree of risk than investing in large company stocks. The value of securities acquired in an IPO may rise or fall more rapidly than investments in more established issuers.
The Portfolio may invest in derivative instruments for cash management purposes or to hedge foreign currency exposure. Use of these instruments may involve certain costs and imposes certain risks such as liquidity risk, market risk, credit risk, management risk and the risk of mispricing or improper valuation. Certain derivatives involve leverage, which could magnify losses, and portfolios investing in derivatives could lose more than the principal amount invested in those instruments.
Top 10 Equity Holdings12/31/18
| | |
Security Description | | % of Net Assets |
Zimmer Biomet Holdings, Inc. | | 3.4% |
Northern Trust Corp. | | 2.7% |
Hubbell, Inc. | | 2.5% |
BB&T Corp. | | 2.2% |
Xcel Energy, Inc. | | 1.9% |
iShares Russell Midcap Value Index Fund | | 1.8% |
Weyerhaeuser Co. | | 1.8% |
Invesco, Ltd. | | 1.6% |
NorthWestern Corp. | | 1.6% |
Johnson Controls International PLC | | 1.6% |
54
Mid Cap Value Portfolio (unaudited)
Sector Allocation 12/31/18
| | |
Sector | | % of Net Assets |
Financials | | 23.2% |
Industrials | | 16.2% |
Health Care | | 9.0% |
Utilities | | 8.6% |
Consumer Discretionary | | 7.9% |
Energy | | 7.6% |
Information Technology | | 6.1% |
Consumer Staples | | 5.9% |
Materials | | 5.6% |
Real Estate | | 4.4% |
Short-Term Investments & Other Net Assets | | 3.7% |
Investment Companies | | 1.8% |
Sector Allocation and Top 10 Holdings are subject to change.
55
Mid Cap Value Portfolio
SCHEDULE OF INVESTMENTS
December 31, 2018
| | | | | | | | |
Common Stocks (94.5%) | | Shares/
Par+ | | | Value $ (000’s) | |
|
Consumer Discretionary (7.9%) | |
Advance Auto Parts, Inc. | | | 30,563 | | | | 4,812 | |
Aptiv PLC | | | 15,822 | | | | 974 | |
BorgWarner, Inc. | | | 116,460 | | | | 4,046 | |
Carnival Corp. | | | 64,486 | | | | 3,179 | |
Genuine Parts Co. | | | 41,477 | | | | 3,983 | |
Honda Motor Co., Ltd., ADR* | | | 158,094 | | | | 4,182 | |
PulteGroup, Inc. | | | 212,264 | | | | 5,517 | |
Sodexo SA | | | 42,068 | | | | 4,314 | |
Target Corp. | | | 47,121 | | | | 3,114 | |
Thor Industries, Inc. | | | 56,463 | | | | 2,936 | |
| | | | | | | | |
Total | | | | | | | 37,057 | |
| | | | | | | | |
| |
Consumer Staples (5.9%) | | | | | |
Conagra Brands, Inc. | | | 227,652 | | | | 4,863 | |
The J.M. Smucker Co. | | | 25,642 | | | | 2,397 | |
Kellogg Co. | | | 48,633 | | | | 2,772 | |
Kimberly-Clark Corp. | | | 44,919 | | | | 5,118 | |
Molson Coors Brewing Co. - Class B | | | 42,008 | | | | 2,359 | |
Mondelez International, | | | | | | | | |
Inc. | | | 145,006 | | | | 5,805 | |
Sysco Corp. | | | 74,651 | | | | 4,678 | |
| | | | | | | | |
Total | | | | | | | 27,992 | |
| | | | | | | | |
| | |
Energy (7.6%) | | | | | | | | |
Anadarko Petroleum | | | | | | | | |
Corp. | | | 77,119 | | | | 3,381 | |
Baker Hughes | | | 241,019 | | | | 5,182 | |
Cimarex Energy Co. | | | 62,348 | | | | 3,844 | |
Devon Energy Corp. | | | 190,481 | | | | 4,293 | |
EQT Corp. | | | 182,949 | | | | 3,456 | |
Equitrans Midstream Corp.* | | | 146,359 | | | | 2,930 | |
Exxon Mobil Corp. | | | 81,665 | | | | 2,069 | |
Halliburton Co. | | | 126,878 | | | | 3,372 | |
National Oilwell Varco, Inc. | | | 103,766 | | | | 2,667 | |
Noble Energy, Inc. | | | 248,341 | | | | 4,659 | |
| | | | | | | | |
Total | | | | | | | 35,853 | |
| | | | | | | | |
| | |
Financials (23.2%) | | | | | | | | |
AFLAC, Inc. | | | 66,090 | | | | 3,011 | |
Ameriprise Financial, Inc. | | | 61,973 | | | | 6,468 | |
Arthur J. Gallagher & Co. | | | 27,208 | | | | 2,005 | |
Bank of Hawaii Corp. | | | 18,521 | | | | 1,247 | |
BB&T Corp. | | | 236,136 | | | | 10,229 | |
Brown & Brown, Inc. | | | 99,395 | | | | 2,739 | |
Capitol Federal Financial, Inc. | | | 382,898 | | | | 4,890 | |
Chubb, Ltd. | | | 55,051 | | | | 7,112 | |
Comerica, Inc. | | | 21,285 | | | | 1,462 | |
Commerce Bancshares, Inc. | | | 89,856 | | | | 5,065 | |
| | | | | | | | |
| Common Stocks (94.5%) | | Shares/
Par+ | | | Value $ (000’s) | |
| |
Financials continued | | | | | |
First Hawaiian, Inc. | | | 237,330 | | | | 5,342 | |
Invesco, Ltd. | | | 445,800 | | | | 7,463 | |
M&T Bank Corp. | | | 44,818 | | | | 6,415 | |
Northern Trust Corp. | | | 152,689 | | | | 12,763 | |
ProAssurance Corp. | | | 58,536 | | | | 2,374 | |
Prosperity Bancshares, | | | | | | | | |
Inc. | | | 40,630 | | | | 2,531 | |
Reinsurance Group of | | | | | | | | |
America, Inc. | | | 33,136 | | | | 4,647 | |
State Street Corp. | | | 58,946 | | | | 3,718 | |
SunTrust Banks, Inc. | | | 100,196 | | | | 5,054 | |
Torchmark Corp. | | | 20,815 | | | | 1,551 | |
The Travelers Cos., Inc. | | | 12,040 | | | | 1,442 | |
UMB Financial Corp. | | | 106,486 | | | | 6,493 | |
Westamerica Bancorporation | | | 97,402 | | | | 5,423 | |
| | | | | | | | |
Total | | | | | | | 109,444 | |
| | | | | | | | |
| | |
Health Care (9.0%) | | | | | | | | |
Cardinal Health, Inc. | | | 153,032 | | | | 6,825 | |
Cerner Corp. * | | | 70,332 | | | | 3,688 | |
Hologic, Inc. * | | | 76,148 | | | | 3,130 | |
McKesson Corp. | | | 46,871 | | | | 5,178 | |
Quest Diagnostics, Inc. | | | 66,499 | | | | 5,537 | |
Siemens Healthineers AG* | | | 55,762 | | | | 2,335 | |
Zimmer Biomet Holdings, Inc. | | | 152,651 | | | | 15,833 | |
| | | | | | | | |
Total | | | | | | | 42,526 | |
| | | | | | | | |
| | |
Industrials (16.2%) | | | | | | | | |
Atlas Copco AB | | | 173,925 | | | | 3,813 | |
Cummins, Inc. | | | 44,775 | | | | 5,984 | |
Eaton Corp. PLC | | | 67,283 | | | | 4,620 | |
Emerson Electric Co. | | | 69,113 | | | | 4,129 | |
Heartland Express, Inc. | | | 272,343 | | | | 4,984 | |
Hubbell, Inc. | | | 117,011 | | | | 11,624 | |
IMI, PLC | | | 422,479 | | | | 5,083 | |
Ingersoll-Rand PLC | | | 13,479 | | | | 1,230 | |
Johnson Controls International PLC | | | 248,449 | | | | 7,366 | |
MSC Industrial Direct Co., Inc. - Class A | | | 84,645 | | | | 6,511 | |
nVent Electric PLC | | | 153,476 | | | | 3,447 | |
PACCAR, Inc. | | | 50,693 | | | | 2,897 | |
Republic Services, Inc. | | | 42,505 | | | | 3,064 | |
Schneider Electric SE | | | 57,039 | | | | 3,903 | |
Southwest Airlines Co. | | | 129,494 | | | | 6,019 | |
Textron, Inc. | | | 39,529 | | | | 1,818 | |
| | | | | | | | |
Total | | | | | | | 76,492 | |
| | | | | | | | |
|
Information Technology (6.1%) | |
Applied Materials, Inc. | | | 88,835 | | | | 2,909 | |
HP, Inc. | | | 161,344 | | | | 3,301 | |
Lam Research Corp. | | | 27,792 | | | | 3,784 | |
| | | | | | | | |
Common Stocks (94.5%) | | Shares/
Par+ | | | Value $ (000’s) | |
Information Technology continued | |
Maxim Integrated | | | | | | | | |
Products, Inc. | | | 126,805 | | | | 6,448 | |
Microchip Technology, | | | | | | | | |
Inc. | | | 67,094 | | | | 4,825 | |
TE Connectivity, Ltd. | | | 64,997 | | | | 4,916 | |
Teradyne, Inc. | | | 76,230 | | | | 2,392 | |
| | | | | | | | |
Total | | | | | | | 28,575 | |
| | | | | | | | |
| | |
Materials (5.6%) | | | | | | | | |
Graphic Packaging Holding Co. | | | 607,458 | | | | 6,463 | |
Orkla ASA | | | 870,978 | | | | 6,849 | |
Sonoco Products Co. | | | 124,714 | | | | 6,626 | |
WestRock Co. | | | 176,428 | | | | 6,662 | |
| | | | | | | | |
Total | | | | | | | 26,600 | |
| | | | | | | | |
| | |
Real Estate (4.4%) | | | | | | | | |
American Tower Corp. | | | 11,819 | | | | 1,870 | |
Empire State Realty Trust, Inc. - Class A | | | 134,268 | | | | 1,911 | |
MGM Growth Properties LLC - Class A | | | 175,360 | | | | 4,631 | |
Piedmont Office Realty Trust, Inc. - Class A | | | 226,012 | | | | 3,851 | |
Weyerhaeuser Co. | | | 380,202 | | | | 8,311 | |
| | | | | | | | |
Total | | | | | | | 20,574 | |
| | | | | | | | |
| | |
Utilities (8.6%) | | | | | | | | |
Ameren Corp. | | | 78,527 | | | | 5,122 | |
Atmos Energy Corp. | | | 36,997 | | | | 3,430 | |
Edison International | | | 58,018 | | | | 3,294 | |
Eversource Energy | | | 46,332 | | | | 3,014 | |
NorthWestern Corp. | | | 124,625 | | | | 7,408 | |
Pinnacle West Capital Corp. | | | 69,370 | | | | 5,910 | |
Spire, Inc. | | | 48,532 | | | | 3,595 | |
Xcel Energy, Inc. | | | 182,006 | | | | 8,968 | |
| | | | | | | | |
Total | | | | | | | 40,741 | |
| | | | | | | | |
Total Common Stocks (Cost: $495,436) | | | | 445,854 | |
Investment Companies (1.8%) | |
|
Investment Companies (1.8%) | |
iShares Russell Midcap Value Index Fund | | | 110,328 | | | | 8,423 | |
| | | | | | | | |
Total | | | | | | | 8,423 | |
| | | | | | | | |
Total Investment Companies (Cost: $9,628) | | | | 8,423 | |
| | | | | | | | |
The Accompanying Notes are an Integral Part of the Financial Statements.
56
Mid Cap Value Portfolio
| | | | | | | | |
Short-Term Investments
(3.1%) | | Shares/
Par + | | | Value
$ (000’s) | |
| | |
Money Market Funds (3.1%) | | | | | | | | |
State Street Institutional U.S. Government Money Market Fund - Premier Class 2.270%# | | | 14,836,009 | | | | 14,836 | |
| | | | | | | | |
Total | | | | | | | 14,836 | |
| | | | | | | | |
| | |
Total Short-Term Investments | | | | | | | | |
(Cost: $14,836) | | | | | | | 14,836 | |
| | | | | | | | |
| | |
Total Investments (99.4%) | | | | | | | | |
| | | | | | | | |
(Cost: $519,900)@ | | | | | | | 469,113 | |
Other Assets, Less | | | | | | | | |
Liabilities (0.6%) | | | | | | | 2,830 | |
| | | | | | | | |
Net Assets (100.0%) | | | | | | | 471,943 | |
| | | | | | | | |
Over the Counter Derivatives Forward Contracts
| | | | | | | | | | | | | | | | | | | | | | |
| Type | | Counterparty | | Currency | | Foreign Principal
Amount
Covered by Contract (000s) | | USD Principal
Amount
Covered by Contract (000’s) | | Settlement Month | | Unrealized Appreciation
(000’s) | | | Unrealized
(Depreciation)
(000’s) | | | Net Unrealized Appreciation/ (Depreciation)
(000’s) | |
Buy | | Morgan Stanley Capital Services, Inc. | | CAD | | 106 | | 77 | | 3/19 | | $ | — | | | $ | — | P | | $ | — | P |
Sell | | Morgan Stanley Capital Services, Inc. | | CAD | | 2,517 | | 1,847 | | 3/19 | | | 30 | | | | — | | | | 30 | |
Sell | | Morgan Stanley Capital Services, Inc. | | EUR | | 7,748 | | 8,941 | | 3/19 | | | — | | | | (65 | ) | | | (65 | ) |
Sell | | Morgan Stanley Capital Services, Inc. | | GBP | | 3,390 | | 4,339 | | 3/19 | | | — | | | | (31 | ) | | | (31 | ) |
Buy | | Morgan Stanley Capital Services, Inc. | | JPY | | 10,267 | | 94 | | 3/19 | | | 1 | | | | — | | | | 1 | |
Sell | | Morgan Stanley Capital Services, Inc. | | JPY | | 280,355 | | 2,575 | | 3/19 | | | — | | | | (62 | ) | | | (62 | ) |
Buy | | Goldman Sachs International | | NOK | | 1,936 | | 225 | | 3/19 | | | 2 | | | | — | | | | 2 | |
Sell | | Goldman Sachs International | | NOK | | 51,332 | | 5,959 | | 3/19 | | | — | | | | (66 | ) | | | (66 | ) |
Buy | | Goldman Sachs International | | SEK | | 747 | | 85 | | 3/19 | | | 2 | | | | — | | | | 2 | |
Sell | | Goldman Sachs International | | SEK | | 29,327 | | 3,332 | | 3/19 | | | — | | | | (71 | ) | | | (71 | ) |
| | | | | | | | | | | | $ | 35 | | | $ | (295 | ) | | $ | (260 | ) |
| | | | | | | | | | | | | | | | | | | | | | | | | | | | |
| | | Financial Derivative Assets (000’s) | | | Financial Derivative Liabilities (000’s) | |
| | | Forward
Contracts | | | Swaps | | | Total | | | Forward
Contracts | | | Options | | | Swaps | | | Total | |
Total Over the Counter | | $ | 35 | | | —$ | | | | 35$ | | | | | (295 | ) | | | — | | | — $ | | | | | (295 | ) |
Derivatives | | | | | | | | | | | | | | | | | | | | | | | | | | | | |
| + | All par is stated in U.S Dollar unless otherwise noted. |
| # | 7-Day yield as of 12/31/2018. |
| @ | At December 31, 2018, the aggregate cost of investments, including derivatives, for federal tax purposes (in thousands) was $525,891 and the net unrealized depreciation of investments based on that cost was $57,038 which is comprised of $20,409 aggregate gross unrealized appreciation and $77,447 aggregate gross unrealized depreciation. |
| p | Amount is less than one thousand. |
The Accompanying Notes are an Integral Part of the Financial Statements.
57
Mid Cap Value Portfolio
The following is a summary of the inputs used in valuing the Portfolio’s assets and liabilities at December 31, 2018. See Note 3 for additional information on portfolio valuation.
| | | | | | | | | | | | | | | | |
| | | Valuation Inputs | | | | |
| Description | | Level 1—Quoted
Prices | | | Level 2—Other
Significant
Observable Inputs | | | Level 3—Significant
Unobservable Inputs | | | | |
| | | (Amounts in thousands) | | | | |
Assets: | | | | | | | | | | | | | | | | |
Common Stocks | | | | | | | | | | | | | | | | |
Health Care | | $ | 40,191 | | | $ | 2,335 | | | $ | - | | | | | |
Industrials | | | 72,679 | | | | 3,813 | | | | - | | | | | |
Materials | | | 19,751 | | | | 6,849 | | | | - | | | | | |
All Others | | | 300,236 | | | | - | | | | - | | | | | |
Investment Companies | | | 8,423 | | | | - | | | | - | | | | | |
Short-Term Investments | | | 14,836 | | | | - | | | | - | | | | | |
Other Financial Instruments^ | | | | | | | | | | | | | | | | |
Forward Currency Contracts | | | - | | | | 35 | | | | - | | | | | |
Total Assets: | | $ | 456,116 | | | $ | 13,032 | | | $ | - | | | | | |
Liabilities: | | | | | | | | | | | | | | | | |
Other Financial Instruments^ | | | | | | | | | | | | | | | | |
Forward Currency Contracts | | | - | | | | (295 | ) | | | - | | | | | |
Total Liabilities: | | $ | - | | | $ | (295 | ) | | $ | - | | | | | |
^ Other financial instruments are derivative instruments such as futures and forwards, which are valued at the unrealized appreciation (depreciation) on the instrument, and securities sold short, reverse repurchase agreements, written options and swaps contracts, which are valued at market value.
The Accompanying Notes are an Integral Part of the Financial Statements.
58
Small Cap Growth Stock Portfolio (unaudited)
| | | | |
| Objective: | | Portfolio Strategy: | | Net Assets: |
| Long-term growth of capital. | | Invest primarily in common stocks of small capitalization companies. | | $521 million |
PORTFOLIO OVERVIEW
Mason Street Advisors, LLC (“Mason Street Advisors”), the investment adviser for the Small Cap Growth Stock Portfolio (the “Portfolio”), has engaged Wellington Management Company LLP (“Wellington”) to act assub-adviser for the Portfolio. Normally, the Portfolio invests in common stocks of small capitalization companies. The Portfolio’s investment process is derived from the observation that the quality and persistence of a company’s business is often not reflected in its current stock price. Central to the investment process is intense, fundamental research focused on uncovering companies with improving quality metrics, business momentum and attractive relative valuations.
MARKET OVERVIEW
U.S. equities, as measured by the S&P 500® Index, posted negative results over the twelve-month period ending December 31, 2018. The U.S. Federal Reserve (the “Fed”) raised its benchmark interest rate by 25 basis points four times during the year, although it signaled a slower pace of interest rate increases heading into 2019. Bullish sentiment was exceptionally strong to start the year, as better-than-expected corporate profits helped drive U.S. equities higher. By the summer of 2018, however, talk of tariffs and trade wars had progressed to implementation, raising concerns in an otherwise strong economy. In the final months of 2018, worries surrounding slowing global growth, rich valuations, rising interest rates and heightened U.S. and Chinese trade tensions were at the forefront of investors’ minds. Returns in October and December were sharply negative, with the latter representing the largest monthly decline in a decade, which culminated in the first year of negative U.S. equity returns since 2008.
PORTFOLIO RESULTS
The Portfolio returned (11.71%) for the twelve months ended December 31, 2018. By comparison, the Portfolio’s benchmark, the Russell 2000® Growth Index (the “Index”) returned (9.31%). (The Index is unmanaged, cannot be invested in directly and does not incur expenses.) According to Lipper® Analytical Services, Inc., an independent mutual fund ranking agency, the average return in 2018 of the Small Cap Growth Funds peer group was (5.99%).
Relative underperformance was primarily driven by weak stock selection in the Health Care, Consumer Discretionary and Consumer Staples sectors. This was partially offset by strong selection in the Information Technology, Energy and Utilities sectors. Sector allocation, a residual of the Portfolio’sbottom-up stock selection process, contributed to performance during the period; an overweight allocation to Information Technology and an underweight to Industrials contributed the most.
Top detractors from relative performance during the period includedJELD-WEN and Altra in the Industrials sector and Visteon in the Consumer Discretionary sector. Shares ofJELD-WEN, a designer, manufacturer and distributor of doors and aluminum windows, fell after the company’s earnings were lower than expected due to weakness in the housing market. The Portfolio reduced its exposure toJELD-WEN but continued to hold an overweight position as of the end of the period. Shares of Altra, a manufacturer of motion control and transmission products, fell during the period due to concerns that tariffs on aluminum and steel could diminish profit margins. The Portfolio maintained an overweight position in Altra as of the end of the period. Visteon supplies and designs electronic products for car manufacturers. Sales decreased during 2018 as Ford, Visteon’s largest customer, decreased production. Shares fell after management lowered guidance for fourth quarter earnings. The Portfolio maintained an overweight position in Visteon as of the end of the period.
Top contributors to relative performance included Wingstop, an owner and operator of restaurants and franchises, which rose on the back of high same-store sales growth and optimism about the company’s rollout of delivery services in 2019. MongoDB, a database platform company, also contributed as a result of strong subscription growth and optimism about its rollout of a mobile database platform. Shares of Etsy, ane-commerce company, rose due to strong revenue growth. Additionally, the company raised its revenue guidance for the year. The Portfolio continued to hold all three names as of the end of the period.
PORTFOLIO MANAGER OUTLOOK
The following forward-looking comments are the opinion of Wellington, the Portfolio’ssub-adviser.
59
Small Cap Growth Stock Portfolio (unaudited)
The U.S. economy remains healthy, although leading indicators are suggesting some moderation in growth in 2019. With unemployment levels low and trending lower, we still believe that risks from U.S. inflation are low. Many companies are facing higher labor and material costs, creating some uncertainty around profitability. While we had worried about the possibility of higher oil prices last quarter given the prospect of Iran sanctions, the waivers granted by the administration actually resulted in oversupply and declining crude prices. The investment team does expect that recent cuts will restore supply/demand balance and allow oil prices to find a firmer footing in the coming months. Given the uncertainty of some of the aforementioned macro items, we do expect volatility to remain somewhat elevated in 2019.
Relative Performance
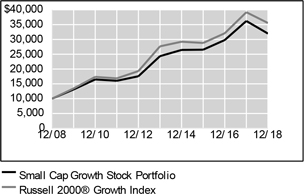
| | | | | | | | | | | | |
Average Annual Total Returns
For Periods Ended December 31, 2018 | |
| | | 1 Year | | | 5 Years | | | 10 Years | |
Small Cap Growth Stock Portfolio | | | -11.71 | % | | | 5.61 | % | | | 12.33 | % |
Russell 2000® Growth Index | | | -9.31 | % | | | 5.13 | % | | | 13.52 | % |
Lipper® Variable Insurance Products (VIP) Small Cap Growth Funds Average | | | -5.99 | % | | | 5.43 | % | | | 13.58 | % |
The performance data quoted represents past performance. Past performance is historical and does not guarantee future performance. Investment return and principal value will fluctuate, so that shares, when redeemed, may be worth more or less than their original cost. Current performance may be lower or higher than the performance data quoted. For the most recentmonth-end performance information visitwww.northwesternmutual.com.
This chart assumes an initial investment of $10,000 made on 12/31/08. Returns shown reflect fee waivers, deductions for management and other portfolio expenses, and reinvestment of all dividends. In the absence of fee waivers, total return would be reduced. Returns exclude deductions for separate account sale loads and account fees. Please refer tothe Benchmark Definitions section of this report for information about the indices cited in the above chart and graph.
Stocks of smaller or newer companies, such as those held in this Portfolio, are more likely to realize more substantialgrowth as well as suffer more significant losses than larger or more established issuers. Investments in such companies can be both more volatile and more speculative. Investing in small company stocks involves a greater degree of risk than investing in medium or large company stocks.
The Portfolio may invest in exchange-traded funds (“ETFs”) for cash management purposes. Investing in ETFs may expose the Portfolio to greater risk of loss and price fluctuation than investing directly in an equity security. The market prices of ETFs may trade at a premium or discount to their net asset value and may be subject to trading halts by the applicable exchange, which may negatively impact the Portfolio.
The Portfolio may invest a relatively high percentage of its assets in a particular sector. The Portfolio will have greater exposure to the risks associated with that sector and its performance will be tied more closely to the performance of the sector.
Top 10 Equity Holdings 12/31/18
| | |
| Security Description | | % of Net Assets |
iShares Russell 2000 Growth Index Fund | | 4.2% |
Wolverine World Wide, Inc. | | 1.3% |
Steven Madden, Ltd. | | 1.2% |
Omnicell, Inc. | | 1.1% |
Globus Medical, Inc. - Class A | | 1.1% |
Merit Medical Systems, Inc. | | 1.1% |
Insulet Corp. | | 1.0% |
Performance Food Group Co. | | 1.0% |
John Bean Technologies Corp. | | 1.0% |
Five9, Inc. | | 1.0% |
60
Small Cap Growth Stock Portfolio (unaudited)
Sector Allocation 12/31/18
| | | | | | | | |
| Sector | | % of Net Assets | | | | | |
Health Care | | | 25.5% | | | | | |
Information Technology | | | 19.5% | | | | | |
Industrials | | | 15.6% | | | | | |
Consumer Discretionary | | | 12.9% | | | | | |
Financials | | | 7.9% | | | | | |
Investment Companies | | | 4.2% | | | | | |
Consumer Staples | | | 4.1% | | | | | |
Materials | | | 2.9% | | | | | |
Real Estate | | | 2.7% | | | | | |
Short-Term Investments & Other Net Assets | | | 1.9% | | | | | |
Energy | | | 1.5% | | | | | |
Communication Services | | | 1.3% | | | | | |
Sector Allocation and Top 10 Holdings are subject to change.
61
Small Cap Growth Stock Portfolio
SCHEDULE OF INVESTMENTS
December 31, 2018
| | | | | | | | |
| Common Stocks (93.9%) | | Shares/
Par+ | | | Value
$ (000’s) | |
| |
Communication Services (1.3%) | | | | | |
ORBCOMM, Inc.* | | | 195,103 | | | | 1,612 | |
TrueCar, Inc.* | | | 261,299 | | | | 2,367 | |
Vonage Holdings Corp.* | | | 306,967 | | | | 2,680 | |
| | | | | | | | |
Total | | | | | | | 6,659 | |
| | | | | | | | |
| |
Consumer Discretionary (12.9%) | | | | | |
Caleres, Inc. | | | 130,358 | | | | 3,628 | |
Carter’s, Inc. | | | 60,797 | | | | 4,962 | |
Cooper Tire & Rubber Co. | | | 73,317 | | | | 2,370 | |
Core-Mark Holding Co., Inc. | | | 99,631 | | | | 2,316 | |
Dunkin’ Brands Group, Inc. | | | 70,259 | | | | 4,505 | |
Etsy, Inc.* | | | 84,942 | | | | 4,041 | |
Five Below, Inc.* | | | 42,682 | | | | 4,367 | |
Floor & Decor Holdings, Inc.* | | | 77,061 | | | | 1,996 | |
Marriott Vacations Worldwide Corp. | | | 55,321 | | | | 3,901 | |
The Michaels Cos., Inc.* | | | 158,031 | | | | 2,140 | |
Oxford Industries, Inc. | | | 66,666 | | | | 4,736 | |
Skyline Champion Corp. | | | 43,700 | | | | 642 | |
Steven Madden, Ltd. | | | 213,343 | | | | 6,456 | |
Tenneco, Inc. | | | 113,473 | | | | 3,108 | |
TopBuild Corp.* | | | 90,722 | | | | 4,083 | |
Visteon Corp.* | | | 40,315 | | | | 2,430 | |
Wingstop, Inc. | | | 75,009 | | | | 4,815 | |
Wolverine World Wide, Inc. | | | 213,026 | | | | 6,793 | |
| | | | | | | | |
Total | | | | | | | 67,289 | |
| | | | | | | | |
| |
Consumer Staples (4.1%) | | | | | |
Casey’s General Stores, Inc. | | | 22,740 | | | | 2,914 | |
Edgewell Personal Care Co.* | | | 98,677 | | | | 3,686 | |
Hostess Brands, Inc.* | | | 277,503 | | | | 3,036 | |
Performance Food Group Co.* | | | 160,697 | | | | 5,186 | |
Post Holdings, Inc.* | | | 38,097 | | | | 3,395 | |
PriceSmart, Inc. | | | 53,510 | | | | 3,162 | |
| | | | | | | | |
Total | | | | | | | 21,379 | |
| | | | | | | | |
| |
Energy (1.5%) | | | | | |
Newfield Exploration Co.* | | | 90,624 | | | | 1,329 | |
PDC Energy, Inc.* | | | 64,265 | | | | 1,912 | |
ProPetro Holding Corp.* | | | 160,700 | | | | 1,980 | |
WildHorse Resource Development Corp.* | | | 184,356 | | | | 2,601 | |
| | | | | | | | |
Total | | | | | | | 7,822 | |
| | | | | | | | |
| | | | | | | | |
| Common Stocks (93.9%) | | Shares/
Par+ | | | Value $ (000’s) | |
| |
Financials (7.9%) | | | | | |
Blucora, Inc. * | | | 119,887 | | | | 3,194 | |
Evercore, Inc. - Class A | | | 54,371 | | | | 3,891 | |
First Busey Corp. | | | 104,637 | | | | 2,568 | |
First Hawaiian, Inc. | | | 125,849 | | | | 2,833 | |
Great Western Bancorp, Inc. | | | 75,396 | | | | 2,356 | |
IBERIABANK Corp. | | | 57,358 | | | | 3,687 | |
James River Group Holdings, Ltd. | | | 126,099 | | | | 4,608 | |
MGIC Investment Corp.* | | | 408,023 | | | | 4,268 | |
OneMain Holdings, Inc.* | | | 74,404 | | | | 1,807 | |
Seacoast Banking Corp. of Florida* | | | 109,390 | | | | 2,846 | |
SLM Corp.* | | | 400,136 | | | | 3,325 | |
Sterling Bancorp | | | 215,806 | | | | 3,563 | |
Triumph Bancorp, Inc.* | | | 63,577 | | | | 1,888 | |
| | | | | | | | |
Total | | | | | | | 40,834 | |
| | | | | | | | |
| |
Health Care (25.5%) | | | | | |
Abeona Therapeutics, Inc.* | | | 106,156 | | | | 758 | |
Aerie Pharmaceuticals, Inc.* | | | 67,607 | | | | 2,441 | |
Agios Pharmaceuticals, Inc.* | | | 27,997 | | | | 1,291 | |
Amicus Therapeutics, Inc.* | | | 301,009 | | | | 2,884 | |
Amneal Pharmaceuticals, Inc.* | | | 206,620 | | | | 2,796 | |
Aptinyx, Inc.* | | | 24,333 | | | | 402 | |
Arena Pharmaceuticals, Inc.* | | | 86,603 | | | | 3,373 | |
Assembly Biosciences, Inc.* | | | 48,150 | | | | 1,089 | |
AtriCure, Inc.* | | | 112,652 | | | | 3,447 | |
Audentes Therapeutics, Inc.* | | | 70,688 | | | | 1,507 | |
Avrobio, Inc.* | | | 21,798 | | | | 363 | |
Biohaven Pharmaceutical Holding Co. Ltd.* | | | 56,041 | | | | 2,072 | |
Blueprint Medicines Corp.* | | | 62,593 | | | | 3,374 | |
Cardiovascular Systems, Inc.* | | | 110,472 | | | | 3,147 | |
Catalent, Inc.* | | | 93,897 | | | | 2,928 | |
Dermira, Inc.* | | | 99,633 | | | | 716 | |
Five Prime Therapeutics, Inc.* | | | 117,316 | | | | 1,091 | |
Flexion Therapeutics, Inc.* | | | 74,270 | | | | 841 | |
G1 Therapeutics, Inc.* | | | 60,936 | | | | 1,167 | |
| | | | | | | | |
| Common Stocks (93.9%) | | Shares/
Par+ | | | Value
$ (000’s) | |
| |
Health Care continued | | | | | |
Globus Medical, Inc. - Class A* | | | 135,086 | | | | 5,847 | |
GlycoMimetics, Inc.* | | | 87,330 | | | | 827 | |
Haemonetics Corp.* | | | 39,895 | | | | 3,992 | |
Heron Therapeutics, Inc.* | | | 128,329 | | | | 3,329 | |
HMS Holdings Corp.* | | | 160,886 | | | | 4,526 | |
ICU Medical, Inc.* | | | 17,989 | | | | 4,131 | |
Insulet Corp.* | | | 67,046 | | | | 5,318 | |
Integra LifeSciences Holdings Corp.* | | | 73,531 | | | | 3,316 | |
Intersect ENT, Inc.* | | | 160,022 | | | | 4,509 | |
Karyopharm Therapeutics, Inc.* | | | 59,046 | | | | 553 | |
LHC Group, Inc.* | | | 37,501 | | | | 3,521 | |
LivaNova PLC* | | | 25,722 | | | | 2,353 | |
Loxo Oncology, Inc.* | | | 33,512 | | | | 4,694 | |
Madrigal Pharmaceuticals, Inc.* | | | 7,803 | | | | 880 | |
Medidata Solutions, Inc.* | | | 43,149 | | | | 2,909 | |
Merit Medical Systems, Inc.* | | | 104,666 | | | | 5,841 | |
Minerva Neurosciences, Inc.* | | | 58,178 | | | | 392 | |
MyoKardia, Inc.* | | | 69,959 | | | | 3,418 | |
Nanostring Technologies, Inc.* | | | 169,871 | | | | 2,519 | |
Omnicell, Inc.* | | | 95,533 | | | | 5,850 | |
OraSure Technologies, Inc.* | | | 172,567 | | | | 2,016 | |
Orthofix Medical, Inc.* | | | 35,394 | | | | 1,858 | |
Portola Pharmaceuticals, Inc.* | | | 74,876 | | | | 1,462 | |
The Providence Service Corp.* | | | 41,661 | | | | 2,500 | |
R1 RCM, Inc.* | | | 323,621 | | | | 2,573 | |
REGENXBIO, Inc.* | | | 45,353 | | | | 1,903 | |
Revance Therapeutics, Inc.* | | | 94,257 | | | | 1,897 | |
Rigel Pharmaceuticals, Inc.* | | | 469,492 | | | | 1,080 | |
Spark Therapeutics, Inc.* | | | 49,722 | | | | 1,946 | |
Syneos Health, Inc.* | | | 85,956 | | | | 3,382 | |
Teladoc, Inc.* | | | 44,386 | | | | 2,200 | |
U.S. Physical Therapy, Inc. | | | 26,586 | | | | 2,721 | |
Ultragenyx Pharmaceutical, Inc.* | | | 68,447 | | | | 2,976 | |
| | | | | | | | |
Total | | | | | | | 132,926 | |
| | | | | | | | |
The Accompanying Notes are an Integral Part of the Financial Statements.
62
Small Cap Growth Stock Portfolio
| | | | | | | | |
| Common Stocks (93.9%) | | Shares/
Par+ | | | Value
$ (000’s) | |
| |
Industrials (15.6%) | | | | | |
Advanced Disposal Services, Inc.* | | | 167,018 | | | | 3,998 | |
Aerojet Rocketdyne Holdings, Inc.* | | | 121,405 | | | | 4,277 | |
Altra Industrial Motion Corp. | | | 125,252 | | | | 3,150 | |
American Woodmark Corp.* | | | 31,277 | | | | 1,742 | |
Applied Industrial Technologies, Inc. | | | 69,349 | | | | 3,741 | |
Armstrong World Industries, Inc. | | | 45,032 | | | | 2,621 | |
ASGN, Inc.* | | | 80,422 | | | | 4,383 | |
Astec Industries, Inc. | | | 49,831 | | | | 1,504 | |
Axon Enterprise, Inc.* | | | 69,872 | | | | 3,057 | |
AZZ, Inc. | | | 62,408 | | | | 2,519 | |
Clean Harbors, Inc.* | | | 73,821 | | | | 3,643 | |
Exponent, Inc. | | | 94,517 | | | | 4,793 | |
Generac Holdings, Inc.* | | | 82,898 | | | | 4,120 | |
Genesee & Wyoming, Inc. - Class A* | | | 55,081 | | | | 4,077 | |
Huron Consulting Group, Inc.* | | | 41,758 | | | | 2,143 | |
ITT, Inc. | | | 100,977 | | | | 4,874 | |
JELD-WEN Holding, Inc.* | | | 119,730 | | | | 1,701 | |
John Bean Technologies Corp. | | | 71,190 | | | | 5,112 | |
Knight-Swift Transportation Holdings | | | 47,159 | | | | 1,182 | |
Marten Transport, Ltd. | | | 147,665 | | | | 2,391 | |
Mercury Systems, Inc.* | | | 61,904 | | | | 2,928 | |
Milacron Holdings Corp.* | | | 195,025 | | | | 2,319 | |
MSA Safety, Inc. | | | 43,240 | | | | 4,076 | |
Rexnord Corp.* | | | 154,544 | | | | 3,547 | |
SiteOne Landscape Supply, Inc.* | | | 35,438 | | | | 1,959 | |
Welbilt, Inc.* | | | 104,866 | | | | 1,165 | |
| | | | | | | | |
Total | | | | | | | 81,022 | |
| | | | | | | | |
| |
Information Technology (19.5%) | | | | | |
2U, Inc.* | | | 52,244 | | | | 2,598 | |
8x8, Inc.* | | | 148,165 | | | | 2,673 | |
Alteryx, Inc.* | | | 38,636 | | | | 2,298 | |
Blackbaud, Inc. | | | 42,736 | | | | 2,688 | |
CACI International, Inc. - Class A* | | | 25,072 | | | | 3,611 | |
Carbonite, Inc.* | | | 108,993 | | | | 2,753 | |
Cirrus Logic, Inc.* | | | 61,573 | | | | 2,043 | |
Cloudera, Inc.* | | | 226,878 | | | | 2,509 | |
Cohu, Inc. | | | 184,430 | | | | 2,964 | |
CTS Corp. | | | 116,745 | | | | 3,022 | |
Diodes, Inc.* | | | 75,827 | | | | 2,446 | |
Entegris, Inc. | | | 168,586 | | | | 4,703 | |
EPAM Systems, Inc.* | | | 22,931 | | | | 2,660 | |
ePlus, Inc.* | | | 53,538 | | | | 3,810 | |
Everbridge, Inc.* | | | 71,223 | | | | 4,043 | |
| | | | | | | | |
| Common Stocks (93.9%) | | Shares/
Par+ | | | Value
$(000’s) | |
| |
Information Technology continued | | | | | |
Fair Isaac Corp.* | | | 23,698 | | | | 4,431 | |
Five9, Inc.* | | | 116,015 | | | | 5,072 | |
ForeScout Technologies, Inc.* | | | 126,624 | | | | 3,291 | |
FormFactor, Inc.* | | | 237,342 | | | | 3,344 | |
HubSpot, Inc.* | | | 31,600 | | | | 3,973 | |
Instructure, Inc.* | | | 56,227 | | | | 2,109 | |
LiveRamp Holdings, Inc.* | | | 61,794 | | | | 2,387 | |
Lumentum Holdings, Inc.* | | | 35,389 | | | | 1,487 | |
MINDBODY, Inc.* | | | 107,601 | | | | 3,917 | |
MongoDB, Inc.* | | | 27,465 | | | | 2,300 | |
New Relic, Inc.* | | | 49,229 | | | | 3,986 | |
Paylocity Holding Corp.* | | | 63,113 | | | | 3,800 | |
Pegasystems, Inc. | | | 73,259 | | | | 3,504 | |
Pivotal Software, Inc. - Class A* | | | 142,232 | | | | 2,325 | |
Q2 Holdings, Inc.* | | | 42,256 | | | | 2,094 | |
Rogers Corp.* | | | 31,239 | | | | 3,095 | |
Science Applications International Corp. | | | 33,134 | | | | 2,111 | |
The Trade Desk, Inc.* | | | 28,462 | | | | 3,303 | |
| | | | | | | | |
Total | | | | | | | 101,350 | |
| | | | | | | | |
| |
Materials (2.9%) | | | | | |
Boise Cascade Co. | | | 66,992 | | | | 1,598 | |
Graphic Packaging Holding Co. | | | 288,170 | | | | 3,066 | |
Louisiana-Pacific Corp. | | | 107,595 | | | | 2,391 | |
Omnova Solutions, Inc.* | | | 239,282 | | | | 1,754 | |
PolyOne Corp. | | | 150,811 | | | | 4,313 | |
Summit Materials, Inc. - Class A* | | | 173,235 | | | | 2,148 | |
| | | | | | | | |
Total | | | | | | | 15,270 | |
| | | | | | | | |
| |
Real Estate (2.7%) | | | | | |
Columbia Property Trust, Inc. | | | 138,303 | | | | 2,676 | |
CoreSite Realty Corp. | | | 28,447 | | | | 2,481 | |
Corporate Office Properties Trust | | | 105,402 | | | | 2,217 | |
Pebblebrook Hotel Trust | | | 111,196 | | | | 3,148 | |
PS Business Parks, Inc. | | | 28,688 | | | | 3,758 | |
| | | | | | | | |
Total | | | | | | | 14,280 | |
| | | | | | | | |
| | |
Total Common Stocks
(Cost: $485,879) | | | | | | | 488,831 | |
| | | | | | | | |
| | | | | | | | |
| Investment Companies (4.2%) | | Shares/
Par+ | | | Value
$ (000’s) | |
| |
Investment Companies (4.2%) | | | | | |
iShares Russell 2000 Growth Index Fund | | | 131,223 | | | | 22,046 | |
| | | | | | | | |
Total | | | | | | | 22,046 | |
| | | | | | | | |
| | |
Total Investment Companies | | | | | | | | |
(Cost: $22,828) | | | | | | | 22,046 | |
| | | | | | | | |
| |
| Short-Term Investments (1.5%) | | | | |
| | |
Money Market Funds (1.5%) | | | | | | | | |
State Street Institutional U.S. Government Money Market Fund - Premier Class 2.270%# | | | 7,787,301 | | | | 7,787 | |
| | | | | | | | |
Total | | | | | | | 7,787 | |
| | | | | | | | |
| | |
Total Short-Term Investments | | | | | | | | |
(Cost: $7,787) | | | | | | | 7,787 | |
| | | | | | | | |
| | |
Total Investments (99.6%) | | | | | | | | |
(Cost: $516,494)@ | | | | | | | 518,664 | |
| | | | | | | | |
Other Assets, Less | | | | | | | | |
Liabilities (0.4%) | | | | | | | 1,958 | |
| | | | | | | | |
Net Assets (100.0%) | | | | | | | 520,622 | |
| | | | | | | | |
The Accompanying Notes are an Integral Part of the Financial Statements.
63
Small Cap Growth Stock Portfolio
| + | All par is stated in U.S Dollar unless otherwise noted. |
| # | 7-Day yield as of 12/31/2018. |
| @ | At December 31, 2018, the aggregate cost of investments, including derivatives, for federal tax purposes (in thousands) was $516,570 and the net unrealized appreciation of investments based on that cost was $2,094 which is comprised of $71,125 aggregate gross unrealized appreciation and $69,031 aggregate gross unrealized depreciation. |
| | The following is a summary of the inputs used in valuing the Portfolio’s assets and liabilities at December 31, 2018. See Note 3 for additional information on portfolio valuation. |
| | | | | | | | | | | | | | |
| | | Valuation Inputs | | | |
| Description | | Level 1 – Quoted Prices | | | Level 2 – Other Significant
Observable Inputs | | | Level 3 – Significant
Unobservable Inputs | | | |
| | | (Amounts in thousands) | | | |
Assets: | | | | | | | | | | | | | | |
Common Stocks | | $ | 488,831 | | | $ | - | | | $ | - | | | |
Investment Companies | | | 22,046 | | | | - | | | | - | | | |
Short-Term Investments | | | 7,787 | | | | - | | | | - | | | |
Total Assets: | | $ | 518,664 | | | $ | - | | | $ | - | | | |
The Accompanying Notes are an Integral Part of the Financial Statements.
64
Index 600 Stock Portfolio (unaudited)
| | | | |
| Objective: | | Portfolio Strategy: | | Net Assets: |
| Investment results that approximate the performance of the S&P SmallCap 600® Index. | | Invest in stocks that make up the S&P SmallCap 600® Index, holding each stock in approximately the same proportion as its weighting in the Index. | | $222 million |
PORTFOLIO OVERVIEW
Mason Street Advisors is the investment adviser for the Index 600 Stock Portfolio (the “Portfolio”). The Portfolio seeks investment results that approximate the performance of the S&P SmallCap 600® Index. The Portfolio attempts to achieve its objective by investing all, or substantially all, of its assets in stocks that make up the S&P SmallCap 600® Index, holding each stock in approximately the same proportion as its weighting in the Index. This is known as a full replication strategy. The Portfolio may also purchase (long) total return equity swap agreements and invest in exchange traded funds and, to a lesser extent, futures contracts, for cash management purposes and to help achieve full replication.
MARKET OVERVIEW
U.S. equity markets hit record highs until a sharpsell-off in the fourth quarter drove stocks lower for the year. Early gains were driven by strong economic fundamentals, high consumer spending and stimulus from tax reform. Markets peaked in October, however, as investors became increasingly concerned that the pace of the U.S. Federal Reserve’s (the “Fed”) interest rate hikes could hurt economic growth and corporate earnings.
Markets were further rattled by several developments late in the year, including lower international growth forecasts, an escalation of the trade dispute between the U.S. and China and a partial U.S. government shutdown. Following the confluence of negative news, market sentiment turned negative, and investors began to consider the possibility of a recession in 2019.
In this environment, large cap stocks, as represented by the S&P 500® Index, posted a return of (4.38%), outperforming the S&P SmallCap 600® and the S&P MidCap 400® Indices, which returned (8.48%) and (11.08%), respectively. Meanwhile, the broader bond market, as represented by the Bloomberg Barclays® U.S. Aggregate Index, was relatively unchanged, while the Bloomberg Barclays® U.S. Corporate High Yield Index declined (2.08%).
PORTFOLIO RESULTS
The Index 600 Stock Portfolio delivered a total return of (8.78%) for the twelve months ended December 31, 2018, trailing the S&P SmallCap 600® Index (the “Index”), which returned (8.48%). (The Index is unmanaged, cannot be invested in directly, and does not incur expenses.) Portfolio performance slightly lagged the Index due to transaction costs, administrative expenses, cash flow effects and costs associated with the use of total return equity swap agreements and exchange traded funds. According to Lipper® Analytical Services, Inc., an independent mutual fund ranking agency, the average return in 2018 of the Small Cap Core Funds peer group was (12.68%). However, the Small Cap Core Funds peer group is not strictly comparable to the Portfolio because many of the funds in the group are actively managed.
Ten of the Index’s eleven sectors posted negative returns for the year. The largest detractor from the Index’s return was the Industrials sector, where small cap industrial stocks were hindered by worries over a potential economic slowdown. Small cap industrial stocks are particularly sensitive to concerns about diminished growth and increased borrowing costs due to higher interest rates. Energy companies also detracted from the Index’s return. Lower estimates of energy demand amid ample supply led to a sharp decline in oil prices late in the year. Profitability in the sector was also lower than expected as producers struggled to contain extraction costs.
The Information Technology sector also detracted from the Index’s return, amid weak performance from small cap companies in the electronic equipment, instruments and components industry. Materials stocks fell due to lower prices for many commodities and weakness in the chemicals industry. The Financials sector also declined, as bank stocks struggled due to concerns about an economic slowdown and competition for deposits. Despite solid consumer spending, Consumer Discretionary stocks were hurt by worsening sentiment about the economy and weakness in the household durables industry.
At the other end of the spectrum, Health Care was the only sector to deliver a positive return. Companies in the sector benefited from ongoing demographic shifts that increased the number of patients using health care equipment and supplies.
65
Index 600 Stock Portfolio (unaudited)
Relative Performance
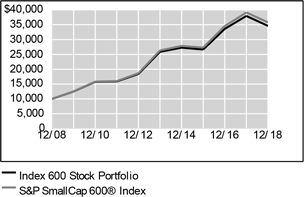
| | | | | | | | | | | | |
Average Annual Total Returns
For Periods Ended December 31, 2018 | |
| | | 1 Year | | | 5 Years | | | 10 Years | |
Index 600 Stock Portfolio | | | -8.78 | % | | | 5.97 | % | | | 13.22 | % |
S&P SmallCap 600® Index | | | -8.48 | % | | | 6.33 | % | | | 13.60 | % |
Lipper® Variable Insurance Products (VIP) Small Cap Core Funds Average | | | -12.68 | % | | | 3.92 | % | | | 11.94 | % |
The performance data quoted represents past performance. Past performance is historical and does not guarantee future performance. Investment return and principal value will fluctuate, so that shares, when redeemed, may be worth more or less than their original cost. Current performance may be lower or higher than the performance data quoted. For the most recentmonth-end performance information visitwww.northwesternmutual.com.
This chart assumes an initial investment of $10,000 made on 12/31/08. Returns shown reflect fee waivers, deductions for management and other portfolio expenses, and reinvestment of all dividends. In the absence of fee waivers, total return would be reduced. Returns exclude deductions for separate account sale loads and account fees. Please refer to the Benchmark Definitions section of this report for information about the indices cited in the above chart and graph.
“Standard & Poor’s®”, “S&P®”, “S&P SmallCap 600” and “Standard & Poor’s SmallCap 600” are trademarks of The McGraw-Hill Companies, Inc. and have been licensed for use by Northwestern Mutual Life Insurance Company. The Portfolio is not sponsored, endorsed, sold or promoted by Standard & Poor’s, and Standard & Poor’s makes no representation regarding the advisability of investing in the Portfolio.
Stocks of smaller or newer companies, such as those held in this Portfolio, are more likely to realize more substantial growth as well as suffer more significant losses than larger
or more established issuers. Investments in such companies can be both more volatile and more speculative. Investing in small company stocks involves a greater degree of risk than investing in medium or large company stocks.
The Portfolio may invest in exchange-traded funds and derivative instruments such as swap agreements and, to a lesser extent, futures contracts, for cash management purposes and to help achieve full replication. Use of these instruments may involve certain costs and imposes certain risks such as liquidity risk, market risk, credit risk, management risk and the risk of mispricing or improper valuation. Certain derivatives involve leverage, which could magnify losses, and portfolios investing in derivatives could lose more than the principal amount invested in those instruments.
Top 10 Equity Holdings 12/31/18
| | | | |
Security Description | | | % of Net Assets | |
iShares Core S&PSmall-Cap ETF | | | 2.0 | % |
First Financial Bankshares, Inc. | | | 0.6 | % |
Green Dot Corp. - Class A | | | 0.5 | % |
Spire, Inc. | | | 0.5 | % |
Selective Insurance Group, Inc. | | | 0.5 | % |
Ingevity Corp. | | | 0.5 | % |
Trex Co., Inc. | | | 0.5 | % |
Amedisys, Inc. | | | 0.5 | % |
Glacier Bancorp, Inc. | | | 0.5 | % |
EastGroup Properties, Inc. | | | 0.5 | % |
Sector Allocation 12/31/18
| | | | |
Sector | | | % of Net Assets | |
Financials | | | 17.7 | % |
Industrials | | | 17.3 | % |
Information Technology | | | 13.4 | % |
Consumer Discretionary | | | 13.0 | % |
Health Care | | | 10.8 | % |
Real Estate | | | 6.2 | % |
Short-Term Investments & Other Net Assets | | | 4.9 | % |
Materials | | | 3.9 | % |
Consumer Staples | | | 3.3 | % |
Energy | | | 3.2 | % |
Utilities | | | 2.4 | % |
Investment Companies | | | 2.1 | % |
Communication Services | | | 1.8 | % |
Sector Allocation and Top 10 Holdings are subject to change.
66
Index 600 Stock Portfolio
SCHEDULE OF INVESTMENTS
December 31, 2018
| | | | | | | | |
| Common Stocks (93.0%) | | Shares/
Par+ | | | Value
$ (000’s) | |
| |
Communication Services (1.8%) | | | | | |
ATN International, Inc. | | | 3,371 | | | | 241 | |
Cincinnati Bell, Inc.* | | | 15,579 | | | | 121 | |
Cogent Communications Holdings, Inc. | | | 12,989 | | | | 587 | |
Consolidated Communications Holdings, Inc. | | | 22,127 | | | | 219 | |
The E.W. Scripps Co. - Class A | | | 17,505 | | | | 275 | |
Frontier Communications Corp.* | | | 32,778 | | | | 78 | |
Gannett Co., Inc. | | | 35,126 | | | | 300 | |
Iridium Communications, Inc.* | | | 30,082 | | | | 555 | |
The Marcus Corp. | | | 6,207 | | | | 245 | |
New Media Investment Group, Inc. | | | 16,853 | | | | 195 | |
QuinStreet, Inc.* | | | 11,940 | | | | 194 | |
Scholastic Corp. | | | 8,618 | | | | 347 | |
Spok Holdings, Inc. | | | 5,619 | | | | 74 | |
TechTarget, Inc.* | | | 6,870 | | | | 84 | |
Vonage Holdings Corp.* | | | 68,450 | | | | 598 | |
| | | | | | | | |
Total | | | | | | | 4,113 | |
| | | | | | | | |
| |
Consumer Discretionary (13.0%) | | | | | |
Abercrombie & Fitch Co. - Class A | | | 20,448 | | | | 410 | |
American Axle & Manufacturing Holdings, Inc.* | | | 34,689 | | | | 385 | |
American Public Education, Inc.* | | | 5,100 | | | | 145 | |
Asbury Automotive Group, Inc.* | | | 6,087 | | | | 406 | |
Ascena Retail Group, Inc.* | | | 53,957 | | | | 135 | |
Barnes & Noble Education, Inc.* | | | 11,373 | | | | 46 | |
Barnes & Noble, Inc. | | | 17,724 | | | | 126 | |
Belmond, Ltd. - Class A* | | | 27,826 | | | | 697 | |
BJ’s Restaurants, Inc. | | | 6,612 | | | | 334 | |
The Buckle, Inc. | | | 8,829 | | | | 171 | |
Caleres, Inc. | | | 13,416 | | | | 373 | |
Callaway Golf Co. | | | 27,587 | | | | 422 | |
Career Education Corp.* | | | 21,664 | | | | 247 | |
The Cato Corp. - Class A | | | 7,095 | | | | 101 | |
Cavco Industries, Inc.* | | | 2,656 | | | | 346 | |
Chico’s FAS, Inc. | | | 39,047 | | | | 220 | |
The Children’s Place, Inc. | | | 5,029 | | | | 453 | |
| | | | | | | | |
| Common Stocks (93.0%) | | Shares/
Par+ | | | Value
$ (000’s) | |
| |
Consumer Discretionary continued | | | | | |
Chuy’s Holdings, Inc.* | | | 5,264 | | | | 93 | |
Cooper Tire & Rubber Co. | | | 15,550 | | | | 503 | |
Cooper-Standard Holding, Inc.* | | | 5,134 | | | | 319 | |
Core-Mark Holding Co., Inc. | | | 14,193 | | | | 330 | |
Crocs, Inc.* | | | 20,745 | | | | 539 | |
Dave & Buster’s Entertainment, Inc. | | | 12,059 | | | | 537 | |
DineEquity, Inc. | | | 5,500 | | | | 370 | |
Dorman Products, Inc.* | | | 9,031 | | | | 813 | |
DSW, Inc. - Class A | | | 21,182 | | | | 523 | |
El Pollo Loco Holdings, Inc.* | | | 6,915 | | | | 105 | |
Ethan Allen Interiors, Inc. | | | 7,673 | | | | 135 | |
Express, Inc.* | | | 21,291 | | | | 109 | |
Fiesta Restaurant Group, Inc.* | | | 7,280 | | | | 113 | |
Fossil Group, Inc.* | | | 14,130 | | | | 222 | |
Fox Factory Holding Corp.* | | | 11,797 | | | | 695 | |
Francesca’s Holdings Corp.* | | | 11,241 | | | | 11 | |
GameStop Corp. - Class A | | | 31,660 | | | | 400 | |
Garrett Motion, Inc. * | | | 22,986 | | | | 284 | |
Genesco, Inc.* | | | 6,271 | | | | 278 | |
Gentherm, Inc.* | | | 10,835 | | | | 433 | |
G-III Apparel Group, Ltd.* | | | 13,028 | | | | 363 | |
Group 1 Automotive, Inc. | | | 5,657 | | | | 298 | |
Guess?, Inc. | | | 17,617 | | | | 366 | |
Haverty Furniture Cos., Inc. | | | 5,893 | | | | 111 | |
Hibbett Sports, Inc.* | | | 5,763 | | | | 82 | |
Installed Building Products, Inc.* | | | 6,788 | | | | 229 | |
iRobot Corp.* | | | 8,598 | | | | 720 | |
J.C. Penney Co., Inc.* | | | 97,948 | | | | 102 | |
Kirkland’s, Inc.* | | | 4,614 | | | | 44 | |
La-Z-Boy, Inc. | | | 14,544 | | | | 403 | |
LCI Industries | | | 7,832 | | | | 523 | |
LGI Homes, Inc.* | | | 5,785 | | | | 262 | |
Liquidity Services, Inc.* | | | 8,218 | | | | 51 | |
Lithia Motors, Inc. - Class A | | | 6,996 | | | | 534 | |
Lumber Liquidators Holdings, Inc.* | | | 8,888 | | | | 85 | |
M.D.C. Holdings, Inc. | | | 14,065 | | | | 395 | |
M/I Homes, Inc.* | | | 8,672 | | | | 182 | |
MarineMax, Inc.* | | | 7,098 | | | | 130 | |
| | | | | | | | |
| Common Stocks (93.0%) | | Shares/
Par+ | | | Value
$ (000’s) | |
| |
Consumer Discretionary continued | | | | | |
Meritage Homes Corp.* | | | 11,667 | | | | 428 | |
Monarch Casino & Resort, Inc.* | | | 3,668 | | | | 140 | |
Monro Muffler Brake, Inc. | | | 10,244 | | | | 704 | |
Motorcar Parts of America, Inc.* | | | 5,874 | | | | 98 | |
Movado Group, Inc. | | | 5,124 | | | | 162 | |
Nautilus, Inc.* | | | 9,250 | | | | 101 | |
Nutrisystem, Inc. | | | 9,137 | | | | 401 | |
Office Depot, Inc. | | | 169,933 | | | | 438 | |
Oxford Industries, Inc. | | | 5,264 | | | | 374 | |
PetMed Express, Inc. | | | 6,420 | | | | 149 | |
Red Robin Gourmet Burgers, Inc.* | | | 4,030 | | | | 108 | |
Regis Corp.* | | | 10,325 | | | | 175 | |
Rent-A-Center, Inc.* | | | 13,794 | | | | 223 | |
Restoration Hardware, Inc.* | | | 5,798 | | | | 695 | |
Ruth’s Hospitality Group, Inc. | | | 8,898 | | | | 202 | |
Shake Shack, Inc. - Class A* | | | 8,027 | | | | 365 | |
Shoe Carnival, Inc. | | | 3,115 | | | | 104 | |
Shutterfly, Inc.* | | | 10,436 | | | | 420 | |
Shutterstock, Inc. | | | 5,767 | | | | 208 | |
Sleep Number Corp.* | | | 10,315 | | | | 327 | |
Sonic Automotive, Inc. - Class A | | | 7,346 | | | | 101 | |
Stamps.com, Inc.* | | | 5,284 | | | | 822 | |
Standard Motor Products, Inc. | | | 6,270 | | | | 304 | |
Steven Madden, Ltd. | | | 24,715 | | | | 748 | |
Strategic Education, Inc. | | | 6,742 | | | | 765 | |
Sturm, Ruger & Co., Inc. | | | 5,422 | | | | 289 | |
Superior Industries International, Inc. | | | 7,148 | | | | 34 | |
Tailored Brands, Inc. The Tile Shop | | | 15,501 | | | | 211 | |
Holdings, Inc. | | | 12,125 | | | | 67 | |
TopBuild Corp.* | | | 10,989 | | | | 495 | |
Unifi, Inc.* | | | 4,510 | | | | 103 | |
Universal Electronics, Inc.* | | | 4,287 | | | | 108 | |
Vera Bradley, Inc.* | | | 6,698 | | | | 57 | |
Vista Outdoor, Inc.* | | | 17,881 | | | | 203 | |
Vitamin Shoppe, Inc.* | | | 4,855 | | | | 23 | |
William Lyon Homes - Class A* | | | 10,229 | | | | 109 | |
Wingstop, Inc. | | | 9,098 | | | | 584 | |
Winnebago Industries, Inc. | | | 9,011 | | | | 218 | |
The Accompanying Notes are an Integral Part of the Financial Statements.
67
Index 600 Stock Portfolio
| | | | | | | | |
| Common Stocks (93.0%) | | Shares/
Par+ | | | Value
$ (000’s) | |
| |
Consumer Discretionary continued | | | | | |
Wolverine World Wide, Inc. | | | 29,453 | | | | 939 | |
Zumiez, Inc.* | | | 5,867 | | | | 113 | |
| | | | | | | | |
Total | | | | | | | 28,824 | |
| | | | | | | | |
| |
Consumer Staples (3.3%) | | | | | |
The Andersons, Inc. | | | 8,173 | | | | 244 | |
Avon Products, Inc.* | | | 137,376 | | | | 209 | |
B&G Foods, Inc. | | | 20,476 | | | | 592 | |
Calavo Growers, Inc. | | | 4,856 | | | | 354 | |
Cal-Maine Foods, Inc. | | | 9,391 | | | | 397 | |
Central Garden & Pet Co.* | | | 3,206 | | | | 111 | |
Central Garden & Pet Co. - Class A* | | | 12,712 | | | | 397 | |
The Chefs’ Warehouse, Inc.* | | | 7,167 | | | | 229 | |
Coca-Cola Bottling Co. Consolidated | | | 1,441 | | | | 256 | |
Darling Ingredients, Inc.* | | | 51,135 | | | | 984 | |
Dean Foods Co. | | | 28,385 | | | | 108 | |
Inter Parfums, Inc. | | | 5,352 | | | | 351 | |
J & J Snack Foods Corp. | | | 4,664 | | | | 674 | |
John B. Sanfilippo & Son, Inc. | | | 2,717 | | | | 151 | |
Medifast, Inc. | | | 3,716 | | | | 465 | |
MGP Ingredients, Inc. | | | 3,926 | | | | 224 | |
Seneca Foods Corp. - Class A* | | | 2,085 | | | | 59 | |
SpartanNash Co. | | | 11,161 | | | | 192 | |
United Natural Foods, Inc.* | | | 15,780 | | | | 167 | |
Universal Corp. | | | 7,754 | | | | 420 | |
WD-40 Co. | | | 4,298 | | | | 788 | |
| | | | | | | | |
Total | | | | | | | 7,372 | |
| | | | | | | | |
| |
Energy (3.2%) | | | | | |
Archrock, Inc. | | | 40,166 | | | | 301 | |
Bonanza Creek Energy, Inc.* | | | 5,806 | | | | 120 | |
Bristow Group, Inc.* | | | 11,117 | | | | 27 | |
C&J Energy Services, Inc.* | | | 19,445 | | | | 262 | |
CARBO Ceramics, Inc.* | | | 6,629 | | | | 23 | |
Carrizo Oil & Gas, Inc.* | | | 26,463 | | | | 299 | |
Cloud Peak Energy, Inc.* | | | 23,531 | | | | 9 | |
CONSOL Energy, Inc.* | | | 8,626 | | | | 273 | |
Denbury Resources, Inc.* | | | 143,024 | | | | 245 | |
ERA Group, Inc.* | | | 6,353 | | | | 55 | |
Exterran Corp.* | | | 9,768 | | | | 173 | |
Geospace Technologies Corp.* | | | 4,224 | | | | 43 | |
Green Plains, Inc. | | | 12,089 | | | | 158 | |
Gulf Island Fabrication, Inc.* | | | 4,263 | | | | 31 | |
| | | | | | | | |
| Common Stocks (93.0%) | | Shares/
Par+ | | | Value $ (000’s) | |
| |
Energy continued | | | | | |
Gulfport Energy Corp.* | | | 48,976 | | | | 321 | |
Helix Energy Solutions Group, Inc.* | | | 43,249 | | | | 234 | |
HighPoint Resources Corp.* | | | 34,307 | | | | 85 | |
KLX Energy Services Holdings, Inc.* | | | 6,945 | | | | 163 | |
Laredo Petroleum, Inc.* | | | 47,211 | | | | 171 | |
Matrix Service Co.* | | | 8,407 | | | | 151 | |
Nabors Industries, Ltd. | | | 101,114 | | | | 202 | |
Newpark Resources, Inc.* | | | 28,201 | | | | 194 | |
Noble Corp. PLC* | | | 76,643 | | | | 201 | |
Oil States International, Inc.* | | | 18,627 | | | | 266 | |
Par Pacific Holdings, Inc.* | | | 8,691 | | | | 123 | |
PDC Energy, Inc.* | | | 20,521 | | | | 611 | |
Penn Virginia Corp.* | | | 4,166 | | | | 225 | |
Pioneer Energy Services Corp.* | | | 24,290 | | | | 30 | |
ProPetro Holding Corp.* | | | 22,838 | | | | 281 | |
Renewable Energy Group, Inc.* | | | 11,584 | | | | 298 | |
REX American Resources Corp.* | | | 1,768 | | | | 120 | |
Ring Energy, Inc.* | | | 17,673 | | | | 90 | |
SEACOR Holdings, Inc.* | | | 5,327 | | | | 197 | |
SRC Energy, Inc.* | | | 75,340 | | | | 354 | |
Superior Energy Services, Inc.* | | | 47,990 | | | | 161 | |
TETRA Technologies, Inc.* | | | 39,039 | | | | 66 | |
Unit Corp.* | | | 16,788 | | | | 240 | |
US Silica Holdings, Inc. | | | 24,071 | | | | 245 | |
| | | | | | | | |
Total | | | | | | | 7,048 | |
| | | | | | | | |
| |
Financials (17.7%) | | | | | |
Ambac Financial Group, Inc.* | | | 14,079 | | | | 243 | |
American Equity Investment Life Holding Co. | | | 28,056 | | | | 784 | |
Ameris Bancorp | | | 12,391 | | | | 392 | |
AMERISAFE, Inc. | | | 5,984 | | | | 339 | |
Appollo Commercial Real Estate Finance, Inc. | | | 34,918 | | | | 582 | |
ARMOUR Residential REIT, Inc. | | | 13,147 | | | | 270 | |
Axos Financial, Inc.* | | | 17,171 | | | | 432 | |
Banc of California, Inc. | | | 13,245 | | | | 176 | |
Banner Corp. | | | 9,787 | | | | 523 | |
Berkshire Hills Bancorp, Inc. | | | 12,553 | | | | 339 | |
Blucora, Inc.* | | | 14,897 | | | | 397 | |
| | | | | | | | |
| Common Stocks (93.0%) | | Shares/
Par+ | | | Value
$ (000’s) | |
| |
Financials continued | | | | | |
Boston Private Financial Holdings, Inc. | | | 26,203 | | | | 277 | |
Brookline Bancorp, Inc. | | | 24,996 | | | | 345 | |
Capstead Mortgage Corp. | | | 28,238 | | | | 188 | |
Central Pacific Financial Corp. | | | 9,059 | | | | 221 | |
City Holding Co. | | | 5,166 | | | | 349 | |
Columbia Banking System, Inc. | | | 22,750 | | | | 826 | |
Community Bank System, Inc. | | | 15,896 | | | | 927 | |
Customers Bancorp, Inc.* | | | 9,048 | | | | 165 | |
CVB Financial Corp. | | | 31,814 | | | | 644 | |
Dime Community Bancshares | | | 9,620 | | | | 163 | |
Donnelley Financial Solutions, Inc.* | | | 10,590 | | | | 149 | |
Eagle Bancorp, Inc.* | | | 9,814 | | | | 478 | |
eHealth, Inc.* | | | 5,062 | | | | 194 | |
Employers Holdings, Inc. | | | 10,186 | | | | 428 | |
Encore Capital Group, Inc.* | | | 7,952 | | | | 187 | |
Enova International, Inc.* | | | 10,644 | | | | 207 | |
EZCORP, Inc. - Class A* | | | 16,029 | | | | 124 | |
Fidelity Southern Corp. | | | 6,860 | | | | 179 | |
First BanCorp | | | 67,464 | | | | 580 | |
First Commonwealth Financial Corp. | | | 30,876 | | | | 373 | |
First Financial Bancorp. | | | 30,406 | | | | 721 | |
First Financial Bankshares, Inc. | | | 21,031 | | | | 1,213 | |
First Midwest Bancorp, Inc. | | | 33,037 | | | | 654 | |
FirstCash, Inc. | | | 13,612 | | | | 985 | |
Flagstar Bancorp, Inc.* | | | 9,127 | | | | 241 | |
Franklin Financial Network, Inc.* | | | 3,789 | | | | 100 | |
Glacier Bancorp, Inc. | | | 26,248 | | | | 1,040 | |
Granite Point Mortgage Trust, Inc. | | | 13,495 | | | | 243 | |
Great Western Bancorp, Inc. | | | 17,908 | | | | 560 | |
Green Bancorp, Inc. | | | 8,240 | | | | 141 | |
Green Dot Corp. - Class A* | | | 14,730 | | | | 1,171 | |
Greenhill & Co., Inc. | | | 5,413 | | | | 132 | |
Hanmi Financial Corp. | | | 9,869 | | | | 194 | |
HCI Group, Inc. | | | 2,251 | | | | 114 | |
Heritage Financial Corp. of Washington | | | 10,306 | | | | 306 | |
HomeStreet, Inc.* | | | 8,382 | | | | 178 | |
Hope Bancorp, Inc. | | | 37,992 | | | | 451 | |
Horace Mann Educators Corp. | | | 12,714 | | | | 476 | |
The Accompanying Notes are an Integral Part of the Financial Statements.
68
Index 600 Stock Portfolio
| | | | | | | | |
| Common Stocks (93.0%) | | Shares/
Par+ | | | Value
$ (000’s) | |
| |
Financials continued | | | | | |
Independent Bank Corp. | | | 8,720 | | | | 613 | |
INTL FCStone, Inc.* | | | 4,932 | | | | 180 | |
Invesco Mortgage Capital, Inc. | | | 34,674 | | | | 502 | |
Investment Technology Group, Inc. | | | 10,271 | | | | 311 | |
James River Group Holdings, Ltd. | | | 9,302 | | | | 340 | |
LegacyTexas Financial Group, Inc. | | | 14,009 | | | | 450 | |
Maiden Holdings, Ltd. | | | 21,379 | | | | 35 | |
Meta Financial Group, Inc. | | | 8,566 | | | | 166 | |
National Bank Holding Corp. - Class A | | | 8,026 | | | | 248 | |
The Navigators Group, Inc. | | | 7,213 | | | | 501 | |
NBT Bancorp, Inc. | | | 13,561 | | | | 469 | |
New York Mortgage Trust, Inc. | | | 48,319 | | | | 285 | |
NMI Holdings, Inc. - Class A* | | | 20,590 | | | | 368 | |
Northfield Bancorp, Inc. | | | 14,616 | | | | 198 | |
Northwest Bancshares, Inc. | | | 32,080 | | | | 543 | |
OFG Bancorp | | | 13,540 | | | | 223 | |
Old National Bancorp | | | 46,771 | | | | 720 | |
Opus Bank | | | 6,719 | | | | 132 | |
Oritani Financial Corp. | | | 12,009 | | | | 177 | |
Pacific Premier Bancorp, Inc.* | | | 13,969 | | | | 357 | |
PennyMac Mortgage Investment Trust | | | 18,928 | | | | 352 | |
Piper Jaffray Cos., Inc. | | | 4,605 | | | | 303 | |
PRA Group, Inc.* | | | 14,069 | | | | 343 | |
Preferred Bank | | | 4,331 | | | | 188 | |
ProAssurance Corp. | | | 16,657 | | | | 676 | |
Provident Financial Services, Inc. | | | 19,093 | | | | 461 | |
Redwood Trust, Inc. | | | 25,765 | | | | 388 | |
RLI Corp. | | | 12,157 | | | | 839 | |
S&T Bancorp, Inc. | | | 10,871 | | | | 411 | |
Safety Insurance Group, Inc. | | | 4,510 | | | | 369 | |
Seacoast Banking Corp. of Florida* | | | 15,922 | | | | 414 | |
Selective Insurance Group, Inc. | | | 18,288 | | | | 1,114 | |
ServisFirst Bancshares, Inc. | | | 14,233 | | | | 454 | |
Simmons First National Corp. - Class A | | | 28,736 | | | | 693 | |
Southside Bancshares, Inc. | | | 10,264 | | | | 326 | |
Stewart Information Services Corp. | | | 7,373 | | | | 305 | |
Third Point Reinsurance, Ltd.* | | | 23,103 | | | | 223 | |
Tompkins Financial Corp. | | | 3,843 | | | | 288 | |
| | | | | | | | |
| Common Stocks (93.0%) | | Shares/
Par+ | | | Value
$ (000’s) | |
| |
Financials continued | | | | | |
Triumph Bancorp, Inc.* | | | 7,508 | | | | 223 | |
TrustCo Bank Corp. | | | 30,018 | | | | 206 | |
United Community Banks, Inc. | | | 24,598 | | | | 528 | |
United Fire Group, Inc. | | | 6,618 | | | | 367 | |
United Insurance Holdings Corp. | | | 6,675 | | | | 111 | |
Universal Insurance Holdings, Inc. | | | 9,982 | | | | 379 | |
Veritex Holdings, Inc.* | | | 7,524 | | | | 161 | |
Virtus Investment Partners, Inc. | | | 2,220 | | | | 176 | |
Waddell & Reed Financial, Inc. - Class A | | | 24,322 | | | | 440 | |
Walker & Dunlop, Inc. | | | 8,925 | | | | 386 | |
Westamerica Bancorporation | | | 8,300 | | | | 462 | |
WisdomTree Investments, Inc. | | | 36,119 | | | | 240 | |
World Acceptance Corp.* | | | 2,083 | | | | 213 | |
| | | | | | | | |
Total | | | | | | | 39,258 | |
| | | | | | | | |
| |
Health Care (10.8%) | | | | | |
Acorda Therapeutics, Inc.* | | | 12,258 | | | | 191 | |
Addus HomeCare Corp.* | | | 3,132 | | | | 213 | |
Akorn, Inc.* | | | 29,229 | | | | 99 | |
AMAG Pharmaceuticals, Inc.* | | | 10,725 | | | | 163 | |
Amedisys, Inc.* | | | 9,012 | | | | 1,055 | |
AMN Healthcare Services, Inc.* | | | 14,555 | | | | 825 | |
Amphastar Pharmaceuticals, Inc.* | | | 10,737 | | | | 214 | |
AngioDynamics, Inc.* | | | 11,528 | | | | 232 | |
ANI Pharmaceuticals, Inc.* | | | 2,575 | | | | 116 | |
Anika Therapeutics, Inc.* | | | 4,413 | | | | 148 | |
Assertio Therapeutics, Inc.* | | | 19,856 | | | | 72 | |
BioTelemetry, Inc.* | | | 10,342 | | | | 618 | |
Cambrex Corp.* | | | 10,422 | | | | 394 | |
Community Health Systems, Inc.* | | | 36,112 | | | | 102 | |
Computer Programs and Systems, Inc. | | | 3,718 | | | | 93 | |
CONMED Corp. | | | 8,037 | | | | 516 | |
Corcept Therapeutics, Inc.* | | | 32,633 | | | | 436 | |
CorVel Corp.* | | | 2,853 | | | | 176 | |
Cross Country Healthcare, Inc.* | | | 11,258 | | | | 83 | |
CryoLife, Inc.* | | | 10,562 | | | | 300 | |
Cutera, Inc.* | | | 4,318 | | | | 73 | |
Cytokinetics, Inc.* | | | 16,990 | | | | 107 | |
| | | | | | | | |
| Common Stocks (93.0%) | | Shares/
Par+ | | | Value
$ (000’s) | |
| |
Health Care continued | | | | | |
Diplomat Pharmacy, Inc.* | | | 17,578 | | | | 237 | |
Eagle Pharmaceuticals, Inc.* | | | 3,415 | | | | 138 | |
Emergent Biosolutions, Inc.* | | | 13,923 | | | | 825 | |
Enanta Pharmaceuticals, Inc.* | | | 4,886 | | | | 346 | |
Endo International PLC* | | | 62,007 | | | | 453 | |
Ensign Group, Inc. | | | 15,273 | | | | 592 | |
HealthStream, Inc. | | | 7,930 | | | | 191 | |
Heska Corp.* | | | 2,121 | | | | 183 | |
HMS Holdings Corp.* | | | 26,057 | | | | 733 | |
Innoviva, Inc.* | | | 21,023 | | | | 367 | |
Integer Holdings Corp.* | | | 9,252 | | | | 706 | |
Invacare Corp. | | | 10,309 | | | | 44 | |
Lannett Co., Inc.* | | | 10,524 | | | | 52 | |
Lantheus Holdings, Inc.* | | | 11,945 | | | | 187 | |
LeMaitre Vascular, Inc. | | | 4,926 | | | | 116 | |
LHC Group, Inc.* | | | 9,061 | | | | 851 | |
Luminex Corp. | | | 12,875 | | | | 298 | |
Magellan Health, Inc.* | | | 7,532 | | | | 428 | |
The Medicines Co.* | | | 20,415 | | | | 391 | |
Medpace Holdings, Inc.* | | | 8,027 | | | | 425 | |
Meridian Bioscience, Inc. | | | 13,168 | | | | 229 | |
Merit Medical Systems, Inc.* | | | 17,029 | | | | 950 | |
Momenta Pharmaceuticals, Inc.* | | | 29,813 | | | | 329 | |
Myriad Genetics, Inc.* | | | 23,217 | | | | 675 | |
Natus Medical, Inc.* | | | 10,491 | | | | 357 | |
Neogen Corp.* | | | 16,147 | | | | 920 | |
NextGen Healthcare, Inc.* | | | 14,861 | | | | 225 | |
Omnicell, Inc.* | | | 12,306 | | | | 754 | |
OraSure Technologies, Inc.* | | | 19,021 | | | | 222 | |
Orthofix Medical, Inc.* | | | 5,876 | | | | 308 | |
Owens & Minor, Inc. | | | 19,338 | | | | 122 | |
Phibro Animal Health Corp. - Class A | | | 6,276 | | | | 202 | |
Progenics Pharmaceuticals, Inc.* | | | 26,255 | | | | 110 | |
The Providence Service Corp.* | | | 3,421 | | | | 205 | |
Quorum Health Corp.* | | | 7,931 | | | | 23 | |
REGENXBIO, Inc.* | | | 9,349 | | | | 392 | |
Repligen Corp.* | | | 12,122 | | | | 639 | |
Select Medical Holdings Corp.* | | | 33,622 | | | | 516 | |
Spectrum Pharmaceuticals, Inc.* | | | 31,542 | | | | 276 | |
The Accompanying Notes are an Integral Part of the Financial Statements.
69
Index 600 Stock Portfolio
| | | | | | | | |
| Common Stocks (93.0%) | | Shares/
Par+ | | | Value
$ (000’s) | |
| |
Health Care continued | | | | | |
Supernus Pharmaceuticals, Inc.* | | | 16,228 | | | | 539 | |
Surmodics, Inc.* | | | 4,161 | | | | 197 | |
Tabula Rasa HealthCare, Inc.* | | | 5,275 | | | | 336 | |
Tactile Systems Technology, Inc.* | | | 5,221 | | | | 238 | |
Tivity Health, Inc.* | | | 12,719 | | | | 316 | |
U.S. Physical Therapy, Inc. | | | 3,939 | | | | 403 | |
Vanda Pharmaceuticals, Inc.* | | | 16,288 | | | | 426 | |
Varex Imaging Corp.* | | | 11,838 | | | | 280 | |
| | | | | | | | |
Total | | | | | | | 23,978 | |
| | | | | | | | |
| |
Industrials (17.3%) | | | | | |
AAON, Inc. | | | 12,619 | | | | 442 | |
AAR Corp. | | | 10,120 | | | | 378 | |
ABM Industries, Inc. | | | 20,450 | | | | 657 | |
Actuant Corp. - Class A | | | 18,964 | | | | 398 | |
Aegion Corp.* | | | 10,035 | | | | 164 | |
Aerojet Rocketdyne Holdings, Inc.* | | | 22,371 | | | | 788 | |
Aerovironment, Inc.* | | | 6,613 | | | | 449 | |
Alamo Group, Inc. | | | 2,988 | | | | 231 | |
Albany International Corp. - Class A | | | 9,006 | | | | 562 | |
Allegiant Travel Co. | | | 3,965 | | | | 397 | |
American Woodmark Corp.* | | | 4,772 | | | | 266 | |
Apogee Enterprises, Inc. | | | 8,752 | | | | 261 | |
Applied Industrial Technologies, Inc. | | | 12,035 | | | | 649 | |
ArcBest Corp. | | | 7,978 | | | | 273 | |
Arcosa, Inc.* | | | 15,144 | | | | 419 | |
Astec Industries, Inc. | | | 7,080 | | | | 214 | |
Atlas Air Worldwide Holdings, Inc.* | | | 7,947 | | | | 335 | |
Axon Enterprise, Inc.* | | | 18,151 | | | | 794 | |
AZZ, Inc. | | | 8,090 | | | | 327 | |
Barnes Group, Inc. | | | 14,659 | | | | 786 | |
Brady Corp. - Class A | | | 15,197 | | | | 661 | |
Briggs & Stratton Corp. | | | 13,164 | | | | 172 | |
Chart Industries, Inc.* | | | 9,690 | | | | 630 | |
CIRCOR International, Inc.* | | | 6,163 | | | | 131 | |
Comfort Systems USA, Inc. | | | 11,537 | | | | 504 | |
Cubic Corp. | | | 8,871 | | | | 477 | |
DXP Enterprises, Inc.* | | | 4,965 | | | | 138 | |
Echo Global Logistics, Inc.* | | | 8,865 | | | | 180 | |
Encore Wire Corp. | | | 6,484 | | | | 325 | |
Engility Holdings, Inc.* | | | 5,626 | | | | 160 | |
EnPro Industries, Inc. | | | 6,441 | | | | 387 | |
ESCO Technologies, Inc. | | | 8,047 | | | | 531 | |
Essendant, Inc. | | | 10,188 | | | | 128 | |
| | | | | | | | |
| Common Stocks (93.0%) | | Shares/
Par+ | | | Value
$ (000’s) | |
| |
Industrials continued | | | | | |
Exponent, Inc. | | | 16,152 | | | | 819 | |
Federal Signal Corp. | | | 18,708 | | | | 372 | |
Forrester Research, Inc. | | | 3,176 | | | | 142 | |
Forward Air Corp. | | | 9,069 | | | | 497 | |
Franklin Electric Co., Inc. | | | 12,049 | | | | 517 | |
FTI Consulting, Inc.* | | | 11,921 | | | | 794 | |
Gibraltar Industries, Inc.* | | | 9,958 | | | | 354 | |
The Greenbrier Cos., Inc. | | | 10,046 | | | | 397 | |
Griffon Corp. | | | 10,496 | | | | 110 | |
Harsco Corp.* | | | 24,941 | | | | 495 | |
Hawaiian Holdings, Inc. | | | 15,342 | | | | 405 | |
Heartland Express, Inc. | | | 14,757 | | | | 270 | |
Heidrick & Struggles International, Inc. | | | 5,888 | | | | 184 | |
Hillenbrand, Inc. | | | 19,362 | | | | 734 | |
Hub Group, Inc. - Class A* | | | 10,438 | | | | 387 | |
Insteel Industries, Inc. | | | 5,671 | | | | 138 | |
Interface, Inc. | | | 18,484 | | | | 263 | |
John Bean Technologies Corp. | | | 9,816 | | | | 705 | |
Kaman Corp. | | | 8,683 | | | | 487 | |
Kelly Services, Inc. - Class A | | | 9,684 | | | | 198 | |
Korn / Ferry International | | | 17,600 | | | | 696 | |
Lindsay Corp. | | | 3,341 | | | | 322 | |
LSC Communications, Inc. | | | 10,348 | | | | 73 | |
Lydall, Inc.* | | | 5,406 | | | | 110 | |
Marten Transport, Ltd. | | | 12,009 | | | | 194 | |
Matson, Inc. | | | 13,262 | | | | 425 | |
Matthews International Corp. - Class A | | | 9,960 | | | | 405 | |
Mercury Systems, Inc.* | | | 15,031 | | | | 711 | |
Mobile Mini, Inc. | | | 13,879 | | | | 441 | |
Moog, Inc. - Class A | | | 10,092 | | | | 782 | |
Mueller Industries, Inc. | | | 17,910 | | | | 418 | |
Multi-Color Corp. | | | 4,333 | | | | 152 | |
MYR Group, Inc.* | | | 5,144 | | | | 145 | |
National Presto Industries, Inc. | | | 1,561 | | | | 183 | |
Navigant Consulting, Inc. | | | 13,226 | | | | 318 | |
Orion Group Holdings, Inc.* | | | 8,996 | | | | 39 | |
Patrick Industries, Inc.* | | | 7,083 | | | | 210 | |
PGT Innovations, Inc.* | | | 17,993 | | | | 285 | |
Powell Industries, Inc. | | | 2,707 | | | | 68 | |
Proto Labs, Inc.* | | | 8,407 | | | | 948 | |
Quanex Building Products Corp. | | | 10,921 | | | | 148 | |
Raven Industries, Inc. | | | 11,166 | | | | 404 | |
Resources Connection, Inc. | | | 9,208 | | | | 131 | |
| | | | | | | | |
| Common Stocks (93.0%) | | Shares/
Par+ | | | Value
$ (000’s) | |
| |
Industrials continued | | | | | |
RR Donnelley & Sons Co. | | | 21,863 | | | | 87 | |
Saia, Inc.* | | | 7,979 | | | | 445 | |
Simpson Manufacturing Co., Inc. | | | 12,848 | | | | 696 | |
SkyWest, Inc. | | | 16,116 | | | | 717 | |
SPX Corp.* | | | 13,475 | | | | 378 | |
SPX Flow, Inc.* | | | 13,215 | | | | 402 | |
Standex International Corp. | | | 3,984 | | | | 268 | |
Team, Inc.* | | | 9,339 | | | | 137 | |
Tennant Co. | | | 5,629 | | | | 293 | |
Tetra Tech, Inc. | | | 17,191 | | | | 890 | |
Titan International, Inc. | | | 15,630 | | | | 73 | |
Trex Co., Inc.* | | | 18,246 | | | | 1,083 | |
Triumph Group, Inc. | | | 15,476 | | | | 178 | |
TrueBlue, Inc.* | | | 12,573 | | | | 280 | |
UniFirst Corp. | | | 4,793 | | | | 686 | |
Universal Forest Products, Inc. | | | 19,147 | | | | 497 | |
US Ecology, Inc. | | | 6,845 | | | | 431 | |
Veritiv Corp.* | | | 3,937 | | | | 98 | |
Viad Corp. | | | 6,317 | | | | 316 | |
Vicor Corp.* | | | 5,029 | | | | 190 | |
Wabash National Corp. | | | 17,401 | | | | 228 | |
WageWorks, Inc.* | | | 12,309 | | | | 334 | |
Watts Water Technologies, Inc. - Class A | | | 8,622 | | | | 556 | |
| | | | | | | | |
Total | | | | | | | 38,353 | |
| | | | | | | | |
| |
Information Technology (13.4%) | | | | | |
3D Systems Corp.* | | | 35,459 | | | | 361 | |
8x8, Inc.* | | | 29,618 | | | | 534 | |
ADTRAN, Inc. | | | 14,798 | | | | 159 | |
Advanced Energy Industries, Inc.* | | | 11,953 | | | | 513 | |
Agilysys, Inc.* | | | 5,480 | | | | 79 | |
Alarm.com Holdings, Inc.* | | | 10,882 | | | | 564 | |
Anixter International, Inc.* | | | 8,942 | | | | 486 | |
Applied Optoelectronics, Inc.* | | | 5,841 | | | | 90 | |
Axcelis Technologies, Inc.* | | | 10,066 | | | | 179 | |
Badger Meter, Inc. | | | 9,041 | | | | 445 | |
Bel Fuse, Inc. - Class B | | | 3,128 | | | | 58 | |
Benchmark Electronics, Inc. | | | 13,574 | | | | 287 | |
Bottomline Technologies, Inc.* | | | 11,366 | | | | 546 | |
Brooks Automation, Inc. | | | 22,290 | | | | 584 | |
Cabot Microelectronics Corp. | | | 8,898 | | | | 848 | |
CalAmp Corp.* | | | 10,795 | | | | 140 | |
Cardtronics PLC* | | | 11,598 | | | | 302 | |
CEVA, Inc.* | | | 6,802 | | | | 150 | |
Cohu, Inc. | | | 12,639 | | | | 203 | |
The Accompanying Notes are an Integral Part of the Financial Statements.
70
Index 600 Stock Portfolio
| | | | | | | | |
| Common Stocks (93.0%) | | Shares/
Par+ | | | Value
$ (000’s) | |
| |
Information Technology continued | | | | | |
Comtech Telecommunications Corp. | | | 7,424 | | | | 181 | |
Control4 Corp.* | | | 8,294 | | | | 146 | |
Cray, Inc.* | | | 12,682 | | | | 274 | |
CSG Systems International, Inc. | | | 10,350 | | | | 329 | |
CTS Corp. | | | 10,275 | | | | 266 | |
Daktronics, Inc. | | | 12,260 | | | | 91 | |
Diebold, Inc. | | | 23,640 | | | | 59 | |
Digi International, Inc.* | | | 8,530 | | | | 86 | |
Diodes, Inc.* | | | 12,321 | | | | 397 | |
DSP Group, Inc.* | | | 5,997 | | | | 67 | |
Ebix, Inc. | | | 6,992 | | | | 298 | |
Electro Scientific Industries, Inc.* | | | 10,657 | | | | 319 | |
Electronics for Imaging, Inc.* | | | 13,643 | | | | 338 | |
ePlus, Inc. * | | | 4,256 | | | | 303 | |
EVERTEC, Inc. | | | 18,750 | | | | 538 | |
Exlservice Holdings, Inc.* | | | 10,639 | | | | 560 | |
Extreme Networks, Inc.* | | | 36,750 | | | | 224 | |
Fabrinet* | | | 11,439 | | | | 587 | |
FARO Technologies, Inc.* | | | 5,358 | | | | 218 | |
Finisar Corp. * | | | 36,460 | | | | 788 | |
FormFactor, Inc.* | | | 23,012 | | | | 324 | |
Harmonic, Inc. * | | | 26,924 | | | | 127 | |
Ichor Holdings, Ltd.* | | | 7,097 | | | | 116 | |
II-VI, Inc.* | | | 18,561 | | | | 602 | |
Insight Enterprises, Inc.* | | | 11,018 | | | | 449 | |
Itron, Inc.* | | | 10,405 | | | | 492 | |
KEMET Corp. | | | 17,839 | | | | 313 | |
Knowles Corp.* | | | 28,013 | | | | 373 | |
Kopin Corp.* | | | 19,033 | | | | 19 | |
Kulicke and Soffa Industries, Inc. | | | 20,860 | | | | 423 | |
LivePerson, Inc.* | | | 18,118 | | | | 342 | |
ManTech International Corp. - Class A | | | 8,243 | | | | 431 | |
MaxLinear, Inc. - Class A* | | | 19,490 | | | | 343 | |
Methode Electronics, Inc. - Class A | | | 11,486 | | | | 267 | |
MicroStrategy, Inc. - Class A* | | | 2,929 | | | | 374 | |
Monotype Imaging Holdings, Inc. | | | 12,901 | | | | 200 | |
MTS Systems Corp. | | | 5,550 | | | | 223 | |
Nanometrics, Inc.* | | | 7,520 | | | | 206 | |
NETGEAR, Inc.* | | | 9,792 | | | | 509 | |
NIC, Inc. | | | 20,673 | | | | 258 | |
OneSpan, Inc.* | | | 9,751 | | | | 126 | |
OSI Systems, Inc.* | | | 5,243 | | | | 384 | |
Park Electrochemical Corp. | | | 5,982 | | | | 108 | |
PDF Solutions, Inc.* | | | 8,620 | | | | 73 | |
Perficient, Inc.* | | | 10,305 | | | | 229 | |
| | | | | | | | |
| Common Stocks (93.0%) | | Shares/
Par+ | | | Value
$ (000’s) | |
| |
Information Technology continued | | | | | |
Photronics, Inc.* | | | 21,238 | | | | 206 | |
Plexus Corp.* | | | 9,772 | | | | 499 | |
Power Integrations, Inc. | | | 9,108 | | | | 555 | |
Progress Software Corp. | | | 13,945 | | | | 495 | |
Qualys, Inc.* | | | 10,517 | | | | 786 | |
Rambus, Inc.* | | | 33,695 | | | | 258 | |
Rogers Corp.* | | | 5,711 | | | | 566 | |
Rudolph Technologies, Inc.* | | | 9,907 | | | | 203 | |
Sanmina Corp.* | | | 21,200 | | | | 510 | |
ScanSource, Inc.* | | | 7,953 | | | | 273 | |
Semtech Corp.* | | | 20,437 | | | | 937 | |
SMART Global Holdings, Inc.* | | | 3,861 | | | | 115 | |
SolarEdge Technologies, Inc.* | | | 13,356 | | | | 469 | |
SPS Commerce, Inc.* | | | 5,486 | | | | 452 | |
Sykes Enterprises, Inc.* | | | 12,356 | | | | 306 | |
TiVo Corp. | | | 38,486 | | | | 362 | |
Travelport Worldwide, Ltd. | | | 40,749 | | | | 636 | |
TTEC Holdings, Inc. | | | 4,304 | | | | 123 | |
TTM Technologies, Inc.* | | | 28,655 | | | | 279 | |
Ultra Clean Holdings, Inc.* | | | 12,116 | | | | 103 | |
Unisys Corp.* | | | 15,846 | | | | 184 | |
Veeco Instruments, Inc.* | | | 14,842 | | | | 110 | |
Viavi Solutions, Inc.* | | | 70,937 | | | | 713 | |
Virtusa Corp.* | | | 8,546 | | | | 364 | |
Xperi Corp. | | | 15,036 | | | | 277 | |
| | | | | | | | |
Total | | | | | | | 29,689 | |
| | | | | | | | |
| |
Materials (3.9%) | | | | | |
AdvanSix, Inc.* | | | 9,255 | | | | 225 | |
AK Steel Holding Corp.* | | | 97,992 | | | | 220 | |
American Vanguard Corp. | | | 8,286 | | | | 126 | |
Balchem Corp. | | | 10,015 | | | | 785 | |
Boise Cascade Co. | | | 12,083 | | | | 288 | |
Century Aluminum Co.* | | | 15,240 | | | | 111 | |
Clearwater Paper Corp.* | | | 5,112 | | | | 125 | |
FutureFuel Corp. | | | 8,015 | | | | 127 | |
H.B. Fuller Co. | | | 15,744 | | | | 672 | |
Hawkins, Inc. | | | 2,996 | | | | 123 | |
Haynes International, Inc. | | | 3,883 | | | | 102 | |
Ingevity Corp.* | | | 13,034 | | | | 1,091 | |
Innophos Holdings, Inc. | | | 6,092 | | | | 149 | |
Innospec, Inc. | | | 7,585 | | | | 468 | |
Kaiser Aluminum Corp. | | | 5,125 | | | | 458 | |
Koppers Holdings, Inc.* | | | 6,369 | | | | 109 | |
Kraton Corp.* | | | 9,924 | | | | 217 | |
LSB Industries, Inc.* | | | 6,310 | | | | 35 | |
| | | | | | | | |
| Common Stocks (93.0%) | | Shares/
Par+ | | | Value
$ (000’s) | |
| |
Materials continued | | | | | |
Materion Corp. | | | 6,287 | | | | 283 | |
Myers Industries, Inc. | | | 10,979 | | | | 166 | |
Neenah Paper, Inc. | | | 5,238 | | | | 309 | |
Olympic Steel, Inc. | | | 2,837 | | | | 40 | |
P.H. Glatfelter | | | 13,597 | | | | 133 | |
Quaker Chemical Corp. | | | 4,141 | | | | 736 | |
Rayonier Advanced Materials, Inc. | | | 15,857 | | | | 169 | |
Schulman, Inc.*,Æ | | | 8,527 | | | | 16 | |
Schweitzer-Mauduit International, Inc. | | | 9,555 | | | | 239 | |
Stepan Co. | | | 6,293 | | | | 466 | |
SunCoke Energy, Inc.* | | | 20,108 | | | | 172 | |
TimkenSteel Corp.* | | | 12,184 | | | | 106 | |
Tredegar Corp. | | | 7,933 | | | | 126 | |
US Concrete, Inc.* | | | 4,962 | | | | 175 | |
| | | | | | | | |
Total | | | | | | | 8,567 | |
| | | | | | | | |
| |
Real Estate (6.2%) | | | | | |
Acadia Realty Trust | | | 25,326 | | | | 602 | |
Agree Realty Corp. | | | 10,708 | | | | 633 | |
American Assets Trust, Inc. | | | 11,732 | | | | 471 | |
Armada Hoffler Properties, Inc. | | | 15,412 | | | | 217 | |
CareTrust REIT, Inc. | | | 26,050 | | | | 481 | |
CBL & Associates Properties, Inc. | | | 53,623 | | | | 103 | |
Cedar Realty Trust, Inc. | | | 27,399 | | | | 86 | |
Chatham Lodging Trust | | | 14,446 | | | | 255 | |
Chesapeake Lodging Trust | | | 18,755 | | | | 457 | |
Community Healthcare Trust, Inc. | | | 5,468 | | | | 158 | |
DiamondRock Hospitality Co. | | | 64,570 | | | | 586 | |
Easterly Government Properties, Inc. | | | 18,887 | | | | 296 | |
EastGroup Properties, Inc. | | | 11,193 | | | | 1,027 | |
Four Corners Property Trust, Inc. | | | 21,041 | | | | 551 | |
Franklin Street Properties Corp. | | | 33,301 | | | | 208 | |
Getty Realty Corp. | | | 10,448 | | | | 307 | |
Global Net Lease, Inc. | | | 23,624 | | | | 416 | |
Government Properties Income Trust | | | 59,535 | | | | 409 | |
Hersha Hospitality Trust | | | 11,264 | | | | 198 | |
HFF, Inc. - Class A | | | 12,148 | | | | 403 | |
Independence Realty Trust, Inc. | | | 27,615 | | | | 254 | |
iStar, Inc. | | | 21,114 | | | | 194 | |
Kite Realty Group Trust | | | 25,998 | | | | 366 | |
Lexington Realty Trust | | | 65,304 | | | | 536 | |
LTC Properties, Inc. | | | 12,316 | | | | 513 | |
Marcus & Millichap, Inc.* | | | 6,602 | | | | 227 | |
National Storage Affiliates Trust | | | 17,568 | | | | 465 | |
The Accompanying Notes are an Integral Part of the Financial Statements.
71
Index 600 Stock Portfolio
| | | | | | | | |
| Common Stocks (93.0%) | | Shares/
Par+ | | | Value
$ (000’s) | |
| |
Real Estate continued | | | | | |
Pennsylvania Real Estate Investment Trust | | | 19,914 | | | | 118 | |
PS Business Parks, Inc. | | | 6,200 | | | | 812 | |
RE/MAX Holdings, Inc. - Class A | | | 5,511 | | | | 169 | |
Retail Opportunity Investments Corp. | | | 35,398 | | | | 562 | |
RPT Realty | | | 24,892 | | | | 297 | |
Saul Centers, Inc. | | | 3,579 | | | | 169 | |
Summit Hotel Properties, Inc. | | | 32,534 | | | | 317 | |
Universal Health Realty Income Trust | | | 3,927 | | | | 241 | |
Urstadt Biddle Properties, Inc. - Class A | | | 9,259 | | | | 178 | |
Washington Prime Group, Inc. | | | 57,786 | | | | 281 | |
Whitestone REIT | | | 12,352 | | | | 151 | |
| | | | | | | | |
Total | | | | | | | 13,714 | |
| | | | | | | | |
| |
Utilities (2.4%) | | | | | |
American States Water Co. | | | 11,411 | | | | 765 | |
Avista Corp. | | | 20,400 | | | | 867 | |
California Water Service Group | | | 14,928 | | | | 711 | |
El Paso Electric Co. | | | 12,637 | | | | 633 | |
Northwest Natural Holding Co. | | | 8,958 | | | | 542 | |
South Jersey Industries, Inc. | | | 26,554 | | | | 738 | |
Spire, Inc. | | | 15,738 | | | | 1,166 | |
| | | | | | | | |
Total | | | | | | | 5,422 | |
| | | | | | | | |
| | |
Total Common Stocks | | | | | | | | |
(Cost: $200,334) | | | | | | | 206,338 | |
| | | | | | | | |
| | | | | | | | |
| Investment Companies (2.1%) | | Shares/
Par+ | | | Value
$ (000’s) | |
| | |
Investment Companies (2.1%) | | | | | | | | |
iShares Core S&PSmall-Cap ETF | | | 64,988 | | | | 4,505 | |
| | | | | | | | |
Total | | | | | | | 4,505 | |
| | | | | | | | |
| | |
Total Investment Companies | | | | | | | | |
(Cost: $4,795) | | | | | | | 4,505 | |
| | | | | | | | |
| | |
| Short-Term Investments (5.0%) | | | | | | |
| | |
Commercial Paper (3.4%) | | | | | | | | |
Apple, Inc.
0.000%, 2/5/19 144A | | | 1,000,000 | | | | 997 | |
The Coca-Cola Co.
0.000%, 1/18/19 144A | | | 500,000 | | | | 499 | |
0.000%, 2/12/19 144A | | | 500,000 | | | | 499 | |
Exxon Mobil Corp.
0.000%, 1/10/19 | | | 500,000 | | | | 500 | |
Marriott International, Inc.
0.000%, 1/25/19 144A | | | 1,000,000 | | | | 998 | |
Mondelez International, Inc. 0.000%, 1/14/19 144A | | | 500,000 | | | | 499 | |
0.000%, 2/6/19 144A | | | 500,000 | | | | 499 | |
Pfizer, Inc.
0.000%, 1/14/19 144A | | | 1,000,000 | | | | 999 | |
Societe Generale SA
0.000%, 3/11/19 144A | | | 1,000,000 | | | | 995 | |
Walgreens Boots Alliance, Inc.
0.000%, 2/19/19 | | | 1,000,000 | | | | 996 | |
| | | | | | | | |
Total | | | | | | | 7,481 | |
| | | | | | | | |
| | | | | | | | |
| Short-Term Investments (5.0%) | | Shares/
Par+ | | | Value
$ (000’s) | |
| | |
Money Market Funds (1.1%) | | | | | | | | |
State Street Institutional U.S. Government Money Market Fund - Premier Class 2.270%# | | | 2,430,330 | | | | 2,430 | |
| | | | | | | | |
Total | | | | | | | 2,430 | |
| | | | | | | | |
| | |
US Government & Agencies (0.5%) | | | | | | | | |
Federal Home Loan Bank
0.000%, 2/1/19 ß | | | 400,000 | | | | 399 | |
0.000%, 3/5/19 ß | | | 800,000 | | | | 797 | |
| | | | | | | | |
Total | | | | | | | 1,196 | |
| | | | | | | | |
| | |
Total Short-Term Investments | | | | | | | | |
(Cost: $11,108) | | | | | | | 11,107 | |
| | | | | | | | |
| | |
Total Investments (100.1%) | | | | | | | | |
(Cost: $216,237)@ | | | | | | | 221,950 | |
| | | | | | | | |
Other Assets, Less | | | | | | | | |
Liabilities(-0.1%) | | | | | | | (147) | |
| | | | | | | | |
Net Assets (100.0%) | | | | | | | 221,803 | |
| | | | | | | | |
The Accompanying Notes are an Integral Part of the Financial Statements.
72
Index 600 Stock Portfolio
Over the Counter Derivatives
Total Return Swaps
| | | | | | | | | | | | | | | | | | | | | | |
| Reference Entity | | Counterparty | | Payment made
by the Fund | | Payment
Received by the
Fund | | Expiration Date | | | Notional
Amount (000’s) | | | Unrealized
Appreciation/
(Depreciation)
(000’s) | | | Market
Value
(000’s) | |
S&P SmallCap 600 Index | | Morgan Stanley | | 1-Month USD LIBOR + 28.5 basis points | | S&P SmallCap 600 Index | | | 5/19 | | | | 12,650 | | | $ | (1,606 | ) | | $ | (1,606 | ) |
| | | | | | | | | | | | | | | | | | | | | | |
| | | | | | | | | | | | | | | | $ | (1,606) | | | $ | (1,606 | ) |
| | | | | | | | | | | | | | | | | | | | | | |
| | |
| | | Financial Derivative Assets (000’s) | | Financial Derivative Liabilities (000’s) | |
| | | Forward
Contracts | | Swaps | | Total | | Forward
Contracts | | | Options | | | Swaps | | | Total | |
Total Over the Counter Derivatives | | - | | - | | - | | | - | | | | - | | | | $(1,606) | | | | $(1,606) | |
| + | All par is stated in U.S Dollar unless otherwise noted |
| Æ | Security valued using significant unobservable inputs. |
| # | 7-Day yield as of 12/31/2018. |
| ß | Cash or securities with an aggregate value of $1,196 (in thousands) has been pledged as collateral for futures, swap contracts outstanding, short sales, when issued securities or written options on 12/31/2018. |
| 144A | Security exempt from registration under Rule 144A of the Securities Act of 1933. These securities may be resold as transactions exempt from registration, normally to qualified institutional buyers. At December 31, 2018 the value of these securities (in thousands) was $5,985 representing 2.8% of the net assets. |
| @ | At December 31, 2018, the aggregate cost of investments, including derivatives, for federal tax purposes (in thousands) was $216,745 and the net unrealized appreciation of investments based on that cost was $3,599 which is comprised of $35,770 aggregate gross unrealized appreciation and $32,171 aggregate gross unrealized depreciation. |
The following is a summary of the inputs used in valuing the Portfolio’s assets and liabilities at December 31, 2018. See Note 3 for additional information on portfolio valuation.
| | | | | | | | | | | | | | |
| | | Valuation Inputs | | | |
| Description | | Level 1 – Quoted Prices | | | Level 2 –
Other Significant
Observable Inputs | | | Level 3 – Significant
Unobservable Inputs | | | |
| | | | | | (Amounts in thousands)
| | | | | | |
Assets: | | | | | | | | | | | | | | |
Common Stocks | | | | | | | | | | | | | | |
Materials | | $ | 8,551 | | | $ | - | | | $ | 16 | | | |
All Others | | | 197,771 | | | | - | | | | - | | | |
Investment Companies | | | 4,505 | | | | - | | | | - | | | |
Short-Term Investments | | | | | | | | | | | | | | |
Money Market Funds | | | 2,430 | | | | - | | | | - | | | |
All Others | | | - | | | | 8,677 | | | | - | | | |
Total Assets: | | $ | 213,257 | | | $ | 8,677 | | | $ | 16 | | | |
Liabilities: | | | | | | | | | | | | | | |
Other Financial Instruments^ | | | | | | | | | | | | | | |
Total Return Swaps | | | - | | | | (1,606 | ) | | | - | | | |
Total Liabilities: | | $ | - | | | $ | (1,606 | ) | | $ | - | | | |
^ Other financial instruments are derivative instruments such as futures and forwards, which are valued at the unrealized appreciation (depreciation) on the instrument, and securities sold short, reverse repurchase agreements, written options and swaps contracts, which are valued at market value.
The Accompanying Notes are an Integral Part of the Financial Statements.
73
Small Cap Value Portfolio (unaudited)
| | | | |
| Objective: | | Portfolio Strategy: | | Net Assets: |
| Long-term growth of capital. | | Invest primarily in common stocks ofsmall-sized companies believed to be undervalued. | | $530 million |
PORTFOLIO OVERVIEW
Mason Street Advisors, LLC, the investment adviser for the Small Cap Value Portfolio (“the Portfolio”), has engaged T. Rowe Price Associates, Inc. (“T. Rowe Price”) to act assub-adviser for the Portfolio. Normally, the Portfolio invests in common stocks of companies with market capitalizations that do not exceed the maximum market capitalization of any security in the Russell 2000® Index at the time of purchase. Reflecting a value approach to investing, the Portfolio will seek the stocks of companies whose current stock prices do not appear to adequately reflect their underlying value as measured by assets, earnings, cash flow or business franchises.
MARKET OVERVIEW
In 2018, U.S. stocks experienced their worst calendar-year losses in a decade, under pressure from rising interest rates, global trade tensions and worries about slowing global growth. Most major U.S. stock indices reachedall-time highs near the end of the third quarter but plunged in the final months of the year, with several indices down at least 20% from recent highs. The U.S. Federal Reserve (the “Fed”) continued normalizing monetary policy with four interest rate hikes in 2018. Expectations that the Fed would raise interest rates two more times in 2019 also weighed on stocks, along with concerns that corporate earnings growth would begin to slow. Large cap stocks outpaced mid and small caps, as measured by Russell® Indices, with growth outperforming value across all capitalization levels.
PORTFOLIO RESULTS
The Portfolio returned (12.73%) for the twelve months ended December 31, 2018. By comparison, the Portfolio’s benchmark, the Russell 2000® Value Index (the “Index”), returned (12.86%). (The Index is unmanaged, cannot be invested in directly and does not incur expenses.) According to Lipper® Analytical Services, Inc., an independent mutual fund ranking agency, the average return in 2018 of the Small Cap Value Funds peer group was (14.65%).
The Portfolio’s outperformance relative to the Index was primarily due to stock selection, while sector weighting detracted overall.
The Health Care sector was the main contributor to relative performance, due to favorable stock picking. A position in Atrion, a company that develops and manufactures components for medical devices, helped the Portfolio. Atrion generates regular cash flow and held up well in a difficult year for the Health Care sector. The Portfolio’s holdings of Ensign Group also contributed to relative performance. Ensign Group recently reported positive quarterly results, and the firm has demonstrated consistent and stable growth.
Stock selection in the Consumer Staples sector also aided relative results, including a position in Post Holdings, which manufactures, markets and distributesready-to-eat cereal and other packaged foods. The firm has proven to be an aggregator of attractive assets and a value creator with an impressive track record. The packaged foods industry is currently undergoing significant consolidation, and the number of sizable acquisitions piqued investor interest and highlighted savvy acquirers like Post. The firm recently announced plans to spin off its active nutrition business as an IPO.
Conversely, weak stock selection in the Industrials sector weighed on relative performance, in particular Triumph Group, a global supplier of aerospace components and systems. The company is a rollup of several acquisitions whose customers include aircraft manufacturers and airlines. The firm’s aerostructures division continued to go through a financially difficult transition, as old programs wound down, and new programs ramped up.
Stock selection in the Financials sector also hurt relative performance. Home Bancshares, an Arkansas-based bank, went public in 2006 and has been expanding by acquiring a number of struggling banks around Florida. Shares declined following third-quarter results as rising competitive pressures in the industry worked against loan growth. The portfolio manager maintained a favorable view of the company given its attractive organic growth potential and strong track record of making shareholder-friendly acquisitions.
PORTFOLIO MANAGER OUTLOOK
The following forward-looking comments are the opinion of T. Rowe Price, the Portfolio’ssub-adviser.
74
Small Cap Value Portfolio (unaudited)
Small cap stocks suffered the largest declines in the market’ssell-off in late 2018, following relatively strong performance earlier in the year amid hopes that smaller, domestically-oriented firms would be insulated from growing trade tensions. These hopes pushed up already rich valuations among small caps in the aging bull market, setting the stage for sharp declines when sentiment soured. While becoming more cautious, we began to search for opportunities among small caps with exposure to China, searching selectively for values among beaten-down companies that were impacted by the new tariffs. The market outlook remains considerably more cloudy than it was a year ago, but we believe our careful fundamental research, supported by our large team of industry-focused analysts, will help us identify companies poised to prosper once confidence returns.
Relative Performance
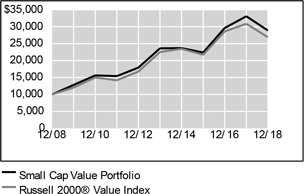
| | | | | | | | | | | | |
Average Annual Total Returns For Periods Ended December 31, 2018 | |
| | | 1 Year | | | 5 Years | | | 10 Years | |
Small Cap Value Portfolio | | | -12.73 | % | | | 4.10 | % | | | 11.19 | % |
Russell 2000® Value Index | | | -12.86 | % | | | 3.61 | % | | | 10.40 | % |
Lipper® Variable Insurance Products (VIP) Small Cap Value Funds Average | | | -14.65 | % | | | 2.56 | % | | | 11.05 | % |
The performance data quoted represents past performance. Past performance is historical and does not guarantee future performance. Investment return and principal value will fluctuate, so that shares, when redeemed, may be worth more or less than their original cost. Current performance may be lower or higher than the performance data quoted. For the most recentmonth-end performance information visitwww.northwesternmutual.com.
This chart assumes an initial investment of $10,000 made on 12/31/08. Returns shown reflect fee waivers, deductions for management and other portfolio expenses, and reinvestment of all dividends. In the absence of fee waivers, total return would be reduced. Returns exclude deductions for separate account sale loads and account fees. Please refer to the Benchmark Definitions section of this report for information about the indices cited in the above chart and graph.
Stocks of smaller or newer companies, such as those held in this Portfolio, are more likely to realize more substantial growth as well as suffer more significant losses than larger or more established issuers. Investments in such companies can be both more volatile and more speculative. Investing in small company stocks involves a greater degree of risk than investing in medium or large company stocks.
The Portfolio may invest a portion of its assets in other investment companies, includingopen-end andclosed-end funds, exchange-traded funds (“ETFs”), and business development companies (“BDCs”), and will bear its pro rata portion of such expenses. The market prices of ETFs,closed-end funds and BDCs may trade at a premium or discount to their net asset values and may be subject to trading halts by the applicable exchange, which may negatively impact the Portfolio. BDCs in particular may be less liquid and more adversely affected by poor economic or market conditions.
The Portfolio may invest a relatively high percentage of its assets in a particular sector. The Portfolio will have greater exposure to the risks associated with that sector and its performance will be tied more closely to the performance of the sector.
Top 10 Equity Holdings 12/31/18
| | | | |
Security Description | | | % of Net Assets | |
Green Dot Corp. - Class A | | | 1.7 | % |
Littelfuse, Inc. | | | 1.6 | % |
Home BancShares, Inc. | | | 1.5 | % |
Atrion Corp. | | | 1.5 | % |
ONE Gas, Inc. | | | 1.3 | % |
Belden, Inc. | | | 1.3 | % |
Nomad Foods, Ltd. | | | 1.2 | % |
Chesapeake Utilities Corp. | | | 1.2 | % |
Landstar System, Inc. | | | 1.2 | % |
Quidel Corp. | | | 1.2 | % |
75
Small Cap Value Portfolio (unaudited)
Sector Allocation 12/31/18
| | | | |
Sector | | | % of Net Assets | |
Financials | | | 25.6 | % |
Industrials | | | 13.0 | % |
Real Estate | | | 10.5 | % |
Information Technology | | | 9.7 | % |
Consumer Discretionary | | | 9.6 | % |
Health Care | | | 7.5 | % |
Utilities | | | 6.8 | % |
Energy | | | 4.8 | % |
Short-Term Investments & Other Net Assets | | | 4.3 | % |
Consumer Staples | | | 3.4 | % |
Materials | | | 3.1 | % |
Communication Services | | | 1.7 | % |
Sector Allocation and Top 10 Holdings are subject to change.
76
Small Cap Value Portfolio
SCHEDULE OF INVESTMENTS
December 31, 2018
| | | | | | | | |
| Common Stocks (95.7%) | | Shares/
Par+ | | | Value
$ (000’s) | |
| |
Communication Services (1.7%) | | | | | |
Cable One, Inc. | | | 6,442 | | | | 5,283 | |
Rosetta Stone, Inc.* | | | 121,600 | | | | 1,994 | |
Scholastic Corp. | | | 50,000 | | | | 2,013 | |
| | | | | | | | |
Total | | | | | | | 9,290 | |
| | | | | | | | |
| |
Consumer Discretionary (9.6%) | | | | | |
Aaron’s, Inc. | | | 137,200 | | | | 5,769 | |
American Public | | | | | | | | |
Education, Inc.* | | | 94,218 | | | | 2,682 | |
Boot Barn Holdings, Inc.* | | | 36,991 | | | | 630 | |
Cavco Industries, Inc.* | | | 30,000 | | | | 3,912 | |
Crocs, Inc.* | | | 43,400 | | | | 1,128 | |
CSS Industries, Inc. | | | 76,059 | | | | 682 | |
Culp, Inc. | | | 86,650 | | | | 1,638 | |
Dorman Products, Inc.* | | | 60,200 | | | | 5,419 | |
Express, Inc.* | | | 157,700 | | | | 806 | |
Garrett Motion, Inc.* | | | 183,000 | | | | 2,258 | |
LCI Industries | | | 38,500 | | | | 2,572 | |
Lumber Liquidators Holdings, Inc.* | | | 164,400 | | | | 1,565 | |
Marriott Vacations Worldwide Corp. | | | 19,433 | | | | 1,370 | |
Monro Muffler Brake, Inc. | | | 24,500 | | | | 1,684 | |
Party City Holdco, Inc.* | | | 167,461 | | | | 1,671 | |
Pool Corp. | | | 37,100 | | | | 5,515 | |
Red Robin Gourmet Burgers, Inc.* | | | 36,000 | | | | 962 | |
Steven Madden, Ltd. | | | 128,250 | | | | 3,881 | |
Strategic Education, Inc. | | | 48,962 | | | | 5,553 | |
Visteon Corp.* | | | 18,800 | | | | 1,133 | |
| | | | | | | | |
Total | | | | | | | 50,830 | |
| | | | | | | | |
| |
Consumer Staples (3.4%) | | | | | |
BJ’s Wholesale Club Holdings, Inc.* | | | 49,246 | | | | 1,091 | |
Nomad Foods, Ltd.* | | | 393,100 | | | | 6,573 | |
Post Holdings, Inc.* | | | 44,200 | | | | 3,939 | |
PriceSmart, Inc. | | | 34,722 | | | | 2,052 | |
The Simply Good Foods Co.* | | | 149,184 | | | | 2,820 | |
SpartanNash Co. | | | 90,471 | | | | 1,554 | |
| | | | | | | | |
Total | | | | | | | 18,029 | |
| | | | | | | | |
| |
Energy (4.8%) | | | | | |
Centennial Resource Development, Inc. - Class A* | | | 326,800 | | | | 3,601 | |
Frank’s International NV* | | | 611,200 | | | | 3,190 | |
International Seaways, Inc.* | | | 153,900 | | | | 2,592 | |
| | | | | | | | |
| Common Stocks (95.7%) | | Shares/
Par+ | | | Value
$ (000’s) | |
| |
Energy continued | | | | | |
Jagged Peak Energy, Inc.* | | | 195,625 | | | | 1,784 | |
Keane Group, Inc.* | | | 340,466 | | | | 2,785 | |
Kosmos Energy Ltd.* | | | 260,300 | | | | 1,059 | |
Matador Resources Co.* | | | 212,800 | | | | 3,305 | |
Oceaneering International, Inc.* | | | 144,700 | | | | 1,751 | |
TETRA Technologies, Inc.* | | | 827,100 | | | | 1,390 | |
WPX Energy, Inc.* | | | 357,600 | | | | 4,059 | |
| | | | | | | | |
Total | | | | | | | 25,516 | |
| | | | | | | | |
| |
Financials (25.6%) | | | | | |
Assured Guaranty, Ltd. | | | 41,400 | | | | 1,585 | |
Atlantic Capital Bancshares, Inc.* | | | 105,956 | | | | 1,735 | |
BankUnited, Inc. | | | 183,200 | | | | 5,485 | |
Beneficial Bancorp, Inc. | | | 223,539 | | | | 3,194 | |
BOK Financial Corp. | | | 37,230 | | | | 2,730 | |
CBOE Holdings, Inc. | | | 16,888 | | | | 1,652 | |
Columbia Banking System, Inc. | | | 153,900 | | | | 5,585 | |
East West Bancorp, Inc. | | | 71,898 | | | | 3,130 | |
Employers Holdings, Inc. | | | 64,100 | | | | 2,690 | |
FB Financial Corp. | | | 89,384 | | | | 3,130 | |
Focus Financial Partners, Inc.* | | | 17,817 | | | | 469 | |
Glacier Bancorp, Inc. | | | 132,100 | | | | 5,234 | |
Green Dot Corp. - Class A* | | | 113,900 | | | | 9,057 | |
Hercules Capital, Inc. | | | 257,400 | | | | 2,844 | |
Heritage Commerce Corp. | | | 128,900 | | | | 1,462 | |
Heritage Financial Corp. of Washington | | | 96,841 | | | | 2,878 | |
Home BancShares, Inc. | | | 485,800 | | | | 7,938 | |
Hope Bancorp, Inc. | | | 188,400 | | | | 2,234 | |
Houlihan Lokey, Inc. | | | 59,775 | | | | 2,200 | |
Howard Bancorp, Inc.* | | | 99,699 | | | | 1,426 | |
Live Oak Bancshares, Inc. | | | 76,237 | | | | 1,129 | |
Main Street Capital Corp. | | | 63,600 | | | | 2,150 | |
Meridian Bancorp, Inc. | | | 181,200 | | | | 2,595 | |
National Bank Holding Corp. - Class A | | | 145,500 | | | | 4,492 | |
Origin Bancorp, Inc. | | | 47,600 | | | | 1,622 | |
PCSB Financial Corp. | | | 111,394 | | | | 2,179 | |
PDL Community Bancorp* | | | 113,159 | | | | 1,442 | |
PennyMac Financial Services, Inc. | | | 110,300 | | | | 2,345 | |
| | | | | | | | |
| Common Stocks (95.7%) | | Shares/
Par+ | | | Value
$ (000’s) | |
| |
Financials continued | | | | | |
Pinnacle Financial Partners, Inc. | | | 49,900 | | | | 2,300 | |
Popular, Inc. | | | 96,400 | | | | 4,552 | |
ProAssurance Corp. | | | 93,700 | | | | 3,801 | |
Prosperity Bancshares, Inc. | | | 70,900 | | | | 4,417 | |
Radian Group, Inc. | | | 226,400 | | | | 3,704 | |
Redwood Trust, Inc. | | | 123,200 | | | | 1,857 | |
Safety Insurance Group, Inc. | | | 28,100 | | | | 2,299 | |
State Auto Financial Corp. | | | 88,200 | | | | 3,002 | |
Sterling Bancorp, Inc. | | | 136,283 | | | | 947 | |
SVB Financial Group* | | | 7,300 | | | | 1,386 | |
Texas Capital Bancshares, Inc.* | | | 55,000 | | | | 2,810 | |
TowneBank | | | 189,700 | | | | 4,543 | |
United Financial Bancorp, Inc. | | | 215,600 | | | | 3,169 | |
Virtus Investment Partners, Inc. | | | 19,100 | | | | 1,517 | |
Webster Financial Corp. | | | 81,833 | | | | 4,034 | |
Wintrust Financial Corp. | | | 60,900 | | | | 4,049 | |
WSFS Financial Corp. | | | 74,400 | | | | 2,821 | |
| | | | | | | | |
Total | | | | | | | 135,820 | |
| | | | | | | | |
| |
Health Care (7.5%) | | | | | |
Atrion Corp. | | | 10,600 | | | | 7,855 | |
Avanos Medical, Inc.* | | | 113,740 | | | | 5,094 | |
Ensign Group, Inc. | | | 142,400 | | | | 5,524 | |
Haemonetics Corp.* | | | 9,910 | | | | 992 | |
Molina Healthcare, Inc.* | | | 43,400 | | | | 5,044 | |
Momenta Pharmaceuticals, Inc.* | | | 100,992 | | | | 1,115 | |
Patterson Cos., Inc. | | | 72,300 | | | | 1,421 | |
Quidel Corp. * | | | 127,122 | | | | 6,206 | |
Select Medical Holdings Corp.* | | | 226,300 | | | | 3,474 | |
West Pharmaceutical Services, Inc. | | | 29,400 | | | | 2,882 | |
| | | | | | | | |
Total | | | | | | | 39,607 | |
| | | | | | | | |
| |
Industrials (13.0%) | | | | | |
Aegion Corp.* | | | 200,800 | | | | 3,277 | |
Beacon Roofing Supply, Inc.* | | | 54,400 | | | | 1,726 | |
Blue Bird Corp.* | | | 89,700 | | | | 1,632 | |
Brady Corp. - Class A | | | 60,800 | | | | 2,642 | |
The Brink’s Co. | | | 21,100 | | | | 1,364 | |
CIRCOR International, Inc.* | | | 94,339 | | | | 2,009 | |
Cubic Corp. | | | 76,787 | | | | 4,127 | |
The Accompanying Notes are an Integral Part of the Financial Statements.
77
Small Cap Value Portfolio
| | | | | | | | |
| Common Stocks (95.7%) | | Shares/
Par+ | | | Value
$ (000’s) | |
| |
Industrials continued | | | | | |
ESCO Technologies, Inc. | | | 72,600 | | | | 4,788 | |
FTI Consulting, Inc.* | | | 73,800 | | | | 4,918 | |
Genesee & Wyoming, Inc. - Class A* | | | 53,500 | | | | 3,960 | |
Hillenbrand, Inc. | | | 52,590 | | | | 1,995 | |
Huron Consulting Group, Inc.* | | | 24,800 | | | | 1,272 | |
Kirby Corp.* | | | 31,600 | | | | 2,129 | |
Landstar System, Inc. | | | 67,200 | | | | 6,429 | |
Lydall, Inc.* | | | 49,700 | | | | 1,009 | |
Matthews International Corp. - Class A | | | 29,500 | | | | 1,198 | |
McGrath RentCorp | | | 68,808 | | | | 3,542 | |
MSA Safety, Inc. | | | 29,200 | | | | 2,753 | |
Navigant Consulting, Inc. | | | 76,400 | | | | 1,837 | |
RBC Bearings, Inc.* | | | 23,500 | | | | 3,081 | |
Stericycle, Inc.* | | | 27,100 | | | | 994 | |
Sun Hydraulics Corp. | | | 70,402 | | | | 2,337 | |
Thermon Group Holdings, Inc.* | | | 91,700 | | | | 1,860 | |
Triumph Group, Inc. | | | 263,550 | | | | 3,031 | |
Universal Forest Products, Inc. | | | 112,800 | | | | 2,928 | |
Universal Logistics Holdings, Inc. | | | 88,930 | | | | 1,609 | |
Upwork, Inc.* | | | 12,353 | | | | 224 | |
| | | | | | | | |
Total | | | | | | | 68,671 | |
| | | | | | | | |
| |
Information Technology (9.7%) | | | | | |
Belden, Inc. | | | 162,600 | | | | 6,792 | |
Cabot Microelectronics Corp. | | | 41,661 | | | | 3,972 | |
Ceridian HCM Holding, Inc.* | | | 60,709 | | | | 2,094 | |
Cision, Ltd.* | | | 238,577 | | | | 2,791 | |
Conduent, Inc.* | | | 255,700 | | | | 2,718 | |
GTT Communications, Inc.* | | | 82,000 | | | | 1,940 | |
Harmonic, Inc.* | | | 771,597 | | | | 3,642 | |
i3 Verticals, Inc.* | | | 79,600 | | | | 1,918 | |
Knowles Corp.* | | | 253,400 | | | | 3,373 | |
Littelfuse, Inc. | | | 48,700 | | | | 8,351 | |
MaxLinear, Inc. - Class A* | | | 123,900 | | | | 2,181 | |
Mesa Laboratories, Inc. | | | 13,900 | | | | 2,897 | |
Methode Electronics, Inc. - Class A | | | 45,400 | | | | 1,057 | |
Q2 Holdings, Inc.* | | | 44,200 | | | | 2,190 | |
RealPage, Inc.* | | | 35,700 | | | | 1,721 | |
Rudolph Technologies, Inc.* | | | 64,000 | | | | 1,310 | |
SVMK, Inc.* | | | 10,859 | | | | 133 | |
Zendesk, Inc.* | | | 38,900 | | | | 2,271 | |
| | | | | | | | |
Total | | | | | | | 51,351 | |
| | | | | | | | |
| | | | | | | | |
| Common Stocks (95.7%) | | Shares/
Par+ | | | Value
$ (000’s) | |
| |
Materials (3.1%) | | | | | |
American Vanguard Corp. | | | 107,700 | | | | 1,636 | |
Carpenter Technology Corp. | | | 93,400 | | | | 3,326 | |
Clearwater Paper Corp.* | | | 44,800 | | | | 1,092 | |
Constellium NV - Class A* | | | 206,600 | | | | 1,444 | |
Minerals Technologies, Inc. | | | 53,300 | | | | 2,736 | |
Myers Industries, Inc. | | | 240,607 | | | | 3,636 | |
New Gold, Inc.* | | | 673,700 | | | | 510 | |
Reliance Steel & Aluminum Co. | | | 29,200 | | | | 2,078 | |
| | | | | | | | |
Total | | | | | | | 16,458 | |
| | | | | | | | |
| |
Real Estate (10.5%) | | | | | |
Acadia Realty Trust | | | 98,400 | | | | 2,338 | |
American Campus Communities, Inc. | | | 74,941 | | | | 3,102 | |
Cedar Realty Trust, Inc. | | | 917,169 | | | | 2,880 | |
Douglas Emmett, Inc. | | | 74,100 | | | | 2,529 | |
EastGroup Properties, Inc. | | | 58,600 | | | | 5,375 | |
Hannon Armstrong Sustainable Infrastructure Capital, Inc. | | | 146,100 | | | | 2,783 | |
Healthcare Realty Trust, Inc. | | | 162,600 | | | | 4,624 | |
JBG SMITH Properties | | | 105,959 | | | | 3,688 | |
Kilroy Realty Corp. | | | 45,200 | | | | 2,842 | |
Potlatch Corp. | | | 90,917 | | | | 2,877 | |
PS Business Parks, Inc. | | | 31,900 | | | | 4,179 | |
Retail Opportunity Investments Corp. | | | 114,900 | | | | 1,825 | |
Saul Centers, Inc. | | | 61,200 | | | | 2,890 | |
The St. Joe Co.* | | | 162,600 | | | | 2,141 | |
Sunstone Hotel Investors, Inc. | | | 303,800 | | | | 3,952 | |
Terreno Realty Corp. | | | 145,000 | | | | 5,100 | |
Washington Real Estate Investment Trust | | | 113,600 | | | | 2,613 | |
| | | | | | | | |
Total | | | | | | | 55,738 | |
| | | | | | | | |
| |
Utilities (6.8%) | | | | | |
Atmos Energy Corp. | | | 29,200 | | | | 2,707 | |
California Water Service Group | | | 67,500 | | | | 3,217 | |
Chesapeake Utilities Corp. | | | 79,200 | | | | 6,439 | |
MGE Energy, Inc. | | | 30,000 | | | | 1,799 | |
NorthWestern Corp. | | | 76,600 | | | | 4,553 | |
ONE Gas, Inc. | | | 87,700 | | | | 6,981 | |
PNM Resources, Inc. | | | 141,700 | | | | 5,823 | |
Portland General Electric Co. | | | 68,100 | | | | 3,122 | |
RGC Resources, Inc. | | | 23,920 | | | | 717 | |
| | | | | | | | |
| Common Stocks (95.7%) | | Shares/
Par+ | | | Value
$ (000’s) | |
| |
Utilities continued | | | | | |
South Jersey Industries, Inc. | | | 22,200 | | | | 617 | |
| | | | | | | | |
Total | | | | | | | 35,975 | |
| | | | | | | | |
| |
Total Common Stocks | | | | | |
(Cost: $444,445) | | | | 507,285 | |
| | | | | | | | |
| |
| Short-Term Investments (3.9%) | | | | | |
| |
Money Market Funds (3.9%) | | | | | |
State Street Institutional U.S. Government Money Market Fund - Premier Class 2.270% # | | | 20,529,928 | | | | 20,530 | |
| | | | | | | | |
Total | | | | | | | 20,530 | |
| | | | | | | | |
| | |
Total Short-Term
Investments | | | | | | | | |
(Cost: $20,530) | | | | | | | 20,530 | |
| | | | | | | | |
| | |
Total Investments
(99.6%) | | | | | | | | |
(Cost: $464,975)@ | | | | | | | 527,815 | |
| | | | | | | | |
| | |
Other Assets, Less | | | | | | | | |
Liabilities (0.4%) | | | | | | | 2,257 | |
| | | | | | | | |
Net Assets (100.0%) | | | | | | | 530,072 | |
| | | | | | | | |
The Accompanying Notes are an Integral Part of the Financial Statements.
78
Small Cap Value Portfolio
| + | All par is stated in U.S Dollar unless otherwise noted. |
| # | 7-Day yield as of 12/31/2018. |
| @ | At December 31, 2018, the aggregate cost of investments, including derivatives, for federal tax purposes (in thousands) was $465,785 and the net unrealized appreciation of investments based on that cost was $62,030 which is comprised of $121,450 aggregate gross unrealized appreciation and $59,420 aggregate gross unrealized depreciation. |
The following is a summary of the inputs used in valuing the Portfolio’s assets and liabilities at December 31, 2018. See Note 3 for additional information on portfolio valuation.
| | | | | | | | | | | | | | |
| | | Valuation Inputs | | | |
| Description | | Level 1 –
Quoted Prices | | | Level 2 –
Other Significant Observable Inputs | | | Level 3 –
Significant
Unobservable Inputs | | | |
| | | (Amounts in thousands) | | | |
Assets: | | | | | | | | | | | | | | |
Common Stocks | | $ | 507,285 | | | $ | - | | | $ | - | | | |
Short-Term Investments | | | 20,530 | | | | | | | | | | | |
Total Assets: | | $ | 527,815 | | | $ | - | | | $ | - | | | |
The Accompanying Notes are an Integral Part of the Financial Statements.
79
International Growth Portfolio (unaudited)
| | | | |
| Objective: | | Portfolio Strategy: | | Net Assets: |
| Long-term growth of capital. | | Invest in securities of issuers from countries outside the | | $626 million |
| | U.S. that have above average growth potential. | | |
PORTFOLIO OVERVIEW
Mason Street Advisors, LLC (“Mason Street Advisors”), the investment adviser for the International Growth Portfolio (the “Portfolio”), has engaged FIAM LLC (“FIAM”) to act assub-adviser for the Portfolio. FIAM is an indirect, wholly-owned subsidiary of FMR LLC (along with its affiliates, “Fidelity Investments”). Normally, the Portfolio will invest in the securities of issuers from countries outside the United States. The Portfolio invests in companies it believes operate in a market environment, or with a competitive advantage, that make it difficult for competition to disrupt current and future profitability, in combination with growth drivers that may offer above-average growth potential measured by factors such as earnings or revenue. In buying and selling securities for the Portfolio, the portfolio manager relies on fundamental analysis, which involves a“bottom-up” assessment of a company’s potential for success in light of factors such as its financial condition, earnings outlook, strategy, management, industry position and economic and market conditions.
MARKET OVERVIEW
Slowing economic growth and political uncertainty worked against the performance of international equities in 2018. Estimates of Eurozone growth were downgraded during the period, and Japan experienced an economic contraction in the second quarter before bouncing back in the third. Chinese growth stalled as well, due to declining domestic spending and worries that the U.S.-Chinese trade dispute would hinder economic growth. Political concerns weighed on growth in Europe, including the possibility of trade disruption due to Brexit and the election of a populist government in Italy. Despite the economic headwinds, growth was still positive in many countries and inflation remained low. Nonetheless, the confluence of economic and political issues in many countries raised concerns among investors, which ultimately weighed on equity prices worldwide.
PORTFOLIO RESULTS
The Portfolio returned (11.28%) for the twelve months ended December 31, 2018. By comparison, the Portfolio’s benchmark, the MSCI EAFE® Growth Index (the “Index”), returned (12.48%). (The Index is unmanaged, cannot be invested in directly and does not incur expenses.) According to Lipper® Analytical Services, Inc., an independent mutual fund ranking agency, the average return in 2018 of the InternationalMulti-Cap Growth Funds peer group was (14.15%).
On a sector basis, security selection in the Information Technology, Health Care and Financials sectors contributed the most to relative returns. Perennial holdings Mastercard and Visa were the top contributors in the Information Technology sector as they benefited from a duopoly in global payment processing. In Health Care, a long-held position in Australia-based blood plasma company CSL Limited boosted returns, as volumes and pricing remained on a steady upward trajectory. In Financials, a newer position in market index and data provider MSCI and Indian financial services firm Housing Development Finance Corporation (“HDFC”) helped lift returns. The Portfolio trimmed its position in MSCI, realizing considerable gains, and added to its position in HDFC after interest rate concerns prompted asell-off in Indian equity markets.
On the negative side, stock selection in the Consumer Staples and Consumer Discretionary sectors weighed on returns, as did a substantial underweight allocation to Consumer Staples. A modest,out-of-benchmark position in U.S.-based Philip Morris International hurt as next-generation products challenged the legacy tobacco manufacturers’ pricing power for the first time in decades.
Within the Consumer Discretionary sector, U.S.-based Mohawk Industries, a global floor coverings manufacturer, was responsible for a large portion of the losses. Cost pressure and a slowdown in U.S. residential home sales drove weaker returns in this cyclical business. The other major detractor was South Africa-based media conglomerate Naspers, which moved from the Consumer Discretionary sector to the Communications Services sector this year. This longtime Portfolio holding tends to move in the same direction as Chinese media firm Tencent, in which Naspers owns a significant stake. General emerging market currency weakness also hurt. The Portfolio reduced its position in Naspers throughout the latter half of the year, but maintained a modest position since the stock still traded at a significant discount to the sum of its parts.
80
International Growth Portfolio (unaudited)
PORTFOLIO MANAGER OUTLOOK
The following forward-looking comments are the opinion of FIAM, the Portfolio’ssub-adviser.
We target companies with multiyear structural growth prospects, high barriers to entry and attractive valuations, based on our earnings forecasts. We typically find these franchise businesses atcheap-to-reasonable prices in one of three ways. First, we target structurally attractive growth themes. Second, we try to capitalize on cyclicallyout-of-favor companies with pricing power when the market becomes excessively focused on near-term cyclical concerns and loses sight of earnings power. Third, we attempt to capitalize on market dislocations driven by macro-shocks.
Over the past year, we have become more pessimistic about Consumer Staples companies, where the benefits of expansive physical distribution networks have diminished due to the rise of online shopping, enabling upstart online brands to challenge the pricing power and brand supremacy of many benchmark constituents. We remain optimistic about the long-term attractiveness of online payments, leading-edge lithography equipment and blood plasma businesses.
Relative Performance
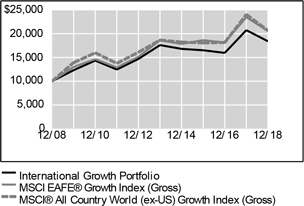
| | | | | | | | | | | | |
Average Annual Total Returns
For Periods Ended December 31, 2018 | |
| | | 1 Year | | | 5 Years | | | 10 Years | |
International Growth Portfolio | | | -11.28 | % | | | 0.90 | % | | | 6.29 | % |
MSCI EAFE® Growth Index (Gross) | | | -12.48 | % | | | 2.00 | % | | | 7.46 | % |
MSCI® All Country World(ex-US) Growth Index (Gross) | | | -14.10 | % | | | 2.06 | % | | | 7.52 | % |
Lipper® Variable Insurance Products (VIP) InternationalMulti-Cap Growth Funds Average | | | -14.15 | % | | | 1.10 | % | | | 7.03 | % |
The performance data quoted represents past performance. Past performance is historical and does not guarantee future performance. Investment return and principal value will fluctuate, so that shares, when redeemed, may be worth more or less than their original cost. Current performance may be lower or higher than the performance data quoted. For the most recentmonth-end performance information visitwww.northwesternmutual.com.
This chart assumes an initial investment of $10,000 made on 12/31/08. Returns shown reflect fee waivers, deductions for management and other portfolio expenses, and reinvestment of all dividends. In the absence of feewaivers, total return would be reduced. Returns exclude deductions for separate account sale loads and account fees. Please refer to the Benchmark Definitions section of this report for information about the indices cited in the above chart and graph.
Investors should be aware of the risks of investments in foreign securities, particularly investments in securities of companies in developing nations. These include the the risks of currency fluctuation, of political and economic instability and of less well-developed government supervision and regulation of business and industry practices, as well as differences in accounting standards.
Investments in the securities of companies in developing nations impose risks different from, and greater than, risks of investing in developed countries.
The Portfolio may invest a relatively large percentage of its assets in issuers located in a single country, a small number of countries, or a particular geographic region. The Portfolio’s performance may be more volatile than that of a more geographically diversified fund, and may be tied more closely to the performance of a single country or region.
Top 10 Equity Holdings 12/31/18
| | | | |
Security Description | | | % of Net Assets | |
Nestle SA | | | 5.2 | % |
Roche Holding AG | | | 3.5 | % |
CSL, Ltd. | | | 3.5 | % |
SAP SE | | | 3.4 | % |
AIA Group, Ltd. | | | 2.9 | % |
ASML Holding NV | | | 2.7 | % |
Keyence Corp. | | | 2.6 | % |
Mastercard, Inc. - Class A | | | 2.3 | % |
Visa, Inc. - Class A | | | 2.3 | % |
Amadeus IT Group SA | | | 2.2 | % |
81
International Growth Portfolio (unaudited)
Sector Allocation 12/31/18
| | | | |
| Sector | | % of Net Assets | |
Industrials | | | 21.2 | % |
Information Technology | | | 18.9 | % |
Financials | | | 14.1 | % |
Health Care | | | 10.8 | % |
Consumer Discretionary | | | 8.8 | % |
Consumer Staples | | | 8.2 | % |
Materials | | | 7.4 | % |
Short-Term Investments & Other Net Assets | | | 5.9 | % |
Communication Services | | | 3.0 | % |
Real Estate | | | 1.3 | % |
Energy | | | 0.4 | % |
Sector Allocation and Top 10 Holdings are subject to change.
82
International Growth Portfolio
SCHEDULE OF INVESTMENTS
December 31, 2018
| | | | | | | | | | |
| Common Stocks (93.7%) | | Country | | Shares/
Par+ | | | Value
$ (000’s) | |
| | |
Communication Services (3.0%) | | | | | | | | |
Alphabet, Inc. - Class A * | | United
States | | | 9,400 | | | | 9,823 | |
Rightmove PLC | | United
Kingdom | | | 331,700 | | | | 1,827 | |
Safaricom, Ltd. | | Kenya | | | 15,115,500 | | | | 3,301 | |
Schibsted ASA - Class B | | Norway | | | 125,299 | | | | 3,801 | |
| | | | | | | | | | |
Total | | | | | | | 18,752 | |
| | | | | | | | | | |
| | |
Consumer Discretionary (8.8%) | | | | | | | | |
Alibaba Group Holding, Ltd., ADR* | | China | | | 36,879 | | | | 5,055 | |
Amazon.com, Inc.* | | United
States | | | 1,500 | | | | 2,253 | |
Autoliv, Inc. | | United
States | | | 57,700 | | | | 4,052 | |
Denso Corp. | | Japan | | | 150,400 | | | | 6,675 | |
Informa PLC | | United
Kingdom | | | 787,698 | | | | 6,327 | |
InterContinental Hotels Group PLC, ADR | | United
Kingdom | | | 208,089 | | | | 11,360 | |
Mohawk Industries, Inc.* | | United
States | | | 24,900 | | | | 2,912 | |
Naspers, Ltd. - Class N | | South
Africa | | | 24,000 | | | | 4,825 | |
USS Co., Ltd. | | Japan | | | 599,600 | | | | 10,007 | |
Veoneer, Inc.* | | United
States | | | 54,200 | | | | 1,277 | |
| | | | | | | | | | |
Total | | | | | | | 54,743 | |
| | | | | | | | | | |
| | |
Consumer Staples (8.2%) | | | | | | | | |
Alimentation Couche-Tard, Inc. - Class B | | Canada | | | 67,600 | | | | 3,363 | |
BGF Retail Co., Ltd.* | | South
Korea | | | 15,224 | | | | 2,783 | |
Clicks Group, Ltd. | | South
Africa | | | 320,152 | | | | 4,260 | |
Nestle SA | | Switzerland | | | 397,269 | | | | 32,298 | |
PriceSmart, Inc. | | United
States | | | 33,500 | | | | 1,980 | |
Reckitt Benckiser Group PLC | | United
Kingdom | | | 88,133 | | | | 6,755 | |
Total | | | | | | | 51,439 | |
| | |
Energy (0.4%) | | | | | | | | |
Pason Systems, Inc. | | Canada | | | 88,700 | | | | 1,188 | |
PrairieSky Royalty, Ltd. | | Canada | | | 96,700 | | | | 1,252 | |
Total | | | | | | | 2,440 | |
| | |
Financials (13.7%) | | | | | | | | |
AIA Group, Ltd. | | Hong Kong | | | 2,197,088 | | | | 18,238 | |
Berkshire Hathaway, Inc. - Class B* | | United
States | | | 37,700 | | | | 7,698 | |
Deutsche Borse Aktiengesellschaft | | Germany | | | 39,100 | | | | 4,702 | |
Housing Development Finance Corp., Ltd. | | India | | | 277,963 | | | | 7,823 | |
Itau Unibanco Holding SA | | Brazil | | | 107,550 | | | | 838 | |
Jyske Bank A/S | | Denmark | | | 82,900 | | | | 2,996 | |
KBC Group NV | | Belgium | | | 94,532 | | | | 6,139 | |
Marsh & McLennan Cos., Inc. | | United
States | | | 70,923 | | | | 5,656 | |
Moody’s Corp. | | United
States | | | 42,800 | | | | 5,994 | |
MSCI, Inc. | | United
States | | | 43,300 | | | | 6,384 | |
Prudential PLC | | United
Kingdom | | | 558,263 | | | | 9,976 | |
S&P Global, Inc. | | United
States | | | 37,000 | | | | 6,288 | |
Svenska Handelsbanken AB | | Sweden | | | 264,800 | | | | 2,933 | |
| | | | | | | | | | |
Total | | | | | | | 85,665 | |
| | | | | | | | | | |
| | | | | | | | | | |
| Common Stocks (93.7%) | | Country | | Shares/
Par+ | | | Value
$ (000’s) | |
| | |
Health Care (10.8%) | | | | | | | | |
Bayer AG | | Germany | | | 45,327 | | | | 3,143 | |
CSL, Ltd. | | Australia | | | 169,495 | | | | 22,105 | |
Grifols SA, ADR | | Spain | | | 235,196 | | | | 4,318 | |
Hoya Corp. | | Japan | | | 134,800 | | | | 8,240 | |
ResMed, Inc. | | United
States | | | 65,900 | | | | 7,504 | |
Roche Holding AG | | Switzerland | | | 89,552 | | | | 22,144 | |
| | | | | | | | | | |
Total | | | | | | | 67,454 | |
| | | | | | | | | | |
| | |
Industrials (21.2%) | | | | | | | | |
ANDRITZ AG | | Austria | | | 150,854 | | | | 6,939 | |
Assa Abloy AB - Class B | | Sweden | | | 739,000 | | | | 13,213 | |
Atlas Copco AB - Class A | | Sweden | | | 304,600 | | | | 7,277 | |
Auckland International Airport, Ltd. | | New
Zealand | | | 621,955 | | | | 2,997 | |
BAE Systems PLC | | United
Kingdom | | | 780,000 | | | | 4,565 | |
Canadian National Railway Co. | | Canada | | | 35,100 | | | | 2,600 | |
Canadian Pacific Railway, Ltd. | | Canada | | | 15,000 | | | | 2,662 | |
East Japan Railway Co. | | Japan | | | 88,600 | | | | 7,875 | |
Edenred | | France | | | 137,300 | | | | 5,051 | |
Elis SA | | France | | | 125,694 | | | | 2,095 | |
Epiroc AB* | | Sweden | | | 426,900 | | | | 4,054 | |
Experian PLC | | Jersey | | | 201,800 | | | | 4,900 | |
Fagerhult AB | | Sweden | | | 156,600 | | | | 1,348 | |
FANUC Corp. | | Japan | | | 35,300 | | | | 5,307 | |
Interpump Group SpA | | Italy | | | 142,000 | | | | 4,222 | |
Komatsu, Ltd. | | Japan | | | 197,500 | | | | 4,207 | |
Legrand SA | | France | | | 71,700 | | | | 4,050 | |
Loomis AB - Class B | | Sweden | | | 56,600 | | | | 1,832 | |
Melrose Industries PLC | | United
Kingdom | | | 1,185,086 | | | | 2,475 | |
MISUMI Group, Inc. | | Japan | | | 297,100 | | | | 6,201 | |
MTU Aero Engines AG | | Germany | | | 31,400 | | | | 5,703 | |
Nabtesco Corp. | | Japan | | | 124,200 | | | | 2,672 | |
OSG Corp. | | Japan | | | 174,300 | | | | 3,424 | |
Prosegur Cia de Seguridad SA | | Spain | | | 687,100 | | | | 3,481 | |
Safran SA | | France | | | 90,100 | | | | 10,881 | |
Schindler Holding AG | | Switzerland | | | 40,878 | | | | 8,096 | |
SHO-BOND Holdings Co., Ltd. | | Japan | | | 65,400 | | | | 4,828 | |
| | | | | | | | | | |
Total | | | | | | | 132,955 | |
| | | | | | | | | | |
| | |
Information Technology (18.9%) | | | | | | | | |
Amadeus IT Group SA | | Spain | | | 200,200 | | | | 13,955 | |
ASML Holding NV | | Netherlands | | | 108,700 | | | | 17,082 | |
Azbil Corp. | | Japan | | | 117,200 | | | | 2,297 | |
Black Knight, Inc.* | | United
States | | | 80,000 | | | | 3,605 | |
Keyence Corp. | | Japan | | | 32,700 | | | | 16,480 | |
Mastercard, Inc. - Class A | | United
States | | | 77,200 | | | | 14,564 | |
Nintendo Co., Ltd. | | Japan | | | 6,100 | | | | 1,612 | |
PayPal Holdings, Inc.* | | United
States | | | 36,000 | | | | 3,027 | |
SAP SE | | Germany | | | 211,219 | | | | 21,040 | |
Spectris PLC | | United
Kingdom | | | 124,400 | | | | 3,614 | |
Taiwan Semiconductor Manufacturing Co., Ltd. | | Taiwan | | | 934,000 | | | | 6,780 | |
The Accompanying Notes are an Integral Part of the Financial Statements.
83
International Growth Portfolio
| | | | | | | | | | |
| Common Stocks (93.7%) | | Country | | Shares/
Par+ | | | Value
$ (000’s) | |
| | |
Information Technology continued | | | | | | | | |
Visa, Inc. - Class A | | United
States | | | 109,825 | | | | 14,490 | |
| | | | | | | | | | |
Total | | | | | | | | | 118,546 | |
| | | | | | | | | | |
| | |
Materials (7.4%) | | | | | | | | |
CRH PLC, ADR | | Ireland | | | 373,100 | | | | 9,831 | |
Elementis PLC | | United
Kingdom | | | 662,025 | | | | 1,537 | |
Franco-Nevada Corp. | | Canada | | | 43,500 | | | | 3,050 | |
James Hardie Industries PLC | | Ireland | | | 468,985 | | | | 4,995 | |
Linde PLC | | Ireland | | | 72,055 | | | | 11,441 | |
Martin Marietta Materials, Inc. | | United
States | | | 35,600 | | | | 6,119 | |
The Sherwin-Williams Co. | | United
States | | | 21,500 | | | | 8,459 | |
Tikkurila Oyj | | Finland | | | 78,800 | | | | 1,086 | |
| | | | | | | | | | |
Total | | | | | | | | | 46,518 | |
| | | | | | | | | | |
| | |
Real Estate (1.3%) | | | | | | | | |
Merlin Properties Socimi SA | | Spain | | | 125,800 | | | | 1,554 | |
Shaftesbury PLC | | United
Kingdom | | | 150,200 | | | | 1,590 | |
Vonovia SE | | Germany | | | 106,700 | | | | 4,843 | |
| | | | | | | | | | |
Total | | | | | | | | | 7,987 | |
| | | | | | | | | | |
| | |
Total Common Stocks | | | | | | | | |
(Cost: $556,913) | | | | | | | | | 586,499 | |
| | | | | | | | | | |
| | | | | | | | | | |
| Preferred Stocks (0.4%) | | Country | | Shares/
Par+ | | | Value
$ (000’s) | |
| | |
Financials (0.4%) | | | | | | | | |
Itau Unibanco Holding SA | | Brazil | | | 296,400 | | | | 2,728 | |
| | | | | | | | | | |
Total | | | | | | | | | 2,728 | |
| | | | | | | | | | |
| | |
Total Preferred Stocks | | | | | | | | |
(Cost: $2,473) | | | | | | | | | 2,728 | |
| | | | | | | | | | |
| | | |
| Short-Term Investments (5.8%) | | | | | | | | |
| | | |
Money Market Funds (5.8%) | | | | | | | | | | |
State Street Institutional U.S. Government Money Market Fund - Premier Class 2.270% # | | United
States | | | 36,273,239 | | | | 36,273 | |
| | | | | | | | | | |
| | | |
Total | | | | | | | | | 36,273 | |
| | | | | | | | | | |
| | |
Total Short-Term Investments | | | | | | | | |
(Cost: $36,273) | | | | | | | 36,273 | |
| | | | | | | | | | |
| | |
Total Investments (99.9%) | | | | | | | | |
(Cost: $595,659)@ | | | | | | | 625,500 | |
| | | | | | | | | | |
Other Assets, Less | | | | | | | | | | |
Liabilities (0.1%) | | | | | | | | | 582 | |
| | | | | | | | | | |
Net Assets (100.0%) | | | | | | | | | 626,082 | |
| | | | | | | | | | |
| | | | | | |
Investments Percentage by Country is based on Net Assets: | | | | | | |
United States | | | 23.7% | | | |
Japan | | | 12.8% | | | |
Switzerland | | | 10.1% | | | |
United Kingdom | | | 8.0% | | | |
Germany | | | 6.4% | | | |
Other | | | 38.9% | | | |
Total | | | 99.9% | | | |
Over the Counter Derivatives
Forward Contracts
| | | | | | | | | | | | | | | | | | | | | | |
| Type | | Counterparty | | Currency | | Foreign
Principal
Amount
Covered by
Contract (000s) | | USD Principal
Amount
Covered by
Contract (000’s) | | Settlement
Month | | Unrealized
Appreciation
(000’s) | | | Unrealized
(Depreciation)
(000’s) | | | Net Unrealized
Appreciation/
(Depreciation)
(000’s) | |
Buy | | Royal Bank of Canada | | EUR | | 199 | | 228 | | 1/19 | | $ | - | p | | $ | - | | | $ | - | p |
Buy | | Morgan Stanley Capital Services, Inc. | | GBP | | 31 | | 39 | | 1/19 | | | - | p | | | - | | | | - | p |
Buy | | Morgan Stanley Capital Services, Inc. | | JPY | | 7,175 | | 66 | | 1/19 | | | 1 | | | | - | | | | 1 | |
Buy | | Goldman Sachs International | | JPY | | 5,620 | | 51 | | 1/19 | | | 1 | | | | - | | | | 1 | |
Buy | | Bank of America, N.A. | | NOK | | 643 | | 74 | | 1/19 | | | 1 | | | | - | | | | 1 | |
Buy | | JP Morgan Chase Bank N.A | | ZAR | | 5,825 | | 405 | | 1/19 | | | - | | | | (1 | ) | | | (1 | ) |
| | | | | | | | | | | | | | | | | | | | | | |
| | | | | | | | | | | | $ | 3 | | | $ | (1 | ) | | $ | 2 | |
| | | | | | | | | | | | | | | | | | | | | | |
| | | | | | | | | | | | | | |
| | | Financial Derivative Assets (000’s) | | Financial Derivative Liabilities (000’s) |
| | | Forward
Contracts | | Swaps | | Total | | Forward
Contracts | | Options | | Swaps | | Total |
Total Over the Counter Derivatives | | $ 3 | | - | | $ 3 | | $ (1) | | - | | - | | $ (1) |
The Accompanying Notes are an Integral Part of the Financial Statements.
84
International Growth Portfolio
| + | All par is stated in U.S Dollar unless otherwise noted. |
| # | 7-Day yield as of 12/31/2018. |
| @ | At December 31, 2018, the aggregate cost of investments, including derivatives, for federal tax purposes (in thousands) was $597,865 and the net unrealized appreciation of investments based on that cost was $27,637 which is comprised of $73,037 aggregate gross unrealized appreciation and $45,400 aggregate gross unrealized depreciation. |
| p | Amount is less than one thousand. |
The following is a summary of the inputs used in valuing the Portfolio’s assets and liabilities at December 31, 2018. See Note 3 for additional information on portfolio valuation.
| | | | | | | | | | | | | | |
| | | Valuation Inputs | | | |
| Description | | Level 1 –
Quoted Prices | | | Level 2 –
Other Significant
Observable Inputs | | | Level 3 –
Significant
Unobservable Inputs | | | |
| | | (Amounts in thousands) | | | |
| Assets: | | | | | | | | | | | |
Preferred Stocks | | $ | - | | | $ | 2,728 | | | $ | - | | | |
Common Stocks | | | | | | | | | | | | | | |
Communication Services | | | 14,951 | | | | 3,801 | | | | - | | | |
Consumer Discretionary | | | 38,061 | | | | 16,682 | | | | - | | | |
Consumer Staples | | | 16,358 | | | | 35,081 | | | | - | | | |
Financials | | | 74,196 | | | | 11,469 | | | | - | | | |
Health Care | | | 33,927 | | | | 33,527 | | | | - | | | |
Industrials | | | 45,757 | | | | 87,198 | | | | - | | | |
Information Technology | | | 70,337 | | | | 48,209 | | | | - | | | |
Materials | | | 33,991 | | | | 12,527 | | | | - | | | |
Real Estate | | | 3,144 | | | | 4,843 | | | | - | | | |
All Others | | | 2,440 | | | | - | | | | - | | | |
Short-Term Investments | | | 36,273 | | | | - | | | | - | | | |
Other Financial Instruments^ | | | | | | | | | | | | | | |
Forward Currency Contracts | | | - | | | | 3 | | | | - | | | |
Total Assets: | | $ | 369,435 | | | $ | 256,068 | | | $ | - | | | |
| Liabilities: | | | | | | | | | | | |
Other Financial Instruments^ | | | | | | | | | | | | | | |
Forward Currency Contracts | | | - | | | | (1 | ) | | | - | | | |
Total Liabilities: | | $ | - | | | $ | (1 | ) | | $ | - | | | |
^ Other financial instruments are derivative instruments such as futures and forwards, which are valued at the unrealized appreciation (depreciation) on the instrument, and securities sold short, reverse repurchase agreements, written options and swaps contracts, which are valued at market value.
The Accompanying Notes are an Integral Part of the Financial Statements.
85
Research International Core Portfolio (unaudited)
| | | | |
| Objective: | | Portfolio Strategy: | | Net Assets: |
| Capital appreciation. | | Invest primarily in foreign equity securities, including emerging markets. | | $596 million |
PORTFOLIO OVERVIEW
Mason Street Advisors, LLC (“Mason Street Advisors”), the investment adviser for the Research International Core Portfolio (the “Portfolio”), has engaged Massachusetts Financial Services Company (“MFS®”) to act assub-adviser for the Portfolio. The Portfolio normally invests in foreign equity securities, including emerging market equity securities. In conjunction with a team of investment research analysts, sector leaders select investments for the Portfolio. An active, “bottom up” investment approach is used to buy and sell investments for the Portfolio. The Portfolio is generally managed to be sector neutral to the MSCI EAFE® Index. The Portfolio may invest in the stocks of companies it believes to have above average earnings growth potential compared to other companies (growth companies), in the stocks of companies it believes are undervalued compared to their perceived worth (value companies), or in a combination of growth and value companies. The Portfolio also may invest in companies of any size.
MARKET OVERVIEW
During the reporting period, the U.S. Federal Reserve (the “Fed”) raised interest rates by 100 basis points, bringing the total number of rate hikes to nine since the central bank began to normalize monetary policy in late 2015. Economic growth rates in the U.S., the eurozone and Japan remained above trend, despite slower global growth, particularly toward the end of the period. Inflation remained contained, particularly outside the U.S. The European political backdrop became a bit more volatile late in the period, spurred by concerns over cohesion in the Eurozone after the election of an anti-establishment, Eurosceptic coalition government in Italy and widespread protests over stagnant wage growth in France. Growing concern about increasing global trade friction appears to have weighed on business sentiment, especially outside the U.S. Tighter financial conditions from rising U.S. interest rates and a strong dollar, combined with trade uncertainty, helped expose structural weaknesses in several emerging markets in the second half of the period.
Volatility increased at the end of the period, amid signs of slowing global economic growth and increasing trade tensions, which prompted a market decline shortly after U.S. markets set record highs in September. While the U.S. economy held up better than most, global economic growth became less synchronized during the period, with Europe and China showing signs of a slowdown and some emerging markets coming under stress.
PORTFOLIO RESULTS
The Portfolio returned (13.66%) for the twelve months ended December 31, 2018. By comparison, the Portfolio’s primary and secondary benchmarks, the MSCI® All Country World(ex-U.S.) Index (the “Index”) and the MSCI EAFE® Index, returned (13.78%) and (13.36%), respectively. (These Indices are unmanaged, cannot be invested in directly and do not incur expenses.) According to Lipper® Analytical Services, Inc., an independent mutual fund ranking company, the average return in 2018 of the InternationalMulti-Cap Core Funds peer group was (13.49%).
Stock selection in the Information Technology sector contributed to performance relative to the Index. Within the sector, holdings of Mastercard, semiconductor company Mellanox Technologies and an overweight position in telecommunications equipment provider Ericsson (Sweden) boosted relative returns.
Stock selection in both the Materials and Consumer Discretionary sectors also aided relative performance. Within the Materials sector, an overweight position in industrial gas supplier Linde (Germany) helped relative results. In the Consumer Discretionary sector, an overweight position in global engineering company GKN (U.K.) boosted relative returns. Stocks in other sectors that contributed to relative performance included overweight positions in medical products and equipment manufacturer Terumo (Japan), parcel delivery services company Yamato (Japan) and pharmaceutical and diagnostic company Roche Holding (Switzerland). Additionally, the Portfolio’s position in risk management and human capital consulting services provider Aon further supported relative returns.
Stock selection in both the Consumer Staples and Industrials sectors detracted from relative performance. Within Consumer Staples, overweight positions in tobacco distributor British American Tobacco (U.K.) and drug store operator Sundrug (Japan) weighed on relative returns. Within the Industrials sector, overweight positions in household fixture manufacturer Toto (Japan) and mechanical engineering firm GEA Group (Germany) also hindered relative results.
86
Research International Core Portfolio (unaudited)
Security selection in the Health Care sector further weakened relative returns led by an overweight position in pharmaceutical company Bayer (Germany). Stocks in other sectors that detracted from relative performance included overweight positions in wealth management firm Julius Baer (Switzerland), investment management and banking firm UBS (Switzerland), global banking group BNP Paribas (France), diversified financial services firm Mitsubishi UFJ Financial Group (Japan), and banking and financial services firm Intesa Sanpaolo (Italy).
PORTFOLIO MANAGER OUTLOOK
The following forward-looking comments are the opinion of MFS®, the Portfolio’ssub-adviser.
Regardless of changing economic and market conditions, we will continue to adhere to our investment process, building a portfolio of fundamentally sound companies. The Portfolio is a sector-neutral portfolio that emphasizesbottom-up fundamental research. Because of this approach, the Portfolio’s sector weightings vary only modestly from those of the broader foreign market. Instead, we attempt to outperform the Index by holding what we believe to be the most attractive opportunities among growth and value companies within each sector of the market without regard to market capitalization.
Relative Performance
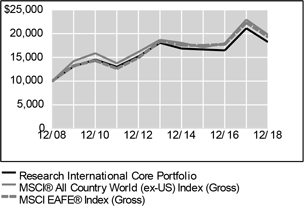
| | | | | | | | | | | | |
Average Annual Total Returns
For Periods Ended December 31, 2018 | |
| | | 1 Year | | | 5 Years | | | 10 Years | |
Research International Core Portfolio | | | -13.66 | % | | | 0.19 | % | | | 6.19 | % |
MSCI® All Country World(ex-US) Index (Gross) | | | -13.78 | % | | | 1.14 | % | | | 7.06 | % |
MSCI EAFE® Index (Gross) | | | -13.36 | % | | | 1.00 | % | | | 6.81 | % |
Lipper® Variable Insurance Products (VIP) InternationalMulit-Cap Core Funds Average | | | -13.49 | % | | | 0.14 | % | | | 5.76 | % |
The performance data quoted represents past performance. Past performance is historical and does not guarantee future performance. Investment return and principal value will fluctuate, so that shares, when redeemed, may be worth more or less than their original cost. Current performance may be lower or higher than the performance data quoted. For the most recentmonth-end performance information visitwww.northwesternmutual.com.
This chart assumes an initial investment of $10,000 made on 12/31/08. Returns shown reflect fee waivers,
deductions for management and other portfolio expenses, and reinvestment of all dividends. In the absence of fee waivers, total return would be reduced. Returns exclude deductions for separate account sale loads and account fees. Please refer to the Benchmark Definitions section of this report for information about the indices cited in the above chart and graph.
Investors should be aware of the risks of investments in foreign securities, particularly investments in securities of companies in developing nations. These include the risks of currency fluctuation, of political and economic instability and of less well-developed government supervision and regulation of business and industry practices, as well as differences in accounting standards.
Investments in the securities of companies in developing nations impose risks different from, and greater than, risks of investing in developed countries.
The Portfolio may invest a relatively large percentage of its assets in issuers located in a single country, a small number of countries, or a particular geographic region. The Portfolio’s performance may be more volatile than that of a more geographically diversified fund, and may be tied more closely to the performance of a single country or region.
The Portfolio may invest a relatively high percentage of its assets in a particular sector. The Portfolio will have greater exposure to the risks associated with that sector and its performance will be tied more closely to the performance of that sector.
87
Research International Core Portfolio (unaudited)
Top 10 Equity Holdings 12/31/18
| | | | | | |
| Security Description | | % of Net Assets | | | |
Nestle SA | | | 2.9 | % | | |
Roche Holding AG | | | 2.8 | % | | |
Linde PLC | | | 2.2 | % | | |
Schneider Electric SE | | | 1.9 | % | | |
Novo Nordisk AS - Class B | | | 1.9 | % | | |
AIA Group, Ltd. | | | 1.8 | % | | |
UBS Group AG | | | 1.6 | % | | |
BP PLC | | | 1.6 | % | | |
Akzo Nobel NV | | | 1.6 | % | | |
Bayer AG | | | 1.5 | % | | |
Sector Allocation 12/31/18
| | | | | | |
| Sector | | % of Net Assets | | | |
Financials | | | 19.6 | % | | |
Industrials | | | 13.5 | % | | |
Consumer Staples | | | 11.5 | % | | |
Health Care | | | 11.0 | % | | |
Information Technology | | | 9.7 | % | | |
Materials | | | 9.1 | % | | |
Consumer Discretionary | | | 6.9 | % | | |
Energy | | | 5.6 | % | | |
Communication Services | | | 4.8 | % | | |
Utilities | | | 3.8 | % | | |
Real Estate | | | 2.5 | % | | |
Short-Term Investments & Other Net Assets | | | 2.0 | % | | |
Sector Allocation and Top 10 Holdings are subject to change.
88
Research International Core Portfolio
SCHEDULE OF INVESTMENTS
December 31, 2018
| | | | | | | | | | |
| Common Stocks (98.0%) | | Country | | Shares/
Par+ | | | Value
$ (000’s) | |
| | |
Communication Services (4.8%) | | | | | | | | |
Advanced Info Service PCL | | Thailand | | | 675,300 | | | | 3,578 | |
Baidu, Inc., ADR* | | Cayman
Islands | | | 7,239 | | | | 1,148 | |
Hellenic Telecommunications Organization SA | | Greece | | | 267,313 | | | | 2,916 | |
KDDI Corp. | | Japan | | | 338,600 | | | | 8,069 | |
NAVER Corp.* | | South
Korea | | | 35,351 | | | | 3,852 | |
SoftBank Group Corp. | | Japan | | | 98,400 | | | | 6,486 | |
Tele2 AB | | Sweden | | | 178,467 | | | | 2,280 | |
| | | | | | | | | | |
Total | | | | | | | | | 28,329 | |
| | | | | | | | | | |
| | |
Consumer Discretionary (6.9%) | | | | | | | | |
adidas AG | | Germany | | | 14,049 | | | | 2,936 | |
Dufry AG* | | Switzerland | | | 28,212 | | | | 2,679 | |
Koito Manufacturing Co., Ltd. | | Japan | | | 116,500 | | | | 5,943 | |
LVMH Moet Hennessy Louis Vuitton SE | | France | | | 29,417 | | | | 8,703 | |
Paddy Power Betfair PLC | | Ireland | | | 34,891 | | | | 2,846 | |
Techtronic Industries Co., Ltd. | | Hong Kong | | | 1,027,500 | | | | 5,459 | |
USS Co., Ltd. | | Japan | | | 369,700 | | | | 6,170 | |
WPP PLC | | Jersey | | | 293,951 | | | | 3,172 | |
Yum China Holdings, Inc. | | United
States | | | 89,754 | | | | 3,009 | |
| | | | | | | | | | |
Total | | | | | | | | | 40,917 | |
| | | | | | | | | | |
| | |
Consumer Staples (11.5%) | | | | | | | | |
Ambev SA, ADR | | Brazil | | | 574,809 | | | | 2,253 | |
British American Tobacco PLC | | United
Kingdom | | | 242,935 | | | | 7,741 | |
Danone SA | | France | | | 93,226 | | | | 6,570 | |
Japan Tobacco, Inc. | | Japan | | | 217,500 | | | | 5,160 | |
Kao Corp. | | Japan | | | 65,100 | | | | 4,800 | |
L’Oreal SA | | France | | | 28,612 | | | | 6,596 | |
Nestle SA | | Switzerland | | | 215,427 | | | | 17,514 | |
Reckitt Benckiser Group PLC | | United
Kingdom | | | 100,544 | | | | 7,706 | |
Sundrug Co., Ltd. | | Japan | | | 185,300 | | | | 5,512 | |
Tesco PLC | | United
Kingdom | | | 1,913,222 | | | | 4,636 | |
| | | | | | | | | | |
Total | | | | | | | | | 68,488 | |
| | | | | | | | | | |
| | |
Energy (5.6%) | | | | | | | | |
BP PLC | | United
Kingdom | | | 1,490,794 | | | | 9,424 | |
Cairn Energy PLC* | | United
Kingdom | | | 1,242,225 | | | | 2,375 | |
Caltex Australia, Ltd. | | Australia | | | 207,110 | | | | 3,717 | |
Enbridge, Inc. | | Canada | | | 134,935 | | | | 4,192 | |
Eni SpA | | Italy | | | 345,057 | | | | 5,434 | |
Galp Energia SGPS SA | | Portugal
Papua New | | | 319,793 | | | | 5,054 | |
Oil Search, Ltd. | | Guinea | | | 640,229 | | | | 3,229 | |
| | | | | | | | | | |
Total | | | | | | | | | 33,425 | |
| | | | | | | | | | |
| | |
Financials (19.6%) | | | | | | | | |
AEON Financial Service Co., Ltd. | | Japan | | | 344,900 | | | | 6,196 | |
AIA Group, Ltd. | | Hong Kong | | | 1,312,600 | | | | 10,896 | |
AIB Group PLC | | Ireland | | | 1,246,383 | | | | 5,255 | |
| | | | | | | | | | |
| Common Stocks (98.0%) | | Country | | Shares/
Par+ | | | Value
$ (000’s) | |
| | |
Financials continued | | | | | | | | |
Aon PLC | | United
Kingdom | | | 56,549 | | | | 8,220 | |
Bankia SA | | Spain | | | 554,478 | | | | 1,626 | |
Barclays PLC | | United
Kingdom | | | 2,837,106 | | | | 5,443 | |
BNP Paribas SA | | France | | | 152,663 | | | | 6,905 | |
Cerved Information Solutions SpA | | Italy | | | 159,419 | | | | 1,307 | |
Erste Group Bank AG* | | Austria | | | 81,097 | | | | 2,702 | |
Euronext NV | | Netherlands | | | 8,398 | | | | 484 | |
HDFC Bank, Ltd. | | India | | | 263,660 | | | | 8,013 | |
Hiscox, Ltd. | | Bermuda | | | 288,591 | | | | 5,963 | |
Intesa Sanpaolo SpA | | Italy | | | 3,522,048 | | | | 7,806 | |
Julius Baer Group, Ltd.* | | Switzerland | | | 155,842 | | | | 5,569 | |
Jyske Bank A/S | | Denmark | | | 53,123 | | | | 1,920 | |
KBC Group NV | | Belgium | | | 102,805 | | | | 6,676 | |
Mitsubishi UFJ Financial Group, Inc. | | Japan | | | 1,317,200 | | | | 6,495 | |
Swiss Re AG | | Switzerland | | | 43,900 | | | | 4,034 | |
TMX Group, Ltd. | | Canada | | | 101,862 | | | | 5,277 | |
UBS Group AG* | | Switzerland | | | 780,745 | | | | 9,746 | |
Zurich Insurance Group AG | | Switzerland | | | 20,843 | | | | 6,228 | |
| | | | | | | | | | |
Total | | | | | | | | | 116,761 | |
| | | | | | | | | | |
| | |
Health Care (11.0%) | | | | | | | | |
Bayer AG | | Germany | | | 130,405 | | | | 9,043 | |
Essilor International SA | | France | | | 68,237 | | | | 8,635 | |
Novo Nordisk AS - Class B | | Denmark | | | 240,385 | | | | 11,050 | |
Roche Holding AG | | Switzerland | | | 66,639 | | | | 16,478 | |
Santen Pharmaceutical Co., Ltd. | | Japan | | | 591,500 | | | | 8,465 | |
Sonic Healthcare, Ltd. | | Australia | | | 209,662 | | | | 3,265 | |
Terumo Corp. | | Japan | | | 153,200 | | | | 8,607 | |
| | | | | | | | | | |
Total | | | | | | | | | 65,543 | |
| | | | | | | | | | |
| | |
Industrials (13.5%) | | | | | | | | |
Aena SA | | Spain | | | 28,093 | | | | 4,369 | |
Brambles, Ltd. | | Australia | | | 846,285 | | | | 6,050 | |
Daikin Industries, Ltd. | | Japan | | | 80,000 | | | | 8,419 | |
GEA Group AG | | Germany | | | 167,344 | | | | 4,315 | |
Hitachi, Ltd. | | Japan | | | 115,600 | | | | 3,073 | |
Kubota Corp. | | Japan | | | 505,800 | | | | 7,122 | |
Legrand SA | | France | | | 83,925 | | | | 4,741 | |
Malaysia Airports Holdings Bhd | | Malaysia | | | 848,200 | | | | 1,720 | |
Melrose Industries PLC | | United
Kingdom | | | 1,300,142 | | | | 2,715 | |
RELX PLC | | United
Kingdom | | | 379,032 | | | | 7,804 | |
Ritchie Bros Auctioneers, Inc. | | Canada | | | 101,631 | | | | 3,325 | |
Schindler Holding AG | | Switzerland | | | 29,306 | | | | 5,822 | |
Schneider Electric SE | | France | | | 164,123 | | | | 11,230 | |
TOTO, Ltd. | | Japan | | | 166,100 | | | | 5,710 | |
Yamato Holdings Co., Ltd. | | Japan | | | 143,200 | | | | 3,902 | |
| | | | | | | | | | |
Total | | | | | | | | | 80,317 | |
| | | | | | | | | | |
The Accompanying Notes are an Integral Part of the Financial Statements.
89
Research International Core Portfolio
| | | | | | | | | | |
| Common Stocks (98.0%) | | Country | | Shares/
Par+ | | | Value
$ (000’s) | |
| | |
Information Technology (9.7%) | | | | | | | | |
Amadeus IT Group SA | | Spain | | | 71,390 | | | | 4,976 | |
Check Point Software Technologies, Ltd.* | | Israel | | | 44,095 | | | | 4,526 | |
Cognizant Technology Solutions Corp. - Class A | | United States | | | 104,684 | | | | 6,645 | |
EPAM Systems, Inc.* | | United
States | | | 45,836 | | | | 5,317 | |
Just Eat PLC* | | United Kingdom | | | 398,513 | | | | 2,981 | |
Mastercard, Inc. - Class A | | United States | | | 21,363 | | | | 4,030 | |
Mellanox Technologies, Ltd.* | | Israel | | | 43,431 | | | | 4,012 | |
Nomura Research Institute, Ltd. | | Japan | | | 104,400 | | | | 3,838 | |
NVIDIA Corp. | | United
States | | | 7,043 | | | | 940 | |
Samsung Electronics Co., Ltd. | | South
Korea | | | 58,469 | | | | 2,023 | |
Scout24 AG | | Germany | | | 68,695 | | | | 3,162 | |
Silicon Motion Technology Corp., ADR | | Cayman
Islands | | | 44,015 | | | | 1,519 | |
Taiwan Semiconductor | | | | | | | | | | |
Manufacturing Co., Ltd. | | Taiwan | | | 1,174,189 | | | | 8,524 | |
Telefonaktiebolaget LM | | | | | | | | | | |
Ericsson - Class B | | Sweden | | | 572,247 | | | | 5,044 | |
| | | | | | | | | | |
Total | | | | | | | | | 57,537 | |
| | | | | | | | | | |
| | |
Materials (9.1%) | | | | | | | | |
Akzo Nobel NV | | Netherlands | | | 115,366 | | | | 9,306 | |
Croda International PLC | | United
Kingdom | | | 131,621 | | | | 7,860 | |
Kansai Paint Co. Ltd. | | Japan | | | 95,900 | | | | 1,841 | |
Linde PLC | | Ireland | | | 83,048 | | | | 13,187 | |
Nitto Denko Corp. | | Japan | | | 61,200 | | | | 3,056 | |
Rio Tinto PLC | | United
Kingdom | | | 148,507 | | | | 7,060 | |
Sika AG | | Switzerland | | | 48,076 | | | | 6,110 | |
| | | | | | | | | | | | |
| Common Stocks (98.0%) | | Country | | | Shares/
Par+ | | | Value
$ (000’s) | |
| | |
Materials continued | | | | | | | | | |
Symrise AG | | | Germany | | | | 80,062 | | | | 5,916 | |
| | | | | | | | | | | | |
Total | | | | | | | | | | | 54,336 | |
| | | | | | | | | | | | |
| | |
Real Estate (2.5%) | | | | | | | | | |
Grand City Properties SA | | | Luxembourg | | | | 337,148 | | | | 7,311 | |
LEG Immobilien AG | | | Germany | | | | 73,071 | | | | 7,630 | |
| | | | | | | | | | | | |
Total | | | | | | | | | | | 14,941 | |
| | | | | | | | | | | | |
| | |
Utilities (3.8%) | | | | | | | | | |
APA Group | | | Australia | | | | 455,170 | | | | 2,725 | |
China Resources Gas Group, Ltd. | | | Bermuda | | | | 846,000 | | | | 3,349 | |
CLP Holdings, Ltd. | | | Hong Kong | | | | 473,000 | | | | 5,346 | |
E.ON SE | | | Germany | | | | 485,730 | | | | 4,802 | |
Iberdrola, SA | | | Spain | | | | 815,331 | | | | 6,556 | |
| | | | | | | | | | | | |
Total | | | | | | | | | | | 22,778 | |
| | | | | | | | | | | | |
| | | |
Total Common Stocks | | | | | | | | | | | | |
(Cost: $594,956) | | | | | | | | | | | 583,372 | |
| | | | | | | | | | | | |
| | | |
| Short-Term Investments (1.8%) | | | | | | | | | |
| | |
Money Market Funds (1.8%) | | | | | | | | | |
State Street Institutional U.S. Government Money Market Fund - Premier Class 2.270%# | |
| United
States |
| | | 10,797,418 | | | | 10,797 | |
| | | | | | | | | | | | |
Total | | | | | | | | | | | 10,797 | |
| | | | | | | | | | | | |
| | | |
Total Short-Term Investments | | | | | | | | | | | | |
(Cost: $10,797) | | | | | | | | | | | 10,797 | |
| | | | | | | | | | | | |
| | | |
Total Investments (99.8%) | | | | | | | | | | | | |
(Cost: $605,753)@ | | | | | | | | | | | 594,169 | |
| | | | | | | | | | | | |
Other Assets, Less | | | | | | | | | | | | |
Liabilities (0.2%) | | | | | | | | | | | 1,416 | |
| | | | | | | | | | | | |
Net Assets (100.0%) | | | | | | | | | | | 595,585 | |
| | | | | | | | | | | | |
| | | | | | |
Investments Percentage by Country is based on Net Assets: | | | | | | |
Japan | | | 18.1% | | | |
Switzerland | | | 12.5% | | | |
United Kingdom | | | 12.5% | | | |
France | | | 9.1% | | | |
Germany | | | 6.3% | | | |
United States | | | 5.2% | | | |
Other | | | 36.1% | | | |
Total | | | 99.8% | | | |
| + | All par is stated in U.S Dollar unless otherwise noted. |
| # | 7-Day yield as of 12/31/2018. |
| @ | At December 31, 2018, the aggregate cost of investments, including derivatives, for federal tax purposes (in thousands) was $609,480 and the net unrealized depreciation of investments based on that cost was $15,311 which is comprised of $54,142 aggregate gross unrealized appreciation and $69,453 aggregate gross unrealized depreciation. |
The Accompanying Notes are an Integral Part of the Financial Statements.
90
Research International Core Portfolio
The following is a summary of the inputs used in valuing the Portfolio’s assets and liabilities at December 31, 2018. See Note 3 for additional information on portfolio valuation.
| | | | | | | | | | | | | | |
| | | Valuation Inputs | | | |
| Description | | Level 1 –
Quoted Prices | | | Level 2 –
Other Significant
Observable Inputs | | | Level 3 –
Significant
Unobservable Inputs | | | |
| | | (Amounts in thousands) | | | |
| Assets: | | | | | | |
Common Stocks | | | | | | | | | | | | | | |
Communication Services | | $ | 4,064 | | | $ | 24,265 | | | $ | - | | | |
Consumer Discretionary | | | 23,189 | | | | 17,728 | | | | - | | | |
Consumer Staples | | | 35,502 | | | | 32,986 | | | | - | | | |
Energy | | | 27,991 | | | | 5,434 | | | | - | | | |
Financials | | | 64,758 | | | | 52,003 | | | | - | | | |
Health Care | | | 11,900 | | | | 53,643 | | | | - | | | |
Industrials | | | 41,954 | | | | 38,363 | | | | - | | | |
Information Technology | | | 34,946 | | | | 22,591 | | | | - | | | |
Materials | | | 24,226 | | | | 30,110 | | | | - | | | |
Utilities | | | 17,976 | | | | 4,802 | | | | - | | | |
All Others | | | - | | | | 14,941 | | | | - | | | |
Short-Term Investments | | | 10,797 | | | | - | | | | - | | | |
Total Assets: | | $ | 297,303 | | | $ | 296,866 | | | $ | - | | | |
The Accompanying Notes are an Integral Part of the Financial Statements.
91
International Equity Portfolio (unaudited)
| | | | |
| Objective: | | Portfolio Strategy: | | Net Assets: |
| Long-term growth of capital. Any income realized will be incidental. | | Invests primarily in equity securities of issuers outside of the U.S. with favorable long-term potential relative to current market values. | | $1.6 billion |
PORTFOLIO OVERVIEW
Mason Street Advisors, LLC (“Mason Street Advisors”), the investment adviser for the International Equity Portfolio (“the Portfolio”), has engaged Templeton Investment Counsel, LLC (“Templeton”) to act assub-adviser for the Portfolio. The Portfolio may purchase securities in any foreign country, including those with developed markets and emerging markets. The Portfolio’s investments in equity securities may include small, medium and large capitalization issues that are believed to be undervalued. The Portfolio’s strategy reflects a “bottom up”, value oriented and long-term investment philosophy. In choosing equity investments, the Portfolio will focus on the market price of a company’s securities in relation to the company’s long-term earnings (typically 5 years), asset value and cash flow potential. A company’s historical value measures, including price/earnings ratio, profit margins and liquidation value, will also be considered.
MARKET OVERVIEW
The global economy expanded during 2018, despite weakness in certain regions. Global developed and emerging market stocks were helped at certain points during the period by higher crude oil prices, upbeat economic data, easing trade tensions and encouraging corporate earnings reports, as well as indications of a slower pace of interest rate increases from the U.S. Federal Reserve (the “Fed”). However, various other factors weighed on global markets during the period, including concerns about tighter regulation of technology companies, political uncertainties in the U.S. and the European Union, and major central banks’ monetary policies. Markets were further pressured by U.S. trade disputes, with its allies and China, and their impact on global growth and corporate earnings. In this environment, global stocks declined for the twelve months ended December 31, 2018.
PORTFOLIO RESULTS
The Portfolio returned (15.41%) for the twelve months ended December 31, 2018. By comparison, the Portfolio’s benchmark, the MSCI® All Country World(ex-US) Index (the “Index”), returned (13.78%). (The Index is unmanaged, cannot be invested in directly and does not incur expenses.) According to Lipper® Analytical Services, Inc., an independent mutual fund rating agency, the average return in 2018 of the InternationalMulti-Cap Value Funds peer group was (17.37%).
The Portfolio underperformed its benchmark for the year. Relative weakness during 2018 was primarily attributable to stock-specific issues in the Financials sector, which offset the positive impact of an underweight in this weak-performing sector. European lenders BNP Paribas (France), ING Groep (Netherlands) and Bank of Ireland (Ireland) detracted from relative performance despite relatively low valuations. The Materials sector also detracted due to stock selection. Leading detractors included German chemicals firm LANXESS and the German and French cement-makers HeidelbergCement and Cie DeSt-Gobain. These stocks have fallen sharply on concerns of a cyclical slowdown.
The Information Technology and Consumer Discretionary sectors also hindered results. While the Portfolio’s cautious underweights in these generally expensive sectors were beneficial, stock-level weakness offset the positive impact.
Turning to contributors, stock selection and an overweight in the Communication Services sector buoyed relative returns. Luxembourg-based satellite specialist SES was a top contributor. Recent results showed stabilization in the firm’s video business and better-than-expected growth in other key segments.
Overweight positions in the Health Care and Energy sectors also benefited results. The portfolio manager believed that select Health Care stocks offered growth uncorrelated to the economy and steady earnings uncorrelated to bond yields. In Energy, the Portfolio continued rotating into more resilient, integrated stocks over the period.
From a regional standpoint, the vast majority of relative underperformance came from Europe, particularly France and Germany. In Asia, solid relative performance in China and Thailand offset the negative effects of positioning in South Korea and Hong Kong.
PORTFOLIO MANAGER OUTLOOK
The following forward-looking comments are the opinion of Templeton, the Portfolio’ssub-adviser.
92
International Equity Portfolio (unaudited)
Looking ahead, we see room for continued moderate global growth as China likely eases monetary policy and the Fed and European Central Bank manage their respective economic cycles. While valuations look extended in some parts of the market, we also see areas of opportunity, particularly outside the U.S. Volatility is likely to remain elevated given rising late-cycle risks, and the resultant dislocations should continue to present opportunities for disciplined stock pickers. The policy backdrop is also an important consideration given ongoing efforts to normalize what has been a very low interest rate environment by historical standards. This has caused markets to expect high profits, particularly in the U.S., due to President Trump’spro-cyclical fiscal stimulus and the Information Technology sector, driven by optimistic growth assumptions and long-dated cash flows. Going forward, we continue to believe that the process of policy normalization will drive a rotation away from expensive growth stocks, to the benefit oflow-cost value shares.
Relative Performance
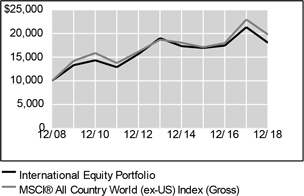
| | | | | | | | | | | | |
Average Annual Total Returns For Periods Ended December 31, 2018 | |
| | | 1 Year | | | 5 Years | | | 10 Years | |
International Equity Portfolio | | | -15.41 | % | | | -1.04 | % | | | 6.08 | % |
MSCI® All Country World(ex-US) Index (Gross) | | | -13.78 | % | | | 1.14 | % | | | 7.06 | % |
MSCI EAFE® Index (Gross) | | | -13.36 | % | | | 1.00 | % | | | 6.81 | % |
Lipper® Variable Insurance Products (VIP) InternationalMulti-Cap Value Funds Average | | | -17.37 | % | | | -1.06 | % | | | 5.72 | % |
The performance data quoted represents past performance. Past performance is historical and does not guarantee future performance. Investment return and principal value will fluctuate, so that shares, when redeemed, may be worth more or less than their original cost. Current performance may be lower or higher than the performance data quoted. For themost recentmonth-end performance information visitwww.northwesternmutual.com.
This chart assumes an initial investment of $10,000 made on 12/31/08. Returns shown reflect fee waivers, deductions for management and other portfolio expenses, and reinvestment of all dividends. In the absence of fee waivers, total return would be reduced. Returns exclude deductions for separate account sale loads and account fees. Please refer to the Benchmark Definitions section of this report for information about the indices cited in the above chart and graph.
Investors should be aware of the risks of investments in foreign securities, particularly investments in securities of companies in developing nations. These include the risks of currency fluctuation, of political and economic instability and of less well-developed government supervision and regulation of business and industry practices, as well as differences in accounting standards.
Investments in the securities of companies in developing nations impose risks different from, and greater than, risks of investing in developed countries.
The Portfolio may invest a relatively large percentage of its assets in issuers located in a single country, a small number of countries, or a particular geographic region. The Portfolio’s performance may be more volatile than that of a more geographically diversified fund, and may be tied more closely to the performance of a single country or region.
The Portfolio may invest a relatively high percentage of its assets in a particular sector. The Portfolio will have greater exposure to the risks associated with that sector and its performance will be tied more closely to the performance of that sector.
Top 10 Equity Holdings12/31/18
| | | | | | |
| Security Description | | % of Net Assets | | | |
Shire PLC | | | 3.2 | % | | |
Samsung Electronics Co., Ltd. | | | 2.7 | % | | |
BP PLC | | | 2.7 | % | | |
Royal Dutch Shell PLC - Class B | | | 2.6 | % | | |
Standard Chartered PLC | | | 2.6 | % | | |
Sanofi | | | 2.3 | % | | |
BNP Paribas SA | | | 2.1 | % | | |
Eni SpA | | | 2.1 | % | | |
TOTAL SA | | | 2.0 | % | | |
UBS Group AG | | | 1.9 | % | | |
93
International Equity Portfolio (unaudited)
Sector Allocation12/31/18
| | | | | | | | |
Sector | | | % of Net Assets | | | | | |
Financials | | | 20.3 | % | | | | |
Health Care | | | 18.2 | % | | | | |
Energy | | | 12.1 | % | | | | |
Communication Services | | | 9.6 | % | | | | |
Industrials | | | 7.9 | % | | | | |
Information Technology | | | 7.4 | % | | | | |
Materials | | | 7.3 | % | | | | |
Consumer Discretionary | | | 5.7 | % | | | | |
Consumer Staples | | | 4.8 | % | | | | |
Utilities | | | 3.1 | % | | | | |
Real Estate | | | 2.0 | % | | | | |
Short-Term Investments & Other Net Assets | | | 1.6 | % | | | | |
Sector Allocation and Top 10 Holdings are subject to change.
94
International Equity Portfolio
SCHEDULE OF INVESTMENTS
December 31, 2018
| | | | | | | | | | |
| Common Stocks (97.9%) | | Country | | Shares/ Par+ | | | Value $ (000’s) | |
| | | |
Communication Services (9.6%) | | | | | | | | | | |
Baidu, Inc., ADR* | | Cayman Islands | | | 110,710 | | | | 17,559 | |
China Mobile, Ltd. | | China | | | 2,588,300 | | | | 24,906 | |
China Telecom Corp., Ltd. - Class H | | China | | | 58,018,160 | | | | 29,637 | |
NetEase, Inc., ADR | | Cayman Islands | | | 47,570 | | | | 11,197 | |
Singapore Telecommunications, Ltd. | | Singapore | | | 11,610,330 | | | | 24,959 | |
SoftBank Group Corp. | | Japan | | | 109,430 | | | | 7,213 | |
Telefonica Deutschland Holding AG | | Germany | | | 5,195,420 | | | | 20,329 | |
Vodafone Group PLC | | United Kingdom | | | 9,251,794 | | | | 18,030 | |
| | | | | | | | | | |
Total | | | | | | | | | 153,830 | |
| | | | | | | | | | |
| | | |
Consumer Discretionary (5.7%) | | | | | | | | | | |
Cie Generale des Etablissements Michelin | | France | | | 147,808 | | | | 14,683 | |
Kingfisher PLC | | United Kingdom | | | 6,667,890 | | | | 17,635 | |
Panasonic Corp. | | Japan | | | 1,590,180 | | | | 14,268 | |
Ryohin Keikaku Co., Ltd. | | Japan | | | 39,360 | | | | 9,579 | |
SES SA | | Luxembourg | | | 1,489,270 | | | | 28,513 | |
Sumitomo Rubber Industries, Ltd. | | Japan | | | 510,910 | | | | 6,080 | |
| | | | | | | | | | |
Total | | | | | | | | | 90,758 | |
| | | | | | | | | | |
| | | |
Consumer Staples (4.8%) | | | | | | | | | | |
Ezaki Glico Co., Ltd. | | Japan | | | 385,810 | | | | 19,487 | |
Kirin Holdings Co., Ltd. | | Japan | | | 863,000 | | | | 18,153 | |
Seven & i Holdings Co., Ltd. | | Japan | | | 474,900 | | | | 20,678 | |
Suntory Beverage & Food, Ltd. | | Japan | | | 401,300 | | | | 18,113 | |
| | | | | | | | | | |
Total | | | | | | | | | 76,431 | |
| | | | | | | | | | |
| | | |
Energy (12.1%) | | | | | | | | | | |
BP PLC | | United Kingdom | | | 6,780,420 | | | | 42,862 | |
Eni SpA | | Italy | | | 2,106,695 | | | | 33,177 | |
Husky Energy, Inc. | | Canada | | | 1,528,240 | | | | 15,795 | |
Kunlun Energy Co., Ltd. | | Bermuda | | | 12,286,350 | | | | 13,023 | |
Royal Dutch Shell PLC - Class B | | United Kingdom | | | 1,390,125 | | | | 41,461 | |
SBM Offshore NV | | Netherlands | | | 1,073,090 | | | | 15,891 | |
TOTAL SA | | France | | | 603,530 | | | | 31,933 | |
| | | | | | | | | | |
Total | | | | | | | | | 194,142 | |
| | | | | | | | | | |
| | | |
Financials (20.3%) | | | | | | | | | | |
AXA SA | | France | | | 1,019,035 | | | | 22,018 | |
Bangkok Bank PCL | | Thailand | | | 4,208,000 | | | | 26,269 | |
Bank of Ireland Group PLC | | Ireland | | | 3,378,320 | | | | 18,812 | |
BNP Paribas SA | | France | | | 759,530 | | | | 34,352 | |
China Life Insurance Co., Ltd. - Class H | | China | | | 9,093,010 | | | | 19,323 | |
Credit Agricole SA | | France | | | 768,660 | | | | 8,305 | |
Hana Financial Group, Inc. | | South Korea | | | 601,660 | | | | 19,524 | |
HSBC Holdings PLC | | United Kingdom | | | 3,236,027 | | | | 26,779 | |
ING Groep NV | | Netherlands | | | 2,222,542 | | | | 23,962 | |
KB Financial Group, Inc., ADR* | | South Korea | | | 600,950 | | | | 25,228 | |
Standard Chartered PLC | | United Kingdom | | | 5,293,022 | | | | 41,106 | |
| | | | | | | | | | |
| Common Stocks (97.9%) | | Country | | Shares/ Par+ | | | Value $ (000’s) | |
| | | |
Financials continued | | | | | | | | | | |
Sumitomo Mitsui Financial Group, Inc. | | Japan | | | 481,700 | | | | 15,885 | |
UBS Group AG* | | Switzerland | | | 2,447,310 | | | | 30,550 | |
UniCredit SpA | | Italy | | | 1,186,810 | | | | 13,463 | |
| | | | | | | | | | |
Total | | | | | | | | | 325,576 | |
| | | | | | | | | | |
| | | |
Health Care (17.7%) | | | | | | | | | | |
Astellas Pharma, Inc. | | Japan | | | 1,956,730 | | | | 24,902 | |
Bayer AG | | Germany | | | 350,908 | | | | 24,332 | |
Fresenius Medial Care AG & Co. | | Germany | | | 141,560 | | | | 9,195 | |
Getinge AB - Class B | | Sweden | | | 587,971 | | | | 5,333 | |
Merck KGaA | | Germany | | | 251,030 | | | | 25,901 | |
Novartis AG | | Switzerland | | | 264,160 | | | | 22,625 | |
Qiagen NV* | | Netherlands | | | 249,992 | | | | 8,524 | |
Roche Holding AG | | Switzerland | | | 96,190 | | | | 23,785 | |
Sanofi | | France | | | 416,285 | | | | 36,087 | |
Shanghai Pharmaceuticals Holding Co., Ltd. | | China | | | 7,252,510 | | | | 14,745 | |
Shire PLC | | Jersey | | | 866,540 | | | | 50,475 | |
Sinopharm Group Co., Ltd. | | China | | | 2,825,200 | | | | 11,870 | |
Teva Pharmaceutical Industries, Ltd., ADR* | | Israel | | | 1,712,820 | | | | 26,412 | |
| | | | | | | | | | |
Total | | | | | | | | | 284,186 | |
| | | | | | | | | | |
| | | |
Industrials (7.9%) | | | | | | | | | | |
A.P. Moeller - Maersk AS - Class B | | Denmark | | | 14,180 | | | | 17,896 | |
BAE Systems PLC | | United Kingdom | | | 1,355,650 | | | | 7,935 | |
Cie de Saint-Gobain | | France | | | 545,920 | | | | 18,242 | |
CK Hutchison Holdings, Ltd. | | Cayman Islands | | | 2,208,070 | | | | 21,205 | |
IHI Corp. | | Japan | | | 368,800 | | | | 10,123 | |
Siemens AG | | Germany | | | 159,550 | | | | 17,795 | |
Siemens AG, ADR | | Germany | | | 101,560 | | | | 5,695 | |
Vestas Wind Systems | | Denmark | | | 371,770 | | | | 28,228 | |
| | | | | | | | | | |
Total | | | | | | | | | 127,119 | |
| | | | | | | | | | |
| | | |
Information Technology (7.4%) | | | | | | | | | | |
Infineon Technologies AG | | Germany | | | 898,400 | | | | 17,877 | |
NXP Semiconductors NV | | Netherlands | | | 235,880 | | | | 17,285 | |
Omron Corp. | | Japan | | | 229,700 | | | | 8,279 | |
Quanta Computer, Inc. | | Taiwan | | | 4,807,820 | | | | 8,213 | |
Samsung Electronics Co., Ltd.* | | South Korea | | | 1,250,500 | | | | 43,268 | |
Taiwan Semiconductor Manufacturing Co., Ltd. | | Taiwan | | | 3,188,135 | | | | 23,144 | |
| | | | | | | | | | |
Total | | | | | | | | | 118,066 | |
| | | | | | | | | | |
| | | |
Materials (7.3%) | | | | | | | | | | |
Akzo Nobel NV | | Netherlands | | | 256,360 | | | | 20,678 | |
CRH PLC | | Ireland | | | 1,089,030 | | | | 28,747 | |
Goldcorp Inc. | | Canada | | | 1,312,780 | | | | 12,857 | |
LANXESS AG | | Germany | | | 334,970 | | | | 15,429 | |
Novozymes AS - Class B | | Denmark | | | 177,130 | | | | 7,917 | |
Sumitomo Metal Mining Co., Ltd. | | Japan | | | 396,270 | | | | 10,540 | |
The Accompanying Notes are an Integral Part of the Financial Statements.
95
International Equity Portfolio
| | | | | | | | | | | | |
| Common Stocks (97.9%) | | Country | | | Shares/ Par+ | | | Value $ (000’s) | |
| | | |
Materials continued | | | | | | | | | | | | |
Wheaton Precious Metals Corp. | | | Canada | | | | 317,420 | | | | 6,196 | |
Yara International ASA | | | Norway | | | | 375,770 | | | | 14,423 | |
| | | | | | | | | | | | |
Total | | | | | | | | | | | 116,787 | |
| | | | | | | | | | | | |
| | | |
Real Estate (2.0%) | | | | | | | | | | | | |
CK Asset Holdings, Ltd. | | | Cayman Islands | | | | 2,040,070 | | | | 14,929 | |
Mitsui Fudosan Co., Ltd. | | | Japan | | | | 811,700 | | | | 17,985 | |
| | | | | | | | | | | | |
Total | | | | | | | | | | | 32,914 | |
| | | | | | | | | | | | |
| | | |
Utilities (3.1%) | | | | | | | | | | | | |
E.ON SE | | | Germany | | | | 2,611,800 | | | | 25,822 | |
Veolia Environnement SA | | | France | | | | 1,198,160 | | | | 24,648 | |
| | | | | | | | | | | | |
Total | | | | | | | | | | | 50,470 | |
| | | | | | | | | | | | |
| | | |
Total Common Stocks
| | | | | | | | | | | | |
(Cost: $1,667,782) | | | | | | | | | | | 1,570,279 | |
| | | | | | | | | | | | |
| | | | | | | | | | | | |
| Preferred Stocks (0.5%) | | Country | | | Shares/ Par+ | | | Value $ (000’s) | |
| | | |
Health Care (0.5%) | | | | | | | | | | | | |
Draegerwerk AG & Co. KGaA | | | Germany | | | | 134,600 | | | | 7,181 | |
| | | | | | | | | | | | |
Total | | | | | | | | | | | 7,181 | |
| | | | | | | | | | | | |
| | | |
Total Preferred Stocks | | | | | | | | | | | | |
(Cost: $15,079) | | | | | | | | | | | 7,181 | |
| | | | | | | | | | | | |
| | | |
| Short-Term Investments (1.4%) | | | | | | | | | |
| | | |
Money Market Funds (1.4%) | | | | | | | | | | | | |
State Street Institutional U.S. Government Money Market Fund - Premier Class 2.270%# | | | United States | | | | 23,240,590 | | | | 23,241 | |
| | | | | | | | | | | | |
Total | | | | | | | | | | | 23,241 | |
| | | | | | | | | | | | |
| | | |
Total Short-Term Investments | | | | | | | | | | | | |
(Cost: $23,241) | | | | | | | | | | | 23,241 | |
| | | | | | | | | | | | |
| | | |
Total Investments (99.8%) | | | | | | | | | | | | |
(Cost: $1,706,102)@ | | | | | | | | | | | 1,600,701 | |
| | | | | | | | | | | | |
Other Assets, Less | | | | | | | | | | | | |
Liabilities (0.2%) | | | | | | | | | | | 3,367 | |
| | | | | | | | | | | | |
Net Assets (100.0%) | | | | | | | | | | | 1,604,068 | |
| | | | | | | | | | | | |
| | | | | | |
Investments Percentage by Country is based on Net Assets: | | | | | | |
Japan | | | 12.5% | | | |
United Kingdom | | | 12.3% | | | |
France | | | 11.8% | | | |
Germany | | | 10.7% | | | |
China | | | 6.2% | | | |
South Korea | | | 5.5% | | | |
Netherlands | | | 5.4% | | | |
Other | | | 35.4% | | | |
Total | | | 99.8% | | | |
| + | All par is stated in U.S Dollar unless otherwise noted. |
| # | 7-Day yield as of 12/31/2018. |
| @ | At December 31, 2018, the aggregate cost of investments, including derivatives, for federal tax purposes (in thousands) was $1,706,102 and the net unrealized depreciation of investments based on that cost was $105,401 which is comprised of $117,562 aggregate gross unrealized appreciation and $222,963 aggregate gross unrealized depreciation. |
The Accompanying Notes are an Integral Part of the Financial Statements.
96
International Equity Portfolio
The following is a summary of the inputs used in valuing the Portfolio’s assets and liabilities at December 31, 2018. See Note 3 for additional information on portfolio valuation.
| | | | | | | | | | | | | | |
| | | Valuation Inputs | | | |
| Description | | Level 1 –
Quoted Prices | | | Level 2 –
Other Significant
Observable Inputs | | | Level 3 –
Significant
Unobservable Inputs | | | |
| | | (Amounts in thousands) | | | |
Assets: | | | | | | | | | | | | | | |
Preferred Stocks | | $ | - | | | $ | 7,181 | | | $ | - | | | |
Common Stocks | | | | | | | | | | | | | | |
Communication Services | | | 126,288 | | | | 27,542 | | | | - | | | |
Consumer Discretionary | | | 60,831 | | | | 29,927 | | | | - | | | |
Energy | | | 160,965 | | | | 33,177 | | | | - | | | |
Financials | | | 219,885 | | | | 105,691 | | | | - | | | |
Health Care | | | 139,589 | | | | 144,597 | | | | - | | | |
Industrials | | | 53,077 | | | | 74,042 | | | | - | | | |
Information Technology | | | 17,285 | | | | 100,781 | | | | - | | | |
Materials | | | 68,478 | | | | 48,309 | | | | - | | | |
Real Estate | | | 14,929 | | | | 17,985 | | | | - | | | |
Utilities | | | 24,648 | | | | 25,822 | | | | - | | | |
All Others | | | - | | | | 76,431 | | | | - | | | |
Short-Term Investments | | | 23,241 | | | | - | | | | - | | | |
Total Assets: | | $ | 909,216 | | | $ | 691,485 | | | $ | - | | | |
The Accompanying Notes are an Integral Part of the Financial Statements.
97
Emerging Markets Equity Portfolio (unaudited)
| | | | |
| Objective: | | Portfolio Strategy: | | Net Assets: |
| Capital Appreciation. | | Invest in equity securities of issuers that are tied economically to emerging market countries. | | $675 million |
PORTFOLIO OVERVIEW
Mason Street Advisors, LLC (“Mason Street Advisors”), the investment adviser for the Emerging Markets Equity Portfolio (“the Portfolio”), has engaged Aberdeen Asset Managers Limited (“Aberdeen”) to act assub-adviser for the Portfolio. The Portfolio normally invests in equity securities of issuers that are tied economically to emerging market countries. Emerging market countries include countries determined by the Portfolio’s portfolio managers to have emerging market economies, taking into account a number of factors, such as the country’s credit rating, its political and economic stability and the development of its financial and capital markets. The Portfolio may invest in companies of any size. The Portfolio employs a fundamental “bottom up” equity investment style, which is characterized by intensive, first-hand research and disciplined company evaluation. Investments are identified for their long-term, fundamental value.
MARKET OVERVIEW
Emerging markets retreated in 2018, with sentiment dampened by the widening U.S.-China trade dispute, signs of moderating economic expansion and rising interest rates. The U.S. dollar strengthened for most of the year, worsening a currency crisis in Turkey, which was already pressured by doubts about the central bank’s credibility. Meanwhile, slowing domestic growth weighed on Chinese mainland markets, prompting Beijing to implement a series of easing measures. Mexican stocks rallied on a revamped North American trade pact and President Lopez Obrador’s election win, but retreated after controversial policy decisions threatened to jeopardize investors’ interests.
PORTFOLIO RESULTS
The Portfolio returned (13.75%) for the twelve months ended December 31, 2018. By comparison, the Portfolio’s benchmark, the MSCI® Emerging Markets Index (the “Index”) returned (14.25%). (This Index is unmanaged, cannot be invested in directly and does not incur expenses.) According to Lipper® Analytical Services, Inc., an independent mutual fund ranking agency, the average return in 2018 of the Emerging Markets Funds peer group was (16.46%).
An underweight allocation to China contributed to performance, as the market was hampered by worries in the Information Technology sector amid U.S. trade-related disruption worries, weaker-than-expected results from U.S. tech majors and a slowing domestic economy. At the stock level, China Resources Land rose on robust results and earnings upgrades, as well as expectations that China’s stimulus would lift the property sector. It also helped that the Portfolio did not hold three of China’s largest listed internet stocks, Alibaba, Baidu and JD.com.
In India, sentiment was lifted by falling oil prices later in the period and sustained growth in rural consumption. Housing Development Finance Corp and Kotak Mahindra Bank were among the best performers, as investors took refuge in higher quality lenders following a crisis involvingnon-banking financial companies. Tata Consultancy Services fared well thanks to improving demand for IT services, capital management efforts and rupee weakness that amplified its foreign-denominated revenues. Hindustan Unilever also contributed to relative return, driven by positive results amid rising rural demand.
Stock selection contributed to relative performance in Indonesia, where Astra’s latest results beat expectations thanks to United Tractor’s strong performance, stabilizing financial services and improving auto business. Likewise, Bank Central Asia posted expanded net interest margins and loan growth, alongside well-managed asset quality. The Portfolio’s Mexican holdings outperformed in a declining market, as Banorte and FEMSA proved relatively resilient following Lopez Obrador’s election.
On the downside, in Brazil, fuel distributor Ultrapar fell on weaker quarterly profit expectations amid rising competition. Food producer BRF was hampered by weak earnings, leadership uncertainty and probes into the alleged provision of substandard meat. However, the portfolio managers were encouraged by BRF’s new CEO, who should bring improved leadership going forward.
Stock selection in Korea also detracted from the Portfolio’s relative performance. Naver (formerly NHN Corp.) posted disappointing results, while Samsung Electronics was pressured by fears of a slowdown in the semiconductor and consumer electronics areas. The Energy sector was another key detractor, given the Portfolio’s underweight position, as exploration and production stocks rose amid robust oil prices earlier in the year.
98
Emerging Markets Equity Portfolio (unaudited)
PORTFOLIO MANAGER OUTLOOK
The following forward-looking comments are the opinion of Aberdeen, the Portfolio’ssub-adviser.
While we do not underplay the risks, we feel recent emerging market concerns have been overdone and expect sentiment to recover along with our higher quality holdings. As the effect from the U.S. tax cuts and fiscal stimulus fades, the relatively strong U.S. dollar should weaken, which would help emerging markets. Despite a temporary U.S.-China trade rapprochement, we think there will be prolonged tension and will continue to monitor developments. Meanwhile, China’s easing measures should prop up domestic consumption and stabilize growth. At the corporate level, our holdings are businesses with healthy fundamentals, wide economic moats and experienced management. With their solid balance sheets, they have been able to support improving returns to shareholders and their earnings forecasts remain positive despite the short-term volatility.
Relative Performance
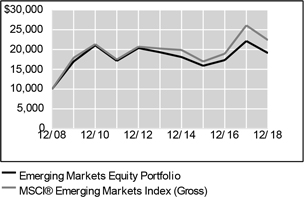
| | | | | | | | | | | | |
Average Annual Total Returns
For Periods Ended December 31, 2018 | |
| | | 1 Year | | | 5 Years | | | 10 Years | |
Emerging Markets Equity Portfolio | | | -13.75 | % | | | -0.21 | % | | | 6.69 | % |
MSCI® Emerging Markets Index (Gross) | | | -14.25 | % | | | 2.03 | % | | | 8.39 | % |
Lipper® Variable Insurance Products (VIP) Emerging Markets Funds Average | | | -16.46 | % | | | 0.92 | % | | | 7.39 | % |
The performance data quoted represents past performance. Past performance is historical and does not guarantee future performance. Investment return and principal value will fluctuate, so that shares, when redeemed, may be worth more or less than their original cost. Current performance may be lower or higher than the performance data quoted. For the most recentmonth-end performance information visitwww.northwesternmutual.com.
This chart assumes an initial investment of $10,000 made on 12/31/08. Returns shown reflect fee waivers, deductions for management and other portfolio expenses, and reinvestment of all dividends. In the absence of fee waivers, total return would be reduced. Returns exclude deductionsfor separate account sale loads and account fees. Please refer to the Benchmark Definitions section of this report forinformation about the indices cited in the above chart and graph.
Investors should be aware of the risks of investments in foreign securities, particularly investments in securities of companies in developing nations. These include the risks of currency fluctuation, of political and economic instability and of less well-developed government supervision and regulation of business and industry practices, as well as differences in accounting standards.
Investments in the securities of companies in developing nations impose risks different from, and greater than, risks of investing in developed countries.
The Portfolio may invest a relatively large percentage of its assets in issuers located in a single country, a small number of countries, or a particular geographic region. The Portfolio’s performance may be more volatile than that of a more geographically diversified fund, and may be tied more closely to the performance of a single country or region.
The Portfolio may invest a relatively high percentage of its assets in a particular sector. The Portfolio will have greater exposure to the risks associated with that sector and its performance will be tied more closely to the performance of that sector.
Top 10 Equity Holdings 12/31/18
| | | | | | | | |
Security Description | | | % of Net Assets | | | | | |
Tencent Holdings, Ltd. | | | 6.4 | % | | | | |
Samsung Electronics Co., Ltd., Various | | | 5.1 | % | | | | |
Taiwan Semiconductor Manufacturing Co., Ltd. | | | 4.6 | % | | | | |
Housing Development Finance Corp., Ltd. | | | 4.0 | % | | | | |
Banco Bradesco SA, ADR | | | 3.5 | % | | | | |
Ping An Insurance Group Co. of China, Ltd. - Class H | | | 3.0 | % | | | | |
Vale SA, ADR | | | 2.5 | % | | | | |
AIA Group, Ltd. | | | 2.5 | % | | | | |
Ayala Land, Inc. | | | 2.3 | % | | | | |
Astra International Tbk PT | | | 2.3 | % | | | | |
99
Emerging Markets Equity Portfolio (unaudited)
Sector Allocation 12/31/18
| | | | | | | | |
Sector | | | % of Net Assets | | | | | |
Financials | | | 25.6 | % | | | | |
Information Technology | | | 12.7 | % | | | | |
Consumer Discretionary | | | 12.5 | % | | | | |
Communication Services | | | 11.8 | % | | | | |
Consumer Staples | | | 11.2 | % | | | | |
Materials | | | 9.2 | % | | | | |
Real Estate | | | 6.5 | % | | | | |
Energy | | | 3.9 | % | | | | |
Short-Term Investments & Other Net Assets | | | 3.3 | % | | | | |
Industrials | | | 2.6 | % | | | | |
Health Care | | | 0.7 | % | | | | |
Sector Allocation and Top 10 Holdings are subject to change.
100
Emerging Markets Equity Portfolio
SCHEDULE OF INVESTMENTS
December 31, 2018
| | | | | | | | | | |
| Common Stocks (95.4%) | | Country | | Shares/ Par+ | | | Value
$ (000’s) | |
| | |
Communication Services (11.8%) | | | | | | | | |
58.com, Inc., ADR* | | Cayman Islands | | | 101,354 | | | | 5,494 | |
Autohome, Inc., ADR | | Cayman Islands | | | 114,696 | | | | 8,973 | |
China Mobile, Ltd. | | Hong Kong | | | 1,063,500 | | | | 10,234 | |
MTN Group, Ltd. | | South Africa | | | 1,015,800 | | | | 6,284 | |
NAVER Corp.* | | South Korea | | | 49,620 | | | | 5,406 | |
Tencent Holdings, Ltd. | | Cayman Islands | | | 1,078,200 | | | | 43,235 | |
| | | | | | | | | | |
Total | | | | | | | 79,626 | |
| | | | | | | | | | |
| | |
Consumer Discretionary (12.5%) | | | | | | | | |
Astra International Tbk PT | | Indonesia | | | 26,527,500 | | | | 15,271 | |
China International Travel Service Corp., Ltd. | | China | | | 1,272,467 | | | | 11,147 | |
Hero MotoCorp, Ltd. | | India | | | 133,100 | | | | 5,891 | |
Huazhu Group, Ltd., ADR | | Cayman Islands | | | 218,320 | | | | 6,250 | |
Lojas Renner SA | | Brazil | | | 880,644 | | | | 9,667 | |
Midea Group Co., Ltd. | | China | | | 1,117,999 | | | | 6,037 | |
Naspers, Ltd. - Class N | | South Africa | | | 39,100 | | | | 7,860 | |
SACI Falabella | | Chile | | | 821,570 | | | | 6,000 | |
Truworths International, Ltd. | | South Africa | | | 917,600 | | | | 5,619 | |
Yum China Holdings, Inc. | | United States | | | 309,509 | | | | 10,378 | |
| | | | | | | | | | |
Total | | | | | | | 84,120 | |
| | | | | | | | | | |
| | |
Consumer Staples (11.0%) | | | | | | | | |
Ambev SA, ADR | | Brazil | | | 2,305,909 | | | | 9,039 | |
BIM Birlesik Magazalar AS | | Turkey | | | 473,600 | | | | 7,785 | |
BRF SA* | | Brazil | | | 698,635 | | | | 3,981 | |
Fomento Economico Mexicano SAB de CV, ADR | | Mexico | | | 151,100 | | | | 13,002 | |
Hindustan Unilever, Ltd. | | India | | | 331,022 | | | | 8,619 | |
ITC, Ltd. | | India | | | 3,035,790 | | | | 12,245 | |
Kweichow Moutai Co., Ltd. | | China | | | 163,880 | | | | 14,070 | |
Massmart Holdings, Ltd. | | South Africa | | | 783,400 | | | | 5,637 | |
| | | | | | | | | | |
Total | | | | | | | 74,378 | |
| | | | | | | | | | |
| | |
Energy (3.9%) | | | | | | | | |
LUKOIL PJSC, ADR | | Russia | | | 195,706 | | | | 13,979 | |
Tenaris SA, ADR | | Luxembourg | | | 219,400 | | | | 4,678 | |
Ultrapar Participacoes SA | | Brazil | | | 547,339 | | | | 7,447 | |
| | | | | | | | | | |
Total | | | | | | | 26,104 | |
| | | | | | | | | | |
| | |
Financials (25.6%) | | | | | | | | |
Aditya Birla Capital, Ltd.* | | India | | | 635,316 | | | | 910 | |
AIA Group, Ltd. | | Hong Kong | | | 2,055,200 | | | | 17,060 | |
Banco Bradesco SA, ADR | | Brazil | | | 2,398,723 | | | | 23,723 | |
Banco Santander Chile, ADR | | Chile | | | 211,312 | | | | 6,318 | |
Bank Central Asia Tbk PT | | Indonesia | | | 8,105,200 | | | | 14,652 | |
Bank of the Philippine Islands | | Philippines | | | 4,831,436 | | | | 8,627 | |
Bank Pekao SA | | Poland | | | 192,900 | | | | 5,613 | |
Grupo Financiero Banorte SAB de CV | | Mexico | | | 2,356,960 | | | | 11,506 | |
Hong Kong Exchanges & Clearing, Ltd. | | Hong Kong | | | 337,747 | | | | 9,774 | |
Housing Development Finance Corp., Ltd. | | India | | | 966,571 | | | | 27,205 | |
| | | | | | | | | | |
| Common Stocks (95.4%) | | Country | | Shares/
Par+ | | | Value
$ (000’s) | |
| | |
Financials continued | | | | | | | | |
Kotak Mahindra Bank, Ltd. | | India | | | 732,561 | | | | 13,148 | |
Ping An Insurance Group Co. of China, Ltd. - Class H | | China | | | 2,311,000 | | | | 20,408 | |
Public Bank Bhd | | Malaysia | | | 1,566,600 | | | | 9,386 | |
The Siam Commercial Bank PCL | | Thailand | | | 1,112,400 | | | | 4,561 | |
| | | | | | | | | | |
Total | | | | | | | 172,891 | |
| | | | | | | | | | |
| | |
Health Care (0.7%) | | | | | | | | |
Richter Gedeon Nyrt | | Hungary | | | 101,900 | | | | 1,974 | |
Wuxi Biologics Cayman, Inc.* | | Cayman Islands | | | 396,500 | | | | 2,539 | |
| | | | | | | | | | |
Total | | | | | | | 4,513 | |
| | | | | | | | | | |
| | |
Industrials (2.6%) | | | | | | | | |
Grupo Aeroportuario del Sureste SAB de CV - Class B | | Mexico | | | 554,980 | | | | 8,371 | |
Shanghai International Airport Co., Ltd. | | China | | | 1,255,182 | | | | 9,323 | |
| | | | | | | | | | |
Total | | | | | | | 17,694 | |
| | | | | | | | | | |
| | |
Information Technology (11.6%) | | | | | | | | |
Hangzhou Hikvision Digital Technology Co., Ltd. | | China | | | 2,016,662 | | | | 7,620 | |
Samsung Electronics Co., Ltd. | | South Korea | | | 768,150 | | | | 26,578 | |
Sunny Optical Technology Group Co., Ltd. | | Cayman Islands | | | 265,900 | | | | 2,363 | |
Taiwan Semiconductor Manufacturing Co., Ltd. | | Taiwan | | | 4,284,290 | | | | 31,101 | |
Tata Consultancy Services, Ltd. | | India | | | 400,260 | | | | 10,863 | |
| | | | | | | | | | |
Total | | | | | | | 78,525 | |
| | | | | | | | | | |
| | |
Materials (9.2%) | | | | | | | | |
Grasim Industries, Ltd. | | India | | | 593,500 | | | | 7,032 | |
Indocement Tunggal Prakarsa Tbk PT | | Indonesia | | | 5,235,000 | | | | 6,715 | |
LG Chem, Ltd.* | | South Korea | | | 29,120 | | | | 9,019 | |
The Siam Cement PCL | | Thailand | | | 950,600 | | | | 12,729 | |
UltraTech Cement, Ltd. | | India | | | 170,489 | | | | 9,744 | |
Vale SA, ADR | | Brazil | | | 1,302,100 | | | | 17,175 | |
| | | | | | | | | | |
Total | | | | | | | 62,414 | |
| | | | | | | | | | |
| | |
Real Estate (6.5%) | | | | | | | | |
Ayala Land, Inc. | | Philippines | | | 20,202,000 | | | | 15,633 | |
China Resources Land, Ltd. | | Cayman Islands | | | 3,404,000 | | | | 13,085 | |
Hang Lung Group, Ltd. | | Hong Kong | | | 889,000 | | | | 2,264 | |
Hang Lung Properties, Ltd. | | Hong Kong | | | 2,326,000 | | | | 4,432 | |
Multiplan Empreendimentos Imobiliarios SA | | Brazil | | | 1,391,100 | | | | 8,761 | |
| | | | | | | | | | |
Total | | | | | | | 44,175 | |
| | | | | | | | | | |
| | |
Total Common Stocks | | | | | | | | |
(Cost: $629,474) | | | | | | | 644,440 | |
| | | | | | | | | | |
The Accompanying Notes are an Integral Part of the Financial Statements.
101
Emerging Markets Equity Portfolio
| | | | | | | | | | |
| Preferred Stocks (1.3%) | | Country | | Shares/
Par+ | | | Value
$ (000’s) | |
| | | |
Consumer Staples (0.2%) | | | | | | | | | | |
Amorepacific Corp.* | | South Korea | | | 14,954 | | | | 1,369 | |
| | | | | | | | | | |
Total | | | | | | | | | 1,369 | |
| | | | | | | | | | |
| | | |
Information Technology (1.1%) | | | | | | | | | | |
Samsung Electronics Co., Ltd. | | South Korea | | | 266,300 | | | | 7,596 | |
| | | | | | | | | | |
Total | | | | | | | | | 7,596 | |
| | | | | | | | | | |
| | |
Total Preferred Stocks | | | | | | | | |
(Cost: $12,070) | | | | | | | 8,965 | |
| | | | | | | | | | |
| | | | | | | | | | |
| Short-Term Investments (2.3%) | | Country | | Shares/
Par+ | | | Value
$ (000’s) | |
| | |
Money Market Funds (2.3%) | | | | | | | | |
State Street Institutional U.S. Government Money Market Fund - Premier Class 2.270%# | | United States | | | 15,390,702 | | | | 15,391 | |
| | | | | | | | | | |
Total | | | | | | | | | 15,391 | |
| | | | | | | | | | |
| | |
Total Short-Term Investments | | | | | | | | |
(Cost: $15,391) | | | | | | | | | 15,391 | |
| | | | | | | | | | |
| | | |
Total Investments (99.0%) | | | | | | | | | | |
(Cost: $656,935)@ | | | | | | | | | 668,796 | |
| | | | | | | | | | |
Other Assets, Less | | | | | | | | | | |
Liabilities (1.0%) | | | | | | | | | 6,554 | |
| | | | | | | | | | |
Net Assets (100.0%) | | | | | | | | | 675,350 | |
| | | | | | | | | | |
| | | | | | |
Investments Percentage by Country is based on Net Assets: | | | | | | |
India | | | 14.1% | | | |
Cayman Islands | | | 12.1% | | | |
Brazil | | | 11.8% | | | |
China | | | 10.2% | | | |
South Korea | | | 7.3% | | | |
Hong Kong | | | 6.5% | | | |
Indonesia | | | 5.5% | | | |
Other | | | 31.5% | | | |
| | | | | | |
Total | | | 99.0% | | | |
| | | | | | |
| + | All par is stated in U.S Dollar unless otherwise noted. |
| # | 7-Day yield as of 12/31/2018. |
| @ | At December 31, 2018, the aggregate cost of investments, including derivatives, for federal tax purposes (in thousands) was $657,556 and the net unrealized appreciation of investments based on that cost was $11,240 which is comprised of $83,468 aggregate gross unrealized appreciation and $72,228 aggregate gross unrealized depreciation. |
The following is a summary of the inputs used in valuing the Portfolio’s assets and liabilities at December 31, 2018. See Note 3 for additional information on portfolio valuation.
| | | | | | | | | | | | | | |
| | | Valuation Inputs | | | |
| Description | | Level 1 –
Quoted Prices | | | Level 2 –
Other Significant
Observable Inputs | | | Level 3 –
Significant
Unobservable Inputs | | | |
| | | (Amounts in thousands) | | | |
Assets: | | | | | | | | | | | | | | |
Preferred Stocks | | $ | - | | | $ | 8,965 | | | $ | - | | | |
Common Stocks | | | | | | | | | | | | | | |
Communication Services | | | 74,220 | | | | 5,406 | | | | - | | | |
Consumer Discretionary | | | 35,998 | | | | 48,122 | | | | - | | | |
Consumer Staples | | | 56,327 | | | | 18,051 | | | | - | | | |
Energy | | | 18,657 | | | | 7,447 | | | | - | | | |
Financials | | | 139,438 | | | | 33,453 | | | | - | | | |
Health Care | | | 2,539 | | | | 1,974 | | | | - | | | |
Industrials | | | 8,371 | | | | 9,323 | | | | - | | | |
Information Technology | | | 13,226 | | | | 65,299 | | | | - | | | |
Materials | | | 33,951 | | | | 28,463 | | | | - | | | |
Real Estate | | | 19,781 | | | | 24,394 | | | | - | | | |
Short-Term Investments | | | 15,391 | | | | - | | | | - | | | |
Total Assets: | | $ | 417,899 | | | $ | 250,897 | | | $ | - | | | |
The Accompanying Notes are an Integral Part of the Financial Statements.
102
Government Money Market Portfolio (unaudited)
| | | | |
| Objective: | | Portfolio Strategy: | | Net Assets: |
| Maximum current income to the extent consistent with liquidity and stability of capital. | | Invest in short-term fixed income obligations issued or guaranteed by the U.S Government, its agencies or instrumentalities. | | $443 million |
PORTFOLIO OVERVIEW
Mason Street Advisors, LLC (“Mason Street Advisors”), the investment adviser for the Government Money Market Portfolio (the “Portfolio”), has engaged BlackRock Advisors, LLC (“BlackRock”) to act assub-adviser for the Portfolio. The Portfolio invests at least 99.5% of its total assets in cash, U.S. Treasury bills, notes and other obligations issued or guaranteed as to principal and interest by the U.S. Government, its agencies or instrumentalities and repurchase agreements secured by such obligations or cash. The Portfolio invests in a portfolio of securities maturing in 397 days or less (with certain exceptions) that will have a dollar-weighted average maturity of 60 days or less and a dollar-weighted average life of 120 days or less. The Portfolio seeks to maintain a net asset value of $1.00 per share.
MARKET OVERVIEW
Noteworthy market conditions for the year ending December 31, 2018 included the continued steady removal of monetary accommodation by the U.S. Federal Reserve (the “Fed”), the ongoing gradual reduction of the Fed’s balance sheet, significant net Treasury supply, and geopolitical events, including tariffs, the Italian elections and Brexit uncertainty. All of these factors contributed to a strong performance year for money market funds in terms of return and flows, but a volatile year for the overall financial markets.
Treasury bill supply during the year was robust, hitting anon-crisis record of $384 billion in net supply during the year. In order to optimize Treasury bill auction schedule sizes, the U.S. Treasury introduced atwo-month Treasury bill into the market in the fourth quarter of 2018. Additional dynamics affecting the U.S. money markets included the impact of tax reform and the anticipated repatriation flows as a result of this law. Many companies rapidly repatriated their cash back to the U.S. in order to put the money towards shareholder-friendly activities and hence reduced their cash positions.
PORTFOLIO RESULTS
The Portfolio returned 1.54% for the twelve months ended December 31, 2018. By comparison, the Portfolio’s benchmark, the Merrill Lynch®3-Month Treasury Bill Index (the “Index”), returned 1.87%. (The Index is unmanaged, cannot be invested in directly and does not incur expenses.) According to Lipper® Analytical Services, Inc., an independent mutual fund ranking agency, the average return in 2018 of the Money Market Funds peer group was 1.31%.
The Portfolio’s yield remained competitive throughout the year. In terms of sector allocation, the Portfolio selectively increased exposure to fixed rate Treasurys during the first quarter, while the high allocation to floating rate notes throughout the year contributed strongly to the Portfolio’s relative performance. The Portfolio’s allocation to floating rate notes was managed in a 20 to 30% range of the Portfolio’s net asset value. Another key security type in the Portfolio wastri-party repurchase agreements with a target allocation of 30% to 45% of the Portfolio’s net asset value. The large allocations to overnighttri-party repurchase agreements largely benefited the Portfolio with liquidity and competitive rates.
In terms of duration and management of the yield curve (a graphical representation of bond yields at different maturities), the Portfolio’s duration exposure was longer than its peer group during the first quarter. In response to increased expectations for multiple rate hikes in 2018, the Portfolio increased its weighted average maturity and weighted average life heading into the March Federal Open Market Committee (“FOMC”) meeting and captured elevated yields before the market repriced lower following the meeting. The Portfolio added exposure to Agency floating-rate securities in the second and fourth quarters as spreads widened meaningfully. During the fourth quarter, the Portfolio was oriented toward the shorter end of the curve with select purchases at longer maturities in anticipation of quarterly interest rate hikes through 2019.
PORTFOLIO MANAGER OUTLOOK
The following forward-looking comments are the opinion of BlackRock, the Portfolio’ssub-adviser.
103
Government Money Market Portfolio (unaudited)
In our view, the Fed’s interest rate normalization campaign appears closer to winding down, although a few additional interest rate hikes remain possible in 2019. The implementation of a press conference after every FOMC meeting reinforces our outlook that policy changes could reasonably occur during all of the scheduled FOMC meeting dates.
In terms of the supply outlook, the net new supply of Treasury bills will continue to grow aggressively in 2019; however, the supply will be volatile and is expected to contract during the first quarter of 2019 as the U.S. Treasury reduces its cash balance to reinstate the debt ceiling in early March. In the event that Congress does not address the debt ceiling in a timely fashion, we anticipate that extraordinary measures would be used to provide additional borrowing authority until around the third quarter of 2019.
Not all obligations of the U.S. government, its agencies and instrumentalities are backed by the full faith and credit of the U.S. Treasury. Some obligations are backed only by the credit of the issuing agency or instrumentality, and in some cases there may be some risk of default by the issuer.Any guarantee by the U.S. government or its agencies or instrumentalities of a security held by the Portfolio does not apply to the market value of such security or to shares of the Portfolio itself.
If the other party to a repurchase agreement defaults on its obligation under the agreement, the Portfolio may suffer delays and incur costs or lose money in exercising its rights under the agreement. These risks may be heightened if the other party is located outside the U.S. If the seller fails to repurchase the security and the market value of the security declines, the Portfolio may lose money.
You could lose money investing in the Government Money Market Portfolio. Although the Portfolio seeks to preserve the value of your investment at $1.00 per share, it cannot guarantee it will do so. An investment in the Portfolio is not insured or guaranteed by the Federal Deposit Insurance Corporation or any other government agency. The Portfolio’s sponsor has no legal obligation to provide financial support to the Portfolio, and you should not expect that the sponsor will provide financial support to the Portfolio at any time.
104
Government Money Market Portfolio
SCHEDULE OF INVESTMENTS
December 31, 2018
| | | | | | | | |
| Money Market Investments (99.6%) | | Shares/
Par+ | | | Value
$ (000’s) | |
| |
Money Market Funds (0.1%) | | | | | |
State Street Institutional U.S. Government Money Market Fund - Premier Class, 2.270%# | | | 509,300 | | | | 509 | |
| | | | | | | | |
Total | | | | | | | 509 | |
| | | | | | | | |
| |
Repurchase Agreements (39.9%) | | | | | |
Tri-Party Bank of Montreal, 2.850%, 1/2/19 (Purchased on 12/31/18, to be repurchased at $25,003,958, collateralized by various US Treasury obligations, 0.000% to 3.000%, due from 1/15/2019 to 2/15/2048, aggregate par and fair value of $25,999,363 and $25,500,034, respectively) | | | 25,000,000 | | | | 25,000 | |
Tri-Party Bank of Nova Scotia, 2.900%, 1/2/19 (Purchased on 12/31/18, to be repurchased at $20,003,222, collateralized by US Treasury Bond, 7.875%, due 2/15/2021, par and fair value of $18,391,790 and $20,403,392, respectively) | | | 20,000,000 | | | | 20,000 | |
Tri-Party BNP Paribas, 2.950%, 1/2/19 (Purchased on 12/31/18, to be repurchased at $10,001,639, collateralized by various US Treasury obligations, 1.125% to 2.625%, due from 12/31/2019 to 5/31/2022, aggregate par and fair value of $10,402,208 and $10,200,072, respectively) | | | 10,000,000 | | | | 10,000 | |
Tri-Party BNP Paribas, 3.000%, 1/2/19 (Purchased on 12/31/18, to be repurchased at $6,001,000, collateralized by various US government sponsored agency obligations, 3.000% to 6.500%, due from 12/15/2033 to 12/20/2047, aggregate par and fair value of $6,226,760 and $6,120,001, respectively) | | | 6,000,000 | | | | 6,000 | |
Tri-Party Citigroup Global Markets, Inc., 2.900%, 1/2/19 (Purchased on 12/31/18, to be repurchased at $10,001,611, collateralized by various US Treasury obligations, 2.750% to 3.000%, due from 9/15/2021 to 9/30/2025, aggregate par and fair value of $10,112,059 and $10,200,073, respectively) | | | 10,000,000 | | | | 10,000 | |
Tri-Party Citigroup Global Markets, Inc., 2.950%, 1/2/19 (Purchased on 12/31/18, to be repurchased at $10,001,639, collateralized by various US Treasury obligations and US government sponsored agency, 1.435% to 2.750%, due from 1/31/2020 to 2/15/2028, aggregate par and fair value of $10,207,027 and $10,200,058, respectively) | | | 10,000,000 | | | | 10,000 | |
| | | | | | | | |
| Money Market Investments (99.6%) | | Shares/
Par+ | | | Value
$ (000’s) | |
| |
Repurchase Agreements continued | | | | | |
Tri-Party Credit Agricole, 3.000%, 1/2/19 (Purchased on 12/31/18, to be repurchased at $10,001,667, collateralized by US government sponsored agency, 4.000%, due 8/1/2048, par and fair value of $10,020,060 and $10,300,000, respectively) | | | 10,000,000 | | | | 10,000 | |
Tri-Party Goldman Sachs Group LP, 2.900%, 1/2/19 (Purchased on 12/31/18, to be repurchased at $10,001,611, collateralized by US government sponsored agency, 3.000%, due 4/1/2033, par and fair value of $10,334,238 and $10,300,000, respectively) | | | 10,000,000 | | | | 10,000 | |
Tri-Party HSBC Securities, 3.000%, 1/2/19 (Purchased on 12/31/18, to be repurchased at $10,001,667, collateralized by various US Treasury obligations, 0.000% to 3.000%, due from 2/15/2019 to 11/15/2048, aggregate par and fair value of $15,229,877 and $10,200,000, respectively) | | | 10,000,000 | | | | 10,000 | |
Tri-Party Mitsubishi UFJ, 3.000%, 1/2/19 (Purchased on 12/31/18, to be repurchased at $10,001,667, collateralized by various US government sponsored agency obligations, 3.500% to 3.625%, due from 3/1/2043 to 5/20/2044, aggregate par and fair value of $10,246,518 and $10,291,180, respectively) | | | 10,000,000 | | | | 10,000 | |
Tri-Party Mizuho Securities, 2.950%, 1/2/19 (Purchased on 12/31/18, to be repurchased at $10,001,639, collateralized by US Treasury Note, 2.625%, due 12/31/2023, par and fair value of $10,175,000 and $10,200,031, respectively) | | | 10,000,000 | | | | 10,000 | |
Tri-Party Natixis S.A., 2.850%, 1/2/19 (Purchased on 12/31/18, to be repurchased at $15,002,375, collateralized by various US Treasury obligations, 2.000% to 8.125%, due from 5/15/2021 to 2/15/2036, aggregate par and fair value of $15,864,455 and $15,300,013, respectively) | | | 15,000,000 | | | | 15,000 | |
Tri-Party Natixis S.A., 2.900%, 1/2/19 (Purchased on 12/31/18, to be repurchased at $5,000,806, collateralized by various US Treasury obligations and various US government sponsored agency obligations, 0.125% to 8.750%, due from 1/21/2020 to 8/1/2048, aggregate par and fair value of $5,196,519 and $5,111,200, respectively) | | | 5,000,000 | | | | 5,000 | |
The Accompanying Notes are an Integral Part of the Financial Statements.
105
Government Money Market Portfolio
| | | | | | | | |
| Money Market Investments (99.6%) | | Shares/
Par+ | | | Value
$ (000’s) | |
Repurchase Agreements continued | | | | | |
Tri-Party TD Securities, 3.000%, 1/2/19 (Purchased on 12/31/18, to be repurchased at $26,004,333, collateralized by US government sponsored agency, 3.500%, due 2/1/2048, par and fair value of $26,854,387 and $26,780,000, respectively) | | | 26,000,000 | | | | 26,000 | |
| | | | | | | | |
Total | | | | | | | 177,000 | |
| | | | | | | | |
US Government & Agencies (59.6%) | | | | | |
Federal Farm Credit Bank, 0.000%, 1/4/19 | | | 2,220,000 | | | | 2,219 | |
Federal Farm Credit Bank, 0.000%, 1/15/19 | | | 6,395,000 | | | | 6,389 | |
Federal Farm Credit Bank, 0.000%, 1/16/19 | | | 4,380,000 | | | | 4,376 | |
Federal Farm Credit Bank, 0.000%, 2/4/19 | | | 2,505,000 | | | | 2,500 | |
Federal Farm Credit Bank, 0.000%, 3/11/19 | | | 2,440,000 | | | | 2,430 | |
Federal Farm Credit Bank, 0.000%, 3/19/19 | | | 2,440,000 | | | | 2,428 | |
Federal Farm Credit Bank, 0.000%, 4/12/19 | | | 635,000 | | | | 631 | |
Federal Farm Credit Bank, 0.000%, 6/17/19 | | | 2,495,000 | | | | 2,467 | |
Federal Farm Credit Bank, 0.000%, 6/28/19 | | | 1,730,000 | | | | 1,709 | |
Federal Farm Credit Bank, 0.000%, 7/22/19 | | | 2,225,000 | | | | 2,193 | |
Federal Farm Credit Bank, 0.000%, 7/23/19 | | | 4,115,000 | | | | 4,057 | |
Federal Farm Credit Bank, 0.000%, 7/29/19 | | | 10,480,000 | | | | 10,323 | |
Federal Farm Credit Bank, 0.000%, 8/15/19 | | | 2,320,000 | | | | 2,285 | |
Federal Farm Credit Bank, 0.000%, 9/12/19 | | | 1,585,000 | | | | 1,556 | |
Federal Farm Credit Bank, 2.333%, (ICE LIBOR USD 1 Month less 0.050%), 2/7/20 | | | 4,910,000 | | | | 4,910 | |
Federal Farm Credit Bank, 2.360%, (ICE LIBOR USD 1 Month less 0.040%), 9/11/20 | | | 1,975,000 | | | | 1,975 | |
Federal Farm Credit Bank, 2.405%, (ICE LIBOR USD 1 Month less 0.050%), 8/17/20 | | | 1,445,000 | | | | 1,445 | |
Federal Farm Credit Bank, 2.411%, (ICE LIBOR USD 1 Month less 0.095%), 7/25/19 | | | 4,500,000 | | | | 4,499 | |
Federal Farm Credit Bank, 2.465%, (ICE LIBOR USD 1 Month plus 0.025%), 12/14/20 | | | 2,185,000 | | | | 2,185 | |
Federal Farm Credit Bank, 2.470%, (ICE LIBOR USD 1 Month), 6/19/20 | | | 4,000,000 | | | | 4,003 | |
Federal Farm Credit Bank, 2.506%, (ICE LIBOR USD 1 Month), 6/26/20 | | | 1,880,000 | | | | 1,880 | |
Federal Home Loan Bank, 0.000%, 1/4/19 | | | 1,690,000 | | | | 1,690 | |
Federal Home Loan Bank, 0.000%, 1/9/19 | | | 6,085,000 | | | | 6,082 | |
Federal Home Loan Bank, 0.000%, 1/11/19 | | | 3,610,000 | | | | 3,608 | |
Federal Home Loan Bank, 0.000%, 1/16/19 | | | 10,250,000 | | | | 10,240 | |
Federal Home Loan Bank, 0.000%, 1/23/19 | | | 1,350,000 | | | | 1,348 | |
Federal Home Loan Bank, 0.000%, 2/5/19 | | | 1,370,000 | | | | 1,367 | |
Federal Home Loan Bank, 0.000%, 2/6/19 | | | 8,565,000 | | | | 8,545 | |
Federal Home Loan Bank, 0.000%, 2/11/19 | | | 4,185,000 | | | | 4,174 | |
Federal Home Loan Bank, 0.000%, 2/13/19 | | | 5,735,000 | | | | 5,719 | |
Federal Home Loan Bank, 0.000%, 2/15/19 | | | 2,520,000 | | | | 2,512 | |
Federal Home Loan Bank, 0.000%, 2/20/19 | | | 1,180,000 | | | | 1,176 | |
Federal Home Loan Bank, 0.000%, 3/6/19 | | | 600,000 | | | | 598 | |
Federal Home Loan Bank, 0.000%, 3/20/19 | | | 4,000,000 | | | | 3,980 | |
Federal Home Loan Bank, 0.000%, 3/27/19 | | | 16,500,000 | | | | 16,405 | |
Federal Home Loan Bank, 0.000%, 6/21/19 | | | 2,505,000 | | | | 2,475 | |
Federal Home Loan Bank, 2.219%, (ICE LIBOR USD 1 Month less 0.130%), 2/1/19 | | | 2,750,000 | | | | 2,750 | |
Federal Home Loan Bank, 2.302%, (ICE LIBOR USD 1 Month less 0.085%), 9/9/19 | | | 5,370,000 | | | | 5,370 | |
| | | | | | | | |
| Money Market Investments (99.6%) | | Shares/
Par+ | | | Value
$ (000’s) | |
US Government & Agencies continued | | | | | |
Federal Home Loan Bank, 2.310%, (ICE LIBOR USD 3 Month less 0.140%), 4/20/20 | | | 2,670,000 | | | | 2,670 | |
Federal Home Loan Bank, 2.330%, (ICE LIBOR USD 1 Month less 0.070%), 2/11/19 | | | 1,010,000 | | | | 1,010 | |
Federal Home Loan Bank, 2.340%, (ICE LIBOR USD 1 Month less 0.060%), 9/11/19 | | | 4,000,000 | | | | 4,000 | |
Federal Home Loan Bank, 2.350%, (ICE LIBOR USD 1 Month less 0.090%), 6/14/19 | | | 5,230,000 | | | | 5,230 | |
Federal Home Loan Bank, 2.365%, (ICE LIBOR USD 1 Month less 0.105%), 7/19/19 | | | 6,745,000 | | | | 6,745 | |
Federal Home Loan Bank, 2.386%, (ICE LIBOR USD 1 Month less 0.120%), 3/25/19 | | | 6,000,000 | | | | 6,000 | |
Federal Home Loan Bank, 2.390%, (ICE LIBOR USD 1 Month less 0.065%), 9/17/19 | | | 2,040,000 | | | | 2,040 | |
Federal Home Loan Bank, 2.391%, (ICE LIBOR USD 1 Month less 0.115%), 2/25/19 | | | 5,000,000 | | | | 5,000 | |
Federal Home Loan Bank, 2.415%, (ICE LIBOR USD 1 Month less 0.040%), 4/17/20 | | | 6,050,000 | | | | 6,049 | |
Federal Home Loan Bank, 2.416%, (ICE LIBOR USD 1 Month less 0.090%), 1/25/19 | | | 3,650,000 | | | | 3,650 | |
Federal Home Loan Bank, 2.426%, (ICE LIBOR USD 1 Month less 0.080%), 8/27/19 | | | 3,045,000 | | | | 3,045 | |
Federal Home Loan Bank, 2.444%, (ICE LIBOR USD 1 Month less 0.060%), 2/24/20 | | | 3,780,000 | | | | 3,780 | |
Federal Home Loan Bank, 2.456%, (ICE LIBOR USD 1 Month less 0.050%), 6/28/19 | | | 1,080,000 | | | | 1,080 | |
Federal Home Loan Bank, 2.458%, (ICE LIBOR USD 1 Month less 0.045%), 6/24/19 | | | 1,955,000 | | | | 1,955 | |
Federal Home Loan Bank, 2.459%, (ICE LIBOR USD 1 Month less 0.045%), 6/20/19 | | | 490,000 | | | | 490 | |
Federal Home Loan Bank, 2.459%, (ICE LIBOR USD 1 Month less 0.045%), 6/24/19 | | | 980,000 | | | | 980 | |
Federal Home Loan Bank, 2.459%, (ICE LIBOR USD 1 Month less 0.045%), 6/28/19 | | | 490,000 | | | | 490 | |
Federal Home Loan Bank, 2.500%, (US SOFR plus 0.040%), 6/21/19 | | | 740,000 | | | | 740 | |
Federal Home Loan Bank, 2.616%, (ICE LIBOR USD 3 Month less 0.160%), 6/12/19 | | | 1,390,000 | | | | 1,390 | |
Federal Home Loan Bank, 2.631%, (ICE LIBOR USD 3 Month less 0.160%), 6/20/19 | | | 1,950,000 | | | | 1,950 | |
The Accompanying Notes are an Integral Part of the Financial Statements.
106
Government Money Market Portfolio
| | | | | | |
| Money Market Investments (99.6%) | | Shares/
Par+ | | Value
$ (000’s) | |
| |
US Government & Agencies continued | | | | |
Federal Home Loan Bank, 2.632%, (ICE LIBOR USD 3 Month less 0.160%), 6/20/19 | | 1,600,000 | | | 1,600 | |
Federal Home Loan Bank, 2.664%, (ICE LIBOR USD 3 Month less 0.140%), 12/19/19 | | 1,770,000 | | | 1,770 | |
Federal Home Loan Bank, 2.665%, (ICE LIBOR USD 3 Month less 0.125%), 12/21/20 | | 2,880,000 | | | 2,880 | |
Federal Home Loan Mortgage Corp., 2.287%, (ICE LIBOR USD 1 Month less 0.100%), 8/8/19 | | 3,975,000 | | | 3,974 | |
Federal National Mortgage Association, 0.000%, 1/9/19 | | 4,655,000 | | | 4,653 | |
US Treasury, 0.000%, 1/17/19 | | 27,500,000 | | | 27,474 | |
| | | | | | |
| Money Market Investments (99.6%) | | Shares/
Par+ | | Value
$ (000’s) | |
| |
US Government & Agencies continued | | | | |
US Treasury, 0.000%, 1/29/19 | | 1,900,000 | | | 1,896 | |
US Treasury, 0.000%, 2/7/19 | | 6,795,000 | | | 6,780 | |
US Treasury, 0.000%, 2/21/19 | | 3,095,000 | | | 3,085 | |
US Treasury, 0.000%, 6/6/19 | | 1,775,000 | | | 1,756 | |
US Treasury, 1.125%, 1/31/19 | | 190,000 | | | 190 | |
US Treasury, 1.250%, 1/31/19 | | 190,000 | | | 190 | |
US Treasury, 2.475%, (US Treasury 3 Month Bill Money Market Yield plus 0.045%), 10/31/20 | | 5,000,000 | | | 4,990 | |
| | | | | | |
Total | | | | | 264,031 | |
| | | | | | |
| |
Total Money Market Investments | | | 441,540 | |
| | | | | | |
(Cost: $441,540) | | | | | | |
| | |
Total Investments (99.6%) | | | | | 441,540 | |
| | | | | | |
(Cost: $441,540) | | | | | | |
Other Assets, Less | | | | | 1,934 | |
| | | | | | |
Liabilities (0.4%) | | | | | | |
Net Assets (100.0%) | | | | | 443,474 | |
| | | | | | |
| + | All par is stated in U.S Dollar unless otherwise noted. |
| # | 7-Day yield as of 12/31/2018. |
The following is a summary of the inputs used in valuing the Portfolio’s assets and liabilities at December 31, 2018. See Note 3 for additional information on portfolio valuation.
| | | | | | | | | | | | | | |
| | | Valuation Inputs | | | |
| Description | | Level 1 –
Quoted Prices | | | Level 2 –
Other Significant
Observable Inputs | | | Level 3 –
Significant
Unobservable Inputs | | | |
| | | (Amounts in thousands) | | | |
Assets: | | | | | | | | | | | | | | |
Short-Term Investments | | | | | | | | | | | | | | |
Money Market Funds | | $ | 509 | | | $ | - | | | $ | - | | | |
All Others | | | - | | | | 441,031 | | | | - | | | |
Total Assets: | | $ | 509 | | | $ | 441,031 | | | $ | - | | | |
The Accompanying Notes are an Integral Part of the Financial Statements.
107
Short-Term Bond Portfolio (unaudited)
| | | | |
| Objective: | | Portfolio Strategy: | | Net Assets: |
| Provide as high a level of current income as is consistent with prudent investment risk. | | Invest in a diversified portfolio of investment grade debt securities. | | $307 million |
PORTFOLIO OVERVIEW
Mason Street Advisors, LLC (“Mason Street Advisors”), the investment adviser for the Short-Term Bond Portfolio (the “Portfolio”), has engaged T. Rowe Price Associates, Inc. (“T. Rowe Price”) to act assub-adviser for the Portfolio. Normally, the Portfolio invests in a diversified portfolio of investment grade debt securities. The Portfolio may also invest up to 10% of net assets innon-investment grade, high yield/high risk bonds (so called “junk bonds”). Also, the Portfolio may invest up to 20% of net assets in foreign securities. Debt securities may be of any maturity, but under normal market conditions, the Portfolio’s average effective maturity will not exceed three years. The Portfolio primarily invests in corporate, government and mortgage- and asset-backed securities. The Portfolio uses both a“top-down” and“bottom-up” investment approach to construct the portfolio of investments. Thetop-down investment approach involves an evaluation of the overall macroeconomic environment and its potential impact on the level and direction of interest rates. Thebottom-up investment approach focuses on fundamental research of individual issuers.
MARKET OVERVIEW
For most of 2018, the yield curve (a graphical representation of bond yields at different maturities) flattened amid expectations of further interest rate increases resulting from stronger economic and sustained employment growth. Short-term Treasury yields rose as the U.S. Federal Reserve (the “Fed”) raised interest rates four times during the year, while longer-term yields increased more modestly. Contained inflation pressures and demand for duration supported longer-term securities. Corporate debt issuance was more modest in 2018, leading to favorable technical conditions for most of the year. Despite generally strong earnings reports, corporate bonds significantly underperformed U.S. Treasurys late in the year amid notable equity market volatility that drove investor demand forlow-risk government debt.
PORTFOLIO RESULTS
The Portfolio returned 1.36% for the twelve months ended December 31, 2018. By comparison, the Portfolio’s benchmark, the Bloomberg Barclays® 1–3 Year U.S. Government/Credit Index (the “Index”), returned 1.60%. (The Index is unmanaged, cannot be invested in directly and does not incur expenses.) According to Lipper® Analytical Services, Inc., an independent mutual fund ranking agency, the average return in 2018 of the Short Investment Grade Debt Funds peer group was 1.19%.
The Portfolio posted positive returns for the period but underperformed the Index. Yield curve positioning held back relative performance, while overall sector allocation decisions and security selection supported returns.
The Portfolio was tactically positioned with a shorter duration than the Index as a defensive stance to protect against interest rate risk as rates rose. This positioning caused the Portfolio to have a lower yield than the Index, leading to underperformance. While overall sector allocation was beneficial, select allocations detracted from performance. An underweight allocation to the Government-related sector modestly underperformed. These state-owned entities outperformed Treasurys, as they are less directly affected by changes in interest rates. Anout-of-benchmark allocation to Treasury Inflation Protected Securities (“TIPS”) weighed on relative performance as inflation expectations moderated throughout the year. Security selection within crossover corporate bonds was a modest drag on performance. Select bonds from Italian bank holdings declined amid investor concerns about Italy’s large public debt.
Demand from investors looking to reduce interest rate risk provided support for short-maturity corporate bonds. As a result, the Portfolio’s significant overweight allocation to corporates provided a positive contribution to relative results. Strong corporate earnings reports, supported by federal tax cuts and generally solid economic growth, supported investor sentiment for the majority of the year. Concerns about global trade amid tariff disputes between the U.S. and China, however, weighed on corporate issues near the end of the year. The Portfolio’s structural underweight to Treasurys contributed to relative return, as investors sought higher yielding, high quality investments with short durations.
The Portfolio’sout-of-benchmark exposure to asset-backed securities (“ABS”) and commercial mortgage-backed securities (“CMBS”) was beneficial, while mortgage-backed securities (“MBS”) were a modest drag on results. High-quality CMBS and ABS provided an incremental yield advantage over Treasurys. Positive consumer fundamentals continued to support the ABS sector and fundamentals remained supportive within the CMBS sector.
108
Short-Term Bond Portfolio (unaudited)
PORTFOLIO MANAGER OUTLOOK
The following forward-looking comments are the opinion of T. Rowe Price, the Portfolio’ssub-adviser.
Our outlook for the coming months remains somewhat guarded, which is reflected in the Portfolio’s relatively defensive profile. Growth slowed overseas in 2018 and is beginning to slow in the U.S. as the year comes to an end. Fiscal stimulus from tax cuts and spending increases will fade throughout 2019. Led by the Fed, global central banks have been withdrawing liquidity over the past year. However, current rates are at or near the neutral rate, which should allow the Fed more flexibility in its policy decisions. We favor higher quality, higher liquidity names with short durations. By focusing on bonds maturing within the next 18 months, we are able to benefit in a variety of credit environments.
Relative Performance
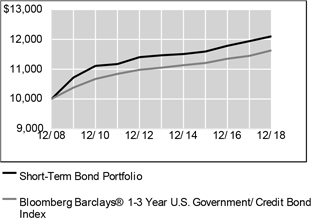
| | | | | | | | | | | | |
Average Annual Total Returns For Periods Ended December 31, 2018 | |
| | | 1 Year | | | 5 Years | | | 10 Years | |
Short-Term Bond Portfolio | | | 1.36 | % | | | 1.09 | % | | | 1.93 | % |
Bloomberg Barclays®1-3 Year U.S. Government/Credit Bond Index | | | 1.60 | % | | | 1.03 | % | | | 1.52 | % |
Lipper® Variable Insurance Products (VIP) Short Investment Grade Debt Funds Average | | | 1.19 | % | | | 0.76 | % | | | 1.60 | % |
The performance data quoted represents past performance. Past performance is historical and does not guarantee future performance. Investment return and principal value will fluctuate, so that shares, when redeemed, may be worth more or less than their original cost. Current performance may be lower or higher than the performance data quoted. For the most recentmonth-end performance information visitwww.northwesternmutual.com.
This chart assumes an initial investment of $10,000 made on 12/31/08. Returns shown reflect fee waivers, deductions for management and other portfolio expenses, and reinvestment of all dividends. In the absence of fee waivers, total return would be reduced. Returns exclude deductions for separate account sale loads and account fees. Please refer to the Benchmark Definitions section of this report for
information about the indices cited in the above chart and graph.
Return of principal is not guaranteed. Bond funds have the same interest rate, inflation and credit risks that are associated with the underlying bonds owned by the Portfolio. When interest rates rise, bond prices fall. With a fixed income fund, when interest rates rise, the value of the fund’s existing bonds drops, which could negatively affect overall fund performance. A portion of the Portfolio’s assets may be invested in lower quality debt securities which may present a significant risk for loss of principal and interest. High yield bonds generally have greater price swings and higher default risks than investment grade bonds.
Investing in bonds issued by foreign corporations and governments carries additional risk, including foreign currency risk, and may increase the volatility of the Portfolio’s performance.
The Portfolio may invest in derivative instruments to adjust the Portfolio’s duration and yield curve exposure, to hedge foreign currency exposure or for any other permissible purpose keeping with its investment objective. Use of these instruments may involve certain costs and imposes certain risks such as liquidity risk, market risk, credit risk, management risk and the risk of mispricing or improper valuation. Certain derivatives involve leverage, which could magnify losses, and portfolios investing in derivatives could lose more than the principal amount invested in those instruments.
The U.S. federal funds rate has been subject to moderate and steady increases over the course of the last three years. A significant rise in interest rates over a short period of time could cause significant losses in the market value of the Portfolio’s fixed income investments.
109
Short-Term Bond Portfolio (unaudited)
Top 10 Fixed Income Holdings 12/31/18
| | | | | | |
Security Description | | | % of Net Assets | | | |
US Treasury, Various | | | 11.7 | % | | |
Federal National Mortgage Association, Various | | | 3.4 | % | | |
Government National Mortgage Association, Various | | | 1.3 | % | | |
Federal Home Loan Bank, 2.625%, 5/28/20 | | | 0.7 | % | | |
Shire Acquisitions Investments Ireland Designated Activity Co., Various | | | 0.7 | % | | |
Bank of America Corp., Various | | | 0.7 | % | | |
SBA Tower Trust, Various | | | 0.6 | % | | |
The Goldman Sachs Group, Inc., Various | | | 0.6 | % | | |
Dell International LLC / EMC Corp., 3.48%, 6/1/19 | | | 0.6 | % | | |
Keysight Technologies, Inc., 3.3%, 10/30/19 | | | 0.6 | % | | |
Sector Allocation 12/31/18
| | | | | | |
Sector | | | % of Net Assets | | | |
Corporate Bonds | | | 51.2 | % | | |
Structured Products | | | 35.8 | % | | |
Governments | | | 11.7 | % | | |
Short-Term Investments & Other Net Assets | | | 1.2 | % | | |
Municipal Bonds | | | 0.1 | % | | |
Sector Allocation and Top 10 Holdings are subject to change.
Consistent with the Portfolio’s stated parameters, no more than 20% of the Portfolio is invested in foreign securities, and no more than 10% is invested in high yield securities.
110
Short-Term Bond Portfolio
SCHEDULE OF INVESTMENTS
December 31, 2018
| | | | | | | | |
| Corporate Bonds (51.2%) | | Shares/ Par+ | | | Value $ (000’s) | |
| |
Basic Materials (2.5%) | | | | | |
Anglo American Capital PLC | | | | | | | | |
3.750%, 4/10/22 144A | | | 315,000 | | | | 308 | |
4.125%, 9/27/22 144A | | | 295,000 | | | | 291 | |
ArcelorMittal 5.250%, 8/5/20 | | | 770,000 | | | | 783 | |
Celulosa Arauco y Constitucion SA 7.250%, 7/29/19 | | | 400,000 | | | | 408 | |
CNAC HK Finbridge Co., Ltd.
3.000%, 7/19/20 § | | | 390,000 | | | | 385 | |
4.125%, 3/14/21 144A § | | | 360,000 | | | | 360 | |
DowDuPont, Inc. 3.766%, 11/15/20 | | | 520,000 | | | | 525 | |
International Flavors & Fragrances, Inc. 3.400%, 9/25/20 | | | 195,000 | | | | 195 | |
INVISTA Finance LLC 4.250%, 10/15/19 144A | | | 515,000 | | | | 511 | |
LyondellBasell Industries NV
5.000%, 4/15/19 | | | 199,000 | | | | 199 | |
6.000%, 11/15/21 | | | 280,000 | | | | 296 | |
Sherwin-Williams Co. 2.250%, 5/15/20 ß | | | 1,550,000 | | | | 1,526 | |
Solvay Finance America LLC 3.400%, 12/3/20 144A ß | | | 1,120,000 | | | | 1,119 | |
Southern Copper Corp. 5.375%, 4/16/20 | | | 245,000 | | | | 250 | |
Syngenta Finance NV 3.698%, 4/24/20 144A | | | 435,000 | | | | 432 | |
| | | | | | | | |
Total | | | | | | | 7,588 | |
| | | | | | | | |
| |
Communications (4.2%) | | | | | |
Alibaba Group Holding, Ltd. 2.500%, 11/28/19 | | | 870,000 | | | | 865 | |
America Movil SAB de CV
5.000%, 10/16/19 | | | 100,000 | | | | 101 | |
5.000%, 3/30/20 | | | 720,000 | | | | 732 | |
Axiata SPV2 Bhd 3.466%, 11/19/20 § | | | 200,000 | | | | 200 | |
Baidu, Inc. 2.750%, 6/9/19 ß | | | 1,140,000 | | | | 1,138 | |
British Telecommunications PLC 2.350%, 2/14/19 | | | 250,000 | | | | 250 | |
Charter Communications Operating LLC / | | | | | | | | |
Charter Communications Operating Capital Corp. 3.579%, 7/23/20 | | | 630,000 | | | | 629 | |
Comcast Corp. 3.700%, 4/15/24 | | | 810,000 | | | | 815 | |
Crown Castle Towers LLC 3.720%, 7/15/43 144A | | | 300,000 | | | | 299 | |
Discovery Communications LLC 2.200%, 9/20/19 | | | 265,000 | | | | 262 | |
eBay, Inc. 2.150%, 6/5/20 | | | 375,000 | | | | 370 | |
The Interpublic Group of Companies, Inc. 3.500%, 10/1/20 | | | 140,000 | | | | 140 | |
| | | | | | | | |
| Corporate Bonds (51.2%) | | Shares/ Par+ | | | Value
$ (000’s) | |
| |
Communications continued | | | | | |
JD.com, Inc. 3.125%, 4/29/21 | | | 520,000 | | | | 503 | |
NBCUniversal Media LLC 5.150%, 4/30/20 | | | 716,000 | | | | 735 | |
Neptune Finco Corp. 10.875%, 10/15/25 144A | | | 337,000 | | | | 378 | |
Omnicom Group, Inc.
4.450%, 8/15/20 | | | 400,000 | | | | 407 | |
6.250%, 7/15/19 | | | 615,000 | | | | 625 | |
The Priceline Group, Inc. 2.750%, 3/15/23 | | | 150,000 | | | | 144 | |
RELX Capital, Inc. 3.500%, 3/16/23 | | | 270,000 | | | | 268 | |
SES GLOBAL Americas Holdings GP 2.500%, 3/25/19 144A | | | 180,000 | | | | 180 | |
Telefonica Emisiones SAU 5.134%, 4/27/20 | | | 260,000 | | | | 265 | |
Telefonos de Mexico SAB de CV 5.500%, 11/15/19 | | | 480,000 | | | | 488 | |
Tencent Holdings, Ltd.
2.875%, 2/11/20 144A | | | 585,000 | | | | 582 | |
3.375%, 5/2/19 144A | | | 520,000 | | | | 521 | |
Time Warner Cable LLC
8.250%, 4/1/19 | | | 970,000 | | | | 981 | |
8.750%, 2/14/19 | | | 590,000 | | | | 593 | |
Warner Media LLC 2.100%, 6/1/19 | | | 250,000 | | | | 249 | |
| | | | | | | | |
Total | | | | | | | 12,720 | |
| | | | | | | | |
| |
Consumer, Cyclical (4.5%) | | | | | |
Aptiv PLC 3.150%, 11/19/20 | | | 510,000 | | | | 506 | |
AutoZone, Inc. 1.625%, 4/21/19 | | | 65,000 | | | | 65 | |
BMW US Capital LLC
2.835%, (ICE LIBOR USD 3 Month plus 0.410%), 4/12/21 144A | | | 525,000 | | | | 520 | |
3.118%, (ICE LIBOR USD 3 Month plus 0.500%), 8/13/21 144A | | | 390,000 | | | | 386 | |
D.R. Horton, Inc. 2.550%, 12/1/20 | | | 240,000 | | | | 234 | |
Daimler Finance North America LLC
1.750%, 10/30/19 144A | | | 480,000 | | | | 474 | |
2.300%, 2/12/21 144A | | | 705,000 | | | | 688 | |
3.100%, 5/4/20 144A | | | 290,000 | | | | 288 | |
Delta Air Lines, Inc.
2.875%, 3/13/20 | | | 295,000 | | | | 293 | |
3.800%, 4/19/23 | | | 620,000 | | | | 610 | |
Dollar Tree, Inc. 3.149%, (ICE LIBOR USD 3 Month plus 0.700%), 4/17/20 | | | 585,000 | | | | 581 | |
Ford Motor Credit Co. LLC
2.021%, 5/3/19 | | | 455,000 | | | | 453 | |
2.343%, 11/2/20 | | | 200,000 | | | | 192 | |
2.459%, 3/27/20 | | | 245,000 | | | | 240 | |
2.681%, 1/9/20 | | | 315,000 | | | | 310 | |
The Accompanying Notes are an Integral Part of the Financial Statements.
111
Short-Term Bond Portfolio
| | | | | | | | |
| Corporate Bonds (51.2%) | | Shares/ Par+ | | | Value
$ (000’s) | |
| |
Consumer, Cyclical continued | | | | | |
3.470%, 4/5/21 | | | 200,000 | | | | 194 | |
General Motors Financial Co., Inc.
3.100%, 1/15/19 | | | 580,000 | | | | 580 | |
3.200%, 7/13/20 | | | 740,000 | | | | 731 | |
3.258%, (ICE LIBOR USD 3 Month plus 0.850%), 4/9/21 | | | 350,000 | | | | 342 | |
Harley-Davidson Financial Services, Inc.
3.146%, (ICE LIBOR USD 3 Month plus 0.500%), 5/21/20 144A | | | 375,000 | | | | 374 | |
3.647%, (ICE LIBOR USD 3 Month plus 0.940%), 3/2/21 144A | | | 470,000 | | | | 470 | |
Hyundai Capital America
2.000%, 7/1/19 144A | | | 400,000 | | | | 397 | |
2.500%, 3/18/19 144A | | | 1,020,000 | | | | 1,018 | |
2.550%, 2/6/19 144A | | | 200,000 | | | | 200 | |
Nissan Motor Acceptance Corp.
1.550%, 9/13/19 144A | | | 340,000 | | | | 335 | |
3.650%, 9/21/21 144A | | | 405,000 | | | | 403 | |
PACCAR Financial Corp. 3.100%, 5/10/21 | | | 585,000 | | | | 583 | |
QVC, Inc. 3.125%, 4/1/19 | | | 910,000 | | | | 908 | |
Royal Caribbean Cruises, Ltd. 2.650%, 11/28/20 | | | 125,000 | | | | 123 | |
Southwest Airlines Co. 2.750%, 11/6/19 | | | 280,000 | | | | 279 | |
Volkswagen Group of America Finance LLC 3.875%, 11/13/20 144A | | | 465,000 | | | | 467 | |
Walmart, Inc. 3.125%, 6/23/21 | | | 555,000 | | | | 559 | |
| | | | | | | | |
Total | | | | | | | 13,803 | |
| | | | | | | | |
| |
Consumer,Non-cyclical (6.9%) | | | | | |
Abbott Laboratories 2.900%, 11/30/21 | | | 480,000 | | | | 475 | |
AbbVie, Inc. 2.300%, 5/14/21 | | | 375,000 | | | | 366 | |
Anthem, Inc.
2.250%, 8/15/19 | | | 500,000 | | | | 497 | |
2.500%, 11/21/20 | | | 105,000 | | | | 104 | |
BAT Capital Corp. 2.297%, 8/14/20 ß | | | 1,210,000 | | | | 1,181 | |
Bayer US Finance II LLC
3.003%, (ICE LIBOR USD 3 Month plus 0.630%), 6/25/21 144A | | | 580,000 | | | | 572 | |
3.500%, 6/25/21 144A | | | 310,000 | | | | 308 | |
Bayer US Finance LLC 2.375%, 10/8/19 144A | | | 440,000 | | | | 437 | |
Biogen, Inc. 2.900%, 9/15/20 | | | 230,000 | | | | 229 | |
Bunge, Ltd. Finance Corp. 3.500%, 11/24/20 | | | 375,000 | | | | 374 | |
Campbell Soup Co.
3.288%, (ICE LIBOR USD 3 Month plus 0.500%), 3/16/20 | | | 475,000 | | | | 471 | |
3.418%, (ICE LIBOR USD 3 Month plus 0.630%), 3/15/21 | | | 475,000 | | | | 466 | |
Celgene Corp.
2.250%, 5/15/19 | | | 340,000 | | | | 339 | |
2.875%, 8/15/20 | | | 567,000 | | | | 563 | |
2.875%, 2/19/21 | | | 320,000 | | | | 317 | |
| | | | | | | | |
| Corporate Bonds (51.2%) | | Shares/ Par+ | | | Value
$ (000’s) | |
| |
Consumer,Non-cyclical continued | | | | | |
Conagra Brands, Inc. 3.219%, (ICE LIBOR USD 3 Month plus 0.750%), 10/22/20 | | | 215,000 | | | | 214 | |
CVS Health Corp.
3.125%, 3/9/20 | | | 390,000 | | | | 389 | |
3.350%, 3/9/21 | | | 635,000 | | | | 633 | |
3.397%, (ICE LIBOR USD 3 Month plus 0.630%), 3/9/20 | | | 295,000 | | | | 294 | |
3.487%, (ICE LIBOR USD 3 Month plus 0.720%), 3/9/21 | | | 320,000 | | | | 317 | |
Danone SA 1.691%, 10/30/19 144A | | | 1,070,000 | | | | 1,055 | |
EMD Finance LLC 2.400%, 3/19/20 144A | | | 460,000 | | | | 455 | |
Equifax, Inc.
2.300%, 6/1/21 | | | 150,000 | | | | 145 | |
3.486%, (ICE LIBOR USD 3 Month plus 0.870%), 8/15/21 | | | 285,000 | | | | 282 | |
3.600%, 8/15/21 | | | 275,000 | | | | 275 | |
ERAC USA Finance LLC 2.350%, 10/15/19 144A | | | 110,000 | | | | 109 | |
Express Scripts Holding Co.
2.250%, 6/15/19 | | | 70,000 | | | | 70 | |
3.457%, (ICE LIBOR USD 3 Month plus 0.750%), 11/30/20 | | | 750,000 | | | | 750 | |
General Mills, Inc. 2.976%, (ICE LIBOR USD 3 Month plus 0.540%), 4/16/21 | | | 910,000 | | | | 896 | |
Halfmoon Parent, Inc.
3.400%, 9/17/21 144A | | | 175,000 | | | | 175 | |
3.438%, (ICE LIBOR USD 3 Month plus 0.650%), 9/17/21 144A | | | 315,000 | | | | 311 | |
Humana, Inc. 2.625%, 10/1/19 | | | 190,000 | | | | 189 | |
Imperial Brands Finance PLC 2.950%, 7/21/20 144A | | | 945,000 | | | | 931 | |
Johnson & Johnson 1.950%, 11/10/20 | | | 225,000 | | | | 222 | |
The Kroger Co.
1.500%, 9/30/19 | | | 272,000 | | | | 268 | |
2.300%, 1/15/19 | | | 165,000 | | | | 165 | |
Maple Escrow Subsidiary, Inc. 3.551%, 5/25/21 144A | | | 770,000 | | | | 769 | |
McKesson Corp. 3.650%, 11/30/20 | | | 650,000 | | | | 653 | |
Medco Health Solutions, Inc. 4.125%, 9/15/20 | | | 325,000 | | | | 328 | |
Molson Coors Brewing Co. - Class B 2.250%, 3/15/20 | | | 430,000 | | | | 424 | |
Reynolds American, Inc.
3.250%, 6/12/20 | | | 145,000 | | | | 144 | |
8.125%, 6/23/19 | | | 160,000 | | | | 163 | |
Shire Acquisitions Investments Ireland Designated Activity Co. 1.900%, 9/23/19 ß | | | 2,120,000 | | | | 2,090 | |
Takeda Pharmaceutical Co., Ltd. 3.800%, 11/26/20 144A | | | 385,000 | | | | 387 | |
Teva Pharmaceutical Finance Netherlands III BV 1.700%, 7/19/19 | | | 1,055,000 | | | | 1,039 | |
The Accompanying Notes are an Integral Part of the Financial Statements.
112
Short-Term Bond Portfolio
| | | | | | | | |
| Corporate Bonds (51.2%) | | Shares/ Par+ | | | Value
$ (000’s) | |
| |
Consumer,Non-cyclical continued | | | | | |
Tyson Foods, Inc. 2.250%, 8/23/21 | | | 280,000 | | | | 271 | |
| | | | | | | | |
Total | | | | | | | 21,112 | |
| | | | | | | | |
| |
Energy (4.1%) | | | | | |
Cenovus Energy, Inc. 5.700%, 10/15/19 | | | 601,923 | | | | 613 | |
China Shenhua Overseas Capital Co., Ltd. 3.125%, 1/20/20 144A § | | | 785,000 | | | | 780 | |
Columbia Pipeline Group, Inc. 3.300%, 6/1/20 | | | 535,000 | | | | 533 | |
DCP Midstream Operating LP 2.700%, 4/1/19 | | | 430,000 | | | | 427 | |
Enable Midstream Partners LP 2.400%, 5/15/19 | | | 295,000 | | | | 293 | |
Enbridge Energy Partners LP 9.875%, 3/1/19 | | | 790,000 | | | | 798 | |
Encana Corp. 6.500%, 5/15/19 | | | 370,000 | | | | 374 | |
Eni SpA 4.000%, 9/12/23 144A | | | 200,000 | | | | 197 | |
EnLink Midstream Partners LP 2.700%, 4/1/19 | | | 285,000 | | | | 283 | |
Enterprise Products Operating LLC
2.800%, 2/15/21 | | | 480,000 | | | | 475 | |
3.500%, 2/1/22 | | | 500,000 | | | | 501 | |
6.500%, 1/31/19 | | | 250,000 | | | | 251 | |
Exxon Mobil Corp. 3.109%, (ICE LIBOR USD 3 Month plus 0.370%), 3/6/22 | | | 1,110,000 | | | | 1,109 | |
Kinder Morgan Energy Partners LP 9.000%, 2/1/19 | | | 415,000 | | | | 417 | |
Magellan Midstream Partners LP 6.550%, 7/15/19 | | | 480,000 | | | | 487 | |
Marathon Oil Corp. 2.700%, 6/1/20 | | | 240,000 | | | | 236 | |
ONEOK Partners LP 8.625%, 3/1/19 | | | 462,000 | | | | 465 | |
Petroleos Mexicanos
5.500%, 1/21/21 | | | 75,000 | | | | 75 | |
6.375%, 2/4/21 | | | 415,000 | | | | 420 | |
8.000%, 5/3/19 | | | 720,000 | | | | 728 | |
Phillips 66 3.289%, (ICE LIBOR USD 3 Month plus 0.600%), 2/26/21 | | | 335,000 | | | | 331 | |
Plains All American Pipeline LP / PAA Finance | | | | | | | | |
Corp. 2.600%, 12/15/19 | | | 170,000 | | | | 168 | |
5.000%, 2/1/21 | | | 220,000 | | | | 224 | |
5.750%, 1/15/20 | | | 205,000 | | | | 209 | |
Sabine Pass Liquefaction LLC 5.625%, 2/1/21 | | | 470,000 | | | | 484 | |
Valero Energy Corp. 6.125%, 2/1/20 | | | 290,000 | | | | 298 | |
Williams Partners LP
3.350%, 8/15/22 | | | 95,000 | | | | 93 | |
5.250%, 3/15/20 ß | | | 1,200,000 | | | | 1,223 | |
| | | | | | | | |
Total | | | | | | | 12,492 | |
| | | | | | | | |
| | | | | | | | |
| Corporate Bonds (51.2%) | | Shares/ Par+ | | | Value
$ (000’s) | |
| |
Financial (18.5%) | | | | | |
ABN AMRO Bank NV
2.100%, 1/18/19 144A | | | 805,000 | | | | 805 | |
3.261%, (ICE LIBOR USD 3 Month plus 0.570%), 8/27/21 144A | | | 760,000 | | | | 756 | |
AerCap Ireland Capital 4.625%, 10/30/20 | | | 300,000 | | | | 302 | |
AerCap Ireland Capital DAC / AerCap Global Aviation Trust 3.750%, 5/15/19 | | | 250,000 | | | | 250 | |
AerCap Ireland Capital, Ltd. / AerCap Global Aviation Trust 3.950%, 2/1/22 | | | 475,000 | | | | 466 | |
AIA Group, Ltd.
2.250%, 3/11/19 144A | | | 200,000 | | | | 200 | |
3.312%, (ICE LIBOR USD 3 Month plus 0.520%), 9/20/21 144A | | | 765,000 | | | | 761 | |
AIG Global Funding
3.350%, 6/25/21 144A | | | 365,000 | | | | 364 | |
Air Lease Corp.
2.125%, 1/15/20 | | | 570,000 | | | | 562 | |
2.500%, 3/1/21 | | | 135,000 | | | | 132 | |
3.500%, 1/15/22 | | | 265,000 | | | | 261 | |
Ally Financial, Inc. 3.500%, 1/27/19 | | | 825,000 | | | | 824 | |
American Campus Communities Operating Partnership LP 3.350%, 10/1/20 | | | 390,000 | | | | 389 | |
American Express Credit Corp.
2.200%, 3/3/20 | | | 700,000 | | | | 692 | |
2.375%, 5/26/20 | | | 110,000 | | | | 109 | |
American International Group, Inc.
2.300%, 7/16/19 | | | 350,000 | | | | 349 | |
6.400%, 12/15/20 | | | 175,000 | | | | 185 | |
ANZ New Zealand International, Ltd.
2.200%, 7/17/20 144A | | | 380,000 | | | | 374 | |
2.750%, 1/22/21 144A | | | 590,000 | | | | 584 | |
Aon Corp. 5.000%, 9/30/20 | | | 60,000 | | | | 62 | |
Aon PLC 2.800%, 3/15/21 | | | 570,000 | | | | 564 | |
Banco de Credito del Peru 2.250%, 10/25/19 144A | | | 200,000 | | | | 198 | |
Banco Santander Chile 2.500%, 12/15/20 144A | | | 860,000 | | | | 838 | |
Banco Santander SA 3.545%, (ICE LIBOR USD 3 Month plus 1.120%), 4/12/23 | | | 400,000 | | | | 392 | |
Bank of America Corp.
2.503%, 10/21/22 | | | 280,000 | | | | 270 | |
2.625%, 4/19/21 | | | 315,000 | | | | 311 | |
2.857%, (ICE LIBOR USD 3 Month plus 0.380%), 1/23/22 | | | 395,000 | | | | 387 | |
3.023%, (ICE LIBOR USD 3 Month plus 0.650%), 6/25/22 | | | 410,000 | | | | 405 | |
3.629%, (ICE LIBOR USD 3 Month plus 1.160%), 1/20/23 | | | 665,000 | | | | 664 | |
Bank of Montreal
1.750%, 9/11/19 | | | 1,100,000 | | | | 1,090 | |
2.896%, (ICE LIBOR USD 3 Month plus 0.460%), 4/13/21 | | | 430,000 | | | | 427 | |
The Accompanying Notes are an Integral Part of the Financial Statements.
113
Short-Term Bond Portfolio
| | | | | | | | |
| Corporate Bonds (51.2%) | | Shares/
Par+ | | | Value
$ (000’s) | |
| | |
Financial continued | | | | | | | | |
The Bank of New York Mellon Corp. 2.200%, 3/4/19 | | | 125,000 | | | | 125 | |
Banque Federative du Credit Mutuel SA 2.000%, 4/12/19 144A | | | 795,000 | | | | 792 | |
3.429%, (ICE LIBOR USD 3 Month plus 0.960%), 7/20/23 144A | | | 600,000 | | | | 592 | |
Barclays Bank PLC 2.650%, 1/11/21 | | | 445,000 | | | | 436 | |
Barclays PLC 2.750%, 11/8/19 | | | 920,000 | | | | 913 | |
4.039%, (ICE LIBOR USD 3 Month plus 1.625%), 1/10/23 | | | 290,000 | | | | 283 | |
BB&T Corp. 2.150%, 2/1/21 | | | 550,000 | | | | 538 | |
BPCE SA 2.500%, 7/15/19 | | | 295,000 | | | | 294 | |
3.897%, (ICE LIBOR USD 3 Month plus 1.220%), 5/22/22 144A | | | 280,000 | | | | 279 | |
Brixmor Operating Partnership LP 3.875%, 8/15/22 | | | 80,000 | | | | 80 | |
Capital One Bank USA NA 8.800%, 7/15/19 | | | 250,000 | | | | 257 | |
Capital One Financial Corp. 2.400%, 10/30/20 | | | 300,000 | | | | 294 | |
2.500%, 5/12/20 | | | 170,000 | | | | 168 | |
Capital One NA 1.850%, 9/13/19 | | | 655,000 | | | | 648 | |
2.350%, 1/31/20 | | | 955,000 | | | | 943 | |
The Charles Schwab Corp. 2.966%, (ICE LIBOR USD 3 Month plus 0.320%), 5/21/21 | | | 470,000 | | | | 468 | |
Chicago Board Options Exchange, Inc. 1.950%, 6/28/19 | | | 285,000 | | | | 283 | |
China Overseas Finance Cayman VI, Ltd. 4.250%, 5/8/19 144A § | | | 750,000 | | | | 752 | |
Citibank NA 2.125%, 10/20/20 | | | 405,000 | | | | 397 | |
Citigroup, Inc. 2.050%, 6/7/19 | | | 235,000 | | | | 234 | |
2.700%, 3/30/21 | | | 35,000 | | | | 34 | |
2.900%, 12/8/21 | | | 675,000 | | | | 664 | |
3.204%, (ICE LIBOR USD 3 Month plus 0.790%), 1/10/20 | | | 680,000 | | | | 681 | |
Citizens Bank NA 2.250%, 3/2/20 | | | 565,000 | | | | 559 | |
2.250%, 10/30/20 | | | 250,000 | | | | 245 | |
2.500%, 3/14/19 | | | 525,000 | | | | 524 | |
2.550%, 5/13/21 | | | 250,000 | | | | 244 | |
Citizens Financial Group, Inc. 2.375%, 7/28/21 | | | 35,000 | | | | 34 | |
CNO Financial Group, Inc. 4.500%, 5/30/20 | | | 140,000 | | | | 138 | |
Cooperatieve Rabobank UA 3.950%, 11/9/22 | | | 645,000 | | | | 643 | |
Credit Agricole SA 3.507%, (ICE LIBOR USD 3 Month plus 1.020%), 4/24/23 144A | | | 315,000 | | | | 310 | |
The Credit Mutuel-CM11 Group 2.200%, 7/20/20 144A | | | 435,000 | | | | 427 | |
| | | | | | | | |
| Corporate Bonds (51.2%) | | Shares/
Par+ | | | Value
$ (000’s) | |
| | |
Financial continued | | | | | | | | |
Credit Suisse AG 5.400%, 1/14/20 | | | 150,000 | | | | 152 | |
Credit Suisse Group Funding Guernsey, Ltd. 2.750%, 3/26/20 | | | 500,000 | | | | 495 | |
Crown Castle International Corp. 2.250%, 9/1/21 | | | 195,000 | | | | 189 | |
3.400%, 2/15/21 | | | 385,000 | | | | 385 | |
Danske Bank A/S 2.200%, 3/2/20 144A | | | 820,000 | | | | 802 | |
Deutsche Bank AG 3.766%, (ICE LIBOR USD 3 Month plus 1.290%), 2/4/21 | | | 745,000 | | | | 725 | |
Discover Bank 3.100%, 6/4/20 | | | 1,025,000 | | | | 1,018 | |
First Niagara Financial Group, Inc. 7.250%, 12/15/21 | | | 245,000 | | | | 268 | |
GE Capital International Funding Co. Unlimited Co. 2.342%, 11/15/20b | | | 1,545,000 | | | | 1,491 | |
The Goldman Sachs Group, Inc. 1.950%, 7/23/19 | | | 240,000 | | | | 238 | |
2.300%, 12/13/19 | | | 370,000 | | | | 366 | |
2.750%, 9/15/20 | | | 95,000 | | | | 94 | |
3.307%, (ICE LIBOR USD 3 Month plus 0.780%), 10/31/22 | | | 330,000 | | | | 322 | |
3.618%, (ICE LIBOR USD 3 Month plus 1.110%), 4/26/22 | | | 520,000 | | | | 514 | |
5.375%, 3/15/20 | | | 195,000 | | | | 199 | |
6.000%, 6/15/20 | | | 60,000 | | | | 62 | |
HCP, Inc. 2.625%, 2/1/20 | | | 60,000 | | | | 60 | |
HSBC Holdings PLC 3.240%, (ICE LIBOR USD 3 Month plus 0.600%), 5/18/21 | | | 545,000 | | | | 537 | |
3.426%, (ICE LIBOR USD 3 Month plus 0.650%), 9/11/21 | | | 320,000 | | | | 316 | |
HSBC USA, Inc. 2.350%, 3/5/20 | | | 465,000 | | | | 460 | |
ING Groep NV 3.536%, (ICE LIBOR USD 3 Month plus 1.150%), 3/29/22 | | | 335,000 | | | | 335 | |
International Lease Finance Corp. 6.250%, 5/15/19 | | | 385,000 | | | | 388 | |
Intesa Sanpaolo SpA 3.375%, 1/12/23 144A | | | 350,000 | | | | 324 | |
3.875%, 1/15/19 | | | 425,000 | | | | 425 | |
JPMorgan Chase & Co. 2.350%, 1/28/19 | | | 250,000 | | | | 250 | |
3.317%, (ICE LIBOR USD 3 Month plus 0.550%), 3/9/21 | | | 675,000 | | | | 672 | |
4.250%, 10/15/20 | | | 200,000 | | | | 204 | |
4.400%, 7/22/20 | | | 105,000 | | | | 107 | |
4.950%, 3/25/20 | | | 150,000 | | | | 153 | |
JPMorgan Chase Bank NA 2.604%, (ICE LIBOR USD 3 Month plus 0.280%), 2/1/21 | | | 250,000 | | | | 248 | |
Lincoln National Corp. 4.000%, 9/1/23 | | | 130,000 | | | | 133 | |
Mitsubishi UFJ Financial Group, Inc. 3.158%, (ICE LIBOR USD 3 Month plus 0.650%), 7/26/21 | | | 193,000 | | | | 192 | |
The Accompanying Notes are an Integral Part of the Financial Statements.
114
Short-Term Bond Portfolio
| | | | | | | | |
| Corporate Bonds (51.2%) | | Shares/
Par+ | | | Value
$ (000’s) | |
| | |
Financial continued | | | | | | | | |
3.368%, (ICE LIBOR USD 3 Month plus 0.860%), 7/26/23 | | | 320,000 | | | | 316 | |
3.609%, (ICE LIBOR USD 3 Month plus 0.920%), 2/22/22 | | | 390,000 | | | | 387 | |
Morgan Stanley 3.168%, (ICE LIBOR USD 3 Month plus 0.550%), 2/10/21 | | | 595,000 | | | | 588 | |
5.500%, 1/26/20 | | | 240,000 | | | | 245 | |
5.500%, 7/24/20 | | | 235,000 | | | | 242 | |
7.300%, 5/13/19 | | | 250,000 | | | | 254 | |
New York Life Global Funding 2.912%, (ICE LIBOR USD 3 Month plus 0.320%), 8/6/21 144A | | | 585,000 | | | | 584 | |
PNC Bank NA 2.450%, 11/5/20 | | | 425,000 | | | | 420 | |
Principal Life Global Funding II 1.500%, 4/18/19 144A | | | 240,000 | | | | 239 | |
2.200%, 4/8/20 144A | | | 445,000 | | | | 440 | |
Regions Bank 2.776%, (ICE LIBOR USD 3 Month plus 0.380%), 4/1/21 | | | 650,000 | | | | 638 | |
3.118%, (ICE LIBOR USD 3 Month plus 0.500%), 8/13/21 | | | 250,000 | | | | 245 | |
Reinsurance Group of America, Inc. 5.000%, 6/1/21 | | | 60,000 | | | | 62 | |
6.450%, 11/15/19 | | | 540,000 | | | | 554 | |
Royal Bank of Scotland Group PLC 6.400%, 10/21/19 | | | 140,000 | | | | 143 | |
Santander UK Group Holdings PLC 2.875%, 10/16/20 | | | 145,000 | | | | 142 | |
Santander UK PLC 2.125%, 11/3/20 | | | 430,000 | | | | 420 | |
Skandinaviska Enskilda Banken AB 1.500%, 9/13/19 | | | 680,000 | | | | 672 | |
Standard Chartered PLC 2.100%, 8/19/19 144A | | | 200,000 | | | | 198 | |
2.400%, 9/8/19 144A | | | 200,000 | | | | 199 | |
3.558%, (ICE LIBOR USD 3 Month plus 1.150%), 1/20/23 144A | | | 435,000 | | | | 431 | |
Sumitomo Mitsui Banking Corp. 2.514%, 1/17/20 | | | 730,000 | | | | 725 | |
Sumitomo Mitsui Trust Holdings 1.950%, 9/19/19 144A | | | 290,000 | | | | 287 | |
SunTrust Bank 2.590%, (ICE LIBOR USD 3 Month plus 0.298%), 1/29/21 | | | 720,000 | | | | 713 | |
Svenska Handelsbanken AB 3.350%, 5/24/21 | | | 525,000 | | | | 525 | |
Synchrony Financial 2.700%, 2/3/20b | | | 1,540,000 | | | | 1,514 | |
The Toronto-Dominion Bank 2.730%, (ICE LIBOR USD 3 Month plus 0.240%), 1/25/21 | | | 755,000 | | | | 751 | |
Trininty Acquisition PLC 3.500%, 9/15/21 | | | 315,000 | | | | 312 | |
U.S. Bank NA 2.828%, (ICE LIBOR USD 3 Month plus 0.320%), 4/26/21 | | | 720,000 | | | | 717 | |
UBS Group Funding AG 3.873%, (ICE LIBOR USD 3 Month plus 1.220%), 5/23/23 144A | | | 415,000 | | | | 411 | |
| | | | | | | | |
| Corporate Bonds (51.2%) | | Shares/
Par+ | | | Value
$ (000’s) | |
| | |
Financial continued | | | | | | | | |
UBS Group Funding Jersey, Ltd. 2.950%, 9/24/20 144A | | | 255,000 | | | | 252 | |
3.000%, 4/15/21 144A | | | 385,000 | | | | 382 | |
UNUM Group 3.000%, 5/15/21 | | | 620,000 | | | | 613 | |
VEREIT Operating Partnership LP 3.000%, 2/6/19b | | | 1,205,000 | | | | 1,204 | |
WEA Finance LLC / Westfield UK & Europe Finance PLC 2.700%, 9/17/19 144A | | | 405,000 | | | | 403 | |
3.250%, 10/5/20 144A | | | 240,000 | | | | 240 | |
Wells Fargo & Co. 2.550%, 12/7/20 | | | 45,000 | | | | 44 | |
Wells Fargo Bank NA 3.325%, (ICE LIBOR USD 3 Month plus 0.490%), 7/23/21 | | | 920,000 | | | | 919 | |
| | | | | | | | |
Total | | | | | | | 56,807 | |
| | | | | | | | |
| | |
Industrial (4.6%) | | | | | | | | |
Avnet, Inc. 3.750%, 12/1/21 | | | 250,000 | | | | 251 | |
Bohai Capital Holding Co., Ltd. 3.625%, 3/15/21 144A | | | 690,000 | | | | 664 | |
Boral Finance, Ltd. 3.000%, 11/1/22 144A | | | 65,000 | | | | 63 | |
Caterpillar Financial Services Corp. 3.046%, (ICE LIBOR USD 3 Month plus 0.280%), 9/7/21 | | | 285,000 | | | | 283 | |
CNH Industrial Capital LLC 4.375%, 11/6/20 | | | 895,000 | | | | 900 | |
DAE Funding LLC 4.000%, 8/1/20 144A | | | 360,000 | | | | 351 | |
5.250%, 11/15/21 144A | | | 305,000 | | | | 300 | |
Fortive Corp. 1.800%, 6/15/19 | | | 8,000 | | | | 8 | |
GATX Corp. 2.500%, 7/30/19 | | | 315,000 | | | | 313 | |
2.600%, 3/30/20 | | | 830,000 | | | | 822 | |
General Dynamics Corp. 2.908%, (ICE LIBOR USD 3 Month plus 0.290%), 5/11/20 | | | 155,000 | | | | 155 | |
2.998%, (ICE LIBOR USD 3 Month plus 0.380%), 5/11/21 | | | 255,000 | | | | 254 | |
Harris Corp. 2.700%, 4/27/20 | | | 510,000 | | | | 506 | |
Honeywell International, Inc. 1.800%, 10/30/19 | | | 505,000 | | | | 500 | |
Kansas City Southern 2.350%, 5/15/20 | | | 915,000 | | | | 901 | |
Keysight Technologies, Inc. 3.300%, 10/30/19b | | | 1,735,000 | | | | 1,730 | |
Martin Marietta Materials, Inc. 3.292%, (ICE LIBOR USD 3 Month plus 0.500%), 12/20/19 | | | 295,000 | | | | 294 | |
3.327%, (ICE LIBOR USD 3 Month plus 0.650%), 5/22/20 | | | 150,000 | | | | 149 | |
Municipality of Beijing China 2.750%, 9/26/20 144A § | | | 645,000 | | | | 632 | |
Northrop Grumman Corp. 2.080%, 10/15/20 | | | 750,000 | | | | 735 | |
The Accompanying Notes are an Integral Part of the Financial Statements.
115
Short-Term Bond Portfolio
| | | | | | | | |
| Corporate Bonds (51.2%) | | Shares/
Par+ | | | Value
$ (000’s) | |
| | |
Industrial continued | | | | | | | | |
Packaging Corp. of America 2.450%, 12/15/20 | | | 270,000 | | | | 265 | |
Penske Truck Leasing Co. LP / PTL Finance Corp. 2.500%, 6/15/19 144A | | | 240,000 | | | | 239 | |
3.200%, 7/15/20 144A | | | 795,000 | | | | 791 | |
Republic Services, Inc. 5.500%, 9/15/19 | | | 250,000 | | | | 254 | |
Rockwell Collins, Inc. 1.950%, 7/15/19 | | | 205,000 | | | | 203 | |
Roper Technologies, Inc. 3.000%, 12/15/20 | | | 225,000 | | | | 223 | |
SMBC Aviation Capital Finance DAC 4.125%, 7/15/23 144A | | | 200,000 | | | | 201 | |
Union Pacific Corp. 2.250%, 2/15/19 | | | 85,000 | | | | 85 | |
3.200%, 6/8/21 | | | 565,000 | | | | 568 | |
United Technologies Corp. 3.279%, (ICE LIBOR USD 3 Month plus 0.650%), 8/16/21 | | | 355,000 | | | | 354 | |
Vulcan Materials Co. 3.388%, (ICE LIBOR USD 3 Month plus 0.600%), 6/15/20 | | | 365,000 | | | | 363 | |
3.388%, (ICE LIBOR USD 3 Month plus 0.650%), 3/1/21 | | | 760,000 | | | | 754 | |
| | | | | | | | |
Total | | | | | | | 14,111 | |
| | | | | | | | |
| | |
Real Estate (0.6%) | | | | | | | | |
SBA Tower Trust | | | | | | | | |
2.877%, 7/10/46 144A | | | 155,000 | | | | 152 | |
2.898%, 10/15/44 144A | | | 335,000 | | | | 333 | |
3.156%, 10/10/45 144A | | | 635,000 | | | | 629 | |
3.168%, 4/9/47 144A | | | 390,000 | | | | 384 | |
3.448%, 3/15/23 144A | | | 415,000 | | | | 412 | |
| | | | | | | | |
Total | | | | | | | 1,910 | |
| | | | | | | | |
| | |
Technology (2.4%) | | | | | | | | |
Apple, Inc. 1.800%, 11/13/19 | | | 690,000 | | | | 684 | |
Broadcom Corp. / Broadcom Cayman Finance, Ltd. 2.375%, 1/15/20 | | | 750,000 | | | | 741 | |
3.000%, 1/15/22 | | | 700,000 | | | | 673 | |
Dell International LLC / EMC Corp. 3.480%, 6/1/19 144Ab | | | 1,765,000 | | | | 1,760 | |
DXC Technology Co. 2.875%, 3/27/20 | | | 445,000 | | | | 441 | |
3.688%, (ICE LIBOR USD 3 Month plus 0.950%), 3/1/21 | | | 677,000 | | | | 676 | |
Fidelity National Information Services, Inc. 2.250%, 8/15/21 | | | 490,000 | | | | 473 | |
3.625%, 10/15/20 | | | 120,000 | | | | 120 | |
Hewlett Packard Enterprise Co. 2.100%, 10/4/19 144A | | | 280,000 | | | | 277 | |
Microchip Technology, Inc. 3.922%, 6/1/21 144A | | | 395,000 | | | | 392 | |
Xerox Corp. 2.750%, 3/15/19 | | | 640,000 | | | | 637 | |
5.625%, 12/15/19 | | | 525,000 | | | | 529 | |
| | | | | | | | |
Total | | | | | | | 7,403 | |
| | | | | | | | |
| | | | | | | | |
| Corporate Bonds (51.2%) | | Shares/
Par+ | | | Value
$ (000’s) | |
| |
Utilities (2.9%) | | | | | |
American Electric Power Co., Inc. 3.650%, 12/1/21 | | | 85,000 | | | | 86 | |
CenterPoint Energy, Inc. 3.600%, 11/1/21 | | | 215,000 | | | | 215 | |
Commonwealth Edison Co. 2.150%, 1/15/19 | | | 250,000 | | | | 250 | |
Dominion Energy, Inc. 2.579%, 7/1/20 | | | 185,000 | | | | 182 | |
Dominion Resources, Inc. 1.875%, 1/15/19 | | | 225,000 | | | | 225 | |
2.962%, 7/1/19 | | | 145,000 | | | | 145 | |
5.200%, 8/15/19 | | | 150,000 | | | | 152 | |
Duke Energy Corp. 3.550%, 9/15/21 | | | 155,000 | | | | 155 | |
EDP Finance BV 4.125%, 1/15/20 144A | | | 205,000 | | | | 205 | |
4.900%, 10/1/19 144A | | | 810,000 | | | | 816 | |
Enel Finance International NV 2.875%, 5/25/22 144A | | | 535,000 | | | | 504 | |
4.250%, 9/14/23 144A | | | 400,000 | | | | 391 | |
ENN Energy Holdings, Ltd. 3.250%, 10/23/19 144A § | | | 400,000 | | | | 399 | |
6.000%, 5/13/21 144A | | | 200,000 | | | | 209 | |
Exelon Generation Co. LLC 2.950%, 1/15/20 | | | 415,000 | | | | 413 | |
5.200%, 10/1/19 | | | 21,000 | | | | 21 | |
FirstEnergy Corp. 2.850%, 7/15/22 | | | 320,000 | | | | 312 | |
MidAmerican Energy Co. 2.400%, 3/15/19 | | | 500,000 | | | | 499 | |
NextEra Energy Capital Holdings, Inc. 2.300%, 4/1/19 | | | 165,000 | | | | 165 | |
3.257%, (ICE LIBOR USD 3 Month plus 0.550%), 8/28/21 | | | 610,000 | | | | 602 | |
PNM Resources, Inc. 3.250%, 3/9/21 | | | 465,000 | | | | 461 | |
San Diego Gas & Electric Co. 1.914%, 2/1/22 | | | 107,501 | | | | 105 | |
Sempra Energy 1.625%, 10/7/19 | | | 163,000 | | | | 161 | |
2.936%, (ICE LIBOR USD 3 Month plus 0.500%), 1/15/21 | | | 495,000 | | | | 487 | |
The Southern Co. 1.850%, 7/1/19 | | | 575,000 | | | | 572 | |
2.350%, 7/1/21 | | | 125,000 | | | | 122 | |
State Grid Overseas Investment 2016, Ltd. | | | | | | | | |
2.250%, 5/4/20 144A | | | 1,030,000 | | | | 1,016 | |
| | | | | | | | |
Total | | | | | | | 8,870 | |
| | | | | | | | |
| | |
Total Corporate Bonds | | | | | | | | |
(Cost: $158,087) | | | | | | | 156,816 | |
| | | | | | | | |
| | |
| Governments (11.7%) | | | | | | |
| |
Governments (11.7%) | | | | | |
US Treasury | | | | | | | | |
1.375%, 9/15/20b | | | 2,870,000 | | | | 2,815 | |
1.375%, 5/31/21 | | | 1,000,000 | | | | 974 | |
1.625%, 11/30/20b | | | 5,605,000 | | | | 5,512 | |
1.875%, 12/15/20b | | | 6,845,000 | | | | 6,762 | |
2.625%, 7/31/20b | | | 6,060,000 | | | | 6,067 | |
2.625%, 8/31/20b | | | 3,000,000 | | | | 3,004 | |
The Accompanying Notes are an Integral Part of the Financial Statements.
116
Short-Term Bond Portfolio
| | | | | | | | |
| Governments (11.7%) | | Shares/
Par+ | | | Value
$ (000’s) | |
| | |
Governments continued | | | | | | | | |
2.625%, 12/15/21 | | | 920,000 | | | | 924 | |
2.750%, 9/30/20b | | | 1,515,000 | | | | 1,520 | |
2.875%, 10/31/20b | | | 2,260,000 | | | | 2,274 | |
2.875%, 10/15/21b | | | 4,535,000 | | | | 4,582 | |
US Treasury Inflation Index Bond 0.625%, 4/15/23b | | | 1,527,045 | | | | 1,502 | |
| | | | | | | | |
Total | | | | | | | 35,936 | |
| | | | | | | | |
| | |
Total Governments | | | | | | | | |
(Cost: $36,124) | | | | | | | 35,936 | |
| | | | | | | | |
| | |
| Municipal Bonds (0.1%) | | | | | | |
| | |
Municipal Bonds (0.1%) | | | | | | | | |
Florida State Board of Administration Finance Corp. 2.163%, 7/1/19 | | | 475,000 | | | | 474 | |
| | | | | | | | |
Total Municipal Bonds | | | | | | | | |
(Cost: $475) | | | | | | | 474 | |
| | | | | | | | |
| | |
| Structured Products (35.8%) | | | | | | |
| |
Asset Backed Securities (19.3%) | | | | | |
Allegro CLO III, Ltd., Series2015-1A, Class AR 3.330%, (ICE LIBOR USD 3 Month plus 0.840%), 7/25/27 144A | | | 585,000 | | | | 577 | |
Ally Auto Receivables Trust, Series2015-2, Class C 2.410%, 1/15/21 144A | | | 505,000 | | | | 504 | |
Ally Auto Receivables Trust, Series2016-1, Class D 2.840%, 9/15/22 | | | 180,000 | | | | 180 | |
Ally Auto Receivables Trust, Series2017-2, Class C 2.460%, 9/15/22 | | | 70,000 | | | | 69 | |
Ally Auto Receivables Trust, Series2017-2, Class D 2.930%, 11/15/23 | | | 95,000 | | | | 94 | |
Ally Master Owner Trust, Series2018-4, Class A 3.300%, 7/17/23 | | | 300,000 | | | | 302 | |
AmeriCredit Automobile Receivables Trust, Series2014-2, Class E 3.370%, 11/8/21 144A | | | 375,000 | | | | 375 | |
AmeriCredit Automobile Receivables Trust, Series2014-3, Class C 2.580%, 9/8/20 | | | 60,047 | | | | 60 | |
AmeriCredit Automobile Receivables Trust, Series2014-3, Class D 3.130%, 10/8/20 | | | 445,000 | | | | 445 | |
AmeriCredit Automobile Receivables Trust, Series2014-3, Class E 3.720%, 3/8/22 144A | | | 170,000 | | | | 170 | |
AmeriCredit Automobile Receivables Trust, Series2014-4, Class C 2.470%, 11/9/20 | | | 69,456 | | | | 69 | |
AmeriCredit Automobile Receivables Trust, Series2014-4, Class E 3.660%, 3/8/22 | | | 150,000 | | | | 150 | |
AmeriCredit Automobile Receivables Trust, Series2015-2, Class D 3.000%, 6/8/21 | | | 245,000 | | | | 244 | |
| | | | | | | | |
| Structured Products (35.8%) | | Shares/
Par+ | | | Value
$ (000’s) | |
| | |
Asset Backed Securities continued | | | | | | | | |
AmeriCredit Automobile Receivables Trust, Series2015-3, Class D 3.340%, 8/8/21 | | | 310,000 | | | | 311 | |
AmeriCredit Automobile Receivables Trust, Series2016-1, Class A3 1.810%, 10/8/20 | | | 131 | | | | – | p |
AmeriCredit Automobile Receivables Trust, Series2016-1, Class C 2.890%, 1/10/22 | | | 1,120,000 | | | | 1,116 | |
AmeriCredit Automobile Receivables Trust, Series2016-3, Class D 2.710%, 9/8/22 | | | 380,000 | | | | 375 | |
AmeriCredit Automobile Receivables Trust, Series2016-4, Class A3 1.530%, 7/8/21 | | | 248,851 | | | | 248 | |
Americredit Automobile Receivables Trust, Series2016-4, Class D 2.740%, 12/8/22 | | | 510,000 | | | | 504 | |
AmeriCredit Automobile Receivables Trust, Series2017-1, Class C 2.710%, 8/18/22 | | | 175,000 | | | | 173 | |
AmeriCredit Automobile Receivables Trust, Series2017-1, Class D 3.130%, 1/18/23 | | | 620,000 | | | | 616 | |
AmeriCredit Automobile Receivables Trust, Series2017-3, Class B 2.240%, 6/19/23 | | | 185,000 | | | | 183 | |
AmeriCredit Automobile Receivables Trust, Series2017-3, Class C 2.690%, 6/19/23 | | | 195,000 | | | | 193 | |
Americredit Automobile Receivables Trust, Series2018-3, Class A3 3.380%, 7/18/23 | | | 760,000 | | | | 766 | |
ARI Fleet Lease Trust, Series2017-A, Class A2 1.910%, 4/15/26 144A | | | 80,846 | | | | 80 | |
ARI Fleet Lease Trust, Series2017-A, Class A3 2.280%, 4/15/26 144A | | | 700,000 | | | | 692 | |
ARI Fleet Lease Trust, Series2018-A, Class A2 2.550%, 10/15/26 144A | | | 405,000 | | | | 403 | |
Ascentium Equipment Receivables Trust LLC, Series2017-1A, Class A2 1.870%, 7/10/19 144A | | | 7,588 | | | | 8 | |
Ascentium Equipment Receivables Trust LLC, Series2017-1A, Class A3 2.290%, 6/10/21 144A | | | 160,000 | | | | 159 | |
Avis Budget Rental Car Funding AESOP LLC, Series2013-2A, Class A 2.970%, 2/20/20 144A | | | 45,000 | | | | 45 | |
Avis Budget Rental Car Funding AESOP LLC, Series2013-2A, Class B 3.660%, 2/20/20 144A | | | 223,333 | | | | 223 | |
Avis Budget Rental Car Funding AESOP LLC, Series2014-1A, Class A 2.460%, 7/20/20 144A | | | 155,000 | | | | 155 | |
Avis Budget Rental Car Funding AESOP LLC, Series2014-2A, Class A 2.500%, 2/20/21 144Ab | | | 1,155,000 | | | | 1,150 | |
The Accompanying Notes are an Integral Part of the Financial Statements.
117
Short-Term Bond Portfolio
| | | | | | | | |
| Structured Products (35.8%) | | Shares/
Par+ | | | Value
$ (000’s) | |
| |
Asset Backed Securities continued | | | | | |
Avis Budget Rental Car Funding AESOP LLC, Series2015-1A, Class A 2.500%, 7/20/21 144A | | | 415,000 | | | | 411 | |
Avis Budget Rental Car Funding AESOP LLC, Series2016-1A, Class A 2.990%, 6/20/22 144A | | | 440,000 | | | | 437 | |
Avis Budget Rental Car Funding AESOP LLC, Series2017-2A, Class A 2.970%, 3/20/24 144A | | | 425,000 | | | | 416 | |
Babson CLO, Ltd., Series2017-IA, Class AR 3.269%, (ICE LIBOR USD 3 Month plus 0.800%), 1/20/28 144A | | | 730,000 | | | | 718 | |
Barlays Dryrock Issuance Trust, Series 2018-1, Class A 2.785%, (ICE LIBOR USD 1 Month plus 0.330%), 7/15/24 | | | 1,100,000 | | | | 1,097 | |
Bayview Mortgage Fund IVc Trust, Series2017-RT3, Class A 3.500%, (AFC), 1/28/58 144A | | | 691,185 | | | | 684 | |
Bayview Opportunity Master Fund IVa Trust, Series 2017-SPL5, Class A 3.500%, (AFC), 6/28/57 144A | | | 597,793 | | | | 592 | |
Bayview Opportunity Master Fund IVb Trust, Series 2017-SPL4, Class A 3.500%, (AFC), 1/28/55 144A | | | 206,056 | | | | 204 | |
BlueMountain CLO, Series2015-2, Class A 3.375%, (ICE LIBOR USD 3 Month plus 0.930%), 7/18/27 144A | | | 750,000 | | | | 740 | |
BMW Vehicle Lease Trust, Series2016-2, Class A3 1.430%, 9/20/19 | | | 61,943 | | | | 62 | |
California Republic Auto Receivables Trust, Series2015-1, Class B 2.510%, 2/16/21 | | | 130,000 | | | | 129 | |
Capital Auto Receivables Asset Trust, Series2016-2, Class A4 1.630%, 1/20/21 | | | 175,000 | | | | 174 | |
Capital Auto Receivables Asset Trust, Series2016-3, Class A3 1.540%, 8/20/20 | | | 25,762 | | | | 26 | |
Capital Auto Receivables Asset Trust, Series2017-1, Class B 2.430%, 5/20/22 144A | | | 70,000 | | | | 69 | |
Capital Auto Receivables Asset Trust, Series2017-1, Class C 2.700%, 9/20/22 144A | | | 115,000 | | | | 114 | |
Capital Auto Receivables Asset Trust, Series2018-1, Class D 3.700%, 6/20/25 144A | | | 575,000 | | | | 577 | |
Capital Auto Receivables Asset Trust, Series2018-2, Class B 3.480%, 10/20/23 144A | | | 180,000 | | | | 181 | |
Capital Auto Receivables Asset Trust, Series2018-2, Class C 3.690%, 12/20/23 144A | | | 225,000 | | | | 227 | |
Carlyle Global Market Strategies, Series2015-1A, Class AR 3.469%, (ICE LIBOR USD 3 Month plus 1.000%), 4/20/27 144A | | | 425,000 | | | | 422 | |
| | | | | | | | |
| Structured Products (35.8%) | | Shares/
Par+ | | | Value
$ (000’s) | |
| |
Asset Backed Securities continued | | | | | |
Carlyle Global Market Strategies, Series2015-3A, Class A1R 3.509%, (ICE LIBOR USD 3 Month plus 1.000%), 7/28/28 144A | | | 760,000 | | | | 751 | |
CarMax Auto Owner Trust, Series2014-4, Class A4 1.810%, 7/15/20 | | | 80,172 | | | | 80 | |
CarMax Auto Owner Trust, Series2015-3, Class D 3.270%, 3/15/22 | | | 220,000 | | | | 220 | |
CarMax Auto Owner Trust, Series2015-4, Class D 3.000%, 5/16/22 | | | 110,000 | | | | 109 | |
CarMax Auto Owner Trust, Series2016-2, Class A3 1.520%, 2/16/21 | | | 141,984 | | | | 141 | |
CarMax Auto Owner Trust, Series2016-4, Class A3 1.400%, 8/15/21 | | | 309,090 | | | | 306 | |
CarMax Auto Owner Trust, Series2017-4, Class C 2.700%, 10/16/23 | | | 95,000 | | | | 94 | |
CCG Receivables Trust, Series2016-1, Class A2 1.690%, 9/14/22 144A | | | 39,457 | | | | 39 | |
CCG Receivables Trust, Series2017-1, Class A2 1.840%, 11/14/23 144A | | | 152,868 | | | | 152 | |
Chrysler Capital Auto Receivables Trust, Series2016-BA, Class A3 1.640%, 7/15/21 144A | | | 67,256 | | | | 67 | |
CNH Equipment Trust, Series2015-B, Class A3 1.370%, 7/15/20 | | | 13,642 | | | | 14 | |
CNH Equipment Trust, Series2015-C, Class B 2.400%, 2/15/23 | | | 570,000 | | | | 568 | |
Cole Park CLO, Ltd., Series2015-1A, Class AR 3.642%, (ICE LIBOR USD 3 Month plus 1.050%), 10/20/28 144A | | | 760,000 | | | | 760 | |
Diamond Resorts Owner Trust, Series2015-2, Class A 2.990%, 5/22/28 144A | | | 46,460 | | | | 46 | |
Elara HGV Timeshare Issuer, Series2017-A, Class A 2.690%, 3/25/30 144A | | | 142,274 | | | | 141 | |
Enterprise Fleet Financing LLC, Series 2016-1, Class A2 1.830%, 9/20/21 144A | | | 11,618 | | | | 12 | |
Enterprise Fleet Financing LLC, Series 2016-2, Class A2 1.740%, 2/22/22 144A | | | 171,253 | | | | 171 | |
Enterprise Fleet Financing LLC, Series 2017-1, Class A2 2.130%, 7/20/22 144A | | | 106,195 | | | | 106 | |
Enterprise Fleet Financing LLC, Series 2017-2, Class A2 1.970%, 1/20/23 144A | | | 109,216 | | | | 108 | |
The Accompanying Notes are an Integral Part of the Financial Statements.
118
Short-Term Bond Portfolio
| | | | | | | | |
| Structured Products (35.8%) | | Shares/
Par+ | | | Value
$ (000’s) | |
| |
Asset Backed Securities continued | | | | | |
Enterprise Fleet Financing LLC, Series 2017-3, Class A2 2.130%, 5/22/23 144A | | | 569,492 | | | | 564 | |
Enterprise Fleet Financing LLC, Series 2017-3, Class A3 2.360%, 5/20/23 144A | | | 195,000 | | | | 192 | |
Enterprise Fleet Financing LLC, Series 2018-1, Class A2 2.870%, 10/20/23 144A | | | 335,000 | | | | 334 | |
Enterprise Fleet Financing LLC, Series 2018-2, Class A2 3.140%, 2/20/24 144A | | | 410,000 | | | | 410 | |
Ford Credit Auto Lease Trust, Series2017-B, Class A3 2.030%, 12/15/20 | | | 255,000 | | | | 253 | |
Ford Credit Floorplan Master Owner Trust A, Series2016-3, Class B 1.750%, 7/15/21 | | | 190,000 | | | | 189 | |
Ford Credit Floorplan Master Owner Trust A, Series2017-2, Class B 2.340%, 9/15/22 ß | | | 1,265,000 | | | | 1,248 | |
Ford Credit Floorplan Master Owner Trust, Series2016-5, Class B 2.160%, 11/15/21 | | | 410,000 | | | | 407 | |
Galaxy XXIX CLO, Ltd., Series2018-29A, Class A 3.406%, (ICE LIBOR USD 3 Month plus 0.790%), 11/15/26 144A ß | | | 1,155,000 | | | | 1,143 | |
GM Financial Automobile Leasing Trust, Series2016-3, Class B 1.970%, 5/20/20 | | | 225,000 | | | | 224 | |
GM Financial Automobile Leasing Trust, Series2017-1, Class A4 2.260%, 8/20/20 | | | 75,000 | | | | 75 | |
GM Financial Automobile Leasing Trust, Series2017-2, Class A3 2.020%, 9/21/20 | | | 325,000 | | | | 323 | |
GM Financial Automobile Leasing Trust, Series2017-3, Class A4 2.120%, 9/20/21 | | | 115,000 | | | | 114 | |
GM Financial Automobile Leasing Trust, Series2017-3, Class C 2.730%, 9/20/21 | | | 140,000 | | | | 139 | |
GM Financial Automobile Leasing Trust, Series2018-1, Class C 3.110%, 12/20/21 | | | 200,000 | | | | 199 | |
GM Financial Automobile Leasing Trust, Series2018-1, Class D 3.370%, 10/20/22 | | | 480,000 | | | | 479 | |
GM Financial Automobile Leasing Trust, Series2018-2, Class A 3.500%, 4/20/22 | | | 220,000 | | | | 221 | |
GM Financial Securitized Term, Series 2017-3A, Class C 2.520%, 3/16/23 144A | | | 475,000 | | | | 468 | |
GMF Floorplan Owner Revolving Trust, Series2016-1, Class B 2.410%, 5/17/21 144A | | | 125,000 | | | | 125 | |
GMF Floorplan Owner Revolving Trust, Series2016-1, Class C 2.850%, 5/17/21 144A | | | 100,000 | | | | 100 | |
| | | | | | | | |
| Structured Products (35.8%) | | Shares/
Par+ | | | Value
$ (000’s) | |
| |
Asset Backed Securities continued | | | | | |
GMF Floorplan Owner Revolving Trust, Series2017-1, Class C 2.970%, 1/18/22 144A | | | 260,000 | | | | 259 | |
GMF Floorplan Owner Revolving Trust, Series2017-2, Class C 2.630%, 7/15/22 144A | | | 170,000 | | | | 168 | |
GMF Floorplan Owner Revolving Trust, Series2017-3, Class B 2.260%, 8/16/21 144A | | | 715,000 | | | | 711 | |
GMF Floorplan Owner Revolving Trust, Series2017-3, Class C 2.460%, 8/16/21 144A | | | 855,000 | | | | 850 | |
GMF Floorplan Owner Revolving Trust, Series2018-4, Class A1 3.500%, 9/15/23 144A | | | 670,000 | | | | 678 | |
Golub Capital Partners CLO, Series 2018-39A, Class A1 3.610%, (ICE LIBOR USD 3 Month plus 1.150%), 10/20/28 144A | | | 440,000 | | | | 435 | |
GreatAmerica Leasing Receivables Funding LLC, Series2017-1, Class A3 2.060%, 6/22/20 144A | | | 82,776 | | | | 82 | |
GreatAmerica Leasing Receivables Funding LLC, Series2018-1, Class A3 2.600%, 6/15/21 144A | | | 185,000 | | | | 184 | |
Halcyon Loan Advisors Funding, Ltd., Series2014-3A, Class B1R 3.060%, (ICE LIBOR USD 3 Month plus 1.700%), 10/22/25 144A | | | 345,000 | | | | 342 | |
Hardee’s Funding LLC, Series 1A, Class AI 4.250%, 6/21/48 144A | | | 439,201 | | | | 444 | |
Hilton Grand Vacations Trust, Series 2017- AA, Class A 2.660%, 12/26/28 144A | | | 102,999 | | | | 102 | |
Hilton Grand Vacations Trust, Series 2017- AA, Class B 2.960%, (EXE), 12/26/28 144A | | | 58,857 | | | | 58 | |
Huntington Auto Trust, Series2016-1, Class A4 1.930%, 4/15/22 | | | 325,000 | | | | 322 | |
Hyundai Auto Lease Securitization Trust, Series2016-B, Class A4 1.680%, 4/15/20 144A | | | 40,061 | | | | 40 | |
Hyundai Auto Lease Securitization Trust, Series2016-C, Class A4 1.650%, 7/15/20 144A | | | 290,000 | | | | 289 | |
Hyundai Auto Lease Securitization Trust, Series2016-C, Class B 1.860%, 5/17/21 144A | | | 320,000 | | | | 319 | |
Hyundai Auto Lease Securitization Trust, Series2017-B, Class A3 1.970%, 7/15/20 144A | | | 500,000 | | | | 497 | |
Hyundai Auto Receivables Trust, Series 2017- A, Class B 2.380%, 4/17/23 | | | 150,000 | | | | 148 | |
John Deere Owner Trust, Series2016-A, Class A3 1.360%, 4/15/20 | | | 62,899 | | | | 63 | |
The Accompanying Notes are an Integral Part of the Financial Statements.
119
Short-Term Bond Portfolio
| | | | | | | | |
| Structured Products (35.8%) | | Shares/
Par+ | | | Value
$ (000’s) | |
| |
Asset Backed Securities continued | | | | | |
KKR Financial CLO, Ltd., Series 2013, Class A1R 3.236%, (ICE LIBOR USD 3 Month plus 0.800%), 1/16/28 144A | | | 755,000 | | | | 741 | |
Kubota Credit Owner Trust, Series2016-1A, Class A3 1.500%, 7/15/20 144A | | | 341,394 | | | | 339 | |
Madison Park Funding, Ltd., Series2015-18A, Class A1R 3.659%, (ICE LIBOR USD 3 Month plus 1.190%), 10/21/30 144A | | | 690,000 | | | | 685 | |
Magnetite XVI, Ltd., Series2015-16A, Class AR 3.245%, (ICE LIBOR USD 3 Month plus 0.800%), 1/18/28 144A | | | 980,000 | | | | 964 | |
Mill City Mortgage Loan Trust, Series2016-1, Class A1 2.500%, (AFC), 4/25/57 144A | | | 73,690 | | | | 72 | |
Mill City Mortgage Loan Trust, Series2017-2, Class A1 2.750%, (AFC), 7/25/59 144A | | | 442,864 | | | | 434 | |
MMAF Equipment Finance LLC, Series 2017- AA, Class A2 1.730%, 5/18/20 144A | | | 50,400 | | | | 50 | |
MVW Owner Trust, Series2015-1A, Class A 2.520%, 12/20/32 144A | | | 194,339 | | | | 191 | |
MVW Owner Trust, Series2017-1A, Class A 2.420%, 12/20/34 144A | | | 85,625 | | | | 84 | |
MVW Owner Trust, Series2017-1A, Class B 2.750%, 12/20/34 144A | | | 71,354 | | | | 70 | |
MVW Owner Trust, Series2017-1A, Class C 2.990%, 12/20/34 144A | | | 78,490 | | | | 77 | |
Navient Student Loan Trust, Series2018-A, Class A1 2.530%, 2/18/42 144A | | | 382,764 | | | | 380 | |
Neuberger Berman CLO, Ltd., Series 2015-19A, Class A1R2 3.236%, (ICE LIBOR USD 3 Month plus 0.800%), 7/15/27 144A | | | 740,000 | | | | 730 | |
Neuberger Berman CLO, Ltd., Series 2017-16SA, Class A 3.286%, (ICE LIBOR USD 3 Month plus 0.850%), 1/15/28 144A | | | 440,000 | | | | 433 | |
Nissan Auto Lease Trust, Series2016-B, Class A 4 1.610%, 1/18/22 | | | 319,934 | | | | 320 | |
Nissan Auto Lease Trust, Series2017-B, Class A4 2.170%, 12/15/21 | | | 290,000 | | | | 287 | |
Nissan Master Owner Trust Receivables, Series2016-A, Class A2 1.540%, 6/15/21 | | | 335,000 | | | | 333 | |
OCP CLO, Ltd., Series2015-10A, Class A1R 3.328%, (ICE LIBOR USD 3 Month plus 0.820%), 10/26/27 144A | | | 665,000 | | | | 658 | |
OZLM VIII, Ltd., Series2014-8A, Class A1RR 3.625%, (ICE LIBOR USD 3 Month plus 1.170%), 10/17/29 144A | | | 485,000 | | | | 481 | |
Planet Fitness Master Issuer L, Series 2018-1A, Class A2I 4.262%, 9/5/48 144A | | | 558,600 | | | | 561 | |
| | | | | | | | |
| Structured Products (35.8%) | | Shares/
Par+ | | | Value
$ (000’s) | |
| |
Asset Backed Securities continued | | | | | |
Santander Drive Auto Receivables Trust, Series2015-3, Class D 3.490%, 5/17/21 | | | 345,000 | | | | 346 | |
Santander Drive Auto Receivables Trust, Series2015-4, Class D 3.530%, 8/16/21 | | | 240,000 | | | | 241 | |
Santander Drive Auto Receivables Trust, Series2015-5, Class C 2.740%, 12/15/21 | | | 255,408 | | | | 255 | |
Santander Drive Auto Receivables Trust, Series2015-5, Class D 3.650%, 12/15/21 | | | 345,000 | | | | 346 | |
Santander Drive Auto Receivables Trust, Series2016-1, Class D 4.020%, 4/15/22 | | | 425,000 | | | | 429 | |
Santander Drive Auto Receivables Trust, Series2016-3, Class C 2.460%, 3/15/22 | | | 274,000 | | | | 272 | |
Santander Drive Auto Receivables Trust, Series2017-1, Class B 2.100%, 6/15/21 | | | 44,851 | | | | 45 | |
Santander Drive Auto Receivables Trust, Series2017-1, Class C 2.580%, 5/16/22 | | | 65,000 | | | | 65 | |
Santander Drive Auto Receivables Trust, Series2017-3, Class B 2.190%, 3/15/22 | | | 365,000 | | | | 362 | |
Santander Drive Auto Receivables Trust, Series2018-1, Class C 2.960%, 3/15/24 | | | 120,000 | | | | 119 | |
Santander Drive Auto Receivables Trust, Series2018-4, Class B 3.270%, 1/17/23 | | | 310,000 | | | | 311 | |
Santander Drive Auto Receivables Trust, Series2018-5, Class B 3.520%, 12/15/22 | | | 375,000 | | | | 375 | |
Santander Retail Auto Lease Trust, Series2017-A, Class C 2.960%, 11/21/22 144A | | | 155,000 | | | | 154 | |
Sierra Receivables Funding Co. LLC, Series2015-1A, Class A 2.400%, 3/22/32 144A | | | 157,188 | | | | 156 | |
Sierra Receivables Funding Co. LLC, Series2015-3A, Class A 2.580%, 9/20/32 144A | | | 150,510 | | | | 149 | |
Sierra Receivables Funding Co. LLC, Series2016-3A, Class A 2.430%, 10/20/33 144A | | | 192,673 | | | | 191 | |
Sierra Receivables Funding Co. LLC, Series2017-1A, Class A 2.910%, 3/20/34 144A | | | 56,294 | | | | 56 | |
Sierra Timeshare Receivables Funding LLC, Series2015-2A, Class A 2.430%, 6/20/32 144A | | | 79,429 | | | | 78 | |
Sierra Timeshare Receivables Funding LLC, Series2016-1A, Class A 3.080%, 3/21/33 144A | | | 212,904 | | | | 212 | |
Sierra Timeshare Receivables Funding LLC, Series2016-2A, Class A 2.330%, 7/20/33 144A | | | 60,081 | | | | 58 | |
The Accompanying Notes are an Integral Part of the Financial Statements.
120
Short-Term Bond Portfolio
| | | | | | | | |
| Structured Products (35.8%) | | Shares/ Par+ | | | Value
$ (000’s) | |
| |
Asset Backed Securities continued | | | | | |
SLM Private Education Loan Trust, Series2013-A, Class B 2.500%, 3/15/47 144A | | | 580,000 | | | | 577 | |
SLM Student Loan Trust, Series2007-7, Class A4 2.820%, (ICE LIBOR USD 3 Month plus 0.330%), 1/25/22 | | | 232,101 | | | | 228 | |
SLM Student Loan Trust, Series2008-4, Class A4 4.140%, (ICE LIBOR USD 3 Month plus 1.650%), 7/25/22 | | | 66,323 | | | | 67 | |
SLM Student Loan Trust, Series2008-5, Class A4 4.190%, (ICE LIBOR USD 3 Month plus 1.700%), 7/25/23 | | | 181,243 | | | | 184 | |
SLM Student Loan Trust, Series2008-9, Class A 3.990%, (ICE LIBOR USD 3 Month plus 1.500%), 4/25/23 | | | 130,604 | | | | 131 | |
SMB Private Education Loan Trust, Series2014-A, Class A3 3.955%, (ICE LIBOR USD 1 Month plus 1.500%), 4/15/32 144A | | | 665,000 | | | | 677 | |
SMB Private Education Loan Trust, Series2015-A, Class A2B 3.455%, (ICE LIBOR USD 1 Month plus 1.000%), 6/15/27 144A | | | 195,482 | | | | 196 | |
SMB Private Education Loan Trust, Series2016-C, Class A2B 3.555%, (ICE LIBOR USD 1 Month plus 1.100%), 9/15/34 144A | | | 712,625 | | | | 718 | |
Synchrony Credit Card Master Note Trust, Series2015-1, Class B 2.640%, 3/15/23 | | | 250,000 | | | | 248 | |
Synchrony Credit Card Master Note Trust, Series2015-4, Class B 2.620%, 9/15/23 | | | 305,000 | | | | 302 | |
Synchrony Credit Card Master Note Trust, Series2016-2, Class C 2.950%, 5/15/24 | | | 522,306 | | | | 516 | |
Synchrony Credit Card Master Note Trust, Series2018-1, Class C 3.360%, 3/15/24 | | | 445,000 | | | | 445 | |
Towd Point Mortgage Trust, Series2015-1, Class A1 3.000%, (AFC), 1/28/58 144A | | | 228,750 | | | | 225 | |
Towd Point Mortgage Trust, Series2015-4, Class A1B 2.750%, (AFC), 4/25/55 144A | | | 191,466 | | | | 189 | |
Towd Point Mortgage Trust, Series2015-5, Class A1B 2.750%, (AFC), 5/25/55 144A | | | 189,153 | | | | 186 | |
Towd Point Mortgage Trust, Series2016-1, Class A1B 2.750%, (AFC), 2/25/55 144A | | | 98,314 | | | | 97 | |
Towd Point Mortgage Trust, Series2016-1, Class A3B 3.000%, (AFC), 2/25/55 144A | | | 134,257 | | | | 133 | |
Towd Point Mortgage Trust, Series2016-2, Class A1A 2.750%, (AFC), 8/25/55 144A | | | 92,968 | | | | 91 | |
| | | | | | | | |
| Structured Products (35.8%) | | Shares/ Par+ | | | Value $ (000’s) | |
| |
Asset Backed Securities continued | | | | | |
Towd Point Mortgage Trust, Series2016-3, Class A1 2.250%, (AFC), 4/25/56 144A | | | 70,134 | | | | 69 | |
Towd Point Mortgage Trust, Series2017-1, Class A1 2.750%, (AFC), 10/25/56 144A | | | 363,244 | | | | 355 | |
Towd Point Mortgage Trust, Series2017-2, Class A1 2.750%, (AFC), 4/25/57 144A | | | 235,202 | | | | 230 | |
Towd Point Mortgage Trust, Series2017-3, Class A1 2.750%, (AFC), 7/25/57 144A | | | 520,853 | | | | 507 | |
Towd Point Mortgage Trust, Series2017-4, Class A1 2.750%, (AFC), 6/25/57 144A | | | 262,913 | | | | 256 | |
Towd Point Mortgage Trust, Series2017-6, Class A1 2.750%, (AFC), 10/25/57 144A | | | 952,066 | | | | 930 | |
Towd Point Mortgage Trust, Series2018-2, Class A1 3.250%, (AFC), 3/25/58 144A ß | | | 1,209,430 | | | | 1,191 | |
Towd Point Mortgage Trust, Series2018-5, Class A1A 3.250%, (AFC), 8/25/58 144A | | | 889,021 | | | | 878 | |
Verizon Owner Trust, Series2016-2A, Class A 1.680%, 5/20/21 144A | | | 445,121 | | | | 443 | |
Verizon Owner Trust, Series2016-2A, Class C 2.360%, 5/20/21 144A | | | 270,000 | | | | 267 | |
Verizon Owner Trust, Series2017-1A,Class C 2.650%, 9/20/21 144A | | | 150,000 | | | | 149 | |
Verizon Owner Trust, Series2017-3A, Class C 2.530%, 4/20/22 144A | | | 550,000 | | | | 544 | |
Verizon Owner Trust, Series2018-1A, Class C 3.200%, 9/20/22 144A | | | 450,000 | | | | 450 | |
Volvo Financial Equipment LLC, Series 2016-1A, Class A3 1.670%, 2/18/20 144A | | | 36,573 | | | | 36 | |
Volvo Financial Equipment LLC, Series 2018-1A, Class B 2.910%, 1/17/23 144A | | | 210,000 | | | | 210 | |
Volvo Financial Equipment Master Owner Trust, Series2017-A, Class A 2.955%, (ICE LIBOR USD 1 Month plus 0.500%), 11/15/22 144A | | | 115,000 | | | | 115 | |
Wheels SPV 2 LLC, Series2016-1A, Class A2 1.590%, 5/20/25 144A | | | 28,421 | | | | 28 | |
World Omni Automobile Lease Securitization Trust, Series2016-A, Class A3 1.450%, 8/15/19 | | | 91,366 | | | | 91 | |
World Omni Automobile Lease Securitization Trust, Series2018-A, Class B 3.060%, 5/15/23 | | | 130,000 | | | | 130 | |
| | | | | | | | |
Total | | | | | | | 59,201 | |
| | | | | | | | |
The Accompanying Notes are an Integral Part of the Financial Statements.
121
Short-Term Bond Portfolio
| | | | | | | | |
| Structured Products (35.8%) | | Shares/ Par+ | | | Value
$ (000’s) | |
| |
Mortgage Securities (16.5%) | | | | | |
Atrium Hotel Portfolio Trust, Series 2017- ATRM, Class A 3.385%, (1 Month LIBOR plus 0.930%), 12/15/36 144A | | | 520,000 | | | | 515 | |
BAMLL Commercial Mortgage Securities Trust, Series 2018-DSNY, Class A 3.305%, (1 Month LIBOR plus 0.850%), 9/15/34 144A | | | 460,000 | | | | 458 | |
Banc of America Commercial Mortgage Trust, Series 2017-BNK3, Class A1 1.957%, 2/15/50 | | | 106,222 | | | | 104 | |
BANK, Series 2017-BNK4, Class A1 2.002%, 5/15/50 | | | 430,898 | | | | 424 | |
BX Trust, Series2017-IMC, Class B 3.855%, (1 Month LIBOR plus 1.400%), 10/15/32 144A | | | 695,000 | | | | 694 | |
BX Trust, Series2017-IMC, Class D 4.705%, (1 Month LIBOR plus 2.250%), 10/15/32 144A | | | 225,000 | | | | 222 | |
BX Trust, Series2018-IND, Class A 3.205%, (1 Month LIBOR plus 0.750%), 11/15/35 144A | | | 484,277 | | | | 481 | |
CD Mortgage Trust, Series2016-CD2, Class A1 1.848%, 11/10/49 | | | 506,891 | | | | 498 | |
CD Mortgage Trust, Series2017-CD3, Class A1 1.965%, 2/10/50 | | | 107,507 | | | | 106 | |
Citigroup Commercial Mortgage Trust, Series 2014-GC25, Class A1 1.485%, 10/10/47 | | | 17,683 | | | | 18 | |
Citigroup Commercial Mortgage Trust, Series 2015-GC27, Class A1 1.353%, 2/10/48 | | | 19,625 | | | | 20 | |
Citigroup Commercial Mortgage Trust, Series 2015-GC31, Class A1 1.637%, 6/10/48 | | | 108,878 | | | | 108 | |
Citigroup Commercial Mortgage Trust, Series 2015-GC33, Class A1 1.643%, 9/10/58 | | | 194,404 | | | | 192 | |
Citigroup Commercial Mortgage Trust, Series2015-P1, Class A1 1.648%, 9/15/48 | | | 67,563 | | | | 67 | |
CLNS Trust, Series 2017-IKPR, Class A 3.200%, (1 Month LIBOR plus 0.800%), 6/11/32 144A | | | 240,000 | | | | 238 | |
CLNS Trust, Series 2017-IKPR, Class B 3.400%, (1 Month LIBOR plus 1.000%), 6/11/32 144A | | | 365,000 | | | | 360 | |
COLT Funding LLC, Series2017-1, Class A1 2.614%, (AFC), 5/27/47 144A | | | 198,101 | | | | 197 | |
COLT Funding LLC, Series2017-1, Class A3 3.074%, (AFC), 5/27/47 144A | | | 34,755 | | | | 34 | |
COLT Funding LLC, Series2017-2, Class A1A 2.415%, (AFC), 10/25/47 144A | | | 303,476 | | | | 301 | |
COLT Funding LLC, Series2017-2, Class A2A 2.568%, (AFC), 10/25/47 144A | | | 128,479 | | | | 128 | |
COLT Funding LLC, Series2017-2, Class A3A 2.773%, (AFC), 10/25/47 144A | | | 55,379 | | | | 55 | |
COLT Funding LLC, Series2018-3, Class A2 3.763%, (AFC), 10/26/48 144A | | | 262,859 | | | | 264 | |
| | | | | | | | |
| Structured Products (35.8%) | | Shares/ Par+ | | | Value
$ (000’s) | |
| |
Mortgage Securities continued | | | | | |
COLT Mortgage Loan Trust, Series2018-1, Class A1 2.930%, (AFC), 2/25/48 144A | | | 124,085 | | | | 123 | |
COLT Mortgage Loan Trust, Series2018-1, Class A3 3.084%, (AFC), 2/25/48 144A | | | 55,149 | | | | 55 | |
COLT Mortgage Loan Trust, Series2018-2, Class A1 3.470%, (AFC), 7/27/48 144A | | | 910,910 | | | | 907 | |
COLT Mortgage Loan Trust, Series2018-2, Class A2 3.542%, (AFC), 7/27/48 144A | | | 331,586 | | | | 330 | |
COLT Mortgage Loan Trust, Series2018-4, Class A1 4.006%, (AFC), 12/28/48 144A | | | 528,139 | | | | 531 | |
Commercial Mortgage Pass Through Certificates, Series 2015-CR22, Class A1 1.569%, 3/10/48 | | | 4,776 | | | | 5 | |
Commercial Mortgage Pass Through Certificates, Series 2015-CR25, Class A1 1.737%, 8/10/48 | | | 154,714 | | | | 153 | |
Commercial Mortgage Pass Through Certificates, Series 2015-LC23, Class A2 3.221%, 10/10/48 | | | 605,000 | | | | 607 | |
Commercial Mortgage Pass Through Certificates, Series2015-PC1, Class A1 1.667%, 7/10/50 | | | 142,807 | | | | 142 | |
Commercial Mortgage Pass Through Certificates, Series 2016-CR28, Class A1 1.770%, 2/10/49 | | | 19,729 | | | | 19 | |
Commercial Mortgage Pass Through Certificates, Series 2017-COR2, Class A1 2.111%, 9/10/50 | | | 136,208 | | | | 134 | |
CSAIL Commercial Mortgage Trust, Series2015-C1, Class A1 1.684%, 4/15/50 | | | 19,963 | | | | 20 | |
CSAIL Commercial Mortgage Trust, Series2015-C2, Class A1 1.454%, 6/15/57 | | | 79,211 | | | | 79 | |
CSAIL Commercial Mortgage Trust, Series2015-C3, Class A1 1.716%, 8/15/48 | | | 137,660 | | | | 136 | |
CSAIL Commercial Mortgage Trust, Series2016-C5, Class A1 1.746%, 11/15/48 | | | 34,121 | | | | 34 | |
CSAIL Commercial Mortgage Trust, Series2017-CX9, Class A1 2.024%, 9/15/50 | | | 80,992 | | | | 79 | |
Deephaven Residential Mortgage Trust, Series2017-1A, Class A3 3.485%, (CSTR, AFC), 12/26/46 144A | | | 60,025 | | | | 60 | |
Deephaven Residential Mortgage Trust, Series2017-3A, Class A1 2.577%, (CSTR, AFC), 10/25/47 144A | | | 286,957 | | | | 283 | |
Deephaven Residential Mortgage Trust, Series2017-3A, Class A2 2.711%, (CSTR, AFC), 10/25/47 144A | | | 47,826 | | | | 47 | |
Deephaven Residential Mortgage Trust, Series2017-3A, Class A3 2.813%, (CSTR, AFC), 10/25/47 144A | | | 47,826 | | | | 47 | |
The Accompanying Notes are an Integral Part of the Financial Statements.
122
Short-Term Bond Portfolio
| | | | | | | | |
| Structured Products (35.8%) | | Shares/ Par+ | | | Value $ (000’s) | |
| |
Mortgage Securities continued | | | | | |
Deephaven Residential Mortgage Trust, Series2018-1A, Class A1 2.976%, (AFC), 1/25/58 144A | | | 254,975 | | | | 252 | |
Deephaven Residential Mortgage Trust, Series2018-3A, Class A3 3.963%, (AFC), 8/25/58 144A | | | 92,501 | | | | 93 | |
FDIC Guaranteed Notes Trust, Series 2010-S2, Class 2A 2.570%, 7/29/47 144A | | | 101,542 | | | | 101 | |
Federal Home Loan Bank 2.625%, 5/28/20 ß | | | 2,240,000 | | | | 2,243 | |
Federal Home Loan Mortgage Corp.
3.500%, 3/1/46 | | | 91,022 | | | | 91 | |
5.500%, 5/1/22 | | | 74,732 | | | | 76 | |
6.000%, 9/1/34 | | | 2,614 | | | | 3 | |
6.000%, 2/1/35 | | | 48,675 | | | | 53 | |
6.000%, 9/1/35 | | | 16,328 | | | | 18 | |
6.000%, 1/1/38 | | | 2,488 | | | | 3 | |
Federal Home Loan Mortgage Corp., Series 2017- DNA1, Class M1 3.706%, (ICE LIBOR USD 1 Month plus 1.200%), 7/25/29 | | | 185,946 | | | | 187 | |
Federal Home Loan Mortgage Corp., Series 2017-DNA2, Class M1 3.706%, (ICE LIBOR USD 1 Month plus 1.200%), 10/25/29 | | | 610,241 | | | | 614 | |
Federal Home Loan Mortgage Corp., Series 2017-HQA1, Class M1 3.515%, (ICE LIBOR USD 1 Month plus 1.200%), 8/25/29 | | | 367,835 | | | | 369 | |
Federal Home Loan Mortgage Corp., Series 2017-HQA2, Class M1 3.306%, (ICE LIBOR USD 1 Month plus 0.800%), 12/25/29 | | | 180,388 | | | | 180 | |
Federal Home Loan Mortgage Corp., Series 2017-SC02, Class M1 3.863%, (CSTR), 5/25/47 144A | | | 109,861 | | | | 110 | |
Federal Home Loan Mortgage Corp., Series 2017-SPI1, Class M1 3.982%, 9/25/47 144A | | | 46,941 | | | | 47 | |
Federal Home Loan Mortgage Corp., Series 2018-DNA2, Class M1 3.306%, (ICE LIBOR USD 1 Month plus 0.800%), 12/25/30 144A | | | 980,000 | | | | 979 | |
Federal Home Loan Mortgage Corp., Series 2018-HQA2, Class M1 3.065%, (ICE LIBOR USD 1 Month plus 0.750%), 10/25/48 144A | | | 430,000 | | | | 429 | |
Federal Home Loan Mortgage Corp., Series 2018-SPI2, Class M1 3.819%, 5/25/48 144A | | | 194,380 | | | | 194 | |
Federal Home Loan Mortgage Corp., Series 2018-SPI3, Class M1 4.167%, 8/25/48 144A | | | 196,214 | | | | 197 | |
Federal Home Loan Mortgage Corp., Series 3713, Class PA 2.000%, 2/15/40 | | | 333,321 | | | | 327 | |
Federal Home Loan Mortgage Corp., Series 3718, Class BC 2.000%, 2/15/25 | | | 262,531 | | | | 259 | |
| | | | | | | | |
| Structured Products (35.8%) | | Shares/ Par+ | | | Value $ (000’s) | |
| |
Mortgage Securities continued | | | | | |
Federal Home Loan Mortgage Corp., Series 4092, Class CL 1.250%, 6/15/27 | | | 1,031,330 | | | | 980 | |
Federal Home Loan Mortgage Corp., Series DNA3, Class M1 3.256%, (ICE LIBOR USD 1 Month plus 0.750%), 3/25/30 | | | 380,812 | | | | 380 | |
Federal National Mortgage Association 1.500%, 7/30/20 ß | | | 1,310,000 | | | | 1,288 | |
2.500%, 10/1/22 | | | 417,852 | | | | 418 | |
2.500%, 12/1/22 | | | 107,571 | | | | 107 | |
3.000%, 6/1/22 | | | 111,255 | | | | 112 | |
3.000%, 4/1/24 | | | 305,766 | | | | 308 | |
3.500%, 5/1/27 | | | 684,069 | | | | 694 | |
3.500%, 5/1/33 | | | 644,923 | | | | 653 | |
3.500%, 4/1/46 | | | 933,295 | | | | 936 | |
3.500%, 2/1/48 | | | 245,747 | | | | 246 | |
4.000%, 6/1/33 | | | 322,285 | | | | 330 | |
4.000%, 8/1/47 ß | | | 1,240,521 | | | | 1,265 | |
4.000%, 7/1/48 | | | 936,737 | | | | 955 | |
4.500%, 5/1/40 | | | 142,149 | | | | 149 | |
4.500%, 9/1/40 | | | 132,083 | | | | 138 | |
4.500%, 2/1/44 | | | 480,625 | | | | 501 | |
4.500%, 9/1/48 | | | 147,068 | | | | 152 | |
5.000%, 10/1/33 | | | 173,519 | | | | 184 | |
5.000%, 5/1/48 | | | 361,179 | | | | 379 | |
5.000%, 9/1/48 | | | 322,386 | | | | 338 | |
5.500%, 8/1/37 | | | 97,363 | | | | 105 | |
5.500%, 2/1/38 | | | 361,097 | | | | 389 | |
6.000%, 8/1/22 | | | 34,296 | | | | 35 | |
6.000%, 3/1/34 | | | 82,625 | | | | 90 | |
6.000%, 8/1/34 | | | 229,828 | | | | 251 | |
6.000%, 11/1/34 | | | 8,793 | | | | 10 | |
6.000%, 12/1/34 | | | 2,859 | | | | 3 | |
6.000%, 4/1/35 | | | 5,349 | | | | 6 | |
6.000%, 5/1/38 | | | 3,677 | | | | 4 | |
6.000%, 10/1/40 | | | 185,737 | | | | 203 | |
6.500%, 7/1/32 | | | 26,603 | | | | 30 | |
6.500%, 12/1/32 | | | 30,633 | | | | 35 | |
Federal National Mortgage Association, Series2010-95, Class BK 1.500%, 2/25/20 | | | 64,258 | | | | 64 | |
Federal National Mortgage Association, Series2011-113, Class AG 2.500%, 11/25/26 | | | 200,837 | | | | 197 | |
Federal National Mortgage Association, Series2013-74, Class AD 2.000%, 7/25/23 | | | 245,291 | | | | 242 | |
Federal National Mortgage Association, Series2016-83, Class FA 3.006%, (1 Month LIBOR plus 0.500%), 11/25/46 | | | 311,104 | | | | 314 | |
Federal National Mortgage Association, Series2016-85, Class FA 3.006%, (1 Month LIBOR plus 0.500%), 11/25/46 | | | 443,181 | | | | 448 | |
Federal National Mortgage Association, Series2016-85, Class FG 3.006%, (1 Month LIBOR plus 0.500%), 11/25/46 | | | 483,088 | | | | 486 | |
The Accompanying Notes are an Integral Part of the Financial Statements.
123
Short-Term Bond Portfolio
| | | | | | | | |
| Structured Products (35.8%) | | Shares/ Par+ | | | Value
$ (000’s) | |
| |
Mortgage Securities continued | | | | | |
Federal National Mortgage Association, Series2016-C07, Class 2M1 3.806%, (ICE LIBOR USD 1 Month plus 1.300%), 5/25/29 | | | 64,176 | | | | 64 | |
Federal National Mortgage Association, Series2017-90, Class KA 3.000%, 11/25/47 | | | 462,675 | | | | 464 | |
Federal National Mortgage Association, Series2017-C01, Class 1M1 3.806%, (ICE LIBOR USD 1 Month plus 1.300%), 7/25/29 | | | 194,299 | | | | 195 | |
Federal National Mortgage Association, Series2017-C02, Class 2M1 3.656%, (ICE LIBOR USD 1 Month plus 1.150%), 9/25/29 | | | 348,569 | | | | 349 | |
Federal National Mortgage Association, Series2017-C03, Class 1M1 3.456%, (ICE LIBOR USD 1 Month plus 0.950%), 10/25/29 | | | 415,617 | | | | 416 | |
Federal National Mortgage Association, Series2017-C04, Class 2M1 3.356%, (ICE LIBOR USD 1 Month plus 0.850%), 11/25/29 | | | 302,833 | | | | 303 | |
Federal National Mortgage Association, Series2017-C05, Class 1M1 3.056%, (ICE LIBOR USD 1 Month plus 0.550%), 1/25/30 | | | 412,585 | | | | 412 | |
Federal National Mortgage Association, Series2017-C06, Class 1M1 3.256%, (ICE LIBOR USD 1 Month plus 0.750%), 2/25/30 | | | 326,176 | | | | 326 | |
Federal National Mortgage Association, Series2017-C06, Class 2M1 3.256%, (ICE LIBOR USD 1 Month plus 0.750%), 2/25/30 | | | 149,823 | | | | 150 | |
Federal National Mortgage Association, Series2018-44, Class PC 4.000%, 6/25/44 ß | | | 1,141,117 | | | | 1,172 | |
Federal National Mortgage Association, Series2018-C02, Class 2M1 3.156%, (ICE LIBOR USD 1 Month plus 0.650%), 8/25/30 | | | 220,318 | | | | 220 | |
Federal National Mortgage Association, Series2018-C03, Class 1M1 3.186%, (ICE LIBOR USD 1 Month plus 0.680%), 10/25/30 | | | 519,366 | | | | 518 | |
Federal National Mortgage Association, Series2018-C05, Class 1M1 3.226%, (ICE LIBOR USD 1 Month plus 0.720%), 1/25/31 | | | 470,751 | | | | 470 | |
Galton Funding Mortgage Trust, Series 2018-1, Class A33 3.500%, (AFC), 11/25/57 144A | | | 341,333 | | | | 335 | |
GCCFC Commercial Mortgage Trust, Series2006-GG7, Class AM 5.666%, (CSTR), 7/10/38 | | | 137,282 | | | | 138 | |
Government National Mortgage Association
3.500%, 12/20/42 | | | 9,039 | | | | 9 | |
3.500%, 9/20/43 | | | 131,237 | | | | 133 | |
5.000%, 3/20/34 | | | 481,545 | | | | 511 | |
5.000%, 1/20/48 | | | 171,470 | | | | 179 | |
| | | | | | | | |
| Structured Products (35.8%) | | Shares/ Par+ | | | Value
$ (000’s) | |
| |
Mortgage Securities continued | | | | | |
5.000%, 2/20/48 | | | 994,748 | | | | 1,036 | |
5.000%, 8/20/48 ß | | | 1,859,907 | | | | 1,938 | |
5.500%, 6/20/37 | | | 112,619 | | | | 120 | |
5.500%, 3/20/48 | | | 113,297 | | | | 119 | |
Great Wolf Trust, Series 2017-WOLF, Class A | | | | | | | | |
3.455%, (1 Month LIBOR plus 0.850%), 9/15/34 144A | | | 310,000 | | | | 305 | |
Great Wolf Trust, Series 2017-WOLF, Class C 3.925%, (1 Month LIBOR plus 1.320%), 9/15/34 144A | | | 455,000 | | | | 448 | |
GS Mortgage Securities Corp. Trust, Series 2018-FBLU, Class A 3.405%, (1 Month LIBOR plus 0.950%), 11/15/35 144A | | | 290,000 | | | | 289 | |
GS Mortgage Securities Corp. Trust, Series 2018-FBLU, Class D 4.455%, (1 Month LIBOR plus 2.000%), 11/15/35 144A | | | 150,000 | | | | 148 | |
GS Mortgage Securities Trust, Series 2014-EB1A, Class 2A1 2.456%, (CSTR), 7/25/44 144A | | | 48,555 | | | | 48 | |
GS Mortgage Securities Trust, Series 2015-GC28, Class A1 1.528%, 2/10/48 | | | 52,219 | | | | 52 | |
GS Mortgage Securities Trust, Series 2015-GC32, Class A1 1.593%, 7/10/48 | | | 88,590 | | | | 88 | |
GS Mortgage Securities Trust, Series 2016-GS3, Class A1 1.429%, 10/10/49 | | | 55,595 | | | | 55 | |
GS Mortgage Securities Trust, Series 2017-GS7, Class A1 1.950%, 8/10/50 | | | 278,315 | | | | 273 | |
Homeward Opportunities Fund I Trust, Series2018-1, Class A1 3.766%, (AFC), 6/25/48 144A | | | 415,030 | | | | 414 | |
Homeward Opportunities Fund I Trust, Series2018-1, Class A2 3.897%, (AFC), 6/25/48 144A | | | 335,556 | | | | 336 | |
Hospitality Mortgage Trust, Series2017-HIT, Class A 3.237%, (1 Month LIBOR plus 0.850%), 5/8/30 144A | | | 410,000 | | | | 404 | |
InTown Hotel Portfolio Trust, Series 2018-STAY, Class A 3.155%, (1 Month LIBOR plus 0.700%), 1/15/33 144A | | | 115,000 | | | | 114 | |
InTown Hotel Portfolio Trust, Series 2018-STAY, Class C 3.705%, (1 Month LIBOR plus 1.250%), 1/15/33 144A | | | 100,000 | | | | 99 | |
JPMBB Commercial Mortgage Securities Trust, Series2015-C27, Class A1 1.413%, 2/15/48 | | | 49,514 | | | | 49 | |
MetLife Securitization Trust, Series2017-1A, Class A 3.000%, (AFC), 4/25/55 144A | | | 251,488 | | | | 247 | |
Morgan Stanley Bank of America Merrill Lynch Trust, Series2014-C19, Class A1 1.573%, 12/15/47 | | | 56,613 | | | | 56 | |
The Accompanying Notes are an Integral Part of the Financial Statements.
124
Short-Term Bond Portfolio
| | | | | | | | |
| Structured Products (35.8%) | | Shares/ Par+ | | | Value
$ (000’s) | |
| |
Mortgage Securities continued | | | | | |
Morgan Stanley Bank of America Merrill Lynch Trust, Series2015-C24, Class A1 1.706%, 5/15/48 | | | 131,056 | | | | 129 | |
Morgan Stanley Bank of America Merrill Lynch Trust, Series2016-C30, Class A1 1.389%, 9/15/49 | | | 94,721 | | | | 93 | |
Morgan Stanley Capital I Trust, Series 2015- MS1, Class A1 1.638%, 5/15/48 | | | 132,154 | | | | 131 | |
Morgan Stanley Capital I Trust, Series 2017- CLS, Class B 3.305%, (1 Month LIBOR plus 0.850%), 11/15/34 144A | | | 365,000 | | | | 359 | |
Morgan Stanley Capital I Trust, Series 2017- CLS, Class C 3.455%, (1 Month LIBOR plus 1.000%), 11/15/34 144A | | | 290,000 | | | | 286 | |
New Residential Funding LLC, Series 2018- NQM1, Class A1 3.986%, (AFC), 11/25/48 144A | | | 707,654 | | | | 718 | |
RETL, Series2018-RVP, Class A 3.555%, (1 Month LIBOR plus 1.100%), 3/15/33 144A | | | 204,278 | | | | 204 | |
Sequoia Mortgage Trust, Series2018-CH1, Class A11 3.500%, (AFC), 2/25/48 144A | | | 580,349 | | | | 578 | |
Sequoia Mortgage Trust, Series2018-CH2, Class A3 4.000%, (AFC), 6/25/48 144A | | | 764,436 | | | | 771 | |
Sequoia Mortgage Trust, Series2018-CH3, Class A19 4.500%, (AFC), 8/25/48 144A | | | 211,144 | | | | 214 | |
Sequoia Mortgage Trust, Series2018-CH4, Class A2 4.000%, (AFC), 10/25/48 144A | | | 380,292 | | | | 385 | |
Slide, Series2018-FUN, Class D 4.305%, (1 Month LIBOR plus 1.850%), 6/15/31 144A | | | 382,416 | | | | 379 | |
STACR Trust, Series 2018-DNA3, Class M1 3.256%, (ICE LIBOR USD 1 Month plus 0.750%), 9/25/48 144A | | | 370,000 | | | | 369 | |
STACR Trust, Series 2018-HRP2, Class M1 3.160%, (ICE LIBOR USD 1 Month plus 0.850%), 2/25/47 144A | | | 175,000 | | | | 175 | |
STACR Trust, Series 2018-HRP2, Class M2 3.560%, (ICE LIBOR USD 1 Month plus 1.250%), 2/25/47 144A | | | 340,000 | | | | 340 | |
TIAA Seasoned Commercial Mortgage Trust, Series2007-C4, Class AJ 5.481%, (CSTR), 8/15/39 | | | 25,586 | | | | 26 | |
Verus Securitization Trust, Series2018-1, Class A1 2.929%, (AFC), 2/25/48 144A | | | 125,560 | | | | 124 | |
Verus Securitization Trust, Series2018-2, Class A1 3.677%, (AFC), 6/1/58 144A | | | 555,346 | | | | 554 | |
Verus Securitization Trust, Series2018-2, Class A2 3.779%, (AFC), 6/1/58 144A | | | 151,852 | | | | 152 | |
| | | | | | | | |
| Structured Products (35.8%) | | Shares/ Par+ | | | Value $ (000’s) | |
| |
Mortgage Securities continued | | | | | |
Verus Securitization Trust, Series2018-2, Class A3 3.830%, (AFC), 6/1/58 144A | | | 95,450 | | | | 96 | |
Verus Securitization Trust, Series2018-3, Class A1 4.108%, (AFC), 10/25/58 144A | | | 724,304 | | | | 720 | |
Wells Fargo Commercial Mortgage Trust, Series2015-C26, Class A1 1.454%, 2/15/48 | | | 11,453 | | | | 11 | |
Wells Fargo Commercial Mortgage Trust, Series2015-C28, Class A1 1.531%, 5/15/48 | | | 35,239 | | | | 35 | |
Wells Fargo Commercial Mortgage Trust, Series 2015-LC20, Class A1 1.471%, 4/15/50 | | | 49,761 | | | | 49 | |
Wells Fargo Commercial Mortgage Trust, Series 2015-NXS2, Class A2 3.020%, 7/15/58 | | | 530,000 | | | | 529 | |
Wells Fargo Commercial Mortgage Trust, Series2016-C32, Class A1 1.577%, 1/15/59 | | | 176,270 | | | | 174 | |
Wells Fargo Commercial Mortgage Trust, Series 2016-LC24, Class A1 1.441%, 10/15/49 | | | 42,782 | | | | 42 | |
Wells Fargo Commercial Mortgage Trust, Series2017-C38, Class A1 1.968%, 7/15/50 | | | 216,059 | | | | 212 | |
Wells Fargo Commercial Mortgage Trust, Series2017-C39, Class A1 1.975%, 9/15/50 | | | 142,188 | | | | 139 | |
| | | | | | | | |
Total | | | | | | | 50,521 | |
| | | | | | | | |
Total Structured Products | | | | | | | | |
(Cost: $110,502) | | | | | | | 109,722 | |
| | | | | | | | |
| | |
| Short-Term Investments (0.6%) | | | | | | |
| |
Commercial Paper (0.3%) | | | | | |
AT&T, Inc. 0.000%, 5/28/19 | | | 765,000 | | | | 755 | |
| | | | | | | | |
| | |
Total | | | | | | | 755 | |
| | | | | | | | |
| |
Money Market Funds (0.3%) | | | | | |
State Street Institutional U.S. Government Money Market Fund - Premier Class 2.270%# | | | 971,360 | | | | 971 | |
| | | | | | | | |
| | |
Total | | | | | | | 971 | |
| | | | | | | | |
| | |
Total Short-Term Investments | | | | | | | | |
(Cost: $1,727) | | | | | | | 1,726 | |
| | | | | | | | |
| | |
Total Investments (99.4%) | | | | | | | | |
(Cost: $306,915)@ | | | | | | | 304,674 | |
| | | | | | | | |
Other Assets, Less | | | | | | | | |
Liabilities (0.6%) | | | | | | | 1,867 | |
| | | | | | | | |
| | |
Net Assets (100.0%) | | | | | | | 306,541 | |
| | | | | | | | |
The Accompanying Notes are an Integral Part of the Financial Statements.
125
Short-Term Bond Portfolio
Exchange Traded or Centrally Cleared Derivatives
Futures
| | | | | | | | | | | | | | | | | | | | | | | | |
| Issuer | | Long/Short | | Currency | | Notional Par
(000’s) | | | Number of
Contracts | | Expiration
Date | | Notional
Value
(000’s) | | | Unrealized
Appreciation/
(Depreciation)
(000’s) | | | Variation Margin
(000’s) | |
Five-Year US Treasury Note Future | | Long | | USD | | | 2,400 | | | 24 | | 3/19 | | $ | 2,752 | | | $ | 47 | | | $ | 6 | |
Ten-Year US Treasury Note Future | | Short | | USD | | | 100 | | | 1 | | 3/19 | | | 122 | | | | (3 | ) | | | - | p |
Two-Year US Treasury Note Future | | Long | | USD | | | 58,600 | | | 293 | | 3/19 | | | 62,208 | | | | 396 | | | | 41 | |
| | | | | | | | | | | | | | | | | | | | |
| | | | | | | | | | | | | | | | | | $ | 440 | | | $ | 47 | |
| | | | | | | | | | | | | | | | | | | | |
| | | | | | | | | | | | | | | | | | | | | | | | | | | | |
| | | Financial Derivative Assets | | | Financial Derivative Liabilities | | | | |
| | | Variation Margin (000’s) | | | Variation Margin (000’s) | | | Market Value
(000’s) | |
| | | Swaps | | | Futures | | | Total | | | Swaps | | | Futures | | | Total | | | Options | |
Total Exchange-Traded or Centrally Cleared Derivatives | | $ | - | | | $ | 47 | | | $ | 47 | | | $ | - | | | $ | - | | | $ | - | | | $ | - | |
| | | | |
| + | All par is stated in U.S Dollar unless otherwise noted. |
144A Security exempt from registration under Rule 144A of the Securities Act of 1933. These securities may be resold as transactions exempt from registration, normally to qualified institutional buyers. At December 31, 2018 the value of these securities (in thousands) was $99,405 representing 32.2% of the net assets.
| § | Security was purchased pursuant to Regulation S under the Securities Act of 1933, which exempts from registration securities offered and sold outside of the United States. At December 31, 2018, the aggregate value of these securities was $3,508 (in thousands), representing 1.0% of net assets. |
| ß | Cash or securities with an aggregate value of $61,898 (in thousands) has been pledged as collateral for futures, swap contracts outstanding, short sales, when issued securities or written options on 12/31/2018. |
| p | Amount is less than one thousand. |
| # | 7-Day yield as of 12/31/2018. |
| @ | At December 31, 2018, the aggregate cost of investments, including derivatives, for federal tax purposes (in thousands) was $307,359 and the net unrealized depreciation of investments based on that cost was $2,245 which is comprised of $341 aggregate gross unrealized appreciation and $2,586 aggregate gross unrealized depreciation. |
The following is a summary of the inputs used in valuing the Portfolio’s assets and liabilities at December 31, 2018. See Note 3 for additional information on portfolio valuation.
| | | | | | | | | | | | | | |
| | | Valuation Inputs | | | |
| Description | | Level 1 – Quoted Prices | | | Level 2 – Other Significant Observable Inputs | | | Level 3 – Significant Unobservable Inputs | | | |
| | | (Amounts in thousands) | | | |
Assets: | | | | | | | | | | | | | | |
Municipal Bonds | | $ | - | | | $ | 474 | | | $ | - | | | |
Corporate Bonds | | | - | | | | 156,816 | | | | - | | | |
Governments | | | - | | | | 35,936 | | | | - | | | |
Structured Products | | | - | | | | 109,722 | | | | - | | | |
Short-Term Investments | | | | | | | | | | | | | | |
Money Market Funds | | | 971 | | | | - | | | | - | | | |
All Others | | | - | | | | 755 | | | | - | | | |
Other Financial Instruments^ | | | | | | | | | | | | | | |
Futures | | | 443 | | | | - | | | | - | | | |
Total Assets: | | $ | 1,414 | | | $ | 303,703 | | | $ | - | | | |
Liabilities: | | | | | | | | | | | | | | |
Other Financial Instruments^ | | | | | | | | | | | | | | |
Futures | | | (3 | ) | | | - | | | | - | | | |
Total Liabilities: | | $ | (3 | ) | | $ | - | | | $ | - | | | |
^ Other financial instruments are derivative instruments such as futures and forwards, which are valued at the unrealized appreciation (depreciation) on the instrument, and securities sold short, reverse repurchase agreements, written options and swaps contracts, which are valued at market value.
For the year ended December 31, 2018, there were transfers from Level 3 to Level 2 in the amount of $1,010 (in thousands). These transfers were the result of an increase in the quantity of observable inputs for securities that were previously not priced by a third party vendor.
The Accompanying Notes are an Integral Part of the Financial Statements.
126
Select Bond Portfolio (unaudited)
| | | | |
| Objective: | | Portfolio Strategy: | | Net Assets: |
| Provide as high a level of total return as is consistent with prudent investment risk. A secondary objective is to seek preservation of shareholders’ capital. | | Invest in a diversified portfolio of investment grade debt securities with maturities exceeding one year. | | $3.0 billion |
PORTFOLIO OVERVIEW
Mason Street Advisors, LLC (“Mason Street Advisors”), the investment adviser for the Select Bond Portfolio (the “Portfolio”), has engaged Wells Capital Management, Inc. (“Wells Capital”) to act assub-adviser for the Portfolio. Normally, the Portfolio invests in a diversified portfolio of investment grade debt securities with maturities exceeding one year. The Portfolio may also invest up to 10% of net assets innon-investment grade, high yield/high risk bonds (so called “junk bonds”) and up to 20% of net assets in foreign securities. Debt securities may be of any maturity or duration, but under normal market conditions, the Portfolio attempts to maintain an overall dollar-weighted average effective duration (a measure of the sensitivity of the price of the Portfolio’s fixed income securities to changes in interest rates) that is within 10% of the Bloomberg Barclays® U.S. Aggregate Index. The Portfolio uses a fundamental, relative value investment approach to construct the portfolio of investments. The Portfolio invests in debt securities that it believes offer competitive returns and are undervalued, offering additional income and/or price appreciation potential relative to other debt securities of similar credit quality and interest rate sensitivity. The Portfolio may engage in active and frequent trading of portfolio securities to achieve its investment objectives.
MARKET OVERVIEW
The year 2018 was characterized by increasing momentum in the U.S. economy, with Europe and Asia showing signs of softening following a period of synchronized global growth in 2017. Well-telegraphed U.S. monetary policy led to four rate hikes, which produced continued weakness among short maturity bonds as the yield curve (a graphical representation of bond yields at different maturities) continued to flatten. Later in the year, investors were concerned by trade tensions and political uncertainty, including Brexit, the Italian budget and a partial closure of the federal government.
PORTFOLIO RESULTS
The Portfolio returned (0.21%) for the twelve months ended December 31, 2018. By comparison, the Portfolio’s benchmark, the Bloomberg Barclays® U.S. Aggregate Index (the “Index”), returned 0.01%. (The Index is unmanaged, cannot be invested in directly and does not incur expenses.) According to Lipper® Analytical Services, Inc., an independent mutual fund ranking agency, the average return in 2018 of the Core Bond Funds peer group was (0.62%).
In Credit, sector and security selection detracted from performance. Contributors were concentrated across names in the Consumer, Cable/Media, Health Care and Sovereign subsectors. Notable contributors included Anheuser-Busch InBev S.A./N.V., CVS Health Corp., Comcast Corp., Nestlé S.A., Walmart Inc., TransCanada Corp. and United Mexican States. Meanwhile, detractors were concentrated across names in thenon-U.S. Banks, Automotive, Technology and Foreign Agency subsectors. Notable detractors included Intesa Sanpaolo S.p.A., Ford Motor Co., British American Tobacco plc and PG&E Corp.
In agency mortgage-backed securities (“MBS”),bottom-up security selection in collateralized mortgage obligations (“CMOs”) and Ginnie Maes contributed to performance. Ginnie/Fannie swaps were volatile throughout the year and provided a good opportunity for trading the sector. The CMO market also proved to be a good source of relative performance again this year, as the Portfolio was able to exploit several security-level opportunities. Positioning in20-year,15-year and30-year mortgages detracted from performance.
In consumer asset-backed securities (“ABS”), an overweight to the sector and security selection were contributors to relative performance, with Federal Family Education Loan Program student loans leading the way. Positioning in private credit student loans and rental car ABS also contributed. An underweight to lower-rated commercial mortgage-backed securities detracted from performance.
PORTFOLIO MANAGER OUTLOOK
The following forward-looking comments are the opinion of Wells Capital, the Portfolio’ssub-adviser.
127
Select Bond Portfolio (unaudited)
Despite market concerns, the U.S. economy slowed only modestly in December, suggesting good momentum heading into the first quarter of 2019. Although manufacturing activity expanded at a slower rate in December, measures of consumer activity remained strong, including auto sales, holiday shopping and employment. Recent declines in commodity prices and interest rates could help consumer spending while stabilizing corporate margins. In contrast, international indicators continue to soften and will need to be closely watched, particularly in European markets affected by political risks, and China, which appeared to have a sharp pullback in consumption and manufacturing amid trade and debt concerns.
U.S. inflation remains relatively muted. The U.S. Personal Consumption Expenditure Core Price Index increased by 0.1% in November, keeping the year-over-year figure to below 2%. Labor costs have picked up somewhat, but ongoing job availability and wage increases appear to be contributing to the growth of the available workforce, mitigating concerns about wage inflation. After a quiet period for monetary policy developments, recent communications from the U.S. Federal Reserve suggest a degree of uncertainty heading into the first quarter, and conflicting statements have added to market volatility.
Consistent with ourbottom-up process, we maintain a neutral duration (a measure of the Portfolio’s relative sensitivity to interest rates). We continue to maintain an overweight position in ABS due to stable fundamentals within the core sectors of the ABS market. We held a small overweight to credit. We maintained our overweight allocation to agency MBS, with additional security selection in recent months. We remain nimble and agile, and we stand ready to take advantage of security selection opportunities as they arise.
Relative Performance
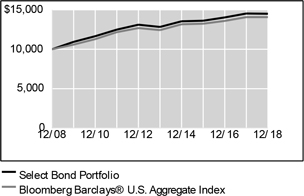
| | | | | | | | | | | | |
Average Annual Total Returns
For Periods Ended December 31, 2018 | |
| | | 1 Year | | | 5 Years | | | 10 Years | |
Select Bond Portfolio | | | -0.21 | % | | | 2.48 | % | | | 3.79 | % |
Bloomberg Barclays® U.S.
Aggregate Index | | | 0.01 | % | | | 2.52 | % | | | 3.48 | % |
Lipper® Variable Insurance
Products (VIP) Core Bond Funds Average | | | -0.62 | % | | | 2.31 | % | | | 4.10 | % |
The performance data quoted represents past performance. Past performance is historical and does not guarantee future performance. Investment return and principal value will fluctuate, so that shares, when redeemed, may be worth more or less than their original cost. Current performance may be lower or higher than the performance data quoted. For the most recentmonth-end performance information visitwww.northwesternmutual.com.
This chart assumes an initial investment of $10,000 made on 12/31/08. Returns shown reflect fee waivers, deductions for management and other portfolio expenses, and reinvestment of all dividends. In the absence of fee waivers, total return would be reduced. Returns exclude deductions for separate account sale loads and account fees. Please refer to the Benchmark Definitions section of this report for information about the indices cited in the above chart and graph.
Return of principal is not guaranteed. Bond funds have the same interest rate, inflation and credit risks that are associated with the underlying bonds owned by the Portfolio. When interest rates rise, bond prices fall. With a fixed income fund, when interest rates rise, the value of the fund’s existing bonds drops, which could negatively affect overall fund performance. A portion of the Portfolio’s assets may be invested in lower quality debt securities which may present a significant risk for loss of principal and interest. High yield bonds generally have greater price swings and higher default risks than investment grade bonds.
Investing in bonds issued by foreign corporations and governments carries additional risk, including foreign currency risk, and may increase the volatility of the Portfolio’s performance.
The U.S. federal funds rate has been subject to moderate and steady increases over the course of the last three years. A significant rise in interest rates over a short period of time could cause significant losses in the market value of the Portfolio’s fixed income investments.
The Portfolio may engage in active and frequent trading of portfolio securities to achieve its investment objectives.
128
Select Bond Portfolio (unaudited)
Active and frequent trading may cause higher brokerage expenses and other transaction costs, which may adversely affect performance.
Top 10 Fixed Income Holdings12/31/18
| | | | | | | | |
| Security Description | | % of Net Assets | | | | |
US Treasury, Various | | | 26.9 | % | | | | |
Federal National Mortgage Association, Various | | | 14.4 | % | | | | |
Government National Mortgage Association, Various | | | 8.9 | % | | | | |
Federal Home Loan Mortgage Corp., Various | | | 6.0 | % | | | | |
Comcast Corp., Various | | | 0.9 | % | | | | |
Bank of America Corp., Various | | | 0.8 | % | | | | |
Federal National Mortgage Association, Series2018-45, Class GA, 3%, 6/25/48 | | | 0.7 | % | | | | |
Federal National Mortgage Association, Series2018-50, Class BA, 3%, 7/25/48 | | | 0.7 | % | | | | |
JPMorgan Chase & Co., Various | | | 0.7 | % | | | | |
CVS Health Corp., Various | | | 0.6 | % | | | | |
Sector Allocation12/31/18
| | | | | | | | |
| Sector | | % of Net Assets | | | | |
Structured Products | | | 52.7 | % | | | | |
Governments | | | 27.8 | % | | | | |
Corporate Bonds | | | 23.5 | % | | | | |
Municipal Bonds | | | 0.5 | % | | | | |
Short-Term Investments & Other Net Assets | | | -4.5 | % | | | | |
Sector Allocation and Top 10 Holdings are subject to change.
Consistent with the Portfolio’s stated parameters, no more than 20% of the Portfolio is invested in foreign securities, and no more than 10% is invested in high yield securities.
129
Select Bond Portfolio
Schedule of Investments
December 31, 2018
| | | | | | | | |
| Corporate Bonds (23.5%) | | Shares/
Par+ | | | Value
$ (000’s) | |
| |
Basic Materials (0.8%) | | | | | |
Barrick North America Finance LLC 5.700%, 5/30/41 | | | 1,321,000 | | | | 1,394 | |
CF Industries, Inc. | | | | | | | | |
3.400%, 12/1/21 144A | | | 3,357,000 | | | | 3,291 | |
4.500%, 12/1/26 144A | | | 2,259,000 | | | | 2,209 | |
The Dow Chemical Co. | | | | | | | | |
4.800%, 11/30/28 144A | | | 1,458,000 | | | | 1,484 | |
5.550%, 11/30/48 144A | | | 127,000 | | | | 128 | |
DowDuPont, Inc. 5.419%, 11/15/48 | | | 1,246,000 | | | | 1,296 | |
Goldcorp Inc. 5.450%, 6/9/44 | | | 853,000 | | | | 848 | |
International Paper Co. | | | | | | | | |
4.350%, 8/15/48 | | | 972,000 | | | | 833 | |
5.150%, 5/15/46 | | | 2,883,000 | | | | 2,710 | |
Nucor Corp. | | | | | | | | |
3.950%, 5/1/28 | | | 725,000 | | | | 715 | |
4.400%, 5/1/48 | | | 554,000 | | | | 532 | |
Sherwin-Williams Co. 2.750%, 6/1/22 | | | 1,585,000 | | | | 1,534 | |
Southern Copper Corp. | | | | | | | | |
3.875%, 4/23/25 | | | 1,262,000 | | | | 1,214 | |
5.875%, 4/23/45 | | | 1,344,000 | | | | 1,375 | |
7.500%, 7/27/35 | | | 525,000 | | | | 613 | |
Suzano Austria GmbH 7.000%, 3/16/47 144A | | | 821,000 | | | | 842 | |
Syngenta Finance NV 5.676%, 4/24/48 144A | | | 1,360,000 | | | | 1,126 | |
Westlake Chemical Corp. 3.600%, 8/15/26 | | | 1,118,000 | | | | 1,026 | |
| | | | | | | | |
Total | | | | | | | 23,170 | |
| | | | | | | | |
| |
Chemicals (0.0%) | | | | | |
Eastman Chemical Co. 4.650%, 10/15/44 | | | 693,000 | | | | 620 | |
| | | | | | | | |
Total | | | | | | | 620 | |
| | | | | | | | |
| |
Communications (2.2%) | | | | | |
21st Century Fox America, Inc. 4.950%, 10/15/45 | | | 1,057,000 | | | | 1,160 | |
Amazon.com, Inc. 2.800%, 8/22/24 | | | 2,076,000 | | | | 2,018 | |
AT&T, Inc. | | | | | | | | |
3.400%, 5/15/25 | | | 2,227,000 | | | | 2,093 | |
4.100%, 2/15/28 | | | 2,775,000 | | | | 2,669 | |
4.750%, 5/15/46 | | | 536,000 | | | | 477 | |
5.150%, 2/15/50 | | | 3,476,000 | | | | 3,224 | |
5.250%, 3/1/37 | | | 2,082,000 | | | | 2,047 | |
5.450%, 3/1/47 | | | 1,345,000 | | | | 1,315 | |
Charter Communications Operating LLC / Charter Communications Operating Capital Corp. | | | | | | | | |
4.464%, 7/23/22 | | | 1,070,000 | | | | 1,080 | |
5.375%, 4/1/38 | | | 954,000 | | | | 889 | |
5.375%, 5/1/47 | | | 742,000 | | | | 673 | |
5.750%, 4/1/48 | | | 2,856,000 | | | | 2,678 | |
| | | | | | | | |
| Corporate Bonds (23.5%) | | Shares/
Par+ | | | Value
$ (000’s) | |
| |
Communications continued | | | | | |
Comcast Corp. 3.300%, 10/1/20 | | | 6,213,000 | | | | 6,236 | |
3.450%, 10/1/21 | | | 4,992,000 | | | | 5,042 | |
3.700%, 4/15/24 | | | 4,327,000 | | | | 4,353 | |
3.950%, 10/15/25 | | | 3,052,000 | | | | 3,090 | |
4.000%, 3/1/48 | | | 1,663,000 | | | | 1,518 | |
4.150%, 10/15/28 | | | 2,496,000 | | | | 2,536 | |
4.600%, 10/15/38 | | | 2,328,000 | | | | 2,353 | |
4.950%, 10/15/58 | | | 2,446,000 | | | | 2,491 | |
Telefonica Emisiones SAU 5.213%, 3/8/47 | | | 795,000 | | | | 729 | |
Time Warner Cable LLC 6.550%, 5/1/37 | | | 775,000 | | | | 796 | |
Verizon Communications, Inc. 4.125%, 8/15/46 | | | 3,225,000 | | | | 2,849 | |
4.150%, 3/15/24 | | | 1,093,000 | | | | 1,116 | |
4.272%, 1/15/36 | | | 1,048,000 | | | | 982 | |
4.329%, 9/21/28 | | | 1,845,000 | | | | 1,854 | |
4.400%, 11/1/34 | | | 2,373,000 | | | | 2,289 | |
4.672%, 3/15/55 | | | 556,000 | | | | 511 | |
5.500%, 3/16/47 | | | 1,617,000 | | | | 1,722 | |
Vodafone Group PLC 3.750%, 1/16/24 | | | 2,114,000 | | | | 2,084 | |
The Walt Disney Co. 4.125%, 6/1/44 | | | 557,000 | | | | 552 | |
Warner Media LLC 5.350%, 12/15/43 | | | 548,000 | | | | 529 | |
5.375%, 10/15/41 | | | 876,000 | | | | 845 | |
Warner Media, LLC 3.800%, 2/15/27 | | | 889,000 | | | | 835 | |
| | | | | | | | |
Total | | | | | | | 65,635 | |
| | | | | | | | |
| |
Consumer, Cyclical (1.4%) | | | | | |
Alimentation Couche-Tard, Inc. 4.500%, 7/26/47 144A | | | 196,000 | | | | 180 | |
Costco Wholesale Corp. 2.750%, 5/18/24 | | | 2,405,000 | | | | 2,339 | |
3.000%, 5/18/27 | | | 3,749,000 | | | | 3,618 | |
Delta Air Lines, Inc. 3.800%, 4/19/23 | | | 1,995,000 | | | | 1,963 | |
4.375%, 4/19/28 | | | 759,000 | | | | 728 | |
Ford Motor Co. 5.291%, 12/8/46 | | | 1,097,000 | | | | 902 | |
Ford Motor Credit Co. LLC 3.815%, 11/2/27 | | | 550,000 | | | | 464 | |
4.140%, 2/15/23 | | | 640,000 | | | | 608 | |
General Motors Co. 5.000%, 10/1/28 | | | 556,000 | | | | 527 | |
5.150%, 4/1/38 | | | 1,051,000 | | | | 899 | |
5.950%, 4/1/49 | | | 3,470,000 | | | | 3,133 | |
GLP Capital LP / GLP Financing II, Inc. 5.300%, 1/15/29 | | | 2,186,000 | | | | 2,138 | |
Starbucks Corp. | | | | | | | | |
3.800%, 8/15/25 | | | 6,031,000 | | | | 5,967 | |
4.000%, 11/15/28 | | | 2,546,000 | | | | 2,516 | |
The Accompanying Notes are an Integral Part of the Financial Statements.
130
Select Bond Portfolio
| | | | | | | | |
| Corporate Bonds (23.5%) | | Shares/
Par+ | | | Value
$ (000’s) | |
| |
Consumer, Cyclical continued | | | | | |
Volkswagen Group of America Finance LLC | | | | | | | | |
4.750%, 11/13/28 144A | | | 3,637,000 | | | | 3,525 | |
Walmart, Inc. | | | | | | | | |
3.400%, 6/26/23 | | | 2,952,000 | | | | 2,982 | |
3.700%, 6/26/28 | | | 7,998,000 | | | | 8,119 | |
4.050%, 6/29/48 | | | 558,000 | | | | 557 | |
| | | | | | | | |
Total | | | | | | | 41,165 | |
| | | | | | | | |
| |
Consumer,Non-cyclical (4.9%) | | | | | |
Abbott Laboratories | | | | | | | | |
3.750%, 11/30/26 | | | 2,009,000 | | | | 1,985 | |
4.900%, 11/30/46 | | | 1,662,000 | | | | 1,747 | |
AbbVie, Inc. | | | | | | | | |
2.500%, 5/14/20 | | | 4,213,000 | | | | 4,172 | |
3.750%, 11/14/23 | | | 2,414,000 | | | | 2,402 | |
4.250%, 11/14/28 | | | 3,042,000 | | | | 2,955 | |
4.875%, 11/14/48 | | | 2,555,000 | | | | 2,387 | |
Anheuser-Busch InBev Worldwide, Inc. | | | | | | | | |
3.500%, 1/12/24 | | | 6,636,000 | | | | 6,483 | |
4.900%, 2/1/46 144A | | | 2,949,000 | | | | 2,738 | |
Anthem, Inc. 2.950%, 12/1/22 | | | 1,221,000 | | | | 1,191 | |
Avery Dennison Corp. 4.875%, 12/6/28 | | | 2,240,000 | | | | 2,261 | |
BAT Capital Corp. | | | | | | | | |
2.297%, 8/14/20 | | | 1,681,000 | | | | 1,641 | |
2.764%, 8/15/22 | | | 1,011,000 | | | | 955 | |
4.540%, 8/15/47 | | | 232,000 | | | | 185 | |
Becton Dickinson and Co. | | | | | | | | |
2.404%, 6/5/20 | | | 3,690,000 | | | | 3,634 | |
3.700%, 6/6/27 | | | 1,849,000 | | | | 1,748 | |
3.734%, 12/15/24 | | | 2,938,000 | | | | 2,838 | |
4.669%, 6/6/47 | | | 766,000 | | | | 721 | |
4.685%, 12/15/44 | | | 2,674,000 | | | | 2,506 | |
Boston Scientific Corp. 4.000%, 3/1/28 | | | 556,000 | | | | 540 | |
Celgene Corp. | | | | | | | | |
2.750%, 2/15/23 | | | 3,945,000 | | | | 3,775 | |
2.875%, 2/19/21 | | | 1,093,000 | | | | 1,082 | |
4.350%, 11/15/47 | | | 688,000 | | | | 580 | |
4.550%, 2/20/48 | | | 2,320,000 | | | | 2,013 | |
Church & Dwight Co., Inc. | | | | | | | | |
2.450%, 8/1/22 | | | 843,000 | | | | 815 | |
3.150%, 8/1/27 | | | 1,389,000 | | | | 1,307 | |
3.950%, 8/1/47 | | | 414,000 | | | | 377 | |
Constellation Brands, Inc. | | | | | | | | |
3.200%, 2/15/23 | | | 539,000 | | | | 523 | |
3.600%, 2/15/28 | | | 2,810,000 | | | | 2,589 | |
4.400%, 11/15/25 | | | 169,000 | | | | 169 | |
4.500%, 5/9/47 | | | 200,000 | | | | 183 | |
4.650%, 11/15/28 | | | 1,884,000 | | | | 1,877 | |
5.250%, 11/15/48 | | | 1,821,000 | | | | 1,830 | |
CVS Health Corp. | | | | | | | | |
3.700%, 3/9/23 | | | 5,544,000 | | | | 5,484 | |
4.000%, 12/5/23 | | | 1,649,000 | | | | 1,654 | |
4.300%, 3/25/28 | | | 5,544,000 | | | | 5,429 | |
4.780%, 3/25/38 | | | 3,375,000 | | | | 3,238 | |
5.050%, 3/25/48 | | | 2,278,000 | | | | 2,219 | |
Danone SA 2.947%, 11/2/26 144A | | | 6,678,000 | | | | 6,096 | |
| | | | | | | | |
| Corporate Bonds (23.5%) | | Shares/
Par+ | | | Value
$ (000’s) | |
| |
Consumer,Non-cyclical continued | | | | | |
Edwards Lifesciences Corp. 4.300%, 6/15/28 | | | 3,680,000 | | | | 3,723 | |
ERAC USA Finance LLC 4.500%, 2/15/45 144A | | | 199,000 | | | | 187 | |
GlaxoSmithKline Capital, Inc. 3.375%, 5/15/23 | | | 5,452,000 | | | | 5,472 | |
Halfmoon Parent, Inc. | | | | | | | | |
3.400%, 9/17/21 144A | | | 2,492,000 | | | | 2,486 | |
3.750%, 7/15/23 144A | | | 4,237,000 | | | | 4,223 | |
4.375%, 10/15/28 144A | | | 925,000 | | | | 931 | |
4.800%, 8/15/38 144A | | | 242,000 | | | | 240 | |
4.900%, 12/15/48 144A | | | 1,514,000 | | | | 1,483 | |
Kraft Heinz Foods Co. | | | | | | | | |
2.800%, 7/2/20 | | | 3,316,000 | | | | 3,287 | |
4.375%, 6/1/46 | | | 2,334,000 | | | | 1,925 | |
5.200%, 7/15/45 | | | 387,000 | | | | 354 | |
Nestle Holdings, Inc. | | | | | | | | |
3.100%, 9/24/21 144A | | | 3,673,000 | | | | 3,694 | |
3.350%, 9/24/23 144A | | | 4,443,000 | | | | 4,487 | |
3.500%, 9/24/25 144A | | | 2,406,000 | | | | 2,418 | |
3.625%, 9/24/28 144A | | | 2,981,000 | | | | 3,003 | |
3.900%, 9/24/38 144A | | | 1,265,000 | | | | 1,228 | |
4.000%, 9/24/48 144A | | | 1,652,000 | | | | 1,623 | |
Pfizer, Inc. | | | | | | | | |
4.100%, 9/15/38 | | | 388,000 | | | | 389 | |
4.200%, 9/15/48 | | | 4,051,000 | | | | 4,116 | |
Reynolds American, Inc. 5.850%, 8/15/45 | | | 2,136,000 | | | | 1,987 | |
Sanofi 3.375%, 6/19/23 | | | 4,029,000 | | | | 4,048 | |
3.625%, 6/19/28 | | | 5,308,000 | | | | 5,388 | |
UnitedHealth Group, Inc. | | | | | | | | |
3.500%, 2/15/24 | | | 1,828,000 | | | | 1,840 | |
3.700%, 12/15/25 | | | 1,219,000 | | | | 1,232 | |
| | | | | | | | |
Total | | | | | | | 144,093 | |
| | | | | | | | |
| |
Energy (2.7%) | | | | | |
Anadarko Petroleum Corp. 4.850%, 3/15/21 | | | 991,000 | | | | 1,015 | |
Andeavor Logistics LP / Tesoro Logistics Finance Corp. 3.500%, 12/1/22 | | | 1,266,000 | | | | 1,225 | |
BP Capital Markets America, Inc. | | | | | | | | |
3.796%, 9/21/25 | | | 3,325,000 | | | | 3,343 | |
3.937%, 9/21/28 | | | 8,295,000 | | | | 8,329 | |
Cenovus Energy, Inc. 4.250%, 4/15/27 | | | 118,000 | | | | 108 | |
Cimarex Energy Co. 4.375%, 6/1/24 | | | 3,817,000 | | | | 3,795 | |
Ecopetrol SA 5.875%, 5/28/45 | | | 752,000 | | | | 709 | |
Enbridge Energy Partners LP 7.375%, 10/15/45 | | | 615,000 | | | | 763 | |
Enbridge, Inc. 2.900%, 7/15/22 | | | 2,317,000 | | | | 2,242 | |
Encana Corp. | | | | | | | | |
6.500%, 2/1/38 | | | 1,708,000 | | | | 1,854 | |
6.625%, 8/15/37 | | | 1,025,000 | | | | 1,094 | |
Energy Transfer Equity LP 5.500%, 6/1/27 | | | 2,596,000 | | | | 2,531 | |
The Accompanying Notes are an Integral Part of the Financial Statements.
131
Select Bond Portfolio
| | | | | | | | |
| Corporate Bonds (23.5%) | | Shares/
Par+ | | | Value
$ (000’s) | |
| |
Energy continued | | | | | |
Energy Transfer Partners LP | | | | | | | | |
6.125%, 12/15/45 | | | 1,890,000 | | | | 1,850 | |
6.500%, 2/1/42 | | | 597,000 | | | | 596 | |
Enterprise Products Operating LLC 3.500%, 2/1/22 | | | 3,662,000 | | | | 3,672 | |
Hess Corp. 5.800%, 4/1/47 | | | 934,000 | | | | 840 | |
HollyFrontier Corp. 5.875%, 4/1/26 | | | 1,439,000 | | | | 1,455 | |
Kinder Morgan Energy Partners LP 4.250%, 9/1/24 | | | 843,000 | | | | 840 | |
Kinder Morgan, Inc. | | | | | | | | |
5.000%, 2/15/21 144A | | | 3,380,000 | | | | 3,462 | |
5.550%, 6/1/45 | | | 1,335,000 | | | | 1,324 | |
Marathon Petroleum Corp. 4.750%, 9/15/44 | | | 1,197,000 | | | | 1,057 | |
MPLX LP | | | | | | | | |
4.125%, 3/1/27 | | | 1,662,000 | | | | 1,583 | |
4.700%, 4/15/48 | | | 510,000 | | | | 442 | |
5.200%, 3/1/47 | | | 1,093,000 | | | | 1,007 | |
5.500%, 2/15/49 | | | 1,474,000 | | | | 1,436 | |
Newfield Exploration Co. | | | | | | | | |
5.625%, 7/1/24 | | | 4,161,000 | | | | 4,213 | |
5.750%, 1/30/22 | | | 759,000 | | | | 767 | |
Northwest Pipeline LLC 4.000%, 4/1/27 | | | 2,903,000 | | | | 2,823 | |
Petroleos Mexicanos | | | | | | | | |
2.460%, 12/15/25 | | | 4,493,300 | | | | 4,446 | |
6.350%, 2/12/48 | | | 1,093,000 | | | | 871 | |
6.500%, 3/13/27 | | | 1,776,000 | | | | 1,669 | |
6.500%, 1/23/29 | | | 1,671,000 | | | | 1,558 | |
6.750%, 9/21/47 | | | 1,275,000 | | | | 1,054 | |
Schlumberger Finance Canada, Ltd. 2.650%, 11/20/22 144A | | | 4,400,000 | | | | 4,270 | |
Schlumberger Holdings Corp. 4.000%, 12/21/25 144A | | | 3,048,000 | | | | 3,010 | |
Shell International Finance BV 3.500%, 11/13/23 | | | 3,477,000 | | | | 3,516 | |
TransCanada PipeLines, Ltd. 5.100%, 3/15/49 | | | 2,683,000 | | | | 2,667 | |
The Williams Cos., Inc. | | | | | | | | |
4.550%, 6/24/24 | | | 1,358,000 | | | | 1,371 | |
5.750%, 6/24/44 | | | 662,000 | | | | 666 | |
Williams Partners LP 5.400%, 3/4/44 | | | 1,102,000 | | | | 1,052 | |
| | | | | | | | |
Total | | | | | | | 80,525 | |
| | | | | | | | |
| |
Financial (6.6%) | | | | | |
AIB Group PLC 4.750%, 10/12/23 144A | | | 4,697,000 | | | | 4,650 | |
Air Lease Corp. 3.625%, 4/1/27 | | | 2,392,000 | | | | 2,141 | |
3.625%, 12/1/27 | | | 2,892,000 | | | | 2,556 | |
4.625%, 10/1/28 | | | 163,000 | | | | 154 | |
American International Group, Inc. | | | | | | | | |
4.200%, 4/1/28 | | | 1,699,000 | | | | 1,640 | |
4.375%, 1/15/55 | | | 852,000 | | | | 708 | |
4.500%, 7/16/44 | | | 928,000 | | | | 829 | |
6.250%, 5/1/36 | | | 1,004,000 | | | | 1,094 | |
Aon PLC 3.875%, 12/15/25 | | | 1,868,000 | | | | 1,844 | |
| | | | | | | | |
| Corporate Bonds (23.5%) | | Shares/
Par+ | | | Value
$ (000’s) | |
| |
Financial continued | | | | | |
Banco Santander SA | | | | | | | | |
3.800%, 2/23/28 | | | 2,200,000 | | | | 1,958 | |
4.379%, 4/12/28 | | | 2,600,000 | | | | 2,429 | |
Bank of America Corp. | | | | | | | | |
3.248%, 10/21/27 | | | 2,661,000 | | | | 2,461 | |
3.300%, 1/11/23 | | | 3,047,000 | | | | 3,001 | |
3.593%, (3 Month LIBOR plus 1.370%), 7/21/28 | | | 1,066,000 | | | | 1,011 | |
3.705%, (ICE LIBOR USD 3 Month plus 1.512%), 4/24/28 | | | 4,119,000 | | | | 3,953 | |
3.864%, (ICE LIBOR USD 3 Month plus 0.940%), 7/23/24 | | | 9,844,000 | | | | 9,820 | |
4.000%, 4/1/24 | | | 2,760,000 | | | | 2,775 | |
4.450%, 3/3/26 | | | 1,717,000 | | | | 1,699 | |
Bank of Ireland Group PLC 4.500%, 11/25/23 144A | | | 2,955,000 | | | | 2,890 | |
Banque Federative du Credit Mutuel SA 3.750%, 7/20/23 144A | | | 3,669,000 | | | | 3,662 | |
Barclays PLC 4.610%, (ICE LIBOR USD 3 Month plus 1.400%), 2/15/23 | | | 4,285,000 | | | | 4,249 | |
BNP Paribas SA 3.500%, 3/1/23 144A | | | 5,547,000 | | | | 5,378 | |
Boston Properties LP 4.500%, 12/1/28 | | | 1,998,000 | | | | 2,044 | |
Brighthouse Financial, Inc. 3.700%, 6/22/27 | | | 1,139,000 | | | | 963 | |
Capital One Financial Corp. | | | | | | | | |
2.400%, 10/30/20 | | | 2,060,000 | | | | 2,016 | |
3.200%, 1/30/23 | | | 1,228,000 | | | | 1,195 | |
3.800%, 1/31/28 | | | 2,767,000 | | | | 2,559 | |
4.250%, 4/30/25 | | | 2,569,000 | | | | 2,551 | |
Capital One NA 2.650%, 8/8/22 | | | 1,950,000 | | | | 1,873 | |
Citigroup, Inc. | | | | | | | | |
3.200%, 10/21/26 | | | 3,567,000 | | | | 3,294 | |
3.668%, (ICE LIBOR USD 3 Month plus 1.390%), 7/24/28 | | | 1,219,000 | | | | 1,152 | |
4.044%, (3 Month LIBOR plus 1.023%), 6/1/24 | | | 3,344,000 | | | | 3,357 | |
4.075%, (3 Month LIBOR plus 1.192%), 4/23/29 | | | 1,075,000 | | | | 1,049 | |
4.450%, 9/29/27 | | | 4,537,000 | | | | 4,375 | |
Comerica, Inc. 3.700%, 7/31/23 | | | 5,138,000 | | | | 5,135 | |
Danske Bank A/S 3.875%, 9/12/23 144A | | | 2,497,000 | | | | 2,404 | |
The Goldman Sachs Group, Inc. 2.876%, (ICE LIBOR USD 3 Month plus | | | | | | | | |
0.821%), 10/31/22 | | | 2,213,000 | | | | 2,149 | |
3.500%, 11/16/26 | | | 1,572,000 | | | | 1,453 | |
4.017%, (3 Month LIBOR plus 1.373%), 10/31/38 | | | 1,112,000 | | | | 978 | |
4.223%, (3 Month LIBOR plus 1.301%), 5/1/29 | | | 3,257,000 | | | | 3,136 | |
4.411%, (3 Month LIBOR plus 1.430%), 4/23/39 | | | 2,984,000 | | | | 2,738 | |
Intesa Sanpaolo SpA | | | | | | | | |
3.875%, 7/14/27 144A | | | 4,251,000 | | | | 3,659 | |
3.875%, 1/12/28 144A | | | 2,783,000 | | | | 2,378 | |
4.375%, 1/12/48 144A | | | 1,207,000 | | | | 910 | |
The Accompanying Notes are an Integral Part of the Financial Statements.
132
Select Bond Portfolio
| | | | | | | | |
| Corporate Bonds (23.5%) | | Shares/
Par+ | | | Value
$ (000’s) | |
| | |
Financial continued | | | | | | | | |
JPMorgan Chase & Co. | | | | | | | | |
3.514%, (3 Month LIBOR plus 0.610%), 6/18/22 | | | 1,111,000 | | | | 1,113 | |
3.797%, (ICE LIBOR USD 3 Month plus 0.890%), 7/23/24 | | | 3,325,000 | | | | 3,331 | |
4.023%, (ICE LIBOR USD 3 Month plus 1.000%), 12/5/24 | | | 13,244,000 | | | | 13,356 | |
4.452%, (ICE LIBOR USD 3 Month plus 1.330%), 12/5/29 | | | 2,215,000 | | | | 2,254 | |
KeyCorp 4.150%, 10/29/25 | | | 913,000 | | | | 928 | |
Lazard Group LLC 4.500%, 9/19/28 | | | 2,642,000 | | | | 2,644 | |
Liberty Mutual Group, Inc. 4.250%, 6/15/23 144A | | | 1,102,000 | | | | 1,111 | |
Lloyds Banking Group PLC | | | | | | | | |
4.050%, 8/16/23 | | | 3,150,000 | | | | 3,112 | |
4.344%, 1/9/48 | | | 1,048,000 | | | | 827 | |
4.375%, 3/22/28 | | | 2,345,000 | | | | 2,226 | |
MetLife, Inc. 4.600%, 5/13/46 | | | 1,367,000 | | | | 1,365 | |
Mid-America Apartments LP | | | | | | | | |
3.600%, 6/1/27 | | | 1,090,000 | | | | 1,049 | |
3.750%, 6/15/24 | | | 2,710,000 | | | | 2,684 | |
4.000%, 11/15/25 | | | 1,389,000 | | | | 1,384 | |
4.300%, 10/15/23 | | | 1,162,000 | | | | 1,191 | |
Morgan Stanley | | | | | | | | |
2.625%, 11/17/21 | | | 3,020,000 | | | | 2,947 | |
2.750%, 5/19/22 | | | 13,000 | | | | 13 | |
Prudential Financial, Inc. 4.600%, 5/15/44 | | | 547,000 | | | | 545 | |
Public Storage | | | | | | | | |
2.370%, 9/15/22 | | | 3,015,000 | | | | 2,912 | |
3.094%, 9/15/27 | | | 2,392,000 | | | | 2,242 | |
Regency Centers LP | | | | | | | | |
3.600%, 2/1/27 | | | 1,102,000 | | | | 1,054 | |
4.125%, 3/15/28 | | | 750,000 | | | | 741 | |
Royal Bank of Scotland Group PLC | | | | | | | | |
4.892%, (3 Month LIBOR plus 1.754%), 5/18/29 | | | 958,000 | | | | 915 | |
5.076%, (ICE LIBOR USD 3 Month plus 1.905%), 1/27/30 | | | 1,440,000 | | | | 1,389 | |
Santander Holdings USA, Inc. 4.450%, 12/3/21 | | | 6,857,000 | | | | 6,976 | |
Santander UK Group Holdings PLC | | | | | | | | |
4.796%, (ICE LIBOR USD 3 Month plus 1.570%), 11/15/24 | | | 3,127,000 | | | | 3,105 | |
SITE Centers Corp. | | | | | | | | |
4.250%, 2/1/26 | | | 495,000 | | | | 486 | |
4.625%, 7/15/22 | | | 965,000 | | | | 991 | |
Store Capital Corp. 4.500%, 3/15/28 | | | 4,268,000 | | | | 4,126 | |
Tanger Properties LP | | | | | | | | |
3.750%, 12/1/24 | | | 1,344,000 | | | | 1,303 | |
3.875%, 12/1/23 | | | 1,480,000 | | | | 1,458 | |
Torchmark Corp. 4.550%, 9/15/28 | | | 3,325,000 | | | | 3,380 | |
UBS Group Funding Jersey, Ltd. 2.650%, 2/1/22 144A | | | 2,848,000 | | | | 2,756 | |
| | | | | | | | |
| Corporate Bonds (23.5%) | | Shares/ Par+ | | | Value $ (000’s) | |
| | |
Financial continued | | | | | | | | |
Voya Financial, Inc. | | | | | | | | |
3.125%, 7/15/24 | | | 3,189,000 | | | | 3,007 | |
4.800%, 6/15/46 | | | 525,000 | | | | 501 | |
Washington Prime Group LP 5.950%, 8/15/24 | | | 1,048,000 | | | | 919 | |
Willis North America, Inc. 4.500%, 9/15/28 | | | 3,444,000 | | | | 3,419 | |
| | | | | | | | |
Total | | | | | | | 196,030 | |
| | | | | | | | |
| | |
Industrial (1.4%) | | | | | | | | |
The Boeing Co. 3.550%, 3/1/38 | | | 468,000 | | | | 441 | |
Burlington Northern Santa Fe LLC 4.050%, 6/15/48 | | | 1,663,000 | | | | 1,605 | |
Crowley Conro LLC 4.181%, 8/15/43 | | | 1,562,000 | | | | 1,625 | |
CSX Corp. | | | | | | | | |
4.250%, 3/15/29 | | | 1,118,000 | | | | 1,136 | |
4.750%, 11/15/48 | | | 1,341,000 | | | | 1,360 | |
FedEx Corp. | | | | | | | | |
4.550%, 4/1/46 | | | 1,215,000 | | | | 1,106 | |
4.950%, 10/17/48 | | | 2,073,000 | | | | 2,006 | |
General Electric Co. 5.875%, 1/14/38 | | | 1,367,000 | | | | 1,308 | |
Northrop Grumman Corp. | | | | | | | | |
2.080%, 10/15/20 | | | 2,551,000 | | | | 2,501 | |
2.550%, 10/15/22 | | | 3,580,000 | | | | 3,468 | |
2.930%, 1/15/25 | | | 159,000 | | | | 151 | |
3.250%, 8/1/23 | | | 3,302,000 | | | | 3,249 | |
3.250%, 1/15/28 | | | 1,517,000 | | | | 1,418 | |
4.030%, 10/15/47 | | | 1,039,000 | | | | 946 | |
United Technologies Corp. | | | | | | | | |
3.650%, 8/16/23 | | | 4,241,000 | | | | 4,224 | |
4.125%, 11/16/28 | | | 4,300,000 | | | | 4,270 | |
4.450%, 11/16/38 | | | 2,064,000 | | | | 2,005 | |
4.625%, 11/16/48 | | | 1,218,000 | | | | 1,178 | |
Valmont Industries, Inc. | | | | | | | | |
5.000%, 10/1/44 | | | 1,070,000 | | | | 948 | |
5.250%, 10/1/54 | | | 1,055,000 | | | | 944 | |
Vulcan Materials Co. 4.500%, 6/15/47 | | | 407,000 | | | | 346 | |
Wabtec Corp. | | | | | | | | |
4.150%, 3/15/24 | | | 1,822,000 | | | | 1,761 | |
4.700%, 9/15/28 | | | 2,414,000 | | | | 2,265 | |
Westrock Co. 4.900%, 3/15/29 144A | | | 776,000 | | | | 798 | |
WRKCo, Inc. 4.000%, 3/15/28 144A | | | 437,000 | | | | 415 | |
| | | | | | | | |
Total | | | | | | | 41,474 | |
| | | | | | | | |
| | |
Technology (1.5%) | | | | | | | | |
Apple, Inc. | | | | | | | | |
2.850%, 5/11/24 | | | 2,077,000 | | | | 2,025 | |
3.200%, 5/13/25 | | | 670,000 | | | | 660 | |
3.200%, 5/11/27 | | | 4,130,000 | | | | 3,988 | |
4.250%, 2/9/47 | | | 3,170,000 | | | | 3,163 | |
4.375%, 5/13/45 | | | 1,025,000 | | | | 1,042 | |
4.500%, 2/23/36 | | | 1,107,000 | | | | 1,174 | |
Fiserv, Inc. | | | | | | | | |
3.800%, 10/1/23 | | | 1,281,000 | | | | 1,289 | |
4.200%, 10/1/28 | | | 2,552,000 | | | | 2,548 | |
The Accompanying Notes are an Integral Part of the Financial Statements.
133
Select Bond Portfolio
| | | | | | | | |
| Corporate Bonds (23.5%) | | Shares/ Par+ | | | Value
$ (000’s) | |
| | |
Technology continued | | | | | | | | |
Hewlett Packard Enterprise Co. 6.350%, 10/15/45 | | | 1,634,000 | | | | 1,527 | |
Microsoft Corp. | | | | | | | | |
2.000%, 8/8/23 | | | 2,756,000 | | | | 2,650 | |
3.300%, 2/6/27 | | | 2,222,000 | | | | 2,202 | |
4.000%, 2/12/55 | | | 886,000 | | | | 872 | |
4.100%, 2/6/37 | | | 1,817,000 | | | | 1,868 | |
4.250%, 2/6/47 | | | 2,464,000 | | | | 2,590 | |
4.500%, 2/6/57 | | | 1,333,000 | | | | 1,423 | |
NXP BV / NXP Funding LLC | | | | | | | | |
3.875%, 9/1/22 144A | | | 2,151,000 | | | | 2,065 | |
4.625%, 6/1/23 144A | | | 6,553,000 | | | | 6,422 | |
4.875%, 3/1/24 144A | | | 1,884,000 | | | | 1,892 | |
5.350%, 3/1/26 144A | | | 1,663,000 | | | | 1,691 | |
5.550%, 12/1/28 144A | | | 1,548,000 | | | | 1,586 | |
Oracle Corp. | | | | | | | | |
2.625%, 2/15/23 | | | 1,499,000 | | | | 1,463 | |
2.950%, 11/15/24 | | | 802,000 | | | | 781 | |
3.800%, 11/15/37 | | | 820,000 | | | | 768 | |
| | | | | | | | |
Total | | | | | | | 45,689 | |
| | | | | | | | |
| | |
Utilities (2.0%) | | | | | | | | |
Alliant Energy Finance LLC 4.250%, 6/15/28 144A | | | 1,823,000 | | | | 1,811 | |
Ameren Illinois Co. 4.500%, 3/15/49 | | | 1,677,000 | | | | 1,776 | |
American Transmission Systems, Inc. 5.000%, 9/1/44 144A | | | 601,000 | | | | 643 | |
Appalachian Power Co. 3.300%, 6/1/27 | | | 730,000 | | | | 698 | |
Dominion Energy Gas Holdings LLC 4.800%, 11/1/43 | | | 155,000 | | | | 156 | |
Dominion Energy, Inc. 4.250%, 6/1/28 | | | 2,063,000 | | | | 2,071 | |
Dominion Resources, Inc. | | | | | | | | |
1.600%, 8/15/19 | | | 2,070,000 | | | | 2,047 | |
2.000%, 8/15/21 | | | 1,595,000 | | | | 1,533 | |
Duke Energy Corp. 1.800%, 9/1/21 | | | 2,391,000 | | | | 2,288 | |
Duquesne Light Holdings, Inc. 3.616%, 8/1/27 144A | | | 3,444,000 | | | | 3,245 | |
Electricite de France SA | | | | | | | | |
4.875%, 9/21/38 144A | | | 1,830,000 | | | | 1,674 | |
5.000%, 9/21/48 144A | | | 905,000 | | | | 803 | |
6.000%, 1/22/14 144A | | | 697,000 | | | | 680 | |
Emera US Finance LP | | | | | | | | |
3.550%, 6/15/26 | | | 1,110,000 | | | | 1,053 | |
4.750%, 6/15/46 | | | 1,365,000 | | | | 1,314 | |
Enel Finance International NV | | | | | | | | |
4.250%, 9/14/23 144A | | | 2,972,000 | | | | 2,906 | |
4.875%, 6/14/29 144A | | | 1,573,000 | | | | 1,501 | |
FirstEnergy Corp. 4.850%, 7/15/47 | | | 558,000 | | | | 559 | |
FirstEnergy Transmission LLC 5.450%, 7/15/44 144A | | | 459,000 | | | | 499 | |
Indiana Michigan Power Co. 4.550%, 3/15/46 | | | 1,115,000 | | | | 1,125 | |
IPALCO Enterprises, Inc. 3.700%, 9/1/24 | | | 2,690,000 | | | | 2,619 | |
Mid-Atlantic Interstate Transmission LLC 4.100%, 5/15/28 144A | | | 2,173,000 | | | | 2,159 | |
| | | | | | | | |
| Corporate Bonds (23.5%) | | Shares/ Par+ | | | Value $ (000’s) | |
| | |
Utilities continued | | | | | | | | |
Mississippi Power Co. 3.950%, 3/30/28 | | | 2,779,000 | | | | 2,744 | |
Pacific Gas & Electric Co. | | | | | | | | |
2.950%, 3/1/26 | | | 1,668,000 | | | | 1,372 | |
3.300%, 3/15/27 | | | 1,940,000 | | | | 1,598 | |
3.300%, 12/1/27 | | | 1,715,000 | | | | 1,400 | |
4.250%, 3/15/46 | | | 559,000 | | | | 435 | |
4.750%, 2/15/44 | | | 391,000 | | | | 321 | |
5.800%, 3/1/37 | | | 174,000 | | | | 161 | |
6.050%, 3/1/34 | | | 1,012,000 | | | | 939 | |
PPL Capital Funding, Inc. 3.100%, 5/15/26 | | | 1,640,000 | | | | 1,538 | |
Sempra Energy | | | | | | | | |
2.900%, 2/1/23 | | | 1,113,000 | | | | 1,081 | |
4.000%, 2/1/48 | | | 3,378,000 | | | | 2,904 | |
South Carolina Electric & Gas Co. | | | | | | | | |
4.250%, 8/15/28 | | | 1,630,000 | | | | 1,689 | |
4.500%, 6/1/64 | | | 315,000 | | | | 292 | |
Southern California Edison Co. | | | | | | | | |
3.500%, 10/1/23 | | | 915,000 | | | | 912 | |
3.700%, 8/1/25 | | | 1,312,000 | | | | 1,309 | |
4.125%, 3/1/48 | | | 4,095,000 | | | | 3,883 | |
Southwestern Electric Power Co. | | | | | | | | |
2.750%, 10/1/26 | | | 520,000 | | | | 479 | |
3.850%, 2/1/48 | | | 842,000 | | | | 749 | |
3.900%, 4/1/45 | | | 729,000 | | | | 657 | |
Virginia Electric & Power Co. 4.600%, 12/1/48 | | | 972,000 | | | | 1,015 | |
| | | | | | | | |
Total | | | | | | | 58,638 | |
| | | | | | | | |
Total Corporate Bonds | | | | | | | | |
(Cost: $710,633) | | | | | | | 697,039 | |
| | | | | | | | |
| | |
| Governments (27.8%) | | | | | | |
| | |
Governments (27.8%) | | | | | | | | |
Colombia Government International Bond | | | | | | | | |
4.500%, 3/15/29 | | | 2,051,000 | | | | 2,027 | |
5.000%, 6/15/45 | | | 1,096,000 | | | | 1,043 | |
Export-Import Bank of Korea 3.000%, 11/1/22 | | | 642,000 | | | | 633 | |
Korea International Bond | | | | | | | | |
3.500%, 9/20/28 | | | 1,870,000 | | | | 1,883 | |
3.875%, 9/20/48 | | | 1,090,000 | | | | 1,090 | |
Panama Government International Bond 4.500%, 4/16/50 | | | 581,000 | | | | 556 | |
Republic of Indonesia | | | | | | | | |
2.950%, 1/11/23 | | | 3,694,000 | | | | 3,526 | |
4.450%, 2/11/24 | | | 1,505,000 | | | | 1,513 | |
4.750%, 2/11/29 | | | 2,004,000 | | | | 2,034 | |
Republic of Paraguay 6.100%, 8/11/44 144A | | | 2,505,000 | | | | 2,583 | |
United Mexican States | | | | | | | | |
3.750%, 1/11/28 | | | 1,266,000 | | | | 1,185 | |
4.600%, 2/10/48 | | | 7,484,000 | | | | 6,642 | |
US Treasury | | | | | | | | |
1.375%, 9/30/23 | | | 22,203,000 | | | | 21,079 | |
1.625%, 7/31/20 | | | 19,455,000 | | | | 19,177 | |
1.625%, 8/31/22 | | | 32,067,000 | | | | 31,105 | |
1.750%, 5/15/22 | | | 28,273,000 | | | | 27,609 | |
1.875%, 1/31/22 | | | 31,407,000 | | | | 30,847 | |
2.000%, 10/31/22 | | | 49,306,000 | | | | 48,433 | |
The Accompanying Notes are an Integral Part of the Financial Statements.
134
Select Bond Portfolio
| | | | | | | | |
| Governments (27.8%) | | Shares/
Par+ | | | Value
$ (000’s) | |
| |
Governments continued | | | | | |
2.000%, 11/15/26 | | | 34,997,000 | | | | 33,431 | |
2.375%, 1/31/23 | | | 5,197,000 | | | | 5,173 | |
2.500%, 2/15/46b | | | 19,549,000 | | | | 17,682 | |
2.500%, 5/15/46 | | | 10,635,000 | | | | 9,609 | |
2.625%, 8/31/20 | | | 1,543,000 | | | | 1,545 | |
2.625%, 5/15/21 | | | 3,655,000 | | | | 3,666 | |
2.625%, 7/15/21 | | | 26,602,000 | | | | 26,693 | |
2.625%, 12/15/21 | | | 19,936,000 | | | | 20,025 | |
2.625%, 12/31/23 | | | 32,094,000 | | | | 32,260 | |
2.750%, 8/15/47 | | | 10,120,000 | | | | 9,602 | |
2.750%, 11/15/47 | | | 43,733,000 | | | | 41,455 | |
2.750%, 11/30/20 | | | 3,858,000 | | | | 3,875 | |
2.750%, 8/15/21 | | | 27,810,000 | | | | 27,995 | |
2.750%, 4/30/23 | | | 948,000 | | | | 958 | |
2.750%, 2/15/28 | | | 68,000,000 | | | | 68,401 | |
2.875%, 11/15/46 | | | 4,658,000 | | | | 4,537 | |
2.875%, 10/31/20 | | | 35,903,000 | | | | 36,122 | |
2.875%, 10/15/21 | | | 38,253,000 | | | | 38,653 | |
2.875%, 11/15/21 | | | 23,505,000 | | | | 23,765 | |
2.875%, 9/30/23 | | | 7,000,000 | | | | 7,113 | |
2.875%, 11/30/23 | | | 15,465,000 | | | | 15,734 | |
2.875%, 11/30/25 | | | 12,802,000 | | | | 13,038 | |
2.875%, 5/15/28 | | | 15,189,000 | | | | 15,433 | |
3.000%, 2/15/47 | | | 2,545,000 | | | | 2,542 | |
3.000%, 2/15/48 | | | 6,683,000 | | | | 6,659 | |
3.000%, 8/15/48 | | | 9,114,000 | | | | 9,087 | |
3.125%, 5/15/48 | | | 43,219,000 | | | | 44,115 | |
3.125%, 11/15/28 | | | 83,544,000 | | | | 86,715 | |
3.375%, 11/15/48 | | | 8,035,000 | | | | 8,607 | |
3.750%, 11/15/43 | | | 5,666,000 | | | | 6,410 | |
| | | | | | | | |
Total | | | | | | | 823,865 | |
| | | | | | | | |
Total Governments | | | | | | | | |
(Cost: $819,126) | | | | | | | 823,865 | |
| | | | | | | | |
| | |
| Municipal Bonds (0.5%) | | | | | | |
| |
Municipal Bonds (0.5%) | | | | | |
County of Clark Department of Aviation 6.820%, 7/1/45 RB | | | 1,780,000 | | | | 2,535 | |
Los Angeles Community College District, Series2010-E 6.750%, 8/1/49 GO | | | 2,600,000 | | | | 3,759 | |
North Texas Tollway Authority, Series2009-B 6.718%, 1/1/49 RB | | | 2,425,000 | | | | 3,337 | |
The Ohio State University 4.800%, 6/1/11 RB | | | 1,070,000 | | | | 1,172 | |
Port Authority of New York & New Jersey 4.458%, 10/1/62 RB | | | 3,540,000 | | | | 3,602 | |
State of California, Series 2010 7.600%, 11/1/40 GO | | | 850,000 | | | | 1,238 | |
State of Illinois 5.100%, 6/1/33 GO | | | 545,000 | | | | 519 | |
| | | | | | | | |
| | |
Total Municipal Bonds | | | | | | | | |
(Cost: $16,380) | | | | | | | 16,162 | |
| | | | | | | | |
| | | | | | | | |
| Structured Products (52.7%) | | Shares/ Par+ | | | Value $ (000’s) | |
| |
Asset Backed Securities (11.2%) | | | | | |
Ally Auto Receivables Trust, Series2015-1, Class A4 1.750%, 5/15/20 | | | 621,661 | | | | 621 | |
Ally Auto Receivables Trust, Series2015-2, Class A4 1.840%, 6/15/20 | | | 729,616 | | | | 728 | |
American Express Credit Account Master Trust, Series2018-9, Class A 2.835%, (ICE LIBOR USD 1 Month plus 0.380%), 4/15/26 | | | 1,532,000 | | | | 1,522 | |
AmeriCredit Automobile Receivables Trust, Series2018-1, Class A3 3.070%, 12/19/22 | | | 1,368,000 | | | | 1,367 | |
Avis Budget Rental Car Funding AESOP LLC, Series2017-1A, Class A 3.070%, 9/20/23 144A | | | 1,667,000 | | | | 1,653 | |
Capital Auto Receivables Asset Trust, Series2015-3, Class A4 2.130%, 5/20/20 | | | 72,052 | | | | 72 | |
Capital Auto Receivables Asset Trust, Series2016-1, Class A4 1.980%, 10/20/20 | | | 1,486,787 | | | | 1,482 | |
Capital Auto Receivables Asset Trust, Series2016-2, Class A4 1.630%, 1/20/21 | | | 710,000 | | | | 706 | |
College Ave Student Loans, Series2017-A, Class A1 4.156%, (ICE LIBOR USD 1 Month plus 1.650%), 11/26/46 144A | | | 2,173,856 | | | | 2,204 | |
College Avenue Student Loans LLC, Series2018-A, Class A2 4.130%, 12/26/47 144A | | | 1,597,770 | | | | 1,621 | |
Discover Card Execution Note Trust, Series2014-A4, Class A4 2.120%, 12/15/21 | | | 2,329,000 | | | | 2,320 | |
Ford Credit Auto Owner Trust, Series2015-A, Class A4 1.640%, 6/15/20 | | | 349,661 | | | | 349 | |
Ford Credit Auto Owner Trust, Series2017-1, Class A 2.620%, 8/15/28 144A | | | 1,371,000 | | | | 1,351 | |
Ford Credit Auto Owner Trust, Series2017-A, Class A4 1.920%, 4/15/22 | | | 2,037,000 | | | | 2,006 | |
Ford Credit Auto Owner Trust, Series2018-1, Class A 3.190%, 7/15/31 144A | | | 4,465,000 | | | | 4,430 | |
Ford Credit Auto Owner Trust, Series2018-2, Class A 3.470%, 1/15/30 144A | | | 3,210,000 | | | | 3,239 | |
Hertz Vehicle Financing II LP, Series2015-3A, Class A 2.670%, 9/25/21 144A | | | 5,403,000 | | | | 5,326 | |
Hertz Vehicle Financing LLC, Series2015-1A, Class A 2.730%, 3/25/21 144A | | | 8,423,000 | | | | 8,352 | |
Hertz Vehicle Financing LLC, Series2016-2A, Class A 2.950%, 3/25/22 144A | | | 2,191,000 | | | | 2,164 | |
The Accompanying Notes are an Integral Part of the Financial Statements.
135
Select Bond Portfolio
| | | | | | | | |
| Structured Products (52.7%) | | Shares/ Par+ | | | Value
$ (000’s) | |
| |
Asset Backed Securities continued | | | | | |
Hertz Vehicle Financing LLC, Series2016-3A, Class B 3.110%, 7/25/20 144A | | | 1,173,000 | | | | 1,170 | |
Hertz Vehicle Financing LLC, Series2016-4, Class A 2.650%, 7/25/22 144A | | | 5,574,000 | | | | 5,456 | |
Hertz Vehicle Financing LLC, Series2017-1A, Class A 2.960%, 10/25/21 144A | | | 3,034,000 | | | | 3,004 | |
Hertz Vehicle Financing LLC, Series2017-2A, Class A 3.290%, 10/25/23 144A | | | 4,111,000 | | | | 4,057 | |
Hertz Vehicle Financing LLC, Series2018-2A, Class A 3.650%, 6/27/22 144A | | | 2,855,000 | | | | 2,877 | |
Hertz Vehicle Financing LLC, Series2018-3A, Class A 4.030%, 7/25/24 144A | | | 4,459,000 | | | | 4,531 | |
Navient Private Education Loan Trust, Series2014-AA, Class A3 4.055%, (ICE LIBOR USD 1
Month plus 1.600%), 10/15/31 144A | | | 3,434,000 | | | | 3,543 | |
Navient Private Education Loan Trust, Series2014-CTA, Class A 3.155%, (ICE LIBOR USD 1
Month plus 0.700%), 9/16/24 144A | | | 894,708 | | | | 896 | |
Navient Private Education Loan Trust, Series2015-CA, Class B 3.250%, 5/15/40 144A | | | 2,181,000 | | | | 2,179 | |
Navient Private Education Loan Trust, Series2018-BA, Class A2B 3.175%, (1 Month LIBOR plus 0.720%), 12/15/59 144A | | | 2,055,000 | | | | 2,044 | |
Navient Private Education Refi Loan Trust, Series2018-A, Class A2 3.190%, 2/18/42 144A | | | 1,163,000 | | | | 1,146 | |
Navient Private Education Refi Loan Trust, Series2018-C, Class A2 3.520%, 6/16/42 144A | | | 1,296,000 | | | | 1,306 | |
Navient Private Education Refi Loan Trust, Series2018-DA, Class A2A 4.000%, 12/15/59 144A | | | 6,858,000 | | | | 7,012 | |
Navient Student Loan Trust, Series2014-1, Class A3 3.016%, (ICE LIBOR USD 1 Month plus 0.510%), 6/25/31 | | | 2,514,484 | | | | 2,502 | |
Navient Student Loan Trust, Series2015-1, Class A2 3.106%, (1 Month LIBOR plus 0.600%), 4/25/40 | | | 2,608,724 | | | | 2,593 | |
Navient Student Loan Trust, Series2016-3A, Class A2 3.356%, (1 Month LIBOR plus 0.850%), 6/25/65 144A | | | 1,405,552 | | | | 1,412 | |
Navient Student Loan Trust, Series2016-AA, Class A2B 4.605%, (ICE LIBOR USD 1 Month plus 2.150%), 12/15/45 144A | | | 1,668,550 | | | | 1,733 | |
| | | | | | | | |
| Structured Products (52.7%) | | Shares/ Par+ | | | Value
$ (000’s) | |
| |
Asset Backed Securities continued | | | | | |
Navient Student Loan Trust, Series2017-4A, Class A2 3.006%, (1 Month LIBOR plus 0.500%), 9/27/66 144A | | | 2,163,000 | | | | 2,165 | |
Navient Student Loan Trust, Series2017-A, Class A2B 3.355%, (1 Month LIBOR plus 0.900%), 12/16/58 144A | | | 4,642,000 | | | | 4,642 | |
Navient Student Loan Trust, Series2018-EA, Class A2 4.000%, 12/15/59 144A | | | 3,615,000 | | | | 3,695 | |
Nelnet Student Loan Trust, Series2004-3, Class A5 2.540%, (3 Month LIBOR plus 0.180%), 10/27/36 | | | 562,081 | | | | 556 | |
Nelnet Student Loan Trust, Series2004-4, Class A5 2.520%, (3 Month LIBOR plus 0.160%), 1/25/37 | | | 4,665,998 | | | | 4,591 | |
Nelnet Student Loan Trust, Series2005-1, Class, A5 2.470%, (3 Month LIBOR plus 0.110%), 10/25/33 | | | 8,698,242 | | | | 8,581 | |
Nelnet Student Loan Trust, Series2005-2, Class A5 2.924%, (3 Month LIBOR plus 0.100%), 3/23/37 | | | 10,876,633 | | | | 10,767 | |
Nelnet Student Loan Trust, Series2005-3, Class A5 2.944%, (3 Month LIBOR plus 0.120%), 12/24/35 | | | 10,063,330 | | | | 9,988 | |
Nelnet Student Loan Trust, Series2005-4, Class A4 3.004%, (3 Month LIBOR plus 0.180%), 3/22/32 | | | 1,606,432 | | | | 1,572 | |
Nelnet Student Loan Trust, Series2010-2A, Class A 3.672%, (3 Month LIBOR plus 0.850%), 9/25/48 144A | | | 9,402,707 | | | | 9,524 | |
Nelnet Student Loan Trust, Series2010-4A, Series A 3.306%, (1 Month LIBOR plus 0.800%), 4/25/46 144A | | | 845,717 | | | | 852 | |
Nelnet Student Loan Trust, Series2012-4A, Class A 3.206%, (1 Month LIBOR plus 0.700%), 9/27/38 144A | | | 8,583,733 | | | | 8,641 | |
Nelnet Student Loan Trust, Series2014-1A, Class A 3.076%, (1 Month LIBOR plus 0.570%), 9/25/41 144A | | | 1,290,306 | | | | 1,292 | |
Nelnet Student Loan Trust, Series2016-1A, Class A 3.306%, (ICE LIBOR USD 1 Month plus 0.800%), 9/25/65 144A | | | 4,539,785 | | | | 4,579 | |
Nelnet Student Loan Trust, Series2017-2A, Class A 3.276%, (ICE LIBOR USD 1 Month plus 0.770%), 9/25/65 144A | | | 4,714,776 | | | | 4,738 | |
The Accompanying Notes are an Integral Part of the Financial Statements.
136
Select Bond Portfolio
| | | | | | | | |
| Structured Products (52.7%) | | Shares/ Par+ | | | Value
$ (000’s) | |
| |
Asset Backed Securities continued | | | | | |
Nelnet Student Loan Trust, Series2017-3A, Class A 3.356%, (1 Month LIBOR plus 0.850%), 2/25/66 144A | | | 2,948,873 | | | | 2,975 | |
Nelnet Student Loan Trust, Series2018-3A, Class A2 2.946%, (ICE LIBOR USD 1 Month plus 0.440%), 9/27/66 144A | | | 1,506,000 | | | | 1,495 | |
SLC Student Loan Trust, Series2008-1, Class A4A 4.388%, (ICE LIBOR USD 3 Month plus 1.600%), 12/15/32 | | | 4,761,140 | | | | 4,876 | |
SLM Private Education Loan Trust, Series2013-B, Class A2B 3.555%, (ICE LIBOR USD 1 Month plus 1.100%), 6/17/30 144A | | | 232,973 | | | | 233 | |
SLM Student Loan Trust, Series2003-1, Class A5C 3.538%, (3 Month LIBOR plus 0.750%), 12/15/32 144A | | | 1,681,951 | | | | 1,647 | |
SLM Student Loan Trust, Series2004-10, Class A7A 2.960%, (3 Month LIBOR plus 0.750%), 10/25/29 144A | | | 6,428,000 | | | | 6,451 | |
SLM Student Loan Trust, Series2005-10, Class A5 2.490%, (3 Month LIBOR plus 0.130%), 7/26/21 | | | 1,517,063 | | | | 1,504 | |
SLM Student Loan Trust, Series2006-1, Class A5 2.470%, (3 Month LIBOR plus 0.110%), 7/26/21 | | | 7,007,973 | | | | 6,914 | |
SLM Student Loan Trust, Series2006-10, Class A6 2.485%, (ICE LIBOR USD 3 Month plus 0.150%), 3/25/44 | | | 10,952,000 | | | | 10,651 | |
SLM Student Loan Trust, Series2006-3, Class A5 2.460%, (3 Month LIBOR plus 0.100%), 1/25/21 | | | 3,967,616 | | | | 3,932 | |
SLM Student Loan Trust, Series2007-1, Class A5 2.425%, (ICE LIBOR USD 3 Month plus 0.090%), 1/26/26 | | | 753,204 | | | | 751 | |
SLM Student Loan Trust, Series2007-2, Class A4 2.420%, (3 Month LIBOR plus 0.060%), 7/25/22 | | | 6,060,000 | | | | 5,894 | |
SLM Student Loan Trust, Series2012-1, Class A3 3.456%, (ICE LIBOR USD 1 Month plus 0.950%), 9/25/28 | | | 7,243,956 | | | | 7,255 | |
SLM Student Loan Trust, Series2012-2, Class A 3.206%, (ICE LIBOR USD 1 Month plus 0.700%), 1/25/29 | | | 6,206,589 | | | | 6,168 | |
SLM Student Loan Trust, Series2012-6, Class A3 3.256%, (ICE LIBOR USD 1 Month plus 0.750%), 5/26/26 | | | 2,866,918 | | | | 2,867 | |
| | | | | | | | |
| Structured Products (52.7%) | | Shares/ Par+ | | | Value
$ (000’s) | |
| |
Asset Backed Securities continued | | | | | |
SLM Student Loan Trust, Series2013-4, Class A 3.056%, (1 Month LIBOR plus 0.550%), 6/25/43 | | | 980,540 | | | | 976 | |
SMB Private Education Loan Trust, Series2015-A, Class A2B 3.455%, (ICE LIBOR USD 1 Month plus 1.000%), 6/15/27 144A | | | 2,667,092 | | | | 2,679 | |
SMB Private Education Loan Trust, Series2015-C, Class A2B 3.855%, (ICE LIBOR USD 1 Month plus 1.400%), 7/15/27 144A | | | 1,224,551 | | | | 1,240 | |
SMB Private Education Loan Trust, Series2016-A, Class A2A 2.700%, 5/15/31 144A | | | 5,137,569 | | | | 5,136 | |
SMB Private Education Loan Trust, Series2016-A, Class A2B 3.955%, (ICE LIBOR USD 1 Month plus 1.500%), 5/15/31 144A | | | 6,921,480 | | | | 7,077 | |
SMB Private Education Loan Trust, Series2016-B, Class A2A 2.430%, 2/17/32 144A | | | 2,659,089 | | | | 2,604 | |
SMB Private Education Loan Trust, Series2016-B, Class A2B 3.905%, (ICE LIBOR USD 1 Month plus 1.450%), 2/17/32 144A | | | 6,875,394 | | | | 7,020 | |
SMB Private Education Loan Trust, Series2016-C, Class A2A 2.340%, 9/15/34 144A | | | 5,937,901 | | | | 5,737 | |
SMB Private Education Loan Trust, Series2016-C, Class A2B 3.555%, (ICE LIBOR USD 1 Month plus 1.100%), 9/15/34 144A | | | 2,894,799 | | | | 2,916 | |
SMB Private Education Loan Trust, Series2017-A, Class A2B 3.355%, (ICE LIBOR USD 1 Month plus 0.900%), 9/15/34 144A | | | 1,997,000 | | | | 1,998 | |
SMB Private Education Loan Trust, Series2017-B, Class A2B 3.205%, (1 Month LIBOR plus 0.750%), 10/15/35 144A | | | 4,236,000 | | | | 4,210 | |
SMB Private Education Loan Trust, Series2018-A, Class A2B 3.255%, (1 Month LIBOR plus 0.800%), 2/15/36 144A | | | 2,318,000 | | | | 2,300 | |
SMB Private Education Loan Trust, Series2018-B, Class A2B 3.175%, (1 Month LIBOR plus 0.720%), 1/15/37 144A | | | 3,662,000 | | | | 3,637 | |
SMB Private Education Loan Trust, Series2018-C, Class A2A 3.630%, 11/15/35 144A | | | 3,423,000 | | | | 3,446 | |
SMB Private Education Loan Trust, Series2018-C, Class A2B 3.205%, (ICE LIBOR USD 1 Month plus 0.750%), 11/15/35 144A | | | 4,084,000 | | | | 4,048 | |
Social Professional Loan Program LLC, Series2017-E, Class A1 3.006%, (1 Month LIBOR plus 0.500%), 11/26/40 144A | | | 778,917 | | | | 781 | |
The Accompanying Notes are an Integral Part of the Financial Statements.
137
Select Bond Portfolio
| | | | | | | | |
| Structured Products (52.7%) | | Shares/ Par+ | | | Value
$ (000’s) | |
|
Asset Backed Securities continued | |
Social Professional Loan Program LLC,
Series2017-E, Class A2B 2.720%, 11/26/40 144A | | | 5,282,000 | | | | 5,236 | |
SoFi Professional Loan Program LLC,
Series2016-A, Class A2 2.760%, 12/26/36 144A | | | 1,891,625 | | | | 1,864 | |
SoFi Professional Loan Program LLC,
Series2016-D, Class A1 3.456%, (ICE LIBOR USD 1 Month plus 0.950%), 1/25/39 144A | | | 398,932 | | | | 401 | |
SoFi Professional Loan Program LLC, Series2018-B, Class A2FX 3.340%, 8/26/47 144A | | | 4,753,000 | | | | 4,761 | |
Sofi Professional Loan Program LLC, Series2018-C, Class A2FX 3.590%, 1/25/48 144A | | | 5,897,000 | | | | 5,930 | |
SoFi Professional Loan Program Trust,
Series2018-D, Class A2FX 3.600%, 2/25/48 144A | | | 6,115,000 | | | | 6,167 | |
SoFi Professional Loan Program, Series2016-E, Class A1 3.356%, (ICE LIBOR USD 1 Month plus 0.850%), 7/25/39 144A | | | 930,021 | | | | 934 | |
SoFi Professional Loan Program, Series2017-A, Class A1 3.206%, (ICE LIBOR USD 1 Month plus 0.700%), 3/26/40 144A | | | 867,599 | | | | 870 | |
SoFi Professional Loan Program, Series2017-D, Class A2FX 2.650%, 9/25/40 144A | | | 356,000 | | | | 350 | |
Synchrony Credit Card Master Note Trust,
Series2018-2, Class A 3.470%, 5/15/26 | | | 1,227,000 | | | | 1,241 | |
World Financial Network Credit Card Master Trust, Series2015-B, Class A 2.550%, 6/17/24 | | | 246,000 | | | | 244 | |
World Financial Network Credit Card Master Trust, Series2016-A, Class A 2.030%, 4/15/25 | | | 5,825,000 | | | | 5,672 | |
World Financial Network Credit Card Master Trust, Series2016-C, Class A 1.720%, 8/15/23 | | | 2,018,000 | | | | 1,996 | |
World Financial Network Credit Card Master Trust, Series2017-A, Class A 2.120%, 3/15/24 | | | 3,908,000 | | | | 3,855 | |
World Financial Network Credit Card Master Trust, Series2017-C, Class A 2.310%, 8/15/24 | | | 5,108,000 | | | | 5,037 | |
World Omni Auto Receivables Trust, Series2016-A, Class A4 1.950%, 5/16/22 | | | 3,212,000 | | | | 3,175 | |
| | | | | | | | |
Total | | | | | | | 332,308 | |
| | | | | | | | |
| |
Mortgage Securities (41.5%) | | | | | |
Asset Securitization Corp., Series1997-D5, Class PS1 1.837%, (CSTR), 2/14/43 IO | | | 254,906 | | | | 2 | |
Benchmark Mortgage Trust, Series2018-B1, Class ASB 3.602%, (AFC), 1/15/51 | | | 854,000 | | | | 859 | |
| | | | | | | | |
| Structured Products (52.7%) | | Shares/ Par+ | | | Value
$ (000’s) | |
|
Mortgage Securities continued | |
CD Commercial Mortgage Trust, Series 2017- CD6, Class ASB 3.332%, 11/13/50 | | | 2,821,000 | | | | 2,794 | |
CFCRE Commercial Mortgage Trust, Series2016-C3, Class A1 1.793%, (CSTR, AFC), 1/10/48 | | | 944,839 | | | | 932 | |
CFCRE Commercial Mortgage Trust, Series2016-C4, Class A4 3.283%, (EXE), 5/10/58 | | | 1,496,000 | | | | 1,461 | |
CFCRE Commercial Mortgage Trust, Series2016-C4, Class ASB 3.091%, 5/10/58 | | | 1,508,000 | | | | 1,497 | |
CFCRE Commercial Mortgage Trust, Series2016-C7, Class A2 3.585%, (CSTR), 12/10/54 | | | 1,536,000 | | | | 1,525 | |
CFCRE Commercial Mortgage Trust, Series2016-C7, Class A3 3.838%, (AFC, EXE), 12/10/54 | | | 2,087,000 | | | | 2,105 | |
CFCRE Commercial Mortgage Trust, Series2017-C8, Class A1 1.964%, 6/15/50 | | | 743,630 | | | | 731 | |
CFCRE Commercial Mortgage Trust, Series2017-C8, Class ASB 3.367%, 6/15/50 | | | 1,226,000 | | | | 1,230 | |
Citigroup / Deutsche Bank Commercial Mortgage Trust, Series2016-CD1, Class A1 1.443%, 8/10/49 | | | 630,421 | | | | 616 | |
Citigroup / Deutsche Bank Commercial Mortgage Trust, Series2016-CD1, Class ASB
2.622%, 8/10/49 | | | 2,660,000 | | | | 2,590 | |
Citigroup / Deutsche Bank Commercial Mortgage Trust, Series2017-C6, Class ASB
3.121%, 6/10/50 | | | 694,000 | | | | 681 | |
Citigroup / Deutsche Bank Commercial Mortgage Trust, Series2017-CD4, Class ASB 3.317%, 5/10/50 | | | 1,173,000 | | | | 1,178 | |
Citigroup Commercial Mortgage Trust, Series 2015-GC29, Class AS 3.457%, 4/10/48 | | | 730,000 | | | | 726 | |
Citigroup Mortgage Loan Trust, Inc., Series2005-1, Class 3A1 6.500%, 4/25/35 | | | 196,592 | | | | 199 | |
Commercial Mortgage Pass Through Certificates, Series2012-CR3, Class A3 2.822%, 10/15/45 | | | 1,206,640 | | | | 1,187 | |
Commercial Mortgage Pass Through Certificates, Series2012-CR4, Class A2 1.801%, 10/15/45 | | | 417,947 | | | | 404 | |
Commercial Mortgage Pass Through Certificates, Series 2013-CR11, Class A1 1.468%, 8/10/50 | | | 25,293 | | | | 25 | |
Commercial Mortgage Pass Through Certificates, Series 2013-CR12, Class A4 4.046%, 10/10/46 | | | 1,225,000 | | | | 1,265 | |
Commercial Mortgage Pass Through Certificates, Series 2014-UBS2, Class A5 3.961%, 3/10/47 | | | 415,000 | | | | 425 | |
The Accompanying Notes are an Integral Part of the Financial Statements.
138
Select Bond Portfolio
| | | | | | | | |
| Structured Products (52.7%) | | Shares/
Par+ | | | Value
$ (000’s) | |
| |
Mortgage Securities continued | | | | | |
Commercial Mortgage Pass Through Certificates, Series 2014-UBS4, Class AM 3.968%, 8/10/47 | | | 1,676,000 | | | | 1,694 | |
Commercial Mortgage Pass Through Certificates, Series 2014-UBS6, Class A5 3.644%, 12/10/47 | | | 2,228,000 | | | | 2,254 | |
Commercial Mortgage Pass Through Certificates, Series2015-DC1, Class A5 3.350%, 2/10/48 | | | 1,756,000 | | | | 1,742 | |
Commercial Mortgage Pass Through Certificates, Series 2016-C0R1, Class ASB 2.972%, 10/10/49 | | | 1,155,000 | | | | 1,142 | |
Commercial Mortgage Pass Through Certificates, Series 2018-COR3, Class A3 4.228%, 5/10/51 | | | 1,206,000 | | | | 1,245 | |
Commercial Mortgage Trust, Series 2018- CD7, Class A4 4.279%, 8/15/51 | | | 493,000 | | | | 515 | |
Commerical Mortgage Pass Through Certificates, Series 2013-CR10, Class A2 2.972%, 8/10/46 | | | 49,769 | | | | 50 | |
Credit Suisse Mortgage Capital Certificates, Series 2016-NXSR, Class A4 3.795%, (AFC), 12/15/49 | | | 3,748,000 | | | | 3,773 | |
Credit Suisse Mortgage Trust, Series 2013- IVR4, Class A6 2.500%, (AFC), 7/25/43 144A | | | 2,766,356 | | | | 2,717 | |
CSAIL Commercial Mortgage Trust, Series2015-C3, Class A4 3.718%, 8/15/48 | | | 1,597,000 | | | | 1,613 | |
CSAIL Commercial Mortgage Trust, Series2015-C4, Class A4 3.807%, 11/15/48 | | | 3,194,000 | | | | 3,237 | |
CSAIL Commercial Mortgage Trust, Series2016-C5, Class ASB 3.532%, 11/15/48 | | | 582,000 | | | | 587 | |
Federal Home Loan Bank 4.000%, 8/1/48 | | | 11,863,848 | | | | 12,097 | |
Federal Home Loan Mortgage Corp. 2.805%, (ICE LIBOR USD 12 Month plus 1.640%), 1/1/47 | | | 2,587,749 | | | | 2,585 | |
3.000%, 3/15/44 | | | 8,003,017 | | | | 7,908 | |
3.500%, 12/1/47 | | | 1,122,444 | | | | 1,123 | |
3.500%, 2/1/48 | | | 1,800,217 | | | | 1,800 | |
3.500%, 3/1/48 | | | 10,558,811 | | | | 10,570 | |
3.859%, (ICE LIBOR USD 12 Month plus 1.640%), 7/1/48 | | | 1,592,037 | | | | 1,631 | |
4.000%, 4/1/34 | | | 1,419,329 | | | | 1,458 | |
4.000%, 1/1/35 | | | 121,979 | | | | 127 | |
4.000%, 1/1/36 | | | 193,434 | | | | 200 | |
4.000%, 10/1/36 | | | 1,263,438 | | | | 1,303 | |
4.000%, 3/1/37 | | | 654,218 | | | | 676 | |
4.000%, 8/1/44 | | | 665,049 | | | | 681 | |
4.000%, 12/1/45 | | | 824,384 | | | | 843 | |
4.000%, 2/1/46 | | | 899,753 | | | | 920 | |
4.000%, 6/1/46 | | | 1,387,503 | | | | 1,419 | |
4.000%, 4/1/48 | | | 1,831,456 | | | | 1,874 | |
4.000%, 6/1/48 | | | 24,938,909 | | | | 25,544 | |
4.000%, 10/1/48 | | | 26,649,678 | | | | 27,174 | |
4.000%, 11/1/48 | | | 46,234,937 | | | | 47,144 | |
4.500%, 6/1/39 | | | 128,747 | | | | 137 | |
| | | | | | | | |
| Structured Products (52.7%) | | Shares/
Par+ | | | Value
$ (000’s) | |
| |
Mortgage Securities continued | | | | | |
4.500%, 7/1/39 | | | 140,581 | | | | 150 | |
4.500%, 11/1/48 | | | 22,350,597 | | | | 23,152 | |
5.000%, 6/1/44 | | | 2,254,045 | | | | 2,429 | |
5.000%, 5/1/48 | | | 6,394,111 | | | | 6,834 | |
5.000%, 6/1/48 | | | 373,455 | | | | 397 | |
5.000%, 11/1/48 | | | 9,967,501 | | | | 10,462 | |
Federal Home Loan Mortgage Corp., Series2012-264, Class 30 3.000%, 7/15/42 | | | 9,748,543 | | | | 9,625 | |
Federal Home Loan Mortgage Corp., Series 2017-7472, Class PA 3.000%, 10/15/47 | | | 18,121,880 | | | | 17,877 | |
Federal Home Loan Mortgage Corp., Series 2018-4767, Class KA 3.000%, 3/15/48 | | | 5,216,237 | | | | 5,217 | |
Federal Home Loan Mortgage Corp., Series 2018-4786, Class DP 4.500%, 7/15/42 | | | 3,076,683 | | | | 3,198 | |
Federal Home Loan Mortgage Corp., Series 2018-4787, Class AK 3.000%, 5/15/48 | | | 8,271,388 | | | | 8,074 | |
Federal Home Loan Mortgage Corp., Series 2439, Class LH 6.000%, 4/15/32 | | | 426,151 | | | | 473 | |
Federal Home Loan Mortgage Corp., Series 356, Class 300 3.000%, 9/15/47 | | | 2,544,072 | | | | 2,498 | |
Federal Home Loan Mortgage Corp., Series 360, Class 300 3.000%, 11/15/47 | | | 5,984,030 | | | | 5,895 | |
Federal Home Loan Mortgage Corp., Series 4640, Class LD 4.000%, 9/15/43 | | | 7,939,474 | | | | 8,227 | |
Federal Home Loan Mortgage Corp., Series 4700, Class QJ 4.000%, 7/15/44 | | | 5,833,883 | | | | 6,060 | |
Federal Home Loan Mortgage Corp., Series 4705, Class A 4.500%, 9/15/42 | | | 4,020,282 | | | | 4,235 | |
Federal Home Loan Mortgage Corp., Series 4763, Class CA 3.000%, 9/15/38 | | | 1,090,038 | | | | 1,093 | |
Federal Home Loan Mortgage Corp., Series 4796, Class AK 3.000%, 5/15/48 | | | 10,600,337 | | | | 10,348 | |
Federal Home Loan Mortgage Corp., Series 4802, Class A 3.000%, 6/15/48 | | | 10,021,181 | | | | 9,806 | |
Federal National Mortgage Association 2.949%, (ICE LIBOR USD 12 Month plus 1.599%), 8/1/47 | | | 2,228,074 | | | | 2,236 | |
3.000%, 11/1/46 | | | 4,361,132 | | | | 4,311 | |
3.135%, (ICE LIBOR USD 12 Month plus 1.620%), 3/1/47 | | | 3,387,628 | | | | 3,419 | |
3.500%, 9/1/33 | | | 447,422 | | | | 456 | |
3.500%, 8/1/34 | | | 1,306,144 | | | | 1,331 | |
3.500%, 5/1/36 | | | 4,120,117 | | | | 4,198 | |
3.500%, 9/1/36 | | | 668,018 | | | | 681 | |
3.500%, 12/1/36 | | | 4,589,715 | | | | 4,664 | |
3.500%, 2/1/41 | | | 14,236,866 | | | | 14,415 | |
3.500%, 2/1/42 | | | 13,662,635 | | | | 13,833 | |
The Accompanying Notes are an Integral Part of the Financial Statements.
139
Select Bond Portfolio
| | | | | | | | |
| Structured Products (52.7%) | | Shares/
Par+ | | | Value $ (000’s) | |
| |
Mortgage Securities continued | | | | | |
3.500%, 5/1/42 | | | 20,995,486 | | | | 21,294 | |
3.500%, 6/1/42 | | | 18,934,685 | | | | 19,171 | |
3.500%, 11/1/46 | | | 4,072,097 | | | | 4,129 | |
3.500%, 11/1/47 | | | 1,472,549 | | | | 1,474 | |
3.500%, 12/1/47 | | | 1,434,538 | | | | 1,438 | |
3.500%, 1/1/48 | | | 12,250,610 | | | | 12,268 | |
3.500%, 2/1/48 | | | 5,177,936 | | | | 5,186 | |
3.500%, 9/1/52 | | | 16,010,729 | | | | 16,042 | |
3.730%, (ICE LIBOR USD 12 Month plus 1.620%), 8/1/48 | | | 3,054,146 | | | | 3,130 | |
3.750%, (ICE LIBOR USD 12 Month plus 1.620%), 8/1/48 | | | 1,513,988 | | | | 1,552 | |
3.751%, (ICE LIBOR USD 12 Month plus 1.620%), 7/1/48 | | | 2,823,083 | | | | 2,894 | |
3.855%, (ICE LIBOR USD 12 Month plus 1.620%), 10/1/48 | | | 2,401,537 | | | | 2,469 | |
4.000%, 7/1/33 | | | 2,024,462 | | | | 2,077 | |
4.000%, 9/1/33 | | | 3,568,916 | | | | 3,662 | |
4.000%, 12/1/33 | | | 273,167 | | | | 284 | |
4.000%, 4/1/34 | | | 3,152,110 | | | | 3,271 | |
4.000%, 7/1/35 | | | 5,263,098 | | | | 5,462 | |
4.000%, 11/1/35 | | | 2,468,106 | | | | 2,561 | |
4.000%, 1/1/36 | | | 3,471,465 | | | | 3,602 | |
4.000%, 7/1/36 | | | 3,269,862 | | | | 3,393 | |
4.000%, 9/1/36 | | | 1,299,952 | | | | 1,341 | |
4.000%, 11/1/36 | | | 995,346 | | | | 1,033 | |
4.000%, 12/1/36 | | | 3,802,955 | | | | 3,945 | |
4.000%, 1/1/37 | | | 144,925 | | | | 149 | |
4.000%, 2/1/37 | | | 500,523 | | | | 517 | |
4.000%, 3/1/37 | | | 4,037,787 | | | | 4,168 | |
4.000%, 4/1/37 | | | 1,437,437 | | | | 1,484 | |
4.000%, 5/1/37 | | | 1,991,360 | | | | 2,056 | |
4.000%, 6/1/37 | | | 954,880 | | | | 986 | |
4.000%, 7/1/37 | | | 4,935,668 | | | | 5,090 | |
4.000%, 9/1/37 | | | 2,872,252 | | | | 2,964 | |
4.000%, 10/1/37 | | | 2,320,035 | | | | 2,404 | |
4.000%, 11/1/37 | | | 948,466 | | | | 978 | |
4.000%, 12/1/37 | | | 1,611,032 | | | | 1,663 | |
4.000%, 1/1/38 | | | 2,573,881 | | | | 2,659 | |
4.000%, 9/1/38 | | | 1,056,656 | | | | 1,091 | |
4.000%, 5/1/41 | | | 8,182,738 | | | | 8,491 | |
4.000%, 5/1/45 | | | 4,780,954 | | | | 4,890 | |
4.000%, 9/1/45 | | | 1,219,501 | | | | 1,260 | |
4.000%, 10/1/45 | | | 798,948 | | | | 817 | |
4.000%, 12/1/45 | | | 796,389 | | | | 815 | |
4.000%, 5/1/46 | | | 1,441,917 | | | | 1,477 | |
4.000%, 7/1/46 | | | 201,525 | | | | 207 | |
4.000%, 4/1/47 | | | 1,576,464 | | | | 1,618 | |
4.000%, 5/1/47 | | | 2,146,953 | | | | 2,197 | |
4.000%, 10/1/47 | | | 843,408 | | | | 868 | |
4.000%, 11/1/47 | | | 15,457,539 | | | | 15,830 | |
4.000%, 2/1/48 | | | 3,751,662 | | | | 3,833 | |
4.000%, 3/1/48 | | | 13,070,953 | | | | 13,348 | |
4.000%, 4/1/48 | | | 6,584,271 | | | | 6,725 | |
4.000%, 5/1/48 | | | 5,308,236 | | | | 5,435 | |
4.000%, 6/1/48 | | | 2,012,116 | | | | 2,059 | |
4.000%, 7/1/48 | | | 2,343,074 | | | | 2,398 | |
4.000%, 8/1/48 | | | 27,615,385 | | | | 28,166 | |
4.000%, 9/1/48 | | | 3,232,844 | | | | 3,325 | |
4.000%, 10/1/48 | | | 3,017,876 | | | | 3,089 | �� |
| | | | | | | | |
| Structured Products (52.7%) | | Shares/
Par+ | | | Value $ (000’s) | |
| |
Mortgage Securities continued | | | | | |
4.500%, 5/1/34 | | | 86,570 | | | | 91 | |
4.500%, 6/1/41 | | | 167,235 | | | | 175 | |
4.500%, 3/1/43 | | | 1,913,411 | | | | 2,005 | |
4.500%, 3/1/44 | | | 1,487,901 | | | | 1,555 | |
4.500%, 10/1/45 | | | 3,140,474 | | | | 3,279 | |
4.500%, 2/1/46 | | | 107,934 | | | | 112 | |
4.500%, 8/1/48 | | | 16,512,661 | | | | 17,114 | |
4.500%, 11/1/48 | | | 31,575,276 | | | | 32,735 | |
5.000%, 7/1/44 | | | 316,690 | | | | 334 | |
5.000%, 5/1/48 | | | 3,371,042 | | | | 3,576 | |
5.000%, 6/1/48 | | | 8,945,133 | | | | 9,583 | |
5.000%, 11/1/48 | | | 8,654,197 | | | | 9,286 | |
5.000%, 8/1/56 | | | 12,204,374 | | | | 12,922 | |
Federal National Mortgage Association Stripped,
Series 414, Class A35 3.500%, 10/25/42 | | | 8,248,182 | | | | 8,346 | |
Federal National Mortgage Association TBA 4.000%, 1/1/47 | | | 19,000,000 | | | | 19,374 | |
4.500%, 1/14/49 | | | 10,600,000 | | | | 10,982 | |
Federal National Mortgage Association,
Series1998-61, Class PL 6.000%, 11/25/28 | | | 958 | | | | 1 | |
Federal National Mortgage Association,
Series2013-30, Class CA 1.500%, 4/25/43 | | | 1,036,729 | | | | 973 | |
Federal National Mortgage Association,
Series2014-40, Class EP 3.500%, 10/25/42 | | | 1,707,785 | | | | 1,745 | |
Federal National Mortgage Association,
Series2017-13, Class PA 3.000%, 8/25/46 | | | 3,151,083 | | | | 3,145 | |
Federal National Mortgage Association,
Series2017-M7, Class A2 2.961%, (AFC), 2/25/27 | | | 1,102,000 | | | | 1,073 | |
Federal National Mortgage Association,
Series2018-12, Class P 3.000%, 3/25/46 | | | 3,690,313 | | | | 3,652 | |
Federal National Mortgage Association,
Series2018-14, Class KC 3.000%, 3/25/48 | | | 6,054,282 | | | | 6,120 | |
Federal National Mortgage Association,
Series2018-15, Class AB 3.000%, 3/25/48 | | | 1,316,943 | | | | 1,319 | |
Federal National Mortgage Association,
Series2018-15, Class CA 3.000%, 3/25/48 | | | 1,273,911 | | | | 1,271 | |
Federal National Mortgage Association,
Series2018-38, Class LA 3.000%, 6/25/48 | | | 10,512,384 | | | | 10,247 | |
Federal National Mortgage Association,
Series2018-4, Class HC 2.500%, 12/25/47 | | | 3,068,690 | | | | 2,964 | |
Federal National Mortgage Association,
Series2018-43, Class CT 3.000%, 6/25/48 | | | 10,019,846 | | | | 9,755 | |
Federal National Mortgage Association,
Series2018-45, Class GA 3.000%, 6/25/48 | | | 21,743,715 | | | | 21,170 | |
Federal National Mortgage Association,
Series2018-50, Class BA 3.000%, 7/25/48 | | | 21,231,328 | | | | 20,546 | |
The Accompanying Notes are an Integral Part of the Financial Statements.
140
Select Bond Portfolio
| | | | | | | | |
| Structured Products (52.7%) | | Shares/ Par+ | | | Value
$ (000’s) | |
| |
Mortgage Securities continued | | | | | |
Federal National Mortgage Association, Series2018-56, Class CH 3.000%, 8/25/48 | | | 4,899,915 | | | | 4,777 | |
Federal National Mortgage Association, Series2018-57, Class PT 3.000%, 8/25/48 | | | 3,757,556 | | | | 3,646 | |
Federal National Mortgage Association, Series2018-59, Class DA 3.000%, 8/25/48 | | | 10,616,163 | | | | 10,299 | |
Federal National Mortgage Association, Series2018-63, Class DA 3.500%, 9/25/48 | | | 2,966,804 | | | | 3,010 | |
Federal National Mortgage Association, Series2018-8, Class KL 2.500%, 3/25/47 | | | 3,852,000 | | | | 3,724 | |
Government National Mortgage Association | | | | | | | | |
3.500%, 9/20/45 | | | 17,728,989 | | | | 17,888 | |
3.500%, 5/20/46 | | | 2,170,793 | | | | 2,192 | |
3.500%, 7/20/46 | | | 8,643,323 | | | | 8,748 | |
3.500%, 1/20/47 | | | 1,763,996 | | | | 1,779 | |
3.500%, 1/20/48 | | | 14,146,808 | | | | 14,260 | |
4.000%, 3/20/48 | | | 1,388,230 | | | | 1,424 | |
4.000%, 4/20/48 | | | 4,555,548 | | | | 4,678 | |
4.500%, 10/20/48 | | | 23,031,640 | | | | 23,848 | |
4.500%, 11/20/48 | | | 2,975,146 | | | | 3,081 | |
4.500%, 12/20/48 | | | 6,288,000 | | | | 6,520 | |
4.500%, 1/23/49 | | | 300,000 | | | | 310 | |
5.000%, 12/20/39 | | | 139,583 | | | | 151 | |
5.000%, 11/20/45 | | | 288,725 | | | | 313 | |
5.000%, 3/20/48 | | | 18,580,900 | | | | 19,358 | |
5.000%, 4/20/48 | | | 776,801 | | | | 823 | |
5.000%, 9/20/48 | | | 12,411,253 | | | | 12,946 | |
5.000%, 10/20/48 | | | 16,145,862 | | | | 16,841 | |
5.000%, 11/20/48 | | | 26,211,608 | | | | 27,313 | |
5.000%, 12/20/48 | | | 26,563,153 | | | | 27,724 | |
5.000%, 1/20/49 | | | 4,676,000 | | | | 4,873 | |
5.000%, 1/23/49 | | | 5,500,000 | | | | 5,722 | |
5.000%, 2/21/49 | | | 62,600,000 | | | | 65,066 | |
Government National Mortgage Association TBA 5.000%, 12/18/49 Æ | | | 13,175,000 | | | | 13,735 | |
Government National Mortgage Association, Series2012-141, Class WA 4.527%, 11/16/41 | | | 968,844 | | | | 1,036 | |
Government National Mortgage Association, Series2017-167, Class BQ 2.500%, 8/20/44 | | | 4,715,293 | | | | 4,632 | |
GS Mortgage Securities Trust, Series 2012- GCJ7, Class AAB 2.935%, 5/10/45 | | | 262,621 | | | | 262 | |
GS Mortgage Securities Trust, Series 2014- GC18, Class A3 3.801%, 1/10/47 | | | 1,044,000 | | | | 1,061 | |
GS Mortgage Securities Trust, Series 2015- GC34, Class A4 3.506%, 10/10/48 | | | 1,483,000 | | | | 1,479 | |
GS Mortgage Securities Trust, Series 2016- GS3, Class A4 2.850%, 10/10/49 | | | 1,160,000 | | | | 1,102 | |
| | | | | | | | |
| Structured Products (52.7%) | | Shares/ Par+ | | | Value $ (000’s) | |
| |
Mortgage Securities continued | | | | | |
GS Mortgage Securities Trust, Series 2016- GS3, Class AAB 2.777%, 10/10/49 | | | 1,740,000 | | | | 1,699 | |
Impact Funding Affordable Multifamily Housing Mortgage Loan Trust, Series 2010-1, Class A1 5.314%, 1/25/51 144A | | | 4,771,712 | | | | 5,113 | |
JP Morgan Chase Commercial Mortgage Securities Corp., Series2012-CBX, Class A4 3.483%, 6/15/45 | | | 1,917,000 | | | | 1,921 | |
JP Morgan Chase Commercial Mortgage Securities Corp., Series2013-C13, Class A2 2.665%, 1/15/46 | | | 833,320 | | | | 831 | |
JP Morgan Chase Commercial Mortgage Securities Corp., Series2014-C20, Class A2 2.871%, 7/15/47 | | | 1,042,392 | | | | 1,039 | |
JP Morgan Chase Commercial Mortgage Securities Corp., Series2016-JP2, Class A1 1.324%, 8/15/49 | | | 1,247,817 | | | | 1,223 | |
JP Morgan Chase Commercial Mortgage Securities Corp., Series2016-JP2, Class ASB 2.713%, 8/15/49 | | | 1,805,000 | | | | 1,748 | |
JP Morgan Chase Commercial Mortgage Securities Corp., Series2017-JP5, Class ASB 3.548%, 3/15/50 | | | 3,358,000 | | | | 3,368 | |
JP Morgan Chase Commercial Mortgage Securities Trust, Series2015-JP1, Class ASB 3.732%, 1/15/49 | | | 1,413,000 | | | | 1,433 | |
JP Morgan Mortgage Trust, Series2016-5, Class A1 2.649%, (AFC), 12/25/46 144A | | | 1,621,240 | | | | 1,601 | |
JP Morgan Mortgage Trust, Series2017-5, Class A1 3.176%, (CSTR), 10/26/48 144A | | | 14,908,188 | | | | 14,831 | |
JPMBB Commercial Mortgage Securities Trust, Series2014-C23, Class A4 3.669%, 9/15/47 | | | 1,323,000 | | | | 1,337 | |
JPMBB Commercial Mortgage Securities Trust, Series2015-C28, Class A2 2.773%, 10/15/48 | | | 944,309 | | | | 937 | |
JPMBB Commercial Mortgage Securities Trust, Series2015-C28, Class A3 2.912%, 10/15/48 | | | 6,101,000 | | | | 5,932 | |
JPMCC Commercial Mortgage Securities Trust, Series2017-JP6, Class ASB 3.282%, 7/15/50 | | | 1,306,000 | | | | 1,291 | |
JPMDB Commercial Mortgage Securities Trust, Series2017-C5, Class ASB 3.491%, 3/15/50 | | | 463,000 | | | | 463 | |
JPMDB Commercial Mortgage Securities Trust, Series2018-C8, Class ASB 4.145%, 6/15/51 | | | 1,453,000 | | | | 1,505 | |
MASTR Asset Securitization Trust, Series2003-12, Class 1A1 5.250%, 12/25/24 | | | 136,357 | | | | 136 | |
The Accompanying Notes are an Integral Part of the Financial Statements.
141
Select Bond Portfolio
| | | | | | | | |
| Structured Products (52.7%) | | Shares/ Par+ | | | Value
$ (000’s) | |
| |
Mortgage Securities continued | | | | | |
MASTR Asset Securitization Trust, Series2004-9, Class 6A1 5.000%, 9/25/19 | | | 2,972 | | | | 3 | |
Morgan Stanley Bank of America Merrill Lynch Trust 2015, Series C20, Class A4 3.249%, 2/15/48 | | | 434,000 | | | | 428 | |
Morgan Stanley Bank of America Merrill Lynch Trust, Series2015-C25, Class A5 3.635%, 10/15/48 | | | 1,477,000 | | | | 1,485 | |
Morgan Stanley Bank of America Merrill Lynch Trust, Series2015-C27, Class A4 3.753%, 12/15/47 | | | 393,000 | | | | 398 | |
Morgan Stanley Bank of America Merrill Lynch Trust, Series2016-C28, Class A4 3.544%, 1/15/49 | | | 774,000 | | | | 773 | |
Morgan Stanley Bank of America Merrill Lynch Trust, Series2016-C30, Class A4 2.600%, 9/15/49 | | | 2,865,000 | | | | 2,680 | |
Morgan Stanley Bank of America Merrill Lynch Trust, Series2016-C30, Class ASB 2.729%, 9/15/49 | | | 5,519,000 | | | | 5,394 | |
Morgan Stanley Capital I Trust, Series 2016- UB11, Class A1 1.445%, 8/15/49 | | | 1,581,208 | | | | 1,552 | |
Morgan Stanley Capital I Trust, Series 2016- UB11, Class ASB 2.606%, 8/15/49 | | | 1,289,000 | | | | 1,251 | |
Morgan Stanley Capital I Trust, Series 2016- UBS9, Class A1 1.711%, 3/15/49 | | | 977,409 | | | | 961 | |
Residential Funding Mortgage Securities I, Series2003-S18, Class A1 4.500%, 10/25/19 | | | 3,733 | | | | 4 | |
| | | | | | | | |
| Structured Products (52.7%) | | Shares/ Par+ | | | Value
$ (000’s) | |
| |
Mortgage Securities continued | | | | | |
Sequoia Mortgage Trust, Series2013-5, Class A2 3.000%, (CSTR, AFC), 5/25/43 144A | | | 2,249,082 | | | | 2,163 | |
UBS Commercial Mortgage Trust, Series2017-C7, Class A4 3.679%, 12/15/50 | | | 346,000 | | | | 345 | |
UBS Commercial Mortgage Trust, Series2018-C10, Class A4 4.313%, 5/15/51 | | | 1,059,000 | | | | 1,106 | |
UBS Commercial Mortgage Trust, Series2018-C13, Class A4 4.334%, 10/15/51 | | | 1,811,000 | | | | 1,895 | |
UBS Commercial Mortgage Trust, Series2018-C9, Class A4 4.117%, (AFC), 3/15/51 | | | 2,328,000 | | | | 2,398 | |
UBS-Barclays Commercial Mortgage Trust, Series2012-C2, Class A4 3.525%, 5/10/63 | | | 1,832,000 | | | | 1,851 | |
| | | | | | | | |
Total | | | | | | | 1,231,710 | |
| | | | | | | | |
Total Structured Products | | | | | | | | |
(Cost: $1,562,138) | | | | | | | 1,564,018 | |
| | | | | | | | |
| |
| Short-Term Investments (1.2%) | | | | |
| | |
Money Market Funds (1.2%) | | | | | | | | |
State Street Institutional U.S. Government Money Market Fund - Premier Class 2.270%# | | | 36,080,092 | | | | 36,080 | |
| | | | | | | | |
Total | | | | | | | 36,080 | |
| | | | | | | | |
| | |
Total Short-Term Investments | | | | | | | | |
(Cost: $36,080) | | | | | | | 36,080 | |
| | | | | | | | |
| | |
Total Investments (105.7%) | | | | | | | | |
(Cost: $3,144,357)@ | | | | | | | 3,137,164 | |
| | | | | | | | |
Other Assets, Less | | | | | | | | |
Liabilities(-5.7%) | | | | | | | (169,171 | ) |
| | | | | | | | |
Net Assets (100.0%) | | | | | | | 2,967,993 | |
| | | | | | | | |
| + | All par is stated in U.S Dollar unless otherwise noted. |
144A Security exempt from registration under Rule 144A of the Securities Act of 1933. These securities may be resold as transactions exempt from registration, normally to qualified institutional buyers. At December 31, 2018 the value of these securities (in thousands) was $354,937 representing 12.2% of the net assets.
| ß | Cash or securities with an aggregate value of $17,682 (in thousands) has been pledged as collateral for futures, swap contracts outstanding, short sales, when issued securities or written options on 12/31/2018. |
| Æ | Security valued using significant unobservable inputs. |
| # | 7-Day yield as of 12/31/2018. |
| @ | At December 31, 2018, the aggregate cost of investments, including derivatives, for federal tax purposes (in thousands) was $3,150,466 and the net unrealized depreciation of investments based on that cost was $13,302 which is comprised of $22,992 aggregate gross unrealized appreciation and $36,294 aggregate gross unrealized depreciation. |
The Accompanying Notes are an Integral Part of the Financial Statements.
142
Select Bond Portfolio
The following is a summary of the inputs used in valuing the Portfolio’s assets and liabilities at December 31, 2018. See Note 3 for additional information on portfolio valuation.
| | | | | | | | | | | | | | |
| | | Valuation Inputs | | | |
| Description | | Level 1 – Quoted Prices | | | Level 2 – Other Significant
Observable Inputs | | | Level 3 – Significant
Unobservable Inputs | | | |
| | | (Amounts in thousands) | | | |
Assets: | | | | | | | | | | | | | | |
Municipal Bonds | | $ | - | | | $ | 16,162 | | | $ | - | | | |
Corporate Bonds | | | - | | | | 697,039 | | | | - | | | |
Governments | | | - | | | | 823,865 | | | | - | | | |
Structured Products | | | | | | | | | | | | | | |
Mortgage Securities | | | - | | | | 1,217,975 | | | | 13,735 | | | |
All Others | | | - | | | | 332,308 | | | | - | | | |
Short-Term Investments | | | 36,080 | | | | - | | | | - | | | |
Total Assets: | | $ | 36,080 | | | $ | 3,087,349 | | | $ | 13,735 | | | |
The Accompanying Notes are an Integral Part of the Financial Statements.
143
Long-Term U.S. Government Bond Portfolio (unaudited)
| | | | |
| Objective: | | Portfolio Strategy: | | Net Assets: |
| Maximum total return, consistent with preservation of capital and prudent investment management. | | Invest in a diversified portfolio of fixed income securities that are issued or guaranteed by the U.S. Government, its agencies or government sponsored enterprises, and in derivatives designed to replicate such securities. | | $111 million |
PORTFOLIO OVERVIEW
Mason Street Advisors, LLC (“Mason Street Advisors”), the investment adviser for the Long-Term U.S. Government Bond Portfolio (the “Portfolio”), has engaged Pacific Investment Management Company LLC (“PIMCO”) to act assub-adviser for the Portfolio. The Portfolio primarily invests in a diversified portfolio of fixed income securities that are issued or guaranteed by the U.S. Government, its agencies or government sponsored enterprises (“U.S. Government Securities”), which may be represented by forwards or derivatives such as options, futures contracts or interest rate swap agreements. Assets not invested in U.S. Government Securities may be invested in other types ofnon-government related investment grade fixed income instruments, such as corporate debt securities of U.S. issuers and mortgage- and asset-backed securities, or in preferred stocks. The Portfolio will normally have a minimum average portfolio duration (a measure of the sensitivity of the Portfolio’s fixed income portfolio securities to changes in interest rates) of eight years and, for point of reference, the dollar-weighted average maturity of the Portfolio, under normal circumstances, is expected to be more than ten years. The Portfolio’s investments in fixed income securities are limited to investment grade U.S. dollar denominated securities of U.S. issuers that are rated at least A by Moody’s or equivalently rated by S&P or Fitch, or, if unrated, determined by the Portfolio to be of comparable quality.
MARKET OVERVIEW
2018 was characterized by a challenging market environment that featured higher yields and lower equities as volatility rose. Sustained U.S.-China trade tensions and geopolitical turmoil weighed on risk sentiment, contributing to wider credit spreads and weakness in emerging market assets, while declining oil prices suppressed global inflation expectations. Fears of monetary policy overtightening further hurt investor confidence, as the U.S. Federal Reserve (the “Fed”) continued to raise interest rates on its path toward policy normalization. Meanwhile, the U.S. dollar strengthened as economic growth and central bank activity diverged between the U.S. and other developed regions.
PORTFOLIO RESULTS
The Portfolio returned (2.04%) for the twelve months ended December 31, 2018. By comparison, the Portfolio’s benchmark, the Bloomberg Barclays® Long-Term U.S. Treasury Index (the “Index”), returned (1.84%). (This Index is unmanaged, cannot be invested in directly and does not incur expenses.) According to Morningstar® Inc., an independent mutual fund ranking agency, the average return in 2018 of the Long Government peer group was (3.31%).
Out-of-benchmark exposure to U.S. breakeven inflation – the difference between nominal and real interest rates – detracted from relative performance as inflation expectations fell. U.S. interest rate positioning, particularly duration and positioning on the yield curve (a graphical representation of bond yields at different maturities), was the main contributor over the period, as interest rates rose. The Portfolio’s duration positioning was partially implemented through the use of futures, interest rate swaps and options.
Looking at sectors, selection within agency mortgage-backed securities and an allocation to government agency debentures contributed to performance.
PORTFOLIO MANAGER OUTLOOK
The following forward-looking comments are the opinion of PIMCO, the Portfolio’ssub-adviser.
We expect world GDP growth to slow somewhat but remain above trend at 2.75%–3.25% in 2019. With tighter global financial conditions, increased political and economic uncertainties, and U.S. fiscal stimulus starting to fade in 2019, we think the economic divergence of 2018 – the U.S. accelerating and other regions slowing – will give way to a more synchronized deceleration.
In the U.S., after an expansion of close to 3% in 2018, we look for growth to slow to a below-consensus 2.0%–2.5% range in 2019. The drop reflects the recent tightening of financial conditions, fading fiscal stimulus, and slower growth in China and elsewhere. Growth momentum is likely to moderate during the year, converging to trend growth of just below 2% in the second half. Headline inflation looks set to drop sharply over the next several months, reflecting base effects and the recent plunge in oil prices, while core CPI of about 2% is expected to remain stable. We expect one or two more interest rate increases byyear-end 2019, with a high chance of the Fed pausing or even ending the hiking cycle in the first half.
144
Long-Term U.S. Government Bond Portfolio (unaudited)
Relative Performance
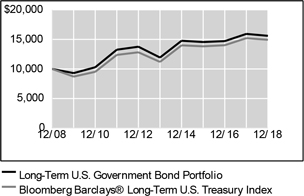
| | | | | | | | | | | | |
Average Annual Total Returns
For Periods Ended December 31, 2018 | |
| | | 1 Year | | | 5 Years | | | 10 Years | |
Long-Term U.S. Government Bond Portfolio | | | -2.04 | % | | | 5.50 | % | | | 4.55 | % |
Bloomberg Barclays® Long-Term U.S. Treasury Index | | | -1.84 | % | | | 5.93 | % | | | 4.09 | % |
Morningstar® US Insurance Fund Long Government Average | | | -3.31 | % | | | 5.62 | % | | | 3.78 | % |
The performance data quoted represents past performance. Past performance is historical and does not guarantee future performance. Investment return and principal value will fluctuate, so that shares, when redeemed, may be worth more or less than their original cost. Current performance may be lower or higher than the performance data quoted. For the most recentmonth-end performance information visitwww.northwesternmutual.com.
This chart assumes an initial investment of $10,000 made on 12/31/08. Returns shown reflect fee waivers, deductions for management and other portfolio expenses, and reinvestment of all dividends. In the absence of fee waivers, total return would be reduced. Returns exclude deductions for separate account sale loads and account fees. Please refer to the Benchmark Definitions section of this report for information about the indices cited in the above chart and graph.
Return of principal is not guaranteed. Bond funds have the same interest rate, inflation and credit risks that are associated with the underlying bonds owned by the Portfolio. When interest rates rise, bond prices fall. With a fixed income fund, when interest rates rise, the value of the fund’s existing bonds drops, which could negatively affect overall fund performance.
The Portfolio may invest in securities that are issued or guaranteed by the U.S. Government or its agencies, and in derivatives designed to replicate such securities. This guarantee provides for the timely repayment of the principal and interest as applicable under the terms of the instrument, if it is held to maturity, and does not apply to derivative securities held by the Portfolio. A guarantee by the U.S. Government or its agencies does not eliminate market risk.
The Portfolio may also use derivative instruments for hedging or other purposes as part of its investment strategy. Use of these instruments may involve certain costs and risks such as liquidity risk, interest rate risk, market risk, credit risk, management risk and the risk that the Portfolio could not close out a position when it would be most advantageous to do so. The potential leverage created by use of derivatives may cause the Portfolio to be more sensitive to interest rate movements and thus more volatile than other long-term U.S. Government bond funds that do not use derivatives. Portfolios investing in derivatives could lose more than the principal amount invested in those instruments.
The U.S. federal funds rate has been subject to moderate and steady increases over the course of the last three years. A significant rise in interest rates over a short period of time could cause significant losses in the market value of the Portfolio’s fixed income investments.
The Portfolio may engage in active and frequent trading of portfolio securities to achieve its investment objectives. Active and frequent trading may cause higher brokerage expenses and other transaction costs, which may adversely affect performance.
145
Long-Term U.S. Government Bond Portfolio (unaudited)
Top 10 Fixed Income Holdings12/31/18
| | | | | | | | |
| Security Description | | % of Net Assets | | | | |
US Treasury, Various | | | 76.0 | % | | | | |
Federal National Mortgage Association, Various | | | 5.0 | % | | | | |
Residual Funding Corp. Stripped, Various | | | 4.7 | % | | | | |
Federal Home Loan Mortgage Corp., Series 4387, Class AZ, 4%, 9/15/44 | | | 2.2 | % | | | | |
Federal Home Loan Mortgage Corp., Series 4092, Class AY, 3%, 8/15/32 | | | 1.9 | % | | | | |
Federal National Mortgage Association, Series2016-61, Class ML, 3%, 9/25/46 | | | 0.8 | % | | | | |
DBWF Mortgage Trust, Series2016-85T, Class A, 3.791%, 12/10/36 | | | 0.7 | % | | | | |
VNDO Trust, Series 2016-350P, Class A, 3.805%, 1/10/35 | | | 0.7 | % | | | | |
Federal Home Loan Mortgage Corp., Series 4398, Class ZX, 4%, 9/15/54 | | | 0.7 | % | | | | |
Morgan Stanley Bank of America Merrill Lynch Trust, Series2016-C32, Class ASB, 3.514%, 12/15/49 | | | 0.6 | % | | | | |
Sector Allocation12/31/18
| | | | | | | | |
| Sector | | % of Net Assets | | | | |
Governments | | | 81.4 | % | | | | |
Structured Products | | | 20.9 | % | | | | |
Corporate Bonds | | | 0.7 | % | | | | |
Purchased Options | | | 0.0 | % | | | | |
Short-Term Investments & Other Net Assets | | | -3.0 | % | | | | |
Sector Allocation and Top 10 Holdings are subject to change.
Consistent with the Portfolio’s stated parameters, no more than 10% of the Portfolio is invested in securities rated A by Moody’s or S&P and no more than 25% of the Portfolio is invested in securities rated Aa by Moody’s or AA by S&P.
146
Long-Term U.S. Government Bond Portfolio
SCHEDULE OF INVESTMENTS
December 31, 2018
| | | | | | | | |
| Corporate Bonds (0.7%) | | Shares/
Par+ | | | Value
$ (000’s) | |
| | |
Consumer, Cyclical (0.3%) | | | | | | | | |
United Airlines Pass Through Trust, Series2016-2, Class A 3.100%, 4/7/30 | | | 189,428 | | | | 175 | |
United Airlines Pass Through Trust, Series2016-2, Class AA 2.875%, 4/7/30 | | | 189,428 | | | | 174 | |
| | | | | | | | |
Total | | | | | | | 349 | |
| | | | | | | | |
| | |
Industrial (0.4%) | | | | | | | | |
Vessel Management Services, Inc. 3.432%, 8/15/36 ß | | | 501,000 | | | | 489 | |
| | | | | | | | |
Total | | | | | | | 489 | |
| | | | | | | | |
| | |
Total Corporate Bonds | | | | | | | | |
(Cost: $880) | | | | | | | 838 | |
| | | | | | | | |
| | |
| Purchased Options (0.0%) | | | | | | |
| | |
Purchased Options (0.0%) | | | | | | | | |
Put –Ten-Year US Treasury Note Future, Strike Price $106.5, Exp. 2/22/19, Counterparty – Goldman Sachs International, Notional – 17,000 | | | 17 | | | | – | p |
| | | | | | | | |
Total | | | | | | | – | p |
| | | | | | | | |
| | |
Total Purchased Options | | | | | | | | |
(Cost: $0) | | | | | | | – | p |
| | | | | | | | |
| | |
| Governments (81.4%) | | | | | | |
| | |
Governments (81.4%) | | | | | | | | |
Federal National Mortgage Association 5.625%, 4/17/28 | | | 100,000 | | | | 120 | |
Residual Funding Corp. Stripped
0.000%, 4/15/30 ß | | | 4,800,000 | | | | 3,358 | |
0.000%, 10/15/20 ß | | | 2,000,000 | | | | 1,908 | |
Resolution Funding Corp. Stripped 0.000%, 4/15/28 | | | 400,000 | | | | 300 | |
Tennessee Valley Authority Stripped 0.000%, 5/1/30 | | | 500,000 | | | | 338 | |
US Treasury
1.875%, 7/31/22 ß | | | 8,000,000 | | | | 7,834 | |
2.000%, 10/31/21 ß | | | 2,700,000 | | | | 2,665 | |
2.125%, 8/15/21 | | | 400,000 | | | | 396 | |
2.500%, 2/15/45 ß | | | 2,660,000 | | | | 2,415 | |
2.500%, 5/15/46 ß | | | 1,710,000 | | | | 1,545 | |
2.500%, 2/15/46 ß | | | 940,000 | | | | 850 | |
2.750%, 8/15/42 ß | | | 2,000,000 | | | | 1,918 | |
2.750%, 11/15/42 | | | 400,000 | | | | 383 | |
2.875%, 5/15/43 ß | | | 3,710,000 | | | | 3,628 | |
2.875%, 8/15/45 ß | | | 5,180,000 | | | | 5,054 | |
3.000%, 5/15/42 ß | | | 530,000 | | | | 531 | |
3.000%, 11/15/45 | | | 370,000 | | | | 370 | |
3.000%, 2/15/48 | | | 330,000 | | | | 329 | |
3.000%, 8/15/48 ß | | | 1,070,000 | | | | 1,067 | |
3.000%, 11/15/44 | | | 390,000 | | | | 390 | |
3.125%, 2/15/43 ß | | | 10,710,000 | | | | 10,944 | |
3.125%, 5/15/48 ß | | | 2,430,000 | | | | 2,480 | |
3.375%, 5/15/44 ß | | | 11,440,000 | | | | 12,206 | |
3.500%, 2/15/39 | | | 50,000 | | | | 55 | |
3.625%, 8/15/43 ß | | | 8,750,000 | | | | 9,702 | |
| | | | | | | | |
| Governments (81.4%) | | Shares/
Par+ | | | Value
$ (000’s) | |
| | |
Governments continued | | | | | | | | |
3.750%, 11/15/43 ß | | | 5,600,000 | | | | 6,336 | |
3.875%, 8/15/40 ß | | | 440,000 | | | | 506 | |
4.250%, 11/15/40 ß | | | 2,400,000 | | | | 2,905 | |
4.375%, 2/15/38 ß | | | 2,240,000 | | | | 2,747 | |
4.500%, 5/15/38 ß | | | 1,440,000 | | | | 1,795 | |
US Treasury Inflation Index Bond
0.125%, 4/15/22 | | | 311,886 | | | | 302 | |
0.375%, 1/15/27 | | | 73,266 | | | | 70 | |
0.375%, 7/15/27 | | | 320,407 | | | | 304 | |
0.500%, 1/15/28 ß | | | 1,065,990 | | | | 1,017 | |
0.750%, 7/15/28 ß | | | 1,309,399 | | | | 1,282 | |
1.000%, 2/15/48 ß | | | 512,640 | | | | 486 | |
1.375%, 2/15/44 | | | 141,028 | | | | 146 | |
1.750%, 1/15/28 | | | 434,466 | | | | 461 | |
2.500%, 1/15/29 ß | | | 423,958 | | | | 483 | |
3.625%, 4/15/28 | | | 156,319 | | | | 192 | |
US Treasury Stripped
0.000%, 8/15/34 ß | | | 850,000 | | | | 540 | |
0.000%, 11/15/43 | | | 700,000 | | | | 328 | |
| | | | | | | | |
Total | | | | | | | 90,686 | |
| | | | | | | | |
| | |
Total Governments | | | | | | | | |
(Cost: $93,750) | | | | | | | 90,686 | |
| | | | | | | | |
| | |
| Structured Products (20.9%) | | | | | | |
| | |
Asset Backed Securities (0.9%) | | | | | | | | |
ECMC Group Student Loan Trust, Series2018-1A, Class A 3.256%, (ICE LIBOR USD 1 Month plus 0.750%), 2/27/68 144A | | | 89,450 | | | | 89 | |
Massachusetts Educational Financing Authority, Series2008-1, Class A1 3.285%, (ICE LIBOR USD 3 Month plus 0.950%), 4/25/38 | | | 55,025 | | | | 55 | |
OneMain Direct Auto Receivables Trust,
Series2018-1A, Class A 3.430%, 12/16/24 144A | | | 600,000 | | | | 601 | |
SLM Student Loan Trust, Series2003-7A, Class A5A 3.988%, (ICE LIBOR USD 3 Month plus 1.200%), 12/15/33 144A | | | 123,053 | | | | 124 | |
SLM Student Loan Trust, Series2008-9, Class A 3.835%, (ICE LIBOR USD 3 Month plus 1.500%), 4/25/23 | | | 155,173 | | | | 156 | |
| | | | | | | | |
Total | | | | | | | 1,025 | |
| | | | | | | | |
| | |
Mortgage Securities (20.0%) | | | | | | | | |
BWAY Mortgage Trust, Series 2013-1515, Class A2 3.454%, 3/10/33 144A | | | 300,000 | | | | 299 | |
CityLine Commercial Mortgage Trust, Series 2016-CLNE, Class A 2.778%, (CSTR), 11/10/31 144A | | | 600,000 | | | | 588 | |
COMM Mortgage Trust, Series 2018-HOME, Class A 3.815%, (AFC), 4/10/33 144A | | | 200,000 | | | | 199 | |
The Accompanying Notes are an Integral Part of the Financial Statements.
147
Long-Term U.S. Government Bond Portfolio
| | | | | | | | |
| Structured Products (20.9%) | | Shares/
Par+ | | | Value
$ (000’s) | |
| | |
Mortgage Securities continued | | | | | | | | |
Commercial Mortgage Pass Through Certificates, Series 2016-667M, Class A 3.140%, 10/10/36 144A | | | 700,000 | | | | 675 | |
Core Industrial Trust, Series 2015-WEST, Class C 3.494%, 2/10/37 144A | | | 300,000 | | | | 291 | |
Credit Suisse First Boston Mortgage Securities Corp., Series 2003-AR18, Class 2A3 3.916%, (CSTR), 7/25/33 | | | 880 | | | | 1 | |
DBWF Mortgage Trust, Series2016-85T, Class A 3.791%, 12/10/36 144A | | | 800,000 | | | | 810 | |
Federal Home Loan Mortgage Corp., Series 2752, Class EZ 5.500%, 2/15/34 | | | 283,228 | | | | 311 | |
Federal Home Loan Mortgage Corp., Series 4092, Class AY 3.000%, 8/15/32 ß | | | 2,200,000 | | | | 2,125 | |
Federal Home Loan Mortgage Corp., Series 4387, Class AZ 4.000%, 9/15/44 ß | | | 2,369,940 | | | | 2,441 | |
Federal Home Loan Mortgage Corp., Series 4398, Class ZX 4.000%, 9/15/54 ß | | | 708,620 | | | | 733 | |
Federal Home Loan Mortgage Corp., Series 4830, Class ZG 3.000%, 4/15/53 ß | | | 683,186 | | | | 620 | |
Federal Home Loan Mortgage Corp., SeriesT-61, Class 1A1 3.557%, (Federal Reserve US 12 Month Cumulative Avg 1 year CMT plus 1.400%), 7/25/44 | | | 10,518 | | | | 11 | |
Federal National Mortgage Association
3.040%, 12/1/30 | | | 355,968 | | | | 345 | |
3.090%, 12/1/36 ß | | | 600,000 | | | | 553 | |
3.600%, 2/1/40 ß | | | 638,300 | | | | 626 | |
5.000%, 6/1/35 | | | 59,156 | | | | 63 | |
5.000%, 2/1/36 | | | 89,252 | | | | 95 | |
Federal National Mortgage Association TBA
3.000%, 1/14/49 ß | | | 2,900,000 | | | | 2,830 | |
4.000%, 1/14/49 ß | | | 3,200,000 | | | | 3,263 | |
4.000%, 2/13/49 ß | | | 600,000 | | | | 611 | |
5.500%, 1/14/49 | | | 200,000 | | | | 212 | |
Federal National Mortgage Association, Series2007-39, Class NZ 4.250%, 5/25/37 | | | 328,086 | | | | 337 | |
Federal National Mortgage Association, Series2016-61, Class ML 3.000%, 9/25/46 ß | | | 900,000 | | | | 849 | |
| | | | | | | | |
| Structured Products (20.9%) | | Shares/
Par+ | | | Value
$ (000’s) | |
| | |
Mortgage Securities continued | | | | | | | | |
GS Mortgage Securities Trust, Series 2015-590M, Class B 3.805%, (CSTR), 10/10/35 144A | | | 300,000 | | | | 292 | |
Hilton USA Trust, Series2016-HHV, Class A 3.719%, 11/5/38 144A | | | 300,000 | | | | 298 | |
Hilton USA Trust, Series2016-HHV, Class C 4.194%, (CSTR), 11/5/38 144A | | | 400,000 | | | | 400 | |
Merrill Lynch Mortgage Investors Trust, Series2003-A4, Class 3A 3.879%, (CSTR, AFC), 5/25/33 | | | 1,848 | | | | 2 | |
Morgan Stanley Bank of America Merrill Lynch Trust, Series2016-C32, Class ASB 3.514%, 12/15/49 ß | | | 700,000 | | | | 708 | |
Morgan Stanley Capital I Trust, Series 2018- MP, Class A 4.418%, 7/11/40 144A | | | 100,000 | | | | 105 | |
MSSG Trust, Series 2017-237P, Class A 3.397%, 9/13/39 144A | | | 700,000 | | | | 684 | |
Structured Asset Mortgage Investments, Inc., Series2004-AR5, Class 1A1 3.130%, (ICE LIBOR USD 1 Month plus 0.660%), (AFC), 10/19/34 | | | 4,598 | | | | 4 | |
VNDO Trust, Series 2016-350P, Class A 3.805%, 1/10/35 144A | | | 800,000 | | | | 808 | |
WaMu Mortgage Pass-Through Certificates, Series2004-AR1, Class A 3.770%, (CSTR, AFC), 3/25/34 | | | 11,487 | | | | 12 | |
Worldwide Plaza Trust, Series2017-WWP, Class A 3.526%, 11/10/36 144A | | | 100,000 | | | | 99 | |
| | | | | | | | |
Total | | | | | | | 22,300 | |
| | | | | | | | |
| | |
Total Structured Products
| | | | | | | | |
(Cost: $23,693) | | | | | | | 23,325 | |
| | | | | | | | |
| | |
| Short-Term Investments (2.4%) | | | | | | |
| | |
Money Market Funds (1.4%) | | | | | | | | |
State Street Institutional U.S. Government Money Market Fund - Premier Class 2.270% #, ß | | | 1,537,362 | | | | 1,537 | |
| | | | | | | | |
Total | | | | | | | 1,537 | |
| | | | | | | | |
| | |
US Government & Agencies (1.0%) | | | | | | | | |
Federal Home Loan Bank 0.000%, 1/4/19 ß | | | 700,000 | | | | 700 | |
US Treasury Bill 0.000%, 1/22/19 | | | 389,000 | | | | 389 | |
| | | | | | | | |
Total | | | | | | | 1,089 | |
| | | | | | | | |
| | |
Total Short-Term Investments | | | | | | | | |
(Cost: $2,626) | | | | | | | 2,626 | |
| | | | | | | | |
| | |
Total Investments (105.4%) | | | | | | | | |
(Cost: $120,949)@ | | | | | | | 117,475 | |
| | | | | | | | |
Other Assets, Less | | | | | | | | |
Liabilities(-5.4%) | | | | | | | (6,007 | ) |
| | | | | | | | |
Net Assets (100.0%) | | | | | | | 111,468 | |
| | | | | | | | |
The Accompanying Notes are an Integral Part of the Financial Statements.
148
Long-Term U.S. Government Bond Portfolio
Securities Sold Short
| | | | | | | | | | | | | | | | | | | | |
| Description | | Coupon | | | Maturity Date | | | Principal Amount
(000’s) | | | Proceeds (000’s) | | | Value (000’s) | |
Federal National Mortgage Association TBA | | | 3.500 | % | | | 1/14/49 | | | $ | (2,200 | ) | | $ | (2,177 | ) | | $ | (2,200 | ) |
Federal National Mortgage Association TBA | | | 4.500 | % | | | 1/14/49 | | | | (900 | ) | | | (927 | ) | | | (932 | ) |
| | | | | | | | | | | | | | | | | | | | |
| | | | | | | | | | $ | (3,100 | ) | | $ | (3,104 | ) | | $ | (3,132 | ) |
| | | | | | | | | | | | | | | | | | | | |
Exchange Traded or Centrally Cleared Derivatives Futures
| | | | | | | | | | | | | | | | | | | | | | | | |
| Issuer | | Long/Short | | Currency | | Notional
Par
(000’s) | | Number of
Contracts | | | Expiration
Date | | Notional
Value
(000’s) | | | Unrealized
Appreciation/
(Depreciation)
(000’s) | | | Variation Margin
(000’s) | |
CMEThree-Month Eurodollar Future | | Long | | USD | | 18,750 | | | 75 | | | 6/19 | | $ | 18,246 | | | $ | 55 | | | $ | 1 | |
CME Three-Month Eurodollar Future | | Short | | USD | | 18,750 | | | 75 | | | 6/20 | | | 18,282 | | | | (116 | ) | | | (5 | ) |
Five-Year US Treasury Note Future | | Long | | USD | | 2,300 | | | 23 | | | 3/19 | | | 2,638 | | | | 42 | | | | 6 | |
Ten-Year US Treasury Note Future | | Long | | USD | | 700 | | | 7 | | | 3/19 | | | 854 | | | | 20 | | | | 3 | |
Two-Year US Treasury Note Future | | Short | | USD | | 10,400 | | | 52 | | | 3/19 | | | 11,040 | | | | (77 | ) | | | (7 | ) |
Ultra Long Term US Treasury Bond Future | | Short | | USD | | 8,500 | | | 85 | | | 3/19 | | | 11,057 | | | | (357 | ) | | | (40 | ) |
Ultra Long Term US Treasury Bond Future | | Long | | USD | | 10,000 | | | 100 | | | 3/19 | | | 16,066 | | | | 833 | | | | 59 | |
US Treasury Long Bond Future | | Long | | USD | | 17,700 | | | 177 | | | 3/19 | | | 25,842 | | | | 1,189 | | | | 83 | |
| | | | | | | | | | | | | | | | | | | | | | | | |
| | | | | | | | | | | | | | | | | | $ | 1,589 | | | $ | 100 | |
| | | | | | | | | | | | | | | | | | | | | | | | |
Centrally Cleared Interest Rate Swaps – Receive Floating Rate
| | | | | | | | | | | | | | | | | | | | | | | | |
| Floating Rate Index | | Fixed
Rate | | Expiration
Date | | Notional
Amount
(000’s) | | Currency | | Upfront
Premium
Paid/
(Received)
(000’s) | | | Unrealized
Appreciation/
(Depreciation)
(000’s) | | | Market
Value
(000’s) | | | Variation
Margin(000’s) | |
3-MonthUSD-LIBOR | | 2.643% | | 3/22 | | 8,700 | | USD | | $ | 1 | | | $ | (15 | ) | | $ | (14 | ) | | $ | (2 | ) |
3-MonthUSD-LIBOR | | 1.750% | | 12/26 | | 3,610 | | USD | | | 147 | | | | 88 | | | | 235 | | | | (6 | ) |
3-MonthUSD-LIBOR | | 2.250% | | 6/28 | | 1,800 | | USD | | | 24 | | | | 44 | | | | 68 | | | | (3 | ) |
3-MonthUSD-LIBOR | | 2.500% | | 6/46 | | 1,300 | | USD | | | 34 | | | | 59 | | | | 93 | | | | (2 | ) |
3-MonthUSD-LIBOR | | 1.750% | | 6/47 | | 600 | | USD | | | 105 | | | | 30 | | | | 135 | | | | (1 | ) |
3-MonthUSD-LIBOR | | 2.384% | | 9/47 | | 2,000 | | USD | | | 102 | | | | 93 | | | | 195 | | | | (3 | ) |
3-MonthUSD-LIBOR | | 2.750% | | 12/47 | | 800 | | USD | | | (26 | ) | | | 40 | | | | 14 | | | | (2 | ) |
| | | | | | | | | | | | | | | | | | | | | | | | |
| | | | | | | | | | $ | 387 | | | $ | 339 | | | $ | 726 | | | $ | (19 | ) |
| | | | | | | | | | | | | | | | | | | | | | | | |
Centrally Cleared Interest Rate Swaps – Pay Floating Rate | |
| Floating Rate Index | | Fixed
Rate | | Expiration
Date | | Notional
Amount
(000’s) | | Currency | | Upfront
Premium
Paid/
(Received)
(000’s) | | | Unrealized
Appreciation/
(Depreciation)
(000’s) | | | Market
Value
(000’s) | | | Variation
Margin(000’s) | |
3-MonthUSD-LIBOR | | 2.600% | | 3/21 | | 8,700 | | USD | | $ | (1 | ) | | $ | 7 | | | $ | 6 | | | $ | - | p |
| | | | | | | | | | | | | | | | | | | | | | | | |
| | | | | | | | | | $ | (1 | ) | | $ | 7 | | | $ | 6 | | | $ | - | p |
| | | | | | | | | | | | | | | | | | | | | | | | |
Written Options
| | | | | | | | | | | | | | | | |
| Description | | Currency | | Notional Par
(000’s) | | Exercise
Price | | | Expiration
Date | | Number of
Contracts | | Value
(000’s) | |
Call -Ten-Year US Treasury Note Future | | USD | | 7,000 | | $ | 121.500 | | | 1/19 | | 7,000 | | $ | (6 | ) |
Call -Ten-Year US Treasury Note Future | | USD | | 5,000 | | | 122.000 | | | 1/19 | | 5,000 | | | (3 | ) |
Call -Ten-Year US Treasury Note Future | | USD | | 2,000 | | | 122.500 | | | 1/19 | | 2,000 | | | (1 | ) |
Put -Ten-Year US Treasury Note Future | | USD | | 7,000 | | | 119.500 | | | 1/19 | | 7,000 | | | - | p |
Put -Ten-Year US Treasury Note Future | | USD | | 5,000 | | | 120.000 | | | 1/19 | | 5,000 | | | - | p |
Put -Ten-Year US Treasury Note Future | | USD | | 2,000 | | | 120.500 | | | 1/19 | | 2,000 | | | - | p |
| | | | | | | | | | | | | | | | |
(Premiums Received $7) | | | | | | | | | | | | | | $ | (10 | ) |
| | | | | | | | | | | | | | | | |
The Accompanying Notes are an Integral Part of the Financial Statements.
149
Long-Term U.S. Government Bond Portfolio
| | | | | | | | | | | | | | | | | | | | | | | | | | | | |
| | | Financial Derivative Assets | | | Financial Derivative Liabilities | |
| | | Variation Margin (000’s) | | | Variation Margin (000’s) | | | Market Value
(000’s) | |
| | | Swaps | | | Futures | | | Total | | | Swaps | | | Futures | | | Total | | | Options | |
Total Exchange-Traded or Centrally Cleared Derivatives | | $ | - | p | | $ | 152 | | | $ | 152 | | | $ | (19 | ) | | $ | (52 | ) | | $ | (71 | ) | | $ | (10 | ) |
| + | All par is stated in U.S Dollar unless otherwise noted. |
| ß | Cash or securities with an aggregate value of $104,287 (in thousands) has been pledged as collateral for futures, swap contracts outstanding, short sales, when issued securities or written options on 12/31/2018. |
| p | Amount is less than one thousand. |
| | 144A Security exempt from registration under Rule 144A of the Securities Act of 1933. These securities may be resold as transactions exempt from registration, normally to qualified institutional buyers. At December 31, 2018 the value of these securities (in thousands) was $6,362 representing 5.8% of the net assets. |
| # | 7-Day yield as of 12/31/2018. |
| @ | At December 31, 2018, the aggregate cost of investments, including derivatives, for federal tax purposes (in thousands) was $123,534 and the net unrealized depreciation of investments based on that cost was $6,879 which is comprised of $1,389 aggregate gross unrealized appreciation and $8,268 aggregate gross unrealized depreciation. |
The following is a summary of the inputs used in valuing the Portfolio’s assets and liabilities at December 31, 2018. See Note 3 for additional information on portfolio valuation.
| | | | | | | | | | | | | | |
| | | Valuation Inputs | | | |
| Description | | Level 1 –
Quoted Prices | | | Level 2 –
Other Significant
Observable Inputs | | | Level 3 – Significant
Unobservable Inputs | | | |
| | | (Amounts in thousands) | | | |
Assets: | | | | | | | | | | | | | | |
Corporate Bonds | | $ | - | | | $ | 838 | | | $ | - | | | |
Governments | | | - | | | | 90,686 | | | | - | | | |
Structured Products | | | - | | | | 23,325 | | | | - | | | |
Short-Term Investments | | | | | | | | | | | | | | |
Money Market Funds | | | 1,537 | | | | - | | | | - | | | |
All Others | | | - | | | | 1,089 | | | | - | | | |
Other Financial Instruments^ | | | | | | | | | | | | | | |
Futures | | | 2,139 | | | | - | | | | - | | | |
Interest Rate Swaps | | | - | | | | 746 | | | | - | | | |
Total Assets: | | $ | 3,676 | | | $ | 116,684 | | | $ | - | | | |
Liabilities: | | | | | | | | | | | | | | |
Other Financial Instruments^ | | | | | | | | | | | | | | |
Futures | | | (550 | ) | | | - | | | | - | | | |
Written Options | | | (10 | ) | | | - | | | | - | | | |
Interest Rate Swaps | | | - | | | | (14 | ) | | | - | | | |
Securities Sold Short | | | - | | | | (3,132 | ) | | | - | | | |
Total Liabilities: | | $ | (560 | ) | | $ | (3,146 | ) | | $ | - | | | |
^ Other financial instruments are derivative instruments such as futures and forwards, which are valued at the unrealized appreciation (depreciation) on the instrument, and securities sold short, reverse repurchase agreements, written options and swaps contracts, which are valued at market value.
The Accompanying Notes are an Integral Part of the Financial Statements.
150
Inflation Protection Portfolio (unaudited)
| | | | |
| Objective: | | Portfolio Strategy: | | Net Assets: |
Total return using a strategy that seeks to protect against U.S. inflation. | | Invest substantially all assets in investment grade debt securities, with a majority in inflation-indexed debt securities. | | $350 million |
PORTFOLIO OVERVIEW
Mason Street Advisors, LLC (“Mason Street Advisors”), the investment adviser for the Inflation Protection Portfolio (the “Portfolio”), has engaged American Century Investment Management, Inc. (“American Century”) to act assub-adviser for the Portfolio. The Portfolio invests substantially all of its assets in investment grade debt securities. To help protect against U.S. inflation, under normal conditions, the Portfolio will invest over 50% of its net assets in inflation-indexed debt securities. These securities include inflation-indexed U.S. Treasury Securities (“TIPS”), inflation-indexed securities issued by U.S. government agencies and instrumentalities other than the U.S. Treasury and inflation-indexed securities issued by domestic and foreign corporations and governments. The Portfolio also may invest in fixed income securities that are not inflation-indexed, including collateralized mortgage obligations, mortgage- and asset-backed securities, whether issued by the U.S. government, its agencies or instrumentalities, corporations or othernon-governmental issuers, or foreign governments. Due to Internal Revenue Code provisions and regulations governing insurance product funds, no more than 55% of the Portfolio’s assets may be invested in securities issued by the same entity.
MARKET OVERVIEW
Bond markets experienced volatility in 2018 amid a changing outlook for inflation and interest rates over the course of the year. Arisk-on trend drove U.S. assets for much of the year, despite headwinds facingnon-U.S. markets. These headwinds included slowing global growth, trade war concerns, Brexit uncertainty, Italy’s budget woes and weakness among some emerging markets debt issuers. In the last three months of the year, prospects for global growth weakened further, weighing heavily on risk-asset performance. Global interest rates and oil prices fell towards the end of the period.
Fundamentals in the U.S. were broadly positive, despite concerns over U.S.-China trade tensions. With tax cuts as a tailwind, economic growth was robust and earnings rose more than 20% compared with 2017. Labor markets were also strong, and inflation measures and interest rates generally rose. The Consumer Price Index, a measure of consumer prices, climbed from about 2.1% at the end of 2017 to a peak of 2.9% in July, before easing back to 2.2% in December.
The U.S. Federal Reserve (the “Fed”) raised interest rates four times during the period, leading to concerns that higher rates could dampen growth. Theten-year inflation breakeven rate, which had been steadily holding above 2% for most of the year, slid 42 basis points (0.42%) in the fourth quarter, ending 2018 at 1.71%, compared with 1.98% at the end of 2017. For the calendar year, TIPS generally declined and underperformed nominal Treasurys, which increased fractionally.
PORTFOLIO RESULTS
The Portfolio returned (2.61%) for the twelve months ended December 31, 2018. By comparison, the Portfolio’s benchmark, the Bloomberg Barclays® U.S. TIPS Index (the “Index”), returned (1.26%). (The Index is unmanaged, cannot be invested in directly and does not incur expenses.) According to Lipper® Analytical Services, Inc., an independent mutual fund ranking company, the average return in 2018 of the Inflation Protected Bonds Funds peer group was (1.77%).
The Portfolio was nearly fully invested in TIPS under the terms allowed by IRS portfolio diversification regulations for insurance products (53% versus the IRS maximum of 55%). The remainder was primarily invested in investment grade corporate and securitized securities. Weaker performance from these allocations, particularly in the fourth quarter, generally accounted for the Portfolio’s underperformance relative to the Index, as credit spreads widened significantly amid weakening growth forecasts. Higher Treasury rates over the year also weighed on bond prices. Together, these effects drove losses for the calendar year among credit segments and the longest-duration U.S. Treasurys.
To achieve Portfolio inflation exposure while adhering to the 55% TIPS limit, the portfolio manager uses inflation swaps to create an inflation overlay for thenon-inflation-linked corporate and securitized securities. This strategy detracted from relative return due to the performance of the credit and securitized sectors as spreads widened at year end.
151
Inflation Protection Portfolio (unaudited)
PORTFOLIO MANAGER OUTLOOK
The following forward-looking comments are the opinion of American Century, the Portfolio’ssub-adviser.
The fourth quarter’s dramatic decrease in oil prices diminished market-based inflation expectations, including theten-year breakeven rate. Breakeven rates dropped below their longer-term averages, suggesting TIPS are inexpensive. We believe that inflation-protected securities are reasonably priced, and we would consider adding exposure on further weakness. The Portfolio’s positioning reflects our expectation for modest yet sustainable global growth, continued market volatility, stabilizing commodity prices, modest wage growth and a slowing or ending of Fed rate increases. We believe these influences will eventually create higher inflation than is currently priced into the bond market. As we enter 2019, we expect headline inflation to weaken due to year-over-year base effects, specifically the drop in oil prices, and we anticipate opportunities to add inflation protection at cheaper prices.
Relative Performance
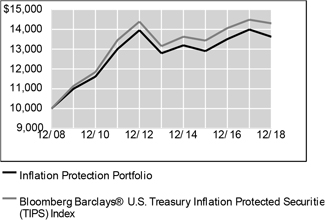
| | | | | | | | | | | | |
Average Annual Total Returns For Periods Ended December 31, 2018 | |
| | | 1 Year | | | 5 Years | | | 10 Years | |
Inflation Protection Portfolio | | | -2.61 | % | | | 1.27 | % | | | 3.14 | % |
Bloomberg Barclays® U.S. Treasury Inflation Protected Securities (TIPS) Index | | | -1.26 | % | | | 1.69 | % | | | 3.64 | % |
Lipper® Variable Insurance Products (VIP) Inflation Protected Bonds Funds Average | | | -1.77 | % | | | 1.50 | % | | | 3.58 | % |
The performance data quoted represents past performance. Past performance is historical and does not guarantee future performance. Investment return and principal value will fluctuate, so that shares, when redeemed, may be worth more or less than their original cost. Current performance may be lower or higher than the performance data quoted. For the most recentmonth-end performance information visitwww.northwesternmutual.com.
This chart assumes an initial investment of $10,000 made on 12/31/08. Returns shown reflect fee waivers, deductions for management and otherportfolio expenses, and reinvestment of all dividends. In the absence of fee waivers, total return would be reduced. Returns exclude deductions for separate account sale loads and account fees. Please refer to the Benchmark Definitions section of
this report for information about the indices cited in the above chart and graph.
Return of principal is not guaranteed. Bond funds have the same interest rate, inflation and credit risks that are associated with the underlying bonds owned by the Portfolio. When interest rates rise, bond prices fall. With a fixed income fund, when interest rates rise, the value of the fund’s existing bonds drops, which could negatively affect overall fund performance.
The U.S. federal funds rate has been subject to moderate and steady increases over the course of the last three years. A significant rise in interest rates over a short period of time could cause significant losses in the market value of the Portfolio’s fixed income investments.
Investing in bonds issued by foreign corporations and governments carries additional risk, including foreign currency risk, and may increase the volatility of the Portfolio’s performance.
As anon-diversified portfolio, the Portfolio may hold fewer securities because of its focused investment strategy. Holding fewer securities increases the risk that the value of the Portfolio could go down because of the poor performance of a single investment.
This Portfolio invests over 50% of its assets in inflation-linked bonds. Inflation-linked bonds issued by the U.S. Government, known as TIPs, are fixed income securities whose principal value is periodically adjusted according to the rate of inflation. Neither the current market value of the inflation-linked bonds nor the share value of the fund that invests in them is guaranteed, and either or both may fluctuate. Those portions of the Portfolio which are not invested in inflation linked securities will not be automatically protected from inflation. The Portfolio may use derivative instruments for hedging or other purposes as part of its investment strategy. Use of these instruments may involve certain costs and risks such as liquidity risk, interest rate risk, market risk, credit risk, management risk and the risk that the Portfolio could not close out a position when it would be most advantageous to do so. Portfolios investing in derivatives could lose more than the principal amount invested in those instruments.
152
Inflation Protection Portfolio (unaudited)
Top 10 Fixed Income Holdings12/31/18
| | | | | | | | |
| Security Description | | % of Net Assets | | | | |
US Treasury, Various | | | 55.3 | % | | | | |
Federal Home Loan Mortgage Corp., Various | | | 1.8 | % | | | | |
Federal National Mortgage Association, 4%, 2/1/46 | | | 1.4 | % | | | | |
JPMorgan Chase & Co., Various | | | 0.9 | % | | | | |
Citigroup, Inc., Various | | | 0.8 | % | | | | |
The Goldman Sachs Group, Inc., Various | | | 0.7 | % | | | | |
Bank of America Corp., Various | | | 0.7 | % | | | | |
Sequoia Mortgage Trust, Series2017-7, Class A7, 3.5%, 10/25/47 | | | 0.6 | % | | | | |
Canadian Government Real Return Bond, Various | | | 0.6 | % | | | | |
Wells Fargo & Co., Various | | | 0.5 | % | | | | |
Sector Allocation12/31/18
| | | | | | | | |
| Sector | | % of Net Assets | | | | |
Governments | | | 55.4 | % | | | | |
Structured Products | | | 18.9 | % | | | | |
Corporate Bonds | | | 16.6 | % | | | | |
Short-Term Investments & Other Net Assets | | | 8.6 | % | | | | |
Municipal Bonds | | | 0.5 | % | | | | |
Sector Allocation and Top 10 Holdings are subject to change.
Consistent with the Portfolio’s stated parameters, no more than 20% of the Portfolio is invested in foreign securities.
153
Inflation Protection Portfolio
SCHEDULE OF INVESTMENTS
December 31, 2018
| | | | | | | | |
| Corporate Bonds (16.6%) | | Shares/
Par+ | | | Value
$ (000’s) | |
| | |
Basic Materials (0.2%) | | | | | | | | |
The Dow Chemical Co.
3.500%, 10/1/24 | | | 200,000 | | | | 193 | |
4.375%, 11/15/42 | | | 200,000 | | | | 176 | |
International Paper Co. 4.400%, 8/15/47 | | | 200,000 | | | | 168 | |
LyondellBasell Industries NV
4.625%, 2/26/55 | | | 100,000 | | | | 84 | |
5.000%, 4/15/19 | | | 37,000 | | | | 37 | |
Westlake Chemical Corp. 4.375%, 11/15/47 | | | 200,000 | | | | 168 | |
| | | | | | | | |
Total | | | | | | | 826 | |
| | | | | | | | |
| | |
Communications (2.2%) | | | | | | | | |
21st Century Fox America, Inc.
4.750%, 9/15/44 | | | 150,000 | | | | 160 | |
6.900%, 8/15/39 | | | 385,000 | | | | 506 | |
AT&T, Inc.
3.400%, 5/15/25 | | | 450,000 | | | | 423 | |
4.450%, 4/1/24 | | | 100,000 | | | | 102 | |
4.750%, 5/15/46 | | | 300,000 | | | | 267 | |
4.800%, 6/15/44 | | | 280,000 | | | | 251 | |
5.150%, 11/15/46 | | | 77,000 | | | | 72 | |
CBS Corp. 3.700%, 6/1/28 | | | 170,000 | | | | 158 | |
Charter Communications Operating LLC / Charter Communications Operating Capital Corp.
4.200%, 3/15/28 | | | 400,000 | | | | 375 | |
6.484%, 10/23/45 | | | 530,000 | | | | 547 | |
Comcast Corp. | | | | | | | | |
4.250%, 10/15/30 | | | 1,080,000 | | | | 1,093 | |
6.500%, 11/15/35 | | | 350,000 | | | | 419 | |
Deutsche Telekom International Finance 3.600%, 1/19/27 144A | | | 450,000 | | | | 425 | |
Discovery Communications LLC 3.950%, 3/20/28 | | | 350,000 | | | | 325 | |
Time Warner Cable LLC 4.500%, 9/15/42 | | | 295,000 | | | | 237 | |
Verizon Communications, Inc. | | | | | | | | |
2.625%, 8/15/26 | | | 125,000 | | | | 113 | |
4.400%, 11/1/34 | | | 150,000 | | | | 145 | |
5.012%, 8/21/54 | | | 300,000 | | | | 290 | |
5.500%, 3/16/47 | | | 330,000 | | | | 351 | |
Viacom, Inc. | | | | | | | | |
4.250%, 9/1/23 | | | 470,000 | | | | 468 | |
4.375%, 3/15/43 | | | 90,000 | | | | 71 | |
Warner Media, LLC | | | | | | | | |
2.950%, 7/15/26 | | | 200,000 | | | | 179 | |
3.800%, 2/15/27 | | | 300,000 | | | | 282 | |
4.050%, 12/15/23 | | | 150,000 | | | | 150 | |
4.700%, 1/15/21 | | | 300,000 | | | | 308 | |
| | | | | | | | |
Total | | | | | | | 7,717 | |
| | | | | | | | |
| | | | | | | | |
| Corporate Bonds (16.6%) | | Shares/
Par+ | | | Value
$ (000’s) | |
| | |
Consumer, Cyclical (0.6%) | | | | | | | | |
Ford Motor Co. 4.346%, 12/8/26 | | | 120,000 | | | | 107 | |
Ford Motor Credit Co. LLC 4.389%, 1/8/26 | | | 300,000 | | | | 271 | |
General Motors Co. 5.150%, 4/1/38 | | | 650,000 | | | | 556 | |
The Home Depot, Inc. 4.200%, 4/1/43 | | | 275,000 | | | | 271 | |
Macy’s Retail Holdings, Inc. 2.875%, 2/15/23 | | | 60,000 | | | | 55 | |
McDonald’s Corp.
3.250%, 6/10/24 | | | 150,000 | | | | 149 | |
4.450%, 3/1/47 | | | 330,000 | | | | 316 | |
Walmart, Inc. 4.050%, 6/29/48 | | | 350,000 | | | | 349 | |
| | | | | | | | |
Total | | | | | | | 2,074 | |
| | | | | | | | |
| | |
Consumer,Non-cyclical (2.5%) | | | | | | | | |
Abbott Laboratories 4.900%, 11/30/46 | | | 400,000 | | | | 420 | |
AbbVie, Inc.
2.900%, 11/6/22 | | | 325,000 | | | | 316 | |
4.450%, 5/14/46 | | | 350,000 | | | | 307 | |
Aetna, Inc.
2.750%, 11/15/22 | | | 230,000 | | | | 221 | |
3.875%, 8/15/47 | | | 170,000 | | | | 144 | |
Allergan Funding SCS
3.850%, 6/15/24 | | | 150,000 | | | | 148 | |
4.550%, 3/15/35 | | | 270,000 | | | | 256 | |
Amgen, Inc. 3.625%, 5/22/24 | | | 240,000 | | | | 239 | |
Anheuser-Busch InBev SA/NV 3.650%, 2/1/26 144A | | | 1,320,000 | | | | 1,248 | |
Anheuser-Busch InBev Worldwide, Inc. 4.900%, 2/1/46 144A | | | 500,000 | | | | 464 | |
Anthem, Inc. 4.650%, 1/15/43 | | | 200,000 | | | | 195 | |
Becton Dickinson and Co. 3.700%, 6/6/27 | | | 400,000 | | | | 378 | |
Catholic Health Initiatives 2.950%, 11/1/22 | | | 100,000 | | | | 98 | |
Celgene Corp.
3.625%, 5/15/24 | | | 50,000 | | | | 49 | |
5.000%, 8/15/45 | | | 170,000 | | | | 157 | |
Constellation Brands, Inc. 3.500%, 5/9/27 | | | 170,000 | | | | 158 | |
CVS Health Corp.
2.750%, 12/1/22 | | | 650,000 | | | | 626 | |
4.780%, 3/25/38 | | | 180,000 | | | | 173 | |
5.050%, 3/25/48 | | | 170,000 | | | | 166 | |
Duke University Health System, Inc. 3.920%, 6/1/47 | | | 268,000 | | | | 262 | |
Express Scripts Holding Co. 4.500%, 2/25/26 | | | 80,000 | | | | 81 | |
Gilead Sciences, Inc.
3.650%, 3/1/26 | | | 200,000 | | | | 196 | |
4.150%, 3/1/47 | | | 265,000 | | | | 244 | |
The Accompanying Notes are an Integral Part of the Financial Statements.
154
Inflation Protection Portfolio
| | | | | | | | |
| Corporate Bonds (16.6%) | | Shares/
Par+ | | | Value
$ (000’s) | |
| | |
Consumer,Non-cyclical continued | | | | | | | | |
Halfmoon Parent, Inc. 4.900%, 12/15/48 144A | | | 200,000 | | | | 196 | |
Kaiser Foundation Hospitals 4.150%, 5/1/47 | | | 200,000 | | | | 198 | |
The Kroger Co. 3.875%, 10/15/46 | | | 400,000 | | | | 326 | |
Medtronic, Inc.
3.500%, 3/15/25 | | | 80,000 | | | | 80 | |
4.625%, 3/15/45 | | | 350,000 | | | | 367 | |
Northwell Health, Inc. 4.260%, 11/1/47 | | | 180,000 | | | | 171 | |
Shire Acquisitions Investments Ireland Designated Activity Co. 3.200%, 9/23/26 | | | 260,000 | | | | 235 | |
Thermo Fisher Scientific, Inc. 2.950%, 9/19/26 | | | 250,000 | | | | 231 | |
UnitedHealth Group, Inc.
3.750%, 10/15/47 | | | 350,000 | | | | 321 | |
4.250%, 3/15/43 | | | 150,000 | | | | 149 | |
| | | | | | | | |
Total | | | | | | | 8,820 | |
| | | | | | | | |
| | |
Energy (2.4%) | | | | | | | | |
Cimarex Energy Co. 4.375%, 6/1/24 | | | 100,000 | | | | 99 | |
Enbridge, Inc.
3.500%, 6/10/24 | | | 150,000 | | | | 146 | |
3.700%, 7/15/27 | | | 200,000 | | | | 190 | |
Energy Transfer Partners LP
3.600%, 2/1/23 | | | 100,000 | | | | 96 | |
4.050%, 3/15/25 | | | 200,000 | | | | 190 | |
5.300%, 4/15/47 | | | 455,000 | | | | 401 | |
Enterprise Products Operating LLC
3.750%, 2/15/25 | | | 200,000 | | | | 198 | |
4.850%, 3/15/44 | | | 100,000 | | | | 97 | |
Halliburton Co. 4.850%, 11/15/35 | | | 410,000 | | | | 403 | |
Hess Corp. 6.000%, 1/15/40 | | | 450,000 | | | | 413 | |
Kinder Morgan Energy Partners LP 5.300%, 9/15/20 | | | 270,000 | | | | 277 | |
Kinder Morgan, Inc. 5.550%, 6/1/45 | | | 500,000 | | | | 496 | |
Magellan Midstream Partners LP 5.150%, 10/15/43 | | | 150,000 | | | | 151 | |
Marathon Oil Corp.
3.850%, 6/1/25 | | | 170,000 | | | | 160 | |
5.200%, 6/1/45 | | | 100,000 | | | | 92 | |
MPLX LP
4.500%, 4/15/38 | | | 200,000 | | | | 175 | |
4.875%, 6/1/25 | | | 400,000 | | | | 403 | |
5.200%, 3/1/47 | | | 200,000 | | | | 184 | |
Noble Energy, Inc. 4.150%, 12/15/21 | | | 480,000 | | | | 482 | |
Petroleos Mexicanos
3.500%, 1/30/23 | | | 130,000 | | | | 118 | |
4.625%, 9/21/23 | | | 200,000 | | | | 188 | |
4.875%, 1/18/24 | | | 400,000 | | | | 373 | |
Phillips 66 4.650%, 11/15/34 | | | 200,000 | | | | 195 | |
| | | | | | | | |
| Corporate Bonds (16.6%) | | Shares/
Par+ | | | Value
$ (000’s) | |
| | |
Energy continued | | | | | | | | |
Plains All American Pipeline LP / PAA Finance Corp. 3.650%, 6/1/22 | | | 200,000 | | | | 196 | |
Sabine Pass Liquefaction LLC 5.625%, 3/1/25 | | | 500,000 | | | | 519 | |
Shell International Finance BV 2.375%, 8/21/22 | | | 1,170,000 | | | | 1,141 | |
Statoil ASA 2.450%, 1/17/23 | | | 250,000 | | | | 243 | |
Sunoco Logistics Partners Operations LP 3.450%, 1/15/23 | | | 300,000 | | | | 290 | |
Williams Partners LP
4.125%, 11/15/20 | | | 80,000 | | | | 81 | |
4.300%, 3/4/24 | | | 300,000 | | | | 299 | |
| | | | | | | | |
Total | | | | | | | 8,296 | |
| | | | | | | | |
| | |
Financial (5.4%) | | | | | | | | |
American International Group, Inc. 4.500%, 7/16/44 | | | 250,000 | | | | 223 | |
American Tower Corp. 3.375%, 10/15/26 | | | 400,000 | | | | 372 | |
Bank of America Corp.
3.248%, 10/21/27 | | | 1,625,000 | | | | 1,503 | |
3.300%, 1/11/23 | | | 425,000 | | | | 419 | |
4.443%, (ICE LIBOR USD 3 Month plus 1.990%), 1/20/48 | | | 450,000 | | | | 433 | |
Berkshire Hathaway, Inc. 4.500%, 2/11/43 | | | 395,000 | | | | 411 | |
Boston Properties LP 3.650%, 2/1/26 | | | 150,000 | | | | 145 | |
BPCE SA 3.500%, 10/23/27 144A | | | 250,000 | | | | 227 | |
Capital One Financial Corp. 3.750%, 3/9/27 | | | 330,000 | | | | 307 | |
Citigroup, Inc.
2.350%, 8/2/21 | | | 300,000 | | | | 291 | |
3.200%, 10/21/26 | | | 665,000 | | | | 614 | |
4.050%, 7/30/22 | | | 450,000 | | | | 452 | |
4.075%, (3 Month LIBOR plus 1.192%), 4/23/29 | | | 300,000 | | | | 293 | |
4.281%, (ICE LIBOR USD 3 Month plus 1.839%), 4/24/48 | | | 200,000 | | | | 185 | |
4.450%, 9/29/27 | | | 975,000 | | | | 940 | |
Cooperatieve Rabobank UA 3.950%, 11/9/22 | | | 250,000 | | | | 249 | |
Credit Suisse AG 3.625%, 9/9/24 | | | 250,000 | | | | 245 | |
Discover Bank 3.450%, 7/27/26 | | | 300,000 | | | | 275 | |
Discover Financial Services 3.750%, 3/4/25 | | | 200,000 | | | | 191 | |
Essex Portfolio LP 3.625%, 8/15/22 | | | 100,000 | | | | 100 | |
The Goldman Sachs Group, Inc.
2.300%, 12/13/19 | | | 300,000 | | | | 297 | |
3.500%, 11/16/26 | | | 400,000 | | | | 370 | |
3.750%, 5/22/25 | | | 850,000 | | | | 814 | |
4.800%, 7/8/44 | | | 675,000 | | | | 644 | |
5.750%, 1/24/22 | | | 330,000 | | | | 346 | |
The Hartford Financial Services Group, Inc. 5.125%, 4/15/22 | | | 150,000 | | | | 157 | |
The Accompanying Notes are an Integral Part of the Financial Statements.
155
Inflation Protection Portfolio
| | | | | | | | |
| Corporate Bonds (16.6%) | | Shares/
Par+ | | | Value
$ (000’s) | |
| | |
Financial continued | | | | | | | | |
HSBC Holdings PLC
2.950%, 5/25/21 | | | 400,000 | | | | 394 | |
4.041%, (ICE LIBOR USD 3 Month plus 1.546%), 3/13/28 | | | 230,000 | | | | 220 | |
4.300%, 3/8/26 | | | 200,000 | | | | 197 | |
4.375%, 11/23/26 | | | 200,000 | | | | 194 | |
Huntington Bancshares, Inc. 2.300%, 1/14/22 | | | 200,000 | | | | 193 | |
International Lease Finance Corp. 5.875%, 8/15/22 | | | 200,000 | | | | 210 | |
Jefferies Group LLC / Jefferies Group Capital Finance, Inc. 4.150%, 1/23/30 | | | 280,000 | | | | 240 | |
JPMorgan Chase & Co.
3.875%, 9/10/24 | | | 1,050,000 | | | | 1,035 | |
3.897%, (ICE LIBOR USD 3 Month plus 1.220%), 1/23/49 | | | 400,000 | | | | 351 | |
3.964%, (ICE LIBOR USD 3 Month plus 1.380%), 11/15/48 | | | 835,000 | | | | 740 | |
4.500%, 1/24/22 | | | 750,000 | | | | 773 | |
4.625%, 5/10/21 | | | 250,000 | | | | 257 | |
Kilroy Realty LP 3.800%, 1/15/23 | | | 120,000 | | | | 120 | |
Markel Corp. 3.500%, 11/1/27 | | | 200,000 | | | | 189 | |
Morgan Stanley
3.772%, (ICE LIBOR USD 3 Month plus 1.140%), 1/24/29 | | | 200,000 | | | | 192 | |
3.875%, 1/27/26 | | | 250,000 | | | | 244 | |
Prudential Financial, Inc. 3.935%, 12/7/49 | | | 251,000 | | | | 225 | |
U.S. Bancorp 3.600%, 9/11/24 | | | 400,000 | | | | 398 | |
Ventas Realty LP / Ventas Capital Corp. 3.250%, 8/15/22 | | | 250,000 | | | | 247 | |
Wells Fargo & Co. 3.000%, 4/22/26 | | | 200,000 | | | | 187 | |
3.550%, 9/29/25 | | | 175,000 | | | | 170 | |
4.100%, 6/3/26 | | | 330,000 | | | | 322 | |
4.125%, 8/15/23 | | | 220,000 | | | | 221 | |
4.400%, 6/14/46 | | | 500,000 | | | | 462 | |
4.750%, 12/7/46 | | | 450,000 | | | | 434 | |
| | | | | | | | |
Total | | | | | | | 18,718 | |
| | | | | | | | |
| | |
Industrial (0.9%) | | | | | | | | |
Burlington Northern Santa Fe LLC
3.000%, 4/1/25 | | | 200,000 | | | | 195 | |
3.750%, 4/1/24 | | | 200,000 | | | | 205 | |
4.125%, 6/15/47 | | | 380,000 | | | | 368 | |
4.950%, 9/15/41 | | | 100,000 | | | | 109 | |
CSX Corp. 3.800%, 11/1/46 | | | 180,000 | | | | 159 | |
FedEx Corp.
4.050%, 2/15/48 | | | 200,000 | | | | 168 | |
4.400%, 1/15/47 | | | 200,000 | | | | 180 | |
Lockheed Martin Corp. 3.800%, 3/1/45 | | | 200,000 | | | | 183 | |
Republic Services, Inc. 3.375%, 11/15/27 | | | 140,000 | | | | 134 | |
Rockwell Collins, Inc. 4.350%, 4/15/47 | | | 300,000 | | | | 276 | |
| | | | | | | | |
| Corporate Bonds (16.6%) | | Shares/
Par+ | | | Value
$ (000’s) | |
| | |
Industrial continued | | | | | | | | |
Union Pacific Corp.
2.750%, 4/15/23 | | | 100,000 | | | | 98 | |
3.350%, 8/15/46 | | | 165,000 | | | | 135 | |
4.000%, 4/15/47 | | | 340,000 | | | | 317 | |
United Technologies Corp. 3.750%, 11/1/46 | | | 525,000 | | | | 443 | |
| | | | | | | | |
Total | | | | | | | 2,970 | |
| | | | | | | | |
| | |
Technology (1.0%) | | | | | | | | |
Apple, Inc.
2.900%, 9/12/27 | | | 650,000 | | | | 613 | |
3.200%, 5/11/27 | | | 550,000 | | | | 531 | |
4.250%, 2/9/47 | | | 370,000 | | | | 369 | |
Dell International LLC / EMC Corp. 6.020%, 6/15/26 144A | | | 470,000 | | | | 472 | |
Fidelity National Information Services, Inc. 3.000%, 8/15/26 | | | 200,000 | | | | 184 | |
Microsoft Corp.
3.450%, 8/8/36 | | | 400,000 | | | | 379 | |
4.250%, 2/6/47 | | | 550,000 | | | | 578 | |
Oracle Corp.
2.500%, 10/15/22 | | | 300,000 | | | | 292 | |
2.650%, 7/15/26 | | | 150,000 | | | | 139 | |
| | | | | | | | |
Total | | | | | | | 3,557 | |
| | | | | | | | |
| | |
Utilities (1.4%) | | | | | | | | |
AEP Transmission Co., LLC 3.750%, 12/1/47 | | | 200,000 | | | | 184 | |
Alabama Power Co. 3.700%, 12/1/47 | | | 240,000 | | | | 220 | |
American Electric Power Co., Inc. 3.200%, 11/13/27 | | | 200,000 | | | | 190 | |
Consolidated Edison Co. of New York, Inc. 3.875%, 6/15/47 | | | 400,000 | | | | 369 | |
Dominion Resources, Inc. 4.900%, 8/1/41 | | | 320,000 | | | | 318 | |
Duke Energy Corp. 3.150%, 8/15/27 | | | 150,000 | | | | 140 | |
Duke Energy Progress LLC 3.700%, 10/15/46 | | | 720,000 | | | | 651 | |
Exelon Corp. 4.450%, 4/15/46 | | | 160,000 | | | | 152 | |
Exelon Generation Co. LLC 5.600%, 6/15/42 | | | 480,000 | | | | 470 | |
FirstEnergy Corp. 4.850%, 7/15/47 | | | 300,000 | | | | 301 | |
Florida Power & Light Co. 3.950%, 3/1/48 | | | 200,000 | | | | 196 | |
MidAmerican Energy Co. 4.400%, 10/15/44 | | | 600,000 | | | | 619 | |
NextEra Energy Capital Holdings, Inc. 3.550%, 5/1/27 | | | 200,000 | | | | 191 | |
Potomac Electric Power Co. 3.600%, 3/15/24 | | | 80,000 | | | | 81 | |
Sempra Energy
3.250%, 6/15/27 | | | 250,000 | | | | 230 | |
3.800%, 2/1/38 | | | 150,000 | | | | 129 | |
Southern Co. Gas Capital Corp. 3.950%, 10/1/46 | | | 200,000 | | | | 175 | |
Southwestern Public Service Co. 3.700%, 8/15/47 | | | 250,000 | | | | 229 | |
The Accompanying Notes are an Integral Part of the Financial Statements.
156
Inflation Protection Portfolio
| | | | | | | | |
| Corporate Bonds (16.6%) | | Shares/
Par+ | | | Value
$ (000’s) | |
| | |
Utilities continued | | | | | | | | |
Virginia Electric & Power Co. 3.450%, 2/15/24 | | | 50,000 | | | | 50 | |
| | | | | | | | |
Total | | | | | | | 4,895 | |
| | | | | | | | |
| | |
Total Corporate Bonds | | | | | | | | |
(Cost: $61,105) | | | | | | | 57,873 | |
| | | | | | | | |
| | |
| Governments (55.4%) | | | | | | |
| | |
Governments (55.4%) | | | | | | | | |
Australian Government Inflation Linked Bond 6.843%, 8/20/20 AUD §,¥ | | | 715,000 | | | | 912 | |
Canadian Government Real Return Bond
4.250%, 12/1/21 CAD¥ | | | 774,725 | | | | 625 | |
4.250%, 12/1/26 CAD¥ | | | 1,526,740 | | | | 1,431 | |
US Treasury Inflation Index Bond | | | | | | | | |
0.125%, 4/15/21 | | | 5,601,383 | | | | 5,447 | |
0.125%, 1/15/22 ß | | | 530,689 | | | | 515 | |
0.125%, 4/15/22 ß | | | 7,278,460 | | | | 7,041 | |
0.125%, 7/15/22 ß | | | 10,446,295 | | | | 10,147 | |
0.125%, 1/15/23 | | | 3,834,320 | | | | 3,704 | |
0.125%, 7/15/24 | | | 1,863,680 | | | | 1,787 | |
0.125%, 7/15/26 ß | | | 14,980,148 | | | | 14,065 | |
0.250%, 1/15/25 ß | | | 10,569,438 | | | | 10,122 | |
0.375%, 7/15/23 ß | | | 6,954,240 | | | | 6,800 | |
0.375%, 7/15/25 ß | | | 6,824,448 | | | | 6,580 | |
0.375%, 1/15/27 | | | 6,699,712 | | | | 6,364 | |
0.500%, 1/15/28 | | | 4,100,640 | | | | 3,914 | |
0.625%, 7/15/21 ß | | | 10,097,640 | | | | 9,988 | |
0.625%, 1/15/24 ß | | | 17,610,775 | | | | 17,337 | |
0.625%, 1/15/26 ß | | | 9,205,503 | | | | 8,961 | |
0.625%, 2/15/43 ß | | | 7,314,069 | | | | 6,411 | |
0.750%, 7/15/28 | | | 5,691,754 | | | | 5,572 | |
0.750%, 2/15/42 ß | | | 8,756,879 | | | | 7,947 | |
0.750%, 2/15/45 ß | | | 7,355,804 | | | | 6,578 | |
0.875%, 2/15/47 | | | 3,456,915 | | | | 3,174 | |
1.000%, 2/15/46 | | | 2,507,944 | | | | 2,378 | |
1.000%, 2/15/48 | | | 1,281,800 | | | | 1,215 | |
1.375%, 2/15/44 ß | | | 11,533,656 | | | | 11,910 | |
1.750%, 1/15/28 | | | 4,822,125 | | | | 5,121 | |
2.000%, 1/15/26 | | | 3,121,423 | | | | 3,332 | |
2.125%, 2/15/40 | | | 2,222,886 | | | | 2,613 | |
2.125%, 2/15/41 ß | | | 5,871,700 | | | | 6,935 | |
2.375%, 1/15/25 | | | 2,213,492 | | | | 2,393 | |
2.375%, 1/15/27 | | | 4,294,676 | | | | 4,741 | |
2.500%, 1/15/29 | | | 3,197,700 | | | | 3,640 | |
3.375%, 4/15/32 | | | 804,910 | | | | 1,032 | |
3.625%, 4/15/28 | | | 2,345,160 | | | | 2,878 | |
| | | | | | | | |
Total | | | | | | | 193,610 | |
| | | | | | | | |
| | |
Total Governments | | | | | | | | |
(Cost: $202,147) | | | | | | | 193,610 | |
| | | | | | | | |
| | |
| Municipal Bonds (0.5%) | | | | | | |
| | |
Municipal Bonds (0.5%) | | | | | | | | |
Bay Area Toll Authority, California, Series 2010 6.918%, 4/1/40 RB | | | 35,000 | | | | 47 | |
City of New York 5.968%, 3/1/36 GO | | | 125,000 | | | | 153 | |
City of San Antonio TX Electric & Gas System | | | | | | | | |
Revenue 5.985%, 2/1/39 RB | | | 150,000 | | | | 196 | |
| | | | | | | | |
| Municipal Bonds (0.5%) | | Shares/
Par+ | | | Value
$ (000’s) | |
| | |
Municipal Bonds continued | | | | | | | | |
City of San Francisco CA Public Utilities Commission Water Revenue 6.950%, 11/1/50 RB | | | 25,000 | | | | 36 | |
Los Angeles Community College District, Series2010-E 6.750%, 8/1/49 GO | | | 95,000 | | | | 137 | |
Metropolitan Transportation Authority 6.814%, 11/15/40 RB | | | 50,000 | | | | 66 | |
Missouri Highway & Transportation Commission 5.445%, 5/1/33 RB | | | 100,000 | | | | 116 | |
New Jersey Turnpike Authority, Series 2010 7.102%, 1/1/41 RB | | | 100,000 | | | | 137 | |
Port Authority of New York & New Jersey, Series 168 4.926%, 10/1/51 RB | | | 50,000 | | | | 57 | |
Rutgers - The State University of New Jersey 5.665%, 5/1/40 RB | | | 55,000 | | | | 65 | |
Santa Clara Valley Transportation Authority 5.876%, 4/1/32 RB | | | 50,000 | | | | 59 | |
State of California
4.600%, 4/1/38 GO | | | 65,000 | | | | 67 | |
7.300%, 10/1/39 GO | | | 55,000 | | | | 75 | |
7.550%, 4/1/39 GO | | | 250,000 | | | | 358 | |
State of Illinois 5.100%, 6/1/33 GO | | | 150,000 | | | | 143 | |
State of Texas, Series 2009A 5.517%, 4/1/39 RB | | | 30,000 | | | | 37 | |
| | | | | | | | |
Total Municipal Bonds | | | | | | | | |
(Cost: $1,799) | | | | | | | 1,749 | |
| | | | | | | | |
| | |
| Structured Products (18.9%) | | | | | | |
| | |
Asset Backed Securities (4.5%) | | | | | | | | |
Bean Creek CLO, Ltd., Series2018-1A, Class AR 3.368%, (ICE LIBOR USD 3 Month plus 1.020%), 4/20/31 144A | | | 1,250,000 | | | | 1,219 | |
BRE Grand Islander Timeshare Issuer, Series2017-1A, Class A 2.940%, 5/25/29 144A | | | 404,719 | | | | 400 | |
CIFC Funding, Ltd., Series2013-3RA, Class A1 3.330%, (ICE LIBOR USD 3 Month plus 0.980%), 4/24/31 144A | | | 1,000,000 | | | | 976 | |
Goldentree Loan Opportunities X, Ltd., Series2015-10A, Class AR 3.311%, (ICE LIBOR USD 3 Month plus 1.120%), 7/20/31 144A | | | 1,250,000 | | | | 1,239 | |
Goldentree Loan Opportunities XI, Ltd., Series2017-11A, Class AR2 3.403%, (ICE LIBOR USD 3 Month plus 1.070%), 1/18/31 144A | | | 1,350,000 | | | | 1,325 | |
Hilton Grand Vacations Trust, Series 2014- AA, Class A 1.770%, 11/25/26 144A | | | 167,857 | | | | 165 | |
KKR CLO, Ltd., Series2018-22A, Class A 3.523%, (ICE LIBOR USD 3 Month plus 1.150%), 7/20/31 144A | | | 1,500,000 | | | | 1,480 | |
The Accompanying Notes are an Integral Part of the Financial Statements.
157
Inflation Protection Portfolio
| | | | | | | | |
| Structured Products (18.9%) | | Shares/
Par+ | | | Value
$ (000’s) | |
| | |
Asset Backed Securities continued | | | | | | | | |
Madison Park Funding, Ltd., Series2014-13A, Class AR2 3.292%, (ICE LIBOR USD 3 Month plus 0.950%), 4/19/30 144A | | | 1,600,000 | | | | 1,574 | |
Magnetite VIII, Ltd., Series2018-8A, Class AR2 3.319%, (ICE LIBOR USD 3 Month plus 0.980%), 4/15/31 144A | | | 1,750,000 | | | | 1,724 | |
MVW Owner Trust, Series2015-1A, Class A 2.520%, 12/20/32 144A | | | 330,940 | | | | 326 | |
MVW Owner Trust, Series2016-1A, Class A 2.250%, 12/20/33 144A | | | 281,994 | | | | 275 | |
Sierra Receivables Funding Co. LLC, Series2015-1A, Class A 2.400%, 3/22/32 144A | | | 88,908 | | | | 88 | |
Sierra Timeshare Receivables Funding LLC, Series2016-1A, Class A 3.080%, 3/21/33 144A | | | 248,204 | | | | 247 | |
Sounds Point CLOIV-R, Ltd., Series 2013-3RA, Class A 3.651%, (ICE LIBOR USD 3 Month plus 1.150%), 4/18/31 144A | | | 1,600,000 | | | | 1,579 | |
Towd Point Mortgage Trust, Series2016-1, Class A1 3.500%, (AFC), 2/25/55 144A | | | 393,255 | | | | 392 | |
Towd Point Mortgage Trust, Series2017-2, Class A1 2.750%, (AFC), 4/25/57 144A | | | 756,006 | | | | 739 | |
Treman Park CLO Ltd., Series2015-1A, Class ARR 3.535%, (ICE LIBOR USD 3 Month plus 1.070%), 10/20/28 144A | | | 1,000,000 | | | | 1,000 | |
VSE VOI Mortgage LLC, Series2017-A, Class A 2.330%, 3/20/35 144A | | | 852,683 | | | | 833 | |
| | | | | | | | |
Total | | | | | | | 15,581 | |
| | | | | | | | |
| | |
Mortgage Securities (14.4%) | | | | | | | | |
Agate Bay Mortgage Trust, Series2014-3, Class A2 3.500%, (AFC), 11/25/44 144A | | | 723,191 | | | | 709 | |
Agate Bay Mortgage Trust, Series2015-7, Class A3 3.500%, (AFC), 10/25/45 144A | | | 1,477,252 | | | | 1,448 | |
Agate Bay Mortgage Trust, Series2016-1, Class A3 3.500%, (AFC), 12/25/45 144A | | | 1,059,746 | | | | 1,043 | |
Agate Bay Mortgage Trust, Series2016-3, Class A3 3.500%, (AFC), 8/25/46 144A | | | 714,138 | | | | 704 | |
BAMLL Commercial Mortgage Securities Trust, Series 2015-200P, Class B 3.490%, 4/14/33 144A | | | 1,110,000 | | | | 1,096 | |
BB-UBS Trust, Series 2012-SHOW, Class A 3.430%, 11/5/36 144A | | | 1,000,000 | | | | 1,000 | |
CD Mortgage Trust, Series2016-CD2, Class A4 3.526%, (AFC), 11/10/49 | | | 700,000 | | | | 697 | |
Citicorp Mortgage Securities Trust, Series2007-8, Class 1A3 6.000%, 9/25/37 | | | 35,594 | | | | 37 | |
| | | | | | | | |
| Structured Products (18.9%) | | Shares/
Par+ | | | Value
$ (000’s) | |
| | |
Mortgage Securities continued | | | | | | | | |
Citigroup / Deutsche Bank Commercial Mortgage Trust, Series2016-CD1, Class AM 2.926%, 8/10/49 | | | 1,000,000 | | | | 942 | |
Commercial Mortgage Pass Through Certificates, Series 2014-CR15, Class AM 4.426%, (AFC), 2/10/47 | | | 1,000,000 | | | | 1,042 | |
Commercial Mortgage Pass Through Certificates, Series 2014-UBS5, Class AM 4.193%, (AFC), 9/10/47 | | | 850,000 | | | | 863 | |
Commercial Mortgage Pass Through Certificates, Series2015-3BP, Class A 3.178%, 2/10/35 144A | | | 875,000 | | | | 862 | |
Commercial Mortgage Pass Through | | | | | | | | |
Certificates, Series 2015-CR22, Class AM 3.603%, (AFC), 3/10/48 | | | 900,000 | | | | 894 | |
Commercial Mortgage Pass Through Certificates, Series 2016-CR28, Class B 4.646%, (CSTR), 2/10/49 | | | 880,000 | | | | 909 | |
Commercial Mortgage Pass Through Certificates, Series 2017-PANW, Class A 3.244%, 11/10/34 144A | | | 850,000 | | | | 835 | |
Core Industrial Trust, Series 2015-TEXW, Class B 3.329%, 2/10/34 144A | | | 725,000 | | | | 718 | |
Core Industrial Trust, Series 2015-WEST, Class A 3.292%, 2/10/37 144A | | | 932,354 | | | | 922 | |
Credit Suisse Mortgage Trust, Series 2015- WIN1, Class A10 3.500%, (AFC), 12/25/44 144A | | | 300,000 | | | | 295 | |
Credit Suisse Mortgage Trust, Series 2017- HL1, Class A3 3.500%, (AFC), 6/25/47 144A | | | 615,219 | | | | 608 | |
Federal Home Loan Mortgage Corp.
4.000%, 5/1/42 | | | 3,479,487 | | | | 3,580 | |
4.500%, 4/1/41 | | | 2,629,950 | | | | 2,755 | |
Federal National Mortgage Association 4.000%, 2/1/46 | | | 4,681,580 | | | | 4,778 | |
GS Mortgage Securities Trust, Series 2016- GS2, Class B 3.759%, (AFC), 5/10/49 | | | 750,000 | | | | 740 | |
Hudson Yards Mortgage Trust, Series 2016-10HY, Class B 2.977%, (CSTR), 8/10/38 144A | | | 1,175,000 | | | | 1,112 | |
Irvine Core Office Trust, Series2013-IRV, Class A2 3.173%, (CSTR), 5/15/48 144A | | | 800,000 | | | | 798 | |
JP Morgan Chase Commercial Mortgage Securities Corp., Series2016-JP2, Class A4 2.821%, 8/15/49 | | | 600,000 | | | | 570 | |
JP Morgan Chase Commercial Mortgage Securities Corp., Series2016-JP3, Class AS 3.144%, 8/15/49 | | | 675,000 | | | | 637 | |
JP Morgan Chase Commercial Mortgage Securities Trust, Series2013-C16, Class A4 4.166%, 12/15/46 | | | 600,000 | | | | 620 | |
JP Morgan Mortgage Trust, Series2013-1, Class 2A2 2.500%, (AFC), 3/25/43 144A | | | 659,586 | | | | 636 | |
The Accompanying Notes are an Integral Part of the Financial Statements.
158
Inflation Protection Portfolio
| | | | | | | | |
| Structured Products (18.9%) | | Shares/
Par+ | | | Value
$ (000’s) | |
| | |
Mortgage Securities continued | | | | | | | | |
JP Morgan Mortgage Trust, Series2014-5, Class A1 2.987%, (AFC), 10/25/29 144A | | | 761,277 | | | | 753 | |
JP Morgan Mortgage Trust, Series2016-1, Class A7 3.500%, 5/25/46 144A | | | 1,750,000 | | | | 1,712 | |
JP Morgan Mortgage Trust, Series2017-1, Class A2 3.500%, (AFC), 1/25/47 144A | | | 1,714,279 | | | | 1,681 | |
JPMBB Commercial Mortgage Securities Trust, Series2014-C21, Class B 4.341%, (AFC), 8/15/47 | | | 700,000 | | | | 701 | |
JPMDB Commercial Mortgage Securities Trust, Series2017-C5, Class A4 3.414%, 3/15/50 | | | 930,000 | | | | 919 | |
Morgan Stanley Bank of America Merrill Lynch Trust, Series2017-C34, Class A3 3.276%, 11/15/52 | | | 1,350,000 | | | | 1,308 | |
Morgan Stanley Capital I Trust, Series 2014- CPT, Class C 3.446%, (CSTR), 7/13/29 144A | | | 600,000 | | | | 594 | |
Morgan Stanley Capital I Trust, Series 2016- UB11, Class A4 2.782%, 8/15/49 | | | 1,575,000 | | | | 1,491 | |
New Residential Mortgage Loan Trust, Series2017-2A, Class A3 4.000%, (CSTR), 3/25/57 144A | | | 1,105,972 | | | | 1,116 | |
New Residential Mortgage Loan Trust, Series2017-5A, Class A1 4.006%, (ICE LIBOR USD 1 Month plus 1.500%), (AFC), 6/25/57 144A | | | 1,135,534 | | | | 1,156 | |
Sequoia Mortgage Trust, Series2014-3, Class A14 3.000%, (AFC), 10/25/44 144A | | | 203,257 | | | | 198 | |
Sequoia Mortgage Trust, Series2014-4, Class A2 3.500%, (AFC), 11/25/44 144A | | | 179,629 | | | | 179 | |
Sequoia Mortgage Trust, Series2017-5, Class A4 3.500%, (AFC), 8/25/47 144A | | | 1,248,604 | | | | 1,233 | |
Sequoia Mortgage Trust, Series2017-7, Class A7 3.500%, (AFC), 10/25/47 144A | | | 2,250,000 | | | | 2,162 | |
Sequoia Mortgage Trust, Series2017-CH1, Class A1 4.000%, (AFC), 10/25/47 144A | | | 770,785 | | | | 776 | |
Sequoia Mortgage Trust, Series2018-7, Class A4 4.000%, (AFC), 9/25/48 144A | | | 721,217 | | | | 729 | |
Thornburg Mortgage Securities Trust, Series2004-3, Class A 3.246%, (ICE LIBOR USD 1 Month plus 0.740%), (AFC), 9/25/44 | | | 270,815 | | | | 265 | |
USB Commercial Mortgage Trust, Series2017-C1, Class A3 3.196%, 6/15/50 | | | 700,000 | | | | 677 | |
Wells Fargo Mortgage Backed Securities Trust, Series2005-17, Class 1A1 5.500%, 1/25/36 | | | 29,210 | | | | 28 | |
| | | | | | | | |
| Structured Products (18.9%) | | Shares/
Par+ | | | Value
$ (000’s) | |
| | |
Mortgage Securities continued | | | | | | | | |
Wells Fargo Mortgage Backed Securities Trust, Series 2005-AR10, Class 1A1 4.520%, (CSTR), 6/25/35 | | | 197,440 | | | | 207 | |
Wells Fargo Mortgage Backed Securities Trust, Series 2005-AR10, Class 2A15 4.513%, (CSTR), 6/25/35 | | | 554,995 | | | | 571 | |
Wells Fargo Mortgage Backed Securities Trust, Series2006-10, Class A4 6.000%, 8/25/36 | | | 37,382 | | | | 37 | |
Wells Fargo Mortgage Backed Securities Trust, Series 2007-AR10, Class 1A1 4.907%, (CSTR), 1/25/38 | | | 40,104 | | | | 38 | |
WinWater Mortgage Loan Trust, Series 2014-1, Class A4 3.500%, (AFC), 6/20/44 144A | | | 119,640 | | | | 119 | |
| | | | | | | | |
Total | | | | | | | 50,500 | |
| | | | | | | | |
| | |
Total Structured Products | | | | | | | | |
(Cost: $67,751) | | | | | | | 66,081 | |
| | | | | | | | |
| | |
| Short-Term Investments (9.5%) | | | | | | |
| | |
Money Market Funds (8.8%) | | | | | | | | |
State Street Institutional U.S. Government Money Market Fund - Premier Class 2.270%# | | | 30,836,302 | | | | 30,836 | |
| | | | | | | | |
Total | | | | | | | 30,836 | |
| | | | | | | | |
| | |
US Government & Agencies (0.7%) | | | | | | | | |
US Treasury 0.000%, 1/24/19 | | | 2,500,000 | | | | 2,497 | |
| | | | | | | | |
Total | | | | | | | 2,497 | |
| | | | | | | | |
| | |
Total Short-Term Investments | | | | | | | | |
(Cost: $33,333) | | | | | | | 33,333 | |
| | | | | | | | |
| | |
Total Investments (100.9%) | | | | | | | | |
(Cost: $366,135)@ | | | | | | | 352,646 | |
| | | | | | | | |
Other Assets, Less Liabilities(-0.9%) | | | | | | | (3,075 | ) |
| | | | | | | | |
Net Assets (100.0%) | | | | | | | 349,571 | |
| | | | | | | | |
The Accompanying Notes are an Integral Part of the Financial Statements.
159
Inflation Protection Portfolio
Exchange Traded or Centrally Cleared Derivatives
Futures
| | | | | | | | | | | | | | | | | | | | | | | | | | |
| Issuer | | Long/Short | | Currency | | Notional Par
(000’s) | | | Number of
Contracts | | | Expiration
Date | | Notional Value
(000’s) | | | Unrealized
Appreciation/
(Depreciation)
(000’s) | | | Variation Margin
(000’s) | |
Five-Year US Treasury Note Future | | Long | | USD | | | 38,300 | | | | 383 | | | 3/19 | | $ | 43,925 | | | $ | 565 | | | $ | 96 | |
Ten-Year US Treasury Note Future | | Long | | USD | | | 28,500 | | | | 285 | | | 3/19 | | | 34,775 | | | | 716 | | | | 111 | |
Ultra Long Term US Treasury Bond Future | | Short | | USD | | | 1,900 | | | | 19 | | | 3/19 | | | 3,053 | | | | (160 | ) | | | (11 | ) |
Ultra Long Term US Treasury Bond Future | | Short | | USD | | | 6,400 | | | | 64 | | | 3/19 | | | 8,325 | | | | (182 | ) | | | (30 | ) |
US Treasury Long Bond Future | | Short | | USD | | | 25,000 | | | | 250 | | | 3/19 | | | 36,500 | | | | (1,688 | ) | | | (117 | ) |
| | | | | | | | | | | | | | | | | | | | | | | | | | |
| | | | | | | | | | | | | | | | | | | | $ | (749 | ) | | $ | 49 | |
| | | | | | | | | | | | | | | | | | | | | | | | | | |
Total Return Swaps — Receive Floating Rate
| | | | | | | | | | | | | | | | | | | | | | | | | | | | | | | | |
| Floating Rate Index | | Fixed
Rate | | | Expiration
Date | | | Notional
Amount
(000’s) | | | Currency | | | Upfront
Premium Paid/
(Received)
(000’s) | | | Unrealized
Appreciation/
(Depreciation)
(000’s) | | | Market
Value
(000’s) | | | Variation
Margin(000’s) | |
U.S. Consumer Price | | | 2.073% | | | | 8/27 | | | | 3,500 | | | | USD | | | $ | - | | | $ | (26 | ) | | $ | (26 | ) | | $ | (6 | ) |
Index - 3 Month | | | | | | | | | | | | | | | | | | | | | | | | | | | | | | | | |
USD LIBOR | | | | | | | | | | | | | | | | | | | | | | | | | | | | | | | | |
U.S. Consumer Price | | | 2.145% | | | | 11/27 | | | | 5,000 | | | | USD | | | | - | | | | (83 | ) | | | (83 | ) | | | (8 | ) |
Index - 3 Month | | | | | | | | | | | | | | | | | | | | | | | | | | | | | | | | |
USD LIBOR | | | | | | | | | | | | | | | | | | | | | | | | | | | | | | | | |
| | | | | | | | | | | | | | | | | | | | | | | | | | | | | | | | |
| | | $ | - | | | $ | (109 | ) | | $ | (109 | ) | | $ | (14 | ) |
| | | | | | | | | | | | | | | | | | | | | | | | | | | | | | | | |
| | | | | | | | | | | | | | | | | | | | | | | | | | | | |
| | | Financial Derivative Assets | | | | | | Financial Derivative Liabilities | |
| | | Variation Margin (000’s) | | | Market Value
(000’s) | | | Variation Margin (000’s) | |
| | | Swaps | | | Futures | | | Total | | | Options | | | Swaps | | | Futures | | | Total | |
Total Exchange-Traded or Centrally Cleared Derivatives | | $ | - | | | $ | 207 | | | $ | 207 | | | $ | - | | | $ | (14 | ) | | $ | (158 | ) | | $ | (172 | ) |
Over the Counter Derivatives
Forward Contracts
| | | | | | | | | | | | | | | | | | | | | | | | |
| Type | | Counterparty | | Currency | | Foreign Principal
Amount
Covered by
Contract (000s) | | USD Principal
Amount
Covered by
Contract (000’s) | | | Settlement
Month | | Unrealized
Appreciation
(000’s) | | | Unrealized
(Depreciation)
(000’s) | | | Net
Unrealized
Appreciation/
(Depreciation)
(000’s) | |
Sell | | Morgan Stanley Capital Services, Inc. | | AUD | | 1,273 | | | 898 | | | 3/19 | | $ | 23 | | | $ | - | | | $ | 23 | |
Sell | | Morgan Stanley Capital Services, Inc. | | CAD | | 2,753 | | | 2,020 | | | 3/19 | | | 50 | | | | - | | | | 50 | |
| | | | | | | | | | | | | | | | | | | | | | | | |
| | | | | | | | | | | | | | $ | 73 | | | $ | - | | | $ | 73 | |
| | | | | | | | | | | | | | | | | | | | | | | | |
The Accompanying Notes are an Integral Part of the Financial Statements.
160
Inflation Protection Portfolio
Total Return Swaps
| | | | | | | | | | | | | | | | |
| Reference Entity | | Counterparty | | Payment made
by the Fund | | Expiration
Date | | Notional
Amount
(000’s) | | Unrealized
Appreciation/
(Depreciation)
(000’s) | | | Market
Value
(000’s) | |
CPURNSA | | Bank of America, N.A. | | 2.210% | | 3/19 | | 6,500 | | $ | (263 | ) | | $ | (263 | ) |
CPURNSA | | Bank of America, N.A. | | 2.640% | | 3/19 | | 4,500 | | | (352 | ) | | | (352 | ) |
CPURNSA | | Bank of America, N.A. | | 2.510% | | 3/19 | | 2,000 | | | (183 | ) | | | (183 | ) |
CPURNSA | | Bank of America, N.A. | | 2.640% | | 2/20 | | 2,800 | | | (328 | ) | | | (328 | ) |
CPURNSA | | Bank of America, N.A. | | 2.670% | | 4/22 | | 3,000 | | | (413 | ) | | | (413 | ) |
CPURNSA | | Bank of America, N.A. | | 2.763% | | 3/23 | | 700 | | | (88 | ) | | | (88 | ) |
CPURNSA | | Bank of America, N.A. | | 2.528% | | 8/24 | | 2,750 | | | (259 | ) | | | (259 | ) |
CPURNSA | | Bank of America, N.A. | | 2.140% | | 7/25 | | 2,900 | | | (79 | ) | | | (79 | ) |
CPURNSA | | Bank of America, N.A. | | 1.790% | | 8/25 | | 1,500 | | | 6 | | | | 6 | |
CPURNSA | | Bank of America, N.A. | | 2.240% | | 4/27 | | 3,500 | | | (111 | ) | | | (111 | ) |
CPURNSA | | Bank of America, N.A. | | 2.218% | | 4/27 | | 2,000 | | | (59 | ) | | | (59 | ) |
CPURNSA | | Bank of America, N.A. | | 2.235% | | 4/27 | | 2,000 | | | (61 | ) | | | (61 | ) |
CPURNSA | | Bank of America, N.A. | | 2.235% | | 5/27 | | 5,000 | | | (152 | ) | | | (152 | ) |
CPURNSA | | Barclays Bank PLC | | 1.710% | | 2/20 | | 1,000 | | | (9 | ) | | | (9 | ) |
CPURNSA | | Barclays Bank PLC | | 2.526% | | 5/23 | | 5,500 | | | (557 | ) | | | (557 | ) |
CPURNSA | | Barclays Bank PLC | | 2.535% | | 5/23 | | 1,000 | | | (102 | ) | | | (102 | ) |
CPURNSA | | Barclays Bank PLC | | 2.589% | | 7/24 | | 1,400 | | | (141 | ) | | | (141 | ) |
CPURNSA | | Barclays Bank PLC | | 2.385% | | 9/24 | | 4,000 | | | (311 | ) | | | (311 | ) |
CPURNSA | | Barclays Bank PLC | | 2.363% | | 9/24 | | 3,500 | | | (262 | ) | | | (262 | ) |
CPURNSA | | Barclays Bank PLC | | 2.310% | | 9/24 | | 1,400 | | | (97 | ) | | | (97 | ) |
CPURNSA | | Barclays Bank PLC | | 2.895% | | 12/27 | | 1,700 | | | (458 | ) | | | (458 | ) |
CPURNSA | | Barclays Bank PLC | | 2.784% | | 7/44 | | 1,400 | | | (346 | ) | | | (346 | ) |
CPURNSA | | Goldman Sachs International | | 1.870% | | 5/26 | | 17,000 | | | 194 | | | | 194 | |
CPURNSA | | Goldman Sachs International | | 1.920% | | 5/26 | | 7,000 | | | 46 | | | | 46 | |
CPURNSA | | Goldman Sachs International | | 1.770% | | 6/26 | | 6,000 | | | 123 | | | | 123 | |
CPURNSA | | Goldman Sachs International | | 2.245% | | 11/26 | | 3,000 | | | (84 | ) | | | (84 | ) |
CPURNSA | | Goldman Sachs International | | 2.280% | | 11/26 | | 3,000 | | | (95 | ) | | | (95 | ) |
CPURNSA | | Goldman Sachs International | | 2.280% | | 11/26 | | 4,000 | | | (127 | ) | | | (127 | ) |
| | | | | | | | | | | | | | | | |
| | | | | | | | | | $ | (4,568 | ) | | $ | (4,568 | ) |
| | | | | | | | | | | | | | | | |
| | | | | | | | | | | | | | | | | | | | | | | | | | | | |
| | | Financial Derivative Assets (000’s) | | | Financial Derivative Liabilities (000’s) | |
| | | Forward
Contracts | | | Swaps | | | Total | | | Forward
Contracts | | | Options | | | Swaps | | | Total | |
Total Over the Counter Derivatives | | $ | 73 | | | $ | 369 | | | $ | 442 | | | | - | | | | - | | | $ | (4,937 | ) | | $ | (4,937 | ) |
| + | All par is stated in U.S Dollar unless otherwise noted. |
| | 144A Security exempt from registration under Rule 144A of the Securities Act of 1933. These securities may be resold as transactions exempt from registration, normally to qualified institutional buyers. At December 31, 2018 the value of these securities (in thousands) was $43,807 representing |
| ¥ | Foreign Bond — par value is foreign denominated |
| § | Security was purchased pursuant to Regulation S under the Securities Act of 1933, which exempts from registration securities offered and sold outside of the United States. At December 31, 2018, the aggregate value of these securities was $912 (in thousands), representing 0.3% of net assets. |
| ß | Cash or securities with an aggregate value of $131,337 (in thousands) has been pledged as collateral for futures, swap contracts outstanding, short sales, when issued securities or written options on 12/31/2018. |
| # | 7-Day yield as of 12/31/2018. |
| @ | At December 31, 2018, the aggregate cost of investments, including derivatives, for federal tax purposes (in thousands) was $367,511 and the net unrealized depreciation of investments based on that cost was $20,219 which is comprised of $981 aggregate gross unrealized appreciation and $21,200 aggregate gross unrealized depreciation. |
The Accompanying Notes are an Integral Part of the Financial Statements.
161
Inflation Protection Portfolio
The following is a summary of the inputs used in valuing the Portfolio’s assets and liabilities at December 31, 2018. See Note 3 for additional information on portfolio valuation.
| | | | | | | | | | | | | | |
| | | Valuation Inputs | | | |
| Description | | Level 1 – Quoted Prices | | | Level 2 – Other Significant
Observable Inputs | | | Level 3 – Significant
Unobservable Inputs | | | |
| | | (Amounts in thousands) | | | |
Assets: | | | | | | | | | | | | | | |
Municipal Bonds | | $ | - | | | $ | 1,749 | | | $ | - | | | |
Corporate Bonds | | | - | | | | 57,873 | | | | - | | | |
Governments | | | - | | | | 193,610 | | | | - | | | |
Structured Products | | | - | | | | 66,081 | | | | - | | | |
Short-Term Investments | | | | | | | | | | | | | | |
Money Market Funds | | | 30,836 | | | | - | | | | - | | | |
All Others | | | - | | | | 2,497 | | | | - | | | |
Other Financial Instruments^ | | | | | | | | | | | | | | |
Futures | | | 1,281 | | | | - | | | | - | | | |
Forward Currency Contracts | | | - | | | | 73 | | | | - | | | |
Total Return Swaps | | | - | | | | 369 | | | | - | | | |
Total Assets: | | $ | 32,117 | | | $ | 322,252 | | | $ | - | | | |
Liabilities: | | | | | | | | | | | | | | |
Other Financial Instruments^ | | | | | | | | | | | | | | |
Futures | | | (2,030 | ) | | | - | | | | - | | | |
Total Return Swaps | | | - | | | | (4,937 | ) | | | - | | | |
Interest Rate Swaps | | | - | | | | (109 | ) | | | - | | | |
Total Liabilities: | | $ | (2,030 | ) | | $ | (5,046 | ) | | $ | - | | | |
^ Other financial instruments are derivative instruments such as futures and forwards, which are valued at the unrealized appreciation (depreciation) on the instrument, and securities sold short, reverse repurchase agreements, written options and swaps contracts, which are valued at market value.
The Accompanying Notes are an Integral Part of the Financial Statements.
162
High Yield Bond Portfolio (unaudited)
| | | | |
| Objective: | | Portfolio Strategy: | | Net Assets: |
High current income and capital appreciation. | | Invest innon-investment grade debt securities. | | $763 million |
PORTFOLIO OVERVIEW
Mason Street Advisors, LLC (“Mason Street Advisors”), the investment adviser for the High Yield Bond Portfolio (the “Portfolio”), has engaged Federated Investment Management Company (“Federated”) to act assub-adviser for the Portfolio. Normally, the Portfolio invests innon-investment grade debt securities, which are generally securities rated below investment grade by major credit rating agencies, or if unrated, determined to be of comparable quality. The Portfolio may invest up to 30% of net assets innon-investment grade foreign securities. The securities in which the Portfolio primarily invests are considered speculative and are sometimes known as “junk bonds.” These securities tend to offer higher yields than higher rated securities of comparable maturities primarily because of the market’s greater uncertainty about the issuer’s ability to make all required interest and principal payments, and therefore about the returns that will in fact be realized by the Portfolio. The Portfolio invests in securities believed to have attractive investment characteristics and seeks to minimize default risk and other risks through careful security selection and diversification. The Portfolio’s security selection process consists of a credit-intensive, fundamental analysis of the issuer. The Portfolio does not limit the investments to securities of a particular maturity range and does not target an average effective maturity or duration.
MARKET OVERVIEW
For much of the year, the high yield market performed well compared with most fixed income assets, benefiting from a growing economy and strong corporate earnings. However, the fourth quarter proved difficult for the high yield market, as a number of factors worked against the market. These included the ongoing trade dispute between the U.S. and China, concerns about U.S. monetary policy, slowing economies in China and Europe and a steep drop in oil prices. These factors, along with rich valuations, led to a sharp drop in equity markets, negatively impacting the high yield market. In the fourth-quarter decline, the high yield market seemed to ignore continued strong corporate earnings, very low levels of U.S. unemployment, good high yield credit profiles and low default rates. The impact of these factors can be seen in the spread between high yield bonds and U.S. Treasury securities with comparable maturities which, according to the Credit Suisse® High Yield Bond Index, began the reporting period at 394 basis points, then hit a low of 353 in October before rising substantially to close the year at 575 basis points.
Within the high yield market, major industry sectors that substantially outperformed the overall Bloomberg Barclays® U.S. Corporate High Yield 2% Issuer Capped Index (the “Index”) during the reporting period included: Pharmaceuticals, Electric Utilities, Media & Entertainment, Cable & Satellite and Health Care. Major industry sectors that substantially underperformed the Index during the reporting period included: Oil Field Services, Independent Energy, Automotive, Home Construction and Banking. From a credit quality perspective, the “CCC”-rated sector was the worst performer with a (3.84%) total return followed by the “BB”-rated sector with a (2.42%) return. TheB-rated sector was the strongest performing quality sector, although it was also in negative territory with a (1.31%) total return during the reporting period.
PORTFOLIO RESULTS
The Portfolio returned (2.71%) for the twelve months ended December 31, 2018. By comparison, the Portfolio’s benchmark, the Bloomberg Barclays® U.S. Corporate High Yield 2% Issuer Capped Index, returned (2.08%). (The Index is unmanaged, cannot be invested in directly and does not incur expenses.) According to Lipper® Analytical Services, Inc., an independent mutual fund rating agency, the average return in 2018 of the High Yield Funds peer group was (2.63%).
The Portfolio’s relative performance was negatively impacted by its security selection during the period. This was especially true in the Health Care, Food & Beverage, Media & Entertainment, Packaging, Cable & Satellite, Technology and Wireless Telecommunications sectors. The Portfolio was overweight the strong-performing Health Care and Cable & Satellite sectors but much of the benefit from this positioning was offset by its specific holdings, which underperformed overall. Specific high yield issuers held by the Portfolio that negatively impacted relative performance included: Anna Merger, Sesi LLC, Raxspace Hosting, Ultra Resources and Altice Luxembourg SA.
Sector allocation helped the Portfolio’s relative performance during the reporting period. In particular, the Portfolio benefited from its underweight to the weak performing Oil Field Services, Independent Energy, Banking and Home Construction industry sectors. The Portfolio was positively impacted by security selection in the Retail industry sector during the reporting period. Specific high yield issuers held by the Portfolio that positively impacted performance relative to the Index included: Platform Specialty Products, Radio One, Bausch Health Cos., Seminole Hard Rock Entertainment and Petsmart.
163
High Yield Bond Portfolio (unaudited)
PORTFOLIO MANAGER OUTLOOK
The following forward-looking comments are the opinion of Federated, the Portfolio’ssub-adviser.
The weak performance for high yield securities in the fourth quarter leaves the market at a crossroads. While investors have many concerns – trade negotiations, the U.S. Federal Reserve, equity markets, political discord – yields just shy of 8% on the Index and credit spreads well above their historical median certainly look more attractive than in recent quarters. Corporate credit quality remains good, default rates are modest, projected earnings growth is steady and theconsumer-led economy appears to be poised to continue the current expansion in an environment of very low unemployment. We believe this should set the stage for the high yield market to experience a rebound from the poor performance in the fourth quarter. The biggest risk we foresee is the possibility of a slowdown in U.S. economic activity in response to a negative outcome in current trade discussions with China.
Relative Performance
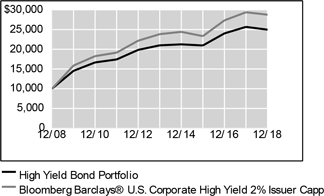
| | | | | | | | | | | | |
Average Annual Total Returns
For Periods Ended December 31, 2018 | |
| | | 1 Year | | | 5 Years | | | 10 Years | |
High Yield Bond Portfolio | | | -2.71 | % | | | 3.53 | % | | | 9.58 | % |
Bloomberg Barclays® U.S. Corporate High Yield 2% Issuer Capped Index | | | -2.08 | % | | | 3.84 | % | | | 11.14 | % |
Lipper® Variable Insurance Products (VIP) High Yield Funds Average | | | -2.63 | % | | | 2.87 | % | | | 9.25 | % |
The performance data quoted represents past performance. Past performance is historical and does not guarantee future performance. Investment return and principal value will fluctuate, so that shares, when redeemed, may be worth more or less than their original cost. Current performance may be lower or higher than the performance data quoted. For the most recentmonth-end performance information visitwww.northwesternmutual.com.
This chart assumes an initial investment of $10,000 made on 12/31/08. Returns shown reflect fee waivers, deductions for management and other portfolio expenses,
and reinvestment of all dividends. In the absence of fee waivers, total return would be reduced. Returns exclude deductions for separate account sale loads and account fees. Please refer to the Benchmark Definitions section of this report for information about the indices cited in the above chart and graph.
The Portfolio invests in lower quality securities, which may represent a significant risk for loss of principal and interest. Bonds and other debt obligations are affected by changes in interest rates, inflation risk and the creditworthiness of their issuers. High yield bonds generally have greater price swings and higher default risks than investment grade bonds. Return of principal is not guaranteed. When interest rates rise, bond prices fall. With a fixed income fund, when interest rates rise, the value of the fund’s existing bonds drops, which could negatively affect overall fund performance.
Investing in bonds issued by foreign corporations and governments carries additional risk, including foreign currency risk, and may increase the volatility of the Portfolio’s performance.
The U.S. federal funds rate has been subject to moderate and steady increases over the course of the last three years. A significant rise in interest rates over a short period of time could cause significant losses in the market value of the Portfolio’s fixed income investments.
164
High Yield Bond Portfolio (unaudited)
Top 10 Fixed Income Holdings12/31/18
| | | | | | | | |
| Security Description | | % of Net Assets | | | | |
HCA, Inc., Various | | | 1.9 | % | | | | |
CCO Holdings LLC / CCO Holdings Capital Corp., Various | | | 1.9 | % | | | | |
Valeant Pharmaceuticals International, Inc., Various | | | 1.9 | % | | | | |
CSC Holdings LLC, Various | | | 1.9 | % | | | | |
Sprint Corp., Various | | | 1.4 | % | | | | |
Post Holdings, Inc., Various | | | 1.0 | % | | | | |
Tenet Healthcare Corp., Various | | | 1.0 | % | | | | |
T-Mobile USA, Inc., Various | | | 0.9 | % | | | | |
BWAY Holding Co., Various | | | 0.9 | % | | | | |
Crimson Merger Sub, Inc., 6.625%, 5/15/22 | | | 0.9 | % | | | | |
Sector Allocation12/31/18
| | | | | | | | |
| Sector | | % of Net Assets | | | | |
Consumer,Non-Cyclical | | | 21.2 | % | | | | |
Communications | | | 17.9 | % | | | | |
Consumer, Cyclical | | | 13.2 | % | | | | |
Energy | | | 12.9 | % | | | | |
Industrial | | | 12.1 | % | | | | |
Technology | | | 6.7 | % | | | | |
Financial | | | 5.8 | % | | | | |
Basic Materials | | | 4.5 | % | | | | |
Short-Term Investments & Other Net Assets | | | 3.7 | % | | | | |
Utilities | | | 1.7 | % | | | | |
Diversified | | | 0.3 | % | | | | |
Pharmaceuticals | | | 0.0 | % | | | | |
Other Holdings | | | – | % | | | | |
Sector Allocation and Top 10 Holdings are subject to change.
165
High Yield Bond Portfolio
SCHEDULE OF INVESTMENTS
December 31, 2018
| | | | | | | | |
| Corporate Bonds (96.3%) | | Shares/
Par+ | | | Value
$ (000’s) | |
| | |
Basic Materials (4.5%) | | | | | | | | |
Alpha 2 BV 8.750%, 6/1/23 144A | | | 950,000 | | | | 910 | |
Alpha 3 BV / Alpha US Bidco, Inc. 6.250%, 2/1/25 144A | | | 2,675,000 | | | | 2,514 | |
Clearwater Paper Corp. 5.375%, 2/1/25 144A | | | 3,350,000 | | | | 3,023 | |
Compass Minerals International, Inc. 4.875%, 7/15/24 144A | | | 2,400,000 | | | | 2,172 | |
Crown Holdings, Inc. 4.250%, 9/30/26 | | | 250,000 | | | | 224 | |
Freeport-McMoRan, Inc.
3.550%, 3/1/22 | | | 175,000 | | | | 166 | |
3.875%, 3/15/23 | | | 3,050,000 | | | | 2,821 | |
5.400%, 11/14/34 | | | 3,000,000 | | | | 2,362 | |
Hexion, Inc. 6.625%, 4/15/20 | | | 3,050,000 | | | | 2,432 | |
HudBay Minerals, Inc.
7.250%, 1/15/23 144A | | | 600,000 | | | | 593 | |
7.625%, 1/15/25 144A | | | 1,750,000 | | | | 1,711 | |
Huntsman International LLC 4.875%, 11/15/20 | | | 730,000 | | | | 732 | |
Platform Specialty Products Corp.
5.875%, 12/1/25 144A | | | 1,450,000 | | | | 1,356 | |
6.500%, 2/1/22 144A | | | 5,325,000 | | | | 5,325 | |
PQ Corp. 5.750%, 12/15/25 144A | | | 650,000 | | | | 601 | |
Starfruit Finco BV / Starfruit US Holdco LLC 8.000%, 10/1/26 144A | | | 2,075,000 | | | | 1,919 | |
Steel Dynamics, Inc.
5.125%, 10/1/21 | | | 620,000 | | | | 619 | |
5.500%, 10/1/24 | | | 930,000 | | | | 921 | |
Teck Resources, Ltd. 5.200%, 3/1/42 | | | 1,325,000 | | | | 1,113 | |
6.000%, 8/15/40 | | | 850,000 | | | | 791 | |
6.125%, 10/1/35 | | | 1,075,000 | | | | 1,027 | |
8.500%, 6/1/24 144A | | | 825,000 | | | | 884 | |
| | | | | | | | |
Total | | | | | | | 34,216 | |
| | | | | | | | |
| | |
Communications (17.9%) | | | | | | | | |
Acosta, Inc. 7.750%, 10/1/22 144A | | | 2,850,000 | | | | 527 | |
Altice France SA 8.125%, 2/1/27 144A | | | 800,000 | | | | 754 | |
Altice Luxembourg SA
7.625%, 2/15/25 144A | | | 3,875,000 | | | | 2,897 | |
7.750%, 5/15/22 144A | | | 200,000 | | | | 182 | |
AMC Networks, Inc.
4.750%, 8/1/25 | | | 1,550,000 | | | | 1,407 | |
5.000%, 4/1/24 | | | 2,000,000 | | | | 1,895 | |
Anixter, Inc. 6.000%, 12/1/25 144A | | | 975,000 | | | | 968 | |
Cablevision Systems Corp. 5.875%, 9/15/22 | | | 2,225,000 | | | | 2,186 | |
CBS Radio, Inc. 7.250%, 11/1/24 144A | | | 2,050,000 | | | | 1,906 | |
| | | | | | | | |
| Corporate Bonds (96.3%) | | Shares/
Par+ | | | Value
$ (000’s) | |
| | |
Communications continued | | | | | | | | |
CCO Holdings LLC / CCO Holdings Capital Corp. 5.000%, 2/1/28 144A | | | 2,450,000 | | | | 2,254 | |
5.125%, 5/1/27 144A | | | 1,975,000 | | | | 1,840 | |
5.250%, 9/30/22 | | | 1,350,000 | | | | 1,338 | |
5.375%, 5/1/25 144A | | | 650,000 | | | | 623 | |
5.500%, 5/1/26 144A | | | 550,000 | | | | 529 | |
5.750%, 9/1/23 | | | 1,000,000 | | | | 995 | |
5.750%, 1/15/24 | | | 3,200,000 | | | | 3,184 | |
5.750%, 2/15/26 144A | | | 2,350,000 | | | | 2,303 | |
5.875%, 4/1/24 144A | | | 575,000 | | | | 572 | |
5.875%, 5/1/27 144A | | | 875,000 | | | | 849 | |
Clear Channel International BV 8.750%, 12/15/20 144A | | | 375,000 | | | | 378 | |
Clear Channel Worldwide Holdings, Inc. 6.500%, 11/15/22 | | | 2,925,000 | | | | 2,925 | |
CommScope Technologies LLC 6.000%, 6/15/25 144A | | | 650,000 | | | | 591 | |
CommScope, Inc. 5.500%, 6/15/24 144A | | | 1,925,000 | | | | 1,761 | |
CSC Holdings LLC
5.125%, 12/15/21 144A | | | 3,335,000 | | | | 3,268 | |
5.250%, 6/1/24 | | | 1,650,000 | | | | 1,512 | |
5.375%, 7/15/23 144A | | | 1,100,000 | | | | 1,074 | |
5.500%, 5/15/26 144A | | | 650,000 | | | | 613 | |
5.500%, 4/15/27 144A | | | 2,425,000 | | | | 2,255 | |
6.625%, 10/15/25 144A | | | 1,250,000 | | | | 1,266 | |
7.500%, 4/1/28 144A | | | 1,750,000 | | | | 1,746 | |
7.750%, 7/15/25 144A | | | 1,450,000 | | | | 1,475 | |
10.125%, 1/15/23 144A | | | 1,000,000 | | | | 1,076 | |
Digicel Group, Ltd. 8.250%, 9/30/20 144A | | | 200,000 | | | | 135 | |
DISH DBS Corp.
5.000%, 3/15/23 | | | 1,810,000 | | | | 1,507 | |
5.875%, 7/15/22 | | | 480,000 | | | | 442 | |
5.875%, 11/15/24 | | | 3,250,000 | | | | 2,616 | |
7.750%, 7/1/26 | | | 1,475,000 | | | | 1,221 | |
The EW Scripps Co. 5.125%, 5/15/25 144A | | | 400,000 | | | | 367 | |
Gray Escrow, Inc. 7.000%, 5/15/27 144A | | | 750,000 | | | | 731 | |
Gray Television, Inc.
5.125%, 10/15/24 144A | | | 675,000 | | | | 622 | |
5.875%, 7/15/26 144A | | | 2,300,000 | | | | 2,144 | |
iHeartCommunications, Inc.
9.000%, 3/1/21*,ℓ | | | 600,000 | | | | 402 | |
9.000%, 9/15/22*,ℓ | | | 1,515,000 | | | | 1,007 | |
Intelsat Jackson Holdings SA
5.500%, 8/1/23 | | | 1,800,000 | | | | 1,566 | |
8.000%, 2/15/24 144A | | | 775,000 | | | | 798 | |
8.500%, 10/15/24 144A | | | 2,525,000 | | | | 2,449 | |
9.750%, 7/15/25 144A | | | 950,000 | | | | 953 | |
LIN Television Corp. 5.875%, 11/15/22 | | | 2,000,000 | | | | 1,995 | |
Match Group, Inc. 5.000%, 12/15/27 144A | | | 1,150,000 | | | | 1,055 | |
The Accompanying Notes are an Integral Part of the Financial Statements.
166
High Yield Bond Portfolio
| | | | | | | | |
| Corporate Bonds (96.3%) | | Shares/
Par+ | | | Value
$ (000’s) | |
| | |
Communications continued | | | | | | | | |
6.375%, 6/1/24 | | | 725,000 | | | | 738 | |
Nexstar Broadcasting, Inc. 6.125%, 2/15/22 144A | | | 1,850,000 | | | | 1,841 | |
Nexstar Escrow Corp. 5.625%, 8/1/24 144A | | | 1,300,000 | | | | 1,215 | |
Outdoor Americas Capital LLC / Outfront Media Capital Corp. 5.875%, 3/15/25 | | | 1,675,000 | | | | 1,646 | |
Radio One, Inc. 7.375%, 4/15/22 144A | | | 1,625,000 | | | | 1,536 | |
SFR Group SA
6.250%, 5/15/24 144A | | | 850,000 | | | | 793 | |
7.375%, 5/1/26 144A | | | 5,525,000 | | | | 5,069 | |
Sinclair Television Group, Inc.
5.125%, 2/15/27 144A | | | 1,375,000 | | | | 1,213 | |
5.375%, 4/1/21 | | | 1,370,000 | | | | 1,367 | |
5.625%, 8/1/24 144A | | | 825,000 | | | | 773 | |
5.875%, 3/15/26 144A | | | 575,000 | | | | 536 | |
6.125%, 10/1/22 | | | 990,000 | | | | 997 | |
Sirius XM Radio, Inc.
4.625%, 5/15/23 144A | | | 550,000 | | | | 527 | |
5.000%, 8/1/27 144A | | | 775,000 | | | | 708 | |
5.375%, 4/15/25 144A | | | 1,100,000 | | | | 1,042 | |
5.375%, 7/15/26 144A | | | 1,675,000 | | | | 1,566 | |
6.000%, 7/15/24 144A | | | 2,185,000 | | | | 2,190 | |
Sprint Capital Corp. 6.875%, 11/15/28 | | | 2,300,000 | | | | 2,173 | |
Sprint Communications, Inc. 6.000%, 11/15/22 | | | 700,000 | | | | 687 | |
Sprint Corp.
7.125%, 6/15/24 | | | 1,150,000 | | | | 1,140 | |
7.625%, 2/15/25 | | | 2,075,000 | | | | 2,075 | |
7.625%, 3/1/26 | | | 1,200,000 | | | | 1,185 | |
7.875%, 9/15/23 | | | 5,740,000 | | | | 5,891 | |
Symantec Corp. 5.000%, 4/15/25 144A | | | 625,000 | | | | 583 | |
TEGNA, Inc.
5.125%, 7/15/20 | | | 980,000 | | | | 979 | |
5.500%, 9/15/24 144A | | | 495,000 | | | | 480 | |
6.375%, 10/15/23 | | | 700,000 | | | | 702 | |
Telenet Finance Luxembourg Notes SARL 5.500%, 3/1/28 144A | | | 4,400,000 | | | | 3,982 | |
T-Mobile USA, Inc.
4.500%, 2/1/26 | | | 525,000 | | | | 482 | |
4.750%, 2/1/28 | | | 275,000 | | | | 249 | |
5.125%, 4/15/25 | | | 2,700,000 | | | | 2,622 | |
5.375%, 4/15/27 | | | 350,000 | | | | 338 | |
6.000%, 3/1/23 | | | 775,000 | | | | 779 | |
6.375%, 3/1/25 | | | 1,460,000 | | | | 1,478 | |
6.500%, 1/15/24 | | | 425,000 | | | | 437 | |
6.500%, 1/15/26 | | | 875,000 | | | | 892 | |
Tribune Media Co. 5.875%, 7/15/22 | | | 3,050,000 | | | | 3,065 | |
Unitymedia Hessen GmbH & Co., KG / Unitymedia NRW GmbH 5.000%, 1/15/25 144A | | | 1,250,000 | | | | 1,221 | |
Unitymedia KabelBW GmbH 6.125%, 1/15/25 144A | | | 2,525,000 | | | | 2,537 | |
VeriSign, Inc. 4.750%, 7/15/27 | | | 550,000 | | | | 516 | |
| | | | | | | | |
| Corporate Bonds (96.3%) | | Shares/
Par+ | | | Value
$ (000’s) | |
| | |
Communications continued | | | | | | | | |
5.250%, 4/1/25 | | | 350,000 | | | | 347 | |
Virgin Media Finance PLC 5.750%, 1/15/25 144A | | | 3,475,000 | | | | 3,267 | |
Virgin Media Secured Finance PLC
5.250%, 1/15/26 144A | | | 3,175,000 | | | | 2,909 | |
5.500%, 8/15/26 144A | | | 425,000 | | | | 393 | |
Ziggo Bond Co. BV
5.875%, 1/15/25 144A | | | 625,000 | | | | 564 | |
6.000%, 1/15/27 144A | | | 1,550,000 | | | | 1,356 | |
Ziggo BV 5.500%, 1/15/27 144A | | | 2,425,000 | | | | 2,170 | |
| | | | | | | | |
Total | | | | | | | 136,415 | |
| | | | | | | | |
| | |
Consumer, Cyclical (13.2%) | | | | | | | | |
1011778 BC Unlimited Liability Co. / New Red Finance, Inc.
4.250%, 5/15/24 144A | | | 1,000,000 | | | | 921 | |
5.000%, 10/15/25 144A | | | 4,525,000 | | | | 4,163 | |
Adient Global Holdings, Ltd. 4.875%, 8/15/26 144A | | | 3,450,000 | | | | 2,639 | |
American Axle & Manufacturing, Inc.
6.250%, 3/15/26 | | | 350,000 | | | | 314 | |
6.500%, 4/1/27 | | | 2,875,000 | | | | 2,573 | |
American Builders & Contractors Supply Co., Inc. 5.750%, 12/15/23 144A | | | 125,000 | | | | 124 | |
5.875%, 5/15/26 144A | | | 2,800,000 | | | | 2,666 | |
Aramark Services, Inc.
5.000%, 4/1/25 144A | | | 1,450,000 | | | | 1,417 | |
5.000%, 2/1/28 144A | | | 1,525,000 | | | | 1,422 | |
5.125%, 1/15/24 | | | 1,525,000 | | | | 1,510 | |
Argos Merger Sub, Inc. 7.125%, 3/15/23 144A | | | 1,550,000 | | | | 903 | |
BCD Acquisition, Inc. 9.625%, 9/15/23 144A | | | 1,550,000 | | | | 1,593 | |
Beacon Escrow Corp. 4.875%, 11/1/25 144A | | | 550,000 | | | | 483 | |
Beacon Roofing Supply, Inc. 6.375%, 10/1/23 | | | 425,000 | | | | 421 | |
Boyd Gaming Corp.
6.000%, 8/15/26 | | | 425,000 | | | | 397 | |
6.375%, 4/1/26 | | | 775,000 | | | | 750 | |
6.875%, 5/15/23 | | | 2,050,000 | | | | 2,070 | |
Cedar Fair LP / Canada’s Wonderland Co. / Magnum Management Corp. 5.375%, 6/1/24 | | | 1,280,000 | | | | 1,251 | |
CRC Escrow Issuer LLC / CRC Finco, Inc. 5.250%, 10/15/25 144A | | | 4,525,000 | | | | 3,891 | |
Dana Financing Luxembourg Sarl
5.750%, 4/15/25 144A | | | 550,000 | | | | 513 | |
6.500%, 6/1/26 144A | | | 2,800,000 | | | | 2,684 | |
Delta Merger Sub, Inc. 6.000%, 9/15/26 144A | | | 325,000 | | | | 307 | |
Eldorado Resorts, Inc. 6.000%, 4/1/25 | | | 1,800,000 | | | | 1,736 | |
EMI Music Publishing Group North America Holdings, Inc. 7.625%, 6/15/24 144A | | | 1,800,000 | | | | 1,917 | |
Ferrellgas LP / Ferrellgas Finance Corp. 6.500%, 5/1/21 | | | 850,000 | | | | 697 | |
6.750%, 1/15/22 | | | 2,300,000 | | | | 1,874 | |
The Accompanying Notes are an Integral Part of the Financial Statements.
167
High Yield Bond Portfolio
| | | | | | | | |
| Corporate Bonds (96.3%) | | Shares/
Par+ | | | Value $ (000’s) | |
| | |
Consumer, Cyclical continued | | | | | | | | |
6.750%, 6/15/23 | | | 1,375,000 | | | | 1,107 | |
GLP Capital LP / GLP Financing II, Inc. 5.375%, 4/15/26 | | | 500,000 | | | | 495 | |
The Goodyear Tire & Rubber Co.
4.875%, 3/15/27 | | | 375,000 | | | | 329 | |
5.000%, 5/31/26 | | | 1,450,000 | | | | 1,305 | |
5.125%, 11/15/23 | | | 250,000 | | | | 245 | |
Hanesbrands, Inc.
4.625%, 5/15/24 144A | | | 425,000 | | | | 398 | |
4.875%, 5/15/26 144A | | | 875,000 | | | | 789 | |
Hilton Domestic Operating Co., Inc. 5.125%, 5/1/26 144A | | | 1,825,000 | | | | 1,752 | |
Hilton Worldwide Finance LLC / Hilton Worldwide Finance Corp. 4.625%, 4/1/25 | | | 725,000 | | | | 687 | |
IHO Verwaltungs GmbH
4.500%, 9/15/23 144A | | | 375,000 | | | | 343 | |
4.750%, 9/15/26 144A | | | 3,325,000 | | | | 2,895 | |
JB Poindexter & Co., Inc. 7.125%, 4/15/26 144A | | | 1,250,000 | | | | 1,169 | |
KAR Auction Services, Inc. 5.125%, 6/1/25 144A | | | 1,425,000 | | | | 1,286 | |
KFC Holding Co. / Pizza Hut Holdings LLC / Taco Bell of America LLC
4.750%, 6/1/27 144A | | | 550,000 | | | | 511 | |
5.000%, 6/1/24 144A | | | 800,000 | | | | 772 | |
5.250%, 6/1/26 144A | | | 1,600,000 | | | | 1,548 | |
Live Nation Entertainment, Inc.
4.875%, 11/1/24 144A | | | 600,000 | | | | 570 | |
5.625%, 3/15/26 144A | | | 400,000 | | | | 391 | |
MGM Resorts International
4.625%, 9/1/26 | | | 150,000 | | | | 135 | |
5.750%, 6/15/25 | | | 1,175,000 | | | | 1,134 | |
6.000%, 3/15/23 | | | 2,525,000 | | | | 2,538 | |
6.625%, 12/15/21 | | | 1,040,000 | | | | 1,066 | |
6.750%, 10/1/20 | | | 510,000 | | | | 524 | |
Michaels Stores, Inc. 5.875%, 12/15/20 144A | | | 1,875,000 | | | | 1,870 | |
Mohegan Tribal Gaming Authority 7.875%, 10/15/24 144A | | | 2,050,000 | | | | 1,914 | |
Party City Holdings, Inc.
6.125%, 8/15/23 144A | | | 2,600,000 | | | | 2,554 | |
6.625%, 8/1/26 144A | | | 1,450,000 | | | | 1,320 | |
Penn National Gaming, Inc. 5.625%, 1/15/27 144A | | | 1,150,000 | | | | 1,029 | |
Performance Food Group, Inc. 5.500%, 6/1/24 144A | | | 325,000 | | | | 314 | |
Red Rock Resorts, Inc. 5.000%, 10/1/25 144A | | | 2,150,000 | | | | 1,946 | |
Rite Aid Corp. 6.125%, 4/1/23 144A | | | 2,025,000 | | | | 1,600 | |
Rivers Pittsburgh Borrower LP / Rivers Pittsburgh Finance Corp. 6.125%, 8/15/21 144A | | | 2,800,000 | | | | 2,716 | |
Sabre GLBL, Inc. 5.375%, 4/15/23 144A | | | 750,000 | | | | 746 | |
Sally Holdings LLC / Sally Capital, Inc. 5.625%, 12/1/25 | | | 2,525,000 | | | | 2,323 | |
| | | | | | | | |
| Corporate Bonds (96.3%) | | Shares/
Par+ | | | Value
$ (000’s) | |
| | |
Consumer, Cyclical continued | | | | | | | | |
Seminole Hard Rock Entertainment, Inc. / Seminole Hard Rock International LLC 5.875%, 5/15/21 144A | | | 4,040,000 | | | | 4,030 | |
Six Flags Entertainment Corp.
4.875%, 7/31/24 144A | | | 850,000 | | | | 801 | |
5.500%, 4/15/27 144A | | | 3,725,000 | | | | 3,511 | |
Stars Group Holdings BV 7.000%, 7/15/26 144A | | | 2,575,000 | | | | 2,504 | |
Suburban Propane Partners LP / Suburban Energy Finance Corp.
5.500%, 6/1/24 | | | 3,425,000 | | | | 3,185 | |
5.750%, 3/1/25 | | | 275,000 | | | | 252 | |
5.875%, 3/1/27 | | | 900,000 | | | | 797 | |
Sugarhouse HSP Gaming Prop Mezz LP / Sugarhouse HSP Gaming Finance Corp. 5.875%, 5/15/25 144A | | | 1,700,000 | | | | 1,590 | |
VOC Escrow, Ltd. 5.000%, 2/15/28 144A | �� | | 1,400,000 | | | | 1,292 | |
WMG Acquisition Corp.
4.875%, 11/1/24 144A | | | 400,000 | | | | 379 | |
5.500%, 4/15/26 144A | | | 500,000 | | | | 478 | |
Wyndham Hotels & Resorts, Inc. 5.375%, 4/15/26 144A | | | 1,750,000 | | | | 1,680 | |
Wynn Las Vegas LLC / Wynn Las Vegas Capital Corp. 5.250%, 5/15/27 144A | | | 1,200,000 | | | | 1,056 | |
| | | | | | | | |
Total | | | | | | | 101,112 | |
| | | | | | | | |
| | |
Consumer,Non-cyclical (21.2%) | | | | | | | | |
Acadia Healthcare Co., Inc.
5.625%, 2/15/23 | | | 575,000 | | | | 545 | |
6.500%, 3/1/24 | | | 3,300,000 | | | | 3,184 | |
Air Medical Merger Sub Corp. 6.375%, 5/15/23 144A | | | 3,575,000 | | | | 3,021 | |
Albertsons Cos. LLC / Safeway, Inc. / New Albertson’s, Inc. / Albertsons’s LLC
5.750%, 3/15/25 | | | 4,125,000 | | | | 3,609 | |
6.625%, 6/15/24 | | | 1,600,000 | | | | 1,484 | |
Avantor, Inc.
6.000%, 10/1/24 144A | | | 825,000 | | | | 811 | |
9.000%, 10/1/25 144A | | | 2,875,000 | | | | 2,875 | |
Avis Budget Car Rental LLC / Avis Budget Finance, Inc. 5.250%, 3/15/25 144A | | | 575,000 | | | | 497 | |
B&G Foods, Inc. 5.250%, 4/1/25 | | | 3,400,000 | | | | 3,162 | |
Centene Escrow I Corp. 5.375%, 6/1/26 144A | | | 1,200,000 | | | | 1,167 | |
Charles River Laboratories International, Inc. 5.500%, 4/1/26 144A | | | 600,000 | | | | 591 | |
CHS / Community Health Systems, Inc.
5.125%, 8/1/21 | | | 200,000 | | | | 185 | |
6.250%, 3/31/23 | | | 1,550,000 | | | | 1,409 | |
6.875%, 2/1/22 | | | 2,510,000 | | | | 1,142 | |
8.625%, 1/15/24 144A | | | 750,000 | | | | 741 | |
Crimson Merger Sub, Inc. 6.625%, 5/15/22 144A | | | 7,975,000 | | | | 7,177 | |
Eagle Holding Co. II LLC 7.625%, 5/15/22 144A | | | 1,500,000 | | | | 1,432 | |
Endo Finance LLC / Endo Finco, Inc.
6.000%, 7/15/23 144A | | | 2,175,000 | | | | 1,658 | |
6.000%, 2/1/25 144A | | | 2,875,000 | | | | 2,063 | |
The Accompanying Notes are an Integral Part of the Financial Statements.
168
High Yield Bond Portfolio
| | | | | | | | |
| Corporate Bonds (96.3%) | | Shares/
Par+ | | | Value
$ (000’s) | |
| | |
Consumer,Non-cyclical continued | | | | | | | | |
Enterprise Merger Sub, Inc. 8.750%, 10/15/26 144A | | | 2,300,000 | | | | 1,989 | |
Financial & Risk US Holdings, Inc.
6.250%, 5/15/26 144A | | | 600,000 | | | | 579 | |
8.250%, 11/15/26 144A | | | 1,650,000 | | | | 1,508 | |
First Quality Finance Co., Inc.
4.625%, 5/15/21 144A | | | 2,435,000 | | | | 2,356 | |
5.000%, 7/1/25 144A | | | 425,000 | | | | 380 | |
Gartner, Inc. 5.125%, 4/1/25 144A | | | 850,000 | | | | 827 | |
GW Honos Security Corp. 8.750%, 5/15/25 144A | | | 2,550,000 | | | | 2,320 | |
HCA Healthcare, Inc. 6.250%, 2/15/21 | | | 1,385,000 | | | | 1,416 | |
HCA, Inc.
4.500%, 2/15/27 | | | 225,000 | | | | 213 | |
5.000%, 3/15/24 | | | 2,575,000 | | | | 2,549 | |
5.250%, 6/15/26 | | | 450,000 | | | | 447 | |
5.375%, 2/1/25 | | | 2,250,000 | | | | 2,194 | |
5.375%, 9/1/26 | | | 975,000 | | | | 948 | |
5.875%, 3/15/22 | | | 1,475,000 | | | | 1,512 | |
5.875%, 5/1/23 | | | 2,520,000 | | | | 2,551 | |
5.875%, 2/15/26 | | | 2,825,000 | | | | 2,811 | |
6.500%, 2/15/20 | | | 1,485,000 | | | | 1,522 | |
Hologic, Inc. 4.375%, 10/15/25 144A | | | 825,000 | | | | 767 | |
Jaguar Holding Co. II / Pharmaceutical Product Development LLC 6.375%, 8/1/23 144A | | | 6,500,000 | | | | 6,211 | |
Lamb Weston Holdings, Inc. 4.875%, 11/1/26 144A | | | 1,075,000 | | | | 1,032 | |
Mallinckrodt International Finance SA / Mallinckrodt CB LLC
5.500%, 4/15/25 144A | | | 4,275,000 | | | | 2,950 | |
5.625%, 10/15/23 144A | | | 2,775,000 | | | | 2,109 | |
MEDNAX, Inc.
5.250%, 12/1/23 144A | | | 425,000 | | | | 417 | |
6.250%, 1/15/27 144A | | | 1,825,000 | | | | 1,761 | |
MPH Acquisition Holdings LLC 7.125%, 6/1/24 144A | | | 5,975,000 | | | | 5,572 | |
The Nielsen Co. Luxembourg SARL 5.000%, 2/1/25 144A | | | 875,000 | | | | 818 | |
Nielsen Finance LLC / Nielsen Finance Co. 5.000%, 4/15/22 144A | | | 3,975,000 | | | | 3,796 | |
Polaris Intermediate Corp. 8.500%, 12/1/22 144A | | | 1,975,000 | | | | 1,801 | |
Post Holdings, Inc.
5.000%, 8/15/26 144A | | | 2,375,000 | | | | 2,161 | |
5.500%, 3/1/25 144A | | | 1,275,000 | | | | 1,224 | |
5.625%, 1/15/28 144A | | | 975,000 | | | | 897 | |
5.750%, 3/1/27 144A | | | 3,775,000 | | | | 3,539 | |
Prestige Brands, Inc.
5.375%, 12/15/21 144A | | | 3,475,000 | | | | 3,397 | |
6.375%, 3/1/24 144A | | | 3,525,000 | | | | 3,402 | |
RegionalCare Hospital Partners Holdings, Inc. / LifePoint Health, Inc. 9.750%, 12/1/26 144A | | | 1,900,000 | | | | 1,800 | |
Sotera Health Holdings LLC 6.500%, 5/15/23 144A | | | 4,450,000 | | | | 4,261 | |
| | | | | | | | |
| Corporate Bonds (96.3%) | | Shares/
Par+ | | | Value
$ (000’s) | |
| | |
Consumer,Non-cyclical continued | | | | | | | | |
Sotera Health Topco, Inc. 8.125%, 11/1/21 144A | | | 2,900,000 | | | | 2,726 | |
Spectrum Brands, Inc. 6.125%, 12/15/24 | | | 2,075,000 | | | | 1,997 | |
Surgery Center Holdings, Inc.
6.750%, 7/1/25 144A | | | 2,825,000 | | | | 2,401 | |
8.875%, 4/15/21 144A | | | 250,000 | | | | 249 | |
Team Health Holdings, Inc. 6.375%, 2/1/25 144A | | | 5,900,000 | | | | 4,816 | |
Teleflex, Inc.
4.625%, 11/15/27 | | | 450,000 | | | | 417 | |
5.250%, 6/15/24 | | | 1,750,000 | | | | 1,741 | |
Tenet Healthcare Corp.
4.500%, 4/1/21 | | | 380,000 | | | | 370 | |
4.625%, 7/15/24 | | | 850,000 | | | | 791 | |
5.125%, 5/1/25 | | | 2,400,000 | | | | 2,238 | |
6.750%, 6/15/23 | | | 3,125,000 | | | | 2,934 | |
7.000%, 8/1/25 | | | 575,000 | | | | 532 | |
7.500%, 1/1/22 144A | | | 700,000 | | | | 711 | |
United Rentals North America, Inc.
4.875%, 1/15/28 | | | 2,075,000 | | | | 1,821 | |
5.500%, 7/15/25 | | | 225,000 | | | | 212 | |
5.500%, 5/15/27 | | | 1,750,000 | | | | 1,623 | |
5.875%, 9/15/26 | | | 850,000 | | | | 801 | |
6.500%, 12/15/26 | | | 600,000 | | | | 591 | |
US Foods, Inc. 5.875%, 6/15/24 144A | | | 3,225,000 | | | | 3,136 | |
Valeant Pharmaceuticals International, Inc.
5.500%, 3/1/23 144A | | | 2,700,000 | | | | 2,462 | |
5.500%, 11/1/25 144A | | | 725,000 | | | | 676 | |
5.625%, 12/1/21 144A | | | 704,000 | | | | 693 | |
5.875%, 5/15/23 144A | | | 3,225,000 | | | | 2,983 | |
6.125%, 4/15/25 144A | | | 5,250,000 | | | | 4,581 | |
6.500%, 3/15/22 144A | | | 300,000 | | | | 302 | |
7.000%, 3/15/24 144A | | | 700,000 | | | | 707 | |
8.500%, 1/31/27 144A | | | 650,000 | | | | 631 | |
9.000%, 12/15/25 144A | | | 800,000 | | | | 796 | |
9.250%, 4/1/26 144A | | | 525,000 | | | | 525 | |
Vizient, Inc. 10.375%, 3/1/24 144A | | | 2,775,000 | | | | 2,942 | |
WellCare Health Plans, Inc. 5.375%, 8/15/26 144A | | | 625,000 | | | | 603 | |
West Street Merger Sub, Inc. 6.375%, 9/1/25 144A | | | 3,300,000 | | | | 2,921 | |
| | | | | | | | |
Total | | | | | | | 161,719 | |
| | | | | | | | |
| | |
Diversified (0.3%) | | | | | | | | |
Trident Merger Sub, Inc. 6.625%, 11/1/25 144A | | | 2,225,000 | | | | 1,980 | |
| | | | | | | | |
Total | | | | | | | 1,980 | |
| | | | | | | | |
| | |
Energy (12.9%) | | | | | | | | |
Antero Midstream Partners LP / Antero Midstream Finance Corp. 5.375%, 9/15/24 | | | 2,000,000 | | | | 1,865 | |
Antero Resources Corp.
5.125%, 12/1/22 | | | 140,000 | | | | 132 | |
5.375%, 11/1/21 | | | 730,000 | | | | 704 | |
5.625%, 6/1/23 | | | 1,000,000 | | | | 950 | |
Apergy Corp. 6.375%, 5/1/26 | | | 300,000 | | | | 291 | |
The Accompanying Notes are an Integral Part of the Financial Statements.
169
High Yield Bond Portfolio
| | | | | | | | |
| Corporate Bonds (96.3%) | | Shares/
Par+ | | | Value
$ (000’s) | |
| | |
Energy continued | | | | | | | | |
Ascent Resources Utica LLC / AEU Finance Corp. 10.000%, 4/1/22 144A | | | 900,000 | | | | 921 | |
Berry Petroleum Co. LLC 7.000%, 2/15/26 144A | | | 1,200,000 | | | | 1,080 | |
Callon Petroleum Co.
6.125%, 10/1/24 | | | 1,502,000 | | | | 1,397 | |
6.375%, 7/1/26 | | | 900,000 | | | | 837 | |
Carrizo Oil & Gas, Inc.
6.250%, 4/15/23 | | | 1,975,000 | | | | 1,827 | |
8.250%, 7/15/25 | | | 425,000 | | | | 416 | |
Cheniere Corpus Christi Holdings LLC
5.125%, 6/30/27 | | | 500,000 | | | | 472 | |
5.875%, 3/31/25 | | | 1,725,000 | | | | 1,716 | |
7.000%, 6/30/24 | | | 1,025,000 | | | | 1,081 | |
Cheniere Energy Partners LP
5.250%, 10/1/25 | | | 2,850,000 | | | | 2,658 | |
5.625%, 10/1/26 144A | | | 1,200,000 | | | | 1,122 | |
Chesapeake Energy Corp.
5.750%, 3/15/23 | | | 225,000 | | | | 194 | |
7.000%, 10/1/24 | | | 1,225,000 | | | | 1,060 | |
8.000%, 1/15/25 | | | 425,000 | | | | 375 | |
8.000%, 6/15/27 | | | 2,675,000 | | | | 2,247 | |
CNX Midstream Finance Corp. 6.500%, 3/15/26 144A | | | 2,425,000 | | | | 2,304 | |
Coeur Mining, Inc. 5.875%, 6/1/24 | | | 1,850,000 | | | | 1,628 | |
CrownRock LP / CrownRock Finance, Inc. 5.625%, 10/15/25 144A | | | 2,975,000 | | | | 2,677 | |
CVR Refining LLC / Coffeyville Finance, Inc. 6.500%, 11/1/22 | | | 3,150,000 | | | | 3,103 | |
Diamondback Energy, Inc. 5.375%, 5/31/25 | | | 425,000 | | | | 414 | |
Endeavor Energy Resources LP / EER Finance, Inc. | | | | | | | | |
5.500%, 1/30/26 144A | | | 375,000 | | | | 384 | |
5.750%, 1/30/28 144A | | | 750,000 | | | | 765 | |
Energy Transfer Equity LP 5.875%, 1/15/24 | | | 1,725,000 | | | | 1,761 | |
Enviva Partners LP / Enviva Partners Finance Corp. 8.500%, 11/1/21 | | | 3,000,000 | | | | 3,075 | |
EP Energy LLC / Everest Acquisition Finance, Inc. 6.375%, 6/15/23 | | | 350,000 | | | | 110 | |
8.000%, 11/29/24 144A | | | 1,850,000 | | | | 1,378 | |
Gulfport Energy Corp.
6.000%, 10/15/24 | | | 550,000 | | | | 487 | |
6.375%, 5/15/25 | | | 1,025,000 | | | | 907 | |
6.375%, 1/15/26 | | | 425,000 | | | | 368 | |
6.625%, 5/1/23 | | | 875,000 | | | | 827 | |
Holly Energy Partners LP / Holly Energy Finance Corp. 6.000%, 8/1/24 144A | | | 3,175,000 | | | | 3,111 | |
Jagged Peak Energy LLC 5.875%, 5/1/26 144A | | | 1,150,000 | | | | 1,069 | |
Laredo Petroleum, Inc.
5.625%, 1/15/22 | | | 1,250,000 | | | | 1,122 | |
6.250%, 3/15/23 | | | 400,000 | | | | 359 | |
| | | | | | | | |
| Corporate Bonds (96.3%) | | Shares/
Par+ | | | Value
$ (000’s) | |
| | |
Energy continued | | | | | | | | |
Nine Energy Service, Inc. 8.750%, 11/1/23 144A | | | 1,450,000 | | | | 1,377 | |
NuStar Logistics LP 5.625%, 4/28/27 | | | 2,725,000 | | | | 2,541 | |
Oasis Petroleum, Inc.
6.250%, 5/1/26 144A | | | 1,850,000 | | | | 1,554 | |
6.875%, 3/15/22 | | | 611,000 | | | | 576 | |
Parsley Energy LLC / Parsley Finance Corp. | | | | | | | | |
5.250%, 8/15/25 144A | | | 425,000 | | | | 385 | |
5.375%, 1/15/25 144A | | | 450,000 | | | | 414 | |
5.625%, 10/15/27 144A | | | 1,225,000 | | | | 1,113 | |
6.250%, 6/1/24 144A | | | 300,000 | | | | 291 | |
PDC Energy, Inc.
5.750%, 5/15/26 | | | 1,575,000 | | | | 1,402 | |
6.125%, 9/15/24 | | | 575,000 | | | | 532 | |
Precision Drilling Corp.
5.250%, 11/15/24 | | | 225,000 | | | | 187 | |
6.500%, 12/15/21 | | | 171,801 | | | | 160 | |
7.125%, 1/15/26 144A | | | 1,025,000 | | | | 881 | |
7.750%, 12/15/23 | | | 1,000,000 | | | | 921 | |
QEP Resources, Inc.
5.250%, 5/1/23 | | | 575,000 | | | | 509 | |
5.625%, 3/1/26 | | | 975,000 | | | | 809 | |
Range Resources Corp.
4.875%, 5/15/25 | | | 1,325,000 | | | | 1,086 | |
5.750%, 6/1/21 | | | 955,000 | | | | 924 | |
SESI LLC
7.125%, 12/15/21 | | | 1,850,000 | | | | 1,572 | |
7.750%, 9/15/24 | | | 2,600,000 | | | | 2,067 | |
Shelf Drilling Holdings, Ltd. 8.250%, 2/15/25 144A | | | 1,900,000 | | | | 1,624 | |
SM Energy Co. 5.625%, 6/1/25 | | | 1,000,000 | | | | 870 | |
6.625%, 1/15/27 | | | 250,000 | | | | 222 | |
6.750%, 9/15/26 | | | 1,300,000 | | | | 1,163 | |
Southwestern Energy Co.
7.500%, 4/1/26 | | | 150,000 | | | | 142 | |
7.750%, 10/1/27 | | | 1,550,000 | | | | 1,472 | |
SRC Energy, Inc. 6.250%, 12/1/25 | | | 1,925,000 | | | | 1,598 | |
Summit Midstream Holdings LLC / Summit Midstream Finance Corp.
5.500%, 8/15/22 | | | 2,680,000 | | | | 2,546 | |
5.750%, 4/15/25 | | | 2,275,000 | | | | 2,093 | |
Sunoco LP / Sunoco Finance Corp.
4.875%, 1/15/23 | | | 150,000 | | | | 146 | |
5.500%, 2/15/26 | | | 550,000 | | | | 521 | |
5.875%, 3/15/28 | | | 900,000 | | | | 842 | |
Targa Resources Partners LP / Targa Resources Partners Finance Corp.
5.000%, 1/15/28 | | | 1,400,000 | | | | 1,267 | |
5.125%, 2/1/25 | | | 1,425,000 | | | | 1,336 | |
5.375%, 2/1/27 | | | 2,150,000 | | | | 2,016 | |
5.875%, 4/15/26 144A | | | 725,000 | | | | 705 | |
TerraForm Power Operating LLC
4.250%, 1/31/23 144A | | | 175,000 | | | | 163 | |
5.000%, 1/31/28 144A | | | 2,550,000 | | | | 2,244 | |
6.625%, 6/15/25 144A | | | 950,000 | | | | 960 | |
The Accompanying Notes are an Integral Part of the Financial Statements.
170
High Yield Bond Portfolio
| | | | | | | | |
| Corporate Bonds (96.3%) | | Shares/
Par+ | | | Value
$ (000’s) | |
| | |
Energy continued | | | | | | | | |
Tesoro Logistics LP / Tesoro Logistics Finance Corp.
6.250%, 10/15/22 | | | 503,000 | | | | 513 | |
6.375%, 5/1/24 | | | 575,000 | | | | 594 | |
TransMontaigne Partners LP / TLP Finance Corp. 6.125%, 2/15/26 | | | 900,000 | | | | 806 | |
Ultra Resources, Inc.
6.875%, 4/15/22 144A | | | 350,000 | | | | 123 | |
7.125%, 4/15/25 144A | | | 1,325,000 | | | | 411 | |
USA Compression Finance Corp. 6.875%, 4/1/26 144A | | | 2,875,000 | | | | 2,760 | |
Weatherford International LLC 6.800%, 6/15/37 | | | 400,000 | | | | 210 | |
Weatherford International, Ltd.
7.000%, 3/15/38 | | | 1,300,000 | | | | 673 | |
8.250%, 6/15/23 | | | 1,400,000 | | | | 844 | |
Whiting Petroleum Corp.
6.250%, 4/1/23 | | | 1,150,000 | | | | 1,047 | |
6.625%, 1/15/26 | | | 1,600,000 | | | | 1,372 | |
WPX Energy, Inc.
5.250%, 9/15/24 | | | 500,000 | | | | 453 | |
5.750%, 6/1/26 | | | 425,000 | | | | 385 | |
| | | | | | | | |
Total | | | | | | | 98,616 | |
| | | | | | | | |
| | |
Financial (5.8%) | | | | | | | | |
Acrisure LLC / Acrisure Finance, Inc. 7.000%, 11/15/25 144A | | | 2,700,000 | | | | 2,302 | |
Ally Financial, Inc.
3.750%, 11/18/19 | | | 1,950,000 | | | | 1,943 | |
5.750%, 11/20/25 | | | 3,725,000 | | | | 3,706 | |
AmWINS Group, Inc. 7.750%, 7/1/26 144A | | | 2,275,000 | | | | 2,150 | |
Ardonagh Midco 3 PLC 8.625%, 7/15/23 Æ | | | 675,000 | | | | 609 | |
AssuredPartners, Inc. 7.000%, 8/15/25 144A | | | 2,925,000 | | | | 2,636 | |
HUB International, Ltd. 7.000%, 5/1/26 144A | | | 6,350,000 | | | | 5,763 | |
KIRS Midco 3 PLC 8.625%, 7/15/23 144A | | | 2,150,000 | | | | 1,827 | |
MGM Growth Properties Operating Partnership LP / MGP FinanceCo-Issuer, Inc. 5.625%, 5/1/24 | | | 475,000 | | | | 470 | |
National Financial Partners Corp. 6.875%, 7/15/25 144A | | | 3,425,000 | | | | 3,065 | |
Navient Corp.
5.500%, 1/25/23 | | | 500,000 | | | | 438 | |
5.875%, 10/25/24 | | | 2,525,000 | | | | 2,108 | |
6.125%, 3/25/24 | | | 2,325,000 | | | | 1,994 | |
6.500%, 6/15/22 | | | 200,000 | | | | 186 | |
6.750%, 6/25/25 | | | 325,000 | | | | 277 | |
6.750%, 6/15/26 | | | 350,000 | | | | 291 | |
7.250%, 9/25/23 | | | 1,150,000 | | | | 1,055 | |
Quicken Loans, Inc. | | | | | | | | |
5.250%, 1/15/28 144A | | | 950,000 | | | | 841 | |
5.750%, 5/1/25 144A | | | 4,350,000 | | | | 4,067 | |
| | | | | | | | |
| Corporate Bonds (96.3%) | | Shares/
Par+ | | | Value
$ (000’s) | |
| | |
Financial continued | | | | | | | | |
Tempo Acquisition LLC / Tempo Acquisition Finance Corp. 6.750%, 6/1/25 144A | | | 5,250,000 | | | | 4,856 | |
USIS Merger Sub, Inc. 6.875%, 5/1/25 144A | | | 3,300,000 | | | | 3,033 | |
Vantiv LLC 4.375%, 11/15/25 144A | | | 775,000 | | | | 709 | |
| | | | | | | | |
Total | | | | | | | 44,326 | |
| | | | | | | | |
| | |
Industrial (12.1%) | | | | | | | | |
ARD Finance SA 7.125%, 9/15/23 | | | 3,650,000 | | | | 3,276 | |
Ardagh Packaging Finance PLC / Ardagh Holdings USA, Inc.
4.625%, 5/15/23 144A | | | 525,000 | | | | 497 | |
6.000%, 2/15/25 144A | | | 2,600,000 | | | | 2,400 | |
7.250%, 5/15/24 144A | | | 2,000,000 | | | | 1,995 | |
Avolon Holdings Funding, Ltd.
5.125%, 10/1/23 144A | | | 600,000 | | | | 573 | |
5.500%, 1/15/23 144A | | | 200,000 | | | | 194 | |
Berry Plastics Corp.
5.125%, 7/15/23 | | | 1,150,000 | | | | 1,137 | |
5.500%, 5/15/22 | | | 4,205,000 | | | | 4,184 | |
6.000%, 10/15/22 | | | 275,000 | | | | 278 | |
BWAY Holding Co.
5.500%, 4/15/24 144A | | | 2,175,000 | | | | 2,044 | |
7.250%, 4/15/25 144A | | | 5,725,000 | | | | 5,138 | |
CD&R Waterworks Merger Sub LLC 6.125%, 8/15/25 144A | | | 2,125,000 | | | | 1,886 | |
Crown Americas LLC / Crown Americas Capital Corp. VI 4.750%, 2/1/26 144A | | | 1,175,000 | | | | 1,115 | |
Energizer Gamma Acquisition, Inc. 6.375%, 7/15/26 144A | | | 1,400,000 | | | | 1,284 | |
Energizer Holdings, Inc. 5.500%, 6/15/25 144A | | | 225,000 | | | | 203 | |
Engility Corp. 8.875%, 9/1/24 | | | 1,425,000 | | | | 1,521 | |
Flex Acquisition Co., Inc.
6.875%, 1/15/25 144A | | | 5,000,000 | | | | 4,450 | |
7.875%, 7/15/26 144A | | | 2,775,000 | | | | 2,497 | |
Gates Global LLC / Gates Global Co. 6.000%, 7/15/22 144A | | | 2,751,000 | | | | 2,696 | |
The Hillman Group, Inc. 6.375%, 7/15/22 144A | | | 2,900,000 | | | | 2,349 | |
JELD-WEN, Inc. 4.875%, 12/15/27 144A | | | 175,000 | | | | 148 | |
JPW Industries Holding Corp. 9.000%, 10/1/24 144A | | | 325,000 | | | | 314 | |
Koppers, Inc. 6.000%, 2/15/25 144A | | | 2,125,000 | | | | 1,870 | |
Masonite International Corp.
5.625%, 3/15/23 144A | | | 640,000 | | | | 621 | |
5.750%, 9/15/26 144A | | | 700,000 | | | | 660 | |
Multi-Color Corp.
4.875%, 11/1/25 144A | | | 950,000 | | | | 812 | |
6.125%, 12/1/22 144A | | | 3,125,000 | | | | 3,102 | |
Owens-Brockway Glass Container, Inc.
5.375%, 1/15/25 144A | | | 1,975,000 | | | | 1,876 | |
5.875%, 8/15/23 144A | | | 900,000 | | | | 902 | |
6.375%, 8/15/25 144A | | | 325,000 | | | | 322 | |
The Accompanying Notes are an Integral Part of the Financial Statements.
171
High Yield Bond Portfolio
| | | | | | | | |
| Corporate Bonds (96.3%) | | Shares/ Par+ | | | Value
$ (000’s) | |
| | |
Industrial continued | | | | | | | | |
Park Aerospace Holdings, Ltd.
4.500%, 3/15/23 144A | | | 550,000 | | | | 514 | |
5.250%, 8/15/22 144A | | | 425,000 | | | | 411 | |
5.500%, 2/15/24 144A | | | 6,100,000 | | | | 5,886 | |
Pisces Midco, Inc. 8.000%, 4/15/26 144A | | | 2,075,000 | | | | 1,899 | |
Resideo Funding, Inc. 6.125%, 11/1/26 144A | | | 625,000 | | | | 616 | |
Reynolds Group Issuer, Inc. / Reynolds Group Issuer LLC / Reynolds Group Issuer LU
5.750%, 10/15/20 | | | 3,057,535 | | | | 3,050 | |
6.875%, 2/15/21 | | | 268,566 | | | | 269 | |
7.000%, 7/15/24 144A | | | 2,575,000 | | | | 2,453 | |
Sealed Air Corp.
4.875%, 12/1/22 144A | | | 1,375,000 | | | | 1,361 | |
5.125%, 12/1/24 144A | | | 1,950,000 | | | | 1,913 | |
Sensata Technologies BV 5.625%, 11/1/24 144A | | | 950,000 | | | | 936 | |
Standard Industries, Inc.
5.000%, 2/15/27 144A | | | 3,100,000 | | | | 2,713 | |
6.000%, 10/15/25 144A | | | 1,625,000 | | | | 1,559 | |
Stevens Holding Co., Inc. 6.125%, 10/1/26 144A | | | 450,000 | | | | 443 | |
Tervita Escrow Corp. 7.625%, 12/1/21 144A | | | 2,350,000 | | | | 2,238 | |
Titan Acquisition, Ltd. / TitanCo-Borrower LLC 7.750%, 4/15/26 144A | | | 1,850,000 | | | | 1,582 | |
TransDigm UK Holdings PLC 6.875%, 5/15/26 144A | | | 325,000 | | | | 310 | |
TransDigm, Inc.
6.000%, 7/15/22 | | | 520,000 | | | | 508 | |
6.375%, 6/15/26 | | | 1,575,000 | | | | 1,465 | |
6.500%, 7/15/24 | | | 4,875,000 | | | | 4,741 | |
6.500%, 5/15/25 | | | 300,000 | | | | 287 | |
TTM Technologies, Inc. 5.625%, 10/1/25 144A | | | 1,675,000 | | | | 1,558 | |
USG Corp. 4.875%, 6/1/27 144A | | | 700,000 | | | | 705 | |
WESCO Distribution, Inc.
5.375%, 12/15/21 | | | 2,780,000 | | | | 2,745 | |
5.375%, 6/15/24 | | | 1,750,000 | | | | 1,649 | |
| | | | | | | | |
Total | | | | | | | 92,155 | |
| | | | | | | | |
| | |
Other Holdings (–%) | | | | | | | | |
General Motors Co. Escrow
7.200%, 1/15/49 *,Æ,ℓ | | | 610,000 | | | | - | |
8.375%, 7/15/49 *,Æ,ℓ | | | 4,865,000 | | | | - | |
| | | | | | | | |
Total | | | | | | | - | |
| | | | | | | | |
| | |
Pharmaceuticals (0.0%) | | | | | | | | |
Endo Finance LLC / Endo Finco, Inc. 5.375%, 1/15/23 144A | | | 175,000 | | | | 133 | |
| | | | | | | | |
Total | | | | | | | 133 | |
| | | | | | | | |
| | |
Technology (6.7%) | | | | | | | | |
Banff Merger Sub, Inc. 9.750%, 9/1/26 144A | | | 2,875,000 | | | | 2,631 | |
CDW LLC / CDW Finance Corp.
5.000%, 9/1/25 | | | 450,000 | | | | 431 | |
5.500%, 12/1/24 | | | 2,075,000 | | | | 2,049 | |
| | | | | | | | |
| Corporate Bonds (96.3%) | | Shares/ Par+ | | | Value
$ (000’s) | |
| | |
Technology continued | | | | | | | | |
Diamond 1 Finance Corp. / Diamond 2 Finance Corp.
5.875%, 6/15/21 144A | | | 450,000 | | | | 449 | |
7.125%, 6/15/24 144A | | | 3,025,000 | | | | 3,078 | |
Entegris, Inc. 4.625%, 2/10/26 144A | | | 1,375,000 | | | | 1,265 | |
First Data Corp.
5.375%, 8/15/23 144A | | | 2,000,000 | | | | 1,965 | |
5.750%, 1/15/24 144A | | | 4,975,000 | | | | 4,859 | |
IMS Health, Inc. 5.000%, 10/15/26 144A | | | 2,250,000 | | | | 2,149 | |
Inception Merger Sub, Inc. / Rackspace Hosting, Inc. 8.625%, 11/15/24 144A | | | 3,825,000 | | | | 2,983 | |
Infor Software Parent LLC / Infor Software Parent, Inc. 7.125%, 5/1/21 144A | | | 4,760,000 | | | | 4,629 | |
Infor US, Inc. 6.500%, 5/15/22 | | | 3,625,000 | | | | 3,506 | |
Informatica LLC 7.125%, 7/15/23 144A | | | 3,450,000 | | | | 3,360 | |
JDA Escrow LLC / JDA Bond Finance, Inc. 7.375%, 10/15/24 144A | | | 3,250,000 | | | | 3,274 | |
MSCI, Inc. 5.750%, 8/15/25 144A | | | 1,050,000 | | | | 1,058 | |
NCR Corp.
4.625%, 2/15/21 | | | 675,000 | | | | 658 | |
5.875%, 12/15/21 | | | 1,450,000 | | | | 1,414 | |
6.375%, 12/15/23 | | | 520,000 | | | | 504 | |
Nuance Communications, Inc.
5.375%, 8/15/20 144A | | | 815,000 | | | | 814 | |
5.625%, 12/15/26 | | | 1,675,000 | | | | 1,591 | |
6.000%, 7/1/24 | | | 1,375,000 | | | | 1,368 | |
Riverbed Technology, Inc. 8.875%, 3/1/23 144A | | | 2,550,000 | | | | 1,881 | |
Sensata Technologies UK Financing Co. PLC 6.250%, 2/15/26 144A | | | 425,000 | | | | 427 | |
Solera LLC / Solera Finance, Inc. 10.500%, 3/1/24 144A | | | 1,675,000 | | | | 1,784 | |
Sophia LP / Sophia Finance, Inc. 9.000%, 9/30/23 144A | | | 1,950,000 | | | | 1,950 | |
Western Digital Corp. 4.750%, 2/15/26 | | | 1,350,000 | | | | 1,171 | |
| | | | | | | | |
Total | | | | | | | 51,248 | |
| | | | | | | | |
| | |
Utilities (1.7%) | | | | | | | | |
AmeriGas Partners LP / AmeriGas Finance Corp.
5.500%, 5/20/25 | | | 350,000 | | | | 320 | |
5.625%, 5/20/24 | | | 825,000 | | | | 780 | |
5.750%, 5/20/27 | | | 550,000 | | | | 487 | |
5.875%, 8/20/26 | | | 2,550,000 | | | | 2,327 | |
Calpine Corp.
5.250%, 6/1/26 144A | | | 550,000 | | | | 502 | |
5.375%, 1/15/23 | | | 2,050,000 | | | | 1,922 | |
5.750%, 1/15/25 | | | 1,375,000 | | | | 1,258 | |
6.000%, 1/15/22 144A | | | 455,000 | | | | 452 | |
NRG Energy, Inc.
5.750%, 1/15/28 | | | 225,000 | | | | 216 | |
6.250%, 5/1/24 | | | 1,750,000 | | | | 1,776 | |
6.625%, 1/15/27 | | | 925,000 | | | | 932 | |
The Accompanying Notes are an Integral Part of the Financial Statements.
172
High Yield Bond Portfolio
| | | | | | | | |
| Corporate Bonds (96.3%) | | Shares/ Par+ | | | Value $ (000’s) | |
| | |
Utilities continued | | | | | | | | |
7.250%, 5/15/26 | | | 1,150,000 | | | | 1,197 | |
Vistra Energy Corp. 5.875%, 6/1/23 | | | 225,000 | | | | 225 | |
Vistra Operations Co. LLC 5.500%, 9/1/26 144A | | | 900,000 | | | | 866 | |
| | | | | | | | |
Total | | | | | | | 13,260 | |
| | | | | | | | |
| | |
Total Corporate Bonds | | | | | | | | |
(Cost: $791,159) | | | | | | | 735,180 | |
| | | | | | | | |
| | | | | | | | |
| Short-Term Investments (2.0%) | | Shares/ Par+ | | | Value $ (000’s) | |
| | |
Money Market Funds (2.0%) | | | | | | | | |
State Street Institutional U.S. Government Money Market Fund - Premier Class 2.270%# | | | 15,586,932 | | | | 15,587 | |
| | | | | | | | |
Total | | | | | | | 15,587 | |
| | | | | | | | |
| | |
Total Short-Term Investments | | | | | | | | |
(Cost: $15,587) | | | | | | | 15,587 | |
| | | | | | | | |
| | |
Total Investments (98.3%) | | | | | | | | |
(Cost: $806,746)@ | | | | | | | 750,767 | |
| | | | | | | | |
Other Assets, Less | | | | | | | | |
Liabilities (1.7%) | | | | | | | 12,599 | |
| | | | | | | | |
Net Assets (100.0%) | | | | | | | 763,366 | |
| | | | | | | | |
| + | All par is stated in U.S Dollar unless otherwise noted. |
144A Security exempt from registration under Rule 144A of the Securities Act of 1933. These securities may be resold as transactions exempt from registration, normally to qualified institutional buyers. At December 31, 2018 the value of these securities (in thousands) was $457,204 representing 60.1% of the net assets.
| Æ | Security valued using significant unobservable inputs. |
| # | 7-Day yield as of 12/31/2018. |
| @ | At December 31, 2018, the aggregate cost of investments, including derivatives, for federal tax purposes (in thousands) was $806,844 and the net unrealized depreciation of investments based on that cost was $56,077 which is comprised of $2,386 aggregate gross unrealized appreciation and $58,463 aggregate gross unrealized depreciation. |
The following is a summary of the inputs used in valuing the Portfolio’s assets and liabilities at December 31, 2018. See Note 3 for additional information on portfolio valuation.
| | | | | | | | | | | | | | |
| | | Valuation Inputs | | | |
| Description | | Level 1 –
Quoted Prices | | | Level 2 –
Other Significant
Observable Inputs | | | Level 3 – Significant
Unobservable Inputs | | | |
| | | (Amounts in thousands) | | | |
Assets: | | | | | | | | | | | | | | |
Corporate Bonds | | $ | - | | | $ | 43,717 | | | $ | 609 | | | |
Financial | | | | | | | | | | | | | | |
All Others | | | - | | | | 690,854 | | | | - | | | |
Short-Term Investments | | | 15,587 | | | | - | | | | - | | | |
Total Assets: | | $ | 15,587 | | | $ | 734,571 | | | $ | 609 | | | |
The Accompanying Notes are an Integral Part of the Financial Statements.
173
Multi-Sector Bond Portfolio (unaudited)
| | | | |
| Objective: | | Portfolio Strategy: | | Net Assets: |
| Maximum total return, consistent with prudent investment management. | | Invest in a diversified portfolio of fixed income instruments of varying maturities and quality, and in derivatives designed to replicate such securities. | | $875 million |
PORTFOLIO OVERVIEW
Mason Street Advisors, LLC (“Mason Street Advisors”), the investment adviser for the Multi-Sector Bond Portfolio (the “Portfolio”), has engaged Pacific Investment Management Company LLC (“PIMCO”) to act assub-adviser for the Portfolio. Normally, the Portfolio invests in a diversified portfolio of fixed income instruments of varying maturities, which may be represented by forwards or derivatives such as options, futures contracts or swap agreements. The average portfolio duration (a measure of the sensitivity of the Portfolio’s fixed income portfolio securities to changes in interest rates) of the Portfolio normally varies from three to eight years, based on the Portfolio’s forecast for interest rates. The Portfolio may invest all of its assets in high yield securities subject to a maximum of 10% of its total assets in securities rated below B by Moody’s or equivalently rated by S&P or Fitch or, if unrated, determined to be of comparable quality (so called “junk bonds”). The Portfolio may invest, without limitation, in securities denominated in foreign currencies and U.S. dollar denominated securities of foreign issuers. In addition, the Portfolio may invest without limit in fixed income securities of issuers that are economically tied to emerging securities markets.
MARKET OVERVIEW
2018 was characterized by a challenging market environment that featured higher yields and lower equities as volatility rose. Sustained U.S.-China trade tensions and geopolitical turmoil weighed on risk sentiment, contributing to wider credit spreads and weakness in emerging market assets, while declining oil prices suppressed global inflation expectations. Fears of monetary policy overtightening further hurt investor confidence as the U.S. Federal Reserve (the “Fed”) continued to raise interest rates on its path toward policy normalization. Meanwhile, the U.S. dollar strengthened as economic growth and central bank activity diverged between the U.S. and other developed regions.
PORTFOLIO RESULTS
The Portfolio returned (1.30%) for the twelve months ended December 31, 2018. By comparison, the Portfolio’s benchmark, the Bloomberg Barclays® Global Credit Hedged USD Index returned (0.81%). The Portfolio’s custom benchmark, comprised of 1/3 each: Bloomberg Barclays® Global Aggregate – Credit Component ex Emerging Markets, Hedged USD; BofA Merrill Lynch® Global High YieldBB-B Rated Constrained Developed Markets Index, Hedged USD; J.P. Morgan® EMBI Global (the “Equal Weighted Composite Index”), returned (2.23%). (These Indices are unmanaged, cannot be invested in directly and do not incur expenses.) According to Morningstar® Inc., an independent mutual fund ranking agency, the average return in 2018 of the Multisector Bond peer group was (2.45%).
When compared to the Equal Weighted Composite Index, underweight positioning and selection within U.S. dollar-denominated emerging market debt and selection within taxable municipals contributed to performance. Additionally, selection withinnon-agency mortgage backed securities was additive. Within corporate credit, underweight positions in Industrials and Utilities supported returns as credit spreads broadly widened, while selection within investment grade Financials detracted. During the year, the Portfolio’s credit exposure was partially obtained through the use of credit default swaps.
The primary detractor from relative returns over the period was long exposure to a basket of emerging market currencies, including the Russian ruble, Turkish lira, Argentine peso and Brazilian real, as these currencies depreciated relative to the U.S. dollar. Currency exposure was partially facilitated through currency forward contracts.
PORTFOLIO MANAGER OUTLOOK
The following forward-looking comments are the opinion of PIMCO, the Portfolio’ssub-adviser.
We expect world GDP growth to slow somewhat but remain above trend at 2.75%–3.25% in 2019. With tighter global financial conditions, increased political and economic uncertainties, and U.S. fiscal stimulus starting to fade in 2019, we think the economic divergence of 2018 – the U.S. accelerating and other regions slowing – will give way to a more synchronized deceleration.
174
Multi-Sector Bond Portfolio (unaudited)
In the U.S., after an expansion of close to 3% in 2018, we look for growth to slow to a below-consensus 2.0%–2.5% range in 2019. The drop reflects the recent tightening of financial conditions, fading fiscal stimulus, and slower growth in China and elsewhere. Growth momentum is likely to moderate during the year, converging to trend growth of just below 2% in the second half. Headline inflation looks set to drop sharply over the next several months, reflecting base effects and the recent plunge in oil prices, while core CPI of about 2% is expected to remain stable. We expect one or two more interest rate increases byyear-end 2019, with a high chance of the Fed pausing or even ending the hiking cycle in the first half.
Relative Performance
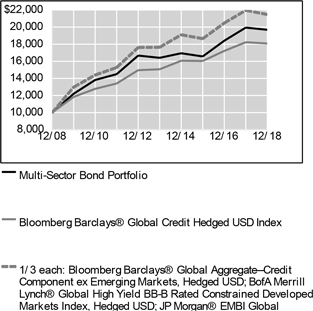
| | | | | | | | | | | | |
Average Annual Total Returns For Periods Ended December 31, 2018 | |
| | | 1 Year | | | 5 Years | | | 10 Years | |
Multi-Sector Bond Portfolio | | | -1.30 | % | | | 3.71 | % | | | 7.01 | % |
Bloomberg Barclays® Global Credit Hedged USD Index | | | -0.81 | % | | | 3.71 | % | | | 6.10 | % |
1/3 each: Bloomberg Barclays® Global Aggregate — Credit Component ex Emerging Markets, Hedged USD; BofA Merrill Lynch® Global High YieldBB-B Rated Constrained Developed Markets Index, Hedged USD; JP Morgan® EMBI Global | | | -2.23 | % | | | 4.01 | % | | | 7.94 | % |
Morningstar® US Insurance Fund Multisector Bond Average | | | -2.45 | % | | | 2.48 | % | | | 6.99 | % |
The performance data quoted represents past performance. Past performance is historical and does not guarantee future performance. Investment return and principal value will fluctuate, so that shares, when redeemed, may be worth more or less than their original cost. Current performance may be lower or higher than the performance data quoted. For the most recentmonth-end performance information visitwww.northwesternmutual.com.
This chart assumes an initial investment of $10,000 made on 12/31/08. Returns shown reflect fee waivers, deductions for management and other portfolio expenses, and reinvestment of all dividends. In the absence of fee waivers, total return would be reduced. Returns exclude deductions for separate account sale loads and account fees. Please refer to the Benchmark Definitions section of this report for information about the indices cited in the above chart and graph.
The Portfolio invests in lower-quality securities, which may present a significant risk for loss of principal and interest. Bonds and other debt obligations are affected by changes in interest rates, inflation risk and the creditworthiness of their issuers. High yield bonds generally have greater price swings and higher default risks than investment grade bonds. Return of principal is not guaranteed. When interest rates rise, bond prices fall. With a fixed income fund, when interest rates rise, the value of the fund’s existing bonds drops, which could negatively affect overall fund performance.
Investing in bonds issued by foreign corporations and governments carries additional risk, including foreign currency risk, and may increase the volatility of the Portfolio’s performance.
The Portfolio may use derivative instruments for hedging purposes or as alternatives to direct investments. Use of these instruments may involve certain costs and risks such as liquidity risk, interest rate risk, market risk, credit risk, management risk and the risk of mispricing or improper valuation. Certain derivatives involve leverage, which could magnify losses, and portfolios investing in derivatives could lose more than the principal amount invested in those instruments.
The Portfolio may invest a portion of its assets in fixed- and floating-rate loans, including senior loans, through loan participations and assignments. Investing in loans may expose the Portfolio to additional risks, including credit risk, interest rate risk, liquidity risk, call risk, settlement risk, and risks associated with being a lender.
The Portfolio may also invest in municipal securities, which may be more sensitive to certain adverse conditions than other fixed income securities, may be or become illiquid, and may have yields which move differently and adversely compared to the yields of the overall debt securities markets.
175
Multi-Sector Bond Portfolio (unaudited)
The U.S. federal funds rate has been subject to moderate and steady increases over the course of the last three years. A significant rise in interest rates over a short period of time could cause significant losses in the market value of the Portfolio’s fixed income investments.
Top 10 Fixed Income Holdings 12/31/18
| | | | | | | | |
| Security Description | | % of Net Assets | | | | |
US Treasury, Various | | | 6.7 | % | | | | |
Federal National Mortgage Association, Various | | | 6.2 | % | | | | |
Turkey Government International Bond, Various | | | 2.7 | % | | | | |
Blackstone CQP Holdco LP, 6.5%, 3/20/21 | | | 1.6 | % | | | | |
Barclays PLC, Various | | | 1.6 | % | | | | |
Argentine Republic Government International Bond, Various | | | 1.5 | % | | | | |
Petroleos Mexicanos, Various | | | 1.4 | % | | | | |
Mastr Asset Backed Securities Trust, Series 2006- FRE2, Class A1, 2.656%, 3/25/36 | | | 1.4 | % | | | | |
Royal Bank of Scotland Group PLC, Various | | | 1.3 | % | | | | |
Ukraine Government International Bond, Various | | | 1.2 | % | | | | |
Sector Allocation 12/31/18
| | | | | | | | |
| Sector | | % of Net Assets | | | | |
Corporate Bonds | | | 53.2 | % | | | | |
Governments | | | 18.8 | % | | | | |
Structured Products | | | 12.7 | % | | | | |
Short-Term Investments & Other Net Assets | | | 11.5 | % | | | | |
Bank Loan Obligations | | | 2.6 | % | | | | |
Municipal Bonds | | | 1.2 | % | | | | |
Sector Allocation and Top 10 Holdings are subject to change.
176
Multi-Sector Bond Portfolio
SCHEDULE OF INVESTMENTS
December 31, 2018
| | | | | | | | |
| Corporate Bonds (53.2%) | | Shares/
Par+ | | | Value
$ (000’s) | |
| | |
Basic Materials (0.9%) | | | | | | | | |
Georgia-Pacific LLC 8.875%, 5/15/31 | | | 200,000 | | | | 293 | |
Indonesia Asahan Aluminum 5.230%, 11/15/21 144A | | | 300,000 | | | | 304 | |
INEOS Finance PLC 4.000%, 5/1/23 144A EUR¥ | | | 1,500,000 | | | | 1,719 | |
Metinvest BV 7.750%, 4/23/23 144A | | | 300,000 | | | | 273 | |
Syngenta Finance NV 4.892%, 4/24/25 144A | | | 5,900,000 | | | | 5,581 | |
| | | | | | | | |
Total | | | | | | | 8,170 | |
| | | | | | | | |
| | |
Communications (8.5%) | | | | | | | | |
Altice Financing SA | | | | | | | | |
6.625%, 2/15/23 144A | | | 2,427,000 | | | | 2,330 | |
7.500%, 5/15/26 144A | | | 4,200,000 | | | | 3,832 | |
Altice France SA 8.125%, 2/1/27 144A | | | 3,200,000 | | | | 3,016 | |
Altice Luxembourg SA | | | | | | | | |
6.250%, 2/15/25 EUR §,¥ | | | 700,000 | | | | 636 | |
7.250%, 5/15/22 EUR §,¥,ß | | | 4,900,000 | | | | 5,214 | |
7.625%, 2/15/25 144A | | | 900,000 | | | | 673 | |
AT&T, Inc. | | | | | | | | |
3.400%, 5/15/25 | | | 1,000,000 | | | | 940 | |
4.900%, 8/15/37 | | | 200,000 | | | | 187 | |
5.300%, 8/15/58 ß | | | 6,200,000 | | | | 5,753 | |
Baidu, Inc. 3.875%, 9/29/23 | | | 200,000 | | | | 199 | |
Charter Communications Operating LLC / Charter Communications Operating Capital Corp. | | | | | | | | |
4.200%, 3/15/28 | | | 1,700,000 | | | | 1,593 | |
4.464%, 7/23/22 ß | | | 2,400,000 | | | | 2,423 | |
5.375%, 4/1/38 | | | 100,000 | | | | 93 | |
CommScope Technologies LLC 5.000%, 3/15/27 144A | | | 100,000 | | | | 81 | |
Deutsche Telekom International Finance 8.250%, 6/15/30 | | | 700,000 | | | | 914 | |
DISH DBS Corp. | | | | | | | | |
5.125%, 5/1/20 | | | 1,982,000 | | | | 1,957 | |
6.750%, 6/1/21 ß | | | 3,200,000 | | | | 3,167 | |
7.875%, 9/1/19 | | | 100,000 | | | | 102 | |
Koninklijke KPN NV 5.750%, 9/17/29 GBP §,¥ | | | 750,000 | | | | 1,157 | |
Qwest Corp. 7.250%, 9/15/25 | | | 500,000 | | | | 515 | |
SFR Group SA
5.625%, 5/15/24 EUR §,¥ | | | 200,000 | | | | 231 | |
7.375%, 5/1/26 144A | | | 7,600,000 | | | | 6,973 | |
SoftBank Group Corp. 5.000%, 4/15/28 EUR §,¥,ß | | | 4,900,000 | | | | 5,428 | |
Sprint Communications, Inc. 7.000%, 8/15/20 | | | 1,710,000 | | | | 1,751 | |
Sprint Corp. 7.250%, 9/15/21 | | | 400,000 | | | | 409 | |
| | | | | | | | |
| Corporate Bonds (53.2%) | | Shares/
Par+ | | | Value
$ (000’s) | |
| | |
Communications continued | | | | | | | | |
Sprint Spectrum Co. LLC / Sprint Spectrum Co. II LLC / Sprint Spectrum Co. III LLC 5.152%, 3/20/28 144A | | | 1,300,000 | | | | 1,277 | |
Stichting Eldfell 4.250%, 1/15/27 144A EUR¥ | | | 500,000 | | | | 563 | |
TDC A/S 5.625%, 2/23/23 GBP §,¥ | | | 400,000 | | | | 561 | |
Telenet Finance Luxembourg Notes SARL 3.500%, 3/1/28 144A EUR¥ | | | 1,100,000 | | | | 1,226 | |
Time Warner Cable LLC
5.875%, 11/15/40 | | | 300,000 | | | | 283 | |
6.750%, 6/15/39 | | | 200,000 | | | | 203 | |
UPCB Finance IV, Ltd. 4.000%, 1/15/27 EUR §,¥ | | | 315,000 | | | | 366 | |
UPCB Finance VII, Ltd. 3.625%, 6/15/29 EUR §,¥,ß | | | 2,800,000 | | | | 3,044 | |
Verizon Communications, Inc. | | | | | | | | |
4.522%, 9/15/48 | | | 100,000 | | | | 94 | |
4.672%, 3/15/55 | | | 2,150,000 | | | | 1,977 | |
5.012%, 4/15/49 ß | | | 2,449,000 | | | | 2,443 | |
5.250%, 3/16/37 | | | 200,000 | | | | 209 | |
Virgin Media Investment Holdings, Ltd. 5.125%, 1/15/25 144A GBP¥ | | | 700,000 | | | | 883 | |
Virgin Media Receivables Financing Notes I Designated Activity Co. 5.500%, 9/15/24 GBP §,¥ | | | 1,300,000 | | | | 1,588 | |
Virgin Media Secured Finance PLC | | | | | | | | |
4.875%, 1/15/27 GBP §,¥,ß | | | 3,100,000 | | | | 3,704 | |
5.000%, 4/15/27 144A GBP¥ | | | 500,000 | | | | 602 | |
5.500%, 1/15/25 GBP §,¥ | | | 189,000 | | | | 239 | |
Wind Tre SpA | | | | | | | | |
2.625%, 1/20/23 144A EUR¥ | | | 3,000,000 | | | | 3,099 | |
2.750%, (Euribor 3 Month plus 2.750%), 1/20/24 144A EUR¥ | | | 600,000 | | | | 614 | |
3.125%, 1/20/25 EUR §,¥ | | | 1,500,000 | | | | 1,528 | |
Ziggo Secured Finance BV 4.250%, 1/15/27 EUR §,¥ | | | 200,000 | | | | 225 | |
| | | | | | | | |
Total | | | | | | | 74,302 | |
| | | | | | | | |
| | |
Consumer, Cyclical (4.6%) | | | | | | | | |
American Airlines Pass Through Trust, Series2011-1, Class A 5.250%, 7/31/22 | | | 86,508 | | | | 88 | |
American Airlines Pass Through Trust, Series2014-1, Class A 3.700%, 4/1/28 | | | 466,648 | | | | 452 | |
Continental Airlines Pass Through Trust, | | | | | | | | |
Series2009-2, Class A 7.250%, 5/10/21 | | | 176,565 | | | | 181 | |
Continental Airlines Pass Through Trust, | | | | | | | | |
Series 2010, Class A 4.750%, 7/12/22 | | | 53,923 | | | | 55 | |
Enterprise Inns PLC 6.875%, 5/9/25 GBP¥,ß | | | 1,600,000 | | | | 2,180 | |
The Accompanying Notes are an Integral Part of the Financial Statements.
177
Multi-Sector Bond Portfolio
| | | | | | | | |
| Corporate Bonds (53.2%) | | Shares/
Par+ | | | Value
$ (000’s) | |
| | |
Consumer, Cyclical continued | | | | | | | | |
FCE Bank PLC
0.184%, (Euribor 3 Month ACT/360 plus 0.500%), 8/26/20 EUR §,¥ | | | 100,000 | | | | 112 | |
0.869%, 9/13/21 EUR §,¥ | | | 400,000 | | | | 444 | |
1.660%, 2/11/21 EUR §,¥ | | | 200,000 | | | | 229 | |
1.875%, 6/24/21 EUR §,¥ | | | 100,000 | | | | 114 | |
Ford Motor Credit Co. LLC
0.054%, (Euribor 3 Month ACT/360 plus 0.370%), 12/1/21 EUR¥ | | | 100,000 | | | | 107 | |
0.114%, (Euribor 3 Month ACT/360 plus 0.430%), 5/14/21 EUR¥ | | | 200,000 | | | | 219 | |
General Motors Financial Co., Inc. 3.450%, 4/10/22 | | | 300,000 | | | | 290 | |
GLP Capital LP / GLP Financing II, Inc. 5.750%, 6/1/28 | | | 400,000 | | | | 404 | |
Hilton Worldwide Finance Corp. 4.875%, 4/1/27 | | | 700,000 | | | | 656 | |
IHO Verwaltungs GmbH 3.750%, 9/15/26 EUR §,¥,ß | | | 4,300,000 | | | | 4,717 | |
Marks & Spencer PLC
3.000%, 12/8/23 GBP §,¥ | | | 300,000 | | | | 376 | |
4.750%, 6/12/25 GBP §,¥ | | | 400,000 | | | | 533 | |
Marriott Ownership Resorts, Inc. 6.500%, 9/15/26 144A | | | 150,000 | | | | 145 | |
Melco Resorts Finance, Ltd. 4.875%, 6/6/25 144A | | | 700,000 | | | | 643 | |
MGM Resorts International 7.750%, 3/15/22 | | | 300,000 | | | | 319 | |
Mitchells & Butlers Finance PLC 1.356%, (ICE LIBOR GBP 3 Month plus 0.450%), 12/15/30 GBP §,¥ | | | 1,421,376 | | | | 1,676 | |
3.238%, (ICE LIBOR USD 3 Month plus 0.450%), 12/15/30 § | | | 258,432 | | | | 236 | |
6.469%, 9/15/32 GBP §,¥ | | | 200,000 | | | | 277 | |
QVC, Inc.
4.375%, 3/15/23 | | | 2,000,000 | | | | 1,919 | |
5.450%, 8/15/34 | | | 800,000 | | | | 699 | |
Sands China, Ltd.
4.600%, 8/8/23 144A | | | 300,000 | | | | 298 | |
5.400%, 8/8/28 144A | | | 3,200,000 | | | | 3,090 | |
Spirit Issuer PLC 6.582%, 12/28/27 GBP §,¥ | | | 495,000 | | | | 635 | |
Toll Brothers Finance Corp.
4.350%, 2/15/28 | | | 100,000 | | | | 86 | |
4.875%, 3/15/27 | | | 1,200,000 | | | | 1,086 | |
Travis Perkins PLC
4.375%, 9/15/21 GBP §,¥ | | | 200,000 | | | | 256 | |
4.500%, 9/7/23 GBP §,¥,ß | | | 1,900,000 | | | | 2,357 | |
The Unique Pub Finance Co. PLC
5.659%, 6/30/27 GBP §,¥ | | | 145,572 | | | | 202 | |
6.542%, 3/30/21 GBP §,¥ | | | 457,080 | | | | 605 | |
7.395%, 3/28/24 GBP §,¥ | | | 400,000 | | | | 556 | |
United Airlines Pass Through Trust, Series2013-1, Class A 4.300%, 8/15/25 | | | 80,249 | | | | 82 | |
US Airways Pass-Through Trust, Series 2012-1, Class A 5.900%, 4/1/26 | | | 982,537 | | | | 1,048 | |
Virgin Australia2013-1A Pass Through Trust 5.000%, 4/23/25 144A | | | 24,049 | | | | 24 | |
| | | | | | | | |
| Corporate Bonds (53.2%) | | Shares/
Par+ | | | Value
$ (000’s) | |
| | |
Consumer, Cyclical continued | | | | | | | | |
Volkswagen Group of America Finance LLC | | | | | | | | |
2.125%, 5/23/19 144A | | | 200,000 | | | | 199 | |
3.875%, 11/13/20 144A | | | 1,500,000 | | | | 1,507 | |
4.000%, 11/12/21 144A | | | 2,500,000 | | | | 2,505 | |
Wynn Las Vegas LLC / Wynn Las Vegas Capital Corp. 5.250%, 5/15/27 144A | | | 800,000 | | | | 704 | |
5.500%, 3/1/25 144A | | | 6,250,000 | | | | 5,828 | |
ZF North America Capital, Inc. | | | | | | | | |
4.500%, 4/29/22 144A | | | 436,000 | | | | 426 | |
4.750%, 4/29/25 144A | | | 2,232,000 | | | | 2,078 | |
| | | | | | | | |
Total | | | | | | | 40,643 | |
| | | | | | | | |
| | |
Consumer,Non-cyclical (3.4%) | | | | | | | | |
AA Bond Co., Ltd.
2.875%, 7/31/43 GBP §,¥,ß | | | 1,900,000 | | | | 2,250 | |
4.875%, 7/31/43 GBP §,¥ | | | 200,000 | | | | 242 | |
5.500%, 7/31/43 GBP §,¥ | | | 400,000 | | | | 407 | |
Allergan Funding SCS 1.500%, 11/15/23 EUR¥ | | | 400,000 | | | | 462 | |
Amgen, Inc. 4.663%, 6/15/51 | | | 1,041,000 | | | | 982 | |
Bacardi, Ltd. 4.700%, 5/15/28 144A | | | 2,900,000 | | | | 2,789 | |
Casino Guichard Perrachon SA
1.865%, 6/13/22 EUR §,¥ | | | 200,000 | | | | 203 | |
4.407%, 8/6/19 EUR §,¥ | | | 100,000 | | | | 116 | |
5.244%, 3/9/20 EUR¥ | | | 600,000 | | | | 704 | |
5.976%, 5/26/21 EUR §,¥ | | | 400,000 | | | | 469 | |
CHS / Community Health Systems, Inc. 5.125%, 8/1/21 | | | 200,000 | | | | 186 | |
CVS Pass-Through Trust
4.704%, 1/10/36 144A | | | 428,239 | | | | 419 | |
5.926%, 1/10/34 144A | | | 729,654 | | | | 786 | |
7.507%, 1/10/32 144A | | | 77,002 | | | | 89 | |
Endo Finance LLC / Endo Finco, Inc.
5.375%, 1/15/23 144A | | | 3,200,000 | | | | 2,432 | |
5.750%, 1/15/22 144A | | | 1,700,000 | | | | 1,415 | |
7.250%, 1/15/22 144A | | | 1,200,000 | | | | 1,038 | |
Greene King Finance PLC 2.986%, (ICE LIBOR GBP 3 Month plus 2.080%), 3/15/36 GBP §,¥ | | | 450,000 | | | | 468 | |
Hamilton College 4.750%, 7/1/13 | | | 100,000 | | | | 101 | |
HCA, Inc.
4.500%, 2/15/27 | | | 100,000 | | | | 95 | |
4.750%, 5/1/23 ß | | | 2,655,000 | | | | 2,615 | |
5.375%, 9/1/26 | | | 400,000 | | | | 389 | |
5.625%, 9/1/28 | | | 1,800,000 | | | | 1,737 | |
6.500%, 2/15/20 | | | 2,000,000 | | | | 2,050 | |
Pfizer, Inc. 5.800%, 8/12/23 | | | 200,000 | | | | 222 | |
RAC Bond Co. PLC 4.565%, 5/6/46 GBP §,¥ | | | 200,000 | | | | 250 | |
4.870%, 5/6/46 GBP §,¥ | | | 700,000 | | | | 852 | |
Tenet Healthcare Corp. 4.500%, 4/1/21 | | | 300,000 | | | | 292 | |
Teva Pharmaceutical Finance Co. BV
2.950%, 12/18/22 | | | 120,000 | | | | 106 | |
3.650%, 11/10/21 ß | | | 2,600,000 | | | | 2,463 | |
The Accompanying Notes are an Integral Part of the Financial Statements.
178
Multi-Sector Bond Portfolio
| | | | | | | | |
| Corporate Bonds (53.2%) | | Shares/
Par+ | | | Value
$ (000’s) | |
| | |
Consumer,Non-cyclical continued | | | | | | | | |
Teva Pharmaceutical Finance IV BV 3.650%, 11/10/21 | | | 400,000 | | | | 379 | |
Teva Pharmaceutical Finance Netherlands II BV 1.250%, 3/31/23 EUR §,¥ | | | 600,000 | | | | 621 | |
Teva Pharmaceutical Finance Netherlands III BV 2.200%, 7/21/21 | | | 400,000 | | | | 368 | |
2.800%, 7/21/23 | | | 2,300,000 | | | | 1,981 | |
| | | | | | | | |
Total | | | | | | | 29,978 | |
| | | | | | | | |
| | |
Diversified (0.3%) | | | | | | | | |
Co-operative Group Holdings 2011, Ltd.
6.875%, 7/8/20 GBP §,¥ | | | 600,000 | | | | 795 | |
7.500%, 7/8/26 GBP §,¥ | | | 1,400,000 | | | | 1,968 | |
| | | | | | | | |
Total | | | | | | | 2,763 | |
| | | | | | | | |
| | |
Energy (8.2%) | | | | | | | | |
Andeavor Logistics LP / Tesoro Logistics Finance Corp. 4.250%, 12/1/27 | | | 100,000 | | | | 94 | |
CNOOC Finance 2013, Ltd. 3.000%, 5/9/23 | | | 500,000 | | | | 483 | |
Continental Resources, Inc. 4.375%, 1/15/28 | | | 1,400,000 | | | | 1,318 | |
Dolphin Energy, Ltd. 5.500%, 12/15/21 144A | | | 1,000,000 | | | | 1,040 | |
El Paso Natural Gas Co. LLC 8.375%, 6/15/32 | | | 200,000 | | | | 242 | |
Energy Transfer Partners LP
3.600%, 2/1/23 | | | 100,000 | | | | 96 | |
4.150%, 10/1/20 | | | 400,000 | | | | 402 | |
4.650%, 6/1/21 | | | 200,000 | | | | 204 | |
7.500%, 7/1/38 | | | 100,000 | | | | 112 | |
Ensco PLC
5.750%, 10/1/44 | | | 200,000 | | | | 112 | |
8.000%, 1/31/24 | | | 80,000 | | | | 66 | |
Gazprom Neft OAO Via GPN Capital SA 6.000%, 11/27/23 §,ß | | | 3,000,000 | | | | 3,098 | |
Harvest Operations Corp. 2.330%, 4/14/21 144A | | | 2,970,000 | | | | 2,884 | |
Kinder Morgan Energy Partners LP 6.550%, 9/15/40 ß | | | 2,382,000 | | | | 2,573 | |
Kinder Morgan, Inc. 7.750%, 1/15/32 | | | 1,216,000 | | | | 1,459 | |
Midcontinent Express Pipeline LLC 6.700%, 9/15/19 144A | | | 1,700,000 | | | | 1,716 | |
Newfield Exploration Co. 5.625%, 7/1/24 ß | | | 2,100,000 | | | | 2,126 | |
NGPL PipeCo LLC 7.768%, 12/15/37 144A | | | 100,000 | | | | 114 | |
Novatek OAO via Novatek Finance, Ltd.
6.604%, 2/3/21 § | | | 200,000 | | | | 208 | |
Odebrecht Drilling Norbe VIII/IX, Ltd.
6.350%, 12/1/21 § | | | 702,666 | | | | 675 | |
7.350%, 12/1/26 §,Þ | | | 1,493,023 | | | | 838 | |
Odebrecht Oil & Gas Finance, Ltd. 0.000%, 2/9/18 § | | | 782,000 | | | | 8 | |
Pertamina Persero PT 6.500%, 11/7/48 144A | | | 3,800,000 | | | | 3,990 | |
| | | | | | | | |
| Corporate Bonds (53.2%) | | Shares/
Par+ | | | Value
$ (000’s) | |
| | |
Energy continued | | | | | | | | |
Petrobras Global Finance BV 7.375%, 1/17/27 ß | | | 4,100,000 | | | | 4,213 | |
Petroleos de Venezuela SA 5.375%, 4/12/27 §,ℓ | | | 6,500,000 | | | | 942 | |
5.500%, 4/12/37 §,ℓ | | | 4,300,000 | | | | 645 | |
Petroleos Mexicanos
2.750%, 4/21/27 EUR §,¥ | | | 1,100,000 | | | | 1,043 | |
3.750%, 2/21/24 EUR §,¥ | | | 400,000 | | | | 440 | |
4.750%, 2/26/29 EUR §,¥,ß | | | 6,700,000 | | | | 7,016 | |
4.875%, 2/21/28 EUR §,¥ | | | 600,000 | | | | 651 | |
6.500%, 3/13/27 | | | 1,700,000 | | | | 1,598 | |
6.625%, 6/15/38 | | | 1,800,000 | | | | 1,539 | |
QEP Resources, Inc. 5.625%, 3/1/26 | | | 700,000 | | | | 581 | |
QGOG Constellation SA 9.500%, 11/9/24 §,Þ | | | 201,001 | | | | 81 | |
Ras Laffan Liquefied Natural Gas Co., Ltd. III 5.838%, 9/30/27 144A | | | 2,300,000 | | | | 2,490 | |
Regency Energy Partners LP / Regency | | | | | | | | |
Energy Finance Corp.
4.500%, 11/1/23 | | | 300,000 | | | | 300 | |
5.000%, 10/1/22 | | | 1,100,000 | | | | 1,123 | |
5.750%, 9/1/20 | | | 300,000 | | | | 308 | |
5.875%, 3/1/22 | | | 800,000 | | | | 832 | |
Reliance Holdings USA, Inc. 4.500%, 10/19/20 § | | | 300,000 | | | | 303 | |
Rio Oil Finance Trust, Series2014-1 | | | | | | | | |
9.250%, 7/6/24 144A | | | 1,560,828 | | | | 1,664 | |
9.250%, 7/6/24 § | | | 1,365,725 | | | | 1,456 | |
Rio Oil Finance Trust, Series2014-3
9.750%, 1/6/27 § | | | 485,554 | | | | 531 | |
Rockies Express Pipeline LLC
5.625%, 4/15/20 144A | | | 1,000,000 | | | | 1,000 | |
Sabine Pass Liquefaction LLC
5.625%, 2/1/21 | | | 900,000 | | | | 927 | |
5.625%, 3/1/25 ß | | | 4,900,000 | | | | 5,090 | |
5.750%, 5/15/24 | | | 800,000 | | | | 839 | |
5.875%, 6/30/26 | | | 400,000 | | | | 424 | |
Sunoco LP / Sunoco Finance Corp. 4.875%, 1/15/23 | | | 100,000 | | | | 98 | |
Tallgrass Energy Partners LP 5.500%, 1/15/28 144A | | | 8,400,000 | | | | 8,064 | |
Transocean Guardian, Ltd. 5.875%, 1/15/24 144A | | | 1,000,000 | | | | 958 | |
Williams Partners LP 3.600%, 3/15/22 ß | | | 2,500,000 | | | | 2,455 | |
| | | | | | | | |
Total | | | | | | | 71,469 | |
| | | | | | | | |
| | |
Financial (23.1%) | | | | | | | | |
AerCap Ireland Capital, Ltd. / AerCap Global Aviation Trust
4.250%, 7/1/20 | | | 150,000 | | | | 150 | |
5.000%, 10/1/21 ß | | | 3,450,000 | | | | 3,504 | |
Alliance Data Systems Corp. 5.875%, 11/1/21 144A | | | 2,900,000 | | | | 2,896 | |
Ally Financial, Inc.
3.500%, 1/27/19 | | | 371,000 | | | | 371 | |
3.750%, 11/18/19 ß | | | 5,290,000 | | | | 5,270 | |
4.125%, 3/30/20 | | | 537,000 | | | | 531 | |
4.250%, 4/15/21 | | | 246,000 | | | | 241 | |
8.000%, 11/1/31 | | | 1,371,000 | | | | 1,522 | |
The Accompanying Notes are an Integral Part of the Financial Statements.
179
Multi-Sector Bond Portfolio
| | | | | | | | |
| Corporate Bonds (53.2%) | | Shares/
Par+ | | | Value
$ (000’s) | |
| | |
Financial continued | | | | | | | | |
Banco Bilbao Vizcaya Argentina SA
6.750%, (Euro Swap Annual 5 Year plus 6.604%), 12/29/49 EUR §,¥,ß | | | 5,200,000 | | | | 5,904 | |
7.000%, (Euro Swap Annual 5 Year plus 6.155%), 12/29/49 EUR §,¥ | | | 1,200,000 | | | | 1,371 | |
Banistmo SA 3.650%, 9/19/22 144A | | | 200,000 | | | | 190 | |
Bank of America Corp.
3.419%, (ICE LIBOR USD 3 Month plus 1.040%), 12/20/28 | | | 973,000 | | | | 909 | |
4.000%, 4/1/24 | | | 1,081,000 | | | | 1,087 | |
5.875%, (ICE LIBOR USD 3 Month plus 2.931%), 3/15/28 ß | | | 4,500,000 | | | | 4,097 | |
Bank of Ireland 7.375%, (Euro Swap Annual 5 Year plus 13.912%), 12/29/49 EUR §,¥ | | | 600,000 | | | | 717 | |
Barclays Bank PLC
7.625%, 11/21/22 ß | | | 2,000,000 | | | | 2,072 | |
14.000%, (ICE LIBOR GBP 3 Month plus 13.400%), 11/29/49 GBP §,¥ | | | 800,000 | | | | 1,066 | |
Barclays PLC 2.375%, (GBP Swap Semi-Annual 1 Year plus 1.320%), 10/6/23 GBP §,¥ | | | 200,000 | | | | 247 | |
3.250%, 2/12/27 GBP §,¥ | | | 1,500,000 | | | | 1,831 | |
3.650%, 3/16/25 ß | | | 3,100,000 | | | | 2,857 | |
4.610%, (ICE LIBOR USD 3 Month plus 1.400%), 2/15/23 ß | | | 3,100,000 | | | | 3,074 | |
6.500%, (Euro Swap Annual 5 Year plus 5.875%), 12/29/49 EUR¥,ß | | | 3,100,000 | | | | 3,458 | |
7.000%, (GBP Swap Semi-Annual 5 Year plus 5.084%), 6/15/49 GBP §,¥ | | | 800,000 | | | | 997 | |
8.000%, (Euro Swap Annual 5 Year plus 6.750%), 12/15/49 EUR¥ | | | 1,300,000 | | | | 1,577 | |
Blackstone CQP Holdco LP 6.500%, 3/20/21 144A | | | 14,200,000 | | | | 14,236 | |
Cantor Fitzgerald LP | | | | | | | | |
6.500%, 6/17/22 144A | | | 200,000 | | | | 212 | |
7.875%, 10/15/19 144A | | | 1,500,000 | | | | 1,544 | |
CIT Group, Inc.
5.000%, 8/15/22 | | | 272,000 | | | | 268 | |
5.000%, 8/1/23 | | | 100,000 | | | | 98 | |
5.250%, 3/7/25 | | | 100,000 | | | | 98 | |
Citigroup, Inc. 3.400%, 5/1/26 | | | 600,000 | | | | 565 | |
Cooperatieve Rabobank UA
5.500%, (Euro Swap Annual 5 Year plus 5.250%), 1/22/49 EUR §,¥ | | | 900,000 | | | | 1,056 | |
6.625%, (Euro Swap Annual 5 Year plus 6.697%), 12/29/49 EUR §,¥,ß | | | 2,600,000 | | | | 3,234 | |
CPI Property Group SA 2.125%, 10/4/24 EUR §,¥ | | | 400,000 | | | | 442 | |
Credit Agricole Assurances SA 4.250%, (Euro Swap Annual 5 Year plus 4.500%), 12/31/49 EUR §,¥,ß | | | 2,000,000 | | | | 2,269 | |
Credit Suisse AG | | | | | | | | |
6.500%, 8/8/23 144A | | | 7,400,000 | | | | 7,714 | |
6.500%, 8/8/23 § | | | 1,700,000 | | | | 1,772 | |
Deutsche Annington Finance BV 5.000%, 10/2/23 144A | | | 300,000 | | | | 310 | |
| | | | | | | | |
| Corporate Bonds (53.2%) | | Shares/
Par+ | | | Value
$ (000’s) | |
| | |
Financial continued | | | | | | | | |
Deutsche Bank AG
0.184%, (Euribor 3 Month ACT/360 plus 0.500%), 12/7/20 EUR §,¥ | | | 700,000 | | | | 780 | |
3.150%, 1/22/21 | | | 400,000 | | | | 387 | |
3.541%, (ICE LIBOR USD 3 Month plus 1.230%), 2/27/23 | | | 1,600,000 | | | | 1,477 | |
4.250%, 2/4/21 | | | 900,000 | | | | 887 | |
4.250%, 10/14/21 ß | | | 4,500,000 | | | | 4,400 | |
The Doctors Co. 6.500%, 10/15/23 144A | | | 300,000 | | | | 324 | |
Emerald Bay SA 0.000%, 10/15/20 144A EUR¥ | | | 3,796,000 | | | | 4,077 | |
Equinix, Inc.
2.875%, 3/15/24 EUR¥ | | | 1,200,000 | | | | 1,369 | |
2.875%, 2/1/26 EUR¥,ß | | | 1,900,000 | | | | 2,060 | |
Fairfax Financial Holdings, Ltd. 2.750%, 3/29/28 144A EUR¥ | | | 500,000 | | | | 569 | |
Freedom Mortgage Corp. 8.125%, 11/15/24 144A | | | 190,000 | | | | 163 | |
GE Capital International Funding Co. Unlimited Co. 4.418%, 11/15/35 | | | 500,000 | | | | 421 | |
The Goldman Sachs Group, Inc.
3.750%, 5/22/25 ß | | | 2,700,000 | | | | 2,584 | |
3.850%, 7/8/24 | | | 1,000,000 | | | | 977 | |
3.988%, (ICE LIBOR USD 3 Month plus 1.200%), 9/15/20 | | | 200,000 | | | | 201 | |
4.000%, 3/3/24 | | | 400,000 | | | | 395 | |
4.100%, (ICE LIBOR USD 3 Month plus 1.770%), 2/25/21 | | | 200,000 | | | | 203 | |
5.750%, 1/24/22 | | | 400,000 | | | | 419 | |
Growthpoint Properties International Pty, Ltd. 5.872%, 5/2/23 144A | | | 300,000 | | | | 300 | |
HBOS PLC 5.374%, 6/30/21 EUR¥ | | | 600,000 | | | | 760 | |
The Howard Hughes Corp. 5.375%, 3/15/25 144A | | | 300,000 | | | | 282 | |
HSBC Holdings PLC 3.600%, 5/25/23 ß | | | 2,100,000 | | | | 2,088 | |
ING Bank NV 5.800%, 9/25/23 144A | | | 1,700,000 | | | | 1,776 | |
International Lease Finance Corp.
5.875%, 8/15/22 | | | 400,000 | | | | 419 | |
8.250%, 12/15/20 ß | | | 2,100,000 | | | | 2,259 | |
8.625%, 1/15/22 | | | 400,000 | | | | 445 | |
Intesa Sanpaolo SpA
5.017%, 6/26/24 144A | | | 2,700,000 | | | | 2,443 | |
6.500%, 2/24/21 144A | | | 4,100,000 | | | | 4,203 | |
Jefferies Finance LLC / JFINCo-Issuer Corp.
6.875%, 4/15/22 144A | | | 800,000 | | | | 778 | |
7.375%, 4/1/20 144A | | | 2,000,000 | | | | 1,995 | |
7.500%, 4/15/21 144A | | | 500,000 | | | | 499 | |
Kennedy Wilson Europe Real Estate PLC 3.950%, 6/30/22 GBP §,¥,ß | | | 2,700,000 | | | | 3,415 | |
Lincoln Finance, Ltd. 6.875%, 4/15/21 EUR §,¥,ß | | | 3,800,000 | | | | 4,441 | |
Lloyds Bank PLC, Series EMTN 7.625%, 4/22/25 GBP §,¥ | | | 1,200,000 | | | | 1,895 | |
Lloyds Banking Group PLC 2.250%, 10/16/24 GBP §,¥,ß | | | 2,000,000 | | | | 2,436 | |
7.000%, (GBP Swap Semi-Annual 5 Year plus 5.060%), 12/29/49 GBP §,¥ | | | 800,000 | | | | 1,019 | |
The Accompanying Notes are an Integral Part of the Financial Statements.
180
Multi-Sector Bond Portfolio
| | | | | | | | |
| Corporate Bonds (53.2%) | | Shares/
Par+ | | | Value
$ (000’s) | |
Financial continued | | | | | | | | |
Macquarie Group, Ltd. 6.250%, 1/14/21 144A | | | 300,000 | | | | 315 | |
Morgan Stanley
3.292%, (ICE LIBOR USD 3 Month plus 0.930%), 7/22/22 | | | 1,000,000 | | | | 986 | |
4.000%, 7/23/25 ß | | | 3,600,000 | | | | 3,553 | |
Nationwide Building Society
4.363%, (ICE LIBOR USD 3 Month plus 1.392%), 8/1/24 144A | | | 4,500,000 | | | | 4,408 | |
6.875%, (GBP Swap Semi-Annual 5 Year plus 4.880%), 12/29/49 GBP §,¥ | | | 400,000 | | | | 513 | |
Natwest Markets PLC
0.084%, (Euribor 3 Month ACT/360 plus 0.400%), 3/2/20 EUR §,¥ | | | 200,000 | | | | 228 | |
0.625%, 3/2/22 EUR §,¥ | | | 1,600,000 | | | | 1,779 | |
Navient Corp. 4.875%, 6/17/19 ß | | | 2,517,000 | | | | 2,508 | |
5.000%, 10/26/20 | | | 100,000 | | | | 96 | |
5.875%, 3/25/21 | | | 500,000 | | | | 479 | |
6.500%, 6/15/22 | | | 1,200,000 | | | | 1,118 | |
6.625%, 7/26/21 | | | 1,300,000 | | | | 1,254 | |
7.250%, 1/25/22 | | | 400,000 | | | | 386 | |
8.000%, 3/25/20 | | | 1,198,000 | | | | 1,217 | |
NN Group NV 4.500%, (Euribor 3 Month plus 4.000%), 7/15/49 EUR §,¥,ß | | | 2,600,000 | | | | 2,968 | |
OMEGA Healthcare Investors, Inc. 4.500%, 1/15/25 | | | 100,000 | | | | 98 | |
4.950%, 4/1/24 | | | 100,000 | | | | 102 | |
Oxford Finance LLC / Oxford Finance Co- Issuer II, Inc. 6.375%, 12/15/22 144A | | | 200,000 | | | | 197 | |
Quicken Loans, Inc. 5.250%, 1/15/28 144A | | | 2,000,000 | | | | 1,770 | |
Royal Bank of Scotland Group PLC
2.500%, 3/22/23 EUR §,¥ | | | 100,000 | | | | 117 | |
4.800%, 4/5/26 ß | | | 2,800,000 | | | | 2,729 | |
4.892%, (3 Month LIBOR plus 1.754%), 5/18/29 ß | | | 3,700,000 | | | | 3,534 | |
7.500%, (USD Swap Semi-Annual 5 Year plus 5.800%), 12/29/49 ß | | | 2,600,000 | | | | 2,574 | |
8.625%, (USD 5 Year Swap Rate plus 7.598%), 12/29/49 ß | | | 2,100,000 | | | | 2,173 | |
Santander UK Group Holdings PLC
3.125%, 1/8/21 ß | | | 2,100,000 | | | | 2,062 | |
3.823%, (ICE LIBOR USD 3 Month plus 1.400%), 11/3/28 ß | | | 2,300,000 | | | | 2,080 | |
6.750%, (GBP Swap Semi-Annual 5 Year plus 5.792%), 6/24/24 GBP §,¥ | | | 1,390,000 | | | | 1,738 | |
Sberbank of Russia Via SB Capital SA
3.080%, 3/7/19 EUR¥ | | | 1,700,000 | | | | 1,952 | |
4.150%, 3/6/19d | | | 500,000 | | | | 497 | |
5.180%, 6/28/19 § | | | 200,000 | | | | 200 | |
Springleaf Finance Corp.
5.250%, 12/15/19 | | | 311,000 | | | | 312 | |
6.000%, 6/1/20 | | | 418,000 | | | | 419 | |
6.125%, 5/15/22 ß | | | 2,900,000 | | | | 2,812 | |
6.875%, 3/15/25 | | | 1,900,000 | | | | 1,700 | |
7.125%, 3/15/26 | | | 1,700,000 | | | | 1,517 | |
| | | | | | | | |
| Corporate Bonds (53.2%) | | Shares/
Par+ | | | Value
$ (000’s) | |
Financial continued | | | | | | | | |
8.250%, 12/15/20 | | | 226,000 | | | | 234 | |
Tesco Property Finance 2 PLC 6.051%, 10/13/39 GBP §,¥ | | | 1,113,156 | | | | 1,631 | |
Tesco Property Finance 3 PLC 5.744%, 4/13/40 GBP §,¥ | | | 97,088 | | | | 139 | |
Tesco Property Finance 6 PLC 5.411%, 7/13/44 GBP §,¥,ß | | | 2,705,069 | | | | 3,718 | |
TP ICAP PLC 5.250%, 1/26/24 GBP §,¥ | | | 300,000 | | | | 356 | |
UBS AG 7.625%, 8/17/22 ß | | | 4,400,000 | | | | 4,686 | |
UBS Group Funding AG 4.125%, 9/24/25 144A | | | 700,000 | | | | 695 | |
UniCredit SpA
3.750%, 4/12/22 144A | | | 200,000 | | | | 193 | |
7.830%, 12/4/23 144A | | | 4,200,000 | | | | 4,390 | |
VEREIT Operating Partnership LP 4.125%, 6/1/21 | | | 100,000 | | | | 101 | |
VIVAT NV 2.375%, 5/17/24 EUR §,¥ | | | 200,000 | | | | 232 | |
Weyerhaeuser Co.
7.375%, 10/1/19 | | | 400,000 | | | | 411 | |
7.375%, 3/15/32 | | | 1,500,000 | | | | 1,836 | |
| | | | | | | | |
Total | | | | | | | 201,916 | |
| | | | | | | | |
| | |
Industrial (2.1%) | | | | | | | | |
Aeropuerto Internacional de Tocumen SA
6.000%, 11/18/48 144A | | | 300,000 | | | | 298 | |
Avolon Holdings Funding, Ltd.
5.125%, 10/1/23 144A | | | 500,000 | | | | 477 | |
5.500%, 1/15/23 144A | | | 800,000 | | | | 776 | |
Cemex SAB de CV 4.375%, 3/5/23 144A EUR¥ | | | 1,400,000 | | | | 1,620 | |
Crown European Holdings SA 3.375%, 5/15/25 144A EUR¥ | | | 500,000 | | | | 576 | |
DAE Funding LLC
4.000%, 8/1/20 144A | | | 2,920,000 | | | | 2,847 | |
5.000%, 8/1/24 144A | | | 400,000 | | | | 387 | |
Flex, Ltd. 4.625%, 2/15/20 | | | 200,000 | | | | 201 | |
Fortress Transportation & Infrastructure 6.750%, 3/15/22 144A | | | 700,000 | | | | 702 | |
General Electric Co.
0.375%, 5/17/22 EUR¥ | | | 100,000 | | | | 108 | |
5.550%, 5/4/20 | | | 100,000 | | | | 102 | |
5.550%, 1/5/26 | | | 200,000 | | | | 196 | |
5.875%, 1/14/38 | | | 100,000 | | | | 96 | |
6.875%, 1/10/39 | | | 100,000 | | | | 105 | |
James Hardie International Finance Designated Activity Co. 3.625%, 10/1/26 144A EUR¥ | | | 490,000 | | | | 546 | |
Lima Metro Line 2 Finance, Ltd. 5.875%, 7/5/34 144A | | | 600,000 | | | | 597 | |
Pacific National Finance Pty, Ltd. 4.625%, 9/23/20 144A | | | 500,000 | | | | 506 | |
Park Aerospace Holdings, Ltd.
4.500%, 3/15/23 144A | | | 3,900,000 | | | | 3,647 | |
5.250%, 8/15/22 144A | | | 650,000 | | | | 629 | |
5.500%, 2/15/24 144A | | | 500,000 | | | | 482 | |
Russian Railways Via RZD Capital PLC 7.487%, 3/25/31 GBP §,¥,ß | | | 1,500,000 | | | | 2,275 | |
The Accompanying Notes are an Integral Part of the Financial Statements.
181
Multi-Sector Bond Portfolio
| | | | | | | | |
| Corporate Bonds (53.2%) | | Shares/
Par+ | | | Value
$ (000’s) | |
| | |
Industrial continued | | | | | | | | |
Standard Industries, Inc. 4.750%, 1/15/28 144A | | | 950,000 | | | | 798 | |
| | | | | | | | |
Total | | | | | | | 17,971 | |
| | | | | | | | |
| | |
Technology (0.9%) | | | | | | | | |
Dell International LLC / EMC Corp. 6.020%, 6/15/26 144A | | | 300,000 | | | | 302 | |
Diamond 1 Finance Corp. / Diamond 2 Finance Corp. 5.450%, 6/15/23 144A | | | 1,100,000 | | | | 1,119 | |
8.100%, 7/15/36 144A | | | 300,000 | | | | 324 | |
EMC Corp. 2.650%, 6/1/20 | | | 1,600,000 | | | | 1,536 | |
Fidelity National Information Services, Inc. 4.500%, 10/15/22 | | | 395,000 | | | | 407 | |
NXP BV / NXP Funding LLC
4.875%, 3/1/24 144A | | | 1,700,000 | | | | 1,707 | |
5.350%, 3/1/26 144A | | | 1,600,000 | | | | 1,627 | |
Pitney Bowes, Inc. 3.625%, 9/15/20 | | | 100,000 | | | | 98 | |
Quintiles IMS, Inc. 3.250%, 3/15/25 144A EUR¥ | | | 500,000 | | | | 561 | |
| | | | | | | | |
Total | | | | | | | 7,681 | |
| | | | | | | | |
| | |
Utilities (1.2%) | | | | | | | | |
Calpine Corp. 5.250%, 6/1/26 144A | | | 650,000 | | | | 593 | |
Centrais Electricas Brasileiras SA 6.875%, 7/30/19 § | | | 700,000 | | | | 709 | |
Dynegy, Inc. 7.375%, 11/1/22 ß | | | 2,500,000 | | | | 2,581 | |
Exelon Generation Co. LLC 4.250%, 6/15/22 | | | 500,000 | | | | 507 | |
FirstEnergy Corp. 7.375%, 11/15/31 | | | 600,000 | | | | 759 | |
Nakilat, Inc.
6.067%, 12/31/33 § | | | 1,000,000 | | | | 1,086 | |
6.267%, 12/31/33 144A | | | 551,859 | | | | 601 | |
National Fuel Gas Co. 5.200%, 7/15/25 | | | 300,000 | | | | 305 | |
Perusahaan Listrik Negara PT 5.450%, 5/21/28 144A | | | 3,200,000 | | | | 3,237 | |
Puget Energy, Inc. 5.625%, 7/15/22 | | | 200,000 | | | | 212 | |
| | | | | | | | |
Total | | | | | | | 10,590 | |
| | | | | | | | |
Total Corporate Bonds (Cost: $486,251) | | | | | | | 465,483 | |
| | | | | | | | |
| Governments (18.8%) | | | | | | |
| | |
Governments (18.8%) | | | | | | | | |
Arab Republic of Egypt
4.750%, 4/16/26 144A EUR ¥ | | | 1,400,000 | | | | 1,451 | |
5.625%, 4/16/30 144A EUR¥ | | | 1,550,000 | | | | 1,534 | |
Argentine Republic Government International Bond | | | | | | | | |
2.260%, 12/31/38 EUR¥,ß | | | 8,830,000 | | | | 5,532 | |
3.375%, 1/15/23 EUR¥ | | | 950,000 | | | | 854 | |
3.875%, 1/15/22 EUR §,¥ | | | 2,300,000 | | | | 2,212 | |
5.000%, 1/15/27 EUR §,¥,ß | | | 4,900,000 | | | | 4,037 | |
5.250%, 1/15/28 EUR¥ | | | 250,000 | | | | 204 | |
6.250%, 4/22/19 | | | 150,000 | | | | 151 | |
| | | | | | | | |
| Governments (18.8%) | | Shares/
Par+ | | | Value
$ (000’s) | |
| | |
Governments continued | | | | | | | | |
59.380%, (Argentina Blended Historical Policy Rate plus 1.000%), 6/21/20 ARS¥ | | | 440,000 | | | | 13 | |
Australian Government 4.250%, 4/21/26 AUD §,¥ | | | 2,400,000 | | | | 1,922 | |
Autonomous Community of Catalonia
4.900%, 9/15/21 EUR¥ | | | 800,000 | | | | 984 | |
4.950%, 2/11/20 EUR¥ | | | 400,000 | | | | 477 | |
Colombia Government International Bond 5.000%, 6/15/45 ß | | | 6,000,000 | | | | 5,712 | |
Dominican Republic International Bond
6.500%, 2/15/48 144A | | | 2,800,000 | | | | 2,646 | |
6.875%, 1/29/26 § | | | 500,000 | | | | 524 | |
Ecuador Government International Bond
8.875%, 10/23/27 144A | | | 900,000 | | | | 774 | |
9.650%, 12/13/26 144A | | | 600,000 | | | | 546 | |
10.750%, 3/28/22 § | | | 1,300,000 | | | | 1,311 | |
Export-Import Bank of India 3.375%, 8/5/26 144A | | | 600,000 | | | | 548 | |
Oman Government International Bond
6.500%, 3/8/47 § | | | 1,800,000 | | | | 1,449 | |
6.750%, 1/17/48 144A | | | 2,600,000 | | | | 2,145 | |
Panama Government International Bond
6.700%, 1/26/36 | | | 1,900,000 | | | | 2,318 | |
8.125%, 4/28/34 | | | 100,000 | | | | 134 | |
Perusahaan Penerbit SBSN Indonesia III 3.400%, 3/29/22 144A | | | 600,000 | | | | 587 | |
Republic of Costa Rica 7.158%, 3/12/45 § | | | 500,000 | | | | 431 | |
Republic of Croatia 6.625%, 7/14/20 §,ß | | | 5,000,000 | | | | 5,194 | |
Republic of Indonesia
3.375%, 7/30/25 144A EUR¥ | | | 800,000 | | | | 975 | |
3.750%, 6/14/28 144A EUR¥ | | | 1,900,000 | | | | 2,361 | |
3.750%, 6/14/28 EUR §,¥,ß | | | 2,200,000 | | | | 2,734 | |
Republic of Kazakhstan 5.125%, 7/21/25 §,ß | | | 5,200,000 | | | | 5,497 | |
Republic of South Africa Government International Bond 5.875%, 9/16/25 | | | 500,000 | | | | 506 | |
The Republic of Trinidad & Tobago 4.500%, 8/4/26 § | | | 400,000 | | | | 368 | |
Romanian Government International Bond 2.375%, 4/19/27 EUR §,¥ | | | 1,600,000 | | | | 1,825 | |
Russian Federation 5.625%, 4/4/42 § | | | 2,000,000 | | | | 2,045 | |
Saudi International Bond
2.875%, 3/4/23 144A | | | 600,000 | | | | 577 | |
4.000%, 4/17/25 144A | | | 3,900,000 | | | | 3,866 | |
Senegal Government International Bond
4.750%, 3/13/28 144A EUR¥ | | | 100,000 | | | | 105 | |
6.250%, 5/23/33 144A | | | 400,000 | | | | 344 | |
State of Qatar
4.500%, 4/23/28 144A | | | 1,100,000 | | | | 1,148 | |
5.103%, 4/23/48 144A | | | 1,200,000 | | | | 1,260 | |
Turkey Government International Bond
4.875%, 10/9/26 ß | | | 4,000,000 | | | | 3,542 | |
5.125%, 3/25/22 ß | | | 12,600,000 | | | | 12,260 | |
5.125%, 2/17/28 ß | | | 4,300,000 | | | | 3,764 | |
5.750%, 3/22/24 | | | 2,400,000 | | | | 2,319 | |
6.125%, 10/24/28 | | | 400,000 | | | | 372 | |
7.250%, 12/23/23 | | | 1,100,000 | | | | 1,129 | |
The Accompanying Notes are an Integral Part of the Financial Statements.
182
Multi-Sector Bond Portfolio
| | | | | | | | |
| Governments (18.8%) | | Shares/ Par+ | | | Value
$ (000’s) | |
| | |
Governments continued | | | | | | | | |
Ukraine Government International Bond
7.375%, 9/25/32 § | | | 500,000 | | | | 397 | |
7.750%, 9/1/19 §,ß | | | 3,100,000 | | | | 3,065 | |
7.750%, 9/1/20 §,ß | | | 5,300,000 | | | | 5,105 | |
8.994%, 2/1/24 144A | | | 1,000,000 | | | | 932 | |
9.750%, 11/1/28 144A | | | 700,000 | | | | 656 | |
United Mexican States
4.600%, 1/23/46 ß | | | 4,700,000 | | | | 4,162 | |
4.750%, 3/8/44 | | | 600,000 | | | | 545 | |
US Treasury 2.000%, 5/31/24 ß | | | 50,500,000 | | | | 49,135 | |
2.250%, 2/15/27 | | | 150,000 | | | | 146 | |
2.750%, 2/15/24 ß | | | 8,700,000 | | | | 8,793 | |
Venezuela Government International Bond
6.000%, 12/9/20 §,ℓ | | | 32,000 | | | | 7 | |
7.000%, 3/31/38 §,ℓ | | | 204,000 | | | | 46 | |
7.650%, 4/21/25 §,ℓ | | | 1,955,000 | | | | 445 | |
8.250%, 10/13/24 §,ℓ | | | 356,000 | | | | 82 | |
9.000%, 5/7/23 §,ℓ | | | 32,000 | | | | 7 | |
9.250%, 5/7/28 §,ℓ | | | 1,241,000 | | | | 282 | |
9.375%, 1/13/34 ℓ | | | 1,400,000 | | | | 386 | |
| | | | | | | | |
Total | | | | | | | 164,878 | |
| | | | | | | | |
Total Governments (Cost: $174,967) | | | | | | | 164,878 | |
| | | | | | | | |
| Municipal Bonds (1.2%) | | | | | | |
| | |
Municipal Bonds (1.2%) | | | | | | | | |
American Municipal Power, Inc., Series 2010B 7.834%, 2/15/41 RB | | | 100,000 | | | | 146 | |
Bay Area Toll Authority, California, Series 2010 6.918%, 4/1/40 RB | | | 200,000 | | | | 267 | |
City of Riverside CA Electric Revenue 7.605%, 10/1/40 RB | | | 200,000 | | | | 293 | |
Irvine Ranch California Water District 6.622%, 5/1/40 RB | | | 100,000 | | | | 132 | |
Los Angeles County California Public Works Financing Authority 7.618%, 8/1/40 RB | | | 200,000 | | | | 292 | |
Metropolitan Government of Nashville & Davidson County Tennessee 6.568%, 7/1/37 RB | | | 100,000 | | | | 131 | |
Municipal Electric Authority of Georgia 6.655%, 4/1/57 RB | | | 100,000 | | | | 110 | |
New York City Transitional Finance Authority 5.508%, 8/1/37 RB | | | 300,000 | | | | 352 | |
New York State Urban Development Corp. 5.770%, 3/15/39 RB | | | 100,000 | | | | 115 | |
Port Authority of New York & New Jersey 5.647%, 11/1/40 RB, GO OF AUTH | | | 1,100,000 | | | | 1,340 | |
Port Authority of New York & New Jersey, Series 168 4.926%, 10/1/51 RB | | | 200,000 | | | | 229 | |
San Diego County Regional Airport Authority, Series C 6.628%, 7/1/40 RB | | | 100,000 | | | | 105 | |
San Diego Redevelopment Agency, Series A 7.625%, 9/1/30 RB | | | 100,000 | | | | 108 | |
State of California 7.950%, 3/1/36 GO | | | 900,000 | | | | 950 | |
| | | | | | | | |
| Municipal Bonds (1.2%) | | Shares/
Par+ | | | Value $ (000’s) | |
| | |
Municipal Bonds continued | | | | | | | | |
State of Illinois 6.630%, 2/1/35 GO | | | 245,000 | | | | 260 | |
6.725%, 4/1/35 GO | | | 95,000 | | | | 102 | |
7.350%, 7/1/35 GO | | | 200,000 | | | | 222 | |
Texas Public Finance Authority 8.250%, 7/1/24 RB | | | 175,000 | | | | 178 | |
Tobacco Settlement Finance Authority of West Virginia, Series A 7.467%, 6/1/47 RB | | | 1,085,000 | | | | 1,063 | |
Tobacco Settlement Financing Corp., Series2007-A 6.706%, 6/1/46 RB | | | 3,285,000 | | | | 3,100 | |
Triborough Bridge & Tunnel Authority 5.550%, 11/15/40 RB, GO OF AUTH | | | 800,000 | | | | 965 | |
| | | | | | | | |
Total Municipal Bonds (Cost: $8,541) | | | | | | | 10,460 | |
| | | | | | | | |
| Structured Products (12.7%) | | | | | | |
| | |
Asset Backed Securities (5.0%) | | | | | | | | |
Accredited Mortgage Loan Trust, Series 2005-3, Class M3 2.903%, (ICE LIBOR USD 1 Month plus 0.480%), 9/25/35 | | | 50,000 | | | | 48 | |
ACE Securities Corp. Home Equity Loan Trust, Series2004-HE4, Class M1 3.406%, (ICE LIBOR USD 1 Month plus 0.900%), 12/25/34 | | | 81,694 | | | | 79 | |
ACE Securities Corp. Home Equity Loan Trust, Series2004-RM2, Class M2 3.301%, (ICE LIBOR USD 1 Month plus 0.795%), 1/25/35 | | | 54,077 | | | | 53 | |
ACE Securities Corp. Home Equity Loan Trust, Series2005-HE4, Class M4 3.481%, (ICE LIBOR USD 1 Month plus 0.975%), 7/25/35 | | | 100,000 | | | | 101 | |
ACE Securities Corp. Home Equity Loan Trust, Series2006-FM1, Class A2C 2.656%, (ICE LIBOR USD 1 Month plus 0.150%), 7/25/36 ß | | | 7,951,743 | | | | 2,911 | |
Aegis Asset Backed Securities Trust, Series2004-6, Class M2 3.506%, (ICE LIBOR USD 1 Month plus 1.000%), (AFC), 3/25/35 | | | 170,140 | | | | 157 | |
Aircraft Certificate Owner Trust, Series 2003-1A, Class E 7.001%, 9/20/22 144A | | | 62,626 | | | | 64 | |
Ameriquest Mortgage Securities, Inc., Series2004-R5, Class M1 3.376%, (ICE LIBOR USD 1 Month plus 0.870%), 7/25/34 | | | 38,219 | | | | 38 | |
Apex Credit CLO, Ltd., Series2018-1A, Class ASR 3.611%, (ICE LIBOR USD 3 Month plus 1.050%), 10/27/28 144A | | | 600,000 | | | | 598 | |
Asset Backed Securities Corp. Home Equity Loan Trust, Series2003-HE4, Class M1 3.700%, (ICE LIBOR USD 1 Month plus 1.245%), 8/15/33 | | | 31,221 | | | | 31 | |
The Accompanying Notes are an Integral Part of the Financial Statements.
183
Multi-Sector Bond Portfolio
| | | | | | | | |
| Structured Products (12.7%) | | Shares/
Par+ | | | Value
$ (000’s) | |
| | |
Asset Backed Securities continued | | | | | | | | |
Asset Backed Securities Corp. Home Equity Loan Trust, Series WMC2005-HE5, Class M4 3.406%, (ICE LIBOR USD 1 Month plus 0.900%), 6/25/35 | | | 200,000 | | | | 198 | |
Bear Stearns Asset Backed Securities I Trust, Series 2005-HE11, Class M1 2.736%, (ICE LIBOR USD 1 Month plus 0.645%), 11/25/35 | | | 6,649 | | | | 7 | |
Bear Stearns Asset Backed Securities I Trust, Series2005-SD3, Class 1A 2.996%, (ICE LIBOR USD 1 Month plus 0.490%), 7/25/35 | | | 12,692 | | | | 13 | |
Bear Stearns Asset Backed Securities I Trust, Series 2006-HE10, Class 1A2 2.706%, (ICE LIBOR USD 1 Month plus 0.200%), 12/25/36 | | | 42,556 | | | | 42 | |
Bear Stearns Asset Backed Securities I Trust, Series2007-AQ1, Class A1 2.616%, (ICE LIBOR USD 1 Month plus 0.110%), 4/25/31 | | | 7,900 | | | | 11 | |
Bear Stearns Asset Backed Securities I Trust, Series2007-HE3, Class 1A2 2.706%, (ICE LIBOR USD 1 Month plus 0.200%), 4/25/37 | | | 124,650 | | | | 165 | |
Bear Stearns Asset Backed Securities I Trust, Series2007-HE6, Class 1A1 3.756%, (ICE LIBOR USD 1 Month plus 1.250%), 8/25/37 | | | 196,756 | | | | 195 | |
Carlyle Global Market Strategies, Series2015-1A, Class A2MZ 3.086%, (ICE LIBOR USD 1 Month plus 0.580%), 1/25/35 | | | 784,058 | | | | 771 | |
Citigroup Mortgage Loan Trust, Inc., Series2005-HE3, Class M2 3.226%, (ICE LIBOR USD 1 Month plus 0.720%), 9/25/35 | | | 76,778 | | | | 77 | |
Citigroup Mortgage Loan Trust, Series 2007- AHL1, Class A2C 2.716%, (ICE LIBOR USD 1 Month plus 0.210%), 12/25/36 | | | 100,000 | | | | 95 | |
Countrywide Asset-Backed Certificates, Series2004-9, Class MV4 4.081%, (ICE LIBOR USD 1 Month plus 1.575%), 11/25/34 | | | 100,000 | | | | 96 | |
Countrywide Asset-Backed Certificates, Series2005-4, Class AF6 4.541%, (AFC), 10/25/35 | | | 6,114 | | | | 6 | |
Countrywide Asset-Backed Certificates, Series2005-AB4, Class 2A4 2.856%, (ICE LIBOR USD 1 Month plus 0.350%), 3/25/36 | | | 95,788 | | | | 86 | |
Countrywide Asset-Backed Certificates, Series2006-1, Class AF5 4.789%, (AFC), 7/25/36 | | | 100,000 | | | | 99 | |
Countrywide Asset-Backed Certificates, Series2006-23, Class 2A3 2.676%, (ICE LIBOR USD 1 Month plus 0.170%), 5/25/37 | | | 97,215 | | | | 97 | |
| | | | | | | | |
| Structured Products (12.7%) | | Shares/
Par+ | | | Value
$ (000’s) | |
| | |
Asset Backed Securities continued | | | | | | | | |
Countrywide Asset-Backed Certificates, Series2006-26, Class 1A 2.646%, (ICE LIBOR USD 1 Month plus 0.140%), 6/25/37 | | | 620,465 | | | | 579 | |
Countrywide Asset-Backed Certificates, Series2006-4, Class 2A3 2.796%, (ICE LIBOR USD 1 Month plus 0.290%), 7/25/36 | | | 60,164 | | | | 59 | |
Countrywide Asset-Backed Certificates, Series2006-5, Class 2A3 2.796%, (ICE LIBOR USD 1 Month plus 0.290%), 8/25/36 | | | 100,789 | | | | 100 | |
Countrywide Asset-Backed Certificates, Series2006-BC3, Class M2 2.411%, (ICE LIBOR USD 1 Month plus 0.320%), 2/25/37 | | | 900,000 | | | | 761 | |
Countrywide Asset-Backed Certificates, Series2007-1, Class 2A3 2.646%, (ICE LIBOR USD 1 Month plus 0.140%), 7/25/37 | | | 44,310 | | | | 38 | |
Countrywide Asset-Backed Certificates, Series2007-13, Class 1A 3.346%, (ICE LIBOR USD 1 Month plus 0.840%), 10/25/47 ß | | | 2,759,731 | | | | 2,710 | |
Countrywide Asset-Backed Certificates, Series2007-9, Class 1A 2.706%, (ICE LIBOR USD 1 Month plus 0.200%), 6/25/47 | | | 1,141,609 | | | | 1,001 | |
Countrywide Asset-Backed Certificates, Series 2007-SEA1, Class 1A1 3.056%, (ICE LIBOR USD 1 Month plus 0.550%), (AFC), 5/25/47 144A | | | 2,269,067 | | | | 1,781 | |
Credit Suisse First Boston Mortgage Securities Corp., Series 2001-HE17, Class A1 3.126%, (ICE LIBOR USD 1 Month plus 0.620%), 1/25/32 | | | 5,633 | | | | 6 | |
Ellington Loan Acquisition Trust, Series 2007-2, Class A1 3.556%, (ICE LIBOR USD 1 Month plus 1.050%), 5/25/37 144A | | | 382,862 | | | | 382 | |
First Franklin Mortgage Loan Trust, Series 2006-FF10, Class A4 2.656%, (ICE LIBOR USD 1 Month plus 0.150%), 7/25/36 | | | 8,198 | | | | 8 | |
First Franklin Mortgage Loan Trust, Series 2006-FF12, Class A4 2.646%, (ICE LIBOR USD 1 Month plus 0.140%), 9/25/36 | | | 71,274 | | | | 70 | |
First Franklin Mortgage Loan Trust, Series2006-FF5, Class 2A5 04/25/36 | | | 200,000 | | | | 172 | |
Fremont Home Loan Trust, Series2005-2, Class M4 3.436%, (ICE LIBOR USD 1 Month plus 0.930%), 6/25/35 | | | 300,000 | | | | 280 | |
GSAA Home Equity Trust, Series2006-17, Class A1 2.566%, (ICE LIBOR USD 1 Month plus 0.060%), 11/25/36 | | | 62,958 | | | | 28 | |
The Accompanying Notes are an Integral Part of the Financial Statements.
184
Multi-Sector Bond Portfolio
| | | | | | | | |
| Structured Products (12.7%) | | Shares/
Par+ | | | Value
$ (000’s) | |
| | |
Asset Backed Securities continued | | | | | | | | |
GSAMP Trust, Series2004-WF, Class M2 4.156%, (ICE LIBOR USD 1 Month plus 1.650%), 10/25/34 | | | 52,680 | | | | 51 | |
GSAMP Trust, Series2007-FM2, Class A2B 2.596%, (ICE LIBOR USD 1 Month plus 0.090%), 1/25/37 | | | 216,668 | | | | 142 | |
GSAMP Trust, Series2007-NC1, Class A2A 2.556%, (ICE LIBOR USD 1 Month plus 0.050%), 12/25/46 | | | 16,939 | | | | 10 | |
Home Equity Loan Trust, Series 2007-FRE1, Class 2AV4 2.846%, (ICE LIBOR USD 1 Month plus 0.340%), 4/25/37 | | | 500,000 | | | | 408 | |
Home Equity Mortgage Loan Asset-Backed Trust, Series2007-B, Class 2A2 2.666%, (ICE LIBOR USD 1 Month plus 0.160%), 7/25/37 | | | 417,371 | | | | 259 | |
HSI Asset Securitization Corp. Trust, Series2005-I1, Class 2A4 2.896%, (ICE LIBOR USD 1 Month plus 0.390%), 11/25/35 | | | 300,000 | | | | 288 | |
Lehman XS Trust, Series2005-4, Class 1A3 3.306%, (ICE LIBOR USD 1 Month plus 0.800%), 10/25/35 | | | 15,892 | | | | 16 | |
Long Beach Mortgage Loan Trust, Series2006-1, Class 2A4 2.806%, (ICE LIBOR USD 1 Month plus 0.300%), 2/25/36 | | | 72,204 | | | | 59 | |
Long Beach Mortgage Loan Trust, Series2006-3, Class 2A4 2.776%, (ICE LIBOR USD 1 Month plus 0.270%), 5/25/46 | | | 331,420 | | | | 135 | |
Long Beach Mortgage Loan Trust, Series2006-4, Class 1A 2.656%, (ICE LIBOR USD 1 Month plus 0.150%), 5/25/36 | | | 1,491,971 | | | | 985 | |
Mastr Asset Backed Securities Trust, Series 2004-WMC2, Class M1 3.406%, (ICE LIBOR USD 1 Month plus 0.900%), 4/25/34 | | | 165,902 | | | | 163 | |
Mastr Asset Backed Securities Trust, Series 2006-FRE2, Class A1 2.656%, (ICE LIBOR USD 1 Month plus 0.150%), 3/25/36 ß | | | 13,947,798 | | | | 11,999 | |
Mastr Asset Backed Securities Trust, Series2006-HE3, Class A2 2.606%, (ICE LIBOR USD 1 Month plus 0.100%), 8/25/36 | | | 2,349,573 | | | | 997 | |
Mastr Asset Backed Securities Trust, Series 2006-WMC4, Class A5 2.656%, (ICE LIBOR USD 1 Month plus 0.150%), 10/25/36 | | | 1,020,859 | | | | 447 | |
Merrill Lynch Mortgage Investors Trust, Series2007-SD1, Class A1 2.956%, (ICE LIBOR USD 1 Month plus 0.450%), 2/25/47 | | | 1,011,491 | | | | 733 | |
Morgan Stanley ABS Capital I, Inc. Trust, Series2005-NC1, Class M2 3.211%, (ICE LIBOR USD 1 Month plus 0.705%), 1/25/35 | | | 162,120 | | | | 158 | |
| | | | | | | | |
| Structured Products (12.7%) | | Shares/
Par+ | | | Value
$ (000’s) | |
| | |
Asset Backed Securities continued | | | | | | | | |
Morgan Stanley ABS Capital I, Inc. Trust, Series 2005-WMC5, Class M5 3.496%, (ICE LIBOR USD 1 Month plus 0.990%), 6/25/35 | | | 300,000 | | | | 298 | |
Morgan Stanley ABS Capital I, Inc., Series2006-HE7, Class A2C 2.666%, (ICE LIBOR USD 1 Month plus 0.160%), 9/25/36 | | | 76,849 | | | | 45 | |
Morgan Stanley ABS Capital I, Inc., Series2006-HE8, Class A2C 2.646%, (ICE LIBOR USD 1 Month plus 0.140%), 10/25/36 | | | 72,433 | | | | 44 | |
Morgan Stanley ABS Capital I, Inc., Series2007-HE5, Class A2C 2.756%, (ICE LIBOR USD 1 Month plus 0.250%), 3/25/37 | | | 70,881 | | | | 37 | |
Morgan Stanley Dean Witter Capital I, Inc., Series2002-HE1, Class M1 3.406%, (ICE LIBOR USD 1 Month plus 0.900%), 7/25/32 | | | 4,684 | | | | 5 | |
Morgan Stanley Dean Witter Capital I, Inc., Series2003-NC1, Class M1 4.081%, (ICE LIBOR USD 1 Month plus 1.575%), 11/25/32 | | | 88,267 | | | | 88 | |
Morgan Stanley Dean Witter Capital I, Inc., Series2003-NC2, Class M1 3.856%, (ICE LIBOR USD 1 Month plus 1.350%), 2/25/33 | | | 35,386 | | | | 35 | |
NovaStar Mortgage Funding Trust, Series2007-2, Class A2B 2.666%, (ICE LIBOR USD 1 Month plus 0.160%), (AFC), 9/25/37 | | | 647,795 | | | | 632 | |
OneMain Financial Issuance Trust, Series2016-2A, Class A 4.100%, 3/20/28 144A | | | 257,660 | | | | 258 | |
Park Place Securities, Inc. Asset-Backed Pass Through Certificates, Series 2005- WCW2, Class M1 3.256%, (ICE LIBOR USD 1 Month plus 0.750%), 7/25/35 | | | 25,817 | | | | 26 | |
People’s Choice Home Loan Securities Trust, Series2005-3, Class M2 2.886%, (ICE LIBOR USD 1 Month plus 0.795%), (AFC), 8/25/35 | | | 150,634 | | | | 149 | |
RAAC Series, Series2007-RP4, Class A 2.856%, (ICE LIBOR USD 1 Month plus 0.350%), (AFC), 11/25/46 144A | | | 305,612 | | | | 286 | |
Residential Asset Mortgage Products, Inc., Series 2005-EFC4, Class M3 2.986%, (ICE LIBOR USD 1 Month plus 0.480%), (AFC), 9/25/35 | | | 300,000 | | | | 301 | |
Residential Asset Securities Corp., Series 2006-EMX1, Class M1 2.916%, (ICE LIBOR USD 1 Month plus 0.410%), (AFC), 1/25/36 | | | 132,787 | | | | 132 | |
Residential Asset Securities Corp., Series2007-KS1, Class A3 2.656%, (ICE LIBOR USD 1 Month plus 0.150%), (AFC), 1/25/37 | | | 194,843 | | | | 192 | |
The Accompanying Notes are an Integral Part of the Financial Statements.
185
Multi-Sector Bond Portfolio
| | | | | | | | |
| Structured Products (12.7%) | | Shares/
Par+ | | | Value
$ (000’s) | |
| | |
Asset Backed Securities continued | | | | | | | | |
Residential Asset Securities Corp., Series2007-KS3, Class AI4 2.846%, (ICE LIBOR USD 1 Month plus 0.340%), (AFC), 4/25/37 | | | 1,600,000 | | | | 1,527 | |
Rise, Ltd., Series2014-1, Class A 4.750%, 2/15/39 Æ,d | | | 409,941 | | | | 400 | |
Saxon Asset Securities Trust, Series2006-1, Class M1 2.971%, (ICE LIBOR USD 1 Month plus 0.465%), (AFC), 3/25/36 | | | 400,000 | | | | 358 | |
Securitized Asset Backed Receivables LLC Trust, Series2005-FR4, Class M2 3.466%, (ICE LIBOR USD 1 Month plus 0.960%), 1/25/36 | | | 91,842 | | | | 68 | |
SLM Private Education Loan Trust, Series2010-A, Class 1A 4.700%, (Prime Rate by Country United States less 0.050%), 5/16/44 144A | | | 9,260 | | | | 9 | |
SLM Private Education Loan Trust, Series2011-B, Class A3 4.705%, (ICE LIBOR USD 1 Month plus 2.250%), 6/16/42 144A | | | 100,000 | | | | 102 | |
Soundview Home Loan Trust, Series2005-3, Class M3 3.331%, (ICE LIBOR USD 1 Month plus 0.825%), 6/25/35 | | | 97,538 | | | | 96 | |
Soundview Home Loan Trust, Series2006-2, Class M2 2.856%, (ICE LIBOR USD 1 Month plus 0.350%), 3/25/36 | | | 400,000 | | | | 385 | |
Soundview Home Loan Trust, Series2006-3, Class A3 2.666%, (ICE LIBOR USD 1 Month plus 0.160%), 11/25/36 | | | 237,866 | | | | 231 | |
Soundview Home Loan Trust, Series 2006- OPT2, Class A4 2.786%, (ICE LIBOR USD 1 Month plus 0.280%), 5/25/36 | | | 200,000 | | | | 192 | |
Soundview Home Loan Trust, Series 2006- OPT3, Class M1 2.816%, (ICE LIBOR USD 1 Month plus 0.310%), 6/25/36b | | | 6,901,474 | | | | 3,600 | |
Specialty Underwriting & Residential Finance Trust, Series2005-BC2, Class M3 3.481%, (ICE LIBOR USD 1 Month plus 0.975%), 12/25/35 | | | 320,375 | | | | 318 | |
Structured Asset Investment Loan Trust, Series 2003-BC11, Class M1 3.481%, (ICE LIBOR USD 1 Month plus 0.975%), 10/25/33 | | | 195,716 | | | | 195 | |
Structured Asset Investment Loan Trust, Series2005-5, Class M2 3.196%, (ICE LIBOR USD 1 Month plus 0.690%), 6/25/35 | | | 22,431 | | | | 22 | |
Structured Asset Investment Loan Trust, Series2005-7, Class M2 3.271%, (ICE LIBOR USD 1 Month plus 0.765%), 8/25/35 | | | 500,000 | | | | 484 | |
| | | | | | | | |
| Structured Products (12.7%) | | Shares/
Par+ | | | Value
$ (000’s) | |
| | |
Asset Backed Securities continued | | | | | | | | |
Structured Asset Investment Loan Trust, Series 2006-BNC3, Class A3 2.656%, (ICE LIBOR USD 1 Month plus 0.150%), 9/25/36 | | | 34,594 | | | | 33 | |
Structured Asset Securities Corp. Mortgage Loan Trust, Series2001-WF1, Class A 6 2.716%, (ICE LIBOR USD 1 Month plus 0.210%), 2/25/37 | | | 125,839 | | | | 124 | |
Structured Asset Securities Corp. Mortgage Loan Trust, Series2006-BC4, Class A4 2.676%, (ICE LIBOR USD 1 Month plus 0.170%), 12/25/36 | | | 441,962 | | | | 424 | |
Truman Capital Mortgage Loan Trust, Series2006-1, Class A 2.766%, (ICE LIBOR USD 1 Month plus 0.260%), 3/25/36 144A | | | 1,602,904 | | | | 1,569 | |
WaMu Asset-Backed Certificates, Series2007-HE1, Class 1A 2.656%, (ICE LIBOR USD 1 Month plus 0.150%), 1/25/37 | | | 184,506 | | | | 148 | |
| | | | | | | | |
Total | | | | | | | 43,676 | |
| | | | | | | | |
| | |
Mortgage Securities (7.7%) | | | | | | | | |
American Home Mortgage Investment Trust, Series2005-2, Class 4A1 4.386%, (ICE LIBOR USD 6 Month plus 1.500%), (AFC), 9/25/45 | | | 2,583 | | | | 3 | |
Banc of America Funding Trust, Series 2005-H, Class 5A1 3.745%, (CSTR), 11/20/35 | | | 171,703 | | | | 160 | |
Banc of America Funding Trust, Series 2006-J, Class 4A1 4.447%, (CSTR), 1/20/47 | | | 78,568 | | | | 74 | |
Banc of America Funding Trust, Series 2007-6, Class A1 2.796%, (ICE LIBOR USD 1 Month plus 0.290%), 7/25/37 | | | 84,458 | | | | 79 | |
Barclays Capital LLC, Series 2009-RR14, Class 2A2 3.849%, (CSTR), 7/26/36 144A | | | 39,837 | | | | 36 | |
Barclays Capital LLC, Series2009-RR5, Class 3A3 6.067%, (CSTR), 8/26/36 144A | | | 3,025,283 | | | | 2,195 | |
Bear Stearns Adjustable Rate Mortgage Trust, Series2004-3, Class 4A 4.383%, (CSTR), 7/25/34 | | | 8,102 | | | | 8 | |
Bear StearnsALT-A Trust, Series2006-6, Class 2A1 3.952%, (CSTR), 11/25/36 | | | 196,957 | | | | 174 | |
Citicorp Mortgage Securities Trust, Series2007-8, Class 1A3 6.000%, 9/25/37 | | | 5,932 | | | | 6 | |
Citigroup Mortgage Loan Trust, Series 2007-10, Class 22AA 4.238%, (CSTR), 9/25/37 | | | 16,831 | | | | 16 | |
Citigroup Mortgage Loan Trust, Series 2007-10, Class 2A3A 4.324%, (CSTR), 9/25/37 | | | 86,561 | | | | 83 | |
Countrywide Alternative Loan Trust, Series 2004-28CB, Class 5A1 5.750%, 1/25/35 | | | 25,060 | | | | 25 | |
The Accompanying Notes are an Integral Part of the Financial Statements.
186
Multi-Sector Bond Portfolio
| | | | | | | | |
| Structured Products (12.7%) | | Shares/
Par+ | | | Value
$ (000’s) | |
| | |
Mortgage Securities continued | | | | | | | | |
Countrywide Alternative Loan Trust, Series2005-59, Class 1A1 2.800%, (ICE LIBOR USD 1 Month plus 0.330%), 11/20/35 | | | 8,059 | | | | 8 | |
Countrywide Alternative Loan Trust, Series2005-76, Class 1A1 3.637%, (Federal Reserve US 12 Month Cumulative Avg 1 year CMT plus 1.480%), 1/25/36 | | | 21,290 | | | | 21 | |
Countrywide Alternative Loan Trust, Series 2005-79CB, Class A3 5.500%, 1/25/36 | | | 238,911 | | | | 206 | |
Countrywide Alternative Loan Trust, Series2005-J1, Class 3A1 6.500%, 8/25/32 | | | 9,922 | | | | 10 | |
Countrywide Alternative Loan Trust, Series 2006-45T1, Class 1A13 6.000%, 2/25/37 | | | 149,464 | | | | 96 | |
Countrywide Alternative Loan Trust, Series2006-5T2, Class A1 3.006%, (ICE LIBOR USD 1 Month plus 0.500%), 4/25/36 | | | 531,050 | | | | 283 | |
Countrywide Alternative Loan Trust, Series 2006-HY10, Class 2A1 3.643%, (CSTR), 5/25/36 | | | 17,820 | | | | 16 | |
Countrywide Alternative Loan Trust, Series 2006-OA12, Class A1B 2.660%, (ICE LIBOR USD 1 Month plus 0.190%), 9/20/46 | | | 25,307 | | | | 21 | |
Countrywide Alternative Loan Trust, Series 2006-OA17, Class 1A1A 2.665%, (ICE LIBOR USD 1 Month plus 0.195%), 12/20/46 | | | 41,595 | | | | 36 | |
Countrywide Alternative Loan Trust, Series2006-OA2, Class A1 2.680%, (ICE LIBOR USD 1 Month plus 0.210%), 5/20/46 | | | 528,357 | | | | 434 | |
Countrywide Alternative Loan Trust, Series2006-OA6, Class 2A 2.610%, (CSTR), 7/25/46 | | | 3 | | | | – | P |
Countrywide Alternative Loan Trust, Series2006-OA9, Class 2A1A 2.680%, (ICE LIBOR USD 1 Month plus 0.210%), 7/20/46 | | | 12,675 | | | | 10 | |
Countrywide Alternative Loan Trust, Series2006-OC9, Class A2A 2.666%, (ICE LIBOR USD 1 Month plus 0.160%), 12/25/46 | | | 3,631 | | | | 4 | |
Countrywide Alternative Loan Trust, Series2007-9T1, Class 2A2 6.000%, 5/25/37 | | | 287,499 | | | | 203 | |
Countrywide Alternative Loan Trust, Series2007-OA3, Class 1A1 2.646%, (ICE LIBOR USD 1 Month plus 0.140%), 4/25/47 | | | 48,030 | | | | 45 | |
Countrywide Home Loan Mortgage Pass Through Trust, Series2005-22, Class 3A1 3.990%, (CSTR), 10/25/35 | | | 20,395 | | | | 17 | |
| | | | | | | | |
| Structured Products (12.7%) | | Shares/
Par+ | | | Value
$ (000’s) | |
| | |
Mortgage Securities continued | | | | | | | | |
Countrywide Home Loan Mortgage Pass Through Trust, Series 2005-HYB8, Class 1A1 4.288%, (CSTR), 12/20/35 | | | 9,433 | | | | 8 | |
Countrywide Home Loan Mortgage Pass Through Trust, Series2006-16, Class 2A1 6.500%, 11/25/36 | | | 25,823 | | | | 18 | |
Countrywide Home Loan Mortgage Pass Through Trust, Series2006-9, Class A1 6.000%, 5/25/36 | | | 197,117 | | | | 160 | |
Countrywide Home Loan Mortgage Pass Through Trust, Series2006-OA4, Class A1 3.117%, (Federal Reserve US 12 Month Cumulative Avg 1 year CMT plus 0.960%), 4/25/46 | | | 43,200 | | | | 22 | |
Countrywide Home Loan Mortgage Pass Through Trust, Series2006-OA4, Class A2 2.776%, (ICE LIBOR USD 1 Month plus 0.270%), 4/25/46 | | | 1,144,811 | | | | 520 | |
Countrywide Home Loan Mortgage Pass Through Trust, Series 2007-HYB1, Class 3A1 3.686%, (CSTR), 3/25/37 | | | 13,973 | | | | 13 | |
Credit Suisse First Boston Mortgage Securities Corp., Series2003-8, Class 5A1 6.500%, 4/25/33 | | | 1,310 | | | | 1 | |
DeutscheAlt-A Securities, Inc. Mortgage Loan Trust, Series2005-6, Class 2A3 5.500%, 12/25/35 | | | 569,543 | | | | 502 | |
EMF-NL BV, Series 2008-APRX, Class A2 0.479%, (Euribor 3 Month plus 0.800%), 4/17/41 EUR §,¥ | | | 184,462 | | | | 202 | |
Eurosail-NL BV, Series 2007-NL2X, Class A 1.179%, (Euribor 3 Month plus 1.500%), 10/17/40 EUR §,¥ | | | 120,279 | | | | 137 | |
Federal National Mortgage Association TBA
3.000%, 1/14/49 | | | 12,000,000 | | | | 11,710 | |
3.500%, 1/14/49 | | | 9,300,000 | | | | 9,301 | |
3.500%, 2/13/49 | | | 33,100,000 | | | | 33,083 | |
Federal National Mortgage Association, Series2003-W6, Class F 2.665%, (ICE LIBOR USD 1 Month plus 0.350%), 9/25/42 | | | 24,560 | | | | 24 | |
First Horizon Mortgage Pass-Through Trust, Series2007-2, Class 1A5 5.750%, 5/25/37 | | | 337,708 | | | | 251 | |
GSR Mortgage Loan Trust, Series2005-AR6, Class 1A1 4.494%, (CSTR), 9/25/35 | | | 8,370 | | | | 9 | |
GSR Mortgage Loan Trust, Series2006-2F, Class 3A6 6.000%, 2/25/36 | | | 128,860 | | | | 105 | |
GSR Mortgage Loan Trust, Series2006-AR1, Class 2A1 4.354%, (CSTR), 1/25/36 | | | 2,731 | | | | 3 | |
GSR Mortgage Loan Trust, Series2007-AR1, Class 2A1 4.152%, (CSTR), 3/25/47 | | | 14,009 | | | | 13 | |
The Accompanying Notes are an Integral Part of the Financial Statements.
187
Multi-Sector Bond Portfolio
| | | | | | | | |
| Structured Products (12.7%) | | Shares/
Par+ | | | Value
$ (000’s) | |
| | |
Mortgage Securities continued | | | | | | | | |
Harborview Mortgage Loan Trust, Series2005-10, Class 2A1A 2.923%, (ICE LIBOR USD 1 Month plus 0.310%), (AFC), 11/19/35 | | | 13,934 | | | | 13 | |
Harborview Mortgage Loan Trust, Series2005-3, Class 2A1A 2.950%, (ICE LIBOR USD 1 Month plus 0.480%), (AFC), 6/19/35 | | | 28,032 | | | | 28 | |
HomeBanc Mortgage Trust, Series2005-1, Class A1 2.756%, (ICE LIBOR USD 1 Month plus 0.250%), 3/25/35 | | | 8,873 | | | | 8 | |
HSI Asset Securitization Corp. Trust, Series2006-NC1, Class 2A 2.726%, (ICE LIBOR USD 1 Month plus 0.220%), 11/25/35 | | | 1,311,220 | | | | 1,171 | |
Impac Secured Assets Trust, Series2007-1, Class A2 2.666%, (ICE LIBOR USD 1 Month plus 0.160%), (AFC), 3/25/37 | | | 116,277 | | | | 106 | |
IndyMac INDX Mortgage Loan Trust, Series2004-AR6, Class 5A1 4.315%, (CSTR), 10/25/34 | | | 24,895 | | | | 25 | |
IndyMac INDX Mortgage Loan Trust, Series 2005-AR12, Class 2A1A 2.986%, (ICE LIBOR USD 1 Month plus 0.480%), (AFC), 7/25/35 | | | 2,619 | | | | 3 | |
IndyMac INDX Mortgage Loan Trust, Series 2005-AR14, Class 2A1A 2.806%, (ICE LIBOR USD 1 Month plus 0.300%), 7/25/35 | | | 14,864 | | | | 14 | |
JP Morgan Mortgage Trust, Series 2005- ALT1, Class 2A1 4.273%, (CSTR), 10/25/35 | | | 13,495 | | | | 12 | |
JP Morgan Mortgage Trust, Series2007-A1, Class 6A1 4.200%, (CSTR), 7/25/35 | | | 14,228 | | | | 14 | |
JP Morgan Mortgage Trust, Series2007-A4, Class 3A1 3.670%, (CSTR), 6/25/37 | | | 85,586 | | | | 82 | |
Merrill Lynch Alternative Note Asset Trust, Series 2007-OAR1, Class A1 2.485%, (ICE LIBOR USD 1 Month plus 0.170%), 2/25/37 | | | 6,401 | | | | 6 | |
Merrill Lynch Mortgage Investors Trust, Series2005-A6, Class 2A3 2.886%, (ICE LIBOR USD 1 Month plus 0.380%), 8/25/35 | | | 29,199 | | | | 29 | |
Merrill Lynch Mortgage Investors Trust, Series2005-A9, Class 5A1 3.969%, (CSTR), 12/25/35 | | | 279,676 | | | | 256 | |
Merrill Lynch Mortgage Investors Trust, Series2006-1, Class 1A 4.324%, (CSTR), 2/25/36 | | | 5,159 | | | | 5 | |
Merrill Lynch Mortgage Investors Trust, Series2006-A3, Class 6A1 3.630%, (CSTR), 5/25/36 | | | 21,456 | | | | 20 | |
Morgan Stanley Mortgage Loan Trust, Series2005-3AR, Class 4A 4.274%, (CSTR), 7/25/35 | | | 38,080 | | | | 35 | |
| | | | | | | | |
| Structured Products (12.7%) | | Shares/
Par+ | | | Value
$ (000’s) | |
| | |
Mortgage Securities continued | | | | | | | | |
Nomura Asset Acceptance Corp. Alternative Loan Trust, Series2005-AR4, Class 3A1 4.638%, (CSTR), 8/25/35 | | | 11,136 | | | | 11 | |
Nomura Resecuritization Trust, Series 2014-1R, Class 2A1 2.815%, (ICE LIBOR USD 1 Month plus 0.130%), 2/26/37 144A | | | 864,044 | | | | 865 | |
Residential Accredit Loans, Inc., Series 2005- QA3, Class NB2 4.240%, (CSTR), 3/25/35 | | | 118,226 | | | | 111 | |
Residential Accredit Loans, Inc., Series 2006- QA7, Class 1A1 2.696%, (ICE LIBOR USD 1 Month plus 0.190%), 8/25/36 | | | 13,588 | | | | 12 | |
Residential Accredit Loans, Inc., Series 2006- QA8, Class A1 2.696%, (ICE LIBOR USD 1 Month plus 0.190%), 9/25/36 | | | 28,763 | | | | 27 | |
Residential Accredit Loans, Inc., Series 2007- QA1, Class A1 2.646%, (ICE LIBOR USD 1 Month plus 0.140%), 1/25/37 | | | 26,149 | | | | 25 | |
Residential Asset Securitization Trust, Series2007-A2, Class 2A2 6.500%, 4/25/37 | | | 3,667,739 | | | | 1,816 | |
Structured Adjustable Rate Mortgage Loan Trust, Series 2005-19XS, Class 1A1 2.826%, (ICE LIBOR USD 1 Month plus 0.320%), 10/25/35 | | | 76,673 | | | | 72 | |
Structured Asset Mortgage Investments II Trust, Series2005-AR8, Class A2 2.612%, (Federal Reserve US 12 Month Cumulative Avg 1 year CMT plus 1.480%), 2/25/36 | | | 631,796 | | | | 618 | |
Structured Asset Mortgage Investments II Trust, Series2006-AR6, Class 1A1 2.686%, (ICE LIBOR USD 1 Month plus 0.180%), (AFC), 7/25/46 | | | 281,345 | | | | 258 | |
Structured Asset Securities Corp. Mortgage Loan Trust, Series2005-1, Class 1A1 2.856%, (ICE LIBOR USD 1 Month plus 0.350%), 2/25/35 | | | 25,618 | | | | 25 | |
Suntrust Alternative Loan Trust, Series 2005-1F, Class 1A1 3.156%, (ICE LIBOR USD 1 Month plus 0.650%), 12/25/35 | | | 20,957 | | | | 17 | |
WaMu Mortgage Pass-Through Certificates, Series 2002-AR19, Class A6 3.793%, (CSTR, AFC), 2/25/33 | | | 1,455 | | | | 1 | |
WaMu Mortgage Pass-Through Certificates, Series 2006-AR12, Class 3A3 3.829%, (CSTR), 10/25/36 | | | 31,702 | | | | 29 | |
WaMu Mortgage Pass-Through Certificates, Series2006-AR2, Class 1A1 3.513%, (CSTR), 3/25/36 | | | 309,375 | | | | 299 | |
WaMu Mortgage Pass-Through Certificates, Series2006-AR8, Class 2A1 3.909%, (CSTR), 8/25/36 | | | 13,917 | | | | 13 | |
WaMu Mortgage Pass-Through Certificates, Series2007-HY1, Class 3A1 3.389%, (CSTR), 2/25/37 | | | 5,183 | | | | 5 | |
The Accompanying Notes are an Integral Part of the Financial Statements.
188
Multi-Sector Bond Portfolio
| | | | | | | | |
| Structured Products (12.7%) | | Shares/
Par+ | | | Value
$ (000’s) | |
| | |
Mortgage Securities continued | | | | | | | | |
Washington Mutual Mortgage Pass-Through Certificates, Series2007-OA3, Class 4A2 2.857%, (Federal Reserve US 12 Month Cumulative Avg 1 year CMT plus 0.700%), 4/25/47 | | | 461,893 | | | | 381 | |
Wells Fargo Alternative Loan Trust, Series2007-PA4, Class 2A1 4.260%, (CSTR), 7/25/37 | | | 64,738 | | | | 60 | |
Wells Fargo Mortgage Backed Securities Trust, Series2005-AR2, Class 1A1 4.127%, (CSTR), 3/25/35 | | | 23,475 | | | | 24 | |
Wells Fargo Mortgage Backed Securities Trust, Series 2006-AR10, Class 4A1 4.138%, (CSTR), 7/25/36 | | | 172,965 | | | | 172 | |
Wells Fargo Mortgage Backed Securities Trust, Series2006-AR5, Class 2A1 4.139%, (CSTR), 4/25/36 | | | 91,230 | | | | 90 | |
Wells Fargo Mortgage Backed Securities Trust, Series2006-AR8, Class 1A3 4.561%, (CSTR), 4/25/36 | | | 1,779 | | | | 2 | |
Wells Fargo Mortgage Backed Securities Trust, Series2007-11, Class A81 6.000%, 8/25/37 | | | 115,680 | | | | 112 | |
Wells Fargo Mortgage Backed Securities Trust, Series2007-AR8, Class A1 4.789%, (CSTR), 11/25/37 | | | 68,437 | | | | 65 | |
| | | | | | | | |
Total | | | | | | | 67,288 | |
| | | | | | | | |
| | |
Total Structured Products | | | | | | | | |
(Cost: $107,996) | | | | | | | 110,964 | |
| | | | | | | | |
| | |
| Bank Loan Obligations (2.6%) | | | | | | |
| | |
Bank Loan Obligations (2.6%) | | | | | | | | |
Avolon TLB Borrower 1 LLC, 1.000%, (ICE LIBOR USD 3 Month plus 2.000%), 1/15/25 | | | 1,919,524 | | | | 1,844 | |
CenturyLink, Inc., 4.076%, (ICE LIBOR USD 3 Month plus 2.750%), 1/31/25 | | | 1,881,000 | | | | 1,753 | |
Charter Communications Operating LLC, 1.000%, (ICE LIBOR USD 3 Month plus 2.000%), 4/30/25 | | | 3,485,404 | | | | 3,332 | |
CHS / Community Health Systems, Inc., 4.315%, (ICE LIBOR USD 3 Month plus 3.250%), 1/27/21 | | | 872,920 | | | | 834 | |
CommScope, Inc., 3.810%, (ICE LIBOR USD 3 Month plus 2.000%), 12/29/22 | | | 77,800 | | | | 73 | |
Dell International LLC, 1.000%, (ICE LIBOR USD 3 Month plus 2.000%), 9/7/23 | | | 1,539,146 | | | | 1,474 | |
Enterprise Merger Sub, Inc., 1.000%, (US LIBOR plus 2.000%), 10/10/25 | | | 500,000 | | | | 466 | |
Grifols SA, 3.561%, (ICE LIBOR USD 3 Month plus 2.250%), 1/31/25 | | | 687,750 | | | | 657 | |
Hilton Worldwide Finance LLC, 3.324%, (ICE LIBOR USD 3 Month plus 1.750%), 10/25/23 | | | 1,120,295 | | | | 1,075 | |
INEOS Finance PLC, 1.000%, (Euribor 3 Month plus 2.000%), 3/31/24 EUR¥ | | | 3,465,000 | | | | 3,879 | |
Las Vegas Sands LLC, 1.000%, (ICE LIBOR USD 3 Month plus 1.750%), 3/27/25 | | | 676,627 | | | | 645 | |
PCF GmbH, 1.000%, (Euribor 3 Month plus 5.000%), 8/1/24 EUR¥ | | | 2,800,000 | | | | 3,176 | |
Sigma Bidco BV, 1.000%, (Euribor 3 Month plus 3.500%), 3/6/25 EUR¥ | | | 1,600,000 | | | | 1,777 | |
| | | | | | | | |
| Bank Loan Obligations (2.6%) | | Shares/
Par+ | | | Value
$ (000’s) | |
| | |
Bank Loan Obligations continued | | | | | | | | |
Valeant Pharmaceuticals International, Inc., 1.000%, (US LIBOR plus 3.000%), 6/2/25 | | | 390,425 | | | | 373 | |
Ziggo Secured Finance BV, 3.000%, (Euribor 3 Month plus 3.000%), 4/15/25 EUR¥ | | | 1,000,000 | | | | 1,115 | |
| | | | | | | | |
| | |
Total Bank Loan Obligations | | | | | | | 22,473 | |
(Cost: $23,635) | | | | | | | | |
| | | | | | | | |
| | |
| Short-Term Investments (21.6%) | | | | | | |
| | |
Governments (1.0%) | | | | | | | | |
Argentine Republic Treasury Bill
0.000%, 1/31/19 ARS¥,b | | | 1,413,000 | | | | 44 | |
0.000%, 2/22/19 ARS¥,b | | | 4,518,000 | | | | 126 | |
0.000%, 2/28/19 ARS¥,b | | | 2,356,000 | | | | 72 | |
0.000%, 3/29/19 ARS¥,b | | | 6,024,000 | | | | 180 | |
0.000%, 4/26/19b | | | 500,000 | | | | 494 | |
0.000%, 4/30/19 ARS¥,b | | | 5,496,000 | | | | 165 | |
Hellenic Republic Treasury Bill
0.000%, 2/1/19 EUR¥,b | | | 600,000 | | | | 687 | |
0.000%, 3/15/19 EUR¥,b | | | 1,400,000 | | | | 1,599 | |
0.000%, 4/5/19 EUR¥,b | | | 4,700,000 | | | | 5,372 | |
US Treasury 0.000%, 1/31/19b | | | 4,000 | | | | 4 | |
| | | | | | | | |
Total | | | | | | | 8,743 | |
| | | | | | | | |
| | |
Money Market Funds (0.3%) | | | | | | | | |
State Street Institutional U.S. Government Money Market Fund - Premier Class 2.270%# | | | 2,985,312 | | | | 2,985 | |
| | | | | | | | |
Total | | | | | | | 2,985 | |
| | | | | | | | |
| | |
Repurchase Agreements (20.3%) | | | | | | | | |
Citigroup repurchase (Purchased 12/28/18, to be repurchased at $100,016,389, collateralized by US Treasury, 1.625%, due 11/30/20, par and fair value of $103,595,000 and $101,871,114, respectively) 2.950%, 1/2/19 | | | 100,000,000 | | | | 100,000 | |
Citigroup repurchase (Purchased 12/31/18, to be repurchased at $50,004,375, collateralized by US Treasury, 2.000%, due 11/30/22, par and fair value of $51,865,000 and $51,016,116,respectively) 3.150%, 1/3/19 | | | 50,000,000 | | | | 50,000 | |
JP Morgan repurchase (Purchased 12/31/18, to be repurchased at $27,204,760, collateralized by US Treasury, 2.500%, due 12/31/20, par and fair value of $27,760,000 and $27,776,266, respectively) 1.930%, 1/4/19 | | | 27,200,000 | | | | 27,200 | |
| | | | | | | | |
Total | | | | | | | 177,200 | |
| | | | | | | | |
| | |
Total Short-Term Investments | | | | | | | | |
(Cost: $189,047) | | | | | | | 188,928 | |
| | | | | | | | |
| | |
Total Investments (110.1%) | | | | | | | | |
(Cost: $990,437)@ | | | | | | | 963,186 | |
| | | | | | | | |
Other Assets, Less | | | | | | | | |
Liabilities(-10.1%) | | | | | | | (88,243 | ) |
| | | | | | | | |
Net Assets (100.0%) | | | | | | | 874,943 | |
| | | | | | | | |
The Accompanying Notes are an Integral Part of the Financial Statements.
189
Multi-Sector Bond Portfolio
Reverse Repurchase Agreements
| | | | | | | | | | | | | | |
| Reference Entity | | Counterparty | | Interest
Rate | | Borrowing
Date | | Maturity
Date | | Currency | | Amount
Borrowed
(000’s) | | Payable for
Reverse
Repurchase
Agreements
(000s) |
Republic of Indonesia | | JP Morgan Chase Bank NA | | (0.750)% | | 12/14/2018 | | Open | | EUR | | (859) | | $ (984) |
| | | | | | | | | | | | | | |
| | | | | | | | | | | | | | $ (984) |
| | | | | | | | | | | | | | |
Exchange Traded or Centrally Cleared Derivatives Futures
| | | | | | | | | | | | | | | | | | | | | | | | | | | | | | | | |
| Issuer | | Long/
Short | | | Currency | | | Notional Par
(000’s) | | | Number
of
Contracts | | | Expiration Date | | | Notional
Value
(000’s) | | | Unrealized
Appreciation/
(Depreciation)
(000’s) | | | Variation Margin
(000’s) | |
CADTen-Year Government Bond Future | | | Long | | | | CAD | | | | 235 | | | | 76 | | | | 3/19 | | | $ | 7,614 | | | $ | 235 | | | $ | (3 | ) |
Euro Schatz Future | | | Long | | | | EUR | | | | 2 | | | | 59 | | | | 3/19 | | | | 7,567 | | | | 2 | | | | – | p |
Euro-Bobl Future | | | Long | | | | EUR | | | | 25 | | | | 71 | | | | 3/19 | | | | 10,780 | | | | 25 | | | | – | p |
Euro-Bund Future | | | Long | | | | EUR | | | | 132 | | | | 65 | | | | 3/19 | | | | 12,179 | | | | 132 | | | | – | p |
Five-Year US Treasury Note Future | | | Long | | | | USD | | | | 2,206 | | | | 1,175 | | | | 3/19 | | | | 134,758 | | | | 2,206 | | | | 294 | |
Ten-Year US Treasury Note Future | | | Long | | | | USD | | | | 622 | | | | 265 | | | | 3/19 | | | | 32,334 | | | | 622 | | | | 104 | |
Two-Year US Treasury Note Future | | | Long | | | | USD | | | | 319 | | | | 219 | | | | 3/19 | | | | 46,496 | | | | 319 | | | | 31 | |
Ultra Long Term US Treasury Bond Future | | | Long | | | | USD | | | | 513 | | | | 69 | | | | 3/19 | | | | 11,085 | | | | 513 | | | | 41 | |
| | | | | | | | | | | | | | | | | | | | | | | | | | | | | | | | |
| | | | | | | | | | | | | | | | | | | | | | | | | | $ | 4,054 | | | $ | 467 | |
| | | | | | | | | | | | | | | | | | | | | | | | | | | | | | | | |
Centrally Cleared Interest Rate Swaps - Receive Floating Rate
| | | | | | | | | | | | | | | | | | | | | | | | | | | | | | | | |
| Floating Rate Index | | Fixed
Rate | | | Expiration
Date | | | Notional
Amount (000’s) | | | Currency | | | Upfront
Premium Paid/
(Received)
(000’s) | | | Unrealized
Appreciation/
(Depreciation)
(000’s) | | | Market Value
(000’s) | | | Variation
Margin(000’s) | |
6-MonthGBP-LIBOR | | | 1.500% | | | | 3/29 | | | | 11,300 | | | | GBP | | | $ | 262 | | | $ | (336 | ) | | $ | (74 | ) | | $ | (6 | ) |
6-MonthGBP-LIBOR | | | 1.750% | | | | 3/49 | | | | 2,200 | | | | GBP | | | | (13 | ) | | | (130 | ) | | | (143 | ) | | | (4 | ) |
6-MonthJPY-LIBOR | | | 0.450% | | | | 3/29 | | | | 1,280,000 | | | | JPY | | | | (62 | ) | | | (244 | ) | | | (306 | ) | | | (3 | ) |
| | | | | | | | | | | | | | | | | | | | | | | | | | | | | | | | |
| | | | | | | | | | | | | | | | | | $ | 187 | | | $ | (710 | ) | | $ | (523 | ) | | $ | (13 | ) |
| | | | | | | | | | | | | | | | | | | | | | | | | | | | | | | | |
Centrally Cleared Interest Rate Swaps - Pay Floating Rate
| | | | | | | | | | | | | | | | | | | | | | | | | | | | | | | | |
| Floating Rate Index | | Fixed
Rate | | | Expiration
Date | | | Notional
Amount (000’s) | | | Currency | | | Upfront
Premium Paid/
(Received)
(000’s) | | | Unrealized Appreciation/
(Depreciation)
(000’s) | | | Market Value
(000’s) | | | Variation
Margin(000’s) | |
3-MonthUSD-LIBOR | | | 2.995% | | | | 5/28 | | | | 9,300 | | | | USD | | | $ | - | | | $ | 226 | | | $ | 226 | | | $ | 18 | |
| | | | | | | | | | | | | | | | | | | | | | | | | | | | | | | | |
| | | | | | | | | | | | | | | | | | $ | - | | | $ | 226 | | | $ | 226 | | | $ | 18 | |
| | | | | | | | | | | | | | | | | | | | | | | | | | | | | | | | |
Centrally Cleared Credit Default Swaps on Credit Indices - Sell Protection
| | | | | | | | | | | | | | | | | | | | | | | | | | | | | | | | | | | | |
| Reference Entity | | Receive
Fixed
Rate | | | Expiration
Date | | | Implied
Credit
Spread | | | Notional
Amount
(000’s) | | | Currency | | | Upfront
Premium
Paid/
(Received)
(000’s) | | | Unrealized
Appreciation/
(Depreciation)
(000’s) | | | Market
Value(000’s) | | | Variation
Margin(000’s) | |
Markit CDX Emerging Markets Index | | | 1.000% | | | | 6/23 | | | | 1.918% | | | | 10,100 | | | | USD | | | $ | (325 | ) | | $ | (46 | ) | | $ | (371 | ) | | $ | 11 | |
Markit CDX Emerging Markets Index | | | 1.000% | | | | 12/23 | | | | 2.068% | | | | 63,400 | | | | USD | | | | (2,881 | ) | | | (91 | ) | | | (2,972 | ) | | | 59 | |
Markit CDX North America High Yield Index | | | 5.000% | | | | 6/23 | | | | 4.169% | | | | 22,800 | | | | USD | | | | 1,445 | | | | (746 | ) | | | 699 | | | | 15 | |
Markit CDX North America High Yield Index | | | 5.000% | | | | 12/23 | | | | 4.491% | | | | 52,800 | | | | USD | | | | 2,350 | | | | (1,284 | ) | | | 1,066 | | | | 48 | |
Markit CDX North America Investment Grade | | | 1.000% | | | | 6/23 | | | | 0.804% | | | | 11,100 | | | | USD | | | | 178 | | | | (88 | ) | | | 90 | | | | 2 | |
Markit CDX North America Investment Grade | | | 1.000% | | | | 12/23 | | | | 0.876% | | | | 75,600 | | | | USD | | | | 1,157 | | | | (736 | ) | | | 421 | | | | 20 | |
| | | | | | | | | | | | | | | | | | | | | | | | | | | | | | | | | | | | |
| | | | | | | | | | | | | | | | | | | | | | $ | 1,924 | | | $ | (2,991 | ) | | $ | (1,067 | ) | | $ | 155 | |
| | | | | | | | | | | | | | | | | | | | | | | | | | | | | | | | | | | | |
The Accompanying Notes are an Integral Part of the Financial Statements.
190
Multi-Sector Bond Portfolio
Centrally Cleared Credit Default Swaps on Corporate or Sovereign Issues - Sell Protection
| | | | | | | | | | | | | | | | | | | | | | | | | | | | |
| Reference Entity | | Receive
Fixed
Rate | | Expiration
Date | | Implied
Credit
Spread | | Notional
Amount
(000’s) | | | Currency | | Upfront
Premium Paid/
(Received)
(000’s) | | | Unrealized
Appreciation/
(Depreciation)
(000’s) | | | Market
Value
(000’s) | | | Variation
Margin
(000’s) | |
Ally Financial, Inc. | | 5.000% | | 6/22 | | 1.510% | | | 1,300 | | | USD | | $ | 176 | | | $ | (28 | ) | | $ | 148 | | | $ | (2 | ) |
Berkshire Hathaway, Inc. | | 1.000% | | 12/22 | | 0.648% | | | 800 | | | USD | | | 13 | | | | (3 | ) | | | 10 | | | | - | p |
Casino Guichard Perrachon SA | | 1.000% | | 12/19 | | 4.091% | | | 400 | | | EUR | | | (12 | ) | | | (2 | ) | | | (14 | ) | | | - | p |
Casino Guichard Perrachon SA | | 1.000% | | 12/20 | | 5.083% | | | 2,000 | | | EUR | | | (112 | ) | | | (62 | ) | | | (174 | ) | | | - | p |
Casino Guichard Perrachon SA | | 1.000% | | 6/23 | | 6.102% | | | 500 | | | EUR | | | (70 | ) | | | (38 | ) | | | (108 | ) | | | - | p |
Casino Guichard Perrachon SA | | 1.000% | | 12/23 | | 6.213% | | | 600 | | | EUR | | | (103 | ) | | | (41 | ) | | | (144 | ) | | | - | p |
Deutsche Bank AG | | 1.000% | | 12/19 | | 1.450% | | | 1,100 | | | EUR | | | (8 | ) | | | 2 | | | | (6 | ) | | | - | p |
Ford Motor Co. | | 5.000% | | 6/23 | | 2.369% | | | 4,000 | | | USD | | | 612 | | | | (188 | ) | | | 424 | | | | 3 | |
Ford Motor Co. | | 5.000% | | 12/23 | | 2.648% | | | 200 | | | USD | | | 37 | | | | (16 | ) | | | 21 | | | | - | p |
Ford Motor Co. | | 5.000% | | 12/23 | | 2.648% | | | 800 | | | USD | | | 116 | | | | (33 | ) | | | 83 | | | | 1 | |
Ford Motor Credit Co. | | 5.000% | | 12/23 | | 2.398% | | | 600 | | | USD | | | 78 | | | | (11 | ) | | | 67 | | | | 1 | |
Ford Motor Credit Co. | | 5.000% | | 12/22 | | 1.906% | | | 200 | | | USD | | | 30 | | | | (8 | ) | | | 22 | | | | - | p |
Frontier Communications Corp. | | 5.000% | | 6/20 | | 19.721% | | | 600 | | | USD | | | (36 | ) | | | (67 | ) | | | (103 | ) | | | (1 | ) |
General Electric Co. | | 1.000% | | 12/20 | | 1.653% | | | 500 | | | USD | | | (13 | ) | | | 7 | | | | (6 | ) | | | - | p |
General Electric Co. | | 1.000% | | 12/23 | | 2.039% | | | 3,900 | | | USD | | | (163 | ) | | | (14 | ) | | | (177 | ) | | | 4 | |
Marks & Spencer PLC | | 1.000% | | 12/23 | | 2.417% | | | 200 | | | EUR | | | (6 | ) | | | (9 | ) | | | (15 | ) | | | - | p |
Marks & Spencer PLC | | 1.000% | | 12/22 | | 2.012% | | | 2,900 | | | EUR | | | (31 | ) | | | (98 | ) | | | (129 | ) | | | (2 | ) |
Navient Corp. | | 5.000% | | 12/21 | | 4.131% | | | 650 | | | USD | | | 55 | | | | (40 | ) | | | 15 | | | | (1 | ) |
Navient Corp. | | 5.000% | | 12/22 | | 5.028% | | | 100 | | | USD | | | 8 | | | | (8 | ) | | | - | p | | | - | p |
Telefonica Emisiones SAU | | 1.000% | | 12/23 | | 1.051% | | | 3,200 | | | EUR | | | (5 | ) | | | (4 | ) | | | (9 | ) | | | - | p |
Telefonica Emisiones SAU | | 1.000% | | 6/23 | | 0.952% | | | 3,000 | | | EUR | | | 45 | | | | (38 | ) | | | 7 | | | | - | p |
Volkswagen International Finance NV | | 1.000% | | 12/23 | | 1.183% | | | 3,700 | | | EUR | | | - | | | | (38 | ) | | | (38 | ) | | | - | p |
Volkswagen International Finance NV | | 1.000% | | 6/23 | | 1.076% | | | 1,200 | | | EUR | | | 26 | | | | (31 | ) | | | (5 | ) | | | - | p |
| | | | | | | | | | | | | | | | | | | | | | | | | | | | |
| | | | | | | | | | | | | | $ | 637 | | | $ | (768 | ) | | $ | (131 | ) | | $ | 3 | |
| | | | | | | | | | | | | | | | | | | | | | | | | | | | |
Written Options
| | | | | | | | | | | | | | |
| Description | | Currency | | Notional Par
(000’s) | | Exercise
Price | | Expiration
Date | | Number of
Contracts | | Value
(000’s) | |
Call —Ten-Year US Treasury Note Future | | USD | | 70,000 | | $121.500 | | 1/19 | | 70,000 | | $ | (57 | ) |
Call —Ten-Year US Treasury Note Future | | USD | | 62,000 | | 122.000 | | 1/19 | | 62,000 | | | (33 | ) |
Put —Ten-Year US Treasury Note Future | | USD | | 132,000 | | 119.500 | | 1/19 | | 132,000 | | | (4 | ) |
| | | | | | | | | | | | | | |
(Premiums Received $61) | | | | | | | | | | | | $ | (94 | ) |
| | | | | | | | | | | | | | |
| | | | | | | | | | | | | | | | | | | | | | | | | | | | |
| | | Financial Derivative Assets | | | Financial Derivative Liabilities | |
| | | |
| | | Variation Margin (000’s) | | | Variation Margin (000’s) | | | Market
Value
(000’s) | |
| | | | | | | |
| | | Swaps | | | Futures | | | Total | | | Swaps | | | Futures | | | Total | | | Options | |
Total Exchange-Traded or Centrally Cleared Derivatives | | $ | 182 | | | $ | 470 | | | $ | 652 | | | $ | (19 | ) | | $ | (3 | ) | | $ | (22 | ) | | $ | (94 | ) |
Over the Counter Derivatives
The Accompanying Notes are an Integral Part of the Financial Statements.
191
Multi-Sector Bond Portfolio
Forward Contracts
| | | | | | | | | | | | | | | | | | | | | | |
| Type | | Counterparty | | Currency | | Foreign Principal
Amount
Covered by
Contract (000’s) | | USD Principal
Amount
Covered by
Contract (000s) | | Settlement
Month | | Unrealized
Appreciation
(000’s) | | | Unrealized
(Depreciation)
(000’s) | | | Net Unrealized
Appreciation/
(Depreciation)
(000’s) | |
Buy | | Bank of America NA | | ARS | | 79,957 | | 2,085 | | 1/19 | | $ | 121 | | | $ | – | | | $ | 121 | |
Buy | | Barclays Bank PLC | | ARS | | 2,938 | | 77 | | 1/19 | | | 2 | | | | – | | | | 2 | |
Buy | | HSBC Bank USA NA | | ARS | | 452 | | 11 | | 2/19 | | | – | p | | | – | | | | –p | |
Sell | | Bank of America NA | | AUD | | 2,670 | | 1,881 | | 1/19 | | | 91 | | | | – | | | | 91 | |
Sell | | Bank of America NA | | CNH | | 30,690 | | 4,467 | | 4/19 | | | – | | | | (93 | ) | | | (93 | ) |
Buy | | Bank of America NA | | EUR | | 777 | | 891 | | 1/19 | | | 8 | | | | – | | | | 8 | |
Buy | | Barclays Bank PLC | | EUR | | 2,258 | | 2,589 | | 1/19 | | | 19 | | | | – | | | | 19 | |
Buy | | HSBC Bank USA NA | | EUR | | 706 | | 809 | | 1/19 | | | 4 | | | | – | | | | 4 | |
Buy | | JP Morgan Bank NA | | EUR | | 493 | | 565 | | 1/19 | | | – | | | | (1 | ) | | | (1 | ) |
Sell | | UBS AG | | EUR | | 116,304 | | 133,344 | | 1/19 | | | – | | | | (689 | ) | | | (689 | ) |
Sell | | UBS AG | | EUR | | 600 | | 689 | | 2/19 | | | 21 | | | | – | | | | 21 | |
Sell | | HSBC Bank USA NA | | EUR | | 1,284 | | 1,480 | | 3/19 | | | 157 | | | | – | | | | 157 | |
Sell | | UBS AG | | EUR | | 99 | | 114 | | 3/19 | | | 12 | | | | – | | | | 12 | |
Sell | | HSBC Bank USA NA | | EUR | | 4,700 | | 5,427 | | 4/19 | | | 70 | | | | – | | | | 70 | |
Buy | | HSBC Bank USA NA | | GBP | | 1,062 | | 1,354 | | 1/19 | | | 1 | | | | – | | | | 1 | |
Sell | | Goldman Sachs International | | GBP | | 40,524 | | 51,672 | | 1/19 | | | 149 | | | | – | | | | 149 | |
Sell | | Bank of America NA | | JPY | | 20,400 | | 186 | | 1/19 | | | – | | | | (5 | ) | | | (5 | ) |
Sell | | UBS AG | | JPY | | 20,500 | | 187 | | 1/19 | | | – | | | | (6 | ) | | | (6 | ) |
Sell | | Goldman Sachs International | | KRW | | 4,926,435 | | 4,427 | | 3/19 | | | – | | | | (43 | ) | | | (43 | ) |
Buy | | HSBC Bank USA NA | | MXN | | 79,160 | | 4,015 | | 1/19 | | | – | | | | (93 | ) | | | (93 | ) |
Sell | | HSBC Bank USA NA | | MXN | | 77,633 | | 3,937 | | 1/19 | | | – | | | | (76 | ) | | | (76 | ) |
Buy | | Goldman Sachs International | | RUB | | 5,481 | | 78 | | 1/19 | | | – | | | | (4 | ) | | | (4 | ) |
Buy | | JP Morgan Bank NA | | TRY | | 19,222 | | 3,539 | | 2/19 | | | 114 | | | | – | | | | 114 | |
Sell | | BNP Paribas SA | | TWD | | 131,342 | | 4,300 | | 3/19 | | | – | | | | (6 | ) | | | (6 | ) |
| | | | | | | | | | | | | | | | | | | | | | |
| | | | | | | | | | | | $ | 769 | | | $ | (1,016 | ) | | $ | (247 | ) |
| | | | | | | | | | | | | | | | | | | | | | |
Credit Default Swaps on Corporate or Sovereign Issues - Sell Protection
| | | | | | | | | | | | | | | | | | | | | | |
| Reference Entity | | Counterparty | | Receive
Fixed
Rate | | Expiration
Date | | Implied
Credit
Spread | | Currency | | Notional
Amount
(000’s) | | Upfront
Premium Paid/
(Received)
(000’s) | | Unrealized
Appreciation/
(Depreciation)
(000’s) | | | Market
Value
(000’s) | |
Federative Republic of Brazil | | Barclays Bank PLC | | 1.000% | | 6/22 | | 1.609% | | USD | | 100 | | $(4) | | $ | 2 | | | $ | (2 | ) |
Federative Republic of Brazil | | Goldman Sachs International | | 1.000% | | 6/23 | | 1.903% | | USD | | 1,600 | | (78) | | $ | 19 | | | | (59 | ) |
Federative Republic of Brazil | | HSBC Bank USA NA | | 1.000% | | 6/23 | | 1.903% | | USD | | 800 | | (45) | | $ | 15 | | | | (30 | ) |
Park Aerospace Holdings, Ltd.Æ | | UBS AG | | 5.000% | | 7/20 | | 4.865% | | USD | | 200 | | 6 | | $ | 4 | | | | 10 | |
Republic of Indonesia | | HSBC Bank USA NA | | 1.000% | | 12/24 | | 1.611% | | USD | | 9,500 | | (67) | | $ | (241 | ) | | | (308 | ) |
Republic of Peru | | Barclays Bank PLC | | 1.000% | | 3/23 | | 0.802% | | USD | | 1,100 | | (13) | | $ | 22 | | | | 9 | |
Republic of South Africa | | Barclays Bank PLC | | 1.000% | | 6/24 | | 2.341% | | USD | | 4,600 | | (267) | | $ | (30 | ) | | | (297 | ) |
Russian Federation | | Goldman Sachs International | | 1.000% | | 9/20 | | 1.046% | | USD | | 400 | | (15) | | $ | 15 | | | | – | p |
Russian Federation | | Goldman Sachs International | | 1.000% | | 9/20 | | 1.046% | | USD | | 900 | | (30) | | $ | 29 | | | | (1 | ) |
Russian Federation | | Goldman Sachs International | | 1.000% | | 6/22 | | 1.295% | | USD | | 2,100 | | (42) | | $ | 22 | | | | (20 | ) |
Russian Federation | | HSBC Bank USA NA | | 1.000% | | 6/21 | | 1.152% | | USD | | 4,200 | | (149) | | $ | 134 | | | | (15 | ) |
Russian Federation | | JP Morgan Chase Bank NA | | 1.000% | | 9/20 | | 1.046% | | USD | | 1,500 | | (56) | | $ | 55 | | | | (1 | ) |
Unicredit SpA | | JP Morgan Chase Bank NA | | 1.000% | | 12/22 | | 3.886% | | EUR | | 900 | | (47) | | $ | (64 | ) | | | (111 | ) |
United Mexican States | | BNP Paribas SA | | 1.000% | | 12/23 | | 1.549% | | USD | | 100 | | (1) | | $ | (2 | ) | | | (3 | ) |
The Accompanying Notes are an Integral Part of the Financial Statements.
192
Multi-Sector Bond Portfolio
Credit Default Swaps on Corporate or Sovereign Issues - Sell Protection (continued)
| | | | | | | | | | | | | | | | | | | | | | | | |
| Reference Entity | | Counterparty | | Receive
Fixed
Rate | | Expiration
Date | | Implied
Credit
Spread | | Currency | | Notional
Amount
(000’s) | | Upfront
Premium Paid/
(Received)
(000’s) | | | Unrealized
Appreciation/
(Depreciation)
(000’s) | | | Market
Value
(000’s) | |
United Mexican States | | Goldman Sachs International | | 1.000% | | 6/23 | | 1.434% | | USD | | 4,500 | | | (31 | ) | | $ | (50 | ) | | | (81 | ) |
United Mexican States | | JP Morgan Chase Bank NA | | 1.000% | | 12/22 | | 1.289% | | USD | | 500 | | | (14 | ) | | $ | 9 | | | | (5 | ) |
United Mexican States | | JP Morgan Chase Bank NA | | 1.000% | | 12/23 | | 1.549% | | USD | | 200 | | | (2 | ) | | $ | (3 | ) | | | (5 | ) |
| | | | | | | | | | | | | | | | | | | | | | | | |
| | | | | | | | | | | | | | $ | (855 | ) | | $ | (64 | ) | | | (919 | ) |
| | | | | | | | | | | | | | | | | | | | | | | | |
Total Return Swaps
| | | | | | | | | | | | | | | | | | | | | | |
| Reference Entity | | Counterparty | | Payment made
by the Fund | | Payment
Received
by the Fund | | Expiration
Date | | | Notional
Amount
(000’s) | | | Unrealized
Appreciation/
(Depreciation)
(000’s) | | | Market
Value
(000’s) | |
iBoxx USD Liquid High Yield Index | | JP Morgan Bank NA | | 3-MonthUSD-LIBOR | | iBoxx USD Liquid High Yield Index | | | 6/19 | | | | 33 | | | $ | (42 | ) | | $ | (42 | ) |
| | | | | | | | | | | | | | | | | | | | | | |
| | | | | | | | | | | | | | | | $ | (42 | ) | | $ | (42 | ) |
| | | | | | | | | | | | | | | | | | | | | | |
| | | | | | | | | | | | | | | | | | | | | | |
| | | Financial Derivative Assets (000’s) | | Financial Derivative Liabilities (000’s) | | | | |
| | | | | | | |
| | | Forward Contracts | | Swaps | | Total | | Forward
Contracts | | | Options | | | Swaps | | | Total | |
Total Over the Counter | | $769 | | $19 | | $788 | | $ | (1,016 | ) | | | – | | | $ | (980 | ) | | | $ (1,996) | |
Derivatives | | | | | | | | | | | | | | | | | | | | | | |
Restricted Securities
| | | | | | | | | | | | |
| Description | | Coupon | | Maturity
Date | | Acquisition
Date | | Cost
(000’s) | | Value
(000’s) | | Value as a
Percentage
of Net
Assets |
Sberbank of Russia Via SB Capital SA | | 4.150% | | 3/6/19 | | 1/16/18 | | $501 | | $497 | | 0.060% |
Rise, Ltd., Series2014-1, Class A | | 4.750% | | 2/15/39 | | 2/21/14 | | 411 | | 400 | | 0.050% |
| + | All par is stated in U.S Dollar unless otherwise noted. |
| 144A | Security exempt from registration under Rule 144A of the Securities Act of 1933. These securities may be resold as transactions exempt from registration, normally to qualified institutional buyers. At December 31, 2018 the value of these securities (in thousands) was $195,419 representing 22.6% of the net assets. |
| ¥ | Foreign Bond — par value is foreign denominated |
| § | Security was purchased pursuant to Regulation S under the Securities Act of 1933, which exempts from registration securities offered and sold outside of the United States. At December 31, 2018, the aggregate value of these securities was $155,727 (in thousands), representing 17.9% of net assets. |
| ß | Cash or securities with an aggregate value of $322,499 (in thousands) has been pledged as collateral for futures, swap contracts outstanding, short sales, when issued securities or written options on 12/31/2018. |
| Þ | PIK—Payment In Kind. PIK rates of Odebrecht Drilling Norbe VIII/IX, Ltd. 7.350%, QGOG Constellation SA 9.500% |
| d | Restricted security – see accompanying table for additional details |
| Æ | Security valued using significant unobservable inputs. |
| p | Amount is less than one thousand. |
| # | 7-Day yield as of 12/31/2018. |
| @ | At December 31, 2018, the aggregate cost of investments, including derivatives, for federal tax purposes (in thousands) was $996,143 and the net unrealized depreciation of investments based on that cost was $32,671 which is comprised of $13,143 aggregate gross unrealized appreciation and $45,814 aggregate gross unrealized depreciation. |
The Accompanying Notes are an Integral Part of the Financial Statements.
193
Multi-Sector Bond Portfolio
The following is a summary of the inputs used in valuing the Portfolio’s assets and liabilities at December 31, 2018. See Note 3 for additional information on portfolio valuation.
| | | | | | | | | | | | | | |
| | | Valuation Inputs | | | |
| Description | | Level 1 –
Quoted Prices | | | Level 2 –
Other Significant
Observable Inputs | | | Level 3 –
Significant
Unobservable Inputs | | | |
| | | (Amounts in thousands) | | | |
Assets: | | | | | | | | | | | | | | |
Bank Loan Obligations | | $ | - | | | $ | 22,473 | | | $ | - | | | |
Municipal Bonds | | | - | | | | 10,460 | | | | - | | | |
Corporate Bonds | | | - | | | | 465,483 | | | | - | | | |
Governments | | | - | | | | 164,878 | | | | - | | | |
Structured Products | | | | | | | | | | | | | | |
Asset Backed Securities | | | - | | | | 43,276 | | | | 400 | | | |
All Others | | | - | | | | 67,288 | | | | - | | | |
Short-Term Investments | | | | | | | | | | | | | | |
Money Market Funds | | | 2,985 | | | | - | | | | - | | | |
All Others | | | - | | | | 185,943 | | | | - | | | |
Other Financial Instruments^ | | | | | | | | | | | | | | |
Futures | | | 4,054 | | | | - | | | | - | | | |
Forward Currency Contracts | | | - | | | | 769 | | | | - | | | |
Interest Rate Swaps | | | - | | | | 226 | | | | - | | | |
Credit Default Swaps | | | - | | | | 3,082 | | | | 10 | | | |
Total Assets: | | $ | 7,039 | | | $ | 963,878 | | | $ | 410 | | | |
Liabilities: | | | | | | | | | | | | | | |
Other Financial Instruments^ | | | | | | | | | | | | | | |
Forward Currency Contracts | | | - | | | | (1,016 | ) | | | - | | | |
Written Options | | | (94 | ) | | | - | | | | - | | | |
Total Return Swaps | | | - | | | | (42 | ) | | | - | | | |
Interest Rate Swaps | | | - | | | | (523 | ) | | | - | | | |
Credit Default Swaps | | | - | | | | (5,209 | ) | | | - | | | |
Reverse Repurchase Agreements | | | - | | | | (984 | ) | | | - | | | |
Total Liabilities: | | $ | (94 | ) | | $ | (7,774 | ) | | $ | - | | | |
^ Other financial instruments are derivative instruments such as futures and forwards, which are valued at the unrealized appreciation (depreciation) on the instrument, and securities sold short, reverse repurchase agreements, written options and swaps contracts, which are valued at market value.
For the year ended December 31, 2018, there were transfers from Level 3 to Level 2 in the amount of $1,585 (in thousands). These transfers were the result of an increase in the quantity of observable inputs for securities that were previously not priced by a third party vendor or priced by a third party vendor utilizing a broker quote.
The Accompanying Notes are an Integral Part of the Financial Statements.
194
Balanced Portfolio (unaudited)
| | | | |
| | |
| Objective: | | Portfolio Strategy: | | Net Assets: |
| Realize as high a level of total return as is consistent with prudent investment risk, through income and capital appreciation. | | Invest in the stock, bond and money market sectors, attempting to capitalize on the variation in return potential produced by the interaction of changing financial markets and economic conditions. | | $2.1 billion |
PORTFOLIO OVERVIEW
Mason Street Advisors, LLC is the investment adviser for the Balanced Portfolio (the “Portfolio”). The Portfolio is tactically and strategically managed to capitalize on changing financial markets and economic conditions following a flexible policy for allocating assets across the stock, bond and money market sectors. The Portfolio operates primarily as a “fund of funds” to gain the Portfolio’s equity and fixed income exposure by investing in one or more of the equity and international portfolios, and one or more of the fixed income portfolios of Northwestern Mutual Series Fund, Inc. (each an “Underlying Portfolio”). The adviser allocates the Portfolio’s assets among the Underlying Portfolios based on the adviser’s economic and market outlook and the investment objectives and strategies of the Underlying Portfolios. Under normal market conditions, the Portfolio will typically hold between35-55% of assets in equity investments,40-60% of assets in fixed income investments, and0-20% of assets in cash equivalent investments.
MARKET OVERVIEW
U.S. equity markets hit record highs until a sharpsell-off in the fourth quarter drove stocks lower for the year. Early year gains were driven by strong economic fundamentals, high consumer spending and stimulus from tax reform. Markets peaked in October, however, as investors became increasingly concerned that the pace of the U.S. Federal Reserve’s (the “Fed”) interest rate hikes could hurt economic growth and corporate earnings.
Markets were further rattled by several developments late in the year, including lower international growth forecasts, an escalation of the trade dispute between the U.S. and China and a partial U.S. government shutdown. Following the confluence of negative news, market sentiment turned negative, and investors began to consider the possibility of a recession in 2019.
In this environment, large cap stocks, as represented by the S&P 500® Index, posted a return of (4.38%), outperforming the S&P SmallCap 600® and the S&P MidCap 400® Indices, which returned (8.48%) and (11.08%), respectively. Meanwhile, the broader bond market’s return, as represented by the Bloomberg Barclays® U.S. Aggregate Index, was relatively unchanged, while the Bloomberg Barclays® U.S. Corporate High Yield Index declined (2.08%).
PORTFOLIO RESULTS
The Portfolio returned (3.45%) for the twelve months ended December 31, 2018, outstripping the (4.38%) return of the broad stock market, as measured by the S&P 500® Index, but trailing the Bloomberg Barclays® U.S. Aggregate Index return of 0.01%. The Portfolio outperformed the Balanced Portfolio Blended Composite Benchmark return of (3.74%). (The benchmark weights are detailed in the “Benchmark Definitions” section of this annual report.) (These Indices are unmanaged, cannot be invested in directly and do not incur expenses.) When compared to peers in 2018, the Portfolio outperformed its Morningstar® Inc. Allocation – 30% to 50% Equity peer group average return of (4.45%) and its Lipper® Analytical Services, Inc. Mixed-Asset Target Allocation Moderate Funds peer group average return of (5.09%). Morningstar® Inc. and Lipper® Analytical Services, Inc. are independent mutual fund ranking agencies.
Although the Portfolio outperformed relative to the blended benchmark, many of the Underlying Portfolios underperformed their respective benchmarks. However, the positive contribution of tactical asset allocation decisions outweighed the negative effect of underperformance by the majority of the Underlying Portfolios. Nonetheless, the Growth Stock Portfolio and value-oriented Underlying Portfolios outpaced their underlying benchmarks by relatively wide margins in a difficult environment for active management.
The Portfolio began the year with an overweight allocation to U.S. equities and an underweight allocation to fixed income. As anticipated earnings growth began to be priced in by markets, the Portfolio moved to a neutral position in equities in January. An early-year slide in equity prices made valuations more attractive, and the Portfolio again moved to an overweight allocation to equities later in the first quarter.
195
Balanced Portfolio (unaudited)
In September, following gains in equity prices, the Portfolio reduced its equity holdings to an underweight position. As equities underperformed in the last quarter of 2018, this positioning also helped the Portfolio outperform its benchmark. At the end of the year, the Portfolio again moved to an overweight allocation to equities to take advantage of lower prices. The Portfolio also took a modest overweight position in emerging market equities as a sharp drop in value made these equities a better value relative to their risk profile.
PORTFOLIO MANAGER OUTLOOK
We are anticipating a generally positive environment for equities in 2019 following the stock market correction in late 2018, as valuations for many equities are more attractive. While economic growth is likely to slow, the fundamental environment for corporate earnings is still positive.
In particular, U.S. equities appear attractive heading into 2019. Growth in 2018 was relatively high for a developed economy, and we expect the U.S. to outperform the E.U. and Japan. While trade tensions remain a risk, there is also a potential opportunity. Trade fears have been a drag on stock prices, and if an accord between the U.S. and China is reached, markets will respond positively in our view. Our outlook for Europe, where growth stalled during 2018, is less positive. The possibility for complications related to Brexit is also a risk to European economic growth. By contrast, emerging market stocks, which were battered in 2018, have fallen to the point where they represent an attractive opportunity.
Market volatility was higher in 2018 than in prior years, and we expect this condition to continue, especially in light of continued quantitative tightening by the Fed. Higher volatility environments represent an opportunity for active management, and we will continue to shift asset allocations with an eye towards market trends and valuations.
Relative Performance

| | | | | | | | | | | | |
Average Annual Total Returns
For Periods Ended December 31, 2018 | |
| | | 1 Year | | | 5 Years | | | 10 Years | |
Balanced Portfolio | | | -3.45% | | | | 3.97% | | | | 7.57% | |
S&P 500® Index | | | -4.38% | | | | 8.49% | | | | 13.11% | |
Bloomberg Barclays® U.S. Aggregate Index | | | 0.01% | | | | 2.52% | | | | 3.48% | |
Balanced Portfolio Blended Composite Benchmark | | | -3.74% | | | | 4.43% | | | | 8.66% | |
Morningstar® US Insurance Fund Allocation - 30% to 50% Equity Index | | | -4.45% | | | | 2.98% | | | | 6.92% | |
Lipper® Variable Insurance Products (VIP) Mixed Asset Target Allocation Moderate Funds Average | | | -5.09% | | | | 3.60% | | | | 8.07% | |
The performance data quoted represents past performance. Past performance is historical and does not guarantee future performance. Investment return and principal value will fluctuate, so that shares, when redeemed, may be worth more or less than their original cost. Current performance may be lower or higher than the performance data quoted. For the most recentmonth-end performance information visitwww.northwesternmutual.com.
This chart assumes an initial investment of $10,000 made on 12/31/08. Returns shown reflect fee waivers, deductions for management and other portfolio expenses, and reinvestment of all dividends. In the absence of fee waivers, total return would be reduced. Returns exclude deductions for separate account sale loads and account fees. Please refer to the Benchmark Definitions section of this report for information about the indices cited in the above chart and graph.
Investors should be aware of the risks of investments in foreign securities, particularly investments in securities of companies in developing nations. These include the risks of currency fluctuation, of political and economic instability and of less well-developed government supervision and regulation of business and industry practices, as well as differences in accounting standards. Small cap stocks also may carry additional risk. Smaller or newer issuers are more likely to realize more substantial growth as well as suffer more significant losses than larger or more established issuers. Investments in such companies can be both volatile and more speculative. Bonds and other debt obligations are affected by changes in interest rates,
196
Balanced Portfolio (unaudited)
inflation risk and the creditworthiness of their issuers. High yield bonds generally have greater price swings and higher default risks than investment grade bonds.
The Portfolio may obtain its exposure to domestic and foreign equity securities by investing in other Series Fund portfolios (Underlying Portfolios). Each of the Underlying Portfolios has its own investment risks, and the Portfolio is indirectly exposed to all the risks of the Underlying Portfolios in which it invests, including that risk that an Underlying Portfolio will not perform as expected. To the extent that the Portfolio invests a significant portion of its assets in a single Underlying Portfolio, it will be particularly sensitive to the risks associated with that Underlying Portfolio may have a significant effect on the Portfolio’s net asset value. The Portfolio will bear a pro rata share of the Underlying Portfolio’s expenses.
The Portfolio may use derivative instruments to gain exposure to certain markets, sectors or regions as alternatives to direct investments, to adjust the Portfolio duration, to provide increased flexibility in asset allocation, to earn income and to otherwise seek to enhance returns or to hedge foreign currency exposure. Use of these instruments may involve certain costs and risks such as liquidity risk, interest rate risk, mispricing or improper valuation. Certain derivatives involve leverage, which could magnify losses, and portfolios investing in derivatives could lose more than the principal amount invested in those investments.
The U.S. federal funds rate has been subject to moderate and steady increases over the course of the last three years. A significant rise in interest ratesover a short period of time could cause significant losses in the market value of the Portfolio’s fixed income investments.
Top 10 Equity Holdings 12/31/18
| | | | |
| Security Description | | % of Net Assets | |
Northwestern Mutual Series Fund, Inc., Select Bond Portfolio | | | 39.7 | % |
Northwestern Mutual Series Fund, Inc., High Yield Bond Portfolio | | | 6.3 | % |
Northwestern Mutual Series Fund, Inc., Growth Stock Portfolio | | | 6.1 | % |
Northwestern Mutual Series Fund, Inc., Research International Core Portfolio | | | 5.0 | % |
Northwestern Mutual Series Fund, Inc., Mid Cap Growth Stock Portfolio | | | 4.3 | % |
Northwestern Mutual Series Fund, Inc., Mid Cap Value Portfolio | | | 4.1 | % |
Northwestern Mutual Series Fund, Inc., Domestic Equity Portfolio | | | 3.3 | % |
Northwestern Mutual Series Fund, Inc., Large Cap Blend Portfolio | | | 3.2 | % |
Northwestern Mutual Series Fund, Inc., Focused Appreciation Portfolio | | | 3.2 | % |
Northwestern Mutual Series Fund, Inc., Equity Income Portfolio | | | 3.1 | % |
Sector Allocation 12/31/18
| | | | |
| Sector | | % of Net Assets | |
Fixed Income | | | 46.0 | % |
Domestic Equity | | | 37.9 | % |
Foreign Equity | | | 10.0 | % |
Short-Term Investments & Other Net Assets | | | 6.1 | % |
Sector Allocation and Top 10 Holdings are subject to change.
197
Balanced Portfolio
SCHEDULE OF INVESTMENTS
December 31, 2018
| | | | | | | | |
| Investment Companies (93.9%) | | Shares/
Par+ | | | Value
$ (000’s) | |
| | |
| Domestic Equity (37.9%) | | | | | | | | |
iShares Core S&PMid-Cap ETF | | | 130,200 | | | | 21,621 | |
iShares Russell 2000 ETF | | | 157,500 | | | | 21,089 | |
iShares RussellMid-Cap ETF | | | 12,400 | | | | 576 | |
Northwestern Mutual Series Fund, Inc., Domestic Equity Portfolio £ | | | 43,402,857 | | | | 67,231 | |
Northwestern Mutual Series Fund, Inc., Equity Income Portfolio £ | | | 42,214,344 | | | | 64,672 | |
Northwestern Mutual Series Fund, Inc., Focused Appreciation Portfolio £ | | | 25,335,596 | | | | 65,037 | |
Northwestern Mutual Series Fund, Inc., Growth Stock Portfolio £ | | | 45,564,144 | | | | 125,484 | |
Northwestern Mutual Series Fund, Inc., Large Cap Blend Portfolio £ | | | 60,675,031 | | | | 66,379 | |
Northwestern Mutual Series Fund, Inc., Large Cap Core Stock Portfolio £ | | | 48,197,770 | | | | 63,284 | |
Northwestern Mutual Series Fund, Inc., Large Company Value Portfolio £ | | | 72,651,988 | | | | 64,660 | |
Northwestern Mutual Series Fund, Inc., Mid Cap Growth Stock Portfolio £ | | | 33,013,119 | | | | 88,838 | |
Northwestern Mutual Series Fund, Inc., Mid Cap Value Portfolio £ | | | 59,631,496 | | | | 85,154 | |
Northwestern Mutual Series Fund, Inc., Small Cap Growth Stock Portfolio £ | | | 8,486,113 | | | | 19,908 | |
Northwestern Mutual Series Fund, Inc., Small Cap Value Portfolio £ | | | 14,656,660 | | | | 29,958 | |
| | | | | | | | |
Total | | | | | | | 783,891 | |
| | | | | | | | |
| | |
| Fixed Income (46.0%) | | | | | | | | |
Northwestern Mutual Series Fund, Inc., High Yield Bond Portfolio £ | | | 189,630,611 | | | | 130,276 | |
Northwestern Mutual Series Fund, Inc., Select Bond Portfolio £ | | | 668,414,393 | | | | 819,476 | |
| | | | | | | | |
Total | | | | | | | 949,752 | |
| | | | | | | | |
| | |
| Foreign Equity (10.0%) | | | | | | | | |
iShares MSCI EAFE ETF | | | 23,679 | | | | 1,392 | |
iShares MSCI Emerging Markets ETF | | | 345,300 | | | | 13,487 | |
Northwestern Mutual Series Fund, Inc., Emerging Markets Equity Portfolio £ | | | 10,333,849 | | | | 9,714 | |
Northwestern Mutual Series Fund, Inc., International Equity Portfolio £ | | | 24,207,492 | | | | 38,248 | |
Northwestern Mutual Series Fund, Inc., International Growth Portfolio £ | | | 29,532,064 | | | | 41,168 | |
| | | | | | | | |
| Investment Companies (93.9%) | | Shares/
Par+ | | | Value
$ (000’s) | |
| | |
| Foreign Equity continued | | | | | | | | |
Northwestern Mutual Series Fund, Inc., Research International Core Portfolio £ | | | 116,023,973 | | | | 102,333 | |
| | | | | | | | |
Total | | | | | | | 206,342 | |
| | | | | | | | |
| | |
Total Investment Companies | | | | | | | | |
(Cost: $2,001,932) | | | | | | | 1,939,985 | |
| | | | | | | | |
| | |
| Short-Term Investments (6.6%) | | | | | | |
| | |
| Commercial Paper (3.2%) | | | | | | | | |
Apple, Inc. 0.000%, 1/23/19 144A | | | 5,000,000 | | | | 4,992 | |
The Coca-Cola Co. 0.000%, 2/12/19 144A | | | 4,500,000 | | | | 4,486 | |
Exxon Mobil Corp. 0.000%, 1/8/19 | | | 10,000,000 | | | | 9,995 | |
Marriott International, Inc. 0.000%, 1/2/19 144A | | | 4,000,000 | | | | 3,999 | |
Mondelez International, Inc.
0.000%, 1/9/19 144A | | | 5,000,000 | | | | 4,997 | |
0.000%, 1/30/19 144A | | | 5,000,000 | | | | 4,988 | |
Royal Bank of Canada 0.000%, 1/25/19 144A | | | 5,000,000 | | | | 4,991 | |
Societe Generale SA 0.000%, 2/12/19 144A | | | 2,500,000 | | | | 2,492 | |
United Parcel Service, Inc. 0.000%, 1/3/19 144A | | | 5,000,000 | | | | 4,999 | |
Walgreens Boots Alliance, Inc. 0.000%, 2/13/19 | | | 10,000,000 | | | | 9,964 | |
Walmart, Inc. 0.000%, 1/2/19 144A | | | 10,000,000 | | | | 9,999 | |
| | | | | | | | |
Total | | | | | | | 65,902 | |
| | | | | | | | |
| | |
| Money Market Funds (3.1%) | | | | | | | | |
State Street Institutional U.S. Government Money Market Fund - Premier Class 2.270%# | | | 63,396,070 | | | | 63,396 | |
| | | | | | | | |
Total | | | | | | | 63,396 | |
| | | | | | | | |
| | |
| US Government & Agencies (0.3%) | | | | | | | | |
Federal Home Loan Bank
0.000%, 1/11/19 | | | 3,000,000 | | | | 2,999 | |
0.000%, 4/15/19b | | | 3,000,000 | | | | 2,979 | |
| | | | | | | | |
Total | | | | | | | 5,978 | |
| | | | | | | | |
| | |
Total Short-Term Investments | | | | | | | | |
(Cost: $135,284) | | | | | | | 135,276 | |
| | | | | | | | |
| | |
Total Investments (100.5%) | | | | | | | | |
(Cost: $2,137,216)@ | | | | | | | 2,075,261 | |
| | | | | | | | |
| | |
Other Assets, Less | | | | | | | | |
Liabilities(-0.5%) | | | | | | | (9,908 | ) |
| | | | | | | | |
Net Assets (100.0%) | | | | | | | 2,065,353 | |
| | | | | | | | |
The Accompanying Notes are an Integral Part of the Financial Statements.
198
Balanced Portfolio
Exchange Traded or Centrally Cleared Derivatives Futures
| | | | | | | | | | | | | | | | | | | | | | |
| Issuer | | Long/Short | | Currency | | Notional Par
(000’s) | | Number of
Contracts | | Expiration
Date | | Notional
Value
(000’s) | | | Unrealized
Appreciation/
(Depreciation)
(000’s) | | | Variation Margin (000’s) | |
E-Mini S&P 500 Futures | | Long | | USD | | 17 | | 338 | | 3/19 | | $ | 42,338 | | | $ | 39 | | | $ | 325 | |
| | | | | | | | | | | | | | | | $ | 39 | | | $ | 325 | |
| | | | | | | | | | | | | | | | | | | | | | | | | | | | |
| | | Financial Derivative Assets | | | Financial Derivative Liabilities | |
| | | Variation Margin (000’s) | | | Variation Margin (000’s) | | | Market Value
(000’s) | |
| | | Swaps | | | Futures | | | Total | | | Swaps | | | Futures | | | Total | | | Options | |
Total Exchange-Traded or | | $ | – | | | $ | 325 | | | $ | 325 | | | $ | – | | | $ | – | | | $ | – | | | $ | – | |
Centrally Cleared Derivatives | | | | | | | | | | | | | | | | | | | | | | | | | | | | |
| + | All par is stated in U.S Dollar unless otherwise noted. |
| 144A | Security exempt from registration under Rule 144A of the Securities Act of 1933. These securities may be resold as transactions exempt from registration, normally to qualified institutional buyers. At December 31, 2018 the value of these securities (in thousands) was $45,943 representing 2.2% of the net assets. |
| # | 7-Day yield as of 12/31/2018. |
| b | Cash or securities with an aggregate value of $2,979 (in thousands) has been pledged as collateral for futures, swap contracts outstanding, short sales, when issued securities or written options on 12/31/2018. |
| @ | At December 31, 2018, the aggregate cost of investments, including derivatives, for federal tax purposes (in thousands) was $2,139,170 and the net unrealized depreciation of investments based on that cost was $63,871 which is comprised of $32,147 aggregate gross unrealized appreciation and $96,018 aggregate gross unrealized depreciation. |
| | The following is a summary of the inputs used in valuing the Portfolio’s assets and liabilities at December 31, 2018. See Note 3 for additional information on portfolio valuation. |
| | | | | | | | | | | | | | |
| | | Valuation Inputs | | | |
| Description | | Level 1 – Quoted Prices | | | Level 2 –
Other Significant
Observable Inputs | | | Level 3 –
Significant
Unobservable Inputs | | | |
| | | (Amounts in thousands) | | | |
Assets: | | | | | | | | | | | | | | |
Investment Companies | | $ | 1,939,985 | | | $ | - | | | $ | - | | | |
Short-Term Investments | | | | | | | | | | | | | | |
Money Market Funds | | | 63,396 | | | | - | | | | - | | | |
All Others | | | - | | | | 71,880 | | | | - | | | |
Other Financial Instruments^ | | | | | | | | | | | | | | |
Futures | | | 39 | | | | - | | | | - | | | |
Total Assets: | | $ | 2,003,420 | | | $ | 71,880 | | | $ | - | | | |
^ Other financial instruments are derivative instruments such as futures and forwards, which are valued at the unrealized appreciation (depreciation) on the instrument, and securities sold short, reverse repurchase agreements, written options and swaps contracts, which are valued at market value.
The Accompanying Notes are an Integral Part of the Financial Statements.
199
Asset Allocation Portfolio (unaudited)
| | | | |
| Objective: | | Portfolio Strategy: | | Net Assets: |
| Realize as high a level of total return as is consistent with reasonable investment risk. | | Invest in the stock, bond and money market sectors, attempting to capitalize on the variation in return potential produced by the interaction of changing financial markets and economic conditions. | | $250 million |
PORTFOLIO OVERVIEW
Mason Street Advisors, LLC is the investment adviser for the Asset Allocation Portfolio (the “Portfolio”). The Portfolio is tactically and strategically managed to capitalize on changing financial markets and economic conditions following a flexible policy for allocating assets across the stock, bond and money market sectors. The Portfolio operates primarily as a “fund of funds” to gain the Portfolio’s equity and fixed income exposure by investing in one or more of the equity and international portfolios, and one or more of the fixed income portfolios of Northwestern Mutual Series Fund, Inc. (each an “Underlying Portfolio”). The adviser allocates the Portfolio’s assets among the Underlying Portfolios based on the adviser’s economic and market outlook and the investment objectives and strategies of the Underlying Portfolios. Under normal market conditions, the Portfolio will typically hold between55-75% of assets in equity investments,25-45% of assets in fixed income investments, and0-15% of assets in cash equivalent investments.
MARKET OVERVIEW
U.S. equity markets hit record highs until a sharpsell-off in the fourth quarter drove stocks lower for the year. Early year gains were driven by strong economic fundamentals, high consumer spending and stimulus from tax reform. Markets peaked in October, however, as investors became increasingly concerned that the pace of the U.S. Federal Reserve’s (the “Fed”) interest rate hikes could hurt economic growth and corporate earnings.
Markets were further rattled by several developments late in the year, including lower international growth forecasts, an escalation of the trade dispute between the U.S. and China and a partial U.S. government shutdown. Following the confluence of negative news, market sentiment turned negative, and investors began to consider the possibility of a recession in 2019.
In this environment, large cap stocks, as represented by the S&P 500® Index, posted a return of (4.38%), outperforming the S&P SmallCap 600® and the S&P MidCap 400® Indices, which returned (8.48%) and (11.08%), respectively. Meanwhile, the broader bond market’s return, as represented by the Bloomberg Barclays® U.S. Aggregate Index, was relatively unchanged, while the Bloomberg Barclays® U.S. Corporate High Yield Index declined (2.08%).
PORTFOLIO RESULTS
The Portfolio returned (4.88%) for the twelve months ended December 31, 2018, trailing the (4.38%) return of the broad stock market, as measured by the S&P 500® Index, and the Bloomberg Barclays® U.S. Aggregate Index return of 0.01%. The Portfolio outperformed the Asset Allocation Portfolio Blended Composite Benchmark return of (5.24%). (The benchmark weights are detailed in the “Benchmark Definitions” section of this annual report.) (These Indices are unmanaged, cannot be invested in directly and do not incur expenses.) When compared to peers in 2018, the Portfolio outperformed its Morningstar® Inc. Allocation – 50% to 70% Equity peer group average return of (5.40%) and its Lipper® Analytical Services, Inc. Mixed-Asset Target Allocation Growth Funds peer group average return of (6.64%). Morningstar® Inc. and Lipper® Analytical Services, Inc. are independent mutual fund ranking agencies.
Although the Portfolio outperformed relative to the blended benchmark, many of the Underlying Portfolios underperformed their respective benchmarks. However, the positive contribution of tactical asset allocation decisions outweighed the negative effect of underperformance by the majority of the Underlying Portfolios. Nonetheless, the Growth Stock Portfolio and value-oriented Underlying Portfolios outpaced their underlying benchmarks by relatively wide margins in a difficult environment for active management.
The Portfolio began the year with an overweight allocation to U.S. equities and an underweight allocation to fixed income. As anticipated earnings growth began to be priced in by markets, the Portfolio moved to a neutral position in equities in January. An early-year slide in equity prices made valuations more attractive, and the Portfolio again moved to an overweight allocation to equities later in the first quarter.
200
Asset Allocation Portfolio (unaudited)
In September, following gains in equity prices, the Portfolio reduced its equity holdings to an underweight position. As equities underperformed in the last quarter of 2018, this positioning also helped the Portfolio outperform its benchmark. At the end of the year, the Portfolio again moved to an overweight allocation to equities to take advantage of lower prices. The Portfolio also took a modest overweight position in emerging market equities as a sharp drop in value made these equities a better value relative to their risk profile.
PORTFOLIO MANAGER OUTLOOK
We are anticipating a generally positive environment for equities in 2019 following the stock market correction in late 2018, as valuations for many equities are more attractive. While economic growth is likely to slow, the fundamental environment for corporate earnings is still positive.
In particular, U.S. equities appear attractive heading into 2019. Growth in 2018 was relatively high for a developed economy, and we expect the U.S. to outperform the E.U. and Japan. While trade tensions remain a risk, there is also a potential opportunity. Trade fears have been a drag on stock prices, and if an accord between the U.S. and China is reached, markets will respond positively in our view. Our outlook for Europe, where growth stalled during 2018, is less positive. The possibility for complications related to Brexit is also a risk to European economic growth. By contrast, emerging market stocks, which were battered in 2018, have fallen to the point where they represent an attractive opportunity.
Market volatility was higher in 2018 than in prior years, and we expect this condition to continue, especially in light of continued quantitative tightening by the Fed. Higher volatility environments represent an opportunity for active management, and we will continue to shift asset allocations with an eye towards market trends and valuations.
Relative Performance

| | | | | | | | | | | | |
Average Annual Total Returns
For Periods Ended December 31, 2018 | |
| | | 1 Year | | | 5 Years | | | 10 Years | |
Asset Allocation Portfolio | | | -4.88 | % | | | 4.28 | % | | | 8.65 | % |
S&P 500® Index | | | -4.38 | % | | | 8.49 | % | | | 13.11 | % |
Bloomberg Barclays® U.S. Aggregate Index | | | 0.01 | % | | | 2.52 | % | | | 3.48 | % |
Asset Allocation Portfolio Blended Composite Benchmark | | | -5.24 | % | | | 4.91 | % | | | 10.22 | % |
Morningstar® US Insurance Fund Allocation - 50% to 70% Equity Index | | | -5.40 | % | | | 3.98 | % | | | 8.70 | % |
Lipper® Variable Insurance Products (VIP) Mixed Asset Target Allocation Growth Funds Average | | | -6.64 | % | | | 3.88 | % | | | 9.03 | % |
The performance data quoted represents past performance. Past performance is historical and does not guarantee future performance. Investment return and principal value will fluctuate, so that shares, when redeemed, may be worth more or less than their original cost. Currentperformance may be lower or higher than the performance data quoted. For the most recentmonth-end performance information visitwww.northwesternmutual.com.
This chart assumes an initial investment of $10,000 made on 12/31/08. Returns shown reflect fee waivers, deductions for management and other portfolio expenses, and reinvestment of all dividends. In the absence of fee waivers, total return would be reduced. Returns exclude deductions for separate account sale loads and account fees. Please refer to the Benchmark Definitions section of this report for information about the indices cited in the above chart and graph.
Investors should be aware of the risks of investments in foreign securities, particularly investments in securities of companies in developing nations. These include the risks of currency fluctuation, of political and economic instability and of less well-developed government supervision and regulation of business and industry practices, as well as differences in accounting standards. Small cap stocks also may carry additional risk. Smaller or newer issuers are more likely to realize more substantial growth as well as suffer more significant losses than larger or more established issuers. Investments in such companies can be both volatile and more speculative. Bonds and other debt obligations are affected by changes in interest rates,
201
Asset Allocation Portfolio (unaudited)
inflation risk and the creditworthiness of their issuers. High yield bonds generally have greater price swings and higher default risks than investment grade bonds.
The Portfolio obtains its exposure to equity and fixed income securities by investing in other Series Fund portfolios (Underlying Portfolios). Each of the Underlying Portfolios has its own investment risks, and the Portfolio is indirectly exposed to all the risks of the Underlying Portfolios in which it invests, including that risk that an Underlying Portfolio will not perform as expected. To the extent that the Portfolio invests a significant portion of its assets in a single Underlying Portfolio, it will be particularly sensitive to the risks associated with that Underlying Portfolio may have a significant effect on the Portfolio’s net asset value. The Portfolio will bear a pro rata share of the Underlying Portfolio’s expenses.
The Portfolio may use derivative instruments to gain exposure to certain markets, sectors or regions as alternatives to direct investments, to adjust the Portfolio duration, to provide increased flexibility in asset allocation, to earn income and to otherwise seek to enhance returns or to hedge foreign currency exposure. Use of these instruments may involve certain costs and risks such as liquidity risk, interest rate risk, mispricing or improper valuation. Certain derivatives involve leverage, which could magnify losses, and portfolios investing in derivatives could lose more than the principal amount invested in those investments.
The U.S. federal funds rate has been subject to moderate and steady increases over the course of the last three years. A significant rise in interest rates over a short period of time could cause significant losses in the market value of the Portfolio’s fixed income investments.
Top 10 Equity Holdings12/31/18
| | |
| Security Description | | % of Net Assets |
Northwestern Mutual Series Fund, Inc., Select Bond Portfolio | | 22.6% |
Northwestern Mutual Series Fund, Inc., High Yield Bond Portfolio | | 8.5% |
Northwestern Mutual Series Fund, Inc., Growth Stock Portfolio | | 7.6% |
Northwestern Mutual Series Fund, Inc., Research International Core Portfolio | | 6.8% |
Northwestern Mutual Series Fund, Inc., Mid Cap Growth Stock Portfolio | | 5.2% |
Northwestern Mutual Series Fund, Inc., Mid Cap Value Portfolio | | 4.9% |
Northwestern Mutual Series Fund, Inc., Large Cap Blend Portfolio | | 4.5% |
Northwestern Mutual Series Fund, Inc., Large Cap Core Stock Portfolio | | 4.3% |
Northwestern Mutual Series Fund, Inc., Domestic Equity Portfolio | | 4.0% |
Northwestern Mutual Series Fund, Inc., Large Company Value Portfolio | | 3.9% |
Sector Allocation12/31/18
| | |
| Sector | | % of Net Assets |
Domestic Equity | | 49.0% |
Fixed Income | | 31.1% |
Foreign Equity | | 15.1% |
Short-Term Investments & Other Net Assets | | 4.8% |
Sector Allocation and Top 10 Holdings are subject to change.
202
Asset Allocation Portfolio
SCHEDULE OF INVESTMENTS
December 31, 2018
| | | | | | | | |
| Investment Companies (95.2%) | | Shares/
Par+ | | | Value
$ (000’s) | |
| |
Domestic Equity (49.0%) | | | | | |
iShares Core S&PMid-Cap ETF | | | 17,825 | | | | 2,960 | |
iShares Russell 2000 ETF | | | 19,785 | | | | 2,649 | |
iShares RussellMid-Cap ETF | | | 14,000 | | | | 651 | |
Northwestern Mutual Series Fund, Inc., Domestic Equity Portfolio £ | | | 6,454,320 | | | | 9,998 | |
Northwestern Mutual Series Fund, Inc., Equity Income Portfolio £ | | | 6,279,726 | | | | 9,620 | |
Northwestern Mutual Series Fund, Inc., Focused Appreciation Portfolio £ | | | 3,805,538 | | | | 9,769 | |
Northwestern Mutual Series Fund, Inc., Growth Stock Portfolio £ | | | 6,849,802 | | | | 18,864 | |
Northwestern Mutual Series Fund, Inc., Large Cap Blend Portfolio £ | | | 10,360,808 | | | | 11,335 | |
Northwestern Mutual Series Fund, Inc., Large Cap Core Stock Portfolio £ | | | 8,175,364 | | | | 10,734 | |
Northwestern Mutual Series Fund, Inc., Large Company Value Portfolio £ | | | 11,015,580 | | | | 9,804 | |
Northwestern Mutual Series Fund, Inc., Mid Cap Growth Stock Portfolio £ | | | 4,772,961 | | | | 12,844 | |
Northwestern Mutual Series Fund, Inc., Mid Cap Value Portfolio £ | | | 8,562,805 | | | | 12,228 | |
Northwestern Mutual Series Fund, Inc., Small Cap Growth Stock Portfolio £ | | | 2,018,643 | | | | 4,736 | |
Northwestern Mutual Series Fund, Inc., Small Cap Value Portfolio £ | | | 3,009,450 | | | | 6,151 | |
| | | | | | | | |
Total | | | | | | | 122,343 | |
| | | | | | | | |
Fixed Income (31.1%) | | | | | |
Northwestern Mutual Series Fund, Inc., High Yield Bond Portfolio £ | | | 30,871,906 | | | | 21,209 | |
Northwestern Mutual Series Fund, Inc., Select Bond Portfolio £ | | | 45,892,340 | | | | 56,264 | |
| | | | | | | | |
Total | | | | | | | 77,473 | |
| | | | | | | | |
| |
Foreign Equity (15.1%) | | | | | |
iShares MSCI EAFE ETF | | | 24,397 | | | | 1,434 | |
iShares MSCI Emerging Markets ETF | | | 56,100 | | | | 2,191 | |
Northwestern Mutual Series Fund, Inc., Emerging Markets Equity Portfolio £ | | | 2,042,621 | | | | 1,920 | |
Northwestern Mutual Series Fund, Inc., International Equity Portfolio £ | | | 4,614,171 | | | | 7,291 | |
Northwestern Mutual Series Fund, Inc., International Growth Portfolio £ | | | 5,597,639 | | | | 7,803 | |
Northwestern Mutual Series Fund, Inc., Research International Core Portfolio £ | | | 19,325,741 | | | | 17,045 | |
| | | | | | | | |
Total | | | | | | | 37,684 | |
| | | | | | | | |
Total Investment Companies | | | | | | | | |
(Cost: $245,768) | | | | | | | 237,500 | |
| | | | | | | | |
| | |
| Short-Term Investments (5.5%) | | | | | | |
| |
Commercial Paper (2.8%) | | | | | |
Apple, Inc. 0.000%, 1/23/19 144A | | | 500,000 | | | | 499 | |
The Coca-Cola Co. 0.000%, 2/12/19 144A | | | 500,000 | | | | 499 | |
Exxon Mobil Corp. 0.000%, 1/8/19 | | | 1,000,000 | | | | 999 | |
| | | | | | | | |
| Short-Term Investments (5.5%) | | Shares/
Par+ | | | Value
$ (000’s) | |
| | |
Commercial Paper continued | | | | | | | | |
Marriott International, Inc. 0.000%, 1/2/19 144A | | | 500,000 | | | | 500 | |
Mondelez International, Inc. 0.000%, 1/30/19 144A | | | 1,000,000 | | | | 998 | |
Royal Bank of Canada 0.000%, 1/25/19 144A | | | 500,000 | | | | 499 | |
Societe Generale SA 0.000%, 1/17/19 144A | | | 500,000 | | | | 499 | |
United Parcel Service, Inc. 0.000%, 1/3/19 144A | | | 500,000 | | | | 500 | |
Walgreens Boots Alliance, Inc. 0.000%, 2/13/19 | | | 1,000,000 | | | | 996 | |
Walmart, Inc. 0.000%, 1/2/19 144A | | | 1,000,000 | | | | 1,000 | |
| | | | | | | | |
Total | | | | | | | 6,989 | |
| | | | | | | | |
| |
Money Market Funds (1.9%) | | | | | |
State Street Institutional U.S. Government Money Market Fund - Premier Class 2.270%# | | | 4,760,680 | | | | 4,761 | |
| | | | | | | | |
Total | | | | | | | 4,761 | |
| | | | | | | | |
| |
US Government & Agencies (0.8%) | | | | | |
Federal Home Loan Bank
0.000%, 1/11/19 | | | 1,000,000 | | | | 1,000 | |
0.000%, 4/15/19ß | | | 1,000,000 | | | | 993 | |
| | | | | | | | |
Total | | | | | | | 1,993 | |
| | | | | | | | |
Total Short-Term Investments | | | | | | | | |
(Cost: $13,743) | | | | | | | 13,743 | |
| | | | | | | | |
Total Investments (100.7%) | | | | | | | | |
(Cost: $259,511)@ | | | | | | | 251,243 | |
| | | | | | | | |
Other Assets, Less | | | | | | | | |
Liabilities(-0.7%) | | | | | | | (1,732 | ) |
| | | | | | | | |
Net Assets (100.0%) | | | | | | | 249,511 | |
| | | | | | | | |
The Accompanying Notes are an Integral Part of the Financial Statements.
203
Asset Allocation Portfolio
Exchange Traded or Centrally Cleared Derivatives Futures
| | | | | | | | | | | | | | | | |
| Issuer | | Long/Short | | Currency | | Notional
Par
(000’s) | | Number of
Contracts | | Expiration Date | | Notional
Value
(000’s) | | Unrealized
Appreciation/
(Depreciation)
(000’s) | | Variation
Margin
(000’s) |
E-Mini S&P 500 Futures | | Long | | USD | | 2 | | 49 | | 3/19 | | $6,138 | | $(35) | | $47 |
| | | | | | | | | | | | | | $(35) | | $47 |
| | | | | | | | | | | | | | |
| | | Financial Derivative Assets | | | | Financial Derivative Liabilities |
| | | Variation Margin (000’s) | | | | Variation Margin (000’s) | | | | Market Value
(000’s) |
| | | Swaps | | Futures | | Total | | Swaps | | Futures | | Total | | Options |
Total Exchange-Traded or Centrally Cleared Derivatives | | $ – | | $ 47 | | $ 47 | | $ – | | $ – | | $ – | | $ – |
| | | | | | | | | | | | | | |
| + | All par is stated in U.S Dollar unless otherwise noted. |
| 144A | Security exempt from registration under Rule 144A of the Securities Act of 1933. These securities may be resold as transactions exempt from registration, normally to qualified institutional buyers. At December 31, 2018 the value of these securities (in thousands) was $4,994 representing 2.0% of the net assets. |
| # | 7-Day yield as of 12/31/2018. |
| ß | Cash or securities with an aggregate value of $993 (in thousands) has been pledged as collateral for futures, swap contracts outstanding, short sales, when issued securities or written options on 12/31/2018. |
| @ | At December 31, 2018, the aggregate cost of investments, including derivatives, for federal tax purposes (in thousands) was $259,803 and the net unrealized depreciation of investments based on that cost was $8,596 which is comprised of $4,978 aggregate gross unrealized appreciation and $13,574 aggregate gross unrealized depreciation. |
The following is a summary of the inputs used in valuing the Portfolio’s assets and liabilities at December 31, 2018. See Note 3 for additional information on portfolio valuation.
| | | | | | | | | | | | | | |
| | | | | | Valuation Inputs | | | | | | |
| Description | | Level 1 – Quoted Prices | | | Level 2 – Other Significant
Observable Inputs | | | Level 3 – Significant
Unobservable Inputs | | | |
| | | | | | (Amounts in thousands)
| | | | | | |
Assets: | | | | | | | | | | | | | | |
Investment Companies | | $ | 237,500 | | | $ | - | | | $ | - | | | |
Short-Term Investments | | | | | | | | | | | | | | |
Money Market Funds | | �� | 4,761 | | | | - | | | | - | | | |
All Others | | | - | | | | 8,982 | | | | - | | | |
Total Assets: | | $ | 242,261 | | | $ | 8,982 | | | $ | - | | | |
Liabilities: | | | | | | | | | | | | | | |
Other Financial Instruments^ | | | | | | | | | | | | | | |
Futures | | | (35 | ) | | | - | | | | - | | | |
Total Liabilities: | | $ | (35 | ) | | $ | - | | | $ | - | | | |
^ Other financial instruments are derivative instruments such as futures and forwards, which are valued at the unrealized appreciation (depreciation) on the instrument, and securities sold short, reverse repurchase agreements, written options and swaps contracts, which are valued at market value.
The Accompanying Notes are an Integral Part of the Financial Statements.
204
Benchmark Definitions (unaudited)
The following indices are used to illustrate investment market, sector or style performance or to serve as Portfolio performance comparisons. Unlike the Portfolios, the indices are not professionally managed and do not incur fees or expenses. It is not possible to invest directly in an index.
1/3 each: Bloomberg Barclays® Global Aggregate —Credit Component ex Emerging Markets, Hedged USD; BofA Merrill Lynch® Global High YieldBB-B Rated Constrained Developed Markets Index, Hedged USD; JPMorgan® EMBI Global — The Bloomberg Barclays Global Aggregate — Credit Component ex Emerging Markets, Hedged USD provides a broad-based measure of the global developed markets investment grade fixed income markets. The BofA Merrill Lynch Global High YieldBB-B Rated Constrained Developed Markets Index, Hedged USD tracks the performance of below investment grade bonds of corporate issuers domiciled in developed market countries rated BB1 through B3, based on an average of Moody’s, S&P and Fitch. Qualifying bonds are capitalization weighted provided the total allocation to an individual issuer (defined by Bloomberg tickers) does not exceed 2%. Issuers that exceed the limit are reduced to 2% and the face value of each of their bonds is adjusted on apro-rata basis. Similarly, the face value of bonds of all other issuers that fall below the 2% cap are increased on apro-rata basis. The index is rebalanced on the last calendar day of the month. The JPMorgan EMBI Global tracks total returns for U.S. dollar-denominated debt instruments issued by emerging market sovereign and quasi-sovereign entities, Brady bonds, loans, Eurobonds and local market instruments. It is not possible to invest in an unmanaged index.
Asset Allocation Portfolio Blended Composite — The Asset Allocation Portfolio Blended Composite Benchmark is an unmanaged, hypothetical combination of unmanaged indices that correspond to the Asset Allocation Portfolio’s model allocation and consists of the Russell 3000® Index (50%), the MSCI® All Country World(ex-US) Index (15%), the Bloomberg Barclays® U.S. Aggregate Index (25%), and the Bloomberg Barclays® U.S. Corporate High Yield 2% Issuer Capped Index (10%).
Balanced Portfolio Blended Composite — The Balanced Portfolio Blended Composite Benchmark is an unmanaged, hypothetical combination of unmanaged indices that correspond to the Balanced Portfolio’s model allocation and consists of the Russell 3000® Index (40%), the MSCI® All Country World(ex-US) Index (10%), the Bloomberg Barclays® U.S. Aggregate Index (45%) and the Bloomberg Barclays® U.S. Corporate High Yield 2% Issuer Capped Index (5%).
Bloomberg Barclays®1-3 Year U.S. Government/Credit Bond Index — The Bloomberg Barclays®1-3 Year U.S. Government/Credit Bond Index is an unmanaged index of publicly issued medium and larger issues of U.S. Government, investment-grade corporate and investment-grade international dollar denominated bonds that have maturities of between one and three years.
Bloomberg Barclays® U.S. Aggregate Index — The Bloomberg Barclays® U.S. Aggregate Index is an unmanaged index of publicly issued investment-grade fixed-rate debt securities including corporate, U.S. Treasury and government agency securities, mortgage pass-through and asset-backed securities with remaining maturities of at least one year regardless of call features.
Bloomberg Barclays® U.S. Corporate High Yield 2% Issuer Capped Index — The Bloomberg Barclays® U. S. Corporate High Yield 2% Issuer Capped Index is an unmanaged index of U.S. Dollar-denominated,non-convertible, fixed-rate, noninvestment-grade debt. Issuers are capped at 2% of the Index. Index holdings must have at least one year to final maturity, at least $150 million par amount outstanding, and be publicly issued with a rating of Ba1 or lower.
Bloomberg Barclays® Global Credit Hedged USD Index — The Bloomberg Barclays® Global Credit Hedged USD Index is an unmanaged index composed of investment-grade and high yield credit securities from the Multiverse represented in U.S. dollars on a hedged basis (Multiverse is the merger of two groups: the Global Aggregate and the Global High Yield).
Bloomberg Barclays® Long-Term U.S. Treasury Index — The Bloomberg Barclays® Long-Term U.S. Treasury Index is an unmanaged index comprised of fixed-income securities with various maturities greater than 10 years.
Bloomberg Barclays® U.S. Treasury Inflation Protected Securities (TIPS) Index — The Bloomberg Barclays® U.S. Treasury Inflation Protected Securities (TIPS) Index is an unmanaged index of inflation-protected public obligations of the U.S. Treasury. The index is market capitalization weighted and includes all publicly-issued U.S. Treasury Inflation-Protected Securities that have at least one year remaining to maturity and have $250 million or more of outstanding face value.
205
Benchmark Definitions (unaudited)
Lipper® Variable Insurance Products (VIP) Average — Each Lipper® Variable Insurance Products (VIP) Average is calculated by Lipper® Analytical Services, Inc. and reflects the investment return of certain portfolios underlying variable life and annuity products. Source: Lipper®, Inc.
Morningstar® Insurance Fund Category Averages — Each Morningstar® category average is an equal-weighted category return. The calculation is simply the average of the returns at the end of the period for all the underlying variable insurance funds in a given category. Source: Morningstar®, Inc.
MSCI® All Country World(ex-US) Index — The MSCI® All Country World(ex-US) Index is an unmanaged, free float-adjusted market capitalization-weighted index that is designed to measure equity performance of companies in the developed and emerging markets, excluding the U.S.
MSCI® All Country World(ex-US) Growth Index— The MSCI® All Country World(ex-US) Growth Index is an unmanaged, free float-adjusted market capitalization-weighted index that is designed to measure equity performance of companies in the developed and emerging markets, excluding the U.S., with higher historical and forecasted growth characteristics.
MSCI EAFE®(Europe-Australasia-Far-East) Index — The MSCI EAFE®(“Europe-Australasia-Far East”) Index is an unmanaged, free float-adjusted, market capitalization-weighted index that is designed to measure equity performance of companies in the developed markets, excluding the U.S. & Canada.
MSCI EAFE®(Europe-Australasia-Far-East) Growth Index — The MSCI EAFE®(“Europe-Australasia-Far East”) Index is an unmanaged, free float-adjusted, market capitalization-weighted index that is designed to measure equity performance of companies in the developed markets, excluding the U.S. & Canada, with higher historical and forecasted growth characteristics.
MSCI® Emerging Markets Index — The MSCI® Emerging Markets Index is an unmanaged, free float-adjusted, market capitalization-weighted index that is designed to measure equity market performance in the global emerging markets.
Russell 1000® Growth Index — The Russell 1000® Growth Index is an unmanaged index that measures the performance of those companies in the Russell 1000® Index with higherprice-to-book ratios and higher forecasted growth values. The Russell 1000® Index is an unmanaged, market capitalization-weighted, large cap index that measures the performance of the 1000 largest companies in the Russell 3000® Index.
Russell 1000® Value Index — The Russell 1000® Value Index is an unmanaged index that measures the performance of those companies in the Russell 1000® Index with lowerprice-to-book ratios and lower forecasted growth values. The Russell 1000® Index is an unmanaged, market capitalization-weighted, large cap index that measures the performance of the 1000 largest companies in the Russell 3000® Index.
Russell 2000® Index — The Russell 2000® Index is an unmanaged, market capitalization-weighted index that measures the performance of the 2000 smallest of the 3000 largest publicly traded U.S. companies, based on total market capitalization.
Russell 2000® Growth Index— The Russell 2000® Growth Index is an unmanaged index that measures the performance of those companies in the Russell 2000® Index with higherprice-to-book ratios and higher forecasted growth values. The Russell 2000® Index is an unmanaged, market capitalization-weighted index that measures the performance of the 2000 smallest of the 3000 largest publicly traded U.S. companies, based on total market capitalization.
Russell 2000® Value Index — The Russell 2000® Value Index is an unmanaged index measures the performance of those companies in the Russell 2000® Index with lowerprice-to-book ratios and lower forecasted growth values. The Russell 2000® Index is an unmanaged, market-capitalization weighted index that measures the performance of the 2000 smallest of the 3000 largest publicly traded U.S. companies, based on total market capitalization.
Russell 3000® Index — The Russell 3000® Index measures the performance of the largest 3000 U.S. companies representing approximately 98% of the investable U.S. equity market.
206
Benchmark Definitions (unaudited)
Russell MidCap® Growth Index — The Russell MidCap® Growth Index is an unmanaged index that measures the performance of the Russell MidCap® companies with higherprice-to-book ratios and higher forecasted growth values. The Russell MidCap® Index is an unmanaged index that measures the performance of the 800 smallest companies in the Russell 1000® Index, which represents approximately 25% of the total market capitalization of the Russell 1000® Index.
Russell MidCap® Value Index — The Russell MidCap® Value Index is an unmanaged index that measures the performance of the Russell MidCap® companies with lowerprice-to-book and lower forecasted growth values. The Russell MidCap® Index is an unmanaged index that measures the performance of the 800 smallest companies in the Russell 1000® Index, which represents approximately 25% of the total market capitalization of the Russell 1000® Index.
S&P 500® Index — The S&P 500® Composite Stock Price Index is an unmanaged, capitalization-weighted index of 500 selected common stocks designed to measure the performance of the broad domestic economy.
S&P MidCap 400® Index — The S&P MidCap 400® Index is an unmanaged, capitalization-weighted index that measures the performance of themid-range sector of the U.S. stock market.
S&P SmallCap 600® Index — The S&P SmallCap 600® Index is an unmanaged index of 600 selected common stocks of U.S.-based companies with small market capitalizations.
207
Statements of Assets and Liabilities
NORTHWESTERN MUTUAL SERIES FUND, INC.
December 31, 2018 (in thousands)
| | | | | | | | | | | | | | | | | | | | |
| | | Growth
Stock
Portfolio | | | Focused
Appreciation
Portfolio | | | Large Cap
Core Stock
Portfolio | | | Large Cap
Blend
Portfolio | | | Index 500 Stock
Portfolio | |
Assets | | | | | | | | | | | | | | | | | | | | |
Unaffiliated Investments, at Value (1) | | $ | 898,936 | | | $ | 848,703 | | | $ | 517,701 | | | $ | 154,151 | | | $ | 3,006,180 | |
Cash | | | – | | | | – | | | | 2 | | | | – | | | | 18 | |
Receivable for Portfolio Shares Sold | | | 58 | | | | 283 | | | | 31 | | | | 75 | | | | 1,271 | |
Receivable for Investment Securities Sold | | | – | | | | – | | | | 1,386 | | | | – | | | | 892 | |
Variation Margin Receivable | | | – | | | | – | | | | – | | | | – | | | | 297 | |
Prepaid Expenses and Other Assets | | | 7 | | | | 7 | | | | 5 | | | | 2 | | | | 30 | |
Dividends and Interest Receivable | | | 356 | | | | 847 | | | | 645 | | | | 355 | | | | 3,448 | |
| | | | | | | | | | | | | | | | | | | | |
Total Assets | | | 899,357 | | | | 849,840 | | | | 519,770 | | | | 154,583 | | | | 3,012,136 | |
| | | | | | | | | | | | | | | | | | | | |
Liabilities | | | | | | | | | | | | | | | | | | | | |
Payable for Portfolio Shares Redeemed | | | 375 | | | | 174 | | | | 58 | | | | 21 | | | | 368 | |
Payable for Investment Securities Purchased | | | – | | | | – | | | | 510 | | | | – | | | | 2,003 | |
Investment Advisory Fees | | | 317 | | | | 453 | | | | 193 | | | | 102 | | | | 507 | |
Accrued Expenses | | | 39 | | | | 44 | | | | 38 | | | | 25 | | | | 117 | |
| | | | | | | | | | | | | | | | | | | | |
Total Liabilities | | | 731 | | | | 671 | | | | 799 | | | | 148 | | | | 2,995 | |
| | | | | | | | | | | | | | | | | | | | |
Net Assets | | $ | 898,626 | | | $ | 849,169 | | | $ | 518,971 | | | $ | 154,435 | | | $ | 3,009,141 | |
| | | | | | | | | | | | | | | | | | | | |
Represented By: | | | | | | | | | | | | | | | | | | | | |
Aggregate Paid in Capital (10) (11) | | $ | 664,669 | | | $ | 608,616 | | | $ | 500,913 | | | $ | 117,677 | | | $ | 1,438,433 | |
Total Distributable Earnings (Loss) | | | 233,957 | | | | 240,553 | | | | 18,058 | | | | 36,758 | | | | 1,570,708 | |
| | | | | | | | | | | | | | | | | | | | |
Net Assets for Shares Outstanding (10) (11) | | $ | 898,626 | | | $ | 849,169 | | | $ | 518,971 | | | $ | 154,435 | | | $ | 3,009,141 | |
| | | | | | | | | | | | | | | | | | | | |
Net Asset Value, Offering and Redemption Price per Share . | | $ | 2.75 | | | $ | 2.57 | | | $ | 1.31 | | | $ | 1.09 | | | $ | 4.59 | |
| | | | | | | | | | | | | | | | | | | | |
(1) Unaffiliated Investments, at Cost | | $ | 778,103 | | | $ | 667,924 | | | $ | 535,171 | | | $ | 134,324 | | | $ | 1,573,193 | |
(10) Shares Outstanding | | | 326,248 | | | | 330,846 | | | | 395,379 | | | | 141,167 | | | | 655,768 | |
(11) Shares Authorized, $.01 Par Value | | | 2,000,000 | | | | 2,000,000 | | | | 2,000,000 | | | | 2,000,000 | | | | 2,000,000 | |
The Accompanying Notes are an Integral Part of the Financial Statements.
208
Statements of Assets and Liabilities
NORTHWESTERN MUTUAL SERIES FUND, INC.
December 31, 2018 (in thousands)
| | | | | | | | | | | | | | | | | | | | |
| | | Large
Company
Value
Portfolio | | | Domestic
Equity
Portfolio | | | Equity
Income
Portfolio | | | Mid Cap
Growth
Stock
Portfolio | | | Index 400
Stock
Portfolio | |
Assets | | | | | | | | | | | | | | | | | | | | |
Unaffiliated Investments, at Value (1) | | $ | 173,682 | | | $ | 773,659 | | | $ | 702,943 | | | $ | 939,842 | | | $ | 792,140 | |
Foreign Currency, at Value (4) | | | – | | | | – | | | | 92 | | | | – | | | | – | |
Receivable for Portfolio Shares Sold | | | 12 | | | | 447 | | | | 227 | | | | 3,460 | | | | 539 | |
Receivable for Investment Securities Sold | | | 104 | | | | – | | | | – | | | | – | | | | 205 | |
Variation Margin Receivable | | | – | | | | – | | | | – | | | | – | | | | 160 | |
Receivable for Foreign Currency | | | 4 | | | | – | | | | – | | | | – | | | | – | |
Prepaid Expenses and Other Assets | | | 2 | | | | 6 | | | | 5 | | | | 8 | | | | 8 | |
Dividends and Interest Receivable | | | 395 | | | | 1,610 | | | | 1,904 | | | | 738 | | | | 904 | |
| | | | | | | | | | | | | | | | | | | | |
Total Assets | | | 174,199 | | | | 775,722 | | | | 705,171 | | | | 944,048 | | | | 793,956 | |
| | | | | | | | | | | | | | | | | | | | |
Liabilities | | | | | | | | | | | | | | | | | | | | |
Payable for Portfolio Shares Redeemed | | | 159 | | | | 85 | | | | 81 | | | | 197 | | | | 122 | |
Payable for Investment Securities Purchased | | | 51 | | | | 2,786 | | | | – | | | | – | | | | 825 | |
Payable for Foreign Currency | | | 161 | | | | – | | | | – | | | | – | | | | – | |
Collateral from Counterparty | | | 338 | | | | – | | | | – | | | | – | | | | – | |
Investment Advisory Fees | | | 103 | | | | 346 | | | | 370 | | | | 431 | | | | 161 | |
Accrued Expenses | | | 37 | | | | 40 | | | | 46 | | | | 50 | | | | 68 | |
| | | | | | | | | | | | | | | | | | | | |
Total Liabilities | | | 849 | | | | 3,257 | | | | 497 | | | | 678 | | | | 1,176 | |
| | | | | | | | | | | | | | | | | | | | |
Net Assets | | $ | 173,350 | | | $ | 772,465 | | | $ | 704,674 | | | $ | 943,370 | | | $ | 792,780 | |
| | | | | | | | | | | | | | | | | | | | |
Represented By: | | | | | | | | | | | | | | | | | | | | |
Aggregate Paid in Capital (10) (11) | | $ | 169,361 | | | $ | 559,746 | | | $ | 611,660 | | | $ | 965,044 | | | $ | 632,475 | |
Total Distributable Earnings (Loss) | | | 3,989 | | | | 212,719 | | | | 93,014 | | | | (21,674 | ) | | | 160,305 | |
| | | | | | | | | | | | | | | | | | | | |
Net Assets for Shares Outstanding (10) (11) | | $ | 173,350 | | | $ | 772,465 | | | $ | 704,674 | | | $ | 943,370 | | | $ | 792,780 | |
| | | | | | | | | | | | | | | | | | | | |
Net Asset Value, Offering and Redemption Price per Share . | | $ | 0.89 | | | $ | 1.55 | | | $ | 1.53 | | | $ | 2.69 | | | $ | 1.74 | |
| | | | | | | | | | | | | | | | | | | | |
(1) Unaffiliated Investments, at Cost | | $ | 185,529 | | | $ | 617,520 | | | $ | 674,424 | | | $ | 1,009,509 | | | $ | 703,007 | |
(4) Foreign Currency, at Cost | | | – | | | | – | | | | 91 | | | | – | | | | – | |
(10) Shares Outstanding | | | 194,839 | | | | 498,627 | | | | 459,841 | | | | 350,548 | | | | 456,806 | |
(11) Shares Authorized, $.01 Par Value | | | 2,000,000 | | | | 2,000,000 | | | | 2,000,000 | | | | 2,000,000 | | | | 2,000,000 | |
The Accompanying Notes are an Integral Part of the Financial Statements.
209
Statements of Assets and Liabilities
NORTHWESTERN MUTUAL SERIES FUND, INC.
December 31, 2018 (in thousands)
| | | | | | | | | | | | | | | | | | | | |
| | | Mid Cap Value
Portfolio | | | Small Cap
Growth Stock
Portfolio | | | Index 600
Stock Portfolio | | | Small Cap
Value Portfolio | | | International
Growth
Portfolio | |
Assets | | | | | | | | | | | | | | | | | | | | |
Unaffiliated Investments, at Value (1) | | $ | 469,113 | | | $ | 518,664 | | | $ | 221,950 | | | $ | 527,815 | | | $ | 625,500 | |
Cash | | | 12 | | | | – | | | | – | | | | – | | | | – | |
Foreign Currency, at Value (4) | | | – | | | | – | | | | – | | | | – | | | | 10 | |
Cash Collateral for Derivative Positions | | | – | | | | – | | | | 1,810 | | | | – | | | | – | |
Receivable for Portfolio Shares Sold | | | 3,571 | | | | 1,959 | | | | 173 | | | | 1,959 | | | | 345 | |
Receivable for Investment Securities Sold | | | 1,304 | | | | 48 | | | | 8 | | | | – | | | | – | |
Receivable for Foreign Currency | | | 37 | | | | – | | | | – | | | | – | | | | 3 | |
Prepaid Expenses and Other Assets | | | 4 | | | | 5 | | | | 7 | | | | 6 | | | | 5 | |
Dividends and Interest Receivable | | | 1,115 | | | | 321 | | | | 260 | | | | 798 | | | | 1,681 | |
| | | | | | | | | | | | | | | | | | | | |
Total Assets | | | 475,156 | | | | 520,997 | | | | 224,208 | | | | 530,578 | | | | 627,544 | |
| | | | | | | | | | | | | | | | | | | | |
Liabilities | | | | | | | | | | | | | | | | | | | | |
Payable for Portfolio Shares Redeemed | | | 70 | | | | 83 | | | | 42 | | | | 59 | | | | 170 | |
Payable for Investment Securities Purchased | | | 1,824 | | | | – | | | | 644 | | | | – | | | | 863 | |
Accrued Foreign Capital Gains Tax | | | – | | | | – | | | | – | | | | – | | | | 20 | |
Outstanding Swap Contracts, at Value (9) | | | – | | | | – | | | | 1,606 | | | | – | | | | – | |
Payable for Foreign Currency | | | 295 | | | | – | | | | – | | | | – | | | | 1 | |
Collateral from Counterparty | | | 667 | | | | – | | | | – | | | | – | | | | – | |
Investment Advisory Fees | | | 297 | | | | 246 | | | | 47 | | | | 394 | | | | 323 | |
Accrued Expenses | | | 60 | | | | 46 | | | | 66 | | | | 53 | | | | 85 | |
| | | | | | | | | | | | | | | | | | | | |
Total Liabilities | | | 3,213 | | | | 375 | | | | 2,405 | | | | 506 | | | | 1,462 | |
| | | | | | | | | | | | | | | | | | | | |
Net Assets | | $ | 471,943 | | | $ | 520,622 | | | $ | 221,803 | | | $ | 530,072 | | | $ | 626,082 | |
| | | | | | | | | | | | | | | | | | | | |
Represented By: | | | | | | | | | | | | | | | | | | | | |
Aggregate Paid in Capital (10) (11) | | $ | 470,803 | | | $ | 429,733 | | | $ | 199,299 | | | $ | 376,544 | | | $ | 587,435 | |
Total Distributable Earnings (Loss) | | | 1,140 | | | | 90,889 | | | | 22,504 | | | | 153,528 | | | | 38,647 | |
| | | | | | | | | | | | | | | | | | | | |
Net Assets for Shares Outstanding (10) (11) | | $ | 471,943 | | | $ | 520,622 | | | $ | 221,803 | | | $ | 530,072 | | | $ | 626,082 | |
| | | | | | | | | | | | | | | | | | | | |
Net Asset Value, Offering and Redemption Price per Share | | $ | 1.43 | | | $ | 2.35 | | | $ | 1.26 | | | $ | 2.04 | | | $ | 1.39 | |
| | | | | | | | | | | | | | | | | | | | |
(1) Unaffiliated Investments, at Cost | | $ | 519,900 | | | $ | 516,494 | | | $ | 216,237 | | | $ | 464,975 | | | $ | 595,659 | |
(4) Foreign Currency, at Cost | | | – | | | | – | | | | – | | | | – | | | | 10 | |
(9) Premiums Received from Swap Contracts | | | – | | | | – | | | | – | | | | – | | | | – | |
(10) Shares Outstanding | | | 330,377 | | | | 221,928 | | | | 176,424 | | | | 259,329 | | | | 449,041 | |
(11) Shares Authorized, $.01 Par Value | | | 2,000,000 | | | | 2,000,000 | | | | 2,000,000 | | | | 2,000,000 | | | | 2,000,000 | |
The Accompanying Notes are an Integral Part of the Financial Statements.
210
Statements of Assets and Liabilities
NORTHWESTERN MUTUAL SERIES FUND, INC.
December 31, 2018 (in thousands)
| | | | | | | | | | | | | | | | | | | | |
| | | Research
International
Core Portfolio | | | International
Equity Portfolio | | | Emerging
Markets Equity
Portfolio | | | Government
Money Market
Portfolio | | | Short-Term
Bond Portfolio | |
Assets | | | | | | | | | | | | | | | | | | | | |
Unaffiliated Investments, at Value (1) | | $ | 594,169 | | | $ | 1,600,701 | | | $ | 668,796 | | | $ | 264,540 | | | $ | 304,674 | |
Investments in Repurchase Agreements, at Value (3) | | | – | | | | – | | | | – | | | | 177,000 | | | | – | |
Foreign Currency, at Value (4) | | | 3 | | | | – | | | | 13 | | | | – | | | | – | |
Receivable for Portfolio Shares Sold | | | 357 | | | | 469 | | | | 9,951 | | | | 2,062 | | | | 432 | |
Receivable for Investment Securities Sold | | | 2,311 | | | | 205 | | | | 242 | | | | – | | | | – | |
Variation Margin Receivable | | | – | | | | – | | | | – | | | | – | | | | 47 | |
Receivable for Foreign Currency | | | 9 | | | | – | | | | – | | | | – | | | | – | |
Prepaid Expenses and Other Assets | | | 5 | | | | 12 | | | | 5 | | | | 1 | | | | 2 | |
Dividends and Interest Receivable | | | 1,941 | | | | 3,799 | | | | 1,229 | | | | 140 | | | | 1,699 | |
| | | | | | | | | | | | | | | | | | | | |
Total Assets | | | 598,795 | | | | 1,605,186 | | | | 680,236 | | | | 443,743 | | | | 306,854 | |
| | | | | | | | | | | | | | | | | | | | |
Liabilities | | | | | | | | | | | | | | | | | | | | |
Payable for Portfolio Shares Redeemed | | | 68 | | | | 250 | | | | 133 | | | | 115 | | | | 44 | |
Payable for Investment Securities Purchased | | | 2,633 | | | | – | | | | 3,301 | | | | – | | | | – | |
Accrued Foreign Capital Gains Tax | | | 54 | | | | – | | | | 830 | | | | – | | | | – | |
Payable to Custodian | | | – | | | | – | | | | – | | | | – | | | | 134 | |
Payable for Foreign Currency | | | 3 | | | | 3 | | | | – | | | | – | | | | – | |
Investment Advisory Fees | | | 377 | | | | 726 | | | | 539 | | | | 111 | | | | 86 | |
Accrued Expenses | | | 75 | | | | 139 | | | | 83 | | | | 43 | | | | 49 | |
| | | | | | | | | | | | | | | | | | | | |
Total Liabilities | | | 3,210 | | | | 1,118 | | | | 4,886 | | | | 269 | | | | 313 | |
| | | | | | | | | | | | | | | | | | | | |
Net Assets | | $ | 595,585 | | | $ | 1,604,068 | | | $ | 675,350 | | | $ | 443,474 | | | $ | 306,541 | |
| | | | | | | | | | | | | | | | | | | | |
Represented By: | | | | | | | | | | | | | | | | | | | | |
Aggregate Paid in Capital (10) (11) | | $ | 580,929 | | | $ | 1,588,353 | | | $ | 684,248 | | | $ | 443,474 | | | $ | 305,489 | |
Total Distributable Earnings (Loss) | | | 14,656 | | | | 15,715 | | | | (8,898 | ) | | | – | | | | 1,052 | |
| | | | | | | | | | | | | | | | | | | | |
Net Assets for Shares Outstanding (10) (11) | | $ | 595,585 | | | $ | 1,604,068 | | | $ | 675,350 | | | $ | 443,474 | | | $ | 306,541 | |
| | | | | | | | | | | | | | | | | | | | |
Net Asset Value, Offering and Redemption Price per Share | | $ | 0.88 | | | $ | 1.58 | | | $ | 0.94 | | | $ | 1.00 | | | $ | 1.03 | |
| | | | | | | | | | | | | | | | | | | | |
(1) Unaffiliated Investments, at Cost | | $ | 605,753 | | | $ | 1,706,102 | | | $ | 656,935 | | | $ | 264,540 | | | $ | 306,915 | |
(3) Investments in Repurchase Agreements, at Cost | | | – | | | | – | | | | – | | | | 177,000 | | | | – | |
(4) Foreign Currency, at Cost | | | 3 | | | | – | | | | 13 | | | | – | | | | – | |
(10) Shares Outstanding | | | 675,564 | | | | 1,015,360 | | | | 718,379 | | | | 443,472 | | | | 297,260 | |
(11) Shares Authorized, $.01 Par Value | | | 2,000,000 | | | | 3,000,000 | | | | 2,000,000 | | | | 2,000,000 | | | | 2,000,000 | |
The Accompanying Notes are an Integral Part of the Financial Statements.
211
Statements of Assets and Liabilities
NORTHWESTERN MUTUAL SERIES FUND, INC.
December 31, 2018 (in thousands)
| | | | | | | | | | | | | | | | | | | | |
| | | Select Bond
Portfolio | | | Long-Term U.S.
Government
Bond Portfolio | | | Inflation
Protection
Portfolio | | | High Yield Bond Portfolio | | | Multi-Sector
Bond Portfolio | |
Assets | | | | | | | | | | | | | | | | | | | | |
Unaffiliated Investments, at Value (1) | | $ | 3,137,164 | | | $ | 117,475 | | | $ | 352,646 | | | $ | 750,767 | | | $ | 785,986 | |
Investments in Repurchase Agreements, at Value (3) | | | – | | | | – | | | | – | | | | – | | | | 177,200 | |
Cash | | | – | | | | – | | | | – | | | | – | | | | 626 | |
Foreign Currency, at Value (4) | | | – | | | | – | | | | – | | | | – | | | | 1,212 | |
Cash Collateral for Derivative Positions | | | – | | | | 406 | | | | – | | | | – | | | | 10,695 | |
Receivable for Portfolio Shares Sold | | | 1,162 | | | | 19 | | | | 367 | | | | 369 | | | | 862 | |
Receivable for Investment Securities Sold | | | 280,512 | | | | 3,693 | | | | – | | | | – | | | | 33,227 | |
Receivable for Financing Transactions | | | – | | | | 95,967 | | | | – | | | | – | | | | – | |
Variation Margin Receivable | | | – | | | | 152 | | | | 207 | | | | – | | | | 652 | |
Outstanding Swap Contracts, at Value (8) | | | – | | | | – | | | | 369 | | | | – | | | | 19 | |
Receivable for Foreign Currency | | | – | | | | – | | | | 73 | | | | – | | | | 769 | |
Prepaid Expenses and Other Assets | | | 19 | | | | 2 | | | | 3 | | | | 5 | | | | 4 | |
Dividends and Interest Receivable | | | 16,315 | | | | 737 | | | | 1,584 | | | | 13,056 | | | | 10,091 | |
| | | | | | | | | | | | | | | | | | | | |
Total Assets | | | 3,435,172 | | | | 218,451 | | | | 355,249 | | | | 764,197 | | | | 1,021,343 | |
| | | | | | | | | | | | | | | | | | | | |
Liabilities | | | | | | | | | | | | | | | | | | | | |
Payable for Portfolio Shares Redeemed | | | 589 | | | | 294 | | | | 138 | | | | 200 | | | | 971 | |
Payable for Investment Securities Purchased | | | 465,745 | | | | 7,403 | | | | – | | | | 286 | | | | 136,063 | |
Payable for Financing Transactions | | | – | | | | 95,975 | | | | – | | | | – | | | | – | |
Accrued Foreign Capital Gains Tax | | | – | | | | – | | | | – | | | | – | | | | 2 | |
Variation Margin Payable | | | – | | | | 71 | | | | 172 | | | | – | | | | 22 | |
Outstanding Options Written, at Value (6) | | | – | | | | 10 | | | | – | | | | – | | | | 94 | |
Payable to Custodian | | | – | | | | – | | | | 6 | | | | – | | | | – | |
Securities Sold Short, at Value (7) | | | – | | | | 3,132 | | | | – | | | | – | | | | – | |
Payable for Reverse Repurchase Agreements | | | – | | | | – | | | | – | | | | – | | | | 984 | |
Outstanding Swap Contracts, at Value (9) | | | – | | | | – | | | | 4,937 | | | | – | | | | 980 | |
Payable for Foreign Currency | | | – | | | | – | | | | – | | | | – | | | | 1,016 | |
Collateral from Counterparty | | | – | | | | – | | | | 223 | | | | – | | | | 5,654 | |
Investment Advisory Fees | | | 747 | | | | 57 | | | | 150 | | | | 276 | | | | 517 | |
Accrued Expenses | | | 98 | | | | 41 | | | | 52 | | | | 69 | | | | 97 | |
| | | | | | | | | | | | | | | | | | | | |
Total Liabilities | | | 467,179 | | | | 106,983 | | | | 5,678 | | | | 831 | | | | 146,400 | |
| | | | | | | | | | | | | | | | | | | | |
Net Assets | | $ | 2,967,993 | | | $ | 111,468 | | | $ | 349,571 | | | $ | 763,366 | | | $ | 874,943 | |
| | | | | | | | | | | | | | | | | | | | |
Represented By: | | | | | | | | | | | | | | | | | | | | |
Aggregate Paid in Capital (10) (11) | | $ | 2,990,503 | | | $ | 119,359 | | | $ | 363,972 | | | $ | 777,372 | | | $ | 884,757 | |
Total Distributable Earnings (Loss) | | | (22,510 | ) | | | (7,891 | ) | | | (14,401 | ) | | | (14,006 | ) | | | (9,814 | ) |
| | | | | | | | | | | | | | | | | | | | |
Net Assets for Shares Outstanding (10) (11) | | $ | 2,967,993 | | | $ | 111,468 | | | $ | 349,571 | | | $ | 763,366 | | | $ | 874,943 | |
| | | | | | | | | | | | | | | | | | | | |
Net Asset Value, Offering and Redemption Price per Share | | $ | 1.23 | | | $ | 1.01 | | | $ | 1.06 | | | $ | 0.69 | | | $ | 1.05 | |
| | | | | | | | | | | | | | | | | | | | |
(1) Unaffiliated Investments, at Cost | | $ | 3,144,357 | | | $ | 120,949 | | | $ | 366,135 | | | $ | 806,746 | | | $ | 813,237 | |
(3) Investments in Repurchase Agreements, at Cost | | | – | | | | – | | | | – | | | | – | | | | 177,200 | |
(4) Foreign Currency, at Cost | | | – | | | | – | | | | – | | | | – | | | | 1,028 | |
(6) Premiums Received on Options Written | | | – | | | | 7 | | | | – | | | | – | | | | 61 | |
(7) Proceeds Received from Short Sales | | | – | | | | 3,104 | | | | – | | | | – | | | | – | |
(8) Premiums Paid on Swap Contracts | | | – | | | | 413 | | | | – | | | | – | | | | 6,597 | |
(9) Premiums Received from Swap Contracts | | | – | | | | 27 | | | | – | | | | – | | | | 4,703 | |
(10) Shares Outstanding | | | 2,420,551 | | | | 110,518 | | | | 328,837 | | | | 1,110,486 | | | | 835,932 | |
(11) Shares Authorized, $.01 Par Value | | | 6,000,000 | | | | 2,000,000 | | | | 2,000,000 | | | | 3,000,000 | | | | 2,000,000 | |
The Accompanying Notes are an Integral Part of the Financial Statements.
212
Statements of Assets and Liabilities
NORTHWESTERN MUTUAL SERIES FUND, INC.
December 31, 2018 (in thousands)
| | | | | | | | |
| | | Balanced
Portfolio | | | Asset
Allocation
Portfolio | |
Assets | | | | | | | | |
Unaffiliated Investments, at Value (1) | | $ | 193,441 | | | $ | 23,628 | |
Affiliated Investments, at Value (2) | | | 1,881,820 | | | | 227,615 | |
Receivable for Portfolio Shares Sold | | | 973 | | | | 45 | |
Receivable for Investment Securities Sold | | | 6,919 | | | | 1,169 | |
Variation Margin Receivable | | | 325 | | | | 47 | |
Prepaid Expenses and Other Assets | | | 14 | | | | 3 | |
Dividends and Interest Receivable | | | 10 | | | | 2 | |
| | | | | | | | |
Total Assets | | | 2,083,502 | | | | 252,509 | |
| | | | | | | | |
Liabilities | | | | | | | | |
Payable for Portfolio Shares Redeemed | | | 1,018 | | | | 57 | |
Payable for Investment Securities Purchased | | | 17,000 | | | | 2,900 | |
Investment Advisory Fees | | | 89 | | | | 11 | |
Accrued Expenses | | | 42 | | | | 30 | |
| | | | | | | | |
Total Liabilities | | | 18,149 | | | | 2,998 | |
| | | | | | | | |
Net Assets | | $ | 2,065,353 | | | $ | 249,511 | |
| | | | | | | | |
Represented By: | | | | | | | | |
Aggregate Paid in Capital (10) (11) | | $ | 1,966,105 | | | $ | 234,942 | |
Total Distributable Earnings (Loss) | | | 99,248 | | | | 14,569 | |
| | | | | | | | |
Net Assets for Shares Outstanding (10) (11) | | $ | 2,065,353 | | | $ | 249,511 | |
| | | | | | | | |
Net Asset Value, Offering and Redemption Price per Share . | | $ | 1.36 | | | $ | 1.10 | |
| | | | | | | | |
(1) Unaffiliated Investments, at Cost | | $ | 197,026 | | | $ | 24,403 | |
(2) Affiliated Investments, at Cost | | | 1,940,190 | | | | 235,108 | |
(10) Shares Outstanding | | | 1,518,569 | | | | 227,741 | |
(11) Shares Authorized, $.01 Par Value | | | 4,000,000 | | | | 2,000,000 | |
The Accompanying Notes are an Integral Part of the Financial Statements.
213
Statements of Operations
NORTHWESTERN MUTUAL SERIES FUND, INC.
For the year ended December 31, 2018 (in thousands)
| | | | | | | | | | | | | | | | | | | | |
| | | Growth Stock
Portfolio | | | Focused
Appreciation
Portfolio | | | Large Cap
Core Stock
Portfolio | | | Large Cap
Blend Portfolio | | | Index 500
Stock Portfolio | |
Investment Income | | | | | | | | | | | | | | | | | | | | |
Income | | | | | | | | | | | | | | | | | | | | |
Interest (1) | | $ | 378 | | | $ | 223 | | | $ | 45 | | | $ | 232 | | | $ | 735 | |
Unaffiliated Dividends (1) | | | 10,617 | | | | 11,864 | | | | 9,785 | | | | 3,195 | | | | 63,301 | |
| | | | | | | | | | | | | | | | | | | | |
Total Income | | | 10,995 | | | | 12,087 | | | | 9,830 | | | | 3,427 | | | | 64,036 | |
| | | | | | | | | | | | | | | | | | | | |
Expenses | | | | | | | | | | | | | | | | | | | | |
Investment Advisory Fees | | | 4,157 | | | | 6,904 | | | | 2,500 | | | | 1,296 | | | | 6,599 | |
Custodian Fees | | | 10 | | | | 18 | | | | 28 | | | | 9 | | | | 26 | |
Shareholder Reporting Fees | | | 26 | | | | 41 | | | | 21 | | | | 6 | | | | 78 | |
Audit Fees | | | 28 | | | | 26 | | | | 26 | | | | 25 | | | | 45 | |
Valuation Services | | | 1 | | | | – | | | | 2 | | | | – | | | | 7 | |
Compliance Fees | | | 8 | | | | 8 | | | | 7 | | | | 7 | | | | 14 | |
Directors Fees | | | 42 | | | | 40 | | | | 38 | | | | 33 | | | | 76 | |
Professional Fees | | | 10 | | | | 10 | | | | 9 | | | | 8 | | | | 13 | |
Trade Name Fees | | | – | | | | – | | | | – | | | | – | | | | 96 | |
Other Expenses | | | 12 | | | | 11 | | | | 7 | | | | 2 | | | | 37 | |
| | | | | | | | | | | | | | | | | | | | |
Total Expenses | | | 4,294 | | | | 7,058 | | | | 2,638 | | | | 1,386 | | | | 6,991 | |
| | | | | | | | | | | | | | | | | | | | |
Less Waived Fees: | | | | | | | | | | | | | | | | | | | | |
Paid by Affiliate | | | (104 | ) | | | (1,144 | ) | | | (32 | ) | | | – | | | | (260 | ) |
| | | | | | | | | | | | | | | | | | | | |
Net Expenses | | | 4,190 | | | | 5,914 | | | | 2,606 | | | | 1,386 | | | | 6,731 | |
| | | | | | | | | | | | | | | | | | | | |
Net Investment Income (Loss) | | | 6,805 | | | | 6,173 | | | | 7,224 | | | | 2,041 | | | | 57,305 | |
Realized and Unrealized Gain (Loss) on Investments | | | | | | | | | | | | | | | | | | | | |
Net Realized Gain (Loss) on: | | | | | | | | | | | | | | | | | | | | |
Unaffiliated Investment Securities | | | 106,549 | | | | 54,399 | | | | 28,558 | | | | 15,518 | | | | 84,015 | |
Futures Contracts | | | – | | | | – | | | | – | | | | – | | | | (88 | ) |
Foreign Currency Transactions | | | – | | | | – | | | | 1 | | | | – | | | | – | |
| | | | | | | | | | | | | | | | | | | | |
Net Realized Gain (Loss) on Investments | | | 106,549 | | | | 54,399 | | | | 28,559 | | | | 15,518 | | | | 83,927 | |
| | | | | | | | | | | | | | | | | | | | |
Net Unrealized Appreciation (Depreciation) of: | | | | | | | | | | | | | | | | | | | | |
Unaffiliated Investment Securities | | | (95,027 | ) | | | (76,232 | ) | | | (67,699 | ) | | | (23,563 | ) | | | (280,813 | ) |
Futures Contracts | | | – | | | | – | | | | – | | | | – | | | | (1,110 | ) |
| | | | | | | | | | | | | | | | | | | | |
Net Change in Unrealized Appreciation (Depreciation) of Investments | | | (95,027 | ) | | | (76,232 | ) | | | (67,699 | ) | | | (23,563 | ) | | | (281,923 | ) |
| | | | | | | | | | | | | | | | | | | | |
Net Gain (Loss) on Investments | | | 11,522 | | | | (21,833 | ) | | | (39,140 | ) | | | (8,045 | ) | | | (197,996 | ) |
| | | | | | | | | | | | | | | | | | | | |
Net Increase (Decrease) in Net Assets Resulting from Operations | | $ | 18,327 | | | $ | (15,660 | ) | | $ | (31,916 | ) | | $ | (6,004 | ) | | $ | (140,691 | ) |
| | | | | | | | | | | | | | | | | | | | |
(1) Net of Foreign Tax | | $ | – | | | $ | 308 | | | $ | 64 | | | $ | 48 | | | $ | – | |
The Accompanying Notes are an Integral Part of the Financial Statements.
214
Statements of Operations
NORTHWESTERN MUTUAL SERIES FUND, INC.
For the year ended December 31, 2018 (in thousands)
| | | | | | | | | | | | | | | | | | | | |
| | | Large
Company
Value Portfolio | | | Domestic
Equity
Portfolio | | | Equity
Income
Portfolio | | | Mid Cap Growth Stock Portfolio | | | Index 400
Stock Portfolio | |
Investment Income | | | | | | | | | | | | | | | | | | | | |
Income | | | | | | | | | | | | | | | | | | | | |
Interest (1) | | $ | 66 | | | $ | 239 | | | $ | 485 | | | $ | 19 | | | $ | 436 | |
Unaffiliated Dividends (1) | | | 5,057 | | | | 20,117 | | | | 22,650 | | | | 7,935 | | | | 13,594 | |
| | | | | | | | | | | | | | | | | | | | |
Total Income | | | 5,123 | | | | 20,356 | | | | 23,135 | | | | 7,954 | | | | 14,030 | |
| | | | | | | | | | | | | | | | | | | | |
Expenses | | | | | | | | | | | | | | | | | | | | |
Investment Advisory Fees | | | 1,351 | | | | 4,370 | | | | 5,105 | | | | 5,736 | | | | 2,269 | |
Custodian Fees | | | 46 | | | | 9 | | | | 18 | | | | 28 | | | | 20 | |
Shareholder Reporting Fees | | | 8 | | | | 37 | | | | 38 | | | | 39 | | | | 47 | |
Audit Fees | | | 25 | | | | 26 | | | | 27 | | | | 31 | | | | 26 | |
Valuation Services | | | 5 | | | | 1 | | | | 1 | | | | 1 | | | | 5 | |
Compliance Fees | | | 7 | | | | 8 | | | | 8 | | | | 8 | | | | 8 | |
Directors Fees | | | 33 | | | | 39 | | | | 40 | | | | 45 | | | | 40 | |
Professional Fees | | | 8 | | | | 9 | | | | 10 | | | | 11 | | | | 11 | |
Trade Name Fees | | | – | | | | – | | | | – | | | | – | | | | 94 | |
Other Expenses | | | 2 | | | | 9 | | | | 10 | | | | 13 | | | | 10 | |
| | | | | | | | | | | | | | | | | | | | |
Total Expenses | | | 1,485 | | | | 4,508 | | | | 5,257 | | | | 5,912 | | | | 2,530 | |
| | | | | | | | | | | | | | | | | | | | |
Less Waived Fees: | | | | | | | | | | | | | | | | | | | | |
Paid by Affiliate | | | (39 | ) | | | (99 | ) | | | (288 | ) | | | (14 | ) | | | (204 | ) |
| | | | | | | | | | | | | | | | | | | | |
Net Expenses | | | 1,446 | | | | 4,409 | | | | 4,969 | | | | 5,898 | | | | 2,326 | |
| | | | | | | | | | | | | | | | | | | | |
Net Investment Income (Loss) | | | 3,677 | | | | 15,947 | | | | 18,166 | | | | 2,056 | | | | 11,704 | |
Realized and Unrealized Gain (Loss) on Investments | | | | | | | | | | | | | | | | | | | | |
Net Realized Gain (Loss) on: | | | | | | | | | | | | | | | | | | | | |
Unaffiliated Investment Securities | | | 13,647 | | | | 40,633 | | | | 48,106 | | | | 47,139 | | | | 63,920 | |
Futures Contracts | | | – | | | | – | | | | – | | | | – | | | | (2,694 | ) |
Foreign Currency Transactions | | | 692 | | | | – | | | | 4 | | | | – | | | | – | |
| | | | | | | | | | | | | | | | | | | | |
Net Realized Gain (Loss) on Investments | | | 14,339 | | | | 40,633 | | | | 48,110 | | | | 47,139 | | | | 61,226 | |
| | | | | | | | | | | | | | | | | | | | |
Net Unrealized Appreciation (Depreciation) of: | | | | | | | | | | | | | | | | | | | | |
Unaffiliated Investment Securities | | | (32,836 | ) | | | (77,719 | ) | | | (137,662 | ) | | | (119,657 | ) | | | (171,991 | ) |
Futures Contracts | | | – | | | | – | | | | – | | | | – | | | | (1,097 | ) |
Foreign Currency Transactions | | | 35 | | | | – | | | | (3 | ) | | | – | | | | – | |
| | | | | | | | | | | | | | | | | | | | |
Net Change in Unrealized Appreciation (Depreciation) of Investments | | | (32,801 | ) | | | (77,719 | ) | | | (137,665 | ) | | | (119,657 | ) | | | (173,088 | ) |
| | | | | | | | | | | | | | | | | | | | |
Net Gain (Loss) on Investments | | | (18,462 | ) | | | (37,086 | ) | | | (89,555 | ) | | | (72,518 | ) | | | (111,862 | ) |
| | | | | | | | | | | | | | | | | | | | |
Net Increase (Decrease) in Net Assets Resulting from Operations | | $ | (14,785 | ) | | $ | (21,139 | ) | | $ | (71,389 | ) | | $ | (70,462 | ) | | $ | (100,158 | ) |
| | | | | | | | | | | | | | | | | | | | |
(1) Net of Foreign Tax | | $ | 73 | | | $ | – | | | $ | 266 | | | $ | 40 | | | $ | 7 | |
The Accompanying Notes are an Integral Part of the Financial Statements.
215
Statements of Operations
NORTHWESTERN MUTUAL SERIES FUND, INC.
For the year ended December 31, 2018 (in thousands)
| | | | | | | | | | | | | | | | | | | | |
| | | Mid Cap Value
Portfolio | | | Small Cap
Growth Stock
Portfolio | | | Index 600
Stock
Portfolio | | | Small Cap Value Portfolio | | | International
Growth
Portfolio | |
Investment Income | | | | | | | | | | | | | | | | | | | | |
Income | | | | | | | | | | | | | | | | | | | | |
Interest (1) | | $ | 257 | | | $ | 175 | | | $ | 267 | | | $ | 188 | | | $ | 455 | |
Unaffiliated Dividends (1) | | | 11,836 | | | | 3,997 | | | | 3,086 | | | | 8,070 | | | | 12,698 | |
| | | | | | | | | | | | | | | | | | | | |
Total Income | | | 12,093 | | | | 4,172 | | | | 3,353 | | | | 8,258 | | | | 13,153 | |
| | | | | | | | | | | | | | | | | | | | |
Expenses | | | | | | | | | | | | | | | | | | | | |
Investment Advisory Fees | | | 4,568 | | | | 3,381 | | | | 590 | | | | 5,413 | | | | 4,113 | |
Custodian Fees | | | 62 | | | | 18 | | | | 28 | | | | 21 | | | | 144 | |
Shareholder Reporting Fees | | | 51 | | | | 43 | | | | 24 | | | | 54 | | | | 60 | |
Audit Fees | | | 25 | | | | 26 | | | | 23 | | | | 26 | | | | 27 | |
Valuation Services | | | 1 | | | | 2 | | | | 8 | | | | 2 | | | | 14 | |
Compliance Fees | | | 7 | | | | 8 | | | | 7 | | | | 8 | | | | 8 | |
Directors Fees | | | 36 | | | | 38 | | | | 33 | | | | 38 | | | | 35 | |
Professional Fees | | | 9 | | | | 9 | | | | 9 | | | | 9 | | | | 16 | |
Trade Name Fees | | | – | | | | – | | | | 25 | | | | – | | | | – | |
Other Expenses | | | 6 | | | | 7 | | | | 2 | | | | 8 | | | | 8 | |
| | | | | | | | | | | | | | | | | | | | |
Total Expenses | | | 4,765 | | | | 3,532 | | | | 749 | | | | 5,579 | | | | 4,425 | |
| | | | | | | | | | | | | | | | | | | | |
Less Waived Fees: | | | | | | | | | | | | | | | | | | | | |
Paid by Affiliate | | | (708 | ) | | | – | | | | – | | | | (68 | ) | | | – | |
| | | | | | | | | | | | | | | | | | | | |
Net Expenses | | | 4,057 | | | | 3,532 | | | | 749 | | | | 5,511 | | | | 4,425 | |
| | | | | | | | | | | | | | | | | | | | |
Net Investment Income (Loss) | | | 8,036 | | | | 640 | | | | 2,604 | | | | 2,747 | | | | 8,728 | |
Realized and Unrealized Gain (Loss) on Investments | | | | | | | | | | | | | | | | | | | | |
Net Realized Gain (Loss) on: | | | | | | | | | | | | | | | | | | | | |
Unaffiliated Investment Securities | | | 46,398 | | | | 88,443 | | | | 15,714 | | | | 88,748 | | | | 21,977 | |
Swap Contracts | | | – | | | | – | | | | 317 | | | | – | | | | – | |
Foreign Currency Transactions | | | 1,228 | | | | – | | | | – | | | | – | | | | (122 | ) |
| | | | | | | | | | | | | | | | | | | | |
Net Realized Gain (Loss) on Investments | | | 47,626 | | | | 88,443 | | | | 16,031 | | | | 88,748 | | | | 21,855 | |
| | | | | | | | | | | | | | | | | | | | |
Net Unrealized Appreciation (Depreciation) of: | | | | | | | | | | | | | | | | | | | | |
Unaffiliated Investment Securities | | | (123,438 | ) | | | (155,661 | ) | | | (39,348 | ) | | | (167,486 | ) | | | (108,608 | ) |
Swap Contracts | | | – | | | | – | | | | (1,616 | ) | | | – | | | | – | |
Foreign Currency Transactions | | | 23 | | | | – | | | | – | | | | – | | | | (17 | ) |
| | | | | | | | | | | | | | | | | | | | |
Net Change in Unrealized Appreciation (Depreciation) of Investments | | | (123,415 | ) | | | (155,661 | ) | | | (40,964 | ) | | | (167,486 | ) | | | (108,625 | ) |
| | | | | | | | | | | | | | | | | | | | |
Net Gain (Loss) on Investments | | | (75,789 | ) | | | (67,218 | ) | | | (24,933 | ) | | | (78,738 | ) | | | (86,770 | ) |
| | | | | | | | | | | | | | | | | | | | |
Net Increase (Decrease) in Net Assets Resulting from Operations | | $ | (67,753 | ) | | $ | (66,578 | ) | | $ | (22,329 | ) | | $ | (75,991 | ) | | $ | (78,042 | ) |
| | | | | | | | | | | | | | | | | | | | |
(1) Net of Foreign Tax | | $ | 69 | | | $ | – | | | $ | 1 | | | $ | 13 | | | $ | 340 | |
The Accompanying Notes are an Integral Part of the Financial Statements.
216
Statements of Operations
NORTHWESTERN MUTUAL SERIES FUND, INC.
For the year ended December 31, 2018 (in thousands)
| | | | | | | | | | | | | | | | | | | | |
| | | Research International
Core
Portfolio | | | International
Equity
Portfolio | | | Emerging
Markets Equity
Portfolio | | | Government Money Market
Portfolio | | | Short–Term
Bond Portfolio | |
Investment Income | | | | | | | | | | | | | | | | | | | | |
Income | | | | | | | | | | | | | | | | | | | | |
Interest (1) | | $ | 152 | | | $ | 684 | | | $ | 235 | | | $ | 7,946 | | | $ | 7,580 | |
Unaffiliated Dividends (1) | | | 16,987 | | | | 52,748 | | | | 15,338 | | | | – | | | | – | |
| | | | | | | | | | | | | | | | | | | | |
Total Income | | | 17,139 | | | | 53,432 | | | | 15,573 | | | | 7,946 | | | | 7,580 | |
| | | | | | | | | | | | | | | | | | | | |
Expenses | | | | | | | | | | | | | | | | | | | | |
Investment Advisory Fees | | | 5,042 | | | | 12,080 | | | | 7,357 | | | | 1,275 | | | | 994 | |
Custodian Fees | | | 120 | | | | 239 | | | | 135 | | | | 52 | | | | 35 | |
Shareholder Reporting Fees | | | 48 | | | | 99 | | | | 60 | | | | 21 | | | | 24 | |
Audit Fees | | | 27 | | | | 35 | | | | 26 | | | | 26 | | | | 28 | |
Valuation Services | | | 14 | | | | 14 | | | | 14 | | | | 6 | | | | 38 | |
Compliance Fees | | | 8 | | | | 10 | | | | 8 | | | | 7 | | | | 7 | |
Directors Fees | | | 34 | | | | 50 | | | | 34 | | | | 37 | | | | 34 | |
Professional Fees | | | 17 | | | | 71 | | | | 16 | | | | 5 | | | | 7 | |
Other Expenses | | | 7 | | | | 22 | | | | 8 | | | | 8 | | | | 3 | |
| | | | | | | | | | | | | | | | | | | | |
Total Expenses | | | 5,317 | | | | 12,620 | | | | 7,658 | | | | 1,437 | | | | 1,170 | |
| | | | | | | | | | | | | | | | | | | | |
Less Waived Fees: | | | | | | | | | | | | | | | | | | | | |
Paid by Affiliate | | | (323 | ) | | | (2,659 | ) | | | (794 | ) | | | – | | | | – | |
| | | | | | | | | | | | | | | | | | | | |
Net Expenses | | | 4,994 | | | | 9,961 | | | | 6,864 | | | | 1,437 | | | | 1,170 | |
| | | | | | | | | | | | | | | | | | | | |
Net Investment Income (Loss) | | | 12,145 | | | | 43,471 | | | | 8,709 | | | | 6,509 | | | | 6,410 | |
Realized and Unrealized Gain (Loss) on Investments | | | | | | | | | | | | | | | | | | | | |
Net Realized Gain (Loss) on: | | | | | | | | | | | | | | | | | | | | |
Unaffiliated Investment Securities | | | 24,259 | | | | 104,398 | | | | (10,557 | ) | | | 1 | | | | (477 | ) |
Futures Contracts | | | – | | | | – | | | | – | | | | – | | | | (478 | ) |
Foreign Currency Transactions | | | (409 | ) | | | (405 | ) | | | (143 | ) | | | – | | | | – | |
| | | | | | | | | | | | | | | | | | | | |
Net Realized Gain (Loss) on Investments | | | 23,850 | | | | 103,993 | | | | (10,700 | ) | | | 1 | | | | (955 | ) |
| | | | | | | | | | | | | | | | | | | | |
Net Unrealized Appreciation (Depreciation) of: | | | | | | | | | | | | | | | | | | | | |
Unaffiliated Investment Securities | | | (127,112 | ) | | | (437,776 | ) | | | (97,712 | ) | | | – | | | | (1,705 | ) |
Futures Contracts | | | – | | | | – | | | | – | | | | – | | | | 529 | |
Foreign Currency Transactions | | | (41 | ) | | | (117 | ) | | | (7 | ) | | | – | | | | – | |
| | | | | | | | | | | | | | | | | | | | |
Net Change in Unrealized Appreciation (Depreciation) of Investments | | | (127,153 | ) | | | (437,893 | ) | | | (97,719 | ) | | | – | | | | (1,176 | ) |
| | | | | | | | | | | | | | | | | | | | |
Net Gain (Loss) on Investments | | | (103,303 | ) | | | (333,900 | ) | | | (108,419 | ) | | | 1 | | | | (2,131 | ) |
| | | | | | | | | | | | | | | | | | | | |
Net Increase (Decrease) in Net Assets Resulting from Operations | | $ | (91,158 | ) | | $ | (290,429 | ) | | $ | (99,710 | ) | | $ | 6,510 | | | $ | 4,279 | |
| | | | | | | | | | | | | | | | | | | | |
(1) Net of Foreign Tax | | $ | 416 | | | $ | 1,201 | | | $ | 401 | | | $ | – | | | $ | 3 | |
The Accompanying Notes are an Integral Part of the Financial Statements.
217
Statements of Operations
NORTHWESTERN MUTUAL SERIES FUND, INC.
For the year ended December 31, 2018 (in thousands)
| | | | | | | | | | | | | | | | | | | | |
| | | Select Bond
Portfolio | | | Long –
Term U.S. Government
Bond
Portfolio | | | Inflation
Protection
Portfolio | | | High Yield
Bond Portfolio | | | Multi–Sector
Bond
Portfolio | |
Investment Income | | | | | | | | | | | | | | | | | | | | |
Income | | | | | | | | | | | | | | | | | | | | |
Interest (1) | | $ | 91,194 | | | $ | 3,679 | | | $ | 11,200 | | | $ | 48,938 | | | $ | 38,239 | |
| | | | | | | | | | | | | | | | | | | | |
Total Income | | | 91,194 | | | | 3,679 | | | | 11,200 | | | | 48,938 | | | | 38,239 | |
| | | | | | | | | | | | | | | | | | | | |
Expenses | | | | | | | | | | | | | | | | | | | | |
Investment Advisory Fees | | | 8,977 | | | | 603 | | | | 1,949 | | | | 3,360 | | | | 6,700 | |
Custodian Fees | | | 76 | | | | 21 | | | | 24 | | | | 12 | | | | 149 | |
Shareholder Reporting Fees | | | 74 | | | | 8 | | | | 44 | | | | 66 | | | | 50 | |
Audit Fees | | | 38 | | | | 40 | | | | 28 | | | | 40 | | | | 45 | |
Valuation Services | | | 46 | | | | 6 | | | | 23 | | | | 31 | | | | 34 | |
Compliance Fees | | | 13 | | | | 6 | | | | 7 | | | | 8 | | | | 8 | |
Directors Fees | | | 59 | | | | 32 | | | | 34 | | | | 39 | | | | 38 | |
Professional Fees | | | 13 | | | | 10 | | | | 7 | | | | 9 | | | | 10 | |
Interest Expense | | | – | | | | 260 | | | | – | | | | – | | | | 89 | |
Other Expenses | | | 35 | | | | 1 | | | | 6 | | | | 10 | | | | 10 | |
| | | | | | | | | | | | | | | | | | | | |
Total Expenses | | | 9,331 | | | | 987 | | | | 2,122 | | | | 3,575 | | | | 7,133 | |
| | | | | | | | | | | | | | | | | | | | |
Less Waived Fees: | | | | | | | | | | | | | | | | | | | | |
Paid by Affiliate | | | (198 | ) | | | (17 | ) | | | (138 | ) | | | – | | | | (665 | ) |
| | | | | | | | | | | | | | | | | | | | |
Net Expenses | | | 9,133 | | | | 970 | | | | 1,984 | | | | 3,575 | | | | 6,468 | |
| | | | | | | | | | | | | | | | | | | | |
Net Investment Income (Loss) | | | 82,061 | | | | 2,709 | | | | 9,216 | | | | 45,363 | | | | 31,771 | |
Realized and Unrealized Gain (Loss) on Investments | | | | | | | | | | | | | | | | | | | | |
Net Realized Gain (Loss) on: | | | | | | | | | | | | | | | | | | | | |
Unaffiliated Investment Securities | | | (83,942 | ) | | | (2,804 | ) | | | (2,773 | ) | | | 1,585 | | | | 1,340 | |
Futures Contracts | | | – | | | | (1,351 | ) | | | 2,332 | | | | – | | | | (8,020 | ) |
Options Written | | | – | | | | 42 | | | | – | | | | – | | | | 534 | |
Short Sales | | | – | | | | 14 | | | | – | | | | – | | | | – | |
Swap Contracts | | | – | | | | (26 | ) | | | (28 | ) | | | – | | | | 3,453 | |
Foreign Currency Transactions | | | – | | | | – | | | | 139 | | | | – | | | | 8,167 | |
Reverse Repurchase Agreements | | | – | | | | – | | | | – | | | | – | | | | 98 | |
| | | | | | | | | | | | | | | | | | | | |
Net Realized Gain (Loss) on Investments | | | (83,942 | ) | | | (4,125 | ) | | | (330 | ) | | | 1,585 | | | | 5,572 | |
| | | | | | | | | | | | | | | | | | | | |
Net Unrealized Appreciation (Depreciation) of: | | | | | | | | | | | | | | | | | | | | |
Unaffiliated Investment Securities | | | (3,374 | ) | | | (2,846 | ) | | | (17,093 | ) | | | (68,201 | ) | | | (49,704 | ) |
Futures Contracts | | | – | | | | 1,514 | | | | (731 | ) | | | – | | | | 4,459 | |
Options Written | | | – | | | | (3 | ) | | | – | | | | – | | | | (34 | ) |
Short Sales | | | – | | | | (29 | ) | | | – | | | | – | | | | – | |
Swap Contracts | | | – | | | | 376 | | | | (1,730 | ) | | | – | | | | (6,197 | ) |
Foreign Currency Transactions | | | – | | | | – | | | | 148 | | | | – | | | | 2,857 | |
| | | | | | | | | | | | | | | | | | | | |
Net Change in Unrealized Appreciation (Depreciation) of Investments | | | (3,374 | ) | | | (988 | ) | | | (19,406 | ) | | | (68,201 | ) | | | (48,619 | ) |
| | | | | | | | | | | | | | | | | | | | |
Net Gain (Loss) on Investments | | | (87,316 | ) | | | (5,113 | ) | | | (19,736 | ) | | | (66,616 | ) | | | (43,047 | ) |
| | | | | | | | | | | | | | | | | | | | |
Net Increase (Decrease) in Net Assets Resulting from Operations | | $ | (5,255 | ) | | $ | (2,404 | ) | | $ | (10,520 | ) | | $ | (21,253 | ) | | $ | (11,276 | ) |
| | | | | | | | | | | | | | | | | | | | |
(1) Net of Foreign Tax | | $ | (6 | ) | | $ | – | | | $ | – | | | $ | – | | | $ | 12 | |
The Accompanying Notes are an Integral Part of the Financial Statements.
218
Statements of Operations
NORTHWESTERN MUTUAL SERIES FUND, INC.
For the year ended December 31, 2018 (in thousands)
| | | | | | | | |
| | | Balanced
Portfolio | | | Asset
Allocation
Portfolio | |
Investment Income | | | | | | | | |
Income | | | | | | | | |
Interest (1) | | $ | 2,689 | | | $ | 307 | |
Unaffiliated Dividends (1) | | | 10,528 | | | | 1,613 | |
Affiliated Dividends | | | 38,554 | | | | 4,437 | |
| | | | | | | | |
Total Income | | | 51,771 | | | | 6,357 | |
| | | | | | | | |
Expenses | | | | | | | | |
Investment Advisory Fees | | | 6,721 | | | | 1,444 | |
Custodian Fees | | | 14 | | | | 13 | |
Shareholder Reporting Fees | | | 27 | | | | 8 | |
Audit Fees | | | 27 | | | | 29 | |
Valuation Services | | | 1 | | | | 1 | |
Compliance Fees | | | 11 | | | | 7 | |
Directors Fees | | | 62 | | | | 34 | |
Professional Fees | | | 12 | | | | 8 | |
Other Expenses | | | 27 | | | | 3 | |
| | | | | | | | |
Total Expenses | | | 6,902 | | | | 1,547 | |
| | | | | | | | |
Less Waived Fees: | | | | | | | | |
Paid by Affiliate | | | (5,601 | ) | | | (1,307 | ) |
| | | | | | | | |
Net Expenses | | | 1,301 | | | | 240 | |
| | | | | | | | |
Net Investment Income (Loss) | | | 50,470 | | | | 6,117 | |
Realized and Unrealized Gain (Loss) on Investments | | | | | | | | |
Net Realized Gain (Loss) on: | | | | | | | | |
Unaffiliated Investment Securities | | | (10,107 | ) | | | (1,657 | ) |
Affiliated Investment Securities | | | 120,031 | | | | 18,302 | |
Futures Contracts | | | 1,296 | | | | 167 | |
| | | | | | | | |
Net Realized Gain (Loss) on Investments | | | 111,220 | | | | 16,812 | |
| | | | | | | | |
Net Unrealized Appreciation (Depreciation) of: | | | | | | | | |
Unaffiliated Investment Securities | | | (4,895 | ) | | | (893 | ) |
Affiliated Investment Securities | | | (229,316 | ) | | | (34,736 | ) |
Futures Contracts | | | 101 | | | | (35 | ) |
| | | | | | | | |
Net Change in Unrealized Appreciation (Depreciation) of Investments | | | (234,110 | ) | | | (35,664 | ) |
| | | | | | | | |
Net Gain (Loss) on Investments | | | (122,890 | ) | | | (18,852 | ) |
| | | | | | | | |
Net Increase (Decrease) in Net Assets Resulting from Operations | | $ | (72,420 | ) | | $ | (12,735 | ) |
| | | | | | | | |
The Accompanying Notes are an Integral Part of the Financial Statements.
219
Statements of Changes in Net Assets
NORTHWESTERN MUTUAL SERIES FUND, INC.
(in thousands)
| | | | | | | | | | | | | | | | | | | | | | | | |
| | | Growth Stock Portfolio | | | Focused Appreciation
Portfolio | | | Large Cap Core Stock
Portfolio | |
| | | For the Year
Ended
December 31,
2018 | | | For the Year
Ended
December 31,
2017 | | | For the Year
Ended
December 31,
2018 | | | For the Year
Ended
December 31,
2017 | | | For the Year
Ended
December 31,
2018 | | | For the Year
Ended
December 31,
2017 | |
Change in Net Assets | | | | | | | | | | | | | | | | | | | | | | | | |
Operations | | | | | | | | | | | | | | | | | | | | | | | | |
Net Investment Income (Loss) | | $ | 6,805 | | | $ | 7,118 | | | $ | 6,173 | | | $ | 5,780 | | | $ | 7,224 | | | $ | 8,766 | |
Net Realized Gain (Loss) on Investments | | | 106,549 | | | | 105,442 | | | | 54,399 | | | | 25,025 | | | | 28,559 | | | | 167,854 | |
Net Change in Unrealized Appreciation
(Depreciation) of Investments | | | (95,027 | ) | | | 84,809 | | | | (76,232 | ) | | | 219,761 | | | | (67,699 | ) | | | (52,818 | ) |
| | | | | | | | | | | | | | | | | | | | | | | | |
Net Increase (Decrease) in Net Assets
Resulting from Operations | | | 18,327 | | | | 197,369 | | | | (15,660 | ) | | | 250,566 | | | | (31,916 | ) | | | 123,802 | |
| | | | | | | | | | | | | | | | | | | | | | | | |
Distributions to Shareholders from: | | | | | | | | | | | | | | | | | | | | | | | | |
Net Investment Income & Net Realized
Gain on Investments | | | (112,201 | ) | | | (49,538 | ) | | | (29,687 | ) | | | (22,448 | ) | | | (175,999 | ) | | | (9,903 | ) |
| | | | | | | | | | | | | | | | | | | | | | | | |
Net Decrease in Net Assets Resulting
from Distributions to Shareholders | | | (112,201 | ) | | | (49,538 | ) | | | (29,687 | ) | | | (22,448 | ) | | | (175,999 | ) | | | (9,903 | ) |
| | | | | | | | | | | | | | | | | | | | | | | | |
Capital Transactions: | | | | | | | | | | | | | | | | | | | | | | | | |
Shares Sold | | | 30,152 | | | | 23,840 | | | | 41,239 | | | | 42,642 | | | | 16,770 | | | | 15,135 | |
Reinvestment of Distributions Paid | | | 112,201 | | | | 49,538 | | | | 29,687 | | | | 22,448 | | | | 175,999 | | | | 9,903 | |
Shares Redeemed | | | (109,707 | ) | | | (99,335 | ) | | | (121,795 | ) | | | (119,623 | ) | | | (58,460 | ) | | | (60,855 | ) |
| | | | | | | | | | | | | | | | | | | | | | | | |
Net Increase (Decrease) in Net Assets Resulting from Capital Transactions | | | 32,646 | | | | (25,957 | ) | | | (50,869 | ) | | | (54,533 | ) | | | 134,309 | | | | (35,817 | ) |
| | | | | | | | | | | | | | | | | | | | | | | | |
Total Increase (Decrease) in Net Assets | | | (61,228 | ) | | | 121,874 | | | | (96,216 | ) | | | 173,585 | | | | (73,606 | ) | | | 78,082 | |
Net Assets
Beginning of Period | | | 959,854 | | | | 837,980 | | | | 945,385 | | | | 771,800 | | | | 592,577 | | | | 514,495 | |
| | | | | | | | | | | | | | | | | | | | | | | | |
End of Period | | $ | 898,626 | | | $ | 959,854 | | | $ | 849,169 | | | $ | 945,385 | | | $ | 518,971 | | | $ | 592,577 | |
| | | | | | | | | | | | | | | | | | | | | | | | |
Portfolio Share Transactions: | | | | | | | | | | | | | | | | | | | | | | | | |
Shares Sold | | | 9,350 | | | | 8,407 | | | | 14,850 | | | | 17,606 | | | | 9,305 | | | | 8,587 | |
Reinvestment of Distributions Paid | | | 34,166 | | | | 17,724 | | | | 10,174 | | | | 9,019 | | | | 114,285 | | | | 5,459 | |
Shares Redeemed | | | (33,587 | ) | | | (34,493 | ) | | | (42,895 | ) | | | (48,788 | ) | | | (31,045 | ) | | | (33,701 | ) |
| | | | | | | | | | | | | | | | | | | | | | | | |
Net Increase (Decrease) in Shares
Resulting from Portfolio Share
Transactions | | | 9,929 | | | | (8,362 | ) | | | (17,871 | ) | | | (22,163 | ) | | | 92,545 | | | | (19,655 | ) |
| | | | | | | | | | | | | | | | | | | | | | | | |
The Accompanying Notes are an Integral Part of the Financial Statements.
220
Statements of Changes in Net Assets
NORTHWESTERN MUTUAL SERIES FUND, INC.
(in thousands)
| | | | | | | | | | | | | | | | | | | | | | | | |
| | | Large Cap Blend Portfolio | | | Index 500 Stock Portfolio | | | Large Company Value
Portfolio | |
| | | | | | |
| | | For the Year
Ended
December 31,
2018 | | | For the Year
Ended
December 31,
2017 | | | For the Year
Ended
December 31,
2018 | | | For the Year
Ended
December 31,
2017 | | | For the Year
Ended
December 31,
2018 | | | For the Year
Ended
December 31,
2017 | |
Change in Net Assets | | | | | | | | | | | | | | | | | | | | | | | | |
Operations | | | | | | | | | | | | | | | | | | | | | | | | |
Net Investment Income (Loss) | | $ | 2,041 | | | $ | 1,299 | | | $ | 57,305 | | | $ | 53,447 | | | $ | 3,677 | | | $ | 4,241 | |
Net Realized Gain (Loss) on Investments | | | 15,518 | | | | 8,073 | | | | 83,927 | | | | 32,498 | | | | 14,339 | | | | 13,747 | |
Net Change in Unrealized Appreciation
(Depreciation) of Investments | | | (23,563 | ) | | | 20,698 | | | | (281,923 | ) | | | 488,462 | | | | (32,801 | ) | | | 2,963 | |
| | | | | | | | | | | | | | | | | | | | | | | | |
Net Increase (Decrease) in Net Assets
Resulting from Operations | | | (6,004 | ) | | | 30,070 | | | | (140,691 | ) | | | 574,407 | | | | (14,785 | ) | | | 20,951 | |
| | | | | | | | | | | | | | | | | | | | | | | | |
Distributions to Shareholders from: | | | | | | | | | | | | | | | | | | | | | | | | |
Net Investment Income & Net Realized Gain on Investments | | | (9,381 | ) | | | (9,733 | ) | | | (83,810 | ) | | | (83,030 | ) | | | (17,825 | ) | | | (11,750 | ) |
| | | | | | | | | | | | | | | | | | | | | | | | |
Net Decrease in Net Assets Resulting
from Distributions to Shareholders | | | (9,381 | ) | | | (9,733 | ) | | | (83,810 | ) | | | (83,030 | ) | | | (17,825 | ) | | | (11,750 | ) |
| | | | | | | | | | | | | | | | | | | | | | | | |
Capital Transactions: | | | | | | | | | | | | | | | | | | | | | | | | |
Shares Sold | | | 5,179 | | | | 7,134 | | | | 222,060 | | | | 217,672 | | | | 9,342 | | | | 10,861 | |
Reinvestment of Distributions Paid | | | 9,381 | | | | 9,733 | | | | 83,810 | | | | 83,030 | | | | 17,825 | | | | 11,750 | |
Shares Redeemed | | | (20,960 | ) | | | (25,736 | ) | | | (294,365 | ) | | | (248,856 | ) | | | (21,043 | ) | | | (27,749 | ) |
| | | | | | | | | | | | | | | | | | | | | | | | |
Net Increase (Decrease) in Net Assets
Resulting from Capital Transactions | | | (6,400 | ) | | | (8,869 | ) | | | 11,505 | | | | 51,846 | | | | 6,124 | | | | (5,138 | ) |
| | | | | | | | | | | | | | | | | | | | | | | | |
Total Increase (Decrease) in Net Assets | | | (21,785 | ) | | | 11,468 | | | | (212,996 | ) | | | 543,223 | | | | (26,486 | ) | | | 4,063 | |
Net Assets | | | | | | | | | | | | | | | | | | | | | | | | |
Beginning of Period | | | 176,220 | | | | 164,752 | | | | 3,222,137 | | | | 2,678,914 | | | | 199,836 | | | | 195,773 | |
| | | | | | | | | | | | | | | | | | | | | | | | |
End of Period | | $ | 154,435 | | | $ | 176,220 | | | $ | 3,009,141 | | | $ | 3,222,137 | | | $ | 173,350 | | | $ | 199,836 | |
| | | | | | | | | | | | | | | | | | | | | | | | |
Portfolio Share Transactions: | | | | | | | | | | | | | | | | | | | | | | | | |
Shares Sold | | | 4,273 | | | | 6,254 | | | | 44,068 | | | | 48,043 | | | | 9,035 | | | | 10,382 | |
Reinvestment of Distributions Paid | | | 7,740 | | | | 8,800 | | | | 15,789 | | | | 18,370 | | | | 17,684 | | | | 11,797 | |
Shares Redeemed | | | (17,081 | ) | | | (22,159 | ) | | | (58,062 | ) | | | (54,718 | ) | | | (20,059 | ) | | | (26,318 | ) |
| | | | | | | | | | | | | | | | | | | | | | | | |
Net Increase (Decrease) in Shares
Resulting from Portfolio Share
Transactions | | | (5,068 | ) | | | (7,105 | ) | | | 1,795 | | | | 11,695 | | | | 6,660 | | | | (4,139 | ) |
| | | | | | | | | | | | | | | | | | | | | | | | |
The Accompanying Notes are an Integral Part of the Financial Statements.
221
Statements of Changes in Net Assets
NORTHWESTERN MUTUAL SERIES FUND, INC.
(in thousands)
| | | | | | | | | | | | | | | | | | | | | | | | |
| | | Domestic Equity Portfolio | | | Equity Income Portfolio | | | Mid Cap Growth Stock
Portfolio | |
| | | For the Year
Ended
December 31,
2018 | | | For the Year
Ended
December 31,
2017 | | | For the Year
Ended
December 31,
2018 | | | For the Year
Ended
December 31,
2017 | | | For the Year
Ended
December 31,
2018 | | | For the Year
Ended
December 31,
2017 | |
Change in Net Assets | | | | | | | | | | | | | | | | | | | | | | | | |
Operations | | | | | | | | | | | | | | | | | | | | | | | | |
Net Investment Income (Loss) | | $ | 15,947 | | | $ | 14,479 | | | $ | 18,166 | | | $ | 16,534 | | | $ | 2,056 | | | $ | 1,469 | |
Net Realized Gain (Loss) on Investments | | | 40,633 | | | | 28,658 | | | | 48,110 | | | | 60,819 | | | | 47,139 | | | | 199,640 | |
Net Change in Unrealized Appreciation (Depreciation) of Investments | | | (77,719 | ) | | | 57,061 | | | | (137,665 | ) | | | 45,354 | | | | (119,657 | ) | | | (8,354 | ) |
| | | | | | | | | | | | | | | | | | | | | | | | |
Net Increase (Decrease) in Net Assets Resulting from Operations | | | (21,139 | ) | | | 100,198 | | | | (71,389 | ) | | | 122,707 | | | | (70,462 | ) | | | 192,755 | |
| | | | | | | | | | | | | | | | | | | | | | | | |
Distributions to Shareholders from: | | | | | | | | | | | | | | | | | | | | | | | | |
Net Investment Income & Net Realized
Gain on Investments | | | (43,137 | ) | | | (30,913 | ) | | | (76,785 | ) | | | (55,773 | ) | | | (183,778 | ) | | | (2,583 | ) |
| | | | | | | | | | | | | | | | | | | | | | | | |
Net Decrease in Net Assets Resulting from Distributions to Shareholders | | | (43,137 | ) | | | (30,913 | ) | | | (76,785 | ) | | | (55,773 | ) | | | (183,778 | ) | | | (2,583 | ) |
| | | | | | | | | | | | | | | | | | | | | | | | |
Capital Transactions: | | | | | | | | | | | | | | | | | | | | | | | | |
Shares Sold | | | 64,890 | | | | 73,348 | | | | 28,491 | | | | 29,597 | | | | 30,197 | | | | 24,615 | |
Reinvestment of Distributions Paid | | | 43,137 | | | | 30,913 | | | | 76,785 | | | | 55,773 | | | | 183,778 | | | | 2,583 | |
Shares Redeemed | | | (90,499 | ) | | | (75,273 | ) | | | (96,826 | ) | | | (106,073 | ) | | | (113,798 | ) | | | (103,332 | ) |
| | | | | | | | | | | | | | | | | | | | | | | | |
Net Increase (Decrease) in Net Assets Resulting from Capital Transactions | | | 17,528 | | | | 28,988 | | | | 8,450 | | | | (20,703 | ) | | | 100,177 | | | | (76,134 | ) |
| | | | | | | | | | | | | | | | | | | | | | | | |
Total Increase (Decrease) in Net Assets | | | (46,748 | ) | | | 98,273 | | | | (139,724 | ) | | | 46,231 | | | | (154,063 | ) | | | 114,038 | |
Net Assets | | | | | | | | | | | | | | | | | | | | | | | | |
Beginning of Period | | | 819,213 | | | | 720,940 | | | | 844,398 | | | | 798,167 | | | | 1,097,433 | | | | 983,395 | |
| | | | | | | | | | | | | | | | | | | | | | | | |
End of Period | | $ | 772,465 | | | $ | 819,213 | | | $ | 704,674 | | | $ | 844,398 | | | $ | 943,370 | | | $ | 1,097,433 | |
| | | | | | | | | | | | | | | | | | | | | | | | |
Portfolio Share Transactions:
Shares Sold | | | 38,131 | | | | 46,374 | | | | 15,812 | | | | 16,579 | | | | 8,943 | | | | 7,810 | |
Reinvestment of Distributions Paid | | | 24,777 | | | | 20,205 | | | | 43,852 | | | | 32,540 | | | | 56,426 | | | | 809 | |
Shares Redeemed | | | (52,647 | ) | | | (47,254 | ) | | | (52,692 | ) | | | (59,237 | ) | | | (32,249 | ) | | | (32,507 | ) |
| | | | | | | | | | | | | | | | | | | | | | | | |
Net Increase (Decrease) in Shares Resulting from Portfolio Share Transactions | | | 10,261 | | | | 19,325 | | | | 6,972 | | | | (10,118 | ) | | | 33,120 | | | | (23,888 | ) |
| | | | | | | | | | | | | | | | | | | | | | | | |
The Accompanying Notes are an Integral Part of the Financial Statements.
222
Statements of Changes in Net Assets
NORTHWESTERN MUTUAL SERIES FUND, INC.
(in thousands)
| | | | | | | | | | | | | | | | | | | | | | | | |
| | | Index 400 Stock Portfolio | | | Mid Cap Value Portfolio | | | Small Cap Growth Stock Portfolio | |
| | | For the Year
Ended
December 31,
2018 | | | For the Year
Ended
December 31,
2017 | | | For the Year Ended
December 31,
2018 | | | For the Year
Ended
December 31,
2017 | | | For the Year
Ended
December 31,
2018 | | | For the Year
Ended
December 31,
2017 | |
Change in Net Assets | | | | | | | | | | | | | | | | | | | | | | | | |
Operations | | | | | | | | | | | | | | | | | | | | | | | | |
Net Investment Income (Loss) | | $ | 11,704 | | | $ | 10,024 | | | $ | 8,036 | | | $ | 9,617 | | | $ | 640 | | | $ | (83 | ) |
Net Realized Gain (Loss) on Investments | | | 61,226 | | | | 58,294 | | | | 47,626 | | | | 49,049 | | | | 88,443 | | | | 51,269 | |
Net Change in Unrealized Appreciation (Depreciation) of Investments | | | (173,088 | ) | | | 55,201 | | | | (123,415 | ) | | | 1,707 | | | | (155,661 | ) | | | 63,084 | |
| | | | | | | | | | | | | | | | | | | | | | | | |
Net Increase (Decrease) in Net Assets Resulting from Operations | | | (100,158 | ) | | | 123,519 | | | | (67,753 | ) | | | 60,373 | | | | (66,578 | ) | | | 114,270 | |
| | | | | | | | | | | | | | | | | | | | | | | | |
Distributions to Shareholders from: | | | | | | | | | | | | | | | | | | | | | | | | |
Net Investment Income & Net Realized Gain on Investments | | | (68,601 | ) | | | (56,729 | ) | | | (58,046 | ) | | | (27,012 | ) | | | (51,016 | ) | | | (7,082 | ) |
| | | | | | | | | | | | | | | | | | | | | | | | |
Net Decrease in Net Assets Resulting from Distributions to Shareholders | | | (68,601 | ) | | | (56,729 | ) | | | (58,046 | ) | | | (27,012 | ) | | | (51,016 | ) | | | (7,082 | ) |
| | | | | | | | | | | | | | | | | | | | | | | | |
Capital Transactions: | | | | | | | | | | | | | | | | | | | | | | | | |
Shares Sold | | | 73,566 | | | | 72,075 | | | | 44,293 | | | | 42,853 | | | | 36,654 | | | | 25,314 | |
Reinvestment of Distributions Paid | | | 68,601 | | | | 56,729 | | | | 58,046 | | | | 27,012 | | | | 51,016 | | | | 7,082 | |
Shares Redeemed | | | (77,187 | ) | | | (72,192 | ) | | | (69,221 | ) | | | (56,819 | ) | | | (77,355 | ) | | | (56,735 | ) |
| | | | | | | | | | | | | | | | | | | | | | | | |
Net Increase (Decrease) in Net Assets Resulting from Capital Transactions | | | 64,980 | | | | 56,612 | | | | 33,118 | | | | 13,046 | | | | 10,315 | | | | (24,339 | ) |
| | | | | | | | | | | | | | | | | | | | | | | | |
Total Increase (Decrease) in Net Assets | | | (103,779 | ) | | | 123,402 | | | | (92,681 | ) | | | 46,407 | | | | (107,279 | ) | | | 82,849 | |
Net Assets | | | | | | | | | | | | | | | | | | | | | | | | |
Beginning of Period | | | 896,559 | | | | 773,157 | | | | 564,624 | | | | 518,217 | | | | 627,901 | | | | 545,052 | |
| | | | | | | | | | | | | | | | | | | | | | | | |
End of Period | | $ | 792,780 | | | $ | 896,559 | | | $ | 471,943 | | | $ | 564,624 | | | $ | 520,622 | | | $ | 627,901 | |
| | | | | | | | | | | | | | | | | | | | | | | | |
Portfolio Share Transactions: | | | | | | | | | | | | | | | | | | | | | | | | |
Shares Sold | | | 35,452 | | | | 35,541 | | | | 25,854 | | | | 24,158 | | | | 12,664 | | | | 9,657 | |
Reinvestment of Distributions Paid | | | 32,792 | | | | 29,779 | | | | 34,613 | | | | 15,974 | | | | 16,926 | | | | 2,722 | |
Shares Redeemed | | | (36,515 | ) | | | (35,640 | ) | | | (38,167 | ) | | | (32,153 | ) | | | (26,019 | ) | | | (21,694 | ) |
| | | | | | | | | | | | | | | | | | | | | | | | |
Net Increase (Decrease) in Shares Resulting from Portfolio Share Transactions | | | 31,729 | | | | 29,680 | | | | 22,300 | | | | 7,979 | | | | 3,571 | | | | (9,315 | ) |
| | | | | | | | | | | | | | | | | | | | | | | | |
The Accompanying Notes are an Integral Part of the Financial Statements.
223
Statements of Changes in Net Assets
NORTHWESTERN MUTUAL SERIES FUND, INC.
(in thousands)
| | | | | | | | | | | | | | | | | | | | | | | | |
| | | Index 600 Stock Portfolio | | | Small Cap Value Portfolio | | | International Growth
Portfolio | |
| | | For the Year
Ended
December 31,
2018 | | | For the Year
Ended
December 31,
2017 | | | For the Year
Ended
December 31,
2018 | | | For the Year
Ended
December 31,
2017 | | | For the Year
Ended
December 31,
2018 | | | For the Year
Ended
December 31,
2017 | |
Change in Net Assets | | | | | | | | | | | | | | | | | | | | | | | | |
Operations | | | | | | | | | | | | | | | | | | | | | | | | |
Net Investment Income (Loss) | | $ | 2,604 | | | $ | 2,021 | | | $ | 2,747 | | | $ | 3,578 | | | $ | 8,728 | | | $ | 8,245 | |
Net Realized Gain (Loss) on Investments | | | 16,031 | | | | 11,348 | | | | 88,748 | | | | 46,804 | | | | 21,855 | | | | (478 | ) |
Net Change in Unrealized Appreciation (Depreciation) of Investments | | | (40,964 | ) | | | 11,407 | | | | (167,486 | ) | | | 20,016 | | | | (108,625 | ) | | | 151,395 | |
| | | | | | | | | | | | | | | | | | | | | | | | |
Net Increase (Decrease) in Net Assets Resulting from Operations | | | (22,329 | ) | | | 24,776 | | | | (75,991 | ) | | | 70,398 | | | | (78,042 | ) | | | 159,162 | |
| | | | | | | | | | | | | | | | | | | | | | | | |
Distributions to Shareholders from: | | | | | | | | | | | | | | | | | | | | | | | | |
Net Investment Income & Net Realized Gain on Investments | | | (13,363 | ) | | | (10,727 | ) | | | (49,860 | ) | | | (38,504 | ) | | | (9,563 | ) | | | (8,203 | ) |
| | | | | | | | | | | | | | | | | | | | | | | | |
Net Decrease in Net Assets Resulting from Distributions to Shareholders | | | (13,363 | ) | | | (10,727 | ) | | | (49,860 | ) | | | (38,504 | ) | | | (9,563 | ) | | | (8,203 | ) |
| | | | | | | | | | | | | | | | | | | | | | | | |
Capital Transactions: | | | | | | | | | | | | | | | | | | | | | | | | |
Shares Sold | | | 45,237 | | | | 42,637 | | | | 23,128 | | | | 35,588 | | | | 78,000 | | | | 72,456 | |
Reinvestment of Distributions Paid | | | 13,363 | | | | 10,727 | | | | 49,860 | | | | 38,504 | | | | 9,563 | | | | 8,203 | |
Shares Redeemed | | | (23,453 | ) | | | (18,948 | ) | | | (90,299 | ) | | | (80,582 | ) | | | (71,457 | ) | | | (57,159 | ) |
| | | | | | | | | | | | | | | | | | | | | | | | |
Net Increase (Decrease) in Net Assets Resulting from Capital Transactions | | | 35,147 | | | | 34,416 | | | | (17,311 | ) | | | (6,490 | ) | | | 16,106 | | | | 23,500 | |
| | | | | | | | | | | | | | | | | | | | | | | | |
Total Increase (Decrease) in Net Assets | | | (545 | ) | | | 48,465 | | | | (143,162 | ) | | | 25,404 | | | | (71,499 | ) | | | 174,459 | |
Net Assets | | | | | | | | | | | | | | | | | | | | | | | | |
Beginning of Period | | | 222,348 | | | | 173,883 | | | | 673,234 | | | | 647,830 | | | | 697,581 | | | | 523,122 | |
| | | | | | | | | | | | | | | | | | | | | | | | |
End of Period | | $ | 221,803 | | | $ | 222,348 | | | $ | 530,072 | | | $ | 673,234 | | | $ | 626,082 | | | $ | 697,581 | |
| | | | | | | | | | | | | | | | | | | | | | | | |
Portfolio Share Transactions: | | | | | | | | | | | | | | | | | | | | | | | | |
Shares Sold | | | 29,990 | | | | 30,997 | | | | 9,601 | | | | 14,351 | | | | 50,417 | | | | 49,958 | |
Reinvestment of Distributions Paid | | | 8,523 | | | | 8,329 | | | | 19,817 | | | | 16,858 | | | | 5,984 | | | | 5,520 | |
Shares Redeemed | | | (15,458 | ) | | | (13,768 | ) | | | (35,622 | ) | | | (33,318 | ) | | | (45,088 | ) | | | (39,225 | ) |
| | | | | | | | | | | | | | | | | | | | | | | | |
Net Increase (Decrease) in Shares Resulting from Portfolio Share Transactions | | | 23,055 | | | | 25,558 | | | | (6,204 | ) | | | (2,109 | ) | | | 11,313 | | | | 16,253 | |
| | | | | | | | | | | | | | | | | | | | | | | | |
The Accompanying Notes are an Integral Part of the Financial Statements.
224
Statements of Changes in Net Assets
NORTHWESTERN MUTUAL SERIES FUND, INC.
(in thousands)
| | | | | | | | | | | | | | | | | | | | | | | | |
| | | Research International Core
Portfolio | | | International Equity
Portfolio | | | Emerging Markets Equity
Portfolio | |
| | | For the Year
Ended
December 31,
2018 | | | For the Year
Ended
December 31,
2017 | | | For the Year
Ended
December 31,
2018 | | | For the Year
Ended
December 31,
2017 | | | For the Year
Ended
December 31,
2018 | | | For the Year
Ended
December 31,
2017 | |
Change in Net Assets | | | | | | | | | | | | | | | | | | | | | | | | |
Operations | | | | | | | | | | | | | | | | | | | | | | | | |
Net Investment Income (Loss) | | $ | 12,145 | | | $ | 10,144 | | | $ | 43,471 | | | $ | 43,342 | | | $ | 8,709 | | | $ | 10,101 | |
Net Realized Gain (Loss) on Investments | | | 23,850 | | | | 12,238 | | | | 103,993 | | | | 44,972 | | | | (10,700 | ) | | | 29,701 | |
Net Change in Unrealized Appreciation (Depreciation) of Investments | | | (127,153 | ) | | | 120,014 | | | | (437,893 | ) | | | 269,911 | | | | (97,719 | ) | | | 109,969 | |
| | | | | | | | | | | | | | | | | | | | | | | | |
Net Increase (Decrease) in Net Assets Resulting from Operations | | | (91,158 | ) | | | 142,396 | | | | (290,429 | ) | | | 358,225 | | | | (99,710 | ) | | | 149,771 | |
| | | | | | | | | | | | | | | | | | | | | | | | |
Distributions to Shareholders from: | | | | | | | | | | | | | | | | | | | | | | | | |
Net Investment Income & Net Realized Gain on Investments | | | (10,485 | ) | | | (9,827 | ) | | | (45,975 | ) | | | (42,550 | ) | | | (9,240 | ) | | | (5,748 | ) |
| | | | | | | | | | | | | | | | | | | | | | | | |
Net Decrease in Net Assets Resulting from Distributions to Shareholders | | | (10,485 | ) | | | (9,827 | ) | | | (45,975 | ) | | | (42,550 | ) | | | (9,240 | ) | | | (5,748 | ) |
| | | | | | | | | | | | | | | | | | | | | | | | |
Capital Transactions: | | | | | | | | | | | | | | | | | | | | | | | | |
Shares Sold | | | 95,574 | | | | 72,547 | | | | 134,477 | | | | 108,920 | | | | 134,734 | | | | 101,162 | |
Reinvestment of Distributions Paid | | | 10,485 | | | | 9,827 | | | | 45,975 | | | | 42,550 | | | | 9,240 | | | | 5,748 | |
Shares Redeemed | | | (66,836 | ) | | | (56,587 | ) | | | (167,653 | ) | | | (167,739 | ) | | | (77,955 | ) | | | (54,452 | ) |
| | | | | | | | | | | | | | | | | | | | | | | | |
Net Increase (Decrease) in Net Assets Resulting from Capital Transactions | | | 39,223 | | | | 25,787 | | | | 12,799 | | | | (16,269 | ) | | | 66,019 | | | | 52,458 | |
| | | | | | | | | | | | | | | | | | | | | | | | |
Total Increase (Decrease) in Net Assets | | | (62,420 | ) | | | 158,356 | | | | (323,605 | ) | | | 299,406 | | | | (42,931 | ) | | | 196,481 | |
Net Assets | | | | | | | | | | | | | | | | | | | | | | | | |
Beginning of Period | | | 658,005 | | | | 499,649 | | | | 1,927,673 | | | | 1,628,267 | | | | 718,281 | | | | 521,800 | |
| | | | | | | | | | | | | | | | | | | | | | | | |
End of Period | | $ | 595,585 | | | $ | 658,005 | | | $ | 1,604,068 | | | $ | 1,927,673 | | | $ | 675,350 | | | $ | 718,281 | |
| | | | | | | | | | | | | | | | | | | | | | | | |
Portfolio Share Transactions: | | | | | | | | | | | | | | | | | | | | | | | | |
Shares Sold | | | 96,319 | | | | 76,894 | | | | 73,779 | | | | 60,655 | | | | 133,512 | | | | 99,983 | |
Reinvestment of Distributions Paid | | | 10,210 | | | | 10,173 | | | | 24,892 | | | | 23,547 | | | | 9,468 | | | | 5,490 | |
Shares Redeemed | | | (64,843 | ) | | | (59,961 | ) | | | (89,966 | ) | | | (93,626 | ) | | | (74,780 | ) | | | (53,874 | ) |
| | | | | | | | | | | | | | | | | | | | | | | | |
Net Increase (Decrease) in Shares Resulting from Portfolio Share Transactions | | | 41,686 | | | | 27,106 | | | | 8,705 | | | | (9,424 | ) | | | 68,200 | | | | 51,599 | |
| | | | | | | | | | | | | | | | | | | | | | | | |
The Accompanying Notes are an Integral Part of the Financial Statements.
225
Statements of Changes in Net Assets
NORTHWESTERN MUTUAL SERIES FUND, INC.
(in thousands)
| | | | | | | | | | | | | | | | | | | | | | | | |
| | | Government Money Market
Portfolio | | | Short-Term Bond Portfolio | | | Select Bond Portfolio | |
| | | For the Year
Ended
December 31,
2018 | | | For the Year
Ended
December 31,
2017 | | | For the Year
Ended
December 31,
2018 | | | For the Year
Ended
December 31,
2017 | | | For the Year
Ended
December 31,
2018 | | | For the Year
Ended
December 31,
2017 | |
Change in Net Assets | | | | | | | | | | | | | | | | | | | | | | | | |
Operations | | | | | | | | | | | | | | | | | | | | | | | | |
Net Investment Income (Loss) | | $ | 6,509 | | | $ | 2,770 | | | $ | 6,410 | | | $ | 4,510 | | | $ | 82,061 | | | $ | 62,247 | |
Net Realized Gain (Loss) on Investments | | | 1 | | | | 5 | | | | (955 | ) | | | (256 | ) | | | (83,942 | ) | | | 9,220 | |
Net Change in Unrealized Appreciation (Depreciation) of Investments | | | – | | | | – | | | | (1,176 | ) | | | (669 | ) | | | (3,374 | ) | | | 31,121 | |
| | | | | | | | | | | | | | | | | | | | | | | | |
Net Increase (Decrease) in Net Assets Resulting from Operations | | | 6,510 | | | | 2,775 | | | | 4,279 | | | | 3,585 | | | | (5,255 | ) | | | 102,588 | |
| | | | | | | | | | | | | | | | | | | | | | | | |
Distributions to Shareholders from: | | | | | | | | | | | | | | | | | | | | | | | | |
Net Investment Income & Net Realized Gain on Investments | | | (6,510 | ) | | | (2,775 | ) | | | (4,636 | ) | | | (3,730 | ) | | | (67,891 | ) | | | (98,769 | ) |
| | | | | | | | | | | | | | | | | | | | | | | | |
Net Decrease in Net Assets Resulting from Distributions to Shareholders | | | (6,510 | ) | | | (2,775 | ) | | | (4,636 | ) | | | (3,730 | ) | | | (67,891 | ) | | | (98,769 | ) |
| | | | | | | | | | | | | | | | | | | | | | | | |
Capital Transactions: | | | | | | | | | | | | | | | | | | | | | | | | |
Shares Sold | | | 197,800 | | | | 198,452 | | | | 44,754 | | | | 52,650 | | | | 363,798 | | | | 261,713 | |
Reinvestment of Distributions Paid | | | 6,510 | | | | 2,774 | | | | 4,636 | | | | 3,730 | | | | 67,891 | | | | 98,769 | |
Shares Redeemed | | | (200,274 | ) | | | (263,423 | ) | | | (36,006 | ) | | | (32,554 | ) | | | (334,484 | ) | | | (259,412 | ) |
| | | | | | | | | | | | | | | | | | | | | | | | |
Net Increase (Decrease) in Net Assets Resulting from Capital Transactions | | | 4,036 | | | | (62,197 | ) | | | 13,384 | | | | 23,826 | | | | 97,205 | | | | 101,070 | |
| | | | | | | | | | | | | | | | | | | | | | | | |
Total Increase (Decrease) in Net Assets | | | 4,036 | | | | (62,197 | ) | | | 13,027 | | | | 23,681 | | | | 24,059 | | | | 104,889 | |
Net Assets | | | | | | | | | | | | | | | | | | | | | | | | |
Beginning of Period | | | 439,438 | | | | 501,635 | | | | 293,514 | | | | 269,833 | | | | 2,943,934 | | | | 2,839,045 | |
| | | | | | | | | | | | | | | | | | | | | | | | |
End of Period | | $ | 443,474 | | | $ | 439,438 | | | $ | 306,541 | | | $ | 293,514 | | | $ | 2,967,993 | | | $ | 2,943,934 | |
| | | | | | | | | | | | | | | | | | | | | | | | |
Portfolio Share Transactions: | | | | | | | | | | | | | | | | | | | | | | | | |
Shares Sold | | | 197,800 | | | | 198,452 | | | | 43,395 | | | | 50,772 | | | | 295,214 | | | | 206,659 | |
Reinvestment of Distributions Paid | | | 6,510 | | | | 2,774 | | | | 4,531 | | | | 3,610 | | | | 56,202 | | | | 78,952 | |
Shares Redeemed | | | (200,274 | ) | | | (263,423 | ) | | | (34,921 | ) | | | (31,382 | ) | | | (272,611 | ) | | | (204,707 | ) |
| | | | | | | | | | | | | | | | | | | | | | | | |
Net Increase (Decrease) in Shares Resulting from Portfolio Share Transactions | | | 4,036 | | | | (62,197 | ) | | | 13,005 | | | | 23,000 | | | | 78,805 | | | | 80,904 | |
| | | | | | | | | | | | | | | | | | | | | | | | |
The Accompanying Notes are an Integral Part of the Financial Statements.
226
Statements of Changes in Net Assets
NORTHWESTERN MUTUAL SERIES FUND, INC.
(in thousands)
| | | | | | | | | | | | | | | | | | | | | | | | |
| | | Long-Term U.S. Government
Bond Portfolio | | | Inflation Protection
Portfolio | | | High Yield Bond Portfolio | |
| | | For the Year
Ended
December 31,
2018 | | | For the Year
Ended
December 31,
2017 | | | For the Year
Ended
December 31,
2018 | | | For the Year
Ended
December 31,
2017 | | | For the Year
Ended
December 31,
2018 | | | For the Year
Ended
December 31,
2017 | |
Change in Net Assets | | | | | | | | | | | | | | | | | | | | | | | | |
Operations | | | | | | | | | | | | | | | | | | | | | | | | |
Net Investment Income (Loss) | | $ | 2,709 | | | $ | 3,003 | | | $ | 9,216 | | | $ | 7,264 | | | $ | 45,363 | | | $ | 43,254 | |
Net Realized Gain (Loss) on Investments | | | (4,125 | ) | | | 793 | | | | (330 | ) | | | (2,060 | ) | | | 1,585 | | | | 5,357 | |
Net Change in Unrealized Appreciation (Depreciation) of Investments | | | (988 | ) | | | 5,288 | | | | (19,406 | ) | | | 7,580 | | | | (68,201 | ) | | | 3,538 | |
| | | | | | | | | | | | | | | | | | | | | | | | |
Net Increase (Decrease) in Net Assets Resulting from Operations | | | (2,404 | ) | | | 9,084 | | | | (10,520 | ) | | | 12,784 | | | | (21,253 | ) | | | 52,149 | |
| | | | | | | | | | | | | | | | | | | | | | | | |
Distributions to Shareholders from: | | | | | | | | | | | | | | | | | | | | | | | | |
Net Investment Income & Net Realized Gain on Investments | | | (4,793 | ) | | | (6,573 | ) | | | (7,200 | ) | | | (3,414 | ) | | | (43,280 | ) | | | (43,155 | ) |
| | | | | | | | | | | | | | | | | | | | | | | | |
Net Decrease in Net Assets Resulting from Distributions to Shareholders | | | (4,793 | ) | | | (6,573 | ) | | | (7,200 | ) | | | (3,414 | ) | | | (43,280 | ) | | | (43,155 | ) |
| | | | | | | | | | | | | | | | | | | | | | | | |
Capital Transactions: | | | | | | | | | | | | | | | | | | | | | | | | |
Shares Sold | | | 13,282 | | | | 16,641 | | | | 47,277 | | | | 90,861 | | | | 50,266 | | | | 61,646 | |
Reinvestment of Distributions Paid | | | 4,793 | | | | 6,573 | | | | 7,200 | | | | 3,414 | | | | 43,280 | | | | 43,155 | |
Shares Redeemed | | | (15,123 | ) | | | (20,403 | ) | | | (88,897 | ) | | | (28,861 | ) | | | (77,525 | ) | | | (58,863 | ) |
| | | | | | | | | | | | | | | | | | | | | | | | |
Net Increase (Decrease) in Net Assets Resulting from Capital Transactions | | | 2,952 | | | | 2,811 | | | | (34,420 | ) | | | 65,414 | | | | 16,021 | | | | 45,938 | |
| | | | | | | | | | | | | | | | | | | | | | | | |
Total Increase (Decrease) in Net Assets | | | (4,245 | ) | | | 5,322 | | | | (52,140 | ) | | | 74,784 | | | | (48,512 | ) | | | 54,931 | |
Net Assets | | | | | | | | | | | | | | | | | | | | | | | | |
Beginning of Period | | | 115,713 | | | | 110,391 | | | | 401,711 | | | | 326,927 | | | | 811,878 | | | | 756,947 | |
| | | | | | �� | | | | | | | | | | | | | | | | | | |
End of Period | | $ | 111,468 | | | $ | 115,713 | | | $ | 349,571 | | | $ | 401,711 | | | $ | 763,366 | | | $ | 811,878 | |
| | | | | | | | | | | | | | | | | | | | | | | | |
Portfolio Share Transactions: | | | | | | | | | | | | | | | | | | | | | | | | |
Shares Sold | | | 13,114 | | | | 15,440 | | | | 43,247 | | | | 82,521 | | | | 68,137 | | | | 81,679 | |
Reinvestment of Distributions Paid | | | 4,941 | | | | 6,189 | | | | 6,666 | | | | 3,121 | | | | 60,112 | | | | 58,635 | |
Shares Redeemed | | | (14,873 | ) | | | (18,859 | ) | | | (81,415 | ) | | | (26,253 | ) | | | (105,671 | ) | | | (77,840 | ) |
| | | | | | | | | | | | | | | | | | | | | | | | |
Net Increase (Decrease) in Shares Resulting from Portfolio Share Transactions | | | 3,182 | | | | 2,770 | | | | (31,502 | ) | | | 59,389 | | | | 22,578 | | | | 62,474 | |
| | | | | | | | | | | | | | | | | | | | | | | | |
The Accompanying Notes are an Integral Part of the Financial Statements.
227
Statements of Changes in Net Assets
NORTHWESTERN MUTUAL SERIES FUND, INC.
(in thousands)
| | | | | | | | | | | | | | | | | | | | | | | | |
| | | Multi-Sector Bond Portfolio | | | Balanced Portfolio | | | Asset Allocation Portfolio | |
| | | For the Year
Ended
December 31,
2018 | | | For the Year
Ended
December 31,
2017 | | | For the Year
Ended
December 31,
2018 | | | For the Year
Ended
December 31,
2017 | | | For the Year
Ended
December 31,
2018 | | | For the Year
Ended
December 31,
2017 | |
Change in Net Assets | | | | | | | | | | | | | | | | | | | | | | | | |
Operations | | | | | | | | | | | | | | | | | | | | | | | | |
Net Investment Income (Loss) | | $ | 31,771 | | | $ | 31,339 | | | $ | 50,470 | | | $ | 39,456 | | | $ | 6,117 | | | $ | 4,435 | |
Net Realized Gain (Loss) on Investments | | | 5,572 | | | | (2,606 | ) | | | 111,220 | | | | 63,304 | | | | 16,812 | | | | 8,344 | |
Net Change in Unrealized Appreciation (Depreciation) of Investments | | | (48,619 | ) | | | 31,875 | | | | (234,110 | ) | | | 152,879 | | | | (35,664 | ) | | | 23,925 | |
| | | | | | | | | | | | | | | | | | | | | | | | |
Net Increase (Decrease) in Net Assets Resulting from Operations | | | (11,276 | ) | | | 60,608 | | | | (72,420 | ) | | | 255,639 | | | | (12,735 | ) | | | 36,704 | |
| | | | | | | | | | | | | | | | | | | | | | | | |
Distributions to Shareholders from: | | | | | | | | | | | | | | | | | | | | | | | | |
Net Investment Income & Net Realized Gain on Investments | | | (26,878 | ) | | | (30,040 | ) | | | (101,798 | ) | | | (132,511 | ) | | | (12,682 | ) | | | (16,954 | ) |
| | | | | | | | | | | | | | | | | | | | | | | | |
Net Decrease in Net Assets Resulting from Distributions to Shareholders | | | (26,878 | ) | | | (30,040 | ) | | | (101,798 | ) | | | (132,511 | ) | | | (12,682 | ) | | | (16,954 | ) |
| | | | | | | | | | | | | | | | | | | | | | | | |
Capital Transactions: | | | | | | | | | | | | | | | | | | | | | | | | |
Shares Sold | | | 134,871 | | | | 153,044 | | | | 93,813 | | | | 110,602 | | | | 18,451 | | | | 17,526 | |
Reinvestment of Distributions Paid | | | 26,878 | | | | 30,040 | | | | 101,798 | | | | 132,511 | | | | 12,682 | | | | 16,954 | |
Shares Redeemed | | | (89,633 | ) | | | (62,520 | ) | | | (263,510 | ) | | | (261,605 | ) | | | (33,418 | ) | | | (27,416 | ) |
| | | | | | | | | | | | | | | | | | | | | | | | |
Net Increase (Decrease) in Net Assets Resulting from Capital Transactions | | | 72,116 | | | | 120,564 | | | | (67,899 | ) | | | (18,492 | ) | | | (2,285 | ) | | | 7,064 | |
| | | | | | | | | | | | | | | | | | | | | | | | |
Total Increase (Decrease) in Net Assets | | | 33,962 | | | | 151,132 | | | | (242,117 | ) | | | 104,636 | | | | (27,702 | ) | | | 26,814 | |
Net Assets | | | | | | | | | | | | | | | | | | | | | | | | |
Beginning of Period | | | 840,981 | | | | 689,849 | | | | 2,307,470 | | | | 2,202,834 | | | | 277,213 | | | | 250,399 | |
| | | | | | | | | | | | | | | | | | | | | | | | |
End of Period | | $ | 874,943 | | | $ | 840,981 | | | $ | 2,065,353 | | | $ | 2,307,470 | | | $ | 249,511 | | | $ | 277,213 | |
| | | | | | | | | | | | | | | | | | | | | | | | |
Portfolio Share Transactions: | | | | | | | | | | | | | | | | | | | | | | | | |
Shares Sold | | | 125,393 | | | | 140,652 | | | | 63,864 | | | | 76,125 | | | | 15,238 | | | | 14,931 | |
Reinvestment of Distributions Paid | | | 25,477 | | | | 27,866 | | | | 69,868 | | | | 93,913 | | | | 10,498 | | | | 14,858 | |
Shares Redeemed | | | (83,748 | ) | | | (57,521 | ) | | | (179,627 | ) | | | (180,257 | ) | | | (27,594 | ) | | | (23,360 | ) |
| | | | | | | | | | | | | | | | | | | | | | | | |
Net Increase (Decrease) in Shares Resulting from Portfolio Share Transactions | | | 67,122 | | | | 110,997 | | | | (45,895 | ) | | | (10,219 | ) | | | (1,858 | ) | | | 6,429 | |
| | | | | | | | | | | | | | | | | | | | | | | | |
The Accompanying Notes are an Integral Part of the Financial Statements.
228
Statement of Cash Flows
NORTHWESTERN MUTUAL SERIES FUND, INC.
For the year ended December 31, 2018 (in thousands)
| | | | |
| | | Long-Term U.S.
Government Bond Portfolio | |
Cash Flows from Operating Activities | | | | |
Net Increase (Decrease) in Net Assets Resulting from Operations | | $ | (2,404 | ) |
Adjustments to Reconcile Net Increase (Decrease) in Net Assets Resulting from Operations to Net Cash from Operating Activities | | | | |
Purchase of Investment Securities | | | (160,185 | ) |
Proceeds from Disposition of Investment Securities | | | 162,087 | |
Proceeds from Disposition (Purchase) of Short-Term Investments, net | | | (938 | ) |
Proceeds from (Payments for) Closed Futures Contracts and Cleared Swaps | | | 393 | |
Proceeds from Securities Sold Short | | | 32,405 | |
Cash Paid for Terminated Options Written | | | (18 | ) |
Premiums Received for Options Written | | | 67 | |
Amortization (Accretion) of Premium/Discount, net | | | (173 | ) |
(Increase) Decrease in: | | | | |
Receivable for Investment Securities Sold | | | 2,103 | |
Prepaid Expenses and Other Assets | | | (1 | ) |
Dividends and Interest Receivable | | | 302 | |
Increase (Decrease) in: | | | | |
Collateral from Counterparty | | | (418 | ) |
Payable for Investment Advisory Fees | | | 11 | |
Accrued Expenses | | | (3 | ) |
Change in Net Unrealized (Appreciation) Depreciation of: | | | | |
Investment Securities | | | 2,846 | |
Futures Contracts | | | (1,514 | ) |
Options Written | | | 3 | |
Short Sales | | | 29 | |
Swap Contracts | | | (376 | ) |
Net Realized (Gain) Loss from: | | | | |
Investment Securities | | | 2,804 | |
Futures Contracts | | | 1,351 | |
Options Written | | | (42 | ) |
Paydowns | | | (2 | ) |
Short Sales | | | (14 | ) |
Swap Contracts | | | 26 | |
| | | | |
Total Adjustments | | | 40,743 | |
| | | | |
Net Cash (Used in) Provided by Operating Activities | | | 38,339 | |
| | | | |
Cash Flows from Financing Activities | | | | |
Cash Received from Financing Transactions | | | 833,146 | |
Cash (Used for) Financing Transactions | | | (870,696 | ) |
Proceeds from Capital Shares Sold | | | 13,280 | |
Payment on Capital Shares Redeemed | | | (14,935 | ) |
| | | | |
Net Cash (Used in) Provided by Financing Activities | | | (39,205 | ) |
| | | | |
Net Increase (Decrease) in Cash and Cash Equivalents | | | (866 | ) |
Cash and Restricted Cash, Beginning of Period | | | 1,272 | |
| | | | |
Cash and Restricted Cash, End of Period | | $ | 406 | |
| | | | |
Supplemental disclosure of cash flow information:
Non-cash financing activities not included herein consist of reinvestment of dividends and distributions of $4,793.
Interest paid was $256 for the period ended December 31, 2018.
The Accompanying Notes are an Integral Part of the Financial Statements.
229
Financial Highlights
NORTHWESTERN MUTUAL SERIES FUND, INC.
(For a share outstanding through the period)
| | | | | | | | | | | | | | | | | | | | | | | | |
| | | Net Asset Value,
Beginning
of Period | | | Net Investment
Income (Loss) | | | Net Realized and
Unrealized Gain
(Loss) on
Investments | | | Total from
Investment
Operations | | | Distributions
from Net
Investment
Income | | | Distributions from
Realized Gains
on Investments | |
Growth Stock Portfolio | |
2018 | | $ | 3.03 | | | $ | 0.02 | | | $ | 0.08 | | | $ | 0.10 | | | $ | (0.02 | ) | | $ | (0.36 | ) |
2017 | | | 2.58 | | | | 0.02 | | | | 0.59 | | | | 0.61 | | | | (0.03 | ) | | | (0.13 | ) |
2016 | | | 2.81 | | | | 0.03 | | | | 0.04 | | | | 0.07 | | | | (0.02 | ) | | | (0.28 | ) |
2015 | | | 2.87 | | | | 0.02 | | | | 0.15 | | | | 0.17 | | | | (0.02 | ) | | | (0.21 | ) |
2014 | | | 2.94 | | | | 0.02 | | | | 0.22 | | | | 0.24 | | | | (0.02 | ) | | | (0.29 | ) |
Focused Appreciation Portfolio | |
2018 | | $ | 2.71 | | | $ | 0.02 | | | $ | (0.07 | ) | | $ | (0.05 | ) | | $ | (0.01 | ) | | $ | (0.08 | ) |
2017 | | | 2.08 | | | | 0.02 | | | | 0.68 | | | | 0.70 | | | | (0.02 | ) | | | (0.05 | ) |
2016 | | | 2.68 | | | | 0.02 | | | | 0.17 | | | | 0.19 | | | | (0.01 | ) | | | (0.78 | ) |
2015 | | | 2.63 | | | | 0.01 | | | | 0.34 | | | | 0.35 | | | | – | | | | (0.30 | ) |
2014 | | | 2.69 | | | | 0.00 | (e) | | | 0.22 | | | | 0.22 | | | | (0.00 | )(e) | | | (0.28 | ) |
Large Cap Core Stock Portfolio | |
2018 | | $ | 1.96 | | | $ | 0.02 | | | $ | (0.05 | ) | | $ | (0.03 | ) | | $ | (0.03 | ) | | $ | (0.59 | ) |
2017 | | | 1.60 | | | | 0.03 | | | | 0.36 | | | | 0.39 | | | | (0.03 | ) | | | – | |
2016 | | | 1.54 | | | | 0.03 | | | | 0.09 | | | | 0.12 | | | | (0.03 | ) | | | (0.03 | ) |
2015 | | | 1.65 | | | | 0.03 | | | | (0.08 | ) | | | (0.05 | ) | | | (0.04 | ) | | | (0.02 | ) |
2014 | | | 1.70 | | | | 0.04 | | | | 0.10 | | | | 0.14 | | | | (0.03 | ) | | | (0.16 | ) |
Large Cap Blend Portfolio | |
2018 | | $ | 1.21 | | | $ | 0.01 | | | $ | (0.06 | ) | | $ | (0.05 | ) | | $ | (0.01 | ) | | $ | (0.06 | ) |
2017 | | | 1.07 | | | | 0.01 | | | | 0.20 | | | | 0.21 | | | | (0.01 | ) | | | (0.06 | ) |
2016 | | | 1.03 | | | | 0.01 | | | | 0.12 | | | | 0.13 | | | | (0.01 | ) | | | (0.08 | ) |
2015 | | | 1.12 | | | | 0.01 | | | | (0.03 | ) | | | (0.02 | ) | | | (0.01 | ) | | | (0.06 | ) |
2014 | | | 1.04 | | | | 0.01 | | | | 0.11 | | | | 0.12 | | | | (0.00 | )(e) | | | (0.04 | ) |
Index 500 Stock Portfolio | |
2018 | | $ | 4.93 | | | $ | 0.09 | | | $ | (0.30 | ) | | $ | (0.21 | ) | | $ | (0.08 | ) | | $ | (0.05 | ) |
2017 | | | 4.17 | | | | 0.08 | | | | 0.81 | | | | 0.89 | | | | (0.08 | ) | | | (0.05 | ) |
2016 | | | 3.88 | | | | 0.08 | | | | 0.37 | | | | 0.45 | | | | (0.07 | ) | | | (0.09 | ) |
2015 | | | 3.98 | | | | 0.07 | | | | (0.03 | ) | | | 0.04 | | | | (0.07 | ) | | | (0.07 | ) |
2014 | | | 3.61 | | | | 0.07 | | | | 0.41 | | | | 0.48 | | | | (0.06 | ) | | | (0.05 | ) |
| Large Company Value Portfolio | |
2018 | | $ | 1.06 | | | $ | 0.02 | | | $ | (0.09 | ) | | $ | (0.07 | ) | | $ | (0.02 | ) | | $ | (0.08 | ) |
2017 | | | 1.02 | | | | 0.02 | | | | 0.08 | | | | 0.10 | | | | (0.02 | ) | | | (0.04 | ) |
2016 | | | 0.99 | | | | 0.02 | | | | 0.12 | | | | 0.14 | | | | (0.02 | ) | | | (0.09 | ) |
2015 | | | 1.15 | | | | 0.02 | | | | (0.06 | ) | | | (0.04 | ) | | | (0.02 | ) | | | (0.10 | ) |
2014 | | | 1.07 | | | | 0.02 | | | | 0.12 | | | | 0.14 | | | | — | | | | (0.06 | ) |
| Domestic Equity Portfolio | |
2018 | | $ | 1.68 | | | $ | 0.03 | | | $ | (0.07 | ) | | $ | (0.04 | ) | | $ | (0.03 | ) | | $ | (0.06 | ) |
2017 | | | 1.54 | | | | 0.03 | | | | 0.18 | | | | 0.21 | | | | (0.03 | ) | | | (0.04 | ) |
2016 | | | 1.41 | | | | 0.03 | | | | 0.19 | | | | 0.22 | | | | (0.03 | ) | | | (0.06 | ) |
2015 | | | 1.44 | | | | 0.03 | | | | (0.03 | ) | | | 0.00 | (e) | | | (0.03 | ) | | | – | |
2014 | | | 1.29 | | | | 0.03 | | | | 0.14 | | | | 0.17 | | | | (0.02 | ) | | | – | |
| (d) | Total Return includes deductions for management and other fund expenses; excludes deductions for sales loads and account fees, not annualized for periods less than one year. |
| (r) | Expense ratios are based on the direct expenses of the Portfolio and do not include the effect of underlying funds’ expenses. For additional information on underlying funds’ expenses, please refer to the Fee and Expense table in the Prospectus. |
| (e) | Amount is less than $0.005. |
The Accompanying Notes are an Integral Part of the Financial Statements.
230
| | | | | | | | | | | | | | | | | | | | | | | | | | | | | | |
Total
Distributions | | | Net Asset Value,
End of Period | | | Total Return(d) | | | Net Assets,
End of Period
(thousands) | | | Ratio of Gross
Expenses to
Average Net
Assets(r) | | | Ratio of Net
Expenses to
Average Net
Assets(r) | | | Ratio of Net
Investment
Income (Loss)
to Average
Net Assets | | | Portfolio
Turnover
Rate | |
| | | | | | | | | | | | | | | | | | | | | | | | | | | | | | | |
| $ | (0.38 | ) | | $ | 2.75 | | | | 1.26 | % | | $ | 898,626 | | | | 0.43 | % | | | 0.42 | % | | | 0.68 | % | | | 47.87 | % |
| | (0.16 | ) | | | 3.03 | | | | 24.27 | | | | 959,854 | | | | 0.43 | | | | 0.42 | | | | 0.78 | | | | 57.70 | |
| | (0.30 | ) | | | 2.58 | | | | 2.47 | | | | 837,980 | | | | 0.43 | | | | 0.43 | | | | 0.97 | | | | 65.66 | |
| | (0.23 | ) | | | 2.81 | | | | 6.01 | | | | 860,348 | | | | 0.43 | | | | 0.42 | | | | 0.82 | | | | 50.12 | |
| | (0.31 | ) | | | 2.87 | | | | 9.02 | | | | 885,880 | | | | 0.43 | | | | 0.41 | | | | 0.76 | | | | 42.36 | |
| | | | | | | | | | | | | | | | | | | | | | | | | | | | | | | |
| $ | (0.09 | ) | | $ | 2.57 | | | | (2.34 | )% | | $ | 849,169 | | | | 0.75 | % | | | 0.63 | % | | | 0.65 | % | | | 7.12 | % |
| | (0.07 | ) | | | 2.71 | | | | 33.62 | | | | 945,385 | | | | 0.75 | | | | 0.63 | | | | 0.66 | | | | 3.50 | |
| | (0.79 | ) | | | 2.08 | | | | 5.87 | | | | 771,800 | | | | 0.76 | | | | 0.63 | | | | 0.83 | | | | 9.38 | |
| | (0.30 | ) | | | 2.68 | | | | 13.64 | | | | 778,837 | | | | 0.76 | | | | 0.63 | | | | 0.27 | | | | 131.33 | |
| | (0.28 | ) | | | 2.63 | | | | 9.43 | | | | 722,379 | | | | 0.77 | | | | 0.64 | | | | (0.02 | ) | | | 54.58 | |
| | | | | | | | | | | | | | | | | | | | | | | | | | | | | | | |
| $ | (0.62 | ) | | $ | 1.31 | | | | (6.04 | )% | | $ | 518,971 | | | | 0.45 | % | | | 0.44 | % | | | 1.23 | % | | | 64.61 | % |
| | (0.03 | ) | | | 1.96 | | | | 24.87 | | | | 592,577 | | | | 0.45 | | | | 0.44 | | | | 1.56 | | | | 100.72 | |
| | (0.06 | ) | | | 1.60 | | | | 7.57 | | | | 514,495 | | | | 0.45 | | | | 0.45 | | | | 1.96 | | | | 6.83 | |
| | (0.06 | ) | | | 1.54 | | | | (3.06 | ) | | | 509,411 | | | | 0.45 | | | | 0.44 | | | | 2.04 | | | | 13.36 | |
| | (0.19 | ) | | | 1.65 | | | | 8.56 | | | | 555,639 | | | | 0.45 | | | | 0.44 | | | | 2.08 | | | | 5.92 | |
| | | | | | | | | | | | | | | | | | | | | | | | | | | | | | | |
| $ | (0.07 | ) | | $ | 1.09 | | | | (4.00 | )% | | $ | 154,435 | | | | 0.82 | % | | | 0.82 | % | | | 1.20 | % | | | 25.22 | % |
| | (0.07 | ) | | | 1.21 | | | | 19.02 | | | | 176,221 | | | | 0.81 | | | | 0.81 | | | | 0.75 | | | | 16.09 | |
| | (0.09 | ) | | | 1.07 | | | | 13.99 | | | | 164,752 | | | | 0.82 | | | | 0.81 | | | | 0.97 | | | | 21.12 | |
| | (0.07 | ) | | | 1.03 | | | | (2.42 | ) | | | 153,841 | | | | 0.81 | | | | 0.81 | | | | 0.99 | | | | 16.11 | |
| | (0.04 | ) | | | 1.12 | | | | 12.58 | | | | 166,948 | | | | 0.82 | | | | 0.82 | | | | 0.91 | | | | 27.31 | |
| | | | | | | | | | | | | | | | | | | | | | | | | | | | | | |
| $ | (0.13 | ) | | $ | 4.59 | | | | (4.58 | )% | | $ | 3,009,141 | | | | 0.21 | % | | | 0.20 | % | | | 1.74 | % | | | 4.16 | % |
| | (0.13 | ) | | | 4.93 | | | | 21.52 | | | | 3,222,137 | | | | 0.21 | | | | 0.21 | | | | 1.82 | | | | 2.92 | |
| | (0.16 | ) | | | 4.17 | | | | 11.73 | | | | 2,678,914 | | | | 0.21 | | | | 0.21 | | | | 1.97 | | | | 3.28 | |
| | (0.14 | ) | | | 3.88 | | | | 1.17 | | | | 2,386,253 | | | | 0.21 | | | | 0.21 | | | | 1.87 | | | | 4.17 | |
| | (0.11 | ) | | | 3.98 | | | | 13.46 | | | | 2,370,298 | | | | 0.22 | | | | 0.22 | | | | 1.84 | | | | 2.65 | |
| | | | | | | | | | | | | | | | | | | | | | | | | | | | | | | |
| $ | (0.10 | ) | | $ | 0.89 | | | | (7.92 | )% | | $ | 173,350 | | | | 0.76 | % | | | 0.74 | % | | | 1.89 | % | | | 60.83 | % |
| | (0.06 | ) | | | 1.06 | | | | 11.10 | | | | 199,836 | | | | 0.75 | | | | 0.73 | | | | 2.15 | | | | 53.45 | |
| | (0.11 | ) | | | 1.02 | | | | 15.36 | | | | 195,773 | | | | 0.75 | | | | 0.72 | | | | 2.07 | | | | 79.86 | |
| | (0.12 | ) | | | 0.99 | | | | (3.85 | ) | | | 174,429 | | | | 0.74 | | | | 0.71 | | | | 1.49 | | | | 52.53 | |
| | (0.06 | ) | | | 1.15 | | | | 13.03 | | | | 190,954 | | | | 0.75 | | | | 0.72 | | | | 1.55 | | | | 55.92 | |
| | | | | | | | | | | | | | | | | | | | | | | | | | | | | | | |
| $ | (0.09 | ) | | $ | 1.55 | | | | (2.81 | )% | | $ | 772,465 | | | | 0.54 | % | | | 0.53 | % | | | 1.92 | % | | | 14.33 | % |
| | (0.07 | ) | | | 1.68 | | | | – | | | | 819,213 | | | | 0.55 | | | | 0.54 | | | | 1.91 | | | | 12.37 | |
| | (0.09 | ) | | | 1.54 | | | | 14.98 | | | | 720,940 | | | | 0.55 | | | | 0.55 | | | | 2.00 | | | | 12.24 | |
| | (0.03 | ) | | | 1.41 | | | | (0.09 | ) | | | 610,458 | | | | 0.56 | | | | 0.55 | | | | 2.06 | | | | 14.15 | |
| | (0.02 | ) | | | 1.44 | | | | 13.87 | | | | 620,021 | | | | 0.56 | | | | 0.56 | | | | 1.92 | | | | 7.97 | |
The Accompanying Notes are an Integral Part of the Financial Statements.
231
Financial Highlights
NORTHWESTERN MUTUAL SERIES FUND, INC.
(For a share outstanding through the period)
| | | | | | | | | | | | | | | | | | | | | | | | |
| | | Net Asset Value,
Beginning of
Period | | | Net Investment
Income (Loss) | | | Net Realized
and Unrealized
Gain (Loss) on
Investments | | | Total from
Investment
Operations | | | Distributions from
Net Investment
Income | | | Distributions from
Realized Gains on
Investments | |
Equity Income Portfolio | |
2018 | | $ | 1.86 | | | $ | 0.04 | | | $ | (0.19 | ) | | $ | (0.15 | ) | | $ | (0.04 | ) | | $ | (0.14 | ) |
2017 | | | 1.72 | | | | 0.04 | | | | 0.23 | | | | 0.27 | | | | (0.04 | ) | | | (0.09 | ) |
2016 | | | 1.56 | | | | 0.04 | | | | 0.24 | | | | 0.28 | | | | (0.03 | ) | | | (0.09 | ) |
2015 | | | 1.77 | | | | 0.03 | | | | (0.14 | ) | | | (0.11 | ) | | | (0.03 | ) | | | (0.07 | ) |
2014 | | | 1.72 | | | | 0.03 | | | | 0.10 | | | | 0.13 | | | | (0.02 | ) | | | (0.06 | ) |
Mid Cap Growth Stock Portfolio | |
2018 | | $ | 3.46 | | | $ | 0.01 | | | $ | (0.17 | ) | | $ | (0.16 | ) | | $ | (0.00 | )(e) | | $ | (0.61 | ) |
2017 | | | 2.88 | | | | 0.00 | (e) | | | 0.59 | | | | 0.59 | | | | (0.01 | ) | | | — | |
2016 | | | 3.11 | | | | 0.01 | | | | 0.02 | | | | 0.03 | | | | (0.01 | ) | | | (0.25 | ) |
2015 | | | 3.40 | | | | 0.01 | | | | 0.02 | | | | 0.03 | | | | (0.00 | )(e) | | | (0.32 | ) |
2014 | | | 3.92 | | | | 0.01 | | | | 0.27 | | | | 0.28 | | | | (0.01 | ) | | | (0.79 | ) |
Index 400 Stock Portfolio | |
2018 | | $ | 2.11 | | | $ | 0.03 | | | $ | (0.24 | ) | | $ | (0.21 | ) | | $ | (0.02 | ) | | $ | (0.14 | ) |
2017 | | | 1.96 | | | | 0.02 | | | | 0.27 | | | | 0.29 | | | | (0.02 | ) | | | (0.12 | ) |
2016 | | | 1.77 | | | | 0.02 | | | | 0.33 | | | | 0.35 | | | | (0.02 | ) | | | (0.14 | ) |
2015 | | | 1.96 | | | | 0.02 | | | | (0.07 | ) | | | (0.05 | ) | | | (0.02 | ) | | | (0.12 | ) |
2014 | | | 1.90 | | | | 0.02 | | | | 0.15 | | | | 0.17 | | | | (0.02 | ) | | | (0.09 | ) |
Mid Cap Value Portfolio | |
2018 | | $ | 1.83 | | | $ | 0.03 | | | $ | (0.23 | ) | | $ | (0.20 | ) | | $ | (0.03 | ) | | $ | (0.17 | ) |
2017 | | | 1.73 | | | | 0.03 | | | | 0.16 | | | | 0.19 | | | | (0.03 | ) | | | (0.06 | ) |
2016 | | | 1.54 | | | | 0.03 | | | | 0.32 | | | | 0.35 | | | | (0.03 | ) | | | (0.13 | ) |
2015 | | | 1.77 | | | | 0.02 | | | | (0.04 | ) | | | (0.02 | ) | | | (0.03 | ) | | | (0.18 | ) |
2014 | | | 1.67 | | | | 0.03 | | | | 0.24 | | | | 0.27 | | | | (0.02 | ) | | | (0.15 | ) |
Small Cap Growth Stock Portfolio | |
2018 | | $ | 2.88 | | | $ | 0.00 | (e) | | $ | (0.28 | ) | | $ | (0.28 | ) | | $ | – | | | $ | (0.25 | ) |
2017 | | | 2.39 | | | | 0.00 | (e) | | | 0.52 | | | | 0.52 | | | | (0.00 | )(e) | | | (0.03 | ) |
2016 | | | 2.37 | | | | 0.00 | (e) | | | 0.28 | | | | 0.28 | | | | (0.01 | ) | | | (0.25 | ) |
2015 | | | 2.50 | | | | 0.01 | | | | (0.01 | ) | | | – | | | | (0.00 | )(e) | | | (0.13 | ) |
2014 | | | 2.60 | | | | 0.00 | (e) | | | 0.20 | | | | 0.20 | | | | – | | | | (0.30 | ) |
Index 600 Stock Portfolio | |
2018 | | $ | 1.45 | | | $ | 0.02 | | | $ | (0.13 | ) | | $ | (0.11 | ) | | $ | (0.02 | ) | | $ | (0.06 | ) |
2017 | | | 1.36 | | | | 0.01 | | | | 0.16 | | | | 0.17 | | | | (0.03 | ) | | | (0.05 | ) |
2016 | | | 1.13 | | | | 0.01 | | | | 0.29 | | | | 0.30 | | | | (0.01 | ) | | | (0.06 | ) |
2015 | | | 1.16 | | | | 0.01 | | | | (0.04 | ) | | | (0.03 | ) | | | – | | | | (0.00 | )(e) |
2014 | | | 1.33 | | | | 0.01 | | | | 0.06 | | | | 0.07 | | | | (0.02 | ) | | | (0.22 | ) |
Small Cap Value Portfolio | |
2018 | | $ | 2.54 | | | $ | 0.01 | | | $ | (0.31 | ) | | $ | (0.30 | ) | | $ | (0.01 | ) | | $ | (0.19 | ) |
2017 | | | 2.42 | | | | 0.02 | | | | 0.25 | | | | 0.27 | | | | (0.02 | ) | | | (0.13 | ) |
2016 | | | 2.10 | | | | 0.02 | | | | 0.61 | | | | 0.63 | | | | (0.02 | ) | | | (0.29 | ) |
2015 | | | 2.38 | | | | 0.02 | | | | (0.14 | ) | | | (0.12 | ) | | | (0.02 | ) | | | (0.14 | ) |
2014 | | | 2.45 | | | | 0.02 | | | | (0.02 | ) | | | 0.00 | (e) | | | (0.01 | ) | | | (0.06 | ) |
| (d) | Total Return includes deductions for management and other fund expenses; excludes deductions for sales loads and account fees, not annualized for periods less than one year. |
| (r) | Expense ratios are based on the direct expenses of the Portfolio and do not include the effect of underlying funds’ expenses. For additional information on underlying funds’ expenses, please refer to the Fee and Expense table in the Prospectus. |
| (e) | Amount is less than $0.005. |
The Accompanying Notes are an Integral Part of the Financial Statements.
232
| | | | | | | | | | | | | | | | | | | | | | | | | | | | | | |
Total
Distributions | | | Net Asset Value,
End of Period | | | Total
Return(d) | | | Net Assets,
End of Period
(thousands) | | | Ratio of Gross
Expenses to
Average Net
Assets(r) | | | Ratio of Net
Expenses to
Average Net
Assets(r) | | | Ratio of Net
Investment
Income (Loss)
to Average Net
Assets | | | Portfolio
Turnover Rate | |
| | | | | | | | | | | | | | | | | | | | | | | | | | | | | | | |
| $ | (0.18 | ) | | $ | 1.53 | | | | (9.35 | )% | | $ | 704,674 | | | | 0.65 | % | | | 0.61 | % | | | 2.25 | % | | | 16.57 | % |
| | (0.13 | ) | | | 1.86 | | | | 16.24 | | | | 844,398 | | | | 0.65 | | | | 0.62 | | | | 2.04 | | | | 21.27 | |
| | (0.12 | ) | | | 1.72 | | | | 19.17 | | | | 798,167 | | | | 0.66 | | | | 0.64 | | | | 2.42 | | | | 23.09 | |
| | (0.10 | ) | | | 1.56 | | | | (6.74 | ) | | | 732,781 | | | | 0.65 | | | | 0.65 | | | | 2.08 | | | | 37.97 | |
| | (0.08 | ) | | | 1.77 | | | | 7.43 | | | | 781,735 | | | | 0.66 | | | | 0.66 | | | | 1.94 | | | | 13.56 | |
| | | | | | | | | | | | | | | | | | | | | | | | | | | | | | | |
| $ | (0.61 | ) | | $ | 2.69 | | | | (7.38 | )% | | $ | 943,370 | | | | 0.54 | % | | | 0.54 | % | | | 0.19 | % | | | 32.73 | % |
| | (0.01 | ) | | | 3.46 | | | | 20.29 | | | | 1,097,433 | | | | 0.54 | | | | 0.54 | | | | 0.14 | | | | 148.03 | |
| | (0.26 | ) | | | 2.88 | | | | 0.83 | | | | 983,395 | | | | 0.54 | | | | 0.54 | | | | 0.29 | | | | 57.23 | |
| | (0.32 | ) | | | 3.11 | | | | 0.71 | | | | 1,025,151 | | | | 0.53 | | | | 0.52 | | | | 0.17 | | | | 68.54 | |
| | (0.80 | ) | | | 3.40 | | | | 8.49 | | | | 1,098,155 | | | | 0.54 | | | | 0.51 | | | | 0.25 | | | | 82.51 | |
| | | | | | | | | | | | | | | | | | | | | | | | | | | | | | | |
| $ | (0.16 | ) | | $ | 1.74 | | | | (11.33 | )% | | $ | 792,780 | | | | 0.28 | % | | | 0.26 | % | | | 1.29 | % | | | 18.23 | % |
| | (0.14 | ) | | | 2.11 | | | | 15.96 | | | | 896,559 | | | | 0.28 | | | | 0.26 | | | | 1.22 | | | | 18.08 | |
| | (0.16 | ) | | | 1.96 | | | | 20.38 | | | | 773,157 | | | | 0.28 | | | | 0.27 | | | | 1.31 | | | | 19.44 | |
| | (0.14 | ) | | | 1.77 | | | | (2.38 | ) | | | 634,401 | | | | 0.28 | | | | 0.27 | | | | 1.23 | | | | 18.70 | |
| | (0.11 | ) | | | 1.96 | | | | 9.42 | | | | 652,404 | | | | 0.28 | | | | 0.27 | | | | 1.25 | | | | 12.20 | |
| | | | | | | | | | | | | | | | | | | | | | | | | | | | | | | |
| $ | (0.20 | ) | | $ | 1.43 | | | | (12.85 | )% | | $ | 471,943 | | | | 0.89 | % | | | 0.76 | % | | | 1.50 | % | | | 61.68 | % |
| | (0.09 | ) | | | 1.83 | | | | 11.81 | | | | 564,624 | | | | 0.88 | | | | 0.76 | | | | 1.79 | | | | 46.45 | |
| | (0.16 | ) | | | 1.73 | | | | 23.23 | | | | 518,217 | | | | 0.89 | | | | 0.77 | | | | 1.71 | | | | 53.81 | |
| | (0.21 | ) | | | 1.54 | | | | (1.33 | ) | | | 410,233 | | | | 0.89 | | | | 0.77 | | | | 1.38 | | | | 71.46 | |
| | (0.17 | ) | | | 1.77 | | | | 16.69 | | | | 427,853 | | | | 0.90 | | | | 0.78 | | | | 1.56 | | | | 66.16 | |
| | | | | | | | | | | | | | | | | | | | | | | | | | | | | | | |
| $ | (0.25 | ) | | $ | 2.35 | | | | (11.71 | )% | | $ | 520,622 | | | | 0.56 | % | | | 0.56 | % | | | 0.10 | % | | | 52.15 | % |
| | (0.03 | ) | | | 2.88 | | | | 21.61 | | | | 627,901 | | | | 0.56 | | | | 0.56 | | | | (0.01 | ) | | | 43.11 | |
| | (0.26 | ) | | | 2.39 | | | | 12.25 | | | | 545,052 | | | | 0.58 | | | | 0.58 | | | | 0.19 | | | | 44.26 | |
| | (0.13 | ) | | | 2.37 | | | | 0.32 | | | | 494,932 | | | | 0.57 | | | | 0.56 | | | | 0.22 | | | | 48.21 | |
| | (0.30 | ) | | | 2.50 | | | | 8.66 | | | | 529,548 | | | | 0.57 | | | | 0.57 | | | | 0.12 | | | | 27.07 | |
| | | | | | | | | | | | | | | | | | | | | | | | | | | | | | | |
| $ | (0.08 | ) | | $ | 1.26 | | | | (8.78 | )% | | $ | 221,803 | | | | 0.31 | % | | | 0.31 | % | | | 1.06 | % | | | 37.83 | % |
| | (0.08 | ) | | | 1.45 | | | | 12.93 | | | | 222,348 | | | | 0.33 | | | | 0.33 | | | | 1.04 | | | | 36.46 | |
| | (0.07 | ) | | | 1.36 | | | | 26.12 | | | | 173,883 | | | | 0.36 | | | | 0.35 | | | | 1.00 | | | | 52.14 | |
| | (0.00 | )(e) | | | 1.13 | | | | (2.35 | ) | | | 113,993 | | | | 0.36 | | | | 0.34 | | | | 0.95 | | | | 46.59 | |
| | (0.24 | ) | | | 1.16 | | | | 5.34 | | | | 101,286 | | | | 0.39 | | | | 0.35 | | | | 0.93 | | | | 49.73 | |
| | | | | | | | | | | | | | | | | | | | | | | | | | | | | | | |
| $ | (0.20 | ) | | $ | 2.04 | | | | (12.73 | )% | | $ | 530,072 | | | | 0.88 | % | | | 0.87 | % | | | 0.43 | % | | | 22.36 | % |
| | (0.15 | ) | | | 2.54 | | | | 11.65 | | | | 673,234 | | | | 0.88 | | | | 0.86 | | | | 0.56 | | | | 14.51 | |
| | (0.31 | ) | | | 2.42 | | | | 32.39 | | | | 647,830 | | | | 0.89 | | | | 0.88 | | | | 0.93 | | | | 24.02 | |
| | (0.16 | ) | | | 2.10 | | | | (5.45 | ) | | | 514,970 | | | | 0.88 | | | | 0.88 | | | | 1.00 | | | | 35.53 | |
| | (0.07 | ) | | | 2.38 | | | | 0.22 | | | | 583,367 | | | | 0.88 | | | | 0.88 | | | | 0.81 | | | | 16.29 | |
The Accompanying Notes are an Integral Part of the Financial Statements.
233
Financial Highlights
NORTHWESTERN MUTUAL SERIES FUND, INC.
(For a share outstanding through the period)
| | | | | | | | | | | | | | | | | | | | | | | | |
| | | Net Asset Value,
Beginning of Period | | | Net Investment
Income (Loss) | | | Net Realized and
Unrealized Gain
(Loss) on
Investments | | | Total from
Investment
Operations | | | Distributions
from Net
Investment
Income | | | Distributions
from Realized
Gains on
Investments | |
International Growth Portfolio | |
2018 | | $ | 1.59 | | | $ | 0.02 | | | $ | (0.20 | ) | | $ | (0.18 | ) | | $ | (0.02 | ) | | $ | – | |
2017 | | | 1.24 | | | | 0.02 | | | | 0.35 | | | | 0.37 | | | | (0.02 | ) | | | – | |
2016 | | | 1.30 | | | | 0.02 | | | | (0.07 | ) | | | (0.05 | ) | | | (0.01 | ) | | | – | |
2015 | | | 1.34 | | | | 0.02 | | | | (0.04 | ) | | | (0.02 | ) | | | (0.02 | ) | | | – | |
2014 | | | 1.43 | | | | 0.02 | | | | (0.09 | ) | | | (0.07 | ) | | | (0.02 | ) | | | – | |
Research International Core Portfolio | | | | | | | | | |
2018 | | $ | 1.04 | | | $ | 0.02 | | | $ | (0.16 | ) | | $ | (0.14 | ) | | $ | (0.02 | ) | | $ | – | |
2017 | | | 0.82 | | | | 0.02 | | | | 0.22 | | | | 0.24 | | | | (0.02 | ) | | | – | |
2016 | | | 0.85 | | | | 0.02 | | | | (0.03 | ) | | | (0.01 | ) | | | (0.01 | ) | | | (0.01 | ) |
2015 | | | 0.90 | | | | 0.02 | | | | (0.03 | ) | | | (0.01 | ) | | | (0.02 | ) | | | (0.02 | ) |
2014 | | | 0.99 | | | | 0.02 | | | | (0.09 | ) | | | (0.07 | ) | | | (0.01 | ) | | | (0.01 | ) |
International Equity Portfolio | |
2018 | | $ | 1.91 | | | $ | 0.04 | | | $ | (0.32 | ) | | $ | (0.28 | ) | | $ | (0.05 | ) | | $ | – | |
2017 | | | 1.60 | | | | 0.04 | | | | 0.31 | | | | 0.35 | | | | (0.04 | ) | | | – | |
2016 | | | 1.61 | | | | 0.04 | | | | 0.00 | (e) | | | 0.04 | | | | (0.03 | ) | | | (0.02 | ) |
2015 | | | 1.77 | | | | 0.04 | | | | (0.08 | ) | | | (0.04 | ) | | | (0.05 | ) | | | (0.07 | ) |
2014 | | | 2.13 | | | | 0.06 | | | | (0.24 | ) | | | (0.18 | ) | | | (0.04 | ) | | | (0.14 | ) |
Emerging Markets Equity Portfolio | |
2018 | | $ | 1.10 | | | $ | 0.01 | | | $ | (0.16 | ) | | $ | (0.15 | ) | | $ | (0.01 | ) | | $ | – | |
2017 | | | 0.87 | | | | 0.02 | | | | 0.22 | | | | 0.24 | | | | (0.01 | ) | | | – | |
2016 | | | 0.80 | | | | 0.01 | | | | 0.07 | | | | 0.08 | | | | (0.01 | ) | | | – | |
2015 | | | 0.93 | | | | 0.01 | | | | (0.13 | ) | | | (0.12 | ) | | | (0.01 | ) | | | – | |
2014 | | | 0.99 | | | | 0.01 | | | | (0.06 | ) | | | (0.05 | ) | | | (0.01 | ) | | | (0.00 | )(e) |
Government Money Market Portfolio | |
2018 | | $ | 1.00 | | | $ | 0.02 | | | $ | – | | | $ | 0.02 | | | $ | (0.02 | ) | | $ | (0.00 | )(e) |
2017 | | | 1.00 | | | | 0.01 | | | | 0.00 | (e) | | | 0.01 | | | | (0.01 | ) | | | (0.00 | )(e) |
2016 | | | 1.00 | | | | 0.00 | (e) | | | – | | | | 0.00 | (e) | | | (0.00 | )(e) | | | (0.00 | )(e) |
2015 | | | 1.00 | | | | 0.00 | (e) | | | – | | | | 0.00 | (e) | | | (0.00 | )(e) | | | (0.00 | )(e) |
2014 | | | 1.00 | | | | 0.00 | (e) | | | – | | | | 0.00 | (e) | | | (0.00 | )(e) | | | – | |
Short-Term Bond Portfolio | |
2018 | | $ | 1.03 | | | $ | 0.02 | | | $ | – | | | $ | 0.02 | | | $ | (0.02 | ) | | $ | – | |
2017 | | | 1.03 | | | | 0.02 | | | | (0.01 | ) | | | 0.01 | | | | (0.01 | ) | | | – | |
2016 | | | 1.03 | | | | 0.01 | | | | – | | | | 0.01 | | | | (0.01 | ) | | | – | |
2015 | | | 1.03 | | | | 0.01 | | | | 0.00 | (e) | | | 0.01 | | | | (0.01 | ) | | | – | |
2014 | | | 1.03 | | | | 0.01 | | | | – | | | | 0.01 | | | | (0.01 | ) | | | – | |
Select Bond Portfolio | |
2018 | | $ | 1.26 | | | $ | 0.03 | | | $ | (0.03 | ) | | $ | 0.00 | (e) | | $ | (0.03 | ) | | $ | – | |
2017 | | | 1.26 | | | | 0.03 | | | | 0.02 | | | | 0.05 | | | | (0.03 | ) | | | (0.02 | ) |
2016 | | | 1.25 | | | | 0.02 | | | | 0.03 | | | | 0.05 | | | | (0.03 | ) | | | (0.01 | ) |
2015 | | | 1.27 | | | | 0.02 | | | | (0.01 | ) | | | 0.01 | | | | (0.02 | ) | | | (0.01 | ) |
2014 | | | 1.23 | | | | 0.02 | | | | 0.05 | | | | 0.07 | | | | (0.03 | ) | | | – | |
| (d) | Total Return includes deductions for management and other fund expenses; excludes deductions for sales loads and account fees, not annualized for periods less than one year. |
| (r) | Expense ratios are based on the direct expenses of the Portfolio and do not include the effect of underlying funds’ expenses. For additional information on underlying funds’ expenses, please refer to the Fee and Expense table in the Prospectus. |
| (e) | Amount is less than $0.005. |
| (g) | Portfolio Turnover Rate excludes the impact of mortgage dollar roll transactions. |
The Accompanying Notes are an Integral Part of the Financial Statements.
234
| | | | | | | | | | | | | | | | | | | | | | | | | | | | | | |
Total
Distributions | | | Net Asset Value,
End of Period | | | Total Return(d) | | | Net Assets, End of Period
(thousands) | | | Ratio of Gross
Expenses to
Average Net
Assets(r) | | | Ratio of Net
Expenses to
Average Net
Assets(r) | | | Ratio of Net
Investment
Income (Loss) to
Average Net Assets | | | Portfolio
Turnover Rate | |
| | | | | | | | | | | | | | | | | | | | | | | | | | | | | | | |
| $ | (0.02 | ) | | $ | 1.39 | | | | (11.28 | )% | | $ | 626,082 | | | | 0.65 | % | | | 0.65 | % | | | 1.28 | % | | | 33.34 | % |
| | (0.02 | ) | | | 1.59 | | | | 30.03 | | | | 697,581 | | | | 0.67 | | | | 0.67 | | | | 1.32 | | | | 19.52 | |
| | (0.01 | ) | | | 1.24 | | | | (3.41 | ) | | | 523,122 | | | | 0.71 | | | | 0.71 | | | | 1.67 | | | | 25.57 | |
| | (0.02 | ) | | | 1.30 | | | | (1.73 | ) | | | 485,313 | | | | 0.74 | | | | 0.74 | | | | 1.12 | | | | 134.92 | |
| | (0.02 | ) | | | 1.34 | | | | (4.52 | ) | | | 436,931 | | | | 0.74 | | | | 0.74 | | | | 1.75 | | | | 64.20 | |
| | | | | | | | | | | | | | | | | | | | | | | | | | | | | | | |
| $ | (0.02 | ) | | $ | 0.88 | | | | (13.66 | )% | | $ | 595,585 | | | | 0.82 | % | | | 0.77 | % | | | 1.88 | % | | | 24.38 | % |
| | (0.02 | ) | | | 1.04 | | | | 28.21 | | | | 658,005 | | | | 0.86 | | | | 0.81 | | | | 1.74 | | | | 27.88 | |
| | (0.02 | ) | | | 0.82 | | | | (1.12 | ) | | | 499,649 | | | | 0.92 | | | | 0.88 | | | | 1.99 | | | | 40.80 | |
| | (0.04 | ) | | | 0.85 | | | | (1.11 | ) | | | 498,395 | | | | 0.91 | | | | 0.91 | | | | 1.78 | | | | 32.43 | |
| | (0.02 | ) | | | 0.90 | | | | (6.71 | ) | | | 457,008 | | | | 0.94 | | | | 0.94 | | | | 2.45 | | | | 25.24 | |
| | | | | | | | | | | | | | | | | | | | | | | | | | | | | | | |
| $ | (0.05 | ) | | $ | 1.58 | | | | (15.41 | )% | | $ | 1,604,068 | | | | 0.68 | % | | | 0.54 | % | | | 2.36 | % | | | 31.04 | % |
| | (0.04 | ) | | | 1.91 | | | | 22.30 | | | | 1,927,673 | | | | 0.70 | | | | 0.57 | | | | 2.40 | | | | 20.68 | |
| | (0.05 | ) | | | 1.60 | | | | 2.89 | | | | 1,628,267 | | | | 0.71 | | | | 0.62 | | | | 2.65 | | | | 16.25 | |
| | (0.12 | ) | | | 1.61 | | | | (2.21 | ) | | | 1,605,948 | | | | 0.73 | | | | 0.64 | | | | 2.05 | | | | 18.80 | |
| | (0.18 | ) | | | 1.77 | | | | (8.80 | ) | | | 1,635,378 | | | | 0.72 | | | | 0.66 | | | | 2.91 | | | | 17.84 | |
| | | | | | | | | | | | | | | | | | | | | | | | | | | | | | | |
| $ | (0.01 | ) | | $ | 0.94 | | | | (13.75 | )% | | $ | 675,350 | | | | 1.11 | % | | | 1.00 | % | | | 1.27 | % | | | 16.67 | % |
| | (0.01 | ) | | | 1.10 | | | | 27.84 | | | | 718,281 | | | | 1.18 | | | | 1.06 | | | | 1.61 | | | | 98.21 | |
| | (0.01 | ) | | | 0.87 | | | | 9.06 | | | | 521,800 | | | | 1.25 | | | | 1.16 | | | | 1.24 | | | | 47.33 | |
| | (0.01 | ) | | | 0.80 | | | | (12.24 | ) | | | 444,297 | | | | 1.32 | | | | 1.32 | | | | 0.91 | | | | 45.83 | |
| | (0.01 | ) | | | 0.93 | | | | (6.25 | ) | | | 416,997 | | | | 1.35 | | | | 1.35 | | | | 1.02 | | | | 45.75 | |
| | | | | | | | | | | | | | | | | | | | | | | | | | | | | | | |
| $ | (0.02 | ) | | $ | 1.00 | | | | 1.54 | % | | $ | 443,474 | | | | 0.34 | % | | | 0.34 | % | | | 1.53 | % | | | – | % |
| | (0.01 | ) | | | 1.00 | | | | 0.60 | | | | 439,438 | | | | 0.33 | | | | 0.33 | | | | 0.59 | | | | – | |
| | (0.00 | )(e) | | | 1.00 | | | | 0.13 | | | | 501,635 | | | | 0.32 | | | | 0.32 | | | | 0.11 | | | | – | |
| | (0.00 | )(e) | | | 1.00 | | | | 0.01 | | | | 445,287 | | | | 0.33 | | | | 0.26 | | | | 0.01 | | | | – | |
| | (0.00 | )(e) | | | 1.00 | | | | 0.07 | | | | 438,752 | | | | 0.33 | | | | 0.07 | | | | 0.07 | | | | – | |
| | | | | | | | | | | | | | | | | | | | | | | | | | | | | | | |
| $ | (0.02 | ) | | $ | 1.03 | | | | 1.36 | % | | $ | 306,541 | | | | 0.39 | % | | | 0.39 | % | | | 2.14 | % | | | 41.45 | %(g) |
| | (0.01 | ) | | | 1.03 | | | | 1.33 | | | | 293,514 | | | | 0.42 | | | | 0.41 | | | | 1.60 | | | | 45.77 | |
| | (0.01 | ) | | | 1.03 | | | | 1.67 | | | | 269,833 | | | | 0.43 | | | | 0.43 | | | | 1.33 | | | | 36.61 | |
| | (0.01 | ) | | | 1.03 | | | | 0.72 | | | | 244,204 | | | | 0.43 | | | | 0.42 | | | | 1.17 | | | | 35.76 | |
| | (0.01 | ) | | | 1.03 | | | | 0.38 | | | | 234,487 | | | | 0.41 | | | | 0.41 | | | | 0.76 | | | | 196.15 | |
| | | | | | | | | | | | | | | | | | | | | | | | | | | | | | |
| $ | (0.03 | ) | | $ | 1.23 | | | | (0.21 | )% | | $ | 2,967,993 | | | | 0.31 | % | | | 0.31 | % | | | 2.74 | % | | | 293.74 | %(g) |
| | (0.05 | ) | | | 1.26 | | | | 3.58 | | | | 2,943,934 | | | | 0.32 | | | | 0.31 | | | | 2.15 | | | | 390.26 | (g) |
| | (0.04 | ) | | | 1.26 | | | | 3.06 | | | | 2,839,045 | | | | 0.32 | | | | 0.31 | | | | 1.91 | | | | 524.79 | (g) |
| | (0.03 | ) | | | 1.25 | | | | 0.53 | | | | 2,856,958 | | | | 0.31 | | | | 0.31 | | | | 1.76 | | | | 476.41 | (g) |
| | (0.03 | ) | | | 1.27 | | | | 5.56 | | | | 2,841,156 | | | | 0.32 | | | | 0.32 | | | | 1.97 | | | | 308.80 | (g) |
The Accompanying Notes are an Integral Part of the Financial Statements.
235
Financial Highlights
NORTHWESTERN MUTUAL SERIES FUND, INC.
(For a share outstanding through the period)
| | | | | | | | | | | | | | | | | | | | | | | | | | | | | | | | |
| | | Net Asset Value,
Beginning
of Period | | | Net Investment
Income (Loss) | | | Net Realized and
Unrealized Gain
(Loss) on
Investments | | | Total from
Investment
Operations | | | Distributions
from Net
Investment
Income | | | Distributions
from Realized
Gains on
Investments | | | | | | | |
Long-Term U.S. Government Bond Portfolio(s) | |
2018 | | $ | 1.08 | | | $ | 0.03 | | | $ | (0.06 | ) | | $ | (0.03 | ) | | $ | (0.02 | ) | | $ | (0.02 | ) | | | | | | | | |
2017 | | | 1.06 | | | | 0.03 | | | | 0.05 | | | | 0.08 | | | | (0.02 | ) | | | (0.04 | ) | | | | | | | | |
2016 | | | 1.08 | | | | 0.03 | | | | (0.01 | ) | | | 0.02 | | | | (0.02 | ) | | | (0.02 | ) | | | | | | | | |
2015 | | | 1.12 | | | | 0.03 | | | | (0.05 | ) | | | (0.02 | ) | | | (0.02 | ) | | | – | | | | | | | | | |
2014 | | | 0.92 | | | | 0.03 | | | | 0.19 | | | | 0.22 | | | | (0.02 | ) | | | – | | | | | | | | | |
Inflation Protection Portfolio | |
2018 | | $ | 1.11 | | | $ | 0.03 | | | $ | (0.06 | ) | | $ | (0.03 | ) | | $ | (0.02 | ) | | $ | – | | | | | | | | | |
2017 | | | 1.09 | | | | 0.02 | | | | 0.01 | | | | 0.03 | | | | (0.01 | ) | | | (0.00 | )(e) | | | | | | | | |
2016 | | | 1.05 | | | | 0.02 | | | | 0.03 | | | | 0.05 | | | | (0.01 | ) | | | – | | | | | | | | | |
2015 | | | 1.10 | | | | 0.01 | | | | (0.03 | ) | | | (0.02 | ) | | | (0.03 | ) | | | – | | | | | | | | | |
2014 | | | 1.08 | | | | 0.01 | | | | 0.03 | | | | 0.04 | | | | (0.01 | ) | | | (0.01 | ) | | | | | | | | |
High Yield Bond Portfolio | |
2018 | | $ | 0.75 | | | $ | 0.04 | | | $ | (0.06 | ) | | $ | (0.02 | ) | | $ | (0.04 | ) | | $ | – | | | | | | | | | |
2017 | | | 0.74 | | | | 0.04 | | | | 0.01 | | | | 0.05 | | | | (0.04 | ) | | | – | | | | | | | | | |
2016 | | | 0.68 | | | | 0.04 | | | | 0.06 | | | | 0.10 | | | | (0.04 | ) | | | – | | | | | | | | | |
2015 | | | 0.72 | | | | 0.04 | | | | (0.05 | ) | | | (0.01 | ) | | | (0.03 | ) | | | – | | | | | | | | | |
2014 | | | 0.75 | | | | 0.04 | | | | (0.03 | ) | | | 0.01 | | | | (0.04 | ) | | | – | | | | | | | | | |
Multi-Sector Bond Portfolio(s) | |
2018 | | $ | 1.09 | | | $ | 0.04 | | | $ | (0.05 | ) | | $ | (0.01 | ) | | $ | (0.03 | ) | | $ | – | | | | | | | | | |
2017 | | | 1.05 | | | | 0.04 | | | | 0.04 | | | | 0.08 | | | | (0.04 | ) | | | – | | | | | | | | | |
2016 | | | 0.99 | | | | 0.04 | | | | 0.07 | | | | 0.11 | | | | (0.05 | ) | | | – | | | | | | | | | |
2015 | | | 1.08 | | | | 0.04 | | | | (0.05 | ) | | | (0.01 | ) | | | (0.06 | ) | | | (0.02 | ) | | | | | | | | |
2014 | | | 1.08 | | | | 0.04 | | | | (0.01 | ) | | | 0.03 | | | | (0.03 | ) | | | – | | | | | | | | | |
Balanced Portfolio | |
2018 | | $ | 1.47 | | | $ | 0.03 | | | $ | (0.07 | ) | | $ | (0.04 | ) | | $ | (0.04 | ) | | $ | (0.03 | ) | | | | | | | | |
2017 | | | 1.40 | | | | 0.03 | | | | 0.12 | | | | 0.15 | | | | (0.03 | ) | | | (0.05 | ) | | | | | | | | |
2016 | | | 1.38 | | | | 0.02 | | | | 0.07 | | | | 0.09 | | | | (0.03 | ) | | | (0.04 | ) | | | | | | | | |
2015 | | | 1.48 | | | | 0.02 | | | | (0.02 | ) | | | – | | | | (0.03 | ) | | | (0.07 | ) | | | | | | | | |
2014 | | | 1.56 | | | | 0.02 | | | | 0.07 | | | | 0.09 | | | | (0.04 | ) | | | (0.13 | ) | | | | | | | | |
Asset Allocation Portfolio | |
2018 | | $ | 1.21 | | | $ | 0.03 | | | $ | (0.09 | ) | | $ | (0.06 | ) | | $ | (0.02 | ) | | $ | (0.03 | ) | | | | | | | | |
2017 | | | 1.12 | | | | 0.02 | | | | 0.15 | | | | 0.17 | | | | (0.03 | ) | | | (0.05 | ) | | | | | | | | |
2016 | | | 1.11 | | | | 0.02 | | | | 0.06 | | | | 0.08 | | | | (0.03 | ) | | | (0.04 | ) | | | | | | | | |
2015 | | | 1.20 | | | | 0.02 | | | | (0.03 | ) | | | (0.01 | ) | | | (0.02 | ) | | | (0.06 | ) | | | | | | | | |
2014 | | | 1.28 | | | | 0.01 | | | | 0.05 | | | | 0.06 | | | | (0.03 | ) | | | (0.11 | ) | | | | | | | | |
| (d) | Total Return includes deductions for management and other fund expenses; excludes deductions for sales loads and account fees, not annualized for periods less than one year. |
| (r) | Expense ratios are based on the direct expenses of the Portfolio and do not include the effect of underlying funds’ expenses. For additional information on underlying funds’ expenses, please refer to the Fee and Expense table in the Prospectus. |
| (s) | The ratios of gross expenses to average net assets and net expenses to average net assets include interest expense. Excluding interest expense, the ratios for the Long-Term U.S. Government Portfolio would be 0.67% and 0.65% respectively for the period ended December 31, 2018, 0.67% and 0.65% respectively for the period ended December 31, 2017, 0.64% and 0.64% respectively in 2016, 0.67% and 0.64% respectively in 2015, and 0.67% and 0.65% respectively in 2014. The ratios for the Multi-Sector Bond Portfolio would be 0.81% and 0.74% respectively for the period ended December 31, 2018. |
| (g) | Portfolio Turnover Rate excludes the impact of mortgage dollar roll transactions. |
| (e) | Amount is less than $0.005. |
| (h) | Portfolio Turnover Rate excludes the impact ofin-kind transactions. |
The Accompanying Notes are an Integral Part of the Financial Statements.
236
| | | | | | | | | | | | | | | | | | | | | | | | | | | | | | |
Total Distributions | | | Net Asset Value,
End of Period | | | Total Return(d)
| | | Net Assets,
End of Period
(thousands) | | | Ratio of Gross
Expenses to
Average Net
Assets(r) | | | Ratio of Net
Expenses to
Average Net
Assets(r) | | | Ratio of Net Investment
Income (Loss)
to Average Net Assets | | | Portfolio
Turnover Rate | |
| | | | | | | | | | | | | | | | | | | | | | | | | | | | | | | |
| $ | (0.04 | ) | | $ | 1.01 | | | | (2.04 | )% | | $ | 111,468 | | | | 0.90 | % | | | 0.89 | % | | | 2.48 | % | | | 42.53 | %(g) |
| | (0.06 | ) | | | 1.08 | | | | 8.28 | | | | 115,713 | | | | 0.94 | | | | 0.92 | | | | 2.64 | | | | 50.94 | (g) |
| | (0.04 | ) | | | 1.06 | | | | 1.09 | | | | 110,391 | | | | 0.77 | | | | 0.77 | | | | 2.19 | | | | 126.34 | (g) |
| | (0.02 | ) | | | 1.08 | | | | (1.47 | ) | | | 104,513 | | | | 0.69 | | | | 0.67 | | | | 2.32 | | | | 32.93 | (g) |
| | (0.02 | ) | | | 1.12 | | | | 23.73 | | | | 109,250 | | | | 0.68 | | | | 0.67 | | | | 2.67 | | | | 116.62 | (g) |
| | | | | | | | | | | | | | | | | | | | | | | | | | | | | | | |
| $ | (0.02 | ) | | $ | 1.06 | | | | (2.61 | )% | | $ | 349,571 | | | | 0.59 | % | | | 0.55 | % | | | 2.55 | % | | | 22.87 | % |
| | (0.01 | ) | | | 1.11 | | | | 3.58 | | | | 401,711 | | | | 0.61 | | | | 0.57 | | | | 2.05 | | | | 20.82 | |
| | (0.01 | ) | | | 1.09 | | | | 4.68 | | | | 326,927 | | | | 0.64 | | | | 0.59 | | | | 1.55 | | | | 33.80 | |
| | (0.03 | ) | | | 1.05 | | | | (2.20 | ) | | | 287,089 | | | | 0.63 | | | | 0.59 | | | | 0.52 | | | | 17.29 | |
| | (0.02 | ) | | | 1.10 | | | | 3.14 | | | | 285,685 | | | | 0.63 | | | | 0.59 | | | | 1.26 | | | | 20.25 | |
| | | | | | | | | | | | | | | | | | | | | | | | | | | | | | | |
| $ | (0.04 | ) | | $ | 0.69 | | | | (2.71 | )% | | $ | 763,366 | | | | 0.45 | % | | | 0.45 | % | | | 5.65 | % | | | 22.94 | % |
| | (0.04 | ) | | | 0.75 | | | | 6.88 | | | | 811,878 | | | | 0.45 | | | | 0.45 | | | | 5.48 | | | | 31.59 | |
| | (0.04 | ) | | | 0.74 | | | | 14.59 | | | | 756,947 | | | | 0.47 | | | | 0.46 | | | | 5.83 | | | | 35.58 | |
| | (0.03 | ) | | | 0.68 | | | | (1.36 | ) | | | 688,124 | | | | 0.46 | | | | 0.46 | | | | 5.55 | | | | 27.49 | |
| | (0.04 | ) | | | 0.72 | | | | 1.18 | | | | 701,988 | | | | 0.47 | | | | 0.47 | | | | 5.43 | | | | 96.48 | |
| | | | | | | | | | | | | | | | | | | | | | | | | | | | | | | |
| $ | (0.03 | ) | | $ | 1.05 | | | | (1.30 | )% | | $ | 874,943 | | | | 0.82 | % | | | 0.75 | % | | | 3.67 | % | | | 37.42 | %(g) |
| | (0.04 | ) | | | 1.09 | | | | 8.38 | | | | 840,981 | | | | 0.82 | | | | 0.75 | | | | 4.06 | | | | 48.84 | |
| | (0.05 | ) | | | 1.05 | | | | 11.09 | | | | 689,849 | | | | 0.84 | | | | 0.78 | | | | 3.86 | | | | 42.81 | |
| | (0.08 | ) | | | 0.99 | | | | (2.22 | ) | | | 580,634 | | | | 0.85 | | | | 0.79 | | | | 4.13 | | | | 58.14 | (g) |
| | (0.03 | ) | | | 1.08 | | | | 3.25 | | | | 546,059 | | | | 0.86 | | | | 0.81 | | | | 3.89 | | | | 58.51 | (g) |
| | | | | | | | | | | | | | | | | | | | | | | | | | | | | | | |
| $ | (0.07 | ) | | $ | 1.36 | | | | (3.45 | )% | | $ | 2,065,353 | | | | 0.31 | % | | | 0.06 | % | | | 2.25 | % | | | 27.29 | % |
| | (0.08 | ) | | | 1.47 | | | | 11.98 | | | | 2,307,470 | | | | 0.31 | | | | 0.06 | | | | 1.75 | | | | 16.58 | |
| | (0.07 | ) | | | 1.40 | | | | 6.58 | | | | 2,202,834 | | | | 0.31 | | | | 0.07 | | | | 1.73 | | | | 23.64 | |
| | (0.10 | ) | | | 1.38 | | | | (0.12 | ) | | | 2,219,466 | | | | 0.31 | | | | 0.08 | | | | 1.43 | | | | 13.53 | |
| | (0.17 | ) | | | 1.48 | | | | 5.56 | | | | 2,367,127 | | | | 0.32 | | | | 0.16 | | | | 1.29 | | | | 56.83 | (g),(h) |
| | | | | | | | | | | | | | | | | | | | | | | | | | | | | | | |
| $ | (0.05 | ) | | $ | 1.10 | | | | (4.88 | )% | | $ | 249,511 | | | | 0.57 | % | | | 0.09 | % | | | 2.24 | % | | | 32.14 | % |
| | (0.08 | ) | | | 1.21 | | | | 14.87 | | | | 277,213 | | | | 0.57 | | | | 0.09 | | | | 1.68 | | | | 22.05 | |
| | (0.07 | ) | | | 1.12 | | | | 7.79 | | | | 250,399 | | | | 0.58 | | | | 0.09 | | | | 1.69 | | | | 25.59 | |
| | (0.08 | ) | | | 1.11 | | | | (0.43 | ) | | | 249,413 | | | | 0.58 | | | | 0.08 | | | | 1.47 | | | | 15.36 | |
| | (0.14 | ) | | | 1.20 | | | | 5.15 | | | | 266,409 | | | | 0.62 | | | | 0.23 | | | | 1.13 | | | | 39.50 | (g),(h) |
The Accompanying Notes are an Integral Part of the Financial Statements.
237
Notes to Financial Statements
NOTE 1. ORGANIZATION
Northwestern Mutual Series Fund, Inc. (the “Series Fund”) is registered as anopen-end management investment company under the Investment Company Act of 1940, as amended (“1940 Act”). The Series Fund is also considered an investment company following the accounting and reporting guidance in Financial Accounting Standards Board (“FASB”) Accounting Standards Codification (“ASC”) Topic 946. The Series Fund consists of the Growth Stock Portfolio, Focused Appreciation Portfolio, Large Cap Core Stock Portfolio, Large Cap Blend Portfolio, Index 500 Stock Portfolio, Large Company Value Portfolio, Domestic Equity Portfolio, Equity Income Portfolio, Mid Cap Growth Stock Portfolio, Index 400 Stock Portfolio, Mid Cap Value Portfolio, Small Cap Growth Stock Portfolio, Index 600 Stock Portfolio, Small Cap Value Portfolio, International Growth Portfolio, Research International Core Portfolio, International Equity Portfolio, Emerging Markets Equity Portfolio, Government Money Market Portfolio, Short-Term Bond Portfolio, Select Bond Portfolio, Long-Term U.S. Government Bond Portfolio, Inflation Protection Portfolio, High Yield Bond Portfolio, Multi-Sector Bond Portfolio, Balanced Portfolio and Asset Allocation Portfolio (each, a “Portfolio” or collectively, the “Portfolios”). All of the outstanding shares of each Portfolio are held by an affiliate, The Northwestern Mutual Life Insurance Company (“Northwestern Mutual”), for its segregated asset accounts (either directly or indirectly through one or more underlying Portfolios operating as affiliated fund of funds). The Government Money Market Portfolio is a government money market fund under Rule2a-7 of the 1940 Act.
NOTE 2. SIGNIFICANT ACCOUNTING POLICIES
The following is a summary of significant accounting policies consistently followed by the Series Fund in the preparation of its financial statements.
A. Use of Estimates— The preparation of financial statements in conformity with accounting principles generally accepted in the United States of America (“U.S. GAAP”) requires management to make estimates and assumptions that affect the reported amounts of assets and liabilities at the date of the financial statements and the reported amounts of revenues and expenses during the reporting period. Actual results could differ from those estimates.
B. Foreign Income and Capital Gains Taxes— The Portfolios may be subject to income taxes imposed by certain countries in which they invest. Foreign withholding taxes on dividends and interest are netted against income and separately disclosed in the Statements of Operations.
Some of the Portfolios may be subject to capital gains taxes imposed by certain countries in which they invest. Any applicable foreign capital gains tax is accrued daily based upon net unrealized gains, and may be payable following the sale of any applicable investments.
C. Federal Income Taxes— The Portfolios’ policy is to continue to comply with the requirements of the Internal Revenue Code that are applicable to regulated investment companies and to distribute all of their taxable income to their respective shareholders. The Portfolios also intend to distribute sufficient net investment income and net capital gains, if any, so that they will not be subject to excise tax, as applicable, on distributable income and gains.
In accordance with the authoritative guidance for uncertainty in income taxes, management of the Series Fund has reviewed all open tax years (2015 to 2018) for major jurisdictions and concluded there was no material impact to the Portfolios’ net assets or results of operations. There is no material tax liability relating to uncertain income tax positions taken or expected to be taken in future tax returns. The Portfolios are also not aware of any tax positions for which it is reasonably possible that the total amounts of unrecognized tax benefits will significantly change in the next 12 months.
D. Distributions— Dividends from net investment income and net realized capital gains are declared and paid each business day for the Government Money Market Portfolio and at least annually for the remaining Portfolios, when applicable. During 2017, the Government Money Market Portfolio utilized earnings and profits distributions to shareholders on redemption of shares as part of the dividends paid deduction for income tax purposes.
E. Other— The Portfolios record security transactions on trade date. The basis for determining cost on sale of securities is identified cost. Interest income is recorded daily on the accrual basis and dividend income is recorded on theex-dividend date or as soon as information from issuers is available. Where applicable, dividends are recorded net of foreign withholding tax. Discounts and premiums on securities purchased are amortized using the effective interest method. Expenses directly
238
Notes to Financial Statements
attributable to a Portfolio are incurred by the respective Portfolio. Expenses that are not directly attributable to one or more Portfolios are allocated among applicable Portfolios on an equitable and consistent basis considering such things as the nature and type of expenses and the relative net assets of the Portfolios. The Portfolios consider highly liquid temporary cash investments purchased with an original maturity of less than three months to be cash equivalents. Cash equivalents are included in the short-term investments on the Schedule of Investments as well as in investments on the Statement of Assets and Liabilities. Temporary cash overdrafts are reported as a payable to custodian.
F. New Accounting Pronouncements— In August 2016, the FASB issued an Accounting Standards Update (“ASU”)2016-15 which amends ASC 230 to clarify guidance on the classification of certain cash receipts and cash payments in the statement of cash flows. The ASU is effective for annual periods beginning after December 15, 2017, and interim periods within those annual periods. In November 2016, the FASB issued ASU2016-18 which amends ASC 230 to provide guidance on the classification and presentation of changes in restricted cash and restricted cash equivalents on the statement of cash flows. The ASU has been adopted.
In March 2017, the FASB issued Accounting Standards UpdateNo. 2017-08, “Receivables—Nonrefundable Fees and Other Costs (Subtopic310-20), Premium Amortization on Purchased Callable Debt Securities” (ASU2017-08). ASU2017-08 amends the amortization period for certain purchased callable debt securities, held at a premium, shortening such period to the earliest call date. The amendments are effective for fiscal years and interim periods within those fiscal years, beginning after December 15, 2018. The ASU has been adopted, and the impacts are not expected to be material.
In August 2018, the FASB issued Accounting Standards Update2018-13, Fair Value Measurement (Topic 820): Disclosure Framework – Changes to the Disclosure Requirements for Fair Value Measurement (“ASU2018-13”). The update introduces new fair value disclosure requirements, eliminates some prior fair value disclosure requirements, and modifies certain existing fair value disclosure requirements. ASU2018-13 will be effective for fiscal years beginning after December 15, 2019, including interim periods within those fiscal years. Early adoption is permitted. Management has early adopted certain aspects that allow removal of certain disclosure requirements. Management is currently assessing the potential impact of the remaining requirements to future financial statements.
In August 2018, the SEC amended certain disclosure requirements that it considered to have become redundant, duplicative, overlapping, outdated or superseded. Management has implemented these changes to the statement of assets and liabilities and statement of changes in net assets. These changes included 1) disclosure of total distributable earnings instead of the components of distributable earnings on the statement of assets and liabilities, 2) removal of the parenthetical disclosure of undistributed net investment income on the statement of changes in net assets and 3) disclosure of total distributions instead of the components of distributions paid to shareholders on the statement of changes in net assets. In the statement of changes in net assets, 2017 amounts were restated to conform to the new requirements. The December 31, 2017 components of distributions paid and undistributed net investment income were as follows (amounts in thousands):
| | | | | | | | | | | | | | | | |
| | | Distributions to Shareholders from: | | | | | | | |
| Portfolio | | Net Investment
Income | | | Net Realized
Gain on
Investments | | | Undistributed Net
Investment Income
(Loss) | | | | |
Growth Stock Portfolio | | $ | (7,919 | ) | | $ | (41,619 | ) | | $ | 6,853 | | | | | |
Focused Appreciation Portfolio | | | (6,369 | ) | | | (16,079 | ) | | | 5,780 | | | | | |
Large Cap Core Stock Portfolio | | | (9,903 | ) | | | - | | | | 8,722 | | | | | |
Large Cap Blend Portfolio | | | (1,520 | ) | | | (8,213 | ) | | | 1,299 | | | | | |
Index 500 Stock Portfolio | | | (52,281 | ) | | | (30,749 | ) | | | 53,108 | | | | | |
Large Company Value Portfolio | | | (3,917 | ) | | | (7,833 | ) | | | 3,613 | | | | | |
Domestic Equity Portfolio | | | (12,408 | ) | | | (18,505 | ) | | | 14,479 | | | | | |
Equity Income Portfolio | | | (17,838 | ) | | | (37,935 | ) | | | 16,447 | | | | | |
Mid Cap Growth Stock Portfolio | | | (2,583 | ) | | | - | | | | 2,294 | | | | | |
Index 400 Stock Portfolio | | | (8,964 | ) | | | (47,765 | ) | | | 9,983 | | | | | |
Mid Cap Value Portfolio | | | (7,902 | ) | | | (19,110 | ) | | | 9,027 | | | | | |
Small Cap Growth Stock Portfolio | | | (625 | ) | | | (6,457 | ) | | | - | | | | | |
Index 600 Stock Portfolio | | | (3,771 | ) | | | (6,956 | ) | | | 3,400 | | | | | |
Small Cap Value Portfolio | | | (4,984 | ) | | | (33,520 | ) | | | 3,487 | | | | | |
International Growth Portfolio | | | (8,203 | ) | | | - | | | | 9,025 | | | | | |
Research International Core Portfolio | | | (9,827 | ) | | | - | | | | 10,078 | | | | | |
239
Notes to Financial Statements
| | | | | | | | | | | | |
| | | Distributions to Shareholders from: | | | | |
| Portfolio | | Net Investment
Income | | | Net Realized
Gain on
Investments | | | Undistributed Net
Investment Income
(Loss) | |
International Equity Portfolio | | $ | (42,550 | ) | | $ | - | | | $ | 45,322 | |
Emerging Markets Equity Portfolio | | | (5,748 | ) | | | - | | | | 9,186 | |
Government Money Market Portfolio | | | (2,770 | ) | | | (5 | ) | | | - | |
Short-Term Bond Portfolio | | | (3,730 | ) | | | - | | | | 4,647 | |
Select Bond Portfolio | | | (59,951 | ) | | | (38,818 | ) | | | 67,846 | |
Long-Term U.S. Government Bond Portfolio | | | (2,157 | ) | | | (4,416 | ) | | | 2,221 | |
Inflation Protection Portfolio | | | (2,412 | ) | | | (1,002 | ) | | | 7,085 | |
High Yield Bond Portfolio | | | (43,155 | ) | | | - | | | | 43,280 | |
Multi-Sector Bond Portfolio | | | (30,040 | ) | | | - | | | | 21,941 | |
Balanced Portfolio | | | (49,621 | ) | | | (82,890 | ) | | | 52,700 | |
Asset Allocation Portfolio | | | (5,486 | ) | | | (11,468 | ) | | | 5,391 | |
NOTE 3. SECURITY VALUATION
For purposes of calculating a net asset value, Portfolio securities and other assets are valued as of the close of trading on the New York Stock Exchange (“Exchange”) on each day during which the Exchange is open for trading.
The Fair Value Measurements and Disclosures Topic of the Financial Accounting Standards Codification defines fair value as the price that a fund would receive to sell an asset or pay to transfer a liability in an orderly transaction between market participants at the measurement date. It establishes and requires disclosure of a fair value hierarchy, separately for each major category of asset and liability, which segregates fair value measurements into levels. A summary of the fair value hierarchy is described below:
| | • | | Level 1 — fair value is determined by unadjusted quoted prices in active markets for identical securities or derivatives |
| | • | | Level 2 — fair value is determined by other significant observable inputs (including quoted prices for similar securities, interest rates, prepayment speeds, credit risk, and other data used in fair valuation) |
| | • | | Level 3 — fair value is determined by significant unobservable inputs (including the Portfolios’ own assumptions in determining fair value) |
The categorization of a value determined for a financial instrument within the hierarchy is based upon the pricing transparency of the instrument and does not necessarily correspond to the Portfolios’ perceived risk of that instrument.
The following is a description of the valuation techniques and significant inputs used in determining the value of the Portfolios’ investments classified as Level 1 and Level 2 in the fair value hierarchy:
| | • | | Equity securities (common and preferred stock) for which market quotations are readily available are valued at the last sale or official closing price as reported by an independent pricing service on the primary market or exchange on which they are traded. In the event there were no sales during the day or closing prices are not available, securities are valued at the last quoted bid price. Equity securities traded only in theover-the-counter market and not on a securities exchange are valued at the last sale price or closing bid price, if no sales have occurred. To the extent these securities are actively traded and valuation adjustments are not applied, they are categorized as Level 1 of the fair value hierarchy. Additionally, for foreign securities, fair value procedures are used if a significant event occurs between the close of the foreign market and the U.S. market close. The fair value price is reflected as Level 2 in the fair value hierarchy where applicable. |
| | • | | Fixed income securities, including corporate, convertible and municipal bonds and notes, U.S. government agencies, U.S. treasury obligations, sovereign issues, bank loans, andnon-U.S. bonds are generally valued on the basis of service provider prices that use broker dealer quotations or valuation estimates from internal pricing models. The service providers’ internal models use inputs that are observable such as issuer details, interest rates, yield curves, call features, maturities, credit risks/spreads and default rates. Securities that use similar valuation techniques and inputs as described above are categorized as Level 2 in the fair value hierarchy. |
240
Notes to Financial Statements
| | • | | Fixed income securities purchased on a delayed delivery basis are marked to market daily until settlement at the forward settlement date and are categorized as Level 2 in the fair value hierarchy. |
| | • | | Mortgage related and asset backed securities are generally issued as separate tranches, or classes, of securities within each deal. These securities are normally valued by pricing service providers that use broker dealer quotations or valuation estimates from their internal pricing models. The pricing models for these securities usually consider tranche level attributes, current market data, estimated cash flows and market based yield spreads for each tranche, and incorporate deal collateral performance, as available. Mortgage related and asset backed securities that use similar valuation techniques and inputs as described above are categorized as Level 2 in the fair value hierarchy. |
| | • | | Investments inopen-end mutual funds (including other Portfolios) are valued at the mutual fund’s closing net asset value per share and are categorized as Level 1 in the fair value hierarchy. Investments in privately held mutual funds are valued at the mutual fund’s closing net asset value per share and are categorized as Level 2 in the fair value hierarchy. |
| | • | | Money market investments, other than in the Government Money Market Portfolio, are generally valued by a pricing service. All securities in the Government Money Market Portfolio are valued using amortized cost, unless the current market value differs substantially from the amortized cost, at which time the securities are marked to market. Because the value is not obtained from a quoted price in an active market, such securities are reflected as Level 2 in the fair value hierarchy. |
| | • | | Listed derivatives, such as futures or option contracts, which are actively traded on a national securities exchange, are stated at the last reported sale or settlement price on the day of valuation and are categorized as Level 1 in the fair value hierarchy. |
| | • | | Centrally cleared swaps andover-the-counter financial derivatives, such as foreign currency contracts, options contracts, or swap agreements derive their value from underlying asset prices, indices, reference rates, and other inputs or a combination of these factors. These derivatives are normally valued on the basis of quotes obtained from brokers and dealers or pricing services. Depending on the product and the terms of the transaction, the value of the derivatives can be estimated using a series of techniques, including simulation pricing models. The pricing models use inputs that are observed from actively quoted markets such as issuer details, indices, spreads, interest rates, curves, dividends and exchange rates. Financial derivatives that use similar valuation techniques and inputs as described above are categorized as Level 2 in the fair value hierarchy. |
The following is a description of the valuation techniques and significant inputs used in determining the value the Portfolios’ investments classified as Level 3 in the fair value hierarchy:
| | • | | Securities and other assets for which market quotes are not readily available are valued at fair market value as determined in good faith in accordance with procedures adopted by the Series Fund’s Board of Directors (“Board”). Market quotes are considered not readily available in circumstances where there is an absence of current or reliable market-based data (e.g. trade information or broker quotes). The factors considered in reaching these values atDecember 31, 2018 included, but were not limited to, broker quotes, analysis of the likely outcome of pending litigation, liquidity, prepayment speed, duration and recoverability. |
A table summarizing each Portfolio’s investments under this hierarchy is included following each Portfolio’s Schedule of Investments. Transfers between investment levels may occur as markets fluctuate and/or the availability of data used in investments’ valuation changes. For fair valuations using significant unobservable inputs, U.S. GAAP requires a reconciliation of the beginning to ending balances for reported fair values that presents changes attributable to total realized and unrealized gains or losses, purchases and sales, and transfers in or out of the Level 3 category during the period. Additionally, U.S GAAP requires quantitative information regarding the significant unobservable inputs used in the determination of fair value of assets categorized as Level 3 in the fair value hierarchy. In accordance with the requirements, a Level 3 reconciliation and details of significant unobservable inputs have been included in the notes to the Schedule of Investments for Portfolios that have a material amount of Level 3 investments. As of December 31, 2018, there were no Portfolios that owned a material amount of Level 3 securities.
241
Notes to Financial Statements
The Series Fund has adopted policies and procedures which govern the pricing of Portfolio securities. The Board has delegated theday-to-day responsibility for pricing Portfolio securities and other investments to Mason Street Advisors, LLC (“MSA”), the Portfolios’ investment adviser, Northwestern Mutual in its capacity as fund administrator, and State Street Bank and Trust Company in its capacity as fund accountant, subject to the oversight of a Pricing Committee appointed by the Board and comprised of representatives of MSA, Northwestern Mutual and Series Fund officers. The Pricing Committee is charged with the primary andday-to-day operational responsibility for executing the valuation process. The Pricing Committee has been delegated the authority to approve the override of any prices as permitted under the pricing policy and procedures approved by the Board and any variances from these pricing procedures when appropriate. All such actions are subject to further review and approval by the Board at its next regular meeting.
NOTE 4. SECURITIES AND OTHER INVESTMENTS
A. Delayed Delivery Transactions and When-Issued Securities— Certain Portfolios may engage in securities transactions on a when-issued or delayed delivery basis. In these transactions, the securities’ prices and yields are fixed on the date of the commitment, with payment and delivery scheduled for a future date. During this period, the securities are subject to market fluctuations. When delayed delivery purchases are outstanding, a Portfolio will earmark liquid assets on its records in amounts sufficient to meet the purchase price. A Portfolio may dispose of or renegotiate a delayed delivery transaction, which may result in a capital gain or loss.
B. Repurchase Agreements— Certain Portfolios may engage in repurchase transactions. Under the terms of a typical repurchase agreement, a Portfolio takes possession of an underlying debt obligation subject to an obligation of the seller to repurchase, and a Portfolio to resell, the obligation at an agreed upon price and time. The underlying securities for all repurchase agreements are held in safekeeping at the Portfolio’s custodian or designatedsub-custodians undertri-party repurchase agreements. The market value of the collateral must be equal to or exceed at all times the total amount of the repurchase obligations, including interest. Securities purchased under repurchase agreements are reflected as an asset on the Statements of Assets and Liabilities. Generally, in the event of counterparty default, a Portfolio has the right to use the collateral to offset losses incurred. If the counterparty should default, a Portfolio will seek to sell the securities which it holds as collateral. This could involve procedural costs or delays in addition to a loss on the securities if their value should fall below their repurchase price.
C. Restricted Securities— Certain Portfolios may invest in securities that are subject to legal or contractual restrictions on resale. These securities may be sold privately, but are required to be registered or exempted from registration before being sold to the public. Disposal of these securities may involve time-consuming negotiations and expense, and prompt sale at an acceptable price may be difficult.
D. Foreign Currency Transactions— Certain Portfolios may have securities and other assets and liabilities denominated in foreign currencies which are translated into U.S. dollar amounts on the date of valuation. Purchases and sales of securities and income items denominated in foreign currencies are translated into U.S. dollar amounts on the respective dates of such transactions. When the Portfolios purchase or sell a foreign security they may enter into a foreign currency exchange contract to minimize exchange rate risk from the trade date to the settlement date of such transaction. Such foreign currency exchange contracts are marked to market daily.
The Portfolios do not separately report the results of operations due to fluctuations in foreign exchange rates on investments from the changes arising from changes in market prices of securities held. Such fluctuations are included with the net realized or unrealized gain or loss from investments.
Net realized foreign exchange gains or losses arise from sales of foreign currencies, currency gains or losses realized between the trade date and the settlement date on security transactions, and the differences between the amounts of income and foreign withholding taxes recorded on the Portfolios’ books and the U.S. dollar equivalent of the amounts actually received or paid.
242
Notes to Financial Statements
E. Mortgage Backed and Asset Backed Securities— Certain Portfolios may invest in mortgage backed securities, including collateralized mortgage obligations, and asset backed securities. Mortgage backed securities are interests in pools of residential or commercial mortgage loans and asset backed securities are interests in pools of other assets, including various types of loans and credit card receivables. These securities provide a monthly payment, consisting of both a principal and interest component. Interest payments may be based on either fixed rates or adjustable rates. Receipt of principal payment reduces the outstanding par amount of the security and may generate realized gains or losses. Yields on mortgage backed securities are affected by interest and prepayment rates, which, in turn, are influenced by a variety of economic, geographical, social and other factors. Maturities on mortgage backed securities represent stated maturity dates. Actual maturity dates may differ based on prepayment rates. Unlike mortgage backed securities issued or guaranteed by the U.S. government or one of its sponsored entities, mortgage backed securities and asset backed securities issued by private issuers do not have a government or government sponsored entity guarantee. These issuers may provide credit enhancements through external entities such as financial institutions or through the structuring of the transaction itself. There is no guarantee that credit enhancements, if any, will be sufficient to prevent losses.
F. Inflation-Indexed Bonds— Certain Portfolios may invest in inflation-indexed bonds. Inflation-indexed bonds are fixed income securities whose principal value is periodically adjusted to the rate of inflation. The interest rate on these bonds is generally fixed at issuance at a rate lower than typical bonds. Over the life of an inflation-indexed bond, interest will be paid based on a principal value, which is adjusted for inflation. Any increase in the principal amount of an inflation-indexed bond will be included as interest income in the applicable Portfolio’s Statement of Operations even though investors do not receive their principal until maturity.
G. Short Sales— Certain Portfolios may enter into short sale transactions. A short sale is a transaction in which a Portfolio sells a security it does not own in anticipation of a decline in the market price of the security. Securities sold in short sale transactions and the interest payable on such securities, if any, are reflected as a liability on the Statements of Assets and Liabilities. A Portfolio is obligated to deliver the security at the market price at the time the short position is closed. The risk of loss on a short sale transaction is theoretically unlimited, because there is no limit to the cost of replacing the security sold short, whereas losses from purchase transactions cannot exceed the total amount invested.
H. Financing Transactions— Certain Portfolios may enter into financing transactions. In a financing transaction, the Portfolio transfers a security to a counterparty with a simultaneous agreement to repurchase the same security at an agreed upon price and future settlement date. For U.S. GAAP purposes, a financing transaction is accounted for as a secured borrowing and not as a purchase or sale. During the term of the borrowing, the Portfolio is entitled to the interest on the security. The difference between the sale price and repurchase price is included in net investment income with the cost of the secured borrowing transaction being recorded in interest expense over the term of the borrowing. The Portfolio will benefit from the transaction if the income earned on the investment purchased with the cash received in the financing transaction exceeds the interest expense incurred by the Portfolio. If the interest expense exceeds the income earned, the Portfolio’s net investment income and dividends to shareholders may be adversely impacted. Financing transactions involve the risk that the market value of the securities that the Portfolio is required to repurchase may decline below the agreed upon repurchase price of those securities. For the year ended December 31, 2018, the Long-Term U.S. Government Bond Portfolio entered into financing transactions utilizing various U.S. Treasury bonds.
I. Loan Participation and Assignments— Certain Portfolios may invest in direct debt instruments which are interests in amounts owed to lenders or lending syndicates by corporate, governmental, or other borrowers. The Portfolios’ investments in a loan may be in the form of either actual participation in loans or assignments of all or part of the loans from third parties. A loan is often administered by a bank or other financial institution that acts as an agent for all holders. The agent administers the terms of the loan which are specified in the loan agreement. The Portfolios may invest in multiple series or tranches of a loan, each of which can have different terms and associated risks. The Portfolios generally do not have a right to enforce compliance with the terms of the loan agreement and as a result, the Portfolios may be subject to the credit risk of the borrower and lender that is selling the loan agreement. When the Portfolios purchase assignments from lenders they acquire direct rights against the borrower of the loan. The Portfolios may also enter into unfunded loan commitments, which are contractual obligations for future funding. Unfunded loan commitments can include lines of credit, which may require the Portfolios to grant additional cash to the borrower upon demand from the borrower. These unfunded loan commitments are in fact a future obligation in full, although a percentage of the loan amount may not be utilized by the borrower. When investing in a loan, the Portfolios have the right to receive principal, interest and any fees from the lender selling the loan agreement and only when the payments are received by the lender from the borrower. There may also be a commitment fee
243
Notes to Financial Statements
due to the Portfolios based on the unused portion of the line of credit of the floating rate loan. In certain cases, the Portfolios may be entitled to a penalty fee if there was a prepayment of a floating rate loan by the borrower. Fees that are earned or paid will be reflected as interest income or interest expense on the Statements of Operations. As of December 31, 2018, there were no unfunded loan commitments outstanding.
J. Reverse Repurchase Agreements— Certain Portfolios may enter into reverse repurchase agreements. In a reverse repurchase agreement, a Portfolio delivers a security in exchange for cash to a financial institution, the counterparty, with a simultaneous agreement to repurchase the same or substantially the same security at an agreed upon price and date. The Portfolio is entitled to receive principal and interest payments, if any, made on the security delivered to the counterparty during the term of the agreement. Cash received in exchange for securities delivered plus accrued interest payments to be made by the Portfolio to counterparties are reflected as a liability on the Statements of Assets and Liabilities. Interest payments made by a Portfolio to counterparties are recorded as a component of interest expense on the Statements of Operations. In periods of increased demand for the security, a Portfolio may receive a fee for use of the security by the counterparty, which may result in interest income to the Portfolio. When effecting reverse repurchase transactions, the Portfolio will hold securities of a dollar amount equal in value to the securities subject to the reverse repurchase agreement in a segregated account. As of December 31, 2018, there were reverse repurchase agreements held in the Multi-Sector Bond Portfolio.
K. Zero Strike Warrants— Certain Portfolios may invest in low exercise price call warrants (zero strike warrants). Zero strike warrants are issued by banks or broker-dealers and allow the fund to gain exposure to common stocks in markets that place restrictions on direct investments by foreign investors and may or may not be traded on an exchange. Income received from zero strike warrants is recorded as dividend income in the Statement of Operations. To the extent the fund invests in zero strike warrants whose returns correspond to the performance of a foreign stock, investing in zero strike warrants will involve risks similar to the risks of investing in foreign securities. Additional risks associated with zero strike warrants include the potential inability of the counterparty to fulfill their obligations under the warrant, inability to transfer or liquidate the warrants and potential delays or an inability to redeem before expiration under certain market conditions.
NOTE 5. DERIVATIVE INSTRUMENTS
The Portfolios may use derivative instruments for various purposes, including as a cash management strategy, to earn income and enhance returns, to increase or decrease exposure to a particular market, to manage or adjust the risk profile of the Portfolio, to hedge exposure to a foreign currency, or as an alternative to direct investments. Because the Portfolios are required to account for derivative instruments at fair value and recognize changes in fair value through the Statements of Operations, the Portfolios’ derivatives do not qualify for hedge accounting treatment.
Certain Portfolios segregate cash to cover margin requirements for derivative positions. These amounts are denoted as “Cash Collateral for Derivative Positions” on the Statements of Assets and Liabilities.
A. Futures Contracts— Certain Portfolios invest in futures contracts as an alternative to investing in individual securities and could be exposed to market risk due to changes in the value of the underlying securities or due to an illiquid secondary market. Futures contracts are marked to market daily based upon quoted settlement prices. The Portfolios receive from or pay to brokers an amount of cash equal to the daily fluctuation in the value of the contracts. Such receipts or payments, known as the “variation margin,” are recorded by the Portfolios as unrealized gains or losses. When a contract is closed, the Portfolios record a realized gain or loss equal to the difference between the value of the contract at the time it was opened and the value at the time it was closed.
B. Forward Foreign Currency Contracts— The Portfolios may enter into forward foreign currency contracts to hedge against exchange rate risk arising from investments in securities denominated in foreign currencies or as part of an investment strategy. Contracts are valued at the contractual forward rate and are marked to market daily, with the change in market value recorded as an unrealized gain or loss. When the contracts are closed, a realized gain or loss is recorded. Risks may arise from changes in market value of the underlying instruments and from the possible inability of counterparties to meet the terms of their contracts.
244
Notes to Financial Statements
C. Options— Certain Portfolios may write call and put options on futures, swaps, securities or currencies they own or in which they may invest. Writing put options tends to increase a Portfolio’s exposure to the underlying instrument. Writing
call options tends to decrease a Portfolio’s exposure to the underlying instrument. The Portfolio receives a premium on the sale of a call option but gives up the opportunity to profit from any increase in the value of the security above the exercise price of the option. When a Portfolio writes a put option, it is exposed to a decline in the price of the underlying security. When a Portfolio writes a call or put option, an amount equal to the premium received is recorded as a liability and subsequently marked to market to reflect the current value of the option written. These liabilities are reflected as written options outstanding in the Statements of Assets and Liabilities. Payments received or made, if any, from writing options with premiums to be determined on a future date are reflected as such on the Statements of Assets and Liabilities. Premiums received from writing options which expire are treated as realized gains. Premiums received from writing options which are exercised or closed are added to the proceeds or offset against amounts paid on the underlying future, swap, security or currency transaction to determine the realized gain or loss. A Portfolio as a writer of an option has no control over whether the underlying future, swap, security or currency may be sold (called) or purchased (put) and as a result bears the market risk of an unfavorable change in the price of the future, swap, security or currency underlying the written option. There is a risk a Portfolio may not be able to enter into a closing transaction because of an illiquid market.
Certain Portfolios may also purchase call and put options on futures, swaps, securities or currencies they own or in which they may invest. Purchasing call options tends to increase a Portfolio’s exposure to the underlying instrument. Purchasing put options tends to decrease a Portfolio’s exposure to the underlying instrument. The Portfolio pays a premium on the purchase of a put option but receives the opportunity to profit from any increase in the value of the security above the exercise price of the option. When a Portfolio purchases a call option, it is exposed to a decline in the price of the underlying security. Premiums paid are reflected in the Statements of Assets and Liabilities as an investment and are subsequently marked to market to reflect the current value of the option. Premiums paid from purchasing options which expire are treated as realized losses. Premiums paid for purchasing options which are exercised or closed are added to the amount paid or offset against the proceeds on the underlying future, swap, security or currency transaction to determine realized gain or loss. The risk associated with a Portfolio purchasing call or put options is limited to the premium paid.
D. Swap Agreements— The Portfolios may enter into swap agreements on interest rate, total return and credit default to manage their exposure to interest rates, foreign currencies, investment style risk and credit risk or as an alternative to direct investing. In connection with these agreements, securities may be identified as collateral in accordance with the terms of the respective swap agreements. Swap agreements are privately negotiated in theover-the-counter market (“OTC swaps”) and may be executed in a multilateral or other trade facility platform, such as a registered commodities exchange (“centrally cleared swaps”).
Swaps are marked to market daily based upon quotations from market makers or values from third party vendors, which may include a registered commodities exchange, and the change in value, if any, is recorded as unrealized gain or loss in the Statements of Operations. Daily changes in the valuation of centrally cleared swaps, if any, are recorded as a receivable or payable for the change in value as appropriate (“variation margin”) on the Statements of Assets and Liabilities. OTC swap payments received or made at the beginning of the measurement period of the swap are reflected on the Statements of Assets and Liabilities. Upfront payments are amortized to realized gain or loss. Upon termination of the swap, unamortized upfront payments are recorded as realized gain or loss in the Statements of Operations. A liquidation payment received or made at the termination of the swap is recorded as realized gain or loss in the Statements of Operations. Net periodic payments received by the Portfolios are included as part of realized gain (loss) on the Statements of Operations. Entering into these agreements involves, to varying degrees, elements of credit and market risk in excess of the amounts recognized on the Statements of Assets and Liabilities. Such risks involve the possibility that there will be no liquid market for these agreements, that the counterparty to the agreements may default on its obligation to perform and that there may be unfavorable changes in interest rates.
Interest Rate Swaps — Interest rate swap agreements involve the exchange by a Portfolio with another party to pay or receive a set of cash flows, e.g., an exchange of floating rate payments for fixed rate payments based on a notional amount of principal.
Total Return Swaps — Total return swap agreements involve commitments to pay or receive a financing rate in exchange for the total return of an underlying reference entity, both based on notional amounts. To the extent the total return of the security or index underlying the transaction exceeds or falls short of the offsetting interest rate obligation, a Portfolio will receive a payment from or make a payment to the counterparty.
245
Notes to Financial Statements
Credit Default Swaps — Credit default swap agreements involve one party making a series of payments to another party in exchange for the right to receive a cash payment equal to the notional value of the swap in the event of a default by a third party, typically corporate issues or sovereign issues of an emerging market country. A Portfolio may use credit default swaps to provide a measure of protection against defaults of the issuers where the Portfolio owns or has exposure to the corporate or sovereign issue or to take an active long or short position on the likelihood of a particular issuer’s default.
As a seller of protection, the Portfolio generally receives an upfront payment and/or a fixed rate of income throughout the term of the swap provided that there is no credit event. As the seller, the Portfolio adds leverage to its investments because the Portfolio has investment exposure on the notional amount of the swap. As a buyer of protection, the Portfolio generally makes an upfront payment or pays a fixed rate of interest throughout the term of the swap provided that there is no credit event. The Portfolio generally receives an amount up to the notional value of the swap if a credit event occurs.
Implied credit spreads, represented in absolute terms, utilized in determining the market value of credit default swap agreements on corporate issues or sovereign issues of an emerging market country serve as an indicator of the current status of the payment/performance risk and represent the likelihood of a credit event occurring. The implied credit spread of a particular referenced entity reflects the cost of selling protection and may include upfront payments required to be made to enter into the agreement. For credit default swap agreements on credit indices, the quoted market prices and resulting values serve as the indicator of the current status of the payment/performance risk. Wider credit spreads and increasing market values, in absolute terms when compared to the notional amount of the swap, represent a deterioration of the referenced entity’s credit soundness and indicate a greater likelihood a credit event could occur as defined under the terms of the agreement. Open credit default swaps on corporate or sovereign issues and credit indices are disclosed in the Schedules of Investments.
If the Portfolio is a seller of protection and a credit event occurs, the Portfolio will either pay to the buyer of the protection an amount equal to the notional value of the swap and may take delivery of the obligation or pay a net settlement amount in the form of cash or securities equal to the notional amount of the swap less the recovery value of the referenced obligation. The maximum potential amount of future payments (undiscounted) that a Portfolio as a seller of protection could be required to make under a credit default swap agreement would be equal to the notional amount of the agreement. Notional amounts and fair market value of all credit default swap agreements outstanding for each Portfolio are disclosed in the Schedules of Investments. These maximum potential amounts would be partially offset by any recovery values of the referenced obligations, upfront payments received upon entering into the agreement, or net amounts received by the Portfolio from the settlement of credit default swap agreements purchasing protection for the same referenced obligation.
E. Derivative Disclosures— Derivative positions held by the Portfolios by contract type and primary risk exposure, including location on the Statement of Assets and Liabilities and value as of December 31, 2018, are (amounts in thousands):
| | | | | | | | | | | | |
| | | Asset Derivatives | | | Liability Derivatives | |
| Portfolio | | Statement of Assets and Liabilities Location | | Value | | | Statement of Assets and Liabilities Location | | Value | |
Index 500 Stock Portfolio | | | | | | | | | | | | |
Equity contracts | | Receivables – Futures Variation Margin | | $ | 297 | | | Payables – Futures Variation Margin | | $ | - | |
Large Company Value Portfolio | | | | | | | | | | | | |
Foreign exchange contracts | | Receivables – Foreign Currency Sold | | | 4 | | | Payables – Foreign Currency Purchased | | | 161 | |
Index 400 Stock Portfolio | | | | | | | | | | | | |
Equity contracts | | Receivables – Futures Variation Margin | | | 160 | | | Payables – Futures Variation Margin | | | - | |
Mid Cap Value Portfolio | | | | | | | | | | | | |
Foreign exchange contracts | | Receivables – Foreign Currency Sold | | | 37 | | | Payables – Outstanding Swaps Contracts, at Value | | | 295 | |
Index 600 Portfolio | | | | | | | | | | | | |
Equity contracts | | Receivables – Outstanding Swaps Contracts, at Value | | | - | | | Payables – Outstanding Swaps Contracts, at Value | | | 1,606 | |
International Growth Portfolio | | | | | | | | | | | | |
Foreign exchange contracts | | Receivables – Foreign Currency Sold | | | 3 | | | Payables – Foreign Currency Purchased | | | 1 | |
246
Notes to Financial Statements
| | | | | | | | | | | | |
| | | Asset Derivatives | | | Liability Derivatives | |
| Portfolio | | Statement of Assets and Liabilities Location | | Value | | | Statement of Assets and Liabilities Location | | Value | |
Research International Core Portfolio | | | | | | | | | | | | |
Foreign exchange contracts | | Receivables – Foreign Currency Sold | | $ | 9 | | | Payables – Foreign Currency Purchased | | $ | 3 | |
International Equity Portfolio | | | | | | | | | | | | |
Foreign exchange contracts | | Receivables – Foreign Currency Sold | | | - | | | Payables – Foreign Currency Purchased | | | 3 | |
Short-Term Bond Portfolio | | | | | | | | | | | | |
Interest rate contracts | | Receivables – Futures Variation Margin | | | 47 | | | Payables – Futures Variation Margin | | | - | |
Long-Term U.S. Government Bond Portfolio | | | | | | | | | | | | |
Interest rate contracts | | Receivables – Futures Variation Margin | | | 152 | | | Payables – Futures Variation Margin | | | 52 | |
Interest rate contracts | | Receivables – Cleared Swap Variation Margin | | | - | | | Payables – Cleared Swap Variation Margin | | | 19 | |
Interest rate contracts | | Receivables – Outstanding Options Written, at Value | | | - | | | Payables – Outstanding Options Written, at Value | | | 10 | |
Inflation Protection Portfolio | | | | | | | | | | | | |
Foreign exchange contracts | | Receivables – Foreign Currency Sold | | | 73 | | | Payables – Foreign Currency Purchased | | | - | |
Interest rate contracts | | Receivables – Futures Variation Margin | | | 207 | | | Payables – Futures Variation Margin | | | 158 | |
Other contracts | | Receivables – Cleared Swap Variation Margin | | | - | | | Payables – Cleared Swap Variation Margin | | | 14 | |
Other contracts | | Receivables – Outstanding Swaps Contracts, at Value | | | 369 | | | Payables – Outstanding Swaps Contracts, at Value | | | 4,937 | |
Multi-Sector Bond Portfolio | | | | | | | | | | | | |
Credit contracts | | Receivables – Outstanding Swaps Contracts, at Value | | | 19 | | | Payables – Outstanding Swaps Contracts, at Value | | | 980 | |
Credit contracts | | Receivables – Cleared Swap Variation Margin | | | 183 | | | Payables – Cleared Swap Variation Margin | | | 19 | |
Foreign exchange contracts | | Receivables – Foreign Currency Sold | | | 767 | | | Payables – Foreign Currency Purchased | | | 1,016 | |
Interest rate contracts | | Receivables – Outstanding Options Written, at Value | | | - | | | Payables – Outstanding Options Written, at Value | | | 94 | |
Interest rate contracts | | Receivables – Futures Variation Margin | | | 469 | | | Payables – Futures Variation Margin | | | 3 | |
Interest rate contracts | | Receivables – Cleared Swap Variation Margin | | | 18 | | | Payables – Cleared Swap Variation Margin | | | 13 | |
Balanced Portfolio | | | | | | | | | | | | |
Equity contracts | | Receivables – Futures Variation Margin | | | 325 | | | Payables – Futures Variation Margin | | | - | |
Asset Allocation Portfolio | | | | | | | | | | | | |
Equity contracts | | Receivables – Futures Variation Margin | | | 47 | | | Payables – Futures Variation Margin | | | - | |
Realized gains and losses on derivative instruments, by contract type and primary risk exposure, for the year ended December 31, 2018 are (amounts in thousands):
| | | | | | | | | | | | | | | | | | | | |
| | | Realized Gain (Loss) on Derivatives Instruments | |
| Portfolio | | Options
Written | | | Futures | | | Forward
Currency
Contracts | | | Swaps | | | Total | |
Index 500 Stock Portfolio | | | | | | | | | | | | | | | | | | | | |
Equity contracts | | $ | - | | | $ | (88 | ) | | $ | - | | | $ | - | | | $ | (88 | ) |
Large Company Value Portfolio | | | | | | | | | | | | | | | | | | | | |
Foreign currency exchange contracts | | | - | | | | - | | | | 692 | | | | - | | | | 692 | |
Equity Income Portfolio | | | | | | | | | | | | | | | | | | | | |
Equity contracts | | | - | | | | - | | | | 4 | | | | - | | | | 4 | |
Index 400 Stock Portfolio | | | | | | | | | | | | | | | | | | | | |
Equity contracts | | | - | | | | (2,694 | ) | | | - | | | | - | | | | (2,694 | ) |
247
Notes to Financial Statements
| | | | | | | | | | | | | | | | | | | | |
| | | Realized Gain (Loss) on Derivatives Instruments | |
| Portfolio | | Options
Written | | | Futures | | | Forward
Currency
Contracts | | | Swaps | | | Total | |
Mid Cap Value Portfolio | | | | | | | | | | | | | | | | | | | | |
Foreign currency exchange contracts | | $ | - | | | $ | - | | | $ | 1,228 | | | $ | - | | | $ | 1,228 | |
Index 600 Stock Portfolio | | | | | | | | | | | | | | | | | | | | |
Equity contracts | | | - | | | | - | | | | - | | | | 317 | | | | 317 | |
International Growth Portfolio | | | | | | | | | | | | | | | | | | | | |
Foreign currency exchange contracts | | | - | | | | - | | | | (122 | ) | | | - | | | | (122 | ) |
Research International Core Portfolio | | | | | | | | | | | | | | | | | | | | |
Foreign currency exchange contracts | | | - | | | | - | | | | (409 | ) | | | - | | | | (409 | ) |
International Equity Portfolio | | | | | | | | | | | | | | | | | | | | |
Foreign currency exchange contracts | | | - | | | | - | | | | (405 | ) | | | - | | | | (405 | ) |
Emerging Markets Equity Portfolio | | | | | | | | | | | | | | | | | | | | |
Foreign currency exchange contracts | | | - | | | | - | | | | (143 | ) | | | - | | | | (143 | ) |
Short-Term Bond Portfolio | | | | | | | | | | | | | | | | | | | | |
Interest rate contracts | | | - | | | | (478 | ) | | | - | | | | - | | | | (478 | ) |
Long-Term U.S. Government Bond Portfolio | | | | | | | | | | | | | | | | | | | | |
Interest rate contracts | | | 42 | | | | (1.351 | ) | | | - | | | | (26 | ) | | | (1,335 | ) |
Inflation Protection Portfolio | | | | | | | | | | | | | | | | | | | | |
Foreign currency exchange contracts | | | - | | | | - | | | | 139 | | | | - | | | | 139 | |
Interest rate contracts | | | - | | | | 2,332 | | | | - | | | | - | | | | 2,332 | |
Other contracts | | | - | | | | - | | | | - | | | | (28 | ) | | | (28 | ) |
Multi-Sector Bond Portfolio | | | | | | | | | | | | | | | | | | | | |
Credit contracts | | | - | | | | - | | | | - | | | | 3,493 | | | | 3,493 | |
Foreign currency exchange contracts | | | - | | | | - | | | | 8,167 | | | | - | | | | 8,167 | |
Interest rate contracts | | | 534 | | | | (8,020 | ) | | | - | | | | (40 | ) | | | (7,526 | ) |
Balanced Portfolio | | | | | | | | | | | | | | | | | | | | |
Equity contracts | | | - | | | | 1,298 | | | | - | | | | - | | | | 1,298 | |
Asset Allocation Portfolio | | | | | | | | | | | | | | | | | | | | |
Equity contracts | | | - | | | | 167 | | | | - | | | | - | | | | 167 | |
Change in unrealized appreciation and depreciation on derivative instruments, by contract type and primary risk exposure for the year ended December 31, 2018 are (amounts in thousands):
| | | | | | | | | | | | | | | | | | | | |
| | | Change in Unrealized Appreciation (Depreciation) on
Derivative Instruments | |
| Portfolio | | Options
Written | | | Futures | | | Forward
Currency
Contracts | | | Swaps | | | Total | |
Index 500 Stock Portfolio | | | | | | | | | | | | | | | | | | | | |
Equity contracts | | $ | - | | | $ | (1,110 | ) | | $ | - | | | $ | - | | | $ | (1,110 | ) |
Large Company Value Portfolio | | | | | | | | | | | | | | | | | | | | |
Foreign currency exchange contracts | | | - | | | | - | | | | 35 | | | | - | | | | 35 | |
Equity Income Portfolio | | | | | | | | | | | | | | | | | | | | |
Foreign currency exchange contracts | | | - | | | | - | | | | (3 | ) | | | - | | | | (3 | ) |
Index 400 Stock Portfolio | | | | | | | | | | | | | | | | | | | | |
Equity contracts | | | - | | | | (1,097 | ) | | | - | | | | - | | | | (1,097 | ) |
Mid Cap Value Portfolio | | | | | | | | | | | | | | | | | | | | |
Foreign currency exchange contracts | | | - | | | | - | | | | 23 | | | | - | | | | 23 | |
Index 600 Stock Portfolio | | | | | | | | | | | | | | | | | | | | |
Equity Contracts | | | - | | | | - | | | | - | | | | (1,616 | ) | | | (1,616 | ) |
International Growth Portfolio | | | | | | | | | | | | | | | | | | | | |
Foreign currency exchange contracts | | | - | | | | - | | | | (18 | ) | | | - | | | | (18 | ) |
Research International Core Portfolio | | | | | | | | | | | | | | | | | | | | |
Foreign currency exchange contracts | | | - | | | | - | | | | (41 | ) | | | - | | | | (41 | ) |
International Equity Portfolio | | | | | | | | | | | | | | | | | | | | |
Foreign currency exchange contracts | | | - | | | | - | | | | (117 | ) | | | - | | | | (117 | ) |
Emerging Markets Equity Portfolio | | | | | | | | | | | | | | | | | | | | |
Foreign currency exchange contracts | | | - | | | | - | | | | (7 | ) | | | - | | | | (7 | ) |
248
Notes to Financial Statements
| | | | | | | | | | | | | | | | | | | | |
| | | Change in Unrealized Appreciation (Depreciation)
on Derivative Instruments | |
| Portfolio | | Options
Written | | | Futures | | | Forward
Currency
Contracts | | | Swaps | | | Total | |
Short-Term Bond Portfolio | | | | | | | | | | | | | | | | | | | | |
Interest rate contracts | | $ | - | | | $ | 529 | | | $ | - | | | $ | - | | | $ | 529 | |
Long-Term U.S. Government Bond Portfolio | | | | | | | | | | | | | | | | | | | | |
Interest rate contracts | | | (3 | ) | | | 1,514 | | | | - | | | | 376 | | | | 1,887 | |
Inflation Protection Portfolio | | | | | | | | | | | | | | | | | | | | |
Foreign currency exchange contracts | | | - | | | | - | | | | 147 | | | | - | | | | 147 | |
Interest rate contracts | | | - | | | | (731 | ) | | | - | | | | - | | | | (731 | ) |
Other contracts | | | - | | | | - | | | | - | | | | (1,730 | ) | | | (1,730 | ) |
Multi-Sector Bond Portfolio | | | | | | | | | | | | | | | | | | | | |
Credit contracts | | | - | | | | - | | | | - | | | | (5,701 | ) | | | (5,701 | ) |
Foreign currency exchange contracts | | | - | | | | - | | | | 2,857 | | | | - | | | | 2,857 | |
Interest rate contracts | | | (34 | ) | | | 4,460 | | | | - | | | | (496 | ) | | | 3,930 | |
Balanced Portfolio | | | | | | | | | | | | | | | | | | | | |
Equity contracts | | | - | | | | 101 | | | | - | | | | - | | | | 101 | |
Asset Allocation Portfolio | | | | | | | | | | | | | | | | | | | | |
Equity contracts | | | - | | | | (35 | ) | | | - | | | | - | | | | (35 | ) |
Volumes on derivative instruments by contract type and primary risk exposure, for the year ended December 31, 2018 are:
| | | | | | | | | | | | | | | | | | | | |
| | | Volume of Derivative Instruments Held | |
| | | Average Number of Contracts | | | Average Notional
(Amounts in Thousands) | |
| Portfolio | | Exchange Traded Options | | | Futures | | | Forward
Currency
Contracts | | | Swaps | | | Over the
Counter
Options | |
Index 500 Stock Portfolio | | | | | | | | | | | | | | | | | | | | |
Equity contracts | | | - | | | | 268 | | | | - | | | | - | | | | - | |
Large Company Value Portfolio | | | | | | | | | | | | | | | | | | | | |
Foreign currency exchange contracts | | | - | | | | - | | | | 15,288 | | | | - | | | | - | |
Equity Income Portfolio | | | | | | | | | | | | | | | | | | | | |
Foreign currency exchange contracts | | | - | | | | - | | | | 8 | | | | - | | | | - | |
Index 400 Stock Portfolio | | | | | | | | | | | | | | | | | | | | |
Equity contracts | | | - | | | | 107 | | | | - | | | | - | | | | - | |
Mid Cap Value Portfolio | | | | | | | | | | | | | | | | | | | | |
Foreign currency exchange contracts | | | - | | | | - | | | | 26,041 | | | | - | | | | - | |
Index 600 Stock Portfolio | | | | | | | | | | | | | | | | | | | | |
Equity contracts | | | - | | | | - | | | | - | | | | 10 | | | | - | |
International Growth Portfolio | | | | | | | | | | | | | | | | | | | | |
Foreign currency exchange contracts | | | - | | | | - | | | | 1,257 | | | | - | | | | - | |
International Equity Portfolio | | | | | | | | | | | | | | | | | | | | |
Foreign currency exchange contracts | | | - | | | | - | | | | 47 | | | | - | | | | - | |
Short-Term Bond Portfolio | | | | | | | | | | | | | | | | | | | | |
Interest rate contracts | | | - | | | | 278 | | | | - | | | | - | | | | - | |
Long-Term U.S. Government Bond Portfolio | | | | | | | | | | | | | | | | | | | | |
Interest rate contracts | | | 291,689 | | | | 372 | | | | - | | | | 27,510 | | | | - | |
Inflation Protection Portfolio | | | | | | | | | | | | | | | | | | | | |
Foreign currency exchange contracts | | | - | | | | - | | | | 3,321 | | | | - | | | | - | |
Interest rate contracts | | | - | | | | 552 | | | | - | | | | - | | | | - | |
Other contracts | | | - | | | | - | | | | - | | | | 115,883 | | | | - | |
249
Notes to Financial Statements
| | | | | | | | | | | | | | | | | | | | |
| | | Volume of Derivative Instruments Held | |
| | | Average Number of Contracts | | | Average Notional
(Amounts in Thousands) | |
| Portfolio | | Exchange Traded Options | | | Futures | | | Forward
Currency
Contracts | | | Swaps | | | Over the
Counter
Options | |
Multi-Sector Bond Portfolio | | | | | | | | | | | | | | | | | | | | |
Credit contracts | | | - | | | | - | | | | - | | | | 248,844 | | | | - | |
Foreign currency exchange contracts | | | - | | | | - | | | | 564,330 | | | | - | | | | - | |
Interest rate contracts | | | 11,041,801 | | | | 2,079 | | | | - | | | | 1,304,375 | | | | - | |
Balanced Portfolio | | | | | | | | | | | | | | | | | | | | |
Equity contracts | | | - | | | | 122 | | | | - | | | | - | | | | - | |
Asset Allocation Portfolio | | | | | | | | | | | | | | | | | | | | |
Equity contracts | | | - | | | | 24 | | | | - | | | | - | | | | - | |
NOTE 6. PORTFOLIO RISK
In the normal course of business the Portfolios trade financial instruments and enter into financial transactions where risk of potential loss exists. Security values fluctuate (market risk) and may decline due to factors affecting securities markets in general, particular industries represented in the securities markets or conditions specifically related to a particular company. Failure of the other party to a transaction to perform (credit risk), for example by not making principal and interest payments when due, reduces the value of the issuer’s debt and could reduce the Portfolios’ income. Similar to credit risk, the Portfolios may be exposed to counterparty risk, or the risk that an institution or other entity with which the Portfolios have unsettled or open transactions will fail to make required payments or otherwise comply with the terms of the instrument, transaction or contract. The potential loss could exceed the value of the financial assets recorded in the financial statements. Some of the Portfolios’ investments may be illiquid and the Portfolios may not be able to vary the portfolio investments in response to changes in economic and other conditions. If a Portfolio is required to liquidate all or a portion of its investments quickly, the Portfolio may realize significantly less than the value at which it previously recorded those investments.
Master Netting Arrangements
The Portfolios are subject to various Master Agreements that govern the terms of certain transactions. Master Repurchase Agreements and Global Master Repurchase Agreements are in place that governs repurchase, reverse repurchase, and sale-buyback financing transactions. Master Securities Forward Transaction Agreements are in place that govern the settlement of certain forward settling transactions includingto-be-announced securities, delayed-delivery or sale-buyback financing transactions. Customer Account Agreements and related addenda are in place that govern certain cleared derivative transactions including futures and cleared OTC derivatives. International Swaps and Derivatives Association, Inc. Master Agreements and Credit Support Annexes (“ISDA agreements”) are in place that governs certain OTC financial derivative transactions. ISDA agreements maintain provisions for general obligations, representations, agreements, collateral and events of default or termination. Events of termination include conditions that may entitle counterparties to elect to terminate early and cause settlement of all outstanding transactions under the applicable ISDA agreement. The terms of Master Agreements may reduce counterparty risk with respect to transactions governed by the Master Agreement under certain circumstances. Certain Portfolios have agreements with counterparties that contain provisions, or contingency features, that allow net settlement in the event of contract termination and permit termination by either party prior to maturity upon the occurrence of certain stated events, such as failure to pay or bankruptcy. In addition, certain agreements specify other events, the occurrence of which would allow one of the parties to terminate. For example, a downgrade in credit rating of a counterparty would allow the fund to terminate while a decline in the Portfolio’s net assets of more than a certain percentage would allow the counterparty to terminate. In such a situation, the counterparty involved would have the option to waive the triggering event or liquidate the affected positions pursuant to the terms of the related agreement. The aggregate amount of derivatives in a liability position is disclosed in Note 5.
Offsetting Assets and Liabilities
Certain Portfolios are parties to enforceable master netting or similar agreements which provide for the right of offset under certain circumstances. The Portfolios have made an accounting policy election not to offset qualifying financial and derivative instruments on the Statements of Assets and Liabilities. As such, all financial and derivative instruments are presented on a
250
Notes to Financial Statements
gross basis on the Statements of Assets and Liabilities. The impacts of netting arrangements that provide the right to offset are detailed below (amounts in thousands). The net amount represents the net receivable or payable that would be due from or to the counterparty in the event of default. Exposure from borrowings and other financing transactions such as repurchase agreements and certain forward settling transactions can only be netted across transactions governed under the same Master Agreement with the same legal entity. For certain Portfolios, derivative amounts do not reconcile to the Statements of Assets and Liabilities due to the Statements of Assets and Liabilities including derivatives that are not covered under master netting or similar agreements. The amount of collateral, for the year ended December 31, 2018, has been limited such that the net amount cannot be less than zero.
The following is a summary by counterparty of the market value of OTC financial derivative instruments and collateral as of period end:
Large Company Value Portfolio
| | | | | | | | | | | | | | | | | | | | | | | | | | | | | | | | | | | | |
| | | Derivative Assets (000’s) | | | Derivative Liabilities (000’s) | | | | | | | | | | |
| Counterparty | | Forward
Contacts | | | Swaps | | | Total
Assets | | | Forward
Contacts | | | Swaps | | | Total
Liabilities | | | Net
Market
Value | | | Collateral
Pledged/
(Received) | | | Net
Exposure | |
Goldman Sachs International | | $ | 1 | | | $ | - | | | $ | 1 | | | $ | (52 | ) | | $ | - | | | $ | (52 | ) | | $ | (51 | ) | | $ | - | | | $ | (51 | ) |
MCV | | | 2 | | | | - | | | | 2 | | | | (109 | ) | | | - | | | | (109 | ) | | | (107 | ) | | | - | | | | (107 | ) |
| | | | | | | | | | | | | | | | | | | | | | | | | | | | | | | | | | | | |
Total | | $ | 3 | | | $ | - | | | $ | 3 | | | $ | (161 | ) | | $ | - | | | $ | (161 | ) | | $ | (158 | ) | | $ | - | | | $ | (158 | ) |
| | | | | | | | | | | | | | | | | | | | | | | | | | | | | | | | | | | | |
Mid Cap Value Portfolio
| | | | | | | | | | | | | | | | | | | | | | | | | | | | | | | | | | | | |
| | | Derivative Assets (000’s) | | | Derivative Liabilities (000’s) | | | | | | | | | | |
| Counterparty | | Forward
Contacts | | | Swaps | | | Total
Assets | | | Forward
Contacts | | | Swaps | | | Total
Liabilities | | | Net
Market
Value | | | Collateral
Pledged/
(Received) | | | Net
Exposure | |
Goldman Sachs International | | $ | 4 | | | $ | - | | | $ | 4 | | | $ | (137 | ) | | $ | - | | | $ | (137 | ) | | $ | (133 | ) | | $ | - | | | $ | (133 | ) |
Morgan Stanley Capital Services, Inc. | | | 31 | | | | - | | | | 31 | | | | (158 | ) | | | - | | | | (158 | ) | | | (127 | ) | | | - | | | | (127 | ) |
| | | | | | | | | | | | | | | | | | | | | | | | | | | | | | | | | | | | |
Total | | $ | 35 | | | $ | - | | | $ | 35 | | | $ | (295 | ) | | $ | - | | | $ | (295 | ) | | $ | (260 | ) | | $ | - | | | $ | (260 | ) |
| | | | | | | | | | | | | | | | | | | | | | | | | | | | | | | | | | | | |
Index 600 Stock Portfolio
| | | | | | | | | | | | | | | | | | | | | | | | | | | | | | | | | | | | |
| | | Derivative Assets (000’s) | | | Derivative Liabilities (000’s) | | | | | | | | | | |
| Counterparty | | Forward
Contacts | | | Swaps | | | Total
Assets | | | Forward
Contacts | | | Swaps | | | Total
Liabilities | | | Net
Market
Value | | | Collateral
Pledged/
(Received) | | | Net
Exposure | |
Morgan Stanley Capital Services, Inc. | | $ | - | | | $ | - | | | $ | - | | | $ | - | | | $ | (1,606 | ) | | $ | (1,606 | ) | | $ | (1,606 | ) | | $ | (1,606 | ) | | $ | - | |
| | | | | | | | | | | | | | | | | | | | | | | | | | | | | | | | | | | | |
Total | | $ | - | | | $ | - | | | $ | - | | | $ | - | | | $ | (1,606 | ) | | $ | (1,606 | ) | | $ | (1,606 | ) | | $ | (1,606 | ) | | $ | - | |
| | | | | | | | | | | | | | | | | | | | | | | | | | | | | | | | | | | | |
Inflation Protection Portfolio
| | | | | | | | | | | | | | | | | | | | | | | | | | | | | | | | | | | | |
| | | Derivative Assets (000’s) | | | Derivative Liabilities (000’s) | | | | | | | | | | |
| Counterparty | | Forward
Contacts | | | Swaps | | | Total
Assets | | | Forward
Contacts | | | Swaps | | | Total
Liabilities | | | Net
Market
Value | | | Collateral
Pledged/
(Received) | | | Net
Exposure | |
Bank of America NA | | $ | - | | | $ | 6 | | | $ | 6 | | | $ | - | | | $ | (2,349 | ) | | $ | (2,349 | ) | | $ | (2,343 | ) | | $ | 2,229 | | | $ | (114 | ) |
Barclays Bank PLC | | | - | | | | - | | | | - | | | | - | | | | (2,283 | ) | | | (2,283 | ) | | | (2,283 | ) | | | 2,099 | | | | (184 | ) |
Goldman Sachs International | | | - | | | | 363 | | | | 363 | | | | - | | | | (306 | ) | | | (306 | ) | | | 57 | | | | (57 | ) | | | - | |
Morgan Stanley Capital Services, Inc. | | | 73 | | | | - | | | | 73 | | | | - | | | | - | | | | - | | | | 73 | | | | - | | | | 73 | |
| | | | | | | | | | | | | | | | | | | | | | | | | | | | | | | | | | | | |
Total | | $ | 73 | | | $ | 369 | | | $ | 442 | | | $ | - | | | $ | (4,938 | ) | | $ | (4,938 | ) | | $ | (4,496 | ) | | $ | 4,271 | | | $ | (225 | ) |
| | | | | | | | | | | | | | | | | | | | | | | | | | | | | | | | | | | | |
251
Notes to Financial Statements
Multi-Sector Bond Portfolio
| | | | | | | | | | | | | | | | | | | | | | | | | | | | | | | | | | | | |
| | | Derivative Assets (000’s) | | | Derivative Liabilities (000’s) | | | | | | | | | | |
| Counterparty | | Forward
Contacts | | | Swaps | | | Total
Assets | | | Forward
Contacts | | | Swaps | | | Total
Liabilities | | | Net
Market
Value | | | Collateral
Pledged/
(Received) | | | Net
Exposure | |
Bank of America NA | | $ | 220 | | | $ | - | | | $ | 220 | | | $ | (98) | | | $ | - | | | $ | (98 | ) | | $ | 122 | | | $ | (30) | | | $ | 92 | |
Barclays Bank PLC | | | 20 | | | | 9 | | | | 29 | | | | | | | | (299 | ) | | | (299 | ) | | | (270 | ) | | | 270 | | | | - | |
BNP Paribas SA | | | - | | | | - | | | | - | | | | (6 | ) | | | (3 | ) | | | (9 | ) | | | (9 | ) | | | - | | | | (9 | ) |
Goldman Sachs International | | | 149 | | | | - | | | | 149 | | | | (47 | ) | | | (161 | ) | | | (208 | ) | | | (59 | ) | | | 59 | | | | - | |
HSBC Bank USA NA | | | 233 | | | | - | | | | 233 | | | | (169 | ) | | | (353 | ) | | | (522 | ) | | | (289 | ) | | | 289 | | | | - | |
JP Morgan Chase Bank NA | | | 114 | | | | - | | | | 114 | | | | (1 | ) | | | (164 | ) | | | (165 | ) | | | (51 | ) | | | 51 | | | | - | |
UBS AG | | | 33 | | | | 10 | | | | 43 | | | | (695 | ) | | | - | | | | (695 | ) | | | (652 | ) | | | 556 | | | | (96 | ) |
| | | | | | | | | | | | | | | | | | | | | | | | | | | | | | | | | | | | |
Total | | $ | 769 | | | $ | 19 | | | $ | 788 | | | $ | (1,016 | ) | | $ | (980 | ) | | $ | (1,996 | ) | | $ | (1,208 | ) | | $ | 1,289 | | | $ | 81 | |
| | | | | | | | | | | | | | | | | | | | | | | | | | | | | | | | | | | | |
The following is a summary by counterparty of the market value of repurchase agreements, financing transactions, collateral and net exposure as of period end:
Government Money Market Portfolio
| | | | | | | | | | | | | | | | | | | | | | | | |
| Counterparty | | Investment in
Repurchase
Agreements | | | Payable for
Reverse
Repurchase
Agreements | | | Payable for
Financing
Transactions | | | Net
Market
Value | | | Collateral
Pledged/
(Received) | | | Net
Exposure | |
Bank of Montreal | | $ | 25,000 | | | $ | - | | | $ | - | | | $ | 25,000 | | | $ | (25,000 | ) | | $ | - | |
Bank of Nova Scotia | | | 20,000 | | | | - | | | | - | | | | 20,000 | | | | (20,000 | ) | | | - | |
BNP Paribas SA | | | 16,000 | | | | - | | | | - | | | | 16,000 | | | | (16,000 | ) | | | - | |
Citigroup Global Markets | | | 20,000 | | | | - | | | | - | | | | 20,000 | | | | (20,000 | ) | | | - | |
Credit Agricole SA | | | 10,000 | | | | - | | | | - | | | | 10,000 | | | | (10,000 | ) | | | - | |
Goldman Sachs International | | | 10,000 | | | | - | | | | - | | | | 10,000 | | | | (10,000 | ) | | | - | |
HSBC Bank USA | | | 10,000 | | | | - | | | | - | | | | 10,000 | | | | (10,0000 | | | | - | |
Mitsubishi UFJ Securities USA | | | 10,000 | | | | - | | | | - | | | | 10,000 | | | | (10,000 | ) | | | - | |
Mizuho Bank | | | 10,000 | | | | - | | | | - | | | | 10,000 | | | | (10,000 | ) | | | - | |
Natixis SA | | | 20,000 | | | | - | | | | - | | | | 20,000 | | | | (20,000 | ) | | | - | |
TD Securities USA | | | 26,000 | | | | - | | | | - | | | | 26,000 | | | | (26,000 | ) | | | - | |
| | | | | | | | | | | | | | | | | | | | | | | | |
Total | | $ | 177,000 | | | $ | - | | | $ | - | | | $ | 177,000 | | | $ | (177,000 | ) | | $ | - | |
| | | | | | | | | | | | | | | | | | | | | | | | |
Long-Term US Government Bond Portfolio
| | | | | | | | | | | | | | | | | | | | | | | | |
| Counterparty | | Investment in
Repurchase
Agreements | | | Payable for
Reverse
Repurchase
Agreements | | | Payable for
Financing
Transactions | | | Net
Market
Value | | | Collateral
Pledged/
(Received) | | | Net
Exposure | |
Goldman Sachs International | | $ | - | | | $ | - | | | $ | (95,975 | ) | | $ | (95,975 | ) | | $ | 95,967 | | | $ | (8 | ) |
| | | | | | | | | | | | | | | | | | | | | | | | |
Total | | $ | - | | | $ | - | | | $ | (95,975 | ) | | $ | (95,975 | ) | | $ | 95,967 | | | $ | (8 | ) |
| | | | | | | | | | | | | | | | | | | | | | | | |
Multi-Sector Bond Portifolio
| | | | | | | | | | | | | | | | | | | | | | | | |
| Counterparty | | Investment in
Repurchase
Agreements | | | Payable for
Reverse
Repurchase
Agreements | | | Payable for
Financing
Transactions | | | Net
Market
Value | | | Collateral
Pledged/
(Received) | | | Net
Exposure | |
Citigroup | | $ | 150,000 | | | $ | - | | | $ | - | | | $ | 150,000 | | | $ | (150,000 | ) | | $ | - | |
JP Morgan Chase Bank NA | | | 27,200 | | | | (984 | ) | | | - | | | | 26,216 | | | | (26,216 | ) | | | - | |
| | | | | | | | | | | | | | | | | | | | | | | | |
Total | | $ | 177,200 | | | $ | (984 | ) | | $ | - | | | $ | 176,216 | | | $ | (176,216 | ) | | $ | - | |
| | | | | | | | | | | | | | | | | | | | | | | | |
NOTE 7. INVESTMENT ADVISORY,SUB-ADVISORY, AND COMPLIANCE FEES
The Series Fund and its Portfolios are parties to annually renewable contracts pursuant to which each Portfolio pays a charge for investment management and administrative services to MSA, an affiliate and wholly owned subsidiary of Northwestern Mutual. Certain Portfolios, listed below, pay at a fixed annual rate based on the average daily net asset values of the Portfolio.
252
Notes to Financial Statements
| | | | |
Portfolio | | Fee | |
Index 500 Stock Portfolio | | | 0.20% | |
Index 400 Stock Portfolio | | | 0.25% | |
Mid Cap Value Portfolio | | | 0.85% | |
Small Cap Value Portfolio | | | 0.85% | |
Government Money Market Portfolio | | | 0.30% | |
Select Bond Portfolio | | | 0.30% | |
Balanced Portfolio | | | 0.30% | |
For the other Portfolios, the rate for the investment advisory fee is graded by the asset size of the Portfolio according to the following schedules:
| | | | | | | | | | | | | | | | |
Portfolio | | First
$50
Million | | | Next
$50
Million | | | Excess Over
$100
Million | | | | |
Growth Stock Portfolio | | | 0.60% | | | | 0.50% | | | | 0.40% | | | | | |
Large Cap Core Stock Portfolio | | | 0.60% | | | | 0.50% | | | | 0.40% | | | | | |
Mid Cap Growth Stock Portfolio | | | 0.80% | | | | 0.65% | | | | 0.50% | | | | | |
Small Cap Growth Stock Portfolio | | | 0.80% | | | | 0.65% | | | | 0.50% | | | | | |
High Yield Bond Portfolio | | | 0.60% | | | | 0.50% | | | | 0.40% | | | | | |
| | | | |
Portfolio | | First
$100
Million | | | Next
$400
Million | | | Excess Over
$500
Million | | | | |
Focused Appreciation Portfolio | | | 0.80% | | | | 0.75% | | | | 0.70% | | | | | |
| | | | |
Portfolio | | First
$100
Million | | | Next
$150
Million | | | Excess Over
$250
Million | | | | |
Large Company Value Portfolio | | | 0.72% | | | | 0.67% | | | | 0.62% | | | | | |
Domestic Equity Portfolio | | | 0.65% | | | | 0.55% | | | | 0.50% | | | | | |
International Growth Portfolio | | | 0.75% | | | | 0.65% | | | | 0.55% | | | | | |
Short-Term Bond Portfolio | | | 0.35% | | | | 0.33% | | | | 0.30% | | | | | |
Long-Term U.S. Government Bond Portfolio | | | 0.555% | | | | 0.515% | | | | 0.495% | | | | | |
Inflation Protection Portfolio | | | 0.58% | | | | 0.55% | | | | 0.49% | | | | | |
Multi-Sector Bond Portfolio | | | 0.79% | | | | 0.78% | | | | 0.77% | | | | | |
Asset Allocation Portfolio | | | 0.60% | | | | 0.50% | | | | 0.40% | | | | | |
| | | | |
Portfolio | | First
$150
Million | | | Next
$150
Million | | | Next
$200
Million | | | Excess Over
$500
Million | |
Large Cap Blend Portfolio | | | 0.77% | | | | 0.70% | | | | 0.62% | | | | 0.56% | |
Research International Core Portfolio | | | 0.88% | | | | 0.82% | | | | 0.75% | | | | 0.68% | |
| | | | |
Portfolio | | First
$500
Million | | | Excess Over
$500
Million | | | | | | | |
Equity Income Portfolio | | | 0.65% | | | | 0.60% | | | | | | | | | |
| | | | |
Portfolio | | First
$200
Million | | | Excess Over
$200
Million | | | | | | | |
Index 600 Stock Portfolio | | | 0.25% | | | | 0.20% | | | | | | | | | |
| | | | |
Portfolio | | First
$50
Million | | | Excess Over
$50
Million | | | | | | | |
International Equity Portfolio | | | 0.85% | | | | 0.65% | | | | | | | | | |
| | | | |
Portfolio | | First
$250
Million | | | Next
$250
Million | | | Next
$500
Million | | | Excess Over
$1.0
Billion | |
Emerging Markets Equity Portfolio | | | 1.14% | | | | 1.08% | | | | 0.96% | | | | 0.78% | |
MSA, which is the manager and investment adviser of the Series Fund, contractually agreed to waive the management fee and absorb certain other operating expenses to the extent necessary so that Total Operating Expenses (excluding taxes,
253
Notes to Financial Statements
brokerage, other investment-related costs, interest and dividend expenses and charges, acquired fund fees and expenses and suchnon-recurring and extraordinary expenses as they may arise) will not exceed the following amounts:
| | | | | | | | |
Portfolio | | | | | Expiration | |
Focused Appreciation Portfolio | | | 0.90 | % | | | April 30, 2019 | |
Large Cap Blend Portfolio | | | 0.85 | % | | | April 30, 2019 | |
Large Company Value Portfolio | | | 0.80 | % | | | April 30, 2019 | |
Domestic Equity Portfolio | | | 0.75 | % | | | April 30, 2019 | |
Equity Income Portfolio | | | 0.75 | % | | | April 30, 2019 | |
Mid Cap Value Portfolio | | | 1.00 | % | | | April 30, 2019 | |
Index 600 Stock Portfolio | | | 0.35 | % | | | April 30, 2019 | |
Small Cap Value Portfolio | | | 1.00 | % | | | April 30, 2019 | |
International Growth Portfolio | | | 1.10 | % | | | April 30, 2019 | |
Research International Core Portfolio | | | 1.15 | % | | | April 30, 2019 | |
Emerging Markets Equity Portfolio | | | 1.50 | % | | | April 30, 2019 | |
Short-Term Bond Portfolio | | | 0.45 | % | | | April 30, 2019 | |
Long-Term U.S. Government Bond Portfolio | | | 0.65 | % | | | April 30, 2019 | |
Inflation Protection Portfolio | | | 0.65 | % | | | April 30, 2019 | |
Multi-Sector Bond Portfolio | | | 0.90 | % | | | April 30, 2019 | |
Asset Allocation Portfolio | | | 0.75 | % | | | April 30, 2019 | |
Growth Stock Portfolio — For the period from January 1, 2018 through April 30, 2018, MSA agreed to waive a portion of its management fee such that the management fee was 0.60% on the Portfolio’s first $50 million of average net assets, 0.50% on the next $50 million, 0.40% on the next $400 million, and 0.38% on average net assets in excess of $500 million. Effective May 1, 2018, MSA has agreed to waive a portion of its management fee such that the management fee is 0.60% on the Portfolio’s first $50 million of average net assets, 0.50% on the next $50 million, 0.40% on the next $400 million, 0.38% on the next $500 million, and 0.36% on average net assets in excess of $1 billion. MSA may terminate this fee waiver agreement at any time after April 30, 2019.
Focused Appreciation Portfolio — MSA has agreed to waive a portion of its management fee such that the management fee is 0.66% on the Portfolio’s first $100 million of average net assets, 0.61% on the next $400 million, 0.60% on the next $500 million, and 0.57% on average net assets in excess of $1 billion. MSA may terminate this fee waiver agreement at any time after April 30, 2019.
Large Cap Core Stock Portfolio — For the period from January 1, 2018 through April 30, 2018, MSA agreed to waive a portion of its management fee such that the management fee was 0.60% on the Portfolio’s first $50 million of average net assets, 0.50% on the next $50 million, 0.40% on the next $400 million, and 0.35% on average net assets in excess of $500 million.Effective May 1, 2018, MSA has agreed to waive a portion of its management fee such that the management fee is 0.60% on the Portfolio’s first $50 million of average net assets, 0.50% on the next $50 million, 0.40% on the next $400 million, and 0.37% on average net assets in excess of $500 million. MSA may terminate this fee waiver agreement at any time after April 30, 2019.
Index 500 Stock Portfolio — MSA has agreed to waive a portion of its management fee such that the management fee is 0.20% on the Portfolio’s first $2 billion of average net assets, and 0.18% on average net assets in excess of $2 billion. MSA may terminate this fee waiver agreement at any time after April 30, 2019.
Large Company Value Portfolio — MSA has agreed to waive a portion of its management fee such that the management fee is 0.70% on the Portfolio’s first $100 million of average net assets, 0.65% on the next $150 million, 0.59% on the next $250 million, and 0.57% on the average net assets in excess of $500 million. MSA may terminate this fee waiver agreement at any time after April 30, 2019.
Domestic Equity Portfolio — For the period from January 1, 2018 through April 30, 2018, MSA agreed to waive a portion of its management fee such that the management fee was 0.65% on the Portfolio’s first $100 million of average net assets, 0.55% on the next $150 million, 0.50% on the next $250 million, and 0.47% on the average net assets in excess of $500 million.Effective May 1, 2018, MSA has agreed to waive a portion of its management fee such that the management fee is 0.65% on the Portfolio’s first $100 million of average net assets, 0.55% on the next $150 million, 0.50% on the next $250 million, 0.47% on the next $500 million, and 0.45% on the average net assets in excess of $1 billion. MSA may terminate this fee waiver agreement at any time after April 30, 2019.
254
Notes to Financial Statements
Equity Income Portfolio — For the period from January 1, 2018 through April 30, 2018, MSA has agreed to waive a portion of its management fee such that the management fee is 0.63% on the Portfolio’s first $500 million of average net assets, 0.55% on the next $1 billion, and 0.52% on the average net assets in excess of $1.5 billion. Effective May 1, 2018, MSA has agreed to waive a portion of its management fee such that the management fee is 0.62% on the Portfolio’s first $500 million of average net assets, 0.55% on the next $1 billion, and 0.52% on the average net assets in excess of $1.5 billion. MSA may terminate this fee waiver agreement at any time after April 30, 2019.
Mid Cap Growth Stock Portfolio — For the period from January 1, 2018 through April 30, 2018, MSA agreed to waive a portion of its management fee such that the management fee was 0.80% on the Portfolio’s first $50 million, 0.65% on the next $50 million, 0.50% on the next $900 million, and 0.48% on average net assets in excess of $1 billion. Effective May 1, 2018, MSA has agreed to waive a portion of its management fee such that the management fee is 0.80% on the Portfolio’s first $50 million, 0.65% on the next $50 million, 0.50% on the next $900 million, and 0.49% on average net assets in excess of $1 billion. MSA may terminate this fee waiver agreement at any time after April 30, 2019.
Index 400 Stock Portfolio — MSA has agreed to waive a portion of its management fee such that the management fee is 0.25% on the Portfolio’s first $500 million and 0.20% on average net assets in excess of $500 million. MSA may terminate this fee waiver agreement at any time after April 30, 2019.
Mid Cap Value Portfolio — For the period from January 1, 2018 through April 30, 2018, MSA agreed to waive a portion of its management fee such that the management fee was 0.79% on the Portfolio’s first $150 million of average net assets, 0.70% on the next $350 million, and 0.67% on the average net assets in excess of $500 million. Effective May 1, 2018, MSA has agreed to waive a portion of its management fee such that the management fee is 0.79% on the Portfolio’s first $150 million of average net assets, 0.69% on the next $350 million, and 0.66% on the average net assets in excess of $500 million. MSA may terminate this fee waiver agreement at any time after April 30, 2019.
Small Cap Value Portfolio — MSA has agreed to waive a portion of its management fee such that the management fee is 0.85% on the Portfolio’s first $500 million of average net assets, and 0.80% on average net assets in excess of $500 million. MSA may terminate this fee waiver agreement at any time after April 30, 2019.
International Growth Portfolio — Effective May 1, 2018, MSA has agreed to waive a portion of its management fee such that the management fee is 0.75% on the Portfolio’s first $100 million of average net assets, 0.65% of the next $150 million, 0.55% on the next $750 million, and 0.54% on average net assets in excess of $1 billion. MSA may terminate this fee waiver agreement at any time after April 30, 2019.
Research International Core Portfolio — MSA has agreed to waive a portion of its management fee such that the management fee is 0.83% on the Portfolio’s first $150 million of average net assets, 0.77% of the next $150 million, 0.70% on the next $200 million, and 0.63% on average net assets in excess of $500 million. MSA may terminate this fee waiver agreement at any time after April 30, 2019.
International Equity Portfolio — For the period from January 1, 2018 through April 30, 2018, MSA agreed to waive a portion of its management fee such that the management fee was 0.77% on the Portfolio’s first $50 million of average net assets, 0.57% on the next $450 million, 0.54% on the next $500 million, 0.47% on the next $500 million, and 0.42% on the average net assets in excess of $1.5 billion. Effective May 1, 2018, MSA has agreed to waive a portion of its management fee such that the management fee is 0.77% on the Portfolio’s first $50 million of average net assets, 0.57% on the next $450 million, 0.54% on the next $500 million, 0.47% on the next $500 million, and 0.41% on the average net assets in excess of $1.5 billion. MSA may terminate this fee waiver agreement at any time after April 30, 2019.
Emerging Markets Equity Portfolio — MSA has agreed to waive a portion of its management fee such that its management fee is 1.01% on the Portfolio’s first $250 million of average net assets, 0.93% on the next $250 million, 0.91% on the next $500 million, and 0.78% on average net assets in excess of $1 billion. MSA may terminate this fee waiver agreement at any time after April 30, 2019.
Government Money Market Portfolio — MSA has agreed to waive a portion of its management fee such that the management fee is 0.30% on the Portfolio’s first $500 million of average net assets, 0.29% on the next $500 million, and 0.28% in excess of $1 billion. MSA may terminate this fee waiver agreement at any time after April 30, 2019.
255
Notes to Financial Statements
Short-Term Bond Portfolio — MSA has agreed to waive a portion of its management fee such that the management fee is 0.35% on the Portfolio’s first $100 million of average net assets, 0.33% on the next $150 million, 0.30% on the next $250 million, and 0.28% on average net assets in excess of $500 million. MSA may terminate this fee waiver agreement at any time after April 30, 2019.
Select Bond Portfolio — MSA has agreed to waive a portion of its management fee such that the management fee is 0.30% on the Portfolio’s first $2 billion of average net assets, and 0.28% on average net assets in excess of $2 billion. MSA may terminate this fee waiver agreement at any time after April 30, 2019.
Long-Term U.S. Government Bond Portfolio — MSA has agreed to waive a portion of its management fee such that the management fee is 0.555% on the Portfolio’s first $100 million of average net assets, 0.515% on the next $150 million, 0.495% of the next $250 million, and 0.445% on average net assets in excess of $500 million. MSA may terminate this fee waiver agreement at any time after April 30, 2019.
Inflation Protection Portfolio — MSA agreed to waive a portion of its management fee such that the management fee is 0.55% on the Portfolio’s first $100 million of average net assets, 0.50% on the next $150 million, and 0.46% on average net assets in excess of $250 million. MSA may terminate this fee waiver agreement at any time after April 30, 2019.
High Yield Bond Portfolio — MSA agreed to waive a portion of its management fee such that the management fee is 0.60% on the Portfolio’s first $50 million of average net assets, 0.50% on the next $50 million, 0.40% on the next $900 million, and 0.30% on average net assets in excess of $1 billion. MSA may terminate this fee waiver agreement at any time after April 30, 2019.
Multi-Sector Bond Portfolio — MSA has agreed to waive a portion of its management fee such that the management fee is 0.74% on the Portfolio’s first $100 million of average net assets, 0.73% on the next $150 million, 0.70% on the next $250 million, and 0.67% on average net assets in excess of $500 million. MSA may terminate this fee waiver agreement at any time after April 30, 2019.
Balanced Portfolio — MSA has agreed to waive a portion of its management fee such that the management fee is 0.05% on all average net assets. MSA may terminate this fee waiver agreement at any time after April 30, 2019.
Asset Allocation Portfolio — MSA has agreed to waive a portion of its management fee such that the management fee is 0.05% on all average net assets. MSA may terminate this fee waiver agreement at any time after April 30, 2019.
Waivers are not recoupable in future periods.
With respect to certain Portfolios, MSA has engaged and overseessub-advisers who manage theday-to-day investment operations of such Portfolios. MSA pays eachsub-adviser a fee based on the average daily net assets of each such Portfolio out of its investment management fee.
Compliance fees are paid to Northwestern Mutual, an affiliate of the Series Fund. The compliance fees paid are for the compensation, benefits and expenses of the Chief Compliance Officer and compliance staff. The amounts paid relate only to the Chief Compliance Officer and compliance staffs’ duties and functions performed for the Series Fund.
NOTE 8. FEDERAL INCOME TAX MATTERS
Taxable distributions from net investment income and realized capital gains in the Portfolios may differ from book amounts earned during the period due to differences in the timing of capital gains recognition and due to the reclassification of certain gains or losses between capital and income. The differences between cost amounts for book purposes and tax purposes are primarily due to the tax treatment of deferred losses, passive foreign investment companies, and financing transactions.
It is the policy of the Portfolios to reclassify the net effect of permanent differences between book and taxable income to capital accounts on the Statements of Assets and Liabilities. Permanent differences primarily relate to character differences with respect to income on swaps, foreign currency transactions, foreign bond sales, passive foreign investment companies and paydowns on structured product investments.
256
Notes to Financial Statements
A summary of the Portfolios’ capital loss carryovers as of December 31, 2018 is provided below:
| | | | | | | | | | | | | | | | |
| | | Short-Term
Loss
Carryover | | | Long-Term
Loss
Carryover | | | Losses
Utilized | |
| | | (Amounts in thousands) | |
International Growth Portfolio | | $ | - | | | $ | | | | | - | | | $ | 18,651 | |
Research International Core Portfolio | | | - | | | | | | | | - | | | | 5,733 | |
International Equity Portfolio | | | - | | | | | | | | - | | | | 21,869 | |
Emerging Markets Equity Portfolio | | | - | | | | | | | | 27,787 | | | | - | |
Short-Term Bond Portfolio | | | 1,292 | | | | | | | | 1,794 | | | | - | |
Select Bond Portfolio | | | 53,137 | | | | | | | | 41,852 | | | | - | |
Long-Term U.S. Government Bond Portfolio | | | 2,299 | | | | | | | | 1,140 | | | | - | |
Inflation Protection Portfolio | | | - | | | | | | | | 2,853 | | | | - | |
High Yield Bond Portfolio | | | - | | | | | | | | 3,390 | | | | 1,585 | |
Multi-Sector Bond Portfolio | | | 15,599 | | | | | | | | 4,204 | | | | - | |
Capital losses are carried forward indefinitely and retain the character of the original loss. These losses are deferred to the first day of the next fiscal year.
When applicable, each of the Portfolios made distributions during the year of ordinary income and long-term capital gains. The tax character of distributions paid for the years ended December 31, 2018 and 2017 was as follows:
| | | | | | | | | | | | | | | | |
| | | 2018 Distributions | | | 2017 Distributions | |
| | | Paid From: | | | Paid From: | |
Portfolio | | Ordinary
Income | | | Long-term
Capital Gain | | | Ordinary
Income | | | Long-term
Capital Gain | |
| | | | | | (Amounts in thousands) | | | | |
Growth Stock Portfolio | | $ | 19,301 | | | $ | 92,900 | | | $ | 7,919 | | | $ | 41,619 | |
Focused Appreciation Portfolio | | | 5,061 | | | | 24,625 | | | | 7,447 | | | | 15,000 | |
Large Cap Core Stock Portfolio | | | 13,132 | | | | 162,866 | | | | 9,903 | | | | - | |
Large Cap Blend Portfolio | | | 1,436 | | | | 7,945 | | | | 1,572 | | | | 8,161 | |
Index 500 Stock Portfolio | | | 55,595 | | | | 28,215 | | | | 53,611 | | | | 29,420 | |
Large Company Value Portfolio | | | 6,580 | | | | 11,246 | | | | 6,519 | | | | 5,231 | |
Domestic Equity Portfolio | | | 16,392 | | | | 26,745 | | | | 16,927 | | | | 13,986 | |
Equity Income Portfolio | | | 18,363 | | | | 58,421 | | | | 19,168 | | | | 36,605 | |
Mid Cap Growth Stock Portfolio | | | 48,744 | | | | 135,034 | | | | 2,583 | | | | - | |
Index 400 Stock Portfolio | | | 11,291 | | | | 57,311 | | | | 9,365 | | | | 47,364 | |
Mid Cap Value Portfolio | | | 14,430 | | | | 43,616 | | | | 11,745 | | | | 15,266 | |
Small Cap Growth Stock Portfolio | | | 6,699 | | | | 44,317 | | | | 625 | | | | 6,457 | |
Index 600 Stock Portfolio | | | 5,807 | | | | 7,556 | | | | 5,210 | | | | 5,517 | |
Small Cap Value Portfolio | | | 4,714 | | | | 45,147 | | | | 4,984 | | | | 33,520 | |
International Growth Portfolio | | | 9,563 | | | | - | | | | 8,203 | | | | - | |
Research International Core Portfolio | | | 10,485 | | | | - | | | | 9,827 | | | | - | |
International Equity Portfolio | | | 45,976 | | | | - | | | | 42,550 | | | | - | |
Emerging Markets Equity Portfolio | | | 9,240 | | | | - | | | | 5,748 | | | | - | |
Government Money Market Portfolio | | | 6,510 | | | | - | | | | 2,770 | | | | 5 | |
Short-Term Bond Portfolio | | | 4,636 | | | | - | | | | 3,730 | | | | - | |
Select Bond Portfolio | | | 67,892 | | | | - | | | | 98,769 | | | | - | |
Long-Term U.S. Government Bond Portfolio | | | 4,123 | | | | 671 | | | | 4,589 | | | | 1,984 | |
Inflation Protection Portfolio | | | 7,199 | | | | - | | | | 3,414 | | | | - | |
High Yield Bond Portfolio | | | 43,280 | | | | - | | | | 43,155 | | | | - | |
Multi-Sector Bond Portfolio | | | 26,878 | | | | - | | | | 30,040 | | | | - | |
Balanced Portfolio | | | 55,333 | | | | 46,465 | | | | 56,193 | | | | 76,318 | |
Asset Allocation Portfolio | | | 6,104 | | | | 6,578 | | | | 6,212 | | | | 10,741 | |
As of December 31, 2018 the components of distributable earnings on a tax basis were as follows:
| | | | | | | | | | | | | | | | |
| | | Undistributed | | | Undistributed | | | | | | Unrealized | |
| | | Ordinary | | | Long-Term | | | Accumulated | | | Appreciation | |
Portfolio | | Income | | | Gains | | | Losses | | | (Depreciation) | |
| | | | | | (Amounts in thousands) | | | | |
Growth Stock Portfolio | | $ | 6,805 | | | $ | 106,399 | | | $ | - | | | $ | 120,793 | |
Focused Appreciation Portfolio | | | 6,173 | | | | 54,376 | | | | - | | | | 180,004 | |
Large Cap Core Stock Portfolio | | | 13,608 | | | | 22,462 | | | | - | | | | (18,012 | ) |
Large Cap Blend Portfolio | | | 2,685 | | | | 14,864 | | | | - | | | | 19,209 | |
Index 500 Stock Portfolio | | | 56,955 | | | | 82,722 | | | | - | | | | 1,431,031 | |
257
Notes to Financial Statements
| | | | | | | | | | | | | | | | |
| | | Undistributed | | | Undistributed | | | | | | Unrealized | |
| Portfolio | | Ordinary
Income | | | Long-Term
Gains | | | Accumulated
Losses | | | Appreciation
(Depreciation) | |
| | | | | | (Amounts in thousands) | | | | |
Large Company Value Portfolio | | $ | 6,196 | | | $ | 11,792 | | | $ | - | | | $ | (13,998 | ) |
Domestic Equity Portfolio | | | 16,004 | | | | 40,576 | | | | - | | | | 156,140 | |
Equity Income Portfolio | | | 19,167 | | | | 46,397 | | | | - | | | | 27,451 | |
Mid Cap Growth Stock Portfolio | | | 39,746 | | | | 9,001 | | | | - | | | | (70,421 | ) |
Index 400 Stock Portfolio | | | 14,512 | | | | 57,141 | | | | - | | | | 88,889 | |
Mid Cap Value Portfolio | | | 14,444 | | | | 43,748 | | | | - | | | | (57,038 | ) |
Small Cap Growth Stock Portfolio | | | 16,390 | | | | 72,405 | | | | - | | | | 2,094 | |
Index 600 Stock Portfolio | | | 3,844 | | | | 15,085 | | | | - | | | | 3,599 | |
Small Cap Value Portfolio | | | 3,918 | | | | 87,580 | | | | - | | | | 62,030 | |
International Growth Portfolio | | | 9,182 | | | | 2,373 | | | | - | | | | 27,637 | |
Research International Core Portfolio | | | 11,737 | | | | 18,842 | | | | - | | | | (15,311 | ) |
International Equity Portfolio | | | 41,463 | | | | 80,375 | | | | - | | | | (105,401 | ) |
Emerging Markets Equity Portfolio | | | 8,489 | | | | - | | | | (27,787 | ) | | | 11,240 | |
Government Money Market Portfolio | | | - | | | | - | | | | - | | | | - | |
Short-Term Bond Portfolio | | | 6,513 | | | | - | | | | (3,086 | ) | | | (2,245 | ) |
Select Bond Portfolio | | | 85,803 | | | | - | | | | (94,989 | ) | | | (13,301 | ) |
Long-Term U.S. Government Bond Portfolio | | | 2,528 | | | | - | | | | (3,439 | ) | | | (6,880 | ) |
Inflation Protection Portfolio | | | 9,618 | | | | - | | | | (2,853 | ) | | | (20,219 | ) |
High Yield Bond Portfolio | | | 45,460 | | | | - | | | | (3,390 | ) | | | (56,077 | ) |
Multi-Sector Bond Portfolio | | | 44,755 | | | | - | | | | (19,803 | ) | | | (32,671 | ) |
Balanced Portfolio | | | 51,404 | | | | 11,849 | | | | - | | | | (63,871 | ) |
Asset Allocation Portfolio | | | 6,129 | | | | 17,044 | | | | - | | | | (8,596 | ) |
NOTE 9. VOLUNTARY REIMBURSEMENTS
Northwestern Mutual voluntarily reimburses foreign equity portfolios for the benefit Northwestern Mutual receives from foreign dividend taxes charged against the Portfolios. The amounts reimbursed represent approximately 79% of the foreign dividend taxes withheld attributable to the portion of the Portfolio owned by Northwestern Mutual. Reimbursements are recorded when foreign dividend taxes are accrued.
Voluntary reimbursements for the year ended December 31, 2018 are summarized below:
| | | | |
Portfolio | | 2018
Reimbursements | |
International Growth Portfolio | | $ | 976,104 | |
International Equity Portfolio | | | 3,993,302 | |
Research International Core Portfolio | | | 1,119,080 | |
Emerging Markets Equity Portfolio | | | 1,507,379 | |
NOTE 10. GUARANTEES
In the normal course of business the Portfolios enter into contracts that contain a variety of representations which provide general indemnifications. The Portfolios’ maximum exposure under these arrangements is unknown as this would involve future claims that may be made against the Portfolios that have not yet occurred. However, the Portfolios expect the risk of material loss to be remote.
NOTE 11. INVESTMENT INCOME AND SECURITIES TRANSACTIONS
For the year ended December 31, 2018, transactions in securities other than short term investments were:
| | | | | | | | | | | | | | | | |
Portfolios | | Total
Security
Purchases | | | U.S. Govt.
Security
Purchases | | | Total
Security
Sales/
Maturities | | | U.S. Govt.
Security
Sales/
Maturities | |
| | | | | | | | | (Amounts in thousands) | |
Growth Stock Portfolio | | $ | 467,478 | | | $ | - | | | $ | 562,931 | | | $ | - | |
Focused Appreciation Portfolio | | | 66,063 | | | | - | | | | 155,427 | | | | - | |
Large Cap Core Stock Portfolio | | | 375,785 | | | | - | | | | 412,016 | | | | - | |
258
Notes to Financial Statements
| | | | | | | | | | | | | | | | |
Portfolios | | Total
Security
Purchases | | | U.S. Govt.
Security
Purchases | | | Total
Security
Sales/
Maturities | | | U.S. Govt.
Security
Sales/
Maturities | |
| | | (Amounts in thousands) | |
Large Cap Blend Portfolio | | $ | 39,282 | | | $ | - | | | $ | 42,145 | | | $ | - | |
Index 500 Stock Portfolio | | | 135,038 | | | | - | | | | 147,532 | | | | - | |
Large Company Value Portfolio | | | 115,525 | | | | - | | | | 126,695 | | | | - | |
Domestic Equity Portfolio | | | 116,333 | | | | - | | | | 148,794 | | | | - | |
Equity Income Portfolio | | | 131,684 | | | | - | | | | 179,293 | | | | - | |
Mid Cap Growth Stock Portfolio | | | 358,207 | | | | - | | | | 441,970 | | | | - | |
Index 400 Stock Portfolio | | | 166,371 | | | | - | | | | 160,496 | | | | - | |
Mid Cap Value Portfolio | | | 321,956 | | | | - | | | | 342,959 | | | | - | |
Small Cap Growth Stock Portfolio | | | 321,512 | | | | - | | | | 365,061 | | | | - | |
Index 600 Stock Portfolio | | | 113,669 | | | | - | | | | 86,752 | | | | - | |
Small Cap Value Portfolio | | | 139,179 | | | | - | | | | 213,492 | | | | - | |
International Growth Portfolio | | | 222,187 | | | | - | | | | 220,169 | | | | - | |
Research International Core Portfolio | | | 196,265 | | | | - | | | | 154,991 | | | | - | |
International Equity Portfolio | | | 588,282 | | | | - | | | | 556,833 | | | | - | |
Emerging Markets Equity Portfolio | | | 166,071 | | | | - | | | | 113,196 | | | | - | |
Short-Term Bond Portfolio | | | 132,530 | | | | 35,076 | | | | 89,142 | | | | 33,936 | |
Select Bond Portfolio | | | 2,604,896 | | | | 7,018,304 | | | | 2,266,395 | | | | 7,037,204 | |
Long-Term U.S. Government Bond Portfolio | | | 1,106 | | | | 42,435 | | | | 525 | | | | 75,807 | |
Inflation Protection Portfolio | | | 31,870 | | | | 47,094 | | | | 54,348 | | | | 51,583 | |
High Yield Bond Portfolio | | | 203,466 | | | | - | | | | 176,083 | | | | - | |
Multi-Sector Bond Portfolio | | | 292,797 | | | | 12 | | | | 322,445 | | | | 8 | |
Balanced Portfolio | | | 572,774 | | | | - | | | | 631,910 | | | | - | |
Asset Allocation Portfolio | | | 86,417 | | | | - | | | | 82,459 | | | | - | |
Transactions with Affiliated Companies
An affiliated company is a company in which a Portfolio has ownership of at least 5% of the voting securities or which the Portfolio controls, is controlled by or with which the Portfolio is under common control. Transactions with affiliated companies during the year ended December 31, 2018 are as follows:
| | | | | | | | | | | | | | | | | | | | | | | | | | | | | | | | | | | | |
Portfolio | | Value at
12/31/2017 | | | Purchases | | | Sales | | | Value at
12/31/2018 | | | Change in
Unrealized
Appreciation
/Depreciation | | | Realized
Gain
(Loss) | | | Income
Dividends | | | Capital Gain
Distributions | | | % Ownership,
12/31/2018 | |
| | | | | | | | | | | | (Amounts in thousands) | | | | | | | | | | | | | |
Balanced: | | | | | | | | | | | | | | | | | | | | | | | | | | | | | | | | | | | | |
Growth Stock | | $ | 151,087 | | | $ | 15,497 | | | $ | 30,550 | | | $ | 125,484 | | | $ | (17,698 | ) | | $ | 7,147 | | | $ | 950 | | | $ | 14,547 | | | | 14.0 | % |
Focused Appreciation | | | 75,676 | | | | 2,250 | | | | 9,900 | | | | 65,037 | | | | (5,332 | ) | | | 2,342 | | | | 345 | | | | 1,905 | | | | 7.7 | % |
Large Cap Core Stock | | | 75,636 | | | | 21,225 | | | | 8,800 | | | | 63,284 | | | | (27,113 | ) | | | 2,335 | | | | 1,052 | | | | 20,173 | | | | 12.2 | % |
Large Cap Blend | | | 75,787 | | | | 3,989 | | | | 6,900 | | | | 66,379 | | | | (8,113 | ) | | | 1,617 | | | | 552 | | | | 3,436 | | | | 43.0 | % |
Large Company Value | | | 75,686 | | | | 6,579 | | | | 5,600 | | | | 64,660 | | | | (12,581 | ) | | | 576 | | | | 1,243 | | | | 5,336 | | | | 37.3 | % |
Domestic Equity | | | 75,695 | | | | 3,748 | | | | 6,850 | | | | 67,231 | | | | (7,754 | ) | | | 2,391 | | | | 1,258 | | | | 2,490 | | | | 8.7 | % |
Equity Income | | | 75,677 | | | | 6,936 | | | | 4,500 | | | | 64,672 | | | | (14,354 | ) | | | 914 | | | | 1,458 | | | | 5,479 | | | | 9.2 | % |
Mid Cap Growth Stock | | | 111,510 | | | | 19,577 | | | | 19,750 | | | | 88,838 | | | | (22,501 | ) | | | 2 | | | | 132 | | | | 16,445 | | | | 9.4 | % |
Mid Cap Value | | | 113,530 | | | | 13,233 | | | | 19,750 | | | | 85,154 | | | | (25,721 | ) | | | 3,862 | | | | 1,511 | | | | 8,722 | | | | 18.0 | % |
Small Cap Growth Stock | | | 37,601 | | | | 3,301 | | | | 17,250 | | | | 19,908 | | | | (7,927 | ) | | | 4,184 | | | | - | | | | 1,801 | | | | 3.8 | % |
Small Cap Value | | | 50,129 | | | | 4,165 | | | | 17,250 | | | | 29,958 | | | | (8,989 | ) | | | 1,903 | | | | 174 | | | | 2,489 | | | | 5.7 | % |
International Growth | | | 53,067 | | | | 5,570 | | | | 12,300 | | | | 41,168 | | | | (7,518 | ) | | | 2,349 | | | | 570 | | | | - | | | | 6.6 | % |
Research International Core | | | 125,619 | | | | 12,691 | | | | 19,600 | | | | 102,333 | | | | (22,651 | ) | | | 6,273 | | | | 1,691 | | | | - | | | | 17.2 | % |
International Equity | | | 51,900 | | | | 5,968 | | | | 12,300 | | | | 38,248 | | | | (9,932 | ) | | | 2,611 | | | | 968 | | | | - | | | | 2.4 | % |
Emerging Markets Equity | | | 13,467 | | | | 8,024 | | | | 11,100 | | | | 9,714 | | | | (1,780 | ) | | | 1,103 | | | | 24 | | | | - | | | | 1.4 | % |
Select Bond | | | 790,177 | | | | 148,876 | | | | 99,500 | | | | 819,476 | | | | (17,712 | ) | | | (2,365 | ) | | | 19,326 | | | | - | | | | 27.6 | % |
Inflation Protection | | | 45,885 | | | | - | | | | 45,030 | | | | - | | | | (723 | ) | | | (133 | ) | | | - | | | | - | | | | 0.0 | % |
High Yield Bond | | | 139,300 | | | | 7,300 | | | | 5,500 | | | | 130,276 | | | | (10,917 | ) | | | 97 | | | | 7,300 | | | | - | | | | 17.1 | % |
| | | | | | | | | | | | | | | | | | | | | | | | | | | | | | | | | | | | |
| | $ | 2,137,429 | | | $ | 288,929 | | | $ | 352,430 | | | $ | 1,881,820 | | | $ | (229,316 | ) | | $ | 37,208 | | | $ | 38,554 | | | $ | 82,823 | | | | | |
| | | | | | | | | | | | | | | | | | | | | | | | | | | | | | | | | | | | |
259
Notes to Financial Statements
| | | | | | | | | | | | | | | | | | | | | | | | | | | | | | | | | | | | |
Portfolio | | Value at
12/31/2017 | | | Purchases | | | Sales | | | Value at
12/31/2018 | | | Change in
Unrealized
Appreciation
/Depreciation | | | Realized
Gain
(Loss) | | | Income
Dividends | | | Capital Gain
Distributions | | | % Ownership,
12/31/2018 | |
| | | | | | | | | | | | (Amounts in thousands) | | | | | | | | | | | | | |
Asset Allocation: | | | | | | | | | | | | | | | | | | | | | | | | | | | | | | | | | | | | |
Growth Stock | | $ | 22,019 | | | $ | 2,330 | | | $ | 3,857 | | | $ | 18,864 | | | $ | (2,565 | ) | | $ | 937 | | | $ | 143 | | | $ | 2,187 | | | | 2.1 | % |
Focused Appreciation | | | 11,034 | | | | 338 | | | | 1,130 | | | | 9,769 | | | | (745 | ) | | | 271 | | | | 52 | | | | 286 | | | | 1.2 | % |
Large Cap Core Stock | | | 12,405 | | | | 3,600 | | | | 1,040 | | | | 10,734 | | | | (4,506 | ) | | | 275 | | | | 179 | | | | 3,422 | | | | 2.1 | % |
Large Cap Blend | | | 12,428 | | | | 681 | | | | 635 | | | | 11,335 | | | | (1,281 | ) | | | 142 | | | | 94 | | | | 587 | | | | 7.3 | % |
Large Company Value | | | 11,030 | | | | 998 | | | | 394 | | | | 9,804 | | | | (1,872 | ) | | | 42 | | | | 188 | | | | 809 | | | | 5.7 | % |
Domestic Equity | | | 11,027 | | | | 557 | | | | 775 | | | | 9,998 | | | | (1,081 | ) | | | 269 | | | | 187 | | | | 370 | | | | 1.3 | % |
Equity Income | | | 11,030 | | | | 1,032 | | | | 430 | | | | 9,620 | | | | (2,096 | ) | | | 85 | | | | 217 | | | | 815 | | | | 1.4 | % |
Mid Cap Growth Stock | | | 16,133 | | | | 2,763 | | | | 2,750 | | | | 12,844 | | | | (3,280 | ) | | | (22 | ) | | | 19 | | | | 2,394 | | | | 1.4 | % |
Mid Cap Value | | | 16,348 | | | | 1,829 | | | | 2,750 | | | | 12,228 | | | | (3,707 | ) | | | 507 | | | | 218 | | | | 1,261 | | | | 2.6 | % |
Small Cap Growth Stock | | | 7,444 | | | | 779 | | | | 2,550 | | | | 4,736 | | | | (1,607 | ) | | | 670 | | | | - | | | | 429 | | | | 0.9 | % |
Small Cap Value | | | 9,237 | | | | 893 | | | | 2,550 | | | | 6,151 | | | | (1,772 | ) | | | 342 | | | | 35 | | | | 508 | | | | 1.2 | % |
International Growth | | | 9,716 | | | | 762 | | | | 1,650 | | | | 7,803 | | | | (1,338 | ) | | | 313 | | | | 112 | | | | - | | | | 1.2 | % |
Research International Core | | | 20,881 | | | | 1,591 | | | | 2,615 | | | | 17,045 | | | | (3,645 | ) | | | 832 | | | | 291 | | | | - | | | | 2.9 | % |
International Equity | | | 9,544 | | | | 843 | | | | 1,650 | | | | 7,291 | | | | (1,792 | ) | | | 346 | | | | 193 | | | | - | | | | 0.5 | % |
Emerging Markets Equity | | | 5,314 | | | | 1,506 | | | | 4,750 | | | | 1,920 | | | | (587 | ) | | | 437 | | | | 6 | | | | - | | | | 0.3 | % |
Select Bond | | | 43,628 | | | | 23,088 | | | | 9,250 | | | | 56,264 | | | | (1,000 | ) | | | (201 | ) | | | 1,313 | | | | - | | | | 1.9 | % |
Inflation Protection | | | 5,607 | | | | - | | | | 5,501 | | | | - | | | | (87 | ) | | | (19 | ) | | | - | | | | - | | | | 0.0 | % |
High Yield Bond | | | 22,290 | | | | 1,188 | | | | 500 | | | | 21,209 | | | | (1,775 | ) | | | 8 | | | | 1,190 | | | | - | | | | 2.8 | % |
| | | | | | | | | | | | | | | | | | | | | | | | | | | | | | | | | | | | |
| | $ | 257,115 | | | $ | 44,778 | | | $ | 44,777 | | | $ | 227,615 | | | $ | (34,736 | ) | | $ | 5,234 | | | $ | 4,437 | | | $ | 13,068 | | | | | |
| | | | | | | | | | | | | | | | | | | | | | | | | | | | | | | | | | | | |
The Series Fund and its Portfolios are permitted to purchase securities from, and sell securities to (so called “cross-trades”), (i) other Portfolios, (ii) any registered investment company which is an affiliate, or an affiliate of an affiliate, or (iii) any person which is an affiliate, or an affiliate of an affiliate, of the Series Fund or the Portfolio solely by reason of having a common investment adviser orsub-adviser (or affiliated investment advisers) or common directors and/or officers, pursuant to procedures adopted by the Board under Rule17a-7 of the 1940 Act (“Procedures”). These Procedures have been designed to ensure that any cross-trade of securities by a Portfolio complies with Rule17a-7 of the 1940 Act. Each cross-trade is effected at the current market price as defined under the Procedures. Pursuant to the Procedures, for the year ended December 31, 2018, the Series Fund Portfolios engaged in the following cross-trades (amounts in thousands):
| | | | |
| | | | |
Portfolio | | Cross Trade
Purchases | |
Large Cap Core Portfolio | | $ | 2,964 | |
Large Company Value Portfolio | | | 1,649 | |
Mid Cap Growth Stock Portfolio | | | 1,694 | |
Mid Cap Value Portfolio | | | 2,827 | |
Small Cap Growth Portfolio | | | 1,090 | |
Small Cap Value Portfolio | | | 382 | |
International Growth Portfolio | | | 6,941 | |
Research International Core Portfolio | | | 591 | |
High Yield Bond Portfolio | | | 7,518 | |
| | | | | | | | |
| | | Cross Trade Sales | |
Portfolio | | Proceeds | | | Net Realized Gains
(Losses) on Sales | |
Large Cap Core Portfolio | | $ | 910 | | | $ | (102 | ) |
Large Company Value Portfolio | | | 1,658 | | | | 77 | |
Mid Cap Growth Stock Portfolio | | | 940 | | | | 269 | |
Mid Cap Value Portfolio | | | 5,520 | | | | 635 | |
Small Cap Growth Portfolio | | | 4,891 | | | | 1,854 | |
Small Cap Value Portfolio | | | 472 | | | | (218 | ) |
International Growth Portfolio | | | 22,056 | | | | 2,650 | |
Research International Core Portfolio | | | 1,330 | | | | 369 | |
NOTE 12. LITIGATION
The Index 500 Stock, Small Cap Value and Equity Income Portfolios are among the defendants in two lawsuits relating to their receipt of proceeds from the 2007 Tribune Co. leveragedbuy-out (“Tribune LBO”) transaction. One lawsuit, filed in a U.S. Bankruptcy Court by a group of unsecured creditors, asserts that the directors and officers of Tribune Co. intentionally defrauded Tribune creditors because Tribune was either insolvent or rendered insolvent by the transactions. Counsel for the Series Fund and other institutional defendants filed a motion to dismiss the intentional fraudulent transfer case in the Southern District of New York and the district court judge granted the motion to dismiss without leave to amend. The trustee’s counsel has filed a motion to certify the dismissal for appeal to the U.S. Court of Appeals for the Second Circuit. The other set of lawsuits, filed by a group of secured creditors in various U.S. federal courts, asserts that the transfer of proceeds to the above-noted Portfolios (and other shareholders) as part of the Tribune LBO were constructively fraudulent. Following
260
Notes to Financial Statements
the grant of a motion to dismiss the secured creditors’ constructive fraud claim by the District Court, the affirmation of that dismissal by the U.S. Court of Appeals for the Second Circuit, followed by a denial of a motion for reconsideration, the Plaintiffs requested review of the decision by the U.S. Supreme Court. Based on a decision issued by the U.S. Supreme Court in a different case, the constructive fraudulent transfer case was remanded to the Second Circuit Court of Appeals for a determination of the effect of the recent decision on the claims asserted in the Tribune case. Proceedings are pending in the Second Circuit Court of Appeals. The lawsuits allege no misconduct by the Portfolios or management, and management intends to vigorously defend all claims and allegations. The plaintiffs in both lawsuits seek to recover amounts paid to Tribune shareholders in the leveraged buyout transaction, plus interest and attorneys’ fees and expenses. The value of the proceeds received by these Portfolios in 2007, and the percentage the proceeds represent of each Portfolio’s net assets as of December 31, 2018, were: Index 500 Stock Portfolio $977,000 (0.03%) of net assets; Small Cap Value Portfolio $618,000 (0.11% of net assets); and Equity Income Portfolio $2,873,000 (0.40% of net assets). Management has not concluded that a loss is reasonably likely to occur, and therefore no loss accrual has been recorded.
The Series Fund, on behalf of the Research International Core Portfolio, is a named plaintiff in an action brought in Belgium against Fortis N.V./S.A., a Belgian company now known as Ageas. The action involves an allegation that Fortis made misleading disclosures regarding the extent of its subprime exposure, its liquidity and solvency, and the consequences of its takeover of ABN Amro. The losses suffered by the Research International Core Portfolio were €228,641 (approximately $261,919, equal to 0.04% of the net assets of the Portfolio as of December 31, 2018, reflecting the December 31, 2018 currency exchange rate), an amount representing the maximum potential recovery in the action, not taking into account attorneys’ fees, and other costs. In March 2016, a collective settlement agreement was reached among the parties providing for compensation to eligible investors in Fortis shares. This collective settlement was initially rejected by the Court; however, on July 13, 2018, the Court issued an order approving an amended settlement agreement which established a settlement pool for all investor claimants of €1.3 billion. The final amount of compensation to be distributed to each eligible shareholder will be subject to adjustment, depending on the number of Fortis shares for which valid claim forms are submitted and approved. Eligible shareholders who submitted claim forms on or before December 31, 2018 will be entitled to an early distribution amounting to 70% of the compensation due under the formula established by the amended settlement agreement (to be paid “as soon as practically possible”), with the balance of compensation due to be paid in the months that follow. The Series Fund has submitted its claim forms in accordance with the terms of the amended settlement agreement. The amount of the final compensation to be paid to the Series Fund and the timing of the receipt of the compensation are contingent on a number of variables, including the number of claimants and the total amount of verified losses, among other factors.
261
Report of Independent Registered Public Accounting Firm
To the Board of Directors of the Northwestern Mutual Series Fund, Inc. and Shareholders of the Growth Stock Portfolio, Focused Appreciation Portfolio, Large Cap Core Stock Portfolio, Large Cap Blend Portfolio, Index 500 Stock Portfolio, Large Company Value Portfolio, Domestic Equity Portfolio, Equity Income Portfolio, Mid Cap Growth Stock Portfolio, Index 400 Stock Portfolio, Mid Cap Value Portfolio, Small Cap Growth Stock Portfolio, Index 600 Stock Portfolio, Small Cap Value Portfolio, International Growth Portfolio, Research International Core Portfolio, International Equity Portfolio, Emerging Markets Equity Portfolio, Government Money Market Portfolio, Short-Term Bond Portfolio, Select Bond Portfolio, Long-Term U.S. Government Bond Portfolio, Inflation Protection Portfolio, High Yield Bond Portfolio, Multi-Sector Bond Portfolio, Balanced Portfolio and Asset Allocation Portfolio.
Opinion on the Financial Statements
We have audited the accompanying statements of assets and liabilities, including the schedules of investments, of the Growth Stock Portfolio, Focused Appreciation Portfolio, Large Cap Core Stock Portfolio, Large Cap Blend Portfolio, Index 500 Stock Portfolio, Large Company Value Portfolio, Domestic Equity Portfolio, Equity Income Portfolio, Mid Cap Growth Stock Portfolio, Index 400 Stock Portfolio, Mid Cap Value Portfolio, Small Cap Growth Stock Portfolio, Index 600 Stock Portfolio, Small Cap Value Portfolio, International Growth Portfolio, Research International Core Portfolio, International Equity Portfolio, Emerging Markets Equity Portfolio, Government Money Market Portfolio, Short-Term Bond Portfolio, Select Bond Portfolio, Long-Term U.S. Government Bond Portfolio, Inflation Protection Portfolio, High Yield Bond Portfolio, Multi-Sector Bond Portfolio, Balanced Portfolio and Asset Allocation Portfolio (constituting Northwestern Mutual Series Fund, Inc., hereafter collectively referred to as the “Funds”) as of December 31, 2018, the related statements of operations for the year ended December 31, 2018, the statements of changes in net assets for each of the two years in the period ended December 31, 2018, and for the Long-Term U.S. Government Bond Portfolio the statement of cash flows for the year ended December 31, 2018, including the related notes, and the financial highlights for each of the five years in the period ended December 31, 2018 (collectively referred to as the “financial statements”). In our opinion, the financial statements present fairly, in all material respects, the financial position of each of the Funds as of December 31, 2018, the results of each of their operations for the year then ended,, the changes in each of their net assets for each of the two years in the period ended December 31, 2018, for the Long-Term U.S. Government Bond Portfolio, the results of its cash flows for the year then ended, and each of the financial highlights for each of the five years in the period ended December 31, 2018 in conformity with accounting principles generally accepted in the United States of America.
Basis for Opinion
These financial statements are the responsibility of the Funds’ management. Our responsibility is to express an opinion on the Funds’ financial statements based on our audits. We are a public accounting firm registered with the Public Company Accounting Oversight Board (United States) (PCAOB) and are required to be independent with respect to the Funds in accordance with the U.S. federal securities laws and the applicable rules and regulations of the Securities and Exchange Commission and the PCAOB.
We conducted our audits of these financial statements in accordance with the standards of the PCAOB. Those standards require that we plan and perform the audit to obtain reasonable assurance about whether the financial statements are free of material misstatement, whether due to error or fraud.
262
Report of Independent Registered Public Accounting Firm
Our audits included performing procedures to assess the risks of material misstatement of the financial statements, whether due to error or fraud, and performing procedures that respond to those risks. Such procedures included examining, on a test basis, evidence regarding the amounts and disclosures in the financial statements. Our audits also included evaluating the accounting principles used and significant estimates made by management, as well as evaluating the overall presentation of the financial statements. Our procedures included confirmation of securities owned as of December 31, 2018 by correspondence with the custodian, transfer agent and brokers. We believe that our audits provide a reasonable basis for our opinions.

Milwaukee, WI
February 19, 2019
We have served as the auditor of one or more investment companies in Northwestern Mutual Series Fund, Inc. since 1984.
263
Abbreviations (unaudited)
Abbreviations that may be used in the preceding statements
| | |
| ADR | | American Depositary Receipt. |
| AFC | | Available Funds Cap security - Security accrues interest at an assumed or uncapped rate. If the interest rate on the |
| | underlying loans is lower than the uncapped rate, then the security will pay at the lower rate. |
| CSTR | | Collateral Strip Rate security - interest is based on the weighted net interest rate of the collateral. |
| EXE | | Security receives collateral principal and interest paid which exceeds the amount of principal and income obligated to all |
| | bonds in the deal. |
| IO | | Interest Only Security |
| GO | | General Obligation |
| RB | | Revenue Bond |
| CPURNSA | | U.S. Consumer Price Index - All Urban Consumers — Not Seasonally Adjusted |
| LIBOR | | London Interbank Offered Rate |
| SOFR | | Secured Overnight Financing Rate |
| CME | | Chicago Mercantile Exchange |
| ICE | | Intercontinental Exchange |
| | |
Currency Abbreviations |
| ARS | | Argentine Peso |
| AUD | | Australian Dollar |
| BRL | | Brazilian Real |
| CAD | | Canadian Dollar |
| CHF | | Swiss Franc |
| CLP | | Chilean Peso |
| CNH | | Chinese Yuan Renminbi - Offshore |
| CNY | | China Yuan Renminbi |
| DKK | | Danish Krone |
| EUR | | Euro |
| GBP | | British Pound |
| HKD | | Hong Kong Dollar |
| HUF | | Hungarian Forint |
| IDR | | Indonesian Rupiah |
| INR | | Indian Rupee |
| JPY | | Japanese Yen |
| KES | | Kenyan Shilling |
| KRW | | South Korean Won |
| MXN | | Mexican New Peso |
| MYR | | Malaysian Ringgit |
| NOK | | Norwegian Krone |
| NZD | | New Zealand Dollar |
| PHP | | Philippines Peso |
| PLN | | Poland Zloty |
| RUB | | Russian Ruble |
| SEK | | Swedish Krona |
| SGD | | Singapore Dollar |
| THB | | Thai Baht |
| TRY | | Turkish Lira |
| TWD | | Taiwan Dollar |
| ZAR | | South African Rand |
264
Proxy Voting and Portfolio Holdings (unaudited)
Proxy Voting Guidelines
A description of the policies and procedures that the Portfolios use to determine how to vote proxies relating to portfolio securities is available without charge, upon request, by calling toll free1-888-455-2232. It is also available on the Securities and Exchange Commission’s website athttp://www.sec.gov.
Information regarding how the Portfolios voted proxies relating to portfolio securities during the most recent twelve-month period ended June 30 is available without charge, upon request, by calling toll free1-888-455-2232. It is also available on the Securities and Exchange Commission’s website athttp://www.sec.gov.
Quarterly Filing of Portfolio Holdings
Each Portfolio files its complete schedule of portfolio holdings with the Securities and Exchange Commission (SEC) for the first and third quarters of each fiscal year on FormN-Q. The Portfolio’s FormN-Q filings are available (i) on the SEC website athttp://www.sec.gov, and may be reviewed and copied at the SEC’s Public Reference Room in Washington, DC. Information on the Public Reference Room may be obtained by calling1-800-SEC-0330. The Portfolios also make their complete schedule of portfolio holdings for the most recent quarter of their fiscal year available on the Internet atwww.northwesternmutual.com.
265
Director and Officer Information (unaudited)
Northwestern Mutual Series Fund, Inc.
The name, address and year of birth of the directors, as well as their affiliations, positions held with the Series Fund, principal occupations during the past five years and the number of portfolios overseen in the Northwestern Mutual fund complex, are shown below as of December 31, 2018, except as otherwise noted. Each director (whenever elected) shall hold office until the next annual meeting of shareholders and until his or her successor is elected and qualifies or until his or her earlier death, resignation or removal. A director shall retire at the end of the calendar year in which the first of the two events occurs: (i) he or she attains the age of seventy-three (73), or (ii) he or she has served a term or successive terms totaling thirteen (13) years, commencing on the date of his or her election or appointment to the Board. The statement of additional information contains additional information about Series Fund directors and is available without charge, upon request, by calling1-888-455-2232.
Independent Directors1
| | | | | | | | |
Name, Address, and Year of Birth | | Position | | Length of Time Served | | Number of Portfolios
in Fund Complex
Overseen by Director | | Other Directorships Held2 |
Miriam M. Allison
720 East Wisconsin Avenue
Milwaukee, WI 53202
1947 | | Director | | Since 2006 | | 27 | | Director of Wasatch Funds, Trust
(15 portfolios) |
|
Principal Occupation During Past 5 Years: Rancher since 2004. From 2001 to 2005, Chairman of UMB Fund Services, Inc. (formerly Sunstone Financial Group, Inc.), a mutual fund service provider. |
Robert H. Huffman III
720 East Wisconsin Avenue
Milwaukee, WI 53202
1959 | | Director | | Since 2007 | | 27 | | None |
|
Principal Occupation During Past 5 Years: Since 2004,Co-Founder and Managing Partner of Relative Value Partners, LLC, a registered investment adviser |
Christy L. Brown
720 East Wisconsin Avenue
Milwaukee, WI 53202
1965 | | Director | | Since 2012 | | 27 | | None |
|
Principal Occupation During Past 5 Years: Since October 2012, Chief Executive Officer, Girl Scouts of Wisconsin Southeast. From 2007 to 2012, Vice Chancellor, Finance and Administrative Affairs, University of Wisconsin, Milwaukee. |
Gail L. Hanson
720 East Wisconsin Avenue
Milwaukee, WI 53202
1955 | | Director | | Since 2012 | | 27 | | Director of Artisan Partner Funds Inc.
(15 portfolios) |
|
Principal Occupation During Past 5 Years: Retired. From February 2011 to April 2018, Chief Financial Officer, Aurora Health Care. Prior thereto, Deputy Executive Director, State of Wisconsin Investment Board. |
William Gerber
720 East Wisconsin Avenue
Milwaukee, WI 53202
1958 | | Director | | Since 2017 | | 27 | | Director of Ballantyne Strong, Inc., a developer of technology solutions for digital applications (2015 to present) |
|
Principal Occupation During Past 5 Years: Retired. From 2006 to 2015, Chief Financial Officer, and from 2007 to 2015, Executive Vice President, of TD Ameritrade Holdings Corporation. |
266
Director and Officer Information (unaudited)
| | | | | | | | |
Name, Address, and Year of Birth | | Position | | Length of Time Served | | Number of Portfolios
in Fund Complex
Overseen by Director | | Other Directorships Held2 |
David Ribbens
720 East Wisconsin Avenue Milwaukee, WI 53202
1961 | | Director | | Since 2017 | | 27 | | None |
|
| Principal Occupation During Past 5 Years: Since March of 2018, Member and Partner of DOMO Capital Management, LLC, a Wisconsin registered investment adviser. Founder and President of Distribution Team Alpha LLC, founded in 2016. From 2015 to 2016, President, Managing Partner, and Director of Heartland Advisors, Inc. From 2008 to 2015, Executive Vice President and Head of Distribution, Managing Partner, and Director of Heartland Advisors, Inc. |
Donald M. Ullmann
720 East Wisconsin Avenue Milwaukee, WI 53202
1957 | | Director | | Since 2017 | | 27 | | None |
|
| Principal Occupation During Past 5 Years: Since 2015, Principal of DMU Financial Consulting, LLC. From 2013 to 2015, Managing Director, Head of Product Development, Fixed Income at Guggenheim Securities. From 2012 to 2013, Executive Managing Director,Co-head, MBS and Rates Division at Gleacher & Co. From 2009 to 2011, Executive Vice President, Head of Fixed Income Trading andCo-Head of Fixed Income Sales at Keefe, Bruyette and Woods, Inc. |
| 1. | This column includes only directorships of companies required to report to the Securities and Exchange Commission (SEC) under the Securities Exchange Act of 1934, as amended (i.e., “public companies”) or other investment companies registered under the Investment Company Act of 1940, as amended. |
Other Directors
| | | | | | | | |
Name, Address, and Year of Birth | | Position | | Length of Time Served | | Number of Portfolios
in Fund Complex
Overseen by Director | | Other Directorships Held |
Ronald P. Joelson
720 East Wisconsin Avenue Milwaukee, WI 53202
1958 | | Chairman of the Board | | Since 2015 | | 27 | | None |
|
| Principal Occupation During Past 5 Years: Since 2012, Executive Vice President of The Northwestern Mutual Life Insurance Company (NM) and Chief Investment Officer of NM. Prior thereto, Chief Investment Officer of Genworth Financial from 2009 to 2012. |
Northwestern Mutual Series Fund, Inc.
Executive Officers
| | | | |
Name, Address, and Year of Birth | | Position | | Length of Time Served |
| | |
Kate M. Fleming
720 East Wisconsin Avenue Milwaukee, WI 53202
1962 | | President | | Since 2013 |
|
| Principal Occupation During Past 5 Years: Since January 2015, President of Mason Street Advisors. Since 2014, a member of the Board of Directors of Mason Street Advisors. Prior thereto, Vice President – Operations of Mason Street Advisors from 2004-December 2014 and Treasurer of Mason Street Advisors from 2008-December 2014. |
267
Director and Officer Information (unaudited)
| | | | |
Name, Address, and Year of Birth | | Position | | Length of Time Served |
Todd M Jones
720 East Wisconsin Avenue Milwaukee, WI 53202 1968 | | Vice President;
Chief Financial Officer & Treasurer | | Since 2015 |
|
| Principal Occupation During Past 5 Years: Since April 2015, Vice President and Controller of Northwestern Mutual. From November 2012 to April 2015, Vice President and Chief Risk Officer of Northwestern Mutual. From April 2012 to October 2012, Vice President of Product Finance for Northwestern Mutual and Treasurer and Financial and Operations Principal (FINOP) of Northwestern Mutual Investment Services, LLC. |
Barbara E. Courtney
720 East Wisconsin Avenue Milwaukee, WI 53202 1957 | | Controller &
Chief Accounting Officer | | Since 1996 |
|
| Principal Occupation During Past 5 Years: Senior Director of Mutual Fund Administration of Northwestern Mutual since 2002. |
Randy M. Pavlick
720 East Wisconsin Avenue Milwaukee, WI 53202 1959 | | Chief Compliance Officer | | Since 2014 |
|
| Principal Occupation During Past 5 Years: Chief Compliance Officer of Mason Street Advisors since 2014; from 2004 to 2014, Assistant General Counsel of Northwestern Mutual, Secretary of the Fund and Assistant Secretary of Mason Street Advisors. |
Lesli H. McLinden
720 East Wisconsin Avenue Milwaukee, WI 53202 1962 | | Secretary | | Since 2014 |
|
| Principal Occupation During Past 5 Years: Assistant General Counsel and Assistant Secretary of Northwestern Mutual since 2007, Secretary of the Fund and Assistant Secretary of Mason Street Advisors, each since 2014. |
Daniel Meehan
720 East Wisconsin Avenue Milwaukee, WI 53202 1973 | | Vice President - Investments | | Since 2012 |
|
| Principal Occupation During Past 5 Years: Vice President of Mason Street Advisors since 2015, Director of Mason Street Advisors from 2007 to 2015. |
268
Approval and Continuance of Investment Advisory andSub-Advisory Agreements (unaudited)
Northwestern Mutual Series Fund, Inc.
Annual Contract Review Process
Under Section 15(c) of the Investment Company Act of 1940, as amended (the “1940 Act”), contracts for investment advisory services are required to be reviewed, evaluated and approved by a majority of an investment company’s independent directors each year. In addition, each investment company is required to disclose in its annual or semi-annual report, as applicable, the material factors and conclusions that formed the basis for the board’s approval or renewal of any investment advisory agreements within the investment company’s most recently completed fiscal half-year period.
At least annually, the Board of Directors (the “Board”) of Northwestern Mutual Series Fund, Inc. (the “Series Fund”) considers and votes upon the renewal of the investmentsub-advisory agreements between Mason Street Advisors, LLC (“Mason Street Advisors”) and each of thesub-advisers of those portfolios of the Series Fund (each, a “Portfolio” and collectively, the “Portfolios”) for which Mason Street Advisors and the Board have appointed asub-adviser. In order to afford the Board the opportunity to focus on a smaller number of relationships at any one meeting, the Board considers the annual continuation of thesub-advisory agreements on a staggered basis during the course of the year.
Board Approvals During theSix-Month Period Ended December 31, 2018
At its August 29, 2018 meeting, the Board, including the Independent Directors, unanimously approved the continuance of (1) the Third Amended and Restated InvestmentSub-Advisory Agreement between Mason Street Advisors and American Century Investment Management, Inc. (“ACI”) relating to the Series Fund’s Mid Cap Value, Large Company Value and Inflation Protection Portfolios, (2) the Second Amended and Restated InvestmentSub-Advisory Agreement between Mason Street Advisors and Delaware Investments Fund Advisers, a series of Macquarie Investment Management Business Trust (“Delaware”) relating to the Series Fund’s Domestic Equity Portfolio, (3) the Second Amended and Restated InvestmentSub-Advisory Agreement between Mason Street Advisors and Federated Investment Management Company (“Federated”) relating to the Series Fund’s High Yield Bond Portfolio, and (4) the Second Amended and Restated InvestmentSub-Advisory Agreement between Mason Street Advisors and Loomis, Sayles & Company, L.P. (“Loomis Sayles”) relating to the Series Fund’s Focused Appreciation Portfolio. Each of the foregoing InvestmentSub-Advisory Agreements with the above-namedSub-Advisers was, in connection with their continuance, modified to incorporate certain updated terms and conditions which resulted in the InvestmentSub-Advisory Agreements being amended and restated.
At its November 28, 2018 meeting, the Board, including the Independent Directors, unanimously approved the continuance of (1) the Fourth Amended and Restated InvestmentSub-Advisory Agreement between Mason Street Advisors and T. Rowe Price Associates, Inc. (“T. Rowe Price”) relating to the Series Fund’s Short-Term Bond, Small Cap Value and Equity Income Portfolios, (2) the Second Amended and Restated InvestmentSub-Advisory Agreement between Mason Street Advisors and Wells Capital Management, Incorporated (“Wells”) relating to the Series Fund’s Select Bond Portfolio, (3) the Third Amended and Restated InvestmentSub-Advisory Agreement between Mason Street Advisors and Pacific Investment Management Company LLC (“PIMCO”) relating to the Series Fund’s Long-Term U.S. Government Bond and Multi-Sector Bond Portfolios, and (4) the Second Amended and Restated InvestmentSub-Advisory Agreement between Mason Street Advisors and BlackRock Advisors, LLC (“BlackRock”) relating to the Series Fund’s Government Money Market Portfolio. Each of the foregoing InvestmentSub-Advisory Agreements with the above-namedSub-Advisers was, in connection with their continuance, modified to incorporate certain updated terms and conditions which resulted in the InvestmentSub-Advisory Agreements being amended and restated.
ACI, Delaware, Federated, Loomis Sayles, T. Rowe Price, Wells, PIMCO and BlackRock are sometimes collectively referred to hereinafter as the“Sub-Advisers,” and their respectivesub-advised Portfolios are collectively referred to herein as the“Sub-Advised Portfolios.” The respective InvestmentSub-Advisory Agreements with theSub-Advisers are collectively referred to herein as the“Sub-Advisory Agreements.”
269
Approval and Continuance of Investment Advisory andSub-Advisory Agreements (unaudited)
In determining whether to approve theSub-Advisory Agreements on behalf of the Series Fund, the Board requested and received detailed information from Mason Street Advisors and theSub-Advisers in advance of each meeting at which suchSub-Advisory Agreements were considered, to assist them in their evaluation, including information compiled by certain independent providers of evaluative data. While particular focus was given to an evaluation of the services, performance, fees, costs, and certain other relevant information under such Agreements at the meeting at which their continuation is formally considered, the evaluation process with respect to theSub-Advisers and the nature, extent and quality of the services they provide to the Portfolios, together with related information, is an ongoing one. As a result, the Board’s consideration of such services, and the performance, fees, costs and other relevant factors was informed by information provided and deliberations that occurred at other meetings throughout the year.
The Independent Directors received a memorandum from their counsel advising them of their responsibilities in connection with the review and approval of theSub-Advisory Agreements and summarizing the legal standards governing the review and approval of these Agreements. The Independent Directors reviewed these standards with their counsel during the course of the meetings, including how these standards should be applied to the review of information relating tosub-advisers under the Series Fund’s manager of managers structure. During the course of their deliberations, the Independent Directors had the opportunity to meet privately without representatives of Mason Street Advisors andSub-Advisers present, and were represented throughout the process by legal counsel.
Continuation of theSub-Advisory Agreements between Mason Street Advisors and CertainSub-Advisors
At its August 29, 2018 and November 28, 2018 meetings, the Board, including the Independent Directors, unanimously approved the continuance of theSub-Advisory Agreements with respect to theSub-Advised Portfolios. In connection with those meetings, the directors received a presentation from representatives of eachSub-Adviser involved in the management of the respectiveSub-Advised Portfolios. In addition to the information presented by and about theSub-Advisers during the course of those meetings, the directors also had available for consideration eachSub-Adviser’s Section 15(c) Report, which contained responses to the information request letter prepared by counsel to the Independent Directors requesting certain information from theSub-Advisers designed to assist the directors in fulfilling their responsibilities when considering the continuation of theSub-Advisory Agreements. The directors also had available Mason Street Advisors’ Executive Summary and Overview regarding each of theSub-Advisers and other materials prepared by Mason Street Advisors. The materials contained detailed information concerning management and personnel, expenses, performance, brokerage commissions, portfolio turnover, portfolio construction and investment processes and other factors with respect to each of theSub-Advised Portfolios, as well as a recap of theSub-Advisers’ responses to the compliance questions contained in the Section 15(c) Report and the observations of the Series Fund’s Chief Compliance Officer regarding the compliance structure and practices of each of theSub-Advisers. The directors also considered their experience with and knowledge of the nature and quality of the services provided by theSub-Advisers and their ongoing discussions with representatives of Mason Street Advisors, its affiliates and eachSub-Adviser.
The material factors and conclusions that formed the basis for the Board’s approval of the continuance of each of theSub-Advisory Agreements include those discussed below. The directors evaluated a variety of information they deemed relevant on aPortfolio-by-Portfolio basis. No one particular factor was identified as determinative, but rather it was a combination of all the factors and conclusions that formed the basis for the determinations made by the Board. Further, different directors may have placed greater weight on certain factors than did other directors.
Nature, Extent and Quality of Services. In considering the nature, extent and quality of eachSub-Adviser’s services, factors considered by the directors included eachSub-Adviser’s financial strength, assets under management, overall business, and organizational and management structure. Also included in the directors’ consideration was an evaluation of the services provided, and investment strategies employed, by each of theSub-Advisers, as well as the personnel providing such services with respect to theSub-Advised Portfolios. The directors considered firm updates given by the portfolio managers and how theSub-Advised Portfolios were being positioned in the current market environment. With respect to ACI, the directors considered personnel changes at the organizational and portfolio management level, including planned changes to ACI’sco-Chief Investment Officer structure and leadership changes to ACI’s value style investment platform. The directors viewed
270
Approval and Continuance of Investment Advisory andSub-Advisory Agreements (unaudited)
favorably the advantages to be gained by the expanded role of a senior portfolio manager with the Large Company Value Portfolio, which was considered to enhance the potential for improved performance returns. The directors noted favorably that ACI had been disciplined and consistent in following its investment strategy and process for the Mid Cap Value Portfolio and were pleased with the leadership provided by ACI’s lead portfolio manager. The directors observed that the portfolio manager for the Inflation Protection Portfolio continued to successfully manage portfolio assets in conformance with the position size limitations imposed by the Internal Revenue Code. The directors considered the tenure of the portfolio manager and ACI’s plans for succession planning. The directors also considered generally the growth in ACI’s assets under management. With respect to Federated, the directors were impressed with the clarity of the firm’s presentation in explaining how the portfolio was managed. The directors considered the portfolio manager’s intention to remain with the firm, and Federated’s succession plans over the longer-term. The directors also considered the potential ramifications of Federated’s acquisition of a London-based asset management firm, observing that such firm had no competing investment mandates with Federated and no U.S. mutual fund presence. With respect to Loomis Sayles, the directors considered favorably the extremely low turnover rate for the Focused Appreciation Portfolio. The directors also were impressed with the portfolio manager’s leadership abilities, his skill at mentoring and developing his colleagues, and his creation of a strong investment team. The directors viewed the firm’s presentation to the Investment Oversight Committee favorably, based upon the connections drawn between the investment strategy and its consistent implementation in managing the Portfolio. The directors also considered the succession planning in place at Loomis Sayles. The directors viewed favorably the portfolio manager’s significant personal investment in the strategy he managed. With respect to Delaware, the directors considered the stability of the current investment team, and viewed favorably the addition of an analyst to the portfolio management group. The directors considered the loss in assets managed for Delaware’s former corporate owner, along with the firm’s explanation for the loss of such assets, and concluded that the investment team was unlikely to be negatively impacted. With respect to T. Rowe Price, the directors considered the long-term investment orientation employed by the firm and the resulting low portfolio turnover rate for the Small Cap Value Portfolio. The directors also considered that the portfolio management teams for each of the Portfolios managed by T. Rowe Price had experienced personnel changes over the prior four years, and noted favorably that the personnel changes had resulted in improved performance returns. With respect to Wells, the directors considered the information provided by the firm with regard to certain cost cutting initiatives and workforce reductions occurring at its parent company and the firm’s assurances that such measures would not impact its investment advisory business, and concluded that the cost-saving actions were unlikely to impact Wells’ ability to provide services to the Select Bond Portfolio. The directors also took into consideration the departure of a portfolio manager for the Select Bond Portfolio, and comments provided by theco-portfolio managers regarding the consistency of the investment process being applied to the Portfolio. The directors concluded that the personnel changes would not negatively impact the level of service being provided by Wells for the Portfolio. With respect to PIMCO, the directors considered the status of the current leadership at the firm and the stability of the firm, as well as the firm’s stated commitment to, and investments in, its advisory business. The directors also considered changes that had impacted the teams managing the Long-Term U.S. Government Bond and Multi-Sector Portfolios. The directors observed that despite the retirement of one of the portfolio managers for the Long-Term U.S. Government Bond Portfolio, PIMCO had added resources to the investment team supporting the mandate. The directors were impressed with the presentation provided by the new portfolio manager for the firm’s Multi-Sector Bond Portfolio, and the knowledge and capabilities of the portfolio manager. The directors also considered and expressed satisfaction with each ExistingSub-Adviser’s investment philosophy and process and the scope of services provided by the ExistingSub-Advisers. Consideration was also given to theSub-Advisers’ respective reputations and experience in providing investment management services and the performance of eachSub-Advised Portfolio. Also considered were recent organizational and other firm developments. Based on their review of these factors, their discussions with theSub-Advisers and their experience with the services provided by theSub-Advisers for the respectiveSub-Advised Portfolios, the Board concluded, within the context of their overall determinations regarding theSub-Advisory Agreements, that they were satisfied with the nature, extent and quality of services, and the resources committed by eachSub-Adviser in providing those services.
Investment Performance.The directors reviewed the investment performance of each of theSub-Advised Portfolios over a variety of time periods. In addition to reviewing the performance of eachSub-Advised Portfolio for both short-term and long-term periods, the directors considered (i) a comparison of eachSub-Advised Portfolio’sone-, three- and five-year(as applicable) performance to the returns of appropriate benchmarks and indices, and to the performance averages of eachSub-Advised Portfolio’s respective Morningstar and Lipper categories for the same periods, (ii) the Morningstar overall
271
Approval and Continuance of Investment Advisory andSub-Advisory Agreements (unaudited)
star rating for eachSub-Advised Portfolio and (iii) the Morningstar and the Lipper rankings for theone-, three- and five-year periods. The directors evaluated eachSub-Advised Portfolio’s performance against these peer groups and industry benchmarks and indices, and viewed this information as providing an objective comparative benchmark against which they could assess the performance of theSub-Advised Portfolios. The directors further considered the performance of accounts managed in a similar manner by each of theSub-Advisers and information from theSub-Advisers regarding any significant differences in the performance of those accounts from that of theSub-Advised Portfolios. In connection with the review of investment performance of theSub-Advised Portfolios over the time periods identified herein, the directors also considered investment performance since the date on which eachSub-Adviser began managing their respectiveSub-Advised Portfolio.
The directors expressed satisfaction with the performance of ACI with respect to the Mid Cap Value and the Inflation Protection Portfolios. The directors commented favorably on the overall strong performance of Federated with respect to the High Yield Bond Portfolio and Delaware with respect to the Domestic Equity Portfolio. The directors also commented positively on the overall performance of Loomis Sayles with respect to the Focused Appreciation Portfolio, but noted that the Portfolio’s performance had lagged over the12-month period ending June 30, 2018. The directors noted favorably the strong performance records achieved by T. Rowe Price with respect to the Small Cap Value and Short-Term Bond Portfolios, PIMCO with respect to the Long-Term U.S. Government Bond and Multi-Sector Bond Portfolios, and BlackRock with respect to the Government Money Market Portfolio. With respect to the Large Company Value Portfolio managed by ACI, the directors considered that the Portfolio had underperformed, but noted that the performance had improved during the three- andsix-month periods ending June 30, 2018. The directors considered certain strategy changes implemented by ACI for the Large Company Value Portfolio that were designed to more closely align it with the investment process utilized by the Mid Cap Value Portfolio, which was grounded in fundamental analysis. The directors also considered that the increased role of the formerco-Chief Investment Officer of the firm’s value strategy as a portfolio manager for the Large Company Value Portfolio had the potential to positively impact performance results, but concluded that performance should be closely monitored. With respect to the Multi-Sector Portfolio managed by PIMCO, the directors considered the firm’s explanation for the continued performance dispersion of the Portfolio compared with the firm’s comparable retail mutual fund with a similar mandate.
In addition to performance information presented at the meeting, the directors considered the detailed performance information, market commentary, portfolio analysis and portfolio manager presentations they received periodically throughout the year. Generally speaking, while attentive to the short-term performance results because of the trend that such performance might signal, the directors accorded greater weight to longer term performance. For the reasons and based on the discussion summarized above, the Board concluded that, in the totality of circumstances and within the context of its overall determinations regarding theSub-Advisory Agreements, it was satisfied with the relative investment performance of theSub-Advised Portfolios.
Management Fees and Other Expenses. The directors evaluated the reasonableness of the management fees and total expenses paid by theSub-Advised Portfolios under theSub-Advisory Agreements. The directors considered the actual and contractual fees paid by eachSub-Advised Portfolio. The directors also considered thesub-advisory fees paid by Mason Street Advisors out of its management fee, including a comparison of those fees with fees charged by the respectiveSub-Advisers for similarly managed accounts. In considering the level of management fees, the directors also considered the size of theSub-Advised Portfolios, expenses assumed by Mason Street Advisors, and the existing expense limitation and/or fee waiver arrangements agreed to by Mason Street Advisors with respect to eachSub-Advised Portfolio.
As part of their evaluation, the directors received and reviewed an independent analysis prepared by Morningstar of comparative expense data for eachSub-Advised Portfolio. Morningstar provided data as of December 31, 2017 comparing eachSub-Advised Portfolio’s net and total expenses with those of a peer group of funds underlying variable insurance products, as well as a universe of funds underlying variable insurance products across each fund’s investment classification and objective, each as selected by Morningstar. The directors considered the comparative data as a guide to help assess the reasonableness of eachSub-Advised Portfolio’s net and total expense ratios. The directors considered that the Morningstar expense rankings of the Portfoliossub-advised by ACI (with respect to the Mid Cap Value Portfolio), Delaware (Domestic Equity Portfolio), Federated (High Yield Bond Portfolio), Loomis Sayles (Focused Apprecation Portfolio), T. Rowe Price (with respect to the Short-Term Bond, Small Cap Value and Equity Income Portfolios), Wells (Select Bond Portfolio) and BlackRock
272
Approval and Continuance of Investment Advisory andSub-Advisory Agreements (unaudited)
(Government Money Market Portfolio) were in the top Morningstar quartile (meaning lowest net expenses) of their respective peer groups. The directors considered that the expense rankings of the Large Company Value Portfoliosub-advised by ACI, and the Long-Term U.S. Government Bond and the Multi-Sector Bond Portfoliossub-advised by PIMCO, were within the second quartile of their respective peer groups. The directors also considered the agreements of T. Rowe Price and PIMCO to providesub-advisory fee reductions for services provided to the Equity Income and Multi-Sector Bond Portfolios.
Based on their review of the above information and other factors deemed relevant by the directors, the Board concluded that the management fees and total operating expenses of each of theSub-Advised Portfolios were reasonable in relation to the nature, scope and quality of services provided and the performance of theSub-Advised Portfolios over time and the expense limitation and fee waivers that are in place.
Costs and Profitability. The directors reviewed information provided by Mason Street Advisors regarding the profitability realized by Mason Street Advisors due to its relationship with theSub-Advised Portfolios. The directors considered Mason Street Advisors’ quarterly presentation to the directors regarding Mason Street Advisors’ revenues, expenses, income and profit margins allocable to its services to theSub-Advised Portfolios on an aggregate and a per Portfolio basis, and Mason Street Advisors’ allocation methodology with respect to the revenues and expenses. The profitability information presented for the directors’ consideration was supplemented by the aforementioned information regarding the ranking of eachSub-Advised Portfolio within the Portfolio’s respective Morningstar category. The directors then considered the profitability information related to certain of theSub-Advised Portfolios where such information had been provided and the financial statements of certainSub-Advisers or their affiliates who had not provided specific profitability information. In all instances, including those where profitability information had not been provided, the directors recognized that thesub-advisory fees were the result ofarm’s-length negotiations between Mason Street Advisors and suchSub-Advisers. The directors also recognized that there are limitations inherent in allocating costs and calculating profitability for organizations such as theSub-Advisers, and that it is difficult to make comparisons of profitability among investment advisers because comparative information is not generally publicly available and, when available, such information may have been developed using a variety of differing assumptions and other factors. The directors concluded that they had received sufficient information to evaluate the issues related to costs and profitability.
The directors considered certainfall-out benefits that may be realized by Mason Street Advisors and its affiliates due to their relationship with theSub-Advised Portfolios, including the participation of mutual fund families advised by certainSub-Advisers to theSub-Advised Portfolios in the brokerage platform and/or mutual fund partner programs offered by an affiliate of Mason Street Advisors and the payment of fees by those entities to affiliates of Mason Street Advisors related to such participation. The directors reviewed information concerning certain of theSub-Advisers’ soft dollar arrangements and any other benefits to theSub-Advisers arising from their relationships with theSub-Advised Portfolios. Based on their review, the Board concluded, within the context of their overall determinations regarding theSub-Advisory Agreements, that they were satisfied that the fees paid by each of theSub-Advised Portfolios, and the profits realized by Mason Street Advisors and theSub-Advisers due to their relationship with theSub-Advised Portfolios, were not excessive.
Economies of Scale. The directors considered whether eachSub-Advised Portfolio’s expense structure permitted economies of scale to be shared with theSub-Advised Portfolio’s investors. The directors considered the breakpoints contained in the advisory fee schedules for theSub-Advised Portfolios and the extent to which eachSub-Advised Portfolio may benefit from economies of scale through those breakpoints. The directors took into account the expense limitation arrangements in place for the Large Company Value, Inflation Protection, Mid Cap Value, Domestic Equity, Focused Appreciation, Equity Income, Small Cap Value, Short-Term Bond, Long-Term U.S. Government Bond and Multi-Sector Bond Portfolios, and the fee waiver arrangements in place with respect to the High Yield Bond, Large Company Value, Inflation Protection, Mid Cap Value, Domestic Equity, Focused Appreciation, Equity Income, Small Cap Value, Short-Term Bond, Select Bond, Long-Term U.S. Government Bond, Multi-Sector Bond and Government Money Market Portfolios. The directors also considered the total assets of eachSub-Advised Portfolio and the expense ratios of theSub-Advised Portfolios. Based on this information, the Board concluded, within the context of its overall determinations regarding theSub-Advisory Agreements, that eachSub-Advised Portfolio’s fee structure reflected appropriate economies of scale for the benefit of such Portfolio’s investors.
273
Approval and Continuance of Investment Advisory andSub-Advisory Agreements (unaudited)
Other Information. The directors were presented with other information intended to assist them in their consideration of the continuation of theSub-Advisory Agreements, including information about the services provided by affiliates of Mason Street Advisors to the Portfolios and information regarding Mason Street Advisors’ and theSub-Advisers’ brokerage practices and commissions. The directors took into consideration reports from Mason Street Advisors on its review of the respective compliance programs of theSub-Advisers, including any recent compliance exceptions noted and the applicableSub-Adviser’s response. Also considered were key affiliations and business relationships between theSub-Advisers and their affiliates and Mason Street Advisors’ parent company and affiliates. Their review further included information relating to eachSub-Adviser’s risk management infrastructure, pending or recent litigation or regulatory actions to which anSub-Adviser or its affiliates may have been a party, and the applicableSub-Adviser’s responses to those actions. The directors also considered information regarding eachSub-Adviser’s code of ethics, cybersecurity program and business continuity plan, portfolio manager compensation, portfolio turnover, succession planning and other matters they deemed relevant.
Conclusions of the Directors.Based on a consideration of all information deemed relevant in its totality, the Board, including the Independent Directors, and assisted by the advice of legal counsel independent of Mason Street Advisors, in the exercise of their reasonable business judgment concluded that the terms of theSub-Advisory Agreements were fair and reasonable and approved the continuation of each Agreement for another year as being in the best interests of each Portfolio.
274
REPORT ON FORM N-CSR
RESPONSES FOR NORTHWESTERN MUTUAL SERIES FUND, INC.
As of the end of the period covered by this report, the Registrant has adopted a code of ethics that applies to the Registrant’s principal executive officer, principal financial officer and principal accounting officer or controller.
| Item 3. | Audit Committee Financial Expert |
The Registrant’s board of directors has determined that the Registrant has two audit committee financial experts serving on its audit committee. The names of the audit committee financial experts are Miriam M. Allison, Gail L. Hanson, and William Gerber. Each of the audit committee financial experts is independent.
| Item 4. | Principal Accountant Fees and Services |
| | | | | | | | |
(a) Audit Fees | | | | | | | | |
| | |
Audit Fees and Expenses of Registrant | | | | | | | | |
| | |
| | | 2017 | | | 2018 | |
| | $
| 852,730
|
| | $ | 682,150 | |
| | |
(b) Audit Related Fees | | | | | | | | |
| | |
Audit-Related Fees and Expenses of Registrant | | | | | | | | |
| | |
| | | 2017 | | | 2018 | |
| | $ | 0 | | | $ | 0 | |
| | |
(c) Tax Fees | | | | | | | | |
| | |
| | | 2017 | | | 2018 | |
| | $ | 102,720 | | | $ | 77,210 | |
| | |
Review of dividend declarations | | | | | | | | |
Review of excise tax calculations | | | | | | | | |
Non-U.S. tax compliance | | | | | | | | |
| | |
(d) All Other Fees | | | | | | | | |
| | |
| | | 2017 | | | 2018 | |
| | $ | 0 | | | $ | 0 | |
(e)(1) It is the audit committee’s policy to pre-approve all audit and non-audit service engagements for the Registrant; and any non-audit service engagement of the Registrant’s auditor by (1) the Registrant’s investment adviser and (2) any other entity in a control relationship with the investment adviser that provides ongoing services to the Registrant if, in each of (1) and (2) above, the non-audit service engagement relates directly to the operations and financial reporting of the Registrant. (2) Not applicable.
(f) Not applicable.
| | | | | | | | |
(g) Aggregate non-audit fees of Registrant, Registrant’s investment advisor and related service providers | | | | | | | | |
| | |
| | | 2017 | | | 2018 | |
| | $
| 161,720
|
| | $ | 203,110 | |
(h) The Registrant’s audit committee has considered whether the auditor’s provision of non-audit services to the Registrant’s investment advisor and related service providers is compatible with the auditor’s independence.
| Item 5. | Audit Committee of Listed Registrants |
Not applicable.
| Item 6. | Schedule of Investments |
Full Schedule of Investments is included in Item 1.
| Item 7. | Disclosure of Proxy Voting Policies and Procedures for Closed-End Management Investment Companies |
Not applicable.
| Item 8. | Portfolio Managers of Closed-End Management Investment Companies |
Not applicable.
| Item 9. | Purchases of Equity Securities by Closed-End Management Investment Company and Affiliated Purchasers |
Not applicable.
| Item 10. | Submission of Matters to a Vote of Security Holders |
Not applicable.
| Item 11. | Disclosure Controls and Procedures |
(a) The Registrant’s Principal Executive Officer and Principal Financial Officer have evaluated the Registrant’s disclosure controls and procedures within 90 days of this filing and have concluded that the Registrant’s disclosure controls and procedures were effective, as of that date, in ensuring that information required to be disclosed by the Registrant in this filing was recorded, processed, summarized, and reported timely.
(b) There was no change in the Registrant’s internal control over financial reporting (as defined in Rule 30a-3(d) under the Investment Company Act of 1940) that occurred during the Registrant’s fourth fiscal quarter that has materially affected, or is reasonably likely to materially affect, the Registrant’s internal control over financial reporting.
(a)(1) The code of ethics referred to in the response to Item 2 above is attached as exhibit EX-99.12(a)(1).
(a)(2) Separate certifications for the Registrant’s principal executive officer and principal financial officer, as required by Section 302 of the Sarbanes-Oxley Act of 2002 and Rule 30a-2(a) under the Investment Company Act of 1940, are attached as exhibit EX-99.CERT.
(a)(3) Not applicable.
(a)(4) Not applicable.
(b) Separate certifications for the Registrant’s principal executive officer and principal financial officer, as required by 18 U.S.C. Section 1350, as adopted pursuant to Section 906 of the Sarbanes-Oxley Act of 2002, and Rule 30a-2(b) under the Investment Company Act of 1940, are attached as exhibit EX-99.906CERT. The certifications furnished pursuant to this paragraph are not deemed to be “filed” for purposes of Section 18 of the Securities Exchange Act of 1934, or otherwise subject to the liability of that section. Such certifications are not deemed to be incorporated by reference into any filing under the Securities Act of 1933 or the Securities Exchange Act of 1934, except to the extent that the Registrant specifically incorporates them by reference.
Pursuant to the requirements of the Securities Exchange Act of 1934 and the Investment Company Act of 1940, the Registrant has duly caused this report to be signed on its behalf by the undersigned, thereunto duly authorized.
NORTHWESTERN MUTUAL SERIES FUND, INC.
| | |
| By: | | /s/ Kate M. Fleming |
| | Kate M. Fleming, President |
|
| Date: February 13, 2019 |
Pursuant to the requirements of the Securities Exchange Act of 1934 and the Investment Company Act of 1940, this report has been signed below by the following persons on behalf of the registrant and in the capacities and on the dates indicated.
| | |
| |
| By: | | /s/ Kate M. Fleming |
| | Kate M. Fleming, President |
|
| Date: February 13, 2019 |
| | |
| |
| By: | | /s/ Todd M. Jones |
| | Todd M. Jones, Vice President, |
| | Chief Financial Officer and Treasurer |
|
| Date: February 13, 2019 |