Table of Contents
UNITED STATES
SECURITIES AND EXCHANGE COMMISSION
Washington, D.C. 20549
FORM N-CSR
CERTIFIED SHAREHOLDER REPORT OF REGISTERED
MANAGEMENT INVESTMENT COMPANIES
Investment Company Act file number 811-3990
Northwestern Mutual Series Fund, Inc.
(Exact name of registrant as specified in charter)
720 East Wisconsin Avenue,
Milwaukee Wisconsin 53202
(Address of principal executive offices) (Zip code)
Phil J. Rinzel, Controller and Chief Accounting Officer Northwestern Mutual Series Fund, Inc.
(Name and address of agent for service)
Registrant’s telephone number, including area code: 414-271-1444
Date of fiscal year end: December 31
Date of reporting period: December 31, 2021
Form N-CSR is to be used by management investment companies to file reports with the Commission not later than 10 days after the transmission to stockholders of any report that is required to be transmitted to stockholders under Rule 30e-1 under the Investment Company Act of 1940 (17 CFR 270.30e-1). The Commission may use the information provided on Form N-CSR in its regulatory, disclosure review, inspection, and policymaking roles.
A registrant is required to disclose the information specified by Form N-CSR, and the Commission will make this information public. A registrant is not required to respond to the collection of information contained in Form N-CSR unless the Form displays a currently valid Office of Management and Budget (“OMB”) control number. Please direct comments concerning the accuracy of the information collection burden estimate and any suggestions for reducing the burden to Secretary, Securities and Exchange Commission, 450 Fifth Street, NW, Washington, DC 20549-0609. The OMB has reviewed this collection of information under the clearance requirements of 44 U.S.C. § 3507.
Table of Contents
REPORT ON FORM N-CSR
RESPONSES FOR NORTHWESTERN MUTUAL SERIES FUND, INC.
| Item 1. | Reports to Stockholders |
(a) The registrant’s annual report transmitted to shareholders pursuant to Rule 30e-1 under the Investment Company Act of 1940, as amended (the “Investment Company Act”), is as follows:
Table of Contents
Annual Report December 31, 2021
Northwestern Mutual Series Fund, Inc.
A Series Fund Offering 27 Portfolios
| • | Growth Stock Portfolio |
| • | Focused Appreciation Portfolio |
| • | Large Cap Core Stock Portfolio |
| • | Large Cap Blend Portfolio |
| • | Index 500 Stock Portfolio |
| • | Large Company Value Portfolio |
| • | Domestic Equity Portfolio |
| • | Equity Income Portfolio |
| • | Mid Cap Growth Stock Portfolio |
| • | Index 400 Stock Portfolio |
| • | Mid Cap Value Portfolio |
| • | Small Cap Growth Stock Portfolio |
| • | Index 600 Stock Portfolio |
| • | Small Cap Value Portfolio |
| • | International Growth Portfolio |
| • | Research International Core Portfolio |
| • | International Equity Portfolio |
| • | Emerging Markets Equity Portfolio |
| • | Government Money Market Portfolio |
| • | Short-Term Bond Portfolio |
| • | Select Bond Portfolio |
| • | Long-Term U.S. Government Bond Portfolio |
| • | Inflation Protection Portfolio |
| • | High Yield Bond Portfolio |
| • | Multi-Sector Bond Portfolio |
| • | Balanced Portfolio |
| • | Asset Allocation Portfolio |
As permitted by regulations adopted by the Securities and Exchange Commission, paper copies of the Fund’s shareholder reports are no longer sent by mail unless you specifically request paper copies of the reports from Northwestern Mutual, the issuer of your variable annuity and/or variable life insurance contract. Instead, your Fund annual and semi-annual reports will be made available on a website and you will be notified by mail each time a report is posted and provided with a website link to access the report.
If you already elected to receive shareholder reports electronically, you will not be affected by this change, will continue to receive reports electronically, and you need not take any action. You may elect to receive all future reports in paper free of charge by informing Northwestern Mutual that you wish to continue receiving paper copies of your shareholder reports. Your election to receive reports in paper will apply to all future shareholder reports.
Table of Contents
Letter to Contract Holders
December 31, 2021
Would anyone have guessed a year ago that COVID-19 would still be a concern going into 2022? We expected that by this time, the prevalence of vaccines and herd immunity would have been firmly established. After the virus-caused market upheaval in 2020, we thought 2021 would be the year to move on! It was and it wasn’t. On the one hand, the rise of the Delta variant resulted in reduced economic activity in the third quarter and now Omicron raises concerns as we move into 2022. On the other hand, economic activity was still solid with 2021 U.S. GDP growth of 5.7%. And the equity markets reflected solid corporate earnings which beat expectations (including our own) and drove the S&P 500® Index1 return to 28.71%, despite lower consumer confidence that reflected a new nagging concern of inflation. Stimulus measures, however, helped boost market confidence and consumer demand was strong enough to propel equities at the expense of fixed income, with broad fixed income indices turning negative for the year. The Bloomberg® U.S. Aggregate Bond Index was down -1.54%.
The United States was clearly the dominant equity market in 2021 and performed well across the market cap spectrum. While there was significant attention this year to the companies of the S&P® 500 Index and their expectations-topping earnings growth (expected to be 44% when reporting concludes early this year), growth in earnings of mid and small cap companies are expected to come in even stronger. Investment returns for mid and small cap companies were slightly behind those of large caps, but still very strong in 2021. The S&P MidCap 400® Index and the S&P SmallCap 600® Index returned 24.76% and 26.82%, respectively.
Foreign markets, as measured by the MSCI EAFE® Index, lagged the U.S. but also had a solid return for the year of 11.26%. In contrast, the MSCI® Emerging Markets Index was down -2.54%, impacted by severe and persistent regulatory crackdowns in China aimed at the technology and for-profit education industries. Other notable asset classes in 2021 included commodities (Bloomberg Commodity Index +27.11%) and Treasury Inflation-Protected Securities (Bloomberg U.S. TIPS Index +5.96%), which performed well as inflation surged, especially in the latter half of the year.
How did the economy and equity markets perform so well despite a continuing global pandemic? Frankly, it appears that the U.S. consumer began to reject lockdowns, focus on a low fatality rate (versus a climbing case rate), made some
purchasing shifts from services to goods, and back again, and businesses learned to adapt to an uncertain environment. Technology use that shifted in 2020 (surprising everyone) became the new normal in 2021, and this productivity improvement helped companies not just survive but, in many cases, thrive. Small businesses certainly had it tougher, especially in the service sector, where it was difficult (and remains difficult) to find workers. Indeed, there remains about 3 million more job openings than unemployed individuals and this has driven up wages which we see reflected in higher inflation.
This presents the biggest question going into 2022: Is the inflation transitory? The answer in large part depends on the labor market. Pre-COVID, the labor participation rate was just north of 63% and there was little indication that we were at maximum employment, i.e. it was trending higher. Today this participation rate is just shy of 62% and we believe there continues to be room for individuals to return to work. This implies that the current growth cycle also has room to grow. This is further supported when we dig into the prime working years of 25 to 54-year olds. This cohort stood at 83% pre-COVID and has reached over 84% during previous peak periods. Today we sit below 82%, well below what we would expect at full employment. We think the labor market will return to normal in 2022. For example, the number of individuals collecting pandemic unemployment benefits peaked at 16.8 million in 2020 and declined to around 9 million a year later. Today this number is close to zero and it’s doubtful that none of these individuals will return to the workforce. This should improve the labor market, help businesses meet demand and therefore prices should moderate somewhat in 2022. As we further think about 2022, let’s keep in mind that GDP is expected to remain strong (both in the U.S. and globally), unemployment is at 3.9%, companies are in excellent financial shape, the consumer balance sheet remains strong with cash still on the sidelines, and monetary policy, despite some tapering ahead, remains easy. Even if the Federal Reserve hikes rates four times in 2022, the overall rate picture adjusted for inflation will remain accommodative and support continued growth.
Risks to think about however, include COVID uncertainty (will Omicron become a persistent problem or will a new variant emerge?) and inflation – which could result in a shift in Federal Reserve sentiment should employment and
Table of Contents
growth goals move their mandate back to a more traditional “fight inflation” position. (I still recall the Volcker days!) Fortunately, these risks are likely to offset each other. For example, if Omicron emerges and consumer spending is curtailed, it’s less likely that inflation will be a major headwind.
The bottom line is that although the outlook for 2022 looks positive, risks and unknowns suggest that a strong diversified portfolio is still the best way to balance opportunity and risk. Certainly, your advisor is in the best place to help you determine how opportunistic you should be or how your own situation may require a more conservative approach.
As we end another solid year of performance and look ahead to 2022, I want to also take a moment to thank you personally for putting your trust in Northwestern Mutual. We know we must earn that trust every year and we look forward to doing so again in 2022!

1 All indices and/or benchmarks referenced are unmanaged and cannot be invested in directly.
Table of Contents
Northwestern Mutual Series Fund, Inc.
| 1 | ||||
Series Fund Overviews and Schedules of Investments: | ||||
| 4 | ||||
| 8 | ||||
| 12 | ||||
| 18 | ||||
| 22 | ||||
| 30 | ||||
| 36 | ||||
| 40 | ||||
| 45 | ||||
| 51 | ||||
| 58 | ||||
| 64 | ||||
| 70 | ||||
| 79 | ||||
| 84 | ||||
| 90 | ||||
| 96 | ||||
| 103 | ||||
| 109 | ||||
| 114 | ||||
| 136 | ||||
| 153 | ||||
| 160 | ||||
| 172 | ||||
| 184 | ||||
| 209 | ||||
| 214 | ||||
| 219 | ||||
| 222 | ||||
| 228 | ||||
| 234 | ||||
| 243 | ||||
| 244 | ||||
| 252 | ||||
| 275 | ||||
| 277 | ||||
| 278 | ||||
| 279 | ||||
Approval and Continuance of Investment Advisory and Sub-Advisory Agreements | 282 | |||
Mason Street Advisors, LLC (“Mason Street Advisors”), adviser to the Northwestern Mutual Series Fund, Inc., is a wholly owned subsidiary of The Northwestern Mutual Life Insurance Company. Mason Street Advisors is the principal investment adviser for all the Portfolios of the Northwestern Mutual Series Fund, Inc., and has engaged and oversees sub-advisers who provide day-to-day management for certain of the Portfolios. Each sub-adviser may be replaced without the approval of shareholders. Please see the Series Fund prospectus for more information.
The views expressed in the portfolio manager commentaries set forth in the following pages reflect those of the portfolio managers only through the end of the period covered by this report and do not necessarily represent the views of any affiliated organization. The views expressed are not guarantees of future performance or economic results and involve certain risks, uncertainties and assumptions that could cause actual outcomes and results to differ materially from the views expressed herein. These views are subject to change at any time based upon market conditions or other events and should not be relied upon as investment advice. Mason Street Advisors disclaims any responsibility to update these views. |
Table of Contents
EXAMPLE
As a shareholder of each Portfolio, you incur two types of costs: (1) transaction costs and (2) ongoing costs, including management fees and other Portfolio expenses. This Example is intended to help you understand your ongoing costs (in dollars) of investing in the Portfolios and to compare these costs with the ongoing costs of investing in other mutual funds.
The Example is based on an investment of $1,000 invested at the beginning of the period and held for the entire period (July 1, 2021 to December 31, 2021).
ACTUAL EXPENSES
The first line of the table below provides information about actual account values and actual expenses. You may use the information in this line, together with the amount you invested, to estimate the expenses that you paid over the period. Simply divide your account value by $1,000 (for example, an $8,600 account value divided by $1,000 = 8.6), then multiply the result by the number in the first line under the heading entitled “Expenses Paid During Period” to estimate the expenses you paid on your account during this period.
HYPOTHETICAL EXAMPLE FOR COMPARISON PURPOSES
The second line of the table below for each Portfolio provides information about hypothetical account values and hypothetical expenses based on each Portfolio’s actual expense ratio and an assumed rate of return of 5% per year before expenses, which is not the Portfolio’s actual return. The hypothetical account values and expenses may not be used to estimate the actual ending account balance or expenses you paid for the period. You may use this information to compare the ongoing costs of investing in a Portfolio and other funds. To do so, compare this 5% hypothetical example with the 5% hypothetical examples that appear in the shareholder reports of the other funds.
Please note that the expenses shown in the table are meant to highlight your ongoing costs only and do not reflect any transactional costs or separate account charges. Therefore, the second line of the table is useful in comparing ongoing costs only, and will not help you determine the relative total costs of owning different funds. In addition, if these transactional costs or separate account charges were included, your costs would have been higher.
Beginning Account Value July 1, 2021 | Ending Account Value December 31, 2021 | Expenses Paid During December 31, 2021* | Annualized Expense Ratio | |||||||||||||
Growth Stock Portfolio | ||||||||||||||||
Actual | $1,000.00 | $1,036.67 | $2.16 | 0.42 | % | |||||||||||
Hypothetical (5% return before expenses) | 1,000.00 | 1,023.09 | 2.14 | 0.42 | ||||||||||||
Focused Appreciation Portfolio | ||||||||||||||||
Actual | 1,000.00 | 1,044.22 | 3.19 | 0.62 | ||||||||||||
Hypothetical (5% return before expenses) | 1,000.00 | 1,022.08 | 3.16 | 0.62 | ||||||||||||
Large Cap Core Stock Portfolio | ||||||||||||||||
Actual | 1,000.00 | 1,094.21 | 2.27 | 0.43 | ||||||||||||
Hypothetical (5% return before expenses) | 1,000.00 | 1,023.04 | 2.19 | 0.43 | ||||||||||||
Large Cap Blend Portfolio | ||||||||||||||||
Actual | 1,000.00 | 1,074.06 | 4.08 | 0.78 | ||||||||||||
Hypothetical (5% return before expenses) | 1,000.00 | 1,021.27 | 3.97 | 0.78 | ||||||||||||
Index 500 Stock Portfolio | ||||||||||||||||
Actual | 1,000.00 | 1,115.65 | 1.01 | 0.19 | ||||||||||||
Hypothetical (5% return before expenses) | 1,000.00 | 1,024.25 | 0.97 | 0.19 | ||||||||||||
1
Table of Contents
Expense Examples (unaudited)
Beginning Account Value July 1, 2021 | Ending Account Value December 31, 2021 | Expenses Paid During Period July 1, 2021 to December 31, 2021* | Annualized Expense Ratio | |||||||||||||
Large Company Value Portfolio | ||||||||||||||||
Actual | $1,000.00 | $1,071.47 | $3.86 | 0.74 | % | |||||||||||
Hypothetical (5% return before expenses) | 1,000.00 | 1,021.48 | 3.77 | 0.74 | ||||||||||||
Domestic Equity Portfolio | ||||||||||||||||
Actual | 1,000.00 | 1,090.34 | 2.63 | 0.50 | ||||||||||||
Hypothetical (5% return before expenses) | 1,000.00 | 1,022.68 | 2.55 | 0.50 | ||||||||||||
Equity Income Portfolio | ||||||||||||||||
Actual | 1,000.00 | 1,061.04 | 2.96 | 0.57 | ||||||||||||
Hypothetical (5% return before expenses) | 1,000.00 | 1,022.33 | 2.91 | 0.57 | ||||||||||||
Mid Cap Growth Stock Portfolio | ||||||||||||||||
Actual | 1,000.00 | 1,014.98 | 2.64 | 0.52 | ||||||||||||
Hypothetical (5% return before expenses) | 1,000.00 | 1,022.58 | 2.65 | 0.52 | ||||||||||||
Index 400 Stock Portfolio | ||||||||||||||||
Actual | 1,000.00 | 1,059.77 | 1.25 | 0.24 | ||||||||||||
Hypothetical (5% return before expenses) | 1,000.00 | 1,024.00 | 1.22 | 0.24 | ||||||||||||
Mid Cap Value Portfolio | ||||||||||||||||
Actual | 1,000.00 | 1,064.99 | 3.75 | 0.72 | ||||||||||||
Hypothetical (5% return before expenses) | 1,000.00 | 1,021.58 | 3.67 | 0.72 | ||||||||||||
Small Cap Growth Stock Portfolio | ||||||||||||||||
Actual | 1,000.00 | 990.95 | 2.71 | 0.54 | ||||||||||||
Hypothetical (5% return before expenses) | 1,000.00 | 1,022.48 | 2.75 | 0.54 | ||||||||||||
Index 600 Stock Portfolio | ||||||||||||||||
Actual | 1,000.00 | 1,024.22 | 1.38 | 0.27 | ||||||||||||
Hypothetical (5% return before expenses) | 1,000.00 | 1,023.84 | 1.38 | 0.27 | ||||||||||||
Small Cap Value Portfolio | ||||||||||||||||
Actual | 1,000.00 | 1,058.00 | 4.46 | 0.86 | ||||||||||||
Hypothetical (5% return before expenses) | 1,000.00 | 1,020.87 | 4.38 | 0.86 | ||||||||||||
International Growth Portfolio | ||||||||||||||||
Actual | 1,000.00 | 1,058.24 | 3.16 | 0.61 | ||||||||||||
Hypothetical (5% return before expenses) | 1,000.00 | 1,022.13 | 3.11 | 0.61 | ||||||||||||
Research International Core Portfolio | ||||||||||||||||
Actual | 1,000.00 | 1,038.90 | 3.75 | 0.73 | ||||||||||||
Hypothetical (5% return before expenses) | 1,000.00 | 1,021.53 | 3.72 | 0.73 | ||||||||||||
International Equity Portfolio | ||||||||||||||||
Actual | 1,000.00 | 961.30 | 2.52 | 0.51 | ||||||||||||
Hypothetical (5% return before expenses) | 1,000.00 | 1,022.63 | 2.60 | 0.51 | ||||||||||||
Emerging Markets Equity Portfolio | ||||||||||||||||
Actual | 1,000.00 | 901.38 | 4.36 | 0.91 | ||||||||||||
Hypothetical (5% return before expenses) | 1,000.00 | 1,020.62 | 4.63 | 0.91 | ||||||||||||
2
Table of Contents
Expense Examples (unaudited)
Beginning Account Value July 1, 2021 | Ending Account Value December 31, 2021 | Expenses Paid During Period July 1, 2021 to December 31, 2021* | Annualized Expense Ratio | |||||||||||||
Government Money Market Portfolio | ||||||||||||||||
Actual | $1,000.00 | $1,000.07 | $0.40 | 0.08 | % | |||||||||||
Hypothetical (5% return before expenses) | 1,000.00 | 1,024.80 | 0.41 | 0.08 | ||||||||||||
Short-Term Bond Portfolio | ||||||||||||||||
Actual | 1,000.00 | 995.34 | 1.91 | 0.38 | ||||||||||||
Hypothetical (5% return before expenses) | 1,000.00 | 1,023.29 | 1.94 | 0.38 | ||||||||||||
Select Bond Portfolio | ||||||||||||||||
Actual | 1,000.00 | 999.50 | 1.51 | 0.30 | ||||||||||||
Hypothetical (5% return before expenses) | 1,000.00 | 1,023.69 | 1.53 | 0.30 | ||||||||||||
Long-Term U.S. Government Bond Portfolio | ||||||||||||||||
Actual | 1,000.00 | 1,025.71 | 3.42 | 0.67 | ||||||||||||
Hypothetical (5% return before expenses) | 1,000.00 | 1,021.83 | 3.41 | 0.67 | ||||||||||||
Inflation Protection Portfolio | ||||||||||||||||
Actual | 1,000.00 | 1,043.68 | 2.73 | 0.53 | ||||||||||||
Hypothetical (5% return before expenses) | 1,000.00 | 1,022.53 | 2.70 | 0.53 | ||||||||||||
High Yield Bond Portfolio | ||||||||||||||||
Actual | 1,000.00 | 1,013.91 | 2.23 | 0.44 | ||||||||||||
Hypothetical (5% return before expenses) | 1,000.00 | 1,022.99 | 2.24 | 0.44 | ||||||||||||
Multi-Sector Bond Portfolio | ||||||||||||||||
Actual | 1,000.00 | 995.80 | 3.57 | 0.71 | ||||||||||||
Hypothetical (5% return before expenses) | 1,000.00 | 1,021.63 | 3.62 | 0.71 | ||||||||||||
Balanced Portfolio | ||||||||||||||||
Actual | 1,000.00 | 1,021.68 | 0.31 | 0.06 | ||||||||||||
Hypothetical (5% return before expenses) | 1,000.00 | 1,024.90 | 0.31 | 0.06 | ||||||||||||
Asset Allocation Portfolio | ||||||||||||||||
Actual | 1,000.00 | 1,028.17 | 0.46 | 0.09 | ||||||||||||
Hypothetical (5% return before expenses) | 1,000.00 | 1,024.75 | 0.46 | 0.09 | ||||||||||||
| * | Expenses are equal to the Portfolio’s annualized expense ratio, multiplied by the average account value over the period, multiplied by 184/365 (to reflect the one-half year period). Expenses are based on the direct and allocated expenses of the Portfolio and do not include the effect of the underlying Portfolios’ expenses which are disclosed in the Fee and Expense table and described more fully in a footnote to that table in the Prospectus. |
3
Table of Contents
Growth Stock Portfolio (unaudited)
| Objective: | Portfolio Strategy: | Net Assets: | ||
| Long-term growth of capital. Current income is a secondary objective. | Invest in the equity securities of medium and large capitalization companies exhibiting the potential for earnings growth or share price appreciation. | $1.4 billion |
PORTFOLIO OVERVIEW
Mason Street Advisors, LLC (“Mason Street Advisors”), the investment adviser for the Growth Stock Portfolio (the “Portfolio”), has engaged T. Rowe Price Associates, Inc. (“T. Rowe Price”) to act as sub-adviser for the Portfolio. The Portfolio invests in “blue chip” growth companies, which are companies that are well established in their industries and have the potential for above-average earnings growth. The Portfolio looks for companies with leading market positions, seasoned management and strong financial fundamentals. The Portfolio’s investment approach reflects the belief that solid company fundamentals (with an emphasis on the potential for strong growth in earnings per share or operating cash flow) combined with a positive outlook for a company’s industry will ultimately reward investors with strong investment performance. The Portfolio may look for companies with good prospects for dividend growth.
MARKET OVERVIEW
Despite the continuation of the coronavirus pandemic, major U.S. stock indices advanced in 2021, extending the brisk rebound that started in March 2020. Many indices repeatedly reached record highs throughout the year. Equities advanced as the economy reopened and recovered, facilitated by the rollout of COVID-19 vaccines, federal fiscal relief and robust corporate earnings growth. Factors that weighed on financial markets included elevated inflation, stemming in part from supply shortages and global supply chain disruptions, the emergence of COVID-19 variants and the Fed’s November 2021 decision to taper its monthly asset purchases.
PORTFOLIO RESULTS
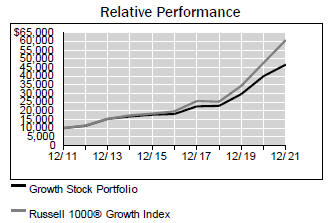
The Portfolio returned 16.67% for the twelve months ended December 31, 2021. By comparison, the Portfolio’s benchmark, the Russell 1000® Growth Index (the “Index”), returned 27.6%. (The Index is unmanaged, cannot be invested in directly and does not incur expenses.) According to Lipper® Analytical Services, Inc., an independent mutual fund ranking agency, the average return in 2021 of the Large Cap Growth Funds peer group was 20.57%.
Overall, security selection detracted from relative returns. Stock selection in the Consumer Discretionary sector detracted the most from the Portfolio’s return, led by Tesla, Inc. An underweight position in Tesla, Inc. detracted as the company’s shares climbed higher as the company successfully ramped up production amid a global supply chain disruption to meet strong electric vehicle (EV) demand. Tesla, Inc. also benefited from a mix of higher-margin Model Y deliveries, particularly in China.
The Information Technology sector also detracted from the Portfolio’s return, due to weak stock selection, such as Global Payments Inc. Better-than-expected top- and bottom-line results were not enough to shake the disruption narrative that has recently plagued legacy payment processors.
The Communication Services sector also detracted due to unfavorable stock selection. Continued waves of regulatory pressure weighed on shares of Tencent Holdings Ltd. as new guidelines were introduced to combat anticompetitive practices and increase the oversight of video game approval.
On the upside, stock selection in the Financials sector contributed the most to the Portfolio’s performance. Shares of The Goldman Sachs Group, Inc. benefited from vigorous capital markets activity, along with notable traction within their consumer and wealth management business. The Industrials sector also contributed, due to a favorable underweight allocation, although this was partially offset by weak stock selection.
PORTFOLIO MANAGER OUTLOOK
The following forward-looking comments are the opinion of T. Rowe Price, the Portfolio’s sub-adviser.
Late 2021 brought several negative surprises, including the rapid spread of the Delta and Omicron variants of COVID-19 and a regulatory crackdown in China, the driver of much of the global economy’s growth in recent years. Nevertheless, growth appears likely to continue in most of the world’s major economies over the coming months. Indeed, the Delta and Omicron variants seem likely to have only delayed rather than derailed the global recovery—perhaps making growth over
4
Table of Contents
Growth Stock Portfolio (unaudited)
the coming quarters modestly more robust than it would have been. There are several challenges on the horizon, including the withdrawal of extraordinary monetary accommodation in the U.S. and other developed markets. How today’s elevated bond and equity valuations will respond to the normalization of monetary policy is an open question, but past tightening episodes have not always led to market corrections. A carefully communicated and slow rise in interest rates in the coming years may allow market growth to continue.
Average Annual Total Returns For Periods Ended December 31, 2021 | ||||||||||||
| 1 Year | 5 Years | 10 Years | ||||||||||
Growth Stock Portfolio | 16.67 | % | 20.77 | % | 16.66 | % | ||||||
Russell 1000® Growth Index | 27.60 | % | 25.32 | % | 19.79 | % | ||||||
Lipper® Variable Insurance Products (VIP) Large Cap Growth Funds Average | 20.57 | % | 23.66 | % | 18.77 | % | ||||||
The performance data quoted represents past performance. Past performance is historical and does not guarantee future performance. Investment return and principal value will fluctuate, so that shares, when redeemed, may be worth more or less than their original cost. Current performance may be lower or higher than the performance data quoted. For the most recent month-end performance information visit www.northwesternmutual.com.
This chart assumes an initial investment of $10,000 made on 12/31/11. Returns shown reflect fee waivers, deductions for management and other portfolio expenses, and reinvestment of all dividends. In the absence of fee waivers, total return would be reduced. Returns exclude deductions for separate account sale loads and account fees. Please refer to the Benchmark Definitions section of this report for information about the indices cited in the above chart and graph.
The Portfolio may invest a relatively high percentage of its assets in a particular sector. The Portfolio will have greater exposure to the risks associated with that sector and its
performance will be tied more closely to the performance of the sector.
Top 10 Equity Holdings 12/31/21
Security Description | % of Net Assets | |||
Amazon.com, Inc. | 10.4 | % | ||
Alphabet, Inc., Various | 9.6 | % | ||
Microsoft Corp. | 7.0 | % | ||
Meta Platforms, Inc. - Class A | 7.0 | % | ||
Apple, Inc. | 6.1 | % | ||
NVIDIA Corp. | 3.6 | % | ||
Tesla Motors, Inc. | 3.5 | % | ||
Visa, Inc. - Class A | 2.6 | % | ||
ServiceNow, Inc. | 2.5 | % | ||
Intuit, Inc. | 2.3 | % |
Sector Allocation 12/31/21
Sector | % of Net Assets | |||
Information Technology | 39.0 | % | ||
Communication Services | 23.6 | % | ||
Consumer Discretionary | 21.3 | % | ||
Health Care | 10.8 | % | ||
Financials | 2.9 | % | ||
Industrials | 1.5 | % | ||
Short-Term Investments & Other Net Assets | 0.4 | % | ||
Materials | 0.4 | % | ||
Real Estate | 0.1 | % |
Sector Allocation and Top 10 Holdings are subject to change.
5
Table of Contents
Growth Stock Portfolio
SCHEDULE OF INVESTMENTS
December 31, 2021
| Common Stocks (99.6%) | Shares/ Par + | Value $ (000’s) | ||||||
Communication Services (23.6%) |
| |||||||
Alphabet, Inc. - Class A * | 8,435 | 24,437 | ||||||
Alphabet, Inc. - Class C * | 37,505 | 108,524 | ||||||
Meta Platforms, Inc. - Class A * | 288,135 | 96,914 | ||||||
Netflix, Inc. * | 46,330 | 27,911 | ||||||
Pinterest, Inc. * | 152,124 | 5,530 | ||||||
Roku, Inc. * | 6,335 | 1,446 | ||||||
Sea, Ltd. * | 109,417 | 24,478 | ||||||
Snap, Inc. * | 410,569 | 19,309 | ||||||
Spotify Technology SA * | 19,662 | 4,601 | ||||||
Tencent Holdings, Ltd. | 121,700 | 7,129 | ||||||
T-Mobile US, Inc. * | 24,039 | 2,788 | ||||||
The Walt Disney Co. * | 34,733 | 5,380 | ||||||
|
| |||||||
Total | 328,447 | |||||||
|
| |||||||
Consumer Discretionary (21.3%) |
| |||||||
Amazon.com, Inc. * | 43,261 | 144,247 | ||||||
Booking Holdings, Inc. * | 3,000 | 7,198 | ||||||
Carvana Co. * | 63,810 | 14,791 | ||||||
Chipotle Mexican Grill, Inc. * | 6,246 | 10,920 | ||||||
Delivery Hero SE * | 17,769 | 1,984 | ||||||
Dollar General Corp. | 41,530 | 9,794 | ||||||
DoorDash, Inc. * | 64,790 | 9,647 | ||||||
Lululemon Athletica, Inc. * | 29,734 | 11,639 | ||||||
NIKE, Inc. - Class B | 75,375 | 12,563 | ||||||
Rivian Automotive, Inc. * | 57,261 | 5,937 | ||||||
Ross Stores, Inc. | 96,975 | 11,082 | ||||||
Starbucks Corp. | 31,136 | 3,642 | ||||||
Tesla Motors, Inc. * | 46,574 | 49,218 | ||||||
The TJX Cos., Inc. | 35,424 | 2,689 | ||||||
|
| |||||||
Total | 295,351 | |||||||
|
| |||||||
Financials (2.9%) |
| |||||||
The Charles Schwab Corp. | 79,637 | 6,698 | ||||||
Chubb, Ltd. | 20,601 | 3,982 | ||||||
The Goldman Sachs Group, Inc. | 38,846 | 14,861 | ||||||
Marsh & McLennan Cos., Inc. | 14,857 | 2,582 | ||||||
MSCI, Inc. | 3,149 | 1,929 | ||||||
S&P Global, Inc. | 21,833 | 10,304 | ||||||
|
| |||||||
Total | 40,356 | |||||||
|
| |||||||
Health Care (10.8%) |
| |||||||
Align Technology, Inc. * | 3,831 | 2,518 | ||||||
| Common Stocks (99.6%) | Shares/ Par + | Value $ (000’s) | ||||||
Health Care continued |
| |||||||
AstraZeneca PLC, ADR | 52,300 | 3,046 | ||||||
Danaher Corp. | 54,457 | 17,917 | ||||||
Eli Lilly & Co. | 62,110 | 17,156 | ||||||
HCA Healthcare, Inc. | 47,304 | 12,153 | ||||||
Humana, Inc. | 10,889 | 5,051 | ||||||
Intuitive Surgical, Inc. * | 70,270 | 25,248 | ||||||
Stryker Corp. | 38,356 | 10,257 | ||||||
Teleflex, Inc. | 9,766 | 3,208 | ||||||
Thermo Fisher Scientific, Inc. | 14,960 | 9,982 | ||||||
UnitedHealth Group, Inc. | 58,979 | 29,616 | ||||||
Veeva Systems, Inc. - Class A * | 16,000 | 4,088 | ||||||
Zoetis, Inc. | 40,479 | 9,878 | ||||||
|
| |||||||
Total | 150,118 | |||||||
|
| |||||||
Industrials (1.5%) |
| |||||||
Cintas Corp. | 3,703 | 1,641 | ||||||
Copart, Inc. * | 26,625 | 4,037 | ||||||
CoStar Group, Inc. * | 1,345 | 106 | ||||||
Equifax, Inc. | 7,283 | 2,132 | ||||||
General Electric Co. | 42,562 | 4,021 | ||||||
Roper Technologies, Inc. | 14,081 | 6,926 | ||||||
TransUnion | 21,730 | 2,577 | ||||||
|
| |||||||
Total | 21,440 | |||||||
|
| |||||||
Information Technology (39.0%) |
| |||||||
Advanced Micro Devices, Inc. * | 134,329 | 19,330 | ||||||
Affirm Holdings, Inc. * | 45,567 | 4,582 | ||||||
Apple, Inc. | 474,049 | 84,177 | ||||||
ASML Holding NV | 16,392 | 13,050 | ||||||
Atlassian Corp. PLC * | 17,050 | 6,501 | ||||||
Bill.com Holdings, Inc. * | 20,180 | 5,028 | ||||||
Coupa Software, Inc. * | 14,196 | 2,244 | ||||||
CrowdStrike Holdings, Inc. * | 6,527 | 1,336 | ||||||
Datadog, Inc. * | 22,720 | 4,047 | ||||||
DocuSign, Inc. * | 28,851 | 4,394 | ||||||
Fiserv, Inc. * | 65,212 | 6,768 | ||||||
Fortinet, Inc. * | 28,089 | 10,095 | ||||||
HashiCorp, Inc. * | 10,613 | 966 | ||||||
Intuit, Inc. | 48,562 | 31,236 | ||||||
Marvell Technology, Inc. | 83,633 | 7,317 | ||||||
Mastercard, Inc. - Class A | 77,469 | 27,836 | ||||||
Microsoft Corp. | 290,699 | 97,768 | ||||||
MongoDB, Inc. * | 18,584 | 9,838 | ||||||
Monolithic Power Systems | 9,871 | 4,870 | ||||||
| Common Stocks (99.6%) | Shares/ Par + | Value $ (000’s) | ||||||
Information Technology continued |
| |||||||
NVIDIA Corp. | 170,426 | 50,124 | ||||||
Paycom Software, Inc. * | 2,744 | 1,139 | ||||||
PayPal Holdings, Inc. * | 79,140 | 14,924 | ||||||
salesforce.com, Inc. * | 12,427 | 3,158 | ||||||
ServiceNow, Inc. * | 54,397 | 35,310 | ||||||
Shopify, Inc. * | 7,446 | 10,256 | ||||||
Snowflake, Inc. * | 8,034 | 2,722 | ||||||
Square, Inc. - Class A * | 54,006 | 8,723 | ||||||
Synopsys, Inc. * | 43,115 | 15,888 | ||||||
Taiwan Semiconductor Manufacturing Co., Ltd., ADR | 41,258 | 4,964 | ||||||
TE Connectivity, Ltd. | 16,708 | 2,696 | ||||||
Texas Instruments, Inc. | 36,357 | 6,852 | ||||||
Toast, Inc. * | 5,703 | 198 | ||||||
Twilio, Inc. - Class A * | 7,641 | 2,012 | ||||||
Visa, Inc. - Class A | 164,662 | 35,684 | ||||||
Zoom Video Communications, Inc. * | 34,394 | 6,325 | ||||||
|
| |||||||
Total | 542,358 | |||||||
|
| |||||||
Materials (0.4%) |
| |||||||
Linde PLC | 11,654 | 4,037 | ||||||
The Sherwin-Williams Co. | 2,215 | 780 | ||||||
|
| |||||||
Total | 4,817 | |||||||
|
| |||||||
Real Estate (0.1%) |
| |||||||
Opendoor Technologies, Inc. * | 121,100 | 1,769 | ||||||
|
| |||||||
Total | 1,769 | |||||||
|
| |||||||
Total Common Stocks (Cost: $846,343) |
| 1,384,656 | ||||||
|
| |||||||
| Short-Term Investments (0.5%) | ||||||||
Money Market Funds (0.5%) |
| |||||||
State Street Institutional U.S. Government Money Market Fund - Premier Class 0.030% # | 7,151,803 | 7,152 | ||||||
|
| |||||||
Total | 7,152 | |||||||
|
| |||||||
Total Short-Term Investments (Cost: $7,152) |
| 7,152 | ||||||
|
| |||||||
The Accompanying Notes are an Integral Part of the Financial Statements.
6
Table of Contents
Growth Stock Portfolio
| Short-Term Investments (0.5%) | Shares/ Par + | Value $ (000’s) | ||||||
Money Market Funds continued |
| |||||||
Total Investments (100.1%) |
| |||||||
(Cost: $853,495)@ | 1,391,808 | |||||||
|
| |||||||
Other Assets, Less | ||||||||
Liabilities (-0.1%) | (1,909 | ) | ||||||
|
| |||||||
Net Assets (100.0%) | 1,389,899 | |||||||
|
| |||||||
| + | All par is stated in U.S. Dollar unless otherwise noted. |
| * | Non income producing |
| # | 7-Day yield as of 12/31/2021. |
| @ | At December 31, 2021, the aggregate cost of investments, including derivatives, for federal tax purposes (in thousands) was $854,593 and the net unrealized appreciation of investments based on that cost was $537,214 which is comprised of $570,594 aggregate gross unrealized appreciation and $33,380 aggregate gross unrealized depreciation. |
The following is a summary of the inputs used in valuing the Portfolio’s Investments at December 31, 2021. See Note 3 for additional information on portfolio valuation.
| Valuation Inputs | ||||||||||||||
| Description | Level 1 – Quoted Prices | Level 2 – Other Significant Observable Inputs | Level 3 – Significant Unobservable Inputs | |||||||||||
| (Amounts in thousands) | ||||||||||||||
Assets: | ||||||||||||||
Common Stocks | ||||||||||||||
Consumer Discretionary | $ | 293,367 | $ | 1,984 | $ | - | ||||||||
All Others | 1,089,305 | - | - | |||||||||||
Short-Term Investments | 7,152 | - | - | |||||||||||
Total Assets: | $ | 1,389,824 | $ | 1,984 | $ | - | ||||||||
The Accompanying Notes are an Integral Part of the Financial Statements.
7
Table of Contents
Focused Appreciation Portfolio (unaudited)
| Objective: | Portfolio Strategy: | Net Assets: | ||
| Long-term growth of capital. | Invest in equity securities selected for their growth potential. | $1.3 billion |
PORTFOLIO OVERVIEW
Mason Street Advisors, LLC (“Mason Street Advisors”), the investment adviser for the Focused Appreciation Portfolio (the “Portfolio”), has engaged Loomis, Sayles & Company, L.P. (“Loomis Sayles”) to act as sub-adviser for the Portfolio. The Portfolio invests primarily in the equity securities of companies selected for their growth potential. The Portfolio focuses on equity securities of large capitalization companies but may invest in companies of any size. The Portfolio employs a growth style of equity management that emphasizes companies with sustainable competitive advantages, long-term structural growth drivers, profitable cash flow returns, and management teams focused on creating long-term value for shareholders. The Portfolio invests primarily in a core group of 30-40 securities but may exceed this range.
MARKET OVERVIEW
U.S. equities produced strong returns in 2021, marking the eighth year out of the past ten in which the major large-capitalization indices posted a double-digit gain. The gradual lifting of pandemic-related restrictions led to a substantial improvement in economic growth and corporate earnings compared to the previous year, contributing to stock gains. While rising inflation prompted the Fed to begin taking action to reduce inflation in the fourth quarter, leading to increased market volatility, the major large-capitalization indices ended the year at or near record highs. In the continuation of a long-standing trend, mega-capitalization Information Technology and Communication Services stocks were the major drivers of U.S. market performance in 2021. As a result, the growth style, after lagging in the early part of the year, recovered to outperform value within the large-capitalization space.
PORTFOLIO RESULTS
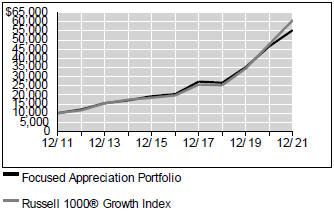
The Portfolio returned 18.9% for the twelve months ended December 31, 2021. By comparison, the Portfolio’s benchmark, the Russell 1000® Growth Index (the “Index”), returned 27.6%. (The Index is unmanaged, cannot be invested in directly and does not incur expenses.) According to Lipper® Analytical Services, Inc., an independent mutual fund ranking agency, the average return in 2021 of the Large Cap Growth Funds peer group was 20.57%.
Stock selection in the Consumer Discretionary, Health Care, Consumer Staples, Communication Services, Energy and Financials sectors as well as allocations to the Information Technology, Industrials, Health Care, Consumer Staples and Financials sectors detracted from the Portfolio’s performance. In terms of specific companies, Alibaba Group Holding, Ltd., Walt Disney Company and Autodesk, Inc. were among the largest detractors.
On the upside, stock selection in the Industrials sector as well as allocations to the Energy, Communication Services and Consumer Discretionary sectors contributed to the Portfolio’s performance. Companies in the Information Technology sector, notably NVIDIA Corp., Alphabet, Inc. and Microsoft Corp., were among the top contributors to the Portfolio’s performance.
During the period, the portfolio managers took advantage of price weakness to initiate a position in Vertex Pharmaceuticals, Inc. and increase positions in several of the high quality growth companies in the Portfolio, including Boeing Company, Walt Disney Company, Illumina, Inc., Salesforce.com, Inc. and Visa, Inc. The portfolio managers decreased existing positions in Alibaba Group Holding, Ltd., Deere & Company, Expeditors International of Washington, Inc. and Qualcomm, Inc. The portfolio managers also trimmed the Portfolio position in NVIDIA Corp. as it approached the Portfolio’s maximum allowable position size. The portfolio managers sold Cerner Corporation as it agreed to be acquired by Oracle and reached the portfolio manager’s view of intrinsic value.
PORTFOLIO MANAGER OUTLOOK
The following forward-looking comments are the opinion of Loomis Sayles, the Portfolio’s sub-adviser.
Our investment process is characterized by bottom-up fundamental research and a long-term investment time horizon. We attempt to identify intrinsic value and exploit the long-term differential between this value and the market’s current perception. We look to invest in those few, high quality businesses with sustainable competitive advantages and profitable growth when they trade at a significant discount to intrinsic value.
8
Table of Contents
Focused Appreciation Portfolio (unaudited)
Relative Performance
| Average Annual Total Returns For Periods Ended December 31, 2021 | ||||||||||||
| 1 Year | 5 Years | 10 Years | ||||||||||
Focused Appreciation Portfolio | 18.90 | % | 22.10 | % | 18.67 | % | ||||||
Russell 1000® Growth Index | 27.60 | % | 25.32 | % | 19.79 | % | ||||||
Lipper® Variable Insurance Products (VIP) Large Cap Growth Funds Average | 20.57 | % | 23.66 | % | 18.77 | % | ||||||
The performance data quoted represents past performance. Past performance is historical and does not guarantee future performance. Investment return and principal value will fluctuate, so that shares, when redeemed, may be worth more or less than their original cost. Current performance may be lower or higher than the performance data quoted. For the most recent month-end performance information visit www.northwesternmutual.com.
This chart assumes an initial investment of $10,000 made on 12/31/11. Returns shown reflect fee waivers, deductions for management and other portfolio expenses, and reinvestment of all dividends. In the absence of fee waivers, total return would be reduced. Returns exclude deductions for separate account sale loads and account fees. Please refer to the Benchmark Definitions section of this report for information about the indices cited in the above chart and graph.
As a non-diversified portfolio, the Portfolio may hold fewer securities because of its focused investment strategy. Holding fewer securities increases the risk that the value of the Portfolio could go down because of the poor performance of a single investment.
The Portfolio may invest a relatively high percentage of its assets in a particular sector. The Portfolio will have greater exposure to the risks associated with that sector and its
performance will be tied more closely to the performance of the sector.
Top 10 Equity Holdings 12/31/21
Security Description | % of Net Assets | |||
Alphabet, Inc., Various | 7.6 | % | ||
NVIDIA Corp. | 7.1 | % | ||
Amazon.com, Inc. | 6.2 | % | ||
Meta Platforms, Inc. - Class A | 5.8 | % | ||
Microsoft Corp. | 5.2 | % | ||
Visa, Inc. - Class A | 5.1 | % | ||
The Boeing Co. | 4.3 | % | ||
Oracle Corp. | 4.3 | % | ||
Autodesk, Inc. | 4.0 | % | ||
salesforce.com, Inc. | 3.8 | % |
Sector Allocation 12/31/21
Sector | % of Net Assets | |||
Information Technology | 36.1 | % | ||
Communication Services | 16.9 | % | ||
Health Care | 15.0 | % | ||
Consumer Discretionary | 12.0 | % | ||
Industrials | 9.0 | % | ||
Consumer Staples | 4.3 | % | ||
Financials | 3.1 | % | ||
Short-Term Investments & Other Net Assets | 2.3 | % | ||
Energy | 1.3 | % |
Sector Allocation and Top 10 Holdings are subject to change.
9
Table of Contents
Focused Appreciation Portfolio
SCHEDULE OF INVESTMENTS
December 31, 2021
| Common Stocks (97.7%) | Shares/ Par + | Value $ (000’s) | ||||||
Communication Services (16.9%) |
| |||||||
Alphabet, Inc. - Class A * | 17,430 | 50,496 | ||||||
Alphabet, Inc. - Class C * | 17,478 | 50,574 | ||||||
Meta Platforms, Inc. - | 230,389 | 77,491 | ||||||
The Walt Disney Co. * | 295,460 | 45,764 | ||||||
|
| |||||||
Total | 224,325 | |||||||
|
| |||||||
Consumer Discretionary (12.0%) |
| |||||||
Alibaba Group Holding, Ltd., ADR * | 160,279 | 19,040 | ||||||
Amazon.com, Inc. * | 24,855 | 82,875 | ||||||
Starbucks Corp. | 266,313 | 31,151 | ||||||
Yum China Holdings, Inc. | 175,758 | 8,760 | ||||||
Yum! Brands, Inc. | 129,962 | 18,046 | ||||||
|
| |||||||
Total | 159,872 | |||||||
|
| |||||||
Consumer Staples (4.3%) |
| |||||||
Colgate-Palmolive Co. | 193,457 | 16,510 | ||||||
Monster Beverage Corp. * | 422,640 | 40,590 | ||||||
|
| |||||||
Total | 57,100 | |||||||
|
| |||||||
Energy (1.3%) |
| |||||||
Schlumberger, Ltd. | 571,645 | 17,121 | ||||||
|
| |||||||
Total | 17,121 | |||||||
|
| |||||||
| Common Stocks (97.7%) | Shares/ Par + | Value $ (000’s) | ||||||
Financials (3.1%) |
| |||||||
FactSet Research Systems, Inc. | 49,382 | 24,000 | ||||||
SEI Investments Co. | 278,711 | 16,985 | ||||||
|
| |||||||
Total | 40,985 | |||||||
|
| |||||||
Health Care (15.0%) |
| |||||||
Illumina, Inc. * | 76,729 | 29,191 | ||||||
Intuitive Surgical, Inc. * | 52,422 | 18,835 | ||||||
Novartis AG, ADR | 383,633 | 33,556 | ||||||
Novo Nordisk A/S, ADR | 141,559 | 15,855 | ||||||
Regeneron Pharmaceuticals, Inc. * | 57,677 | 36,424 | ||||||
Roche Holding AG, ADR | 638,267 | 32,992 | ||||||
Vertex Pharmaceuticals, Inc. * | 150,688 | 33,091 | ||||||
|
| |||||||
Total | 199,944 | |||||||
|
| |||||||
Industrials (9.0%) |
| |||||||
The Boeing Co. * | 284,722 | 57,320 | ||||||
Deere & Co. | 93,644 | 32,109 | ||||||
Expeditors International of Washington, Inc. | 220,699 | 29,638 | ||||||
|
| |||||||
Total | 119,067 | |||||||
|
| |||||||
Information Technology (36.1%) |
| |||||||
Autodesk, Inc. * | 190,038 | 53,437 | ||||||
Automatic Data Processing, Inc. | 44,357 | 10,938 | ||||||
Cisco Systems, Inc. | 410,234 | 25,996 | ||||||
| Common Stocks (97.7%) | Shares/ Par + | Value $ (000’s) | ||||||
Information Technology continued |
| |||||||
Microsoft Corp. | 204,664 | 68,833 | ||||||
NVIDIA Corp. | 318,667 | 93,723 | ||||||
Oracle Corp. | 655,630 | 57,177 | ||||||
QUALCOMM, Inc. | 180,689 | 33,043 | ||||||
salesforce.com, Inc. * | 195,764 | 49,749 | ||||||
Visa, Inc. - Class A | 313,751 | 67,993 | ||||||
Workday, Inc. - Class A * | 66,426 | 18,146 | ||||||
|
| |||||||
Total | 479,035 | |||||||
|
| |||||||
Total Common Stocks |
| |||||||
(Cost: $638,724) |
| 1,297,449 | ||||||
|
| |||||||
| Short-Term Investments (1.8%) | ||||||||
Money Market Funds (1.8%) |
| |||||||
State Street Institutional U.S. Government Money Market Fund - Premier Class 0.030% # | 23,721,175 | 23,721 | ||||||
|
| |||||||
Total | 23,721 | |||||||
|
| |||||||
Total Short-Term Investments |
| |||||||
(Cost: $23,721) | 23,721 | |||||||
|
| |||||||
Total Investments (99.5%) |
| |||||||
(Cost: $662,445)@ |
| 1,321,170 | ||||||
|
| |||||||
Other Assets, Less | ||||||||
Liabilities (0.5%) | 6,191 | |||||||
|
| |||||||
Net Assets (100.0%) | 1,327,361 | |||||||
|
| |||||||
| + | All par is stated in U.S. Dollar unless otherwise noted. |
| * | Non income producing |
| # | 7-Day yield as of 12/31/2021. |
| @ | At December 31, 2021, the aggregate cost of investments, including derivatives, for federal tax purposes (in thousands) was $665,086 and the net unrealized appreciation of investments based on that cost was $656,084 which is comprised of $666,094 aggregate gross unrealized appreciation and $10,010 aggregate gross unrealized depreciation. |
The Accompanying Notes are an Integral Part of the Financial Statements.
10
Table of Contents
Focused Appreciation Portfolio
The following is a summary of the inputs used in valuing the Portfolio’s Investments at December 31, 2021. See Note 3 for additional information on portfolio valuation.
Valuation Inputs | ||||||||||||||
| Description | Level 1 – Quoted Prices | Level 2 – Other Significant Observable Inputs | Level 3 – Significant Unobservable Inputs | |||||||||||
(Amounts in thousands) | ||||||||||||||
Assets: | ||||||||||||||
Common Stocks | $ | 1,297,449 | $ | - | $ | - | ||||||||
Short-Term Investments | 23,721 | - | - | |||||||||||
Total Assets: | $ | 1,321,170 | $ | - | $ | - | ||||||||
The Accompanying Notes are an Integral Part of the Financial Statements.
11
Table of Contents
Large Cap Core Stock Portfolio (unaudited)
| Objective: | Portfolio Strategy: | Net Assets: | ||
| Long-term growth of capital and income. | Invest primarily in common stocks of large capitalization U.S. companies. | $843 million |
PORTFOLIO OVERVIEW
Mason Street Advisors, LLC (“Mason Street Advisors”), the investment adviser for the Large Cap Core Stock Portfolio (the “Portfolio”), has engaged Wellington Management Company LLP (“Wellington”) to act as sub-adviser for the Portfolio. The Portfolio allocates its assets across a variety of industries, selecting companies in each industry based on the research of a team of global industry analysts. The Portfolio typically seeks to maintain representation in each major industry represented by broad-based, large cap U.S. equity indices. The Portfolio utilizes a “bottom-up” approach, which is the use of fundamental analysis to identify specific securities for purchase or sale. Fundamental analysis of a company involves the assessment of a variety of factors, including the company’s business environment, management quality, balance sheet, income statement, anticipated earnings, revenues and dividends, and other related measures or indicators of valuation and growth potential. The Portfolio’s sector exposures generally conform with the sector weights present in the Portfolio’s benchmark index.
MARKET OVERVIEW
U.S. equities gained for the year 2021 amid the accelerating global rollout of COVID-19 vaccines, a favorable outlook for economic growth and fiscal and monetary stimulus. However, markets contended with volatile COVID-19 trends, fluctuating economic growth projections and the imminent prospect of reduced quantitative easing and policy tightening from the Federal Reserve (the “Fed”). Inflation surged amidst severe supply and labor shortages, rising energy prices and heightened demand for goods and services. Concerns that inflation could persist for longer than expected prompted the Fed to announce an accelerated tapering of asset purchases. The Fed also projected three interest rate increases in 2022, up from its September 2021 forecast of one increase. The rapid spread of the Omicron variant prompted a renewal of restrictions and event cancellations late in 2021. Returns during the period varied by market capitalization, with large-capitalization stocks outperforming mid- and small-capitalization stocks.
PORTFOLIO RESULTS
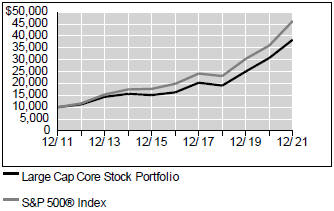
The Large Cap Core Stock Portfolio returned 25.1% for the twelve months ended December 31, 2021. By comparison, the S&P 500® Index (the “Index”) returned 28.71% for the year. (The Index is unmanaged, cannot be invested in directly and does not incur expenses.) According to Lipper® Analytical Services, Inc., an independent mutual fund ranking company, the average return in 2021 for the Large Cap Core Funds peer group was 26.29%.
The Portfolio’s relative underperformance during the period was driven by challenging stock selection within the Information Technology and Consumer Discretionary sectors. This was partially offset by selection within the Health Care and Financials sectors.
Top detractors from the Portfolio’s return included overweight positions in the Information Technology company Global Payments, Inc. and the Financials company Bank of America Corp., as well as an underweight position in NVIDIA Corp., also in the Information Technology sector. While Global Payments Inc. posted consistent results driven by strength in its Merchant Solutions and Business and Consumer segments, shares remained under pressure throughout the year amid investors’ elevated expectations for further growth, compounded with disruption narratives driven by newer entrants to the electronic payments industry. During the period, the portfolio managers initiated a position in NVIDIA Corp., whose shares rose as optimism around the metaverse concept surged. NVIDIA Corp. is at the forefront of the metaverse transformation due to its data center network and technology infrastructure. Bank of America Corp. advanced as the Fed’s decision in September 2021 to reduce its bond-buying program while leaving short-term interest rates unchanged, sent share prices higher. However, the portfolio managers eliminated the position in the stock in September and did not benefit from its most recent rally in share prices.
Top contributors to the Portfolio’s performance included an out-of-benchmark position in the Information Technology firm Marvell Technology, Inc., owning the Financials company JPMorgan Chase and Co., and an underweight position in the Communication Services firm Walt Disney Company. Marvell Technology, Inc. advanced as management released top- and bottom-line third-quarter 2021 results ahead of expectations and raised guidance for the fourth quarter. JPMorgan Chase and Co. advanced in the first quarter of 2021 after the bank reported fourth-quarter 2020 and first-quarter 2021 results that came in ahead of estimates due to better-than-anticipated revenues and lower provision expenses related to loan
12
Table of Contents
Large Cap Core Stock Portfolio (unaudited)
losses. The Walt Disney Company declined during the period after reporting fourth-quarter revenue below expectations, slowing subscriber growth for its streaming service, Disney+, and lower-than-expected results at the company’s theme parks.
PORTFOLIO MANAGER OUTLOOK
The following forward-looking comments are the opinion of Wellington, the Portfolio’s sub-adviser.
Despite the backdrop of accelerating COVID-19 spread, driven by the Delta and Omicron variants, strong consumer spending and still-accommodative monetary policy were supportive of developed equity markets. In the U.S., the Infrastructure Investment and Jobs Act was signed into law, but the U.S. government continues its debate on the Build Back Better social spending plan.
We remain diligent in the face of a considerably unpredictable and volatile market and cognizant of the emergence of new COVID-19 variants and the impacts of waning stimulus measures globally. The inflation and supply chain disruptions being felt globally are also top of mind. We utilize our deep industry knowledge to discern likely impacts on their coverage and look for opportunities amongst the dispersion of outcomes.
Relative Performance
Average Annual Total Returns For Periods Ended December 31, 2021 | ||||||||||||
| 1 Year | 5 Years | 10 Years | ||||||||||
Large Cap Core Stock Portfolio | 25.10 | % | 18.77 | % | 14.40 | % | ||||||
S&P 500® Index | 28.71 | % | 18.45 | % | 16.53 | % | ||||||
Lipper® Variable Insurance Products (VIP) Large Cap Core Funds Average | 26.29 | % | 17.01 | % | 15.31 | % | ||||||
The performance data quoted represents past performance. Past performance is historical and does not guarantee future performance. Investment return and principal value will fluctuate, so that shares, when redeemed, may be worth more or less than their original cost. Current performance may be lower or higher than the performance data quoted. For the most recent month-end performance information visit www.northwesternmutual.com.
This chart assumes an initial investment of $10,000 made on 12/31/11. Returns shown reflect fee waivers, deductions for management and other portfolio expenses, and reinvestment of all dividends. In the absence of fee
waivers, total return would be reduced. Returns exclude deductions for separate account sale loads and account fees. Please refer to the Benchmark Definitions section of this report for information about the indices cited in the above chart and graph.
The Portfolio may invest a relatively high percentage of its assets in a particular sector. The Portfolio will have greater exposure to the risks associated with that sector and its performance will be tied more closely to the performance of the sector.
Top 10 Equity Holdings 12/31/21
| Security Description | % of Net Assets | |||||
Microsoft Corp. | 6.2 | % | ||||
Alphabet, Inc. - Class A | 5.0 | % | ||||
Amazon.com, Inc. | 4.6 | % | ||||
Apple, Inc. | 4.5 | % | ||||
The Charles Schwab Corp. | 2.3 | % | ||||
Meta Platforms, Inc. - Class A | 2.0 | % | ||||
Royal Dutch Shell PLC, Various | 1.9 | % | ||||
Tesla Motors, Inc. | 1.9 | % | ||||
Sysco Corp. | 1.8 | % | ||||
Morgan Stanley | 1.5 | % | ||||
13
Table of Contents
Large Cap Core Stock Portfolio (unaudited)
Sector Allocation 12/31/21
| Sector | % of Net Assets | |||||
Information Technology | 22.7 | % | ||||
Health Care | 14.0 | % | ||||
Communication Services | 12.7 | % | ||||
Financials | 11.5 | % | ||||
Consumer Discretionary | 11.3 | % | ||||
Industrials | 9.8 | % | ||||
Consumer Staples | 5.7 | % | ||||
Energy | 3.2 | % | ||||
Utilities | 3.1 | % | ||||
Materials | 2.8 | % | ||||
Real Estate | 2.6 | % | ||||
Short-Term Investments & Other Net Assets | 0.6 | % | ||||
Sector Allocation and Top 10 Holdings are subject to change.
14
Table of Contents
Large Cap Core Stock Portfolio
SCHEDULE OF INVESTMENTS
December 31, 2021
| Common Stocks (99.4%) | Shares/ Par + | Value $ (000’s) | ||||||
Communication Services (12.7%) |
| |||||||
Alphabet, Inc. - Class A * | 14,502 | 42,013 | ||||||
Charter Communications, Inc. - Class A * | 14,677 | 9,569 | ||||||
DISH Network Corp. - Class A * | 82,193 | 2,666 | ||||||
Electronic Arts, Inc. | 45,242 | 5,967 | ||||||
Match Group, Inc. * | 31,073 | 4,109 | ||||||
Meta Platforms, Inc. - Class A * | 48,958 | 16,467 | ||||||
Netflix, Inc. * | 4,134 | 2,491 | ||||||
Omnicom Group, Inc. | 149,709 | 10,969 | ||||||
Roblox Corp. * | 32,757 | 3,379 | ||||||
Roku, Inc. * | 12,781 | 2,917 | ||||||
Snap, Inc. * | 29,389 | 1,382 | ||||||
T-Mobile US, Inc. * | 45,728 | 5,304 | ||||||
|
| |||||||
Total | 107,233 | |||||||
|
| |||||||
Consumer Discretionary (11.3%) |
| |||||||
Airbnb, Inc. * | 34,290 | 5,709 | ||||||
Amazon.com, Inc. * | 11,737 | 39,135 | ||||||
Chipotle Mexican Grill, Inc. * | 1,836 | 3,210 | ||||||
D.R. Horton, Inc. | 41,597 | 4,511 | ||||||
Ross Stores, Inc. | 42,638 | 4,873 | ||||||
Starbucks Corp. | 80,380 | 9,402 | ||||||
Tesla Motors, Inc. * | 14,765 | 15,603 | ||||||
The TJX Cos., Inc. | 106,698 | 8,101 | ||||||
Ulta Beauty, Inc. * | 10,841 | 4,470 | ||||||
|
| |||||||
Total | 95,014 | |||||||
|
| |||||||
Consumer Staples (5.7%) |
| |||||||
Constellation Brands, Inc. - Class A | 29,555 | 7,417 | ||||||
The Estee Lauder Cos., Inc. - Class A | 14,855 | 5,499 | ||||||
Mondelez International, Inc. | 127,672 | 8,466 | ||||||
Monster Beverage Corp. * | 61,983 | 5,953 | ||||||
Philip Morris International, Inc. | 60,617 | 5,759 | ||||||
Sysco Corp. | 192,509 | 15,122 | ||||||
|
| |||||||
Total | 48,216 | |||||||
|
| |||||||
Energy (3.2%) | ||||||||
ConocoPhillips | 74,280 | 5,362 | ||||||
Marathon Petroleum Corp. | 41,665 | 2,666 | ||||||
Pioneer Natural Resources Co. | 10,953 | 1,992 | ||||||
| Common Stocks (99.4%) | Shares/ Par + | Value $ (000’s) | ||||||
Energy continued | ||||||||
Royal Dutch Shell PLC - Class A, ADR | 132,961 | 5,771 | ||||||
Royal Dutch Shell PLC - Class B, ADR | 227,876 | 9,878 | ||||||
Schlumberger, Ltd. | 51,462 | 1,541 | ||||||
|
| |||||||
Total | 27,210 | |||||||
|
| |||||||
Financials (11.5%) | ||||||||
American Express Co. | 58,989 | 9,651 | ||||||
American International Group, Inc. | 96,989 | 5,515 | ||||||
Ares Management Corp. - Class A | 90,406 | 7,347 | ||||||
Berkshire Hathaway, Inc. - | 15,236 | 4,556 | ||||||
The Charles Schwab Corp. | 228,677 | 19,232 | ||||||
Chubb, Ltd. | 28,632 | 5,535 | ||||||
Equitable Holdings, Inc. | 196,093 | 6,430 | ||||||
The Hartford Financial Services Group, Inc. | 45,631 | 3,150 | ||||||
Host Hotels & Resorts, Inc. * | 180,653 | 3,141 | ||||||
Marsh & McLennan Cos., Inc. | 29,485 | 5,125 | ||||||
MetLife, Inc. | 30,829 | 1,926 | ||||||
Morgan Stanley | 127,760 | 12,541 | ||||||
PNC Financial Services Group, Inc. | 36,709 | 7,361 | ||||||
S&P Global, Inc. | 12,217 | 5,766 | ||||||
|
| |||||||
Total | 97,276 | |||||||
|
| |||||||
Health Care (14.0%) | ||||||||
Agilent Technologies, Inc. | 21,284 | 3,398 | ||||||
Align Technology, Inc. * | 4,496 | 2,955 | ||||||
Anthem, Inc. | 10,263 | 4,757 | ||||||
AstraZeneca PLC, ADR | 112,325 | 6,543 | ||||||
Baxter International, Inc. | 32,665 | 2,804 | ||||||
Biogen, Inc. * | 3,728 | 894 | ||||||
Boston Scientific Corp. * | 105,563 | 4,484 | ||||||
Bristol-Myers Squibb Co. | 138,139 | 8,613 | ||||||
Centene Corp. * | 53,462 | 4,405 | ||||||
Danaher Corp. | 20,586 | 6,773 | ||||||
Edwards Lifesciences Corp. * | 34,669 | 4,491 | ||||||
Eli Lilly & Co. | 42,124 | 11,636 | ||||||
Exact Sciences Corp. * | 18,019 | 1,402 | ||||||
HCA Healthcare, Inc. | 7,909 | 2,032 | ||||||
Humana, Inc. | 7,828 | 3,631 | ||||||
| Common Stocks (99.4%) | Shares/ Par + | Value $ (000’s) | ||||||
Health Care continued |
| |||||||
Illumina, Inc. * | 7,454 | 2,836 | ||||||
Insulet Corp. * | 7,117 | 1,894 | ||||||
Laboratory Corp. of America Holdings * | 6,741 | 2,118 | ||||||
McKesson Corp. | 7,656 | 1,903 | ||||||
Moderna, Inc. * | 2,205 | 560 | ||||||
Pfizer, Inc. | 203,404 | 12,011 | ||||||
Regeneron Pharmaceuticals, Inc. * | 2,424 | 1,531 | ||||||
Seattle Genetics, Inc. * | 7,083 | 1,095 | ||||||
Stryker Corp. | 17,185 | 4,596 | ||||||
Teleflex, Inc. | 9,561 | 3,141 | ||||||
UnitedHealth Group, Inc. | 11,922 | 5,987 | ||||||
Vertex Pharmaceuticals, Inc. * | 8,317 | 1,826 | ||||||
Waters Corp. * | 3,513 | 1,309 | ||||||
Zoetis, Inc. | 35,042 | 8,551 | ||||||
|
| |||||||
Total | 118,176 | |||||||
|
| |||||||
Industrials (9.8%) | ||||||||
The Boeing Co. * | 15,773 | 3,175 | ||||||
Equifax, Inc. | 7,805 | 2,285 | ||||||
FedEx Corp. | 24,137 | 6,243 | ||||||
Fortive Corp. | 75,995 | 5,798 | ||||||
General Dynamics Corp. | 16,229 | 3,383 | ||||||
Honeywell International, Inc. | 17,965 | 3,746 | ||||||
IHS Markit, Ltd. | 60,169 | 7,998 | ||||||
Ingersoll-Rand, Inc. | 87,653 | 5,423 | ||||||
J.B. Hunt Transport Services, Inc. | 29,651 | 6,061 | ||||||
Johnson Controls International PLC | 68,908 | 5,603 | ||||||
Parker Hannifin Corp. | 13,622 | 4,333 | ||||||
Raytheon Co. | 66,111 | 5,689 | ||||||
Southwest Airlines Co. * | 83,684 | 3,585 | ||||||
Trane Technologies PLC | 13,252 | 2,677 | ||||||
Uber Technologies, Inc. * | 121,954 | 5,114 | ||||||
Wabtec Corp. | 82,527 | 7,602 | ||||||
Waste Management, Inc. | 21,546 | 3,596 | ||||||
|
| |||||||
Total | 82,311 | |||||||
|
| |||||||
Information Technology (22.7%) | ||||||||
Adobe Systems, Inc. * | 8,016 | 4,546 | ||||||
The Accompanying Notes are an Integral Part of the Financial Statements.
15
Table of Contents
Large Cap Core Stock Portfolio
| Common Stocks (99.4%) | Shares/ Par + | Value $ (000’s) | ||||||
Information Technology continued |
| |||||||
Advanced Micro Devices, | 80,863 | 11,636 | ||||||
Apple, Inc. | 215,162 | 38,206 | ||||||
Avalara, Inc. * | 692 | 89 | ||||||
Ceridian HCM Holding, Inc. * | 18,289 | 1,911 | ||||||
Cognizant Technology Solutions Corp. - Class A | 22,366 | 1,984 | ||||||
Confluent, Inc. - Class A * | 2,700 | 206 | ||||||
FLEETCOR Technologies, | 20,016 | 4,480 | ||||||
Gitlab, Inc. - Class A * | 2,315 | 201 | ||||||
Global Payments, Inc. | 62,069 | 8,391 | ||||||
GoDaddy, Inc. * | 13,664 | 1,160 | ||||||
HashiCorp, Inc. - Class A * | 4,900 | 446 | ||||||
KLA-Tencor Corp. | 9,853 | 4,238 | ||||||
Marvell Technology, Inc. | 121,209 | 10,605 | ||||||
Micron Technology, Inc. | 74,560 | 6,945 | ||||||
Microsoft Corp. | 155,563 | 52,319 | ||||||
Nuvei Corp. * | 25,601 | 1,664 | ||||||
NVIDIA Corp. | 13,798 | 4,058 | ||||||
Palo Alto Networks, Inc. * | 1,719 | 957 | ||||||
PayPal Holdings, Inc. * | 20,913 | 3,944 | ||||||
Qualtrics International, Inc. - Class A * | 23,653 | 837 | ||||||
salesforce.com, Inc. * | 30,405 | 7,727 | ||||||
ServiceNow, Inc. * | 4,735 | 3,074 | ||||||
Shopify, Inc. * | 1,903 | 2,621 | ||||||
Snowflake, Inc. * | 1,551 | 525 | ||||||
Teradyne, Inc. | 14,077 | 2,302 | ||||||
Texas Instruments, Inc. | 35,914 | 6,769 | ||||||
UiPath, Inc. - Class A * | 20,244 | 873 | ||||||
Visa, Inc. - Class A | 27,158 | 5,885 | ||||||
Workday, Inc. - Class A * | 10,532 | 2,877 | ||||||
|
| |||||||
Total | 191,476 | |||||||
|
| |||||||
Materials (2.8%) | ||||||||
Ball Corp. | 23,901 | 2,301 | ||||||
Celanese Corp. - Class A | 29,521 | 4,961 | ||||||
Crown Holdings, Inc. | 19,040 | 2,106 | ||||||
FMC Corp. | 37,444 | 4,115 | ||||||
Linde PLC | 16,453 | 5,700 | ||||||
PPG Industries, Inc. | 23,576 | 4,065 | ||||||
|
| |||||||
Total | 23,248 | |||||||
|
| |||||||
Real Estate (2.6%) | ||||||||
American Tower Corp. | 13,991 | 4,092 | ||||||
AvalonBay Communities, Inc. | 24,718 | 6,244 | ||||||
Prologis, Inc. | 40,723 | 6,856 | ||||||
| Common Stocks (99.4%) | Shares/ Par + | Value $ (000’s) | ||||||
Real Estate continued |
| |||||||
Welltower, Inc. | 57,173 | 4,904 | ||||||
|
| |||||||
Total | 22,096 | |||||||
|
| |||||||
Utilities (3.1%) |
| |||||||
Duke Energy Corp. | 70,634 | 7,410 | ||||||
Edison International | 68,445 | 4,671 | ||||||
Exelon Corp. | 116,160 | 6,709 | ||||||
FirstEnergy Corp. | 168,496 | 7,008 | ||||||
|
| |||||||
Total | 25,798 | |||||||
|
| |||||||
Total Common Stocks |
| |||||||
(Cost: $589,385) | 838,054 | |||||||
|
| |||||||
| Short-Term Investments (0.6%) | ||||||||
Money Market Funds (0.6%) |
| |||||||
State Street Institutional U.S. Government Money Market Fund - Premier Class 0.030% # | 4,952,199 | 4,952 | ||||||
|
| |||||||
Total | 4,952 | |||||||
|
| |||||||
Total Short-Term Investments |
| |||||||
(Cost: $4,952) | 4,952 | |||||||
|
| |||||||
Total Investments (100.0%) |
| |||||||
(Cost: $594,337)@ | 843,006 | |||||||
|
| |||||||
Other Assets, Less |
| |||||||
Liabilities (0.0%) | (200 | ) | ||||||
|
| |||||||
Net Assets (100.0%) |
| 842,806 | ||||||
|
| |||||||
The Accompanying Notes are an Integral Part of the Financial Statements.
16
Table of Contents
Large Cap Core Stock Portfolio
| + | All par is stated in U.S. Dollar unless otherwise noted. |
| * | Non income producing |
| # | 7-Day yield as of 12/31/2021. |
| @ | At December 31, 2021, the aggregate cost of investments, including derivatives, for federal tax purposes (in thousands) was $596,527 and the net unrealized appreciation of investments based on that cost was $246,479 which is comprised of $251,384 aggregate gross unrealized appreciation and $4,905 aggregate gross unrealized depreciation. |
The following is a summary of the inputs used in valuing the Portfolio’s Investments at December 31, 2021. See Note 3 for additional information on portfolio valuation.
| Valuation Inputs | ||||||||||||||
| Description | Level 1 – Quoted Prices | Level 2 – Other Significant | Level 3 – Significant | |||||||||||
| (Amounts in thousands) | ||||||||||||||
Assets: | ||||||||||||||
Common Stocks | $ | 838,054 | $ | - | $ | - | ||||||||
Short-Term Investments | 4,952 | - | - | |||||||||||
Total Assets: | $ | 843,006 | $ | - | $ | - | ||||||||
The Accompanying Notes are an Integral Part of the Financial Statements.
17
Table of Contents
Large Cap Blend Portfolio (unaudited)
| Objective: | Portfolio Strategy: | Net Assets: | ||
| Long-term growth of capital and income. | Invest primarily in equity securities of U.S. large capitalization companies listed or traded on U.S. securities exchanges. | $203 million |
PORTFOLIO OVERVIEW
Mason Street Advisors, LLC (“Mason Street Advisors”), the investment adviser for the Large Cap Blend Portfolio (the “Portfolio”), has engaged Fiduciary Management, Inc. (“FMI”) to act as sub-adviser for the Portfolio. Normally, the Portfolio invests in equity securities of large capitalization companies listed or traded on U.S. securities exchanges. In selecting investments, greater consideration is given to potential appreciation and future dividends than to current income. The Portfolio uses fundamental analysis to look for stocks of good businesses that are selling at value prices. The Portfolio employs a focused investment strategy, typically investing in a core group of 20-30 large capitalization common stocks and American Depositary Receipts.
MARKET OVERVIEW
2021 was another exceptional year for investment markets and continued to be marked by a divergence between growth and value stocks, especially in the second half of the year. Following the emergence of the COVID-19 Delta and Omicron variants, beginning in the second quarter of 2021, the market experienced a surge in growth stocks. This surge was dominated by eight stocks: Meta Platforms, Inc., Apple, Amazon, Alphabet, Netflix, NVIDIA, Microsoft and Tesla.
PORTFOLIO RESULTS
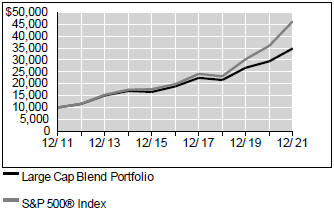
The Portfolio returned 18.46% for the twelve months ended December 31, 2021. By comparison, the Portfolio’s benchmark, the S&P 500® Index (the “Index”) returned 28.71%. (The Index is unmanaged, cannot be invested in directly and does not incur expenses.) According to Lipper® Analytical Services, Inc., an independent mutual fund ranking agency, the average return in 2021 of the Large Cap Core Funds peer group was 26.29%.
The value orientation of the Portfolio detracted from the Portfolio’s return. From a sector perspective, the Health Care sector detracted from the Portfolio’s return amid a sharp increase in COVID-19 cases. For example, the healthcare equipment and services industry declined as hospitals deferred elective medical procedures, weighing negatively on Smith and Nephew PLC. Fresenius Medical Care AG & Co. KGaA, a dialysis provider, was pressured by higher mortality among its patients, who are at higher risk from COVID-19. Koninklijke Philips N.V. declined amid a product recall. The Communication Services sector also detracted from the Portfolio’s performance amid a renewed decline in travel, which weighed on companies such as Booking Holdings, Inc., in the interactive media and services industry.
On the upside, the Health Care sector also produced some winners for the Portfolio, led by UnitedHealth Group, Inc., and Quest Diagnostics, Inc. UnitedHealth Group, Inc.’s leading scale and capabilities allowed for superior navigation of coronavirus-related issues. Their Optum division, which represents over 50% of the company’s profits, is a data-centric powerhouse that provides services to other company divisions, health insurers and medical businesses. Quest Diagnostics benefited from their efficient, low-cost lab network. The company has benefited from the rise in COVID-19 testing during the pandemic, and they have been taking market share from both small labs and hospital labs that are not as cost efficient. The portfolio managers reduced the Portfolio’s position in Quest Diagnostics on the expectation that coronavirus-related testing volumes will eventually return to a lower, more steady level.
The Financials sector also contributed to the Portfolio’s return. Notably, The Charles Schwab Corporation advanced amid expectations of a higher interest rate environment, which would increase their interest-sensitive revenues.
PORTFOLIO MANAGER OUTLOOK
The following forward-looking comments are the opinion of FMI, the Portfolio’s sub-adviser.
We are confident the pandemic-related issues which detracted from the Portfolio’s performance are temporary in nature, and the stocks they affected look poised for a strong rebound in the future. The risk profile of the S&P 500® Index has been extremely elevated, and valuations are at or near record highs. We believe the idea that “Indexing” is cheaper, easier, and less risky will erode significantly in the back half of this market cycle. The market has been enamored with growth and does not appear to have much concern about the possibility of valuations regressing to the mean. As a result, the balance sheet quality has been an afterthought. As the prices of stocks we consider overpriced decreases, we expect the Portfolio’s
18
Table of Contents
Large Cap Blend Portfolio (unaudited)
relative performance to benefit. It is our view that this process may have already begun. We are comfortable maintaining quality value stocks in the Portfolio, with a bevy of durable businesses, good balance sheets, and one of the largest discounts compared to the S&P 500® Index that we have ever experienced.
Relative Performance
Average Annual Total Returns For Periods Ended December 31, 2021 | ||||||||||||
| 1 Year | 5 Years | 10 Years | ||||||||||
Large Cap Blend Portfolio | 18.46 | % | 13.05 | % | 13.30 | % | ||||||
S&P 500® Index | 28.71 | % | 18.45 | % | 16.53 | % | ||||||
Lipper® Variable Insurance Products (VIP) Large Cap Core Funds Average | 26.29 | % | 17.01 | % | 15.31 | % | ||||||
The performance data quoted represents past performance. Past performance is historical and does not guarantee future performance. Investment return and principal value will fluctuate, so that shares, when redeemed, may be worth more or less than their original cost. Current performance may be lower or higher than the performance data quoted. For the most recent month-end performance information visit www.northwesternmutual.com.
This chart assumes an initial investment of $10,000 made on 12/31/11. Returns shown reflect fee waivers, deductions for management and other portfolio expenses, and reinvestment of all dividends. In the absence of fee waivers, total return would be reduced. Returns exclude deductions for separate account sale loads and account fees. Please refer to the Benchmark Definitions section of this report for information about the indices cited in the above chart and graph.
The Portfolio may hold fewer securities than other diversified portfolios because of its more focused investment strategy. Holding fewer securities increases the risk that the value of the Portfolio could go down because of the poor performance of a single investment.
The Portfolio may invest a relatively high percentage of its assets in a particular sector. The Portfolio will have greater exposure to the risks associated with that sector and its performance will be tied more closely to the performance of the sector.
Top 10 Equity Holdings 12/31/21
| Security Description | % of Net Assets | |||||||||
Berkshire Hathaway, Inc. - Class B | 6.8 | % | ||||||||
Masco Corp. | 5.6 | % | ||||||||
Sony Corp., ADR | 5.1 | % | ||||||||
Dollar General Corp. | 4.7 | % | ||||||||
UnitedHealth Group, Inc. | 4.5 | % | ||||||||
Micron Technology, Inc. | 4.2 | % | ||||||||
The Charles Schwab Corp. | 4.0 | % | ||||||||
Quest Diagnostics, Inc. | 3.9 | % | ||||||||
Comcast Corp. - Class A | 3.9 | % | ||||||||
JPMorgan Chase & Co. | 3.6 | % | ||||||||
Sector Allocation 12/31/21
| Sector | % of Net Assets | |||||||||
Financials | 23.9 | % | ||||||||
Consumer Discretionary | 18.9 | % | ||||||||
Health Care | 15.7 | % | ||||||||
Industrials | 14.3 | % | ||||||||
Communication Services | 11.7 | % | ||||||||
Information Technology | 4.2 | % | ||||||||
Consumer Staples | 3.4 | % | ||||||||
Short-Term Investments & Other Net Assets | 3.4 | % | ||||||||
Materials | 2.9 | % | ||||||||
Energy | 1.6 | % | ||||||||
Sector Allocation and Top 10 Holdings are subject to change.
19
Table of Contents
Large Cap Blend Portfolio
SCHEDULE OF INVESTMENTS
December 31, 2021
| Common Stocks (96.6%) | Shares/ Par + | Value $ (000’s) | ||||||
Communication Services (11.7%) |
| |||||||
Alphabet, Inc. | 2,081 | 6,029 | ||||||
Comcast Corp. | 155,285 | 7,815 | ||||||
Meta Platforms, Inc. | 15,371 | 5,170 | ||||||
Omnicom Group, Inc. | 66,530 | 4,875 | ||||||
|
| |||||||
Total | 23,889 | |||||||
|
| |||||||
Consumer Discretionary (18.9%) |
| |||||||
Booking Holdings, | 2,991 | 7,176 | ||||||
Dollar General Corp. | 40,756 | 9,612 | ||||||
Dollar Tree, Inc. * | 47,771 | 6,713 | ||||||
Sony Corp., ADR | 81,965 | 10,360 | ||||||
The TJX Cos., Inc. | 59,487 | 4,516 | ||||||
|
| |||||||
Total | 38,377 | |||||||
|
| |||||||
Consumer Staples (3.4%) |
| |||||||
Unilever PLC, ADR | 127,391 | 6,852 | ||||||
|
| |||||||
Total | 6,852 | |||||||
|
| |||||||
Energy (1.6%) | ||||||||
Schlumberger, Ltd. | 106,360 | 3,186 | ||||||
|
| |||||||
Total | 3,186 | |||||||
|
| |||||||
Financials (23.9%) | ||||||||
Arch Capital Group, | 88,876 | 3,951 | ||||||
| Common Stocks (96.6%) | Shares/ Par + | Value $ (000’s) | ||||||
Financials continued | ||||||||
Berkshire Hathaway, | 46,351 | 13,859 | ||||||
The Charles Schwab | 95,796 | 8,057 | ||||||
Chubb, Ltd. | 20,709 | 4,003 | ||||||
JPMorgan Chase & Co. | 46,000 | 7,284 | ||||||
Northern Trust Corp. | 49,330 | 5,900 | ||||||
The Progressive Corp. | 54,683 | 5,613 | ||||||
|
| |||||||
Total | 48,667 | |||||||
|
| |||||||
Health Care (15.7%) | ||||||||
Fresenius Medical | 136,158 | 4,420 | ||||||
Koninklijke Philips NV | 135,986 | 5,011 | ||||||
Quest Diagnostics, Inc. | 45,961 | 7,952 | ||||||
Smith & Nephew PLC, | 160,005 | 5,539 | ||||||
UnitedHealth Group, | 18,100 | 9,089 | ||||||
|
| |||||||
Total | 32,011 | |||||||
|
| |||||||
Industrials (14.3%) | ||||||||
Dover Corp. | 27,264 | 4,951 | ||||||
Eaton Corp. PLC | 23,509 | 4,063 | ||||||
Emerson Electric Co. | 27,925 | 2,596 | ||||||
Masco Corp. | 162,304 | 11,397 | ||||||
PACCAR, Inc. | 68,336 | 6,031 | ||||||
|
| |||||||
Total | 29,038 | |||||||
|
| |||||||
| Common Stocks (96.6%) | Shares/ Par + | Value $ (000’s) | ||||||
Information Technology (4.2%) |
| |||||||
Micron Technology, Inc. | 91,180 | 8,493 | ||||||
|
| |||||||
Total | 8,493 | |||||||
|
| |||||||
Materials (2.9%) | ||||||||
PPG Industries, Inc. | 33,715 | 5,814 | ||||||
|
| |||||||
Total | 5,814 | |||||||
|
| |||||||
Total Common Stocks |
| |||||||
(Cost: $135,285) |
| 196,327 | ||||||
|
| |||||||
| Short-Term Investments (3.3%) | ||||||||
Money Market Funds (3.3%) |
| |||||||
State Street | 6,690,909 | 6,691 | ||||||
|
| |||||||
Total | 6,691 | |||||||
|
| |||||||
Total Short-Term Investments |
| |||||||
(Cost: $6,691) |
| 6,691 | ||||||
|
| |||||||
Total Investments (99.9%) |
| |||||||
(Cost: $141,976)@ |
| 203,018 | ||||||
|
| |||||||
Other Assets, Less | ||||||||
Liabilities (0.1%) | 108 | |||||||
|
| |||||||
Net Assets (100.0%) | 203,126 | |||||||
|
| |||||||
| + | All par is stated in U.S. Dollar unless otherwise noted. |
| * | Non income producing |
| # | 7-Day yield as of 12/31/2021. |
| @ | At December 31, 2021, the aggregate cost of investments, including derivatives, for federal tax purposes (in thousands) was $141,993 and the net unrealized appreciation of investments based on that cost was $61,025 which is comprised of $66,962 aggregate gross unrealized appreciation and $5,937 aggregate gross unrealized depreciation. |
The Accompanying Notes are an Integral Part of the Financial Statements.
20
Table of Contents
Large Cap Blend Portfolio
The following is a summary of the inputs used in valuing the Portfolio’s Investments at December 31, 2021. See Note 3 for additional information on portfolio valuation.
| Valuation Inputs | ||||||||||||||
| Description | Level 1 – Quoted Prices | Level 2 – Other Significant Observable Inputs | Level 3 – Significant | |||||||||||
| (Amounts in thousands) | ||||||||||||||
Assets: | ||||||||||||||
Common Stocks | $ | 196,327 | $ | - | $ | - | ||||||||
Short-Term Investments | 6,691 | - | - | |||||||||||
Total Assets: | $ | 203,018 | $ | - | $ | - | ||||||||
The Accompanying Notes are an Integral Part of the Financial Statements.
21
Table of Contents
Index 500 Stock Portfolio (unaudited)
| Objective: | Portfolio Strategy: | Net Assets: | ||
| Investment results that approximate the performance of the S&P 500® Index. | Invest in stocks that make up the S&P 500® Index, holding each stock in approximately the same proportion as its weighting in the Index. | $5.5 billion |
PORTFOLIO OVERVIEW
Mason Street Advisors, LLC (“Mason Street Advisors”), the investment adviser for the Index 500 Stock Portfolio (“the Portfolio”), has engaged BlackRock Advisors, LLC (“BlackRock”) to act as sub-adviser for the Portfolio. The Portfolio employs a “passive management” investment approach designed to track the performance of the S&P 500® Index, which is composed of the stocks of primarily large capitalization companies that represent a broad spectrum of the U.S. economy and a substantial part of the U.S. stock market’s total capitalization. The Portfolio attempts to achieve its objective by investing all, or substantially all, of its assets in the stocks that make up the S&P 500® Index, holding each stock in approximately the same proportion as its weighting in the Index. This is known as a full replication strategy. The Portfolio may also invest in equity index futures and exchange traded funds for cash management and liquidity purposes and to help achieve full replication.
MARKET OVERVIEW
U.S. equity markets gained during the reporting period, supported by a broad economic recovery following the COVID-19-related disruptions of 2020, to reach a series of record highs throughout the year. The widespread distribution of vaccines helped consumers return to their pre-pandemic activities and spending habits. The Federal Reserve maintained its accommodative policy stance during the year, with near-zero interest rates and bond-buying programs continuing to provide monetary stimulus. Rising raw material costs and energy prices, higher wages and supply-chain constraints led to a significant increase in inflation. However, the strong growth in consumer spending helped boost corporate earnings.
In this environment, large cap stocks, as represented by the S&P 500® Index, posted a return of 28.71%, outperforming the S&P MidCap 400® and the S&P SmallCap 600® Indices, which returned 24.76% and 26.82%, respectively. Meanwhile, the broader bond market, as represented by the Bloomberg® U.S. Aggregate Index, returned (1.54%), while the Bloomberg® U.S. Corporate High Yield Index advanced 5.26%.
PORTFOLIO RESULTS
The Index 500 Stock Portfolio returned 28.45% for the twelve months ended December 31, 2021. By comparison, the S&P 500® Index (“the Index”) returned 28.71%. (The Index is unmanaged, cannot be invested in directly and does not incur expenses.) Portfolio performance slightly lagged the Index due to transaction costs, administrative expenses, cash flow effects and costs associated with the use of equity index futures contracts. According to Lipper® Analytical Services, Inc., an independent mutual fund ranking agency, the average return in 2021 of the S&P 500® Index Funds peer group was 28.38%.
All eleven of the Portfolio’s sectors advanced for the reporting period. The Information Technology sector was the largest contributor to the Portfolio’s return, as demand from enterprises and consumers remained strong amid the lingering effects of the pandemic. Software companies benefited from the global shift to remote work, with cloud computing and enterprise software sales continuing to accelerate. The semiconductor industry was supported by a combination of persistent demand from multiple industries and low supply, along with ongoing investment in emerging technologies. The communications equipment industry reported strong sales of personal technology, from smartphones and computers to wearable devices, throughout the year.
Companies in the Financials sector also contributed meaningfully to the Portfolio’s return, as the U.S. economy saw continued growth and fears of a lengthy post-pandemic slowdown dissipated. Bank earnings were boosted by steady loan repayments from consumers and businesses, enabling them to release capital that had been set aside earlier in the pandemic to cover potential loan losses. New loan activity began to increase in the latter half of the year, signaling a growing appetite for debt among consumers and small businesses.
The Consumer Discretionary sector was another solid contributor. Within the specialty retail industry, home improvement chains benefitted from an ongoing shortage in the U.S. housing supply, encouraging continued consumer spending on renovation and remodeling projects. Automobile companies were buoyed by fast-growing demand for electric vehicles, along with increased production capacity and improved delivery rates.
22
Table of Contents
Index 500 Stock Portfolio (unaudited)
Relative Performance
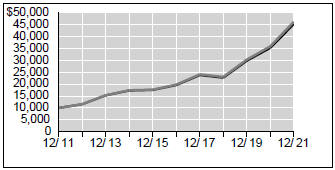
Average Annual Total Returns For Periods Ended December 31, 2021 | ||||||||||||
| 1 Year | 5 Years | 10 Years | ||||||||||
Index 500 Stock Portfolio | 28.45 | % | 18.22 | % | 16.30 | % | ||||||
S&P 500® Index | 28.71 | % | 18.45 | % | 16.53 | % | ||||||
Lipper® Variable Insurance Products (VIP) S&P 500 Index Objective Funds Average | 28.38 | % | 18.06 | % | 16.14 | % | ||||||
The performance data quoted represents past performance. Past performance is historical and does not guarantee future performance. Investment return and principal value will fluctuate, so that shares, when redeemed, may be worth more or less than their original cost. Current performance may be lower or higher than the performance data quoted. For the most recent month-end performance information visit www.northwesternmutual.com.
This chart assumes an initial investment of $10,000 made on 12/31/11. Returns shown reflect fee waivers, deductions for management and other portfolio expenses, and reinvestment of all dividends. In the absence of fee waivers, total return would be reduced. Returns exclude deductions for separate account sale loads and account fees. Please refer to the Benchmark Definitions section of this report for information about the indices cited in the above chart and graph.
“Standard & Poor’s®”, “S&P®”, “S&P 500” and “Standard & Poor’s 500” are trademarks of The McGraw-Hill Companies, Inc. and have been licensed for use by Northwestern Mutual Life Insurance Company. The Portfolio is not sponsored, endorsed, sold or promoted by Standard & Poor’s, and Standard & Poor’s makes no representation regarding the advisability of investing in the Portfolio.
The Portfolio may invest in exchange traded funds and derivative instruments, such as equity index futures for
cash management and liquidity purposes to help achieve full replication. Use of these instruments may involve certain costs and imposes certain risks such as liquidity risk, market risk, credit risk, management risk and the risk of mispricing or improper valuation. Certain derivatives involve leverage, which could magnify losses, and portfolios investing in derivatives could lose more than the principal amount invested in those instruments.
Top 10 Equity Holdings 12/31/21
Security Description | % of Net Assets | |||
Apple, Inc. | 6.8 | % | ||
Microsoft Corp. | 6.2 | % | ||
Alphabet, Inc., Various | 4.1 | % | ||
Amazon.com, Inc. | 3.6 | % | ||
Tesla Motors, Inc. | 2.1 | % | ||
Meta Platforms, Inc. - Class A | 2.0 | % | ||
NVIDIA Corp. | 1.8 | % | ||
Berkshire Hathaway, Inc. - Class B | 1.3 | % | ||
UnitedHealth Group, Inc. | 1.2 | % | ||
JPMorgan Chase & Co. | 1.2 | % |
Sector Allocation 12/31/21
Sector | % of Net Assets | |||
Information Technology | 28.9 | % | ||
Health Care | 13.2 | % | ||
Consumer Discretionary | 12.4 | % | ||
Financials | 10.5 | % | ||
Communication Services | 10.1 | % | ||
Industrials | 7.7 | % | ||
Consumer Staples | 5.8 | % | ||
Real Estate | 2.8 | % | ||
Energy | 2.6 | % | ||
Materials | 2.5 | % | ||
Utilities | 2.5 | % | ||
Short-Term Investments & Other Net Assets | 1.0 | % |
Sector Allocation and Top 10 Holdings are subject to change.
23
Table of Contents
Index 500 Stock Portfolio
SCHEDULE OF INVESTMENTS
December 31, 2021
| Common Stocks (99.0%) | Shares/ Par + | Value $ (000’s) | ||||||
Communication Services (10.1%) |
| |||||||
Activision Blizzard, Inc. | 105,038 | 6,988 | ||||||
Alphabet, Inc. - Class A * | 40,609 | 117,646 | ||||||
Alphabet, Inc. - Class C * | 37,750 | 109,233 | ||||||
AT&T, Inc. | 964,337 | 23,723 | ||||||
Charter Communications, Inc. - Class A * | 16,702 | 10,889 | ||||||
Comcast Corp. - | ||||||||
Class A | 615,360 | 30,971 | ||||||
Discovery Communications, Inc. - Class A * | 22,115 | 521 | ||||||
Discovery Communications, Inc. - Class C * | 44,914 | 1,028 | ||||||
DISH Network Corp. - Class A * | 34,111 | 1,107 | ||||||
Electronic Arts, Inc. | 37,715 | 4,975 | ||||||
Fox Corp. - Class A | 42,670 | 1,574 | ||||||
Fox Corp. - Class B | 21,340 | 731 | ||||||
The Interpublic Group of Companies, Inc. | 53,804 | 2,015 | ||||||
Live Nation Entertainment, Inc. * | 17,935 | 2,147 | ||||||
Lumen Technologies Inc | 122,755 | 1,541 | ||||||
Match Group, Inc. * | 38,973 | 5,154 | ||||||
Meta Platforms, Inc. - Class A * | 319,471 | 107,454 | ||||||
Netflix, Inc. * | 59,778 | 36,013 | ||||||
News Corp. - Class A | 53,931 | 1,203 | ||||||
News Corp. - Class B | 16,798 | 378 | ||||||
Omnicom Group, Inc. | 27,451 | 2,011 | ||||||
Take-Two Interactive Software, Inc. * | 15,867 | 2,820 | ||||||
T-Mobile US, Inc. * | 79,208 | 9,186 | ||||||
Twitter, Inc. * | 107,424 | 4,643 | ||||||
Verizon Communications, Inc. | 559,169 | 29,054 | ||||||
ViacomCBS, Inc. | 82,545 | 2,491 | ||||||
The Walt Disney Co. * | 245,423 | 38,014 | ||||||
|
| |||||||
Total | 553,510 | |||||||
|
| |||||||
Consumer Discretionary (12.4%) |
| |||||||
Advance Auto Parts, Inc. | 8,557 | 2,053 | ||||||
Amazon.com, Inc. * | 58,884 | 196,339 | ||||||
Aptiv PLC * | 36,432 | 6,009 | ||||||
AutoZone, Inc. * | 2,831 | 5,935 | ||||||
Bath & Body Works, Inc. | 36,037 | 2,515 | ||||||
Best Buy Co., Inc. | 30,385 | 3,087 | ||||||
| Common Stocks (99.0%) | Shares/ Par + | Value $ (000’s) | ||||||
Consumer Discretionary continued |
| |||||||
Booking Holdings, Inc. * | 5,531 | 13,270 | ||||||
BorgWarner, Inc. | 33,702 | 1,519 | ||||||
Caesars Entertainment, Inc. * | 28,727 | 2,687 | ||||||
CarMax, Inc. * | 21,680 | 2,823 | ||||||
Carnival Corp. * | 109,318 | 2,199 | ||||||
Chipotle Mexican Grill, Inc. * | 3,777 | 6,603 | ||||||
D.R. Horton, Inc. | 44,087 | 4,781 | ||||||
Darden Restaurants, Inc. | 16,895 | 2,545 | ||||||
Dollar General Corp. | 31,491 | 7,427 | ||||||
Dollar Tree, Inc. * | 30,044 | 4,222 | ||||||
Domino’s Pizza, Inc. | 4,801 | 2,709 | ||||||
eBay, Inc. | 84,517 | 5,620 | ||||||
Etsy, Inc. * | 16,663 | 3,648 | ||||||
Expedia, Inc. * | 19,534 | 3,530 | ||||||
Ford Motor Co. | 529,968 | 11,007 | ||||||
The Gap, Inc. | 28,378 | 501 | ||||||
Garmin, Ltd. | 20,577 | 2,802 | ||||||
General Motors Co. * | 197,733 | 11,593 | ||||||
Genuine Parts Co. | 19,823 | 2,779 | ||||||
Hasbro, Inc. | 17,580 | 1,789 | ||||||
Hilton Worldwide Holdings, Inc. * | 38,327 | 5,979 | ||||||
The Home Depot, Inc. | 142,484 | 59,132 | ||||||
Las Vegas Sands Corp. * | 45,538 | 1,714 | ||||||
Lennar Corp. - Class A | 36,391 | 4,227 | ||||||
LKQ Corp. | 35,613 | 2,138 | ||||||
Lowe’s Companies, Inc. | 93,485 | 24,164 | ||||||
Marriott International, | 36,798 | 6,081 | ||||||
McDonald’s Corp. | 100,864 | 27,039 | ||||||
MGM Resorts International | 52,839 | 2,371 | ||||||
Mohawk Industries, Inc. * | 7,475 | 1,362 | ||||||
Newell Brands, Inc. | 52,092 | 1,138 | ||||||
NIKE, Inc. - Class B | 172,620 | 28,771 | ||||||
Norwegian Cruise Line Holdings, Ltd. * | 49,769 | 1,032 | ||||||
NVR, Inc. * | 450 | 2,659 | ||||||
O’Reilly Automotive, Inc. * | 9,097 | 6,425 | ||||||
Penn National Gaming, Inc. * | 23,777 | 1,233 | ||||||
Pool Corp. | 5,255 | 2,974 | ||||||
PulteGroup, Inc. | 34,275 | 1,959 | ||||||
PVH Corp. | 9,807 | 1,046 | ||||||
Ralph Lauren Corp. | 6,652 | 791 | ||||||
Ross Stores, Inc. | 47,835 | 5,467 | ||||||
| Common Stocks (99.0%) | Shares/ Par + | Value $ (000’s) | ||||||
Consumer Discretionary continued |
| |||||||
Royal Caribbean Cruises, Ltd. * | 29,997 | 2,307 | ||||||
Starbucks Corp. | 159,251 | 18,628 | ||||||
Tapestry, Inc. | 38,268 | 1,554 | ||||||
Target Corp. | 65,890 | 15,250 | ||||||
Tesla Motors, Inc. * | 109,824 | 116,060 | ||||||
The TJX Cos., Inc. | 161,409 | 12,254 | ||||||
Tractor Supply Co. | 15,233 | 3,635 | ||||||
Ulta Beauty, Inc. * | 7,330 | 3,022 | ||||||
Under Armour, Inc. - | 26,008 | 551 | ||||||
Under Armour, Inc. - | 26,845 | 484 | ||||||
VF Corp. | 44,116 | 3,230 | ||||||
Whirlpool Corp. | 7,943 | 1,864 | ||||||
Wynn Resorts, Ltd. * | 14,416 | 1,226 | ||||||
Yum! Brands, Inc. | 39,039 | 5,421 | ||||||
|
| |||||||
Total | 683,180 | |||||||
|
| |||||||
Consumer Staples (5.8%) |
| |||||||
Altria Group, Inc. | 247,009 | 11,706 | ||||||
Archer-Daniels-Midland Co. | 74,302 | 5,022 | ||||||
Brown-Forman Corp. - Class B | 25,179 | 1,835 | ||||||
Campbell Soup Co. | 27,937 | 1,214 | ||||||
Church & Dwight Co., Inc. | 32,504 | 3,332 | ||||||
The Clorox Co. | 16,542 | 2,884 | ||||||
The Coca-Cola Co. | 524,707 | 31,068 | ||||||
Colgate-Palmolive Co. | 112,574 | 9,607 | ||||||
Conagra Brands, Inc. | 63,562 | 2,171 | ||||||
Constellation Brands, Inc. - Class A | 22,089 | 5,544 | ||||||
Costco Wholesale Corp. | 59,706 | 33,895 | ||||||
The Estee Lauder | ||||||||
Cos., Inc. - Class A | 31,262 | 11,573 | ||||||
General Mills, Inc. | 81,964 | 5,523 | ||||||
The Hershey Co. | 19,511 | 3,775 | ||||||
Hormel Foods Corp. | 38,729 | 1,890 | ||||||
The J.M. Smucker Co. | 14,454 | 1,963 | ||||||
Kellogg Co. | 35,087 | 2,260 | ||||||
Kimberly-Clark Corp. | 44,744 | 6,395 | ||||||
The Kraft Heinz Co. | 95,849 | 3,441 | ||||||
The Kroger Co. | 89,072 | 4,031 | ||||||
Lamb Weston Holdings, Inc. | 20,187 | 1,279 | ||||||
McCormick & Co., Inc. | 32,571 | 3,147 | ||||||
Molson Coors Beverage Co. - Class B | 25,954 | 1,203 | ||||||
Mondelez International, Inc. | 188,636 | 12,508 | ||||||
The Accompanying Notes are an Integral Part of the Financial Statements.
24
Table of Contents
Index 500 Stock Portfolio
| Common Stocks (99.0%) | Shares/ Par + | Value $ (000’s) | ||||||
Consumer Staples continued |
| |||||||
Monster Beverage Corp. * | 51,114 | 4,909 | ||||||
PepsiCo, Inc. | 186,670 | 32,426 | ||||||
Philip Morris International, Inc. | 210,264 | 19,975 | ||||||
The Procter & Gamble Co. | 326,717 | 53,444 | ||||||
Sysco Corp. | 70,594 | 5,545 | ||||||
Tyson Foods, Inc. - | ||||||||
Class A | 38,720 | 3,375 | ||||||
Walgreens Boots | ||||||||
Alliance, Inc. | 96,140 | 5,015 | ||||||
Walmart, Inc. | 191,918 | 27,769 | ||||||
|
| |||||||
Total | 319,724 | |||||||
|
| |||||||
Energy (2.6%) |
| |||||||
APA Corp. | 45,701 | 1,229 | ||||||
Baker Hughes | 119,373 | 2,872 | ||||||
Cabot Oil & Gas Corp. | 111,150 | 2,112 | ||||||
Chevron Corp. | 259,828 | 30,491 | ||||||
ConocoPhillips | 178,071 | 12,853 | ||||||
Devon Energy Corp. | 87,156 | 3,839 | ||||||
Diamondback Energy, Inc. | 23,054 | 2,487 | ||||||
EOG Resources, Inc. | 78,760 | 6,996 | ||||||
Exxon Mobil Corp. | 571,790 | 34,988 | ||||||
Halliburton Co. | 121,947 | 2,789 | ||||||
Hess Corp. | 37,700 | 2,791 | ||||||
Kinder Morgan, Inc. | 262,116 | 4,157 | ||||||
Marathon Oil Corp. | 98,423 | 1,616 | ||||||
Marathon Petroleum | ||||||||
Corp. | 82,606 | 5,286 | ||||||
Occidental Petroleum Corp. | 121,468 | 3,521 | ||||||
ONEOK, Inc. | 58,626 | 3,445 | ||||||
Phillips 66 | 59,155 | 4,286 | ||||||
Pioneer Natural | ||||||||
Resources Co. | 30,582 | 5,562 | ||||||
Schlumberger, Ltd. | 192,805 | 5,775 | ||||||
Valero Energy Corp. | 53,923 | 4,050 | ||||||
The Williams Cos., Inc. | 163,154 | 4,249 | ||||||
|
| |||||||
Total | 145,394 | |||||||
|
| |||||||
Financials (10.5%) |
| |||||||
AFLAC, Inc. | 81,988 | 4,787 | ||||||
The Allstate Corp. | 38,154 | 4,489 | ||||||
American Express Co. | 84,704 | 13,858 | ||||||
American International Group, Inc. | 112,099 | 6,374 | ||||||
Ameriprise Financial, Inc. | 14,939 | 4,506 | ||||||
Aon PLC | 29,747 | 8,941 | ||||||
Arthur J. Gallagher & Co. | 27,927 | 4,738 | ||||||
Assurant, Inc. | 7,147 | 1,114 | ||||||
Bank of America Corp. | 972,339 | 43,259 | ||||||
The Bank of New York Mellon Corp. | 102,574 | 5,957 | ||||||
| Common Stocks (99.0%) | Shares/ Par + | Value $ (000’s) | ||||||
Financials continued |
| |||||||
Berkshire Hathaway, Inc. - Class B * | 247,253 | 73,929 | ||||||
BlackRock, Inc. | 19,198 | 17,577 | ||||||
Brown & Brown, Inc. | 31,816 | 2,236 | ||||||
Capital One Financial Corp. | 57,463 | 8,337 | ||||||
CBOE Holdings, Inc. | 14,903 | 1,943 | ||||||
The Charles Schwab Corp. | 203,485 | 17,113 | ||||||
Chubb, Ltd. | 58,071 | 11,226 | ||||||
Cincinnati Financial Corp. | 20,642 | 2,352 | ||||||
Citigroup, Inc. | 267,895 | 16,178 | ||||||
Citizens Financial Group, Inc. | 59,128 | 2,794 | ||||||
CME Group, Inc. | 48,156 | 11,002 | ||||||
Comerica, Inc. | 18,933 | 1,647 | ||||||
Discover Financial Services | 39,866 | 4,607 | ||||||
Everest Re Group, Ltd. | 4,923 | 1,348 | ||||||
Fifth Third Bancorp | 90,927 | 3,960 | ||||||
First Republic Bank | 23,995 | 4,955 | ||||||
Franklin Resources, Inc. | 37,588 | 1,259 | ||||||
Globe Life, Inc. | 11,551 | 1,083 | ||||||
The Goldman Sachs Group, Inc. | 45,905 | 17,561 | ||||||
The Hartford Financial | ||||||||
Services Group, Inc. | 44,899 | 3,100 | ||||||
Huntington Bancshares, Inc. | 191,606 | 2,955 | ||||||
Intercontinental Exchange, Inc. | 76,219 | 10,424 | ||||||
Invesco, Ltd. | 45,792 | 1,054 | ||||||
JPMorgan Chase & Co. | 398,990 | 63,180 | ||||||
KeyCorp | 127,936 | 2,959 | ||||||
Lincoln National Corp. | 22,714 | 1,550 | ||||||
Loews Corp. | 27,666 | 1,598 | ||||||
M&T Bank Corp. | 17,698 | 2,718 | ||||||
MarketAxess Holdings, Inc. | 5,237 | 2,154 | ||||||
Marsh & McLennan Cos., Inc. | 67,981 | 11,816 | ||||||
MetLife, Inc. | 95,557 | 5,971 | ||||||
Moody’s Corp. | 21,804 | 8,516 | ||||||
Morgan Stanley | 193,811 | 19,024 | ||||||
MSCI, Inc. | 11,165 | 6,841 | ||||||
Nasdaq, Inc. | 15,840 | 3,327 | ||||||
Northern Trust Corp. | 27,357 | 3,272 | ||||||
People’s United Financial, Inc. | 58,608 | 1,044 | ||||||
PNC Financial Services Group, Inc. | 56,867 | 11,403 | ||||||
Principal Financial Group, Inc. | 33,095 | 2,394 | ||||||
The Progressive Corp. | 79,305 | 8,141 | ||||||
Prudential Financial, Inc. | 50,258 | 5,440 | ||||||
| Common Stocks (99.0%) | Shares/ Par + | Value $ (000’s) | ||||||
Financials continued |
| |||||||
Raymond James Financial, Inc. | 25,218 | 2,532 | ||||||
Regions Financial Corp. | 131,859 | 2,875 | ||||||
S&P Global, Inc. | 32,445 | 15,312 | ||||||
Signature Bank | 8,185 | 2,648 | ||||||
State Street Corp. | 49,363 | 4,591 | ||||||
SVB Financial Group * | 7,985 | 5,416 | ||||||
Synchrony Financial | 73,885 | 3,428 | ||||||
T. Rowe Price Group, Inc. | 30,423 | 5,982 | ||||||
The Travelers Cos., Inc. | 33,048 | 5,170 | ||||||
Truist Financial Corp. | 180,785 | 10,585 | ||||||
U.S. Bancorp | 181,595 | 10,200 | ||||||
W.R. Berkley Corp. | 19,422 | 1,600 | ||||||
Wells Fargo & Co. | 538,315 | 25,828 | ||||||
Willis Towers Watson PLC | 16,564 | 3,934 | ||||||
Zions Bancorporation | 20,072 | 1,268 | ||||||
|
| |||||||
Total | 579,380 | |||||||
|
| |||||||
Health Care (13.2%) |
| |||||||
Abbott Laboratories | 238,243 | 33,530 | ||||||
AbbVie, Inc. | 238,677 | 32,317 | ||||||
ABIOMED, Inc. * | 6,234 | 2,239 | ||||||
Agilent Technologies, Inc. | 41,213 | 6,580 | ||||||
Align Technology, Inc. * | 9,739 | 6,400 | ||||||
AmerisourceBergen Corp. | 20,286 | 2,696 | ||||||
Amgen, Inc. | 75,815 | 17,056 | ||||||
Anthem, Inc. | 32,776 | 15,193 | ||||||
Baxter International, Inc. | 68,764 | 5,903 | ||||||
Becton Dickinson and Co. | 39,107 | 9,835 | ||||||
Biogen, Inc. * | 19,637 | 4,711 | ||||||
Bio-Rad Laboratories, Inc. - Class A * | 2,969 | 2,243 | ||||||
Bio-Techne Corp. | 5,298 | 2,741 | ||||||
Boston Scientific Corp. * | 190,091 | 8,075 | ||||||
Bristol-Myers Squibb Co. | 299,389 | 18,667 | ||||||
Cardinal Health, Inc. | 37,768 | 1,945 | ||||||
Catalent, Inc. * | 23,939 | 3,065 | ||||||
Centene Corp. * | 78,040 | 6,431 | ||||||
Cerner Corp. | 38,406 | 3,567 | ||||||
Charles River Laboratories International, Inc. * | 6,814 | 2,567 | ||||||
Cigna Corp. | 44,747 | 10,275 | ||||||
The Cooper Cos., Inc. | 6,765 | 2,834 | ||||||
CVS Health Corp. | 178,608 | 18,425 | ||||||
Danaher Corp. | 85,814 | 28,234 | ||||||
DaVita, Inc. * | 9,009 | 1,025 | ||||||
Dentsply Sirona, Inc. | 30,149 | 1,682 | ||||||
Dexcom, Inc. * | 13,270 | 7,125 | ||||||
The Accompanying Notes are an Integral Part of the Financial Statements.
25
Table of Contents
Index 500 Stock Portfolio
| Common Stocks (99.0%) | Shares/ Par + | Value $ (000’s) | ||||||
Health Care continued |
| |||||||
Edwards Lifesciences Corp. * | 84,512 | 10,949 | ||||||
Eli Lilly & Co. | 107,233 | 29,620 | ||||||
Gilead Sciences, Inc. | 170,704 | 12,395 | ||||||
HCA Healthcare, Inc. | 32,333 | 8,307 | ||||||
Henry Schein, Inc. * | 19,866 | 1,540 | ||||||
Hologic, Inc. * | 35,606 | 2,726 | ||||||
Humana, Inc. | 17,274 | 8,013 | ||||||
IDEXX Laboratories, Inc. * | 11,519 | 7,585 | ||||||
Illumina, Inc. * | 21,102 | 8,028 | ||||||
Incyte Corp. * | 25,678 | 1,885 | ||||||
Intuitive Surgical, Inc. * | 48,124 | 17,291 | ||||||
IQVIA Holdings, Inc. * | 25,829 | 7,287 | ||||||
Johnson & Johnson | 355,546 | 60,823 | ||||||
Laboratory Corp. of America Holdings * | 12,917 | 4,059 | ||||||
McKesson Corp. | 20,361 | 5,061 | ||||||
Medtronic PLC | 182,169 | 18,845 | ||||||
Merck & Co., Inc. | 339,735 | 26,037 | ||||||
Mettler-Toledo International, Inc. * | 3,051 | 5,178 | ||||||
Moderna, Inc. * | 47,908 | 12,168 | ||||||
Organon & Co. | 34,671 | 1,056 | ||||||
PerkinElmer, Inc. | 17,038 | 3,426 | ||||||
Pfizer, Inc. | 757,246 | 44,715 | ||||||
Quest Diagnostics, Inc. | 16,450 | 2,846 | ||||||
Regeneron Pharmaceuticals, Inc. * | 14,387 | 9,086 | ||||||
ResMed, Inc. | 20,084 | 5,232 | ||||||
STERIS PLC | 13,340 | 3,247 | ||||||
Stryker Corp. | 45,723 | 12,227 | ||||||
Teleflex, Inc. | 6,424 | 2,110 | ||||||
Thermo Fisher Scientific, Inc. | 53,136 | 35,454 | ||||||
UnitedHealth Group, Inc. | 127,020 | 63,782 | ||||||
Universal Health Services, Inc. - Class B | 9,673 | 1,254 | ||||||
Vertex Pharmaceuticals, Inc. * | 34,327 | 7,538 | ||||||
Viatris, Inc. | 166,424 | 2,252 | ||||||
Waters Corp. * | 8,530 | 3,178 | ||||||
West Pharmaceutical Services, Inc. | 10,228 | 4,797 | ||||||
Zimmer Biomet Holdings, Inc. | 28,593 | 3,632 | ||||||
Zoetis, Inc. | 63,912 | 15,596 | ||||||
|
| |||||||
Total | 724,586 | |||||||
|
| |||||||
Industrials (7.7%) |
| |||||||
3M Co. | 77,992 | 13,854 | ||||||
A.O. Smith Corp. | 16,744 | 1,438 | ||||||
Alaska Air Group, Inc. * | 17,059 | 889 | ||||||
Allegion PLC | 12,804 | 1,696 | ||||||
| Common Stocks (99.0%) | Shares/ Par + | Value $ (000’s) | ||||||
Industrials continued |
| |||||||
American Airlines Group, Inc. * | 93,208 | 1,674 | ||||||
AMETEK, Inc. | 30,611 | 4,501 | ||||||
The Boeing Co. * | 74,416 | 14,981 | ||||||
C.H. Robinson Worldwide, Inc. | 17,342 | 1,867 | ||||||
Carrier Global Corp. | 115,143 | 6,245 | ||||||
Caterpillar, Inc. | 73,032 | 15,099 | ||||||
Cintas Corp. | 12,090 | 5,358 | ||||||
Copart, Inc. * | 28,665 | 4,346 | ||||||
CSX Corp. | 298,492 | 11,223 | ||||||
Cummins, Inc. | 19,166 | 4,181 | ||||||
Deere & Co. | 38,184 | 13,093 | ||||||
Delta Air Lines, Inc. * | 83,623 | 3,268 | ||||||
Dover Corp. | 19,903 | 3,614 | ||||||
Eaton Corp. PLC | 53,986 | 9,330 | ||||||
Emerson Electric Co. | 81,009 | 7,531 | ||||||
Equifax, Inc. | 16,770 | 4,910 | ||||||
Expeditors International of Washington, Inc. | 22,156 | 2,975 | ||||||
Fastenal Co. | 78,922 | 5,056 | ||||||
FedEx Corp. | 32,663 | 8,448 | ||||||
Fortive Corp. | 48,784 | 3,722 | ||||||
Fortune Brands Home & Security, Inc. | 17,633 | 1,885 | ||||||
Generac Holdings, Inc. * | 8,613 | 3,031 | ||||||
General Dynamics Corp. | 31,323 | 6,530 | ||||||
General Electric Co. | 148,252 | 14,005 | ||||||
Honeywell International, Inc. | 92,475 | 19,282 | ||||||
Howmet Aerospace, Inc. | 48,478 | 1,543 | ||||||
Huntington Ingalls Industries, Inc. | 5,586 | 1,043 | ||||||
IDEX Corp. | 10,443 | 2,468 | ||||||
IHS Markit, Ltd. | 53,052 | 7,052 | ||||||
Illinois Tool Works, Inc. | 38,403 | 9,478 | ||||||
Ingersoll-Rand, Inc. | 55,152 | 3,412 | ||||||
J.B. Hunt Transport Services, Inc. | 11,517 | 2,354 | ||||||
Jacobs Engineering Group, Inc. | 17,881 | 2,490 | ||||||
Johnson Controls International PLC | 95,409 | 7,758 | ||||||
L3Harris Technologies, Inc. | 26,123 | 5,570 | ||||||
Lockheed Martin Corp. | 33,221 | 11,807 | ||||||
Masco Corp. | 33,536 | 2,355 | ||||||
Nielsen Holdings PLC | 49,247 | 1,010 | ||||||
Norfolk Southern Corp. | 32,771 | 9,756 | ||||||
Northrop Grumman Corp. | 19,981 | 7,734 | ||||||
Old Dominion Freight Line, Inc. | 12,692 | 4,549 | ||||||
Otis Worldwide Corp. | 56,219 | 4,895 | ||||||
PACCAR, Inc. | 45,987 | 4,059 | ||||||
Parker Hannifin Corp. | 17,285 | 5,499 | ||||||
| Common Stocks (99.0%) | Shares/ Par + | Value $ (000’s) | ||||||
Industrials continued |
| |||||||
Pentair PLC | 22,947 | 1,676 | ||||||
Quanta Services, Inc. | 19,155 | 2,196 | ||||||
Raytheon Co. | 202,080 | 17,391 | ||||||
Republic Services, Inc. | 28,960 | 4,039 | ||||||
Robert Half International, Inc. | 15,705 | 1,751 | ||||||
Rockwell Automation, Inc. | 15,965 | 5,569 | ||||||
Rollins, Inc. | 30,518 | 1,044 | ||||||
Roper Technologies, Inc. | 14,490 | 7,127 | ||||||
Snap-on, Inc. | 7,479 | 1,611 | ||||||
Southwest Airlines Co. * | 77,477 | 3,319 | ||||||
Stanley Black & Decker, Inc. | 22,102 | 4,169 | ||||||
Teledyne Technologies, Inc. * | 6,386 | 2,790 | ||||||
Textron, Inc. | 29,542 | 2,281 | ||||||
Trane Technologies PLC | 32,259 | 6,517 | ||||||
TransDigm Group, Inc. * | 7,127 | 4,535 | ||||||
Union Pacific Corp. | 86,795 | 21,866 | ||||||
United Continental Holdings, Inc. * | 43,638 | 1,910 | ||||||
United Parcel Service, Inc. - Class B | 98,364 | 21,083 | ||||||
United Rentals, Inc. * | 9,480 | 3,150 | ||||||
Verisk Analytics, Inc. | 21,607 | 4,942 | ||||||
W.W. Grainger, Inc. | 5,865 | 3,040 | ||||||
Wabtec Corp. | 24,725 | 2,277 | ||||||
Waste Management, Inc. | 51,613 | 8,614 | ||||||
Xylem, Inc. | 24,951 | 2,992 | ||||||
|
| |||||||
Total | 424,753 | |||||||
|
| |||||||
Information Technology (28.9%) |
| |||||||
Accenture PLC - Class A | 85,217 | 35,327 | ||||||
Adobe Systems, Inc. * | 64,084 | 36,339 | ||||||
Advanced Micro Devices, Inc. * | 162,986 | 23,454 | ||||||
Akamai Technologies, Inc. * | 21,065 | 2,465 | ||||||
Amphenol Corp. - Class A | 80,405 | 7,032 | ||||||
Analog Devices, Inc. | 72,386 | 12,723 | ||||||
ANSYS, Inc. * | 11,847 | 4,752 | ||||||
Apple, Inc. | 2,104,273 | 373,656 | ||||||
Applied Materials, Inc. | 121,904 | 19,183 | ||||||
Arista Networks, Inc. * | 30,060 | 4,321 | ||||||
Autodesk, Inc. * | 29,811 | 8,383 | ||||||
Automatic Data Processing, Inc. | 56,951 | 14,043 | ||||||
Broadcom, Inc. | 55,669 | 37,043 | ||||||
Broadridge Financial Solutions, Inc. | 15,949 | 2,916 | ||||||
The Accompanying Notes are an Integral Part of the Financial Statements.
26
Table of Contents
Index 500 Stock Portfolio
| Common Stocks (99.0%) | Shares/ Par + | Value $ (000’s) | ||||||
Information Technology continued |
| |||||||
Cadence Design Systems, Inc. * | 37,299 | 6,951 | ||||||
CDW Corp. | 17,878 | 3,661 | ||||||
Ceridian HCM Holding, | 18,359 | 1,918 | ||||||
Cisco Systems, Inc. | 569,176 | 36,069 | ||||||
Citrix Systems, Inc. | 16,985 | 1,607 | ||||||
Cognizant Technology Solutions Corp. - Class A | 70,045 | 6,214 | ||||||
Corning, Inc. | 101,072 | 3,763 | ||||||
DXC Technology Co. * | 35,095 | 1,130 | ||||||
Enphase Energy, Inc. * | 18,580 | 3,399 | ||||||
EPAM Systems, Inc. * | 7,646 | 5,111 | ||||||
F5 Networks, Inc. * | 7,791 | 1,907 | ||||||
FactSet Research | ||||||||
Systems, Inc. | 5,082 | 2,470 | ||||||
Fidelity National Information Services, Inc. | 81,917 | 8,941 | ||||||
Fiserv, Inc. * | 79,657 | 8,268 | ||||||
FLEETCOR Technologies, Inc. * | 10,903 | 2,441 | ||||||
Fortinet, Inc. * | 18,606 | 6,687 | ||||||
Gartner, Inc. * | 11,195 | 3,743 | ||||||
Global Payments, Inc. | 39,505 | 5,340 | ||||||
Hewlett Packard Enterprise Co. | 177,540 | 2,800 | ||||||
HP, Inc. | 155,601 | 5,861 | ||||||
Intel Corp. | 551,141 | 28,384 | ||||||
International Business Machines Corp. | 120,778 | 16,143 | ||||||
Intuit, Inc. | 38,245 | 24,600 | ||||||
IPG Photonics Corp. * | 4,926 | 848 | ||||||
Jack Henry & Associates, Inc. | 10,622 | 1,774 | ||||||
Juniper Networks, Inc. | 40,745 | 1,455 | ||||||
Keysight Technologies, | 25,322 | 5,229 | ||||||
KLA-Tencor Corp. | 20,452 | 8,797 | ||||||
Lam Research Corp. | 19,009 | 13,670 | ||||||
Leidos Holdings, Inc. | 18,554 | 1,649 | ||||||
Mastercard, Inc. - Class A | 117,120 | 42,084 | ||||||
Microchip Technology, Inc. | 75,655 | 6,587 | ||||||
Micron Technology, Inc. | 151,613 | 14,123 | ||||||
Microsoft Corp. | 1,013,651 | 340,911 | ||||||
Monolithic Power Systems | 5,845 | 2,883 | ||||||
Motorola Solutions, Inc. | 22,707 | 6,169 | ||||||
NetApp, Inc. | 28,985 | 2,666 | ||||||
NortonLifeLock, Inc. | 82,850 | 2,152 | ||||||
NVIDIA Corp. | 337,524 | 99,269 | ||||||
NXP Semiconductors NV | 36,090 | 8,221 | ||||||
Oracle Corp. | 217,754 | 18,990 | ||||||
Paychex, Inc. | 44,032 | 6,010 | ||||||
| Common Stocks (99.0%) | Shares/ Par + | Value $ (000’s) | ||||||
Information Technology continued |
| |||||||
Paycom Software, Inc. * | 6,429 | 2,669 | ||||||
PayPal Holdings, Inc. * | 158,701 | 29,928 | ||||||
PTC, Inc. * | 14,404 | 1,745 | ||||||
Qorvo, Inc. * | 14,926 | 2,334 | ||||||
QUALCOMM, Inc. | 151,211 | 27,652 | ||||||
salesforce.com, Inc. * | 132,175 | 33,590 | ||||||
Seagate Technology Holdings PLC | 27,498 | 3,107 | ||||||
ServiceNow, Inc. * | 26,934 | 17,483 | ||||||
Skyworks Solutions, Inc. | 22,141 | 3,435 | ||||||
SolarEdge | ||||||||
Technologies, Inc. * | 7,091 | 1,989 | ||||||
Synopsys, Inc. * | 20,913 | 7,706 | ||||||
TE Connectivity, Ltd. | 43,538 | 7,024 | ||||||
Teradyne, Inc. | 22,669 | 3,707 | ||||||
Texas Instruments, Inc. | 124,690 | 23,500 | ||||||
Trimble Navigation, Ltd. * | 34,306 | 2,991 | ||||||
Tyler Technologies, Inc. * | 5,563 | 2,993 | ||||||
VeriSign, Inc. * | 13,187 | 3,347 | ||||||
Visa, Inc. - Class A | 226,411 | 49,066 | ||||||
Western Digital Corp. * | 41,969 | 2,737 | ||||||
Xilinx, Inc. | 33,056 | 7,009 | ||||||
Zebra Technologies Corp. - Class A * | 7,325 | 4,360 | ||||||
|
| |||||||
Total | 1,590,904 | |||||||
|
| |||||||
Materials (2.5%) |
| |||||||
Air Products and Chemicals, Inc. | 29,902 | 9,098 | ||||||
Albemarle Corp. | 15,981 | 3,736 | ||||||
Amcor PLC | 203,784 | 2,447 | ||||||
Avery Dennison Corp. | 11,576 | 2,507 | ||||||
Ball Corp. | 43,463 | 4,184 | ||||||
Celanese Corp. - Class A | 14,078 | 2,366 | ||||||
CF Industries Holdings, Inc. | 29,509 | 2,089 | ||||||
Corteva, Inc. | 99,460 | 4,702 | ||||||
Dow, Inc. | 99,687 | 5,654 | ||||||
DuPont de Nemours, Inc. | 69,942 | 5,650 | ||||||
Eastman Chemical Co. | 17,316 | 2,094 | ||||||
Ecolab, Inc. | 33,559 | 7,873 | ||||||
FMC Corp. | 16,380 | 1,800 | ||||||
Freeport-McMoRan, Inc. | 200,409 | 8,363 | ||||||
International Flavors & Fragrances, Inc. | 34,424 | 5,186 | ||||||
International Paper Co. | 51,855 | 2,436 | ||||||
Linde PLC | 69,200 | 23,973 | ||||||
LyondellBasell Industries NV - Class A | 35,469 | 3,271 | ||||||
| Common Stocks (99.0%) | Shares/ Par + | Value $ (000’s) | ||||||
Materials continued |
| |||||||
Martin Marietta Materials, Inc. | 8,226 | 3,624 | ||||||
The Mosaic Co. | 52,026 | 2,044 | ||||||
Newmont Mining Corp. | 108,025 | 6,700 | ||||||
Nucor Corp. | 38,299 | 4,372 | ||||||
Packaging Corp. of America | 13,082 | 1,781 | ||||||
PPG Industries, Inc. | 31,605 | 5,450 | ||||||
Sealed Air Corp. | 21,234 | 1,433 | ||||||
The Sherwin-Williams Co. | 32,606 | 11,482 | ||||||
Vulcan Materials Co. | 17,500 | 3,633 | ||||||
WestRock Co. | 36,233 | 1,607 | ||||||
|
| |||||||
Total | 139,555 | |||||||
|
| |||||||
Real Estate (2.8%) |
| |||||||
Alexandria Real Estate Equities, Inc. | 19,448 | 4,336 | ||||||
American Tower Corp. | 61,409 | 17,962 | ||||||
AvalonBay Communities, Inc. | 19,223 | 4,856 | ||||||
Boston Properties, Inc. | 19,540 | 2,251 | ||||||
CBRE Group, Inc. * | 44,679 | 4,848 | ||||||
Crown Castle International Corp. | 58,597 | 12,232 | �� | |||||
Digital Realty Trust, Inc. | 37,697 | 6,667 | ||||||
Duke Realty Corp. | 51,310 | 3,368 | ||||||
Equinix, Inc. | 12,295 | 10,400 | ||||||
Equity Residential | 47,187 | 4,270 | ||||||
Essex Property Trust, Inc. | 8,535 | 3,006 | ||||||
Extra Space Storage, Inc. | 17,940 | 4,067 | ||||||
Federal Realty Investment Trust | 9,496 | 1,294 | ||||||
Healthpeak Properties, Inc. | 74,265 | 2,680 | ||||||
Host Hotels & Resorts, Inc. * | 97,298 | 1,692 | ||||||
Iron Mountain, Inc. | 39,752 | 2,080 | ||||||
Kimco Realty Corp. | 81,888 | 2,019 | ||||||
Mid-America Apartment Communities, Inc. | 15,777 | 3,620 | ||||||
Prologis, Inc. | 99,530 | 16,757 | ||||||
Public Storage | 20,492 | 7,675 | ||||||
Realty Income Corp. | 77,593 | 5,555 | ||||||
Regency Centers Corp. | 21,720 | 1,637 | ||||||
SBA Communications Corp. | 14,407 | 5,605 | ||||||
Simon Property Group, Inc. | 44,207 | 7,063 | ||||||
UDR, Inc. | 40,457 | 2,427 | ||||||
Ventas, Inc. | 55,002 | 2,812 | ||||||
Vornado Realty Trust | 21,635 | 906 | ||||||
Welltower, Inc. | 57,519 | 4,933 | ||||||
The Accompanying Notes are an Integral Part of the Financial Statements.
27
Table of Contents
Index 500 Stock Portfolio
| Common Stocks (99.0%) | Shares/ Par + | Value $ (000’s) | ||||||
Real Estate continued |
| |||||||
Weyerhaeuser Co. | 98,881 | 4,072 | ||||||
|
| |||||||
Total | 151,090 | |||||||
|
| |||||||
Utilities (2.5%) |
| |||||||
The AES Corp. | 91,753 | 2,230 | ||||||
Alliant Energy Corp. | 34,454 | 2,118 | ||||||
Ameren Corp. | 35,952 | 3,200 | ||||||
American Electric Power Co., Inc. | 68,545 | 6,098 | ||||||
American Water Works Co., Inc. | 25,060 | 4,733 | ||||||
Atmos Energy Corp. | 18,770 | 1,967 | ||||||
CenterPoint Energy, Inc. | 86,517 | 2,415 | ||||||
CMS Energy Corp. | 39,499 | 2,569 | ||||||
Consolidated Edison, Inc. | 47,296 | 4,035 | ||||||
Dominion Resources, Inc. | 110,422 | 8,675 | ||||||
DTE Energy Co. | 25,348 | 3,030 | ||||||
Duke Energy Corp. | 103,908 | 10,900 | ||||||
Edison International | 49,819 | 3,400 | ||||||
Entergy Corp. | 27,621 | 3,111 | ||||||
Evergy, Inc. | 31,291 | 2,147 | ||||||
Eversource Energy | 45,511 | 4,141 | ||||||
Exelon Corp. | 131,460 | 7,593 | ||||||
FirstEnergy Corp. | 70,874 | 2,948 | ||||||
NextEra Energy, Inc. | 264,957 | 24,736 | ||||||
NiSource, Inc. | 52,863 | 1,460 | ||||||
NRG Energy, Inc. | 33,690 | 1,451 | ||||||
Pinnacle West Capital Corp. | 15,533 | 1,096 | ||||||
PPL Corp. | 100,820 | 3,031 | ||||||
Public Service Enterprise Group, Inc. | 69,855 | 4,661 | ||||||
Sempra Energy | 42,913 | 5,676 | ||||||
The Southern Co. | 143,405 | 9,835 | ||||||
WEC Energy Group, Inc. | 43,543 | 4,227 | ||||||
Xcel Energy, Inc. | 72,537 | 4,911 | ||||||
|
| |||||||
Total | 136,394 | |||||||
|
| |||||||
Total Common Stocks | ||||||||
(Cost: $1,697,986) | 5,448,470 | |||||||
|
| |||||||
| Short-Term Investments (0.9%) | Shares/ Par + | Value $ (000’s) | ||||||
Money Market Funds (0.9%) |
| |||||||
State Street Institutional U.S. Government Money Market Fund - Premier Class 0.030% #, b | 51,117,983 | 51,118 | ||||||
|
| |||||||
Total | 51,118 | |||||||
|
| |||||||
Total Short-Term Investments | ||||||||
(Cost: $51,118) | 51,118 | |||||||
|
| |||||||
Total Investments (99.9%) | ||||||||
(Cost: $1,749,104)@ | 5,499,588 | |||||||
|
| |||||||
Other Assets, Less | ||||||||
Liabilities (0.1%) | 5,382 | |||||||
|
| |||||||
Net Assets (100.0%) | 5,504,970 | |||||||
|
| |||||||
The Accompanying Notes are an Integral Part of the Financial Statements.
28
Table of Contents
Index 500 Stock Portfolio
Exchange Traded or Centrally Cleared Derivatives Futures
Issuer | Long/Short | Currency | Notional Par (000’s) | Number of Contracts | Expiration Date | Notional Value (000’s) | Unrealized Appreciation/ (Depreciation) | Variation Margin (000’s) | ||||||||||||||||||||||||
E-mini S&P 500 Futures | Long | USD | 12 | 236 | 3/22 | $ | 56,150 | $ | 1,136 | $ | (162 | ) | ||||||||||||||||||||
|
|
|
| |||||||||||||||||||||||||||||
| $ | 1,136 | $ | (162 | ) | ||||||||||||||||||||||||||||
|
|
|
| |||||||||||||||||||||||||||||
| Financial Derivative Assets | Financial Derivative Liabilities | |||||||||||||||||||||||||||||||
| Variation Margin (000’s) | Variation Margin (000’s) | Market Value (000’s) | ||||||||||||||||||||||||||||||
| Swaps | Futures | Total | Swaps | Futures | Total | Options | ||||||||||||||||||||||||||
Total Exchange-Traded or | $ | - | $ | - | $ | - | $ | – | $ | (162 | ) | $ | (162 | ) | $ | - | ||||||||||||||||
Centrally Cleared Derivatives | ||||||||||||||||||||||||||||||||
| + | All par is stated in U.S. Dollar unless otherwise noted. |
| * | Non income producing |
| b | Cash or securities with an aggregate value of $51,118 (in thousands) has been pledged as collateral for futures, swap contracts outstanding, short sales, when issued securities or written options on 12/31/2021. |
| # | 7-Day yield as of 12/31/2021. |
| @ | At December 31, 2021, the aggregate cost of investments, including derivatives, for federal tax purposes (in thousands) was $1,752,678 and the net unrealized appreciation of investments based on that cost was $3,748,046 which is comprised of $3,813,608 aggregate gross unrealized appreciation and $65,562 aggregate gross unrealized depreciation. |
The following is a summary of the inputs used in valuing the Portfolio’s Investments at December 31, 2021. See Note 3 for additional information on portfolio valuation.
| Valuation Inputs | ||||||||||||||
| Description | Level 1 – Quoted Prices | Level 2 – Observable Inputs | Level 3 – Unobservable Inputs | |||||||||||
| (Amounts in thousands) | ||||||||||||||
Assets: | ||||||||||||||
Common Stocks | $ | 5,448,470 | $ | - | $ | - | ||||||||
Short-Term Investments | 51,118 | - | - | |||||||||||
Other Financial Instruments^ | ||||||||||||||
Futures | 1,136 | - | - | |||||||||||
Total Assets: | $ | 5,500,724 | $ | - | $ | - | ||||||||
^ Other financial instruments are derivative instruments such as futures and forward foreign currency contracts, which are valued at the unrealized appreciation (depreciation) on the instrument, and securities sold short, reverse repurchase agreements, written options and swaps contracts, which are valued at market value.
The Accompanying Notes are an Integral Part of the Financial Statements.
29
Table of Contents
Large Company Value Portfolio (unaudited)
| Objective: | Portfolio Strategy: | Net Assets: | ||
| Long-term growth of capital. Current income is a secondary objective. | Invest primarily in equity securities of larger companies considered to be undervalued. | $228 million |
PORTFOLIO OVERVIEW
Mason Street Advisors, LLC (“Mason Street Advisors”), the investment adviser for the Large Company Value Portfolio (the “Portfolio”), has engaged American Century Investment Management, Inc. (“American Century”) to act as sub-adviser for the Portfolio. The Portfolio looks for stocks of companies that it believes are undervalued at the time of purchase. The Portfolio attempts to purchase the stocks of these undervalued companies and hold each stock until it has returned to favor in the market and the price has increased to, or is higher than, a level the Portfolio believes more accurately reflects the fair value of the company. Companies may be undervalued due to market declines, poor economic conditions, actual or anticipated bad news regarding the issuer or its industry, or because they have been overlooked by the market.
MARKET OVERVIEW
Broad U.S. equity markets advanced strongly in 2021, buoyed by expanding COVID-19 vaccine availability, federal aid, positive economic news and strong corporate earnings reports. Stocks experienced minor volatility throughout the year, however, due to the emergence of the Delta and Omicron variants of COVID-19, supply chain constraints, inflation concerns and labor shortages.
In this environment, large-cap stocks outperformed mid- and small-cap stocks. Within large-cap stocks, growth stocks modestly outperformed value stocks. However, among mid- and small-cap stocks, value significantly outperformed growth.
PORTFOLIO RESULTS
The Portfolio returned 21.92% for the twelve months ended December 31, 2021. By comparison, the Portfolio’s benchmark, the Russell 1000® Value Index (the “Index”), returned 25.16%. (The Index is unmanaged, cannot be invested in directly and does not include administrative expenses.) According to Lipper® Analytical Services, Inc., an independent mutual fund ranking agency, the average return in 2021 of the Large Cap Value Funds peer group was 25.58%.
The Health Care sector detracted from the Portfolio’s return, particularly Medtronic and Zimmer Biomet Holdings. Both stocks were pressured by concerns about continued delays in elective procedures due to the ongoing pandemic. Merck & Co., a large pharmaceuticals company, was another notable detractor as investors became concerned about possible drug pricing reform.
The Consumer Staples sector also detracted from the Portfolio’s performance as the Portfolio’s overweight in the sector relative to the benchmark weighed negatively on performance. Consumer goods company Unilever was a significant detractor. Unilever reported weak profits for the second half of 2020, driven in part by rising input costs. Several other Consumer Staples holdings declined because they were not direct beneficiaries of economic reopening. The Communications and Utilities sectors also detracted from performance. Notable detractors include, Verizon Communications, a telecommunications conglomerate, and Pinnacle West Capital, an electric utility company based in Arizona. Verizon’s stock was pressured by investors’ increasing concerns regarding more competition in the wireless space from AT&T and T-Mobile US. Pinnacle West declined as a pending general rate challenge in Arizona led to concerns about possible new regulations.
In contrast, the Information Technology sector contributed to the Portfolio’s performance. The Portfolio benefited from a lack of exposure to several IT services companies held by the benchmark. In the software industry, stock selection was a contributor, as Oracle was buoyed by momentum in cloud computing and enterprise resource planning, which boosted earnings, along with increased investment in its cloud infrastructure. Another solid contributor was Cisco Systems, which advanced amid strong demand for its security and networking products amid hybrid work environments, 5G-related upgrades, pent-up consumer demand and positive competitive outcomes.
In the Energy sector, ConocoPhillips was a meaningful contributor due in part to a successful acquisition. In addition, higher commodity prices increased the free cash flow and return on invested capital generation potential of the business.
30
Table of Contents
Large Company Value Portfolio (unaudited)
PORTFOLIO MANAGER OUTLOOK
The following forward-looking comments are the opinion of American Century, the Portfolio’s sub-adviser.
We remain overweight in the Health Care sector. We believe long-term demographic trends support demand for companies in this sector. Through our bottom-up process, we are finding quality companies with attractive risk/reward profiles, particularly in the health care equipment and supplies and pharmaceuticals industries. We also ended the period with an overweight in the Consumer Staples sector. Despite a challenging environment from a cost inflation perspective, many Consumer Staples companies are generating strong returns on capital, buying back stock and growing dividends. Moreover, industry consolidation over time has enabled companies to pass cost increases to consumers. We believe actions to offset inflation, including fewer promotions and price increases, should support earnings and margins.
Conversely, we maintained an underweight position in the Real Estate sector due to valuations that we believe are elevated throughout the sector. We are also underweight in the Information Technology sector, but have found select stocks in the sector that meet our investment criteria.
Relative Performance
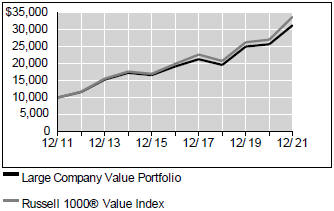
| Average Annual Total Returns | ||||||||||||
| For Periods Ended December 31, 2021 | ||||||||||||
| 1 Year | 5 Years | 10 Years | ||||||||||
Large Company Value Portfolio | 21.92 | % | 10.32 | % | 12.10 | % | ||||||
Russell 1000® Value Index | 25.16 | % | 11.16 | % | 12.97 | % | ||||||
Lipper® Variable Insurance Products (VIP) Large Cap Value Funds Average | 25.58 | % | 11.67 | % | 12.56 | % | ||||||
The performance data quoted represents past performance. Past performance is historical and does not guarantee future performance. Investment return and principal value will fluctuate, so that shares, when redeemed, may be worth more or less than their original cost. Current performance may be lower or higher than the performance data quoted. For the most recent month-end performance information visit www.northwesternmutual.com.
This chart assumes an initial investment of $10,000 made on 12/31/11. Returns shown reflect fee waivers, deductions for management and other portfolio expenses, and reinvestment of all dividends. In the absence of fee waivers, total return would be reduced. Returns exclude
deductions for separate account sale loads and account fees. Please refer to the Benchmark Definitions section of this report for information about the indices cited in the above chart and graph.
The Portfolio may invest in derivative instruments for cash management purposes or to hedge foreign currency exposure. Use of these instruments may involve certain costs and imposes certain risks such as liquidity risk, market risk, credit risk, management risk and the risk of mispricing or improper valuation. Certain derivatives involve leverage, which could magnify losses, and portfolios investing in derivatives could lose more than the principal amount invested in those instruments.
The Portfolio may invest a relatively high percentage of its assets in a particular sector. The Portfolio will have greater exposure to the risks associated with that sector and its performance will be tied more closely to the performance of the sector.
Top 10 Equity Holdings 12/31/21
Security Description | % of Net Assets | |||
Johnson & Johnson | 4.5 | % | ||
Berkshire Hathaway, Inc. - Class B | 3.9 | % | ||
Medtronic PLC | 3.9 | % | ||
Verizon Communications, Inc. | 3.6 | % | ||
Cisco Systems, Inc. | 3.3 | % | ||
JPMorgan Chase & Co. | 3.1 | % | ||
The Bank of New York Mellon Corp. | 2.8 | % | ||
Zimmer Biomet Holdings, Inc. | 2.6 | % | ||
Unilever PLC, ADR | 2.4 | % | ||
Chevron Corp. | 2.3 | % |
31
Table of Contents
Large Company Value Portfolio (unaudited)
Sector Allocation 12/31/21
Sector | % of Net Assets | |||
Health Care | 24.0 | % | ||
Financials | 22.2 | % | ||
Consumer Staples | 12.8 | % | ||
Industrials | 10.0 | % | ||
Information Technology | 6.6 | % | ||
Energy | 5.8 | % | ||
Utilities | 5.3 | % | ||
Communication Services | 4.6 | % | ||
Consumer Discretionary | 3.9 | % | ||
Materials | 2.0 | % | ||
Real Estate | 1.1 | % | ||
Investment Companies | 1.0 | % | ||
Short-Term Investments & Other Net Assets | 0.7 | % |
Sector Allocation and Top 10 Holdings are subject to change.
32
Table of Contents
Large Company Value Portfolio
SCHEDULE OF INVESTMENTS
December 31, 2021
| Common Stocks (97.6%) | Shares/ Par + | Value $ (000’s) | ||||||
Communication Services (4.6%) |
| |||||||
Verizon | ||||||||
Communications, Inc. | 157,296 | 8,173 | ||||||
The Walt Disney Co. * | 14,499 | 2,246 | ||||||
|
| |||||||
Total | 10,419 | |||||||
|
| |||||||
Consumer Discretionary (3.2%) |
| |||||||
Advance Auto Parts, Inc. | 10,598 | 2,542 | ||||||
Dollar Tree, Inc. * | 18,671 | 2,624 | ||||||
Sodexo SA | 23,160 | 2,032 | ||||||
|
| |||||||
Total | 7,198 | |||||||
|
| |||||||
Consumer Staples (12.8%) |
| |||||||
Colgate-Palmolive Co. | 26,191 | 2,235 | ||||||
Conagra Brands, Inc. | 109,940 | 3,754 | ||||||
Danone SA | 18,697 | 1,162 | ||||||
Kimberly-Clark Corp. | 21,113 | 3,018 | ||||||
Koninklijke Ahold Delhaize NV | 56,607 | 1,942 | ||||||
Mondelez International, Inc. | 47,710 | 3,164 | ||||||
PepsiCo, Inc. | 16,529 | 2,871 | ||||||
The Procter & Gamble Co. | 15,439 | 2,526 | ||||||
Unilever PLC, ADR | 99,857 | 5,371 | ||||||
Walmart, Inc. | 20,927 | 3,028 | ||||||
|
| |||||||
Total | 29,071 | |||||||
|
| |||||||
Energy (5.8%) |
| |||||||
Baker Hughes | 95,785 | 2,305 | ||||||
Chevron Corp. | 43,844 | 5,145 | ||||||
ConocoPhillips | 36,083 | 2,604 | ||||||
Total SA, ADR | 64,266 | 3,179 | ||||||
|
| |||||||
Total | 13,233 | |||||||
|
| |||||||
Financials (22.2%) |
| |||||||
AFLAC, Inc. | 61,112 | 3,568 | ||||||
The Allstate Corp. | 35,321 | 4,156 | ||||||
Ameriprise Financial, Inc. | 8,847 | 2,669 | ||||||
The Bank of New York Mellon Corp. | 110,400 | 6,412 | ||||||
Berkshire Hathaway, Inc. - Class B * | 29,770 | 8,901 | ||||||
Chubb, Ltd. | 19,224 | 3,716 | ||||||
JPMorgan Chase & Co. | 44,080 | 6,980 | ||||||
MetLife, Inc. | 38,334 | 2,396 | ||||||
Northern Trust Corp. | 21,812 | 2,609 | ||||||
Truist Financial Corp. | 81,083 | 4,747 | ||||||
| Common Stocks (97.6%) | Shares/ Par + | Value $ (000’s) | ||||||
Financials continued U.S. Bancorp | 76,415 | 4,292 | ||||||
|
| |||||||
Total | 50,446 | |||||||
|
| |||||||
Health Care (24.0%) |
| |||||||
Becton Dickinson and Co. | 13,258 | 3,334 | ||||||
Cerner Corp. | 50,028 | 4,646 | ||||||
Cigna Corp. | 11,766 | 2,702 | ||||||
CVS Health Corp. | 30,494 | 3,146 | ||||||
Johnson & Johnson | 60,339 | 10,322 | ||||||
McKesson Corp. | 9,526 | 2,368 | ||||||
Medtronic PLC | 84,820 | 8,775 | ||||||
Merck & Co., Inc. | 63,452 | 4,863 | ||||||
Pfizer, Inc. | 33,188 | 1,960 | ||||||
Quest Diagnostics, Inc. | 13,233 | 2,289 | ||||||
Roche Holding AG | 4,680 | 1,940 | ||||||
Universal Health Services, Inc. - Class B | 19,029 | 2,467 | ||||||
Zimmer Biomet Holdings, Inc. | 46,097 | 5,856 | ||||||
|
| |||||||
Total | 54,668 | |||||||
|
| |||||||
Industrials (10.0%) |
| |||||||
Emerson Electric Co. | 45,521 | 4,232 | ||||||
General Dynamics Corp. | 13,410 | 2,795 | ||||||
Norfolk Southern Corp. | 6,030 | 1,795 | ||||||
nVent Electric PLC | 60,177 | 2,287 | ||||||
Oshkosh Corp. | 16,604 | 1,871 | ||||||
Raytheon Co. | 50,178 | 4,318 | ||||||
Siemens AG | 16,486 | 2,866 | ||||||
Southwest Airlines Co. * | 62,432 | 2,675 | ||||||
|
| |||||||
Total | 22,839 | |||||||
|
| |||||||
Information Technology (6.6%) |
| |||||||
Automatic Data Processing, Inc. | 7,631 | 1,882 | ||||||
Cisco Systems, Inc. | 119,454 | 7,570 | ||||||
F5 Networks, Inc. * | 9,649 | 2,361 | ||||||
TE Connectivity, Ltd. | 6,861 | 1,107 | ||||||
Texas Instruments, Inc. | 11,392 | 2,147 | ||||||
|
| |||||||
Total | 15,067 | |||||||
| �� |
|
| ||||||
Materials (2.0%) |
| |||||||
Mondi PLC | 72,639 | 1,795 | ||||||
Sonoco Products Co. | 48,904 | 2,831 | ||||||
|
| |||||||
Total | 4,626 | |||||||
|
| |||||||
| Common Stocks (97.6%) | Shares/ Par + | Value $ (000’s) | ||||||
Real Estate (1.1%) |
| |||||||
Healthpeak Properties, Inc. | 68,155 | 2,460 | ||||||
|
| |||||||
Total | 2,460 | |||||||
|
| |||||||
Utilities (5.3%) |
| |||||||
Duke Energy Corp. | 26,154 | 2,744 | ||||||
Eversource Energy | 23,265 | 2,117 | ||||||
Pinnacle West Capital Corp. | 50,168 | 3,541 | ||||||
Xcel Energy, Inc. | 54,610 | 3,697 | ||||||
|
| |||||||
Total | 12,099 | |||||||
|
| |||||||
Total Common Stocks | ||||||||
(Cost: $184,951) | 222,126 | |||||||
|
| |||||||
| Preferred Stocks (0.7%) | ||||||||
Consumer Discretionary (0.7%) |
| |||||||
Volkswagen AG, 4.860%, | 7,398 | 1,495 | ||||||
|
| |||||||
Total | 1,495 | |||||||
|
| |||||||
Total Preferred Stocks | ||||||||
(Cost: $1,645) | 1,495 | |||||||
|
| |||||||
| Investment Companies (1.0%) | ||||||||
Investment Companies (1.0%) | ||||||||
iShares Russell 1000 Value ETF | 13,861 | 2,328 | ||||||
|
| |||||||
Total | 2,328 | |||||||
|
| |||||||
Total Investment Companies | ||||||||
(Cost: $2,260) | 2,328 | |||||||
|
| |||||||
| Short-Term Investments (2.6%) | ||||||||
Money Market Funds (2.6%) |
| |||||||
State Street Institutional U.S. Government Money Market Fund - Premier Class 0.030% # | 5,881,457 | 5,881 | ||||||
|
| |||||||
Total | 5,881 | |||||||
|
| |||||||
Total Short-Term Investments | ||||||||
(Cost: $5,881) | 5,881 | |||||||
|
| |||||||
The Accompanying Notes are an Integral Part of the Financial Statements.
33
Table of Contents
Large Company Value Portfolio
| Short-Term Investments (2.6%) | Shares/ Par + | Value $ (000’s) | ||||||
Money Market Funds continued |
| |||||||
Total Investments (101.9%) |
| |||||||
(Cost: $194,737)@ |
| 231,830 | ||||||
|
| |||||||
Other Assets, Less | ||||||||
Liabilities (-1.9%) | (4,270 | ) | ||||||
|
| |||||||
Net Assets (100.0%) | 227,560 | |||||||
|
| |||||||
Over the Counter Derivatives
Forward Foreign Currency Contracts
| Type | Counterparty | Currency | Foreign Principal Covered by | USD Principal Amount Covered by Contract (000’s) | Settlement Date | Unrealized Appreciation (000’s) | Unrealized (Depreciation) | Net Unrealized | ||||||||||||||
Sell | Morgan Stanley Capital Services, Inc. | CHF | 1,504 | 1,655 | 3/31/2022 | $ | - | $ | (18 | ) | $ | (18 | ) | |||||||||
Sell | Goldman Sachs International | EUR | 9,440 | 10,767 | 3/31/2022 | - | (85 | ) | (85 | ) | ||||||||||||
Sell | Goldman Sachs International | GBP | 4,503 | 6,093 | 3/31/2022 | - | (133 | ) | (133 | ) | ||||||||||||
|
|
|
|
|
| |||||||||||||||||
| $ | - | $ | (236 | ) | $ | (236 | ) | |||||||||||||||
|
|
|
|
|
| |||||||||||||||||
| Financial Derivative Assets (000’s) | Financial Derivative Liabilities (000’s) | |||||||||||||||||||||
Forward Foreign | Swaps | Total | Forward Foreign Currency Contracts | Options | Swaps | Total | ||||||||||||||||
Total Over the Counter Derivatives | - | - | - | $ | (236 | ) | - | - | $ | (236) | ||||||||||||
| + | All par is stated in U.S. Dollar unless otherwise noted. |
| * | Non income producing |
| # | 7-Day yield as of 12/31/2021. |
| @ | At December 31, 2021, the aggregate cost of investments, including derivatives, for federal tax purposes (in thousands) was $196,388 and the net |
unrealized appreciation of investments based on that cost was $35,205 which is comprised of $38,431 aggregate gross unrealized appreciation and $3,226 aggregate gross unrealized depreciation.
The Accompanying Notes are an Integral Part of the Financial Statements.
34
Table of Contents
Large Company Value Portfolio
The following is a summary of the inputs used in valuing the Portfolio’s Investments at December 31, 2021. See Note 3 for additional information on portfolio valuation.
| Valuation Inputs | ||||||||||||||
| Description | Level 1 - Quoted Prices | Level 2 - Other Significant | Level 3 - Significant | |||||||||||
| (Amounts in thousands) | ||||||||||||||
Assets: | ||||||||||||||
Preferred Stocks | $ | - | $ | 1,495 | $ | - | ||||||||
Common Stocks | ||||||||||||||
Health Care | 52,728 | 1,940 | - | |||||||||||
Industrials | 19,973 | 2,866 | - | |||||||||||
All Others | 144,619 | - | - | |||||||||||
Investment Companies | 2,328 | - | - | |||||||||||
Short-Term Investments | 5,881 | - | - | |||||||||||
Total Assets: | $ | 225,529 | $ | 6,301 | $ | - | ||||||||
Liabilities: | ||||||||||||||
Other Financial Instruments^ | ||||||||||||||
Forward Foreign Currency Contracts | - | (236 | ) | - | ||||||||||
Total Liabilities: | $ | - | $ | (236 | ) | $ | - | |||||||
^ Other financial instruments are derivative instruments such as futures and forward foreign currency contracts, which are valued at the unrealized appreciation
(depreciation) on the instrument, and securities sold short, reverse repurchase agreements, written options and swaps contracts, which are valued at market
value.
The Accompanying Notes are an Integral Part of the Financial Statements.
35
Table of Contents
Domestic Equity Portfolio (unaudited)
| Objective: | Portfolio Strategy: | Net Assets: | ||
| Long-term growth of capital and | Invest primarily in equity securities of U.S. issuers that are | $1.1 billion | ||
| income. | selling at attractive prices relative to their intrinsic value. |
PORTFOLIO OVERVIEW
Mason Street Advisors, LLC (“Mason Street Advisors”), the investment adviser for the Domestic Equity Portfolio (the “Portfolio”), has engaged Delaware Investments Fund Advisers, a series of Macquarie Investment Management Business Trust (“Delaware”), to act as sub-adviser for the Portfolio. The Portfolio primarily invests in common stocks of large capitalization companies, but may also invest in mid-capitalization companies, that are believed to have long-term capital appreciation potential. Typically, the Portfolio seeks securities that are believed to be undervalued in relation to their intrinsic value, as indicated by multiple factors, including the earnings and cash flow potential or the asset valuation of the respective issuers. The Portfolio employs a focused investment strategy and typically invests in a core group of 30-40 securities.
MARKET OVERVIEW
Aided by rising COVID-19 vaccination rates, the Federal Reserve’s highly accommodative monetary policy and unprecedented amounts of fiscal stimulus, the U.S. equity market advanced and posted strong gains in 2021. The broad market S&P 500® Index continued setting record highs, margin debt reached over U.S. $900 billion for the first time ever and the volume of initial public offerings reached a new record. Amid the high level of investor enthusiasm, several notable challenges surfaced during the year, including the continued disruptions of COVID-19 (including the emergence of new variants), worker shortages due to persistently low vaccination rates in some parts of the world, manufacturing delays and supply chain bottlenecks. The result was longer delivery times, higher freight costs and rising prices for a broad array of goods.
PORTFOLIO RESULTS
The Portfolio returned 22.71% for the twelve months ended December 31, 2021. By comparison, the Portfolio’s benchmark, the Russell 1000® Value Index (the “Index”), returned 25.16%. (The Index is unmanaged, cannot be invested in directly and does not incur expenses.) According to Lipper® Analytical Services, Inc., an independent mutual fund ranking agency, the average return in 2021 of the Large Cap Value Funds peer group was 25.58%.
The Health Care sector was the largest detractor from the Portfolio’s return. In the pharmaceuticals industry, Viatris, Inc. declined significantly amid higher-than-anticipated expenses related to a merger. In the health care equipment and services industry, medical products distributor Cardinal Health, Inc. was another notable detractor, as the company experienced execution problems, primarily in the medical segment of its business, weighing on the stock and contributing to an erosion in investor confidence. The position was sold from the Portfolio because the portfolio managers no longer had a strong conviction in Cardinal’s long-term business prospects.
The Consumer Staples sector also detracted from the Portfolio’s performance. Despite benefiting from strong growth in packaged food sales early in the pandemic, packaged food maker Conagra Brands, Inc. experienced a decline in year-over-year sales growth during 2021 amid the economic recovery. Additionally, the company’s margins have been pressured by commodity price inflation.
The Information Technology sector was the largest contributor to the Portfolio’s return, led by Motorola Solutions, Inc., a provider of mission critical communication systems and analytics. The company’s revenue guidance for fiscal 2022 was above the consensus estimate. It also announced a record-high order backlog for the most recent quarter.
The Energy and Consumer Discretionary sectors also contributed. The Portfolio’s single Energy sector holding, exploration and production company ConocoPhillips, was buoyed by its announcement of an all-cash acquisition of Royal Dutch Shell’s Permian Basin assets, as well as the company’s updated long-term financial and capital return outlook. In the Consumer Discretionary sector, home improvement retailer Lowe’s Companies, Inc. benefited from ongoing strength in the housing market, economic reopening and the company’s transformation initiatives. Nevertheless, because Lowe’s Companies, Inc was nearing the portfolio managers’ price target, the position was sold late in 2021.
PORTFOLIO MANAGER OUTLOOK
The following forward-looking comments are the opinion of Delaware, the Portfolio’s sub-adviser.
36
Table of Contents
Domestic Equity Portfolio (unaudited)
Over the past three years, the broad market S&P 500® Index posted an annualized total return of 26.1%, higher than any three-year period (on a rolling monthly basis) since March 2000, near the peak of the Internet bubble. In our view, this level of returns is unsustainable, and given the changing market environment, such as slowing economic growth, tighter monetary conditions, decelerating corporate profits and currently high inflation, we believe a period of below-average returns is ahead. In response, we have been placing an even greater emphasis on quality and downside protection. The Portfolio trades at a discount to the Russell 1000® Value Index across a range of valuation measures and at an even larger discount to the broader market. In our opinion, its discounted valuation and the higher-quality profile of its holdings position the Portfolio very well for the next five years.
Relative Performance
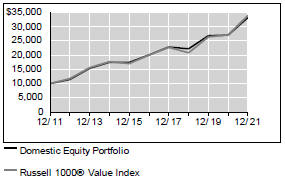
Average Annual Total Returns For Periods Ended December 31, 2021 | ||||||||||||
| 1 Year | 5 Years | 10 Years | ||||||||||
Domestic Equity Portfolio | 22.71 | % | 10.54 | % | 12.71 | % | ||||||
Russell 1000® Value Index | 25.16 | % | 11.16 | % | 12.97 | % | ||||||
Lipper® Variable Insurance Products (VIP) Large Cap Value Funds Average | 25.58 | % | 11.67 | % | 12.56 | % | ||||||
The performance data quoted represents past performance. Past performance is historical and does not guarantee future performance. Investment return and principal value will fluctuate, so that shares, when redeemed, may be worth more or less than their original cost. Current performance may be lower or higher than the performance data quoted. For the most recent month-end performance information visit www.northwesternmutual.com.
This chart assumes an initial investment of $10,000 made on 12/31/11. Returns shown reflect fee waivers, deductions for management and other portfolio expenses, and reinvestment of all dividends. In the absence of fee waivers, total return would be reduced. Returns exclude deductions for separate account sale loads and account fees. Please refer to the Benchmark Definitions section of this report for information about the indices cited in the above chart and graph.
The Portfolio may hold fewer securities than other diversified portfolios because of its more focused investment strategy. Holding fewer securities increases the risk that the value of the Portfolio could go down because of the poor performance of a single investment.
Top 10 Equity Holdings 12/31/21
Security Description | % of Net Assets | |||
Dollar Tree, Inc. | 3.4 | % | ||
Cognizant Technology Solutions Corp. - Class A | 3.4 | % | ||
CVS Health Corp. | 3.4 | % | ||
Cisco Systems, Inc. | 3.3 | % | ||
ConocoPhillips | 3.2 | % | ||
Broadcom, Inc. | 3.2 | % | ||
DuPont de Nemours, Inc. | 3.2 | % | ||
Northrop Grumman Corp. | 3.2 | % | ||
Equity Residential | 3.1 | % | ||
Motorola Solutions, Inc. | 3.1 | % |
Sector Allocation 12/31/21
Sector | % of Net Assets | |||
Information Technology | 18.5 | % | ||
Health Care | 17.6 | % | ||
Financials | 14.5 | % | ||
Industrials | 11.8 | % | ||
Consumer Discretionary | 9.6 | % | ||
Communication Services | 8.5 | % | ||
Consumer Staples | 5.9 | % | ||
Energy | 3.2 | % | ||
Materials | 3.2 | % | ||
Real Estate | 3.1 | % | ||
Utilities | 3.0 | % | ||
Short-Term Investments & Other Net Assets | 1.1 | % |
Sector Allocation and Top 10 Holdings are subject to change.
37
Table of Contents
Domestic Equity Portfolio
SCHEDULE OF INVESTMENTS
December 31, 2021
| Common Stocks (98.9%) | Shares/ Par + | Value $ (000’s) | ||||||
Communication Services (8.5%) |
| |||||||
Comcast Corp. - Class A | 598,111 | 30,103 | ||||||
Verizon Communications, Inc. | 576,800 | 29,971 | ||||||
The Walt Disney Co. * | 216,136 | 33,477 | ||||||
|
| |||||||
Total | 93,551 | |||||||
|
| |||||||
Consumer Discretionary (9.6%) |
| |||||||
Dollar General Corp. | 144,440 | 34,063 | ||||||
Dollar Tree, Inc. * | 268,900 | 37,786 | ||||||
The TJX Cos., Inc. | 438,500 | 33,291 | ||||||
|
| |||||||
Total | 105,140 | |||||||
|
| |||||||
Consumer Staples (5.9%) |
| |||||||
Archer-Daniels-Midland Co. | 468,500 | 31,666 | ||||||
Conagra Brands, Inc. | 968,233 | 33,065 | ||||||
|
| |||||||
Total | 64,731 | |||||||
|
| |||||||
Energy (3.2%) | ||||||||
ConocoPhillips | 489,000 | 35,296 | ||||||
|
| |||||||
Total | 35,296 | |||||||
|
| |||||||
Financials (14.5%) |
| |||||||
American International Group, Inc. | 534,100 | 30,369 | ||||||
Discover Financial Services | 278,613 | 32,197 | ||||||
MetLife, Inc. | 517,832 | 32,359 | ||||||
Truist Financial Corp. | 541,200 | 31,687 | ||||||
U.S. Bancorp | 577,100 | 32,416 | ||||||
|
| |||||||
Total | 159,028 | |||||||
|
| |||||||
| Common Stocks (98.9%) | Shares/ Par + | Value $ (000’s) | ||||||
Health Care (17.6%) | ||||||||
Baxter International, Inc. | 382,100 | 32,799 | ||||||
Cigna Corp. | 136,803 | 31,414 | ||||||
CVS Health Corp. | 357,200 | 36,849 | ||||||
Johnson & Johnson | 180,700 | 30,912 | ||||||
Merck & Co., Inc. | 409,500 | 31,384 | ||||||
Viatris, Inc. | 2,164,275 | 29,283 | ||||||
|
| |||||||
Total | 192,641 | |||||||
|
| |||||||
Industrials (11.8%) | ||||||||
Dover Corp. | 177,942 | 32,314 | ||||||
Honeywell International, Inc. | 140,860 | 29,371 | ||||||
Northrop Grumman Corp. | 89,200 | 34,527 | ||||||
Raytheon Co. | 384,279 | 33,071 | ||||||
|
| |||||||
Total | 129,283 | |||||||
|
| |||||||
Information Technology (18.5%) |
| |||||||
Broadcom, Inc. | 53,000 | 35,267 | ||||||
Cisco Systems, Inc. | 573,500 | 36,343 | ||||||
Cognizant Technology Solutions Corp. - Class A | 417,118 | 37,007 | ||||||
Fidelity National Information Services, Inc. | 279,427 | 30,499 | ||||||
Motorola Solutions, Inc. | 125,900 | 34,207 | ||||||
Oracle Corp. | 342,500 | 29,869 | ||||||
|
| |||||||
Total | 203,192 | |||||||
|
| |||||||
| Common Stocks (98.9%) | Shares/ Par + | Value $ (000’s) | ||||||
Materials (3.2%) | ||||||||
DuPont de Nemours, Inc. | 427,484 | 34,532 | ||||||
|
| |||||||
Total | 34,532 | |||||||
|
| |||||||
Real Estate (3.1%) | ||||||||
Equity Residential | 378,195 | 34,227 | ||||||
|
| |||||||
Total | 34,227 | |||||||
|
| |||||||
Utilities (3.0%) | ||||||||
Edison International | 485,700 | 33,149 | ||||||
|
| |||||||
Total | 33,149 | |||||||
|
| |||||||
Total Common Stocks |
| |||||||
(Cost: $782,179) |
| 1,084,770 | ||||||
|
| |||||||
| Short-Term Investments (1.0%) | ||||||||
Money Market Funds (1.0%) |
| |||||||
State Street Institutional U.S. Government Money Market Fund - Premier Class 0.030% # | 11,333,254 | 11,333 | ||||||
|
| |||||||
Total | 11,333 | |||||||
|
| |||||||
Total Short-Term Investments |
| |||||||
(Cost: $11,333) |
| 11,333 | ||||||
|
| |||||||
Total Investments (99.9%) |
| |||||||
(Cost: $793,512)@ |
| 1,096,103 | ||||||
|
| |||||||
Other Assets, Less |
| |||||||
Liabilities (0.1%) |
| 574 | ||||||
|
| |||||||
Net Assets (100.0%) |
| 1,096,677 | ||||||
|
| |||||||
| + | All par is stated in U.S. Dollar unless otherwise noted. |
| * | Non income producing |
| # | 7-Day yield as of 12/31/2021. |
| @ | At December 31, 2021, the aggregate cost of investments, including derivatives, for federal tax purposes (in thousands) was $794,250 and the net unrealized appreciation of investments based on that cost was $301,853 which is comprised of $314,218 aggregate gross unrealized appreciation and $12,365 aggregate gross unrealized depreciation. |
The Accompanying Notes are an Integral Part of the Financial Statements.
38
Table of Contents
Domestic Equity Portfolio
The following is a summary of the inputs used in valuing the Portfolio’s Investments at December 31, 2021. See Note 3 for additional information on portfolio valuation.
| Valuation Inputs | ||||||||||||||
| Description | Level 1 – Quoted Prices | Level 2 – Other Significant | Level 3 – Significant Unobservable Inputs | |||||||||||
| (Amounts in thousands) | ||||||||||||||
Assets: | ||||||||||||||
Common Stocks | $ | 1,084,770 | $ | - | $ | - | ||||||||
Short-Term Investments | 11,333 | - | - | |||||||||||
Total Assets: | $ | 1,096,103 | $ | - | $ | - | ||||||||
The Accompanying Notes are an Integral Part of the Financial Statements.
39
Table of Contents
Equity Income Portfolio (unaudited)
| Objective: | Portfolio Strategy: | Net Assets: | ||
| Long-term growth of capital and income. | Invest in common stocks with a focus on larger capitalization stocks with a strong track record of paying dividends, or that are believed to be undervalued. | $868 million |
PORTFOLIO OVERVIEW
Mason Street Advisors, LLC (“Mason Street Advisors”), the investment adviser for the Equity Income Portfolio (the “Portfolio”), has engaged T. Rowe Price Associates, Inc. (“T. Rowe Price”) to act as sub-adviser for the Portfolio. Normally, the Portfolio invests in common stocks, with an emphasis on larger capitalization stocks with a strong track record of paying dividends or that are believed to be undervalued. The Portfolio’s yield, which reflects the level of dividends paid by the Portfolio, is expected to normally exceed the yield of the Russell 1000® Value Index. The Portfolio will typically employ a value approach in selecting investments. The Portfolio’s in-house research team seeks to identify companies that appear to be undervalued as measured by price to earnings ratio, dividend yield, enterprise value to sales, among other metrics and may be temporarily out of favor but have good prospects for capital appreciation and dividend growth.
MARKET OVERVIEW
Despite the continuation of the coronavirus pandemic, major U.S. stock indices advanced in 2021, extending the brisk rebound that started in March 2020. Many indices repeatedly reached record highs throughout the year. Equities advanced as the economy reopened and recovered, facilitated by the rollout of COVID-19 vaccines, federal fiscal relief and robust corporate earnings growth. Factors that occasionally weighed on financial markets included elevated inflation, stemming in part from supply shortages and global supply chain disruptions, the emergence of COVID-19 variants and the Fed’s November 2021 decision to taper its monthly asset purchases.
PORTFOLIO RESULTS
The Portfolio returned 25.7% for the twelve months ended December 31, 2021. By comparison, the Portfolio’s benchmark, the Russell 1000® Value Index (the “Index”), returned 25.16%. (The Index is unmanaged, cannot be invested in directly and does not incur expenses.) According to Lipper® Analytical Services, Inc., an independent mutual fund ranking agency, the average return in 2021 of the Equity Income Funds peer group was 23.5%.
Overall, favorable sector positioning was primarily responsible for relative outperformance, while stock selection also had a positive impact
The Financials sector contributed the most to the Portfolio’s return, due to stock selection such as Wells Fargo and Company. The company advanced due to continued consumer credit resilience and the Fed greenlighting banks to resume returning capital to shareholders in the second half of 2021. Despite shares being impacted by headlines in which the OCC assessed a civil penalty against the company in relation to deficiencies in its lending loss mitigation program, the company delivered strong loan growth figures late in 2021, lifting shares.
The Information Technology sector also contributed to the Portfolio’s return, due to strong stock choices. Applied Materials, Inc. advanced as shares continued to benefit from cyclical strength within the industry and robust semiconductor demand over the year. Additionally, the Communication Services sector contributed, owing to a favorable underweight allocation.
On the downside, stock selection in the Consumer Discretionary sector was the largest detractor from the Portfolio’s performance. Las Vegas Sands Corporation declined following continued pandemic-related travel restrictions imposed by the Macanese government.
Stock selection in the Industrials sector also weighed on the Portfolio’s return as General Electric Company underperformed the broader sector for the period following a muted reaction to the company’s late-2021 proposed plan to split into three separate companies. Additionally, with the initial reports of the Omicron variant, there was growing concern within the market regarding the impact the variant would have on the aviation industry
PORTFOLIO MANAGER OUTLOOK
The following forward-looking comments are the opinion of T. Rowe Price, the Portfolio’s sub-adviser.
40
Table of Contents
Equity Income Portfolio (unaudited)
Market concerns surrounding the pandemic were met with an aggressive and coordinated fiscal and monetary policy response. Moving forward, all eyes remain on the trajectory of both the virus and government policy. Given this duality, we expect a choppy market throughout 2022, with a focus on potential missteps by the Fed. While fundamentals are strong, the equity market is relatively expensive, particularly on the growth side. However, low bond yields mean that there are few alternatives to equities.
Although markets are showing isolated signs of exuberance, the economic backdrop seems reasonable. For markets to continue their ascent, they will need to contend with concerns about pandemic dynamics, inflation and labor shortages. The intensity of each concern will likely have a strong bearing on equity market returns in 2022. Amid this backdrop, we remain consistent in our style with a focus on valuation, dividend yield and a long-term orientation
Relative Performance
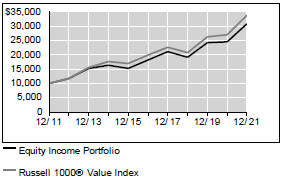
Average Annual Total Returns For Periods Ended December 31, 2021 | ||||||||||||
| 1 Year | 5 Years | 10 Years | ||||||||||
Equity Income Portfolio | 25.70 | % | 11.16 | % | 11.93 | % | ||||||
Russell 1000® Value Index | 25.16 | % | 11.16 | % | 12.97 | % | ||||||
Lipper® Variable Insurance Products (VIP) Equity Income Funds Average | 23.50 | % | 11.05 | % | 11.93 | % | ||||||
The performance data quoted represents past performance. Past performance is historical and does not guarantee future performance. Investment return and principal value will fluctuate, so that shares, when redeemed, may be worth more or less than their original cost. Current performance may be lower or higher than the performance data quoted. For the most recent month-end performance information visit www.northwesternmutual. com.
This chart assumes an initial investment of $10,000 made on 12/31/11. Returns shown reflect fee waivers, deductions for management and other portfolio expenses, and reinvestment of all dividends. In the absence of fee waivers, total return would be reduced. Returns exclude deductions for separate account sale loads and account fees. Please refer to the Benchmark Definitions section of this report for information about the indices cited in the above chart and graph.
The Portfolio invests with an emphasis on larger capitalization stocks with a strong track record of paying dividends or that are believed to be undervalued. The Portfolio may underperform similar funds that invest without an emphasis on dividend-paying stocks. Dividend-paying stocks may not participate in a broad market advance to the same degree as other stocks.
The U.S. federal funds rate has been subject to frequent adjustments over the course of the last several years. A significant rise in interest rates or economic downturn could cause a company to unexpectedly reduce or eliminate its dividend.
Top 10 Equity Holdings 12/31/21
| Security Description | % of Net Assets | |||
Wells Fargo & Co. | 3.9 | % | ||
QUALCOMM, Inc. | 3.0 | % | ||
The Southern Co., Various | 3.0 | % | ||
United Parcel Service, Inc. - Class B | 2.6 | % | ||
General Electric Co. | 2.5 | % | ||
American International Group, Inc. | 2.5 | % | ||
Anthem, Inc. | 2.4 | % | ||
Total SA, ADR | 2.3 | % | ||
Tyson Foods, Inc. - Class A | 1.9 | % | ||
Chubb, Ltd. | 1.9 | % | ||
41
Table of Contents
Equity Income Portfolio (unaudited)
Sector Allocation 12/31/21
| Sector | % of Net Assets | |||
Financials | 22.5 | % | ||
Health Care | 17.1 | % | ||
Industrials | 10.7 | % | ||
Information Technology | 9.3 | % | ||
Utilities | 8.9 | % | ||
Consumer Staples | 6.9 | % | ||
Energy | 5.4 | % | ||
Materials | 5.1 | % | ||
Communication Services | 4.6 | % | ||
Real Estate | 4.6 | % | ||
Consumer Discretionary | 3.6 | % | ||
Short-Term Investments & Other Net Assets | 1.3 | % | ||
Sector Allocation and Top 10 Holdings are subject to change.
42
Table of Contents
Equity Income Portfolio
SCHEDULE OF INVESTMENTS
December 31, 2021
| Common Stocks (97.3%) | Shares/ Par + | Value $ (000’s) | ||||||
Communication Services (4.6%) |
| |||||||
AT&T, Inc. | 106,362 | 2,616 | ||||||
Comcast Corp. - Class A | 256,030 | 12,886 | ||||||
Fox Corp. - Class B | 138,301 | 4,740 | ||||||
News Corp. - Class A | 423,356 | 9,445 | ||||||
Verizon Communications, Inc. | 19,814 | 1,030 | ||||||
The Walt Disney Co. * | 58,916 | 9,125 | ||||||
|
| |||||||
Total | 39,842 | |||||||
|
| |||||||
Consumer Discretionary (3.6%) |
| |||||||
Kohl’s Corp. | 106,983 | 5,284 | ||||||
Las Vegas Sands Corp. * | 147,615 | 5,556 | ||||||
Mattel, Inc. * | 266,453 | 5,745 | ||||||
The TJX Cos., Inc. | 78,554 | 5,964 | ||||||
Volkswagen Group of America Finance LLC | 431,074 | 8,656 | ||||||
|
| |||||||
Total | 31,205 | |||||||
|
| |||||||
Consumer Staples (6.9%) |
| |||||||
Altria Group, Inc. | 42,030 | 1,992 | ||||||
The Coca-Cola Co. | 79,424 | 4,703 | ||||||
Conagra Brands, Inc. | 274,277 | 9,366 | ||||||
Kimberly-Clark Corp. | 91,933 | 13,139 | ||||||
Mondelez International, Inc. | 8,400 | 557 | ||||||
Philip Morris International, Inc. | 109,017 | 10,357 | ||||||
Tyson Foods, Inc. - Class A | 193,369 | 16,854 | ||||||
Walmart, Inc. | 21,712 | 3,141 | ||||||
|
| |||||||
Total | 60,109 | |||||||
|
| |||||||
Energy (5.4%) |
| |||||||
Chevron Corp. | 12,200 | 1,432 | ||||||
EOG Resources, Inc. | 106,191 | 9,433 | ||||||
Exxon Mobil Corp. | 118,349 | 7,242 | ||||||
Halliburton Co. | 30,700 | 702 | ||||||
Hess Corp. | 8,200 | 607 | ||||||
Occidental Petroleum Corp. | 55,186 | 1,600 | ||||||
Targa Resources Corp. | 14,035 | 733 | ||||||
TC Energy Corp. | 109,305 | 5,087 | ||||||
Total SA, ADR | 405,133 | 20,038 | ||||||
|
| |||||||
Total | 46,874 | |||||||
|
| |||||||
Financials (22.5%) |
| |||||||
American International Group, Inc. | 375,262 | 21,337 | ||||||
Bank of America Corp. | 110,523 | 4,917 | ||||||
| Common Stocks (97.3%) | Shares/ Par + | Value $ (000’s) | ||||||
Financials continued |
| |||||||
The Bank of New York Mellon Corp. | 17,200 | 999 | ||||||
The Charles Schwab Corp. | 59,045 | 4,966 | ||||||
Chubb, Ltd. | 87,122 | 16,841 | ||||||
Citigroup, Inc. | 40,600 | 2,452 | ||||||
Citizens Financial | ||||||||
Group, Inc. | 25,713 | 1,215 | ||||||
Equitable Holdings, Inc. | 316,969 | 10,393 | ||||||
Fifth Third Bancorp | 348,465 | 15,176 | ||||||
Franklin Resources, Inc. | 30,228 | 1,012 | ||||||
The Goldman Sachs Group, Inc. | 27,100 | 10,367 | ||||||
The Hartford Financial Services Group, Inc. | 56,300 | 3,887 | ||||||
Huntington Bancshares, Inc. | 580,200 | 8,947 | ||||||
JPMorgan Chase & Co. | 31,846 | 5,043 | ||||||
Loews Corp. | 246,902 | 14,261 | ||||||
Marsh & McLennan Cos., Inc. | 7,484 | 1,301 | ||||||
MetLife, Inc. | 249,143 | 15,569 | ||||||
Morgan Stanley | 86,977 | 8,538 | ||||||
PNC Financial Services Group, Inc. | 14,931 | 2,994 | ||||||
Raymond James Financial, Inc. | 13,306 | 1,336 | ||||||
State Street Corp. | 110,300 | 10,258 | ||||||
Wells Fargo & Co. | 707,964 | 33,968 | ||||||
|
| |||||||
Total | 195,777 | |||||||
|
| |||||||
Health Care (16.7%) |
| |||||||
AbbVie, Inc. | 123,692 | 16,748 | ||||||
Anthem, Inc. | 44,554 | 20,653 | ||||||
AstraZeneca PLC, ADR | 57,500 | 3,349 | ||||||
Becton Dickinson and Co. | 54,491 | 13,703 | ||||||
Biogen, Inc. * | 8,600 | 2,063 | ||||||
Cardinal Health, Inc. | 73,300 | 3,774 | ||||||
Centene Corp. * | 68,100 | 5,612 | ||||||
Cigna Corp. | 37,884 | 8,699 | ||||||
CVS Health Corp. | 115,785 | 11,944 | ||||||
Gilead Sciences, Inc. | 18,977 | 1,378 | ||||||
GlaxoSmithKline PLC | 44,000 | 957 | ||||||
Johnson & Johnson | 61,724 | 10,559 | ||||||
Medtronic PLC | 104,155 | 10,775 | ||||||
Merck & Co., Inc. | 84,368 | 6,466 | ||||||
Organon & Co. | 3,696 | 113 | ||||||
Pfizer, Inc. | 193,655 | 11,435 | ||||||
Sanofi | 146,706 | 7,350 | ||||||
UnitedHealth Group, Inc. | 8,900 | 4,469 | ||||||
| Common Stocks (97.3%) | Shares/ Par + | Value $ (000’s) | ||||||
Health Care continued |
| |||||||
Zimmer Biomet Holdings, Inc. | 42,600 | 5,412 | ||||||
|
| |||||||
Total | 145,459 | |||||||
|
| |||||||
Industrials (10.7%) |
| |||||||
3M Co. | 9,500 | 1,688 | ||||||
The Boeing Co. * | 38,500 | 7,751 | ||||||
Flowserve Corp. | 23,281 | 712 | ||||||
General Electric Co. | 232,639 | 21,978 | ||||||
L3Harris Technologies, Inc. | 57,302 | 12,219 | ||||||
Nielsen Holdings PLC | 201,327 | 4,129 | ||||||
PACCAR, Inc. | 44,800 | 3,954 | ||||||
Siemens AG, ADR | 76,342 | 6,611 | ||||||
Snap-on, Inc. | 8,512 | 1,833 | ||||||
Southwest Airlines Co. * | 48,600 | 2,082 | ||||||
Stericycle, Inc. * | 117,123 | 6,985 | ||||||
United Parcel Service, Inc. - Class B | 106,382 | 22,802 | ||||||
|
| |||||||
Total | 92,744 | |||||||
|
| |||||||
Information Technology (9.3%) |
| |||||||
Applied Materials, Inc. | 58,583 | 9,219 | ||||||
Cisco Systems, Inc. | 82,950 | 5,256 | ||||||
Citrix Systems, Inc. | 70,140 | 6,635 | ||||||
Fiserv, Inc. * | 34,100 | 3,539 | ||||||
Microsoft Corp. | 42,291 | 14,223 | ||||||
NXP Semiconductors NV | 15,386 | 3,505 | ||||||
QUALCOMM, Inc. | 142,681 | 26,092 | ||||||
TE Connectivity, Ltd. | 16,300 | 2,630 | ||||||
Texas Instruments, Inc. | 49,230 | 9,278 | ||||||
|
| |||||||
Total | 80,377 | |||||||
|
| |||||||
Materials (5.1%) |
| |||||||
Akzo Nobel NV, ADR | 88,853 | 3,264 | ||||||
CF Industries Holdings, Inc. | 212,714 | 15,056 | ||||||
DuPont de Nemours, Inc. | 23,665 | 1,912 | ||||||
International Flavors & Fragrances, Inc. | 63,403 | 9,552 | ||||||
International Paper Co. | 280,380 | 13,172 | ||||||
RPM International, Inc. | 9,900 | 1,000 | ||||||
Sylvamo Corp. * | 633 | 18 | ||||||
|
| |||||||
Total | 43,974 | |||||||
|
| |||||||
Real Estate (4.6%) |
| |||||||
Equity Residential | 149,884 | 13,565 | ||||||
Rayonier, Inc. | 173,309 | 6,995 | ||||||
Vornado Realty Trust | 22,600 | 946 | ||||||
The Accompanying Notes are an Integral Part of the Financial Statements.
43
Table of Contents
Equity Income Portfolio
| Common Stocks (97.3%) | Shares/ Par + | Value $ (000’s) | ||||||
Real Estate continued |
| |||||||
Welltower, Inc. | 32,765 | 2,810 | ||||||
Weyerhaeuser Co. | 376,714 | 15,513 | ||||||
|
| |||||||
Total | 39,829 | |||||||
|
| |||||||
Utilities (7.9%) |
| |||||||
Ameren Corp. | 62,500 | 5,563 | ||||||
Dominion Resources, Inc. | 106,100 | 8,335 | ||||||
Entergy Corp. | 19,200 | 2,163 | ||||||
NextEra Energy, Inc. | 54,955 | 5,131 | ||||||
NiSource, Inc. | 347,114 | 9,584 | ||||||
Sempra Energy | 108,225 | 14,316 | ||||||
The Southern Co. | 322,328 | 22,105 | ||||||
Xcel Energy, Inc. | 19,400 | 1,313 | ||||||
|
| |||||||
Total | 68,510 | |||||||
|
| |||||||
Total Common Stocks |
| |||||||
(Cost: $609,582) | 844,700 | |||||||
|
| |||||||
| Preferred Stocks (0.3%) | Shares/ Par + | Value $ (000’s) | ||||||
Utilities (0.3%) | ||||||||
NiSource, Inc., 7.750%, | 23,878 | 2,674 | ||||||
|
| |||||||
Total | 2,674 | |||||||
|
| |||||||
Total Preferred Stocks | ||||||||
(Cost: $2,388) | 2,674 | |||||||
|
| |||||||
| Convertible Preferred Stocks (1.1%) | ||||||||
Health Care (0.4%) |
| |||||||
Becton Dickinson and Co., 6.000%, 6/1/23 | 59,093 | 3,117 | ||||||
|
| |||||||
Total | 3,117 | |||||||
|
| |||||||
Utilities (0.7%) |
| |||||||
NextEra Energy, Inc., 5.279%, 3/1/23 | 49,295 | 2,836 | ||||||
The Southern Co., 6.750%, 8/1/22 | 66,083 | 3,552 | ||||||
|
| |||||||
Total | 6,388 | |||||||
|
| |||||||
Total Convertible Preferred Stocks |
| |||||||
(Cost: $8,653) | 9,505 | |||||||
|
| |||||||
| Short-Term Investments (1.3%) | Shares/ Par + | Value $ (000’s) | ||||||
Money Market Funds (1.3%) |
| |||||||
State Street Institutional U.S. Government Money Market Fund - Premier Class 0.030% # | 10,873,116 | 10,873 | ||||||
|
| |||||||
Total | 10,873 | |||||||
|
| |||||||
Total Short-Term Investments |
| |||||||
(Cost: $10,873) | 10,873 | |||||||
|
| |||||||
Total Investments (100.0%) |
| |||||||
(Cost: $631,496)@ | 867,752 | |||||||
|
| |||||||
Other Assets, Less | ||||||||
Liabilities (0.0%) | 184 | |||||||
|
| |||||||
Net Assets (100.0%) | 867,936 | |||||||
|
| |||||||
| + | All par is stated in U.S. Dollar unless otherwise noted. |
| * | Non income producing |
| # | 7-Day yield as of 12/31/2021. |
| @ | At December 31, 2021, the aggregate cost of investments, including derivatives, for federal tax purposes (in thousands) was $632,981 and the net unrealized appreciation of investments based on that cost was $234,771 which is comprised of $249,323 aggregate gross unrealized appreciation and $14,552 aggregate gross unrealized depreciation. |
The following is a summary of the inputs used in valuing the Portfolio’s Investments at December 31, 2021. See Note 3 for additional information on portfolio valuation.
| Valuation Inputs | ||||||||||||||
| Description | Level 1 – Quoted Prices | Level 2 – Other Significant Observable Inputs | Level 3 – Significant Unobservable Inputs | |||||||||||
| (Amounts in thousands) | ||||||||||||||
| Assets: | ||||||||||||||
Preferred Stocks | $ | 2,674 | $ | - | $ | - | ||||||||
Common Stocks | 844,700 | - | - | |||||||||||
Convertible Preferred Stocks | 9,505 | - | - | |||||||||||
Short-Term Investments | 10,873 | - | - | |||||||||||
Total Assets: | $ | 867,752 | $ | - | $ | - | ||||||||
The Accompanying Notes are an Integral Part of the Financial Statements.
44
Table of Contents
Mid Cap Growth Stock Portfolio (unaudited)
| Objective: | Portfolio Strategy: | Net Assets: | ||
| Long-term growth of capital. | Invest primarily in common stocks of mid cap domestic companies selected on the basis of their potential for capital appreciation. | $1.4 billion |
PORTFOLIO OVERVIEW
Mason Street Advisors, LLC (“Mason Street Advisors”), the investment adviser for the Mid Cap Growth Stock Portfolio (the “Portfolio”), has engaged Wellington Management Company LLP (“Wellington”) to act as sub-adviser for the Portfolio. The Portfolio invests primarily in common stocks of mid cap companies selected on the basis of their potential for capital appreciation. The Portfolio focuses on companies that are determined to be of high quality. The key characteristics of high quality companies include a leadership position within an industry, a strong balance sheet, a high return on equity, and/or a strong management team. The Portfolio seeks to reduce overall risk by diversifying across sectors, industry groups and companies. The Portfolio’s sector exposure relative to its benchmark is driven by an investment process which relies on fundamental company analysis and individual stock selection.
MARKET OVERVIEW
U.S. equities advanced during 2021, despite markets contending with pandemic uncertainty, fluctuating economic growth projections and heightened concerns over U.S. Federal Reserve (Fed) policy actions. Inflation continued to increase amidst severe supply and labor shortages, rising energy prices and heightened demand for goods and services. Concerns that inflation could persist for longer than expected prompted the Fed to announce an accelerated tapering of asset purchases. The Fed also projected three interest rate increases in 2022, up from its September 2021 forecast of one increase. The rapid spread of the Omicron variant of COVID-19 prompted a renewal of restrictions and event cancellations late in 2021. Returns during the period varied by market capitalization, with large- and mid-capitalization stocks outperforming small-capitalization stocks.
PORTFOLIO RESULTS
The Portfolio returned 10.18% for the twelve months ended December 31, 2021. By comparison, the Portfolio’s benchmark, the Russell Midcap® Growth Index (the “Index”), returned 12.73%. (The Index is unmanaged, cannot be invested in directly, and does not incur expenses.) According to Lipper® Analytical Services, Inc., an independent mutual fund ranking agency, the average return in 2021 of the Mid Cap Growth Funds peer group was 13.23%.
Weak stock selection within the Health Care, Real Estate and Information Technology sectors detracted the most from the Portfolio’s return. In the Health Care sector, out-of-benchmark positions in Allakos, Inc. and ChemoCentryx, Inc., and an overweight position in Reata Pharmaceuticals, Inc. led to the decline. Allakos, Inc. declined sharply at the end of the period after the company reported disappointing results from studies of the pipeline drug Lirentelimab for the treatment of eosinophil gastrointestinal diseases. Reata Pharmaceuticals, Inc. declined at the end of 2021, following a Food and Drug Administration (FDA) panel’s unanimous vote that the benefits of the company’s kidney disease drug, Bardoxolone methyl, do not outweigh the risks. Additionally, an FDA panel’s surprising split vote on the question of whether the risk-benefit profile of the drug Tavneos supports approval, due to efficacy concerns, weighed negatively on ChemoCentryx stocks.
On the upside, strong selection in the Consumer Discretionary, Financials and Communication Services sectors contributed to the Portfolio’s return. Sector allocation, a residual of the Portfolio’s bottom-up stock selection process, contributed to relative performance, led by the Portfolio’s overweight position in the Real Estate sector and underweight position in the Communication Services sector.
The top contributors to the Portfolio’s performance included overweight positions in Information Technology companies Coherent, Inc. and Teradata Corp. Coherent, Inc. advanced during the period after the laser equipment maker accepted a bid from II-VI, Inc. that will exchange each Coherent, Inc. share for $220 in cash and 0.91 shares of II-VI, Inc. Teradata Corp. contributed, as the company provided enthusiastic guidance for 2021, highlighted by an aim to double cloud annual recurring revenue. An out-of-benchmark holding in Financials company Credit Acceptance Corp. also contributed. The subprime auto lender gained over the period after reporting a consolidated net income for the second quarter of 2021 of $288.6 million compared to $94.6 million for the same period in 2020.
PORTFOLIO MANAGER OUTLOOK
The following forward-looking comments are the opinion of Wellington, the Portfolio’s sub-adviser.
45
Table of Contents
Mid Cap Growth Stock Portfolio (unaudited)
At the end of the period, the Portfolio was most overweight the Financials, Utilities and Real Estate sectors and most underweight the Information Technology, Consumer Discretionary and Energy sectors.
Our premise that specific pockets of the market were overvalued (notably high growth software businesses) and supported by continued, low interest rates is beginning to play out as 2022 begins. Physical inflation and labor inflation continue to be persistent across many sectors. Our focus on market leaders in the mid-capitalization segment of the market typically leads us to companies with strong pricing power dynamics, however we are seeing some degree of short-term impact to several companies held within the Portfolio. Additionally, from a historical perspective, strong demand trends have been able to overcome inflation cost pressures within the Portfolio.
Areas that excite us include electrical equipment and technology infrastructure businesses with strong demand stories trading at attractive valuations that have been completely left behind in this multi-year rally. With the recent rotation from growth to value, we are now getting an opportunity to allocate more towards some secular growth stories that have fallen to more reasonable valuations. In addition, we remain excited about our collection of Health Care holdings and see the potential for a significant rebound in that area.
Relative Performance
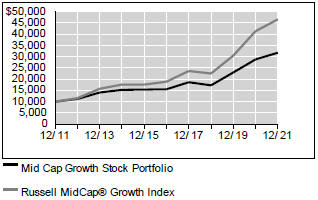
Average Annual Total Returns For Periods Ended December 31, 2021 | ||||||||||||
| 1 Year | 5 Years | 10 Years | ||||||||||
Mid Cap Growth Stock Portfolio | 10.18 | % | 15.41 | % | 12.23 | % | ||||||
Russell MidCap® Growth Index | 12.73 | % | 19.83 | % | 16.63 | % | ||||||
Lipper® Variable Insurance Products (VIP) Mid Cap Growth Funds Average | 13.23 | % | 19.98 | % | 15.73 | % | ||||||
The performance data quoted represents past performance. Past performance is historical and does not guarantee future performance. Investment return and principal value will fluctuate, so that shares, when redeemed, may be worth more or less than their original cost. Current performance may be lower or higher than the performance data quoted. For the most recent month-end performance information visit www.northwesternmutual.com.
This chart assumes an initial investment of $10,000 made on 12/31/11. Returns shown reflect fee waivers, deductions for management and other portfolio expenses, and reinvestment of all dividends. In the absence of fee
waivers, total return would be reduced. Returns exclude deductions for separate account sale loads and account fees. Please refer to the Benchmark Definitions section of this report for information about the indices cited in the above chart and graph.
Investing in medium-sized companies involves a greater degree of risk than investing in large company stocks. The Portfolio may invest a relatively high percentage of its assets in a particular sector. The Portfolio will have greater exposure to the risks associated with that sector and its performance will be tied more closely to the performance of the sector.
Top 10 Equity Holdings 12/31/21
| Security Description | % of Net Assets | |||||
Genpact, Ltd. | 2.3 | % | ||||
F5 Networks, Inc. | 2.3 | % | ||||
Ingersoll-Rand, Inc. | 2.2 | % | ||||
Credit Acceptance Corp. | 2.1 | % | ||||
II-VI, Inc. | 2.1 | % | ||||
NVR, Inc. | 2.0 | % | ||||
Lumentum Holdings, Inc. | 1.9 | % | ||||
Choice Hotels International, Inc. | 1.8 | % | ||||
WEX, Inc. | 1.7 | % | ||||
MKS Instruments, Inc. | 1.7 | % | ||||
46
Table of Contents
Mid Cap Growth Stock Portfolio (unaudited)
Sector Allocation 12/31/21
| Sector | % of Net Assets | |||||||
Information Technology | 26.6 | % | ||||||
Health Care | 17.6 | % | ||||||
Industrials | 16.7 | % | ||||||
Financials | 12.3 | % | ||||||
Consumer Discretionary | 12.2 | % | ||||||
Real Estate | 4.7 | % | ||||||
Materials | 3.1 | % | ||||||
Communication Services | 3.0 | % | ||||||
Utilities | 2.6 | % | ||||||
Consumer Staples | 1.1 | % | ||||||
Energy | 0.1 | % | ||||||
Short-Term Investments & Other Net Assets | 0.0 | % | ||||||
Sector Allocation and Top 10 Holdings are subject to change.
47
Table of Contents
Mid Cap Growth Stock Portfolio
SCHEDULE OF INVESTMENTS
December 31, 2021
| Common Stocks (100.0%) | Shares/ Par + | Value $ (000’s) | ||||||
Communication Services (3.0%) |
| |||||||
Cable One, Inc. | 11,693 | 20,620 | ||||||
CarGurus, Inc. * | 317,234 | 10,672 | ||||||
Zynex, Inc. * | 1,443,446 | 9,238 | ||||||
|
| |||||||
Total | 40,530 | |||||||
|
| |||||||
Consumer Discretionary (12.2%) |
| |||||||
Arrival SA * | 366,968 | 2,723 | ||||||
CarMax, Inc. * | 93,498 | 12,176 | ||||||
Carter’s, Inc. | 138,265 | 13,995 | ||||||
Chewy, Inc. * | 101,911 | 6,010 | ||||||
Choice Hotels International, Inc. | 154,804 | 24,148 | ||||||
Etsy, Inc. * | 100,848 | 22,080 | ||||||
Hyatt Hotels Corp. - Class A * | 80,822 | 7,751 | ||||||
NVR, Inc. * | 4,627 | 27,340 | ||||||
PVH Corp. | 137,069 | 14,619 | ||||||
Under Armour, Inc. - | 660,477 | 11,915 | ||||||
Vizio Holding Corp. * | 299,188 | 5,813 | ||||||
YETI Holdings, Inc. * | 238,515 | 19,756 | ||||||
|
| |||||||
Total | 168,326 | |||||||
|
| |||||||
Consumer Staples (1.1%) |
| |||||||
Lamb Weston Holdings, Inc. | 225,175 | 14,271 | ||||||
Performance Food Group | 14,181 | 651 | ||||||
|
| |||||||
Total | 14,922 | |||||||
|
| |||||||
Energy (0.1%) |
| |||||||
Cabot Oil & Gas Corp. | 75,054 | 1,426 | ||||||
|
| |||||||
Total | 1,426 | |||||||
|
| |||||||
Financials (12.3%) |
| |||||||
Credit Acceptance Corp. * | 42,896 | 29,499 | ||||||
Cullen / Frost Bankers, Inc. | 101,236 | 12,763 | ||||||
Erie Indemnity Co. | 28,213 | 5,435 | ||||||
First Citizens BancShares, Inc. - Class A | 20,435 | 16,958 | ||||||
First Republic Bank | 81,044 | 16,736 | ||||||
FNF Group | 214,392 | 11,187 | ||||||
Globe Life, Inc. | 100,619 | 9,430 | ||||||
Hamilton Lane, Inc. | 70,230 | 7,277 | ||||||
M&T Bank Corp. | 95,734 | 14,703 | ||||||
Markel Corp. * | 14,192 | 17,513 | ||||||
Prosperity Bancshares, Inc. | 153,494 | 11,098 | ||||||
W.R. Berkley Corp. | 96,431 | 7,945 | ||||||
| Common Stocks (100.0%) | Shares/ Par + | Value $ (000’s) | ||||||
Financials continued |
| |||||||
White Mountains Insurance Group, Ltd. | 8,494 | 8,612 | ||||||
|
| |||||||
Total | 169,156 | |||||||
|
| |||||||
Health Care (17.6%) |
| |||||||
Alnylam Pharmaceuticals, Inc. * | 17,830 | 3,024 | ||||||
Apellis Pharmaceuticals, Inc. * | 315,669 | 14,925 | ||||||
Arena Pharmaceuticals, Inc. * | 97,053 | 9,020 | ||||||
Bio-Techne Corp. | 4,065 | 2,103 | ||||||
Encompass Health Corp. | 84,375 | 5,506 | ||||||
Exact Sciences Corp. * | 124,323 | 9,676 | ||||||
ICON PLC * | 64,461 | 19,963 | ||||||
Inari Medical, Inc. * | 68,343 | 6,238 | ||||||
Insulet Corp. * | 5,499 | 1,463 | ||||||
Integra LifeSciences Holdings Corp. * | 294,829 | 19,751 | ||||||
Iovance Biotherapeutics, Inc. * | 559,358 | 10,678 | ||||||
Jazz Pharmaceuticals PLC * | 143,534 | 18,286 | ||||||
Kodiak Sciences, Inc. * | 118,949 | 10,084 | ||||||
Masimo Corp. * | 6,919 | 2,026 | ||||||
Mirati Therapeutics, Inc. * | 50,579 | 7,419 | ||||||
Molina Healthcare, Inc. * | 51,033 | 16,233 | ||||||
NeoGenomics, Inc. * | 126,427 | 4,314 | ||||||
Nevro Corp. * | 48,361 | 3,921 | ||||||
PTC Therapeutics, Inc. * | 292,958 | 11,668 | ||||||
Reata Pharmaceuticals, Inc. * | 141,509 | 3,732 | ||||||
Sage Therapeutics, Inc. * | 280,183 | 11,919 | ||||||
Syneos Health, Inc. * | 136,372 | 14,003 | ||||||
Teleflex, Inc. | 44,889 | 14,745 | ||||||
Ultragenyx Pharmaceutical, Inc. * | 140,936 | 11,851 | ||||||
United Therapeutics Corp. * | 45,534 | 9,839 | ||||||
|
| |||||||
Total | 242,387 | |||||||
|
| |||||||
| Common Stocks (100.0%) | Shares/ Par + | Value $ (000’s) | ||||||
Industrials (16.7%) |
| |||||||
AMERCO | 22,882 | 16,618 | ||||||
Axon Enterprise, Inc. * | 90,591 | 14,223 | ||||||
Builders FirstSource, Inc. * | 133,375 | 11,432 | ||||||
Dun & Bradstreet Holdings, Inc. * | 690,208 | 14,142 | ||||||
GFL Environmental, Inc. | 410,345 | 15,532 | ||||||
Graco, Inc. | 97,767 | 7,882 | ||||||
IAA, Inc. * | 107,625 | 5,448 | ||||||
IDEX Corp. | 96,708 | 22,854 | ||||||
Ingersoll-Rand, Inc. | 493,082 | 30,507 | ||||||
J.B. Hunt Transport Services, Inc. | 17,216 | 3,519 | ||||||
Knight-Swift Transportation Holdings, Inc. | 274,889 | 16,752 | ||||||
Lennox International, Inc. | 59,856 | 19,415 | ||||||
Lincoln Electric Holdings, Inc. | 106,992 | 14,922 | ||||||
The Middleby Corp. * | 45,859 | 9,023 | ||||||
Science Applications International Corp. | 91,342 | 7,635 | ||||||
Wabtec Corp. | 94,229 | 8,679 | ||||||
Watsco, Inc. | 34,074 | 10,661 | ||||||
|
| |||||||
Total | 229,244 | |||||||
|
| |||||||
Information Technology (26.6%) |
| |||||||
Black Knight, Inc. * | 84,697 | 7,021 | ||||||
CDW Corp. | 67,431 | 13,809 | ||||||
CommScope Holding Co., Inc. * | 1,094,215 | 12,080 | ||||||
Digital Turbine, Inc. * | 204,021 | 12,443 | ||||||
F5 Networks, Inc. * | 127,837 | 31,283 | ||||||
First Solar, Inc. * | 266,467 | 23,225 | ||||||
Flex, Ltd. * | 1,172,462 | 21,491 | ||||||
Genpact, Ltd. | 598,181 | 31,751 | ||||||
Guidewire Software, Inc. * | 121,247 | 13,765 | ||||||
II-VI, Inc. * | 423,274 | 28,922 | ||||||
Informatica, Inc. * | 245,772 | 9,089 | ||||||
LiveRamp Holdings, Inc. * | 181,250 | 8,691 | ||||||
Lumentum Holdings, Inc. * | 244,960 | 25,909 | ||||||
MKS Instruments, Inc. | 133,892 | 23,320 | ||||||
National Instruments Corp. | 112,516 | 4,914 | ||||||
Olo, Inc. * | 243,904 | 5,076 | ||||||
Q2 Holdings, Inc. * | 130,748 | 10,387 | ||||||
Shift4 Payments, Inc. * | 178,271 | 10,327 | ||||||
Silicon Laboratories, Inc. * | 68,070 | 14,051 | ||||||
The Accompanying Notes are an Integral Part of the Financial Statements.
48
Table of Contents
Mid Cap Growth Stock Portfolio
| Common Stocks (100.0%) | Shares/ Par + | Value $ (000’s) | ||||||
Information Technology continued |
| |||||||
Synaptics, Inc. * | 65,811 | 19,053 | ||||||
Teradata Corp. * | 358,692 | 15,234 | ||||||
WEX, Inc. * | 168,932 | 23,716 | ||||||
|
| |||||||
Total | 365,557 | |||||||
|
| |||||||
Materials (3.1%) |
| |||||||
Element Solutions, Inc. | 738,184 | 17,923 | ||||||
Silgan Holdings, Inc. | 258,246 | 11,063 | ||||||
Steel Dynamics, Inc. | 220,715 | 13,700 | ||||||
|
| |||||||
Total | 42,686 | |||||||
|
| |||||||
Real Estate (4.7%) |
| |||||||
Life Storage, Inc. | 137,218 | 21,019 | ||||||
PS Business Parks, Inc. | 33,174 | 6,110 | ||||||
Redfin Corp. * | 182,995 | 7,025 | ||||||
Rexford Industrial Realty, Inc. | 209,766 | 17,014 | ||||||
Store Capital Corp. | 392,922 | 13,516 | ||||||
|
| |||||||
Total | 64,684 | |||||||
|
| |||||||
Utilities (2.6%) |
| |||||||
Black Hills Corp. | 127,317 | 8,985 | ||||||
NiSource, Inc. | 203,634 | 5,622 | ||||||
UGI Corp. | 468,197 | 21,495 | ||||||
|
| |||||||
Total | 36,102 | |||||||
|
| |||||||
Total Common Stocks | ||||||||
(Cost: $1,057,819) | 1,375,020 | |||||||
|
| |||||||
| Short-Term Investments (0.1%) | ||||||||
Money Market Funds (0.1%) |
| |||||||
State Street Institutional U.S. Government Money Market Fund - Premier Class 0.030% # | 1,639,058 | 1,639 | ||||||
|
| |||||||
Total | 1,639 | |||||||
|
| |||||||
Total Short-Term | ||||||||
(Cost: $1,639) | 1,639 | |||||||
|
| |||||||
Total Investments | ||||||||
(Cost: $1,059,458)@ | 1,376,659 | |||||||
|
| |||||||
Other Assets, Less | ||||||||
Liabilities (-0.1%) | (1,091 | ) | ||||||
|
| |||||||
Net Assets (100.0%) | 1,375,568 | |||||||
|
| |||||||
| + | All par is stated in U.S. Dollar unless otherwise noted. |
| * | Non income producing |
| # | 7-Day yield as of 12/31/2021. |
| @ | At December 31, 2021, the aggregate cost of investments, including derivatives, for federal tax purposes (in thousands) was $1,065,384 and the net unrealized appreciation of investments based on that cost was $311,275 which is comprised of $371,338 aggregate gross unrealized appreciation and $60,063 aggregate gross unrealized depreciation. |
The Accompanying Notes are an Integral Part of the Financial Statements.
49
Table of Contents
Mid Cap Growth Stock Portfolio
The following is a summary of the inputs used in valuing the Portfolio’s Investments at December 31, 2021. See Note 3 for additional information on portfolio valuation.
| Description | Valuation Inputs | |||||||||||||
Level 1 – Quoted Prices | Level 2 – Other Significant Observable Inputs | Level 3 – Significant Unobservable Inputs | ||||||||||||
| (Amounts in thousands) | ||||||||||||||
Assets: | ||||||||||||||
Common Stocks | $ | 1,375,020 | $ | - | $ | - | ||||||||
Short-Term Investments | 1,639 | - | - | |||||||||||
Total Assets: | $ | 1,376,659 | $ | - | $ | - | ||||||||
The Accompanying Notes are an Integral Part of the Financial Statements.
50
Table of Contents
Index 400 Stock Portfolio (unaudited)
| Objective: | Portfolio Strategy: | Net Assets: | ||
| Investment results that approximate the performance of the S&P MidCap 400® Index. | Invest in stocks that make up the S&P MidCap 400® Index, holding each stock in approximately the same proportion as its weighting in the Index. | $1.3 billion |
PORTFOLIO OVERVIEW
Mason Street Advisors, LLC (“Mason Street Advisors”), the investment adviser for the Index 400 Stock Portfolio (“the Portfolio”), has engaged Northern Trust Investments, Inc. (“Northern Trust”) to act as sub-adviser for the Portfolio. The Portfolio seeks investment results that approximate the performance of the S&P MidCap 400® Index, which is composed of the stocks of companies whose capitalizations generally are smaller than those of companies that comprise the S&P 500® Index. The S&P MidCap 400® Index does not include the stocks of the very large companies that account for most of the weighting in the S&P 500® Index. The Portfolio attempts to achieve its objective by investing all, or substantially all, of its assets in the stocks that make up the S&P MidCap 400® Index, holding each stock in approximately the same proportion as its weighting in the Index. This is known as a full replication strategy. The Portfolio may also invest in equity index futures and exchange traded funds for cash management and liquidity purposes and to help achieve full replication.
MARKET OVERVIEW
U.S. equity markets gained during the reporting period, supported by a broad economic recovery following the COVID- 19-related disruptions of 2020, to reach a series of record highs throughout the year. The widespread distribution of vaccines helped consumers return to their pre-pandemic activities and spending habits. The Federal Reserve maintained its accommodative policy stance during the year, with near-zero interest rates and bond-buying programs continuing to provide monetary stimulus. Rising raw material costs and energy prices, higher wages and supply-chain constraints led to a significant increase in inflation. However, the strong growth in consumer spending helped boost corporate earnings.
In this environment, large cap stocks, as represented by the S&P 500® Index, posted a return of 28.71%, outperforming the S&P MidCap 400® and the S&P SmallCap 600® Indices, which returned 24.76% and 26.82%, respectively. Meanwhile, the broader bond market, as represented by the Bloomberg® U.S. Aggregate Index, returned (1.54%), while the Bloomberg® U.S. Corporate High Yield Index advanced 5.28%.
PORTFOLIO RESULTS
The Index 400 Stock Portfolio delivered a total return of 24.46% for the twelve months ended December 31, 2021. By comparison, the S&P MidCap 400® Index (“the Index”) returned 24.76%. (The Index is unmanaged, cannot be invested in directly and does not incur expenses.) Portfolio performance slightly lagged the Index due to transaction costs, administrative expenses, cash flow effects and costs associated with the use of equity index futures contracts. According to Lipper® Analytical Services, Inc., an independent mutual fund ranking agency, the average return in 2021 of the S&P Midcap 400® Index Funds peer group was 24.14%.
All eleven of the Portfolio’s sectors advanced for the reporting period. The Industrials sector was the largest contributor to the Portfolio’s return, as companies innovated to meet the needs of customers navigating the impacts of the prolonged COVID-19 pandemic. Machinery companies benefitted from technological advances, such as increased cloud connectivity, as well as mergers and acquisition activity that helped them broaden their product portfolios. Companies in the commercial services and supplies sector saw increased demand for their offerings to help address various pandemic-driven needs, from supporting clinical trials to remote customer services. Labor shortages and a housing supply-demand imbalance supported companies in the building products industry.
The Financials sector also contributed to the Portfolio’s return, as lending and underwriting activity increased in the wake of a broader U.S. economic recovery following the disruptions of 2020. Banks benefitted from expansion into new and specialist markets, such as digital currencies and China, as well as through an increase in loan underwriting later in the year. Insurance companies were buoyed by strong pricing, which helped drive profitability amid increased renewal rates.
Stocks in the Consumer Discretionary sector also advanced, as the availability of vaccines encouraged more travel and leisure among consumers. Companies in the hotel, restaurants and leisure industry were supported by an increase in domestic travel, with more Americans opting to visit locations closer to home. Gaming companies that brought betting direct to consumers also performed well. The specialty retail sector continued to benefit from consumer interest in at-home activities, such as home decor and health and wellness.
51
Table of Contents
Index 400 Stock Portfolio (unaudited)
Relative Performance
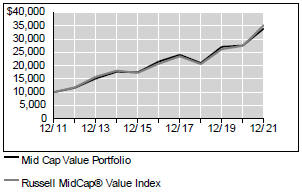
Average Annual Total Returns For Periods Ended December 31, 2021 | ||||||||||||
| 1 Year | 5 Years | 10 Years | ||||||||||
Index 400 Stock Portfolio | 24.46 | % | 12.80 | % | 13.91 | % | ||||||
S&P MidCap 400® Index | 24.76 | % | 13.07 | % | 14.19 | % | ||||||
Lipper® Variable Insurance Products (VIP) S&P Midcap 400 Index Funds | 24.14 | % | 12.53 | % | 13.59 | % | ||||||
The performance data quoted represents past performance. Past performance is historical and does not guarantee future performance. Investment return and principal value will fluctuate, so that shares, when redeemed, may be worth more or less than their original cost. Current performance may be lower or higher than the performance data quoted. For the most recent month-end performance information visit www.northwesternmutual.com.
This chart assumes an initial investment of $10,000 made on 12/31/11. Returns shown reflect fee waivers, deductions for management and other portfolio expenses, and reinvestment of all dividends. In the absence of fee waivers, total return would be reduced. Returns exclude deductions for separate account sale loads and account fees. Please refer to the Benchmark Definitions section of this report for information about the indices cited in the above chart and graph.
“Standard & Poor’s®”, “S&P®”, “S&P MidCap 400 Index” and “Standard & Poor’s MidCap 400 Index” are trademarks of The McGraw-Hill Companies, Inc. and have been licensed for use by Northwestern Mutual Life Insurance Company. The Portfolio is not sponsored, endorsed, sold or promoted by Standard & Poor’s, and Standard & Poor’s makes no representation regarding the advisability of investing in the Portfolio.
Investing in medium-sized companies involves a greater degree of risk than investing in large company stocks.
The Portfolio may invest in exchange traded funds and derivative instruments, such as equity index futures for cash management and liquidity purposes to help achieve full replication. Use of these instruments may involve certain costs and imposes certain risks such as liquidity risk, market risk, credit risk, management risk and the risk of mispricing or improper valuation. Certain derivatives involve leverage, which could magnify losses, and portfolios investing in derivatives could lose more than the principal amount invested in those instruments.
Top 10 Equity Holdings 12/31/21
Security Description | % of Net Assets | |||
Molina Healthcare, Inc. | 0.7 | % | ||
Camden Property Trust | 0.7 | % | ||
Builders FirstSource, Inc. | 0.7 | % | ||
Trex Co., Inc. | 0.6 | % | ||
Masimo Corp. | 0.6 | % | ||
Medical Properties Trust, Inc. | 0.6 | % | ||
Nordson Corp. | 0.6 | % | ||
Cognex Corp. | 0.6 | % | ||
Graco, Inc. | 0.6 | % | ||
Repligen Corp. | 0.6 | % |
Sector Allocation 12/31/21
Sector | % of Net Assets | |||
Industrials | 18.1 | % | ||
Consumer Discretionary | 15.3 | % | ||
Information Technology | 14.7 | % | ||
Financials | 13.5 | % | ||
Real Estate | 10.2 | % | ||
Health Care | 9.8 | % | ||
Materials | 6.7 | % | ||
Consumer Staples | 3.4 | % | ||
Utilities | 3.3 | % | ||
Energy | 2.1 | % | ||
Communication Services | 1.7 | % | ||
Short-Term Investments & Other Net Assets | 1.2 | % |
Sector Allocation and Top 10 Holdings are subject to change.
52
Table of Contents
Index 400 Stock Portfolio
SCHEDULE OF INVESTMENTS
December 31, 2021
| Common Stocks (98.8%) | Shares/ Par + | Value $ (000’s) | ||||||
Communication Services (1.7%) |
| |||||||
Cable One, Inc. | 2,654 | 4,680 | ||||||
Iridium Communications, Inc. * | 70,781 | 2,923 | ||||||
John Wiley & Sons, Inc. - Class A | 23,314 | 1,335 | ||||||
The New York Times Co. - Class A | 89,462 | 4,321 | ||||||
TEGNA, Inc. | 118,469 | 2,199 | ||||||
TripAdvisor, Inc. * | 53,044 | 1,446 | ||||||
World Wrestling Entertainment, Inc.- Class A | 23,990 | 1,184 | ||||||
Yelp, Inc. * | 36,785 | 1,333 | ||||||
Ziff Davis, Inc. * | 25,819 | 2,862 | ||||||
|
| |||||||
Total | 22,283 | |||||||
|
| |||||||
Consumer Discretionary (15.3%) |
| |||||||
Adient PLC * | 50,470 | 2,417 | ||||||
American Eagle Outfitters, Inc. | 82,155 | 2,080 | ||||||
AutoNation, Inc. * | 21,411 | 2,502 | ||||||
Boyd Gaming Corp. * | 43,909 | 2,879 | ||||||
Brunswick Corp. | 41,279 | 4,158 | ||||||
Callaway Golf Co. * | 62,738 | 1,722 | ||||||
Capri Holdings, Ltd. * | 80,488 | 5,225 | ||||||
Carter’s, Inc. | 22,628 | 2,290 | ||||||
Choice Hotels International, Inc. | 17,573 | 2,741 | ||||||
Churchill Downs, Inc. | 18,430 | 4,440 | ||||||
Columbia Sportswear Co. | 18,515 | 1,804 | ||||||
Cracker Barrel Old Country Store, Inc. | 12,627 | 1,624 | ||||||
Crocs, Inc. * | 31,509 | 4,040 | ||||||
Dana Holding Corp. | 76,830 | 1,753 | ||||||
Deckers Outdoor Corp. * | 14,697 | 5,384 | ||||||
Dick’s Sporting Goods, Inc. | 34,699 | 3,990 | ||||||
Five Below, Inc. * | 29,998 | 6,206 | ||||||
Foot Locker, Inc. | 48,376 | 2,111 | ||||||
Fox Factory Holding Corp. * | 22,548 | 3,835 | ||||||
GameStop Corp. - Class A * | 33,173 | 4,923 | ||||||
Gentex Corp. | 126,449 | 4,407 | ||||||
The Goodyear Tire & Rubber | 150,482 | 3,208 | ||||||
Graham Holdings Co. - Class B | 2,145 | 1,351 | ||||||
Grand Canyon Education, Inc. * | 21,439 | 1,838 | ||||||
H&R Block, Inc. | 94,283 | 2,221 | ||||||
| Common Stocks (98.8%) | Shares/ Par + | Value $ (000’s) | ||||||
Consumer Discretionary continued |
| |||||||
Hanesbrands, Inc. | 186,957 | 3,126 | ||||||
Harley-Davidson, Inc. | 82,413 | 3,106 | ||||||
Helen of Troy, Ltd. * | 12,917 | 3,158 | ||||||
Jack in the Box, Inc. | 11,610 | 1,016 | ||||||
KB Home | 45,889 | 2,053 | ||||||
Kohl’s Corp. | 80,607 | 3,981 | ||||||
Lear Corp. | 31,930 | 5,842 | ||||||
Leggett & Platt, Inc. | 71,408 | 2,939 | ||||||
Lithia Motors, Inc. - Class A | 16,215 | 4,815 | ||||||
Macy’s, Inc. | 165,831 | 4,341 | ||||||
Marriott Vacations Worldwide Corp. | 22,803 | 3,853 | ||||||
Mattel, Inc. * | 187,600 | 4,045 | ||||||
Murphy USA, Inc. | 12,644 | 2,519 | ||||||
Nordstrom, Inc. * | 59,301 | 1,341 | ||||||
Ollie’s Bargain Outlet Holdings, | 32,408 | 1,659 | ||||||
Papa John’s International, Inc. | 17,327 | 2,313 | ||||||
Polaris Industries, Inc. | 30,542 | 3,357 | ||||||
Restoration Hardware, Inc. * | 9,288 | 4,978 | ||||||
Scientific Games Corp. - Class A * | 51,674 | 3,453 | ||||||
Service Corp. International | 88,259 | 6,266 | ||||||
Six Flags Entertainment Corp. * | 41,435 | 1,764 | ||||||
Skechers USA, Inc. - Class A * | 72,232 | 3,135 | ||||||
Taylor Morrison Home Corp. * | 65,798 | 2,300 | ||||||
Tempur Sealy International, Inc. | 103,067 | 4,847 | ||||||
Texas Roadhouse, Inc. | 37,285 | 3,329 | ||||||
Thor Industries, Inc. | 29,730 | 3,085 | ||||||
Toll Brothers, Inc. | 61,245 | 4,434 | ||||||
TopBuild Corp. * | 17,627 | 4,863 | ||||||
Travel + Leisure Co. | 46,205 | 2,554 | ||||||
TRI Pointe Homes, Inc. * | 59,515 | 1,660 | ||||||
Urban Outfitters, Inc. * | 35,311 | 1,037 | ||||||
Victoria’s Secret & Co. * | 38,796 | 2,155 | ||||||
Visteon Corp. * | 15,012 | 1,668 | ||||||
The Wendy’s Co. | 94,354 | 2,250 | ||||||
Williams-Sonoma, Inc. | 39,776 | 6,727 | ||||||
Wingstop, Inc. | 15,967 | 2,759 | ||||||
Wyndham Hotels & Resorts, Inc. | 49,883 | 4,472 | ||||||
YETI Holdings, Inc. * | 46,931 | 3,887 | ||||||
|
| |||||||
Total | 204,236 | |||||||
|
| |||||||
| Common Stocks (98.8%) | Shares/ Par + | Value $ (000’s) | ||||||
Consumer Staples (3.4%) |
| |||||||
BJ’s Wholesale Club Holdings, Inc. * | 73,109 | 4,896 | ||||||
The Boston Beer Co., Inc. - Class A * | 5,026 | 2,539 | ||||||
Casey’s General Stores, Inc. | 19,871 | 3,922 | ||||||
Coty, Inc. - Class A * | 179,686 | 1,887 | ||||||
Darling Ingredients, Inc. * | 86,641 | 6,003 | ||||||
Energizer Holdings, Inc. | 33,691 | 1,351 | ||||||
Flowers Foods, Inc. | 106,441 | 2,924 | ||||||
Grocery Outlet Holding Corp. * | 46,775 | 1,323 | ||||||
The Hain Celestial Group, Inc. * | 49,552 | 2,111 | ||||||
Ingredion, Inc. | 35,637 | 3,444 | ||||||
Lancaster Colony Corp. | 10,620 | 1,759 | ||||||
Nu Skin Enterprises, Inc. | 26,726 | 1,356 | ||||||
Performance Food Group Co. * | 82,618 | 3,791 | ||||||
Pilgrim’s Pride Corp. * | 25,800 | 728 | ||||||
Post Holdings, Inc. * | 31,354 | 3,534 | ||||||
Sanderson Farms, Inc. | 11,361 | 2,171 | ||||||
Sprouts Farmers Market, Inc. * | 60,079 | 1,783 | ||||||
|
| |||||||
Total | 45,522 | |||||||
|
| |||||||
Energy (2.1%) | ||||||||
Antero Midstream Corp. | 173,835 | 1,683 | ||||||
ChampionX Corp. * | 108,197 | 2,187 | ||||||
CNX Resources Corp. * | 113,099 | 1,555 | ||||||
DT Midstream, Inc. | 51,788 | 2,485 | ||||||
EQT Corp. * | 161,883 | 3,531 | ||||||
Equitrans Midstream Corp. | 217,644 | 2,250 | ||||||
HollyFrontier Corp. | 80,022 | 2,623 | ||||||
Murphy Oil Corp. | 77,739 | 2,030 | ||||||
NOV, Inc. | 209,196 | 2,834 | ||||||
Targa Resources Corp. | 122,599 | 6,404 | ||||||
|
| |||||||
Total | 27,582 | |||||||
|
| |||||||
Financials (13.5%) | ||||||||
Affiliated Managers Group, Inc. | 21,761 | 3,580 | ||||||
Alleghany Corp. * | 7,331 | 4,894 | ||||||
American Financial Group, Inc. | 35,423 | 4,864 | ||||||
Associated Banc-Corp. | 80,319 | 1,814 | ||||||
Bank of Hawaii Corp. | 21,674 | 1,815 | ||||||
Bank OZK | 64,745 | 3,013 | ||||||
The Accompanying Notes are an Integral Part of the Financial Statements.
53
Table of Contents
Index 400 Stock Portfolio
| Common Stocks (98.8%) | Shares/ Par + | Value $ (000’s) | ||||||
Financials continued |
| |||||||
Brighthouse Financial, Inc. * | 42,739 | 2,214 | ||||||
Cadence Bank | 104,892 | 3,125 | ||||||
Cathay General Bancorp | 41,502 | 1,784 | ||||||
CIT Group, Inc. | 53,093 | 2,726 | ||||||
CNO Financial Group, Inc. | 66,048 | 1,575 | ||||||
Commerce Bancshares, Inc. | 59,435 | 4,086 | ||||||
Cullen / Frost Bankers, Inc. | 30,362 | 3,828 | ||||||
East West Bancorp, Inc. | 75,977 | 5,978 | ||||||
Essent Group, Ltd. | 58,996 | 2,686 | ||||||
Evercore, Inc. - Class A | 20,895 | 2,839 | ||||||
F.N.B. Corp. | 170,610 | 2,069 | ||||||
Federated Investors, Inc. - Class B | 51,649 | 1,941 | ||||||
First American Financial Corp. | 58,768 | 4,597 | ||||||
First Financial Bankshares, Inc. | 68,649 | 3,490 | ||||||
First Horizon National Corp. | 289,440 | 4,727 | ||||||
FirstCash Holdings, Inc. | 21,402 | 1,601 | ||||||
Fulton Financial Corp. | 86,476 | 1,470 | ||||||
Glacier Bancorp, Inc. | 58,072 | 3,293 | ||||||
Hancock Holding Co. | 46,477 | 2,325 | ||||||
Hanover Insurance Group, Inc. | 19,048 | 2,496 | ||||||
Home BancShares, Inc. | 80,702 | 1,965 | ||||||
Interactive Brokers Group, Inc. - Class A | 46,780 | 3,715 | ||||||
International Bancshares Corp. | 28,509 | 1,208 | ||||||
Janus Henderson Group PLC | 91,271 | 3,828 | ||||||
Jefferies Financial Group, Inc. | 105,196 | 4,082 | ||||||
Kemper Corp. | 32,041 | 1,884 | ||||||
Kinsale Capital Group, Inc. | 11,484 | 2,732 | ||||||
Mercury General Corp. | 14,099 | 748 | ||||||
MGIC Investment Corp. | 174,308 | 2,514 | ||||||
Navient Corp. | 86,289 | 1,831 | ||||||
New York Community Bancorp, Inc. | 248,948 | 3,040 | ||||||
Old Republic International Corp. | 152,919 | 3,759 | ||||||
PacWest Bancorp | 62,784 | 2,836 | ||||||
Pinnacle Financial Partners, Inc. | 40,761 | 3,893 | ||||||
Primerica, Inc. | 21,149 | 3,241 | ||||||
PROG Holdings, Inc. * | 30,357 | 1,369 | ||||||
Prosperity Bancshares, Inc. | 49,359 | 3,569 | ||||||
| Common Stocks (98.8%) | Shares/ Par + | Value $ (000’s) | ||||||
Financials continued |
| |||||||
Reinsurance Group of America, Inc. | 36,195 | 3,963 | ||||||
RenaissanceRe Holdings, Ltd. | 24,636 | 4,172 | ||||||
RLI Corp. | 21,322 | 2,390 | ||||||
SEI Investments Co. | 56,786 | 3,461 | ||||||
Selective Insurance Group, Inc. | 32,197 | 2,638 | ||||||
SLM Corp. | 156,965 | 3,087 | ||||||
Sterling Bancorp | 103,163 | 2,661 | ||||||
Stifel Financial Corp. | 55,756 | 3,926 | ||||||
Synovus Financial Corp. | 77,888 | 3,728 | ||||||
Texas Capital Bancshares, Inc. * | 27,096 | 1,633 | ||||||
UMB Financial Corp. | 23,037 | 2,444 | ||||||
Umpqua Holdings Corp. | 115,944 | 2,231 | ||||||
United Bankshares, Inc. | 72,979 | 2,648 | ||||||
Unum Group | 109,447 | 2,689 | ||||||
Valley National Bancorp | 217,846 | 2,995 | ||||||
Voya Financial, Inc. | 59,424 | 3,940 | ||||||
Washington Federal, Inc. | 34,903 | 1,165 | ||||||
Webster Financial Corp. | 48,500 | 2,708 | ||||||
Wintrust Financial Corp. | 30,513 | 2,771 | ||||||
|
| |||||||
Total | 180,294 | |||||||
|
| |||||||
Health Care (9.8%) |
| |||||||
Acadia Healthcare Co., Inc. * | 48,157 | 2,923 | ||||||
Amedisys, Inc. * | 17,455 | 2,826 | ||||||
Arrowhead Pharmaceuticals, Inc. * | 55,818 | 3,701 | ||||||
Bruker Corp. | 54,396 | 4,564 | ||||||
Chemed Corp. | 8,243 | 4,361 | ||||||
Encompass Health Corp. | 53,262 | 3,476 | ||||||
Envista Holdings Corp. * | 86,385 | 3,893 | ||||||
Exelixis, Inc. * | 169,400 | 3,097 | ||||||
Globus Medical, Inc. - Class A * | 42,319 | 3,056 | ||||||
Haemonetics Corp. * | 27,363 | 1,451 | ||||||
Halozyme Therapeutics, Inc. * | 75,366 | 3,031 | ||||||
HealthEquity, Inc. * | 44,715 | 1,978 | ||||||
ICU Medical, Inc. * | 10,689 | 2,537 | ||||||
Integra LifeSciences Holdings | 38,997 | 2,612 | ||||||
Jazz Pharmaceuticals PLC * | 32,908 | 4,193 | ||||||
LHC Group, Inc. * | 16,958 | 2,327 | ||||||
LivaNova PLC * | 28,494 | 2,491 | ||||||
| Common Stocks (98.8%) | Shares/ Par + | Value $ (000’s) | ||||||
Health Care continued |
| |||||||
Masimo Corp. * | 27,199 | 7,963 | ||||||
Medpace Holdings, Inc. * | 15,394 | 3,350 | ||||||
Molina Healthcare, Inc. * | 31,267 | 9,945 | ||||||
Neogen Corp. * | 57,550 | 2,613 | ||||||
Neurocrine Biosciences, Inc. * | 50,792 | 4,326 | ||||||
NuVasive, Inc. * | 27,700 | 1,454 | ||||||
Option Care Health, Inc. * | 74,154 | 2,109 | ||||||
Patterson Cos., Inc. | 46,379 | 1,361 | ||||||
Penumbra, Inc. * | 18,801 | 5,402 | ||||||
Perrigo Co. PLC | 71,628 | 2,786 | ||||||
Progyny, Inc. * | 37,285 | 1,877 | ||||||
Quidel Corp. * | 20,303 | 2,741 | ||||||
R1 RCM, Inc. * | 71,340 | 1,819 | ||||||
Repligen Corp. * | 27,528 | 7,291 | ||||||
STAAR Surgical Co. * | 25,485 | 2,327 | ||||||
Syneos Health, Inc. * | 55,514 | 5,700 | ||||||
Tandem Diabetes Care, Inc. * | 34,011 | 5,119 | ||||||
Tenet Healthcare Corp. * | 57,353 | 4,685 | ||||||
United Therapeutics Corp. * | 24,113 | 5,210 | ||||||
|
| |||||||
Total | 130,595 | |||||||
|
| |||||||
Industrials (18.1%) | ||||||||
Acuity Brands, Inc. | 18,700 | 3,959 | ||||||
AECOM * | 77,127 | 5,966 | ||||||
AGCO Corp. | 32,856 | 3,812 | ||||||
ASGN, Inc. * | 27,894 | 3,442 | ||||||
Avis Budget Group, Inc. * | 21,458 | 4,450 | ||||||
Axon Enterprise, Inc. * | 35,162 | 5,520 | ||||||
The Brink’s Co. | 26,357 | 1,728 | ||||||
Builders FirstSource, Inc. * | 102,523 | 8,787 | ||||||
Carlisle Cos., Inc. | 27,992 | 6,945 | ||||||
Clean Harbors, Inc. * | 26,798 | 2,674 | ||||||
Colfax Corp. * | 72,105 | 3,315 | ||||||
Crane Co. | 26,726 | 2,719 | ||||||
Curtiss-Wright Corp. | 21,001 | 2,912 | ||||||
Donaldson Co., Inc. | 66,171 | 3,921 | ||||||
Dycom Industries, Inc. * | 16,151 | 1,514 | ||||||
EMCOR Group, Inc. | 28,578 | 3,641 | ||||||
EnerSys | 22,473 | 1,777 | ||||||
Flowserve Corp. | 69,736 | 2,134 | ||||||
Fluor Corp. * | 75,705 | 1,875 | ||||||
FTI Consulting, Inc. * | 18,355 | 2,816 | ||||||
GATX Corp. | 19,008 | 1,980 | ||||||
Graco, Inc. | 91,001 | 7,337 | ||||||
GXO Logistics, Inc. * | 52,783 | 4,794 | ||||||
Herman Miller, Inc. | 40,564 | 1,590 | ||||||
Hexcel Corp. * | 44,914 | 2,327 | ||||||
Hubbell, Inc. | 29,132 | 6,067 | ||||||
The Accompanying Notes are an Integral Part of the Financial Statements.
54
Table of Contents
Index 400 Stock Portfolio
| Common Stocks (98.8%) | Shares/ Par + | Value $ (000’s) | ||||||
Industrials continued |
| |||||||
IAA, Inc. * | 72,190 | 3,654 | ||||||
Insperity, Inc. | 19,170 | 2,264 | ||||||
ITT, Inc. | 45,826 | 4,683 | ||||||
JetBlue Airways Corp. * | 170,305 | 2,425 | ||||||
Kennametal, Inc. | 44,788 | 1,608 | ||||||
Kirby Corp. * | 32,178 | 1,912 | ||||||
Knight-Swift Transportation Holdings, Inc. | 88,842 | 5,414 | ||||||
Landstar System, Inc. | 20,402 | 3,652 | ||||||
Lennox International, Inc. | 18,021 | 5,845 | ||||||
Lincoln Electric Holdings, Inc. | 31,617 | 4,410 | ||||||
ManpowerGroup, Inc. | 29,039 | 2,826 | ||||||
MasTec, Inc. * | 30,631 | 2,827 | ||||||
Mercury Systems, Inc. * | 30,326 | 1,670 | ||||||
The Middleby Corp. * | 29,782 | 5,860 | ||||||
MSA Safety, Inc. | 19,520 | 2,947 | ||||||
MSC Industrial Direct Co., Inc. - Class A | 25,067 | 2,107 | ||||||
Nordson Corp. | 28,935 | 7,386 | ||||||
nVent Electric PLC | 90,075 | 3,423 | ||||||
Oshkosh Corp. | 36,746 | 4,142 | ||||||
Owens Corning, Inc. | 53,798 | 4,869 | ||||||
Regal Beloit Corp. | 36,280 | 6,174 | ||||||
Ryder System, Inc. | 28,741 | 2,369 | ||||||
Saia, Inc. * | 14,101 | 4,752 | ||||||
Simpson Manufacturing Co., Inc. | 23,254 | 3,234 | ||||||
Stericycle, Inc. * | 49,182 | 2,933 | ||||||
Sunrun, Inc. * | 110,833 | 3,802 | ||||||
Terex Corp. | 37,379 | 1,643 | ||||||
Tetra Tech, Inc. | 28,947 | 4,915 | ||||||
The Timken Co. | 36,954 | 2,561 | ||||||
The Toro Co. | 56,985 | 5,693 | ||||||
Trex Co., Inc. * | 61,630 | 8,322 | ||||||
Trinity Industries, Inc. | 43,762 | 1,322 | ||||||
Univar Solutions, Inc. * | 91,538 | 2,595 | ||||||
Valmont Industries, Inc. | 11,362 | 2,846 | ||||||
Vicor Corp. * | 11,488 | 1,459 | ||||||
Watsco, Inc. | 17,683 | 5,533 | ||||||
Werner Enterprises, Inc. | 32,717 | 1,559 | ||||||
Woodward, Inc. | 33,762 | 3,696 | ||||||
XPO Logistics, Inc. * | 52,812 | 4,089 | ||||||
|
| |||||||
Total | 241,423 | |||||||
|
| |||||||
Information Technology (14.7%) |
| |||||||
ACI Worldwide, Inc. * | 62,929 | 2,184 | ||||||
Alliance Data Systems Corp. | 26,650 | 1,774 | ||||||
Amkor Technology, Inc. | 53,688 | 1,331 | ||||||
Arrow Electronics, Inc. * | 37,292 | 5,007 | ||||||
Aspen Technology, Inc. * | 35,828 | 5,453 | ||||||
Avnet, Inc. | 53,123 | 2,190 | ||||||
| Common Stocks (98.8%) | Shares/ Par + | Value $ (000’s) | ||||||
Information Technology continued |
| |||||||
Belden, Inc. | 24,042 | 1,580 | ||||||
Blackbaud, Inc. * | 22,251 | 1,757 | ||||||
Brooks Automation, Inc. | 39,809 | 4,105 | ||||||
CACI International, Inc. - | 12,471 | 3,357 | ||||||
CDK Global, Inc. | 63,366 | 2,645 | ||||||
Cerence, Inc. * | 20,351 | 1,560 | ||||||
Ciena Corp. * | 82,950 | 6,385 | ||||||
Cirrus Logic, Inc. * | 30,497 | 2,806 | ||||||
Cognex Corp. | 94,664 | 7,361 | ||||||
Coherent, Inc. * | 13,135 | 3,501 | ||||||
CommVault Systems, Inc. * | 24,260 | 1,672 | ||||||
Concentrix Corp. | 22,969 | 4,103 | ||||||
Digital Turbine, Inc. * | 47,078 | 2,871 | ||||||
Envestnet, Inc. * | 29,256 | 2,321 | ||||||
Fair Isaac Corp. * | 14,647 | 6,352 | ||||||
First Solar, Inc. * | 52,945 | 4,615 | ||||||
Genpact, Ltd. | 92,617 | 4,916 | ||||||
II-VI, Inc. * | 56,820 | 3,883 | ||||||
Jabil Circuit, Inc. | 76,745 | 5,399 | ||||||
KBR, Inc. | 75,098 | 3,576 | ||||||
Kyndryl Holdings, Inc. * | 95,919 | 1,736 | ||||||
Lattice Semiconductor Corp. * | 73,328 | 5,651 | ||||||
Littelfuse, Inc. | 13,189 | 4,150 | ||||||
LiveRamp Holdings, Inc. * | 36,455 | 1,748 | ||||||
Lumentum Holdings, Inc. * | 38,707 | 4,094 | ||||||
Manhattan Associates, Inc. * | 33,885 | 5,269 | ||||||
MAXIMUS, Inc. | 32,910 | 2,622 | ||||||
Mimecast, Ltd. * | 33,057 | 2,630 | ||||||
MKS Instruments, Inc. | 29,695 | 5,172 | ||||||
National Instruments Corp. | 70,628 | 3,084 | ||||||
NCR Corp. * | 70,673 | 2,841 | ||||||
Paylocity Holding Corp. * | 21,212 | 5,009 | ||||||
Power Integrations, Inc. | 32,310 | 3,001 | ||||||
Qualys, Inc. * | 17,878 | 2,453 | ||||||
Sabre Corp. * | 173,166 | 1,488 | ||||||
SailPoint Technologies Holdings, Inc. * | 49,927 | 2,414 | ||||||
Science Applications International Corp. | 30,819 | 2,576 | ||||||
Semtech Corp. * | 34,492 | 3,067 | ||||||
Silicon Laboratories, Inc. * | 21,509 | 4,440 | ||||||
Sitime Corp. * | 8,024 | 2,347 | ||||||
SunPower Corp. * | 44,469 | 928 | ||||||
Synaptics, Inc. * | 21,025 | 6,087 | ||||||
SYNNEX Corp. | 22,105 | 2,528 | ||||||
Teradata Corp. * | 58,091 | 2,467 | ||||||
Universal Display Corp. | 23,216 | 3,831 | ||||||
ViaSat, Inc. * | 39,325 | 1,752 | ||||||
| Common Stocks (98.8%) | Shares/ Par + | Value $ (000’s) | ||||||
Information Technology continued |
| |||||||
Vishay Intertechnology, Inc. | 71,103 | 1,555 | ||||||
Vontier Corp. | 90,513 | 2,782 | ||||||
Western Union Co. | 215,198 | 3,839 | ||||||
WEX, Inc. * | 23,996 | 3,369 | ||||||
Wolfspeed, Inc. * | 62,048 | 6,935 | ||||||
Xerox Holdings Corp. | 73,577 | 1,666 | ||||||
|
| |||||||
Total | 196,235 | |||||||
|
| |||||||
Materials (6.7%) | ||||||||
Alcoa Corp. | 100,196 | 5,970 | ||||||
AptarGroup, Inc. | 35,249 | 4,317 | ||||||
Ashland Global Holdings, Inc. | 30,242 | 3,256 | ||||||
Avient Corp. | 48,992 | 2,741 | ||||||
Cabot Corp. | 30,401 | 1,709 | ||||||
The Chemours Co. | 87,462 | 2,935 | ||||||
Cleveland-Cliffs, Inc. * | 243,646 | 5,304 | ||||||
CMC Materials, Inc. | 15,219 | 2,917 | ||||||
Commercial Metals Co. | 64,565 | 2,343 | ||||||
Compass Minerals International, Inc. | 18,078 | 923 | ||||||
Eagle Materials, Inc. | 21,777 | 3,625 | ||||||
Grief, Inc. - Class A | 14,236 | 859 | ||||||
Ingevity Corp. * | 21,042 | 1,509 | ||||||
Louisiana-Pacific Corp. | 47,111 | 3,691 | ||||||
Minerals Technologies, Inc. | 17,713 | 1,296 | ||||||
NewMarket Corp. | 3,699 | 1,268 | ||||||
Olin Corp. | 76,802 | 4,418 | ||||||
Reliance Steel & Aluminum Co. | 33,545 | 5,442 | ||||||
Royal Gold, Inc. | 35,172 | 3,700 | ||||||
RPM International, Inc. | 69,447 | 7,014 | ||||||
The Scotts Miracle-Gro Co. - Class A | 21,810 | 3,511 | ||||||
Sensient Technologies Corp. | 22,507 | 2,252 | ||||||
Silgan Holdings, Inc. | 44,924 | 1,925 | ||||||
Sonoco Products Co. | 52,634 | 3,047 | ||||||
Steel Dynamics, Inc. | 100,952 | 6,266 | ||||||
United States Steel Corp. | 144,689 | 3,445 | ||||||
Valvoline, Inc. | 96,777 | 3,609 | ||||||
Worthington Industries, Inc. | 17,310 | 946 | ||||||
|
| |||||||
Total | 90,238 | |||||||
|
| |||||||
Real Estate (10.2%) | ||||||||
American Campus Communities, Inc. | 74,496 | 4,268 | ||||||
Apartment Income REIT Corp. | 84,056 | 4,595 | ||||||
Brixmor Property Group, Inc. | 159,011 | 4,041 | ||||||
Camden Property Trust | 54,713 | 9,776 | ||||||
Corporate Office Properties Trust | 60,143 | 1,682 | ||||||
The Accompanying Notes are an Integral Part of the Financial Statements.
55
Table of Contents
Index 400 Stock Portfolio
| Common Stocks (98.8%) | Shares/ Par + | Value $ (000’s) | ||||||
Real Estate continued |
| |||||||
Cousins Properties, Inc. | 79,603 | 3,206 | ||||||
CyrusOne, Inc. | 67,941 | 6,096 | ||||||
Douglas Emmett, Inc. | 93,951 | 3,147 | ||||||
EastGroup Properties, Inc. | 21,779 | 4,962 | ||||||
EPR Properties | 40,052 | 1,902 | ||||||
First Industrial Realty Trust, Inc. | 69,747 | 4,617 | ||||||
Healthcare Realty Trust, Inc. | 78,973 | 2,499 | ||||||
Highwoods Properties, Inc. | 55,874 | 2,491 | ||||||
Hudson Pacific Properties, Inc. | 81,617 | 2,017 | ||||||
JBG SMITH Properties | 61,422 | 1,764 | ||||||
Jones Lang LaSalle, Inc. * | 27,021 | 7,278 | ||||||
Kilroy Realty Corp. | 56,114 | 3,729 | ||||||
Kite Realty Group Trust | 117,249 | 2,554 | ||||||
Lamar Advertising Co. - Class A | 46,484 | 5,639 | ||||||
Life Storage, Inc. | 43,909 | 6,726 | ||||||
The Macerich Co. | 114,065 | 1,971 | ||||||
Medical Properties Trust, Inc. | 319,196 | 7,543 | ||||||
National Retail Properties, Inc. | 94,004 | 4,519 | ||||||
National Storage Affiliates Trust | 43,865 | 3,036 | ||||||
OMEGA Healthcare Investors, Inc. | 127,917 | 3,785 | ||||||
Park Hotels & Resorts, Inc. * | 126,616 | 2,391 | ||||||
Pebblebrook Hotel Trust | 70,367 | 1,574 | ||||||
Physicians Realty Trust | 117,914 | 2,220 | ||||||
Potlatch Corp. | 35,921 | 2,163 | ||||||
PS Business Parks, Inc. | 10,770 | 1,984 | ||||||
Rayonier, Inc. | 76,645 | 3,093 | ||||||
Rexford Industrial Realty, Inc. | 81,091 | 6,577 | ||||||
Sabra Health Care REIT, Inc. | 122,405 | 1,657 | ||||||
SL Green Realty Corp. | 35,720 | 2,561 | ||||||
Spirit Realty Capital, Inc. | 66,018 | 3,181 | ||||||
Store Capital Corp. | 131,365 | 4,519 | ||||||
Urban Edge Properties | 58,987 | 1,121 | ||||||
|
| |||||||
Total | 136,884 | |||||||
|
| |||||||
Utilities (3.3%) | ||||||||
ALLETE, Inc. | 28,152 | 1,868 | ||||||
Black Hills Corp. | 34,161 | 2,411 | ||||||
Essential Utilities, Inc. | 123,134 | 6,611 | ||||||
Hawaiian Electric Industries, Inc. | 58,525 | 2,429 | ||||||
IDACORP, Inc. | 27,044 | 3,064 | ||||||
| Common Stocks (98.8%) | Shares/ Par + | Value $ (000’s) | ||||||
Utilities continued |
| |||||||
MDU Resources Group, Inc. | 108,874 | 3,358 | ||||||
National Fuel Gas Co. | 48,820 | 3,121 | ||||||
New Jersey Resources Corp. | 51,628 | 2,120 | ||||||
NorthWestern Corp. | 28,196 | 1,612 | ||||||
OGE Energy Corp. | 107,161 | 4,113 | ||||||
ONE Gas, Inc. | 28,685 | 2,225 | ||||||
PNM Resources, Inc. | 45,971 | 2,097 | ||||||
Southwest Gas Holdings, Inc. | 32,326 | 2,264 | ||||||
Spire, Inc. | 27,670 | 1,804 | ||||||
UGI Corp. | 111,951 | 5,140 | ||||||
|
| |||||||
Total | 44,237 | |||||||
|
| |||||||
Total Common Stocks | 1,319,529 | |||||||
|
| |||||||
| Short-Term Investments (1.1%) | ||||||||
Governments (0.0%) |
| |||||||
US Treasury 0.000%, 1/27/22 ß | 915,000 | 915 | ||||||
|
| |||||||
Total | 915 | |||||||
|
| |||||||
Money Market Funds (1.1%) |
| |||||||
State Street Institutional U.S. Government Money Market Fund - Premier Class 0.030% # | 14,526,884 | 14,527 | ||||||
|
| |||||||
Total | 14,527 | |||||||
|
| |||||||
Total Short-Term Investments | ||||||||
(Cost: $15,442) | 15,442 | |||||||
|
| |||||||
Total Investments (99.9%) | ||||||||
(Cost: $873,907)@ | 1,334,971 | |||||||
|
| |||||||
Other Assets, Less | ||||||||
Liabilities (0.1%) | 966 | |||||||
|
| |||||||
Net Assets (100.0%) | 1,335,937 | |||||||
|
| |||||||
The Accompanying Notes are an Integral Part of the Financial Statements.
56
Table of Contents
Index 400 Stock Portfolio
Exchange Traded or Centrally Cleared Derivatives
Futures
| Issuer | Long/Short | Currency | Notional Par (000’s) | Number of Contracts | Expiration Date | Notional Value (000’s) | Unrealized Appreciation/ (Depreciation) (000’s) | Variation Margin (000’s) | ||||||||
E-Mini S&P MidCap 400 Futures | Long | USD | 6 | 58 | 3/22 | $16,458 | $ 445 | $4 | ||||||||
| $ 445 | $4 |
Financial Derivative Assets | Financial Derivative Liabilities | |||||||||||||
| Variation Margin (000’s) | Variation Margin (000’s) | Market Value (000’s) | ||||||||||||
| Swaps | Futures | Total | Swaps | Futures | Total | Options | ||||||||
Total Exchange-Traded or Centrally Cleared Derivatives | $– | $4 | $4 | $– | $– | $– | $– | |||||||
| + | All par is stated in U.S. Dollar unless otherwise noted. |
| * | Non income producing |
| b | Cash or securities with an aggregate value of $915 (in thousands) has been pledged as collateral for futures, swap contracts outstanding, short sales, when issued securities or written options on 12/31/2021. |
| # | 7-Day yield as of 12/31/2021. |
| @ | At December 31, 2021, the aggregate cost of investments, including derivatives, for federal tax purposes (in thousands) was $874,998 and the net unrealized appreciation of investments based on that cost was $460,419 which is comprised of $491,373 aggregate gross unrealized appreciation and $30,954 aggregate gross unrealized depreciation. |
The following is a summary of the inputs used in valuing the Portfolio’s Investments at December 31, 2021. See Note 3 for additional information on portfolio valuation.
| Valuation Inputs | ||||||||||||||
| Description | Level 1 – Quoted Prices | Level 2 – Other Significant | Level 3 – Significant | |||||||||||
(Amounts in thousands) | ||||||||||||||
Assets: | ||||||||||||||
Common Stocks | $ | 1,319,529 | $ | - | $ | - | ||||||||
Short-Term Investments | ||||||||||||||
Money Market Funds | 14,527 | - | - | |||||||||||
All Others | - | 915 | - | |||||||||||
Other Financial Instruments^ | ||||||||||||||
Futures | 445 | - | - | |||||||||||
Total Assets: | $ | 1,334,501 | $ | 915 | $ | - | ||||||||
^ Other financial instruments are derivative instruments such as futures and forward foreign currency contracts, which are valued at the unrealized appreciation (depreciation) on the instrument, and securities sold short, reverse repurchase agreements, written options and swaps contracts, which are valued at market value.
The Accompanying Notes are an Integral Part of the Financial Statements.
57
Table of Contents
Mid Cap Value Portfolio (unaudited)
| Objective: | Portfolio Strategy: | Net Assets: | ||
| Long-term capital growth. Current | Invest primarily in equity securities of mid-sized companies | $705 million | ||
| income is a secondary objective. | that are determined to be undervalued. |
PORTFOLIO OVERVIEW
Mason Street Advisors, LLC (“Mason Street Advisors”), the investment adviser for the Mid Cap Value Portfolio (the “Portfolio”), has engaged American Century Investment Management, Inc. (“American Century”) to act as sub-adviser for the Portfolio. The Portfolio invests primarily in a diversified portfolio of equity securities of mid-sized companies that are determined to be undervalued at the time of purchase. In selecting securities, the Portfolio attempts to identify companies whose long-term earnings, cash flows and/or assets are not reflected in the current market price of their securities and hold each security until it has returned to favor in the market and the price has increased to, or is higher than, a level believed to more accurately reflect the fair value of the company.
MARKET OVERVIEW
Broad U.S. equity markets advanced strongly in 2021, buoyed by expanding COVID-19 vaccine availability, federal aid, positive economic news and strong corporate earnings reports. Stocks experienced minor volatility throughout the year, however, due to the emergence of the Delta and Omicron variants of the coronavirus, supply chain constraints, inflation concerns and labor shortages.
Mid-cap stocks as measured by the Russell family of indices outperformed small-cap stocks but underperformed large-cap stocks. Within mid-cap stocks, value stocks outperformed growth stocks for the reporting period.
PORTFOLIO RESULTS
The Portfolio returned 23.27% for the twelve months ended December 31, 2021. By comparison, the Portfolio’s benchmark, the Russell Midcap® Value Index (the “Index”), returned 28.34%. (The Index is unmanaged, cannot be invested in directly and does not incur expenses.) According to Lipper® Analytical Services, Inc., an independent mutual fund ranking agency, the average return in 2021 of the Mid Cap Value Funds peer group was 29.07%.
The Financials sector detracted from the Portfolio’s return, despite an environment of strong equity markets and continued reopenings. Security selection in the Financials sector weighed negatively on the Portfolio’s return, particularly the portfolio managers’ preference for higher quality banks, investments in insurance and an underweight in the consumer finance industry.
The Health Care sector was another detractor from performance. In the medical equipment and devices industry, Zimmer Biomet Holdings declined as elective surgeries were delayed amid the surge of the Omicron variant late in 2021.
On the upside, the Industrials sector contributed to the Portfolio’s performance. The machinery and electrical equipment industries advanced, particularly electrical product provider nVent Electric. The Information Technology sector also contributed amid strong demand and pricing in both the semiconductor and semiconductor equipment industry and the technology hardware and equipment industry.
In the Energy sector, the exploration and production company ConocoPhillips advanced amid stronger commodity prices and the company’s continued strong execution. During the third quarter of 2021, the company released a ten-year financial plan and announced an attractively priced acquisition of assets from a competitor.
PORTFOLIO MANAGER OUTLOOK
The following forward-looking comments are the opinion of American Century, the Portfolio’s sub-adviser.
We continue to build the Portfolio bottom-up through our fundamental research, seeking higher quality, mid-sized companies temporarily selling at a discount to fair value.
Long-term demographic trends support demand for companies in the Health Care sector. Through our bottom-up process, we are finding quality companies with attractive risk/reward profiles, particularly in the health care providers and services and health care equipment and supplies industries.
58
Table of Contents
Mid Cap Value Portfolio (unaudited)
The Portfolio remains overweight in the Consumer Staples sector. Despite a challenging environment from a cost inflation perspective, many consumer staples companies are generating strong returns on capital, buying back stock and growing dividends.
We also believe the Financials sector offers higher quality companies that fit our process. Our Financials positions include holdings in the banking, capital markets and insurance industries.
Relative Performance
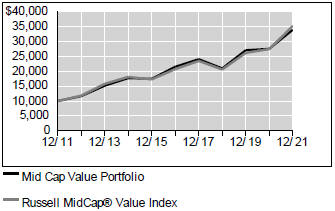
Average Annual Total Returns For Periods Ended December 31, 2021 | ||||||||||||
| 1 Year | 5 Years | 10 Years | ||||||||||
Mid Cap Value Portfolio | 23.27 | % | 9.55 | % | 13.02 | % | ||||||
Russell MidCap® Value Index | 28.34 | % | 11.22 | % | 13.44 | % | ||||||
Lipper® Variable Insurance Products (VIP) Mid Cap Value Funds Average | 29.07 | % | 11.03 | % | 12.68 | % | ||||||
The performance data quoted represents past performance. Past performance is historical and does not guarantee future performance. Investment return and principal value will fluctuate, so that shares, when redeemed, may be worth more or less than their original cost. Current performance may be lower or higher than the performance data quoted. For the most recent month-end performance information visit www.northwesternmutual.com.
This chart assumes an initial investment of $10,000 made on 12/31/11. Returns shown reflect fee waivers, deductions for management and other portfolio expenses, and reinvestment of all dividends. In the absence of fee waivers, total return would be reduced. Returns exclude deductions for separate account sale loads and account fees. Please refer to the Benchmark Definitions section of this report for information about the indices cited in the above chart and graph.
Investing in medium-sized companies involves a greater degree of risk than investing in large company stocks. The value of securities acquired in an IPO may rise or fall more rapidly than investments in more established issuers.
The Portfolio may invest in derivative instruments for cash management purposes or to hedge foreign currency exposure. Use of these instruments may involve certain costs and imposes certain risks such as liquidity risk, market risk, credit risk, management risk and the risk of mispricing or improper valuation. Certain derivatives involve leverage, which could magnify losses, and portfolios investing in derivatives could lose more than the principal amount invested in those instruments.
The Portfolio may invest a relatively high percentage of its assets in a particular sector. The Portfolio will have greater exposure to the risks associated with that sector and its performance will be tied more closely to the performance of the sector.
Top 10 Equity Holdings 12/31/21
Security Description | % of Net Assets | |||
Zimmer Biomet Holdings, Inc. | 3.1 | % | ||
Northern Trust Corp. | 2.4 | % | ||
Cerner Corp. | 2.3 | % | ||
Conagra Brands, Inc. | 2.1 | % | ||
The Bank of New York Mellon Corp. | 2.0 | % | ||
Advance Auto Parts, Inc. | 1.9 | % | ||
Edison International | 1.9 | % | ||
Southwest Airlines Co. | 1.8 | % | ||
Emerson Electric Co. | 1.8 | % | ||
Sonoco Products Co. | 1.8 | % |
59
Table of Contents
Mid Cap Value Portfolio (unaudited)
Sector Allocation 12/31/21
| Sector | % of Net Assets | |||
Financials | 19.5 | % | ||
Health Care | 16.9 | % | ||
Industrials | 13.7 | % | ||
Consumer Staples | 8.3 | % | ||
Consumer Discretionary | 7.8 | % | ||
Utilities | 7.7 | % | ||
Real Estate | 6.6 | % | ||
Information Technology | 6.1 | % | ||
Materials | 5.5 | % | ||
Energy | 4.5 | % | ||
Short-Term Investments & Other Net Assets | 2.0 | % | ||
Communication Services | 1.4 | % | ||
Sector Allocation and Top 10 Holdings are subject to change.
60
Table of Contents
Mid Cap Value Portfolio
SCHEDULE OF INVESTMENTS
December 31, 2021
| Common Stocks (98.0%) | Shares/ Par + | Value $ (000’s) | ||||||
Communication Services (1.4%) |
| |||||||
Fox Corp. - Class B | 282,148 | 9,669 | ||||||
|
| |||||||
Total | 9,669 | |||||||
|
| |||||||
Consumer Discretionary (7.8%) |
| |||||||
Advance Auto Parts, Inc. | 57,014 | 13,677 | ||||||
BorgWarner, Inc. | 225,275 | 10,153 | ||||||
Bridgestone Corp. | 78,400 | 3,373 | ||||||
Cracker Barrel Old Country Store, Inc. | 27,509 | 3,539 | ||||||
Dollar Tree, Inc. * | 63,790 | 8,964 | ||||||
Honda Motor Co., Ltd., ADR | 118,009 | 3,357 | ||||||
Polaris Industries, Inc. | 45,005 | 4,947 | ||||||
Sodexo SA | 77,387 | 6,789 | ||||||
|
| |||||||
Total | 54,799 | |||||||
|
| |||||||
Consumer Staples (8.3%) |
| |||||||
Conagra Brands, Inc. | 427,696 | 14,606 | ||||||
General Mills, Inc. | 78,860 | 5,313 | ||||||
The J.M. Smucker Co. | 40,912 | 5,557 | ||||||
Kellogg Co. | 71,279 | 4,592 | ||||||
Kimberly-Clark Corp. | 55,339 | 7,909 | ||||||
Koninklijke Ahold Delhaize NV | 293,663 | 10,075 | ||||||
Orkla ASA | 526,244 | 5,276 | ||||||
Sysco Corp. | 66,135 | 5,195 | ||||||
|
| |||||||
Total | 58,523 | |||||||
|
| |||||||
Energy (4.5%) |
| |||||||
Baker Hughes | 295,248 | 7,104 | ||||||
ConocoPhillips | 135,792 | 9,801 | ||||||
Devon Energy Corp. | 201,139 | 8,860 | ||||||
Pioneer Natural Resources Co. | 33,658 | 6,122 | ||||||
|
| |||||||
Total | 31,887 | |||||||
|
| |||||||
Financials (19.5%) |
| |||||||
AFLAC, Inc. | 204,373 | 11,933 | ||||||
The Allstate Corp. | 64,852 | 7,630 | ||||||
Ameriprise Financial, Inc. | 23,942 | 7,222 | ||||||
Arthur J. Gallagher & Co. | 16,004 | 2,715 | ||||||
The Bank of New York Mellon Corp. | 236,321 | 13,726 | ||||||
Capitol Federal Financial, Inc. | 248,342 | 2,814 | ||||||
Chubb, Ltd. | 55,257 | 10,682 | ||||||
Commerce Bancshares, Inc. | 18,368 | 1,263 | ||||||
First Hawaiian, Inc. | 214,092 | 5,851 | ||||||
| Common Stocks (98.0%) | Shares/ Par + | Value $ (000’s) | ||||||
Financials continued | ||||||||
M&T Bank Corp. | 52,458 | 8,057 | ||||||
Northern Trust Corp. | 140,594 | 16,816 | ||||||
The Progressive Corp. | 37,254 | 3,824 | ||||||
Prosperity Bancshares, Inc. | 97,182 | 7,026 | ||||||
Reinsurance Group of America, Inc. | 103,512 | 11,334 | ||||||
State Street Corp. | 39,207 | 3,646 | ||||||
T. Rowe Price Group, Inc. | 41,274 | 8,116 | ||||||
Truist Financial Corp. | 186,138 | 10,898 | ||||||
Westamerica Bancorporation | 73,207 | 4,226 | ||||||
|
| |||||||
Total | 137,779 | |||||||
|
| |||||||
Health Care (16.9%) |
| |||||||
AmerisourceBergen Corp. | 37,672 | 5,006 | ||||||
Becton Dickinson and Co. | 29,606 | 7,445 | ||||||
Cardinal Health, Inc. | 150,181 | 7,733 | ||||||
Centene Corp. * | 61,488 | 5,067 | ||||||
Cerner Corp. | 175,555 | 16,304 | ||||||
Envista Holdings Corp. * | 144,448 | 6,509 | ||||||
Henry Schein, Inc. * | 144,734 | 11,221 | ||||||
Koninklijke Philips NV | 120,393 | 4,437 | ||||||
McKesson Corp. | 43,103 | 10,714 | ||||||
Quest Diagnostics, Inc. | 62,986 | 10,897 | ||||||
Universal Health Services, Inc. - Class B | 94,358 | 12,234 | ||||||
Zimmer Biomet Holdings, Inc. | 170,899 | 21,711 | ||||||
|
| |||||||
Total | 119,278 | |||||||
|
| |||||||
Industrials (13.7%) |
| |||||||
BAE Systems PLC | 984,152 | 7,324 | ||||||
Beacon Roofing Supply, Inc. * | 65,362 | 3,748 | ||||||
Cummins, Inc. | 15,114 | 3,297 | ||||||
Emerson Electric Co. | 133,796 | 12,439 | ||||||
General Dynamics Corp. | 45,494 | 9,484 | ||||||
Heartland Express, Inc. | 282,822 | 4,757 | ||||||
Hubbell, Inc. | 19,051 | 3,968 | ||||||
IMI PLC | 20,239 | 476 | ||||||
MSC Industrial Direct Co., Inc. - Class A | 124,726 | 10,484 | ||||||
nVent Electric PLC | 282,129 | 10,721 | ||||||
Oshkosh Corp. | 58,589 | 6,604 | ||||||
PACCAR, Inc. | 73,948 | 6,527 | ||||||
Republic Services, Inc. | 27,501 | 3,835 | ||||||
| Common Stocks (98.0%) | Shares/ Par + | Value $ (000’s) | ||||||
Industrials continued |
| |||||||
Southwest Airlines Co. * | 301,966 | 12,936 | ||||||
|
| |||||||
Total | 96,600 | |||||||
|
| |||||||
Information Technology (6.1%) |
| |||||||
Amdocs, Ltd. | 62,943 | 4,711 | ||||||
CDK Global, Inc. | 106,269 | 4,436 | ||||||
Corning, Inc. | 48,998 | 1,824 | ||||||
Euronet Worldwide, Inc. * | 31,365 | 3,738 | ||||||
F5 Networks, Inc. * | 30,036 | 7,350 | ||||||
HP, Inc. | 259,553 | 9,777 | ||||||
Juniper Networks, Inc. | 114,072 | 4,073 | ||||||
Open Text Corp. | 154,518 | 7,337 | ||||||
|
| |||||||
Total | 43,246 | |||||||
|
| |||||||
Materials (5.5%) |
| |||||||
Amcor PLC | 223,297 | 2,682 | ||||||
Axalta Coating Systems, Ltd. * | 190,597 | 6,313 | ||||||
Mondi PLC | 400,603 | 9,901 | ||||||
Packaging Corp. of America | 52,201 | 7,107 | ||||||
Sonoco Products Co. | 214,351 | 12,409 | ||||||
|
| |||||||
Total | 38,412 | |||||||
|
| |||||||
Real Estate (6.6%) |
| |||||||
Equinix, Inc. | 7,257 | 6,138 | ||||||
Essex Property Trust, Inc. | 19,111 | 6,732 | ||||||
Healthcare Trust of America, Inc. | 222,412 | 7,426 | ||||||
Healthpeak Properties, Inc. | 267,643 | 9,659 | ||||||
MGM Growth Properties LLC - Class A | 180,732 | 7,383 | ||||||
Regency Centers Corp. | 87,605 | 6,601 | ||||||
Weyerhaeuser Co. | 58,500 | 2,409 | ||||||
|
| |||||||
Total | 46,348 | |||||||
|
| |||||||
Utilities (7.7%) |
| |||||||
Atmos Energy Corp. | 61,341 | 6,427 | ||||||
Edison International | 199,459 | 13,613 | ||||||
Evergy, Inc. | 70,291 | 4,823 | ||||||
Eversource Energy | 52,611 | 4,786 | ||||||
NorthWestern Corp. | 175,714 | 10,044 | ||||||
Pinnacle West Capital Corp. | 91,631 | 6,468 | ||||||
Spire, Inc. | 71,676 | 4,675 | ||||||
The Accompanying Notes are an Integral Part of the Financial Statements.
61
Table of Contents
Mid Cap Value Portfolio
| Common Stocks (98.0%) | Shares/ Par + | Value $ (000’s) | ||||||
Utilities continued | ||||||||
Xcel Energy, Inc. | 46,590 | 3,154 | ||||||
|
| |||||||
Total | 53,990 | |||||||
|
| |||||||
Total Common Stocks | ||||||||
(Cost: $584,419) | 690,531 | |||||||
|
| |||||||
| Short-Term Investments (2.9%) | ||||||||
Money Market Funds (2.9%) |
| |||||||
State Street Institutional U.S. Government Money Market Fund - Premier Class 0.030% # | 20,318,584 | 20,319 | ||||||
|
| |||||||
Total | 20,319 | |||||||
|
| |||||||
Total Short-Term Investments | ||||||||
(Cost: $20,319) | 20,319 | |||||||
Total Investments (100.9%) | ||||||||
(Cost: $604,738)@ | 710,850 | |||||||
Other Assets, Less | ||||||||
Liabilities (-0.9%) | (5,995 | ) | ||||||
|
| |||||||
Net Assets (100.0%) | 704,855 | |||||||
|
| |||||||
Over the Counter Derivatives Forward Foreign Currency Contracts
| Type | Counterparty | Currency | Foreign Principal Amount Covered by Contract (000s) | USD Principal Amount Covered by Contract (000’s) | Settlement Date | Unrealized Appreciation (000’s) | Unrealized (Depreciation) (000’s) | Net Unrealized Appreciation/ (Depreciation) (000’s) | ||||||||||||||
Sell | Goldman Sachs International | EUR | 16,066 | 18,324 | 3/31/2022 | $ | — | $ | (143 | ) | $ | (143 | ) | |||||||||
Sell | Goldman Sachs International | GBP | 11,158 | 15,098 | 3/31/2022 | — | (322 | ) | (322 | ) | ||||||||||||
Buy | Bank Of America, N.A. | JPY | 23,945 | 209 | 3/31/2022 | — | (2 | ) | (2 | ) | ||||||||||||
Sell | Bank Of America, N.A. | JPY | 684,232 | 5,953 | 3/31/2022 | 75 | — | 75 | ||||||||||||||
Sell | Goldman Sachs International | NOK | 39,488 | 4,477 | 3/31/2022 | — | (107 | ) | (107 | ) | ||||||||||||
| $ | 75 | $ | (574 | ) | $ | (499 | ) | |||||||||||||||
| Financial Derivative Assets (000’s) | Financial Derivative Liabilities (000’s) | |||||||||||||||||||||||||||
Forward Foreign Currency Contracts | Swaps | Total | Forward Foreign Currency Contracts | Options | Swaps | Total | ||||||||||||||||||||||
Total Over the Counter Derivatives | $ | 75 | – | $ | 75 | $ | (574 | ) | – | – | $ | (574 | ) | |||||||||||||||
| + | All par is stated in U.S. Dollar unless otherwise noted. |
| * | Non income producing |
| # | 7-Day yield as of 12/31/2021. |
The Accompanying Notes are an Integral Part of the Financial Statements.
62
Table of Contents
Mid Cap Value Portfolio
| @ | At December 31, 2021, the aggregate cost of investments, including derivatives, for federal tax purposes (in thousands) was $611,263 and the net unrealized appreciation of investments based on that cost was $99,088 which is comprised of $109,259 aggregate gross unrealized appreciation and $10,171 aggregate gross unrealized depreciation. |
The following is a summary of the inputs used in valuing the Portfolio’s Investments at December 31, 2021. See Note 3 for additional information on portfolio valuation.
| Valuation Inputs | ||||||||||||||||
| Description | Level 1 – Quoted Prices | Level 2 – Other Significant Observable Inputs | Level 3 – Significant Unobservable Inputs | |||||||||||||
| (Amounts in thousands) | ||||||||||||||||
Assets: | ||||||||||||||||
Common Stocks | ||||||||||||||||
Consumer Discretionary | $ | 51,426 | $ | 3,373 | $ | - | ||||||||||
Consumer Staples | 53,247 | 5,276 | - | |||||||||||||
All Others | 577,209 | - | - | |||||||||||||
Short-Term Investments | 20,319 | - | - | |||||||||||||
Other Financial Instruments^ | ||||||||||||||||
Forward Foreign Currency Contracts | - | 75 | - | |||||||||||||
Total Assets: | $ | 702,201 | $ | 8,724 | $ | - | ||||||||||
Liabilities: | ||||||||||||||||
Other Financial Instruments^ | ||||||||||||||||
Forward Foreign Currency Contracts | - | (574 | ) | - | ||||||||||||
Total Liabilities: | $ | - | $ | (574 | ) | $ | - | |||||||||
^ Other financial instruments are derivative instruments such as futures and forward foreign currency contracts, which are valued at the unrealized appreciation (depreciation) on the instrument, and securities sold short, reverse repurchase agreements, written options and swaps contracts, which are valued at market value.
The Accompanying Notes are an Integral Part of the Financial Statements.
63
Table of Contents
Small Cap Growth Stock Portfolio (unaudited)
| Objective: | Portfolio Strategy: | Net Assets: | ||
| Long-term growth of capital. | Invest primarily in common stocks of small capitalization companies. | $830 million |
PORTFOLIO OVERVIEW
Mason Street Advisors, LLC (“Mason Street Advisors”), the investment adviser for the Small Cap Growth Stock Portfolio (the “Portfolio”), has engaged Wellington Management Company LLP (“Wellington”) to act as sub-adviser for the Portfolio. Normally, the Portfolio invests in common stocks of small capitalization companies. The Portfolio’s investment process is derived from the observation that the quality and persistence of a company’s business is often not reflected in its current stock price. Central to the investment process is intense, fundamental research focused on uncovering companies with improving quality metrics, business momentum and attractive relative valuations.
MARKET OVERVIEW
U.S. equities advanced for the year 2021, despite markets contending with pandemic uncertainty, fluctuating economic growth projections and heightened concerns of U.S. Federal Reserve (Fed) policy actions. Inflation continued to increase amidst severe supply and labor shortages, rising energy prices and heightened demand for goods and services. Concerns that inflation could persist for longer than expected prompted the Fed to announce an accelerated tapering of asset purchases. The Fed also projected three interest rate increases in 2022, up from its September 2021 forecast of one increase. The rapid spread of the Omicron variant of COVID-19 prompted a renewal of restrictions and event cancellations late in 2021. Returns during the period varied by market capitalization, with large- and mid-capitalization stocks outperforming small-capitalization stocks.
PORTFOLIO RESULTS
The Portfolio returned 4.11% for the twelve months ended December 31, 2021. By comparison, the Portfolio’s benchmark, the Russell 2000® Growth Index (the “Index”) returned 2.84%. (The Index is unmanaged, cannot be invested in directly and does not incur expenses.) According to Lipper® Analytical Services, Inc., an independent mutual fund ranking agency, the average return in 2021 of the Small Cap Growth Funds peer group was 9.4%.
Sector allocation, a residual of the Portfolio’s bottom-up stock selection process, contributed to the Portfolio’s return, especially due to the Portfolio’s underweight position in the Health Care sector and overweight positions in the Industrials and Real Estate sectors. This was partially offset by an underweight allocation in the Energy sector. Security selection modestly contributed to the Portfolio’s return, driven by strong selection in the Information Technology, Industrials and Real Estate sectors.
The top contributors to the Portfolio’s performance were overweight positions in Information Technology companies Perficient, Inc. and Synaptics, Inc., as well as Financials company Triumph Bancorp, Inc. Perficient, Inc. advanced after posting strong second-quarter 2021 results, and third-quarter results also showed strong year-over-year growth. Synaptics, Inc. benefited from reported fiscal first-quarter results that beat consensus estimates. Demand continues to be far in excess of supply, with a backlog of purchase orders now constituting over 90% of fiscal 2022 estimated revenues. Synaptics, Inc. also completed its previously announced acquisition of DSP Group, Inc. in December 2021. Triumph Bancorp advanced as the company’s subsidiary, TriumphPay, announced it entered a definitive agreement to acquire HubTran, a cloud-based provider of automation software for the transportation industry. The company also reported third-quarter 2021 results that grew year-over-year on net interest income and net interest margin.
The top detractors from the Portfolio’s performance included overweight positions in Communication Services company Cardlytics, Inc., Consumer Discretionary firm GAN, Ltd. and Industrials company Hydrofarm Holdings. Cardlytics, Inc. declined after the company reported its second-quarter earnings results in August 2021. Revenue came in below consensus estimates and platform billings were below guidance amid labor shortages and supply chain challenges. Management updated full-year guidance during third-quarter results that showed solid year-over-year growth. GAN, Ltd. shares dropped on the back of third-quarter 2021 earnings that saw revenue decrease 7% quarter-over-quarter. Hydrofarm Holdings declined after reporting third-quarter results and reaffirming their full-year 2021 outlook.
PORTFOLIO MANAGER OUTLOOK
The following forward-looking comments are the opinion of Wellington, the Portfolio’s sub-adviser.
64
Table of Contents
Small Cap Growth Stock Portfolio (unaudited)
At the conclusion of 2021, negotiations on the Build Back Better social spending bill resumed. Our expectation remains that the total spending package, which includes the bipartisan bill signed into law, will support growth in 2022. Consistent with the last several months, the more critical question surrounds expectations for inflation as companies struggle to offset costs with pricing and are seeing margin compression. The Fed has subtly changed its view on tightening monetary conditions over the last few months, and we continue to monitor this very closely. Labor force participation rates should continue to increase as stimulus effects wane, limiting the risk of runaway inflation. Additionally, we are encouraged by the lower mortality resulting from the Omicron variant. As confidence returns, we expect inflation to be sustained into 2022.
As always, we continue to focus on the long-term and continue to be incremental and mindful of the impact of volatility. At the end of the period, the Portfolio was most overweight the Industrials, Real Estate and Information Technology sectors and most underweight in the Health Care, Energy and Materials sectors.
Relative Performance
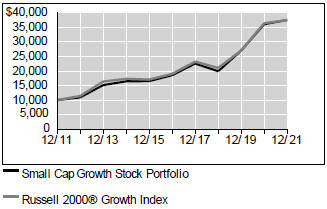
Average Annual Total Returns |
| |||||||||||
| 1 Year | 5 Years | 10 Years | ||||||||||
Small Cap Growth Stock Portfolio | 4.11 | % | 15.15 | % | 14.16 | % | ||||||
Russell 2000® Growth Index | 2.84 | % | 14.53 | % | 14.14 | % | ||||||
Lipper® Variable Insurance Products (VIP) Small Cap Growth Funds Average | 9.40 | % | 17.64 | % | 14.98 | % | ||||||
The performance data quoted represents past performance. Past performance is historical and does not guarantee future performance. Investment return and principal value will fluctuate, so that shares, when redeemed, may be worth more or less than their original cost. Current performance may be lower or higher than the performance data quoted. For the most recent month-end performance information visit www.northwesternmutual.com.
This chart assumes an initial investment of $10,000 made on 12/31/11. Returns shown reflect fee waivers, deductions for management and other portfolio expenses, and reinvestment of all dividends. In the absence of fee waivers, total return would be reduced. Returns exclude deductions for separate account sale loads and account fees. Please refer to the Benchmark Definitions section of
this report for information about the indices cited in the above chart and graph.
Stocks of smaller companies, such as those held in this Portfolio, are more likely to realize more substantial growth as well as suffer more significant losses than larger or more established issuers. Investments in such companies can be both more volatile and more speculative. Investing in small company stocks involves a greater degree of risk than investing in medium or large company stocks.
The Portfolio may invest in exchange-traded funds (“ETFs”) for cash management purposes. Investing in ETFs may expose the Portfolio to greater risk of loss and price fluctuation than investing directly in an equity security. The market prices of ETFs may trade at a premium or discount to their net asset value and may be subject to trading halts by the applicable exchange, which may negatively impact the Portfolio.
The Portfolio may invest a relatively high percentage of its assets in a particular sector. The Portfolio will have greater exposure to the risks associated with that sector and its performance will be tied more closely to the performance of the sector.
Top 10 Equity Holdings 12/31/21
| Security Description | % of Net Assets | |||
Synaptics, Inc. | 1.8 | % | ||
WillScot Mobile Mini Holdings Corp. | 1.8 | % | ||
Omnicell, Inc. | 1.6 | % | ||
ExlService Holdings, Inc. | 1.4 | % | ||
R1 RCM, Inc. | 1.4 | % | ||
Wingstop, Inc. | 1.4 | % | ||
ASGN, Inc. | 1.4 | % | ||
Fox Factory Holding Corp. | 1.4 | % | ||
Lattice Semiconductor Corp. | 1.4 | % | ||
Perficient, Inc. | 1.3 | % | ||
65
Table of Contents
Small Cap Growth Stock Portfolio (unaudited)
Sector Allocation 12/31/21
| Sector | % of Net Assets | |||
Information Technology | 24.4 | % | ||
Health Care | 23.7 | % | ||
Industrials | 17.1 | % | ||
Consumer Discretionary | 14.5 | % | ||
Real Estate | 4.9 | % | ||
Financials | 4.9 | % | ||
Consumer Staples | 4.1 | % | ||
Communication Services | 2.5 | % | ||
Materials | 2.4 | % | ||
Short-Term Investments & Other Net Assets | 1.0 | % | ||
Energy | 0.5 | % | ||
Sector Allocation and Top 10 Holdings are subject to change.
66
Table of Contents
Small Cap Growth Stock Portfolio
SCHEDULE OF INVESTMENTS
December 31, 2021
| Common Stocks (99.0%) | Shares/ Par + | Value $ (000’s) | ||||||
Communication Services (2.5%) |
| |||||||
Bandwidth, Inc. * | 27,287 | 1,958 | ||||||
Bumble, Inc. * | 99,857 | 3,381 | ||||||
Cardlytics, Inc. * | 104,368 | 6,898 | ||||||
Ziff Davis, Inc. * | 76,935 | 8,529 | ||||||
|
| |||||||
Total | 20,766 | |||||||
|
| |||||||
Consumer Discretionary (14.5%) |
| |||||||
BJ’s Restaurants, Inc. * | 152,800 | 5,279 | ||||||
Churchill Downs, Inc. | 32,558 | 7,843 | ||||||
Deckers Outdoor Corp. * | 15,902 | 5,825 | ||||||
Foot Locker, Inc. | 123,687 | 5,396 | ||||||
Fox Factory Holding Corp. * | 66,873 | 11,375 | ||||||
GAN, Ltd. * | 310,723 | 2,856 | ||||||
Mister Car Wash, Inc. * | 323,779 | 5,896 | ||||||
Ollie’s Bargain Outlet Holdings, Inc. * | 112,945 | 5,782 | ||||||
Patrick Industries, Inc. | 85,238 | 6,878 | ||||||
Penn National Gaming, Inc. * | 97,373 | 5,049 | ||||||
PVH Corp. | 55,809 | 5,952 | ||||||
Shutterstock, Inc. | 66,866 | 7,414 | ||||||
Texas Roadhouse, Inc. | 109,978 | 9,819 | ||||||
Thor Industries, Inc. | 62,082 | 6,442 | ||||||
TopBuild Corp. * | 29,868 | 8,241 | ||||||
Traeger, Inc. * | 176,455 | 2,146 | ||||||
Under Armour, Inc. - Class C * | 166,586 | 3,005 | ||||||
Wingstop, Inc. | 67,025 | 11,582 | ||||||
YETI Holdings, Inc. * | 42,735 | 3,540 | ||||||
|
| |||||||
Total | 120,320 | |||||||
|
| |||||||
Consumer Staples (4.1%) |
| |||||||
The Beauty Health Co. * | 194,767 | 4,705 | ||||||
Freshpet, Inc. * | 57,286 | 5,458 | ||||||
Lancaster Colony Corp. | 34,941 | 5,786 | ||||||
Performance Food Group Co. * | 198,177 | 9,094 | ||||||
The Simply Good Foods Co. * | 116,019 | 4,823 | ||||||
Sovos Brands, Inc. * | 279,991 | 4,214 | ||||||
|
| |||||||
Total | 34,080 | |||||||
|
| |||||||
Energy (0.5%) |
| |||||||
Magnolia Oil & Gas Corp. | 220,574 | 4,162 | ||||||
|
| |||||||
Total | 4,162 | |||||||
|
| |||||||
| Common Stocks (99.0%) | Shares/ Par + | Value $ (000’s) | ||||||
Financials (4.9%) |
| |||||||
James River Group Holdings, Ltd. | 102,355 | 2,949 | ||||||
Kemper Corp. | 50,704 | 2,981 | ||||||
MGIC Investment Corp. | 378,961 | 5,464 | ||||||
OneMain Holdings, Inc. | 118,280 | 5,919 | ||||||
Stifel Financial Corp. | 82,779 | 5,829 | ||||||
Synovus Financial Corp. | 108,147 | 5,177 | ||||||
Triumph Bancorp, Inc. * | 66,457 | 7,914 | ||||||
Western Alliance Bancorporation | 43,661 | 4,700 | ||||||
|
| |||||||
Total | 40,933 | |||||||
|
| |||||||
Health Care (23.7%) |
| |||||||
Aclaris Therapeutics, Inc. * | 189,225 | 2,751 | ||||||
Akero Therapeutics, Inc. * | 87,046 | 1,841 | ||||||
ALX Oncology Holdings, Inc. * | 60,613 | 1,303 | ||||||
Amedisys, Inc. * | 16,007 | 2,591 | ||||||
Apellis Pharmaceuticals, Inc. * | 85,187 | 4,028 | ||||||
Arena Pharmaceuticals, Inc. * | 47,441 | 4,409 | ||||||
Arrowhead Pharmaceuticals, Inc. * | 28,167 | 1,867 | ||||||
Arvinas, Inc. * | 48,376 | 3,974 | ||||||
AtriCure, Inc. * | 61,675 | 4,288 | ||||||
Avidity Biosciences, Inc. * | 79,839 | 1,898 | ||||||
BioAtla, Inc. * | 49,948 | 981 | ||||||
Biohaven Pharmaceutical Holding Co., Ltd. * | 16,607 | 2,289 | ||||||
Blueprint Medicines Corp. * | 60,443 | 6,474 | ||||||
Celldex Therapeutics, Inc. * | 94,146 | 3,638 | ||||||
Covetrus, Inc. * | 168,340 | 3,362 | ||||||
Cytokinetics, Inc. * | 103,378 | 4,712 | ||||||
Dyne Therapeutics, Inc. * | 91,640 | 1,090 | ||||||
Fate Therapeutics, Inc. * | 27,555 | 1,612 | ||||||
Glaukos Corp. * | 71,295 | 3,168 | ||||||
Globus Medical, Inc. - Class A * | 89,872 | 6,489 | ||||||
Health Catalyst, Inc. * | 112,160 | 4,444 | ||||||
Heron Therapeutics, Inc. * | 217,348 | 1,984 | ||||||
| Common Stocks (99.0%) | Shares/ Par + | Value $ (000’s) | ||||||
Health Care continued |
| |||||||
ImmunoGen, Inc. * | 392,786 | 2,914 | ||||||
Integer Holdings Corp. * | 69,934 | 5,986 | ||||||
Integra LifeSciences Holdings Corp. * | 104,517 | 7,002 | ||||||
Intellia Therapeutics, Inc. * | 35,488 | 4,196 | ||||||
KalVista Pharmaceuticals, Inc. * | 107,875 | 1,427 | ||||||
Karuna Therapeutics, Inc. * | 30,830 | 4,039 | ||||||
Kodiak Sciences, Inc. * | 40,681 | 3,449 | ||||||
Kymera Therapeutics, Inc. * | 69,577 | 4,417 | ||||||
LHC Group, Inc. * | 43,783 | 6,008 | ||||||
Madrigal Pharmaceuticals, Inc. * | 35,062 | 2,971 | ||||||
Mersana Therapeutics, Inc. * | 232,788 | 1,448 | ||||||
Mirati Therapeutics, Inc. * | 19,192 | 2,815 | ||||||
ModivCare, Inc. * | 26,925 | 3,993 | ||||||
Nanostring Technologies, Inc. * | 102,500 | 4,329 | ||||||
NeoGenomics, Inc. * | 135,149 | 4,611 | ||||||
Nevro Corp. * | 40,809 | 3,308 | ||||||
Omnicell, Inc. * | 71,465 | 12,895 | ||||||
Owens & Minor, Inc. | 148,296 | 6,451 | ||||||
PTC Therapeutics, Inc. * | 101,584 | 4,046 | ||||||
R1 RCM, Inc. * | 461,115 | 11,754 | ||||||
RAPT Therapeutics, Inc. * | 93,915 | 3,450 | ||||||
Revance Therapeutics, Inc. * | 135,872 | 2,217 | ||||||
Revolution Medicines, Inc. * | 84,515 | 2,127 | ||||||
Scholar Rock Holding Corp. * | 71,154 | 1,767 | ||||||
Syndax Pharmaceuticals, Inc. * | 149,321 | 3,269 | ||||||
Tandem Diabetes Care, Inc. * | 46,017 | 6,927 | ||||||
TCR2 Therapeutics, Inc. * | 140,621 | 655 | ||||||
TG Therapeutics, Inc. * | 122,418 | 2,326 | ||||||
Turning Point Therapeutics, | 47,634 | 2,272 | ||||||
Veracyte, Inc. * | 70,194 | 2,892 | ||||||
The Accompanying Notes are an Integral Part of the Financial Statements.
67
Table of Contents
Small Cap Growth Stock Portfolio
| Common Stocks (99.0%) | Shares/ Par + | Value $ (000’s) | ||||||
Health Care continued | ||||||||
Y-mAbs Therapeutics, Inc. * | 102,833 | 1,667 | ||||||
|
| |||||||
Total | 196,821 | |||||||
|
| |||||||
Industrials (17.1%) | ||||||||
Altra Industrial Motion Corp. | 73,194 | 3,775 | ||||||
Applied Industrial Technologies, Inc. | 68,110 | 6,995 | ||||||
Armstrong World Industries, Inc. | 48,850 | 5,672 | ||||||
ASGN, Inc. * | 93,126 | 11,492 | ||||||
Boise Cascade Co. | 49,459 | 3,522 | ||||||
Builders FirstSource, Inc. * | 41,220 | 3,533 | ||||||
CACI International, Inc. - Class A * | 29,445 | 7,927 | ||||||
Chart Industries, Inc. * | 46,047 | 7,344 | ||||||
Clean Harbors, Inc. * | 32,498 | 3,242 | ||||||
Curtiss-Wright Corp. | 38,566 | 5,348 | ||||||
Exponent, Inc. | 54,554 | 6,368 | ||||||
Hydrofarm Holdings Group, Inc. * | 155,615 | 4,402 | ||||||
Insperity, Inc. | 71,025 | 8,389 | ||||||
ITT, Inc. | 65,502 | 6,694 | ||||||
John Bean Technologies Corp. | 64,015 | 9,830 | ||||||
SPX Corp. * | 98,849 | 5,899 | ||||||
SPX Flow, Inc. | 58,473 | 5,057 | ||||||
Tetra Tech, Inc. | 56,860 | 9,655 | ||||||
Viad Corp. * | 90,293 | 3,864 | ||||||
WillScot Mobile Mini | ||||||||
Holdings Corp. * | 359,904 | 14,698 | ||||||
Zurn Water Solutions Corp. | 227,784 | 8,291 | ||||||
|
| |||||||
Total | 141,997 | |||||||
|
| |||||||
Information Technology (24.4%) |
| |||||||
Alarm.com Holdings, Inc. * | 76,193 | 6,462 | ||||||
Axcelis Technologies, Inc. * | 108,271 | 8,073 | ||||||
Blackbaud, Inc. * | 70,471 | 5,566 | ||||||
Cirrus Logic, Inc. * | 67,089 | 6,173 | ||||||
Concentrix Corp. | 57,756 | 10,316 | ||||||
Consensus Cloud Solutions, Inc. * | 25,253 | 1,461 | ||||||
Digital Turbine, Inc. * | 125,170 | 7,634 | ||||||
DigitalOcean Holdings, Inc. * | 25,400 | 2,040 | ||||||
Everbridge, Inc. * | 18,427 | 1,241 | ||||||
ExlService Holdings, Inc. * | 82,152 | 11,893 | ||||||
II-VI, Inc. * | 124,975 | 8,540 | ||||||
Insight Enterprises, Inc. * | 63,669 | 6,787 | ||||||
Lattice Semiconductor Corp. * | 147,027 | 11,330 | ||||||
| Common Stocks (99.0%) | Shares/ Par + | Value $ (000’s) | ||||||
Information Technology continued |
| |||||||
LiveRamp Holdings, Inc. * | 84,794 | 4,066 | ||||||
Lumentum Holdings, Inc. * | 62,349 | 6,595 | ||||||
Manhattan Associates, Inc. * | 35,239 | 5,479 | ||||||
Mimecast, Ltd. * | 80,084 | 6,372 | ||||||
Olo, Inc. * | 125,650 | 2,615 | ||||||
Perficient, Inc. * | 84,241 | 10,891 | ||||||
Power Integrations, Inc. | 98,019 | 9,105 | ||||||
Q2 Holdings, Inc. * | 58,248 | 4,627 | ||||||
Rapid7, Inc. * | 86,582 | 10,190 | ||||||
Repay Holdings Corp. * | 300,418 | 5,489 | ||||||
Shift4 Payments, Inc. * | 54,734 | 3,171 | ||||||
Sprinklr, Inc. * | 64,313 | 1,021 | ||||||
Sprout Social, Inc. * | 64,878 | 5,884 | ||||||
Synaptics, Inc. * | 50,908 | 14,738 | ||||||
Telos Corp. * | 156,686 | 2,416 | ||||||
Varonis Systems, Inc. * | 139,559 | 6,808 | ||||||
Veritone, Inc. * | 138,518 | 3,114 | ||||||
Verra Mobility Corp. * | 492,494 | 7,599 | ||||||
Workiva, Inc. * | 36,698 | 4,789 | ||||||
|
| |||||||
Total | 202,485 | |||||||
|
| |||||||
Materials (2.4%) |
| |||||||
Axalta Coating | ||||||||
Systems, Ltd. * | 236,555 | 7,835 | ||||||
Ingevity Corp. * | 48,866 | 3,504 | ||||||
Louisiana-Pacific Corp. | 74,685 | 5,851 | ||||||
Ranpak Holdings Corp. * | 67,881 | 2,551 | ||||||
|
| |||||||
Total | 19,741 | |||||||
|
| |||||||
Real Estate (4.9%) |
| |||||||
Essential Properties Realty Trust, Inc. | 226,731 | 6,537 | ||||||
Independence Realty Trust, Inc. | 310,623 | 8,023 | ||||||
PS Business Parks, Inc. | 44,840 | 8,258 | ||||||
Redfin Corp. * | 60,848 | 2,336 | ||||||
Rexford Industrial Realty, Inc. | 110,182 | 8,937 | ||||||
Ryman Hospitality | ||||||||
Properties, Inc. * | 75,836 | 6,974 | ||||||
|
| |||||||
Total | 41,065 | |||||||
|
| |||||||
Total Common Stocks |
| |||||||
(Cost: $622,062) | 822,370 | |||||||
|
| |||||||
| Short-Term Investments (1.0%) | Shares/ Par + | Value $ (000’s) | ||||||
Money Market Funds (1.0%) |
| |||||||
State Street Institutional U.S. Government Money Market Fund - Premier Class 0.030% # | 7,913,349 | 7,913 | ||||||
|
| |||||||
Total | 7,913 | |||||||
|
| |||||||
Total Short-Term Investments |
| |||||||
(Cost: $7,913) |
| 7,913 | ||||||
|
| |||||||
Total Investments (100.0%) |
| |||||||
(Cost: $629,975)@ | 830,283 | |||||||
|
| |||||||
Other Assets, Less | ||||||||
Liabilities (0.0%) | (269 | ) | ||||||
|
| |||||||
Net Assets (100.0%) | 830,014 | |||||||
|
| |||||||
The Accompanying Notes are an Integral Part of the Financial Statements.
68
Table of Contents
Small Cap Growth Stock Portfolio
| + | All par is stated in U.S. Dollar unless otherwise noted. |
| * | Non income producing |
| # | 7-Day yield as of 12/31/2021. |
| @ | At December 31, 2021, the aggregate cost of investments, including derivatives, for federal tax purposes (in thousands) was $630,838 and the net unrealized appreciation of investments based on that cost was $199,444 which is comprised of $263,487 aggregate gross unrealized appreciation and $64,043 aggregate gross unrealized depreciation. |
The following is a summary of the inputs used in valuing the Portfolio’s Investments at December 31, 2021. See Note 3 for additional information on portfolio valuation.
| Valuation Inputs | ||||||||||||||
| Description | Level 1 – Quoted Prices | Level 2 – Observable Inputs | Level 3 – Unobservable Inputs | |||||||||||
| (Amounts in thousands) | ||||||||||||||
Assets: | ||||||||||||||
Common Stocks | $ | 822,370 | $ | - | $ | - | ||||||||
Short-Term Investments | 7,913 | - | - | |||||||||||
Total Assets: | $ | 830,283 | $ | - | $ | - | ||||||||
The Accompanying Notes are an Integral Part of the Financial Statements.
69
Table of Contents
Index 600 Stock Portfolio (unaudited)
| Objective: | Portfolio Strategy: | Net Assets: | ||
| Investment results that approximate the performance of the S&P SmallCap 600® Index. | Invest in stocks that make up the S&P SmallCap 600® Index, holding each stock in approximately the same proportion as its weighting in the Index. | $434 million |
PORTFOLIO OVERVIEW
Mason Street Advisors is the investment adviser for the Index 600 Stock Portfolio (“the Portfolio”). The Portfolio seeks investment results that approximate the performance of the S&P SmallCap 600® Index. The Portfolio attempts to achieve its objective by investing all, or substantially all, of its assets in stocks that make up the S&P SmallCap 600® Index, holding each stock in approximately the same proportion as its weighting in the Index. This is known as a full replication strategy. The Portfolio may also invest in equity index futures and exchange traded funds for cash management and liquidity purposes and to help achieve full replication.
MARKET OVERVIEW
U.S. equity markets gained during the reporting period, supported by a broad economic recovery following the COVID-19-related disruptions of 2020, to reach a series of record highs throughout the year. The widespread distribution of vaccines helped consumers return to their pre-pandemic activities and spending habits. The Federal Reserve maintained its accommodative policy stance during the year, with near-zero interest rates and bond-buying programs continuing to provide monetary stimulus. Rising raw material costs and energy prices, higher wages and supply-chain constraints led to a significant increase in inflation. However, the strong growth in consumer spending helped boost corporate earnings.
In this environment, large-cap stocks, as represented by the S&P 500® Index, posted a return of 28.71%, outperforming the S&P MidCap 400® and the S&P SmallCap 600® Indices, which returned 24.76% and 26.82%, respectively. Meanwhile, the broader bond market, as represented by the Bloomberg® U.S. Aggregate Index, returned (1.54%), while the Bloomberg® U.S. Corporate High Yield Index advanced 5.28%.
PORTFOLIO RESULTS
The Index 600 Stock Portfolio returned 26.22% for the twelve months ending December 31, 2021, trailing the S&P 600® Index, which advanced by 26.82%. (The Index is unmanaged, cannot be invested in directly and does not incur expenses.) Portfolio performance lagged the Index due to transaction costs, administrative expenses, cash flow effects and costs associated with stock index futures contracts. According to Lipper® Analytical Services, Inc., an independent mutual fund ranking agency, the average return in 2021 of the Small Cap Core Funds peer group was 23.81%. However, the Small Cap Core Funds peer group is not strictly comparable to the Portfolio because many of the funds in the group are actively managed.
All eleven of the Portfolio’s sectors advanced for the reporting period. The Consumer Discretionary sector was the largest contributor to the Portfolio’s return as more consumers returned to in-person shopping while suppliers saw increased demand from multiple industries. The specialty retail industry saw its largest gains come from GameStop Corp., which attracted an unusual amount of interest from retail investors. Beyond this, specialty retail firms achieved growth through improvements in integration between online and in-store shopping, as well as increases in the number of brick-and-mortar locations. Companies in the household durables industry benefitted from an ongoing shortage in housing supply and an appetite for new, lower cost homes among first-time buyers. These same trends, along with strong sales growth across a diverse range of product lines, also supported distribution company stocks.
The Industrials sector was another solid contributor to the Portfolio’s return. A consistent demand for advanced technologies essential to production, such as 3D printers and semiconductors, supported machinery companies. Professional services firms saw notable growth from their healthcare customers, which sought solutions to staffing and operational challenges. The construction and engineering industry was another beneficiary of ongoing housing supply constraints, while also being supported by new investments to improve productivity.
Companies in the Financials sector also advanced. Banks found new pockets of growth by expanding their activity to specialist markets, ranging from cryptocurrencies to trucking, and in utilizing financial technology to improve processes such as payments. Consumer finance firms, particularly real estate lenders, benefitted from improved lending activity.
70
Table of Contents
Index 600 Stock Portfolio (unaudited)
Relative Performance
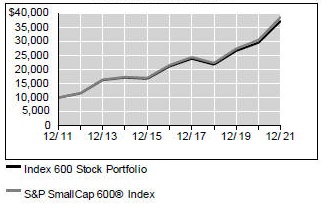
| Average Annual Total Returns | ||||||||||||
| For Periods Ended December 31, 2021 | ||||||||||||
| 1 Year | 5 Years | 10 Years | ||||||||||
Index 600 Stock Portfolio | 26.22 | % | 12.05 | % | 14.08 | % | ||||||
S&P SmallCap 600® Index | 26.82 | % | 12.41 | % | 14.48 | % | ||||||
Lipper® Variable Insurance Products (VIP) Small Cap Core Funds Average | 23.81 | % | 10.64 | % | 12.54 | % | ||||||
The performance data quoted represents past performance. Past performance is historical and does not guarantee future performance. Investment return and principal value will fluctuate, so that shares, when redeemed, may be worth more or less than their original cost. Current performance may be lower or higher than the performance data quoted. For the most recent month-end performance information visit www.northwesternmutual.com.
This chart assumes an initial investment of $10,000 made on 12/31/11. Returns shown reflect fee waivers, deductions for management and other portfolio expenses, and reinvestment of all dividends. In the absence of fee waivers, total return would be reduced. Returns exclude deductions for separate account sale loads and account fees. Please refer to the Benchmark Definitions section of this report for information about the indices cited in the above chart and graph.
“Standard & Poor’s®”, “S&P®”, “S&P SmallCap 600” and “Standard & Poor’s SmallCap 600” are trademarks of The McGraw-Hill Companies, Inc. and have been licensed for use by Northwestern Mutual Life Insurance Company. The Portfolio is not sponsored, endorsed, sold or promoted by Standard & Poor’s, and Standard & Poor’s makes no representation regarding the advisability of investing in the Portfolio.
Stocks of smaller companies, such as those held in this Portfolio, are more likely to realize more substantial growth as well as suffer more significant losses than larger or
more established issuers. Investments in such companies can be both more volatile and more speculative. Investing in small company stocks involves a greater degree of risk than investing in medium or large company stocks.
The Portfolio may invest in exchange-traded funds and derivative instruments, such as equity index futures for cash management and liquidity purposes and to help achieve full replication. Use of these instruments may involve certain costs and imposes certain risks such as liquidity risk, market risk, credit risk, management risk and the risk of mispricing or improper valuation. Certain derivatives involve leverage, which could magnify losses, and portfolios investing in derivatives could lose more than the principal amount invested in those instruments.
Top 10 Equity Holdings 12/31/21
| Security Description | % of Net Assets | |||
Omnicell, Inc. | 0.7 | % | ||
Innovative Industrial Properties, Inc. | 0.6 | % | ||
Exponent, Inc. | 0.6 | % | ||
AMN Healthcare Services, Inc. | 0.5 | % | ||
UFP Industries, Inc. | 0.5 | % | ||
Chart Industries, Inc. | 0.5 | % | ||
Balchem Corp. | 0.5 | % | ||
Watts Water Technologies, Inc. - Class A | 0.5 | % | ||
MaxLinear, Inc. - Class A | 0.5 | % | ||
Vonage Holdings Corp. | 0.5 | % | ||
Sector Allocation 12/31/21
Sector | % of Net Assets | |||||||
Financials | 18.4 | % | ||||||
Industrials | 16.5 | % | ||||||
Information Technology | 13.2 | % | ||||||
Health Care | 12.1 | % | ||||||
Consumer Discretionary | 11.7 | % | ||||||
Real Estate | 8.1 | % | ||||||
Materials | 5.2 | % | ||||||
Energy | 4.7 | % | ||||||
Consumer Staples | 4.5 | % | ||||||
Communication Services | 2.2 | % | ||||||
Utilities | 1.9 | % | ||||||
Short-Term Investments & Other Net Assets | 1.1 | % | ||||||
Investment Companies | 0.4 | % |
Sector Allocation and Top 10 Holdings are subject to change.
71
Table of Contents
Index 600 Stock Portfolio
SCHEDULE OF INVESTMENTS
December 31, 2021
| Common Stocks (98.5%) | Shares/ Par + | Value $ (000’s) | ||||||
Communication Services (2.2%) |
| |||||||
AMC Networks, Inc. - | 11,626 | 400 | ||||||
ATN International, Inc. | 4,366 | 174 | ||||||
Cars.com, Inc. * | 25,834 | 416 | ||||||
Cinemark Holdings, Inc. * | 42,334 | 682 | ||||||
Cogent Communications Holdings, Inc. | 16,875 | 1,235 | ||||||
Consolidated Communications Holdings, Inc. * | 28,345 | 212 | ||||||
The E.W. Scripps Co. - Class A * | 22,733 | 440 | ||||||
Gannett Co., Inc. * | 56,394 | 301 | ||||||
Loyalty Ventures, Inc. * | 7,812 | 235 | ||||||
The Marcus Corp. * | 8,533 | 152 | ||||||
QuinStreet, Inc. * | 19,847 | 361 | ||||||
Scholastic Corp. | 12,115 | 484 | ||||||
Shenandoah Telecommunications Co. | 19,870 | 507 | ||||||
TechTarget, Inc. * | 10,314 | 987 | ||||||
Telephone and Data Systems, Inc. | 39,288 | 792 | ||||||
Thryv Holdings, Inc. * | 6,648 | 274 | ||||||
Vonage Holdings Corp. * | 100,404 | 2,087 | ||||||
|
| |||||||
Total | 9,739 | |||||||
|
| |||||||
Consumer Discretionary (11.7%) |
| |||||||
Aaron’s Holdings Company, Inc. | 12,509 | 308 | ||||||
Abercrombie & Fitch Co. - Class A * | 23,492 | 818 | ||||||
Adtalem Global Education, Inc. * | 19,786 | 585 | ||||||
American Axle & Manufacturing Holdings, Inc. * | 44,977 | 420 | ||||||
American Public Education, Inc. * | 7,426 | 165 | ||||||
America’s Car-Mart, | ||||||||
Inc. * | 2,417 | 248 | ||||||
Asbury Automotive Group, Inc. * | 9,200 | 1,589 | ||||||
Barnes & Noble Education, Inc. * | 14,022 | 95 | ||||||
Bed Bath & Beyond, Inc. * | 40,187 | 586 | ||||||
Big Lots, Inc. | 12,944 | 583 | ||||||
BJ’s Restaurants, Inc. * | 9,148 | 316 | ||||||
Bloomin’ Brands, Inc. * | 32,285 | 677 | ||||||
| Common Stocks (98.5%) | Shares/ Par + | Value $ (000’s) | ||||||
Consumer Discretionary continued |
| |||||||
Boot Barn Holdings, Inc. * | 11,775 | 1,449 | ||||||
Brinker International, Inc. * | 17,971 | 658 | ||||||
The Buckle, Inc. | 11,681 | 494 | ||||||
Caleres, Inc. | 15,039 | 341 | ||||||
The Cato Corp. - Class A | 7,807 | 134 | ||||||
Cavco Industries, Inc. * | 3,394 | 1,078 | ||||||
Century Communities, Inc. | 11,817 | 967 | ||||||
The Cheesecake Factory, Inc. * | 19,289 | 755 | ||||||
Chico’s FAS, Inc. * | 47,893 | 258 | ||||||
The Children’s Place, Inc. * | 5,561 | 441 | ||||||
Chuy’s Holdings, Inc. * | 7,906 | 238 | ||||||
Conn’s, Inc. * | 7,497 | 176 | ||||||
Cooper-Standard Holding, Inc. * | 6,570 | 147 | ||||||
Dave & Buster’s Entertainment, Inc. * | 15,346 | 589 | ||||||
Designer Brands, Inc. * | 24,395 | 347 | ||||||
DineEquity, Inc. | 6,843 | 519 | ||||||
Dorman Products, Inc. * | 11,315 | 1,279 | ||||||
El Pollo Loco Holdings, Inc. * | 7,697 | 109 | ||||||
Ethan Allen Interiors, Inc. | 8,712 | 229 | ||||||
Fiesta Restaurant Group, Inc. * | 6,851 | 75 | ||||||
Fossil Group, Inc. * | 18,744 | 193 | ||||||
Genesco, Inc. * | 5,647 | 362 | ||||||
Gentherm, Inc. * | 13,212 | 1,148 | ||||||
G-III Apparel Group, Ltd. * | 17,376 | 480 | ||||||
Group 1 Automotive, Inc. | 7,198 | 1,405 | ||||||
Guess?, Inc. | 15,498 | 367 | ||||||
Haverty Furniture Cos., Inc. | 5,954 | 182 | ||||||
Hibbett Sports, Inc. | 5,990 | 431 | ||||||
Installed Building Products, Inc. | 9,333 | 1,304 | ||||||
iRobot Corp. * | 10,719 | 706 | ||||||
Kontoor Brands, Inc. | 18,917 | 969 | ||||||
La-Z-Boy, Inc. | 17,625 | 640 | ||||||
LCI Industries | 10,051 | 1,567 | ||||||
LGI Homes, Inc. * | 8,511 | 1,315 | ||||||
Liquidity Services, Inc. * | 10,533 | 233 | ||||||
Lumber Liquidators Holdings, Inc. * | 11,539 | 197 | ||||||
M.D.C. Holdings, Inc. | 22,494 | 1,256 | ||||||
| Common Stocks (98.5%) | Shares/ Par + | Value $ (000’s) | ||||||
Consumer Discretionary continued |
| |||||||
M/I Homes, Inc. * | 11,573 | 720 | ||||||
MarineMax, Inc. * | 8,653 | 511 | ||||||
Meritage Homes Corp. * | 14,839 | 1,811 | ||||||
Monarch Casino & Resort, | 5,140 | 380 | ||||||
Monro, Inc. | 13,335 | 777 | ||||||
Motorcar Parts of America, | 7,649 | 131 | ||||||
Movado Group, Inc. | 6,664 | 279 | ||||||
The ODP Corporation * | 18,251 | 717 | ||||||
Oxford Industries, Inc. | 6,316 | 641 | ||||||
Perdoceo Education Corp. * | 27,950 | 329 | ||||||
PetMed Express, Inc. | 8,325 | 210 | ||||||
Red Robin Gourmet Burgers, Inc. * | 6,100 | 101 | ||||||
Rent-A-Center, Inc. | 24,052 | 1,155 | ||||||
Ruth’s Hospitality Group, Inc. * | 12,643 | 252 | ||||||
Sally Beauty Holdings, Inc. * | 44,951 | 830 | ||||||
Shake Shack, Inc. - Class A * | 15,562 | 1,123 | ||||||
Shoe Carnival, Inc. | 6,965 | 272 | ||||||
Shutterstock, Inc. | 9,302 | 1,031 | ||||||
Signet Jewelers, Ltd. | 21,098 | 1,836 | ||||||
Sleep Number Corp. * | 9,005 | 690 | ||||||
Sonic Automotive, Inc. - Class A | 8,306 | 411 | ||||||
Standard Motor Products, Inc. | 7,640 | 400 | ||||||
Steven Madden, Ltd. | 30,424 | 1,414 | ||||||
Strategic Education, Inc. | 8,998 | 520 | ||||||
Sturm, Ruger & Co., Inc. | 6,998 | 476 | ||||||
Tupperware Brands Corp. * | 19,588 | 300 | ||||||
Unifi, Inc. * | 5,537 | 128 | ||||||
Universal Electronics, Inc. * | 5,303 | 216 | ||||||
Vera Bradley, Inc. * | 9,896 | 84 | ||||||
Vista Outdoor, Inc. * | 22,784 | 1,050 | ||||||
Weight Watchers International, Inc. * | 20,945 | 338 | ||||||
Winnebago Industries, Inc. | 13,305 | 997 | ||||||
Wolverine World Wide, Inc. | 32,749 | 944 | ||||||
Zumiez, Inc. * | 8,504 | 408 | ||||||
|
| |||||||
Total | 50,910 | |||||||
|
| |||||||
The Accompanying Notes are an Integral Part of the Financial Statements.
72
Table of Contents
Index 600 Stock Portfolio
| Common Stocks (98.5%) | Shares/ Par + | Value $ (000’s) | ||||||
Consumer Staples (4.5%) |
| |||||||
The Andersons, Inc. | 12,308 | 476 | ||||||
B&G Foods, Inc. | 25,806 | 793 | ||||||
Calavo Growers, Inc. | 7,032 | 298 | ||||||
Cal-Maine Foods, Inc. | 14,892 | 551 | ||||||
Celsius Holdings, Inc. * | 15,172 | 1,131 | ||||||
Central Garden & Pet Co. * | 3,840 | 202 | ||||||
Central Garden & Pet Co. - Class A * | 16,010 | 766 | ||||||
The Chefs’ Warehouse, Inc. * | 12,978 | 432 | ||||||
Coca-Cola Consolidated, Inc. | 1,846 | 1,143 | ||||||
e.l.f. Beauty, Inc. * | 19,035 | 632 | ||||||
Edgewell Personal Care Co. | 21,621 | 988 | ||||||
Fresh Del Monte Produce, Inc. | 13,115 | 362 | ||||||
Inter Parfums, Inc. | 7,067 | 756 | ||||||
J & J Snack Foods Corp. | 5,914 | 934 | ||||||
John B. Sanfilippo & Son, Inc. | 3,506 | 316 | ||||||
Medifast, Inc. | 4,607 | 965 | ||||||
MGP Ingredients, Inc. | 4,979 | 423 | ||||||
National Beverage Corp. | 9,277 | 421 | ||||||
PriceSmart, Inc. | 9,566 | 700 | ||||||
Seneca Foods Corp. - Class A * | 2,493 | 120 | ||||||
The Simply Good Foods Co. * | 33,536 | 1,394 | ||||||
SpartanNash Co. | 14,186 | 365 | ||||||
Tootsie Roll Industries, Inc. | 6,886 | 250 | ||||||
TreeHouse Foods, Inc. * | 22,186 | 899 | ||||||
United Natural Foods, Inc. * | 22,408 | 1,100 | ||||||
Universal Corp. | 9,786 | 537 | ||||||
USANA Health Sciences, Inc. * | 4,645 | 470 | ||||||
Vector Group, Ltd. | 52,043 | 598 | ||||||
WD-40 Co. | 5,452 | 1,334 | ||||||
|
| |||||||
Total | 19,356 | |||||||
|
| |||||||
Energy (4.7%) | ||||||||
Archrock, Inc. | 53,197 | 398 | ||||||
Bristow Group, Inc. * | 9,143 | 290 | ||||||
Callon Petroleum Co. * | 18,876 | 892 | ||||||
Civitas Resources, Inc. | 28,659 | 1,403 | ||||||
CONSOL Energy, Inc. * | 12,520 | 284 | ||||||
Core Laboratories NV | 18,405 | 411 | ||||||
DMC Global, Inc. * | 7,435 | 294 | ||||||
Dorian LPG, Ltd. | 10,916 | 139 | ||||||
Dril-Quip, Inc. * | 13,896 | 273 | ||||||
Green Plains, Inc. * | 21,314 | 741 | ||||||
Helix Energy Solutions Group, Inc. * | 55,452 | 173 | ||||||
| Common Stocks (98.5%) | Shares/ Par + | Value $ (000’s) | ||||||
Energy continued | ||||||||
Helmerich & Payne, Inc. | 42,884 | 1,016 | ||||||
Laredo Petroleum, Inc. * | 5,701 | 343 | ||||||
Matador Resources Co. | 43,854 | 1,619 | ||||||
Nabors Industries, Ltd. * | 3,060 | 248 | ||||||
Oceaneering International, | 39,649 | 448 | ||||||
Oil States International, Inc. * | 23,676 | 118 | ||||||
Par Pacific Holdings, Inc. * | 18,063 | 298 | ||||||
Patterson-UTI Energy, Inc. | 85,496 | 722 | ||||||
PBF Energy, Inc. * | 37,772 | 490 | ||||||
PDC Energy, Inc. | 38,744 | 1,890 | ||||||
Penn Virginia Corp. * | 8,383 | 226 | ||||||
ProPetro Holding Corp. * | 33,285 | 270 | ||||||
Range Resources Corp. * | 99,327 | 1,771 | ||||||
Renewable Energy Group, | 19,988 | 848 | ||||||
REX American Resources | 2,100 | 202 | ||||||
RPC, Inc. * | 27,786 | 126 | ||||||
SM Energy Co. | 48,303 | 1,424 | ||||||
Southwestern Energy Co. * | 403,598 | 1,881 | ||||||
Talos Energy, Inc. * | 15,969 | 156 | ||||||
US Silica Holdings, Inc. * | 29,543 | 278 | ||||||
World Fuel Services Corp. | 25,125 | 665 | ||||||
|
| |||||||
Total | 20,337 | |||||||
|
| |||||||
Financials (18.4%) | ||||||||
Allegiance Bancshares, Inc. | 7,502 | 317 | ||||||
Ambac Financial Group, Inc. * | 18,410 | 296 | ||||||
American Equity Investment Life Holding Co. | 32,741 | 1,274 | ||||||
Ameris Bancorp | 26,298 | 1,307 | ||||||
AMERISAFE, Inc. | 7,719 | 416 | ||||||
Apollo Commercial Real Estate Finance, Inc. | 52,277 | 688 | ||||||
ARMOUR Residential REIT, Inc. | 35,697 | 350 | ||||||
Assured Guaranty, Ltd. | 27,757 | 1,393 | ||||||
Axos Financial, Inc. * | 21,289 | 1,190 | ||||||
B. Riley Financial, Inc. | 6,307 | 560 | ||||||
Banc of California, Inc. | 21,502 | 422 | ||||||
BancFirst Corp. | 7,540 | 532 | ||||||
The Bancorp, Inc. * | 22,653 | 573 | ||||||
| Common Stocks (98.5%) | Shares/ Par + | Value $ (000’s) | ||||||
Financials continued | ||||||||
BankUnited, Inc. | 35,424 | 1,499 | ||||||
Banner Corp. | 13,663 | 829 | ||||||
Benefit Street Partners Realty Trust, Inc. | 17,474 | 261 | ||||||
Berkshire Hills Bancorp, Inc. | 19,244 | 547 | ||||||
Blucora, Inc. * | 19,236 | 333 | ||||||
Brightsphere Investment Group, Inc. | 14,256 | 365 | ||||||
Brookline Bancorp, Inc. | 31,030 | 502 | ||||||
Capitol Federal Financial, Inc. | 51,321 | 581 | ||||||
Central Pacific Financial Corp. | 11,075 | 312 | ||||||
City Holding Co. | 6,025 | 493 | ||||||
Columbia Banking System, Inc. | 30,907 | 1,011 | ||||||
Community Bank System, Inc. | 21,445 | 1,597 | ||||||
Customers Bancorp, Inc. * | 11,856 | 775 | ||||||
CVB Financial Corp. | 50,653 | 1,085 | ||||||
Dime Community Bancshares, Inc. | 13,241 | 466 | ||||||
Donnelley Financial Solutions, Inc. * | 11,611 | 547 | ||||||
Eagle Bancorp, Inc. | 12,691 | 740 | ||||||
eHealth, Inc. * | 9,285 | 237 | ||||||
Ellington Financial, Inc. | 21,692 | 371 | ||||||
Employers Holdings, Inc. | 11,116 | 460 | ||||||
Encore Capital Group, Inc. * | 9,860 | 612 | ||||||
Enova International, Inc. * | 14,487 | 593 | ||||||
EZCORP, Inc. - Class A * | 21,130 | 156 | ||||||
FB Financial Corp. | 14,220 | 623 | ||||||
First Bancorp | 95,612 | 1,756 | ||||||
First Commonwealth Financial Corp. | 37,668 | 606 | ||||||
First Financial Bancorp | 37,246 | 908 | ||||||
First Hawaiian, Inc. | 51,221 | 1,400 | ||||||
First Midwest Bancorp, Inc. | 45,382 | 929 | ||||||
Flagstar Bancorp, Inc. | 21,020 | 1,008 | ||||||
Genworth Financial, Inc. - Class A * | 201,753 | 817 | ||||||
Granite Point Mortgage Trust, Inc. | 21,540 | 252 | ||||||
Great Western Bancorp, Inc. | 21,915 | 744 | ||||||
Green Dot Corp. - Class A * | 21,743 | 788 | ||||||
Greenhill & Co., Inc. | 5,497 | 99 | ||||||
Hanmi Financial Corp. | 12,167 | 288 | ||||||
HCI Group, Inc. | 3,179 | 266 | ||||||
The Accompanying Notes are an Integral Part of the Financial Statements.
73
Table of Contents
Index 600 Stock Portfolio
| Common Stocks (98.5%) | Shares/ Par + | Value $ (000’s) | ||||||
Financials continued | ||||||||
Heritage Financial Corp. of Washington | 13,969 | 341 | ||||||
Hilltop Holdings, Inc. | 24,172 | 849 | ||||||
HomeStreet, Inc. | 8,088 | 421 | ||||||
Hope Bancorp, Inc. | 47,767 | 703 | ||||||
Horace Mann Educators Corp. | 16,495 | 638 | ||||||
Independent Bank Corp. | 18,891 | 1,540 | ||||||
Independent Bank Group, Inc. | 14,679 | 1,059 | ||||||
Invesco Mortgage Capital, Inc. | 123,976 | 345 | ||||||
Investors Bancorp, Inc. | 89,641 | 1,358 | ||||||
James River Group Holdings, Ltd. | 14,836 | 427 | ||||||
KKR Real Estate Finance Trust, Inc. | 17,661 | 368 | ||||||
Lakeland Financial Corp. | 10,060 | 806 | ||||||
LendingTree, Inc. * | 4,560 | 559 | ||||||
Meta Financial Group, Inc. | 12,534 | 748 | ||||||
Mr. Cooper Group, Inc. * | 29,871 | 1,243 | ||||||
National Bank Holding Corp. - Class A | 12,088 | 531 | ||||||
NBT Bancorp, Inc. | 17,229 | 664 | ||||||
New York Mortgage Trust, Inc. | 150,832 | 561 | ||||||
NMI Holdings, Inc. - | 34,090 | 745 | ||||||
Northfield Bancorp, Inc. | 17,417 | 281 | ||||||
Northwest Bancshares, Inc. | 50,306 | 712 | ||||||
OFG Bancorp | 19,812 | 526 | ||||||
Old National Bancorp | 65,926 | 1,195 | ||||||
Pacific Premier Bancorp, Inc. | 37,510 | 1,502 | ||||||
Palomar Holdings, Inc. * | 9,599 | 622 | ||||||
Park National Corp. | 5,724 | 786 | ||||||
PennyMac Mortgage Investment Trust | 38,448 | 666 | ||||||
Piper Jaffray Cos., Inc. | 5,611 | 1,002 | ||||||
PRA Group, Inc. * | 17,342 | 871 | ||||||
Preferred Bank | 5,473 | 393 | ||||||
ProAssurance Corp. | 21,465 | 543 | ||||||
Provident Financial Services, Inc. | 30,788 | 746 | ||||||
Ready Capital Corp. | 23,412 | 366 | ||||||
Redwood Trust, Inc. | 45,608 | 602 | ||||||
Renasant Corp. | 22,129 | 840 | ||||||
S&T Bancorp, Inc. | 15,636 | 493 | ||||||
Safety Insurance Group, Inc. | 5,662 | 481 | ||||||
Seacoast Banking Corp. of Florida | 23,190 | 821 | ||||||
Selectquote, Inc. * | 49,544 | 449 | ||||||
| Common Stocks (98.5%) | Shares/ Par + | Value $ (000’s) | ||||||
Financials continued | ||||||||
ServisFirst Bancshares, Inc. | 19,400 | 1,648 | ||||||
Simmons First National Corp. - Class A | 45,651 | 1,350 | ||||||
SiriusPoint, Ltd. * | 34,853 | 283 | ||||||
Southside Bancshares, Inc. | 12,795 | 535 | ||||||
Stewart Information Services Corp. | 10,694 | 853 | ||||||
StoneX Group, Inc. * | 6,718 | 411 | ||||||
Tompkins Financial Corp. | 4,703 | 393 | ||||||
Triumph Bancorp, Inc. * | 9,391 | 1,118 | ||||||
Trupanion, Inc. * | 13,645 | 1,802 | ||||||
TrustCo Bank Corp. | 7,703 | 257 | ||||||
Trustmark Corp. | 24,822 | 806 | ||||||
Two Harbors Investment Corp. | 136,796 | 789 | ||||||
United Community Banks, Inc. | 41,543 | 1,493 | ||||||
United Fire Group, Inc. | 8,572 | 199 | ||||||
Universal Insurance Holdings, Inc. | 11,065 | 188 | ||||||
Veritex Holdings, Inc. | 19,590 | 779 | ||||||
Virtus Investment Partners, Inc. | 2,842 | 844 | ||||||
Walker & Dunlop, Inc. | 11,721 | 1,768 | ||||||
Westamerica Bancorporation | 10,681 | 617 | ||||||
WisdomTree Investments, Inc. | 42,964 | 263 | ||||||
World Acceptance Corp. * | 1,678 | 412 | ||||||
WSFS Financial Corp. | 25,992 | 1,303 | ||||||
|
| |||||||
Total | 80,088 | |||||||
|
| |||||||
Health Care (12.1%) | ||||||||
Addus HomeCare Corp. * | 6,332 | 592 | ||||||
Allscripts Healthcare Solutions, Inc. * | 48,746 | 899 | ||||||
AMN Healthcare Services, | 18,800 | 2,300 | ||||||
Amphastar Pharmaceuticals, Inc. * | 14,655 | 341 | ||||||
AngioDynamics, Inc. * | 15,365 | 424 | ||||||
ANI Pharmaceuticals, Inc. * | 4,303 | 198 | ||||||
Anika Therapeutics, Inc. * | 5,708 | 205 | ||||||
Apollo Medical Holdings, Inc. * | 15,021 | 1,104 | ||||||
Avanos Medical, Inc. * | 19,157 | 664 | ||||||
Avid Bioservices, Inc. * | 24,391 | 712 | ||||||
BioLife Solutions, Inc. * | 11,650 | 434 | ||||||
Cara Therapeutics, Inc. * | 16,675 | 203 | ||||||
| Common Stocks (98.5%) | Shares/ Par + | Value $ (000’s) | ||||||
Health Care continued | ||||||||
Cardiovascular Systems, Inc. * | 16,117 | 303 | ||||||
Coherus Biosciences, Inc. * | 25,342 | 404 | ||||||
Collegium Pharmaceutical, Inc. * | 13,728 | 256 | ||||||
Community Health Systems, Inc. * | 49,379 | 657 | ||||||
Computer Programs and Systems, Inc. * | 5,701 | 167 | ||||||
CONMED Corp. | 11,630 | 1,649 | ||||||
Corcept Therapeutics, Inc. * | 37,741 | 747 | ||||||
CorVel Corp. * | 3,711 | 772 | ||||||
Covetrus, Inc. * | 41,088 | 821 | ||||||
Cross Country Healthcare, | 14,055 | 390 | ||||||
CryoLife, Inc. * | 15,453 | 314 | ||||||
Cutera, Inc. * | 6,495 | 268 | ||||||
Cytokinetics, Inc. * | 33,356 | 1,520 | ||||||
Eagle Pharmaceuticals, Inc. * | 4,533 | 231 | ||||||
Emergent Biosolutions, Inc. * | 19,041 | 828 | ||||||
Enanta Pharmaceuticals, Inc. * | 7,093 | 530 | ||||||
Endo International PLC * | 92,098 | 346 | ||||||
Ensign Group, Inc. | 20,873 | 1,753 | ||||||
Fulgent Genetics, Inc. * | 7,711 | 776 | ||||||
Glaukos Corp. * | 18,644 | 829 | ||||||
Hanger, Inc. * | 14,642 | 265 | ||||||
Harmony Biosciences Holdings, Inc. * | 9,068 | 387 | ||||||
HealthStream, Inc. * | 10,058 | 265 | ||||||
Heska Corp. * | 4,259 | 777 | ||||||
Innoviva, Inc. * | 24,866 | 429 | ||||||
Inogen, Inc. * | 8,042 | 273 | ||||||
Integer Holdings Corp. * | 13,129 | 1,124 | ||||||
The Joint Corp. * | 5,656 | 372 | ||||||
Lantheus Holdings, Inc. * | 26,915 | 778 | ||||||
LeMaitre Vascular, Inc. | 7,562 | 380 | ||||||
Ligand Pharmaceuticals, Inc. - Class B * | 6,646 | 1,027 | ||||||
Magellan Health, Inc. * | 9,254 | 879 | ||||||
MEDNAX, Inc. * | 34,378 | 935 | ||||||
Meridian Bioscience, Inc. * | 17,240 | 352 | ||||||
Merit Medical Systems, Inc. * | 20,204 | 1,259 | ||||||
Mesa Laboratories, Inc. | 2,078 | 682 | ||||||
ModivCare, Inc. * | 4,898 | 726 | ||||||
Myriad Genetics, Inc. * | 31,752 | 876 | ||||||
Natus Medical, Inc. * | 13,474 | 320 | ||||||
The Accompanying Notes are an Integral Part of the Financial Statements.
74
Table of Contents
Index 600 Stock Portfolio
| Common Stocks (98.5%) | Shares/ Par + | Value $ (000’s) | ||||||
Health Care continued | ||||||||
Nektar Therapeutics * | 73,388 | 992 | ||||||
NeoGenomics, Inc. * | 48,951 | 1,670 | ||||||
NextGen Healthcare, Inc. * | 22,844 | 406 | ||||||
Omnicell, Inc. * | 17,474 | 3,153 | ||||||
Optimizerx Corp. * | 7,065 | 439 | ||||||
OraSure Technologies, Inc. * | 28,685 | 249 | ||||||
Organogenesis Holdings, Inc. * | 25,064 | 232 | ||||||
Orthofix Medical, Inc. * | 7,884 | 245 | ||||||
Owens & Minor, Inc. | 30,006 | 1,305 | ||||||
Pacira Biosciences, Inc. * | 17,713 | 1,066 | ||||||
The Pennant Group, Inc. * | 10,753 | 248 | ||||||
Phibro Animal Health Corp. - Class A | 8,087 | 165 | ||||||
Prestige Brands Holdings, Inc. * | 19,924 | 1,208 | ||||||
RadNet, Inc. * | 17,633 | 531 | ||||||
REGENXBIO, Inc. * | 14,965 | 489 | ||||||
Select Medical Holdings Corp. | 42,135 | 1,239 | ||||||
Simulations Plus, Inc. | 6,218 | 294 | ||||||
Spectrum Pharmaceuticals, Inc. * | 65,233 | 83 | ||||||
Supernus Pharmaceuticals, Inc. * | 21,147 | 617 | ||||||
Surmodics, Inc. * | 5,534 | 266 | ||||||
Tabula Rasa HealthCare, Inc. * | 9,404 | 141 | ||||||
Tactile Systems Technology, Inc. * | 7,784 | 148 | ||||||
Tivity Health, Inc. * | 17,627 | 466 | ||||||
uniQure NV * | 14,342 | 297 | ||||||
US Physical Therapy, Inc. | 5,133 | 490 | ||||||
Vanda Pharmaceuticals, Inc. * | 22,152 | 348 | ||||||
Varex Imaging Corp. * | 15,668 | 494 | ||||||
Vericel Corp. * | 18,616 | 732 | ||||||
Xencor, Inc. * | 23,252 | 933 | ||||||
Zynex, Inc. * | 7,971 | 80 | ||||||
|
| |||||||
Total | 52,769 | |||||||
|
| |||||||
Industrials (16.5%) | ||||||||
AAON, Inc. | 16,472 | 1,308 | ||||||
AAR Corp. * | 13,258 | 517 | ||||||
ABM Industries, Inc. | 26,740 | 1,092 | ||||||
Aerojet Rocketdyne Holdings, Inc. | 29,773 | 1,392 | ||||||
Aerovironment, Inc. * | 9,175 | 569 | ||||||
Alamo Group, Inc. | 3,933 | 579 | ||||||
Albany International | ||||||||
Corp. - Class A | 12,875 | 1,139 | ||||||
| Common Stocks (98.5%) | Shares/ Par + | Value $ (000’s) | ||||||
Industrials continued | ||||||||
Allegiant Travel Co. * | 6,043 | 1,130 | ||||||
American Woodmark Corp. * | 6,607 | 431 | ||||||
Apogee Enterprises, Inc. | 10,054 | 484 | ||||||
Applied Industrial Technologies, Inc. | 15,315 | 1,573 | ||||||
ArcBest Corp. | 10,167 | 1,219 | ||||||
Arcosa, Inc. | 19,218 | 1,013 | ||||||
Astec Industries, Inc. | 9,052 | 627 | ||||||
Atlas Air Worldwide Holdings, Inc. * | 10,734 | 1,010 | ||||||
AZZ, Inc. | 9,849 | 545 | ||||||
Barnes Group, Inc. | 18,522 | 863 | ||||||
Brady Corp. - Class A | 19,299 | 1,040 | ||||||
Chart Industries, Inc. * | 14,165 | 2,259 | ||||||
CIRCOR International, Inc. * | 7,931 | 216 | ||||||
Comfort Systems USA, Inc. | 14,332 | 1,418 | ||||||
Deluxe Corp. | 16,942 | 544 | ||||||
DXP Enterprises, Inc. * | 6,782 | 174 | ||||||
Encore Wire Corp. | 8,055 | 1,153 | ||||||
Enerpac Tool Group Corp. | 23,975 | 486 | ||||||
EnPro Industries, Inc. | 8,194 | 902 | ||||||
ESCO Technologies, Inc. | 10,363 | 933 | ||||||
Exponent, Inc. | 20,725 | 2,419 | ||||||
Federal Signal Corp. | 24,284 | 1,052 | ||||||
Forrester Research, Inc. * | 4,409 | 259 | ||||||
Forward Air Corp. | 10,719 | 1,298 | ||||||
Franklin Electric Co., Inc. | 15,510 | 1,467 | ||||||
Gibraltar Industries, Inc. * | 12,995 | 866 | ||||||
GMS, Inc. * | 17,157 | 1,031 | ||||||
Granite Construction, Inc. | 18,222 | 705 | ||||||
The Greenbrier Cos., Inc. | 12,941 | 594 | ||||||
Griffon Corp. | 18,955 | 540 | ||||||
Harsco Corp. * | 31,497 | 526 | ||||||
Hawaiian Holdings, Inc. * | 20,385 | 374 | ||||||
Healthcare Services Group, Inc. | 29,641 | 527 | ||||||
Heartland Express, Inc. | 18,599 | 313 | ||||||
Heidrick & Struggles International, Inc. | 7,790 | 341 | ||||||
Hillenbrand, Inc. | 29,045 | 1,510 | ||||||
HNI Corp. | 17,262 | 726 | ||||||
Hub Group, Inc. - Class A * | 13,504 | 1,138 | ||||||
Insteel Industries, Inc. | 7,672 | 305 | ||||||
Interface, Inc. | 23,516 | 375 | ||||||
John Bean Technologies Corp. | 12,633 | 1,940 | ||||||
| Common Stocks (98.5%) | Shares/ Par + | Value $ (000’s) | ||||||
Industrials continued | ||||||||
Kaman Corp. | 10,965 | 473 | ||||||
KAR Auction Services, Inc. * | 48,183 | 753 | ||||||
Kelly Services, Inc. - Class A | 14,342 | 241 | ||||||
Korn Ferry | 21,675 | 1,641 | ||||||
Lindsay Corp. | 4,337 | 659 | ||||||
Marten Transport, Ltd. | 23,766 | 408 | ||||||
Matson, Inc. | 16,714 | 1,505 | ||||||
Matthews International Corp. - Class A | 12,571 | 461 | ||||||
Meritor, Inc. * | 27,883 | 691 | ||||||
Moog, Inc. - Class A | 11,642 | 943 | ||||||
Mueller Industries, Inc. | 22,814 | 1,354 | ||||||
MYR Group, Inc. * | 6,709 | 742 | ||||||
National Presto Industries, Inc. | 2,018 | 166 | ||||||
NOW, Inc. * | 43,958 | 375 | ||||||
NV5 Global, Inc. * | 4,710 | 651 | ||||||
Park Aerospace Corp. | 7,618 | 101 | ||||||
Patrick Industries, Inc. | 8,936 | 721 | ||||||
PGT Innovations, Inc. * | 23,700 | 533 | ||||||
Pitney Bowes, Inc. | 65,833 | 436 | ||||||
Powell Industries, Inc. | 3,610 | 106 | ||||||
Proto Labs, Inc. * | 10,906 | 560 | ||||||
Quanex Building Products Corp. | 13,367 | 331 | ||||||
Resideo Technologies, Inc. * | 57,415 | 1,495 | ||||||
Resources Connection, Inc. | 12,404 | 221 | ||||||
SkyWest, Inc. * | 20,031 | 787 | ||||||
SPX Corp. * | 18,057 | 1,078 | ||||||
SPX Flow, Inc. | 16,691 | 1,443 | ||||||
Standex International Corp. | 4,853 | 537 | ||||||
Tennant Co. | 7,334 | 594 | ||||||
Titan International, Inc. * | 20,318 | 223 | ||||||
Triumph Group, Inc. * | 25,724 | 477 | ||||||
TrueBlue, Inc. * | 14,126 | 391 | ||||||
UFP Industries, Inc. | 24,612 | 2,265 | ||||||
UniFirst Corp. | 6,055 | 1,274 | ||||||
US Ecology, Inc. * | 12,535 | 400 | ||||||
Veritiv Corp. * | 5,513 | 676 | ||||||
Viad Corp. * | 8,162 | 349 | ||||||
Wabash National Corp. | 19,544 | 381 | ||||||
Watts Water Technologies, Inc. - Class A | 10,959 | 2,128 | ||||||
|
| |||||||
Total | 71,492 | |||||||
|
| |||||||
Information Technology (13.2%) |
| |||||||
3D Systems Corp. * | 50,791 | 1,094 | ||||||
8x8, Inc. * | 45,307 | 759 | ||||||
ADTRAN, Inc. | 19,360 | 442 | ||||||
Advanced Energy Industries, Inc. | 14,978 | 1,364 | ||||||
Agilysys, Inc. * | 7,654 | 340 | ||||||
The Accompanying Notes are an Integral Part of the Financial Statements.
75
Table of Contents
Index 600 Stock Portfolio
| Common Stocks (98.5%) | Shares/ Par + | Value $ (000’s) | ||||||
Information Technology continued |
| |||||||
Alarm.com Holdings, Inc. * | 18,314 | 1,553 | ||||||
Arlo Technologies, Inc. * | 33,527 | 352 | ||||||
Axcelis Technologies, Inc. * | 13,260 | 989 | ||||||
Badger Meter, Inc. | 11,633 | 1,240 | ||||||
Benchmark Electronics, Inc. | 14,002 | 380 | ||||||
Bottomline Technologies, Inc. * | 15,447 | 872 | ||||||
CalAmp Corp. * | 14,083 | 99 | ||||||
CEVA, Inc. * | 9,135 | 395 | ||||||
Cohu, Inc. * | 19,360 | 737 | ||||||
Comtech Telecommunications Corp. | 10,474 | 248 | ||||||
Consensus Cloud Solutions, Inc. * | 6,325 | 366 | ||||||
CSG Systems International, Inc. | 12,985 | 748 | ||||||
CTS Corp. | 12,753 | 468 | ||||||
Diebold, Inc. * | 28,815 | 261 | ||||||
Digi International, Inc. * | 13,562 | 333 | ||||||
Diodes, Inc. * | 17,903 | 1,966 | ||||||
Ebix, Inc. | 9,357 | 284 | ||||||
ePlus, Inc. * | 10,744 | 579 | ||||||
EVERTEC, Inc. | 23,757 | 1,187 | ||||||
ExlService Holdings, Inc. * | 13,244 | 1,917 | ||||||
Extreme Networks, Inc. * | 51,651 | 811 | ||||||
Fabrinet * | 14,721 | 1,744 | ||||||
FARO Technologies, Inc. * | 7,237 | 507 | ||||||
FormFactor, Inc. * | 31,101 | 1,422 | ||||||
Harmonic, Inc. * | 40,783 | 480 | ||||||
Ichor Holdings, Ltd. * | 11,301 | 520 | ||||||
Insight Enterprises, Inc. * | 13,873 | 1,479 | ||||||
InterDigital, Inc. | 12,199 | 874 | ||||||
Itron, Inc. * | 18,002 | 1,234 | ||||||
Knowles Corp. * | 36,728 | 858 | ||||||
Kulicke and Soffa Industries, Inc. | 24,644 | 1,492 | ||||||
LivePerson, Inc. * | 26,166 | 935 | ||||||
ManTech International Corp. - Class A | 10,960 | 799 | ||||||
MaxLinear, Inc. - Class A * | 28,074 | 2,117 | ||||||
Methode Electronics, Inc. - Class A | 15,178 | 746 | ||||||
NETGEAR, Inc. * | 11,637 | 340 | ||||||
NetScout Systems, Inc. * | 29,378 | 972 | ||||||
OneSpan, Inc. * | 13,692 | 232 | ||||||
Onto Innovation, Inc. * | 19,597 | 1,984 | ||||||
OSI Systems, Inc. * | 6,635 | 618 | ||||||
PC Connection, Inc. | 4,367 | 188 | ||||||
| Common Stocks (98.5%) | Shares/ Par + | Value $ (000’s) | ||||||
Information Technology continued |
| |||||||
PDF Solutions, Inc. * | 11,794 | 375 | ||||||
Perficient, Inc. * | 13,098 | 1,693 | ||||||
Photronics, Inc. * | 24,454 | 461 | ||||||
Plantronics, Inc. * | 16,992 | 499 | ||||||
Plexus Corp. * | 11,234 | 1,077 | ||||||
Progress Software Corp. | 17,434 | 842 | ||||||
Rambus, Inc. * | 43,499 | 1,278 | ||||||
Rogers Corp. * | 7,448 | 2,033 | ||||||
Sanmina Corp. * | 25,558 | 1,060 | ||||||
ScanSource, Inc. * | 10,152 | 356 | ||||||
SMART Global Holdings, Inc. * | 9,210 | 654 | ||||||
SPS Commerce, Inc. * | 14,302 | 2,036 | ||||||
TTEC Holdings, Inc. | 7,287 | 660 | ||||||
TTM Technologies, Inc. * | 41,498 | 618 | ||||||
Ultra Clean Holdings, Inc. * | 17,855 | 1,024 | ||||||
Unisys Corp. * | 26,700 | 549 | ||||||
Veeco Instruments, Inc. * | 20,081 | 572 | ||||||
Viavi Solutions, Inc. * | 94,520 | 1,665 | ||||||
Xperi Holding Corp. | 41,569 | 786 | ||||||
|
| |||||||
Total | 57,563 | |||||||
|
| |||||||
Materials (5.2%) | ||||||||
AdvanSix, Inc. | 11,186 | 529 | ||||||
Allegheny Technologies, Inc. * | 50,607 | 806 | ||||||
American Vanguard Corp. | 10,638 | 174 | ||||||
Arconic Corp. * | 42,348 | 1,398 | ||||||
Balchem Corp. | 12,878 | 2,171 | ||||||
Boise Cascade Co. | 15,640 | 1,114 | ||||||
Carpenter Technology Corp. | 19,164 | 559 | ||||||
Century Aluminum Co. * | 19,743 | 327 | ||||||
Clearwater Paper Corp. * | 6,624 | 243 | ||||||
Ferro Corp. * | 32,905 | 718 | ||||||
FutureFuel Corp. | 9,934 | 76 | ||||||
GCP Applied Technologies, | 21,342 | 676 | ||||||
Glatfelter Corp. | 17,707 | 305 | ||||||
H.B. Fuller Co. | 20,901 | 1,693 | ||||||
Hawkins, Inc. | 7,418 | 293 | ||||||
Haynes International, Inc. | 5,041 | 203 | ||||||
Innospec, Inc. | 9,801 | 885 | ||||||
Kaiser Aluminum Corp. | 6,309 | 593 | ||||||
Koppers Holdings, Inc. * | 8,474 | 265 | ||||||
Kraton Corp. * | 12,784 | 592 | ||||||
Livent Corp. * | 64,250 | 1,566 | ||||||
Materion Corp. | 8,129 | 747 | ||||||
Mercer International, Inc. | 15,852 | 190 | ||||||
| Common Stocks (98.5%) | Shares/ Par + | Value $ (000’s) | ||||||
Materials continued | ||||||||
Myers Industries, Inc. | 14,415 | 289 | ||||||
Neenah Paper, Inc. | 6,695 | 310 | ||||||
O-I Glass, Inc. * | 62,362 | 750 | ||||||
Olympic Steel, Inc. | 3,542 | 83 | ||||||
Quaker Chemical Corp. | 5,336 | 1,231 | ||||||
Rayonier Advanced Materials, Inc. * | 25,375 | 145 | ||||||
Schweitzer-Mauduit International, Inc. | 12,556 | 375 | ||||||
Stepan Co. | 8,468 | 1,053 | ||||||
SunCoke Energy, Inc. | 32,911 | 217 | ||||||
Sylvamo Corp. * | 14,005 | 391 | ||||||
TimkenSteel Corp. * | 16,359 | 270 | ||||||
Tredegar Corp. | 10,048 | 119 | ||||||
Trinseo PLC | 15,444 | 810 | ||||||
Warrior Met Coal, Inc. | 20,442 | 526 | ||||||
|
| |||||||
Total | 22,692 | |||||||
|
| |||||||
Real Estate (8.1%) | ||||||||
Acadia Realty Trust | 35,173 | 768 | ||||||
Agree Realty Corp. | 27,753 | 1,981 | ||||||
Alexander & Baldwin, Inc. | 28,841 | 724 | ||||||
American Assets Trust, Inc. | 20,919 | 785 | ||||||
Armada Hoffler Properties, Inc. | 24,454 | 372 | ||||||
Brandywine Realty Trust | 68,056 | 913 | ||||||
CareTrust REIT, Inc. | 38,593 | 881 | ||||||
Centerspace REIT | 5,681 | 630 | ||||||
Chatham Lodging Trust * | 19,262 | 264 | ||||||
Community Healthcare Trust, Inc. | 9,338 | 441 | ||||||
CoreCivic, Inc. * | 47,834 | 477 | ||||||
DiamondRock Hospitality Co. * | 83,737 | 805 | ||||||
Diversified Healthcare Trust | 93,621 | 289 | ||||||
Douglas Elliman, Inc. * | 26,022 | 299 | ||||||
Easterly Government Properties, Inc. | 34,267 | 785 | ||||||
Essential Properties Realty Trust, Inc. | 48,343 | 1,394 | ||||||
Four Corners Property Trust, Inc. | 30,760 | 905 | ||||||
Franklin Street Properties Corp. | 38,488 | 229 | ||||||
The GEO Group, Inc. | 48,160 | 373 | ||||||
Getty Realty Corp. | 15,687 | 503 | ||||||
Global Net Lease, Inc. | 41,197 | 630 | ||||||
Hersha Hospitality Trust * | 12,898 | 118 | ||||||
Independence Realty Trust, Inc. | 41,587 | 1,074 | ||||||
Industrial Logistics Properties Trust | 26,007 | 652 | ||||||
The Accompanying Notes are an Integral Part of the Financial Statements.
76
Table of Contents
Index 600 Stock Portfolio
| Common Stocks (98.5%) | Shares/ Par + | Value $ (000’s) | ||||||
Real Estate continued | ||||||||
Innovative Industrial Properties, Inc. | 9,515 | 2,502 | ||||||
iStar, Inc. | 27,627 | 714 | ||||||
Lexington Realty Trust | 112,487 | 1,757 | ||||||
LTC Properties, Inc. | 15,663 | 535 | ||||||
Mack-Cali Realty Corp. * | 31,824 | 585 | ||||||
Marcus & Millichap, Inc. * | 9,938 | 511 | ||||||
NexPoint Residential Trust, Inc. | 9,039 | 758 | ||||||
Office Properties Income Trust | 19,251 | 478 | ||||||
Orion Office, Inc. * | 21,623 | 404 | ||||||
RE/MAX Holdings, Inc. - Class A | 7,475 | 228 | ||||||
Realogy Holdings Corp. * | 46,362 | 779 | ||||||
Retail Opportunity Investments Corp. | 48,293 | 947 | ||||||
RPT Realty | 33,516 | 449 | ||||||
Safehold, Inc. | 5,622 | 449 | ||||||
Saul Centers, Inc. | 5,222 | 277 | ||||||
Service Properties Trust | 65,636 | 577 | ||||||
SITE Centers Corp. | 71,393 | 1,130 | ||||||
The St. Joe Co. | 13,113 | 683 | ||||||
Summit Hotel Properties, | 42,339 | 413 | ||||||
Tanger Factory Outlet Centers, Inc. | 41,354 | 797 | ||||||
Uniti Group, Inc. | 93,881 | 1,315 | ||||||
Universal Health Realty Income Trust | 5,098 | 303 | ||||||
Urstadt Biddle Properties, Inc. - Class A | 11,935 | 254 | ||||||
Washington Real Estate Investment Trust | 33,663 | 870 | ||||||
Whitestone REIT | 18,367 | 186 | ||||||
Xenia Hotels & Resorts, Inc. * | 45,412 | 822 | ||||||
|
| |||||||
Total | 35,015 | |||||||
|
| |||||||
Utilities (1.9%) | ||||||||
American States Water Co. | 14,691 | 1,520 | ||||||
Avista Corp. | 28,144 | 1,196 | ||||||
California Water Service Group | 20,923 | 1,503 | ||||||
Chesapeake Utilities Corp. | 7,001 | 1,021 | ||||||
Middlesex Water Co. | 6,958 | 837 | ||||||
Northwest Natural Holding Co. | 12,222 | 596 | ||||||
South Jersey Industries, Inc. | 44,722 | 1,168 | ||||||
| Common Stocks (98.5%) | Shares/ Par + | Value $ (000’s) | ||||||
Utilities continued | ||||||||
Unitil Corp. | 6,352 | 292 | ||||||
|
| |||||||
Total | 8,133 | |||||||
|
| |||||||
Total Common Stocks | ||||||||
(Cost: $305,642) | 428,094 | |||||||
|
| |||||||
| Investment Companies (0.4%) | ||||||||
Investment Companies (0.4%) |
| |||||||
iShares Core S&P Small-Cap ETF | 15,973 | 1,829 | ||||||
|
| |||||||
Total | 1,829 | |||||||
|
| |||||||
Total Investment Companies | ||||||||
(Cost: $1,612) | 1,829 | |||||||
|
| |||||||
| Warrants (0.0%) | ||||||||
Energy (0.0%) | ||||||||
Nabors Industries, Ltd. * | 1,013 | 4 | ||||||
|
| |||||||
Total | 4 | |||||||
|
| |||||||
Total Warrants | ||||||||
(Cost: $–) | 4 | |||||||
|
| |||||||
| Short-Term Investments (1.1%) | ||||||||
Governments (0.1%) | ||||||||
US Treasury | 495,000 | 495 | ||||||
|
| |||||||
Total | 495 | |||||||
|
| |||||||
Money Market Funds (1.0%) |
| |||||||
State Street Institutional U.S. Government Money Market Fund - Premier Class 0.030% # | 4,133,355 | 4,133 | ||||||
|
| |||||||
Total | 4,133 | |||||||
|
| |||||||
Total Short-Term Investments | ||||||||
(Cost: $4,629) | 4,628 | |||||||
|
| |||||||
Total Investments (100.0%) | ||||||||
(Cost: $311,883)@ | 434,555 | |||||||
|
| |||||||
Other Assets, Less | ||||||||
Liabilities (0.0%) | (129 | ) | ||||||
|
| |||||||
Net Assets (100.0%) | 434,426 | |||||||
|
| |||||||
The Accompanying Notes are an Integral Part of the Financial Statements.
77
Table of Contents
Index 600 Stock Portfolio
Exchange Traded or Centrally Cleared Derivatives
Futures
| Issuer | Long/Short | Currency | Notional Par (000’s) | Number of Contracts | Expiration Date | Notional Value (000’s) | Unrealized Appreciation/ (Depreciation) (000’s) | Variation Margin (000’s) | ||||||||||||
E-mini Russell 2000 Index Futures | Long | USD | 2 | 39 | 3/22 | $4,373 | $ | 82 | $ | (9 | ) | |||||||||
|
|
|
| |||||||||||||||||
| $ | 82 | $ | (9 | ) | ||||||||||||||||
|
|
|
| |||||||||||||||||
Financial Derivative Assets | Financial Derivative Liabilities | |||||||||||||
| Variation Margin (000’s) | Variation Margin (000’s) | Market Value (000’s) | ||||||||||||
| Swaps | Futures | Total | Swaps | Futures | Total | Options | ||||||||
Total Exchange-Traded or Centrally Cleared Derivatives | $– | $– | $– | $– | $(9) | $(9) | $– | |||||||
| + | All par is stated in U.S. Dollar unless otherwise noted. |
| * | Non income producing |
| b | Cash or securities with an aggregate value of $495 (in thousands) has been pledged as collateral for futures, swap contracts outstanding, short sales, when issued securities or written options on 12/31/2021. |
| # | 7-Day yield as of 12/31/2021. |
| @ | At December 31, 2021, the aggregate cost of investments, including derivatives, for federal tax purposes (in thousands) was $312,254 and the net unrealized appreciation of investments based on that cost was $122,383 which is comprised of $143,128 aggregate gross unrealized appreciation and $20,745 aggregate gross unrealized depreciation. |
The following is a summary of the inputs used in valuing the Portfolio’s Investments at December 31, 2021. See Note 3 for additional information on portfolio valuation.
Valuation Inputs | ||||||||||||||
| Description | Level 1 – Quoted Prices | Level 2 – Other Significant Observable Inputs | Level 3 - Significant | |||||||||||
| (Amounts in thousands) | ||||||||||||||
Assets: | ||||||||||||||
Common Stocks | $ | 428,094 | $ | - | $ | - | ||||||||
Investment Companies | 1,829 | - | - | |||||||||||
Short-Term Investments | ||||||||||||||
Money Market Funds | 4,133 | - | - | |||||||||||
All Others | - | 495 | - | |||||||||||
Other Financial Instruments^ | ||||||||||||||
Futures | 82 | - | - | |||||||||||
Warrants | 4 | - | - | |||||||||||
Total Assets: | $ | 434,142 | $ | 495 | $ | - | ||||||||
^ Other financial instruments are derivative instruments such as futures and forward foreign currency contracts, which are valued at the unrealized appreciation (depreciation) on the instrument, and securities sold short, reverse repurchase agreements, written options and swaps contracts, which are valued at market value.
The Accompanying Notes are an Integral Part of the Financial Statements.
78
Table of Contents
Small Cap Value Portfolio (unaudited)
| Objective: | Portfolio Strategy: | Net Assets: | ||
| Long-term growth of capital. | Invest primarily in common stocks of small-sized companies believed to be undervalued. | $685 million |
PORTFOLIO OVERVIEW
Mason Street Advisors, LLC (“Mason Street Advisors”), the investment adviser for the Small Cap Value Portfolio (“the Portfolio”), has engaged T. Rowe Price Associates, Inc. (“T. Rowe Price”) to act as sub-adviser for the Portfolio. Normally, the Portfolio invests in common stocks of companies with market capitalizations that do not exceed the maximum market capitalization of any security in the Russell 2000® Index at the time of purchase. Reflecting a value approach to investing, the Portfolio will seek the stocks of companies whose current stock prices do not appear to adequately reflect their underlying value as measured by assets, earnings, cash flow or business franchises.
MARKET OVERVIEW
Despite the continuing coronavirus pandemic, major U.S. stock indices advanced in 2021, extending the brisk rebound that started in March 2020. Many indices repeatedly reached record highs throughout the year. Equities advanced as the economy reopened and recovered, facilitated by the rollout of COVID-19 vaccines, federal fiscal relief and robust corporate earnings growth. Factors that weighed negatively on financial markets included elevated inflation, stemming in part from supply shortages and global supply chain disruptions, the emergence of new COVID-19 variants and the Fed’s decision to taper its monthly asset purchases starting in November 2021.
PORTFOLIO RESULTS
The Portfolio returned 23.0% for the twelve months ended December 31, 2021. By comparison, the Portfolio’s benchmark, the Russell 2000® Value Index (the “Index”), returned 28.27%. (The Index is unmanaged, cannot be invested in directly and does not incur expenses.) According to Lipper® Analytical Services, Inc., an independent mutual fund ranking agency, the average return in 2021 of the Small Cap Value Funds peer group was 30.05%.
Unfavorable stock selection was the main detractor from the Portfolio’s performance. From a sector perspective, the Consumer Discretionary sector was the leading detractor from relative results, driven by adverse stock choices. For example, Strategic Education, Inc. declined sharply amid a deceleration in enrollment growth and regulatory concerns.
Stock selection in the Industrials sector also detracted from the Portfolio’s return, driven by ESCO Technologies, Inc. The Communication Services sector further weighed on the Portfolio’s performance due to stock selection, however, this was partially offset by a positive underweight allocation in the sector. Shares of the telecommunications company Cable One, Inc., a fully integrated provider of high-speed internet, cable television and telephony services, also weighed heavily on relative performance for the period. The portfolio managers maintain a favorable view of the company and its experienced management team, under-levered balance sheet and synergies from recent mergers.
On the upside, the Energy sector contributed the most to the Portfolio’s performance, driven by strong stock choices. U.S. oil and gas exploration and production company Devon Energy Corporation advanced sharply during 2021, buoyed by an increase in oil prices and as the company continued to execute on improved capital productivity and cost reduction initiatives. The company underwent a major transformation via the sale of several non-core assets and a merger of equals with WPX Energy earlier this year. Stock selection in the Financials sector, led by the Portfolio’s exposure to insurance company State Auto Financial Corporation, also contributed.
PORTFOLIO MANAGER OUTLOOK
The following forward-looking comments are the opinion of T. Rowe Price, the Portfolio’s sub-adviser.
Late 2021 brought several negative surprises, including the rapid spread of the Delta and Omicron variants of COVID-19 and a regulatory crackdown in China, the driver of much of the global economy’s growth in recent years. Nevertheless, growth appears likely to continue in most of the world’s major economies over the coming months. Indeed, the Delta and Omicron variants seem likely to have only delayed rather than derailed the global recovery—perhaps making growth over the coming quarters modestly more robust than it would have been. There are several challenges on the horizon, including the withdrawal of extraordinary monetary accommodation in the U.S. and other developed markets. How today’s elevated bond and equity valuations will respond to the normalization of monetary policy is an open question, but past tightening
79
Table of Contents
Small Cap Value Portfolio (unaudited)
episodes have not always led to market corrections. A carefully communicated and slow rise in interest rates in the coming years may allow market growth to continue.
Relative Performance
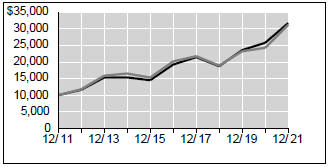
| Average Annual Total Returns For Periods Ended December 31, 2021 | ||||||||||||
| 1 Year | 5 Years | 10 Years | ||||||||||
Small Cap Value Portfolio | 23.00 | % | 10.52 | % | 12.23 | % | ||||||
Russell 2000® Value Index | 28.27 | % | 9.07 | % | 12.03 | % | ||||||
Lipper® Variable Insurance Products (VIP) Small Cap Value Funds Average | 30.05 | % | 9.60 | % | 11.97 | % | ||||||
The performance data quoted represents past performance. Past performance is historical and does not guarantee future performance. Investment return and principal value will fluctuate, so that shares, when redeemed, may be worth more or less than their original cost. Current performance may be lower or higher than the performance data quoted. For the most recent month-end performance information visit www.northwesternmutual.com.
This chart assumes an initial investment of $10,000 made on 12/31/11. Returns shown reflect fee waivers, deductions for management and other portfolio expenses, and reinvestment of all dividends. In the absence of fee waivers, total return would be reduced. Returns exclude deductions for separate account sale loads and account fees. Please refer to the Benchmark Definitions section of this report for information about the indices cited in the above chart and graph.
Stocks of smaller companies, such as those held in this Portfolio, are more likely to realize more substantial growth as well as suffer more significant losses than larger or more established issuers. Investments in such companies can be both more volatile and more speculative. Investing in small company stocks involves a greater degree of risk than investing in medium or large company stocks.
The Portfolio may invest a portion of its assets in other investment companies, including open-end and closed-end funds, exchange-traded funds (“ETFs”), and business development companies (“BDCs”), and will bear its pro rata portion of such expenses. The market prices of ETFs, closed-end funds and BDCs may trade at a premium or discount to their net asset values and may be subject to trading halts by the applicable exchange, which may negatively impact the Portfolio. BDCs in particular may be less liquid and more adversely affected by poor economic or market conditions.
The Portfolio may invest a relatively high percentage of its assets in a particular sector. The Portfolio will have greater exposure to the risks associated with that sector and its performance will be tied more closely to the performance of the sector.
Top 10 Equity Holdings 12/31/21
| Security Description | % of Net Assets | |||||
Western Alliance Bancorporation | 1.7 | % | ||||
Littelfuse, Inc. | 1.6 | % | ||||
Devon Energy Corp. | 1.5 | % | ||||
Live Oak Bancshares, Inc. | 1.5 | % | ||||
UFP Industries, Inc. | 1.5 | % | ||||
Chesapeake Utilities Corp. | 1.4 | % | ||||
Pinnacle Financial Partners, Inc. | 1.4 | % | ||||
Belden, Inc. | 1.4 | % | ||||
Terreno Realty Corp. | 1.3 | % | ||||
Matador Resources Co. | 1.2 | % | ||||
Sector Allocation 12/31/21
Sector | % of Net Assets | |||
Financials | 25.7 | % | ||
Industrials | 14.9 | % | ||
Real Estate | 10.2 | % | ||
Health Care | 9.2 | % | ||
Consumer Discretionary | 9.1 | % | ||
Information Technology | 8.1 | % | ||
Energy | 6.4 | % | ||
Utilities | 4.9 | % | ||
Materials | 4.6 | % | ||
Consumer Staples | 3.0 | % | ||
Communication Services | 2.3 | % | ||
Short-Term Investments & Other Net Assets | 1.6 | % |
Sector Allocation and Top 10 Holdings are subject to change.
80
Table of Contents
Small Cap Value Portfolio
SCHEDULE OF INVESTMENTS
December 31, 2021
| Common Stocks (98.4%) | Shares/ Par + | Value $ (000’s) | ||||||
Communication Services (2.3%) |
| |||||||
Advantage Solutions, Inc. * | 245,014 | 1,965 | ||||||
Boston Omaha Corp. * | 109,275 | 3,139 | ||||||
Cable One, Inc. | 3,182 | 5,611 | ||||||
Integral Ad Science Holding Corp. * | 65,646 | 1,458 | ||||||
NerdWallet, Inc. * | 60,419 | 940 | ||||||
Scholastic Corp. | 73,320 | 2,930 | ||||||
|
| |||||||
Total | 16,043 | |||||||
|
| |||||||
Consumer Discretionary (9.1%) |
| |||||||
Allbirds, Inc. * | 84,114 | 1,268 | ||||||
BJ’s Restaurants, Inc. * | 69,353 | 2,396 | ||||||
Cavco Industries, Inc. * | 22,358 | 7,102 | ||||||
Dorman Products, Inc. * | 35,294 | 3,989 | ||||||
Hibbett Sports, Inc. | 34,516 | 2,483 | ||||||
LCI Industries | 26,370 | 4,110 | ||||||
Lumber Liquidators Holdings, Inc. * | 150,231 | 2,565 | ||||||
Marriott Vacations Worldwide Corp. | 25,547 | 4,317 | ||||||
Meritage Homes Corp. * | 33,552 | 4,095 | ||||||
Monro, Inc. | 52,817 | 3,078 | ||||||
On Holding AG * | 10,554 | 399 | ||||||
Papa John’s | ||||||||
International, Inc. | 35,352 | 4,718 | ||||||
Petco Health & | ||||||||
Wellness Co., Inc. * | 102,683 | 2,032 | ||||||
Pool Corp. | 8,156 | 4,616 | ||||||
Red Robin Gourmet Burgers, Inc. * | 70,895 | 1,172 | ||||||
Rent the Runway, Inc. * | 19,915 | 162 | ||||||
Steven Madden, Ltd. | 115,954 | 5,388 | ||||||
Strategic Education, Inc. | 75,354 | 4,359 | ||||||
Sweetgreen, Inc. * | 16,561 | 530 | ||||||
Visteon Corp. * | 28,058 | 3,118 | ||||||
Xometry, Inc. * | 6,139 | 315 | ||||||
|
| |||||||
Total | 62,212 | |||||||
|
| |||||||
Consumer Staples (3.0%) |
| |||||||
Coca-Cola Consolidated, Inc. | 9,871 | 6,112 | ||||||
Grocery Outlet Holding Corp. * | 68,755 | 1,944 | ||||||
Nomad Foods, Ltd. * | 226,294 | 5,746 | ||||||
Post Holdings, Inc. * | 33,496 | 3,776 | ||||||
The Simply Good Foods Co. * | 79,036 | 3,286 | ||||||
|
| |||||||
Total | 20,864 | |||||||
|
| |||||||
| Common Stocks (98.4%) | Shares/ Par + | Value $ (000’s) | ||||||
Energy (6.4%) | ||||||||
Cactus, Inc. | 138,502 | 5,281 | ||||||
ChampionX Corp. * | 299,413 | 6,051 | ||||||
Devon Energy Corp. | 231,782 | 10,210 | ||||||
International Seaways, Inc. | 99,072 | 1,454 | ||||||
Liberty Oilfield Services, Inc. * | 318,526 | 3,090 | ||||||
Magnolia Oil & Gas Corp. | 342,512 | 6,463 | ||||||
Matador Resources Co. | 221,769 | 8,188 | ||||||
REX American Resources | 32,930 | 3,161 | ||||||
|
| |||||||
Total | 43,898 | |||||||
|
| |||||||
Financials (25.7%) | ||||||||
BankUnited, Inc. | 169,670 | 7,179 | ||||||
BRP Group, Inc. * | 165,829 | 5,988 | ||||||
Columbia Banking System, Inc. | 118,551 | 3,879 | ||||||
CrossFirst Bankshares, Inc. * | 160,925 | 2,512 | ||||||
Eastern Bankshares, Inc. | 135,343 | 2,730 | ||||||
FB Financial Corp. | 117,947 | 5,168 | ||||||
Glacier Bancorp, Inc. | 85,178 | 4,830 | ||||||
Green Dot Corp. - Class A * | 67,755 | 2,455 | ||||||
Hannon Armstrong Sustainable Infrastructure Capital, Inc. | 119,314 | 6,338 | ||||||
HarborOne Bancorp, Inc. | 267,555 | 3,971 | ||||||
Hercules Capital, Inc. | 191,035 | 3,169 | ||||||
Home BancShares, Inc. | 321,749 | 7,835 | ||||||
Houlihan Lokey, Inc. | 60,274 | 6,240 | ||||||
Independent Bank Corp. | 64,079 | 5,224 | ||||||
James River Group Holdings, Ltd. | 86,517 | 2,493 | ||||||
Live Oak Bancshares, Inc. | 115,638 | 10,094 | ||||||
National Bank Holding Corp. - Class A | 108,417 | 4,764 | ||||||
Origin Bancorp, Inc. | 90,930 | 3,903 | ||||||
Palomar Holdings, Inc. * | 29,876 | 1,935 | ||||||
PCSB Financial Corp. | 77,169 | 1,469 | ||||||
PennyMac Financial Services, Inc. | 55,335 | 3,861 | ||||||
PennyMac Mortgage Investment Trust | 182,779 | 3,168 | ||||||
| Common Stocks (98.4%) | Shares/ Par + | Value $ (000’s) | ||||||
Financials continued | ||||||||
Pinnacle Financial Partners, Inc. | 100,059 | 9,556 | ||||||
Popular, Inc. | 64,965 | 5,330 | ||||||
PRA Group, Inc. * | 34,538 | 1,734 | ||||||
ProAssurance Corp. | 121,081 | 3,063 | ||||||
PROG Holdings, Inc. * | 88,017 | 3,970 | ||||||
Radian Group, Inc. | 209,982 | 4,437 | ||||||
Ryan Specialty Group Holdings, Inc. * | 67,839 | 2,737 | ||||||
Southern First Bancshares, | 65,527 | 4,095 | ||||||
StepStone Group, Inc. | 42,850 | 1,781 | ||||||
TowneBank | 165,253 | 5,220 | ||||||
Virtus Investment Partners, Inc. | 20,542 | 6,103 | ||||||
Walker & Dunlop, Inc. | 29,663 | 4,476 | ||||||
Webster Financial Corp. | 85,072 | 4,750 | ||||||
Western Alliance Bancorporation | 110,210 | 11,864 | ||||||
WSFS Financial Corp. | 149,219 | 7,479 | ||||||
|
| |||||||
Total | 175,800 | |||||||
|
| |||||||
Health Care (9.2%) | ||||||||
Agiliti, Inc. * | 127,593 | 2,955 | ||||||
Arvinas, Inc. * | 24,211 | 1,989 | ||||||
Atrion Corp. | 7,359 | 5,187 | ||||||
Blueprint Medicines Corp. * | 21,050 | 2,255 | ||||||
C4 Therapeutics, Inc. * | 41,400 | 1,333 | ||||||
Ensign Group, Inc. | 41,807 | 3,510 | ||||||
Fate Therapeutics, Inc. * | 29,900 | 1,749 | ||||||
FIGS, Inc. * | 95,387 | 2,629 | ||||||
Insmed, Inc. * | 76,610 | 2,087 | ||||||
Ionis Pharmaceuticals, Inc. * | 22,100 | 673 | ||||||
Karuna Therapeutics, Inc. * | 12,563 | 1,646 | ||||||
Kodiak Sciences, Inc. * | 16,917 | 1,434 | ||||||
Kymera Therapeutics, Inc. * | 29,038 | 1,844 | ||||||
Molina Healthcare, Inc. * | 4,505 | 1,433 | ||||||
Option Care Health, Inc. * | 216,472 | 6,156 | ||||||
Ortho Clinical Diagnostics Holdings PLC * | 136,423 | 2,918 | ||||||
Pacific Biosciences of California, Inc. * | 75,700 | 1,549 | ||||||
The Pennant Group, Inc. * | 72,904 | 1,683 | ||||||
Phreesia, Inc. * | 49,808 | 2,075 | ||||||
The Accompanying Notes are an Integral Part of the Financial Statements.
81
Table of Contents
Small Cap Value Portfolio
| Common Stocks (98.4%) | Shares/ Par + | Value $ (000’s) | ||||||
Health Care continued | ||||||||
Prothena Corp. PLC * | 29,300 | 1,447 | ||||||
Quidel Corp. * | 11,353 | 1,533 | ||||||
Replimune Group, Inc. * | 59,510 | 1,613 | ||||||
Select Medical Holdings Corp. | 197,013 | 5,792 | ||||||
Turning Point Therapeutics, Inc. * | 31,100 | 1,483 | ||||||
Ultragenyx Pharmaceutical, Inc. * | 25,785 | 2,168 | ||||||
Xencor, Inc. * | 56,857 | 2,281 | ||||||
Zentalis Pharmaceuticals, Inc. * | 21,100 | 1,774 | ||||||
|
| |||||||
Total | 63,196 | |||||||
|
| |||||||
Industrials (14.9%) | ||||||||
ABM Industries, Inc. | 35,766 | 1,461 | ||||||
Alamo Group, Inc. | 12,575 | 1,851 | ||||||
Allegiant Travel Co. * | 7,590 | 1,420 | ||||||
Ameresco, Inc. * | 19,667 | 1,602 | ||||||
Aris Water Solutions, Inc. * | 106,287 | 1,376 | ||||||
Beacon Roofing Supply, Inc. * | 104,558 | 5,996 | ||||||
Blue Bird Corp. * | 97,002 | 1,517 | ||||||
Brady Corp. - Class A | 64,174 | 3,459 | ||||||
Chart Industries, Inc. * | 8,259 | 1,317 | ||||||
CIRCOR International, Inc. * | 83,832 | 2,279 | ||||||
Enerpac Tool Group Corp. | 124,730 | 2,529 | ||||||
ESCO Technologies, Inc. | 48,535 | 4,368 | ||||||
FTI Consulting, Inc. * | 11,857 | 1,819 | ||||||
Helios Technologies, Inc. | 71,625 | 7,533 | ||||||
Herc Holdings, Inc. | 1,800 | 282 | ||||||
JELD-WEN Holding, Inc. * | 92,210 | 2,431 | ||||||
Korn Ferry | 74,252 | 5,623 | ||||||
Landstar System, Inc. | 27,232 | 4,875 | ||||||
Matson, Inc. | 31,869 | 2,869 | ||||||
McGrath RentCorp | 49,141 | 3,944 | ||||||
MSA Safety, Inc. | 20,397 | 3,079 | ||||||
Parsons Corp. * | 56,541 | 1,903 | ||||||
Regal Beloit Corp. | 16,830 | 2,864 | ||||||
Rush Enterprises, Inc. | 39,083 | 2,175 | ||||||
Shoals Technologies Group, Inc. * | 69,197 | 1,681 | ||||||
SPX Corp. * | 59,514 | 3,552 | ||||||
Stericycle, Inc. * | 68,319 | �� | 4,074 | |||||
The Timken Co. | 35,780 | 2,479 | ||||||
Triumph Group, Inc. * | 324,493 | 6,013 | ||||||
UFP Industries, Inc. | 109,268 | 10,054 | ||||||
UniFirst Corp. | 1,243 | 261 | ||||||
Univar Solutions, Inc. * | 127,045 | 3,602 | ||||||
| Common Stocks (98.4%) | Shares/ Par + | Value $ (000’s) | ||||||
Industrials continued | ||||||||
Zurn Water Solutions | ||||||||
Corp. | 54,200 | 1,973 | ||||||
|
| |||||||
Total | 102,261 | |||||||
|
| |||||||
Information Technology (8.1%) |
| |||||||
Belden, Inc. | 143,951 | 9,462 | ||||||
Ceridian HCM Holding, Inc. * | 42,767 | 4,467 | ||||||
Clearwater Analytics Holdings, Inc. * | 34,565 | 794 | ||||||
Entegris, Inc. | 31,188 | 4,322 | ||||||
Harmonic, Inc. * | 656,202 | 7,717 | ||||||
Littelfuse, Inc. | 33,787 | 10,632 | ||||||
MaxLinear, Inc. - Class A * | 69,243 | 5,220 | ||||||
nCino, Inc. * | 28,916 | 1,586 | ||||||
Onto Innovation, Inc. * | 26,140 | 2,646 | ||||||
PAR Technology Corp. * | 30,659 | 1,618 | ||||||
Payoneer Global, Inc. * | 303,600 | 2,232 | ||||||
Semtech Corp. * | 26,271 | 2,336 | ||||||
Workiva, Inc. * | 17,369 | 2,267 | ||||||
|
| |||||||
Total | 55,299 | |||||||
|
| |||||||
Materials (4.6%) | ||||||||
Carpenter Technology Corp. | 93,235 | 2,722 | ||||||
Clearwater Paper Corp. * | 106,441 | 3,903 | ||||||
Constellium SE * | 330,957 | 5,927 | ||||||
Element Solutions, Inc. | 183,800 | 4,463 | ||||||
Minerals Technologies, Inc. | 9,695 | 709 | ||||||
Myers Industries, Inc. | 131,245 | 2,626 | ||||||
Orion Engineered Carbons | 203,035 | 3,728 | ||||||
Quaker Chemical Corp. | 16,412 | 3,788 | ||||||
Reliance Steel & Aluminum Co. | 21,502 | 3,488 | ||||||
|
| |||||||
Total | 31,354 | |||||||
|
| |||||||
Real Estate (10.2%) | ||||||||
American Campus Communities, Inc. | 63,061 | 3,613 | ||||||
Apartment Investment & Management Co. - | 220,612 | 1,703 | ||||||
EastGroup Properties, Inc. | 31,857 | 7,259 | ||||||
Essential Properties Realty Trust, Inc. | 97,107 | 2,800 | ||||||
Healthcare Realty Trust, Inc. | 116,601 | 3,689 | ||||||
JBG SMITH Properties | 156,499 | 4,493 | ||||||
NexPoint Residential Trust, Inc. | 10,400 | 872 | ||||||
Potlatch Corp. | 91,628 | 5,518 | ||||||
| Common Stocks (98.4%) | Shares/ Par + | Value $ (000’s) | ||||||
Real Estate continued | ||||||||
PS Business Parks, Inc. | 24,469 | 4,507 | ||||||
Safehold, Inc. | 47,018 | 3,754 | ||||||
Saul Centers, Inc. | 98,113 | 5,202 | ||||||
The St. Joe Co. | 138,778 | 7,223 | ||||||
Sunstone Hotel Investors, Inc. * | 479,738 | 5,627 | ||||||
Terreno Realty Corp. | 100,618 | 8,582 | ||||||
Tricon Residential, Inc. | 74,609 | 1,140 | ||||||
Washington Real Estate Investment Trust | 143,260 | 3,703 | ||||||
|
| |||||||
Total | 69,685 | |||||||
|
| |||||||
Utilities (4.9%) | ||||||||
California Water Service Group | 72,610 | 5,218 | ||||||
Chesapeake Utilities Corp. | 67,181 | 9,796 | ||||||
IDACORP, Inc. | 59,488 | 6,740 | ||||||
MGE Energy, Inc. | 62,121 | 5,109 | ||||||
NorthWestern Corp. | 99,298 | 5,676 | ||||||
Sunnova Energy International, Inc. * | 32,761 | 915 | ||||||
|
| |||||||
Total | 33,454 | |||||||
|
| |||||||
Total Common Stocks |
| |||||||
(Cost: $432,955) | 674,066 | |||||||
|
| |||||||
| Warrants (0.0%) | ||||||||
Communication Services (0.0%) |
| |||||||
Advantage Solutions, Inc. * | 19,088 | 47 | ||||||
|
| |||||||
Total | 47 | |||||||
|
| |||||||
Total Warrants | ||||||||
(Cost: $25) | 47 | |||||||
|
| |||||||
| Short-Term Investments (1.6%) | ||||||||
Money Market Funds (1.6%) |
| |||||||
State Street Institutional U.S. Government Money Market Fund - Premier Class 0.030% # | 11,275,380 | 11,275 | ||||||
|
| |||||||
Total | 11,275 | |||||||
|
| |||||||
Total Short-Term Investments | ||||||||
(Cost: $11,275) | 11,275 | |||||||
|
| |||||||
The Accompanying Notes are an Integral Part of the Financial Statements.
82
Table of Contents
Small Cap Value Portfolio
| Short-Term Investments (1.6%) | Shares/ Par + | Value $ (000’s) | ||||||
Money Market Funds continued |
| |||||||
Total Investments |
| |||||||
(Cost: $444,255)@ | 685,388 | |||||||
|
| |||||||
Other Assets, Less | ||||||||
Liabilities (0.0%) | (84 | ) | ||||||
|
| |||||||
Net Assets (100.0%) | 685,304 | |||||||
|
| |||||||
| + | All par is stated in U.S. Dollar unless otherwise noted. |
| * | Non income producing |
| # | 7-Day yield as of 12/31/2021. |
| @ | At December 31, 2021, the aggregate cost of investments, including derivatives, for federal tax purposes (in thousands) was $447,243 and the net unrealized appreciation of investments based on that cost was $238,146 which is comprised of $256,772 aggregate gross unrealized appreciation and $18,626 aggregate gross unrealized depreciation. |
The following is a summary of the inputs used in valuing the Portfolio’s Investments at December 31, 2021. See Note 3 for additional information on portfolio valuation.
| Valuation Inputs | ||||||||||||||
| Description | Level 1 – Quoted Prices | Level 2 – Other Significant Observable Inputs | Level 3 – Significant | |||||||||||
| (Amounts in thousands) | ||||||||||||||
Assets: | ||||||||||||||
Common Stocks | $ | 674,066 | $ | - | $ | - | ||||||||
Short-Term Investments | 11,275 | - | - | |||||||||||
Warrants | 47 | - | - | |||||||||||
Total Assets: | $ | 685,388 | $ | - | $ | - | ||||||||
The Accompanying Notes are an Integral Part of the Financial Statements.
83
Table of Contents
International Growth Portfolio (unaudited)
| Objective: | Portfolio Strategy: | Net Assets: | ||
| Long-term growth of capital. | Invest in securities of issuers from countries outside the U.S. that have above average growth potential. | $1.1 billion |
PORTFOLIO OVERVIEW
Mason Street Advisors, LLC (“Mason Street Advisors”), the investment adviser for the International Growth Portfolio (the “Portfolio”), has engaged FIAM LLC (“FIAM”) to act as sub-adviser for the Portfolio. FIAM is an indirect, wholly owned subsidiary of FMR LLC (along with its affiliates, “Fidelity Investments”). Normally, the Portfolio will invest in the securities of issuers from countries outside the United States. The Portfolio invests in companies it believes operate in a market environment, or with a competitive advantage, that make it difficult for competition to disrupt current and future profitability, in combination with growth drivers that may offer above-average growth potential measured by factors such as earnings or revenue. In buying and selling securities for the Portfolio, the portfolio manager relies on fundamental analysis, which involves a “bottom-up” assessment of a company’s potential for success in light of factors such as its financial condition, earnings outlook, strategy, management, industry position and economic and market conditions.
MARKET OVERVIEW
Global equities advanced in early 2021, with the U.S. again outpacing non-U.S. equity markets. European equity markets posted positive returns while Japanese equity markets posted marginally positive returns. On a sector basis, the Financials, Information Technology and Energy sectors supported developed markets, and only the Communication Services sector detracted (in U.S. dollar terms).
Emerging market equities underperformed relative to developed market equities, driven in large part by China, which made up over one-third of the market value. Gains in the Chinese Information Technology sector trailed those of developed-market peers. Sizeable losses in the Consumer Discretionary, Health Care and Real Estate sectors weighed on overall emerging market equity returns in 2021.
PORTFOLIO RESULTS
The Portfolio returned 15.92% for the twelve months ended December 31, 2021. By comparison, the Portfolio’s benchmark, the MSCI EAFE® Growth Index (the “Index”), returned 11.25%. (The Index is unmanaged, cannot be invested in directly and does not incur expenses.) According to Lipper® Analytical Services, Inc., an independent mutual fund ranking agency, the average return in 2021 of the International Large Cap Growth Funds peer group was 8.46%.
From a country perspective, Japan was the largest contributor to the Portfolio’s return, driven primarily by strong stock selection. Out-of-benchmark exposure in the U.S. also contributed. The portfolio’s managers used the output of bottom-up stock selection to determine geographic positioning.
On a sector basis, ten of eleven sectors contributed to the Portfolio’s return. The Information Technology sector contributed significantly to the Portfolio’s return. An overweight position in Netherlands-based ASML Holding was the leading contributor, as their next generation lithography technology continued to be a crucial component for semiconductor design. Lasertec Corp. also contributed as its semi-optical and extreme ultraviolet (EUV) lithographic mask blanks and mask inspection systems form a critical part of the manufacturing pipeline, helping assure the quality of leading-edge semiconductors. Lasertec Corp. remained a highly profitable asset-lite business and increased its order backlog during the year, offering the portfolio managers a longer-term positive view for earnings.
The Communication Services sector also contributed, led by an out-of-benchmark position in Alphabet, Inc. The company benefited from its dominant position in search and advertising as consumer spending at companies with integrated online and brick-and-mortar shopping experiences increased. The Materials sector was another notable contributor, buoyed by a long-time holding in the industrial gases company Linde PLC. The company has maintained strong pricing power as one of the key players in a market dominated by a few large companies.
On the downside, the Portfolio’s sole position in the Real Estate sector, Vonovia SE, detracted from the Portfolio’s return, due to poor performance in the second half of 2021. Meanwhile, not owning Danish drug maker Novo Nordisk, which had several strong launches in 2021, also detracted.
84
Table of Contents
International Growth Portfolio (unaudited)
PORTFOLIO MANAGER OUTLOOK
The following forward-looking comments are the opinion of FIAM, the Portfolio’s sub-adviser.
The Portfolio targets companies with multiyear structural growth prospects, high barriers to entry and attractive valuations, based on our earnings forecasts. We typically find these franchise businesses at cheap-to-reasonable prices in one of three ways: First, we target structurally attractive growth themes. Second, we try to capitalize on cyclically out-of-favor companies with pricing power when the market becomes excessively focused on near-term cyclical concerns and loses sight of the cross-cycle earnings power. Third, we attempt to capitalize on market dislocations driven by macro-shocks.
Over the past year, we have been focused on finding companies that may emerge from the COVID-19 pandemic in notably stronger competitive positions and potentially generate better cycle-to-cycle earnings-per-share, even if short-term prospects are challenging.
We remain optimistic about the long-term attractiveness of the online payments, leading-edge EUV lithography equipment and blood plasma market segments and are enthusiastic about the increasingly consolidated industrial gas market.
Relative Performance
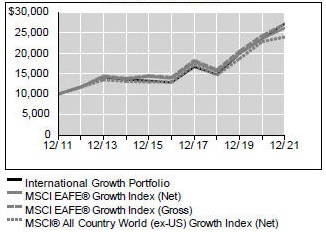
| Average Annual Total Returns For Periods Ended December 31, 2021 | ||||||||||||
| 1 Year | 5 Years | 10 Years | ||||||||||
International Growth Portfolio | 15.92 | % | 16.28 | % | 10.54 | % | ||||||
MSCI EAFE® Growth Index (Net) | 11.25 | % | 13.59 | % | 10.08 | % | ||||||
MSCI EAFE® Growth Index (Gross) | 11.59 | % | 14.00 | % | 10.48 | % | ||||||
MSCI® All Country World (ex-US) Growth Index (Net) | 5.09 | % | 13.06 | % | 9.13 | % | ||||||
Lipper® Variable Insurance Products (VIP) International Large Cap Growth Funds | 8.46 | % | 12.82 | % | 9.31 | % | ||||||
With respect to its broad-based benchmark, the Portfolio has elected to calculate the MSCI® EAFE (Europe-Australasia-Far East) Growth Index net of withholding taxes on reinvested dividends rather than the MSCI® EAFE (Europe-AustralasiaFar East) Growth Index gross of withholding taxes on reinvested dividends because the net calculation more closely reflects the Portfolio’s performance for an investor.
The performance data quoted represents past performance. Past performance is historical and does
not guarantee future performance. Investment return and principal value will fluctuate, so that shares, when redeemed, may be worth more or less than their original cost. Current performance may be lower or higher than the performance data quoted. For the most recent month-end performance information visit www.northwesternmutual.com.
This chart assumes an initial investment of $10,000 made on 12/31/11. Returns shown reflect fee waivers, deductions for management and other portfolio expenses, and reinvestment of all dividends. In the absence of fee waivers, total return would be reduced. Returns exclude deductions for separate account sale loads and account fees. Please refer to the Benchmark Definitions section of this report for information about the indices cited in the above chart and graph.
Investors should be aware of the risks of investments in foreign securities, particularly investments in securities of companies in developing nations.
The Portfolio may invest a relatively large percentage of its assets in issuers located in a single country, a small number of countries, or a particular geographic region. The Portfolio’s performance may be more volatile than that of a more geographically diversified fund, and may be tied more closely to the performance of a single country or region.
85
Table of Contents
International Growth Portfolio (unaudited)
Top 10 Equity Holdings 12/31/21
Security Description | % of Net Assets | |||
ASML Holding NV | 6.5 | % | ||
Nestle SA | 4.6 | % | ||
LVMH Moet Hennessy Louis Vuitton SE | 4.3 | % | ||
Roche Holding AG | 4.1 | % | ||
Recruit Holdings Co., Ltd. | 3.6 | % | ||
Keyence Corp. | 3.4 | % | ||
Linde PLC | 2.6 | % | ||
Atlas Copco AB - Class A | 2.5 | % | ||
Hoya Corp. | 2.4 | % | ||
Assa Abloy AB - Class B | 2.2 | % |
Sector Allocation 12/31/21
| Sector | % of Net Assets | |||
Industrials | 27.3 | % | ||
Information Technology | 24.6 | % | ||
Financials | 12.1 | % | ||
Health Care | 9.7 | % | ||
Consumer Discretionary | 7.9 | % | ||
Materials | 6.1 | % | ||
Consumer Staples | 5.1 | % | ||
Communication Services | 3.1 | % | ||
Short-Term Investments & Other Net Assets | 2.6 | % | ||
Real Estate | 0.8 | % | ||
Energy | 0.7 | % | ||
Sector Allocation and Top 10 Holdings are subject to change.
86
Table of Contents
International Growth Portfolio
SCHEDULE OF INVESTMENTS
December 31, 2021
| Common Stocks (97.4%) | Country | Shares/ Par + | Value $ (000’s) | |||||||
Communication Services (3.1%) | ||||||||||
Adevinta ASA - Class B * | Norway | 269,857 | 3,587 | |||||||
Alphabet, Inc. - Class A * | United States | 4,000 | 11,588 | |||||||
Rightmove PLC | United Kingdom | 641,600 | 6,904 | |||||||
Safaricom, Ltd. | Kenya | 16,324,600 | 5,482 | |||||||
Schibsted ASA - Class B | Norway | 162,799 | 5,451 | |||||||
|
| |||||||||
Total | 33,012 | |||||||||
|
| |||||||||
Consumer Discretionary (7.9%) | ||||||||||
Autoliv, Inc. | United States | 57,400 | 5,936 | |||||||
| Compass Group PLC * | United Kingdom | 631,900 | 14,121 | |||||||
| InterContinental Hotels | ||||||||||
| Group PLC, ADR * | United Kingdom | 100,184 | 6,533 | |||||||
LVMH Moet Hennessy Louis Vuitton SE | France | 55,200 | 45,688 | |||||||
| PRADA SPA | Italy | 1,193,200 | 7,636 | |||||||
| USS Co., Ltd. | Japan | 290,600 | 4,538 | |||||||
|
| |||||||||
Total | 84,452 | |||||||||
|
| |||||||||
| Consumer Staples (5.1%) | ||||||||||
| Clicks Group, Ltd. | South Africa | 142,852 | 2,829 | |||||||
| Nestle SA | Switzerland | 352,569 | 49,286 | |||||||
| PriceSmart, Inc. | United States | 36,000 | 2,634 | |||||||
|
| |||||||||
Total | 54,749 | |||||||||
|
| |||||||||
| Energy (0.7%) | ||||||||||
| Reliance Industries, Ltd. | India | 60,000 | 1,912 | |||||||
| Reliance Industries, Ltd., GDR | India | 86,300 | 5,519 | |||||||
|
| |||||||||
Total | 7,431 | |||||||||
|
| |||||||||
| Financials (12.1%) | ||||||||||
| AIA Group, Ltd. | Hong Kong | 2,196,688 | 22,143 | |||||||
| Deutsche Borse Aktiengesellschaft | Germany | 48,500 | 8,125 | |||||||
| Hong Kong Exchanges & Clearing, Ltd. | Hong Kong | 226,800 | 13,246 | |||||||
| Housing Development | ||||||||||
| Finance Corp., Ltd. | India | 135,463 | 4,714 | |||||||
| Kotak Mahindra Bank, Ltd. | India | 197,500 | 4,776 | |||||||
| Marsh & McLennan Cos., Inc. | United States | 123,723 | 21,506 | |||||||
| Moody’s Corp. | United States | 45,400 | 17,732 | |||||||
| MSCI, Inc. | United States | 29,700 | 18,197 | |||||||
| S&P Global, Inc. | United States | 39,200 | 18,500 | |||||||
|
| |||||||||
Total | 128,939 | |||||||||
|
| |||||||||
| Health Care (9.7%) | ||||||||||
| Dechra Pharmaceuticals PLC | United Kingdom | 73,800 | 5,319 | |||||||
| Hoya Corp. | Japan | 170,200 | 25,236 | |||||||
| ResMed, Inc. | United States | 67,500 | 17,582 | |||||||
| Roche Holding AG | Switzerland | 105,812 | 43,863 | |||||||
| Sanofi | France | 42,100 | 4,246 | |||||||
| UCB SA | Belgium | 63,500 | 7,255 | |||||||
|
| |||||||||
Total | 103,501 | |||||||||
|
| |||||||||
| Common Stocks (97.4%) | Country | Shares/ Par + | Value $ (000’s) | |||||||
Industrials (27.3%) | ||||||||||
| Aalberts NV | Netherlands | 45,000 | 2,985 | |||||||
| Airbus SE * | Netherlands | 139,000 | 17,781 | |||||||
| Assa Abloy AB - Class B | Sweden | 774,400 | 23,525 | |||||||
| Atlas Copco AB - Class A | Sweden | 391,700 | 27,115 | |||||||
| Auckland International Airport, Ltd. * | New Zealand | 568,455 | 2,998 | |||||||
| Azelis Group NV * | Belgium | 86,385 | 2,481 | |||||||
| CAE, Inc. * | Canada | 201,200 | 5,075 | |||||||
| Canadian Pacific Railway, Ltd. | Canada | 185,900 | 13,371 | |||||||
| Cellnex Telecom SA | Spain | 140,739 | 8,171 | |||||||
| Edenred | France | 128,800 | 5,949 | |||||||
| Epiroc AB | Sweden | 408,200 | 10,349 | |||||||
| Experian PLC | Jersey | 355,200 | 17,462 | |||||||
| FANUC Corp. | Japan | 81,900 | 17,362 | |||||||
| IMCD NV | Netherlands | 26,100 | 5,785 | |||||||
| Interpump Group SpA | Italy | 122,400 | 8,910 | |||||||
| KONE Oyj | Finland | 88,600 | 6,300 | |||||||
| Legrand SA | France | 139,500 | 16,343 | |||||||
| MISUMI Group, Inc. | Japan | 441,700 | 18,126 | |||||||
| OSG Corp. | Japan | 150,600 | 2,339 | |||||||
| Otis Worldwide Corp. | United States | 57,000 | 4,963 | |||||||
| Recruit Holdings Co., Ltd. | Japan | 626,000 | 37,947 | |||||||
| Safran SA | France | 103,200 | 12,649 | |||||||
| Schindler Holding AG | Switzerland | 21,953 | 5,890 | |||||||
| Schindler Holding AG - Registered Shares | Switzerland | 6,085 | 1,625 | |||||||
| SHO-BOND Holdings Co., Ltd. | Japan | 137,261 | 6,170 | |||||||
| Vestas Wind Systems A/S | Denmark | 319,500 | 9,662 | |||||||
|
| |||||||||
Total | 291,333 | |||||||||
|
| |||||||||
Information Technology (24.6%) | ||||||||||
| Amadeus IT Group SA * | Spain | 310,400 | 20,907 | |||||||
| ASML Holding NV | Netherlands | 85,800 | 69,033 | |||||||
| Azbil Corp. | Japan | 293,900 | 13,390 | |||||||
| Black Knight, Inc. * | United States | 53,500 | 4,435 | |||||||
| Keyence Corp. | Japan | 56,900 | 35,760 | |||||||
| Lam Research Corp. | United States | 30,800 | 22,150 | |||||||
| Lasertec Corp. | Japan | 56,600 | 17,206 | |||||||
| Mastercard, Inc. - Class A | United States | 36,750 | 13,205 | |||||||
| NICE, Ltd. * | Israel | 49,000 | 14,876 | |||||||
| SAP SE | Germany | 93,419 | 13,342 | |||||||
| Spectris PLC | United Kingdom | 150,900 | 7,471 | |||||||
| Taiwan Semiconductor | ||||||||||
| Manufacturing Co., Ltd. | Taiwan | 806,000 | 17,847 | |||||||
| Temenos AG | Switzerland | 28,100 | 3,877 | |||||||
| Visa, Inc. - Class A | United States | 41,225 | 8,934 | |||||||
|
| |||||||||
Total | 262,433 | |||||||||
|
| |||||||||
Materials (6.1%) | ||||||||||
| CRH PLC, ADR | Ireland | 313,700 | 16,563 | |||||||
| Franco-Nevada Corp. | Canada | 49,600 | 6,860 | |||||||
| Linde PLC | Ireland | 80,755 | 28,131 | |||||||
| The Sherwin-Williams Co. | United States | 40,500 | 14,263 | |||||||
|
| |||||||||
Total | 65,817 | |||||||||
|
| |||||||||
The Accompanying Notes are an Integral Part of the Financial Statements.
87
Table of Contents
International Growth Portfolio
| Common Stocks (97.4%) | Country | Shares/ Par + | Value $ (000’s) | |||||||||
Real Estate (0.8%) | ||||||||||||
Vonovia SE | Germany | 163,360 | 9,020 | |||||||||
|
| |||||||||||
Total | 9,020 | |||||||||||
|
| |||||||||||
Total Common Stocks |
| |||||||||||
(Cost: $659,580) |
| 1,040,687 | ||||||||||
|
| |||||||||||
| Short-Term Investments (2.5%) | ||||||||||||
Money Market Funds (2.5%) | ||||||||||||
State Street Institutional U.S. Government Money Market Fund - Premier Class 0.030%# | United States | 26,607,114 | 26,607 | |||||||||
|
| |||||||||||
Total | 26,607 | |||||||||||
|
| |||||||||||
Total Short-Term Investments |
| |||||||||||
(Cost: $26,607) |
| 26,607 | ||||||||||
|
| |||||||||||
Total Investments (99.9%) |
| |||||||||||
(Cost: $686,187)@ |
| 1,067,294 | ||||||||||
|
| |||||||||||
Other Assets, Less | ||||||||||||
Liabilities (0.1%) | 938 | |||||||||||
|
| |||||||||||
Net Assets (100.0%) | 1,068,232 | |||||||||||
|
| |||||||||||
Investments Percentage by Country is based on Net Assets: | ||||||
United States | 19.4% | |||||
Japan | 16.7% | |||||
Switzerland | 9.8% | |||||
Netherlands | 9.0% | |||||
France | 8.0% | |||||
Sweden | 5.7% | |||||
Other | 31.3% | |||||
Total | 99.9% |
The Accompanying Notes are an Integral Part of the Financial Statements.
88
Table of Contents
International Growth Portfolio
| + | All par is stated in U.S. Dollar unless otherwise noted. |
| * | Non income producing |
| # | 7-Day yield as of 12/31/2021. |
| @ | At December 31, 2021, the aggregate cost of investments, including derivatives, for federal tax purposes (in thousands) was $686,832 and the net unrealized appreciation of investments based on that cost was $380,462 which is comprised of $389,440 aggregate gross unrealized appreciation and $8,978 aggregate gross unrealized depreciation. |
The following is a summary of the inputs used in valuing the Portfolio’s Investments at December 31, 2021. See Note 3 for additional information on portfolio valuation.
| Valuation Inputs | ||||||||||||||
| Description | Level 1 – Quoted Prices | Level 2 – Other Significant Observable Inputs | Level 3 – Significant Unobservable Inputs | |||||||||||
| (Amounts in thousands) | ||||||||||||||
Assets: | ||||||||||||||
Common Stocks | ||||||||||||||
Energy | $ | 7,431 | $ | - | $ | - | ||||||||
Communication Services | 23,974 | 9,038 | - | |||||||||||
Consumer Discretionary | 79,914 | 4,538 | - | |||||||||||
Consumer Staples | 5,463 | 49,286 | - | |||||||||||
Financials | 120,814 | 8,125 | - | |||||||||||
Health Care | 34,402 | 69,099 | - | |||||||||||
Industrials | 107,842 | 183,491 | - | |||||||||||
Information Technology | 140,104 | 122,329 | - | |||||||||||
Materials | 37,686 | 28,131 | - | |||||||||||
Real Estate | - | 9,020 | - | |||||||||||
Short-Term Investments | 26,607 | - | - | |||||||||||
Total Assets: | $ | 584,237 | $ | 483,057 | $ | - | ||||||||
The Accompanying Notes are an Integral Part of the Financial Statements.
89
Table of Contents
Research International Core Portfolio (unaudited)
| Objective: | Portfolio Strategy: | Net Assets: | ||
| Capital appreciation. | Invest primarily in foreign equity securities, including emerging markets. | $963 million |
PORTFOLIO OVERVIEW
Mason Street Advisors, LLC (“Mason Street Advisors”), the investment adviser for the Research International Core Portfolio (the “Portfolio”), has engaged Massachusetts Financial Services Company (“MFS®”) to act as sub-adviser for the Portfolio. The Portfolio normally invests in foreign equity securities, including emerging market equity securities. In conjunction with a team of investment research analysts, sector leaders select investments for the Portfolio. An active, “bottom up” investment approach is used to buy and sell investments for the Portfolio. The Portfolio is generally managed to be sector neutral to the MSCI EAFE® Index. The Portfolio may invest in the stocks of companies it believes to have above average earnings growth potential compared to other companies (growth companies), in the stocks of companies it believes are undervalued compared to their perceived worth (value companies), or in a combination of growth and value companies.
MARKET OVERVIEW
During 2021, the global economy experienced volatility as it adjusted to changing conditions of the coronavirus pandemic. The global economy was buoyed by ample fiscal stimulus, accommodative monetary policy and the rollout of several highly effective COVID-19 vaccines. However, the rapid spread of several COVID-19 variants, widespread global production bottlenecks and a surge in inflation weighed negatively on the economy. In the first half of 2021, the economy experienced strong economic activity as the global economy began to reopen. Activity became more muted in the second half of 2021 amid ongoing supply chain disruptions and a new wave of coronavirus infections.
In response to rising inflation, markets anticipated a transition from an exceptionally accommodative environment to a more mixed monetary landscape. Indeed, several central banks in emerging markets tightened their monetary policy and the Fed reduced the pace of its asset purchases in November and December 2021. However, the European Central Bank, the Bank of Japan and the People’s Bank of China have maintained accommodative policies. Sovereign bond yields moved modestly higher during the period of higher inflation and on expectations of tighter Fed policies but remain historically low.
A harsher Chinese regulatory posture towards industries such as online gaming, food delivery and education increased market volatility, as has stress in China’s highly leveraged property development sector. Trade relations between the United States and China remained quite strained despite a change in presidential administrations.
Signs of excess investor enthusiasm continued to be seen in pockets of the market such as “meme stocks,” popular with users of online message boards, and cryptocurrencies, while there has also been heavy retail participation in the market for short-dated options.
PORTFOLIO RESULTS
The Portfolio returned 12.07% for the twelve months ended December 31, 2021. By comparison, the Portfolio’s primary and secondary benchmarks, the MSCI® All Country World (ex-U.S.) Index (the “Index”) and the MSCI EAFE® Index, returned 7.82% and 11.26%, respectively. (These Indices are unmanaged, cannot be invested in directly and do not incur expenses.) According to Lipper® Analytical Services, Inc., an independent mutual fund ranking company, the average return in 2021 of the International Multi-Cap Core Funds peer group was 10.41%.
The Industrials sector was the primary contributor to the Portfolio’s performance, due in part to stock selection and, to a lesser extent, an overweight allocation in the sector. Notably, the Portfolio’s overweight holdings of electrical equipment manufacturer Schneider Electric SE and machinery company GEA Group AG contributed to performance results.
The Consumer Discretionary and Materials sectors also contributed to the Portfolio’s performance, led by a combination of security selection and an underweight allocation to the sector. The portfolio manager’s avoidance of e-commerce company Alibaba Group Holding Limited boosted the sector’s contribution. The Materials sector benefited from gains in the chemicals companies Linde PLC, an industrial gas supplier, and Croda International PLC, a specialty chemicals manufacturer.
On the downside, the Energy sector detracted the most from the Portfolio’s performance, due to a combination of security selection and an underweight position in the sector. The Utilities sector also detracted from the Portfolio’s return, led by the renewable energy solutions provider Orsted A/S.
90
Table of Contents
Research International Core Portfolio (unaudited)
During the reporting period, the Portfolio’s relative currency exposure, resulting primarily from differences between the Portfolio’s and the Index’s exposures to holdings of securities denominated in foreign currencies, detracted from the Portfolio’s return. All of the portfolio managers’ investment decisions are driven by the fundamentals of each individual opportunity and as such, it is common for the Portfolio to have different currency exposure than the Index.
PORTFOLIO MANAGER OUTLOOK
The following forward-looking comments are the opinion of MFS®, the Portfolio’s sub-adviser.
Regardless of changing economic and market conditions, we will continue to adhere to our investment process, building a Portfolio of fundamentally sound companies. The Portfolio is a sector-neutral portfolio that emphasizes bottom-up fundamental research. Because of this approach, the Portfolio’s sector weightings vary only modestly from those of the broader foreign market. Instead, we attempt to outperform the Index by holding what we believe to be the most attractive opportunities among growth and value companies within each sector of the market without regard to market capitalization.
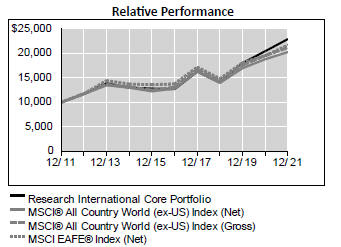
Average Annual Total Returns For Periods Ended December 31, 2021 | ||||||||||||
| 1 Year | 5 Years | 10 Years | ||||||||||
Research International Core Portfolio | 12.07 | % | 12.54 | % | 8.62 | % | ||||||
MSCI® All Country World (ex-US) Index (Net) | 7.82 | % | 9.61 | % | 7.28 | % | ||||||
MSCI® All Country World (ex-US) Index (Gross) | 8.29 | % | 10.12 | % | 7.77 | % | ||||||
MSCI EAFE® Index (Net) | 11.26 | % | 9.55 | % | 8.03 | % | ||||||
Lipper® Variable Insurance Products (VIP) International Multi-Cap Core Funds Average | 10.41 | % | 8.97 | % | 7.52 | % | ||||||
With respect to its broad-based benchmark, the Portfolio has elected to calculate the MSCI® All Country World (ex-US) Index net of withholding taxes on reinvested dividends rather than the MSCI® All Country World (ex-US) Index gross of withholding taxes on reinvested dividends because the net calculation more closely reflects the Portfolio’s performance for an investor.
The performance data quoted represents past performance. Past performance is historical and does not guarantee future performance. Investment return
and principal value will fluctuate, so that shares, when redeemed, may be worth more or less than their original cost. Current performance may be lower or higher than the performance data quoted. For the most recent month-end performance information visit www.northwesternmutual.com.
This chart assumes an initial investment of $10,000 made on 12/31/11. Returns shown reflect fee waivers, deductions for management and other portfolio expenses, and reinvestment of all dividends. In the absence of fee waivers, total return would be reduced. Returns exclude deductions for separate account sale loads and account fees. Please refer to the Benchmark Definitions section of this report for information about the indices cited in the above chart and graph.
Investors should be aware of the risks of investments in foreign securities, particularly investments in securities of companies in developing nations.
The Portfolio may invest a relatively large percentage of its assets in issuers located in a single country, a small number of countries, or a particular geographic region. The Portfolio’s performance may be more volatile than that of a more geographically diversified fund, and may be tied more closely to the performance of a single country or region.
91
Table of Contents
Research International Core Portfolio (unaudited)
Top 10 Equity Holdings 12/31/21
| Security Description | % of Net Assets | |||
Roche Holding AG | 3.4 | % | ||
Novo Nordisk AS - Class B | 3.2 | % | ||
Nestle SA | 3.2 | % | ||
Schneider Electric SE | 2.9 | % | ||
Linde PLC | 2.6 | % | ||
LVMH Moet Hennessy Louis Vuitton SE | 2.4 | % | ||
Aon PLC | 2.1 | % | ||
Hitachi, Ltd. | 1.7 | % | ||
Diageo PLC | 1.7 | % | ||
BNP Paribas SA | 1.7 | % | ||
Sector Allocation 12/31/21
| Sector | % of Net Assets | |||
Financials | 16.3 | % | ||
Industrials | 15.3 | % | ||
Health Care | 12.2 | % | ||
Consumer Discretionary | 11.4 | % | ||
Information Technology | 10.0 | % | ||
Materials | 9.6 | % | ||
Consumer Staples | 9.3 | % | ||
Communication Services | 6.4 | % | ||
Energy | 3.3 | % | ||
Utilities | 3.2 | % | ||
Real Estate | 2.4 | % | ||
Short-Term Investments & Other Net Assets | 0.6 | % | ||
Sector Allocation and Top 10 Holdings are subject to change.
92
Table of Contents
Research International Core Portfolio
SCHEDULE OF INVESTMENTS
December 31, 2021
| Common Stocks (99.4%) | Country | Shares/ Par + | Value $ (000’s) | |||||||||
Communication Services (6.4%) |
| |||||||||||
Advanced Info Service PCL - Foreign Shares | Thailand | 662,300 | 4,560 | |||||||||
carsales.com, Ltd. | Australia | 149,784 | 2,734 | |||||||||
Hellenic Telecommunications Organization SA | Greece | 225,806 | 4,179 | |||||||||
KDDI Corp. | Japan | 295,200 | 8,628 | |||||||||
NAVER Corp. * | South Korea | 23,485 | 7,456 | |||||||||
NetEase, Inc., ADR | | Cayman Islands | | 155,145 | 15,791 | |||||||
SEEK, Ltd. | Australia | 133,944 | 3,194 | |||||||||
SoftBank Group Corp. | Japan | 114,200 | 5,396 | |||||||||
Tencent Holdings, Ltd. | | Cayman Islands | | 164,300 | 9,625 | |||||||
|
| |||||||||||
Total | 61,563 | |||||||||||
|
| |||||||||||
Consumer Discretionary (11.4%) |
| |||||||||||
adidas AG | Germany | 41,473 | 11,961 | |||||||||
Bridgestone Corp. | Japan | 118,900 | 5,116 | |||||||||
Burberry Group PLC | | United Kingdom | | 109,077 | 2,683 | |||||||
Cie Financiere Richemont SA | Switzerland | 64,367 | 9,612 | |||||||||
Continental AG * | Germany | 46,058 | 4,876 | |||||||||
Flutter Entertainment PLC * | Ireland | 37,507 | 5,970 | |||||||||
Koito Manufacturing Co., Ltd. | Japan | 129,100 | 6,836 | |||||||||
LVMH Moet Hennessy Louis Vuitton SE | France | 27,488 | 22,752 | |||||||||
Ocado Group PLC * | | United Kingdom | | 96,598 | 2,194 | |||||||
Prosus NV * | Netherlands | 58,028 | 4,858 | |||||||||
Techtronic Industries Co., Ltd. | Hong Kong | 563,000 | 11,206 | |||||||||
Toyota Industries Corp. | Japan | 72,800 | 5,817 | |||||||||
Whitbread PLC * | | United Kingdom | | 54,673 | 2,216 | |||||||
Yamaha Corp. | Japan | 78,100 | 3,850 | |||||||||
Yum China Holdings, Inc. | | United States | | 118,374 | 5,900 | |||||||
ZOZO, Inc. | Japan | 122,500 | 3,814 | |||||||||
|
| |||||||||||
Total | 109,661 | |||||||||||
|
| |||||||||||
Consumer Staples (9.3%) |
| |||||||||||
British American Tobacco PLC | | United Kingdom | | 326,587 | 12,084 | |||||||
Danone SA | France | 99,940 | 6,212 | |||||||||
Diageo PLC | | United Kingdom | | 298,398 | 16,301 | |||||||
Kao Corp. | Japan | 110,000 | 5,756 | |||||||||
Kirin Holdings Co., Ltd. | Japan | 302,300 | 4,848 | |||||||||
Nestle SA | Switzerland | 222,275 | 31,072 | |||||||||
Reckitt Benckiser Group PLC | | United Kingdom | | 127,525 | 10,947 | |||||||
Sugi Holdings Co. | Japan | 45,700 | 2,765 | |||||||||
|
| |||||||||||
Total | 89,985 | |||||||||||
|
| |||||||||||
Energy (3.3%) |
| |||||||||||
Cairn Energy PLC | | United Kingdom | | 1,298,012 | 3,308 | |||||||
Eni SpA | Italy | 611,852 | 8,458 | |||||||||
Galp Energia SGPS SA | Portugal | 662,911 | 6,430 | |||||||||
Idemitsu Kosan Co., Ltd. | Japan | 190,600 | 4,868 | |||||||||
Santos, Ltd. | Australia | 811,486 | 3,726 | |||||||||
TC Energy Corp. | Canada | 103,019 | 4,791 | |||||||||
|
| |||||||||||
Total | 31,581 | |||||||||||
|
| |||||||||||
Financials (16.3%) |
| |||||||||||
AIA Group, Ltd. | Hong Kong | 1,275,400 | 12,856 | |||||||||
AIB Group PLC * | Ireland | 1,353,670 | 3,298 | |||||||||
Aon PLC | Ireland | 67,902 | 20,409 | |||||||||
| Common Stocks (99.4%) | Country | Shares/ Par + | Value $ (000’s) | |||||||||
Financials continued | ||||||||||||
Beazley PLC * | | United Kingdom | | 309,270 | 1,952 | |||||||
BNP Paribas SA | France | 231,757 | 16,035 | |||||||||
Credit Suisse Group AG | Switzerland | 662,454 | 6,425 | |||||||||
Euronext NV | Netherlands | 96,287 | 10,003 | |||||||||
HDFC Bank, Ltd. | India | 582,264 | 11,601 | |||||||||
Hiscox, Ltd. | Bermuda | 300,341 | 3,499 | |||||||||
Hong Kong Exchanges & Clearing, Ltd. | Hong Kong | 112,300 | 6,559 | |||||||||
ING Groep NV | Netherlands | 612,533 | 8,537 | |||||||||
Julius Baer Group, Ltd. | Switzerland | 119,398 | 7,979 | |||||||||
Macquarie Group, Ltd. | Australia | 68,285 | 10,204 | |||||||||
Mitsubishi UFJ Financial Group, Inc. | Japan | 1,441,900 | 7,834 | |||||||||
Natwest Group PLC | | United Kingdom | | 3,048,626 | 9,313 | |||||||
UBS Group AG | Switzerland | 632,292 | 11,348 | |||||||||
Zurich Insurance Group AG | Switzerland | 20,464 | 8,968 | |||||||||
|
| |||||||||||
Total | 156,820 | |||||||||||
|
| |||||||||||
Health Care (12.2%) |
| |||||||||||
Bayer AG | Germany | 94,505 | 5,059 | |||||||||
ConvaTec Group PLC | | United Kingdom | | 1,605,463 | 4,197 | |||||||
Koninklijke Philips NV | Netherlands | 246,161 | 9,183 | |||||||||
Kyowa Hakko Kirin Co., Ltd. | Japan | 322,700 | 8,796 | |||||||||
Novo Nordisk AS - Class B | Denmark | 279,749 | 31,274 | |||||||||
Qiagen NV * | Netherlands | 210,237 | 11,715 | |||||||||
Roche Holding AG | Switzerland | 78,918 | 32,714 | |||||||||
Santen Pharmaceutical Co., Ltd. | Japan | 612,700 | 7,476 | |||||||||
Terumo Corp. | Japan | 159,200 | 6,727 | |||||||||
|
| |||||||||||
Total | 117,141 | |||||||||||
|
| |||||||||||
Industrials (15.3%) |
| |||||||||||
Cellnex Telecom SA | Spain | 100,946 | 5,861 | |||||||||
Daikin Industries, Ltd. | Japan | 61,500 | 13,952 | |||||||||
GEA Group AG | Germany | 209,443 | 11,468 | |||||||||
Hitachi, Ltd. | Japan | 311,300 | 16,862 | |||||||||
Kubota Corp. | Japan | 524,000 | 11,634 | |||||||||
Legrand SA | France | 101,421 | 11,882 | |||||||||
MTU Aero Engines AG | Germany | 29,158 | 5,928 | |||||||||
Persol Holdings Co., Ltd. | Japan | 133,600 | 3,880 | |||||||||
Ritchie Bros Auctioneers, Inc. | Canada | 94,948 | 5,810 | |||||||||
Ryanair Holdings PLC * | Ireland | 40,175 | 4,111 | |||||||||
Schindler Holding AG | Switzerland | 28,913 | 7,757 | |||||||||
Schneider Electric SE | France | 141,205 | 27,725 | |||||||||
SMC Corp. | Japan | 17,700 | 11,941 | |||||||||
Weir Group PLC | | United Kingdom | | 52,117 | 1,207 | |||||||
Wolters Kluwer NV | Netherlands | 60,574 | 7,145 | |||||||||
|
| |||||||||||
Total | 147,163 | |||||||||||
|
| |||||||||||
Information Technology (10.0%) |
| |||||||||||
Amadeus IT Group SA * | Spain | 107,008 | 7,207 | |||||||||
Cadence Design Systems, Inc. * | | United States | | 36,508 | 6,803 | |||||||
Constellation Software, Inc. | Canada | 5,195 | 9,639 | |||||||||
EPAM Systems, Inc. * | | United States | | 13,854 | 9,261 | |||||||
Fujitsu, Ltd. | Japan | 67,300 | 11,531 | |||||||||
Kyocera Corp. | Japan | 91,100 | 5,693 | |||||||||
The Accompanying Notes are an Integral Part of the Financial Statements.
93
Table of Contents
Research International Core Portfolio
| Common Stocks (99.4%) | Country | Shares/ Par + | Value $ (000’s) | |||||||||
Information Technology continued | ||||||||||||
Nomura Research Institute, Ltd. | Japan | 210,700 | 8,973 | |||||||||
NXP Semiconductors NV | Netherlands | 41,765 | 9,513 | |||||||||
Samsung Electronics Co., Ltd. | South Korea | 95,300 | 6,256 | |||||||||
Scout24 AG | Germany | 65,930 | 4,622 | |||||||||
Taiwan Semiconductor Manufacturing Co., Ltd. | Taiwan | 475,189 | 10,522 | |||||||||
Visa, Inc. - Class A | | United States | | 30,738 | 6,661 | |||||||
|
| |||||||||||
Total | 96,681 | |||||||||||
|
| |||||||||||
Materials (9.6%) | ||||||||||||
Akzo Nobel NV | Netherlands | 105,831 | 11,627 | |||||||||
Croda International PLC | | United Kingdom | | 97,053 | 13,294 | |||||||
Glencore PLC * | Jersey | 1,676,023 | 8,506 | |||||||||
Kansai Paint Co., Ltd. | Japan | 182,900 | 3,976 | |||||||||
Linde PLC | Ireland | 70,919 | 24,705 | |||||||||
Nitto Denko Corp. | Japan | 96,600 | 7,467 | |||||||||
Sika AG | Switzerland | 30,434 | 12,633 | |||||||||
Symrise AG | Germany | 71,606 | 10,621 | |||||||||
|
| |||||||||||
Total | 92,829 | |||||||||||
|
| |||||||||||
Real Estate (2.4%) | ||||||||||||
ESR Cayman, Ltd. * | | Cayman Islands | | 1,519,800 | 5,136 | |||||||
Grand City Properties SA | Luxembourg | 307,155 | 7,300 | |||||||||
LEG Immobilien AG | Germany | 73,375 | 10,250 | |||||||||
|
| |||||||||||
Total | 22,686 | |||||||||||
|
| |||||||||||
Utilities (3.2%) | ||||||||||||
APA Group | Australia | 425,668 | 3,116 | |||||||||
China Resources Gas Group, Ltd. | Bermuda | 806,000 | 4,553 | |||||||||
| Common Stocks (99.4%) | Country | Shares/ Par + | Value $ (000’s) | |||||||||
Utilities continued | ||||||||||||
CLP Holdings, Ltd. | Hong Kong | 478,500 | 4,833 | |||||||||
E.ON SE | Germany | 395,854 | 5,491 | |||||||||
Iberdrola SA | Spain | 783,078 | 9,176 | |||||||||
Orsted A/S | Denmark | 30,082 | 3,863 | |||||||||
|
| |||||||||||
Total | 31,032 | |||||||||||
|
| |||||||||||
Total Common Stocks | ||||||||||||
(Cost: $695,549) |
| 957,142 | ||||||||||
|
| |||||||||||
| Warrants (0.0%) | ||||||||||||
Consumer Discretionary (0.0%) |
| |||||||||||
Cie Financiere Richemont SA * | Switzerland | 136,342 | 150 | |||||||||
|
| |||||||||||
Total | 150 | |||||||||||
|
| |||||||||||
Total Warrants | ||||||||||||
(Cost: $–) |
| 150 | ||||||||||
|
| |||||||||||
| Short-Term Investments (1.2%) | ||||||||||||
Money Market Funds (1.2%) |
| |||||||||||
State Street Institutional U.S. Government Money Market Fund - Premier | | United States | | 11,631,439 | 11,631 | |||||||
|
| |||||||||||
Total | 11,631 | |||||||||||
|
| |||||||||||
Total Short-Term Investments | ||||||||||||
(Cost: $11,631) |
| 11,631 | ||||||||||
|
| |||||||||||
Total Investments (100.6%) |
| |||||||||||
(Cost: $707,180)@ |
| 968,923 | ||||||||||
|
| |||||||||||
Other Assets, Less Liabilities (-0.6%) |
| (5,820 | ) | |||||||||
|
| |||||||||||
Net Assets (100.0%) | 963,103 | |||||||||||
|
| |||||||||||
Investments Percentage by Country is based on Net Assets: | ||||||
Japan | 19.2% | |||||
Switzerland | 13.3% | |||||
France | 8.8% | |||||
United Kingdom | 8.2% | |||||
Netherlands | 7.6% | |||||
Germany | 7.4% | |||||
Ireland | 5.9% | |||||
Other | 30.2% | |||||
Total | 100.6% |
The Accompanying Notes are an Integral Part of the Financial Statements.
94
Table of Contents
Research International Core Portfolio
| + | All par is stated in U.S. Dollar unless otherwise noted. |
| * | Non income producing |
| # | 7-Day yield as of 12/31/2021. |
| @ | At December 31, 2021, the aggregate cost of investments, including derivatives, for federal tax purposes (in thousands) was $711,097 and the net unrealized appreciation of investments based on that cost was $ 257,826 which is comprised of $288,355 aggregate gross unrealized appreciation and $30,529 aggregate gross unrealized depreciation. |
The following is a summary of the inputs used in valuing the Portfolio’s Investments at December 31, 2021. See Note 3 for additional information on
portfolio valuation.
Valuation Inputs | ||||||||||||||
| Description | Level 1 – Quoted Prices | Level 2 – Other Significant Observable | Level 3 – Significant | |||||||||||
(Amounts in thousands) | ||||||||||||||
Assets: | ||||||||||||||
Common Stocks | ||||||||||||||
Communication Services | $ | 35,523 | $ | 26,040 | $ | - | ||||||||
Consumer Discretionary | 57,779 | 51,882 | - | |||||||||||
Consumer Staples | 45,544 | 44,441 | - | |||||||||||
Energy | 18,255 | 13,326 | - | |||||||||||
Financials | 114,266 | 42,554 | - | |||||||||||
Health Care | 13,380 | 103,761 | - | |||||||||||
Industrials | 57,880 | 89,283 | - | |||||||||||
Information Technology | 41,877 | 54,804 | - | |||||||||||
Materials | 33,427 | 59,402 | - | |||||||||||
Real Estate | 5,136 | 17,550 | - | |||||||||||
Utilities | 12,502 | 18,530 | - | |||||||||||
Short-Term Investments | 11,631 | - | - | |||||||||||
Warrants | 150 | - | - | |||||||||||
Total Assets: | $ | 447,350 | $ | 521,573 | $ | - | ||||||||
The Accompanying Notes are an Integral Part of the Financial Statements.
95
Table of Contents
International Equity Portfolio (unaudited)
| Objective: | Portfolio Strategy: | Net Assets: | ||
| Long-term growth of capital. Any income realized will be incidental. | Invests primarily in equity securities of issuers outside of the U.S. with favorable long-term potential relative to current market values. | $1.9 billion |
PORTFOLIO OVERVIEW
Mason Street Advisors, LLC (“Mason Street Advisors”), the investment adviser for the International Equity Portfolio (“the Portfolio”), has engaged Dodge & Cox to act as sub-adviser for the Portfolio. Dodge & Cox was appointed sub-adviser to the Portfolio effective November 1, 2021. Prior to that time, the Portfolio was sub-advised by Templeton Investment Counsel, LLC (“Templeton”). The Portfolio may purchase securities in any country, including those with developed markets and emerging markets and is not required to allocate its investments in set percentages in particular countries, except that the Portfolio’s investments in emerging markets countries normally will be limited to 30% of its net assets. The Portfolio typically invests in well-established companies of medium-to-large capitalization based on standards of the applicable market. The Portfolio typically invests in companies that appear to be temporarily undervalued but have a favorable outlook for long-term growth. The portfolio managers also focus on the underlying financial condition and prospects of individual companies, including future earnings, cash flow, and dividends.
MARKET OVERVIEW
International equity markets rose through the first half of 2021, then seesawed downward in the second half amid concerns about inflation and COVID-19 variants. Overall, international markets posted strong results in 2021. However, within the international universe developed markets led emerging markets by a large margin. Emerging market returns were negative in 2021 overall. China tumbled due to the Chinese government’s increased regulations across multiple industries, notably internet-related companies. Value outperformed growth for the year, thanks in large part to strong returns from the Energy and Financials sectors and weak returns from internet-oriented stocks.
PORTFOLIO RESULTS
The Portfolio returned 5.00% for the twelve months ended December 31, 2021. By comparison, the Portfolio’s benchmark, the MSCI® All Country World (ex-US) Value Index (the “Index”), returned 10.46%. (The Index is unmanaged, cannot be invested in directly and does not incur expenses.) According to Lipper® Analytical Services, Inc., an independent mutual fund rating agency, the average return in 2021 of the International Large Cap Value Funds peer group was 11.86%.
As noted above, prior to November 1, 2021, the Portfolio was managed by Templeton. With respect to the period prior to November 1, 2021 stock selection in Europe detracted from the Portfolio’s performance. Currency factors, primarily in Asia, also detracted. In contrast, an underweight position and stock selection in China and stock selection in Japan contributed significantly.
From a sector perspective, holdings in the Financials, Industrials and Health Care sectors detracted from the Portfolio’s return. The Portfolio held an underweight position in Financials, given the structural challenges of low interest rates combined with increasing and varying degrees of government regulation across geographies. While most commercial banks in developed markets, particularly in Europe, were failing to meet the Portfolio managers’ criteria for long-term value creation, the Portfolio managers found select opportunities among high quality franchises that could benefit from some combination of a higher nominal yields, economic reflation and repaired consumer balance sheets.
On the upside, an overweight position and stock selection in the Energy sector contributed to the Portfolio’s performance, as did stock selection in the Utilities and Consumer Discretionary sectors. Pandemic-related disruptions and continued supply discipline have created a healthy supply/demand dynamic in energy markets. The Portfolio managers added to select stocks that exhibited stability despite economic reopening, a resumption of air travel, rising oil prices and, in many cases, significant fundamental improvements to balance sheet quality and operational efficiency.
The following performance attribution comments relate to the period November 1, 2021 through December 31, 2021, during which time Dodge & Cox acted as the Portfolio’s sub-adviser.
The Portfolio’s Emerging Market holdings, especially Alibaba Group Holding Limited, JD.com, Inc. and Itau Unibanco SA, detracted from the Portfolio’s return. From a sector perspective, the Financials sector, notably Banco Santander SA and Prudential PLC, detracted. The Consumer Discretionary sector also detracted.
96
Table of Contents
International Equity Portfolio (unaudited)
On the upside, the Health Care sector contributed to the Portfolio’s performance, led by pharmaceuticals companies GlaxoSmithKline PLC, Novartis International AG and Roche Holdings,Inc. The Industrials sector contributed as Johnson Controls International, an electrical equipment company, advanced. The Energy Sector also contributed.
PORTFOLIO MANAGER OUTLOOK
The following forward-looking comments are the opinion of Dodge & Cox, the Portfolio’s sub-adviser.
While valuations continue to be reasonable for the overall market, wide valuation disparities remain between value and growth stocks, as well as between stocks that benefit from or are hurt by low interest rates. The market divergence between value and growth is significantly above average. The valuation spread between stocks benefiting or suffering from low interest rates is at its highest level since 2001. This valuation spread is extraordinary given the incredibly low level of nominal and real interest rates, reflecting more certainty about the likelihood of rates staying lower for longer than we believe is merited. These two wide valuation disparities continue to provide attractive opportunities for active,value oriented, bottom-up investment managers. In particular, the Financials and Energy sectors both contain large portions of value and low-rate sensitive stocks and account for 35% of the Portfolio.
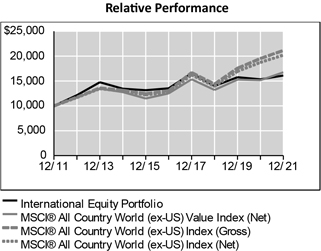
Average Annual Total Returns For Periods Ended December 31, 2021 | ||||||||||||
| 1 Year | 5 Years | 10 Years | ||||||||||
International Equity Portfolio | 5.00 | % | 3.54 | % | 4.88 | % | ||||||
MSCI® All Country World (ex-US) Value Index (Net) | 10.46 | % | 6.00 | % | 5.29 | % | ||||||
MSCI® All Country World (ex-US) Index (Gross) | 8.29 | % | 10.12 | % | 7.77 | % | ||||||
MSCI® All Country World (ex-US) Index (Net) | 7.82 | % | 9.61 | % | 7.28 | % | ||||||
Lipper® Variable Insurance Products (VIP) International Large Cap Value Funds Average | 11.86 | % | 7.17 | % | 6.34 | % | ||||||
With respect to its broad-based benchmark, the Portfolio has elected to calculate the MSCI® All Country World (ex-US) Index net of withholding taxes on reinvested dividends rather than the MSCI® All Country World (ex-US) Index gross of withholding taxes on reinvested dividends because the net calculation more closely reflects the Portfolio’s performance for an investor.
The performance data quoted represents past performance. Past performance is historical and does not guarantee future performance. Investment return and principal value will fluctuate, so that shares, when redeemed, may be worth more or less than their original cost. Current performance may be lower or higher than the performance data quoted. For the most recent month-end performance information visit www.northwesternmutual.com.
This chart assumes an initial investment of $10,000 made on 12/31/11. Returns shown reflect fee waivers, deductions for management and other portfolio expenses, and reinvestment of all dividends. In the absence of fee waivers, total return would be reduced. Returns exclude deductions for separate account sale loads and account fees. Please refer to the Benchmark Definitions section of this report for information about the indices cited in the above chart and graph.
Investors should be aware of the risks of investments in foreign securities, particularly investments in securities of companies in developing nations.
The Portfolio may invest a relatively large percentage of its assets in issuers located in a single country, a small number of countries, or a particular geographic region. The Portfolio’s performance may be more volatile than that of a more geographically diversified fund, and may be tied more closely to the performance of a single country or region.
97
Table of Contents
International Equity Portfolio (unaudited)
Top 10 Equity Holdings 12/31/21
| Security Description | % of Net Assets | |||||
GlaxoSmithKline PLC | 4.0 | % | ||||
Sanofi | 3.9 | % | ||||
UBS Group AG | 3.4 | % | ||||
Novartis AG | 3.4 | % | ||||
Roche Holding AG | 3.3 | % | ||||
BNP Paribas SA | 3.0 | % | ||||
ICICI Bank, Ltd. | 2.8 | % | ||||
Samsung Electronics Co., Ltd. | 2.7 | % | ||||
Banco Santander SA | 2.6 | % | ||||
Barclays PLC | 2.5 | % | ||||
Sector Allocation 12/31/21
| Sector | % of Net Assets | |||||
Financials | 26.6 | % | ||||
Health Care | 18.0 | % | ||||
Consumer Discretionary | 10.4 | % | ||||
Materials | 10.1 | % | ||||
Energy | 7.6 | % | ||||
Industrials | 6.8 | % | ||||
Information Technology | 6.6 | % | ||||
Consumer Staples | 4.8 | % | ||||
Communication Services | 3.5 | % | ||||
Short-Term Investments & Other Net Assets | 2.9 | % | ||||
Real Estate | 2.1 | % | ||||
Utilities | 0.6 | % | ||||
Sector Allocation and Top 10 Holdings are subject to change.
98
Table of Contents
International Equity Portfolio
SCHEDULE OF INVESTMENTS
December 31, 2021
| Common Stocks (92.8%) | Country | Shares/ Par + | Value $ (000’s) | |||||||||
| Communication Services (3.5%) |
| |||||||||||
Baidu, Inc., ADR * | Cayman Islands | 200,000 | 29,758 | |||||||||
Liberty Global PLC * | United Kingdom | 502,000 | 14,040 | |||||||||
Millicom International Cellular, SDR * | Luxembourg | 220,000 | 6,234 | |||||||||
Vodafone Group PLC | United Kingdom | 10,600,000 | 16,107 | |||||||||
|
| |||||||||||
Total | 66,139 | |||||||||||
|
| |||||||||||
| Consumer Discretionary (10.4%) |
| |||||||||||
Alibaba Group Holding, Ltd., ADR * | Cayman Islands | 250,000 | 29,697 | |||||||||
Bayerische Motoren Werke AG | Germany | 80,000 | 8,062 | |||||||||
Booking Holdings, Inc. * | United States | 7,300 | 17,514 | |||||||||
Grupo Televisa SA, ADR | Mexico | 1,850,000 | 17,335 | |||||||||
Honda Motor Co., Ltd. | Japan | 1,540,000 | 43,247 | |||||||||
JD.com, Inc., ADR * | Cayman Islands | 355,000 | 24,875 | |||||||||
Naspers, Ltd. - Class N | South Africa | 70,000 | 10,859 | |||||||||
Prosus NV * | Netherlands | 455,000 | 38,090 | |||||||||
Yamaha Motor Co., Ltd. | Japan | 180,000 | 4,318 | |||||||||
|
| |||||||||||
Total | 193,997 | |||||||||||
|
| |||||||||||
| Consumer Staples (4.8%) |
| |||||||||||
Anheuser-Busch InBev SA/NV | Belgium | 475,000 | 28,754 | |||||||||
Beiersdorf AG | Germany | 137,000 | 14,096 | |||||||||
Imperial Brands PLC | United Kingdom | 1,625,000 | 35,555 | |||||||||
Magnit PJSC | Russia | 135,000 | 9,786 | |||||||||
Seven & i Holdings Co., Ltd. | Japan | 9,900 | 435 | |||||||||
|
| |||||||||||
Total | 88,626 | |||||||||||
|
| |||||||||||
| Energy (7.6%) |
| |||||||||||
Equinor ASA | Norway | 600,000 | 15,830 | |||||||||
Ovintiv, Inc. | United States | 525,000 | 17,693 | |||||||||
Schlumberger, Ltd. | Curaçao | 420,000 | 12,579 | |||||||||
Suncor Energy, Inc. | Canada | 1,480,000 | 37,044 | |||||||||
TC Energy Corp. | Canada | 400,000 | 18,616 | |||||||||
TotalEnergies SE | France | 785,000 | 39,887 | |||||||||
|
| |||||||||||
Total | 141,649 | |||||||||||
|
| |||||||||||
| Financials (25.0%) |
| |||||||||||
Aegon NV | Netherlands | 2,870,000 | 14,354 | |||||||||
Aviva PLC | United Kingdom | 5,660,000 | 31,441 | |||||||||
Axis Bank, Ltd. * | India | 3,400,000 | 31,095 | |||||||||
Banco Santander SA | Spain | 14,419,600 | 48,129 | |||||||||
Barclays PLC | United Kingdom | 18,030,000 | 45,636 | |||||||||
BNP Paribas SA | France | 800,000 | 55,349 | |||||||||
Credicorp, Ltd. | Bermuda | 135,000 | 16,480 | |||||||||
Credit Suisse Group AG | Switzerland | 4,180,000 | 40,543 | |||||||||
ICICI Bank, Ltd. | India | 5,300,000 | 52,818 | |||||||||
Mitsubishi UFJ Financial Group, Inc. | Japan | 4,200,000 | 22,818 | |||||||||
Prudential PLC | United Kingdom | 1,110,000 | 19,149 | |||||||||
Standard Chartered PLC | United Kingdom | 3,273,094 | 19,866 | |||||||||
UBS Group AG | Switzerland | 3,580,000 | 64,254 | |||||||||
XP, Inc. * | Cayman Islands | 170,574 | 4,902 | |||||||||
|
| |||||||||||
Total | 466,834 | |||||||||||
|
| |||||||||||
| Common Stocks (92.8%) | Country | Shares/ Par + | Value $ (000’s) | |||||||||
| Health Care (18.0%) |
| |||||||||||
Bayer AG | Germany | 480,000 | 25,697 | |||||||||
Fresenius Medical Care AG & Co. | Germany | 360,000 | 23,321 | |||||||||
GlaxoSmithKline PLC | United Kingdom | 3,450,000 | 75,024 | |||||||||
Novartis AG | Switzerland | 715,000 | 62,789 | |||||||||
Olympus Corp. | Japan | 650,000 | 14,930 | |||||||||
Roche Holding AG | Switzerland | 150,000 | 62,180 | |||||||||
Sanofi | France | 715,000 | 72,106 | |||||||||
|
| |||||||||||
Total | 336,047 | |||||||||||
|
| |||||||||||
| Industrials (6.8%) |
| |||||||||||
Johnson Controls International PLC | Ireland | 522,000 | 42,444 | |||||||||
Komatsu, Ltd. | Japan | 115,000 | 2,693 | |||||||||
Mitsubishi Electric Corp. | Japan | 2,790,000 | 35,379 | |||||||||
Nidec Corp. | Japan | 90,000 | 10,580 | |||||||||
Schneider Electric SE | France | 101,000 | 19,831 | |||||||||
Smiths Group PLC | United Kingdom | 765,000 | 16,355 | |||||||||
|
| |||||||||||
Total | 127,282 | |||||||||||
|
| |||||||||||
| Information Technology (3.9%) |
| |||||||||||
Brother Industries, Ltd. | Japan | 385,000 | 7,402 | |||||||||
Kyocera Corp. | Japan | 335,000 | 20,933 | |||||||||
Micro Focus International PLC | United Kingdom | 515,000 | 2,913 | |||||||||
Murata Manufacturing Co., Ltd. | Japan | 205,000 | 16,276 | |||||||||
TE Connectivity, Ltd. | Switzerland | 162,000 | 26,137 | |||||||||
|
| |||||||||||
Total | 73,661 | |||||||||||
|
| |||||||||||
| Materials (10.1%) |
| |||||||||||
Akzo Nobel NV | Netherlands | 285,000 | 31,312 | |||||||||
Glencore PLC * | Jersey | 5,100,000 | 25,883 | |||||||||
Holcim, Ltd. * | Switzerland | 706,534 | 35,957 | |||||||||
Linde PLC | Ireland | 55,000 | 19,159 | |||||||||
Mitsubishi Chemical Holdings Corp. | Japan | 2,694,000 | 19,957 | |||||||||
Nutrien, Ltd. | Canada | 465,000 | 34,968 | |||||||||
Teck Resources, Ltd. | Canada | 725,000 | 20,894 | |||||||||
|
| |||||||||||
Total | 188,130 | |||||||||||
|
| |||||||||||
| Real Estate (2.1%) |
| |||||||||||
CK Asset Holdings, Ltd. | Cayman Islands | 2,534,900 | 15,978 | |||||||||
Daito Trust Construction Co., Ltd. | Japan | 126,000 | 14,395 | |||||||||
Hang Lung Group, Ltd. | Hong Kong | 4,000,000 | 8,546 | |||||||||
|
| |||||||||||
Total | 38,919 | |||||||||||
|
| |||||||||||
| Utilities (0.6%) |
| |||||||||||
Engie SA | France | 700,000 | 10,371 | |||||||||
|
| |||||||||||
Total | 10,371 | |||||||||||
|
| |||||||||||
Total Common Stocks (Cost: $1,760,736) |
| 1,731,655 | ||||||||||
|
| |||||||||||
The Accompanying Notes are an Integral Part of the Financial Statements.
99
Table of Contents
International Equity Portfolio
| Preferred Stocks (4.3%) | Country | Shares/ Par + | Value $ (000’s) | |||||||||
Financials (1.6%) | ||||||||||||
Itau Unibanco Holding SA * | Brazil | 8,000,000 | 30,427 | |||||||||
|
| |||||||||||
Total |
| 30,427 | ||||||||||
|
| |||||||||||
Information Technology (2.7%) | ||||||||||||
Samsung Electronics Co., Ltd. * | South Korea | 835,000 | 49,980 | |||||||||
|
| |||||||||||
Total |
| 49,980 | ||||||||||
|
| |||||||||||
Total Preferred Stocks (Cost: $81,202) |
| 80,407 | ||||||||||
|
| |||||||||||
| Short-Term Investments (2.6%) | ||||||||||||
Money Market Funds (2.6%) | ||||||||||||
State Street Institutional U.S. Government Money Market Fund - Premier Class 0.030%# | United States | 48,019,329 | 48,019 | |||||||||
|
| |||||||||||
Total |
| 48,019 | ||||||||||
|
| |||||||||||
Total Short-Term Investments (Cost: $48,019) |
| 48,019 | ||||||||||
|
| |||||||||||
Total Investments (99.7%) (Cost: $1,889,957)@ |
| 1,860,081 | ||||||||||
|
| |||||||||||
Other Assets, Less Liabilities (0.3%) |
| 5,127 | ||||||||||
|
| |||||||||||
Net Assets (100.0%) |
| 1,865,208 | ||||||||||
|
| |||||||||||
Investments Percentage by Country is based on Net Assets: | ||||||
Switzerland | 15.6% | |||||
United Kingdom | 14.7% | |||||
Japan | 11.4% | |||||
France | 10.6% | |||||
Canada | 6.0% | |||||
Cayman Islands | 5.5% | |||||
Other | 35.9% | |||||
Total | 99.7% |
The Accompanying Notes are an Integral Part of the Financial Statements.
100
Table of Contents
International Equity Portfolio
Over the Counter Derivatives
Forward Foreign Currency Contracts
| Type | Counterparty | Currency | Foreign Principal Amount Covered by Contract (000s) | USD Principal Amount Covered by Contract (000’s) | Settlement Date | Unrealized Appreciation (000’s) | Unrealized (Depreciation) (000’s) | Net Unrealized Appreciation/ | ||||||||||||||
Sell | Bank Of America, N.A. | CHF | 14,748 | 16,189 | 1/12/22 | $- | $(179) | $(179) | ||||||||||||||
Sell | Bank Of America, N.A. | CHF | 16,998 | 18,675 | 2/16/22 | - | (178) | (178) | ||||||||||||||
Sell | Bank Of America, N.A. | CHF | 14,748 | 16,216 | 3/16/22 | - | (177) | (177) | ||||||||||||||
Buy | HSBC Bank USA | CNH | 18,500 | 2,889 | 4/27/22 | 6 | - | 6 | ||||||||||||||
Sell | Bank Of America, N.A. | CNH | 219,779 | 34,322 | 4/27/22 | - | (81) | (81) | ||||||||||||||
Sell | JP Morgan Chase Bank N.A | CNH | 219,779 | 34,091 | 8/10/22 | - | (132) | (132) | ||||||||||||||
Sell | Bank Of America, N.A. | CNH | 36,000 | 5,546 | 12/7/22 | - | (13) | (13) | ||||||||||||||
Sell | HSBC Bank USA | CNH | 219,778 | 33,858 | 12/7/22 | - | (177) | (177) | ||||||||||||||
|
|
|
|
|
| |||||||||||||||||
| $ | 6 | $ | (937 | ) | $ | (931 | ) | |||||||||||||||
|
|
|
|
|
| |||||||||||||||||
| Financial Derivative Assets (000’s) | Financial Derivative Liabilities (000’s) | |||||||||||||||||||||
| Forward Foreign Currency Contracts | Swaps | Total | Forward Foreign Currency Contracts | Options | Swaps | Total | ||||||||||||||||
Total Over the Counter Derivatives | $ | 6 | - | $ | 6 | $ | (937) | - | - | $ | (937) | |||||||||||
| + | All par is stated in U.S. Dollar unless otherwise noted. |
| * | Non income producing |
| # | 7-Day yield as of 12/31/2021. |
| @ | At December 31, 2021, the aggregate cost of investments, including derivatives, for federal tax purposes (in thousands) was $1,899,881 and the net unrealized depreciation of investments based on that cost was $40,732 which is comprised of $61,260 aggregate gross unrealized appreciation and $101,992 aggregate gross unrealized depreciation. |
The Accompanying Notes are an Integral Part of the Financial Statements.
101
Table of Contents
International Equity Portfolio
The following is a summary of the inputs used in valuing the Portfolio’s Investments at December 31, 2021. See Note 3 for additional information on portfolio valuation.
| Valuation Inputs | ||||||||||||||
| Description | Level 1 – Quoted Prices | Level 2 – Other Significant Observable Inputs | Level 3 – Significant | |||||||||||
| (Amounts in thousands) | ||||||||||||||
Assets: | ||||||||||||||
Preferred Stocks | $ | - | $ | 80,407 | $ | - | ||||||||
Common Stocks | ||||||||||||||
Communication Services | 59,905 | 6,234 | - | |||||||||||
Consumer Discretionary | 138,370 | 55,627 | - | |||||||||||
Consumer Staples | 64,309 | 24,317 | - | |||||||||||
Energy | 125,819 | 15,830 | - | |||||||||||
Financials | 291,090 | 175,744 | - | |||||||||||
Health Care | 147,130 | 188,917 | - | |||||||||||
Industrials | 78,630 | 48,652 | - | |||||||||||
Information Technology | 29,050 | 44,611 | - | |||||||||||
Materials | 113,057 | 75,073 | - | |||||||||||
Real Estate | 24,524 | 14,395 | - | |||||||||||
All Others | 10,371 | - | - | |||||||||||
Short-Term Investments | 48,019 | - | - | |||||||||||
Other Financial Instruments^ | ||||||||||||||
Forward Foreign Currency Contracts | - | 6 | - | |||||||||||
Total Assets: | $ | 1,130,274 | $ | 729,813 | $ | - | ||||||||
Liabilities: | ||||||||||||||
Other Financial Instruments^ | ||||||||||||||
Forward Foreign Currency Contracts | - | (937 | ) | - | ||||||||||
Total Liabilities: | $ | - | $ | (937 | ) | $ | - | |||||||
^ Other financial instruments are derivative instruments such as futures and forward foreign currency contracts, which are valued at the unrealized appreciation (depreciation) on the instrument, and securities sold short, reverse repurchase agreements, written options and swaps contracts, which are valued at market value.
The Accompanying Notes are an Integral Part of the Financial Statements.
102
Table of Contents
Emerging Markets Equity Portfolio (unaudited)
| Objective: | Portfolio Strategy: | Net Assets: | ||
| Capital Appreciation. | Invest in equity securities of issuers that are tied economically to emerging market countries. | $993.5 million |
PORTFOLIO OVERVIEW
Mason Street Advisors, LLC (“Mason Street Advisors”), the investment adviser for the Emerging Markets Equity Portfolio (“the Portfolio��), has engaged Aberdeen Asset Managers Limited (“Aberdeen”) to act as sub-adviser for the Portfolio. The Portfolio normally invests in equity securities of issuers that are tied economically to emerging market countries. Emerging market countries include countries determined by the Portfolio’s portfolio managers to have emerging market economies, taking into account a number of factors, such as the country’s credit rating, its political and economic stability and the development of its financial and capital markets. The Portfolio may invest in companies of any size. The Portfolio employs a fundamental “bottom up” equity investment style, which is characterized by intensive, first-hand research and disciplined company evaluation. Investments are identified for their long-term, fundamental value.
MARKET OVERVIEW
Emerging market equities retreated in 2021, lagging their developed market peers. Stocks got off to a strong start thanks to the rollout of COVID-19 vaccines worldwide and optimism over increased U.S. stimulus under President Joe Biden. Markets extended their gains as economies reopened and commodity prices rallied. However, risk aversion resurfaced in the second half. The emergence of COVID-19 variants, Delta and Omicron, prompted renewed lockdowns and fresh travel curbs, and stoked concerns about further supply chain disruptions. Also denting sentiment were geopolitical tensions and the changing monetary policy environment amid rising inflation.
Across regions, markets in Asia lagged, dragged lower by steep losses in China. In addition to the impact from persistent tensions with the U.S., Chinese stocks were also affected by increased regulatory scrutiny across sectors and a resurgence in COVID-19 cases, particularly given the country’s zero tolerance approach. Conversely, Indian stocks rallied, buoyed by the country’s vaccine rollout and improving macro backdrop. Taiwanese equities outperformed on the back of robust semiconductor demand.
Latin America underperformed, with most markets closing lower. Elsewhere, markets in Emerging Europe, Middle East and Africa outpaced other emerging markets, helped largely by elevated energy prices
PORTFOLIO RESULTS
The Portfolio returned (4.55%) for the twelve months ended December 31, 2021. By comparison, the Portfolio’s benchmark, the MSCI® Emerging Markets Index (the “Index”) returned (2.54%). (This Index is unmanaged, cannot be invested in directly and does not incur expenses.) According to Lipper® Analytical Services, Inc., an independent mutual fund ranking agency, the average return in 2021 of the Emerging Markets Funds peer group was (2.19%).
Underperformance during the period was driven by the exposure to Asian markets, particularly India, Hong Kong and Taiwan. In India, not holding IT services company Infosys detracted as its demand outlook remained robust. Kotak Mahindra Bank declined on worries that the COVID-19 outbreak would affect credit quality and borrowers’ ability to repay loans on schedule. The muted recovery in credit growth weighed further on the stock.
The non-benchmark exposure to Hong Kong disappointed, with Sands China among the key laggards. Sentiment towards the Macau gaming sector waned as tourist traffic remained lackluster amid ongoing COVID-related restrictions, while fears of further regulation added to the uncertainty. The underweight position and stock selection in Taiwan hampered performance. Not holding chip supplier MediaTek proved costly as demand continued to improve amid a global chip shortage, though the attractive supply and demand dynamics for the industry benefited some of the Portfolio’s core semiconductor holdings, including Taiwan Semiconductor Manufacturing Co. and ASML Holding in the Netherlands.
Outside Asia, the lack of exposure to Petrobras dampened returns. The Portfolio exited the Brazilian oil giant early in the year on concerns of political interference after an unexpected leadership change at the company. However, the stock later rebounded on the back of higher oil prices and optimism about the group’s divestment strategy.
Conversely, the Portfolio’s underweight to China and stock picks there mitigated losses. Clean energy names were among the main contributors to relative performance. Nari Technology benefited from its alignment to clean energy objectives
103
Table of Contents
Emerging Markets Equity Portfolio (unaudited)
and the country’s power constraints. The government’s 14th Five-Year Plan underpinned the potential for significant grid investment and a more aggressive grid upgrade. The Portfolio’s solar energy exposures, Longi Green Energy Technology and Sungrow Power Supply, outperformed due to their attractive long-term outlooks, supported by the country’s carbon-neutral target. Battery separator maker Yunnan Energy New Material also proved rewarding thanks to optimism over demand for electric vehicles.
PORTFOLIO MANAGER OUTLOOK
The following forward-looking comments are the opinion of Aberdeen, the Portfolio’s sub-adviser.
2021 was a year of stark underperformance and lackluster absolute returns for emerging markets, despite a very strong earnings recovery over the year. This has left the asset class at an extreme relative discount to global developed markets and U.S. equities, indicating a potentially attractive entry point.
Looking ahead, investors will be pondering how stubborn inflation is likely to be, after being surprised by its persistence in 2021. With supply chain pressure easing and stimulus effects fading,inflation may normalize over the year, though this should be balanced against rising wages, which may indicate stickier inflation.
In China, further support to the economy is likely over the first quarter of 2022. With muted consumer inflation and a flagging property market, policymakers have made clear their intentions to support growth. However, the current zero tolerance approach to COVID may be tested by the highly transmissible Omicron variant.
Globally, the investment cycle is turning after years of decline. Green infrastructure should feature heavily in renewed investment, and this is an area in which emerging market companies are especially prominent. There are a number of positions in the Portfolio that should benefit from these trends,including renewable energy and technology hardware companies
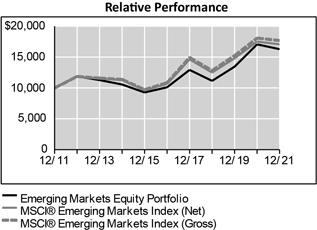
Average Annual Total Returns For Periods Ended December 31, 2021 | ||||||||||||
| 1 Year | 5 Years | 10 Years | ||||||||||
Emerging Markets Equity Portfolio | -4.55 | % | 9.99 | % | 5.00 | % | ||||||
MSCI® Emerging Markets Index (Net) | -2.54 | % | 9.88 | % | 5.49 | % | ||||||
MSCI® Emerging Markets Index (Gross) | -2.22 | % | 10.26 | % | 5.87 | % | ||||||
Lipper® Variable Insurance Products (VIP) Emerging Markets Funds Average | -2.19 | % | 10.05 | % | 5.66 | % | ||||||
With respect to its broad-based benchmark, the Portfolio has elected to calculate the MSCI® Emerging Markets Index net of withholding taxes on reinvested dividends rather than the MSCI® Emerging Markets Index gross of withholding taxes on reinvested dividends because the net
calculation more closely reflects the Portfolio’s performance for an investor.
The performance data quoted represents past performance. Past performance is historical and does not guarantee future performance. Investment return and principal value will fluctuate, so that shares, when redeemed, may be worth more or less than their original cost. Current performance may be lower or higher than the performance data quoted. For the most recent month-end performance information visit www.northwesternmutual.com.
This chart assumes an initial investment of $10,000 made on 12/31/11. Returns shown reflect fee waivers, deductions for management and other portfolio expenses, and reinvestment of all dividends. In the absence of fee waivers, total return would be reduced. Returns exclude deductions for separate account sale loads and account fees. Please refer to the Benchmark Definitions section of this report for information about the indices cited in the above chart and graph.
Investors should be aware of the risks of investments in foreign securities, particularly investments in securities of companies in developing nations.
104
Table of Contents
Emerging Markets Equity Portfolio (unaudited)
The Portfolio may invest a relatively large percentage of its assets in issuers located in a single country, a small number of countries, or a particular geographic region. The Portfolio’s performance may be more volatile than that of a more geographically diversified fund, and may be tied more closely to the performance of a single country or region.
Top 10 Equity Holdings 12/31/21
| Security Description | % of Net Assets | |||||
Taiwan Semiconductor Manufacturing Co., Ltd. | 9.6 | % | ||||
Samsung Electronics Co., Ltd., Various | 8.5 | % | ||||
Tencent Holdings, Ltd. | 3.7 | % | ||||
Alibaba Group Holding, Ltd. | 3.5 | % | ||||
Housing Development Finance Corp., Ltd. | 2.8 | % | ||||
Prosus NV | 2.4 | % | ||||
China Merchants Bank Co., Ltd. - Class H | 2.0 | % | ||||
LUKOIL PJSC, ADR, Various | 1.9 | % | ||||
ASML Holding NV | 1.9 | % | ||||
Novatek PJSC | 1.8 | % | ||||
Sector Allocation 12/31/21
| Sector | % of Net Assets | |||||
Information Technology | 29.8 | % | ||||
Financials | 19.1 | % | ||||
Consumer Discretionary | 15.7 | % | ||||
Materials | 9.3 | % | ||||
Industrials | 5.7 | % | ||||
Communication Services | 5.6 | % | ||||
Consumer Staples | 4.2 | % | ||||
Energy | 3.7 | % | ||||
Utilities | 2.0 | % | ||||
Short-Term Investments & Other Net Assets | 2.0 | % | ||||
Health Care | 2.0 | % | ||||
Real Estate | 0.9 | % | ||||
Sector Allocation and Top 10 Holdings are subject to change.
105
Table of Contents
Emerging Markets Equity Portfolio
SCHEDULE OF INVESTMENTS
December 31, 2021
| Common Stocks (93.3%) | Country | Shares/ Par + | Value $ (000’s) | |||||||||
Communication Services (5.6%) |
| |||||||||||
Kakao Corp. | South Korea | 40,073 | 3,779 | |||||||||
Sea, Ltd. * | Cayman Islands | 40,315 | 9,019 | |||||||||
Tencent Holdings, Ltd. | Cayman Islands | 619,500 | 36,292 | |||||||||
Yandex NV * | Netherlands | 107,006 | 6,474 | |||||||||
|
| |||||||||||
Total | 55,564 | |||||||||||
|
| |||||||||||
Consumer Discretionary (15.7%) |
| |||||||||||
Alibaba Group Holding, Ltd. * | Cayman Islands | 2,250,300 | 34,314 | |||||||||
Allegro.eu SA * | Luxembourg | 692,907 | 6,654 | |||||||||
China Tourism Group Duty Free Corp, Ltd. - Class A | China | 393,986 | 13,563 | |||||||||
Li Ning Co., Ltd. | Cayman Islands | 963,500 | 10,546 | |||||||||
Maruti Suzuki India, Ltd. | India | 102,770 | 10,258 | |||||||||
Meituan Dianping - Class B * | Cayman Islands | 328,900 | 9,507 | |||||||||
MercadoLibre, Inc. * | United States | 6,835 | 9,216 | |||||||||
Midea Group Co., Ltd. - Class A | China | 961,267 | 11,133 | |||||||||
Prosus NV * | Netherlands | 290,076 | 24,283 | |||||||||
Sands China, Ltd. * | Cayman Islands | 2,360,000 | 5,496 | |||||||||
Shenzhou International Group Holdings, Ltd. | Cayman Islands | 755,800 | 14,530 | |||||||||
Zhongsheng Group Holdings, Ltd. | Cayman Islands | 859,500 | 6,702 | |||||||||
|
| |||||||||||
Total | 156,202 | |||||||||||
|
| |||||||||||
Consumer Staples (4.2%) | ||||||||||||
Budweiser Brewing Co. APAC, Ltd. | Cayman Islands | 3,824,100 | 10,029 | |||||||||
Fomento Economico Mexicano SAB de CV, ADR | Mexico | 158,900 | 12,348 | |||||||||
Hindustan Unilever, Ltd. | India | 377,936 | 12,004 | |||||||||
Kweichow Moutai Co., Ltd. - Class A | China |
| 23,280 |
|
| 7,488 |
| |||||
|
| |||||||||||
Total | 41,869 | |||||||||||
|
| |||||||||||
Energy (3.7%) | ||||||||||||
LUKOIL PJSC, ADR | Russia | 211,798 | 19,001 | |||||||||
Novatek PJSC | Russia | 795,201 | 18,182 | |||||||||
|
| |||||||||||
Total | 37,183 | |||||||||||
|
| |||||||||||
Financials (19.1%) | ||||||||||||
AIA Group, Ltd. | Hong Kong | 1,504,000 | 15,160 | |||||||||
B3 SA - Brasil, Bolsa, Balcao | Brazil | 2,279,753 | 4,556 | |||||||||
Banco Bradesco SA, ADR | Brazil | 3,212,293 | 10,986 | |||||||||
Bank Central Asia Tbk PT | Indonesia | 27,285,500 | 13,827 | |||||||||
Bank of the Philippine Islands | Philippines | 2,680,376 | 4,844 | |||||||||
China Merchants Bank Co., Ltd. - Class H | China | 2,493,500 | 19,363 | |||||||||
Grupo Financiero Banorte SAB de CV | Mexico | 2,409,150 | 15,669 | |||||||||
Hong Kong Exchanges & Clearing, Ltd. | Hong Kong | 266,492 | 15,564 | |||||||||
Housing Development Finance Corp., Ltd. | India | 803,284 | 27,956 | |||||||||
Kotak Mahindra Bank, Ltd. | India | 665,311 | 16,090 | |||||||||
| Common Stocks (93.3%) | Country | Shares/ Par + | Value $ (000’s) | |||||||||
Financials continued | ||||||||||||
PT Bank Rakyat Indonesia Persero Tbk | Indonesia | 43,958,756 | 12,671 | |||||||||
Sberbank of Russia PJSC | Russia | 2,734,764 | 10,653 | |||||||||
SBI Life Insurance Co., Ltd. | India | 972,100 | 15,627 | |||||||||
TCS Group Holding PLC | Cyprus | 85,551 | 7,214 | |||||||||
|
| |||||||||||
Total | 190,180 | |||||||||||
|
| |||||||||||
Health Care (2.0%) |
| |||||||||||
Hangzhou Tigermed Consulting Co., Ltd. - Class A | China | 198,999 | 3,991 | |||||||||
Hangzhou Tigermed Consulting Co., Ltd. - Class H | China | 92,100 | 1,169 | |||||||||
Wuxi Biologics Cayman, Inc. * | Cayman Islands | 1,215,500 | 14,427 | |||||||||
|
| |||||||||||
Total | 19,587 | |||||||||||
|
| |||||||||||
Industrials (5.7%) |
| |||||||||||
China Conch Venture Holdings, Ltd. | Cayman Islands | 1,223,100 | 5,976 | |||||||||
Grupo Aeroportuario del Sureste SAB de CV - Class B | Mexico | 298,110 | 6,146 | |||||||||
NARI Technology Co., Ltd. - Class A | China | 2,794,715 | 17,553 | |||||||||
Rumo SA * | Brazil | 1,905,326 | 6,077 | |||||||||
Sungrow Power Supply Co., Ltd. - Class A | China | 679,397 | 15,542 | |||||||||
WEG SA | Brazil | 848,533 | 5,023 | |||||||||
|
| |||||||||||
Total | 56,317 | |||||||||||
|
| |||||||||||
Information Technology (25.1%) |
| |||||||||||
ASM International NV | Netherlands | 21,243 | 9,401 | |||||||||
ASML Holding NV | Netherlands | 22,927 | 18,446 | |||||||||
Delta Electronics, Inc. | Taiwan | 1,079,000 | 10,726 | |||||||||
GDS Holdings, Ltd. * | Cayman Islands | 1,115,700 | 6,482 | |||||||||
Globant SA * | Luxembourg | 25,681 | 8,066 | |||||||||
Hon Hai Precision Industry Co., Ltd. | Taiwan | 3,425,000 | 12,840 | |||||||||
LONGi Green Energy Technology Co., Ltd. - Class A | China | 1,247,308 | 16,870 | |||||||||
Samsung Electronics Co., Ltd. | South Korea | 587,460 | 38,567 | |||||||||
Samsung SDI Co., Ltd. | South Korea | 20,008 | 10,959 | |||||||||
Taiwan Semiconductor Manufacturing Co., Ltd. | Taiwan | 4,297,290 | 95,154 | |||||||||
Tata Consultancy Services, Ltd. | India | 333,106 | 16,759 | |||||||||
Yonyou Network Technology Co., Ltd. - Class A | China | 888,297 | 5,001 | |||||||||
|
| |||||||||||
Total | 249,271 | |||||||||||
|
| |||||||||||
Materials (9.3%) |
| |||||||||||
Anglo American Platinum, Ltd. | South Africa | 127,378 | 14,523 | |||||||||
Grupo Mexico SAB de CV | Mexico | 3,307,613 | 14,419 | |||||||||
LG Chem, Ltd. * | South Korea | 30,623 | 15,800 | |||||||||
Mondi PLC | United Kingdom | 571,239 | 14,165 | |||||||||
The Accompanying Notes are an Integral Part of the Financial Statements.
106
Table of Contents
Emerging Markets Equity Portfolio
| Common Stocks (93.3%) | Country | Shares/ Par + | Value $ (000’s) | |||||||||
Materials continued | ||||||||||||
UltraTech Cement, Ltd. | India | 142,589 | 14,584 | |||||||||
Vale SA, ADR | Brazil | 865,144 | 12,129 | |||||||||
Yunnan Energy New Material Co., Ltd. - Class A | China | 180,695 | 7,099 | |||||||||
|
| |||||||||||
Total | 92,719 | |||||||||||
|
| |||||||||||
Real Estate (0.9%) | ||||||||||||
China Resources Land, Ltd. | Cayman Islands | 2,068,000 | 8,699 | |||||||||
|
| |||||||||||
Total | 8,699 | |||||||||||
|
| |||||||||||
Utilities (2.0%) | ||||||||||||
China Resources Gas Group, Ltd. | Bermuda | 1,916,000 | 10,824 | |||||||||
Power Grid Corp. of India, Ltd. | India | 3,314,310 | 9,118 | |||||||||
|
| |||||||||||
Total | 19,942 | |||||||||||
|
| |||||||||||
Total Common Stocks (Cost: $735,165) | 927,533 | |||||||||||
|
| |||||||||||
| Preferred Stocks (4.7%) | Country | Shares/ Par + | Value $ (000’s) | |||||||||
Information Technology (4.7%) | ||||||||||||
Samsung Electronics Co., Ltd. | South Korea | 774,516 | 46,360 | |||||||||
|
| |||||||||||
Total | 46,360 | |||||||||||
|
| |||||||||||
Total Preferred Stocks (Cost: $29,494) | 46,360 | |||||||||||
|
| |||||||||||
| Short-Term Investments (2.2%) | ||||||||||||
Money Market Funds (2.2%) | ||||||||||||
State Street Institutional U.S. Government Money Market Fund - Premier Class 0.030%# | United States | 21,622,668 | 21,623 | |||||||||
|
| |||||||||||
Total | 21,623 | |||||||||||
|
| |||||||||||
Total Short-Term Investments (Cost: $21,623) | 21,623 | |||||||||||
|
| |||||||||||
Total Investments (100.2%) (Cost: $786,282)@ | 995,516 | |||||||||||
|
| |||||||||||
Other Assets, Less Liabilities (-0.2%) | (2,023 | ) | ||||||||||
|
| |||||||||||
Net Assets (100.0%) | 993,493 | |||||||||||
|
| |||||||||||
Investments Percentage by Country is based on Net Assets: | ||||||
Cayman Islands | 17.4 | % | ||||
India | 12.3 | % | ||||
China | 12.0 | % | ||||
Taiwan | 12.0 | % | ||||
South Korea | 11.7 | % | ||||
Netherlands | 5.8 | % | ||||
Other | 29.0 | % | ||||
Total | 100.2 | % |
The Accompanying Notes are an Integral Part of the Financial Statements.
107
Table of Contents
Emerging Markets Equity Portfolio
| + | All par is stated in U.S. Dollar unless otherwise noted. |
| * | Non income producing |
| # | 7-Day yield as of 12/31/2021. |
| @ | At December 31, 2021, the aggregate cost of investments, including derivatives, for federal tax purposes (in thousands) was $787,398 and the net unrealized appreciation of investments based on that cost was $208,118 which is comprised of $285,706 aggregate gross unrealized appreciation and $77,588 aggregate gross unrealized depreciation. |
The following is a summary of the inputs used in valuing the Portfolio’s Investments at December 31, 2021. See Note 3 for additional information on portfolio valuation.
| Valuation Inputs | ||||||||||||||
| Description | Level 1 – Quoted Prices | Level 2 – Other Significant Observable Inputs | Level 3 – Significant | |||||||||||
| (Amounts in thousands) | ||||||||||||||
Assets: | ||||||||||||||
Preferred Stocks | $ | - | $ | 46,360 | $ | - | ||||||||
Common Stocks | ||||||||||||||
Communication Services | 51,785 | 3,779 | - | |||||||||||
Consumer Discretionary | 149,548 | 6,654 | - | |||||||||||
Energy | 19,001 | 18,182 | - | |||||||||||
Financials | 148,473 | 41,707 | - | |||||||||||
Industrials | 45,217 | 11,100 | - | |||||||||||
Information Technology | 81,025 | 168,246 | - | |||||||||||
Materials | 76,919 | 15,800 | - | |||||||||||
All Others | 90,097 | - | - | |||||||||||
Short-Term Investments | 21,623 | - | - | |||||||||||
Total Assets: | $ | 683,688 | $ | 311,828 | $ | - | ||||||||
The Accompanying Notes are an Integral Part of the Financial Statements.
108
Table of Contents
Government Money Market Portfolio (unaudited)
| Objective: | Portfolio Strategy: | Net Assets: | ||
| Maximum current income to the extent consistent with liquidity and stability of capital. | Invest in short-term fixed income obligations issued or guaranteed by the U.S Government, its agencies or instrumentalities. | $489 million |
PORTFOLIO OVERVIEW
Mason Street Advisors, LLC (“Mason Street Advisors”), the investment adviser for the Government Money Market Portfolio (the “Portfolio”), has engaged BlackRock Advisors, LLC (“BlackRock”) to act as sub-adviser for the Portfolio. The Portfolio invests at least 99.5% of its total assets in cash, U.S. Treasury bills, notes and other obligations issued or guaranteed as to principal and interest by the U.S. Government, its agencies or instrumentalities and repurchase agreements secured by such obligations or cash. The Portfolio invests in a portfolio of securities maturing in 397 days or less (with certain exceptions) that will have a dollar-weighted average maturity of 60 days or less and a dollar-weighted average life of 120 days or less. The Portfolio seeks to maintain a net asset value of $1.00 per share.
MARKET OVERVIEW
Economic conditions in the U.S. vastly improved in 2021 as the unemployment rate fell from 6.3% to 3.9%. At the end of the second and third quarters, real gross domestic product increased at an annual rate of 6.7% and 2.3%, respectively, with the Consumer Price Index rising to 7% in 2021, the largest increase since 1982, leading the Federal Reserve to view inflation as more than transitory.
The Federal Open Market Committee (FOMC) made adjustments of 0.05% to the interest rate paid on required and excess reserves (IOER) and the offering rate on overnight reverse repurchase agreement (RRP) operations in June 2021, to 0.15% and 0.05%, respectively. The FOMC began tapering their asset purchases in November and doubled the pace of monthly reductions in December, stating that they will begin raising interest rates in 2022.
The U.S. debt limit increased by $2.5 trillion in December 2021, an amount expected to provide the U.S. government borrowing authority into early 2023.
PORTFOLIO RESULTS
The Portfolio returned 0.01% for the twelve months ended December 31, 2021. By comparison, the Portfolio’s benchmark, the Merrill Lynch® 3-Month Treasury Bill Index (the “Index”), returned 0.05%. (The Index is unmanaged, cannot be invested in directly and does not incur expenses.) According to Lipper® Analytical Services, Inc., an independent mutual fund ranking agency, the average return in 2021 of the Money Market Funds peer group was 0.01%.
The main investment themes that dominated most of 2021 included the ultra-accommodative monetary policy put in place by the FOMC, the large and growing supply versus demand imbalance for front-end securities and the debt ceiling impasse toward the later part of the year. The duration of the Portfolio was managed to best take advantage of yield movements in this environment. Although it was a relatively flat curve during the period, yields did move within that tight range. Duration was managed lower at the mid-year point with the expectation that the FOMC would adjust the RRP and IOER rates. After their technical adjustment, a slightly longer duration profile was employed to take advantage of the back-up in yields that followed.
Toward the later part of 2021, the debt ceiling impasse dominated headlines. The general market avoidance of U.S. Treasury securities, which may have matured inside of the default date range, pushed yields on surrounding maturities through the RRP rate. Positioning around the debt ceiling dominated the portfolio managers’ strategy during this time as they targeted securities that matured outside of what they believed to be the most vulnerable period.
After the debt ceiling resolution, the U.S. Treasury was free to increase issuance of U.S. Treasury bills, which helped to support yields in the front end. Furthermore, following the FOMC’s December 2021 meeting, longer-dated points on the U.S. Treasury bill curve backed up as the market began to incorporate the possibility of multiple interest rate increases in 2022. The portfolio managers took advantage of this repricing to add back some duration into the Portfolio.
PORTFOLIO MANAGER OUTLOOK
The following forward-looking comments are the opinion of BlackRock, the Portfolio’s sub-adviser.
109
Table of Contents
Government Money Market Portfolio (unaudited)
With the U.S. Treasury quickly increasing debt issuance to build back its general account balance, which had been depleted due to the limitations placed on it, yields have been supported in the front end. Overall, net new U.S. Treasury bill supply is expected to be positive going forward. This new supply will be well received as there is still excess liquidity in the front end.
The FOMC’s nod to inflation reduction at their December 2021 meeting has the market now pricing in multiple interest rate increases in 2022. The timing of these hikes remains unknown and market pricing will remain volatile as new economic data is released. The repricing of FOMC interest rate increase expectations will dominate market pricing through 2022. As the FOMC interest rate increase path is not set and there are many variables that could alter the interest rates outlook, we are proceeding selectively with longer term trades.
Not all obligations of the U.S. government, its agencies and instrumentalities are backed by the full faith and credit of the U.S. Treasury. Some obligations are backed only by the credit of the issuing agency or instrumentality, and in some cases there may be some risk of default by the issuer. Any guarantee by the U.S. government or its agencies or instrumentalities of a security held by the Portfolio does not apply to the market value of such security or to shares of the Portfolio itself.
If the other party to a repurchase agreement defaults on its obligation under the agreement, the Portfolio may suffer delays and incur costs or lose money in exercising its rights under the agreement. These risks may be heightened if the other party is located outside the U.S. If the seller fails to repurchase the security and the market value of the security declines, the Portfolio may lose money.
You could lose money investing in the Government Money Market Portfolio. Although the Portfolio seeks to preserve the value of your investment at $1.00 per share, it cannot guarantee it will do so. An investment in the Portfolio is not insured or guaranteed by the Federal Deposit Insurance Corporation or any other government agency. The Portfolio’s sponsor has no legal obligation to provide financial support to the Portfolio, and you should not expect that the sponsor will provide financial support to the Portfolio at any time.
110
Table of Contents
Government Money Market Portfolio
SCHEDULE OF INVESTMENTS
December 31, 2021
| Money Market Investments (103.3%) | Shares/ Par + | Value $ (000’s) | ||||||
Money Market Funds (0.1%) | ||||||||
State Street Institutional U.S. Government Money Market Fund - Premier Class, 0.030% # | 488,365 | 489 | ||||||
|
| |||||||
Total | 489 | |||||||
|
| |||||||
Repurchase Agreements (37.5%) | ||||||||
Tri-Party Bank of Montreal, 0.050%, 1/3/22 (Purchased on 12/31/21, to be repurchased at $17,000,071, collateralized by various US Treasury obligations, 0.000% to 4.375%, due from 4/21/2022 to 2/15/2049, aggregate par and fair value of $19,420,036 and $17,340,000, respectively) | 17,000,000 | 17,000 | ||||||
Tri-Party Bank of Nova Scotia, 0.050%, 1/3/22 (Purchased on 12/31/21, to be repurchased at $21,000,088, collateralized by various US Treasury obligations, 0.000% to 3.000%, due from 1/11/2022 to 2/15/2051, aggregate par and fair value of $20,870,093 and $21,420,090, respectively) | 21,000,000 | 21,000 | ||||||
Tri-Party BNP, 0.050%, 1/3/22 (Purchased on 12/31/21, to be repurchased at $10,000,042, collateralized by various US Treasury obligations, 0.000% to 2.750%, due from 2/15/2024 to 5/15/2048, aggregate par and fair value of $11,311,857 and $10,200,024, respectively) | 10,000,000 | 10,000 | ||||||
Tri-Party BNP, 0.050%, 1/3/22 (Purchased on 12/31/21, to be repurchased at $10,000,042, collateralized by various US Treasury obligations and various US government sponsored agency obligations, 0.000% to 3.500%, due from 2/15/2022 to 10/20/2051, aggregate par and fair value of $9,965,450 and $10,200,000, respectively) | 10,000,000 | 10,000 | ||||||
Tri-Party Citigroup Global Markets, Inc., 0.050%, 1/3/22 (Purchased on 12/31/21, to be repurchased at $15,000,063, collateralized by various US Treasury obligations, 1.250% to 3.625%, due from 4/15/2028 to 5/15/2028, aggregate par and fair value of $14,043,396 and $15,300,099, respectively) | 15,000,000 | 15,000 | ||||||
Tri-Party Citigroup Global Markets, Inc., 0.060%, 1/3/22 (Purchased on 12/31/21, to be repurchased at $10,000,050, collateralized by various US government sponsored agency obligations, 2.500% to 4.000%, due from 11/20/2050 to 12/20/2050, aggregate par and fair value of $9,681,461 and $10,200,984, respectively) | 10,000,000 | 10,000 | ||||||
| Money Market Investments (103.3%) | Shares/ Par + | Value $ (000’s) | ||||||
Repurchase Agreements continued | ||||||||
Tri-Party Goldman Sachs Group LP, 0.050%, 1/3/22 (Purchased on 12/31/21, to be repurchased at $25,000,104, collateralized by various US government sponsored agency obligations, 3.000% to 3.500%, due from 11/20/2047 to 11/20/2051, aggregate par and fair value of $24,126,651 and $25,500,001, respectively) | 25,000,000 | 25,000 | ||||||
Tri-Party Mitsubishi UFJ, 0.055%, 1/3/22 (Purchased on 12/31/21, to be repurchased at $15,000,069, collateralized by various US government sponsored agency obligations, 2.000% to 3.500%, due from 4/20/2047 to 10/20/2051, aggregate par and fair value of $14,946,756 and $15,300,001, respectively) | 15,000,000 | 15,000 | ||||||
Tri-Party Mizuho Securities, 0.050%, 1/3/22 (Purchased on 12/31/21, to be repurchased at $20,000,083, collateralized by various US Treasury obligations, 0.500% to 1.750%, due from 5/31/2022 to 10/31/2027, aggregate par and fair value of $21,387,272 and $20,400,031, respectively) | 20,000,000 | 20,000 | ||||||
Tri-Party Natixis S.A., 0.050%, 1/3/22 (Purchased on 12/31/21, to be repurchased at $20,000,083, collateralized by various US Treasury obligations, 0.125% to 2.375%, due from 6/30/2022 to 5/15/2040, aggregate par and fair value of $20,131,941 and $20,400,001, respectively) | 20,000,000 | 20,000 | ||||||
Tri-Party TD Securities, 0.050%, 1/3/22 (Purchased on 12/31/21, to be repurchased at $20,000,083, collateralized by US Treasury Note, 0.125%, due 7/31/2023, par and fair value of $20,564,768 and $20,400,024, respectively) | 20,000,000 | 20,000 | ||||||
|
| |||||||
Total | 183,000 | |||||||
|
| |||||||
US Government & Agencies (65.7%) | ||||||||
Federal Farm Credit Bank, 0.000%, 1/7/22 | 965,000 | 965 | ||||||
Federal Farm Credit Bank, 0.000%, 1/31/22 | 1,640,000 | 1,640 | ||||||
Federal Farm Credit Bank, 0.000%, 3/3/22 | 5,000,000 | 5,000 | ||||||
Federal Farm Credit Bank, 0.000%, 4/19/22 | 3,615,000 | 3,614 | ||||||
Federal Farm Credit Bank, 0.000%, 6/21/22 | 2,270,000 | 2,269 | ||||||
Federal Farm Credit Bank, 0.070%, 8/10/22 | 6,915,000 | 6,915 | ||||||
Federal Farm Credit Bank, 0.100%, (US SOFR plus 0.050%), 5/5/22 | 3,000,000 | 3,000 | ||||||
The Accompanying Notes are an Integral Part of the Financial Statements.
111
Table of Contents
Government Money Market Portfolio
SCHEDULE OF INVESTMENTS
December 31, 2021
| Money Market Investments (103.3%) | Shares/ Par + | Value $ (000’s) | ||||||
US Government & Agencies continued | ||||||||
Federal Farm Credit Bank, 0.100%, (US SOFR plus 0.050%), 2/17/23 | 2,270,000 | 2,270 | ||||||
Federal Farm Credit Bank, 0.100%, (US SOFR plus 0.050%), 8/22/23 | 2,720,000 | 2,720 | ||||||
Federal Farm Credit Bank, 0.100%, (US SOFR plus 0.050%), 9/28/23 | 1,830,000 | 1,830 | ||||||
Federal Farm Credit Bank, 0.110%, (US SOFR plus 0.060%), 1/20/23 | 550,000 | 550 | ||||||
Federal Farm Credit Bank, 0.110%, (US SOFR plus 0.060%), 11/22/23 | 3,350,000 | 3,350 | ||||||
Federal Farm Credit Bank, 0.125%, (US SOFR plus 0.075%), 11/3/22 | 1,050,000 | 1,050 | ||||||
Federal Farm Credit Bank, 0.135%, (US SOFR plus 0.085%), 10/7/22 | 1,985,000 | 1,985 | ||||||
Federal Farm Credit Bank, 0.145%, (US SOFR plus 0.095%), 9/2/22 | 2,535,000 | 2,535 | ||||||
Federal Farm Credit Bank, 0.205%, (US Treasury 3 Month Bill Money Market Yield plus 0.120%), 5/2/22 | 735,000 | 735 | ||||||
Federal Farm Credit Bank, 0.230%, (US SOFR plus 0.180%), 1/14/22 | 1,940,000 | 1,940 | ||||||
Federal Farm Credit Bank, 0.240%, (US SOFR plus 0.190%), 7/14/22 | 1,630,000 | 1,630 | ||||||
Federal Farm Credit Bank, 0.260%, (US SOFR plus 0.180%), 7/20/22 | 5,575,000 | 5,575 | ||||||
Federal Home Loan Bank, 0.000%, 1/12/22 | 5,195,000 | 5,195 | ||||||
Federal Home Loan Bank, 0.000%, 1/14/22 | 1,500,000 | 1,500 | ||||||
Federal Home Loan Bank, 0.000%, 2/8/22 | 1,245,000 | 1,245 | ||||||
Federal Home Loan Bank, 0.000%, 2/11/22 | 4,700,000 | 4,700 | ||||||
Federal Home Loan Bank, 0.000%, 2/14/22 | 9,555,000 | 9,554 | ||||||
Federal Home Loan Bank, 0.000%, 2/15/22 | 3,765,000 | 3,765 | ||||||
Federal Home Loan Bank, 0.000%, 2/16/22 | 8,610,000 | 8,610 | ||||||
Federal Home Loan Bank, 0.000%, 2/18/22 | 3,550,000 | 3,550 | ||||||
Federal Home Loan Bank, 0.000%, 3/2/22 | 7,045,000 | 7,044 | ||||||
Federal Home Loan Bank, 0.000%, 3/8/22 | 7,400,000 | 7,399 | ||||||
Federal Home Loan Bank, 0.000%, 3/18/22 | 9,405,000 | 9,404 | ||||||
Federal Home Loan Bank, 0.000%, 4/1/22 | 1,740,000 | 1,740 | ||||||
Federal Home Loan Bank, 0.000%, 4/22/22 | 5,330,000 | 5,329 | ||||||
Federal Home Loan Bank, 0.035%, 2/1/22 | 4,350,000 | 4,350 | ||||||
Federal Home Loan Bank, 0.040%, 1/12/22 | 4,685,000 | 4,685 | ||||||
Federal Home Loan Bank, 0.040%, 1/28/22 | 6,760,000 | 6,760 | ||||||
Federal Home Loan Bank, 0.050%, 1/25/22 | 735,000 | 735 | ||||||
Federal Home Loan Bank, 0.050%, 2/7/22 | 1,280,000 | 1,280 | ||||||
Federal Home Loan Bank, 0.055%, 3/22/22 | 4,690,000 | 4,690 | ||||||
Federal Home Loan Bank, 0.055%, 5/23/22 | 2,310,000 | 2,310 | ||||||
Federal Home Loan Bank, 0.060%, (US SOFR plus 0.010%), 3/28/22 | 385,000 | 385 | ||||||
| Money Market Investments (103.3%) | Shares/ Par + | Value $ (000’s) | ||||||
US Government & Agencies continued | ||||||||
Federal Home Loan Bank, 0.060%, (US SOFR plus 0.010%), 3/30/22 | 615,000 | 615 | ||||||
Federal Home Loan Bank, 0.060%, (US SOFR plus 0.010%), 9/6/22 | 2,925,000 | 2,925 | ||||||
Federal Home Loan Bank, 0.065%, (US SOFR plus 0.015%), 12/16/22 | 5,915,000 | 5,915 | ||||||
Federal Home Loan Bank, 0.115%, (US SOFR plus 0.065%), 4/28/22 | 945,000 | 945 | ||||||
Federal Home Loan Bank, 0.170%, (US SOFR plus 0.120%), 2/28/22 | 2,695,000 | 2,695 | ||||||
Federal Home Loan Mortgage Corp., 0.115%, (US SOFR plus 0.065%), 11/10/22 | 1,605,000 | 1,605 | ||||||
Federal Home Loan Mortgage Corp., 0.125%, 7/25/22 | 2,110,000 | 2,110 | ||||||
Federal Home Loan Mortgage Corp., 0.240%, (US SOFR plus 0.190%), 6/2/22 | 6,140,000 | 6,140 | ||||||
Federal National Mortgage Association, 0.000%, 3/2/22 | 1,675,000 | 1,675 | ||||||
Federal National Mortgage Association, 0.350%, (US SOFR plus 0.300%), 4/28/22 | 5,000,000 | 5,000 | ||||||
Federal National Mortgage Association, 0.400%, (US SOFR plus 0.350%), 4/7/22 | 2,740,000 | 2,740 | ||||||
Federal National Mortgage Association, 0.440%, (US SOFR plus 0.390%), 4/15/22 | 3,090,000 | 3,090 | ||||||
US Treasury, 0.000%, 3/1/22 | 4,730,200 | 4,730 | ||||||
US Treasury, 0.000%, 3/3/22 | 31,935,000 | 31,932 | ||||||
US Treasury, 0.000%, 3/10/22 | 20,085,000 | 20,083 | ||||||
US Treasury, 0.000%, 3/24/22 | 3,870,000 | 3,869 | ||||||
US Treasury, 0.000%, 3/31/22 | 11,355,000 | 11,353 | ||||||
US Treasury, 0.000%, 4/5/22 | 275,000 | 275 | ||||||
US Treasury, 0.000%, 4/26/22 | 10,155,000 | 10,152 | ||||||
US Treasury, 0.000%, 5/3/22 | 11,305,000 | 11,300 | ||||||
US Treasury, 0.000%, 6/16/22 | 9,580,000 | 9,574 | ||||||
US Treasury, 0.000%, 6/23/22 | 8,280,000 | 8,274 | ||||||
US Treasury, 0.000%, 6/30/22 | 4,565,000 | 4,560 | ||||||
US Treasury, 0.000%, 9/8/22 | 2,179,200 | 2,178 | ||||||
US Treasury, 0.000%, 12/29/22 | 985,000 | 981 | ||||||
US Treasury, 0.120%, (US Treasury 3 Month Bill Money Market Yield plus 0.035%), 10/31/23 | 7,500,000 | 7,500 | ||||||
US Treasury, 0.125%, 6/30/22 | 410,000 | 410 | ||||||
US Treasury, 0.134%, (US Treasury 3 Month Bill Money Market Yield plus 0.049%), 1/31/23 | 9,500,000 | 9,500 | ||||||
US Treasury, 0.375%, 3/31/22 | 135,000 | 135 | ||||||
US Treasury, 1.375%, 1/31/22 | 4,060,000 | 4,065 | ||||||
US Treasury, 1.750%, 2/28/22 | 135,000 | 135 | ||||||
US Treasury, 1.750%, 6/15/22 | 110,000 | 111 | ||||||
The Accompanying Notes are an Integral Part of the Financial Statements.
112
Table of Contents
Government Money Market Portfolio
| Money Market Investments (103.3%) | Shares/ Par + | Value $ (000’s) | ||||||
US Government & Agencies continued | ||||||||
US Treasury, 2.125%, 5/16/22 | 920,000 | 927 | ||||||
|
| |||||||
Total | 321,302 | |||||||
|
| |||||||
Total Money Market Investments | ||||||||
(Cost: $504,791) |
| 504,791 | ||||||
|
| |||||||
Total Investments (103.3%) | ||||||||
(Cost: $504,791) |
| 504,791 | ||||||
|
| |||||||
Other Assets, Less Liabilities (-3.3%) | (15,933 | ) | ||||||
|
| |||||||
Net Assets (100.0%) | 488,858 | |||||||
|
| |||||||
| + | All par is stated in U.S. Dollar unless otherwise noted. |
| # | 7-Day yield as of 12/31/2021. |
The following is a summary of the inputs used in valuing the Portfolio’s Investments at December 31, 2021. See Note 3 for additional information on portfolio valuation.
Valuation Inputs | ||||||||||||||
| Description | Level 1 – Quoted Prices | Level 2 – Other Significant Observable Inputs | Level 3 – Significant Unobservable Inputs | |||||||||||
| (Amounts in thousands) | ||||||||||||||
Assets: | ||||||||||||||
Short-Term Investments | ||||||||||||||
Money Market Funds | $ | 489 | $ | - | $ | - | ||||||||
All Others | - | 504,302 | - | |||||||||||
Total Assets: | $ | 489 | $ | 504,302 | $ | - | ||||||||
The Accompanying Notes are an Integral Part of the Financial Statements.
113
Table of Contents
Short-Term Bond Portfolio (unaudited)
| Objective: | Portfolio Strategy: | Net Assets: | ||
| Provide as high a level of current income as is consistent with prudent investment risk. | Invest in a diversified portfolio of investment grade debt securities. | $412 million |
PORTFOLIO OVERVIEW
Mason Street Advisors, LLC (“Mason Street Advisors”), the investment adviser for the Short-Term Bond Portfolio (the “Portfolio”), has engaged T. Rowe Price Associates, Inc. (“T. Rowe Price”) to act as sub-adviser for the Portfolio. Normally, the Portfolio invests in a diversified portfolio of investment grade debt securities. The Portfolio may also invest up to 10% of net assets in non-investment grade, high yield/high risk bonds (so called “junk bonds”). Also, the Portfolio may invest up to 20% of net assets in foreign securities. Debt securities may be of any maturity, but under normal market conditions, the Portfolio’s effective dollar-weighted average maturity will not exceed three years. The Portfolio primarily invests in corporate, government and mortgage- and asset-backed securities. The Portfolio uses both a “top-down” and “bottom-up” investment approach to construct the portfolio of investments. The top-down investment approach involves an evaluation of the overall macroeconomic environment and its potential impact on the level and direction of interest rates. The bottom-up investment approach focuses on fundamental research of individual issuers.
MARKET OVERVIEW
Domestic bond returns were mixed in 2021, as bond yields rose across the Treasury yield curve, especially in the intermediate-term portion of the curve, amid expectations that the Fed’s tapering of asset purchases, which was announced in November, would be a prelude to tighter monetary policy in 2022.
At its December 2021 meeting, the Federal Open Market Committee announced an accelerated timeline to taper asset purchases and projected three rate hikes in 2022, up from the one it predicted in September. The yield of the two-year Treasury note rose as the Fed rhetoric focused increasingly on reducing inflation and markets priced-in anticipated interest rate increases.
U.S. Treasurys posted negative absolute returns and lagged the broader investment grade market. Among spread sectors, corporate bonds recorded the strongest excess returns, as improving corporate fundamentals and strong technicals provided support.
PORTFOLIO RESULTS
The Portfolio returned (0.10%) for the twelve months ended December 31, 2021. By comparison, the Portfolio’s benchmark, the Bloomberg® 1–3 Year U.S. Government/Credit Index (the “Index”), returned (0.47%). (The Index is unmanaged, cannot be invested in directly and does not incur expenses.) According to Lipper® Analytical Services, Inc., an independent mutual fund ranking agency, the average return in 2021 of the Short Investment Grade Debt Funds peer group was (0.22%).
Sector allocation was the primary contributor to the Portfolio’s performance. Out-of-benchmark holdings in the Financials sector, particularly in mortgage-backed securities, asset-backed securities and commercial mortgage-backed securities, contributed as the industries continued to recover from liquidity issues brought on by the coronavirus pandemic. Moreover, concerns regarding inflation and the emergence of COVID-19 variants boosted demand for the generally higher quality securitized sectors. In addition, an overweight position in investment grade corporate bonds and a corresponding underweight to U.S. Treasurys contributed to the Portfolio’s return as improving corporate fundamentals, generally encouraging corporate earnings and a continued desire for yield among investors fueled demand for corporate bonds.
Security selection within investment grade corporate bonds also contributed, and yield curve positioning further supported relative results. A shorter average-duration profile relative to the benchmark was beneficial as U.S. Treasury yields rose across most of the curve. Additionally, the Portfolio’s cash allocation, which is necessary for portfolio liquidity, was a modest detractor from relative results during the period.
PORTFOLIO MANAGER OUTLOOK
The following forward-looking comments are the opinion of T. Rowe Price, the Portfolio’s sub-adviser.
114
Table of Contents
Short-Term Bond Portfolio (unaudited)
Although the Fed’s increased focus on reducing inflation and the emergence of the Omicron variant of COVID-19 have complicated the interest rate outlook, we believe a strengthening U.S. economy and moderating inflation will support higher Treasury yields in 2022. However, we believe the pace of the two-year yield’s rise will moderate if the Fed’s rate increase cycle aligns with expectations.
The Fed’s mid-December 2021 policy meeting provided some clarity about the accelerated pace of tapering as well as the number and timing of interest rate increases. Any policy missteps by the Fed, such as tightening policy more quickly in the face of a less certain economic outlook, could lead to increased levels of market volatility and further fluctuations in short-term credit spreads. However, bouts of volatility should also provide tactical opportunities for us, particularly given the strong growth environment.
While valuations have become more attractive following widening credit spreads in November 2021, spreads remain near the tighter end of their longer-term range. Given current spread levels, we believe the liquidity we have built up will be advantageous in periods of spread widening. In such a climate, active sector and security selection are likely to play critical roles in generating yield and managing risk, and we are confident that our research platform is well positioned to capitalize on the current market environment.
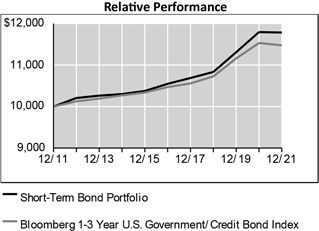
Average Annual Total Returns For Periods Ended December 31, 2021 | ||||||||||||
| 1 Year | 5 Years | 10 Years | ||||||||||
Short-Term Bond Portfolio | -0.10 | % | 2.24 | % | 1.65 | % | ||||||
Bloomberg 1-3 Year U.S. Government/Credit Bond Index | -0.47 | % | 1.85 | % | 1.39 | % | ||||||
Lipper® Variable Insurance Products (VIP) Short Investment Grade Debt Funds Average | -0.22 | % | 1.84 | % | 1.54 | % | ||||||
The performance data quoted represents past performance. Past performance is historical and does not guarantee future performance. Investment return and principal value will fluctuate, so that shares, when redeemed, may be worth more or less than their original cost. Current performance may be lower or higher than the performance data quoted. For the most recent month-end performance information visit www.northwesternmutual.com.
This chart assumes an initial investment of $10,000 made on 12/31/11. Returns shown reflect fee waivers, deductions for management and other portfolio expenses, and reinvestment of all dividends. In the absence of fee waivers,
total return would be reduced. Returns exclude deductions for separate account sale loads and account fees. Please refer to the Benchmark Definitions section of this report for information about the indices cited in the above chart and graph.
Return of principal is not guaranteed. Bond funds have the same risks that are associated with the underlying bonds owned by the Portfolio. When interest rates rise, bond prices fall. With a fixed income fund, when interest rates rise, the value of the fund’s existing bonds drops, which could negatively affect overall fund performance. High yield bonds generally have greater price swings and higher default risks than investment grade bonds.
Investing in bonds issued by foreign corporations and governments carries additional risk, including foreign currency risk, and may increase the volatility of the Portfolio’s performance.
The Portfolio may invest in derivative instruments to adjust the Portfolio’s duration and yield curve exposure, to hedge foreign currency exposure or for any other permissible purpose keeping with its investment objective. Use of these instruments may involve certain costs and imposes certain risks such as liquidity risk, market risk, credit risk, management risk and the risk of mispricing or improper valuation. Certain derivatives involve leverage, which could magnify losses, and portfolios investing in derivatives could lose more than the principal amount invested in those instruments.
The U.S. federal funds rate has been subject to adjustments over the course of the last several years. A significant rise in interest rates over the course of the last several years. A significant rise in interest rates over a short period of time
115
Table of Contents
Short-Term Bond Portfolio (unaudited)
could cause significant losses in the market value of the Portfolio’s fixed income investments.
Top 10 Fixed Income Holdings 12/31/21
| Security Description | % of Net Assets | |||||||
US Treasury, Various | 15.5 | % | ||||||
Government National Mortgage Association, Various | 1.1 | % | ||||||
Federal National Mortgage Association, Various | 1.0 | % | ||||||
Pacific Gas & Electric Co., Various | 1.0 | % | ||||||
Imperial Brands Finance PLC, Various | 1.0 | % | ||||||
Charter Communications Operating LLC / Charter Communications Operating Capital Corp., Various | 0.9 | % | ||||||
AbbVie, Inc., Various | 0.8 | % | ||||||
Hyundai Capital America, Various | 0.8 | % | ||||||
Synchrony Financial, Various | 0.8 | % | ||||||
Morgan Stanley, Various | 0.8 | % | ||||||
Sector Allocation 12/31/21
| Sector | % of Net Assets | |||||||
Corporate Bonds | 49.2 | % | ||||||
Structured Products | 33.1 | % | ||||||
Governments | 15.5 | % | ||||||
Short-Term Investments | 1.4 | % | ||||||
Municipal Bonds | 0.8 | % | ||||||
Sector Allocation and Top 10 Holdings are subject to change.
Consistent with the Portfolio’s stated parameters, no more than 20% of the Portfolio is invested in foreign securities, and no more than 10% is invested in high yield securities.
116
Table of Contents
Short-Term Bond Portfolio
SCHEDULE OF INVESTMENTS
December 31, 2021
| Corporate Bonds (49.2%) | Shares/ Par+ | Value $ (000’s) | ||||||
Basic Materials (0.6%) | ||||||||
ArcelorMittal | 225,000 | 234 | ||||||
Celulosa Arauco y Constitucion SA | 365,000 | 388 | ||||||
Ecolab, Inc. | 215,000 | 216 | ||||||
LYB International Finance III, LLC | 373,000 | 367 | ||||||
Nucor Corp. | 155,000 | 158 | ||||||
POSCO | 810,000 | 819 | ||||||
Westlake Chemical Corp. | 100,000 | 99 | ||||||
|
| |||||||
Total | 2,281 | |||||||
|
| |||||||
Communications (3.4%) | ||||||||
AT&T, Inc. | 1,060,000 | 1,055 | ||||||
Baidu, Inc. | 405,000 | 408 | ||||||
3.500%, 11/28/22 | 345,000 | 352 | ||||||
Charter Communications Operating LLC / Charter Communications Operating Capital Corp. | 2,107,000 | 2,138 | ||||||
4.908%, 7/23/25 b | 1,270,000 | 1,398 | ||||||
Comcast Corp. | 460,000 | 489 | ||||||
Cox Communications, Inc. | 443,000 | 462 | ||||||
Crown Castle Towers LLC | 300,000 | 304 | ||||||
Expedia, Inc. | 565,000 | 587 | ||||||
Fox Corp. | 420,000 | 421 | ||||||
NBN Co., Ltd. | 1,000,000 | 985 | ||||||
NTT Finance Corp. | 660,000 | 657 | ||||||
0.583%, 3/1/24 144A | 265,000 | 262 | ||||||
The Priceline Group, Inc. | 150,000 | 153 | ||||||
SES SA | 195,000 | 200 | ||||||
Sky, Ltd. | 1,450,000 | 1,544 | ||||||
T-Mobile USA, Inc. | 470,000 | 471 | ||||||
3.500%, 4/15/25 | 515,000 | 546 | ||||||
Verizon Communications, Inc. | 500,000 | 488 | ||||||
1.450%, 3/20/26 | 650,000 | 647 | ||||||
3.376%, 2/15/25 | 230,000 | 245 | ||||||
| Corporate Bonds (49.2%) | Shares/ Par+ | Value $ (000’s) | ||||||
Communications continued | ||||||||
The Walt Disney Co. | 140,000 | 141 | ||||||
|
| |||||||
Total | 13,953 | |||||||
|
| |||||||
Consumer Staples (0.2%) | ||||||||
China Mengniu Dairy Co., Ltd. | 856,000 | 850 | ||||||
|
| |||||||
Total | 850 | |||||||
|
| |||||||
Consumer, Cyclical (5.4%) | ||||||||
7-Eleven, Inc. | 200,000 | 199 | ||||||
0.800%, 2/10/24 144A | 325,000 | 321 | ||||||
American Airlines Pass Through Trust, Series 2017-2, Class B 3.700%, 4/15/27 | 248,759 | 240 | ||||||
AutoZone, Inc. | 235,000 | 251 | ||||||
Brunswick Corp. | 685,000 | 675 | ||||||
Daimler Finance North America LLC | 580,000 | 584 | ||||||
1.750%, 3/10/23 144A | 815,000 | 823 | ||||||
General Motors Co. | 530,000 | 563 | ||||||
5.400%, 10/2/23 | 500,000 | 535 | ||||||
General Motors Financial Co., Inc. | 845,000 | 874 | ||||||
Harley-Davidson Financial Services, Inc. | 210,000 | 211 | ||||||
4.050%, 2/4/22 144A | 560,000 | 561 | ||||||
Hasbro, Inc. | 980,000 | 1,020 | ||||||
Hyatt Hotels Corp. | 325,000 | 325 | ||||||
Hyundai Capital America | 390,000 | 384 | ||||||
0.875%, 6/14/24 144A | 510,000 | 500 | ||||||
1.000%, 9/17/24 144A | 255,000 | 251 | ||||||
1.150%, 11/10/22 144A | 385,000 | 386 | ||||||
2.375%, 2/10/23 144A | 865,000 | 877 | ||||||
2.850%, 11/1/22 144A | 228,000 | 232 | ||||||
3.000%, 6/20/22 144A | 470,000 | 475 | ||||||
3.950%, 2/1/22 144A | 245,000 | 246 | ||||||
Marriott International, Inc. | 200,000 | 202 | ||||||
3.125%, 2/15/23 | 170,000 | 173 | ||||||
3.600%, 4/15/24 | 1,160,000 | 1,213 | ||||||
McDonald’s Corp. | 270,000 | 272 | ||||||
3.300%, 7/1/25 | 155,000 | 164 | ||||||
3.350%, 4/1/23 | 305,000 | 314 | ||||||
Nissan Motor Acceptance Corp. | 1,010,000 | 1,020 | ||||||
2.650%, 7/13/22 144A | 215,000 | 217 | ||||||
The Accompanying Notes are an Integral Part of the Financial Statements.
117
Table of Contents
Short-Term Bond Portfolio
| Corporate Bonds (49.2%) | Shares/ Par+ | Value $ (000’s) | ||||||
Consumer, Cyclical continued | ||||||||
Nissan Motor Co., Ltd. | 775,000 | 795 | ||||||
Nordstrom, Inc. | 85,000 | 85 | ||||||
O’Reilly Automotive, Inc. | 195,000 | 198 | ||||||
Panasonic Corp. | 335,000 | 338 | ||||||
QVC, Inc. | 2,065,000 | 2,127 | ||||||
Ralph Lauren Corp. | 100,000 | 101 | ||||||
Ross Stores, Inc. | 245,000 | 237 | ||||||
4.600%, 4/15/25 | 1,100,000 | 1,205 | ||||||
Starbucks Corp. | 205,000 | 206 | ||||||
Stellantis Finance US, Inc. | 260,000 | 256 | ||||||
Toyota Motor Credit Corp. | 875,000 | 880 | ||||||
United Airlines Pass Through Trust, Series 2019-2, Class B 3.500%, 11/1/29 | 150,406 | 149 | ||||||
Volkswagen Group of America Finance LLC | 360,000 | 360 | ||||||
0.875%, 11/22/23 144A | 345,000 | 343 | ||||||
2.700%, 9/26/22 144A | 290,000 | 294 | ||||||
2.900%, 5/13/22 144A | 200,000 | 202 | ||||||
3.125%, 5/12/23 144A | 200,000 | 206 | ||||||
|
| |||||||
Total | 22,090 | |||||||
|
| |||||||
Consumer, Non-cyclical (7.8%) | ||||||||
AbbVie, Inc. | 1,935,000 | 2,008 | ||||||
2.900%, 11/6/22 | 775,000 | 789 | ||||||
2.950%, 11/21/26 | 50,000 | 53 | ||||||
3.200%, 11/6/22 | 85,000 | 86 | ||||||
3.200%, 5/14/26 | 100,000 | 106 | ||||||
3.250%, 10/1/22 | 80,000 | 81 | ||||||
3.450%, 3/15/22 | 265,000 | 265 | ||||||
Aetna, Inc. | 275,000 | 282 | ||||||
AmerisourceBergen Corp. | 1,050,000 | 1,047 | ||||||
AstraZeneca Finance LLC | 575,000 | 570 | ||||||
1.200%, 5/28/26 | 805,000 | 795 | ||||||
BAT International Finance PLC | 475,000 | 466 | ||||||
Baxalta, Inc. | 125,000 | 126 | ||||||
Bayer US Finance II LLC | 505,000 | 528 | ||||||
Becton Dickinson and Co. | 315,000 | 330 | ||||||
3.734%, 12/15/24 | 61,000 | 65 | ||||||
Bristol-Myers Squibb Co. | 268,000 | 280 | ||||||
3.250%, 2/20/23 | 91,000 | 93 | ||||||
| Corporate Bonds (49.2%) | Shares/ Par+ | Value $ (000’s) | ||||||
Consumer, Non-cyclical continued | ||||||||
Bunge, Ltd. Finance Corp. | 2,000,000 | 2,031 | ||||||
4.350%, 3/15/24 | 55,000 | 59 | ||||||
Cardinal Health, Inc. | 310,000 | 321 | ||||||
3.200%, 3/15/23 | 395,000 | 406 | ||||||
3.500%, 11/15/24 | 525,000 | 554 | ||||||
Cigna Corp. | 190,000 | 188 | ||||||
3.000%, 7/15/23 | 320,000 | 329 | ||||||
3.750%, 7/15/23 | 179,000 | 186 | ||||||
Coca-Cola European Partners PLC | 1,135,000 | 1,116 | ||||||
CommonSpirit Health | 365,000 | 362 | ||||||
CVS Health Corp. | 150,000 | 155 | ||||||
2.875%, 6/1/26 | 265,000 | 277 | ||||||
3.000%, 8/15/26 | 100,000 | 106 | ||||||
Diageo Capital PLC | 300,000 | 298 | ||||||
EMD Finance LLC | 190,000 | 190 | ||||||
Gilead Sciences, Inc. | 836,000 | 833 | ||||||
Health Care Service Corp., a Mutual Legacy Reserve Co. 1.500%, 6/1/25 144A | 780,000 | 778 | ||||||
HPHT Finance 19, Ltd. | 500,000 | 517 | ||||||
Humana, Inc. | 320,000 | 318 | ||||||
1.350%, 2/3/27 | 75,000 | 73 | ||||||
2.900%, 12/15/22 | 140,000 | 143 | ||||||
3.150%, 12/1/22 | 150,000 | 153 | ||||||
3.850%, 10/1/24 | 545,000 | 579 | ||||||
4.500%, 4/1/25 | 565,000 | 616 | ||||||
IHS Markit, Ltd. | 560,000 | 587 | ||||||
Imperial Brands Finance PLC | 855,000 | 884 | ||||||
3.500%, 2/11/23 144A | 1,210,000 | 1,233 | ||||||
3.750%, 7/21/22 144A | 2,059,000 | 2,082 | ||||||
JDE Peet’s NV | 295,000 | 289 | ||||||
Moody’s Corp. | 505,000 | 540 | ||||||
PeaceHealth Obligated Group | 105,000 | 104 | ||||||
PerkinElmer, Inc. | 390,000 | 387 | ||||||
0.850%, 9/15/24 | 745,000 | 734 | ||||||
Perrigo Company PLC | 200,000 | 206 | ||||||
Perrigo Finance Unlimited Co. | 1,960,000 | 2,052 | ||||||
Philip Morris International, Inc. | 220,000 | 221 | ||||||
Prosperous Ray, Ltd. | 650,000 | 684 | ||||||
The Accompanying Notes are an Integral Part of the Financial Statements.
118
Table of Contents
Short-Term Bond Portfolio
| Corporate Bonds (49.2%) | Shares/ Par+ | Value $ (000’s) | ||||||
Consumer, Non-cyclical continued | ||||||||
RELX Capital, Inc. | 270,000 | 278 | ||||||
Royalty Pharma PLC | 425,000 | 422 | ||||||
Shire Acquisitions Investments Ireland DAC | 1,005,000 | 1,034 | ||||||
Stryker Corp. | 190,000 | 189 | ||||||
Thermo Fisher Scientific, Inc. | 1,050,000 | 1,046 | ||||||
Triton Container International, Ltd. | 780,000 | 772 | ||||||
|
| |||||||
Total | 32,302 | |||||||
|
| |||||||
Diversified (0.2%) | ||||||||
CK Hutchison International 17 II, Ltd. | 650,000 | 663 | ||||||
|
| |||||||
Total | 663 | |||||||
|
| |||||||
Energy (5.6%) | ||||||||
Aker BP ASA | 445,000 | 461 | ||||||
Baker Hughes Holdings LLC / Baker Hughes Co-Obligor, Inc. 1.231%, 12/15/23 | 210,000 | 211 | ||||||
Canadian Natural Resources, Ltd. | 760,000 | 767 | ||||||
Cheniere Corpus Christi Holdings LLC | 425,000 | 471 | ||||||
7.000%, 6/30/24 | 1,110,000 | 1,228 | ||||||
Devon Energy Corp. | 290,000 | 317 | ||||||
Diamondback Energy, Inc. | 1,330,000 | 1,380 | ||||||
4.750%, 5/31/25 | 660,000 | 723 | ||||||
Enbridge, Inc. | 205,000 | 205 | ||||||
2.500%, 1/15/25 | 640,000 | 658 | ||||||
4.000%, 10/1/23 | 365,000 | 381 | ||||||
Energy Transfer LP | 115,000 | 119 | ||||||
3.600%, 2/1/23 | 175,000 | 178 | ||||||
Energy Transfer Operating LP | 135,000 | 141 | ||||||
4.250%, 3/15/23 | 780,000 | 802 | ||||||
4.900%, 2/1/24 | 425,000 | 450 | ||||||
5.875%, 1/15/24 | 1,054,000 | 1,134 | ||||||
Eni SpA | 955,000 | 999 | ||||||
Enterprise Products Operating LLC | 500,000 | 501 | ||||||
EOG Resources, Inc. | 140,000 | 142 | ||||||
EQT Corp. | 1,020,000 | 1,030 | ||||||
Equinor ASA | 880,000 | 918 | ||||||
Exxon Mobil Corp. | 1,025,000 | 1,077 | ||||||
Florida Gas Transmission LLC | 250,000 | 252 | ||||||
| Corporate Bonds (49.2%) | Shares/ Par+ | Value $ (000’s) | ||||||
Energy continued | ||||||||
Gray Oak Pipeline LLC | 295,000 | 298 | ||||||
2.600%, 10/15/25 144A | 205,000 | 205 | ||||||
Kinder Morgan Energy Partners LP | 70,000 | 71 | ||||||
Pioneer Natural Resources Co. | 350,000 | 349 | ||||||
0.750%, 1/15/24 | 370,000 | 365 | ||||||
Plains All American Pipeline LP / PAA Finance Corp. | 725,000 | 735 | ||||||
Reliance Industries, Ltd. | 800,000 | 804 | ||||||
Sabine Pass Liquefaction LLC | 1,025,000 | 1,072 | ||||||
5.750%, 5/15/24 | 100,000 | 109 | ||||||
Saudi Arabian Oil Co. | 805,000 | 810 | ||||||
Schlumberger Finance Canada, Ltd. | 155,000 | 154 | ||||||
Schlumberger Holdings Corp. | 865,000 | 907 | ||||||
4.000%, 12/21/25 144A | 170,000 | 183 | ||||||
Suncor Energy, Inc. | 395,000 | 404 | ||||||
Sunoco Logistics Partners Operations LP | 55,000 | 56 | ||||||
4.250%, 4/1/24 | 35,000 | 37 | ||||||
Western Midstream Operating LP | 800,000 | 802 | ||||||
The Williams Cos., Inc. | 979,000 | 1,001 | ||||||
Williams Partners LP | 95,000 | 96 | ||||||
4.300%, 3/4/24 | 145,000 | 153 | ||||||
|
| |||||||
Total | 23,156 | |||||||
|
| |||||||
Financial (16.9%) | ||||||||
AerCap Ireland Capital DAC / AerCap Global Aviation Trust | 770,000 | 769 | ||||||
4.125%, 7/3/23 | 960,000 | 997 | ||||||
4.500%, 9/15/23 | 485,000 | 509 | ||||||
4.875%, 1/16/24 | 150,000 | 160 | ||||||
Air Lease Corp. | 360,000 | 364 | ||||||
3.500%, 1/15/22 | 265,000 | 265 | ||||||
American International Group, Inc. | 650,000 | 670 | ||||||
American Tower Corp. | 225,000 | 242 | ||||||
Aon Corp. | 180,000 | 182 | ||||||
Avolon Holdings Funding, Ltd. | 610,000 | 599 | ||||||
2.875%, 2/15/25 144A | 435,000 | 444 | ||||||
3.625%, 5/1/22 144A | 670,000 | 674 | ||||||
3.950%, 7/1/24 144A | 130,000 | 136 | ||||||
Banco Bilbao Vizcaya Argentaria SA | 1,000,000 | 996 | ||||||
The Accompanying Notes are an Integral Part of the Financial Statements.
119
Table of Contents
Short-Term Bond Portfolio
| Corporate Bonds (49.2%) | Shares/ Par+ | Value $ (000’s) | ||||||
Financial continued | ||||||||
Banco del Estado de Chile | 260,000 | 265 | ||||||
Banco Santander Mexico SA Institucion De Banca Multiple Grupo Financiero Santander Mexico | 775,000 | 793 | ||||||
Banco Santander SA | 600,000 | 597 | ||||||
Bank of America Corp. | 695,000 | 690 | ||||||
0.976%, (US SOFR plus 0.690%), 4/22/25 | 605,000 | 600 | ||||||
1.292%, (ICE LIBOR USD 3 Month plus 1.160%), 1/20/23 | 665,000 | 664 | ||||||
1.734%, (US SOFR plus 0.960%), 7/22/27 | 450,000 | 447 | ||||||
Bank of Ireland Group PLC | 1,540,000 | 1,629 | ||||||
Banque Federative du Credit Mutuel SA | 505,000 | 499 | ||||||
0.998%, 2/4/25 144A | 665,000 | 654 | ||||||
2.125%, 11/21/22 144A | 630,000 | 639 | ||||||
Barclays Bank PLC | 285,000 | 286 | ||||||
Barclays PLC | 370,000 | 385 | ||||||
BDO Unibank, Inc. | 800,000 | 814 | ||||||
BPCE SA | 280,000 | 281 | ||||||
5.700%, 10/22/23 144A | 1,480,000 | 1,591 | ||||||
Brighthouse Financial Global Funding | 1,315,000 | 1,308 | ||||||
1.000%, 4/12/24 144A | 495,000 | 491 | ||||||
Capital One Financial Corp. | 345,000 | 353 | ||||||
3.500%, 6/15/23 | 245,000 | 254 | ||||||
3.900%, 1/29/24 | 240,000 | 253 | ||||||
CC Holdings GS V LLC | 1,360,000 | 1,407 | ||||||
The Charles Schwab Corp. | 525,000 | 571 | ||||||
Citigroup, Inc. | 500,000 | 496 | ||||||
3.106%, (US SOFR plus 2.842%), 4/8/26 | 650,000 | 681 | ||||||
Citizens Bank NA | 290,000 | 290 | ||||||
CNO Global Funding | 490,000 | 484 | ||||||
Credit Agricole SA | 315,000 | 318 | ||||||
Credit Suisse AG | 485,000 | 479 | ||||||
1.000%, 5/5/23 | 860,000 | 862 | ||||||
Credit Suisse Group AG | 500,000 | 508 | ||||||
| Corporate Bonds (49.2%) | Shares/ Par+ | Value $ (000’s) | ||||||
Financial continued | ||||||||
Creditcorp, Ltd. | 200,000 | 202 | ||||||
Crown Castle International Corp. | 615,000 | 594 | ||||||
3.150%, 7/15/23 | 430,000 | 443 | ||||||
Danske Bank A/S | 880,000 | 879 | ||||||
5.000%, 1/12/22 144A | 665,000 | 666 | ||||||
5.375%, 1/12/24 144A | 455,000 | 490 | ||||||
Eastern Creation II Investment Holdings, Ltd. | 900,000 | 894 | ||||||
Equitable Financial Life Global Funding | 1,145,000 | 1,139 | ||||||
1.100%, 11/12/24 144A | 435,000 | 430 | ||||||
The Goldman Sachs Group, Inc. | 385,000 | 384 | ||||||
0.627%, (US SOFR plus 0.538%), 11/17/23 | 115,000 | 115 | ||||||
0.657%, (US SOFR plus 0.505%), 9/10/24 | 335,000 | 332 | ||||||
0.673%, (US SOFR plus 0.572%), 3/8/24 | 335,000 | 334 | ||||||
0.925%, (US SOFR plus 0.486%), 10/21/24 | 315,000 | 314 | ||||||
3.500%, 4/1/25 | 490,000 | 518 | ||||||
5.750%, 1/24/22 | 825,000 | 828 | ||||||
Highwoods Realty LP | 740,000 | 753 | ||||||
HPHT Finance 17, Ltd. | 765,000 | 772 | ||||||
HSBC Holdings PLC | 420,000 | 419 | ||||||
1.645%, (US SOFR plus 1.538%), 4/18/26 | 910,000 | 902 | ||||||
2.099%, (US SOFR plus 1.929%), 6/4/26 | 320,000 | 322 | ||||||
Jackson Financial, Inc. | ||||||||
1.125%, 11/22/23 144A | 620,000 | 619 | ||||||
JPMorgan Chase & Co. | 560,000 | 554 | ||||||
0.934%, (US SOFR plus 0.885%), 4/22/27 | 350,000 | 354 | ||||||
2.083%, (US SOFR plus 1.850%), 4/22/26 | 890,000 | 903 | ||||||
KeyBank NA | 580,000 | 583 | ||||||
LeasePlan Corp. NV | 600,000 | 619 | ||||||
Lincoln National Corp. | 130,000 | 136 | ||||||
Lloyds Banking Group PLC | 200,000 | 200 | ||||||
LSEGA Financing PLC | 765,000 | 754 | ||||||
Marsh & McLennan Cos., Inc. | 345,000 | 365 | ||||||
Metropolitan Life Global Funding I | 430,000 | 425 | ||||||
Mitsubishi UFJ Financial Group, Inc. | 985,000 | 973 | ||||||
1.080%, (ICE LIBOR USD 3 Month plus 0.920%), 2/22/22 | 390,000 | 390 | ||||||
Mizuho Financial Group Cayman 2, Ltd. | 930,000 | 946 | ||||||
The Accompanying Notes are an Integral Part of the Financial Statements.
120
Table of Contents
Short-Term Bond Portfolio
| Corporate Bonds (49.2%) | Shares/ Par+ | Value $ (000’s) | ||||||
Financial continued | ||||||||
Morgan Stanley | 450,000 | 448 | ||||||
0.560%, (US SOFR plus 0.466%), 11/10/23 | 640,000 | 639 | ||||||
0.731%, (US SOFR plus 0.616%), 4/5/24 | 560,000 | 558 | ||||||
1.164%, (US SOFR plus 0.560%), 10/21/25 | 445,000 | 442 | ||||||
2.750%, 5/19/22 | 485,000 | 489 | ||||||
4.100%, 5/22/23 | 160,000 | 167 | ||||||
4.875%, 11/1/22 | 375,000 | 388 | ||||||
Nasdaq, Inc. | 415,000 | 414 | ||||||
Nationwide Building Society | ||||||||
3.622%, (ICE LIBOR USD 3 Month plus 1.181%), 4/26/23 144A | 615,000 | 620 | ||||||
3.766%, (ICE LIBOR USD 3 Month plus 1.064%), 3/8/24 144A | 260,000 | 268 | ||||||
NatWest Group PLC | 520,000 | 542 | ||||||
NatWest Markets PLC | 390,000 | 384 | ||||||
2.375%, 5/21/23 144A | 640,000 | 652 | ||||||
Park Aerospace Holdings, Ltd. | 525,000 | 542 | ||||||
5.250%, 8/15/22 144A | 375,000 | 383 | ||||||
PNC Bank NA | 325,000 | 328 | ||||||
2.950%, 1/30/23 | 335,000 | 342 | ||||||
Principal Life Global Funding II | 530,000 | 526 | ||||||
Public Storage | 280,000 | 280 | ||||||
QNB Finance, Ltd. | 880,000 | 922 | ||||||
SBA Tower Trust | 280,000 | 276 | ||||||
1.884%, 1/15/26 144A | 160,000 | 160 | ||||||
2.836%, 1/15/50 144A | 440,000 | 451 | ||||||
Simon Property Group LP | 225,000 | 229 | ||||||
3.375%, 10/1/24 | 450,000 | 473 | ||||||
Standard Chartered PLC | ||||||||
0.991%, (US Treasury Yield Curve Rate T Note Constant Maturity 1 Year plus 0.780%), 1/12/25 144A | 220,000 | 218 | ||||||
1.282%, (ICE LIBOR USD 3 Month plus 1.150%), 1/20/23 144A | 435,000 | 435 | ||||||
1.319%, (US Treasury Yield Curve Rate T Note Constant Maturity 1 Year plus 1.170%), 10/14/23 144A | 455,000 | 455 | ||||||
1.822%, (US Treasury Yield Curve Rate T Note Constant Maturity 1 Year plus 0.950%), 11/23/25 144A | 255,000 | 255 | ||||||
3.950%, 1/11/23 144A | 800,000 | 820 | ||||||
State Street Corp. | 160,000 | 161 | ||||||
SunTrust Bank | 480,000 | 484 | ||||||
Svenska Handelsbanken AB | 420,000 | 414 | ||||||
1.418%, (US Treasury Yield Curve Rate T Note Constant Maturity 1 Year plus 0.630%), 6/11/27 144A | 400,000 | 394 | ||||||
| Corporate Bonds (49.2%) | Shares/ Par+ | Value $ (000’s) | ||||||
Financial continued | ||||||||
Swedbank AB | 505,000 | 508 | ||||||
Synchrony Bank | 250,000 | 252 | ||||||
Synchrony Financial | 2,066,000 | 2,087 | ||||||
4.250%, 8/15/24 | 1,130,000 | 1,197 | ||||||
The Toronto-Dominion Bank | 1,015,000 | 1,004 | ||||||
Trininty Acquisition PLC | 200,000 | 210 | ||||||
Truist Financial Corp. | 410,000 | 409 | ||||||
UBS AG | 280,000 | 277 | ||||||
UBS Group AG | ||||||||
1.008%, (US Treasury Yield Curve Rate T Note Constant Maturity 1 Year plus 0.830%), 7/30/24 144A | 620,000 | 618 | ||||||
1.384%, (ICE LIBOR USD 3 Month plus 1.220%), 5/23/23 144A | 415,000 | 417 | ||||||
1.494%, (US Treasury Yield Curve Rate T Note Constant Maturity 1 Year plus 0.850%), 8/10/27 144A | 215,000 | 210 | ||||||
Wells Fargo & Co. | 410,000 | 414 | ||||||
2.188%, (US SOFR plus 2.000%), 4/30/26 | 400,000 | 407 | ||||||
3.500%, 3/8/22 | 56,000 | 56 | ||||||
Western Union Co. | 570,000 | 590 | ||||||
Yongda Investment, Ltd. | 443,000 | 442 | ||||||
|
| |||||||
Total | 69,804 | |||||||
|
| |||||||
Industrial (2.4%) | ||||||||
Amphenol Corp. | 405,000 | 413 | ||||||
Avnet, Inc. | 180,000 | 186 | ||||||
Boral Finance, Ltd. | 345,000 | 349 | ||||||
Canadian Pacific Railway Co. | 725,000 | 726 | ||||||
1.750%, 12/2/26 | 315,000 | 316 | ||||||
Carrier Global Corp. | 835,000 | 855 | ||||||
DAE Funding LLC | 265,000 | 263 | ||||||
Deere & Co. | 195,000 | 204 | ||||||
GATX Corp. | 360,000 | 372 | ||||||
4.350%, 2/15/24 | 547,000 | 580 | ||||||
Guangzhou Metro Investment Finance BVI, Ltd. | 800,000 | 784 | ||||||
Honeywell International, Inc. | 435,000 | 437 | ||||||
Kansas City Southern | 565,000 | 578 | ||||||
The Accompanying Notes are an Integral Part of the Financial Statements.
121
Table of Contents
Short-Term Bond Portfolio
| Corporate Bonds (49.2%) | Shares/ Par+ | Value $ (000’s) | ||||||
Industrial continued | ||||||||
Martin Marietta Materials, Inc. | 475,000 | 473 | ||||||
Otis Worldwide Corp. | 485,000 | 493 | ||||||
Republic Services, Inc. | 375,000 | 386 | ||||||
Roper Technologies, Inc. | 100,000 | 100 | ||||||
1.000%, 9/15/25 | 115,000 | 112 | ||||||
2.350%, 9/15/24 | 165,000 | 169 | ||||||
3.125%, 11/15/22 | 660,000 | 670 | ||||||
3.650%, 9/15/23 | 125,000 | 130 | ||||||
Siemens Financieringsmaatschappij NV | 390,000 | 387 | ||||||
SMBC Aviation Capital Finance DAC | 200,000 | 209 | ||||||
4.125%, 7/15/23 144A | 200,000 | 208 | ||||||
Sydney Airport Finance Co. Pty, Ltd. | 643,000 | 664 | ||||||
|
| |||||||
Total | 10,064 | |||||||
|
| |||||||
Real Estate (0.2%) | ||||||||
SBA Tower Trust | 775,000 | 779 | ||||||
|
| |||||||
Total | 779 | |||||||
|
| |||||||
Technology (2.9%) | ||||||||
Analog Devices, Inc. | 170,000 | 170 | ||||||
2.950%, 4/1/25 | 140,000 | 147 | ||||||
CDW LLC / CDW Finance Corp. | 180,000 | 197 | ||||||
Fidelity National Information Services, Inc. | 650,000 | 647 | ||||||
0.600%, 3/1/24 | 310,000 | 305 | ||||||
Fiserv, Inc. | 800,000 | 828 | ||||||
3.800%, 10/1/23 | 470,000 | 491 | ||||||
Fortinet, Inc. | 380,000 | 368 | ||||||
HCL America, Inc. | 1,000,000 | 973 | ||||||
International Business Machines Corp. | 155,000 | 158 | ||||||
Marvell Technology, Inc. | 590,000 | 613 | ||||||
Microchip Technology, Inc. | 685,000 | 679 | ||||||
0.983%, 9/1/24 144A | 560,000 | 550 | ||||||
2.670%, 9/1/23 | 640,000 | 654 | ||||||
NXP BV / NXP Funding LLC | 1,585,000 | 1,659 | ||||||
4.875%, 3/1/24 144A | 400,000 | 430 | ||||||
NXP BV / NXP Funding LLC / NXP USA, Inc. | 90,000 | 93 | ||||||
Oracle Corp. | 745,000 | 760 | ||||||
2.500%, 4/1/25 b | 1,250,000 | 1,279 | ||||||
Qorvo, Inc. | 275,000 | 275 | ||||||
| Corporate Bonds (49.2%) | Shares/ Par+ | Value $ (000’s) | ||||||
Technology continued | ||||||||
Skyworks Solutions, Inc. | 175,000 | 174 | ||||||
VMware, Inc. | 385,000 | 382 | ||||||
|
| |||||||
Total | 11,832 | |||||||
|
| |||||||
Utilities (3.6%) | ||||||||
AES Corp. | 365,000 | 378 | ||||||
Alexander Funding Trust | 530,000 | 532 | ||||||
APT Pipelines, Ltd. | 930,000 | 995 | ||||||
Edison International | 310,000 | 315 | ||||||
3.125%, 11/15/22 | 290,000 | 295 | ||||||
Enel Finance International NV | 645,000 | 628 | ||||||
2.650%, 9/10/24 144A | 595,000 | 613 | ||||||
FirstEnergy Corp. | 320,000 | 321 | ||||||
Hero Asia Investment, Ltd. | 950,000 | 944 | ||||||
Korea Hydro & Nuclear Power Co., Ltd. | 795,000 | 780 | ||||||
NextEra Energy Capital Holdings, Inc. | 685,000 | 689 | ||||||
NRG Energy, Inc. | 270,000 | 282 | ||||||
Pacific Gas & Electric Co. | 100,000 | 100 | ||||||
1.750%, 6/16/22 b | 3,535,000 | 3,535 | ||||||
3.500%, 6/15/25 | 555,000 | 576 | ||||||
San Diego Gas & Electric Co. | 15,359 | 15 | ||||||
Saudi Electricity Global Sukuk Co. 2 | 800,000 | 825 | ||||||
Sinosing Services Pte, Ltd. | 1,000,000 | 1,004 | ||||||
Southern California Edison Co. | 180,000 | 180 | ||||||
Vistra Operations Co. LLC | 1,985,000 | 2,044 | ||||||
|
| |||||||
Total | 15,051 | |||||||
|
| |||||||
Total Corporate Bonds | ||||||||
(Cost: $201,778) | 202,825 | |||||||
|
| |||||||
| Governments (15.5%) | ||||||||
Governments (15.5%) | ||||||||
US Treasury | 100,000 | 100 | ||||||
0.125%, 4/30/23 b | 21,815,000 | 21,698 | ||||||
0.125%, 5/31/23 b | 2,250,000 | 2,236 | ||||||
0.125%, 6/30/23 b | 8,260,000 | 8,204 | ||||||
0.125%, 7/31/23 b | 3,910,000 | 3,879 | ||||||
0.125%, 8/31/23 b | 4,195,000 | 4,158 | ||||||
0.375%, 10/31/23 b | 14,830,000 | 14,743 | ||||||
0.375%, 8/15/24 | 625,000 | 617 | ||||||
0.500%, 11/30/23 b | 2,070,000 | 2,062 | ||||||
0.750%, 12/31/23 b | 4,125,000 | 4,126 | ||||||
The Accompanying Notes are an Integral Part of the Financial Statements.
122
Table of Contents
Short-Term Bond Portfolio
| Governments (15.5%) | Shares/ Par+ | Value $ (000’s) | ||||||
Governments continued | ||||||||
US Treasury Inflation Index Bond | 1,987,098 | 2,077 | ||||||
|
| |||||||
Total | 63,900 | |||||||
|
| |||||||
Total Governments | ||||||||
(Cost: $64,171) | 63,900 | |||||||
|
| |||||||
| Municipal Bonds (0.8%) | ||||||||
Municipal Bonds (0.8%) | ||||||||
Chicago Transit Authority | 20,000 | 20 | ||||||
1.838%, 12/1/23 RB | 20,000 | 20 | ||||||
2.064%, 12/1/24 RB | 55,000 | 56 | ||||||
City of Houston Texas Airport System Revenue | 40,000 | 40 | ||||||
1.054%, 7/1/23 RB | 65,000 | 65 | ||||||
1.272%, 7/1/24 RB | 215,000 | 216 | ||||||
Dallas/Fort Worth International Airport | 110,000 | 110 | ||||||
Florida State Board of Administration Finance Corp. | 735,000 | 731 | ||||||
Golden State Tobacco Securitization Corp. | 310,000 | 311 | ||||||
1.711%, 6/1/24 RB | 435,000 | 437 | ||||||
Long Island Power Authority | 160,000 | 160 | ||||||
State of Connecticut | 125,000 | 127 | ||||||
2.000%, 7/1/23 GO | 50,000 | 51 | ||||||
2.098%, 7/1/25 GO | 85,000 | 87 | ||||||
State of Illinois | 885,000 | 893 | ||||||
|
| |||||||
Total Municipal Bonds | ||||||||
(Cost: $3,310) | 3,324 | |||||||
|
| |||||||
| Structured Products (33.1%) | ||||||||
Asset Backed Securities (13.6%) | ||||||||
AmeriCredit Automobile Receivables Trust, Series 2017-3, Class C 2.690%, 6/19/23 | 8,633 | 9 | ||||||
AmeriCredit Automobile Receivables Trust, Series 2018-1, Class D 3.820%, 3/18/24 | 790,000 | 808 | ||||||
AmeriCredit Automobile Receivables Trust, Series 2019-3, Class B 2.130%, 7/18/25 | 240,000 | 242 | ||||||
AmeriCredit Automobile Receivables Trust, Series 2020-1, Class C 1.590%, 10/20/25 | 320,000 | 322 | ||||||
AmeriCredit Automobile Receivables Trust, Series 2020-1, Class D 1.800%, 12/18/25 | 315,000 | 318 | ||||||
AmeriCredit Automobile Receivables Trust, Series 2020-3, Class C 1.060%, 8/18/26 | 245,000 | 244 | ||||||
AmeriCredit Automobile Receivables Trust, Series 2021-1, Class C 0.890%, 10/19/26 | 430,000 | 425 | ||||||
AmeriCredit Automobile Receivables Trust, Series 2021-1, Class D 1.210%, 12/18/26 | 270,000 | 266 | ||||||
| Structured Products (33.1%) | Shares/ Par+ | Value $ (000’s) | ||||||
Asset Backed Securities continued | ||||||||
AmeriCredit Automobile Receivables Trust, Series 2021-2, Class D 1.290%, 6/18/27 | 575,000 | 566 | ||||||
Applebee’s Funding LLC / IHOP Funding LLC, Series 2019-1A, Class A2I 4.194%, 6/7/49 144A | 688,050 | 696 | ||||||
Arbor Realty Collateralized Loan Obligation, Ltd., Series 2021-FL4, Class A 1.440%, (ICE LIBOR USD 1 Month plus 1.350%), 11/15/36 144A | 465,000 | 465 | ||||||
Arbor Realty Commercial Real Estate Notes, Series 2021-FL3, Class A 1.180%, (ICE LIBOR USD 1 Month plus 1.070%), 8/15/34 144A | 640,000 | 638 | ||||||
ARI Fleet Lease Trust, Series 2020-A, Class B 2.060%, 11/15/28 144A | 345,000 | 347 | ||||||
Avis Budget Rental Car Funding AESOP LLC, Series 2017-2A, Class A 2.970%, 3/20/24 144A | 425,000 | 434 | ||||||
Avis Budget Rental Car Funding AESOP LLC, Series 2017-2A, Class B 3.330%, 3/20/24 144A | 435,000 | 443 | ||||||
Avis Budget Rental Car Funding AESOP LLC, Series 2018-2A, Class C 4.950%, 3/20/25 144A | 195,000 | 206 | ||||||
Avis Budget Rental Car Funding AESOP LLC, Series 2019-1A, Class B 3.700%, 3/20/23 144A | 60,000 | 60 | ||||||
Avis Budget Rental Car Funding AESOP LLC, Series 2019-2A, Class A 3.350%, 9/22/25 144A | 340,000 | 356 | ||||||
Avis Budget Rental Car Funding AESOP LLC, Series 2020-1A, Class A 2.330%, 8/20/26 144A | 250,000 | 256 | ||||||
Babson CLO, Ltd., Series 2017-IA, Class AR 0.932%, (ICE LIBOR USD 3 Month plus 0.800%), 1/20/28 144A | 582,677 | 582 | ||||||
Bayview Mortgage Fund IVc Trust, Series 2017-RT3, Class A 3.500%, (AFC), 1/28/58 144A | 279,226 | 280 | ||||||
Bayview Opportunity Master Fund IVa Trust, Series 2017-SPL5, Class A 3.500%, (AFC), 6/28/57 144A | 246,026 | 250 | ||||||
Bayview Opportunity Master Fund IVb Trust, Series 2017-SPL4, Class A 3.500%, (AFC), 1/28/55 144A | 84,645 | 86 | ||||||
Blackbird Capital Aircraft, Series 2016-1A, Class A4 2.487%, 12/16/41 144A ∑ | 319,896 | 315 | ||||||
BlueMountain CLO, Series 2015-2, Class A 1.052%, (ICE LIBOR USD 3 Month plus 0.930%), 7/18/27 144A | 228,393 | 228 | ||||||
BRE Grand Islander Timeshare Issuer LLC, Series 2019-A, Class A 3.280%, 9/26/33 144A | 150,396 | 155 | ||||||
Carlyle Global Market Strategies, Series 2015-3A, Class A1R 1.136%, (ICE LIBOR USD 3 Month plus 1.000%), 7/28/28 144A | 306,118 | 306 | ||||||
The Accompanying Notes are an Integral Part of the Financial Statements.
123
Table of Contents
Short-Term Bond Portfolio
| Structured Products (33.1%) | Shares/ Par+ | Value $ (000’s) | ||||||
Asset Backed Securities continued | ||||||||
CarMax Auto Owner Trust, Series 2019-2, Class B 3.010%, 12/16/24 | 455,000 | 467 | ||||||
CarMax Auto Owner Trust, Series 2019-4, Class A4 2.130%, 7/15/25 | 345,000 | 352 | ||||||
CarMax Auto Owner Trust, Series 2020-1, Class B 2.210%, 9/15/25 | 430,000 | 438 | ||||||
CarMax Auto Owner Trust, Series 2020-1, Class C 2.340%, 11/17/25 | 190,000 | 194 | ||||||
CarMax Auto Owner Trust, Series 2020-4, Class D 1.750%, 4/15/27 | 300,000 | 299 | ||||||
Cedar Funding, Ltd., Series 2021-14A, Class A 1.224%, (ICE LIBOR USD 3 Month plus 1.100%), 7/15/33 144A | 695,000 | 693 | ||||||
CIFC Funding, Ltd., Series 2014-2RA, Class A1 1.174%, (ICE LIBOR USD 3 Month plus 1.050%), 4/24/30 144A | 915,000 | 915 | ||||||
CIFC Funding, Ltd., Series 2021-4A, Class A 1.174%, (ICE LIBOR USD 3 Month plus 1.050%), 7/15/33 144A | 905,000 | 903 | ||||||
CNH Equipment Trust, Series 2020-A, Class A4 1.510%, 4/15/27 | 260,000 | 262 | ||||||
Daimler Trucks Retail Trust, Series 2020-1, Class A4 1.370%, 6/15/27 | 855,000 | 861 | ||||||
Drive Auto Receivables Trust, Series 2020-1, Class C 2.360%, 3/16/26 | 380,000 | 383 | ||||||
Drive Auto Receivables Trust, Series 2021-2, Class D 1.390%, 3/15/29 | 445,000 | 436 | ||||||
Dryden Senior Loan Fund, Series 2020-86A, Class AR1 1.222%, (ICE LIBOR USD 3 Month plus 1.100%), 7/17/34 144A | 610,000 | 610 | ||||||
Elara HGV Timeshare Issuer, Series 2017-A, Class A 2.690%, 3/25/30 144A | 52,308 | 53 | ||||||
Elara HGV Timeshare Issuer, Series 2019-A, Class A 2.610%, 1/25/34 144A | 122,219 | 123 | ||||||
Enterprise Fleet Financing LLC, Series 2019-1, Class A2 2.980%, 10/22/24 144A | 29,505 | 30 | ||||||
Enterprise Fleet Financing LLC, Series 2019-3, Class A2 2.060%, 5/20/25 144A | 148,448 | 150 | ||||||
Exeter Automobile Receivables Trust, Series 2021-2A, Class C 0.980%, 6/15/26 | 265,000 | 264 | ||||||
Ford Credit Auto Owner Trust, Series 2020-2, Class C 1.740%, 4/15/33 144A | 310,000 | 306 | ||||||
| Structured Products (33.1%) | Shares/ Par+ | Value $ (000’s) | ||||||
Asset Backed Securities continued | ||||||||
Ford Credit Floorplan Master Owner Trust, Series 2020-1, Class C 1.420%, 9/15/25 | 440,000 | 440 | ||||||
GM Financial Automobile Leasing Trust, Series 2020-2, Class C 2.560%, 7/22/24 | 265,000 | 270 | ||||||
GM Financial Consumer Automobile Receivables Trust, Series 2020-4, Class C 1.050%, 5/18/26 | 225,000 | 223 | �� | |||||
GMF Floorplan Owner Revolving Trust, Series 2019-1, Class A 2.700%, 4/15/24 144A | 355,000 | 357 | ||||||
GS Mortgage Securities Trust, Series 2020-2, Class A3 1.490%, 12/16/24 | 134,355 | 135 | ||||||
Hardee’s Funding LLC, Series 2018-1A, Class A21I 4.959%, 6/20/48 144A | 304,763 | 320 | ||||||
Hilton Grand Vacations Trust, Series 2017-AA, Class A 2.660%, 12/26/28 144A | 528,430 | 536 | ||||||
Hilton Grand Vacations Trust, Series 2017-AA, Class B 2.960%, (EXE), 12/26/28 144A | 115,312 | 117 | ||||||
Hilton Grand Vacations Trust, Series 2020-AA, Class A 2.740%, 2/25/39 144A | 370,298 | 380 | ||||||
Hyundai Auto Lease Securitization Trust, Series 2020-A, Class A3 1.410%, 11/15/24 | 350,000 | 352 | ||||||
Hyundai Auto Receivables Trust, Series 2019-A, Class B 2.940%, 5/15/25 | 325,000 | 332 | ||||||
JPMorgan Chase Bank NA, Series 2021-2, Class D 1.138%, 12/26/28 144A | 352,595 | 351 | ||||||
KKR Financial CLO, Ltd., Series 2013, Class A1R 0.922%, (ICE LIBOR USD 3 Month plus 0.800%), 1/16/28 144A | 397,390 | 397 | ||||||
KKR Financial CLO, Ltd., Series 2029, Class A 1.324%, (ICE LIBOR USD 3 Month plus 1.200%), 1/15/32 144A | 1,000,000 | 1,000 | ||||||
Kubota Credit Owner Trust, Series 2020-1A, Class A3 1.960%, 3/15/24 144A | 183,819 | 185 | ||||||
Madison Park Funding, Ltd., Series 2017-23A, Class AR 1.105%, (ICE LIBOR USD 3 Month plus 0.970%), 7/27/31 144A | 715,000 | 715 | ||||||
Madison Park Funding, Ltd., Series 2017-23A, Class BR 1.685%, (ICE LIBOR USD 3 Month plus 1.550%), 7/27/31 144A | 460,000 | 460 | ||||||
Madison Park Funding, Ltd., Series 2019-37A, Class AR 1.194%, (ICE LIBOR USD 3 Month plus 1.070%), 7/15/33 144A | 450,000 | 450 | ||||||
The Accompanying Notes are an Integral Part of the Financial Statements.
124
Table of Contents
Short-Term Bond Portfolio
| Structured Products (33.1%) | Shares/ Par+ | Value $ (000’s) | ||||||
Asset Backed Securities continued | ||||||||
Magnetite CLO, Ltd., Series 2020-25A, Class A 1.324%, (ICE LIBOR USD 3 Month plus 1.200%), 1/25/32 144A | 405,000 | 405 | ||||||
Magnetite XVI, Ltd., Series 2015-16A, Class AR 0.922%, (ICE LIBOR USD 3 Month plus 0.800%), 1/18/28 144A | 937,718 | 938 | ||||||
MetLife Securitization Trust, Series 2017-1A, Class A 3.000%, (AFC), 4/25/55 144A | 104,530 | 106 | ||||||
MF1, Series 2021-FL7, Class A 1.188%, (ICE LIBOR USD 1 Month plus 1.080%), 10/18/36 144A | 465,000 | 463 | ||||||
Mill City Mortgage Loan Trust, Series 2016-1, Class A1 2.500%, (AFC), 4/25/57 144A | 2,208 | 2 | ||||||
Mill City Mortgage Loan Trust, Series 2017-2, Class A1 2.750%, (AFC), 7/25/59 144A | 108,125 | 109 | ||||||
MVW Owner Trust, Series 2017-1A, Class A 2.420%, 12/20/34 144A | 185,081 | 187 | ||||||
MVW Owner Trust, Series 2017-1A, Class B 2.750%, 12/20/34 144A | 19,482 | 20 | ||||||
MVW Owner Trust, Series 2017-1A, Class C 2.990%, 12/20/34 144A | 21,430 | 22 | ||||||
MVW Owner Trust, Series 2019-2A, Class A 2.440%, 10/20/38 144A | 108,556 | 110 | ||||||
MVW Owner Trust, Series 2020-1A, Class A 1.740%, 10/20/37 144A | 184,679 | 185 | ||||||
MVW Owner Trust, Series 2020-1A, Class B 2.730%, 10/20/37 144A | 252,102 | 255 | ||||||
MVW Owner Trust, Series 2021-1WA, Class C 1.940%, 1/22/41 144A | 157,510 | 155 | ||||||
Navient Private Education Refi Loan Trust, Series 2019-A, Class A2A 3.420%, 1/15/43 144A | 317,202 | 324 | ||||||
Navient Private Education Refi Loan Trust, Series 2019-D, Class A2A 3.010%, 12/15/59 144A | 262,982 | 271 | ||||||
Navient Private Education Refi Loan Trust, Series 2019-EA, Class A2A 2.640%, 5/15/68 144A | 469,542 | 473 | ||||||
Navient Private Education Refi Loan Trust, Series 2020-A, Class A2A 2.460%, 11/15/68 144A | 372,377 | 380 | ||||||
Navient Private Education Refi Loan Trust, Series 2020-CA, Class A2A 2.150%, 11/15/68 144A | 1,205,000 | 1,215 | ||||||
Navient Private Education Refi Loan Trust, Series 2020-DA, Class A 1.690%, 5/15/69 144A | 273,897 | 274 | ||||||
Navient Private Education Refi Loan Trust, Series 2020-GA, Class A 1.170%, 9/16/69 144A | 172,604 | 172 | ||||||
Navient Student Loan Trust, Series 2019-GA, Class A 2.400%, 10/15/68 144A | 633,101 | 642 | ||||||
Navient Student Loan Trust, Series 2020-HA, Class A 1.310%, 1/15/69 144A | 97,806 | 97 | ||||||
| Structured Products (33.1%) | Shares/ Par+ | Value $ (000’s) | ||||||
Asset Backed Securities continued | ||||||||
Navient Student Loan Trust, Series 2021-BA, Class A 0.940%, 7/15/69 144A | 461,747 | 457 | ||||||
Navient Student Loan Trust, Series 2021-EA, Class A 0.970%, 12/16/69 144A | 264,856 | 260 | ||||||
Navistar Financial Dealer Note Master Trust, Series 2020-1, Class A 1.052%, (ICE LIBOR USD 1 Month plus 0.950%), 7/25/25 144A | 395,000 | 396 | ||||||
Nelnet Student Loan Trust, Series 2020-1A, Class A 0.843%, (ICE LIBOR USD 1 Month plus 0.740%), 3/26/68 144A | 148,387 | 149 | ||||||
Nelnet Student Loan Trust, Series 2021-CA, Class AFX 1.320%, 4/20/62 144A | 970,931 | 956 | ||||||
Nelnet Student Loan Trust, Series 2021-DA, Class AFX 1.630%, 4/20/62 144A | 330,350 | 328 | ||||||
Neuberger Berman CLO, Ltd., Series 2017-26A, Class BR 1.545%, (ICE LIBOR USD 3 Month plus 1.400%), 10/18/30 144A | 500,000 | 498 | ||||||
Neuberger Berman CLO, Ltd., Series 2019-32A, Class AR 1.114%, (ICE LIBOR USD 3 Month plus 0.990%), 1/20/32 144A | 955,000 | 955 | ||||||
Neuberger Berman CLO, Ltd., Series 2021-40A, Class A 1.182%, (ICE LIBOR USD 3 Month plus 1.060%), 4/16/33 144A | 270,000 | 270 | ||||||
Nissan Auto Lease Trust, Series 2020-A, Class A3 1.380%, 12/16/24 | 184,880 | 186 | ||||||
Nissan Master Owner Trust Receivables, Series 2019-A, Class A 0.670%, (ICE LIBOR USD 1 Month plus 0.560%), 2/15/24 | 650,000 | 650 | ||||||
OCP CLO, Ltd., Series 2017-13A, Class A2R 1.674%, (ICE LIBOR USD 3 Month plus 1.550%), 7/15/30 144A | 760,000 | 758 | ||||||
Octane Receivables Trust, Series 2021-2A, Class A 1.210%, 9/20/28 144A | 407,215 | 405 | ||||||
Palmer Square CLO, Ltd., Series 2020-3A, Class A1AR 1.291%, (ICE LIBOR USD 3 Month plus 1.080%), 11/15/31 144A | 635,000 | 634 | ||||||
Planet Fitness Master Issuer LLC, Series 2018-A1, Class A2II 4.666%, 9/5/48 144A | 822,375 | 840 | ||||||
Santander Bank NA, Series 2021-1A, Class B 1.833%, 12/15/31 144A | 250,000 | 250 | ||||||
Santander Consumer Auto Receivables Trust, Series 2021-AA, Class D 1.570%, 1/15/27 144A | 450,000 | 445 | ||||||
Santander Drive Auto Receivables Trust, Series 2019-1, Class C 3.420%, 4/15/25 | 14,653 | 15 | ||||||
The Accompanying Notes are an Integral Part of the Financial Statements.
125
Table of Contents
Short-Term Bond Portfolio
| Structured Products (33.1%) | Shares/ Par+ | Value $ (000’s) | ||||||
Asset Backed Securities continued | ||||||||
Santander Drive Auto Receivables Trust, Series 2019-C, Class A3 1.860%, 2/21/23 144A | 165,918 | 166 | ||||||
Santander Drive Auto Receivables Trust, Series 2019-C, Class B 2.170%, 11/20/23 144A | 215,000 | 217 | ||||||
Santander Drive Auto Receivables Trust, Series 2019-C, Class C 2.390%, 11/20/23 144A | 360,000 | 364 | ||||||
Santander Drive Auto Receivables Trust, Series 2019-C, Class D 2.880%, 6/20/24 144A | 425,000 | 431 | ||||||
Santander Drive Auto Receivables Trust, Series 2020-3, Class B 0.690%, 3/17/25 | 650,000 | 650 | ||||||
Santander Drive Auto Receivables Trust, Series 2020-4, Class C 1.010%, 1/15/26 | 400,000 | 401 | ||||||
Santander Drive Auto Receivables Trust, Series 2020-BA, Class C 1.290%, 4/15/26 144A | 650,000 | 651 | ||||||
Santander Drive Auto Receivables Trust, Series 2021-3, Class D 1.330%, 9/15/27 | 560,000 | 553 | ||||||
Santander Drive Auto Receivables Trust, Series 2021-4, Class D 1.670%, 10/15/27 | 450,000 | 447 | ||||||
Santander Retail Auto Lease Trust, Series 2019-A, Class C 3.300%, 5/22/23 144A | 284,849 | 285 | ||||||
Santander Retail Auto Lease Trust, Series 2019-B, Class C 2.770%, 8/21/23 144A | 305,000 | 308 | ||||||
Santander Retail Auto Lease Trust, Series 2020-A, Class D 2.520%, 11/20/24 144A | 320,000 | 323 | ||||||
Santander Retail Auto Lease Trust, Series 2021-A, Class C 1.140%, 3/20/26 144A | 1,030,000 | 1,017 | ||||||
Santander Retail Auto Lease Trust, Series 2021-B, Class D 1.410%, 11/20/25 144A | 440,000 | 436 | ||||||
Santander Retail Auto Lease Trust, Series 2021-C, Class C 1.110%, 3/20/26 144A | 365,000 | 360 | ||||||
Sierra Receivables Funding Co. LLC, Series 2017-1A, Class A 2.910%, 3/20/34 144A | 115,753 | 116 | ||||||
Sierra Receivables Funding Co. LLC, Series 2019-1A, Class A 3.200%, 1/20/36 144A | 73,602 | 75 | ||||||
Sierra Receivables Funding Co. LLC, Series 2019-2, Class A 2.590%, 5/20/36 144A | 241,502 | 244 | ||||||
Sierra Receivables Funding Co. LLC, Series 2019-3, Class A 2.340%, 7/15/38 144A | 602,079 | 606 | ||||||
Sierra Receivables Funding Co. LLC, Series 2020-2A, Class C 3.510%, 7/20/37 144A | 138,865 | 141 | ||||||
| Structured Products (33.1%) | Shares/ Par+ | Value $ (000’s) | ||||||
Asset Backed Securities continued | ||||||||
SMB Private Education Loan Trust, Series 2014-A, Class A3 1.610%, (ICE LIBOR USD 1 Month plus 1.500%), 4/15/32 144A | 555,682 | 561 | ||||||
SMB Private Education Loan Trust, Series 2015-A, Class A2B 1.110%, (ICE LIBOR USD 1 Month plus 1.000%), 6/15/27 144A | 3,715 | 4 | ||||||
SMB Private Education Loan Trust, Series 2016-C, Class A2B 1.210%, (ICE LIBOR USD 1 Month plus 1.100%), 9/15/34 144A | 298,228 | 301 | ||||||
SMB Private Education Loan Trust, Series 2018-B, Class A2A 3.600%, 1/15/37 144A | 178,601 | 186 | ||||||
SMB Private Education Loan Trust, Series 2018-B, Class A2B 0.830%, (ICE LIBOR USD 1 Month plus 0.720%), 1/15/37 144A | 427,367 | 429 | ||||||
SMB Private Education Loan Trust, Series 2020-BA, Class A1A 1.290%, 7/15/53 144A | 174,977 | 173 | ||||||
SMB Private Education Loan Trust, Series 2021-BA, Class 144A 1.310%, 7/17/51 144A | 869,966 | 863 | ||||||
SMB Private Education Loan Trust, Series 2020-PTB, Class A2A 1.600%, 9/15/54 144A | 1,293,853 | 1,275 | ||||||
Symphony CLO I, Ltd., Series 2021-1A, Class B 1.579%, (ICE LIBOR USD 3 Month plus 1.450%), 10/25/29 144A | 815,000 | 814 | ||||||
Symphony CLO XXIII, Ltd., Series 2021-23A, Class AR 1.195%, (ICE LIBOR USD 3 Month plus 1.020%), 1/15/34 144A | 1,045,000 | 1,044 | ||||||
Symphony CLO XXVI, Ltd., Series 2021-26A, Class AR 1.212%, (ICE LIBOR USD 3 Month plus 1.080%), 4/20/33 144A | 285,000 | 285 | ||||||
Towd Point Mortgage Trust, Series 2015-1, Class A1 3.000%, (AFC), 1/28/58 144A | 89,288 | 90 | ||||||
Towd Point Mortgage Trust, Series 2016-1, Class A3B 3.000%, (AFC), 2/25/55 144A | 20,076 | 20 | ||||||
Towd Point Mortgage Trust, Series 2016-2, Class A1A 2.750%, (AFC), 8/25/55 144A | 9,476 | 10 | ||||||
Towd Point Mortgage Trust, Series 2016-3, Class A1 2.250%, (AFC), 4/25/56 144A | 3,212 | 3 | ||||||
Towd Point Mortgage Trust, Series 2017-1, Class A1 2.750%, (AFC), 10/25/56 144A | 91,299 | 92 | ||||||
Towd Point Mortgage Trust, Series 2017-2, Class A1 2.750%, (AFC), 4/25/57 144A | 58,695 | 59 | ||||||
Towd Point Mortgage Trust, Series 2017-3, Class A1 2.750%, (AFC), 7/25/57 144A | 158,698 | 160 | ||||||
The Accompanying Notes are an Integral Part of the Financial Statements.
126
Table of Contents
Short-Term Bond Portfolio
| Structured Products (33.1%) | Shares/ Par+ | Value $ (000’s) | ||||||
Asset Backed Securities continued | ||||||||
Towd Point Mortgage Trust, Series 2017-4, Class A1 2.750%, (AFC), 6/25/57 144A | 107,121 | 109 | ||||||
Towd Point Mortgage Trust, Series 2017-6, Class A1 2.750%, (AFC), 10/25/57 144A | 388,386 | 393 | ||||||
Towd Point Mortgage Trust, Series 2018-2, Class A1 3.250%, (AFC), 3/25/58 144A | 538,118 | 549 | ||||||
Towd Point Mortgage Trust, Series 2018-5, Class A1A 3.250%, (AFC), 8/25/58 144A | 336,511 | 342 | ||||||
World Omni Auto Receivables Trust, Series 2019-C, Class C 2.400%, 6/15/26 | 380,000 | 386 | ||||||
World Omni Auto Receivables Trust, Series 2020-A, Class C 1.640%, 8/17/26 | 225,000 | 226 | ||||||
World Omni Select Auto Trust, Series 2020-A, Class B 0.840%, 6/15/26 | 270,000 | 270 | ||||||
World Omni Select Auto Trust, Series 2020-A, Class C 1.250%, 10/15/26 | 310,000 | 310 | ||||||
|
| |||||||
Total | 56,064 | |||||||
|
| |||||||
Mortgage Securities (19.5%) | ||||||||
Angel Oak Mortgage Trust LLC, Series 2019-4, Class A 3.301%, (AFC), 7/26/49 144A | 103,908 | 104 | ||||||
Angel Oak Mortgage Trust LLC, Series 2019-2, Class A1 3.628%, (AFC), 3/25/49 144A | 63,132 | 63 | ||||||
Angel Oak Mortgage Trust LLC, Series 2019-2, Class M1 4.065%, (AFC), 3/25/49 144A | 270,000 | 271 | ||||||
Angel Oak Mortgage Trust LLC, Series 2020-3, Class A1 1.691%, (AFC), 4/25/65 144A | 267,927 | 269 | ||||||
Angel Oak Mortgage Trust LLC, Series 2020-3, Class A3 2.872%, (AFC), 4/25/65 144A | 99,973 | 101 | ||||||
Angel Oak Mortgage Trust LLC, Series 2020-5, Class A2 1.579%, (AFC), 5/25/65 144A | 149,974 | 150 | ||||||
Angel Oak Mortgage Trust LLC, Series 2020-6, Class A1 1.261%, (AFC), 5/25/65 144A | 194,160 | 194 | ||||||
Angel Oak Mortgage Trust LLC, Series 2021-1, Class A1 0.909%, (AFC), 1/25/66 144A | 513,217 | 510 | ||||||
Angel Oak Mortgage Trust LLC, Series 2021-1, Class A2 1.115%, (AFC), 1/25/66 144A | 150,143 | 149 | ||||||
Angel Oak Mortgage Trust LLC, Series 2021-2, Class A1 0.985%, (AFC), 4/25/66 144A | 433,655 | 429 | ||||||
Angel Oak Mortgage Trust LLC, Series 2021-2, Class A2 1.190%, (AFC), 4/25/66 144A | 136,768 | 135 | ||||||
| Structured Products (33.1%) | Shares/ Par+ | Value $ (000’s) | ||||||
Mortgage Securities continued | ||||||||
Angel Oak Mortgage Trust LLC, Series 2021-3, Class A1 1.068%, (AFC), 5/25/66 144A | 318,600 | 316 | ||||||
Atrium Hotel Portfolio Trust, Series 2017-ATRM, Class A 1.040%, (ICE LIBOR USD 1 Month plus 0.930%), 12/15/36 144A | 520,000 | 519 | ||||||
Austin Fairmont Hotel Trust, Series 2019-FAIR, Class A 1.160%, (ICE LIBOR USD 1 Month plus 1.050%), 9/15/32 144A | 545,000 | 545 | ||||||
BAMLL Commercial Mortgage Securities Trust, Series 2018-DSNY, Class A 0.960%, (ICE LIBOR USD 1 Month plus 0.850%), 9/15/34 144A | 460,000 | 459 | ||||||
BAMLL Commercial Mortgage Securities Trust, Series 2021-JACX, Class C 2.110%, (ICE LIBOR USD 1 Month plus 2.000%), 9/15/38 144A | 435,000 | 434 | ||||||
Banc of America Commercial Mortgage Trust, Series 2017-BNK3, Class A1 1.957%, 2/15/50 | 6,559 | 7 | ||||||
BANK, Series 2019-BNK24, Class A1 2.056%, 11/15/62 | 163,479 | 165 | ||||||
Barclays Mortgage Loan Trust, Series 2021-NQM1, Class A1 1.747%, (AFC), 9/25/51 144A | 783,104 | 780 | ||||||
Bayview MSR Opportunity Master Fund Trust, Series 2021-5, Class A5 2.500%, (AFC), 11/25/51 144A | 407,553 | 412 | ||||||
Bayview MSR Opportunity Master Fund Trust, Series 2021-INV2, Class A5 2.500%, (AFC), 6/25/51 144A | 552,917 | 559 | ||||||
BCP Trust, Series 2021-330N, Class A 0.909%, (ICE LIBOR USD 1 Month plus 0.799%), 6/15/38 144A | 290,000 | 287 | ||||||
BINOM Securitization Trust, Series 2021-INV1, Class A3 2.625%, (AFC), 6/25/56 144A | 265,000 | 265 | ||||||
BPR Trust, Series 2021-TY, Class B 1.260%, (ICE LIBOR USD 1 Month plus 1.150%), 9/25/38 144A | 450,000 | 449 | ||||||
BRAVO Residential Funding Trust, Series 2021-NQM3, Class A1 1.699%, (AFC), 4/26/60 144A | 517,344 | 515 | ||||||
BSREP Commercial Mortgage Trust, Series 2021-DC, Class D 2.010%, (ICE LIBOR USD 1 Month plus 1.900%), 8/15/38 144A | 200,000 | 199 | ||||||
BX Commercial Mortgage Trust, Series 2019-XL, Class A 1.030%, (ICE LIBOR USD 1 Month plus 0.920%), 10/15/36 144A | 283,641 | 284 | ||||||
BX Commercial Mortgage Trust, Series 2020-BXLP, Class C 1.230%, (ICE LIBOR USD 1 Month plus 1.120%), 12/15/36 144A | 300,615 | 300 | ||||||
BX Commercial Mortgage Trust, Series 2020-BXLP, Class D 1.360%, (ICE LIBOR USD 1 Month plus 1.250%), 12/15/36 144A | 288,089 | 287 | ||||||
The Accompanying Notes are an Integral Part of the Financial Statements.
127
Table of Contents
Short-Term Bond Portfolio
| Structured Products (33.1%) | Shares/ Par+ | Value $ (000’s) | ||||||
Mortgage Securities continued | ||||||||
BX Trust, Series 2018-GW, Class A 0.910%, (ICE LIBOR USD 1 Month plus 0.800%), 5/15/35 144A | 1,095,000 | 1,093 | ||||||
BX Trust, Series 2019-XL, Class B 1.190%, (ICE LIBOR USD 1 Month plus 1.080%), 10/15/36 144A | 318,750 | 318 | ||||||
BX Trust, Series 2021-ARIA, Class C 1.756%, (ICE LIBOR USD 1 Month plus 1.646%), 10/15/36 144A | 330,000 | 329 | ||||||
BX Trust, Series 2021-SOAR, Class D 1.510%, (ICE LIBOR USD 1 Month plus 1.400%), 6/15/38 144A | 375,000 | 373 | ||||||
BX Trust, Series 2021-VIEW, Class A 1.390%, (ICE LIBOR USD 1 Month plus 1.280%), 6/15/23 144A | 255,000 | 255 | ||||||
CGDB Commercial Mortgage Trust, Series 2019-MOB, Class D 1.760%, (ICE LIBOR USD 1 Month plus 1.650%), 11/15/36 144A | 660,000 | 653 | ||||||
CIM Trust, Series 2020-INV1, Class A2 2.500%, (AFC), 4/25/50 144A | 358,621 | 361 | ||||||
Citigroup Commercial Mortgage Trust, Series 2013-375P, Class B 3.518%, (CSTR), 5/10/35 144A | 435,000 | 443 | ||||||
Citigroup Commercial Mortgage Trust, Series 2013-375P, Class C 3.518%, (CSTR), 5/10/35 144A | 255,000 | 257 | ||||||
Citigroup Mortgage Loan Trust, Series 2019-IMC1, Class A1 2.720%, (AFC), 7/25/49 144A | 92,961 | 93 | ||||||
Citigroup Mortgage Loan Trust, Series 2020-EXP2, Class A3 2.500%, 8/25/50 144A | 388,354 | 391 | ||||||
Citigroup Mortgage Loan Trust, Series 2020-EXP2, Class A4 2.500%, (AFC), 8/25/50 144A | 539,380 | 539 | ||||||
Cold Storage Trust, Series 2020-ICE5, Class B 1.410%, (ICE LIBOR USD 1 Month plus 1.300%), 11/15/37 144A | 953,501 | 952 | ||||||
COLT Funding LLC, Series 2020-3, Class A1 1.506%, (AFC), 4/27/65 144A | 69,644 | 70 | ||||||
COLT Funding LLC, Series 2021-3, Class A3 1.419%, (AFC), 9/27/66 144A | 259,962 | 256 | ||||||
COLT Mortgage Loan Trust, Series 2021-1, Class A2 1.167%, (AFC), 6/25/66 144A | 364,492 | 359 | ||||||
COMM Mortgage Trust, Series 2013-300P, Class A1 4.353%, 8/10/30 144A | 275,000 | 285 | ||||||
COMM Mortgage Trust, Series 2020-CBM, Class D 3.633%, (CSTR), 11/13/39 144A | 235,000 | 232 | ||||||
Commercial Mortgage Pass Through Certificates, Series 2014-CR15, Class B 4.641%, (CSTR), 2/10/47 | 435,000 | 459 | ||||||
Commercial Mortgage Pass Through Certificates, Series 2014-CR19, Class AM 4.080%, 8/10/47 | 495,000 | 522 | ||||||
Commercial Mortgage Pass Through Certificates, Series 2014-CR19, Class D 4.703%, (CSTR), 8/10/47 144A | 185,000 | 182 | ||||||
| Structured Products (33.1%) | Shares/ Par+ | Value $ (000’s) | ||||||
Mortgage Securities continued | ||||||||
Commercial Mortgage Pass Through Certificates, Series 2014-UBS2, Class B 4.701%, 3/10/47 | 480,000 | 504 | ||||||
Commercial Mortgage Pass Through Certificates, Series 2014-UBS5, Class A4 3.838%, 9/10/47 | 630,000 | 665 | ||||||
Commercial Mortgage Pass Through Certificates, Series 2015-CR22, Class B 3.926%, (AFC), 3/10/48 | 235,000 | 246 | ||||||
Commercial Mortgage Pass Through Certificates, Series 2015-CR22, Class C 4.106%, (CSTR), 3/10/48 | 440,000 | 456 | ||||||
Commercial Mortgage Pass Through Certificates, Series 2015-LC23, Class A2 3.221%, 10/10/48 | 357,213 | 360 | ||||||
Commercial Mortgage Pass Through Certificates, Series 2017-COR2, Class A1 2.111%, 9/10/50 | 38,584 | 39 | ||||||
Credit Suisse Mortgage Capital Certificates, Series 2019-ICE4, Class C 1.540%, (ICE LIBOR USD 1 Month plus 1.430%), 5/15/36 144A | 515,000 | 513 | ||||||
Credit Suisse Mortgage Capital Certificates, Series 2019-ICE4, Class D 1.710%, (ICE LIBOR USD 1 Month plus 1.600%), 5/15/36 144A | 405,000 | 403 | ||||||
Credit Suisse Mortgage Capital Certificates, Series 2020-NET, Class A 2.256%, 8/15/37 144A | 205,000 | 207 | ||||||
Credit Suisse Mortgage Capital Certificates, Series 2020-NET, Class D 3.704%, (CSTR), 8/15/37 144A | 445,000 | 453 | ||||||
CSAIL Commercial Mortgage Trust, Series 2015-C3, Class A4 3.718%, 8/15/48 | 305,000 | 324 | ||||||
CSAIL Commercial Mortgage Trust, Series 2017-CX9, Class A1 2.024%, 9/15/50 | 8,262 | 8 | ||||||
CSAIL Commerical Mortgage Trust, Series 2019-C16, Class A1 2.360%, 6/15/52 | 172,016 | 174 | ||||||
Deephaven Residential Mortgage Trust, Series 2021-1A, Class A3 1.128%, (AFC), 5/25/65 144A | 156,805 | 156 | ||||||
Deephaven Residential Mortgage Trust, Series 2021-2, Class A1 0.899%, (AFC), 4/25/66 144A | 171,600 | 169 | ||||||
Deephaven Residential Mortgage Trust, Series 2021-2, Class A3 1.260%, (AFC), 4/25/66 144A | 192,527 | 189 | ||||||
Eagle RE, Ltd., Series 2021-2, Class M1A 1.599%, (US 30 Day Average SOFR plus 1.550%), 4/25/34 144A | 255,000 | 255 | ||||||
Ellington Financial Mortgage Trust, Series 2019-2, Class A3 3.046%, (AFC), 11/25/59 144A | 90,104 | 91 | ||||||
Ellington Financial Mortgage Trust, Series 2020-1, Class A1 2.006%, (AFC), 6/25/65 144A | 233,607 | 234 | ||||||
The Accompanying Notes are an Integral Part of the Financial Statements.
128
Table of Contents
Short-Term Bond Portfolio
| Structured Products (33.1%) | Shares/ Par+ | Value $ (000’s) | ||||||
Mortgage Securities continued | ||||||||
Ellington Financial Mortgage Trust, Series 2021-1, Class A1 0.797%, (AFC), 2/25/66 144A | 117,374 | 116 | ||||||
Ellington Financial Mortgage Trust, Series 2021-1, Class A3 1.106%, (AFC), 2/25/66 144A | 97,334 | 96 | ||||||
Ellington Financial Mortgage Trust, Series 2021-2, Class A1 0.931%, (AFC), 6/25/66 144A | 703,966 | 691 | ||||||
Ellington Financial Mortgage Trust, Series 2021-2, Class A3 1.291%, (AFC), 6/25/66 144A | 207,990 | 204 | ||||||
Ellington Financial Mortgage Trust, Series 2021-3, Class A1 1.241%, (AFC), 9/25/66 144A | 274,417 | 270 | ||||||
Ellington Financial Mortgage Trust, Series 2021-3, Class A3 1.550%, (AFC), 9/25/66 144A | 205,270 | 201 | ||||||
Extended Stay America Trust, Series 2021-ESH, Class C 1.810%, (ICE LIBOR USD 1 Month plus 1.700%), 7/15/38 144A | 477,516 | 478 | ||||||
Federal Home Loan Bank | 433,508 | 445 | ||||||
4.000%, 12/1/49 | 114,350 | 123 | ||||||
4.500%, 5/1/50 | 83,684 | 90 | ||||||
Federal Home Loan Mortgage Corp. | 766,649 | 787 | ||||||
3.000%, 11/1/34 | 48,110 | 51 | ||||||
3.500%, 3/1/46 | 41,801 | 45 | ||||||
3.500%, 12/1/47 | 385,039 | 408 | ||||||
5.000%, 12/1/41 | 159,637 | 175 | ||||||
5.500%, 5/1/22 | 672 | 1 | ||||||
6.000%, 9/1/34 | 1,258 | 1 | ||||||
6.000%, 2/1/35 | 27,529 | 31 | ||||||
6.000%, 9/1/35 | 8,549 | 10 | ||||||
7.000%, 3/1/39 | 55,986 | 63 | ||||||
7.500%, 6/1/38 | 53,300 | 60 | ||||||
Federal Home Loan Mortgage Corp., Series 2014-DNA3, Class M1 4.103%, (ICE LIBOR USD 1 Month plus 4.000%), 8/25/24 | 82,195 | 84 | ||||||
Federal Home Loan Mortgage Corp., Series 2016-DNA2, Class M3 4.753%, (ICE LIBOR USD 1 Month plus 4.650%), 10/25/28 | 257,949 | 267 | ||||||
Federal Home Loan Mortgage Corp., Series 2016-DNA3, Class M3 4.803%, (ICE LIBOR USD 1 Month plus 4.700%), 4/25/28 | 292,680 | 302 | ||||||
Federal Home Loan Mortgage Corp., Series 2017-DNA2, Class M1 1.303%, (ICE LIBOR USD 1 Month plus 1.200%), 10/25/29 | 36,044 | 36 | ||||||
Federal Home Loan Mortgage Corp., Series 2017-SC02, Class M1 3.849%, (CSTR), 5/25/47 144A | 31,183 | 31 | ||||||
Federal Home Loan Mortgage Corp., Series 2018-DNA2, Class M1 0.903%, (ICE LIBOR USD 1 Month plus 0.800%), 12/25/30 144A | 108,869 | 109 | ||||||
| Structured Products (33.1%) | Shares/ Par+ | Value $ (000’s) | ||||||
Mortgage Securities continued | ||||||||
Federal Home Loan Mortgage Corp., Series 2018-HQA2, Class M1 0.853%, (ICE LIBOR USD 1 Month plus 0.750%), 10/25/48 144A | 30,677 | 31 | ||||||
Federal Home Loan Mortgage Corp., Series 3713, Class PA 2.000%, 2/15/40 | 112,897 | 114 | ||||||
Federal Home Loan Mortgage Corp., Series 4092, Class CL 1.250%, 6/15/27 | 353,147 | 355 | ||||||
Federal National Mortgage Association | 30,258 | 31 | ||||||
2.500%, 12/1/22 | 9,222 | 10 | ||||||
3.000%, 6/1/22 | 3,789 | 4 | ||||||
3.000%, 4/1/24 | 54,958 | 57 | ||||||
3.000%, 9/1/28 | 233,112 | 245 | ||||||
3.000%, 12/1/34 | 111,161 | 118 | ||||||
3.000%, 3/1/35 | 46,087 | 49 | ||||||
3.500%, 5/1/27 | 250,961 | 265 | ||||||
3.500%, 4/1/46 | 253,555 | 271 | ||||||
3.500%, 2/1/48 | 460,394 | 488 | ||||||
4.000%, 1/1/47 | 75,884 | 81 | ||||||
4.000%, 2/1/49 | 17,278 | 18 | ||||||
4.000%, 11/1/49 | 47,173 | 50 | ||||||
4.000%, 12/1/49 | 19,121 | 20 | ||||||
4.500%, 5/1/40 | 56,586 | 62 | ||||||
4.500%, 9/1/40 | 50,050 | 55 | ||||||
4.500%, 5/1/41 | 99,050 | 110 | ||||||
4.500%, 8/1/48 | 33,465 | 36 | ||||||
4.500%, 9/1/48 | 32,320 | 35 | ||||||
4.500%, 10/1/48 | 206,392 | 223 | ||||||
4.500%, 11/1/48 | 49,288 | 53 | ||||||
4.500%, 12/1/48 | 248,514 | 266 | ||||||
4.500%, 5/1/49 | 131,811 | 143 | ||||||
4.500%, 1/1/50 | 24,695 | 26 | ||||||
5.000%, 10/1/33 | 88,081 | 99 | ||||||
5.000%, 6/1/40 | 48,548 | 55 | ||||||
5.000%, 7/1/45 | 75,720 | 85 | ||||||
5.000%, 9/1/48 | 78,756 | 86 | ||||||
5.000%, 2/1/49 | 43,202 | 47 | ||||||
5.000%, 8/1/49 | 31,526 | 34 | ||||||
5.500%, 8/1/37 | 51,067 | 58 | ||||||
5.500%, 2/1/38 | 190,662 | 216 | ||||||
6.000%, 8/1/22 | 1,750 | 2 | ||||||
6.000%, 3/1/34 | 44,761 | 51 | ||||||
6.000%, 8/1/34 | 121,674 | 137 | ||||||
6.000%, 11/1/34 | 4,481 | 5 | ||||||
6.000%, 12/1/34 | 1,615 | 2 | ||||||
6.000%, 4/1/35 | 2,840 | 3 | ||||||
6.000%, 5/1/38 | 1,919 | 2 | ||||||
6.000%, 10/1/40 | 94,538 | 110 | ||||||
6.000%, 2/1/49 | 406,339 | 476 | ||||||
6.500%, 7/1/32 | 14,399 | 16 | ||||||
6.500%, 12/1/32 | 14,214 | 16 | ||||||
Federal National Mortgage Association, Series 2011-113, Class AG 2.500%, 11/25/26 | 63,166 | 64 | ||||||
Federal National Mortgage Association, Series 2013-74, Class AD 2.000%, 7/25/23 | 24,081 | 24 | ||||||
The Accompanying Notes are an Integral Part of the Financial Statements.
129
Table of Contents
Short-Term Bond Portfolio
| Structured Products (33.1%) | Shares/ Par+ | Value $ (000’s) | ||||||
Mortgage Securities continued | ||||||||
Federal National Mortgage Association, Series 2017-90, Class KA 3.000%, 11/25/47 | 244,374 | 255 | ||||||
Federal National Mortgage Association, Series 2017-C02, Class 2ED3 1.453%, (ICE LIBOR USD 1 Month plus 1.350%), 9/25/29 | 14,717 | 15 | ||||||
Federal National Mortgage Association, Series 2017-C04, Class 2ED2 1.203%, (ICE LIBOR USD 1 Month plus 1.100%), 11/25/29 | 574,541 | 575 | ||||||
Federal National Mortgage Association, Series 2017-C05, Class 1ED3 1.303%, (ICE LIBOR USD 1 Month plus 1.200%), 1/25/30 | 239,139 | 239 | ||||||
Federal National Mortgage Association, Series 2018-C01, Class 1ED2 0.953%, (ICE LIBOR USD 1 Month plus 0.850%), 7/25/30 | 386,345 | 386 | ||||||
Federal National Mortgage Association, Series 2018-C03, Class 1EB2 0.953%, (ICE LIBOR USD 1 Month plus 0.850%), 10/25/30 | 660,000 | 657 | ||||||
Flagstar Mortgage Trust, Series 2020-1INV, Class A11 0.952%, (ICE LIBOR USD 1 Month plus 0.850%), 3/25/50 144A | 141,966 | 142 | ||||||
Fontainebleau Miami Beach Trust, Series 2019-FBLU, Class B 3.447%, 12/10/36 144A | 605,000 | 617 | ||||||
FWD Securitization Trust, Series 2020-INV1, Class A-1 2.240%, (AFC), 1/25/50 144A | 353,745 | 356 | ||||||
Galton Funding Mortgage Trust, Series 2018-1, Class A33 3.500%, (AFC), 11/25/57 144A | 50,600 | 51 | ||||||
Galton Funding Mortgage Trust, Series 2019-1, Class A21 4.500%, (AFC), 2/25/59 144A | 77,969 | 79 | ||||||
Galton Funding Mortgage Trust, Series 2019-1, Class A32 4.000%, (AFC), 2/25/59 144A | 33,921 | 34 | ||||||
Galton Funding Mortgage Trust, Series 2019-H1, Class M1 3.339%, (AFC), 10/25/59 144A | 260,000 | 259 | ||||||
Galton Funding Mortgage Trust, Series 2020-H1, Class A1 2.310%, (AFC), 1/25/60 144A | 39,060 | 39 | ||||||
Galton Funding Mortgage Trust, Series 2020-H1, Class M1 2.832%, (AFC), 1/25/60 144A | 285,000 | 283 | ||||||
GCT LLC, Series 2021-GCT, Class A 0.910%, (ICE LIBOR USD 1 Month plus 0.800%), 2/15/38 144A | 335,000 | 335 | ||||||
Government National Mortgage Association | 4,052 | 4 | ||||||
3.500%, 9/20/43 | 54,752 | 59 | ||||||
3.500%, 8/20/44 | 109,146 | 116 | ||||||
3.500%, 10/20/46 | 747 | 1 | ||||||
3.500%, 11/20/46 | 45,421 | 48 | ||||||
| Structured Products (33.1%) | Shares/ Par+ | Value $ (000’s) | ||||||
Mortgage Securities continued | ||||||||
3.500%, 1/20/47 | 48,862 | 51 | ||||||
3.500%, 8/20/51 | 1,001,250 | 1,045 | ||||||
3.500%, 1/21/52 b | 1,274,000 | 1,327 | ||||||
4.000%, 3/20/48 | 91,393 | 99 | ||||||
4.000%, 4/20/50 | 313,223 | 339 | ||||||
4.000%, 10/20/50 | 224,743 | 237 | ||||||
4.500%, 7/20/41 | 228,043 | 252 | ||||||
5.000%, 3/20/34 | 249,808 | 276 | ||||||
5.000%, 1/20/48 | 43,854 | 48 | ||||||
5.000%, 2/20/48 | 211,957 | 230 | ||||||
5.500%, 6/20/37 | 52,504 | 61 | ||||||
5.500%, 9/15/45 | 164,814 | 192 | ||||||
5.500%, 3/20/48 | 32,447 | 36 | ||||||
5.500%, 12/20/48 | 21,496 | 23 | ||||||
5.500%, 2/20/49 | 242,914 | 264 | ||||||
Great Wolf Trust, Series 2019-WOLF, Class A 1.144%, (ICE LIBOR USD 1 Month plus 1.034%), 12/15/36 144A | 255,000 | 255 | ||||||
Great Wolf Trust, Series 2019-WOLF, Class C 1.743%, (ICE LIBOR USD 1 Month plus 1.633%), 12/15/36 144A | 270,000 | 268 | ||||||
GS Mortgage Backed Securities Trust, Series 2021-HP1, Class A6 2.500%, 1/25/52 144A | 330,385 | 334 | ||||||
GS Mortgage Backed Securities Trust, Series 2021-PJ5, Class A8 2.500%, 10/25/51 144A | 786,308 | 794 | ||||||
GS Mortgage Backed Securities Trust, Series GR2, Class A6 2.500%, (AFC), 2/25/52 144A | 398,009 | 402 | ||||||
GS Mortgage Backed Securities Trust, Series NQM1, Class A1 1.017%, (AFC), 7/25/61 144A | 242,784 | 241 | ||||||
GS Mortgage Securities Trust, Series 2014-EB1A, Class 2A1 1.636%, (CSTR), 7/25/44 144A | 5,326 | 5 | ||||||
GS Mortgage Securities Trust, Series 2021-ROSS, Class B 1.710%, (ICE LIBOR USD 1 Month plus 1.600%), 5/15/26 144A | 390,000 | 389 | ||||||
Homeward Opportunities Fund I Trust, Series 2019-3, Class A1 2.675%, (AFC), 11/25/59 144A | 53,718 | 54 | ||||||
Homeward Opportunities Fund I Trust, Series 2020-2, Class A1 1.657%, (AFC), 5/25/65 144A | 107,159 | 107 | ||||||
Hundred Acre Wood Trust, Series 2021-INV1, Class A9 2.500%, 7/25/51 144A | 541,937 | 548 | ||||||
Imperial Fund Mortgage Trust, Series 2021-NQM2, Class A3 1.516%, (AFC), 9/25/56 144A | 344,789 | 341 | ||||||
InTown Hotel Portfolio Trust, Series 2018-STAY, Class A 1.060%, (ICE LIBOR USD 1 Month plus 0.950%), 1/15/33 144A | 115,000 | 115 | ||||||
InTown Hotel Portfolio Trust, Series 2018-STAY, Class C 1.610%, (ICE LIBOR USD 1 Month plus 1.500%), 1/15/33 144A | 100,000 | 100 | ||||||
The Accompanying Notes are an Integral Part of the Financial Statements.
130
Table of Contents
Short-Term Bond Portfolio
| Structured Products (33.1%) | Shares/ Par+ | Value $ (000’s) | ||||||
Mortgage Securities continued | ||||||||
JP Morgan Chase Commercial Mortgage Securities Trust, Series 2020-609M, Class B 1.880%, (ICE LIBOR USD 1 Month plus 1.770%), 10/15/33 144A | 540,000 | 539 | ||||||
JP Morgan Chase Commercial Mortgage Securities Trust, Series 2020-609M, Class C 2.280%, (ICE LIBOR USD 1 Month plus 2.170%), 10/15/33 144A | 440,000 | 438 | ||||||
JP Morgan Mortgage Trust, Series 2020-INV1, Class A11 0.919%, (ICE LIBOR USD 1 Month plus 0.830%), (AFC), 8/25/50 144A | 74,294 | 75 | ||||||
JP Morgan Mortgage Trust, Series 2020-INV1, Class A15 3.500%, (AFC), 8/25/50 144A | 120,943 | 123 | ||||||
JPMBB Commercial Mortgage Securities Trust, Series 2014-C23, Class A5 3.934%, 9/15/47 | 540,000 | 572 | ||||||
JPMCC Commercial Mortgage Securities Trust, Series 2019-BKWD, Class B 1.460%, (ICE LIBOR USD 1 Month plus 1.350%), 9/15/29 144A | 790,000 | 780 | ||||||
JPMCC Commercial Mortgage Securities Trust, Series 2019-BKWD, Class C 1.710%, (ICE LIBOR USD 1 Month plus 1.600%), 9/15/29 144A | 250,000 | 246 | ||||||
KKR Industrial Portfolio Trust, Series 2021-KDIP, Class C 1.110%, (ICE LIBOR USD 1 Month plus 1.000%), 12/15/37 144A | 157,500 | 156 | ||||||
KKR Industrial Portfolio Trust, Series 2021-KDIP, Class D 1.360%, (ICE LIBOR USD 1 Month plus 1.250%), 12/15/37 144A | 116,250 | 115 | ||||||
KNDR Mortgage Trust, Series 2021-KIND, Class C 1.860%, (ICE LIBOR USD 1 Month plus 1.750%), 8/15/26 144A | 580,000 | 576 | ||||||
LSTAR Commercial Mortgage Trust, Series 2017-5, Class AS 4.021%, 3/10/50 144A | 340,000 | 363 | ||||||
Mello Mortgage Capital Acceptance, Series 2021-INV3, Class A4 2.500%, (AFC), 10/25/51 144A | 458,733 | 463 | ||||||
Merit, Series 2020-HILL, Class B 1.510%, (ICE LIBOR USD 1 Month plus 1.400%), 8/15/37 144A | 400,789 | 401 | ||||||
Merit, Series 2020-HILL, Class C 1.810%, (ICE LIBOR USD 1 Month plus 1.700%), 8/15/37 144A | 174,461 | 174 | ||||||
Merit, Series 2020-HILL, Class D 2.460%, (ICE LIBOR USD 1 Month plus 2.350%), 8/15/37 144A | 235,758 | 236 | ||||||
MFRA Trust, Series 2021-INV1, Class A1 0.852%, (AFC), 1/25/56 144A | 249,571 | 248 | ||||||
MFRA Trust, Series 2021-NQM2, Class A2 1.317%, (AFC), 11/25/64 144A | 197,081 | 196 | ||||||
MHC Commercial Mortgage Trust, Series 2021-MHC2, Class B 1.210%, (ICE LIBOR USD 1 Month plus 1.100%), 5/15/23 144A | 380,000 | 377 | ||||||
| Structured Products (33.1%) | Shares/ Par+ | Value $ (000’s) | ||||||
Mortgage Securities continued | ||||||||
Morgan Stanley Bank of America Merrill Lynch Trust, Series 2014-C18, Class AS 4.110%, (AFC), 10/15/47 | 185,000 | 194 | ||||||
Morgan Stanley Capital I Trust, Series 2014-150E, Class A 3.912%, 9/9/32 144A | 610,000 | 638 | ||||||
Morgan Stanley Capital I Trust, Series 2019-MEAD, Class D 3.177%, (CSTR), 11/10/36 144A | 480,000 | 470 | ||||||
Morgan Stanley Capital I Trust, Series 2019-NUGS, Class D 3.300%, (ICE LIBOR USD 1 Month plus 1.800%), 12/15/36 144A | 315,000 | 315 | ||||||
Morgan Stanley Residential Mortgage Loan Trust, Series 2021-2, Class A4 2.500%, (AFC), 5/25/51 144A | 175,871 | 177 | ||||||
New Orleans Hotel Trust, Series 2019-HNLA, Class B 1.399%, (ICE LIBOR USD 1 Month plus 1.289%), 4/15/32 144A | 790,000 | 783 | ||||||
New Residential Mortgage Loan Trust, Series 2019-NQM2, Class A1 1.650%, (AFC), 5/24/60 144A | 203,198 | 203 | ||||||
New Residential Mortgage Loan Trust, Series 2019-NQM5, Class A1 2.710%, (AFC), 11/25/59 144A | 227,799 | 229 | ||||||
New Residential Mortgage Loan Trust, Series 2020-NQM1, Class A1 2.464%, (AFC), 1/26/60 144A | 175,853 | 176 | ||||||
New Residential Mortgage Loan Trust, Series 2021-INV1, Class A6 2.500%, (AFC), 6/25/51 144A | 348,341 | 352 | ||||||
New Residential Mortgage Loan Trust, Series 2021-INV2, Class A7 2.500%, (AFC), 9/25/51 144A | 1,004,760 | 1,015 | ||||||
New Residential Mortgage Loan Trust, Series 2021-NQM1R, Class A1 0.943%, (AFC), 7/25/55 144A | 373,763 | 371 | ||||||
NMLT Trust, Series 2021-INV2, Class A1 1.162%, (AFC), 8/25/56 144A | 1,069,823 | 1,053 | ||||||
NMLT Trust, Series 2021-INV2, Class A3 1.520%, (AFC), 8/25/56 144A | 277,008 | 273 | ||||||
OBX Trust, Series 2019-EXP2, Class 2A1A 1.002%, (ICE LIBOR USD 1 Month plus 0.900%), 7/25/59 144A | 21,457 | 21 | ||||||
OBX Trust, Series 2019-EXP2, Class 2A2 1.302%, (ICE LIBOR USD 1 Month plus 1.200%), 7/25/59 144A | 161,635 | 161 | ||||||
OBX Trust, Series 2019-EXP3, Class 2A1 1.002%, (ICE LIBOR USD 1 Month plus 0.900%), (AFC), 10/25/59 144A | 175,603 | 176 | ||||||
OBX Trust, Series 2020-INV1, Class A5 3.500%, (AFC), 12/25/49 144A | 64,255 | 65 | ||||||
OBX Trust, Series 2021-NQM1, Class A1 1.072%, (AFC), 2/25/66 144A | 527,119 | 521 | ||||||
ONE Park Mortgage Trust, Series 2021-PARK, Class B 1.060%, (ICE LIBOR USD 1 Month plus 0.950%), 3/15/36 144A | 755,000 | 749 | ||||||
The Accompanying Notes are an Integral Part of the Financial Statements.
131
Table of Contents
Short-Term Bond Portfolio
| Structured Products (33.1%) | Shares/ Par+ | Value $ (000’s) | ||||||
Mortgage Securities continued | ||||||||
ONE Park Mortgage Trust, Series 2021-PARK, Class C 1.210%, (ICE LIBOR USD 1 Month plus 1.100%), 3/15/36 144A | 405,000 | 401 | ||||||
Onslow Bay Financial LLC, Series 2020-EXP1, Class 1A8 3.500%, 2/25/60 144A | 214,372 | 217 | ||||||
Onslow Bay Financial LLC, Series 2020-EXP1, Class 2A1 0.852%, (ICE LIBOR USD 1 Month plus 0.750%), 2/25/60 144A | 254,016 | 254 | ||||||
Onslow Bay Financial LLC, Series 2020-EXP1, Class 2A2 1.052%, (ICE LIBOR USD 1 Month plus 0.950%), 2/25/60 144A | 151,163 | 151 | ||||||
Onslow Bay Financial LLC, Series 2020-EXP2, Class A8 3.000%, (AFC), 5/25/60 144A | 275,413 | 277 | ||||||
Onslow Bay Financial LLC, Series 2020-EXP2, Class A9 3.000%, (AFC), 5/25/60 144A | 68,853 | 69 | ||||||
Onslow Bay Financial LLC, Series 2020-EXP3, Class 1A8 3.000%, (AFC), 1/25/60 144A | 247,132 | 247 | ||||||
Onslow Bay Financial LLC, Series 2021-J1, Class A4 2.500%, (AFC), 5/25/51 144A | 586,777 | 592 | ||||||
Onslow Bay Mortgage Loan Trust, Series 2021-NQM3, Class A1 1.054%, (AFC), 7/25/61 144A | 266,465 | 263 | ||||||
PSMC Trust, Series 2021-1, Class A11 2.500%, (AFC), 3/25/51 144A | 853,238 | 861 | ||||||
PSMC Trust, Series 2021-2, Class A3 2.500%, (AFC), 5/25/51 144A | 662,701 | 670 | ||||||
Sequoia Mortgage Trust, Series 2018-CH2, Class A21 4.000%, (AFC), 6/25/48 144A | 40,541 | 41 | ||||||
Sequoia Mortgage Trust, Series 2018-CH2, Class A3 4.000%, (AFC), 6/25/48 144A | 93,516 | 94 | ||||||
Sequoia Mortgage Trust, Series 2018-CH3, Class A19 4.500%, (AFC), 8/25/48 144A | 16,317 | 16 | ||||||
Sequoia Mortgage Trust, Series 2018-CH4, Class A2 4.000%, (AFC), 10/25/48 144A | 24,246 | 24 | ||||||
SG Residential Mortgage Trust, Series 2019-3, Class A2 2.877%, (AFC), 9/25/59 144A | 284,642 | 288 | ||||||
SG Residential Mortgage Trust, Series 2020-2, Class A1 1.381%, (AFC), 5/25/65 144A | 161,833 | 161 | ||||||
Shelter Growth CRE Issuer, Ltd., Series 2021-FL3, Class A 1.190%, (ICE LIBOR USD 1 Month plus 1.080%), 9/15/36 144A | 329,008 | 328 | ||||||
Slide, Series 2018-FUN, Class D 2.210%, (ICE LIBOR USD 1 Month plus 2.100%), 6/15/31 144A | 356,364 | 351 | ||||||
| Structured Products (33.1%) | Shares/ Par+ | Value $ (000’s) | ||||||
Mortgage Securities continued | ||||||||
STACR Trust, Series 2018-DNA2, Class M2 1.053%, (ICE LIBOR USD 1 Month plus 0.950%), 12/25/30 144A | 460,000 | 460 | ||||||
STACR Trust, Series 2018-DNA3, Class M1 0.853%, (ICE LIBOR USD 1 Month plus 0.750%), 9/25/48 144A | 874 | 1 | ||||||
STACR Trust, Series 2018-DNA3, Class M2 1.003%, (ICE LIBOR USD 1 Month plus 0.900%), 9/25/48 144A | 340,000 | 340 | ||||||
STACR Trust, Series 2018-HRP2, Class M2 1.353%, (ICE LIBOR USD 1 Month plus 1.250%), 2/25/47 144A | 226,411 | 226 | ||||||
STACR Trust, Series 2020-DNA6, Class M1 0.950%, (US 30 Day Average SOFR plus 0.900%), 12/25/50 144A | 40,843 | 41 | ||||||
STACR Trust, Series 2021-DNA1, Class M1 0.700%, (US 30 Day Average SOFR plus 0.650%), 1/25/51 144A | 57,162 | 57 | ||||||
STACR Trust, Series 2021-DNA2, Class M1 0.850%, (US 30 Day Average SOFR plus 0.800%), 8/25/33 144A | 281,046 | 281 | ||||||
STACR Trust, Series 2021-DNA3, Class M2 2.150%, (US 30 Day Average SOFR plus 2.100%), 10/25/33 144A | 395,000 | 402 | ||||||
STACR Trust, Series 2021-DNA5, Class M2 1.700%, (US 30 Day Average SOFR plus 1.650%), 1/25/34 144A | 260,000 | 261 | ||||||
STACR Trust, Series 2021-DNA6, Class M2 1.550%, (US 30 Day Average SOFR plus 1.500%), 10/25/41 144A | 325,000 | 325 | ||||||
STACR Trust, Series 2021-DNA7, Class M2 1.850%, (US 30 Day Average SOFR plus 1.800%), 11/25/41 144A | 375,000 | 376 | ||||||
STACR Trust, Series 2021-HQA1, Class M1 0.750%, (US 30 Day Average SOFR plus 0.700%), 8/25/33 144A | 389,800 | 390 | ||||||
STACR Trust, Series 2021-HQA3, Class M1 0.900%, (US 30 Day Average SOFR plus 0.850%), 9/25/41 144A | 255,000 | 255 | ||||||
Starvest Emerging Markets CBO I, Series 2021-2, Class A1 0.943%, (AFC), 5/25/65 144A | 281,884 | 280 | ||||||
Starwood Mortgage Residential Trust, Series 2019-INV1, Class A1 2.610%, (AFC), 9/27/49 144A | 17,870 | 18 | ||||||
Starwood Mortgage Residential Trust, Series 2019-INV1, Class A3 2.916%, (AFC), 9/27/49 144A | 181,793 | 182 | ||||||
Starwood Mortgage Residential Trust, Series 2020-1, Class A2 2.408%, (AFC), 2/25/50 144A | 208,100 | 209 | ||||||
Starwood Mortgage Residential Trust, Series 2021-4, Class A1 1.162%, (AFC), 8/25/56 144A | 924,267 | 916 | ||||||
Toorak Mortgage Corp., Series 2021-INV1, Class A2 1.409%, (AFC), 12/31/99 144A | 175,111 | 173 | ||||||
Uniform Mortgage Backed Security TBA | 245,000 | 244 | ||||||
2.500%, 1/14/50 | 160,000 | 163 | ||||||
3.000%, 2/13/48 b | 1,205,000 | 1,247 | ||||||
The Accompanying Notes are an Integral Part of the Financial Statements.
132
Table of Contents
Short-Term Bond Portfolio
| Structured Products (33.1%) | Shares/ Par+ | Value $ (000’s) | ||||||
Mortgage Securities continued | ||||||||
4.000%, 2/11/51 | 340,000 | 361 | ||||||
United Wholsale Mortgage LLC, Series 2021-INV2, Class A4 2.500%, (AFC), 9/25/51 144A | 182,155 | 184 | ||||||
United Wholsale Mortgage LLC, Series 2021-INV5, Class B 2.500%, (AFC), 1/25/52 144A | 205,000 | 207 | ||||||
Verus Securitization Trust, Series 2019-4, Class A3 3.000%, (AFC), 11/25/59 144A Σ | 419,969 | 424 | ||||||
Verus Securitization Trust, Series 2019-INV2, Class A1 2.913%, (AFC), 7/25/59 144A | 209,017 | 210 | ||||||
Verus Securitization Trust, Series 2019-INV2, Class A2 3.117%, (AFC), 7/25/59 144A | 279,496 | 281 | ||||||
Verus Securitization Trust, Series 2019-INV3, Class A3 1.977%, (AFC), 4/25/60 144A | 147,966 | 148 | ||||||
3.100%, (AFC), 11/25/59 144A | 250,279 | 255 | ||||||
Verus Securitization Trust, Series 2020-1, Class A1 2.417%, (AFC), 1/25/60 144A | 163,306 | 164 | ||||||
Verus Securitization Trust, Series 2020-1, Class A3 2.724%, (AFC), 1/25/60 144A Σ | 303,936 | 304 | ||||||
Verus Securitization Trust, Series 2020-2, Class A1 2.226%, (AFC), 5/25/60 144A | 283,654 | 284 | ||||||
Verus Securitization Trust, Series 2020-5, Class A3 1.733%, (AFC), 5/25/65 144A Σ | 131,936 | 131 | ||||||
Verus Securitization Trust, Series 2021-1, Class A1 0.815%, (AFC), 1/25/66 144A | 155,955 | 154 | ||||||
Verus Securitization Trust, Series 2021-1, Class A3 1.155%, (AFC), 1/25/66 144A | 127,316 | 125 | ||||||
Verus Securitization Trust, Series 2021-2, Class A1 1.031%, (AFC), 2/25/66 144A | 290,593 | 288 | ||||||
Verus Securitization Trust, Series 2021-2, Class A2 1.052%, (AFC), 1/25/66 144A | 216,438 | 214 | ||||||
Verus Securitization Trust, Series 2021-5, Class A3 1.373%, (AFC), 9/25/66 144A | 286,546 | 282 | ||||||
Verus Securitization Trust, Series 2021-7, Class A1 1.829%, (AFC), 10/25/66 144A | 1,029,360 | 1,027 | ||||||
Verus Securitization Trust, Series 2021-R1, Class A2 1.057%, (AFC), 10/25/63 144A | 119,175 | 119 | ||||||
Verus Securitization Trust, Series 2021-R2, Class A1 0.918%, (AFC), 2/25/64 144A | 294,349 | 293 | ||||||
| Structured Products (33.1%) | Shares/ Par+ | Value $ (000’s) | ||||||
Mortgage Securities continued | ||||||||
Vista Point Securitization Trust, Series 2020-1, Class A1 1.763%, (AFC), 3/25/65 144A | 66,487 | 67 | ||||||
Vista Point Securitization Trust, Series 2020-2, Class A3 2.496%, (AFC), 4/25/65 144A | 98,062 | 98 | ||||||
Wells Fargo Commercial Mortgage Trust, Series 2015-NXS2, Class A2 3.020%, 7/15/58 | 123,873 | 125 | ||||||
Wells Fargo Commercial Mortgage Trust, Series 2017-C39, Class A1 1.975%, 9/15/50 | 7,349 | 7 | ||||||
Wells Fargo Mortgage Backed Securities Trust, Series 2020-RR1, Class A17 3.000%, (AFC), 5/25/50 144A | 53,262 | 54 | ||||||
Wells Fargo Mortgage Backed Securities Trust, Series 2021-RR1, Class A3 2.500%, (AFC), 12/25/50 144A | 732,813 | 739 | ||||||
WFRBS Commercial Mortgage Trust, Series 2012-C6, Class B 4.697%, 4/15/45 | 276,834 | 277 | ||||||
WFRBS Commercial Mortgage Trust, Series 2014-C23, Class A5 3.917%, 10/15/57 | 575,000 | 610 | ||||||
WFRBS Commercial Mortgage Trust, Series 2014-LC14, Class A5 4.045%, 3/15/47 | 325,000 | 340 | ||||||
ZH Trust, Series 2021-1, Class A 2.253%, 2/18/27 144A | 350,000 | 348 | ||||||
|
| |||||||
Total | 80,279 | |||||||
|
| |||||||
Total Structured Products | ||||||||
(Cost: $136,589) | 136,343 | |||||||
|
| |||||||
| Short-Term Investments (1.9%) | ||||||||
Consumer, Cyclical (0.0%) | ||||||||
Marriott International, Inc. | 50,000 | 50 | ||||||
|
| |||||||
Total | 50 | |||||||
|
| |||||||
Financial (0.2%) | ||||||||
UniCredit SpA 3.750%, 4/12/22 144A | 1,010,000 | 1,017 | ||||||
|
| |||||||
Total | 1,017 | |||||||
|
| |||||||
Money Market Funds (1.7%) | ||||||||
State Street Institutional U.S. Government Money Market Fund - Premier Class 0.030%# | 6,859,542 | 6,860 | ||||||
|
| |||||||
Total | 6,860 | |||||||
|
| |||||||
Total Short-Term Investments | ||||||||
(Cost: $7,928) | 7,927 | |||||||
|
| |||||||
Total Investments (100.5%) | ||||||||
(Cost: $413,776)@ | 414,319 | |||||||
|
| |||||||
Other Assets, Less | ||||||||
Liabilities (-0.5%) | (2,035 | ) | ||||||
|
| |||||||
Net Assets (100.0%) | 412,284 | |||||||
|
| |||||||
The Accompanying Notes are an Integral Part of the Financial Statements.
133
Table of Contents
Short-Term Bond Portfolio
Exchange Traded or Centrally Cleared Derivatives
Futures
| Issuer | Long/Short | Currency | Notional Par (000’s) | Number of Contracts | Expiration Date | Notional Value (000’s) | Unrealized Appreciation/ (Depreciation) (000’s) | Variation Margin (000’s) | ||||||||||||||||||||
Five-Year US Treasury Note Future | Short | USD | 11,300 | 113 | 3/22 | $ | 13,670 | $ | 1 | $ | (8) | |||||||||||||||||
Ten-Year US Treasury Note Future | Short | USD | 100 | 1 | 3/22 | 131 | – | π | – | π | ||||||||||||||||||
Two-Year US Treasury Note Future | Long | USD | 62,600 | 313 | 3/22 | 68,288 | (141 | ) | 15 | |||||||||||||||||||
Ultra Ten-Year US Treasury Note Future | Short | USD | 1,700 | 17 | 3/22 | 2,489 | (36 | ) | (5 | ) | ||||||||||||||||||
|
| |||||||||||||||||||||||||||
| $ | (176 | ) | $ | 2 | ||||||||||||||||||||||||
|
| |||||||||||||||||||||||||||
| Financial Derivative Assets | Financial Derivative Liabilities | |||||||||||||||||||||||||||
| Variation Margin (000’s) | Variation Margin (000’s) | Market Value (000’s) | ||||||||||||||||||||||||||
| Swaps | Futures | Total | Swaps | Futures | Total | Options | ||||||||||||||||||||||
Total Exchange-Traded or Centrally Cleared Derivatives | $ | - | $ | 15 | $ | 15 | $ | - | $ | (13 | ) | $ | (13 | ) | $ | - | ||||||||||||
| + | All par is stated in U.S. Dollar unless otherwise noted. |
144A Security exempt from registration under Rule 144A of the Securities Act of 1933. These securities may be resold as transactions exempt from registration, normally to qualified institutional buyers. At December 31, 2021 the value of these securities (in thousands) was $168,120 representing 40.8% of the net assets. |
| b | Cash or securities with an aggregate value of $88,027 (in thousands) has been pledged as collateral for futures, swap contracts outstanding, short sales, when issued securities or written options on 12/31/2021. |
| § | Security was purchased pursuant to Regulation S under the Securities Act of 1933, which exempts from registration securities offered and sold outside of the United States. At December 31, 2021, the aggregate value of these securities was $12,658 (in thousands), representing 3.1% of net assets. |
| Σ | Stepped coupon bond for which the coupon rate of interest adjusts on specified date(s); rate shown is effective rate at period-end. |
| # | 7-Day yield as of 12/31/2021. |
| @ | At December 31, 2021, the aggregate cost of investments, including derivatives, for federal tax purposes (in thousands) was $413,635 and the net unrealized appreciation of investments based on that cost was $508 which is comprised of $2,526 aggregate gross unrealized appreciation and $2,018 aggregate gross unrealized depreciation. |
| π | Amount is less than one thousand. |
The Accompanying Notes are an Integral Part of the Financial Statements.
134
Table of Contents
Short-Term Bond Portfolio
The following is a summary of the inputs used in valuing the Portfolio’s Investments at December 31, 2021. See Note 3 for additional information on portfolio valuation.
| Valuation Inputs | ||||||||||||||
| Description | Level 1 – Quoted Prices | Level 2 – Other Significant Observable Inputs | Level 3 – Significant | |||||||||||
| (Amounts in thousands) | ||||||||||||||
Assets: | ||||||||||||||
Municipal Bonds | $ | - | $ | 3,324 | $ | - | ||||||||
Corporate Bonds | - | 202,825 | - | |||||||||||
Governments | - | 63,900 | - | |||||||||||
Structured Products | - | 136,343 | - | |||||||||||
Short-Term Investments | ||||||||||||||
Money Market Funds | 6,860 | - | - | |||||||||||
All Others | - | 1,067 | - | |||||||||||
Other Financial Instruments^ | ||||||||||||||
Futures | 1 | - | - | |||||||||||
Total Assets: | $ | 6,861 | $ | 407,459 | $ | - | ||||||||
Liabilities: | ||||||||||||||
Other Financial Instruments^ | ||||||||||||||
Futures | (177 | ) | - | - | ||||||||||
Total Liabilities: | $ | (177 | ) | $ | - | $ | - | |||||||
^ Other financial instruments are derivative instruments such as futures and forward foreign currency contracts, which are valued at the unrealized appreciation (depreciation) on the instrument, and securities sold short, reverse repurchase agreements, written options and swaps contracts, which are valued at market value.
The Accompanying Notes are an Integral Part of the Financial Statements.
135
Table of Contents
Select Bond Portfolio (unaudited)
| Objective: | Portfolio Strategy: | Net Assets: | ||
| Provide as high a level of total return as is consistent with prudent investment risk. A secondary objective is to seek preservation of shareholders’ capital. | Invest in a diversified portfolio of investment grade debt securities with maturities exceeding one year. | $3.4 billion |
PORTFOLIO OVERVIEW
Mason Street Advisors, LLC (“Mason Street Advisors”), the investment adviser for the Select Bond Portfolio (the “Portfolio”), has engaged Allspring Global Investments, LLC (“Allspring”) to act as sub-adviser for the Portfolio. Normally, the Portfolio invests in a diversified portfolio of investment grade debt securities with maturities exceeding one year. The Portfolio may also invest up to 10% of net assets in non-investment grade, high yield/high risk bonds (so called “junk bonds”) and up to 20% of net assets in foreign securities. Debt securities may be of any maturity or duration, but under normal market conditions, the Portfolio attempts to maintain an overall dollar-weighted average effective duration (a measure of the sensitivity of the price of the Portfolio’s fixed income securities to changes in interest rates) that is within 10% of the Bloomberg® U.S. Aggregate Index. The Portfolio uses a fundamental, relative value investment approach to construct the portfolio of investments. The Portfolio invests in debt securities that it believes offer competitive returns and are undervalued, offering additional income and/or price appreciation potential relative to other debt securities of similar credit quality and interest rate sensitivity. The Portfolio may engage in active and frequent trading of portfolio securities to achieve its investment objectives.
MARKET OVERVIEW
The U.S. and global economies performed particularly well during 2021, despite the unique economic and public health challenges, including the inflationary combination of resurgent business demand, supply-chain bottlenecks and labor shortages. Inflation concerns began early in 2021 and never abated amid debates over whether inflation would be “persistent” or “transitory.” Rate volatility persisted throughout the year, along with a flattening of the U.S. yield curve as short-term rates increased. With credit performing well against a backdrop of strong global demand for U.S. credit and improving corporate fundamentals and credit ratings, credit spreads edged tighter during the year. Inflation concerns and shifts in monetary policy resulted in the center of the U.S. yield curve moving higher during 2021.
PORTFOLIO RESULTS
The Portfolio returned (1.59%) for the twelve months ended December 31, 2021. By comparison, the Portfolio’s benchmark, the Bloomberg® U.S. Aggregate Index (the “Index”), returned (1.54%). (The Index is unmanaged, cannot be invested in directly and does not incur expenses.) According to Lipper® Analytical Services, Inc., an independent mutual fund ranking agency, the average return in 2020 of the Core Bond Funds peer group was (1.48%).
The Financials sector detracted the most from the Portfolio’s performance, led by the diversified financials industry. Mortgage-backed securities (“MBS”) and agency securities detracted the most due to positioning in collateralized mortgage obligations (“CMOs”), lower coupon 30-year collateral and select higher coupons. After the portfolio managers reduced the Portfolio’s exposure to lower coupon MBS to a relative underweight earlier in the year, robust Federal Reserve purchases led to tighter spreads, resulting in a net detraction from the Portfolio’s performance. A relative overweight positioning in high coupon Ginnie Mae and conventional 30-year bonds 5.0 bonds also detracted given elevated speeds of yield curve flattening. The Consumer Discretionary sector also detracted from the Portfolio’s return. Examples include overweight positions in The Home Depot, Inc. and Altria Group, Inc.
On the upside, within MBS, dynamic sector positioning contributed to the Portfolio’s performance, as did positioning in 15-year, Ginnie Mae and conventional 30-year bonds. Other contributors included companies in the Financials sector, (such as FS KKR Capital Corp., SBL Holdings, LLC and Brighthouse Financial, Inc.), the Information Technology sector, (such as Oracle Corp. and Broadcom Corp.) and the Consumer Discretionary sector, (such as Ford Motor Co.).
In structured products, a sector overweight to the asset-backed securities (“ABS”) sector contributed. Security selection in the ABS sector, notably positioning in Federal Family Education Loan Program and private credit student loan ABS, rental car ABS and revolving prime auto ABS, also contributed.
PORTFOLIO MANAGER OUTLOOK
The following forward-looking comments are the opinion of Allspring, the Portfolio’s sub-adviser.
136
Table of Contents
Select Bond Portfolio (unaudited)
Entering 2022, we believe policymakers and investors alike will be grappling with risks of persistent inflation and a slowdown of growth, as well as monetary policy focused on reducing inflation. Yields have risen as central banks have moved to address inflation risks, although growth concerns could also pose a risk factor going forward, suggesting there could eventually be a risk of reversal. In time, policymakers and market participants alike will learn more about the precise interaction among reductions in central bank assets, higher forward rate paths and fiscal stimulus as they translate to economic and financial conditions. The risk that cycles have become shorter could also contribute to a more volatile environment in future periods relative to the recent past.
We believe volatility will provide for a fertile security selection environment across sectors of the most liquid parts of the U.S. investment grade, fixed income markets. Consistent with our bottom-up process, we maintain a neutral duration, with a pure focus on security selection.
Relative Performance

Average Annual Total Returns For Periods Ended December 31, 2021 | ||||||||||||
| 1 Year | 5 Years | 10 Years | ||||||||||
Select Bond Portfolio | -1.59 | % | 3.79 | % | 3.07 | % | ||||||
Bloomberg U.S. | -1.54 | % | 3.57 | % | 2.90 | % | ||||||
Lipper® Variable Insurance | -1.48 | % | 3.65 | % | 3.07 | % | ||||||
The performance data quoted represents past performance. Past performance is historical and does not guarantee future performance. Investment return and principal value will fluctuate, so that shares, when redeemed, may be worth more or less than their original cost. Current performance may be lower or higher than the performance data quoted. For the most recent month-end performance information visit www.northwesternmutual.com.
This chart assumes an initial investment of $10,000 made on 12/31/11. Returns shown reflect fee waivers, deductions for management and other portfolio expenses, and reinvestment of all dividends. In the absence of fee waivers, total return would be reduced. Returns exclude deductions for separate account sale loads and account fees. Please refer to the Benchmark Definitions section of this report for information about the indices cited in the above chart and graph.
Return of principal is not guaranteed. Bond funds have the same risks that are associated with the underlying bonds owned by the Portfolio. When interest rates rise, bond prices fall. With a fixed income fund, when interest rates rise, the value of the fund’s existing bonds drops, which could negatively affect overall fund performance. High yield bonds generally have greater price swings and higher default risks than investment grade bonds.
Investing in bonds issued by foreign corporations and governments carries additional risk, including foreign currency risk, and may increase the volatility of the Portfolio’s performance.
The U.S. federal funds rate has been subject to frequent adjustments over the course of the last several years. A significant rise in interest rates over a short period of time could causetime could cause significant losses in the market value of the Portfolio’s fixed income investments.
The Portfolio may engage in active and frequent trading of portfolio securities to achieve its investment objectives. Active and frequent trading may cause higher brokerage expenses and other transaction costs, which may adversely affect performance.
Top 10 Fixed Income Holdings 12/31/21
Security Description | % of Net Assets | |||||||
US Treasury, Various | 37.8 | % | ||||||
Uniform Mortgage Backed Security TBA, Various | 9.3 | % | ||||||
Federal National Mortgage Association, Various | 7.5 | % | ||||||
Government National Mortgage Association, Various | 2.1 | % | ||||||
Bank of America Corp., Various | 1.8 | % | ||||||
JPMorgan Chase & Co., Various | 1.6 | % | ||||||
Federal Home Loan Mortgage Corp., Various | 1.5 | % | ||||||
Morgan Stanley, Various | 1.4 | % | ||||||
T-Mobile USA, Inc., Various | 0.9 | % | ||||||
Mitsubishi UFJ Financial Group, Inc., Various | 0.7 | % |
137
Table of Contents
Select Bond Portfolio (unaudited)
Sector Allocation 12/31/21
| Sector | % of Net Assets | |||||||
Governments | 37.6 | % | ||||||
Structured Products | 35.7 | % | ||||||
Corporate Bonds | 31.0 | % | ||||||
Municipal Bonds | 0.4 | % | ||||||
Short-Term Investments & Other Net Assets | -4.7 | % | ||||||
Sector Allocation and Top 10 Holdings are subject to change.
Consistent with the Portfolio’s stated parameters, no more than 20% of the Portfolio is invested in foreign securities, and no more than 10% is invested in high yield securities.
138
Table of Contents
Select Bond Portfolio
SCHEDULE OF INVESTMENTS
December 31, 2021
| Corporate Bonds (31.0%) | Shares/ Par + | Value $ (000’s) | ||||||
Basic Materials (0.7%) | ||||||||
The Dow Chemical Co. | 2,130,000 | 2,307 | ||||||
Ecolab, Inc. | 3,168,000 | 3,142 | ||||||
2.700%, 12/15/51 | 1,162,000 | 1,141 | ||||||
LYB International Finance III, LLC | 3,184,000 | 3,316 | ||||||
3.625%, 4/1/51 | 3,157,000 | 3,341 | ||||||
Teck Resources, Ltd. | 1,255,000 | 1,476 | ||||||
6.125%, 10/1/35 | 1,085,000 | 1,407 | ||||||
6.250%, 7/15/41 | 1,221,000 | 1,619 | ||||||
Westlake Chemical Corp. | 3,808,000 | 3,667 | ||||||
3.600%, 8/15/26 | 1,161,000 | 1,245 | ||||||
|
| |||||||
Total | 22,661 | |||||||
|
| |||||||
Communications (3.0%) | ||||||||
Amazon.com, Inc. | 7,256,000 | 7,186 | ||||||
1.650%, 5/12/28 | 3,271,000 | 3,276 | ||||||
2.100%, 5/12/31 | 5,107,000 | 5,177 | ||||||
2.700%, 6/3/60 | 494,000 | 476 | ||||||
3.100%, 5/12/51 | 2,581,000 | 2,756 | ||||||
3.250%, 5/12/61 | 1,103,000 | 1,187 | ||||||
AT&T, Inc. | 875,000 | 846 | ||||||
3.100%, 2/1/43 | 539,000 | 524 | ||||||
3.500%, 6/1/41 | 1,134,000 | 1,166 | ||||||
3.500%, 9/15/53 | 4,558,000 | 4,599 | ||||||
3.550%, 9/15/55 | 1,114,000 | 1,118 | ||||||
3.650%, 6/1/51 | 853,000 | 883 | ||||||
3.650%, 9/15/59 | 2,238,000 | 2,260 | ||||||
3.800%, 12/1/57 | 2,037,000 | 2,121 | ||||||
Charter Communications Operating LLC / Charter Communications Operating Capital Corp. | 4,758,000 | 4,642 | ||||||
3.500%, 6/1/41 | 1,401,000 | 1,366 | ||||||
3.500%, 3/1/42 | 2,587,000 | 2,509 | ||||||
3.700%, 4/1/51 | 560,000 | 541 | ||||||
3.900%, 6/1/52 | 1,698,000 | 1,703 | ||||||
4.400%, 12/1/61 | 1,568,000 | 1,622 | ||||||
4.464%, 7/23/22 | 1,015,000 | 1,030 | ||||||
4.800%, 3/1/50 | 2,086,000 | 2,336 | ||||||
Comcast Corp. | 1,588,000 | 1,537 | ||||||
3.750%, 4/1/40 | 1,298,000 | 1,453 | ||||||
Discovery Communications LLC | 468,000 | 494 | ||||||
Netflix, Inc. | 1,896,000 | 1,998 | ||||||
5.875%, 11/15/28 | 2,035,000 | 2,447 | ||||||
T-Mobile USA, Inc. | 10,540,000 | 10,566 | ||||||
| Corporate Bonds (31.0%) | Shares/ Par + | Value $ (000’s) | ||||||
Communications continued | ||||||||
2.250%, 2/15/26 | 2,071,000 | 2,076 | ||||||
2.875%, 2/15/31 | 723,000 | 714 | ||||||
3.375%, 4/15/29 144A | 5,317,000 | 5,418 | ||||||
3.375%, 4/15/29 | 4,557,000 | 4,643 | ||||||
3.400%, 10/15/52 144A | 2,319,000 | 2,308 | ||||||
3.500%, 4/15/31 144A | 3,921,000 | 4,079 | ||||||
Verizon Communications, Inc. | 2,135,000 | 2,029 | ||||||
2.355%, 3/15/32 144A | 2,124,000 | 2,093 | ||||||
2.550%, 3/21/31 | 1,015,000 | 1,024 | ||||||
2.650%, 11/20/40 | 4,466,000 | 4,244 | ||||||
2.875%, 11/20/50 | 857,000 | 813 | ||||||
3.400%, 3/22/41 | 2,146,000 | 2,247 | ||||||
3.700%, 3/22/61 | 1,559,000 | 1,690 | ||||||
4.329%, 9/21/28 | 738,000 | 838 | ||||||
ViacomCBS, Inc. | 593,000 | 706 | ||||||
4.950%, 5/19/50 | 1,031,000 | 1,314 | ||||||
|
| |||||||
Total | 104,055 | |||||||
|
| |||||||
Consumer, Cyclical (1.8%) | ||||||||
Advance Auto Parts, Inc. | 4,259,000 | 4,645 | ||||||
AutoNation, Inc. | 1,069,000 | 1,221 | ||||||
Delta Air Lines, Inc./SkyMiles IP, Ltd. | 4,319,000 | 4,539 | ||||||
4.750%, 10/20/28 144A | 6,268,000 | 6,845 | ||||||
Ford Motor Co. | 868,000 | 958 | ||||||
Ford Motor Credit Co. LLC | 4,770,000 | 4,812 | ||||||
3.625%, 6/17/31 | 3,653,000 | 3,845 | ||||||
4.000%, 11/13/30 | 1,593,000 | 1,714 | ||||||
4.063%, 11/1/24 | 859,000 | 904 | ||||||
The Home Depot, Inc. | 1,700,000 | 1,562 | ||||||
3.125%, 12/15/49 | 2,065,000 | 2,176 | ||||||
3.300%, 4/15/40 | 441,000 | 478 | ||||||
Hyundai Capital America | 2,830,000 | 2,789 | ||||||
1.250%, 9/18/23 144A | 1,657,000 | 1,656 | ||||||
1.300%, 1/8/26 144A | 3,309,000 | 3,214 | ||||||
1.800%, 10/15/25 144A | 2,651,000 | 2,637 | ||||||
2.000%, 6/15/28 144A | 1,607,000 | 1,567 | ||||||
Marriott International, Inc. | 2,619,000 | 2,611 | ||||||
3.500%, 10/15/32 | 1,603,000 | 1,679 | ||||||
4.625%, 6/15/30 | 3,786,000 | 4,259 | ||||||
5.750%, 5/1/25 | 653,000 | 735 | ||||||
Starbucks Corp. | 1,351,000 | 1,355 | ||||||
3.500%, 11/15/50 | 2,118,000 | 2,281 | ||||||
Tapestry, Inc. | 2,949,000 | 2,966 | ||||||
The Accompanying Notes are an Integral Part of the Financial Statements.
139
Table of Contents
Select Bond Portfolio
| Corporate Bonds (31.0%) | Shares/ Par + | Value $ (000’s) | ||||||
Consumer, Cyclical continued | ||||||||
Walmart, Inc. | 852,000 | 859 | ||||||
|
| |||||||
Total | 62,307 | |||||||
|
| |||||||
Consumer, Non-cyclical (4.8%) | ||||||||
AbbVie, Inc. | 3,320,000 | 3,366 | ||||||
3.200%, 11/21/29 | 3,166,000 | 3,385 | ||||||
4.050%, 11/21/39 | 1,791,000 | 2,055 | ||||||
4.250%, 11/21/49 | 1,689,000 | 2,030 | ||||||
4.300%, 5/14/36 | 770,000 | 908 | ||||||
4.450%, 5/14/46 | 781,000 | 944 | ||||||
Adani International Container Terminal Private, Ltd. | 903,560 | 871 | ||||||
Adani Ports & Special Economic Zone, Ltd. | 1,876,000 | 1,947 | ||||||
Altria Group, Inc. | 463,000 | 474 | ||||||
2.450%, 2/4/32 | 1,254,000 | 1,191 | ||||||
3.400%, 2/4/41 | 2,510,000 | 2,315 | ||||||
Amgen, Inc. | 4,281,000 | 4,195 | ||||||
3.000%, 1/15/52 | 1,179,000 | 1,144 | ||||||
Anheuser-Busch Cos. LLC / Anheuser-Busch InBev Worldwide, Inc. | 3,009,000 | 3,631 | ||||||
4.900%, 2/1/46 | 2,699,000 | 3,411 | ||||||
Anheuser-Busch InBev Worldwide, Inc. | 1,063,000 | 1,165 | ||||||
3.750%, 7/15/42 | 971,000 | 1,058 | ||||||
4.375%, 4/15/38 | 3,161,000 | 3,702 | ||||||
AstraZeneca Finance LLC | 3,754,000 | 3,732 | ||||||
AstraZeneca PLC | 532,000 | 472 | ||||||
3.000%, 5/28/51 | 245,000 | 257 | ||||||
Bacardi, Ltd. | 1,126,000 | 1,273 | ||||||
5.300%, 5/15/48 144A | 2,348,000 | 3,063 | ||||||
BAT Capital Corp. | 570,000 | 555 | ||||||
2.726%, 3/25/31 | 4,982,000 | 4,835 | ||||||
4.390%, 8/15/37 | 566,000 | 596 | ||||||
Bristol-Myers Squibb Co. | 1,715,000 | 1,622 | ||||||
Bunge, Ltd. Finance Corp. | 1,853,000 | 1,846 | ||||||
2.750%, 5/14/31 | 3,966,000 | 4,025 | ||||||
3.750%, 9/25/27 | 5,384,000 | 5,841 | ||||||
Centene Corp. | 5,791,000 | 5,704 | ||||||
2.500%, 3/1/31 | 353,000 | 344 | ||||||
3.000%, 10/15/30 | 1,167,000 | 1,186 | ||||||
CVS Health Corp. | 1,145,000 | 1,209 | ||||||
4.300%, 3/25/28 | 830,000 | 931 | ||||||
4.780%, 3/25/38 | 1,673,000 | 2,036 | ||||||
Danaher Corp. | 1,265,000 | 1,206 | ||||||
2.800%, 12/10/51 | 846,000 | 834 | ||||||
| Corporate Bonds (31.0%) | Shares/ Par + | Value $ (000’s) | ||||||
Consumer, Non-cyclical continued | ||||||||
DH Europe Finance II SARL | 1,695,000 | 1,717 | ||||||
2.200%, 11/15/24 | 2,917,000 | 2,981 | ||||||
The Estee Lauder Co., Inc. | 635,000 | 626 | ||||||
Gilead Sciences, Inc. | 1,842,000 | 1,775 | ||||||
2.800%, 10/1/50 | 1,217,000 | 1,180 | ||||||
4.000%, 9/1/36 | 950,000 | 1,093 | ||||||
Global Payments, Inc. | 1,581,000 | 1,581 | ||||||
2.150%, 1/15/27 | 3,162,000 | 3,175 | ||||||
2.900%, 11/15/31 | 2,108,000 | 2,138 | ||||||
HCA, Inc. | 2,661,000 | 2,812 | ||||||
5.375%, 2/1/25 | 7,669,000 | 8,428 | ||||||
5.875%, 2/1/29 | 961,000 | 1,145 | ||||||
Humana, Inc. | 1,950,000 | 1,896 | ||||||
Molson Coors Beverage Co. | 3,694,000 | 4,095 | ||||||
Pfizer, Inc. | 3,700,000 | 3,691 | ||||||
2.800%, 3/11/22 | 1,020,000 | 1,025 | ||||||
Quanta Services, Inc. | 2,581,000 | 2,553 | ||||||
Roche Holdings, Inc. | 3,841,000 | 3,830 | ||||||
2.607%, 12/13/51 144A | 1,487,000 | 1,460 | ||||||
Shire Acquisitions Investments Ireland DAC | 2,211,000 | 2,274 | ||||||
Sodexo, Inc. | 3,000,000 | 2,972 | ||||||
STERIS Irish FinCo Unlimited Co. | 4,710,000 | 5,154 | ||||||
Sysco Corp. | 1,076,000 | 1,059 | ||||||
Takeda Pharmaceutical Co., Ltd. | 4,021,000 | 3,938 | ||||||
3.025%, 7/9/40 | 1,196,000 | 1,217 | ||||||
3.175%, 7/9/50 | 835,000 | 842 | ||||||
4.400%, 11/26/23 | 1,858,000 | 1,966 | ||||||
Thermo Fisher Scientific, Inc. | 4,270,000 | 4,265 | ||||||
1.750%, 10/15/28 | 2,021,000 | 2,008 | ||||||
2.000%, 10/15/31 | 1,798,000 | 1,772 | ||||||
2.800%, 10/15/41 | 852,000 | 862 | ||||||
UnitedHealth Group, Inc. | 1,183,000 | 1,204 | ||||||
2.750%, 5/15/40 | 814,000 | 826 | ||||||
2.900%, 5/15/50 | 1,891,000 | 1,926 | ||||||
3.050%, 5/15/41 | 554,000 | 580 | ||||||
3.250%, 5/15/51 | 1,787,000 | 1,933 | ||||||
Yale University | 521,000 | 516 | ||||||
1.482%, 4/15/30 | 1,629,000 | 1,590 | ||||||
|
| |||||||
Total | 163,464 | |||||||
|
| |||||||
Energy (1.6%) | ||||||||
Aker BP ASA | 1,473,000 | 1,593 | ||||||
The Accompanying Notes are an Integral Part of the Financial Statements.
140
Table of Contents
Select Bond Portfolio
| Corporate Bonds (31.0%) | Shares/ Par + | Value $ (000’s) | ||||||
Energy continued | ||||||||
BP Capital Markets America, Inc. | 1,602,000 | 1,509 | ||||||
3.379%, 2/8/61 | 2,488,000 | 2,556 | ||||||
Devon Energy Corp. | 559,000 | 647 | ||||||
5.000%, 6/15/45 | 1,964,000 | 2,374 | ||||||
Diamondback Energy, Inc. | 907,000 | 1,040 | ||||||
Enable Midstream Partners LP | 1,248,000 | 1,335 | ||||||
4.400%, 3/15/27 | 2,108,000 | 2,275 | ||||||
4.950%, 5/15/28 | 3,575,000 | 3,965 | ||||||
5.000%, 5/15/44 | 472,000 | 507 | ||||||
Energy Transfer LP | 1,072,000 | 1,211 | ||||||
5.300%, 4/15/47 | 2,803,000 | 3,248 | ||||||
6.000%, 6/15/48 | 434,000 | 539 | ||||||
6.050%, 6/1/41 | 494,000 | 604 | ||||||
6.125%, 12/15/45 | 950,000 | 1,182 | ||||||
Galaxy Pipeline Assets Bidco, Ltd. | 3,263,798 | 3,267 | ||||||
2.160%, 3/31/34 144A | 2,403,000 | 2,355 | ||||||
2.625%, 3/31/36 144A | 1,480,000 | 1,446 | ||||||
2.940%, 9/30/40 144A | 957,000 | 952 | ||||||
Lundin Energy Finance B.V. | 3,818,000 | 3,791 | ||||||
3.100%, 7/15/31 144A | 6,988,000 | 7,038 | ||||||
Marathon Oil Corp. | 685,000 | 820 | ||||||
Oleoducto Central SA | 1,181,000 | 1,174 | ||||||
Petroleos del Peru SA | 1,545,000 | 1,530 | ||||||
Petroleos Mexicanos | 2,567,600 | 2,638 | ||||||
Pioneer Natural Resources Co. | 2,852,000 | 2,709 | ||||||
Sunoco Logistics Partners Operations LP | 814,000 | 935 | ||||||
6.100%, 2/15/42 | 554,000 | 676 | ||||||
|
| |||||||
Total | 53,916 | |||||||
|
| |||||||
Financial (12.7%) | ||||||||
AerCap Ireland Capital DAC / AerCap Global Aviation Trust | 8,515,000 | 8,478 | ||||||
1.650%, 10/29/24 | 5,564,000 | 5,554 | ||||||
1.750%, 10/29/24 | 6,918,000 | 6,901 | ||||||
Agree LP | 2,320,000 | 2,273 | ||||||
2.600%, 6/15/33 | 526,000 | 516 | ||||||
Alleghany Corp. | 1,607,000 | 1,583 | ||||||
American Campus Communities Operating Partnership LP 2.250%, 1/15/29 | 1,597,000 | 1,580 | ||||||
American International Group, Inc. | 1,041,000 | 1,126 | ||||||
4.375%, 6/30/50 | 572,000 | 713 | ||||||
Ares Capital Corporation | 3,309,000 | 3,253 | ||||||
| Corporate Bonds (31.0%) | Shares/ Par + | Value $ (000’s) | ||||||
Financial continued | ||||||||
ASB Bank, Ltd. | 2,659,000 | 2,643 | ||||||
Athene Global Funding | 3,195,000 | 3,136 | ||||||
1.985%, 8/19/28 144A | 2,662,000 | 2,587 | ||||||
2.500%, 3/24/28 144A | 3,727,000 | 3,748 | ||||||
2.646%, 10/4/31 144A | 3,515,000 | 3,468 | ||||||
Bain Capital Specialty Finance, Inc. | 2,179,000 | 2,118 | ||||||
Banco de Chile | 1,651,000 | 1,628 | ||||||
Banco Santander SA | 2,800,000 | 2,749 | ||||||
3.225%, (US Treasury Yield Curve Rate T Note Constant Maturity 1 Year plus 1.600%), 11/22/32 | 2,600,000 | 2,602 | ||||||
Bank of America Corp. | 2,911,000 | 2,892 | ||||||
1.197%, (US SOFR plus 1.010%), 10/24/26 | 2,389,000 | 2,341 | ||||||
1.319%, (US SOFR plus 1.150%), 6/19/26 | 1,423,000 | 1,408 | ||||||
1.530%, (US SOFR plus 0.650%), 12/6/25 | 7,566,000 | 7,578 | ||||||
1.658%, (US SOFR plus 0.910%), 3/11/27 | 10,733,000 | 10,658 | ||||||
1.734%, (US SOFR plus 0.960%), 7/22/27 | 10,268,000 | 10,193 | ||||||
1.898%, (US SOFR plus 1.530%), 7/23/31 | 2,113,000 | 2,022 | ||||||
1.922%, (US SOFR plus 1.370%), 10/24/31 | 1,782,000 | 1,706 | ||||||
2.496%, (ICE LIBOR USD 3 Month plus 0.990%), 2/13/31 | 2,994,000 | 3,002 | ||||||
2.592%, (US SOFR plus 2.150%), 4/29/31 | 3,439,000 | 3,474 | ||||||
2.687%, (US SOFR plus 1.320%), 4/22/32 | 8,153,000 | 8,274 | ||||||
3.004%, (ICE LIBOR USD 3 Month plus 0.790%), 12/20/23 | 4,231,000 | 4,318 | ||||||
3.483%, (US SOFR plus 1.650%), 3/13/52 | 1,053,000 | 1,162 | ||||||
3.500%, 4/19/26 | 543,000 | 585 | ||||||
3.559%, (ICE LIBOR USD 3 Month plus 1.060%), 4/23/27 | 2,630,000 | 2,812 | ||||||
Barclays PLC | 5,268,000 | 5,277 | ||||||
2.894%, (US Treasury Yield Curve Rate T Note Constant Maturity 1 Year plus 1.300%), 11/24/32 | 1,638,000 | 1,650 | ||||||
3.330%, (US Treasury Yield Curve Rate T Note Constant Maturity 1 Year plus 1.300%), 11/24/42 | 1,192,000 | 1,213 | ||||||
BlackRock, Inc. | 2,112,000 | 2,096 | ||||||
Blackstone Holdings Finance Co. LLC | 316,000 | 308 | ||||||
Blackstone Private Credit Fund | 2,726,000 | 2,724 | ||||||
2.625%, 12/15/26 144A | 9,166,000 | 8,936 | ||||||
3.250%, 3/15/27 144A | 3,819,000 | 3,858 | ||||||
Blackstone Secured Lending Fund | 2,759,000 | 2,690 | ||||||
Blue Owl Finance LLC | 457,000 | 458 | ||||||
Brighthouse Financial Global Funding | 4,230,000 | 4,237 | ||||||
The Accompanying Notes are an Integral Part of the Financial Statements.
141
Table of Contents
Select Bond Portfolio
| Corporate Bonds (31.0%) | Shares/ Par + | Value $ (000’s) | ||||||
Financial continued | ||||||||
Brighthouse Financial, Inc. | 1,054,000 | 1,040 | ||||||
Brixmor Operating Partnership LP | 743,000 | 739 | ||||||
2.500%, 8/16/31 | 1,287,000 | 1,259 | ||||||
CNO Global Funding | 3,290,000 | 3,250 | ||||||
Cooperatieve Rabobank U.A. | 4,247,000 | 4,248 | ||||||
Credit Suisse AG | 4,823,000 | 4,704 | ||||||
Crown Castle International Corp. | 3,189,000 | 3,080 | ||||||
2.100%, 4/1/31 | 5,893,000 | 5,639 | ||||||
2.500%, 7/15/31 | 2,331,000 | 2,314 | ||||||
2.900%, 4/1/41 | 1,489,000 | 1,448 | ||||||
4.000%, 3/1/27 | 532,000 | 578 | ||||||
Enstar Group, Ltd. | 2,677,000 | 2,624 | ||||||
Essex Portfolio LP | 2,787,000 | 2,714 | ||||||
2.550%, 6/15/31 | 1,096,000 | 1,099 | ||||||
Extra Space Storage LP | 955,000 | 928 | ||||||
F&G Global Funding | 4,243,000 | 4,125 | ||||||
Federal Realty Investment Trust | 1,472,000 | 1,542 | ||||||
GA Global Funding Trust | 3,727,000 | 3,655 | ||||||
1.950%, 9/15/28 144A | 5,005,000 | 4,864 | ||||||
GLP Capital LP / GLP Financing II, Inc. | 1,455,000 | 1,463 | ||||||
5.300%, 1/15/29 | 1,074,000 | 1,219 | ||||||
The Goldman Sachs Group, Inc. | 5,334,000 | 5,289 | ||||||
0.925%, (US SOFR plus 0.486%), 10/21/24 | 10,673,000 | 10,627 | ||||||
1.948%, (US SOFR plus 0.913%), 10/21/27 | 2,640,000 | 2,628 | ||||||
2.650%, (US SOFR plus 1.264%), 10/21/32 | 1,841,000 | 1,853 | ||||||
Golub Capital BDC, Inc. | 1,107,000 | 1,088 | ||||||
Healthpeak Properties, Inc. | 1,054,000 | 1,055 | ||||||
Jackson Financial, Inc. | 2,715,000 | 2,729 | ||||||
4.000%, 11/23/51 144A | 1,369,000 | 1,380 | ||||||
JPMorgan Chase & Co. | 10,656,000 | 10,313 | ||||||
1.045%, (US SOFR plus 0.800%), 11/19/26 | 5,942,000 | 5,789 | ||||||
1.470%, (US SOFR plus 0.765%), 9/22/27 | 5,307,000 | 5,202 | ||||||
1.561%, (US SOFR plus 0.605%), 12/10/25 | 17,633,000 | 17,652 | ||||||
2.069%, (US SOFR plus 1.015%), 6/1/29 | 5,313,000 | 5,269 | ||||||
2.083%, (US SOFR plus 1.850%), 4/22/26 | 4,661,000 | 4,731 | ||||||
2.182%, (US SOFR plus 1.890%), 6/1/28 | 3,265,000 | 3,292 | ||||||
2.301%, (US SOFR plus 1.160%), 10/15/25 | 664,000 | 679 | ||||||
Kilroy Realty LP | 1,451,000 | 1,410 | ||||||
| Corporate Bonds (31.0%) | Shares/ Par + | Value $ (000’s) | ||||||
Financial continued | ||||||||
KKR Group Finance Co. X LLC | 1,425,000 | 1,420 | ||||||
Macquarie Group, Ltd. | 4,798,000 | 4,756 | ||||||
1.935%, (US SOFR plus 0.995%), 4/14/28 144A | 4,074,000 | 4,007 | ||||||
2.871%, (US SOFR plus 1.532%), 1/14/33 144A | 2,872,000 | 2,863 | ||||||
Mid-America Apartments LP | 1,069,000 | 1,193 | ||||||
4.000%, 11/15/25 | 1,302,000 | 1,407 | ||||||
4.300%, 10/15/23 | 1,091,000 | 1,142 | ||||||
Mitsubishi UFJ Financial Group, Inc. | 6,334,000 | 6,256 | ||||||
1.538%, (US Treasury Yield Curve Rate T Note Constant Maturity 1 Year plus 0.750%), 7/20/27 | 6,256,000 | 6,145 | ||||||
1.640%, (US Treasury Yield Curve Rate T Note Constant Maturity 1 Year plus 0.670%), 10/13/27 | 5,306,000 | 5,237 | ||||||
2.309%, (US Treasury Yield Curve Rate T Note Constant Maturity 1 Year plus 0.950%), 7/20/32 | 3,272,000 | 3,226 | ||||||
2.494%, (US Treasury Yield Curve Rate T Note Constant Maturity 1 Year plus 0.970%), 10/13/32 | 2,167,000 | 2,170 | ||||||
Morgan Stanley | 11,107,000 | 10,962 | ||||||
0.791%, (US SOFR plus 0.509%), 1/22/25 | 14,879,000 | 14,728 | ||||||
0.864%, (US SOFR plus 0.745%), 10/21/25 | 2,111,000 | 2,081 | ||||||
0.985%, (US SOFR plus 0.720%), 12/10/26 | 5,421,000 | 5,258 | ||||||
1.164%, (US SOFR plus 0.560%), 10/21/25 | 8,006,000 | 7,943 | ||||||
1.512%, (US SOFR plus 0.858%), 7/20/27 | 4,144,000 | 4,079 | ||||||
2.239%, (US SOFR plus 1.178%), 7/21/32 | 3,161,000 | 3,092 | ||||||
Owl Rock Capital Corp. | 1,112,000 | 1,092 | ||||||
3.400%, 7/15/26 | 4,562,000 | 4,635 | ||||||
Owl Rock Capital Corp. III | 3,629,000 | 3,548 | ||||||
Pricoa Global Funding I | 473,000 | 463 | ||||||
Realty Income Corp. | 1,139,000 | 1,150 | ||||||
2.850%, 12/15/32 | 1,543,000 | 1,601 | ||||||
3.400%, 1/15/28 | 1,129,000 | 1,218 | ||||||
Regency Centers LP | 2,314,000 | 2,401 | ||||||
Rexford Industrial Realty, Inc. | 1,178,000 | 1,112 | ||||||
SBL Holdings, LLC | 3,689,000 | 3,897 | ||||||
Scentre Group Trust 1/2 | 1,679,000 | 1,792 | ||||||
Spirit Realty LP | 2,119,000 | 2,062 | ||||||
2.700%, 2/15/32 | 636,000 | 629 | ||||||
3.400%, 1/15/30 | 1,281,000 | 1,347 | ||||||
The Accompanying Notes are an Integral Part of the Financial Statements.
142
Table of Contents
Select Bond Portfolio
| Corporate Bonds (31.0%) | Shares/ Par + | Value $ (000’s) | ||||||
Financial continued | ||||||||
Stewart Information Services Corp. | 1,435,000 | 1,453 | ||||||
Store Capital Corp. | 739,000 | 723 | ||||||
2.750%, 11/18/30 | 1,885,000 | 1,869 | ||||||
4.500%, 3/15/28 | 4,020,000 | 4,442 | ||||||
4.625%, 3/15/29 | 1,357,000 | 1,520 | ||||||
Sumitomo Mitsui Financial Group, Inc. | 4,264,000 | 4,162 | ||||||
1.902%, 9/17/28 | 6,641,000 | 6,510 | ||||||
Sun Communities Operating LP | 1,063,000 | 1,062 | ||||||
The Toronto-Dominion Bank | 2,672,000 | 2,625 | ||||||
Trust Fibra Uno | 1,646,000 | 1,802 | ||||||
6.390%, 1/15/50 144A | 1,319,000 | 1,540 | ||||||
Westpac Banking Corp. | 4,276,000 | 4,259 | ||||||
3.020%, (US Treasury Yield Curve Rate T Note Constant Maturity 5 year plus 1.530%), 11/18/36 | 532,000 | 526 | ||||||
3.133%, 11/18/41 | 532,000 | 527 | ||||||
|
| |||||||
Total | 433,978 | |||||||
|
| |||||||
Industrial (1.5%) | ||||||||
The Boeing Co. | 4,031,000 | 4,030 | ||||||
3.250%, 2/1/28 | 2,282,000 | 2,378 | ||||||
3.250%, 2/1/35 | 1,304,000 | 1,314 | ||||||
3.625%, 2/1/31 | 2,293,000 | 2,445 | ||||||
3.750%, 2/1/50 | 2,331,000 | 2,423 | ||||||
5.150%, 5/1/30 | 1,063,000 | 1,238 | ||||||
5.705%, 5/1/40 | 646,000 | 830 | ||||||
5.805%, 5/1/50 | 717,000 | 971 | ||||||
Canadian Pacific Railway Co. | 7,908,000 | 7,917 | ||||||
1.750%, 12/2/26 | 2,634,000 | 2,643 | ||||||
2.450%, 12/2/31 | 2,107,000 | 2,148 | ||||||
3.000%, 12/2/41 | 844,000 | 863 | ||||||
3.100%, 12/2/51 | 1,369,000 | 1,408 | ||||||
Crowley Conro LLC | 1,342,581 | 1,558 | ||||||
GE Capital International Funding Co. Unlimited Co. | 2,475,000 | 2,954 | ||||||
Howmet Aerospace, Inc. | 3,146,000 | 3,150 | ||||||
John Deere Capital Corp. | 3,259,000 | 3,261 | ||||||
1.200%, 4/6/23 | 2,509,000 | 2,528 | ||||||
Northrop Grumman Corp. | 3,108,000 | 3,215 | ||||||
3.250%, 1/15/28 | 1,918,000 | 2,053 | ||||||
Union Pacific Corp. | 1,684,000 | 1,727 | ||||||
2.400%, 2/5/30 | 2,086,000 | 2,126 | ||||||
|
| |||||||
Total | 53,180 | |||||||
|
| |||||||
| Corporate Bonds (31.0%) | Shares/ Par + | Value $ (000’s) | ||||||
Technology (2.6%) | ||||||||
Analog Devices, Inc. | 1,597,000 | 1,592 | ||||||
2.100%, 10/1/31 | 2,124,000 | 2,128 | ||||||
Apple, Inc. | 4,254,000 | 4,166 | ||||||
1.700%, 8/5/31 | 3,189,000 | 3,112 | ||||||
2.375%, 2/8/41 | 866,000 | 840 | ||||||
2.550%, 8/20/60 | 2,494,000 | 2,342 | ||||||
2.650%, 5/11/50 | 2,624,000 | 2,580 | ||||||
2.650%, 2/8/51 | 2,662,000 | 2,617 | ||||||
2.850%, 8/5/61 | 2,124,000 | 2,128 | ||||||
Broadcom Corp. / Broadcom Cayman Finance, Ltd. | 803,000 | 871 | ||||||
Broadcom, Inc. | 1,858,000 | 1,822 | ||||||
3.150%, 11/15/25 | 1,391,000 | 1,456 | ||||||
3.419%, 4/15/33 144A | 4,449,000 | 4,664 | ||||||
3.469%, 4/15/34 144A | 2,744,000 | 2,872 | ||||||
4.150%, 11/15/30 | 1,891,000 | 2,097 | ||||||
Dell International LLC / EMC Corp. | 2,640,000 | 2,610 | ||||||
3.450%, 12/15/51 144A | 3,168,000 | 3,042 | ||||||
4.900%, 10/1/26 | 543,000 | 612 | ||||||
6.100%, 7/15/27 | 1,080,000 | 1,288 | ||||||
8.350%, 7/15/46 | 282,000 | 469 | ||||||
HP, Inc. | 3,423,000 | 3,494 | ||||||
Intel Corp. | 2,678,000 | 2,646 | ||||||
2.000%, 8/12/31 | 3,133,000 | 3,112 | ||||||
2.800%, 8/12/41 | 1,710,000 | 1,706 | ||||||
3.200%, 8/12/61 | 863,000 | 884 | ||||||
KLA-Tencor Corp. | 1,240,000 | 1,325 | ||||||
NXP BV / NXP Funding LLC / NXP USA, Inc. | 1,058,000 | 1,113 | ||||||
3.250%, 5/11/41 144A | 1,163,000 | 1,202 | ||||||
3.875%, 6/18/26 144A | 4,547,000 | 4,907 | ||||||
Oracle Corp. | 1,846,000 | 1,903 | ||||||
3.650%, 3/25/41 | 1,103,000 | 1,115 | ||||||
3.950%, 3/25/51 | 2,337,000 | 2,426 | ||||||
Texas Instruments, Inc. | 1,063,000 | 1,053 | ||||||
VMware, Inc. | 5,275,000 | 5,238 | ||||||
1.000%, 8/15/24 | 3,694,000 | 3,658 | ||||||
1.400%, 8/15/26 | 4,221,000 | 4,148 | ||||||
1.800%, 8/15/28 | 2,320,000 | 2,258 | ||||||
3.900%, 8/21/27 | 423,000 | 460 | ||||||
4.700%, 5/15/30 | 2,135,000 | 2,485 | ||||||
|
| |||||||
Total | 88,441 | |||||||
|
| |||||||
Utilities (2.3%) | ||||||||
AES Corp. | 2,293,000 | 2,225 | ||||||
American Transmission Systems, Inc. | 738,000 | 745 | ||||||
Baltimore Gas & Electric Co. | 1,586,000 | 1,587 | ||||||
The Accompanying Notes are an Integral Part of the Financial Statements.
143
Table of Contents
Select Bond Portfolio
| Corporate Bonds (31.0%) | Shares/ Par + | Value $ (000’s) | ||||||
Utilities continued | ||||||||
Black Hills Corp. | 955,000 | 1,045 | ||||||
Comision Federal de Electricidad | 1,196,000 | 1,173 | ||||||
Consumers Energy Co. | 901,000 | 794 | ||||||
2.650%, 8/15/52 | 1,167,000 | 1,135 | ||||||
Dominion Energy, Inc. | 1,347,000 | 1,331 | ||||||
DTE Electric Co. | 1,853,000 | 1,867 | ||||||
DTE Energy Co. | 1,112,000 | 1,090 | ||||||
2.950%, 3/1/30 | 1,422,000 | 1,458 | ||||||
Duke Energy Carolinas LLC | 1,076,000 | 1,105 | ||||||
Duke Energy Corp. | 4,232,000 | 4,237 | ||||||
3.500%, 6/15/51 | 635,000 | 656 | ||||||
Duke Energy Florida LLC | 1,582,000 | 1,601 | ||||||
Duke Energy Progress LLC | 1,597,000 | 1,475 | ||||||
Entergy Arkansas LLC | 1,423,000 | 1,322 | ||||||
Eversource Energy | 1,607,000 | 1,575 | ||||||
Florida Power & Light Co. | 527,000 | 534 | ||||||
Interstate Power & Light Co. | 132,000 | 131 | ||||||
3.500%, 9/30/49 | 654,000 | 701 | ||||||
ITC Holdings Corp. | 2,151,000 | 2,184 | ||||||
Jersey Central Power & Light Co. | 1,739,000 | 1,762 | ||||||
Metropolitan Edison Co. | 2,380,000 | 2,647 | ||||||
MidAmerican Energy Co. | 1,375,000 | 1,335 | ||||||
Mississippi Power Co. | 1,902,000 | 1,876 | ||||||
3.950%, 3/30/28 | 2,624,000 | 2,874 | ||||||
4.250%, 3/15/42 | 727,000 | 833 | ||||||
Northern States Power Co. | 1,069,000 | 1,133 | ||||||
NSTAR Electric Co. | 977,000 | 1,024 | ||||||
Oncor Electric Delivery Co. LLC | 1,019,000 | 980 | ||||||
Pacific Gas & Electric Co. | 2,054,000 | 1,983 | ||||||
3.950%, 12/1/47 | 2,386,000 | 2,298 | ||||||
4.200%, 6/1/41 | 917,000 | 923 | ||||||
4.500%, 7/1/40 | 543,000 | 565 | ||||||
4.750%, 2/15/44 | 532,000 | 552 | ||||||
4.950%, 7/1/50 | 2,140,000 | 2,331 | ||||||
PacifiCorp | 1,369,000 | 1,343 | ||||||
| Corporate Bonds (31.0%) | Shares/ Par + | Value $ (000’s) | ||||||
Utilities continued | ||||||||
PECO Energy Co. 2.850%, 9/15/51 | 1,912,000 | 1,893 | ||||||
Pennsylvania Electric Co. 3.250%, 3/15/28 144A | 1,542,000 | 1,613 | ||||||
Piedmont Natural Gas Company, Inc. 2.500%, 3/15/31 | 1,597,000 | 1,596 | ||||||
Public Service Company of Colorado 1.875%, 6/15/31 | 2,439,000 | 2,371 | ||||||
Public Service Company of Oklahoma | 1,607,000 | 1,578 | ||||||
3.150%, 8/15/51 | 1,070,000 | 1,078 | ||||||
Public Service Electric & Gas Co. | 2,124,000 | 2,067 | ||||||
2.050%, 8/1/50 | 441,000 | 373 | ||||||
2.700%, 5/1/50 | 1,065,000 | 1,028 | ||||||
Public Service Enterprise Group, Inc. | 1,220,000 | 1,131 | ||||||
2.450%, 11/15/31 | 2,471,000 | 2,442 | ||||||
Southern California Edison Co. 4.125%, 3/1/48 | 1,189,000 | 1,334 | ||||||
Southern Co. Gas Capital Corp. 1.750%, 1/15/31 | 1,673,000 | 1,567 | ||||||
Southwestern Electric Power Co. 3.250%, 11/1/51 | 830,000 | 823 | ||||||
Trans-Allegheny Interstate Line Co. | 750,000 | 794 | ||||||
Virginia Electric & Power Co. 2.450%, 12/15/50 | 615,000 | 567 | ||||||
WEC Energy Group, Inc. | 2,689,000 | 2,661 | ||||||
1.375%, 10/15/27 | 1,543,000 | 1,488 | ||||||
|
| |||||||
Total | 80,834 | |||||||
|
| |||||||
Total Corporate Bonds | ||||||||
(Cost: $1,062,393) | 1,062,836 | |||||||
|
| |||||||
| Governments (37.6%) | ||||||||
Governments (37.6%) | ||||||||
Abu Dhabi Government International Bond | 717,000 | 717 | ||||||
Colombia Government International Bond | 3,090,000 | 2,835 | ||||||
Federal Home Loan Mortgage Corp. | 6,393,000 | 5,659 | ||||||
0.000%, 12/14/29 PO | 4,007,000 | 3,512 | ||||||
Federal National Mortgage Association | 11,778,000 | 10,088 | ||||||
Japan Bank for International Cooperation | 2,974,000 | 3,028 | ||||||
Republic of Italy Government International Bond | 3,369,000 | 3,598 | ||||||
Republic of Paraguay | 612,000 | 687 | ||||||
5.400%, 3/30/50 144A | 1,824,000 | 2,082 | ||||||
Republic of Peru | 2,221,000 | 2,254 | ||||||
2.783%, 1/23/31 | 4,204,000 | 4,183 | ||||||
3.000%, 1/15/34 | 3,737,000 | 3,722 | ||||||
3.600%, 1/15/72 | 2,352,000 | 2,293 | ||||||
United Mexican States | 2,962,000 | 2,663 | ||||||
The Accompanying Notes are an Integral Part of the Financial Statements.
144
Table of Contents
Select Bond Portfolio
| Governments (37.6%) | Shares/ Par + | Value $ (000’s) | ||||||
Governments continued | ||||||||
4.280%, 8/14/41 | 4,847,000 | 5,023 | ||||||
4.500%, 1/31/50 | 379,000 | 402 | ||||||
4.500%, 4/22/29 | 3,887,000 | 4,325 | ||||||
4.750%, 3/8/44 | 1,304,000 | 1,420 | ||||||
US Treasury | 10,084,000 | 10,082 | ||||||
0.125%, 9/30/22 | 16,289,000 | 16,267 | ||||||
0.125%, 12/31/22 | 42,449,000 | 42,318 | ||||||
0.125%, 3/31/23 | 47,589,000 | 47,370 | ||||||
0.125%, 8/31/23 | 1,128,000 | 1,118 | ||||||
0.125%, 1/15/24 | 20,483,000 | 20,225 | ||||||
0.250%, 5/15/24 | 31,874,000 | 31,439 | ||||||
0.250%, 6/15/24 | 28,465,000 | 28,046 | ||||||
0.250%, 8/31/25 | 18,823,000 | 18,234 | ||||||
0.250%, 10/31/25 | 34,529,000 | 33,373 | ||||||
0.375%, 10/31/23 | 6,685,000 | 6,646 | ||||||
0.375%, 4/15/24 | 23,567,000 | 23,330 | ||||||
0.375%, 11/30/25 | 41,731,000 | 40,471 | ||||||
0.375%, 12/31/25 | 52,938,000 | 51,313 | ||||||
0.375%, 1/31/26 | 28,542,000 | 27,612 | ||||||
0.500%, 2/28/26 | 44,380,000 | 43,120 | ||||||
0.500%, 8/31/27 | 25,638,000 | 24,463 | ||||||
0.625%, 12/31/23 b | 57,614,000 | 57,625 | ||||||
0.750%, 11/15/24 | 8,845,000 | 8,795 | ||||||
0.750%, 5/31/26 | 50,687,000 | 49,645 | ||||||
0.875%, 12/15/24 b | 65,991,000 | 66,063 | ||||||
0.875%, 6/30/26 | 40,028,000 | 39,393 | ||||||
0.875%, 9/30/26 | 34,235,000 | 33,624 | ||||||
1.125%, 5/15/40 | 54,471,000 | 47,743 | ||||||
1.125%, 8/15/40 | 36,259,000 | 31,659 | ||||||
1.125%, 12/31/26 | 44,648,000 | 44,599 | ||||||
1.375%, 11/15/31 | 52,951,000 | 52,281 | ||||||
1.375%, 11/15/40 | 59,347,000 | 54,085 | ||||||
1.375%, 8/15/50 | 16,828,000 | 14,741 | ||||||
1.375%, 10/31/28 | 13,622,000 | 13,567 | ||||||
1.375%, 12/31/28 | 33,522,000 | 33,370 | ||||||
1.500%, 9/30/24 | 1,248,000 | 1,268 | ||||||
1.500%, 11/30/28 | 4,083,000 | 4,099 | ||||||
1.625%, 11/15/50 | 15,650,000 | 14,581 | ||||||
1.750%, 8/15/41 b | 56,979,000 | 55,243 | ||||||
1.875%, 2/15/41 | 12,392,000 | 12,266 | ||||||
1.875%, 11/15/51 | 14,269,000 | 14,155 | ||||||
2.000%, 11/15/41 | 36,366,000 | 36,781 | ||||||
2.000%, 8/15/51 | 27,122,000 | 27,647 | ||||||
2.125%, 5/15/25 | 25,935,000 | 26,846 | ||||||
2.250%, 5/15/41 | 17,861,000 | 18,760 | ||||||
2.500%, 2/15/45 | 7,522,000 | 8,272 | ||||||
|
| |||||||
Total | 1,291,026 | |||||||
|
| |||||||
Total Governments | ||||||||
(Cost: $1,306,508) | 1,291,026 | |||||||
|
| |||||||
| Municipal Bonds (0.4%) | ||||||||
Municipal Bonds (0.4%) | ||||||||
County of Clark Department of Aviation | 1,780,000 | 2,794 | ||||||
North Texas Tollway Authority, Series 2009-B | 1,950,000 | 3,295 | ||||||
The Ohio State University | 1,070,000 | 1,618 | ||||||
Port Authority of New York & New Jersey | 3,110,000 | 4,122 | ||||||
| Municipal Bonds (0.4%) | Shares/ Par + | Value $ (000’s) | ||||||
Municipal Bonds continued | ||||||||
The University of Texas System | 925,000 | 915 | ||||||
|
| |||||||
Total Municipal Bonds | ||||||||
(Cost: $10,521) | 12,744 | |||||||
|
| |||||||
| Structured Products (35.7%) | ||||||||
Asset Backed Securities (7.7%) | ||||||||
American Express Credit Account Master Trust, Series 2021-1, Class A 0.900%, 11/16/26 | 10,902,000 | 10,813 | ||||||
AmeriCredit Automobile Receivables Trust, Series 2020-2, Class A2A 0.600%, 12/18/23 | 547,840 | 548 | ||||||
Avis Budget Rental Car Funding AESOP LLC, Series 2019-3A, Class A 2.360%, 3/20/26 144A | 2,229,000 | 2,278 | ||||||
Avis Budget Rental Car Funding AESOP LLC, Series 2020-1A, Class A 2.330%, 8/20/26 144A | 2,436,000 | 2,494 | ||||||
Avis Budget Rental Car Funding AESOP LLC, Series 2021-2A, Class A 1.660%, 2/20/28 144A | 4,820,000 | 4,776 | ||||||
Capital One Multi-Asset Execution Trust, Series 2021-A2, Class A2 1.390%, 7/15/30 | 3,405,000 | 3,348 | ||||||
College Avenue Student Loans LLC, Series 2017-A, Class A1 1.753%, (ICE LIBOR USD 1 Month plus 1.650%), 11/26/46 144A | 1,025,577 | 1,037 | ||||||
College Avenue Student Loans LLC, Series 2018-A, Class A2 4.130%, 12/26/47 144A | 871,811 | 904 | ||||||
College Avenue Student Loans LLC, Series 2019-A, Class A2 3.280%, 12/28/48 144A | 1,639,054 | 1,686 | ||||||
College Avenue Student Loans LLC, Series 2021-A, Class A2 1.600%, 7/25/51 144A | 2,203,737 | 2,160 | ||||||
Ford Credit Auto Owner Trust, Series 2018-1, Class A 3.190%, 7/15/31 144A | 1,949,000 | 2,053 | ||||||
Hertz Vehicle Financing II LP, Series 2021-2A, Class A 1.680%, 12/27/27 144A | 4,174,000 | 4,111 | ||||||
Hyundai Auto Receivables Trust, Series 2021- C, Class A4 1.030%, 12/15/27 | 1,869,000 | 1,853 | ||||||
Mercedes-Benz Auto Receivables Trust, Series 2021-1, Class A3 0.460%, 6/15/26 | 2,839,000 | 2,806 | ||||||
Navient Private Education Loan Trust, Series 2014-AA, Class A3 1.710%, (ICE LIBOR USD 1 Month plus 1.600%), 10/15/31 144A | 1,539,000 | 1,564 | ||||||
Navient Private Education Refi Loan Trust, Series 2018-C, Class A2 3.520%, 6/16/42 144A | 273,188 | 277 | ||||||
Navient Private Education Refi Loan Trust, Series 2018-DA, Class A2A 4.000%, 12/15/59 144A | 2,660,530 | 2,760 | ||||||
The Accompanying Notes are an Integral Part of the Financial Statements.
145
Table of Contents
Select Bond Portfolio
| Structured Products (35.7%) | Shares/ Par + | Value $ (000’s) | ||||||
Asset Backed Securities continued | ||||||||
Navient Private Education Refi Loan Trust, Series 2019-A, Class A2A 3.420%, 1/15/43 144A | 2,953,548 | 3,015 | ||||||
Navient Private Education Refi Loan Trust, Series 2019-C, Class A2 3.130%, 2/15/68 144A | 2,213,558 | 2,256 | ||||||
Navient Private Education Refi Loan Trust, Series 2019-D, Class A2A 3.010%, 12/15/59 144A | 4,554,528 | 4,686 | ||||||
Navient Private Education Refi Loan Trust, Series 2020-BA, Class A2 2.120%, 1/15/69 144A | 1,776,708 | 1,796 | ||||||
Navient Private Education Refi Loan Trust, Series 2020-DA, Class A 1.690%, 5/15/69 144A | 1,211,082 | 1,212 | ||||||
Navient Private Education Refi Loan Trust, Series 2020-GA, Class A 1.170%, 9/16/69 144A | 3,930,318 | 3,912 | ||||||
Navient Private Education Refi Loan Trust, Series 2021-A, Class A 0.840%, 5/15/69 144A | 859,467 | 849 | ||||||
Navient Private Education Refi Loan Trust, Series 2021-FA, Class A 1.110%, 2/18/70 144A | 8,510,301 | 8,366 | ||||||
Navient Student Loan Trust, Series 2016-AA, Class A2B 2.260%, (ICE LIBOR USD 1 Month plus 2.150%), 12/15/45 144A | 811,055 | 832 | ||||||
Navient Student Loan Trust, Series 2019-BA, Class A2A 3.390%, 12/15/59 144A | 3,526,242 | 3,632 | ||||||
Navient Student Loan Trust, Series 2019-FA, Class A2 2.600%, 8/15/68 144A | 3,007,312 | 3,046 | ||||||
Navient Student Loan Trust, Series 2019-GA, Class A 2.400%, 10/15/68 144A | 1,479,752 | 1,501 | ||||||
Navient Student Loan Trust, Series 2020-EA, Class A 1.690%, 5/15/69 144A | 356,228 | 356 | ||||||
Navient Student Loan Trust, Series 2020-HA, Class A 1.310%, 1/15/69 144A | 1,848,814 | 1,841 | ||||||
Navient Student Loan Trust, Series 2020-IA, Class A1A 1.330%, 4/15/69 144A | 6,790,406 | 6,689 | ||||||
Navient Student Loan Trust, Series 2021-3A, Class A1A 1.770%, 8/25/70 144A | 4,185,880 | 4,140 | ||||||
Navient Student Loan Trust, Series 2021-BA, Class A 0.940%, 7/15/69 144A | 1,121,709 | 1,110 | ||||||
Navient Student Loan Trust, Series 2021-CA, Class A 1.060%, 10/15/69 144A | 4,647,289 | 4,579 | ||||||
Navient Student Loan Trust, Series 2021-EA, Class A 0.970%, 12/16/69 144A | 7,445,197 | 7,318 | ||||||
Navient Student Loan Trust, Series 2021-GA, Class A 1.580%, 4/15/70 144A | 3,776,000 | 3,762 | ||||||
| Structured Products (35.7%) | Shares/ Par + | Value $ (000’s) | ||||||
Asset Backed Securities continued | ||||||||
Nelnet Student Loan Trust, Series 2004-3, Class A5 0.304%, (ICE LIBOR USD 3 Month plus 0.180%), 10/27/36 | 556,859 | 549 | ||||||
Nelnet Student Loan Trust, Series 2004-4, Class A5 0.284%, (ICE LIBOR USD 3 Month plus 0.160%), 1/25/37 | 2,811,847 | 2,780 | ||||||
Nelnet Student Loan Trust, Series 2005-1, Class A5 0.234%, (ICE LIBOR USD 3 Month plus 0.110%), 10/25/33 | 8,307,242 | 8,206 | ||||||
Nelnet Student Loan Trust, Series 2005-2, Class A5 0.314%, (ICE LIBOR USD 3 Month plus 0.100%), 3/23/37 | 7,951,822 | 7,825 | ||||||
Nelnet Student Loan Trust, Series 2005-3, Class A5 0.334%, (ICE LIBOR USD 3 Month plus 0.120%), 12/24/35 | 6,148,616 | 6,084 | ||||||
Nelnet Student Loan Trust, Series 2005-4, Class A4 0.394%, (ICE LIBOR USD 3 Month plus 0.180%), 3/22/32 | 1,051,552 | 1,022 | ||||||
Santander Drive Auto Receivables Trust, Series 2020-3, Class A3 0.520%, 7/15/24 | 649,014 | 649 | ||||||
Santander Drive Auto Receivables Trust, Series 2020-4, Class A3 0.480%, 7/15/24 | 1,324,566 | 1,325 | ||||||
Santander Retail Auto Lease Trust, Series 2020-1, Class A3 2.030%, 2/15/24 | 25,827 | 26 | ||||||
SLM Student Loan Trust, Series 2003-1, Class A5C 0.953%, (ICE LIBOR USD 3 Month plus 0.750%), 12/15/32 144A | 1,228,053 | 1,215 | ||||||
SLM Student Loan Trust, Series 2003-10A, Class A4 0.873%, (ICE LIBOR USD 3 Month plus 0.670%), 12/17/68 144A | 5,473,000 | 5,470 | ||||||
SLM Student Loan Trust, Series 2007-2, Class A4 0.184%, (ICE LIBOR USD 3 Month plus 0.060%), 7/25/22 | 8,165,370 | 7,938 | ||||||
SLM Student Loan Trust, Series 2012-1, Class A3 1.042%, (ICE LIBOR USD 1 Month plus 0.950%), 9/25/28 | 5,315,311 | 5,267 | ||||||
SLM Student Loan Trust, Series 2012-2, Class A 0.792%, (ICE LIBOR USD 1 Month plus 0.700%), 1/25/29 | 4,587,079 | 4,478 | ||||||
SLM Student Loan Trust, Series 2012-6, Class A3 0.842%, (ICE LIBOR USD 1 Month plus 0.750%), 5/26/26 | 1,997,764 | 1,962 | ||||||
SMB Private Education Loan Trust, Series 2016-A, Class A2A 2.700%, 5/15/31 144A | 2,228,118 | 2,257 | ||||||
The Accompanying Notes are an Integral Part of the Financial Statements.
146
Table of Contents
Select Bond Portfolio
| Structured Products (35.7%) | Shares/ Par + | Value $ (000’s) | ||||||
Asset Backed Securities continued | ||||||||
SMB Private Education Loan Trust, Series 2016-B, Class A2A 2.430%, 2/17/32 144A | 1,140,029 | 1,155 | ||||||
SMB Private Education Loan Trust, Series 2016-B, Class A2B 1.560%, (ICE LIBOR USD 1 Month plus 1.450%), 2/17/32 144A | 1,070,327 | 1,083 | ||||||
SMB Private Education Loan Trust, Series 2016-C, Class A2B 1.210%, (ICE LIBOR USD 1 Month plus 1.100%), 9/15/34 144A | 1,169,942 | 1,179 | ||||||
SMB Private Education Loan Trust, Series 2018-C, Class A2A 3.630%, 11/15/35 144A | 1,435,360 | 1,489 | ||||||
SMB Private Education Loan Trust, Series 2019-A, Class A2A 3.440%, 7/15/36 144A | 5,974,113 | 6,168 | ||||||
SMB Private Education Loan Trust, Series 2020-BA, Class A1A 1.290%, 7/15/53 144A | 3,966,358 | 3,921 | ||||||
SMB Private Education Loan Trust, Series 2020-PTA, Class A2A 1.600%, 9/15/54 144A | 3,980,295 | 3,948 | ||||||
SMB Private Education Loan Trust, Series 2021-A, Class APT1 1.070%, 1/15/53 144A | 9,119,408 | 8,876 | ||||||
SMB Private Education Loan Trust, Series 2021-BA, Class 144A 1.310%, 7/17/51 144A | 4,862,332 | 4,823 | ||||||
SMB Private Education Loan Trust, Series 2021-C, Class A2 0.890%, (ICE LIBOR USD 1 Month plus 0.800%), 1/15/53 144A | 4,242,000 | 4,236 | ||||||
SMB Private Education Loan Trust, Series 2021-D, Class A1A 1.340%, 3/17/53 144A | 7,517,719 | 7,399 | ||||||
SMB Private Education Loan Trust, Series 2021-E, Class A1A 1.680%, 2/15/51 144A | 5,371,000 | 5,325 | ||||||
SMB Private Education Loan Trust, Series 2020-PTB, Class A2A 1.600%, 9/15/54 144A | 11,509,084 | 11,344 | ||||||
SoFi Professional Loan Program LLC, Series 2016-A, Class A2 2.760%, 12/26/36 144A | 431,521 | 433 | ||||||
SoFi Professional Loan Program LLC, Series 2016-D, Class A1 1.053%, (ICE LIBOR USD 1 Month plus 0.950%), 1/25/39 144A | 81,441 | 82 | ||||||
SoFi Professional Loan Program LLC, Series 2016-E, Class A1 0.953%, (ICE LIBOR USD 1 Month plus 0.850%), 7/25/39 144A | 84,310 | 84 | ||||||
SoFi Professional Loan Program LLC, Series 2017-A, Class A1 0.803%, (ICE LIBOR USD 1 Month plus 0.700%), 3/26/40 144A | 130,449 | 131 | ||||||
SoFi Professional Loan Program LLC, Series 2017-D, Class A2FX 2.650%, 9/25/40 144A | 104,263 | 105 | ||||||
| Structured Products (35.7%) | Shares/ Par + | Value $ (000’s) | ||||||
Asset Backed Securities continued | ||||||||
SoFi Professional Loan Program LLC, Series 2017-E, Class A1 0.603%, (ICE LIBOR USD 1 Month plus 0.500%), 11/26/40 144A | 33,216 | 33 | ||||||
SoFi Professional Loan Program LLC, Series 2017-E, Class A2B 2.720%, 11/26/40 144A | 1,505,933 | 1,522 | ||||||
SoFi Professional Loan Program LLC, Series 2018-A, Class A2B 2.950%, 2/25/42 144A | 712,045 | 722 | ||||||
SoFi Professional Loan Program LLC, Series 2018-B, Class A2FX 3.340%, 8/26/47 144A | 2,109,647 | 2,146 | ||||||
SoFi Professional Loan Program LLC, Series 2020-C, Class AFX 1.950%, 2/15/46 144A | 2,599,390 | 2,617 | ||||||
SoFi Professional Loan Program LLC, Series 2021-A, Class AFX 1.030%, 8/17/43 144A | 1,416,716 | 1,397 | ||||||
SoFi Professional Loan Program LLC, Series 2021-B, Class AFX 1.140%, 2/15/47 144A | 3,094,708 | 3,040 | ||||||
Toyota Auto Loan Extended Note Trust, Series 2021-1A, Class A 1.070%, 2/27/34 144A | 4,921,000 | 4,827 | ||||||
Toyota Auto Receivables Owner Trust, Series 2021-D, Class A4 1.020%, 3/15/27 | 2,005,000 | 1,985 | ||||||
Triton Container Finance VIII LLC, Series 2020-1A, Class A 2.110%, 9/20/45 144A | 1,249,463 | 1,239 | ||||||
Verizon Owner Trust, Series 2021-1, Class A | 5,328,000 | 5,259 | ||||||
Verizon Owner Trust, Series 2021-2, Class A | 8,588,000 | 8,545 | ||||||
|
| |||||||
Total | 262,532 | |||||||
|
| |||||||
Mortgage Securities (28.0%) | ||||||||
3650R Commercial Mortgage Trust, Series 2021-PF1, Class A5 2.522%, 11/15/54 | 1,584,000 | 1,608 | ||||||
Angel Oak Mortgage Trust LLC, Series 2019- 2, Class A1 3.628%, (AFC), 3/25/49 144A | 253,971 | 255 | ||||||
Angel Oak Mortgage Trust LLC, Series 2020- 2, Class A1A 2.531%, (AFC), 1/26/65 144A | 1,514,369 | 1,519 | ||||||
Angel Oak Mortgage Trust LLC, Series 2020- 5, Class A1 1.373%, (AFC), 5/25/65 144A | 561,987 | 561 | ||||||
Angel Oak Mortgage Trust LLC, Series 2021-6 Class A1 1.458%, (AFC), 9/25/66 144A | 2,149,137 | 2,129 | ||||||
Barclays Commercial Mortgage Trust, Series 2018-C2, Class ASB 4.236%, 12/15/51 | 729,000 | 801 | ||||||
Barclays Commercial Mortgage Trust, Series 2019-C3, Class A3 3.319%, 5/15/52 | 363,000 | 388 | ||||||
The Accompanying Notes are an Integral Part of the Financial Statements.
147
Table of Contents
Select Bond Portfolio
| Structured Products (35.7%) | Shares/ Par + | Value $ (000’s) | ||||||
Mortgage Securities continued | ||||||||
BBCMS Mortgage Trust, Series 2021-C12, Class A5 2.689%, 11/15/54 | 2,122,000 | 2,200 | ||||||
Benchmark Mortgage Trust, Series 2021-B31, Class A5 2.669%, 12/15/54 | 1,065,000 | 1,104 | ||||||
Bunker Hill Loan Depositary Trust, Series 2019-2, Class A1 2.879%, (AFC), 7/25/49 144A S | 1,883,883 | 1,895 | ||||||
Bunker Hill Loan Depositary Trust, Series 2019-3, Class A1 2.724%, (AFC), 11/25/59 144A S | 1,254,723 | 1,264 | ||||||
BX Commercial Mortgage Trust, Series 2021- VOLT, Class A 0.810%, (ICE LIBOR USD 1 Month plus 0.700%), 9/15/36 144A | 6,842,000 | 6,819 | ||||||
BX Commercial Mortgage Trust, Series 2021- XL2, Class A 0.799%, (ICE LIBOR USD 1 Month plus 0.689%), 10/15/38 144A | 3,399,000 | 3,378 | ||||||
CD Mortgage Trust, Series 2019-CD8, Class A4 2.912%, 8/15/57 | 1,349,000 | 1,416 | ||||||
CFCRE Commercial Mortgage Trust, Series 2017-C8, Class ASB 3.367%, 6/15/50 | 1,013,000 | 1,061 | ||||||
Citigroup Mortgage Loan Trust, Series 2005-1, Class 3A1 6.500%, 4/25/35 | 88,503 | 94 | ||||||
COLT Funding LLC, Series 2021-2, Class A1 0.924%, (AFC), 8/25/66 144A | 2,654,247 | 2,617 | ||||||
COLT Funding LLC, Series 2021-4, Class A1 1.397%, (AFC), 10/25/66 144A | 2,837,020 | 2,810 | ||||||
Commercial Mortgage Pass Through Certificates, Series 2012-CR3, Class A3 2.822%, 10/15/45 | 1,547,006 | 1,555 | ||||||
Commercial Mortgage Pass Through Certificates, Series 2013-CR10, Class A4 4.210%, (AFC), 8/10/46 | 52,000 | 54 | ||||||
Commercial Mortgage Pass Through Certificates, Series 2013-CR11, Class A4 4.258%, 8/10/50 | 6,049,000 | 6,334 | ||||||
Commercial Mortgage Pass Through Certificates, Series 2013-CR6, Class A4 3.101%, 3/10/46 | 4,482,000 | 4,527 | ||||||
Commercial Mortgage Pass Through Certificates, Series 2014-UBS4, Class A4 3.420%, 8/10/47 | 2,348,000 | 2,419 | ||||||
Commercial Mortgage Trust, Series 2015- LC21, Class A4 3.708%, 7/10/48 | 980,000 | 1,042 | ||||||
Commercial Mortgage Trust, Series 2015- LC23, Class A3 3.521%, 10/10/48 | 1,230,000 | 1,291 | ||||||
CSAIL Commercial Mortgage Trust, Series 2015-C2, Class A4 3.504%, 6/15/57 | 1,424,000 | 1,501 | ||||||
CSAIL Commercial Mortgage Trust, Series 2021-C20, Class A3 2.805%, 3/17/54 | 793,000 | 824 | ||||||
| Structured Products (35.7%) | Shares/ Par + | Value $ (000’s) | ||||||
Mortgage Securities continued | ||||||||
EQUS Mortgage Trust, Series 2021-EQAZ, Class A 0.865%, (ICE LIBOR USD 1 Month plus 0.755%), 10/15/38 144A | 2,684,000 | 2,671 | ||||||
Federal Home Loan Mortgage Corp. | 3,273,444 | 3,277 | ||||||
2.500%, 1/1/36 | 8,697,537 | 9,087 | ||||||
2.817%, (ICE LIBOR USD 12 Month plus 1.640%), 5/1/49 | 1,441,497 | 1,491 | ||||||
3.000%, 12/1/31 | 5,171,462 | 5,430 | ||||||
3.000%, 1/1/32 | 799,663 | 844 | ||||||
4.000%, 1/1/35 | 64,207 | 70 | ||||||
4.000%, 1/1/36 | 121,554 | 132 | ||||||
4.000%, 10/1/36 | 608,136 | 659 | ||||||
4.000%, 3/1/37 | 317,617 | 346 | ||||||
4.000%, 8/1/38 | 2,789,168 | 2,997 | ||||||
4.000%, 11/1/48 | 3,786,936 | 4,131 | ||||||
4.000%, 7/1/49 | 5,200,777 | 5,729 | ||||||
4.500%, 6/1/39 | 98,219 | 108 | ||||||
4.500%, 7/1/39 | 127,037 | 142 | ||||||
5.000%, 5/1/48 | 2,678,706 | 3,018 | ||||||
5.000%, 3/1/49 | 5,105,108 | 5,690 | ||||||
Federal Home Loan Mortgage Corp. Multifamily Structured Pass through Certificates, Series K136, Class A2 2.127%, 11/25/31 | 2,681,000 | 2,755 | ||||||
Federal Home Loan Mortgage Corp., Series 2012-264, Class 30 3.000%, 7/15/42 | 3,607,716 | 3,725 | ||||||
Federal Home Loan Mortgage Corp., Series 2017-4742, Class PA 3.000%, 10/15/47 | 2,966,404 | 3,031 | ||||||
Federal Home Loan Mortgage Corp., Series 2018-4767, Class KA 3.000%, 3/15/48 | 1,294,044 | 1,355 | ||||||
Federal Home Loan Mortgage Corp., Series 2439, Class LH 6.000%, 4/15/32 | 215,923 | 243 | ||||||
Federal Home Loan Mortgage Corp., Series 4205, Class PA 1.750%, 5/15/43 | 1,138,114 | 1,152 | ||||||
Federal Home Loan Mortgage Corp., Series 4426, Class QC 1.750%, 7/15/37 | 1,959,722 | 1,981 | ||||||
Federal Home Loan Mortgage Corp., Series 4705, Class A 4.500%, 9/15/42 | 237,037 | 239 | ||||||
Federal Home Loan Mortgage Corp., Series 4763, Class CA 3.000%, 9/15/38 | 547,351 | 573 | ||||||
Federal Home Loan Mortgage Corp., Series 4880, Class DA 3.000%, 5/15/50 | 2,528,481 | 2,647 | ||||||
Federal Home Loan Mortgage Corp., Series 4897, Class F 0.460%, (ICE LIBOR USD 1 Month plus 0.350%), 12/15/48 | 323,529 | 322 | ||||||
Federal Home Loan Mortgage Corp., Series 5091, Class AB 1.500%, 3/25/51 | 4,850,595 | 4,770 | ||||||
The Accompanying Notes are an Integral Part of the Financial Statements.
148
Table of Contents
Select Bond Portfolio
| Structured Products (35.7%) | Shares/ Par + | Value $ (000’s) | ||||||
Mortgage Securities continued | ||||||||
Federal Home Loan Mortgage Corp., Series 5119, Class AB 1.500%, 8/25/49 | 2,352,073 | 2,326 | ||||||
Federal National Mortgage Association | 4,541,382 | 4,532 | ||||||
2.000%, 9/1/30 | 1,109,746 | 1,137 | ||||||
2.000%, 5/1/31 | 3,008,299 | 3,083 | ||||||
2.000%, 4/1/51 | 6,559,169 | 6,565 | ||||||
2.292%, (ICE LIBOR USD 12 Month plus 1.578%), 6/1/45 | 1,115,282 | 1,156 | ||||||
2.500%, 12/1/35 | 8,215,880 | 8,615 | ||||||
2.500%, 2/1/36 | 6,019,341 | 6,267 | ||||||
2.500%, 3/1/36 | 12,316,298 | 12,907 | ||||||
2.500%, 4/1/36 | 1,784,765 | 1,872 | ||||||
2.500%, 5/1/36 | 12,554,570 | 13,129 | ||||||
2.500%, 6/1/36 | 5,955,335 | 6,245 | ||||||
2.695%, (ICE LIBOR USD 12 Month plus 1.585%), 1/1/46 | 3,504,668 | 3,634 | ||||||
3.000%, 1/1/43 | 2,984,427 | 3,160 | ||||||
3.000%, 12/1/54 | 14,128,162 | 14,927 | ||||||
3.000%, 2/1/55 | 1,480,987 | 1,555 | ||||||
3.000%, 7/1/60 | 31,295,531 | 33,150 | ||||||
4.000%, 9/1/33 | 1,020,607 | 1,082 | ||||||
4.000%, 12/1/36 | 114,442 | 124 | ||||||
4.000%, 10/1/37 | 715,797 | 771 | ||||||
4.000%, 9/1/45 | 616,959 | 680 | ||||||
4.000%, 1/1/46 | 3,036,922 | 3,373 | ||||||
4.000%, 2/1/47 | 1,741,551 | 1,900 | ||||||
4.000%, 4/1/47 | 807,978 | 886 | ||||||
4.000%, 10/1/47 | 572,602 | 633 | ||||||
4.000%, 7/1/48 | 9,605,989 | 10,496 | ||||||
4.000%, 9/1/48 | 1,865,948 | 2,031 | ||||||
4.000%, 10/1/48 | 1,583,146 | 1,723 | ||||||
4.000%, 11/1/48 | 1,708,242 | 1,865 | ||||||
4.000%, 12/1/48 | 1,593,464 | 1,772 | ||||||
4.000%, 2/1/49 | 2,716,855 | 2,969 | ||||||
4.000%, 5/1/49 | 1,526,141 | 1,677 | ||||||
4.000%, 12/1/49 | 1,539,873 | 1,680 | ||||||
4.000%, 8/1/59 | 1,994,886 | 2,225 | ||||||
4.500%, 5/1/34 | 42,337 | 46 | ||||||
4.500%, 6/1/41 | 96,745 | 108 | ||||||
4.500%, 3/1/43 | 1,394,864 | 1,552 | ||||||
4.500%, 10/1/45 | 2,137,521 | 2,379 | ||||||
4.500%, 2/1/46 | 69,372 | 77 | ||||||
4.500%, 7/1/48 | 2,492,553 | 2,766 | ||||||
4.500%, 8/1/48 | 3,408,353 | 3,772 | ||||||
4.500%, 10/1/48 | 2,936,240 | 3,232 | ||||||
4.500%, 11/1/48 | 1,117,887 | 1,250 | ||||||
4.500%, 1/1/49 | 5,444,593 | 6,017 | ||||||
4.500%, 2/1/49 | 2,835,791 | 3,123 | ||||||
4.500%, 6/1/49 | 2,333,878 | 2,581 | ||||||
4.500%, 7/1/49 | 2,349,325 | 2,600 | ||||||
4.500%, 8/1/49 | 2,120,243 | 2,335 | ||||||
4.500%, 4/1/50 | 1,727,925 | 1,940 | ||||||
5.000%, 7/1/44 | 130,990 | 145 | ||||||
5.000%, 10/1/48 | 527,707 | 594 | ||||||
5.000%, 12/1/48 | 1,618,453 | 1,792 | ||||||
5.000%, 6/1/49 | 11,340,628 | 12,639 | ||||||
5.000%, 8/1/49 | 24,588,157 | 27,661 | ||||||
5.000%, 11/1/49 | 2,294,207 | 2,529 | ||||||
| Structured Products (35.7%) | Shares/ Par + | Value $ (000’s) | ||||||
Mortgage Securities continued | ||||||||
5.500%, 12/1/48 | 1,871,214 | 2,124 | ||||||
5.500%, 6/1/49 | 5,124,663 | 5,826 | ||||||
Federal National Mortgage Association Stripped, Series 414, Class A35 3.500%, 10/25/42 PO | 3,141,296 | 3,363 | ||||||
Federal National Mortgage Association, Series 2012-151, Class NX 1.500%, 1/25/43 | 1,280,968 | 1,267 | ||||||
Federal National Mortgage Association, Series 2013-11, Class AP 1.500%, 1/25/43 | 4,499,043 | 4,481 | ||||||
Federal National Mortgage Association, Series 2013-43, Class BP 1.750%, 5/25/43 | 1,503,004 | 1,518 | ||||||
Federal National Mortgage Association, Series 2014-73, Class MA 2.500%, 11/25/44 | 920,354 | 938 | ||||||
Federal National Mortgage Association, Series 2015-84, Class PA 1.700%, 8/25/33 | 5,367,378 | 5,449 | ||||||
Federal National Mortgage Association, Series 2016-48, Class MA 2.000%, 6/25/38 | 5,300,047 | 5,417 | ||||||
Federal National Mortgage Association, Series 2016-57, Class PC 1.750%, 6/25/46 | 10,116,669 | 10,067 | ||||||
Federal National Mortgage Association, Series 2017-13, Class PA 3.000%, 8/25/46 | 1,623,293 | 1,677 | ||||||
Federal National Mortgage Association, Series 2017-M7, Class A2 2.961%, (AFC), 2/25/27 | 1,064,000 | 1,126 | ||||||
Federal National Mortgage Association, Series 2018-14, Class KC 3.000%, 3/25/48 | 3,137,195 | 3,284 | ||||||
Federal National Mortgage Association, Series 2018-15, Class AB 3.000%, 3/25/48 | 677,509 | 709 | ||||||
Federal National Mortgage Association, Series 2018-8, Class KL 2.500%, 3/25/47 | 1,613,450 | 1,651 | ||||||
Federal National Mortgage Association, Series 2019-15, Class AB 3.500%, 5/25/53 | 4,537,281 | 4,853 | ||||||
Federal National Mortgage Association, Series 2019-25, Class PA 3.000%, 5/25/48 | 3,530,905 | 3,689 | ||||||
Federal National Mortgage Association, Series 2019-35, Class A 3.000%, 7/25/49 | 1,274,052 | 1,309 | ||||||
Federal National Mortgage Association, Series 2020-48, Class AB 2.000%, 7/25/50 | 2,025,142 | 2,050 | ||||||
Federal National Mortgage Association, Series 2020-48, Class DA 2.000%, 7/25/50 | 6,227,492 | 6,224 | ||||||
Federal National Mortgage Association, Series 2021-27, Class EC 1.500%, 5/25/51 | 7,795,541 | 7,697 | ||||||
Government National Mortgage Association 3.000%, 10/20/51 | 22,970,220 | 23,831 | ||||||
The Accompanying Notes are an Integral Part of the Financial Statements.
149
Table of Contents
Select Bond Portfolio
| Structured Products (35.7%) | Shares/ Par + | Value $ (000’s) | ||||||
Mortgage Securities continued | ||||||||
3.500%, 1/20/48 | 1,643,172 | 1,743 | ||||||
4.000%, 6/20/47 | 12,140,426 | 12,921 | ||||||
4.000%, 3/20/48 | 416,264 | 445 | ||||||
4.000%, 4/20/48 | 1,536,132 | 1,650 | ||||||
4.000%, 5/20/49 | 738,277 | 785 | ||||||
4.000%, 6/20/49 | 1,653,504 | 1,753 | ||||||
4.000%, 7/20/49 | 1,642,025 | 1,765 | ||||||
4.500%, 8/15/47 | 262,462 | 295 | ||||||
4.500%, 6/20/48 | 2,199,914 | 2,340 | ||||||
4.500%, 2/20/49 | 2,172,905 | 2,395 | ||||||
4.500%, 3/20/49 | 195,284 | 210 | ||||||
4.500%, 4/20/49 | 254,340 | 270 | ||||||
4.500%, 5/20/49 | 826,865 | 880 | ||||||
5.000%, 12/20/39 | 73,156 | 81 | ||||||
5.000%, 3/20/48 | 3,664,385 | 3,987 | ||||||
5.000%, 5/20/48 | 1,734,522 | 1,860 | ||||||
5.000%, 6/20/48 | 5,297,011 | 5,665 | ||||||
5.000%, 7/20/48 | 1,140,080 | 1,221 | ||||||
5.000%, 8/20/48 | 1,785,512 | 1,915 | ||||||
5.000%, 12/20/48 | 1,198,190 | 1,278 | ||||||
5.000%, 1/20/49 | 2,188,806 | 2,363 | ||||||
5.000%, 2/20/49 | 197,543 | 216 | ||||||
5.000%, 3/20/49 | 516,231 | 564 | ||||||
Government National Mortgage Association TBA 2.500%, 1/21/52 | 22,200,000 | 22,734 | ||||||
Government National Mortgage Association, Series 2012-141, Class WA 4.534%, 11/16/41 | 512,486 | 562 | ||||||
Government National Mortgage Association, Series 2017-167, Class BQ 2.500%, 8/20/44 | 1,764,646 | 1,799 | ||||||
Government National Mortgage Association, Series 2018-11, Class PC 2.750%, 12/20/47 | 2,168,286 | 2,203 | ||||||
Government National Mortgage Association, Series 2019-31, Class JC 3.500%, 3/20/49 | 1,171,919 | 1,238 | ||||||
Government National Mortgage Association, Series 2019-32, Class NA 3.500%, 9/20/49 | 1,838,527 | 1,924 | ||||||
Government National Mortgage Association, Series 2021-23, Class MG 1.500%, 2/20/51 | 5,253,619 | 5,174 | ||||||
GS Mortgage Securities Trust, Series 2013- GC14, Class A5 4.243%, 8/10/46 | 1,372,000 | 1,429 | ||||||
GS Mortgage Securities Trust, Series 2014- GC18, Class A4 4.074%, 1/10/47 | 3,116,000 | 3,254 | ||||||
GS Mortgage Securities Trust, Series 2020- GC47, Class A5 2.377%, 5/12/53 | 2,393,000 | 2,424 | ||||||
GS Mortgage Securities Trust, Series 2020- GSA2, Class A4 1.721%, 12/12/53 | 2,669,000 | 2,572 | ||||||
GS Mortgage Securities Trust, Series 2021- GSA3, Class A5 2.618%, 12/15/54 | 2,663,000 | 2,720 | ||||||
| Structured Products (35.7%) | Shares/ Par + | Value $ (000’s) | ||||||
Mortgage Securities continued | ||||||||
Impact Funding Affordable Multifamily Housing Mortgage Loan Trust, Series 2010-1, Class A1 5.314%, 1/25/51 144A | 2,793,962 | 2,908 | ||||||
JP Morgan Chase Commercial Mortgage Securities Corp., Series 2016-JP4, Class A3 3.392%, 12/15/49 | 674,000 | 707 | ||||||
JP Morgan Chase Commercial Mortgage Securities Trust, Series 2013-C12, Class A5 3.663%, 7/15/45 | 1,997,000 | 2,052 | ||||||
JP Morgan Chase Commercial Mortgage Securities Trust, Series 2013-C16, Class A4 4.166%, 12/15/46 | 2,999,000 | 3,134 | ||||||
JPMBB Commercial Mortgage Securities Trust, Series 2014-C23, Class A4 3.669%, 9/15/47 | 907,854 | 945 | ||||||
JPMBB Commercial Mortgage Securities Trust, Series 2015-C28, Class A3 2.912%, 10/15/48 | 5,537,242 | 5,618 | ||||||
MASTR Asset Securitization Trust, Series 2003-12, Class 1A1 5.250%, 12/25/24 | 41,835 | 43 | ||||||
MED Trust, Series 2021-MDLN, Class A 1.060%, (ICE LIBOR USD 1 Month plus 0.950%), 11/15/38 144A | 4,333,000 | 4,328 | ||||||
Mello Warehouse Securitization Trust, Series 2020-2, Class A 0.892%, (ICE LIBOR USD 1 Month plus 0.800%), 11/25/53 144A | 3,220,000 | 3,208 | ||||||
Mello Warehouse Securitization Trust, Series 2021-1, Class A 0.789%, (ICE LIBOR USD 1 Month plus 0.700%), 2/25/55 144A | 941,000 | 935 | ||||||
Mello Warehouse Securitization Trust, Series 2021-2, Class A 0.842%, (ICE LIBOR USD 1 Month plus 0.750%), 4/25/55 144A | 2,577,000 | 2,568 | ||||||
MFRA Trust, Series 2021-NQM2, Class A1 1.029%, (AFC), 11/25/64 144A | 1,501,104 | 1,487 | ||||||
Morgan Stanley Bank of America Merrill Lynch Trust, Series 2012-C5, Class A4 3.176%, 8/15/45 | 646,076 | 648 | ||||||
Morgan Stanley Bank of America Merrill Lynch Trust, Series 2015-C20, Class A4 3.249%, 2/15/48 | 434,000 | 453 | ||||||
Morgan Stanley Capital I Trust, Series 2020- HR8, Class A3 1.790%, 7/15/53 | 1,911,000 | 1,849 | ||||||
Morgan Stanley Capital I Trust, Series 2021- L6, Class A4 2.444%, 6/15/54 | 675,000 | 682 | ||||||
Morgan Stanley Capital I Trust, Series 2021- L7, Class A5 2.574%, 10/15/54 | 2,608,000 | 2,664 | ||||||
MSG III Securitization Trust, Series 2021-1, Class A 0.842%, (ICE LIBOR USD 1 Month plus 0.750%), 6/25/54 144A | 1,625,000 | 1,624 | ||||||
New Residential Mortgage Loan Trust, Series 2019-NQM4, Class A1 2.492%, (AFC), 9/25/59 144A | 695,099 | 697 | ||||||
The Accompanying Notes are an Integral Part of the Financial Statements.
150
Table of Contents
Select Bond Portfolio
| Structured Products (35.7%) | Shares/ Par + | Value $ (000’s) | ||||||
Mortgage Securities continued | ||||||||
NewRez Warehouse Securitization Trust, Series 2021-1, Class A 0.842%, (ICE LIBOR USD 1 Month plus 0.750%), 5/25/55 144A | 6,429,000 | 6,414 | ||||||
Residential Funding Mortgage Securities I, Series 2003-S18, Class A1 4.500%, 10/25/25 | 2,120 | 1 | ||||||
Starvest Emerging Markets CBO I, Series 2020-INV1, Class A1 1.027%, (AFC), 11/25/55 144A | 1,214,574 | 1,207 | ||||||
Starwood Mortgage Residential Trust, Series 2020-1, Class A1 2.275%, (AFC), 2/25/50 144A | 1,267,651 | 1,272 | ||||||
Starwood Mortgage Residential Trust, Series 2020-3, Class A1 1.486%, (AFC), 4/25/65 144A | 1,421,697 | 1,422 | ||||||
Starwood Mortgage Residential Trust, Series 2021-1, Class A1 1.219%, (AFC), 5/25/65 144A | 1,422,807 | 1,417 | ||||||
Starwood Mortgage Residential Trust, Series 2021-4, Class A1 1.162%, (AFC), 8/25/56 144A | 3,154,004 | 3,124 | ||||||
Uniform Mortgage Backed Security TBA | 41,900,000 | 41,771 | ||||||
2.500%, 2/12/51 | 45,800,000 | 46,611 | ||||||
2.500%, 3/11/51 b | 102,400,000 | 103,980 | ||||||
2.500%, 1/14/50 b | 103,600,000 | 105,697 | ||||||
3.000%, 2/13/48 | 20,900,000 | 21,620 | ||||||
Verus Securitization Trust, Series 2019-3, Class A1 2.784%, (AFC), 7/25/59 144A S | 1,072,447 | 1,076 | ||||||
Verus Securitization Trust, Series 2019-4, Class A1 2.642%, (AFC), 11/25/59 144A S | 1,549,690 | 1,565 | ||||||
Verus Securitization Trust, Series 2019-INV2, Class A1 2.913%, (AFC), 7/25/59 144A | 831,363 | 835 | ||||||
Verus Securitization Trust, Series 2019-INV3, Class A1 2.692%, (AFC), 11/25/59 144A | 628,496 | 635 | ||||||
Verus Securitization Trust, Series 2020-1, Class A1 2.417%, (AFC), 1/25/60 144A | 333,894 | 335 | ||||||
Verus Securitization Trust, Series 2020-2, Class A1 2.226%, (AFC), 5/25/60 144A | 1,464,825 | 1,466 | ||||||
Verus Securitization Trust, Series 2020-5, Class A1 1.218%, (AFC), 5/25/65 144A S | 518,580 | 516 | ||||||
| Structured Products (35.7%) | Shares/ Par + | Value $ (000’s) | ||||||
Mortgage Securities continued | ||||||||
Verus Securitization Trust, Series 2021-1, Class A1 0.815%, (AFC), 1/25/66 144A | 1,763,885 | 1,746 | ||||||
Verus Securitization Trust, Series 2021-2, Class A1 1.031%, (AFC), 2/25/66 144A | 3,380,561 | 3,345 | ||||||
Verus Securitization Trust, Series 2021-3, Class A1 1.046%, (AFC), 6/25/66 144A | 2,295,243 | 2,269 | ||||||
Verus Securitization Trust, Series 2021-4, Class A1 0.938%, (AFC), 7/25/66 144A | 2,533,860 | 2,484 | ||||||
Verus Securitization Trust, Series 2021-5, Class A1 1.013%, (AFC), 9/25/66 144A | 9,189,565 | 9,023 | ||||||
Verus Securitization Trust, Series 2021-7, Class A1 1.829%, (AFC), 10/25/66 144A | 3,688,950 | 3,680 | ||||||
Verus Securitization Trust, Series 2021-8, Class A1 1.824%, (AFC), 11/25/66 144A | 2,685,000 | 2,683 | ||||||
Verus Securitization Trust, Series 2021-R1, Class A1 0.820%, (AFC), 10/25/63 144A | 1,859,978 | 1,851 | ||||||
Verus Securitization Trust, Series 2021-R3, Class A1 1.020%, (AFC), 5/25/64 144A | 1,923,087 | 1,917 | ||||||
Visio Trust, Series 2020-1R, Class A1 | 1,358,287 | 1,351 | ||||||
|
| |||||||
Total | 960,414 | |||||||
|
| |||||||
Total Structured Products | ||||||||
(Cost: $1,222,463) |
| 1,222,946 | ||||||
|
| |||||||
| Short-Term Investments (6.1%) | ||||||||
Governments (1.9%) | ||||||||
US Treasury | 1,821,000 | 1,826 | ||||||
1.875%, 2/28/22 | 35,716,000 | 35,817 | ||||||
2.000%, 2/15/22 | 27,034,000 | 27,095 | ||||||
|
| |||||||
Total | 64,738 | |||||||
|
| |||||||
Money Market Funds (4.2%) | ||||||||
State Street Institutional U.S. Government Money Market Fund - Premier Class 0.030%# | 143,229,226 | 143,229 | ||||||
|
| |||||||
Total | 143,229 | |||||||
|
| |||||||
Total Short-Term Investments |
| |||||||
(Cost: $207,974) |
| 207,967 | ||||||
|
| |||||||
Total Investments (110.8%) |
| |||||||
(Cost: $3,809,859)@ | 3,797,519 | |||||||
|
| |||||||
Other Assets, Less Liabilities (-10.8%) | (369,103 | ) | ||||||
|
| |||||||
Net Assets (100.0%) | 3,428,416 | |||||||
|
| |||||||
| + | All par is stated in U.S. Dollar unless otherwise noted. |
144A Security exempt from registration under Rule 144A of the Securities Act of 1933. These securities may be resold as transactions exempt from registration, normally to qualified institutional buyers. At December 31, 2021 the value of these securities (in thousands) was $490,570 representing 14.3% of the net assets. |
| b | Cash or securities with an aggregate value of $388,608 (in thousands) has been pledged as collateral for futures, swap contracts outstanding, short sales, when issued securities or written options on 12/31/2021. |
The Accompanying Notes are an Integral Part of the Financial Statements.
151
Table of Contents
Select Bond Portfolio
| Σ | Stepped coupon bond for which the coupon rate of interest adjusts on specified date(s); rate shown is effective rate at period-end. |
| # | 7-Day yield as of 12/31/2021. |
| @ | At December 31, 2021, the aggregate cost of investments, including derivatives, for federal tax purposes (in thousands) was $3,820,837 and the net unrealized depreciation of investments based on that cost was $23,318 which is comprised of $18,843 aggregate gross unrealized appreciation and $42,161 aggregate gross unrealized depreciation. |
The following is a summary of the inputs used in valuing the Portfolio’s Investments at December 31, 2021. See Note 3 for additional information on portfolio valuation.
| Valuation Inputs | ||||||||||||||
| Description | Level 1 - Quoted Prices | Level 2 - Other Significant Observable Inputs | Level 3 - Significant Unobservable Inputs | |||||||||||
| (Amounts in thousands) | ||||||||||||||
Assets: | ||||||||||||||
Municipal Bonds | $ | - | $ | 12,744 | $ | - | ||||||||
Corporate Bonds | - | 1,062,836 | - | |||||||||||
Governments | - | 1,291,026 | - | |||||||||||
Structured Products | - | 1,222,946 | - | |||||||||||
Short-Term Investments | ||||||||||||||
Money Market Funds | 143,229 | - | - | |||||||||||
All Others | - | 64,738 | - | |||||||||||
Total Assets: | $ | 143,229 | $ | 3,654,290 | $ | - | ||||||||
The Accompanying Notes are an Integral Part of the Financial Statements.
152
Table of Contents
Long-Term U.S. Government Bond Portfolio (unaudited)
| Objective: | Portfolio Strategy: | Net Assets: | ||
| Maximum total return, consistent with preservation of capital and prudent investment management. | Invest in a diversified portfolio of fixed income securities that are issued or guaranteed by the U.S. Government, its agencies or government sponsored enterprises, and in derivatives designed to replicate such securities. | $139 million |
PORTFOLIO OVERVIEW
Mason Street Advisors, LLC (“Mason Street Advisors”), the investment adviser for the Long-Term U.S. Government Bond Portfolio (the “Portfolio”), has engaged Pacific Investment Management Company LLC (“PIMCO”) to act as sub-adviser for the Portfolio. The Portfolio primarily invests in a diversified portfolio of fixed income securities that are issued or guaranteed by the U.S. Government, its agencies or government sponsored enterprises (“U.S. Government Securities”), which may be represented by forwards or derivatives such as options, futures contracts or interest rate swap agreements. Assets not invested in U.S. Government Securities may be invested in other types of investment grade fixed income instruments, such as corporate debt securities of U.S. issuers and mortgage- and asset-backed securities, or in preferred stocks. The Portfolio will normally have minimum average portfolio duration (a measure of the sensitivity of the Portfolio’s fixed income portfolio securities to changes in interest rates) of eight years and, for point of reference, the dollar-weighted average maturity of the Portfolio, under normal circumstances, is expected to be more than ten years. The Portfolio’s investments in fixed income securities are limited to investment grade U.S. dollar denominated securities of U.S. issuers that are rated at least A by Moody’s or equivalently rated by S&P or Fitch, or, if unrated, determined by the Portfolio to be of comparable quality.
MARKET OVERVIEW
As markets adjusted to longer-than-expected pandemic-related restrictions and higher-than-expected inflation in 2021, asset class returns diverged. In the first half of 2021, global economic data continued to improve in most regions. The U.S. was a notable standout as consumer sentiment rose, the labor market improved and manufacturing rebounded strongly amid an increase in hiring and demand for goods. Inflation increased globally, while U.S. inflation in particular experienced a faster-than-expected acceleration, driven mainly by higher prices of used cars and pandemic-sensitive services. COVID-19 vaccinations continued to advance globally, although the spread of new COVID-19 variants underscored a key risk for the economic recovery, particularly in countries where vaccination rates remained low. In the second half of 2021, the global economic recovery continued at a slower pace but remained uneven across sectors. A rise in COVID-19 Delta and Omicron variant cases slowed U.S. services activity and weighed on job growth in the leisure and hospitality industries. Meanwhile, similar COVID-19 outbreaks in emerging market countries prolonged supply chain bottlenecks, particularly in the automobile industry. Equities broadly gained despite volatility related to elevated inflation risks, rising COVID-19 variant cases and expectations of multiple rate hikes in 2022. The latter contributed to rising front-end interest rates, which in turn spurred yield curve flattening. Within economies, growth remained varied across sectors given differing impacts of rising COVID-19 cases, supply chain disruptions and higher energy prices. In response to rising inflation, the central bank committed to tapering its asset purchases and signaled rate hikes in 2022.
PORTFOLIO RESULTS
The Portfolio returned (5.37%) for the twelve months ended December 31, 2021. By comparison, the Portfolio’s benchmark, the Bloomberg® Long-Term U.S. Treasury Index (the “Index”), returned (4.65%). (This Index is unmanaged, cannot be invested in directly and does not incur expenses.) According to Morningstar® Inc., an independent mutual fund ranking agency, the average return in 2021 of the Long Government peer group was (5.84%).
Tactical U.S. interest rate positioning detracted from the Portfolio’s return. The Portfolio’s duration positioning was partially implemented through the use of futures, interest rate swaps and options.
On the upside, within spread sectors, exposure to agency mortgage-backed securities and commercial mortgage-backed securities (CMBS) contributed to the Portfolio’s performance. Exposure to U.S. breakeven inflation and the difference between nominal and real interest rates contributed as inflation expectations increased over the period.
PORTFOLIO MANAGER OUTLOOK
The following forward-looking comments are the opinion of PIMCO, the Portfolio’s sub-adviser.
153
Table of Contents
Long-Term U.S. Government Bond Portfolio (unaudited)
Much of the global economy has transitioned quickly from an early cycle recovery to a mid-cycle expansion. In our view this necessitates a faster policy shift from the extraordinarily easy conditions that prevailed in 2020 and 2021. We expect developed market (“DM”) GDP growth to decelerate from a 5.0% annual average pace in 2021 to 4.0% in 2022. Rolling global outbreaks of the Delta variant in the second half of 2021 constrained output across various economies and will likely weigh on the projected annual average growth rates for 2022. We expect DM inflation to eventually moderate back toward the respective central bank targets by the end of 2022, but only after peaking at 5.1% in the fourth quarter of 2021. Finally, as a result of the magnitude and the persistence of the recent inflation increases, we now expect an earlier start to DM central bank rate-increase cycles and have raised our expectations for the likely level of terminal rates in many emerging market economies.
Relative Performance
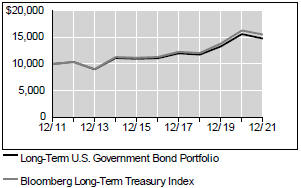
Average Annual Total Returns For Periods Ended December 31, 2021 | ||||||||||||
| 1 Year | 5 Years | 10 Years | ||||||||||
Long-Term U.S. Government Bond Portfolio | -5.37 | % | 5.92 | % | 3.99 | % | ||||||
Bloomberg Long-Term Treasury Index | -4.65 | % | 6.55 | % | 4.51 | % | ||||||
Morningstar® US Insurance Fund Long Government Average | -5.84 | % | 5.69 | % | 3.70 | % | ||||||
The performance data quoted represents past performance. Past performance is historical and does not guarantee future performance. Investment return and principal value will fluctuate, so that shares, when redeemed, may be worth more or less than their original cost. Current performance may be lower or higher than the performance data quoted. For the most recent month-end performance information visit www.northwesternmutual.com.
This chart assumes an initial investment of $10,000 made on 12/31/11. Returns shown reflect fee waivers, deductions for management and other portfolio expenses, and reinvestment of all dividends. In the absence of fee waivers, total return would be reduced. Returns exclude deductions for separate account sale loads and account fees. Please refer to the Benchmark Definitions section of this report for information about the indices cited in the above chart and graph.
Return of principal is not guaranteed. Bond funds have the same risks that are associated with the underlying bonds owned by the Portfolio. When interest rates rise, bond prices fall. With a fixed income fund, when interest rates rise, the value of the fund’s existing bonds drops, which could negatively affect overall fund performance.
The Portfolio may invest in securities that are issued or guaranteed by the U.S. Government or its agencies, and in derivatives designed to replicate such securities. This guarantee provides for the timely repayment of the principal and interest as applicable under the terms of the instrument, if it is held to maturity, and does not apply to derivative securities held by the Portfolio. A guarantee by the U.S. Government or its agencies does not eliminate market risk.
The Portfolio may also use derivative instruments for hedging or other purposes as part of its investment strategy. Use of these instruments may involve certain costs and risks such as liquidity risk, interest rate risk, market risk, credit risk, management risk and the risk that the Portfolio could not close out a position when it would be most advantageous to do so. The potential leverage created by use of derivatives may cause the Portfolio to be more sensitive to interest rate movements and thus more volatile than other long-term U.S. Government bond funds that do not use derivatives. Portfolios investing in derivatives could lose more than the principal amount invested in those instruments.
The U.S. federal funds rate has been subject to frequent adjustments over the course of the last several years. A significant rise in interest rates over a short period of time could cause significant losses in the market value of the Portfolio’s fixed income investments.
154
Table of Contents
Long-Term U.S. Government Bond Portfolio (unaudited)
Top 10 Fixed Income Holdings 12/31/21
| Security Description | % of Net Assets | |||
US Treasury, Various | 99.3 | % | ||
Resolution Funding Corp. Stripped, Various | 3.3 | % | ||
Federal Home Loan Mortgage Corp., Series 4387, Class AZ, 4%, 9/15/44 | 2.0 | % | ||
Federal Home Loan Mortgage Corp., Series 4092, Class AY, 3%, 8/15/32 | 1.7 | % | ||
Federal National Mortgage Association, Series 2016-61, Class ML, 3%, 9/25/46 | 0.7 | % | ||
Federal Home Loan Mortgage Corp., Series 4398, Class ZX, 4%, 9/15/54 | 0.7 | % | ||
Federal National Mortgage Association, Various | 0.7 | % | ||
DBWF Mortgage Trust, Series 2016-85T, Class A, 3.791%, 12/10/36 | 0.6 | % | ||
VNDO Trust, Series 2016-350P, Class A, 3.805%, 1/10/35 | 0.6 | % | ||
Federal Home Loan Mortgage Corp., Series 4830, Class ZG, 3%, 4/15/53 | 0.5 | % | ||
Sector Allocation 12/31/21
| Sector | % of Total Investments | |||
Governments | 88.6 | % | ||
Structured Products | 9.9 | % | ||
Short-Term Investments | 1.0 | % | ||
Corporate Bonds | 0.5 | % | ||
Sector Allocation and Top 10 Holdings are subject to change.
Consistent with the Portfolio’s stated parameters, no more than 10% of the Portfolio is invested in securities rated A by Moody’s or S&P and no more than 25% of the Portfolio is invested in securities rated Aa by Moody’s or AA by S&P.
155
Table of Contents
Long-Term U.S. Government Bond Portfolio
SCHEDULE OF INVESTMENTS
December 31, 2021
| Corporate Bonds (0.6%) | Shares/ Par + | Value $ (000’s) | ||||||
Consumer, Cyclical (0.1%) | ||||||||
United Airlines Pass-Through Trust, Series 2016-2, Class AA | 157,710 | 161 | ||||||
|
| |||||||
Total | 161 | |||||||
|
| |||||||
Industrial (0.3%) | ||||||||
Vessel Management Services, Inc. | 417,000 | 457 | ||||||
|
| |||||||
Total | 457 | |||||||
|
| |||||||
Utilities (0.2%) | ||||||||
Duke Energy Florida LLC 2.500%, 12/1/29 | 200,000 | 205 | ||||||
|
| |||||||
Total | 205 | |||||||
|
| |||||||
Total Corporate Bonds | ||||||||
(Cost: $775) | 823 | |||||||
|
| |||||||
| Governments (103.5%) | ||||||||
Governments (103.5%) | ||||||||
Federal National Mortgage Association | 582,014 | 662 | ||||||
5.000%, 6/1/35 | 28,054 | 32 | ||||||
5.000%, 2/1/36 | 43,758 | 49 | ||||||
5.500%, 5/1/49 | 37,118 | 41 | ||||||
5.625%, 4/17/28 | 100,000 | 125 | ||||||
Resolution Funding Corp. Stripped | 4,800,000 | 4,149 | ||||||
0.000%, 4/15/28 IO | 400,000 | 360 | ||||||
Tennessee Valley Authority Stripped | 500,000 | 431 | ||||||
US Treasury | 6,790,000 | 5,951 | ||||||
1.125%, 8/15/40 | 65,580,000 | 57,260 | ||||||
1.375%, 11/15/40 | 11,700,000 | 10,663 | ||||||
1.375%, 8/15/50 | 3,300,000 | 2,891 | ||||||
1.625%, 11/15/50 | 400,000 | 373 | ||||||
1.750%, 8/15/41 | 2,000,000 | 1,939 | ||||||
1.875%, 2/15/41 | 1,900,000 | 1,881 | ||||||
2.000%, 11/15/41 | 2,400,000 | 2,417 | ||||||
2.000%, 2/15/50 b | 38,480,000 | 39,086 | ||||||
2.000%, 8/15/51 | 4,300,000 | 4,383 | ||||||
2.375%, 5/15/51 | 2,300,000 | 2,540 | ||||||
2.500%, 2/15/46 | 940,000 | 1,038 | ||||||
2.875%, 5/15/49 | 1,350,000 | 1,626 | ||||||
3.000%, 11/15/45 | 370,000 | 444 | ||||||
3.000%, 2/15/48 | 330,000 | 403 | ||||||
3.000%, 8/15/48 b | 700,000 | 857 | ||||||
3.125%, 5/15/48 | 2,430,000 | 3,037 | ||||||
US Treasury Stripped | 850,000 | 677 | ||||||
0.000%, 11/15/43 PO | 700,000 | 454 | ||||||
|
| |||||||
Total | 143,769 | |||||||
|
| |||||||
Total Governments | ||||||||
(Cost: $150,960) | 143,769 | |||||||
|
| |||||||
| Structured Products (11.6%) | Shares/ Par + | Value $ (000’s) | ||||||
Asset Backed Securities (0.2%) | ||||||||
ECMC Group Student Loan Trust, Series 2018-1A, Class A 0.853%, (ICE LIBOR USD 1 Month plus | 60,247 | 60 | ||||||
Massachusetts Educational Financing Authority, Series 2008-1, Class A1 1.074%, (ICE LIBOR USD 3 Month plus 0.950%), 4/25/38 | 29,732 | 30 | ||||||
OneMain Direct Auto Receivables Trust, Series 2018-1A, Class A 3.430%, 12/16/24 144A | 17,768 | 18 | ||||||
Towd Point Mortgage Trust, Series 2019-4, Class A1 2.900%, (AFC), 10/25/59 144A | 116,426 | 119 | ||||||
|
| |||||||
Total | 227 | |||||||
|
| |||||||
Mortgage Securities (11.4%) | ||||||||
BWAY Mortgage Trust, Series 2013-1515, Class A2 3.454%, 3/10/33 144A | 300,000 | 314 | ||||||
CityLine Commercial Mortgage Trust, Series 2016-CLNE, Class A 2.778%, (CSTR), 11/10/31 144A | 600,000 | 610 | ||||||
COMM Mortgage Trust, Series 2018-HOME, Class A 3.815%, (AFC), 4/10/33 144A | 200,000 | 217 | ||||||
Commercial Mortgage Pass-Through Certificates, Series 2016-667M, Class A 3.140%, 10/10/36 144A | 700,000 | 725 | ||||||
Credit Suisse First Boston Mortgage Securities Corp., Series 2003-AR18, Class 2A3 2.142%, (CSTR), 7/25/33 | 291 | - | π | |||||
DBWF Mortgage Trust, Series 2016-85T, Class A 3.791%, 12/10/36 144A | 800,000 | 863 | ||||||
Extended Stay America Trust, Series 2021- ESH, Class A 1.190%, (ICE LIBOR USD 1 Month plus 1.080%), 7/15/38 144A | 397,930 | 399 | ||||||
Federal Home Loan Mortgage Corp., Series 2752, Class EZ 5.500%, 2/15/34 | 143,342 | 160 | ||||||
Federal Home Loan Mortgage Corp., Series 3759, Class FB 0.610%, (ICE LIBOR USD 1 Month plus 0.500%), 11/15/40 | 26,780 | 27 | ||||||
Federal Home Loan Mortgage Corp., Series 4092, Class AY 3.000%, 8/15/32 | 2,200,000 | 2,352 | ||||||
Federal Home Loan Mortgage Corp., Series 4387, Class AZ 4.000%, 9/15/44 | 2,565,268 | 2,734 | ||||||
Federal Home Loan Mortgage Corp., Series 4398, Class ZX 4.000%, 9/15/54 | 798,807 | 915 | ||||||
The Accompanying Notes are an Integral Part of the Financial Statements.
156
Table of Contents
Long-Term U.S. Government Bond Portfolio
| Structured Products (11.6%) | Shares/ Par + | Value $ (000’s) | ||||||
Mortgage Securities continued | ||||||||
Federal Home Loan Mortgage Corp., Series 4830, Class ZG 3.000%, 4/15/53 | 735,186 | 747 | ||||||
Federal Home Loan Mortgage Corp., Series T-61, Class 1A1 1.482%, (Federal Reserve US 12 Month Cumulative Avg 1 year Constant Maturity plus 1.400%), 7/25/44 | 5,602 | 6 | ||||||
Federal National Mortgage Association, Series 2007-39, Class NZ 4.250%, 5/25/37 | 100,764 | 107 | ||||||
Federal National Mortgage Association, Series 2012-101, Class FC 0.602%, (ICE LIBOR USD 1 Month plus 0.500%), 9/25/42 | 33,652 | 33 | ||||||
Federal National Mortgage Association, Series 2016-61, Class ML 3.000%, 9/25/46 | 900,000 | 951 | ||||||
Freddie Mac Military Housing Bonds Resecuritization Trust, Series 2015-R1, Class A2 4.321%, (CSTR), 10/25/52 144A | 568,432 | 640 | ||||||
Government National Mortgage Association, Series 2010-26, Class OW 0.000%, 2/20/40 PO | 367,172 | 344 | ||||||
Government National Mortgage Association, Series 2010-75, Class OA 0.000%, 9/20/35 PO | 244,288 | 224 | ||||||
GS Mortgage Securities Trust, Series 2015- 590M, Class B 3.805%, (CSTR), 10/10/35 144A | 300,000 | 314 | ||||||
Hilton USA Trust, Series 2016-HHV, Class A 3.719%, 11/5/38 144A | 600,000 | 636 | ||||||
Hilton USA Trust, Series 2016-HHV, Class C 4.194%, (CSTR), 11/5/38 144A | 400,000 | 420 | ||||||
Luxe Trust, Series 2021 - MLBH, Class A 1.090%, (ICE LIBOR USD 1 Month plus 0.980%), 11/15/26 144A | 100,000 | 100 | ||||||
| Structured Products (11.6%) | Shares/ Par + | Value $ (000’s) | ||||||
Mortgage Securities continued | ||||||||
Merrill Lynch Mortgage Investors Trust, Series 2003-A4, Class 3A 2.331%, (CSTR, AFC), 5/25/33 | 644 | 1 | ||||||
Morgan Stanley Capital I Trust, Series 2021- 230P, Class A 1.279%, (ICE LIBOR USD 1 Month plus 1.169%), 12/15/23 144A | 200,000 | 200 | ||||||
MSSG Trust, Series 2017-237P, Class A 3.397%, 9/13/39 144A | 700,000 | 738 | ||||||
New Residential Mortgage Loan Trust, Series 2020-RPL1, Class A1 2.750%, (AFC), 11/25/59 144A | 132,798 | 135 | ||||||
Structured Asset Mortgage Investments, Inc., Series 2004-AR5, Class 1A1 0.434%, (ICE LIBOR USD 1 Month plus 0.660%), (AFC), 10/19/34 | 2,270 | 2 | ||||||
VNDO Trust, Series 2016-350P, Class A 3.805%, 1/10/35 144A | 800,000 | 860 | ||||||
Worldwide Plaza Trust, Series 2017-WWP, Class A 3.526%, 11/10/36 144A | 100,000 | 106 | ||||||
|
| |||||||
Total | 15,880 | |||||||
|
| |||||||
Total Structured Products | ||||||||
(Cost: $15,401) | 16,107 | |||||||
|
| |||||||
| Short-Term Investments (1.1%) | ||||||||
Money Market Funds (1.1%) | ||||||||
State Street Institutional U.S. Government Money Market Fund - Premier Class 0.030%# | 1,519,393 | 1,519 | ||||||
|
| |||||||
Total | 1,519 | |||||||
|
| |||||||
Total Short-Term Investments | ||||||||
(Cost: $1,519) |
| 1,519 | ||||||
|
| |||||||
Total Investments (116.8%) |
| |||||||
(Cost: $168,655)@ |
| 162,218 | ||||||
|
| |||||||
Other Assets, Less Liabilities (-16.8%) | (23,349 | ) | ||||||
|
| |||||||
Net Assets (100.0%) | 138,869 | |||||||
|
| |||||||
Securities Sold Short
| Description | Coupon | Maturity Date | Principal Amount (000’s) | Proceeds (000’s) | Value (000’s) | |||||||||||||
Uniform Mortgage Backed Security TBA | 2.000 | % | 1/14/51 | $ | (5,300 | ) | $ | (5,277 | ) | $ | (5,284 | ) | ||||||
|
|
|
|
|
| |||||||||||||
| $ | (5,300 | ) | $ | (5,277 | ) | $ | (5,284 | ) | ||||||||||
|
|
|
|
|
| |||||||||||||
Exchange Traded or Centrally Cleared Derivatives Futures
| Issuer | Long/Short | Currency | Notional Par (000’s) | Number of Contracts | Expiration Date | Notional Value (000’s) | Unrealized Appreciation/ (Depreciation) (000’s) | Variation Margin (000’s) | ||||||||||||||||||||
Five-Year US Treasury Note Future | Short | USD | 1,300 | 13 | 3/22 | $ | 1,573 | $ | - | π | $ | (1 | ) | |||||||||||||||
Ten-Year US Treasury Note Future | Long | USD | 300 | 3 | 3/22 | 391 | 2 | - | π | |||||||||||||||||||
Two-Year US Treasury Note Future | Long | USD | 6,200 | 31 | 3/22 | 6,763 | (13 | ) | 2 | |||||||||||||||||||
Ultra Long Term US Treasury Bond Future | Long | USD | 4,400 | 44 | 3/22 | 8,674 | 122 | 69 | ||||||||||||||||||||
Ultra Ten-Year US Treasury Note Future | Short | USD | 8,500 | 85 | 3/22 | 12,447 | (179 | ) | (23 | ) | ||||||||||||||||||
US Treasury Long Bond Future | Short | USD | 8,900 | 89 | 3/22 | 14,279 | (41 | ) | (50 | ) | ||||||||||||||||||
|
|
|
| |||||||||||||||||||||||||
| $ (109) | $ (3) | |||||||||||||||||||||||||||
|
|
|
| |||||||||||||||||||||||||
The Accompanying Notes are an Integral Part of the Financial Statements.
157
Table of Contents
Long-Term U.S. Government Bond Portfolio
Centrally Cleared Interest Rate Swaps - Receive Floating Rate
| Floating Rate Index | Fixed Rate | Expiration Date | Notional Amount (000’s) | Currency | Upfront Premium Paid/ (Received) (000’s) | Unrealized Appreciation/ (Depreciation) (000’s) | Market Value (000’s) | Variation Margin (000’s) | ||||||||||||||||||||||
1-Day USD-SOFR Compounded-OIS | 1.750% | 10/53 | 2,200 | USD | $ | (37 | ) | $ | (89 | ) | $ | (126 | ) | $ | (6 | ) | ||||||||||||||
3-Month USD-LIBOR | 0.750% | 3/31 | 1,000 | USD | 9 | 61 | 70 | - | π | |||||||||||||||||||||
3-Month USD-LIBOR | 1.250% | 6/41 | 6,010 | USD | 132 | 375 | 507 | (8 | ) | |||||||||||||||||||||
3-Month USD-LIBOR | 1.150% | 3/51 | 680 | USD | 15 | 78 | 93 | (2 | ) | |||||||||||||||||||||
|
|
|
|
|
|
|
| |||||||||||||||||||||||
| $ | 119 | $ | 425 | $ | 544 | $ | (16 | ) | ||||||||||||||||||||||
|
|
|
|
|
|
|
| |||||||||||||||||||||||
Centrally Cleared Interest Rate Swaps - Pay Floating Rate
| Floating Rate Index | Fixed Rate | Expiration Date | Notional Amount (000’s) | Currency | Upfront Premium Paid/ (Received) (000’s) | Unrealized Appreciation/ (Depreciation) (000’s) | Market Value (000’s) | Variation Margin (000’s) | ||||||||||||||||
1-Day USD-SOFR Compounded-OIS | 1.600% | 10/28 | 10,700 | USD | $ | 23 | $ | 73 | $ | 95 | $ | 1 | ||||||||||||
3-Month USD-LIBOR | 1.000% | 12/25 | 3,170 | USD | 60 | (95 | ) | (35 | ) | - | π | |||||||||||||
3-Month USD-LIBOR | 1.250% | 12/50 | 2,100 | USD | (180 | ) | (63 | ) | (243 | ) | 5 | |||||||||||||
|
|
|
|
|
|
|
| |||||||||||||||||
| $ | (97 | ) | $ | (85 | ) | $ | (183 | ) | $ | 6 | ||||||||||||||
|
|
|
|
|
|
|
| |||||||||||||||||
| Financial Derivative Assets | Financial Derivative Liabilities | |||||||||||||||||||||||||||
| Variation Margin (000’s) | Variation Margin (000’s) | Market Value (000’s) | ||||||||||||||||||||||||||
| Swaps | Futures | Total | Swaps | Futures | Total | Options | ||||||||||||||||||||||
Total Exchange-Traded or Centrally Cleared Derivatives | $ | 6 | $ | 71 | $ | 77 | $ | (16 | ) | $ | (74 | ) | $ | (90 | ) | $ | - | |||||||||||
| + | All par is stated in U.S. Dollar unless otherwise noted. |
| b | Cash or securities with an aggregate value of $39,943 (in thousands) has been pledged as collateral for futures, swap contracts outstanding, short sales, when issued securities or written options on 12/31/2021. |
144A Security exempt from registration under Rule 144A of the Securities Act of 1933. These securities may be resold as transactions exempt from registration, normally to qualified institutional buyers. At December 31, 2021 the value of these securities (in thousands) was $7,474 representing 5.4% of the net assets. |
| π | Amount is less than one thousand. |
| # | 7-Day yield as of 12/31/2021. |
| @ | At December 31, 2021, the aggregate cost of investments, including derivatives, for federal tax purposes (in thousands) was $176,862 and the net unrealized depreciation of investments based on that cost was $19,676 which is comprised of $4,603 aggregate gross unrealized appreciation and $24,279 aggregate gross unrealized depreciation. |
The Accompanying Notes are an Integral Part of the Financial Statements.
158
Table of Contents
Long-Term U.S. Government Bond Portfolio
The following is a summary of the inputs used in valuing the Portfolio’s Investments at December 31, 2021. See Note 3 for additional information on portfolio valuation.
| Valuation Inputs | ||||||||||||||
| Description | Level 1 – Quoted Prices | Level 2 – Other Significant Observable Inputs | Level 3 – Significant Unobservable Inputs | |||||||||||
| (Amounts in thousands) | ||||||||||||||
Assets: | ||||||||||||||
Corporate Bonds | $ | - | $ | 823 | $ | - | ||||||||
Governments | - | 143,769 | - | |||||||||||
Structured Products | - | 16,107 | - | |||||||||||
Short-Term Investments | 1,519 | - | - | |||||||||||
Other Financial Instruments^ | ||||||||||||||
Futures | 124 | - | - | |||||||||||
Interest Rate Swaps | - | 765 | - | |||||||||||
Total Assets: | $ | 1,643 | $ | 161,464 | $ | - | ||||||||
Liabilities: | ||||||||||||||
Other Financial Instruments^ | ||||||||||||||
Futures | (233 | ) | - | - | ||||||||||
Interest Rate Swaps | - | (404 | ) | - | ||||||||||
Securities Sold Short | - | (5,284 | ) | - | ||||||||||
Total Liabilities: | $ | (233 | ) | $ | (5,688 | ) | $ | - | ||||||
^ Other financial instruments are derivative instruments such as futures and forward foreign currency contracts, which are valued at the unrealized appreciation (depreciation) on the instrument, and securities sold short, reverse repurchase agreements, written options and swaps contracts, which are valued at market value.
The Accompanying Notes are an Integral Part of the Financial Statements.
159
Table of Contents
Inflation Protection Portfolio (unaudited)
| Objective: | Portfolio Strategy: | Net Assets: | ||
| Total return using a strategy that seeks to protect against U.S. inflation. | Invest substantially all assets in investment grade debt securities, with a majority in inflation-indexed debt securities. | $514 million |
PORTFOLIO OVERVIEW
Mason Street Advisors, LLC (“Mason Street Advisors”), the investment adviser for the Inflation Protection Portfolio (the “Portfolio”), has engaged American Century Investment Management, Inc. (“American Century”) to act as sub-adviser for the Portfolio. The Portfolio invests substantially all of its assets in investment grade debt securities. To help protect against U.S. inflation, under normal conditions, the Portfolio will invest over 50% of its net assets in inflation-indexed debt securities. These securities include inflation-indexed U.S. Treasury Securities (“TIPS”), inflation-indexed securities issued by U.S. government agencies and instrumentalities other than the U.S. Treasury, and inflation-indexed securities issued by domestic and foreign corporations and governments, and may include those located in emerging markets. The Portfolio also may invest in fixed income securities that are not inflation-indexed. Such investments may include other investment grade debt securities, including collateralized mortgage obligations, mortgage-backed securities, and asset-backed securities, whether issued by the U.S. government, its agencies or instrumentalities, corporations or other non-governmental issuers, or foreign governments. Due to Internal Revenue Code provisions and regulations governing insurance product funds, no more than 55% of the Portfolio’s assets may be invested in securities issued by the same entity.
MARKET OVERVIEW
The events of early 2021 set the stage for improving economic growth and rising inflation as the year unfolded. In the beginning of the year, the federal government delivered another round of pandemic-related fiscal relief and indicated additional spending would be forthcoming. The combination of massive monetary support already in place, federal spending, expanding vaccine availability and improving economic data boosted growth outlooks and sparked risk-on investing.
Meanwhile, annual inflation rates began accelerating in March, largely due to base effects from 2020’s pandemic-related shutdowns. But other factors quickly conspired to push consumer prices to multiyear highs. Supply chain disruptions along with pent-up consumer demand and labor shortages sent prices soaring. Additionally, surging energy prices contributed to the rapidly rising inflation rate. The Federal Reserve (the “Fed”), which had initially labeled inflation’s rise as transitory, eventually admitted that inflation would be higher and more persistent than originally expected.
Overall, the rising yield/rising inflation environment pressured one-year total returns for Treasuries, which declined and underperformed the Bloomberg® U.S. Aggregate Bond Index, which also declined. Other U.S. bond market sectors, including investment-grade corporate bonds and securitized securities, also retreated in the rising-yield environment. However, TIPS advanced and significantly outperformed nominal Treasuries and the broad investment-grade bond market.
PORTFOLIO RESULTS
The Portfolio returned 6.61% for the twelve months ended December 31, 2021. By comparison, the Portfolio’s benchmark, the Bloomberg® U.S. TIPS Index (the “Index”), returned 5.96%. (The Index is unmanaged, cannot be invested in directly and does not incur expenses.) According to Lipper® Analytical Services, Inc., an independent mutual fund ranking company, the average return in 2021 of the Inflation Protected Bonds Funds peer group was 4.99%.
The Portfolio was nearly fully invested in TIPS as allowed by IRS portfolio diversification regulations for insurance products (53% versus the IRS maximum of 55%). The Portfolio’s TIPS exposure was the main driver of the Portfolio’s performance. The remainder of the Portfolio was primarily invested in securitized and investment grade corporate securities and non-U.S. dollar, inflation-linked securities (hedged against currency risk). The Portfolio’s non-dollar inflation-linked position, which consisted primarily of securities from France and Japan, contributed to the Portfolio’s return. On the downside, securitized and corporate allocations declined in the second half of 2021, detracting from the Portfolio’s performance.
To maximize inflation exposure while adhering to the IRS’s TIPS limit, the portfolio managers used inflation swaps to create an inflation overlay for the corporate and securitized securities. This strategy boosted the Portfolio’s exposure to inflation, which aided performance as breakeven rates increased.
160
Table of Contents
Inflation Protection Portfolio (unaudited)
PORTFOLIO MANAGER OUTLOOK
The following forward-looking comments are the opinion of American Century, the Portfolio’s sub-adviser.
We expect inflation to peak in the first half of 2022. However, we believe several factors will cause inflation to remain at notably higher levels than before the pandemic. These factors include record federal spending and deficits, rising housing costs, supply/demand imbalances and onshoring trends among U.S. businesses. Despite the Fed’s recent pivot to inflation-lowering policies, we remain optimistic toward inflation-linked securities. In our view, inflation breakeven rates don’t adequately reflect the persistent inflationary pressures prevalent in the economy, highlighting continued value in TIPS and other inflation-linked securities.
Relative Performance
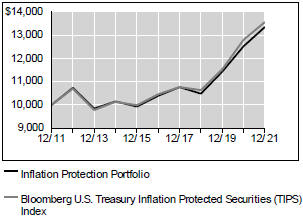
Average Annual Total Returns For Periods Ended December 31, 2021 | ||||||||||||
| 1 Year | 5 Years | 10 Years | ||||||||||
Inflation Protection Portfolio | 6.61 | % | 5.14 | % | 2.93 | % | ||||||
Bloomberg U.S. Treasury Inflation Protected Securities (TIPS) Index | 5.96 | % | 5.34 | % | 3.09 | % | ||||||
Lipper® Variable Insurance Products (VIP) Inflation Protected Bonds Funds Average | 4.99 | % | 4.88 | % | 2.83 | % | ||||||
The performance data quoted represents past performance. Past performance is historical and does not guarantee future performance. Investment return and principal value will fluctuate, so that shares, when redeemed, may be worth more or less than their original cost. Current performance may be lower or higher than the performance data quoted. For the most recent month-end performance information visit www.northwesternmutual.com.
This chart assumes an initial investment of $10,000 made on 12/31/11. Returns shown reflect fee waivers, deductions for management and other portfolio expenses, and reinvestment of all dividends. In the absence of fee waivers, total return would be reduced. Returns exclude deductions for separate account sale loads and account fees. Please refer to the Benchmark Definitions section of
this report for information about the indices cited in the above chart and graph.
Return of principal is not guaranteed. Bond funds have the same interest rate, inflation and credit risks that are associated with the underlying bonds owned by the Portfolio. When interest rates rise, bond prices fall. With a fixed income fund, when interest rates rise, the value of the fund’s existing bonds drops, which could negatively affect overall fund performance.
The Portfolio may use derivative instruments for hedging purposes or as alternatives to direct investments. Use of these instruments may involve certain costs and risks such as liquidity risk, interest rate risk, market risk, credit risk, management risk and the risk of mispricing or improper valuation. Certain derivatives involve leverage, which could magnify losses, and portfolios investing in derivatives could lose more than the principal amount invested in those instruments.
The U.S. federal funds rate has been subject to frequent adjustments over the course of the last several years. A significant rise in interest rates over a short period of time could cause significant losses in the market value of the Portfolio’s fixed income investments.
Investing in bonds issued by foreign corporations and governments carries additional risk, including foreign currency risk, and may increase the volatility of the Portfolio’s performance.
161
Table of Contents
Inflation Protection Portfolio (unaudited)
Top 10 Fixed Income Holdings 12/31/21
| Security Description | % of Net Assets | |||
US Treasury Inflation Index Bond, Various | 39.3 | % | ||
US Treasury, Various | 12.6 | % | ||
Canadian Government Real Return Bond, 4.25%, 12/1/26 | 1.7 | % | ||
Progress Residential Trust, Series 2021-SFR2, Class C, 1.997%, 4/19/38 | 1.0 | % | ||
Federal Home Loan Mortgage Corp., Series K108, Class A2, 1.517%, 3/25/30 | 0.8 | % | ||
Wendys Funding LLC, Series 2021-1A, Class A2II, 2.775%, 6/15/51 | 0.7 | % | ||
Federal Home Loan Mortgage Corp. Multifamily Structured Pass Through Certificates, Series 2019- K088, Class A2, 3.69%, 1/25/29 | 0.7 | % | ||
Sequoia Mortgage Trust, Series 2019-4, Class A7, 3.5%, 11/25/49 | 0.6 | % | ||
JPMorgan Chase & Co., Various | 0.6 | % | ||
Taco Bell Funding LLC, Series 2021-1A, Class A23, 2.542%, 8/25/51 | 0.5 | % | ||
Sector Allocation 12/31/21
| Sector | % of Net Assets | |||
Governments | 54.0 | % | ||
Structured Products | 20.3 | % | ||
Corporate Bonds | 11.7 | % | ||
Short-Term Investments & Other Net Assets | 10.4 | % | ||
Investment Companies | 3.4 | % | ||
Municipal Bonds | 0.2 | % | ||
Sector Allocation and Top 10 Holdings are subject to change.
Consistent with the Portfolio’s stated parameters, no more than 20% of the Portfolio is invested in foreign securities.
162
Table of Contents
Inflation Protection Portfolio
SCHEDULE OF INVESTMENTS
December 31, 2021
| Corporate Bonds (11.7%) | Shares/ Par + | Value $ (000’s) | ||||||
Communications (2.1%) | ||||||||
Amazon.com, Inc. | 875,000 | 909 | ||||||
AT&T, Inc. | 720,000 | 704 | ||||||
3.550%, 9/15/55 | 651,000 | 653 | ||||||
British Telecommunications PLC | 340,000 | 348 | ||||||
Charter Communications Operating LLC / Charter Communications Operating Capital Corp. | 585,000 | 570 | ||||||
5.125%, 7/1/49 | 820,000 | 951 | ||||||
Comcast Corp. | 500,000 | 560 | ||||||
Discovery Communications LLC | 285,000 | 334 | ||||||
Rogers Communications, Inc. | 1,605,000 | 1,635 | ||||||
Telefonica Emisiones SAU | 825,000 | 992 | ||||||
Time Warner Cable LLC | 745,000 | 812 | ||||||
T-Mobile USA, Inc. | 325,000 | 324 | ||||||
Verizon Communications, Inc. | 10,000 | 10 | ||||||
2.650%, 11/20/40 | 427,000 | 406 | ||||||
2.987%, 10/30/56 | 315,000 | 298 | ||||||
4.329%, 9/21/28 | 621,000 | 705 | ||||||
ViacomCBS, Inc. | 330,000 | 367 | ||||||
4.375%, 3/15/43 | 350,000 | 398 | ||||||
|
| |||||||
Total | 10,976 | |||||||
|
| |||||||
Consumer, Cyclical (0.4%) | ||||||||
American Airlines Pass-Through Enhanced Equipment Trust Certificates, Series 2021- 1, Class A | 206,000 | 204 | ||||||
AutoNation, Inc. | 400,000 | 391 | ||||||
British Airways Pass-Through Trust, Series 2020-1, Class A 2.900%, 9/15/36 144A | 404,961 | 403 | ||||||
Ford Motor Credit Co. LLC | 300,000 | 323 | ||||||
General Motors Co. | 650,000 | 784 | ||||||
|
| |||||||
Total | 2,105 | |||||||
|
| |||||||
Consumer, Non-cyclical (0.4%) | ||||||||
Block Financial LLC | 270,000 | 289 | ||||||
Cigna Corp. | 200,000 | 258 | ||||||
| Corporate Bonds (11.7%) | Shares/ Par + | Value $ (000’s) | ||||||
Consumer, Non-cyclical continued | ||||||||
CVS Health Corp. | 180,000 | 219 | ||||||
Duke University Health System, Inc. | 268,000 | 318 | ||||||
Global Payments, Inc. | 385,000 | 387 | ||||||
Mondelez International, Inc. | 153,000 | 158 | ||||||
Moody’s Corp. | 255,000 | 253 | ||||||
Viatris, Inc. | 140,000 | 149 | ||||||
|
| |||||||
Total | 2,031 | |||||||
|
| |||||||
Energy (0.3%) | ||||||||
Enterprise Products Operating LLC | 100,000 | 120 | ||||||
Petroleos Mexicanos | 130,000 | 131 | ||||||
6.700%, 2/16/32 144A | 243,000 | 246 | ||||||
Sabine Pass Liquefaction LLC | 500,000 | 555 | ||||||
Transcontinental Gas Pipe Line Co. LLC | 260,000 | 274 | ||||||
|
| |||||||
Total | 1,326 | |||||||
|
| |||||||
Financial (6.5%) | ||||||||
AerCap Ireland Capital DAC / AerCap Global Aviation Trust | 497,000 | 504 | ||||||
3.400%, 10/29/33 | 204,000 | 208 | ||||||
3.850%, 10/29/41 | 153,000 | 159 | ||||||
Assured Guaranty US Holdings, Inc. | 305,000 | 317 | ||||||
Athene Global Funding | 846,000 | 822 | ||||||
2.673%, 6/7/31 144A | 162,000 | 161 | ||||||
Avolon Holdings Funding, Ltd. | 587,000 | 576 | ||||||
Banco Santander SA | 800,000 | 891 | ||||||
Bank of America Corp. | 325,000 | 315 | ||||||
2.572%, (US SOFR plus 1.210%), 10/20/32 | 466,000 | 468 | ||||||
2.676%, (US SOFR plus 1.930%), 6/19/41 | 654,000 | 630 | ||||||
3.419%, (ICE LIBOR USD 3 Month plus 1.040%), 12/20/28 | 939,000 | 1,003 | ||||||
Bank of Ireland Group PLC 2.029%, (US Treasury Yield Curve Rate T Note Constant Maturity 1 Year plus 1.100%), 9/30/27 144A | 377,000 | 370 | ||||||
The Accompanying Notes are an Integral Part of the Financial Statements.
163
Table of Contents
Inflation Protection Portfolio
| Corporate Bonds (11.7%) | Shares/ Par + | Value $ (000’s) | ||||||
Financial continued | ||||||||
Barclays PLC | 510,000 | 511 | ||||||
Blackstone Private Credit Fund | 129,000 | 126 | ||||||
3.250%, 3/15/27 144A | 526,000 | 531 | ||||||
Blue Owl Finance LLC | 151,000 | 148 | ||||||
4.125%, 10/7/51 144A | 504,000 | 505 | ||||||
BNP Paribas SA 4.375%, (USD 5 Year Swap Rate plus 1.483%), 3/1/33 144A | 460,000 | 499 | ||||||
Brighthouse Financial Global Funding | 322,000 | 317 | ||||||
Broadstone Net Lease LLC | 247,000 | 240 | ||||||
Citigroup, Inc. 3.520%, (ICE LIBOR USD 3 Month plus 1.151%), 10/27/28 | 662,000 | 710 | ||||||
Commonwealth Bank of Australia 3.610%, (US Treasury Yield Curve Rate T Note Constant Maturity 5 year plus 2.050%), 9/12/34 144A | 505,000 | 528 | ||||||
Crown Castle International Corp. | 395,000 | 417 | ||||||
CubeSmart LP | 233,000 | 233 | ||||||
Deutsche Bank AG | 714,000 | 714 | ||||||
3.961%, (US SOFR plus 2.581%), 11/26/25 | 1,175,000 | 1,241 | ||||||
FS KKR Capital Corp. | 630,000 | 627 | ||||||
Global Atlantic Finance Co. | 265,000 | 262 | ||||||
The Goldman Sachs Group, Inc. | 170,000 | 169 | ||||||
2.908%, (US SOFR plus 1.472%), 7/21/42 | 580,000 | 577 | ||||||
4.250%, 10/21/25 | 925,000 | 1,009 | ||||||
Golub Capital BDC, Inc. | 181,000 | 178 | ||||||
Hercules Capital, Inc. | 345,000 | 342 | ||||||
4.625%, 10/23/22 | 679,000 | 692 | ||||||
Hill City Funding Trust | 667,000 | 645 | ||||||
HSBC Holdings PLC | 528,000 | 526 | ||||||
2.804%, (US SOFR plus 1.187%), 5/24/32 | 280,000 | 281 | ||||||
JPMorgan Chase & Co. | 330,000 | 326 | ||||||
2.069%, (US SOFR plus 1.015%), 6/1/29 | 2,050,000 | 2,033 | ||||||
3.157%, (US SOFR plus 1.460%), 4/22/42 | 435,000 | 454 | ||||||
Lexington Realty Trust 2.375%, 10/1/31 | 630,000 | 604 | ||||||
| Corporate Bonds (11.7%) | Shares/ Par + | Value $ (000’s) | ||||||
Financial continued | ||||||||
Main Street Capital Corp. | 309,000 | 310 | ||||||
Morgan Stanley | 1,288,000 | 1,275 | ||||||
2.239%, (US SOFR plus 1.178%), 7/21/32 | 115,000 | 112 | ||||||
2.484%, (US SOFR plus 1.360%), 9/16/36 | 594,000 | 572 | ||||||
National Australia Bank, Ltd. 2.332%, 8/21/30 144A | 332,000 | 318 | ||||||
2.990%, 5/21/31 144A | 241,000 | 242 | ||||||
Nationwide Building Society 4.125%, (USD ICE SWAP Rate plus 1.849%), 10/18/32 144A | 650,000 | 693 | ||||||
Office Properties Income Trust | 392,000 | 379 | ||||||
Ontario Teachers’ Cadillac Fairview Properties Trust 2.500%, 10/15/31 144A | 202,000 | 201 | ||||||
Phillips Edison Grocery Center Operating Partnership I, LP 2.625%, 11/15/31 | 240,000 | 233 | ||||||
Physicians Realty LP | 444,000 | 444 | ||||||
Piedmont Operating Partnership LP | 428,000 | 418 | ||||||
Prospect Capital Corp. | 470,000 | 452 | ||||||
3.706%, 1/22/26 | 480,000 | 488 | ||||||
Rexford Industrial Realty, Inc. | 529,000 | 499 | ||||||
Safehold Operating Partnership LP | 533,000 | 522 | ||||||
Sammons Financial Group, Inc. | 119,000 | 120 | ||||||
SBL Holdings, LLC | 350,000 | 381 | ||||||
SLM Corp. | 651,000 | 644 | ||||||
Societe Generale SA | 1,180,000 | 1,256 | ||||||
Stewart Information Services Corp. | 576,000 | 583 | ||||||
Store Capital Corp. | 242,000 | 237 | ||||||
UBS Group AG 1.494%, (US Treasury Yield Curve Rate T Note Constant Maturity 1 Year plus 0.850%), 8/10/27 144A | 480,000 | 468 | ||||||
US Bancorp | 495,000 | 493 | ||||||
Westpac Banking Corp. | 280,000 | 277 | ||||||
|
| |||||||
Total | 33,486 | |||||||
|
| |||||||
Industrial (0.2%) | ||||||||
DAE Funding LLC | 316,000 | 314 | ||||||
The Accompanying Notes are an Integral Part of the Financial Statements.
164
Table of Contents
Inflation Protection Portfolio
| Corporate Bonds (11.7%) | Shares/ Par + | Value $ (000’s) | ||||||
Industrial continued | ||||||||
United Technologies Corp. 4.125%, 11/16/28 | 530,000 | 593 | ||||||
|
| |||||||
Total | 907 | |||||||
|
| |||||||
Technology (1.0%) | ||||||||
Apple, Inc. 2.650%, 2/8/51 | 250,000 | 246 | ||||||
Autodesk, Inc. 2.400%, 12/15/31 | 730,000 | 728 | ||||||
Dell International LLC / EMC Corp. | 845,000 | 952 | ||||||
HP, Inc. 2.650%, 6/17/31 144A | 625,000 | 616 | ||||||
Intel Corp. 2.800%, 8/12/41 | 650,000 | 648 | ||||||
NXP BV / NXP Funding LLC / NXP USA, Inc. | 220,000 | 247 | ||||||
Oracle Corp. | 705,000 | 707 | ||||||
Qorvo, Inc. | 335,000 | 341 | ||||||
4.375%, 10/15/29 | 478,000 | 507 | ||||||
|
| |||||||
Total | 4,992 | |||||||
|
| |||||||
Utilities (0.8%) | ||||||||
CenterPoint Energy, Inc. 2.650%, 6/1/31 | 370,000 | 375 | ||||||
Dominion Energy, Inc. 2.250%, 8/15/31 | 320,000 | 312 | ||||||
Dominion Resources, Inc. 4.900%, 8/1/41 | 320,000 | 394 | ||||||
Duke Energy Florida LLC 1.750%, 6/15/30 | 400,000 | 384 | ||||||
Duke Energy Progress LLC 2.000%, 8/15/31 | 780,000 | 762 | ||||||
Essential Utilities, Inc. 2.704%, 4/15/30 | 370,000 | 376 | ||||||
NextEra Energy Capital Holdings, Inc. 3.550%, 5/1/27 | 200,000 | 217 | ||||||
PG&E Energy Recovery Funding LLC 2.822%, 7/15/46 b | 900,000 | 895 | ||||||
Sempra Energy 3.250%, 6/15/27 | 250,000 | 264 | ||||||
Southern Co. Gas Capital Corp. 3.950%, 10/1/46 | 200,000 | 219 | ||||||
|
| |||||||
Total | 4,198 | |||||||
|
| |||||||
Total Corporate Bonds | ||||||||
(Cost: $59,959) | 60,021 | |||||||
|
| |||||||
| Investment Companies (3.4%) | ||||||||
Investment Companies (3.4%) | ||||||||
Vanguard Intermediate-Term Corporate Bond ETF | 94,300 | 8,747 | ||||||
Vanguard Short-Term Corporate Bond ETF | 106,100 | 8,622 | ||||||
|
| |||||||
Total | 17,369 | |||||||
|
| |||||||
Total Investment Companies | ||||||||
(Cost: $17,521) | 17,369 | |||||||
|
| |||||||
| Governments (54.0%) | Shares/ Par + | Value $ (000’s) | ||||||
Governments (54.0%) | ||||||||
Canadian Government Real Return Bond | 8,600,078 | 8,580 | ||||||
Tennessee Valley Authority | 1,658,000 | 2,142 | ||||||
US Treasury 0.125%, 1/15/31 | 27,086,865 | 30,325 | ||||||
0.125%, 7/15/31 | 5,674,295 | 6,378 | ||||||
0.125%, 10/15/25 | 7,193,408 | 7,754 | ||||||
0.125%, 4/15/26 | 4,112,160 | 4,437 | ||||||
0.125%, 10/15/26 | 10,119,200 | 11,004 | ||||||
0.250%, 7/15/29 b | 2,053,919 | 2,301 | ||||||
US Treasury Inflation Index Bond | 24,235,613 | 26,897 | ||||||
0.125%, 7/15/30 | 15,098,860 | 16,892 | ||||||
0.125%, 2/15/51 | 8,656,034 | 10,244 | ||||||
0.125%, 7/15/26 | 5,248,789 | 5,698 | ||||||
0.250%, 2/15/50 | 5,936,981 | 7,180 | ||||||
0.250%, 1/15/25 | 4,716,498 | 5,053 | ||||||
0.375%, 7/15/25 | 4,547,517 | 4,939 | ||||||
0.375%, 1/15/27 b | 11,904,984 | 13,094 | ||||||
0.375%, 7/15/27 | 4,239,000 | 4,703 | ||||||
0.500%, 1/15/28 | 8,407,575 | 9,407 | ||||||
0.625%, 2/15/43 | 7,998,022 | 9,937 | ||||||
0.625%, 1/15/26 | 18,212,375 | 20,001 | ||||||
0.750%, 2/15/42 | 7,862,465 | 9,931 | ||||||
0.750%, 2/15/45 | 11,566,461 | 14,880 | ||||||
0.750%, 7/15/28 | 1,652,370 | 1,892 | ||||||
0.875%, 2/15/47 | 2,921,025 | 3,943 | ||||||
0.875%, 1/15/29 | 3,285,300 | 3,799 | ||||||
1.000%, 2/15/46 | 1,342,062 | 1,833 | ||||||
1.000%, 2/15/48 | 1,289,530 | 1,807 | ||||||
1.000%, 2/15/49 | 2,691,133 | 3,818 | ||||||
1.375%, 2/15/44 | 6,739,093 | 9,613 | ||||||
1.750%, 1/15/28 | 1,445,301 | 1,734 | ||||||
2.000%, 1/15/26 | 3,413,291 | 3,949 | ||||||
2.125%, 2/15/41 | 3,832,234 | 5,930 | ||||||
2.375%, 1/15/25 | 1,540,298 | 1,754 | ||||||
2.375%, 1/15/27 | 788,423 | 952 | ||||||
2.500%, 1/15/29 | 920,863 | 1,177 | ||||||
3.625%, 4/15/28 | 2,564,445 | 3,407 | ||||||
|
| |||||||
Total | 277,385 | |||||||
|
| |||||||
Total Governments | ||||||||
(Cost: $253,673) | 277,385 | |||||||
|
| |||||||
| Municipal Bonds (0.2%) | ||||||||
Municipal Bonds (0.2%) | ||||||||
Golden State Tobacco Securitization Corp. | 740,000 | 744 | ||||||
Santa Clara Valley Transportation Authority | 50,000 | 60 | ||||||
|
| |||||||
Total Municipal Bonds | ||||||||
(Cost: $803) | 804 | |||||||
|
| |||||||
| Structured Products (20.3%) | ||||||||
Asset Backed Securities (9.9%) | ||||||||
Aligned Data Centers Issuer LLC, Series 2021-1A, Class B 2.482%, 8/15/46 144A | 2,350,000 | 2,321 | ||||||
The Accompanying Notes are an Integral Part of the Financial Statements.
165
Table of Contents
Inflation Protection Portfolio
| Structured Products (20.3%) | Shares/ Par + | Value $ (000’s) | ||||||
Asset Backed Securities continued | ||||||||
Ares XXXIX CLO, Ltd., Series 2016-39A, Class BR2 1.722%, (ICE LIBOR USD 3 Month plus 1.600%), 4/18/31 144A | 2,000,000 | 1,997 | ||||||
Bean Creek CLO, Ltd., Series 2018-1A, Class AR 1.152%, (ICE LIBOR USD 3 Month plus 1.020%), 4/20/31 144A | 1,250,000 | 1,247 | ||||||
Blackbird Capital Aircraft, Series 2021-1A, Class A 2.443%, 7/15/46 144A | 973,958 | 961 | ||||||
BRE Grand Islander Timeshare Issuer, Series 2017-1A, Class A 2.940%, 5/25/29 144A | 157,713 | 160 | ||||||
Capital Automotive REIT, Series 2021-1A, Class A4 2.760%, 8/15/51 144A | 1,000,000 | 988 | ||||||
Dryden Senior Loan Fund, Series 2016-43A, Class B2R2 3.093%, 4/20/34 144A | 2,000,000 | 2,001 | ||||||
FirstKey Homes Trust, Series 2020-SFR2, Class D 1.968%, 10/19/37 144A | 1,300,000 | 1,266 | ||||||
Global SC Finance SRL, Series 2021-1A, Class A 2.170%, 10/17/40 144A | 1,011,651 | 1,009 | ||||||
Global SC Finance SRL, Series 2021- 2A, Class A 1.950%, 8/17/41 144A | 794,799 | 785 | ||||||
Goldentree Loan Opportunities X, Ltd., Series 2015-10A, Class AR 1.252%, (ICE LIBOR USD 3 Month plus 1.120%), 7/20/31 144A | 1,125,000 | 1,125 | ||||||
Goodgreen Trust, Series 2020-1A, Class A 2.630%, 4/15/55 144A | 795,376 | 793 | ||||||
Goodgreen Trust, Series 2021-1A, Class A 2.660%, 10/20/56 144A | 549,175 | 543 | ||||||
Hilton Grand Vacations Trust, Series 2017- AA, Class A 2.660%, 12/26/28 144A | 601,628 | 610 | ||||||
Hilton Grand Vacations Trust, Series 2019- AA, Class B 2.540%, 7/25/33 144A | 955,022 | 965 | ||||||
Instar Leasing III, LLC, Series 2021-1A, Class A 2.300%, 2/15/54 144A | 1,626,069 | 1,614 | ||||||
J.G. Wentworth XLI LLC, Series 2018-1A, Class B 4.700%, 10/15/74 144A | 400,000 | 464 | ||||||
KKR Financial CLO, Ltd., Series 2018-22A, Class A 1.282%, (ICE LIBOR USD 3 Month plus 1.150%), 7/20/31 144A | 1,500,000 | 1,500 | ||||||
Magnetite CLO, Ltd., Series 2014-8A, Class AR2 1.104%, (ICE LIBOR USD 3 Month plus 0.980%), 4/15/31 144A | 1,750,000 | 1,750 | ||||||
Magnetite CLO, Ltd., Series 2021-29A, Class B 1.524%, (ICE LIBOR USD 3 Month plus 1.400%), 1/15/34 144A | 1,650,000 | 1,646 | ||||||
| Structured Products (20.3%) | Shares/ Par + | Value $ (000’s) | ||||||
Asset Backed Securities continued | ||||||||
Mosaic Solar Loans LLC, Series 2021-1, Class A 1.510%, 12/20/46 144A | 1,361,001 | 1,321 | ||||||
MVW Owner Trust, Series 2019-2A, Class A 2.220%, 10/20/38 144A | 704,458 | 712 | ||||||
Progress Residential Trust, Series 2019- SFR1, Class A 3.422%, 8/17/35 144A | 1,998,027 | 1,999 | ||||||
Progress Residential Trust, Series 2021- SFR1, Class D 1.805%, 4/17/38 144A | 1,000,000 | 957 | ||||||
Progress Residential Trust, Series 2021- SFR2, Class C 1.997%, 4/19/38 144A | 5,050,000 | 4,939 | ||||||
Progress Residential Trust, Series 2021- SFR8, Class E1 2.382%, 9/17/38 144A | 1,100,000 | 1,072 | ||||||
Rockford Tower CLO, Ltd., Series 2017-1A, Class BR2A 1.782%, (ICE LIBOR USD 3 Month plus 1.650%), 4/20/34 144A | 2,000,000 | 1,979 | ||||||
Rockford Tower CLO, Ltd., Series 2020-1A, Class B 1.932%, (ICE LIBOR USD 3 Month plus 1.800%), 1/20/32 144A | 1,350,000 | 1,350 | ||||||
ServiceMaster Brands, Series 2020-1, Class A2I 2.841%, 1/30/51 144A | 1,240,625 | 1,229 | ||||||
Sierra Receivables Funding Co. LLC, Series 2019-3A, Class B 2.750%, 7/15/38 144A | 1,312,672 | 1,327 | ||||||
Sierra Receivables Funding Co. LLC, Series 2021-A1, Class B 1.340%, 11/20/37 144A | 2,432,664 | 2,396 | ||||||
Taco Bell Funding LLC, Series 2021-1A, Class A23 2.542%, 8/25/51 144A | 2,575,000 | 2,516 | ||||||
Treman Park CLO, Ltd., Series 2015-1A, Class ARR 1.202%, (ICE LIBOR USD 3 Month plus 1.070%), 10/20/28 144A | 877,264 | 877 | ||||||
Tricon American Homes, Series 2020-SFR2, Class B 1.832%, 11/17/39 144A | 1,400,000 | 1,354 | ||||||
Wendys Funding LLC, Series 2021-1A, Class A2II 2.775%, 6/15/51 144A | 3,407,875 | 3,400 | ||||||
|
| |||||||
Total | 51,173 | |||||||
|
| |||||||
Mortgage Securities (10.4%) | ||||||||
Agate Bay Mortgage Trust, Series 2015-7, Class A3 3.500%, (AFC), 10/25/45 144A | 201,037 | 201 | ||||||
Agate Bay Mortgage Trust, Series 2016-1, Class A3 3.500%, (AFC), 12/25/45 144A | 146,603 | 147 | ||||||
Angel Oak Mortgage Trust LLC, Series 2019-4, Class A 3.301%, (AFC), 7/26/49 144A | 154,101 | 155 | ||||||
The Accompanying Notes are an Integral Part of the Financial Statements.
166
Table of Contents
Inflation Protection Portfolio
| Structured Products (20.3%) | Shares/ Par + | Value $ (000’s) | ||||||
Mortgage Securities continued | ||||||||
Angel Oak Mortgage Trust LLC, Series 2019-6, Class A3 2.927%, (AFC), 11/25/59 144A | 497,409 | 497 | ||||||
Arroyo Mortgage Trust, Series 2021-1R, Class A2 1.483%, (CSTR, AFC), 10/25/48 144A | 505,435 | 503 | ||||||
Arroyo Mortgage Trust, Series 2021-1R, Class A3 1.637%, (CSTR, AFC), 10/25/48 144A | 388,796 | 387 | ||||||
Bellemeade Re, Ltd., Series 2021-2A, Class M1C 1.900%, (US 30 Day Average SOFR plus 1.850%), 6/25/31 144A | 2,108,000 | 2,107 | ||||||
Bellemeade Re, Ltd., Series 2021-3A, Class M1A 1.050%, (US 30 Day Average SOFR plus 1.000%), 9/25/31 144A | 1,475,000 | 1,467 | ||||||
BX Commercial Mortgage Trust, Series 2021-VOLT, Class E 2.110%, (ICE LIBOR USD 1 Month plus 2.000%), 9/15/36 144A | 1,200,000 | 1,189 | ||||||
BX Commercial Mortgage Trust, Series 2021-VOLT, Class F 2.510%, (ICE LIBOR USD 1 Month plus 2.400%), 9/15/36 144A | 1,400,000 | 1,387 | ||||||
BX Trust, Series 2019-OC11, Class A 3.202%, 12/9/41 144A | 1,850,000 | 1,947 | ||||||
BX Trust, Series 2019-OC11, Class C 3.856%, 12/9/41 144A | 1,350,000 | 1,388 | ||||||
BX Trust, Series 2021-B29, Class D 3.549%, (CSTR), 3/11/44 144A | 2,014,962 | 2,007 | ||||||
BXMT, Ltd., Series 2020-FL2, Class B 1.564%, (US 30 Day Average SOFR plus 1.514%), 2/15/38 144A | 1,600,000 | 1,595 | ||||||
Chase Mortgage Finance Corp., Series 2021-CL1, Class M1 1.250%, (US 30 Day Average SOFR plus 1.200%), 2/25/50 144A | 471,477 | 473 | ||||||
Citigroup Mortgage Loan Trust, Series 2019- IMC1, Class A1 2.720%, (AFC), 7/25/49 144A | 273,183 | 274 | ||||||
Credit Suisse Mortgage Capital Certificates, Series 2019-ICE4, Class B 1.340%, (ICE LIBOR USD 1 Month plus 1.230%), 5/15/36 144A | 875,000 | 874 | ||||||
Credit Suisse Mortgage Capital Certificates, Series 2019-ICE4, Class D 1.710%, (ICE LIBOR USD 1 Month plus 1.600%), 5/15/36 144A | 2,155,000 | 2,147 | ||||||
Credit Suisse Mortgage Trust, Series 2015- WIN1, Class A10 3.500%, (AFC), 12/25/44 144A | 73,616 | 74 | ||||||
Credit Suisse Mortgage Trust, Series 2021- NQM2, Class A3 1.538%, (AFC), 2/25/66 144A | 455,387 | 450 | ||||||
Deephaven Residential Mortgage Trust, Series 2021-3, Class A3 1.554%, (AFC), 8/25/66 144A | 1,262,653 | 1,248 | ||||||
FARM 2021-1 Mortgage Trust, Series 2021- 1, Class A 2.180%, (CSTR), 1/25/51 144A | 2,335,786 | 2,321 | ||||||
| Structured Products (20.3%) | Shares/ Par + | Value $ (000’s) | ||||||
Mortgage Securities continued | ||||||||
Federal Home Loan Mortgage Corp. Multifamily Structured Pass Through Certificates, Series 2019-K088, Class A2 3.690%, 1/25/29 | 3,000,000 | 3,389 | ||||||
Federal Home Loan Mortgage Corp., Series K108, Class A2 1.517%, 3/25/30 | 4,000,000 | 3,931 | ||||||
Federal National Mortgage Association, Series 2018-C03, Class 1EB2 2.692%, (ICE LIBOR USD 1 Month plus 2.600%), 5/25/24 | 373,621 | 379 | ||||||
GS Mortgage Securities Corp. Trust, Series 2017-STAY, Class D 2.560%, (ICE LIBOR USD 1 Month plus 2.450%), 7/15/32 144A | 1,225,000 | 1,227 | ||||||
Imperial Fund Mortgage Trust, Series 2021- NQM1, Class A3 1.617%, (AFC), 6/25/56 144A | 525,714 | 518 | ||||||
JP Morgan Mortgage Trust, Series 2014-5, Class A1 2.878%, (AFC), 10/25/29 144A | 489,394 | 497 | ||||||
JP Morgan Mortgage Trust, Series 2016-1, Class A7 3.500%, 5/25/46 144A | 848,635 | 860 | ||||||
JP Morgan Mortgage Trust, Series 2017-1, Class A2 3.478%, (AFC), 1/25/47 144A | 374,477 | 376 | ||||||
New Residential Mortgage Loan Trust, Series 2020-NQM2, Class A2 2.891%, (AFC), 5/24/60 144A | 1,383,000 | 1,396 | ||||||
Sequoia Mortgage Trust, Series 2017-7, Class A7 3.500%, (AFC), 10/25/47 144A | 1,467,666 | 1,477 | ||||||
Sequoia Mortgage Trust, Series 2019-4, Class A7 3.500%, (AFC), 11/25/49 144A | 2,837,193 | 2,858 | ||||||
Sequoia Mortgage Trust, Series 2021-5, Class A4 2.500%, (AFC), 7/25/51 144A | 1,832,818 | 1,848 | ||||||
SG Residential Mortgage Trust, Series 2021- 1, Class A3 1.560%, (AFC), 7/25/61 144A | 1,051,857 | 1,037 | ||||||
SLG Office Trust, Series 2021-OVA, Class C 2.850%, 7/15/41 144A | 1,850,000 | 1,866 | ||||||
Starwood Mortgage Residential Trust, Series 2020-2, Class B1E 3.000%, (AFC), 4/25/60 144A | 2,503,000 | 2,507 | ||||||
Starwood Mortgage Residential Trust, Series 2021-1, Class A1 1.219%, (AFC), 5/25/65 144A | 1,437,610 | 1,432 | ||||||
Verus Securitization Trust, Series 2019-4, Class A3 3.000%, (AFC), 11/25/59 144A ∑ | 1,031,503 | 1,041 | ||||||
Verus Securitization Trust, Series 2020-1, Class A3 2.724%, (AFC), 1/25/60 144A ∑ | 759,840 | 761 | ||||||
Verus Securitization Trust, Series 2021-1, Class A3 1.155%, (AFC), 1/25/66 144A | 1,209,506 | 1,189 | ||||||
The Accompanying Notes are an Integral Part of the Financial Statements.
167
Table of Contents
Inflation Protection Portfolio
| Structured Products (20.3%) | Shares/ Par + | Value $ (000’s) | ||||||
Mortgage Securities continued | ||||||||
Verus Securitization Trust, Series 2021-5, Class A3 1.373%, (AFC), 9/25/66 144A | 1,193,941 | 1,175 | ||||||
Vista Point Securitization Trust, Series 2020- 2, Class A3 2.496%, (AFC), 4/25/65 144A | 637,400 | 637 | ||||||
|
| |||||||
Total | 53,239 | |||||||
|
| |||||||
Total Structured Products | ||||||||
(Cost: $105,522) |
| 104,412 | ||||||
|
| |||||||
| Short-Term Investments (10.2%) | ||||||||
Commercial Paper (6.6%) | ||||||||
Banco Santander SA 0.000%, 1/3/22 | 1,000,000 | 1,000 | ||||||
BNP Paribas SA 0.000%, 4/29/22 | 8,000,000 | 7,995 | ||||||
Glencove Funding DAC / Glencove Funding LLC 0.000%, 2/7/22 | 8,000,000 | 7,999 | ||||||
LMA SA / LMA Americas LLC | 5,000,000 | 5,000 | ||||||
0.000%, 1/14/22 | 12,000,000 | 11,999 | ||||||
|
| |||||||
Total | 33,993 | |||||||
|
| |||||||
Money Market Funds (3.6%) | ||||||||
State Street Institutional U.S. Government Money Market Fund - Premier Class 0.030%# | 18,690,581 | 18,691 | ||||||
|
| |||||||
Total | 18,691 | |||||||
|
| |||||||
Total Short-Term Investments | ||||||||
(Cost: $52,683) |
| 52,684 | ||||||
|
| |||||||
Total Investments (99.8%) |
| |||||||
(Cost: $490,161)@ |
| 512,675 | ||||||
|
| |||||||
Other Assets, Less Liabilities (0.2%) | 1,256 | |||||||
|
| |||||||
Net Assets (100.0%) | 513,931 | |||||||
|
| |||||||
Exchange Traded or Centrally Cleared Derivatives
Futures
| Issuer | Long/Short | Currency | Notional Par (000’s) | Number of Contracts | Expiration Date | Notional Value (000’s) | Unrealized Appreciation/ (Depreciation) (000’s) | Variation Margin (000’s) | ||||||||||||||||
Five-Year US Treasury Note Future | Long | USD | 18,300 | 183 | 3/22 | $ | 22,139 | $ | 94 | $ | 13 | |||||||||||||
US Treasury Long Bond Future | Short | USD | 4,500 | 45 | 3/22 | 7,220 | (93 | ) | (25 | ) | ||||||||||||||
US Treasury Ultra Future | Short | USD | 3,400 | 34 | 3/22 | 6,702 | (135 | ) | (53 | ) | ||||||||||||||
|
|
|
| |||||||||||||||||||||
| $ | (134 | ) | $ | (65 | ) | |||||||||||||||||||
|
|
|
| |||||||||||||||||||||
The Accompanying Notes are an Integral Part of the Financial Statements.
168
Table of Contents
Inflation Protection Portfolio
Total Return Swaps - Receive Floating Rate
| Floating Rate Index | Fixed Rate | Expiration Date | Notional Amount (000’s) | Currency | Upfront Premium Paid/ (Received) (000’s) | Unrealized Appreciation/ (Depreciation) (000’s) | Market Value (000’s) | Variation Margin(000’s) | ||||||||||||||||||||||||
CPURNSA | 1.777% | 6/24 | 11,000 | USD | $ | - | $ | 912 | $ | 912 | $ | (7 | ) | |||||||||||||||||||
CPURNSA | 1.715% | 6/24 | 7,400 | USD | - | 632 | 632 | (5 | ) | |||||||||||||||||||||||
CPURNSA | 1.860% | 7/24 | 7,500 | USD | - | 584 | 584 | (7 | ) | |||||||||||||||||||||||
CPURNSA | 1.858% | 8/24 | 12,700 | USD | - | 991 | 991 | (12 | ) | |||||||||||||||||||||||
CPURNSA | 1.616% | 10/24 | 7,500 | USD | - | 704 | 704 | (8 | ) | |||||||||||||||||||||||
CPURNSA | 2.073% | 8/27 | 3,500 | USD | - | 347 | 347 | (5 | ) | |||||||||||||||||||||||
CPURNSA | 2.145% | 11/27 | 5,000 | USD | (1 | ) | 448 | 447 | (14 | ) | ||||||||||||||||||||||
CPURNSA | 1.793% | 10/29 | 3,700 | USD | - | 487 | 487 | (19 | ) | |||||||||||||||||||||||
CPURNSA | 1.800% | 10/29 | 3,700 | USD | - | 485 | 485 | (19 | ) | |||||||||||||||||||||||
CPURNSA | 1.884% | 11/29 | 2,000 | USD | - | 248 | 248 | (11 | ) | |||||||||||||||||||||||
CPURNSA | 2.695% | 8/26 | 10,000 | USD | 1 | 295 | 296 | (20 | ) | |||||||||||||||||||||||
CPURNSA | 2.513% | 8/31 | 5,000 | USD | 1 | 217 | 218 | (27 | ) | |||||||||||||||||||||||
CPURNSA | 2.498% | 9/31 | 7,000 | USD | 1 | 304 | 305 | (38 | ) | |||||||||||||||||||||||
CPURNSA | 2.333% | 2/26 | 13,000 | USD | - | 950 | 950 | (25 | ) | |||||||||||||||||||||||
CPURNSA | 2.210% | 1/24 | 8,000 | USD | - | 521 | 521 | (8 | ) | |||||||||||||||||||||||
CPURNSA | 2.273% | 1/24 | 10,000 | USD | - | 633 | 633 | (11 | ) | |||||||||||||||||||||||
CPURNSA | 2.260% | 2/25 | 8,000 | USD | - | 567 | 567 | (12 | ) | |||||||||||||||||||||||
CPURNSA | 2.243% | 1/26 | 6,000 | USD | - | 468 | 468 | (10 | ) | |||||||||||||||||||||||
CPURNSA | 1.078% | 6/25 | 3,000 | USD | - | 401 | 401 | (2 | ) | |||||||||||||||||||||||
CPURNSA | 1.291% | 5/30 | 2,000 | USD | - | 380 | 380 | (10 | ) | |||||||||||||||||||||||
CPURNSA | 1.629% | 6/30 | 2,000 | USD | - | 337 | 337 | (11 | ) | |||||||||||||||||||||||
|
|
|
|
|
|
|
| |||||||||||||||||||||||||
| $ | 2 | $ | 10,911 | $ | 10,913 | $ | (281 | ) | ||||||||||||||||||||||||
|
|
|
|
|
|
|
| |||||||||||||||||||||||||
| Financial Derivative Assets | Financial Derivative Liabilities | |||||||||||||||||||||||||||
| Variation Margin (000’s) | Variation Margin (000’s) | Market Value (000’s) | ||||||||||||||||||||||||||
| Swaps | Futures | Total | Swaps | Futures | Total | Options | ||||||||||||||||||||||
Total Exchange-Traded or Centrally Cleared Derivatives | $ | - | $ | 13 | $ | 13 | $ | (281 | ) | $ | (78 | ) | $ | (359 | ) | $ | - | |||||||||||
|
|
|
|
|
|
|
|
|
|
|
|
|
| |||||||||||||||
Over the Counter Derivatives
Forward Foreign Currency Contracts
| Type | Counterparty | Currency | Foreign Principal Covered by Contract (000s) | USD Principal Amount Covered by Contract (000’s) | Settlement Date | Unrealized Appreciation (000’s) | Unrealized (Depreciation) (000’s) | Net Unrealized Appreciation/ (Depreciation) | ||||||||||||||||||
Buy | Morgan Stanley Capital Services, Inc. | CAD | 13,648 | 10,788 | 3/16/2022 | $ | 114 | $ | - | $ | 114 | |||||||||||||||
Sell | Morgan Stanley Capital Services, Inc. | CAD | 24,254 | 19,171 | 3/16/2022 | - | (193 | ) | (193 | ) | ||||||||||||||||
|
|
|
|
|
| |||||||||||||||||||||
| $ | 114 | $ | (193 | ) | $ | (79 | ) | |||||||||||||||||||
|
|
|
|
|
| |||||||||||||||||||||
The Accompanying Notes are an Integral Part of the Financial Statements.
169
Table of Contents
Inflation Protection Portfolio
Total Return Swaps
| Reference Entity | Counterparty | Payment made by the Fund | Expiration Date | Notional Amount (000’s) | Unrealized Appreciation/ (Depreciation) (000’s) | Market Value (000’s) | ||||||||||
CPURNSA | Bank of America NA | 2.670% | 4/22 | 3,000 | $ | (236 | ) | $ | (236 | ) | ||||||
CPURNSA | Bank of America NA | 2.763% | 3/23 | 700 | (42 | ) | (42 | ) | ||||||||
CPURNSA | Bank of America NA | 2.528% | 8/24 | 2,750 | (43 | ) | (43 | ) | ||||||||
CPURNSA | Bank of America NA | 2.140% | 7/25 | 2,900 | 197 | 197 | ||||||||||
CPURNSA | Bank of America NA | 1.790% | 8/25 | 1,500 | 156 | 156 | ||||||||||
CPURNSA | Bank of America NA | 2.240% | 4/27 | 3,500 | 251 | 251 | ||||||||||
CPURNSA | Bank of America NA | 2.218% | 4/27 | 2,000 | 149 | 149 | ||||||||||
CPURNSA | Bank of America NA | 2.235% | 4/27 | 2,000 | 146 | 146 | ||||||||||
CPURNSA | Bank of America NA | 2.235% | 5/27 | 5,000 | 366 | 366 | ||||||||||
CPURNSA | Barclays Bank PLC | 2.526% | 5/23 | 5,500 | (186 | ) | (186 | ) | ||||||||
CPURNSA | Barclays Bank PLC | 2.535% | 5/23 | 1,000 | (35 | ) | (35 | ) | ||||||||
CPURNSA | Barclays Bank PLC | 2.589% | 7/24 | 1,400 | (33 | ) | (33 | ) | ||||||||
CPURNSA | Barclays Bank PLC | 2.385% | 9/24 | 4,000 | 13 | 13 | ||||||||||
CPURNSA | Barclays Bank PLC | 2.363% | 9/24 | 3,500 | 24 | 24 | ||||||||||
CPURNSA | Barclays Bank PLC | 2.310% | 9/24 | 1,400 | 19 | 19 | ||||||||||
CPURNSA | Barclays Bank PLC | 2.895% | 12/27 | 1,700 | (308 | ) | (308 | ) | ||||||||
CPURNSA | Barclays Bank PLC | 2.784% | 7/44 | 1,400 | (224 | ) | (224 | ) | ||||||||
CPURNSA | Goldman Sachs International | 1.870% | 5/26 | 8,500 | 1,003 | 1,003 | ||||||||||
CPURNSA | Goldman Sachs International | 1.920% | 5/26 | 7,000 | 788 | 788 | ||||||||||
CPURNSA | Goldman Sachs International | 1.770% | 6/26 | 6,000 | 773 | 773 | ||||||||||
CPURNSA | Goldman Sachs International | 2.245% | 11/26 | 3,000 | 226 | 226 | ||||||||||
CPURNSA | Goldman Sachs International | 2.280% | 11/26 | 3,000 | 214 | 214 | ||||||||||
CPURNSA | Goldman Sachs International | 2.280% | 11/26 | 4,000 | 285 | 285 | ||||||||||
|
|
|
| |||||||||||||
| $ | 3,503 | $ | 3,503 | |||||||||||||
|
|
|
| |||||||||||||
| Financial Derivative Assets (000’s) | Financial Derivative Liabilities (000’s) | |||||||||||||||||||||||||||
| Forward Foreign Currency Contracts | Swaps | Total | Forward Foreign Currency Contracts | Options | Swaps | Total | ||||||||||||||||||||||
Total Over the Counter Derivatives | $ | 114 | $ | 4,610 | $ | 4,724 | $ | (193 | ) | - | $ | (1,107 | ) | $ | (1,300 | ) | ||||||||||||
| + | All par is stated in U.S. Dollar unless otherwise noted. |
144A Security exempt from registration under Rule 144A of the Securities Act of 1933. These securities may be resold as transactions exempt from registration, normally to qualified institutional buyers. At December 31, 2021 the value of these securities (in thousands) was $108,721 representing 21.2% of the net assets. |
| b | Cash or securities with an aggregate value of $16,350 (in thousands) has been pledged as collateral for futures, swap contracts outstanding, short sales, when issued securities or written options on 12/31/2021. |
| ∞ | Foreign Bond — par value is foreign denominated |
| S | Stepped coupon bond for which the coupon rate of interest adjusts on specified date(s); rate shown is effective rate at period-end. |
| # | 7-Day yield as of 12/31/2021. |
| @ | At December 31, 2021, the aggregate cost of investments, including derivatives, for federal tax purposes (in thousands) was $490,006 and the net unrealized appreciation of investments based on that cost was $36,870 which is comprised of $40,940 aggregate gross unrealized appreciation and $4,070 aggregate gross unrealized depreciation. |
The Accompanying Notes are an Integral Part of the Financial Statements.
170
Table of Contents
Inflation Protection Portfolio
The following is a summary of the inputs used in valuing the Portfolio’s Investments at December 31, 2021. See Note 3 for additional information on portfolio valuation.
| Valuation Inputs | ||||||||||||||
| Description | Level 1– Quoted Prices | Level 2– Other Significant Observable Inputs | Level 3 – Significant Unobservable Inputs | |||||||||||
| (Amounts in thousands) | ||||||||||||||
Assets: | ||||||||||||||
Municipal Bonds | $ | - | $ | 804 | $ | - | ||||||||
Corporate Bonds | - | 60,021 | - | |||||||||||
Governments | - | 277,385 | - | |||||||||||
Structured Products | - | 104,412 | - | |||||||||||
Investment Companies | 17,369 | - | - | |||||||||||
Short-Term Investments | ||||||||||||||
Money Market Funds | 18,691 | - | - | |||||||||||
All Others | - | 33,993 | - | |||||||||||
Other Financial Instruments^ | ||||||||||||||
Futures | 94 | -�� | - | |||||||||||
Forward Foreign Currency Contracts | - | 114 | - | |||||||||||
Total Return Swaps | - | 15,523 | - | |||||||||||
Total Assets: | $ | 36,154 | $ | 492,252 | $ | - | ||||||||
Liabilities: | ||||||||||||||
Other Financial Instruments^ | �� | |||||||||||||
Futures | (228 | ) | - | - | ||||||||||
Forward Foreign Currency Contracts | - | (193 | ) | - | ||||||||||
Total Return Swaps | - | (1,107 | ) | - | ||||||||||
Total Liabilities: | $ | (228 | ) | $ | (1,300 | ) | $ | - | ||||||
^ Other financial instruments are derivative instruments such as futures and forward foreign currency contracts, which are valued at the unrealized appreciation (depreciation) on the instrument, and securities sold short, reverse repurchase agreements, written options and swaps contracts, which are valued at market value.
The Accompanying Notes are an Integral Part of the Financial Statements.
171
Table of Contents
High Yield Bond Portfolio (unaudited)
| Objective: | Portfolio Strategy: | Net Assets: | ||
| High current income and capital appreciation. | Invest in non-investment grade debt securities. | $842 million |
PORTFOLIO OVERVIEW
Mason Street Advisors, LLC (“Mason Street Advisors”), the investment adviser for the High Yield Bond Portfolio (the “Portfolio”), has engaged Federated Investment Management Company (“Federated”) to act as sub-adviser for the Portfolio. Normally, the Portfolio invests in non-investment grade debt securities, which are generally securities rated below investment grade by major credit rating agencies, or if unrated, determined to be of comparable quality. The Portfolio may invest up to 30% of net assets in non-investment grade foreign securities. The securities in which the Portfolio primarily invests are considered speculative and are sometimes known as “junk bonds.” These securities tend to offer higher yields than higher rated securities of comparable maturities primarily because of the market’s greater uncertainty about the issuer’s ability to make all required interest and principal payments, and therefore about the returns that will in fact be realized by the Portfolio. The Portfolio invests in securities believed to have attractive investment characteristics and seeks to minimize default risk and other risks through careful security selection and diversification. The Portfolio’s security selection process consists of a credit-intensive, fundamental analysis of the issuer. The Portfolio does not limit the investments to securities of a particular maturity range and does not target an average effective maturity or duration.
MARKET OVERVIEW
The U.S. economy showed strong growth for 2021 despite several headwinds, including uncertainty regarding the coronavirus pandemic and its impact on the reopening of the global economy. Additionally, the interest rate on U.S. Treasury securities increased in response to confidence in economic growth and signs that inflationary pressures may be less transitory than expected. Indications that the Fed would begin to taper its asset purchases and eventually begin raising the interest rate on federal funds also increased the rate on U.S. Treasury securities. Offsetting these headwinds was the very strong financial performance of U.S. high yield issuers. This can be seen in the declining default rate for high yield securities and a strong increase in the number of credit rating agency upgrades for high yield securities. The impact of these factors can be seen in the movement of the yield spread between the Bloomberg® U.S. Corporate High Yield 2% Issuer Capped Index and U.S. Treasury securities of comparable maturities, which declined from 361 basis points at the beginning of the period to 284 basis points on December 31, 2021.
PORTFOLIO RESULTS
The Portfolio returned 5.31% for the twelve months ended December 31, 2021. By comparison, the Portfolio’s benchmark, the Bloomberg® U.S. Corporate High Yield 2% Issuer Capped Index, returned 5.26%. (The Index is unmanaged, cannot be invested in directly and does not incur expenses.) According to Lipper® Analytical Services, Inc., an independent mutual fund rating agency, the average return in 2021 of the High Yield Funds peer group was 4.85%.
The Energy sector contributed to the Portfolio’s return, led by companies in the oil and gas industry, such as Callon Petroleum, Summit Midstream, Western Midstream and Antero Midstream. The Health Care, Information Technology and the Materials sectors also contributed, led by gains in the pharmaceutical company Mallinckrodt, as well as in the gaming and chemicals industries. The Portfolio’s holdings of equity securities in Oasis Petroleum and Superior Energy, which it received in debt restructurings in late 2020, also contributed to the Portfolio’s return. In addition, an overweight position in the strong-performing midstream and oil field services industry and an underweight position in the underperforming wireline and wireless telecommunication industry contributed.
On the downside, security selection in the Communication Services, Health Care, Financials, Consumer Discretionary, Materials and Industrial sectors detracted from the Portfolio’s performance. Specifically, the cable and satellite services companies Intelsat and CSC Holdings, media and entertainment company Diamond Sports, the pharmaceuticals company Bausch Health and asset management company NFP Corp. were detractors. An overweight in the underperforming cable and satellite, media and entertainment and packaging industries also detracted from the Portfolio’s return.
PORTFOLIO MANAGER OUTLOOK
The following forward-looking comments are the opinion of Federated, the Portfolio’s sub-adviser.
High yield spreads ended 2021 at cycle tights and at the lowest month-end level since 2007. The factors that drove spreads to current levels including, a strong economy, excellent corporate credit fundamentals, low default rates and high oil and
172
Table of Contents
High Yield Bond Portfolio (unaudited)
natural gas prices, remain largely in place. We believe that 2022 should see a significant percentage of high yield debt outstanding upgraded to investment grade. This suggests that aggressive spread widening of existing high yield debt is unlikely in the near term. However, current levels also suggest that material spread tightening is unlikely. We continue to see value in selective lower quality issuers which should benefit from the strong economy and specific company factors. We also continue to monitor the risks posed by COVID-19, supply chain issues and likely Fed policy changes in 2022. At this point, relatively higher income generated by high yield securities and comparatively short duration should allow high yield securities to modestly outperform other fixed income alternatives.
Relative Performance
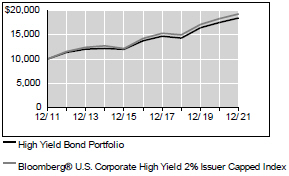
Average Annual Total Returns For Periods Ended December 31, 2021 | ||||||||||||
| 1 Year | 5 Years | 10 Years | ||||||||||
High Yield Bond Portfolio | 5.31 | % | 6.07 | % | 6.35 | % | ||||||
Bloomberg® U.S. Corporate High Yield 2% Issuer Capped Index | 5.26 | % | 6.28 | % | 6.82 | % | ||||||
Lipper® Variable Insurance Products (VIP) High Yield Funds Average | 4.85 | % | 5.34 | % | 5.95 | % | ||||||
The performance data quoted represents past performance. Past performance is historical and does not guarantee future performance. Investment return and principal value will fluctuate, so that shares, when redeemed, may be worth more or less than their original cost. Current performance may be lower or higher than the performance data quoted. For the most recent month-end performance information visit www.northwesternmutual.com.
This chart assumes an initial investment of $10,000 made on 12/31/11. Returns shown reflect fee waivers, deductions for management and other portfolio expenses, and reinvestment of all dividends. In the absence of fee waivers, total return would be reduced. Returns exclude deductions for separate account sale loads and account fees. Please refer to the Benchmark Definitions section of this report for information about the indices cited in the above chart and graph.
Return of principal is not guaranteed. When interest rates rise, bond prices fall. With a fixed income fund,
when interest rates rise, the value of the fund’s existing bonds drops, which could negatively affect overall fund performance.
Investing in bonds issued by foreign corporations carries additional risk, including foreign currency risk, and may increase the volatility of the Portfolio’s performance.
The U.S. federal funds rate has been subject to frequent adjustments over the course of the last several years. A significant rise in interest rates over a short period of time could cause significant losses in the market value of the Portfolio’s fixed income investments.
Top 10 Fixed Income Holdings 12/31/21
| Security Description | % of Net Assets | |||
Ford Motor Credit Co. LLC, Various | 2.3 | % | ||
CCO Holdings LLC / CCO Holdings Capital Corp., Various | 2.0 | % | ||
CSC Holdings LLC, Various | 2.0 | % | ||
HUB International, Ltd., Various | 1.4 | % | ||
Occidental Petroleum Corp., Various | 1.3 | % | ||
TransDigm, Inc., Various | 1.2 | % | ||
Targa Resources Partners LP / Targa Resources Partners Finance Corp., Various | 1.1 | % | ||
Tenet Healthcare Corp., Various | 1.1 | % | ||
EQM Midstream Partners LP, Various | 1.1 | % | ||
Bausch Health Cos., Inc., Various | 1.1 | % | ||
173
Table of Contents
High Yield Bond Portfolio (unaudited)
Sector Allocation 12/31/21
| Sector | % of Net Assets | |||||||
Consumer, Non-Cyclical | 18.2 | % | ||||||
Communications | 17.2 | % | ||||||
Consumer, Cyclical | 16.0 | % | ||||||
Energy | 14.6 | % | ||||||
Industrial | 11.0 | % | ||||||
Financial | 7.2 | % | ||||||
Technology | 5.5 | % | ||||||
Basic Materials | 4.4 | % | ||||||
Short-Term Investments & Other Net Assets | 3.1 | % | ||||||
Utilities | 2.1 | % | ||||||
Health Care | 0.4 | % | ||||||
Diversified | 0.2 | % | ||||||
Materials | 0.1 | % | ||||||
Sector Allocation and Top 10 Holdings are subject to change.
174
Table of Contents
High Yield Bond Portfolio
SCHEDULE OF INVESTMENTS
December 31, 2021
| Common Stocks (0.4%) | Shares/ Par + | Value $ (000’s) | ||||||
Communications (0.0%) | ||||||||
iHeartMedia, Inc. * | 22,266 | 469 | ||||||
|
| |||||||
Total | 469 | |||||||
|
| |||||||
Energy (0.3%) | ||||||||
Chesapeake Energy Corp. | 109 | 7 | ||||||
Superior Energy Services, Inc. *,Æ | 60,602 | 2,621 | ||||||
|
| |||||||
Total | 2,628 | |||||||
|
| |||||||
Materials (0.1%) | ||||||||
Hexion Holdings Corp. * | 20,667 | 587 | ||||||
|
| |||||||
Total | 587 | |||||||
|
| |||||||
Total Common Stocks (Cost: $2,621) | 3,684 | |||||||
|
| |||||||
| Corporate Bonds (96.5%) | ||||||||
Basic Materials (4.4%) | ||||||||
Ashland LLC 3.375%, 9/1/31 144A | 825,000 | 819 | ||||||
Axalta Coating Systems LLC 3.375%, 2/15/29 144A | 625,000 | 605 | ||||||
Axalta Coating Systems LLC / Axalta Coating Systems Dutch Holding 4.750%, 6/15/27 144A | 350,000 | 365 | ||||||
Clearwater Paper Corp. 4.750%, 8/15/28 144A | 150,000 | 153 | ||||||
5.375%, 2/1/25 144A | 2,625,000 | 2,835 | ||||||
Cleveland-Cliffs, Inc. 4.625%, 3/1/29 144A | 1,900,000 | 1,938 | ||||||
4.875%, 3/1/31 144A | 2,225,000 | 2,311 | ||||||
Coeur Mining, Inc. 5.125%, 2/15/29 144A | 1,500,000 | 1,375 | ||||||
Compass Minerals International, Inc. | 2,225,000 | 2,275 | ||||||
6.750%, 12/1/27 144A | 1,425,000 | 1,509 | ||||||
Diamond BC BV 4.625%, 10/1/29 144A | 1,250,000 | 1,240 | ||||||
Element Solutions, Inc. 3.875%, 9/1/28 144A | 1,650,000 | 1,658 | ||||||
Freeport-McMoRan, Inc. | 350,000 | 363 | ||||||
4.375%, 8/1/28 | 1,950,000 | 2,045 | ||||||
4.625%, 8/1/30 | 1,475,000 | 1,582 | ||||||
5.000%, 9/1/27 | 625,000 | 650 | ||||||
5.250%, 9/1/29 | 725,000 | 794 | ||||||
5.400%, 11/14/34 | 925,000 | 1,126 | ||||||
H.B. Fuller Co. 4.250%, 10/15/28 | 525,000 | 541 | ||||||
Herens Holdco SARL 4.750%, 5/15/28 144A | 2,400,000 | 2,352 | ||||||
Hexion, Inc. 7.875%, 7/15/27 144A | 2,400,000 | 2,532 | ||||||
Illuminate Buyer LLC / Illuminate Holdings IV, Inc. 9.000%, 7/1/28 144A | 725,000 | 773 | ||||||
Olympus Water US Holding Corp. 4.250%, 10/1/28 144A | 1,250,000 | 1,243 | ||||||
| Corporate Bonds (96.5%) | Shares/ Par + | Value $ (000’s) | ||||||
Basic Materials continued | ||||||||
6.250%, 10/1/29 144A | 1,575,000 | 1,536 | ||||||
Polar US Borrower LLC 6.750%, 5/15/26 144A | 1,925,000 | 1,891 | ||||||
SPCM SA 3.125%, 3/15/27 144A | 250,000 | 247 | ||||||
3.375%, 3/15/30 144A | 425,000 | 409 | ||||||
WR Grace Holdings LLC 4.875%, 6/15/27 144A | 675,000 | 693 | ||||||
5.625%, 8/15/29 144A | 1,200,000 | 1,228 | ||||||
|
| |||||||
Total | 37,088 | |||||||
|
| |||||||
Communications (17.2%) | ||||||||
AMC Networks, Inc. | 1,625,000 | 1,615 | ||||||
4.750%, 8/1/25 | 1,200,000 | 1,225 | ||||||
5.000%, 4/1/24 | 910,000 | 917 | ||||||
Cars.com, Inc. 6.375%, 11/1/28 144A | 1,900,000 | 2,023 | ||||||
CCO Holdings LLC / CCO Holdings Capital Corp. | 750,000 | 757 | ||||||
4.250%, 1/15/34 144A | 1,200,000 | 1,181 | ||||||
4.500%, 8/15/30 144A | 2,175,000 | 2,225 | ||||||
4.500%, 5/1/32 | 1,050,000 | 1,080 | ||||||
4.500%, 6/1/33 144A | 1,175,000 | 1,199 | ||||||
4.750%, 3/1/30 144A | 3,600,000 | 3,744 | ||||||
5.000%, 2/1/28 144A | 2,000,000 | 2,080 | ||||||
5.125%, 5/1/27 144A | 2,975,000 | 3,064 | ||||||
5.375%, 6/1/29 144A | 1,350,000 | 1,457 | ||||||
5.500%, 5/1/26 144A | 275,000 | 283 | ||||||
CSC Holdings LLC | 825,000 | 772 | ||||||
4.125%, 12/1/30 144A | 950,000 | 927 | ||||||
4.500%, 11/15/31 144A | 2,750,000 | 2,716 | ||||||
4.625%, 12/1/30 144A | 1,650,000 | 1,561 | ||||||
5.250%, 6/1/24 | 1,650,000 | 1,716 | ||||||
5.500%, 4/15/27 144A | 2,425,000 | 2,507 | ||||||
5.750%, 1/15/30 144A | 3,750,000 | 3,736 | ||||||
6.500%, 2/1/29 144A | 675,000 | 722 | ||||||
7.500%, 4/1/28 144A | 1,925,000 | 2,065 | ||||||
Cumulus Media New Holdings, Inc. 6.750%, 7/1/26 144A | 1,751,000 | 1,817 | ||||||
Diamond Sports Group LLC / Diamond Sports Finance Co. | 925,000 | 462 | ||||||
6.625%, 8/15/27 144A | 2,150,000 | 602 | ||||||
DIRECTV Holdings LLC / DIRECTV Financing Co., Inc. 5.875%, 8/15/27 144A | 2,025,000 | 2,073 | ||||||
DISH DBS Corp. | 2,700,000 | 2,457 | ||||||
5.750%, 12/1/28 144A | 1,100,000 | 1,111 | ||||||
5.875%, 11/15/24 | 725,000 | 745 | ||||||
7.375%, 7/1/28 | 750,000 | 759 | ||||||
7.750%, 7/1/26 | 1,350,000 | 1,424 | ||||||
The Accompanying Notes are an Integral Part of the Financial Statements.
175
Table of Contents
High Yield Bond Portfolio
| Corporate Bonds (96.5%) | Shares/ Par + | Value $ (000’s) | ||||||
Communications continued | ||||||||
Entercom Media Corp. | 2,250,000 | 2,226 | ||||||
6.750%, 3/31/29 144A | 1,650,000 | 1,612 | ||||||
Go Daddy Operating Co. LLC / GD Finance Co., Inc. 5.250%, 12/1/27 144A | 1,625,000 | 1,680 | ||||||
Gray Escrow II, Inc. 5.375%, 11/15/31 144A | 1,175,000 | 1,209 | ||||||
Gray Television, Inc. | 525,000 | 522 | ||||||
5.875%, 7/15/26 144A | 2,575,000 | 2,660 | ||||||
7.000%, 5/15/27 144A | 750,000 | 802 | ||||||
iHeartCommunications, Inc. | 425,000 | 431 | ||||||
5.250%, 8/15/27 144A | 1,075,000 | 1,118 | ||||||
6.375%, 5/1/26 | 375,901 | 390 | ||||||
8.375%, 5/1/27 | 4,928,194 | 5,196 | ||||||
Intelsat Jackson Holdings SA | 1,525,000 | 691 | ||||||
8.500%, 10/15/24 144A *,j | 800,000 | 367 | ||||||
9.750%, 7/15/25 144A *,j | 475,000 | 218 | ||||||
Lamar Media Corp. | 425,000 | 414 | ||||||
4.000%, 2/15/30 | 100,000 | 101 | ||||||
4.875%, 1/15/29 | 675,000 | 705 | ||||||
Match Group, Inc. | 2,175,000 | 2,197 | ||||||
4.625%, 6/1/28 144A | 1,450,000 | 1,509 | ||||||
5.000%, 12/15/27 144A | 825,000 | 858 | ||||||
Midas OpCo Holdings LLC 5.625%, 8/15/29 144A | 3,700,000 | 3,788 | ||||||
Millennium Escrow Corp. 6.625%, 8/1/26 144A | 1,225,000 | 1,228 | ||||||
Nexstar Broadcasting, Inc. | 2,275,000 | 2,318 | ||||||
5.625%, 7/15/27 144A | 3,225,000 | 3,400 | ||||||
Outfront Media Capital LLC / Outfront Media Capital Corp. | 1,150,000 | 1,152 | ||||||
4.625%, 3/15/30 144A | 1,100,000 | 1,097 | ||||||
Scripps Escrow II, Inc. | 500,000 | 499 | ||||||
5.375%, 1/15/31 144A | 1,175,000 | 1,194 | ||||||
Scripps Escrow, Inc. 5.875%, 7/15/27 144A | 1,925,000 | 2,022 | ||||||
Sinclair Television Group, Inc. | 150,000 | 142 | ||||||
5.125%, 2/15/27 144A | 3,800,000 | 3,686 | ||||||
5.500%, 3/1/30 144A | 600,000 | 582 | ||||||
5.875%, 3/15/26 144A | 825,000 | 837 | ||||||
Sirius XM Radio, Inc. | 1,075,000 | 1,075 | ||||||
3.875%, 9/1/31 144A | 3,025,000 | 2,966 | ||||||
4.000%, 7/15/28 144A | 725,000 | 729 | ||||||
4.125%, 7/1/30 144A | 1,775,000 | 1,775 | ||||||
5.500%, 7/1/29 144A | 925,000 | 997 | ||||||
Sprint Corp. 7.625%, 2/15/25 | 700,000 | 805 | ||||||
TEGNA, Inc. 4.625%, 3/15/28 | 600,000 | 606 | ||||||
| Corporate Bonds (96.5%) | Shares/ Par + | Value $ (000’s) | ||||||
Communications continued | ||||||||
5.000%, 9/15/29 | 3,800,000 | 3,885 | ||||||
Telenet Finance Luxembourg Notes SARL 5.500%, 3/1/28 144A | 4,400,000 | 4,532 | ||||||
Terrier Media Buyer, Inc. 8.875%, 12/15/27 144A | 5,025,000 | 5,431 | ||||||
T-Mobile USA, Inc. | 1,950,000 | 1,955 | ||||||
2.875%, 2/15/31 | 650,000 | 642 | ||||||
3.375%, 4/15/29 144A | 1,025,000 | 1,044 | ||||||
3.375%, 4/15/29 | 500,000 | 509 | ||||||
Townsquare Media, Inc. 6.875%, 2/1/26 144A | 525,000 | 557 | ||||||
Univision Communications, Inc. 4.500%, 5/1/29 144A | 1,400,000 | 1,414 | ||||||
UPC Broadband Finco BV 4.875%, 7/15/31 144A | 3,450,000 | 3,519 | ||||||
Urban One, Inc. 7.375%, 2/1/28 144A | 2,050,000 | 2,112 | ||||||
Viavi Solutions, Inc. 3.750%, 10/1/29 144A | 350,000 | 350 | ||||||
Virgin Media Finance PLC 5.000%, 7/15/30 144A | 2,700,000 | 2,687 | ||||||
Virgin Media Secured Finance PLC 5.500%, 5/15/29 144A | 475,000 | 502 | ||||||
Virgin Media Vendor Financing Notes IV 5.000%, 7/15/28 144A | 1,550,000 | 1,562 | ||||||
VMED O2 UK Financing I PLC | 875,000 | 858 | ||||||
4.750%, 7/15/31 144A | 1,475,000 | 1,493 | ||||||
Ziggo Bond Co. BV | 575,000 | 578 | ||||||
6.000%, 1/15/27 144A | 2,200,000 | 2,266 | ||||||
Ziggo BV | 200,000 | 205 | ||||||
5.500%, 1/15/27 144A | 1,936,000 | 1,989 | ||||||
|
| |||||||
Total | 144,916 | |||||||
|
| |||||||
Consumer, Cyclical (16.0%) | ||||||||
1011778 BC ULC / New Red Finance, Inc. | 525,000 | 520 | ||||||
3.875%, 1/15/28 144A | 1,125,000 | 1,139 | ||||||
4.000%, 10/15/30 144A | 5,775,000 | 5,674 | ||||||
4.375%, 1/15/28 144A | 1,175,000 | 1,198 | ||||||
Academy, Ltd. 6.000%, 11/15/27 144A | 850,000 | 906 | ||||||
Adient Global Holdings, Ltd. 4.875%, 8/15/26 144A | 3,450,000 | 3,519 | ||||||
Adient US LLC 9.000%, 4/15/25 144A | 250,000 | 266 | ||||||
Affinity Gaming 6.875%, 12/15/27 144A | 2,300,000 | 2,392 | ||||||
American Airlines, Inc. / AAdvantage Loyalty IP, Ltd. | 2,200,000 | 2,288 | ||||||
5.750%, 4/20/29 144A | 1,525,000 | 1,630 | ||||||
American Axle & Manufacturing, Inc. 6.500%, 4/1/27 | 625,000 | 649 | ||||||
American Builders & Contractors Supply Co., Inc. 4.000%, 1/15/28 144A | 725,000 | 742 | ||||||
The Accompanying Notes are an Integral Part of the Financial Statements.
176
Table of Contents
High Yield Bond Portfolio
| Corporate Bonds (96.5%) | Shares/ Par + | Value $ (000’s) | ||||||
Consumer, Cyclical continued | ||||||||
Aramark Services, Inc. | 1,025,000 | 1,046 | ||||||
5.000%, 2/1/28 144A | 225,000 | 233 | ||||||
6.375%, 5/1/25 144A | 2,525,000 | 2,639 | ||||||
Asbury Automotive Group, Inc. | 450,000 | 458 | ||||||
5.000%, 2/15/32 144A | 450,000 | 467 | ||||||
BCPE Empire Holdings, Inc. 7.625%, 5/1/27 144A | 3,500,000 | 3,574 | ||||||
Boyd Gaming Corp. | 1,650,000 | 1,683 | ||||||
4.750%, 6/15/31 144A | 575,000 | 586 | ||||||
8.625%, 6/1/25 144A | 100,000 | 107 | ||||||
Caesars Entertainment, Inc. | 825,000 | 825 | ||||||
5.750%, 7/1/25 144A | 600,000 | 627 | ||||||
6.250%, 7/1/25 144A | 1,600,000 | 1,679 | ||||||
8.125%, 7/1/27 144A | 1,975,000 | 2,187 | ||||||
CCM Merger, Inc. 6.375%, 5/1/26 144A | 275,000 | 286 | ||||||
Clarios Global LP 6.750%, 5/15/25 144A | 135,000 | 141 | ||||||
Dana Financing Luxembourg SARL 5.750%, 4/15/25 144A | 650,000 | 665 | ||||||
Dana, Inc. 4.500%, 2/15/32 | 675,000 | 673 | ||||||
5.625%, 6/15/28 | 175,000 | 186 | ||||||
Dornoch Debt Merger Sub, Inc. 6.625%, 10/15/29 144A | 3,000,000 | 2,962 | ||||||
Ford Motor Credit Co. LLC | 725,000 | 731 | ||||||
3.375%, 11/13/25 | 3,250,000 | 3,376 | ||||||
4.000%, 11/13/30 | 2,225,000 | 2,394 | ||||||
4.063%, 11/1/24 | 1,700,000 | 1,789 | ||||||
4.125%, 8/17/27 | 1,350,000 | 1,457 | ||||||
4.140%, 2/15/23 | 800,000 | 819 | ||||||
4.271%, 1/9/27 | 1,675,000 | 1,801 | ||||||
4.389%, 1/8/26 | 1,975,000 | 2,128 | ||||||
5.113%, 5/3/29 | 2,950,000 | 3,352 | ||||||
5.125%, 6/16/25 | 1,600,000 | 1,740 | ||||||
Foundation Building Materials, Inc. 6.000%, 3/1/29 144A | 2,925,000 | 2,874 | ||||||
The Gap, Inc. | 325,000 | 321 | ||||||
3.875%, 10/1/31 144A | 475,000 | 468 | ||||||
GYP Holdings III Corp. 4.625%, 5/1/29 144A | 1,250,000 | 1,253 | ||||||
H&E Equipment Services, Inc. 3.875%, 12/15/28 144A | 2,775,000 | 2,754 | ||||||
Hilton Domestic Operating Co., Inc. | 700,000 | 696 | ||||||
3.750%, 5/1/29 144A | 1,150,000 | 1,159 | ||||||
4.875%, 1/15/30 | 500,000 | 534 | ||||||
5.750%, 5/1/28 144A | 550,000 | 588 | ||||||
IHO Verwaltungs GmbH | 2,375,000 | 2,423 | ||||||
6.000%, 5/15/27 144A | 800,000 | 823 | ||||||
6.375%, 5/15/29 144A | 900,000 | 967 | ||||||
Interface, Inc. 5.500%, 12/1/28 144A | 625,000 | 655 | ||||||
| Corporate Bonds (96.5%) | Shares/ Par + | Value $ (000’s) | ||||||
Consumer, Cyclical continued | ||||||||
JB Poindexter & Co., Inc. 7.125%, 4/15/26 144A | 2,600,000 | 2,720 | ||||||
KAR Auction Services, Inc. 5.125%, 6/1/25 144A | 2,650,000 | 2,690 | ||||||
KFC Holding Co. / Pizza Hut Holdings LLC / Taco Bell of America LLC 4.750%, 6/1/27 144A | 550,000 | 569 | ||||||
Kontoor Brands, Inc. 4.125%, 11/15/29 144A | 450,000 | 450 | ||||||
MGM Resorts International | 550,000 | 566 | ||||||
6.000%, 3/15/23 | 1,725,000 | 1,803 | ||||||
6.750%, 5/1/25 | 675,000 | 705 | ||||||
Midwest Gaming Borrower LLC 4.875%, 5/1/29 144A | 950,000 | 955 | ||||||
Mohegan Gaming & Entertainment | 500,000 | 522 | ||||||
8.000%, 2/1/26 144A | 4,050,000 | 4,252 | ||||||
NMG Holding Co., Inc. / Neiman Marcus Group LLC 7.125%, 4/1/26 144A | 1,200,000 | 1,274 | ||||||
Panther BF Aggregator 2 LP / Panther Finance Co., Inc. | 270,000 | 282 | ||||||
8.500%, 5/15/27 144A | 6,450,000 | 6,837 | ||||||
Penn National Gaming, Inc. | 575,000 | 558 | ||||||
5.625%, 1/15/27 144A | 250,000 | 255 | ||||||
Raptor Acquisition Corp / Raptor Co-Issuer LLC 4.875%, 11/1/26 144A | 200,000 | 202 | ||||||
Real Hero Merger Sub 2, Inc. 6.250%, 2/1/29 144A | 4,750,000 | 4,743 | ||||||
Ritchie Bros. Holdings, Inc. 4.750%, 12/15/31 144A | 325,000 | 339 | ||||||
Scientific Games International, Inc. | 1,250,000 | 1,394 | ||||||
8.250%, 3/15/26 144A | 1,400,000 | 1,474 | ||||||
8.625%, 7/1/25 144A | 1,400,000 | 1,495 | ||||||
SeaWorld Parks & Entertainment, Inc. 5.250%, 8/15/29 144A | 2,500,000 | 2,546 | ||||||
Six Flags Entertainment Corp. | 2,400,000 | 2,484 | ||||||
7.000%, 7/1/25 144A | 275,000 | 294 | ||||||
SRS Distribution, Inc. | 1,900,000 | 1,909 | ||||||
6.125%, 7/1/29 144A | 1,050,000 | 1,070 | ||||||
Station Casinos LLC | 2,000,000 | 2,011 | ||||||
4.625%, 12/1/31 144A | 1,300,000 | 1,311 | ||||||
Suburban Propane Partners LP / Suburban Energy Finance Corp. | 2,525,000 | 2,553 | ||||||
5.875%, 3/1/27 | 900,000 | �� | 929 | |||||
White Cap Buyer LLC 6.875%, 10/15/28 144A | 1,825,000 | 1,903 | ||||||
White Cap Parent LLC 8.250%, 3/15/26 144A | 1,450,000 | 1,483 | ||||||
The William Carter Co. 5.500%, 5/15/25 144A | 400,000 | 415 | ||||||
The Accompanying Notes are an Integral Part of the Financial Statements.
177
Table of Contents
High Yield Bond Portfolio
| Corporate Bonds (96.5%) | Shares/ Par + | Value $ (000’s) | ||||||
Consumer, Cyclical continued | ||||||||
5.625%, 3/15/27 144A | 225,000 | 233 | ||||||
WMG Acquisition Corp. | 800,000 | 798 | ||||||
3.875%, 7/15/30 144A | 325,000 | 330 | ||||||
Wyndham Hotels & Resorts, Inc. 4.375%, 8/15/28 144A | 550,000 | 567 | ||||||
Yum! Brands, Inc. | 1,625,000 | 1,727 | ||||||
4.750%, 1/15/30 144A | 725,000 | 785 | ||||||
7.750%, 4/1/25 144A | 350,000 | 369 | ||||||
|
| |||||||
Total | 134,851 | |||||||
|
| |||||||
Consumer, Non-cyclical (18.2%) | ||||||||
Acadia Healthcare Co., Inc. | 225,000 | 231 | ||||||
5.500%, 7/1/28 144A | 225,000 | 236 | ||||||
AdaptHealth LLC | 1,450,000 | 1,450 | ||||||
5.125%, 3/1/30 144A | 1,425,000 | 1,450 | ||||||
AHP Health Partners, Inc. 5.750%, 7/15/29 144A | 1,025,000 | 1,015 | ||||||
Albertsons Cos., Inc. / Safeway, Inc. / New Albertson’s LP / Albertson’s LLC | 350,000 | 357 | ||||||
3.500%, 2/15/23 144A | 325,000 | 331 | ||||||
3.500%, 3/15/29 144A | 2,050,000 | 2,054 | ||||||
4.875%, 2/15/30 144A | 450,000 | 486 | ||||||
5.875%, 2/15/28 144A | 700,000 | 742 | ||||||
7.500%, 3/15/26 144A | 625,000 | 667 | ||||||
Allied Universal Holdco LLC | 1,500,000 | 1,459 | ||||||
6.625%, 7/15/26 144A | 1,275,000 | 1,338 | ||||||
9.750%, 7/15/27 144A | 5,425,000 | 5,796 | ||||||
Avantor Funding, Inc. | 1,825,000 | 1,845 | ||||||
4.625%, 7/15/28 144A | 2,675,000 | 2,789 | ||||||
Bausch Health Cos., Inc. 4.875%, (ICE LIBOR USD 3 Month plus | 350,000 | 357 | ||||||
5.000%, 1/30/28 144A | 1,300,000 | 1,196 | ||||||
5.000%, 2/15/29 144A | 625,000 | 552 | ||||||
5.250%, 1/30/30 144A | 1,900,000 | 1,672 | ||||||
5.250%, 2/15/31 144A | 625,000 | 549 | ||||||
5.750%, 8/15/27 144A | 775,000 | 804 | ||||||
6.250%, 2/15/29 144A | 1,775,000 | 1,687 | ||||||
7.250%, 5/30/29 144A | 2,200,000 | 2,178 | ||||||
The Brink’s Co. 5.500%, 7/15/25 144A | 400,000 | 416 | ||||||
Catalent Pharma Solutions, Inc. 3.500%, 4/1/30 144A | 700,000 | 698 | ||||||
Centene Corp. | 275,000 | 271 | ||||||
2.625%, 8/1/31 | 725,000 | 710 | ||||||
3.000%, 10/15/30 | 375,000 | 381 | ||||||
3.375%, 2/15/30 | 900,000 | 917 | ||||||
4.250%, 12/15/27 | 2,775,000 | 2,893 | ||||||
4.625%, 12/15/29 | 2,425,000 | 2,615 | ||||||
Charles River Laboratories International, Inc. | 525,000 | 530 | ||||||
4.000%, 3/15/31 144A | 550,000 | 564 | ||||||
| Corporate Bonds (96.5%) | Shares/ Par + | Value $ (000’s) | ||||||
Consumer, Non-cyclical continued | ||||||||
CHS / Community Health Systems, Inc. | 750,000 | 794 | ||||||
6.000%, 1/15/29 144A | 225,000 | 240 | ||||||
6.125%, 4/1/30 144A | 1,075,000 | 1,063 | ||||||
6.625%, 2/15/25 144A | 525,000 | 543 | ||||||
6.875%, 4/15/29 144A | 2,825,000 | 2,878 | ||||||
8.000%, 3/15/26 144A | 1,125,000 | 1,183 | ||||||
DaVita HealthCare Partners, Inc. 4.625%, 6/1/30 144A | 1,250,000 | 1,280 | ||||||
Edgewell Personal Care Co. | 1,000,000 | 1,007 | ||||||
5.500%, 6/1/28 144A | 875,000 | 929 | ||||||
Endo Finance LLC / Endo Finco, Inc. | 1,100,000 | 819 | ||||||
9.500%, 7/31/27 144A | 625,000 | 636 | ||||||
Garda World Security Corp. | 875,000 | 871 | ||||||
6.000%, 6/1/29 144A | 2,050,000 | 1,958 | ||||||
Gartner, Inc. | 550,000 | 562 | ||||||
4.500%, 7/1/28 144A | 250,000 | 261 | ||||||
Global Medical Response, Inc. 6.500%, 10/1/25 144A | 3,325,000 | 3,358 | ||||||
Grifols Escrow Issuer SA 4.750%, 10/15/28 144A | 475,000 | 485 | ||||||
GW B-CR Security Corp. 9.500%, 11/1/27 144A | 4,969,000 | 5,357 | ||||||
HCA, Inc. | 1,400,000 | 1,480 | ||||||
5.375%, 2/1/25 | 1,925,000 | 2,116 | ||||||
5.375%, 9/1/26 | 1,325,000 | 1,489 | ||||||
5.875%, 5/1/23 | 1,120,000 | 1,186 | ||||||
5.875%, 2/15/26 | 1,600,000 | 1,805 | ||||||
HealthEquity, Inc. 4.500%, 10/1/29 144A | 1,150,000 | 1,138 | ||||||
Jazz Securities DAC 4.375%, 1/15/29 144A | 1,825,000 | 1,890 | ||||||
Kraft Heinz Foods Co. | 3,475,000 | 4,069 | ||||||
5.200%, 7/15/45 | 2,175,000 | 2,765 | ||||||
LifePoint Health, Inc. | 625,000 | 630 | ||||||
5.375%, 1/15/29 144A | 150,000 | 149 | ||||||
6.750%, 4/15/25 144A | 825,000 | 860 | ||||||
Mallinckrodt International Finance SA / Mallinckrodt CB LLC | 4,600,000 | 2,507 | ||||||
5.625%, 10/15/23 144A *,j | 2,775,000 | 1,512 | ||||||
MEDNAX, Inc. 6.250%, 1/15/27 144A | 1,700,000 | 1,779 | ||||||
Mozart Debt Merger Sub, Inc. | 1,625,000 | 1,619 | ||||||
5.250%, 10/1/29 144A | 3,675,000 | 3,725 | ||||||
MPH Acquisition Holdings LLC | 900,000 | 912 | ||||||
5.750%, 11/1/28 144A | 4,500,000 | 4,279 | ||||||
The Nielsen Co. Luxembourg SARL 5.000%, 2/1/25 144A | 1,275,000 | 1,295 | ||||||
Nielsen Finance LLC / Nielsen Finance Co. 4.500%, 7/15/29 144A | 475,000 | 467 | ||||||
The Accompanying Notes are an Integral Part of the Financial Statements.
178
Table of Contents
High Yield Bond Portfolio
| Corporate Bonds (96.5%) | Shares/ Par + | Value $ (000’s) | ||||||
Consumer, Non-cyclical continued | ||||||||
4.750%, 7/15/31 144A | 625,000 | 617 | ||||||
5.625%, 10/1/28 144A | 875,000 | 903 | ||||||
5.875%, 10/1/30 144A | 1,050,000 | 1,109 | ||||||
Organon Finance 1 LLC | 425,000 | 432 | ||||||
5.125%, 4/30/31 144A | 1,800,000 | 1,880 | ||||||
Performance Food Group, Inc. 4.250%, 8/1/29 144A | 1,425,000 | 1,414 | ||||||
Post Holdings, Inc. | 850,000 | 844 | ||||||
4.625%, 4/15/30 144A | 1,550,000 | 1,579 | ||||||
5.500%, 12/15/29 144A | 900,000 | 946 | ||||||
5.625%, 1/15/28 144A | 975,000 | 1,033 | ||||||
5.750%, 3/1/27 144A | 3,975,000 | 4,104 | ||||||
Prestige Brands, Inc. | 700,000 | 679 | ||||||
5.125%, 1/15/28 144A | 425,000 | 443 | ||||||
RegionalCare Hospital Partners Holdings, Inc. / LifePoint Health, Inc. 9.750%, 12/1/26 144A | 3,925,000 | 4,148 | ||||||
Signal Parent, Inc. 6.125%, 4/1/29 144A | 1,950,000 | 1,731 | ||||||
Syneos Health, Inc. 3.625%, 1/15/29 144A | 925,000 | 913 | ||||||
Team Health Holdings, Inc. 6.375%, 2/1/25 144A | 1,875,000 | 1,765 | ||||||
Teleflex, Inc. | 250,000 | 258 | ||||||
4.625%, 11/15/27 | 450,000 | 468 | ||||||
Tenet Healthcare Corp. | 625,000 | 635 | ||||||
4.625%, 7/15/24 | 576,000 | 583 | ||||||
4.625%, 6/15/28 144A | 125,000 | 128 | ||||||
4.875%, 1/1/26 144A | 1,200,000 | 1,233 | ||||||
5.125%, 11/1/27 144A | 1,450,000 | 1,510 | ||||||
6.125%, 10/1/28 144A | 1,850,000 | 1,954 | ||||||
6.250%, 2/1/27 144A | 825,000 | 854 | ||||||
6.750%, 6/15/23 | 2,100,000 | 2,244 | ||||||
United Rentals North America, Inc. | 500,000 | 503 | ||||||
3.875%, 11/15/27 | 325,000 | 337 | ||||||
3.875%, 2/15/31 | 275,000 | 279 | ||||||
4.875%, 1/15/28 | 1,225,000 | 1,287 | ||||||
5.250%, 1/15/30 | 425,000 | 460 | ||||||
5.500%, 5/15/27 | 800,000 | 832 | ||||||
US Foods, Inc. | 700,000 | 708 | ||||||
4.750%, 2/15/29 144A | 1,500,000 | 1,524 | ||||||
6.250%, 4/15/25 144A | 225,000 | 234 | ||||||
Valeant Pharmaceuticals International, Inc. | 725,000 | 737 | ||||||
6.125%, 4/15/25 144A | 4,321,000 | 4,401 | ||||||
8.500%, 1/31/27 144A | 2,175,000 | 2,284 | ||||||
9.000%, 12/15/25 144A | 850,000 | 895 | ||||||
9.250%, 4/1/26 144A | 525,000 | 555 | ||||||
Vizient, Inc. 6.250%, 5/15/27 144A | 675,000 | 705 | ||||||
|
| |||||||
Total | 153,280 | |||||||
|
| |||||||
| Corporate Bonds (96.5%) | Shares/ Par + | Value $ (000’s) | ||||||
Diversified (0.2%) | ||||||||
Stena International SA 6.125%, 2/1/25 144A | 1,375,000 | 1,409 | ||||||
|
| |||||||
Total | 1,409 | |||||||
|
| |||||||
Energy (14.3%) | ||||||||
Antero Midstream Partners LP / Antero Midstream Finance Corp. | 2,200,000 | 2,321 | ||||||
5.750%, 3/1/27 144A | 2,375,000 | 2,461 | ||||||
5.750%, 1/15/28 144A | 2,600,000 | 2,726 | ||||||
7.875%, 5/15/26 144A | 675,000 | 744 | ||||||
Antero Resources Corp. | 925,000 | 989 | ||||||
7.625%, 2/1/29 144A | 417,000 | 463 | ||||||
8.375%, 7/15/26 144A | 211,000 | 240 | ||||||
Apache Corp. | 225,000 | 242 | ||||||
4.875%, 11/15/27 | 700,000 | 763 | ||||||
Archrock Partners LP | 1,975,000 | 2,059 | ||||||
6.875%, 4/1/27 144A | 3,100,000 | 3,255 | ||||||
Ascent Resources Utica Holdings LLC / ARU Finance Corp. | 600,000 | 577 | ||||||
7.000%, 11/1/26 144A | 1,650,000 | 1,673 | ||||||
8.250%, 12/31/28 144A | 575,000 | 599 | ||||||
9.000%, 11/1/27 144A | 414,000 | 553 | ||||||
Berry Petroleum Co. LLC 7.000%, 2/15/26 144A | 875,000 | 866 | ||||||
Callon Petroleum Co. 6.375%, 7/1/26 | 900,000 | 855 | ||||||
Carrizo Oil & Gas, Inc. 8.250%, 7/15/25 | 425,000 | 418 | ||||||
Centennial Resource Production LLC | 25,000 | 24 | ||||||
6.875%, 4/1/27 144A | 1,650,000 | 1,683 | ||||||
Cheniere Energy Partners LP | 550,000 | 555 | ||||||
4.000%, 3/1/31 | 1,500,000 | 1,573 | ||||||
4.500%, 10/1/29 | 1,150,000 | 1,219 | ||||||
Cheniere Energy, Inc. 4.625%, 10/15/28 | 975,000 | 1,037 | ||||||
Chesapeake Energy Corp. 5.875%, 2/1/29 144A | 225,000 | 241 | ||||||
Chesapeake Energy Corp. Escrow 7.000%, 10/1/24 * | 1,000,000 | 15 | ||||||
CNX Midstream Partners LP 4.750%, 4/15/30 144A | 1,125,000 | 1,121 | ||||||
Comstock Resources, Inc. | 500,000 | 512 | ||||||
6.750%, 3/1/29 144A | 2,400,000 | 2,603 | ||||||
Continental Resources, Inc. | 750,000 | 811 | ||||||
5.750%, 1/15/31 144A | 1,125,000 | 1,325 | ||||||
CrownRock LP / CrownRock Finance, Inc. | 325,000 | 337 | ||||||
5.625%, 10/15/25 144A | 3,025,000 | 3,093 | ||||||
DT Midstream, Inc. 4.375%, 6/15/31 144A | 1,450,000 | 1,508 | ||||||
The Accompanying Notes are an Integral Part of the Financial Statements.
179
Table of Contents
High Yield Bond Portfolio
| Corporate Bonds (96.5%) | Shares/ Par + | Value $ (000’s) | ||||||
Energy continued | ||||||||
Endeavor Energy Resources LP / EER Finance, Inc. | 850,000 | 906 | ||||||
6.625%, 7/15/25 144A | 775,000 | 820 | ||||||
Enviva Partners LP / Enviva Partners Finance Corp. | 4,150,000 | 4,285 | ||||||
EQM Midstream Partners LP | 1,050,000 | 1,092 | ||||||
4.750%, 7/15/23 | 219,000 | 228 | ||||||
4.750%, 1/15/31 144A | 1,325,000 | 1,401 | ||||||
5.500%, 7/15/28 | 1,925,000 | 2,103 | ||||||
6.000%, 7/1/25 144A | 900,000 | 979 | ||||||
6.500%, 7/1/27 144A | 1,825,000 | 2,044 | ||||||
6.500%, 7/15/48 | 1,025,000 | 1,245 | ||||||
EQT Corp. | 750,000 | 770 | ||||||
3.625%, 5/15/31 144A | 500,000 | 519 | ||||||
3.900%, 10/1/27 | 425,000 | 456 | ||||||
5.000%, 1/15/29 | 350,000 | 388 | ||||||
6.625%, 2/1/25 | 350,000 | 395 | ||||||
7.500%, 2/1/30 | 250,000 | 321 | ||||||
Hess Midstream Operations LP 4.250%, 2/15/30 144A | 625,000 | 620 | ||||||
Hess Midstream Partners LP 5.125%, 6/15/28 144A | 1,300,000 | 1,354 | ||||||
Holly Energy Partners LP / Holly Energy Finance Corp. 5.000%, 2/1/28 144A | 1,225,000 | 1,220 | ||||||
Nabors Industries, Ltd. | 1,300,000 | 1,202 | ||||||
7.375%, 5/15/27 144A | 225,000 | 233 | ||||||
7.500%, 1/15/28 144A | 950,000 | 860 | ||||||
NuStar Logistics LP 5.625%, 4/28/27 | 2,700,000 | 2,855 | ||||||
Oasis Midstream Partners LP / OMP Finance Corp. | 1,200,000 | 1,308 | ||||||
Oasis Petroleum, Inc. 6.375%, 6/1/26 144A | 300,000 | 314 | ||||||
Occidental Petroleum Corp. | 675,000 | 661 | ||||||
4.300%, 8/15/39 | 1,525,000 | 1,521 | ||||||
4.400%, 8/15/49 | 975,000 | 987 | ||||||
5.875%, 9/1/25 | 1,225,000 | 1,351 | ||||||
6.450%, 9/15/36 | 1,225,000 | 1,562 | ||||||
6.625%, 9/1/30 | 1,400,000 | 1,732 | ||||||
8.000%, 7/15/25 | 625,000 | 730 | ||||||
8.875%, 7/15/30 | 1,600,000 | 2,158 | ||||||
PDC Energy, Inc. | 1,525,000 | 1,576 | ||||||
6.125%, 9/15/24 | 213,000 | 216 | ||||||
Precision Drilling Corp. | 375,000 | 382 | ||||||
7.125%, 1/15/26 144A | 1,025,000 | 1,043 | ||||||
Range Resources Corp. | 350,000 | 361 | ||||||
5.000%, 3/15/23 | 113,000 | 116 | ||||||
8.250%, 1/15/29 | 875,000 | 976 | ||||||
9.250%, 2/1/26 | 825,000 | 889 | ||||||
| Corporate Bonds (96.5%) | Shares/ Par + | Value $ (000’s) | ||||||
Energy continued | ||||||||
Rattler Midstream LP 5.625%, 7/15/25 144A | 875,000 | 910 | ||||||
Rockcliff Energy II LLC 5.500%, 10/15/29 144A | 1,025,000 | 1,056 | ||||||
Shelf Drilling Holdings, Ltd. 8.250%, 2/15/25 144A | 975,000 | 712 | ||||||
SM Energy Co. | 1,000,000 | 1,008 | ||||||
6.500%, 7/15/28 | 200,000 | 207 | ||||||
6.625%, 1/15/27 | 250,000 | 258 | ||||||
6.750%, 9/15/26 | 1,100,000 | 1,130 | ||||||
Southwestern Energy Co. | 725,000 | 764 | ||||||
5.375%, 3/15/30 | 300,000 | 321 | ||||||
8.375%, 9/15/28 | 1,100,000 | 1,228 | ||||||
Summit Midstream Holdings LLC / Summit Midstream Finance Corp. 5.750%, 4/15/25 | 1,850,000 | 1,665 | ||||||
Tap Rock Resources LLC 7.000%, 10/1/26 144A | 1,000,000 | 1,040 | ||||||
Targa Resources Partners LP / Targa Resources Partners Finance Corp. | 950,000 | 993 | ||||||
5.000%, 1/15/28 | 1,675,000 | 1,765 | ||||||
5.375%, 2/1/27 | 2,150,000 | 2,216 | ||||||
5.500%, 3/1/30 | 2,250,000 | 2,458 | ||||||
5.875%, 4/15/26 | 1,600,000 | 1,670 | ||||||
6.500%, 7/15/27 | 300,000 | 322 | ||||||
TerraForm Power Operating LLC | 175,000 | 179 | ||||||
4.750%, 1/15/30 144A | 1,725,000 | 1,808 | ||||||
5.000%, 1/31/28 144A | 1,775,000 | 1,880 | ||||||
TransMontaigne Partners LP / TLP Finance Corp. 6.125%, 2/15/26 | 1,175,000 | 1,162 | ||||||
Ultra Resources, Inc. Escrow 0.000%, 4/15/25 *,Æ | 1,325,000 | - | ||||||
USA Compression Finance Corp. 6.875%, 4/1/26 | 3,550,000 | 3,692 | ||||||
USA Compression Partners LP / USA Compression Finance Corp. 6.875%, 9/1/27 | 1,475,000 | 1,558 | ||||||
Western Gas Partners LP | 1,100,000 | 1,196 | ||||||
5.300%, 3/1/48 | 2,650,000 | 3,193 | ||||||
5.450%, 4/1/44 | 650,000 | 777 | ||||||
5.500%, 8/15/48 | 400,000 | 478 | ||||||
Western Midstream Operating LP | 850,000 | 852 | ||||||
4.650%, 7/1/26 | 175,000 | 190 | ||||||
5.300%, 2/1/30 | 325,000 | 357 | ||||||
|
| |||||||
Total | 120,685 | |||||||
|
| |||||||
Financial (7.2%) | ||||||||
Alliant Holdings Intermediate LLC / Alliant Holdings Co-Issuer 6.750%, 10/15/27 144A | 3,025,000 | 3,138 | ||||||
AmWINS Group, Inc. 4.875%, 6/30/29 144A | 2,575,000 | 2,601 | ||||||
Ardonagh Midco 2 PLC 11.500%, 1/15/27 144A Þ | 2,128,857 | 2,371 | ||||||
The Accompanying Notes are an Integral Part of the Financial Statements.
180
Table of Contents
High Yield Bond Portfolio
| Corporate Bonds (96.5%) | Shares/ Par + | Value $ (000’s) | ||||||
Financial continued | ||||||||
AssuredPartners, Inc. | 525,000 | 510 | ||||||
7.000%, 8/15/25 144A | 3,250,000 | 3,274 | ||||||
BroadStreet Partners, Inc. 5.875%, 4/15/29 144A | 4,075,000 | 4,004 | ||||||
Cushman & Wakefield US Borrower LLC 6.750%, 5/15/28 144A | 400,000 | 428 | ||||||
GTCR AP Finance, Inc. 8.000%, 5/15/27 144A | 1,725,000 | 1,790 | ||||||
HUB International, Ltd. | 1,675,000 | 1,726 | ||||||
7.000%, 5/1/26 144A | 9,775,000 | 10,044 | ||||||
LD Holdings Group LLC 6.125%, 4/1/28 144A | 1,575,000 | 1,484 | ||||||
MGM Growth Properties Operating Partnership LP / MGP Finance Co-Issuer, Inc. | 200,000 | 210 | ||||||
4.500%, 9/1/26 | 450,000 | 484 | ||||||
4.625%, 6/15/25 144A | 400,000 | 426 | ||||||
5.625%, 5/1/24 | 475,000 | 508 | ||||||
5.750%, 2/1/27 | 300,000 | 339 | ||||||
National Financial Partners Corp. 4.875%, 8/15/28 144A | 300,000 | 303 | ||||||
Navient Corp. | 450,000 | 459 | ||||||
5.500%, 3/15/29 | 550,000 | 549 | ||||||
5.875%, 10/25/24 | 850,000 | 906 | ||||||
6.750%, 6/25/25 | 1,175,000 | 1,292 | ||||||
6.750%, 6/15/26 | 350,000 | 387 | ||||||
NFP Corp. 6.875%, 8/15/28 144A | 6,000,000 | 6,015 | ||||||
Quicken Loans LLC | 875,000 | 878 | ||||||
3.875%, 3/1/31 144A | 1,525,000 | 1,548 | ||||||
Rocket Mortgage LLC / Rocket Mortgage Co- Issuer, Inc. | 1,200,000 | 1,191 | ||||||
4.000%, 10/15/33 144A | 950,000 | 962 | ||||||
United Shore Financial Services LLC 5.500%, 11/15/25 144A | 3,475,000 | 3,540 | ||||||
United Wholesale Mortgage LLC | 1,175,000 | 1,153 | ||||||
5.750%, 6/15/27 144A | 725,000 | 727 | ||||||
USIS Merger Sub, Inc. | 4,625,000 | 4,660 | ||||||
VICI Properties LP / VICI Note Co., Inc. | 125,000 | 127 | ||||||
4.125%, 8/15/30 144A | 400,000 | 423 | ||||||
4.250%, 12/1/26 144A | 1,125,000 | 1,172 | ||||||
4.625%, 12/1/29 144A | 1,350,000 | 1,437 | ||||||
|
| |||||||
Total | 61,066 | |||||||
|
| |||||||
Health Care (0.4%) | ||||||||
IQVIA, Inc. | 2,250,000 | 2,309 | ||||||
5.000%, 5/15/27 144A | 750,000 | 776 | ||||||
|
| |||||||
Total | 3,085 | |||||||
|
| |||||||
Industrial (11.0%) | ||||||||
ARD Finance SA 6.500%, 6/30/27 144A | 4,300,000 | 4,429 | ||||||
| Corporate Bonds (96.5%) | Shares/ Par + | Value $ (000’s) | ||||||
Industrial continued | ||||||||
Ardagh Packaging Finance PLC / Ardagh Holdings USA, Inc. | 1,700,000 | 1,684 | ||||||
5.250%, 8/15/27 144A | 3,775,000 | 3,799 | ||||||
Ball Corp. | 1,575,000 | 1,528 | ||||||
3.125%, 9/15/31 | 300,000 | 296 | ||||||
Berry Global Escrow Corp. | 1,125,000 | 1,164 | ||||||
5.625%, 7/15/27 144A | 1,150,000 | 1,203 | ||||||
BWAY Holding Co. | 1,125,000 | 1,135 | ||||||
7.250%, 4/15/25 144A | 2,450,000 | 2,456 | ||||||
CFX Escrow Corp. 6.375%, 2/15/26 144A | 338,000 | 349 | ||||||
Cornerstone Building Brands, Inc. 6.125%, 1/15/29 144A | 900,000 | 962 | ||||||
CP Atlas Buyer, Inc. 7.000%, 12/1/28 144A | 3,400,000 | 3,383 | ||||||
Crown Americas LLC / Crown Americas Capital Corp. VI 4.750%, 2/1/26 | 1,175,000 | 1,204 | ||||||
Energizer Holdings, Inc. | 1,975,000 | 1,928 | ||||||
4.750%, 6/15/28 144A | 900,000 | 919 | ||||||
Flex Acquisition Co., Inc. | 4,050,000 | 4,058 | ||||||
7.875%, 7/15/26 144A | 4,175,000 | 4,335 | ||||||
Gates Global LLC / Gates Global Co. 6.250%, 1/15/26 144A | 4,550,000 | 4,698 | ||||||
Graphic Packaging International LLC | 425,000 | 424 | ||||||
3.500%, 3/1/29 144A | 450,000 | 447 | ||||||
3.750%, 2/1/30 144A | 175,000 | 177 | ||||||
4.750%, 7/15/27 144A | 500,000 | 540 | ||||||
II-VI, Inc. 5.000%, 12/15/29 144A | 875,000 | 894 | ||||||
Koppers, Inc. 6.000%, 2/15/25 144A | 4,075,000 | 4,146 | ||||||
Madison IAQ LLC | 250,000 | 251 | ||||||
5.875%, 6/30/29 144A | 3,750,000 | 3,750 | ||||||
OI European Group BV 4.750%, 2/15/30 144A | 450,000 | 456 | ||||||
Owens-Brockway Glass Container, Inc. | 2,075,000 | 2,142 | ||||||
5.875%, 8/15/23 144A | 900,000 | 943 | ||||||
6.375%, 8/15/25 144A | 925,000 | 997 | ||||||
6.625%, 5/13/27 144A | 500,000 | 527 | ||||||
Roller Bearing Company of America, Inc. 4.375%, 10/15/29 144A | 225,000 | 229 | ||||||
Sealed Air Corp. 5.125%, 12/1/24 144A | 1,950,000 | 2,087 | ||||||
Standard Industries, Inc. | 725,000 | 698 | ||||||
4.375%, 7/15/30 144A | 1,275,000 | 1,301 | ||||||
4.750%, 1/15/28 144A | 1,325,000 | 1,368 | ||||||
5.000%, 2/15/27 144A | 3,375,000 | 3,474 | ||||||
Terex Corp. 5.000%, 5/15/29 144A | 575,000 | 591 | ||||||
The Accompanying Notes are an Integral Part of the Financial Statements.
181
Table of Contents
High Yield Bond Portfolio
| Corporate Bonds (96.5%) | Shares/ Par + | Value $ (000’s) | ||||||
Industrial continued | ||||||||
TransDigm UK Holdings PLC 6.875%, 5/15/26 | 1,775,000 | 1,855 | ||||||
TransDigm, Inc. | 2,275,000 | 2,267 | ||||||
4.875%, 5/1/29 | 775,000 | 778 | ||||||
5.500%, 11/15/27 | 1,250,000 | 1,288 | ||||||
6.250%, 3/15/26 144A | 3,000,000 | 3,118 | ||||||
6.375%, 6/15/26 | 1,850,000 | 1,901 | ||||||
7.500%, 3/15/27 | 675,000 | 705 | ||||||
Trident TPI Holdings, Inc. | 2,225,000 | 2,231 | ||||||
9.250%, 8/1/24 144A | 1,450,000 | 1,515 | ||||||
Trivium Packaging Finance BV | 525,000 | 546 | ||||||
8.500%, 8/15/27 144A | 3,250,000 | 3,437 | ||||||
TTM Technologies, Inc. 4.000%, 3/1/29 144A | 700,000 | 696 | ||||||
Vertical Holdco GmbH 7.625%, 7/15/28 144A | 1,121,000 | 1,201 | ||||||
Vertical U.S. Newco, Inc. 5.250%, 7/15/27 144A | 2,175,000 | 2,286 | ||||||
Watco Cos. LLC / Watco Finance Corp. 6.500%, 6/15/27 144A | 2,150,000 | 2,236 | ||||||
WESCO Distribution, Inc. | 525,000 | 557 | ||||||
7.250%, 6/15/28 144A | 1,075,000 | 1,178 | ||||||
|
| |||||||
Total | 92,767 | |||||||
|
| |||||||
Technology (5.5%) | ||||||||
AMG AG 7.000%, 7/31/25 144A | 1,050,000 | 1,114 | ||||||
Black Knight InfoServ LLC 3.625%, 9/1/28 144A | 1,225,000 | 1,223 | ||||||
Booz Allen Hamilton, Inc. | 400,000 | 407 | ||||||
4.000%, 7/1/29 144A | 250,000 | 258 | ||||||
Boxer Parent Co., Inc. 9.125%, 3/1/26 144A | 375,000 | 391 | ||||||
CDW LLC / CDW Finance Corp. | 350,000 | 353 | ||||||
5.500%, 12/1/24 | 275,000 | 301 | ||||||
Clarivate Science Holdings Corp. | 350,000 | 352 | ||||||
4.875%, 7/1/29 144A | 1,350,000 | 1,369 | ||||||
Consensus Cloud Solutions, Inc. | 725,000 | 754 | ||||||
6.500%, 10/15/28 144A | 1,250,000 | 1,306 | ||||||
Diebold Nixdorf, Inc. 9.375%, 7/15/25 144A | 325,000 | 350 | ||||||
The Dun & Bradstreet Corp. 5.000%, 12/15/29 144A | 450,000 | 460 | ||||||
Elastic NV 4.125%, 7/15/29 144A | 1,125,000 | 1,113 | ||||||
Entegris, Inc. 3.625%, 5/1/29 144A | 725,000 | 727 | ||||||
Fair Isaac Corp. 4.000%, 6/15/28 144A | 625,000 | 643 | ||||||
Helios Software Holdings, Inc. 4.625%, 5/1/28 144A | 1,800,000 | 1,769 | ||||||
Logan Merger Sub, Inc. 5.500%, 9/1/27 144A | 2,550,000 | 2,581 | ||||||
| Corporate Bonds (96.5%) | Shares/ Par + | Value $ (000’s) | ||||||
Technology continued | ||||||||
NCR Corp. | 875,000 | 901 | ||||||
5.125%, 4/15/29 144A | 1,475,000 | 1,527 | ||||||
5.250%, 10/1/30 144A | 1,425,000 | 1,464 | ||||||
5.750%, 9/1/27 144A | 1,025,000 | 1,071 | ||||||
6.125%, 9/1/29 144A | 650,000 | 695 | ||||||
Nuance Communications, Inc. 5.625%, 12/15/26 | 1,050,000 | 1,083 | ||||||
ON Semiconductor Corp. 3.875%, 9/1/28 144A | 675,000 | 692 | ||||||
Open Text Corp. | 800,000 | 815 | ||||||
3.875%, 12/1/29 144A | 125,000 | 127 | ||||||
4.125%, 2/15/30 144A | 800,000 | 824 | ||||||
4.125%, 12/1/31 144A | 300,000 | 303 | ||||||
PTC, Inc. | 125,000 | 127 | ||||||
4.000%, 2/15/28 144A | 500,000 | 509 | ||||||
Qorvo, Inc. 4.375%, 10/15/29 | 900,000 | 955 | ||||||
Rackspace Technology Global, Inc. | 1,825,000 | 1,737 | ||||||
5.375%, 12/1/28 144A | 1,975,000 | 1,926 | ||||||
Roblox Corp. 3.875%, 5/1/30 144A | 1,375,000 | 1,395 | ||||||
Rocket Software, Inc. 6.500%, 2/15/29 144A | 2,925,000 | 2,854 | ||||||
Science Applications International Corp. 4.875%, 4/1/28 144A | 325,000 | 333 | ||||||
Seagate HDD Cayman | 1,475,000 | 1,440 | ||||||
3.375%, 7/15/31 | 1,225,000 | 1,192 | ||||||
Sensata Technologies, Inc. | 225,000 | 224 | ||||||
4.375%, 2/15/30 144A | 325,000 | 341 | ||||||
SS&C Technologies, Inc. 5.500%, 9/30/27 144A | 3,600,000 | 3,762 | ||||||
Star Merger Sub, Inc. 6.875%, 8/15/26 144A | 584,000 | 607 | ||||||
Synaptics, Inc. 4.000%, 6/15/29 144A | 575,000 | 584 | ||||||
Veritas US, Inc. / Veritas Bermuda, Ltd. 7.500%, 9/1/25 144A | 2,950,000 | 3,053 | ||||||
|
| |||||||
Total | 46,012 | |||||||
|
| |||||||
Utilities (2.1%) | ||||||||
Allied Universal Holdco LLC 4.375%, 5/1/29 144A | 375,000 | 376 | ||||||
AmeriGas Partners LP / AmeriGas Finance Corp. | 425,000 | 459 | ||||||
5.750%, 5/20/27 | 550,000 | 608 | ||||||
5.875%, 8/20/26 | 2,350,000 | 2,629 | ||||||
Calpine Corp. | 1,250,000 | 1,205 | ||||||
4.500%, 2/15/28 144A | 1,575,000 | 1,634 | ||||||
4.625%, 2/1/29 144A | 350,000 | 345 | ||||||
5.000%, 2/1/31 144A | 200,000 | 200 | ||||||
5.125%, 3/15/28 144A | 1,075,000 | 1,091 | ||||||
5.250%, 6/1/26 144A | 299,000 | 307 | ||||||
The Accompanying Notes are an Integral Part of the Financial Statements.
182
Table of Contents
High Yield Bond Portfolio
| Corporate Bonds (96.5%) | Shares/ Par + | Value $ (000’s) | ||||||
Utilities continued | ||||||||
NRG Energy, Inc. | 2,300,000 | 2,254 | ||||||
5.250%, 6/15/29 144A | 775,000 | 830 | ||||||
5.750%, 1/15/28 | 225,000 | 238 | ||||||
6.625%, 1/15/27 | 625,000 | 650 | ||||||
Pattern Energy Operations LP / Pattern Energy Operations, Inc. 4.500%, 8/15/28 144A | 375,000 | 389 | ||||||
Solaris Midstream Holdings LLC 7.625%, 4/1/26 144A | 425,000 | 447 | ||||||
Vistra Operations Co. LLC | 1,100,000 | 1,142 | ||||||
5.500%, 9/1/26 144A | 900,000 | 929 | ||||||
5.625%, 2/15/27 144A | 1,925,000 | 1,983 | ||||||
|
| |||||||
Total | 17,716 | |||||||
|
| |||||||
Total Corporate Bonds | ||||||||
(Cost: $794,369) | 812,875 | |||||||
|
| |||||||
| Warrants (0.0%) | ||||||||
Energy (0.0%) | ||||||||
Chesapeake Energy Corp. * | 6,149 | 244 | ||||||
|
| |||||||
Total | 244 | |||||||
|
| |||||||
Total Warrants | ||||||||
(Cost: $153) | 244 | |||||||
|
| |||||||
| Short-Term Investments (1.6%) | Shares/ Par + | Value $ (000’s) | ||||||
Money Market Funds (1.6%) | ||||||||
State Street Institutional U.S. Government Money Market Fund - Premier Class 0.030%# | 13,126,809 | 13,127 | ||||||
|
| |||||||
Total | 13,127 | |||||||
|
| |||||||
Total Short-Term Investments | ||||||||
(Cost: $13,127) | 13,127 | |||||||
|
| |||||||
Total Investments (98.5%) |
| |||||||
(Cost: $810,270)@ | 829,930 | |||||||
|
| |||||||
Other Assets, Less Liabilities (1.5%) | 12,402 | |||||||
|
| |||||||
Net Assets (100.0%) | 842,332 | |||||||
|
| |||||||
| + | All par is stated in U.S. Dollar unless otherwise noted. |
| * | Non income producing |
| Æ | Security valued using significant unobservable inputs. |
| 144A | Security exempt from registration under Rule 144A of the Securities Act of 1933. These securities may be resold as transactions exempt from registration, normally to qualified institutional buyers. At December 31, 2021 the value of these securities (in thousands) was $634,324 representing 75.3% of the net assets. |
| f | Defaulted Security |
| Þ | PIK—Payment In Kind. PIK rate of Ardonagh Midco 2 PLC 12.75%. |
| # | 7-Day yield as of 12/31/2021. |
| @ | At December 31, 2021, the aggregate cost of investments, including derivatives, for federal tax purposes (in thousands) was $809,988 and the net unrealized appreciation of investments based on that cost was $19,942 which is comprised of $30,828 aggregate gross unrealized appreciation and $10,886 aggregate gross unrealized depreciation. |
The following is a summary of the inputs used in valuing the Portfolio’s Investments at December 31, 2021. See Note 3 for additional information on portfolio valuation.
| Valuation Inputs | ||||||||||||||
| Description | Level 1 – Quoted Prices | Level 2 – Other Significant Observable Inputs | Level 3 – Significant | |||||||||||
(Amounts in thousands) | ||||||||||||||
Assets: | ||||||||||||||
Common Stocks | ||||||||||||||
Energy | $ | 7 | $ | - | $ | 2,621 | ||||||||
All Others | 1,056 | - | - | |||||||||||
Corporate Bonds | - | 812,875 | - | |||||||||||
Short-Term Investments | 13,127 | - | - | |||||||||||
Warrants | 244 | - | - | |||||||||||
|
| |||||||||||||
Total Assets: | $ | 14,434 | $ | 812,875 | $ | 2,621 | ||||||||
|
| |||||||||||||
Management has determined that the amount of Level 3 securities compared to total net assets is not material; therefore, the reconciliation of Level 3 securities and assumptions is not shown for the period ended December 31, 2021.
The Accompanying Notes are an Integral Part of the Financial Statements.
183
Table of Contents
Multi-Sector Bond Portfolio (unaudited)
| Objective: | Portfolio Strategy: | Net Assets: | ||
| Maximum total return, consistent with prudent investment management. | Invest in a diversified portfolio of fixed income instruments of varying maturities and quality, and in derivatives designed to replicate such securities. | $1.3 billion |
PORTFOLIO OVERVIEW
Mason Street Advisors, LLC (“Mason Street Advisors”), the investment adviser for the Multi-Sector Bond Portfolio (the “Portfolio”), has engaged Pacific Investment Management Company LLC (“PIMCO”) to act as sub-adviser for the Portfolio. Normally, the Portfolio invests in a diversified portfolio of fixed income instruments of varying maturities, which may be represented by forwards or derivatives such as options, futures contracts or swap agreements. The average portfolio duration (a measure of the sensitivity of the Portfolio’s fixed income portfolio securities to changes in interest rates) of the Portfolio normally varies from three to eight years, based on the Portfolio’s forecast for interest rates. The Portfolio may invest all of its assets in high yield securities subject to a maximum of 10% of its total assets in securities rated below B by Moody’s or equivalently rated by S&P or Fitch or, if unrated, determined to be of comparable quality (so called “junk bonds”). The Portfolio may invest, without limitation, in securities denominated in foreign currencies and U.S. dollar denominated securities of foreign issuers. In addition, the Portfolio may invest without limit in fixed income securities of issuers that are economically tied to emerging securities markets.
MARKET OVERVIEW
As markets adjusted to longer-than-expected pandemic-related restrictions and higher-than-expected inflation in 2021, asset class returns diverged. In the first half of 2021, global economic data continued to improve in most regions. The U.S. was a notable standout as consumer sentiment rose, the labor market improved and manufacturing rebounded strongly amid an increase in hiring and demand for goods. Inflation increased globally, while U.S. inflation in particular experienced a faster-than-expected acceleration, driven mainly by higher prices of used cars and pandemic-sensitive services. COVID-19 vaccinations continued to advance globally, although the spread of new COVID-19 variants underscored a key risk for the economic recovery, particularly in countries where vaccination rates remained low. In the second half of 2021, the global economic recovery continued at a slower pace but remained uneven across sectors. A rise in COVID-19 Delta and Omicron variant cases slowed U.S. services activity and weighed on job growth in the leisure and hospitality industries. Meanwhile, similar COVID-19 outbreaks in emerging market countries prolonged supply chain bottlenecks, particularly in the automobile industry. Equities broadly gained despite volatility related to elevated inflation risks, rising COVID-19 variant cases and expectations of multiple rate hikes in 2022. The latter contributed to rising front-end interest rates, which in turn spurred yield curve flattening. Within economies, growth remained varied across sectors given differing impacts of rising COVID-19 cases, supply chain disruptions and higher energy prices. In response to rising inflation, the central bank committed to tapering its asset purchases and signaled rate hikes in 2022.
PORTFOLIO RESULTS
The Portfolio returned (0.08%) for the twelve months ended December 31, 2021. By comparison, the Portfolio’s benchmark, the Bloomberg® Global Credit Hedged USD Index returned (0.41%). The Portfolio’s custom benchmark, comprised of 1/3 each: Bloomberg® Global Aggregate—Credit Component ex Emerging Markets, Hedged USD; BofA Merrill Lynch® Global High Yield BB-B Rated Constrained Developed Markets Index, Hedged USD; J.P. Morgan® EMBI Global (the “Equal Weighted Composite Index”), returned 0.62%. (These Indices are unmanaged, cannot be invested in directly and do not incur expenses.) According to Lipper® Analytical Services, Inc., an independent mutual fund ranking agency, the average return in 2021 of the Multi-Sector Income Funds peer group was 0.59%.
The largest contributor to the Portfolio’s performance was an overweight to non-agency mortgage-backed securities (MBS). Within corporate credit, an overweight to investment grade and high yield stocks in the Financials sector contributed positively to performance. During the year, the Portfolio’s credit exposure was partially obtained through the use of credit default swaps.
The primary detractor from the Portfolio’s return was an underweight exposure to external emerging market debt as spreads tightened. Additionally, select positioning in high yield stocks within the Industrials sector detracted.
PORTFOLIO MANAGER OUTLOOK
The following forward-looking comments are the opinion of PIMCO, the Portfolio’s sub-adviser.
184
Table of Contents
Multi-Sector Bond Portfolio (unaudited)
Much of the global economy has transitioned quickly from an early cycle recovery to a mid-cycle expansion. In our view this necessitates a faster policy shift from the extraordinarily easy conditions that prevailed in 2020 and 2021. We expect developed market (“DM”) GDP growth to decelerate from a 5.0% annual average pace in 2021 to 4.0% in 2022. Rolling global outbreaks of the Delta variant in the second half of 2021 constrained output across various economies and will likely weigh on the projected annual average growth rates for 2022. We expect DM inflation to eventually moderate back toward the respective central bank targets by the end of 2022, but only after peaking at 5.1% in the fourth quarter of 2021. Finally, as a result of the magnitude and the persistence of the recent inflation increases, we also now expect an earlier start to DM central bank rate-increase cycles and have raised our expectations for the likely level of terminal rates in many emerging market economies.
Relative Performance
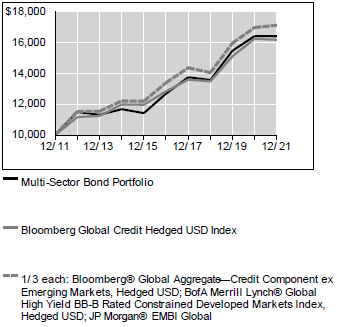
Average Annual Total Returns For Periods Ended December 31, 2021 | ||||||||||||
| 1 Year | 5 Years | 10 Years | ||||||||||
Multi-Sector Bond Portfolio | -0.08 | % | 5.28 | % | 5.08 | % | ||||||
Bloomberg Global Credit Hedged USD Index | -0.41 | % | 4.74 | % | 4.93 | % | ||||||
1/3 each: Bloomberg® Global Aggregate — Credit Component ex Emerging Markets, Hedged USD; BofA Merrill Lynch® Global High Yield BB-B Rated Constrained Developed Markets Index, Hedged USD; JP Morgan® EMBI Global | 0.62 | % | 5.05 | % | 5.53 | % | ||||||
Lipper® Variable Insurance Products (VIP) Multi-Sector Income Funds | 0.59 | % | 4.20 | % | 4.20 | % | ||||||
The performance data quoted represents past performance. Past performance is historical and does not guarantee future performance. Investment return and principal value will fluctuate, so that shares, when redeemed, may be worth more or less than their original cost. Current performance may be lower or higher than the performance data quoted. For the
most recent month-end performance information visit www.northwesternmutual.com.
This chart assumes an initial investment of $10,000 made on 12/31/11. Returns shown reflect fee waivers, deductions for management and other portfolio expenses, and reinvestment of all dividends. In the absence of fee waivers, total return would be reduced. Returns exclude deductions for separate account sale loads and account fees. Please refer to the Benchmark Definitions section of this report for information about the indices cited in the above chart and graph.
Return of principal is not guaranteed. When interest rates rise, bond prices fall. With a fixed income fund, when interest rates rise, the value of the fund’s existing bonds drops, which could negatively affect overall fund performance.
Investing in bonds issued by foreign corporations and governments carries additional risk, including foreign currency risk, and may increase the volatility of the Portfolio’s performance.
The Portfolio may use derivative instruments for hedging purposes or as alternatives to direct investments. Use of these instruments may involve certain costs and risks such as liquidity risk, interest rate risk, market risk, credit risk, management risk and the risk of mispricing or improper valuation. Certain derivatives involve leverage, which could magnify losses, and portfolios investing in derivatives could lose more than the principal amount invested in those instruments.
The Portfolio may invest a portion of its assets in fixed- and floating-rate loans, including senior loans, through loan participations and assignments. Investing in loans may expose the Portfolio to additional risks, including credit risk, interest rate risk, liquidity risk, call risk, settlement risk, and risks associated with being a lender. The Portfolio may also invest in municipal securities, which may be more sensitive to certain adverse conditions than other fixed income securities, may be or become illiquid, and may have yields which move differently and adversely compared to the yields of the overall debt securities markets.
185
Table of Contents
Multi-Sector Bond Portfolio (unaudited)
The U.S. federal funds rate has been subject to frequent adjustments over the course of the last several years. A significant rise in interest rates over a short period of time could cause significant losses in the market value of the Portfolio’s fixed income investments.
The Portfolio may engage in active and frequent trading of portfolio securities to achieve its investment objectives. Active and frequent trading may cause higher brokerage expenses and other transaction costs, which may adversely affect performance.
Top 10 Fixed Income Holdings 12/31/21
| Security Description | % of Net Assets | |||||||
US Treasury, Various | 14.3 | % | ||||||
Petroleos Mexicanos, Various | 1.9 | % | ||||||
Deutsche Bank AG, Various | 1.6 | % | ||||||
Ford Motor Credit Co. LLC, Various | 1.5 | % | ||||||
UniCredit SpA, Various | 1.4 | % | ||||||
Republic of Indonesia, Various | 1.3 | % | ||||||
Turkey Government International Bond, Various | 1.2 | % | ||||||
Banca Monte dei Paschi di Siena SpA, Various | 1.2 | % | ||||||
Saudi International Bond, Various | 1.2 | % | ||||||
HSBC Holdings PLC, Various | 1.2 | % | ||||||
Sector Allocation 12/31/21
| Sector | % of Net Assets | |||||||
Corporate Bonds | 59.3 | % | ||||||
Governments | 16.3 | % | ||||||
Short-Term Investments & Other Net Assets | 11.7 | % | ||||||
Structured Products | 7.4 | % | ||||||
Bank Loan Obligations | 4.2 | % | ||||||
Municipal Bonds | 0.7 | % | ||||||
Convertible Corporate Bonds | 0.4 | % | ||||||
Common Stocks | 0.0 | % | ||||||
Sector Allocation and Top 10 Holdings are subject to change.
186
Table of Contents
Multi-Sector Bond Portfolio
SCHEDULE OF INVESTMENTS
December 31, 2021
| Common Stocks (0.0%) | Shares/ Par + | Value $ (000’s) | ||||||
Energy (0.0%) | ||||||||
Noble Corp. PLC *,ð | 20,347 | 505 | ||||||
Noble Finance Co. *,Æ | 2,440 | 61 | ||||||
Valaris, Ltd. * | 1,429 | 51 | ||||||
|
| |||||||
Total | 617 | |||||||
|
| |||||||
Total Common Stocks (Cost: $259) | 617 | |||||||
|
| |||||||
| Corporate Bonds (59.3%) | ||||||||
Basic Materials (2.4%) | ||||||||
ALROSA Finance SA | 8,500,000 | 8,558 | ||||||
4.650%, 4/9/24 144A | 500,000 | 524 | ||||||
Georgia-Pacific LLC 8.875%, 5/15/31 | 200,000 | 309 | ||||||
INEOS Finance PLC | 2,700,000 | 3,098 | ||||||
2.875%, 5/1/26 EUR §,∞ | 3,400,000 | 3,902 | ||||||
INEOS Styrolution Group GmbH | 200,000 | 222 | ||||||
2.250%, 1/16/27 EUR §,∞ | 3,200,000 | 3,548 | ||||||
MMK International Capital DAC | 1,400,000 | 1,458 | ||||||
Sappi Papier Holding GmbH | 200,000 | 230 | ||||||
Sasol Financing USA LLC | 500,000 | 522 | ||||||
Syngenta Finance NV | 200,000 | 207 | ||||||
4.892%, 4/24/25 144A | 5,900,000 | 6,336 | ||||||
5.182%, 4/24/28 144A | 2,800,000 | 3,143 | ||||||
|
| |||||||
Total | 32,057 | |||||||
|
| |||||||
Communications (6.4%) | ||||||||
Altice Financing SA | 200,000 | 216 | ||||||
4.250%, 8/15/29 144A EUR ∞ | 2,300,000 | 2,558 | ||||||
5.750%, 8/15/29 144A | 5,400,000 | 5,346 | ||||||
Altice France Holding SA | 1,700,000 | 1,624 | ||||||
8.000%, 5/15/27 EUR §,∞ | 1,000,000 | 1,203 | ||||||
Altice France SA | 1,850,000 | 2,075 | ||||||
4.000%, 7/15/29 EUR §,∞ | 1,400,000 | 1,570 | ||||||
4.250%, 10/15/29 144A EUR ∞ | 400,000 | 452 | ||||||
5.500%, 10/15/29 144A | 800,000 | 788 | ||||||
8.125%, 2/1/27 144A | 3,200,000 | 3,420 | ||||||
AT&T, Inc. | 1,800,000 | 1,750 | ||||||
3.500%, 9/15/53 | 237,000 | 239 | ||||||
3.650%, 9/15/59 ß | 6,663,000 | 6,729 | ||||||
3.800%, 12/1/57 | 115,000 | 120 | ||||||
Baidu, Inc. | ||||||||
3.875%, 9/29/23 | 200,000 | 208 | ||||||
CCO Holdings LLC / CCO Holdings Capital Corp. | ||||||||
4.250%, 2/1/31 144A | 2,500,000 | 2,522 | ||||||
| Corporate Bonds (59.3%) | Shares/ Par + | Value $ (000’s) | ||||||
Communications continued | ||||||||
4.500%, 6/1/33 144A | 800,000 | 816 | ||||||
Charter Communications Operating LLC / Charter Communications Operating Capital Corp. | ||||||||
4.200%, 3/15/28 | 1,700,000 | 1,862 | ||||||
4.800%, 3/1/50 | 200,000 | 224 | ||||||
5.125%, 7/1/49 ß | 3,300,000 | 3,828 | ||||||
5.375%, 4/1/38 | 100,000 | 119 | ||||||
CommScope, Inc. 4.750%, 9/1/29 144A | | 5,700,000 | | 5,665 | ||||
Connect Finco SARL / Connect US Finco LLC 6.750%, 10/1/26 144A | 1,800,000 | 1,892 | ||||||
Deutsche Telekom International Finance 8.750%, 6/15/30 | 475,000 | 690 | ||||||
DISH DBS Corp. 5.750%, 12/1/28 144A | 5,200,000 | 5,252 | ||||||
Iliad Holding SASU 6.500%, 10/15/26 144A | 2,700,000 | 2,837 | ||||||
Intelsat Jackson Holdings SA | 700,000 | 317 | ||||||
6.500%, 12/1/29 144A Æ | 703,000 | 702 | ||||||
8.500%, 10/15/24 144A *,j | 200,000 | 92 | ||||||
9.750%, 7/15/25 144A *,j | 100,000 | 46 | ||||||
Lumen Technologies, Inc. 4.000%, 2/15/27 144A | 100,000 | 101 | ||||||
Sprint Corp. | 100,000 | 112 | ||||||
7.875%, 9/15/23 ß | 6,400,000 | 7,048 | ||||||
Sprint Spectrum Co. LLC / Sprint Spectrum Co. II LLC / Sprint Spectrum Co. III LLC 5.152%, 3/20/28 144A | 1,300,000 | 1,433 | ||||||
Summer (BC) Bidco B LLC 5.500%, 10/31/26 144A | 400,000 | 410 | ||||||
Time Warner Cable LLC | 300,000 | 374 | ||||||
6.750%, 6/15/39 | 200,000 | 273 | ||||||
UPC Broadband Finco BV 4.875%, 7/15/31 144A | 4,800,000 | 4,896 | ||||||
Virgin Media Secured Finance PLC | 1,200,000 | 1,600 | ||||||
4.250%, 1/15/30 GBP §,∞ | 3,200,000 | 4,285 | ||||||
5.000%, 4/15/27 GBP §,∞ | 500,000 | 696 | ||||||
VMED O2 UK Financing I PLC | 1,200,000 | 1,354 | ||||||
4.000%, 1/31/29 144A GBP ∞ | 2,600,000 | 3,445 | ||||||
4.500%, 7/15/31 144A GBP ∞ | 400,000 | 539 | ||||||
4.750%, 7/15/31 144A | 1,100,000 | 1,114 | ||||||
Vodafone Group PLC 7.000%, (USD 5 Year Swap Rate plus 4.873%), 4/4/79 | 1,700,000 | 2,056 | ||||||
|
| |||||||
Total | 84,898 | |||||||
|
| |||||||
Consumer, Cyclical (9.7%) | ||||||||
Adient Global Holdings, Ltd. | 400,000 | 461 | ||||||
The Accompanying Notes are an Integral Part of the Financial Statements.
187
Table of Contents
Multi-Sector Bond Portfolio
| Corporate Bonds (59.3%) | Shares/ Par + | Value $ (000’s) | ||||||
Consumer, Cyclical continued | ||||||||
Air Canada Pass-Through Trust, Series 2020-2, | 874,297 | 951 | ||||||
Alaska Airlines Pass-Through Trust, Series 2020-1, Class A 4.800%, 2/15/29 144A | 184,322 | 201 | ||||||
American Airlines Pass-Through Trust, Series 2014-1, Class A 3.700%, 4/1/28 | 187,610 | 190 | ||||||
American Airlines Pass-Through Trust, Series 2015-1, Class A 3.375%, 11/1/28 | 338,186 | 335 | ||||||
American Airlines Pass-Through Trust, Series 2016-1, Class AA 3.575%, 7/15/29 | 838,059 | 851 | ||||||
American Airlines Pass-Through Trust, Series 2017-2, Class AA 3.350%, 4/15/31 | 162,114 | 165 | ||||||
BMW Finance NV 2.250%, 8/12/22 144A | 400,000 | 404 | ||||||
British Airways Pass-Through Trust, Series 2020-1, Class A | 399,962 | 398 | ||||||
4.250%, 5/15/34 144A | 114,838 | 122 | ||||||
Caesars Entertainment, Inc. 5.750%, 7/1/25 144A | 7,300,000 | 7,623 | ||||||
Delta Air Lines, Inc. 7.000%, 5/1/25 144A | 877,000 | 1,003 | ||||||
Delta Air Lines, Inc./SkyMiles IP, Ltd. 4.500%, 10/20/25 144A | 300,000 | 315 | ||||||
Ford Motor Co. | 400,000 | 410 | ||||||
Ford Motor Credit Co. LLC 0.068%, (Euribor 3 Month ACT/360 plus 0.420%), 12/7/22 EUR ∞ | 400,000 | 454 | ||||||
0.130%, (Euribor 3 Month ACT/360 plus 0.700%), 12/1/24 EUR ∞ | 1,300,000 | 1,457 | ||||||
0.167%, (Euribor 3 Month ACT/360 plus 0.730%), 11/15/23 EUR ∞ | 100,000 | 113 | ||||||
1.391%, (ICE LIBOR USD 3 Month plus 1.235%), 2/15/23 | 600,000 | 599 | ||||||
1.744%, 7/19/24 EUR ∞ | 200,000 | 231 | ||||||
2.330%, 11/25/25 EUR ∞ | 100,000 | 118 | ||||||
2.386%, 2/17/26 EUR ∞ | 100,000 | 119 | ||||||
2.700%, 8/10/26 | 1,800,000 | 1,816 | ||||||
2.748%, 6/14/24 GBP ∞ | 700,000 | 953 | ||||||
3.021%, 3/6/24 EUR ∞ | 900,000 | 1,068 | ||||||
3.096%, 5/4/23 | 500,000 | 509 | ||||||
3.250%, 9/15/25 EUR ∞ | 300,000 | 366 | ||||||
3.264%, (ICE LIBOR USD 3 Month plus 3.140%), 1/7/22 | 200,000 | 200 | ||||||
3.350%, 11/1/22 | 1,400,000 | 1,418 | ||||||
3.625%, 6/17/31 ß | 2,900,000 | 3,053 | ||||||
3.815%, 11/2/27 | 300,000 | 317 | ||||||
4.063%, 11/1/24 ß | 3,200,000 | 3,367 | ||||||
4.134%, 8/4/25 | 200,000 | 212 | ||||||
4.389%, 1/8/26 | 800,000 | 862 | ||||||
4.535%, 3/6/25 GBP ∞ | 100,000 | 143 | ||||||
5.584%, 3/18/24 | 600,000 | 646 | ||||||
5.596%, 1/7/22 | 1,500,000 | 1,501 | ||||||
| Corporate Bonds (59.3%) | Shares/ Par + | Value $ (000’s) | ||||||
Consumer, Cyclical continued | ||||||||
Fortune Star BVI, Ltd. 5.050%, 1/27/27 § | 2,000,000 | 1,916 | ||||||
General Motors Financial Co., Inc. 5.100%, 1/17/24 | 1,200,000 | 1,287 | ||||||
IHO Verwaltungs GmbH | 800,000 | 922 | ||||||
3.750%, 9/15/26 EUR §,∞ | 5,100,000 | 5,896 | ||||||
Jaguar Land Rover Automotive PLC | 2,500,000 | 3,410 | ||||||
4.500%, 7/15/28 144A EUR ∞ | 200,000 | 232 | ||||||
5.875%, 11/15/24 EUR §,∞ | 2,300,000 | 2,826 | ||||||
JetBlue Airways Corp. 4.000%, 5/15/34 | 841,107 | 907 | ||||||
John Lewis PLC 4.250%, 12/18/34 GBP §,∞ | 1,000,000 | 1,380 | ||||||
Las Vegas Sands Corp. | 100,000 | 101 | ||||||
3.900%, 8/8/29 | 100,000 | 101 | ||||||
Marks & Spencer PLC | 400,000 | 560 | ||||||
6.000%, 6/12/25 GBP §,∞ | 1,000,000 | 1,461 | ||||||
Mattel, Inc. 3.375%, 4/1/26 144A | 100,000 | 103 | ||||||
Melco Resorts Finance, Ltd. | 5,700,000 | 5,615 | ||||||
5.375%, 12/4/29 144A | 700,000 | 679 | ||||||
MGM Resorts International 7.750%, 3/15/22 ß | 6,400,000 | 6,480 | ||||||
Mitchells & Butlers Finance PLC 0.548%, (ICE LIBOR GBP 3 Month plus 0.450%), 12/15/30 | 1,055,384 | 1,336 | ||||||
0.653%, (ICE LIBOR USD 3 Month plus 0.450%), 12/15/30 § | 191,888 | 178 | ||||||
6.469%, 9/15/32 GBP §,∞ | 200,000 | 300 | ||||||
Nissan Motor Acceptance Corp. 2.000%, 3/9/26 144A | 400,000 | 394 | ||||||
Nissan Motor Co., Ltd. | 100,000 | 122 | ||||||
3.201%, 9/17/28 144A EUR ∞ | 500,000 | 634 | ||||||
4.345%, 9/17/27 144A | 6,400,000 | 6,909 | ||||||
4.810%, 9/17/30 144A | 500,000 | 559 | ||||||
Pinnacle Bidco PLC | 100,000 | 116 | ||||||
6.375%, 2/15/25 GBP §,∞ | 400,000 | 547 | ||||||
Renault SA | 900,000 | 1,006 | ||||||
2.375%, 5/25/26 EUR §,∞ | 4,800,000 | 5,499 | ||||||
Royal Caribbean Cruises, Ltd. 9.125%, 6/15/23 144A | 1,100,000 | 1,163 | ||||||
Sands China, Ltd. | ||||||||
2.300%, 3/8/27 144A | 400,000 | 377 | ||||||
3.250%, 8/8/31 144A | 1,100,000 | 1,034 | ||||||
3.800%, 1/8/26 | 1,700,000 | 1,709 | ||||||
5.400%, 8/8/28 ß | 3,200,000 | 3,445 | ||||||
Southwest Airlines Co. | 1,000,000 | 1,143 | ||||||
5.250%, 5/4/25 | 1,000,000 | 1,111 | ||||||
Toll Brothers Finance Corp. | 100,000 | 110 | ||||||
4.875%, 3/15/27 | 1,200,000 | 1,343 | ||||||
The Accompanying Notes are an Integral Part of the Financial Statements.
188
Table of Contents
Multi-Sector Bond Portfolio
| Corporate Bonds (59.3%) | Shares/ Par + | Value $ (000’s) | ||||||
Consumer, Cyclical continued | ||||||||
Travis Perkins PLC 4.500%, 9/7/23 GBP §,∞ | 1,900,000 | 2,656 | ||||||
United Airlines Pass-Through Trust, Series 2014-1, Class A 4.000%, 10/11/27 | 642,511 | 672 | ||||||
United Airlines Pass-Through Trust, Series 2019-2, Class A 2.900%, 11/1/29 | 93,008 | 92 | ||||||
United Airlines Pass-Through Trust, Series 2020-1, Class A 5.875%, 4/15/29 ß | 2,619,570 | 2,869 | ||||||
US Airways Pass-Through Trust, Series 2012-1, Class A 5.900%, 4/1/26 | 683,206 | 716 | ||||||
Volkswagen Bank GmbH 1.250%, 6/10/24 EUR §,∞ | 3,000,000 | 3,512 | ||||||
Volkswagen Financial Services Aktiengesellschaft 0.875%, 4/12/23 EUR §,∞ | 200,000 | 230 | ||||||
Volkswagen International Finance NV 3.875%, (9 Year EUR Annual Swap Rate plus 3.958%), 6/17/29 | 2,100,000 | 2,595 | ||||||
Volkswagen Leasing GmbH 2.625%, 1/15/24 EUR §,∞ | 1,800,000 | 2,157 | ||||||
Wynn Macau, Ltd. | 4,100,000 | 3,854 | ||||||
5.125%, 12/15/29 144A | 1,100,000 | 999 | ||||||
5.500%, 1/15/26 144A | 200,000 | 188 | ||||||
5.500%, 1/15/26 § | 500,000 | 470 | ||||||
5.500%, 10/1/27 144A | 200,000 | 186 | ||||||
5.500%, 10/1/27 § | 200,000 | 186 | ||||||
5.625%, 8/26/28 144A | 300,000 | 278 | ||||||
Wynn Resorts Finance LLC / Wynn Resorts Capital Corp. 5.125%, 10/1/29 144A | 800,000 | 812 | ||||||
ZF Europe Finance BV | 2,000,000 | 2,287 | ||||||
ZF Finance GmbH | 4,300,000 | 5,016 | ||||||
3.750%, 9/21/28 EUR §,∞ | 2,000,000 | 2,453 | ||||||
|
| |||||||
Total | 128,090 | |||||||
|
| |||||||
Consumer, Non-cyclical (3.6%) | ||||||||
AA Bond Co., Ltd. | 100,000 | 136 | ||||||
4.875%, 7/31/43 GBP §,∞ | 1,200,000 | 1,704 | ||||||
AbbVie, Inc. 1.500%, 11/15/23 EUR ∞ | 400,000 | 469 | ||||||
Abertis Infraestructuras SA | 500,000 | 588 | ||||||
1.875%, 3/26/32 EUR §,∞ | 600,000 | 713 | ||||||
3.000%, 3/27/31 EUR §,∞ | 600,000 | 783 | ||||||
3.375%, 11/27/26 GBP §,∞ | 2,100,000 | 3,006 | ||||||
Albion Financing 1 SARL / Aggreko | ||||||||
Holdings, Inc. 6.125%, 10/15/26 144A | 300,000 | 303 | ||||||
Allied Universal Holdco LLC / Allied Universal Finance Corp. / Atlas LuxCo 4 SARL | 1,400,000 | 1,556 | ||||||
| Corporate Bonds (59.3%) | Shares/ Par + | Value $ (000’s) | ||||||
Consumer, Non-cyclical continued | ||||||||
Atlantia SpA | 1,200,000 | 1,387 | ||||||
1.875%, 7/13/27 EUR §,∞ | 400,000 | 469 | ||||||
1.875%, 2/12/28 EUR §,∞ | 4,400,000 | 5,127 | ||||||
Bacardi, Ltd. 4.700%, 5/15/28 144A | 2,900,000 | 3,280 | ||||||
BAT Capital Corp. | 100,000 | 104 | ||||||
3.557%, 8/15/27 | 500,000 | 524 | ||||||
Bausch Health Cos., Inc. | 300,000 | 306 | ||||||
Bellis Acquisition Co. PLC 3.250%, 2/16/26 144A GBP ∞ | 4,000,000 | 5,205 | ||||||
Centene Corp. | 200,000 | 209 | ||||||
4.625%, 12/15/29 | 500,000 | 539 | ||||||
Constellation Brands, Inc. 3.700%, 12/6/26 | 200,000 | 216 | ||||||
Coty, Inc. | 1,880,000 | 2,145 | ||||||
5.000%, 4/15/26 144A | 2,900,000 | 2,987 | ||||||
CVS Pass-Through Trust | 375,584 | 422 | ||||||
5.926%, 1/10/34 144A | 631,162 | 749 | ||||||
7.507%, 1/10/32 144A | 63,994 | 79 | ||||||
DaVita HealthCare Partners, Inc. 4.625%, 6/1/30 144A | 1,900,000 | 1,945 | ||||||
HCA, Inc. 4.750%, 5/1/23 ß | 2,655,000 | 2,781 | ||||||
Imperial Brands Finance PLC 3.500%, 7/26/26 144A | 200,000 | 210 | ||||||
Loxam SAS | 100,000 | 113 | ||||||
3.250%, 1/14/25 EUR §,∞ | 900,000 | 1,027 | ||||||
Nielsen Finance LLC / Nielsen Finance Co. | 600,000 | 590 | ||||||
4.750%, 7/15/31 144A | 900,000 | 889 | ||||||
Organon Finance 1 LLC | 400,000 | 459 | ||||||
4.125%, 4/30/28 144A | 1,100,000 | 1,118 | ||||||
Perrigo Finance Unlimited Co. 3.900%, 6/15/30 | 200,000 | 203 | ||||||
Q-Park Holding I BV | 1,200,000 | 1,317 | ||||||
2.000%, 3/1/27 EUR §,∞ | 2,000,000 | 2,147 | ||||||
RegionalCare Hospital Partners Holdings, Inc. / LifePoint Health, Inc. 9.750%, 12/1/26 144A | 500,000 | 528 | ||||||
Teva Pharmaceutical Finance Netherlands II BV 4.500%, 3/1/25 EUR ∞ | 800,000 | 944 | ||||||
|
| |||||||
Total | 47,277 | |||||||
|
| |||||||
Diversified (0.0%) | ||||||||
Stena International SA 6.125%, 2/1/25 144A | 400,000 | 410 | ||||||
|
| |||||||
Total | 410 | |||||||
|
| |||||||
The Accompanying Notes are an Integral Part of the Financial Statements.
189
Table of Contents
Multi-Sector Bond Portfolio
| Corporate Bonds (59.3%) | Shares/ Par + | Value $ (000’s) | ||||||
Energy (8.7%) | ||||||||
Aker BP ASA 3.750%, 1/15/30 144A | 400,000 | 424 | ||||||
Blue Racer Midstream LLC / Blue Racer Finance Corp. 6.625%, 7/15/26 144A | 100,000 | 103 | ||||||
Boardwalk Pipelines LP 3.400%, 2/15/31 | 200,000 | 206 | ||||||
CGG SA | 200,000 | 226 | ||||||
8.750%, 4/1/27 144A | 3,400,000 | 3,357 | ||||||
Cheniere Corpus Christi Holdings LLC 5.125%, 6/30/27 | 100,000 | 113 | ||||||
Cheniere Energy Partners LP 4.000%, 3/1/31 | 1,400,000 | 1,469 | ||||||
Constellation Oil Services Holding SA 10.000%, 11/9/24 144A | 253,248 | 69 | ||||||
Continental Resources, Inc. 4.375%, 1/15/28 | 1,400,000 | 1,513 | ||||||
El Paso Natural Gas Co. LLC 8.375%, 6/15/32 | 200,000 | 286 | ||||||
Enable Midstream Partners LP 4.950%, 5/15/28 | 1,200,000 | 1,331 | ||||||
Energy Transfer LP | 100,000 | 103 | ||||||
3.600%, 2/1/23 | 100,000 | 102 | ||||||
3.750%, 5/15/30 | 200,000 | 212 | ||||||
5.000%, 5/15/50 | 200,000 | 230 | ||||||
5.250%, 4/15/29 | 100,000 | 115 | ||||||
6.050%, 6/1/41 | 100,000 | 122 | ||||||
6.500%, 2/1/42 | 300,000 | 386 | ||||||
6.625%, 10/15/36 | 500,000 | 633 | ||||||
7.500%, 7/1/38 | 1,700,000 | 2,343 | ||||||
EQT Corp. 6.625%, 2/1/25 ß | 5,500,000 | 6,201 | ||||||
Gazprom Neft OAO Via GPN Capital SA 6.000%, 11/27/23 § | 3,000,000 | 3,207 | ||||||
Gazprom PJSC via Gaz Finance PLC 3.500%, 7/14/31 § | 600,000 | 578 | ||||||
Gray Oak Pipeline LLC 3.450%, 10/15/27 144A | 500,000 | 522 | ||||||
Greenko Solar Mauritius, Ltd. 5.550%, 1/29/25 144A | 1,000,000 | 1,020 | ||||||
Kinder Morgan Energy Partners LP 6.550%, 9/15/40 ß | 2,382,000 | 3,199 | ||||||
Kinder Morgan, Inc. 7.750%, 1/15/32 | 1,216,000 | 1,708 | ||||||
Midwest Connector Capital Co. LLC | 300,000 | 301 | ||||||
3.900%, 4/1/24 144A | 200,000 | 207 | ||||||
MPLX LP 4.250%, 12/1/27 | 100,000 | 111 | ||||||
Newfield Exploration Co. 5.625%, 7/1/24 | 2,100,000 | 2,312 | ||||||
NGPL PipeCo LLC 7.768%, 12/15/37 144A | 3,900,000 | 5,460 | ||||||
Noble Corp. PLC | 32,532 | 36 | ||||||
11.000%, 2/15/28 | 45,537 | 50 | ||||||
NuStar Logistics LP 5.625%, 4/28/27 | 1,400,000 | 1,480 | ||||||
| Corporate Bonds (59.3%) | Shares/ Par + | Value $ (000’s) | ||||||
Energy continued | ||||||||
6.000%, 6/1/26 | 200,000 | 217 | ||||||
Occidental Petroleum Corp. | 400,000 | 412 | ||||||
3.400%, 4/15/26 | 500,000 | 513 | ||||||
5.500%, 12/1/25 ß | 4,300,000 | 4,770 | ||||||
5.875%, 9/1/25 | 700,000 | 772 | ||||||
Odebrecht Drilling Norbe VIII/IX, Ltd. 7.350%, 12/1/26 §,Þ | 1,685,599 | 919 | ||||||
Odebrecht Oil & Gas Finance, Ltd. 0.000%, 2/11/22 §,µ | 782,000 | 5 | ||||||
Patterson-UTI Energy, Inc. 5.150%, 11/15/29 | 600,000 | 609 | ||||||
Pertamina Persero PT 6.500%, 11/7/48 144A | 3,800,000 | 5,077 | ||||||
Petrobras Global Finance BV | 1,800,000 | 2,546 | ||||||
5.500%, 6/10/51 | 100,000 | 93 | ||||||
6.250%, 12/14/26 GBP ∞ | 200,000 | 293 | ||||||
6.625%, 1/16/34 GBP ∞ | 300,000 | 448 | ||||||
6.900%, 3/19/49 | 300,000 | 320 | ||||||
Petroleos de Venezuela SA | 6,500,000 | 252 | ||||||
5.500%, 4/12/37 §,∞j | 4,300,000 | 167 | ||||||
Petroleos Mexicanos | 1,100,000 | 1,160 | ||||||
4.750%, 2/26/29 EUR §,∞ | 3,500,000 | 3,925 | ||||||
4.875%, 2/21/28 EUR §,∞ | 600,000 | 683 | ||||||
5.625%, 1/23/46 | 378,000 | 311 | ||||||
5.950%, 1/28/31 ß | 4,300,000 | 4,178 | ||||||
6.350%, 2/12/48 | 100,000 | 86 | ||||||
6.625%, 6/15/35 ß | 4,200,000 | 4,035 | ||||||
6.625%, 6/15/38 | 2,000,000 | 1,830 | ||||||
6.700%, 2/16/32 144A | 4,536,000 | 4,581 | ||||||
6.750%, 9/21/47 ß | 2,900,000 | 2,574 | ||||||
7.690%, 1/23/50 | 1,880,000 | 1,814 | ||||||
Petrorio Luxembourg SARL 6.125%, 6/9/26 144A | 200,000 | 201 | ||||||
Plains All American Pipeline LP / PAA Finance Corp. | 1,100,000 | 1,194 | ||||||
6.650%, 1/15/37 | 277,000 | 356 | ||||||
Ras Laffan Liquefied Natural Gas Co., Ltd. III 5.838%, 9/30/27 144A | 2,109,560 | 2,363 | ||||||
Regency Energy Partners LP / Regency Energy Finance Corp. | 300,000 | 314 | ||||||
5.000%, 10/1/22 | 1,100,000 | 1,122 | ||||||
Rio Oil Finance Trust, Series 2014-1 | 919,774 | 986 | ||||||
9.250%, 7/6/24 § | 804,802 | 863 | ||||||
Rio Oil Finance Trust, Series 2014-3 9.750%, 1/6/27 § | 355,221 | 407 | ||||||
SA Global Sukuk, Ltd. 2.694%, 6/17/31 144A | 500,000 | 503 | ||||||
Sabine Pass Liquefaction LLC | 700,000 | 790 | ||||||
5.625%, 3/1/25 ß | 4,900,000 | 5,440 | ||||||
5.750%, 5/15/24 | 800,000 | 870 | ||||||
5.875%, 6/30/26 | 400,000 | 459 | ||||||
The Accompanying Notes are an Integral Part of the Financial Statements.
190
Table of Contents
Multi-Sector Bond Portfolio
| Corporate Bonds (59.3%) | Shares/ Par + | Value $ (000’s) | ||||||
Energy continued | ||||||||
Santos Finance, Ltd. 3.649%, 4/29/31 144A | 700,000 | 713 | ||||||
Southwestern Energy Co. 5.375%, 2/1/29 | 100,000 | 106 | ||||||
Tallgrass Energy Partners LP 5.500%, 1/15/28 144A | 8,400,000 | 8,327 | ||||||
Targa Resources Partners LP / Targa Resources Partners Finance Corp. 5.500%, 3/1/30 | 1,200,000 | 1,311 | ||||||
Transocean Guardian, Ltd. 5.875%, 1/15/24 144A | 1,373,500 | 1,301 | ||||||
Transocean Poseidon, Ltd. 6.875%, 2/1/27 144A | 200,000 | 193 | ||||||
Valaris, Ltd. 8.250%, 4/30/28 | 10,000 | 10 | ||||||
Western Midstream Operating, LP 4.350%, 2/1/25 | 1,200,000 | 1,254 | ||||||
Williams Partners LP 3.600%, 3/15/22 | 2,500,000 | 2,502 | ||||||
|
| |||||||
Total | 113,910 | |||||||
|
| |||||||
Financial (22.9%) | ||||||||
ADLER Group SA | 1,100,000 | 1,049 | ||||||
2.750%, 11/13/26 EUR §,∞ | 1,400,000 | 1,339 | ||||||
ADLER Real Estate AG 2.125%, 2/6/24 EUR §,∞ | 4,900,000 | 5,132 | ||||||
AerCap Ireland Capital DAC / AerCap Global Aviation Trust | 3,600,000 | 3,713 | ||||||
3.650%, 7/21/27 | 500,000 | 527 | ||||||
4.450%, 4/3/26 | 900,000 | 978 | ||||||
4.625%, 10/15/27 | 500,000 | 553 | ||||||
4.875%, 1/16/24 | 1,200,000 | 1,276 | ||||||
Aircastle, Ltd. | 600,000 | 603 | ||||||
4.250%, 6/15/26 | 300,000 | 321 | ||||||
5.250%, 8/11/25 144A | 2,400,000 | 2,639 | ||||||
Ally Financial, Inc. | 400,000 | 410 | ||||||
8.000%, 11/1/31 | 1,371,000 | 1,941 | ||||||
Antares Holdings LP 2.750%, 1/15/27 144A | 250,000 | 245 | ||||||
Athora Netherlands NV | 700,000 | 825 | ||||||
7.000%, (5 Year EUR Annual Swap Rate plus 6.463%), 6/19/25 EUR §,µ,∞ | 200,000 | 254 | ||||||
Atrium European Real Estate, Ltd. 3.000%, 9/11/25 EUR §,∞ | 3,439,000 | 4,017 | ||||||
Aviation Capital Group LLC 5.500%, 12/15/24 144A | 1,000,000 | 1,094 | ||||||
Avolon Holdings Funding, Ltd. 2.528%, 11/18/27 144A | 2,173,000 | 2,111 | ||||||
Banca Monte dei Paschi di Siena SpA | 300,000 | 332 | ||||||
2.625%, 4/28/25 EUR §,∞ | 3,300,000 | 3,753 | ||||||
3.625%, 9/24/24 EUR §,∞ | 3,800,000 | 4,396 | ||||||
5.375%, (5 Year EUR Annual Swap Rate plus 5.005%), 1/18/28 EUR §,∞ | 7,100,000 | 6,317 | ||||||
8.000%, (5 Year EUR Annual Swap Rate plus 8.149%), 1/22/30 EUR §,∞ | 500,000 | 469 | ||||||
| Corporate Bonds (59.3%) | Shares/ Par + | Value $ (000’s) | ||||||
Financial continued | ||||||||
8.500%, (5 Year EUR Annual Swap Rate plus 8.917%), 9/10/30 EUR §,∞ | 800,000 | 775 | ||||||
Banco Bilbao Vizcaya Argentaria SA | 1,600,000 | 1,951 | ||||||
Banco Bradesco SA 2.850%, 1/27/23 144A | 600,000 | 606 | ||||||
Banco BTG Pactual SA 4.500%, 1/10/25 144A | 500,000 | 504 | ||||||
Banco de Sabadell SA | 200,000 | 232 | ||||||
1.750%, 5/10/24 EUR §,∞ | 900,000 | 1,049 | ||||||
Banco do Brasil SA 4.625%, 1/15/25 144A | 1,100,000 | 1,147 | ||||||
Banco Votorantim SA 4.500%, 9/24/24 § | 200,000 | 208 | ||||||
Bank of America Corp. | 973,000 | 1,039 | ||||||
5.875%, (ICE LIBOR USD 3 Month plus 2.931%), 3/15/28 µ,ß | 4,500,000 | 5,006 | ||||||
Bank of Ireland Group PLC 7.500%, (5 Year EUR Annual Swap Rate plus 7.924%), 5/19/25 EUR §,µ,∞ | 1,700,000 | 2,228 | ||||||
Barclays Bank PLC 7.625%, 11/21/22 | 488,000 | 515 | ||||||
Barclays PLC | 200,000 | 273 | ||||||
3.250%, 2/12/27 GBP §,∞ | 1,500,000 | 2,143 | ||||||
3.375%, (1 Year EUR Annual Swap Rate plus 3.700%), 4/2/25 EUR §,∞ | 1,200,000 | 1,464 | ||||||
3.650%, 3/16/25 ß | 3,100,000 | 3,274 | ||||||
6.125%, (US Treasury Yield Curve Rate | ||||||||
T Note Constant Maturity 5 Year plus | 500,000 | 541 | ||||||
7.875%, (5 Year GBP Swap Rate plus | ||||||||
6.099%), 9/15/22 GBP §,µ,∞ | 400,000 | 564 | ||||||
7.875%, (5 Year GBP Swap Rate plus | ||||||||
6.772%), 3/15/22 GBP §,µ,∞ | 900,000 | 910 | ||||||
BNP Paribas SA | 1,700,000 | 1,660 | ||||||
2.219%, (US SOFR plus 2.074%), 6/9/26 144A | 200,000 | 202 | ||||||
4.705%, (ICE LIBOR USD 3 Month plus | ||||||||
2.235%), 1/10/25 144A | 5,800,000 | 6,175 | ||||||
BPCE SA 2.375%, 1/14/25 144A | 200,000 | 203 | ||||||
CaixaBank SA 6.750%, (5 Year EUR Annual Swap Rate plus 6.498%), 12/31/99 EUR §,µ,∞ | 200,000 | 253 | ||||||
Cantor Fitzgerald LP | 100,000 | 107 | ||||||
6.500%, 6/17/22 144A | 200,000 | 205 | ||||||
Chubb INA Holdings, Inc. 0.875%, 6/15/27 EUR ∞ | 200,000 | 233 | ||||||
CIT Group, Inc. | 272,000 | 278 | ||||||
5.000%, 8/1/23 | 100,000 | 106 | ||||||
The Accompanying Notes are an Integral Part of the Financial Statements.
191
Table of Contents
Multi-Sector Bond Portfolio
| Corporate Bonds (59.3%) | Shares/ Par + | Value $ (000’s) | ||||||
Financial continued | ||||||||
Citigroup, Inc. | ||||||||
1.660%), 7/6/26 EUR §,∞ | 200,000 | 235 | ||||||
3.400%, 5/1/26 | 400,000 | 429 | ||||||
Corestate Capital Holding SA 3.500%, 4/15/23 EUR §,∞ | 700,000 | 696 | ||||||
Country Garden Holdings Co., Ltd. | 4,600,000 | 4,049 | ||||||
4.750%, 1/17/23 § | 1,200,000 | 1,170 | ||||||
6.500%, 4/8/24 § | 600,000 | 586 | ||||||
CPI Property Group SA | 700,000 | 811 | ||||||
2.125%, 10/4/24 EUR §,∞ | 400,000 | 473 | ||||||
4.750%, 3/8/23 § | 1,300,000 | 1,351 | ||||||
Credit Agricole SA | ||||||||
1.676%), 6/16/26 144A | 500,000 | 501 | ||||||
Credit Suisse AG | 7,400,000 | 7,964 | ||||||
6.500%, 8/8/23 § | 1,700,000 | 1,830 | ||||||
DAE Sukuk (DIFC), Ltd. 3.750%, 2/15/26 144A | 1,000,000 | 1,031 | ||||||
Deutsche Bank AG | ||||||||
1.500%), 2/17/32 EUR §,∞ | 2,500,000 | 2,839 | ||||||
1.625%, 1/20/27 EUR §,∞ | 100,000 | 119 | ||||||
1.750%, (Euribor 3 Month ACT/360 plus | ||||||||
2.050%), 11/19/30 EUR §,∞ | 6,700,000 | 7,918 | ||||||
2.625%, 12/16/24 GBP §,∞ | 500,000 | 690 | ||||||
3.035%, (US SOFR plus 1.718%), 5/28/32 | 200,000 | 202 | ||||||
3.547%, (US SOFR plus 3.043%), 9/18/31 | 1,300,000 | 1,368 | ||||||
3.729%, (US SOFR plus 2.757%), 1/14/32 | 1,500,000 | 1,533 | ||||||
5.625%, (5 Year EUR Annual Swap Rate plus 6.000%), 5/19/31 EUR §,∞ | 4,500,000 | 6,001 | ||||||
5.882%, (US SOFR plus 5.438%), 7/8/31 | 400,000 | 469 | ||||||
The Doctors Co. 6.500%, 10/15/23 144A | 300,000 | 316 | ||||||
Erste Group Bank AG | ||||||||
6.500%, (5 Year EUR Annual Swap Rate plus 6.204%), 12/31/99 EUR §,µ,∞ | 600,000 | 752 | ||||||
Fairfax Financial Holdings, Ltd. | ||||||||
2.750%, 3/29/28 144A EUR ∞ | 500,000 | 617 | ||||||
2.750%, 3/29/28 EUR §,∞ | 1,200,000 | 1,481 | ||||||
Fidelity National Financial, Inc. 3.400%, 6/15/30 | 200,000 | 211 | ||||||
Freedom Mortgage Corp. | 500,000 | 489 | ||||||
7.625%, 5/1/26 144A | 2,100,000 | 2,145 | ||||||
8.125%, 11/15/24 144A | 3,690,000 | 3,736 | ||||||
8.250%, 4/15/25 144A | 782,000 | 801 | ||||||
Globalworth Real Estate Investments, Ltd. 3.000%, 3/29/25 EUR §,∞ | 3,900,000 | 4,669 | ||||||
GLP Capital LP / GLP Financing II, Inc. | 100,000 | 104 | ||||||
5.750%, 6/1/28 | 400,000 | 462 | ||||||
The Goldman Sachs Group, Inc. 0.002%, (Euribor 3 Month ACT/360 plus | ||||||||
0.550%), 4/21/23 EUR §,∞ | 900,000 | 1,026 | ||||||
0.077%, (Euribor 3 Month ACT/360 plus | ||||||||
0.620%), 9/26/23 EUR §,∞ | 300,000 | 342 | ||||||
| Corporate Bonds (59.3%) | Shares/ Par + | Value $ (000’s) | ||||||
Financial continued | ||||||||
2.125%, 9/30/24 EUR §,∞ | 1,200,000 | 1,442 | ||||||
3.375%, 3/27/25 EUR §,∞ | 200,000 | 251 | ||||||
Growthpoint Properties International Pty, Ltd. | 300,000 | 308 | ||||||
5.872%, 5/2/23 § | 5,800,000 | 5,963 | ||||||
Hospitality Properties Trust | 200,000 | 196 | ||||||
4.750%, 10/1/26 ß | 4,900,000 | 4,765 | ||||||
HSBC Holdings PLC | 200,000 | 198 | ||||||
2.099%, (US SOFR plus 1.929%), 6/4/26 | 200,000 | 201 | ||||||
2.804%, (US SOFR plus | ||||||||
1.187%), 5/24/32 ß | 3,300,000 | 3,310 | ||||||
3.900%, 5/25/26 ß | 2,600,000 | 2,804 | ||||||
3.973%, (ICE LIBOR USD 3 Month plus | ||||||||
1.610%), 5/22/30 ß | 4,900,000 | 5,315 | ||||||
4.000%, (US Treasury Yield Curve Rate | ||||||||
T Note Constant Maturity 5 Year plus | 200,000 | 199 | ||||||
4.300%, 3/8/26 ß | 3,000,000 | 3,287 | ||||||
Huarong Finance 2019 Co., Ltd. | ||||||||
1.125%), 2/24/23 § | 3,800,000 | 3,705 | ||||||
2.125%, 9/30/23 § | 1,100,000 | 1,082 | ||||||
2.500%, 2/24/23 § | 800,000 | 794 | ||||||
Huarong Finance II Co., Ltd. 5.000%, 11/19/25 § | 400,000 | 415 | ||||||
ING Groep NV 5.750%, (US Treasury Yield Curve Rate | ||||||||
T Note Constant Maturity 5 Year plus | 1,800,000 | 1,937 | ||||||
6.750%, (5 Year ICE Swap Rate plus | ||||||||
4.204%), 4/16/24 §,µ | 900,000 | 970 | ||||||
6.875%, (5 Year ICE Swap Rate plus | ||||||||
5.124%), 4/16/22 §,µ | 200,000 | 203 | ||||||
International Lease Finance Corp. | 400,000 | 412 | ||||||
8.625%, 1/15/22 | 400,000 | 401 | ||||||
Intesa Sanpaolo SpA | 300,000 | 312 | ||||||
4.000%, 9/23/29 144A | 200,000 | 214 | ||||||
5.017%, 6/26/24 144A | 2,700,000 | 2,893 | ||||||
5.500%, (5 Year EUR Annual Swap Rate plus 5.848%), 3/1/28 EUR §,µ,∞ | 4,050,000 | 5,026 | ||||||
5.875%, (5 Year EUR Annual Swap Rate plus 6.086%), 9/1/31 EUR §,µ,∞ | 900,000 | 1,168 | ||||||
Itau Unibanco Holding SA 2.900%, 1/24/23 144A | 200,000 | 202 | ||||||
Jefferies Finance LLC / JFIN Co-Issuer Corp. 5.000%, 8/15/28 144A | 1,500,000 | 1,537 | ||||||
Kaisa Group Holdings, Ltd. | 400,000 | 104 | ||||||
9.750%, 9/28/23 § | 600,000 | 153 | ||||||
10.500%, 1/15/25 § | 1,100,000 | 283 | ||||||
10.875%, 7/23/23 § | 400,000 | 102 | ||||||
11.250%, 4/16/25 § | 3,500,000 | 901 | ||||||
11.650%, 6/1/26 § | 1,000,000 | 255 | ||||||
Kennedy Wilson, Inc. 4.750%, 2/1/30 | 1,800,000 | 1,825 | ||||||
The Accompanying Notes are an Integral Part of the Financial Statements.
192
Table of Contents
Multi-Sector Bond Portfolio
| Corporate Bonds (59.3%) | Shares/ Par + | Value $ (000’s) | ||||||
Financial continued | ||||||||
LeasePlan Corp. NV 2.875%, 10/24/24 144A | 300,000 | 309 | ||||||
Liberty Mutual Finance Europe DAC 1.750%, 3/27/24 EUR §,∞ | 100,000 | 118 | ||||||
Lincoln Financing SARL 3.625%, 4/1/24 EUR §,∞ | 5,600,000 | 6,414 | ||||||
Lloyds Banking Group PLC | 500,000 | 681 | ||||||
2.250%, 10/16/24 GBP §,∞ | 1,400,000 | 1,930 | ||||||
3.500%, (1 Year EUR Annual Swap Rate plus 3.750%), 4/1/26 EUR §,∞ | 200,000 | 251 | ||||||
4.450%, 5/8/25 ß | 2,800,000 | 3,041 | ||||||
Logicor Financing SARL 3.250%, 11/13/28 EUR §,∞ | 600,000 | 775 | ||||||
Marsh & McLennan Cos., Inc. 1.349%, 9/21/26 EUR ∞ | 100,000 | 119 | ||||||
Morgan Stanley 4.000%, 7/23/25 ß | 3,600,000 | 3,901 | ||||||
Nationwide Building Society 4.363%, (ICE LIBOR USD 3 Month plus 1.392%), 8/1/24 144A | 4,500,000 | 4,713 | ||||||
NatWest Group PLC | 1,600,000 | 1,829 | ||||||
2.500%, 3/22/23 EUR §,∞ | 100,000 | 118 | ||||||
4.519%, (ICE LIBOR USD 3 Month plus 1.550%), 6/25/24 | 200,000 | 209 | ||||||
4.800%, 4/5/26 ß | 2,800,000 | 3,114 | ||||||
4.892%, (ICE LIBOR USD 3 Month plus 1.754%), 5/18/29 ß | 3,700,000 | 4,232 | ||||||
6.000%, (US Treasury Yield Curve Rate T Note Constant Maturity 5 Year plus 5.625%), | 500,000 | 547 | ||||||
New Metro Global, Ltd. 4.500%, 5/2/26 § | 1,700,000 | 1,442 | ||||||
NN Group NV 4.500%, (Euribor 3 Month ACT/360 plus 4.000%), 1/15/26 EUR §,µ,∞ | 2,600,000 | 3,334 | ||||||
OMEGA Healthcare Investors, Inc. | 100,000 | 107 | ||||||
4.950%, 4/1/24 | 100,000 | 107 | ||||||
OneMain Finance Corp. | 1,100,000 | 1,088 | ||||||
4.000%, 9/15/30 | 700,000 | 688 | ||||||
Oxford Finance LLC / Oxford Finance Co- Issuer II, Inc. 6.375%, 12/15/22 144A | 200,000 | 200 | ||||||
Pacific Life Global Funding II 1.200%, 6/24/25 144A | 200,000 | 198 | ||||||
Park Aerospace Holdings, Ltd. | 3,900,000 | 4,025 | ||||||
5.500%, 2/15/24 144A | 112,000 | 120 | ||||||
RLJ Lodging Trust LP 3.750%, 7/1/26 144A | 200,000 | 201 | ||||||
Santander UK Group Holdings PLC | 400,000 | 459 | ||||||
2.896%, (US SOFR plus 1.475%), 3/15/32 | 800,000 | 808 | ||||||
3.823%, (ICE LIBOR USD 3 Month plus 1.400%), 11/3/28 ß | 4,000,000 | 4,293 | ||||||
| Corporate Bonds (59.3%) | Shares/ Par + | Value $ (000’s) | ||||||
Financial continued | ||||||||
6.750%, (GBP Swap Semi-Annual 5 Year plus 5.792%), 6/24/24 GBP §,µ, ∞ | 1,390,000 | 2,025 | ||||||
Sberbank of Russia Via SB Capital SA | 4,500,000 | 4,657 | ||||||
6.125%, 2/7/22 § | 1,700,000 | 1,704 | ||||||
Seazen Group, Ltd. 6.000%, 8/12/24 § | 200,000 | 169 | ||||||
Sitka Holdings LLC 5.250%, (ICE LIBOR USD 3 Month plus 4.500%), 7/6/26 144A | 600,000 | 614 | ||||||
Societe Generale SA 7.375%, (USD 5 Year Swap Rate plus 4.302%), 10/4/23 144A µ | 300,000 | 322 | ||||||
Springleaf Finance Corp. | 2,500,000 | 2,651 | ||||||
6.875%, 3/15/25 | 1,900,000 | 2,114 | ||||||
7.125%, 3/15/26 | 1,700,000 | 1,938 | ||||||
Standard Chartered PLC 7.500%, (USD 5 Year Swap Rate plus 6.301%), 4/2/22 144A µ | 200,000 | 203 | ||||||
Sunac China Holdings, Ltd. | 2,000,000 | 1,280 | ||||||
6.650%, 8/3/24 § | 600,000 | 383 | ||||||
7.250%, 6/14/22 § | 2,800,000 | 2,107 | ||||||
8.350%, 4/19/23 § | 1,600,000 | 1,052 | ||||||
Synovus Bank 2.289%, (US SOFR plus 0.945%), 2/10/23 | 250,000 | 250 | ||||||
Tesco Property Finance 3 PLC 5.744%, 4/13/40 | 94,001 | 164 | ||||||
Tesco Property Finance 6 PLC 5.411%, 7/13/44 | 2,599,667 | 4,456 | ||||||
TP ICAP PLC 5.250%, 1/26/24 GBP §,∞ | 3,700,000 | 5,337 | ||||||
Trust Fibra Uno 6.390%, 1/15/50 144A | 200,000 | 233 | ||||||
UBS AG 7.625%, 8/17/22 | 2,400,000 | 2,493 | ||||||
UBS Group Funding AG 4.125%, 9/24/25 144A | 700,000 | 756 | ||||||
UniCredit SpA | 300,000 | 360 | ||||||
2.569%, (US Treasury Yield Curve Rate T Note Constant Maturity 1 Year plus 2.300%), 9/22/26 144A | 2,900,000 | 2,894 | ||||||
4.027%, (ICE LIBOR USD 3 Month plus 3.900%), 1/14/22 144A | 1,550,000 | 1,551 | ||||||
7.296%, (USD 5 Year Swap Rate plus 4.914%), 4/2/34 144A | 5,700,000 | 6,829 | ||||||
7.830%, 12/4/23 144A | 5,650,000 | 6,290 | ||||||
The Unique Pub Finance Co. PLC 7.395%, 3/28/24 GBP §,∞ | 308,160 | 435 | ||||||
Virgin Money UK PLC | 100,000 | 139 | ||||||
3.375%, (1 Year GBP Swap Rate plus 2.145%), 4/24/26 GBP §,∞ | 100,000 | 140 | ||||||
4.000%, (1 Year UK Gilts plus 2.800%), 9/25/26 | 500,000 | 717 | ||||||
4.000%, (1 Year UK Gilts plus 3.750%), 9/3/27 | 200,000 | 291 | ||||||
The Accompanying Notes are an Integral Part of the Financial Statements.
193
Table of Contents
Multi-Sector Bond Portfolio
| Corporate Bonds (59.3%) | Shares/ Par + | Value $ (000’s) | ||||||
Financial continued | ||||||||
Vonovia Finance BV 5.000%, 10/2/23 144A | 300,000 | 316 | ||||||
Wells Fargo & Co. 1.338%, (Euribor 3 Month ACT/360 plus 1.670%), 5/4/25 EUR §,∞ | 1,500,000 | 1,756 | ||||||
Weyerhaeuser Co. 7.375%, 3/15/32 | 1,500,000 | 2,110 | ||||||
Yango Justice International, Ltd. | 4,200,000 | 966 | ||||||
7.875%, 9/4/24 § | 600,000 | 144 | ||||||
Yanlord Land HK Co., Ltd. 5.125%, 5/20/26 § | 1,900,000 | 1,833 | ||||||
|
| |||||||
Total | 301,744 | |||||||
|
| |||||||
Industrial (3.1%) | ||||||||
Berry Global, Inc. 1.570%, 1/15/26 | 100,000 | 98 | ||||||
Bombardier, Inc. 7.500%, 12/1/24 144A | 200,000 | 208 | ||||||
DAE Funding LLC | 1,700,000 | 1,687 | ||||||
1.625%, 2/15/24 144A | 1,000,000 | 980 | ||||||
2.625%, 3/20/25 144A | 500,000 | 502 | ||||||
3.375%, 3/20/28 144A | 700,000 | 707 | ||||||
3.375%, 3/20/28 § | 200,000 | 202 | ||||||
Empresa de Transporte de Pasajeros Metro SA 4.700%, 5/7/50 § | 1,400,000 | 1,628 | ||||||
Flex, Ltd. 3.750%, 2/1/26 | 700,000 | 748 | ||||||
Fortress Transportation & Infrastructure | 400,000 | 408 | ||||||
6.500%, 10/1/25 144A | 6,300,000 | 6,513 | ||||||
GE Capital UK Funding Unlimited Co. 5.875%, 1/18/33 GBP ∞ | 800,000 | 1,456 | ||||||
General Electric Co. 4.125%, 9/19/35 EUR §,∞ | 500,000 | 773 | ||||||
Greif, Inc. 6.500%, 3/1/27 144A | 6,300,000 | 6,536 | ||||||
Lima Metro Line 2 Finance, Ltd. 5.875%, 7/5/34 144A | 300,201 | 345 | ||||||
The Manitowoc Co., Inc. 9.000%, 4/1/26 144A | 6,200,000 | 6,525 | ||||||
Rolls-Royce PLC 0.875%, | 5,300,000 | 5,950 | ||||||
4.625%, 2/16/26 EUR §,∞ | 1,600,000 | 2,015 | ||||||
5.750%, 10/15/27 144A | 300,000 | 371 | ||||||
SMBC Aviation Capital Finance DAC 2.300%, 6/15/28 144A | 200,000 | 198 | ||||||
Standard Industries, Inc. | 1,300,000 | 1,449 | ||||||
2.250%, 11/21/26 EUR §,∞ | 900,000 | 1,003 | ||||||
4.750%, 1/15/28 144A | 450,000 | 465 | ||||||
|
| |||||||
Total | 40,767 | |||||||
|
| |||||||
Technology (1.0%) | ||||||||
Broadcom, Inc. 2.450%, 2/15/31 144A | 700,000 | 686 | ||||||
| Corporate Bonds (59.3%) | Shares/ Par + | Value $ (000’s) | ||||||
Technology continued | ||||||||
Dell International LLC / EMC Corp. | 4,300,000 | 5,040 | ||||||
5.450%, 6/15/23 | 293,000 | 309 | ||||||
6.020%, 6/15/26 | 400,000 | 462 | ||||||
8.100%, 7/15/36 | 162,000 | 247 | ||||||
Lenovo Group, Ltd. 3.421%, 11/3/30 144A | 400,000 | 403 | ||||||
NXP BV / NXP Funding LLC | 1,700,000 | 1,826 | ||||||
5.350%, 3/1/26 144A | 1,600,000 | 1,808 | ||||||
VMware, Inc. 4.500%, 5/15/25 | 300,000 | 327 | ||||||
4.650%, 5/15/27 | 1,400,000 | 1,575 | ||||||
4.700%, 5/15/30 | 100,000 | 116 | ||||||
|
| |||||||
Total | 12,799 | |||||||
|
| |||||||
Utilities (1.5%) | ||||||||
Adani Electricity Mumbai, Ltd. 3.949%, 2/12/30 144A | 300,000 | 296 | ||||||
Centrais Eletricas Brasileiras SA 4.625%, 2/4/30 144A | 300,000 | 297 | ||||||
Edison International 5.750%, 6/15/27 | 100,000 | 114 | ||||||
Electricite de France SA 4.500%, 9/21/28 144A | 900,000 | 1,017 | ||||||
FEL Energy VI SARL 5.750%, 12/1/40 § | 3,183,882 | 3,190 | ||||||
FirstEnergy Corp. 7.375%, 11/15/31 | 400,000 | 540 | ||||||
Nakilat, Inc. | 947,519 | 1,161 | ||||||
6.267%, 12/31/33 144A | 478,091 | 588 | ||||||
National Fuel Gas Co. 5.200%, 7/15/25 | 300,000 | 329 | ||||||
Pacific Gas & Electric Co. | 1,600,000 | 1,590 | ||||||
2.100%, 8/1/27 | 100,000 | 97 | ||||||
2.500%, 2/1/31 | 100,000 | 95 | ||||||
2.950%, 3/1/26 | 100,000 | 102 | ||||||
3.150%, 1/1/26 | 1,600,000 | 1,635 | ||||||
3.250%, 6/15/23 | 100,000 | 102 | ||||||
3.300%, 3/15/27 | 200,000 | 203 | ||||||
3.300%, 12/1/27 | 500,000 | 508 | ||||||
3.300%, 8/1/40 | 2,700,000 | 2,503 | ||||||
3.450%, 7/1/25 | 300,000 | 311 | ||||||
3.500%, 6/15/25 | 1,500,000 | 1,557 | ||||||
3.750%, 7/1/28 | 100,000 | 104 | ||||||
4.200%, 6/1/41 | 100,000 | 101 | ||||||
4.250%, 8/1/23 | 200,000 | 207 | ||||||
4.250%, 3/15/46 | 100,000 | 100 | ||||||
4.450%, 4/15/42 | 300,000 | 304 | ||||||
4.550%, 7/1/30 | 500,000 | 541 | ||||||
Perusahaan Listrik Negara PT 3.000%, 6/30/30 144A | 1,500,000 | 1,489 | ||||||
Puget Energy, Inc. 5.625%, 7/15/22 | 200,000 | 203 | ||||||
|
| |||||||
Total | 19,284 | |||||||
|
| |||||||
Total Corporate Bonds | ||||||||
(Cost: $780,281) | 781,236 | |||||||
|
| |||||||
The Accompanying Notes are an Integral Part of the Financial Statements.
194
Table of Contents
Multi-Sector Bond Portfolio
| Convertible Corporate Bonds (0.4%) | Shares/ Par + | Value $ (000’s) | ||||||
Financial (0.4%) | ||||||||
Corestate Capital Holding SA 1.375%, 11/28/22 | 5,700,000 | 5,662 | ||||||
|
| |||||||
Total | 5,662 | |||||||
|
| |||||||
Total Convertible Corporate Bonds | ||||||||
(Cost: $6,153) | 5,662 | |||||||
|
| |||||||
| Governments (16.3%) | ||||||||
Governments (16.3%) | ||||||||
Abu Dhabi Government International Bond | 3,700,000 | 3,366 | ||||||
2.700%, 9/2/70 § | 900,000 | 819 | ||||||
3.875%, 4/16/50 144A | 1,500,000 | 1,747 | ||||||
Albania Government International Bond 3.500%, 6/16/27 144A EUR ∞ | 1,400,000 | 1,655 | ||||||
Arab Republic of Egypt | 600,000 | 676 | ||||||
5.625%, 4/16/30 144A EUR ∞ | 1,550,000 | 1,592 | ||||||
7.500%, 2/16/61 144A | 1,900,000 | 1,549 | ||||||
Argentine Republic Government International Bond | 866,857 | 306 | ||||||
1.000%, 7/9/29 | 405,455 | 147 | ||||||
1.125%, 7/9/35 S | 5,922,164 | 1,910 | ||||||
2.500%, 7/9/41 S,b | 13,420,196 | 4,747 | ||||||
Australian Government 4.250%, 4/21/26 AUD §,∞ | 2,400,000 | 1,963 | ||||||
Banque Centrale de Tunisie International Bond 5.625%, 2/17/24 EUR §,∞ | 300,000 | 265 | ||||||
Banque Ouest Africaine de Developpement 2.750%, 1/22/33 144A EUR ∞ | 500,000 | 598 | ||||||
Brazilian Government International Bond 5.000%, 1/27/45 | 1,000,000 | 937 | ||||||
Colombia Government International Bond | 6,000,000 | 5,415 | ||||||
5.200%, 5/15/49 | 200,000 | 184 | ||||||
Dominican Republic International Bond | 550,000 | 559 | ||||||
4.875%, 9/23/32 § | 1,700,000 | 1,728 | ||||||
6.500%, 2/15/48 144A | 2,800,000 | 2,968 | ||||||
6.500%, 2/15/48 § | 2,800,000 | 2,968 | ||||||
6.875%, 1/29/26 § | 500,000 | 570 | ||||||
Ecuador Government International Bond | 323,958 | 182 | ||||||
0.500%, 7/31/35 144A | 2,674,620 | 1,755 | ||||||
0.500%, 7/31/40 144A | 1,225,800 | 717 | ||||||
Egypt Government International Bond | 2,500,000 | 2,628 | ||||||
7.500%, 2/16/61 § | 800,000 | 652 | ||||||
Export-Import Bank of India 3.375%, 8/5/26 § | 600,000 | 629 | ||||||
Federal Republic of Nigeria | 700,000 | 625 | ||||||
7.696%, 2/23/38 § | 600,000 | 554 | ||||||
7.875%, 2/16/32 § | 2,800,000 | 2,754 | ||||||
Ghana Government International Bond | 600,000 | 527 | ||||||
8.125%, 3/26/32 144A | 400,000 | 327 | ||||||
8.950%, 3/26/51 144A | 600,000 | 479 | ||||||
8.950%, 3/26/51 § | 200,000 | 160 | ||||||
| Governments (16.3%) | Shares/ Par + | Value $ (000’s) | ||||||
Governments continued | ||||||||
Ivory Coast Government International Bond | 500,000 | 581 | ||||||
5.875%, 10/17/31 144A EUR ∞ | 300,000 | 350 | ||||||
6.625%, 3/22/48 144A EUR ∞ | 900,000 | 1,016 | ||||||
6.625%, 3/22/48 EUR §,∞ | 800,000 | 903 | ||||||
6.875%, 10/17/40 144A EUR ∞ | 400,000 | 475 | ||||||
6.875%, 10/17/40 EUR §,∞ | 100,000 | 119 | ||||||
Japan Government Thirty Year Bond 0.400%, 3/20/50 JPY ∞ | 40,000,000 | 324 | ||||||
Kingdom of Jordan | 300,000 | 309 | ||||||
5.850%, 7/7/30 144A | 400,000 | 404 | ||||||
Morocco Government International Bond | 500,000 | 453 | ||||||
5.500%, 12/11/42 § | 800,000 | 882 | ||||||
North Macedonia 3.675%, 6/3/26 144A EUR ∞ | 500,000 | 603 | ||||||
Oman Government International Bond | 900,000 | 969 | ||||||
6.250%, 1/25/31 144A | 2,300,000 | 2,512 | ||||||
6.500%, 3/8/47 § | 500,000 | 495 | ||||||
6.750%, 1/17/48 § | 4,800,000 | 4,877 | ||||||
Panama Government International Bond | 1,900,000 | 2,541 | ||||||
8.125%, 4/28/34 | 100,000 | 147 | ||||||
Perusahaan Penerbit SBSN Indonesia III 3.400%, 3/29/22 144A | 600,000 | 604 | ||||||
Provincia de Buenos Aires 37.463%, (Argentina Private Banks Deposit Rates Index plus 3.750%), 4/12/25 144A ARS §,∞ | 740,000 | 3 | ||||||
Republic of Belarus Ministry of Finance 5.875%, 2/24/26 144A | 600,000 | 530 | ||||||
Republic of Indonesia | 1,700,000 | 1,936 | ||||||
1.400%, 10/30/31 EUR ∞ | 1,900,000 | 2,167 | ||||||
1.450%, 9/18/26 EUR ∞ | 700,000 | 824 | ||||||
3.375%, 7/30/25 144A EUR ∞ | 800,000 | 1,001 | ||||||
3.750%, 6/14/28 144A EUR ∞ | 1,900,000 | 2,512 | ||||||
3.750%, 6/14/28 EUR §,∞ | 2,200,000 | 2,909 | ||||||
4.625%, 4/15/43 § | 2,700,000 | 3,170 | ||||||
5.125%, 1/15/45 § | 1,800,000 | 2,236 | ||||||
Republic of Paraguay | 600,000 | 693 | ||||||
6.100%, 8/11/44 § | 300,000 | 369 | ||||||
Republic of Peru 3.300%, 3/11/41 ß | 2,700,000 | 2,700 | ||||||
Republic of Serbia 1.650%, 3/3/33 144A EUR ∞ | 700,000 | 741 | ||||||
Republic of South Africa Government International Bond | 1,200,000 | 1,239 | ||||||
4.875%, 4/14/26 | 600,000 | 639 | ||||||
5.000%, 10/12/46 | 500,000 | 452 | ||||||
5.750%, 9/30/49 ß | 4,500,000 | 4,325 | ||||||
Romanian Government International Bond | 1,400,000 | 1,451 | ||||||
2.875%, 4/13/42 144A EUR ∞ | 500,000 | 509 | ||||||
4.125%, 3/11/39 EUR §,∞ | 1,500,000 | 1,823 | ||||||
The Accompanying Notes are an Integral Part of the Financial Statements.
195
Table of Contents
Multi-Sector Bond Portfolio
| Governments (16.3%) | Shares/ Par + | Value $ (000’s) | ||||||
Governments continued | ||||||||
Russian Federation 5.625%, 4/4/42 § | 2,000,000 | 2,605 | ||||||
Saudi International Bond | 300,000 | 314 | ||||||
4.000%, 4/17/25 § | 3,900,000 | 4,201 | ||||||
4.500%, 10/26/46 § | 9,300,000 | 10,897 | ||||||
Sri Lanka Government International Bond | 1,600,000 | 792 | ||||||
7.850%, 3/14/29 § | 500,000 | 251 | ||||||
State of Qatar | 1,200,000 | 1,491 | ||||||
4.400%, 4/16/50 § | 2,400,000 | 2,982 | ||||||
4.500%, 4/23/28 § | 1,100,000 | 1,263 | ||||||
4.817%, 3/14/49 § | 800,000 | 1,049 | ||||||
5.103%, 4/23/48 § | 1,200,000 | 1,624 | ||||||
Turkey Government International Bond | 1,200,000 | 1,107 | ||||||
4.750%, 1/26/26 | 2,200,000 | 2,017 | ||||||
4.875%, 4/16/43 | 1,900,000 | 1,454 | ||||||
4.875%, 10/9/26 ß | 4,000,000 | 3,620 | ||||||
5.125%, 2/17/28 ß | 4,300,000 | 3,847 | ||||||
5.600%, 11/14/24 | 400,000 | 385 | ||||||
5.750%, 5/11/47 ß | 4,400,000 | 3,553 | ||||||
6.125%, 10/24/28 | 400,000 | 372 | ||||||
Ukraine Government International Bond | 1,600,000 | 1,461 | ||||||
4.375%, 1/27/30 EUR §,∞ | 1,700,000 | 1,552 | ||||||
6.750%, 6/20/26 144A EUR ∞ | 600,000 | 649 | ||||||
6.876%, 5/21/29 144A | 900,000 | 795 | ||||||
7.375%, 9/25/32 § | 300,000 | 267 | ||||||
8.994%, 2/1/24 144A | 1,000,000 | 997 | ||||||
United Mexican States | 1,000,000 | 939 | ||||||
3.771%, 5/24/61 ß | 5,400,000 | 4,972 | ||||||
US Treasury | 7,310,000 | 7,496 | ||||||
2.125%, 3/31/24 ß | 3,970,000 | 4,086 | ||||||
2.125%, 11/30/24 ß | 3,400,000 | 3,513 | ||||||
2.250%, 11/15/24 ß | 15,910,000 | 16,494 | ||||||
2.250%, 2/15/27 | 150,000 | 157 | ||||||
2.375%, 8/15/24 ß | 3,700,000 | 3,842 | ||||||
2.500%, 1/31/24 ß | 10,590,000 | 10,969 | ||||||
2.750%, 2/15/24 ß | 8,700,000 | 9,061 | ||||||
2.875%, 11/30/23 ß | 4,230,000 | 4,403 | ||||||
Venezuela Government International Bond | 32,000 | 2 | ||||||
7.000%, 3/31/38 §,f | 204,000 | 12 | ||||||
7.650%, 4/21/25 §,f | 1,955,000 | 117 | ||||||
8.250%, 10/13/24 §,f | 356,000 | 21 | ||||||
9.000%, 5/7/23 §,f | 32,000 | 2 | ||||||
9.250%, 5/7/28 §,f | 1,241,000 | 74 | ||||||
9.375%, 1/13/34 f | 1,400,000 | 84 | ||||||
|
| |||||||
Total | 215,240 | |||||||
|
| |||||||
Total Governments (Cost: $222,614) | 215,240 | |||||||
|
| |||||||
| Municipal Bonds (0.7%) | Shares/ Par + | Value $ (000’s) | ||||||
Municipal Bonds (0.7%) | ||||||||
American Municipal Power, Inc., Series 2010-B 7.834%, 2/15/41 RB | 100,000 | 165 | ||||||
Bay Area Toll Authority, California, Series 2010 6.918%, 4/1/40 RB | 200,000 | 299 | ||||||
City of Riverside California Electric Revenue 7.605%, 10/1/40 RB | 200,000 | 325 | ||||||
Irvine Ranch California Water District 6.622%, 5/1/40 RB | 100,000 | 151 | ||||||
Los Angeles County California Public Works Financing Authority 7.618%, 8/1/40 RB | 200,000 | 330 | ||||||
Metropolitan Government of Nashville & Davidson County Tennessee 6.568%, 7/1/37 RB | 100,000 | 143 | ||||||
Municipal Electric Authority of Georgia 6.655%, 4/1/57 RB | 97,000 | 150 | ||||||
New York City Transitional Finance Authority 5.508%, 8/1/37 RB | 300,000 | 394 | ||||||
New York State Urban Development Corp. 5.770%, 3/15/39 RB | 100,000 | 123 | ||||||
Port Authority of New York & New Jersey, Series 165 5.647%, 11/1/40 RB | 1,100,000 | 1,540 | ||||||
Port Authority of New York & New Jersey, Series 168 4.926%, 10/1/51 RB | 200,000 | 277 | ||||||
State of Illinois | 245,000 | 299 | ||||||
6.725%, 4/1/35 GO | 95,000 | 117 | ||||||
7.350%, 7/1/35 GO | 200,000 | 252 | ||||||
Texas Public Finance Authority 8.250%, 7/1/24 RB | 100,000 | 101 | ||||||
Tobacco Settlement Financing Corp. of Virginia, Series 2007-A 6.706%, 6/1/46 RB ß | 3,125,000 | 3,283 | ||||||
Triborough Bridge & Tunnel Authority 5.550%, 11/15/40 RB | 800,000 | 1,094 | ||||||
|
| |||||||
Total Municipal Bonds (Cost: $6,430) | 9,043 | |||||||
|
| |||||||
| Structured Products (7.4%) | ||||||||
Asset Backed Securities (6.5%) | ||||||||
Accredited Mortgage Loan Trust, Series 2005-3, Class M3 1.050%, (ICE LIBOR USD 1 Month plus 0.480%), 9/25/35 | 208,489 | 208 | ||||||
ACE Securities Corp. Home Equity Loan Trust, Series 2004-HE4, Class M1 0.702%, (ICE LIBOR USD 1 Month plus 0.900%), 12/25/34 | 59,984 | 59 | ||||||
ACE Securities Corp. Home Equity Loan Trust, Series 2004-RM2, Class M2 0.632%, (ICE LIBOR USD 1 Month plus 0.795%), 1/25/35 | 39,556 | 39 | ||||||
ACE Securities Corp. Home Equity Loan Trust, Series 2005-HE4, Class M4 0.752%, (ICE LIBOR USD 1 Month plus 0.975%), 7/25/35 | 42,992 | 43 | ||||||
The Accompanying Notes are an Integral Part of the Financial Statements.
196
Table of Contents
Multi-Sector Bond Portfolio
| Structured Products (7.4%) | Shares/ Par + | Value $ (000’s) | ||||||
Asset Backed Securities continued | ||||||||
ACE Securities Corp. Home Equity Loan Trust, Series 2006-FM1, Class A2C | ||||||||
0.252%, (ICE LIBOR USD 1 Month plus 0.300%), 7/25/36 b | 7,329,175 | 2,544 | ||||||
Aegis Asset Backed Securities Trust, Series 2004-6, Class M2 | ||||||||
1.092%, (ICE LIBOR USD 1 Month plus 1.000%), (AFC), 3/25/35 | 94,836 | 94 | ||||||
Ameriquest Mortgage Securities, Inc., Series 2004-R5, Class M1 | ||||||||
0.682%, (ICE LIBOR USD 1 Month plus 0.870%), 7/25/34 | 16,024 | 16 | ||||||
Ares European CLO, Series 10A, Class AR 0.780%, (Euribor 3 Month ACT/360 plus 0.780%), 10/15/31 144A EUR ∞ | ||||||||
Asset Backed Securities Corp. Home Equity | 1,100,000 | 1,252 | ||||||
Loan Trust, Series 2005-HE5, Class M4 0.702%, (ICE LIBOR USD 1 Month plus 0.900%), 6/25/35 | 139,559 | 140 | ||||||
Bain Capital Euro CLO, Series 2018-2A, Class AR | ||||||||
2.100%, (Euribor 3 Month ACT/360 plus 0.740%), 1/20/32 144A EUR ∞ | 300,000 | 341 | ||||||
Bear Stearns Asset Backed Securities I Trust, Series 2006-HE10, Class 1A2 | ||||||||
0.292%, (ICE LIBOR USD 1 Month plus 0.200%), 12/25/36 | 7,289 | 7 | ||||||
Bear Stearns Asset Backed Securities I Trust, Series 2007-HE6, Class 1A1 | ||||||||
1.352%, (ICE LIBOR USD 1 Month plus 1.250%), 8/25/37 | 78,105 | 78 | ||||||
Cairn CLO BV, Series 2014-A4, Class ARRR | ||||||||
0.600%, (Euribor 3 Month ACT/360 plus 0.600%), 4/30/31 144A EUR ∞ | 300,000 | 341 | ||||||
Cairn CLO X BV, Series 2018-10A, Class AR | ||||||||
0.780%, (Euribor 3 Month ACT/360 plus 0.780%), 10/15/31 144A EUR ∞ | 700,000 | 798 | ||||||
Carlyle Global Market Strategies Euro CLO, Series 2017-3A, Class A1R | ||||||||
0.700%, (Euribor 3 Month ACT/360 plus 0.700%), 1/15/31 144A EUR ∞ | 900,000 | 1,023 | ||||||
Citigroup Mortgage Loan Trust, Series 2007- AHL1, Class A2C | ||||||||
0.312%, (ICE LIBOR USD 1 Month plus 0.210%), 12/25/36 | 100,000 | 98 | ||||||
Countrywide Alternative Loan Trust, Series 2006-5, Class M1 | ||||||||
0.452%, (ICE LIBOR USD 1 Month plus 0.525%), 8/25/36 | 1,500,000 | 1,487 | ||||||
Countrywide Asset-Backed Certificates, Series 2004-9, Class MV4 | ||||||||
1.152%, (ICE LIBOR USD 1 Month plus 1.575%), 11/25/34 | 98,479 | 99 | ||||||
Countrywide Asset-Backed Certificates, Series 2005-4, Class AF6 | ||||||||
4.740%, (AFC), 10/25/35 | 149 | – | π | |||||
Countrywide Asset-Backed Certificates, Series 2005-AB4, Class 2A4 | ||||||||
0.452%, (ICE LIBOR USD 1 Month plus 0.700%), 3/25/36 | 83,045 | 79 | ||||||
| Structured Products (7.4%) | Shares/ Par + | Value $ (000’s) | ||||||
Asset Backed Securities continued | ||||||||
Countrywide Asset-Backed Certificates, Series 2006-1, Class AF5 4.571%, (AFC), 7/25/36 S | 100,000 | 99 | ||||||
Countrywide Asset-Backed Certificates, Series 2006-26, Class 1A | ||||||||
0.242%, (ICE LIBOR USD 1 Month plus 0.140%), 6/25/37 | 421,072 | 401 | ||||||
Countrywide Asset-Backed Certificates, Series 2006-5, Class 2A3 | ||||||||
0.392%, (ICE LIBOR USD 1 Month plus 0.580%), 8/25/36 | 26,755 | 27 | ||||||
Countrywide Asset-Backed Certificates, Series 2006-BC3, Class M2 | ||||||||
0.422%, (ICE LIBOR USD 1 Month plus 0.480%), 2/25/37 | 900,000 | 846 | ||||||
Countrywide Asset-Backed Certificates, Series 2007-1, Class 2A3 | ||||||||
0.242%, (ICE LIBOR USD 1 Month plus 0.140%), 7/25/37 | 16,899 | 17 | ||||||
Countrywide Asset-Backed Certificates, Series 2007-13, Class 1A | ||||||||
0.942%, (ICE LIBOR USD 1 Month plus 0.840%), 10/25/47 | 1,431,300 | 1,408 | ||||||
Countrywide Asset-Backed Certificates, Series 2007-9, Class 1A | ||||||||
0.303%, (ICE LIBOR USD 1 Month plus 0.200%), 6/25/47 | 833,498 | 783 | ||||||
Countrywide Asset-Backed Certificates, Series 2007-SEA1, Class 1A1 | ||||||||
0.652%, (ICE LIBOR USD 1 Month plus 0.550%), (AFC), 5/25/47 144A | 1,300,024 | 1,150 | ||||||
Credit Suisse First Boston Mortgage Securities Corp., Series 2001-HE17, Class A1 | ||||||||
0.712%, (ICE LIBOR USD 1 Month plus 0.620%), 1/25/32 | 3,046 | 3 | ||||||
CVC Cordatus Loan Fund XI DAC, Series 2011-A, Class AR | ||||||||
0.650%, (Euribor 3 Month ACT/360 plus 0.650%), 10/15/31 144A EUR ∞ | 800,000 | 911 | ||||||
Ellington Loan Acquisition Trust, Series 2007-2, Class A1 | ||||||||
1.152%, (ICE LIBOR USD 1 Month plus 1.050%), 5/25/37 144A | 238,880 | 240 | ||||||
Euro-Galaxy III CLO BV, Series 2013-3A, Class ARRR | ||||||||
0.620%, (Euribor 3 Month ACT/360 plus 0.620%), 4/24/34 144A EUR ∞ | 300,000 | 340 | ||||||
First Franklin Mortgage Loan Trust, Series 2006-FF5, Class 2A5 04/25/36 | 99,236 | 99 | ||||||
Fremont Home Loan Trust, Series 2005-2, Class M4 | ||||||||
0.722%, (ICE LIBOR USD 1 Month plus 0.930%), 6/25/35 | 300,000 | 297 | ||||||
GSAA Home Equity Trust, Series 2006-17, Class A1 | ||||||||
0.212%, (ICE LIBOR USD 1 Month plus | ||||||||
0.120%), 11/25/36 | 50,158 | 17 | ||||||
The Accompanying Notes are an Integral Part of the Financial Statements.
197
Table of Contents
Multi-Sector Bond Portfolio
| Structured Products (7.4%) | Shares/ Par + | Value $ (000’s) | ||||||
Asset Backed Securities continued | ||||||||
GSAMP Trust, Series 2004-WF, Class M2 1.202%, (ICE LIBOR USD 1 Month plus 1.650%), 10/25/34 | 14,664 | 15 | ||||||
GSAMP Trust, Series 2007-FM2, Class A2B 0.182%, (ICE LIBOR USD 1 Month plus 0.090%), 1/25/37 | 168,467 | 122 | ||||||
GSAMP Trust, Series 2007-NC1, Class A2A 0.142%, (ICE LIBOR USD 1 Month plus 0.050%), 12/25/46 | 13,421 | 9 | ||||||
Harvest CLO XX DAC, Series 2020-A, Class AR 0.680%, (Euribor 3 Month ACT/360 plus 0.680%), 10/20/31 144A EUR ∞ | 600,000 | 681 | ||||||
Home Equity Loan Trust, Series 2007-FRE1, Class 2AV4 0.442%, (ICE LIBOR USD 1 Month plus 0.340%), 4/25/37 | 500,000 | 470 | ||||||
HSI Asset Securitization Corp. Trust, Series 2005-I1, Class 2A4 0.492%, (ICE LIBOR USD 1 Month plus 0.780%), 11/25/35 | 182,774 | 183 | ||||||
IndyMac Residential Asset Backed Trust, Series 2007-B, Class 2A2 0.262%, (ICE LIBOR USD 1 Month plus 0.160%), 7/25/37 | 341,814 | 227 | ||||||
JP Morgan Mortgage Acquisition Trust, Series 2007-CH3, Class M1 0.402%, (ICE LIBOR USD 1 Month plus 0.300%), 3/25/37 | 400,000 | 388 | ||||||
KKR Financial CLO, Ltd., Series 9, Class AR2 1.074%, (ICE LIBOR USD 3 Month plus 0.950%), 7/15/30 144A | 2,200,000 | 2,195 | ||||||
Laurelin DAC, Series 2016-1A, Class ARR 0.720%, (Euribor 3 Month ACT/360 plus 0.720%), 10/20/31 144A EUR ∞ | 400,000 | 455 | ||||||
LCM XV LP, Series 2015-A, Class AR2 1.132%, (ICE LIBOR USD 3 Month plus 1.000%), 7/20/30 144A | 1,800,000 | 1,795 | ||||||
Lehman XS Trust, Series 2005-4, Class 1A3 0.892%, (ICE LIBOR USD 1 Month plus 0.800%), 10/25/35 | 3,688 | 4 | ||||||
Long Beach Mortgage Loan Trust, Series 2006-1, Class 2A4 0.702%, (ICE LIBOR USD 1 Month plus 0.600%), 2/25/36 | 57,519 | 53 | ||||||
Long Beach Mortgage Loan Trust, Series 2006-3, Class 2A4 0.642%, (ICE LIBOR USD 1 Month plus 0.540%), 5/25/46 | 289,371 | 131 | ||||||
Long Beach Mortgage Loan Trust, Series 2006-4, Class 1A 0.402%, (ICE LIBOR USD 1 Month plus 0.300%), 5/25/36 | 1,132,461 | 757 | ||||||
Madison Park Euro Funding XIV DAC, Series 14A, Class A1R 0.800%, (Euribor 3 Month ACT/360 plus 0.800%), 7/15/32 144A EUR ∞ | 300,000 | 341 | ||||||
| Structured Products (7.4%) | Shares/ Par + | Value $ (000’s) | ||||||
Asset Backed Securities continued | ||||||||
Man GLG EURO CLO III DAC, Series 3A, Class AR 0.680%, (Euribor 3 Month ACT/360 plus 0.680%), 10/15/30 144A EUR ∞ | 400,000 | 455 | ||||||
Marathon CLO, Ltd., Series 2017-9A, Class A1AR 1.274%, (ICE LIBOR USD 3 Month plus 1.150%), 4/15/29 144A | 1,837,629 | 1,838 | ||||||
Marble Point CLO X, Ltd., Series 2017-1A, Class AR 1.164%, (ICE LIBOR USD 3 Month plus 1.040%), 10/15/30 144A | 5,200,000 | 5,200 | ||||||
MASTR Asset Backed Securities Trust, Series 2004-OPT1, Class M1 0.622%, (ICE LIBOR USD 1 Month plus 0.780%), 2/25/34 | 831,912 | 818 | ||||||
MASTR Asset Backed Securities Trust, Series 2004-WMC2, Class M1 1.002%, (ICE LIBOR USD 1 Month plus 0.900%), 4/25/34 | 95,431 | 94 | ||||||
MASTR Asset Backed Securities Trust, Series 2006-FRE2, Class A1 0.252%, (ICE LIBOR USD 1 Month plus 0.300%), 3/25/36 b | 9,834,697 | 9,275 | ||||||
MASTR Asset Backed Securities Trust, Series 2006-HE3, Class A2 0.202%, (ICE LIBOR USD 1 Month plus 0.200%), 8/25/36 | 2,059,813 | 795 | ||||||
MASTR Asset Backed Securities Trust, Series 2006-WMC4, Class A5 0.252%, (ICE LIBOR USD 1 Month plus 0.150%), 10/25/36 | 878,242 | 377 | ||||||
Merrill Lynch Mortgage Investors Trust, Series 2007-SD1, Class A1 0.542%, (ICE LIBOR USD 1 Month plus 0.450%), 2/25/47 | 813,876 | 585 | ||||||
Morgan Stanley ABS Capital I, Inc. Trust, Series 2005-NC1, Class A2MZ 0.392%, (ICE LIBOR USD 1 Month plus 0.580%), 1/25/35 | 784,058 | 780 | ||||||
Morgan Stanley ABS Capital I, Inc. Trust, Series 2005-NC1, Class M2 0.572%, (ICE LIBOR USD 1 Month plus 0.705%), 1/25/35 | 162,120 | 159 | ||||||
Morgan Stanley ABS Capital I, Inc. Trust, Series 2005-WMC5, Class M5 0.762%, (ICE LIBOR USD 1 Month plus 0.990%), 6/25/35 | 194,709 | 195 | ||||||
Morgan Stanley ABS Capital I, Inc. Trust, Series 2006-HE7, Class A2C 0.262%, (ICE LIBOR USD 1 Month plus 0.160%), 9/25/36 | 64,289 | 36 | ||||||
Morgan Stanley ABS Capital I, Inc. Trust, Series 2006-HE8, Class A2C 0.232%, (ICE LIBOR USD 1 Month plus 0.140%), 10/25/36 | 58,347 | 34 | ||||||
Morgan Stanley ABS Capital I, Inc. Trust, Series 2007-HE5, Class A2C 0.342%, (ICE LIBOR USD 1 Month plus 0.250%), 3/25/37 | 59,355 | 34 | ||||||
The Accompanying Notes are an Integral Part of the Financial Statements.
198
Table of Contents
Multi-Sector Bond Portfolio
| Structured Products (7.4%) | Shares/ Par + | Value $ (000’s) | ||||||
Asset Backed Securities continued | ||||||||
Morgan Stanley Dean Witter Capital I, Inc., Series 2003-NC1, Class M1 1.152%, (ICE LIBOR USD 1 Month plus 1.575%), 11/25/32 | 24,727 | 25 | ||||||
Morgan Stanley Dean Witter Capital I, Inc., Series 2003-NC2, Class M1 1.002%, (ICE LIBOR USD 1 Month plus 1.350%), 2/25/33 | 20,314 | 20 | ||||||
NovaStar Mortgage Funding Trust, Series 2007-2, Class A2B 0.262%, (ICE LIBOR USD 1 Month plus 0.160%), (AFC), 9/25/37 | 301,411 | 298 | ||||||
Oak Hill Euro Credit Partners VII DAC, Series 2021-7A, Class AR 0.740%, (Euribor 3 Month ACT/360 plus 0.740%), 10/20/31 144A EUR ∞ | 1,200,000 | 1,359 | ||||||
Popular Mortgage Pass-Through Trust, Series 2006-A, Class M1 0.492%, (ICE LIBOR USD 1 Month plus 0.585%), (AFC), 2/25/36 | 71,165 | 71 | ||||||
RAAC Series, Series 2007-RP4, Class A 0.453%, (ICE LIBOR USD 1 Month plus 0.350%), (AFC), 11/25/46 144A | 203,376 | 198 | ||||||
Renaissance Home Equity Loan Trust, Series 2006-4, Class AF6 5.340%, 1/25/37 Σ | 1,526,159 | 729 | ||||||
Residential Asset Securities Corp., Series 2007-KS1, Class A3 0.242%, (ICE LIBOR USD 1 Month plus 0.150%), (AFC), 1/25/37 | 28,467 | 28 | ||||||
Residential Asset Securities Corp., Series 2007-KS3, Class AI4 0.432%, (ICE LIBOR USD 1 Month plus 0.340%), (AFC), 4/25/37 | 1,600,000 | 1,570 | ||||||
Saranac CLO, Ltd., Series 2018-6A, Class A1R 1.256%, (ICE LIBOR USD 3 Month plus 1.140%), 8/13/31 144A | 2,900,000 | 2,897 | ||||||
Saxon Asset Securities Trust, Series 2006-1, Class M1 0.412%, (ICE LIBOR USD 1 Month plus 0.465%), (AFC), 3/25/36 | 237,436 | 237 | ||||||
Sculptor CLO XXV, Ltd., Series 25A, Class A1 1.394%, (ICE LIBOR USD 3 Month plus 1.270%), 1/15/31 144A | 2,100,000 | 2,100 | ||||||
Securitized Asset Backed Receivables LLC Trust, Series 2005-FR4, Class M2 0.742%, (ICE LIBOR USD 1 Month plus 0.960%), 1/25/36 | 45,420 | 42 | ||||||
Sound Point CLO XIV, Ltd., Series 2016-3A, Class AR2 1.114%, (ICE LIBOR USD 3 Month plus 0.990%), 1/23/29 144A | 591,809 | 591 | ||||||
Sound Point CLO XIV, Ltd., Series 2017-2A, Class AR 1.104%, (ICE LIBOR USD 3 Month plus 0.980%), 7/25/30 144A | 5,200,000 | 5,197 | ||||||
| Structured Products (7.4%) | Shares/ Par + | Value $ (000’s) | ||||||
Asset Backed Securities continued | ||||||||
Soundview Home Loan Trust, Series 2005-3, Class M3 0.652%, (ICE LIBOR USD 1 Month plus 0.825%), 6/25/35 | 2,356 | 3 | ||||||
Soundview Home Loan Trust, Series 2006-2, Class M2 0.452%, (ICE LIBOR USD 1 Month plus 0.525%), 3/25/36 | 260,678 | 260 | ||||||
Soundview Home Loan Trust, Series 2006- OPT2, Class A4 0.382%, (ICE LIBOR USD 1 Month plus 0.560%), 5/25/36 | 148,435 | 148 | ||||||
Soundview Home Loan Trust, Series 2006- OPT3, Class M1 0.413%, (ICE LIBOR USD 1 Month plus 0.465%), 6/25/36 b | 6,642,179 | 6,733 | ||||||
Specialty Underwriting & Residential Finance Trust, Series 2005-BC2, Class M3 0.752%, (ICE LIBOR USD 1 Month plus 0.975%), 12/25/35 | 159,493 | 159 | ||||||
Structured Asset Investment Loan Trust, Series 2003-BC11, Class M1 1.067%, (ICE LIBOR USD 1 Month plus 0.975%), 10/25/33 | 44,012 | 44 | ||||||
Structured Asset Investment Loan Trust, Series 2005-7, Class M2 0.867%, (ICE LIBOR USD 1 Month plus 0.765%), 8/25/35 | 373,299 | 371 | ||||||
Structured Asset Investment Loan Trust, Series 2006-BNC3, Class A3 0.253%, (ICE LIBOR USD 1 Month plus 0.150%), 9/25/36 | 9,647 | 9 | ||||||
Structured Asset Securities Corp. Mortgage Loan Trust, Series 2006-BC4, Class A4 0.442%, (ICE LIBOR USD 1 Month plus 0.340%), 12/25/36 | 191,116 | 189 | ||||||
Structured Asset Securities Corp. Mortgage Loan Trust, Series 2007-WF1, Class A6 0.512%, (ICE LIBOR USD 1 Month plus 0.420%), 2/25/37 | 67,973 | 67 | ||||||
Toro European CLO 6 DAC, Series 6A, Class AR 0.920%, (Euribor 3 Month ACT/360 plus 0.920%), 1/12/32 144A EUR ∞ | 500,000 | 570 | ||||||
Toro European CLO, Series 7A , Class ARE 0.810%, (Euribor 3 Month ACT/360 plus 0.810%), 2/15/34 144A EUR ∞ | 250,000 | 285 | ||||||
Truman Capital Mortgage Loan Trust, Series 2006-1, Class A 0.362%, (ICE LIBOR USD 1 Month plus 0.260%), 3/25/36 144A | 657,682 | 654 | ||||||
Venture CDO, Ltd., Series 2018-33A, Class A1LR 1.184%, (ICE LIBOR USD 3 Month plus 1.060%), 7/15/31 144A | 1,000,000 | 1,000 | ||||||
Venture XIV CLO, Ltd., Series 2013-14A, Class ARR 1.206%, (ICE LIBOR USD 3 Month plus 1.030%), 8/28/29 144A | 5,500,000 | 5,496 | ||||||
The Accompanying Notes are an Integral Part of the Financial Statements.
199
Table of Contents
Multi-Sector Bond Portfolio
| Structured Products (7.4%) | Shares/ Par + | Value $ (000’s) | ||||||
Asset Backed Securities continued | ||||||||
Venture XXV CLO, Ltd., Series 2016-25A, Class ARR 1.152%, (ICE LIBOR USD 3 Month plus 1.020%), 4/20/29 144A | 3,661,450 | 3,661 | ||||||
Venture XXVIII CLO, Ltd., Series 2017-28A, Class A1R 1.122%, (ICE LIBOR USD 3 Month plus 0.990%), 7/20/30 144A | 200,000 | 199 | ||||||
Vibrant CLO VII, Ltd., Series 2017-7A, Class A1R 1.172%, (ICE LIBOR USD 3 Month plus 1.040%), 9/15/30 144A | 300,000 | 300 | ||||||
WaMu Asset-Backed Certificates, Series 2007-HE1, Class 1A 0.252%, (ICE LIBOR USD 1 Month plus 0.150%), 1/25/37 | 125,093 | 117 | ||||||
Wellfleet CLO, Ltd., Series 2015-1A, Class AR4 1.022%, (ICE LIBOR USD 3 Month plus 0.890%), 7/20/29 144A | 1,853,463 | 1,850 | ||||||
Wellfleet CLO, Ltd., Series 2017-1, Class 1A 1.022%, (ICE LIBOR USD 3 Month plus 0.890%), 4/20/29 144A | 4,746,858 | 4,740 | ||||||
|
| |||||||
Total | 86,102 | |||||||
|
| |||||||
Mortgage Securities (0.9%) | ||||||||
American Home Mortgage Investment Trust, Series 2005-2, Class 4A1 1.746%, (ICE LIBOR USD 6 Month plus 1.500%), (AFC), 9/25/45 | 305 | – | π | |||||
Banc of America Funding Trust, Series 2005-H, Class 5A1 2.245%, (CSTR), 11/20/35 | 111,381 | 103 | ||||||
Banc of America Funding Trust, Series 2006-J, Class 4A1 3.417%, (CSTR), 1/20/47 | 36,340 | 35 | ||||||
Banc of America Funding Trust, Series 2007-6, Class A1 0.392%, (ICE LIBOR USD 1 Month plus 0.290%), 7/25/37 | 48,243 | 47 | ||||||
Barclays Capital LLC, Series 2009-RR14, Class 2A2 3.115%, (CSTR), 7/26/36 144A | 18,307 | 17 | ||||||
Barclays Capital LLC, Series 2009-RR5, Class 3A3 6.250%, (CSTR), 8/26/36 144A | 2,115,975 | 1,100 | ||||||
Bear Stearns Adjustable Rate Mortgage Trust, Series 2004-3, Class 4A 2.934%, (CSTR), 7/25/34 | 1,321 | 1 | ||||||
Bear Stearns ALT-A Trust, Series 2006-6, Class 2A1 3.238%, (CSTR), 11/25/36 | 132,677 | 88 | ||||||
Bear Stearns ARM Trust, Series 2007-4, Class 22A1 3.283%, (CSTR), 6/25/47 | 71,459 | 71 | ||||||
Citicorp Mortgage Securities Trust, Series 2007-8, Class 1A3 6.000%, 9/25/37 | 2,099 | 2 | ||||||
Citigroup Mortgage Loan Trust, Series 2007-10, Class 22AA 3.153%, (CSTR), 9/25/37 | 7,623 | 8 | ||||||
| Structured Products (7.4%) | Shares/ Par + | Value $ (000’s) | ||||||
Mortgage Securities continued | ||||||||
Citigroup Mortgage Loan Trust, Series 2007-10, Class 2A3A 3.411%, (CSTR), 9/25/37 | 22,973 | 23 | ||||||
Citigroup Mortgage Loan Trust, Series 2007- AR4, Class 2A2A 3.144%, (CSTR), 3/25/37 | 312,597 | 300 | ||||||
Countrywide Alternative Loan Trust, Series 2004-28CB, Class 5A1 5.750%, 1/25/35 | 12,297 | 13 | ||||||
Countrywide Alternative Loan Trust, Series 2005-1CB, Class 2A1 6.000%, 3/25/35 | 272,065 | 177 | ||||||
Countrywide Alternative Loan Trust, Series 2005-59, Class 1A1 0.763%, (ICE LIBOR USD 1 Month plus 0.660%), 11/20/35 | 4,653 | 5 | ||||||
Countrywide Alternative Loan Trust, Series 2005-76, Class 1A1 1.562%, (Federal Reserve US 12 Month Cumulative Avg 1 year CMT plus 1.480%), 1/25/36 | 13,019 | 13 | ||||||
Countrywide Alternative Loan Trust, Series 2005-79CB, Class A3 5.500%, 1/25/36 | 129,115 | 102 | ||||||
Countrywide Alternative Loan Trust, Series 2005-J1, Class 1A8 5.500%, 2/25/35 | 111,381 | 114 | ||||||
Countrywide Alternative Loan Trust, Series 2005-J1, Class 3A1 6.500%, 8/25/32 | 1,489 | 2 | ||||||
Countrywide Alternative Loan Trust, Series 2005-J11, Class 1A13 5.500%, 11/25/35 | 163,890 | 123 | ||||||
Countrywide Alternative Loan Trust, Series 2006-45T1, Class 1A13 6.000%, 2/25/37 | 110,019 | 58 | ||||||
Countrywide Alternative Loan Trust, Series 2006-5T2, Class A1 0.592%, (ICE LIBOR USD 1 Month plus 0.500%), 4/25/36 | 371,548 | 119 | ||||||
Countrywide Alternative Loan Trust, Series 2006-HY10, Class 2A1 2.825%, (CSTR), 5/25/36 | 7,740 | 7 | ||||||
Countrywide Alternative Loan Trust, Series 2006-OA12, Class A1B 0.294%, (ICE LIBOR USD 1 Month plus 0.190%), 9/20/46 | 10,058 | 10 | ||||||
Countrywide Alternative Loan Trust, Series 2006-OA17, Class 1A1A 0.299%, (ICE LIBOR USD 1 Month plus 0.195%), 12/20/46 | 25,056 | 22 | ||||||
Countrywide Alternative Loan Trust, Series 2006-OA2, Class A1 0.524%, (ICE LIBOR USD 1 Month plus 0.420%), 5/20/46 | 327,653 | 297 | ||||||
Countrywide Alternative Loan Trust, Series 2006-OA9, Class 2A1A 0.314%, (ICE LIBOR USD 1 Month plus 0.210%), 7/20/46 | 8,194 | 6 | ||||||
The Accompanying Notes are an Integral Part of the Financial Statements.
200
Table of Contents
Multi-Sector Bond Portfolio
| Structured Products (7.4%) | Shares/ Par + | Value $ (000’s) | ||||||
Mortgage Securities continued | ||||||||
Countrywide Alternative Loan Trust, Series 2007-9T1, Class 2A2 6.000%, 5/25/37 | 222,387 | 144 | ||||||
Countrywide Alternative Loan Trust, Series 2007-OA3, Class 1A1 0.242%, (ICE LIBOR USD 1 Month plus 0.280%), 4/25/47 | 30,782 | 28 | ||||||
Countrywide Home Loan Mortgage Pass-Through Trust, Series 2005-22, Class 3A1 2.334%, (CSTR), 10/25/35 | 9,392 | 8 | ||||||
Countrywide Home Loan Mortgage Pass-Through Trust, Series 2005-HYB8, Class 1A1 2.727%, (CSTR), 12/20/35 | 3,326 | 3 | ||||||
Countrywide Home Loan Mortgage Pass-Through Trust, Series 2006-16, Class 2A1 6.500%, 11/25/36 | 16,331 | 9 | ||||||
Countrywide Home Loan Mortgage Pass-Through Trust, Series 2006-9, Class A1 6.000%, 5/25/36 | 103,837 | 70 | ||||||
Countrywide Home Loan Mortgage Pass-Through Trust, Series 2006-OA4, Class A1 1.042%, (Federal Reserve US 12 Month Cumulative Avg 1 year CMT plus 0.960%), 4/25/46 | 35,611 | 14 | ||||||
Countrywide Home Loan Mortgage Pass-Through Trust, Series 2006-OA4, Class A2 0.372%, (ICE LIBOR USD 1 Month plus 0.540%), 4/25/46 | 943,681 | 318 | ||||||
Countrywide Home Loan Mortgage Pass-Through Trust, Series 2007-HYB1, Class 3A1 2.971%, (CSTR), 3/25/37 | 7,762 | 7 | ||||||
Credit Suisse First Boston Mortgage Securities Corp., Series 2003-8, Class 5A1 6.500%, 4/25/33 | 382 | – | π | |||||
Deutsche ALT-A Securities, Inc. Mortgage Loan Trust, Series 2005-6, Class 2A3 5.500%, 12/25/35 | 347,983 | 346 | ||||||
EMF-NL BV, Series 2008-APRX, Class A2 0.249%, (Euribor 3 Month ACT/360 plus 0.800%), 4/17/41 EUR §,∞ | 106,248 | 116 | ||||||
Eurosail-NL BV, Series 2007-NL2X, Class A 0.949%, (Euribor 3 Month ACT/360 plus 1.500%), 10/17/40 EUR §,∞ | 51,164 | 58 | ||||||
Federal National Mortgage Association, Series 2003-W6, Class F 0.442%, (ICE LIBOR USD 1 Month plus 0.350%), 9/25/42 | 17,310 | 17 | ||||||
First Horizon Mortgage Pass-Through Trust, Series 2007-2, Class 1A5 5.750%, 5/25/37 | 166,444 | 97 | ||||||
GSR Mortgage Loan Trust, Series 2005- AR6, Class 1A1 2.747%, (CSTR), 9/25/35 | 1,756 | 2 | ||||||
GSR Mortgage Loan Trust, Series 2006-2F, Class 3A6 6.000%, 2/25/36 | 77,644 | 51 | ||||||
GSR Mortgage Loan Trust, Series 2006-AR1, Class 2A1 2.913%, (CSTR), 1/25/36 | 1,225 | 1 | ||||||
| Structured Products (7.4%) | Shares/ Par + | Value $ (000’s) | ||||||
Mortgage Securities continued | ||||||||
GSR Mortgage Loan Trust, Series 2007-AR1, Class 2A1 2.772%, (CSTR), 3/25/47 | 7,447 | 6 | ||||||
Harborview Mortgage Loan Trust, Series 2005-10, Class 2A1A 0.724%, (ICE LIBOR USD 1 Month plus 0.620%), (AFC), 11/19/35 | 8,013 | 7 | ||||||
Harborview Mortgage Loan Trust, Series 2005-3, Class 2A1A 0.584%, (ICE LIBOR USD 1 Month plus 0.480%), (AFC), 6/19/35 | 12,482 | 13 | ||||||
HomeBanc Mortgage Trust, Series 2005-1, Class A1 0.592%, (ICE LIBOR USD 1 Month plus 0.500%), 3/25/35 | 4,295 | 4 | ||||||
HSI Asset Securitization Corp. Trust, Series 2006-NC1, Class 2A 0.322%, (ICE LIBOR USD 1 Month plus 0.440%), 11/25/35 | 892,992 | 855 | ||||||
Impac Secured Assets Trust, Series 2007-1, Class A2 0.262%, (ICE LIBOR USD 1 Month plus 0.160%), (AFC), 3/25/37 | 16,045 | 16 | ||||||
IndyMac INDX Mortgage Loan Trust, Series 2004-AR6, Class 5A1 2.810%, (CSTR), 10/25/34 | 16,281 | 17 | ||||||
IndyMac INDX Mortgage Loan Trust, Series 2005-AR12, Class 2A1A 0.582%, (ICE LIBOR USD 1 Month plus 0.480%), (AFC), 7/25/35 | 1,358 | 1 | ||||||
IndyMac INDX Mortgage Loan Trust, Series 2005-AR14, Class 2A1A 0.702%, (ICE LIBOR USD 1 Month plus 0.600%), 7/25/35 | 9,411 | 9 | ||||||
JP Morgan Mortgage Trust, Series 2005-ALT1, Class 2A1 2.472%, (CSTR), 10/25/35 | 7,621 | 7 | ||||||
JP Morgan Mortgage Trust, Series 2007-A1, Class 6A1 2.622%, (CSTR), 7/25/35 | 4,878 | 5 | ||||||
JP Morgan Mortgage Trust, Series 2007-A4, Class 3A1 2.790%, (CSTR), 6/25/37 | 38,294 | 31 | ||||||
Merrill Lynch Mortgage Investors Trust, Series 2005-A9, Class 5A1 2.943%, (CSTR), 12/25/35 | 84,901 | 72 | ||||||
Merrill Lynch Mortgage Investors Trust, Series 2006-1, Class 1A 2.091%, (CSTR), 2/25/36 | 2,108 | 2 | ||||||
Merrill Lynch Mortgage Investors Trust, Series 2006-A3, Class 6A1 2.987%, (CSTR), 5/25/36 | 9,270 | 9 | ||||||
New Residential Mortgage Loan Trust, Series 2021-NQM1R, Class A3 1.198%, (AFC), 7/25/55 144A | 1,163,722 | 1,154 | ||||||
Nomura Asset Acceptance Corp. Alternative Loan Trust, Series 2005-AR4, Class 3A1 2.955%, (CSTR), 8/25/35 | 2,148 | 2 | ||||||
The Accompanying Notes are an Integral Part of the Financial Statements.
201
Table of Contents
Multi-Sector Bond Portfolio
| Structured Products (7.4%) | Shares/ Par + | Value $ (000’s) | ||||||
Mortgage Securities continued | ||||||||
Residential Accredit Loans, Inc., Series 2006-QA7, Class 1A1 0.482%, (ICE LIBOR USD 1 Month plus 0.380%), 8/25/36 | 5,995 | 6 | ||||||
Residential Accredit Loans, Inc., Series 2006-QA8, Class A1 0.482%, (ICE LIBOR USD 1 Month plus 0.380%), 9/25/36 | 15,896 | 16 | ||||||
Residential Accredit Loans, Inc., Series 2007-QA1, Class A1 0.242%, (ICE LIBOR USD 1 Month plus 0.140%), 1/25/37 | 8,790 | 9 | ||||||
Residential Asset Securitization Trust, Series 2007-A2, Class 2A2 6.500%, 4/25/37 | 3,300,487 | 1,378 | ||||||
Structured Adjustable Rate Mortgage Loan Trust, Series 2005-19XS, Class 1A1 0.412%, (ICE LIBOR USD 1 Month plus 0.320%), 10/25/35 | 43,229 | 43 | ||||||
Structured Asset Mortgage Investments II Trust, Series 2005-AR8, Class A2 1.979%, (Federal Reserve US 12 Month Cumulative Avg 1 year CMT plus 1.480%), 2/25/36 | 407,847 | 405 | ||||||
Structured Asset Mortgage Investments II Trust, Series 2006-AR6, Class 1A1 0.282%, (ICE LIBOR USD 1 Month plus 0.360%), (AFC), 7/25/46 | 180,733 | 160 | ||||||
Suntrust Alternative Loan Trust, Series 2005-1F, Class 1A1 0.742%, (ICE LIBOR USD 1 Month plus 0.650%), 12/25/35 | 8,802 | 8 | ||||||
Towd Point Mortgage Funding, Series 2019- GR4A, Class A1 1.236%, (ICE LIBOR GBP 3 Month plus 1.025%), 10/20/51 144A GBP ∞ | 1,693,965 | 2,309 | ||||||
WaMu Mortgage Pass-Through Certificates, Series 2002-AR19, Class A6 2.610%, (CSTR, AFC), 2/25/33 | 704 | 1 | ||||||
WaMu Mortgage Pass-Through Certificates, Series 2006-AR12, Class 3A3 3.262%, (CSTR), 10/25/36 | 16,532 | 16 | ||||||
WaMu Mortgage Pass-Through Certificates, Series 2006-AR2, Class 1A1 2.986%, (CSTR), 3/25/36 | 111,909 | 113 | ||||||
WaMu Mortgage Pass-Through Certificates, Series 2006-AR8, Class 2A1 2.873%, (CSTR), 8/25/36 | 7,694 | 7 | ||||||
WaMu Mortgage Pass-Through Certificates, Series 2007-HY1, Class 3A1 3.051%, (CSTR), 2/25/37 | 2,862 | 3 | ||||||
WaMu Mortgage Pass-Through Certificates, Series 2007-OA3, Class 4A2 0.782%, (Federal Reserve US 12 Month Cumulative Avg 1 year CMT plus 0.700%), 4/25/47 | 269,409 | 239 | ||||||
Wells Fargo Alternative Loan Trust, Series 2007-PA4, Class 2A1 2.587%, (CSTR), 7/25/37 | 36,724 | 34 | ||||||
| Structured Products (7.4%) | Shares/ Par + | Value $ (000’s) | ||||||
Mortgage Securities continued | ||||||||
Wells Fargo Mortgage Backed Securities Trust, Series 2006-AR5, Class 2A1 2.637%, (CSTR), 4/25/36 | 30,771 | 31 | ||||||
Wells Fargo Mortgage Backed Securities Trust, Series 2007-AR8, Class A1 2.667%, (CSTR), 11/25/37 | 27,989 | 28 | ||||||
|
| |||||||
Total | 11,168 | |||||||
|
| |||||||
Total Structured Products | ||||||||
(Cost: $94,519) | 97,270 | |||||||
|
| |||||||
| Bank Loan Obligations (4.2%) | ||||||||
Bank Loan Obligations (4.2%) | ||||||||
Adient U.S. LLC, 3.560%, (ICE LIBOR USD 1 Month plus 3.500%), 4/8/28b | 6,666,500 | 6,659 | ||||||
Albion Acquisitions, Ltd., 5.210%, (Euribor 3 Month ACT/360 plus 5.250%), 8/17/26 EUR∞ | 3,400,000 | 3,866 | ||||||
Altice Financing SA, 2.810%, 01/31/26 | 1,172,519 | 1,159 | ||||||
Altice France SA, 2.810%, (US LIBOR plus 2.750%), 7/31/25 | 194,402 | 191 | ||||||
Avolon TLB Borrower 1 LLC, 2.310%, (ICE LIBOR USD 1 Month plus 2.250%), 12/1/27 | 1,191,000 | 1,192 | ||||||
Bausch Health Cos., Inc., 3.060%, (US LIBOR plus 3.000%), 6/2/25 | 250,735 | 249 | ||||||
Casino Guichard Perrachon SA, 3.960%, (Euribor 3 Month ACT/360 plus 4.000%), 8/31/25 EUR∞ | 1,300,000 | 1,472 | ||||||
CenturyLink, Inc., 2.310%, (ICE LIBOR USD 1 Month plus 2.250%), 3/15/27b | 5,285,359 | 5,219 | ||||||
Charter Communications Operating LLC, 1.810%, (ICE LIBOR USD 1 Month plus 1.750%), 2/1/27b | 3,381,172 | 3,347 | ||||||
CommScope, Inc., 3.310%, (US LIBOR plus 3.250%), 4/6/26 | 488,750 | 482 | ||||||
Connect Finco SARL, 3.560%, (ICE LIBOR USD 1 Month plus 3.500%), 12/11/26 | 1,179,000 | 1,178 | ||||||
Envision Healthcare Corp., 3.810%, (US LIBOR plus 3.750%), 10/10/25 | 485,000 | 389 | ||||||
Grifols SA, 2.210%, (Euribor 3 Month ACT/360 plus 2.250%), 11/15/27 EUR∞ | 1,850,815 | 2,080 | ||||||
Hilton Worldwide Finance LLC, 1.810%, (US LIBOR plus 1.750%), 6/22/26 | 1,120,295 | 1,110 | ||||||
INEOS Quattro Finance 2 PLC, 2.810%, (ICE LIBOR USD 1 Month plus 2.750%), 1/29/26b | 3,383,000 | 3,375 | ||||||
Intelsat Jackson Holdings SA, 4.810%, (ICE LIBOR USD 1 Month plus 4.750%), 10/13/22 | 68,185 | 68 | ||||||
Intelsat Jackson Holdings SA - Term Loan B, 4.310%, (ICE LIBOR USD 3 Month plus 4.250%), 12/1/28Æ | 63,016 | 63 | ||||||
Setanta Aircraft Leasing DAC, 2.060%, (ICE LIBOR USD 1 Month plus 2.000%), 11/5/28b | 4,000,000 | 3,998 | ||||||
Sigma Bidco BV, 3.460%, (Euribor 3 Month plus 3.500%), 7/2/25 EUR∞ | 1,600,000 | 1,767 | ||||||
SOCAR Turkey Energy, Inc., 3.410%, (Euribor 3 Month ACT/360 plus 3.450%), 8/17/26 EUR∞ | 5,800,000 | 6,471 | ||||||
The Accompanying Notes are an Integral Part of the Financial Statements.
202
Table of Contents
Multi-Sector Bond Portfolio
| Bank Loan Obligations (4.2%) | Shares/ Par + | Value $ (000’s) | ||||||
Bank Loan Obligations continued | ||||||||
Standard Industries, Inc., 2.560%, (ICE LIBOR USD 1 Month plus 2.500%), 9/22/28 | 1,216,475 | 1,216 | ||||||
Summer BC Holdco B SARL, 4.560%, (ICE LIBOR USD 1 Month plus 4.500%), 12/4/26 | 997,500 | 994 | ||||||
WP/AP Telecom Holdings IV BV, 3.960%, (Euribor 3 Month ACT/360 plus 4.000%), 11/18/28 EUR∞ | 5,800,000 | 6,598 | ||||||
Ziggo Finance Partnership BV, 2.560%, (ICE LIBOR USD 1 Month plus 2.500%), 4/30/28 | 1,555,228 | 1,537 | ||||||
|
| |||||||
Total Bank Loan Obligations | ||||||||
(Cost: $55,354) | 54,680 | |||||||
|
| |||||||
| Short-Term Investments (10.6%) | ||||||||
Bank Loan Obligations (0.0%) | ||||||||
Intelsat Jackson Holdings SA - Term Loan A 2.810%, (ICE LIBOR USD 3 Month plus 2.750%), 12/1/22Æ | 78,921 | 79 | ||||||
|
| |||||||
Total | 79 | |||||||
|
| |||||||
Governments (9.9%) | ||||||||
Federal Home Loan Bank | ||||||||
0.040%, 2/11/22 | 2,500,000 | 2,500 | ||||||
US Treasury | ||||||||
0.000%, 1/4/22b | 8,400,000 | 8,400 | ||||||
0.000%, 2/17/22b | 5,100,000 | 5,100 | ||||||
| Short-Term Investments (10.6%) | Shares/ Par + | Value $ (000’s) | ||||||
Governments continued | ||||||||
0.000%, 3/10/22b | 4,600,000 | 4,600 | ||||||
0.000%, 3/24/22b | 18,900,000 | 18,898 | ||||||
0.000%, 3/31/22b | 29,700,000 | 29,696 | ||||||
0.000%, 2/15/22b | 3,200,000 | 3,200 | ||||||
0.000%, 2/24/22b | 3,800,000 | 3,800 | ||||||
0.000%, 3/15/22b | 5,500,000 | 5,499 | ||||||
0.000%, 3/22/22b | 11,900,000 | 11,898 | ||||||
0.000%, 3/29/22b | 18,800,000 | 18,797 | ||||||
0.000%, 4/7/22b | 13,300,000 | 13,297 | ||||||
0.000%, 4/14/22b | 4,700,000 | 4,699 | ||||||
|
| |||||||
Total | 130,384 | |||||||
|
| |||||||
Money Market Funds (0.6%) | ||||||||
State Street Institutional U.S. Government Money Market Fund - Premier Class 0.030%#,b | 7,806,563 | 7,807 | ||||||
|
| |||||||
Total | 7,807 | |||||||
|
| |||||||
Utilities (0.1%) | ||||||||
Pacific Gas & Electric Co. 1.750%, 6/16/22 | 800,000 | 800 | ||||||
|
| |||||||
Total | 800 | |||||||
|
| |||||||
Total Short-Term Investments |
| |||||||
(Cost: $139,071) |
| 139,070 | ||||||
|
| |||||||
Total Investments (98.9%) |
| |||||||
(Cost: $1,304,681)@ | 1,302,818 | |||||||
|
| |||||||
Other Assets, Less | ||||||||
Liabilities (1.1%) | 13,833 | |||||||
|
| |||||||
Net Assets (100.0%) | 1,316,651 | |||||||
|
| |||||||
Reverse Repurchase Agreements
| Reference Entity | Counterparty | Interest Rate | Borrowing Date | Maturity Date | Currency | Amount Borrowed (000’s) | Payable for Reverse Repurchase Agreements (000s) | |||||||||
AerCap Ireland Capital DAC / AerCap Global Aviation Trust | JP Morgan Chase Bank NA | (0.070)% | 11/5/21 | 1/20/22 | USD | (97) | $ | (97 | ) | |||||||
Fortune Star BVI, Ltd. | JP Morgan Chase Bank NA | (0.070)% | 10/28/21 | Open | USD | (1,551) | (1,551 | ) | ||||||||
|
| |||||||||||||||
| �� | $ | (1,648 | ) | |||||||||||||
|
| |||||||||||||||
Exchange Traded or Centrally Cleared Derivatives
Futures
| Issuer | Long/ Short | Currency | Notional Par (000’s) | Number of Contracts | Expiration Date | Notional Value (000’s) | Unrealized Appreciation/ (Depreciation) (000’s) | Variation Margin (000’s) | ||||||||||||||||||
Five-Year US Treasury Note Future | Long | USD | 18,700 | 187 | 3/22 | $ | 22,623 | $ | 2 | $ | 2 | |||||||||||||||
Ten-Year US Treasury Note Future | Long | USD | 122,600 | 1,226 | 3/22 | 159,955 | 577 | 77 | ||||||||||||||||||
Two-Year US Treasury Note Future | Long | USD | 100,400 | 502 | 3/22 | 109,522 | (212 | ) | 24 | |||||||||||||||||
Ultra Long Term US Treasury Bond Future | Long | USD | 32,600 | 326 | 3/22 | 64,263 | 394 | 509 | ||||||||||||||||||
Ultra Ten-Year US Treasury Note Future | Long | USD | 13,900 | 139 | 3/22 | 20,355 | 306 | 37 | ||||||||||||||||||
|
|
|
| |||||||||||||||||||||||
| $ | 1,067 | $ | 649 | |||||||||||||||||||||||
|
|
|
| |||||||||||||||||||||||
The Accompanying Notes are an Integral Part of the Financial Statements.
203
Table of Contents
Multi-Sector Bond Portfolio
Centrally Cleared Interest Rate Swaps - Receive Floating Rate
| Floating Rate Index | Fixed Rate | Expiration Date | Notional Amount (000’s) | Currency | Upfront Premium Paid/ (Received) (000’s) | Unrealized Appreciation/ (Depreciation) | Market Value (000’s) | Variation Margin (000’s) | ||||||||||||||||||
1-Day GBP - SONIO Compounded-OIS | 0.500 | % | 3/27 | 6,300 | GBP | $ | 31 | $ | 206 | $ | 237 | $ | (7 | ) | ||||||||||||
3-Month USD-LIBOR | 1.000 | % | 12/25 | 48,330 | USD | (998 | ) | 1,529 | 531 | 5 | ||||||||||||||||
6-Month EUR-EURIBOR | 0.500 | % | 3/52 | 6,400 | EUR | (262 | ) | 227 | (35 | ) | 14 | |||||||||||||||
|
|
|
|
|
|
|
| |||||||||||||||||||
| $ | (1,229 | ) | $ | 1,962 | $ | 733 | $ | 12 | ||||||||||||||||||
|
|
|
|
|
|
|
| |||||||||||||||||||
Centrally Cleared Interest Rate Swaps - Pay Floating Rate
| Floating Rate Index | Fixed Rate | Expiration Date | Notional Amount (000’s) | Currency | Upfront Premium Paid/ (Received) (000’s) | Unrealized Appreciation/ (Depreciation) (000’s) | Market Value (000’s) | Variation (000’s) | ||||||||||||||||
3-Month Canada Bankers Acceptances | 2.050% | 11/23 | 33,800 | CAD | $ | (12 | ) | $ | 53 | $ | 41 | $ | 13 | |||||||||||
3-Month Canada Bankers Acceptances | 0.880% | 3/24 | 12,600 | CAD | – | π | (150 | ) | (150 | ) | 3 | |||||||||||||
3-Month Canada Bankers Acceptances | 2.500% | 6/29 | 8,000 | CAD | 132 | 151 | 283 | 12 | ||||||||||||||||
6-Month EUR-EURIBOR | 0.250% | 3/32 | 31,200 | EUR | 35 | (330 | ) | (295 | ) | (36 | ) | |||||||||||||
|
|
|
|
|
|
|
| |||||||||||||||||
| $ | 155 | $ | (276 | ) | $ | (121 | ) | $ | (8 | ) | ||||||||||||||
|
|
|
|
|
|
|
| |||||||||||||||||
Centrally Cleared Credit Default Swaps on Credit Indices - Sell Protection
| Reference Entity | Receive Fixed Rate | Expiration Date | Implied Credit Spread | Notional Amount (000’s) | Currency | Upfront (Received) | Unrealized Appreciation/ (Depreciation) (000’s) | Market Value (000’s) | Variation (000’s) | |||||||||||||||||
Markit CDX Emerging Markets Index, Series 34 | 1.000% | 12/25 | 2.172% | 29,600 | USD | $ | (881 | ) | $ | (415 | ) | $ | (1,296 | ) | $ | – | π | |||||||||
Markit CDX Emerging Markets Index, Series 35 | 1.000% | 6/26 | 1.790% | 200 | USD | (6 | ) | (1 | ) | (7 | ) | – | π | |||||||||||||
Markit CDX Emerging Markets Index, Series 36 | 1.000% | 12/26 | 1.873% | 66,300 | USD | $ | (2,668 | ) | $ | (8 | ) | $ | (2,676 | ) | $ | 5 | ||||||||||
Markit CDX North America Investment Grade Index, | 1.000% | 12/25 | 0.388% | 200 | USD | 4 | 1 | 5 | – | π | ||||||||||||||||
Markit CDX North America Investment Grade Index, | 1.000% | 6/26 | 0.441% | 800 | USD | 18 | 2 | 20 | – | π | ||||||||||||||||
Markit CDX North America Investment Grade Index, | 1.000% | 12/26 | 0.493% | 13,000 | USD | 296 | 22 | 318 | 3 | |||||||||||||||||
Markit iTraxx Europe Crossover Index, Series 35 | 1.000% | 6/26 | 0.426% | 7,100 | EUR | 199 | 10 | 209 | 2 | |||||||||||||||||
Markit iTraxx Europe Crossover Index, Series 36 | 1.000% | 12/26 | 0.477% | 59,500 | EUR | 1,616 | 149 | 1,765 | 18 | |||||||||||||||||
Markit iTraxx Europe Crossover Index, Series 36 | 5.000% | 12/26 | 2.421% | 72,600 | EUR | 9,279 | 520 | 9,799 | 94 | |||||||||||||||||
|
|
|
|
|
|
|
| |||||||||||||||||||
| $ | 7,857 | $ | 280 | $ | 8,137 | $ | 122 | |||||||||||||||||||
|
|
|
|
|
|
|
| |||||||||||||||||||
The Accompanying Notes are an Integral Part of the Financial Statements.
204
Table of Contents
Multi-Sector Bond Portfolio
Centrally Cleared Credit Default Swaps on Corporate or Sovereign Issues - Sell Protection
| Reference Entity | Receive Fixed Rate | Expiration Date | Implied Credit Spread | Notional Amount (000’s) | Currency | Upfront (Received) | Unrealized Appreciation/ (Depreciation) (000’s) | Market (000’s) | Variation (000’s) | |||||||||||||||||
AT&T, Inc. | 1.000% | 6/26 | 0.618% | 100 | USD | $ | 2 | $ | - | $ | 2 | $ | - | π | ||||||||||||
AT&T, Inc. | 1.000% | 6/24 | 0.447% | 200 | USD | - | 3 | 3 | - | π | ||||||||||||||||
AT&T, Inc. | 1.000% | 6/25 | 0.510% | 100 | USD | (3 | ) | 5 | 2 | - | π | |||||||||||||||
Atlantia SpA | 1.000% | 12/25 | 0.859% | 1,400 | EUR | (55 | ) | 64 | 9 | - | π | |||||||||||||||
Auchan Holding SA | 1.000% | 12/27 | 1.059% | 100 | EUR | (2 | ) | 2 | - | π | - | π | ||||||||||||||
Casino Guichard Perrachon SA | 5.000% | 6/23 | 2.546% | 600 | EUR | 17 | 7 | 24 | - | π | ||||||||||||||||
Casino Guichard Perrachon SA | 5.000% | 6/22 | 1.877% | 1,500 | EUR | (36 | ) | 61 | 25 | - | π | |||||||||||||||
Casino Guichard Perrachon SA | 5.000% | 12/22 | 2.425% | 1,700 | EUR | (34 | ) | 82 | 48 | - | π | |||||||||||||||
Ford Motor Co. | 5.000% | 12/23 | 0.949% | 200 | USD | 15 | 1 | 16 | - | π | ||||||||||||||||
Ford Motor Co. | 5.000% | 12/23 | 0.949% | 700 | USD | 40 | 16 | 56 | - | π | ||||||||||||||||
General Electric Co. | 1.000% | 12/26 | 0.675% | 400 | USD | 4 | 2 | 6 | - | π | ||||||||||||||||
General Electric Co. | 1.000% | 6/24 | 0.360% | 900 | USD | (4 | ) | 18 | 14 | - | π | |||||||||||||||
General Electric Co. | 1.000% | 12/24 | 0.400% | 400 | USD | (4 | ) | 11 | 7 | - | π | |||||||||||||||
General Electric Co. | 1.000% | 6/26 | 0.614% | 3,800 | USD | 38 | 26 | 64 | - | π | ||||||||||||||||
Glencore Finance Europe, Ltd. | 5.000% | 12/25 | 0.924% | 2,700 | EUR | 500 | (3 | ) | 497 | 3 | ||||||||||||||||
Glencore Finance Europe, Ltd. | 5.000% | 12/27 | 1.475% | 1,600 | EUR | 397 | (24 | ) | 373 | 3 | ||||||||||||||||
Glencore Finance Europe, Ltd. | 5.000% | 12/26 | 1.195% | 700 | EUR | 150 | (1 | ) | 149 | 1 | ||||||||||||||||
Marks & Spencer PLC | 1.000% | 12/24 | 1.097% | 2,900 | EUR | (82 | ) | 73 | (9 | ) | (1 | ) | ||||||||||||||
Marks & Spencer PLC | 1.000% | 6/27 | 1.977% | 100 | EUR | (8 | ) | 2 | (6 | ) | - | π | ||||||||||||||
Marks & Spencer PLC | 1.000% | 12/28 | 2.325% | 500 | EUR | (37 | ) | (12 | ) | (49 | ) | (1 | ) | |||||||||||||
Telefonica Emisiones SAU | 1.000% | 6/26 | 0.617% | 800 | EUR | 12 | 4 | 16 | - | π | ||||||||||||||||
|
|
|
|
|
|
|
| |||||||||||||||||||
| $ | 910 | $ | 337 | $ | 1,247 | $ | 5 | |||||||||||||||||||
|
|
|
|
|
|
|
| |||||||||||||||||||
| Financial Derivative Assets | Financial Derivative Liabilities | |||||||||||||||||||||||||||
| Variation Margin (000’s) | Variation Margin (000’s) | Market Value (000’s) | ||||||||||||||||||||||||||
| Swaps | Futures | Total | Swaps | Futures | Total | Options | ||||||||||||||||||||||
Total Exchange-Traded or Centrally Cleared Derivatives | $ | 176 | $ | 649 | $ | 825 | $ | (45 | ) | $ | - | $ | (45 | ) | $ | - | ||||||||||||
Over the Counter Derivatives
Forward Foreign Currency Contracts
| Type | Counterparty | Currency | Foreign Principal Amount Covered by Contract (000s) | USD Principal Amount Covered by Contract (000’s) | Settlement Date | Unrealized Appreciation (000’s) | Unrealized (Depreciation) (000’s) | Net Unrealized Appreciation/ (Depreciation) (000’s) | ||||||||||||||
Sell | JP Morgan Chase Bank NA | AUD | 2,798 | 2,036 | 1/7/22 | $ | – | $ | (33 | ) | $ | (33 | ) | |||||||||
Sell | Goldman Sachs Bank USA | CAD | 779 | 616 | 1/7/22 | – | (4 | ) | (4 | ) | ||||||||||||
Buy | Goldman Sachs Bank USA | CNH | 12,867 | 2,022 | 1/21/22 | 11 | – | 11 | ||||||||||||||
Sell | HSBC Bank USA NA | CNH | 4,608 | 724 | 1/21/22 | – | (8 | ) | (8 | ) | ||||||||||||
Sell | JP Morgan Chase Bank NA | CNH | 7,787 | 1,225 | 1/21/22 | – | (9 | ) | (9 | ) | ||||||||||||
Buy | Goldman Sachs Bank USA | EUR | 1,762 | 2,006 | 1/4/22 | 7 | – | 7 | ||||||||||||||
Sell | Bank of America NA | EUR | 4,362 | 4,966 | 1/4/22 | – | (48 | ) | (48 | ) | ||||||||||||
Sell | Barclays Bank PLC | EUR | 5,514 | 6,278 | 1/4/22 | – | (61 | ) | (61 | ) | ||||||||||||
Sell | Royal Bank of Canada | EUR | 215,839 | 245,733 | 1/4/22 | – | (2,425 | ) | (2,425 | ) | ||||||||||||
Sell | Royal Bank of Canada | EUR | 223,953 | 255,119 | 2/2/22 | – | (294 | ) | (294 | ) | ||||||||||||
Buy | Goldman Sachs Bank USA | GBP | 750 | 1,015 | 1/7/22 | 18 | – | 18 | ||||||||||||||
The Accompanying Notes are an Integral Part of the Financial Statements.
205
Table of Contents
Multi-Sector Bond Portfolio
Forward Foreign Currency Contracts
(continued)
| Type | Counterparty | Currency | Foreign Principal Amount Covered by Contract (000s) | USD Principal Amount Covered by Contract (000’s) | Settlement Date | Unrealized Appreciation (000’s) | Unrealized (Depreciation) (000’s) | Net Unrealized Appreciation/ (Depreciation) (000’s) | ||||||||||||||
Buy | HSBC Bank USA NA | GBP | 1,089 | 1,474 | 1/7/22 | $ | 29 | $ | - | $ | 29 | |||||||||||
Sell | BNP Paribas SA | GBP | 47,307 | 64,032 | 1/5/22 | - | (1,391 | ) | (1,391 | ) | ||||||||||||
Sell | BNP Paribas SA | GBP | 47,307 | 64,028 | 2/2/22 | 42 | - | 42 | ||||||||||||||
Buy | BNP Paribas SA | IDR | 185,823 | 13 | 1/21/22 | - | π | - | - | π | ||||||||||||
Buy | HSBC Bank USA NA | IDR | 309,920 | 22 | 1/21/22 | - | π | - | - | π | ||||||||||||
Sell | Barclays Bank PLC | JPY | 35,600 | 309 | 1/5/22 | 4 | - | 4 | ||||||||||||||
Sell | Barclays Bank PLC | JPY | 35,604 | 310 | 2/2/22 | - | - | π | - | π | ||||||||||||
Buy | BNP Paribas SA | MXN | 9,380 | 458 | 1/12/22 | - | (1 | ) | (1 | ) | ||||||||||||
Buy | Bank of America NA | MXN | 9,380 | 453 | 3/4/22 | 7 | - | 7 | ||||||||||||||
Sell | Bank of America NA | MXN | 9,380 | 457 | 1/12/22 | - | (7 | ) | (7 | ) | ||||||||||||
Sell | Bank of America NA | MXN | 8,276 | 399 | 3/18/22 | - | - | π | - | π | ||||||||||||
Buy | Goldman Sachs Bank USA | RUB | 1,167 | 16 | 1/24/22 | - | - | π | - | π | ||||||||||||
Buy | UBS AG | RUB | 413 | 6 | 1/24/22 | - | - | π | - | π | ||||||||||||
Buy | HSBC Bank USA NA | RUB | 683 | 9 | 2/18/22 | - | - | π | - | π | ||||||||||||
Buy | HSBC Bank USA NA | RUB | 307 | 4 | 3/18/22 | - | - | π | - | π | ||||||||||||
Buy | JP Morgan Chase Bank NA | RUB | 1,481 | 19 | 3/18/22 | - | - | π | - | π | ||||||||||||
Buy | BNP Paribas SA | ZAR | 506 | 31 | 11/8/22 | - | (1 | ) | (1 | ) | ||||||||||||
|
|
|
|
|
| |||||||||||||||||
| $ | 118 | $ | (4,282 | ) | $ | (4,164 | ) | |||||||||||||||
|
|
|
|
|
| |||||||||||||||||
Credit Default Swaps on Corporate or Sovereign Issues - Sell Protection
| Reference Entity | Counterparty | Receive Fixed Rate | Expiration Date | Implied Credit Spread | Currency | Notional Amount (000’s) | Upfront Premium Paid/ (Received) (000’s) | Unrealized Appreciation/ (Depreciation) (000’s) | Market Value (000’s) | |||||||||||||||||
Atlantia SpA | JP Morgan Chase Bank NA | 1.000% | 6/26 | 0.939% | EUR | 200 | $ | (7 | ) | $ | 8 | $ | 1 | |||||||||||||
Casino Guichard Perrachon SA | JP Morgan Chase Bank NA | 5.000% | 12/22 | 2.425% | EUR | 100 | 2 | 1 | 3 | |||||||||||||||||
Hochtief AG | JP Morgan Chase Bank NA | 5.000% | 12/26 | 1.120% | EUR | 1,000 | 224 | (7 | ) | 217 | ||||||||||||||||
Hochtief AG | JP Morgan Chase Bank NA | 5.000% | 12/26 | 1.120% | EUR | 1,800 | 408 | (17 | ) | 391 | ||||||||||||||||
Intrum AB | Barclays Bank PLC | 5.000% | 12/24 | 2.250% | EUR | 100 | 5 | 4 | 9 | |||||||||||||||||
Intrum AB | Goldman Sachs International | 5.000% | 12/24 | 2.250% | EUR | 200 | 12 | 6 | 18 | |||||||||||||||||
Intrum AB | Goldman Sachs International | 5.000% | 12/24 | 2.250% | EUR | 200 | 10 | 8 | 18 | |||||||||||||||||
Intrum AB | Goldman Sachs International | 5.000% | 12/24 | 2.250% | EUR | 200 | 11 | 7 | 18 | |||||||||||||||||
Intrum AB | Goldman Sachs International | 5.000% | 12/24 | 2.250% | EUR | 300 | 19 | 8 | 27 | |||||||||||||||||
Intrum AB | Goldman Sachs International | 5.000% | 12/24 | 2.250% | EUR | 300 | 20 | 7 | 27 | |||||||||||||||||
Intrum AB | Goldman Sachs International | 5.000% | 12/24 | 2.250% | EUR | 400 | 26 | 10 | 36 | |||||||||||||||||
Intrum AB | Goldman Sachs International | 5.000% | 12/24 | 2.250% | EUR | 400 | 26 | 10 | 36 | |||||||||||||||||
Intrum AB | Goldman Sachs International | 5.000% | 12/24 | 2.250% | EUR | 500 | 25 | 20 | 45 | |||||||||||||||||
Intrum AB | Goldman Sachs International | 5.000% | 12/24 | 2.250% | EUR | 600 | 33 | 22 | 55 | |||||||||||||||||
Intrum AB | Goldman Sachs International | 5.000% | 12/24 | 2.250% | EUR | 600 | 39 | 16 | 55 | |||||||||||||||||
Intrum AB | JP Morgan Chase Bank NA | 5.000% | 12/24 | 2.250% | EUR | 800 | 40 | 33 | 73 | |||||||||||||||||
The Accompanying Notes are an Integral Part of the Financial Statements.
206
Table of Contents
Multi-Sector Bond Portfolio
Credit Default Swaps on Corporate or Sovereign Issues - Sell Protection (continued)
| Reference Entity | Counterparty | Receive Fixed Rate | Expiration Date | Implied Credit Spread | Currency | Notional Amount (000’s) | Upfront Premium Paid/ (Received) (000’s) | Unrealized Appreciation/ (Depreciation) (000’s) | Market Value (000’s) | |||||||||||||||||
Intrum AB | Morgan Stanley Capital Services | 5.000% | 12/24 | 2.250% | EUR | 100 | $ | 5 | $ | 4 | $ | 9 | ||||||||||||||
Intrum AB | Morgan Stanley Capital Services | 5.000% | 12/24 | 2.250% | EUR | 100 | 5 | 4 | 9 | |||||||||||||||||
Intrum AB | Morgan Stanley Capital Services | 5.000% | 12/24 | 2.250% | EUR | 200 | 13 | 5 | 18 | |||||||||||||||||
Republic of Indonesia | Barclays Bank PLC | 1.000% | 6/31 | 1.361% | USD | 5,700 | (228 | ) | 55 | (173 | ) | |||||||||||||||
United Mexican States | Morgan Stanley Capital Services | 1.000% | 12/26 | 0.913% | USD | 900 | 1 | 3 | 4 | |||||||||||||||||
|
|
|
|
|
| |||||||||||||||||||||
| $ | 689 | $ | 207 | $ | 896 | |||||||||||||||||||||
|
|
|
|
|
| |||||||||||||||||||||
| Financial Derivative Assets (000’s) | Financial Derivative Liabilities (000’s) | |||||||||||||||||||||||||||
| Forward Foreign Currency Contracts | Swaps | Total | Forward Foreign Currency Contracts | Options | Swaps | Total | ||||||||||||||||||||||
Total Over the Counter Derivatives | $ | 118 | $ | 1,069 | $ | 1,187 | $ | (4,282 | ) | - | $ | (173 | ) | $ | (4,455) | |||||||||||||
Restricted Securities
| Description | Acquisition Date | Cost (000’s) | Value (000’s) | Value as a Percentage of Net Assets | ||||||||||
| Noble Corp. PLC | 2/5/21 | $ | 237 | $ | 505 | 0.04 | % | |||||||
| + | All par is stated in U.S. Dollar unless otherwise noted. |
| * | Non income producing |
| Æ | Security valued using significant unobservable inputs. |
| d | Restricted security – see accompanying table for additional details. |
| 144A | Security exempt from registration under Rule 144A of the Securities Act of 1933. These securities may be resold as transactions exempt from registration, normally to qualified institutional buyers. At December 31, 2021 the value of these securities (in thousands) was $360,949 representing 27.5% of the net assets. |
| ∞ | Foreign Bond — par value is foreign denominated |
| § | Security was purchased pursuant to Regulation S under the Securities Act of 1933, which exempts from registration securities offered and sold outside of the United States. At December 31, 2021, the aggregate value of these securities was $335,213 (in thousands), representing 25.4% of net assets. |
| b | Cash or securities with an aggregate value of $400,910 (in thousands) has been pledged as collateral for futures, swap contracts outstanding, short sales, when issued securities or written options on 12/31/2021. |
| f | Defaulted Security |
| µ | Perpetual maturity, date shown, if applicable, represents next contractual call date. |
| Þ | PIK - Payment In Kind. PIK rate of Odebrecht Drilling Norbe VII/IX, Ltd. 7.350%. |
| S | Stepped coupon bond for which the coupon rate of interest adjusts on specified date(s); rate shown is effective rate at period-end. |
| π | Amount is less than one thousand. |
| # | 7-Day yield as of 12/31/2021. |
| @ | At December 31, 2021, the aggregate cost of investments, including derivatives, for federal tax purposes (in thousands) was $1,305,036 and the net unrealized appreciation of investments based on that cost was $3,929 which is comprised of $54,529 aggregate gross unrealized appreciation and $50,600 aggregate gross unrealized depreciation. |
The Accompanying Notes are an Integral Part of the Financial Statements.
207
Table of Contents
Multi-Sector Bond Portfolio
The following is a summary of the inputs used in valuing the Portfolio’s Investments at December 31, 2021. See Note 3 for additional information on portfolio valuation.
| Valuation Inputs | ||||||||||||||
| Description | Level 1 – Quoted Prices | Level 2 – Other Significant Observable Inputs | Level 3 – Significant Unobservable Inputs | |||||||||||
| (Amounts in thousands) | ||||||||||||||
Assets: | ||||||||||||||
Bank Loan Obligations | ||||||||||||||
Bank Loan Obligations | $ | - | $ | 54,617 | $ | 63 | ||||||||
Common Stocks | ||||||||||||||
Energy | 556 | - | 61 | |||||||||||
Convertible Corporate Bonds | - | 5,662 | - | |||||||||||
Municipal Bonds | - | 9,043 | - | |||||||||||
Corporate Bonds | ||||||||||||||
Communications | - | 84,196 | 702 | |||||||||||
All Others | - | 696,338 | - | |||||||||||
Governments | - | 215,240 | - | |||||||||||
Structured Products | - | 97,270 | - | |||||||||||
Short-Term Investments | ||||||||||||||
Money Market Funds | 7,807 | - | - | |||||||||||
All Others | - | 131,184 | 79 | |||||||||||
Other Financial Instruments^ | ||||||||||||||
Futures | 1,279 | - | - | |||||||||||
Forward Foreign Currency Contracts | - | 118 | - | |||||||||||
Interest Rate Swaps | - | 1,092 | - | |||||||||||
Credit Default Swaps | - | 14,496 | - | |||||||||||
Total Assets: | $ | 9,642 | $ | 1,309,256 | $ | 905 | ||||||||
Liabilities: | ||||||||||||||
Other Financial Instruments^ | ||||||||||||||
Futures | (212 | ) | - | - | ||||||||||
Forward Foreign Currency Contracts | - | (4,282 | ) | - | ||||||||||
Interest Rate Swaps | - | (480 | ) | - | ||||||||||
Credit Default Swaps | - | (4,216 | ) | - | ||||||||||
Reverse Repurchase Agreements | - | (1,648 | ) | - | ||||||||||
Total Liabilities: | $ | (212 | ) | $ | (10,626 | ) | $ | - | ||||||
^ Other financial instruments are derivative instruments such as futures and forward foreign currency contracts, which are valued at the unrealized appreciation (depreciation) on the instrument, and securities sold short, reverse repurchase agreements, written options and swaps contracts, which are valued at market value.
Management has determined that the amount of Level 3 securities compared to total net assets is not material; therefore, the reconciliation of Level 3 securities and assumptions is not shown for the period ended December 31, 2021.
The Accompanying Notes are an Integral Part of the Financial Statements.
208
Table of Contents
Balanced Portfolio (unaudited)
| Objective: | Portfolio Strategy: | Net Assets: | ||
| Realize as high a level of total return as is consistent with prudent investment risk, through income and capital appreciation. | Invest in the stock, bond and money market sectors, attempting to capitalize on the variation in return potential produced by the interaction of changing financial markets and economic conditions. | $2.4 billion | ||
PORTFOLIO OVERVIEW
Mason Street Advisors, LLC is the investment adviser for the Balanced Portfolio (the “Portfolio”). The Portfolio is tactically and strategically managed to capitalize on changing financial markets and economic conditions following a flexible policy for allocating assets across the stock, bond and money market sectors. The Portfolio operates primarily as a “fund of funds” to gain the Portfolio’s equity and fixed income exposure by investing in one or more of the equity and international portfolios, and one or more of the fixed income portfolios of Northwestern Mutual Series Fund, Inc. (each an “Underlying Portfolio”). The adviser allocates the Portfolio’s assets among the Underlying Portfolios based on the adviser’s economic and market outlook and the investment objectives and strategies of the Underlying Portfolios. Under normal market conditions, the Portfolio will typically hold between 35-55% of assets in equity investments, 40-60% of assets in fixed income investments, and 0-20% of assets in cash equivalent investments.
MARKET OVERVIEW
U.S. equity markets gained during the reporting period, supported by a broad economic recovery following the COVID-19-related disruptions of 2020, to reach a series of record highs throughout the year. The widespread distribution of vaccines helped consumers return to their pre-pandemic activities and spending habits. The Federal Reserve (the “Fed”) maintained its accommodative policy stance during the year, with near-zero interest rates and bond-buying programs continuing to provide monetary stimulus. Rising raw material costs and energy prices, higher wages and supply-chain constraints led to a significant increase in inflation. However, the strong growth in consumer spending helped boost corporate earnings.
In this environment, large-cap stocks, as represented by the S&P 500® Index, posted a return of 28.71%, outperforming the S&P MidCap 400® and the S&P SmallCap 600® Indices, which returned 24.76% and 26.82%, respectively. Meanwhile, the broader bond market, as represented by the Bloomberg® U.S. Aggregate Index, returned (1.54%), while the Bloomberg® U.S. Corporate High Yield Index advanced 5.28%.
PORTFOLIO RESULTS
The Portfolio returned 7.56% for the twelve months ended December 31, 2021, trailing the 28.71% return of the broad stock market, as measured by the S&P 500® Index, but outperforming the Bloomberg® U.S. Aggregate Index return of (1.54%). The Portfolio underperformed the Balanced Portfolio Blended Composite Benchmark return of 9.59%. (The benchmark weights are detailed in the “Benchmark Definitions” section of this annual report.) (These Indices are unmanaged, cannot be invested in directly and do not incur expenses.) Comparative peer performance in 2021 included the Morningstar® Inc. Allocation – 30% to 50% Equity peer group average return of 8.41% and the Lipper® Analytical Services, Inc. Mixed-Asset Target Allocation Moderate Funds peer group average return of 11.03%. Morningstar® Inc. and Lipper® Analytical Services, Inc. are independent mutual fund ranking agencies.
Security selection of the Underlying Portfolios detracted from the Portfolio’s performance relative to the blended benchmark, representing the majority of the relative underperformance. Weakness was seen across the majority of the equity Underlying Portfolios when compared to their respective benchmarks. While equities had a significant absolute return for the period, notable Underlying Portfolio detractors during the period included the Growth Stock Portfolio, Focused Appreciation Portfolio and Large Cap Blend Portfolio, which were hindered by an underweight to large technology companies. Large technology companies continued their significant price appreciation in 2021 and represented a substantial portion of overall returns for large-capitalization domestic stocks.
While the absolute performance of international stocks trailed domestic stocks, the Portfolio’s investments in the International Growth Portfolio and the Research International Core Portfolio were notable contributors, benefiting from strong security selection decisions. From a tactical allocation perspective, the Portfolio’s tilt toward international and emerging market equities detracted from relative performance. International equities underperformed domestic equities during the reporting period as economic growth in other developed countries lagged growth domestically, and emerging market stocks faced near-term headwinds from a strengthening U.S. dollar and regulatory changes in China.
209
Table of Contents
Balanced Portfolio (unaudited)
PORTFOLIO MANAGER OUTLOOK
As we enter 2022, we continue to have a positive outlook. The economy continues to show strength and the earnings and balance sheets of corporations are healthy. While the strong economic environment has been accompanied by higher rates of inflation, we believe there are reasons for inflation risks to moderate as 2022 develops, including the unclogging of supply chains as consumers shift their spending from goods to services, a normalization of labor markets and the Fed reigning in its historically stimulative policies. High valuations in certain areas of the markets are another area of concern. As the Fed begins to raise rates, this will put pressure on many growth-oriented stocks that have benefited from the Fed’s near zero interest-rate policy of the recent past. In this environment, we have been tilting the Portfolio toward areas with better relative valuations, such as small caps and foreign developed and emerging markets. As the year progresses, we will continue to position the Portfolio as necessary to take advantage of market opportunities.
Relative Performance
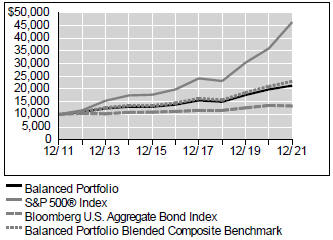
Average Annual Total Returns For Periods Ended December 31, 2021 | ||||||||||||
| 1 Year | 5 Years | 10 Years | ||||||||||
Balanced Portfolio | 7.56 | % | 9.06 | % | 7.86 | % | ||||||
S&P 500® Index | 28.71 | % | 18.45 | % | 16.53 | % | ||||||
Bloomberg U.S. Aggregate Bond Index | -1.54 | % | 3.57 | % | 2.90 | % | ||||||
Balanced Portfolio Blended Composite Benchmark | 9.59 | % | 9.71 | % | 8.69 | % | ||||||
Morningstar® US Insurance Fund Allocation - 30% to 50% Equity Average | 8.41 | % | 7.70 | % | 6.92 | % | ||||||
Lipper® Variable Insurance Products (VIP) Mixed Asset Target Allocation Moderate Funds Average | 11.03 | % | 9.29 | % | 8.56 | % | ||||||
The performance data quoted represents past performance. Past performance is historical and does not guarantee future performance. Investment return and principal value will fluctuate, so that shares, when redeemed, may be worth more or less than their original cost. Current performance may be lower or higher than the performance data quoted. For the most recent month-end performance information visit www.northwesternmutual.com.
This chart assumes an initial investment of $10,000 made on 12/31/11. Returns shown reflect fee waivers, deductions for management and other portfolio expenses,
and reinvestment of all dividends. In the absence of fee waivers, total return would be reduced. Returns exclude deductions for separate account sale loads and account fees. Please refer to the Benchmark Definitions section of this report for information about the indices cited in the above chart and graph.
The Portfolio may obtain its exposure to domestic and foreign equity securities by investing in other Series Fund portfolios (Underlying Portfolios). Each of the Underlying Portfolios has its own investment risks, and the Portfolio is indirectly exposed to all the risks of the Underlying Portfolios in which it invests, including that risk that an Underlying Portfolio will not perform as expected. To the extent that the Portfolio invests a significant portion of its assets in a single Underlying Portfolio, it will be particularly sensitive to the risks associated with that Underlying Portfolio may have a significant effect on the Portfolio’s net asset value. The Portfolio will bear a pro rata share of the Underlying Portfolio’s expenses.
The Portfolio may use derivative instruments to gain exposure to certain markets, sectors or regions as alternatives to direct investments, to adjust the Portfolio duration, to provide increased flexibility in asset allocation, to earn income and to otherwise seek to enhance returns or to hedge foreign currency exposure. Use of these instruments may involve certain costs and risks such as liquidity risk, interest rate risk, mispricing or improper valuation. Certain derivatives involve leverage, which could magnify losses, and portfolios investing in derivatives could lose more than the principal amount invested in those investments.
The U.S. federal funds rate has been at historically low levels and a significant rise in interest rates over a short period of time could cause significant losses in the market value of the Portfolio’s fixed income investments.
210
Table of Contents
Balanced Portfolio (unaudited)
Top 10 Equity Holdings 12/31/21
| Security Description | % of Net Assets | |||
Northwestern Mutual Series Fund, Inc., Select Bond Portfolio | 36.3 | % | ||
Northwestern Mutual Series Fund, Inc., Multi- Sector Bond Portfolio | 5.0 | % | ||
Northwestern Mutual Series Fund, Inc., Focused Appreciation Portfolio | 4.6 | % | ||
Northwestern Mutual Series Fund, Inc., Growth Stock Portfolio | 4.6 | % | ||
Northwestern Mutual Series Fund, Inc., Mid Cap Value Portfolio | 4.5 | % | ||
Northwestern Mutual Series Fund, Inc., Research International Core Portfolio | 4.4 | % | ||
Northwestern Mutual Series Fund, Inc., Mid Cap Growth Stock Portfolio | 4.2 | % | ||
Northwestern Mutual Series Fund, Inc., Large Cap Blend Portfolio | 3.9 | % | ||
Northwestern Mutual Series Fund, Inc., Large Cap Core Stock Portfolio | 3.8 | % | ||
Northwestern Mutual Series Fund, Inc., High Yield Bond Portfolio | 3.5 | % | ||
Sector Allocation 12/31/21
| Sector | % of Net Assets | |||
Fixed Income | 47.1 | % | ||
Domestic Equity | 37.7 | % | ||
Foreign Equity | 11.2 | % | ||
Short-Term Investments & Other Net Assets | 4.0 | % | ||
Sector Allocation and Top 10 Holdings are subject to change.
211
Table of Contents
Balanced Portfolio
SCHEDULE OF INVESTMENTS
December 31, 2021
| Investment Companies (96.0%) | Shares/ Par + | Value $ (000’s) | ||||||
Domestic Equity (37.7%) | ||||||||
iShares Core S&P 500 ETF | 19,500 | 9,301 | ||||||
iShares Core S&P Mid-Cap ETF | 25,550 | 7,233 | ||||||
iShares Russell 2000 ETF | 64,400 | 14,326 | ||||||
Northwestern Mutual Series Fund, Inc., Domestic Equity Portfolio £ | 34,743,777 | 67,194 | ||||||
Northwestern Mutual Series Fund, Inc., Equity Income Portfolio £ | 33,477,547 | 67,424 | ||||||
Northwestern Mutual Series Fund, Inc., Focused Appreciation Portfolio £ | 25,252,230 | 109,064 | ||||||
Northwestern Mutual Series Fund, Inc., Growth Stock Portfolio £ | 26,917,040 | 108,826 | ||||||
Northwestern Mutual Series Fund, Inc., Large Cap Blend Portfolio £ | 67,029,855 | 92,903 | ||||||
Northwestern Mutual Series Fund, Inc., Large Cap Core Stock Portfolio £ | 41,346,757 | 91,335 | ||||||
Northwestern Mutual Series Fund, Inc., Large Company Value Portfolio £ | 56,066,843 | 66,888 | ||||||
Northwestern Mutual Series Fund, Inc., Mid Cap Growth Stock Portfolio £ | 25,574,987 | 100,637 | ||||||
Northwestern Mutual Series Fund, Inc., Mid Cap Value Portfolio £ | 53,402,427 | 106,645 | ||||||
Northwestern Mutual Series Fund, Inc., Small Cap Growth Stock Portfolio £ | 8,155,274 | 26,276 | ||||||
Northwestern Mutual Series Fund, Inc., Small Cap Value Portfolio £ | 11,778,432 | 30,377 | ||||||
|
| |||||||
Total | 898,429 | |||||||
|
| |||||||
Fixed Income (47.1%) | ||||||||
iShares Core U.S. Aggregate Bond ETF | 168,200 | 19,188 | ||||||
iShares iBoxx High Yield Corporate Bond ETF | 99,900 | 8,692 | ||||||
Northwestern Mutual Series Fund, Inc., High Yield Bond Portfolio £ | 112,032,118 | 84,024 | ||||||
Northwestern Mutual Series Fund, Inc., Multi-Sector Bond Portfolio £ | 106,601,548 | 119,927 | ||||||
Northwestern Mutual Series Fund, Inc., Select Bond Portfolio £ | 688,900,019 | 865,259 | ||||||
Northwestern Mutual Series Fund, Inc., Short-Term Bond Portfolio £ | 22,680,206 | 23,905 | ||||||
|
| |||||||
Total | 1,120,995 | |||||||
|
| |||||||
Foreign Equity (11.2%) | ||||||||
iShares Core MSCI Emerging Markets ETF | 124,900 | 7,476 | ||||||
iShares MSCI EAFE ETF | 139,900 | 11,007 | ||||||
Northwestern Mutual Series Fund, Inc., Emerging Markets Equity Portfolio £ | 12,906,835 | 17,063 | ||||||
| Investment Companies (96.0%) | Shares/ Par + | Value $ (000’s) | ||||||
Foreign Equity continued | ||||||||
Northwestern Mutual Series Fund, Inc., International Equity Portfolio £ | 40,424,417 | 64,275 | ||||||
Northwestern Mutual Series Fund, Inc., International Growth Portfolio £ | 26,444,000 | 63,466 | ||||||
Northwestern Mutual Series Fund, Inc., Research International Core Portfolio £ | 80,714,219 | 104,121 | ||||||
|
| |||||||
Total | 267,408 | |||||||
|
| |||||||
Total Investment Companies | ||||||||
(Cost: $2,060,294) | 2,286,832 | |||||||
|
| |||||||
| Short-Term Investments (3.6%) | ||||||||
Commercial Paper (1.3%) | ||||||||
Apple, Inc. 0.000%, 1/11/22 144A | 2,500,000 | 2,500 | ||||||
Caterpillar Financial Services Corp. 0.000%, 1/13/22 | 5,000,000 | 5,000 | ||||||
LVMH Moet Hennessy Louis Vuitton SE | 2,000,000 | 2,000 | ||||||
0.000%, 2/22/22 144A | 5,000,000 | 4,999 | ||||||
0.000%, 3/23/22 144A | 3,250,000 | 3,249 | ||||||
Royal Bank of Canada 0.000%, 1/7/22 | 2,250,000 | 2,250 | ||||||
Societe Generale SA | 1,600,000 | 1,600 | ||||||
0.000%, 1/31/22 144A | 1,000,000 | 1,000 | ||||||
Unilever Capital Corp. | 5,275,000 | 5,275 | ||||||
0.000%, 2/28/22 144A | 2,500,000 | 2,499 | ||||||
|
| |||||||
Total | 30,372 | |||||||
|
| |||||||
Investment Companies (1.9%) | ||||||||
JPMorgan Ultra-Short Income ETF | 452,950 | 22,865 | ||||||
PIMCO Enhanced Short Maturity Active ETF | 225,400 | 22,891 | ||||||
|
| |||||||
Total | 45,756 | |||||||
|
| |||||||
Money Market Funds (0.4%) | ||||||||
State Street Institutional U.S. Government Money Market Fund - Premier Class 0.030%# | 9,882,589 | 9,883 | ||||||
|
| |||||||
Total | 9,883 | |||||||
|
| |||||||
Total Short-Term Investments | ||||||||
(Cost: $86,254) | 86,011 | |||||||
|
| |||||||
Total Investments (99.6%) | ||||||||
(Cost: $2,146,548)@ | 2,372,843 | |||||||
|
| |||||||
Other Assets, Less Liabilities (0.4%) | 8,730 | |||||||
|
| |||||||
Net Assets (100.0%) | 2,381,573 | |||||||
|
| |||||||
The Accompanying Notes are an Integral Part of the Financial Statements.
212
Table of Contents
Balanced Portfolio
| + | All par is stated in U.S. Dollar unless otherwise noted. |
| £ | Affiliated Company |
| 144A | Security exempt from registration under Rule 144A of the Securities Act of 1933. These securities may be resold as transactions exempt from registration, normally to qualified institutional buyers. At December 31, 2021 the value of these securities (in thousands) was $23,122 representing 1.0% of the net assets. |
| # | 7-Day yield as of 12/31/2021. |
| @ | At December 31, 2021, the aggregate cost of investments, including derivatives, for federal tax purposes (in thousands) was $2,147,513 and the net unrealized appreciation of investments based on that cost was $225,330 which is comprised of $246,397 aggregate gross unrealized appreciation and $21,067 aggregate gross unrealized depreciation. |
The following is a summary of the inputs used in valuing the Portfolio’s Investments at December 31, 2021. See Note 3 for additional information on portfolio valuation. |
| Valuation Inputs | ||||||||||||||
| Description | Level 1 – Quoted Prices | Level 2 – Other Significant Observable Inputs | Level 3 – Significant Unobservable Inputs | |||||||||||
| (Amounts in thousands) | ||||||||||||||
Assets: | ||||||||||||||
Investment Companies | $ | 2,286,832 | $ | - | $ | - | ||||||||
Short-Term Investments | ||||||||||||||
Investment Companies | 45,756 | - | - | |||||||||||
Money Market Funds | 9,883 | - | - | |||||||||||
Commercial Paper | - | 30,372 | - | |||||||||||
Total Assets: | $ | 2,342,471 | $ | 30,372 | $ | - | ||||||||
The Accompanying Notes are an Integral Part of the Financial Statements.
213
Table of Contents
Asset Allocation Portfolio (unaudited)
| Objective: | Portfolio Strategy: | Net Assets: | ||
| Realize as high a level of total return as is consistent with reasonable investment risk. | Invest in the stock, bond and money market sectors, attempting to capitalize on the variation in return potential produced by the interaction of changing financial markets and economic conditions. | $321 million |
PORTFOLIO OVERVIEW
Mason Street Advisors, LLC is the investment adviser for the Asset Allocation Portfolio (the “Portfolio”). The Portfolio is tactically and strategically managed to capitalize on changing financial markets and economic conditions following a flexible policy for allocating assets across the stock, bond and money market sectors. The Portfolio operates primarily as a “fund of funds” to gain the Portfolio’s equity and fixed income exposure by investing in one or more of the equity and international portfolios, and one or more of the fixed income portfolios of Northwestern Mutual Series Fund, Inc. (each an “Underlying Portfolio”). The adviser allocates the Portfolio’s assets among the Underlying Portfolios based on the adviser’s economic and market outlook and the investment objectives and strategies of the Underlying Portfolios. Under normal market conditions, the Portfolio will typically hold between 55-75% of assets in equity investments, 25-45% of assets in fixed income investments, and 0-15% of assets in cash equivalent investments.
MARKET OVERVIEW
U.S. equity markets gained during the reporting period, supported by a broad economic recovery following the COVID-19-related disruptions of 2020, to reach a series of record highs throughout the year. The widespread distribution of vaccines helped consumers return to their pre-pandemic activities and spending habits. The Federal Reserve (the “Fed”) maintained its accommodative policy stance during the year, with near-zero interest rates and bond-buying programs continuing to provide monetary stimulus. Rising raw material costs and energy prices, higher wages and supply-chain constraints led to a significant increase in inflation. However, the strong growth in consumer spending helped boost corporate earnings. In this environment, large-cap stocks, as represented by the S&P 500® Index, posted a return of 28.71%, outperforming the S&P MidCap 400® and the S&P SmallCap 600® Indices, which returned 24.76% and 26.82%, respectively. Meanwhile, the broader bond market, as represented by the Bloomberg® U.S. Aggregate Index, returned (1.54%), while the Bloomberg® U.S. Corporate High Yield Index advanced 5.28%.
PORTFOLIO RESULTS
The Portfolio returned 10.45% for the twelve months ended December 31, 2021, trailing the 28.71% return of the broad stock market, as measured by the S&P 500® Index, but outperforming the Bloomberg® U.S. Aggregate Index return of (1.54%). The Portfolio underperformed the Asset Allocation Portfolio Blended Composite Benchmark return of 13.05%. (The benchmark weights are detailed in the “Benchmark Definitions” section of this annual report.) (These Indices are unmanaged, cannot be invested in directly and do not incur expenses.) Comparative peer performance in 2021 included the Morningstar® Inc. Allocation – 50% to 70% Equity peer group average return of 13.01% and the Lipper® Analytical Services, Inc. Mixed-Asset Target Allocation Growth Funds peer group average return of 14.09%. Morningstar® Inc. and Lipper® Analytical Services, Inc. are independent mutual fund ranking agencies.
Security selection of the Underlying Portfolios detracted from the Portfolio’s performance relative to the blended benchmark, representing the majority of the relative underperformance. Weakness was seen across the majority of the equity Underlying Portfolios when compared to their respective benchmarks. While equities had a significant absolute return for the period, notable Underlying Portfolio detractors during the period included the Growth Stock Portfolio, Focused Appreciation Portfolio and Large Cap Blend Portfolio, which were hindered by an underweight to large technology companies. Large technology companies continued their significant price appreciation in 2021 and represented a substantial portion of overall returns for large-capitalization domestic stocks.
While the absolute performance of international stocks trailed domestic stocks, the Portfolio’s investments in the International Growth Portfolio and the Research International Core Portfolio were notable contributors, benefiting from strong security selection decisions.
From a tactical allocation perspective, the Portfolio’s tilt toward international and emerging market equities detracted from relative performance. International equities underperformed domestic equities during the reporting period as economic
214
Table of Contents
Asset Allocation Portfolio (unaudited)
growth in other developed countries lagged growth domestically, and emerging market stocks faced near-term headwinds from a strengthening U.S. dollar and regulatory changes in China.
PORTFOLIO MANAGER OUTLOOK
As we enter 2022, we continue to have a positive outlook. The economy continues to show strength and the earnings and balance sheets of corporations are healthy. While the strong economic environment has been accompanied by higher rates of inflation, we believe there are reasons for inflation risks to moderate as 2022 develops, including the unclogging of supply chains as consumers shift their spending from goods to services, a normalization of labor markets and the Fed reigning in its historically stimulative policies. High valuations in certain areas of the markets are another area of concern. As the Fed begins to raise rates, this will put pressure on many growth-oriented stocks that have benefited from the Fed’s near zero interest-rate policy of the recent past. In this environment, we have been tilting the Portfolio toward areas with better relative valuations, such as small caps and foreign developed and emerging markets. As the year progresses, we will continue to position the Portfolio as necessary to take advantage of market opportunities.
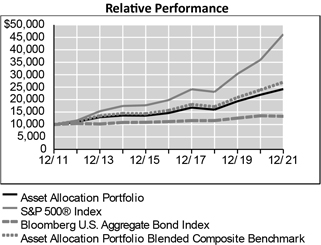
Average Annual Total Returns For Periods Ended December 31, 2021 | ||||||||||||
| 1 Year | 5 Years | 10 Years | ||||||||||
Asset Allocation Portfolio | 10.45 | % | 10.64 | % | 9.25 | % | ||||||
S&P 500® Index | 28.71 | % | 18.45 | % | 16.53 | % | ||||||
Bloomberg U.S. Aggregate Bond Index | -1.54 | % | 3.57 | % | 2.90 | % | ||||||
Asset Allocation Portfolio Blended Composite Benchmark | 13.05 | % | 11.54 | % | 10.45 | % | ||||||
Morningstar® US Insurance Fund Allocation - 50% to 70% Equity Average | 13.01 | % | 10.32 | % | 9.53 | % | ||||||
Lipper® Variable Insurance Products (VIP) Mixed Asset Target Allocation Growth Funds Average | 14.09 | % | 10.83 | % | 9.95 | % | ||||||
The performance data quoted represents past performance. Past performance is historical and does not guarantee future performance. Investment return and principal value will fluctuate, so that shares, when redeemed, may be worth more or less than their original cost. Current performance may be lower or higher than the performance data quoted. For the most recent month-end performance information visit www.northwesternmutual.com.
This chart assumes an initial investment of $10,000 made on 12/31/11. Returns shown reflect fee waivers, deductions for management and other portfolio expenses, and reinvestment of all dividends. In the absence of fee waivers, total return would be reduced. Returns exclude deductions for separate account sale loads and account fees. Please refer to the Benchmark Definitions section of this report for information about the indices cited in the above chart and graph.
The Portfolio obtains its exposure to equity and fixed income securities by investing in other Series Fund portfolios (Underlying Portfolios). Each of the Underlying Portfolios has its own investment risks, and the Portfolio is indirectly exposed to all the risks of the Underlying Portfolios in which it invests, including that risk that an Underlying Portfolio will not perform as expected. To the extent that the Portfolio invests a significant portion of its assets in a single Underlying Portfolio, it will be particularly sensitive to the risks associated with that Underlying Portfolio may have a significant effect on the Portfolio’s net asset value. The Portfolio will bear a pro rata share of the Underlying Portfolio’s expenses.
The Portfolio may use derivative instruments to gain exposure to certain markets, sectors or regions as alternatives to direct investments, to adjust the Portfolio duration, to provide increased flexibility in asset allocation, to earn income and to otherwise seek to enhance returns or to hedge foreign currency exposure. Use of these instruments may involve certain costs and risks such as liquidity risk, interest rate risk, mispricing or improper valuation. Certain derivatives involve leverage, which could magnify losses, and portfolios investing in derivatives could lose more than the principal amount invested in those investments.
The U.S. federal funds rate has been at historically low levels and a significant rise in interest rates over a short period of time could cause significant losses in the market value of the Portfolio’s fixed income investments.
215
Table of Contents
Asset Allocation Portfolio (unaudited)
Top 10 Equity Holdings 12/31/21
| Security Description | % of Net Assets | |||
Northwestern Mutual Series Fund, Inc., Select Bond Portfolio | 19.3% | |||
Northwestern Mutual Series Fund, Inc., Research International Core Portfolio | 6.5% | |||
Northwestern Mutual Series Fund, Inc., Focused Appreciation Portfolio | 5.8% | |||
Northwestern Mutual Series Fund, Inc., Growth Stock Portfolio | 5.8% | |||
Northwestern Mutual Series Fund, Inc., High Yield Bond Portfolio | 5.5% | |||
Northwestern Mutual Series Fund, Inc., Mid Cap Value Portfolio | 5.4% | |||
Northwestern Mutual Series Fund, Inc., Mid Cap Growth Stock Portfolio | 5.1% | |||
Northwestern Mutual Series Fund, Inc., Multi- Sector Bond Portfolio | 5.0% | |||
Northwestern Mutual Series Fund, Inc., Large Cap Blend Portfolio | 4.9% | |||
Northwestern Mutual Series Fund, Inc., Large Cap Core Stock Portfolio | 4.8% |
Sector Allocation 12/31/21
| Sector | % of Net Assets | |||
Domestic Equity | 48.7% | |||
Fixed Income | 32.0% | |||
Foreign Equity | 16.3% | |||
Short-Term Investments & Other Net Assets | 3.0% |
Sector Allocation and Top 10 Holdings are subject to change.
216
Table of Contents
Asset Allocation Portfolio
SCHEDULE OF INVESTMENTS
December 31, 2021
Investment Companies (97.0%) | Shares/ Par + | Value $ (000’s) | ||||||
Domestic Equity (48.7%) | ||||||||
iShares Core S&P 500 ETF | 3,800 | 1,812 | ||||||
iShares Core S&P Mid-Cap ETF | 5,750 | 1,628 | ||||||
iShares Russell 2000 ETF | 300 | 67 | ||||||
Northwestern Mutual Series Fund, Inc., Domestic Equity Portfolio £ | 5,967,483 | 11,541 | ||||||
Northwestern Mutual Series Fund, Inc., Equity Income Portfolio £ | 5,711,530 | 11,503 | ||||||
Northwestern Mutual Series Fund, Inc., Focused Appreciation Portfolio £ | 4,338,463 | 18,738 | ||||||
Northwestern Mutual Series Fund, Inc., Growth Stock Portfolio £ | 4,624,598 | 18,697 | ||||||
Northwestern Mutual Series Fund, Inc., Large Cap Blend Portfolio £ | 11,373,464 | 15,764 | ||||||
Northwestern Mutual Series Fund, Inc., Large Cap Core Stock Portfolio £ | 7,007,062 | 15,479 | ||||||
Northwestern Mutual Series Fund, Inc., Large Company Value Portfolio £ | 9,593,497 | 11,445 | ||||||
Northwestern Mutual Series Fund, Inc., Mid Cap Growth Stock Portfolio £ | 4,168,870 | 16,404 | ||||||
Northwestern Mutual Series Fund, Inc., Mid Cap Value Portfolio £ | 8,642,996 | 17,260 | ||||||
Northwestern Mutual Series Fund, Inc., Small Cap Growth Stock Portfolio £ | 2,305,661 | 7,429 | ||||||
Northwestern Mutual Series Fund, Inc., Small Cap Value Portfolio £ | 3,286,156 | 8,475 | ||||||
|
| |||||||
Total | 156,242 | |||||||
|
| |||||||
Fixed Income (32.0%) | ||||||||
iShares Core U.S. Aggregate Bond ETF | 22,800 | 2,601 | ||||||
iShares iBoxx High Yield Corporate Bond ETF | 14,800 | 1,288 | ||||||
Northwestern Mutual Series Fund, Inc., High Yield Bond Portfolio £ | 23,533,506 | 17,650 | ||||||
Northwestern Mutual Series Fund, Inc., Multi-Sector Bond Portfolio £ | 14,257,333 | 16,039 | ||||||
Northwestern Mutual Series Fund, Inc., Select Bond Portfolio £ | 49,304,786 | 61,927 | ||||||
Northwestern Mutual Series Fund, Inc., Short-Term Bond Portfolio £ | 3,099,764 | 3,267 | ||||||
|
| |||||||
Total | 102,772 | |||||||
|
| |||||||
Foreign Equity (16.3%) | ||||||||
iShares Core MSCI Emerging Markets ETF | 23,600 | 1,413 | ||||||
Investment Companies (97.0%) | Shares/ Par + | Value $ (000’s) | ||||||
Foreign Equity continued | ||||||||
iShares MSCI EAFE ETF | 22,100 | 1,739 | ||||||
Northwestern Mutual Series Fund, Inc., Emerging Markets Equity Portfolio £ | 2,692,289 | 3,559 | ||||||
Northwestern Mutual Series Fund, Inc., International Equity Portfolio £ | 7,772,184 | 12,358 | ||||||
Northwestern Mutual Series Fund, Inc., International Growth Portfolio £ | 5,066,412 | 12,159 | ||||||
Northwestern Mutual Series Fund, Inc., Research International Core Portfolio £ | 16,201,104 | 20,899 | ||||||
|
| |||||||
Total | 52,127 | |||||||
|
| |||||||
Total Investment Companies | ||||||||
(Cost: $268,477) | 311,141 | |||||||
|
| |||||||
| Short-Term Investments (2.6%) | ||||||||
Commercial Paper (0.9%) | ||||||||
Apple, Inc. 0.000%, 1/11/22 144A | 1,000,000 | 1,000 | ||||||
LVMH Moet Hennessy Louis Vuitton SE 0.000%, 2/22/22 144A | 1,000,000 | 1,000 | ||||||
Royal Bank of Canada 0.000%, 1/11/22 | 200,000 | 200 | ||||||
Societe Generale SA | 400,000 | 400 | ||||||
0.000%, 1/14/22 144A | 300,000 | 300 | ||||||
|
| |||||||
Total | 2,900 | |||||||
|
| |||||||
Investment Companies (1.2%) | ||||||||
JPMorgan Ultra-Short Income ETF | 40,300 | 2,034 | ||||||
PIMCO Enhanced Short Maturity Active ETF | 20,100 | 2,042 | ||||||
|
| |||||||
Total | 4,076 | |||||||
|
| |||||||
Money Market Funds (0.5%) | ||||||||
State Street Institutional U.S. Government Money Market Fund - Premier Class 0.030%# | 1,452,362 | 1,452 | ||||||
|
| |||||||
Total | 1,452 | |||||||
|
| |||||||
Total Short-Term Investments | ||||||||
(Cost: $8,449) | 8,428 | |||||||
|
| |||||||
Total Investments (99.6%) | ||||||||
(Cost: $276,926)@ | 319,569 | |||||||
|
| |||||||
Other Assets, Less Liabilities (0.4%) | 1,168 | |||||||
|
| |||||||
Net Assets (100.0%) | 320,737 | |||||||
|
| |||||||
| + | All par is stated in U.S. Dollar unless otherwise noted. |
| £ | Affiliated Company |
| 144A | Security exempt from registration under Rule 144A of the Securities Act of 1933. These securities may be resold as transactions exempt from registration, normally to qualified institutional buyers. At December 31, 2021 the value of these securities (in thousands) was $2,700 representing 0.8% of the net assets. |
| # | 7-Day yield as of 12/31/2021. |
| @ | At December 31, 2021, the aggregate cost of investments, including derivatives, for federal tax purposes (in thousands) was $277,083 and the net unrealized appreciation of investments based on that cost was $42,486 which is comprised of $44,934 aggregate gross unrealized appreciation and $2,448 aggregate gross unrealized depreciation. |
The Accompanying Notes are an Integral Part of the Financial Statements.
217
Table of Contents
Asset Allocation Portfolio
The following is a summary of the inputs used in valuing the Portfolio’s Investments at December 31, 2021. See Note 3 for additional information on portfolio valuation.
Valuation Inputs | ||||||||||||||
Description | Level 1 – Quoted Prices | Level 2 – Other Significant | Level 3 – Significant | |||||||||||
| (Amounts in thousands) | ||||||||||||||
Assets: | ||||||||||||||
Investment Companies | $ | 311,141 | $ | – | $ | – | ||||||||
Short-Term Investments | ||||||||||||||
Investment Companies | 4,076 | – | – | |||||||||||
Money Market Funds | 1,452 | – | – | |||||||||||
Commercial Paper | – | 2,900 | — | |||||||||||
Total Assets: | $ | 316,669 | $ | 2,900 | $ | – | ||||||||
The Accompanying Notes are an Integral Part of the Financial Statements.
218
Table of Contents
Benchmark Definitions (unaudited)
The following indices are used to illustrate investment market, sector or style performance or to serve as Portfolio performance comparisons. Unlike the Portfolios, the indices are not professionally managed and do not incur fees or expenses. It is not possible to invest directly in an index.
1/3 each: Bloomberg® Global Aggregate — Credit Component ex Emerging Markets, Hedged USD; BofA Merrill Lynch® Global High Yield BB-B Rated Constrained Developed Markets Index, Hedged USD; JPMorgan® EMBI Global — The Bloomberg® Global Aggregate — Credit Component ex Emerging Markets, Hedged USD provides a broad-based measure of the global developed markets investment grade fixed income markets. The BofA Merrill Lynch Global High Yield BB-B Rated Constrained Developed Markets Index, Hedged USD tracks the performance of below investment grade bonds of corporate issuers domiciled in developed market countries rated BB1 through B3, based on an average of Moody’s, S&P and Fitch. Qualifying bonds are capitalization weighted provided the total allocation to an individual issuer (defined by Bloomberg tickers) does not exceed 2%. Issuers that exceed the limit are reduced to 2% and the face value of each of their bonds is adjusted on a pro-rata basis. Similarly, the face value of bonds of all other issuers that fall below the 2% cap are increased on a pro-rata basis. The index is rebalanced on the last calendar day of the month. The JPMorgan EMBI Global tracks total returns for U.S. dollar-denominated debt instruments issued by emerging market sovereign and quasi-sovereign entities, Brady bonds, loans, Eurobonds and local market instruments. It is not possible to invest in an unmanaged index.
Asset Allocation Portfolio Blended Composite Benchmark — The Asset Allocation Portfolio Blended Composite Benchmark is an unmanaged, hypothetical combination of unmanaged indices that correspond to the Asset Allocation Portfolio’s model allocation and consists of the Russell 1000® Index (33%), the Russell MidCap Index (11%), the Russell 2000® Index (5%), the MSCI EAFE® (Europe-Australasia-Far-East) Index (13%), the MSCI® Emerging Markets Index (3%), the Bloomberg® U.S. Aggregate Bond Index (24%), the Bloomberg® U.S. Corporate High Yield 2% Issuer Capped Bond Index (8%), and the BofA Merrill Lynch® US 3-Month Treasury Bill Index (3%).
Balanced Portfolio Blended Composite Benchmark — The Balanced Portfolio Blended Composite Benchmark is an unmanaged, hypothetical combination of unmanaged indices that correspond to the Balanced Portfolio’s model allocation and consists of the Russell 1000® Index (26%), the Russell MidCap Index (9%), the Russell 2000® Index (3%), the MSCI EAFE® (Europe-Australasia-Far-East) Index (9%), the MSCI® Emerging Markets Index (2%), the Bloomberg® U.S. Aggregate Bond Index (41%), the Bloomberg® U.S. Corporate High Yield 2% Issuer Capped Bond Index (6%), and the BofA Merrill Lynch® US 3-Month Treasury Bill Index (4%).
Bloomberg® 1-3 Year U.S. Government/Credit Bond Index — The Bloomberg® 1-3 Year U.S. Government/Credit Bond Index is an unmanaged index of publicly issued medium and larger issues of U.S. Government, investment-grade corporate and investment-grade international dollar denominated bonds that have maturities of between one and three years.
Bloomberg® U.S. Aggregate Bond Index — The Bloomberg® U.S. Aggregate Index is an unmanaged index of publicly issued investment-grade fixed-rate debt securities including corporate, U.S. Treasury and government agency securities, mortgage pass-through and asset-backed securities with remaining maturities of at least one year regardless of call features.
Bloomberg® U.S. Corporate High Yield 2% Issuer Capped Bond Index — The Bloomberg® U. S. Corporate High Yield 2% Issuer Capped Index is an unmanaged index of U.S. Dollar-denominated, non-convertible, fixed-rate, noninvestment-grade debt. Issuers are capped at 2% of the Index. Index holdings must have at least one year to final maturity, at least $150 million par amount outstanding, and be publicly issued with a rating of Ba1 or lower.
Bloomberg® Global Credit Hedged USD Index — The Bloomberg® Global Credit Hedged USD Index is an unmanaged index composed of investment-grade and high yield credit securities from the Multiverse represented in U.S. dollars on a hedged basis (Multiverse is the merger of two groups: the Global Aggregate and the Global High Yield).
Bloomberg® Long-Term U.S. Treasury Index — The Bloomberg® Long-Term U.S. Treasury Index is an unmanaged index comprised of fixed-income securities with various maturities greater than 10 years.
219
Table of Contents
Benchmark Definitions (unaudited)
Bloomberg® U.S. Treasury Inflation Protected Securities (TIPS) Index — The Bloomberg® U.S. Treasury Inflation Protected Securities (TIPS) Index is an unmanaged index of inflation-protected public obligations of the U.S. Treasury. The index is market capitalization weighted and includes all publicly-issued U.S. Treasury Inflation-Protected Securities that have at least one year remaining to maturity and have $250 million or more of outstanding face value.
BofA Merrill Lynch® US 3-Month Treasury Bill Index — The BofA Merrill Lynch® US 3-Month Treasury Bill Index is comprised of a single issue purchased at the beginning of the month and held for a full month. At the end of the month that issue is sold and rolled into a newly selected issue. The issue selected at each month-end rebalancing is the outstanding Treasury Bill that matures closest to, but not beyond, three months from the rebalancing date. To qualify for selection, an issue must have settled on or before the month-end rebalancing date.
Lipper® Variable Insurance Products (VIP) Average — Each Lipper® Variable Insurance Products (VIP) Average is calculated by Lipper® Analytical Services, Inc. and reflects the investment return of certain portfolios underlying variable life and annuity products. Source: Lipper®, Inc.
Morningstar® Insurance Fund Category Averages — Each Morningstar® category average is an equal-weighted category return. The calculation is simply the average of the returns at the end of the period for all the underlying variable insurance funds in a given category. Source: Morningstar®, Inc.
Morningstar® US Insurance Fund Allocation – 30% to 50% Equity Average — Funds in allocation categories seek to provide both income and capital appreciation by investing in multiple asset classes, including stocks, bonds, and cash. These portfolios are dominated by domestic holdings and have equity exposures between 30% and 50%. Source: Morningstar®, Inc.
Morningstar® US Insurance Fund Allocation – 50% to 70% Equity Average — Funds in allocation categories seek to provide both income and capital appreciation by investing in multiple asset classes, including stocks, bonds, and cash. These portfolios are dominated by domestic holdings and have equity exposures between 50% and 70%. Source: Morningstar®, Inc.
MSCI® All Country World (ex-US) Index — The MSCI® All Country World (ex-US) Index is an unmanaged, free float-adjusted market capitalization-weighted index that is designed to measure equity performance of companies in the developed and emerging markets, excluding the U.S.
MSCI® All Country World (ex-US) Growth Index — The MSCI® All Country World (ex-US) Growth Index is an unmanaged, free float-adjusted market capitalization-weighted index that is designed to measure equity performance of companies in the developed and emerging markets, excluding the U.S., with higher historical and forecasted growth characteristics.
MSCI® All Country World (ex-US) Value Index — The MSCI® All Country World (ex-US) Value Index is an unmanaged, free float-adjusted market capitalization-weighted index that is designed to measure equity performance of companies in the developed and emerging markets, excluding the U.S., which captures large and mid cap securities exhibiting overall value style characteristics.
MSCI EAFE® (Europe-Australasia-Far-East) Index — The MSCI EAFE® (“Europe-Australasia-Far East”) Index is an unmanaged, free float-adjusted, market capitalization-weighted index that is designed to measure equity performance of companies in the developed markets, excluding the U.S. & Canada.
MSCI EAFE® (Europe-Australasia-Far-East) Growth Index — The MSCI EAFE® (“Europe-Australasia-Far East”) Index is an unmanaged, free float-adjusted, market capitalization-weighted index that is designed to measure equity performance of companies in the developed markets, excluding the U.S. & Canada, with higher historical and forecasted growth characteristics.
MSCI® Emerging Markets Index — The MSCI® Emerging Markets Index is an unmanaged, free float-adjusted, market capitalization-weighted index that is designed to measure equity market performance in the global emerging markets.
Russell 1000® Index — The Russell 1000® Index is an unmanaged, market capitalization-weighted, large cap index that measures the performance of the 1000 largest companies in the Russell 3000® Index.
Russell 1000® Growth Index — The Russell 1000® Growth Index is an unmanaged index that measures the performance of those companies in the Russell 1000® Index with higher price-to-book ratios and higher forecasted growth values.
220
Table of Contents
Benchmark Definitions (unaudited)
Russell 1000® Value Index — The Russell 1000® Value Index is an unmanaged index that measures the performance of those companies in the Russell 1000® Index with lower price-to-book ratios and lower forecasted growth values.
Russell 2000® Index — The Russell 2000® Index is an unmanaged, market capitalization-weighted index that measures the performance of the 2000 companies in the Russell 3000® Index and represents approximately 10% of the total market capitalization of the Russell 3000® Index.
Russell 2000® Growth Index — The Russell 2000® Growth Index is an unmanaged index that measures the performance of those companies in the Russell 2000® Index with higher price-to-book ratios and higher forecasted growth values.
Russell 2000® Value Index — The Russell 2000® Value Index is an unmanaged index measures the performance of those companies in the Russell 2000® Index with lower price-to-book ratios and lower forecasted growth values.
Russell 3000® Index — The Russell 3000® Index measures the performance of the 3000 largest U.S. companies representing approximately 98% of the investable U.S. equity market.
Russell MidCap® Index — The Russell MidCap® Index is an unmanaged index that measures the performance of the 800 smallest companies in the Russell 1000® Index, which represents approximately 25% of the total market capitalization of the Russell 1000® Index.
Russell MidCap® Growth Index — The Russell MidCap® Growth Index is an unmanaged index that measures the performance of the Russell MidCap® companies with higher price-to-book ratios and higher forecasted growth values.
Russell MidCap® Value Index — The Russell MidCap® Value Index is an unmanaged index that measures the performance of the Russell MidCap® companies with lower price-to-book and lower forecasted growth values.
S&P 500® Index — The S&P 500® Composite Stock Price Index is an unmanaged, capitalization-weighted index of 500 selected common stocks designed to measure the performance of the broad domestic economy.
S&P MidCap 400® Index — The S&P MidCap 400® Index is an unmanaged, capitalization-weighted index that measures the performance of the mid-range sector of the U.S. stock market.
S&P SmallCap 600® Index — The S&P SmallCap 600® Index is an unmanaged index of 600 selected common stocks of U.S.-based companies with small market capitalizations.
221
Table of Contents
Statements of Assets and Liabilities
NORTHWESTERN MUTUAL SERIES FUND, INC.
December 31, 2021 (in thousands)
Growth Stock Portfolio | Focused Appreciation Portfolio | Large Cap Core Stock Portfolio | Large Cap Blend Portfolio | Index 500 Stock Portfolio | ||||||||||||||||
Assets | ||||||||||||||||||||
Unaffiliated Investments, at Value (1) | $ | 1,391,808 | $ | 1,321,170 | $ | 843,006 | $ | 203,018 | $ | 5,499,588 | ||||||||||
Cash | – | – | 8 | – | 229 | |||||||||||||||
Cash Collateral for Derivative Positions | – | – | – | – | 2,741 | |||||||||||||||
Receivable for Portfolio Shares Sold | 46 | 127 | 49 | 2 | 584 | |||||||||||||||
Receivable for Investment Securities Sold | 180 | 12,893 | – | – | – | |||||||||||||||
Prepaid Expenses and Other Assets | 10 | 9 | 6 | 1 | 44 | |||||||||||||||
Dividends and Interest Receivable | 92 | 1,174 | 523 | 255 | 3,276 | |||||||||||||||
|
|
|
|
|
|
|
|
|
| |||||||||||
Total Assets | 1,392,136 | 1,335,373 | 843,592 | 203,276 | 5,506,462 | |||||||||||||||
|
|
|
|
|
|
|
|
|
| |||||||||||
Liabilities | ||||||||||||||||||||
Payable for Portfolio Shares Redeemed | 1,722 | 7,282 | 78 | 6 | 404 | |||||||||||||||
Payable for Investment Securities Purchased | – | – | 391 | – | – | |||||||||||||||
Variation Margin Payable | – | – | – | – | 162 | |||||||||||||||
Investment Advisory Fees | 477 | 676 | 285 | 121 | 858 | |||||||||||||||
Compliance Fees Payable | 3 | 3 | 3 | 2 | 5 | |||||||||||||||
Accrued Expenses | 35 | 51 | 29 | 21 | 63 | |||||||||||||||
|
|
|
|
|
|
|
|
|
| |||||||||||
Total Liabilities | 2,237 | 8,012 | 786 | 150 | 1,492 | |||||||||||||||
|
|
|
|
|
|
|
|
|
| |||||||||||
Net Assets | $ | 1,389,899 | $ | 1,327,361 | $ | 842,806 | $ | 203,126 | $ | 5,504,970 | ||||||||||
|
|
|
|
|
|
|
|
|
| |||||||||||
Represented By: | ||||||||||||||||||||
Aggregate Paid in Capital (10) (11) | $ | 701,331 | $ | 543,696 | $ | 480,570 | $ | 122,785 | $ | 1,548,210 | ||||||||||
Total Distributable Earnings (Loss) | 688,568 | 783,665 | 362,236 | 80,341 | 3,956,760 | |||||||||||||||
|
|
|
|
|
|
|
|
|
| |||||||||||
Net Assets for Shares Outstanding (10) (11) | $ | 1,389,899 | $ | 1,327,361 | $ | 842,806 | $ | 203,126 | $ | 5,504,970 | ||||||||||
|
|
|
|
|
|
|
|
|
| |||||||||||
Net Asset Value, Offering and Redemption Price per Share | $ | 4.04 | $ | 4.32 | $ | 2.21 | $ | 1.39 | $ | 8.18 | ||||||||||
|
|
|
|
|
|
|
|
|
| |||||||||||
(1) Unaffiliated Investments, at Cost | $ | 853,495 | $ | 662,445 | $ | 594,337 | $ | 141,976 | $ | 1,749,104 | ||||||||||
(10) Shares Outstanding | 343,803 | 307,323 | 381,447 | 146,548 | 673,265 | |||||||||||||||
(11) Shares Authorized, $.01 Par Value | 2,000,000 | 2,000,000 | 2,000,000 | 2,000,000 | 2,000,000 | |||||||||||||||
The Accompanying Notes are an Integral Part of the Financial Statements.
222
Table of Contents
Statements of Assets and Liabilities
NORTHWESTERN MUTUAL SERIES FUND, INC.
December 31, 2021 (in thousands)
Large Company Value Portfolio | Domestic Equity Portfolio | Equity Income Portfolio | Mid Cap Growth Stock Portfolio | Index 400 Stock Portfolio | ||||||||||||||||
Assets | ||||||||||||||||||||
Unaffiliated Investments, at Value (1) | $ | 231,830 | $ | 1,096,103 | $ | 867,752 | $ | 1,376,659 | $ | 1,334,971 | ||||||||||
Cash | – | – | 23 | – | – | |||||||||||||||
Cash Collateral for Derivative Positions | – | – | – | – | 2 | |||||||||||||||
Receivable for Portfolio Shares Sold | 21 | 186 | 129 | 78 | 194 | |||||||||||||||
Receivable for Investment Securities Sold | – | 3,225 | 3,118 | 10,113 | – | |||||||||||||||
Variation Margin Receivable | – | – | – | – | 4 | |||||||||||||||
Prepaid Expenses and Other Assets | 1 | 7 | 6 | 9 | 25 | |||||||||||||||
Dividends and Interest Receivable | 431 | 1,423 | 1,581 | 669 | 1,209 | |||||||||||||||
|
|
|
|
|
|
|
|
|
| |||||||||||
Total Assets | 232,283 | 1,100,944 | 872,609 | 1,387,528 | 1,336,405 | |||||||||||||||
|
|
|
|
|
|
|
|
|
| |||||||||||
Liabilities | ||||||||||||||||||||
Payable for Portfolio Shares Redeemed | 3,679 | 3,797 | 3,952 | 5,576 | 196 | |||||||||||||||
Payable for Investment Securities Purchased | – | – | 293 | 5,754 | – | |||||||||||||||
Payable for Foreign Currency | 236 | – | – | – | – | |||||||||||||||
Collateral from Counterparty | 641 | – | – | – | – | |||||||||||||||
Investment Advisory Fees | 128 | 437 | 396 | 590 | 242 | |||||||||||||||
Compliance Fees Payable | 2 | 3 | 3 | 3 | 3 | |||||||||||||||
Accrued Expenses | 37 | 30 | 29 | 37 | 27 | |||||||||||||||
|
|
|
|
|
|
|
|
|
| |||||||||||
Total Liabilities | 4,723 | 4,267 | 4,673 | 11,960 | 468 | |||||||||||||||
|
|
|
|
|
|
|
|
|
| |||||||||||
Net Assets | $ | 227,560 | $ | 1,096,677 | $ | 867,936 | $ | 1,375,568 | $ | 1,335,937 | ||||||||||
|
|
|
|
|
|
|
|
|
| |||||||||||
Represented By: | ||||||||||||||||||||
Aggregate Paid in Capital (10) (11) | $ | 159,968 | $ | 658,225 | $ | 538,684 | $ | 964,245 | $ | 742,189 | ||||||||||
Total Distributable Earnings (Loss) | 67,592 | 438,452 | 329,252 | 411,323 | 593,748 | |||||||||||||||
|
|
|
|
|
|
|
|
|
| |||||||||||
Net Assets for Shares Outstanding (10) (11) | $ | 227,560 | $ | 1,096,677 | $ | 867,936 | $ | 1,375,568 | $ | 1,335,937 | ||||||||||
|
|
|
|
|
|
|
|
|
| |||||||||||
Net Asset Value, Offering and Redemption Price per Share | $ | 1.19 | $ | 1.93 | $ | 2.01 | $ | 3.94 | $ | 2.57 | ||||||||||
|
|
|
|
|
|
|
|
|
| |||||||||||
(1) Unaffiliated Investments, at Cost | $ | 194,737 | $ | 793,512 | $ | 631,496 | $ | 1,059,458 | $ | 873,907 | ||||||||||
(10) Shares Outstanding | 190,804 | 567,127 | 430,912 | 349,542 | 519,175 | |||||||||||||||
(11) Shares Authorized, $.01 Par Value | 2,000,000 | 2,000,000 | 2,000,000 | 2,000,000 | 2,000,000 | |||||||||||||||
The Accompanying Notes are an Integral Part of the Financial Statements.
223
Table of Contents
Statements of Assets and Liabilities
NORTHWESTERN MUTUAL SERIES FUND, INC.
December 31, 2021 (in thousands)
Mid Cap Value Portfolio | Small Cap Growth Stock Portfolio | Index 600 Stock Portfolio | Small Cap Value Portfolio | International Growth Portfolio | ||||||||||||||||
Assets | ||||||||||||||||||||
Unaffiliated Investments, at Value (1) | $ | 710,850 | $ | 830,283 | $ | 434,555 | $ | 685,388 | $ | 1,067,294 | ||||||||||
Receivable for Portfolio Shares Sold | 171 | 66 | 132 | 99 | 236 | |||||||||||||||
Receivable for Investment Securities Sold | 680 | – | 72 | – | – | |||||||||||||||
Receivable for Foreign Currency | 75 | – | – | – | – | |||||||||||||||
Prepaid Expenses and Other Assets | 4 | 6 | 8 | 5 | 7 | |||||||||||||||
Dividends and Interest Receivable | 1,334 | 212 | 440 | 479 | 1,541 | |||||||||||||||
|
|
|
|
|
|
|
|
|
| |||||||||||
Total Assets | 713,114 | 830,567 | 435,207 | 685,971 | 1,069,078 | |||||||||||||||
|
|
|
|
|
|
|
|
|
| |||||||||||
Liabilities | ||||||||||||||||||||
Payable for Portfolio Shares Redeemed | 5,564 | 103 | 81 | 155 | 140 | |||||||||||||||
Payable for Investment Securities Purchased | 221 | 53 | 572 | – | – | |||||||||||||||
Accrued Foreign Capital Gains Tax | – | – | – | – | 99 | |||||||||||||||
Variation Margin Payable | – | – | 9 | – | – | |||||||||||||||
Payable for Foreign Currency | 574 | – | – | – | – | |||||||||||||||
Collateral from Counterparty | 1,440 | – | – | – | – | |||||||||||||||
Investment Advisory Fees | 403 | 364 | 81 | 476 | 517 | |||||||||||||||
Compliance Fees Payable | 2 | 3 | 2 | 3 | 3 | |||||||||||||||
Accrued Expenses | 55 | 30 | 36 | 33 | 87 | |||||||||||||||
|
|
|
|
|
|
|
|
|
| |||||||||||
Total Liabilities | 8,259 | 553 | 781 | 667 | 846 | |||||||||||||||
|
|
|
|
|
|
|
|
|
| |||||||||||
Net Assets | $ | 704,855 | $ | 830,014 | $ | 434,426 | $ | 685,304 | $ | 1,068,232 | ||||||||||
|
|
|
|
|
|
|
|
|
| |||||||||||
Represented By: | ||||||||||||||||||||
Aggregate Paid in Capital (10) (11) | $ | 496,550 | $ | 519,851 | $ | 274,582 | $ | 369,537 | $ | 587,473 | ||||||||||
Total Distributable Earnings (Loss) | 208,305 | 310,163 | 159,844 | 315,767 | 480,759 | |||||||||||||||
|
|
|
|
|
|
|
|
|
| |||||||||||
Net Assets for Shares Outstanding (10) (11) | $ | 704,855 | $ | 830,014 | $ | 434,426 | $ | 685,304 | $ | 1,068,232 | ||||||||||
|
|
|
|
|
|
|
|
|
| |||||||||||
Net Asset Value, Offering and Redemption Price per Share | $ | 2.00 | $ | 3.22 | $ | 1.85 | $ | 2.58 | $ | 2.40 | ||||||||||
|
|
|
|
|
|
|
|
|
| |||||||||||
(1) Unaffiliated Investments, at Cost | $ | 604,738 | $ | 629,975 | $ | 311,883 | $ | 444,255 | $ | 686,187 | ||||||||||
(10) Shares Outstanding | 352,913 | 257,617 | 235,147 | 265,707 | 445,053 | |||||||||||||||
(11) Shares Authorized, $.01 Par Value | 2,000,000 | 2,000,000 | 2,000,000 | 2,000,000 | 2,000,000 | |||||||||||||||
The Accompanying Notes are an Integral Part of the Financial Statements.
224
Table of Contents
Statements of Assets and Liabilities
NORTHWESTERN MUTUAL SERIES FUND, INC.
December 31, 2021 (in thousands)
Research International Core Portfolio | International Equity Portfolio | Emerging Markets Equity Portfolio | Government Money Market Portfolio | Short-Term Bond Portfolio | ||||||||||||||||
Assets | ||||||||||||||||||||
Unaffiliated Investments, at Value (1) | $ | 968,923 | $ | 1,860,081 | $ | 995,516 | $ | 321,791 | $ | 414,319 | ||||||||||
Investments in Repurchase Agreements, at Value (3) | – | – | – | 183,000 | – | |||||||||||||||
Cash | – | 24 | – | – | – | |||||||||||||||
Foreign Currency, at Value (4) | – | 1,066 | 920 | – | – | |||||||||||||||
Receivable for Portfolio Shares Sold | 247 | 383 | 398 | 531 | 97 | |||||||||||||||
Receivable for Investment Securities Sold | 119 | – | 444 | – | 2,857 | |||||||||||||||
Variation Margin Receivable | – | – | – | – | 15 | |||||||||||||||
Receivable for Foreign Currency | – | 6 | – | – | – | |||||||||||||||
Prepaid Expenses and Other Assets | 7 | 13 | 7 | 3 | 3 | |||||||||||||||
Dividends and Interest Receivable | 2,631 | 6,048 | 1,657 | 55 | 1,635 | |||||||||||||||
|
|
|
|
|
|
|
|
|
| |||||||||||
Total Assets | 971,927 | 1,867,621 | 998,942 | 505,380 | 418,926 | |||||||||||||||
|
|
|
|
|
|
|
|
|
| |||||||||||
Liabilities | ||||||||||||||||||||
Payable for Portfolio Shares Redeemed | 7,689 | 205 | 95 | 435 | 140 | |||||||||||||||
Payable for Investment Securities Purchased | 197 | 398 | 1,023 | 16,030 | 6,312 | |||||||||||||||
Accrued Foreign Capital Gains Tax | 286 | – | 3,496 | – | – | |||||||||||||||
Variation Margin Payable | – | – | – | – | 13 | |||||||||||||||
Payable for Foreign Currency | – | 937 | – | – | – | |||||||||||||||
Collateral from Counterparty | – | – | – | – | 3 | |||||||||||||||
Investment Advisory Fees | 565 | 761 | 731 | 18 | 113 | |||||||||||||||
Compliance Fees Payable | 3 | 3 | 3 | 2 | 2 | |||||||||||||||
Accrued Expenses | 84 | 109 | 101 | 37 | 59 | |||||||||||||||
|
|
|
|
|
|
|
|
|
| |||||||||||
Total Liabilities | 8,824 | 2,413 | 5,449 | 16,522 | 6,642 | |||||||||||||||
|
|
|
|
|
|
|
|
|
| |||||||||||
Net Assets | $ | 963,103 | $ | 1,865,208 | $ | 993,493 | $ | 488,858 | $ | 412,284 | ||||||||||
|
|
|
|
|
|
|
|
|
| |||||||||||
Represented By: | ||||||||||||||||||||
Aggregate Paid in Capital (10) (11) | $ | 651,833 | $ | 1,819,119 | $ | 710,596 | $ | 488,858 | $ | 405,896 | ||||||||||
Total Distributable Earnings (Loss) | 311,270 | 46,089 | 282,897 | – | 6,388 | |||||||||||||||
|
|
|
|
|
|
|
|
|
| |||||||||||
Net Assets for Shares Outstanding (10) (11) | $ | 963,103 | $ | 1,865,208 | $ | 993,493 | $ | 488,858 | $ | 412,284 | ||||||||||
|
|
|
|
|
|
|
|
|
| |||||||||||
Net Asset Value, Offering and Redemption Price per Share | $ | 1.29 | $ | 1.59 | $ | 1.32 | $ | 1.00 | $ | 1.05 | ||||||||||
|
|
|
|
|
|
|
|
|
| |||||||||||
(1) Unaffiliated Investments, at Cost | $ | 707,180 | $ | 1,889,957 | $ | 786,282 | $ | 321,791 | $ | 413,776 | ||||||||||
(3) Investments in Repurchase Agreements, at Cost | – | – | – | 183,000 | – | |||||||||||||||
(4) Foreign Currency, at Cost | – | 1,063 | 919 | – | – | |||||||||||||||
(10) Shares Outstanding | 746,795 | 1,173,387 | 751,413 | 488,856 | 391,270 | |||||||||||||||
(11) Shares Authorized, $.01 Par Value | 2,000,000 | 3,000,000 | 2,000,000 | 2,000,000 | 2,000,000 | |||||||||||||||
The Accompanying Notes are an Integral Part of the Financial Statements.
225
Table of Contents
Statements of Assets and Liabilities
NORTHWESTERN MUTUAL SERIES FUND, INC.
December 31, 2021 (in thousands)
Select Bond Portfolio | Long-Term U.S. Government Bond Portfolio | Inflation Protection Portfolio | High Yield Bond Portfolio | Multi-Sector Bond Portfolio | ||||||||||||||||
Assets | ||||||||||||||||||||
Unaffiliated Investments, at Value (1) | $ | 3,797,519 | $ | 162,218 | $ | 512,675 | $ | 829,930 | $ | 1,302,818 | ||||||||||
Cash | 1 | – | – | – | 55 | |||||||||||||||
Foreign Currency, at Value (4) | – | – | – | – | 4,006 | |||||||||||||||
Cash Collateral for Derivative Positions | 470 | 423 | – | ��� | 8,579 | |||||||||||||||
Receivable for Portfolio Shares Sold | 14,415 | 15 | 184 | 181 | 248 | |||||||||||||||
Receivable for Investment Securities Sold | 251,689 | 5,255 | 412 | 7 | 10 | |||||||||||||||
Receivable for Financing Transactions | – | 127,216 | – | – | – | |||||||||||||||
Variation Margin Receivable | – | 77 | 13 | – | 825 | |||||||||||||||
Outstanding Swap Contracts, at Value (8) | – | – | 4,610 | – | 1,069 | |||||||||||||||
Receivable for Foreign Currency | – | – | 114 | – | 410 | |||||||||||||||
Prepaid Expenses and Other Assets | 23 | 1 | 3 | 8 | 9 | |||||||||||||||
Dividends and Interest Receivable | 11,513 | 810 | 1,162 | 12,661 | 14,322 | |||||||||||||||
|
|
|
|
|
|
|
|
|
| |||||||||||
Total Assets | 4,075,630 | 296,015 | 519,173 | 842,787 | 1,332,351 | |||||||||||||||
|
|
|
|
|
|
|
|
|
| |||||||||||
Liabilities | ||||||||||||||||||||
Payable for Portfolio Shares Redeemed | 334 | 22 | 40 | 110 | 88 | |||||||||||||||
Payable for Investment Securities Purchased | 645,942 | – | 105 | – | 7,462 | |||||||||||||||
Payable for Financing Transactions | – | 151,639 | – | – | – | |||||||||||||||
Variation Margin Payable | – | 90 | 359 | – | 45 | |||||||||||||||
Securities Sold Short, at Value (7) | – | 5,284 | – | – | – | |||||||||||||||
Payable for Reverse Repurchase Agreements | – | – | – | – | 1,648 | |||||||||||||||
Outstanding Swap Contracts, at Value (9) | – | – | 1,107 | – | 173 | |||||||||||||||
Payable for Foreign Currency | – | – | 193 | – | 4,326 | |||||||||||||||
Collateral from Counterparty | – | – | 3,181 | – | 1,090 | |||||||||||||||
Investment Advisory Fees | 849 | 66 | 212 | 297 | 753 | |||||||||||||||
Compliance Fees Payable | 4 | 2 | 2 | 3 | 3 | |||||||||||||||
Deferred Income for Financing Transactions | – | 6 | – | – | – | |||||||||||||||
Accrued Expenses | 85 | 37 | 43 | 45 | 112 | |||||||||||||||
|
|
|
|
|
|
|
|
|
| |||||||||||
Total Liabilities | 647,214 | 157,146 | 5,242 | 455 | 15,700 | |||||||||||||||
|
|
|
|
|
|
|
|
|
| |||||||||||
Net Assets | $ | 3,428,416 | $ | 138,869 | $ | 513,931 | $ | 842,332 | $ | 1,316,651 | ||||||||||
|
|
|
|
|
|
|
|
|
| |||||||||||
Represented By: | ||||||||||||||||||||
Aggregate Paid in Capital (10) (11) | $ | 3,396,353 | $ | 159,661 | $ | 453,988 | $ | 786,832 | $ | 1,268,433 | ||||||||||
Total Distributable Earnings (Loss) | 32,063 | (20,792 | ) | 59,943 | 55,500 | 48,218 | ||||||||||||||
|
|
|
|
|
|
|
|
|
| |||||||||||
Net Assets for Shares Outstanding (10) (11) | $ | 3,428,416 | $ | 138,869 | $ | 513,931 | $ | 842,332 | $ | 1,316,651 | ||||||||||
|
|
|
|
|
|
|
|
|
| |||||||||||
Net Asset Value, Offering and Redemption Price per Share | $ | 1.26 | $ | 0.94 | $ | 1.28 | $ | 0.75 | $ | 1.13 | ||||||||||
|
|
|
|
|
|
|
|
|
| |||||||||||
(1) Unaffiliated Investments, at Cost | $ | 3,809,859 | $ | 168,655 | $ | 490,161 | $ | 810,270 | $ | 1,304,681 | ||||||||||
(4) Foreign Currency, at Cost | – | – | – | – | 4,050 | |||||||||||||||
(7) Proceeds Received from Short Sales | – | 5,277 | – | – | – | |||||||||||||||
(8) Premiums Paid on Swap Contracts | – | 239 | 3 | – | 13,709 | |||||||||||||||
(9) Premiums Received from Swap Contracts | – | 217 | 1 | – | 5,327 | |||||||||||||||
(10) Shares Outstanding | 2,730,480 | 147,894 | 402,237 | 1,123,756 | 1,170,080 | |||||||||||||||
(11) Shares Authorized, $.01 Par Value | 6,000,000 | 2,000,000 | 2,000,000 | 3,000,000 | 2,000,000 | |||||||||||||||
The Accompanying Notes are an Integral Part of the Financial Statements.
226
Table of Contents
Statements of Assets and Liabilities
NORTHWESTERN MUTUAL SERIES FUND, INC.
December 31, 2021 (in thousands)
Balanced Portfolio | Asset Allocation Portfolio | |||||||
Assets | ||||||||
Unaffiliated Investments, at Value (1) | $ | 163,234 | $ | 18,976 | ||||
Affiliated Investments, at Value (2) | 2,209,609 | 300,593 | ||||||
Receivable for Portfolio Shares Sold | 237 | 21 | ||||||
Receivable for Investment Securities Sold | 35,752 | 3,912 | ||||||
Prepaid Expenses and Other Assets | 16 | 2 | ||||||
Dividends and Interest Receivable | 42 | 7 | ||||||
|
|
|
| |||||
Total Assets | 2,408,890 | 323,511 | ||||||
|
|
|
| |||||
Liabilities | ||||||||
Payable for Portfolio Shares Redeemed | 244 | 107 | ||||||
Payable for Investment Securities Purchased | 26,935 | 2,629 | ||||||
Investment Advisory Fees | 100 | 14 | ||||||
Compliance Fees Payable | 4 | 2 | ||||||
Accrued Expenses | 34 | 22 | ||||||
|
|
|
| |||||
Total Liabilities | 27,317 | 2,774 | ||||||
|
|
|
| |||||
Net Assets | $ | 2,381,573 | $ | 320,737 | ||||
|
|
|
| |||||
Represented By: | ||||||||
Aggregate Paid in Capital (10) (11) | $ | 1,951,876 | $ | 251,060 | ||||
Total Distributable Earnings (Loss) | 429,697 | 69,677 | ||||||
|
|
|
| |||||
Net Assets for Shares Outstanding (10) (11) | $ | 2,381,573 | $ | 320,737 | ||||
|
|
|
| |||||
Net Asset Value, Offering and Redemption Price per Share | $ | 1.57 | $ | 1.33 | ||||
|
|
|
| |||||
(1) Unaffiliated Investments, at Cost | $ | 157,883 | $ | 18,732 | ||||
(2) Affiliated Investments, at Cost | 1,988,665 | 258,194 | ||||||
(10) Shares Outstanding | 1,513,430 | 241,513 | ||||||
(11) Shares Authorized, $.01 Par Value | 4,000,000 | 2,000,000 | ||||||
The Accompanying Notes are an Integral Part of the Financial Statements.
227
Table of Contents
NORTHWESTERN MUTUAL SERIES FUND, INC.
For the Year Ended December 31, 2021 (in thousands)
Growth Stock Portfolio | Focused Appreciation Portfolio | Large Cap Core Stock Portfolio | Large Cap Blend Portfolio | Index 500 Stock Portfolio | ||||||||||||||||
Investment Income | ||||||||||||||||||||
Income | ||||||||||||||||||||
Interest (1) | $ | 2 | $ | 3 | $ | 1 | $ | 2 | $ | 11 | ||||||||||
Unaffiliated Dividends (1) | 4,356 | 7,773 | 8,873 | 2,809 | 68,757 | |||||||||||||||
|
|
|
|
|
|
|
|
|
| |||||||||||
Total Income | 4,358 | 7,776 | 8,874 | 2,811 | 68,768 | |||||||||||||||
|
|
|
|
|
|
|
|
|
| |||||||||||
Expenses | ||||||||||||||||||||
Investment Advisory Fees | 5,558 | 9,238 | 3,303 | 1,453 | 9,944 | |||||||||||||||
Custodian Fees | 45 | 74 | 27 | 18 | 38 | |||||||||||||||
Shareholder Reporting Fees | 13 | 14 | 13 | 15 | 12 | |||||||||||||||
Audit Fees | 28 | 25 | 28 | 21 | 41 | |||||||||||||||
Valuation Services | 1 | 1 | 2 | – | 6 | |||||||||||||||
Compliance Fees | 10 | 10 | 9 | 8 | 18 | |||||||||||||||
Directors Fees | 47 | 46 | 41 | 36 | 81 | |||||||||||||||
Professional Fees | 9 | 8 | 7 | 7 | 13 | |||||||||||||||
Trade Name Fees | – | – | – | – | 62 | |||||||||||||||
Other Expenses | 15 | 14 | 8 | 2 | 51 | |||||||||||||||
|
|
|
|
|
|
|
|
|
| |||||||||||
Total Expenses | 5,726 | 9,430 | 3,438 | 1,560 | 10,266 | |||||||||||||||
|
|
|
|
|
|
|
|
|
| |||||||||||
Less Waived Fees: | ||||||||||||||||||||
Paid by Affiliate | (71 | ) | (1,560 | ) | (87 | ) | (58 | ) | (594 | ) | ||||||||||
|
|
|
|
|
|
|
|
|
| |||||||||||
Net Expenses | 5,655 | 7,870 | 3,351 | 1,502 | 9,672 | |||||||||||||||
|
|
|
|
|
|
|
|
|
| |||||||||||
Net Investment Income (Loss) | (1,297 | ) | (94 | ) | 5,523 | 1,309 | 59,096 | |||||||||||||
Realized and Unrealized Gain (Loss) on Investments | ||||||||||||||||||||
Net Realized Gain (Loss) on: | ||||||||||||||||||||
Unaffiliated Investment Securities | 152,928 | 126,915 | 111,487 | 18,019 | 136,231 | |||||||||||||||
Futures Contracts | – | – | – | – | 13,259 | |||||||||||||||
|
|
|
|
|
|
|
|
|
| |||||||||||
Net Realized Gain (Loss) on Investments | 152,928 | 126,915 | 111,487 | 18,019 | 149,490 | |||||||||||||||
|
|
|
|
|
|
|
|
|
| |||||||||||
Net Unrealized Appreciation (Depreciation) of: | ||||||||||||||||||||
Unaffiliated Investment Securities | 51,611 | 91,159 | 58,406 | 13,123 | 1,029,895 | |||||||||||||||
Futures Contracts | – | – | – | – | (172 | ) | ||||||||||||||
|
|
|
|
|
|
|
|
|
| |||||||||||
Net Change in Unrealized Appreciation (Depreciation) of Investments | 51,611 | 91,159 | 58,406 | 13,123 | 1,029,723 | |||||||||||||||
|
|
|
|
|
|
|
|
|
| |||||||||||
Net Gain (Loss) on Investments | 204,539 | 218,074 | 169,893 | 31,142 | 1,179,213 | |||||||||||||||
|
|
|
|
|
|
|
|
|
| |||||||||||
Net Increase (Decrease) in Net Assets Resulting from Operations | $ | 203,242 | $ | 217,980 | $ | 175,416 | $ | 32,451 | $ | 1,238,309 | ||||||||||
|
|
|
|
|
|
|
|
|
| |||||||||||
(1) Net of Foreign Witholding Tax | $ | 18 | $ | 607 | $ | 63 | $ | 71 | $ | 9 | ||||||||||
The Accompanying Notes are an Integral Part of the Financial Statements.
228
Table of Contents
Statements of Operations
NORTHWESTERN MUTUAL SERIES FUND, INC.
For the Year Ended December 31, 2021 (in thousands)
Large Company Value Portfolio | Domestic Equity Portfolio | Equity Income Portfolio | Mid Cap Growth Stock Portfolio | Index 400 Stock Portfolio | ||||||||||||||||
Investment Income | ||||||||||||||||||||
Income | ||||||||||||||||||||
Interest (1) | $ | 1 | $ | 3 | $ | 53 | $ | – | $ | 4 | ||||||||||
Unaffiliated Dividends (1) | 5,415 | 23,428 | 19,607 | 9,090 | 16,085 | |||||||||||||||
|
|
|
|
|
|
|
|
|
| |||||||||||
Total Income | 5,416 | 23,431 | 19,660 | 9,090 | 16,089 | |||||||||||||||
|
|
|
|
|
|
|
|
|
| |||||||||||
Expenses | ||||||||||||||||||||
Investment Advisory Fees | 1,581 | 5,386 | 5,371 | 7,149 | 3,164 | |||||||||||||||
Custodian Fees | 49 | 20 | 28 | 34 | 32 | |||||||||||||||
Shareholder Reporting Fees | 14 | 14 | 13 | 11 | 13 | |||||||||||||||
Audit Fees | 25 | 25 | 26 | 28 | 29 | |||||||||||||||
Valuation Services | 14 | – | 1 | 1 | 5 | |||||||||||||||
Compliance Fees | 8 | 9 | 9 | 10 | 10 | |||||||||||||||
Directors Fees | 36 | 44 | 42 | 48 | 46 | |||||||||||||||
Professional Fees | 7 | 8 | 8 | 8 | 8 | |||||||||||||||
Trade Name Fees | – | – | – | – | 102 | |||||||||||||||
Other Expenses | 2 | 10 | 9 | 14 | 12 | |||||||||||||||
|
|
|
|
|
|
|
|
|
| |||||||||||
Total Expenses | 1,736 | 5,516 | 5,507 | 7,303 | 3,421 | |||||||||||||||
|
|
|
|
|
|
|
|
|
| |||||||||||
Less Waived Fees: | ||||||||||||||||||||
Paid by Affiliate | (46 | ) | (348 | ) | (664 | ) | (38 | ) | (383 | ) | ||||||||||
|
|
|
|
|
|
|
|
|
| |||||||||||
Net Expenses | 1,690 | 5,168 | 4,843 | 7,265 | 3,038 | |||||||||||||||
|
|
|
|
|
|
|
|
|
| |||||||||||
Net Investment Income (Loss) | 3,726 | 18,263 | 14,817 | 1,825 | 13,051 | |||||||||||||||
Realized and Unrealized Gain (Loss) on Investments | ||||||||||||||||||||
Net Realized Gain (Loss) on: | ||||||||||||||||||||
Unaffiliated Investment Securities | 28,571 | 118,336 | 79,832 | 97,265 | 115,945 | |||||||||||||||
Futures Contracts | – | – | – | – | 4,153 | |||||||||||||||
Foreign Currency Transactions | 1,082 | – | 4 | – | – | |||||||||||||||
|
|
|
|
|
|
|
|
|
| |||||||||||
Net Realized Gain (Loss) on Investments | 29,653 | 118,336 | 79,836 | 97,265 | 120,098 | |||||||||||||||
|
|
|
|
|
|
|
|
|
| |||||||||||
Net Unrealized Appreciation (Depreciation) of: | ||||||||||||||||||||
Unaffiliated Investment Securities | 11,529 | 72,800 | 97,811 | 35,035 | 134,980 | |||||||||||||||
Futures Contracts | – | – | – | – | (68 | ) | ||||||||||||||
Foreign Currency Transactions | (127 | ) | – | (1 | ) | – | – | |||||||||||||
|
|
|
|
|
|
|
|
|
| |||||||||||
Net Change in Unrealized Appreciation (Depreciation) of Investments | 11,402 | 72,800 | 97,810 | 35,035 | 134,912 | |||||||||||||||
|
|
|
|
|
|
|
|
|
| |||||||||||
Net Gain (Loss) on Investments | 41,055 | 191,136 | 177,646 | 132,300 | 255,010 | |||||||||||||||
|
|
|
|
|
|
|
|
|
| |||||||||||
Net Increase (Decrease) in Net Assets Resulting from Operations | $ | 44,781 | $ | 209,399 | $ | 192,463 | $ | 134,125 | $ | 268,061 | ||||||||||
|
|
|
|
|
|
|
|
|
| |||||||||||
(1) Net of Foreign Witholding Tax | $ | 103 | $ | – | $ | 379 | $ | 3 | $ | – | ||||||||||
The Accompanying Notes are an Integral Part of the Financial Statements.
229
Table of Contents
Statements of Operations
NORTHWESTERN MUTUAL SERIES FUND, INC.
For the Year Ended December 31, 2021 (in thousands)
Mid Cap Value Portfolio | Small Cap Growth Stock Portfolio | Index 600 Stock Portfolio | Small Cap Value Portfolio | International Growth Portfolio | ||||||||||||||||
Investment Income | ||||||||||||||||||||
Income | ||||||||||||||||||||
Interest (1) | $ | 4 | $ | 1 | $ | 2 | $ | 2 | $ | 73 | ||||||||||
Unaffiliated Dividends (1) | 15,132 | 4,075 | 6,341 | 7,586 | 11,270 | |||||||||||||||
|
|
|
|
|
|
|
|
|
| |||||||||||
Total Income | 15,136 | 4,076 | 6,343 | 7,588 | 11,343 | |||||||||||||||
|
|
|
|
|
|
|
|
|
| |||||||||||
Expenses | ||||||||||||||||||||
Investment Advisory Fees | 5,703 | 4,484 | 918 | 5,703 | 5,889 | |||||||||||||||
Custodian Fees | 61 | 28 | 53 | 32 | 155 | |||||||||||||||
Shareholder Reporting Fees | 15 | 13 | 15 | 13 | 13 | |||||||||||||||
Audit Fees | 27 | 25 | 26 | 24 | 29 | |||||||||||||||
Valuation Services | 15 | 2 | 8 | 2 | 15 | |||||||||||||||
Compliance Fees | 9 | 9 | 8 | 9 | 9 | |||||||||||||||
Directors Fees | 40 | 42 | 38 | 40 | 44 | |||||||||||||||
Professional Fees | 8 | 8 | 7 | 8 | 27 | |||||||||||||||
Trade Name Fees | – | – | 28 | – | – | |||||||||||||||
Other Expenses | 7 | 8 | 3 | 6 | 11 | |||||||||||||||
|
|
|
|
|
|
|
|
|
| |||||||||||
Total Expenses | 5,885 | 4,619 | 1,104 | 5,837 | 6,192 | |||||||||||||||
|
|
|
|
|
|
|
|
|
| |||||||||||
Less Waived Fees: | ||||||||||||||||||||
Paid by Affiliate | (1,079 | ) | – | – | (86 | ) | (3 | ) | ||||||||||||
|
|
|
|
|
|
|
|
|
| |||||||||||
Net Expenses | 4,806 | 4,619 | 1,104 | 5,751 | 6,189 | |||||||||||||||
|
|
|
|
|
|
|
|
|
| |||||||||||
Net Investment Income (Loss) | 10,330 | (543 | ) | 5,239 | 1,837 | 5,154 | ||||||||||||||
Realized and Unrealized Gain (Loss) on Investments | ||||||||||||||||||||
Net Realized Gain (Loss) on: | ||||||||||||||||||||
Unaffiliated Investment Securities | 98,349 | 111,184 | 31,885 | 75,354 | 96,158 | |||||||||||||||
Futures Contracts | – | – | 126 | – | – | |||||||||||||||
Swap Contracts | – | – | 1,689 | – | – | |||||||||||||||
Foreign Currency Transactions | 2,406 | – | – | – | (59 | ) | ||||||||||||||
|
|
|
|
|
|
|
|
|
| |||||||||||
Net Realized Gain (Loss) on Investments | 100,755 | 111,184 | 33,700 | 75,354 | 96,099 | |||||||||||||||
|
|
|
|
|
|
|
|
|
| |||||||||||
Net Unrealized Appreciation (Depreciation) of: | ||||||||||||||||||||
Unaffiliated Investment Securities | 26,706 | (75,989 | ) | 51,474 | 59,393 | 47,387 | ||||||||||||||
Futures Contracts | – | – | 81 | – | – | |||||||||||||||
Swap Contracts | – | – | (894 | ) | – | – | ||||||||||||||
Foreign Currency Transactions | (164 | ) | – | – | – | (96 | ) | |||||||||||||
|
|
|
|
|
|
|
|
|
| |||||||||||
Net Change in Unrealized Appreciation (Depreciation) of Investments | 26,542 | (75,989 | ) | 50,661 | 59,393 | 47,291 | ||||||||||||||
|
|
|
|
|
|
|
|
|
| |||||||||||
Net Gain (Loss) on Investments | 127,297 | 35,195 | 84,361 | 134,747 | 143,390 | |||||||||||||||
|
|
|
|
|
|
|
|
|
| |||||||||||
Net Increase (Decrease) in Net Assets Resulting from Operations | $ | 137,627 | $ | 34,652 | $ | 89,600 | $ | 136,584 | $ | 148,544 | ||||||||||
|
|
|
|
|
|
|
|
|
| |||||||||||
(1) Net of Foreign Witholding Tax | $ | 189 | $ | – | $ | 5 | $ | 12 | $ | 448 | ||||||||||
The Accompanying Notes are an Integral Part of the Financial Statements.
230
Table of Contents
Statements of Operations
NORTHWESTERN MUTUAL SERIES FUND, INC.
For the Year Ended December 31, 2021 (in thousands)
Research International Core Portfolio | International Equity Portfolio | Emerging Markets Equity Portfolio | Government Money Market Portfolio | Short-Term Bond Portfolio | ||||||||||||||||
Investment Income | ||||||||||||||||||||
Income | ||||||||||||||||||||
Interest (1) | $ | – | $ | 9 | $ | 6 | $ | 429 | $ | 6,690 | ||||||||||
Unaffiliated Dividends (1) | 19,711 | 52,886 | 21,152 | – | – | |||||||||||||||
|
|
|
|
|
|
|
|
|
| |||||||||||
Total Income | 19,711 | 52,895 | 21,158 | 429 | 6,690 | |||||||||||||||
|
|
|
|
|
|
|
|
|
| |||||||||||
Expenses | ||||||||||||||||||||
Investment Advisory Fees | 7,012 | 12,341 | 10,592 | 1,593 | 1,317 | |||||||||||||||
Custodian Fees | 150 | 228 | 200 | 41 | 54 | |||||||||||||||
Shareholder Reporting Fees | 15 | 11 | 14 | 15 | 17 | |||||||||||||||
Audit Fees | 29 | 32 | 29 | 25 | 31 | |||||||||||||||
Valuation Services | 16 | 15 | 15 | 9 | 58 | |||||||||||||||
Compliance Fees | 9 | 11 | 10 | 8 | 8 | |||||||||||||||
Directors Fees | 43 | 52 | 44 | 40 | 38 | |||||||||||||||
Professional Fees | 40 | 29 | 32 | 6 | 8 | |||||||||||||||
Other Expenses | 10 | 19 | 11 | 7 | 4 | |||||||||||||||
|
|
|
|
|
|
|
|
|
| |||||||||||
Total Expenses | 7,324 | 12,738 | 10,947 | 1,744 | 1,535 | |||||||||||||||
|
|
|
|
|
|
|
|
|
| |||||||||||
Less Waived Fees: | ||||||||||||||||||||
Paid by Affiliate | (468 | ) | (3,133 | ) | (1,597 | ) | (1,318 | ) | – | |||||||||||
|
|
|
|
|
|
|
|
|
| |||||||||||
Net Expenses | 6,856 | 9,605 | 9,350 | 426 | 1,535 | |||||||||||||||
|
|
|
|
|
|
|
|
|
| |||||||||||
Net Investment Income (Loss) | 12,855 | 43,290 | 11,808 | 3 | 5,155 | |||||||||||||||
Realized and Unrealized Gain (Loss) on Investments | ||||||||||||||||||||
Net Realized Gain (Loss) on: | ||||||||||||||||||||
Unaffiliated Investment Securities | 41,141 | 328,728 | 89,785 | 34 | 1,443 | |||||||||||||||
Futures Contracts | – | – | – | – | 289 | |||||||||||||||
Foreign Currency Transactions | (14 | ) | (340 | ) | (514 | ) | – | – | ||||||||||||
|
|
|
|
|
|
|
|
|
| |||||||||||
Net Realized Gain (Loss) on Investments | 41,127 | 328,388 | 89,271 | 34 | 1,732 | |||||||||||||||
|
|
|
|
|
|
|
|
|
| |||||||||||
Net Unrealized Appreciation (Depreciation) of: | ||||||||||||||||||||
Unaffiliated Investment Securities | 50,483 | (281,275 | ) | (145,190 | ) | – | (7,459 | ) | ||||||||||||
Futures Contracts | – | – | – | – | (203 | ) | ||||||||||||||
Foreign Currency Transactions | (147 | ) | (1,259 | ) | 5 | – | – | |||||||||||||
|
|
|
|
|
|
|
|
|
| |||||||||||
Net Change in Unrealized Appreciation (Depreciation) of Investments | 50,336 | (282,534 | ) | (145,185 | ) | – | (7,662 | ) | ||||||||||||
|
|
|
|
|
|
|
|
|
| |||||||||||
Net Gain (Loss) on Investments | 91,463 | 45,854 | (55,914 | ) | 34 | (5,930 | ) | |||||||||||||
|
|
|
|
|
|
|
|
|
| |||||||||||
Net Increase (Decrease) in Net Assets Resulting from Operations | $ | 104,318 | $ | 89,144 | $ | (44,106 | ) | $ | 37 | $ | (775 | ) | ||||||||
|
|
|
|
|
|
|
|
|
| |||||||||||
(1) Net of Foreign Witholding Tax | $ | 172 | $ | 1,524 | $ | 1,018 | $ | – | $ | 1 | ||||||||||
The Accompanying Notes are an Integral Part of the Financial Statements.
231
Table of Contents
Statements of Operations
NORTHWESTERN MUTUAL SERIES FUND, INC.
For the Year Ended December 31, 2021 (in thousands)
Select Bond Portfolio | Long – Term U.S. Government Bond Portfolio | Inflation Protection Portfolio | High Yield Bond Portfolio | Multi-Sector Bond Portfolio | ||||||||||||||||
Investment Income | ||||||||||||||||||||
Income | ||||||||||||||||||||
Interest (1) | $ | 49,501 | $ | 3,411 | $ | 17,081 | $ | 44,503 | $ | 45,436 | ||||||||||
Unaffiliated Dividends (1) | – | – | 275 | 90 | – | |||||||||||||||
|
|
|
|
|
|
|
|
|
| |||||||||||
Total Income | 49,501 | 3,411 | 17,356 | 44,593 | 45,436 | |||||||||||||||
|
|
|
|
|
|
|
|
|
| |||||||||||
Expenses | ||||||||||||||||||||
Investment Advisory Fees | 10,256 | 774 | 2,482 | 3,506 | 9,721 | |||||||||||||||
Custodian Fees | 84 | 34 | 39 | 24 | 176 | |||||||||||||||
Shareholder Reporting Fees | 15 | 15 | 15 | 14 | 18 | |||||||||||||||
Audit Fees | 44 | 34 | 35 | 36 | 45 | |||||||||||||||
Valuation Services | 58 | 11 | 20 | 40 | 63 | |||||||||||||||
Compliance Fees | 14 | 8 | 8 | 9 | 10 | |||||||||||||||
Directors Fees | 69 | 35 | 38 | 42 | 46 | |||||||||||||||
Professional Fees | 11 | 8 | 8 | 8 | 11 | |||||||||||||||
Interest Expense | – | 31 | – | – | 32 | |||||||||||||||
Other Expenses | 39 | 2 | 4 | 10 | 13 | |||||||||||||||
|
|
|
|
|
|
|
|
|
| |||||||||||
Total Expenses | 10,590 | 952 | 2,649 | 3,689 | 10,135 | |||||||||||||||
|
|
|
|
|
|
|
|
|
| |||||||||||
Less Waived Fees: | ||||||||||||||||||||
Paid by Affiliate | (284 | ) | (1 | ) | (171 | ) | – | (1,209 | ) | |||||||||||
|
|
|
|
|
|
|
|
|
| |||||||||||
Net Expenses | 10,306 | 951 | 2,478 | 3,689 | 8,926 | |||||||||||||||
|
|
|
|
|
|
|
|
|
| |||||||||||
Net Investment Income (Loss) | 39,195 | 2,460 | 14,878 | 40,904 | 36,510 | |||||||||||||||
Realized and Unrealized Gain (Loss) on Investments | ||||||||||||||||||||
Net Realized Gain (Loss) on: | ||||||||||||||||||||
Unaffiliated Investment Securities | 10,542 | (2,491 | ) | 10,662 | 3,902 | 10,087 | ||||||||||||||
Distributions of Realized Gains by Other Unaffiliated Investment Companies | – | – | 75 | – | – | |||||||||||||||
Futures Contracts | – | 2,233 | (600 | ) | – | (11,264 | ) | |||||||||||||
Options Written | – | – | – | – | 71 | |||||||||||||||
Short Sales | – | 100 | – | – | – | |||||||||||||||
Swap Contracts | – | 259 | (10 | ) | – | 14,995 | ||||||||||||||
Foreign Currency Transactions | – | – | 198 | – | 18,972 | |||||||||||||||
|
|
|
|
|
|
|
|
|
| |||||||||||
Net Realized Gain (Loss) on Investments | 10,542 | 101 | 10,325 | 3,902 | 32,861 | |||||||||||||||
|
|
|
|
|
|
|
|
|
| |||||||||||
Net Unrealized Appreciation (Depreciation) of: | ||||||||||||||||||||
Unaffiliated Investment Securities | (105,282 | ) | (10,380 | ) | (11,729 | ) | (1,638 | ) | (64,170 | ) | ||||||||||
Futures Contracts | – | (442 | ) | (87 | ) | – | 1,424 | |||||||||||||
Short Sales | – | 97 | – | – | – | |||||||||||||||
Swap Contracts | – | 102 | 17,054 | – | (5,660 | ) | ||||||||||||||
Foreign Currency Transactions | – | – | 227 | – | (468 | ) | ||||||||||||||
|
|
|
|
|
|
|
|
|
| |||||||||||
Net Change in Unrealized Appreciation (Depreciation) of Investments | (105,282 | ) | (10,623 | ) | 5,465 | (1,638 | ) | (68,874 | ) | |||||||||||
|
|
|
|
|
|
|
|
|
| |||||||||||
Net Gain (Loss) on Investments | (94,740 | ) | (10,522 | ) | 15,790 | 2,264 | (36,013 | ) | ||||||||||||
|
|
|
|
|
|
|
|
|
| |||||||||||
Net Increase (Decrease) in Net Assets Resulting from Operations | $ | (55,545 | ) | $ | (8,062 | ) | $ | 30,668 | $ | 43,168 | $ | 497 | ||||||||
|
|
|
|
|
|
|
|
|
| |||||||||||
The Accompanying Notes are an Integral Part of the Financial Statements.
232
Table of Contents
Statements of Operations
NORTHWESTERN MUTUAL SERIES FUND, INC.
For the Year Ended December 31, 2021 (in thousands)
Balanced Portfolio | Asset Allocation Portfolio | |||||||
Investment Income | ||||||||
Income | ||||||||
Interest (1) | $ | 31 | $ | 5 | ||||
Unaffiliated Dividends (1) | 1,499 | 215 | ||||||
Affiliated Dividends | 35,907 | 4,413 | ||||||
|
|
|
| |||||
Total Income | 37,437 | 4,633 | ||||||
|
|
|
| |||||
Expenses | ||||||||
Investment Advisory Fees | 7,170 | 1,623 | ||||||
Custodian Fees | 18 | 18 | ||||||
Shareholder Reporting Fees | 13 | 13 | ||||||
Audit Fees | 36 | 29 | ||||||
Valuation Services | 1 | 1 | ||||||
Compliance Fees | 12 | 8 | ||||||
Directors Fees | 58 | 37 | ||||||
Professional Fees | 10 | 7 | ||||||
Other Expenses | 27 | 3 | ||||||
|
|
|
| |||||
Total Expenses | 7,345 | 1,739 | ||||||
|
|
|
| |||||
Less Waived Fees: | ||||||||
Paid by Affiliate | (5,975 | ) | (1,464 | ) | ||||
|
|
|
| |||||
Net Expenses | 1,370 | 275 | ||||||
|
|
|
| |||||
Net Investment Income (Loss) | 36,067 | 4,358 | ||||||
Realized and Unrealized Gain (Loss) on Investments | ||||||||
Net Realized Gain (Loss) on: | ||||||||
Unaffiliated Investment Securities | 12,247 | 2,238 | ||||||
Affiliated Investment Securities | 66,743 | 8,712 | ||||||
Distributions of Realized Gains by Other Affiliated Investment Companies | 90,853 | 11,865 | ||||||
Distributions of Realized Gains by Other Unaffiliated Investment Companies | 17 | 2 | ||||||
|
|
|
| |||||
Net Realized Gain (Loss) on Investments | 169,860 | 22,817 | ||||||
|
|
|
| |||||
Net Unrealized Appreciation (Depreciation) of: | ||||||||
Unaffiliated Investment Securities | (6,507 | ) | (1,383 | ) | ||||
Affiliated Investment Securities | (26,853 | ) | 5,684 | |||||
|
|
|
| |||||
Net Change in Unrealized Appreciation (Depreciation) of Investments | (33,360 | ) | 4,301 | |||||
|
|
|
| |||||
Net Gain (Loss) on Investments | 136,500 | 27,118 | ||||||
|
|
|
| |||||
Net Increase (Decrease) in Net Assets Resulting from Operations | $ | 172,567 | $ | 31,476 | ||||
|
|
|
| |||||
The Accompanying Notes are an Integral Part of the Financial Statements.
233
Table of Contents
Statements of Changes in Net Assets
NORTHWESTERN MUTUAL SERIES FUND, INC.
(in thousands)
Growth Stock Portfolio | Focused Appreciation Portfolio | Large Cap Core Stock Portfolio | ||||||||||||||||||||||
For the Year Ended December 31, 2021 | For the Year Ended December 31, 2020 | For the Year Ended December 31, 2021 | For the Year Ended December 31, 2020 | For the Year Ended December 31, 2021 | For the Year Ended December 31, 2020 | |||||||||||||||||||
Change in Net Assets | ||||||||||||||||||||||||
Operations | ||||||||||||||||||||||||
Net Investment Income (Loss) | $ | (1,297 | ) | $ | 49 | $ | (94 | ) | $ | 1,975 | $ | 5,523 | $ | 6,178 | ||||||||||
Net Realized Gain (Loss) on Investments | 152,928 | 54,774 | 126,915 | 125,701 | 111,487 | 54,967 | ||||||||||||||||||
Net Change in Unrealized Appreciation | 51,611 | 301,919 | 91,159 | 175,696 | 58,406 | 74,476 | ||||||||||||||||||
|
|
|
|
|
|
|
|
|
|
|
| |||||||||||||
Net Increase (Decrease) in Net Assets | 203,242 | 356,742 | 217,980 | 303,372 | 175,416 | 135,621 | ||||||||||||||||||
|
|
|
|
|
|
|
|
|
|
|
| |||||||||||||
Distributions to Shareholders from: | ||||||||||||||||||||||||
Net Investment Income & Net Realized | (55,999 | ) | (195,980 | ) | (128,631 | ) | (50,373 | ) | (63,357 | ) | (24,636 | ) | ||||||||||||
|
|
|
|
|
|
|
|
|
|
|
| |||||||||||||
Net Decrease in Net Assets Resulting | (55,999 | ) | (195,980 | ) | (128,631 | ) | (50,373 | ) | (63,357 | ) | (24,636 | ) | ||||||||||||
|
|
|
|
|
|
|
|
|
|
|
| |||||||||||||
Capital Transactions: | ||||||||||||||||||||||||
Shares Sold | 66,958 | 45,556 | 67,399 | 59,733 | 18,494 | 22,905 | ||||||||||||||||||
Reinvestment of Distributions Paid | 55,999 | 195,980 | 128,631 | 50,373 | 63,357 | 24,636 | ||||||||||||||||||
Shares Redeemed | (166,704 | ) | (199,219 | ) | (144,714 | ) | (189,033 | ) | (71,081 | ) | (71,757 | ) | ||||||||||||
|
|
|
|
|
|
|
|
|
|
|
| |||||||||||||
Net Increase (Decrease) in Net Assets | (43,747 | ) | 42,317 | 51,316 | (78,927 | ) | 10,770 | (24,216 | ) | |||||||||||||||
|
|
|
|
|
|
|
|
|
|
|
| |||||||||||||
Total Increase (Decrease) in Net Assets | 103,496 | 203,079 | 140,665 | 174,072 | 122,829 | 86,769 | ||||||||||||||||||
Net Assets | ||||||||||||||||||||||||
Beginning of Period | 1,286,403 | 1,083,324 | 1,186,696 | 1,012,624 | 719,977 | 633,208 | ||||||||||||||||||
|
|
|
|
|
|
|
|
|
|
|
| |||||||||||||
End of Period | $ | 1,389,899 | $ | 1,286,403 | $ | 1,327,361 | $ | 1,186,696 | $ | 842,806 | $ | 719,977 | ||||||||||||
|
|
|
|
|
|
|
|
|
|
|
| |||||||||||||
Portfolio Share Transactions: | ||||||||||||||||||||||||
Shares Sold | 16,816 | 13,216 | 15,424 | 16,862 | 8,789 | 14,085 | ||||||||||||||||||
Reinvestment of Distributions Paid | 13,432 | 59,841 | 29,970 | 13,644 | 29,913 | 14,440 | ||||||||||||||||||
Shares Redeemed | (43,417 | ) | (57,015 | ) | (33,493 | ) | (54,134 | ) | (33,738 | ) | (43,249 | ) | ||||||||||||
|
|
|
|
|
|
|
|
|
|
|
| |||||||||||||
Net Increase (Decrease) in Shares | (13,169 | ) | 16,042 | 11,901 | (23,628 | ) | 4,964 | (14,724 | ) | |||||||||||||||
|
|
|
|
|
|
|
|
|
|
|
| |||||||||||||
The Accompanying Notes are an Integral Part of the Financial Statements.
234
Table of Contents
Statements of Changes in Net Assets
NORTHWESTERN MUTUAL SERIES FUND, INC.
(in thousands)
Large Cap Blend Portfolio | Index 500 Stock Portfolio | Large Company Value Portfolio | ||||||||||||||||||||||
For the Year Ended December 31, 2021 | For the Year Ended December 31, 2020 | For the Year Ended December 31, 2021 | For the Year Ended December 31, 2020 | For the Year Ended December 31, 2021 | For the Year Ended December 31, 2020 | |||||||||||||||||||
Change in Net Assets | ||||||||||||||||||||||||
Operations | ||||||||||||||||||||||||
Net Investment Income (Loss) | $ | 1,309 | $ | 1,226 | $ | 59,096 | $ | 62,303 | $ | 3,726 | $ | 3,767 | ||||||||||||
Net Realized Gain (Loss) on Investments | 18,019 | 12,450 | 149,490 | 124,699 | 29,653 | 1,679 | ||||||||||||||||||
Net Change in Unrealized Appreciation | 13,123 | 2,686 | 1,029,723 | 495,371 | 11,402 | 607 | ||||||||||||||||||
|
|
|
|
|
|
|
|
|
|
|
| |||||||||||||
Net Increase (Decrease) in Net Assets | 32,451 | 16,362 | 1,238,309 | 682,373 | 44,781 | 6,053 | ||||||||||||||||||
|
|
|
|
|
|
|
|
|
|
|
| |||||||||||||
Distributions to Shareholders from: | ||||||||||||||||||||||||
Net Investment Income & Net Realized | (13,080 | ) | (10,592 | ) | (186,699 | ) | (139,079 | ) | (5,187 | ) | (10,823 | ) | ||||||||||||
|
|
|
|
|
|
|
|
|
|
|
| |||||||||||||
Net Decrease in Net Assets Resulting | (13,080 | ) | (10,592 | ) | (186,699 | ) | (139,079 | ) | (5,187 | ) | (10,823 | ) | ||||||||||||
|
|
|
|
|
|
|
|
|
|
|
| |||||||||||||
Capital Transactions: | ||||||||||||||||||||||||
Shares Sold | 4,803 | 7,220 | 291,017 | 239,426 | 18,519 | 20,650 | ||||||||||||||||||
Reinvestment of Distributions Paid | 13,080 | 10,592 | 186,699 | 139,079 | 5,187 | 10,823 | ||||||||||||||||||
Shares Redeemed | (14,692 | ) | (17,971 | ) | (444,085 | ) | (369,350 | ) | (47,738 | ) | (20,255 | ) | ||||||||||||
|
|
|
|
|
|
|
|
|
|
|
| |||||||||||||
Net Increase (Decrease) in Net Assets | 3,191 | (159 | ) | 33,631 | 9,155 | (24,032 | ) | 11,218 | ||||||||||||||||
|
|
|
|
|
|
|
|
|
|
|
| |||||||||||||
Total Increase (Decrease) in Net Assets | 22,562 | 5,611 | 1,085,241 | 552,449 | 15,562 | 6,448 | ||||||||||||||||||
Net Assets | ||||||||||||||||||||||||
Beginning of Period | 180,564 | 174,953 | 4,419,729 | 3,867,280 | 211,998 | 205,550 | ||||||||||||||||||
|
|
|
|
|
|
|
|
|
|
|
| |||||||||||||
End of Period | $ | 203,126 | $ | 180,564 | $ | 5,504,970 | $ | 4,419,729 | $ | 227,560 | $ | 211,998 | ||||||||||||
|
|
|
|
|
|
|
|
|
|
|
| |||||||||||||
Portfolio Share Transactions: | ||||||||||||||||||||||||
Shares Sold | 3,584 | 6,546 | 39,131 | 42,394 | 16,602 | 22,777 | ||||||||||||||||||
Reinvestment of Distributions Paid | 10,031 | 9,577 | 24,195 | 23,469 | 4,538 | 12,065 | ||||||||||||||||||
Shares Redeemed | (11,061 | ) | (15,787 | ) | (59,643 | ) | (64,668 | ) | (42,048 | ) | (22,038 | ) | ||||||||||||
|
|
|
|
|
|
|
|
|
|
|
| |||||||||||||
Net Increase (Decrease) in Shares | 2,554 | 336 | 3,683 | 1,195 | (20,908 | ) | 12,804 | |||||||||||||||||
|
|
|
|
|
|
|
|
|
|
|
| |||||||||||||
The Accompanying Notes are an Integral Part of the Financial Statements.
235
Table of Contents
Statements of Changes in Net Assets
NORTHWESTERN MUTUAL SERIES FUND, INC.
(in thousands)
Domestic Equity Portfolio | Equity Income Portfolio | Mid Cap Growth Stock Portfolio | ||||||||||||||||||||||
For the Year Ended December 31, 2021 | For the Year Ended December 31, 2020 | For the Year Ended December 31, 2021 | For the Year Ended December 31, 2020 | For the Year Ended December 31, 2021 | For the Year Ended December 31, 2020 | |||||||||||||||||||
Change in Net Assets | ||||||||||||||||||||||||
Operations | ||||||||||||||||||||||||
Net Investment Income (Loss) | $ | 18,263 | $ | 18,599 | $ | 14,817 | $ | 17,281 | $ | 1,825 | $ | 2,019 | ||||||||||||
Net Realized Gain (Loss) on Investments | 118,336 | 22,615 | 79,836 | (705 | ) | 97,265 | 171,779 | |||||||||||||||||
Net Change in Unrealized Appreciation | 72,800 | (27,842 | ) | 97,810 | (7,003 | ) | 35,035 | 99,912 | ||||||||||||||||
|
|
|
|
|
|
|
|
|
|
|
| |||||||||||||
Net Increase (Decrease) in Net Assets | 209,399 | 13,372 | 192,463 | 9,573 | 134,125 | 273,710 | ||||||||||||||||||
|
|
|
|
|
|
|
|
|
|
|
| |||||||||||||
Distributions to Shareholders from: | ||||||||||||||||||||||||
Net Investment Income & Net Realized | (41,951 | ) | (57,933 | ) | (17,168 | ) | (63,828 | ) | (177,020 | ) | (52,240 | ) | ||||||||||||
|
|
|
|
|
|
|
|
|
|
|
| |||||||||||||
Net Decrease in Net Assets Resulting | (41,951 | ) | (57,933 | ) | (17,168 | ) | (63,828 | ) | (177,020 | ) | (52,240 | ) | ||||||||||||
|
|
|
|
|
|
|
|
|
|
|
| |||||||||||||
Capital Transactions: | ||||||||||||||||||||||||
Shares Sold | 67,692 | 86,700 | 26,819 | 49,586 | 27,950 | 29,297 | ||||||||||||||||||
Reinvestment of Distributions Paid | 41,951 | 57,933 | 17,168 | 63,828 | 177,020 | 52,240 | ||||||||||||||||||
Shares Redeemed | (126,486 | ) | (74,776 | ) | (138,867 | ) | (85,890 | ) | (131,071 | ) | (112,200 | ) | ||||||||||||
|
|
|
|
|
|
|
|
|
|
|
| |||||||||||||
Net Increase (Decrease) in Net Assets | (16,843 | ) | 69,857 | (94,880 | ) | 27,524 | 73,899 | (30,663 | ) | |||||||||||||||
|
|
|
|
|
|
|
|
|
|
|
| |||||||||||||
Total Increase (Decrease) in Net Assets | 150,605 | 25,296 | 80,415 | (26,731 | ) | 31,004 | 190,807 | |||||||||||||||||
Net Assets | ||||||||||||||||||||||||
Beginning of Period | 946,072 | 920,776 | 787,521 | 814,252 | 1,344,564 | 1,153,757 | ||||||||||||||||||
|
|
|
|
|
|
|
|
|
|
|
| |||||||||||||
End of Period | $ | 1,096,677 | $ | 946,072 | $ | 867,936 | $ | 787,521 | $ | 1,375,568 | $ | 1,344,564 | ||||||||||||
|
|
|
|
|
|
|
|
|
|
|
| |||||||||||||
Portfolio Share Transactions: | ||||||||||||||||||||||||
Shares Sold | 37,242 | 58,482 | 14,138 | 34,469 | 6,644 | 8,941 | ||||||||||||||||||
Reinvestment of Distributions Paid | 23,229 | 39,707 | 8,979 | 45,690 | 45,390 | 15,850 | ||||||||||||||||||
Shares Redeemed | (69,390 | ) | (48,392 | ) | (73,961 | ) | (56,283 | ) | (30,976 | ) | (33,225 | ) | ||||||||||||
|
|
|
|
|
|
|
|
|
|
|
| |||||||||||||
Net Increase (Decrease) in Shares | (8,919 | ) | 49,797 | (50,844 | ) | 23,876 | 21,058 | (8,434 | ) | |||||||||||||||
|
|
|
|
|
|
|
|
|
|
|
| |||||||||||||
The Accompanying Notes are an Integral Part of the Financial Statements.
236
Table of Contents
Statements of Changes in Net Assets
NORTHWESTERN MUTUAL SERIES FUND, INC.
(in thousands)
Index 400 Stock Portfolio | Mid Cap Value Portfolio | Small Cap Growth Stock Portfolio | ||||||||||||||||||||||
For the Year Ended December 31, 2021 | For the Year Ended December 31, 2020 | For the Year Ended December 31, 2021 | For the Year Ended December 31, 2020 | For the Year Ended December 31, 2021 | For the Year Ended December 31, 2020 | |||||||||||||||||||
Change in Net Assets | ||||||||||||||||||||||||
Operations | ||||||||||||||||||||||||
Net Investment Income (Loss) | $ | 13,051 | $ | 12,047 | $ | 10,330 | $ | 9,497 | $ | (543 | ) | $ | 660 | |||||||||||
Net Realized Gain (Loss) on Investments | 120,098 | 37,405 | 100,755 | 2,441 | 111,184 | 82,005 | ||||||||||||||||||
Net Change in Unrealized Appreciation | 134,912 | 88,149 | 26,542 | 2,425 | (75,989 | ) | 130,687 | |||||||||||||||||
|
|
|
|
|
|
|
|
|
|
|
| |||||||||||||
Net Increase (Decrease) in Net Assets | 268,061 | 137,601 | 137,627 | 14,363 | 34,652 | 213,352 | ||||||||||||||||||
|
|
|
|
|
|
|
|
|
|
|
| |||||||||||||
Distributions to Shareholders from: | ||||||||||||||||||||||||
Net Investment Income & Net Realized | (49,492 | ) | (56,269 | ) | (12,785 | ) | (9,956 | ) | (82,706 | ) | (39,514 | ) | ||||||||||||
|
|
|
|
|
|
|
|
|
|
|
| |||||||||||||
Net Decrease in Net Assets Resulting | (49,492 | ) | (56,269 | ) | (12,785 | ) | (9,956 | ) | (82,706 | ) | (39,514 | ) | ||||||||||||
|
|
|
|
|
|
|
|
|
|
|
| |||||||||||||
Capital Transactions: | ||||||||||||||||||||||||
Shares Sold | 79,432 | 77,991 | 47,082 | 51,959 | 39,867 | 30,495 | ||||||||||||||||||
Reinvestment of Distributions Paid | 49,492 | 56,269 | 12,785 | 9,956 | 82,706 | 39,514 | ||||||||||||||||||
Shares Redeemed | (127,025 | ) | (93,413 | ) | (80,257 | ) | (57,433 | ) | (84,951 | ) | (75,271 | ) | ||||||||||||
|
|
|
|
|
|
|
|
|
|
|
| |||||||||||||
Net Increase (Decrease) in Net Assets | 1,899 | 40,847 | (20,390 | ) | 4,482 | 37,622 | (5,262 | ) | ||||||||||||||||
|
|
|
|
|
|
|
|
|
|
|
| |||||||||||||
Total Increase (Decrease) in Net Assets | 220,468 | 122,179 | 104,452 | 8,889 | (10,432 | ) | 168,576 | |||||||||||||||||
Net Assets | ||||||||||||||||||||||||
Beginning of Period | 1,115,469 | 993,290 | 600,403 | 591,514 | 840,446 | 671,870 | ||||||||||||||||||
|
|
|
|
|
|
|
|
|
|
|
| |||||||||||||
End of Period | $ | 1,335,937 | $ | 1,115,469 | $ | 704,855 | $ | 600,403 | $ | 830,014 | $ | 840,446 | ||||||||||||
|
|
|
|
|
|
|
|
|
|
|
| |||||||||||||
Portfolio Share Transactions: | ||||||||||||||||||||||||
Shares Sold | 32,105 | 45,756 | 25,282 | 37,414 | 11,481 | 11,794 | ||||||||||||||||||
Reinvestment of Distributions Paid | 20,185 | 31,899 | 6,732 | 6,838 | 24,821 | 14,996 | ||||||||||||||||||
Shares Redeemed | (51,909 | ) | (50,960 | ) | (42,723 | ) | (38,243 | ) | (24,328 | ) | (27,751 | ) | ||||||||||||
|
|
|
|
|
|
|
|
|
|
|
| |||||||||||||
Net Increase (Decrease) in Shares | 381 | 26,695 | (10,709 | ) | 6,009 | 11,974 | (961 | ) | ||||||||||||||||
|
|
|
|
|
|
|
|
|
|
|
| |||||||||||||
The Accompanying Notes are an Integral Part of the Financial Statements.
237
Table of Contents
Statements of Changes in Net Assets
��
NORTHWESTERN MUTUAL SERIES FUND, INC.
(in thousands)
Index 600 Stock Portfolio | Small Cap Value Portfolio | International Growth Portfolio | ||||||||||||||||||||||
For the Year Ended December 31, 2021 | For the Year Ended December 31, 2020 | For the Year Ended December 31, 2021 | For the Year Ended December 31, 2020 | For the Year Ended December 31, 2021 | For the Year Ended December 31, 2020 | |||||||||||||||||||
Change in Net Assets | ||||||||||||||||||||||||
Operations | ||||||||||||||||||||||||
Net Investment Income (Loss) | $ | 5,239 | $ | 2,939 | $ | 1,837 | $ | 2,586 | $ | 5,154 | $ | 5,151 | ||||||||||||
Net Realized Gain (Loss) on Investments | 33,700 | 6,020 | 75,354 | 29,017 | 96,099 | 29,704 | ||||||||||||||||||
Net Change in Unrealized Appreciation | 50,661 | 31,689 | 59,393 | 20,993 | 47,291 | 106,591 | ||||||||||||||||||
|
|
|
|
|
|
|
|
|
|
|
| |||||||||||||
Net Increase (Decrease) in Net Assets | 89,600 | 40,648 | 136,584 | 52,596 | 148,544 | 141,446 | ||||||||||||||||||
|
|
|
|
|
|
|
|
|
|
|
| |||||||||||||
Distributions to Shareholders from: | ||||||||||||||||||||||||
Net Investment Income & Net Realized | (9,577 | ) | (15,825 | ) | (31,940 | ) | (35,987 | ) | (34,654 | ) | (16,639 | ) | ||||||||||||
|
|
|
|
|
|
|
|
|
|
|
| |||||||||||||
Net Decrease in Net Assets Resulting | (9,577 | ) | (15,825 | ) | (31,940 | ) | (35,987 | ) | (34,654 | ) | (16,639 | ) | ||||||||||||
|
|
|
|
|
|
|
|
|
|
|
| |||||||||||||
Capital Transactions: | ||||||||||||||||||||||||
Shares Sold | 52,725 | 47,484 | 18,877 | 27,670 | 82,450 | 60,618 | ||||||||||||||||||
Reinvestment of Distributions Paid | 9,577 | 15,825 | 31,940 | 35,987 | 34,654 | 16,639 | ||||||||||||||||||
Shares Redeemed | (52,001 | ) | (34,141 | ) | (85,236 | ) | (70,721 | ) | (87,004 | ) | (93,935 | ) | ||||||||||||
|
|
|
|
|
|
|
|
|
|
|
| |||||||||||||
Net Increase (Decrease) in Net Assets | 10,301 | 29,168 | (34,419 | ) | (7,064 | ) | 30,100 | (16,678 | ) | |||||||||||||||
|
|
|
|
|
|
|
|
|
|
|
| |||||||||||||
Total Increase (Decrease) in Net Assets | 90,324 | 53,991 | 70,225 | 9,545 | 143,990 | 108,129 | ||||||||||||||||||
Net Assets | ||||||||||||||||||||||||
Beginning of Period | 344,102 | 290,111 | 615,079 | 605,534 | 924,242 | 816,113 | ||||||||||||||||||
|
|
|
|
|
|
|
|
|
|
|
| |||||||||||||
End of Period | $ | 434,426 | $ | 344,102 | $ | 685,304 | $ | 615,079 | $ | 1,068,232 | $ | 924,242 | ||||||||||||
|
|
|
|
|
|
|
|
|
|
|
| |||||||||||||
Portfolio Share Transactions: | ||||||||||||||||||||||||
Shares Sold | 29,519 | 41,370 | 7,540 | 16,477 | 36,250 | 33,344 | ||||||||||||||||||
Reinvestment of Distributions Paid | 5,423 | 13,446 | 13,016 | 20,635 | 14,284 | 8,446 | ||||||||||||||||||
Shares Redeemed | (29,578 | ) | (27,540 | ) | (34,221 | ) | (36,952 | ) | (37,660 | ) | (50,648 | ) | ||||||||||||
|
|
|
|
|
|
|
|
|
|
|
| |||||||||||||
Net Increase (Decrease) in Shares | 5,364 | 27,276 | (13,665 | ) | 160 | 12,874 | (8,858 | ) | ||||||||||||||||
|
|
|
|
|
|
|
|
|
|
|
| |||||||||||||
The Accompanying Notes are an Integral Part of the Financial Statements.
238
Table of Contents
Statements of Changes in Net Assets
NORTHWESTERN MUTUAL SERIES FUND, INC.
(in thousands)
Research International Core Portfolio | International Equity Portfolio | Emerging Markets Equity Portfolio | ||||||||||||||||||||||
For the Year Ended December 31, 2021 | For the Year Ended December 31, 2020 | For the Year Ended December 31, 2021 | For the Year Ended December 31, 2020 | For the Year Ended December 31, 2021 | For the Year Ended December 31, 2020 | |||||||||||||||||||
Change in Net Assets | ||||||||||||||||||||||||
Operations | ||||||||||||||||||||||||
Net Investment Income (Loss) | $ | 12,855 | $ | 10,392 | $ | 43,290 | $ | 41,111 | $ | 11,808 | $ | 5,407 | ||||||||||||
Net Realized Gain (Loss) on Investments | 41,127 | 14,833 | 328,388 | (250,648 | ) | 89,271 | 1,940 | |||||||||||||||||
Net Change in Unrealized Appreciation | 50,336 | 82,425 | (282,534 | ) | 170,374 | (145,185 | ) | 220,945 | ||||||||||||||||
|
|
|
|
|
|
|
|
|
|
|
| |||||||||||||
Net Increase (Decrease) in Net Assets | 104,318 | 107,650 | 89,144 | (39,163 | ) | (44,106 | ) | 228,292 | ||||||||||||||||
|
|
|
|
|
|
|
|
|
|
|
| |||||||||||||
Distributions to Shareholders from: | ||||||||||||||||||||||||
Net Investment Income & Net Realized | (24,775 | ) | (30,940 | ) | (43,243 | ) | (56,976 | ) | (5,199 | ) | (18,235 | ) | ||||||||||||
|
|
|
|
|
|
|
|
|
|
|
| |||||||||||||
Net Decrease in Net Assets Resulting | (24,775 | ) | (30,940 | ) | (43,243 | ) | (56,976 | ) | (5,199 | ) | (18,235 | ) | ||||||||||||
|
|
|
|
|
|
|
|
|
|
|
| |||||||||||||
Capital Transactions: | ||||||||||||||||||||||||
Shares Sold | 93,466 | 68,253 | 144,483 | 149,908 | 141,055 | 89,800 | ||||||||||||||||||
Reinvestment of Distributions Paid | 24,775 | 30,940 | 43,243 | 56,976 | 5,199 | 18,235 | ||||||||||||||||||
Shares Redeemed | (125,682 | ) | (69,787 | ) | (148,238 | ) | (123,960 | ) | (127,554 | ) | (128,004 | ) | ||||||||||||
|
|
|
|
|
|
|
|
|
|
|
| |||||||||||||
Net Increase (Decrease) in Net Assets | (7,441 | ) | 29,406 | 39,488 | 82,924 | 18,700 | (19,969 | ) | ||||||||||||||||
|
|
|
|
|
|
|
|
|
|
|
| |||||||||||||
Total Increase (Decrease) in Net Assets | 72,102 | 106,116 | 85,389 | (13,215 | ) | (30,605 | ) | 190,088 | ||||||||||||||||
Net Assets | ||||||||||||||||||||||||
Beginning of Period | 891,001 | 784,885 | 1,779,819 | 1,793,034 | 1,024,098 | 834,010 | ||||||||||||||||||
|
|
|
|
|
|
|
|
|
|
|
| |||||||||||||
End of Period | $ | 963,103 | $ | 891,001 | $ | 1,865,208 | $ | 1,779,819 | $ | 993,493 | $ | 1,024,098 | ||||||||||||
|
|
|
|
|
|
|
|
|
|
|
| |||||||||||||
Portfolio Share Transactions: | ||||||||||||||||||||||||
Shares Sold | 74,528 | 67,304 | 88,595 | 107,989 | 100,724 | 90,152 | ||||||||||||||||||
Reinvestment of Distributions Paid | 18,927 | 28,782 | 26,050 | 40,209 | 3,633 | 16,137 | ||||||||||||||||||
Shares Redeemed | (100,841 | ) | (67,172 | ) | (90,302 | ) | (85,956 | ) | (88,474 | ) | (114,781 | ) | ||||||||||||
|
|
|
|
|
|
|
|
|
|
|
| |||||||||||||
Net Increase (Decrease) in Shares | (7,386 | ) | 28,914 | 24,343 | 62,242 | 15,883 | (8,492 | ) | ||||||||||||||||
|
|
|
|
|
|
|
|
|
|
|
| |||||||||||||
The Accompanying Notes are an Integral Part of the Financial Statements.
239
Table of Contents
Statements of Changes in Net Assets
NORTHWESTERN MUTUAL SERIES FUND, INC.
(in thousands)
Government Money Market Portfolio | Short-Term Bond Portfolio | Select Bond Portfolio | ||||||||||||||||||||||
For the Year Ended December 31, 2021 | For the Year Ended December 31, 2020 | For the Year Ended December 31, 2021 | For the Year Ended December 31, 2020 | For the Year Ended December 31, 2021 | For the Year Ended December 31, 2020 | |||||||||||||||||||
Change in Net Assets | ||||||||||||||||||||||||
Operations | ||||||||||||||||||||||||
Net Investment Income (Loss) | $ | 3 | $ | 1,420 | $ | 5,155 | $ | 6,974 | $ | 39,195 | $ | 56,772 | ||||||||||||
Net Realized Gain (Loss) on Investments | 34 | 3 | 1,732 | 2,746 | 10,542 | 169,614 | ||||||||||||||||||
Net Change in Unrealized Appreciation | – | – | (7,662 | ) | 5,520 | (105,282 | ) | 49,086 | ||||||||||||||||
|
|
|
|
|
|
|
|
|
|
|
| |||||||||||||
Net Increase (Decrease) in Net Assets | 37 | 1,423 | (775 | ) | 15,240 | (55,545 | ) | 275,472 | ||||||||||||||||
|
|
|
|
|
|
|
|
|
|
|
| |||||||||||||
Distributions to Shareholders from: | ||||||||||||||||||||||||
Net Investment Income & Net Realized | (37 | ) | (1,423 | ) | (8,138 | ) | (8,186 | ) | (227,916 | ) | (108,721 | ) | ||||||||||||
|
|
|
|
|
|
|
|
|
|
|
| |||||||||||||
Net Decrease in Net Assets Resulting | (37 | ) | (1,423 | ) | (8,138 | ) | (8,186 | ) | (227,916 | ) | (108,721 | ) | ||||||||||||
|
|
|
|
|
|
|
|
|
|
|
| |||||||||||||
Capital Transactions: | ||||||||||||||||||||||||
Shares Sold | 349,697 | 443,083 | 74,950 | 85,625 | 375,420 | 422,239 | ||||||||||||||||||
Reinvestment of Distributions Paid | 37 | 1,423 | 8,138 | 8,186 | 227,916 | 108,721 | ||||||||||||||||||
Shares Redeemed | (443,188 | ) | (308,711 | ) | (45,499 | ) | (51,831 | ) | (295,727 | ) | (485,493 | ) | ||||||||||||
|
|
|
|
|
|
|
|
|
|
|
| |||||||||||||
Net Increase (Decrease) in Net Assets | (93,454 | ) | 135,795 | 37,589 | 41,980 | 307,609 | 45,467 | |||||||||||||||||
|
|
|
|
|
|
|
|
|
|
|
| |||||||||||||
Total Increase (Decrease) in Net Assets | (93,454 | ) | 135,795 | 28,676 | 49,034 | 24,148 | 212,218 | |||||||||||||||||
Net Assets | ||||||||||||||||||||||||
Beginning of Period | 582,312 | 446,517 | 383,608 | 334,574 | 3,404,268 | 3,192,050 | ||||||||||||||||||
|
|
|
|
|
|
|
|
|
|
|
| |||||||||||||
End of Period | $ | 488,858 | $ | 582,312 | $ | 412,284 | $ | 383,608 | $ | 3,428,416 | $ | 3,404,268 | ||||||||||||
|
|
|
|
|
|
|
|
|
|
|
| |||||||||||||
Portfolio Share Transactions: | ||||||||||||||||||||||||
Shares Sold | 349,697 | 443,083 | 69,725 | 80,297 | 284,777 | 310,277 | ||||||||||||||||||
Reinvestment of Distributions Paid | 37 | 1,423 | 7,678 | 7,664 | 179,886 | 80,237 | ||||||||||||||||||
Shares Redeemed | (443,188 | ) | (308,711 | ) | (42,495 | ) | (48,697 | ) | (225,698 | ) | (362,003 | ) | ||||||||||||
|
|
|
|
|
|
|
|
|
|
|
| |||||||||||||
Net Increase (Decrease) in Shares | (93,454 | ) | 135,795 | 34,908 | 39,264 | 238,965 | 28,511 | |||||||||||||||||
|
|
|
|
|
|
|
|
|
|
|
| |||||||||||||
The Accompanying Notes are an Integral Part of the Financial Statements.
240
Table of Contents
Statements of Changes in Net Assets
NORTHWESTERN MUTUAL SERIES FUND, INC.
(in thousands)
Long-Term U.S. Government Bond Portfolio | Inflation Protection Portfolio | High Yield Bond Portfolio | ||||||||||||||||||||||
For the Year Ended December 31, 2021 | For the Year Ended December 31, 2020 | For the Year Ended December 31, 2021 | For the Year Ended December 31, 2020 | For the Year Ended December 31, 2021 | For the Year Ended December 31, 2020 | |||||||||||||||||||
Change in Net Assets | ||||||||||||||||||||||||
Operations | ||||||||||||||||||||||||
Net Investment Income (Loss) | $ | 2,460 | $ | 2,384 | $ | 14,878 | $ | 5,263 | $ | 40,904 | $ | 43,223 | ||||||||||||
Net Realized Gain (Loss) on Investments | 101 | 21,534 | 10,325 | 3,962 | 3,902 | (5,892 | ) | |||||||||||||||||
Net Change in Unrealized Appreciation | (10,623 | ) | (2,718 | ) | 5,465 | 26,273 | (1,638 | ) | 12,622 | |||||||||||||||
|
|
|
|
|
|
|
|
|
|
|
| |||||||||||||
Net Increase (Decrease) in Net Assets | (8,062 | ) | 21,200 | 30,668 | 35,498 | 43,168 | 49,953 | |||||||||||||||||
|
|
|
|
|
|
|
|
|
|
|
| |||||||||||||
Distributions to Shareholders from: | ||||||||||||||||||||||||
Net Investment Income & Net Realized | (26,311 | ) | (11,663 | ) | (5,725 | ) | (7,844 | ) | (43,872 | ) | (47,246 | ) | ||||||||||||
|
|
|
|
|
|
|
|
|
|
|
| |||||||||||||
Net Decrease in Net Assets Resulting | (26,311 | ) | (11,663 | ) | (5,725 | ) | (7,844 | ) | (43,872 | ) | (47,246 | ) | ||||||||||||
|
|
|
|
|
|
|
|
|
|
|
| |||||||||||||
Capital Transactions: | ||||||||||||||||||||||||
Shares Sold | 21,188 | 42,306 | 104,626 | 55,618 | 70,556 | 54,306 | ||||||||||||||||||
Reinvestment of Distributions Paid | 26,311 | 11,663 | 5,725 | 7,844 | 43,872 | 47,246 | ||||||||||||||||||
Shares Redeemed | (28,190 | ) | (32,427 | ) | (44,752 | ) | (48,859 | ) | (96,595 | ) | (125,183 | ) | ||||||||||||
|
|
|
|
|
|
|
|
|
|
|
| |||||||||||||
Net Increase (Decrease) in Net Assets | 19,309 | 21,542 | 65,599 | 14,603 | 17,833 | (23,631 | ) | |||||||||||||||||
|
|
|
|
|
|
|
|
|
|
|
| |||||||||||||
Total Increase (Decrease) in Net Assets | (15,064 | ) | 31,079 | 90,542 | 42,257 | 17,129 | (20,924 | ) | ||||||||||||||||
Net Assets | ||||||||||||||||||||||||
Beginning of Period | 153,933 | 122,854 | 423,389 | 381,132 | 825,203 | 846,127 | ||||||||||||||||||
|
|
|
|
|
|
|
|
|
|
|
| |||||||||||||
End of Period | $ | 138,869 | $ | 153,933 | $ | 513,931 | $ | 423,389 | $ | 842,332 | $ | 825,203 | ||||||||||||
|
|
|
|
|
|
|
|
|
|
|
| |||||||||||||
Portfolio Share Transactions: | ||||||||||||||||||||||||
Shares Sold | 19,506 | 32,760 | 84,711 | 47,335 | 92,955 | 75,206 | ||||||||||||||||||
Reinvestment of Distributions Paid | 27,931 | 9,285 | 4,555 | 6,597 | 58,809 | 66,079 | ||||||||||||||||||
Shares Redeemed | (26,405 | ) | (25,020 | ) | (36,047 | ) | (42,550 | ) | (127,142 | ) | (174,093 | ) | ||||||||||||
|
|
|
|
|
|
|
|
|
|
|
| |||||||||||||
Net Increase (Decrease) in Shares | 21,032 | 17,025 | 53,219 | 11,382 | 24,622 | (32,808 | ) | |||||||||||||||||
|
|
|
|
|
|
|
|
|
|
|
| |||||||||||||
The Accompanying Notes are an Integral Part of the Financial Statements.
241
Table of Contents
Statements of Changes in Net Assets
NORTHWESTERN MUTUAL SERIES FUND, INC.
(in thousands)
Multi-Sector Bond Portfolio | Balanced Portfolio | Asset Allocation Portfolio | ||||||||||||||||||||||
For the Year Ended December 31, 2021 | For the Year Ended December 31, 2020 | For the Year Ended December 31, 2021 | For the Year Ended December 31, 2020 | For the Year Ended December 31, 2021 | For the Year Ended December 31, 2020 | |||||||||||||||||||
Change in Net Assets | ||||||||||||||||||||||||
Operations | ||||||||||||||||||||||||
Net Investment Income (Loss) | $ | 36,510 | $ | 32,774 | $ | 36,067 | $ | 52,676 | $ | 4,358 | $ | 6,436 | ||||||||||||
Net Realized Gain (Loss) on Investments | 32,861 | (8,245 | ) | 169,860 | 113,863 | 22,817 | 16,277 | |||||||||||||||||
Net Change in Unrealized Appreciation | (68,874 | ) | 36,162 | (33,360 | ) | 96,326 | 4,301 | 13,395 | ||||||||||||||||
|
|
|
|
|
|
|
|
|
|
|
| |||||||||||||
Net Increase (Decrease) in Net Assets | 497 | 60,691 | 172,567 | 262,865 | 31,476 | 36,108 | ||||||||||||||||||
|
|
|
|
|
|
|
|
|
|
|
| |||||||||||||
Distributions to Shareholders from: | ||||||||||||||||||||||||
Net Investment Income & Net Realized | (39,035 | ) | (42,858 | ) | (168,562 | ) | (132,286 | ) | (22,798 | ) | (18,159 | ) | ||||||||||||
|
|
|
|
|
|
|
|
|
|
|
| |||||||||||||
Net Decrease in Net Assets Resulting | (39,035 | ) | (42,858 | ) | (168,562 | ) | (132,286 | ) | (22,798 | ) | (18,159 | ) | ||||||||||||
|
|
|
|
|
|
|
|
|
|
|
| |||||||||||||
Capital Transactions: | ||||||||||||||||||||||||
Shares Sold | 266,137 | 178,458 | 105,540 | 87,127 | 20,000 | 19,009 | ||||||||||||||||||
Reinvestment of Distributions Paid | 39,035 | 42,858 | 168,562 | 132,286 | 22,798 | 18,159 | ||||||||||||||||||
Shares Redeemed | (98,494 | ) | (112,462 | ) | (263,921 | ) | (236,840 | ) | (37,431 | ) | (36,163 | ) | ||||||||||||
|
|
|
|
|
|
|
|
|
|
|
| |||||||||||||
Net Increase (Decrease) in Net Assets | 206,678 | 108,854 | 10,181 | (17,427 | ) | 5,367 | 1,005 | |||||||||||||||||
|
|
|
|
|
|
|
|
|
|
|
| |||||||||||||
Total Increase (Decrease) in Net Assets | 168,140 | 126,687 | 14,186 | 113,152 | 14,045 | 18,954 | ||||||||||||||||||
Net Assets | ||||||||||||||||||||||||
Beginning of Period | 1,148,511 | 1,021,824 | 2,367,387 | 2,254,235 | 306,692 | 287,738 | ||||||||||||||||||
|
|
|
|
|
|
|
|
|
|
|
| |||||||||||||
End of Period | $ | 1,316,651 | $ | 1,148,511 | $ | 2,381,573 | $ | 2,367,387 | $ | 320,737 | $ | 306,692 | ||||||||||||
|
|
|
|
|
|
|
|
|
|
|
| |||||||||||||
Portfolio Share Transactions: | ||||||||||||||||||||||||
Shares Sold | 232,274 | 157,167 | 65,875 | 58,859 | 14,856 | 15,965 | ||||||||||||||||||
Reinvestment of Distributions Paid | 34,092 | 38,233 | 107,570 | 90,236 | 17,297 | 15,402 | ||||||||||||||||||
Shares Redeemed | (86,001 | ) | (102,415 | ) | (164,644 | ) | (161,177 | ) | (27,887 | ) | (30,510 | ) | ||||||||||||
|
|
|
|
|
|
|
|
|
|
|
| |||||||||||||
Net Increase (Decrease) in Shares | 180,365 | 92,985 | 8,801 | (12,082 | ) | 4,266 | 857 | |||||||||||||||||
|
|
|
|
|
|
|
|
|
|
|
| |||||||||||||
The Accompanying Notes are an Integral Part of the Financial Statements.
242
Table of Contents
NORTHWESTERN MUTUAL SERIES FUND, INC.
For the Year Ended December 31, 2021 (in thousands)
Long-Term U.S. Government Bond Portfolio | ||||
Cash Flows from Operating Activities | ||||
Net Increase (Decrease) in Net Assets Resulting from Operations | $ | (8,062 | ) | |
Adjustments to Reconcile Net Increase (Decrease) in Net Assets Resulting from Operations to Net Cash from Operating Activities | ||||
Purchase of Investment Securities | (224,003 | ) | ||
Proceeds from Disposition of Investment Securities | 166,434 | |||
Proceeds from Disposition (Purchase) of Short-Term Investments, net | 6,525 | |||
Proceeds from (Payments for) Closed Futures Contracts and Cleared Swaps | 2,097 | |||
Proceeds from Securities Sold Short | 51,996 | |||
Amortization (Accretion) of Premium/Discount, net | (317 | ) | ||
(Increase) Decrease in: | ||||
Receivable for Investment Securities Sold | 75,145 | |||
Dividends and Interest Receivable | 263 | |||
Increase (Decrease) in: | ||||
Payable for Investment Advisory Fees | (4 | ) | ||
Accrued Expenses | 14 | |||
Change in Net Unrealized (Appreciation) Depreciation of: | ||||
Investment Securities | 10,380 | |||
Futures Contracts | 442 | |||
Short Sales | (97 | ) | ||
Swap Contracts | (102 | ) | ||
Net Realized (Gain) Loss from: | ||||
Investment Securities | 2,491 | |||
Futures Contracts | (2,233 | ) | ||
Paydowns | (18 | ) | ||
Short Sales | (100 | ) | ||
Swap Contracts | (259 | ) | ||
|
| |||
Total Adjustments | 88,654 | |||
|
| |||
Net Cash (Used in) Provided by Operating Activities | 80,592 | |||
|
| |||
Cash Flows from Financing Activities | ||||
Cash Received from Financing Transactions | 2,613,644 | |||
Cash (Used for) Financing Transactions | (2,687,101 | ) | ||
Proceeds from Reverse Repurchase Agreements | 3,497 | |||
Payments on Reverse Repurchase Agreements | (3,497 | ) | ||
Proceeds from Capital Shares Sold | 21,286 | |||
Payment on Capital Shares Redeemed | (28,181 | ) | ||
|
| |||
Net Cash (Used in) Provided by Financing Activities | (80,352 | ) | ||
|
| |||
Net Increase (Decrease) in Cash and Cash Equivalents | 240 | |||
Cash and Restricted Cash, Beginning of Period | 183 | |||
|
| |||
Cash and Restricted Cash, End of Period | $ | 423 | ||
|
| |||
Cash and Restricted Cash is the sum of Cash and Cash Collateral for Derivative Positions from the Statement of Assets and Liabilities. Supplemental disclosure of cash flow information:
Non-cash financing activities not included herein consist of reinvestment of dividends and distributions of $26,311.
Interest paid was $153.
The Accompanying Notes are an Integral Part of the Financial Statements.
243
Table of Contents
NORTHWESTERN MUTUAL SERIES FUND, INC.
(For a share outstanding through the period)
Net Asset Value, Beginning of Period | Net Investment Income (Loss) | Net Realized and Unrealized Gain (Loss) on Investments | Total from Investment Operations | Distributions from Net Investment Income | Distributions from Realized Gains on Investments | |||||||||||||||||||
Growth Stock Portfolio |
| |||||||||||||||||||||||
2021 | $ | 3.60 | $ | 0.00 | (e) | $ | 0.61 | $ | 0.61 | $ | (0.00 | )(e) | $ | (0.17 | ) | |||||||||
2020 | 3.18 | 0.00 | (e) | 1.04 | 1.04 | (0.02 | ) | (0.60 | ) | |||||||||||||||
2019 | 2.75 | 0.02 | 0.77 | 0.79 | (0.02 | ) | (0.34 | ) | ||||||||||||||||
2018 | �� | 3.03 | 0.02 | 0.08 | 0.10 | (0.02 | ) | (0.36 | ) | |||||||||||||||
2017 | 2.58 | 0.02 | 0.59 | 0.61 | (0.03 | ) | (0.13 | ) | ||||||||||||||||
Focused Appreciation Portfolio |
| |||||||||||||||||||||||
2021 | $ | 4.02 | $ | 0.00 | (e) | $ | 0.76 | $ | 0.76 | $ | (0.01 | ) | $ | (0.45 | ) | |||||||||
2020 | 3.17 | 0.01 | 1.02 | 1.03 | (0.02 | ) | (0.16 | ) | ||||||||||||||||
2019 | 2.57 | 0.02 | 0.78 | 0.80 | (0.02 | ) | (0.18 | ) | ||||||||||||||||
2018 | 2.71 | 0.02 | (0.07 | ) | (0.05 | ) | (0.01 | ) | (0.08 | ) | ||||||||||||||
2017 | 2.08 | 0.02 | 0.68 | 0.70 | (0.02 | ) | (0.05 | ) | ||||||||||||||||
Large Cap Core Stock Portfolio |
| |||||||||||||||||||||||
2021 | $ | 1.91 | $ | 0.01 | $ | 0.47 | $ | 0.48 | $ | (0.02 | ) | $ | (0.16 | ) | ||||||||||
2020 | 1.62 | 0.02 | 0.34 | 0.36 | (0.02 | ) | (0.05 | ) | ||||||||||||||||
2019 | 1.31 | 0.02 | 0.39 | 0.41 | (0.02 | ) | (0.08 | ) | ||||||||||||||||
2018 | 1.96 | 0.02 | (0.05 | ) | (0.03 | ) | (0.03 | ) | (0.59 | ) | ||||||||||||||
2017 | 1.60 | 0.03 | 0.36 | 0.39 | (0.03 | ) | – | |||||||||||||||||
Large Cap Blend Portfolio |
| |||||||||||||||||||||||
2021 | $ | 1.25 | $ | 0.01 | $ | 0.22 | $ | 0.23 | $ | (0.01 | ) | $ | (0.08 | ) | ||||||||||
2020 | 1.22 | 0.01 | 0.10 | 0.11 | (0.06 | ) | (0.02 | ) | ||||||||||||||||
2019 | 1.09 | 0.06 | 0.20 | 0.26 | (0.01 | ) | (0.12 | ) | ||||||||||||||||
2018 | 1.21 | 0.01 | (0.06 | ) | (0.05 | ) | (0.01 | ) | (0.06 | ) | ||||||||||||||
2017 | 1.07 | 0.01 | 0.20 | 0.21 | (0.01 | ) | (0.06 | ) | ||||||||||||||||
Index 500 Stock Portfolio |
| |||||||||||||||||||||||
2021 | $ | 6.60 | $ | 0.09 | $ | 1.77 | $ | 1.86 | $ | (0.09 | ) | $ | (0.19 | ) | ||||||||||
2020 | 5.79 | 0.09 | 0.94 | 1.03 | (0.10 | ) | (0.12 | ) | ||||||||||||||||
2019 | 4.59 | 0.10 | 1.32 | 1.42 | (0.09 | ) | (0.13 | ) | ||||||||||||||||
2018 | 4.93 | 0.09 | (0.30 | ) | (0.21 | ) | (0.08 | ) | (0.05 | ) | ||||||||||||||
2017 | 4.17 | 0.08 | 0.81 | 0.89 | (0.08 | ) | (0.05 | ) | ||||||||||||||||
Large Company Value Portfolio |
| |||||||||||||||||||||||
2021 | $ | 1.00 | $ | 0.02 | $ | 0.19 | $ | 0.21 | $ | (0.01 | ) | $ | (0.01 | ) | ||||||||||
2020 | 1.03 | 0.02 | 0.00 | (e) | 0.02 | (0.02 | ) | (0.03 | ) | |||||||||||||||
2019 | 0.89 | 0.02 | 0.21 | 0.23 | (0.02 | ) | (0.07 | ) | ||||||||||||||||
2018 | 1.06 | 0.02 | (0.09 | ) | (0.07 | ) | (0.02 | ) | (0.08 | ) | ||||||||||||||
2017 | 1.02 | 0.02 | 0.08 | 0.10 | (0.02 | ) | (0.04 | ) | ||||||||||||||||
Domestic Equity Portfolio |
| |||||||||||||||||||||||
2021 | $ | 1.64 | $ | 0.03 | $ | 0.33 | $ | 0.36 | $ | (0.03 | ) | $ | (0.04 | ) | ||||||||||
2020 | 1.75 | 0.03 | (0.04 | ) | (0.01 | ) | (0.03 | ) | (0.07 | ) | ||||||||||||||
2019 | 1.55 | 0.03 | 0.28 | 0.31 | (0.03 | ) | (0.08 | ) | ||||||||||||||||
2018 | 1.68 | 0.03 | (0.07 | ) | (0.04 | ) | (0.03 | ) | (0.06 | ) | ||||||||||||||
2017 | 1.54 | 0.03 | 0.18 | 0.21 | (0.03 | ) | (0.04 | ) | ||||||||||||||||
| (d) | Total Return includes deductions for management and other fund expenses; excludes deductions for sales loads and account fees, not annualized for periods less than one year. |
| (r) | Expense ratios are based upon the direct and allocated expenses of the Portfolio and do not include the effect of underlying funds’ expenses. For additional information on underlying funds’ expenses, please refer to the Fee and Expense table in the Prospectus. |
| (e) | Amount is less than $0.005. |
The Accompanying Notes are an Integral Part of the Financial Statements.
244
Table of Contents
Total Distributions | Net Asset Value, End of Period | Total Return(d) | Net Assets, End of Period (thousands) | Ratio of Gross Expenses to Average Net Assets(r) | Ratio of Net Expenses to Average Net Assets(r) | Ratio of Net Investment Income (Loss) to Average Net Assets | Portfolio Turnover Rate | |||||||||||||||||||||||
| $ | (0.17 | ) | $ | 4.04 | 16.67 | % | $ | 1,389,899 | 0.42 | % | 0.42 | % | (0.10 | )% | 36 | % | ||||||||||||||
| (0.62 | ) | 3.60 | 34.97 | 1,286,403 | 0.43 | 0.42 | 0.00 | 24 | ||||||||||||||||||||||
| (0.36 | ) | 3.18 | 29.68 | 1,083,324 | 0.43 | 0.42 | 0.71 | 116 | ||||||||||||||||||||||
| (0.38 | ) | 2.75 | 1.26 | 898,626 | 0.43 | 0.42 | 0.68 | 48 | ||||||||||||||||||||||
| (0.16 | ) | 3.03 | 24.27 | 959,854 | 0.43 | 0.42 | 0.78 | 58 | ||||||||||||||||||||||
| $ | (0.46 | ) | $ | 4.32 | 18.90 | % | $ | 1,327,361 | 0.74 | % | 0.62 | % | (0.01 | )% | 11 | % | ||||||||||||||
| (0.18 | ) | 4.02 | 32.55 | 1,186,696 | 0.75 | 0.62 | 0.19 | 21 | ||||||||||||||||||||||
| (0.20 | ) | 3.17 | 31.97 | 1,012,624 | 0.75 | 0.63 | 0.58 | 7 | ||||||||||||||||||||||
| (0.09 | ) | 2.57 | (2.34 | ) | 849,169 | 0.75 | 0.63 | 0.65 | 7 | |||||||||||||||||||||
| (0.07 | ) | 2.71 | 33.62 | 945,385 | 0.75 | 0.63 | 0.66 | 4 | ||||||||||||||||||||||
| $ | (0.18 | ) | $ | 2.21 | 25.10 | % | $ | 842,806 | 0.44 | % | 0.43 | % | 0.70 | % | 56 | % | ||||||||||||||
| (0.07 | ) | 1.91 | 22.74 | 719,977 | 0.45 | 0.44 | 0.98 | 72 | ||||||||||||||||||||||
| (0.10 | ) | 1.62 | 31.19 | 633,208 | 0.45 | 0.44 | 1.19 | 54 | ||||||||||||||||||||||
| (0.62 | ) | 1.31 | (6.04 | ) | 518,971 | 0.45 | 0.44 | 1.23 | 65 | |||||||||||||||||||||
| (0.03 | ) | 1.96 | 24.87 | 592,577 | 0.45 | 0.44 | 1.56 | 101 | ||||||||||||||||||||||
| $ | (0.09 | ) | $ | 1.39 | 18.46 | % | $ | 203,126 | 0.81 | % | 0.78 | % | 0.68 | % | 19 | % | ||||||||||||||
| (0.08 | ) | 1.25 | 10.05 | 180,564 | 0.83 | 0.80 | 0.77 | 28 | ||||||||||||||||||||||
| (0.13 | ) | 1.22 | 23.97 | 174,953 | 0.82 | 0.82 | 4.92 | 24 | ||||||||||||||||||||||
| (0.07 | ) | 1.09 | (4.00 | ) | 154,435 | 0.82 | 0.82 | 1.20 | 25 | |||||||||||||||||||||
| (0.07 | ) | 1.21 | 19.02 | 176,221 | 0.81 | 0.81 | 0.75 | 16 | ||||||||||||||||||||||
| $ | (0.28 | ) | $ | 8.18 | 28.45 | % | $ | 5,504,970 | 0.21 | % | 0.19 | % | 1.19 | % | 3 | % | ||||||||||||||
| (0.22 | ) | 6.60 | 18.18 | 4,419,729 | 0.21 | 0.20 | 1.63 | 5 | ||||||||||||||||||||||
| (0.22 | ) | 5.79 | 31.18 | 3,867,280 | 0.21 | 0.20 | 1.81 | 4 | ||||||||||||||||||||||
| (0.13 | ) | 4.59 | (4.58 | ) | 3,009,141 | 0.21 | 0.20 | 1.74 | 4 | |||||||||||||||||||||
| (0.13 | ) | 4.93 | 21.52 | 3,222,137 | 0.21 | 0.21 | 1.82 | 3 | ||||||||||||||||||||||
| $ | (0.02 | ) | $ | 1.19 | 21.92 | % | $ | 227,560 | 0.76 | % | 0.74 | % | 1.63 | % | 40 | % | ||||||||||||||
| (0.05 | ) | 1.00 | 2.64 | 211,998 | 0.78 | 0.76 | 2.02 | 84 | ||||||||||||||||||||||
| (0.09 | ) | 1.03 | 27.66 | 205,550 | 0.77 | 0.75 | 1.86 | 62 | ||||||||||||||||||||||
| (0.10 | ) | 0.89 | (7.92 | ) | 173,350 | 0.76 | 0.74 | 1.89 | 61 | |||||||||||||||||||||
| (0.06 | ) | 1.06 | 11.10 | 199,836 | 0.75 | 0.73 | 2.15 | 53 | ||||||||||||||||||||||
| $ | (0.07 | ) | $ | 1.93 | 22.71 | % | $ | 1,096,677 | 0.53 | % | 0.50 | % | 1.77 | % | 29 | % | ||||||||||||||
| (0.10 | ) | 1.64 | 0.73 | 946,072 | 0.55 | 0.53 | 2.25 | 33 | ||||||||||||||||||||||
| (0.11 | ) | 1.75 | 20.77 | 920,776 | 0.54 | 0.53 | 2.08 | 12 | ||||||||||||||||||||||
| (0.09 | ) | 1.55 | (2.81 | ) | 772,465 | 0.54 | 0.53 | 1.92 | 14 | |||||||||||||||||||||
| (0.07 | ) | 1.68 | 13.78 | 819,213 | 0.55 | 0.54 | 1.91 | 12 | ||||||||||||||||||||||
The Accompanying Notes are an Integral Part of the Financial Statements.
245
Table of Contents
Financial Highlights
NORTHWESTERN MUTUAL SERIES FUND, INC.
(For a share outstanding through the period)
Net Asset Value, Beginning of Period | Net Investment Income (Loss) | Net Realized and Unrealized Gain (Loss) on Investments | Total from Investment Operations | Distributions from Net Investment Income | Distributions from Realized Gains on Investments | |||||||||||||||||||
Equity Income Portfolio |
| |||||||||||||||||||||||
2021 | $ | 1.63 | $ | 0.03 | $ | 0.39 | $ | 0.42 | $ | (0.04 | ) | $ | – | |||||||||||
2020 | 1.78 | 0.04 | (0.05 | ) | (0.01 | ) | (0.07 | ) | (0.07 | ) | ||||||||||||||
2019 | 1.53 | 0.07 | 0.33 | 0.40 | (0.04 | ) | (0.11 | ) | ||||||||||||||||
2018 | 1.86 | 0.04 | (0.19 | ) | (0.15 | ) | (0.04 | ) | (0.14 | ) | ||||||||||||||
2017 | 1.72 | 0.04 | 0.23 | 0.27 | (0.04 | ) | (0.09 | ) | ||||||||||||||||
Mid Cap Growth Stock Portfolio |
| |||||||||||||||||||||||
2021 | $ | 4.09 | $ | 0.01 | $ | 0.41 | $ | 0.42 | $ | (0.01 | ) | $ | (0.56 | ) | ||||||||||
2020 | 3.42 | 0.01 | 0.82 | 0.83 | (0.01 | ) | (0.15 | ) | ||||||||||||||||
2019 | 2.69 | 0.01 | 0.87 | 0.88 | (0.01 | ) | (0.14 | ) | ||||||||||||||||
2018 | 3.46 | 0.01 | (0.17 | ) | (0.16 | ) | (0.00 | )(e) | (0.61 | ) | ||||||||||||||
2017 | 2.88 | 0.00 | (e) | 0.59 | 0.59 | (0.01 | ) | – | ||||||||||||||||
Index 400 Stock Portfolio |
| |||||||||||||||||||||||
2021 | $ | 2.15 | $ | 0.03 | $ | 0.49 | $ | 0.52 | $ | (0.02 | ) | $ | (0.08 | ) | ||||||||||
2020 | 2.02 | 0.02 | 0.23 | 0.25 | (0.03 | ) | (0.09 | ) | ||||||||||||||||
2019 | 1.74 | 0.03 | 0.40 | 0.43 | (0.02 | ) | (0.13 | ) | ||||||||||||||||
2018 | 2.11 | 0.03 | (0.24 | ) | (0.21 | ) | (0.02 | ) | (0.14 | ) | ||||||||||||||
2017 | 1.96 | 0.02 | 0.27 | 0.29 | (0.02 | ) | (0.12 | ) | ||||||||||||||||
Mid Cap Value Portfolio |
| |||||||||||||||||||||||
2021 | $ | 1.65 | $ | 0.03 | $ | 0.35 | $ | 0.38 | $ | (0.02 | ) | $ | (0.01 | ) | ||||||||||
2020 | 1.65 | 0.03 | – | 0.03 | (0.03 | ) | – | |||||||||||||||||
2019 | 1.43 | 0.03 | 0.37 | 0.40 | (0.03 | ) | (0.15 | ) | ||||||||||||||||
2018 | 1.83 | 0.03 | (0.23 | ) | (0.20 | ) | (0.03 | ) | (0.17 | ) | ||||||||||||||
2017 | 1.73 | 0.03 | 0.16 | 0.19 | (0.03 | ) | (0.06 | ) | ||||||||||||||||
Small Cap Growth Stock Portfolio |
| |||||||||||||||||||||||
2021 | $ | 3.42 | $ | 0.00 | (e) | $ | 0.15 | $ | 0.15 | $ | (0.00 | )(e) | $ | (0.35 | ) | |||||||||
2020 | 2.72 | 0.00 | (e) | 0.86 | 0.86 | (0.00 | )(e) | (0.16 | ) | |||||||||||||||
2019 | 2.35 | 0.00 | (e) | 0.79 | 0.79 | (0.00 | )(e) | (0.42 | ) | |||||||||||||||
2018 | 2.88 | 0.00 | (e) | (0.28 | ) | (0.28 | ) | – | (0.25 | ) | ||||||||||||||
2017 | 2.39 | 0.00 | (e) | 0.52 | 0.52 | (0.00 | )(e) | (0.03 | ) | |||||||||||||||
Index 600 Stock Portfolio |
| |||||||||||||||||||||||
2021 | $ | 1.50 | $ | 0.02 | $ | 0.37 | $ | 0.39 | $ | (0.01 | ) | $ | (0.03 | ) | ||||||||||
2020 | 1.43 | 0.01 | 0.13 | 0.14 | (0.02 | ) | (0.05 | ) | ||||||||||||||||
2019 | 1.26 | 0.02 | 0.25 | 0.27 | (0.00 | )(e) | (0.10 | ) | ||||||||||||||||
2018 | 1.45 | 0.02 | (0.13 | ) | (0.11 | ) | (0.02 | ) | (0.06 | ) | ||||||||||||||
2017 | 1.36 | 0.01 | 0.16 | 0.17 | (0.03 | ) | (0.05 | ) | ||||||||||||||||
Small Cap Value Portfolio |
| |||||||||||||||||||||||
2021 | $ | 2.20 | $ | 0.01 | $ | 0.49 | $ | 0.50 | $ | (0.01 | ) | $ | (0.11 | ) | ||||||||||
2020 | 2.17 | 0.01 | 0.15 | 0.16 | (0.01 | ) | (0.12 | ) | ||||||||||||||||
2019 | 2.04 | 0.01 | 0.50 | 0.51 | (0.01 | ) | (0.37 | ) | ||||||||||||||||
2018 | 2.54 | 0.01 | (0.31 | ) | (0.30 | ) | (0.01 | ) | (0.19 | ) | ||||||||||||||
2017 | 2.42 | 0.02 | 0.25 | 0.27 | (0.02 | ) | (0.13 | ) | ||||||||||||||||
| (d) | Total Return includes deductions for management and other fund expenses; excludes deductions for sales loads and account fees, not annualized for periods less than one year. |
| (r) | Expense ratios are based upon the direct and allocated expenses of the Portfolio and do not include the effect of underlying funds’ expenses. For additional information on underlying funds’ expenses, please refer to the Fee and Expense table in the Prospectus. |
| (e) | Amount is less than $0.005. |
The Accompanying Notes are an Integral Part of the Financial Statements.
246
Table of Contents
Total Distributions | Net Asset Value, End of Period | Total Return(d) | Net Assets, End of Period (thousands) | Ratio of Gross Expenses to Average Net Assets(r) | Ratio of Net Expenses to Average Net Assets(r) | Ratio of Net Investment Income (Loss) to Average Net Assets | Portfolio Turnover Rate | |||||||||||||||||||||||
| $ | (0.04 | ) | $ | 2.01 | 25.70 | % | $ | 867,936 | 0.65 | % | 0.57 | % | 1.74 | % | 18 | % | ||||||||||||||
| (0.14 | ) | 1.63 | 1.20 | 787,521 | 0.66 | 0.59 | 2.48 | 30 | ||||||||||||||||||||||
| (0.15 | ) | 1.78 | 26.61 | 814,252 | 0.65 | 0.61 | 4.21 | 18 | ||||||||||||||||||||||
| (0.18 | ) | 1.53 | (9.35 | ) | 704,674 | 0.65 | 0.61 | 2.25 | 17 | |||||||||||||||||||||
| (0.13 | ) | 1.86 | 16.24 | 844,398 | 0.65 | 0.62 | 2.04 | 21 | ||||||||||||||||||||||
| $ | (0.57 | ) | $ | 3.94 | 10.18 | % | $ | 1,375,568 | 0.53 | % | 0.52 | % | 0.13 | % | 30 | % | ||||||||||||||
| (0.16 | ) | 4.09 | 25.41 | 1,344,564 | 0.54 | 0.54 | 0.18 | 47 | ||||||||||||||||||||||
| (0.15 | ) | 3.42 | 33.01 | 1,153,757 | 0.54 | 0.54 | 0.28 | 30 | ||||||||||||||||||||||
| (0.61 | ) | 2.69 | (7.38 | ) | 943,370 | 0.54 | 0.54 | 0.19 | 33 | |||||||||||||||||||||
| (0.01 | ) | 3.46 | 20.29 | 1,097,433 | 0.54 | 0.54 | 0.14 | 148 | ||||||||||||||||||||||
| $ | (0.10 | ) | $ | 2.57 | 24.46 | % | $ | 1,335,937 | 0.27 | % | 0.24 | % | 1.03 | % | 20 | % | ||||||||||||||
| (0.12 | ) | 2.15 | 13.37 | 1,115,469 | 0.28 | 0.26 | 1.31 | 18 | ||||||||||||||||||||||
| (0.15 | ) | 2.02 | 25.88 | 993,290 | 0.28 | 0.26 | 1.38 | 16 | ||||||||||||||||||||||
| (0.16 | ) | 1.74 | (11.33 | ) | 792,780 | 0.28 | 0.26 | 1.29 | 18 | |||||||||||||||||||||
| (0.14 | ) | 2.11 | 15.96 | 896,559 | 0.28 | 0.26 | 1.22 | 18 | ||||||||||||||||||||||
| $ | (0.03 | ) | $ | 2.00 | 23.27 | % | $ | 704,855 | 0.88 | % | 0.72 | % | 1.54 | % | 54 | % | ||||||||||||||
| (0.03 | ) | 1.65 | 1.67 | 600,403 | 0.89 | 0.75 | 1.79 | 76 | ||||||||||||||||||||||
| (0.18 | ) | 1.65 | 29.21 | 591,514 | 0.89 | 0.75 | 1.74 | 44 | ||||||||||||||||||||||
| (0.20 | ) | 1.43 | (12.85 | ) | 471,943 | 0.89 | 0.76 | 1.50 | 62 | |||||||||||||||||||||
| (0.09 | ) | 1.83 | 11.81 | 564,624 | 0.88 | 0.76 | 1.79 | 46 | ||||||||||||||||||||||
| $ | (0.35 | ) | $ | 3.22 | 4.11 | % | $ | 830,014 | 0.54 | % | 0.54 | % | (0.06 | )% | 43 | % | ||||||||||||||
| (0.16 | ) | 3.42 | 33.47 | 840,446 | 0.56 | 0.56 | 0.10 | 60 | ||||||||||||||||||||||
| (0.42 | ) | 2.72 | 35.69 | 671,870 | 0.56 | 0.56 | 0.13 | 42 | ||||||||||||||||||||||
| (0.25 | ) | 2.35 | (11.71 | ) | 520,622 | 0.56 | 0.56 | 0.10 | 52 | |||||||||||||||||||||
| (0.03 | ) | 2.88 | 21.61 | 627,901 | 0.56 | 0.56 | (0.01 | ) | 43 | |||||||||||||||||||||
| $ | (0.04 | ) | $ | 1.85 | 26.22 | % | $ | 434,426 | 0.27 | % | 0.27 | % | 1.28 | % | 22 | % | ||||||||||||||
| (0.07 | ) | 1.50 | 10.93 | 344,102 | 0.31 | 0.31 | 1.10 | 28 | ||||||||||||||||||||||
| (0.10 | ) | 1.43 | 22.44 | 290,111 | 0.31 | 0.31 | 1.25 | 33 | ||||||||||||||||||||||
| (0.08 | ) | 1.26 | (8.78 | ) | 221,803 | 0.31 | 0.31 | 1.06 | 38 | |||||||||||||||||||||
| (0.08 | ) | 1.45 | 12.93 | 222,348 | 0.33 | 0.33 | 1.04 | 36 | ||||||||||||||||||||||
| $ | (0.12 | ) | $ | 2.58 | 23.00 | % | $ | 685,304 | 0.87 | % | 0.86 | % | 0.27 | % | 22 | % | ||||||||||||||
| (0.13 | ) | 2.20 | 9.29 | 615,079 | 0.88 | 0.88 | 0.50 | 28 | ||||||||||||||||||||||
| (0.38 | ) | 2.17 | 25.89 | 605,534 | 0.88 | 0.87 | 0.48 | 25 | ||||||||||||||||||||||
| (0.20 | ) | 2.04 | (12.73 | ) | 530,072 | 0.88 | 0.87 | 0.43 | 22 | |||||||||||||||||||||
| (0.15 | ) | 2.54 | 11.65 | 673,234 | 0.88 | 0.86 | 0.56 | 15 | ||||||||||||||||||||||
The Accompanying Notes are an Integral Part of the Financial Statements.
247
Table of Contents
Financial Highlights
NORTHWESTERN MUTUAL SERIES FUND, INC.
(For a share outstanding through the period)
Net Asset Value, Beginning of Period | Net Investment Income (Loss) | Net Realized and Unrealized Gain (Loss) on Investments | Total from Investment Operations | Distributions from Net Investment Income | Distributions from Realized Gains on Investments | |||||||||||||||||||||||||||
International Growth Portfolio |
| |||||||||||||||||||||||||||||||
2021 | $ | 2.14 | $ | 0.01 | $ | 0.33 | $ | 0.34 | $ | (0.01 | ) | $ | (0.07 | ) | ||||||||||||||||||
2020 | 1.85 | 0.01 | 0.32 | 0.33 | (0.03 | ) | (0.01 | ) | ||||||||||||||||||||||||
2019 | 1.39 | 0.03 | 0.46 | 0.49 | (0.02 | ) | (0.01 | ) | ||||||||||||||||||||||||
2018 | 1.59 | 0.02 | (0.20 | ) | (0.18 | ) | (0.02 | ) | – | |||||||||||||||||||||||
2017 | 1.24 | 0.02 | 0.35 | 0.37 | (0.02 | ) | – | |||||||||||||||||||||||||
Research International Core Portfolio |
| |||||||||||||||||||||||||||||||
2021 | $ | 1.18 | $ | 0.02 | $ | 0.12 | $ | 0.14 | $ | (0.01 | ) | $ | (0.02 | ) | ||||||||||||||||||
2020 | 1.08 | 0.01 | 0.13 | 0.14 | (0.02 | ) | (0.02 | ) | ||||||||||||||||||||||||
2019 | 0.88 | 0.02 | 0.23 | 0.25 | (0.02 | ) | (0.03 | ) | ||||||||||||||||||||||||
2018 | 1.04 | 0.02 | (0.16 | ) | (0.14 | ) | (0.02 | ) | – | |||||||||||||||||||||||
2017 | 0.82 | 0.02 | 0.22 | 0.24 | (0.02 | ) | – | |||||||||||||||||||||||||
International Equity Portfolio |
| |||||||||||||||||||||||||||||||
2021 | $ | 1.55 | $ | 0.04 | $ | 0.04 | $ | 0.08 | $ | (0.04 | ) | $ | – | |||||||||||||||||||
2020 | 1.65 | 0.04 | (0.09 | ) | (0.05 | ) | (0.05 | ) | – | |||||||||||||||||||||||
2019 | 1.58 | 0.05 | 0.14 | 0.19 | (0.04 | ) | (0.08 | ) | ||||||||||||||||||||||||
2018 | 1.91 | 0.04 | (0.32 | ) | (0.28 | ) | (0.05 | ) | – | |||||||||||||||||||||||
2017 | 1.60 | 0.04 | 0.31 | 0.35 | (0.04 | ) | – | |||||||||||||||||||||||||
Emerging Markets Equity Portfolio |
| |||||||||||||||||||||||||||||||
2021 | $ | 1.39 | $ | 0.02 | $ | (0.08 | ) | $ | (0.06 | ) | $ | (0.01 | ) | $ | – | |||||||||||||||||
2020 | 1.12 | 0.01 | 0.28 | 0.29 | (0.02 | ) | – | |||||||||||||||||||||||||
2019 | 0.94 | 0.02 | 0.17 | 0.19 | (0.01 | ) | – | |||||||||||||||||||||||||
2018 | 1.10 | 0.01 | (0.16 | ) | (0.15 | ) | (0.01 | ) | – | |||||||||||||||||||||||
2017 | 0.87 | 0.02 | 0.22 | 0.24 | (0.01 | ) | – | |||||||||||||||||||||||||
Government Money Market Portfolio |
| |||||||||||||||||||||||||||||||
2021 | $ | 1.00 | $ | 0.00 | (e) | $ | – | $ | 0.00 | (e) | $ | (0.00 | )(e) | $ | (0.00 | )(e) | ||||||||||||||||
2020 | 1.00 | 0.00 | (e) | – | 0.00 | (e) | (0.00 | )(e) | (0.00 | )(e) | ||||||||||||||||||||||
2019 | 1.00 | 0.02 | – | 0.02 | (0.02 | ) | (0.00 | )(e) | ||||||||||||||||||||||||
2018 | 1.00 | 0.02 | – | 0.02 | (0.02 | ) | (0.00 | )(e) | ||||||||||||||||||||||||
2017 | 1.00 | 0.01 | 0.00 | (e) | 0.01 | (0.01 | ) | (0.00 | )(e) | |||||||||||||||||||||||
Short-Term Bond Portfolio |
| |||||||||||||||||||||||||||||||
2021 | $ | 1.08 | $ | 0.01 | $ | (0.02 | ) | $ | (0.01 | ) | $ | (0.02 | ) | $ | (0.00 | )(e) | ||||||||||||||||
2020 | 1.06 | 0.02 | 0.02 | 0.04 | (0.02 | ) | – | |||||||||||||||||||||||||
2019 | 1.03 | 0.03 | 0.02 | 0.05 | (0.02 | ) | – | |||||||||||||||||||||||||
2018 | 1.03 | 0.02 | – | 0.02 | (0.02 | ) | – | |||||||||||||||||||||||||
2017 | 1.03 | 0.02 | (0.01 | ) | 0.01 | (0.01 | ) | – | ||||||||||||||||||||||||
Select Bond Portfolio |
| |||||||||||||||||||||||||||||||
2021 | $ | 1.37 | $ | 0.02 | $ | (0.04 | ) | $ | (0.02 | ) | $ | (0.03 | ) | $ | (0.06 | ) | ||||||||||||||||
2020 | 1.30 | 0.02 | 0.10 | 0.12 | (0.04 | ) | (0.01 | ) | ||||||||||||||||||||||||
2019 | 1.23 | 0.04 | 0.07 | 0.11 | (0.04 | ) | – | |||||||||||||||||||||||||
2018 | 1.26 | 0.03 | (0.03 | ) | 0.00 | (e) | (0.03 | ) | – | |||||||||||||||||||||||
2017 | 1.26 | 0.03 | 0.02 | 0.05 | (0.03 | ) | (0.02 | ) | ||||||||||||||||||||||||
| (d) | Total Return includes deductions for management and other fund expenses; excludes deductions for sales loads and account fees, not annualized for periods less than one year. |
| (m) | During the years ended December 31, 2021 and 2020, MSA voluntarily agreed to waive a portion of its advisory fee to maintain a positive yield in the Government Money Market Portfolio. The Government Money Market Portfolio’s net expense ratio would increase by an amount of 0.25% and 0.08%, respectively, if such voluntary waiver were excluded for the years ended December 31, 2021 and 2020. See Note 7 -Investment Advisory, Sub-Advisory and Compliance Fees for more information. |
| (r) | Expense ratios are based upon the direct and allocated expenses of the Portfolio and do not include the effect of underlying funds’ expenses. For additional information on underlying funds’ expenses, please refer to the Fee and Expense table in the Prospectus. |
| (e) | Amount is less than $0.005. |
| (g) | Portfolio Turnover Rate excludes the impact of TBA transactions. |
The Accompanying Notes are an Integral Part of the Financial Statements.
248
Table of Contents
Total Distributions | Net Asset Value, End of Period | Total Return(d) | Net Assets, End of Period (thousands) | Ratio of Gross Expenses to Average Net Assets(r) | Ratio of Net Expenses to Average Net Assets(r) | Ratio of Net Investment Income (Loss) to Average Net Assets | Portfolio Turnover Rate | |||||||||||||||||||||||
| $ | (0.08 | ) | $ | 2.40 | 15.92 | % | $ | 1,068,232 | 0.62 | % | 0.61 | % | 0.51 | % | 25 | % | ||||||||||||||
| (0.04 | ) | 2.14 | 17.91 | 924,242 | 0.63 | 0.63 | 0.64 | 21 | ||||||||||||||||||||||
| (0.03 | ) | 1.85 | 34.80 | 816,113 | 0.64 | 0.64 | 1.79 | 21 | ||||||||||||||||||||||
| (0.02 | ) | 1.39 | (11.28 | ) | 626,082 | 0.65 | 0.65 | 1.28 | 33 | |||||||||||||||||||||
| (0.02 | ) | 1.59 | 30.03 | 697,581 | 0.67 | 0.67 | 1.32 | 20 | ||||||||||||||||||||||
| $ | (0.03 | ) | $ | 1.29 | 12.07 | % | $ | 963,103 | 0.78 | % | 0.73 | % | 1.37 | % | 18 | % | ||||||||||||||
| (0.04 | ) | 1.18 | 13.46 | 891,001 | 0.81 | 0.76 | 1.36 | 25 | ||||||||||||||||||||||
| (0.05 | ) | 1.08 | 28.25 | 784,885 | 0.82 | 0.77 | 2.32 | 18 | ||||||||||||||||||||||
| (0.02 | ) | 0.88 | (13.66 | ) | 595,585 | 0.82 | 0.77 | 1.88 | 24 | |||||||||||||||||||||
| (0.02 | ) | 1.04 | 28.21 | 658,005 | 0.86 | 0.81 | 1.74 | 28 | ||||||||||||||||||||||
| $ | (0.04 | ) | $ | 1.59 | 5.00 | % | $ | 1,865,208 | 0.68 | % | 0.51 | % | 2.30 | % | 118 | % | ||||||||||||||
| (0.05 | ) | 1.55 | (2.71 | ) | 1,779,819 | 0.68 | 0.54 | 2.59 | 65 | |||||||||||||||||||||
| (0.12 | ) | 1.65 | 12.60 | 1,793,034 | 0.68 | 0.54 | 3.33 | 43 | ||||||||||||||||||||||
| (0.05 | ) | 1.58 | (15.41 | ) | 1,604,068 | 0.68 | 0.54 | 2.36 | 31 | |||||||||||||||||||||
| (0.04 | ) | 1.91 | 22.30 | 1,927,673 | 0.70 | 0.57 | 2.40 | 21 | ||||||||||||||||||||||
| $ | (0.01 | ) | $ | 1.32 | (4.55 | )% | $ | 993,493 | 1.06 | % | 0.91 | % | 1.14 | % | 33 | % | ||||||||||||||
| (0.02 | ) | 1.39 | 26.86 | 1,024,098 | 1.10 | 0.95 | 0.67 | 31 | ||||||||||||||||||||||
| (0.01 | ) | 1.12 | 20.60 | 834,010 | 1.11 | 0.99 | 2.40 | 22 | ||||||||||||||||||||||
| (0.01 | ) | 0.94 | (13.75 | ) | 675,350 | 1.11 | 1.00 | 1.27 | 17 | |||||||||||||||||||||
| (0.01 | ) | 1.10 | 27.84 | 718,281 | 1.18 | 1.06 | 1.61 | 98 | ||||||||||||||||||||||
| $ | (0.00 | )(e) | $ | 1.00 | – | % | $ | 488,858 | 0.33 | % | 0.08 | %(m) | 0.00 | % | – | % | ||||||||||||||
| (0.00 | )(e) | 1.00 | 0.31 | 582,312 | 0.33 | 0.25 | (m) | 0.26 | – | |||||||||||||||||||||
| (0.02 | ) | 1.00 | 1.94 | 446,517 | 0.33 | 0.33 | 1.91 | – | ||||||||||||||||||||||
| (0.02 | ) | 1.00 | 1.54 | 443,474 | 0.34 | 0.34 | 1.53 | – | ||||||||||||||||||||||
| (0.01 | ) | 1.00 | 0.60 | 439,438 | 0.33 | 0.33 | 0.59 | – | ||||||||||||||||||||||
| $ | (0.02 | ) | $ | 1.05 | (0.10 | )% | $ | 412,284 | 0.38 | % | 0.38 | % | 1.27 | % | 46 | %(g) | ||||||||||||||
| (0.02 | ) | 1.08 | 4.29 | 383,608 | 0.39 | 0.39 | 1.96 | 49 | (g) | |||||||||||||||||||||
| (0.02 | ) | 1.06 | 4.38 | 334,574 | 0.39 | 0.39 | 2.47 | 56 | (g) | |||||||||||||||||||||
| (0.02 | ) | 1.03 | 1.36 | 306,541 | 0.39 | 0.39 | 2.14 | 41 | (g) | |||||||||||||||||||||
| (0.01 | ) | 1.03 | 1.33 | 293,514 | 0.42 | 0.41 | 1.60 | 46 | ||||||||||||||||||||||
| $ | (0.09 | ) | $ | 1.26 | (1.59 | )% | $ | 3,428,416 | 0.31 | % | 0.30 | % | 1.15 | % | 272 | %(g) | ||||||||||||||
| (0.05 | ) | 1.37 | 8.98 | 3,404,268 | 0.31 | 0.30 | 1.75 | 340 | (g) | |||||||||||||||||||||
| (0.04 | ) | 1.30 | 8.65 | 3,192,050 | 0.31 | 0.30 | 2.76 | 403 | (g) | |||||||||||||||||||||
| (0.03 | ) | 1.23 | (0.21 | ) | 2,967,993 | 0.31 | 0.31 | 2.74 | 294 | (g) | ||||||||||||||||||||
| (0.05 | ) | 1.26 | 3.58 | 2,943,934 | 0.32 | 0.31 | 2.15 | 390 | (g) | |||||||||||||||||||||
The Accompanying Notes are an Integral Part of the Financial Statements.
249
Table of Contents
Financial Highlights
NORTHWESTERN MUTUAL SERIES FUND, INC.
(For a share outstanding through the period)
Net Asset Value, Beginning of Period | Net Investment Income (Loss) | Net Realized and Unrealized Gain (Loss) on Investments | Total from Investment Operations | Distributions from Net Investment Income | Distributions from Realized Gains on Investments | |||||||||||||||||||||||||||
Long-Term U.S. Government Bond Portfolio(s) |
| |||||||||||||||||||||||||||||||
2021 | $ | 1.21 | $ | 0.02 | $ | (0.08 | ) | $ | (0.06 | ) | $ | (0.01 | ) | $ | (0.20 | ) | ||||||||||||||||
2020 | 1.12 | 0.02 | 0.17 | 0.19 | (0.02 | ) | (0.08 | ) | ||||||||||||||||||||||||
2019 | 1.01 | 0.02 | 0.11 | 0.13 | (0.02 | ) | – | |||||||||||||||||||||||||
2018 | 1.08 | 0.03 | (0.06 | ) | (0.03 | ) | (0.02 | ) | (0.02 | ) | ||||||||||||||||||||||
2017 | 1.06 | 0.03 | 0.05 | 0.08 | (0.02 | ) | (0.04 | ) | ||||||||||||||||||||||||
Inflation Protection Portfolio |
| |||||||||||||||||||||||||||||||
2021 | $ | 1.21 | $ | 0.04 | $ | 0.04 | $ | 0.08 | $ | (0.01 | ) | $ | (0.00 | )(e) | ||||||||||||||||||
2020 | 1.13 | 0.02 | 0.08 | 0.10 | (0.02 | ) | – | |||||||||||||||||||||||||
2019 | 1.06 | 0.02 | 0.08 | 0.10 | (0.03 | ) | – | |||||||||||||||||||||||||
2018 | 1.11 | 0.03 | (0.06 | ) | (0.03 | ) | (0.02 | ) | – | |||||||||||||||||||||||
2017 | 1.09 | 0.02 | 0.01 | 0.03 | (0.01 | ) | (0.00 | )(e) | ||||||||||||||||||||||||
High Yield Bond Portfolio |
| |||||||||||||||||||||||||||||||
2021 | $ | 0.75 | $ | 0.04 | $ | – | $ | 0.04 | $ | (0.04 | ) | $ | – | |||||||||||||||||||
2020 | 0.75 | 0.04 | – | 0.04 | (0.04 | ) | – | |||||||||||||||||||||||||
2019 | 0.69 | 0.04 | 0.06 | 0.10 | (0.04 | ) | – | |||||||||||||||||||||||||
2018 | 0.75 | 0.04 | (0.06 | ) | (0.02 | ) | (0.04 | ) | – | |||||||||||||||||||||||
2017 | 0.74 | 0.04 | 0.01 | 0.05 | (0.04 | ) | – | |||||||||||||||||||||||||
Multi-Sector Bond Portfolio(s) |
| |||||||||||||||||||||||||||||||
2021 | $ | 1.16 | $ | 0.03 | $ | (0.03 | ) | $ | 0.00 | (e) | $ | (0.02 | ) | $ | (0.01 | ) | ||||||||||||||||
2020 | 1.14 | 0.04 | 0.03 | 0.07 | (0.05 | ) | (0.00 | )(e) | ||||||||||||||||||||||||
2019 | 1.05 | 0.04 | 0.10 | 0.14 | (0.05 | ) | – | |||||||||||||||||||||||||
2018 | 1.09 | 0.04 | (0.05 | ) | (0.01 | ) | (0.03 | ) | – | |||||||||||||||||||||||
2017 | 1.05 | 0.04 | 0.04 | 0.08 | (0.04 | ) | – | |||||||||||||||||||||||||
Balanced Portfolio |
| |||||||||||||||||||||||||||||||
2021 | $ | 1.57 | $ | 0.02 | $ | 0.10 | $ | 0.12 | $ | (0.04 | ) | $ | (0.08 | ) | ||||||||||||||||||
2020 | 1.49 | 0.04 | 0.13 | 0.17 | (0.04 | ) | (0.05 | ) | ||||||||||||||||||||||||
2019 | 1.36 | 0.03 | 0.21 | 0.24 | (0.04 | ) | (0.08 | ) | ||||||||||||||||||||||||
2018 | 1.47 | 0.03 | (0.07 | ) | (0.04 | ) | (0.04 | ) | (0.03 | ) | ||||||||||||||||||||||
2017 | 1.40 | 0.03 | 0.12 | 0.15 | (0.03 | ) | (0.05 | ) | ||||||||||||||||||||||||
Asset Allocation Portfolio |
| |||||||||||||||||||||||||||||||
2021 | $ | 1.29 | $ | 0.02 | $ | 0.12 | $ | 0.14 | $ | (0.03 | ) | $ | (0.07 | ) | ||||||||||||||||||
2020 | 1.22 | 0.03 | 0.12 | 0.15 | (0.03 | ) | (0.05 | ) | ||||||||||||||||||||||||
2019 | 1.10 | 0.02 | 0.20 | 0.22 | (0.03 | ) | (0.08 | ) | ||||||||||||||||||||||||
2018 | 1.21 | 0.03 | (0.09 | ) | (0.06 | ) | (0.02 | ) | (0.03 | ) | ||||||||||||||||||||||
2017 | 1.12 | 0.02 | 0.15 | 0.17 | (0.03 | ) | (0.05 | ) | ||||||||||||||||||||||||
| (d) | Total Return includes deductions for management and other fund expenses; excludes deductions for sales loads and account fees, not annualized for periods less than one year. |
| (r) | Expense ratios are based upon the direct and allocated expenses of the Portfolio and do not include the effect of underlying funds’ expenses. For additional information on underlying funds’ expenses, please refer to the Fee and Expense table in the Prospectus. |
| (s) | The ratios of gross expenses to average net assets and net expenses to average net assets include interest expense. Excluding interest expense, the ratios for the Long-Term U.S. Government Portfolio would be 0.65% and 0.65% respectively for the period ended December 31, 2021, 0.64% and 0.64% respectively in 2020, 0.67% and 0.65% respectively in 2019, 0.67% and 0.65% respectively in 2018, 0.67% and 0.65% respectively in 2017. The ratios for the Multi-Sector Bond Portfolio would be 0.80% and 0.71% respectively for the period ended December 31, 2021, 0.81% and 0.72% respectively in 2020, 0.82% and 0.73% respectively in 2019, 0.81% and 0.74% respectively in 2018. (g) Portfolio Turnover Rate excludes the impact of TBA transactions. |
| (e) | Amount is less than $0.005. |
The Accompanying Notes are an Integral Part of the Financial Statements.
250
Table of Contents
Total | Net Asset Value, | Total Return(d) | Net Assets, | Ratio of Gross | Ratio of Net | Ratio of Net | Portfolio | |||||||||||||||||||||||
| $ | (0.21 | ) | $ | 0.94 | (5.37 | )% | $ | 138,869 | 0.67 | % | 0.67 | % | 1.73 | % | 28 | %(g) | ||||||||||||||
| (0.10 | ) | 1.21 | 17.37 | 153,933 | 0.94 | 0.94 | 1.61 | 157 | (g) | |||||||||||||||||||||
| (0.02 | ) | 1.12 | 13.17 | 122,854 | 1.25 | 1.23 | 2.06 | 5 | (g) | |||||||||||||||||||||
| (0.04 | ) | 1.01 | (2.04 | ) | 111,468 | 0.90 | 0.89 | 2.48 | 43 | (g) | ||||||||||||||||||||
| (0.06 | ) | 1.08 | 8.28 | 115,713 | 0.94 | 0.92 | 2.64 | 51 | (g) | |||||||||||||||||||||
| $ | (0.01 | ) | $ | 1.28 | 6.61 | % | $ | 513,931 | 0.56 | % | 0.53 | % | 3.17 | % | 78 | % | ||||||||||||||
| (0.02 | ) | 1.21 | 9.57 | 423,389 | 0.58 | 0.55 | 1.34 | 56 | ||||||||||||||||||||||
| (0.03 | ) | 1.13 | 9.02 | 381,132 | 0.59 | 0.55 | 2.13 | 40 | ||||||||||||||||||||||
| (0.02 | ) | 1.06 | (2.61 | ) | 349,571 | 0.59 | 0.55 | 2.55 | 23 | |||||||||||||||||||||
| (0.01 | ) | 1.11 | 3.58 | 401,711 | 0.61 | 0.57 | 2.05 | 21 | ||||||||||||||||||||||
| $ | (0.04 | ) | $ | 0.75 | 5.31 | % | $ | 842,332 | 0.44 | % | 0.44 | % | 4.87 | % | 35 | % | ||||||||||||||
| (0.04 | ) | 0.75 | 6.64 | 825,203 | 0.45 | 0.45 | 5.36 | 42 | ||||||||||||||||||||||
| (0.04 | ) | 0.75 | 14.97 | 846,127 | 0.45 | 0.45 | 5.73 | 33 | ||||||||||||||||||||||
| (0.04 | ) | 0.69 | (2.71 | ) | 763,366 | 0.45 | 0.45 | 5.65 | 23 | |||||||||||||||||||||
| (0.04 | ) | 0.75 | 6.88 | 811,878 | 0.45 | 0.45 | 5.48 | 32 | ||||||||||||||||||||||
| $ | (0.03 | ) | $ | 1.13 | (0.08 | )% | $ | 1,316,651 | 0.81 | % | 0.71 | % | 2.90 | % | 21 | % | ||||||||||||||
| (0.05 | ) | 1.16 | 6.13 | 1,148,511 | 0.82 | 0.73 | 3.23 | 30 | (g) | |||||||||||||||||||||
| (0.05 | ) | 1.14 | 14.04 | 1,021,824 | 0.83 | 0.74 | 3.53 | 30 | (g) | |||||||||||||||||||||
| (0.03 | ) | 1.05 | (1.30 | ) | 874,943 | 0.82 | 0.75 | 3.67 | 37 | (g) | ||||||||||||||||||||
| (0.04 | ) | 1.09 | 8.38 | 840,981 | 0.82 | 0.75 | 4.06 | 49 | ||||||||||||||||||||||
| $ | (0.12 | ) | $ | 1.57 | 7.56 | % | $ | 2,381,573 | 0.31 | % | 0.06 | % | 1.51 | % | 20 | % | ||||||||||||||
| (0.09 | ) | 1.57 | 12.49 | 2,367,387 | 0.31 | 0.06 | 2.40 | 28 | ||||||||||||||||||||||
| (0.11 | ) | 1.49 | 17.92 | 2,254,235 | 0.31 | 0.06 | 2.14 | 17 | ||||||||||||||||||||||
| (0.07 | ) | 1.36 | (3.45 | ) | 2,065,353 | 0.31 | 0.06 | 2.25 | 27 | |||||||||||||||||||||
| (0.08 | ) | 1.47 | 11.98 | 2,307,470 | 0.31 | 0.06 | 1.75 | 17 | ||||||||||||||||||||||
| $ | (0.10 | ) | $ | 1.33 | 10.45 | % | $ | 320,737 | 0.55 | % | 0.09 | % | 1.37 | % | 18 | % | ||||||||||||||
| (0.08 | ) | 1.29 | 13.43 | 306,692 | 0.57 | 0.09 | 2.32 | 29 | ||||||||||||||||||||||
| (0.10 | ) | 1.22 | 21.08 | 287,738 | 0.57 | 0.09 | 1.96 | 15 | ||||||||||||||||||||||
| (0.05 | ) | 1.10 | (4.88 | ) | 249,511 | 0.57 | 0.09 | 2.24 | 32 | |||||||||||||||||||||
| (0.08 | ) | 1.21 | 14.87 | 277,213 | 0.57 | 0.09 | 1.68 | 22 | ||||||||||||||||||||||
The Accompanying Notes are an Integral Part of the Financial Statements.
251
Table of Contents
NOTE 1. ORGANIZATION
Northwestern Mutual Series Fund, Inc. (the “Series Fund”) is registered as an open-end management investment company under the Investment Company Act of 1940, as amended (“1940 Act”). The Series Fund is also considered an investment company following the accounting and reporting guidance in Financial Accounting Standards Board (“FASB”) Accounting Standards Codification (“ASC”) Topic 946. The Series Fund consists of the Growth Stock Portfolio, Focused Appreciation Portfolio, Large Cap Core Stock Portfolio, Large Cap Blend Portfolio, Index 500 Stock Portfolio, Large Company Value Portfolio, Domestic Equity Portfolio, Equity Income Portfolio, Mid Cap Growth Stock Portfolio, Index 400 Stock Portfolio, Mid Cap Value Portfolio, Small Cap Growth Stock Portfolio, Index 600 Stock Portfolio, Small Cap Value Portfolio, International Growth Portfolio, Research International Core Portfolio, International Equity Portfolio, Emerging Markets Equity Portfolio, Government Money Market Portfolio, Short-Term Bond Portfolio, Select Bond Portfolio, Long-Term U.S. Government Bond Portfolio, Inflation Protection Portfolio, High Yield Bond Portfolio, Multi-Sector Bond Portfolio, Balanced Portfolio and Asset Allocation Portfolio (each, a “Portfolio” or collectively, the “Portfolios”). All of the outstanding shares of each Portfolio are held by an affiliate, The Northwestern Mutual Life Insurance Company (“Northwestern Mutual”), for its segregated asset accounts (either directly or indirectly through one or more underlying Portfolios operating as affiliated fund of funds). The Government Money Market Portfolio is a government money market fund under Rule 2a-7 of the 1940 Act.
NOTE 2. SIGNIFICANT ACCOUNTING POLICIES
The following is a summary of significant accounting policies consistently followed by the Series Fund in the preparation of its financial statements.
A. Use of Estimates — The preparation of financial statements in conformity with accounting principles generally accepted in the United States of America (“U.S. GAAP”) requires management to make estimates and assumptions that affect the reported amounts of assets and liabilities at the date of the financial statements and the reported amounts of revenues and expenses during the reporting period. Actual results could differ from those estimates.
B. Foreign Income and Capital Gains Taxes — The Portfolios may be subject to income taxes imposed by certain countries in which they invest. Foreign withholding taxes on dividends and interest are netted against income and separately disclosed in the Statements of Operations.
Some of the Portfolios may be subject to capital gains taxes imposed by certain countries in which they invest. Any applicable foreign capital gains tax is accrued daily based upon net unrealized gains, and may be payable following the sale of any applicable investments.
C. Federal Income Taxes — The Portfolios’ policy is to continue to comply with the requirements of the Internal Revenue Code that are applicable to regulated investment companies and to distribute all of their taxable income to their respective shareholders. The Portfolios also intend to distribute sufficient net investment income and net capital gains, if any, so that they will not be subject to excise tax, as applicable, on distributable income and gains.
In accordance with the authoritative guidance for uncertainty in income taxes, management of the Series Fund has reviewed all open tax years (2018 to 2021) for major jurisdictions and concluded there was no material impact to the Portfolios’ net assets or results of operations. There is no material tax liability relating to uncertain income tax positions taken or expected to be taken in future tax returns. The Portfolios are also not aware of any tax positions for which it is reasonably possible that the total amounts of unrecognized tax benefits will significantly change in the next 12 months.
D. Distributions — Dividends from net investment income and net realized capital gains are declared and paid each business day for the Government Money Market Portfolio and at least annually for the remaining Portfolios, when applicable.
E. Other — The Portfolios record security transactions on trade date. The basis for determining cost on sale of securities is identified cost. Interest income is recorded daily on the accrual basis and dividend income is recorded on the ex-dividend date or as soon as information from issuers is available. Where applicable, dividends are recorded net of foreign withholding tax. Discounts and premiums on securities purchased are amortized or accreted using the effective interest method. Expenses directly attributable to a Portfolio are incurred by the respective Portfolio. Expenses that are not directly attributable to one
252
Table of Contents
Notes to Financial Statements
or more Portfolios are allocated among applicable Portfolios on an equitable and consistent basis considering such things as the nature and type of expenses and the relative net assets of the Portfolios. The Portfolios consider highly liquid temporary cash investments purchased with an original maturity of less than three months to be cash equivalents. Cash equivalents are included in the short-term investments on the Schedule of Investments as well as in investments on the Statements of Assets and Liabilities. Temporary cash overdrafts are reported as a payable to custodian.
F. New Accounting Pronouncements — In March 2020, the FASB issued Accounting Standards Update (“ASU”) 2020-04, “Reference Rate Reform (Topic 848): Facilitation of the Effects of Reference Rate Reform on Financial Reporting.” In January 2021, the FASB issued ASU 2021-01 with further amendments to Topic 848. Collectively, these ASUs provide optional guidance to ease the potential accounting burden associated with transitioning away from the London Interbank Offered Rate and other reference rates that are expected to be discontinued. The ASUs are effective immediately upon release of the update on March 12, 2020 through December 31, 2022. Management is evaluating implications of this guidance on the financial statements in light of the status of the reference rate transitioning described therein.
NOTE 3. SECURITY VALUATION
For purposes of calculating a net asset value, Portfolio securities and other assets are valued as of the close of trading on the New York Stock Exchange (“Exchange”) on each day during which the Exchange is open for trading.
The Fair Value Measurements and Disclosures Topic of the Financial Accounting Standards Codification defines fair value as the price that a fund would receive to sell an asset or pay to transfer a liability in an orderly transaction between market participants at the measurement date. It establishes and requires disclosure of a fair value hierarchy, separately for each major category of asset and liability, which segregates fair value measurements into levels. A summary of the fair value hierarchy is described below:
| • | Level 1 — fair value is determined by unadjusted quoted prices in active markets for identical securities or derivatives |
| • | Level 2 — fair value is determined by other significant observable inputs (including quoted prices for similar securities, interest rates, prepayment speeds, credit risk, and other data used in fair valuation) |
| • | Level 3 — fair value is determined by significant unobservable inputs (including the Portfolios’ own assumptions in determining fair value) |
The categorization of a value determined for a financial instrument within the hierarchy is based upon the pricing transparency of the instrument and does not necessarily correspond to the Portfolios’ perceived risk of that instrument.
The following is a description of the valuation techniques and significant inputs used in determining the value of the Portfolios’ investments classified as Level 1 and Level 2 in the fair value hierarchy:
| • | Equity securities (common and preferred stock) for which market quotations are readily available are valued at the last sale or, when available, official closing price as reported by an independent pricing service on the primary market or exchange on which they are traded. In the event there were no sales during the day or closing prices are not available, securities are generally valued at the last quoted bid price. Equity securities traded only in the over-the-counter market and not on a securities exchange are valued at the last sale price or closing bid price, if no sales have occurred. To the extent these securities are actively traded and valuation adjustments are not applied, they are categorized as Level 1 of the fair value hierarchy. Additionally, for foreign securities, fair value procedures are used if a significant event occurs between the close of the foreign market and the U.S. market close. The fair value price is reflected as Level 2 in the fair value hierarchy when such fair value procedures are applied. |
| • | Fixed income securities, including corporate, convertible and municipal bonds and notes, U.S. government agencies, U.S. treasury obligations, sovereign issues, bank loans, and non-U.S. bonds are generally valued on the basis of service provider prices that use broker dealer quotations or valuation estimates from internal pricing models. The |
253
Table of Contents
Notes to Financial Statements
| service providers’ internal models use inputs that are observable such as issuer details, interest rates, yield curves, call features, maturities, credit risks/spreads and default rates. Securities that use similar valuation techniques and inputs as described above are categorized as Level 2 in the fair value hierarchy. |
| • | Fixed income securities purchased on a delayed delivery basis are marked to market daily until settlement at the forward settlement date and are categorized as Level 2 in the fair value hierarchy. |
| • | Mortgage related and asset backed securities are generally issued as separate tranches, or classes, of securities within each deal. These securities are normally valued by pricing service providers that use broker dealer quotations or valuation estimates from their internal pricing models. The pricing models for these securities usually consider tranche level attributes, current market data, estimated cash flows and market-based yield spreads for each tranche, and incorporate deal collateral performance, as available. Mortgage related and asset backed securities that use similar valuation techniques and inputs as described above are categorized as Level 2 in the fair value hierarchy. |
| • | Investments in open-end mutual funds (including other Portfolios) are valued at the mutual fund’s closing net asset value per share and are categorized as Level 1 in the fair value hierarchy. Investments in privately held mutual funds are valued at the mutual fund’s closing net asset value per share and are categorized as Level 2 in the fair value hierarchy. |
| • | Money market investments, other than in the Government Money Market Portfolio, are generally valued by a pricing service. All securities in the Government Money Market Portfolio are valued using amortized cost, unless the current market value differs substantially from the amortized cost, at which time the securities are marked to market. Because the value is not obtained from a quoted price in an active market, such securities are reflected as Level 2 in the fair value hierarchy. |
| • | Listed derivatives, such as futures or option contracts, which are actively traded on a national securities exchange, are stated at the last reported sale or settlement price on the day of valuation and are categorized as Level 1 in the fair value hierarchy. |
| • | Centrally-cleared swaps and over-the-counter financial derivatives, such as foreign currency contracts, options contracts, or swap agreements derive their value from underlying asset prices, indices, reference rates, and other inputs or a combination of these factors. These derivatives are normally valued on the basis of quotes obtained from brokers and dealers or pricing services. Depending on the product and the terms of the transaction, the value of the derivatives can be estimated using a series of techniques, including simulation pricing models. The pricing models use inputs that are observed from actively quoted markets such as issuer details, indices, spreads, interest rates, curves, dividends and exchange rates. Financial derivatives that use similar valuation techniques and inputs as described above are categorized as Level 2 in the fair value hierarchy. |
The following is a description of the valuation techniques and significant inputs used in determining the value the Portfolios’ investments classified as Level 3 in the fair value hierarchy:
| • | Securities and other assets for which market quotes are not readily available are valued at fair market value as determined in good faith in accordance with procedures adopted by the Series Fund’s Board of Directors (“Board”). Market quotes are considered not readily available in circumstances where there is an absence of current or reliable market-based data (e.g. trade information or broker quotes). The factors considered in reaching these values at December 31, 2021 included, but were not limited to, broker quotes, liquidity, prepayment speed, duration and recoverability. |
A table summarizing each Portfolio’s investments under this hierarchy is included following each Portfolio’s Schedule of Investments. Transfers between investment levels may occur as markets fluctuate and/or the availability of data used in investments’ valuation changes. For fair valuations using significant unobservable inputs, U.S. GAAP requires a reconciliation of the beginning to ending balances for reported fair values that presents changes attributable to total realized and unrealized gains or losses, purchases and sales, and transfers in or out of the Level 3 category during the period. Additionally, U.S GAAP requires quantitative information regarding the significant unobservable inputs used in the determination of fair value of
254
Table of Contents
Notes to Financial Statements
assets categorized as Level 3 in the fair value hierarchy. In accordance with the requirements, a Level 3 reconciliation and details of significant unobservable inputs have been included in the notes to the Schedule of Investments for Portfolios that have a material amount of Level 3 investments. As of December 31, 2021, there were no Portfolios that owned a material amount of Level 3 securities.
The Series Fund has adopted policies and procedures which govern the pricing of Portfolio securities. The Board has delegated the day-to-day responsibility for pricing Portfolio securities and other investments to Mason Street Advisors, LLC (“MSA”), the Portfolios’ investment adviser, Northwestern Mutual in its capacity as fund administrator, and State Street Bank and Trust Company in its capacity as fund accountant, subject to the oversight of a Pricing Committee appointed by the Board and comprised of representatives of MSA, Northwestern Mutual and Series Fund officers. The Pricing Committee is charged with the primary and day-to-day operational responsibility for executing the valuation process. The Pricing Committee has been delegated the authority to approve the override of any prices as permitted under the pricing policy and procedures approved by the Board and any variances from these pricing procedures when appropriate. All such actions are subject to further review and approval by the Board at its next regular meeting.
NOTE 4. SECURITIES AND OTHER INVESTMENTS
A. Delayed Delivery Transactions and When-Issued Securities — Certain Portfolios may engage in securities transactions on a when-issued or delayed delivery basis. In these transactions, the securities’ prices and yields are fixed on the date of the commitment, with payment and delivery scheduled for a future date. During this period, the securities are subject to market fluctuations. When delayed delivery purchases are outstanding, a Portfolio will earmark liquid assets on its records in amounts sufficient to meet the purchase price. A Portfolio may dispose of or renegotiate a delayed delivery transaction, which may result in a capital gain or loss.
B. Repurchase Agreements — Certain Portfolios may engage in repurchase transactions. Under the terms of a typical repurchase agreement, a Portfolio takes possession of an underlying debt obligation subject to an obligation of the seller to repurchase, and a Portfolio to resell, the obligation at an agreed upon price and time. The underlying securities for all repurchase agreements are held in safekeeping at the Portfolio’s custodian or designated sub-custodians under tri-party repurchase agreements. The market value of the collateral must be equal to or exceed at all times the total amount of the repurchase obligations, including interest. Securities purchased under repurchase agreements are reflected as an asset on the Statements of Assets and Liabilities. Generally, in the event of counterparty default, a Portfolio has the right to use the collateral to offset losses incurred. If the counterparty should default, a Portfolio will seek to sell the securities which it holds as collateral. This could involve procedural costs or delays in addition to a loss on the securities if their value should fall below their repurchase price.
C. Restricted Securities — Certain Portfolios may invest in securities that are subject to legal or contractual restrictions on resale. These securities may be sold privately, but are required to be registered or exempted from registration before being sold to the public. Disposal of these securities may involve time-consuming negotiations and expense, and prompt sale at an acceptable price may be difficult.
D. Foreign Currency Transactions — Certain Portfolios may have securities and other assets and liabilities denominated in foreign currencies which are translated into U.S. dollar amounts on the date of valuation. Purchases and sales of securities and income items denominated in foreign currencies are translated into U.S. dollar amounts on the respective dates of such transactions. When the Portfolios purchase or sell a foreign security they may enter into a foreign currency exchange contract to minimize exchange rate risk from the trade date to the settlement date of such transaction. Such foreign currency exchange contracts are marked to market daily.
The Portfolios do not separately report the results of operations due to fluctuations in foreign exchange rates on investments from the changes arising from changes in market prices of securities held. Such fluctuations are included with the net realized or unrealized gain or loss from investments.
Net realized foreign exchange gains or losses arise from sales of foreign currencies, currency gains or losses realized between the trade date and the settlement date on security transactions, and the differences between the amounts of income and foreign withholding taxes recorded on the Portfolios’ books and the U.S. dollar equivalent of the amounts actually received or paid.
255
Table of Contents
Notes to Financial Statements
E. Mortgage Backed and Asset Backed Securities — Certain Portfolios may invest in mortgage backed securities, including collateralized mortgage obligations, and asset backed securities. Mortgage backed securities are interests in pools of residential or commercial mortgage loans and asset backed securities are interests in pools of other assets, including various types of loans and credit card receivables. These securities provide a monthly payment, consisting of both a principal and interest component. Interest payments may be based on either fixed rates or adjustable rates. Receipt of principal payment reduces the outstanding par amount of the security and may generate realized gains or losses. Yields on mortgage backed securities are affected by interest and prepayment rates, which, in turn, are influenced by a variety of economic, geographical, social and other factors. Maturities on mortgage backed securities represent stated maturity dates. Actual maturity dates may differ based on prepayment rates. Unlike mortgage backed securities issued or guaranteed by the U.S. government or one of its sponsored entities, mortgage backed securities and asset backed securities issued by private issuers do not have a government or government sponsored entity guarantee. These issuers may provide credit enhancements through external entities such as financial institutions or through the structuring of the transaction itself. There is no guarantee that credit enhancements, if any, will be sufficient to prevent losses.
F. Inflation-Indexed Bonds — Certain Portfolios may invest in inflation-indexed bonds. Inflation-indexed bonds are fixed income securities whose principal value is periodically adjusted to the rate of inflation. The interest rate on these bonds is generally fixed at issuance at a rate lower than typical bonds. Over the life of an inflation-indexed bond, interest will be paid based on a principal value, which is adjusted for inflation. Any increase or decrease in the principal amount of an inflation-indexed bond will be included as interest income in the applicable Portfolio’s Statements of Operations even though investors do not receive their principal until maturity.
G. Short Sales — Certain Portfolios may enter into short sale transactions. A short sale is a transaction in which a Portfolio sells a security it does not own in anticipation of a decline in the market price of the security. Securities sold in short sale transactions and the interest payable on such securities, if any, are reflected as a liability on the Statements of Assets and Liabilities. A Portfolio is obligated to deliver the security at the market price at the time the short position is closed. The risk of loss on a short sale transaction is theoretically unlimited, because there is no limit to the cost of replacing the security sold short, whereas losses from purchase transactions cannot exceed the total amount invested.
H. Financing Transactions — Certain Portfolios may enter into financing transactions. In a financing transaction, the Portfolio transfers a security to a counterparty with a simultaneous agreement to repurchase the same security at an agreed upon price and future settlement date. For U.S. GAAP purposes, a financing transaction is accounted for as a secured borrowing and not as a purchase or sale. During the term of the borrowing, the Portfolio is entitled to the interest on the security. The difference between the sale price and repurchase price is included in net investment income with the cost of the secured borrowing transaction being recorded in interest expense over the term of the borrowing. The Portfolio will benefit from the transaction if the income earned on the investment purchased with the cash received in the financing transaction exceeds the interest expense incurred by the Portfolio. If the interest expense exceeds the income earned, the Portfolio’s net investment income and dividends to shareholders may be adversely impacted. Financing transactions involve the risk that the market value of the securities that the Portfolio is required to repurchase may decline below the agreed upon repurchase price of those securities. For the year ended December 31, 2021, the Long-Term U.S. Government Bond Portfolio entered into financing transactions utilizing various U.S. Treasury bonds.
I. Loan Participation and Assignments — Certain Portfolios may invest in direct debt instruments which are interests in amounts owed to lenders or lending syndicates by corporate, governmental, or other borrowers. The Portfolios’ investments in a loan may be in the form of either actual participation in loans or assignments of all or part of the loans from third parties. A loan is often administered by a bank or other financial institution that acts as an agent for all holders. The agent administers the terms of the loan which are specified in the loan agreement. The Portfolios may invest in multiple series or tranches of a loan, each of which can have different terms and associated risks. The Portfolios generally do not have a right to enforce compliance with the terms of the loan agreement and as a result, the Portfolios may be subject to the credit risk of the borrower and lender that is selling the loan agreement. When the Portfolios purchase assignments from lenders they acquire direct rights against the borrower of the loan. The Portfolios may also enter into unfunded loan commitments, which are contractual obligations for future funding. Unfunded loan commitments can include lines of credit, which may require the Portfolios to grant additional cash to the borrower upon demand from the borrower. These unfunded loan commitments
256
Table of Contents
Notes to Financial Statements
are in fact a future obligation in full, although a percentage of the loan amount may not be utilized by the borrower. When investing in a loan, the Portfolios have the right to receive principal, interest and any fees from the lender selling the loan agreement and only when the payments are received by the lender from the borrower. There may also be a commitment fee due to the Portfolios based on the unused portion of the line of credit of the floating rate loan. In certain cases, the Portfolios may be entitled to a penalty fee if there was a prepayment of a floating rate loan by the borrower. Fees that are earned or paid will be reflected as interest income or interest expense on the Statements of Operations. As of December 31, 2021, there were no unfunded loan commitments outstanding.
J. Reverse Repurchase Agreements — Certain Portfolios may enter into reverse repurchase agreements. In a reverse repurchase agreement, a Portfolio delivers a security in exchange for cash to a financial institution, the counterparty, with a simultaneous agreement to repurchase the same or substantially the same security at an agreed upon price and date. The Portfolio is entitled to receive principal and interest payments, if any, made on the security delivered to the counterparty during the term of the agreement. Cash received in exchange for securities delivered plus accrued interest payments to be made by the Portfolio to counterparties are reflected as a liability on the Statements of Assets and Liabilities. Interest payments made by a Portfolio to counterparties are recorded as a component of interest expense on the Statements of Operations. In periods of increased demand for the security, a Portfolio may receive a fee for use of the security by the counterparty, which may result in interest income to the Portfolio. When effecting reverse repurchase transactions, the Portfolio will hold securities of a dollar amount equal in value to the securities subject to the reverse repurchase agreement in a segregated account.
NOTE 5. DERIVATIVE INSTRUMENTS
The Portfolios may use derivative instruments for various purposes, including as a cash management strategy, to earn income and enhance returns, to increase or decrease exposure to a particular market, to manage or adjust the risk profile of the Portfolio, to hedge exposure to a foreign currency, or as an alternative to direct investments. Because the Portfolios are required to account for derivative instruments at fair value and recognize changes in fair value through the Statements of Operations, the Portfolios’ derivatives do not qualify for hedge accounting treatment.
Certain Portfolios segregate cash to cover margin requirements for derivative positions. These amounts are denoted as “Cash Collateral for Derivative Positions” on the Statements of Assets and Liabilities.
A. Futures Contracts — Certain Portfolios invest in futures contracts as an alternative to investing in individual securities and could be exposed to market risk due to changes in the value of the underlying securities or due to an illiquid secondary market. Futures contracts are marked to market daily based upon quoted settlement prices. The Portfolios receive from or pay to brokers an amount of cash equal to the daily fluctuation in the value of the contracts. Such receipts or payments, known as the “variation margin,” are recorded by the Portfolios as unrealized gains or losses. When a contract is closed, the Portfolios record a realized gain or loss equal to the difference between the value of the contract at the time it was opened and the value at the time it was closed.
B. Forward Foreign Currency Contracts — The Portfolios may enter into forward foreign currency contracts to hedge against exchange rate risk arising from investments in securities denominated in foreign currencies or as part of an investment strategy. Contracts are valued at the contractual forward rate and are marked to market daily, with the change in market value recorded as an unrealized gain or loss. When the contracts are closed, a realized gain or loss is recorded. Risks may arise from changes in market value of the underlying instruments and from the possible inability of counterparties to meet the terms of their contracts.
C. Options — Certain Portfolios may write call and put options on futures, swaps, securities or currencies they own or in which they may invest. Writing put options tends to increase a Portfolio’s exposure to the underlying instrument. Writing call options tends to decrease a Portfolio’s exposure to the underlying instrument. The Portfolio receives a premium on the sale of a call option but gives up the opportunity to profit from any increase in the value of the security above the exercise price of the option. When a Portfolio writes a put option, it is exposed to a decline in the price of the underlying security. When a Portfolio writes a call or put option, an amount equal to the premium received is recorded as a liability and subsequently marked to market to reflect the current value of the option written. These liabilities are reflected as written options outstanding in the Statements of Assets and Liabilities. Payments received or made, if any, from writing options with
257
Table of Contents
Notes to Financial Statements
premiums to be determined on a future date are reflected as such on the Statements of Assets and Liabilities. Premiums received from writing options which expire are treated as realized gains. Premiums received from writing options which are exercised or closed are added to the proceeds or offset against amounts paid on the underlying future, swap, security or currency transaction to determine the realized gain or loss. A Portfolio as a writer of an option has no control over whether the underlying future, swap, security or currency may be sold (called) or purchased (put) and as a result bears the market risk of an unfavorable change in the price of the future, swap, security or currency underlying the written option. There is a risk a Portfolio may not be able to enter into a closing transaction because of an illiquid market.
Certain Portfolios may also purchase call and put options on futures, swaps, securities or currencies they own or in which they may invest. Purchasing call options tends to increase a Portfolio’s exposure to the underlying instrument. Purchasing put options tends to decrease a Portfolio’s exposure to the underlying instrument. The Portfolio pays a premium on the purchase of a put option but receives the opportunity to profit from any increase in the value of the security above the exercise price of the option. When a Portfolio purchases a call option, it is exposed to a decline in the price of the underlying security. Premiums paid are reflected in the Statements of Assets and Liabilities as an investment and are subsequently marked to market to reflect the current value of the option. Premiums paid from purchasing options which expire are treated as realized losses. Premiums paid for purchasing options which are exercised or closed are added to the amount paid or offset against the proceeds on the underlying future, swap, security or currency transaction to determine realized gain or loss. The risk associated with a Portfolio purchasing call or put options is limited to the premium paid.
D. Swap Agreements — The Portfolios may enter into swap agreements on interest rate, total return and credit default to manage their exposure to interest rates, foreign currencies, investment style risk and credit risk or as an alternative to direct investing. In connection with these agreements, securities may be identified as collateral in accordance with the terms of the respective swap agreements. Swap agreements are privately negotiated in the over-the-counter market (“OTC swaps”) and may be executed in a multilateral or other trade facility platform, such as a registered commodities exchange (“centrally cleared swaps”).
Swaps are marked to market daily based upon quotations from market makers or values from third party vendors, which may include a registered commodities exchange, and the change in value, if any, is recorded as unrealized gain or loss in the Statements of Operations. Daily changes in the valuation of centrally cleared swaps, if any, are recorded as a receivable or payable for the change in value as appropriate (“variation margin”) on the Statements of Assets and Liabilities. OTC swap payments received or made at the beginning of the measurement period of the swap are reflected on the Statements of Assets and Liabilities. Upfront payments are amortized to realized gain or loss. Upon termination of the swap, unamortized upfront payments are recorded as realized gain or loss in the Statements of Operations. A liquidation payment received or made at the termination of the swap is recorded as realized gain or loss in the Statements of Operations. Net periodic payments received by the Portfolios are included as part of realized gain (loss) on the Statements of Operations. Entering into these agreements involves, to varying degrees, elements of credit and market risk in excess of the amounts recognized on the Statements of Assets and Liabilities. Such risks involve the possibility that there will be no liquid market for these agreements, that the counterparty to the agreements may default on its obligation to perform and that there may be unfavorable changes in interest rates.
Interest Rate Swaps — Interest rate swap agreements involve the exchange by a Portfolio with another party to pay or receive a set of cash flows, e.g., an exchange of floating rate payments for fixed rate payments based on a notional amount of principal.
Total Return Swaps — Total return swap agreements involve commitments to pay or receive a financing rate in exchange for the total return of an underlying reference entity, both based on notional amounts. To the extent the total return of the security or index underlying the transaction exceeds or falls short of the offsetting interest rate obligation, a Portfolio will receive a payment from or make a payment to the counterparty.
Credit Default Swaps — Credit default swap agreements involve one party making a series of payments to another party in exchange for the right to receive a cash payment equal to the notional value of the swap in the event of a default by a third party, typically corporate issues or sovereign issues of an emerging market country. A Portfolio may use credit default swaps to provide a measure of protection against defaults of the issuers where the Portfolio owns or has exposure to the corporate or sovereign issue or to take an active long or short position on the likelihood of a particular issuer’s default.
258
Table of Contents
Notes to Financial Statements
As a seller of protection, the Portfolio generally receives an upfront payment and/or a fixed rate of income throughout the term of the swap provided that there is no credit event. As the seller, the Portfolio adds leverage to its investments because the Portfolio has investment exposure on the notional amount of the swap. As a buyer of protection, the Portfolio generally makes an upfront payment or pays a fixed rate of interest throughout the term of the swap provided that there is no credit event. The Portfolio generally receives an amount up to the notional value of the swap if a credit event occurs.
Implied credit spreads, represented in absolute terms, utilized in determining the market value of credit default swap agreements on corporate issues or sovereign issues of an emerging market country serve as an indicator of the current status of the payment/performance risk and represent the likelihood of a credit event occurring. The implied credit spread of a particular referenced entity reflects the cost of selling protection and may include upfront payments required to be made to enter into the agreement. For credit default swap agreements on credit indices, the quoted market prices and resulting values serve as the indicator of the current status of the payment/performance risk. Wider credit spreads and increasing market values, in absolute terms when compared to the notional amount of the swap, represent a deterioration of the referenced entity’s credit soundness and indicate a greater likelihood a credit event could occur as defined under the terms of the agreement. Open credit default swaps on corporate or sovereign issues and credit indices are disclosed in the Schedules of Investments.
If the Portfolio is a seller of protection and a credit event occurs, the Portfolio will either pay to the buyer of the protection an amount equal to the notional value of the swap and may take delivery of the obligation or pay a net settlement amount in the form of cash or securities equal to the notional amount of the swap less the recovery value of the referenced obligation. The maximum potential amount of future payments (undiscounted) that a Portfolio as a seller of protection could be required to make under a credit default swap agreement would be equal to the notional amount of the agreement. Notional amounts and fair market value of all credit default swap agreements outstanding for each Portfolio are disclosed in the Schedules of Investments. These maximum potential amounts would be partially offset by any recovery values of the referenced obligations, upfront payments received upon entering into the agreement, or net amounts received by the Portfolio from the settlement of credit default swap agreements purchasing protection for the same referenced obligation.
E. Derivative Disclosures — Derivative positions held by the Portfolios by contract type and primary risk exposure, including location on the Statement of Assets and Liabilities and value as of December 31, 2021, are (amounts in thousands):
| Portfolio | Asset Derivatives | Liability Derivatives | ||||||||||
Statement of Assets and Liabilities Location | Value | Statement of Assets and Liabilities Location | Value | |||||||||
Index 500 Stock Portfolio | ||||||||||||
Equity contracts | Receivables – Variation Margin (Futures) | $ | - | Payables – Variation Margin (Futures) | $ | 162 | ||||||
Large Company Value Portfolio | ||||||||||||
Forward foreign currency contracts | Receivables – Foreign Currency | - | Payables – Foreign Currency | 236 | ||||||||
Index 400 Stock Portfolio | ||||||||||||
Equity contracts | Receivables – Variation Margin (Futures) | 4 | Payables – Variation Margin (Futures) | - | ||||||||
Mid Cap Value Portfolio | ||||||||||||
Forward foreign currency contracts | Receivables – Foreign Currency | 75 | Payables – Foreign Currency | 574 | ||||||||
Index 600 Portfolio | ||||||||||||
Equity contracts | Receivables – Variation Margin (Futures) | - | Payables – Variation Margin (Futures) | 9 | ||||||||
International Equity Portfolio | ||||||||||||
Forward foreign currency contracts | Receivables – Foreign Currency | 6 | Payables – Foreign Currency | 937 | ||||||||
Short-Term Bond Portfolio | ||||||||||||
Interest rate contracts | Receivables – Variation Margin (Futures) | 15 | Payables – Variation Margin (Futures) | 13 | ||||||||
259
Table of Contents
Notes to Financial Statements
| Portfolio | Asset Derivatives | Liability Derivatives | ||||||||||
Statement of Assets and Liabilities Location | Value | Statement of Assets and Liabilities Location | Value | |||||||||
Long-Term U.S. Government Bond Portfolio | ||||||||||||
Interest rate contracts | Receivables – Variation Margin (Futures) | $ 71 | Payables – Variation Margin (Futures) | $ | 74 | |||||||
Interest rate contracts | Receivables – Variation Margin (Cleared Swap) | 6 | Payables – Variation Margin (Cleared Swap) | 16 | ||||||||
Inflation Protection Portfolio | ||||||||||||
Forward foreign currency contracts | Receivables – Foreign Currency | 114 | Payables – Foreign Currency | 193 | ||||||||
Interest rate contracts | Receivables – Variation Margin (Futures) | 13 | Payables – Variation Margin (Futures) | 78 | ||||||||
Inflation contracts | Receivables – Variation Margin (Cleared Swap) | - | Payables – Variation Margin (Cleared Swap) | 281 | ||||||||
Inflation contracts | Receivables – Outstanding Swaps Contracts, at Value | 4,610 | Payables – Outstanding Swaps Contracts, at Value | 1,107 | ||||||||
Multi-Sector Bond Portfolio | ||||||||||||
Credit contracts | Receivables – Outstanding Swaps Contracts, at Value | 1,069 | Payables – Outstanding Swaps Contracts, at Value | 173 | ||||||||
Credit contracts | Receivables – Variation Margin (Cleared Swap) | 129 | Payables – Variation Margin (Cleared Swap) | 2 | ||||||||
Forward foreign currency contracts | Receivables – Foreign Currency | 410 | Payables – Foreign Currency | 4,326 | ||||||||
Interest rate contracts | Receivables – Variation Margin (Futures) | 649 | Payables – Variation Margin (Futures) | - | ||||||||
Interest rate contracts | Receivables – Variation Margin (Cleared Swap) | 47 | Payables – Variation Margin (Cleared Swap) | 43 | ||||||||
Realized gains and losses on derivative instruments, by contract type and primary risk exposure, for the year ended December 31, 2021 are (amounts in thousands):
| Realized Gain (Loss) on Derivatives Instruments | ||||||||||||||||||||
| Portfolio | Options Written | Futures | Forward Foreign Currency Contracts | Swaps | Total | |||||||||||||||
Index 500 Stock Portfolio | ||||||||||||||||||||
Equity contracts | $ | - | $ | 13,265 | $ | - | $ | - | $ | 13,265 | ||||||||||
Large Company Value Portfolio | ||||||||||||||||||||
Forward foreign currency contracts | - | - | 1,082 | - | 1,082 | |||||||||||||||
Equity Income Portfolio | ||||||||||||||||||||
Forward foreign currency contracts | - | - | 4 | - | 4 | |||||||||||||||
Index 400 Stock Portfolio | ||||||||||||||||||||
Equity contracts | - | 4,153 | - | - | 4,153 | |||||||||||||||
Mid Cap Value Portfolio | ||||||||||||||||||||
Forward foreign currency contracts | - | - | 2,406 | - | 2,406 | |||||||||||||||
Index 600 Stock Portfolio | ||||||||||||||||||||
Equity contracts | - | 126 | - | 1,689 | 1,815 | |||||||||||||||
International Growth Portfolio | ||||||||||||||||||||
Forward foreign currency contracts | - | - | (59 | ) | - | (59 | ) | |||||||||||||
Research International Core Portfolio | ||||||||||||||||||||
Forward foreign currency contracts | - | - | (14 | ) | - | (14 | ) | |||||||||||||
International Equity Portfolio | ||||||||||||||||||||
Forward foreign currency contracts | - | - | (340 | ) | - | (340 | ) | |||||||||||||
Emerging Markets Equity Portfolio | ||||||||||||||||||||
Forward foreign currency contracts | - | - | (514 | ) | - | (514 | ) | |||||||||||||
Short-Term Bond Portfolio | ||||||||||||||||||||
Interest rate contracts | - | 289 | - | - | 289 | |||||||||||||||
Long-Term U.S. Government Bond Portfolio | ||||||||||||||||||||
Interest rate contracts | - | 2,233 | - | 259 | 2,492 | |||||||||||||||
260
Table of Contents
Notes to Financial Statements
| Realized Gain (Loss) on Derivatives Instruments | ||||||||||||||||||||
| Portfolio | Options Written | Futures | Forward Foreign Currency Contracts | Swaps | Total | |||||||||||||||
Inflation Protection Portfolio | ||||||||||||||||||||
Forward foreign currency contracts | $ | - | $ | - | $ | 198 | $ | - | $ | 198 | ||||||||||
Interest rate contracts | - | (600 | ) | - | - | (600 | ) | |||||||||||||
Inflation contracts | - | - | - | (10 | ) | (10 | ) | |||||||||||||
Multi-Sector Bond Portfolio | ||||||||||||||||||||
Credit contracts | - | - | - | 12,803 | 12,803 | |||||||||||||||
Forward foreign currency contracts | - | - | 18,972 | - | 18,972 | |||||||||||||||
Interest rate contracts | 71 | (11,264 | ) | - | 2,192 | (9,001 | ) | |||||||||||||
Change in unrealized appreciation and depreciation on derivative instruments, by contract type and primary risk exposure for the year ended December 31, 2021 are (amounts in thousands):
| Change in Unrealized Appreciation (Depreciation) on Derivative Instruments | ||||||||||||||||||||
| Portfolio | Options Written | Futures | Forward Foreign Currency Contracts | Swaps | Total | |||||||||||||||
Index 500 Stock Portfolio | ||||||||||||||||||||
Equity contracts | $ | - | $ | (178 | ) | $ | - | $ | - | $ | (178 | ) | ||||||||
Large Company Value Portfolio | ||||||||||||||||||||
Forward foreign currency contracts | - | - | (127 | ) | - | (127 | ) | |||||||||||||
Equity Income Portfolio | ||||||||||||||||||||
Forward foreign currency contracts | - | - | (1 | ) | - | (1 | ) | |||||||||||||
Index 400 Stock Portfolio | ||||||||||||||||||||
Equity contracts | - | (68 | ) | - | - | (68 | ) | |||||||||||||
Mid Cap Value Portfolio | ||||||||||||||||||||
Forward foreign currency contracts | - | - | (164 | ) | - | (164 | ) | |||||||||||||
Index 600 Stock Portfolio | ||||||||||||||||||||
Equity Contracts | - | 81 | - | (894 | ) | (813 | ) | |||||||||||||
International Growth Portfolio | ||||||||||||||||||||
Forward foreign currency contracts | - | - | (96 | ) | - | (96 | ) | |||||||||||||
Research International Core Portfolio | ||||||||||||||||||||
Forward foreign currency contracts | - | - | (147 | ) | - | (147 | ) | |||||||||||||
International Equity Portfolio | ||||||||||||||||||||
Forward foreign currency contracts | - | - | (1,259 | ) | - | (1,259 | ) | |||||||||||||
Emerging Markets Equity Portfolio | ||||||||||||||||||||
Forward foreign currency contracts | - | - | 5 | - | 5 | |||||||||||||||
Short-Term Bond Portfolio | ||||||||||||||||||||
Interest rate contracts | - | (203 | ) | - | - | (203 | ) | |||||||||||||
Long-Term U.S. Government Bond Portfolio | ||||||||||||||||||||
Interest rate contracts | - | (442 | ) | - | 102 | (340 | ) | |||||||||||||
Inflation Protection Portfolio | ||||||||||||||||||||
Forward foreign currency contracts | - | - | 227 | - | 227 | |||||||||||||||
Interest rate contracts | - | (87 | ) | - | - | (87 | ) | |||||||||||||
Inflation contracts | - | - | - | 17,054 | 17,054 | |||||||||||||||
Multi-Sector Bond Portfolio | ||||||||||||||||||||
Credit contracts | - | - | - | (7,148 | ) | (7,148 | ) | |||||||||||||
Forward foreign currency contracts | - | - | (468 | ) | - | (468 | ) | |||||||||||||
Interest rate contracts | - | 1,424 | - | 1,488 | 2,912 | |||||||||||||||
261
Table of Contents
Notes to Financial Statements
Volumes on derivative instruments by contract type and primary risk exposure, for the year ended December 31, 2021 are:
| Portfolio | Volume of Derivative Instruments Held | |||||||||||||||||||
| Average Number of Contracts | Average Notional (Amounts in Thousands) | |||||||||||||||||||
| Exchange Traded Options | Futures | Forward Foreign Currency Contracts | Swaps | Over the Counter Options | ||||||||||||||||
Index 500 Stock Portfolio | ||||||||||||||||||||
Equity contracts | - | 184 | - | - | - | |||||||||||||||
Large Company Value Portfolio | ||||||||||||||||||||
Forward foreign currency contracts | - | - | 20,399 | - | - | |||||||||||||||
Equity Income Portfolio | ||||||||||||||||||||
Forward foreign currency contracts | - | - | - | - | - | |||||||||||||||
Index 400 Stock Portfolio | ||||||||||||||||||||
Equity contracts | - | 47 | - | - | - | |||||||||||||||
Mid Cap Value Portfolio | ||||||||||||||||||||
Forward foreign currency contracts | - | - | 52,755 | - | - | |||||||||||||||
Index 600 Stock Portfolio | ||||||||||||||||||||
Equity contracts | - | 44 | - | 2,537 | - | |||||||||||||||
International Growth Portfolio | ||||||||||||||||||||
Forward foreign currency contracts | - | - | 333 | - | - | |||||||||||||||
Research International Core Portfolio | ||||||||||||||||||||
Forward foreign currency contracts | - | - | 68 | - | - | |||||||||||||||
International Equity Portfolio | ||||||||||||||||||||
Forward foreign currency contracts | - | - | 10,131 | - | - | |||||||||||||||
Emerging Markets Equity Portfolio | ||||||||||||||||||||
Forward foreign currency contracts | - | - | 52 | - | - | |||||||||||||||
Short-Term Bond Portfolio | ||||||||||||||||||||
Interest rate contracts | - | 480 | - | - | - | |||||||||||||||
Long-Term U.S. Government Bond Portfolio | ||||||||||||||||||||
Interest rate contracts | - | 231 | - | 32,663 | - | |||||||||||||||
Inflation Protection Portfolio | ||||||||||||||||||||
Forward foreign currency contracts | - | - | 32,123 | - | - | |||||||||||||||
Interest rate contracts | - | 360 | - | - | - | |||||||||||||||
Inflation contracts | - | - | - | 190,550 | - | |||||||||||||||
Multi-Sector Bond Portfolio | ||||||||||||||||||||
Credit contracts | - | - | - | 259,221 | - | |||||||||||||||
Forward foreign currency contracts | - | - | 747,733 | - | - | |||||||||||||||
Interest rate contracts | 21 | 2,422 | - | 120,504 | 3,908 | |||||||||||||||
NOTE 6. PORTFOLIO RISK
In the normal course of business, the Portfolios trade financial instruments and enter into financial transactions where risk of potential loss exists. Security values fluctuate (market risk) and may decline due to factors affecting securities markets in general, particular industries represented in the securities markets or conditions specifically related to a particular company. Failure of the other party to a transaction to perform (credit risk), for example by not making principal and interest payments when due, reduces the value of the issuer’s debt and could reduce the Portfolios’ income. Similar to credit risk, the Portfolios may be exposed to counterparty risk, or the risk that an institution or other entity with which the Portfolios have unsettled or open transactions will fail to make required payments or otherwise comply with the terms of the instrument, transaction or contract. The potential loss could exceed the value of the financial assets recorded in the financial statements. Some of the Portfolios’ investments may be illiquid and the Portfolios may not be able to vary the portfolio investments in response to changes in economic and other conditions. If a Portfolio is required to liquidate all or a portion of its investments quickly, the Portfolio may realize significantly less than the value at which it previously recorded those investments.
262
Table of Contents
Notes to Financial Statements
LIBOR
Instruments in which the Fund invests may pay interest at floating rates based on the London Interbank Offered Rate (“LIBOR”) or may be subject to interest caps or floors based on LIBOR. In 2017, the head of the United Kingdom’s Financial Conduct Authority (“FCA”) announced a desire to phase out the use of LIBOR by the end of 2021. In March 2021, the FCA and LIBOR’s administrator, ICE Benchmarks Administration announced that LIBOR would no longer be provided (i) for all sterling euro, Swiss franc and Japanese yen settings, and the one-week and two-month U.S. dollar LIBOR settings after December 31, 2021 and (ii) for the remaining U.S. dollar LIBOR settings after June 30, 2023. Various financial industry groups have been planning for the transition away from LIBOR to a new reference rate such as the Secured Overnight Financing Rate (“SOFR”), which is intended to replace the U.S. dollar LIBOR but there are various challenges to converting certain securities and transactions to a new reference rate. Abandonment of or modifications to LIBOR could have adverse impacts on newly issued financial instruments and existing financial instruments which reference LIBOR and could lead to significant short-term and long-term uncertainty and market instability. Uncertainty remains regarding the effects of implementing replacement references for LIBOR on the Fund, issuers of instruments in which the Fund invests and financial markets generally. Changes accompanying the transition to a new reference rate may have an adverse impact on a Fund’s investments, performance or financial condition.
COVID-19
During the first quarter of 2020, the World Health Organization declared the COVID-19 coronavirus to constitute a public health emergency. COVID-19 led to increased short-term market volatility during 2020 and resulted in ongoing additional adverse effects on the U.S. and world economies and markets in general during 2021. The COVID-19 pandemic adversely affected the value of the Portfolios’ investments in certain periods during 2021 and may have adverse impacts on Portfolio investments in the future. Because of the uncertainties regarding the ongoing and future impacts of COVID-19 and related virus variants on the global economy, and business operations, and securities markets, values reflected in these financial statements may materially differ from the value received upon actual sales of those investments.
The extent of the impact on the performance of the Portfolios and their investments will depend on future developments, including the duration and spread of the COVID-19 virus and related variants, the imposition of travel, movement and other restrictions as a result of public health advisories, the effectiveness of responsive measures by individual countries (such as vaccine distribution), and the effects of the pandemic on the financial markets and economy overall, all of which are highly uncertain and cannot be predicted.
Master Netting Arrangements
The Portfolios are subject to various Master Agreements that govern the terms of certain transactions. Master Repurchase Agreements and Global Master Repurchase Agreements are in place that governs repurchase, reverse repurchase, and sale-buyback financing transactions. Master Securities Forward Transaction Agreements are in place that govern the settlement of certain forward settling transactions including to-be-announced securities, delayed-delivery or sale-buyback financing transactions. Customer Account Agreements and related addenda are in place that govern certain cleared derivative transactions including futures and cleared OTC derivatives. International Swaps and Derivatives Association, Inc. Master Agreements and Credit Support Annexes (“ISDA agreements”) are in place that governs certain OTC financial derivative transactions. ISDA agreements maintain provisions for general obligations, representations, agreements, collateral and events of default or termination. Events of termination include conditions that may entitle counterparties to elect to terminate early and cause settlement of all outstanding transactions under the applicable ISDA agreement. The terms of Master Agreements may reduce counterparty risk with respect to transactions governed by the Master Agreement under certain circumstances. Certain Portfolios have agreements with counterparties that contain provisions, or contingency features, that allow net settlement in the event of contract termination and permit termination by either party prior to maturity upon the occurrence of certain stated events, such as failure to pay or bankruptcy. In addition, certain agreements specify other events, the occurrence of which would allow one of the parties to terminate. For example, a downgrade in credit rating of a counterparty would allow the Portfolio to terminate while a decline in the Portfolio’s net assets of more than a certain percentage would allow the counterparty to terminate. In such a situation, the counterparty involved would have the option to waive the triggering event or liquidate the affected positions pursuant to the terms of the related agreement. The aggregate amount of derivatives in a liability position is disclosed in Note 5.
263
Table of Contents
Notes to Financial Statements
Offsetting Assets and Liabilities
Certain Portfolios are parties to enforceable master netting or similar agreements which provide for the right of offset under certain circumstances. The Portfolios have made an accounting policy election not to offset qualifying financial and derivative instruments on the Statements of Assets and Liabilities. As such, all financial and derivative instruments are presented on a gross basis on the Statements of Assets and Liabilities. The impacts of netting arrangements that provide the right to offset are detailed below (amounts in thousands). The net amount represents the net receivable or payable that would be due from or to the counterparty in the event of default. Exposure from borrowings and other financing transactions such as repurchase agreements and certain forward settling transactions can only be netted across transactions governed under the same Master Agreement with the same legal entity. For certain Portfolios, derivative amounts do not reconcile to the Statements of Assets and Liabilities due to the Statements of Assets and Liabilities including derivatives that are not covered under master netting or similar agreements. The amount of collateral, for the year ended December 31, 2021, has been limited such that the net amount cannot be less than zero.
The following is a summary by counterparty of the market value of OTC financial derivative instruments and collateral as of period end:
Large Company Value Portfolio
| Derivative Assets (000’s) | Derivative Liabilities (000’s) | |||||||||||||||||||||||||||||||||||
| Counterparty | Forward Foreign Currency Contracts | Swaps | Total Assets | Forward Foreign Currency Contracts | Swaps | Total Liabilities | Net Market Value | Collateral Pledged/ (Received) | Net Exposure | |||||||||||||||||||||||||||
Morgan Stanley Capital Services, Inc. | $ | - | $ | - | $ | - | $ | (18 | ) | $ | - | $ | (18 | ) | $ | (18 | ) | $ | - | $ | (18 | ) | ||||||||||||||
Goldman Sachs International | - | - | - | (218 | ) | - | (218 | ) | (218 | ) | - | (218 | ) | |||||||||||||||||||||||
|
|
|
|
|
|
|
|
|
|
|
|
|
|
|
|
|
| |||||||||||||||||||
Total | $ | - | $ | - | $ | - | $ | (236 | ) | $ | - | $ | (236 | ) | $ | (236 | ) | $ | - | $ | (236 | ) | ||||||||||||||
|
|
|
|
|
|
|
|
|
|
|
|
|
|
|
|
|
| |||||||||||||||||||
Mid Cap Value Portfolio |
| |||||||||||||||||||||||||||||||||||
| Derivative Assets (000’s) | Derivative Liabilities (000’s) | |||||||||||||||||||||||||||||||||||
| Counterparty | Forward Foreign Currency Contracts | Swaps | Total Assets | Forward Foreign Currency Contracts | Swaps | Total Liabilities | Net Market Value | Collateral Pledged/ (Received) | Net Exposure | |||||||||||||||||||||||||||
Goldman Sachs International | $ | - | $ | - | $ | - | $ | (572 | ) | $ | - | $ | (572 | ) | $ | (572 | ) | $ | - | $ | (572 | ) | ||||||||||||||
Bank of America NA. | 75 | - | 75 | (2 | ) | - | (2 | ) | 73 | - | 73 | |||||||||||||||||||||||||
|
|
|
|
|
|
|
|
|
|
|
|
|
|
|
|
|
| |||||||||||||||||||
Total | $ | 75 | $ | - | $ | 75 | $ | (574 | ) | $ | - | $ | (574 | ) | $ | (499 | ) | $ | - | $ | (499 | ) | ||||||||||||||
|
|
|
|
|
|
|
|
|
|
|
|
|
|
|
|
|
| |||||||||||||||||||
| International Equity Portfolio |
| |||||||||||||||||||||||||||||||||||
| Derivative Assets (000’s) | Derivative Liabilities (000’s) | |||||||||||||||||||||||||||||||||||
| Counterparty | Forward Foreign Currency Contracts | Swaps | Total Assets | Forward Foreign Currency Contracts | Swaps | Total Liabilities | Net Market Value | Collateral Pledged/ (Received) | Net Exposure | |||||||||||||||||||||||||||
Bank of America NA | $ | - | $ | - | $ | - | $ | (628 | ) | $ | - | $ | (628 | ) | $ | (628 | ) | $ | - | $ | (628 | ) | ||||||||||||||
HSBC Bank USA NA | 6 | - | 6 | (177 | ) | - | (177 | ) | (171 | ) | - | (171 | ) | |||||||||||||||||||||||
JP Morgan Chase Bank NA | - | - | - | (132 | ) | - | (132 | ) | (132 | ) | - | (132 | ) | |||||||||||||||||||||||
|
|
|
|
|
|
|
|
|
|
|
|
|
|
|
|
|
| |||||||||||||||||||
Total | $ | 6 | $ | - | $ | 6 | $ | (937 | ) | $ | - | $ | (937 | ) | $ | (931 | ) | $ | - | $ | (931 | ) | ||||||||||||||
|
|
|
|
|
|
|
|
|
|
|
|
|
|
|
|
|
| |||||||||||||||||||
| Inflation Protection Portfolio |
| |||||||||||||||||||||||||||||||||||
| Derivative Assets (000’s) | Derivative Liabilities (000’s) | |||||||||||||||||||||||||||||||||||
| Counterparty | Forward Foreign Currency Contracts | Swaps | Total Assets | Forward Foreign Currency Contracts | Swaps | Total Liabilities | Net Market Value | Collateral Pledged/ (Received) | Net Exposure | |||||||||||||||||||||||||||
Bank of America NA | $ | - | $ | 1,265 | $ | 1,265 | $ | - | $ | (321 | ) | $ | (321 | ) | $ | 944 | $ | (792 | ) | $ | 152 | |||||||||||||||
Barclays Bank PLC | - | 56 | 56 | - | (786 | ) | (786 | ) | (730 | ) | 568 | (162 | ) | |||||||||||||||||||||||
Goldman Sachs International | - | 3,289 | 3,289 | - | - | - | 3,289 | (3,210 | ) | 79 | ||||||||||||||||||||||||||
264
Table of Contents
Notes to Financial Statements
Inflation Protection Portfolio
| Derivative Assets (000’s) | Derivative Liabilities (000’s) | |||||||||||||||||||||||||||||||||||
| Counterparty | Forward Foreign Currency Contracts | Swaps | Total Assets | Forward Foreign Currency Contracts | Swaps | Total Liabilities | Net Market Value | Collateral Pledged/ (Received) | Net Exposure | |||||||||||||||||||||||||||
Morgan Stanley Capital Services, Inc. | $ | 114 | $ | - | $ | 114 | $ | (193 | ) | $ | - | $ | (193 | ) | $ | (79 | ) | $ | - | $ | (79 | ) | ||||||||||||||
|
|
|
|
|
|
|
|
|
|
|
|
|
|
|
|
|
| |||||||||||||||||||
Total | $ | 114 | $ | 4,610 | $ | 4,724 | $ | (193 | ) | $ | (1,107 | ) | $ | (1,300 | ) | $ | 3,424 | $ | (3,434 | ) | $ | (10 | ) | |||||||||||||
|
|
|
|
|
|
|
|
|
|
|
|
|
|
|
|
|
| |||||||||||||||||||
Multi-Sector Bond Portfolio
| Derivative Assets (000’s) | Derivative Liabilities (000’s) | |||||||||||||||||||||||||||||||||||
| Counterparty | Forward Foreign Currency Contracts | Swaps | Total Assets | Forward Foreign Currency Contracts | Swaps | Total Liabilities | Net Market Value | Collateral Pledged/ (Received) | Net Exposure | |||||||||||||||||||||||||||
Bank of America NA | $ | 7 | $ | - | $ | 7 | $ | (55 | ) | $ | - | $ | (55 | ) | $ | (48 | ) | $ | - | $ | (48 | ) | ||||||||||||||
Barclays Bank PLC | 5 | 9 | 14 | (61 | ) | (173 | ) | (234 | ) | (220 | ) | - | (220 | ) | ||||||||||||||||||||||
BNP Paribas SA | 42 | - | 42 | (1,435 | ) | - | (1,435 | ) | (1,393 | ) | 1,177 | (216 | ) | |||||||||||||||||||||||
Goldman Sachs International | - | 335 | 335 | - | - | - | 335 | (280 | ) | 55 | ||||||||||||||||||||||||||
Goldman Sachs Bank USA | 36 | - | 36 | (4 | ) | - | (4 | ) | 32 | - | 32 | |||||||||||||||||||||||||
HSBC Bank USA NA | 29 | - | 29 | (10 | ) | - | (10 | ) | 19 | - | 19 | |||||||||||||||||||||||||
JP Morgan Chase Bank NA | - | 685 | 685 | (42 | ) | - | (42 | ) | 643 | (643 | ) | - | ||||||||||||||||||||||||
Morgan Stanley Capital Services, Inc. | - | 40 | 40 | - | - | - | 40 | - | 40 | |||||||||||||||||||||||||||
Royal Bank of Canada | 291 | - | 291 | (2,719 | ) | - | (2,719 | ) | (2,428 | ) | - | (2,428 | ) | |||||||||||||||||||||||
|
|
|
|
|
|
|
|
|
|
|
|
|
|
|
|
|
| |||||||||||||||||||
Total | $ | 410 | $ | 1,069 | $ | 1,479 | $ | (4,326 | ) | $ | (173 | ) | $ | (4,499 | ) | $ | (3,020 | ) | $ | 254 | $ | (2,766 | ) | |||||||||||||
|
|
|
|
|
|
|
|
|
|
|
|
|
|
|
|
|
| |||||||||||||||||||
The following is a summary by counterparty of the market value of repurchase agreements, financing transactions, collateral and net exposure as of period end:
Government Money Market Portfolio
| Counterparty | Investment in Repurchase Agreements | Payable for Reverse Repurchase Agreements | Payable for Financing Transactions | Net Market Value | Collateral Pledged/ (Received) | Net Exposure | ||||||||||||||||||
Bank of Montreal | $ | 17,000 | $ | - | $ | - | $ | 17,000 | $ | (17,000 | ) | $ | - | |||||||||||
Bank of Nova Scotia | 21,000 | - | - | 21,000 | (21,000 | ) | - | |||||||||||||||||
BNP Paribas SA | 20,000 | - | - | 20,000 | (20,000 | ) | - | |||||||||||||||||
Citigroup Global Markets | 25,000 | - | - | 25,000 | (25,000 | ) | - | |||||||||||||||||
Goldman Sachs International | 25,000 | - | - | 25,000 | (25,000 | ) | - | |||||||||||||||||
Mitsubishi UFJ Securities USA | 15,000 | - | - | 15,000 | (15,000 | ) | - | |||||||||||||||||
Mizuho Bank | 20,000 | - | - | 20,000 | (20,000 | ) | - | |||||||||||||||||
Natixis SA | 20,000 | - | - | 20,000 | (20,000 | ) | - | |||||||||||||||||
TD Securities USA | 20,000 | - | - | 20,000 | (20,000 | ) | - | |||||||||||||||||
|
|
|
|
|
|
|
|
|
|
|
| |||||||||||||
Total | $ | 183,000 | $ | - | $ | - | $ | 183,000 | $ | (183,000 | ) | $ | - | |||||||||||
|
|
|
|
|
|
|
|
|
|
|
| |||||||||||||
Long-Term U.S. Government Bond Portfolio |
| |||||||||||||||||||||||
| Counterparty | Investment in Repurchase Agreements | Payable for Short Sales | Payable for Financing Transactions | Net Market Value | Collateral Pledged/ (Received) | Net Exposure | ||||||||||||||||||
Credit Suisse AG | $ | - | $ | (5,284 | ) | $ | (17,356 | ) | $ | (22,640 | ) | $ | 17,355 | $ | (5,285 | ) | ||||||||
Goldman Sachs International | - | - | (129,645 | ) | (129,645 | ) | 129,645 | - | ||||||||||||||||
Morgan Stanley Capital | ||||||||||||||||||||||||
Services | - | - | (4,638 | ) | (4,638 | ) | 4,638 | - | ||||||||||||||||
|
|
|
|
|
|
|
|
|
|
|
| |||||||||||||
Total | $ | - | $ | (5,284 | ) | $ | (151,639 | ) | $ | (156,923 | ) | $ | 151,638 | $ | (5,285 | ) | ||||||||
|
|
|
|
|
|
|
|
|
|
|
| |||||||||||||
The Long-Term U.S. Government Bond Portfolio average amount of borrowings outstanding during the year ended December 31, 2021 was $49,295 (amount in thousands) at a weighted average interest rate of 0.040%. Average borrowings include reverse repurchase agreements and sale-buyback transactions, if held during the period.
265
Table of Contents
Notes to Financial Statements
Multi-Sector Bond Portfolio
| Counterparty | Investment in Repurchase Agreements | Payable for Reverse Repurchase Agreements | Payable for Financing Transactions | Net Market Value | Collateral Pledged/ (Received) | Net Exposure | ||||||||||||||||||
JP Morgan Chase Bank NA | $ | - | $ | (1,648 | ) | $ | - | $ | (1,648 | ) | $ | 1,648 | $ | - | ||||||||||
|
|
|
|
|
|
|
|
|
|
|
| |||||||||||||
Total | $ | - | $ | (1,648 | ) | $ | - | $ | (1,648 | ) | $ | 1,648 | $ | - | ||||||||||
|
|
|
|
|
|
|
|
|
|
|
| |||||||||||||
The Multi-Sector Bond Portfolio average amount of borrowings outstanding during the year ended December 31, 2021 was $1,542 (amount in thousands) at a weighted average interest rate of 0.898%. Average borrowings include reverse repurchase agreements, if held during the period.
NOTE 7. INVESTMENT ADVISORY, SUB-ADVISORY, AND COMPLIANCE FEES
The Series Fund and its Portfolios are parties to annually renewable contracts pursuant to which each Portfolio pays a charge for investment management and administrative services to MSA, an affiliate and wholly-owned subsidiary of Northwestern Mutual. Certain Portfolios, listed below, pay a fixed annual rate based on the average daily net asset values of the Portfolio.
Portfolio | Fee | |||
Index 500 Stock Portfolio | 0.20 | % | ||
Index 400 Stock Portfolio | 0.25 | % | ||
Mid Cap Value Portfolio | 0.85 | % | ||
Small Cap Value Portfolio | 0.85 | % | ||
Government Money Market Portfolio | 0.30 | % | ||
Select Bond Portfolio | 0.30 | % | ||
Balanced Portfolio | 0.30 | % | ||
For the other Portfolios, the rate for the investment advisory fee is graded by the asset size of the Portfolio according to the following schedules:
Portfolio | First $50 Million | Next $50 Million | Excess Over $100 Million | |||||||||||
Growth Stock Portfolio | 0.60 | % | 0.50 | % | 0.40 | % | ||||||||
Large Cap Core Stock Portfolio | 0.60 | % | 0.50 | % | 0.40 | % | ||||||||
Mid Cap Growth Stock Portfolio | 0.80 | % | 0.65 | % | 0.50 | % | ||||||||
Small Cap Growth Stock Portfolio | 0.80 | % | 0.65 | % | 0.50 | % | ||||||||
High Yield Bond Portfolio | 0.60 | % | 0.50 | % | 0.40 | % | ||||||||
Portfolio | First $100 Million | Next $400 Million | Excess Over $500 Million | |||||||||||
Focused Appreciation Portfolio | 0.80 | % | 0.75 | % | 0.70 | % | ||||||||
Portfolio | First $100 Million | Next $150 Million | Excess Over $250 Million | |||||||||||
Large Company Value Portfolio | 0.72 | % | 0.67 | % | 0.62 | % | ||||||||
Domestic Equity Portfolio | 0.65 | % | 0.55 | % | 0.50 | % | ||||||||
International Growth Portfolio | 0.75 | % | 0.65 | % | 0.55 | % | ||||||||
Short-Term Bond Portfolio | 0.35 | % | 0.33 | % | 0.30 | % | ||||||||
Long-Term U.S. Government Bond Portfolio . | 0.555 | % | 0.515 | % | 0.495 | % | ||||||||
Inflation Protection Portfolio | 0.58 | % | 0.55 | % | 0.49 | % | ||||||||
Multi-Sector Bond Portfolio | 0.79 | % | 0.78 | % | 0.77 | % | ||||||||
Asset Allocation Portfolio | 0.60 | % | 0.50 | % | 0.40 | % | ||||||||
Portfolio | First $150 Million | Next $150 Million | Next $200 Million | Excess Over | ||||||||||
Large Cap Blend Portfolio | 0.77 | % | 0.70 | % | 0.62 | % | 0.56% | |||||||
Research International Core Portfolio | 0.88 | % | 0.82 | % | 0.75 | % | 0.68% | |||||||
266
Table of Contents
Notes to Financial Statements
Portfolio | First $500 Million | Excess Over $500 Million | ||||||||||||
Equity Income Portfolio | 0.65 | % | 0.60 | % | ||||||||||
Portfolio | First $200 Million | Excess Over $200 Million | ||||||||||||
Index 600 Stock Portfolio | 0.25 | % | 0.20 | % | ||||||||||
Portfolio | First $50 Million | Excess Over $50 Million | ||||||||||||
International Equity Portfolio | 0.85 | % | 0.65 | % | ||||||||||
Portfolio | First $250 Million | Next $250 Million | Next $500 Million | Excess Over Billion | ||||||||||
Emerging Markets Equity Portfolio | 1.14 | % | 1.08 | % | 0.96 | % | 0.78% | |||||||
For certain Portfolios, MSA contractually agreed to waive the management fee and absorb certain other operating expenses to the extent necessary so that Total Operating Expenses (excluding taxes, brokerage, other investment-related costs, interest and dividend expenses and charges, acquired fund fees, fees for class actions, other passive securities litigation and antitrust claim filing services and such non-recurring and extraordinary expenses as they may arise) will not exceed the following amounts:
Portfolio | Expiration | |||||||
Focused Appreciation Portfolio | 0.90 | % | April 30, 2022 | |||||
Large Cap Blend Portfolio | 0.85 | % | April 30, 2022 | |||||
Large Company Value Portfolio | 0.80 | % | April 30, 2022 | |||||
Domestic Equity Portfolio | 0.75 | % | April 30, 2022 | |||||
Equity Income Portfolio | 0.75 | % | April 30, 2022 | |||||
Mid Cap Value Portfolio | 1.00 | % | April 30, 2022 | |||||
Index 600 Stock Portfolio | 0.35 | % | April 30, 2022 | |||||
Small Cap Value Portfolio | 1.00 | % | April 30, 2022 | |||||
International Growth Portfolio | 1.10 | % | April 30, 2022 | |||||
Research International Core Portfolio | 1.15 | % | April 30, 2022 | |||||
Emerging Markets Equity Portfolio | 1.50 | % | April 30, 2022 | |||||
Short-Term Bond Portfolio | 0.45 | % | April 30, 2022 | |||||
Long-Term U.S. Government Bond Portfolio . | 0.65 | % | April 30, 2022 | |||||
Inflation Protection Portfolio | 0.65 | % | April 30, 2022 | |||||
Multi-Sector Bond Portfolio | 0.90 | % | April 30, 2022 | |||||
Asset Allocation Portfolio | 0.75 | % | April 30, 2022 | |||||
Growth Stock Portfolio — MSA has agreed to waive a portion of its management fee such that the management fee is 0.60% on the Portfolio’s first $50 million of average net assets, 0.50% on the next $50 million, 0.40% on the next $900 million, and 0.38% on average net assets in excess of $1 billion. MSA may terminate this fee waiver agreement at any time after April 30, 2022.
Focused Appreciation Portfolio — MSA has agreed to waive a portion of its management fee such that the management fee is 0.66% on the Portfolio’s first $100 million of average net assets, 0.61% on the next $400 million, 0.60% on the next $500 million, and 0.57% on average net assets in excess of $1 billion. MSA may terminate this fee waiver agreement at any time after April 30, 2022.
Large Cap Core Stock Portfolio — MSA has agreed to waive a portion of its management fee such that the management fee is 0.60% on the Portfolio’s first $50 million of average net assets, 0.50% on the next $50 million, 0.40% on the next $400 million, and 0.37% on average net assets in excess of $500 million. MSA may terminate this fee waiver agreement at any time after April 30, 2022.
267
Table of Contents
Notes to Financial Statements
Large Cap Blend Portfolio — MSA has agreed to waive a portion of its management fee such that the management fee is 0.74% on the Portfolio’s first $150 million of average net assets, 0.67% on the next $150 million, 0.62% on the next $200 million, and 0.56% on average net assets in excess of $500 million. MSA may terminate this fee waiver agreement at any time after April 30, 2022.
Index 500 Stock Portfolio — MSA has agreed to waive a portion of its management fee such that the management fee is 0.20% on the Portfolio’s first $2 billion of average net assets, and 0.18% on average net assets in excess of $2 billion. MSA may terminate this fee waiver agreement at any time after April 30, 2022.
Large Company Value Portfolio — MSA has agreed to waive a portion of its management fee such that the management fee is 0.70% on the Portfolio’s first $100 million of average net assets, 0.65% on the next $150 million, 0.59% on the next $250 million, and 0.57% on the average net assets in excess of $500 million. MSA may terminate this fee waiver agreement at any time after April 30, 2022.
Domestic Equity Portfolio — For the period from January 1, 2021 through April 30, 2021, MSA agreed to waive a portion of its management fee such that the management fee was 0.65% on the Portfolio’s first $100 million of average net assets, 0.55% on the next $150 million, 0.50% on the next $250 million, 0.45% on the next $500 million, and 0.43% on the average net assets in excess of $1 billion. Effective May 1, 2021, MSA has agreed to waive a portion of its management fee such that the management fee is 0.65% on the Portfolio’s first $100 million of average net assets, 0.55% on the next $150 million, 0.50% on the next $250 million, 0.43% on the next $500 million, and 0.41% on the average net assets in excess of $1 billion. MSA may terminate this fee waiver agreement at any time after April 30, 2022.
Equity Income Portfolio — For the period from January 1, 2021 through April 30, 2021, MSA agreed to waive a portion of its management fee such that the management fee was 0.58% on the Portfolio’s first $500 million of average net assets, 0.53% on the next $1 billion, and 0.52% on the average net assets in excess of $1.5 billion. Effective May 1, 2021, MSA has agreed to waive a portion of its management fee such that the management fee is 0.56% on the Portfolio’s first $500 million of average net assets, 0.53% on the next $1 billion, and 0.52% on the average net assets in excess of $1.5 billion. MSA may terminate this fee waiver agreement at any time after April 30, 2022.
Mid Cap Growth Stock Portfolio — MSA has agreed to waive a portion of its management fee such that the management fee is 0.80% on the Portfolio’s first $50 million, 0.65% on the next $50 million, 0.50% on the next $900 million, and 0.49% on average net assets in excess of $1 billion. MSA may terminate this fee waiver agreement at any time after April 30, 2022.
Index 400 Stock Portfolio — MSA has agreed to waive a portion of its management fee such that the management fee is 0.25% on the Portfolio’s first $500 million and 0.20% on average net assets in excess of $500 million. MSA may terminate this fee waiver agreement at any time after April 30, 2022.
Mid Cap Value Portfolio — MSA has agreed to waive a portion of its management fee such that the management fee is 0.79% on the Portfolio’s first $150 million of average net assets, 0.67% on the next $350 million, and 0.64% on the average net assets in excess of $500 million. MSA may terminate this fee waiver agreement at any time after April 30, 2022.
Small Cap Value Portfolio — MSA has agreed to waive a portion of its management fee such that the management fee is 0.85% on the Portfolio’s first $500 million of average net assets, and 0.80% on average net assets in excess of $500 million. MSA may terminate this fee waiver agreement at any time after April 30, 2022.
International Growth Portfolio — MSA has agreed to waive a portion of its management fee such that the management fee is 0.75% on the Portfolio’s first $100 million of average net assets, 0.65% on the next $150 million, 0.55% on the next $750 million, and 0.54% on average net assets in excess of $1 billion. MSA may terminate this fee waiver agreement at any time after April 30, 2022.
Research International Core Portfolio — MSA has agreed to waive a portion of its management fee such that the management fee is 0.83% on the Portfolio’s first $150 million of average net assets, 0.77% on the next $150 million, 0.70% on the next $200 million, and 0.63% on average net assets in excess of $500 million. MSA may terminate this fee waiver agreement at any time after April 30, 2022.
268
Table of Contents
Notes to Financial Statements
International Equity Portfolio — MSA has agreed to waive a portion of its management fee such that the management fee is 0.69% on the Portfolio’s first $50 million of average net assets, 0.54% on the next $450 million, 0.52% on the next $500 million, 0.46% on the next $500 million, and 0.40% on the average net assets in excess of $1.5 billion. MSA may terminate this fee waiver agreement at any time after April 30, 2022.
Emerging Markets Equity Portfolio — MSA has agreed to waive a portion of its management fee such that its management fee was 0.95% on the Portfolio’s first $250 million of average net assets, 0.87% on the next $250 million, 0.84% on the next $500 million, and 0.78% on average net assets in excess of $1 billion. MSA may terminate this fee waiver agreement at any time after April 30, 2022.
Government Money Market Portfolio — MSA has agreed to waive a portion of its management fee such that the management fee is 0.30% on the Portfolio’s first $500 million of average net assets, 0.29% on the next $500 million, and 0.28% in excess of $1 billion. MSA may terminate this fee waiver agreement at any time after April 30, 2022. In addition, MSA has voluntarily agreed to waive its advisory fee and/or reimburse expenses in excess of the Government Money Market Portfolio’s daily yield so as to maintain a zero or positive yield for the Portfolio. This voluntary waiver is reviewed periodically by MSA in light of market and economic developments and may be revised or discontinued at any time without advance notice.
Short-Term Bond Portfolio — MSA has agreed to waive a portion of its management fee such that the management fee is 0.35% on the Portfolio’s first $100 million of average net assets, 0.33% on the next $150 million, 0.30% on the next $250 million, and 0.28% on average net assets in excess of $500 million. MSA may terminate this fee waiver agreement at any time after April 30, 2022.
Select Bond Portfolio — MSA has agreed to waive a portion of its management fee such that the management fee is 0.30% on the Portfolio’s first $2 billion of average net assets, and 0.28% on average net assets in excess of $2 billion. MSA may terminate this fee waiver agreement at any time after April 30, 2022.
Long-Term U.S. Government Bond Portfolio — MSA has agreed to waive a portion of its management fee such that the management fee is 0.555% on the Portfolio’s first $100 million of average net assets, 0.515% on the next $150 million, 0.495% of the next $250 million, and 0.445% on average net assets in excess of $500 million. MSA may terminate this fee waiver agreement at any time after April 30, 2022.
Inflation Protection Portfolio — MSA agreed to waive a portion of its management fee such that the management fee is 0.55% on the Portfolio’s first $100 million of average net assets, 0.50% on the next $150 million, and 0.46% on average net assets in excess of $250 million. MSA may terminate this fee waiver agreement at any time after April 30, 2022.
High Yield Bond Portfolio — MSA agreed to waive a portion of its management fee such that the management fee is 0.60% on the Portfolio’s first $50 million of average net assets, 0.50% on the next $50 million, 0.40% on the next $900 million, and 0.30% on average net assets in excess of $1 billion. MSA may terminate this fee waiver agreement at any time after April 30, 2022.
Multi-Sector Bond Portfolio — MSA has agreed to waive a portion of its management fee such that the management fee is 0.74% on the Portfolio’s first $100 million of average net assets, 0.73% on the next $150 million, 0.70% on the next $250 million, and 0.65% on average net assets in excess of $500 million. MSA may terminate this fee waiver agreement at any time after April 30, 2022.
Balanced Portfolio — MSA has agreed to waive a portion of its management fee such that the management fee is 0.05% on all average net assets. MSA may terminate this fee waiver agreement at any time after April 30, 2022.
Asset Allocation Portfolio — MSA has agreed to waive a portion of its management fee such that the management fee is 0.05% on all average net assets. MSA may terminate this fee waiver agreement at any time after April 30, 2022.
Waivers are not recoupable in future periods.
With respect to certain Portfolios, MSA has engaged and oversees unaffiliated sub-advisers who manage the day-to-day
269
Table of Contents
Notes to Financial Statements
investment operations of such Portfolios. MSA pays each sub-adviser a fee based on the average daily net assets of each such Portfolio out of its investment management fee.
Compliance fees are paid to Northwestern Mutual, an affiliate of the Series Fund. The compliance fees paid are for the compensation, benefits and expenses of the Chief Compliance Officer and compliance staff. The amounts paid relate only to the Chief Compliance Officer and compliance staffs’ duties and functions performed for the Series Fund.
NOTE 8. FEDERAL INCOME TAX MATTERS
Taxable distributions from net investment income and realized capital gains in the Portfolios may differ from book amounts earned during the period due to differences in the timing of capital gains recognition and due to the reclassification of certain gains or losses between capital and income. The differences between cost amounts for book purposes and tax purposes are primarily due to the tax treatment of deferred losses, passive foreign investment companies, and financing transactions.
It is the policy of the Portfolios to reclassify the net effect of permanent differences between book and taxable income to capital accounts on the Statements of Assets and Liabilities. Permanent differences primarily relate to character differences with respect to income on swaps, foreign currency transactions, foreign bond sales, passive foreign investment companies and paydowns on structured product investments.
A summary of the Portfolios’ capital loss carryovers as of December 31, 2021 is provided below:
| Short-Term Loss Carryover | Long-Term Loss Carryover | Losses Utilized | ||||||||||
| (Amounts in thousands) | ||||||||||||
Equity Income Portfolio | $ | - | $ | - | $ | 119 | ||||||
International Equity Portfolio | - | - | 282,054 | |||||||||
Emerging Markets Equity Portfolio | - | - | 22,115 | |||||||||
Long-Term U.S. Government Bond Portfolio | 146 | 1,585 | - | |||||||||
High Yield Bond Portfolio | - | 5,092 | 3,780 | |||||||||
Capital losses are carried forward indefinitely and retain the character of the original loss. These losses are deferred to the first day of the next fiscal year.
When applicable, each of the Portfolios made distributions during the year of ordinary income and long-term capital gains. The tax character of distributions paid for the years ended December 31, 2021 and 2020 was as follows:
2021 Distributions Paid From: | 2020 Distributions Paid From: | |||||||||||||||
Portfolio | Ordinary Income | Long-term Capital Gain | Ordinary Income | Long-term Capital Gain | ||||||||||||
| (Amounts in thousands) | ||||||||||||||||
Growth Stock Portfolio | $ | 50 | $ | 55,949 | $ | 7,243 | $ | 188,737 | ||||||||
Focused Appreciation Portfolio | 8,040 | 120,591 | 5,853 | 44,520 | ||||||||||||
Large Cap Core Stock Portfolio | 10,068 | 53,289 | 8,189 | 16,446 | ||||||||||||
Large Cap Blend Portfolio | 1,241 | 11,839 | 8,282 | 2,310 | ||||||||||||
Index 500 Stock Portfolio | 66,172 | 120,527 | 66,724 | 72,356 | ||||||||||||
Large Company Value Portfolio | 5,187 | - | 4,036 | 6,787 | ||||||||||||
Domestic Equity Portfolio | 18,598 | 23,353 | 17,733 | 40,200 | ||||||||||||
Equity Income Portfolio | 17,168 | - | 33,847 | 29,982 | ||||||||||||
Mid Cap Growth Stock Portfolio | 37,141 | 139,880 | 3,099 | 49,141 | ||||||||||||
Index 400 Stock Portfolio | 20,914 | 28,578 | 12,712 | 43,558 | ||||||||||||
Mid Cap Value Portfolio | 7,676 | 5,109 | 9,956 | - | ||||||||||||
Small Cap Growth Stock Portfolio | 24,801 | 57,905 | 8,721 | 30,794 | ||||||||||||
Index 600 Stock Portfolio | 5,359 | 4,217 | 5,826 | 9,999 | ||||||||||||
Small Cap Value Portfolio | 2,594 | 29,347 | 4,704 | 31,283 | ||||||||||||
International Growth Portfolio | 5,610 | 29,044 | 13,439 | 3,199 | ||||||||||||
Research International Core Portfolio | 10,349 | 14,425 | 17,093 | 13,848 | ||||||||||||
International Equity Portfolio | 43,243 | - | 56,976 | - | ||||||||||||
Emerging Markets Equity Portfolio | 5,199 | - | 18,235 | - | ||||||||||||
Government Money Market Portfolio | 10 | 27 | 1,423 | - | ||||||||||||
270
Table of Contents
Notes to Financial Statements
2021 Distributions Paid From: | 2020 Distributions Paid From: | |||||||||||||||
Portfolio | Ordinary Income | Long-term Capital Gain | Ordinary Income | Long-term Capital Gain | ||||||||||||
| (Amounts in thousands) | ||||||||||||||||
Short-Term Bond Portfolio | $ | 8,138 | $ | - | $ | 8,186 | $ | - | ||||||||
Select Bond Portfolio | 202,684 | 25,232 | 108,721 | - | ||||||||||||
Long-Term U.S. Government Bond Portfolio | 26,311 | - | 9,500 | 2,162 | ||||||||||||
Inflation Protection Portfolio | 5,663 | 62 | 7,844 | - | ||||||||||||
High Yield Bond Portfolio | 43,872 | - | 47,246 | - | ||||||||||||
Multi-Sector Bond Portfolio | 32,327 | 6,708 | 42,792 | 66 | ||||||||||||
Balanced Portfolio | 64,727 | 103,835 | 58,432 | 73,855 | ||||||||||||
Asset Allocation Portfolio | 7,196 | 15,602 | 7,007 | 11,152 | ||||||||||||
As of December 31, 2021 the components of distributable earnings on a tax basis were as follows:
Portfolio | Undistributed Ordinary Income | Undistributed Long-Term Gains | Accumulated Losses | Unrealized Appreciation (Depreciation) | ||||||||||||
| (Amounts in thousands) | ||||||||||||||||
Growth Stock Portfolio | $ | 8,528 | $ | 142,825 | $ | - | $ | 537,214 | ||||||||
Focused Appreciation Portfolio | 2,197 | 125,795 | - | 656,084 | ||||||||||||
Large Cap Core Stock Portfolio | 34,456 | 81,320 | - | 246,479 | ||||||||||||
Large Cap Blend Portfolio | 1,337 | 18,030 | - | 61,025 | ||||||||||||
Index 500 Stock Portfolio | 64,246 | 144,466 | - | 3,748,046 | ||||||||||||
Large Company Value Portfolio | 12,442 | 19,968 | - | 35,205 | ||||||||||||
Domestic Equity Portfolio | 30,279 | 106,319 | - | 301,853 | ||||||||||||
Equity Income Portfolio | 22,906 | 71,575 | - | 234,771 | ||||||||||||
Mid Cap Growth Stock Portfolio | 1,825 | 98,222 | - | 311,275 | ||||||||||||
Index 400 Stock Portfolio | 32,136 | 101,320 | - | 460,419 | ||||||||||||
Mid Cap Value Portfolio | 44,502 | 64,719 | - | 99,088 | ||||||||||||
Small Cap Growth Stock Portfolio | 3,361 | 107,357 | - | 199,444 | ||||||||||||
Index 600 Stock Portfolio | 12,254 | �� | 25,215 | - | 122,383 | |||||||||||
Small Cap Value Portfolio | 12,419 | 65,202 | - | 238,146 | ||||||||||||
International Growth Portfolio | 8,195 | 93,077 | - | 380,462 | ||||||||||||
Research International Core Portfolio | 20,345 | 34,292 | - | 257,826 | ||||||||||||
International Equity Portfolio | 41,795 | 46,804 | - | (40,732 | ) | |||||||||||
Emerging Markets Equity Portfolio | 19,996 | 58,276 | - | 208,118 | ||||||||||||
Government Money Market Portfolio | - | - | - | - | ||||||||||||
Short-Term Bond Portfolio | 6,233 | 172 | - | 508 | ||||||||||||
Select Bond Portfolio | 51,441 | 3,950 | - | (23,318 | ) | |||||||||||
Long-Term U.S. Government Bond Portfolio | 1,876 | - | (1,731 | ) | (19,676 | ) | ||||||||||
Inflation Protection Portfolio | 16,642 | 8,985 | - | 36,870 | ||||||||||||
High Yield Bond Portfolio | 40,650 | - | (5,092 | ) | 19,942 | |||||||||||
Multi-Sector Bond Portfolio | 47,671 | - | - | 3,929 | ||||||||||||
Balanced Portfolio | 82,626 | 121,741 | - | 225,330 | ||||||||||||
Asset Allocation Portfolio | 9,305 | 17,887 | - | 42,486 | ||||||||||||
NOTE 9. VOLUNTARY REIMBURSEMENTS
Northwestern Mutual voluntarily reimburses foreign equity portfolios for the tax benefit Northwestern Mutual receives from foreign dividend taxes charged against the Portfolios. The amounts reimbursed represent approximately 79% of the foreign dividend taxes withheld attributable to the portion of the Portfolio owned by Northwestern Mutual. Reimbursements are recorded when foreign dividend taxes are accrued.
Voluntary reimbursements for the year ended December 31, 2021 are summarized below (amounts in thousands):
Portfolio | 2021 Reimbursements | |||
International Growth Portfolio | $ | 981 | ||
International Equity Portfolio | 4,418 | |||
Research International Core Portfolio | 1,523 | |||
Emerging Markets Equity Portfolio | 1,645 | |||
271
Table of Contents
Notes to Financial Statements
NOTE 10. GUARANTEES
In the normal course of business, the Portfolios enter into contracts that contain a variety of representations which provide general indemnifications. The Portfolios’ maximum exposure under these arrangements is unknown as this would involve future claims that may be made against the Portfolios that have not yet occurred. However, the Portfolios expect the risk of material loss to be remote.
NOTE 11. INVESTMENT INCOME AND SECURITIES TRANSACTIONS
For the year ended December 31, 2021, transactions in securities other than short term investments were:
Portfolios | Non-U.S. Govt. Security Purchases | U.S. Govt. Security Purchases | Non-U.S. Govt. Security Sales/ Maturities | U.S. Govt. Security Sales/ Maturities | ||||||||||||
| (Amounts in thousands) | ||||||||||||||||
Growth Stock Portfolio | $ | 483,134 | $ | - | $ | 584,347 | $ | - | ||||||||
Focused Appreciation Portfolio | 132,951 | - | 232,778 | - | ||||||||||||
Large Cap Core Stock Portfolio | 431,758 | - | 480,328 | - | ||||||||||||
Large Cap Blend Portfolio | 35,258 | - | 43,366 | - | ||||||||||||
Index 500 Stock Portfolio | 159,075 | - | 242,232 | - | ||||||||||||
Large Company Value Portfolio | 89,294 | - | 111,866 | - | ||||||||||||
Domestic Equity Portfolio | 293,730 | - | 335,352 | - | ||||||||||||
Equity Income Portfolio | 150,666 | - | 249,138 | - | ||||||||||||
Mid Cap Growth Stock Portfolio | 413,471 | - | 505,709 | - | ||||||||||||
Index 400 Stock Portfolio | 242,507 | -�� | 270,739 | - | ||||||||||||
Mid Cap Value Portfolio | 348,012 | - | 370,953 | - | ||||||||||||
Small Cap Growth Stock Portfolio | 364,850 | - | 412,249 | - | ||||||||||||
Index 600 Stock Portfolio | 103,652 | - | 87,230 | - | ||||||||||||
Small Cap Value Portfolio | 146,238 | - | 214,965 | - | ||||||||||||
International Growth Portfolio | 245,421 | - | 245,135 | - | ||||||||||||
Research International Core Portfolio | 164,787 | - | 185,504 | - | ||||||||||||
International Equity Portfolio | 2,163,783 | - | 2,129,379 | - | ||||||||||||
Emerging Markets Equity Portfolio | 337,044 | - | 326,967 | - | ||||||||||||
Short-Term Bond Portfolio | 178,276 | 78,038 | 112,021 | 71,738 | ||||||||||||
Select Bond Portfolio | 2,704,825 | 6,690,133 | 2,636,954 | 6,331,994 | ||||||||||||
Long-Term U.S. Government Bond Portfolio | 1,330 | 47,940 | 1,442 | 80,938 | ||||||||||||
Inflation Protection Portfolio | 238,367 | 147,931 | 218,836 | 125,253 | ||||||||||||
High Yield Bond Portfolio | 296,657 | - | 285,431 | - | ||||||||||||
Multi-Sector Bond Portfolio | 504,237 | 37,027 | 244,235 | 6,300 | ||||||||||||
Balanced Portfolio | 464,602 | - | 471,045 | - | ||||||||||||
Asset Allocation Portfolio | 57,506 | - | 57,105 | - | ||||||||||||
Transactions with Affiliated Companies
An affiliated company is a company in which a Portfolio has ownership of at least 5% of the voting securities or which the Portfolio controls, is controlled by or with which the Portfolio is under common control. Transactions with affiliated companies during the year ended December 31, 2021 are as follows:
272
Table of Contents
Notes to Financial Statements
Portfolio | Value at 12/31/2020 | Purchases | Sales | Value at 12/31/2021 | Change in Unrealized Appreciation/ Depreciation | Realized Gain (Loss) | Income Dividends | Capital Gain Distributions | % Ownership, 12/31/2021 | |||||||||||||||||||||||||||
| (Amounts in thousands) | ||||||||||||||||||||||||||||||||||||
Balanced Portfolio: | ||||||||||||||||||||||||||||||||||||
Growth Stock | $ | 103,721 | $ | 26,582 | $ | 30,740 | $ | 108,826 | $ | (89 | ) | $ | 9,352 | $ | 4 | $ | 4,178 | 7.8 | % | |||||||||||||||||
Focused Appreciation | 80,740 | 29,491 | 6,320 | 109,064 | 2,585 | 2,568 | 167 | 10,124 | 8.2 | % | ||||||||||||||||||||||||||
Large Cap Core Stock | 80,193 | 8,310 | 9,600 | 91,335 | 9,670 | 2,762 | 691 | 6,318 | 10.8 | % | ||||||||||||||||||||||||||
Large Cap Blend | 79,713 | 5,947 | 1,420 | 92,903 | 8,295 | 368 | 565 | 5,382 | 45.7 | % | ||||||||||||||||||||||||||
Large Company Value | 76,500 | 1,677 | 24,960 | 66,888 | 10,144 | 3,527 | 829 | 848 | 29.4 | % | ||||||||||||||||||||||||||
Domestic Equity | 77,327 | 4,195 | 26,820 | 67,194 | 2,475 | 10,017 | 1,328 | 1,667 | 6.1 | % | ||||||||||||||||||||||||||
Equity Income | 77,083 | 1,506 | 27,400 | 67,424 | 11,222 | 5,013 | 1,507 | - | 7.8 | % | ||||||||||||||||||||||||||
Mid Cap Growth Stock | 104,743 | 14,571 | 16,000 | 100,637 | (6,745 | ) | 4,068 | 150 | 13,001 | 7.3 | % | |||||||||||||||||||||||||
Mid Cap Value | 98,371 | 4,838 | 16,870 | 106,645 | 17,253 | 3,053 | 1,223 | 814 | 15.1 | % | ||||||||||||||||||||||||||
Small Cap Growth Stock | 25,240 | 2,590 | - | 26,276 | (1,554 | ) | - | 4 | 2,586 | 3.2 | % | |||||||||||||||||||||||||
Small Cap Value | 24,696 | 1,382 | - | 30,377 | 4,299 | - | 112 | 1,270 | 4.4 | % | ||||||||||||||||||||||||||
International Growth | 54,751 | 2,056 | - | 63,466 | 6,659 | - | 316 | 1,740 | 5.9 | % | ||||||||||||||||||||||||||
Research International Core | 142,307 | 2,881 | 51,600 | 104,121 | (9,981 | ) | 20,514 | 1,204 | 1,678 | 10.8 | % | |||||||||||||||||||||||||
International Equity | 60,205 | 6,282 | 3,790 | 64,275 | 1,368 | 210 | 1,482 | - | 3.4 | % | ||||||||||||||||||||||||||
Emerging Markets Equity | 17,445 | 7,592 | 7,300 | 17,063 | (2,615 | ) | 1,941 | 92 | - | 1.7 | % | |||||||||||||||||||||||||
Short-Term Bond | 13,162 | 11,269 | - | 23,905 | (526 | ) | - | 424 | 45 | 5.8 | % | |||||||||||||||||||||||||
Select Bond | 936,914 | 78,685 | 76,850 | 865,259 | (75,962 | ) | 2,472 | 18,508 | 40,147 | 25.2 | % | |||||||||||||||||||||||||
High Yield Bond | 107,889 | 4,764 | 28,950 | 84,024 | (557 | ) | 878 | 4,764 | - | 10.0 | % | |||||||||||||||||||||||||
Multi-Sector Bond | 44,229 | 78,492 | - | 119,927 | (2,794 | ) | - | 2,537 | 1,055 | 9.1 | % | |||||||||||||||||||||||||
|
|
|
|
|
|
|
|
|
|
|
|
|
|
|
| |||||||||||||||||||||
| $ | 2,205,229 | $ | 293,110 | $ | 328,620 | $ | 2,209,609 | $ | (26,853 | ) | $ | 66,743 | $ | 35,907 | $ | 90,853 | ||||||||||||||||||||
|
|
|
|
|
|
|
|
|
|
|
|
|
|
|
| |||||||||||||||||||||
Asset Allocation Portfolio: | ||||||||||||||||||||||||||||||||||||
Growth Stock | $ | 17,329 | $ | 3,628 | $ | 3,945 | $ | 18,697 | $ | 569 | $ | 1,116 | $ | 1 | $ | 717 | 1.3 | % | ||||||||||||||||||
Focused Appreciation | 13,532 | 5,220 | 850 | 18,738 | 487 | 349 | 29 | 1,731 | 1.4 | % | ||||||||||||||||||||||||||
Large Cap Core Stock | 13,454 | 1,301 | 1,370 | 15,479 | 1,702 | 392 | 119 | 1,083 | 1.8 | % | ||||||||||||||||||||||||||
Large Cap Blend | 13,344 | 1,422 | 440 | 15,764 | 1,324 | 114 | 97 | 925 | 7.8 | % | ||||||||||||||||||||||||||
Large Company Value | 12,759 | 281 | 3,910 | 11,445 | 1,725 | 590 | 139 | 142 | 5.0 | % | ||||||||||||||||||||||||||
Domestic Equity | 12,772 | 503 | 3,830 | 11,541 | 663 | 1,433 | 223 | 280 | 1.1 | % | ||||||||||||||||||||||||||
Equity Income | 12,894 | 251 | 4,380 | 11,503 | 1,916 | 822 | 251 | - | 1.3 | % | ||||||||||||||||||||||||||
Mid Cap Growth Stock | 15,785 | 2,367 | 1,270 | 16,404 | (679 | ) | 201 | 24 | 2,064 | 1.2 | % | |||||||||||||||||||||||||
Mid Cap Value | 14,743 | 1,174 | 1,800 | 17,260 | 2,788 | 355 | 195 | 130 | 2.4 | % | ||||||||||||||||||||||||||
Small Cap Growth Stock | 7,136 | 732 | - | 7,429 | (439 | ) | - | 1 | 731 | 0.9 | % | |||||||||||||||||||||||||
Small Cap Value | 7,059 | 386 | 200 | 8,475 | 1,201 | 29 | 31 | 354 | 1.2 | % | ||||||||||||||||||||||||||
International Growth | 10,750 | 394 | 300 | 12,159 | 1,170 | 145 | 60 | 333 | 1.1 | % | ||||||||||||||||||||||||||
Research International Core | 24,430 | 577 | 6,150 | 20,899 | (576 | ) | 2,618 | 241 | 336 | 2.2 | % | |||||||||||||||||||||||||
International Equity | 11,230 | 1,246 | 410 | 12,358 | 269 | 23 | 276 | - | 0.7 | % | ||||||||||||||||||||||||||
Emerging Markets Equity | 3,704 | 819 | 800 | 3,559 | (439 | ) | 275 | 19 | - | 0.4 | % | |||||||||||||||||||||||||
Short-Term Bond | 1,376 | 1,964 | - | 3,267 | (73 | ) | - | 58 | 6 | 0.8 | % | |||||||||||||||||||||||||
Select Bond | 68,858 | 5,975 | 7,590 | 61,927 | (5,520 | ) | 204 | 1,333 | 2,892 | 1.8 | % | |||||||||||||||||||||||||
High Yield Bond | 19,409 | 977 | 2,750 | 17,650 | (32 | ) | 46 | 977 | - | 2.1 | % | |||||||||||||||||||||||||
Multi-Sector Bond | 6,031 | 10,380 | - | 16,039 | (372 | ) | - | 339 | 141 | 1.2 | % | |||||||||||||||||||||||||
|
|
|
|
|
|
|
|
|
|
|
|
|
|
|
| |||||||||||||||||||||
| $ | 286,595 | $ | 39,597 | $ | 39,995 | $ | 300,593 | $ | 5,684 | $ | 8,712 | $ | 4,413 | $ | 11,865 | |||||||||||||||||||||
|
|
|
|
|
|
|
|
|
|
|
|
|
|
|
| |||||||||||||||||||||
The Series Fund and its Portfolios are permitted to purchase securities from, and sell securities to (so called “cross-trades”), (i) other Portfolios, (ii) any registered investment company which is an affiliate, or an affiliate of an affiliate, or (iii) any person which is an affiliate, or an affiliate of an affiliate, of the Series Fund or the Portfolio solely by reason of having a common investment adviser or sub-adviser (or affiliated investment advisers) or common directors and/or officers, pursuant to procedures adopted by the Board under Rule 17a-7 of the 1940 Act (“Procedures”). These Procedures have been designed to ensure that any cross-trade of securities by a Portfolio complies with Rule 17a-7 of the 1940 Act. Each cross-trade is effected at the current market price as defined under the Procedures. Pursuant to the Procedures, for the year ended December 31, 2021, the Series Fund Portfolios engaged in the following cross-trades (amounts in thousands):
273
Table of Contents
Notes to Financial Statements
Portfolio | Cross Trade Purchases | |||
Growth Stock Portfolio | $ | 1,037 | ||
Large Cap Core Portfolio | 1,361 | |||
Large Company Value Portfolio | 282 | |||
Small Cap Value Portfolio | 230 | |||
International Growth Portfolio | 11,802 | |||
Research International Core Portfolio | 1,074 | |||
High Yield Bond Portfolio | 28 | |||
| Cross Trade Sales | ||||||||
Portfolio | Proceeds | Net Realized Gain (Loss) on Sales | ||||||
Growth Stock Portfolio | $ | 1,619 | $ | 329 | ||||
Mid Cap Growth Stock Portfolio | 549 | (6 | ) | |||||
Mid Cap Value Portfolio | 1,090 | 197 | ||||||
Small Cap Growth Stock Portfolio | 979 | 154 | ||||||
Small Cap Value Portfolio | 1,479 | 14 | ||||||
International Growth Portfolio | 10,746 | 4,427 | ||||||
Research International Core Portfolio | 57 | - | ||||||
NOTE 12. LITIGATION
The Index 500 Stock, Small Cap Value and Equity Income Portfolios are among the defendants in a lawsuit relating to their receipt of proceeds from the 2007 Tribune Co. leveraged buy-out (“Tribune LBO”) transaction. The lawsuit asserts that the directors and officers of Tribune Co. intentionally defrauded Tribune creditors because Tribune was either insolvent or rendered insolvent by the transactions. Counsel for the Series Fund and other institutional defendants filed a motion to dismiss the intentional fraudulent transfer case in the Southern District of New York and the district court judge granted the motion to dismiss without leave to amend. The dismissal was appealed to the U.S. Court of Appeals for the Second Circuit. The U.S. Court of Appeals for the Second Circuit denied the appeal and then denied a motion for reconsideration. Plaintiff has filed a petition to review with the U.S. Supreme Court. The lawsuit alleges no misconduct by the Portfolios or management, and management intends to vigorously defend all claims and allegations. The plaintiff seeks to recover amounts paid to Tribune shareholders in the leveraged buyout transaction, plus interest and attorneys’ fees and expenses. The value of the proceeds received by these Portfolios in 2007, and the percentage the proceeds represent of each Portfolio’s net assets as of December 31, 2021, were: Index 500 Stock Portfolio $977,000 (0.02% of net assets); Small Cap Value Portfolio $618,000 (0.09% of net assets); and Equity Income Portfolio $2,873,000 (0.33% of net assets). Management has not concluded that a loss is reasonably likely to occur, and therefore no loss accrual has been recorded.
274
Table of Contents
Report of Independent Registered Public Accounting Firm
To the Board of Directors of Northwestern Mutual Series Fund, Inc. and Shareholders of Growth Stock Portfolio, Focused Appreciation Portfolio, Large Cap Core Stock Portfolio, Large Cap Blend Portfolio, Index 500 Stock Portfolio, Large Company Value Portfolio, Domestic Equity Portfolio, Equity Income Portfolio, Mid Cap Growth Stock Portfolio, Index 400 Stock Portfolio, Mid Cap Value Portfolio, Small Cap Growth Stock Portfolio, Index 600 Stock Portfolio, Small Cap Value Portfolio, International Growth Portfolio, Research International Core Portfolio, International Equity Portfolio, Emerging Markets Equity Portfolio, Government Money Market Portfolio, Short-Term Bond Portfolio, Select Bond Portfolio, Long-Term U.S. Government Bond Portfolio, Inflation Protection Portfolio, High Yield Bond Portfolio, Multi-Sector Bond Portfolio, Balanced Portfolio and Asset Allocation Portfolio
Opinions on the Financial Statements
We have audited the accompanying statements of assets and liabilities, including the schedules of investments, of Growth Stock Portfolio, Focused Appreciation Portfolio, Large Cap Core Stock Portfolio, Large Cap Blend Portfolio, Index 500 Stock Portfolio, Large Company Value Portfolio, Domestic Equity Portfolio, Equity Income Portfolio, Mid Cap Growth Stock Portfolio, Index 400 Stock Portfolio, Mid Cap Value Portfolio, Small Cap Growth Stock Portfolio, Index 600 Stock Portfolio, Small Cap Value Portfolio, International Growth Portfolio, Research International Core Portfolio, International Equity Portfolio, Emerging Markets Equity Portfolio, Government Money Market Portfolio, Short-Term Bond Portfolio, Select Bond Portfolio, Long-Term U.S. Government Bond Portfolio, Inflation Protection Portfolio, High Yield Bond Portfolio, Multi-Sector Bond Portfolio, Balanced Portfolio and Asset Allocation Portfolio (constituting Northwestern Mutual Series Fund, Inc., hereafter collectively referred to as the “Funds”) as of December 31, 2021, the related statements of operations for the year ended December 31, 2021, the statements of changes in net assets for each of the two years in the period ended December 31, 2021, and for Long-Term U.S. Government Bond Portfolio the statement of cash flows for the year ended December 31, 2021, including the related notes, and the financial highlights for each of the five years in the period ended December 31, 2021 (collectively referred to as the “financial statements”). In our opinion, the financial statements present fairly, in all material respects, the financial position of each of the Funds as of December 31, 2021, the results of each of their operations for the year then ended, the changes in each of their net assets for each of the two years in the period ended December 31, 2021, for Long-Term U.S. Government Bond Portfolio, the results of its cash flows for the year then ended, and each of the financial highlights for each of the five years in the period ended December 31, 2021 in conformity with accounting principles generally accepted in the United States of America.
Basis for Opinions
These financial statements are the responsibility of the Funds’ management. Our responsibility is to express an opinion on the Funds’ financial statements based on our audits. We are a public accounting firm registered with the Public Company Accounting Oversight Board (United States) (PCAOB) and are required to be independent with respect to the Funds in accordance with the U.S. federal securities laws and the applicable rules and regulations of the Securities and Exchange Commission and the PCAOB.
We conducted our audits of these financial statements in accordance with the standards of the PCAOB. Those standards require that we plan and perform the audit to obtain reasonable assurance about whether the financial statements are free of material misstatement, whether due to error or fraud.
275
Table of Contents
Report of Independent Registered Public Accounting Firm
Our audits included performing procedures to assess the risks of material misstatement of the financial statements, whether due to error or fraud, and performing procedures that respond to those risks. Such procedures included examining, on a test basis, evidence regarding the amounts and disclosures in the financial statements. Our audits also included evaluating the accounting principles used and significant estimates made by management, as well as evaluating the overall presentation of the financial statements. Our procedures included confirmation of securities owned as of December 31, 2021 by correspondence with the custodian, transfer agent and brokers; when replies were not received from brokers, we performed other auditing procedures. We believe that our audits provide a reasonable basis for our opinions.

Milwaukee, WI
February 22, 2022
We have served as the auditor of one or more investment companies in Northwestern Mutual Series Fund, Inc. since 1984.
276
Table of Contents
Abbreviations that may be used in the preceding statements
| ADR | American Depositary Receipt | |
| AFC | Available Funds Cap security - Security accrues interest at an assumed or uncapped rate. If the interest rate on the underlying loans is lower than the uncapped rate, then the security will pay at the lower rate. | |
| CSTR | Collateral Strip Rate security - interest is based on the weighted net interest rate of the collateral. | |
| EXE | Security receives collateral principal and interest paid which exceeds the amount of principal and income obligated to all bonds in the deal. | |
| IO | Interest Only Security | |
| PO | Principal Only Security | |
| GDR | Global Depositary Receipt | |
| GO | General Obligation | |
| RB | Revenue Bond | |
| CPURNSA | U.S. Consumer Price Index - All Urban Consumers - Not Seasonally Adjusted | |
| LIBOR | London Interbank Offered Rate | |
| SOFR | Secured Overnight Financing Rate | |
| ICE | Intercontinental Exchange | |
| SONIO | Sterling Overnight Interbank Average Rate | |
| DAC | Designated Activity Company | |
| TBA | To Be Announced | |
| OIS | Overnight Index Swaps | |
| DIFC | Dubai International Financial Centre | |
| EURIBOR | Euro Interbank Offered Rate | |
| SDR | Swedish Depository Receipt |
Currency Abbreviations
| ARS | Argentine Peso | |
| AUD | Australian Dollar | |
| BRL | Brazilian Real | |
| CAD | Canadian Dollar | |
| CHF | Swiss Franc | |
| CNH | Chinese Yuan Renminbi - Offshore | |
| CNY | Chinese Yuan Renminbi | |
| DKK | Danish Krone | |
| EUR | Euro | |
| GBP | British Pound | |
| HKD | Hong Kong Dollar | |
| IDR | Indonesian Rupiah | |
| INR | Indian Rupee | |
| JPY | Japanese Yen | |
| KES | Kenyan Shilling | |
| KRW | South Korean Won | |
| MXN | Mexican New Peso | |
| NOK | Norwegian Krone | |
| NZD | New Zealand Dollar | |
| PHP | Philippines Peso | |
| PLN | Polish Zloty | |
| RUB | Russian Ruble | |
| SEK | Swedish Krona | |
| THB | Thai Baht | |
| TWD | Taiwan Dollar | |
| USD | United States Dollar | |
| ZAR | South African Rand |
277
Table of Contents
Proxy Voting and Portfolio Holdings (unaudited)
Proxy Voting Guidelines
A description of the policies and procedures that the Portfolios use to determine how to vote proxies relating to portfolio securities is available without charge, upon request, by calling toll free 1-888-455-2232. It is also available on the Securities and Exchange Commission’s website at http://www.sec.gov.
Information regarding how the Portfolios voted proxies relating to portfolio securities during the most recent twelve-month period ended June 30 is available without charge, upon request, by calling toll free 1-888-455-2232. It is also available on the Securities and Exchange Commission’s website at http://www.sec.gov.
Quarterly Filing of Portfolio Holdings
Each Portfolio, other than the Government Money Market Portfolio, files its complete schedule of portfolio holdings on a monthly basis with the Securities and Exchange Commission (SEC) as an exhibit to its reports on Form N-PORT. Each Portfolio’s holdings reported on Form N-PORT for the first and third quarters of the fiscal year are available on the SEC’s website at http://www.sec.gov. Portfolios that file their holdings on Form N-PORT also make their complete schedule of portfolio holdings for the most recent quarter of their fiscal year available on the Internet at www.northwesternmutual.com.
The Government Money Market Portfolio files its complete schedule of portfolio holdings on a monthly basis with the SEC on Form N-MFP. Form N-MFP is available on the SEC’s website at http://www.sec.gov. The Government Money Market Portfolio also makes its complete schedule of portfolio holdings for the most recent month available on the Internet at www. northwesternmutual.com.
278
Table of Contents
Director and Officer Information (unaudited)
Northwestern Mutual Series Fund, Inc.
The name, address and year of birth of the directors, as well as their affiliations, positions held with the Series Fund, principal occupations during the past five years and the number of portfolios overseen in the Northwestern Mutual fund complex, are shown below as of December 31, 2021, except as otherwise noted. Each director (whenever elected) shall hold office until the next annual meeting of shareholders and until his or her successor is elected and qualifies or until his or her earlier death, resignation or removal. A director shall retire at the end of the calendar year in which the first of the two events occurs: (i) he or she attains the age of seventy-three (73), or (ii) he or she has served a term or successive terms totaling thirteen (13) years, commencing on the date of his or her election or appointment to the Board. The statement of additional information contains additional information about Series Fund directors and is available without charge, upon request, by calling 1-888-455-2232.
Independent Directors
Name, Address, and Year of Birth | Position | Length of Time Served | Number of Portfolios in Fund Complex Overseen by Director | Other Directorships Held1 | ||||
| Robert H. Huffman III 720 East Wisconsin Avenue Milwaukee, WI 53202 1959 | Director | Since 2007 | 27 | None | ||||
Principal Occupation During Past 5 Years: Since 2015, CEO of RVP Management, LLC, a registered investment adviser. | ||||||||
| Christy L. Brown 720 East Wisconsin Avenue Milwaukee, WI 53202 1965 | Director | Since 2012 | 27 | None | ||||
Principal Occupation During Past 5 Years: Since October 2012, Chief Executive Officer, Girl Scouts of Wisconsin Southeast. From 2007 to 2012, Vice Chancellor, Finance and Administrative Affairs, University of Wisconsin, Milwaukee. | ||||||||
| Gail L. Hanson 720 East Wisconsin Avenue Milwaukee, WI 53202 1955 | Director | Since 2012 | 27 | Director of Artisan Partner Funds (17 portfolios) | ||||
Principal Occupation During Past 5 Years: Retired. From February 2011 to April 2018, Chief Financial Officer, Aurora Health Care. Prior thereto, Deputy Executive Director, State of Wisconsin Investment Board. | ||||||||
| William Gerber 720 East Wisconsin Avenue Milwaukee, WI 53202 1958 | Director | Since 2017 | 27 | Director of Ballantyne Strong, Inc., a developer of technology solutions for digital applications (2015 to present) | ||||
Principal Occupation During Past 5 Years: Retired. From 2006 to 2015, Chief Financial Officer, and from 2007 to 2015, Executive Vice President, of TD Ameritrade Holdings Corporation. | ||||||||
| David Ribbens 720 East Wisconsin Avenue Milwaukee, WI 53202 1961 | Director | Since 2017 | 27 | None | ||||
| Principal Occupation During Past 5 Years: Since March of 2018, Member and Partner of DOMO Capital Management, LLC, a Wisconsin registered investment adviser. Founder and President of Distribution Team Alpha LLC, founded in 2016. From 2015 to 2016, President, Managing Partner, and Director of Heartland Advisors, Inc. From 2008 to 2015, Executive Vice President and Head of Distribution, Managing Partner, and Director of Heartland Advisors, Inc. | ||||||||
279
Table of Contents
Director and Officer Information (unaudited)
Name, Address, and Year of Birth | Position | Length of Time Served | Number of Portfolios in Fund Complex Overseen by Director | Other Directorships Held1 | ||||
| Donald M. Ullmann 720 East Wisconsin Avenue Milwaukee, WI 53202 1957 | Director | Since 2017 | 27 | None | ||||
| Principal Occupation During Past 5 Years: Since 2015, Principal of DMU Financial Consulting, LLC. From 2013 to 2015, Managing Director, Head of Product Development, Fixed Income at Guggenheim Securities. From 2012 to 2013, Executive Managing Director, Co-head, MBS and Rates Division at Gleacher & Co. From 2009 to 2011, Executive Vice President, Head of Fixed Income Trading and Co-Head of Fixed Income Sales at Keefe, Bruyette and Woods, Inc. | ||||||||
| 1. | This column includes only directorships of companies required to report to the Securities and Exchange Commission (SEC) under the Securities Exchange Act of 1934, as amended (i.e., “public companies”) or other investment companies registered under the Investment Company Act of 1940, as amended. |
Other Directors
Name, Address, and Year of Birth | Position | Length of Time Served | Number of Portfolios in Fund Complex Overseen by Director | Other Directorships Held | ||||
| Ronald P. Joelson 720 East Wisconsin Avenue Milwaukee, WI 53202 1958 | Chairman of the Board | Since 2015 | 27 | None | ||||
| Principal Occupation During Past 5 Years: Since January 1, 2021, Executive Vice President of The Northwestern Mutual Life Insurance Company. From 2012 through 2020, Executive Vice President and Chief Investment Officer of The Northwestern Mutual Life Insurance Company. Prior thereto, Chief Investment Officer of Genworth Financial from 2009-2012. | ||||||||
Northwestern Mutual Series Fund, Inc.
Executive Officers
Name, Address, and Year of Birth | Position | Length of Time Served | ||
Ronald P. Joelson 720 East Wisconsin Avenue Milwaukee, WI 53202 | President | Since 2021 | ||
| Principal Occupation During Past 5 Years: Since January 1, 2021, Executive Vice President of The Northwestern Mutual Life Insurance Company. From 2012 through 2020, Executive Vice President and Chief Investment Officer of The Northwestern Mutual Life Insurance Company. | ||||
| Todd M. Jones 720 East Wisconsin Avenue Milwaukee, WI 53202 1968 | Vice President; Chief Financial Officer & Treasurer | Since 2015 | ||
| Principal Occupation During Past 5 Years: Since April 2015, Vice President and Controller of Northwestern Mutual. | ||||
| Phil J. Rinzel 720 East Wisconsin Avenue Milwaukee, WI 53202 1957 | Controller & Chief Accounting Officer | Since 2021 | ||
| Principal Occupation During Past 5 Years: Since 2016, Senior Director – Investment Accounting of Northwestern Mutual. | ||||
280
Table of Contents
Director and Officer Information (unaudited)
Name, Address, and Year of Birth | Position | Length of Time Served | ||
| Michael J. Conmey 720 East Wisconsin Avenue Milwaukee, WI 53202 1980 | Chief Compliance Officer | Since 2020 | ||
| Principal Occupation During Past 5 Years: Vice President – Managed Investments Compliance of Northwestern Mutual and Chief Compliance Officer of Mason Street Advisors and Northwestern Mutual Investment Management Company since June 2020. Assistant General Counsel and Assistant Secretary of Northwestern Mutual from 2011 - 2020. | ||||
| Lesli H. McLinden 720 East Wisconsin Avenue Milwaukee, WI 53202 1962 | Secretary | Since 2014 | ||
| Principal Occupation During Past 5 Years: Assistant General Counsel and Assistant Secretary of Northwestern Mutual since 2007. Secretary of Mason Street Advisors from 2015 to 2017 and Assistant Secretary since 2017. | ||||
| James E. Fleming 720 East Wisconsin Avenue Milwaukee, WI 53202 1975 | Vice President - Investments | Since 2020 | ||
| Principal Occupation During Past 5 Years: Vice President of Mason Street Advisors since 2015. | ||||
| Rodney A. Schmucker 720 East Wisconsin Avenue Milwaukee, WI 53202 1966 | Vice President - Investments | Since 2020 | ||
| Principal Occupation During Past 5 Years: Vice President of Mason Street Advisors since 2015. | ||||
281
Table of Contents
Approval and Continuance of Investment Advisory and Sub-Advisory Agreements (unaudited)
Northwestern Mutual Series Fund, Inc.
Annual Contract Review Process
Under Section 15(c) of the Investment Company Act of 1940, as amended (the “1940 Act”), contracts for investment advisory services are required to be reviewed, evaluated and approved by a majority of an investment company’s independent directors each year. In addition, each investment company is required to disclose in its annual or semi-annual report, as applicable, the material factors and conclusions that formed the basis for the board’s approval or renewal of any investment advisory agreements within the investment company’s most recently completed fiscal half-year period.
At least annually, the Board of Directors (the “Board”) of Northwestern Mutual Series Fund, Inc. (the “Series Fund”) considers and votes upon the renewal of the investment sub-advisory agreements between Mason Street Advisors, LLC (“Mason Street Advisors”) and each of the sub-advisers of those portfolios of the Series Fund (each, a “Portfolio” and collectively, the “Portfolios”) for which Mason Street Advisors and the Board have appointed a sub-adviser. In order to afford the Board the opportunity to focus on a smaller number of relationships at any one meeting, the Board considers the annual continuation of the sub-advisory agreements on a staggered basis during the course of the year.
Board Approvals During the Six-Month Period Ended December 31, 2021
At its August 26, 2021 meeting, the Board, including the Directors who are not “interested persons” (as that term is defined in the 1940 Act) of the Series Fund or Mason Street Advisors (“Independent Directors”), unanimously approved the continuance of a (1) Third Amended and Restated Investment Sub-Advisory Agreement between Mason Street Advisors and American Century Investment Management, Inc. (“American Century”), relating to the Series Fund’s Mid Cap Value, Large Company Value and Inflation Protection Portfolios, (2) Second Amended and Restated Investment Sub-Advisory Agreement between Mason Street Advisors and Delaware Investments Fund Advisers, a series of Macquarie Investment Management Business Trust (“Delaware”) relating to the Series Fund’s Domestic Equity Portfolio, (3) Second Amended and Restated Investment Sub-Advisory Agreement between Mason Street Advisors and Federated Investment Management Company (“Federated”) relating to the Series Fund’s High Yield Bond Portfolio, and a (4) Second Amended and Restated Investment Sub-Advisory Agreement between Mason Street Advisors and Loomis, Sayles & Company, L.P. (“Loomis Sayles”) relating to the Series Fund’s Focused Appreciation Portfolio, together with an amendment thereto incorporating a sub-advisory fee reduction.
Also at its August 26, 2021 meeting, the Board including the Independent Directors, unanimously approved an Investment Sub-Advisory Agreement between Mason Street Advisors and Dodge & Cox relating to the Series Fund’s International Equity Portfolio. The foregoing Investment Sub-Advisory Agreement will sometimes be referred to herein as the “Dodge & Cox Sub-Advisory Agreement.”
At its December 2, 2021 meeting, the Board, including the Independent Directors, unanimously approved a Fifth Amended and Restated Investment Sub-Advisory Agreement between Mason Street Advisors and T. Rowe Price Associates, Inc. (“T. Rowe Price”) relating to the Series Fund’s Short-Term Bond, Small Cap Value, Equity Income and Growth Stock Portfolios, incorporating a sub-advisory fee reduction for the Short-Term Bond Portfolio, and approved the continuance of: (1) an Investment Sub-Advisory Agreement between Mason Street Advisors and Allspring Global Investments, LLC (“Allspring”) relating to the Series Fund’s Select Bond Portfolio, (2) a Third Amended and Restated Investment Sub-Advisory Agreement between Mason Street Advisors and Pacific Investment Management Company LLC (“PIMCO”) relating to the Series Fund’s Long-Term U.S. Government Bond and Multi-Sector Bond Portfolios, (3) a Second Amended and Restated Investment Sub-Advisory Agreement between Mason Street Advisors and BlackRock Advisors, LLC (“BlackRock”) relating to the Series Fund’s Government Money Market Portfolio, together with an amendment thereto incorporating a sub-advisory fee reduction, and (4) an Investment Sub-Advisory Agreement between Mason Street Advisors and BlackRock relating to the Index 500 Stock Portfolio.
Also at its December 2, 2021 meeting, the Board, including the Independent Directors, unanimously and conditionally approved: (i) an Investment Sub-Advisory Agreement between Mason Street Advisors and T. Rowe Price Investment
282
Table of Contents
Approval and Continuance of Investment Advisory and Sub-Advisory Agreements (unaudited)
Management, Inc. (“TRPIM”) with respect to the Small Cap Value Portfolio; and (ii) an amendment to the Fifth Amended and Restated Sub-Advisory Agreement between Mason Street Advisors and T. Rowe Price pursuant to the terms of which all references to the Small Cap Value Portfolio would be removed from the agreement. Both of the foregoing documents were conditionally approved, effective as of the consummation of the internal reorganization involving T. Rowe Price and TRPIM, planned to occur on March 7, 2022. The foregoing Investment Sub-Advisory Agreement with TRPIM will sometimes be referred to herein as the “TRPIM Sub-Advisory Agreement.”
American Century, Delaware, Federated, Loomis Sayles, T. Rowe Price, Allspring, PIMCO and BlackRock are sometimes collectively referred to hereinafter as the “Sub-Advisers,” and their respective sub-advised Portfolios are collectively referred to herein as the “Sub-Advised Portfolios.” The respective Investment Sub-Advisory Agreements with the Sub-Advisers are collectively referred to herein as the “Existing Sub-Advisory Agreements
In determining whether to approve the continuance of the Existing Sub-Advisory Agreements and determining whether to approve the Dodge & Cox Sub-Advisory Agreement and the TRPIM Sub-Advisory Agreement on behalf of the Series Fund, the Board requested and received detailed information from Mason Street Advisors, the Sub-Advisers, Dodge & Cox and TRPIM in advance of each of the foregoing meetings to assist them in their evaluation, including information compiled by certain independent providers of evaluative data. With respect to the continuation of the Existing Sub-Advisory Agreements, while particular focus was given to an evaluation of the services, performance, fees, costs, and certain other relevant information under such Agreements at the meeting at which their continuation was formally considered, the evaluation process with respect to the Sub-Advisers and the nature, extent and quality of the services they provide to the Sub-Advised Portfolios pursuant to the terms of the Existing Sub-Advisory Agreements is an ongoing one. As a result, the Board’s consideration of such services, and the performance, fees, costs and other relevant factors was informed by information provided and deliberations that occurred at other meetings throughout the year.
The Independent Directors received a memorandum from their counsel advising them of their responsibilities in connection with the review and approval of the Dodge & Cox Sub-Advisory Agreement and the TRPIM Sub-Advisory Agreement and the continuance of the Existing Sub-Advisory Agreements, and summarizing the legal standards governing the review and approval of these Agreements. The Independent Directors reviewed these standards with their counsel during the course of the meetings, including how these standards should be applied to the review of information relating to the Sub-Advisers, Dodge & Cox and TRPIM under the Series Fund’s manager of managers structure. During the course of their deliberations, the Independent Directors had the opportunity to meet privately without representatives of Mason Street Advisors, the Sub-Advisers, Dodge & Cox or TRPIM present, and were represented throughout the process by legal counsel.
Continuation of the Sub-Advisory Agreements between Mason Street Advisors and Certain Sub-Advisors
At its August 26, 2021 and December 2, 2021 meetings, the Board, including the Independent Directors, unanimously approved the continuance of the Existing Sub-Advisory Agreements. In connection with those meetings, the Directors received a presentation from representatives of each Sub-Adviser involved in the management of the respective Sub-Advised Portfolios. In addition to the information presented by and about the Sub-Advisers during the course of those meetings, the Directors also had available for consideration each Sub-Adviser’s Section 15(c) Report, which contained responses to the information request letter prepared by counsel to the Independent Directors requesting certain information from the Sub-Advisers designed to assist the Directors in fulfilling their responsibilities when considering the continuation of the Existing Sub-Advisory Agreements. The Directors also had available Mason Street Advisors’ Executive Summary and Overview regarding each of the Sub-Advisers, and other materials prepared by Mason Street Advisors. The materials contained detailed information on performance over multiple time periods, expenses, brokerage commissions, portfolio turnover, style consistency, key portfolio statistics and metrics, and other factors with respect to each of the Sub-Advised Portfolios. The materials also contained an analysis of the Sub-Advisers’ responses to the compliance questions contained in the Section 15(c) Report and the observations of the Series Fund’s Chief Compliance Officer regarding the compliance structure and practices of each of the Sub-Advisers. The Directors also considered their experience with and knowledge of the nature and quality of the services provided by the Sub-Advisers and their ongoing discussions with representatives of Mason Street Advisors, its affiliates and each Sub-Adviser.
283
Table of Contents
Approval and Continuance of Investment Advisory and Sub-Advisory Agreements (unaudited)
The material factors and conclusions that formed the basis for the Board’s approval of the continuance of each of the Existing Sub-Advisory Agreements include those discussed below. No one particular factor was identified as determinative, but rather it was a combination of all the factors and conclusions that formed the basis for the determinations made by the Board. Further, different Directors may have placed greater weight on certain factors than did other Directors.
Nature, Extent and Quality of Services. In considering the nature, extent and quality of each Sub-Adviser’s services the Directors reviewed each Sub-Adviser’s financial strength, assets under management, and overall reputation. The Directors evaluated the investment strategies employed by each Sub-Adviser, as well as the personnel providing such services with respect to each Sub-Advised Portfolio. The Directors considered informational updates given by the portfolio managers, which included reports regarding how the Sub-Advised Portfolios were being positioned in the current market environment. The Directors also considered Mason Street Advisors’ reports on due diligence visits and conference calls that had been conducted with certain of the Sub-Advisers. The Directors also considered information about each Sub-Adviser’s ongoing operational capabilities in response to the COVID-19 pandemic and concluded that the Sub-Advisers retained the ability to continue to provide services in a remote work environment.
With respect to American Century, the Directors considered additional analyst resources allocated by the firm to the fixed income team servicing the Inflation Protection Portfolio. The Directors also considered the updated succession planning developments related to the portfolio manager for the Large Company Value Portfolio. With respect to Federated, the Directors considered the firm’s comments regarding the benefits from having a long-tenured portfolio management team for the High Yield Bond Portfolio to navigate through the market challenges created by the COVID-19 pandemic. The Directors also considered comments from Delaware, Federated and American Century regarding the integration of environmental, social and governance factors into their investment processes, where applicable to the Sub-Advised Portfolios.
With respect to Allspring, the Directors considered that Mason Street Advisors had obtained representations from the firm that the consummation of the change-in-control transaction that had been completed on November 1, 2021 had taken place substantially on the terms described in the responses provided to the Change-in-Control Questionnaire previously prepared by Wells Capital Management, Incorporated and reviewed by the Board, and in conformance with the terms of the transaction as presented to the Board at the Board’s June 3, 2021 meeting. The director’s also considered the representations of Allspring’s portfolio management team that the change-in-control transaction had not impacted the day-to-day investment process or philosophy for the Select Bond Portfolio, or the composition of the investment team.
The Directors also considered and expressed satisfaction with each Sub-Adviser’s investment philosophy and process and the scope of services provided by the Sub-Advisers. Consideration was also given to the Sub-Advisers’ respective reputations and experience in providing investment management services and the performance of each Sub-Advised Portfolio. Based on their review of these factors, their discussions with the Sub-Advisers, and their experience with the services provided by the Sub-Advisers for their respective Sub-Advised Portfolios, the Board concluded, within the context of their overall determinations regarding the Existing Sub-Advisory Agreements, that they were satisfied with the nature, extent and quality of services, and the resources committed by each Sub-Adviser in providing those services, and were satisfied with the experience and capabilities of the Sub-Advisers and the personnel associated with the Sub-Advised Portfolios.
Investment Performance. The Directors reviewed the investment performance of each of the Sub-Advised Portfolios over a variety of time periods. In addition to reviewing the performance of each Sub-Advised Portfolio for both short-term and long-term periods, the Directors considered (i) a comparison of each Sub-Advised Portfolio’s one-, three- and five-year (as applicable) performance to the returns of appropriate benchmarks and indices, and to the performance averages of each Sub-Advised Portfolio’s respective Morningstar and Lipper peer groups for the same periods, (ii) the Morningstar overall star rating and Lipper quintile rating for each Sub-Advised Portfolio and (iii) the Morningstar and the Lipper performance rankings for one-, three- and five-year time periods (as applicable). The Directors evaluated each Sub-Advised Portfolio’s performance against these peer groups and industry benchmarks and indices, and viewed this information as providing an objective comparative benchmark against which they could assess the performance of the Sub-Advised Portfolios. The Directors further considered the performance of accounts managed in a similar manner by each of the Sub-Advisers and
284
Table of Contents
Approval and Continuance of Investment Advisory and Sub-Advisory Agreements (unaudited)
information from the Sub-Advisers regarding any significant differences in the performance of those accounts from that of the Sub-Advised Portfolios.
With respect to American Century, the Directors acknowledged the performance challenges encountered over prior periods by the Mid Cap Value and Large Company Value Portfolios. The Directors viewed favorably the consistent investment approaches applied by the portfolio managers for the Portfolios despite the challenges experienced during the extraordinary market conditions created by the COVID-19 pandemic. The Directors also considered the positive benefits of the firm’s investment approaches in providing downside protection for investors in the Portfolios. With respect to the Inflation Protection Portfolio, the Directors were satisfied with the Portfolio’s performance and cited no concerns. With respect to Federated, the Directors commented favorably on the continued strong performance of the High Yield Bond Portfolio and the firm’s effective bond selection. With respect to Loomis Sayles, the Directors acknowledged the challenged performance results of the Focused Appreciation Portfolio during recent periods, but balanced this against the Portfolio’s very strong performance record over the longer-term, the benefits of providing downside protection, and the consistency of the Loomis Sayles investment process. With respect to Delaware, the Directors considered the Portfolio’s recent performance challenge in light of the portfolio manager’s explanation regarding performance results and the portfolio manager’s conviction in the investment strategy utilized for the Portfolio. The Directors also considered the Portfolio’s strong since-inception performance record.
With respect to the Portfolios sub-advised by T. Rowe Price, the Directors considered the portfolio manager’s comments about the reasons for the underperformance of the Growth Stock Portfolio, as well as the shorter-term performance challenges experienced by the Small Cap Value Portfolio. The Directors expressed no performance concerns with the Equity Income Portfolio or the Short-Term Bond Portfolio. The Directors were satisfied with the performance for the Portfolios sub-advised by Allspring, PIMCO and BlackRock.
In addition to performance information presented at the meeting, the Directors considered the performance information, market commentary, portfolio analysis and portfolio manager presentations they received periodically throughout the year. Generally speaking, while attentive to the short-term performance results because of the trend that such performance might signal, the Directors placed greater weight on longer-term performance. For the reasons summarized above, the Board concluded that, considering the investment performance within the context of its overall determinations regarding the Existing Sub-Advisory Agreements, it was satisfied with the relative investment performance of the Sub-Advised Portfolios.
Management Fees and Other Expenses. The Directors evaluated the reasonableness of the management fees and total expenses paid by the Sub-Advised Portfolios under the Existing Sub-Advisory Agreements. The Directors considered the actual and contractual fees paid by each Sub-Advised Portfolio. The Directors also considered the sub-advisory fees paid by Mason Street Advisors out of its management fee, including a comparison of those fees with fees charged by the respective Sub-Advisers for similarly managed accounts. In considering the level of management fees, the Directors also considered the size of the Sub-Advised Portfolios, expenses assumed by Mason Street Advisors, and the applicable expense limitation and/ or fee waiver arrangements agreed to by Mason Street Advisors with respect to each Sub-Advised Portfolio.
As part of their evaluation, the Directors received and reviewed an independent analysis prepared by Broadridge of comparative expense data for each Sub-Advised Portfolio. Broadridge provided data as of December 31, 2020 comparing each Sub-Advised Portfolio’s net and total expenses with those in a category of funds underlying variable insurance products. Categories were selected by Broadridge based upon having similar investment classifications, objectives, and asset allocations. The Directors considered the comparative data as a guide to help assess the reasonableness of each Sub-Advised Portfolio’s net and total expense ratios. The Directors considered that the Broadridge expense rankings of the Mid Cap Value and Inflation Protection Portfolios sub-advised by American Century, the Domestic Equity Portfolio sub-advised by Delaware, the High Yield Bond Portfolio sub-advised by Federated, the Focused Appreciation Portfolio sub-advised by Loomis Sayles, the Short-Term Bond, Equity Income and Growth Stock Portfolios sub-advised by T. Rowe Price, the Select Bond Portfolio sub-advised by Allspring, the Government Money Market Portfolio sub-advised by BlackRock, and the Long-Term U. S. Government Bond Portfolio sub-advised by PIMCO were in the top Broadridge quartile (meaning lowest net expenses) of their respective categories. The Directors considered that the expense rankings of the Large Company Value Portfolio sub-
285
Table of Contents
Approval and Continuance of Investment Advisory and Sub-Advisory Agreements (unaudited)
advised by American Century, the Small Cap Value Portfolio sub-advised by T. Rowe Price, and the Multi-Sector Bond Portfolio sub-advised by PIMCO were within the second quartile of their respective categories. The Directors also considered that reduced sub-advisory fee schedules would be put into place for: (i) the Focused Appreciation Portfolio in connection with the renewal of the sub-advisory agreement with Loomis Sayles; (ii) the Government Money Market Portfolio in connection with the renewal of the sub-advisory agreement with BlackRock; and (iii) the Short-Term Bond Portfolio in connection with the renewal of the sub-advisory agreement with T. Rowe Price.
Based on their review of the above information and other factors deemed relevant by the Directors, the Board concluded that the management fees and total operating expenses of each of the Sub-Advised Portfolios were reasonable in relation to the nature, scope and quality of services provided and the performance of the Sub-Advised Portfolios over time and the expense limitation and fee waivers that are in place.
Costs and Profitability. The Directors reviewed information provided by Mason Street Advisors regarding the profitability realized by Mason Street Advisors from the Sub-Advised Portfolios. The Directors considered Mason Street Advisors’ fee and expense analysis regarding fees, expenses and profit margins related to the Sub-Advised Portfolios on a per Portfolio basis, and Mason Street Advisors’ allocation methodology with respect to expenses. The profitability information presented for the Directors’ consideration was supplemented by the aforementioned information regarding the expense-based ranking of each Sub-Advised Portfolio within the Portfolio’s respective Broadridge peer group category. The Directors recognized that the sub-advisory fees were the result of arm’s-length negotiations between Mason Street Advisors and such Sub-Advisers. The Directors also recognized that there are limitations inherent in allocating costs and calculating profitability for organizations such as the Sub-Advisers, and that it is difficult to make comparisons of profitability among investment advisers because comparative information is not generally publicly available and, when available, such information may have been developed using a variety of assumptions and other factors. The Directors concluded that they had received sufficient information to evaluate the issues related to costs and profitability.
The Directors considered certain fall-out benefits that may be realized by Mason Street Advisors and its affiliates due to their relationship with the Sub-Advised Portfolios, including the participation of mutual fund families advised by certain Sub-Advisers to the Sub-Advised Portfolios on the brokerage platform maintained by a brokerage affiliate of Mason Street Advisors, the participation of such fund families in mutual fund partner programs offered by such brokerage affiliate, and the payment of fees by the fund families based upon participation on the brokerage platform and the mutual fund partner program maintained by the brokerage affiliate of Mason Street Advisors. The Directors reviewed information concerning certain of the Sub-Advisers’ soft dollar arrangements and any other benefits to the Sub-Advisers arising from their relationships with the Sub-Advised Portfolios. Based on their review, the Board concluded, within the context of their overall determinations regarding the Existing Sub-Advisory Agreements, that they were satisfied that the fees paid by each of the Sub-Advised Portfolios, and the profits realized by Mason Street Advisors and the Sub-Advisers due to their relationship with the Sub-Advised Portfolios, were not excessive.
Economies of Scale. The Directors considered whether each Sub-Advised Portfolio’s expense structure permitted economies of scale to be shared with the Sub-Advised Portfolio’s investors. The Directors considered the breakpoints contained in the advisory fee schedules for the Sub-Advised Portfolios, as applicable, and the extent to which each Sub-Advised Portfolio may benefit from economies of scale through those breakpoints. The Directors took into account the expense limitation arrangements in place for the Mid Cap Value, Large Company Value, Inflation Protection, Domestic Equity, Focused Appreciation, Short-Term Bond, Small Cap Value, Equity Income, Long-Term U.S. Government Bond and Multi-Sector Bond Portfolios, and the fee waiver arrangements in place with respect to the Mid Cap Value, Large Company Value, Inflation Protection, Domestic Equity, High Yield Bond, Focused Appreciation, Short-Term Bond, Small Cap Value, Equity Income, Growth Stock, Select Bond, Long-Term U.S. Government Bond, Multi-Sector Bond, Government Money Market, and Index 500 Stock Portfolios. The Directors also considered the total assets and expense ratio of each Sub-Advised Portfolio. Based on this information, the Board concluded, within the context of its overall determinations regarding the Existing Sub-Advisory Agreements, that each Sub-Advised Portfolio’s fee structure reflected appropriate economies of scale for the benefit of such Portfolio’s investors.
286
Table of Contents
Approval and Continuance of Investment Advisory and Sub-Advisory Agreements (unaudited)
Other Information. The Directors were presented with other information intended to assist them in their consideration of the continuation of the Existing Sub-Advisory Agreements, including information about the services provided by affiliates of Mason Street Advisors to the Sub-Advised Portfolios and information regarding Mason Street Advisors’ and the Sub-Advisers’ brokerage practices and commissions. The Directors took into consideration reports from Mason Street Advisors on its review of the respective compliance programs of the Sub-Advisers, including any recent compliance exceptions noted and the applicable Sub-Adviser’s response. Also considered were key affiliations and business relationships between the Sub-Advisers and their affiliates and Mason Street Advisors’ parent company and affiliates. Their review further included information relating to each Sub-Adviser’s risk management infrastructure, pending or recent litigation or regulatory actions to which an Sub-Adviser or its affiliates may have been a party, and the applicable Sub-Adviser’s responses to those actions. The Directors also considered information regarding each Sub-Adviser’s code of ethics, approach to portfolio manager compensation, succession planning, as well as information supplied by the Sub-Advisers related to their cybersecurity programs and business continuity plans, and other matters they deemed relevant.
Conclusions of the Directors. Based on a consideration of all information deemed relevant in its totality, the Board, including the Independent Directors, and assisted by the advice of legal counsel independent of Mason Street Advisors, in the exercise of their reasonable business judgment concluded that the terms of the Existing Sub-Advisory Agreements were fair and reasonable and approved the continuation of each Agreement for another year as being in the best interests of each Portfolio.
Approval of Sub-Advisory Agreement between Mason Street Advisors and Dodge & Cox
At the August 26, 2021 meeting, the Directors, including the Independent Directors, unanimously approved the Dodge & Cox Sub-Advisory Agreement between Mason Street Advisors and Dodge & Cox relating to the International Equity Portfolio. (The International Equity Portfolio is hereinafter referred to in this section as the “Portfolio.”) The Board’s decision to retain Dodge & Cox as sub-adviser for the Portfolio was reached after extensive research, evaluation and review of numerous candidate firms and their respective organizational structures, investment processes and long-term performance records.
Board Consideration of Alternative Sub-Advisory Candidates and Selection of Northern Trust and BlackRock as New Sub-Advisers
In determining whether to approve the Doge & Cox Sub-Advisory Agreement on behalf of the Portfolio, the Directors requested and received detailed information from Mason Street Advisors and Dodge & Cox to assist them in their evaluation. The Independent Directors also received a memorandum from their counsel advising them of their responsibilities in connection with the approval of the Dodge & Cox Sub-Advisory Agreement, and had an opportunity to review with their counsel the legal standards governing the review of the Dodge & Cox Sub-Advisory Agreement, including how these standards should be applied to the review of information relating to an individual sub-adviser under the Series Fund’s manager of managers structure. In addition, during the course of their deliberations, the Independent Directors had the opportunity to meet privately without representatives of Mason Street Advisors present, and were represented throughout the process by legal counsel to the Independent Directors.
The material factors and conclusions that formed the basis for the Board’s determination to approve the Dodge & Cox Sub-Advisory Agreement include those discussed below. In addition to the information provided to them in anticipation of and at the August 26, 2021 Board meeting, the Directors considered the presentation of Dodge & Cox at a meeting of the Investment Oversight Committee of the Board held on August 25, 2021, and Dodge & Cox’s responses to the Directors’ questions during its presentation session.
The Director’s determination to engage Dodge & Cox as the investment sub-adviser for the Portfolio was the culmination of a process that began several months earlier upon direction from the Board of Directors that Mason Street Advisors begin compiling a list of investment managers as potential candidates to consider as a replacement sub-adviser to the Portfolio. At its June 3, 2021 meeting the Board considered and evaluated a group of sub-advisory candidates which Mason Street Advisors had reviewed and determined were qualified to serve as a sub-advisory investment manager for the Portfolio, along with a detailed presentation reviewing comparative information regarding each of the candidates. Based upon a review
287
Table of Contents
Approval and Continuance of Investment Advisory and Sub-Advisory Agreements (unaudited)
of the list of qualified sub-advisers, the Directors narrowed down the list of candidates to three sub-advisory candidate firms that would receive formal requests for proposals with respect to the Portfolio mandate and would be invited to make presentations to the Board at its August 2021 meeting.
The three final candidates for the Portfolio mandate were reviewed and considered at the Board’s August 26, 2021 meeting. The Directors received a separate presentation provided by representatives from each of the three candidate firms. Extensive background information and assessment data were used to evaluate, compare and contrast the three candidates. The information compiled for purposes of facilitating the Board’s review of the candidates was a combination of assessment data and evaluative reports developed by Mason Street Advisors as well as data provided by the candidates, which was presented in order to permit the Board to effectively conduct its due diligence review of the information and engage in a thorough comparative analysis. Among other factors, the Board considered details of each candidate’s investment performance over multiple time periods, peer group rankings, representative holdings, key points of differentiation and competitive advantages, portfolio characteristics and metrics, mandate assets under management, firm leadership and investment personnel, investment processes and strategies, proposed sub-advisory fees (and the impact of such fees on Mason Street Advisors’ profitability), and other operational and firm-level factors. The Directors considered information provided regarding each candidate’s investment philosophy and portfolio construction process.
Also considered by the Directors were the results of due diligence compliance reviews that had been prepared on the three final sub-advisory candidates. The due diligence reviews were based on the candidates’ responses to informational requests, as well as interviews with compliance and/or legal staff representatives of each candidate. Such reviews included information about each candidate’s compliance program, compliance policies and procedures, brokerage practices, trading policies and procedures, codes of ethics and proxy voting procedures. The Series Fund’s Chief Compliance Officer received compliance-related due diligence materials from the sub-advisory candidates, and provided a report to the Directors at the August 26, 2021 Board meeting. The Directors also had available for consideration each candidate’s responses to the compliance sections of the informational requests, and the candidates’ responses to informational requests related to proxy voting, brokerage and risk management practices.
The Board’s review of the candidates involved assessment of multiple factors which included, without limitation, the following:
Nature, Extent and Quality of Services. The Directors evaluated the nature, scope, extent and quality of services that would be provided to the Portfolio by each of the candidates. The Directors considered the information developed from the extensive process utilized to identify qualified sub-advisers for the Portfolio, as well as the analysis and assessment provided by Mason Street Advisors with respect to the sub-advisory candidates. The Directors’ consideration included information about each candidate’s organization and ownership structure, and the composition of each candidate’s investment management team.
The Directors considered Mason Street Advisors’ assessment of Dodge & Cox, including positive evaluations of its investment performance and investment process. The Directors viewed favorably the experience and talent on the Dodge & Cox investment team and the status of the firm’s succession planning. The Directors considered the benefits of the positive brand recognition of Dodge & Cox, including enhancement of the ability to attract and retain assets.
The Directors considered the investment approaches utilized by each of the sub-advisory candidates. The Directors considered the tenure, experience and performance of the investment management teams for each of the candidates, including particularly the qualifications and experience of the investment personnel who would be providing services to the Portfolio. The Directors took into consideration the general reputation of Dodge & Cox and the strength of its investment-related resources. Based on their review of these factors and other factors deemed relevant, the Board concluded that they were satisfied with the nature, extent and quality of the services to be provided by Dodge & Cox to the Portfolio and the resources to be committed by the firm in providing such services.
Investment Performance. In order to evaluate investment performance, the Directors reviewed the performance record of the three final sub-advisory candidates for a composite of managed accounts with investment objectives, investment policies and strategies similar to the Portfolio (the “composites”). The Directors considered the performance returns of
288
Table of Contents
Approval and Continuance of Investment Advisory and Sub-Advisory Agreements (unaudited)
these composites for both short- and long-term periods. The Directors also considered performance analysis reports which compared multiple metrics for the composites of each candidate. The Directors also evaluated the relative performance of the candidates’ composites versus the appropriate benchmark index performance returns, and considered Morningstar peer group rankings for each of the candidates’ mandates.
The Directors also took into consideration detailed comparative information presented regarding the composites of the candidates, including sector weighting, number of holdings, portfolio turnover, and top ten holdings percentages, as well as attribution information presented regarding the drivers of performance of such composite accounts.
The Directors viewed favorably the strong performance record of Dodge & Cox and the team-based approach employed for the strategy mandate, as well as the depth of the firm’s resources. The Directors were also positively impressed with the thoroughness and repeatability of the investment process utilized by Dodge & Cox.
Based on these and other factors deemed relevant, the Board concluded that they were satisfied with the experience and capabilities of Dodge & Cox, the personnel to be associated with the management of the Portfolio, and the firm’s investment performance record across accounts managed in mandates similar to the Portfolio.
Management Fees and Other Expenses. In evaluating the management fees paid by the Portfolio, the Directors considered the contractual fees paid by the Portfolio under the Advisory Agreement between Mason Street Advisors and the Series Fund. The Directors considered the sub-advisory fees proposed by the three sub-advisory candidates for services to be provided to the Portfolio. In connection with their review of proposed sub-advisory fees, the Directors also considered the proposed allocation between Mason Street Advisors and each sub-advisory candidate of the Portfolio’s investment advisory fee (i.e., the amount of the advisory fee retained by Mason Street Advisors relative to that would be paid to a sub-advisory candidate as a management fee). The Directors considered the existing structure, size, and total operating expenses of the Portfolio. They also considered the advisory fee waiver arrangement that was in place for the Portfolio.
The Directors determined that the fees proposed by Dodge & Cox were the product of an arm’s-length negotiation between Mason Street Advisors and Dodge & Cox and reflected market-based sub-advisory fee rates. Based on their review of the management fees and other expenses, comparative fee data and other factors deemed relevant by the Directors, the Board concluded that the management fees, the sub-advisory fees proposed by Dodge & Cox for the Portfolio, and the total operating expenses of the Portfolio were reasonable in relation to the nature, scope and quality of the services to be provided by Dodge & Cox.
Costs and Profitability. The Directors considered Mason Street Advisors’ pricing methodology for its services as investment adviser for the products of which the Portfolio is an investment option. Mason Street Advisors provided comparative information regarding the proposed sub-advisory fees of the candidates, projections regarding Mason Street Advisors’ advisory fee spread, and an associated profitability analysis. The Directors considered the financial condition of Mason Street Advisors and Mason Street Advisors’ costs and profitability related to the Portfolio in light of the sub-advisory fee negotiated with Dodge & Cox.
The Directors recognized that there are limitations inherent in allocating costs and calculating profitability for an organization such as Mason Street Advisors, and that it is difficult to make comparisons of profitability among investment advisers and clients because comparative information is not generally publicly available and, when available, such information has been developed using a variety of assumptions and other factors. Based on their review of the sub-advisory fee proposed by Dodge & Cox and the associated profitability analysis for the Portfolio, the Board concluded that they were satisfied that Mason Street Advisors’ level of profitability from its relationship with the Portfolio was appropriate and not excessive.
Economies of Scale. The Directors considered whether the Portfolio’s expense structure permitted economies of scale to be shared with investors in the Portfolio. They also took into consideration the total assets and expense ratios of the Portfolio. The Directors considered the breakpoints contained in the management fee schedule applicable to the Portfolio, as well as the breakpoints contained in the sub-advisory fee schedule for the Portfolio proposed by Dodge & Cox, and the extent to
289
Table of Contents
Approval and Continuance of Investment Advisory and Sub-Advisory Agreements (unaudited)
which a Portfolio may benefit from economies of scale through those breakpoints. The Directors also considered the fee waiver agreement in place for the Portfolio. Based on this information, the Board concluded that the fee structure for the Portfolio reflected appropriate economies of scale between the Portfolio and Mason Street Advisors.
Other Information. The Directors were presented with other information intended to assist them in their consideration of the approval of the Dodge & Cox Sub-Advisory Agreement, including information regarding Dodge & Cox’s compliance management structure, any pending or recent litigation or regulatory actions to which Dodge & Cox or its affiliates may have been a party, and responses to those actions. The Directors also received information regarding Dodge & Cox’s cybersecurity program and business continuity plan, as well as information regarding portfolio manager compensation practices as they may apply to those portfolio managers proposed to provide services to the Portfolio.
Conclusions of the Directors. Based on a consideration of all information deemed relevant in its totality, the Board, including the Independent Directors, and assisted by the advice of legal counsel independent of Mason Street Advisors, in the exercise of its business judgment concluded that it was in the best interest of the Portfolio to approve hiring Dodge & Cox as sub-adviser for the Portfolio and entering into the Dodge & Cox Sub-Advisory Agreement between Mason Street Advisors and Dodge & Cox.
Approval of Sub-Advisory Agreement between Mason Street Advisors and T. Rowe Price Investment Management, Inc.
At the December 2, 2021 meeting, the Directors, including the Independent Directors, unanimously and conditionally approved the Investment Sub-Advisory Agreement between Mason Street Advisors and T. Rowe Price Investment Management, Inc. (“TRPIM”) relating to the Small Cap Value Portfolio (the “TRPIM Sub-Advisory Agreement”). (The Small Cap Value Portfolio is hereinafter referred to in this section as the “Portfolio.”) An affiliate of TRPIM’s, T. Rowe Price Associates, Inc. (“TRPA”), currently serves as the sub-adviser to the Portfolio pursuant to the terms of a Fifth Amended and Restated Investment Sub-Advisory Agreement by and between Mason Street Advisors and TRPA dated December 2, 2021 (the “Existing TRPA Agreement”) and TRPA had been providing sub-advisory services to the Portfolio since 2001. Mason Street Advisors had informed the Board that an internal reorganization involving TRPA and TRPIM is planned to occur on March 7, 2022, and that in connection with such reorganization: (i) the TRPA investment team providing sub-advisory services to the Portfolio would be moved to become part of TRPIM; and (ii) advisory services related to the firm’s U.S. Small Cap Value Equity investment strategy would be transferred to and provided by TRPIM (the “Reorganization”).
Board Consideration of TRPIM as New Sub-Adviser
In anticipation of the completion of the Reorganization, the Board considered the conditional approval of a sub-advisory agreement with TRPIM based upon the review of information provided by Mason Street Advisors, TRPA and TRPIM related to the Reorganization.
To facilitate the Board’s review of the Reorganization and the consideration of the TRPIM Sub-Advisory Agreement, Mason Street Advisors provided a detailed synopsis of the investment platform restructuring underlying the Reorganization, including information outlining the goals of the Reorganization. The Board was provided with a report detailing the chief components of the restructuring, including the investment strategies moving to TRPIM, information regarding the executive management and investment leadership personnel to be associated with TRPIM, and the analyst and operational resource support model to be emplyed by TRPIM. Mason Street Advisors explained the rationale supporting the decision to develop the new investment platform, including the need to address investment capacity constraints being experienced by certain of the firm’s investment strategies.
Mason Street Advisors advised the Board that TRPIM, a wholly-owned subsidiary of TRPA, will serve as the investment adviser for T. Rowe Price’s U.S. Small-Cap Value Equity investment strategy, (the strategy utilized by the Portfolio). Mason Street Advisors advised the Board that following completion of the Reorganization, the investment team currently providing sub-advisory services to the Portfolio, including the portfolio manager presently serving the Portfolio, will transfer to TRPIM. The Board considered representations from TRPA that all services currently delivered to the Portfolio, including services
290
Table of Contents
Approval and Continuance of Investment Advisory and Sub-Advisory Agreements (unaudited)
related to the operation of the compliance program, would continue to be delivered without interrruption and without any material changes in resources, staff or service components, and there would be no change in the investment process or strategies currently utilized in managing the Portfolio.
Based upon information presented by Mason Street Advisors and the materials and presentation made by TRPA at the Board meeting, the Board considered the terms of the TRPIM Sub-Advisory Agreement. In addition to the information provided to them in anticipation of and at the December 2, 2021 Board meeting, the Directors considered the presentation of TRPIM at a meeting of the Investment Oversight Committee of the Board held on December 1, 2021, and the firm’s responses to the Directors’ questions during its presentation session.
The material factors and conclusions that formed the basis for the Board’s determination to approve the TRPIM Sub-Advisory Agreement included those referenced above related to the Reorganization as well as those discussed below. The Independent Directors also received a memorandum from their counsel advising them of their responsibilities in connection with the approval of the TRPIM Sub-Advisory Agreement, and had an opportunity to review with their counsel the legal standards governing the review of the TRPIM Sub-Advisory Agreement, including how these standards should be applied to the review of information relating to an individual sub-adviser under the Series Fund’s manager of managers structure. In considering the TRPIM Sub-Advisory Agreement and evaluating and assessing information related thereto, different Directors may have placed greater weight on certain factors than did other Directors.
Nature, Extent and Quality of Services. In determining whether to approve the TRPIM Sub-Advisory Agreement, the Board considered the nature, extent and quality of the services that had been and were currently being provided by TRPA under the Existing TRPA Agreement as well as the services that would continue to be provided by TRPIM under the TRPIM Sub-Advisory Agreement. In particular, the Directors considered TRPA’s representations that, following the Reorganization: (i) the portfolio manager presently serving the Portfolio would transfer to TRPIM and would continue to provide the same nature, extent and quality of service currently provided to the Portfolio; (ii) the portfolio manager would continue to manage the Portfolio’s assets in accordance with the investment objective, investment strategies, and policies that currently apply to the Portfolio; and (iii) the portfolio manager would have a supporting analyst team and the additional resources necessary and adequate to maintain continuity in the quality of the investment management services provided to the Portfolio. Although the Directors noted that TRPIM would not house a mid cap value strategy and that this may negatively impact the small cap value strategy’s ability to evaluate those holdings that had grown substantially in market capitalization, it was also noted that TRPIM will house both a small cap core and mid cap growth strategy and that the necessary expertise would still be available to the small cap value investment team. In addition, the Directors also considered that the portfolio manager for the small cap value strategy (and the Portfolio) advised that he is retaining most of his key analysts in the transition. In approving the TRPIM Sub-Advisory Agreement, the Board also considered its prior conclusions with respect to its approvals of the Existing TRPA Agreement, including the Board’s general satisfaction with the nature, quality and extent of services being provided by TRPA to the Portfolio. In making its most recent approval and continuance of the Existing TRPA Agreement, the Board considered a variety of factors, including for example, the experience and qualifications of the portfolio manager and the supporting investment team, and the Portfolio’s performance. The Board considered the form of the TRPIM Sub-Advisory Agreement and concluded that it substantially conformed, in all material respects, with the form, terms and provisions of the Existing TRPA Agreement. Based on their review of the foregoing factors and other factors deemed relevant, the Board concluded that they were satisfied with the nature, extent and quality of the services to be provided by TRPIM to the Portfolio and the resources to be committed by the firm in providing such services.
Investment Performance. The Directors reviewed the investment performance record of TRPA as sub-adviser to the Portfolio over multiple periods. In addition to considering performance for the Portfolio for both short- and long-term periods, the Directors considered a comparison of the Portfolio’s one-, three-, and five-year performance to the returns of the appropriate index benchmarks and indices, and the performance averages of the Portfolio’s respective Morningstar and Lipper fund group categories for the same periods. The Directors also reviewed the applicable Morningstar and Lipper ratings and rankings for the Portfolio, along with key Portfolio characteristics and metrics. Based on its review of performance returns and related performance factors, the Board concluded that they were satisfied with the investment performance record of the TRPA investment team as it related to the Portfolio.
291
Table of Contents
Approval and Continuance of Investment Advisory and Sub-Advisory Agreements (unaudited)
Management Fees and Expenses and Related Matters. In evaluating the management fees paid by the Portfolio, the Directors considered the contractual fees paid by the Portfolio under the Advisory Agreement between Mason Street Advisors and the Series Fund and the sub-advisory fees proposed to be paid to TRPIM for services to be provided to the Portfolio. The Directors considered that there would be no change in the sub-advisory fees to be paid to TRPIM under the TRPIM Sub-Advisory Agreement and that the fees payable would be identical to those paid under the terms of the Existing TRPA Agreement. The Directors also considered the advisory fee waiver arrangement and expense limitation agreement that were in place for the Portfolio. Based upon the foregoing, the Board concluded that the sub-advisory fees proposed by TRPIM for the Portfolio were reasonable in relation to the nature, scope and quality of the services to be provided by TRPIM.
Costs and Profitability. The Directors considered Mason Street Advisors’ pricing methodology for its services as investment adviser for the products of which the Portfolio is an investment option. Mason Street Advisors provided information regarding the amount of the advisory fee that Mason Street Advisors would retain based upon TRPIM’s sub-advisory fees. The Directors considered that the proposed fees under the TRPIM Sub-Advisory Agreement will remain unchanged from the current Agreement. Based on their review of the sub-advisory fees proposed by TRPIM, the Board concluded that they were satisfied that Mason Street Advisors’ resulting level of profitability related to services provided to the Portfolio was appropriate and not excessive.
Economies of Scale. The Directors considered whether the expense structure for the Portfolio permitted economies of scale to be shared with investors in the Portfolio. They took into consideration the total assets and expense ratio of the Portfolio. The Directors considered the breakpoints contained in the sub-advisory fee schedule proposed by TRPIM for the Portfolio and the extent to which the Portfolio may benefit from economies of scale through those breakpoints. The Directors also considered the fee waiver agreement in place for the Portfolio. Based on this information, the Board concluded that the fee structure for the Portfolio reflected appropriate economies of scale between the Portfolio and Mason Street Advisors.
Other Information. The Directors were presented with other information about the operations and resource structure of TRPIM following the completion of the Reorganization intended to assist them in their consideration of the approval of the TRPIM Sub-Advisory Agreement, including information regarding compliance management structure and resources, information regarding operational matters, including trading capabilities, and information regarding portfolio manager compensation practices for those portfolio managers servicing the Portfolio.
Conclusions of the Directors. Based on a consideration of all information deemed relevant in its totality, the Board, including the Independent Directors, and assisted by the advice of legal counsel independent of Mason Street Advisors, in the exercise of its business judgment concluded that it was in the best interest of the Small Cap Value Portfolio to conditionally approve hiring TRPIM as sub-adviser for the Portfolio and entering into the TRPIM Sub-Advisory Agreement, contingent upon completion of the Reorganization.
292
Table of Contents
(b) Not applicable.
| Item 2. | Code of Ethics |
As of the end of the period covered by this report, the Registrant has adopted a code of ethics that applies to the Registrant’s principal executive officer, principal financial officer and principal accounting officer or controller.
| Item 3. | Audit Committee Financial Expert |
The Registrant’s board of directors has determined that the Registrant has two audit committee financial experts serving on its audit committee. The names of the audit committee financial experts are Gail L. Hanson and William Gerber. Each of the audit committee financial experts is independent.
| Item 4. | Principal Accountant Fees and Services |
(a) Audit Fees | ||||||||
Audit Fees and Expenses of Registrant | 2020 | 2021 | ||||||
| $799,450 | $811,450 | |||||||
(b) Audit Related Fees | ||||||||
Audit-Related Fees and Expenses of Registrant | 2020 | 2021 | ||||||
| $ 0 | $ 0 | |||||||
(c) Tax Fees | 2020 | 2021 | ||||||
| $81,900 | $82,440 | |||||||
Review of dividend declarations | ||||||||
Review of excise tax calculations | ||||||||
Non-U.S. tax compliance | ||||||||
Table of Contents
(d) All Other Fees | 2020 | 2021 | ||
| $ 0 | $ 0 | |||
(e)(1) It is the audit committee’s policy to pre-approve all audit and non-audit service engagements for the Registrant; and any non-audit service engagement of the Registrant’s auditor by (1) the Registrant’s investment adviser and (2) any other entity in a control relationship with the investment adviser that provides ongoing services to the Registrant if, in each of (1) and (2) above, the non-audit service engagement relates directly to the operations and financial reporting of the Registrant. (2) Not applicable.
(f) Not applicable.
| ||||
| (g) Aggregate non-audit fees of Registrant, Registrant’s investment adviser, and related service providers | 2020 | 2021 | ||
| $175,945 | $219,033 | |||
(h) The Registrant’s audit committee has considered whether the auditor’s provision of non-audit services to the Registrant’s investment adviser and related service providers is compatible with the auditor’s independence.
| Item 5. | Audit Committee of Listed Registrants |
Not applicable.
| Item 6. | Investments |
Full Schedule of Investments is included in Item 1.
| Item 7. | Disclosure of Proxy Voting Policies and Procedures for Closed-End Management Investment Companies |
Not applicable.
| Item 8. | Portfolio Managers of Closed-End Management Investment Companies |
Not applicable.
| Item 9. | Purchases of Equity Securities by Closed-End Management Investment Company and Affiliated Purchasers |
Not applicable.
Table of Contents
| Item 10. | Submission of Matters to a Vote of Security Holders |
Not applicable.
| Item 11. | Controls and Procedures |
(a) The Registrant’s Principal Executive Officer and Principal Financial Officer have evaluated the Registrant’s disclosure controls and procedures within 90 days of this filing and have concluded that the Registrant’s disclosure controls and procedures were effective, as of that date, in ensuring that information required to be disclosed by the Registrant in this filing was recorded, processed, summarized, and reported timely.
(b) There was no change in the Registrant’s internal control over financial reporting (as defined in Rule 30a-3(d) under the Investment Company Act of 1940) that occurred during the period covered by this report that has materially affected, or is reasonably likely to materially affect, the Registrant’s internal control over financial reporting.
| Item 12. | Disclosure of Securities Lending Activities for Closed-End Management Investment Companies |
Not applicable.
| Item 13. | Exhibits |
EX-99.CERT.
(a)(3) Not applicable.
(a)(4) Not applicable.
Table of Contents
Pursuant to the requirements of the Securities Exchange Act of 1934 and the Investment Company Act of 1940, the Registrant has duly caused this report to be signed on its behalf by the undersigned, thereunto duly authorized.
| NORTHWESTERN MUTUAL SERIES FUND, INC. | ||
| By: | /s/ Ronald P. Joelson | |
| Ronald P. Joelson, President | ||
| Date: | February 16, 2022 | |
Table of Contents
Pursuant to the requirements of the Securities and Exchange Act of 1934 and the Investment Company Act of 1940, this report has been signed below by the following persons on behalf of the registrant and in the capacities and on the dates indicated.
| By: | /s/ Ronald P. Joelson | |
| Ronald P. Joelson, President | ||
| Date: | February 16, 2022 | |
| By: | /s/ Todd M. Jones | |
| Todd M. Jones, Vice President, | ||
| Chief Financial Officer and Treasurer | ||
| Date: | February 16, 2022 | |