UNITED STATES
SECURITIES AND EXCHANGE COMMISSION
Washington, D.C. 20549
FORM N-CSR/A
CERTIFIED SHAREHOLDER REPORT OF REGISTERED
MANAGEMENT INVESTMENT COMPANIES
Investment Company Act file number 811-3990
Northwestern Mutual Series Fund, Inc.
(Exact name of registrant as specified in charter)
720 East Wisconsin Avenue,
Milwaukee Wisconsin 53202
(Address of principal executive offices) (Zip code)
Phil J. Rinzel, Controller and Chief Accounting Officer Northwestern Mutual Series Fund, Inc.
(Name and address of agent for service)
Registrant’s telephone number, including area code: 414-271-1444
Date of fiscal year end: December 31
Date of reporting period: December 31, 2023
Explanatory Note:
The Registrant is filing this amendment (“Amendment”) to its Form N-CSR for the year ended December 31, 2023, originally filed with the Securities and Exchange Commission on March 4, 2024 (Accession Number 0001193125-24-057220) to amend Item 1, “Reports to Stockholders” for Northwestern Mutual Series Fund, Inc. The sole purpose of this amendment is to replace the Report of Independent Registered Public Accounting Firm set forth on pages 254-255. Items 1 (except as noted above) through 13 (a)(1) of the Registrant’s Form N-CSR originally filed on March 4, 2024 are incorporated herein by reference. Other than the aforementioned, no other information or disclosures contained in the original filing are being amended by this Amendment.
REPORT ON FORM N-CSR
RESPONSES FOR NORTHWESTERN MUTUAL SERIES FUND, INC.
| Item 1. | Reports to Stockholders |
(a) The registrant’s annual report transmitted to shareholders pursuant to Rule 30e-1 under the Investment Company Act of 1940, as amended (the “Investment Company Act”), is as follows:
Annual Report December 31, 2023
Northwestern Mutual Series Fund, Inc.
A Series Fund Offering 27 Portfolios
| | | | |
● Growth Stock Portfolio | | | | ● International Growth Portfolio |
| | |
● Focused Appreciation Portfolio | | | | ● Research International Core Portfolio |
| | |
● Large Cap Core Stock Portfolio | | | | ● International Equity Portfolio |
| | |
● Large Cap Blend Portfolio | | | | ● Emerging Markets Equity Portfolio |
| | |
● Index 500 Stock Portfolio | | | | ● Government Money Market Portfolio |
| | |
● Large Company Value Portfolio | | | | ● Short-Term Bond Portfolio |
| | |
● Domestic Equity Portfolio | | | | ● Select Bond Portfolio |
| | |
● Equity Income Portfolio | | | | ● Long-Term U.S. Government Bond Portfolio |
| | |
● Mid Cap Growth Stock Portfolio | | | | ● Inflation Protection Portfolio |
| | |
● Index 400 Stock Portfolio | | | | ● High Yield Bond Portfolio |
| | |
● Mid Cap Value Portfolio | | | | ● Multi-Sector Bond Portfolio |
| | |
● Small Cap Growth Stock Portfolio | | | | ● Balanced Portfolio |
| | |
● Index 600 Stock Portfolio | | | | ● Asset Allocation Portfolio |
| | |
● Small Cap Value Portfolio | | | | |
As permitted by regulations adopted by the Securities and Exchange Commission, paper copies of the Fund’s shareholder reports are no longer sent by mail unless you specifically request paper copies of the reports from Northwestern Mutual, the issuer of your variable annuity and/or variable life insurance contract. Instead, your Fund annual and semi-annual reports will be made available on a website and you will be notified by mail each time a report is posted and provided with a website link to access the report.
If you already elected to receive shareholder reports electronically, you will not be affected by this change, will continue to receive reports electronically, and you need not take any action. You may elect to receive all future reports in paper free of charge by informing Northwestern Mutual that you wish to continue receiving paper copies of your shareholder reports. Your election to receive reports in paper will apply to all future shareholder reports.
Northwestern Mutual Series Fund, Inc.
Table of Contents
Mason Street Advisors, LLC (“Mason Street Advisors”), adviser to the Northwestern Mutual Series Fund, Inc., is a wholly owned subsidiary of The Northwestern Mutual Life Insurance Company. Mason Street Advisors is the principal investment adviser for all the Portfolios of the Northwestern Mutual Series Fund, Inc., and has engaged and oversees sub-advisers who provide day-to-day management for certain of the Portfolios. Each sub-adviser may be replaced without the approval of shareholders. Please see the Series Fund prospectus for more information.
The views expressed in the portfolio manager commentaries set forth in the following pages reflect those of the portfolio managers only through the end of the period covered by this report and do not necessarily represent the views of any affiliated organization. The views expressed are not guarantees of future performance or economic results and involve certain risks, uncertainties and assumptions that could cause actual outcomes and results to differ materially from the views expressed herein. These views are subject to change at any time based upon market conditions or other events and should not be relied upon as investment advice. Mason Street Advisors disclaims any responsibility to update these views.
Expense Examples (unaudited)
EXAMPLE
As a shareholder of each Portfolio, you incur two types of costs: (1) transaction costs and (2) ongoing costs, including management fees and other Portfolio expenses. This Example is intended to help you understand your ongoing costs (in dollars) of investing in the Portfolios and to compare these costs with the ongoing costs of investing in other mutual funds.
The Example is based on an investment of $1,000 invested at the beginning of the period and held for the entire period (July 1, 2023 to December 31, 2023).
ACTUAL EXPENSES
The first line of the table below provides information about actual account values and actual expenses. You may use the information in this line, together with the amount you invested, to estimate the expenses that you paid over the period. Simply divide your account value by $1,000 (for example, an $8,600 account value divided by $1,000 = 8.6), then multiply the result by the number in the first line under the heading entitled “Expenses Paid During Period” to estimate the expenses you paid on your account during this period.
HYPOTHETICAL EXAMPLE FOR COMPARISON PURPOSES
The second line of the table below for each Portfolio provides information about hypothetical account values and hypothetical expenses based on each Portfolio’s actual expense ratio and an assumed rate of return of 5% per year before expenses, which is not the Portfolio’s actual return. The hypothetical account values and expenses may not be used to estimate the actual ending account balance or expenses you paid for the period. You may use this information to compare the ongoing costs of investing in a Portfolio and other funds. To do so, compare this 5% hypothetical example with the 5% hypothetical examples that appear in the shareholder reports of the other funds.
Please note that the expenses shown in the table are meant to highlight your ongoing costs only and do not reflect any transactional costs or separate account charges. Therefore, the second line of the table is useful in comparing ongoing costs only, and will not help you determine the relative total costs of owning different funds. In addition, if these transactional costs or separate account charges were included, your costs would have been higher.
| | | | | | | | | | | | | | | | |
| | | Beginning Account Value
July 1, 2023 | | | Ending Account Value
December 31, 2023 | | | Expenses Paid During
Period July 1, 2023 to
December 31, 2023* | | | Annualized
Expense Ratio | |
| | | | |
Growth Stock Portfolio | | | | | | | | | | | | | | | | |
Actual | | | $1,000.00 | | | | $1,111.26 | | | | $2.29 | | | | 0.43 | % |
Hypothetical (5% return before expenses) | | | 1,000.00 | | | | 1,023.04 | | | | 2.19 | | | | 0.43 | |
| | | | |
Focused Appreciation Portfolio | | | | | | | | | | | | | | | | |
Actual | | | 1,000.00 | | | | 1,099.05 | | | | 3.28 | | | | 0.62 | |
Hypothetical (5% return before expenses) | | | 1,000.00 | | | | 1,022.08 | | | | 3.16 | | | | 0.62 | |
| | | | |
Large Cap Core Stock Portfolio | | | | | | | | | | | | | | | | |
Actual | | | 1,000.00 | | | | 1,086.76 | | | | 2.31 | | | | 0.44 | |
Hypothetical (5% return before expenses) | | | 1,000.00 | | | | 1,022.99 | | | | 2.24 | | | | 0.44 | |
| | | | |
Large Cap Blend Portfolio | | | | | | | | | | | | | | | | |
Actual | | | 1,000.00 | | | | 1,101.16 | | | | 4.03 | | | | 0.76 | |
Hypothetical (5% return before expenses) | | | 1,000.00 | | | | 1,021.37 | | | | 3.87 | | | | 0.76 | |
| | | | |
Index 500 Stock Portfolio | | | | | | | | | | | | | | | | |
Actual | | | 1,000.00 | | | | 1,079.42 | | | | 1.05 | | | | 0.20 | |
Hypothetical (5% return before expenses) | | | 1,000.00 | | | | 1,024.20 | | | | 1.02 | | | | 0.20 | |
1
Expense Examples (unaudited)
| | | | | | | | | | | | | | | | |
| | | Beginning Account Value
July 1, 2023 | | | Ending Account Value
December 31, 2023 | | | Expenses Paid During
Period July 1, 2023 to
December 31, 2023* | | | Annualized
Expense Ratio | |
| | | | |
Large Company Value Portfolio | | | | | | | | | | | | | | | | |
Actual | | | $1,000.00 | | | | $1,029.07 | | | | $3.89 | | | | 0.76 | % |
Hypothetical (5% return before expenses) | | | 1,000.00 | | | | 1,021.37 | | | | 3.87 | | | | 0.76 | |
| | | | |
Domestic Equity Portfolio | | | | | | | | | | | | | | | | |
Actual | | | 1,000.00 | | | | 1,039.70 | | | | 2.57 | | | | 0.50 | |
Hypothetical (5% return before expenses) | | | 1,000.00 | | | | 1,022.68 | | | | 2.55 | | | | 0.50 | |
| | | | |
Equity Income Portfolio | | | | | | | | | | | | | | | | |
Actual | | | 1,000.00 | | | | 1,070.25 | | | | 2.97 | | | | 0.57 | |
Hypothetical (5% return before expenses) | | | 1,000.00 | | | | 1,022.33 | | | | 2.91 | | | | 0.57 | |
| | | | |
Mid Cap Growth Stock Portfolio | | | | | | | | | | | | | | | | |
Actual | | | 1,000.00 | | | | 1,056.09 | | | | 2.80 | | | | 0.54 | |
Hypothetical (5% return before expenses) | | | 1,000.00 | | | | 1,022.48 | | | | 2.75 | | | | 0.54 | |
| | | | |
Index 400 Stock Portfolio | | | | | | | | | | | | | | | | |
Actual | | | 1,000.00 | | | | 1,068.36 | | | | 1.30 | | | | 0.25 | |
Hypothetical (5% return before expenses) | | | 1,000.00 | | | | 1,023.95 | | | | 1.28 | | | | 0.25 | |
| | | | |
Mid Cap Value Portfolio | | | | | | | | | | | | | | | | |
Actual | | | 1,000.00 | | | | 1,034.24 | | | | 3.69 | | | | 0.72 | |
Hypothetical (5% return before expenses) | | | 1,000.00 | | | | 1,021.58 | | | | 3.67 | | | | 0.72 | |
| | | | |
Small Cap Growth Stock Portfolio | | | | | | | | | | | | | | | | |
Actual | | | 1,000.00 | | | | 1,046.04 | | | | 2.89 | | | | 0.56 | |
Hypothetical (5% return before expenses) | | | 1,000.00 | | | | 1,022.38 | | | | 2.85 | | | | 0.56 | |
| | | | |
Index 600 Stock Portfolio | | | | | | | | | | | | | | | | |
Actual | | | 1,000.00 | | | | 1,093.13 | | | | 1.48 | | | | 0.28 | |
Hypothetical (5% return before expenses) | | | 1,000.00 | | | | 1,023.79 | | | | 1.43 | | | | 0.28 | |
| | | | |
Small Cap Value Portfolio | | | | | | | | | | | | | | | | |
Actual | | | 1,000.00 | | | | 1,096.72 | | | | 4.60 | | | | 0.87 | |
Hypothetical (5% return before expenses) | | | 1,000.00 | | | | 1,020.82 | | | | 4.43 | | | | 0.87 | |
| | | | |
International Growth Portfolio | | | | | | | | | | | | | | | | |
Actual | | | 1,000.00 | | | | 1,051.77 | | | | 3.21 | | | | 0.62 | |
Hypothetical (5% return before expenses) | | | 1,000.00 | | | | 1,022.08 | | | | 3.16 | | | | 0.62 | |
| | | | |
Research International Core Portfolio | | | | | | | | | | | | | | | | |
Actual | | | 1,000.00 | | | | 1,028.13 | | | | 3.83 | | | | 0.75 | |
Hypothetical (5% return before expenses) | | | 1,000.00 | | | | 1,021.42 | | | | 3.82 | | | | 0.75 | |
| | | | |
International Equity Portfolio | | | | | | | | | | | | | | | | |
Actual | | | 1,000.00 | | | | 1,052.70 | | | | 3.52 | | | | 0.68 | |
Hypothetical (5% return before expenses) | | | 1,000.00 | | | | 1,021.78 | | | | 3.47 | | | | 0.68 | |
| | | | |
Emerging Markets Equity Portfolio | | | | | | | | | | | | | | | | |
Actual | | | 1,000.00 | | | | 1,016.77 | | | | 4.63 | | | | 0.91 | |
Hypothetical (5% return before expenses) | | | 1,000.00 | | | | 1,020.62 | | | | 4.63 | | | | 0.91 | |
2
Expense Examples (unaudited)
| | | | | | | | | | | | | | | | |
| | | Beginning Account Value
July 1, 2023 | | | Ending Account Value
December 31, 2023 | | | Expenses Paid During
Period July 1, 2023 to
December 31, 2023* | | | Annualized
Expense Ratio | |
| | | | |
Government Money Market Portfolio | | | | | | | | | | | | | | | | |
Actual | | | $1,000.00 | | | | $1,025.64 | | | | $1.68 | | | | 0.33 | % |
Hypothetical (5% return before expenses) | | | 1,000.00 | | | | 1,023.54 | | | | 1.68 | | | | 0.33 | |
| | | | |
Short-Term Bond Portfolio | | | | | | | | | | | | | | | | |
Actual | | | 1,000.00 | | | | 1,036.90 | | | | 2.00 | | | | 0.39 | |
Hypothetical (5% return before expenses) | | | 1,000.00 | | | | 1,023.24 | | | | 1.99 | | | | 0.39 | |
| | | | |
Select Bond Portfolio | | | | | | | | | | | | | | | | |
Actual | | | 1,000.00 | | | | 1,034.76 | | | | 1.59 | | | | 0.31 | |
Hypothetical (5% return before expenses) | | | 1,000.00 | | | | 1,023.64 | | | | 1.58 | | | | 0.31 | |
| | | | |
Long-Term U.S. Government Bond Portfolio | | | | | | | | | | | | | | | | |
Actual | | | 1,000.00 | | | | 989.13 | | | | 12.08 | | | | 2.41 | |
Hypothetical (5% return before expenses) | | | 1,000.00 | | | | 1,013.06 | | | | 12.23 | | | | 2.41 | |
| | | | |
Inflation Protection Portfolio | | | | | | | | | | | | | | | | |
Actual | | | 1,000.00 | | | | 1,016.68 | | | | 2.54 | | | | 0.50 | |
Hypothetical (5% return before expenses) | | | 1,000.00 | | | | 1,022.68 | | | | 2.55 | | | | 0.50 | |
| | | | |
High Yield Bond Portfolio | | | | | | | | | | | | | | | | |
Actual | | | 1,000.00 | | | | 1,075.79 | | | | 2.35 | | | | 0.45 | |
Hypothetical (5% return before expenses) | | | 1,000.00 | | | | 1,022.94 | | | | 2.29 | | | | 0.45 | |
| | | | |
Multi-Sector Bond Portfolio | | | | | | | | | | | | | | | | |
Actual | | | 1,000.00 | | | | 1,063.23 | | | | 3.85 | | | | 0.74 | |
Hypothetical (5% return before expenses) | | | 1,000.00 | | | | 1,021.48 | | | | 3.77 | | | | 0.74 | |
| | | | |
Balanced Portfolio | | | | | | | | | | | | | | | | |
Actual | | | 1,000.00 | | | | 1,053.98 | | | | 0.31 | | | | 0.06 | |
Hypothetical (5% return before expenses) | | | 1,000.00 | | | | 1,024.90 | | | | 0.31 | | | | 0.06 | |
| | | | |
Asset Allocation Portfolio | | | | | | | | | | | | | | | | |
Actual | | | 1,000.00 | | | | 1,058.41 | | | | 0.52 | | | | 0.10 | |
Hypothetical (5% return before expenses) | | | 1,000.00 | | | | 1,024.70 | | | | 0.51 | | | | 0.10 | |
* Expenses are equal to the Portfolio’s annualized expense ratio, multiplied by the average account value over the period, multiplied by 184/365 (to reflect the one-half year period). Expenses are based on the direct expenses of the Portfolio and do not include the effect of the underlying Portfolios’ expenses which are disclosed in the Fee and Expense table and described more fully in a footnote to that table in the Prospectus.
3
Growth Stock Portfolio (unaudited)
| | | | |
| Objective: | | Portfolio Strategy: | | Net Assets: |
| Long-term growth of capital. Current income is a secondary objective. | | Invest in equity securities of medium and large capitalization companies exhibiting the potential for earnings growth or share price appreciation. | | $1.1 billion |
PORTFOLIO OVERVIEW
Mason Street Advisors, LLC (“Mason Street Advisors”), the investment adviser for the Growth Stock Portfolio (the “Portfolio”), has engaged T. Rowe Price Associates, Inc. (“T. Rowe Price”) to act as sub-adviser for the Portfolio. The Portfolio invests in “blue chip” growth companies, which are companies that are well established in their industries and have the potential for above-average earnings growth. The Portfolio looks for companies with leading market positions, seasoned management and strong financial fundamentals. The Portfolio’s investment approach reflects the belief that solid company fundamentals (with an emphasis on the potential for strong growth in earnings per share or operating cash flow) combined with a positive outlook for a company’s industry will ultimately reward investors with strong investment performance. The Portfolio may look for companies with good prospects for dividend growth.
MARKET OVERVIEW
U.S. equities posted strong gains in 2023, driven by generally favorable corporate earnings, a resilient economy and increased investor interest in artificial intelligence. The market overcame bearish factors such as regional bank turmoil in March; uncertainty about the debt ceiling; geopolitical concerns stemming from the ongoing Russian invasion of Ukraine and from Israel’s response to deadly Hamas attacks in early October; and a sluggish Chinese economic recovery. Arguably, the most significant factor affecting the U.S. economy throughout the year was rising interest rates in response to elevated inflation. The U.S. Federal Reserve (the “Fed”) raised short-term interest rates four times through the end of July, lifting the fed funds target rate to a range of 5.25% – 5.50%. Equities rallied through year-end as Fed officials projected at their mid-December policy meeting that there could be three, quarter-point interest rate cuts in 2024. Generally, growth stocks strongly outperformed value stocks across all market capitalizations, especially among large-capitalization stocks.
PORTFOLIO RESULTS
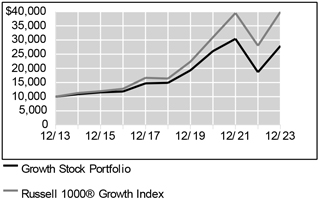
The Portfolio returned 49.69% for the twelve months ended December 31, 2023. By comparison, the Portfolio’s benchmark, the Russell 1000® Growth Index (the “Index”), returned 42.68%. (The Index is unmanaged, cannot be invested in directly and does not incur expenses.)
Overall, security selection and sector allocation contributed to the Portfolio’s relative return for the reporting period. More specifically, an overweight allocation and stock selection in the Communication Services sector contributed to relative performance. Shares of Meta Platforms advanced strongly for the year, driven by the company’s continued focus on cost discipline, a rebound in digital advertising spending and improving monetization trends within short-form videos.
An underweight allocation and favorable stock picks in the Industrials sector also contributed to the Portfolio’s relative return. For this sector, the Portfolio focuses on areas of secular, rather than cyclical, growth. As such, the Portfolio continued to emphasize unique, company-specific opportunities believed to drive meaningful growth regardless of the economic backdrop.
The Information Technology sector also contributed, due to favorable stock choices, although this was partially offset by an underweight allocation to the sector. Shares of NVIDIA Corporation advanced sharply amid expectations of elevated future demand for advanced graphics processing units (“GPUs”) that are critical for the development of artificial intelligence (“AI”) infrastructure.
On the downside, an overweight allocation and stock selection in the Financials sector detracted from the Portfolio’s relative performance. Chubb, a global insurance provider, declined amid an earnings miss driven by losses in its North American agriculture segment due to a drought in corn-producing states.
The Healthcare sector also detracted, driven by an overweight allocation, although this was partially offset by favorable stock selection in the sector. The Portfolio’s overweight allocation to Healthcare emphasized select managed care companies positioned to benefit from industry consolidation and the implementation of cost-effective solutions. Innovative medical device and equipment manufacturers that are focused on meaningfully improving patient outcomes also represented some of the more attractive opportunities in the sector.
4
Growth Stock Portfolio (unaudited)
PORTFOLIO MANAGER OUTLOOK
The following forward-looking comments are the opinion of T. Rowe Price, the Portfolio’s sub-adviser.
Continued trends in disinflation, alongside a handful of benign jobs reports, have increased the likelihood of a soft landing for the economy. The Fed’s pivot to less aggressive actions — and implied rate cut cadence — has encouraged an appetite for risk as the probability of a recession continues to decline. We believe equity returns are likely to be more subdued in 2024; the possibility of future increases will likely hinge on the ability of companies to demonstrate meaningful earnings and free cash flow growth. From a positioning standpoint, we continue to refrain from taking a pronounced stance on macroeconomic implications. Instead, we are aiming for a balanced approach of offensive ideas that can thrive if the economy continues to improve and defensive positions that can provide downside support. Similarly, predicting election outcomes and subsequent market impacts is not an area of focus at this stage. However, as political agendas come into focus and the balance of political power crystalizes, actionable idiosyncratic investment opportunities may present themselves.
Relative Performance
| | | | | | |
Average Annual Total Returns For Periods Ended December 31, 2023 |
| | | 1 Year | | 5 Years | | 10 Years |
Growth Stock Portfolio | | 49.69% | | 13.38% | | 10.82% |
Russell 1000® Growth Index | | 42.68% | | 19.50% | | 14.86% |
The performance data quoted represents past performance. Past performance is historical and does not guarantee future performance. Investment return and principal value will fluctuate, so that shares, when redeemed, may be worth more or less than their original cost. Current performance may be lower or higher than the performance data quoted. For the most recent month-end performance information visit www.northwesternmutual.com.
This chart assumes an initial investment of $10,000 made on 12/31/13. Returns shown reflect fee waivers, deductions for management and other portfolio expenses, and reinvestment of all dividends. In the absence of fee waivers, total return would be reduced. Returns exclude deductions for separate account sale loads and account fees. Please refer to the Benchmark Definitions section of
this report for information about the indices cited in the above chart and graph.
The Portfolio may invest a relatively high percentage of its assets in a particular sector. The Portfolio will have greater exposure to the risks associated with that sector and its performance will be tied more closely to the performance of the sector.
Top 10 Holdings 12/31/23
| | | | | | | | |
| | | | |
| | | Security Description | | % of Net Assets | | | | |
| | | | |
| | | Microsoft Corp. | | 10.2% | | | | |
| | | | |
| | | Amazon.com, Inc. | | 8.7% | | | | |
| | | | |
| | | Apple, Inc. | | 8.6% | | | | |
| | | | |
| | | Alphabet, Inc., Various | | 8.0% | | | | |
| | | | |
| | | NVIDIA Corp. | | 6.8% | | | | |
| | | | |
| | | Meta Platforms, Inc. - Class A | | 5.8% | | | | |
| | | | |
| | | Visa, Inc. - Class A | | 3.5% | | | | |
| | | | |
| | | UnitedHealth Group, Inc. | | 3.5% | | | | |
| | | | |
| | | Eli Lilly & Co. | | 3.2% | | | | |
| | | | |
| | | Mastercard, Inc. - Class A | | 2.8% | | | | |
Sector Allocation 12/31/23
| | | | | | | | |
| | | | |
| | | Sector | | % of Net Assets | | | | |
| | | | |
| | | Information Technology | | 38.3% | | | | |
| | | | |
| | | Communication Services | | 16.7% | | | | |
| | | | |
| | | Consumer Discretionary | | 16.1% | | | | |
| | | | |
| | | Health Care | | 13.4% | | | | |
| | | | |
| | | Financials | | 10.6% | | | | |
| | | | |
| | | Industrials | | 1.6% | | | | |
| | | | |
| | | Consumer Staples | | 1.4% | | | | |
| | | | |
| | | Materials | | 1.0% | | | | |
| | | | |
| | | Utilities | | 0.5% | | | | |
| | | | |
| | | Energy | | 0.3% | | | | |
| | | | |
| | | Short-Term Investments & Other Net Assets | | 0.1% | | | | |
Sector Allocation and Top 10 Holdings are subject to change.
5
Growth Stock Portfolio
SCHEDULE OF INVESTMENTS
December 31, 2023
| | | | | | | | |
Common Stocks (99.9%) | | Shares/ Par + | | | Value $ (000’s) | |
Communication Services (16.7%) | |
Alphabet, Inc. - Class A * | | | 90,053 | | | | 12,579 | |
Alphabet, Inc. - Class C * | | | 518,516 | | | | 73,074 | |
Meta Platforms, Inc. - Class A * | | | 174,711 | | | | 61,841 | |
Netflix, Inc. * | | | 35,155 | | | | 17,116 | |
Sea, Ltd., ADR * | | | 55,676 | | | | 2,255 | |
T-Mobile US, Inc. | | | 73,808 | | | | 11,834 | |
| | | | | | | | |
Total | | | | | | | 178,699 | |
| | | | | | | | |
|
Consumer Discretionary (16.1%) | |
Amazon.com, Inc. * | | | 607,583 | | | | 92,316 | |
Booking Holdings, Inc. * | | | 3,089 | | | | 10,958 | |
Carvana Co. * | | | 55,200 | | | | 2,922 | |
Chipotle Mexican Grill, Inc. * | | | 4,792 | | | | 10,959 | |
DoorDash, Inc. * | | | 31,001 | | | | 3,066 | |
Lululemon Athletica, Inc. * | | | 11,986 | | | | 6,128 | |
NIKE, Inc. - Class B | | | 32,018 | | | | 3,476 | |
Ross Stores, Inc. | | | 53,822 | | | | 7,449 | |
Tesla, Inc. * | | | 115,439 | | | | 28,684 | |
The TJX Cos., Inc. | | | 56,483 | | | | 5,299 | |
| | | | | | | | |
Total | | | | | | | 171,257 | |
| | | | | | | | |
|
Consumer Staples (1.4%) | |
Colgate-Palmolive Co. | | | 33,100 | | | | 2,638 | |
Dollar General Corp. | | | 52,899 | | | | 7,192 | |
Mondelez International, Inc. | | | 41,200 | | | | 2,984 | |
The Procter & Gamble Co. | | | 17,100 | | | | 2,506 | |
| | | | | | | | |
Total | | | | | | | 15,320 | |
| | | | | | | | |
|
Energy (0.3%) | |
Schlumberger, Ltd. | | | 67,000 | | | | 3,487 | |
| | | | | | | | |
Total | | | | | | | 3,487 | |
| | | | | | | | |
|
Financials (10.6%) | |
Adyen NV * | | | 196,321 | | | | 2,529 | |
The Charles Schwab Corp. | | | 62,921 | | | | 4,329 | |
Chubb, Ltd. | | | 52,892 | | | | 11,954 | |
Fiserv, Inc. * | | | 18,694 | | | | 2,483 | |
The Goldman Sachs Group, Inc. | | | 8,554 | | | | 3,300 | |
Marsh & McLennan Cos., Inc. | | | 37,728 | | | | 7,148 | |
Mastercard, Inc. - Class A | | | 70,709 | | | | 30,158 | |
Morgan Stanley | | | 59,165 | | | | 5,517 | |
MSCI, Inc. | | | 2,349 | | | | 1,329 | |
S&P Global, Inc. | | | 14,409 | | | | 6,347 | |
| | | | | | | | |
Common Stocks (99.9%) | | Shares/ Par + | | | Value $ (000’s) | |
Financials continued | |
Visa, Inc. - Class A | | | 143,855 | | | | 37,453 | |
| | | | | | | | |
Total | | | | | | | 112,547 | |
| | | | | | | | |
|
Health Care (13.4%) | |
Align Technology, Inc. * | | | 3,197 | | | | 876 | |
AstraZeneca PLC, ADR | | | 41,203 | | | | 2,775 | |
Danaher Corp. | | | 30,742 | | | | 7,112 | |
Elevance Health, Inc. | | | 10,474 | | | | 4,939 | |
Eli Lilly & Co. | | | 58,677 | | | | 34,204 | |
Humana, Inc. | | | 15,368 | | | | 7,036 | |
Intuitive Surgical, Inc. * | | | 51,501 | | | | 17,374 | |
Stryker Corp. | | | 21,714 | | | | 6,502 | |
Teleflex, Inc. | | | 6,727 | | | | 1,677 | |
Thermo Fisher Scientific, Inc. | | | 25,928 | | | | 13,762 | |
UnitedHealth Group, Inc. | | | 70,989 | | | | 37,374 | |
Veeva Systems, Inc. - Class A * | | | 12,767 | | | | 2,458 | |
Zoetis, Inc. | | | 34,933 | | | | 6,895 | |
| | | | | | | | |
Total | | | | | | | 142,984 | |
| | | | | | | | |
|
Industrials (1.6%) | |
Cintas Corp. | | | 4,012 | | | | 2,418 | |
General Electric Co. | | | 47,734 | | | | 6,092 | |
Old Dominion Freight | | | | | | | | |
Line, Inc. | | | 10,754 | | | | 4,359 | |
TransDigm Group, Inc. | | | 2,931 | | | | 2,965 | |
Veralto Corp. | | | 10,635 | | | | 875 | |
| | | | | | | | |
Total | | | | | | | 16,709 | |
| | | | | | | | |
|
Information Technology (38.3%) | |
Advanced Micro Devices, Inc. * | | | 54,461 | | | | 8,028 | |
Apple, Inc. | | | 474,049 | | | | 91,269 | |
ASML Holding NV | | | 17,837 | | | | 13,501 | |
Atlassian Corp. - Class A * | | | 18,006 | | | | 4,283 | |
Bill.com Holdings, Inc. * | | | 29,951 | | | | 2,444 | |
Confluent, Inc. - Class A * | | | 58,611 | | | | 1,372 | |
CrowdStrike Holdings, Inc. * | | | 10,186 | | | | 2,601 | |
Datadog, Inc. - Class A * | | | 19,624 | | | | 2,382 | |
Fortinet, Inc. * | | | 15,057 | | | | 881 | |
Intuit, Inc. | | | 22,263 | | | | 13,915 | |
Lam Research Corp. | | | 2,513 | | | | 1,968 | |
Microsoft Corp. | | | 290,699 | | | | 109,314 | |
MongoDB, Inc. * | | | 16,589 | | | | 6,782 | |
Monolithic Power Systems, Inc. | | | 11,119 | | | | 7,014 | |
NVIDIA Corp. | | | 147,468 | | | | 73,029 | |
Roper Technologies, Inc. | | | 15,863 | | | | 8,648 | |
| | | | | | | | |
Common Stocks (99.9%) | | Shares/ Par + | | | Value $ (000’s) | |
Information Technology continued | |
ServiceNow, Inc. * | | | 39,609 | | | | 27,983 | |
Shopify, Inc. * | | | 99,202 | | | | 7,728 | |
Snowflake, Inc. * | | | 13,106 | | | | 2,608 | |
Synopsys, Inc. * | | | 27,494 | | | | 14,157 | |
Taiwan Semiconductor Manufacturing Co., Ltd., ADR | | | 38,883 | | | | 4,044 | |
TE Connectivity, Ltd. | | | 14,836 | | | | 2,084 | |
Texas Instruments, Inc. | | | 14,936 | | | | 2,546 | |
| | | | | | | | |
Total | | | | | | | 408,581 | |
| | | | | | | | |
|
Materials (1.0%) | |
Linde PLC | | | 13,332 | | | | 5,476 | |
The Sherwin-Williams Co. | | | 17,269 | | | | 5,386 | |
| | | | | | | | |
Total | | | | | | | 10,862 | |
| | | | | | | | |
|
Utilities (0.5%) | |
Constellation Energy Corp. | | | 46,600 | | | | 5,447 | |
| | | | | | | | |
Total | | | | | | | 5,447 | |
| | | | | | | | |
|
Total Common Stocks | |
(Cost: $645,913) | | | | | | | 1,065,893 | |
| | | | | | | | |
|
Total Investments (99.9%) | |
(Cost: $645,913)@ | | | | | | | 1,065,893 | |
| | | | | | | | |
|
Other Assets, Less | |
Liabilities (0.1%) | | | | | | | 1,210 | |
| | | | | | | | |
| |
Net Assets (100.0%) | | | | 1,067,103 | |
| | | | | | | | |
The Accompanying Notes are an Integral Part of the Financial Statements.
6
Growth Stock Portfolio
| + | All par is stated in U.S. Dollar unless otherwise noted. |
| @ | At December 31, 2023, the aggregate cost of investments, including derivatives, for federal tax purposes (in thousands) was $654,095 and the net unrealized appreciation of investments based on that cost was $411,798 which is comprised of $439,420 aggregate gross unrealized appreciation and $27,622 aggregate gross unrealized depreciation. |
The following is a summary of the inputs used in valuing the Portfolio’s Investments at December 31, 2023. See Note 3 for additional information on portfolio valuation.
| | | | | | | | | | | | | | |
| | | | | Valuation Inputs | |
| Description | | | | Level 1 - Quoted Prices | | | Level 2 - Other Significant Observable Inputs | | | Level 3 - Significant Unobservable Inputs | |
| | | | | (Amounts in thousands) | |
Assets: | | | | | | | | | | | | | | |
Common Stocks | | | | $ | 1,065,893 | | | $ | — | | | $ | — | |
| | | | | | |
Total Assets: | | | | $ | 1,065,893 | | | $ | — | | | $ | — | |
| | | | | | |
The Accompanying Notes are an Integral Part of the Financial Statements.
7
Focused Appreciation Portfolio (unaudited)
| | | | |
| Objective: | | Portfolio Strategy: | | Net Assets: |
| Long-term growth of capital. | | Invest in equity securities selected for their growth potential. | | $1.3 billion |
PORTFOLIO OVERVIEW
Mason Street Advisors, LLC (“Mason Street Advisors”), the investment adviser for the Focused Appreciation Portfolio (the “Portfolio”), has engaged Loomis, Sayles & Company, L.P. (“Loomis Sayles”) to act as sub-adviser for the Portfolio. The Portfolio invests primarily in the equity securities of companies selected for their growth potential. The Portfolio focuses on equity securities of large capitalization companies but may invest in companies of any size. The Portfolio employs a growth style of equity management that emphasizes companies with sustainable competitive advantages, long-term structural growth drivers, profitable cash flow returns, and management teams focused on creating long-term value for shareholders. The Portfolio invests primarily in a core group of 30-40 securities but may exceed this range.
MARKET OVERVIEW
The U.S. equity market overcame several potential headwinds to post a robust total return in 2023. The interest-rate outlook was a key driver of volatility throughout the year, as the U.S Federal Reserve (the “Fed”) continued to raise rates — albeit at a slower pace than in 2022 — to combat inflation. This issue became more prominent in late summer and early autumn, when rising energy prices fueled concerns that persistent inflation could compel the Fed to keep rates higher for longer than anticipated. The backdrop changed considerably in the fourth quarter after a series of lower-than-expected inflation reports. In addition, Fed Chairman Jerome Powell surprised the markets in December by indicating that the central bank was likely finished raising rates and possibly on track to begin enacting rate cuts in 2024. Not least, it appeared that Gross Domestic Product growth would remain in positive territory and potentially allow the Fed to achieve the ideal outcome of a soft landing for the economy. Stocks rose in response, bringing most major large-cap indices to near all-time highs by year-end.
The late rally was broad-based, with strong participation from market segments — including the value style, small-caps and mid-caps — that had underperformed for most of 2023. Despite this shift, growth stocks were the key source of market leadership over the full year. Mega-cap technology-related companies produced particularly large gains that were fueled, in part, by excitement about the long-term prospects for artificial intelligence. On the other hand, the more traditionally defensive segments of the market lagged.
PORTFOLIO RESULTS
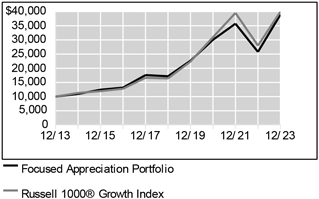
The Portfolio returned 50.99% for the twelve months ended December 31, 2023. By comparison, the Portfolio’s benchmark, the Russell 1000® Growth Index (the “Index”), returned 42.68%. (The Index is unmanaged, cannot be invested in directly and does not incur expenses.)
Stock selection in the Information Technology, Communication Services, Healthcare, Industrials and Consumer Staples sectors, as well as the allocations in the Communication Services and Consumer Staples sectors contributed positively to the Portfolio’s relative performance. Nvidia Corporation, Meta Platforms and Amazon.com were among the top contributors to the Portfolio’s performance.
Stock selection in the Financials and Consumer Discretionary sectors, as well as the allocations in the Information Technology, Financials, Healthcare and Industrials sectors detracted from the Portfolio’s relative performance. Illumina, PayPal Holdings and Deere & Company were among the largest detractors from performance.
During the year, a position was initiated in Thermo Fisher Scientific and existing positions were increased in Amazon. com, Block, Illumina, PayPal Holdings, Tesla and The Walt Disney Company as near-term price weaknesses created more attractive reward-to-risk opportunities. Existing positions were trimmed in Roche Holding and Novartis as well as in Meta Platforms and Nvidia Corporation as they reached the Portfolio’s maximum allowable position size of eight percent.
PORTFOLIO MANAGER OUTLOOK
The following forward-looking comments are the opinion of Loomis Sayles, the Portfolio’s sub-adviser.
We employ a style of equity management that emphasizes companies with sustainable competitive advantages, long-term secular growth drivers, attractive cash flow returns on invested capital and management teams focused on creating long-
8
Focused Appreciation Portfolio (unaudited)
term value for shareholders. We aim to invest in companies when they trade at a significant discount to the estimate of intrinsic value.
Our investment process is characterized by bottom-up fundamental research and a long-term investment time horizon. All aspects of our quality-growth-valuation investment thesis must be present simultaneously for us to make an investment. Often our research is completed well in advance of the opportunity to invest. We are patient investors and maintain coverage of high quality businesses in order to take advantage of meaningful price dislocations if and when they occur. The nature of the process leads to a lower turnover Portfolio where sector positioning is the result of stock selection. As of December 31, 2023, we were overweight in the Communication Services, Financials, Healthcare and Industrials sectors relative to the benchmark. We were underweight in the Information Technology, Consumer Staples and Consumer Discretionary sectors. We held no positions in the Energy, Real Estate, Materials or Utilities sectors.
Relative Performance
| | | | | | |
Average Annual Total Returns For Periods Ended December 31, 2023 |
| | | 1 Year | | 5 Years | | 10 Years |
Focused Appreciation Portfolio | | 50.99% | | 17.78% | | 14.56% |
Russell 1000® Growth Index | | 42.68% | | 19.50% | | 14.86% |
The performance data quoted represents past performance. Past performance is historical and does not guarantee future performance. Investment return and principal value will fluctuate, so that shares, when redeemed, may be worth more or less than their original cost. Current performance may be lower or higher than the performance data quoted. For the most recent month-end performance information visit www.northwesternmutual.com.
This chart assumes an initial investment of $10,000 made on 12/31/13. Returns shown reflect fee waivers, deductions for management and other portfolio expenses, and reinvestment of all dividends. In the absence of fee waivers, total return would be reduced. Returns exclude deductions for separate account sale loads and account fees. Please refer to the Benchmark Definitions section of this report for information about the indices cited in the above chart and graph.
The Portfolio may invest a relatively high percentage of its assets in a particular sector. The Portfolio will have greater exposure to the risks associated with that sector and its performance will be tied more closely to the performance of the sector.
Top 10 Holdings 12/31/23
| | | | | | | | |
| | | | |
| | | Security Description | | % of Net Assets | | | | |
| | | | |
| | | Meta Platforms, Inc. - Class A | | 7.7% | | | | |
| | | | |
| | | NVIDIA Corp. | | 7.5% | | | | |
| | | | |
| | | Alphabet, Inc., Various | | 6.2% | | | | |
| | | | |
| | | The Boeing Co. | | 5.7% | | | | |
| | | | |
| | | Visa, Inc. - Class A | | 5.5% | | | | |
| | | | |
| | | Amazon.com, Inc. | | 5.5% | | | | |
| | | | |
| | | Tesla, Inc. | | 5.2% | | | | |
| | | | |
| | | Microsoft Corp. | | 5.1% | | | | |
| | | | |
| | | Netflix, Inc. | | 4.4% | | | | |
| | | | |
| | | Oracle Corp. | | 4.0% | | | | |
Sector Allocation 12/31/23
| | | | | | | | |
| | | | |
| | | Sector | | % of Net Assets | | | | |
| | | | |
| | | Information Technology | | 28.2% | | | | |
| | | | |
| | | Communication Services | | 21.1% | | | | |
| | | | |
| | | Consumer Discretionary | | 14.8% | | | | |
| | | | |
| | | Health Care | | 13.3% | | | | |
| | | | |
| | | Financials | | 10.5% | | | | |
| | | | |
| | | Industrials | | 7.9% | | | | |
| | | | |
| | | Consumer Staples | | 3.0% | | | | |
| | | | |
| | | Short-Term Investments & Other Net Assets | | 1.2% | | | | |
Sector Allocation and Top 10 Holdings are subject to change.
9
Focused Appreciation Portfolio
SCHEDULE OF INVESTMENTS
December 31, 2023
| | | | | | | | |
Common Stocks
(98.8%) | | Shares/ Par + | | | Value $ (000’s) | |
Communication Services (21.1%) | |
Alphabet, Inc. - Class A * | | | 368,300 | | | | 51,448 | |
Alphabet, Inc. - Class C * | | | 198,351 | | | | 27,953 | |
Meta Platforms, Inc. - Class A * | | | 279,042 | | | | 98,770 | |
Netflix, Inc. * | | | 114,843 | | | | 55,915 | |
The Walt Disney Co. | | | 392,504 | | | | 35,439 | |
| | | | | | | | |
Total | | | | | | | 269,525 | |
| | | | | | | | |
|
Consumer Discretionary (14.8%) | |
Alibaba Group Holding, Ltd., ADR | | | 133,950 | | | | 10,382 | |
Amazon.com, Inc. * | | | 462,936 | | | | 70,338 | |
Starbucks Corp. | | | 228,296 | | | | 21,919 | |
Tesla, Inc. * | | | 268,568 | | | | 66,734 | |
Yum China Holdings, Inc. | | | 130,958 | | | | 5,557 | |
Yum! Brands, Inc. | | | 111,922 | | | | 14,624 | |
| | | | | | | | |
Total | | | | | | | 189,554 | |
| | | | | | | | |
|
Consumer Staples (3.0%) | |
Monster Beverage Corp. * | | | 674,180 | | | | 38,839 | |
| | | | | | | | |
Total | | | | | | | 38,839 | |
| | | | | | | | |
| | | | | | | | |
Common Stocks
(98.8%) | | Shares/ Par + | | | Value $ (000’s) | |
Financials (10.5%) | |
Block, Inc. - Class A * | | | 205,592 | | | | 15,903 | |
FactSet Research | | | | | | | | |
Systems, Inc. | | | 42,612 | | | | 20,328 | |
PayPal Holdings, Inc. * | | | 186,484 | | | | 11,452 | |
SEI Investments Co. | | | 242,734 | | | | 15,426 | |
Visa, Inc. - Class A | | | 271,056 | | | | 70,569 | |
| | | | | | | | |
Total | | | | | | | 133,678 | |
| | | | | | | | |
|
Health Care (13.3%) | |
Illumina, Inc. * | | | 120,171 | | | | 16,733 | |
Intuitive Surgical, Inc. * | | | 49,373 | | | | 16,656 | |
Novartis AG, ADR | | | 161,734 | | | | 16,330 | |
Novo Nordisk A/S, ADR | | | 243,125 | | | | 25,151 | |
Regeneron Pharmaceuticals, Inc. * | | | 31,907 | | | | 28,024 | |
Roche Holding AG, ADR | | | 367,913 | | | | 13,330 | |
Sandoz Group AG * | | | 32,347 | | | | 1,035 | |
Thermo Fisher Scientific, Inc. | | | 33,362 | | | | 17,708 | |
Vertex Pharmaceuticals, Inc. * | | | 85,794 | | | | 34,909 | |
| | | | | | | | |
Total | | | | | | | 169,876 | |
| | | | | | | | |
| | | | | | | | |
Common Stocks
(98.8%) | | Shares/ Par + | | | Value $ (000’s) | |
Industrials (7.9%) | |
The Boeing Co. * | | | 280,216 | | | | 73,041 | |
Deere & Co. | | | 19,943 | | | | 7,975 | |
Expeditors International of Washington, Inc. | | | 161,723 | | | | 20,571 | |
| | | | | | | | |
Total | | | | | | | 101,587 | |
| | | | | | | | |
|
Information Technology (28.2%) | |
Autodesk, Inc. * | | | 163,097 | | | | 39,711 | |
Microsoft Corp. | | | 174,074 | | | | 65,459 | |
NVIDIA Corp. | | | 192,387 | | | | 95,274 | |
Oracle Corp. | | | 490,356 | | | | 51,698 | |
QUALCOMM, Inc. | | | 156,552 | | | | 22,642 | |
Salesforce, Inc. * | | | 163,745 | | | | 43,088 | |
Shopify, Inc. * | | | 340,844 | | | | 26,552 | |
Workday, Inc. - Class A * | | | 56,827 | | | | 15,687 | |
| | | | | | | | |
Total | | | | | | | 360,111 | |
| | | | | | | | |
| |
Total Common Stocks
(Cost: $693,361) | | | | 1,263,170 | |
| | | | | | | | |
| |
Total Investments (98.8%)
(Cost: $693,361)@ | | | | 1,263,170 | |
| | | | | | | | |
| |
Other Assets, Less
Liabilities (1.2%) | | | | 15,949 | |
| | | | | | | | |
| |
Net Assets (100.0%) | | | | 1,279,119 | |
| | | | | | | | |
| + | All par is stated in U.S. Dollar unless otherwise noted. |
| @ | At December 31, 2023, the aggregate cost of investments, including derivatives, for federal tax purposes (in thousands) was $697,751 and the net unrealized appreciation of investments based on that cost was $565,419 which is comprised of $615,616 aggregate gross unrealized appreciation and $50,197 aggregate gross unrealized depreciation. |
The following is a summary of the inputs used in valuing the Portfolio’s Investments at December 31, 2023. See Note 3 for additional information on portfolio valuation.
| | | | | | | | | | | | | | |
| | | | | Valuation Inputs | |
| Description | | | | Level 1 - Quoted
Prices | | | Level 2 - Other
Significant
Observable Inputs | | | Level 3
- Significant
Unobservable
Inputs | |
| | | | | (Amounts in thousands) | |
Assets: | | | | | | | | | | | | | | |
Common Stocks | | | | $ | 1,263,170 | | | $ | — | | | $ | — | |
| | | | | | |
Total Assets: | | | | $ | 1,263,170 | | | $ | — | | | $ | — | |
| | | | | | |
The Accompanying Notes are an Integral Part of the Financial Statements.
10
Large Cap Core Stock Portfolio (unaudited)
| | | | |
| Objective: | | Portfolio Strategy: | | Net Assets: |
| Long-term growth of capital and income. | | Invest primarily in common stocks of large capitalization U.S. companies. | | $669 million |
PORTFOLIO OVERVIEW
Mason Street Advisors, LLC (“Mason Street Advisors”), the investment adviser for the Large Cap Core Stock Portfolio (the “Portfolio”), has engaged Wellington Management Company LLP (“Wellington”) to act as sub-adviser for the Portfolio. The Portfolio allocates its assets across a variety of industries, selecting companies in each industry based on the research of a team of global industry analysts. The Portfolio typically seeks to maintain representation in each major industry represented by broad-based, large cap U.S. equity indices. The Portfolio utilizes a “bottom-up” approach, which is the use of fundamental analysis to identify specific securities for purchase or sale. Fundamental analysis of a company involves the assessment of a variety of factors, including the company’s business environment, management quality, balance sheet, income statement, anticipated earnings, revenues and dividends, and other related measures or indicators of valuation and growth potential. The Portfolio’s sector exposures generally conform with the sector weights present in the Portfolio’s benchmark index.
MARKET OVERVIEW
U.S. equities rose during the twelve months ended December 31, 2023 amid easing inflation, optimism for lower interest rates, strong performances in select mega-capitalization technology companies and steady Gross Domestic Product growth. Early in 2023, the collapse of two U.S. regional banks prompted swift policy actions by federal regulators, which helped stabilize liquidity and stem the potential for broader contagion. The U.S. Federal Reserve (the “Fed”) slowed its pace of policy tightening. Shares of a narrow group of mega-capitalization technology companies surged, helping growth stocks significantly outperform their value counterparts. These companies benefited from investor optimism about earnings potential and growth prospects and exuberance surrounding generative artificial intelligence (“AI”). U.S. equities fell in the third quarter, pressured by rising U.S. Treasury yields amid views that the Fed would keep interest rates elevated for a prolonged period. In the fourth quarter, U.S. equities rallied, registering their largest quarterly return in three years as gains broadened beyond those select mega-capitalization stocks that dominated the stock market’s earlier performance. A rapid descent in inflation prompted the Fed to pivot, with policymakers anticipating 75 bps of interest rate cuts in 2024. Large-capitalization stocks outperformed mid-and small-capitalization stocks.
PORTFOLIO RESULTS
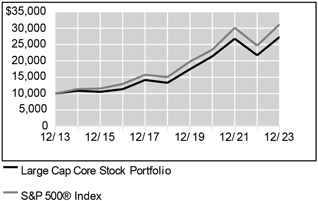
The Portfolio returned 25.78% for the twelve months ended December 31, 2023. By comparison, the S&P 500® Index (the “Index”) returned 26.29% for the year. (The Index is unmanaged, cannot be invested in directly and does not incur expenses.)
An underweight allocation to the Information Technology sector and overweight allocation to the Healthcare sector detracted from the Portfolio’s relative performance, while strong stock selection within the Communication Services, Healthcare and Energy sectors contributed.
Top detractors from the Portfolio’s relative performance included underweight positions in Information Technology sector companies NVIDIA Corporation and Apple. NVIDIA Corporation benefited from strong data center demand and the growing need for chips in AI and language learning models. Apple saw its install base grew to 2 billion devices, supporting share prices. Finally, an underweight position in Consumer Discretionary sector company Tesla also weighed on performance. Shares of Tesla rose over the period after reporting strong financial results in 2022. Investors were optimistic that demand would remain strong and outpace production capacity following vehicle price cuts.
Top contributors to the Portfolio’s relative performance included an overweight position in Communication Services sector company Meta Platforms. Meta Platforms advanced amid strong revenues, an increase to their stock buyback authorization, cost-cutting efforts and a rebound in online advertising. In the Consumer Discretionary sector, an overweight position in Amazon.com contributed as shares benefited as cost cutting measures and advancements in AI boosted investor sentiment. Finally, an out-of-benchmark position in Financials sector company Ares Management contributed, benefiting from healthy results with continued fundraising momentum as underlying demand for the firm’s strategies remained strong.
11
Large Cap Core Stock Portfolio (unaudited)
PORTFOLIO MANAGER OUTLOOK
The following forward-looking comments are the opinion of Wellington, the Portfolio’s sub-adviser.
The final quarter of 2023 was marked by a significant market rally in December, closing out a resilient year for global equity markets. The broad rally underscored the adaptability of global equity markets, even as geopolitical tensions and policy uncertainties posed headwinds.
Inflation remains at the forefront of global economic considerations. As 2023 drew to a close, the market observed indications of inflationary pressures beginning to ease in most of the world, including the U.S. However, officials warn that inflation mitigation is an ongoing process, and premature rate cuts could lead to a trend reversal in 2024. While the recent rally is generally pricing in positivity, we acknowledge monetary policy effects typically are felt with a lag and global growth remains at risk. We will continue to closely track these macroeconomic developments.
Relative Performance
| | | | | | |
Average Annual Total Returns For Periods Ended December 31, 2023 |
| | | 1 Year | | 5 Years | | 10 Years |
Large Cap Core Stock Portfolio | | 25.78% | | 15.50% | | 10.57% |
S&P 500® Index | | 26.29% | | 15.70% | | 12.03% |
The performance data quoted represents past performance. Past performance is historical and does not guarantee future performance. Investment return and principal value will fluctuate, so that shares, when redeemed, may be worth more or less than their original cost. Current performance may be lower or higher than the performance data quoted. For the most recent month-end performance information visit www.northwesternmutual.com.
This chart assumes an initial investment of $10,000 made on 12/31/13. Returns shown reflect fee waivers, deductions for management and other portfolio expenses, and reinvestment of all dividends. In the absence of fee waivers, total return would be reduced. Returns exclude deductions for separate account sale loads and account fees. Please refer to the Benchmark Definitions section of this report for information about the indices cited in the above chart and graph.
The Portfolio may invest a relatively high percentage of its assets in a particular sector. The Portfolio will have greater exposure to the risks associated with that sector and its performance will be tied more closely to the performance of the sector.
Top 10 Holdings 12/31/23
| | | | | | | | |
| | | | |
| | | Security Description | | % of Net Assets | | | | |
| | | | |
| | | Microsoft Corp. | | 8.8% | | | | |
| | | | |
| | | Amazon.com, Inc. | | 5.5% | | | | |
| | | | |
| | | Apple, Inc. | | 5.1% | | | | |
| | | | |
| | | Alphabet, Inc. - Class A | | 3.3% | | | | |
| | | | |
| | | Meta Platforms, Inc. - Class A | | 2.4% | | | | |
| | | | |
| | | Berkshire Hathaway, Inc. - Class B | | 2.2% | | | | |
| | | | |
| | | JPMorgan Chase & Co. | | 2.2% | | | | |
| | | | |
| | | Advanced Micro Devices, Inc. | | 1.7% | | | | |
| | | | |
| | | Adobe, Inc. | | 1.7% | | | | |
| | | | |
| | | Eli Lilly & Co. | | 1.7% | | | | |
Sector Allocation 12/31/23
| | | | | | | | |
| | | | |
| | | Sector | | % of Net Assets | | | | |
| | | | |
| | | Information Technology | | 26.6% | | | | |
| | | | |
| | | Health Care | | 13.8% | | | | |
| | | | |
| | | Financials | | 13.7% | | | | |
| | | | |
| | | Consumer Discretionary | | 10.3% | | | | |
| | | | |
| | | Industrials | | 9.3% | | | | |
| | | | |
| | | Communication Services | | 8.8% | | | | |
| | | | |
| | | Energy | | 5.0% | | | | |
| | | | |
| | | Consumer Staples | | 4.5% | | | | |
| | | | |
| | | Utilities | | 2.6% | | | | |
| | | | |
| | | Materials | | 2.5% | | | | |
| | | | |
| | | Real Estate | | 2.1% | | | | |
| | | | |
| | | Short-Term Investments & Other Net Assets | | 0.7% | | | | |
| | | | |
| | | Investment Companies | | 0.1% | | | | |
Sector Allocation and Top 10 Holdings are subject to change.
12
Large Cap Core Stock Portfolio
SCHEDULE OF INVESTMENTS
December 31, 2023
| | | | | | | | |
Common Stocks (99.2%) | | Shares/ Par + | | | Value
$ (000’s) | |
Communication Services (8.8%) | |
Alphabet, Inc. - Class A * | | | 157,635 | | | | 22,020 | |
Meta Platforms, Inc. -Class A * | | | 45,879 | | | | 16,239 | |
Netflix, Inc. * | | | 10,542 | | | | 5,133 | |
Omnicom Group, Inc. | | | 46,574 | | | | 4,029 | |
Spotify Technology SA * | | | 19,531 | | | | 3,670 | |
T-Mobile US, Inc. | | | 48,561 | | | | 7,786 | |
| | | | | | | | |
Total | | | | | | | 58,877 | |
| | | | | | | | |
|
Consumer Discretionary (10.3%) | |
Amazon.com, Inc. * | | | 241,733 | | | | 36,729 | |
AutoZone, Inc. * | | | 1,909 | | | | 4,936 | |
Chipotle Mexican Grill, Inc. * | | | 2,416 | | | | 5,525 | |
Lennar Corp. - Class A | | | 25,289 | | | | 3,769 | |
Marriott International, Inc. - Class A | | | 15,084 | | | | 3,402 | |
Tesla, Inc. * | | | 12,977 | | | | 3,225 | |
The TJX Cos., Inc. | | | 118,455 | | | | 11,112 | |
| | | | | | | | |
Total | | | | | | | 68,698 | |
| | | | | | | | |
|
Consumer Staples (4.5%) | |
Constellation Brands, Inc. - Class A | | | 25,962 | | | | 6,276 | |
Haleon PLC | | | 558,873 | | | | 4,599 | |
Monster Beverage Corp. * | | | 156,217 | | | | 9,000 | |
Philip Morris International, Inc. | | | 111,860 | | | | 10,524 | |
| | | | | | | | |
Total | | | | | | | 30,399 | |
| | | | | | | | |
|
Energy (5.0%) | |
BP PLC, ADR | | | 228,659 | | | | 8,094 | |
ConocoPhillips | | | 42,300 | | | | 4,910 | |
EOG Resources, Inc. | | | 12,787 | | | | 1,547 | |
EQT Corp. | | | 34,900 | | | | 1,349 | |
Marathon Petroleum Corp. | | | 31,947 | | | | 4,740 | |
Schlumberger, Ltd. | | | 39,434 | | | | 2,052 | |
Shell PLC | | | 129,715 | | | | 8,535 | |
Targa Resources Corp. | | | 23,188 | | | | 2,014 | |
| | | | | | | | |
Total | | | | | | | 33,241 | |
| | | | | | | | |
|
Financials (13.7%) | |
Arch Capital Group, Ltd. * | | | 29,864 | | | | 2,218 | |
Ares Management Corp. - Class A | | | 79,605 | | | | 9,466 | |
Berkshire Hathaway, Inc. - Class B * | | | 41,421 | | | | 14,773 | |
Block, Inc. - Class A * | | | 64,395 | | | | 4,981 | |
Chubb, Ltd. | | | 15,598 | | | | 3,525 | |
Everest Re Group, Ltd. | | | 8,083 | | | | 2,858 | |
| | | | | | | | |
Common Stocks (99.2%) | | Shares/ Par + | | | Value
$ (000’s) | |
Financials continued | |
FLEETCOR Technologies, Inc. * | | | 12,815 | | | | 3,622 | |
Global Payments, Inc. | | | 38,221 | | | | 4,854 | |
Intercontinental Exchange, Inc. | | | 33,202 | | | | 4,264 | |
JPMorgan Chase & Co. | | | 86,319 | | | | 14,683 | |
KKR & Co., Inc. | | | 57,451 | | | | 4,760 | |
Marsh & McLennan Cos., Inc. | | | 12,519 | | | | 2,372 | |
PayPal Holdings, Inc. * | | | 36,888 | | | | 2,265 | |
The Progressive Corp. | | | 26,455 | | | | 4,214 | |
S&P Global, Inc. | | | 18,028 | | | | 7,942 | |
Visa, Inc. - Class A | | | 20,055 | | | | 5,221 | |
| | | | | | | | |
Total | | | | | | | 92,018 | |
| | | | | | | | |
|
Health Care (13.8%) | |
Abbott Laboratories | | | 36,600 | | | | 4,029 | |
AbbVie, Inc. | | | 11,220 | | | | 1,739 | |
Agilent Technologies, Inc. | | | 18,922 | | | | 2,631 | |
Alnylam Pharmaceuticals, Inc. * | | | 3,395 | | | | 650 | |
AmerisourceBergen Corp. | | | 18,228 | | | | 3,744 | |
AstraZeneca PLC, ADR | | | 59,488 | | | | 4,006 | |
Biogen, Inc. * | | | 5,518 | | | | 1,428 | |
Boston Scientific Corp. * | | | 64,551 | | | | 3,732 | |
Centene Corp. * | | | 29,861 | | | | 2,216 | |
Danaher Corp. | | | 23,492 | | | | 5,435 | |
Dexcom, Inc. * | | | 21,756 | | | | 2,700 | |
Edwards Lifesciences Corp. * | | | 36,377 | | | | 2,774 | |
Elevance Health, Inc. | | | 4,918 | | | | 2,319 | |
Eli Lilly & Co. | | | 19,583 | | | | 11,415 | |
Gilead Sciences, Inc. | | | 11,872 | | | | 962 | |
GSK PLC, ADR | | | 49,636 | | | | 1,839 | |
HCA Healthcare, Inc. | | | 10,006 | | | | 2,708 | |
Humana, Inc. | | | 5,937 | | | | 2,718 | |
Illumina, Inc. * | | | 10,195 | | | | 1,420 | |
Insulet Corp. * | | | 8,227 | | | | 1,785 | |
Laboratory Corp. of America Holdings | | | 9,940 | | | | 2,259 | |
Merck & Co., Inc. | | | 66,781 | | | | 7,280 | |
Moderna, Inc. * | | | 2,685 | | | | 267 | |
Molina Healthcare, Inc. * | | | 7,234 | | | | 2,614 | |
Novartis AG, ADR | | | 22,198 | | | | 2,241 | |
Pfizer, Inc. | | | 68,432 | | | | 1,970 | |
Regeneron Pharmaceuticals, Inc. * | | | 1,941 | | | | 1,705 | |
Stryker Corp. | | | 5,513 | | | | 1,651 | |
| | | | | | | | |
Common Stocks (99.2%) | | Shares/ Par + | | | Value
$ (000’s) | |
Health Care continued | |
UnitedHealth Group, Inc. | | | 11,773 | | | | 6,198 | |
Vertex Pharmaceuticals, Inc. * | | | 6,069 | | | | 2,469 | |
Zoetis, Inc. | | | 16,957 | | | | 3,347 | |
| | | | | | | | |
Total | | | | | | | 92,251 | |
| | | | | | | | |
|
Industrials (9.3%) | |
AerCap Holdings NV * | | | 15,271 | | | | 1,135 | |
The Boeing Co. * | | | 10,379 | | | | 2,705 | |
Builders FirstSource, Inc. * | | | 26,236 | | | | 4,380 | |
C.H. Robinson Worldwide, Inc. | | | 89,319 | | | | 7,716 | |
Ceridian HCM Holding, Inc. * | | | 50,869 | | | | 3,414 | |
Deere & Co. | | | 1,323 | | | | 529 | |
Delta Air Lines, Inc. | | | 185,964 | | | | 7,481 | |
Emerson Electric Co. | | | 15,731 | | | | 1,531 | |
Equifax, Inc. | | | 6,662 | | | | 1,647 | |
Fortive Corp. | | | 52,953 | | | | 3,899 | |
General Dynamics Corp. | | | 25,350 | | | | 6,583 | |
Ingersoll-Rand, Inc. | | | 39,898 | | | | 3,086 | |
Johnson Controls International PLC | | | 30,273 | | | | 1,745 | |
Raytheon Technologies Corp. | | | 30,950 | | | | 2,604 | |
Trane Technologies PLC | | | 9,170 | | | | 2,237 | |
Uber Technologies, Inc. * | | | 115,785 | | | | 7,129 | |
Veralto Corp. | | | 7,830 | | | | 644 | |
Waste Connections, Inc. | | | 18,976 | | | | 2,833 | |
Westinghouse Air Brake Technologies Corp. | | | 6,799 | | | | 863 | |
| | | | | | | | |
Total | | | | | | | 62,161 | |
| | | | | | | | |
|
Information Technology (26.6%) | |
Adobe, Inc. * | | | 19,175 | | | | 11,440 | |
Advanced Micro Devices, Inc. * | | | 78,281 | | | | 11,539 | |
Apple, Inc. | | | 177,669 | | | | 34,207 | |
First Solar, Inc. * | | | 6,833 | | | | 1,177 | |
HubSpot, Inc. * | | | 8,706 | | | | 5,054 | |
Intuit, Inc. | | | 16,096 | | | | 10,060 | |
KLA Corp. | | | 9,406 | | | | 5,468 | |
Marvell Technology, Inc. | | | 50,416 | | | | 3,041 | |
Micron Technology, Inc. | | | 54,457 | | | | 4,647 | |
Microsoft Corp. | | | 156,153 | | | | 58,720 | |
NVIDIA Corp. | | | 14,750 | | | | 7,305 | |
The Accompanying Notes are an Integral Part of the Financial Statements.
13
Large Cap Core Stock Portfolio
| | | | | | | | |
Common Stocks (99.2%) | | Shares/ Par + | | | Value $ (000’s) | |
Information Technology continued | |
ON Semiconductor | | | | | | | | |
Corp. * | | | 29,091 | | | | 2,430 | |
ServiceNow, Inc. * | | | 14,099 | | | | 9,961 | |
Synopsys, Inc. * | | | 9,823 | | | | 5,058 | |
Texas Instruments, Inc. | | | 45,321 | | | | 7,725 | |
| | | | | | | | |
Total | | | | | | | 177,832 | |
| | | | | | | | |
|
Materials (2.5%) | |
Ball Corp. | | | 17,875 | | | | 1,028 | |
Celanese Corp. - Class A | | | 23,302 | | | | 3,621 | |
Crown Holdings, Inc. | | | 13,913 | | | | 1,281 | |
FMC Corp. | | | 34,673 | | | | 2,186 | |
Linde PLC | | | 13,257 | | | | 5,445 | |
PPG Industries, Inc. | | | 19,206 | | | | 2,872 | |
| | | | | | | | |
Total | | | | | | | 16,433 | |
| | | | | | | | |
| | | | | | | | |
Common Stocks (99.2%) | | Shares/ Par + | | | Value $ (000’s) | |
Real Estate (2.1%) | |
CBRE Group,
Inc. - Class A * | | | 41,367 | | | | 3,851 | |
CoStar Group, Inc. * | | | 15,751 | | | | 1,376 | |
Extra Space Storage, Inc. | | | 14,349 | | | | 2,301 | |
Prologis, Inc. | | | 27,463 | | | | 3,661 | |
Welltower, Inc. | | | 35,433 | | | | 3,195 | |
| | | | | | | | |
Total | | | | | | | 14,384 | |
| | | | | | | | |
|
Utilities (2.6%) | |
Atmos Energy Corp. | | | 24,393 | | | | 2,827 | |
Edison International | | | 52,872 | | | | 3,780 | |
Exelon Corp. | | | 72,965 | | | | 2,619 | |
NextEra Energy, Inc. | | | 57,813 | | | | 3,512 | |
| | | | | | | | |
Common Stocks (99.2%) | | Shares/ Par + | | | Value $ (000’s) | |
Utilities continued | |
PG&E Corp. | | | 257,784 | | | | 4,648 | |
| | | | | | | | |
Total | | | | | | | 17,386 | |
| | | | | | | | |
| |
Total Common Stocks
(Cost: $523,741) | | | | 663,680 | |
| | | | | | | | |
|
Investment Companies (0.1%) | |
| |
Investment Companies (0.1%) | |
SPDR S&P 500 ETF Trust | | | 1,643 | | | | 781 | |
| | | | | | | | |
Total | | | | | | | 781 | |
| | | | | | | | |
| |
Total Investment Companies
(Cost: $698) | | | | 781 | |
| | | | | | | | |
| |
Total Investments (99.3%)
(Cost: $524,439)@ | | | | 664,461 | |
| | | | | | | | |
| |
Other Assets, Less
Liabilities (0.7%) | | | | 4,435 | |
| | | | | | | | |
| |
Net Assets (100.0%) | | | | 668,896 | |
| | | | | | | | |
| + | All par is stated in U.S. Dollar unless otherwise noted. |
| @ | At December 31, 2023, the aggregate cost of investments, including derivatives, for federal tax purposes (in thousands) was $528,012 and the net unrealized appreciation of investments based on that cost was $136,449 which is comprised of $147,169 aggregate gross unrealized appreciation and $10,720 aggregate gross unrealized depreciation. |
The following is a summary of the inputs used in valuing the Portfolio’s Investments at December 31, 2023. See Note 3 for additional information on portfolio valuation.
| | | | | | | | | | | | | | |
| | | | | Valuation Inputs | |
| Description | | | | Level 1 - Quoted Prices | | | Level 2 - Other Significant Observable Inputs | | | Level 3
- Significant Unobservable Inputs | |
| | | | | (Amounts in thousands) | |
Assets: | | | | | | | | | | | | | | |
Common Stocks | | | | $ | 663,680 | | | $ | — | | | $ | — | |
Investment Companies | | | | | 781 | | | | — | | | | — | |
| | | | | | |
Total Assets: | | | | $ | 664,461 | | | $ | — | | | $ | — | |
| | | | | | |
The Accompanying Notes are an Integral Part of the Financial Statements.
14
Large Cap Blend Portfolio (unaudited)
| | | | |
| Objective: | | Portfolio Strategy: | | Net Assets: |
| Long-term growth of capital and income. | | Invest primarily in equity securities of large-and medium-capitalization U.S. companies listed or traded on U.S. securities exchanges. | | $188 million |
PORTFOLIO OVERVIEW
Mason Street Advisors, LLC (“Mason Street Advisors”), the investment adviser for the Large Cap Blend Portfolio (the “Portfolio”), has engaged J.P. Morgan Investment Management, Inc. (“JP Morgan”) to act as sub-adviser for the Portfolio. JP Morgan was appointed sub-adviser to the Portfolio effective July 31, 2023. Prior to that time, the Portfolio was sub-advised by Fiduciary Management, Inc. (“FMI”). Normally, the Portfolio invests in equity securities of large-and medium-capitalization U.S. companies listed or traded on U.S. securities exchanges. The Portfolio may also invest up to 20% of its net assets in common stocks of foreign issuers, and may hold American Depositary Receipts (ADRs). The Portfolio focuses on those equity securities that it considers attractively valued and seeks to outperform the benchmark through superior stock selection.
MARKET OVERVIEW
The U.S. equity markets ended the year strong despite witnessing the second largest bank failure in the history of the United States. The U.S. Federal Reserve (the “Fed”) hiked the fed funds target rate to 5.25% - 5.50%, the highest level in more than 22 years to curb record high inflation. The Consumer Price Index was at 6.4% in January 2023 and trended downwards to 3.1% in November 2023. Meanwhile, third quarter Gross Domestic Product (GDP) was a bright spot, with GDP rising at 4.9% annualized; the increase was primarily driven by an increase in consumer spending and inventory investment. The labor market experienced some weakness as the unemployment rate went up from 3.4% in January 2023 to 3.7% in November 2023. Business spending held up better than expected despite tighter lending standards, supported by increased spending on intellectual property with greater emphasis on building and integrating artificial intelligence capabilities. Finally, earnings forecasts for 2024 witnessed an uptick towards the end of the year as recession fears subsided.
PORTFOLIO RESULTS
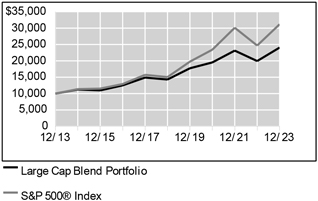
The Portfolio returned 20.61% for the twelve months ended December 31, 2023. By comparison, the Portfolio’s benchmark, the S&P 500® Index (the “Index”) returned 26.29%. (The Index is unmanaged, cannot be invested in directly and does not incur expenses.)
As noted above, prior to July 31, 2023, the Portfolio was managed by FMI. With respect to the period prior to July 31, 2023, relative performance was hindered by sector allocation weakness, mainly due to an underweight in Information Technology stocks, which was the top performing Index group and most heavily weighted group in the Index, followed by an overweight in the Financials sector. Financials sector investments detracted from the Portfolio’s relative performance due to holdings Charles Schwab Corp. and Northern Trust’s hangover from the Silicon Valley Bank crisis.
The following performance attribution comments relate to the period July 31, 2023, through December 31, 2023, during which time JP Morgan acted as the Portfolio’s sub-adviser.
The Portfolio saw relative strength during this period, as stock selection in the Industrials, Financials, and Healthcare sectors helped the most. Alternatively, stock selection within Utilities, Consumer Discretionary and Information Technology detracted the most from performance versus the Index.
At the individual stock level, the top contributors were positions in Progressive Corporation, Eaton Corp., Regeneron Pharmaceuticals, Inc. and Microsoft Corp., while top detractors included NextEra Energy, Inc., Bristol-Myers Squibb Company and an underweight position in Eli Lilly and Company.
PORTFOLIO MANAGER OUTLOOK
The following forward-looking comments are the opinion of JP Morgan, the Portfolio’s sub-adviser.
We continue to focus on fundamentals of the economy and company earnings. Our analysts’ estimates for S&P 500® Index earnings currently project 12% for 2024 and 12% for 2025. While subject to revision, this forecast includes our best analysis of earnings expectations.
15
Large Cap Blend Portfolio (unaudited)
Easing inflation and improved prospects for growth have helped fuel optimism for a soft landing. However, be it the U.S. election, higher policy rates or significant geopolitical tension, risks continue to remain that could push the economy into recession in 2024. Through the volatility, we continue to focus on high conviction stocks and take advantage of market dislocations for compelling stock selection opportunities.
Relative Performance
| | | | | | |
| Average Annual Total Returns |
| For Periods Ended December 31, 2023 |
| | | |
| | | 1 Year | | 5 Years | | 10 Years |
Large Cap Blend Portfolio | | 20.61% | | 10.94% | | 9.17% |
S&P 500® Index | | 26.29% | | 15.70% | | 12.03% |
The performance data quoted represents past performance. Past performance is historical and does not guarantee future performance. Investment return and principal value will fluctuate, so that shares, when redeemed, may be worth more or less than their original cost. Current performance may be lower or higher than the performance data quoted. For the most recent month-end performance information visit www.northwesternmutual.com.
This chart assumes an initial investment of $10,000 made on 12/31/13. Returns shown reflect fee waivers, deductions for management and other portfolio expenses, and reinvestment of all dividends. In the absence of fee waivers, total return would be reduced. Returns exclude deductions for separate account sale loads and account fees. Please refer to the Benchmark Definitions section of this report for information about the indices cited in the above chart and graph.
The Portfolio may invest a relatively high percentage of its assets in a particular sector. The Portfolio will have greater exposure to the risks associated with that sector and its performance will be tied more closely to the performance of the sector.
Top 10 Holdings 12/31/23
| | | | | | | | |
| | | | |
| | | Security Description | | % of Net Assets | | | | |
| | | | |
| | | Microsoft Corp. | | 9.5% | | | | |
| | | | |
| | | Apple, Inc. | | 5.1% | | | | |
| | | | |
| | | Amazon.com, Inc. | | 4.7% | | | | |
| | | | |
| | | NVIDIA Corp. | | 3.4% | | | | |
| | | | |
| | | UnitedHealth Group, Inc. | | 3.2% | | | | |
| | | | |
| | | Alphabet, Inc. - Class A | | 3.1% | | | | |
| | | | |
| | | Meta Platforms, Inc. - Class A | | 2.9% | | | | |
| | | | |
| | | AbbVie, Inc. | | 2.7% | | | | |
| | | | |
| | | Morgan Stanley | | 2.5% | | | | |
| | | | |
| | | NXP Semiconductors NV | | 2.5% | | | | |
Sector Allocation 12/31/23
| | | | | | | | | | |
| | | | |
| | | Sector | | | % of Net Assets | | | | | |
| | | | |
| | | Information Technology | | | 29.7% | | | | | |
| | | | |
| | | Health Care | | | 14.1% | | | | | |
| | | | |
| | | Consumer Discretionary | | | 11.7% | | | | | |
| | | | |
| | | Financials | | | 11.6% | | | | | |
| | | | |
| | | Industrials | | | 11.4% | | | | | |
| | | | |
| | | Communication Services | | | 6.0% | | | | | |
| | | | |
| | | Energy | | | 5.4% | | | | | |
| | | | |
| | | Utilities | | | 4.1% | | | | | |
| | | | |
| | | Materials | | | 2.9% | | | | | |
| | | | |
| | | Real Estate | | | 2.4% | | | | | |
| | | | |
| | | Consumer Staples | | | 2.3% | | | | | |
| | | | |
| | | Short-Term Investments & Other Net Assets | | | -1.6% | | | | | |
Sector Allocation and Top 10 Holdings are subject to change.
16
Large Cap Blend Portfolio
SCHEDULE OF INVESTMENTS
December 31, 2023
| | | | | | | | |
Common Stocks (101.6%) | | Shares/ Par + | | | Value $ (000’s) | |
Communication Services (6.0%) | |
Alphabet, Inc.
- Class A * | | | 41,364 | | | | 5,778 | |
Meta Platforms, Inc.
- Class A * | | | 15,502 | | | | 5,487 | |
| | | | | | | | |
Total | | | | | | | 11,265 | |
| | | | | | | | |
|
Consumer Discretionary (11.7%) | |
Amazon.com, Inc. * | | | 58,025 | | | | 8,816 | |
Lowe’s Companies, Inc. | | | 19,676 | | | | 4,379 | |
Marriott International, Inc. - Class A | | | 5,153 | | | | 1,162 | |
McDonald’s Corp. | | | 15,019 | | | | 4,453 | |
Tesla, Inc. * | | | 5,137 | | | | 1,277 | |
The TJX Cos., Inc. | | | 19,394 | | | | 1,819 | |
| | | | | | | | |
Total | | | | | | | 21,906 | |
| | | | | | | | |
|
Consumer Staples (2.3%) | |
The Coca-Cola Co. | | | 75,131 | | | | 4,427 | |
| | | | | | | | |
Total | | | | | | | 4,427 | |
| | | | | | | | |
|
Energy (5.4%) | |
Baker Hughes | | | 133,848 | | | | 4,575 | |
ConocoPhillips | | | 21,663 | | | | 2,514 | |
Pioneer Natural Resources Co. | | | 13,330 | | | | 2,998 | |
| | | | | | | | |
Total | | | | | | | 10,087 | |
| | | | | | | | |
|
Financials (11.6%) | |
American Express Co. | | | 16,325 | | | | 3,058 | |
Ameriprise Financial, Inc. | | | 7,127 | | | | 2,707 | |
FLEETCOR Technologies, Inc. * | | | 3,221 | | | | 910 | |
Morgan Stanley | | | 51,135 | | | | 4,768 | |
The Progressive Corp. | | | 10,383 | | | | 1,654 | |
S&P Global, Inc. | | | 4,326 | | | | 1,906 | |
U.S. Bancorp | | | 59,138 | | | | 2,560 | |
| | | | | | | | |
Common Stocks (101.6%) | | Shares/ Par + | | | Value $ (000’s) | |
Financials continued | |
Wells Fargo & Co. | | | 86,743 | | | | 4,270 | |
| | | | | | | | |
Total | | | | | | | 21,833 | |
| | | | | | | | |
|
Health Care (14.1%) | |
AbbVie, Inc. | | | 33,186 | | | | 5,143 | |
Biogen, Inc. * | | | 6,144 | | | | 1,590 | |
Bristol-Myers Squibb Co. | | | 46,707 | | | | 2,397 | |
Danaher Corp. | | | 9,528 | | | | 2,204 | |
Eli Lilly & Co. | | | 1,839 | | | | 1,072 | |
Regeneron Pharmaceuticals, Inc. * | | | 4,112 | | | | 3,611 | |
Stryker Corp. | | | 9,285 | | | | 2,780 | |
UnitedHealth Group, Inc. | | | 11,487 | | | | 6,048 | |
Vertex Pharmaceuticals, Inc. * | | | 4,168 | | | | 1,696 | |
| | | | | | | | |
Total | | | | | | | 26,541 | |
| | | | | | | | |
|
Industrials (11.4%) | |
CSX Corp. | | | 53,782 | | | | 1,865 | |
Deere & Co. | | | 11,801 | | | | 4,719 | |
Eaton Corp. PLC | | | 16,014 | | | | 3,856 | |
Howmet Aerospace, Inc. | | | 19,530 | | | | 1,057 | |
Norfolk Southern Corp. | | | 11,838 | | | | 2,798 | |
Northrop Grumman Corp. | | | 7,815 | | | | 3,658 | |
Trane Technologies PLC | | | 8,850 | | | | 2,159 | |
Uber Technologies, Inc. * | | | 22,409 | | | | 1,380 | |
| | | | | | | | |
Total | | | | | | | 21,492 | |
| | | | | | | | |
| | | | | | | | |
Common Stocks (101.6%) | | Shares/ Par + | | | Value $ (000’s) | |
Information Technology (29.7%) | |
Accenture PLC - Class A | | | 7,427 | | | | 2,606 | |
Advanced Micro Devices, Inc. * | | | 17,379 | | | | 2,562 | |
Analog Devices, Inc. | | | 7,131 | | | | 1,416 | |
Apple, Inc. | | | 49,790 | | | | 9,586 | |
ASML Holding NV | | | 1,515 | | | | 1,147 | |
Intuit, Inc. | | | 2,305 | | | | 1,441 | |
Mastercard, Inc. - Class A | | | 9,753 | | | | 4,160 | |
Microsoft Corp. | | | 47,316 | | | | 17,793 | |
NVIDIA Corp. | | | 12,720 | | | | 6,299 | |
NXP Semiconductors NV | | | 20,664 | | | | 4,746 | |
Oracle Corp. | | | 27,354 | | | | 2,884 | |
Seagate Technology Holdings PLC | | | 12,423 | | | | 1,060 | |
| | | | | | | | |
Total | | | | | | | 55,700 | |
| | | | | | | | |
|
Materials (2.9%) | |
Eastman Chemical Co. | | | 11,062 | | | | 994 | |
PPG Industries, Inc. | | | 12,644 | | | | 1,891 | |
Vulcan Materials Co. | | | 11,099 | | | | 2,519 | |
| | | | | | | | |
Total | | | | | | | 5,404 | |
| | | | | | | | |
|
Real Estate (2.4%) | |
Prologis, Inc. | | | 33,811 | | | | 4,507 | |
| | | | | | | | |
Total | | | | | | | 4,507 | |
| | | | | | | | |
|
Utilities (4.1%) | |
NextEra Energy, Inc. | | | 69,037 | | | | 4,193 | |
PG&E Corp. | | | 190,097 | | | | 3,428 | |
| | | | | | | | |
Total | | | | | | | 7,621 | |
| | | | | | | | |
| |
Total Common Stocks
(Cost: $177,089) | | | | 190,783 | |
| | | | | | | | |
| |
Total Investments (101.6%)
(Cost: $177,089)@ | | | | 190,783 | |
| | | | | | | | |
| |
Other Assets, Less
Liabilities (-1.6%) | | | | (3,050 | ) |
| | | | | | | | |
| |
Net Assets (100.0%) | | | | 187,733 | |
| | | | | | | | |
| + | All par is stated in U.S. Dollar unless otherwise noted. |
| @ | At December 31, 2023, the aggregate cost of investments, including derivatives, for federal tax purposes (in thousands) was $177,451 and the net unrealized appreciation of investments based on that cost was $13,332 which is comprised of $16,146 aggregate gross unrealized appreciation and $2,814 aggregate gross unrealized depreciation. |
The Accompanying Notes are an Integral Part of the Financial Statements.
17
Large Cap Blend Portfolio
The following is a summary of the inputs used in valuing the Portfolio’s Investments at December 31, 2023. See Note 3 for additional information on portfolio valuation.
| | | | | | | | | | | | | | |
| | | | | Valuation Inputs | |
| Description | | | | Level 1 - Quoted Prices | | | Level 2 - Other Significant
Observable Inputs | | | Level 3 - Significant Unobservable Inputs | |
| | | | | (Amounts in thousands) | |
Assets: | | | | | | | | | | | | | | |
Common Stocks | | | | $ | 190,783 | | | $ | — | | | $ | — | |
| | | | | | |
Total Assets: | | | | $ | 190,783 | | | $ | — | | | $ | — | |
| | | | | | |
The Accompanying Notes are an Integral Part of the Financial Statements.
18
Index 500 Stock Portfolio (unaudited)
| | | | |
| Objective: | | Portfolio Strategy: | | Net Assets: |
| Investment results that approximate the performance of the S&P 500® Index. | | Invest in stocks that make up the S&P 500® Index, holding each stock in approximately the same proportion as its weighting in the Index. | | $5.5 billion |
PORTFOLIO OVERVIEW
Mason Street Advisors, LLC (“Mason Street Advisors”), the investment adviser for the Index 500 Stock Portfolio (the “Portfolio”), has engaged BlackRock Advisors, LLC (“BlackRock”) to act as sub-advisor for the Portfolio. The Portfolio seeks investment results that approximate the performance of the S&P 500® Index, which is composed of the stocks of primarily large capitalization companies that represent a broad spectrum of the U.S. economy and a substantial part of the U.S. stock market’s total capitalization. The Portfolio attempts to achieve its objective by investing all, or substantially all, of its assets in the stocks that make up the S&P 500® Index, holding each stock in approximately the same proportion as its weighting in the Index. This is known as a full replication strategy. The Portfolio may also invest in S&P 500® Index stock futures to help achieve full replication.
MARKET OVERVIEW
The U.S. equity market climbed a wall of worry in 2023 - stock prices jumped double digits despite a year filled with extraordinary events that had the potential to give any investor pause, including the Silicon Valley Bank crisis, U.S. debt default fears, as well as geopolitical tensions in the Middle East. In the end, investors focused on the U.S.’s resilient economic growth, rapidly declining inflation reports, and the widely held expectation late in the year that the U.S. Federal Reserve would prove successful in soft landing the economy in 2024.
In this environment, large-cap stocks, as represented by the S&P 500® Index, posted a return of 26.29%, outperforming the S&P MidCap 400® and the S&P SmallCap 600® Indices, which returned 16.44% and 16.05%, respectively. Meanwhile, the broader bond market, as represented by the Bloomberg® U.S. Aggregate Index, returned 5.53%, while the Bloomberg® U.S. Corporate High Yield Index returned 13.45%.
PORTFOLIO RESULTS
The Portfolio returned 26.04% for the twelve months ended December 31, 2023. By comparison, the S&P 500® Index (the “Index”) returned 26.29%. (The Index is unmanaged, cannot be invested in directly and does not incur expenses.) Portfolio performance slightly lagged the Index due to transaction costs, administrative expenses, cash flow effects and costs associated with the use of equity index futures contracts.
The Information Technology sector contributed the most to the Portfolio’s return for the reporting period, followed by the Communication Services and Consumer Discretionary sectors. These three sectors benefited from better-than-expected earnings growth, investor enthusiasm for corporate cost-cutting and optimism that artificial intelligence (AI) could lead to strong growth opportunities in technology and technology-related companies.
The Magnificent Seven, a group of large technology companies that includes Apple, Microsoft, Alphabet, Amazon.com, NVIDIA, Meta Platforms and Tesla, generated approximately 62% of the Index’s annual total return.
The Industrials and Financials sectors also contributed to the Portfolio’s return, supported generally by resilient economic growth. The Industrials sector advanced amid steady increases in construction spending, which supported corporate earnings. The Financials sector was buoyed as higher interest rates raised revenues on insurance company holdings and boosted lending revenue for banks.
On the downside, the Consumer Staples, Utilities and Energy sectors detracted from the Portfolio’s return. The Utilities and Consumer Staples sectors are generally seen as more defensive sectors, typically benefiting from lower volatility returns and consistent dividend payments. However, as higher monetary policy rates pushed longer-dated U.S. Treasury yields to 15-year highs, investors favored the higher yields on these government-issued securities. Weakness in the Energy sector was largely due to a decline in oil prices, as global growth slowed, which weighed on energy company earnings. The price of a barrel of West Texas Intermediate (WTI), a benchmark for oil prices, fell over 10% in 2023.
19
Index 500 Stock Portfolio (unaudited)
Relative Performance
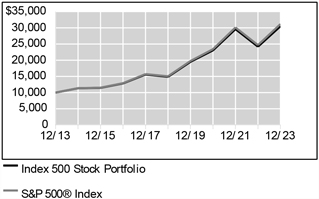
| | | | | | |
Average Annual Total Returns For Periods Ended December 31, 2023 |
| | | 1 Year | | 5 Years | | 10 Years |
Index 500 Stock Portfolio | | 26.04% | | 15.45% | | 11.80% |
S&P 500® Index | | 26.29% | | 15.70% | | 12.03% |
The performance data quoted represents past performance. Past performance is historical and does not guarantee future performance. Investment return and principal value will fluctuate, so that shares, when redeemed, may be worth more or less than their original cost. Current performance may be lower or higher than the performance data quoted. For the most recent month-end performance information visit www.northwesternmutual.com.
This chart assumes an initial investment of $10,000 made on 12/31/13. Returns shown reflect fee waivers, deductions for management and other portfolio expenses, and reinvestment of all dividends. In the absence of fee waivers, total return would be reduced. Returns exclude deductions for separate account sale loads and account fees. Please refer to the Benchmark Definitions section of this report for information about the indices cited in the above chart and graph.
Top 10 Holdings 12/31/23
| | | | | | | | |
| | | | |
| | | Security Description | | % of Net Assets | | | | |
| | | | |
| | | Apple, Inc. | | 7.0% | | | | |
| | | | |
| | | Microsoft Corp. | | 6.9% | | | | |
| | | | |
| | | Alphabet, Inc., Various | | 3.8% | | | | |
| | | | |
| | | Amazon.com, Inc. | | 3.4% | | | | |
| | | | |
| | | NVIDIA Corp. | | 3.0% | | | | |
| | | | |
| | | Meta Platforms, Inc. - Class A | | 1.9% | | | | |
| | | | |
| | | Tesla, Inc. | | 1.7% | | | | |
| | | | |
| | | Berkshire Hathaway, Inc. - Class B | | 1.6% | | | | |
| | | | |
| | | JPMorgan Chase & Co. | | 1.2% | | | | |
| | | | |
| | | Broadcom, Inc. | | 1.2% | | | | |
Sector Allocation 12/31/23
| | | | | | | | |
| | | | |
| | | Sector | | % of Net Assets | | | | |
| | | | |
| | | Information Technology | | 28.6% | | | | |
| | | | |
| | | Financials | | 12.8% | | | | |
| | | | |
| | | Health Care | | 12.5% | | | | |
| | | | |
| | | Consumer Discretionary | | 10.7% | | | | |
| | | | |
| | | Industrials | | 8.7% | | | | |
| | | | |
| | | Communication Services | | 8.5% | | | | |
| | | | |
| | | Consumer Staples | | 6.1% | | | | |
| | | | |
| | | Energy | | 3.8% | | | | |
| | | | |
| | | Real Estate | | 2.5% | | | | |
| | | | |
| | | Materials | | 2.4% | | | | |
| | | | |
| | | Utilities | | 2.3% | | | | |
| | | | |
| | | Short-Term Investments & Other Net Assets | | 1.1% | | | | |
Sector Allocation and Top 10 Holdings are subject to change.
20
Index 500 Stock Portfolio
SCHEDULE OF INVESTMENTS
December 31, 2023
| | | | | | | | |
Common Stocks (98.9%) | | Shares/
Par + | | | Value
$ (000’s) | |
Communication Services (8.5%) | |
Alphabet, Inc. - Class A * | | | 802,189 | | | | 112,058 | |
Alphabet, Inc. - Class C * | | | 675,144 | | | | 95,148 | |
AT&T, Inc. | | | 969,190 | | | | 16,263 | |
Charter Communications, Inc. - Class A * | | | 13,634 | | | | 5,299 | |
Comcast Corp. - Class A | | | 544,322 | | | | 23,868 | |
Electronic Arts, Inc. | | | 33,177 | | | | 4,539 | |
Fox Corp. - Class A | | | 34,594 | | | | 1,026 | |
Fox Corp. - Class B | | | 17,886 | | | | 495 | |
The Interpublic Group of Companies, Inc. | | | 51,916 | | | | 1,695 | |
Live Nation Entertainment, Inc. * | | | 19,386 | | | | 1,815 | |
Match Group, Inc. * | | | 36,844 | | | | 1,345 | |
Meta Platforms, Inc. - Class A * | | | 300,869 | | | | 106,496 | |
Netflix, Inc. * | | | 59,328 | | | | 28,886 | |
News Corp. - Class A | | | 51,547 | | | | 1,265 | |
News Corp. - Class B | | | 16,798 | | | | 432 | |
Omnicom Group, Inc. | | | 27,256 | | | | 2,358 | |
Paramount Global - Class B | | | 65,127 | | | | 963 | |
Take-Two Interactive Software, Inc. * | | | 21,634 | | | | 3,482 | |
T-Mobile US, Inc. | | | 68,975 | | | | 11,059 | |
Verizon Communications, Inc. | | | 569,869 | | | | 21,484 | |
The Walt Disney Co. | | | 248,028 | | | | 22,394 | |
Warner Bros. | | | | | | | | |
Discovery, Inc. * | | | 299,918 | | | | 3,413 | |
| | | | | | | | |
Total | | | | | | | 465,783 | |
| | | | | | | | |
|
Consumer Discretionary (10.7%) | |
Airbnb, Inc. * | | | 58,141 | | | | 7,915 | |
Amazon.com, Inc. * | | | 1,232,691 | | | | 187,295 | |
Aptiv PLC * | | | 36,968 | | | | 3,317 | |
AutoZone, Inc. * | | | 2,390 | | | | 6,180 | |
Bath & Body Works, Inc. | | | 31,151 | | | | 1,344 | |
Best Buy Co., Inc. | | | 26,623 | | | | 2,084 | |
Booking Holdings, Inc. * | | | 4,729 | | | | 16,775 | |
BorgWarner, Inc. | | | 32,487 | | | | 1,165 | |
Caesars Entertainment, Inc. * | | | 28,727 | | | | 1,347 | |
CarMax, Inc. * | | | 21,680 | | | | 1,664 | |
Carnival Corp. * | | | 134,683 | | | | 2,497 | |
Chipotle Mexican Grill, Inc. * | | | 3,720 | | | | 8,507 | |
D.R. Horton, Inc. | | | 40,850 | | | | 6,208 | |
| | | | | | | | |
Common Stocks (98.9%) | | Shares/
Par + | | | Value
$ (000’s) | |
Consumer Discretionary continued | |
Darden Restaurants, Inc. | | | 16,543 | | | | 2,718 | |
Domino’s Pizza, Inc. | | | 4,889 | | | | 2,015 | |
eBay, Inc. | | | 70,351 | | | | 3,069 | |
Etsy, Inc. * | | | 16,232 | | | | 1,316 | |
Expedia Group, Inc. * | | | 18,072 | | | | 2,743 | |
Ford Motor Co. | | | 532,999 | | | | 6,497 | |
Garmin, Ltd. | | | 20,577 | | | | 2,645 | |
General Motors Co. | | | 185,634 | | | | 6,668 | |
Genuine Parts Co. | | | 19,204 | | | | 2,660 | |
Hasbro, Inc. | | | 17,580 | | | | 898 | |
Hilton Worldwide Holdings, Inc. | | | 34,761 | | | | 6,330 | |
The Home Depot, Inc. | | | 135,560 | | | | 46,978 | |
Las Vegas Sands Corp. | | | 45,538 | | | | 2,241 | |
Lennar Corp. - Class A | | | 33,908 | | | | 5,054 | |
LKQ Corp. | | | 35,613 | | | | 1,702 | |
Lowe’s Companies, Inc. | | | 78,228 | | | | 17,410 | |
Lululemon Athletica, Inc. * | | | 15,609 | | | | 7,981 | |
Marriott International, Inc. - Class A | | | 33,440 | | | | 7,541 | |
McDonald’s Corp. | | | 98,321 | | | | 29,153 | |
MGM Resorts International * | | | 38,279 | | | | 1,710 | |
Mohawk Industries, Inc. * | | | 6,980 | | | | 722 | |
NIKE, Inc. - Class B | | | 165,916 | | | | 18,014 | |
Norwegian Cruise Line Holdings, Ltd. * | | | 57,774 | | | | 1,158 | |
NVR, Inc. * | | | 419 | | | | 2,933 | |
O’Reilly Automotive, Inc. * | | | 8,019 | | | | 7,619 | |
Pool Corp. | | | 5,243 | | | | 2,090 | |
PulteGroup, Inc. | | | 29,224 | | | | 3,017 | |
Ralph Lauren Corp. | | | 5,388 | | | | 777 | |
Ross Stores, Inc. | | | 45,902 | | | | 6,352 | |
Royal Caribbean Cruises, Ltd. * | | | 29,997 | | | | 3,884 | |
Starbucks Corp. | | | 154,880 | | | | 14,870 | |
Tapestry, Inc. | | | 31,710 | | | | 1,167 | |
Tesla, Inc. * | | | 374,887 | | | | 93,152 | |
The TJX Cos., Inc. | | | 155,081 | | | | 14,548 | |
Tractor Supply Co. | | | 14,838 | | | | 3,191 | |
Ulta Beauty, Inc. * | | | 6,673 | | | | 3,270 | |
VF Corp. | | | 44,116 | | | | 829 | |
Whirlpool Corp. | | | 7,622 | | | | 928 | |
Wynn Resorts, Ltd. | | | 13,206 | | | | 1,203 | |
Yum! Brands, Inc. | | | 38,315 | | | | 5,006 | |
| | | | | | | | |
Total | | | | | | | 588,357 | |
| | | | | | | | |
| | | | | | | | |
Common Stocks (98.9%) | | Shares/
Par + | | | Value
$ (000’s) | |
Consumer Staples (6.1%) | |
Altria Group, Inc. | | | 239,741 | | | | 9,671 | |
Archer-Daniels-Midland Co. | | | 72,300 | | | | 5,221 | |
Brown-Forman Corp. - Class B | | | 25,179 | | | | 1,438 | |
Bunge Global SA | | | 19,694 | | | | 1,988 | |
Campbell Soup Co. | | | 27,937 | | | | 1,208 | |
Church & Dwight Co., Inc. | | | 33,144 | | | | 3,134 | |
The Clorox Co. | | | 16,949 | | | | 2,417 | |
The Coca-Cola Co. | | | 527,438 | | | | 31,082 | |
Colgate-Palmolive Co. | | | 111,609 | | | | 8,896 | |
Conagra Brands, Inc. | | | 65,083 | | | | 1,865 | |
Constellation Brands, Inc. - Class A | | | 22,058 | | | | 5,333 | |
Costco Wholesale Corp. | | | 60,014 | | | | 39,614 | |
Dollar General Corp. | | | 29,974 | | | | 4,075 | |
Dollar Tree, Inc. * | | | 28,331 | | | | 4,024 | |
The Estee Lauder Cos., Inc. - Class A | | | 31,629 | | | | 4,626 | |
General Mills, Inc. | | | 78,793 | | | | 5,133 | |
The Hershey Co. | | | 20,040 | | | | 3,736 | |
Hormel Foods Corp. | | | 39,922 | | | | 1,282 | |
The J.M. Smucker Co. | | | 13,924 | | | | 1,760 | |
Kellogg Co. | | | 35,160 | | | | 1,966 | |
Kenvue, Inc. | | | 233,621 | | | | 5,030 | |
Keurig Dr. Pepper, Inc. | | | 137,187 | | | | 4,571 | |
Kimberly-Clark Corp. | | | 45,951 | | | | 5,584 | |
The Kraft Heinz Co. | | | 108,684 | | | | 4,019 | |
The Kroger Co. | | | 88,977 | | | | 4,067 | |
Lamb Weston Holdings, Inc. | | | 19,529 | | | | 2,111 | |
McCormick & Co., Inc. | | | 34,058 | | | | 2,330 | |
Molson Coors Beverage Co. - Class B | | | 25,100 | | | | 1,536 | |
Mondelez International, Inc. | | | 184,406 | | | | 13,357 | |
Monster Beverage Corp. * | | | 100,133 | | | | 5,769 | |
PepsiCo, Inc. | | | 186,364 | | | | 31,652 | |
Philip Morris International, Inc. | | | 210,430 | | | | 19,797 | |
The Procter & Gamble Co. | | | 319,478 | | | | 46,816 | |
Sysco Corp. | | | 68,345 | | | | 4,998 | |
Target Corp. | | | 62,571 | | | | 8,911 | |
Tyson Foods, Inc. - Class A | | | 39,540 | | | | 2,125 | |
Walgreens Boots Alliance, Inc. | | | 97,233 | | | | 2,539 | |
Walmart, Inc. | | | 193,367 | | | | 30,484 | |
| | | | | | | | |
Total | | | | | | | 334,165 | |
| | | | | | | | |
The Accompanying Notes are an Integral Part of the Financial Statements.
21
Index 500 Stock Portfolio
| | | | | | | | |
Common Stocks (98.9%) | | Shares/
Par + | | | Value
$ (000’s) | |
Energy (3.8%) | |
APA Corp. | | | 42,216 | | | | 1,515 | |
Baker Hughes | | | 136,396 | | | | 4,662 | |
Chevron Corp. | | | 237,974 | | | | 35,496 | |
ConocoPhillips | | | 160,954 | | | | 18,682 | |
Coterra Energy, Inc. | | | 103,618 | | | | 2,644 | |
Devon Energy Corp. | | | 87,784 | | | | 3,976 | |
Diamondback Energy, Inc. | | | 24,385 | | | | 3,782 | |
EOG Resources, Inc. | | | 79,400 | | | | 9,603 | |
EQT Corp. | | | 49,277 | | | | 1,905 | |
Exxon Mobil Corp. | | | 542,972 | | | | 54,286 | |
Halliburton Co. | | | 121,325 | | | | 4,386 | |
Hess Corp. | | | 37,763 | | | | 5,444 | |
Kinder Morgan, Inc. | | | 264,345 | | | | 4,663 | |
Marathon Oil Corp. | | | 79,331 | | | | 1,917 | |
Marathon Petroleum Corp. | | | 51,468 | | | | 7,636 | |
Occidental Petroleum Corp. | | | 89,501 | | | | 5,344 | |
ONEOK, Inc. | | | 79,277 | | | | 5,567 | |
Phillips 66 | | | 59,636 | | | | 7,940 | |
Pioneer Natural Resources Co. | | | 31,625 | | | | 7,112 | |
Schlumberger, Ltd. | | | 193,801 | | | | 10,085 | |
Targa Resources Corp. | | | 30,225 | | | | 2,626 | |
Valero Energy Corp. | | | 46,149 | | | | 5,999 | |
The Williams Cos., Inc. | | | 165,192 | | | | 5,754 | |
| | | | | | | | |
Total | | | | | | | 211,024 | |
| | | | | | | | |
|
Financials (12.8%) | |
Aflac, Inc. | | | 72,084 | | | | 5,947 | |
The Allstate Corp. | | | 35,472 | | | | 4,965 | |
American Express Co. | | | 78,038 | | | | 14,620 | |
American International Group, Inc. | | | 95,163 | | | | 6,447 | |
Ameriprise Financial, Inc. | | | 13,717 | | | | 5,210 | |
Aon PLC | | | 27,139 | | | | 7,898 | |
Arch Capital Group, Ltd. * | | | 50,394 | | | | 3,743 | |
Arthur J. Gallagher & Co. | | | 28,962 | | | | 6,513 | |
Assurant, Inc. | | | 7,147 | | | | 1,204 | |
Bank of America Corp. | | | 933,259 | | | | 31,423 | |
The Bank of New York Mellon Corp. | | | 104,248 | | | | 5,426 | |
Berkshire Hathaway, Inc. - Class B * | | | 246,627 | | | | 87,962 | |
BlackRock, Inc. | | | 18,955 | | | | 15,388 | |
The Blackstone Group, Inc. | | | 96,785 | | | | 12,671 | |
Brown & Brown, Inc. | | | 31,816 | | | | 2,262 | |
Capital One Financial Corp. | | | 51,624 | | | | 6,769 | |
Cboe Global Markets, Inc. | | | 14,402 | | | | 2,572 | |
The Charles Schwab Corp. | | | 201,728 | | | | 13,879 | |
Chubb, Ltd. | | | 55,303 | | | | 12,499 | |
| | | | | | | | |
Common Stocks (98.9%) | | Shares/
Par + | | | Value
$ (000’s) | |
Financials continued | |
Cincinnati Financial Corp. | | | 21,722 | | | | 2,247 | |
Citigroup, Inc. | | | 259,429 | | | | 13,345 | |
Citizens Financial Group, Inc. | | | 64,405 | | | | 2,134 | |
CME Group, Inc. | | | 49,043 | | | | 10,328 | |
Comerica, Inc. | | | 17,893 | | | | 999 | |
Discover Financial Services | | | 34,084 | | | | 3,831 | |
Everest Re Group, Ltd. | | | 5,448 | | | | 1,926 | |
FactSet Research Systems, Inc. | | | 5,233 | | | | 2,496 | |
Fidelity National Information Services, Inc. | | | 81,045 | | | | 4,868 | |
Fifth Third Bancorp | | | 92,312 | | | | 3,184 | |
Fiserv, Inc. * | | | 81,356 | | | | 10,807 | |
FLEETCOR Technologies, Inc. * | | | 9,787 | | | | 2,766 | |
Franklin Resources, Inc. | | | 37,588 | | | | 1,120 | |
Global Payments, Inc. | | | 35,296 | | | | 4,483 | |
Globe Life, Inc. | | | 11,610 | | | | 1,413 | |
The Goldman Sachs Group, Inc. | | | 44,205 | | | | 17,053 | |
The Hartford Financial Services Group, Inc. | | | 40,770 | | | | 3,277 | |
Huntington Bancshares, Inc. | | | 195,187 | | | | 2,483 | |
Intercontinental Exchange, Inc. | | | 76,199 | | | | 9,786 | |
Invesco, Ltd. | | | 62,069 | | | | 1,107 | |
Jack Henry & Associates, Inc. | | | 9,805 | | | | 1,602 | |
JPMorgan Chase & Co. | | | 391,878 | | | | 66,658 | |
KeyCorp | | | 126,465 | | | | 1,821 | |
Loews Corp. | | | 24,815 | | | | 1,727 | |
M&T Bank Corp. | | | 22,691 | | | | 3,111 | |
MarketAxess Holdings, Inc. | | | 5,237 | | | | 1,534 | |
Marsh & McLennan Cos., Inc. | | | 66,836 | | | | 12,663 | |
Mastercard, Inc. - Class A | | | 112,248 | | | | 47,875 | |
MetLife, Inc. | | | 84,280 | | | | 5,573 | |
Moody’s Corp. | | | 21,333 | | | | 8,332 | |
Morgan Stanley | | | 171,310 | | | | 15,975 | |
MSCI, Inc. | | | 10,785 | | | | 6,101 | |
Nasdaq, Inc. | | | 46,248 | | | | 2,689 | |
Northern Trust Corp. | | | 28,020 | | | | 2,364 | |
PayPal Holdings, Inc. * | | | 146,143 | | | | 8,975 | |
The PNC Financial Services Group, Inc. | | | 53,995 | | | | 8,361 | |
Principal Financial Group, Inc. | | | 29,732 | | | | 2,339 | |
The Progressive Corp. | | | 79,709 | | | | 12,696 | |
Prudential Financial, Inc. | | | 48,934 | | | | 5,075 | |
| | | | | | | | |
Common Stocks (98.9%) | | Shares/
Par + | | | Value
$ (000’s) | |
Financials continued | |
Raymond James Financial, Inc. | | | 25,631 | | | | 2,858 | |
Regions Financial Corp. | | | 127,547 | | | | 2,472 | |
S&P Global, Inc. | | | 43,918 | | | | 19,347 | |
State Street Corp. | | | 41,829 | | | | 3,240 | |
Synchrony Financial | | | 56,091 | | | | 2,142 | |
T. Rowe Price Group, Inc. | | | 30,292 | | | | 3,262 | |
The Travelers Cos., Inc. | | | 31,220 | | | | 5,947 | |
Truist Financial Corp. | | | 180,785 | | | | 6,675 | |
U.S. Bancorp | | | 212,316 | | | | 9,189 | |
Visa, Inc. - Class A | | | 216,068 | | | | 56,253 | |
W.R. Berkley Corp. | | | 28,414 | | | | 2,009 | |
Wells Fargo & Co. | | | 492,271 | | | | 24,230 | |
Willis Towers Watson PLC | | | 13,997 | | | | 3,376 | |
Zions Bancorp NA | | | 20,072 | | | | 881 | |
| | | | | | | | |
Total | | | | | | | 704,403 | |
| | | | | | | | |
|
Health Care (12.5%) | |
Abbott Laboratories | | | 235,229 | | | | 25,892 | |
AbbVie, Inc. | | | 239,320 | | | | 37,087 | |
Agilent Technologies, Inc. | | | 39,660 | | | | 5,514 | |
Align Technology, Inc. * | | | 9,735 | | | | 2,667 | |
AmerisourceBergen Corp. | | | 22,246 | | | | 4,569 | |
Amgen, Inc. | | | 72,544 | | | | 20,894 | |
Baxter International, Inc. | | | 69,248 | | | | 2,677 | |
Becton Dickinson and Co. | | | 38,914 | | | | 9,488 | |
Biogen, Inc. * | | | 19,641 | | | | 5,082 | |
Bio-Rad Laboratories, Inc. - Class A * | | | 2,969 | | | | 959 | |
Bio-Techne Corp. | | | 21,192 | | | | 1,635 | |
Boston Scientific Corp. * | | | 196,747 | | | | 11,374 | |
Bristol-Myers Squibb Co. | | | 275,813 | | | | 14,152 | |
Cardinal Health, Inc. | | | 33,409 | | | | 3,368 | |
Catalent, Inc. * | | | 24,453 | | | | 1,099 | |
Centene Corp. * | | | 72,411 | | | | 5,374 | |
Charles River Laboratories International, Inc. * | | | 6,814 | | | | 1,611 | |
Cigna Corp. | | | 39,665 | | | | 11,878 | |
The Cooper Cos., Inc. | | | 6,765 | | | | 2,560 | |
CVS Health Corp. | | | 174,101 | | | | 13,747 | |
Danaher Corp. | | | 89,144 | | | | 20,623 | |
DaVita, Inc. * | | | 7,599 | | | | 796 | |
DENTSPLY SIRONA, Inc. | | | 30,149 | | | | 1,073 | |
Dexcom, Inc. * | | | 52,373 | | | | 6,499 | |
Edwards Lifesciences Corp. * | | | 82,930 | | | | 6,323 | |
Elevance Health, Inc. | | | 31,849 | | | | 15,019 | |
Eli Lilly & Co. | | | 108,091 | | | | 63,008 | |
The Accompanying Notes are an Integral Part of the Financial Statements.
22
Index 500 Stock Portfolio
| | | | | | | | |
Common Stocks (98.9%) | | Shares/
Par + | | | Value
$ (000’s) | |
Health Care continued | |
GE HealthCare Technologies, Inc. | | | 50,030 | | | | 3,868 | |
Gilead Sciences, Inc. | | | 168,902 | | | | 13,683 | |
HCA Healthcare, Inc. | | | 26,848 | | | | 7,267 | |
Henry Schein, Inc. * | | | 17,921 | | | | 1,357 | |
Hologic, Inc. * | | | 33,202 | | | | 2,372 | |
Humana, Inc. | | | 16,688 | | | | 7,640 | |
IDEXX Laboratories, Inc. * | | | 11,264 | | | | 6,252 | |
Illumina, Inc. * | | | 21,436 | | | | 2,985 | |
Incyte Corp. * | | | 25,678 | | | | 1,612 | |
Insulet Corp. * | | | 9,534 | | | | 2,069 | |
Intuitive Surgical, Inc. * | | | 47,934 | | | | 16,171 | |
IQVIA Holdings, Inc. * | | | 24,972 | | | | 5,778 | |
Johnson & Johnson | | | 326,308 | | | | 51,145 | |
Laboratory Corp. of America Holdings | | | 11,508 | | | | 2,616 | |
McKesson Corp. | | | 18,037 | | | | 8,351 | |
Medtronic PLC | | | 180,355 | | | | 14,858 | |
Merck & Co., Inc. | | | 343,489 | | | | 37,447 | |
Mettler-Toledo International, Inc. * | | | 2,939 | | | | 3,565 | |
Moderna, Inc. * | | | 44,848 | | | | 4,460 | |
Molina Healthcare, Inc. * | | | 7,880 | | | | 2,847 | |
Pfizer, Inc. | | | 765,375 | | | | 22,035 | |
Quest Diagnostics, Inc. | | | 15,323 | | | | 2,113 | |
Regeneron Pharmaceuticals, Inc. * | | | 14,556 | | | | 12,784 | |
ResMed, Inc. | | | 20,038 | | | | 3,447 | |
Revvity, Inc. | | | 16,728 | | | | 1,828 | |
STERIS PLC | | | 13,580 | | | | 2,986 | |
Stryker Corp. | | | 45,831 | | | | 13,724 | |
Teleflex, Inc. | | | 6,424 | | | | 1,602 | |
Thermo Fisher Scientific, Inc. | | | 52,373 | | | | 27,799 | |
UnitedHealth Group, Inc. | | | 125,374 | | | | 66,006 | |
Universal Health Services, Inc. - Class B | | | 8,609 | | | | 1,312 | |
Vertex Pharmaceuticals, Inc. * | | | 34,929 | | | | 14,212 | |
Viatris, Inc. | | | 166,424 | | | | 1,802 | |
Waters Corp. * | | | 8,069 | | | | 2,657 | |
West Pharmaceutical Services, Inc. | | | 10,072 | | | | 3,547 | |
Zimmer Biomet Holdings, Inc. | | | 28,593 | | | | 3,480 | |
Zoetis, Inc. | | | 62,233 | | | | 12,283 | |
| | | | | | | | |
Total | | | | | | | 684,928 | |
| | | | | | | | |
| | |
Industrials (8.7%) | | | | | | | | |
3M Co. | | | 75,538 | | | | 8,258 | |
A.O. Smith Corp. | | | 16,649 | | | | 1,372 | |
Allegion PLC | | | 12,067 | | | | 1,529 | |
American Airlines Group, Inc. * | | | 88,090 | | | | 1,210 | |
| | | | | | | | |
Common Stocks (98.9%) | | Shares/
Par + | | | Value
$ (000’s) | |
Industrials continued | |
AMETEK, Inc. | | | 31,317 | | | | 5,164 | |
Automatic Data Processing, Inc. | | | 55,753 | | | | 12,989 | |
Axon Enterprise, Inc. * | | | 9,316 | | | | 2,407 | |
The Boeing Co. * | | | 77,085 | | | | 20,093 | |
Broadridge Financial Solutions, Inc. | | | 15,949 | | | | 3,281 | |
Builders FirstSource, Inc. * | | | 16,727 | | | | 2,792 | |
C.H. Robinson Worldwide, Inc. | | | 15,929 | | | | 1,376 | |
Carrier Global Corp. | | | 114,205 | | | | 6,561 | |
Caterpillar, Inc. | | | 69,150 | | | | 20,445 | |
Ceridian HCM Holding, Inc. * | | | 20,884 | | | | 1,402 | |
Cintas Corp. | | | 11,856 | | | | 7,145 | |
Copart, Inc. * | | | 116,744 | | | | 5,720 | |
CSX Corp. | | | 267,866 | | | | 9,287 | |
Cummins, Inc. | | | 19,166 | | | | 4,592 | |
Deere & Co. | | | 36,306 | | | | 14,518 | |
Delta Air Lines, Inc. | | | 87,814 | | | | 3,533 | |
Dover Corp. | | | 19,074 | | | | 2,934 | |
Eaton Corp. PLC | | | 54,346 | | | | 13,088 | |
Emerson Electric Co. | | | 77,277 | | | | 7,521 | |
Equifax, Inc. | | | 16,887 | | | | 4,176 | |
Expeditors International of Washington, Inc. | | | 19,708 | | | | 2,507 | |
Fastenal Co. | | | 78,066 | | | | 5,056 | |
FedEx Corp. | | | 31,354 | | | | 7,932 | |
Fortive Corp. | | | 47,637 | | | | 3,507 | |
Generac Holdings, Inc. * | | | 8,613 | | | | 1,113 | |
General Dynamics Corp. | | | 30,684 | | | | 7,968 | |
General Electric Co. | | | 147,531 | | | | 18,829 | |
Honeywell International, Inc. | | | 89,362 | | | | 18,740 | |
Howmet Aerospace, Inc. | | | 51,011 | | | | 2,761 | |
Hubbell, Inc. | | | 7,316 | | | | 2,406 | |
Huntington Ingalls Industries, Inc. | | | 5,379 | | | | 1,397 | |
IDEX Corp. | | | 10,443 | | | | 2,267 | |
Illinois Tool Works, Inc. | | | 37,115 | | | | 9,722 | |
Ingersoll-Rand, Inc. | | | 55,152 | | | | 4,265 | |
J.B. Hunt Transport Services, Inc. | | | 11,133 | | | | 2,224 | |
Jacobs Solutions, Inc. | | | 17,445 | | | | 2,264 | |
Johnson Controls International PLC | | | 91,842 | | | | 5,294 | |
L3Harris Technologies, Inc. | | | 25,854 | | | | 5,445 | |
Leidos Holdings, Inc. | | | 18,535 | | | | 2,006 | |
Lockheed Martin Corp. | | | 29,931 | | | | 13,566 | |
Masco Corp. | | | 30,771 | | | | 2,061 | |
Nordson Corp. | | | 7,294 | | | | 1,927 | |
Norfolk Southern Corp. | | | 30,653 | | | | 7,246 | |
Northrop Grumman Corp. | | | 19,214 | | | | 8,995 | |
| | | | | | | | |
Common Stocks (98.9%) | | Shares/
Par + | | | Value
$ (000’s) | |
Industrials continued | |
Old Dominion Freight Line, Inc. | | | 12,128 | | | | 4,916 | |
Otis Worldwide Corp. | | | 55,475 | | | | 4,963 | |
PACCAR, Inc. | | | 71,355 | | | | 6,968 | |
Parker Hannifin Corp. | | | 17,516 | | | | 8,070 | |
Paychex, Inc. | | | 43,577 | | | | 5,190 | |
Paycom Software, Inc. | | | 6,632 | | | | 1,371 | |
Pentair PLC | | | 22,165 | | | | 1,612 | |
Quanta Services, Inc. | | | 19,515 | | | | 4,211 | |
Raytheon Technologies Corp. | | | 194,909 | | | | 16,400 | |
Republic Services, Inc. | | | 27,722 | | | | 4,572 | |
Robert Half International, Inc. | | | 14,354 | | | | 1,262 | |
Rockwell Automation, Inc. | | | 15,544 | | | | 4,826 | |
Rollins, Inc. | | | 35,876 | | | | 1,567 | |
Snap-on, Inc. | | | 7,239 | | | | 2,091 | |
Southwest Airlines Co. | | | 80,951 | | | | 2,338 | |
Stanley Black & Decker, Inc. | | | 20,474 | | | | 2,008 | |
Textron, Inc. | | | 26,569 | | | | 2,137 | |
Trane Technologies PLC | | | 30,960 | | | | 7,551 | |
TransDigm Group, Inc. | | | 7,525 | | | | 7,612 | |
Uber Technologies, Inc. * | | | 278,944 | | | | 17,175 | |
Union Pacific Corp. | | | 82,631 | | | | 20,296 | |
United Continental Holdings, Inc. * | | | 44,908 | | | | 1,853 | |
United Parcel Service, Inc. - Class B | | | 98,038 | | | | 15,414 | |
United Rentals, Inc. | | | 9,188 | | | | 5,269 | |
Veralto Corp. | | | 29,870 | | | | 2,457 | |
Verisk Analytics, Inc. | | | 19,659 | | | | 4,696 | |
W.W. Grainger, Inc. | | | 5,988 | | | | 4,962 | |
Waste Management, Inc. | | | 49,683 | | | | 8,898 | |
Westinghouse Air Brake Technologies Corp. | | | 24,285 | | | | 3,082 | |
Xylem, Inc. | | | 32,508 | | | | 3,718 | |
| | | | | | | | |
Total | | | | | | | 478,376 | |
| | | | | | | | |
|
Information Technology (28.6%) | |
Accenture PLC - Class A | | | 85,073 | | | | 29,853 | |
Adobe, Inc. * | | | 61,716 | | | | 36,820 | |
Advanced Micro Devices, Inc. * | | | 219,005 | | | | 32,283 | |
Akamai Technologies, Inc. * | | | 20,821 | | | | 2,464 | |
Amphenol Corp. - Class A | | | 81,162 | | | | 8,046 | |
Analog Devices, Inc. | | | 67,547 | | | | 13,412 | |
ANSYS, Inc. * | | | 11,847 | | | | 4,299 | |
Apple, Inc. | | | 1,981,695 | | | | 381,536 | |
Applied Materials, Inc. | | | 113,393 | | | | 18,378 | |
Arista Networks, Inc. * | | | 34,120 | | | | 8,036 | |
Autodesk, Inc. * | | | 28,976 | | | | 7,055 | |
The Accompanying Notes are an Integral Part of the Financial Statements.
23
Index 500 Stock Portfolio
| | | | | | | | |
Common Stocks (98.9%) | | Shares/
Par + | | | Value
$ (000’s) | |
Information Technology continued | |
Broadcom, Inc. | | | 59,499 | | | | 66,416 | |
Cadence Design Systems, Inc. * | | | 36,878 | | | | 10,044 | |
CDW Corp. | | | 18,280 | | | | 4,155 | |
Cisco Systems, Inc. | | | 549,054 | | | | 27,738 | |
Cognizant Technology Solutions Corp. - Class A | | | 67,967 | | | | 5,134 | |
Corning, Inc. | | | 103,095 | | | | 3,139 | |
Enphase Energy, Inc. * | | | 18,483 | | | | 2,442 | |
EPAM Systems, Inc. * | | | 7,827 | | | | 2,327 | |
F5, Inc. * | | | 8,201 | | | | 1,468 | |
Fair Isaac Corp. * | | | 3,350 | | | | 3,899 | |
First Solar, Inc. * | | | 13,619 | | | | 2,346 | |
Fortinet, Inc. * | | | 86,395 | | | | 5,057 | |
Gartner, Inc. * | | | 10,566 | | | | 4,766 | |
Hewlett Packard Enterprise Co. | | | 173,893 | | | | 2,953 | |
HP, Inc. | | | 118,591 | | | | 3,568 | |
Intel Corp. | | | 570,586 | | | | 28,672 | |
International Business Machines Corp. | | | 124,194 | | | | 20,312 | |
Intuit, Inc. | | | 37,989 | | | | 23,744 | |
Jabil, Inc. | | | 17,343 | | | | 2,209 | |
Juniper Networks, Inc. | | | 44,995 | | | | 1,326 | |
Keysight Technologies, Inc. * | | | 24,070 | | | | 3,829 | |
KLA Corp. | | | 18,426 | | | | 10,711 | |
Lam Research Corp. | | | 17,864 | | | | 13,992 | |
Microchip Technology, Inc. | | | 73,339 | | | | 6,614 | |
Micron Technology, Inc. | | | 148,839 | | | | 12,702 | |
Microsoft Corp. | | | 1,007,448 | | | | 378,841 | |
Monolithic Power Systems, Inc. | | | 6,065 | | | | 3,826 | |
Motorola Solutions, Inc. | | | 22,497 | | | | 7,044 | |
NetApp, Inc. | | | 28,302 | | | | 2,495 | |
NortonLifeLock, Inc. | | | 76,734 | | | | 1,751 | |
NVIDIA Corp. | | | 334,810 | | | | 165,805 | |
NXP Semiconductors NV | | | 35,559 | | | | 8,167 | |
ON Semiconductor Corp. * | | | 58,929 | | | | 4,922 | |
Oracle Corp. | | | 214,676 | | | | 22,633 | |
Palo Alto Networks, Inc. * | | | 41,396 | | | | 12,207 | |
PTC, Inc. * | | | 16,108 | | | | 2,818 | |
Qorvo, Inc. * | | | 13,352 | | | | 1,504 | |
QUALCOMM, Inc. | | | 150,868 | | | | 21,820 | |
Roper Technologies, Inc. | | | 14,478 | | | | 7,893 | |
Salesforce, Inc. * | | | 131,891 | | | | 34,706 | |
Seagate Technology Holdings PLC | | | 25,994 | | | | 2,219 | |
ServiceNow, Inc. * | | | 27,871 | | | | 19,691 | |
Skyworks Solutions, Inc. | | | 22,141 | | | | 2,489 | |
Synopsys, Inc. * | | | 20,615 | | | | 10,615 | |
TE Connectivity, Ltd. | | | 42,126 | | | | 5,919 | |
| | | | | | | | |
Common Stocks (98.9%) | | Shares/
Par + | | | Value
$ (000’s) | |
Information Technology continued | |
Teledyne Technologies, Inc. * | | | 6,386 | | | | 2,850 | |
Teradyne, Inc. | | | 21,347 | | | | 2,317 | |
Texas Instruments, Inc. | | | 123,108 | | | | 20,985 | |
Trimble, Inc. * | | | 34,306 | | | | 1,825 | |
Tyler Technologies, Inc. * | | | 5,685 | | | | 2,377 | |
VeriSign, Inc. * | | | 12,041 | | | | 2,480 | |
Western Digital Corp. * | | | 44,019 | | | | 2,305 | |
Zebra Technologies Corp. - Class A * | | | 7,122 | | | | 1,947 | |
| | | | | | | | |
Total | | | | | | | 1,566,196 | |
| | | | | | | | |
|
Materials (2.4%) | |
Air Products and Chemicals, Inc. | | | 30,112 | | | | 8,245 | |
Albemarle Corp. | | | 15,981 | | | | 2,309 | |
Amcor PLC | | | 195,917 | | | | 1,889 | |
Avery Dennison Corp. | | | 11,082 | | | | 2,240 | |
Ball Corp. | | | 43,463 | | | | 2,500 | |
Celanese Corp. | | | 13,601 | | | | 2,113 | |
CF Industries Holdings, Inc. | | | 26,311 | | | | 2,092 | |
Corteva, Inc. | | | 95,527 | | | | 4,578 | |
Dow, Inc. | | | 95,075 | | | | 5,214 | |
DuPont de Nemours, Inc. | | | 58,292 | | | | 4,484 | |
Eastman Chemical Co. | | | 16,071 | | | | 1,443 | |
Ecolab, Inc. | | | 33,833 | | | | 6,711 | |
FMC Corp. | | | 17,080 | | | | 1,077 | |
Freeport-McMoRan, Inc. | | | 195,117 | | | | 8,306 | |
International Flavors & Fragrances, Inc. | | | 35,022 | | | | 2,836 | |
International Paper Co. | | | 47,477 | | | | 1,716 | |
Linde PLC | | | 65,727 | | | | 26,995 | |
LyondellBasell Industries NV - Class A | | | 34,717 | | | | 3,301 | |
Martin Marietta Materials, Inc. | | | 8,458 | | | | 4,220 | |
The Mosaic Co. | | | 45,432 | | | | 1,623 | |
Newmont Corp. | | | 157,091 | | | | 6,502 | |
Nucor Corp. | | | 33,324 | | | | 5,800 | |
Packaging Corp. of America | | | 12,303 | | | | 2,004 | |
PPG Industries, Inc. | | | 32,034 | | | | 4,791 | |
The Sherwin-Williams Co. | | | 31,921 | | | | 9,956 | |
Steel Dynamics, Inc. | | | 20,618 | | | | 2,435 | |
Vulcan Materials Co. | | | 18,022 | | | | 4,091 | |
WestRock Co. | | | 34,564 | | | | 1,435 | |
| | | | | | | | |
Total | | | | | | | 130,906 | |
| | | | | | | | |
|
Real Estate (2.5%) | |
Alexandria Real Estate Equities, Inc. | | | 21,200 | | | | 2,688 | |
American Tower Corp. | | | 63,189 | | | | 13,641 | |
AvalonBay Communities, Inc. | | | 19,230 | | | | 3,600 | |
| | | | | | | | |
Common Stocks (98.9%) | | Shares/
Par + | | | Value
$ (000’s) | |
Real Estate continued | |
Boston Properties, Inc. | | | 19,540 | | | | 1,371 | |
Camden Property Trust | | | 14,560 | | | | 1,446 | |
CBRE Group, Inc. - Class A * | | | 41,315 | | | | 3,846 | |
CoStar Group, Inc. * | | | 55,237 | | | | 4,827 | |
Crown Castle International Corp. | | | 58,829 | | | | 6,777 | |
Digital Realty Trust, Inc. | | | 39,637 | | | | 5,334 | |
Equinix, Inc. | | | 12,711 | | | | 10,237 | |
Equity Residential | | | 46,410 | | | | 2,838 | |
Essex Property Trust, Inc. | | | 8,700 | | | | 2,157 | |
Extra Space Storage, Inc. | | | 29,111 | | | | 4,667 | |
Federal Realty Investment Trust | | | 9,945 | | | | 1,025 | |
Healthpeak Properties, Inc. | | | 74,265 | | | | 1,470 | |
Host Hotels & Resorts, Inc. | | | 97,298 | | | | 1,894 | |
Invitation Homes, Inc. | | | 79,117 | | | | 2,699 | |
Iron Mountain, Inc. | | | 39,752 | | | | 2,782 | |
Kimco Realty Corp. | | | 84,389 | | | | 1,798 | |
Mid-America Apartment Communities, Inc. | | | 15,777 | | | | 2,121 | |
Prologis, Inc. | | | 125,245 | | | | 16,695 | |
Public Storage | | | 21,557 | | | | 6,575 | |
Realty Income Corp. | | | 98,128 | | | | 5,635 | |
Regency Centers Corp. | | | 21,039 | | | | 1,410 | |
SBA Communications Corp. | | | 14,831 | | | | 3,762 | |
Simon Property Group, Inc. | | | 44,222 | | | | 6,308 | |
UDR, Inc. | | | 41,020 | | | | 1,571 | |
Ventas, Inc. | | | 55,187 | | | | 2,751 | |
VICI Properties, Inc. | | | 138,359 | | | | 4,411 | |
Welltower, Inc. | | | 72,651 | | | | 6,551 | |
Weyerhaeuser Co. | | | 98,953 | | | | 3,441 | |
| | | | | | | | |
Total | | | | | | | 136,328 | |
| | | | | | | | |
|
Utilities (2.3%) | |
The AES Corp. | | | 91,753 | | | | 1,766 | |
Alliant Energy Corp. | | | 34,454 | | | | 1,767 | |
Ameren Corp. | | | 35,531 | | | | 2,570 | |
American Electric Power Co., Inc. | | | 70,100 | | | | 5,694 | |
American Water Works Co., Inc. | | | 26,600 | | | | 3,511 | |
Atmos Energy Corp. | | | 19,735 | | | | 2,287 | |
CenterPoint Energy, Inc. | | | 86,516 | | | | 2,472 | |
CMS Energy Corp. | | | 40,251 | | | | 2,337 | |
Consolidated Edison, Inc. | | | 46,795 | | | | 4,257 | |
Constellation Energy Corp. | | | 43,854 | | | | 5,126 | |
Dominion Energy, Inc. | | | 113,591 | | | | 5,339 | |
DTE Energy Co. | | | 26,492 | | | | 2,921 | |
Duke Energy Corp. | | | 104,471 | | | | 10,138 | |
The Accompanying Notes are an Integral Part of the Financial Statements.
24
Index 500 Stock Portfolio
| | | | | | | | |
Common Stocks (98.9%) | | Shares/
Par + | | | Value
$ (000’s) | |
Utilities continued | |
Edison International | | | 52,691 | | | | 3,767 | |
Entergy Corp. | | | 27,973 | | | | 2,831 | |
Evergy, Inc. | | | 31,291 | | | | 1,633 | |
Eversource Energy | | | 47,845 | | | | 2,953 | |
Exelon Corp. | | | 136,504 | | | | 4,900 | |
FirstEnergy Corp. | | | 70,368 | | | | 2,580 | |
NextEra Energy, Inc. | | | 275,965 | | | | 16,762 | |
NiSource, Inc. | | | 55,036 | | | | 1,461 | |
NRG Energy, Inc. | | | 30,602 | | | | 1,582 | |
PG&E Corp. | | | 285,173 | | | | 5,142 | |
Pinnacle West Capital Corp. | | | 15,533 | | | | 1,116 | |
PPL Corp. | | | 100,820 | | | | 2,732 | |
Public Service Enterprise Group, Inc. | | | 67,547 | | | | 4,131 | |
Sempra Energy | | | 85,826 | | | | 6,414 | |
The Southern Co. | | | 147,834 | | | | 10,366 | |
WEC Energy Group, Inc. | | | 43,219 | | | | 3,638 | |
Xcel Energy, Inc. | | | 75,438 | | | | 4,670 | |
| | | | | | | | |
Total | | | | | | | 126,863 | |
| | | | | | | | |
| |
Total Common Stocks
(Cost: $1,810,073) | | | | 5,427,329 | |
| | | | | | | | |
| |
Total Investments (98.9%)
(Cost: $1,810,073)@ | | | | 5,427,329 | |
| | | | | | | | |
| |
Other Assets, Less
Liabilities (1.1%) | | | | 57,752 | |
| | | | | | | | |
| |
Net Assets (100.0%) | | | | 5,485,081 | |
| | | | | | | | |
Exchange Traded or Centrally Cleared Derivatives Futures
| | | | | | | | | | | | | | | | | | | | | | | | | | | | | | | | |
| Issuer | | Long/ Short | | | Currency | | | Notional Par (000’s) | | | Number of Contracts | | | Expiration Date | | | Notional Value
(000’s) | | | Unrealized Appreciation/ (Depreciation) (000’s) | | | Variation Margin
(000’s) | |
| |
E-Mini S&P 500 Future | | | Long | | | | USD | | | | 12 | | | | 239 | | | | 3/24 | | | $ | 57,599 | | | $ | 1,234 | | | $ | (145) | |
| | | | | | | | | | | | | | | | | | | | | | | | | | | | |
| | | | | | | | | | | | | | | | | | | | | | | | | | $ | 1,234 | | | $ | (145) | |
| | | | | | | | | | | | | | | | | | | | | | | | | | | | |
| | | | | | | | | | | | | | | | | | | | | | | | | | | | |
| | | Financial Derivative Assets | | | Financial Derivative Liabilities | |
| | | | | | | | | | | | | | | | | | | | | Market Value | |
| | | Variation Margin (000’s) | | | Variation Margin (000’s) | | | (000’s) | |
| | | Swaps | | | Futures | | | Total | | | Swaps | | | Futures | | | Total | | | Options | |
| | | | |
| Total Exchange-Traded or Centrally Cleared Derivatives | | $ | – | | | $ | – | | | $ | – | | | $ | – | | | $ | (145 | ) | | $ | (145 | ) | | $ | – | |
| | | | |
| + | All par is stated in U.S. Dollar unless otherwise noted. |
| @ | At December 31, 2023, the aggregate cost of investments, including derivatives, for federal tax purposes (in thousands) was $1,813,646 and the net unrealized appreciation of investments based on that cost was $3,614,917 which is comprised of $3,700,124 aggregate gross unrealized appreciation and $85,207 aggregate gross unrealized depreciation. |
The Accompanying Notes are an Integral Part of the Financial Statements.
25
Index 500 Stock Portfolio
The following is a summary of the inputs used in valuing the Portfolio’s Investments at December 31, 2023. See Note 3 for additional information on portfolio valuation.
| | | | | | | | | | | | | | |
| | | | | Valuation Inputs | |
| Description | | | | Level 1 - Quoted Prices | | | Level 2 - Other Significant Observable Inputs | | | Level 3 - Significant Unobservable Inputs | |
| | | | | (Amounts in thousands) | |
Assets: | | | | | | | | | | | | | | |
Common Stocks | | | | $ | 5,427,329 | | | $ | — | | | $ | — | |
Other Financial Instruments^ | | | | | | | | | | | | | | |
Futures | | | | | 1,234 | | | | — | | | | — | |
| | | | | | |
Total Assets: | | | | $ | 5,428,563 | | | $ | — | | | $ | — | |
| | | | | | |
^ Other financial instruments are derivative instruments such as futures and forward foreign currency contracts, which are valued at the unrealized appreciation (depreciation) on the instrument, and securities sold short, reverse repurchase agreements, written options and swaps contracts, which are valued at market value.
The Accompanying Notes are an Integral Part of the Financial Statements.
26
Large Company Value Portfolio (unaudited)
| | | | |
| Objective: | | Portfolio Strategy: | �� | Net Assets: |
| Long-term growth of capital. Income is a secondary objective. | | Invest primarily in equity securities of larger companies considered to be undervalued. | | $152 million |
PORTFOLIO OVERVIEW
Mason Street Advisors, LLC (“Mason Street Advisors”), the investment adviser for the Large Company Value Portfolio (the “Portfolio”), has engaged American Century Investment Management, Inc. (“American Century”) to act as sub-adviser for the Portfolio. The Portfolio looks for stocks of companies that it believes are undervalued at the time of purchase. The Portfolio attempts to purchase the stocks of these undervalued companies and hold each stock until it has returned to favor in the market and the price has increased to, or is higher than, a level the Portfolio believes more accurately reflects the fair value of the company. Companies may be undervalued due to market declines, poor economic conditions, actual or anticipated bad news regarding the issuer or its industry, or because they have been overlooked by the market.
MARKET OVERVIEW
Broad U.S. equity markets rallied in 2023, aided by a surge in the fourth quarter as bond yields dropped substantially. Inflation moderated and optimism increased that the U.S. Federal Reserve may soon begin cutting interest rates while the U.S. economy negotiates a soft landing. Against this backdrop, growth stocks outperformed value stocks for the year, and cyclical sectors generally outperformed defensive sectors.
PORTFOLIO RESULTS
The Portfolio returned 3.80% for the twelve months ended December 31, 2023. By comparison, the Portfolio’s benchmark, the Russell 1000® Value Index (the “Index”), returned 11.46%. (The Index is unmanaged, cannot be invested in directly and does not include administrative expenses.)
Security selection and an underweight in the Communication Services sector detracted from relative results. Notably, lack of exposure to Meta Platforms weighed on the Portfolio’s performance. Shares of this technology conglomerate benefited from Meta Platforms’ cost-cutting efforts and its investments in artificial intelligence. The Portfolio did not own the stock because the Portfolio’s managers felt its risk/reward profile was less attractive relative to other stocks.
The Industrials sector also detracted from the Portfolio’s relative returns, driven by aerospace and defense company RTX. RTX shares were pressured after the company noted a problem with the powdered metal used in airplane engine manufacturing. In turn, RTX made the decision to compensate its airline customers as aircrafts are grounded while RTX replaces the contaminated parts.
Another notable detractor during the period was Conagra Brands, in the Consumer Staples sector. An investor shift toward less defensive sectors pressured shares of this packaged food producer. Additionally, investors became concerned about consumers shifting to store brands to save money and about pushback on future price increases.
On the upside, security selection and an underweight in the Energy sector relative to the benchmark contributed to the Portfolio’s performance. The Portfolio’s underweight position in Chevron was particularly beneficial, as Chevron’s shares underperformed after the company announced operational issues with two of its largest assets. Chevron also announced the expensive acquisition of Hess, another energy company.
Stock selection in the Materials sector also contributed, led by Packaging Corporation of America. This packaging and logistics company reported strong financial results with improved year-over-year shipments of containerboard. The market’s expectations of a bottoming in demand for containerboard also buoyed company shares.
In the Industrials sector, nVent Electric was a key contributor. This electrical equipment supplier delivered solid financial results, primarily driven by its strong pricing power. Furthermore, the company’s acquisition of ECM Industries and the potential for the company to benefit from the infrastructure bill buoyed investor sentiment.
PORTFOLIO MANAGER OUTLOOK
The following forward-looking comments are the opinion of American Century, the Portfolio’s sub-adviser.
27
Large Company Value Portfolio (unaudited)
Our research has led us to several stocks in the Healthcare sector that we think offer compelling valuations and risk/ reward profiles, leading to a notable overweight in the sector. We consider Healthcare less cyclical because the economy’s performance tends to have less impact on demand. We also believe health care utilization rates will continue to normalize after the COVID-19 pandemic caused patients to delay services and procedures. Additionally, we think shares of companies affected by sell-offs from drugs related to weight-loss will continue to recover.
Conversely, we maintained our underweight in Real Estate due to valuations that we believe are elevated throughout the sector. Additionally, life science real estate continues to be challenged by slowing leasing activities and elevated new supply coming online in 2024. Our bottom-up approach also resulted in an underweight in the Consumer Discretionary sector, a sector where we find it difficult to identify companies with durable business models. Furthermore, we expect a decline in overall consumer spending due to economic pressures like inflation and evaporating personal savings.
Relative Performance
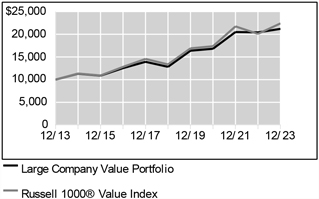
| | | | | | |
Average Annual Total Returns For Periods Ended December 31, 2023 |
| | | 1 Year | | 5 Years | | 10 Years |
Large Company Value Portfolio | | 3.80% | | 10.57% | | 7.80% |
Russell 1000® Value Index | | 11.46% | | 10.91% | | 8.40% |
The performance data quoted represents past performance. Past performance is historical and does not guarantee future performance. Investment return and principal value will fluctuate, so that shares, when redeemed, may be worth more or less than their original cost. Current performance may be lower or higher than the performance data quoted. For the most recent month-end performance information visit www.northwesternmutual.com.
This chart assumes an initial investment of $10,000 made on 12/31/13. Returns shown reflect fee waivers, deductions for management and other portfolio expenses, and reinvestment of all dividends. In the absence of fee waivers, total return would be reduced. Returns exclude deductions for separate account sale loads and account fees. Please refer to the Benchmark Definitions section of this report for information about the indices cited in the above chart and graph.
The Portfolio may invest a relatively high percentage of its assets in a particular sector. The Portfolio will have greater exposure to the risks associated with that sector and its performance will be tied more closely to the performance of the sector.
Top 10 Holdings 12/31/23
| | | | | | | | |
| | | | |
| | | Security Description | | % of Net Assets | | | | |
| | | | |
| | | Johnson & Johnson | | 4.8% | | | | |
| | | | |
| | | Medtronic PLC | | 4.6% | | | | |
| | | | |
| | | Zimmer Biomet Holdings, Inc. | | 3.7% | | | | |
| | | | |
| | | Berkshire Hathaway, Inc. - Class B | | 3.0% | | | | |
| | | | |
| | | JPMorgan Chase & Co. | | 2.6% | | | | |
| | | | |
| | | Raytheon Technologies Corp. | | 2.3% | | | | |
| | | | |
| | | Duke Energy Corp. | | 2.3% | | | | |
| | | | |
| | | Colgate-Palmolive Co. | | 2.3% | | | | |
| | | | |
| | | Exxon Mobil Corp. | | 2.3% | | | | |
| | | | |
| | | The Allstate Corp. | | 2.2% | | | | |
Sector Allocation 12/31/23
| | | | | | | | |
| | | | |
| | | Sector | | % of Net Assets | | | | |
| | | | |
| | | Health Care | | 23.5% | | | | |
| | | | |
| | | Financials | | 19.6% | | | | |
| | | | |
| | | Consumer Staples | | 16.0% | | | | |
| | | | |
| | | Industrials | | 9.8% | | | | |
| | | | |
| | | Energy | | 7.6% | | | | |
| | | | |
| | | Information Technology | | 7.1% | | | | |
| | | | |
| | | Utilities | | 6.5% | | | | |
| | | | |
| | | Materials | | 3.2% | | | | |
| | | | |
| | | Communication Services | | 3.2% | | | | |
| | | | |
| | | Short-Term Investments & Other Net Assets | | 2.3% | | | | |
| | | | |
| | | Consumer Discretionary | | 0.7% | | | | |
| | | | |
| | | Real Estate | | 0.5% | | | | |
Sector Allocation and Top 10 Holdings are subject to change.
28
Large Company Value Portfolio
SCHEDULE OF INVESTMENTS
December 31, 2023
| | | | | | | | |
Common Stocks (97.7%) | | Shares/ Par + | | | Value
$ (000’s) | |
Communication Services (3.2%) | |
BCE, Inc. | | | 22,919 | | | | 902 | |
Verizon | | | | | | | | |
Communications, Inc. | | | 62,822 | | | | 2,369 | |
The Walt Disney Co. | | | 16,870 | | | | 1,523 | |
| | | | | | | | |
Total | | | | | | | 4,794 | |
| | | | | | | | |
|
Consumer Discretionary (0.7%) | |
General Motors Co. | | | 28,332 | | | | 1,018 | |
| | | | | | | | |
Total | | | | | | | 1,018 | |
| | | | | | | | |
| |
Consumer Staples (16.0%) | | | | | |
Colgate-Palmolive Co. | | | 42,858 | | | | 3,416 | |
Conagra Brands, Inc. | | | 81,997 | | | | 2,350 | |
Dollar Tree, Inc. * | | | 17,760 | | | | 2,523 | |
General Mills, Inc. | | | 11,406 | | | | 743 | |
Heineken Holding NV | | | 10,824 | | | | 917 | |
Kenvue, Inc. | | | 76,463 | | | | 1,646 | |
Kimberly-Clark Corp. | | | 24,598 | | | | 2,989 | |
Koninklijke Ahold Delhaize NV | | | 34,644 | | | | 995 | |
Mondelez International, Inc. | | | 32,752 | | | | 2,372 | |
PepsiCo, Inc. | | | 4,215 | | | | 716 | |
The Procter & Gamble Co. | | | 6,119 | | | | 897 | |
Unilever PLC, ADR | | | 61,028 | | | | 2,959 | |
Walmart, Inc. | | | 11,063 | | | | 1,744 | |
| | | | | | | | |
Total | | | | | | | 24,267 | |
| | | | | | | | |
| | |
Energy (7.6%) | | | | | | | | |
Baker Hughes | | | 45,576 | | | | 1,558 | |
Chevron Corp. | | | 5,598 | | | | 835 | |
ConocoPhillips | | | 6,500 | | | | 754 | |
Enterprise Products Partners LP | | | 56,553 | | | | 1,490 | |
Exxon Mobil Corp. | | | 34,141 | | | | 3,413 | |
Shell PLC | | | 39,004 | | | | 1,267 | |
TotalEnergies SE, ADR | | | 33,073 | | | | 2,229 | |
| | | | | | | | |
Total | | | | | | | 11,546 | |
| | | | | | | | |
| | |
Financials (19.6%) | | | | | | | | |
The Allstate Corp. | | | 24,098 | | | | 3,373 | |
The Bank of New York Mellon Corp. | | | 63,533 | | | | 3,307 | |
Berkshire Hathaway, Inc. - Class B * | | | 12,926 | | | | 4,610 | |
BlackRock, Inc. | | | 3,399 | | | | 2,759 | |
The Charles Schwab Corp. | | | 39,240 | | | | 2,700 | |
Chubb, Ltd. | | | 5,176 | | | | 1,170 | |
JPMorgan Chase & Co. | | | 23,073 | | | | 3,925 | |
MetLife, Inc. | | | 11,870 | | | | 785 | |
Northern Trust Corp. | | | 12,419 | | | | 1,048 | |
Truist Financial Corp. | | | 69,349 | | | | 2,560 | |
U.S. Bancorp | | | 59,303 | | | | 2,567 | |
| | | | | | | | |
Common Stocks (97.7%) | | Shares/ Par + | | | Value
$ (000’s) | |
Financials continued | | | | | | | | |
Willis Towers Watson PLC | | | 4,351 | | | | 1,049 | |
| | | | | | | | |
Total | | | | | | | 29,853 | |
| | | | | | | | |
| | |
Health Care (23.5%) | | | | | | | | |
Becton Dickinson and Co. | | | 7,314 | | | | 1,783 | |
CVS Health Corp. | | | 21,632 | | | | 1,708 | |
Henry Schein, Inc. * | | | 34,055 | | | | 2,578 | |
Johnson & Johnson | | | 46,905 | | | | 7,352 | |
Medtronic PLC | | | 85,344 | | | | 7,031 | |
Merck & Co., Inc. | | | 12,524 | | | | 1,365 | |
Pfizer, Inc. | | | 38,986 | | | | 1,123 | |
Quest Diagnostics, Inc. | | | 21,908 | | | | 3,021 | |
Roche Holding AG | | | 5,664 | | | | 1,642 | |
Universal Health Services, Inc. - Class B | | | 16,159 | | | | 2,463 | |
Zimmer Biomet Holdings, Inc. | | | 46,287 | | | | 5,633 | |
| | | | | | | | |
Total | | | | | | | 35,699 | |
| | | | | | | | |
| | |
Industrials (9.8%) | | | | | | | | |
Emerson Electric Co. | | | 14,002 | | | | 1,363 | |
Johnson Controls International PLC | | | 15,661 | | | | 903 | |
Norfolk Southern Corp. | | | 12,678 | | | | 2,997 | |
Oshkosh Corp. | | | 11,077 | | | | 1,201 | |
Raytheon Technologies Corp. | | | 41,624 | | | | 3,502 | |
Siemens AG | | | 4,577 | | | | 858 | |
Southwest Airlines Co. | | | 41,582 | | | | 1,201 | |
United Parcel Service, Inc. - Class B | | | 18,363 | | | | 2,887 | |
| | | | | | | | |
Total | | | | | | | 14,912 | |
| | | | | | | | |
|
Information Technology (7.1%) | |
Automatic Data Processing, Inc. | | | 5,727 | | | | 1,334 | |
Cisco Systems, Inc. | | | 42,466 | | | | 2,145 | |
F5, Inc. * | | | 14,514 | | | | 2,598 | |
Juniper Networks, Inc. | | | 34,786 | | | | 1,026 | |
TE Connectivity, Ltd. | | | 12,498 | | | | 1,756 | |
Texas Instruments, Inc. | | | 11,260 | | | | 1,919 | |
| | | | | | | | |
Total | | | | | | | 10,778 | |
| | | | | | | | |
| | |
Materials (3.2%) | | | | | | | | |
Akzo Nobel NV | | | 10,899 | | | | 901 | |
Packaging Corp. of America | | | 11,304 | | | | 1,841 | |
Sonoco Products Co. | | | 37,813 | | | | 2,113 | |
| | | | | | | | |
Total | | | | | | | 4,855 | |
| | | | | | | | |
| | | | | | | | |
Common Stocks (97.7%) | | Shares/ Par + | | | Value
$ (000’s) | |
Real Estate (0.5%) | | | | | | | | |
American Tower Corp. | | | 3,848 | | | | 831 | |
| | | | | | | | |
Total | | | | | | | 831 | |
| | | | | | | | |
| | |
Utilities (6.5%) | | | | | | | | |
Duke Energy Corp. | | | 35,383 | | | | 3,434 | |
Edison International | | | 23,673 | | | | 1,692 | |
Eversource Energy | | | 27,720 | | | | 1,711 | |
Pinnacle West Capital Corp. | | | 9,244 | | | | 664 | |
Xcel Energy, Inc. | | | 39,269 | | | | 2,431 | |
| | | | | | | | |
Total | | | | | | | 9,932 | |
| | | | | | | | |
| |
Total Common Stocks
(Cost: $144,538) | | | | 148,485 | |
| | | | | |
| |
Total Investments (97.7%)
(Cost: $144,538)@ | | | | 148,485 | |
| | | | | |
| |
Other Assets, Less
Liabilities (2.3%) | | | | 3,513 | |
| | | | | |
| |
Net Assets (100.0%) | | | | 151,998 | |
| | | | | | | | |
The Accompanying Notes are an Integral Part of the Financial Statements.
29
Large Company Value Portfolio
Over the Counter Derivatives
Forward Foreign Currency Contracts
| | | | | | | | | | | | | | | | | | | | | | | | | | |
| Type | | Counterparty | | Currency | | Foreign Principal
Amount
Covered by
Contract (000s) | | | USD Principal
Amount
Covered by
Contract (000’s) | | | Settlement
Date | | Unrealized
Appreciation
(000’s) | | | Unrealized
(Depreciation)
(000’s) | | | Net
Unrealized
Appreciation/
(Depreciation)
(000’s) | |
Sell | | Bank of America NA | | CAD | | | 1,009 | | | | 762 | | | 3/28/24 | | $ | — | | | $ | (8) | | | $ | (8 | ) |
Sell | | Morgan Stanley Capital Services LLC | | CHF | | | 1,184 | | | | 1,420 | | | 3/28/24 | | | — | | | | (42) | | | | (42 | ) |
Buy | | Bank of America NA | | EUR | | | 120 | | | | 133 | | | 3/28/24 | | | 1 | | | | — | | | | 1 | |
Sell | | Bank of America NA | | EUR | | | 4,637 | | | | 5,136 | | | 3/28/24 | | | — | | | | (51) | | | | (51 | ) |
Sell | | Goldman Sachs International | | GBP | | | 2,796 | | | | 3,566 | | | 3/28/24 | | | — | | | | (20) | | | | (20 | ) |
| | | | | | | | | | | | | | | | | | |
| | | | | | | | | | | | | | | | $ | 1 | | | $ | (121) | | | $ | (120 | ) |
| | | | | | | | | | | | | | | | | | |
| | | | | | | | | | | | | | | | | | | | | | | | | | | | |
| | | Financial Derivative Assets (000’s) | | | Financial Derivative Liabilities (000’s) | |
| | | Forward
Foreign
Currency
Contracts | | | Swaps | | | Total | | | Forward
Foreign
Currency
Contracts | | | Options | | | Swaps | | | Total | |
Total Over the Counter Derivatives | | $ | 1 | | | | — | | | $ | 1 | | | $ | (121) | | | | — | | | | — | | | $ | (121) | |
| | | | |
| + | All par is stated in U.S. Dollar unless otherwise noted. |
| @ | At December 31, 2023, the aggregate cost of investments, including derivatives, for federal tax purposes (in thousands) was $145,607 and the net unrealized appreciation of investments based on that cost was $2,758 which is comprised of $10,315 aggregate gross unrealized appreciation and $7,557 aggregate gross unrealized depreciation. |
The following is a summary of the inputs used in valuing the Portfolio’s Investments at December 31, 2023. See Note 3 for additional information on portfolio valuation.
| | | | | | | | | | | | | | |
| | | | | Valuation Inputs | |
| Description | | | | Level 1 - Quoted
Prices | | | Level 2 - Other
Significant
Observable Inputs | | | Level 3
- Significant
Unobservable
Inputs | |
| | | | | (Amounts in thousands) | |
Assets: | | | | | | | | | | | | | | |
Common Stocks | | | | | | | | | | | | | | |
Consumer Staples | | | | $ | 22,355 | | | $ | 1,912 | | | $ | — | |
Energy | | | | | 10,279 | | | | 1,267 | | | | — | |
Health Care | | | | | 34,057 | | | | 1,642 | | | | — | |
Industrials | | | | | 14,054 | | | | 858 | | | | — | |
Materials | | | | | 3,954 | | | | 901 | | | | — | |
All Others | | | | | 57,206 | | | | — | | | | — | |
Other Financial Instruments^ | | | | | | | | | | | | | | |
Forward Foreign Currency Contracts | | | | | — | | | | 1 | | | | — | |
| | | | | | |
Total Assets: | | | | $ | 141,905 | | | $ | 6,581 | | | $ | — | |
| | | | | | |
Liabilities: | | | | | | | | | | | | | | |
Other Financial Instruments^ | | | | | | | | | | | | | | |
Forward Foreign Currency Contracts | | | | | — | | | | (121) | | | | — | |
| | | | | | |
Total Liabilities: | | | | $ | — | | | $ | (121) | | | $ | — | |
| | | | | | |
^ Other financial instruments are derivative instruments such as futures and forward foreign currency contracts, which are valued at the unrealized appreciation (depreciation) on the instrument, and securities sold short, reverse repurchase agreements, written options and swaps contracts, which are valued at market value.
The Accompanying Notes are an Integral Part of the Financial Statements.
30
Domestic Equity Portfolio (unaudited)
| | | | |
| Objective: | | Portfolio Strategy: | | Net Assets: |
| Long-term growth of capital and income. | | Invest primarily in equity securities of U.S. issuers that are selling at attractive prices relative to their intrinsic value. | | $1.1 billion |
PORTFOLIO OVERVIEW
Mason Street Advisors, LLC (“Mason Street Advisors”), the investment adviser for the Domestic Equity Portfolio (the “Portfolio”), has engaged Delaware Investments Fund Advisers, a series of Macquarie Investment Management Business Trust (“Delaware”), to act as sub-adviser for the Portfolio. The Portfolio primarily invests in common stocks of large capitalization companies, but may also invest in mid-capitalization companies, that are believed to have long-term capital appreciation potential. Typically, the Portfolio seeks securities that are believed to be undervalued in relation to their intrinsic value, as indicated by multiple factors, including the earnings and cash flow potential or the asset valuation of the respective issuers. The Portfolio employs a focused investment strategy and typically invests in a core group of 30-40 securities.
MARKET OVERVIEW
U.S. stocks were broadly higher for the year ended December 31, 2023, led by stocks of the largest companies, particularly those of technology-related businesses. By the end of the period, the 10 largest stocks in the broad market S&P 500® Index accounted for approximately 30% of the Index’s market capitalization, a historically high level of concentration. Early in the year, the high-profile failures of several regional banks added to an already volatile period. The failures caused a sell-off of bank stocks, especially smaller and mid-sized institutions, which helped drive investor flight to large cap growth stocks. Falling inflation, exuberance for companies involved in artificial intelligence (“AI”) and a growing belief that the U.S. Federal Reserve could engineer a soft landing for the economy helped push the major indices higher during the year.
PORTFOLIO RESULTS
The Portfolio returned 3.71% for the twelve months ended December 31, 2023. By comparison, the Portfolio’s benchmark, the Russell 1000® Value Index (the “Index”), returned 11.46%. (The Index is unmanaged, cannot be invested in directly and does not incur expenses.)
In general, stock selection detracted from the Portfolio’s relative performance while sector allocation was a contributor. The three largest detractors from a sector perspective were Consumer Staples, Industrials and Communication Services. Stock selection was the primary driver of underperformance for these three sectors. The three largest contributors at the sector level were Information Technology, Utilities and Energy. An overweight allocation drove positive attribution in the Information Technology sector. Stock selection and underweight allocations supported contribution in the Utilities and Energy sectors.
At the stock level, discount retailer Dollar General was a leading detractor from the Portfolio’s relative performance. The company’s shares came under significant pressure during the period, owing to weaker-than-expected results, lowered full-year guidance and missteps around inventory management. Packaged food maker Conagra Brands was another leading detractor, as the industry was pressured by investors’ concerns around pricing power, consumer demand and the potential effects of GLP-1 drugs (used to treat diabetes and obesity) on dietary habits. Grain processor and agricultural services provider Archer-Daniels-Midland Company was another notable detractor. Results in the company’s nutrition segment were weaker than expected, and it lowered its operating profit target for that business.
Broadcom, a provider of semiconductor and enterprise software solutions, was a leading contributor to the Portfolio’s relative return (note that the Portfolio’s position in Broadcom was sold during the year). The company’s offerings include products that support artificial intelligence (AI) technology, and strong investor enthusiasm for companies exposed to AI supported the stock. Cloud services provider Oracle was also a leading contributor. Oracle’s autonomous database business is a beneficiary of generative AI, and the company has indicated that demand for its AI processing exceeds capacity. Information Technology (IT) services and consulting provider Cognizant Technology Solutions was another notable contributor. Despite a generally challenging environment for IT services in 2023, the company raised its full-year earnings-per-share (EPS) guidance while reaffirming guidance for revenue and operating margin.
PORTFOLIO MANAGER OUTLOOK
The following forward-looking comments are the opinion of Delaware, the Portfolio’s sub-adviser.
31
Domestic Equity Portfolio (unaudited)
While relative performance in 2023 was disappointing, we think the Portfolio’s positioning is especially strong right now. Valuation is attractive with the Portfolio’s price-to-earnings (P/E) ratio below that of the benchmark. From a quality factor perspective, the Portfolio’s exposure to earnings quality and profitability are at the high ends of their historical ranges. In addition, the Portfolio’s net debt to earnings before interest, taxes, depreciation and amortization (EBITDA) ratio, a measure of debt relative to earnings, is lower than the benchmark’s. Overall, we think investors have already priced in a soft landing, as evidenced by the market’s lofty valuation multiples. In this environment, which includes an extended period of above-average market returns, we think a discounted portfolio of companies with higher quality attributes represents a compelling offering with the potential for downside protection and attractive long-term total returns.
Relative Performance
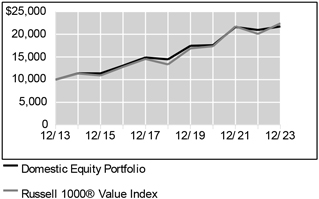
| | | | | | |
Average Annual Total Returns For Periods Ended December 31, 2023 |
| | | 1 Year | | 5 Years | | 10 Years |
Domestic Equity Portfolio | | 3.71% | | 8.48% | | 8.07% |
Russell 1000® Value Index | | 11.46% | | 10.91% | | 8.40% |
The performance data quoted represents past performance. Past performance is historical and does not guarantee future performance. Investment return and principal value will fluctuate, so that shares, when redeemed, may be worth more or less than their original cost. Current performance may be lower or higher than the performance data quoted. For the most recent month-end performance information visit www.northwesternmutual.com.
This chart assumes an initial investment of $10,000 made on 12/31/13. Returns shown reflect fee waivers, deductions for management and other portfolio expenses, and reinvestment of all dividends. In the absence of fee waivers, total return would be reduced. Returns exclude deductions for separate account sale loads and account fees. Please refer to the Benchmark Definitions section of this report for information about the indices cited in the above chart and graph.
Top 10 Holdings 12/31/23
| | | | | | | | |
| | | | |
| | | Security Description | | % of Net Assets | | | | |
| | | | |
| | | American International Group, Inc. | | 3.4% | | | | |
| | | | |
| | | Honeywell International, Inc. | | 3.4% | | | | |
| | | | |
| | | U.S. Bancorp | | 3.4% | | | | |
| | | | |
| | | CVS Health Corp. | | 3.3% | | | | |
| | | | |
| | | The TJX Cos., Inc. | | 3.3% | | | | |
| | | | |
| | | The Allstate Corp. | | 3.3% | | | | |
| | | | |
| | | Dollar Tree, Inc. | | 3.2% | | | | |
| | | | |
| | | Motorola Solutions, Inc. | | 3.2% | | | | |
| | | | |
| | | Dover Corp. | | 3.1% | | | | |
| | | | |
| | | Cognizant Technology Solutions Corp. - Class A | | 3.1% | | | | |
Sector Allocation 12/31/23
| | | | | | | | |
| | | | |
| | | Sector | | % of Net Assets | | | | |
| | | | |
| | | Financials | | 18.6% | | | | |
| | | | |
| | | Health Care | | 17.9% | | | | |
| | | | |
| | | Information Technology | | 14.7% | | | | |
| | | | |
| | | Industrials | | 12.3% | | | | |
| | | | |
| | | Consumer Staples | | 11.2% | | | | |
| | | | |
| | | Consumer Discretionary | | 6.4% | | | | |
| | | | |
| | | Communication Services | | 5.8% | | | | |
| | | | |
| | | Materials | | 3.1% | | | | |
| | | | |
| | | Energy | | 3.0% | | | | |
| | | | |
| | | Utilities | | 3.0% | | | | |
| | | | |
| | | Real Estate | | 2.6% | | | | |
| | | | |
| | | Short-Term Investments & Other Net Assets | | 1.4% | | | | |
Sector Allocation and Top 10 Holdings are subject to change.
32
Domestic Equity Portfolio
SCHEDULE OF INVESTMENTS
December 31, 2023
| | | | | | | | |
Common Stocks (98.6%) | | Shares/ Par + | | | Value
$ (000’s) | |
Communication Services (5.8%) | | | | | |
Comcast Corp. - Class A | | | 105,356 | | | | 4,620 | |
Verizon Communications, Inc. | | | 797,600 | | | | 30,070 | |
The Walt Disney Co. | | | 299,436 | | | | 27,036 | |
| | | | | | | | |
Total | | | | | | | 61,726 | |
| | | | | | | | |
| |
Consumer Discretionary (6.4%) | | | | | |
Lowe’s Companies, Inc. | | | 145,900 | | | | 32,470 | |
The TJX Cos., Inc. | | | 371,700 | | | | 34,869 | |
| | | | | | | | |
Total | | | | | | | 67,339 | |
| | | | | | | | |
| |
Consumer Staples (11.2%) | | | | | |
Archer-Daniels-Midland Co. | | | 358,400 | | | | 25,884 | |
Conagra Brands, Inc. | | | 945,833 | | | | 27,107 | |
Dollar General Corp. | | | 233,040 | | | | 31,682 | |
Dollar Tree, Inc. * | | | 240,500 | | | | 34,163 | |
| | | | | | | | |
Total | | | | | | | 118,836 | |
| | | | | | | | |
| | |
Energy (3.0%) | | | | | | | | |
ConocoPhillips | | | 277,500 | | | | 32,209 | |
| | | | | | | | |
Total | | | | | | | 32,209 | |
| | | | | | | | |
| | | | | | | | |
Common Stocks (98.6%) | | Shares/ Par + | | | Value
$ (000’s) | |
Financials (18.6%) | | | | | | | | |
The Allstate Corp. | | | 245,405 | | | | 34,352 | |
American International Group, Inc. | | | 530,600 | | | | 35,948 | |
Fidelity National Information Services, Inc. | | | 537,427 | | | | 32,283 | |
The Travelers Cos., Inc. | | | 145,498 | | | | 27,716 | |
Truist Financial Corp. | | | 831,200 | | | | 30,688 | |
U.S. Bancorp | | | 828,600 | | | | 35,862 | |
| | | | | | | | |
Total | | | | | | | 196,849 | |
| | | | | | | | |
| | |
Health Care (17.9%) | | | | | | | | |
Baxter International, Inc. | | | 838,200 | | | | 32,405 | |
Cigna Corp. | | | 94,003 | | | | 28,149 | |
CVS Health Corp. | | | 444,100 | | | | 35,066 | |
Hologic, Inc. * | | | 423,488 | | | | 30,258 | |
Johnson & Johnson | | | 198,000 | | | | 31,035 | |
Merck & Co., Inc. | | | 298,000 | | | | 32,488 | |
| | | | | | | | |
Total | | | | | | | 189,401 | |
| | | | | | | | |
| | |
Industrials (12.3%) | | | | | | | | |
Dover Corp. | | | 214,342 | | | | 32,968 | |
Honeywell International, Inc. | | | 171,060 | | | | 35,873 | |
Northrop Grumman Corp. | | | 68,300 | | | | 31,974 | |
Raytheon Technologies Corp. | | | 342,979 | | | | 28,858 | |
| | | | | | | | |
Total | | | | | | | 129,673 | |
| | | | | | | | |
| | | | | | | | |
Common Stocks (98.6%) | | Shares/ Par + | | | Value
$ (000’s) | |
Information Technology (14.7%) | |
Cisco Systems, Inc. | | | 543,500 | | | | 27,458 | |
Cognizant Technology Solutions Corp. - Class A | | | 434,718 | | | | 32,834 | |
Motorola Solutions, Inc. | | | 106,300 | | | | 33,282 | |
Oracle Corp. | | | 272,800 | | | | 28,761 | |
Teledyne Technologies, Inc. * | | | 72,818 | | | | 32,498 | |
| | | | | | | | |
Total | | | | | | | 154,833 | |
| | | | | | | | |
| | |
Materials (3.1%) | | | | | | | | |
DuPont de Nemours, Inc. | | | 423,384 | | | | 32,571 | |
| | | | | | | | |
Total | | | | | | | 32,571 | |
| | | | | | | | |
| | |
Real Estate (2.6%) | | | | | | | | |
Equity Residential | | | 446,995 | | | | 27,338 | |
| | | | | | | | |
Total | | | | | | | 27,338 | |
| | | | | | | | |
| | |
Utilities (3.0%) | | | | | | | | |
Duke Energy Corp. | | | 328,300 | | | | 31,858 | |
| | | | | | | | |
Total | | | | | | | 31,858 | |
| | | | | | | | |
| |
Total Common Stocks
(Cost: $899,773) | | | | 1,042,633 | |
| | | | | | | | |
| |
Total Investments (98.6%)
(Cost: $899,773)@ | | | | 1,042,633 | |
| | | | | | | | |
| |
Other Assets, Less Liabilities (1.4%) | | | | 14,433 | |
| | | | | | | | |
| |
Net Assets (100.0%) | | | | 1,057,066 | |
| | | | | | | | |
| + | All par is stated in U.S. Dollar unless otherwise noted. |
| @ | At December 31, 2023, the aggregate cost of investments, including derivatives, for federal tax purposes (in thousands) was $899,851 and the net unrealized appreciation of investments based on that cost was $142,782 which is comprised of $216,126 aggregate gross unrealized appreciation and $73,344 aggregate gross unrealized depreciation. |
The following is a summary of the inputs used in valuing the Portfolio’s Investments at December 31, 2023. See Note 3 for additional information on portfolio valuation.
| | | | | | | | | | | | |
| | | Valuation Inputs | |
| Description | | Level 1 - Quoted
Prices | | | Level 2 - Other
Significant
Observable Inputs | | | Level 3
- Significant
Unobservable
Inputs | |
| | | (Amounts in thousands) | |
Assets: | | | | | | | | | | | | |
Common Stocks | | $ | 1,042,633 | | | $ | — | | | $ | — | |
| | | | |
Total Assets: | | $ | 1,042,633 | | | $ | — | | | $ | — | |
| | | | |
The Accompanying Notes are an Integral Part of the Financial Statements.
33
Equity Income Portfolio (unaudited)
| | | | |
| Objective: | | Portfolio Strategy: | | Net Assets: |
| Long-term growth of capital and income. | | Invest in common stocks with a focus on larger capitalization stocks with a strong track record of paying dividends, or that are believed to be undervalued. | | $718 million |
PORTFOLIO OVERVIEW
Mason Street Advisors, LLC (“Mason Street Advisors”), the investment adviser for the Equity Income Portfolio (the “Portfolio”), has engaged T. Rowe Price Associates, Inc. (“T. Rowe Price”) to act as sub-adviser for the Portfolio. Normally, the Portfolio invests in common stocks, with an emphasis on larger capitalization stocks with a strong track record of paying dividends or that are believed to be undervalued. The Portfolio’s yield, which reflects the level of dividends paid by the Portfolio, is expected to normally exceed the yield of the Russell 1000® Value Index. The Portfolio will typically employ a value approach in selecting investments. The Portfolio’s in-house research team seeks to identify companies that appear to be undervalued as measured by price to earnings ratio, dividend yield, enterprise value to sales, among other metrics and may be temporarily out of favor but have good prospects for capital appreciation and dividend growth.
MARKET OVERVIEW
U.S. equities posted strong gains in 2023, driven by generally favorable corporate earnings, a resilient economy and increased investor interest in artificial intelligence. The market overcame bearish factors such as regional bank turmoil in March; uncertainty about the debt ceiling; geopolitical concerns stemming from the ongoing Russian invasion of Ukraine and from Israel’s response to deadly Hamas attacks in early October; and a sluggish Chinese economic recovery. Arguably the most significant factor affecting the U.S. economy throughout the year was rising interest rates in response to elevated inflation. The U.S. Federal Reserve (the “Fed”) raised short-term interest rates four times through the end of July, lifting the fed funds target rate to a range of 5.25% – 5.50%. Equities rallied through year-end as Fed officials projected at their mid-December policy meeting that there could be three, quarter-point interest rate cuts in 2024.
PORTFOLIO RESULTS
The Portfolio returned 9.68% for the twelve months ended December 31, 2023. By comparison, the Portfolio’s benchmark, the Russell 1000® Value Index (the “Index”), returned 11.46%. (The Index is unmanaged, cannot be invested in directly and does not incur expenses.)
Overall, sector allocation was responsible for the Portfolio’s relative underperformance, but this was partially offset by security selection.
The Materials sector weighed on the Portfolio’s relative performance, due to unfavorable stock choices. CF Industries Holdings, the largest nitrogen fertilizer producer in North America, faced volatile fertilizer demand and pricing throughout the year. Early in 2023, weak fertilizer demand weighed on the company. This trend later reversed amid improved sentiment around the fertilizer cycle at the midpoint of the year but again fell to weaker levels during the last quarter of 2023.
The Consumer Discretionary sector also weighed on relative performance, owing to unfavorable stock choices. Early in 2023, Porsche AG benefited from increased delivery, management focusing on pricing and optimism around the company’s upcoming electric vehicle launches. Later in the year, shares were impacted as the company reported declining vehicle deliveries in China and leaned on volume instead of pricing to drive revenue growth.
The Communication Services sector detracted notably from the Portfolio’s relative performance, due to an underweight exposure and stock selection. The Communication Services sector contains several types of companies, including diversified telecommunication services, entertainment and media names.
On the upside, stock selection in the Industrials sector significantly contributed to relative performance. General Electric Company (“GE”) is a global industrial company operating in three segments: aviation, power and renewables. Over the year, GE trended upward as it made progress toward streamlining the business and benefited from a better-than-expected recovery in the aviation industry, improvement in renewables and a successful spinoff of its healthcare business.
34
Equity Income Portfolio (unaudited)
Stock choices in the Energy sector also contributed. Shares of TotalEnergies advanced over the period, as shares benefited from the company’s continued strong execution and focus on low cost production and shareholder-friendly capital allocation policies.
PORTFOLIO MANAGER OUTLOOK
The following forward-looking comments are the opinion of T. Rowe Price, the Portfolio’s sub-adviser.
The market was data point driven throughout 2023, and the most recent quarter was no exception, as the market rallied sharply on favorable inflation and employment news. While all eyes continue to be on the direction of monetary policy, we believe the Fed is also being heavily influenced by new data. We therefore expect the market to continue to be volatile, switching between optimism and pessimism depending on the next data point.
This backdrop creates a wide range of potential outcomes, and the likelihood of a recession versus a “soft landing” is largely unknown. For that reason, we aim to maintain a portfolio that is balanced for a variety of markets, focusing on taking advantage of attractive opportunities as they are presented to us. Ultimately, we believe stock picking will be critical, and our valuation discipline and long-term investment horizon will help serve clients well.
Relative Performance
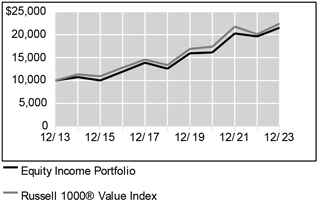
| | | | | | |
Average Annual Total Returns For Periods Ended December 31, 2023 |
| | | 1 Year | | 5 Years | | 10 Years |
Equity Income Portfolio | | 9.68% | | 11.32% | | 7.96% |
Russell 1000® Value Index | | 11.46% | | 10.91% | | 8.40% |
The performance data quoted represents past performance. Past performance is historical and does not guarantee future performance. Investment return and principal value will fluctuate, so that shares, when redeemed, may be worth more or less than their original cost. Current performance may be lower or higher than the performance data quoted. For the most recent month-end performance information visit www.northwesternmutual. com.
This chart assumes an initial investment of $10,000 made on 12/31/13. Returns shown reflect fee waivers, deductions for management and other portfolio expenses, and reinvestment of all dividends. In the absence of fee waivers, total return would be reduced. Returns exclude
deductions for separate account sale loads and account fees. Please refer to the Benchmark Definitions section of this report for information about the indices cited in the above chart and graph.
The Portfolio may invest a relatively high percentage of its assets in a particular sector. The Portfolio will have greater exposure to the risks associated with that sector and its performance will be tied more closely to the performance of the sector.
Top 10 Holdings 12/31/23
| | | | | | | | |
| | | | |
| | | Security Description | | % of Net Assets | | | | |
| | | | |
| | | Wells Fargo & Co. | | 3.0% | | | | |
| | | | |
| | | TotalEnergies SE, ADR | | 2.9% | | | | |
| | | | |
| | | QUALCOMM, Inc. | | 2.9% | | | | |
| | | | |
| | | The Southern Co. | | 2.6% | | | | |
| | | | |
| | | American International Group, Inc. | | 2.6% | | | | |
| | | | |
| | | General Electric Co. | | 2.4% | | | | |
| | | | |
| | | Elevance Health, Inc. | | 2.3% | | | | |
| | | | |
| | | News Corp., Various | | 2.2% | | | | |
| | | | |
| | | Chubb, Ltd. | | 2.2% | | | | |
| | | | |
| | | CF Industries Holdings, Inc. | | 1.8% | | | | |
35
Equity Income Portfolio (unaudited)
Sector Allocation 12/31/23
| | | | | | | | |
| | | | |
| | | Sector | | % of Net Assets | | | | |
| | | | |
| | | Financials | | 21.7% | | | | |
| | | | |
| | | Health Care | | 15.8% | | | | |
| | | | |
| | | Industrials | | 12.7% | | | | |
| | | | |
| | | Information Technology | | 9.9% | | | | |
| | | | |
| | | Energy | | 8.5% | | | | |
| | | | |
| | | Consumer Staples | | 8.0% | | | | |
| | | | |
| | | Utilities | | 6.4% | | | | |
| | | | |
| | | Communication Services | | 4.6% | | | | |
| | | | |
| | | Real Estate | | 4.2% | | | | |
| | | | |
| | | Consumer Discretionary | | 3.9% | | | | |
| | | | |
| | | Materials | | 3.2% | | | | |
| | | | |
| | | Short-Term Investments & Other Net Assets | | 1.1% | | | | |
Sector Allocation and Top 10 Holdings are subject to change.
36
Equity Income Portfolio
SCHEDULE OF INVESTMENTS
December 31, 2023
| | | | | | | | |
Common Stocks (98.7%) | | Shares/ Par + | | | Value
$ (000’s) | |
Communication Services (4.6%) | | | | | |
AT&T, Inc. | | | 61,563 | | | | 1,033 | |
Comcast Corp. - Class A | | | 55,144 | | | | 2,418 | |
Meta Platforms, Inc. - Class A * | | | 3,402 | | | | 1,204 | |
News Corp. - Class A | | | 585,877 | | | | 14,384 | |
News Corp. - Class B | | | 59,602 | | | | 1,533 | |
Verizon Communications, Inc. | | | 123,925 | | | | 4,672 | |
The Walt Disney Co. | | | 89,968 | | | | 8,123 | |
| | | | | | | | |
Total | | | | | | | 33,367 | |
| | | | | | | | |
| |
Consumer Discretionary (3.9%) | | | | | |
Best Buy Co., Inc. | | | 32,589 | | | | 2,551 | |
Dr. Ing. h.c. F. Porsche AG - Preference Shares | | | 48,030 | | | | 4,236 | |
Kohl’s Corp. | | | 120,347 | | | | 3,451 | |
Las Vegas Sands Corp. | | | 147,615 | | | | 7,264 | |
Mattel, Inc. * | | | 198,959 | | | | 3,756 | |
The TJX Cos., Inc. | | | 23,481 | | | | 2,203 | |
Volkswagen AG, ADR | | | 384,765 | | | | 4,721 | |
| | | | | | | | |
Total | | | | | | | 28,182 | |
| | | | | | | | |
| |
Consumer Staples (8.0%) | | | | | |
Colgate-Palmolive Co. | | | 56,500 | | | | 4,504 | |
Conagra Brands, Inc. | | | 296,809 | | | | 8,506 | |
Constellation Brands, Inc. - Class A | | | 8,000 | | | | 1,934 | |
Dollar General Corp. | | | 12,900 | | | | 1,754 | |
Kenvue, Inc. | | | 320,887 | | | | 6,909 | |
Kimberly-Clark Corp. | | | 59,911 | | | | 7,280 | |
Mondelez International, Inc. | | | 13,400 | | | | 970 | |
Philip Morris International, Inc. | | | 128,126 | | | | 12,054 | |
Tyson Foods, Inc. - Class A | | | 112,238 | | | | 6,033 | |
Walmart, Inc. | | | 47,612 | | | | 7,506 | |
| | | | | | | | |
Total | | | | | | | 57,450 | |
| | | | | | | | |
| | |
Energy (8.5%) | | | | | | | | |
Chevron Corp. | | | 9,199 | | | | 1,372 | |
ConocoPhillips | | | 13,500 | | | | 1,567 | |
Enbridge, Inc. | | | 118,135 | | | | 4,255 | |
EOG Resources, Inc. | | | 47,523 | | | | 5,748 | |
EQT Corp. | | | 71,900 | | | | 2,780 | |
Exxon Mobil Corp. | | | 94,935 | | | | 9,492 | |
Hess Corp. | | | 41,400 | | | | 5,968 | |
Suncor Energy, Inc. | | | 105,700 | | | | 3,387 | |
TC Energy Corp. | | | 75,493 | | | | 2,951 | |
TotalEnergies SE, ADR | | | 309,680 | | | | 20,866 | |
The Williams Cos., Inc. | | | 67,800 | | | | 2,361 | |
| | | | | | | | |
Total | | | | | | | 60,747 | |
| | | | | | | | |
| | | | | | | | |
Common Stocks (98.7%) | | Shares/ Par + | | | Value
$ (000’s) | |
Financials (21.7%) | | | | | | | | |
American International Group, Inc. | | | 269,784 | | | | 18,278 | |
Apollo Global Management, Inc. | | | 20,264 | | | | 1,889 | |
Bank of America Corp. | | | 109,899 | | | | 3,700 | |
The Bank of New York Mellon Corp. | | | 28,900 | | | | 1,504 | |
The Carlyle Group, Inc. | | | 14,700 | | | | 598 | |
The Charles Schwab Corp. | | | 163,127 | | | | 11,223 | |
Chubb, Ltd. | | | 69,798 | | | | 15,774 | |
Citigroup, Inc. | | | 78,611 | | | | 4,044 | |
Equitable Holdings, Inc. | | | 359,636 | | | | 11,976 | |
Fifth Third Bancorp | | | 275,073 | | | | 9,487 | |
The Goldman Sachs Group, Inc. | | | 6,480 | | | | 2,500 | |
The Hartford Financial Services Group, Inc. | | | 93,964 | | | | 7,553 | |
Huntington Bancshares, Inc. | | | 573,971 | | | | 7,301 | |
JPMorgan Chase & Co. | | | 46,859 | | | | 7,971 | |
Loews Corp. | | | 106,520 | | | | 7,413 | |
MetLife, Inc. | | | 159,472 | | | | 10,546 | |
Morgan Stanley | | | 32,858 | | | | 3,064 | |
U.S. Bancorp | | | 224,355 | | | | 9,710 | |
Wells Fargo & Co. | | | 434,401 | | | | 21,381 | |
| | | | | | | | |
Total | | | | | | | 155,912 | |
| | | | | | | | |
| | |
Health Care (15.8%) | | | | | | | | |
AbbVie, Inc. | | | 31,784 | | | | 4,926 | |
AstraZeneca PLC, ADR | | | 69,761 | | | | 4,698 | |
Becton Dickinson and Co. | | | 53,026 | | | | 12,929 | |
Biogen, Inc. * | | | 9,603 | | | | 2,485 | |
Cardinal Health, Inc. | | | 11,975 | | | | 1,207 | |
Centene Corp. * | | | 23,849 | | | | 1,770 | |
Cigna Corp. | | | 25,681 | | | | 7,690 | |
CVS Health Corp. | | | 110,711 | | | | 8,742 | |
Elevance Health, Inc. | | | 34,908 | | | | 16,461 | |
GE HealthCare Technologies, Inc. | | | 47,432 | | | | 3,667 | |
Humana, Inc. | | | 1,600 | | | | 733 | |
Johnson & Johnson | | | 52,968 | | | | 8,302 | |
Medtronic PLC | | | 72,360 | | | | 5,961 | |
Merck & Co., Inc. | | | 58,805 | | | | 6,411 | |
Pfizer, Inc. | | | 249,692 | | | | 7,189 | |
Sanofi | | | 105,209 | | | | 5,232 | |
Viatris, Inc. | | | 464,900 | | | | 5,035 | |
Zimmer Biomet | | | | | | | | |
Holdings, Inc. | | | 79,153 | | | | 9,633 | |
| | | | | | | | |
Total | | | | | | | 113,071 | |
| | | | | | | | |
| | | | | | | | |
Common Stocks (98.7%) | | Shares/ Par + | | | Value
$ (000’s) | |
Industrials (12.7%) | | | | | | | | |
3M Co. | | | 14,516 | | | | 1,587 | |
The Boeing Co. * | | | 47,437 | | | | 12,365 | |
Cummins, Inc. | | | 9,467 | | | | 2,268 | |
Flowserve Corp. | | | 15,375 | | | | 634 | |
General Electric Co. | | | 132,196 | | | | 16,872 | |
Honeywell International, Inc. | | | 4,600 | | | | 965 | |
L3Harris Technologies, Inc. | | | 61,072 | | | | 12,863 | |
Norfolk Southern Corp. | | | 22,400 | | | | 5,295 | |
Siemens AG, ADR | | | 97,485 | | | | 9,119 | |
Southwest Airlines Co. | | | 214,600 | | | | 6,197 | |
Stanley Black & Decker, Inc. | | | 92,406 | | | | 9,065 | |
Stericycle, Inc. * | | | 69,813 | | | | 3,460 | |
Union Pacific Corp. | | | 14,500 | | | | 3,561 | |
United Parcel Service, Inc. - Class B | | | 45,276 | | | | 7,119 | |
| | | | | | | | |
Total | | | | | | | 91,370 | |
| | | | | | | | |
| |
Information Technology (9.9%) | | | | | |
Accenture PLC - Class A | | | 11,100 | | | | 3,895 | |
Advanced Micro Devices, Inc. * | | | 3,700 | | | | 545 | |
Applied Materials, Inc. | | | 51,571 | | | | 8,358 | |
Cisco Systems, Inc. | | | 26,019 | | | | 1,315 | |
Fiserv, Inc. * | | | 60,847 | | | | 8,083 | |
Intel Corp. | | | 15,300 | | | | 769 | |
Microsoft Corp. | | | 31,862 | | | | 11,981 | |
QUALCOMM, Inc. | | | 142,240 | | | | 20,572 | |
Samsung Electronics Co., Ltd. | | | 101,195 | | | | 6,155 | |
TE Connectivity, Ltd. | | | 24,973 | | | | 3,509 | |
Texas Instruments, Inc. | | | 36,216 | | | | 6,173 | |
| | | | | | | | |
Total | | | | | | | 71,355 | |
| | | | | | | | |
| | |
Materials (3.2%) | | | | | | | | |
CF Industries Holdings, Inc. | | | 163,321 | | | | 12,984 | |
International Flavors & Fragrances, Inc. | | | 20,048 | | | | 1,623 | |
International Paper Co. | | | 222,879 | | | | 8,057 | |
| | | | | | | | |
Total | | | | | | | 22,664 | |
| | | | | | | | |
| | |
Real Estate (4.2%) | | | | | | | | |
Equity Residential | | | 159,672 | | | | 9,766 | |
Rayonier, Inc. | | | 183,920 | | | | 6,145 | |
Vornado Realty Trust | | | 11,300 | | | | 319 | |
Welltower, Inc. | | | 15,750 | | | | 1,420 | |
Weyerhaeuser Co. | | | 356,520 | | | | 12,396 | |
| | | | | | | | |
Total | | | | | | | 30,046 | |
| | | | | | | | |
The Accompanying Notes are an Integral Part of the Financial Statements.
37
Equity Income Portfolio
| | | | | | | | |
Common Stocks (98.7%) | | Shares/ Par + | | | Value
$ (000’s) | |
Utilities (6.2%) | | | | | | | | |
Ameren Corp. | | | 40,118 | | | | 2,902 | |
Dominion Energy, Inc. | | | 203,125 | | | | 9,547 | |
NextEra Energy, Inc. | | | 83,409 | | | | 5,066 | |
NiSource, Inc. | | | 51,985 | | | | 1,380 | |
PG&E Corp. | | | 59,424 | | | | 1,071 | |
Sempra Energy | | | 74,990 | | | | 5,604 | |
The Southern Co. | | | 266,592 | | | | 18,694 | |
| | | | | | | | |
Total | | | | 44,264 | |
| | | | | |
| |
Total Common Stocks
(Cost: $553,308) | | | | 708,428 | |
| | | | | | | | |
| | | | | | | | |
Convertible Preferred Stocks (0.2%) | | Shares/ Par + | | | Value
$ (000’s) | |
Utilities (0.2%) | | | | | | | | |
NextEra Energy, Inc.,
6.926%, 8/28/25 | | | 28,779 | | | | 1,097 | |
| | | | | | | | |
Total | | | | | | | 1,097 | |
| | | | | | | | |
| |
Total Convertible Preferred Stocks (Cost: $1,403) | | | | 1,097 | |
| | | | | | | | |
| |
Total Investments (98.9%)
(Cost: $554,711)@ | | | | 709,525 | |
| | | | | | | | |
| |
Other Assets, Less Liabilities (1.1%) | | | | 7,966 | |
| | | | | | | | |
| |
Net Assets (100.0%) | | | | 717,491 | |
| | | | | | | | |
| + | All par is stated in U.S. Dollar unless otherwise noted. |
| @ | At December 31, 2023, the aggregate cost of investments, including derivatives, for federal tax purposes (in thousands) was $555,969 and the net unrealized appreciation of investments based on that cost was $153,556 which is comprised of $178,169 aggregate gross unrealized appreciation and $24,613 aggregate gross unrealized depreciation. |
The following is a summary of the inputs used in valuing the Portfolio’s Investments at December 31, 2023. See Note 3 for additional information on portfolio valuation.
| | | | | | | | | | | | |
| | | Valuation Inputs | |
| Description | | Level 1 - Quoted
Prices | | | Level 2 - Other
Significant
Observable Inputs | | | Level 3
- Significant
Unobservable
Inputs | |
| | | (Amounts in thousands) | |
Assets: | | | | | | | | | | | | |
Common Stocks | | | | | | | | | | | | |
Consumer Discretionary | | $ | 23,946 | | | $ | 4,236 | | | $ | — | |
Information Technology | | | 65,200 | | | | 6,155 | | | | — | |
All Others | | | 608,891 | | | | — | | | | — | |
Convertible Preferred Stocks | | | 1,097 | | | | — | | | | — | |
| | | | |
Total Assets: | | $ | 699,134 | | | $ | 10,391 | | | $ | — | |
| | | | |
The Accompanying Notes are an Integral Part of the Financial Statements.
38
Mid Cap Growth Stock Portfolio (unaudited)
| | | | |
| Objective: | | Portfolio Strategy: | | Net Assets: |
| Long-term growth of capital. | | Invest primarily in common stocks of mid cap domestic companies selected on the basis of their potential for capital appreciation. | | $1.1 billion |
PORTFOLIO OVERVIEW
Mason Street Advisors, LLC (“Mason Street Advisors”), the investment adviser for the Mid Cap Growth Stock Portfolio (the “Portfolio”), has engaged Wellington Management Company LLP (“Wellington”) to act as sub-adviser for the Portfolio. The Portfolio invests primarily in common stocks of mid cap companies selected on the basis of their potential for capital appreciation. The Portfolio focuses on companies that are determined to be of high quality. The key characteristics of high quality companies include a leadership position within an industry, a strong balance sheet, a high return on equity and/or a strong management team. The Portfolio seeks to reduce overall risk by diversifying across sectors, industry groups and companies. The Portfolio’s sector exposure relative to its benchmark is driven by an investment process which relies on fundamental company analysis and individual stock selection.
MARKET OVERVIEW
U.S. equities rose during the twelve months ended December 31, 2023 amid easing inflation, optimism for lower interest rates, strong performances in select mega-capitalization technology companies and steady Gross Domestic Product growth. Early in 2023, the collapse of two U.S. regional banks prompted swift policy actions by federal regulators, which helped stabilize liquidity and stem the potential for broader contagion. The U.S. Federal Reserve (the “Fed”) slowed its pace of policy tightening. Shares of a narrow group of mega-capitalization technology companies surged, helping growth stocks significantly outperform their value counterparts. These companies benefited from investor optimism about earnings potential and growth prospects and exuberance surrounding generative artificial intelligence. U.S. equities fell in the third quarter, pressured by rising U.S. Treasury yields amid views that the Fed would keep interest rates elevated for a prolonged period. In the fourth quarter, U.S. equities rallied, registering their largest quarterly return in three years as gains broadened beyond those select mega-capitalization stocks that dominated the stock market’s earlier performance. A rapid descent in inflation prompted the Fed to pivot, with policymakers anticipating 75 bps of interest rate cuts in 2024.
PORTFOLIO RESULTS
The Portfolio returned 14.96% for the twelve months ended December 31, 2023. By comparison, the Portfolio’s benchmark, the Russell Midcap® Growth Index (the “Index”), returned 25.87%. (The Index is unmanaged, cannot be invested in directly and does not incur expenses.)
Weak stock selection within the Financials, Healthcare and Consumer Discretionary sectors drove the Portfolio’s relative underperformance during the period. Sector allocation, a residual of the Portfolio’s bottom-up stock selection process, also underperformed, mainly due to an underweight in the Information Technology sector and overweight to the Healthcare and Materials sectors.
The top detractors included out-of-benchmark positions in Consumer Discretionary sector company, Chewy, Financials sector company, First Republic Bank and Healthcare sector company, United Therapeutics. Shares of online pet retailer Chewy, Inc. declined as customers switched to lower priced pet food amid high inflation and the company reported a modest decrease in active customers year-over-year. Shares of First Republic Bank fell sharply during the first quarter on fears a wave of banking failures could hit the regional lender, especially as officials considered providing additional support to allow the bank more time for balance sheet adjustments. The share price has bottomed out and not recovered. Shares of biotechnology company United Therapeutics declined after reporting fourth quarter 2022 and first quarter 2023 earnings missed consensus estimates.
Strong selection in the Energy sector, an underweight to the Consumer Staples sector and overweight to the Industrials sector contributed to the Portfolio’s relative performance. The top contributors included an overweight to Healthcare sector company, Apellis Pharmaceuticals, which advanced as the company reported strong third quarter 2023 revenue results for a new eye medication, Syfovre. Out-of-benchmark positions in Industrials sector companies, Builders FirstSource and Lennox International also contributed to relative performance. Builders FirstSource benefited as the homebuilder reported consecutive earnings above consensus estimates. The company has seen better-than-expected results in their manufactured products and windows, doors and millwork segments. Lennox International, an HVAC systems provider,
39
Mid Cap Growth Stock Portfolio (unaudited)
advanced after surpassing consensus earnings-per-share estimates over the last four quarters and raising full-year guidance.
PORTFOLIO MANAGER OUTLOOK
The following forward-looking comments are the opinion of Wellington, the Portfolio’s sub-adviser.
Our belief that business fundamentals will drive stock prices moving forward remains unchanged. While rate expectations have continued to drive market sentiment in the short-term, the valuation paradigm of negative real interest rates has changed dramatically. We are finding more opportunities in stable growth software companies. While growth will be harder to come by with higher costs of capital, the pace of technological change will continue to move forward and accelerate. In that context, we remain focused on finding businesses that can benefit from this change. We remain sensitive to cyclical demand risks for the companies we invest in, choosing to focus on those that have more control over their own destiny.
Relative Performance

| | | | | | |
Average Annual Total Returns For Periods Ended December 31, 2023 |
| | | 1 Year | | 5 Years | | 10 Years |
Mid Cap Growth Stock Portfolio | | 14.96% | | 10.00% | | 7.05% |
Russell MidCap® Growth Index | | 25.87% | | 13.81% | | 10.57% |
The performance data quoted represents past performance. Past performance is historical and does not guarantee future performance. Investment return and principal value will fluctuate, so that shares, when redeemed, may be worth more or less than their original cost. Current performance may be lower or higher than the performance data quoted. For the most recent month-end performance information visit www.northwesternmutual.com.
This chart assumes an initial investment of $10,000 made on 12/31/13. Returns shown reflect fee waivers, deductions for management and other portfolio expenses, and reinvestment of all dividends. In the absence of fee waivers, total return would be reduced. Returns exclude deductions for separate account sale loads and account fees. Please refer to the Benchmark Definitions section of this report for information about the indices cited in the above chart and graph.
The Portfolio may invest a relatively high percentage of its assets in a particular sector. The Portfolio will have greater exposure to the risks associated with that sector and its performance will be tied more closely to the performance of the sector.
Top 10 Holdings 12/31/23
| | | | | | | | |
| | | | |
| | | Security Description | | % of Net Assets | | | | |
| | | | |
| | | NVR, Inc. | | 2.2% | | | | |
| | | | |
| | | Datadog, Inc. - Class A | | 2.1% | | | | |
| | | | |
| | | HubSpot, Inc. | | 2.1% | | | | |
| | | | |
| | | Fair Isaac Corp. | | 2.0% | | | | |
| | | | |
| | | Apellis Pharmaceuticals, Inc. | | 1.9% | | | | |
| | | | |
| | | WEX, Inc. | | 1.9% | | | | |
| | | | |
| | | Lennox International, Inc. | | 1.9% | | | | |
| | | | |
| | | MongoDB, Inc. | | 1.8% | | | | |
| | | | |
| | | Dynatrace, Inc. | | 1.8% | | | | |
| | | | |
| | | Inari Medical, Inc. | | 1.8% | | | | |
Sector Allocation 12/31/23
| | | | | | | | |
| | | | |
| | | Sector | | % of Net Assets | | | | |
| | | | |
| | | Information Technology | | 22.0% | | | | |
| | | | |
| | | Health Care | | 21.5% | | | | |
| | | | |
| | | Industrials | | 20.4% | | | | |
| | | | |
| | | Consumer Discretionary | | 12.4% | | | | |
| | | | |
| | | Financials | | 11.6% | | | | |
| | | | |
| | | Energy | | 4.3% | | | | |
| | | | |
| | | Materials | | 2.4% | | | | |
| | | | |
| | | Communication Services | | 1.7% | | | | |
| | | | |
| | | Consumer Staples | | 1.5% | | | | |
| | | | |
| | | Real Estate | | 1.3% | | | | |
| | | | |
| | | Utilities | | 0.8% | | | | |
| | | | |
| | | Short-Term Investments & Other Net Assets | | 0.1% | | | | |
Sector Allocation and Top 10 Holdings are subject to change.
40
Mid Cap Growth Stock Portfolio
SCHEDULE OF INVESTMENTS
December 31, 2023
| | | | | | | | |
Common Stocks (99.9%) | | Shares/ Par + | | | Value
$ (000’s) | |
Communication Services (1.7%) | | | | | |
Cable One, Inc. | | | 13,211 | | | | 7,353 | |
Pinterest, Inc. * | | | 182,721 | | | | 6,768 | |
Roku, Inc. * | | | 48,937 | | | | 4,486 | |
| | | | | | | | |
Total | | | | | | | 18,607 | |
| | | | | | | | |
|
Consumer Discretionary (12.4%) | |
BorgWarner, Inc. | | | 114,944 | | | | 4,121 | |
CarMax, Inc. * | | | 167,686 | | | | 12,868 | |
Chewy, Inc. * | | | 244,852 | | | | 5,786 | |
Choice Hotels International, Inc. | | | 90,914 | | | | 10,301 | |
Deckers Outdoor Corp. * | | | 23,007 | | | | 15,379 | |
DraftKings, Inc. * | | | 500,905 | | | | 17,657 | |
Floor & Decor Holdings, Inc. * | | | 69,755 | | | | 7,782 | |
Hyatt Hotels Corp. - Class A | | | 90,875 | | | | 11,851 | |
NVR, Inc. * | | | 3,384 | | | | 23,689 | |
Valvoline, Inc. * | | | 342,534 | | | | 12,872 | |
Visteon Corp. * | | | 94,652 | | | | 11,822 | |
| | | | | | | | |
Total | | | | | | | 134,128 | |
| | | | | | | | |
| |
Consumer Staples (1.5%) | | | | | |
BJ’s Wholesale Club | | | | | | | | |
Holdings, Inc. * | | | 107,191 | | | | 7,145 | |
Post Holdings, Inc. * | | | 98,093 | | | | 8,638 | |
| | | | | | | | |
Total | | | | | | | 15,783 | |
| | | | | | | | |
| | |
Energy (4.3%) | | | | | | | | |
Coterra Energy, Inc. | | | 348,861 | | | | 8,903 | |
Marathon Oil Corp. | | | 434,425 | | | | 10,496 | |
Ovintiv, Inc. | | | 217,872 | | | | 9,569 | |
Targa Resources Corp. | | | 207,196 | | | | 17,999 | |
| | | | | | | | |
Total | | | | | | | 46,967 | |
| | | | | | | | |
| | |
Financials (11.6%) | | | | | | | | |
Credit Acceptance Corp. * | | | 33,851 | | | | 18,033 | |
Hamilton Lane, Inc. | | | 74,731 | | | | 8,477 | |
M&T Bank Corp. | | | 36,927 | | | | 5,062 | |
Markel Corp. * | | | 12,231 | | | | 17,367 | |
Morningstar, Inc. | | | 5,359 | | | | 1,534 | |
Nuvei Corp. | | | 529,635 | | | | 13,908 | |
Shift4 Payments, Inc. * | | | 243,403 | | | | 18,095 | |
Tradeweb Markets, Inc. | | | 151,493 | | | | 13,768 | |
W.R. Berkley Corp. | | | 70,316 | | | | 4,973 | |
WEX, Inc. * | | | 107,437 | | | | 20,902 | |
White Mountains Insurance Group, Ltd. | | | 2,483 | | | | 3,737 | |
| | | | | | | | |
Total | | | | | | | 125,856 | |
| | | | | | | | |
| | | | | | | | |
Common Stocks (99.9%) | | Shares/ Par + | | | Value
$ (000’s) | |
Health Care (21.5%) | |
Acadia Healthcare Co., Inc. * | | | 112,919 | | | | 8,781 | |
Agilon Health, Inc. * | | | 785,281 | | | | 9,855 | |
Alnylam Pharmaceuticals, Inc. * | | | 50,992 | | | | 9,760 | |
Apellis Pharmaceuticals, Inc. * | | | 351,632 | | | | 21,049 | |
Bio-Techne Corp. | | | 145,752 | | | | 11,246 | |
Exact Sciences Corp. * | | | 239,866 | | | | 17,745 | |
ICON PLC * | | | 44,791 | | | | 12,679 | |
Inari Medical, Inc. * | | | 291,850 | | | | 18,947 | |
Jazz Pharmaceuticals PLC * | | | 88,633 | | | | 10,902 | |
Mettler-Toledo International, Inc. * | | | 3,383 | | | | 4,103 | |
Molina Healthcare, Inc. * | | | 33,933 | | | | 12,260 | |
Neurocrine Biosciences, Inc. * | | | 103,550 | | | | 13,644 | |
PTC Therapeutics, Inc. * | | | 374,066 | | | | 10,309 | |
Repligen Corp. * | | | 49,670 | | | | 8,931 | |
Sarepta Therapeutics, Inc. * | | | 105,067 | | | | 10,132 | |
Shockwave Medical, Inc. * | | | 62,783 | | | | 11,964 | |
Ultragenyx Pharmaceutical, Inc. * | | | 225,920 | | | | 10,803 | |
United Therapeutics Corp. * | | | 64,762 | | | | 14,241 | |
Veeva Systems, Inc. - Class A * | | | 77,238 | | | | 14,870 | |
| | | | | | | | |
Total | | | | | | | 232,221 | |
| | | | | | | | |
| | |
Industrials (20.4%) | | | | | | | | |
Acuity Brands, Inc. | | | 8,519 | | | | 1,745 | |
AMERCO | | | 216,526 | | | | 15,252 | |
Axon Enterprise, Inc. * | | | 70,622 | | | | 18,244 | |
Builders FirstSource, Inc. * | | | 52,437 | | | | 8,754 | |
Ceridian HCM Holding, Inc. * | | | 171,925 | | | | 11,540 | |
Expeditors International of Washington, Inc. | | | 128,799 | | | | 16,383 | |
Fortive Corp. | | | 154,778 | | | | 11,396 | |
Genpact, Ltd. | | | 352,797 | | | | 12,245 | |
Graco, Inc. | | | 159,092 | | | | 13,803 | |
IDEX Corp. | | | 55,649 | | | | 12,082 | |
Ingersoll-Rand, Inc. | | | 139,349 | | | | 10,777 | |
J.B. Hunt Transport Services, Inc. | | | 62,630 | | | | 12,510 | |
| | | | | | | | |
Common Stocks (99.9%) | | Shares/ Par + | | | Value
$ (000’s) | |
Industrials continued | |
Knight-Swift Transportation Holdings, Inc. | | | 147,662 | | | | 8,513 | |
Lennox International, Inc. | | | 44,979 | | | | 20,129 | |
Lincoln Electric Holdings, Inc. | | | 43,915 | | | | 9,550 | |
Robert Half International, Inc. | | | 78,705 | | | | 6,920 | |
TransUnion | | | 41,747 | | | | 2,868 | |
Watsco, Inc. | | | 30,464 | | | | 13,053 | |
Westinghouse Air Brake Technologies Corp. | | | 117,577 | | | | 14,920 | |
| | | | | | | | |
Total | | | | | | | 220,684 | |
| | | | | | | | |
| |
Information Technology (22.0%) | | | | | |
ANSYS, Inc. * | | | 37,295 | | | | 13,534 | |
CDW Corp. | | | 38,454 | | | | 8,741 | |
CyberArk Software, Ltd. * | | | 48,387 | | | | 10,599 | |
Datadog, Inc. - Class A * | | | 186,451 | | | | 22,631 | |
Dynatrace, Inc. * | | | 352,497 | | | | 19,278 | |
F5, Inc. * | | | 31,701 | | | | 5,674 | |
Fair Isaac Corp. * | | | 18,962 | | | | 22,072 | |
First Solar, Inc. * | | | 31,637 | | | | 5,450 | |
Flex, Ltd. * | | | 177,483 | | | | 5,406 | |
HubSpot, Inc. * | | | 38,167 | | | | 22,157 | |
Informatica, Inc. * | | | 559,159 | | | | 15,875 | |
Lattice Semiconductor Corp. * | | | 47,647 | | | | 3,287 | |
MKS Instruments, Inc. | | | 98,193 | | | | 10,101 | |
MongoDB, Inc. * | | | 47,511 | | | | 19,425 | |
Monolithic Power Systems, Inc. | | | 23,443 | | | | 14,787 | |
Onto Innovation, Inc. * | | | 34,189 | | | | 5,228 | |
PTC, Inc. * | | | 50,261 | | | | 8,794 | |
Rambus, Inc. * | | | 98,224 | | | | 6,704 | |
Silicon Laboratories, Inc. * | | | 21,518 | | | | 2,846 | |
Unity Software, Inc. * | | | 87,060 | | | | 3,560 | |
VeriSign, Inc. * | | | 57,952 | | | | 11,936 | |
| | | | | | | | |
Total | | | | | | | 238,085 | |
| | | | | | | | |
| | |
Materials (2.4%) | | | | | | | | |
Ball Corp. | | | 86,050 | | | | 4,949 | |
Celanese Corp. | | | 34,383 | | | | 5,342 | |
Element Solutions, Inc. | | | 229,375 | | | | 5,308 | |
Graphic Packaging Holding Co. | | | 215,083 | | | | 5,302 | |
Silgan Holdings, Inc. | | | 116,821 | | | | 5,286 | |
| | | | | | | | |
Total | | | | | | | 26,187 | |
| | | | | | | | |
The Accompanying Notes are an Integral Part of the Financial Statements.
41
Mid Cap Growth Stock Portfolio
| | | | | | | | |
Common Stocks (99.9%) | | Shares/ Par + | | | Value
$ (000’s) | |
Real Estate (1.3%) | | | | | | | | |
Lamar Advertising Co. - Class A | | | 87,757 | | | | 9,327 | |
Rexford Industrial Realty, Inc. | | | 81,585 | | | | 4,577 | |
| | | | | | | | |
Total | | | | | | | 13,904 | |
| | | | | | | | |
| | |
Utilities (0.8%) | | | | | | | | |
Atmos Energy Corp. | | | 40,374 | | | | 4,679 | |
NiSource, Inc. | | | 161,101 | | | | 4,277 | |
| | | | | | | | |
Total | | | | | | | 8,956 | |
| | | | | | | | |
| |
Total Common Stocks
(Cost: $906,899) | | | | 1,081,378 | |
| | | | | |
| |
Total Investments (99.9%)
(Cost: $906,899)@ | | | | 1,081,378 | |
| | | | | |
| |
Other Assets, Less Liabilities (0.1%) | | | | 596 | |
| | | | | |
| |
Net Assets (100.0%) | | | | 1,081,974 | |
| | | | | | | | |
| + | All par is stated in U.S. Dollar unless otherwise noted. |
| @ | At December 31, 2023, the aggregate cost of investments, including derivatives, for federal tax purposes (in thousands) was $911,837 and the net unrealized appreciation of investments based on that cost was $169,541 which is comprised of $223,079 aggregate gross unrealized appreciation and $53,538 aggregate gross unrealized depreciation. |
The following is a summary of the inputs used in valuing the Portfolio’s Investments at December 31, 2023. See Note 3 for additional information on portfolio valuation.
| | | | | | | | | | | | |
| | | Valuation Inputs | |
| Description | | Level 1 - Quoted
Prices | | | Level 2 - Other
Significant
Observable Inputs | | | Level 3
- Significant
Unobservable
Inputs | |
| | | (Amounts in thousands) | |
Assets: | | | | | | | | | | | | |
Common Stocks | | $ | 1,081,378 | | | $ | — | | | $ | — | |
| | | | |
Total Assets: | | $ | 1,081,378 | | | $ | — | | | $ | — | |
| | | | |
The Accompanying Notes are an Integral Part of the Financial Statements.
42
Index 400 Stock Portfolio (unaudited)
| | | | |
| Objective: | | Portfolio Strategy: | | Net Assets: |
| Investment results that approximate the performance of the S&P MidCap 400® Index. | | Invest in stocks that make up the S&P MidCap 400® Index, holding each stock in approximately the same proportion as its weighting in the Index. | | $1.3 billion |
PORTFOLIO OVERVIEW
Mason Street Advisors, LLC (“Mason Street Advisors”), the investment adviser for the Index 400 Stock Portfolio (the “Portfolio”), has engaged Northern Trust Investments, Inc. (“Northern Trust”) to act as sub-adviser for the Portfolio. The Portfolio seeks investment results that approximate the performance of the S&P MidCap 400® Index, which is composed of the stocks of companies whose capitalizations generally are smaller than those of companies that comprise the S&P 500® Index. The S&P MidCap 400® Index does not include the stocks of the very large companies that account for most of the weighting in the S&P 500® Index. The Portfolio attempts to achieve its objective by investing all, or substantially all, of its assets in the stocks that make up the S&P MidCap 400® Index, holding each stock in approximately the same proportion as its weighting in the Index. This is known as a full replication strategy. The Portfolio may also invest in S&P MidCap 400® Index stock futures to help achieve full replication.
MARKET OVERVIEW
The U.S. equity market climbed a wall of worry in 2023 - stock prices jumped double digits despite a year filled with extraordinary events that had the potential to give any investor pause, including the Silicon Valley Bank crisis, U.S. debt default fears, as well as geopolitical tensions in the Middle East. In the end, investors focused on the U.S.’s resilient economic growth, rapidly declining inflation reports, and the widely held expectation late in the year that the U.S. Federal Reserve would prove successful in soft landing the economy in 2024.
In this environment, large-cap stocks, as represented by the S&P 500® Index, posted a return of 26.29%, outperforming the S&P MidCap 400® and the S&P SmallCap 600® Indices, which returned 16.44% and 16.05%, respectively. Meanwhile, the broader bond market, as represented by the Bloomberg® U.S. Aggregate Index, returned 5.53%, while the Bloomberg® U.S. Corporate High Yield Index returned 13.45%.
PORTFOLIO RESULTS
The Portfolio delivered a total return of 16.15% for the twelve months ended December 31, 2023, trailing the S&P MidCap 400® Index (the “Index”), which returned 16.44%. (The Index is unmanaged, cannot be invested in directly and does not incur expenses.) Portfolio performance slightly lagged the Index due to transaction costs, administrative expenses, cash flow effects and costs associated with the use of stock index futures contracts.
The Industrials sector contributed the most to the Portfolio’s return. Strength in the Industrials sector was driven by the machinery industry, which benefited from the incorporation of major advances in technology to improve productivity, leading to lower operating costs. The building products industry contributed as rising home prices increased the need for new construction. The construction surge also supported the Consumer Discretionary sector as companies in the specialty retail industry provided materials for new home construction.
The Information Technology sector also contributed meaningfully, benefiting from better-than-expected earnings growth, investor enthusiasm for corporate cost-cutting and optimism that artificial intelligence (AI) could lead to strong growth opportunities in technology and technology-related companies. The Materials sector also advanced, driven by the metals and mining industry as the shift to renewable energy increased demand for metals used in the transition, particularly those needed for electric batteries.
On the downside, the Utilities and Healthcare sectors detracted modestly from the Portfolio’s return for the reporting period. The Utilities sector is generally seen as a more defensive sector, typically benefiting from lower volatility returns and consistent dividend payments. However, as higher monetary policy rates pushed longer-dated U.S. Treasury yields to 15-year highs, investors favored the higher yields on these government issued securities. Weakness in the Healthcare sector was driven by falling share prices in the biotechnology industry, largely due to rising interest rates weakening these companies’ ability to borrow capital.
43
Index 400 Stock Portfolio (unaudited)
Relative Performance
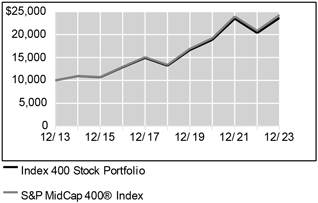
| | | | | | |
Average Annual Total Returns For Periods Ended December 31, 2023 |
| | | 1 Year | | 5 Years | | 10 Years |
Index 400 Stock Portfolio | | 16.15% | | 12.34% | | 8.99% |
S&P MidCap 400® Index | | 16.44% | | 12.63% | | 9.27% |
The performance data quoted represents past performance. Past performance is historical and does not guarantee future performance. Investment return and principal value will fluctuate, so that shares, when redeemed, may be worth more or less than their original cost. Current performance may be lower or higher than the performance data quoted. For the most recent month-end performance information visit www.northwesternmutual.com.
This chart assumes an initial investment of $10,000 made on 12/31/13. Returns shown reflect fee waivers, deductions for management and other portfolio expenses, and reinvestment of all dividends. In the absence of fee waivers, total return would be reduced. Returns exclude deductions for separate account sale loads and account fees. Please refer to the Benchmark Definitions section of this report for information about the indices cited in the above chart and graph.
Top 10 Holdings 12/31/23
| | | | | | | | |
| | | | |
| | | Security Description | | % of Net Assets | | | | |
| | | | |
| | | Deckers Outdoor Corp. | | 0.7% | | | | |
| | | | |
| | | Reliance Steel & Aluminum Co. | | 0.6% | | | | |
| | | | |
| | | Carlisle Cos., Inc. | | 0.6% | | | | |
| | | | |
| | | GoDaddy, Inc. | | 0.6% | | | | |
| | | | |
| | | Graco, Inc. | | 0.6% | | | | |
| | | | |
| | | Watsco, Inc. | | 0.6% | | | | |
| | | | |
| | | RPM International, Inc. | | 0.6% | | | | |
| | | | |
| | | Lennox International, Inc. | | 0.6% | | | | |
| | | | |
| | | WP Carey, Inc. | | 0.6% | | | | |
| | | | |
| | | Manhattan Associates, Inc. | | 0.5% | | | | |
Sector Allocation 12/31/23
| | | | | | | | |
| | | | |
| | | Sector | | % of Net Assets | | | | |
| | | | |
| | | Industrials | | 21.0% | | | | |
| | | | |
| | | Financials | | 15.8% | | | | |
| | | | |
| | | Consumer Discretionary | | 15.7% | | | | |
| | | | |
| | | Information Technology | | 9.7% | | | | |
| | | | |
| | | Real Estate | | 7.9% | | | | |
| | | | |
| | | Health Care | | 7.7% | | | | |
| | | | |
| | | Materials | | 7.1% | | | | |
| | | | |
| | | Energy | | 5.0% | | | | |
| | | | |
| | | Consumer Staples | | 4.1% | | | | |
| | | | |
| | | Utilities | | 3.2% | | | | |
| | | | |
| | | Communication Services | | 1.7% | | | | |
| | | | |
| | | Short-Term Investments & Other Net Assets | | 1.0% | | | | |
| | | | |
| | | Governments | | 0.1% | | | | |
Sector Allocation and Top 10 Holdings are subject to change.
44
Index 400 Stock Portfolio
SCHEDULE OF INVESTMENTS
December 31, 2023
| | | | | | | | |
Common Stocks (98.9%) | | Shares/ Par + | | | Value $ (000’s) | |
Communication Services (1.7%) | |
Cable One, Inc. | | | 2,321 | | | | 1,292 | |
Frontier Communications Parent, Inc. * | | | 112,520 | | | | 2,851 | |
Iridium Communications, Inc. | | | 62,772 | | | | 2,584 | |
The New York Times Co. - Class A | | | 83,035 | | | | 4,068 | |
Nexstar Media Group, Inc. | | | 16,341 | | | | 2,561 | |
TEGNA, Inc. | | | 99,930 | | | | 1,529 | |
TKO Group Holdings, Inc. | | | 30,433 | | | | 2,483 | |
Ziff Davis, Inc. * | | | 23,293 | | | | 1,565 | |
ZoomInfo Technologies, Inc. * | | | 150,203 | | | | 2,777 | |
| | | | | | | | |
Total | | | | | | | 21,710 | |
| | | | | | | | |
|
Consumer Discretionary (15.7%) | |
Adient PLC * | | | 47,277 | | | | 1,719 | |
Aramark | | | 132,542 | | | | 3,724 | |
Autoliv, Inc. | | | 37,994 | | | | 4,187 | |
AutoNation, Inc. * | | | 13,168 | | | | 1,978 | |
Boyd Gaming Corp. | | | 35,261 | | | | 2,208 | |
Brunswick Corp. | | | 34,927 | | | | 3,379 | |
Burlington Stores, Inc. * | | | 32,921 | | | | 6,403 | |
Capri Holdings, Ltd. * | | | 59,009 | | | | 2,965 | |
Carter’s, Inc. | | | 18,659 | | | | 1,397 | |
Choice Hotels International, Inc. | | | 12,650 | | | | 1,433 | |
Churchill Downs, Inc. | | | 34,451 | | | | 4,649 | |
Columbia Sportswear Co. | | | 17,516 | | | | 1,393 | |
Crocs, Inc. * | | | 30,727 | | | | 2,870 | |
Deckers Outdoor Corp. * | | | 13,059 | | | | 8,729 | |
Dick’s Sporting Goods, Inc. | | | 31,188 | | | | 4,583 | |
Five Below, Inc. * | | | 28,257 | | | | 6,023 | |
Floor & Decor Holdings, Inc. * | | | 54,059 | | | | 6,031 | |
Fox Factory Holding Corp. * | | | 21,592 | | | | 1,457 | |
GameStop Corp. - Class A * | | | 136,468 | | | | 2,392 | |
The Gap, Inc. | | | 108,846 | | | | 2,276 | |
Gentex Corp. | | | 118,522 | | | | 3,871 | |
The Goodyear Tire & Rubber Co. * | | | 144,417 | | | | 2,068 | |
Graham Holdings Co. - Class B | | | 1,819 | | | | 1,267 | |
Grand Canyon Education, Inc. * | | | 14,978 | | | | 1,978 | |
H&R Block, Inc. | | | 73,056 | | | | 3,534 | |
Harley-Davidson, Inc. | | | 64,193 | | | | 2,365 | |
| | | | | | | | |
Common Stocks (98.9%) | | Shares/ Par + | | | Value $ (000’s) | |
Consumer Discretionary continued | |
Helen of Troy, Ltd. * | | | 12,042 | | | | 1,455 | |
Hilton Grand Vacations, Inc. * | | | 36,132 | | | | 1,452 | |
Hyatt Hotels Corp. - Class A | | | 22,447 | | | | 2,927 | |
KB Home | | | 38,816 | | | | 2,424 | |
Lear Corp. | | | 29,550 | | | | 4,173 | |
Leggett & Platt, Inc. | | | 67,853 | | | | 1,776 | |
Lithia Motors, Inc. - Class A | | | 13,936 | | | | 4,589 | |
Macy’s, Inc. | | | 138,800 | | | | 2,793 | |
Marriott Vacations Worldwide Corp. | | | 16,723 | | | | 1,420 | |
Mattel, Inc. * | | | 179,033 | | | | 3,380 | |
Murphy USA, Inc. | | | 9,834 | | | | 3,506 | |
Nordstrom, Inc. | | | 49,289 | | | | 909 | |
Ollie’s Bargain Outlet Holdings, Inc. * | | | 31,246 | | | | 2,371 | |
Penn National Gaming, Inc. * | | | 76,866 | | | | 2,000 | |
Penske Automotive Group, Inc. | | | 9,846 | | | | 1,580 | |
Planet Fitness, Inc. * | | | 43,344 | | | | 3,164 | |
Polaris, Inc. | | | 26,911 | | | | 2,550 | |
PVH Corp. | | | 30,667 | | | | 3,745 | |
RH * | | | 7,867 | | | | 2,293 | |
Scientific Games Corp. - Class A * | | | 45,676 | | | | 3,750 | |
Service Corp. International | | | 74,962 | | | | 5,131 | |
Skechers USA, Inc. - Class A * | | | 67,719 | | | | 4,222 | |
Taylor Morrison Home Corp. * | | | 54,520 | | | | 2,909 | |
Tempur Sealy International, Inc. | | | 87,379 | | | | 4,454 | |
Texas Roadhouse, Inc. | | | 33,940 | | | | 4,149 | |
Thor Industries, Inc. | | | 27,081 | | | | 3,202 | |
Toll Brothers, Inc. | | | 54,569 | | | | 5,609 | |
TopBuild Corp. * | | | 16,120 | | | | 6,033 | |
Travel + Leisure Co. | | | 36,716 | | | | 1,435 | |
Under Armour, Inc. - Class A * | | | 96,260 | | | | 846 | |
Under Armour, Inc. - Class C * | | | 97,315 | | | | 813 | |
Vail Resorts, Inc. | | | 19,330 | | | | 4,126 | |
Valvoline, Inc. * | | | 70,581 | | | | 2,652 | |
Visteon Corp. * | | | 14,079 | | | | 1,758 | |
The Wendy’s Co. | | | 84,649 | | | | 1,649 | |
Williams-Sonoma, Inc. | | | 32,568 | | | | 6,572 | |
Wingstop, Inc. | | | 14,926 | | | | 3,830 | |
Wyndham Hotels & Resorts, Inc. | | | 42,113 | | | | 3,386 | |
| | | | | | | | |
Common Stocks (98.9%) | | Shares/ Par + | | | Value $ (000’s) | |
Consumer Discretionary continued | |
YETI Holdings, Inc. * | | | 44,162 | | | | 2,287 | |
| | | | | | | | |
Total | | | | | | | 202,199 | |
| | | | | | | | |
|
Consumer Staples (4.1%) | |
BellRing Brands, Inc. * | | | 66,586 | | | | 3,691 | |
BJ’s Wholesale Club Holdings, Inc. * | | | 67,931 | | | | 4,528 | |
The Boston Beer Co., Inc. - Class A * | | | 4,774 | | | | 1,650 | |
Casey’s General Stores, Inc. | | | 18,917 | | | | 5,197 | |
Celsius Holdings, Inc. * | | | 75,210 | | | | 4,100 | |
Coca-Cola Consolidated, Inc. | | | 2,386 | | | | 2,215 | |
Coty, Inc. - Class A * | | | 189,898 | | | | 2,358 | |
Darling Ingredients, Inc. * | | | 80,937 | | | | 4,034 | |
Flowers Foods, Inc. | | | 97,738 | | | | 2,200 | |
Grocery Outlet Holding Corp. * | | | 50,343 | | | | 1,357 | |
Ingredion, Inc. | | | 33,131 | | | | 3,596 | |
Lancaster Colony Corp. | | | 10,289 | | | | 1,712 | |
Performance Food Group Co. * | | | 78,954 | | | | 5,460 | |
Pilgrim’s Pride Corp. * | | | 20,484 | | | | 567 | |
Post Holdings, Inc. * | | | 25,703 | | | | 2,263 | |
Sprouts Farmers Market, Inc. * | | | 51,561 | | | | 2,481 | |
US Foods Holding Corp. * | | | 114,833 | | | | 5,215 | |
| | | | | | | | |
Total | | | | | | | 52,624 | |
| | | | | | | | |
|
Energy (5.0%) | |
Antero Midstream Corp. | | | 173,331 | | | | 2,172 | |
Antero Resources Corp. * | | | 143,556 | | | | 3,256 | |
ChampionX Corp. | | | 98,561 | | | | 2,879 | |
Chesapeake Energy Corp. | | | 56,503 | | | | 4,347 | |
Civitas Resources, Inc. | | | 43,401 | | | | 2,968 | |
CNX Resources Corp. * | | | 80,354 | | | | 1,607 | |
DT Midstream, Inc. | | | 49,279 | | | | 2,701 | |
Equitrans Midstream Corp. | | | 220,661 | | | | 2,246 | |
HF Sinclair Corp. | | | 79,458 | | | | 4,416 | |
Matador Resources Co. | | | 56,339 | | | | 3,203 | |
Murphy Oil Corp. | | | 74,262 | | | | 3,168 | |
NOV, Inc. | | | 199,897 | | | | 4,054 | |
Oasis Petroleum, Inc. | | | 20,929 | | | | 3,479 | |
Ovintiv, Inc. | | | 128,749 | | | | 5,655 | |
PBF Energy, Inc. | | | 55,172 | | | | 2,425 | |
Permian Resources Corp. | | | 210,915 | | | | 2,868 | |
The Accompanying Notes are an Integral Part of the Financial Statements.
45
Index 400 Stock Portfolio
| | | | | | | | |
Common Stocks (98.9%) | | Shares/ Par + | | | Value $ (000’s) | |
Energy continued | | | | | | | | |
Range Resources Corp. | | | 122,666 | | | | 3,734 | |
Southwestern Energy Co. * | | | 559,748 | | | | 3,666 | |
Valaris, Ltd. * | | | 31,750 | | | | 2,177 | |
Weatherford International PLC * | | | 36,676 | | | | 3,588 | |
| | | | | | | | |
Total | | | | | | | 64,609 | |
| | | | | | | | |
| | |
Financials (15.8%) | | | | | | | | |
Affiliated Managers Group, Inc. | | | 17,163 | | | | 2,599 | |
Ally Financial, Inc. | | | 137,793 | | | | 4,812 | |
American Financial Group, Inc. | | | 33,149 | | | | 3,941 | |
Annaly Capital Management, Inc. | | | 253,544 | | | | 4,911 | |
Associated Banc-Corp. | | | 74,983 | | | | 1,604 | |
Bank OZK | | | 53,233 | | | | 2,653 | |
Brighthouse Financial, Inc. * | | | 32,424 | | | | 1,716 | |
Cadence Bank | | | 92,924 | | | | 2,750 | |
The Carlyle Group, Inc. | | | 110,028 | | | | 4,477 | |
CNO Financial Group, Inc. | | | 56,971 | | | | 1,589 | |
Columbia Banking System, Inc. | | | 105,985 | | | | 2,828 | |
Commerce Bancshares, Inc. | | | 60,208 | | | | 3,216 | |
Cullen/Frost Bankers, Inc. | | | 32,553 | | | | 3,532 | |
East West Bancorp, Inc. | | | 71,570 | | | | 5,149 | |
Equitable Holdings, Inc. | | | 161,367 | | | | 5,373 | |
Erie Indemnity Co. | | | 12,666 | | | | 4,242 | |
Essent Group, Ltd. | | | 54,131 | | | | 2,855 | |
Euronet Worldwide, Inc. * | | | 22,218 | | | | 2,255 | |
Evercore, Inc. - Class A | | | 17,559 | | | | 3,003 | |
F.N.B. Corp. | | | 182,077 | | | | 2,507 | |
Federated Hermes, Inc. | | | 43,692 | | | | 1,479 | |
First American Financial Corp. | | | 52,385 | | | | 3,376 | |
First Financial Bankshares, Inc. | | | 65,389 | | | | 1,981 | |
First Horizon Corp. | | | 283,677 | | | | 4,017 | |
FirstCash Holdings, Inc. | | | 18,715 | | | | 2,028 | |
FNF Group | | | 131,317 | | | | 6,700 | |
Glacier Bancorp, Inc. | | | 56,416 | | | | 2,331 | |
Hancock Whitney Corp. | | | 43,801 | | | | 2,128 | |
The Hanover Insurance Group, Inc. | | | 18,169 | | | | 2,206 | |
Home BancShares, Inc. | | | 95,217 | | | | 2,412 | |
Houlihan Lokey, Inc. | | | 26,188 | | | | 3,140 | |
Interactive Brokers Group, Inc. - Class A | | | 54,320 | | | | 4,503 | |
International Bancshares Corp. | | | 27,199 | | | | 1,477 | |
| | | | | | | | |
Common Stocks (98.9%) | | Shares/ Par + | | | Value $ (000’s) | |
Financials continued | | | | | | | | |
Janus Henderson Group PLC | | | 66,963 | | | | 2,019 | |
Jefferies Financial Group, Inc. | | | 85,333 | | | | 3,448 | |
Kemper Corp. | | | 30,687 | | | | 1,494 | |
Kinsale Capital Group, Inc. | | | 11,177 | | | | 3,743 | |
MGIC Investment Corp. | | | 140,513 | | | | 2,710 | |
Morningstar, Inc. | | | 13,221 | | | | 3,784 | |
New York Community Bancorp, Inc. | | | 367,026 | | | | 3,755 | |
Old National Bancorp | | | 148,754 | | | | 2,512 | |
Old Republic International Corp. | | | 132,467 | | | | 3,895 | |
Pinnacle Financial Partners, Inc. | | | 39,001 | | | | 3,402 | |
Primerica, Inc. | | | 17,773 | | | | 3,657 | |
Prosperity Bancshares, Inc. | | | 47,632 | | | | 3,226 | |
Reinsurance Group of America, Inc. | | | 33,414 | | | | 5,406 | |
RenaissanceRe Holdings, Ltd. | | | 26,641 | | | | 5,222 | |
RLI Corp. | | | 20,320 | | | | 2,705 | |
SEI Investments Co. | | | 50,670 | | | | 3,220 | |
Selective Insurance Group, Inc. | | | 30,796 | | | | 3,064 | |
SLM Corp. | | | 115,063 | | | | 2,200 | |
South State Corp. | | | 38,635 | | | | 3,263 | |
Starwood Property Trust, Inc. | | | 151,280 | | | | 3,180 | |
Stifel Financial Corp. | | | 51,699 | | | | 3,575 | |
Synovus Financial Corp. | | | 74,159 | | | | 2,792 | |
Texas Capital Bancshares, Inc. * | | | 24,466 | | | | 1,581 | |
UMB Financial Corp. | | | 22,055 | | | | 1,843 | |
United Bankshares, Inc. | | | 68,256 | | | | 2,563 | |
Unum Group | | | 93,002 | | | | 4,206 | |
Valley National Bancorp | | | 216,945 | | | | 2,356 | |
Voya Financial, Inc. | | | 53,043 | | | | 3,870 | |
Webster Financial Corp. | | | 87,129 | | | | 4,423 | |
WEX, Inc. * | | | 21,718 | | | | 4,225 | |
Wintrust Financial Corp. | | | 31,106 | | | | 2,885 | |
| | | | | | | | |
Total | | | | | | | 204,014 | |
| | | | | | | | |
| | |
Health Care (7.7%) | | | | | | | | |
Acadia Healthcare Co.,
Inc. * | | | 46,757 | | | | 3,636 | |
Amedisys, Inc. * | | | 16,630 | | | | 1,581 | |
Arrowhead Pharmaceuticals, Inc. * | | | 54,629 | | | | 1,672 | |
Azenta, Inc. * | | | 30,393 | | | | 1,980 | |
Bruker Corp. | | | 46,979 | | | | 3,452 | |
Chemed Corp. | | | 7,650 | | | | 4,473 | |
| | | | | | | | |
Common Stocks (98.9%) | | Shares/ Par + | | | Value $ (000’s) | |
Health Care continued | | | | | | | | |
Doximity, Inc. * | | | 59,889 | | | | 1,679 | |
Encompass Health Corp. | | | 50,831 | | | | 3,391 | |
Enovis Corp. * | | | 25,338 | | | | 1,419 | |
Envista Holdings Corp. * | | | 86,693 | | | | 2,086 | |
Exelixis, Inc. * | | | 157,715 | | | | 3,784 | |
Globus Medical, Inc. - Class A * | | | 58,425 | | | | 3,113 | |
Haemonetics Corp. * | | | 25,798 | | | | 2,206 | |
Halozyme Therapeutics, Inc. * | | | 67,083 | | | | 2,479 | |
HealthEquity, Inc. * | | | 43,453 | | | | 2,881 | |
Inari Medical, Inc. * | | | 26,013 | | | | 1,689 | |
Integra LifeSciences Holdings Corp. * | | | 34,391 | | | | 1,498 | |
Jazz Pharmaceuticals PLC * | | | 32,016 | | | | 3,938 | |
Lantheus Holdings, Inc. * | | | 34,806 | | | | 2,158 | |
LivaNova PLC * | | | 27,462 | | | | 1,421 | |
Masimo Corp. * | | | 22,565 | | | | 2,645 | |
Medpace Holdings, Inc. * | | | 11,832 | | | | 3,627 | |
Neogen Corp. * | | | 100,226 | | | | 2,015 | |
Neurocrine Biosciences, Inc. * | | | 49,840 | | | | 6,567 | |
Option Care Health, Inc. * | | | 89,760 | | | | 3,024 | |
Patterson Cos., Inc. | | | 43,369 | | | | 1,234 | |
Penumbra, Inc. * | | | 19,573 | | | | 4,923 | |
Perrigo Co. PLC | | | 68,903 | | | | 2,217 | |
Progyny, Inc. * | | | 42,299 | | | | 1,573 | |
QuidelOrtho Corp. * | | | 25,169 | | | | 1,855 | |
R1 RCM, Inc. * | | | 100,353 | | | | 1,061 | |
Repligen Corp. * | | | 26,335 | | | | 4,735 | |
Shockwave Medical, Inc. * | | | 18,713 | | | | 3,566 | |
Sotera Health Co. * | | | 50,319 | | | | 848 | |
Tenet Healthcare Corp. * | | | 51,550 | | | | 3,896 | |
United Therapeutics
Corp. * | | | 23,815 | | | | 5,237 | |
| | | | | | | | |
Total | | | | | | | 99,559 | |
| | | | | | | | |
| | |
Industrials (21.0%) | | | | | | | | |
Acuity Brands, Inc. | | | 15,688 | | | | 3,213 | |
Advanced Drainage Systems, Inc. | | | 34,777 | | | | 4,891 | |
AECOM | | | 70,399 | | | | 6,507 | |
AGCO Corp. | | | 31,556 | | | | 3,831 | |
ASGN, Inc. * | | | 23,932 | | | | 2,302 | |
Avis Budget Group, Inc. | | | 9,366 | | | | 1,660 | |
The Brink’s Co. | | | 22,855 | | | | 2,010 | |
BWX Technologies, Inc. | | | 46,322 | | | | 3,554 | |
CACI International, Inc. - Class A * | | | 11,307 | | | | 3,662 | |
Carlisle Cos., Inc. | | | 24,704 | | | | 7,718 | |
Chart Industries, Inc. * | | | 21,354 | | | | 2,911 | |
The Accompanying Notes are an Integral Part of the Financial Statements.
46
Index 400 Stock Portfolio
| | | | | | | | |
Common Stocks (98.9%) | | Shares/ Par + | | | Value $ (000’s) | |
Industrials continued | |
Clean Harbors, Inc. * | | | 25,574 | | | | 4,463 | |
Comfort Systems USA, Inc. | | | 18,120 | | | | 3,727 | |
Concentrix Corp. | | | 23,983 | | | | 2,355 | |
Core & Main, Inc. - Class A * | | | 69,348 | | | | 2,802 | |
Crane NXT Co. | | | 24,841 | | | | 2,935 | |
Curtiss-Wright Corp. | | | 19,387 | | | | 4,319 | |
Donaldson Co., Inc. | | | 61,315 | | | | 4,007 | |
EMCOR Group, Inc. | | | 23,860 | | | | 5,140 | |
EnerSys | | | 20,482 | | | | 2,068 | |
ESAB Corp. | | | 28,675 | | | | 2,484 | |
ExlService Holdings, Inc. * | | | 83,756 | | | | 2,584 | |
Exponent, Inc. | | | 25,688 | | | | 2,262 | |
Flowserve Corp. | | | 66,691 | | | | 2,749 | |
Fluor Corp. * | | | 86,405 | | | | 3,384 | |
Fortune Brands Home & Security, Inc. | | | 63,975 | | | | 4,871 | |
FTI Consulting, Inc. * | | | 18,023 | | | | 3,589 | |
GATX Corp. | | | 18,011 | | | | 2,165 | |
Genpact, Ltd. | | | 84,712 | | | | 2,940 | |
Graco, Inc. | | | 85,695 | | | | 7,435 | |
GXO Logistics, Inc. * | | | 60,399 | | | | 3,694 | |
Hertz Global Holdings, Inc. * | | | 66,387 | | | | 690 | |
Hexcel Corp. | | | 42,693 | | | | 3,149 | |
Insperity, Inc. | | | 17,965 | | | | 2,106 | |
ITT, Inc. | | | 41,686 | | | | 4,974 | |
KBR, Inc. | | | 68,517 | | | | 3,796 | |
Kirby Corp. * | | | 30,063 | | | | 2,359 | |
Knight-Swift Transportation Holdings, Inc. | | | 81,851 | | | | 4,719 | |
Landstar System, Inc. | | | 18,278 | | | | 3,540 | |
Lennox International, Inc. | | | 16,231 | | | | 7,264 | |
Lincoln Electric Holdings, Inc. | | | 29,066 | | | | 6,321 | |
ManpowerGroup, Inc. | | | 24,759 | | | | 1,968 | |
MasTec, Inc. * | | | 30,752 | | | | 2,329 | |
MAXIMUS, Inc. | | | 30,772 | | | | 2,581 | |
MDU Resources Group, Inc. | | | 103,000 | | | | 2,039 | |
The Middleby Corp. * | | | 27,158 | | | | 3,997 | |
MSA Safety, Inc. | | | 18,786 | | | | 3,172 | |
MSC Industrial Direct Co., Inc. - Class A | | | 23,544 | | | | 2,384 | |
nVent Electric PLC | | | 84,150 | | | | 4,972 | |
Oshkosh Corp. | | | 33,177 | | | | 3,597 | |
Owens Corning, Inc. | | | 45,096 | | | | 6,685 | |
Paylocity Holding Corp. * | | | 21,942 | | | | 3,617 | |
RBC Bearings, Inc. * | | | 14,753 | | | | 4,203 | |
Regal Rexnord Corp. | | | 33,658 | | | | 4,982 | |
Ryder System, Inc. | | | 22,501 | | | | 2,589 | |
Saia, Inc. * | | | 13,467 | | | | 5,901 | |
Science Applications International Corp. | | | 26,871 | | | | 3,341 | |
| | | | | | | | |
Common Stocks (98.9%) | | Shares/ Par + | | | Value $ (000’s) | |
Industrials continued | |
Sensata Technologies Holding PLC | | | 76,934 | | | | 2,890 | |
Simpson Manufacturing Co., Inc. | | | 21,685 | | | | 4,293 | |
Stericycle, Inc. * | | | 47,065 | | | | 2,333 | |
Sunrun, Inc. * | | | 110,478 | | | | 2,169 | |
Terex Corp. | | | 34,043 | | | | 1,956 | |
Tetra Tech, Inc. | | | 27,036 | | | | 4,513 | |
The Timken Co. | | | 33,033 | | | | 2,648 | |
The Toro Co. | | | 52,729 | | | | 5,061 | |
Trex Co., Inc. * | | | 55,128 | | | | 4,564 | |
UFP Industries, Inc. | | | 31,314 | | | | 3,931 | |
Valmont Industries, Inc. | | | 10,611 | | | | 2,478 | |
Watsco, Inc. | | | 17,189 | | | | 7,365 | |
Watts Water Technologies, Inc. - Class A | | | 13,863 | | | | 2,888 | |
Werner Enterprises, Inc. | | | 32,300 | | | | 1,369 | |
WESCO International, Inc. | | | 22,264 | | | | 3,871 | |
Woodward, Inc. | | | 30,677 | | | | 4,176 | |
XPO Logistics, Inc. * | | | 58,865 | | | | 5,156 | |
| | | | | | | | |
Total | | | | | | | 271,168 | |
| | | | | | | | |
|
Information Technology (9.7%) | |
Allegro Microsystems, Inc. * | | | 36,206 | | | | 1,096 | |
Amkor Technology, Inc. | | | 52,633 | | | | 1,751 | |
Arrow Electronics, Inc. * | | | 27,504 | | | | 3,362 | |
Aspen Technology, Inc. * | | | 14,220 | | | | 3,131 | |
Avnet, Inc. | | | 45,820 | | | | 2,309 | |
Belden, Inc. | | | 21,136 | | | | 1,633 | |
Blackbaud, Inc. * | | | 21,931 | | | | 1,902 | |
Calix, Inc. * | | | 29,707 | | | | 1,298 | |
Ciena Corp. * | | | 75,040 | | | | 3,378 | |
Cirrus Logic, Inc. * | | | 27,338 | | | | 2,274 | |
Cognex Corp. | | | 87,342 | | | | 3,646 | |
Coherent Corp. * | | | 66,848 | | | | 2,910 | |
CommVault Systems, Inc. * | | | 22,137 | | | | 1,768 | |
Crane Holdings Co. | | | 24,607 | | | | 1,399 | |
Dolby Laboratories, Inc. | | | 30,141 | | | | 2,598 | |
Dropbox, Inc. * | | | 130,002 | | | | 3,833 | |
Dynatrace, Inc. * | | | 120,952 | | | | 6,615 | |
GoDaddy, Inc. * | | | 71,459 | | | | 7,586 | |
IPG Photonics Corp. * | | | 14,983 | | | | 1,626 | |
Kyndryl Holdings, Inc. * | | | 116,601 | | | | 2,423 | |
Lattice Semiconductor Corp. * | | | 70,027 | | | | 4,831 | |
Littelfuse, Inc. | | | 12,637 | | | | 3,381 | |
Lumentum Holdings, Inc. * | | | 33,960 | | | | 1,780 | |
MACOM Technology Solutions Holdings, Inc. * | | | 27,449 | | | | 2,551 | |
| | | | | | | | |
Common Stocks (98.9%) | | Shares/ Par + | | | Value $ (000’s) | |
Information Technology continued | |
Manhattan Associates, Inc. * | | | 31,277 | | | | 6,735 | |
MKS Instruments, Inc. | | | 31,925 | | | | 3,284 | |
Novanta, Inc. * | | | 18,201 | | | | 3,065 | |
Onto Innovation, Inc. * | | | 24,922 | | | | 3,811 | |
Power Integrations, Inc. | | | 28,756 | | | | 2,361 | |
Qualys, Inc. * | | | 18,669 | | | | 3,664 | |
Rambus, Inc. * | | | 54,550 | | | | 3,723 | |
Silicon Laboratories, Inc. * | | | 16,102 | | | | 2,130 | |
Super Micro Computer, Inc. * | | | 23,538 | | | | 6,691 | |
Synaptics, Inc. * | | | 19,970 | | | | 2,278 | |
TD SYNNEX Corp. | | | 26,003 | | | | 2,798 | |
Teradata Corp. * | | | 49,583 | | | | 2,157 | |
Universal Display Corp. | | | 22,111 | | | | 4,229 | |
Vishay Intertechnology, Inc. | | | 64,007 | | | | 1,534 | |
Vontier Corp. | | | 78,299 | | | | 2,705 | |
The Western Union Co. | | | 184,875 | | | | 2,204 | |
Wolfspeed, Inc. * | | | 63,528 | | | | 2,764 | |
| | | | | | | | |
Total | | | | | | | 125,214 | |
| | | | | | | | |
|
Materials (7.1%) | |
Alcoa Corp. | | | 90,685 | | | | 3,083 | |
AptarGroup, Inc. | | | 33,389 | | | | 4,128 | |
Ashland Global Holdings, Inc. | | | 25,966 | | | | 2,189 | |
Avient Corp. | | | 46,413 | | | | 1,929 | |
Axalta Coating Systems, Ltd. * | | | 111,613 | | | | 3,791 | |
Berry Global Group, Inc. | | | 60,009 | | | | 4,044 | |
Cabot Corp. | | | 28,002 | | | | 2,338 | |
The Chemours Co. | | | 75,277 | | | | 2,374 | |
Cleveland-Cliffs, Inc. * | | | 256,012 | | | | 5,228 | |
Commercial Metals Co. | | | 59,374 | | | | 2,971 | |
Crown Holdings, Inc. | | | 61,234 | | | | 5,639 | |
Eagle Materials, Inc. | | | 17,696 | | | | 3,589 | |
Graphic Packaging Holding Co. | | | 155,465 | | | | 3,832 | |
Greif, Inc. - Class A | | | 12,954 | | | | 850 | |
Knife River Corp. * | | | 28,808 | | | | 1,907 | |
Livent Corp. * | | | 91,093 | | | | 1,638 | |
Louisiana-Pacific Corp. | | | 32,441 | | | | 2,298 | |
MP Materials Corp. * | | | 73,329 | | | | 1,456 | |
NewMarket Corp. | | | 3,518 | | | | 1,920 | |
Olin Corp. | | | 62,136 | | | | 3,352 | |
Reliance Steel & Aluminum Co. | | | 29,160 | | | | 8,155 | |
Royal Gold, Inc. | | | 33,356 | | | | 4,035 | |
RPM International, Inc. | | | 65,436 | | | | 7,305 | |
The Scotts Miracle-Gro Co. | | | 21,141 | | | | 1,348 | |
Silgan Holdings, Inc. | | | 41,061 | | | | 1,858 | |
Sonoco Products Co. | | | 49,560 | | | | 2,769 | |
United States Steel Corp. | | | 113,219 | | | | 5,508 | |
The Accompanying Notes are an Integral Part of the Financial Statements.
47
Index 400 Stock Portfolio
| | | | | | | | |
Common Stocks (98.9%) | | Shares/ Par + | | | Value $ (000’s) | |
Materials continued | |
Westlake Corp. | | | 16,262 | | | | 2,276 | |
| | | | | | | | |
Total | | | | | | | 91,810 | |
| | | | | | | | |
|
Real Estate (7.9%) | |
Agree Realty Corp. | | | 50,894 | | | | 3,204 | |
Apartment Income REIT Corp. | | | 74,624 | | | | 2,592 | |
Brixmor Property Group, Inc. | | | 152,467 | | | | 3,548 | |
Corporate Office Properties Trust | | | 57,334 | | | | 1,470 | |
Cousins Properties, Inc. | | | 76,662 | | | | 1,867 | |
CubeSmart LP | | | 114,066 | | | | 5,287 | |
EastGroup Properties, Inc. | | | 23,495 | | | | 4,312 | |
EPR Properties | | | 38,342 | | | | 1,858 | |
Equity LifeStyle Properties, Inc. | | | 94,596 | | | | 6,673 | |
First Industrial Realty Trust, Inc. | | | 67,123 | | | | 3,535 | |
Gaming and Leisure Properties, Inc. | | | 135,380 | | | | 6,681 | |
Healthcare Realty Trust, Inc. | | | 193,061 | | | | 3,326 | |
Independence Realty Trust, Inc. | | | 114,328 | | | | 1,749 | |
Jones Lang LaSalle, Inc. * | | | 24,113 | | | | 4,554 | |
Kilroy Realty Corp. | | | 54,145 | | | | 2,157 | |
Kite Realty Group Trust | | | 111,472 | | | | 2,548 | |
Lamar Advertising Co. - Class A | | | 44,434 | | | | 4,722 | |
Medical Properties Trust, Inc. | | | 304,944 | | | | 1,497 | |
National Retail Properties, Inc. | | | 92,526 | | | | 3,988 | |
National Storage Affiliates Trust | | | 39,106 | | | | 1,622 | |
Omega Healthcare Investors, Inc. | | | 124,323 | | | | 3,812 | |
Park Hotels & Resorts, Inc. | | | 106,372 | | | | 1,628 | |
Physicians Realty Trust | | | 121,484 | | | | 1,617 | |
PotlatchDeltic Corp. | | | 40,386 | | | | 1,983 | |
Rayonier, Inc. | | | 69,419 | | | | 2,319 | |
Rexford Industrial Realty, Inc. | | | 107,024 | | | | 6,004 | |
Sabra Health Care REIT, Inc. | | | 117,791 | | | | 1,681 | |
Spirit Realty Capital, Inc. | | | 71,810 | | | | 3,137 | |
STAG Industrial, Inc. | | | 92,101 | | | | 3,616 | |
Vornado Realty Trust | | | 81,428 | | | | 2,300 | |
WP Carey, Inc. | | | 110,922 | | | | 7,189 | |
| | | | | | | | |
Total | | | | | | | 102,476 | |
| | | | | | | | |
| | | | | | | | |
Common Stocks (98.9%) | | Shares/ Par + | | | Value $ (000’s) | |
Utilities (3.2%) | |
ALLETE, Inc. | | | 29,254 | | | | 1,789 | |
Black Hills Corp. | | | 34,590 | | | | 1,866 | |
Essential Utilities, Inc. | | | 127,610 | | | | 4,766 | |
IDACORP, Inc. | | | 25,626 | | | | 2,520 | |
National Fuel Gas Co. | | | 46,460 | | | | 2,331 | |
New Jersey Resources Corp. | | | 49,367 | | | | 2,201 | |
NorthWestern Corp. | | | 31,245 | | | | 1,590 | |
OGE Energy Corp. | | | 101,589 | | | | 3,548 | |
ONE Gas, Inc. | | | 28,007 | | | | 1,785 | |
Ormat Technologies, Inc. | | | 27,323 | | | | 2,071 | |
PNM Resources, Inc. | | | 43,387 | | | | 1,805 | |
Portland General Electric Co. | | | 51,164 | | | | 2,217 | |
Southwest Gas Holdings, Inc. | | | 30,354 | | | | 1,923 | |
Spire, Inc. | | | 26,798 | | | | 1,671 | |
UGI Corp. | | | 106,434 | | | | 2,618 | |
Vistra Corp. | | | 170,643 | | | | 6,573 | |
| | | | | | | | |
Total | | | | | | | 41,274 | |
| | | | | | | | |
|
Total Common Stocks | |
(Cost: $938,141) | | | | | | | 1,276,657 | |
| | | | | | | | |
| | |
Short-Term | | | | | | | | |
Investments (0.1%) | | | | | | | | |
| |
Governments (0.1%) | |
US Treasury
0.000%, 4/11/24 ß | | | 865,000 | | | | 852 | |
| | | | | | | | |
Total | | | | | | | 852 | |
| | | | | | | | |
| |
Total Short-Term Investments
(Cost: $852) | | | | 852 | |
| | | | | | | | |
|
Total Investments (99.0%) | |
(Cost: $938,993)@ | | | | | | | 1,277,509 | |
| | | | | | | | |
|
Other Assets, Less | |
Liabilities (1.0%) | | | | | | | 13,305 | |
| | | | | | | | |
| |
Net Assets (100.0%) | | | | 1,290,814 | |
| | | | | | | | |
The Accompanying Notes are an Integral Part of the Financial Statements.
48
Index 400 Stock Portfolio
Exchange Traded or Centrally Cleared Derivatives
Futures
| | | | | | | | | | | | | | | | | | | | | | | | | | |
| Issuer | | Long/ Short | | Currency | | Notional Par
(000’s) | | | Number
of
Contracts | | | Expiration
Date | | Notional Value (000’s) | | | Unrealized Appreciation/ (Depreciation)
(000’s) | | | Variation Margin (000’s) | |
| |
E-Mini S&P MidCap 400 Future | | Long | | USD | | | 5 | | | | 52 | | | 3/24 | | $ | 14,609 | | | $ | 465 | | | $ | (173) | |
| | | | | | | | | | | | | | | | | | | | | | |
| | | | | | | | | | | | | | | | | | | | $ | 465 | | | $ | (173) | |
| | | | | | | | | | | | | | | | | | | | | | |
| | | | | | | | | | | | | | | | | | | | | | | | | | | | |
| | | Financial Derivative Assets | | | Financial Derivative Liabilities | |
| | | Variation Margin (000’s) | | | Variation Margin (000’s) | | | Market Value
(000’s) | |
| | | Swaps | | | Futures | | | Total | | | Swaps | | | Futures | | | Total | | | Options | |
| Total Exchange-Traded or Centrally Cleared Derivatives | | $ | – | | | $ | – | | | $ | – | | | $ | – | | | $ | (173 | ) | | $ | (173 | ) | | $ | – | |
| + | All par is stated in U.S. Dollar unless otherwise noted. |
| ß | Part or all of the security has been pledged as collateral. |
| @ | At December 31, 2023, the aggregate cost of investments, including derivatives, for federal tax purposes (in thousands) was $940,257 and the net unrealized appreciation of investments based on that cost was $337,717 which is comprised of $396,525 aggregate gross unrealized appreciation and $58,808 aggregate gross unrealized depreciation. |
The following is a summary of the inputs used in valuing the Portfolio’s Investments at December 31, 2023. See Note 3 for additional information on portfolio valuation.
| | | | | | | | | | | | | | |
| | | Valuation Inputs | |
| Description | | | | Level 1 -Quoted
Prices | | | Level 2 -Other
Significant
Observable Inputs | | | Level 3 -
Significant
Unobservable
Inputs | |
| | | | | (Amounts in thousands) | | | | |
Assets: | | | | | | | | | | | | | | |
Common Stocks | | | | $ | 1,276,657 | | | $ | — | | | $ | — | |
Short-Term Investments | | | | | — | | | | 852 | | | | — | |
Other Financial Instruments^ | | | | | | | | | | | | | | |
Futures | | | | | 465 | | | | — | | | | — | |
| | | | | | |
Total Assets: | | | | $ | 1,277,122 | | | $ | 852 | | | $ | — | |
| | | | | | |
^ Other financial instruments are derivative instruments such as futures and forward foreign currency contracts, which are valued at the unrealized appreciation (depreciation) on the instrument, and securities sold short, reverse repurchase agreements, written options and swaps contracts, which are valued at market value.
The Accompanying Notes are an Integral Part of the Financial Statements.
49
Mid Cap Value Portfolio (unaudited)
| | | | |
| Objective: | | Portfolio Strategy: | | Net Assets: |
| Long-term capital growth. Current income is a secondary objective. | | Invest primarily in equity securities of mid-sized companies that are determined to be undervalued. | | $666 million |
PORTFOLIO OVERVIEW
Mason Street Advisors, LLC (“Mason Street Advisors”), the investment adviser for the Mid Cap Value Portfolio (the “Portfolio”), has engaged American Century Investment Management, Inc. (“American Century”) to act as sub-adviser for the Portfolio. The Portfolio invests primarily in a diversified portfolio of equity securities of mid-sized companies that are determined to be undervalued at the time of purchase. In selecting securities, the Portfolio attempts to identify companies whose long-term earnings, cash flows and/or assets are not reflected in the current market price of their securities and hold each security until it has returned to favor in the market and the price has increased to, or is higher than, a level believed to more accurately reflect the fair value of the company.
MARKET OVERVIEW
U.S. equity markets ended the year higher. Stocks rose in the first half of 2023 as economic growth remained relatively resilient despite higher interest rates, and investors hoped the U.S. Federal Reserve (the “Fed”) would slow or pause its rate-hike campaign. Stocks retreated in the third quarter, however, as stubbornly high inflation raised expectations for interest rates to remain higher for longer than previously expected. Stocks rallied in the fourth quarter as moderating inflation spurred renewed hopes that the Fed would stop increasing rates. Economic growth and corporate earnings also remained relatively resilient. Mid-cap stocks lagged large-cap stocks but outperformed small-cap stocks, as measured by the Russell Indices. Value stocks underperformed growth for the twelve-month period.
PORTFOLIO RESULTS
The Portfolio returned 6.26% for the twelve months ended December 31, 2023. By comparison, the Portfolio’s benchmark, the Russell MidCap® Value Index (the “Index”), returned 12.71%. (The Index is unmanaged, cannot be invested in directly and does not incur expenses.)
Security selection and an underweight in the Consumer Discretionary sector detracted from the Portfolio’s relative return. The Portfolio did not own several benchmark stocks in the specialty retail industry, which weighed on the Portfolio’s performance. A position in automotive replacement parts retailer Advance Auto Parts underperformed due to a recent quarterly earnings miss and guidance reduction. The company has been forced to raise prices less than product cost inflation in its commercial channel as competitors have become more promotional.
In the Financials sector, stock selection in the capital markets industry hindered the Portfolio’s performance due in part to a lack of exposure to stocks that were strong performers for the market. Conversely, lack of exposure to First Republic Bank supported performance. In general, bank stocks underperformed amid the failure of two mid-cap banks in the first quarter. First Republic Bank was also pressured by near-term liquidity fears associated with large unrealized losses in its relatively longer-duration assets.
In the Consumer Staples sector, shares of packaged food producer Conagra Brands were pressured as investors shifted toward less defensive sectors. Additionally, investors became concerned about consumers shifting to store brands to save money and about pushback on future price increases.
On the upside, selection in the Materials sector contributed to the Portfolio’s performance, particularly due to not owning several benchmark companies in the chemicals industry. Stock selection and an underweight in the Energy sector also contributed to relative performance.
Stock selection in the building products industry also contributed, notably Cie de Saint-Gobain, a global diversified building products manufacturer with notable exposure to Europe. Its shares outperformed early in the period as fears of an energy crisis in Europe eased due to a much warmer-than-expected winter. The improved global economic outlook later in the year also buoyed the stock.
PORTFOLIO MANAGER OUTLOOK
The following forward-looking comments are the opinion of American Century, the Portfolio’s sub-adviser.
50
Mid Cap Value Portfolio (unaudited)
We seek to invest in companies where we believe the valuation does not reflect the quality and normal earnings power of the company. Our process is based on individual security selection, but broad themes have emerged: higher quality stocks, attractive valuations in the Healthcare sector and limited opportunities in the Consumer Discretionary sector. We continue to focus on companies that we view as higher quality with stable revenues and profits, low indebtedness, stable cash flows and predictable business models that are less sensitive to economic conditions.
Our research has led us to several Healthcare sector stocks that we think offer compelling valuations and risk/reward profiles. We consider Healthcare to be less cyclical because the economy’s performance tends to have less impact on demand.
Finally, we have identified few high quality companies in the Consumer Discretionary sector with durable business models. Additionally, with consumers facing economic pressures like inflation and diminishing personal savings, we expect a decline in discretionary spending.
Relative Performance
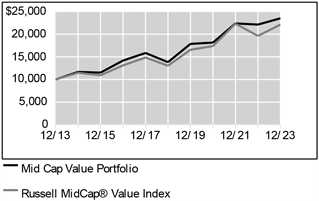
| | | | | | |
Average Annual Total Returns For Periods Ended December 31, 2023 |
| | | 1 Year | | 5 Years | | 10 Years |
Mid Cap Value Portfolio | | 6.26% | | 11.21% | | 8.93% |
Russell MidCap® Value Index | | 12.71% | | 11.16% | | 8.26% |
The performance data quoted represents past performance. Past performance is historical and does not guarantee future performance. Investment return and principal value will fluctuate, so that shares, when redeemed, may be worth more or less than their original cost. Current performance may be lower or higher than the performance data quoted. For the most recent month-end performance information visit www.northwesternmutual.com.
This chart assumes an initial investment of $10,000 made on 12/31/13. Returns shown reflect fee waivers, deductions for management and other portfolio expenses, and reinvestment of all dividends. In the absence of fee waivers, total return would be reduced. Returns exclude deductions for separate account sale loads and account fees. Please refer to the Benchmark Definitions section of this report for information about the indices cited in the above chart and graph.
The Portfolio may invest a relatively high percentage of its assets in a particular sector. The Portfolio will have greater exposure to the risks associated with that sector and its performance will be tied more closely to the performance of the sector.
Top 10 Holdings 12/31/23
| | | | | | | | |
| | | | |
| | | Security Description | | % of Net Assets | | | | |
| | | | |
| | | Zimmer Biomet Holdings, Inc. | | 3.1% | | | | |
| | | | |
| | | Conagra Brands, Inc. | | 2.4% | | | | |
| | | | |
| | | The Allstate Corp. | | 2.3% | | | | |
| | | | |
| | | Henry Schein, Inc. | | 2.3% | | | | |
| | | | |
| | | Northern Trust Corp. | | 2.2% | | | | |
| | | | |
| | | The Bank of New York Mellon Corp. | | 2.2% | | | | |
| | | | |
| | | Quest Diagnostics, Inc. | | 1.9% | | | | |
| | | | |
| | | Enterprise Products Partners LP | | 1.9% | | | | |
| | | | |
| | | Norfolk Southern Corp. | | 1.8% | | | | |
| | | | |
| | | Koninklijke Ahold Delhaize NV | | 1.8% | | | | |
Sector Allocation 12/31/23
| | | | | | | | |
| | | | |
| | | Sector | | % of Net Assets | | | | |
| | | | |
| | | Industrials | | 15.8% | | | | |
| | | | |
| | | Financials | | 15.6% | | | | |
| | | | |
| | | Health Care | | 14.9% | | | | |
| | | | |
| | | Utilities | | 11.3% | | | | |
| | | | |
| | | Consumer Staples | | 10.5% | | | | |
| | | | |
| | | Real Estate | | 7.6% | | | | |
| | | | |
| | | Information Technology | | 6.7% | | | | |
| | | | |
| | | Energy | | 5.0% | | | | |
| | | | |
| | | Materials | | 4.3% | | | | |
| | | | |
| | | Consumer Discretionary | | 3.6% | | | | |
| | | | |
| | | Communication Services | | 2.6% | | | | |
| | | | |
| | | Short-Term Investments & Other Net Assets | | 2.1% | | | | |
Sector Allocation and Top 10 Holdings are subject to change.
51
Mid Cap Value Portfolio
SCHEDULE OF INVESTMENTS
December 31, 2023
| | | | | | | | |
Common Stocks (97.9%) | | Shares/ Par + | | | Value $ (000’s) | |
Communication Services (2.6%) | |
BCE, Inc. | | | 140,428 | | | | 5,529 | |
Fox Corp. - Class B | | | 262,130 | | | | 7,248 | |
Omnicom Group, Inc. | | | 51,609 | | | | 4,465 | |
| | | | | | | | |
Total | | | | | | | 17,242 | |
| | | | | | | | |
|
Consumer Discretionary (3.6%) | |
Aptiv PLC * | | | 57,241 | | | | 5,136 | |
BorgWarner, Inc. | | | 194,619 | | | | 6,977 | |
Compagnie Generale des Etablissements Michelin | | | 116,741 | | | | 4,195 | |
The Interpublic Group of Companies, Inc. | | | 234,977 | | | | 7,669 | |
| | | | | | | | |
Total | | | | | | | 23,977 | |
| | | | | | | | |
|
Consumer Staples (10.5%) | |
Conagra Brands, Inc. | | | 552,091 | | | | 15,823 | |
Dollar Tree, Inc. * | | | 81,988 | | | | 11,646 | |
General Mills, Inc. | | | 105,741 | | | | 6,888 | |
Heineken NV | | | 26,755 | | | | 2,722 | |
Henkel AG & Co. KGaA - Preference Shares | | | 66,358 | | | | 5,337 | |
Kenvue, Inc. | | | 149,393 | | | | 3,217 | |
Kimberly-Clark Corp. | | | 97,902 | | | | 11,896 | |
Koninklijke Ahold Delhaize NV | | | 416,670 | | | | 11,964 | |
| | | | | | | | |
Total | | | | | | | 69,493 | |
| | | | | | | | |
|
Energy (5.0%) | |
Baker Hughes | | | 138,330 | | | | 4,728 | |
Diamondback Energy, Inc. | | | 30,653 | | | | 4,754 | |
Enterprise Products Partners LP | | | 474,870 | | | | 12,513 | |
EQT Corp. | | | 120,023 | | | | 4,640 | |
Occidental Petroleum Corp. | | | 115,181 | | | | 6,877 | |
| | | | | | | | |
Total | | | | | | | 33,512 | |
| | | | | | | | |
|
Financials (15.6%) | |
Aflac, Inc. | | | 45,691 | | | | 3,770 | |
The Allstate Corp. | | | 108,386 | | | | 15,172 | |
The Bank of New York Mellon Corp. | | | 274,503 | | | | 14,288 | |
Commerce Bancshares, Inc. | | | 73,812 | | | | 3,942 | |
First Hawaiian, Inc. | | | 161,883 | | | | 3,701 | |
The Hanover Insurance Group, Inc. | | | 39,970 | | | | 4,853 | |
Northern Trust Corp. | | | 170,435 | | | | 14,381 | |
Prosperity Bancshares, Inc. | | | 42,262 | | | | 2,862 | |
Reinsurance Group of America, Inc. | | | 60,163 | | | | 9,733 | |
T. Rowe Price Group, Inc. | | | 83,939 | | | | 9,039 | |
| | | | | | | | |
Common Stocks (97.9%) | | Shares/ Par + | | | Value $ (000’s) | |
Financials continued | |
Truist Financial Corp. | | | 220,158 | | | | 8,128 | |
U.S. Bancorp | | | 66,787 | | | | 2,891 | |
Westamerica Bancorporation | | | 56,972 | | | | 3,214 | |
Willis Towers Watson PLC | | | 32,447 | | | | 7,826 | |
| | | | | | | | |
Total | | | | | | | 103,800 | |
| | | | | | | | |
|
Health Care (14.9%) | |
AmerisourceBergen Corp. | | | 5,938 | | | | 1,219 | |
Becton Dickinson and Co. | | | 15,326 | | | | 3,737 | |
Cardinal Health, Inc. | | | 66,913 | | | | 6,745 | |
Centene Corp. * | | | 61,706 | | | | 4,579 | |
DENTSPLY SIRONA, Inc. | | | 122,951 | | | | 4,376 | |
Envista Holdings Corp. * | | | 189,678 | | | | 4,564 | |
Henry Schein, Inc. * | | | 198,263 | | | | 15,010 | |
Hologic, Inc. * | | | 72,847 | | | | 5,205 | |
Laboratory Corp. of America Holdings | | | 38,311 | | | | 8,708 | |
Quest Diagnostics, Inc. | | | 92,784 | | | | 12,793 | |
Universal Health Services, Inc. - Class B | | | 76,018 | | | | 11,588 | |
Zimmer Biomet Holdings, Inc. | | | 169,670 | | | | 20,649 | |
| | | | | | | | |
Total | | | | | | | 99,173 | |
| | | | | | | | |
|
Industrials (15.8%) | |
Beacon Roofing | | | | | | | | |
Supply, Inc. * | | | 78,579 | | | | 6,838 | |
Bunzl PLC | | | 201,369 | | | | 8,174 | |
Cie de Saint-Gobain | | | 82,572 | | | | 6,106 | |
Cummins, Inc. | | | 16,780 | | | | 4,020 | |
Emerson Electric Co. | | | 113,782 | | | | 11,074 | |
General Dynamics Corp. | | | 13,071 | | | | 3,394 | |
Heartland Express, Inc. | | | 279,335 | | | | 3,983 | |
Huntington Ingalls Industries, Inc. | | | 35,537 | | | | 9,227 | |
IMI PLC | | | 122,262 | | | | 2,617 | |
Johnson Controls International PLC | | | 80,146 | | | | 4,620 | |
MSC Industrial Direct Co., Inc. - Class A | | | 56,091 | | | | 5,680 | |
Norfolk Southern Corp. | | | 51,411 | | | | 12,152 | |
Oshkosh Corp. | | | 63,026 | | | | 6,833 | |
Republic Services, Inc. | | | 20,910 | | | | 3,448 | |
Southwest Airlines Co. | | | 331,355 | | | | 9,570 | |
VINCI SA | | | 60,806 | | | | 7,637 | |
| | | | | | | | |
Total | | | | | | | 105,373 | |
| | | | | | | | |
| | | | | | | | |
Common Stocks (97.9%) | | Shares/ Par + | | | Value $ (000’s) | |
Information Technology (6.7%) | |
Amdocs, Ltd. | | | 96,316 | | | | 8,465 | |
Corning, Inc. | | | 74,319 | | | | 2,263 | |
Electronic Arts, Inc. | | | 19,605 | | | | 2,682 | |
F5, Inc. * | | | 47,104 | | | | 8,431 | |
HP, Inc. | | | 216,266 | | | | 6,508 | |
Juniper Networks, Inc. | | | 183,350 | | | | 5,405 | |
TE Connectivity, Ltd. | | | 52,558 | | | | 7,384 | |
Teradyne, Inc. | | | 29,297 | | | | 3,179 | |
| | | | | | | | |
Total | | | | | | | 44,317 | |
| | | | | | | | |
|
Materials (4.3%) | |
Akzo Nobel NV | | | 100,236 | | | | 8,282 | |
Amcor PLC | | | 917,408 | | | | 8,844 | |
Packaging Corp. of America | | | 44,635 | | | | 7,272 | |
Sonoco Products Co. | | | 78,975 | | | | 4,412 | |
| | | | | | | | |
Total | | | | | | | 28,810 | |
| | | | | | | | |
|
Real Estate (7.6%) | |
Essex Property Trust, Inc. | | | 33,430 | | | | 8,289 | |
Healthpeak Properties, Inc. | | | 410,678 | | | | 8,131 | |
Public Storage | | | 26,254 | | | | 8,007 | |
Realty Income Corp. | | | 186,964 | | | | 10,736 | |
Regency Centers Corp. | | | 125,523 | | | | 8,410 | |
VICI Properties, Inc. | | | 137,201 | | | | 4,374 | |
WP Carey, Inc. | | | 37,895 | | | | 2,456 | |
| | | | | | | | |
Total | | | | | | | 50,403 | |
| | | | | | | | |
|
Utilities (11.3%) | |
Atmos Energy Corp. | | | 13,581 | | | | 1,574 | |
CMS Energy Corp. | | | 101,022 | | | | 5,866 | |
Duke Energy Corp. | | | 97,661 | | | | 9,477 | |
Edison International | | | 130,864 | | | | 9,355 | |
Evergy, Inc. | | | 136,118 | | | | 7,105 | |
Eversource Energy | | | 104,658 | | | | 6,460 | |
NorthWestern Corp. | | | 207,862 | | | | 10,578 | |
ONE Gas, Inc. | | | 53,605 | | | | 3,416 | |
Pinnacle West Capital Corp. | | | 73,188 | | | | 5,258 | |
Spire, Inc. | | | 171,737 | | | | 10,706 | |
WEC Energy Group, Inc. | | | 66,875 | | | | 5,629 | |
| | | | | | | | |
Total | | | | | | | 75,424 | |
| | | | | | | | |
| |
Total Common Stocks
(Cost: $645,869) | | | | 651,524 | |
| | | | | | | | |
| |
Total Investments (97.9%)
(Cost: $645,869)@ | | | | 651,524 | |
| | | | | | | | |
| |
Other Assets, Less
Liabilities (2.1%) | | | | 14,019 | |
| | | | | | | | |
| |
Net Assets (100.0%) | | | | 665,543 | |
| | | | | | | | |
The Accompanying Notes are an Integral Part of the Financial Statements.
52
Mid Cap Value Portfolio
Over the Counter Derivatives
Forward Foreign Currency Contracts
| | | | | | | | | | | | | | | | | | | | | | | | | | | | |
| Type | | Counterparty | | Currency | | Foreign Principal
Amount
Covered by
Contract (000s) | | | USD Principal
Amount Covered by
Contract (000’s) | | | Settlement
Date | | | Unrealized
Appreciation
(000’s) | | Unrealized
(Depreciation)
(000’s) | | | Net
Unrealized
Appreciation/
(Depreciation)
(000’s) | |
Sell | | Bank of America NA | | CAD | | | 6,141 | | | | 4,640 | | | | 3/28/24 | | | $ | — | | | $ | (49) | | | $ | (49) | |
Sell | | Bank of America NA | | EUR | | | 35,928 | | | | 39,798 | | | | 3/28/24 | | | | — | | | | (389) | | | | (389) | |
Sell | | Goldman Sachs International | | GBP | | | 7,366 | | | | 9,393 | | | | 3/28/24 | | | | — | | | | (56) | | | | (56) | |
| | | | | | | | | | | | | | | | | | | | |
| | | | | | | | | | | | | | | | | | $ | — | | | $ | (494) | | | $ | (494) | |
| | | | | | | | | | | | | | | | | | | | |
| | | | | | | | | | | | | | | | | | | | | | | | | | |
| | | Financial Derivative Assets (000’s) | | | Financial Derivative Liabilities (000’s) | |
| | | Forward
Foreign
Currency
Contracts | | Swaps | | | Total | | | Forward
Foreign
Currency
Contracts | | | Options | | | Swaps | | | Total | |
Total Over the Counter Derivatives | | — | | | — | | | | — | | | $ | (494) | | | | — | | | | — | | | $ | (494) | |
| + | All par is stated in U.S. Dollar unless otherwise noted. |
| @ | At December 31, 2023, the aggregate cost of investments, including derivatives, for federal tax purposes (in thousands) was $648,196 and the net unrealized appreciation of investments based on that cost was $2,834 which is comprised of $41,425 aggregate gross unrealized appreciation and $38,591 aggregate gross unrealized depreciation. | |
The following is a summary of the inputs used in valuing the Portfolio’s Investments at December 31, 2023. See Note 3 for additional information on portfolio valuation.
| | | | | | | | | | | | |
| | | Valuation Inputs | |
| Description | | Level 1 - Quoted
Prices | | | Level 2 - Other Significant Observable Inputs | | | Level 3 - Significant Unobservable Inputs | |
| | | (Amounts in thousands) | |
Assets: | | | | | | | | | | | | |
Common Stocks | | | | | | | | | | | | |
Consumer Discretionary | | $ | 19,782 | | | $ | 4,195 | | | $ | — | |
Consumer Staples | | | 49,470 | | | | 20,023 | | | | — | |
Industrials | | | 80,839 | | | | 24,534 | | | | — | |
Materials | | | 20,528 | | | | 8,282 | | | | — | |
All Others | | | 423,871 | | | | — | | | | — | |
| | | | |
Total Assets: | | $ | 594,490 | | | $ | 57,034 | | | $ | — | |
| | | | |
Liabilities: | | | | | | | | | | | | |
Other Financial Instruments^ | | | | | | | | | | | | |
Forward Foreign Currency Contracts | | | — | | | | (494 | ) | | | — | |
| | | | |
Total Liabilities: | | $ | — | | | $ | (494 | ) | | $ | — | |
| | | | |
^ Other financial instruments are derivative instruments such as futures and forward foreign currency contracts, which are valued at the unrealized appreciation (depreciation) on the instrument, and securities sold short, reverse repurchase agreements, written options and swaps contracts, which are valued at market value.
The Accompanying Notes are an Integral Part of the Financial Statements.
53
Small Cap Growth Stock Portfolio (unaudited)
| | | | |
| Objective: | | Portfolio Strategy: | | Net Assets: |
| Long-term growth of capital. | | Invest primarily in common stocks of small capitalization companies. | | $687 million |
PORTFOLIO OVERVIEW
Mason Street Advisors, LLC (“Mason Street Advisors”), the investment adviser for the Small Cap Growth Stock Portfolio (the “Portfolio”), has engaged Wellington Management Company LLP (“Wellington”) to act as sub-adviser for the Portfolio. Normally, the Portfolio invests in common stocks of small capitalization companies. The Portfolio’s investment process is derived from the observation that the quality and persistence of a company’s business is often not reflected in its current stock price. Central to the investment process is intense, fundamental research focused on uncovering companies with improving quality metrics, business momentum and attractive relative valuations.
MARKET OVERVIEW
U.S. equities rose during the twelve months ended December 31, 2023 amid easing inflation, optimism for lower interest rates, strong performances in select mega-capitalization technology companies and steady Gross Domestic Product growth. Early in 2023, the collapse of two U.S. regional banks prompted swift policy actions by federal regulators, which helped stabilize liquidity and stem the potential for broader contagion. The U.S. Federal Reserve (the “Fed”) slowed its pace of policy tightening. Shares of a narrow group of mega-capitalization technology companies surged, helping growth stocks significantly outperform their value counterparts. These companies benefited from investor optimism about earnings potential and growth prospects and exuberance surrounding generative artificial intelligence (“AI”). U.S. equities fell in the third quarter, pressured by rising U.S. Treasury yields amid views that the Fed would keep interest rates elevated for a prolonged period. In the fourth quarter, U.S. equities rallied, registering their largest quarterly return in three years as gains broadened beyond those select mega-capitalization stocks that dominated the stock market’s earlier performance. A rapid descent in inflation prompted the Fed to pivot, with policymakers anticipating 75 bps of interest rate cuts in 2024.
PORTFOLIO RESULTS
The Portfolio returned 18.36% for the twelve months ended December 31, 2023. By comparison, the Portfolio’s benchmark, the Russell 2000® Growth Index (the “Index”) returned 18.66%. (The Index is unmanaged, cannot be invested in directly and does not incur expenses.)
Security selection detracted from the Portfolio’s relative return, driven by weak selection in the Healthcare, Industrials and Communication Services sectors. The top relative detractors included overweight positions in Healthcare sector companies, Ventyx Biosciences and Aclaris Therapeutics. Shares of Ventyx Biosciences, a clinical-stage biopharmaceutical company, declined after the company announced a decision to halt further development of a new psoriasis treatment following disappointing results for its phase-two trial. Aclaris Therapeutics fell, as the company announced disappointing top-line results from its Phase 2b study of a treatment for rheumatoid arthritis and noting the trial will be discontinued. An out-of-benchmark position in Financials sector company, Western Alliance Bancorporation also weighed on relative performance. The company came under pressure after the failure of Silicon Valley Bank caused concerns that other banks would need to sell long-term assets at steep losses to meet liquidity needs.
Strong sector allocation, particularly a lack of exposure to the Utilities sector, an underweight allocation to the Healthcare sector and an overweight allocation to the Industrials sector contributed to the Portfolio’s relative performance. Top contributors to relative performance were overweight positions in Healthcare sector company ImmunoGen, Consumer Discretionary sector company Wingstop and Consumer Staples sector company Sovos Brands. ImmunoGen advanced as the company reported strong topline results from a Phase 3 study of their ovarian cancer drug, Elahere. Wingstop contributed as the company reported third-quarter results that beat expectations. Shares of Sovos Brands, a packaged-food company, rallied after Campbell Soup Company announced it would be acquiring the company for $2.7 billion in cash.
PORTFOLIO MANAGER OUTLOOK
The following forward-looking comments are the opinion of Wellington, the Portfolio’s sub-adviser.
With increasingly dovish commentary and the Fed indicating it will cut rates several times in 2024, we believe the U.S. market has now fully accepted that the dramatic rate cycle which began in March 2022 has come to an end. There has been constructive evidence that inflationary trends are in fact moving downward toward the Fed’s stated goal of 2%, yet what remains to be seen is the precise onset, cadence and true depth of how interest rate cuts will be enacted.
54
Small Cap Growth Stock Portfolio (unaudited)
An easing in the cost of capital for companies and consumers alike should be constructive for the U.S. economy and could lead to an improved housing market, increased mergers and acquisitions and increasing levels of investment. This should benefit more rate-sensitive sectors, including Financials. Furthermore, robust and continued innovation within the Information Technology sector promises to provide opportunities increased productivity within the U.S. workforce as companies continue to explore the burgeoning capabilities promised by AI-based technology.
Relative Performance
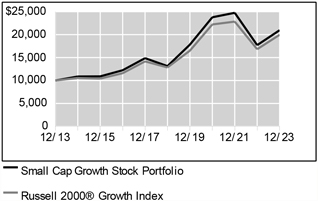
| | | | | | |
Average Annual Total Returns For Periods Ended December 31, 2023 |
| | | 1 Year | | 5 Years | | 10 Years |
Small Cap Growth Stock Portfolio | | 18.36% | | 9.80% | | 7.68% |
Russell 2000® Growth Index | | 18.66% | | 9.22% | | 7.16% |
The performance data quoted represents past performance. Past performance is historical and does not guarantee future performance. Investment return and principal value will fluctuate, so that shares, when redeemed, may be worth more or less than their original cost. Current performance may be lower or higher than the performance data quoted. For the most recent month-end performance information visit www.northwesternmutual.com.
This chart assumes an initial investment of $10,000 made on 12/31/13. Returns shown reflect fee waivers, deductions for management and other portfolio expenses, and reinvestment of all dividends. In the absence of fee waivers, total return would be reduced. Returns exclude deductions for separate account sale loads and account fees. Please refer to the Benchmark Definitions section of this report for information about the indices cited in the above chart and graph.
The Portfolio may invest a relatively high percentage of its assets in a particular sector. The Portfolio will have greater exposure to the risks associated with that sector and its performance will be tied more closely to the performance of the sector.
Top 10 Holdings 12/31/23
| | | | | | | | |
| | | | |
| | | Security Description | | % of Net Assets | | | | |
| | | | |
| | | e.l.f. Beauty, Inc. | | 1.5% | | | | |
| | | | |
| | | Fabrinet | | 1.4% | | | | |
| | | | |
| | | iShares Russell 2000 Growth ETF | | 1.4% | | | | |
| | | | |
| | | Applied Industrial Technologies, Inc. | | 1.4% | | | | |
| | | | |
| | | Ensign Group, Inc. | | 1.4% | | | | |
| | | | |
| | | Verra Mobility Corp. | | 1.3% | | | | |
| | | | |
| | | Cabot Corp. | | 1.3% | | | | |
| | | | |
| | | Visteon Corp. | | 1.3% | | | | |
| | | | |
| | | FTAI Aviation, Ltd. | | 1.2% | | | | |
| | | | |
| | | Blackbaud, Inc. | | 1.2% | | | | |
Sector Allocation 12/31/23
| | | | | | | | |
| | | | |
| | | Sector | | % of Net Assets | | | | |
| | | | |
| | | Information Technology | | 23.2% | | | | |
| | | | |
| | | Health Care | | 22.1% | | | | |
| | | | |
| | | Industrials | | 19.9% | | | | |
| | | | |
| | | Consumer Discretionary | | 12.1% | | | | |
| | | | |
| | | Financials | | 6.1% | | | | |
| | | | |
| | | Energy | | 4.4% | | | | |
| | | | |
| | | Materials | | 4.2% | | | | |
| | | | |
| | | Consumer Staples | | 3.0% | | | | |
| | | | |
| | | Real Estate | | 1.6% | | | | |
| | | | |
| | | Communication Services | | 1.5% | | | | |
| | | | |
| | | Investment Companies | | 1.4% | | | | |
| | | | |
| | | Short-Term Investments & Other Net Assets | | 0.5% | | | | |
Sector Allocation and Top 10 Holdings are subject to change.
55
Small Cap Growth Stock Portfolio
SCHEDULE OF INVESTMENTS
December 31, 2023
| | | | | | | | |
Common Stocks (98.1%) | | Shares/ Par + | | | Value $ (000’s) | |
Communication Services (1.5%) | |
Bumble, Inc. * | | | 118,645 | | | | 1,749 | |
Eventbrite, Inc. * | | | 397,813 | | | | 3,326 | |
ZoomInfo Technologies, Inc. * | | | 290,628 | | | | 5,373 | |
| | | | | | | | |
Total | | | | | | | 10,448 | |
| | | | | | | | |
|
Consumer Discretionary (12.1%) | |
Boot Barn Holdings, Inc. * | | | 58,460 | | | | 4,487 | |
Burlington Stores, Inc. * | | | 21,044 | | | | 4,093 | |
Century Communities, Inc. | | | 60,014 | | | | 5,470 | |
Chewy, Inc. * | | | 169,845 | | | | 4,013 | |
Crocs, Inc. * | | | 29,674 | | | | 2,772 | |
Duolingo, Inc. * | | | 23,731 | | | | 5,383 | |
Etsy, Inc. * | | | 57,131 | | | | 4,631 | |
European Wax Center, Inc. * | | | 278,961 | | | | 3,791 | |
Patrick Industries, Inc. | | | 24,462 | | | | 2,455 | |
PVH Corp. | | | 19,340 | | | | 2,362 | |
SharkNinja, Inc. | | | 111,010 | | | | 5,680 | |
Texas Roadhouse, Inc. | | | 47,653 | | | | 5,825 | |
VF Corp. | | | 237,188 | | | | 4,459 | |
Visteon Corp. * | | | 69,602 | | | | 8,693 | |
Wingstop, Inc. | | | 21,763 | | | | 5,584 | |
Wyndham Hotels & Resorts, Inc. | | | 91,884 | | | | 7,388 | |
YETI Holdings, Inc. * | | | 110,795 | | | | 5,737 | |
| | | | | | | | |
Total | | | | | | | 82,823 | |
| | | | | | | | |
|
Consumer Staples (3.0%) | |
The Boston Beer Co., Inc. - Class A * | | | 11,381 | | | | 3,933 | |
e.l.f. Beauty, Inc. * | | | 72,134 | | | | 10,412 | |
Freshpet, Inc. * | | | 73,205 | | | | 6,351 | |
| | | | | | | | |
Total | | | | | | | 20,696 | |
| | | | | | | | |
|
Energy (4.4%) | |
Cactus, Inc. | | | 79,857 | | | | 3,625 | |
Gulfport Energy Corp. * | | | 27,767 | | | | 3,699 | |
Helmerich & Payne, Inc. | | | 112,439 | | | | 4,073 | |
Magnolia Oil & Gas Corp. | | | 231,741 | | | | 4,934 | |
Oasis Petroleum, Inc. | | | 27,384 | | | | 4,552 | |
SM Energy Co. | | | 112,063 | | | | 4,339 | |
Weatherford International PLC * | | | 47,502 | | | | 4,647 | |
| | | | | | | | |
Total | | | | | | | 29,869 | |
| | | | | | | | |
|
Financials (6.1%) | |
MGIC Investment Corp. | | | 318,463 | | | | 6,143 | |
Remitly Global, Inc. * | | | 216,802 | | | | 4,210 | |
Selective Insurance Group, Inc. | | | 37,932 | | | | 3,774 | |
Shift4 Payments, Inc. * | | | 25,335 | | | | 1,884 | |
| | | | | | | | |
Common Stocks (98.1%) | | Shares/ Par + | | | Value $ (000’s) | |
Financials continued | |
StepStone Group, Inc. | | | 158,442 | | | | 5,043 | |
Stifel Financial Corp. | | | 94,812 | | | | 6,556 | |
Synovus Financial Corp. | | | 97,219 | | | | 3,660 | |
Triumph Financial, Inc. * | | | 56,929 | | | | 4,565 | |
WEX, Inc. * | | | 29,811 | | | | 5,800 | |
| | | | | | | | |
Total | | | | | | | 41,635 | |
| | | | | | | | |
|
Health Care (22.1%) | |
Akero Therapeutics, Inc. * | | | 77,552 | | | | 1,811 | |
Alkermes PLC * | | | 210,875 | | | | 5,850 | |
Amicus Therapeutics, Inc. * | | | 234,763 | | | | 3,331 | |
Apogee Therapeutics, Inc. * | | | 44,960 | | | | 1,256 | |
AtriCure, Inc. * | | | 95,882 | | | | 3,422 | |
Blueprint Medicines Corp. * | | | 64,923 | | | | 5,989 | |
BridgeBio Pharma, Inc. * | | | 65,004 | | | | 2,624 | |
Celldex Therapeutics, Inc. * | | | 87,279 | | | | 3,462 | |
Crinetics Pharmaceuticals, Inc. * | | | 112,973 | | | | 4,020 | |
Cytek Biosciences, Inc. * | | | 261,366 | | | | 2,384 | |
Cytokinetics, Inc. * | | | 82,929 | | | | 6,924 | |
Denali Therapeutics, Inc. * | | | 113,301 | | | | 2,431 | |
Encompass Health Corp. | | | 108,392 | | | | 7,232 | |
Ensign Group, Inc. | | | 83,034 | | | | 9,317 | |
Geron Corp. * | | | 773,961 | | | | 1,633 | |
Haemonetics Corp. * | | | 78,412 | | | | 6,705 | |
HealthEquity, Inc. * | | | 88,853 | | | | 5,891 | |
Inari Medical, Inc. * | | | 71,134 | | | | 4,618 | |
Inspire Medical Systems, Inc. * | | | 20,073 | | | | 4,083 | |
Intellia Therapeutics, Inc. * | | | 36,435 | | | | 1,111 | |
Intra-Cellular Therapies, Inc. * | | | 91,134 | | | | 6,527 | |
Ionis Pharmaceuticals, Inc. * | | | 53,632 | | | | 2,713 | |
iRhythm Technologies, Inc. * | | | 47,852 | | | | 5,122 | |
Kymera Therapeutics, Inc. * | | | 58,834 | | | | 1,498 | |
Lantheus Holdings, Inc. * | | | 53,152 | | | | 3,295 | |
MoonLake | | | 25,748 | | | | 1,555 | |
Morphic Holding, Inc. * | | | 60,863 | | | | 1,758 | |
| | | | | | | | |
Common Stocks (98.1%) | | Shares/ Par + | | | Value $ (000’s) | |
Health Care continued | |
Nuvalent, Inc. - Class A * | | | 43,917 | | | | 3,232 | |
Option Care Health, Inc. * | | | 191,189 | | | | 6,441 | |
Owens & Minor, Inc. * | | | 88,010 | | | | 1,696 | |
Prothena Corp. PLC * | | | 45,380 | | | | 1,649 | |
QuidelOrtho Corp. * | | | 41,026 | | | | 3,024 | |
RadNet, Inc. * | | | 149,064 | | | | 5,183 | |
RayzeBio, Inc. * | | | 55,342 | | | | 3,441 | |
Revolution Medicines, Inc. * | | | 155,232 | | | | 4,452 | |
Rocket Pharmaceuticals, Inc. * | | | 110,486 | | | | 3,311 | |
Sage Therapeutics, Inc. * | | | 49,583 | | | | 1,074 | |
Structure Therapeutics, Inc., ADR * | | | 32,489 | | | | 1,324 | |
Ultragenyx Pharmaceutical, Inc. * | | | 48,114 | | | | 2,301 | |
Vaxcyte, Inc. * | | | 91,197 | | | | 5,727 | |
Veracyte, Inc. * | | | 92,778 | | | | 2,552 | |
| | | | | | | | |
Total | | | | | | | 151,969 | |
| | | | | | | | |
|
Industrials (19.9%) | |
Applied Industrial Technologies, Inc. | | | 56,438 | | | | 9,746 | |
The AZEK Co., Inc. * | | | 160,102 | | | | 6,124 | |
Boise Cascade Co. | | | 40,991 | | | | 5,303 | |
CACI International, Inc. - Class A * | | | 15,473 | | | | 5,011 | |
Casella Waste Systems, Inc. - Class A * | | | 48,959 | | | | 4,184 | |
Ceridian HCM Holding, Inc. * | | | 45,989 | | | | 3,087 | |
Chart Industries, Inc. * | | | 50,183 | | | | 6,841 | |
Clean Harbors, Inc. * | | | 30,735 | | | | 5,364 | |
Comfort Systems USA, Inc. | | | 29,740 | | | | 6,117 | |
Curtiss-Wright Corp. | | | 23,854 | | | | 5,314 | |
ExlService Holdings, Inc. * | | | 115,850 | | | | 3,574 | |
Fluor Corp. * | | | 184,881 | | | | 7,242 | |
FTAI Aviation, Ltd. | | | 179,703 | | | | 8,338 | |
Herc Holdings, Inc. | | | 12,654 | | | | 1,884 | |
Hillman Solutions Corp. * | | | 649,684 | | | | 5,984 | |
Insperity, Inc. | | | 22,158 | | | | 2,597 | |
ITT, Inc. | | | 31,006 | | | | 3,700 | |
John Bean Technologies Corp. | | | 66,304 | | | | 6,594 | |
KBR, Inc. | | | 50,875 | | | | 2,819 | |
Rush Enterprises, Inc. | | | 120,142 | | | | 6,043 | |
The Accompanying Notes are an Integral Part of the Financial Statements.
56
Small Cap Growth Stock Portfolio
| | | | | | | | |
Common Stocks (98.1%) | | Shares/ Par + | | | Value $ (000’s) | |
Industrials continued | |
Shoals Technologies Group, Inc. * | | | 276,855 | | | | 4,302 | |
SPX Technologies, Inc. * | | | 73,134 | | | | 7,387 | |
TriNet Group, Inc. * | | | 23,349 | | | | 2,777 | |
Verra Mobility Corp. * | | | 395,267 | | | | 9,103 | |
WillScot Mobile Mini Holdings Corp. * | | | 70,507 | | | | 3,138 | |
Zurn Water Solutions Corp. | | | 146,688 | | | | 4,314 | |
| | | | | | | | |
Total | | | | | | | 136,887 | |
| | | | | | | | |
| |
Information Technology (23.2%) | | | | | |
Agilysys, Inc. * | | | 56,740 | | | | 4,813 | |
Alarm.com Holdings, Inc. * | | | 80,285 | | | | 5,188 | |
Altair Engineering, Inc. - Class A * | | | 74,805 | | | | 6,295 | |
AppFolio, Inc. * | | | 23,422 | | | | 4,058 | |
Axcelis Technologies, Inc. * | | | 26,163 | | | | 3,393 | |
Blackbaud, Inc. * | | | 94,198 | | | | 8,167 | |
Braze, Inc. * | | | 75,831 | | | | 4,029 | |
CCC Intelligent Solutions Holdings, Inc. * | | | 256,862 | | | | 2,926 | |
Cirrus Logic, Inc. * | | | 44,364 | | | | 3,691 | |
Credo Technology Group Holding, Ltd. * | | | 154,728 | | | | 3,012 | |
DoubleVerify Holdings, Inc. * | | | 95,238 | | | | 3,503 | |
Fabrinet * | | | 51,408 | | | | 9,784 | |
Five9, Inc. * | | | 42,963 | | | | 3,381 | |
FormFactor, Inc. * | | | 68,871 | | | | 2,873 | |
Grid Dynamics Holdings, Inc. * | | | 271,461 | | | | 3,619 | |
Guidewire Software, Inc. * | | | 46,074 | | | | 5,024 | |
Insight Enterprises, Inc. * | | | 44,019 | | | | 7,800 | |
Intapp, Inc. * | | | 115,866 | | | | 4,405 | |
Littelfuse, Inc. | | | 11,123 | | | | 2,976 | |
MKS Instruments, Inc. | | | 48,921 | | | | 5,032 | |
Novanta, Inc. * | | | 35,860 | | | | 6,039 | |
Onto Innovation, Inc. * | | | 39,491 | | | | 6,038 | |
Perficient, Inc. * | | | 67,425 | | | | 4,438 | |
Power Integrations, Inc. | | | 72,298 | | | | 5,936 | |
PowerSchool Holdings, Inc. * | | | 197,160 | | | | 4,645 | |
Rambus, Inc. * | | | 75,008 | | | | 5,119 | |
Rapid7, Inc. * | | | 36,687 | | | | 2,095 | |
Sprinklr, Inc. * | | | 185,577 | | | | 2,234 | |
Sprout Social, Inc. * | | | 88,913 | | | | 5,463 | |
SPS Commerce, Inc. * | | | 28,583 | | | | 5,540 | |
Squarespace, Inc. * | | | 184,040 | | | | 6,075 | |
Super Micro Computer, Inc. * | | | 12,748 | | | | 3,624 | |
Varonis Systems, Inc. * | | | 99,995 | | | | 4,528 | |
| | | | | | | | |
Common Stocks (98.1%) | | Shares/ Par + | | | Value $ (000’s) | |
Information Technology continued | |
Workiva, Inc. * | | | 34,284 | | | | 3,481 | |
| | | | | | | | |
Total | | | | | | | 159,224 | |
| | | | | | | | |
| | |
Materials (4.2%) | | | | | | | | |
Axalta Coating Systems, Ltd. * | | | 178,735 | | | | 6,072 | |
Cabot Corp. | | | 107,989 | | | | 9,017 | |
FMC Corp. | | | 43,020 | | | | 2,712 | |
Livent Corp. * | | | 323,737 | | | | 5,821 | |
Louisiana-Pacific Corp. | | | 77,981 | | | | 5,523 | |
| | | | | | | | |
Total | | | | | | | 29,145 | |
| | | | | | | | |
| | |
Real Estate (1.6%) | | | | | | | | |
Phillips Edison & Co., Inc. | | | 167,831 | | | | 6,122 | |
Ryman Hospitality | | | | | | | | |
Properties, Inc. | | | 43,590 | | | | 4,798 | |
| | | | | | | | |
Total | | | | | | | 10,920 | |
| | | | | | | | |
| |
Total Common Stocks
(Cost: $561,475) | | | | 673,616 | |
| | | | | |
| |
Investment Companies
(1.4%) | | | | |
Investment Companies (1.4%) | |
iShares Russell 2000 Growth ETF | | | 38,666 | | | | 9,752 | |
| | | | | |
Total | | | | | | | 9,752 | |
| | | | | |
| |
Total Investment Companies
(Cost: $8,710) | | | | 9,752 | |
| | | | | |
| |
Total Investments (99.5%)
(Cost: $570,185)@ | | | | 683,368 | |
| | | | | |
| |
Other Assets, Less Liabilities (0.5%) | | | | 3,301 | |
| | | | | |
| |
Net Assets (100.0%) | | | | 686,669 | |
| | | | | |
The Accompanying Notes are an Integral Part of the Financial Statements.
57
Small Cap Growth Stock Portfolio
| + | All par is stated in U.S. Dollar unless otherwise noted. |
| @ | At December 31, 2023, the aggregate cost of investments, including derivatives, for federal tax purposes (in thousands) was $574,567 and the net unrealized appreciation of investments based on that cost was $108,801 which is comprised of $133,025 aggregate gross unrealized appreciation and $24,224 aggregate gross unrealized depreciation. |
The following is a summary of the inputs used in valuing the Portfolio’s Investments at December 31, 2023. See Note 3 for additional information on portfolio valuation.
| | | | | | | | | | | | | | | | |
| | | Valuation Inputs | |
| Description | | | | | Level 1 - Quoted
Prices | | | Level 2 - Other
Significant
Observable Inputs | | | Level 3 - Significant Unobservable Inputs | |
| | | (Amounts in thousands) | |
Assets: | | | | | | | | | | | | | | | | |
Common Stocks | | | | | | $ | 673,616 | | | $ | — | | | $ | — | |
Investment Companies | | | | | | | 9,752 | | | | — | | | | — | |
| | | | | | | | |
Total Assets: | | | | | | $ | 683,368 | | | $ | — | | | $ | — | |
| | | | | | | | |
The Accompanying Notes are an Integral Part of the Financial Statements.
58
Index 600 Stock Portfolio (unaudited)
| | | | |
| Objective: | | Portfolio Strategy: | | Net Assets: |
| Investment results that approximate the performance of the S&P SmallCap 600® Index. | | Invest in stocks that make up the S&P SmallCap 600® Index, holding each stock in approximately the same proportion as its weighting in the Index. | | $438 million |
PORTFOLIO OVERVIEW
Mason Street Advisors, LLC (“Mason Street Advisors”), the investment adviser for the Index 600 Stock Portfolio (the “Portfolio”), has engaged Northern Trust Investments, Inc. (“Northern Trust”) to act as sub-adviser for the Portfolio. The Portfolio seeks investment results that approximate the performance of the S&P SmallCap 600® Index. The Portfolio attempts to achieve its objective by investing all, or substantially all, of its assets in stocks that make up the S&P SmallCap 600® Index, holding each stock in approximately the same proportion as its weighting in the Index. This is known as a full replication strategy. The Portfolio may also invest in equity index futures to help achieve full replication.
MARKET OVERVIEW
The U.S. equity market climbed a wall of worry in 2023 - stock prices jumped double digits despite a year filled with extraordinary events that had the potential to give any investor pause, including the Silicon Valley Bank crisis, U.S. debt default fears, as well as geopolitical tensions in the Middle East. In the end, investors focused on the U.S.’s resilient economic growth, rapidly declining inflation reports, and the widely held expectation late in the year that the U.S. Federal Reserve would prove successful in soft landing the economy in 2024.
In this environment, large-cap stocks, as represented by the S&P 500® Index, posted a return of 26.29%, outperforming the S&P MidCap 400® and the S&P SmallCap 600® Indices, which returned 16.44% and 16.05%, respectively. Meanwhile, the broader bond market, as represented by the Bloomberg® U.S. Aggregate Index, returned 5.53%, while the Bloomberg® U.S. Corporate High Yield Index returned 13.45%.
PORTFOLIO RESULTS
The Portfolio delivered a total return of 15.76% for the twelve months ending December 31, 2023, trailing the S&P 600® Index (the “Index”), which posted a return of 16.05%. (The Index is unmanaged, cannot be invested in directly and does not incur expenses.) Portfolio performance lagged the Index due to transaction costs, administrative expenses, cash flow effects and costs associated with stock index futures contracts.
The Industrials, Consumer Discretionary and Information Technology sectors were significant contributors to the Portfolio’s return over the reporting period. Strength in the Industrials sector was driven by the machinery industry, which benefited from the incorporation of major advances in technology to improve productivity gains leading to lower operating costs. The building products industry contributed as rising home prices increased the need for new construction. Similarly, the Consumer Discretionary sector advanced, driven by homebuilding stocks. Construction of new homes continued at a brisk pace despite slower home sales and higher interest rates, reflecting the ongoing shortage of new homes in the U.S. real estate market. The Information Technology sector also contributed meaningfully, benefiting from better-than-expected earnings growth, investor enthusiasm for corporate cost-cutting and optimism that artificial intelligence (AI) could lead to strong growth opportunities in technology and technology-related companies.
The Real Estate, Materials and Financials sectors also contributed meaningfully to the Portfolio’s return. Real Estate was buoyed by increasing expectations for monetary policy easing as lower financing costs provide support to real estate prices. The Materials sector was supported by the mineral and mining industry which benefited as the shift to renewable energy increased demand for metals used in the transition, particularly those needed for electric batteries. The Financials sector benefited from performance in the insurance industry as higher interest rates raised revenues on their bond holdings.
The Utilities sector detracted modestly from the Portfolio’s return for the reporting period. The Utilities sector is generally seen as a more defensive sector, typically benefiting from lower volatility returns and consistent dividend payments. However, as higher monetary policy rates pushed longer-dated U.S. Treasury yields to 15-year highs, investors favored the higher yields of these government-issued securities.
59
Index 600 Stock Portfolio (unaudited)
Relative Performance
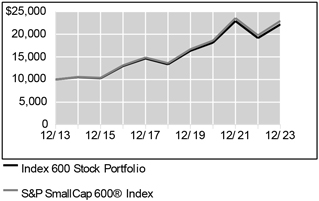
| | | | | | |
Average Annual Total Returns For Periods Ended December 31, 2023 |
| | | |
| | | 1 Year | | 5 Years | | 10 Years |
Index 600 Stock Portfolio | | 15.76% | | 10.66% | | 8.29% |
S&P SmallCap 600® Index | | 16.05% | | 11.04% | | 8.66% |
The performance data quoted represents past performance. Past performance is historical and does not guarantee future performance. Investment return and principal value will fluctuate, so that shares, when redeemed, may be worth more or less than their original cost. Current performance may be lower or higher than the performance data quoted. For the most recent month-end performance information visit www.northwesternmutual.com.
This chart assumes an initial investment of $10,000 made on 12/31/13. Returns shown reflect fee waivers, deductions for management and other portfolio expenses, and reinvestment of all dividends. In the absence of fee waivers, total return would be reduced. Returns exclude deductions for separate account sale loads and account fees. Please refer to the Benchmark Definitions section of this report for information about the indices cited in the above chart and graph.
Top 10 Holdings 12/31/23
| | | | | | | | |
| | | | |
| | | Security Description | | % of Net Assets | | | | |
| | | | |
| | | Cytokinetics, Inc. | | 0.7% | | | | |
| | | | |
| | | e.l.f. Beauty, Inc. | | 0.7% | | | | |
| | | | |
| | | SPS Commerce, Inc. | | 0.6% | | | | |
| | | | |
| | | Fabrinet | | 0.6% | | | | |
| | | | |
| | | Applied Industrial Technologies, Inc. | | 0.6% | | | | |
| | | | |
| | | Meritage Homes Corp. | | 0.6% | | | | |
| | | | |
| | | Ensign Group, Inc. | | 0.6% | | | | |
| | | | |
| | | Allegheny Technologies, Inc. | | 0.5% | | | | |
| | | | |
| | | Mueller Industries, Inc. | | 0.5% | | | | |
| | | | |
| | | SolarEdge Technologies, Inc. | | 0.5% | | | | |
Sector Allocation 12/31/23
| | | | | | | | | | |
| | | | |
| | | Sector | | | % of Net Assets | | | | | |
| | | | |
| | | Financials | | | 18.3% | | | | | |
| | | | |
| | | Industrials | | | 17.4% | | | | | |
| | | | |
| | | Consumer Discretionary | | | 14.8% | | | | | |
| | | | |
| | | Information Technology | | | 12.3% | | | | | |
| | | | |
| | | Health Care | | | 10.4% | | | | | |
| | | | |
| | | Real Estate | | | 7.5% | | | | | |
| | | | |
| | | Materials | | | 5.6% | | | | | |
| | | | |
| | | Consumer Staples | | | 4.4% | | | | | |
| | | | |
| | | Energy | | | 4.2% | | | | | |
| | | | |
| | | Communication Services | | | 2.8% | | | | | |
| | | | |
| | | Utilities | | | 2.0% | | | | | |
| | | | |
| | | Short-Term Investments & Other Net Assets | | | 0.3% | | | | | |
| | | | |
| | | Governments | | | 0.0% | | | | | |
Sector Allocation and Top 10 Holdings are subject to change.
60
Index 600 Stock Portfolio
SCHEDULE OF INVESTMENTS
December 31, 2023
| | | | | | | | |
Common Stocks (99.7%) | | Shares/ Par + | | | Value $ (000’s) | |
Communication Services (2.8%) | |
AMC Networks, Inc. - Class A * | | | 11,440 | | | | 215 | |
ATN International, Inc. | | | 3,966 | | | | 154 | |
CarGurus, Inc. * | | | 32,482 | | | | 785 | |
Cars.com, Inc. * | | | 23,348 | | | | 443 | |
Cinemark Holdings, Inc. * | | | 40,209 | | | | 566 | |
Cogent Communications Holdings, Inc. | | | 16,403 | | | | 1,248 | |
Consolidated Communications Holdings, Inc. * | | | 28,248 | | | | 123 | |
DISH Network Corp. - Class A * | | | 94,222 | | | | 544 | |
The E.W. Scripps Co. - Class A * | | | 22,495 | | | | 180 | |
EchoStar Corp. * | | | 12,555 | | | | 208 | |
Gogo, Inc. * | | | 23,652 | | | | 239 | |
John Wiley & Sons, Inc. - Class A | | | 16,101 | | | | 511 | |
Lumen Technologies, Inc. * | | | 382,380 | | | | 700 | |
Madison Square Garden Sports Corp. * | | | 6,325 | | | | 1,150 | |
The Marcus Corp. | | | 9,308 | | | | 136 | |
QuinStreet, Inc. * | | | 19,631 | | | | 252 | |
Scholastic Corp. | | | 10,347 | | | | 390 | |
Shenandoah Telecommunications Co. | | | 19,045 | | | | 412 | |
Shutterstock, Inc. | | | 9,070 | | | | 438 | |
TechTarget, Inc. * | | | 9,793 | | | | 341 | |
Telephone and Data Systems, Inc. | | | 37,488 | | | | 688 | |
Thryv Holdings, Inc. * | | | 11,663 | | | | 237 | |
TripAdvisor, Inc. * | | | 40,981 | | | | 882 | |
Yelp, Inc. * | | | 25,957 | | | | 1,229 | |
| | | | | | | | |
Total | | | | | | | 12,071 | |
| | | | | | | | |
|
Consumer Discretionary (14.8%) | |
Abercrombie & Fitch Co. - Class A * | | | 19,087 | | | | 1,684 | |
Academy Sports & Outdoors, Inc. | | | 28,251 | | | | 1,865 | |
Adtalem Global Education, Inc. * | | | 15,095 | | | | 890 | |
Advance Auto Parts, Inc. | | | 22,541 | | | | 1,376 | |
American Axle & Manufacturing Holdings, Inc. * | | | 44,360 | | | | 391 | |
American Eagle Outfitters, Inc. | | | 70,362 | | | | 1,489 | |
| | | | | | | | |
Common Stocks (99.7%) | | Shares/ Par + | | | Value $ (000’s) | |
Consumer Discretionary continued | |
America’s Car-Mart, Inc. * | | | 2,202 | | | | 167 | |
Asbury Automotive Group, Inc. * | | | 7,800 | | | | 1,755 | |
BJ’s Restaurants, Inc. * | | | 8,806 | | | | 317 | |
Bloomin’ Brands, Inc. | | | 32,904 | | | | 926 | |
Boot Barn Holdings, Inc. * | | | 11,484 | | | | 881 | |
Brinker International, Inc. * | | | 16,747 | | | | 723 | |
The Buckle, Inc. | | | 11,275 | | | | 536 | |
Caleres, Inc. | | | 12,659 | | | | 389 | |
Callaway Golf Co. * | | | 53,853 | | | | 772 | |
Cavco Industries, Inc. * | | | 2,935 | | | | 1,017 | |
Century Communities, Inc. | | | 10,714 | | | | 976 | |
The Cheesecake Factory, Inc. | | | 17,701 | | | | 620 | |
Chico’s FAS, Inc. * | | | 46,792 | | | | 355 | |
Chuy’s Holdings, Inc. * | | | 6,574 | | | | 251 | |
Cracker Barrel Old Country Store, Inc. | | | 8,398 | | | | 647 | |
Dana Holding Corp. | | | 48,690 | | | | 711 | |
Dave & Buster’s Entertainment, Inc. * | | | 13,023 | | | | 701 | |
Designer Brands, Inc. | | | 16,616 | | | | 147 | |
Dine Brands Global, Inc. | | | 5,893 | | | | 293 | |
Dorman Products, Inc. * | | | 10,741 | | | | 896 | |
Ethan Allen Interiors, Inc. | | | 8,740 | | | | 279 | |
Foot Locker, Inc. | | | 31,049 | | | | 967 | |
Frontdoor, Inc. * | | | 30,181 | | | | 1,063 | |
Gentherm, Inc. * | | | 12,430 | | | | 651 | |
G-III Apparel Group, Ltd. * | | | 15,423 | | | | 524 | |
Golden Entertainment, Inc. | | | 8,132 | | | | 325 | |
Green Brick Partners, Inc. * | | | 9,632 | | | | 500 | |
Group 1 Automotive, Inc. | | | 5,240 | | | | 1,597 | |
Guess?, Inc. | | | 10,454 | | | | 241 | |
Hanesbrands, Inc. * | | | 132,668 | | | | 592 | |
Haverty Furniture Cos., Inc. | | | 5,144 | | | | 183 | |
Hibbett, Inc. | | | 4,697 | | | | 338 | |
Installed Building Products, Inc. | | | 8,938 | | | | 1,634 | |
iRobot Corp. * | | | 10,566 | | | | 409 | |
Jack in the Box, Inc. | | | 7,622 | | | | 622 | |
Kohl’s Corp. | | | 41,953 | | | | 1,203 | |
Kontoor Brands, Inc. | | | 18,951 | | | | 1,183 | |
La-Z-Boy, Inc. | | | 16,312 | | | | 602 | |
| | | | | | | | |
Common Stocks (99.7%) | | Shares/ Par + | | | Value $ (000’s) | |
Consumer Discretionary continued | |
LCI Industries | | | 9,598 | | | | 1,207 | |
Leslie’s, Inc. * | | | 69,744 | | | | 482 | |
LGI Homes, Inc. * | | | 7,771 | | | | 1,035 | |
M.D.C. Holdings, Inc. | | | 22,638 | | | | 1,251 | |
M/I Homes, Inc. * | | | 10,557 | | | | 1,454 | |
MarineMax, Inc. * | | | 7,633 | | | | 297 | |
Meritage Homes Corp. | | | 13,937 | | | | 2,428 | |
Mister Car Wash, Inc. * | | | 34,695 | | | | 300 | |
Monarch Casino & Resort, Inc. | | | 5,056 | | | | 350 | |
Monro, Inc. | | | 11,913 | | | | 349 | |
Movado Group, Inc. | | | 5,947 | | | | 179 | |
National Vision Holdings, Inc. * | | | 29,657 | | | | 621 | |
Newell Brands, Inc. | | | 144,426 | | | | 1,254 | |
The ODP Corp. * | | | 12,604 | | | | 710 | |
Oxford Industries, Inc. | | | 5,564 | | | | 556 | |
Papa John’s International, Inc. | | | 12,417 | | | | 946 | |
Patrick Industries, Inc. | | | 7,881 | | | | 791 | |
Perdoceo Education Corp. | | | 24,895 | | | | 437 | |
PHINIA Inc. | | | 17,696 | | | | 536 | |
Rent-A-Center, Inc. | | | 16,874 | | | | 573 | |
Sabre Corp. * | | | 143,848 | | | | 633 | |
Sally Beauty Holdings, Inc. * | | | 40,842 | | | | 542 | |
Shake Shack, Inc. - Class A * | | | 14,213 | | | | 1,053 | |
Shoe Carnival, Inc. | | | 6,915 | | | | 209 | |
Signet Jewelers, Ltd. | | | 17,013 | | | | 1,825 | |
Six Flags Entertainment Corp. * | | | 27,233 | | | | 683 | |
Sonic Automotive, Inc. - Class A | | | 5,633 | | | | 317 | |
Sonos, Inc. * | | | 48,613 | | | | 833 | |
Standard Motor Products, Inc. | | | 7,077 | | | | 282 | |
Steven Madden, Ltd. | | | 26,579 | | | | 1,116 | |
Strategic Education, Inc. | | | 8,328 | | | | 769 | |
Stride, Inc. * | | | 15,065 | | | | 894 | |
Sturm, Ruger & Co., Inc. | | | 6,712 | | | | 305 | |
TRI Pointe Homes, Inc. * | | | 36,780 | | | | 1,302 | |
Urban Outfitters, Inc. * | | | 21,451 | | | | 766 | |
Victoria’s Secret & Co. * | | | 29,289 | | | | 777 | |
Vista Outdoor, Inc. * | | | 22,008 | | | | 651 | |
Winnebago Industries, Inc. | | | 11,331 | | | | 826 | |
Wolverine World Wide, Inc. | | | 30,448 | | | | 271 | |
The Accompanying Notes are an Integral Part of the Financial Statements.
61
Index 600 Stock Portfolio
| | | | | | | | |
Common Stocks (99.7%) | | Shares/ Par + | | | Value $ (000’s) | |
Consumer Discretionary continued | |
Worthington Enterprises, Inc. | | | 11,553 | | | | 665 | |
XPEL, Inc. * | | | 8,064 | | | | 434 | |
| | | | | | | | |
Total | | | | | | | 64,597 | |
| | | | | | | | |
|
Consumer Staples (4.4%) | |
The Andersons, Inc. | | | 12,001 | | | | 691 | |
B&G Foods, Inc. | | | 29,792 | | | | 313 | |
Calavo Growers, Inc. | | | 6,810 | | | | 200 | |
Cal-Maine Foods, Inc. | | | 15,402 | | | | 884 | |
Central Garden & Pet Co. * | | | 3,651 | | | | 183 | |
Central Garden & Pet Co. - Class A * | | | 15,485 | | | | 682 | |
The Chefs’ Warehouse, Inc. * | | | 13,381 | | | | 394 | |
e.l.f. Beauty, Inc. * | | | 20,923 | | | | 3,020 | |
Edgewell Personal Care Co. | | | 19,243 | | | | 705 | |
Energizer Holdings, Inc. | | | 25,193 | | | | 798 | |
Fresh Del Monte Produce, Inc. | | | 12,899 | | | | 339 | |
The Hain Celestial Group, Inc. * | | | 34,250 | | | | 375 | |
Inter Parfums, Inc. | | | 6,788 | | | | 978 | |
J & J Snack Foods Corp. | | | 5,848 | | | | 978 | |
John B. Sanfilippo & Son, Inc. | | | 3,430 | | | | 353 | |
Medifast, Inc. | | | 4,127 | | | | 277 | |
MGP Ingredients, Inc. | | | 5,924 | | | | 584 | |
National Beverage Corp. * | | | 8,848 | | | | 440 | |
Nu Skin Enterprises, Inc. | | | 18,714 | | | | 363 | |
PriceSmart, Inc. | | | 9,487 | | | | 719 | |
The Simply Good Foods Co. * | | | 34,354 | | | | 1,360 | |
SpartanNash Co. | | | 13,107 | | | | 301 | |
Tootsie Roll Industries, Inc. | | | 6,540 | | | | 217 | |
TreeHouse Foods, Inc. * | | | 19,067 | | | | 790 | |
United Natural Foods, Inc. * | | | 22,439 | | | | 364 | |
Universal Corp. | | | 9,304 | | | | 626 | |
USANA Health Sciences, Inc. * | | | 4,202 | | | | 225 | |
Vector Group, Ltd. | | | 50,219 | | | | 567 | |
WD-40 Co. | | | 5,138 | | | | 1,228 | |
WK Kellogg Co. | | | 25,232 | | | | 332 | |
| | | | | | | | |
Total | | | | | | | 19,286 | |
| | | | | | | | |
|
Energy (4.2%) | |
Archrock, Inc. | | | 52,037 | | | | 801 | |
Bristow Group, Inc. * | | | 9,169 | | | | 259 | |
California Resources Corp. | | | 24,453 | | | | 1,337 | |
Callon Petroleum Co. * | | | 21,071 | | | | 683 | |
| | | | | | | | |
Common Stocks (99.7%) | | Shares/ Par + | | | Value $ (000’s) | |
Energy continued | |
Comstock Resources, Inc. | | | 35,189 | | | | 311 | |
CONSOL Energy, Inc. | | | 10,580 | | | | 1,064 | |
Core Laboratories, Inc. | | | 17,873 | | | | 316 | |
CVR Energy, Inc. | | | 11,053 | | | | 335 | |
Dorian LPG, Ltd. | | | 12,913 | | | | 567 | |
Dril-Quip, Inc. * | | | 13,087 | | | | 305 | |
Green Plains, Inc. * | | | 22,559 | | | | 569 | |
Helix Energy Solutions Group, Inc. * | | | 53,674 | | | | 552 | |
Helmerich & Payne, Inc. | | | 37,674 | | | | 1,365 | |
Liberty Energy, Inc. | | | 58,149 | | | | 1,055 | |
Nabors Industries, Ltd. * | | | 3,371 | | | | 275 | |
Northern Oil and Gas, Inc. | | | 34,594 | | | | 1,282 | |
Oceaneering International, Inc. * | | | 38,168 | | | | 812 | |
Oil States International, Inc. * | | | 24,473 | | | | 166 | |
Par Pacific Holdings, Inc. * | | | 21,098 | | | | 767 | |
Patterson-UTI Energy, Inc. | | | 121,779 | | | | 1,315 | |
ProPetro Holding Corp. * | | | 32,132 | | | | 269 | |
REX American Resources Corp. * | | | 5,793 | | | | 274 | |
RPC, Inc. | | | 32,600 | | | | 237 | |
SM Energy Co. | | | 44,099 | | | | 1,708 | |
Talos Energy, Inc. * | | | 38,106 | | | | 542 | |
US Silica Holdings, Inc. * | | | 29,231 | | | | 331 | |
Vital Energy, Inc. * | | | 9,396 | | | | 427 | |
World Fuel Services Corp. | | | 22,816 | | | | 520 | |
| | | | | | | | |
Total | | | | | | | 18,444 | |
| | | | | | | | |
|
Financials (18.3%) | |
Ambac Financial Group, Inc. * | | | 17,126 | | | | 282 | |
American Equity Investment Life Holding Co. * | | | 23,685 | | | | 1,322 | |
Ameris Bancorp | | | 24,602 | | | | 1,305 | |
AMERISAFE, Inc. | | | 7,267 | | | | 340 | |
Apollo Commercial Real Estate Finance, Inc. | | | 49,264 | | | | 578 | |
Arbor Realty Trust, Inc. | | | 71,418 | | | | 1,084 | |
ARMOUR Residential REIT, Inc. | | | 18,573 | | | | 359 | |
Artisan Partners Asset Management, Inc. | | | 25,952 | | | | 1,147 | |
Assured Guaranty, Ltd. | | | 20,606 | | | | 1,542 | |
Atlantic Union Bankshares Corp. | | | 28,428 | | | | 1,039 | |
Axos Financial, Inc. * | | | 19,474 | | | | 1,063 | |
B. Riley Financial, Inc. | | | 6,388 | | | | 134 | |
| | | | | | | | |
Common Stocks (99.7%) | | Shares/ Par + | | | Value $ (000’s) | |
Financials continued | |
Banc of California, Inc. | | | 49,553 | | | | 666 | |
BancFirst Corp. | | | 5,490 | | | | 534 | |
The Bancorp, Inc. * | | | 20,337 | | | | 784 | |
Bank of Hawaii Corp. | | | 15,066 | | | | 1,092 | |
BankUnited, Inc. | | | 28,201 | | | | 915 | |
Banner Corp. | | | 13,009 | | | | 697 | |
Berkshire Hills Bancorp, Inc. | | | 16,236 | | | | 403 | |
Blackstone Mortgage Trust, Inc. | | | 65,320 | | | | 1,389 | |
Brightsphere Investment Group, Inc. | | | 12,400 | | | | 238 | |
Brookline Bancorp, Inc. | | | 33,646 | | | | 367 | |
Capitol Federal Financial, Inc. | | | 47,883 | | | | 309 | |
Cathay General Bancorp | | | 27,523 | | | | 1,227 | |
Central Pacific Financial Corp. | | | 10,356 | | | | 204 | |
City Holding Co. | | | 5,616 | | | | 619 | |
Community Bank System, Inc. | | | 20,231 | | | | 1,054 | |
Customers Bancorp, Inc. * | | | 10,716 | | | | 617 | |
CVB Financial Corp. | | �� | 50,168 | | | | 1,013 | |
Dime Community Bancshares, Inc. | | | 13,234 | | | | 356 | |
Donnelley Financial Solutions, Inc. * | | | 9,376 | | | | 585 | |
Eagle Bancorp, Inc. | | | 11,452 | | | | 345 | |
Ellington Financial, Inc. | | | 29,742 | | | | 378 | |
Employers Holdings, Inc. | | | 9,743 | | | | 384 | |
Encore Capital Group, Inc. * | | | 8,992 | | | | 456 | |
Enova International, Inc. * | | | 11,320 | | | | 627 | |
EVERTEC, Inc. | | | 24,944 | | | | 1,021 | |
EZCORP, Inc. - Class A * | | | 19,947 | | | | 174 | |
FB Financial Corp. | | | 13,309 | | | | 530 | |
First Bancorp | | | 80,949 | | | | 1,652 | |
First Commonwealth Financial Corp. | | | 38,670 | | | | 597 | |
First Financial Bancorp | | | 36,033 | | | | 856 | |
First Hawaiian, Inc. | | | 48,348 | | | | 1,105 | |
Franklin BSP Realty Trust, Inc. | | | 31,103 | | | | 420 | |
Fulton Financial Corp. | | | 62,215 | | | | 1,024 | |
Genworth Financial, Inc. - Class A * | | | 170,949 | | | | 1,142 | |
Goosehead Insurance, Inc. * | | | 9,269 | | | | 703 | |
Green Dot Corp. - Class A * | | | 17,234 | | | | 171 | |
Hanmi Financial Corp. | | | 11,673 | | | | 226 | |
The Accompanying Notes are an Integral Part of the Financial Statements.
62
Index 600 Stock Portfolio
| | | | | | | | |
Common Stocks (99.7%) | | Shares/ Par + | | | Value $ (000’s) | |
Financials continued | |
Hannon Armstrong Sustainable Infrastructure Capital, Inc. | | | 42,139 | | | | 1,162 | |
HCI Group, Inc. | | | 2,302 | | | | 201 | |
Heritage Financial Corp. | | | 13,423 | | | | 287 | |
Hilltop Holdings, Inc. | | | 17,529 | | | | 617 | |
Hope Bancorp, Inc. | | | 45,469 | | | | 549 | |
Horace Mann Educators Corp. | | | 15,473 | | | | 506 | |
Independent Bank Corp. | | | 16,620 | | | | 1,094 | |
Independent Bank Group, Inc. | | | 13,610 | | | | 693 | |
Jackson Financial, Inc. | | | 26,820 | | | | 1,373 | |
KKR Real Estate Finance Trust, Inc. | | | 22,237 | | | | 294 | |
Lakeland Financial Corp. | | | 9,637 | | | | 628 | |
Lincoln National Corp. | | | 64,317 | | | | 1,735 | |
Mercury General Corp. | | | 10,074 | | | | 376 | |
Meta Financial Group, Inc. | | | 9,922 | | | | 525 | |
Moelis & Co. | | | 25,266 | | | | 1,418 | |
Mr. Cooper Group, Inc. * | | | 24,962 | | | | 1,626 | |
National Bank Holding Corp. - Class A | | | 14,304 | | | | 532 | |
Navient Corp. | | | 32,066 | | | | 597 | |
NBT Bancorp, Inc. | | | 17,839 | | | | 748 | |
NCR Atleos Corp. * | | | 25,362 | | | | 616 | |
New York Mortgage Trust, Inc. | | | 34,363 | | | | 293 | |
NMI Holdings, Inc. - Class A * | | | 30,736 | | | | 912 | |
Northfield Bancorp, Inc. | | | 15,167 | | | | 191 | |
Northwest Bancshares, Inc. | | | 48,101 | | | | 600 | |
OFG Bancorp | | | 17,823 | | | | 668 | |
Pacific Premier Bancorp, Inc. | | | 36,339 | | | | 1,058 | |
Palomar Holdings, Inc. * | | | 9,376 | | | | 520 | |
Park National Corp. | | | 5,434 | | | | 722 | |
Payoneer Global, Inc. * | | | 99,021 | | | | 516 | |
PennyMac Mortgage Investment Trust | | | 32,885 | | | | 492 | |
Piper Sandler Cos. | | | 5,701 | | | | 997 | |
PJT Partners, Inc. - Class A | | | 8,452 | | | | 861 | |
PRA Group, Inc. * | | | 15,026 | | | | 394 | |
Preferred Bank | | | 4,731 | | | | 346 | |
ProAssurance Corp. | | | 19,319 | | | | 266 | |
PROG Holdings, Inc. * | | | 16,950 | | | | 524 | |
Provident Financial Services, Inc. | | | 28,590 | | | | 516 | |
Radian Group, Inc. | | | 58,050 | | | | 1,657 | |
Ready Capital Corp. | | | 60,012 | | | | 615 | |
| | | | | | | | |
Common Stocks (99.7%) | | Shares/ Par + | | | Value $ (000’s) | |
Financials continued | |
Redwood Trust, Inc. | | | 44,968 | | | | 333 | |
Renasant Corp. | | | 21,267 | | | | 716 | |
S&T Bancorp, Inc. | | | 14,475 | | | | 484 | |
Safety Insurance Group, Inc. | | | 5,605 | | | | 426 | |
Seacoast Banking Corp. of Florida | | | 32,275 | | | | 919 | |
ServisFirst Bancshares, Inc. | | | 18,570 | | | | 1,237 | |
Simmons First National Corp. - Class A | | | 47,422 | | | | 941 | |
SiriusPoint, Ltd. * | | | 34,412 | | | | 399 | |
Southside Bancshares, Inc. | | | 10,862 | | | | 340 | |
Stellar Bancorp, Inc. | | | 17,764 | | | | 495 | |
Stewart Information Services Corp. | | | 10,371 | | | | 609 | |
StoneX Group, Inc. * | | | 10,167 | | | | 751 | |
Tompkins Financial Corp. | | | 4,787 | | | | 288 | |
Triumph Financial, Inc. * | | | 8,210 | | | | 658 | |
Trupanion, Inc. * | | | 13,622 | | | | 416 | |
TrustCo Bank Corp. | | | 7,290 | | | | 226 | |
Trustmark Corp. | | | 23,138 | | | | 645 | |
Two Harbors Investment Corp. | | | 36,447 | | | | 508 | |
United Community Banks, Inc. | | | 45,100 | | | | 1,320 | |
United Fire Group, Inc. | | | 8,115 | | | | 163 | |
Veritex Holdings, Inc. | | | 20,772 | | | | 483 | |
Virtus Investment Partners, Inc. | | | 2,559 | | | | 619 | |
Walker & Dunlop, Inc. | | | 12,678 | | | | 1,407 | |
Washington Federal, Inc. | | | 24,524 | | | | 808 | |
Westamerica Bancorporation | | | 10,093 | | | | 569 | |
WisdomTree Investments, Inc. | | | 41,820 | | | | 290 | |
World Acceptance Corp. * | | | 1,295 | | | | 169 | |
WSFS Financial Corp. | | | 23,012 | | | | 1,057 | |
| | | | | | | | |
Total | | | | | | | 80,076 | |
| | | | | | | | |
|
Health Care (10.4%) | |
AdaptHealth LLC * | | | 31,269 | | | | 228 | |
Addus HomeCare Corp. * | | | 6,146 | | | | 571 | |
Agiliti, Inc. * | | | 13,407 | | | | 106 | |
Alkermes PLC * | | | 63,246 | | | | 1,754 | |
Allscripts Healthcare Solutions, Inc. * | | | 41,402 | | | | 434 | |
AMN Healthcare Services, Inc. * | | | 14,324 | | | | 1,073 | |
Amphastar Pharmaceuticals, Inc. * | | | 14,164 | | | | 876 | |
ANI Pharmaceuticals, Inc. * | | | 5,713 | | | | 315 | |
| | | | | | | | |
Common Stocks (99.7%) | | Shares/ Par + | | | Value $ (000’s) | |
Health Care continued | |
Apollo Medical Holdings, Inc. * | | | 15,749 | | | | 603 | |
Arcus Biosciences, Inc. * | | | 20,536 | | | | 392 | |
Artivion, Inc. * | | | 14,929 | | | | 267 | |
Avanos Medical, Inc. * | | | 17,736 | | | | 398 | |
BioLife Solutions, Inc. * | | | 13,154 | | | | 214 | |
Catalyst Pharmaceuticals, Inc. * | | | 37,980 | | | | 638 | |
Certara, Inc. * | | | 40,597 | | | | 714 | |
Collegium Pharmaceutical, Inc. * | | | 12,357 | | | | 380 | |
CONMED Corp. | | | 11,658 | | | | 1,277 | |
Corcept Therapeutics, Inc. * | | | 34,203 | | | | 1,111 | |
CorVel Corp. * | | | 3,437 | | | | 850 | |
Cross Country Healthcare, Inc. * | | | 12,525 | | | | 284 | |
Cytek Biosciences, Inc. * | | | 37,508 | | | | 342 | |
Cytokinetics, Inc. * | | | 37,164 | | | | 3,103 | |
Dynavax Technologies Corp. * | | | 48,978 | | | | 685 | |
Embecta Corp. | | | 21,756 | | | | 412 | |
Enhabit, Inc. * | | | 19,183 | | | | 199 | |
Ensign Group, Inc. | | | 21,401 | | | | 2,401 | |
Fortrea Holdings, Inc. * | | | 33,656 | | | | 1,175 | |
Fulgent Genetics, Inc. * | | | 7,637 | | | | 221 | |
Glaukos Corp. * | | | 18,468 | | | | 1,468 | |
Harmony Biosciences Holdings, Inc. * | | | 12,432 | | | | 402 | |
HealthStream, Inc. | | | 9,069 | | | | 245 | |
ICU Medical, Inc. * | | | 7,686 | | | | 767 | |
Innoviva, Inc. * | | | 21,349 | | | | 342 | |
Integer Holdings Corp. * | | | 12,633 | | | | 1,252 | |
Ironwood Pharmaceuticals, Inc. * | | | 52,038 | | | | 595 | |
LeMaitre Vascular, Inc. | | | 7,510 | | | | 426 | |
Ligand Pharmaceuticals, Inc. - Class B * | | | 6,248 | | | | 446 | |
MEDNAX, Inc. * | | | 31,359 | | | | 292 | |
Merit Medical Systems, Inc. * | | | 21,891 | | | | 1,663 | |
Mesa Laboratories, Inc. | | | 1,949 | | | | 204 | |
ModivCare, Inc. * | | | 4,723 | | | | 208 | |
Myriad Genetics, Inc. * | | | 33,603 | | | | 643 | |
National HealthCare Corp. | | | 5,110 | | | | 472 | |
NeoGenomics, Inc. * | | | 48,315 | | | | 782 | |
OmniAb, Inc. - 12.50 Earnout Consideration *,Æ | | | 2,585 | | | | 2 | |
The Accompanying Notes are an Integral Part of the Financial Statements.
63
Index 600 Stock Portfolio
| | | | | | | | |
Common Stocks (99.7%) | | Shares/ Par + | | | Value $ (000’s) | |
Health Care continued | |
OmniAb, Inc. - 15.00 Earnout Consideration *,Æ | | | 2,585 | | | | 2 | |
Omnicell, Inc. * | | | 17,313 | | | | 651 | |
OraSure Technologies, Inc. * | | | 27,852 | | | | 228 | |
Organon & Co. | | | 96,872 | | | | 1,397 | |
Owens & Minor, Inc. * | | | 28,997 | | | | 559 | |
Pacira Biosciences, Inc. * | | | 17,597 | | | | 594 | |
Phibro Animal Health Corp. - Class A | | | 7,553 | | | | 87 | |
Premier, Inc. - Class A | | | 45,355 | | | | 1,014 | |
Prestige Consumer Healthcare, Inc. * | | | 18,802 | | | | 1,151 | |
Privia Health Group, Inc. * | | | 38,937 | | | | 897 | |
RadNet, Inc. * | | | 22,906 | | | | 796 | |
REGENXBIO, Inc. * | | | 15,334 | | | | 275 | |
Schrodinger, Inc. * | | | 20,734 | | | | 742 | |
Select Medical Holdings Corp. | | | 39,793 | | | | 935 | |
Simulations Plus, Inc. | | | 6,029 | | | | 270 | |
STAAR Surgical Co. * | | | 18,571 | | | | 580 | |
Supernus Pharmaceuticals, Inc. * | | | 20,694 | | | | 599 | |
Tandem Diabetes Care, Inc. * | | | 24,668 | | | | 730 | |
UFP Technologies, Inc. * | | | 2,664 | | | | 458 | |
US Physical Therapy, Inc. | | | 5,681 | | | | 529 | |
Varex Imaging Corp. * | | | 15,473 | | | | 317 | |
Vericel Corp. * | | | 18,084 | | | | 644 | |
Vir Biotechnology, Inc. * | | | 32,890 | | | | 331 | |
Xencor, Inc. * | | | 23,199 | | | | 492 | |
| | | | | | | | |
Total | | | | | | | 45,510 | |
| | | | | | | | |
|
Industrials (17.4%) | |
3D Systems Corp. * | | | 50,575 | | | | 321 | |
AAON, Inc. | | | 25,561 | | | | 1,888 | |
AAR Corp. * | | | 12,724 | | | | 794 | |
ABM Industries, Inc. | | | 24,842 | | | | 1,114 | |
Aerovironment, Inc. * | | | 9,965 | | | | 1,256 | |
Alamo Group, Inc. | | | 3,914 | | | | 823 | |
Alaska Air Group, Inc. * | | | 48,541 | | | | 1,897 | |
Albany International Corp. - Class A | | | 11,821 | | | | 1,161 | |
Allegiant Travel Co. | | | 5,719 | | | | 472 | |
American Woodmark Corp. * | | | 6,223 | | | | 578 | |
Apogee Enterprises, Inc. | | | 8,356 | | | | 446 | |
Applied Industrial Technologies, Inc. | | | 14,692 | | | | 2,537 | |
ArcBest Corp. | | | 8,969 | | | | 1,078 | |
Arcosa, Inc. | | | 18,481 | | | | 1,527 | |
Armstrong World Industries, Inc. | | | 16,745 | | | | 1,646 | |
| | | | | | | | |
Common Stocks (99.7%) | | Shares/ Par + | | | Value $ (000’s) | |
Industrials continued | |
Astec Industries, Inc. | | | 8,706 | | | | 324 | |
AZZ, Inc. | | | 9,504 | | | | 552 | |
Barnes Group, Inc. | | | 19,206 | | | | 627 | |
Boise Cascade Co. | | | 15,006 | | | | 1,941 | |
Brady Corp. - Class A | | | 16,994 | | | | 997 | |
CoreCivic, Inc. * | | | 43,062 | | | | 626 | |
CSG Systems International, Inc. | | | 10,766 | | | | 573 | |
Deluxe Corp. | | | 16,701 | | | | 358 | |
DXP Enterprises, Inc. * | | | 5,025 | | | | 169 | |
Dycom Industries, Inc. * | | | 11,118 | | | | 1,280 | |
Encore Wire Corp. | | | 5,979 | | | | 1,277 | |
Enerpac Tool Group Corp. | | | 20,591 | | | | 640 | |
EnPro Industries, Inc. | | | 7,923 | | | | 1,242 | |
ESCO Technologies, Inc. | | | 9,770 | | | | 1,143 | |
Federal Signal Corp. | | | 23,093 | | | | 1,772 | |
Forrester Research, Inc. * | | | 4,413 | | | | 118 | |
Forward Air Corp. | | | 9,727 | | | | 612 | |
Franklin Electric Co., Inc. | | | 15,035 | | | | 1,453 | |
The GEO Group, Inc. * | | | 46,258 | | | | 501 | |
Gibraltar Industries, Inc. * | | | 11,533 | | | | 911 | |
GMS, Inc. * | | | 15,385 | | | | 1,268 | |
Granite Construction, Inc. | | | 16,649 | | | | 847 | |
The Greenbrier Cos., Inc. | | | 11,826 | | | | 523 | |
Griffon Corp. | | | 15,522 | | | | 946 | |
Harsco Corp. * | | | 30,538 | | | | 275 | |
Hayward Holdings, Inc. * | | | 47,785 | | | | 650 | |
Healthcare Services Group, Inc. * | | | 27,987 | | | | 290 | |
Heartland Express, Inc. | | | 17,331 | | | | 247 | |
Heidrick & Struggles International, Inc. | | | 7,555 | | | | 223 | |
Hillenbrand, Inc. | | | 26,498 | | | | 1,268 | |
HNI Corp. | | | 17,658 | | | | 739 | |
Hub Group, Inc. - Class A * | | | 11,823 | | | | 1,087 | |
Insteel Industries, Inc. | | | 7,355 | | | | 282 | |
Interface, Inc. | | | 22,252 | | | | 281 | |
JetBlue Airways Corp. * | | | 126,342 | | | | 701 | |
John Bean Technologies Corp. | | | 12,068 | | | | 1,200 | |
Kaman Corp. | | | 10,671 | | | | 256 | |
KAR Auction Services, Inc. * | | | 40,937 | | | | 606 | |
Kelly Services, Inc. - Class A | | | 12,111 | | | | 262 | |
Kennametal, Inc. | | | 30,143 | | | | 777 | |
Korn Ferry | | | 19,982 | | | | 1,186 | |
Lindsay Corp. | | | 4,172 | | | | 539 | |
| | | | | | | | |
Common Stocks (99.7%) | | Shares/ Par + | | | Value $ (000’s) | |
Industrials continued | |
Liquidity Services, Inc. * | | | 8,584 | | | | 148 | |
Marten Transport, Ltd. | | | 21,877 | | | | 459 | |
Masterbrand, Inc. * | | | 48,042 | | | | 713 | |
Matson, Inc. | | | 13,242 | | | | 1,451 | |
Matthews International Corp. - Class A | | | 11,551 | | | | 423 | |
Mercury Systems, Inc. * | | | 19,771 | | | | 723 | |
MillerKnoll, Inc. | | | 27,854 | | | | 743 | |
Moog, Inc. - Class A | | | 10,899 | | | | 1,578 | |
Mueller Industries, Inc. | | | 43,032 | | | | 2,029 | |
MYR Group, Inc. * | | | 6,333 | | | | 916 | |
National Presto Industries, Inc. | | | 2,011 | | | | 161 | |
NOW, Inc. * | | | 40,287 | | | | 456 | |
NV5 Global, Inc. * | | | 4,819 | | | | 536 | |
PGT Innovations, Inc. * | | | 21,621 | | | | 880 | |
Pitney Bowes, Inc. | | | 58,655 | | | | 258 | |
Powell Industries, Inc. | | | 3,497 | | | | 309 | |
Proto Labs, Inc. * | | | 9,773 | | | | 381 | |
Quanex Building Products Corp. | | | 12,618 | | | | 386 | |
Resideo Technologies, Inc. * | | | 55,333 | | | | 1,041 | |
Resources Connection, Inc. | | | 12,042 | | | | 171 | |
Rush Enterprises, Inc. | | | 23,350 | | | | 1,175 | |
RXO, Inc. * | | | 44,348 | | | | 1,032 | |
SkyWest, Inc. * | | | 15,519 | | | | 810 | |
SPX Technologies, Inc. * | | | 17,302 | | | | 1,748 | |
Standex International Corp. | | | 4,537 | | | | 719 | |
Sun Country Airlines Holdings, Inc. * | | | 14,774 | | | | 232 | |
SunPower Corp. * | | | 32,871 | | | | 159 | |
Tennant Co. | | | 7,116 | | | | 660 | |
Titan International, Inc. * | | | 19,172 | | | | 285 | |
Trinity Industries, Inc. | | | 31,023 | | | | 825 | |
Triumph Group, Inc. * | | | 29,375 | | | | 487 | |
TrueBlue, Inc. * | | | 11,874 | | | | 182 | |
TTEC Holdings, Inc. | | | 7,265 | | | | 157 | |
UniFirst Corp. | | | 5,727 | | | | 1,048 | |
Verra Mobility Corp. * | | | 63,049 | | | | 1,452 | |
Vestis Corp. | | | 49,555 | | | | 1,048 | |
Viad Corp. * | | | 7,907 | | | | 286 | |
Vicor Corp. * | | | 8,591 | | | | 386 | |
Wabash National Corp. | | | 17,462 | | | | 447 | |
| | | | | | | | |
Total | | | | | | | 76,007 | |
| | | | | | | | |
|
Information Technology (12.3%) | |
A10 Networks, Inc. | | | 26,419 | | | | 348 | |
ACI Worldwide, Inc. * | | | 41,213 | | | | 1,261 | |
Adeia, Inc. | | | 40,880 | | | | 506 | |
Adtran Holdings, Inc. | | | 27,101 | | | | 199 | |
Advanced Energy | | | | | | | | |
Industries, Inc. | | | 14,132 | | | | 1,539 | |
The Accompanying Notes are an Integral Part of the Financial Statements.
64
Index 600 Stock Portfolio
| | | | | | | | |
Common Stocks (99.7%) | | Shares/ Par + | | | Value $ (000’s) | |
Information Technology continued | |
Agilysys, Inc. * | | | 7,694 | | | | 653 | |
Alarm.com Holdings, Inc. * | | | 18,951 | | | | 1,225 | |
Alliance Data Systems Corp. | | | 18,697 | | | | 616 | |
Alpha & Omega Semiconductor, Ltd. * | | | 8,578 | | | | 224 | |
Arlo Technologies, Inc. * | | | 36,014 | | | | 343 | |
Axcelis Technologies, Inc. * | | | 12,412 | | | | 1,610 | |
Badger Meter, Inc. | | | 11,124 | | | | 1,717 | |
Benchmark Electronics, Inc. | | | 13,506 | | | | 373 | |
Cerence, Inc. * | | | 15,447 | | | | 304 | |
CEVA, Inc. * | | | 9,050 | | | | 206 | |
Cohu, Inc. * | | | 17,986 | | | | 637 | |
Consensus Cloud Solutions, Inc. * | | | 6,753 | | | | 177 | |
Corsair Gaming, Inc. * | | | 16,318 | | | | 230 | |
CTS Corp. | | | 11,804 | | | | 516 | |
Digi International, Inc. * | | | 13,631 | | | | 354 | |
Digital Turbine, Inc. * | | | 34,643 | | | | 238 | |
Diodes, Inc. * | | | 17,407 | | | | 1,402 | |
DoubleVerify Holdings, Inc. * | | | 52,841 | | | | 1,943 | |
DXC Technology Co. * | | | 73,400 | | | | 1,679 | |
Envestnet, Inc. * | | | 18,854 | | | | 934 | |
ePlus, Inc. * | | | 10,209 | | | | 815 | |
Extreme Networks, Inc. * | | | 49,128 | | | | 867 | |
Fabrinet * | | | 13,771 | | | | 2,621 | |
FormFactor, Inc. * | | | 29,500 | | | | 1,230 | |
Harmonic, Inc. * | | | 42,520 | | | | 554 | |
Ichor Holdings, Ltd. * | | | 11,201 | | | | 377 | |
Insight Enterprises, Inc. * | | | 10,495 | | | | 1,860 | |
InterDigital, Inc. | | | 9,742 | | | | 1,057 | |
Itron, Inc. * | | | 17,243 | | | | 1,302 | |
Knowles Corp. * | | | 34,192 | | | | 612 | |
Kulicke and Soffa Industries, Inc. | | | 21,394 | | | | 1,171 | |
LiveRamp Holdings, Inc. * | | | 24,834 | | | | 941 | |
MaxLinear, Inc. - Class A * | | | 28,230 | | | | 671 | |
Methode Electronics, Inc. - Class A | | | 13,646 | | | | 310 | |
N-able, Inc. * | | | 26,348 | | | | 349 | |
NCR Voyix Corp. * | | | 50,678 | | | | 857 | |
NetScout Systems, Inc. * | | | 26,909 | | | | 591 | |
OSI Systems, Inc. * | | | 5,923 | | | | 764 | |
PC Connection, Inc. | | | 4,326 | | | | 291 | |
PDF Solutions, Inc. * | | | 11,679 | | | | 375 | |
Perficient, Inc. * | | | 13,181 | | | | 868 | |
Photronics, Inc. * | | | 23,694 | | | | 743 | |
Plexus Corp. * | | | 10,415 | | | | 1,126 | |
| | | | | | | | |
Common Stocks (99.7%) | | Shares/ Par + | | | Value $ (000’s) | |
Information Technology continued | |
Progress Software Corp. | | | 16,518 | | | | 897 | |
Rogers Corp. * | | | 6,350 | | | | 839 | |
Sanmina Corp. * | | | 21,688 | | | | 1,114 | |
ScanSource, Inc. * | | | 9,539 | | | | 378 | |
Semtech Corp. * | | | 24,322 | | | | 533 | |
SiTime Corp. * | | | 6,548 | | | | 799 | |
SMART Global Holdings, Inc. * | | | 19,676 | | | | 372 | |
SolarEdge Technologies, Inc. * | | | 21,533 | | | | 2,015 | |
SPS Commerce, Inc. * | | | 13,913 | | | | 2,697 | |
TTM Technologies, Inc. * | | | 38,731 | | | | 612 | |
Ultra Clean Holdings, Inc. * | | | 17,116 | | | | 584 | |
Veeco Instruments, Inc. * | | | 21,342 | | | | 662 | |
ViaSat, Inc. * | | | 28,317 | | | | 791 | |
Viavi Solutions, Inc. * | | | 84,277 | | | | 849 | |
Xerox Holdings Corp. | | | 42,838 | | | | 785 | |
Xperi, Inc. * | | | 16,580 | | | | 183 | |
| | | | | | | | |
Total | | | | | | | 53,696 | |
| | | | | | | | |
|
Materials (5.6%) | |
AdvanSix, Inc. | | | 10,207 | | | | 306 | |
Allegheny Technologies, Inc. * | | | 48,362 | | | | 2,199 | |
Alpha Metallurgical Resources, Inc. | | | 4,482 | | | | 1,519 | |
Balchem Corp. | | | 12,221 | | | | 1,818 | |
Carpenter Technology Corp. | | | 18,691 | | | | 1,323 | |
Century Aluminum Co. * | | | 19,804 | | | | 240 | |
Clearwater Paper Corp. * | | | 6,277 | | | | 227 | |
Compass Minerals International, Inc. | | | 12,788 | | | | 324 | |
H.B. Fuller Co. | | | 20,477 | | | | 1,667 | |
Hawkins, Inc. | | | 7,169 | | | | 505 | |
Haynes International, Inc. | | | 4,873 | | | | 278 | |
Ingevity Corp. * | | | 12,771 | | | | 603 | |
Innospec, Inc. | | | 9,423 | | | | 1,161 | |
Kaiser Aluminum Corp. | | | 6,131 | | | | 436 | |
Koppers Holdings, Inc. | | | 7,889 | | | | 404 | |
Materion Corp. | | | 7,821 | | | | 1,018 | |
Mercer International, Inc. | | | 16,814 | | | | 159 | |
Minerals Technologies, Inc. | | | 12,333 | | | | 879 | |
Myers Industries, Inc. | | | 14,094 | | | | 276 | |
O-I Glass, Inc. * | | | 58,774 | | | | 963 | |
Olympic Steel, Inc. | | | 3,713 | | | | 248 | |
Quaker Chemical Corp. | | | 5,249 | | | | 1,120 | |
Schweitzer-Mauduit International, Inc. | | | 20,540 | | | | 315 | |
Sealed Air Corp. | | | 54,752 | | | | 2,000 | |
| | | | | | | | |
Common Stocks (99.7%) | | Shares/ Par + | | | Value $ (000’s) | |
Materials continued | |
Sensient Technologies Corp. | | | 16,013 | | | | 1,057 | |
Stepan Co. | | | 8,053 | | | | 761 | |
SunCoke Energy, Inc. | | | 31,743 | | | | 341 | |
Sylvamo Corp. | | | 13,387 | | | | 657 | |
TimkenSteel Corp. * | | | 14,556 | | | | 341 | |
Warrior Met Coal, Inc. | | | 19,718 | | | | 1,202 | |
Worthington Steel, Inc. * | | | 11,547 | | | | 325 | |
| | | | | | | | |
Total | | | | | | | 24,672 | |
| | | | | | | | |
|
Real Estate (7.5%) | |
Acadia Realty Trust | | | 36,131 | | | | 614 | |
Alexander & Baldwin, Inc. | | | 27,466 | | | | 522 | |
American Assets Trust, Inc. | | | 18,412 | | | | 414 | |
Apple Hospitality REIT, Inc. | | | 80,673 | | | | 1,340 | |
Armada Hoffler Properties, Inc. | | | 25,550 | | | | 316 | |
Brandywine Realty Trust | | | 65,905 | | | | 356 | |
CareTrust REIT, Inc. | | | 45,155 | | | | 1,011 | |
Centerspace | | | 5,725 | | | | 333 | |
Chatham Lodging Trust | | | 18,414 | | | | 197 | |
Community Healthcare Trust, Inc. | | | 9,612 | | | | 256 | |
Cushman & Wakefield PLC * | | | 63,751 | | | | 689 | |
DiamondRock Hospitality Co. | | | 79,472 | | | | 746 | |
Douglas Emmett, Inc. | | | 63,198 | | | | 916 | |
Easterly Government Properties, Inc. | | | 35,780 | �� | | | 481 | |
Elme Communities Real Estate Investment Trust | | | 33,279 | | | | 486 | |
Essential Properties Realty Trust, Inc. | | | 59,163 | | | | 1,512 | |
eXp World Holdings, Inc. | | | 29,151 | | | | 452 | |
Four Corners Property Trust, Inc. | | | 34,335 | | | | 869 | |
Getty Realty Corp. | | | 18,178 | | | | 531 | |
Global Net Lease, Inc. | | | 74,076 | | | | 737 | |
Highwoods Properties, Inc. | | | 40,059 | | | | 920 | |
Hudson Pacific Properties, Inc. | | | 48,079 | | | | 448 | |
Innovative Industrial Properties, Inc. | | | 10,629 | | | | 1,072 | |
iStar, Inc. | | | 16,970 | | | | 397 | |
JBG SMITH Properties | | | 33,003 | | | | 561 | |
Kennedy-Wilson Holdings, Inc. | | | 44,907 | | | | 556 | |
LTC Properties, Inc. | | | 15,689 | | | | 504 | |
LXP Industrial Trust | | | 110,912 | | | | 1,100 | |
The Macerich Co. | | | 81,669 | | | | 1,260 | |
The Accompanying Notes are an Integral Part of the Financial Statements.
65
Index 600 Stock Portfolio
| | | | | | | | |
Common Stocks (99.7%) | | Shares/ Par + | | | Value $ (000’s) | |
Real Estate continued | |
Marcus & Millichap, Inc. | | | 9,130 | | | | 399 | |
NexPoint Residential Trust, Inc. | | | 8,658 | | | | 298 | |
OUTFRONT Media, Inc. | | | 55,057 | | | | 769 | |
Pebblebrook Hotel Trust | | | 45,684 | | | | 730 | |
Phillips Edison & Co., Inc. | | | 45,340 | | | | 1,654 | |
Realogy Holdings Corp. * | | | 42,306 | | | | 343 | |
Retail Opportunity Investments Corp. | | | 47,763 | | | | 670 | |
Saul Centers, Inc. | | | 4,952 | | | | 194 | |
Service Properties Trust | | | 62,838 | | | | 537 | |
SITE Centers Corp. | | | 68,242 | | | | 930 | |
SL Green Realty Corp. | | | 24,416 | | | | 1,103 | |
The St. Joe Co. | | | 13,500 | | | | 812 | |
Summit Hotel Properties, Inc. | | | 40,725 | | | | 274 | |
Sunstone Hotel Investors, Inc. | | | 77,871 | | | | 836 | |
Tanger Factory Outlet Centers, Inc. | | | 39,940 | | | | 1,107 | |
Uniti Group, Inc. | | | 90,474 | | | | 523 | |
Universal Health Realty Income Trust | | | 4,799 | | | | 208 | |
Urban Edge Properties | | | 44,590 | | | | 816 | |
Veris Residential, Inc. | | | 30,411 | | | | 478 | |
Whitestone REIT | | | 17,591 | | | | 216 | |
Xenia Hotels & Resorts, Inc. | | | 40,200 | | | | 548 | |
| | | | | | | | |
Total | | | | | | | 33,041 | |
| | | | | | | | |
|
Utilities (2.0%) | |
American States Water Co. | | | 14,010 | | | | 1,127 | |
Avista Corp. | | | 29,294 | | | | 1,047 | |
California Water Service Group | | | 21,866 | | | | 1,134 | |
Chesapeake Utilities Corp. | | | 8,204 | | | | 867 | |
Clearway Energy, Inc. | | | 44,469 | | | | 1,195 | |
Middlesex Water Co. | | | 6,793 | | | | 446 | |
Northwest Natural Holding Co. | | | 13,913 | | | | 542 | |
Otter Trail Corp. | | | 15,808 | | | | 1,343 | |
SJW Group | | | 11,004 | | | | 719 | |
Unitil Corp. | | | 6,153 | | | | 323 | |
| | | | | | | | |
Total | | | | | | | 8,743 | |
| | | | | | | | |
|
Total Common Stocks | |
(Cost: $360,458) | | | | 436,143 | |
| | | | | | | | |
| | | | | | | | |
Short-Term Investments (0.0%) | | Shares/ Par + | | | Value $ (000’s) | |
Governments (0.0%) | |
US Treasury
0.000%, 4/11/24 ß | | | 140,000 | | | | 138 | |
| | | | | | | | |
Total | | | | | | | 138 | |
| | | | | | | | |
|
Total Short-Term Investments | |
(Cost: $138) | | | | 138 | |
| | | | | | | | |
|
Total Investments (99.7%) | |
(Cost: $360,596)@ | | | | 436,281 | |
| | | | | | | | |
|
Other Assets, Less | |
Liabilities (0.3%) | | | | 1,265 | |
| | | | | | | | |
| |
Net Assets (100.0%) | | | | 437,546 | |
| | | | | | | | |
The Accompanying Notes are an Integral Part of the Financial Statements.
66
Index 600 Stock Portfolio
Exchange Traded or Centrally Cleared Derivatives
Futures
| | | | | | | | | | | | | | | | | | | | | | | | | | | | |
| Issuer | | Long/ Short | | Currency | | Notional Par (000’s) | | | Number of Contracts | | | Expiration Date | | | Notional Value (000’s) | | | Unrealized Appreciation/ (Depreciation) (000’s) | | | Variation Margin (000’s) | |
E-mini Russell 2000 Index Futures | | Long | | USD | | | 1 | | | | 11 | | | | 3/24 | | | $ | 1,126 | | | $ | 52 | | | $ | (45) | |
E-Mini S&P MidCap 400 Future | | Long | | USD | | | –π | | | | 1 | | | | 3/24 | | | | 281 | | | | (3 | ) | | | (36) | |
| | | | | | | | | | | | | | | | | | | | | | | | |
| | | | | | | | | | | | | | | | | | | | | | $ | 49 | | | $ | (81) | |
| | | | | | | | | | | | | | | | | | | | | | | | |
| | | | | | | | | | | | | | | | | | | | | | | | | | | | |
| | | Financial Derivative Assets | | | Financial Derivative Liabilities | |
| | | Variation Margin (000’s) | | | Variation Margin (000’s) | | | Market Value (000’s) Options | |
| | | Swaps | | | Futures | | | Total | | | Swaps | | | Futures | | | Total | |
| Total Exchange-Traded or Centrally Cleared Derivatives | | $ | – | | | $ | – | | | $ | – | | | $ | – | | | $ | (81 | ) | | $ | (81 | ) | | $ | – | |
| + | All par is stated in U.S. Dollar unless otherwise noted. |
| Æ | Security valued using significant unobservable inputs. |
| ß | Part or all of the security has been pledged as collateral. |
| @ | At December 31, 2023, the aggregate cost of investments, including derivatives, for federal tax purposes (in thousands) was $361,602 and the net unrealized appreciation of investments based on that cost was $74,728 which is comprised of $114,897 aggregate gross unrealized appreciation and $40,169 aggregate gross unrealized depreciation. |
| π | Amount is less than one thousand. |
The following is a summary of the inputs used in valuing the Portfolio’s Investments at December 31, 2023. See Note 3 for additional information on portfolio valuation.
| | | | | | | | | | | | | | | | | | | | | | | | |
| | | | | | Valuation Inputs | |
| Description | | | | | Level 1 - Quoted
Prices | | | | | | Level 2 - Other
Significant
Observable Inputs | | | | | | Level 3
- Significant
Unobservable
Inputs | |
| | | | | | (Amounts in thousands) | |
Assets: | | | | | | | | | | | | | | | | | | | | | | | | |
Common Stocks | | | | | | | | | | | | | | | | | | | | | | | | |
Health Care | | | | | | $ | 45,506 | | | | | | | $ | — | | | | | | | $ | 4 | |
All Others | | | | | | | 390,633 | | | | | | | | — | | | | | | | | — | |
Other Financial Instruments^ | | | | | | | | | | | | | | | | | | | | | | | | |
Futures | | | | | | | 52 | | | | | | | | — | | | | | | | | — | |
Short-Term Investments | | | | | | | — | | | | | | | | 138 | | | | | | | | — | |
| | | | | | | | |
Total Assets: | | | | | | $ | 436,191 | | | | | | | $ | 138 | | | | | | | $ | 4 | |
| | | | | | | | |
Liabilities: | | | | | | | | | | | | | | | | | | | | | | | | |
Other Financial Instruments^ | | | | | | | | | | | | | | | | | | | | | | | | |
Futures | | | | | | | (3) | | | | | | | | — | | | | | | | | — | |
| | | | | | | | |
Total Liabilities: | | | | | | $ | (3) | | | | | | | $ | — | | | | | | | $ | — | |
| | | | | | | | |
^ Other financial instruments are derivative instruments such as futures and forward foreign currency contracts, which are valued at the unrealized appreciation (depreciation) on the instrument, and securities sold short, reverse repurchase agreements, written options and swaps contracts, which are valued at market value.
Management has determined that the amount of Level 3 securities compared to total net assets is not material; therefore, the reconciliation of Level 3 securities and assumptions is not shown for the period ended December 31, 2023.
The Accompanying Notes are an Integral Part of the Financial Statements.
67
Small Cap Value Portfolio (unaudited)
| | | | |
| Objective: | | Portfolio Strategy: | | Net Assets: |
| Long-term growth of capital. | | Invest primarily in common stocks of
small-sized companies believed to be undervalued. | | $576 million |
PORTFOLIO OVERVIEW
Mason Street Advisors, LLC (“Mason Street Advisors”), the investment adviser for the Small Cap Value Portfolio (“the Portfolio”), has engaged T. Rowe Price Investment Management, Inc. (“T. Rowe Price”) to act as sub-adviser for the Portfolio. Normally, the Portfolio invests in common stocks of companies with market capitalizations that do not exceed the maximum market capitalization of any security in the Russell 2000® Index at the time of purchase. Reflecting a value approach to investing, the Portfolio will seek the stocks of companies whose current stock prices do not appear to adequately reflect their underlying value as measured by assets, earnings, cash flow or business franchises.
MARKET OVERVIEW
U.S. equities posted strong gains in 2023, driven by generally favorable corporate earnings, a resilient economy and increased investor interest in artificial intelligence. The market overcame bearish factors such as regional bank turmoil in March; uncertainty about the debt ceiling; geopolitical concerns stemming from the ongoing Russian invasion of Ukraine and from Israel’s response to deadly Hamas attacks in early October; and a sluggish Chinese economic recovery. Arguably the most significant factor affecting the U.S. economy throughout the year was rising interest rates in response to elevated inflation. The U.S. Federal Reserve (the “Fed”) raised short-term interest rates four times through the end of July, lifting the fed funds target rate to a range of 5.25% – 5.50%. Equities rallied through year-end as Fed officials projected at their mid-December policy meeting that there could be three, quarter-point interest rate cuts in 2024.
PORTFOLIO RESULTS
The Portfolio returned 13.85% for the twelve months ended December 31, 2023. By comparison, the Portfolio’s benchmark, the Russell 2000® Value Index (the “Index”), returned 14.65%. (The Index is unmanaged, cannot be invested in directly and does not incur expenses.)
The Consumer Discretionary sector was a significant detractor from the Portfolio’s relative return for the reporting period, driven by adverse stock choices. Marriott Vacations Worldwide Corporation is a large, U.S.-based vacation ownership and timeshare exchange company with an attractive property portfolio across multiple countries and brands. Shares fell in summer 2023 after a disappointing quarter, reflecting challenges in rolling out new initiatives and with some brand conversions. Later in the year, shares were pressured again as default rates in the loan portfolio were higher than expected, raising concerns about whether this was a guidance issue or a warning sign for the consumer. Stock selection in the Energy and Industrials sectors and the business services industry also weighed on relative performance.
On the upside, the Healthcare sector contributed significantly to the Portfolio’s relative performance, due to strong stock choices. Karuna Therapeutics, a clinical-stage biopharmaceutical company, advanced late in the period following an announcement that Bristol Myers Squibb Company is expected to acquire the company.
Favorable stock selection in the Materials sector also boosted the Portfolio’s relative performance. Constellium, a manufacturer of refined, downstream aluminum products, rose on the year as the management team began executing a structural shift toward higher margin products while emphasizing deleveraging and capital discipline in the process. The company has benefited from easing inflationary pressures as well as strengthening demand across multiple end markets.
PORTFOLIO MANAGER OUTLOOK
The following forward-looking comments are the opinion of T. Rowe Price, the Portfolio’s sub-adviser.
At the end of 2023, the market reacted quickly and violently to signs inflation was cooling and the Fed telegraphing that it would likely begin reducing rates in 2024. December brought one of the Index’s best months ever and the market has now priced in much of that positive news. We are cautious following the market’s strong year-end move, seeing both the green shoots that drove strong upside, but also areas that could cause the Fed to move more slowly than the market anticipates. We also head into what will likely be a highly contentious election year in the U.S., while geopolitical tensions run high across most of the world. Regardless of what lies ahead, we remain confident in our bottom-up stock selection process and continue to approach our opportunity set with a focus on long-term investment horizons and best-in-class businesses that are trading at attractive valuations.
68
Small Cap Value Portfolio (unaudited)
Relative Performance
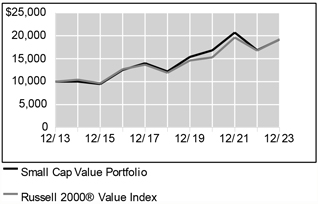
| | | | | | |
Average Annual Total Returns For Periods Ended December 31, 2023 |
| | | 1 Year | | 5 Years | | 10 Years |
Small Cap Value Portfolio | | 13.85% | | 9.43% | | 6.73% |
Russell 2000® Value Index | | 14.65% | | 10.00% | | 6.76% |
The performance data quoted represents past performance. Past performance is historical and does not guarantee future performance. Investment return and principal value will fluctuate, so that shares, when redeemed, may be worth more or less than their original cost. Current performance may be lower or higher than the performance data quoted. For the most recent month-end performance information visit www.northwesternmutual.com.
This chart assumes an initial investment of $10,000 made on 12/31/13. Returns shown reflect fee waivers, deductions for management and other portfolio expenses, and reinvestment of all dividends. In the absence of fee waivers, total return would be reduced. Returns exclude deductions for separate account sale loads and account fees. Please refer to the Benchmark Definitions section of this report for information about the indices cited in the above chart and graph.
The Portfolio may invest a relatively high percentage of its assets in a particular sector. The Portfolio will have greater exposure to the risks associated with that sector and its performance will be tied more closely to the performance of the sector.
Top 10 Holdings 12/31/23
| | | | | | | | |
| | | | |
| | | Security Description | | % of Net Assets | | | | |
| | | | |
| | | Pinnacle Financial Partners, Inc. | | 1.7% | | | | |
| | | | |
| | | PennyMac Financial Services, Inc. | | 1.6% | | | | |
| | | | |
| | | Matador Resources Co. | | 1.6% | | | | |
| | | | |
| | | BankUnited, Inc. | | 1.2% | | | | |
| | | | |
| | | Strategic Education, Inc. | | 1.2% | | | | |
| | | | |
| | | Popular, Inc. | | 1.1% | | | | |
| | | | |
| | | Meritage Homes Corp. | | 1.1% | | | | |
| | | | |
| | | Terreno Realty Corp. | | 1.1% | | | | |
| | | | |
| | | Houlihan Lokey, Inc. | | 1.1% | | | | |
| | | | |
| | | UFP Industries, Inc. | | 1.1% | | | | |
Sector Allocation 12/31/23
| | | | | | | | |
| | | | |
| | | Sector | | % of Net Assets | | | | |
| | | | |
| | | Financials | | 27.7% | | | | |
| | | | |
| | | Industrials | | 13.6% | | | | |
| | | | |
| | | Consumer Discretionary | | 10.9% | | | | |
| | | | |
| | | Real Estate | | 9.6% | | | | |
| | | | |
| | | Health Care | | 8.9% | | | | |
| | | | |
| | | Energy | | 8.1% | | | | |
| | | | |
| | | Information Technology | | 6.2% | | | | |
| | | | |
| | | Materials | | 4.4% | | | | |
| | | | |
| | | Utilities | | 3.8% | | | | |
| | | | |
| | | Short-Term Investments & Other Net Assets | | 3.4% | | | | |
| | | | |
| | | Consumer Staples | | 2.1% | | | | |
| | | | |
| | | Communication Services | | 1.3% | | | | |
Sector Allocation and Top 10 Holdings are subject to change.
69
Small Cap Value Portfolio
SCHEDULE OF INVESTMENTS
December 31, 2023
| | | | | | | | |
Common Stocks
(96.6%) | | Shares/ Par + | | | Value
$ (000’s) | |
Communication Services (1.3%) | |
Advantage Solutions, Inc. * | | | 347,714 | | | | 1,259 | |
Frontier Communications Parent, Inc. * | | | 54,300 | | | | 1,376 | |
The New York Times Co. - Class A | | | 100,600 | | | | 4,928 | |
| | | | | | | | |
Total | | | | | | | 7,563 | |
| | | | | | | | |
|
Consumer Discretionary (10.9%) | |
Abercrombie & Fitch Co. - Class A * | | | 6,900 | | | | 609 | |
Asbury Automotive Group, Inc. * | | | 16,000 | | | | 3,600 | |
BJ’s Restaurants, Inc. * | | | 51,620 | | | | 1,859 | |
Caleres, Inc. | | | 56,700 | | | | 1,742 | |
Carvana Co. * | | | 20,987 | | | | 1,111 | |
CAVA Group, Inc. * | | | 104,758 | | | | 4,502 | |
Chewy, Inc. * | | | 59,600 | | | | 1,408 | |
Dorman Products, Inc. * | | | 36,720 | | | | 3,063 | |
Dutch Bros, Inc. * | | | 41,746 | | | | 1,322 | |
FIGS, Inc. * | | | 314,870 | | | | 2,188 | |
Floor & Decor Holdings, Inc. * | | | 18,022 | | | | 2,011 | |
Kohl’s Corp. | | | 38,900 | | | | 1,116 | |
LCI Industries | | | 23,341 | | | | 2,934 | |
Marriott Vacations Worldwide Corp. | | | 26,146 | | | | 2,220 | |
Meritage Homes Corp. | | | 36,794 | | | | 6,409 | |
Modine Manufacturing Co. * | | | 12,000 | | | | 716 | |
Monro, Inc. | | | 81,218 | | | | 2,383 | |
Oxford Industries, Inc. | | | 7,900 | | | | 790 | |
Papa John’s International, Inc. | | | 52,923 | | | | 4,034 | |
Peloton Interactive, Inc. * | | | 155,318 | | | | 946 | |
Pool Corp. | | | 3,409 | | | | 1,359 | |
Savers Value Village, Inc. * | | | 28,307 | | | | 492 | |
Skyline Champion Corp. * | | | 18,000 | | | | 1,337 | |
Steven Madden, Ltd. | | | 109,762 | | | | 4,610 | |
Strategic Education, Inc. | | | 75,024 | | | | 6,930 | |
Visteon Corp. * | | | 13,367 | | | | 1,670 | |
Wyndham Hotels & Resorts, Inc. | | | 19,000 | | | | 1,528 | |
| | | | | | | | |
Total | | | | | | | 62,889 | |
| | | | | | | | |
| | | | | | | | |
Common Stocks
(96.6%) | | Shares/ Par + | | | Value
$ (000’s) | |
Consumer Staples (2.1%) | |
Coca-Cola Consolidated, Inc. | | | 2,382 | | | | 2,211 | |
Nomad Foods, Ltd. * | | | 262,615 | | | | 4,451 | |
Post Holdings, Inc. * | | | 30,111 | | | | 2,652 | |
The Simply Good Foods Co. * | | | 68,442 | | | | 2,710 | |
| | | | | | | | |
Total | | | | | | | 12,024 | |
| | | | | | | | |
|
Energy (8.1%) | |
Cactus, Inc. | | | 82,154 | | | | 3,730 | |
ChampionX Corp. | | | 182,450 | | | | 5,329 | |
Enerflex, Ltd. | | | 403,900 | | | | 1,886 | |
Frank’s International NV * | | | 143,200 | | | | 2,280 | |
Liberty Energy, Inc. | | | 143,592 | | | | 2,605 | |
Magnolia Oil & Gas Corp. | | | 138,961 | | | | 2,958 | |
Matador Resources Co. | | | 157,958 | | | | 8,982 | |
Permian Resources Corp. | | | 203,933 | | | | 2,773 | |
Range Resources Corp. | | | 163,800 | | | | 4,986 | |
SM Energy Co. | | | 55,400 | | | | 2,145 | |
Southwestern Energy Co. * | | | 637,800 | | | | 4,178 | |
TechnipFMC PLC | | | 226,300 | | | | 4,558 | |
| | | | | | | | |
Total | | | | | | | 46,410 | |
| | | | | | | | |
|
Financials (27.7%) | |
BankUnited, Inc. | | | 215,790 | | | | 6,998 | |
Cathay General Bancorp | | | 77,300 | | | | 3,445 | |
Columbia Banking System, Inc. | | | 233,849 | | | | 6,239 | |
CrossFirst Bankshares, Inc. * | | | 177,654 | | | | 2,413 | |
Eastern Bankshares, Inc. | | | 401,897 | | | | 5,707 | |
FB Financial Corp. | | | 131,543 | | | | 5,242 | |
First American Financial Corp. | | | 43,033 | | | | 2,773 | |
Green Dot Corp. - Class A * | | | 140,955 | | | | 1,395 | |
Hannon Armstrong Sustainable Infrastructure Capital, Inc. | | | 164,703 | | | | 4,543 | |
HarborOne Bancorp, Inc. | | | 219,642 | | | | 2,631 | |
Home BancShares, Inc. | | | 236,716 | | | | 5,996 | |
Houlihan Lokey, Inc. | | | 53,423 | | | | 6,406 | |
James River Group | | | | | | | | |
Holdings, Ltd. | | | 101,026 | | | | 933 | |
| | | | | | | | |
Common Stocks
(96.6%) | | Shares/ Par + | | | Value
$ (000’s) | |
Financials continued | | | | | | | | |
Live Oak Bancshares, Inc. | | | 132,320 | | | | 6,021 | |
National Bank Holding Corp. - Class A | | | 124,221 | | | | 4,620 | |
NerdWallet, Inc. * | | | 88,619 | | | | 1,304 | |
Origin Bancorp, Inc. | | | 86,002 | | | | 3,059 | |
PennyMac Financial Services, Inc. | | | 102,147 | | | | 9,027 | |
PennyMac Mortgage Investment Trust | | | 209,976 | | | | 3,139 | |
Pinnacle Financial Partners, Inc. | | | 111,322 | | | | 9,710 | |
Popular, Inc. | | | 79,553 | | | | 6,529 | |
PRA Group, Inc. * | | | 53,259 | | | | 1,395 | |
ProAssurance Corp. | | | 163,968 | | | | 2,261 | |
Prosperity Bancshares, Inc. | | | 9,800 | | | | 664 | |
Radian Group, Inc. | | | 146,434 | | | | 4,181 | |
Ryan Specialty Group Holdings, Inc. * | | | 85,315 | | | | 3,670 | |
Sandy Spring Bancorp, Inc. | | | 105,300 | | | | 2,868 | |
Selective Insurance Group, Inc. | | | 13,700 | | | | 1,363 | |
South State Corp. | | | 72,418 | | | | 6,116 | |
Southern First Bancshares, Inc. * | | | 62,415 | | | | 2,316 | |
StepStone Group, Inc. | | | 39,850 | | | | 1,268 | |
Texas Capital Bancshares, Inc. * | | | 70,154 | | | | 4,534 | |
Towne Bank | | | 159,291 | | | | 4,740 | |
Veritex Holdings, Inc. | | | 95,997 | | | | 2,234 | |
Virtus Investment Partners, Inc. | | | 18,015 | | | | 4,355 | |
Voya Financial, Inc. | | | 25,200 | | | | 1,839 | |
Walker & Dunlop, Inc. | | | 44,424 | | | | 4,932 | |
Webster Financial Corp. | | | 76,660 | | | | 3,891 | |
Western Alliance Bancorp | | | 58,810 | | | | 3,869 | |
WSFS Financial Corp. | | | 103,328 | | | | 4,746 | |
| | | | | | | | |
Total | | | | | | | 159,372 | |
| | | | | | | | |
|
Health Care (8.9%) | |
Agiliti, Inc. * | | | 163,723 | | | | 1,297 | |
Alignment Healthcare, Inc. * | | | 197,600 | | | | 1,701 | |
Apellis Pharmaceuticals, Inc. * | | | 27,255 | | | | 1,631 | |
Ascendis Pharma A/S * | | | 18,500 | | | | 2,330 | |
Atrion Corp. | | | 4,717 | | | | 1,787 | |
Avanos Medical, Inc. * | | | 61,000 | | | | 1,368 | |
Black Diamond Therapeutics, Inc. * | | | 201,600 | | | | 567 | |
The Accompanying Notes are an Integral Part of the Financial Statements.
70
Small Cap Value Portfolio
| | | | | | | | |
Common Stocks
(96.6%) | | Shares/ Par + | | | Value
$ (000’s) | |
Health Care continued | |
Blueprint Medicines Corp. * | | | 20,650 | �� | | | 1,905 | |
Crinetics Pharmaceuticals, Inc. * | | | 24,400 | | | | 868 | |
CRISPR Therapeutics AG * | | | 20,900 | | | | 1,308 | |
Cytokinetics, Inc. * | | | 23,300 | | | | 1,945 | |
Elanco Animal Health, Inc. * | | | 64,339 | | | | 959 | |
Ensign Group, Inc. | | | 37,358 | | | | 4,192 | |
Insmed, Inc. * | | | 71,892 | | | | 2,228 | |
Ionis Pharmaceuticals, Inc. * | | | 56,900 | | | | 2,879 | |
Karuna Therapeutics, Inc. * | | | 12,805 | | | | 4,053 | |
Kymera Therapeutics, Inc. * | | | 30,938 | | | | 788 | |
Lantheus Holdings, Inc. * | | | 36,800 | | | | 2,282 | |
MacroGenics, Inc. * | | | 124,000 | | | | 1,193 | |
MoonLake | | | 8,198 | | | | 495 | |
MultiPlan Corp. * | | | 784,941 | | | | 1,130 | |
The Pennant Group, Inc. * | | | 94,704 | | | | 1,318 | |
Phreesia, Inc. * | | | 63,190 | | | | 1,463 | |
QuidelOrtho Corp. * | | | 43,016 | | | | 3,170 | |
Select Medical Holdings Corp. | | | 204,783 | | | | 4,812 | |
Syndax Pharmaceuticals, Inc. * | | | 54,215 | | | | 1,172 | |
Verve Therapeutics, Inc. * | | | 58,453 | | | | 815 | |
Xencor, Inc. * | | | 44,296 | | | | 940 | |
Zentalis Pharmaceuticals, Inc. * | | | 42,509 | | | | 644 | |
| | | | | | | | |
Total | | | | | | | 51,240 | |
| | | | | | | | |
|
Industrials (13.6%) | |
Alamo Group, Inc. | | | 16,735 | | | | 3,517 | |
Allegiant Travel Co. | | | 34,590 | | | | 2,857 | |
Arcosa, Inc. | | | 11,086 | | | | 916 | |
ASGN, Inc. * | | | 11,500 | | | | 1,106 | |
Beacon Roofing Supply, Inc. * | | | 66,782 | | | | 5,811 | |
Brady Corp. - Class A | | | 69,025 | | | | 4,051 | |
Casella Waste Systems, Inc. - Class A * | | | 24,700 | | | | 2,111 | |
Conduent, Inc. * | | | 371,600 | | | | 1,356 | |
Crane NXT Co. | | | 16,900 | | | | 1,997 | |
ESAB Corp. | | | 44,996 | | | | 3,898 | |
ESCO Technologies, Inc. | | | 22,432 | | | | 2,625 | |
FTI Consulting, Inc. * | | | 11,439 | | | | 2,278 | |
Herc Holdings, Inc. | | | 16,800 | | | | 2,501 | |
John Bean | | | | | | | | |
Technologies Corp. | | | 16,200 | | | | 1,611 | |
| | | | | | | | |
Common Stocks
(96.6%) | | Shares/ Par + | | | Value
$ (000’s) | |
Industrials continued | |
Landstar System, Inc. | | | 26,666 | | | | 5,164 | |
Leonardo DRS, Inc. * | | | 66,966 | | | | 1,342 | |
McGrath RentCorp | | | 15,571 | | | | 1,863 | |
Moog, Inc. - Class A | | | 22,600 | | | | 3,272 | |
MSA Safety, Inc. | | | 12,080 | | | | 2,039 | |
Parsons Corp. * | | | 57,441 | | | | 3,602 | |
Paycor HCM, Inc. * | | | 135,008 | | | | 2,915 | |
RBC Bearings, Inc. * | | | 13,109 | | | | 3,735 | |
SPX Technologies, Inc. * | | | 20,212 | | | | 2,042 | |
Stericycle, Inc. * | | | 21,063 | | | | 1,044 | |
UFP Industries, Inc. | | | 50,049 | | | | 6,284 | |
UniFirst Corp. | | | 9,000 | | | | 1,646 | |
Valmont Industries, Inc. | | | 9,467 | | | | 2,211 | |
WillScot Mobile Mini Holdings Corp. * | | | 21,143 | | | | 941 | |
Zurn Water Solutions Corp. | | | 119,822 | | | | 3,524 | |
| | | | | | | | |
Total | | | | | | | 78,259 | |
| | | | | | | | |
|
Information Technology (6.2%) | |
Altair Engineering, Inc. - Class A * | | | 7,900 | | | | 665 | |
Amplitude, Inc. - Class A * | | | 48,100 | | | | 612 | |
Diodes, Inc. * | | | 15,600 | | | | 1,256 | |
DoubleVerify Holdings, Inc. * | | | 65,100 | | | | 2,394 | |
Endava PLC * | | | 17,100 | | | | 1,331 | |
Entegris, Inc. | | | 7,449 | | | | 892 | |
Intapp, Inc. * | | | 14,653 | | | | 557 | |
JFrog, Ltd. * | | | 18,600 | | | | 644 | |
Lattice Semiconductor Corp. * | | | 19,100 | | | | 1,318 | |
Littelfuse, Inc. | | | 21,927 | | | | 5,867 | |
MACOM Technology | | | | | | | | |
Solutions Holdings, Inc. * | | | 38,600 | | | | 3,588 | |
Mirion Technologies, Inc. * | | | 237,525 | | | | 2,435 | |
nCino, Inc. * | | | 59,716 | | | | 2,008 | |
Onto Innovation, Inc. * | | | 22,093 | | | | 3,378 | |
PAR Technology Corp. * | | | 20,670 | | | | 900 | |
Viavi Solutions, Inc. * | | | 199,200 | | | | 2,006 | |
Vishay Intertechnology, Inc. | | | 70,500 | | | | 1,690 | |
Vontier Corp. | | | 75,700 | | | | 2,615 | |
Workiva, Inc. * | | | 13,969 | | | | 1,418 | |
| | | | | | | | |
Total | | | | | | | 35,574 | |
| | | | | | | | |
|
Materials (4.4%) | |
Carpenter Technology Corp. | | | 32,736 | | | | 2,318 | |
Clearwater Paper Corp. * | | | 43,543 | | | | 1,573 | |
Constellium SE * | | | 247,878 | | | | 4,948 | |
Element Solutions, Inc. | | | 195,574 | | | | 4,525 | |
Myers Industries, Inc. | | | 36,017 | | | | 704 | |
| | | | | | | | |
Common Stocks
(96.6%) | | Shares/ Par + | | | Value
$ (000’s) | |
Materials continued | |
Orion Engineered Carbons SA | | | 108,017 | | | | 2,995 | |
Quaker Chemical Corp. | | | 11,212 | | | | 2,393 | |
Reliance Steel & Aluminum Co. | | | 17,166 | | | | 4,801 | |
West Fraser Timber Co., Ltd. | | | 15,950 | | | | 1,365 | |
| | | | | | | | |
Total | | | | | | | 25,622 | |
| | | | | | | | |
|
Real Estate (9.6%) | |
Apple Hospitality REIT, Inc. | | | 377,595 | | | | 6,272 | |
CubeSmart LP | | | 88,500 | | | | 4,102 | |
EastGroup Properties, Inc. | | | 27,201 | | | | 4,992 | |
Essential Properties Realty Trust, Inc. | | | 129,115 | | | | 3,300 | |
FirstService Corp. | | | 22,131 | | | | 3,587 | |
Independence Realty Trust, Inc. | | | 194,861 | | | | 2,981 | |
iStar, Inc. | | | 86,142 | | | | 2,016 | |
NETSTREIT Corp. | | | 159,936 | | | | 2,855 | |
NexPoint Residential Trust, Inc. | | | 47,707 | | | | 1,643 | |
PotlatchDeltic Corp. | | | 73,697 | | | | 3,618 | |
Saul Centers, Inc. | | | 90,854 | | | | 3,568 | |
The St. Joe Co. | | | 73,244 | | | | 4,408 | |
Terreno Realty Corp. | | | 102,260 | | | | 6,409 | |
Tricon Residential, Inc. | | | 397,294 | | | | 3,615 | |
UMH Properties, Inc. | | | 125,300 | | | | 1,920 | |
| | | | | | | | |
Total | | | | | | | 55,286 | |
| | | | | | | | |
|
Utilities (3.8%) | |
Artesian Resources Corp. | | | 24,751 | | | | 1,026 | |
California Water | | | | | | | | |
Service Group | | | 58,336 | | | | 3,026 | |
Chesapeake Utilities Corp. | | | 22,738 | | | | 2,402 | |
IDACORP, Inc. | | | 62,717 | | | | 6,166 | |
MGE Energy, Inc. | | | 52,034 | | | | 3,763 | |
OGE Energy Corp. | | | 72,100 | | | | 2,518 | |
ONE Gas, Inc. | | | 48,746 | | | | 3,106 | |
| | | | | | | | |
Total | | | | | | | 22,007 | |
| | | | | | | | |
| |
Total Common Stocks
(Cost: $433,998) | | | | 556,246 | |
| | | | | | | | |
The Accompanying Notes are an Integral Part of the Financial Statements.
71
Small Cap Value Portfolio
| | | | | | | | |
| Warrants (0.0%) | | Shares/ Par + | | | Value $ (000’s) | |
Communication Services (0.0%) | |
Advantage Solutions, Inc. * | | | 19,088 | | | | 2 | |
| | | | | | | | |
Total | | | | | | | 2 | |
| | | | | | | | |
| |
Total Warrants (Cost: $25) | | | | 2 | |
| | | | | | | | |
| |
Total Investments (96.6%)
(Cost: $434,023)@ | | | | 556,248 | |
| | | | | | | | |
| |
Other Assets, Less
Liabilities (3.4%) | | | | 19,601 | |
| | | | | | | | |
| | |
Net Assets (100.0%) | | | | | | | 575,849 | |
| | | | | | | | |
| + | All par is stated in U.S. Dollar unless otherwise noted. |
| @ | At December 31, 2023, the aggregate cost of investments, including derivatives, for federal tax purposes (in thousands) was $435,714 and the net unrealized appreciation of investments based on that cost was $120,534 which is comprised of $153,315 aggregate gross unrealized appreciation and $32,781 aggregate gross unrealized depreciation. |
The following is a summary of the inputs used in valuing the Portfolio’s Investments at December 31, 2023. See Note 3 for additional information on portfolio valuation.
| | | | | | | | | | | | | | | | | | | | | | | | |
| | | Valuation Inputs | |
| Description | | | | | Level 1 - Quoted Prices | | | | | | Level 2 - Other
Significant
Observable Inputs | | | | | | Level 3 - Significant
Unobservable
Inputs | |
| | | | | | (Amounts in thousands) | | | | |
Assets: | | | | | | | | | | | | | | | | | | | | | | | | |
Common Stocks | | | | | | $ | 556,246 | | | | | | | $ | — | | | | | | | $ | — | |
Warrants | | | | | | | 2 | | | | | | | | — | | | | | | | | — | |
| | | | | | | | |
Total Assets: | | | | | | $ | 556,248 | | | | | | | $ | — | | | | | | | $ | — | |
| | | | | | | | |
The Accompanying Notes are an Integral Part of the Financial Statements.
72
International Growth Portfolio (unaudited)
| | | | |
| Objective: | | Portfolio Strategy: | | Net Assets: |
| Long-term growth of capital. | | Invest in securities of issuers from countries outside the U.S. that have above average growth potential. | | $1.0 billion |
PORTFOLIO OVERVIEW
Mason Street Advisors, LLC (“Mason Street Advisors”), the investment adviser for the International Growth Portfolio (the “Portfolio”), has engaged FIAM LLC (“FIAM”) to act as sub-adviser for the Portfolio. FIAM is an indirect, wholly owned subsidiary of FMR LLC (along with its affiliates, “Fidelity Investments”). Normally, the Portfolio will invest in the securities of issuers from countries outside the United States. The Portfolio invests in companies it believes operate in a market environment, or with a competitive advantage, that make it difficult for competition to disrupt current and future profitability, in combination with growth drivers that may offer above-average growth potential measured by factors such as earnings or revenue. In buying and selling securities for the Portfolio, the portfolio manager relies on fundamental analysis, which involves a “bottom-up” assessment of a company’s potential for success in light of factors such as its financial condition, earnings outlook, strategy, management, industry position and economic and market conditions.
MARKET OVERVIEW
International equities largely advanced in the fourth quarter of 2023. U.S. stocks finished 2023 with a powerful rally driven by the U.S. Federal Reserve signaling that disinflationary trends were sufficient to project a shift to monetary easing in 2024. This news, along with resilient late-cycle expansion of the U.S. economy and a sharp decline in U.S. Treasury yields, provided a favorable environment for higher risk assets. Well known, large-cap growth stocks advanced the most, as fourth quarter corporate earnings announcements were much better than expected.
Developed market international stocks trailed U.S. stocks by a sizeable margin for 2023. Within developed markets, value stocks outperformed growth stocks modestly, despite a sharp rally in growth stocks during the fourth quarter. Emerging markets stocks also advanced but lagged their developed market counterparts. Performance was challenged by a lackluster post-Coronavirus pandemic recovery in China.
PORTFOLIO RESULTS
The Portfolio returned 20.77% for the twelve months ended December 31, 2023. By comparison, the Portfolio’s benchmark, the MSCI EAFE® Growth Index (the “Index”), returned 17.58%. (The Index is unmanaged, cannot be invested in directly and does not incur expenses.)
From a geographic standpoint (geographic positioning was an output of bottom-up stock selection), stock selection in Europe and an underweighting in Asia Pacific, excluding Japan, were the largest contributors to the Portfolio’s relative return. On the downside, out-of-benchmark exposure in Canada and stock selection in Asia Pacific, excluding Japan, detracted the most.
On a sector basis, stock selection in the Financials sector contributed the most to the Portfolio’s relative return. Out-of-benchmark positions in global bond rating firms Moody’s Investors Service and S&P Global helped drive contribution, as the outlook for bond issuance recovered in the fourth quarter of 2023.
The combined impact of stock selection and a sizeable underweighting in the Healthcare sector was the second largest contributor to the Portfolio’s relative returns. A long-held overweighting in Japanese opto-electronics maker Hoya Corporation benefited from share gains and premium product positioning in its high growth semiconductor and hard disk drive division, as well as steady demand in its eyeglass business.
A significant underweighting in the Consumer Staples sector also contributed. In particular, not holding British beverage company Diageo, which struggled with excess inventory as the initial post-pandemic travel and leisure enthusiasm subsided, benefitted the Portfolio’s relative performance in the sector. In the Materials sector, an overweighting in Ireland-based building materials supplier CRH was the single largest individual contributor. The company beat and raised earnings estimates due to strong pricing power in concrete and aggregates.
On the downside, stock selection in the Information Technology and Industrials sectors, two historically strong sectors for the Portfolio, detracted from the Portfolio’s relative return. Specifically, an underweighting in German information technology firm SAP was a major detractor. Within Industrials, an overweighting in Japanese machinery maker Misumi
73
International Growth Portfolio (unaudited)
Group detracted from performance as the company was challenged by intensifying Chinese competition. The single largest detractor was an out-of-benchmark position in healthcare equipment company ResMed, which declined amid an equipment recall.
PORTFOLIO MANAGER OUTLOOK
The following forward-looking comments are the opinion of FIAM, the Portfolio’s sub-adviser.
We target companies with multiyear structural growth prospects, high barriers to entry and attractive valuations, based on our earnings forecasts. We typically find these franchise businesses at cheap-to-reasonable prices in one of three ways. First, we target structurally attractive growth themes. Second, we try to capitalize on cyclically out-of-favor companies with pricing power when the market becomes excessively focused on near-term cyclical concerns and loses sight of the cross-cycle earnings power. Third, we attempt to capitalize on market dislocations driven by macroeconomic shocks.
Over the past year, we have been looking for companies outside the U.S. that may benefit from artificial intelligence in ways that are not well appreciated by the market. We always look for companies with improving competitive positions that can potentially generate better cycle-to-cycle earnings-per-share, even if short-term prospects are challenging.
We remain optimistic about the long-term attractiveness of the online payments, leading-edge lithography (EUV) equipment and aerospace themes, and we are enthusiastic about the increasingly consolidated industrial gas market.
Relative Performance
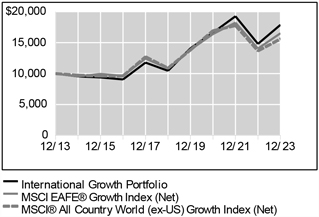
| | | | | | |
Average Annual Total Returns For Periods Ended December 31, 2023 |
| | | 1 Year | | 5 Years | | 10 Years |
International Growth Portfolio | | 20.77% | | 11.33% | | 5.99% |
MSCI EAFE® Growth Index (Net) | | 17.58% | | 8.81% | | 5.15% |
MSCI® All Country World (ex-US) | | | | | | |
Growth Index (Net) | | 14.03% | | 7.49% | | 4.55% |
The performance data quoted represents past performance. Past performance is historical and does not guarantee future performance. Investment return and principal value will fluctuate, so that shares, when redeemed, may be worth more or less than their original cost. Current performance may be lower or higher than the performance data quoted. For the most recent month-end performance information visit www.northwesternmutual.com.
This chart assumes an initial investment of $10,000 made on 12/31/13. Returns shown reflect fee waivers, deductions for management and other portfolio expenses, and reinvestment of all dividends. In the absence of fee waivers, total return would be reduced. Returns exclude deductions for separate account sale loads and account fees. Please refer to the Benchmark Definitions section of this report for information about the indices cited in the above chart and graph.
The Portfolio may invest a relatively high percentage of its assets in a particular sector. The Portfolio will have greater exposure to the risks associated with that sector and its performance will be tied more closely to the performance of the sector.
Top 10 Holdings 12/31/23
| | | | | | | | |
| | | | |
| | | Security Description | | % of Net Assets | | | | |
| | | | |
| | | ASML Holding NV | | 5.8% | | | | |
| | | | |
| | | Novo Nordisk A/S - Class B | | 4.8% | | | | |
| | | | |
| | | LVMH Moet Hennessy Louis Vuitton SE | | 4.7% | | | | |
| | | | |
| | | Nestle SA | | 4.3% | | | | |
| | | | |
| | | Linde PLC | | 3.7% | | | | |
| | | | |
| | | Safran SA | | 3.5% | | | | |
| | | | |
| | | Atlas Copco AB - Class A | | 3.3% | | | | |
| | | | |
| | | Keyence Corp. | | 3.1% | | | | |
| | | | |
| | | CRH PLC | | 2.7% | | | | |
| | | | |
| | | Airbus SE | | 2.4% | | | | |
74
International Growth Portfolio (unaudited)
Sector Allocation 12/31/23
| | | | | | | | |
| | | | |
| | | Sector | | % of Net Assets | | | | |
| | | | |
| | | Industrials | | 28.7% | | | | |
| | | | |
| | | Information Technology | | 22.1% | | | | |
| | | | |
| | | Financials | | 14.7% | | | | |
| | | | |
| | | Consumer Discretionary | | 10.4% | | | | |
| | | | |
| | | Materials | | 8.8% | | | | |
| | | | |
| | | Health Care | | 7.1% | | | | |
| | | | |
| | | Consumer Staples | | 4.5% | | | | |
| | | | |
| | | Short-Term Investments & Other Net Assets | | 2.4% | | | | |
| | | | |
| | | Energy | | 1.0% | | | | |
| | | | |
| | | Communication Services | | 0.3% | | | | |
Sector Allocation and Top 10 Holdings are subject to change.
75
International Growth Portfolio
SCHEDULE OF INVESTMENTS
December 31, 2023
| | | | | | | | | | | | |
| Common Stocks (97.6%) | | Country | | | Shares/ Par + | | | Value
$ (000’s) | |
Communication Services (0.3%) | | | | | |
Rightmove PLC | | | United Kingdom | | | | 462,957 | | | | 3,383 | |
| | | | | | | | | | | | |
Total | | | | | | | | | | | 3,383 | |
| | | | | | | | | | | | |
| |
Consumer Discretionary (10.4%) | | | | | |
Autoliv, Inc. | | | Sweden | | | | 77,700 | | | | 8,562 | |
Compass Group PLC | | | United Kingdom | | | | 811,000 | | | | 22,161 | |
InterContinental Hotels Group PLC, ADR | | | United Kingdom | | | | 178,384 | | | | 16,265 | |
LVMH Moet Hennessy Louis Vuitton SE | | | France | | | | 59,300 | | | | 48,100 | |
PRADA SpA | | | Italy | | | | 1,084,500 | | | | 6,188 | |
USS Co., Ltd. | | | Japan | | | | 205,400 | | | | 4,123 | |
| | | | | | | | | | | | |
Total | | | | | | | | | | | 105,399 | |
| | | | | | | | | | | | |
| |
Consumer Staples (4.5%) | | | | | |
Nestle SA | | | United States | | | | 380,159 | | | | 43,998 | |
PriceSmart, Inc. | | | United States | | | | 24,900 | | | | 1,887 | |
| | | | | | | | | | | | |
Total | | | | | | | | | | | 45,885 | |
| | | | | | | | | | | | |
| |
Energy (1.0%) | | | | | |
NOV, Inc. | | | United States | | | | 252,000 | | | | 5,111 | |
Reliance Industries, Ltd. | | | India | | | | 75,000 | | | | 2,327 | |
Reliance Industries, Ltd., GDR | | | India | | | | 37,400 | | | | 2,338 | |
| | | | | | | | | | | | |
Total | | | | | | | | | | | 9,776 | |
| | | | | | | | | | | | |
| |
Financials (14.7%) | | | | | |
AIA Group, Ltd. | | | Hong Kong | | | | 769,088 | | | | 6,680 | |
Deutsche Borse AG | | | Germany | | | | 56,900 | | | | 11,715 | |
HDFC Bank, Ltd. | | | India | | | | 570,729 | | | | 11,708 | |
Jio Financial Services, Ltd. * | | | India | | | | 75,000 | | | | 210 | |
Kotak Mahindra Bank, Ltd. | | | India | | | | 201,700 | | | | 4,621 | |
Marsh & McLennan Cos., Inc. | | | United States | | | | 122,923 | | | | 23,290 | |
Mastercard, Inc. - Class A | | | United States | | | | 42,350 | | | | 18,063 | |
Moody’s Corp. | | | United States | | | | 44,000 | | | | 17,185 | |
MSCI, Inc. | | | United States | | | | 19,400 | | | | 10,974 | |
S&P Global, Inc. | | | United States | | | | 38,600 | | | | 17,004 | |
UBS Group AG | | | Switzerland | | | | 356,300 | | | | 11,066 | |
Visa, Inc. - Class A | | | United States | | | | 68,025 | | | | 17,710 | |
| | | | | | | | | | | | |
Total | | | | | | | | | | | 150,226 | |
| | | | | | | | | | | | |
| |
Health Care (7.1%) | | | | | |
Hoya Corp. | | | Japan | | | | 136,100 | | | | 16,927 | |
Novo Nordisk A/S - Class B | | | Denmark | | | | 468,000 | | | | 48,407 | |
ResMed, Inc. | | | United States | | | | 41,600 | | | | 7,156 | |
| | | | | | | | | | | | |
Total | | | | | | | | | | | 72,490 | |
| | | | | | | | | | | | |
| |
Industrials (28.7%) | | | | | |
Aalberts NV | | | Netherlands | | | | 47,200 | | | | 2,054 | |
Airbus SE | | | France | | | | 161,400 | | | | 24,914 | |
Assa Abloy AB - Class B | | | Sweden | | | | 462,100 | | | | 13,313 | |
Atlas Copco AB - Class A | | | Sweden | | | | 1,961,600 | | | | 33,778 | |
Azelis Group NV | | | Belgium | | | | 168,307 | | | | 4,126 | |
BAE Systems PLC | | | United Kingdom | | | | 943,600 | | | | 13,350 | |
| | | | | | | | | | |
| Common Stocks (97.6%) | | Country | | Shares/Par + | | | Value $ (000’s) | |
Industrials continued | | | | | |
CAE, Inc. * | | Canada | | | 277,900 | | | | 5,998 | |
Canadian Pacific Kansas City, Ltd. | | Canada | | | 250,300 | | | | 19,804 | |
Edenred | | France | | | 234,866 | | | | 14,102 | |
Epiroc AB | | Sweden | | | 669,645 | | | | 13,436 | |
Experian PLC | | United States | | | 481,100 | | | | 19,606 | |
IMCD NV | | Netherlands | | | 48,700 | | | | 8,497 | |
Interpump Group SpA | | Italy | | | 122,400 | | | | 6,341 | |
KONE Oyj | | Finland | | | 102,600 | | | | 5,134 | |
Legrand SA | | France | | | 143,800 | | | | 14,978 | |
MISUMI Group, Inc. | | Japan | | | 494,700 | | | | 8,343 | |
OSG Corp. | | Japan | | | 152,700 | | | | 2,183 | |
Otis Worldwide Corp. | | United States | | | 68,300 | | | | 6,111 | |
Recruit Holdings Co., Ltd. | | Japan | | | 462,900 | | | | 19,763 | |
Safran SA | | France | | | 201,900 | | | | 35,616 | |
Schindler Holding AG | | Switzerland | | | 26,608 | | | | 6,581 | |
SHO-BOND Holdings Co., Ltd. | | Japan | | | 156,061 | | | | 6,926 | |
Vestas Wind Systems A/S * | | Denmark | | | 222,200 | | | | 7,064 | |
| | | | | | | | | | |
Total | | | | | | | | | 292,018 | |
| | | | | | | | | | |
| |
Information Technology (22.1%) | | | | | |
Amadeus IT Group SA | | Spain | | | 271,100 | | | | 19,443 | |
ASML Holding NV | | Netherlands | | | 78,100 | | | | 58,967 | |
Azbil Corp. | | Japan | | | 342,300 | | | | 11,281 | |
BE Semiconductor Industries N.V. | | Netherlands | | | 37,350 | | | | 5,628 | |
Keyence Corp. | | Japan | | | 71,600 | | | | 31,385 | |
Lagercrantz Group AB | | Sweden | | | 111,200 | | | | 1,497 | |
Lasertec Corp. | | Japan | | | 48,700 | | | | 12,728 | |
Lectra | | France | | | 75,400 | | | | 2,608 | |
Microsoft Corp. | | United States | | | 21,500 | | | | 8,085 | |
NICE, Ltd., ADR * | | Israel | | | 26,200 | | | | 5,227 | |
The Sage Group PLC | | United Kingdom | | | 395,000 | | | | 5,892 | |
SAP SE | | Germany | | | 160,000 | | | | 24,612 | |
Spectris PLC | | United Kingdom | | | 222,600 | | | | 10,683 | |
Synopsys, Inc. * | | United States | | | 12,500 | | | | 6,436 | |
Taiwan Semiconductor Manufacturing Co., Ltd. | | Taiwan | | | 1,094,000 | | | | 21,055 | |
| | | | | | | | | | |
Total | | | | | | | | | 225,527 | |
| | | | | | | | | | |
| |
Materials (8.8%) | | | | | |
CRH PLC | | United States | | | 403,500 | | | | 27,806 | |
Franco-Nevada Corp. | | Canada | | | 59,000 | | | | 6,535 | |
Linde PLC | | United States | | | 91,755 | | | | 37,685 | |
The Accompanying Notes are an Integral Part of the Financial Statements.
76
International Growth Portfolio
| | | | | | | | | | |
| Common Stocks (97.6%) | | Country | | Shares/Par + | | | Value $ (000’s) | |
Materials continued | | | | | | | | | | |
The Sherwin-Williams Co. | | United States | | | 55,200 | | | | 17,217 | |
| | | | | | | | | | |
Total | | | | | | | | | 89,243 | |
| | | | | | | | | | |
| |
Total Common Stocks (Cost: $742,022) | | | | 993,947 | |
| | | | | | | | | | |
| |
Total Investments (97.6%) (Cost: $742,022)@ | | | | 993,947 | |
| | | | | | | | | | |
| |
Other Assets, Less Liabilities (2.4%) | | | | 24,925 | |
| | | | | | | | | | |
| | | |
Net Assets (100.0%) | | | | | | | | | 1,018,872 | |
| | | | | | | | | | |
| | | | |
Investments by Country of Risk as a Percentage of Net Assets: | | | | |
United States | | | 28.0% | |
France | | | 13.9% | |
Japan | | | 11.1% | |
Netherlands | | | 7.4% | |
United Kingdom | | | 7.0% | |
Sweden | | | 6.9% | |
Denmark | | | 5.4% | |
Other | | | 17.9% | |
| | | | |
Total | | | 97.6% | |
| | | | |
| + | All par is stated in U.S. Dollar unless otherwise noted. |
| @ | At December 31, 2023, the aggregate cost of investments, including derivatives, for federal tax purposes (in thousands) was $743,501 and the net unrealized appreciation of investments based on that cost was $250,446 which is comprised of $265,423 aggregate gross unrealized appreciation and $14,977 aggregate gross unrealized depreciation. |
The following is a summary of the inputs used in valuing the Portfolio’s Investments at December 31, 2023. See Note 3 for additional information on portfolio valuation.
| | | | | | | | | | | | | | |
| | | Valuation Inputs | |
| Description | | | | Level 1 - Quoted
Prices | | | Level 2 - Other
Significant
Observable Inputs | | | Level 3 -
Significant
Unobservable
Inputs | |
| | | | | (Amounts in thousands) | |
Assets: | | | | | | | | | | | | | | |
Common Stocks | | | | | | | | | | | | | | |
Communication Services | | | | $ | — | | | $ | 3,383 | | | $ | — | |
Consumer Discretionary | | | | | 24,827 | | | | 80,572 | | | | — | |
Consumer Staples | | | | | 1,887 | | | | 43,998 | | | | — | |
Energy | | | | | 7,324 | | | | 2,452 | | | | — | |
Financials | | | | | 104,226 | | | | 46,000 | | | | — | |
Health Care | | | | | 7,156 | | | | 65,334 | | | | — | |
Industrials | | | | | 31,913 | | | | 260,105 | | | | — | |
Information Technology | | | | | 19,748 | | | | 205,779 | | | | — | |
Materials | | | | | 61,437 | | | | 27,806 | | | | — | |
| | | | | | |
Total Assets: | | | | $ | 258,518 | | | $ | 735,429 | | | $ | — | |
| | | | | | |
The Accompanying Notes are an Integral Part of the Financial Statements.
77
Research International Core Portfolio (unaudited)
| | | | |
| Objective: | | Portfolio Strategy: | | Net Assets: |
| Capital appreciation. | | Invest primarily in foreign equity securities, including emerging markets. | | $829 million |
PORTFOLIO OVERVIEW
Mason Street Advisors, LLC (“Mason Street Advisors”), the investment adviser for the Research International Core Portfolio (the “Portfolio”), has engaged Massachusetts Financial Services Company (“MFS®”) to act as sub-adviser for the Portfolio. The Portfolio normally invests in foreign equity securities, including emerging market equity securities. In conjunction with a team of investment research analysts, sector leaders select investments for the Portfolio. An active, “bottom up” investment approach is used to buy and sell investments for the Portfolio. The Portfolio is generally managed to be sector neutral to the MSCI EAFE® Index. The Portfolio may invest in the stocks of companies it believes to have above average earnings growth potential compared to other companies (growth companies), in the stocks of companies it believes are undervalued compared to their perceived worth (value companies), or in a combination of growth and value companies.
MARKET OVERVIEW
International equities largely advanced during the reporting period. At the start of 2023, countries faced the strongest inflationary pressures in four decades, fueled by the global fiscal response to the Coronavirus pandemic, disrupted supply chains and the dislocations to energy markets stemming from the war in Ukraine. Central banks focused on controlling price pressures while also confronting increasing financial stability concerns. As inflationary pressures eased toward the end of 2023, financial conditions loosened in anticipation of easier monetary policy, boosting the market’s appetite for risk. Normalizing supply chains, low levels of unemployment across developed markets and signs that inflation levels had peaked contributed to a rally in international equities in the fourth quarter. Rapid advancements in artificial intelligence were a focus for investors.
China’s abandonment of its Zero-COVID policy in early 2023 ushered in a brief increase in economic activity in the world’s second-largest economy, although its momentum soon stalled as the focus turned to the country’s highly indebted property development sector.
PORTFOLIO RESULTS
The Portfolio returned 12.95% for the twelve months ended December 31, 2023. By comparison, the Portfolio’s primary and secondary benchmarks, the MSCI® All Country World (ex-U.S.) Index (the “Index”) and the MSCI EAFE® Index, returned 15.62% and 18.24%, respectively. (These Indices are unmanaged, cannot be invested in directly and do not incur expenses.)
Stock selection in the Financials sector was the primary detractor from the Portfolio’s relative performance, driven by the Portfolio’s overweight positions in insurance company AIA Group and international banking and financial services provider NatWest Group. The Portfolio’s out-of-benchmark holding of insurance provider Beazley further weighed on relative performance.
An underweight allocation to the Information Technology sector and security selection in the Consumer Staples sector also detracted from the Portfolio’s relative return. While there were no individual stocks within Information Technology among the Portfolio’s top relative detractors over the reporting period, in Consumer Staples, detraction was driven by overweight positions in U.K.-based drinks distributor Diageo and tobacco distributor British American Tobacco.
Overweight positioning in the Healthcare and Industrials sectors also detracted, particularly in Healthcare companies Kyowa Kirin, Roche Holding, QIAGEN and Merck KGaA. In the Industrials sector, an overweight in U.K. specialty chemical products maker Croda International drove detraction.
On the upside, a combination of security selection and an overweight position in the Industrials sector contributed to the Portfolio’s relative returns, led by overweight holdings of Schneider Electric and Japanese multinational conglomerate Hitachi. Security selection in the Communication Services sector also supported relative returns.
Individual stocks that contributed to the Portfolio’s relative performance include, overweight positions in pharmaceutical company Novo Nordisk, enterprise software solutions Constellation Software and investment management and banking firm UBS. The Portfolio’s holdings of out-of-benchmark industrial gas supplier Linde and integrated circuits and electronic
78
Research International Core Portfolio (unaudited)
devices developer Cadence Design Systems further contributed. Additionally, not owning shares of e-commerce platform manager Meituan bolstered relative performance.
During the reporting period, the Portfolio’s relative currency exposure, resulting primarily from differences between the Portfolio’s and the Index’s exposures to holdings of securities denominated in foreign currencies, benefited relative performance.
PORTFOLIO MANAGER OUTLOOK
The following forward-looking comments are the opinion of MFS®, the Portfolio’s sub-adviser.
Regardless of changing economic and market conditions, we will continue to adhere to our investment process, building a portfolio of fundamentally sound companies. The Portfolio is a sector-neutral portfolio that emphasizes bottom-up fundamental research. Because of this approach, the Portfolio’s sector weightings vary only modestly from those of the broader foreign market. Instead, we attempt to outperform the Index by holding what we believe to be the most attractive opportunities among growth and value companies within each sector of the market without regard to market capitalization.
Relative Performance
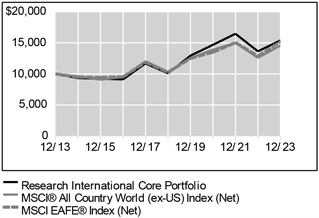
| | | | | | |
Average Annual Total Returns For Periods Ended December 31, 2023 |
| | | 1 Year | | 5 Years | | 10 Years |
Research International Core Portfolio | | 12.95% | | 8.82% | | 4.42% |
MSCI® All Country World (ex-US) Index (Net) | | 15.62% | | 7.08% | | 3.83% |
MSCI EAFE® Index (Net) | | 18.24% | | 8.16% | | 4.28% |
The performance data quoted represents past performance. Past performance is historical and does not guarantee future performance. Investment return and principal value will fluctuate, so that shares, when redeemed, may be worth more or less than their original cost. Current performance may be lower or higher than the performance data quoted. For the most recent month- end performance information visit www.northwesternmutual.com.
This chart assumes an initial investment of $10,000 made on 12/31/13. Returns shown reflect fee waivers, deductions for management and other portfolio expenses, and reinvestment of all dividends. In the absence of fee
waivers, total return would be reduced. Returns exclude deductions for separate account sale loads and account fees. Please refer to the Benchmark Definitions section of this report for information about the indices cited in the above chart and graph.
The Portfolio may invest a relatively high percentage of its assets in a particular sector. The Portfolio will have greater exposure to the risks associated with that sector and its performance will be tied more closely to the performance of the sector.
Top 10 Holdings 12/31/23
| | | | | | | | |
| | | | |
| | | Security Description | | % of Net Assets | | | | |
| | | | |
| | | Schneider Electric SE | | 3.1% | | | | |
| | | | |
| | | Linde PLC | | 3.1% | | | | |
| | | | |
| | | Novo Nordisk A/S - Class B | | 3.0% | | | | |
| | | | |
| | | Roche Holding AG | | 2.7% | | | | |
| | | | |
| | | Nestle SA | | 2.7% | | | | |
| | | | |
| | | LVMH Moet Hennessy Louis Vuitton SE | | 2.5% | | | | |
| | | | |
| | | Hitachi, Ltd. | | 1.9% | | | | |
| | | | |
| | | TotalEnergies SE | | 1.8% | | | | |
| | | | |
| | | London Stock Exchange Group PLC | | 1.6% | | | | |
| | | | |
| | | BNP Paribas SA | | 1.6% | | | | |
79
Research International Core Portfolio (unaudited)
Sector Allocation 12/31/23
| | | | | | | | |
| | | | |
| | | Sector | | % of Net Assets | | | | |
| | | | |
| | | Financials | | 19.1% | | | | |
| | | | |
| | | Industrials | | 17.2% | | | | |
| | | | |
| | | Health Care | | 12.3% | | | | |
| | | | |
| | | Consumer Discretionary | | 10.4% | | | | |
| | | | |
| | | Information Technology | | 9.9% | | | | |
| | | | |
| | | Materials | | 9.8% | | | | |
| | | | |
| | | Consumer Staples | | 7.8% | | | | |
| | | | |
| | | Energy | | 5.1% | | | | |
| | | | |
| | | Utilities | | 2.8% | | | | |
| | | | |
| | | Communication Services | | 2.7% | | | | |
| | | | |
| | | Short-Term Investments & Other Net Assets | | 1.6% | | | | |
| | | | |
| | | Real Estate | | 1.3% | | | | |
Sector Allocation and Top 10 Holdings are subject to change.
80
Research International Core Portfolio
SCHEDULE OF INVESTMENTS
December 31, 2023
| | | | | | | | | | |
| Common Stocks (98.4%) | | Country | | Shares/ Par + | | | Value
$ (000’s) | |
Communication Services (2.7%) | |
Advanced Info Service PCL - Foreign Shares | | Thailand | | | 737,000 | | | | 4,685 | |
carsales.com, Ltd. | | Australia | | | 127,584 | | | | 2,701 | |
Hellenic Telecommunications Organization SA | | Greece | | | 190,748 | | | | 2,715 | |
KDDI Corp. | | Japan | | | 205,500 | | | | 6,524 | |
SEEK, Ltd. | | Australia | | | 122,624 | | | | 2,225 | |
SoftBank Group Corp. | | Japan | | | 86,500 | | | | 3,822 | |
| | | | | | | | | | |
Total | | | | | | | | | 22,672 | |
| | | | | | | | | | |
| |
Consumer Discretionary (10.4%) | | | | | |
Aristocrat Leisure, Ltd. | | Australia | | | 201,172 | | | | 5,578 | |
Bridgestone Corp. | | Japan | | | 128,300 | | | | 5,299 | |
Burberry Group PLC | | United Kingdom | | | 99,859 | | | | 1,814 | |
Cie Financiere Richemont SA | | Switzerland | | | 65,593 | | | | 9,047 | |
Compagnie Generale des Etablissements Michelin | | France | | | 162,886 | | | | 5,853 | |
Denso Corp. | | Japan | | | 460,200 | | | | 6,902 | |
Flutter Entertainment PLC * | | Australia | | | 15,090 | | | | 2,673 | |
Koito Manufacturing Co., Ltd. | | Japan | | | 269,800 | | | | 4,192 | |
LVMH Moet Hennessy Louis Vuitton SE | | France | | | 25,512 | | | | 20,693 | |
NIKE, Inc. - Class B | | United States | | | 29,484 | | | | 3,201 | |
Sands China, Ltd. * | | Macau | | | 960,400 | | | | 2,803 | |
Techtronic Industries Co., Ltd. | | Hong Kong | | | 607,000 | | | | 7,260 | |
Whitbread PLC | | United Kingdom | | | 81,108 | | | | 3,768 | |
Yamaha Corp. | | Japan | | | 80,500 | | | | 1,856 | |
Yum China Holdings, Inc. | | China | | | 66,259 | | | | 2,811 | |
ZOZO, Inc. | | Japan | | | 105,100 | | | | 2,361 | |
| | | | | | | | | | |
Total | | | | | | | | | 86,111 | |
| | | | | | | | | | |
| |
Consumer Staples (7.8%) | | | | | |
British American Tobacco PLC | | United Kingdom | | | 296,862 | | | | 8,663 | |
Diageo PLC | | United Kingdom | | | 337,846 | | | | 12,269 | |
Heineken NV | | Netherlands | | | 68,342 | | | | 6,953 | |
Kao Corp. | | Japan | | | 155,000 | | | | 6,370 | |
Kirin Holdings Co., Ltd. | | Japan | | | 344,400 | | | | 5,042 | |
Nestle SA | | United States | | | 191,018 | | | | 22,108 | |
Seven & i Holdings Co., Ltd. | | Japan | | | 82,700 | | | | 3,275 | |
| | | | | | | | | | |
Total | | | | | | | | | 64,680 | |
| | | | | | | | | | |
| |
Energy (5.1%) | | | | | |
Eni SpA | | Italy | | | 505,237 | | | | 8,576 | |
Galp Energia SGPS SA | | Portugal | | | 579,843 | | | | 8,529 | |
Reliance Industries, Ltd. | | India | | | 136,355 | | | | 4,232 | |
TotalEnergies SE | | France | | | 223,018 | | | | 15,149 | |
Woodside Energy Group, Ltd. | | Australia | | | 290,254 | | | | 6,149 | |
| | | | | | | | | | |
Total | | | | | | | | | 42,635 | |
| | | | | | | | | | |
| |
Financials (19.1%) | | | | | |
AIA Group, Ltd. | | Hong Kong | | | 1,081,800 | | | | 9,396 | |
Aon PLC | | United States | | | 33,642 | | | | 9,791 | |
Bank of Ireland Group PLC | | Ireland | | | 393,764 | | | | 3,569 | |
Beazley PLC | | United Kingdom | | | 958,682 | | | | 6,364 | |
| | | | | | | | | | |
| Common Stocks (98.4%) | | Country | | Shares/ Par + | | | Value
$ (000’s) | |
Financials continued | |
BNP Paribas SA | | France | | | 193,574 | | | | 13,412 | |
DBS Group Holdings, Ltd. | | Singapore | | | 229,500 | | | | 5,798 | |
Euronext NV | | Netherlands | | | 146,782 | | | | 12,745 | |
HDFC Bank, Ltd. | | India | | | 317,285 | | | | 6,509 | |
Hiscox, Ltd. | | United Kingdom | | | 332,818 | | | | 4,464 | |
Hong Kong Exchanges & Clearing, Ltd. | | Hong Kong | | | 167,600 | | | | 5,735 | |
Julius Baer Group, Ltd. | | Switzerland | | | 162,935 | | | | 9,155 | |
London Stock Exchange Group PLC | | United Kingdom | | | 113,951 | | | | 13,471 | |
Macquarie Group, Ltd. | | Australia | | | 56,081 | | | | 6,989 | |
Mitsubishi UFJ Financial Group, Inc. | | Japan | | | 919,100 | | | | 7,910 | |
NatWest Group PLC | | United Kingdom | | | 3,508,539 | | | | 9,792 | |
UBS Group AG | | Switzerland | | | 328,380 | | | | 10,199 | |
Visa, Inc. - Class A | | United States | | | 34,367 | | | | 8,948 | |
Willis Towers Watson PLC | | United States | | | 16,214 | | | | 3,911 | |
Zurich Insurance Group AG | | Switzerland | | | 18,734 | | | | 9,794 | |
| | | | | | | | | | |
Total | | | | | | | | | 157,952 | |
| | | | | | | | | | |
| |
Health Care (12.3%) | | | | | |
Bayer AG | | Germany | | | 113,161 | | | | 4,201 | |
ConvaTec Group PLC | | United Kingdom | | | 1,742,923 | | | | 5,422 | |
CSL, Ltd. | | Australia | | | 40,732 | | | | 7,941 | |
Kyowa Kirin Co., Ltd. | | Japan | | | 355,500 | | | | 5,979 | |
Merck KGaA | | Germany | | | 48,947 | | | | 7,785 | |
Novo Nordisk A/S - Class B | | Denmark | | | 236,919 | | | | 24,506 | |
Olympus Corp. | | Japan | | | 183,700 | | | | 2,651 | |
Qiagen NV * | | United States | | | 192,468 | | | | 8,374 | |
Roche Holding AG | | United States | | | 77,217 | | | | 22,380 | |
Sanofi | | United States | | | 59,109 | | | | 5,860 | |
Santen Pharmaceutical Co., Ltd. | | Japan | | | 324,400 | | | | 3,227 | |
Terumo Corp. | | Japan | | | 108,100 | | | | 3,528 | |
| | | | | | | | | | |
Total | | | | | | | | | 101,854 | |
| | | | | | | | | | |
| |
Industrials (17.2%) | | | | | |
Cellnex Telecom SA | | Spain | | | 134,394 | | | | 5,310 | |
Daikin Industries, Ltd. | | Japan | | | 58,700 | | | | 9,535 | |
GEA Group AG | | Germany | | | 209,508 | | | | 8,720 | |
Hitachi, Ltd. | | Japan | | | 213,900 | | | | 15,459 | |
Legrand SA | | France | | | 97,277 | | | | 10,132 | |
Mitsubishi Electric Corp. | | Japan | | | 574,000 | | | | 8,103 | |
Mitsui & Co., Ltd. | | Japan | | | 114,500 | | | | 4,266 | |
MTU Aero Engines AG | | Germany | | | 32,240 | | | | 6,949 | |
Persol Holdings Co., Ltd. | | Japan | | | 1,336,000 | | | | 2,286 | |
RB Global, Inc. | | Canada | | | 70,917 | | | | 4,746 | |
Ryanair Holdings PLC * | | Ireland | | | 36,956 | | | | 4,929 | |
Schneider Electric SE | | United States | | | 129,272 | | | | 26,029 | |
Secom Co., Ltd. | | Japan | | | 32,700 | | | | 2,351 | |
SMC Corp. | | Japan | | | 20,400 | | | | 10,909 | |
Thales SA | | France | | | 33,296 | | | | 4,924 | |
Toyota Industries Corp. | | Japan | | | 79,800 | | | | 6,479 | |
Weir Group PLC | | United Kingdom | | | 192,303 | | | | 4,617 | |
The Accompanying Notes are an Integral Part of the Financial Statements.
81
Research International Core Portfolio
| | | | | | | | | | | | |
| Common Stocks (98.4%) | | Country | | | Shares/Par + | | | Value
$ (000’s) | |
Industrials continued | | | | | | | | | | | | |
Wolters Kluwer NV | | | Netherlands | | | | 47,165 | | | | 6,702 | |
| | | | | | | | | | | | |
Total | | | | | | | | | | | 142,446 | |
| | | | | | | | | | | | |
| |
Information Technology (9.9%) | | | | | |
Amadeus IT Group SA | | | Spain | | | | 141,228 | | | | 10,129 | |
ASML Holding NV | | | Netherlands | | | | 6,807 | | | | 5,139 | |
Cadence Design Systems, Inc. * | | | United States | | | | 30,785 | | | | 8,385 | |
Constellation Software, Inc. | | | Canada | | | | 3,798 | | | | 9,417 | |
Fujitsu, Ltd. | | | Japan | | | | 68,300 | | | | 10,311 | |
Kyocera Corp. | | | Japan | | | | 399,600 | | | | 5,808 | |
Nomura Research Institute, Ltd. | | | Japan | | | | 219,900 | | | | 6,372 | |
NXP Semiconductors NV | | | China | | | | 23,756 | | | | 5,456 | |
Rohm Co., Ltd. | | | Japan | | | | 167,200 | | | | 3,203 | |
Samsung Electronics Co., Ltd. | | | South Korea | | | | 164,519 | | | | 10,006 | |
Taiwan Semiconductor Manufacturing Co., Ltd. | | | Taiwan | | | | 396,189 | | | | 7,625 | |
| | | | | | | | | | | | |
Total | | | | | | | | | | | 81,851 | |
| | | | | | | | | | | | |
| |
Materials (9.8%) | | | | | |
Akzo Nobel NV | | | Netherlands | | | | 90,455 | | | | 7,474 | |
Croda International PLC | | | United Kingdom | | | | 101,348 | | | | 6,513 | |
Glencore PLC | | | Australia | | | | 1,848,057 | | | | 11,087 | |
Kansai Paint Co., Ltd. | | | Japan | | | | 167,300 | | | | 2,848 | |
Linde PLC | | | United States | | | | 63,005 | | | | 25,877 | |
Nitto Denko Corp. | | | Japan | | | | 94,100 | | | | 7,016 | |
Novozymes A/S - Class B | | | Denmark | | | | 82,944 | | | | 4,567 | |
Sika AG | | | Switzerland | | | | 27,862 | | | | 9,103 | |
| | | | | | | | | | | | |
| Common Stocks (98.4%) | | Country | | | Shares/Par + | | | Value
$ (000’s) | |
Materials continued | | | | | |
Symrise AG | | | Germany | | | | 65,553 | | | | 7,210 | |
| | | | | | | | | | | | |
Total | | | | | | | | | | | 81,695 | |
| | | | | | | | | | | | |
| |
Real Estate (1.3%) | | | | | |
LEG Immobilien SE * | | | Germany | | �� | | 119,310 | | | | 10,448 | |
| | | | | | | | | | | | |
Total | | | | | | | | | | | 10,448 | |
| | | | | | | | | | | | |
| |
Utilities (2.8%) | | | | | |
APA Group | | | Australia | | | | 418,642 | | | | 2,431 | |
China Resources Gas Group, Ltd. | | | China | | | | 740,400 | | | | 2,424 | |
CLP Holdings, Ltd. | | | Hong Kong | | | | 438,000 | | | | 3,610 | |
E.ON SE | | | Germany | | | | 362,399 | | | | 4,862 | |
Iberdrola SA | | | Spain | | | | 730,747 | | | | 9,557 | |
| | | | | | | | | | | | |
Total | | | | | | | | | | | 22,884 | |
| | | | | | | | | | | | |
| |
Total Common Stocks (Cost: $675,492) | | | | 815,228 | |
| | | | | | | | | | | | |
| | | |
| Warrants (–%) | | | | | | | | | |
Information Technology (–%) | | | | | |
Constellation Software, Inc. *,Æ | | | Canada | | | | 5,207 | | | | – | |
| | | | | | | | | | | | |
Total | | | | | | | | | | | – | |
| | | | | | | | | | | | |
| |
Total Warrants (Cost: $–) | | | | – | |
| | | | | | | | | | | | |
| |
Total Investments (98.4%) (Cost: $675,492)@ | | | | 815,228 | |
| | | | | | | | | | | | |
| |
Other Assets, Less Liabilities (1.6%) | | | | 13,423 | |
| | | | | | | | | | | | |
| | | |
Net Assets (100.0%) | | | | | | | | | | | 828,651 | |
| | | | | | | | | | | | |
| | | | |
Investments by Country of Risk as a Percentage of Net Assets: | | | | |
Japan | | | 19.8% | |
United States | | | 17.5% | |
United Kingdom | | | 9.4% | |
France | | | 8.4% | |
Germany | | | 6.1% | |
Australia | | | 5.9% | |
Switzerland | | | 5.7% | |
Other | | | 25.6% | |
| | | | |
Total | | | 98.4% | |
| | | | |
| + | All par is stated in U.S. Dollar unless otherwise noted. |
| Æ | Security valued using significant unobservable inputs. |
| @ | At December 31, 2023, the aggregate cost of investments, including derivatives, for federal tax purposes (in thousands) was $678,393 and the net unrealized appreciation of investments based on that cost was $136,835 which is comprised of $172,380 aggregate gross unrealized appreciation and $35,545 aggregate gross unrealized depreciation. |
The Accompanying Notes are an Integral Part of the Financial Statements.
82
Research International Core Portfolio
The following is a summary of the inputs used in valuing the Portfolio’s Investments at December 31, 2023. See Note 3 for additional information on portfolio valuation.
| | | | | | | | | | | | | | |
| | | | | Valuation Inputs | |
| Description | | | | Level 1 - Quoted
Prices | | | Level 2 - Other
Significant
Observable Inputs | | | Level 3
- Significant
Unobservable
Inputs | |
| | | | | (Amounts in thousands) | |
Assets: | | | | | | | | | | | | | | |
Common Stocks | | | | | | | | | | | �� | | | |
Consumer Discretionary | | | | $ | 6,012 | | | $ | 80,099 | | | $ | — | |
Financials | | | | | 22,650 | | | | 135,302 | | | | — | |
Industrials | | | | | 9,675 | | | | 132,771 | | | | — | |
Information Technology | | | | | 23,258 | | | | 58,593 | | | | — | |
Materials | | | | | 25,877 | | | | 55,818 | | | | — | |
All Others | | | | | — | | | | 265,173 | | | | — | |
Warrants | | | | | — | | | | — | | | | — | |
| | | | | | |
Total Assets: | | | | $ | 87,472 | | | $ | 727,756 | | | $ | — | |
| | | | | | |
Management has determined that the amount of Level 3 securities compared to total net assets is not material; therefore, the reconciliation of Level 3 securities and assumptions is not shown for the period ended December 31, 2023.
The Accompanying Notes are an Integral Part of the Financial Statements.
83
International Equity Portfolio (unaudited)
| | | | |
| Objective: | | Portfolio Strategy: | | Net Assets: |
| Long-term growth of capital. Any income realized will be incidental. | | Invests primarily in equity securities of issuers outside
of the U.S. with favorable long-term potential relative to
current market values. | | $1.9 billion |
PORTFOLIO OVERVIEW
Mason Street Advisors, LLC (“Mason Street Advisors”), the investment adviser for the International Equity Portfolio (“the Portfolio”), has engaged Dodge & Cox to act as sub-adviser for the Portfolio. The Portfolio may purchase securities in any country, including those with developed markets and emerging markets and is not required to allocate its investments in set percentages in particular countries, except that the Portfolio’s investments in emerging markets countries normally will be limited to 30% of its net assets. The Portfolio typically invests in well-established companies of medium-to-large capitalization based on standards of the applicable market. The Portfolio typically invests in companies that appear to be temporarily undervalued but have a favorable outlook for long-term growth. The portfolio managers also focus on the underlying financial condition and prospects of individual companies, including future earnings, cash flow, and dividends.
MARKET OVERVIEW
Global equity markets surged in the fourth quarter of 2023 as inflation decelerated and investors became increasingly convinced the U.S. Federal Reserve would lower U.S. interest rates in 2024. As a result, most developed and emerging markets posted strong returns for the full year with both the MSCI® ACWI ex USA Value Index and the MSCI® ACWI ex USA Index advancing significantly. However, the MSCI® China Index declined due to growing macroeconomic concerns and heightened geopolitical tensions. As a result, the overall MSCI® Emerging Markets Index (which includes China) trailed developed market returns.
PORTFOLIO RESULTS
The Portfolio returned 16.09% for the twelve months ended December 31, 2023. By comparison, the Portfolio’s benchmark, the MSCI® All Country World (ex-US) Value Index (the “Index”), returned 17.30%. (The Index is unmanaged, cannot be invested in directly and does not incur expenses.)
Despite the U.S. regional banking crisis and concerns about global financial contagion in the first half of 2023, the Financials sector contributed the most to the Portfolio’s relative return. In the eye of the financial storm, the portfolio management team added to select holdings, including BNP Paribas and Banco Santander, that later significantly outperformed, as their balance sheets proved resilient, and their earnings benefited from a combination of rising interest rates and contained credit losses. Brazilian holdings XP and Itaú Unibanco also advanced strongly. On strength, the portfolio managers trimmed several holdings, including UBS Group and sold Mitsubishi UFJ Financial Group, redeploying the proceeds into other areas of the Portfolio. Despite these reductions, the Portfolio remained overweight in Financials. The portfolio managers believed holdings in the Financials sector have attractive risk/reward profiles due to their resilient balance sheets, improved profitability, attractive capital return and inexpensive valuations.
Consumer-related companies also contributed to the Portfolio’s relative return. This is an area of the market where the portfolio managers had previously not found much value due to relatively expensive valuations. However, a handful of companies that the portfolio managers have been monitoring finally became compelling. For example, in the Chemicals sector, the portfolio managers started a position in International Flavors and Fragrances (IFF), a global leader in selling flavors, scents and other key ingredients to food, beverage and consumer products companies. IFF operates in an attractive, consolidated and resilient market. Other consumer-related new purchases included the German apparel and footwear manufacturer Adidas, multinational food products company Danone and fast-food restaurant operator Yum China Holdings.
During the year, the Health Care sector had the largest negative impact on relative performance. The underperformance can be attributed to an overweight position relative to the Index and stock selection. Additionally, stock selection in other sectors, such as Consumer Discretionary, Industrials, Energy, and Information Technology also contributed to underperformance relative to the Index.
PORTFOLIO MANAGER OUTLOOK
The following forward-looking comments are the opinion of Dodge & Cox, the Portfolio’s sub-adviser.
84
International Equity Portfolio (unaudited)
Overall, we continue to be enthusiastic about the Portfolio, which is diversified by sector, geography and investment thesis. The opportunity set of attractive companies has broadened amongst the market volatility of the past two years. Our experienced investment team’s deep institutional knowledge of companies and industry dynamics enables us to unearth new opportunities and adjust the Portfolio’s positioning. The valuation gap between value stocks and growth stocks remains wide, international stocks are inexpensive relative to U.S. stocks and the valuation spread between stocks benefiting from, and those hindered by, low interest rates remains significant. We focus on finding individual companies with strong business fundamentals and attractive valuations. This combination provides a compelling foundation for long term returns.
Relative Performance
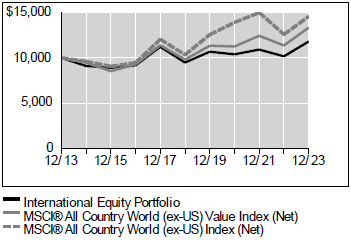
| | | | | | |
Average Annual Total Returns For Periods Ended December 31, 2023 |
| | | 1 Year | | 5 Years | | 10 Years |
International Equity Portfolio | | 16.09% | | 4.47% | | 1.68% |
MSCI® All Country World (ex-US) Value Index (Net) | | 17.30% | | 6.34% | | 2.92% |
MSCI® All Country World (ex-US) Index (Net) | | 15.62% | | 7.08% | | 3.83% |
The performance data quoted represents past performance. Past performance is historical and does not guarantee future performance. Investment return and principal value will fluctuate, so that shares, when redeemed, may be worth more or less than their original cost. Current performance may be lower or higher than the performance data quoted. For the most recent month-end performance information visit www.northwesternmutual.com.
This chart assumes an initial investment of $10,000 made on 12/31/13. Returns shown reflect fee waivers, deductions for management and other portfolio expenses, and reinvestment of all dividends. In the absence of fee waivers, total return would be reduced. Returns exclude deductions for separate account sale loads and account fees. Please refer to the Benchmark Definitions section of this report for information about the indices cited in the above chart and graph.
The Portfolio may invest a relatively high percentage of its assets in a particular sector. The Portfolio will have greater exposure to the risks associated with that sector and its performance will be tied more closely to the performance of the sector.
Top 10 Holdings 12/31/23
| | | | | | | | |
| | | | |
| | | Security Description | | % of Net Assets | | | | |
| | | | |
| | | BNP Paribas SA | | 3.5% | | | | |
| | | | |
| | | UBS Group AG | | 3.3% | | | | |
| | | | |
| | | Sanofi | | 3.3% | | | | |
| | | | |
| | | Banco Santander SA | | 3.2% | | | | |
| | | | |
| | | Novartis AG | | 3.2% | | | | |
| | | | |
| | | TotalEnergies SE | | 2.9% | | | | |
| | | | |
| | | GSK PLC | | 2.9% | | | | |
| | | | |
| | | Holcim, Ltd. | | 2.7% | | | | |
| | | | |
| | | Itau Unibanco Holding SA | | 2.6% | | | | |
| | | | |
| | | Axis Bank, Ltd. | | 2.4% | | | | |
Sector Allocation 12/31/23
| | | | | | | | |
| | | | |
| | | Sector | | % of Net Assets | | | | |
| | | | |
| | | Financials | | 25.9% | | | | |
| | | | |
| | | Health Care | | 14.4% | | | | |
| | | | |
| | | Materials | | 12.0% | | | | |
| | | | |
| | | Consumer Discretionary | | 11.5% | | | | |
| | | | |
| | | Energy | | 8.1% | | | | |
| | | | |
| | | Consumer Staples | | 7.7% | | | | |
| | | | |
| | | Industrials | | 6.6% | | | | |
| | | | |
| | | Information Technology | | 6.5% | | | | |
| | | | |
| | | Communication Services | | 3.3% | | | | |
| | | | |
| | | Short-Term Investments & Other Net Assets | | 1.9% | | | | |
| | | | |
| | | Real Estate | | 1.6% | | | | |
| | | | |
| | | Utilities | | 0.5% | | | | |
Sector Allocation and Top 10 Holdings are subject to change.
85
International Equity Portfolio
SCHEDULE OF INVESTMENTS
December 31, 2023
| | | | | | | | | | |
| Common Stocks (94.4%) | | Country | | Shares/Par + | | | Value
$ (000’s) | |
Communication Services (3.3%) | |
Baidu, Inc., ADR * | | China | | | 88,000 | | | | 10,480 | |
Deutsche Telekom AG | | Germany | | | 1,050,000 | | | | 25,215 | |
Grupo Televisa SAB, ADR | | Mexico | | | 1,850,000 | | | | 6,179 | |
Liberty Global, Ltd. - Class A * | | Belgium | | | 155,000 | | | | 2,754 | |
Liberty Global, Ltd. - Class C * | | Belgium | | | 327,000 | | | | 6,095 | |
Millicom International Cellular SA, SDR * | | Guatemala | | | 360,000 | | | | 6,452 | |
NetEase, Inc., ADR | | China | | | 60,000 | | | | 5,590 | |
| | | | | | | | | | |
Total | | | | | | | | | 62,765 | |
| | | | | | | | | | |
|
Consumer Discretionary (11.5%) | |
adidas AG | | Germany | | | 54,100 | | | | 11,001 | |
Alibaba Group Holding, Ltd., ADR | | China | | | 460,000 | | | | 35,655 | |
Booking Holdings, Inc. * | | United States | | | 7,000 | | | | 24,831 | |
Entain PLC | | United Kingdom | | | 1,950,337 | | | | 24,635 | |
Flutter Entertainment PLC * | | Australia | | | 20,000 | | | | 3,522 | |
Honda Motor Co., Ltd. | | Japan | | | 1,975,100 | | | | 20,416 | |
JD.com, Inc., ADR | | China | | | 665,000 | | | | 19,212 | |
Prosus NV | | China | | | 1,490,000 | | | | 44,427 | |
Stellantis NV | | United States | | | 1,225,000 | | | | 28,688 | |
Yum China Holdings, Inc. | | China | | | 96,051 | | | | 4,075 | |
| | | | | | | | | | |
Total | | | | | | | | | 216,462 | |
| | | | | | | | | | |
|
Consumer Staples (7.7%) | |
Anheuser-Busch InBev SA/NV | | Belgium | | | 545,000 | | | | 35,210 | |
Beiersdorf AG | | Germany | | | 95,000 | | | | 14,234 | |
Danone SA | | France | | | 270,000 | | | | 17,513 | |
Haleon PLC | | United States | | | 6,500,000 | | | | 26,612 | |
Imperial Brands PLC | | United Kingdom | | | 1,625,000 | | | | 37,342 | |
Seven & i Holdings Co., Ltd. | | Japan | | | 355,000 | | | | 14,060 | |
| | | | | | | | | | |
Total | | | | | | | | | 144,971 | |
| | | | | | | | | | |
|
Energy (8.1%) | |
Equinor ASA | | Norway | | | 530,000 | | | | 16,790 | |
Ovintiv, Inc. | | United States | | | 595,000 | | | | 26,133 | |
Suncor Energy, Inc. | | Canada | | | 1,135,000 | | | | 36,365 | |
TC Energy Corp. | | Canada | | | 475,000 | | | | 18,568 | |
TotalEnergies SE | | France | | | 810,000 | | | | 55,022 | |
| | | | | | | | | | |
Total | | | | | | | | | 152,878 | |
| | | | | | | | | | |
|
Financials (23.4%) | |
Aegon, Ltd. | | Netherlands | | | 2,150,000 | | | | 12,463 | |
Aviva PLC | | United Kingdom | | | 4,301,600 | | | | 23,793 | |
Axis Bank, Ltd. | | India | | | 3,359,299 | | | | 44,435 | |
Banco Santander SA | | Spain | | | 14,550,000 | | | | 60,738 | |
Barclays PLC | | United Kingdom | | | 22,350,000 | | | | 43,533 | |
BNP Paribas SA | | France | | | 945,000 | | | | 65,476 | |
Credicorp, Ltd. | | Peru | | | 140,000 | | | | 20,990 | |
HDFC Bank, Ltd. | | India | | | 438,000 | | | | 8,985 | |
ICICI Bank, Ltd. | | India | | | 1,553,822 | | | | 18,583 | |
Prudential PLC | | Hong Kong | | | 1,905,000 | | | | 21,445 | |
Standard Chartered PLC | | United Kingdom | | | 4,411,996 | | | | 37,321 | |
UBS Group AG | | Switzerland | | | 1,983,312 | | | | 61,599 | |
| | | | | | | | | | | | |
| Common Stocks (94.4%) | | Country | | | Shares/Par + | | | Value
$ (000’s) | |
Financials continued | | | | | | | | | | | | |
XP, Inc. - Class A | | | Brazil | | | | 730,000 | | | | 19,031 | |
| | | | | | | | | | | | |
Total | | | | | | | | | | | 438,392 | |
| | | | | | | | | | | | |
|
Health Care (14.4%) | |
Bayer AG | | | Germany | | | | 562,680 | | | | 20,889 | |
Fresenius Medical Care AG | | | Germany | | | | 515,200 | | | | 21,544 | |
GSK PLC | | | United States | | | | 2,920,000 | | | | 53,936 | |
Novartis AG | | | Switzerland | | | | 585,000 | | | | 59,067 | |
Olympus Corp. | | | Japan | | | | 835,000 | | | | 12,050 | |
Roche Holding AG | | | United States | | | | 141,500 | | | | 41,011 | |
Sanofi | | | United States | | | | 620,000 | | | | 61,468 | |
| | | | | | | | | | | | |
Total | | | | | | | | | | | 269,965 | |
| | | | | | | | | | | | |
|
Industrials (6.6%) | |
Johnson Controls International PLC | | | United States | | | | 770,000 | | | | 44,383 | |
Mitsubishi Electric Corp. | | | Japan | | | | 2,675,000 | | | | 37,762 | |
Nidec Corp. | | | Japan | | | | 160,000 | | | | 6,520 | |
Schneider Electric SE | | | United States | | | | 85,000 | | | | 17,115 | |
Smiths Group PLC | | | United Kingdom | | | | 790,000 | | | | 17,727 | |
| | | | | | | | | | | | |
Total | | | | | | | | | | | 123,507 | |
| | | | | | | | | | | | |
|
Information Technology (5.3%) | |
Brother Industries, Ltd. | | | Japan | | | | 385,000 | | | | 6,129 | |
Infineon Technologies AG | | | Germany | | | | 140,000 | | | | 5,839 | |
Kyocera Corp. | | | Japan | | | | 1,020,000 | | | | 14,826 | |
Murata Manufacturing Co., Ltd. | | | Japan | | | | 855,000 | | | | 18,057 | |
Samsung Electronics Co., Ltd. | | | South Korea | | | | 40,000 | | | | 2,433 | |
Taiwan Semiconductor Manufacturing Co., Ltd. | | | Taiwan | | | | 1,550,000 | | | | 29,830 | |
TE Connectivity, Ltd. | | | United States | | | | 155,000 | | | | 21,778 | |
| | | | | | | | | | | | |
Total | | | | | | | | | | | 98,892 | |
| | | | | | | | | | | | |
|
Materials (12.0%) | |
Akzo Nobel NV | | | Netherlands | | | | 460,000 | | | | 38,008 | |
Glencore PLC | | | Australia | | | | 4,800,000 | | | | 28,796 | |
Holcim, Ltd. * | | | United States | | | | 640,000 | | | | 50,258 | |
International Flavors & Fragrances, Inc. | | | United States | | | | 205,000 | | | | 16,599 | |
Linde PLC | | | United States | | | | 49,000 | | | | 20,125 | |
Mitsubishi Chemical Group Corp. | | | Japan | | | | 4,700,000 | | | | 28,720 | |
Nutrien, Ltd. | | | Canada | | | | 325,000 | | | | 18,307 | |
Teck Resources, Ltd. - Class B | | | Canada | | | | 560,000 | | | | 23,671 | |
| | | | | | | | | | | | |
Total | | | | | | | | | | | 224,484 | |
| | | | | | | | | | | | |
The Accompanying Notes are an Integral Part of the Financial Statements.
86
International Equity Portfolio
| | | | | | | | | | | | |
| Common Stocks (94.4%) | | Country | | | Shares/Par + | | | Value
$ (000’s) | |
Real Estate (1.6%) | | | | | | | | | | | | |
CK Asset Holdings, Ltd. | | | Hong Kong | | | | 2,435,500 | | | | 12,179 | |
Daito Trust Construction Co., Ltd. | | | Japan | | | | 110,000 | | | | 12,733 | |
Hang Lung Group, Ltd. | | | Hong Kong | | | | 3,500,000 | | | | 4,774 | |
| | | | | | | | | | | | |
Total | | | | | | | | | | | 29,686 | |
| | | | | | | | | | | | |
| | | |
Utilities (0.5%) | | | | | | | | | | | | |
Engie SA * | | | France | | | | 525,000 | | | | 9,232 | |
| | | | | | | | | | | | |
Total | | | | | | | | | | | 9,232 | |
| | | | | | | | | | | | |
| |
Total Common Stocks (Cost: $1,762,635) | | | | 1,771,234 | |
| | | | | | | | | | | | |
| | | | | | | | | | | | |
| Preferred Stocks (3.7%) | | Country | | | Shares/Par + | | | Value
$ (000’s) | |
Financials (2.5%) | | | | | | | | | | | | |
Itau Unibanco Holding SA | | | Brazil | | | | 6,870,000 | | | | 47,771 | |
| | | | | | | | | | | | |
Total | | | | | | | | | | | 47,771 | |
| | | | | | | | | | | | |
Information Technology (1.2%) | |
Samsung Electronics Co., Ltd.South Korea | | | | | | | 460,000 | | | | 22,182 | |
| | | | | | | | | | | | |
Total | | | | | | | | | | | 22,182 | |
| | | | | | | | | | | | |
| |
Total Preferred Stocks (Cost: $54,133) | | | | 69,953 | |
| | | | | | | | | | | | |
| |
Total Investments (98.1%) (Cost: $1,816,768)@ | | | | 1,841,187 | |
| | | | | | | | | | | | |
| |
Other Assets, Less Liabilities (1.9%) | | | | 36,088 | |
| | | | | | | | | | | | |
| | | |
Net Assets (100.0%) | | | | | | | | | | | 1,877,275 | |
| | | | | | | | | | | | |
| | | | |
Investments by Country of Risk as a Percentage of Net Assets: | | | | |
United States | | | 23.2% | |
United Kingdom | | | 9.8% | |
Japan | | | 9.1% | |
France | | | 7.8% | |
China | | | 6.4% | |
Switzerland | | | 6.4% | |
Germany | | | 5.3% | |
Canada | | | 5.2% | |
Other | | | 24.9% | |
| | | | |
Total | | | 98.1% | |
| | | | |
Over the Counter Derivatives
Forward Foreign Currency Contracts
| | | | | | | | | | | | | | | | | | | | | | | | | | |
| Type | | Counterparty | | Currency | | Foreign Principal
Amount Covered by
Contract (000s) | | | USD Principal
Amount
Covered by
Contract (000’s) | | | Settlement
Date | | Unrealized
Appreciation
(000’s) | | | Unrealized (Depreciation)
(000’s) | | | Net
Unrealized Appreciation/
(Depreciation)
(000’s) | |
Sell | | Bank of America NA | | CNH | | | 18,654 | | | | 2,619 | | | 1/10/24 | | $ | 162 | | | $ | — | | | $ | 162 | |
Sell | | HSBC Bank USA | | CNH | | | 37,299 | | | | 5,238 | | | 1/10/24 | | | 334 | | | | — | | | | 334 | |
Sell | | JP Morgan Chase Bank NA | | CNH | | | 55,947 | | | | 7,856 | | | 1/10/24 | | | 497 | | | | — | | | | 497 | |
Sell | | Bank of America NA | | CNH | | | 1,325 | | | | 186 | | | 2/7/24 | | | 13 | | | | — | | | | 13 | |
Sell | | Goldman Sachs Bank USA | | CNH | | | 1,325 | | | | 186 | | | 2/7/24 | | | 13 | | | | — | | | | 13 | |
Sell | | HSBC Bank USA | | CNH | | | 12,011 | | | | 1,689 | | | 2/7/24 | | | 15 | | | | — | | | | 15 | |
Sell | | JP Morgan Chase Bank NA | | CNH | | | 1,325 | | | | 186 | | | 2/7/24 | | | 13 | | | | — | | | | 13 | |
Sell | | Barclays Bank PLC | | CNH | | | 3,663 | | | | 517 | | | 3/13/24 | | | 6 | | | | — | | | | 6 | |
Sell | | HSBC Bank USA | | CNH | | | 106,490 | | | | 15,017 | | | 3/13/24 | | | 70 | | | | — | | | | 70 | |
Sell | | UBS AG | | CNH | | | 14,385 | | | | 2,029 | | | 3/13/24 | | | 9 | | | | — | | | | 9 | |
Sell | | Citibank NA | | CNH | | | 10,735 | | | | 1,518 | | | 4/17/24 | | | 14 | | | | — | | | | 14 | |
Sell | | HSBC Bank USA | | CNH | | | 4,539 | | | | 642 | | | 4/17/24 | | | 34 | | | | — | | | | 34 | |
Sell | | JP Morgan Chase Bank NA | | CNH | | | 65,626 | | | | 9,277 | | | 4/17/24 | | | 38 | | | | — | | | | 38 | |
Sell | | UBS AG | | CNH | | | 21,470 | | | | 3,036 | | | 4/17/24 | | | 29 | | | | — | | | | 29 | |
Sell | | Bank of America NA | | CNH | | | 11,718 | | | | 1,660 | | | 5/22/24 | | | 10 | | | | — | | | | 10 | |
Sell | | Barclays Bank PLC | | CNH | | | 11,718 | | | | 1,660 | | | 5/22/24 | | | 11 | | | | — | | | | 11 | |
Sell | | Citibank NA | | CNH | | | 11,718 | | | | 1,660 | | | 5/22/24 | | | 14 | | | | — | | | | 14 | |
Sell | | JP Morgan Chase Bank NA | | CNH | | | 11,718 | | | | 1,660 | | | 5/22/24 | | | 12 | | | | — | | | | 12 | |
Sell | | UBS AG | | CNH | | | 7,700 | | | | 1,091 | | | 5/22/24 | | | — | | | | (21 | ) | | | (21) | |
Sell | | Bank of America NA | | CNH | | | 51,413 | | | | 7,293 | | | 6/5/24 | | | 33 | | | | — | | | | 33 | |
Sell | | HSBC Bank USA | | CNH | | | 7,768 | | | | 1,102 | | | 6/5/24 | | | — | | | | (19 | ) | | | (19) | |
Sell | | UBS AG | | CNH | | | 9,090 | | | | 1,295 | | | 8/14/24 | | | — | | | | (10 | ) | | | (10) | |
Sell | | Bank of America NA | | CNH | | | 8,151 | | | | 1,163 | | | 9/12/24 | | | — | | | | (21 | ) | | | (21) | |
Sell | | HSBC Bank USA | | CNH | | | 24,454 | | | | 3,489 | | | 9/12/24 | | | — | | | | (63 | ) | | | (63) | |
The Accompanying Notes are an Integral Part of the Financial Statements.
87
International Equity Portfolio
Forward Foreign Currency Contracts
(continued)
| | | | | | | | | | | | | | | | | | | | | | | | | | | | | | |
| Type | | Counterparty | | Currency | | | Foreign Principal
Amount Covered by
Contract (000s) | | | USD Principal
Amount
Covered by
Contract (000’s) | | | Settlement
Date | | | Unrealized
Appreciation
(000’s) | | | Unrealized (Depreciation)
(000’s) | | | Net
Unrealized Appreciation/
(Depreciation)
(000’s) | |
Sell | | JP Morgan Chase Bank NA | | | CNH | | | | 9,090 | | | | 1,297 | | | | 9/12/24 | | | $ | — | | | $ | (9 | ) | | $ | (9) | |
Sell | | HSBC Bank USA | | | CNH | | | | 18,325 | | | | 2,621 | | | | 10/17/24 | | | | — | | | | (32 | ) | | | (32) | |
Sell | | UBS AG | | | CNH | | | | 9,235 | | | | 1,321 | | | | 10/17/24 | | | | — | | | | (23 | ) | | | (23) | |
Sell | | HSBC Bank USA | | | CNH | | | | 33,638 | | | | 4,816 | | | | 11/7/24 | | | | — | | | | (74 | ) | | | (74) | |
Sell | | UBS AG | | | CNH | | | | 21,772 | | | | 3,117 | | | | 11/7/24 | | | | — | | | | (47 | ) | | | (47) | |
Sell | | HSBC Bank USA | | | CNH | | | | 24,260 | | | | 3,478 | | | | 12/5/24 | | | | 7 | | | | — | | | | 7 | |
Sell | | JP Morgan Chase Bank NA | | | CNH | | | | 12,130 | | | | 1,739 | | | | 12/5/24 | | | | 4 | | | | — | | | | 4 | |
Sell | | UBS AG | | | CNH | | | | 24,260 | | | | 3,478 | | | | 12/5/24 | | | | 7 | | | | — | | | | 7 | |
Sell | | State Street Bank And Trust Company | | | CNY | | | | 6,354 | | | | 916 | | | | 8/14/24 | | | | — | | | | (27 | ) | | | (27) | |
| | | | | | | | | | | | | | | | | | | | | | |
| | | | | | | | | | | | | | | | | | | | $ | 1,345 | | | $ | (346 | ) | | $ | 999 | |
| | | | | | | | | | | | | | | | | | | | | | |
| | | | | | | | | | | | | | | | | | | | | | | | | | | | |
| | | Financial Derivative Assets (000’s) | | | Financial Derivative Liabilities (000’s) | |
| | | Forward
Foreign
Currency
Contracts | | | Swaps | | | Total | | | Forward
Foreign
Currency
Contracts | | | Options | | | Swaps | | | Total | |
Total Over the Counter Derivatives | | $ | 1,345 | | | | — | | | $ | 1,345 | | | $ | (346) | | | | — | | | | — | | | $ | (346) | |
| + | All par is stated in U.S. Dollar unless otherwise noted. |
| @ | At December 31, 2023, the aggregate cost of investments, including derivatives, for federal tax purposes (in thousands) was $1,826,909 and the net unrealized appreciation of investments based on that cost was $15,277 which is comprised of $214,884 aggregate gross unrealized appreciation and $199,607 aggregate gross unrealized depreciation. |
The Accompanying Notes are an Integral Part of the Financial Statements.
88
International Equity Portfolio
The following is a summary of the inputs used in valuing the Portfolio’s Investments at December 31, 2023. See Note 3 for additional information on portfolio valuation.
| | | | | | | | | | | | | | |
| | | | | Valuation Inputs | |
| Description | | | | Level 1 - Quoted
Prices | | | Level 2 - Other
Significant
Observable Inputs | | | Level 3 -
Significant
Unobservable
Inputs | |
| | | | | (Amounts in thousands) | |
Assets: | | | | | | | | | | | | | | |
Preferred Stocks | | | | $ | — | | | $ | 69,953 | | | $ | — | |
Common Stocks | | | | | | | | | | | | | | |
Communication Services | | | | | 31,098 | | | | 31,667 | | | | — | |
Consumer Discretionary | | | | | 83,773 | | | | 132,689 | | | | — | |
Energy | | | | | 81,066 | | | | 71,812 | | | | — | |
Financials | | | | | 40,021 | | | | 398,371 | | | | — | |
Industrials | | | | | 44,383 | | | | 79,124 | | | | — | |
Information Technology | | | | | 21,778 | | | | 77,114 | | | | — | |
Materials | | | | | 78,702 | | | | 145,782 | | | | — | |
All Others | | | | | — | | | | 453,854 | | | | — | |
Other Financial Instruments^ | | | | | | | | | | | | | | |
Forward Foreign Currency Contracts | | | | | — | | | | 1,345 | | | | — | |
| | | | | | |
Total Assets: | | | | $ | 380,821 | | | $ | 1,461,711 | | | $ | — | |
| | | | | | |
Liabilities: | | | | | | | | | | | | | | |
Other Financial Instruments^ | | | | | | | | | | | | | | |
Forward Foreign Currency Contracts | | | | | — | | | | (346 | ) | | | — | |
| | | | | | |
Total Liabilities: | | | | $ | — | | | $ | (346 | ) | | $ | — | |
| | | | | | |
^ Other financial instruments are derivative instruments such as futures and forward foreign currency contracts, which are valued at the unrealized appreciation (depreciation) on the instrument, and securities sold short, reverse repurchase agreements, written options and swaps contracts, which are valued at market value.
The Accompanying Notes are an Integral Part of the Financial Statements.
89
Emerging Markets Equity Portfolio (unaudited)
| | | | |
| Objective: | | Portfolio Strategy: | | Net Assets: |
| Capital Appreciation. | | Invest in equity securities of issuers that are tied economically to emerging market countries. | | $922 million |
PORTFOLIO OVERVIEW
Mason Street Advisors, LLC (“Mason Street Advisors”), the investment adviser for the Emerging Markets Equity Portfolio (“the Portfolio”), has engaged abrdn Investments Limited (“abrdn”) to act as sub-adviser for the Portfolio. The Portfolio normally invests in equity securities of issuers that are tied economically to emerging market countries. Emerging market countries include countries determined by the Portfolio’s portfolio managers to have emerging market economies, taking into account a number of factors, such as the country’s credit rating, its political and economic stability and the development of its financial and capital markets. The Portfolio may invest in companies of any size. The Portfolio employs a fundamental “bottom up” equity investment style, which is characterized by intensive, first-hand research and disciplined company evaluation. Investments are identified for their long-term, fundamental value.
MARKET OVERVIEW
Emerging markets advanced for 2023 despite an extremely challenging year, although they lagged developed markets. Sentiment was driven largely by interest rate expectations and China’s economic outlook. Successive interest rate hikes from the U.S. Federal Reserve (the “Fed”) to tame U.S. inflation initially led to recession fears. However, as the year progressed, markets turned hopeful that interest rates might be nearing a peak, and the U.S. economy was on track for a soft landing.
Meanwhile, optimism surrounding China’s post-Coronavirus pandemic reopening weakened as economic data missed the market’s high expectations. Chinese authorities enacted proactive policies to help the economy, particularly the troubled property sector. However, despite suggestions of a prolonged economic recovery, which emerged as the measures began to affect the economy, investors continue to wait for a more sustainable and meaningful rebound. Chinese stocks ended the year as notable laggards, even as all other major emerging markets advanced.
PORTFOLIO RESULTS
The Portfolio returned 6.91% for the twelve months ended December 31, 2023. By comparison, the Portfolio’s benchmark, the MSCI® Emerging Markets Index (the “Index”) returned 9.83%. (This Index is unmanaged, cannot be invested in directly and does not incur expenses.)
The major detractor from the Portfolio’s relative returns was China, including the off-benchmark position in Hong Kong. The Portfolio’s domestic consumption-focused companies declined despite solid fundamentals, as investors rotated into large state-owned enterprises and value oriented companies. Sluggish sales in Hainan weighed on China Tourism Group Duty Free, while luxury car dealer Zhongsheng Group faced pressure from weak consumer sentiment and lackluster car sales. WuXi Biologics shares declined toward the end of 2023, as the company lowered its guidance due to soft biotechnology funding prospects and project delays. The Portfolio’s Hong Kong-listed holdings also detracted despite posting resilient quarterly earnings, as weak investor sentiment carried over from the general Chinese market.
South African miner Anglo American Platinum also detracted from the Portfolio’s relative performance due to the decline in spot prices for the platinum group of metals it produces. However, its share price rebounded in the fourth quarter of 2023 on improving sentiment for precious metals, in particular platinum and palladium.
On the upside, stock selection in Brazil and Mexico contributed to the Portfolio’s relative performance, as holdings there were supported by positive market sentiment on the back of encouraging economic indicators and domestic consumption strength, as well as growing expectations that global interest rates were nearing their peak. Mexico further benefitted from nearshoring trends due to a global effort by companies to diversify their supply chains and reduce reliance on China. Mexican conglomerate Fomento Economico Mexicano (FEMSA) and lender Grupo Financiero Banorte rallied, while Latin American e-commerce company MercadoLibre advanced on strong domestic consumption trends and competitive strength.
Semiconductor-related holdings in ASM, ASML Holding and Taiwan Semiconductor Manufacturing Company also contributed, advancing amid an artificial intelligence-driven tech rally and expectations of a broader technology recovery as the year progressed, particularly in the memory sector.
90
Emerging Markets Equity Portfolio (unaudited)
Other major stock contributors included India’s UltraTech Cement, which was buoyed by the ongoing public sector push for infrastructure development, and Power Grid Corporation of India, which outperformed on positive market sentiment.
PORTFOLIO MANAGER OUTLOOK
The following forward-looking comments are the opinion of abrdn, the Portfolio’s sub-adviser.
The outlook for emerging markets remains encouraging. With inflation near target levels in many parts of emerging markets, we are at the early stages of a monetary easing cycle — ahead of the Fed, which is widely expected to start cutting rates in 2024. China’s gradual consumption recovery is still underway, and the government remains committed to supporting growth through widespread policy support. Meanwhile, India continues to be an emerging star, underpinned by a robust domestic economy.
Emerging market valuations remain undemanding, both relative to history and versus the U.S. Our companies are, on the whole, delivering results, which we believe will be rewarded by the market. We expect our more domestic oriented positions in China, which weighed on performance in 2023, to do better as the economy stabilises and recovers. We remain focused on businesses with quality characteristics, including sustainable free cash flow generation and earnings growth, pricing power and low debt levels.
Relative Performance
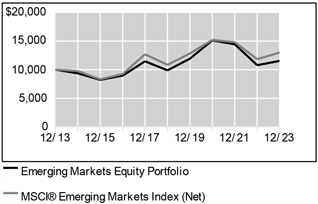
| | | | | | |
Average Annual Total Returns For Periods Ended December 31, 2023 |
| | | 1 Year | | 5 Years | | 10 Years |
Emerging Markets Equity Portfolio | | 6.91% | | 3.13% | | 1.44% |
MSCI® Emerging Markets Index (Net) | | 9.83% | | 3.68% | | 2.66% |
The performance data quoted represents past performance. Past performance is historical and does not guarantee future performance. Investment return and principal value will fluctuate, so that shares, when redeemed, may be worth more or less than their original cost. Current performance may be lower or higher than the performance data quoted. For the most recent month-end performance information visit www.northwesternmutual.com.
This chart assumes an initial investment of $10,000 made on 12/31/13. Returns shown reflect fee waivers, deductions for management and other portfolio expenses, and reinvestment of all dividends. In the absence of fee waivers, total return would be reduced. Returns exclude
deductions for separate account sale loads and account fees. Please refer to the Benchmark Definitions section of this report for information about the indices cited in the above chart and graph.
The Portfolio may invest a relatively high percentage of its assets in a particular sector. The Portfolio will have greater exposure to the risks associated with that sector and its performance will be tied more closely to the performance of the sector.
Top 10 Holdings 12/31/23
| | | | | | | | |
| | | | |
| | | Security Description | | % of Net Assets | | | | |
| | | | |
| | | Taiwan Semiconductor Manufacturing Co., Ltd. | | 9.4% | | | | |
| | | | |
| | | Samsung Electronics Co., Ltd., Various | | 7.1% | | | | |
| | | | |
| | | Tencent Holdings, Ltd. | | 5.5% | | | | |
| | | | |
| | | HDFC Bank, Ltd. | | 4.0% | | | | |
| | | | |
| | | Alibaba Group Holding, Ltd. | | 4.0% | | | | |
| | | | |
| | | SBI Life Insurance Co., Ltd. | | 2.6% | | | | |
| | | | |
| | | AIA Group, Ltd. | | 2.2% | | | | |
| | | | |
| | | Power Grid Corp. of India, Ltd. | | 2.2% | | | | |
| | | | |
| | | Fomento Economico Mexicano SAB de CV, ADR | | 1.9% | | | | |
| | | | |
| | | TotalEnergies SE | | 1.9% | | | | |
91
Emerging Markets Equity Portfolio (unaudited)
Sector Allocation 12/31/23
| | | | | | | | |
| | | | |
| | | Sector | | % of Net Assets | | | | |
| | | | |
| | | Information Technology | | 26.4% | | | | |
| | | | |
| | | Financials | | 24.4% | | | | |
| | | | |
| | | Consumer Discretionary | | 11.2% | | | | |
| | | | |
| | | Consumer Staples | | 7.9% | | | | |
| | | | |
| | | Materials | | 6.9% | | | | |
| | | | |
| | | Communication Services | | 6.5% | | | | |
| | | | |
| | | Industrials | | 6.1% | | | | |
| | | | |
| | | Energy | | 3.6% | | | | |
| | | | |
| | | Health Care | | 2.3% | | | | |
| | | | |
| | | Utilities | | 2.2% | | | | |
| | | | |
| | | Short-Term Investments & Other Net Assets | | 1.3% | | | | |
| | | | |
| | | Real Estate | | 1.2% | | | | |
Sector Allocation and Top 10 Holdings are subject to change.
92
Emerging Markets Equity Portfolio
SCHEDULE OF INVESTMENTS
December 31, 2023
| | | | | | | | | | |
| Common Stocks (93.6%) | | Country | | Shares/ Par + | | | Value
$ (000’s) | |
Communication Services (6.5%) | | | | | |
Telkom Indonesia Persero Tbk PT | | Indonesia | | | 36,276,100 | | | | 9,311 | |
Tencent Holdings, Ltd. | | China | | | 1,337,100 | | | | 50,517 | |
| | | | | | | | | | |
Total | | | | | | | | | 59,828 | |
| | | | | | | | | | |
| |
Consumer Discretionary (11.2%) | | | | | |
Alibaba Group Holding, Ltd. | | China | | | 3,807,500 | | | | 36,797 | |
Americana Restaurants International PLC | | United Arab Emirates | | | 7,774,929 | | | | 6,652 | |
ANTA Sports Products, Ltd. | | China | | | 515,600 | | | | 5,025 | |
China Tourism Group Duty Free Corp., Ltd. - Class H | | China | | | 383,100 | | | | 3,755 | |
China Tourism Group Duty Free Corp., Ltd. - Class A | | China | | | 317,586 | | | | 3,739 | |
Li Auto, Inc. - Class A * | | China | | | 477,600 | | | | 8,947 | |
Maruti Suzuki India, Ltd. | | India | | | 81,998 | | | | 10,144 | |
MercadoLibre, Inc. * | | Brazil | | | 6,664 | | | | 10,473 | |
Midea Group Co., Ltd. - Class A | | China | | | 1,758,866 | | | | 13,543 | |
Zhongsheng Group Holdings, Ltd. | | China | | | 1,814,000 | | | | 4,375 | |
| | | | | | | | | | |
Total | | | | | | | | | 103,450 | |
| | | | | | | | | | |
| |
Consumer Staples (7.9%) | | | | | |
Budweiser Brewing Co. APAC, Ltd. | | China | | | 3,315,500 | | | | 6,190 | |
Fomento Economico Mexicano SAB de CV, ADR | | Mexico | | | 135,521 | | | | 17,665 | |
Hindustan Unilever, Ltd. | | India | | | 479,301 | | | | 15,333 | |
Kweichow Moutai Co., Ltd. - Class A | | China | | | 70,673 | | | | 17,167 | |
Raia Drogasil SA | | Brazil | | | 2,711,651 | | | | 16,367 | |
| | | | | | | | | | |
Total | | | | | | | | | 72,722 | |
| | | | | | | | | | |
| |
Energy (3.6%) | | | | | |
LUKOIL PJSC *,Æ | | Russia | | | 225,143 | | | | – | |
NovaTek PJSC *,Æ | | Russia | | | 795,201 | | | | – | |
PRIO SA | | Brazil | | | 855,203 | | | | 8,079 | |
Saudi Arabian Oil Co. | | Saudi Arabia | | | 871,178 | | | | 7,679 | |
TotalEnergies SE | | France | | | 259,493 | | | | 17,627 | |
| | | | | | | | | | |
Total | | | | | | | | | 33,385 | |
| | | | | | | | | | |
| |
Financials (24.4%) | | | | | |
AIA Group, Ltd. | | Hong Kong | | | 2,356,600 | | | | 20,468 | |
Al Rajhi Bank | | Saudi Arabia | | | 654,593 | | | | 15,177 | |
B3 SA - Brasil, Bolsa, Balcao | | Brazil | | | 4,349,566 | | | | 12,935 | |
Bank Negara Indonesia Persero Tbk PT | | Indonesia | | | 27,331,700 | | | | 9,525 | |
Bank Rakyat Indonesia Persero Tbk PT | | Indonesia | | | 46,581,356 | | | | 17,270 | |
Cholamandalam Investment and Finance Co., Ltd. | | India | | | 265,162 | | | | 4,009 | |
Credicorp, Ltd. | | Peru | | | 38,913 | | | | 5,834 | |
Grupo Financiero Banorte SAB de CV | | Mexico | | | 1,624,351 | | | | 16,334 | |
| | | | | | | | | | |
| Common Stocks (93.6%) | | Country | | Shares/ Par + | | | Value
$ (000’s) | |
Financials continued | | | | | |
HDFC Bank, Ltd. | | India | | | 1,798,676 | | | | 36,899 | |
Hong Kong Exchanges & Clearing, Ltd. | | Hong Kong | | | 251,492 | | | | 8,605 | |
Itausa SA - Preference Shares | | Brazil | | | 6,852,808 | | | | 14,567 | |
Kaspi.KZ Joint Stock Co. | | Kazakhstan | | | 139,880 | | | | 12,869 | |
Kotak Mahindra Bank, Ltd. | | India | | | 645,745 | | | | 14,796 | |
Sanlam, Ltd. | | South Africa | | | 2,866,116 | | | | 11,413 | |
Sberbank of Russia PJSC *,Æ | | Russia | | | 1,471,064 | | | | – | |
SBI Life Insurance Co., Ltd. | | India | | | 1,391,054 | | | | 23,938 | |
| | | | | | | | | | |
Total | | | | | | | | | 224,639 | |
| | | | | | | | | | |
| |
Health Care (2.3%) | | | | | |
Shenzhen Mindray Bio- Medical Electronics Co., Ltd. | | China | | | 350,215 | | | | 14,372 | |
Wuxi Biologics Cayman, Inc. * | | China | | | 1,793,500 | | | | 6,775 | |
| | | | | | | | | | |
Total | | | | | | | | | 21,147 | |
| | | | | | | | | | |
| |
Industrials (6.1%) | | | | | |
Grupo Aeroportuario del Sureste SAB de CV - Class B | | Mexico | | | 318,330 | | | | 9,325 | |
HD Korea Shipbuilding & Offshore Engineering Co., Ltd. * | | South Korea | | | 102,970 | | | | 9,637 | |
NARI Technology Co., Ltd. - Class A | | China | | | 3,297,898 | | | | 10,403 | |
Samsung Engineering Co., Ltd. * | | South Korea | | | 592,172 | | | | 13,282 | |
Sociedad Quimica y Minera de Chile SA | | Chile | | | 78,669 | | | | 4,737 | |
Sungrow Power Supply Co., Ltd. - Class A | | China | | | 731,000 | | | | 9,013 | |
| | | | | | | | | | |
Total | | | | | | | | | 56,397 | |
| | | | | | | | | | |
| |
Information Technology (21.3%) | | | | | |
Accton Technology Corp. | | Taiwan | | | 623,000 | | | | 10,556 | |
ASM International NV | | Netherlands | | | 23,927 | | | | 12,460 | |
ASML Holding NV | | Netherlands | | | 11,763 | | | | 8,881 | |
Delta Electronics, Inc. | | Taiwan | | | 927,000 | | | | 9,441 | |
Globant SA * | | United States | | | 43,141 | | | | 10,267 | |
Hon Hai Precision Industry Co., Ltd. | | Taiwan | | | 2,686,000 | | | | 9,136 | |
MediaTek, Inc. | | Taiwan | | | 506,000 | | | | 16,665 | |
Samsung Electronics Co., Ltd. | | South Korea | | | 304,844 | | | | 18,541 | |
Taiwan Semiconductor Manufacturing Co., Ltd. | | Taiwan | | | 4,503,290 | | | | 86,668 | |
Tata Consultancy Services, Ltd. | | India | | | 307,320 | | | | 13,993 | |
| | | | | | | | | | |
Total | | | | | | | | | 196,608 | |
| | | | | | | | | | |
| |
Materials (6.9%) | | | | | |
Anglo American Platinum, Ltd. | | South Africa | | | 156,276 | | | | 8,216 | |
LG Chem, Ltd. * | | South Korea | | | 39,028 | | | | 15,033 | |
Mondi PLC | | Austria | | | 454,850 | | | | 9,028 | |
The Accompanying Notes are an Integral Part of the Financial Statements.
93
Emerging Markets Equity Portfolio
| | | | | | | | | | |
| Common Stocks (93.6%) | | Country | | Shares/ Par + | | | Value
$ (000’s) | |
Materials continued | | | | | |
Southern Copper Corp. | | Mexico | | | 177,916 | | | | 15,313 | |
UltraTech Cement, Ltd. | | India | | | 129,963 | | | | 16,392 | |
| | | | | | | | | | |
Total | | | | | | | | | 63,982 | |
| | | | | | | �� | | | |
| |
Real Estate (1.2%) | | | | | |
China Resources Land, Ltd. | | China | | | 2,934,000 | | | | 10,585 | |
| | | | | | | | | | |
Total | | | | | | | | | 10,585 | |
| | | | | | | | | | |
| |
Utilities (2.2%) | | | | | |
Power Grid Corp. of India, Ltd. | | India | | | 7,083,013 | | | | 20,164 | |
| | | | | | | | | | |
Total | | | | | | | | | 20,164 | |
| | | | | | | | | | |
| |
Total Common Stocks (Cost: $835,274) | | | | 862,907 | |
| | | | | | | | | | |
| | | | | | | | | | |
| Preferred Stocks (5.1%) | | Country | | Shares/ Par + | | | Value
$ (000’s) | |
Information Technology (5.1%) | | | | | |
Samsung Electronics Co., Ltd. | | South Korea | | | 977,245 | | | | 47,125 | |
| | | | | | | | | | |
Total | | | | | | | | | 47,125 | |
| | | | | | | | | | |
| |
Total Preferred Stocks (Cost: $39,073) | | | | 47,125 | |
| | | | | | | | | | |
| |
Total Investments (98.7%) (Cost: $874,347)@ | | | | 910,032 | |
| | | | | | | | | | |
| |
Other Assets, Less Liabilities (1.3%) | | | | 11,785 | |
| | | | | | | | | | |
| | | |
Net Assets (100.0%) | | | | | | | | | 921,817 | |
| | | | | | | | | | |
| | | | |
Investments by Country of Risk as a Percentage of Net Assets: | | | | |
China | | | 21.9% | |
India | | | 16.9% | |
Taiwan | | | 14.3% | |
South Korea | | | 11.2% | |
Brazil | | | 6.8% | |
Mexico | | | 6.3% | |
Other | | | 21.3% | |
| | | | |
Total | | | 98.7% | |
| | | | |
| + | All par is stated in U.S. Dollar unless otherwise noted. |
| Æ | Security valued using significant unobservable inputs. |
| @ | At December 31, 2023, the aggregate cost of investments, including derivatives, for federal tax purposes (in thousands) was $882,867 and the net unrealized appreciation of investments based on that cost was $27,165 which is comprised of $173,524 aggregate gross unrealized appreciation and $146,359 aggregate gross unrealized depreciation. |
The Accompanying Notes are an Integral Part of the Financial Statements.
94
Emerging Markets Equity Portfolio
The following is a summary of the inputs used in valuing the Portfolio’s Investments at December 31, 2023. See Note 3 for additional information on portfolio valuation.
| | | | | | | | | | | | | | |
| | | | | Valuation Inputs | |
| Description | | | | Level 1 - Quoted Prices | | | Level 2 - Other Significant Observable Inputs | | | Level 3 - Significant Unobservable Inputs | |
| | | | | (Amounts in thousands) | |
Assets: | | | | | | | | | | | | | | |
Preferred Stocks | | | | $ | — | | | $ | 47,125 | | | $ | — | |
Common Stocks | | | | | | | | | | | | | | |
Consumer Discretionary | | | | | 10,473 | | | | 92,977 | | | | — | |
Consumer Staples | | | | | 17,665 | | | | 55,057 | | | | — | |
Energy | | | | | — | | | | 33,385 | | | | — | |
Financials | | | | | 35,037 | | | | 189,602 | | | | — | |
Industrials | | | | | 14,062 | | | | 42,335 | | | | — | |
Information Technology | | | | | 10,267 | | | | 186,341 | | | | — | |
Materials | | | | | 15,313 | | | | 48,669 | | | | — | |
All Others | | | | | — | | | | 111,724 | | | | — | |
| | | | | | |
Total Assets: | | | | $ | 102,817 | | | $ | 807,215 | | | $ | — | |
| | | | | | |
Management has determined that the amount of Level 3 securities compared to total net assets is not material; therefore, the reconciliation of Level 3 securities and assumptions is not shown for the period ended December 31, 2023.
The Accompanying Notes are an Integral Part of the Financial Statements.
95
Government Money Market Portfolio (unaudited)
| | | | |
| Objective: | | Portfolio Strategy: | | Net Assets: |
| Maximum current income to the extent consistent with liquidity and stability of capital. | | Invest in short-term fixed income obligations issued or guaranteed by the U.S. Government, its agencies or instrumentalities. | | $526 million |
PORTFOLIO OVERVIEW
Mason Street Advisors, LLC (“Mason Street Advisors”), the investment adviser for the Government Money Market Portfolio (the “Portfolio”), has engaged BlackRock Advisors, LLC (“BlackRock”) to act as sub-adviser for the Portfolio. The Portfolio invests at least 99.5% of its total assets in cash, U.S. Treasury bills, notes and other obligations issued or guaranteed as to principal and interest by the U.S. Government, its agencies or instrumentalities and repurchase agreements secured by such obligations or cash. The Portfolio invests in a portfolio of securities maturing in 397 days or less (with certain exceptions) that will have a dollar-weighted average maturity of 60 days or less and a dollar-weighted average life of 120 days or less. The Portfolio seeks to maintain a net asset value of $1.00 per share.
MARKET OVERVIEW
At the onset of 2023, the U.S. Federal Reserve (the “Fed”) slowly continued to reduce fiscal accommodation, remaining highly attentive to inflation risks and anticipating the possible necessity of additional policy firming to reduce inflation to its 2% objective. As the year progressed, the Fed shifted focus from the amount of tightening to how long the restrictive stance should be maintained and the importance of minimizing the risk of elevated inflation with a slowing economy. At its December 2023 meeting, the Fed kept its benchmark interest rate unchanged for the third consecutive time, leaving it within the range of 5.25% to 5.50%. Additionally, the Fed signaled ending its rate-hiking campaign altogether in 2024.
Issuance of U.S. Treasurys increased in 2023. Following a mid-year debt ceiling impasse, President Biden signed the Fiscal Responsibility Act in June 2023, permitting the U.S. Treasury to again issue all necessary debt to cover expenditures. The U.S. Treasury issued over $1.6 trillion net new bills through the end of the year. Investors absorbed this new supply by reducing their use of the New York Federal Reserve (RRP) facility. Facility use fell from a 2023 calendar-year high of $2.375 trillion to a low of $683 billion by mid-December 2023.
PORTFOLIO RESULTS
The Portfolio returned 4.83% for the twelve months ended December 31, 2023. By comparison, the Portfolio’s benchmark, the ICE BofA® US 3-Month Treasury Bill Index (the “Index”), returned 5.01%. (The Index is unmanaged, cannot be invested in directly and does not incur expenses.)
The Fed’s shifting narrative altered the investment strategy of the Portfolio throughout 2023. During the first half of the year, a shorter duration profile was maintained as a majority of Portfolio investments were targeted in overnight Repurchase Agreements and in short-dated U.S. Treasury and Agency debt. As of June 30, 2023, the weighted average maturity (“WAM”) and weighted average life (“WAL”) of the Portfolio were 15 days and 53 days, respectively. Additionally, approximately 61% of the Portfolio was allocated into overnight Repurchase Agreements, 6% in U.S. Treasury debt and 33% in U.S. Agency debt. The Portfolio’s relative performance benefited from this posture as the Fed continued to move its benchmark rate higher.
Concerns regarding the debt ceiling also impacted investment decisions. The Treasury General Account (“TGA”) cash balance fell to a low of approximately $45 billion prior to the debt ceiling resolution, significantly diminishing U.S. Treasury bill supply. To rebuild the TGA, the U.S. Treasury largely increased supply to replenish extraordinary measures and fund chronic budget deficits.
During the second half of 2023, with a shift in focus from the Fed and the debt ceiling resolved, the Portfolio’s investment bias moved toward a longer duration profile. Targeted investments in longer-tenor, fixed rate securities, specifically 6 to 12-month issuance, were executed to lock-in yields at current market levels. As of December 29, 2023, the WAM and WAL of the Portfolio were 37 days and 90 days, respectively. A longer duration profile is expected to benefit the Portfolio’s relative performance as the tightening cycle concludes and the Fed signals it will begin lowering interest rates.
PORTFOLIO MANAGER OUTLOOK
The following forward-looking comments are the opinion of BlackRock, the Portfolio’s sub-adviser.
96
Government Money Market Portfolio (unaudited)
The Summary of Economic Projections (SEP) was updated at the Fed’s December 2023 meeting, and the median federal funds rate forecast for the end of 2024 was revised from 5.10% to 4.60%. At the end of 2023, markets were pricing in 75 bps in additional rate cuts by the Fed by the end of 2024. We believe this is slightly overdone and are looking for pockets of opportunity in the 6-month space and potentially out to 1-year to continue to lock in higher long-term rates. Our assessment of the timing and magnitude of any future downward adjustments in the Fed’s key policy rate will continue to affect our investment strategy.
Net new U.S. Treasury bill supply is expected to increase in the first quarter of 2024. Demand, in our view, will be driven by investor’s assessment of future monetary policy actions and prevailing valuations.
Not all obligations of the U.S. government, its agencies and instrumentalities are backed by the full faith and credit of the U.S. Treasury. Some obligations are backed only by the credit of the issuing agency or instrumentality, and in some cases there may be some risk of default by the issuer. Any guarantee by the U.S. government or its agencies or instrumentalities of a security held by the Portfolio does not apply to the market value of such security or to shares of the Portfolio itself.
You could lose money investing in the Government Money Market Portfolio. Although the Portfolio seeks to preserve the value of your investment at $1.00 per share, it cannot guarantee it will do so. An investment in the Portfolio is not insured or guaranteed by the Federal Deposit Insurance Corporation or any other government agency. The Portfolio’s sponsor has no legal obligation to provide financial support to the Portfolio, and you should not expect that the sponsor will provide financial support to the Portfolio at any time.
97
Government Money Market Portfolio
SCHEDULE OF INVESTMENTS
December 31, 2023
| | | | | | | | |
| Money Market Investments (99.9%) | | Shares/Par + | | | Value
$ (000’s) | |
Repurchase Agreements (44.8%) | | | | | | | | |
Tri-Party Bank of Montreal, 0.000%, 1/2/24 (Purchased on 12/29/23, to be repurchased at $20,011,844, collateralized by US Treasury Bill, 0.000%, due 5/9/2024, par and fair value of $20,792,500 and $20,400,083, respectively) | | | 20,000,000 | | | | 20,000 | |
Tri-Party Bank of Nova Scotia, 0.000%, 1/2/24 (Purchased on 12/29/23, to be repurchased at $20,011,844, collateralized by various US Treasury obligations, 0.000% to 5.000%, due from 12/26/2024 to 11/15/2053, aggregate par and fair value of $20,471,993 and $20,412,127, respectively) | | | 20,000,000 | | | | 20,000 | |
Tri-Party BNP Paribas, 0.000%, 1/2/24 (Purchased on 12/29/23, to be repurchased at $15,008,900, collateralized by various US Treasury obligations, 0.000% to 5.000%, due from 1/15/2024 to 11/15/2050, aggregate par and fair value of $26,749,934 and $15,300,000, respectively) | | | 15,000,000 | | | | 15,000 | |
Tri-Party BNP Paribas, 0.000%, 1/2/24 (Purchased on 12/29/23, to be repurchased at $5,002,972, collateralized by US government sponsored agency and various US government sponsored agency obligations, 2.000% to 7.000%, due from 1/15/2026 to 12/20/2063, aggregate par and fair value of $5,224,449 and $5,100,001, respectively) | | | 5,000,000 | | | | 5,000 | |
Tri-Party Citigroup Global Markets, Inc., 0.000%, 1/2/24 (Purchased on 12/29/23, to be repurchased at $10,005,944, collateralized by various US government sponsored agency obligations, 5.500% to 6.500%, due from 6/20/2053 to 6/20/2053, aggregate par and fair value of $10,137,989 and $10,200,951, respectively) | | | 10,000,000 | | | | 10,000 | |
Tri-Party Citigroup Global Markets, Inc., 0.000%, 1/2/24 (Purchased on 12/29/23, to be repurchased at $10,005,922, collateralized by various US Treasury obligations, 4.250% to 4.625%, due from 2/28/2025 to 5/31/2025, aggregate par and fair value of $10,220,835 and $10,200,058, respectively) | | | 10,000,000 | | | | 10,000 | |
| | | | | | | | |
| Money Market Investments (99.9%) | | Shares/Par + | | | Value
$ (000’s) | |
Repurchase Agreements continued | | | | | | | | |
Tri-Party Goldman Sachs Group LP, 0.000%, 1/2/24 (Purchased on 12/29/23, to be repurchased at $30,017,833, collateralized by various US government sponsored agency obligations, 2.000% to 5.500%, due from 3/20/2025 to 3/20/2051, aggregate par and fair value of $35,290,815 and $30,600,000, respectively) | | | 30,000,000 | | | | 30,000 | |
Tri-Party Mitsubishi UFJ, 0.000%, 1/2/24 (Purchased on 12/29/23, to be repurchased at $30,017,833, collateralized by various US government sponsored agency obligations, 2.500% to 6.500%, due from 3/20/2029 to 9/20/2053, aggregate par and fair value of $30,593,687 and $30,600,000, respectively) | | | 30,000,000 | | | | 30,000 | |
Tri-Party Mizuho Securities, 0.000%, 1/2/24 (Purchased on 12/29/23, to be repurchased at $30,017,833, collateralized by US Treasury Bond, 3.875%, due 8/15/2040, par and fair value of $31,229,451 and $30,600,021, respectively) | | | 30,000,000 | | | | 30,000 | |
Tri-Party Morgan Stanley, 0.000%, 1/2/24 (Purchased on 12/29/23, to be repurchased at $30,017,767, collateralized by various US Treasury obligations, 0.000% to 3.625%, due from 3/31/2030 to 8/15/2042, aggregate par and fair value of $43,825,322 and $30,600,055, respectively) | | | 30,000,000 | | | | 30,000 | |
Tri-Party Natixis S.A., 0.000%, 1/2/24 (Purchased on 12/29/23, to be repurchased at $20,011,844, collateralized by various US Treasury obligations, 0.000% to 4.750%, due from 3/31/2026 to 11/15/2053, aggregate par and fair value of $22,643,940 and $20,400,000, respectively) | | | 20,000,000 | | | | 20,000 | |
Tri-Party TD Securities, 0.000%, 1/2/24 (Purchased on 12/29/23, to be repurchased at $16,009,511, collateralized by various US government sponsored agency obligations, 6.000% to 8.000%, due from 3/20/2053 to 12/20/2053, aggregate par and fair value of $15,658,536 and $16,320,000, respectively) | | | 16,000,000 | | | | 16,000 | |
| | | | | | | | |
| | |
Total | | | | | | | 236,000 | |
| | | | | | | | |
The Accompanying Notes are an Integral Part of the Financial Statements.
98
Government Money Market Portfolio
| | | | | | | | |
| Money Market Investments (99.9%) | | Shares/Par + | | | Value
$ (000’s) | |
US Government & Agencies (55.1%) | | | | | | | | |
Federal Farm Credit Bank, 0.000%, 9/19/24 | | | 1,290,000 | | | | 1,241 | |
Federal Farm Credit Bank, 5.125%, 12/4/24 | | | 785,000 | | | | 785 | |
Federal Farm Credit Bank, 5.445%, (US SOFR plus 0.045%), 2/20/24 | | | 4,010,000 | | | | 4,010 | |
Federal Farm Credit Bank, 5.450%, (US SOFR plus 0.050%), 5/9/24 | | | 2,425,000 | | | | 2,425 | |
Federal Farm Credit Bank, 5.455%, (US SOFR plus 0.055%), 1/10/24 | | | 505,000 | | | | 505 | |
Federal Farm Credit Bank, 5.485%, (US SOFR plus 0.085%), 9/23/24 | | | 1,720,000 | | | | 1,720 | |
Federal Farm Credit Bank, 5.490%, (US SOFR plus 0.090%), 8/26/24 | | | 4,540,000 | | | | 4,540 | |
Federal Farm Credit Bank, 5.500%, (US SOFR plus 0.100%), 8/1/24 | | | 1,095,000 | | | | 1,095 | |
Federal Farm Credit Bank, 5.540%, (US SOFR plus 0.140%), 11/7/24 | | | 3,100,000 | | | | 3,100 | |
Federal Farm Credit Bank, 5.540%, (US SOFR plus 0.140%), 5/27/25 | | | 3,225,000 | | | | 3,225 | |
Federal Farm Credit Bank, 5.570%, (US SOFR plus 0.170%), 1/23/25 | | | 2,685,000 | | | | 2,685 | |
Federal Home Loan Bank, 0.000%, 2/5/24 | | | 292,000 | | | | 291 | |
Federal Home Loan Bank, 0.000%, 6/17/24 | | | 500,000 | | | | 488 | |
Federal Home Loan Bank, 0.000%, 2/9/24 | | | 7,580,000 | | | | 7,539 | |
Federal Home Loan Bank, 0.000%, 2/2/24 | | | 1,810,000 | | | | 1,803 | |
Federal Home Loan Bank, 0.000%, 2/15/24 | | | 1,645,000 | | | | 1,634 | |
Federal Home Loan Bank, 0.000%, 3/1/24 | | | 990,000 | | | | 981 | |
Federal Home Loan Bank, 0.000%, 6/10/24 | | | 9,650,000 | | | | 9,423 | |
Federal Home Loan Bank, 0.000%, 4/15/24 | | | 1,815,000 | | | | 1,787 | |
Federal Home Loan Bank, 0.000%, 11/1/24 | | | 5,148,000 | | | | 4,929 | |
Federal Home Loan Bank, 0.000%, 11/4/24 | | | 1,194,000 | | | | 1,144 | |
Federal Home Loan Bank, 0.000%, 8/2/24 | | | 1,425,000 | | | | 1,382 | |
Federal Home Loan Bank, 0.000%, 9/3/24 | | | 593,000 | | | | 573 | |
Federal Home Loan Bank, 0.000%, 1/4/24 | | | 3,160,000 | | | | 3,159 | |
Federal Home Loan Bank, 4.900%, 4/15/24 | | | 3,595,000 | | | | 3,588 | |
Federal Home Loan Bank, 5.430%, (US SOFR plus 0.030%), 1/4/24 | | | 7,800,000 | | | | 7,800 | |
Federal Home Loan Bank, 5.435%, (US SOFR plus 0.035%), 1/19/24 | | | 3,420,000 | | | | 3,420 | |
Federal Home Loan Bank, 5.435%, (US SOFR plus 0.035%), 1/26/24 | | | 7,550,000 | | | | 7,550 | |
Federal Home Loan Bank, 5.435%, (US SOFR plus 0.035%), 2/5/24 | | | 2,100,000 | | | | 2,100 | |
Federal Home Loan Bank, 5.440%, (US SOFR plus 0.040%), 1/23/24 | | | 3,180,000 | | | | 3,180 | |
Federal Home Loan Bank, 5.440%, (US SOFR plus 0.040%), 1/29/24 | | | 2,400,000 | | | | 2,400 | |
Federal Home Loan Bank, 5.440%, (US SOFR plus 0.040%), 2/20/24 | | | 13,760,000 | | | | 13,760 | |
Federal Home Loan Bank, 5.450%, (US SOFR plus 0.050%), 3/25/24 | | | 4,240,000 | | | | 4,240 | |
Federal Home Loan Bank, 5.470%, (US SOFR plus 0.070%), 7/12/24 | | | 780,000 | | | | 780 | |
Federal Home Loan Bank, 5.480%, (US SOFR plus 0.080%), 1/24/24 | | | 8,000,000 | | | | 8,000 | |
Federal Home Loan Bank, 5.505%, (US SOFR plus 0.105%), 10/28/24 | | | 2,300,000 | | | | 2,300 | |
Federal Home Loan Bank, 5.530%, 1/8/25 | | | 2,155,000 | | | | 2,155 | |
Federal Home Loan Bank, 5.560%, (US SOFR plus 0.160%), 7/21/25 | | | 4,330,000 | | | | 4,330 | |
Federal Home Loan Bank, 5.600%, (US SOFR plus 0.200%), 11/13/25 | | | 3,270,000 | | | | 3,270 | |
| | | | | | | | |
| Money Market Investments (99.9%) | | Shares/Par + | | | Value
$ (000’s) | |
US Government & Agencies continued | | | | | | | | |
US Treasury, 0.000%, 1/11/24 | | | 5,135,000 | | | | 5,127 | |
US Treasury, 0.000%, 9/5/24 | | | 1,840,000 | | | | 1,775 | |
US Treasury, 0.000%, 1/18/24 | | | 25,090,000 | | | | 25,027 | |
US Treasury, 0.000%, 4/4/24 | | | 5,815,000 | | | | 5,734 | |
US Treasury, 0.000%, 2/6/24 | | | 3,135,000 | | | | 3,118 | |
US Treasury, 0.000%, 2/13/24 | | | 7,956,000 | | | | 7,905 | |
US Treasury, 0.000%, 4/18/24 | | | 3,525,000 | | | | 3,469 | |
US Treasury, 0.000%, 1/2/24 | | | 1,314,000 | | | | 1,314 | |
US Treasury, 0.000%, 1/4/24 | | | 3,650,000 | | | | 3,648 | |
US Treasury, 0.000%, 2/22/24 | | | 969,000 | | | | 962 | |
US Treasury, 0.000%, 2/29/24 | | | 2,075,100 | | | | 2,057 | |
US Treasury, 0.000%, 6/13/24 | | | 3,251,000 | | | | 3,177 | |
US Treasury, 0.000%, 5/16/24 | | | 12,060,000 | | | | 11,820 | |
US Treasury, 0.000%, 10/31/24 | | | 912,000 | | | | 873 | |
US Treasury, 0.000%, 5/9/24 | | | 9,995,000 | | | | 9,807 | |
US Treasury, 0.000%, 5/23/24 | | | 14,635,000 | | | | 14,331 | |
US Treasury, 0.000%, 3/5/24 | | | 1,090,000 | | | | 1,080 | |
US Treasury, 0.000%, 3/12/24 | | | 3,448,000 | | | | 3,412 | |
US Treasury, 0.000%, 3/19/24 | | | 12,910,000 | | | | 12,763 | |
US Treasury, 0.000%, 6/20/24 | | | 8,102,400 | | | | 7,905 | |
US Treasury, 0.000%, 2/8/24 | | | 626,000 | | | | 622 | |
US Treasury, 0.000%, 1/30/24 | | | 1,120,000 | | | | 1,115 | |
US Treasury, 0.000%, 4/16/24 | | | 1,464,000 | | | | 1,441 | |
US Treasury, 5.256%, (US Treasury 3 Month Bill Money Market Yield less 0.075%), 4/30/24 | | | 5,315,000 | | | | 5,314 | |
US Treasury, 5.456%, (US Treasury 3 Month Bill Money Market Yield plus 0.125%), 7/31/25 | | | 10,740,000 | | | | 10,738 | |
US Treasury, 5.471%, (US Treasury 3 Month Bill Money Market Yield plus 0.140%), 10/31/24 | | | 4,025,000 | | | | 4,028 | |
US Treasury, 5.501%, (US Treasury 3 Month Bill Money Market Yield plus 0.170%), 10/31/25 | | | 7,131,000 | | | | 7,129 | |
US Treasury, 5.531%, (US Treasury 3 Month Bill Money Market Yield plus 0.200%), 1/31/25 | | | 5,000,000 | | | | 5,000 | |
| | | | | | | | |
| | |
Total | | | | | | | 290,028 | |
| | | | | | | | |
| |
Total Money Market Investments (Cost: $526,028) | | | | 526,028 | |
| | | | | | | | |
| |
Total Investments (99.9%) (Cost: $526,028) | | | | 526,028 | |
| | | | | | | | |
| | |
Other Assets, Less Liabilities (0.1%) | | | | | | | 356 | |
| | | | | | | | |
| | |
Net Assets (100.0%) | | | | | | | 526,384 | |
| | | | | | | | |
The Accompanying Notes are an Integral Part of the Financial Statements.
99
Government Money Market Portfolio
| + | All par is stated in U.S. Dollar unless otherwise noted. |
The following is a summary of the inputs used in valuing the Portfolio’s Investments at December 31, 2023. See Note 3 for additional information on portfolio valuation.
| | | | | | | | | | | | | | |
| | | | | Valuation Inputs | |
| Description | | | | Level 1 - Quoted Prices | | | Level 2 - Other Significant Observable Inputs | | | Level 3 - Significant Unobservable Inputs | |
| | | | | (Amounts in thousands) | |
Assets: | | | | | | | | | | | | | | |
Short-Term Investments | | | | $ | — | | | $ | 526,028 | | | $ | — | |
| | | | | | |
Total Assets: | | | | $ | — | | | $ | 526,028 | | | $ | — | |
| | | | | | |
The Accompanying Notes are an Integral Part of the Financial Statements.
100
Short-Term Bond Portfolio (unaudited)
| | | | |
| Objective: | | Portfolio Strategy: | | Net Assets: |
| Provide as high a level of current income as is consistent with prudent investment risk. | | Invest in a diversified portfolio of investment grade debt securities. | | $385 million |
PORTFOLIO OVERVIEW
Mason Street Advisors, LLC (“Mason Street Advisors”), the investment adviser for the Short-Term Bond Portfolio (the “Portfolio”), has engaged T. Rowe Price Associates, Inc. (“T. Rowe Price”) to act as sub-adviser for the Portfolio. Normally, the Portfolio invests in a diversified portfolio of investment grade debt securities. Also, the Portfolio may invest up to 20% of net assets in foreign securities. Debt securities may be of any maturity, but under normal market conditions, the Portfolio’s effective dollar-weighted average maturity will not exceed three years. The Portfolio primarily invests in corporate, government and mortgage- and asset-backed securities. The Portfolio uses both a “top-down” and “bottom-up” investment approach to construct the portfolio of investments. The top-down investment approach involves an evaluation of the overall macroeconomic environment and its potential impact on the level and direction of interest rates. The bottom-up investment approach focuses on fundamental research of individual issuers.
MARKET OVERVIEW
Shifts in market expectations for monetary policy contributed to notable volatility in U.S. Treasury yields across 2023. The two-year U.S. Treasury note yield began the period at 4.41% and reached 5.19% by October before ending the period at 4.23% as the U.S. Federal Reserve (the “Fed”) signaled the end of its most aggressive rate hike campaign since the 1980s.
U.S. Treasury yields fell sharply in the final two months of 2023 and ended the period lower across most key rates, despite the Fed electing to keep the fed funds target rate unchanged at its November and December 2023 meetings. Intermediate- and long-term U.S. Treasury yields declined more significantly as inflation continued to show signs of waning.
Yields on investment grade corporate bonds and securitized credits followed U.S. Treasury yields lower late in the period, bringing total returns across spread sectors into positive territory. Risk sentiment improved during the rally, and corporate bonds and securitized sectors outpaced U.S. Treasuries on a total return basis for the year. Among spread sectors, corporate bonds were notable outperformers in terms of total and excess return as yields fell and credit spreads tightened. Securitized sectors — asset-backed securities (“ABS”), commercial mortgage-backed securities and residential mortgage-backed securities (“RMBS”) — also generated positive total and excess returns.
PORTFOLIO RESULTS
The Portfolio returned 5.26% for the twelve months ended December 31, 2023. By comparison, the Portfolio’s benchmark, the Bloomberg® 1–3 Year U.S. Government/Credit Index (the “Index”), returned 4.61%. (The Index is unmanaged, cannot be invested in directly and does not incur expenses.)
Sector allocation contributed to the Portfolio’s relative performance for the reporting period. An out-of-benchmark allocation to RMBS contributed, as the interest rate-sensitive sector benefited from the rally in U.S. Treasury yields seen in late 2023. An out-of-benchmark allocation to ABS also contributed, as the shorter-duration sector performed well during periods of rising U.S. Treasury yields.
An overweight to investment grade corporate bonds and a corresponding underweight to U.S. Treasurys also contributed to the Portfolio’s relative return amid periods of limited new supply, encouraging corporate earnings reports and a late 2023 improvement in risk sentiment. Security selection within investment grade corporate bonds also contributed. In addition, specific positioning across the yield curve aided relative performance as the Portfolio’s preference to hold longer maturities was beneficial in a period that realized greater volatility in front-end rates.
On the downside, interest rate management detracted in aggregate, declining due to average duration positioning. While the Portfolio’s duration ended the period slightly lower than where it began, duration ticked upward through the first half of 2023. As a result of this upward trend, the Portfolio’s profile was slightly long relative to the benchmark, which weighed on relative performance, as U.S. Treasury yields rose during much of the trailing one-year period.
PORTFOLIO MANAGER OUTLOOK
The following forward-looking comments are the opinion of T. Rowe Price, the Portfolio’s sub-adviser.
101
Short-Term Bond Portfolio (unaudited)
As the Fed’s preferred measure of inflation continued to decelerate while U.S. growth simultaneously remained resilient, market sentiment began to price in the possibility of the Fed orchestrating a soft landing. With this in mind, front-end rates have likely seen a peak for this cycle, but we are well positioned to capitalize on elevated yield opportunities with rate inversion still persistent across the yield curve, in our view.
While rate and spread volatility could oscillate and persist as additional economic data adjusts the forecast and timing for interest rate cuts, we agree that cuts are the most logical next step for the Fed should macroeconomic data continue to cool. However, we acknowledge that the path to sustainable lower inflation could get bumpier if the trend of economic data deviates from current market expectations.
In the current environment, active management can play an even more instrumental role in achieving investor objectives. Our continued goal is to provide high quality, consistent yield and income appropriate for a short-term bond strategy with modest credit and duration risk. Using the breadth and depth of our global research platform, we will look to selectively add to high conviction positions as volatility creates attractive entry points.
Relative Performance
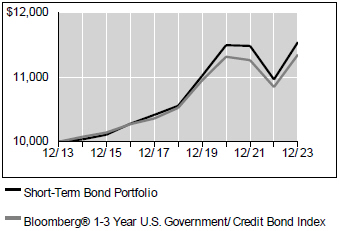
| | | | | | |
Average Annual Total Returns For Periods Ended December 31, 2023 |
| | | 1 Year | | 5 Years | | 10 Years |
Short-Term Bond Portfolio | | 5.26% | | 1.80% | | 1.44% |
Bloomberg® 1-3 Year U.S. Government/ Credit Bond Index | | 4.61% | | 1.51% | | 1.27% |
The performance data quoted represents past performance. Past performance is historical and does not guarantee future performance. Investment return and principal value will fluctuate, so that shares, when redeemed, may be worth more or less than their original cost. Current performance may be lower or higher than the performance data quoted. For the most recent month-end performance information visit www.northwesternmutual.com.
This chart assumes an initial investment of $10,000 made on 12/31/13. Returns shown reflect fee waivers, deductions for management and other portfolio expenses, and reinvestment of all dividends. In the absence of fee waivers, total return would be reduced. Returns exclude deductions for separate account sale loads and account
fees. Please refer to the Benchmark Definitions section of this report for information about the indices cited in the above chart and graph.
Top 10 Holdings 12/31/23
| | | | | | | | |
| | | | |
| | | Security Description | | % of Net Assets | | | | |
| | | | |
| | | US Treasury, Various | | 17.6% | | | | |
| | | | |
| | | Federal National Mortgage Association, Various | | 2.9% | | | | |
| | | | |
| | | Government National Mortgage Association, Various | | 1.1% | | | | |
| | | | |
| | | Federal Home Loan Mortgage Corp., Various | | 0.8% | | | | |
| | | | |
| | | AbbVie, Inc., Various | | 0.8% | | | | |
| | | | |
| | | The Goldman Sachs Group, Inc., Various | | 0.8% | | | | |
| | | | |
| | | Vistra Operations Co. LLC, Various | | 0.8% | | | | |
| | | | |
| | | Bank of America Corp., Various | | 0.7% | | | | |
| | | | |
| | | Bank of Montreal, Various | | 0.7% | | | | |
| | | | |
| | | JPMorgan Chase & Co., Various | | 0.7% | | | | |
Sector Allocation 12/31/23
| | | | | | | | |
| | | | |
| | | Sector | | % of Net Assets | | | | |
| | | | |
| | | Corporate Bonds | | 49.4% | | | | |
| | | | |
| | | Structured Products | | 29.2% | | | | |
| | | | |
| | | Governments | | 18.8% | | | | |
| | | | |
| | | Short-Term Investments & Other Net Assets | | 2.5% | | | | |
| | | | |
| | | Municipal Bonds | | 0.1% | | | | |
Sector Allocation and Top 10 Holdings are subject to change.
Consistent with the Portfolio’s stated parameters, no more than 20% of the Portfolio is invested in foreign securities, and no more than 10% is invested in high yield securities.
102
Short-Term Bond Portfolio
SCHEDULE OF INVESTMENTS
December 31, 2023
| | | | | | | | |
| Corporate Bonds (49.4%) | | Shares/ Par + | | Value $ (000’s) | |
Basic Materials (1.2%) | | | | | | | | |
ArcelorMittal
3.600%, 7/16/24 | | | 225,000 | | | | 222 | |
Celanese US Holdings LLC
6.050%, 3/15/25 | | | 334,000 | | | | 336 | |
Celulosa Arauco y Constitucion SA
4.500%, 8/1/24 | | | 365,000 | | | | 361 | |
Ecolab, Inc.
1.650%, 2/1/27 | | | 215,000 | | | | 197 | |
5.250%, 1/15/28 | | | 625,000 | | | | 645 | |
LYB International Finance III, LLC
1.250%, 10/1/25 | | | 373,000 | | | | 348 | |
Nucor Corp.
2.000%, 6/1/25 | | | 155,000 | | | | 149 | |
3.950%, 5/23/25 | | | 275,000 | | | | 271 | |
Nutrien, Ltd.
4.900%, 3/27/28 | | | 240,000 | | | | 242 | |
POSCO
4.375%, 8/4/25 § | | | 1,000,000 | | | | 985 | |
The Sherwin-Williams Co.
4.050%, 8/8/24 | | | 155,000 | | | | 154 | |
4.250%, 8/8/25 | | | 230,000 | | | | 228 | |
Steel Dynamics, Inc.
2.800%, 12/15/24 | | | 200,000 | | | | 195 | |
Westlake Chemical Corp.
0.875%, 8/15/24 | | | 435,000 | | | | 422 | |
| | | | | | | | |
Total | | | | | | | 4,755 | |
| | | | | | | | |
| | |
Communications (2.9%) | | | | | | | | |
AT&T, Inc.
4.100%, 2/15/28 | | | 205,000 | | | | 200 | |
Charter Communications Operating LLC / Charter Communications Operating Capital Corp.
4.908%, 7/23/25 | | | 2,090,000 | | | | 2,070 | |
6.150%, 11/10/26 | | | 255,000 | | | | 261 | |
Cox Communications, Inc.
3.150%, 8/15/24 144A | | | 1,023,000 | | | | 1,006 | |
3.500%, 8/15/27 144A | | | 215,000 | | | | 204 | |
Crown Castle Towers LLC
4.241%, 7/15/48 144A | | | 175,000 | | | | 166 | |
KT Corp.
4.000%, 8/8/25 144A | | | 1,020,000 | | | | 1,003 | |
Meta Platforms, Inc.
4.600%, 5/15/28 | | | 400,000 | | | | 406 | |
NBN Co., Ltd.
1.450%, 5/5/26 144A | | | 1,000,000 | | | | 923 | |
NTT Finance Corp.
0.583%, 3/1/24 144A | | | 265,000 | | | | 263 | |
4.142%, 7/26/24 144A | | | 200,000 | | | | 199 | |
4.239%, 7/25/25 144A | | | 200,000 | | | | 198 | |
Rogers Communications, Inc.
2.950%, 3/15/25 | | | 930,000 | | | | 902 | |
3.200%, 3/15/27 | | | 690,000 | | | | 659 | |
T-Mobile USA, Inc.
2.250%, 2/15/26 | | | 470,000 | | | | 445 | |
3.500%, 4/15/25 | | | 595,000 | | | | 582 | |
| | | | | | | | |
| Corporate Bonds (49.4%) | | Shares/ Par + | | Value $ (000’s) | |
Communications continued | | | | | | | | |
Verizon Communications, Inc.
0.850%, 11/20/25 | | | 500,000 | | | | 465 | |
1.450%, 3/20/26 | | | 650,000 | | | | 605 | |
2.625%, 8/15/26 | | | 845,000 | | | | 805 | |
| | | | | | | | |
Total | | | | | | | 11,362 | |
| | | | | | | | |
| | |
Consumer, Cyclical (5.8%) | | | | | | | | |
7-Eleven, Inc.
0.800%, 2/10/24 144A | | | 325,000 | | | | 323 | |
Advance Auto Parts, Inc.
5.900%, 3/9/26 | | | 475,000 | | | | 473 | |
American Airlines Pass Through Trust, Series 2017-2, Class B
3.700%, 4/15/27 | | | 170,908 | | | | 161 | |
Aptiv PLC / Aptiv Corp.
2.396%, 2/18/25 | | | 130,000 | | | | 126 | |
AutoZone, Inc.
3.125%, 4/18/24 | | | 515,000 | | | | 511 | |
3.625%, 4/15/25 | | | 235,000 | | | | 231 | |
6.250%, 11/1/28 | | | 370,000 | | | | 393 | |
Brunswick Corp.
0.850%, 8/18/24 | | | 685,000 | | | | 663 | |
Daimler Finance North America LLC
1.625%, 12/13/24 144A | | | 580,000 | | | | 559 | |
5.150%, 1/16/26 144A | | | 165,000 | | | | 165 | |
5.200%, 1/17/25 144A | | | 215,000 | | | | 215 | |
Dollar General Corp.
4.625%, 11/1/27 | | | 145,000 | | | | 144 | |
5.200%, 7/5/28 | | | 347,000 | | | | 352 | |
Ford Motor Credit Co. LLC
5.125%, 6/16/25 | | | 605,000 | | | | 597 | |
6.798%, 11/7/28 | | | 315,000 | | | | 330 | |
General Motors Financial Co., Inc.
2.900%, 2/26/25 | | | 965,000 | | | | 936 | |
5.400%, 4/6/26 | | | 300,000 | | | | 302 | |
Genuine Parts Co.
1.750%, 2/1/25 | | | 220,000 | | | | 211 | |
Hasbro, Inc.
3.000%, 11/19/24 | | | 1,030,000 | | | | 1,005 | |
Hyundai Capital America
0.800%, 1/8/24 144A | | | 390,000 | | | | 390 | |
0.875%, 6/14/24 144A | | | 510,000 | | | | 498 | |
1.000%, 9/17/24 144A | | | 255,000 | | | | 247 | |
5.500%, 3/30/26 144A | | | 270,000 | | | | 271 | |
5.600%, 3/30/28 144A | | | 350,000 | | | | 355 | |
6.250%, 11/3/25 144A | | | 260,000 | | | | 264 | |
Hyundai Motor Co.
2.125%, 4/24/25 144A | | | 200,000 | | | | 192 | |
Lowe’s Companies, Inc.
3.350%, 4/1/27 | | | 175,000 | | | | 169 | |
4.400%, 9/8/25 | | | 660,000 | | | | 655 | |
4.800%, 4/1/26 | | | 385,000 | | | | 385 | |
Marriott International, Inc.
3.600%, 4/15/24 | | | 1,160,000 | | | | 1,154 | |
3.750%, 3/15/25 | | | 110,000 | | | | 108 | |
4.900%, 4/15/29 | | | 120,000 | | | | 121 | |
The Accompanying Notes are an Integral Part of the Financial Statements.
103
Short-Term Bond Portfolio
| | | | | | | | |
| Corporate Bonds (49.4%) | | Shares/ Par + | | Value $ (000’s) | |
Consumer, Cyclical continued | | | | | | | | |
5.450%, 9/15/26 | | | 195,000 | | | | 198 | |
5.750%, 5/1/25 | | | 120,000 | | | | 121 | |
Mattel, Inc.
3.375%, 4/1/26 144A | | | 445,000 | | | | 423 | |
5.875%, 12/15/27 144A | | | 485,000 | | | | 484 | |
Mercedes-Benz Finance North America LLC
4.800%, 3/30/26 144A | | | 410,000 | | | | 410 | |
Nordstrom, Inc.
2.300%, 4/8/24 | | | 85,000 | | | | 84 | |
O’Reilly Automotive, Inc.
5.750%, 11/20/26 | | | 380,000 | | | | 389 | |
Ross Stores, Inc.
0.875%, 4/15/26 | | | 625,000 | | | | 573 | |
3.375%, 9/15/24 | | | 135,000 | | | | 133 | |
4.600%, 4/15/25 | | | 1,355,000 | | | | 1,344 | |
Starbucks Corp.
4.750%, 2/15/26 | | | 465,000 | | | | 467 | |
Stellantis Finance US, Inc.
1.711%, 1/29/27 144A | | | 260,000 | | | | 236 | |
Tapestry, Inc.
7.000%, 11/27/26 | | | 95,000 | | | | 99 | |
7.050%, 11/27/25 | | | 80,000 | | | | 82 | |
Toyota Motor Credit Corp.
3.050%, 3/22/27 | | | 325,000 | | | | 311 | |
VF Corp.
2.400%, 4/23/25 | | | 881,000 | | | | 842 | |
2.800%, 4/23/27 | | | 455,000 | | | | 418 | |
Volkswagen Group of America Finance LLC
3.950%, 6/6/25 144A | | | 390,000 | | | | 382 | |
5.700%, 9/12/26 144A | | | 335,000 | | | | 340 | |
5.800%, 9/12/25 144A | | | 395,000 | | | | 398 | |
6.000%, 11/16/26 144A | | | 380,000 | | | | 389 | |
WarnerMedia Holdings, Inc.
3.755%, 3/15/27 | | | 1,545,000 | | | | 1,480 | |
6.412%, 3/15/26 | | | 275,000 | | | | 275 | |
| | | | | | | | |
Total | | | | | | | 22,384 | |
| | | | | | | | |
| | |
Consumer, Non-cyclical (8.8%) | | | | | | | | |
AbbVie, Inc.
2.600%, 11/21/24 | | | 1,935,000 | | | | 1,890 | |
2.950%, 11/21/26 | | | 1,120,000 | | | | 1,074 | |
3.200%, 5/14/26 | | | 100,000 | | | | 97 | |
Amgen, Inc.
5.250%, 3/2/25 | | | 215,000 | | | | 215 | |
AstraZeneca Finance LLC
1.200%, 5/28/26 | | | 805,000 | | | | 745 | |
BAT International Finance PLC
1.668%, 3/25/26 | | | 475,000 | | | | 441 | |
4.448%, 3/16/28 | | | 1,010,000 | | | | 993 | |
Becton Dickinson and Co.
3.363%, 6/6/24 | | | 690,000 | | | | 683 | |
3.734%, 12/15/24 | | | 170,000 | | | | 167 | |
4.693%, 2/13/28 | | | 805,000 | | | | 808 | |
Cardinal Health, Inc.
3.079%, 6/15/24 | | | 310,000 | | | | 306 | |
3.500%, 11/15/24 | | | 525,000 | | | | 516 | |
Coca-Cola European Partners PLC
0.800%, 5/3/24 144A | | | 1,335,000 | | | | 1,310 | |
1.500%, 1/15/27 144A | | | 200,000 | | | | 181 | |
| | | | | | | | |
| Corporate Bonds (49.4%) | | Shares/ Par + | | Value $ (000’s) | |
Consumer, Non-cyclical continued | | | | | | | | |
Constellation Brands, Inc.
3.600%, 5/9/24 | | | 485,000 | | | | 481 | |
CSL Finance PLC
3.850%, 4/27/27 144A | | | 200,000 | | | | 195 | |
CVS Health Corp.
1.300%, 8/21/27 | | | 945,000 | | | | 839 | |
2.875%, 6/1/26 | | | 265,000 | | | | 253 | |
3.000%, 8/15/26 | | | 220,000 | | | | 210 | |
5.000%, 2/20/26 | | | 560,000 | | | | 563 | |
Elevance Health, Inc.
5.350%, 10/15/25 | | | 180,000 | | | | 181 | |
ERAC USA Finance LLC
4.600%, 5/1/28 144A | | | 735,000 | | | | 730 | |
HCA, Inc.
3.125%, 3/15/27 | | | 580,000 | | | | 550 | |
5.375%, 2/1/25 | | | 350,000 | | | | 350 | |
5.875%, 2/15/26 | | | 390,000 | | | | 393 | |
Health Care Service Corp.
1.500%, 6/1/25 144A | | | 780,000 | | | | 740 | |
HPHT Finance 19, Ltd.
2.875%, 11/5/24 § | | | 1,200,000 | | | | 1,175 | |
Humana, Inc.
1.350%, 2/3/27 | | | 75,000 | | | | 68 | |
3.850%, 10/1/24 | | | 545,000 | | | | 538 | |
4.500%, 4/1/25 | | | 565,000 | | | | 560 | |
5.750%, 3/1/28 | | | 140,000 | | | | 146 | |
Imperial Brands Finance PLC
3.125%, 7/26/24 144A | | | 1,055,000 | | | | 1,038 | |
4.250%, 7/21/25 144A | | | 710,000 | | | | 697 | |
IQVIA, Inc.
6.250%, 2/1/29 144A | | | 255,000 | | | | 266 | |
JDE Peet’s NV
0.800%, 9/24/24 144A | | | 295,000 | | | | 284 | |
Kenvue, Inc.
5.350%, 3/22/26 | | | 250,000 | | | | 254 | |
Mars, Inc.
2.700%, 4/1/25 144A | | | 370,000 | | | | 360 | |
4.550%, 4/20/28 144A | | | 770,000 | | | | 774 | |
Mondelez International, Inc.
2.125%, 3/17/24 | | | 410,000 | | | | 407 | |
2.625%, 3/17/27 | | | 415,000 | | | | 391 | |
4.250%, 9/15/25 144A | | | 305,000 | | | | 301 | |
Moody’s Corp.
3.750%, 3/24/25 | | | 505,000 | | | | 497 | |
Mylan NV
3.950%, 6/15/26 | | | 935,000 | | | | 904 | |
PeaceHealth Obligated Group
1.375%, 11/15/25 | | | 105,000 | | | | 98 | |
Pelabuhan Indonesia Persero PT
4.875%, 10/1/24 | | | 950,000 | | | | 942 | |
Perrigo Finance Unlimited Co.
3.900%, 12/15/24 | | | 372,000 | | | | 361 | |
Pfizer Investment Enterprises Pte., Ltd.
4.450%, 5/19/26 | | | 985,000 | | | | 982 | |
4.450%, 5/19/28 | | | 590,000 | | | | 590 | |
Philip Morris International, Inc.
4.875%, 2/13/26 | | | 490,000 | | | | 492 | |
5.000%, 11/17/25 | | | 295,000 | | | | 296 | |
5.125%, 11/15/24 | | | 585,000 | | | | 584 | |
The Accompanying Notes are an Integral Part of the Financial Statements.
104
Short-Term Bond Portfolio
| | | | | | | | |
| Corporate Bonds (49.4%) | | Shares/ Par + | | Value $ (000’s) | |
Consumer, Non-cyclical continued | | | | | | | | |
Revvity, Inc.
0.850%, 9/15/24 | | | 745,000 | | | | 719 | |
S&P Global, Inc.
2.450%, 3/1/27 | | | 1,120,000 | | | | 1,056 | |
UnitedHealth Group, Inc.
3.700%, 5/15/27 | | | 605,000 | | | | 593 | |
4.250%, 1/15/29 | | | 507,000 | | | | 506 | |
5.150%, 10/15/25 | | | 535,000 | | | | 541 | |
5.250%, 2/15/28 | | | 380,000 | | | | 393 | |
Viatris, Inc.
1.650%, 6/22/25 | | | 800,000 | | | | 758 | |
2.300%, 6/22/27 | | | 429,000 | | | | 389 | |
Viterra Finance BV
4.900%, 4/21/27 144A | | | 600,000 | | | | 595 | |
Zoetis, Inc.
5.400%, 11/14/25 | | | 575,000 | | | | 580 | |
| | | | | | | | |
Total | | | | | | | 34,046 | |
| | | | | | | | |
| | |
Energy (3.3%) | | | | | | | | |
Aker BP ASA
2.000%, 7/15/26 144A | | | 246,000 | | | | 227 | |
Canadian Natural Resources, Ltd.
2.050%, 7/15/25 | | | 760,000 | | | | 724 | |
Cheniere Corpus Christi Holdings LLC
5.875%, 3/31/25 | | | 910,000 | | | | 912 | |
Columbia Pipelines Holding Co. LLC
6.055%, 8/15/26 144A | | | 90,000 | | | | 92 | |
DCP Midstream Operating LP
5.375%, 7/15/25 | | | 1,040,000 | | | | 1,041 | |
Enbridge, Inc.
2.150%, 2/16/24 | | | 275,000 | | | | 274 | |
2.500%, 1/15/25 | | | 640,000 | | | | 621 | |
2.500%, 2/14/25 | | | 330,000 | | | | 320 | |
5.900%, 11/15/26 | | | 230,000 | | | | 236 | |
6.000%, 11/15/28 | | | 190,000 | | | | 199 | |
Energy Transfer LP
2.900%, 5/15/25 | | | 115,000 | | | | 111 | |
4.250%, 4/1/24 | | | 35,000 | | | | 35 | |
4.900%, 2/1/24 | | | 425,000 | | | | 424 | |
5.875%, 1/15/24 | | | 1,054,000 | | | | 1,054 | |
6.050%, 12/1/26 | | | 875,000 | | | | 900 | |
Equinor ASA
2.875%, 4/6/25 | | | 880,000 | | | | 858 | |
Gray Oak Pipeline LLC
2.600%, 10/15/25 144A | | | 205,000 | | | | 194 | |
ONEOK, Inc.
5.550%, 11/1/26 | | | 410,000 | | | | 417 | |
Ovintiv, Inc.
5.650%, 5/15/25 | | | 465,000 | | | | 467 | |
Pioneer Natural Resources Co.
5.100%, 3/29/26 | | | 505,000 | | | | 509 | |
Sabine Pass Liquefaction LLC
5.625%, 3/1/25 | | | 700,000 | | | | 701 | |
5.750%, 5/15/24 | | | 103,000 | | | | 103 | |
Schlumberger Finance Canada, Ltd.
1.400%, 9/17/25 | | | 155,000 | | | | 147 | |
TransCanada PipeLines, Ltd.
6.203%, 3/9/26 | | | 910,000 | | | | 910 | |
The Williams Cos., Inc.
5.400%, 3/2/26 | | | 985,000 | | | | 995 | |
| | | | | | | | |
| Corporate Bonds (49.4%) | | Shares/ Par + | | Value $ (000’s) | |
Energy continued | | | | | | | | |
Williams Partners LP
4.300%, 3/4/24 | | | 145,000 | | | | 145 | |
| | | | | | | | |
Total | | | | | | | 12,616 | |
| | | | | | | | |
| | |
Financial (19.0%) | | | | | | | | |
ABN AMRO Bank NV
6.339%, (US Treasury Yield Curve Rate | | | | | | | | |
T Note Constant Maturity 1 Year plus
1.650%), 9/18/27 144A α | | | 400,000 | | | | 409 | |
AerCap Ireland Capital DAC / AerCap Global Aviation Trust
1.650%, 10/29/24 | | | 331,000 | | | | 319 | |
4.875%, 1/16/24 | | | 550,000 | | | | 550 | |
6.100%, 1/15/27 | | | 420,000 | | | | 429 | |
6.450%, 4/15/27 | | | 842,000 | | | | 872 | |
American Express Co.
2.250%, 3/4/25 | | | 975,000 | | | | 943 | |
American Tower Corp.
1.600%, 4/15/26 | | | 931,000 | | | | 861 | |
2.400%, 3/15/25 | | | 360,000 | | | | 348 | |
3.550%, 7/15/27 | | | 379,000 | | | | 363 | |
5.000%, 2/15/24 | | | 225,000 | | | | 225 | |
Athene Global Funding
1.716%, 1/7/25 144A | | | 930,000 | | | | 891 | |
2.514%, 3/8/24 144A | | | 1,165,000 | | | | 1,157 | |
Avolon Holdings Funding, Ltd.
2.125%, 2/21/26 144A | | | 610,000 | | | | 565 | |
2.875%, 2/15/25 144A | | | 435,000 | | | | 420 | |
3.950%, 7/1/24 144A | | | 130,000 | | | | 128 | |
6.375%, 5/4/28 144A | | | 185,000 | | | | 189 | |
Banco del Estado de Chile
2.704%, 1/9/25 144A | | | 260,000 | | | | 251 | |
Banco Santander Mexico SA Institucion de Banca Multiple Grupo Financiero Santander Mexico
5.375%, 4/17/25 § | | | 800,000 | | | | 799 | |
Banco Santander SA
3.496%, 3/24/25 | | | 600,000 | | | | 587 | |
5.770%, (US Treasury Yield Curve Rate T Note Constant Maturity 1 Year plus 0.450%), 6/30/24 α | | | 600,000 | | | | 600 | |
Bank Mandiri Persero Tbk PT
5.500%, 4/4/26 § | | | 670,000 | | | | 671 | |
Bank of America Corp.
0.976%, (US SOFR plus 0.690%), 4/22/25 α | | | 605,000 | | | | 595 | |
1.734%, (US SOFR plus 0.960%), 7/22/27 α | | | 450,000 | | | | 412 | |
1.843%, (US SOFR plus 0.670%), 2/5/25 α | | | 460,000 | | | | 458 | |
3.384%, (US SOFR plus 1.330%), 4/2/26 α | | | 580,000 | | | | 564 | |
3.841%, (US SOFR plus 1.110%), 4/25/25 α | | | 415,000 | | | | 412 | |
5.080%, (US SOFR plus 1.290%), 1/20/27 α | | | 395,000 | | | | 394 | |
Bank of Montreal
3.700%, 6/7/25 | | | 775,000 | | | | 759 | |
4.250%, 9/14/24 | | | 390,000 | | | | 386 | |
5.300%, 6/5/26 | | | 455,000 | | | | 459 | |
5.920%, 9/25/25 | | | 1,100,000 | | | | 1,117 | |
The Bank of New York Mellon Corp.
4.414%, (US SOFR plus 1.345%), 7/24/26 α | | | 515,000 | | | | 509 | |
4.947%, (US SOFR plus 1.026%), 4/26/27 α | | | 560,000 | | | | 560 | |
5.148%, (US SOFR plus 1.067%), 5/22/26 α | | | 410,000 | | | | 410 | |
The Accompanying Notes are an Integral Part of the Financial Statements.
105
Short-Term Bond Portfolio
| | | | | | | | |
| Corporate Bonds (49.4%) | | Shares/ Par + | | Value $ (000’s) | |
Financial continued | | | | | | | | |
Banque Federative du Credit Mutuel SA
0.650%, 2/27/24 144A | | | 505,000 | | | | 501 | |
0.998%, 2/4/25 144A | | | 665,000 | | | | 634 | |
4.935%, 1/26/26 144A | | | 400,000 | | | | 399 | |
Barclays PLC
| | | | | | | | |
5.304%, (US Treasury Yield Curve Rate T Note Constant Maturity 1 Year plus 2.300%), 8/9/26 α | | | 385,000 | | | | 383 | |
7.325%, (US Treasury Yield Curve Rate T Note Constant Maturity 1 Year plus 3.050%), 11/2/26 α | | | 390,000 | | | | 403 | |
Brighthouse Financial Global Funding
1.000%, 4/12/24 144A | | | 495,000 | | | | 488 | |
1.550%, 5/24/26 144A | | | 145,000 | | | | 133 | |
Brixmor Operating Partnership LP
3.650%, 6/15/24 | | | 440,000 | | | | 434 | |
CaixaBank SA
| | | | | | | | |
6.208%, (US SOFR plus 2.700%), 1/18/29 144A α | | | 590,000 | | | | 602 | |
6.684%, (US SOFR plus 2.080%), 9/13/27 144A α | | | 615,000 | | | | 630 | |
Capital One Financial Corp.
2.636%, (US SOFR plus 1.290%), 3/3/26 α | | | 585,000 | | | | 561 | |
4.250%, 4/30/25 | | | 120,000 | | | | 118 | |
4.985%, (US SOFR plus 2.160%), 7/24/26 α | | | 460,000 | | | | 455 | |
6.312%, (US SOFR plus 2.640%), 6/8/29 α | | | 255,000 | | | | 262 | |
7.149%, (US SOFR plus 2.440%), 10/29/27 α | | | 240,000 | | | | 249 | |
The Charles Schwab Corp.
2.450%, 3/3/27 | | | 1,316,000 | | | | 1,225 | |
4.200%, 3/24/25 | | | 525,000 | | | | 519 | |
Citigroup, Inc.
0.981%, (US SOFR plus 0.669%), 5/1/25 α | | | 500,000 | | | | 491 | |
3.106%, (US SOFR plus 2.842%), 4/8/26 α | | | 650,000 | | | | 632 | |
4.140%, (US SOFR plus 1.372%), 5/24/25 α | | | 555,000 | | | | 552 | |
4.400%, 6/10/25 | | | 250,000 | | | | 247 | |
CNO Global Funding
1.650%, 1/6/25 144A | | | 685,000 | | | | 654 | |
1.750%, 10/7/26 144A | | | 830,000 | | | | 750 | |
Cooperatieve Rabobank UA
3.875%, 8/22/24 | | | 355,000 | | | | 351 | |
Corebridge Financial, Inc.
3.500%, 4/4/25 | | | 455,000 | | | | 444 | |
Credit Suisse AG
0.495%, 2/2/24 | | | 485,000 | | | | 483 | |
Creditcorp, Ltd.
2.750%, 6/17/25 144A | | | 200,000 | | | | 191 | |
Crown Castle International Corp.
1.050%, 7/15/26 | | | 615,000 | | | | 555 | |
2.900%, 3/15/27 | | | 580,000 | | | | 542 | |
4.450%, 2/15/26 | | | 570,000 | | | | 561 | |
5.000%, 1/11/28 | | | 185,000 | | | | 184 | |
Crown Castle, Inc.
5.600%, 6/1/29 | | | 295,000 | | | | 302 | |
Danske Bank A/S
| | | | | | | | |
3.773%, (US Treasury Yield Curve Rate T Note Constant Maturity 1 Year plus 1.450%), 3/28/25 144A α | | | 405,000 | | | | 403 | |
5.375%, 1/12/24 144A | | | 455,000 | | | | 455 | |
| | | | | | | | |
| Corporate Bonds (49.4%) | | Shares/ Par + | | Value $ (000’s) | |
Financial continued | | | | | | | | |
6.259%, (US Treasury Yield Curve Rate T Note Constant Maturity 1 Year plus 1.180%), 9/22/26 144A α | | | 265,000 | | | | 270 | |
Discover Bank
2.450%, 9/12/24 | | | 580,000 | | | | 566 | |
Equitable Financial Life Global Funding
1.000%, 1/9/26 144A | | | 210,000 | | | | 192 | |
1.100%, 11/12/24 144A | | | 530,000 | | | | 510 | |
1.400%, 7/7/25 144A | | | 75,000 | | | | 71 | |
1.700%, 11/12/26 144A | | | 305,000 | | | | 275 | |
Essex Portfolio LP
3.875%, 5/1/24 | | | 600,000 | | | | 596 | |
Fifth Third Bancorp
6.339%, (US SOFR plus 2.340%), 7/27/29 α | | | 210,000 | | | | 219 | |
Fifth Third Bank NA
2.250%, 2/1/27 | | | 250,000 | | | | 231 | |
5.852%, (US SOFR Index plus 1.230%), 10/27/25 α | | | 1,235,000 | | | | 1,232 | |
First American Financial Corp.
4.600%, 11/15/24 | | | 195,000 | | | | 193 | |
The Goldman Sachs Group, Inc.
1.757%, (US SOFR plus 0.730%), 1/24/25 α | | | 565,000 | | | | 563 | |
3.500%, 4/1/25 | | | 490,000 | | | | 479 | |
4.482%, (US SOFR plus 1.725%), 8/23/28 α | | | 465,000 | | | | 457 | |
5.700%, 11/1/24 | | | 230,000 | | | | 231 | |
5.798%, (US SOFR plus 1.075%), 8/10/26 α | | | 625,000 | | | | 631 | |
5.824%, (US SOFR plus 0.505%), 9/10/24 | | | 335,000 | | | | 334 | |
5.828%, (US SOFR plus 0.486%), 10/21/24 | | | 315,000 | | | | 315 | |
HSBC Holdings PLC
1.645%, (US SOFR plus 1.538%), 4/18/26 α | | | 910,000 | | | | 865 | |
Huntington National Bank
5.699%, (US SOFR plus 1.215%), 11/18/25 α | | | 270,000 | | | | 267 | |
ING Groep NV
6.083%, (US SOFR plus 1.560%), 9/11/27 α | | | 360,000 | | | | 367 | |
Jackson National Life Global Funding
1.750%, 1/12/25 144A | �� | | 620,000 | | | | 594 | |
JPMorgan Chase & Co.
| | | | | | | | |
0.824%, (US SOFR 3 Month plus 0.540%), 6/1/25 α | | | 560,000 | | | | 548 | |
2.083%, (US SOFR plus 1.850%), 4/22/26 α | | | 890,000 | | | | 852 | |
4.080%, (US SOFR plus 1.320%), 4/26/26 α | | | 865,000 | | | | 851 | |
6.234%, (US SOFR plus 0.885%), 4/22/27 | | | 350,000 | | | | 349 | |
Kilroy Realty LP
4.375%, 10/1/25 | | | 180,000 | | | | 175 | |
LeasePlan Corp. NV
2.875%, 10/24/24 144A | | | 1,005,000 | | | | 982 | |
LPL Financial Holdings, Inc.
6.750%, 11/17/28 | | | 190,000 | | | | 203 | |
LSEGA Financing PLC
0.650%, 4/6/24 144A | | | 1,105,000 | | | | 1,089 | |
Marsh & McLennan Cos., Inc.
3.750%, 3/14/26 | | | 105,000 | | | | 103 | |
3.875%, 3/15/24 | | | 345,000 | | | | 344 | |
Metropolitan Life Global Funding I 0.400%, 1/7/24 144A | | | 430,000 | | | | 430 | |
Mitsubishi UFJ Financial Group, Inc.
| | | | | | | | |
0.953%, (US Treasury Yield Curve Rate T Note
Constant Maturity 1 Year plus 0.550%), 7/19/25 α | | | 785,000 | | | | 765 | |
The Accompanying Notes are an Integral Part of the Financial Statements.
106
Short-Term Bond Portfolio
| | | | | | | | |
| Corporate Bonds (49.4%) | | Shares/ Par + | | Value $ (000’s) | |
Financial continued | | | | | | | | |
Morgan Stanley
| | | | | | | | |
1.164%, (US SOFR plus 0.560%), 10/21/25 α | | | 445,000 | | | | 428 | |
2.630%, (US SOFR plus 0.940%), 2/18/26 α | | | 545,000 | | | | 527 | |
3.620%, (US SOFR plus 1.160%), 4/17/25 α | | | 390,000 | | | | 388 | |
5.050%, (US SOFR plus 1.295%), 1/28/27 α | | | 225,000 | | | | 225 | |
6.138%, (US SOFR plus 1.770%), 10/16/26 α | | | 525,000 | | | | 534 | |
Morgan Stanley Bank NA
4.754%, 4/21/26 | | | 475,000 | | | | 475 | |
Nasdaq, Inc.
5.650%, 6/28/25 | | | 95,000 | | | | 96 | |
NatWest Markets PLC
0.800%, 8/12/24 144A | | | 390,000 | | | | 378 | |
Northern Trust Corp.
3.950%, 10/30/25 | | | 330,000 | | | | 324 | |
Park Aerospace Holdings, Ltd.
5.500%, 2/15/24 144A | | | 245,000 | | | | 245 | |
The PNC Financial Services Group, Inc. | | | | | | | | |
4.758%, (US SOFR Index plus 1.085%), 1/26/27 α | | | 575,000 | | | | 570 | |
5.671%, (US SOFR Index plus 1.090%), 10/28/25 α | | | 760,000 | | | | 760 | |
5.812%, (US SOFR plus 1.322%), 6/12/26 α | | | 215,000 | | | | 216 | |
Principal Life Global Funding II
0.750%, 4/12/24 144A | | | 530,000 | | | | 522 | |
Public Storage
5.125%, 1/15/29 | | | 205,000 | | | | 212 | |
5.819%, (US SOFR plus 0.470%), 4/23/24 | | | 280,000 | | | | 280 | |
QNB Finance, Ltd.
3.500%, 3/28/24 § | | | 880,000 | | | | 875 | |
Realty Income Corp.
5.050%, 1/13/26 | | | 140,000 | | | | 140 | |
Santander Holdings USA, Inc.
2.490%, (US SOFR plus 1.249%), 1/6/28 α | | | 410,000 | | | | 375 | |
SBA Tower Trust
1.631%, 5/15/51 144A | | | 280,000 | | | | 250 | |
1.884%, 1/15/26 144A | | | 160,000 | | | | 148 | |
2.836%, 1/15/50 144A | | | 770,000 | | | | 744 | |
3.869%, 10/15/49 144A | | | 120,000 | | | | 118 | |
6.599%, 11/15/52 144A | | | 325,000 | | | | 334 | |
Simon Property Group LP
2.000%, 9/13/24 | | | 225,000 | | | | 220 | |
3.375%, 10/1/24 | | | 450,000 | | | | 443 | |
Standard Chartered PLC | | | | | | | | |
0.991%, (US Treasury Yield Curve Rate T Note Constant Maturity 1 Year plus 0.780%), 1/12/25 144A α | | | 220,000 | | | | 220 | |
1.822%, (US Treasury Yield Curve Rate T Note Constant Maturity 1 Year plus 0.950%), 11/23/25 144A α | | | 255,000 | | | | 246 | |
State Street Corp.
4.857%, (US SOFR plus 0.604%), 1/26/26 α | | | 245,000 | | | | 244 | |
5.104%, (US SOFR plus 1.130%), 5/18/26 α | | | 385,000 | | | | 385 | |
5.272%, 8/3/26 | | | 685,000 | | | | 695 | |
Svenska Handelsbanken AB
0.550%, 6/11/24 144A | | | 420,000 | | | | 410 | |
Synchrony Financial
4.250%, 8/15/24 | | | 1,130,000 | | | | 1,118 | |
| | | | | | | | |
| Corporate Bonds (49.4%) | | Shares/ Par + | | Value $ (000’s) | |
Financial continued | | | | | | | | |
The Toronto-Dominion Bank
4.285%, 9/13/24 | | | 985,000 | | | | 977 | |
5.532%, 7/17/26 | | | 970,000 | | | | 988 | |
Truist Financial Corp.
5.729%, (US SOFR plus 0.400%), 6/9/25 | | | 410,000 | | | | 404 | |
UBS AG
0.700%, 8/9/24 144A | | | 280,000 | | | | 272 | |
UBS Group AG | | | | | | | | |
1.494%, (US Treasury Yield Curve Rate T Note Constant Maturity 1 Year plus 0.850%), 8/10/27 144A α | | | 215,000 | | | | 194 | |
4.488%, (US Treasury Yield Curve Rate T Note Constant Maturity 1 Year plus 1.550%), 5/12/26 144A α | | | 200,000 | | | | 197 | |
4.490%, (US Treasury Yield Curve Rate T Note Constant Maturity 1 Year plus 1.600%), 8/5/25 144A α | | | 565,000 | | | | 561 | |
6.327%, (US Treasury Yield Curve Rate T Note Constant Maturity 1 Year plus 1.600%), 12/22/27 144A α | | | 425,000 | | | | 438 | |
US Bancorp
4.548%, (US SOFR plus 1.660%), 7/22/28 α | | | 1,080,000 | | | | 1,064 | |
5.727%, (US SOFR plus 1.430%), 10/21/26 α | | | 320,000 | | | | 322 | |
Wells Fargo & Co.
2.188%, (US SOFR plus 2.000%), 4/30/26 α | | | 400,000 | | | | 383 | |
3.526%, (US SOFR plus 1.510%), 3/24/28 α | | | 375,000 | | | | 358 | |
3.908%, (US SOFR plus 1.320%), 4/25/26 α | | | 610,000 | | | | 598 | |
4.540%, (US SOFR plus 1.560%), 8/15/26 α | | | 590,000 | | | | 584 | |
The Western Union Co.
2.850%, 1/10/25 | | | 1,225,000 | | | | 1,190 | |
WP Carey, Inc.
4.600%, 4/1/24 | | | 805,000 | | | | 802 | |
| | | | | | | | |
Total | | | | | | | 73,031 | |
| | | | | | | | |
| | |
Industrial (2.7%) | | | | | | | | |
Amcor Flexibles North America, Inc.
4.000%, 5/17/25 | | | 450,000 | | | | 442 | |
Amphenol Corp.
2.050%, 3/1/25 | | | 405,000 | | | | 391 | |
4.750%, 3/30/26 | | | 205,000 | | | | 205 | |
Canadian Pacific Railway Co.
1.350%, 12/2/24 | | | 725,000 | | | | 699 | |
1.750%, 12/2/26 | | | 315,000 | | | | 291 | |
Carrier Global Corp.
2.242%, 2/15/25 | | | 117,000 | | | | 113 | |
DAE Funding LLC
1.550%, 8/1/24 144A | | | 265,000 | | | | 258 | |
Deere & Co.
2.750%, 4/15/25 | | | 195,000 | | | | 190 | |
GATX Corp.
3.250%, 3/30/25 | | | 870,000 | | | | 847 | |
3.250%, 9/15/26 | | | 360,000 | | | | 343 | |
3.850%, 3/30/27 | | | 164,000 | | | | 157 | |
4.350%, 2/15/24 | | | 772,000 | | | | 770 | |
Mohawk Industries, Inc.
5.850%, 9/18/28 | | | 310,000 | | | | 321 | |
Otis Worldwide Corp.
2.056%, 4/5/25 | | | 485,000 | | | | 466 | |
The Accompanying Notes are an Integral Part of the Financial Statements.
107
Short-Term Bond Portfolio
| | | | | | | | |
| Corporate Bonds (49.4%) | | Shares/ Par + | | Value $ (000’s) | |
Industrial continued | | | | | | | | |
Owens Corning, Inc.
3.400%, 8/15/26 | | | 66,000 | | | | 64 | |
Parker Hannifin Corp.
3.650%, 6/15/24 | | | 875,000 | | | | 867 | |
Penske Truck Leasing Co. LP / PTL Finance Corp.
2.700%, 11/1/24 144A | | | 497,000 | | | | 483 | |
3.450%, 7/1/24 144A | | | 200,000 | | | | 198 | |
3.900%, 2/1/24 144A | | | 620,000 | | | | 619 | |
5.750%, 5/24/26 144A | | | 495,000 | | | | 499 | |
Regal Rexnord Corp.
6.050%, 2/15/26 144A | | | 370,000 | | | | 374 | |
Republic Services, Inc.
0.875%, 11/15/25 | | | 120,000 | | | | 111 | |
2.500%, 8/15/24 | | | 495,000 | | | | 486 | |
4.875%, 4/1/29 | | | 170,000 | | | | 173 | |
SMBC Aviation Capital Finance DAC
3.550%, 4/15/24 144A | | | 400,000 | | | | 397 | |
Tyco Electronics Group SA
4.500%, 2/13/26 | | | 530,000 | | | | 528 | |
| | | | | | | | |
Total | | | | | | | 10,292 | |
| | | | | | | | |
| | |
Technology (2.7%) | | | | | | | | |
Analog Devices, Inc. | | | | | | | | |
5.603%, (US SOFR Index plus 0.250%), 10/1/24 | | | 170,000 | | | | 170 | |
CDW LLC / CDW Finance Corp.
5.500%, 12/1/24 | | | 180,000 | | | | 179 | |
Fidelity National Information Services, Inc.
0.600%, 3/1/24 | | | 310,000 | | | | 307 | |
4.500%, 7/15/25 | | | 305,000 | | | | 302 | |
Fiserv, Inc.
2.750%, 7/1/24 | | | 800,000 | | | | 788 | |
Fortinet, Inc.
1.000%, 3/15/26 | | | 380,000 | | | | 348 | |
Intuit, Inc.
5.250%, 9/15/26 | | | 965,000 | | | | 984 | |
Microchip Technology, Inc.
0.972%, 2/15/24 | | | 685,000 | | | | 681 | |
0.983%, 9/1/24 | | | 560,000 | | | | 543 | |
Micron Technology, Inc.
4.185%, 2/15/27 | | | 95,000 | | | | 93 | |
4.975%, 2/6/26 | | | 100,000 | | | | 100 | |
5.375%, 4/15/28 | | | 575,000 | | | | 585 | |
NXP BV / NXP Funding LLC
4.875%, 3/1/24 | | | 520,000 | | | | 519 | |
NXP BV / NXP Funding LLC / NXP USA, Inc.
2.700%, 5/1/25 | | | 445,000 | | | | 429 | |
3.150%, 5/1/27 | | | 40,000 | | | | 38 | |
3.875%, 6/18/26 | | | 340,000 | | | | 331 | |
4.400%, 6/1/27 | | | 80,000 | | | | 79 | |
Oracle Corp.
2.500%, 4/1/25 | | | 1,250,000 | | | | 1,208 | |
Qorvo, Inc.
1.750%, 12/15/24 | | | 275,000 | | | | 264 | |
Roper Technologies, Inc.
1.000%, 9/15/25 | | | 115,000 | | | | 108 | |
2.350%, 9/15/24 | | | 165,000 | | | | 161 | |
Take-Two Interactive Software, Inc.
3.300%, 3/28/24 | | | 19,000 | | | | 19 | |
| | | | | | | | |
| Corporate Bonds (49.4%) | | Shares/ Par + | | Value $ (000’s) | |
Technology continued | | | | | | | | |
3.550%, 4/14/25 | | | 295,000 | | | | 289 | |
5.000%, 3/28/26 | | | 585,000 | | | | 588 | |
Western Digital Corp.
4.750%, 2/15/26 | | | 990,000 | | | | 971 | |
Workday, Inc.
3.500%, 4/1/27 | | | 265,000 | | | | 256 | |
| | | | | | | | |
Total | | | | | | | 10,340 | |
| | | | | | | | |
| | |
Utilities (3.0%) | | | | | | | | |
The AES Corp.
3.300%, 7/15/25 144A | | | 365,000 | | | | 352 | |
American Electric Power Co., Inc.
5.200%, 1/15/29 | | | 675,000 | | | | 684 | |
APT Pipelines, Ltd.
4.200%, 3/23/25 144A | | | 1,335,000 | | | | 1,315 | |
Constellation Energy Generation, LLC
5.600%, 3/1/28 | | | 315,000 | | | | 324 | |
DTE Energy Co.
4.220%, 11/1/24 | | | 550,000 | | | | 544 | |
Enel Finance International NV
1.375%, 7/12/26 144A | | | 645,000 | | | | 587 | |
2.650%, 9/10/24 144A | | | 1,000,000 | | | | 976 | |
6.800%, 10/14/25 144A | | | 200,000 | | | | 205 | |
NextEra Energy Capital Holdings, Inc.
1.875%, 1/15/27 | | | 685,000 | | | | 630 | |
4.450%, 6/20/25 | | | 540,000 | | | | 535 | |
5.749%, 9/1/25 | | | 280,000 | | | | 283 | |
6.051%, 3/1/25 | | | 255,000 | | | | 257 | |
NiSource, Inc.
5.250%, 3/30/28 | | | 130,000 | | | | 133 | |
NRG Energy, Inc.
3.750%, 6/15/24 144A | | | 270,000 | | | | 267 | |
Pacific Gas & Electric Co.
3.500%, 6/15/25 | | | 555,000 | | | | 538 | |
Sempra Energy
3.300%, 4/1/25 | | | 385,000 | | | | 376 | |
5.400%, 8/1/26 | | | 270,000 | | | | 273 | |
Southern California Gas Co.
2.950%, 4/15/27 | | | 410,000 | | | | 389 | |
Vistra Operations Co. LLC
3.550%, 7/15/24 144A | | | 2,390,000 | | | | 2,356 | |
5.125%, 5/13/25 144A | | | 610,000 | | | | 604 | |
| | | | | | | | |
Total | | | | | | | 11,628 | |
| | | | | | | | |
| |
Total Corporate Bonds (Cost: $192,945) | | | | 190,454 | |
| | | | | | | | |
| | |
Governments (18.8%) | | | | | | | | |
Governments (18.8%) | | | | | | | | |
Federal Home Loan Bank
5.000%, 2/28/25 | | | 1,390,000 | | | | 1,395 | |
Korea Electric Power Corp.
5.375%, 4/6/26 144A | | | 1,000,000 | | | | 1,010 | |
Korea Housing Finance Corp.
4.625%, 2/24/28 144A | | | 960,000 | | | | 958 | |
Korea Hydro & Nuclear Power Co., Ltd.
1.250%, 4/27/26 144A | | | 795,000 | | | | 730 | |
4.250%, 7/27/27 144A | | | 220,000 | | | | 216 | |
5.000%, 7/18/28 144A | | | 250,000 | | | | 252 | |
The Accompanying Notes are an Integral Part of the Financial Statements.
108
Short-Term Bond Portfolio
| | | | | | | | |
| Governments (18.8%) | | Shares/ Par + | | Value $ (000’s) | |
Governments continued | | | | | | | | |
US Treasury
3.500%, 9/15/25 | | | 8,965,000 | | | | 8,833 | |
4.000%, 12/15/25 | | | 1,025,000 | | | | 1,020 | |
4.500%, 11/15/25 | | | 10,210,000 | | | | 10,244 | |
4.875%, 11/30/25 | | | 2,635,000 | | | | 2,662 | |
5.000%, 8/31/25 | | | 4,845,000 | | | | 4,890 | |
5.000%, 9/30/25 b | | | 20,630,000 | | | | 20,840 | |
5.000%, 10/31/25 | | | 19,090,000 | | | | 19,308 | |
| | | | | | | | |
Total | | | | | | | 72,358 | |
| | | | | | | | |
| |
Total Governments (Cost: $71,813) | | | | 72,358 | |
| | | | | | | | |
| | |
| Municipal Bonds (0.1%) | | | | | |
Municipal Bonds (0.1%) | | | | | | | | |
Golden State Tobacco Securitization Corp.
1.711%, 6/1/24 RB | | | 435,000 | | | | 428 | |
| | | | | | | | |
Total Municipal Bonds (Cost: $435) | | | | 428 | |
| | | | | | | | |
| | |
| Structured Products (29.2%) | | | | | |
Asset Backed Securities (14.5%) | | | | | | | | |
Ally Auto Receivables Trust, Series 2023-A, Class B
6.010%, 1/17/34 144A | | | 89,190 | | | | 89 | |
Ally Auto Receivables Trust, Series 2023-A, Class C
6.080%, 1/17/34 144A | | | 165,680 | | | | 167 | |
AmeriCredit Automobile Receivables Trust, Series 2020-1, Class C
1.590%, 10/20/25 | | | 118,558 | | | | 118 | |
AmeriCredit Automobile Receivables Trust, Series 2020-1, Class D
1.800%, 12/18/25 | | | 315,000 | | | | 308 | |
AmeriCredit Automobile Receivables Trust, Series 2020-3, Class C
1.060%, 8/18/26 | | | 245,000 | | | | 236 | |
AmeriCredit Automobile Receivables Trust, Series 2021-1, Class C
0.890%, 10/19/26 | | | 430,000 | | | | 411 | |
AmeriCredit Automobile Receivables Trust, Series 2021-1, Class D
1.210%, 12/18/26 | | | 270,000 | | | | 252 | |
AmeriCredit Automobile Receivables Trust, Series 2021-2, Class D
1.290%, 6/18/27 | | | 575,000 | | | | 531 | |
AmeriCredit Automobile Receivables Trust, Series 2023-1, Class C
5.800%, 12/18/28 | | | 380,000 | | | | 383 | |
Auxilior Term Funding LLC, Series 2023-1A, Class A2
6.180%, 12/15/28 144A | | | 575,000 | | | | 577 | |
Avis Budget Rental Car Funding AESOP LLC, Series 2018-2A, Class C
4.950%, 3/20/25 144A | | | 97,500 | | | | 97 | |
Avis Budget Rental Car Funding AESOP LLC, Series 2019-2A, Class A
3.350%, 9/22/25 144A | | | 340,000 | | | | 336 | |
| | | | | | | | |
| Structured Products (29.2%) | | Shares/ Par + | | Value $ (000’s) | |
Asset Backed Securities continued | | | | | | | | |
Avis Budget Rental Car Funding AESOP LLC, Series 2020-1A, Class A
2.330%, 8/20/26 144A | | | 250,000 | | | | 239 | |
AXIS Equipment Finance Receivables LLC,
Series 2021-1A, Class D
2.300%, 11/22/27 144A | | | 280,000 | | | | 269 | |
Ballyrock, Ltd. | | | | | | | | |
6.715%, (US SOFR 3 Month plus 1.322%), 4/15/34 144A | | | 250,000 | | | | 249 | |
BRE Grand Islander Timeshare Issuer LLC, Series 2019-A, Class A
3.280%, 9/26/33 144A | | | 117,756 | | | | 112 | |
CarMax Auto Owner Trust, Series 2020-1, Class B
2.210%, 9/15/25 | | | 430,000 | | | | 427 | |
CarMax Auto Owner Trust, Series 2020-1, Class C
2.340%, 11/17/25 | | | 190,000 | | | | 189 | |
CarMax Auto Owner Trust, Series 2020-4, Class D
1.750%, 4/15/27 | | | 300,000 | | | | 288 | |
CarMax Auto Owner Trust, Series 2023-2, Class C
5.570%, 11/15/28 | | | 585,000 | | | | 583 | |
CarMax Auto Owner Trust, Series 2023-2, Class D
6.550%, 10/15/29 | | | 390,000 | | | | 389 | |
CarMax Auto Owner Trust, Series 2023-3, Class B
5.470%, 2/15/29 | | | 225,000 | | | | 226 | |
CarMax Auto Owner Trust, Series 2023-3, Class C
5.610%, 2/15/29 | | | 655,000 | | | | 657 | |
CarMax Auto Owner Trust, Series 2023-3, Class D
6.440%, 12/16/30 | | | 210,000 | | | | 211 | |
Cedar Funding, Ltd., Series 2018-7A, Class A1 | | | | | | | | |
6.677%, (US SOFR 3 Month plus 1.262%), 1/20/31 144A | | | 282,890 | | | | 282 | |
Cedar Funding, Ltd., Series 2021-14A, Class A | | | | | | | | |
6.755%, (US SOFR 3 Month plus 1.362%), 7/15/33 144A | | | 695,000 | | | | 694 | |
CIFC Funding, Ltd., Series 2014-2RA, Class A1 | | | | | | | | |
6.710%, (US SOFR 3 Month plus 1.312%), 4/24/30 144A | | | 729,417 | | | | 729 | |
CIFC Funding, Ltd., Series 2021-4A, Class A | | | | | | | | |
6.705%, (US SOFR 3 Month plus 1.312%), 7/15/33 144A | | | 905,000 | | | | 905 | |
Dell International LLC
6.750%, 10/22/29 144A | | | 100,000 | | | | 102 | |
DLLAA LLC, Series 2023-1A, Class A3
5.640%, 2/22/28 144A | | | 395,000 | | | | 401 | |
Driven Brands Funding LLC, Series 2018-1A, Class A2
4.739%, 4/20/48 144A | | | 193,725 | | | | 189 | |
Dryden Senior Loan Fund, Series 2020-86A, Class A1R | | | | | | | | |
6.764%, (US SOFR 3 Month plus 1.362%), 7/17/34 144A | | | 610,000 | | | | 609 | |
The Accompanying Notes are an Integral Part of the Financial Statements.
109
Short-Term Bond Portfolio
| | | | | | | | |
| Structured Products (29.2%) | | Shares/ Par + | | Value $ (000’s) | |
Asset Backed Securities continued | | | | | | | | |
Elara HGV Timeshare Issuer LLC, Series 2017-A, Class A
2.690%, 3/25/30 144A | | | 21,618 | | | | 21 | |
Elara HGV Timeshare Issuer LLC, Series 2019-A, Class A
2.610%, 1/25/34 144A | | | 117,100 | | | | 112 | |
Elara HGV Timeshare Issuer LLC, Series 2023-A, Class A
6.160%, 2/25/38 144A | | | 283,159 | | | | 289 | |
Elara HGV Timeshare Issuer LLC, Series 2023-A, Class C
7.300%, 2/25/38 144A | | | 246,023 | | | | 252 | |
Enterprise Fleet Financing LLC, Series 2023- 2, Class A2
5.560%, 4/22/30 144A | | | 625,000 | | | | 627 | |
Enterprise Fleet Financing LLC, Series 2023- 3, Class A2
6.400%, 3/20/30 144A | | | 630,000 | | | | 644 | |
Exeter Automobile Receivables Trust, Series 2022-2A, Class C
3.850%, 7/17/28 | | | 655,000 | | | | 642 | |
Exeter Automobile Receivables Trust, Series 2022-3A, Class C
5.300%, 9/15/27 | | | 190,000 | | | | 189 | |
Exeter Automobile Receivables Trust, Series 2022-4A, Class D
5.980%, 12/15/28 | | | 305,000 | | | | 302 | |
Exeter Automobile Receivables Trust, Series 2022-5A, Class C
6.510%, 12/15/27 | | | 965,000 | | | | 972 | |
Exeter Automobile Receivables Trust, Series 2022-6A, Class A3
5.700%, 8/17/26 | | | 100,000 | | | | 100 | |
Exeter Automobile Receivables Trust, Series 2023-1A, Class D
6.690%, 6/15/29 | | | 80,000 | | | | 81 | |
Finance of America HECM Buyout, Series 2022-HB2, Class A1A
4.000%, (AFC), 8/1/32 144A | �� | | 466,784 | | | | 457 | |
FirstKey Homes Trust, Series 2020-SFR1, Class D
2.241%, 8/17/37 144A | | | 1,080,000 | | | | 1,009 | |
FirstKey Homes Trust, Series 2020-SFR2, Class D
1.968%, 10/19/37 144A | | | 655,000 | | | | 607 | |
Ford Credit Auto Lease Trust, Series 2023-B,
Class B
6.200%, 2/15/27 | | | 150,000 | | | | 152 | |
Ford Credit Auto Lease Trust, Series 2023-B,
Class C
6.430%, 4/15/27 | | | 285,000 | | | | 290 | |
Ford Credit Auto Owner Trust, Series 2020-1,
Class B
2.290%, 8/15/31 144A | | | 445,000 | | | | 428 | |
Ford Credit Auto Owner Trust, Series 2020-2,
Class C
1.740%, 4/15/33 144A | | | 310,000 | | | | 288 | |
Ford Credit Auto Owner Trust, Series 2022-A,
Class C
4.180%, 10/15/25 | | | 1,020,000 | | | | 1,005 | |
| | | | | | | | |
| Structured Products (29.2%) | | Shares/ Par + | | | Value $ (000’s) | |
Asset Backed Securities continued | | | | | | | | |
Ford Credit Auto Owner Trust, Series 2023-A, Class B
5.070%, 1/15/29 | | | 905,000 | | | | 900 | |
Ford Credit Floorplan Master Owner Trust, Series 2023-1, Class C
5.750%, 5/15/28 144A | | | 245,000 | | | | 244 | |
Ford Credit Floorplan Master Owner Trust, Series 2023-1, Class D
6.620%, 5/15/28 144A | | | 295,000 | | | | 294 | |
GM Financial Automobile Leasing Trust, Series 2022-3, Class C
5.130%, 8/20/26 | | | 585,000 | | | | 581 | |
GM Financial Automobile Leasing Trust, Series 2023-1, Class B
5.030%, 9/18/28 | | | 155,000 | | | | 154 | |
GM Financial Automobile Leasing Trust, Series 2023-1, Class C
5.760%, 1/20/27 | | | 970,000 | | | | 971 | |
GM Financial Consumer Automobile Receivables Trust, Series 2020-4, Class C
1.050%, 5/18/26 | | | 225,000 | | | | 218 | |
Hardee’s Funding LLC, Series 2018-1A, Class A23
5.710%, 6/20/48 144A | | | 236,875 | | | | 220 | |
Hardee’s Funding LLC, Series 2018-1A, Class A21I
4.959%, 6/20/48 144A | | | 667,988 | | | | 640 | |
Hardee’s Funding LLC, Series 2020-1A, Class A2
3.981%, 12/20/50 144A | | | 625,650 | | | | 550 | |
Hilton Grand Vacations Trust, Series 2020-AA, Class A
2.740%, 2/25/39 144A | | | 181,510 | | | | 172 | |
Hilton Grand Vacations Trust, Series 2022-1D, Class A
3.610%, 6/20/34 144A | | | 136,802 | | | | 132 | |
Hilton Grand Vacations Trust, Series 2023-1A, Class B
6.110%, 1/25/38 144A | | | 747,133 | | | | 756 | |
Hilton Grand Vacations Trust, Series 2023-1A, Class C
6.940%, 1/25/38 144A | | | 139,525 | | | | 141 | |
Home Partners of America Trust, Series 2022- 1, Class A
3.930%, 4/17/39 144A | | | 282,029 | | | | 270 | |
HPEFS Equipment Trust, Series 2021-2A, Class D
1.290%, 3/20/29 144A | | | 340,000 | | | | 330 | |
HPEFS Equipment Trust, Series 2023-1A, Class C
5.910%, 4/20/28 144A | | | 355,000 | | | | 356 | |
HPEFS Equipment Trust, Series 2023-2A, Class C
6.480%, 1/21/31 144A | | | 125,000 | | | | 127 | |
HPEFS Equipment Trust, Series 2023-2A, Class D
6.970%, 7/21/31 144A | | | 125,000 | | | | 128 | |
JPMorgan Chase Bank NA, Series 2021-2, Class D
1.138%, 12/26/28 144A | | | 63,990 | | | | 63 | |
The Accompanying Notes are an Integral Part of the Financial Statements.
110
Short-Term Bond Portfolio
| | | | | | | | |
| Structured Products (29.2%) | | Shares/ Par + | | Value $ (000’s) | |
Asset Backed Securities continued | | | | | | | | |
KKR Financial CLO, Ltd., Series 2021-29A, Class A | | | | | | | | |
6.855%, (US SOFR 3 Month plus 1.462%), 1/15/32 144A | | | 1,000,000 | | | | 998 | |
Madison Park Funding, Ltd., Series 2017-23A, Class AR | | | | | | | | |
6.619%, (US SOFR 3 Month plus 1.232%), 7/27/31 144A | | | 693,809 | | | | 693 | |
Madison Park Funding, Ltd., Series 2017-23A, Class BR | | | | | | | | |
7.199%, (US SOFR 3 Month plus 1.812%), 7/27/31 144A | | | 710,000 | | | | 706 | |
Madison Park Funding, Ltd., Series 2019-37A, Class AR | | | | | | | | |
6.725%, (US SOFR 3 Month plus 1.332%), 7/15/33 144A | | | 450,000 | | | | 449 | |
Madison Park Funding, Ltd., Series 2022-33A, Class AR | | | | | | | | |
6.684%, (US SOFR 3 Month plus 1.290%), 10/15/32 144A | | | 1,025,000 | | | | 1,022 | |
Magnetite CLO, Ltd., Series 2020-25A, Class A | | | | | | | | |
6.840%, (US SOFR 3 Month plus 1.462%), 1/25/32 144A | | | 965,000 | | | | 965 | |
MidOcean Credit CLO XI, Ltd. | | | | | | | | |
7.096%, (US SOFR 3 Month plus 1.730%), 10/18/33 144A | | | 305,000 | | | | 304 | |
8.016%, (US SOFR 3 Month plus 2.650%), 10/18/33 144A | | | 455,000 | | | | 455 | |
MVW Owner Trust, Series 2019-2A, Class A
2.440%, 10/20/38 144A | | | 52,269 | | | | 49 | |
MVW Owner Trust, Series 2020-1A, Class A
1.740%, 10/20/37 144A | | | 259,264 | | | | 243 | |
MVW Owner Trust, Series 2020-1A, Class B
2.730%, 10/20/37 144A | | | 144,642 | | | | 137 | |
MVW Owner Trust, Series 2021-1WA, Class B
1.440%, 1/22/41 144A | | | 46,922 | | | | 43 | |
MVW Owner Trust, Series 2021-1WA, Class C
1.940%, 1/22/41 144A | | | 69,444 | | | | 64 | |
MVW Owner Trust, Series 2023-1A, Class A
4.930%, 10/20/40 144A | | | 703,447 | | | | 699 | |
MVW Owner Trust, Series 2023-2A, Class A
6.180%, 11/20/40 144A | | | 507,009 | | | | 518 | |
MVW Owner Trust, Series 2023-2A, Class B
6.330%, 11/20/40 144A | | | 108,293 | | | | 111 | |
Navient Private Education Refi Loan Trust, Series 2019-A, Class A2A
3.420%, 1/15/43 144A | | | 128,904 | | | | 125 | |
Navient Private Education Refi Loan Trust, Series 2019-D, Class A2A
3.010%, 12/15/59 144A | | | 164,570 | | | | 155 | |
Navient Private Education Refi Loan Trust, Series 2019-EA, Class A2A
2.640%, 5/15/68 144A | | | 224,509 | | | | 213 | |
Navient Private Education Refi Loan Trust, Series 2020-A, Class A2A
2.460%, 11/15/68 144A | | | 222,912 | | | | 209 | |
Navient Private Education Refi Loan Trust, Series 2020-CA, Class A2A
2.150%, 11/15/68 144A | | | 825,728 | | | | 765 | |
| | | | | | | | |
| Structured Products (29.2%) | | Shares/ Par + | | Value $ (000’s) | |
Asset Backed Securities continued | | | | | | | | |
Navient Private Education Refi Loan Trust, Series 2020-DA, Class A
1.690%, 5/15/69 144A | | | 154,279 | | | | 140 | |
Navient Private Education Refi Loan Trust, Series 2020-GA, Class A
1.170%, 9/16/69 144A | | | 97,067 | | | | 87 | |
Navient Student Loan Trust, Series 2019-GA, Class A
2.400%, 10/15/68 144A | | | 341,578 | | | | 320 | |
Navient Student Loan Trust, Series 2020-HA, Class A
1.310%, 1/15/69 144A | | | 48,364 | | | | 44 | |
Navistar Financial Dealer Note Master Trust, Series 2023-1, Class A
6.180%, 8/25/28 144A | | | 360,000 | | | | 363 | |
Nelnet Student Loan Trust, Series 2020-1A, Class A
6.210%, (US SOFR 1 Month plus 0.855%), 3/26/68 144A | | | 92,041 | | | | 91 | |
Nelnet Student Loan Trust, Series 2021-CA,
Class AFX
1.320%, 4/20/62 144A | | | 567,086 | | | | 509 | |
Nelnet Student Loan Trust, Series 2021-DA,
Class AFX
1.630%, 4/20/62 144A | | | 199,379 | | | | 182 | |
Neuberger Berman CLO, Ltd., Series 2017-26A, Class BR
7.057%, (US SOFR 3 Month plus 1.662%), 10/18/30 144A | | | 500,000 | | | | 494 | |
Neuberger Berman CLO, Ltd., Series 2019-32A, Class AR | | | | | | | | |
6.648%, (US SOFR 3 Month plus 1.252%), 1/20/32 144A | | | 250,000 | | | | 249 | |
Neuberger Berman CLO, Ltd., Series 2021-40A, Class A | | | | | | | | |
6.715%, (US SOFR 3 Month plus 1.322%), 4/16/33 144A | | | 270,000 | | | | 270 | |
Oaktree CLO, Ltd., Series 2022-2A, Class A1R | | | | | | | | |
6.925%, (US SOFR 3 Month plus 1.550%), 7/15/33 144A | | | 700,000 | | | | 700 | |
OCP CLO, Ltd., Series 2017-13A, Class A2R | | | | | | | | |
7.205%, (US SOFR 3 Month plus 1.812%), 7/15/30 144A | | | 760,000 | | | | 756 | |
Octane Receivables Trust, Series 2021-2A, Class A
1.210%, 9/20/28 144A | | | 111,736 | | | | 109 | |
Octane Receivables Trust, Series 2022-1A, Class B
4.900%, 5/22/28 144A | | | 395,000 | | | | 388 | |
Octane Receivables Trust, Series 2023-1A, Class A
5.870%, 5/21/29 144A | | | 95,352 | | | | 96 | |
Octane Receivables Trust, Series 2023-1A,
Class B
5.960%, 7/20/29 144A | | | 225,000 | | | | 226 | |
Octane Receivables Trust, Series 2023-3A, Class B
6.480%, 7/20/29 144A | | | 135,000 | | | | 138 | |
Octane Receivables Trust, Series 2023-3A, Class C
6.740%, 8/20/29 144A | | | 100,000 | | | | 102 | |
The Accompanying Notes are an Integral Part of the Financial Statements.
111
Short-Term Bond Portfolio
| | | | | | | | |
| Structured Products (29.2%) | | Shares/ Par + | | Value $ (000’s) | |
Asset Backed Securities continued | | | | | | | | |
Octane Receivables Trust, Series 2023-3A, Class D
7.580%, 9/20/29 144A | | | 100,000 | | | | 102 | |
Planet Fitness Master Issuer LLC, Series 2018-A1, Class A2II
4.666%, 9/5/48 144A | | | 805,375 | | | | 786 | |
Progress Residential Trust, Series 2020-SFR2, Class A
2.078%, 6/18/37 144A | | | 154,644 | | | | 147 | |
Progress Residential Trust, Series 2022-SFR6, Class A
4.451%, 7/20/39 144A | | | 524,238 | | | | 505 | |
Santander Bank Auto Credit-Linked Notes, Series 2021-1A, Class B
1.833%, 12/15/31 144A | | | 53,866 | | | | 52 | |
Santander Bank Auto Credit-Linked Notes, Series 2022-B, Class C
5.916%, 8/16/32 144A | | | 110,634 | | | | 110 | |
Santander Bank Auto Credit-Linked Notes, Series 2022-C, Class B
6.451%, 12/15/32 144A | | | 515,804 | | | | 516 | |
Santander Bank Auto Credit-Linked Notes, Series 2023-B, Class A2
5.644%, 12/15/33 144A | | | 250,000 | | | | 251 | |
Santander Bank Auto Credit-Linked Notes, Series 2023-B, Class D
6.663%, 12/15/33 144A | | | 280,000 | | | | 280 | |
Santander Consumer Auto Receivables Trust, Series 2020-BA, Class C
1.290%, 4/15/26 144A | | | 414,867 | | | | 412 | |
Santander Consumer Auto Receivables Trust, Series 2021-AA, Class D
1.570%, 1/15/27 144A | | | 450,000 | | | | 421 | |
Santander Drive Auto Receivables Trust, Series 2020-3, Class D
1.640%, 11/16/26 | | | 190,144 | | | | 187 | |
Santander Drive Auto Receivables Trust, Series 2021-4, Class D
1.670%, 10/15/27 | | | 450,000 | | | | 425 | |
Santander Drive Auto Receivables Trust, Series 2023-1, Class C
5.090%, 5/15/30 | | | 260,000 | | | | 258 | |
Santander Retail Auto Lease Trust, Series
2021-A, Class C
1.140%, 3/20/26 144A | | | 1,030,000 | | | | 1,021 | |
Santander Retail Auto Lease Trust, Series
2021-B, Class D
1.410%, 11/20/25 144A | | | 440,000 | | | | 431 | |
Santander Retail Auto Lease Trust, Series
2021-C, Class C
1.110%, 3/20/26 144A | | | 365,000 | | | | 357 | |
Santander Retail Auto Lease Trust, Series
2022-B, Class B
3.850%, 3/22/27 144A | | | 150,000 | | | | 147 | |
SCF Equipment Leasing Trust, Series 2023-1A, Class A2
6.560%, 1/22/30 144A | | | 225,000 | | | | 227 | |
SCF Equipment Leasing Trust, Series 2023-1A, Class A3
6.170%, 5/20/32 144A | | | 470,000 | | | | 481 | |
| | | | | | | | |
| Structured Products (29.2%) | | Shares/ Par + | | Value $ (000’s) | |
Asset Backed Securities continued | | | | | | | | |
Sierra Receivables Funding Co. LLC, Series
2019-1A, Class A
3.200%, 1/20/36 144A | | | 28,083 | | | | 28 | |
Sierra Receivables Funding Co. LLC, Series
2019-2A, Class A
2.590%, 5/20/36 144A | | | 94,484 | | | | 93 | |
Sierra Receivables Funding Co. LLC, Series
2019-3A, Class A
2.340%, 7/15/38 144A | | | 228,157 | | | | 219 | |
Sierra Receivables Funding Co. LLC, Series
2020-2A, Class C
3.510%, 7/20/37 144A | | | 79,921 | | | | 77 | |
Sierra Receivables Funding Co. LLC, Series
2021-2A, Class B
1.800%, 9/20/38 144A | | | 126,910 | | | | 119 | |
Sierra Receivables Funding Co. LLC, Series
2021-2A, Class C
1.950%, 9/20/38 144A | | | 265,101 | | | | 246 | |
SMB Private Education Loan Trust, Series 2014-A, Class A3 | | | | | | | | |
6.976%, (US SOFR 1 Month plus 1.615%), 4/15/32 144A | | | 67,771 | | | | 68 | |
SMB Private Education Loan Trust, Series 2016-C, Class A2B | | | | | | | | |
6.576%, (US SOFR 1 Month plus 1.215%), 9/15/34 144A | | | 78,364 | | | | 78 | |
SMB Private Education Loan Trust, Series 2018-B, Class A2A
3.600%, 1/15/37 144A | | | 88,784 | | | | 86 | |
SMB Private Education Loan Trust, Series 2018-B, Class A2B | | | | | | | | |
6.196%, (US SOFR 1 Month plus 0.835%), 1/15/37 144A | | | 212,447 | | | | 210 | |
SMB Private Education Loan Trust, Series 2020-BA, Class A1A
1.290%, 7/15/53 144A | | | 100,846 | | | | 91 | |
SMB Private Education Loan Trust, Series 2020-PTB, Class A2A
1.600%, 9/15/54 144A | | | 725,658 | | | | 658 | |
SMB Private Education Loan Trust, Series 2021-B, Class A
1.310%, 7/17/51 144A | | | 483,996 | | | | 437 | |
Symphony CLO I, Ltd., Series 2021-1A, Class B | | | | | | | | |
7.090%, (US SOFR 3 Month plus 1.712%), 10/25/29 144A | | | 815,000 | | | | 794 | |
Symphony CLO XXIII, Ltd., Series 2021-23A, Class AR | | | | | | | | |
6.675%, (US SOFR 3 Month plus 1.282%), 1/15/34 144A | | | 1,045,000 | | | | 1,043 | |
Symphony CLO XXVI, Ltd., Series 2021-26A, Class AR | | | | | | | | |
6.757%, (US SOFR 3 Month plus 1.342%), 4/20/33 144A | | | 285,000 | | | | 284 | |
U.S. Bank NA, Series 2023-1, Class B
6.789%, 8/25/32 144A | | | 250,000 | | | | 251 | |
Verdant Receivables LLC, Series 2023-1A, Class A2
6.240%, 1/13/31 144A | | | 565,000 | | | | 568 | |
The Accompanying Notes are an Integral Part of the Financial Statements.
112
Short-Term Bond Portfolio
| | | | | | | | |
| Structured Products (29.2%) | | Shares/ Par + | | Value $ (000’s) | |
Asset Backed Securities continued | | | | | | | | |
Wheels Fleet Lease Funding, Series 2023-2A, Class A
6.460%, 8/18/38 144A | | | 775,000 | | | | 784 | |
World Omni Auto Receivables Trust, Series
2020-A, Class C
1.640%, 8/17/26 | | | 225,000 | | | | 223 | |
World Omni Auto Receivables Trust, Series
2022-A, Class C
2.550%, 9/15/28 | | | 325,000 | | | | 306 | |
World Omni Select Auto Trust, Series 2020-A, Class B
0.840%, 6/15/26 | | | 90,017 | | | | 90 | |
World Omni Select Auto Trust, Series 2020-A, Class C
1.250%, 10/15/26 | | | 310,000 | | | | 304 | |
World Omni Select Auto Trust, Series 2021-A, Class D
1.440%, 11/15/27 | | | 180,000 | | | | 167 | |
World Omni Select Auto Trust, Series 2023-A, Class B
5.870%, 8/15/28 | | | 445,000 | | | | 449 | |
| | | | | | | | |
Total | | | | | | | 55,945 | |
| | | | | | | | |
| | |
Mortgage Securities (14.7%) | | | | | | | | |
Angel Oak Mortgage Trust, Series 2020-3,
Class A3
2.872%, (AFC), 4/25/65 144A | | | 46,588 | | | | 44 | |
Angel Oak Mortgage Trust, Series 2021-1,
Class A1
0.909%, (AFC), 1/25/66 144A | | | 270,200 | | | | 229 | |
Angel Oak Mortgage Trust, Series 2021-1,
Class A2
1.115%, (AFC), 1/25/66 144A | | | 79,048 | | | | 66 | |
Angel Oak Mortgage Trust, Series 2021-2, Class A1
0.985%, (AFC), 4/25/66 144A | | | 255,073 | | | | 215 | |
Angel Oak Mortgage Trust, Series 2021-2, Class A2
1.190%, (AFC), 4/25/66 144A | | | 80,446 | | | | 67 | |
Angel Oak Mortgage Trust, Series 2021-3, Class A1
1.068%, (AFC), 5/25/66 144A | | | 189,453 | | | | 158 | |
BAMLL Commercial Mortgage Securities Trust, Series 2018-DSNY, Class A
6.509%, (US SOFR 1 Month plus 1.147%),
9/15/34 144A | | | 935,000 | | | | 930 | |
BAMLL Commercial Mortgage Securities Trust, Series 2021-JACX, Class C
7.476%, (US SOFR 1 Month plus 2.115%),
9/15/38 144A | | | 435,000 | | | | 370 | |
BANK, Series 2019-BNK24, Class A1
2.056%, 11/15/62 | | | 22,631 | | | | 22 | |
Bayview MSR Opportunity Master Fund Trust, Series 2021-2, Class A5
2.500%, (AFC), 6/25/51 144A | | | 437,467 | | | | 381 | |
Bayview MSR Opportunity Master Fund Trust, Series 2021-5, Class A5
2.500%, (AFC), 11/25/51 144A | | | 324,888 | | | | 282 | |
| | | | | | | | |
| Structured Products (29.2%) | | Shares/ Par + | | Value $ (000’s) | |
Mortgage Securities continued | | | | | | | | |
Bayview MSR Opportunity Master Fund Trust, Series 2022-1, Class A5
2.500%, (AFC), 12/25/51 144A | | | 410,827 | | | | 356 | |
BCP Trust, Series 2021-330N, Class A | | | | | | | | |
6.275%, (US SOFR 1 Month plus 0.914%), 6/15/38 144A | | | 290,000 | | | | 260 | |
BINOM Securitization Trust, Series 2021-INV1, Class A3
2.625%, (AFC), 6/25/56 144A | | | 174,922 | | | | 150 | |
BPR Trust, Series 2021-TY, Class B | | | | | | | | |
6.626%, (US SOFR 1 Month plus 1.265%), 9/25/38 144A | | | 450,000 | | | | 429 | |
BRAVO Residential Funding Trust, Series 2021-NQM3, Class A1
1.699%, (AFC), 4/26/60 144A | | | 272,691 | | | | 244 | |
BSREP Commercial Mortgage Trust, Series 2021-DC, Class D | | | | | | | | |
7.376%, (US SOFR 1 Month plus 2.015%), 8/15/38 144A | | | 189,541 | | | | 141 | |
BX Commercial Mortgage Trust, Series 2019-IMC, Class A | | | | | | | | |
6.408%, (US SOFR 1 Month plus 1.046%), 4/15/34 144A | | | 100,000 | | | | 99 | |
BX Commercial Mortgage Trust, Series 2019-XL, Class A | | | | | | | | |
6.396%, (US SOFR 1 Month plus 1.035%), 10/15/36 144A | | | 114,236 | | | | 114 | |
BX Commercial Mortgage Trust, Series 2019-XL, Class B | | | | | | | | |
6.556%, (US SOFR 1 Month plus 1.195%), 10/15/36 144A | | | 318,750 | | | | 317 | |
BX Commercial Mortgage Trust, Series 2022-CSMO, Class B | | | | | | | | |
8.503%, (US SOFR 1 Month plus 3.141%), 6/15/27 144A | | | 570,000 | | | | 570 | |
BX Commerical Mortgage Trust, Series 2019-IMC, Class B | | | | | | | | |
6.708%, (US SOFR 1 Month plus 1.346%), 4/15/34 144A | | | 355,000 | | | | 352 | |
BX Trust, Series 2021-ARIA, Class C | | | | | | | | |
7.122%, (US SOFR 1 Month plus 1.761%), 10/15/36 144A | | | 330,000 | | | | 319 | |
BX Trust, Series 2021-VIEW, Class A | | | | | | | | |
6.756%, (US SOFR 1 Month plus 1.395%), 6/15/36 144A | | | 255,000 | | | | 244 | |
CGDB Commercial Mortgage Trust, Series 2019-MOB, Class D | | | | | | | | |
7.126%, (US SOFR 1 Month plus 1.765%), 11/15/36 144A | | | 308,300 | | | | 281 | |
CIM Trust, Series 2020-INV1, Class A2
2.500%, (AFC), 4/25/50 144A | | | 275,028 | | | | 226 | |
Citigroup Commercial Mortgage Trust, Series 2013-375P, Class B
3.518%, (CSTR), 5/10/35 144A | | | 435,000 | | | | 401 | |
Citigroup Commercial Mortgage Trust, Series 2013-375P, Class C
3.518%, (CSTR), 5/10/35 144A | | | 255,000 | | | | 232 | |
Citigroup Mortgage Loan Trust, Series 2020-EXP2, Class A3
2.500%, 8/25/50 144A | | | 267,101 | | | | 224 | |
The Accompanying Notes are an Integral Part of the Financial Statements.
113
Short-Term Bond Portfolio
| | | | | | | | |
| Structured Products (29.2%) | | Shares/ Par + | | Value $ (000’s) | |
Mortgage Securities continued | | | | | | | | |
Citigroup Mortgage Loan Trust, Series 2020-EXP2, Class A4
2.500%, (AFC), 8/25/50 144A | | | 370,973 | | | | 305 | |
Cold Storage Trust, Series 2020-ICE5, Class B | | | | | | | | |
6.772%, (US SOFR 1 Month plus 1.415%), 11/15/37 144A | | | 953,501 | | | | 943 | |
COLT Mortgage Loan Trust, Series 2020-3, Class A1
1.506%, (AFC), 4/27/65 144A | | | 25,498 | | | | 24 | |
COLT Mortgage Loan Trust, Series 2021-1, Class A2
1.167%, (AFC), 6/25/66 144A | | | 250,851 | | | | 204 | |
COMM Mortgage Trust, Series 2014-CR15, Class B
4.509%, (CSTR), 2/10/47 | | | 435,000 | | | | 413 | |
COMM Mortgage Trust, Series 2014-CR19, Class AM
4.080%, 8/10/47 | | | 495,000 | | | | 478 | |
COMM Mortgage Trust, Series 2014-CR19, Class D
4.629%, (CSTR), 8/10/47 144A | | | 185,000 | | | | 157 | |
COMM Mortgage Trust, Series 2014-UBS2, Class B
4.701%, 3/10/47 | | | 480,000 | | | | 454 | |
COMM Mortgage Trust, Series 2014-UBS5, Class A4
3.838%, 9/10/47 | | | 630,000 | | | | 618 | |
COMM Mortgage Trust, Series 2015-CR22, Class B
3.926%, (AFC), 3/10/48 | | | 235,000 | | | | 218 | |
COMM Mortgage Trust, Series 2015-CR22, Class C
4.067%, (CSTR), 3/10/48 | | | 440,000 | | | | 396 | |
Commercial Mortgage Pass Through
Certificates, Series 2017-PANW, Class D
3.935%, (CSTR, AFC), 10/10/29 144A | | | 195,000 | | | | 165 | |
Connecticut Avenue Securities Trust, Series 2022-R01, Class 1M1 | | | | | | | | |
6.337%, (US 30 Day Average SOFR plus 1.000%), 12/25/41 144A | | | 220,745 | | | | 220 | |
Credit Suisse Mortgage Trust, Series 2019-ICE4, Class C | | | | | | | | |
6.839%, (US SOFR 1 Month plus 1.477%), 5/15/36 144A | | | 513,722 | | | | 512 | |
Credit Suisse Mortgage Trust, Series 2019-ICE4, Class D | | | | | | | | |
7.009%, (US SOFR 1 Month plus 1.647%), 5/15/36 144A | | | 403,995 | | | | 403 | |
Credit Suisse Mortgage Trust, Series 2020-NET, Class A
2.256%, 8/15/37 144A | | | 196,421 | | | | 182 | |
Credit Suisse Mortgage Trust, Series 2020-NET, Class D
3.704%, (CSTR), 8/15/37 144A | | | 445,000 | | | | 393 | |
CSAIL Commercial Mortgage Trust, Series 2015-C3, Class A4
3.718%, 8/15/48 | | | 305,000 | | | | 294 | |
CSAIL Commercial Mortgage Trust, Series 2019-C16, Class A1
2.360%, 6/15/52 | | | 42,083 | | | | 42 | |
| | | | | | | | |
| Structured Products (29.2%) | | Shares/ Par + | | Value $ (000’s) | |
Mortgage Securities continued | | | | | | | | |
Deephaven Residential Mortgage Trust, Series 2021-1, Class A3
1.128%, (AFC), 5/25/65 144A | | | 60,006 | | | | 55 | |
Deephaven Residential Mortgage Trust, Series 2021-2, Class A3
1.260%, (AFC), 4/25/66 144A | | | 113,522 | | | | 97 | |
Ellington Financial Mortgage Trust, Series 2019-2, Class A3
3.046%, (AFC), 11/25/59 144A | | | 42,186 | | | | 39 | |
Ellington Financial Mortgage Trust, Series 2021-1, Class A1
0.797%, (AFC), 2/25/66 144A | | | 58,946 | | | | 50 | |
Ellington Financial Mortgage Trust, Series 2021-1, Class A3
1.106%, (AFC), 2/25/66 144A | | | 48,882 | | | | 41 | |
Ellington Financial Mortgage Trust, Series 2021-2, Class A1
0.931%, (AFC), 6/25/66 144A | | | 508,505 | | | | 405 | |
Ellington Financial Mortgage Trust, Series 2021-2, Class A3
1.291%, (AFC), 6/25/66 144A | | | 150,240 | | | | 119 | |
Ellington Financial Mortgage Trust, Series 2021-3, Class A3
1.550%, (AFC), 9/25/66 144A | | | 158,037 | | | | 124 | |
Extended Stay America Trust, Series 2021- ESH, Class C | | | | | | | | |
7.176%, (US SOFR 1 Month plus 1.815%), 7/15/38 144A | | | 448,051 | | | | 441 | |
Federal Home Loan Mortgage Corp.
1.500%, 2/1/36 | | | 637,134 | | | | 557 | |
2.500%, 1/1/52 | | | 557,266 | | | | 478 | |
2.500%, 4/1/52 | | | 301,877 | | | | 259 | |
3.000%, 11/1/34 | | | 31,301 | | | | 30 | |
3.500%, 3/1/46 | | | 30,973 | | | | 29 | |
3.500%, 12/1/47 | | | 277,368 | | | | 259 | |
4.000%, 12/1/49 | | | 85,965 | | | | 82 | |
4.500%, 4/1/38 | | | 369,360 | | | | 367 | |
4.500%, 5/1/50 | | | 50,120 | | | | 49 | |
5.000%, 12/1/41 | | | 107,203 | | | | 109 | |
5.500%, 8/1/53 | | | 543,768 | | | | 546 | |
6.000%, 9/1/34 | | | 963 | | | | 1 | |
6.000%, 2/1/35 | | | 18,500 | | | | 19 | |
6.000%, 9/1/35 | | | 6,148 | | | | 6 | |
6.000%, 2/1/53 | | | 303,410 | | | | 313 | |
7.000%, 3/1/39 | | | 36,197 | | | | 38 | |
7.500%, 6/1/38 | | | 30,952 | | | | 32 | |
Federal Home Loan Mortgage Corp., Series 2014-DNA3, Class M1 | | | | | | | | |
9.452%, (US 30 Day Average SOFR plus 4.115%), 8/25/24 | | | 44,492 | | | | 45 | |
Federal Home Loan Mortgage Corp., Series 2017-SC02, Class M1
3.866%, (CSTR), 5/25/47 144A | | | 19,730 | | | | 19 | |
Federal Home Loan Mortgage Corp., Series 3713, Class PA
2.000%, 2/15/40 | | | 35,408 | | | | 34 | |
Federal Home Loan Mortgage Corp., Series 4092, Class CL
1.250%, 6/15/27 | | | 97,134 | | | | 94 | |
The Accompanying Notes are an Integral Part of the Financial Statements.
114
Short-Term Bond Portfolio
| | | | | | | | |
| Structured Products (29.2%) | | Shares/ Par + | | Value $ (000’s) | |
Mortgage Securities continued | | | | | | | | |
Federal Home Loan Mortgage Corp., Series K753, Class A1
4.600%, 6/25/30 | | | 334,332 | | | | 337 | |
Federal National Mortgage Association
2.000%, 10/1/50 | | | 209,598 | | | | 172 | |
2.500%, 1/1/52 | | | 777,570 | | | | 666 | |
3.000%, 4/1/24 | | | 1,083 | | | | 1 | |
3.000%, 9/1/28 | | | 127,822 | | | | 124 | |
3.000%, 12/1/34 | | | 73,045 | | | | 69 | |
3.000%, 3/1/35 | | | 31,052 | | | | 30 | |
3.000%, 6/1/52 | | | 1,122,381 | | | | 993 | |
3.500%, 5/1/27 | | | 118,017 | | | | 115 | |
3.500%, 4/1/46 | | | 189,501 | | | | 177 | |
3.500%, 2/1/48 | | | 331,267 | | | | 309 | |
3.500%, 1/1/52 | | | 127,167 | | | | 117 | |
4.000%, 1/1/47 | | | 51,508 | | | | 50 | |
4.000%, 2/1/49 | | | 10,812 | | | | 10 | |
4.000%, 11/1/49 | | | 30,426 | | | | 29 | |
4.000%, 12/1/49 | | | 10,156 | | | | 10 | |
4.000%, 8/1/52 | | | 190,156 | | | | 180 | |
4.000%, 9/1/52 | | | 967,700 | | | | 915 | |
4.500%, 5/1/40 | | | 40,673 | | | | 41 | |
4.500%, 9/1/40 | | | 35,360 | | | | 35 | |
4.500%, 5/1/41 | | | 69,889 | | | | 70 | |
4.500%, 8/1/48 | | | 20,587 | | | | 20 | |
4.500%, 9/1/48 | | | 19,403 | | | | 19 | |
4.500%, 10/1/48 | | | 138,744 | | | | 137 | |
4.500%, 11/1/48 | | | 27,918 | | | | 27 | |
4.500%, 12/1/48 | | | 147,304 | | | | 145 | |
4.500%, 5/1/49 | | | 83,034 | | | | 82 | |
4.500%, 1/1/50 | | | 18,023 | | | | 18 | |
4.500%, 7/1/52 | | | 1,193,161 | | | | 1,157 | |
4.500%, 8/1/52 | | | 732,872 | | | | 711 | |
5.000%, 10/1/33 | | | 58,655 | | | | 60 | |
5.000%, 6/1/40 | | | 35,020 | | | | 36 | |
5.000%, 7/1/45 | | | 51,762 | | | | 53 | |
5.000%, 9/1/48 | | | 51,603 | | | | 52 | |
5.000%, 2/1/49 | | | 22,438 | | | | 22 | |
5.000%, 8/1/49 | | | 18,142 | | | | 18 | |
5.000%, 10/1/52 | | | 368,252 | | | | 365 | |
5.000%, 9/1/53 | | | 314,350 | | | | 311 | |
5.500%, 8/1/37 | | | 35,014 | | | | 36 | |
5.500%, 2/1/38 | | | 133,272 | | | | 137 | |
5.500%, 10/1/53 | | | 351,553 | | | | 353 | |
6.000%, 3/1/34 | | | 30,309 | | | | 31 | |
6.000%, 8/1/34 | | | 82,352 | | | | 86 | |
6.000%, 11/1/34 | | | 3,010 | | | | 3 | |
6.000%, 12/1/34 | | | 1,121 | | | | 1 | |
6.000%, 4/1/35 | | | 1,944 | | | | 2 | |
6.000%, 5/1/38 | | | 1,319 | | | | 1 | |
6.000%, 10/1/40 | | | 66,437 | | | | 69 | |
6.000%, 2/1/49 | | | 274,982 | | | | 291 | |
6.000%, 7/1/53 | | | 315,445 | | | | 321 | |
6.000%, 8/1/53 | | | 2,320,211 | | | | 2,361 | |
6.500%, 7/1/32 | | | 9,448 | | | | 10 | |
6.500%, 12/1/32 | | | 8,915 | | | | 9 | |
Federal National Mortgage Association, Series 2011-113, Class AG
2.500%, 11/25/26 | | | 16,396 | | | | 16 | |
| | | | | | | | |
| Structured Products (29.2%) | | Shares/ Par + | | Value $ (000’s) | |
Mortgage Securities continued | | | | | | | | |
Federal National Mortgage Association, Series 2017-90, Class KA
3.000%, 11/25/47 | | | 164,087 | | | | 152 | |
Federal National Mortgage Association, Series 2017-C05, Class 1ED3 | | | | | | | | |
6.652%, (US 30 Day Average SOFR plus 1.315%), 1/25/30 | | | 3,379 | | | | 3 | |
Federal National Mortgage Association, Series 2018-C03, Class 1EB2 | | | | | | | | |
6.302%, (US 30 Day Average SOFR plus 0.965%), 10/25/30 | | | 157,171 | | | | 157 | |
Flagstar Mortgage Trust, Series 2020-1INV, Class A11 | | | | | | | | |
6.000%, (US SOFR 1 Month plus 0.965%), 3/25/50 144A | | | 98,350 | | | | 92 | |
Fontainebleau Miami Beach Trust, Series 2019-FBLU, Class A
3.144%, 12/10/36 144A | | | 300,000 | | | | 291 | |
Fontainebleau Miami Beach Trust, Series 2019-FBLU, Class B
3.447%, 12/10/36 144A | | | 605,000 | | | | 586 | |
Galton Funding Mortgage Trust, Series 2018-1, Class A33
3.500%, (AFC), 11/25/57 144A | | | 24,953 | | | | 23 | |
Galton Funding Mortgage Trust, Series 2019-1, Class A21
4.500%, (AFC), 2/25/59 144A | | | 31,029 | | | | 30 | |
Galton Funding Mortgage Trust, Series 2019-1, Class A32
4.000%, (AFC), 2/25/59 144A | | | 13,499 | | | | 13 | |
Galton Funding Mortgage Trust, Series 2019-H1, Class M1
3.339%, (AFC), 10/25/59 144A | | | 260,000 | | | | 242 | |
Galton Funding Mortgage Trust, Series 2020-H1, Class M1
2.832%, (AFC), 1/25/60 144A | | | 285,000 | | | | 221 | |
Government National Mortgage Association
3.000%, 9/20/47 | | | 458,854 | | | | 420 | |
3.500%, 12/20/42 | | | 2,993 | | | | 3 | |
3.500%, 9/20/43 | | | 40,661 | | | | 39 | |
3.500%, 8/20/44 | | | 77,831 | | | | 74 | |
3.500%, 10/20/46 | | | 513 | | | | –π | |
3.500%, 11/20/46 | | | 31,002 | | | | 29 | |
3.500%, 1/20/47 | | | 33,898 | | | | 32 | |
3.500%, 7/20/52 | | | 1,050,521 | | | | 978 | |
4.000%, 3/20/48 | | | 61,688 | | | | 59 | |
4.000%, 4/20/50 | | | 239,913 | | | | 230 | |
4.000%, 10/20/50 | | | 147,942 | | | | 143 | |
4.000%, 9/20/52 | | | 192,970 | | | | 184 | |
4.500%, 7/20/41 | | | 166,954 | | | | 167 | |
4.500%, 10/20/52 | | | 1,148,745 | | | | 1,121 | |
5.000%, 3/20/34 | | | 173,307 | | | | 177 | |
5.000%, 1/20/48 | | | 26,879 | | | | 27 | |
5.000%, 2/20/48 | | | 128,800 | | | | 131 | |
5.500%, 6/20/37 | | | 39,562 | | | | 41 | |
5.500%, 9/15/45 | | | 115,020 | | | | 116 | |
5.500%, 3/20/48 | | | 18,925 | | | | 20 | |
5.500%, 12/20/48 | | | 11,041 | | | | 11 | |
5.500%, 2/20/49 | | | 142,946 | | | | 146 | |
The Accompanying Notes are an Integral Part of the Financial Statements.
115
Short-Term Bond Portfolio
| | | | | | | | |
| Structured Products (29.2%) | | Shares/ Par + | | Value $ (000’s) | |
Mortgage Securities continued | | | | | | | | |
Government National Mortgage Association TBA
6.500%, 1/22/54 | | | 455,000 | | | | 466 | |
Great Wolf Trust, Series 2019-WOLF, Class A | | | | | | | | |
6.710%, (US SOFR 1 Month plus 1.149%), 12/15/36 144A | | | 390,000 | | | | 389 | |
Great Wolf Trust, Series 2019-WOLF, Class B | | | | | | | | |
7.010%, (US SOFR 1 Month plus 1.449%), 12/15/36 144A | | | 85,000 | | | | 84 | |
Great Wolf Trust, Series 2019-WOLF, Class C | | | | | | | | |
7.309%, (US SOFR 1 Month plus 1.748%), 12/15/36 144A | | | 270,000 | | | | 268 | |
GS Mortgage Backed Securities Trust, Series 2014-EB1A, Class 2A1
4.459%, (CSTR), 7/25/44 144A | | | 2,848 | | | | 3 | |
GS Mortgage Backed Securities Trust, Series
2021-GR2, Class A6
2.500%, (AFC), 2/25/52 144A | | | 317,350 | | | | 276 | |
GS Mortgage Backed Securities Trust, Series
2022-GR1, Class A5
2.500%, (AFC), 6/25/52 144A | | | 868,680 | | | | 750 | |
GS Mortgage Securities Trust, Series 2021-ROSS, Class B | | | | | | | | |
7.076%, (US SOFR 1 Month plus 1.715%), 5/15/26 144A | | | 390,000 | | | | 303 | |
Imperial Fund Mortgage Trust, Series 2021-NQM2, Class A3
1.516%, (AFC), 9/25/56 144A | | | 240,177 | | | | 189 | |
Imperial Fund Mortgage Trust, Series 2022-NQM4, Class A1
4.767%, (AFC), 6/25/67 144A S | | | 721,594 | | | | 704 | |
JP Morgan Chase Commercial Mortgage
Securities Trust, Series 2019-BKWD, Class C | | | | | | | | |
7.576%, (US SOFR 1 Month plus 2.215%), 9/15/29 144A | | | 250,000 | | | | 191 | |
JP Morgan Chase Commercial Mortgage
Securities Trust, Series 2020-609M, Class B | | | | | | | | |
7.496%, (US SOFR 1 Month plus 2.135%), 10/15/33 144A | | | 540,000 | | | | 483 | |
JP Morgan Chase Commercial Mortgage
Securities Trust, Series 2020-609M, Class C | | | | | | | | |
7.896%, (US SOFR 1 Month plus 2.535%), 10/15/33 144A | | | 440,000 | | | | 363 | |
JP Morgan Mortgage Trust, Series 2020-INV1, Class A11 | | | | | | | | |
6.000%, (US SOFR 1 Month plus 0.945%), (AFC), 8/25/50 144A | | | 42,114 | | | | 40 | |
JP Morgan Mortgage Trust, Series 2020-INV1, Class A15
3.500%, (AFC), 8/25/50 144A | | | 68,557 | | | | 61 | |
JPMBB Commercial Mortgage
Securities Trust, Series 2014-C23, Class A5
3.934%, 9/15/47 | | | 540,000 | | | | 531 | |
KIND Trust, Series 2021-KIND, Class C | | | | | | | | |
7.226%, (US SOFR 1 Month plus 1.865%), 8/15/38 144A | | | 575,838 | | | | 536 | |
LSTAR Commercial Mortgage Trust, Series 2017-5, Class AS
4.021%, 3/10/50 144A | | | 340,000 | | | | 300 | |
| | | | | | | | |
| Structured Products (29.2%) | | Shares/ Par + | | Value $ (000’s) | |
Mortgage Securities continued | | | | | | | | |
MetLife Securitization Trust, Series
2017-1A, Class A
3.000%, (AFC), 4/25/55 144A | | | 69,356 | | | | 65 | |
MFRA Trust, Series 2021-INV1, Class A1
0.852%, (AFC), 1/25/56 144A | | | 99,158 | | | | 91 | |
MFRA Trust, Series 2021-NQM2,
Class A2
1.317%, (AFC), 11/25/64 144A | | | 112,538 | | | | 96 | |
Mill City Mortgage Loan Trust, Series 2017-2, Class A1
2.750%, (AFC), 7/25/59 144A | | | 3,016 | | | | 3 | |
Morgan Stanley Capital I Trust, Series 2014-150E, Class A
3.912%, 9/9/32 144A | | | 610,000 | | | | 501 | |
Morgan Stanley Capital I Trust, Series 2019-NUGS, Class D
| | | | | | | | |
7.276%, (US SOFR 1 Month plus 1.915%), 12/15/36 144A | | | 315,000 | | | | 112 | |
Morgan Stanley Residential Mortgage Loan Trust, Series 2021-2, Class A4
2.500%, (AFC), 5/25/51 144A | | | 131,789 | | | | 115 | |
Morgan Stanley Residential Mortgage Loan Trust, Series 2023-NQM1, Class A2
7.530%, (AFC), 9/25/68 144A ∑ | | | 147,583 | | | | 150 | |
New Residential Mortgage Loan Trust, Series 2021-INV1, Class A6
2.500%, (AFC), 6/25/51 144A | | | 277,112 | | | | 242 | |
New Residential Mortgage Loan Trust, Series 2021-INV2, Class A7
2.500%, (AFC), 9/25/51 144A | | | 786,060 | | | | 686 | |
NLT Trust, Series 2021-INV2, Class A3
1.520%, (AFC), 8/25/56 144A | | | 210,405 | | | | 171 | |
OBX Trust, Series 2019-EXP2, Class 2A2 6.444%, (US SOFR 1 Month plus 1.315%), 7/25/59 144A | | | 51,583 | | | | 50 | |
OBX Trust, Series 2019-EXP3, Class 2A1
6.370%, (US SOFR 1 Month plus 1.015%), (AFC), 10/25/59 144A | | | 58,861 | | | | 57 | |
OBX Trust, Series 2020-EXP1, Class 1A8
3.500%, 2/25/60 144A | | | 140,956 | | | | 125 | |
OBX Trust, Series 2020-EXP1, Class 2A1 | | | | | | | | |
6.220%, (US SOFR 1 Month plus 0.865%), 2/25/60 144A | | | 131,959 | | | | 124 | |
OBX Trust, Series 2020-EXP1, Class 2A2
6.420%, (US SOFR 1 Month plus 1.065%), 2/25/60 144A | | | 78,528 | | | | 71 | |
OBX Trust, Series 2020-EXP2, Class A8
3.000%, (AFC), 5/25/60 144A | | | 175,720 | | | | 148 | |
OBX Trust, Series 2020-EXP2, Class A9
3.000%, (AFC), 5/25/60 144A | | | 43,930 | | | | 37 | |
OBX Trust, Series 2020-EXP3, Class 1A8
3.000%, (AFC), 1/25/60 144A | | | 150,581 | | | | 131 | |
OBX Trust, Series 2020-INV1, Class A5
3.500%, (AFC), 12/25/49 144A | | | 39,543 | | | | 35 | |
OBX Trust, Series 2023-NQM10, Class A2 7.920%, (AFC), 10/25/63 144A S | | | 99,171 | | | | 100 | |
ONE Park Mortgage Trust, Series 2021-PARK, Class B | | | | | | | | |
6.426%, (US SOFR 1 Month plus 1.065%), 3/15/36 144A | | | 755,000 | | | | 704 | |
The Accompanying Notes are an Integral Part of the Financial Statements.
116
Short-Term Bond Portfolio
| | | | | | | | |
| Structured Products (29.2%) | | Shares/ Par + | | Value $ (000’s) | |
Mortgage Securities continued | | | | | | | | |
ONE Park Mortgage Trust, Series 2021-PARK, Class C | | | | | | | | |
6.576%, (US SOFR 1 Month plus 1.215%), 3/15/36 144A | | | 405,000 | | | | 372 | |
Onslow Bay Financial LLC, Series 2023-NQM9, Class A2
8.513%, (AFC), 10/25/63 144A S | | | 98,431 | | | | 101 | |
SCG Mortgage Trust, Series 2023-NASH, Class A | | | | | | | | |
7.752%, (US SOFR 1 Month plus 2.391%), 12/15/40 144A | | | 380,000 | | | | 380 | |
Sequoia Mortgage Trust, Series 2018-CH2, Class A21
4.000%, (AFC), 6/25/48 144A | | | 20,255 | | | | 19 | |
Sequoia Mortgage Trust, Series 2018-CH2, Class A3
4.000%, (AFC), 6/25/48 144A | | | 46,720 | | | | 43 | |
Sequoia Mortgage Trust, Series 2018-CH3, Class A19
4.500%, (AFC), 8/25/48 144A | | | 2,879 | | | | 3 | |
SG Residential Mortgage Trust, Series 2020-2, Class A1
1.381%, (AFC), 5/25/65 144A | | | 92,993 | | | | 83 | |
SG Residential Mortgage Trust, Series 2022-1, Class A1
3.166%, (AFC), 3/27/62 144A | | | 552,404 | | | | 497 | |
STACR Trust, Series 2021-DNA3, Class M2 | | | | | | | | |
7.437%, (US 30 Day Average SOFR plus 2.100%), 10/25/33 144A | | | 395,000 | | | | 396 | |
STACR Trust, Series 2021-DNA5, Class M2 | | | | | | | | |
6.987%, (US 30 Day Average SOFR plus 1.650%), 1/25/34 144A | | | 162,246 | | | | 163 | |
STACR Trust, Series 2021-DNA7,
Class M1 | | | | | | | | |
6.187%, (US 30 Day Average SOFR plus 0.850%), 11/25/41 144A | | | 167,643 | | | | 167 | |
STACR Trust, Series 2021-DNA7, Class M2 | | | | | | | | |
7.137%, (US 30 Day Average SOFR plus 1.800%), 11/25/41 144A | | | 375,000 | | | | 370 | |
STACR Trust, Series 2022-DNA5, Class M1A | | | | | | | | |
8.287%, (US 30 Day Average SOFR plus 2.950%), 6/25/42 144A | | | 511,005 | | | | 525 | |
STACR Trust, Series 2023-HQA3, Class A1 | | | | | | | | |
7.187%, (US 30 Day Average SOFR plus 1.850%), 11/25/43 144A | | | 168,672 | | | | 170 | |
Starwood Mortgage Residential Trust, Series 2019-INV1, Class A3
2.916%, (AFC), 9/27/49 144A | | | 178,579 | | | | 172 | |
Starwood Mortgage Residential Trust, Series 2020-1, Class A2
2.408%, (AFC), 2/25/50 144A | | | 157,008 | | | | 147 | |
Starwood Mortgage Residential Trust, Series 2021-2, Class A1
0.943%, (AFC), 5/25/65 144A | | | 131,503 | | | | 119 | |
Starwood Mortgage Residential Trust, Series 2021-4, Class A1
1.162%, (AFC), 8/25/56 144A | | | 586,096 | | | | 490 | |
Toorak Mortgage Corp., Series 2021-INV1, Class A2
1.409%, (AFC), 12/31/99 144A | | | 109,073 | | | | 94 | |
| | | | | | | | |
| Structured Products (29.2%) | | Shares/ Par + | | Value $ (000’s) | |
Mortgage Securities continued | | | | | | | | |
Towd Point Mortgage Trust, Series
2015-1, Class A1
3.000%, (AFC), 1/28/58 144A | | | 38,781 | | | | 38 | |
Towd Point Mortgage Trust, Series
2017-1, Class A1
2.750%, (AFC), 10/25/56 144A | | | 6,550 | | | | 6 | |
Towd Point Mortgage Trust, Series
2017-3, Class A1
2.750%, (AFC), 7/25/57 144A | | | 43,915 | | | | 43 | |
Towd Point Mortgage Trust, Series
2022-4, Class A1
3.750%, (AFC), 9/25/62 144A | | | 836,343 | | | | 782 | |
Uniform Mortgage Backed Security TBA
6.000%, 1/16/54 | | | 625,000 | | | | 635 | |
United Wholsale Mortgage LLC, Series 2021-INV2, Class A4
2.500%, (AFC), 9/25/51 144A | | | 147,075 | | | | 128 | |
United Wholsale Mortgage LLC, Series 2021-INV5, Class B
2.500%, (AFC), 1/25/52 144A | | | 173,314 | | | | 150 | |
Verus Securitization Trust, Series 2019-INV2, Class A1
3.913%, (AFC), 7/25/59 144A | | | 59,902 | | | | 57 | |
Verus Securitization Trust, Series 2019-INV2, Class A2
4.117%, (AFC), 7/25/59 144A | | | 80,360 | | | | 77 | |
Verus Securitization Trust, Series 2020-2, Class A1
2.226%, (AFC), 5/25/60 144A | | | 57,416 | | | | 56 | |
Verus Securitization Trust, Series 2020-5, Class A3
1.733%, (AFC), 5/25/65 144A S | | | 63,456 | | | | 59 | |
Verus Securitization Trust, Series 2020-INV1, Class A1
1.977%, (AFC), 4/25/60 144A | | | 15,124 | | | | 15 | |
Verus Securitization Trust, Series 2021-1, Class A1
0.815%, (AFC), 1/25/66 144A | | | 81,446 | | | | 70 | |
Verus Securitization Trust, Series 2021-1, Class A3
1.155%, (AFC), 1/25/66 144A | | | 66,490 | | | | 57 | |
Verus Securitization Trust, Series 2021-2, Class A1
1.031%, (AFC), 2/25/66 144A | | | 155,536 | | | | 134 | |
Verus Securitization Trust, Series 2021-2, Class A2
1.052%, (AFC), 1/25/66 144A | | | 113,033 | | | | 97 | |
Verus Securitization Trust, Series 2021-5, Class A3
1.373%, (AFC), 9/25/66 144A | | | 199,586 | | | | 164 | |
Verus Securitization Trust, Series 2021-7, Class A1
1.829%, (AFC), 10/25/66 144A | | | 775,950 | | | | 674 | |
Verus Securitization Trust, Series 2021-R1, Class A2
1.057%, (AFC), 10/25/63 144A | | | 47,989 | | | | 44 | |
Verus Securitization Trust, Series 2021-R2, Class A1
0.918%, (AFC), 2/25/64 144A | | | 161,952 | | | | 142 | |
The Accompanying Notes are an Integral Part of the Financial Statements.
117
Short-Term Bond Portfolio
| | | | | | | | |
| Structured Products (29.2%) | | Shares/ Par + | | Value $ (000’s) | |
Mortgage Securities continued | | | | | | | | |
Verus Securitization Trust, Series 2022-1, Class A3
3.288%, (AFC), 1/25/67 144A | | | 851,409 | | | | 739 | |
Verus Securitization Trust, Series 2022-6, Class A1
4.910%, (AFC), 6/25/67 144A S | | | 216,412 | | | | 212 | |
Verus Securitization Trust, Series 2023-6, Class A2
6.939%, (AFC), 9/25/68 144A S | | | 263,409 | | | | 266 | |
Verus Securitization Trust, Series 2023-7, Class A2
7.272%, (AFC), 10/25/68 144A S | | | 324,171 | | | | 330 | |
Verus Securitization Trust, Series 2023-8, Class A2
6.664%, (AFC), 12/25/68 144A S | | | 215,000 | | | | 216 | |
Verus Securitization Trust, Series 2023-INV3, Class A2
7.330%, (AFC), 11/25/68 144A | | | 552,614 | | | | 561 | |
Vista Point Securitization Trust, Series 2020-2, Class A3
2.496%, (AFC), 4/25/65 144A | | | 41,066 | | | | 38 | |
Wells Fargo Commercial Mortgage Trust, Series 2015-NXS2, Class A2
3.020%, 7/15/58 | | | 34,481 | | | | 33 | |
Wells Fargo Mortgage Backed Securities Trust, Series 2020-RR1, Class A17
3.000%, (AFC), 5/25/50 144A | | | 33,014 | | | | 28 | |
Wells Fargo Mortgage Backed Securities Trust, Series 2021-RR1, Class A3
2.500%, (AFC), 12/25/50 144A | | | 573,506 | | | | 504 | |
WFRBS Commercial Mortgage Trust, Series 2014-LC14, Class A5
4.045%, 3/15/47 | | | 20,002 | | | | 20 | |
| | | | | | | | |
Total | | | | | | | 56,686 | |
| | | | | | | | |
| |
Total Structured Products (Cost: $117,689) | | | | 112,631 | |
| | | | | | | | |
| | |
| Short-Term Investments (0.8%) | | | | | |
Commercial Paper (0.6%) | | | | | | | | |
Harley-Davidson, Inc.
0.000%, 1/5/24 | | | 1,005,000 | | | | 1,004 | |
Western Midstream Operating LP
0.000%, 1/26/24 | | | 1,015,000 | | | | 1,010 | |
| | | | | | | | |
Total | | | | | | | 2,014 | |
| | | | | | | | |
| | |
Financial (0.2%) | | | | | | | | |
Ally Financial, Inc. | | | | | | | | |
3.875%, 5/21/24 | | | 840,000 | | | | 833 | |
| | | | | | | | |
Total | | | | | | | 833 | |
| | | | | | | | |
| |
Total Short-Term Investments (Cost: $2,847) | | | | 2,847 | |
| | | | | | | | |
| |
Total Investments (98.3%) (Cost: $385,729)@ | | | | 378,718 | |
| | | | | | | | |
| | |
Other Assets, Less Liabilities (1.7%) | | | | | | | 6,514 | |
| | | | | | | | |
| | |
Net Assets (100.0%) | | | | | | | 385,232 | |
| | | | | | | | |
The Accompanying Notes are an Integral Part of the Financial Statements.
118
Short-Term Bond Portfolio
Exchange Traded or Centrally Cleared Derivatives
Futures
| | | | | | | | | | | | | | | | | | | | | | | | | | | | | | | | |
| Issuer | | Long/ Short | | | Currency | | | Notional Par (000’s) | | | Number of Contracts | | | Expiration Date | | | Notional Value
(000’s) | | | Unrealized Appreciation/ (Depreciation) (000’s) | | | Variation Margin
(000’s) | |
| |
Five-Year US Treasury Note Future | | | Short | | | | USD | | | | 1,400 | | | | 14 | | | | 3/24 | | | $ | 1,523 | | | $ | (38 | ) | | $ | (1) | |
Ten-Year US Treasury Note Future | | | Short | | | | USD | | | | 6,500 | | | | 65 | | | | 3/24 | | | | 7,338 | | | | (232 | ) | | | – | |
Two-Year US Treasury Note Future | | | Long | | | | USD | | | | 91,200 | | | | 456 | | | | 3/24 | | | | 93,897 | | | | 847 | | | | 57 | |
Ultra Long Term US Treasury Bond Future | | | Short | | | | USD | | | | 1,400 | | | | 14 | | | | 3/24 | | | | 1,870 | | | | (181 | ) | | | 7 | |
Ultra Ten-Year US Treasury Note Future | | | Short | | | | USD | | | | 7,000 | | | | 70 | | | | 3/24 | | | | 8,261 | | | | (359 | ) | | | 7 | |
| | | | | | | | | | | | | | | | | | | | | | | | | | | | |
| | | | | | | | | | | | | | | | | | | | | | | | | | $ | 37 | | | $ | 70 | |
| | | | | | | | | | | | | | | | | | | | | | | | | | | | |
| | | | | | | | | | | | | | | | | | | | | | | | | | | | |
| | | Financial Derivative Assets | | | Financial Derivative Liabilities | | | | |
| | | | | | | | | Market Value | |
| | | Variation Margin (000’s) | | | Variation Margin (000’s) | | | (000’s) | |
| | | Swaps | | | Futures | | | Total | | | Swaps | | | Futures | | | Total | | | Options | |
| | | | |
Total Exchange-Traded or Centrally Cleared Derivatives | | $ | – | | | $ | 71 | | | $ | 71 | | | $ | – | | | $ | (1 | ) | | $ | (1 | ) | | $ | – | |
| | | | |
| + | All par is stated in U.S. Dollar unless otherwise noted. |
| § | Security was purchased pursuant to Regulation S under the Securities Act of 1933, which exempts from registration securities offered and sold outside of the United States. At December 31, 2023, the aggregate value of these securities was $4,505 (in thousands), representing 1.2% of net assets. |
| 144A | Security exempt from registration under Rule 144A of the Securities Act of 1933. These securities may be resold as transactions exempt from registration, normally to qualified institutional buyers. At December 31, 2023 the value of these securities (in thousands) was $125,302 representing 32.5% of the net assets. |
| α | Rate shown is the rate as of the period end. The rate may be based on a fixed rate, a capped rate or a floor rate and may convert to a variable or floating rate in the future. |
| b | Part or all of the security has been pledged as collateral. |
| π | Amount is less than one thousand. |
| Σ | Stepped coupon bond for which the coupon rate of interest adjusts on specified date(s); rate shown is effective rate at period-end. |
| @ | At December 31, 2023, the aggregate cost of investments, including derivatives, for federal tax purposes (in thousands) was $385,765 and the net unrealized depreciation of investments based on that cost was $7,010 which is comprised of $2,895 aggregate gross unrealized appreciation and $9,905 aggregate gross unrealized depreciation. |
The Accompanying Notes are an Integral Part of the Financial Statements.
119
Short-Term Bond Portfolio
The following is a summary of the inputs used in valuing the Portfolio’s Investments at December 31, 2023. See Note 3 for additional information on portfolio valuation.
| | | | | | | | | | | | | | | | |
| | | | | | Valuation Inputs | |
| Description | | | | | Level 1 - Quoted Prices | | | Level 2 - Other Significant Observable Inputs | | | Level 3 - Significant Unobservable Inputs | |
| | | | | | (Amounts in thousands) | |
Assets: | | | | | | | | | | | | | | | | |
Municipal Bonds | | | | | | $ | — | | | $ | 428 | | | $ | — | |
Corporate Bonds | | | | | | | — | | | | 190,454 | | | | — | |
Governments | | | | | | | — | | | | 72,358 | | | | — | |
Structured Products | | | | | | | — | | | | 112,631 | | | | — | |
Short-Term Investments | | | | | | | — | | | | 2,847 | | | | — | |
Other Financial Instruments^ | | | | | | | | | | | | | | | | |
Futures | | | | | | | 847 | | | | — | | | | — | |
| | | | | | | | |
Total Assets: | | | | | | $ | 847 | | | $ | 378,718 | | | $ | — | |
| | | | | | | | |
Liabilities: | | | | | | | | | | | | | | | | |
Other Financial Instruments^ | | | | | | | | | | | | | | | | |
Futures | | | | | | | (810 | ) | | | — | | | | — | |
| | | | | | | | |
Total Liabilities: | | | | | | $ | (810 | ) | | $ | — | | | $ | — | |
| | | | | | | | |
^ Other financial instruments are derivative instruments such as futures and forward foreign currency contracts, which are valued at the unrealized appreciation (depreciation) on the instrument, and securities sold short, reverse repurchase agreements, written options and swaps contracts, which are valued at market value.
The Accompanying Notes are an Integral Part of the Financial Statements.
120
Select Bond Portfolio (unaudited)
| | | | |
| Objective: | | Portfolio Strategy: | | Net Assets: |
| Provide as high a level of total return as is consistent with prudent investment risk. A secondary objective is to seek preservation of shareholders’ capital. | | Invest in a diversified portfolio of investment grade debt securities with maturities exceeding one year. | | $2.9 billion |
PORTFOLIO OVERVIEW
Mason Street Advisors, LLC (“Mason Street Advisors”), the investment adviser for the Select Bond Portfolio (the “Portfolio”), has engaged Allspring Global Investments, LLC (“Allspring”) to act as sub-adviser for the Portfolio. Normally, the Portfolio invests in a diversified portfolio of investment grade debt securities with maturities exceeding one year. The Portfolio may also invest up to 20% of net assets in foreign securities. Debt securities may be of any maturity or duration, but under normal market conditions, the Portfolio attempts to maintain an overall dollar-weighted average effective duration (a measure of the sensitivity of the price of the Portfolio’s fixed income securities to changes in interest rates) that is within 10% of the Bloomberg® U.S. Aggregate Index. The Portfolio uses a fundamental, relative value investment approach to construct the portfolio of investments. The Portfolio invests in debt securities that it believes offer competitive returns and are undervalued, offering additional income and/or price appreciation potential relative to other debt securities of similar credit quality and interest rate sensitivity. The Portfolio may engage in active and frequent trading of portfolio securities to achieve its investment objectives.
MARKET OVERVIEW
Fixed income returns for 2023 were more in line with historical returns than they were with the more unusual returns of the last few years. Nevertheless, they remained substantially nonlinear, as rate volatility persisted through the year. Spread performance exhibited a tightening trend despite periods of widening, such as when regional banks came under pressure early in 2023.
Credit spreads and measures of implied volatility for equities fell to some of the lowest levels in the post-Coronavirus pandemic era, and yields on the 10-year U.S. Treasury fell to under 4%, a level consistent with a normalized environment of stable growth and inflation over time. Toward the end of 2023, the U.S. Federal Reserve’s aggressive rate-hike campaign, a response to pandemic- and geopolitical-related inflation, showed signs of slowing as inflation declined, leaving investors with optimism about the possibility of loosening monetary policy in 2024.
PORTFOLIO RESULTS
The Portfolio returned 6.19% for the twelve months ended December 31, 2023. By comparison, the Portfolio’s benchmark, the Bloomberg® U.S. Aggregate Index (the “Index”), returned 5.53%. (The Index is unmanaged, cannot be invested in directly and does not incur expenses.)
All sectors within the Portfolio contributed to the Portfolio’s relative return, led strongly by the credit sector. In credit, issuer positioning across U.S. banks, non-U.S. banks and communications subsectors led contributions to the Portfolio’s relative performance, with a significant majority of subsectors making positive contributions to overall security selection. U.S. banks contributed due to active trading in Bank of America, Morgan Stanley & Company and Citigroup and an underweight to SVB Financial Group. Contributions from non-U.S. banks were due to active trading in UBS Group, Barclays, Sumitomo Mitsui Financial Group and Deutsche Bank. In the communications subsector, an active overweight in Warner Bros. Discovery and active trading in T-Mobile and AT&T contributed. In addition, active trading in technology company Intel Corporation and Mexican sovereign bonds made notable contributions.
In agency mortgages, active sector positioning amid elevated spread volatility was a significant contributor to the Portfolio’s relative performance. Security selection and positioning in passthroughs also meaningfully contributed, given the multitude of coupons and underlying stories available to trade and the contrasting performance among them. Specifically, overweights to 20-year 2.0s and seasoned 30-year 3.0s were the largest contributors, as the portfolio managers built significant positions at attractive prices in both cohorts throughout the year. Underweights to 15-year mortgage-backed securities (MBS) and 30-year lower- and mid-stack coupons also contributed. Conversely, overweights to floating rate collateralized mortgage obligations (CMOs) and hybrid adjustable-rate mortgages (ARMs) detracted modestly from the Portfolio’s relative performance, as spreads did not recover as quickly as with fixed rate cash flows. Positioning in select higher coupon 30-year MBS detracted materially as well.
121
Select Bond Portfolio (unaudited)
In structured products, a sector overweight to the asset-backed security (ABS) sector contributed as spreads compressed. Security selection in the ABS sector across sub-sectors, including private credit student loan ABS, auto ABS, FFELP student loan ABS, rental car ABS, credit card ABS and auto dealer floorplan ABS contributed. Within commercial mortgage-backed securities (CMBS), front last cash flows (LCFs) and single-asset/single-borrower positions were small contributors, while the small sector underweight detracted.
PORTFOLIO MANAGER OUTLOOK
The following forward-looking comments are the opinion of Allspring, the Portfolio’s sub-adviser.
Measures of inflation finally seem to be normalizing. Policymakers appear to have taken an optimistic view of recent developments, such as decelerating inflation, resilient growth and the lack of re-emergence of financial stability risks from earlier in 2023. With inflation decreasing, policymakers have indicated that further deceleration of inflation could lead to rate cuts sometime in 2024, as a means of avoiding incremental policy restriction in the form of higher short-term real rates.
We believe volatility will continue to provide for fertile security selection across sectors of the most liquid parts of the U.S. investment grade, fixed income markets, our preferred habitat for selection and rotation. Consistent with our bottom-up process, we maintain a neutral duration, with a pure focus on security selection. We remain nimble and agile, and we stand ready to take advantage of security selection opportunities where they arise.
Relative Performance
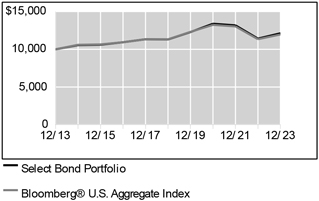
| | | | | | |
|
Average Annual Total Returns For Periods Ended December 31, 2023 |
| | | 1 Year | | 5 Years | | 10 Years |
Select Bond Portfolio | | 6.19% | | 1.41% | | 1.94% |
Bloomberg® U.S. Aggregate Index | | 5.53% | | 1.10% | | 1.81% |
The performance data quoted represents past performance. Past performance is historical and does not guarantee future performance. Investment return and principal value will fluctuate, so that shares, when redeemed, may be worth more or less than their original cost. Current performance may be lower or higher than the performance data quoted. For the most recent month-end performance information visit www.northwesternmutual.com.
This chart assumes an initial investment of $10,000 made on 12/31/13. Returns shown reflect fee waivers,
deductions for management and other portfolio expenses, and reinvestment of all dividends. In the absence of fee waivers, total return would be reduced. Returns exclude deductions for separate account sale loads and account fees. Please refer to the Benchmark Definitions section of this report for information about the indices cited in the above chart and graph.
Top 10 Holdings 12/31/23
| | | | | | | | |
| | | | |
| | | Security Description | | % of Net Assets | | | | |
| | | | |
| | | US Treasury, Various | | 26.8% | | | | |
| | | | |
| | | Federal National Mortgage Association, Various | | 19.2% | | | | |
| | | | |
| | | Federal Home Loan Mortgage Corp., Various | | 4.8% | | | | |
| | | | |
| | | Uniform Mortgage Backed Security TBA, Various | | 2.7% | | | | |
| | | | |
| | | Government National Mortgage Association, Various | | 1.5% | | | | |
| | | | |
| | | Bank of America Corp., Various | | 1.3% | | | | |
| | | | |
| | | Government National Mortgage Association TBA, 6.5%, 1/22/54 | | 1.0% | | | | |
| | | | |
| | | Wells Fargo & Co., Various | | 0.7% | | | | |
| | | | |
| | | T-Mobile USA, Inc., Various | | 0.6% | | | | |
| | | | |
| | | Energy Transfer LP, Various | | 0.5% | | | | |
Sector Allocation 12/31/23
| | | | | | | | |
| | | | |
| | | Sector | | % of Net Assets | | | | |
| | | | |
| | | Structured Products | | 50.8% | | | | |
| | | | |
| | | Governments | | 28.4% | | | | |
| | | | |
| | | Corporate Bonds | | 22.1% | | | | |
| | | | |
| | | Municipal Bonds | | 0.3% | | | | |
| | | | |
| | | Short-Term Investments & Other Net Assets | | -1.6% | | | | |
Sector Allocation and Top 10 Holdings are subject to change.
122
Select Bond Portfolio (unaudited)
Consistent with the Portfolio’s stated parameters, no more than 20% of the Portfolio is invested in foreign securities, and no more than 10% is invested in high yield securities.
123
Select Bond Portfolio
SCHEDULE OF INVESTMENTS
December 31, 2023
| | | | | | | | |
| Corporate Bonds (22.1%) | | Shares/ Par + | | Value $ (000’s) | |
Basic Materials (0.3%) | | | | | | | | |
Anglo American Capital PLC
4.750%, 3/16/52 144A | | | 3,036,000 | | | | 2,604 | |
Celanese US Holdings LLC
6.700%, 11/15/33 | | | 2,142,000 | | | | 2,323 | |
Glencore Finance Canada, Ltd.
5.300%, 10/25/42 144A | | | 483,000 | | | | 468 | |
6.000%, 11/15/41 144A | | | 392,000 | | | | 399 | |
6.900%, 11/15/37 144A | | | 1,109,000 | | | | 1,222 | |
Glencore Funding LLC
6.500%, 10/6/33 144A | | | 2,133,000 | | | | 2,325 | |
| | | | | | | | |
Total | | | | | | | 9,341 | |
| | | | | | | | |
| | |
Communications (1.6%) | | | | | | | | |
AT&T, Inc.
3.500%, 6/1/41 | | | 1,032,000 | | | | 819 | |
3.500%, 9/15/53 | | | 1,601,000 | | | | 1,162 | |
3.550%, 9/15/55 | | | 1,597,000 | | | | 1,148 | |
3.650%, 9/15/59 | | | 1,010,000 | | | | 724 | |
3.800%, 12/1/57 | | | 2,905,000 | | | | 2,159 | |
5.400%, 2/15/34 | | | 5,536,000 | | | | 5,709 | |
Charter Communications Operating LLC / Charter Communications Operating Capital Corp.
3.500%, 6/1/41 | | | 555,000 | | | | 392 | |
3.500%, 3/1/42 | | | 3,499,000 | | | | 2,434 | |
6.150%, 11/10/26 | | | 2,232,000 | | | | 2,282 | |
Comcast Corp.
2.987%, 11/1/63 | | | 1,207,000 | | | | 778 | |
4.049%, 11/1/52 | | | 1,041,000 | | | | 878 | |
5.350%, 11/15/27 | | | 2,121,000 | | | | 2,192 | |
Discovery Communications LLC
4.000%, 9/15/55 | | | 1,129,000 | | | | 803 | |
Meta Platforms, Inc.
5.600%, 5/15/53 | | | 2,035,000 | | | | 2,206 | |
5.750%, 5/15/63 | | | 2,035,000 | | | | 2,227 | |
T-Mobile USA, Inc.
1.500%, 2/15/26 | | | 723,000 | | | | 673 | |
2.250%, 2/15/26 | | | 2,254,000 | | | | 2,136 | |
2.550%, 2/15/31 | | | 1,613,000 | | | | 1,389 | |
3.750%, 4/15/27 | | | 3,431,000 | | | | 3,328 | |
4.800%, 7/15/28 | | | 2,143,000 | | | | 2,161 | |
4.950%, 3/15/28 | | | 2,141,000 | | | | 2,170 | |
5.050%, 7/15/33 | | | 2,679,000 | | | | 2,700 | |
5.750%, 1/15/34 | | | 2,138,000 | | | | 2,268 | |
Verizon Communications, Inc.
2.355%, 3/15/32 | | | 3,236,000 | | | | 2,692 | |
2.650%, 11/20/40 | | | 1,352,000 | | | | 974 | |
ViacomCBS, Inc.
4.950%, 5/19/50 | | | 1,303,000 | | | | 1,056 | |
| | | | | | | | |
Total | | | | | | | 47,460 | |
| | | | | | | | |
| | | | | | | | |
| Corporate Bonds (22.1%) | | Shares/ Par + | | Value $ (000’s) | |
Consumer, Cyclical (1.7%) | | | | | | | | |
Delta Air Lines, Inc./SkyMiles IP, Ltd.
4.750%, 10/20/28 144A | | | 3,541,000 | | | | 3,483 | |
Ford Motor Credit Co. LLC
2.900%, 2/10/29 | | | 4,413,000 | | | | 3,865 | |
General Motors Financial Co., Inc.
5.800%, 1/7/29 | | | 3,192,000 | | | | 3,267 | |
6.100%, 1/7/34 | | | 1,065,000 | | | | 1,097 | |
Harley-Davidson Financial Services, Inc.
6.500%, 3/10/28 144A | | | 1,611,000 | | | | 1,672 | |
Hyundai Capital America
0.800%, 1/8/24 144A | | | 849,000 | | | | 848 | |
1.300%, 1/8/26 144A | | | 2,035,000 | | | | 1,879 | |
5.500%, 3/30/26 144A | | | 1,102,000 | | | | 1,108 | |
5.600%, 3/30/28 144A | | | 3,357,000 | | | | 3,407 | |
5.700%, 6/26/30 144A | | | 1,065,000 | | | | 1,090 | |
5.950%, 9/21/26 144A | | | 2,996,000 | | | | 3,047 | |
6.500%, 1/16/29 144A | | | 2,468,000 | | | | 2,605 | |
Lowe’s Companies, Inc.
4.250%, 4/1/52 | | | 2,024,000 | | | | 1,714 | |
5.625%, 4/15/53 | | | 3,717,000 | | | | 3,897 | |
5.750%, 7/1/53 | | | 1,077,000 | | | | 1,141 | |
5.850%, 4/1/63 | | | 538,000 | | | | 563 | |
McDonald’s Corp.
4.700%, 12/9/35 | | | 745,000 | | | | 736 | |
4.800%, 8/14/28 | | | 2,138,000 | | | | 2,175 | |
5.450%, 8/14/53 | | | 1,001,000 | | | | 1,065 | |
O’Reilly Automotive, Inc.
5.750%, 11/20/26 | | | 798,000 | | | | 817 | |
Tapestry, Inc.
7.350%, 11/27/28 | | | 533,000 | | | | 559 | |
7.700%, 11/27/30 | | | 2,141,000 | | | | 2,254 | |
Walmart, Inc.
4.100%, 4/15/33 | | | 2,692,000 | | | | 2,666 | |
4.500%, 4/15/53 | | | 1,065,000 | | | | 1,035 | |
WarnerMedia Holdings, Inc.
5.050%, 3/15/42 | | | 1,045,000 | | | | 921 | |
5.141%, 3/15/52 | | | 981,000 | | | | 842 | |
5.391%, 3/15/62 | | | 1,015,000 | | | | 869 | |
| | | | | | | | |
Total | | | | | | | 48,622 | |
| | | | | | | | |
| | |
Consumer, Non-cyclical (3.4%) | | | | | | | | |
Abbott Laboratories
1.400%, 6/30/30 | | | 2,415,000 | | | | 2,043 | |
4.750%, 11/30/36 | | | 1,072,000 | | | | 1,098 | |
AbbVie, Inc.
3.200%, 11/21/29 | | | 3,999,000 | | | | 3,738 | |
4.050%, 11/21/39 | | | 1,140,000 | | | | 1,029 | |
4.250%, 11/21/49 | | | 2,770,000 | | | | 2,469 | |
4.500%, 5/14/35 | | | 2,353,000 | | | | 2,301 | |
4.550%, 3/15/35 | | | 2,686,000 | | | | 2,634 | |
Adani International Container Terminal Private, Ltd.
3.000%, 2/16/31 144A | | | 818,275 | | | | 670 | |
Altria Group, Inc.
6.875%, 11/1/33 | | | 3,019,000 | | | | 3,323 | |
The Accompanying Notes are an Integral Part of the Financial Statements.
124
Select Bond Portfolio
| | | | | | | | |
| Corporate Bonds (22.1%) | | Shares/ Par + | | Value $ (000’s) | |
Consumer, Non-cyclical continued | | | | | | | | |
Amgen, Inc.
5.250%, 3/2/25 | | | 3,211,000 | | | | 3,218 | |
5.650%, 3/2/53 | | | 7,454,000 | | | | 7,842 | |
Anheuser-Busch Cos. LLC / Anheuser-Busch InBev Worldwide, Inc.
4.700%, 2/1/36 | | | 3,287,000 | | | | 3,276 | |
Anheuser-Busch InBev Worldwide, Inc.
4.375%, 4/15/38 | | | 1,394,000 | | | | 1,322 | |
5.800%, 1/23/59 | | | 804,000 | | | | 901 | |
Bunge, Ltd. Finance Corp.
1.630%, 8/17/25 | | | 1,107,000 | | | | 1,047 | |
Constellation Brands, Inc.
5.250%, 11/15/48 | | | 2,242,000 | | | | 2,219 | |
CVS Health Corp.
5.875%,��6/1/53 | | | 746,000 | | | | 785 | |
DH Europe Finance II SARL
2.200%, 11/15/24 | | | 2,640,000 | | | | 2,571 | |
Gilead Sciences, Inc.
2.600%, 10/1/40 | | | 1,670,000 | | | | 1,230 | |
HCA, Inc.
3.625%, 3/15/32 | | | 2,195,000 | | | | 1,963 | |
4.625%, 3/15/52 | | | 1,029,000 | | | | 875 | |
5.500%, 6/1/33 | | | 1,100,000 | | | | 1,117 | |
5.900%, 6/1/53 | | | 4,337,000 | | | | 4,446 | |
The J.M. Smucker Co.
6.500%, 11/15/43 | | | 532,000 | | | | 593 | |
JBS USA LUX SA / JBS USA Food Co / JBS Luxembourg SARL
6.750%, 3/15/34 144A | | | 1,065,000 | | | | 1,122 | |
7.250%, 11/15/53 144A | | | 1,183,000 | | | | 1,286 | |
Kenvue, Inc.
5.050%, 3/22/28 | | | 2,147,000 | | | | 2,200 | |
5.050%, 3/22/53 | | | 1,390,000 | | | | 1,438 | |
Keurig Dr. Pepper, Inc.
4.500%, 4/15/52 | | | 2,029,000 | | | | 1,855 | |
Merck & Co., Inc.
5.000%, 5/17/53 | | | 1,086,000 | | | | 1,117 | |
5.150%, 5/17/63 | | | 815,000 | | | | 850 | |
PepsiCo, Inc.
5.125%, 11/10/26 | | | 4,179,000 | | | | 4,267 | |
Pfizer Investment Enterprises Pte., Ltd.
4.750%, 5/19/33 | | | 4,184,000 | | | | 4,193 | |
5.300%, 5/19/53 | | | 3,837,000 | | | | 3,917 | |
5.340%, 5/19/63 | | | 2,152,000 | | | | 2,173 | |
Philip Morris International, Inc.
4.875%, 2/15/28 | | | 4,653,000 | | | | 4,703 | |
5.000%, 11/17/25 | | | 2,278,000 | | | | 2,287 | |
5.125%, 11/17/27 | | | 290,000 | | | | 295 | |
5.250%, 9/7/28 | | | 2,320,000 | | | | 2,386 | |
5.375%, 2/15/33 | | | 1,766,000 | | | | 1,811 | |
5.500%, 9/7/30 | | | 1,513,000 | | | | 1,568 | |
5.625%, 9/7/33 | | | 910,000 | | | | 950 | |
5.750%, 11/17/32 | | | 547,000 | | | | 574 | |
Quanta Services, Inc.
0.950%, 10/1/24 | | | 1,918,000 | | | | 1,848 | |
UnitedHealth Group, Inc.
3.050%, 5/15/41 | | | 505,000 | | | | 395 | |
5.200%, 4/15/63 | | | 1,109,000 | | | | 1,132 | |
| | | | | | | | |
| Corporate Bonds (22.1%) | | Shares/ Par + | | Value $ (000’s) | |
Consumer, Non-cyclical continued | | | | | | | | |
5.875%, 2/15/53 | | | 2,011,000 | | | | 2,278 | |
| | | | | | | | |
Total | | | | | | | 97,355 | |
| | | | | | | | |
| | |
Energy (1.8%) | | | | | | | | |
Aker BP ASA
5.600%, 6/13/28 144A | | | 2,805,000 | | | | 2,859 | |
6.000%, 6/13/33 144A | | | 3,468,000 | | | | 3,602 | |
BP Capital Markets America, Inc.
3.001%, 3/17/52 | | | 1,283,000 | | | | 900 | |
4.812%, 2/13/33 | | | 5,888,000 | | | | 5,937 | |
Diamondback Energy, Inc.
4.250%, 3/15/52 | | | 322,000 | | | | 260 | |
6.250%, 3/15/33 | | | 1,607,000 | | | | 1,717 | |
6.250%, 3/15/53 | | | 2,730,000 | | | | 2,910 | |
Enbridge, Inc.
6.000%, 11/15/28 | | | 1,607,000 | | | | 1,687 | |
6.200%, 11/15/30 | | | 1,607,000 | | | | 1,720 | |
6.700%, 11/15/53 | | | 2,357,000 | | | | 2,741 | |
Energy Transfer LP
4.400%, 3/15/27 | | | 476,000 | | | | 465 | |
4.950%, 5/15/28 | | | 2,034,000 | | | | 2,024 | |
5.300%, 4/15/47 | | | 2,779,000 | | | | 2,548 | |
5.750%, 2/15/33 | | | 3,908,000 | | | | 4,029 | |
6.100%, 12/1/28 | | | 2,561,000 | | | | 2,695 | |
6.125%, 12/15/45 | | | 859,000 | | | | 865 | |
6.400%, 12/1/30 | | | 2,143,000 | | | | 2,291 | |
Galaxy Pipeline Assets Bidco, Ltd.
2.160%, 3/31/34 144A | | | 1,871,316 | | | | 1,623 | |
2.625%, 3/31/36 144A | | | 1,480,000 | | | | 1,222 | |
2.940%, 9/30/40 144A | | | 404,041 | | | | 333 | |
MPLX LP
4.950%, 3/14/52 | | | 1,992,000 | | | | 1,772 | |
5.000%, 3/1/33 | | | 3,230,000 | | | | 3,164 | |
5.650%, 3/1/53 | | | 578,000 | | | | 571 | |
ONEOK, Inc.
6.625%, 9/1/53 | | | 2,782,000 | | | | 3,114 | |
Petroleos Mexicanos
2.460%, 12/15/25 | | | 1,283,800 | | | | 1,239 | |
Sunoco Logistics Partners Operations LP
5.400%, 10/1/47 | | | 816,000 | | | | 760 | |
| | | | | | | | |
Total | | | | | | | 53,048 | |
| | | | | | | | |
| | |
Financial (7.8%) | | | | | | | | |
Agree LP
2.000%, 6/15/28 | | | 2,012,000 | | | | 1,745 | |
2.600%, 6/15/33 | | | 458,000 | | | | 363 | |
4.800%, 10/1/32 | | | 1,009,000 | | | | 953 | |
American Express Co.
5.282%, (US SOFR plus 1.280%), 7/27/29 a | | | 4,286,000 | | | | 4,375 | |
5.389%, (US SOFR plus 0.970%), 7/28/27 a | | | 3,204,000 | | | | 3,241 | |
6.489%, (US SOFR plus 1.940%), 10/30/31 a | | | 1,608,000 | | | | 1,744 | |
American Homes 4 Rent LP
3.625%, 4/15/32 | | | 1,852,000 | | | | 1,659 | |
4.300%, 4/15/52 | | | 830,000 | | | | 668 | |
American Tower Corp.
2.950%, 1/15/51 | | | 537,000 | | | | 358 | |
3.125%, 1/15/27 | | | 907,000 | | | | 857 | |
5.500%, 3/15/28 | | | 2,143,000 | | | | 2,190 | |
5.900%, 11/15/33 | | | 3,207,000 | | | | 3,395 | |
The Accompanying Notes are an Integral Part of the Financial Statements.
125
Select Bond Portfolio
| | | | | | | | |
| Corporate Bonds (22.1%) | | Shares/ Par + | | Value $ (000’s) | |
Financial continued | | | | | | | | |
Banco Bilbao Vizcaya Argentaria SA | | | | | | | | |
7.883%, (US Treasury Yield Curve Rate T Note Constant Maturity 1 Year plus
3.300%), 11/15/34 a | | | 2,200,000 | | | | 2,394 | |
Banco Santander SA | | | | | | | | |
6.527%, (US Treasury Yield Curve Rate
T Note Constant Maturity 1 Year plus
1.650%), 11/7/27 a | | | 2,600,000 | | | | 2,688 | |
6.607%, 11/7/28 | | | 2,600,000 | | | | 2,768 | |
6.938%, 11/7/33 | | | 2,200,000 | | | | 2,442 | |
Bank of America Corp.
1.734%, (US SOFR plus 0.960%), 7/22/27 a | | | 7,367,000 | | | | 6,749 | |
3.419%, (US SOFR 3 Month plus | | | | | | | | |
1.302%), 12/20/28 a | | | 7,528,000 | | | | 7,091 | |
5.288%, (US SOFR plus 1.910%), 4/25/34 a | | | 6,087,000 | | | | 6,101 | |
5.819%, (US SOFR plus 1.570%), 9/15/29 a | | | 8,230,000 | | | | 8,496 | |
5.872%, (US SOFR plus 1.840%), 9/15/34 a | | | 4,115,000 | | | | 4,307 | |
5.933%, (US SOFR plus 1.340%), 9/15/27 a | | | 5,879,000 | | | | 5,998 | |
Barclays PLC
6.224%, (US SOFR plus 2.980%), 5/9/34 a | | | 3,291,000 | | | | 3,413 | |
6.490%, (US SOFR plus 2.220%), 9/13/29 a | | | 3,201,000 | | | | 3,333 | |
6.692%, (US SOFR plus 2.620%), 9/13/34 a | | | 3,283,000 | | | | 3,510 | |
BNP Paribas SA | | | | | | | | |
5.335%, (US Treasury Yield Curve Rate
T Note Constant Maturity 1 Year plus 1.500%), 6/12/29 144A a | | | 4,256,000 | | | | 4,317 | |
5.894%, (US SOFR plus 1.866%), 12/5/34 144A a | | | 3,192,000 | | | | 3,335 | |
BPCE SA | | | | | | | | |
6.612%, (US SOFR plus 1.980%), 10/19/27 144A a | | | 3,266,000 | | | | 3,361 | |
6.714%, (US SOFR plus 2.270%), 10/19/29 144A a | | | 2,230,000 | | | | 2,348 | |
7.003%, (US SOFR plus 2.590%), 10/19/34 144A a | | | 1,676,000 | | | | 1,821 | |
Brixmor Operating Partnership LP
2.500%, 8/16/31 | | | 1,771,000 | | | | 1,485 | |
Canadian Imperial Bank of Commerce
6.092%, 10/3/33 | | | 3,210,000 | | | | 3,425 | |
Capital One Financial Corp.
7.149%, (US SOFR plus 2.440%), 10/29/27 a | | | 2,681,000 | | | | 2,783 | |
Capitol One Financial Corp.
7.624%, (US SOFR plus 3.070%), 10/30/31 a | | | 2,681,000 | | | | 2,946 | |
The Charles Schwab Corp.
6.136%, (US SOFR plus 2.010%), 8/24/34 a | | | 2,136,000 | | | | 2,251 | |
Citibank NA
5.803%, 9/29/28 | | | 5,347,000 | | | | 5,583 | |
Citigroup, Inc.
6.174%, (US SOFR plus 2.661%), 5/25/34 a | | | 2,551,000 | | | | 2,640 | |
Cooperatieve Rabobank U.A. | | | | | | | | |
5.564%, (US Treasury Yield Curve Rate
T Note Constant Maturity 1 Year plus
1.400%), 2/28/29 144A a | | | 7,590,000 | | | | 7,708 | |
Crown Castle International Corp.
1.050%, 7/15/26 | | | 2,886,000 | | | | 2,604 | |
2.100%, 4/1/31 | | | 1,810,000 | | | | 1,474 | |
2.900%, 4/1/41 | | | 1,072,000 | | | | 765 | |
5.000%, 1/11/28 | | | 3,606,000 | | | | 3,592 | |
5.100%, 5/1/33 | | | 1,563,000 | | | | 1,547 | |
| | | | | | | | |
| Corporate Bonds (22.1%) | | Shares/ Par + | | Value $ (000’s) | |
Financial continued | | | | | | | | |
Crown Castle, Inc.
5.600%, 6/1/29 | | | 1,702,000 | | | | 1,740 | |
5.800%, 3/1/34 | | | 3,302,000 | | | | 3,418 | |
Deutsche Bank AG
3.742%, (US SOFR plus 2.257%), 1/7/33 a | | | 4,166,000 | | | | 3,420 | |
Essex Portfolio LP
2.550%, 6/15/31 | | | 955,000 | | | | 799 | |
Federal Realty Investment Trust
3.950%, 1/15/24 | | | 1,281,000 | | | | 1,280 | |
HSBC Holdings PLC | | | | | | | | |
3.973%, (US SOFR 3 Month plus
1.610%), 5/22/30 a | | | 2,692,000 | | | | 2,514 | |
4.583%, (US SOFR 3 Month plus
1.796%), 6/19/29 a | | | 796,000 | | | | 772 | |
7.399%, (US SOFR plus
3.020%), 11/13/34 a | | | 2,701,000 | | | | 2,963 | |
ING Groep NV
6.083%, (US SOFR plus 1.560%), 9/11/27 a | | | 3,202,000 | | | | 3,268 | |
6.114%, (US SOFR plus 2.090%), 9/11/34 a | | | 2,205,000 | | | | 2,313 | |
Invitation Homes Operating Partnership LP
2.000%, 8/15/31 | | | 319,000 | | | | 254 | |
4.150%, 4/15/32 | | | 1,843,000 | | | | 1,694 | |
KeyBank NA
5.000%, 1/26/33 | | | 1,567,000 | | | | 1,465 | |
M&T Bank Corp. | | | | | | | | |
7.413%, (US SOFR plus
2.800%), 10/30/29 a | | | 2,197,000 | | | | 2,363 | |
Morgan Stanley | | | | | | | | |
5.123%, (US SOFR plus 1.730%), 2/1/29 a | | | 1,065,000 | | | | 1,070 | |
5.164%, (US SOFR plus 1.590%), 4/20/29 a | | | 1,065,000 | | | | 1,071 | |
5.250%, (US SOFR plus 1.870%), 4/21/34 a | | | 3,218,000 | | | | 3,218 | |
5.449%, (US SOFR plus 1.630%), 7/20/29 a | | | 2,130,000 | | | | 2,170 | |
6.342%, (US SOFR plus 2.560%), 10/18/33 a | | | 3,667,000 | | | | 3,954 | |
NNN REIT, Inc.
5.600%, 10/15/33 | | | 1,602,000 | | | | 1,654 | |
Realty Income Corp.
2.200%, 6/15/28 | | | 992,000 | | | | 889 | |
2.850%, 12/15/32 | | | 1,340,000 | | | | 1,138 | |
4.900%, 7/15/33 | | | 1,788,000 | | | | 1,785 | |
5.625%, 10/13/32 | | | 1,874,000 | | | | 1,971 | |
Regency Centers LP
2.950%, 9/15/29 | | | 2,537,000 | | | | 2,275 | |
Santander Holdings USA, Inc.
7.660%, (US SOFR plus 3.280%), 11/9/31 a | | | 2,679,000 | | | | 2,899 | |
Store Capital Corp.
2.700%, 12/1/31 | | | 644,000 | | | | 488 | |
2.750%, 11/18/30 | | | 1,638,000 | | | | 1,279 | |
4.500%, 3/15/28 | | | 1,064,000 | | | | 978 | |
4.625%, 3/15/29 | | | 1,182,000 | | | | 1,090 | |
Sun Communities Operating LP
4.200%, 4/15/32 | | | 1,852,000 | | | | 1,689 | |
Truist Financial Corp. | | | | | | | | |
7.161%, (US SOFR plus
2.446%), 10/30/29 a | | | 3,751,000 | | | | 4,051 | |
Trust Fibra Uno
6.390%, 1/15/50 144A | | | 1,215,000 | | | | 980 | |
UBS AG
5.650%, 9/11/28 | | | 2,480,000 | | | | 2,572 | |
The Accompanying Notes are an Integral Part of the Financial Statements.
126
Select Bond Portfolio
| | | | | | | | |
| Corporate Bonds (22.1%) | | Shares/ Par + | | Value $ (000’s) | |
Financial continued | | | | | | | | |
UBS Group AG | | | | | | | | |
4.194%, (US SOFR plus 3.730%), 4/1/31
144A a | | | 1,682,000 | | | | 1,566 | |
4.282%, 1/9/28 144A | | | 2,436,000 | | | | 2,359 | |
6.301%, (US Treasury Yield Curve Rate T Note Constant Maturity 1 Year plus 2.000%), 9/22/34 144A a | | | 1,666,000 | | | | 1,764 | |
Wells Fargo & Co. | | | | | | | | |
4.611%, (US SOFR plus 2.130%), 4/25/53 a | | | 1,065,000 | | | | 957 | |
4.897%, (US SOFR plus 2.100%), 7/25/33 a | | | 7,502,000 | | | | 7,308 | |
5.574%, (US SOFR plus 1.740%), 7/25/29 a | | | 1,071,000 | | | | 1,094 | |
6.303%, (US SOFR plus 1.790%), 10/23/29 a | | | 3,747,000 | | | | 3,949 | |
6.491%, (US SOFR plus 2.060%), 10/23/34 a | | | 5,894,000 | | | | 6,412 | |
| | | | | | | | |
Total | | | | | | | 225,716 | |
| | | | | | | | |
| | |
Industrial (1.4%) | | | | | | | | |
The Boeing Co.
2.196%, 2/4/26 | | | 3,649,000 | | | | 3,448 | |
3.250%, 2/1/35 | | | 1,182,000 | | | | 997 | |
3.750%, 2/1/50 | | | 2,108,000 | | | | 1,636 | |
5.805%, 5/1/50 | | | 4,824,000 | | | | 4,995 | |
Burlington Northern Santa Fe LLC
4.450%, 1/15/53 | | | 430,000 | | | | 405 | |
Canadian Pacific Railway Co.
1.350%, 12/2/24 | | | 2,390,000 | | | | 2,304 | |
1.750%, 12/2/26 | | | 462,000 | | | | 426 | |
Carrier Global Corp.
5.900%, 3/15/34 144A | | | 2,141,000 | | | | 2,316 | |
6.200%, 3/15/54 144A | | | 749,000 | | | | 866 | |
Crowley Conro LLC
4.181%, 8/15/43 | | | 1,220,528 | | | | 1,179 | |
John Deere Capital Corp.
4.150%, 9/15/27 | | | 2,130,000 | | | | 2,116 | |
4.950%, 7/14/28 | | | 854,000 | | | | 876 | |
5.150%, 9/8/26 | | | 3,735,000 | | | | 3,802 | |
Northrop Grumman Corp.
4.400%, 5/1/30 | | | 1,235,000 | | | | 1,228 | |
Republic Services, Inc.
5.000%, 4/1/34 | | | 1,613,000 | | | | 1,652 | |
RTX Corp.
6.100%, 3/15/34 | | | 2,764,000 | | | | 3,000 | |
6.400%, 3/15/54 | | | 2,211,000 | | | | 2,560 | |
Union Pacific Corp.
2.375%, 5/20/31 | | | 1,023,000 | | | | 889 | |
2.800%, 2/14/32 | | | 1,388,000 | | | | 1,231 | |
3.375%, 2/14/42 | | | 1,154,000 | | | | 942 | |
Veralto Corp.
5.500%, 9/18/26 144A | | | 1,002,000 | | | | 1,015 | |
Waste Management, Inc.
4.875%, 2/15/34 | | | 2,118,000 | | | | 2,160 | |
| | | | | | | | |
Total | | | | | | | 40,043 | |
| | | | | | | | |
| | |
Technology (2.0%) | | | | | | | | |
Apple, Inc.
2.375%, 2/8/41 | | | 782,000 | | | | 572 | |
2.650%, 5/11/50 | | | 854,000 | | | | 588 | |
2.650%, 2/8/51 | | | 658,000 | | | | 450 | |
3.950%, 8/8/52 | | | 1,510,000 | | | | 1,322 | |
| | | | | | | | |
| Corporate Bonds (22.1%) | | Shares/ Par + | | Value $ (000’s) | |
Technology continued | | | | | | | | |
4.850%, 5/10/53 | | | 546,000 | | | | 556 | |
Broadcom, Inc.
2.450%, 2/15/31 144A | | | 1,682,000 | | | | 1,438 | |
3.150%, 11/15/25 | | | 1,260,000 | | | | 1,220 | |
3.469%, 4/15/34 144A | | | 1,079,000 | | | | 939 | |
4.926%, 5/15/37 144A | | | 1,537,000 | | | | 1,487 | |
Fiserv, Inc.
5.375%, 8/21/28 | | | 3,201,000 | | | | 3,293 | |
5.600%, 3/2/33 | | | 549,000 | | | | 573 | |
5.625%, 8/21/33 | | | 3,201,000 | | | | 3,353 | |
Intel Corp.
2.800%, 8/12/41 | | | 923,000 | | | | 691 | |
5.625%, 2/10/43 | | | 617,000 | | | | 660 | |
5.700%, 2/10/53 | | | 2,141,000 | | | | 2,315 | |
5.900%, 2/10/63 | | | 1,499,000 | | | | 1,671 | |
Intuit, Inc.
5.125%, 9/15/28 | | | 2,124,000 | | | | 2,195 | |
5.200%, 9/15/33 | | | 2,124,000 | | | | 2,224 | |
5.250%, 9/15/26 | | | 2,658,000 | | | | 2,710 | |
5.500%, 9/15/53 | | | 2,138,000 | | | | 2,338 | |
KLA-Tencor Corp.
3.300%, 3/1/50 | | | 881,000 | | | | 672 | |
Marvell Technology, Inc.
5.750%, 2/15/29 | | | 1,603,000 | | | | 1,656 | |
5.950%, 9/15/33 | | | 1,603,000 | | | | 1,700 | |
Micron Technology, Inc.
3.477%, 11/1/51 | | | 526,000 | | | | 381 | |
5.375%, 4/15/28 | | | 5,386,000 | | | | 5,481 | |
5.875%, 2/9/33 | | | 632,000 | | | | 657 | |
NXP BV / NXP Funding LLC / NXP USA, Inc.
2.500%, 5/11/31 | | | 1,071,000 | | | | 910 | |
3.250%, 5/11/41 | | | 1,054,000 | | | | 803 | |
Oracle Corp.
4.000%, 7/15/46 | | | 1,867,000 | | | | 1,496 | |
4.375%, 5/15/55 | | | 648,000 | | | | 537 | |
5.550%, 2/6/53 | | | 657,000 | | | | 657 | |
QUALCOMM, Inc.
6.000%, 5/20/53 | | | 2,423,000 | | | | 2,788 | |
Texas Instruments, Inc.
5.000%, 3/14/53 | | | 2,363,000 | | | | 2,419 | |
VMware, Inc.
1.000%, 8/15/24 | | | 3,343,000 | | | | 3,247 | |
1.400%, 8/15/26 | | | 3,127,000 | | | | 2,860 | |
4.700%, 5/15/30 | | | 1,932,000 | | | | 1,906 | |
| | | | | | | | |
Total | | | | | | | 58,765 | |
| | | | | | | | |
| | |
Utilities (2.1%) | | | | | | | | |
American Transmission Systems, Inc.
2.650%, 1/15/32 144A | | | 669,000 | | | | 566 | |
Baltimore Gas & Electric Co.
2.250%, 6/15/31 | | | 1,435,000 | | | | 1,222 | |
5.400%, 6/1/53 | | | 1,607,000 | | | | 1,658 | |
CenterPoint Energy Houston Electric LLC
3.600%, 3/1/52 | | | 1,060,000 | | | | 841 | |
5.200%, 10/1/28 | | | 1,607,000 | | | | 1,658 | |
Consolidated Edison Co. of New York, Inc.
3.200%, 12/1/51 | | | 319,000 | | | | 225 | |
5.200%, 3/1/33 | | | 569,000 | | | | 588 | |
5.500%, 3/15/34 | | | 2,672,000 | | | | 2,802 | |
5.900%, 11/15/53 | | | 1,069,000 | | | | 1,175 | |
The Accompanying Notes are an Integral Part of the Financial Statements.
127
Select Bond Portfolio
| | | | | | | | |
| Corporate Bonds (22.1%) | | Shares/ Par + | | Value $ (000’s) | |
Utilities continued | | | | | | | | |
Consumers Energy Co.
2.500%, 5/1/60 | | | 873,000 | | | | 533 | |
DTE Electric Co.
2.950%, 3/1/50 | | | 1,675,000 | | | | 1,169 | |
3.650%, 3/1/52 | | | 767,000 | | | | 605 | |
Duke Energy Carolinas LLC
2.550%, 4/15/31 | | | 976,000 | | | | 846 | |
2.850%, 3/15/32 | | | 1,782,000 | | | | 1,553 | |
3.550%, 3/15/52 | | | 1,298,000 | | | | 994 | |
4.950%, 1/15/33 | | | 1,597,000 | | | | 1,627 | |
5.350%, 1/15/53 | | | 2,151,000 | | | | 2,202 | |
Duke Energy Corp.
2.550%, 6/15/31 | | | 1,596,000 | | | | 1,362 | |
3.500%, 6/15/51 | | | 297,000 | | | | 218 | |
5.750%, 9/15/33 | | | 857,000 | | | | 906 | |
Duke Energy Florida LLC
2.400%, 12/15/31 | | | 1,431,000 | | | | 1,207 | |
Duke Energy Progress LLC
2.500%, 8/15/50 | | | 1,448,000 | | | | 910 | |
5.250%, 3/15/33 | | | 1,066,000 | | | | 1,099 | |
Entergy Arkansas LLC
2.650%, 6/15/51 | | | 1,292,000 | | | | 812 | |
5.150%, 1/15/33 | | | 2,152,000 | | | | 2,194 | |
Israel Electric Corp., Ltd.
3.750%, 2/22/32 144A § | | | 960,000 | | | | 812 | |
Jersey Central Power & Light Co.
2.750%, 3/1/32 144A | | | 1,576,000 | | | | 1,330 | |
Metropolitan Edison Co.
4.300%, 1/15/29 144A | | | 1,687,000 | | | | 1,633 | |
5.200%, 4/1/28 144A | | | 1,614,000 | | | | 1,626 | |
MidAmerican Energy Co.
2.700%, 8/1/52 | | | 1,244,000 | | | | 803 | |
Mississippi Power Co.
3.100%, 7/30/51 | | | 1,720,000 | | | | 1,154 | |
4.250%, 3/15/42 | | | 731,000 | | | | 622 | |
NSTAR Electric Co.
3.100%, 6/1/51 | | | 885,000 | | | | 621 | |
Pacific Gas & Electric Co. | | | | | | | | |
2.100%, 8/1/27 | | | 768,000 | | | | 692 | |
3.950%, 12/1/47 | | | 3,311,000 | | | | 2,421 | |
4.200%, 6/1/41 | | | 833,000 | | | | 665 | |
4.500%, 7/1/40 | | | 494,000 | | | | 418 | |
4.750%, 2/15/44 | | | 483,000 | | | | 403 | |
4.950%, 7/1/50 | | | 4,587,000 | | | | 3,918 | |
PacifiCorp
5.500%, 5/15/54 | | | 479,000 | | | | 470 | |
PECO Energy Co.
2.850%, 9/15/51 | | | 1,731,000 | | | | 1,164 | |
Pennsylvania Electric Co. | | | | | | | | |
3.250%, 3/15/28 144A | | | 1,398,000 | | | | 1,303 | |
5.150%, 3/30/26 144A | | | 1,077,000 | | | | 1,075 | |
Public Service Company of Oklahoma
3.150%, 8/15/51 | | | 971,000 | | | | 663 | |
Public Service Electric & Gas Co. | | | | | | | | |
1.900%, 8/15/31 | | | 2,467,000 | | | | 2,024 | |
2.050%, 8/1/50 | | | 398,000 | | | | 230 | |
2.700%, 5/1/50 | | | 669,000 | | | | 458 | |
Public Service Enterprise Group, Inc. | | | | | | | | |
5.875%, 10/15/28 | | | 3,216,000 | | | | 3,370 | |
6.125%, 10/15/33 | | | 1,286,000 | | | | 1,382 | |
| | | | | | | | |
| Corporate Bonds (22.1%) | | Shares/ Par + | | Value $ (000’s) | |
Utilities continued | | | | | | | | |
Southern California Edison Co.
4.125%, 3/1/48 | | | 1,081,000 | | | | 907 | |
Virginia Electric & Power Co.
2.950%, 11/15/51 | | | 1,435,000 | | | | 976 | |
| | | | | | | | |
Total | | | | | | | 60,112 | |
| | | | | | | | |
| | |
Total Corporate Bonds (Cost: $641,406) | | | | | | | 640,462 | |
| | | | | | | | |
| | |
Governments (28.4%) | | | | | | | | |
Governments (28.4%) | | | | | | | | |
Bermuda Government International Bond
5.000%, 7/15/32 144A | | | 1,186,000 | | | | 1,177 | |
Export Finance & Insurance Corp.
4.625%, 10/26/27 144A | | | 3,690,000 | | | | 3,753 | |
Federal Home Loan Bank
1.250%, 9/30/31 Σ | | | 5,185,000 | | | | 4,474 | |
Federal Home Loan Mortgage Corp.
0.000%, 12/14/29 PO | | | 4,007,000 | | | | 3,139 | |
Federal National Mortgage Association
0.000%, 11/15/30 PO | | | 11,778,000 | | | | 8,811 | |
1.520%, 8/21/35 | | | 5,256,000 | | | | 3,865 | |
1.900%, 1/25/36 | | | 4,686,000 | | | | 3,570 | |
Panama Government International Bond
6.853%, 3/28/54 | | | 3,002,000 | | | | 2,805 | |
Republic of Paraguay
5.400%, 3/30/50 144A | | | 1,658,000 | | | | 1,472 | |
5.850%, 8/21/33 144A | | | 1,341,000 | | | | 1,362 | |
State of Israel
3.875%, 7/3/50 | | | 775,000 | | | | 598 | |
4.500%, 1/17/33 | | | 2,417,000 | | | | 2,294 | |
United Mexican States
2.659%, 5/24/31 | | | 1,776,000 | | | | 1,501 | |
3.250%, 4/16/30 | | | 826,000 | | | | 747 | |
3.500%, 2/12/34 | | | 3,210,000 | | | | 2,716 | |
3.750%, 4/19/71 | | | 1,253,000 | | | | 835 | |
3.771%, 5/24/61 | | | 595,000 | | | | 403 | |
6.050%, 1/11/40 | | | 682,000 | | | | 688 | |
US Treasury
0.375%, 7/31/27 | | | 20,972,000 | | | | 18,498 | |
0.750%, 5/31/26 | | | 1,756,000 | | | | 1,621 | |
0.750%, 1/31/28 | | | 6,703,000 | | | | 5,910 | |
1.000%, 7/31/28 | | | 10,687,000 | | | | 9,400 | |
1.125%, 5/15/40 | | | 3,189,000 | | | | 2,055 | |
1.125%, 8/15/40 | | | 85,136,000 | | | | 54,341 | |
1.125%, 8/31/28 | | | 2,229,000 | | | | 1,968 | |
1.375%, 11/15/40 | | | 92,283,000 | | | | 61,228 | |
1.500%, 8/15/26 | | | 9,178,000 | | | | 8,590 | |
1.625%, 11/15/50 | | | 10,967,000 | | | | 6,534 | |
1.750%, 8/15/41 | | | 62,635,000 | | | | 43,561 | |
2.000%, 11/15/41 | | | 45,173,000 | | | | 32,675 | |
2.000%, 8/15/51 | | | 10,041,000 | | | | 6,557 | |
2.000%, 11/15/26 | | | 838,000 | | | | 792 | |
2.375%, 2/15/42 | | | 7,768,000 | | | | 5,960 | |
2.375%, 3/31/29 | | | 18,481,000 | | | | 17,158 | |
2.625%, 7/31/29 | | | 5,197,000 | | | | 4,867 | |
2.750%, 7/31/27 | | | 11,543,000 | | | | 11,080 | |
2.875%, 5/15/52 | | | 6,847,000 | | | | 5,451 | |
2.875%, 8/15/28 | | | 7,739,000 | | | | 7,406 | |
3.000%, 8/15/52 | | | 13,245,000 | | | | 10,831 | |
The Accompanying Notes are an Integral Part of the Financial Statements.
128
Select Bond Portfolio
| | | | | | | | |
| Governments (28.4%) | | Shares/ Par + | | Value $ (000’s) | |
Governments continued | | | | | | | | |
3.125%, 11/15/28 | | | 5,486,000 | | | | 5,300 | |
3.250%, 6/30/29 | | | 37,498,000 | | | | 36,292 | |
3.500%, 9/15/25 | | | 15,303,000 | | | | 15,078 | |
3.625%, 2/15/53 | | | 23,891,000 | | | | 22,062 | |
3.625%, 5/15/53 | | | 3,965,000 | | | | 3,666 | |
3.750%, 12/31/28 | | | 37,488,000 | | | | 37,315 | |
3.875%, 5/15/43 | | | 10,464,000 | | | | 9,975 | |
3.875%, 4/30/25 | | | 8,751,000 | | | | 8,672 | |
3.875%, 11/30/27 | | | 6,424,000 | | | | 6,410 | |
4.000%, 2/28/30 | | | 13,394,000 | | | | 13,457 | |
4.000%, 2/15/26 | | | 307,000 | | | | 306 | |
4.125%, 8/15/53 | | | 19,005,000 | | | | 19,210 | |
4.125%, 1/31/25 | | | 1,831,000 | | | | 1,820 | |
4.250%, 5/31/25 | | | 36,744,000 | | | | 36,609 | |
4.375%, 11/30/30 | | | 8,408,000 | | | | 8,646 | |
4.375%, 8/15/43 | | | 4,699,000 | | | | 4,797 | |
4.375%, 10/31/24 | | | 665,000 | | | | 662 | |
4.375%, 8/15/26 | | | 2,093,000 | | | | 2,107 | |
4.375%, 12/15/26 | | | 28,773,000 | | | | 29,054 | |
4.375%, 11/30/28 | | | 22,951,000 | | | | 23,485 | |
4.500%, 11/15/33 | | | 27,240,000 | | | | 28,598 | |
4.500%, 11/30/24 | | | 149,000 | | | | 148 | |
4.625%, 11/15/26 | | | 21,290,000 | | | | 21,626 | |
4.750%, 11/15/43 | | | 1,745,000 | | | | 1,872 | |
4.750%, 11/15/53 | | | 7,779,000 | | | | 8,723 | |
4.875%, 11/30/25 | | | 19,485,000 | | | | 19,687 | |
4.875%, 10/31/28 | | | 44,469,000 | | | | 46,418 | |
5.000%, 8/31/25 | | | 15,260,000 | | | | 15,401 | |
5.000%, 9/30/25 | | | 34,647,000 | | | | 35,000 | |
| | | | | | | | |
Total | | | | | | | 823,089 | |
| | | | | | | | |
| | |
Total Governments (Cost: $854,330) | | | | | | | 823,089 | |
| | | | | | | | |
| | |
| Municipal Bonds (0.3%) | | | | | |
Municipal Bonds (0.3%) | | | | | | | | |
County of Clark Department of Aviation
6.820%, 7/1/45 RB | | | 1,780,000 | | | | 2,179 | |
North Texas Tollway Authority, Series 2009-B
6.718%, 1/1/49 RB | | | 1,950,000 | | | | 2,406 | |
The Ohio State University
4.800%, 6/1/11 RB | | | 1,070,000 | | | | 1,017 | |
Port Authority of New York & New Jersey
4.458%, 10/1/62 RB | | | 3,110,000 | | | | 2,837 | |
The University of Texas System
2.439%, 8/15/49 RB | | | 925,000 | | | | 618 | |
| | | | | | | | |
Total Municipal Bonds (Cost: $10,454) | | | | | | | 9,057 | |
| | | | | | | | |
| | |
| Structured Products (50.8%) | | | | | |
Asset Backed Securities (7.0%) | | | | | | | | |
Ally Auto Receivables Trust, Series 2022-3, Class A3
5.070%, 6/15/31 | | | 1,172,000 | | | | 1,176 | |
American Express Credit Account Master Trust, Series 2023-1, Class A
4.870%, 5/15/28 | | | 1,560,000 | | | | 1,571 | |
AmeriCredit Automobile Receivables Trust, Series 2022-2, Class A3
4.380%, 4/18/28 | | | 2,236,000 | | | | 2,214 | |
| | | | | | | | |
| Structured Products (50.8%) | | Shares/ Par + | | Value $ (000’s) | |
Asset Backed Securities continued | | | | | | | | |
AmeriCredit Automobile Receivables Trust, Series 2023-1, Class A3
5.620%, 11/18/27 | | | 1,070,000 | | | | 1,076 | |
AmeriCredit Automobile Receivables Trust, Series 2023-2, Class A3
5.810%, 5/18/28 | | | 2,140,000 | | | | 2,165 | |
BA Credit Card Trust, Series 2023-A2, Class A2
4.980%, 11/15/28 | | | 9,049,000 | | | | 9,154 | |
BMW Vehicle Lease Trust, Series 2023-1, Class A4
5.070%, 6/25/26 | | | 1,628,000 | | | | 1,628 | |
Capital One Prime Auto Receivables Trust, Series 2023-1, Class A3
4.870%, 2/15/28 | | | 3,871,000 | | | | 3,872 | |
Chase Auto Owner Trust, Series 2022-AA, Class A4
3.990%, 3/27/28 144A | | | 1,504,000 | | | | 1,474 | |
Citibank Credit Card Issuance Trust, Series 2023-A1, Class A1
5.230%, 12/8/27 | | | 4,239,000 | | | | 4,271 | |
College Avenue Student Loans LLC, Series 2017-A, Class A1
7.120%, (US SOFR 1 Month plus 1.765%),
11/26/46 144A | | | 632,315 | | | | 635 | |
College Avenue Student Loans LLC, Series 2018-A, Class A2
4.130%, 12/26/47 144A | | | 577,659 | | | | 554 | |
College Avenue Student Loans LLC, Series 2019-A, Class A2
3.280%, 12/28/48 144A | | | 1,143,705 | | | | 1,054 | |
Discover Card Execution Note Trust, Series 2022-A3, Class A3
3.560%, 7/15/27 | | | 537,000 | | | | 526 | |
Discover Card Execution Note Trust, Series
2023-A1, Class A
4.310%, 3/15/28 | | | 4,147,000 | | | | 4,118 | |
Discover Card Execution Note Trust, Series
2023-A2, Class A
4.930%, 6/15/28 | | | 9,524,000 | | | | 9,597 | |
Ford Credit Auto Owner Trust, Series 2022-1, Class A
3.880%, 11/15/34 144A | | | 3,386,000 | | | | 3,294 | |
Ford Credit Auto Owner Trust, Series 2022-D, Class A4
5.300%, 3/15/28 | | | 1,060,000 | | | | 1,071 | |
Ford Credit Auto Owner Trust, Series 2023-A, Class A3
4.650%, 2/15/28 | | | 4,627,000 | | | | 4,610 | |
GM Financial Automobile Leasing Trust, Series 2023-2, Class A4
5.090%, 5/20/27 | | | 1,491,000 | | | | 1,490 | |
GM Financial Automobile Leasing Trust, Series 2023-3, Class A4
5.440%, 8/20/27 | | | 955,000 | | | | 963 | |
GM Financial Consumer Automobile Receivables Trust, Series 2022-4, Class A3
4.820%, 8/16/27 | | | 1,841,000 | | | | 1,834 | |
Hertz Vehicle Financing III LLC, Series 2023- 4A, Class A
6.150%, 3/25/30 144A | | | 530,000 | | | | 549 | |
The Accompanying Notes are an Integral Part of the Financial Statements.
129
Select Bond Portfolio
| | | | | | | | |
| Structured Products (50.8%) | | Shares/ Par + | | Value
$ (000’s) | |
Asset Backed Securities continued | | | | | | | | |
Hertz Vehicle Financing LLC, Series 2022-4A, Class A
3.730%, 9/25/26 144A | | | 1,905,000 | | | | 1,855 | |
Hyundai Auto Lease Securitization Trust, Series 2023-B, Class A4
5.170%, 4/15/27 144A | | | 2,377,000 | | | | 2,378 | |
Hyundai Auto Lease Securitization Trust, Series 2023-C, Class A4
5.840%, 9/15/27 144A | | | 1,597,000 | | | | 1,624 | |
Hyundai Auto Receivables Trust, Series 2021- C, Class A4
1.030%, 12/15/27 | | | 1,869,000 | | | | 1,759 | |
Hyundai Auto Receivables Trust, Series 2022- A, Class A3
2.220%, 10/15/26 | | | 3,405,622 | | | | 3,328 | |
Hyundai Auto Receivables Trust, Series 2022- A, Class A4
2.350%, 4/17/28 | | | 1,194,000 | | | | 1,138 | |
Hyundai Auto Receivables Trust, Series 2023- A, Class A4
4.480%, 7/17/28 | | | 2,148,000 | | | | 2,130 | |
Hyundai Auto Receivables Trust, Series 2023- B, Class A3
5.480%, 4/17/28 | | | 1,222,000 | | | | 1,243 | |
Mercedes-Benz Auto Receivables Trust, Series 2022-1, Class A4
5.250%, 2/15/29 | | | 2,454,000 | | | | 2,482 | |
Mercedes-Benz Auto Receivables Trust, Series 2023-1, Class A4
4.310%, 4/16/29 | | | 1,914,000 | | | | 1,892 | |
Navient Private Education Refi Loan Trust, Series 2014-AA, Class A3 | | | | | | | | |
7.076%, (US SOFR 1 Month plus 1.715%), 10/15/31 144A | | | 830,525 | | | | 832 | |
Navient Private Education Refi Loan Trust, Series 2018-C, Class A2
3.520%, 6/16/42 144A | | | 41,345 | | | | 41 | |
Navient Private Education Refi Loan Trust, Series 2018-DA, Class A2A
4.000%, 12/15/59 144A | | | 1,538,237 | | | | 1,484 | |
Navient Private Education Refi Loan Trust, Series 2019-A, Class A2A
3.420%, 1/15/43 144A | | | 1,200,262 | | | | 1,164 | |
Navient Private Education Refi Loan Trust, Series 2019-C, Class A2
3.130%, 2/15/68 144A | | | 1,011,758 | | | | 971 | |
Navient Private Education Refi Loan Trust, Series 2019-D, Class A2A
3.010%, 12/15/59 144A | | | 2,850,152 | | | | 2,678 | |
Navient Private Education Refi Loan Trust, Series 2020-GA, Class A
1.170%, 9/16/69 144A | | | 1,837,018 | | | | 1,644 | |
Navient Private Education Refi Loan Trust, Series 2021-FA, Class A
1.110%, 2/18/70 144A | | | 2,718,135 | | | | 2,315 | |
Navient Private Education Refi Loan Trust, Series 2022-A, Class A
2.230%, 7/15/70 144A | | | 6,691,971 | | | | 5,899 | |
| | | | | | | | |
| Structured Products (50.8%) | | Shares/ Par + | | Value
$ (000’s) | |
Asset Backed Securities continued | | | | | | | | |
Navient Student Loan Trust, Series 2016-AA, Class A2B | | | | | | | | |
7.626%, (US SOFR 1 Month plus 2.265%), 12/15/45 144A | | | 403,059 | | | | 405 | |
Navient Student Loan Trust, Series 2019-FA, Class A2
2.600%, 8/15/68 144A | | | 1,687,765 | | | | 1,571 | |
Navient Student Loan Trust, Series 2020-EA, Class A
1.690%, 5/15/69 144A | | | 98,374 | | | | 89 | |
Navient Student Loan Trust, Series 2021-3A, Class A1A
1.770%, 8/25/70 144A | | | 2,922,934 | | | | 2,570 | |
Navient Student Loan Trust, Series 2021-BA, Class A
0.940%, 7/15/69 144A | | | 773,745 | | | | 673 | |
Navient Student Loan Trust, Series 2021-CA, Class A
1.060%, 10/15/69 144A | | | 3,043,383 | | | | 2,638 | |
Navient Student Loan Trust, Series 2021-EA, Class A
0.970%, 12/16/69 144A | | | 4,373,651 | | | | 3,769 | |
Navient Student Loan Trust, Series 2021-GA, Class A
1.580%, 4/15/70 144A | | | 692,282 | | | | 600 | |
Nelnet Student Loan Trust, Series 2004-3, Class A5 | | | | | | | | |
5.776%, (US 90 Day Average SOFR plus 0.442%), 10/27/36 | | | 292,033 | | | | 287 | |
Nelnet Student Loan Trust, Series 2004-4, Class A5 | | | | | | | | |
5.756%, (US 90 Day Average SOFR plus 0.422%), 1/25/37 | | | 1,945,834 | | | | 1,923 | |
Nelnet Student Loan Trust, Series 2005-1, Class A5 | | | | | | | | |
5.706%, (US 90 Day Average SOFR plus 0.372%), 10/25/33 | | | 4,514,365 | | | | 4,433 | |
Nelnet Student Loan Trust, Series 2005-2, Class A5 | | | | | | | | |
5.714%, (US 90 Day Average SOFR plus 0.362%), 3/23/37 | | | 4,195,915 | | | | 4,119 | |
Nelnet Student Loan Trust, Series 2005-3, Class A5 | | | | | | | | |
5.734%, (US 90 Day Average SOFR plus 0.382%), 12/24/35 | | | 3,240,472 | | | | 3,187 | |
Nelnet Student Loan Trust, Series 2005-4, Class A4 | | | | | | | | |
5.794%, (US 90 Day Average SOFR plus 0.442%), 3/22/32 | | | 593,846 | | | | 565 | |
Nissan Auto Lease Trust, Series 2023-B, Class A4
5.610%, 11/15/27 | | | 2,116,000 | | | | 2,137 | |
Nissan Auto Receivables Owner Trust, Series 2022-B, Class A4
4.450%, 11/15/29 | | | 1,459,000 | | | | 1,446 | |
PenFed Auto Receivables Owner Trust, Series 2022-A, Class A3
3.960%, 4/15/26 144A | | | 2,179,526 | | | | 2,161 | |
PenFed Auto Receivables Owner Trust, Series 2022-A, Class A4
4.180%, 12/15/28 144A | | | 1,093,000 | | | | 1,078 | |
The Accompanying Notes are an Integral Part of the Financial Statements.
130
Select Bond Portfolio
| | | | | | | | |
| Structured Products (50.8%) | | Shares/ Par + | | Value
$ (000’s) | |
Asset Backed Securities continued | | | | | | | | |
Santander Drive Auto Receivables Trust, Series 2022-2, Class A3
2.980%, 10/15/26 | | | 1,873,511 | | | | 1,863 | |
Santander Drive Auto Receivables Trust, Series 2022-3, Class A3
3.400%, 12/15/26 | | | 1,073,251 | | | | 1,065 | |
Santander Drive Auto Receivables Trust, Series 2022-4, Class A3
4.140%, 2/16/27 | | | 2,262,309 | | | | 2,247 | |
Santander Drive Auto Receivables Trust, Series 2022-5, Class A3
4.110%, 8/17/26 | | | 1,497,522 | | | | 1,491 | |
Santander Drive Auto Receivables Trust, Series 2022-6, Class A3
4.490%, 11/16/26 | | | 4,125,532 | | | | 4,107 | |
Santander Drive Auto Receivables Trust, Series 2022-7, Class A3
5.750%, 4/15/27 | | | 1,242,000 | | | | 1,242 | |
SMB Private Education Loan Trust, Series 2016-B, Class A2A
2.430%, 2/17/32 144A | | | 306,642 | | | | 299 | |
SMB Private Education Loan Trust, Series 2016-C, Class A2B | | | | | | | | |
6.576%, (US SOFR 1 Month plus 1.215%), 9/15/34 144A | | | 307,420 | | | | 308 | |
SMB Private Education Loan Trust, Series 2020-BA, Class A1A
1.290%, 7/15/53 144A | | | 1,046,514 | | | | 944 | |
SMB Private Education Loan Trust, Series 2020-PTB, Class A2A
1.600%, 9/15/54 144A | | | 6,014,516 | | | | 5,456 | |
SMB Private Education Loan Trust, Series 2021-A, Class APT1
1.070%, 1/15/53 144A | | | 3,955,660 | | | | 3,462 | |
SMB Private Education Loan Trust, Series 2021-B, Class A
1.310%, 7/17/51 144A | | | 1,331,709 | | | | 1,202 | |
SMB Private Education Loan Trust, Series 2021-E, Class A1A
1.680%, 2/15/51 144A | | | 2,540,803 | | | | 2,298 | |
SoFi Professional Loan Program LLC, Series 2017-D, Class A2FX
2.650%, 9/25/40 144A | | | 41,322 | | | | 40 | |
SoFi Professional Loan Program LLC, Series 2020-C, Class AFX
1.950%, 2/15/46 144A | | | 260,760 | | | | 237 | |
SoFi Professional Loan Program LLC, Series 2021-B, Class AFX
1.140%, 2/15/47 144A | | | 2,120,322 | | | | 1,783 | |
Synchrony Card Funding LLC, Series 2023- A1, Class A
5.540%, 7/15/29 | | | 6,734,000 | | | | 6,859 | |
T-Mobile U.S. Trust, Series 2022-1A, Class A
4.910%, 5/22/28 144A | | | 2,281,000 | | | | 2,276 | |
Toyota Auto Receivables Owner Trust, Series 2022-D, Class A4
5.430%, 4/17/28 | | | 1,337,000 | | | | 1,364 | |
Toyota Auto Receivables Owner Trust, Series 2023-A, Class A4
4.420%, 8/15/28 | | | 1,801,000 | | | | 1,784 | |
| | | | | | | | |
| Structured Products (50.8%) | | Shares/ Par + | | Value
$ (000’s) | |
Asset Backed Securities continued | | | | | | | | |
Toyota Auto Receivables Owner Trust, Series 2023-B, Class A3
4.710%, 2/15/28 | | | 2,775,000 | | | | 2,771 | |
Toyota Auto Receivables Owner Trust, Series 2023-C, Class A3
5.160%, 4/17/28 | | | 4,418,000 | | | | 4,449 | |
Verizon Master Trust, Series 2022-2, Class A
1.530%, 7/20/28 | | | 2,007,000 | | | | 1,933 | |
Verizon Master Trust, Series 2022-4, Class A
3.400%, 11/20/28 | | | 3,688,000 | | | | 3,606 | |
Verizon Master Trust, Series 2022-6, Class A
3.670%, 1/22/29 | | | 2,765,000 | | | | 2,711 | |
Verizon Master Trust, Series 2023-1, Class A
4.490%, 1/22/29 | | | 4,180,000 | | | | 4,158 | |
Verizon Master Trust, Series 2023-2, Class A
4.890%, 4/20/28 | | | 1,546,000 | | | | 1,541 | |
Verizon Master Trust, Series 2023-4, Class A1A
5.160%, 6/20/29 | | | 7,176,000 | | | | 7,261 | |
Volkswagen Auto Loan Enhanced Trust, Series 2023-1, Class A3
5.020%, 6/20/28 | | | 3,085,000 | | | | 3,102 | |
World Omni Select Auto Trust, Series 2023-A, Class A2A
5.920%, 3/15/27 | | | 2,070,413 | | | | 2,071 | |
| | | | | | | | |
Total | | | | | | | 203,334 | |
| | | | | | | | |
| | |
Mortgage Securities (43.8%) | | | | | | | | |
Angel Oak Mortgage Trust, Series 2020-2, Class A1A
2.531%, (AFC), 1/26/65 144A | | | 776,416 | | | | 715 | |
Angel Oak Mortgage Trust, Series 2020-5, Class A1
1.373%, (AFC), 5/25/65 144A | | | 229,488 | | | | 206 | |
Angel Oak Mortgage Trust, Series 2021-6, Class A1
1.458%, (AFC), 9/25/66 144A | | | 1,561,603 | | | | 1,256 | |
Barclays Commercial Mortgage Securities LLC, Series 2018-C2, Class ASB
4.236%, 12/15/51 | | | 665,538 | | | | 649 | |
Bunker Hill Loan Depositary Trust, Series 2019-2, Class A1
2.879%, (AFC), 7/25/49 144A Σ | | | 984,821 | | | | 934 | |
Bunker Hill Loan Depositary Trust, Series 2019-3, Class A1
2.724%, (AFC), 11/25/59 144A Σ | | | 409,041 | | | | 397 | |
BX Commercial Mortgage Trust, Series 2021- VOLT, Class A | | | | | | | | |
6.176%, (US SOFR 1 Month plus 0.815%), 9/15/36 144A | | | 6,842,000 | | | | 6,666 | |
BX Trust, Series 2021-XL2, Class A | | | | | | | | |
6.165%, (US SOFR 1 Month plus 0.803%), 10/15/38 144A | | | 2,499,049 | | | | 2,452 | |
CFCRE Commercial Mortgage Trust, Series 2017-C8, Class ASB
3.367%, 6/15/50 | | | 660,192 | | | | 639 | |
Citigroup Mortgage Loan Trust, Series 2005-1, Class 3A1
6.500%, 4/25/35 | | | 61,357 | | | | 60 | |
The Accompanying Notes are an Integral Part of the Financial Statements.
131
Select Bond Portfolio
| | | | | | | | |
| Structured Products (50.8%) | | Shares/ Par + | | Value
$ (000’s) | |
Mortgage Securities continued | | | | | | | | |
COLT Mortgage Loan Trust, Series 2021-2, Class A1
0.924%, (AFC), 8/25/66 144A | | | 2,074,405 | | | | 1,659 | |
COLT Mortgage Loan Trust, Series 2021-4, Class A1
1.397%, (AFC), 10/25/66 144A | | | 2,198,798 | | | | 1,759 | |
COMM Mortgage Trust, Series 2014-UBS4, Class A4
3.420%, 8/10/47 | | | 2,226,131 | | | | 2,193 | |
COMM Mortgage Trust, Series 2015-LC23, Class A3
3.521%, 10/10/48 | | | 1,180,282 | | | | 1,150 | |
EQUS Mortgage Trust, Series 2021-EQAZ, Class A | | | | | | | | |
6.231%, (US SOFR 1 Month plus 0.869%), 10/15/38 144A | | | 2,683,946 | | | | 2,630 | |
Federal Home Loan Mortgage Corp.
2.000%, 7/1/32 | | | 842,794 | | | | 788 | |
2.000%, 6/1/40 | | | 6,427,391 | | | | 5,541 | |
2.000%, 7/1/40 | | | 6,625,966 | | | | 5,703 | |
2.000%, 8/1/40 | | | 6,877,658 | | | | 5,920 | |
2.000%, 11/1/40 | | | 8,556,555 | | | | 7,365 | |
2.000%, 12/1/40 | | | 1,966,249 | | | | 1,692 | |
2.000%, 1/1/41 | | | 1,483,214 | | | | 1,277 | |
2.000%, 2/1/41 | | | 1,606,413 | | | | 1,383 | |
2.000%, 4/1/41 | | | 2,800,039 | | | | 2,405 | |
2.000%, 7/1/41 | | | 2,646,115 | | | | 2,266 | |
2.000%, 11/1/41 | | | 3,026,489 | | | | 2,599 | |
2.000%, 1/1/42 | | | 1,809,178 | | | | 1,544 | |
2.000%, 2/1/42 | | | 14,160,886 | | | | 12,091 | |
2.000%, 8/1/42 | | | 2,861,100 | | | | 2,462 | |
2.000%, 2/1/47 | | | 1,102,473 | | | | 909 | |
2.000%, 12/1/51 | | | 851,293 | | | | 702 | |
2.500%, 4/1/42 | | | 972,923 | | | | 865 | |
2.500%, 5/1/42 | | | 3,863,163 | | | | 3,431 | |
2.500%, 6/1/42 | | | 1,330,985 | | | | 1,182 | |
2.500%, 8/1/43 | | | 3,173,137 | | | | 2,845 | |
2.500%, 6/1/46 | | | 3,658,932 | | | | 3,280 | |
2.500%, 9/1/51 | | | 6,486,465 | | | | 5,597 | |
2.500%, 2/1/52 | | | 687,388 | | | | 590 | |
2.500%, 3/1/52 | | | 2,266,928 | | | | 1,939 | |
2.983%, (FTSE USD IBOR Consumer Cash Fallbacks Term 1 Year plus 1.642%), 5/1/49 | | | 855,826 | | | | 851 | |
3.000%, 9/1/33 | | | 1,108,919 | | | | 1,047 | |
3.000%, 4/1/40 | | | 1,762,221 | | | | 1,631 | |
3.000%, 4/1/43 | | | 4,964,808 | | | | 4,563 | |
3.000%, 8/1/43 | | | 3,165,775 | | | | 2,910 | |
3.000%, 4/1/45 | | | 4,638,739 | | | | 4,263 | |
3.000%, 5/1/45 | | | 2,391,628 | | | | 2,186 | |
3.000%, 9/1/46 | | | 2,890,645 | | | | 2,633 | |
3.000%, 1/1/47 | | | 2,428,589 | | | | 2,203 | |
3.000%, 2/1/47 | | | 2,233,511 | | | | 2,026 | |
3.067%, (FTSE USD IBOR Consumer Cash Fallbacks Term 1 Year plus 1.633%), 2/1/50 | | | 2,039,487 | | | | 1,999 | |
3.130%, (FTSE USD IBOR Consumer Cash Fallbacks Term 1 Year plus 1.640%), 11/1/48 | | | 1,537,530 | | | | 1,504 | |
3.913%, (US 30 Day Average SOFR plus 2.130%), 7/1/52 | | | 1,365,549 | | | | 1,307 | |
| | | | | | | | |
| Structured Products (50.8%) | | Shares/ Par + | | Value
$ (000’s) | |
Mortgage Securities continued | | | | | | | | |
3.970%, (US 30 Day Average SOFR plus 2.140%), 8/1/52 | | | 1,812,276 | | | | 1,719 | |
4.000%, 7/1/49 | | | 3,767,335 | | | | 3,650 | |
4.000%, 3/1/50 | | | 6,491,630 | | | | 6,298 | |
4.123%, (US 30 Day Average SOFR plus 2.380%), 9/1/52 | | | 931,312 | | | | 897 | |
4.186%, (US 30 Day Average SOFR plus 2.304%), 5/1/53 | | | 5,278,351 | | | | 5,145 | |
4.299%, (US 30 Day Average SOFR plus 2.130%), 7/1/52 | | | 1,613,130 | | | | 1,564 | |
4.500%, 6/1/39 | | | 82,176 | | | | 81 | |
4.500%, 7/1/39 | | | 108,114 | | | | 107 | |
5.129%, (US 30 Day Average SOFR plus 2.215%), 8/1/53 | | | 1,100,531 | | | | 1,097 | |
5.197%, (US 30 Day Average SOFR plus 2.301%), 6/1/53 | | | 1,028,706 | | | | 1,027 | |
5.218%, (FTSE USD IBOR Consumer Cash Fallbacks Term 1 Year plus 1.638%), 3/1/49 | | | 1,143,896 | | | | 1,157 | |
5.712%, (FTSE USD IBOR Consumer Cash Fallbacks Term 1 Year plus 1.637%), 4/1/48 | | | 2,739,138 | | | | 2,778 | |
5.942%, (FTSE USD IBOR Consumer Cash Fallbacks Term 1 Year plus 1.730%), 1/1/44 | | | 459,721 | | | | 470 | |
6.263%, (FTSE USD IBOR Consumer Cash Fallbacks Term 1 Year plus 1.679%), 9/1/47 | | | 1,253,069 | | | | 1,266 | |
6.809%, (FTSE USD IBOR Consumer Cash Fallbacks Term 1 Year plus 1.642%), 8/1/43 | | | 210,689 | | | | 215 | |
6.840%, (FTSE USD IBOR Consumer Cash Fallbacks Term 1 Year plus 1.637%), 9/1/45 | | | 1,905,010 | | | | 1,943 | |
6.881%, (FTSE USD IBOR Consumer Cash Fallbacks Term 1 Year plus 1.635%), 7/1/43 | | | 132,581 | | | | 135 | |
7.036%, (FTSE USD IBOR Consumer Cash Fallbacks Term 1 Year plus 1.645%), 10/1/43 | | | 228,807 | | | | 234 | |
7.043%, (FTSE USD IBOR Consumer Cash Fallbacks Term 1 Year plus 1.650%), 3/1/43 | | | 208,638 | | | | 213 | |
7.171%, (FTSE USD IBOR Consumer Cash Fallbacks Term 1 Year plus 1.603%), 9/1/43 | | | 118,321 | | | | 121 | |
7.188%, (FTSE USD IBOR Consumer Cash Fallbacks Term 1 Year plus 1.629%), 11/1/43 | | | 170,321 | | | | 174 | |
7.345%, (FTSE USD IBOR Consumer Cash Fallbacks Term 1 Year plus 1.674%), 2/1/43 | | | 319,167 | | | | 327 | |
7.431%, (FTSE USD IBOR Consumer Cash Fallbacks Term 1 Year plus 1.609%), 10/1/43 | | | 223,327 | | | | 228 | |
7.461%, (FTSE USD IBOR Consumer Cash Fallbacks Term 1 Year plus 1.770%), 9/1/42 | | | 192,747 | | | | 198 | |
Federal Home Loan Mortgage Corp., Series 1582, Class M
2.500%, 5/25/49 | | | 1,650,833 | | | | 1,444 | |
The Accompanying Notes are an Integral Part of the Financial Statements.
132
Select Bond Portfolio
| | | | | | | | |
| Structured Products (50.8%) | | Shares/ Par + | | | Value
$ (000’s) | |
Mortgage Securities continued | | | | | | | | |
Federal Home Loan Mortgage Corp., Series 2012-264, Class 30
3.000%, 7/15/42 | | | 2,581,379 | | | | 2,373 | |
Federal Home Loan Mortgage Corp., Series 2012-272, Class F1 | | | | | | | | |
5.953%, (US 30 Day Average SOFR plus 0.615%), 8/15/42 | | | 1,575,674 | | | | 1,541 | |
Federal Home Loan Mortgage Corp., Series 2012-280, Class F1 | | | | | | | | |
5.953%, (US 30 Day Average SOFR plus 0.615%), 9/15/42 | | | 1,586,475 | | | | 1,552 | |
Federal Home Loan Mortgage Corp., Series 2439, Class LH
6.000%, 4/15/32 | | | 128,518 | | | | 132 | |
Federal Home Loan Mortgage Corp., Series 271, Class F5 | | | | | | | | |
5.953%, (US 30 Day Average SOFR plus 0.615%), 8/15/42 | | | 987,609 | | | | 966 | |
Federal Home Loan Mortgage Corp., Series 3924, Class NC
4.000%, 9/15/41 | | | 1,555,694 | | | | 1,506 | |
Federal Home Loan Mortgage Corp., Series 4047, Class CX
3.500%, 5/15/42 | | | 2,934,000 | | | | 2,691 | |
Federal Home Loan Mortgage Corp., Series 4091, Class BX
3.250%, 10/15/41 | | | 1,598,458 | | | | 1,484 | |
Federal Home Loan Mortgage Corp., Series 4091, Class EX
3.375%, 7/15/42 | | | 1,002,466 | | | | 933 | |
Federal Home Loan Mortgage Corp., Series 4091, Class MX
3.250%, 2/15/42 | | | 1,295,304 | | | | 1,197 | |
Federal Home Loan Mortgage Corp., Series 4122, Class FP | | | | | | | | |
5.853%, (US 30 Day Average SOFR plus 0.515%), 10/15/42 | | | 764,305 | | | | 745 | |
Federal Home Loan Mortgage Corp., Series 4177, Class HB
2.500%, 10/15/42 | | | 1,010,000 | | | | 873 | |
Federal Home Loan Mortgage Corp., Series 4205, Class PA
1.750%, 5/15/43 | | | 883,988 | | | | 750 | |
Federal Home Loan Mortgage Corp., Series 4240, Class FA | | | | | | | | |
5.953%, (US 30 Day Average SOFR plus 0.615%), 8/15/43 | | | 2,918,753 | | | | 2,851 | |
Federal Home Loan Mortgage Corp., Series 4248, Class FT | | | | | | | | |
5.953%, (US 30 Day Average SOFR plus 0.615%), 9/15/43 | | | 1,013,960 | | | | 994 | |
Federal Home Loan Mortgage Corp., Series 4286, Class VF | | | | | | | | |
5.903%, (US 30 Day Average SOFR plus 0.565%), 12/15/43 | | | 2,155,650 | | | | 2,107 | |
Federal Home Loan Mortgage Corp., Series 4446, Class CP
2.250%, 3/15/45 | | | 1,370,149 | | | | 1,200 | |
Federal Home Loan Mortgage Corp., Series 4582, Class HA
3.000%, 9/15/45 | | | 5,039,486 | | | | 4,682 | |
| | | | | | | | |
| Structured Products (50.8%) | | Shares/ Par + | | | Value
$ (000’s) | |
Mortgage Securities continued | | | | | | | | |
Federal Home Loan Mortgage Corp., Series 4614, Class FG | | | | | | | | |
5.953%, (US 30 Day Average SOFR plus 0.615%), 9/15/46 | | | 1,167,180 | | | | 1,137 | |
Federal Home Loan Mortgage Corp., Series 4628, Class KF | | | | | | | | |
5.953%, (US 30 Day Average SOFR plus 0.615%), 1/15/55 | | | 1,451,231 | | | | 1,406 | |
Federal Home Loan Mortgage Corp., Series 4631, Class FA | | | | | | | | |
5.953%, (US 30 Day Average SOFR plus 0.615%), 11/15/46 | | | 1,936,901 | | | | 1,889 | |
Federal Home Loan Mortgage Corp., Series 4719, Class LA
3.500%, 9/15/47 | | | 1,445,472 | | | | 1,330 | |
Federal Home Loan Mortgage Corp., Series 4719, Class LM
3.000%, 9/15/47 | | | 1,134,114 | | | | 1,013 | |
Federal Home Loan Mortgage Corp., Series 4742, Class PA
3.000%, 10/15/47 | | | 1,932,918 | | | | 1,756 | |
Federal Home Loan Mortgage Corp., Series 4793, Class FD | | | | | | | | |
5.753%, (US 30 Day Average SOFR plus 0.415%), 6/15/48 | | | 439,558 | | | | 424 | |
Federal Home Loan Mortgage Corp., Series 4826, Class KF | | | | | | | | |
5.753%, (US 30 Day Average SOFR plus 0.415%), 9/15/48 | | | 925,305 | | | | 896 | |
Federal Home Loan Mortgage Corp., Series 4857, Class JA
3.350%, 1/15/49 | | | 4,590,566 | | | | 4,364 | |
Federal Home Loan Mortgage Corp., Series 4880, Class DA
3.000%, 5/15/50 | | | 1,785,731 | | | | 1,625 | |
Federal Home Loan Mortgage Corp., Series 4903, Class NF | | | | | | | | |
5.852%, (US 30 Day Average SOFR plus 0.515%), 8/25/49 | | | 892,461 | | | | 870 | |
Federal Home Loan Mortgage Corp., Series 4927, Class BG
3.000%, 11/25/49 | | | 1,979,447 | | | | 1,785 | |
Federal Home Loan Mortgage Corp., Series 4937, Class MD
2.500%, 10/25/49 | | | 1,972,025 | | | | 1,730 | |
Federal Home Loan Mortgage Corp., Series 4941, Class GA
2.000%, 12/15/47 | | | 1,126,242 | | | | 945 | |
Federal Home Loan Mortgage Corp., Series 4957, Class MY
3.000%, 2/25/50 | | | 1,143,000 | | | | 954 | |
Federal Home Loan Mortgage Corp., Series 4979, Class UC
1.500%, 6/25/50 | | | 3,606,674 | | | | 2,920 | |
Federal Home Loan Mortgage Corp., Series 4990, Class FN | | | | | | | | |
5.802%, (US 30 Day Average SOFR plus 0.465%), 5/25/50 | | | 2,504,929 | | | | 2,418 | |
The Accompanying Notes are an Integral Part of the Financial Statements.
133
Select Bond Portfolio
| | | | | | | | |
| Structured Products (50.8%) | | Shares/ Par + | | Value $ (000’s) | |
Mortgage Securities continued | |
Federal Home Loan Mortgage Corp., Series 4993, Class KF | | | | | | | | |
5.902%, (US 30 Day Average SOFR plus 0.565%), 7/25/50 | | | 8,223,588 | | | | 7,972 | |
Federal Home Loan Mortgage Corp., Series 5004, Class FM | | | | | | | | |
5.802%, (US 30 Day Average SOFR plus 0.465%), 8/25/50 | | | 1,739,688 | | | | 1,675 | |
Federal Home Loan Mortgage Corp., Series 5020, Class ET
3.500%, 10/25/50 | | | 1,624,099 | | | | 1,482 | |
Federal Home Loan Mortgage Corp., Series 5058, Class BC
5.000%, 11/25/50 | | | 1,183,245 | | | | 1,187 | |
Federal Home Loan Mortgage Corp., Series 5091, Class AB
1.500%, 3/25/51 | | | 3,132,303 | | | | 2,537 | |
Federal Home Loan Mortgage Corp., Series 5092, Class HE
2.000%, 2/25/51 | | | 1,969,884 | | | | 1,648 | |
Federal Home Loan Mortgage Corp., Series 5116, Class PB
2.250%, 2/25/51 | | | 2,043,362 | | | | 1,740 | |
Federal Home Loan Mortgage Corp., Series 5118, Class CA
1.500%, 10/15/33 | | | 1,715,000 | | | | 1,507 | |
Federal Home Loan Mortgage Corp., Series 5119, Class AB
1.500%, 8/25/49 | | | 1,674,894 | | | | 1,338 | |
Federal Home Loan Mortgage Corp., Series 5119, Class QF | | | | | | | | |
5.537%, (US 30 Day Average SOFR plus 0.200%), 6/25/51 | | | 2,464,373 | | | | 2,332 | |
Federal Home Loan Mortgage Corp., Series 5143, Class GA
2.000%, 6/25/49 | | | 1,230,510 | | | | 1,014 | |
Federal Home Loan Mortgage Corp., Series 5156, Class DC
2.000%, 9/25/51 | | | 2,214,167 | | | | 1,888 | |
Federal Home Loan Mortgage Corp., Series 5159, Class UA
2.500%, 12/25/48 | | | 2,162,948 | | | | 1,896 | |
Federal Home Loan Mortgage Corp., Series 5178, Class TP
2.500%, 4/25/49 | | | 2,711,739 | | | | 2,360 | |
Federal Home Loan Mortgage Corp., Series 5182, Class D
2.500%, 11/25/43 | | | 8,373,006 | | | | 7,639 | |
Federal Home Loan Mortgage Corp., Series 5184, Class AB
2.500%, 5/25/48 | | | 1,232,227 | | | | 1,087 | |
Federal Home Loan Mortgage Corp., Series 5194, Class G
2.500%, 1/25/51 | | | 2,446,394 | | | | 2,018 | |
Federal Home Loan Mortgage Corp., Series 5201, Class CA
2.500%, 7/25/48 | | | 2,426,857 | | | | 2,160 | |
Federal Home Loan Mortgage Corp., Series 5202, Class BH
2.000%, 12/25/47 | | | 1,336,876 | | | | 1,204 | |
| | | | | | | | |
| Structured Products (50.8%) | | Shares/ Par + | | Value $ (000’s) | |
Mortgage Securities continued | |
Federal Home Loan Mortgage Corp., Series 5202, Class LA
2.500%, 5/25/49 | | | 2,472,458 | | | | 2,166 | |
Federal Home Loan Mortgage Corp., Series 5202, Class MB
3.000%, 11/25/48 | | | 3,192,190 | | | | 2,887 | |
Federal Home Loan Mortgage Corp., Series 5202, Class TA
2.500%, 12/25/48 | | | 3,841,526 | | | | 3,480 | |
Federal Home Loan Mortgage Corp., Series 5203, Class G
2.500%, 11/25/48 | | | 1,101,653 | | | | 972 | |
Federal Home Loan Mortgage Corp., Series 5206, Class CD
3.500%, 5/25/49 | | | 2,484,230 | | | | 2,271 | |
Federal Home Loan Mortgage Corp., Series 5207, Class PA
3.000%, 6/25/51 | | | 2,634,955 | | | | 2,367 | |
Federal Home Loan Mortgage Corp., Series 5209, Class EA
3.000%, 8/25/50 | | | 2,041,581 | | | | 1,858 | |
Federal Home Loan Mortgage Corp., Series 5209, Class EJ
3.000%, 8/25/50 | | | 2,041,581 | | | | 1,858 | |
Federal Home Loan Mortgage Corp., Series 5210, Class DC
3.000%, 9/25/51 | | | 1,922,093 | | | | 1,776 | |
Federal Home Loan Mortgage Corp., Series 5217, Class CD
2.500%, 7/25/49 | | | 2,003,602 | | | | 1,837 | |
Federal Home Loan Mortgage Corp., Series 5220, Class QK
3.500%, 9/25/50 | | | 3,894,951 | | | | 3,693 | |
Federal Home Loan Mortgage Corp., Series 5228, Class TN
3.500%, 7/25/39 | | | 1,592,596 | | | | 1,520 | |
Federal Home Loan Mortgage Corp., Series 5300, Class C
2.000%, 9/25/47 | | | 3,359,560 | | | | 3,093 | |
Federal Home Loan Mortgage Corp., Series 5335, Class FB | | | | | | | | |
6.153%, (US 30 Day Average SOFR plus 0.815%), 10/15/39 | | | 3,358,600 | | | | 3,371 | |
Federal Home Loan Mortgage Corp., Series 5338, Class FH | | | | | | | | |
5.753%, (US 30 Day Average SOFR plus 0.415%), 4/15/45 | | | 3,231,920 | | | | 3,134 | |
Federal National Mortgage Association
1.500%, 11/1/41 | | | 11,667,916 | | | | 9,670 | |
1.500%, 7/1/51 | | | 9,561,332 | | | | 7,462 | |
2.000%, 3/1/28 | | | 978,229 | | | | 931 | |
2.000%, 2/1/31 | | | 2,054,174 | | | | 1,925 | |
2.000%, 6/1/40 | | | 1,952,054 | | | | 1,695 | |
2.000%, 7/1/40 | | | 6,531,324 | | | | 5,623 | |
2.000%, 9/1/40 | | | 7,333,411 | | | | 6,313 | |
2.000%, 10/1/40 | | | 9,493,633 | | | | 8,173 | |
2.000%, 11/1/40 | | | 6,654,767 | | | | 5,729 | |
2.000%, 12/1/40 | | | 34,457,706 | | | | 29,707 | |
2.000%, 1/1/41 | | | 11,928,233 | | | | 10,269 | |
2.000%, 2/1/41 | | | 102,557 | | | | 88 | |
2.000%, 4/1/41 | | | 1,333,759 | | | | 1,144 | |
The Accompanying Notes are an Integral Part of the Financial Statements.
134
Select Bond Portfolio
| | | | | | | | |
| Structured Products (50.8%) | | Shares/ Par + | | | Value $ (000’s) | |
Mortgage Securities continued | |
2.000%, 5/1/41 | | | 12,994,588 | | | | 11,174 | |
2.000%, 6/1/41 | | | 1,037,383 | | | | 889 | |
2.000%, 7/1/41 | | | 11,899,106 | | | | 10,192 | |
2.000%, 10/1/41 | | | 4,366,733 | | | | 3,769 | |
2.000%, 11/1/41 | | | 3,686,690 | | | | 3,164 | |
2.000%, 1/1/42 | | | 2,819,116 | | | | 2,409 | |
2.000%, 2/1/42 | | | 30,823,539 | | | | 26,348 | |
2.000%, 4/1/42 | | | 2,257,139 | | | | 1,945 | |
2.000%, 11/1/42 | | | 1,133,268 | | | | 976 | |
2.000%, 4/1/46 | | | 6,817,158 | | | | 5,646 | |
2.000%, 1/1/47 | | | 1,269,985 | | | | 1,049 | |
2.000%, 3/1/47 | | | 9,023,886 | | | | 7,452 | |
2.500%, 12/1/40 | | | 4,088,920 | | | | 3,644 | |
2.500%, 5/1/41 | | | 4,205,037 | | | | 3,752 | |
2.500%, 8/1/41 | | | 2,091,731 | | | | 1,862 | |
2.500%, 2/1/42 | | | 2,410,776 | | | | 2,151 | |
2.500%, 4/1/42 | | | 5,177,244 | | | | 4,568 | |
2.500%, 5/1/42 | | | 3,162,087 | | | | 2,812 | |
2.500%, 6/1/42 | | | 2,831,081 | | | | 2,533 | |
2.500%, 5/1/46 | | | 997,997 | | | | 865 | |
2.500%, 12/1/47 | | | 5,742,522 | | | | 5,184 | |
2.500%, 10/1/50 | | | 3,752,312 | | | | 3,251 | |
2.500%, 3/1/52 | | | 2,647,141 | | | | 2,270 | |
2.778%, (FTSE USD IBOR Consumer Cash Fallbacks Term 1 Year plus 1.606%), 6/1/50 | | | 1,385,659 | | | | 1,292 | |
3.000%, 11/1/39 | | | 1,398,347 | | | | 1,312 | |
3.000%, 5/1/40 | | | 4,105,202 | | | | 3,784 | |
3.000%, 11/1/42 | | | 2,072,857 | | | | 1,905 | |
3.000%, 1/1/43 | | | 2,075,136 | | | | 1,949 | |
3.000%, 2/1/43 | | | 12,292,356 | | | | 11,116 | |
3.000%, 7/1/43 | | | 1,662,075 | | | | 1,528 | |
3.000%, 8/1/43 | | | 2,277,064 | | | | 2,093 | |
3.000%, 9/1/43 | | | 1,856,830 | | | | 1,707 | |
3.000%, 12/1/43 | | | 2,175,287 | | | | 1,999 | |
3.000%, 2/1/44 | | | 2,186,397 | | | | 2,010 | |
3.000%, 10/1/44 | | | 11,451,241 | | | | 10,525 | |
3.000%, 2/1/45 | | | 3,595,491 | | | | 3,305 | |
3.000%, 10/1/46 | | | 8,788,718 | | | | 8,030 | |
3.000%, 11/1/46 | | | 6,133,571 | | | | 5,571 | |
3.000%, 12/1/46 | | | 8,903,720 | | | | 8,081 | |
3.000%, 1/1/47 | | | 6,237,887 | | | | 5,657 | |
3.000%, 2/1/47 | | | 10,670,414 | | | | 9,769 | |
3.000%, 3/1/47 | | | 1,249,852 | | | | 1,125 | |
3.000%, 9/1/47 | | | 1,015,642 | | | | 924 | |
3.000%, 1/1/48 | | | 3,147,246 | | | | 2,845 | |
3.000%, 2/1/48 | | | 1,549,909 | | | | 1,410 | |
3.000%, 4/1/48 | | | 8,812,943 | | | | 8,101 | |
3.000%, 8/1/48 | | | 1,842,172 | | | | 1,693 | |
3.000%, 12/1/48 | | | 3,880,607 | | | | 3,514 | |
3.000%, 1/1/49 | | | 852,599 | | | | 784 | |
3.000%, 2/1/49 | | | 3,698,435 | | | | 3,357 | |
3.000%, 10/1/49 | | | 26,911,824 | | | | 24,736 | |
3.000%, 2/1/50 | | | 36,842,540 | | | | 33,504 | |
3.000%, 5/1/50 | | | 8,411,330 | | | | 7,533 | |
3.000%, 7/1/50 | | | 10,864,418 | | | | 9,860 | |
3.000%, 7/1/52 | | | 1,649,479 | | | | 1,472 | |
3.000%, 2/1/55 | | | 1,213,914 | | | | 1,089 | |
3.000%, 7/1/60 | | | 14,694,923 | | | | 12,740 | |
| | | | | | | | |
| Structured Products (50.8%) | | Shares/ Par + | | | Value $ (000’s) | |
Mortgage Securities continued | |
3.044%, (FTSE USD IBOR Consumer Cash Fallbacks Term 1 Year plus 1.603%), 3/1/50 | | | 3,232,385 | | | | 3,209 | |
3.500%, 5/1/37 | | | 3,325,785 | | | | 3,196 | |
3.500%, 6/1/41 | | | 1,760,575 | | | | 1,724 | |
3.500%, 3/1/42 | | | 1,430,350 | | | | 1,354 | |
3.500%, 4/1/42 | | | 3,036,162 | | | | 2,872 | |
3.500%, 5/1/42 | | | 794,749 | | | | 774 | |
3.500%, 6/1/42 | | | 1,450,346 | | | | 1,409 | |
3.500%, 11/1/42 | | | 1,156,035 | | | | 1,092 | |
3.500%, 8/1/43 | | | 9,891,631 | | | | 9,366 | |
3.500%, 12/1/43 | | | 5,516,519 | | | | 5,223 | |
3.500%, 1/1/44 | | | 801,704 | | | | 781 | |
3.500%, 7/1/47 | | | 14,201,061 | | | | 13,418 | |
3.500%, 6/1/49 | | | 4,743,583 | | | | 4,427 | |
3.500%, 1/1/50 | | | 3,255,008 | | | | 3,031 | |
3.500%, 2/1/50 | | | 1,611,819 | | | | 1,510 | |
3.500%, 4/1/50 | | | 7,706,898 | | | | 7,216 | |
3.677%, (US 30 Day Average SOFR plus 2.370%), 8/1/52 | | | 1,947,634 | | | | 1,856 | |
3.962%, (US 30 Day Average SOFR plus 2.120%), 8/1/52 | | | 777,047 | | | | 739 | |
4.000%, 9/1/33 | | | 662,731 | | | | 655 | |
4.000%, 3/1/35 | | | 9,293,811 | | | | 9,167 | |
4.000%, 10/1/37 | | | 4,246,965 | | | | 4,187 | |
4.000%, 6/1/38 | | | 1,050,622 | | | | 1,031 | |
4.000%, 4/1/45 | | | 14,640,613 | | | | 14,115 | |
4.000%, 9/1/45 | | | 438,513 | | | | 426 | |
4.000%, 1/1/46 | | | 2,204,498 | | | | 2,142 | |
4.000%, 1/1/47 | | | 1,147,924 | | | | 1,112 | |
4.000%, 2/1/47 | | | 936,914 | | | | 908 | |
4.000%, 4/1/47 | | | 541,778 | | | | 524 | |
4.000%, 10/1/47 | | | 407,071 | | | | 395 | |
4.000%, 7/1/48 | | | 6,965,812 | | | | 6,724 | |
4.000%, 12/1/48 | | | 1,110,783 | | | | 1,080 | |
4.000%, 5/1/49 | | | 1,109,944 | | | | 1,074 | |
4.122%, (US 30 Day Average SOFR plus 2.120%), 9/1/52 | | | 2,699,536 | | | | 2,639 | |
4.132%, (US 30 Day Average SOFR plus 2.120%), 7/1/52 | | | 2,760,399 | | | | 2,638 | |
4.147%, (US 30 Day Average SOFR plus 2.132%), 10/1/52 | | | 6,418,005 | | | | 6,276 | |
4.213%, (US 30 Day Average SOFR plus 2.370%), 9/1/52 | | | 880,908 | | | | 854 | |
4.222%, (US 30 Day Average SOFR plus 2.127%), 11/1/52 | | | 2,253,468 | | | | 2,209 | |
4.295%, (US 30 Day Average SOFR plus 2.126%), 8/1/52 | | | 3,524,978 | | | | 3,427 | |
4.355%, (US 30 Day Average SOFR plus 2.125%), 7/1/52 | | | 3,306,486 | | | | 3,221 | |
4.500%, 6/1/41 | | | 87,271 | | | | 87 | |
4.500%, 3/1/43 | | | 1,098,460 | | | | 1,097 | |
4.500%, 10/1/45 | | | 1,748,199 | | | | 1,735 | |
4.500%, 2/1/46 | | | 66,162 | | | | 66 | |
4.500%, 7/1/48 | | | 1,823,918 | | | | 1,803 | |
4.500%, 11/1/48 | | | 813,558 | | | | 808 | |
4.616%, (US 30 Day Average SOFR plus 2.125%), 8/1/52 | | | 3,839,090 | | | | 3,771 | |
4.630%, (US 30 Day Average SOFR plus 2.123%), 8/1/52 | | | 2,937,509 | | | | 2,860 | |
The Accompanying Notes are an Integral Part of the Financial Statements.
135
Select Bond Portfolio
| | | | | | | | |
| Structured Products (50.8%) | | Shares/ Par + | | | Value $ (000’s) | |
Mortgage Securities continued | |
4.649%, (US 30 Day Average SOFR plus 2.130%), 8/1/52 | | | 3,028,831 | | | | 2,978 | |
4.793%, (FTSE USD IBOR Consumer Cash Fallbacks Term 1 Year plus 1.582%), 1/1/46 | | | 1,842,575 | | | | 1,877 | |
5.391%, (FTSE USD IBOR Consumer Cash Fallbacks Term 1 Year plus 1.578%), 6/1/45 | | | 732,590 | | | | 746 | |
6.723%, (FTSE USD IBOR Consumer Cash Fallbacks Term 1 Year plus 1.560%), 6/1/43 | | | 146,865 | | | | 150 | |
6.952%, (FTSE USD IBOR Consumer Cash Fallbacks Term 1 Year plus 1.560%), 3/1/43 | | | 34,171 | | | | 34 | |
7.138%, (FTSE USD IBOR Consumer Cash Fallbacks Term 1 Year plus 1.582%), 10/1/43 | | | 479,403 | | | | 491 | |
7.357%, (FTSE USD IBOR Consumer Cash Fallbacks Term 1 Year plus 1.664%), 1/1/43 | | | 137,387 | | | | 141 | |
Federal National Mortgage Association Stripped, Series 414, Class A35
3.500%, 10/25/42 | | | 2,189,890 | | | | 2,046 | |
Federal National Mortgage Association, Series 2012-111, Class FC | | | | | | | | |
5.852%, (US 30 Day Average SOFR plus 0.515%), 10/25/42 | | | 1,252,163 | | | | 1,228 | |
Federal National Mortgage Association, Series 2012-133, Class JF | | | | | | | | |
5.802%, (US 30 Day Average SOFR plus 0.465%), 12/25/42 | | | 1,329,831 | | | | 1,293 | |
Federal National Mortgage Association, Series 2012-151, Class NX
1.500%, 1/25/43 | | | 918,028 | | | | 773 | |
Federal National Mortgage Association, Series 2013-11, Class AP
1.500%, 1/25/43 | | | 2,976,357 | | | | 2,659 | |
Federal National Mortgage Association, Series 2013-15, Class FA | | | | | | | | |
5.802%, (US 30 Day Average SOFR plus 0.465%), 3/25/43 | | | 1,596,125 | | | | 1,552 | |
Federal National Mortgage Association, Series 2013-43, Class BP
1.750%, 5/25/43 | | | 1,094,552 | | | | 931 | |
Federal National Mortgage Association, Series 2014-17, Class DY
3.500%, 4/25/44 | | | 1,915,000 | | | | 1,744 | |
Federal National Mortgage Association, Series 2014-25, Class EL
3.000%, 5/25/44 | | | 1,487,241 | | | | 1,339 | |
Federal National Mortgage Association, Series 2014-74, Class PC
2.500%, 6/25/44 | | | 1,206,393 | | | | 1,116 | |
Federal National Mortgage Association, Series 2015-20, Class EF | | | | | | | | |
5.802%, (US 30 Day Average SOFR plus 0.465%), 4/25/45 | | | 3,742,077 | | | | 3,632 | |
Federal National Mortgage Association, Series 2015-26, Class GF | | | | | | | | |
5.752%, (US 30 Day Average SOFR plus 0.415%), 5/25/45 | | | 2,324,962 | | | | 2,257 | |
| | | | | | | | |
| Structured Products (50.8%) | | Shares/ Par + | | | Value $ (000’s) | |
Mortgage Securities continued | |
Federal National Mortgage Association, Series 2015-32, Class FA | | | | | | | | |
5.752%, (US 30 Day Average SOFR plus 0.415%), 5/25/45 | | | 1,421,058 | | | | 1,375 | |
Federal National Mortgage Association, Series 2015-48, Class FB | | | | | | | | |
5.752%, (US 30 Day Average SOFR plus 0.415%), 7/25/45 | | | 1,734,461 | | | | 1,680 | |
Federal National Mortgage Association, Series 2015-8, Class AP
2.000%, 3/25/45 | | | 2,714,403 | | | | 2,370 | |
Federal National Mortgage Association, Series 2015-84, Class PA
1.700%, 8/25/33 | | | 3,455,866 | | | | 3,156 | |
Federal National Mortgage Association, Series 2016-19, Class FD | | | | | | | | |
5.852%, (US 30 Day Average SOFR plus 0.515%), 4/25/46 | | | 5,066,126 | | | | 4,991 | |
Federal National Mortgage Association, Series 2016-48, Class MA
2.000%, 6/25/38 | | | 3,520,085 | | | | 3,218 | |
Federal National Mortgage Association, Series 2016-57, Class PC
1.750%, 6/25/46 | | | 7,287,776 | | | | 6,073 | |
Federal National Mortgage Association, Series 2017-13, Class PA
3.000%, 8/25/46 | | | 1,168,103 | | | | 1,071 | |
Federal National Mortgage Association, Series 2017-30, Class FA | | | | | | | | |
5.802%, (US 30 Day Average SOFR plus 0.465%), 5/25/47 | | | 876,285 | | | | 851 | |
Federal National Mortgage Association, Series 2017-78, Class FC | | | | | | | | |
5.802%, (US 30 Day Average SOFR plus 0.465%), 10/25/47 | | | 1,688,692 | | | | 1,637 | |
Federal National Mortgage Association, Series 2018-14, Class KC
3.000%, 3/25/48 | | | 2,198,605 | | | | 2,065 | |
Federal National Mortgage Association, Series 2018-38, Class MA
3.300%, 6/25/48 | | | 2,249,610 | | | | 2,127 | |
Federal National Mortgage Association, Series 2018-45, Class TM
3.000%, 6/25/48 | | | 1,771,012 | | | | 1,596 | |
Federal National Mortgage Association, Series 2018-55, Class GA
3.375%, 8/25/48 | | | 1,722,455 | | | | 1,628 | |
Federal National Mortgage Association, Series 2018-64, Class A
3.000%, 9/25/48 | | | 1,500,632 | | | | 1,324 | |
Federal National Mortgage Association, Series 2018-8, Class KL
2.500%, 3/25/47 | | | 1,184,605 | | | | 1,064 | |
Federal National Mortgage Association, Series 2018-85, Class EA
3.500%, 12/25/48 | | | 1,238,100 | | | | 1,176 | |
Federal National Mortgage Association, Series 2019-15, Class FA | | | | | | | | |
5.952%, (US 30 Day Average SOFR plus 0.615%), 4/25/49 | | | 884,644 | | | | 863 | |
The Accompanying Notes are an Integral Part of the Financial Statements.
136
Select Bond Portfolio
| | | | | | | | |
| Structured Products (50.8%) | | Shares/ Par + | | | Value $ (000’s) | |
Mortgage Securities continued | |
Federal National Mortgage Association, Series 2019-25, Class PA
3.000%, 5/25/48 | | | 2,379,179 | | | | 2,183 | |
Federal National Mortgage Association, Series 2019-41, Class FG | | | | | | | | |
5.952%, (US 30 Day Average SOFR plus 0.615%), 8/25/59 | | | 2,137,425 | | | | 2,079 | |
Federal National Mortgage Association, Series 2019-43, Class FC | | | | | | | | |
5.852%, (US 30 Day Average SOFR plus 0.515%), 8/25/49 | | | 1,750,876 | | | | 1,704 | |
Federal National Mortgage Association, Series 2019-67, Class FB | | | | | | | | |
5.902%, (US 30 Day Average SOFR plus 0.565%), 11/25/49 | | | 883,546 | | | | 860 | |
Federal National Mortgage Association, Series 2020-34, Class F | | | | | | | | |
5.902%, (US 30 Day Average SOFR plus 0.565%), 6/25/50 | | | 1,209,548 | | | | 1,175 | |
Federal National Mortgage Association, Series 2020-37, Class DA
1.500%, 6/25/50 | | | 1,272,208 | | | | 1,109 | |
Federal National Mortgage Association, Series 2020-45, Class JL
3.000%, 7/25/40 | | | 2,843,497 | | | | 2,578 | |
Federal National Mortgage Association, Series 2020-48, Class AB
2.000%, 7/25/50 | | | 1,288,954 | | | | 1,071 | |
Federal National Mortgage Association, Series 2020-48, Class DA
2.000%, 7/25/50 | | | 3,879,325 | | | | 3,273 | |
Federal National Mortgage Association, Series 2020-59, Class NC
3.000%, 8/25/40 | | | 1,854,786 | | | | 1,696 | |
Federal National Mortgage Association, Series 2021-22, Class MN
2.750%, 10/25/50 | | | 2,077,279 | | | | 1,815 | |
Federal National Mortgage Association, Series 2021-26, Class BD
1.750%, 5/25/51 | | | 1,148,231 | | | | 1,000 | |
Federal National Mortgage Association, Series 2021-27, Class EC
1.500%, 5/25/51 | | | 5,512,963 | | | | 4,471 | |
Federal National Mortgage Association, Series 2021-33, Class AV
2.500%, 3/25/48 | | | 838,962 | | | | 635 | |
Federal National Mortgage Association, Series 2021-42, Class AC
2.000%, 2/25/51 | | | 1,657,049 | | | | 1,394 | |
Federal National Mortgage Association, Series 2021-42, Class DC
2.000%, 11/25/50 | | | 3,991,115 | | | | 3,370 | |
Federal National Mortgage Association, Series 2021-73, Class A
2.500%, 11/25/49 | | | 2,160,463 | | | | 1,872 | |
Federal National Mortgage Association, Series 2021-73, Class DJ
2.000%, 3/25/49 | | | 2,240,805 | | | | 1,824 | |
Federal National Mortgage Association, Series 2021-76, Class KB
1.250%, 11/25/51 | | | 995,846 | | | | 816 | |
| | | | | | | | |
| Structured Products (50.8%) | | Shares/ Par + | | | Value $ (000’s) | |
Mortgage Securities continued | |
Federal National Mortgage Association, Series 2021-78, Class ND
1.500%, 11/25/51 | | | 3,115,611 | | | | 2,546 | |
Federal National Mortgage Association, Series 2021-78, Class PA
2.500%, 11/25/51 | | | 1,902,759 | | | | 1,649 | |
Federal National Mortgage Association, Series 2021-86, Class MA
2.500%, 11/25/47 | | | 3,552,438 | | | | 3,180 | |
Federal National Mortgage Association, Series 2021-91, Class AB
2.500%, 9/25/49 | | | 2,095,756 | | | | 1,824 | |
Federal National Mortgage Association, Series 2021-95, Class MA
2.500%, 4/25/50 | | | 2,609,629 | | | | 2,248 | |
Federal National Mortgage Association, Series 2021-96, Class AH
2.500%, 3/25/49 | | | 2,332,165 | | | | 2,021 | |
Federal National Mortgage Association, Series 2022-11, Class A
2.500%, 7/25/47 | | | 5,264,607 | | | | 4,746 | |
Federal National Mortgage Association, Series 2022-11, Class D
3.000%, 1/25/50 | | | 2,297,678 | | | | 2,079 | |
Federal National Mortgage Association, Series 2022-18, Class DL
3.250%, 7/25/46 | | | 2,981,882 | | | | 2,768 | |
Federal National Mortgage Association, Series 2022-28, Class CA
2.000%, 1/25/48 | | | 2,043,654 | | | | 1,835 | |
Federal National Mortgage Association, Series 2022-3, Class N
2.000%, 10/25/47 | | | 6,130,928 | | | | 5,308 | |
Federal National Mortgage Association, Series 2022-4, Class MH
3.000%, 9/25/48 | | | 2,419,744 | | | | 2,218 | |
Federal National Mortgage Association, Series 2022-89, Class AY
3.000%, 2/25/48 | | | 2,263,000 | | | | 1,924 | |
Federal National Mortgage Association, Series 2022-9, Class DJ
3.250%, 3/25/49 | | | 1,643,371 | | | | 1,497 | |
Federal National Mortgage Association, Series 2023-37, Class FG | | | | | | | | |
5.752%, (US 30 Day Average SOFR plus 0.415%), 8/25/50 | | | 5,746,159 | | | | 5,554 | |
Federal National Mortgage Association, Series 2023-37, Class FH | | | | | | | | |
5.852%, (US 30 Day Average SOFR plus 0.515%), 1/25/50 | | | 3,565,619 | | | | 3,474 | |
Federal National Mortgage Association, Series 2023-38, Class FC | | | | | | | | |
6.002%, (US 30 Day Average SOFR plus 0.665%), 6/25/40 | | | 2,295,794 | | | | 2,278 | |
Government National Mortgage Association | | | | | | | | |
2.500%, 12/20/37 | | | 2,536,460 | | | | 2,325 | |
2.500%, 6/20/38 | | | 4,748,306 | | | | 4,345 | |
3.000%, 6/20/43 | | | 2,197,707 | | | | 2,003 | |
3.000%, 8/20/43 | | | 719,595 | | | | 656 | |
3.000%, 10/20/46 | | | 375,693 | | | | 342 | |
3.000%, 12/20/46 | | | 1,831,051 | | | | 1,669 | |
The Accompanying Notes are an Integral Part of the Financial Statements.
137
Select Bond Portfolio
| | | | | | | | |
| Structured Products (50.8%) | | Shares/ Par + | | | Value $ (000’s) | |
Mortgage Securities continued | |
3.000%, 1/20/47 | | | 632,471 | | | | 577 | |
3.000%, 3/20/47 | | | 1,409,998 | | | | 1,285 | |
3.000%, 4/20/47 | | | 1,966,132 | | | | 1,792 | |
3.000%, 7/20/47 | | | 674,785 | | | | 615 | |
3.000%, 8/20/47 | | | 895,616 | | | | 816 | |
3.000%, 9/20/47 | | | 457,707 | | | | 417 | |
3.000%, 11/15/47 | | | 6,517,925 | | | | 5,952 | |
3.000%, 11/20/47 | | | 1,501,156 | | | | 1,368 | |
3.000%, 12/20/47 | | | 147,151 | | | | 133 | |
3.000%, 1/20/48 | | | 859,388 | | | | 781 | |
3.000%, 2/20/48 | | | 570,035 | | | | 519 | |
3.000%, 3/20/48 | | | 225,358 | | | | 205 | |
3.000%, 10/20/50 | | | 5,602,584 | | | | 5,083 | |
3.500%, 1/20/48 | | | 1,157,878 | | | | 1,089 | |
4.000%, 3/20/48 | | | 336,790 | | | | 323 | |
4.000%, 4/20/48 | | | 1,073,993 | | | | 1,030 | |
4.500%, 8/15/47 | | | 206,128 | | | | 204 | |
4.500%, 2/20/49 | | | 1,379,239 | | | | 1,329 | |
6.000%, 1/20/53 | | | 9,347,510 | | | | 9,567 | |
Government National Mortgage Association TBA
6.500%, 1/22/54 | | | 27,900,000 | | | | 28,559 | |
Government National Mortgage Association, Series 2010-163, Class NC
4.000%, 12/20/40 | | | 1,836,251 | | | | 1,806 | |
Government National Mortgage Association, Series 2012-141, Class WA
4.513%, 11/16/41 | | | 398,525 | | | | 389 | |
Government National Mortgage Association, Series 2013-152, Class HA
2.500%, 6/20/43 | | | 1,951,056 | | | | 1,775 | |
Government National Mortgage Association, Series 2014-181, Class L
3.000%, 12/20/44 | | | 1,211,000 | | | | 1,083 | |
Government National Mortgage Association, Series 2015-144, Class CA
2.500%, 10/20/45 | | | 2,030,062 | | | | 1,777 | |
Government National Mortgage Association, Series 2015-161, Class GF | | | | | | | | |
5.772%, (US SOFR 1 Month plus 0.415%), 11/20/45 | | | 1,096,589 | | | | 1,063 | |
Government National Mortgage Association, Series 2016-93, Class AB
1.750%, 7/20/44 | | | 2,207,422 | | | | 1,775 | |
Government National Mortgage Association, Series 2017-139, Class GA
3.000%, 9/20/47 | | | 4,583,149 | | | | 4,158 | |
Government National Mortgage Association, Series 2017-167, Class BQ
2.500%, 8/20/44 | | | 1,166,189 | | | | 1,067 | |
Government National Mortgage Association, Series 2018-65, Class DC
3.500%, 5/20/48 | | | 1,482,000 | | | | 1,350 | |
Government National Mortgage Association, Series 2020-133, Class GA
1.000%, 9/20/50 | | | 2,405,681 | | | | 2,031 | |
Government National Mortgage Association, Series 2020-138, Class LE
1.500%, 9/20/50 | | | 5,450,775 | | | | 4,352 | |
| | | | | | | | |
| Structured Products (50.8%) | | Shares/ Par + | | | Value $ (000’s) | |
Mortgage Securities continued | |
Government National Mortgage Association, Series 2021-215, Class GA
2.000%, 12/20/51 | | | 1,246,356 | | | | 1,066 | |
Government National Mortgage Association, Series 2021-227, Class E
2.500%, 7/20/50 | | | 8,710,483 | | | | 7,590 | |
Government National Mortgage Association, Series 2021-27, Class BD
5.000%, 2/20/51 | | | 1,523,731 | | | | 1,521 | |
Government National Mortgage Association, Series 2021-27, Class CW
5.001%, 2/20/51 | | | 2,226,715 | | | | 2,191 | |
Government National Mortgage Association, Series 2021-27, Class NT
5.000%, 2/20/51 | | | 1,729,698 | | | | 1,672 | |
Government National Mortgage Association, Series 2021-27, Class Q
5.000%, 2/20/51 | | | 1,524,639 | | | | 1,478 | |
Government National Mortgage Association, Series 2021-8, Class CY
5.000%, 1/20/51 | | | 1,551,372 | | | | 1,561 | |
Government National Mortgage Association, Series 2022-107, Class C
2.500%, 6/20/51 | | | 7,162,381 | | | | 5,969 | |
Government National Mortgage Association, Series 2022-153, Class KA
4.000%, 12/20/49 | | | 2,040,719 | | | | 1,983 | |
Government National Mortgage Association, Series 2022-191, Class B
4.000%, 6/20/41 | | | 8,606,000 | | | | 8,086 | |
Government National Mortgage Association, Series 2022-191, Class BY
4.000%, 8/20/41 | | | 9,389,000 | | | | 8,827 | |
Government National Mortgage Association, Series 2022-197, Class LF | | | | | | | | |
6.038%, (US 30 Day Average SOFR plus 0.700%), 11/20/52 | | | 6,569,210 | | | | 6,508 | |
Government National Mortgage Association, Series 2022-205, Class A
2.000%, 9/20/51 | | | 2,616,048 | | | | 2,099 | |
Government National Mortgage Association, Series 2022-31, Class GH
2.500%, 12/20/49 | | | 4,614,173 | | | | 4,085 | |
Government National Mortgage Association, Series 2022-34, Class DN
3.500%, 9/20/41 | | | 3,816,272 | | | | 3,569 | |
Government National Mortgage Association, Series 2022-5, Class BA
2.000%, 10/20/49 | | | 9,097,407 | | | | 7,790 | |
Government National Mortgage Association, Series 2022-50, Class DC
2.500%, 8/20/51 | | | 2,141,730 | | | | 1,874 | |
Government National Mortgage Association, Series 2022-66, Class CG
3.500%, 4/20/52 | | | 4,229,944 | | | | 4,003 | |
Government National Mortgage Association, Series 2022-84, Class A
2.500%, 1/20/52 | | | 13,578,824 | | | | 11,397 | |
GS Mortgage Securities Trust, Series 2015- GC32, Class A3
3.498%, 7/10/48 | | | 1,068,355 | | | | 1,034 | |
The Accompanying Notes are an Integral Part of the Financial Statements.
138
Select Bond Portfolio
| | | | | | | | |
| Structured Products (50.8%) | | Shares/ Par + | | | Value $ (000’s) | |
Mortgage Securities continued | |
GS Mortgage Securities Trust, Series 2020- GSA2, Class A4
1.721%, 12/12/53 | | | 3,499,000 | | | | 2,805 | |
Impact Funding Affordable Multifamily Housing Mortgage Loan Trust, Series 2010-1, Class A1
5.314%, 1/25/51 144A | | | 1,094,353 | | | | 1,074 | |
JP Morgan Chase Commercial Mortgage Securities Trust, Series 2016-JP4, Class A3
3.392%, 12/15/49 | | | 674,000 | | | | 637 | |
JPMBB Commercial Mortgage Securities Trust, Series 2014-C23, Class A4
3.669%, 9/15/47 | | | 735,697 | | | | 726 | |
JPMBB Commercial Mortgage Securities Trust, Series 2015-C28, Class A3
2.912%, 10/15/48 | | | 3,340,808 | | | | 3,258 | |
JPMBB Commercial Mortgage Securities Trust, Series 2015-C30, Class A5
3.821%, 7/15/48 | | | 1,895,000 | | | | 1,812 | |
MED Trust, Series 2021-MDLN, Class A | | | | | | | | |
6.426%, (US SOFR 1 Month plus 1.065%), 11/15/38 144A | | | 4,312,304 | | | | 4,228 | |
MFRA Trust, Series 2021-NQM2, Class A1
1.029%, (AFC), 11/25/64 144A | | | 855,435 | | | | 722 | |
Morgan Stanley Capital I Trust, Series 2020- HR8, Class A3
1.790%, 7/15/53 | | | 1,911,000 | | | | 1,574 | |
New Residential Mortgage Loan Trust, Series 2019-NQM4, Class A1
2.492%, (AFC), 9/25/59 144A | | | 363,395 | | | | 334 | |
NewRez Warehouse Securitization Trust, Series 2021-1, Class A | | | | | | | | |
6.220%, (US SOFR 1 Month plus 0.865%), 5/25/55 144A | | | 3,041,133 | | | | 3,037 | |
Residential Funding Mortgage Securities I, Series 2003-S18, Class A1
4.500%, 10/25/25 | | | 2,120 | | | | 1 | |
Starvest Emerging Markets CBO I, Series 2020-INV1, Class A1
1.027%, (AFC), 11/25/55 144A | | | 536,456 | | | | 481 | |
Starwood Mortgage Residential Trust, Series 2020-1, Class A1
2.275%, (AFC), 2/25/50 144A | | | 132,314 | | | | 124 | |
Starwood Mortgage Residential Trust, Series 2020-3, Class A1
1.486%, (AFC), 4/25/65 144A | | | 594,015 | | | | 552 | |
Starwood Mortgage Residential Trust, Series 2021-1, Class A1
1.219%, (AFC), 5/25/65 144A | | | 709,041 | | | | 627 | |
Starwood Mortgage Residential Trust, Series 2021-4, Class A1
1.162%, (AFC), 8/25/56 144A | | | 2,000,017 | | | | 1,672 | |
| | | | | | | | |
| Structured Products (50.8%) | | Shares/ Par + | | | Value $ (000’s) | |
Mortgage Securities continued | |
Uniform Mortgage Backed Security TBA | | | | | | | | |
6.000%, 1/16/54 | | | 15,000,000 | | | | 15,230 | |
6.500%, 1/16/54 | | | 28,600,000 | | | | 29,307 | |
7.000%, 1/16/54 | | | 24,600,000 | | | | 25,374 | |
7.000%, 2/13/54 | | | 7,000,000 | | | | 7,214 | |
Verus Securitization Trust, Series 2019-4, Class A1
3.642%, (AFC), 11/25/59 144A Σ | | | 597,413 | | | | 579 | |
Verus Securitization Trust, Series 2019-INV3, Class A1
3.692%, (AFC), 11/25/59 144A | | | 243,896 | | | | 237 | |
Verus Securitization Trust, Series 2020-2, Class A1
2.226%, (AFC), 5/25/60 144A | | | 296,502 | | | | 290 | |
Verus Securitization Trust, Series 2021-1, Class A1
0.815%, (AFC), 1/25/66 144A | | | 921,172 | | | | 787 | |
Verus Securitization Trust, Series 2021-2, Class A1
1.031%, (AFC), 2/25/66 144A | | | 1,809,397 | | | | 1,562 | |
Verus Securitization Trust, Series 2021-3, Class A1
1.046%, (AFC), 6/25/66 144A | | | 1,403,451 | | | | 1,167 | |
Verus Securitization Trust, Series 2021-4, Class A1
0.938%, (AFC), 7/25/66 144A | | | 1,816,594 | | | | 1,442 | |
Verus Securitization Trust, Series 2021-5, Class A1
1.013%, (AFC), 9/25/66 144A | | | 4,591,115 | | | | 3,767 | |
Verus Securitization Trust, Series 2021-7, Class A1
1.829%, (AFC), 10/25/66 144A | | | 2,025,638 | | | | 1,759 | |
Verus Securitization Trust, Series 2021-8, Class A1
1.824%, (AFC), 11/25/66 144A | | | 2,005,237 | | | | 1,734 | |
Verus Securitization Trust, Series 2021-R1, Class A1
0.820%, (AFC), 10/25/63 144A | | | 748,670 | | | | 678 | |
Verus Securitization Trust, Series 2021-R3, Class A1
1.020%, (AFC), 5/25/64 144A | | | 849,189 | | | | 755 | |
Visio Trust, Series 2020-1R, Class A1
1.312%, 11/25/55 144A | | | 564,338 | | | | 507 | |
| | | | | | | | |
Total | | | | | | | 1,272,832 | |
| | | | | | | | |
| |
Total Structured Products (Cost: $1,499,045) | | | | 1,476,166 | |
| | | | | | | | |
| |
Total Investments (101.6%) (Cost: $3,005,235)@ | | | | 2,948,774 | |
| | | | | | | | |
| | |
Other Assets, Less Liabilities (-1.6%) | | | | | | | (45,077 | ) |
| | | | | | | | |
| | |
Net Assets (100.0%) | | | | | | | 2,903,697 | |
| | | | | | | | |
| + | All par is stated in U.S. Dollar unless otherwise noted. |
| 144A | Security exempt from registration under Rule 144A of the Securities Act of 1933. These securities may be resold as transactions exempt from registration, normally to qualified institutional buyers. At December 31, 2023 the value of these securities (in thousands) was $203,696 representing 7.0% of the net assets. |
| α | Rate shown is the rate as of the period end. The rate may be based on a fixed rate, a capped rate or a floor rate and may convert to a variable or floating rate in the future. |
The Accompanying Notes are an Integral Part of the Financial Statements.
139
Select Bond Portfolio
| § | Security was purchased pursuant to Regulation S under the Securities Act of 1933, which exempts from registration securities offered and sold outside of the United States. At December 31, 2023, the aggregate value of these securities was $812 (in thousands), representing 0.0% of net assets. |
| ∑ | Stepped coupon bond for which the coupon rate of interest adjusts on specified date(s); rate shown is effective rate at period-end. |
| @ | At December 31, 2023, the aggregate cost of investments, including derivatives, for federal tax purposes (in thousands) was $3,014,232 and the net unrealized depreciation of investments based on that cost was $65,458 which is comprised of $45,367 aggregate gross unrealized appreciation and $110,825 aggregate gross unrealized depreciation. |
The following is a summary of the inputs used in valuing the Portfolio’s Investments at December 31, 2023. See Note 3 for additional information on portfolio valuation.
| | | | | | | | | | | | | | | | | | | | | | | | |
| | | Valuation Inputs | |
| Description | | | | | Level 1 - Quoted Prices | | | | | | Level 2 - Other Significant Observable Inputs | | | | | | Level 3 - Significant Unobservable Inputs | |
| |
| | | (Amounts in thousands) | |
| | | | | | |
Assets: | | | | | | | | | | | | | | | | | | | | | | | | |
Municipal Bonds | | | | | | $ | — | | | | | | | $ | 9,057 | | | | | | | $ | — | |
Corporate Bonds | | | | | | | — | | | | | | | | 640,462 | | | | | | | | — | |
Governments | | | | | | | — | | | | | | | | 823,089 | | | | | | | | — | |
Structured Products | | | | | | | — | | | | | | | | 1,476,166 | | | | | | | | — | |
| | | | | | | | |
Total Assets: | | | | | | $ | — | | | | | | | $ | 2,948,774 | | | | | | | $ | — | |
| | | | | | | | |
The Accompanying Notes are an Integral Part of the Financial Statements.
140
Long-Term U.S. Government Bond Portfolio (unaudited)
| | | | |
| Objective: | | Portfolio Strategy: | | Net Assets: |
| Maximum total return, consistent with preservation of capital and prudent investment management. | | Invest in a diversified portfolio of fixed income securities that are issued or guaranteed by the U.S. Government, its agencies or government sponsored enterprises, and in derivatives designed to replicate such securities. | | $121 million |
PORTFOLIO OVERVIEW
Mason Street Advisors, LLC (“Mason Street Advisors”), the investment adviser for the Long-Term U.S. Government Bond Portfolio (the “Portfolio”), has engaged Pacific Investment Management Company LLC (“PIMCO”) to act as sub-adviser for the Portfolio. The Portfolio primarily invests in a diversified portfolio of fixed income securities that are issued or guaranteed by the U.S. Government, its agencies or government sponsored enterprises (“U.S. Government Securities”), which may be represented by forwards or derivatives such as options, futures contracts or interest rate swap agreements. Assets not invested in U.S. Government Securities may be invested in other types of investment grade fixed income instruments, such as corporate debt securities of U.S. issuers and mortgage- and asset-backed securities, or in preferred stocks. The Portfolio will normally have minimum average portfolio duration (a measure of the sensitivity of the Portfolio’s fixed income portfolio securities to changes in interest rates) of eight years and, for point of reference, the dollar-weighted average maturity of the Portfolio, under normal circumstances, is expected to be more than ten years. The Portfolio’s investments in fixed income securities are limited to investment grade U.S. dollar denominated securities of U.S. issuers that are rated at least A by Moody’s or equivalently rated by S&P or Fitch, or, if unrated, determined by the Portfolio to be of comparable quality.
MARKET OVERVIEW
Despite the collapse of Silicon Valley Bank and financial sector concerns, risk assets rose in early 2023. Bond yields fell, the yield curve inverted further, and market volatility increased due to instability in Credit Suisse Group and its takeover by UBS Group. Fears of financial contagion led to a drop in global stock indices and a rally in bond yields.
In the second quarter of 2023, risk assets improved despite banking sector stress and potential U.S. debt default fears. Bond yields rose due to resilient growth and persistent inflation, and central banks resumed hawkish guidance. Despite U.S. debt default concerns, market optimism continued due to positive debt ceiling negotiations, leading the S&P 500® Index to a 9-month high. The U.S. Federal Reserve (the “Fed”) signaled two additional rate hikes due to resilient growth and a swift banking sector stress resolution.
The third quarter saw a decline in risk sentiment due to economic data surprises and fears of prolonged high rates. Bond yields rose due to resilient growth and sticky inflation, and central banks maintained hawkish guidance. 10-year U.S. Treasury real yields increased to an approximately 15-year high, while U.S. core inflation cooled.
Signs of slowing inflation and a cooling labor market in the fourth quarter led to an accelerated path of rate cuts for 2024, prompting a global bond market rally. Risk sentiment rebounded, with the MSCI World® Index rising sizably, while the U.S. dollar weakened. In December 2023, the Fed paused rate hikes for the third consecutive time, while signaling the potential for 75 bps of cuts in 2024. Global developed central banks maintained hawkish stances, with both the European Central Bank and the Bank of England signaling that rates would remain restrictive for longer. The Bank of Japan maintained its negative interest rate policy and left its dovish guidance unchanged.
PORTFOLIO RESULTS
The Portfolio returned 3.33% for the twelve months ended December 31, 2023. By comparison, the Portfolio’s benchmark, the Bloomberg® Long-Term U.S. Treasury Index (the “Index”), returned 3.06%. (This Index is unmanaged, cannot be invested in directly and does not incur expenses.) Tactical U.S. interest rate positioning contributed to the Portfolio’s relative performance for the reporting period. The Portfolio’s duration positioning was partially implemented through the use of futures, interest rate swaps and options. Within spread sectors, exposure to out-of-benchmark agency securities and agency mortgage-backed securities detracted from performance.
PORTFOLIO MANAGER OUTLOOK
The following forward-looking comments are the opinion of PIMCO, the Portfolio’s sub-adviser.
141
Long-Term U.S. Government Bond Portfolio (unaudited)
After major economies showed surprising resilience in 2023, we anticipate a downshift toward stagnation or mild contraction in 2024. The standout strength of the U.S. is likely to fade over our six- to twelve-month cyclical horizon, and countries with more rate-sensitive markets will likely slow more markedly. With inflation easing, developed market central banks have likely reached the end of their hiking cycles. This has shifted attention toward the timing and pace of eventual rate cuts. We believe the Fed and other central banks have scope to cut rates aggressively if growth slows. However, there are also scenarios in which the recent market-based easing of financial conditions has done much of the work for central banks. That easing, alongside continued consumer and corporate sector strength could potentially prompt inflation to rise again.
We expect fiscal concerns will continue, both in the U.S. and globally. We see potential for further bouts of long-end curve weakness amid anxiety about elevated supply, stemming from the increased bond issuance needed to fund large fiscal deficits. We therefore expect to have a curve-steepening bias in our portfolios, with overweight positions in the 5- to 10-year part of the curve globally and underweights in the 30-year area. At current valuations, we continue to find bonds attractive relative to equities, while fixed income offers correlation and diversification benefits in portfolios. Furthermore, bond returns tend to be less dependent on a positive economic outcome.
Relative Performance
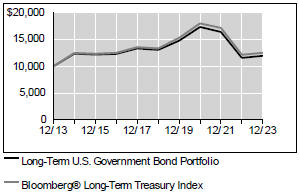
| | | | | | |
Average Annual Total Returns For Periods Ended December 31, 2023 |
| | | 1 Year | | 5 Years | | 10 Years |
Long-Term U.S. Government Bond Portfolio | | 3.33% | | -1.76% | | 1.81% |
Bloomberg® Long-Term Treasury Index | | 3.06% | | -1.24% | | 2.28% |
The performance data quoted represents past performance. Past performance is historical and does not guarantee future performance. Investment return and principal value will fluctuate, so that shares, when redeemed, may be worth more or less than their original cost. Current performance may be lower or higher than the performance data quoted. For the most recent month-end performance information visit www.northwesternmutual.com.
This chart assumes an initial investment of $10,000 made on 12/31/13. Returns shown reflect fee waivers, deductions for management and other portfolio expenses, and reinvestment of all dividends. In the absence of fee waivers, total return would be reduced. Returns exclude deductions for separate account sale loads and account
fees. Please refer to the Benchmark Definitions section of this report for information about the indices cited in the above chart and graph.
Top 10 Holdings 12/31/23
| | | | | | | | |
| | | | |
| | | Security Description | | % of Net Assets | | | | |
| | | | |
| | | US Treasury, Various | | 108.9% | | | | |
| | | | |
| | | Uniform Mortgage Backed Security TBA, Various | | 9.3% | | | | |
| | | | |
| | | US Treasury Inflation Index Bond, Various | | 3.6% | | | | |
| | | | |
| | | Resolution Funding Corp. Stripped, Various | | 3.3% | | | | |
| | | | |
| | | Federal Home Loan Mortgage Corp., Series 4092,
Class AY, 3%, 8/15/32 | | 1.7% | | | | |
| | | | |
| | | Federal Home Loan Mortgage Corp., Series 4387,
Class AZ, 4%, 9/15/44 | | 1.7% | | | | |
| | | | |
| | | Federal Home Loan Mortgage Corp., Series 4398,
Class ZX, 4%, 9/15/54 | | 0.6% | | | | |
| | | | |
| | | US Treasury Stripped, Various | | 0.6% | | | | |
| | | | |
| | | Government National Mortgage Association TBA,
4%, 2/20/54 | | 0.6% | | | | |
| | | | |
| | | Federal National Mortgage Association, Series
2016-61, Class ML, 3%, 9/25/46 | | 0.6% | | | | |
Sector Allocation 12/31/23
| | | | | | | | |
| | | | |
| | | Sector | | % of Net Assets | | | | |
| | | | |
| | | Governments | | 116.9% | | | | |
| | | | |
| | | Structured Products | | 19.0% | | | | |
| | | | |
| | | Corporate Bonds | | 0.3% | | | | |
| | | | |
| | | Short-Term Investments & Other Net Assets | | -36.2% | | | | |
Sector Allocation and Top 10 Holdings are subject to change.
Consistent with the Portfolio’s stated parameters, no more than 10% of the Portfolio is invested in securities rated A by Moody’s or S&P and no more than 25% of the Portfolio is invested in securities rated Aa by Moody’s or AA by S&P.
142
Long-Term U.S. Government Bond Portfolio
SCHEDULE OF INVESTMENTS
December 31, 2023
| | | | | | | | |
| Corporate Bonds (0.3%) | | Shares/ Par + | | | Value $ (000’s) | |
Industrial (0.3%) | | | | | | | | |
Vessel Management Services, Inc.
3.432%, 8/15/36 | | | 361,000 | | | | 338 | |
| | | | | | | | |
Total | | | | | | | 338 | |
| | | | | | | | |
| |
Total Corporate Bonds (Cost: $361) | | | | 338 | |
| | | | | | | | |
| | |
| Governments (116.9%) | | | | | | |
Governments (116.9%) | | | | | | | | |
Federal National Mortgage Association
5.625%, 4/17/28 | | | 100,000 | | | | 106 | |
Resolution Funding Corp. Stripped
0.000%, 4/15/30 PO | | | 4,800,000 | | | | 3,655 | |
0.000%, 4/15/28 IO | | | 400,000 | | | | 335 | |
Tennessee Valley Authority Stripped
0.000%, 5/1/30 PO | | | 500,000 | | | | 380 | |
US Treasury
1.125%, 5/15/40 | | | 6,790,000 | | | | 4,376 | |
1.125%, 8/15/40 | | | 45,990,000 | | | | 29,355 | |
1.375%, 11/15/40 | | | 11,200,000 | | | | 7,431 | |
1.375%, 8/15/50 | | | 1,080,000 | | | | 602 | |
1.625%, 11/15/50 | | | 400,000 | | | | 238 | |
1.875%, 2/15/41 | | | 1,900,000 | | | | 1,366 | |
2.000%, 2/15/50 | | | 12,920,000 | | | | 8,501 | |
2.250%, 8/15/49 | | | 300,000 | | | | 209 | |
2.375%, 5/15/51 | | | 2,300,000 | | | | 1,641 | |
2.500%, 2/15/45 | | | 1,440,000 | | | | 1,090 | |
2.500%, 2/15/46 | | | 850,000 | | | | 638 | |
2.875%, 5/15/49 | | | 1,750,000 | | | | 1,391 | |
3.000%, 11/15/44 | | | 1,620,000 | | | | 1,341 | |
3.000%, 5/15/45 | | | 1,410,000 | | | | 1,163 | |
3.000%, 11/15/45 | | | 370,000 | | | | 304 | |
3.000%, 2/15/48 | | | 330,000 | | | | 269 | |
3.000%, 8/15/48 b | | | 700,000 | | | | 570 | |
3.000%, 2/15/49 | | | 10,470,000 | | | | 8,520 | |
3.000%, 8/15/52 | | | 4,500,000 | | | | 3,680 | |
3.125%, 8/15/44 | | | 1,620,000 | | | | 1,372 | |
3.125%, 5/15/48 | | | 2,430,000 | | | | 2,024 | |
3.375%, 8/15/42 | | | 6,500,000 | | | | 5,796 | |
3.625%, 2/15/53 | | | 2,900,000 | | | | 2,678 | |
3.625%, 5/15/53 | | | 1,700,000 | | | | 1,572 | |
3.875%, 2/15/43 | | | 900,000 | | | | 858 | |
3.875%, 5/15/43 | | | 3,100,000 | | | | 2,955 | |
4.000%, 11/15/42 | | | 2,800,000 | | | | 2,721 | |
4.000%, 11/15/52 | | | 15,830,000 | | | | 15,619 | |
4.375%, 5/15/41 | | | 16,080,000 | | | | 16,575 | |
4.375%, 8/15/43 | | | 6,800,000 | | | | 6,941 | |
US Treasury Inflation Index Bond
0.125%, 1/15/32 | | | 887,944 | | | | 780 | |
0.625%, 7/15/32 | | | 1,694,100 | | | | 1,547 | |
1.125%, 1/15/33 | | | 2,210,406 | | | | 2,091 | |
US Treasury Stripped
0.000%, 8/15/34 IO | | | 850,000 | | | | 553 | |
0.000%, 5/15/41 IO | | | 40,000 | | | | 19 | |
0.000%, 8/15/41 IO | | | 50,000 | | | | 23 | |
0.000%, 11/15/41 IO | | | 80,000 | | | | 37 | |
| | | | | | | | |
| Governments (116.9%) | | Shares/ Par + | | | Value $ (000’s) | |
Governments continued | | | | | | | | |
0.000%, 5/15/42 IO | | | 70,000 | | | | 31 | |
0.000%, 8/15/42 IO | | | 220,000 | | | | 97 | |
0.000%, 11/15/42 IO | | | 50,000 | | | | 22 | |
| | | | | | | | |
Total | | | | | | | 141,472 | |
| | | | | | | | |
| |
Total Governments (Cost: $160,144) | | | | 141,472 | |
| | | | | | | | |
| | |
| Structured Products (19.0%) | | | | | | |
Asset Backed Securities (0.3%) | | | | | | | | |
ECMC Group Student Loan Trust, Series 2018-1A, Class A
| | | | | | | | |
6.202%, (US 30 Day Average SOFR plus 0.865%), 2/27/68 144A | | | 46,837 | | | | 46 | |
Hertz Vehicle Financing LLC, Series 2022-2A, Class A
2.330%, 6/26/28 144A
| | | 300,000 | | | | 273 | |
Massachusetts Educational Financing Authority, Series 2008-1, Class A1
| | | | | | | | |
6.590%, (US 90 Day Average SOFR plus 1.212%), 4/25/38 | | | 16,556 | | | | 16 | |
| | | | | | | | |
Total | | | | | | | 335 | |
| | | | | | | | |
| | |
Mortgage Securities (18.7%) | | | | | | | | |
Benchmark Mortgage Trust, Series 2019-B9, Class A5
4.015%, 3/15/52 | | | 600,000 | | | | 560 | |
BWAY Mortgage Trust, Series 2013-1515, Class A2
3.454%, 3/10/33 144A | | | 300,000 | | | | 282 | |
COMM Mortgage Trust, Series 2018-HOME, Class A
3.815%, (CSTR, AFC), 4/10/33 144A | | | 200,000 | | | | 184 | |
Credit Suisse First Boston Mortgage Securities Corp., Series 2003-AR18, Class 2A3
4.858%, (CSTR), 7/25/33 | | | 149 | | | | –π | |
Extended Stay America Trust, Series 2021- ESH, Class A
| | | | | | | | |
6.556%, (US SOFR 1 Month plus 1.195%), 7/15/38 144A | | | 373,376 | | | | 370 | |
Federal Home Loan Mortgage Corp., Series 2752, Class EZ
5.500%, 2/15/34 | | | 96,338 | | | | 97 | |
Federal Home Loan Mortgage Corp., Series 3759, Class FB
| | | | | | | | |
5.953%, (US 30 Day Average SOFR plus 0.615%), 11/15/40 | | | 17,535 | | | | 17 | |
Federal Home Loan Mortgage Corp., Series 4092, Class AY
3.000%, 8/15/32 | | | 2,200,000 | | | | 2,064 | |
Federal Home Loan Mortgage Corp., Series 4387, Class AZ
4.000%, 9/15/44 | | | 2,170,900 | | | | 2,056 | |
Federal Home Loan Mortgage Corp., Series 4398, Class ZX
4.000%, 9/15/54 | | | 865,222 | | | | 782 | |
The Accompanying Notes are an Integral Part of the Financial Statements.
143
Long-Term U.S. Government Bond Portfolio
| | | | | | | | |
| Structured Products (19.0%) | | Shares/ Par + | | Value $ (000’s) | |
Mortgage Securities continued | | | | | | | | |
Federal Home Loan Mortgage Corp., Series 4830, Class ZG
3.000%, 4/15/53 | | | 621,775 | | | | 507 | |
Federal Home Loan Mortgage Corp., Series T-61, Class 1A1 | | | | | | | | |
6.412%, (Federal Reserve US 12 Month
Cumulative Avg 1 year CMT plus 1.400%), 7/25/44 | | | 3,894 | | | | 4 | |
Federal National Mortgage Association
3.600%, 2/1/40 | | | 539,929 | | | | 506 | |
5.000%, 6/1/35 | | | 19,322 | | | | 20 | |
5.000%, 2/1/36 | | | 29,762 | | | | 30 | |
5.500%, 5/1/49 | | | 24,705 | | | | 25 | |
Federal National Mortgage Association, Series 2007-39, Class NZ
4.250%, 5/25/37 | | | 40,991 | | | | 40 | |
Federal National Mortgage Association, Series 2012-101, Class FC | | | | | | | | |
5.952%, (US 30 Day Average SOFR plus 0.615%), 9/25/42 | | | 24,371 | | | | 24 | |
Federal National Mortgage Association, Series 2016-61, Class ML
3.000%, 9/25/46 | | | 900,000 | | | | 746 | |
Freddie Mac Military Housing Bonds Resecuritization Trust, Series 2015-R1, Class A2
4.312%, (CSTR), 10/25/52 144A | | | 555,396 | | | | 535 | |
Government National Mortgage Association TBA
4.000%, 2/20/54 | | | 800,000 | | | | 764 | |
Government National Mortgage Association, Series 2010-26, Class OW
0.000%, 2/20/40 PO | | | 267,725 | | | | 208 | |
Government National Mortgage Association, Series 2010-75, Class OA
0.000%, 9/20/35 PO | | | 170,454 | | | | 134 | |
GS Mortgage Securities Trust, Series 2015- 590M, Class B
3.805%, (CSTR), 10/10/35 144A | | | 300,000 | | | | 271 | |
| | | | | | | | |
| Structured Products (19.0%) | | Shares/ Par + | | Value $ (000’s) | |
Mortgage Securities continued | | | | | | | | |
Hilton USA Trust, Series 2016-HHV, Class A
3.719%, 11/5/38 144A | | | 600,000 | | | | 569 | |
Merrill Lynch Mortgage Investors Trust, Series 2003-A4, Class 3A
4.970%, (CSTR, AFC), 5/25/33 | | | 547 | | | | –π | |
Morgan Stanley Capital I Trust, Series 2021- 230P, Class A
6.645%, (US SOFR 1 Month plus
1.284%), 12/15/38 144A | | | 200,000 | | | | 186 | |
New Residential Mortgage Loan Trust, Series 2020-RPL1, Class A1
2.750%, (AFC), 11/25/59 144A | | | 88,646 | | | | 83 | |
Ready Capital Mortgage Financing LLC, Series 2022-FL8, Class A | | | | | | | | |
6.987%, (US 30 Day Average SOFR plus
1.650%), 1/25/37 144A | | | 168,235 | | | | 168 | |
Structured Asset Mortgage Investments, Inc., Series 2004-AR5, Class 1A1
6.130%, (US SOFR 1 Month plus 0.775%),
(AFC), 10/19/34 | | | 1,459 | | | | 1 | |
Towd Point Mortgage Trust, Series 2020-1, Class A2A
3.100%, (AFC), 1/25/60 144A | | | 200,000 | | | | 173 | |
Uniform Mortgage Backed Security TBA
3.000%, 3/13/54 | | | 300,000 | | | | 266 | |
4.500%, 2/12/50 | | | 4,000,000 | | | | 3,880 | |
5.500%, 1/14/49 | | | 1,000,000 | | | | 1,004 | |
5.500%, 2/13/54 | | | 1,700,000 | | | | 1,708 | |
6.000%, 1/16/54 | | | 3,100,000 | | | | 3,147 | |
6.500%, 1/16/54 | | | 1,200,000 | | | | 1,230 | |
Worldwide Plaza Trust, Series 2017-WWP, Class A
3.526%, 11/10/36 144A | | | 100,000 | | | | 76 | |
| | | | | | | | |
| | |
Total | | | | | | | 22,717 | |
| | | | | | | | |
| |
Total Structured Products (Cost: $24,084) | | | | 23,052 | |
| | | | | | | | |
| |
Total Investments (136.2%) (Cost: $184,589)@ | | | | 164,862 | |
| | | | | | | | |
| |
Other Assets, Less Liabilities (-36.2%) | | | | (43,813 | ) |
| | | | | | | | |
| |
Net Assets (100.0%) | | | | 121,049 | |
| | | | | | | | |
Exchange Traded or Centrally Cleared Derivatives
Futures
| | | | | | | | | | | | | | | | | | | | | | | | | | | | | | | | |
| Issuer | | Long/ Short | | | Currency | | | Notional Par (000’s) | | | Number of Contracts | | | Expiration Date | | | Notional Value
(000’s) | | | Unrealized Appreciation/ (Depreciation) (000’s) | | | Variation Margin
(000’s) | |
| |
Five-Year US Treasury Note Future | | | Short | | | | USD | | | | 17,900 | | | | 179 | | | | 3/24 | | | $ | 19,470 | | | $ | (478 | ) | | $ | (15) | |
Ten-Year US Treasury Note Future | | | Long | | | | USD | | | | 3,700 | | | | 37 | | | | 3/24 | | | | 4,177 | | | | 136 | | | | – | |
Two-Year US Treasury Note Future | | | Short | | | | USD | | | | 1,600 | | | | 8 | | | | 3/24 | | | | 1,647 | | | | (17 | ) | | | (1) | |
Ultra Long Term US Treasury Bond Future | | | Long | | | | USD | | | | 2,100 | | | | 21 | | | | 3/24 | | | | 2,806 | | | | 15 | | | | (11) | |
Ultra Ten-Year US Treasury Note Future | | | Short | | | | USD | | | | 22,900 | | | | 229 | | | | 3/24 | | | | 27,026 | | | | (1,238 | ) | | | 21 | |
US Treasury Long Bond Future | | | Short | | | | USD | | | | 5,700 | | | | 57 | | | | 3/24 | | | | 7,121 | | | | (527 | ) | | | 11 | |
| | | | | | | | | | | | | | | | | | | | | | | | | | | | |
| | | | | | | | | | | | | | | | | | | | | | | | | | $ | (2,109 | ) | | $ | 5 | |
| | | | | | | | | | | | | | | | | | | | | | | | | | | | |
The Accompanying Notes are an Integral Part of the Financial Statements.
144
Long-Term U.S. Government Bond Portfolio
Centrally Cleared Interest Rate Swaps - Receive Floating Rate
| | | | | | | | | | | | | | | | | | | | | | | | | | | | | | | | |
| Floating Rate Index | | Fixed Rate | | | Expiration Date | | | Notional Amount (000’s) | | | Currency | | | Upfront Premium Paid/ (Received)
(000’s) | | Unrealized Appreciation/ (Depreciation) (000’s) | | | Market Value (000’s) | | | Variation Margin(000’s) |
1-Day USD-SOFR
Compounded-OIS | | | 1.750% | | | | 10/53 | | | | 500 | | | | USD | | | $ | (7 | ) | | $ | 151 | | | $ | 144 | | | $ | 1 | |
1-Day USD-SOFR
Compounded-OIS | | | 0.750% | | | | 3/31 | | | | 1,000 | | | | USD | | | | 15 | | | | 175 | | | | 190 | | | | –π | |
1-Day USD-SOFR
Compounded-OIS | | | 1.250% | | | | 6/41 | | | | 3,110 | | | | USD | | | | 97 | | | | 923 | | | | 1,020 | | | | 5 | |
| | | | | | | | | | | | | | | | | | | | | | | | | | | | | | | | |
| | | | | | | | | | | | | | | | | | | | |
| | | | | | | | | | | | | | | | | | $ | 105 | | | $ | 1,249 | | | $ | 1,354 | | | $ | 6 | |
| | | | | | | | | | | | | | | | | | | | |
Centrally Cleared Interest Rate Swaps - Pay Floating Rate
| | | | | | | | | | | | | | | | | | | | | | | | | | | | | | | | |
| Floating Rate Index | | Fixed Rate | | | Expiration Date | | | Notional Amount (000’s) | | | Currency | | | Upfront Premium Paid/ (Received)
(000’s) | | Unrealized Appreciation/ (Depreciation) (000’s) | | | Market Value (000’s) | | | Variation Margin(000’s) |
1-Day USD-SOFR
Compounded-OIS | | | 1.600% | | | | 10/28 | | | | 9,000 | | | | USD | | | $ | 13 | | | $ | (777 | ) | | $ | (764 | ) | | $ | 4 | |
1-Day USD-SOFR
Compounded-OIS | | | 1.000% | | | | 12/25 | | | | 3,170 | | | | USD | | | | 30 | | | | (230 | ) | | | (200 | ) | | | 2 | |
| | | | | | | | | | | | | | | | | | | | |
| | | | | | | | | | | | | | | | | | $ | 43 | | | $ | (1,007 | ) | | $ | (964 | ) | | $ | 6 | |
| | | | | | | | | | | | | | | | | | | | |
| | | | | | | | | | | | | | | | | | | | | | | | | | | | |
| | | Financial Derivative Assets | | | Financial Derivative Liabilities | |
| | | Variation Margin (000’s) | | | Variation Margin (000’s) | | | Market Value (000’s) | |
| | | Swaps | | | Futures | | | Total | | | Swaps | | | Futures | | | Total | | | Options | |
Total Exchange-Traded or Centrally Cleared Derivatives | | $ | 12 | | | $ | 32 | | | $ | 44 | | | $ | – | | | $ | (27) | | | $ | (27) | | | $ | – | |
Over the Counter Derivatives
Written Options
| | | | | | | | | | | | | | | | | | | | | | | | | | | | |
| Description | | Counterparty | | | Currency | | | Notional Par
(000’s) | | | Exercise
Price | | | Expiration
Date | | | Number of
Contracts | | | Value (000’s) | |
Call - OTC Uniform Mortgage | | | J.P. Morgan Securities LLC | | | | USD | | | | 1,300 | | | $ | 101.227 | | | | 2/24 | | | | 1,300,000 | | | $ | (9 | ) |
Backed Security TBA | | | | | | | | | | | | | | | | | | | | | | | | | | | | |
Put - OTC Uniform Mortgage | | | J.P. Morgan Securities LLC | | | | USD | | | | 1,300 | | | | 99.227 | | | | 2/24 | | | | 1,300,000 | | | | (1 | ) |
Backed Security TBA | | | | | | | | | | | | | | | | | | | | | | | | | | | | |
| | | | | | | | | | | | | | | | | | | | | | | | | | | | |
(Premiums Received $12) | | | | | | | | | | | | | | | | | | | | | | | | | | $ | (10 | ) |
| | | | | | | | | | | | | | | | | | | | | | | | | | | | |
| | | | | | | | | | | | | | | | | | | | | | | | | | | | |
| | | Financial Derivative Assets (000’s) | | | Financial Derivative Liabilities (000’s) | |
| | | Forward Foreign Currency | | | | | | | | | Forward Foreign Currency | | | | | | | | | | |
| | | Contracts | | | Swaps | | | Total | | | Contracts | | | Options | | | Swaps | | | Total | |
Total Over the Counter Derivatives | | | — | | | | — | | | | — | | | | — | | | $ | (10) | | | | — | | | $ | (10) | |
| + | All par is stated in U.S. Dollar unless otherwise noted. |
| b | Part or all of the security has been pledged as collateral. |
| 144A | Security exempt from registration under Rule 144A of the Securities Act of 1933. These securities may be resold as transactions exempt from registration, normally to qualified institutional buyers. At December 31, 2023 the value of these securities (in thousands) was $3,216 representing 2.6% of the net assets. |
| π | Amount is less than one thousand. |
| @ | At December 31, 2023, the aggregate cost of investments, including derivatives, for federal tax purposes (in thousands) was $212,077 and the net unrealized depreciation of investments based on that cost was $48,944 which is comprised of $5,048 aggregate gross unrealized appreciation and $53,992 aggregate gross unrealized depreciation. |
The Accompanying Notes are an Integral Part of the Financial Statements.
145
Long-Term U.S. Government Bond Portfolio
The following is a summary of the inputs used in valuing the Portfolio’s Investments at December 31, 2023. See Note 3 for additional information on portfolio valuation.
| | | | | | | | | | | | | | |
| | | | | Valuation Inputs | |
| Description | | | | Level 1 - Quoted Prices | | | Level 2 - Other Significant Observable Inputs | | | Level 3 - Significant Unobservable Inputs | |
| | | | | (Amounts in thousands) | |
Assets: | | | | | | | | | | | | | | |
Corporate Bonds | | | | $ | — | | | $ | 338 | | | $ | — | |
Governments | | | | | — | | | | 141,472 | | | | — | |
Structured Products | | | | | — | | | | 23,052 | | | | — | |
Other Financial Instruments^ | | | | | | | | | | | | | | |
Futures | | | | | 151 | | | | — | | | | — | |
Interest Rate Swaps | | | | | — | | | | 1,354 | | | | — | |
| | | | | | |
Total Assets: | | | | $ | 151 | | | $ | 166,216 | | | $ | — | |
| | | | | | |
Liabilities: | | | | | | | | | | | | | | |
Other Financial Instruments^ | | | | | | | | | | | | | | |
Futures | | | | | (2,260) | | | | — | | | | — | |
Written Options | | | | | — | | | | (10) | | | | — | |
Interest Rate Swaps | | | | | — | | | | (964) | | | | — | |
| | | | | | |
Total Liabilities: | | | | $ | (2,260) | | | $ | (974) | | | $ | — | |
| | | | | | |
^ Other financial instruments are derivative instruments such as futures and forward foreign currency contracts, which are valued at the unrealized appreciation (depreciation) on the instrument, and securities sold short, reverse repurchase agreements, written options and swaps contracts, which are valued at market value.
The Accompanying Notes are an Integral Part of the Financial Statements.
146
Inflation Protection Portfolio (unaudited)
| | | | |
| | |
| Objective: | | Portfolio Strategy: | | Net Assets: |
| Total return using a strategy that seeks to protect against U.S. inflation. | | Invest substantially all assets in investment grade debt securities, with a majority in inflation-indexed debt securities. | | $417 million |
PORTFOLIO OVERVIEW
Mason Street Advisors, LLC (“Mason Street Advisors”), the investment adviser for the Inflation Protection Portfolio (the “Portfolio”), has engaged American Century Investment Management, Inc. (“American Century”) to act as sub-adviser for the Portfolio. The Portfolio invests substantially all of its assets in investment grade debt securities. To help protect against U.S. inflation, under normal conditions, the Portfolio will invest over 50% of its net assets in inflation-indexed debt securities. These securities include inflation-indexed U.S. Treasury Securities (“TIPS”), inflation-indexed securities issued by U.S. government agencies and instrumentalities other than the U.S. Treasury, and inflation-indexed securities issued by domestic and foreign corporations and governments and may include those located in emerging markets. The Portfolio also may invest in fixed income securities that are not inflation-indexed. Such investments may include other investment grade debt securities, including collateralized mortgage obligations, mortgage-backed securities, and asset-backed securities, including collateralized loan obligations, whether issued by the U.S. government, its agencies or instrumentalities, corporations or other non-governmental issuers, or foreign governments. Due to Internal Revenue Code (“IRC”) provisions and regulations governing insurance product funds, no more than 55% of the Portfolio’s assets may be invested in securities issued by the same entity.
MARKET OVERVIEW
Fixed income investors navigated another volatile market in 2023. But unlike 2022, broad indices ended the twelve-month period with solid gains, largely due to early and late-year rallies.
Bonds broadly advanced early in 2023, when high-profile bank failures sparked a flight to quality. However, sentiment quickly shifted, and U.S. Treasury yields reversed course and generally surged through October, when they reached multi-year highs. Amid moderating inflation and expectations for a Fed policy pivot, yields reversed course again and dropped sharply by year-end. Similarly, market-based inflation expectations declined.
The U.S. Federal Reserve’s (the “Fed”) tightening campaign helped fuel a steady slowdown in consumer prices during the year. The Fed increased interest rates at its first three policy meetings of the year before pausing in June. Policymakers lifted rates again in July, to a range of 5.25% to 5.5%, where they remained through year-end. By December, the Fed adopted a more dovish tone and penciled in three rate cuts for 2024.
The late-year rally helped restore twelve-month gains for the broad U.S. bond market and all its sectors. With inflation expectations easing, TIPS underperformed nominal U.S. Treasurys, corporate securities and MBS.
PORTFOLIO RESULTS
The Portfolio returned 3.90% for the twelve months ended December 31, 2023. By comparison, the Portfolio’s benchmark, the Bloomberg® U.S. TIPS Index (the “Index”), returned 3.90%. (The Index is unmanaged, cannot be invested in directly and does not incur expenses.)
The Portfolio was fully invested in TIPS as allowed by IRC portfolio diversification regulations for insurance products (a maximum of 55%). The remainder of the Portfolio was invested mainly in securitized and investment grade corporate securities, which generally contributed to the Portfolio’s performance versus the all-TIPS Index.
To maximize inflation exposure while adhering to the IRC’s TIPS limit, the portfolio managers used inflation swaps to create an inflation overlay for the corporate and securitized securities. This strategy combined with the portfolio managers’ preference for the short end of the inflation curve contributed to the Portfolio’s relative performance for the year.
Meanwhile, the Portfolio maintained a slightly longer-than-Index duration position throughout the year. With real yields rising overall for the year and nominal yields rising through much of the period, this strategy modestly weighed on the Portfolio’s performance.
147
Inflation Protection Portfolio (unaudited)
PORTFOLIO MANAGER OUTLOOK
The following forward-looking comments are the opinion of American Century, the Portfolio’s sub-adviser.
We believe structural forces from the labor and housing markets will keep the annual inflation rate higher than pre-pandemic levels. We expect the year-over-year Consumer Price Index to settle in a range of approximately 2.5% to 3%. However, if the Fed cuts rates too soon or too fast, inflation could head higher.
Given the magnitude of Fed tightening and the cumulative effects of inflation, we continue to expect the economy to slow down in 2024. However, a recession seems less likely due to the U.S. economy’s surprising resilience. Accordingly, we’ve reduced our duration overweight and still prefer higher quality securitized and corporate securities.
Relative Performance
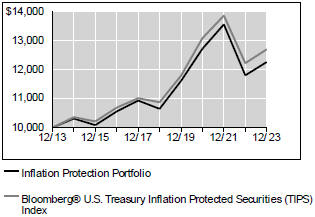
| | | | | | |
Average Annual Total Returns For Periods Ended December 31, 2023 |
| | | 1 Year | | 5 Years | | 10 Years |
Inflation Protection Portfolio | | 3.90% | | 2.86% | | 2.06% |
Bloomberg® U.S. Treasury Inflation Protected Securities (TIPS) Index | | 3.90% | | 3.15% | | 2.42% |
The performance data quoted represents past performance. Past performance is historical and does not guarantee future performance. Investment return and principal value will fluctuate, so that shares, when redeemed, may be worth more or less than their original cost. Current performance may be lower or higher than the performance data quoted. For the most recent month-end performance information visit www.northwesternmutual.com.
This chart assumes an initial investment of $10,000 made on 12/31/13. Returns shown reflect fee waivers, deductions for management and other portfolio expenses, and reinvestment of all dividends. In the absence of fee waivers, total return would be reduced. Returns exclude deductions for separate account sale loads and account fees. Please refer to the Benchmark Definitions section of this report for information about the indices cited in the above chart and graph.
Top 10 Holdings 12/31/23
| | | | | | | | |
| | | | |
| | | Security Description | | % of Net Assets | | | | |
| | | | |
| | | US Treasury Inflation Index Bond, Various | | 53.9% | | | | |
| | | | |
| | | Federal National Mortgage Association, Various | | 8.6% | | | | |
| | | | |
| | | Federal Home Loan Mortgage Corp., Various | | 5.9% | | | | |
| | | | |
| | | Canadian Government Real Return Bond, 3.5%, 3/1/28 | | 4.9% | | | | |
| | | | |
| | | Caterpillar Financial Services Corp., Various | | 3.3% | | | | |
| | | | |
| | | Chariot Funding LLC, 0.00%, 1/3/24 | | 2.0% | | | | |
| | | | |
| | | Tennessee Valley Authority, Various | | 1.6% | | | | |
| | | | |
| | | Thunder Bay Funding LLC, 0.00%, 1/5/24 | | 1.4% | | | | |
| | | | |
| | | Bank of America Corp., Various | | 0.6% | | | | |
| | | | |
| | | JPMorgan Chase & Co., Various | | 0.6% | | | | |
Sector Allocation 12/31/23
| | | | | | | | |
| | | | |
| | | Sector | | % of Net Assets | | | | |
| | | | |
| | | Governments | | 68.7% | | | | |
| | | | |
| | | Structured Products | | 17.5% | | | | |
| | | | |
| | | Short-Term Investments & Other Net Assets | | 7.8% | | | | |
| | | | |
| | | Corporate Bonds | | 5.6% | | | | |
| | | | |
| | | Municipal Bonds | | 0.4% | | | | |
Sector Allocation and Top 10 Holdings are subject to change.
Consistent with the Portfolio’s stated parameters, no more than 20% of the Portfolio is invested in foreign securities.
148
Inflation Protection Portfolio
SCHEDULE OF INVESTMENTS
December 31, 2023
| | | | | | | | |
| Corporate Bonds (5.6%) | | Shares/ Par + | | | Value $ (000’s) | |
Consumer, Cyclical (0.9%) | |
Honda Motor Co., Ltd.
2.271%, 3/10/25 | | | 1,550,000 | | | | 1,502 | |
Toyota Motor Credit Corp.
2.500%, 3/22/24 | | | 2,218,000 | | | | 2,204 | |
| | | | | | | | |
Total | | | | | | | 3,706 | |
| | | | | | | | |
| | |
Consumer, Non-cyclical (1.2%) | | | | | | | | |
AbbVie, Inc.
2.950%, 11/21/26 | | | 800,000 | | | | 767 | |
Roche Holdings, Inc.
2.314%, 3/10/27 144A | | | 1,270,000 | | | | 1,195 | |
Stryker Corp.
4.850%, 12/8/28 | | | 800,000 | | | | 809 | |
Thermo Fisher Scientific, Inc.
1.215%, 10/18/24 | | | 2,570,000 | | | | 2,488 | |
| | | | | | | | |
Total | | | | | | | 5,259 | |
| | | | | | | | |
| | |
Energy (0.6%) | | | | | | | | |
Exxon Mobil Corp.
2.709%, 3/6/25 | | | 2,560,000 | | | | 2,500 | |
| | | | | | | | |
Total | | | | | | | 2,500 | |
| | | | | | | | |
| | |
Financial (2.3%) | | | | | | | | |
Bank of America Corp. | | | | | | | | |
2.884%, (US SOFR 3 Month plus 1.452%), 10/22/30 α | | | 512,000 | | | | 454 | |
3.458%, (US SOFR 3 Month plus 1.232%), 3/15/25 α | | | 2,210,000 | | | | 2,199 | |
Bank of Montreal
5.266%, 12/11/26 | | | 261,000 | | | | 265 | |
BOC Aviation USA Corp.
1.625%, 4/29/24 144A | | | 696,000 | | | | 687 | |
Citigroup, Inc. | | | | | | | | |
3.520%, (US SOFR 3 Month plus 1.413%), 10/27/28 α | | | 100,000 | | | | 95 | |
3.980%, (US SOFR 3 Month plus 1.600%), 3/20/30 α | | | 152,000 | | | | 144 | |
The Goldman Sachs Group, Inc.
1.757%, (US SOFR plus 0.730%), 1/24/25 α | | | 441,000 | | | | 439 | |
JPMorgan Chase & Co. | | | | | | | | |
2.522%, (US SOFR plus 2.040%), 4/22/31 α | | | 358,000 | | | | 309 | |
4.005%, (US SOFR 3 Month plus
1.382%), 4/23/29 α | | | 360,000 | | | | 346 | |
5.299%, (US SOFR plus 1.450%), 7/24/29 α | | | 760,000 | | | | 771 | |
5.546%, (US SOFR plus
1.070%), 12/15/25 α | | | 918,000 | | | | 919 | |
6.087%, (US SOFR plus
1.570%), 10/23/29 α | | | 285,000 | | | | 300 | |
JPMorgan Chase Bank NA
5.110%, 12/8/26 | | | 563,000 | | | | 568 | |
The Toronto-Dominion Bank
5.264%, 12/11/26 | | | 217,000 | | | | 221 | |
Wells Fargo & Co. | | | | | | | | |
4.897%, (US SOFR plus 2.100%), 7/25/33 α | | | 325,000 | | | | 317 | |
5.389%, (US SOFR plus 2.020%), 4/24/34 α | | | 215,000 | | | | 216 | |
| | | | | | | | |
| Corporate Bonds (5.6%) | | Shares/ Par + | | | Value $ (000’s) | |
Financial continued | |
5.574%, (US SOFR plus 1.740%), 7/25/29 α | | | 280,000 | | | | 286 | |
Wells Fargo Bank NA
5.254%, 12/11/26 | | | 1,050,000 | | | | 1,063 | |
| | | | | | | | |
Total | | | | | | | 9,599 | |
| | | | | | | | |
| | |
Industrial (0.5%) | | | | | | | | |
Caterpillar Financial Services Corp.
3.650%, 8/12/25 | | | 1,970,000 | | | | 1,938 | |
| | | | | | | | |
Total | | | | | | | 1,938 | |
| | | | | | | | |
| | |
Utilities (0.1%) | | | | | | | | |
Sempra Energy
3.300%, 4/1/25 | | | 507,000 | | | | 495 | |
| | | | | | | | |
Total | | | | | | | 495 | |
| | | | | | | | |
| |
Total Corporate Bonds (Cost: $23,727) | | | | 23,497 | |
| | | | | | | | |
| | |
| Governments (68.7%) | | | | | | |
Governments (68.7%) | |
Canadian Government Real Return Bond
3.500%, 3/1/28 CAD ∞ | | | 27,000,000 | | | | 20,588 | |
Federal Home Loan Banks
5.500%, 7/15/36 | | | 1,000,000 | | | | 1,130 | |
Federal Home Loan Mortgage Corp.
6.250%, 7/15/32 | | | 14,850,000 | | | | 17,217 | |
Federal National Mortgage Association
6.625%, 11/15/30 | | | 13,650,000 | | | | 15,711 | |
Tennessee Valley Authority | | | | | | | | |
1.500%, 9/15/31 | | | 1,500,000 | | | | 1,242 | |
3.875%, 3/15/28 | | | 1,750,000 | | | | 1,742 | |
5.880%, 4/1/36 | | | 3,250,000 | | | | 3,711 | |
US Treasury Inflation Index Bond | | | | | | | | |
0.125%, 1/15/30 b | | | 18,834,795 | | | | 17,069 | |
0.125%, 7/15/30 | | | 11,220,196 | | | | 10,135 | |
0.125%, 1/15/31 | | | 14,277,714 | | | | 12,742 | |
0.125%, 7/15/31 | | | 6,313,725 | | | | 5,612 | |
0.125%, 1/15/32 | | | 12,653,202 | | | | 11,111 | |
0.125%, 2/15/51 | | | 8,863,275 | | | | 5,480 | |
0.125%, 4/15/26 | | | 4,575,519 | | | | 4,355 | |
0.125%, 7/15/26 | | | 5,840,289 | | | | 5,565 | |
0.125%, 10/15/26 b | | | 3,580,521 | | | | 3,400 | |
0.250%, 2/15/50 | | | 6,606,005 | | | | 4,302 | |
0.375%, 1/15/27 | | | 13,246,480 | | | | 12,587 | |
0.375%, 7/15/27 | | | 10,376,603 | | | | 9,859 | |
0.500%, 1/15/28 | | | 9,355,050 | | | | 8,852 | |
0.625%, 7/15/32 | | | 9,689,393 | | | | 8,851 | |
0.625%, 2/15/43 | | | 8,899,230 | | | | 6,947 | |
0.625%, 1/15/26 | | | 5,684,479 | | | | 5,484 | |
0.750%, 2/15/42 | | | 10,613,906 | | | | 8,598 | |
0.750%, 2/15/45 | | | 17,795,620 | | | | 13,903 | |
0.750%, 7/15/28 | | | 1,838,580 | | | | 1,759 | |
0.875%, 2/15/47 | | | 5,735,610 | | | | 4,516 | |
0.875%, 1/15/29 | | | 10,966,500 | | | | 10,494 | |
1.000%, 2/15/46 | | | 3,830,605 | | | | 3,131 | |
The Accompanying Notes are an Integral Part of the Financial Statements.
149
Inflation Protection Portfolio
| | | | | | | | |
| Governments (68.7%) | | Shares/ Par + | | | Value $ (000’s) | |
Governments continued | |
1.000%, 2/15/48 | | | 1,434,844 | | | | 1,157 | |
1.000%, 2/15/49 | | | 2,994,392 | | | | 2,408 | |
1.125%, 1/15/33 | | | 5,164,500 | | | | 4,885 | |
1.250%, 4/15/28 | | | 8,718,960 | | | | 8,491 | |
1.375%, 7/15/33 | | | 8,945,320 | | | | 8,672 | |
1.375%, 2/15/44 | | | 10,138,829 | | | | 9,056 | |
1.750%, 1/15/28 | | | 506,681 | | | | 504 | |
2.125%, 2/15/41 | | | 3,612,178 | | | | 3,708 | |
2.375%, 1/15/27 | | | 877,266 | | | | 885 | |
2.500%, 1/15/29 | | | 3,317,511 | | | | 3,429 | |
3.625%, 4/15/28 | | | 2,853,420 | | | | 3,057 | |
3.875%, 4/15/29 | | | 3,743,160 | | | | 4,126 | |
| | | | | | | | |
Total | | | | | | | 286,471 | |
| | | | | | | | |
| |
Total Governments (Cost: $324,392) | | | | 286,471 | |
| | | | | | | | |
| | |
| Municipal Bonds (0.4%) | | | | | | |
Municipal Bonds (0.4%) | |
Golden State Tobacco Securitization Corp.
2.746%, 6/1/34 RB | | | 740,000 | | | | 623 | |
University of California
1.316%, 5/15/27 RB | | | 1,105,000 | | | | 1,000 | |
| | | | | | | | |
Total Municipal Bonds (Cost: $1,752) | | | | 1,623 | |
| | | | | | | | |
| | |
| Structured Products (17.5%) | | | | | | |
Asset Backed Securities (5.6%) | |
Aligned Data Centers Issuer LLC, Series
2021-1A, Class B
2.482%, 8/15/46 144A | | | 2,350,000 | | | | 2,054 | |
Bean Creek CLO, Ltd., Series 2018-1A,
Class AR | | | | | | | | |
6.697%, (US SOFR 3 Month plus 1.282%), 4/20/31 144A | | | 1,209,434 | | | | 1,208 | |
Blackbird Capital Aircraft, Series 2021-1A, Class A
2.443%, 7/15/46 144A | | | 765,915 | | | | 661 | |
BRE Grand Islander Timeshare Issuer, Series 2017-1A, Class A
2.940%, 5/25/29 144A | | | 69,013 | | | | 67 | |
Cologix Canadian Issuer LP, Series 2022- 1CAN, Class A2
4.940%, 1/25/52 144A CAD ∞ | | | 1,950,000 | | | | 1,371 | |
Dryden Senior Loan Fund, Series 2016-43A, Class B2R2
3.093%, 4/20/34 144A | | | 2,000,000 | | | | 1,764 | |
FirstKey Homes Trust, Series 2020-SFR2,
Class D
1.968%, 10/19/37 144A | | | 1,000,000 | | | | 927 | |
Goldentree Loan Opportunities X, Ltd., Series 2015-10A, Class AR | | | | | | | | |
6.797%, (US SOFR 3 Month plus 1.382%), 7/20/31 144A | | | 1,125,000 | | | | 1,125 | |
Goodgreen Trust, Series 2020-1A, Class A
2.630%, 4/15/55 144A | | | 554,720 | | | | 437 | |
Goodgreen Trust, Series 2021-1A, Class A
2.660%, 10/20/56 144A | | | 383,552 | | | | 303 | |
| | | | | | | | |
| Structured Products (17.5%) | | Shares/ Par + | | | Value $ (000’s) | |
Asset Backed Securities continued | |
Greenwood Park CLO, Ltd., Series 2018-1A, Class A1 | | | | | | | | |
6.685%, (US SOFR 3 Month plus 1.292%), 4/15/31 144A | | | 492,779 | | | | 492 | |
Hilton Grand Vacations Trust, Series 2019-AA, Class B
2.540%, 7/25/33 144A | | | 442,536 | | | | 419 | |
J.G. Wentworth XLI LLC, Series 2018-1A,
Class B
4.700%, 10/15/74 144A | | | 363,259 | | | | 301 | |
KKR Financial CLO, Ltd., Series 2018-22A, Class A | | | | | | | | |
6.827%, (US SOFR 3 Month plus 1.412%), 7/20/31 144A | | | 1,474,058 | | | | 1,473 | |
KKR Financial CLO, Ltd., Series 2022-1A,
Class B | | | | | | | | |
8.016%, (US SOFR 3 Month plus 2.600%), 7/20/31 144A | | | 1,400,000 | | | | 1,400 | |
KKR Financial CLO, Ltd., Series 2022-1A,
Class BR | | | | | | | | |
1.000%, (US SOFR 3 Month plus 2.000%), 7/20/31 144A | | | 1,425,000 | | | | 1,425 | |
Magnetite CLO, Ltd., Series 2021-29A, Class B | | | | | | | | |
7.055%, (US SOFR 3 Month plus 1.662%), 1/15/34 144A | | | 1,650,000 | | | | 1,633 | |
Palmer Square CLO, Ltd., Series 2018-1A,
Class A1R2 | | | | | | | | |
6.794%, (US SOFR 3 Month plus 1.392%), 1/17/31 144A | | | 1,135,615 | | | | 1,136 | |
Rockford Tower CLO, Ltd., Series 2020-1A,
Class B | | | | | | | | |
7.477%, (US SOFR 3 Month plus 2.062%), 1/20/32 144A | | | 1,350,000 | | | | 1,346 | |
Shelter Growth CRE Issuer, Ltd., Series 2022- FL4, Class A | | | | | | | | |
7.652%, (US SOFR 1 Month plus 2.296%), 6/17/37 144A | | | 1,207,129 | | | | 1,207 | |
Sierra Receivables Funding Co. LLC, Series 2019-3A, Class B
2.750%, 7/15/38 144A | | | 497,434 | | | | 477 | |
Sierra Receivables Funding Co. LLC, Series 2021-A1, Class B
1.340%, 11/20/37 144A | | | 898,155 | | | | 847 | |
Wellfleet CLO, Ltd., Series 2022-1A, Class B2
4.775%, 4/15/34 144A | | | 1,250,000 | | | | 1,204 | |
| | | | | | | | |
Total | | | | | | | 23,277 | |
| | | | | | | | |
| | |
Mortgage Securities (11.9%) | | | | | | | | |
Agate Bay Mortgage Trust, Series 2015-7,
Class A3
3.500%, (AFC), 10/25/45 144A | | | 391,675 | | | | 348 | |
Angel Oak Mortgage Trust, Series 2019-6,
Class A3
2.927%, (AFC), 11/25/59 144A | | | 177,864 | | | | 171 | |
Arroyo Mortgage Trust, Series 2021-1R, Class A2
1.483%, (CSTR, AFC), 10/25/48 144A | | | 297,286 | | | | 245 | |
Arroyo Mortgage Trust, Series 2021-1R, Class A3
1.637%, (CSTR, AFC), 10/25/48 144A | | | 228,682 | | | | 188 | |
The Accompanying Notes are an Integral Part of the Financial Statements.
150
Inflation Protection Portfolio
| | | | | | | | |
| Structured Products (17.5%) | | Shares/ Par + | | | Value $ (000’s) | |
Mortgage Securities continued | |
Bellemeade Re, Ltd., Series 2019-3A,
Class M1C | | | | | | | | |
7.420%, (US SOFR 1 Month plus 2.065%), 7/25/29 144A | | | 894,107 | | | | 896 | |
Bellemeade Re, Ltd., Series 2021-3A,
Class M1A | | | | | | | | |
6.337%, (US 30 Day Average SOFR plus 1.000%), 9/25/31 144A | | | 429,675 | | | | 429 | |
BX Commercial Mortgage Trust, Series 2021- VOLT, Class E | | | | | | | | |
7.476%, (US SOFR 1 Month plus 2.115%), 9/15/36 144A | | | 745,455 | | | | 713 | |
BX Commercial Mortgage Trust, Series 2021- VOLT, Class F | | | | | | | | |
7.876%, (US SOFR 1 Month plus 2.515%), 9/15/36 144A | | | 1,400,000 | | | | 1,334 | |
Connecticut Avenue Securities Trust, Series 2022-R03, Class 1M1 | | | | | | | | |
7.437%, (US 30 Day Average SOFR plus 2.100%), 3/25/42 144A | | | 522,311 | | | | 528 | |
Credit Suisse Mortgage Trust, Series 2015- WIN1, Class A10
3.500%, (AFC), 12/25/44 144A | | | 44,635 | | | | 41 | |
Credit Suisse Mortgage Trust, Series 2019- ICE4, Class B | | | | | | | | |
6.639%, (US SOFR 1 Month plus 1.277%), 5/15/36 144A | | | 872,829 | | | | 871 | |
Credit Suisse Mortgage Trust, Series 2019- ICE4, Class D | | | | | | | | |
7.009%, (US SOFR 1 Month plus 1.647%), 5/15/36 144A | | | 2,149,652 | | | | 2,143 | |
Credit Suisse Mortgage Trust, Series 2021- NQM2, Class A3
1.538%, (AFC), 2/25/66 144A | | | 265,411 | | | | 223 | |
Deephaven Residential Mortgage Trust, Series 2020-2, Class A3
2.856%, 5/25/65 144A | | | 1,449,456 | | | | 1,418 | |
Extended Stay America Trust, Series 2021- ESH, Class E | | | | | | | | |
8.326%, (US SOFR 1 Month plus 2.965%), 7/15/38 144A | | | 1,605,517 | | | | 1,575 | |
Federal Home Loan Mortgage Corp.
2.500%, 10/1/51 | | | 2,027,096 | | | | 1,737 | |
3.500%, 8/1/52 | | | 2,006,820 | | | | 1,841 | |
4.500%, 10/1/52 | | | 1,860,510 | | | | 1,804 | |
6.000%, 1/1/53 | | | 2,042,596 | | | | 2,078 | |
Federal National Mortgage Association
2.500%, 1/1/52 | | | 7,933,777 | | | | 6,789 | |
4.000%, 9/1/52 | | | 9,847,600 | | | | 9,320 | |
5.500%, 1/1/53 | | | 3,964,139 | | | | 3,981 | |
Federal National Mortgage Association, Series 2018-C03, Class 1EB2 | | | | | | | | |
8.052%, (US 30 Day Average SOFR plus 2.715%), 5/25/24 | | | 189,542 | | | | 191 | |
Government National Mortgage Association
5.500%, 12/20/52 | | | 1,790,564 | | | | 1,805 | |
JP Morgan Chase Commercial Mortgage
Securities Trust, Series 2018-AON, Class A 4.128%, 7/5/31 144A | | | 2,020,000 | | | | 1,808 | |
| | | | | | | | |
| Structured Products (17.5%) | | Shares/ Par + | | | Value $ (000’s) | |
Mortgage Securities continued | |
JP Morgan Mortgage Trust, Series 2014-5,
Class A1
2.749%, (AFC), 10/25/29 144A | | | 245,510 | | | | 234 | |
JP Morgan Mortgage Trust, Series 2016-1,
Class A7
3.500%, 5/25/46 144A | | | 557,883 | | | | 493 | |
JP Morgan Mortgage Trust, Series 2017-1,
Class A2
3.450%, (AFC), 1/25/47 144A | | | 267,229 | | | | 236 | |
Onslow Bay Financial LLC, Series 2023-
NQM9, Class A2
7.513%, (AFC), 10/25/63 144A Σ | | | 935,093 | | | | 956 | |
Sequoia Mortgage Trust, Series 2017-7,
Class A7
3.500%, (AFC), 10/25/47 144A | | | 995,412 | | | | 877 | |
Starwood Mortgage Residential Trust, Series
2020-2, Class B1E
3.000%, (AFC), 4/25/60 144A | | | 2,503,000 | | | | 2,263 | |
Starwood Mortgage Residential Trust, Series
2021-1, Class A1
1.219%, (AFC), 5/25/65 144A | | | 716,418 | | | | 633 | |
Verus Securitization Trust, Series
2021-1, Class A3
1.155%, (AFC), 1/25/66 144A | | | 631,654 | | | | 542 | |
Verus Securitization Trust, Series 2021-5,
Class A3
1.373%, (AFC), 9/25/66 144A | | | 998,596 | | | | 820 | |
Vista Point Securitization Trust, Series 2020-2, Class A3
2.496%, (AFC), 4/25/65 144A | | | 266,927 | | | | 246 | |
| | | | | | | | |
Total | | | | | | | 49,777 | |
| | | | | | | | |
| |
Total Structured Products (Cost: $76,405) | | | | 73,054 | |
| | | | | | | | |
| | |
Short-Term Investments (6.3%) | | | | | | | | |
Commercial Paper (6.3%) | |
Caterpillar Financial Services Corp.
0.000%, 1/16/24 | | | 12,000,000 | | | | 11,968 | |
Chariot Funding LLC
0.000%, 1/3/24 | | | 8,500,000 | | | | 8,494 | |
Thunder Bay Funding LLC
0.000%, 1/5/24 | | | 5,800,000 | | | | 5,797 | |
| | | | | | | | |
Total | | | | | | | 26,259 | |
| | | | | | | | |
| |
Total Short-Term Investments (Cost: $26,268) | | | | 26,259 | |
| | | | | | | | |
| |
Total Investments (98.5%) (Cost: $452,544)@ | | | | 410,904 | |
| | | | | | | | |
| |
Other Assets, Less Liabilities (1.5%) | | | | 6,385 | |
| | | | | | | | |
| |
Net Assets (100.0%) | | | | 417,289 | |
| | | | | | | | |
The Accompanying Notes are an Integral Part of the Financial Statements.
151
Inflation Protection Portfolio
Exchange Traded or Centrally Cleared Derivatives
Futures
| | | | | | | | | | | | | | | | | | | | | | | | | | |
| Issuer | | Long/ Short | | Currency | | Notional Par (000’s) | | | Number of Contracts | | | Expiration Date | | Notional Value (000’s) | | | Unrealized Appreciation/ (Depreciation) (000’s) | | | Variation Margin (000’s) | |
| |
Five-Year US Treasury Note Future | | Long | | USD | | | 9,600 | | | | 96 | | | 3/24 | | $ | 10,442 | | | $ | 203 | | | $ | 8 | |
Ten-Year US Treasury Note Future | | Long | | USD | | | 10,700 | | | | 107 | | | 3/24 | | | 12,079 | | | | 337 | | | | (79) | |
Two-Year US Treasury Note Future | | Long | | USD | | | 1,600 | | | | 8 | | | 3/24 | | | 1,647 | | | | 16 | | | | 1 | |
Ultra Ten-Year US Treasury Note Future | | Long | | USD | | | 5,300 | | | | 53 | | | 3/24 | | | 6,255 | | | | 260 | | | | (5) | |
| | | | | | | | | | | | | | | | | | | | | | |
| | | | | | | | | | | | | | | | | | | | $ | 816 | | | $ | (75) | |
| | | | | | | | | | | | | | | | | | | | | | |
Total Return Swaps - Receive Floating Rate
| | | | | | | | | | | | | | | | | | | | | | | | | | |
| Floating Rate Index | | Fixed Rate | | Expiration Date | | Notional Amount
(000’s) | | | Currency | | Upfront Premium Paid/ (Received) (000’s) | | Unrealized Appreciation/ (Depreciation) (000’s) | | | Market Value (000’s) | | | Variation Margin(000’s) |
CPURNSA | | 1.777% | | 6/24 | | | 11,000 | | | USD | | $ | – | | | $ | 1,370 | | | $ | 1,370 | | | $ | 3 | |
CPURNSA | | 1.715% | | 6/24 | | | 7,400 | | | USD | | | – | | | | 931 | | | | 931 | | | | – | π |
CPURNSA | | 1.860% | | 7/24 | | | 7,500 | | | USD | | | – | | | | 870 | | | | 870 | | | | 2 | |
CPURNSA | | 1.858% | | 8/24 | | | 12,700 | | | USD | | | – | | | | 1,477 | | | | 1,477 | | | | 3 | |
CPURNSA | | 2.073% | | 8/27 | | | 3,500 | | | USD | | | – | | | | 424 | | | | 424 | | | | – | π |
CPURNSA | | 2.145% | | 11/27 | | | 5,000 | | | USD | | | (1 | ) | | | 556 | | | | 555 | | | | 1 | |
CPURNSA | | 1.800% | | 10/29 | | | 3,700 | | | USD | | | – | | | | 545 | | | | 545 | | | | 1 | |
CPURNSA | | 1.884% | | 11/29 | | | 2,000 | | | USD | | | – | | | | 280 | | | | 280 | | | | – | π |
CPURNSA | | 2.243% | | 1/26 | | | 6,000 | | | USD | | | – | | | | 625 | | | | 625 | | | | (2 | ) |
CPURNSA | | 1.078% | | 6/25 | | | 3,000 | | | USD | | | – | | | | 490 | | | | 490 | | | | 1 | |
CPURNSA | | 2.503% | | 8/26 | | | 7,000 | | | USD | | | – | | | | (36 | ) | | | (36 | ) | | | – | π |
CPURNSA | | 2.415% | | 2/28 | | | 2,500 | | | USD | | | – | | | | 5 | | | | 5 | | | | – | π |
CPURNSA | | 2.565% | | 4/28 | | | 1,500 | | | USD | | | – | | | | (9 | ) | | | (9 | ) | | | 1 | |
CPURNSA | | 2.438% | | 2/30 | | | 9,500 | | | USD | | | 1 | | | | 28 | | | | 29 | | | | – | π |
CPURNSA | | 1.291% | | 5/30 | | | 2,000 | | | USD | | | – | | | | 395 | | | | 395 | | | | 1 | |
CPURNSA | | 1.629% | | 6/30 | | | 2,000 | | | USD | | | – | | | | 356 | | | | 356 | | | | – | π |
CPURNSA | | 2.663% | | 8/30 | | | 1,200 | | | USD | | | 1 | | | | (18 | ) | | | (17 | ) | | | – | π |
CPURNSA | | 2.498% | | 9/31 | | | 7,000 | | | USD | | | – | | | | 434 | | | | 434 | | | | 2 | |
CPURNSA | | 2.619% | | 3/33 | | | 5,500 | | | USD | | | 1 | | | | (52 | ) | | | (51 | ) | | | 1 | |
CPURNSA | | 2.495% | | 5/33 | | | 3,500 | | | USD | | | 1 | | | | (10 | ) | | | (9 | ) | | | 2 | |
CPURNSA | | 2.650% | | 8/33 | | | 8,500 | | | USD | | | 1 | | | | (145 | ) | | | (144 | ) | | | 5 | |
| | | | | | | | | | | | | | |
| | | | | | | | | | | | $ | 4 | | | $ | 8,516 | | | $ | 8,520 | | | $ | 21 | |
| | | | | | | | | | | | | | |
| | | | | | | | | | | | | | | | | | | | | | | | | | | | |
| | | Financial Derivative Assets | | | Financial Derivative Liabilities | |
| | | Variation Margin (000’s) | | | Variation Margin (000’s) | | | Market Value (000’s) | |
| | | Swaps | | | Futures | | | Total | | | Swaps | | | Futures | | | Total | | | Options | |
Total Exchange-Traded or Centrally Cleared Derivatives | | $ | 23 | | | $ | 9 | | | $ | 32 | | | $ | (2) | | | $ | (84) | | | $ | (86) | | | $ | – | |
Over the Counter Derivatives
Forward Foreign Currency Contracts
| | | | | | | | | | | | | | | | | | | | | | | | | | |
| Type | | Counterparty | | Currency | | Foreign Principal
Amount
Covered by
Contract (000s) | | | USD Principal
Amount Covered by
Contract (000’s) | | | Settlement
Date | | Unrealized
Appreciation
(000’s) | | | Unrealized
(Depreciation)
(000’s) | | | Net
Unrealized
Appreciation/
(Depreciation)
(000’s) | |
Sell | | Goldman Sachs International | | CAD | | | 28,470 | | | | 21,507 | | | 3/15/24 | | $ | — | | | $ | (517) | | | $ | (517) | |
| | | | | | | | | | | | | | | | | | |
| | | | | | | | | | | | | | | | $ | — | | | $ | (517) | | | $ | (517) | |
| | | | | | | | | | | | | | | | | | |
The Accompanying Notes are an Integral Part of the Financial Statements.
152
Inflation Protection Portfolio
Total Return Swaps
| | | | | | | | | | | | | | | | | | | | | | |
| Reference Entity | | Counterparty | | Payment made by the Fund | | | Expiration Date | | | Notional Amount (000’s) | | | Unrealized Appreciation/ (Depreciation) (000’s) | | | Market Value (000’s) | |
CPURNSA | | Bank of America NA | | | 2.528% | | | | 8/24 | | | | 2,750 | | | $ | 72 | | | $ | 72 | |
CPURNSA | | Bank of America NA | | | 2.140% | | | | 7/25 | | | | 2,900 | | | | 293 | | | | 293 | |
CPURNSA | | Bank of America NA | | | 1.790% | | | | 8/25 | | | | 1,500 | | | | 202 | | | | 202 | |
CPURNSA | | Bank of America NA | | | 2.240% | | | | 4/27 | | | | 3,500 | | | | 334 | | | | 334 | |
CPURNSA | | Bank of America NA | | | 2.218% | | | | 4/27 | | | | 2,000 | | | | 196 | | | | 196 | |
CPURNSA | | Bank of America NA | | | 2.235% | | | | 4/27 | | | | 2,000 | | | | 193 | | | | 193 | |
CPURNSA | | Bank of America NA | | | 2.235% | | | | 5/27 | | | | 5,000 | | | | 485 | | | | 485 | |
CPURNSA | | Barclays Bank PLC | | | 2.589% | | | | 7/24 | | | | 1,400 | | | | 25 | | | | 25 | |
CPURNSA | | Barclays Bank PLC | | | 2.385% | | | | 9/24 | | | | 4,000 | | | | 180 | | | | 180 | |
CPURNSA | | Barclays Bank PLC | | | 2.363% | | | | 9/24 | | | | 3,500 | | | | 169 | | | | 169 | |
CPURNSA | | Barclays Bank PLC | | | 2.895% | | | | 12/27 | | | | 1,700 | | | | (235 | ) | | | (235 | ) |
CPURNSA | | Barclays Bank PLC | | | 2.784% | | | | 7/44 | | | | 1,400 | | | | (115 | ) | | | (115 | ) |
CPURNSA | | Goldman Sachs International | | | 1.870% | | | | 5/26 | | | | 8,500 | | | | 1,223 | | | | 1,223 | |
CPURNSA | | Goldman Sachs International | | | 1.920% | | | | 5/26 | | | | 7,000 | | | | 962 | | | | 962 | |
CPURNSA | | Goldman Sachs International | | | 1.770% | | | | 6/26 | | | | 6,000 | | | | 917 | | | | 917 | |
CPURNSA | | Goldman Sachs International | | | 2.245% | | | | 11/26 | | | | 3,000 | | | | 297 | | | | 297 | |
CPURNSA | | Goldman Sachs International | | | 2.280% | | | | 11/26 | | | | 3,000 | | | | 286 | | | | 286 | |
CPURNSA | | Goldman Sachs International | | | 2.280% | | | | 11/26 | | | | 4,000 | | | | 380 | | | | 380 | |
| | | | | | | | | | | | | | | | | | |
| | | | | | | | | | | | | | | | $ | 5,864 | | | $ | 5,864 | |
| | | | | | | | | | | | | | | | | | |
| | | | | | | | | | | | | | | | | | | | | | | | | | | | |
| | | Financial Derivative Assets (000’s) | | | Financial Derivative Liabilities (000’s) | |
| | | Forward Foreign Currency Contracts | | | Swaps | | | Total | | | Forward Foreign Currency Contracts | | | Options | | | Swaps | | | Total | |
| Total Over the Counter Derivatives | | | — | | | $ | 6,214 | | | $ | 6,214 | | | $ | (517) | | | | — | | | $ | (350) | | | $ | (867) | |
| + | All par is stated in U.S. Dollar unless otherwise noted. |
| 144A | Security exempt from registration under Rule 144A of the Securities Act of 1933. These securities may be resold as transactions exempt from registration, normally to qualified institutional buyers. At December 31, 2023 the value of these securities (in thousands) was $45,390 representing 10.9% of the net assets. |
| α | Rate shown is the rate as of the period end. The rate may be based on a fixed rate, a capped rate or a floor rate and may convert to a variable or floating rate in the future. |
| ∞ | Foreign Bond — par value is foreign denominated. |
| b | Part or all of the security has been pledged as collateral. |
| Σ | Stepped coupon bond for which the coupon rate of interest adjusts on specified date(s); rate shown is effective rate at period-end. |
| @ | At December 31, 2023, the aggregate cost of investments, including derivatives, for federal tax purposes (in thousands) was $452,995 and the net unrealized depreciation of investments based on that cost was $27,408 which is comprised of $16,801 aggregate gross unrealized appreciation and $44,209 aggregate gross unrealized depreciation. |
| π | Amount is less than one thousand. |
The Accompanying Notes are an Integral Part of the Financial Statements.
153
Inflation Protection Portfolio
The following is a summary of the inputs used in valuing the Portfolio’s Investments at December 31, 2023. See Note 3 for additional information on portfolio valuation.
| | | | | | | | | | | | | | |
| | | Valuation Inputs | |
| Description | | | | Level 1 - Quoted Prices | | | Level 2 - Other Significant Observable Inputs | | | Level 3 - Significant Unobservable Inputs | |
| | | (Amounts in thousands) | |
Assets: | | | | | | | | | | | | | | |
Municipal Bonds | | | | $ | — | | | $ | 1,623 | | | $ | — | |
Corporate Bonds | | | | | — | | | | 23,497 | | | | — | |
Governments | | | | | — | | | | 286,471 | | | | — | |
Structured Products | | | | | — | | | | 73,054 | | | | — | |
Short-Term Investments | | | | | — | | | | 26,259 | | | | — | |
Other Financial Instruments^ | | | | | | | | | | | | | | |
Futures | | | | | 816 | | | | — | | | | — | |
Total Return Swaps | | | | | — | | | | 15,000 | | | | — | |
| | | | | | |
Total Assets: | | | | $ | 816 | | | $ | 425,904 | | | $ | — | |
| | | | | | |
Liabilities: | | | | | | | | | | | | | | |
Other Financial Instruments^ | | | | | | | | | | | | | | |
Forward Foreign Currency Contracts | | | | | — | | | | (517) | | | | — | |
Total Return Swaps | | | | | — | | | | (616) | | | | — | |
| | | | | | |
Total Liabilities: | | | | $ | — | | | $ | (1,133) | | | $ | — | |
| | | | | | |
^ Other financial instruments are derivative instruments such as futures and forward foreign currency contracts, which are valued at the unrealized appreciation (depreciation) on the instrument, and securities sold short, reverse repurchase agreements, written options and swaps contracts, which are valued at market value.
The Accompanying Notes are an Integral Part of the Financial Statements.
154
High Yield Bond Portfolio (unaudited)
| | | | |
| Objective: | | Portfolio Strategy: | | Net Assets: |
| High current income and capital appreciation. | | Invest in non-investment grade debt securities. | | $744 million |
PORTFOLIO OVERVIEW
Mason Street Advisors, LLC (“Mason Street Advisors”), the investment adviser for the High Yield Bond Portfolio (the “Portfolio”), has engaged Federated Investment Management Company (“Federated”) to act as sub-adviser for the Portfolio. Normally, the Portfolio invests in non-investment grade debt securities, which are generally securities rated below investment grade by major credit rating agencies, or if unrated, determined to be of comparable quality. The Portfolio may invest up to 30% of net assets in non-investment grade foreign securities. The securities in which the Portfolio primarily invests are considered speculative and are sometimes known as “junk bonds.” These securities tend to offer higher yields than higher rated securities of comparable maturities primarily because of the market’s greater uncertainty about the issuer’s ability to make all required interest and principal payments, and therefore about the returns that will in fact be realized by the Portfolio. The Portfolio invests in securities believed to have attractive investment characteristics and seeks to minimize default risk and other risks through careful security selection and diversification. The Portfolio’s security selection process consists of a credit-intensive, fundamental analysis of the issuer. The Portfolio does not limit the investments to securities of a particular maturity range and does not target an average effective maturity or duration.
MARKET OVERVIEW
The major factors influencing markets during 2023 were the economy and the trajectory of interest rates. From the start of the year, the economy proved resilient despite several indicators signaling potential weakness on the horizon. Corporate earnings, while off their peak, proved stronger than expected. Early in 2023, the U.S. Federal Reserve (the “Fed”) addressed high inflation by continuing to push short-term rates higher. However, late in 2023, as inflation declined by more than half, the Fed signaled that its rate-hiking cycle may be coming to an end. Interest rates peaked in October and declined significantly in November and December. For example, the 5-year U.S. Treasury’s yield began the year at 3.9%, peaked near 5% in late October and declined back to 3.85% at year-end. With no recession in 2023 and the market betting on a soft landing in 2024, risk assets rallied, and spreads ended the year tighter. The overall impact of these factors can be illustrated by the change in credit spreads between the Credit Suisse High Yield Bond Index and U.S. Treasury securities with similar maturities which began the period at 499 basis points and ended the fiscal year at 363 basis points.
From a quality perspective, the CCC-rated sector led the way with a total return of 19.84% followed by the B-rated sector at 13.78%. The BB-rated sector lagged with a return of 11.56%.
PORTFOLIO RESULTS
The Portfolio returned 13.24% for the twelve months ended December 31, 2023. By comparison, the Portfolio’s benchmark, the Bloomberg® U.S. Corporate High Yield 2% Issuer Capped Index (the “Index”), returned 13.44%. (The Index is unmanaged, cannot be invested in directly and does not incur expenses.)
Within the high yield market, industries that detracted substantially from the Portfolio’s relative performance during the reporting period included wirelines, pharmaceuticals, aerospace and defense, airlines and electric utilities. Industries that contributed substantially included leisure, retailing, finance companies and building materials.
Sector allocation detracted from the Portfolio’s relative return, driven by the Portfolio’s underweight to the strong performing leisure and retail industry. Given the strong absolute returns for the period, the Portfolio’s cash position also detracted. Security selection in the media and entertainment, electric utilities and cable and satellite industries also weighed on relative performance. Specific high yield issuers held by the Portfolio that detracted from the Portfolio’s relative performance included Enviva, iHeartCommunications, ARD Finance, Rackspace Technology and Audacy Capital.
An overweight to the strong-performing building materials industry and an underweight to the poor-performing wireline telecommunications and airline industries contributed to the Portfolio’s relative return. Security selection in the Information Technology and Healthcare sectors and in the consumer cyclical services, chemicals, building materials, diversified manufacturing and property and casualty insurance industries also contributed. Specific high yield issuers held by the Portfolio that contributed to relative performance included NFP, Diamond (BC) B.V., Madison IAQ, Minerva Merger Sub and Dornoch Debt Merger Sub.
155
High Yield Bond Portfolio (unaudited)
PORTFOLIO MANAGER OUTLOOK
The following forward-looking comments are the opinion of Federated, the Portfolio’s sub-adviser.
The U.S. economy continues to surprise to the upside with the consensus now leaning toward a soft landing in 2024. Credit spreads largely reflect this outlook as they have moved close to cycle lows. Over the past few years, the economy has benefited from significant monetary and fiscal policy stimulus, but those policies have mostly come to an end. Meanwhile, many historically accurate economic indicators are signaling caution. We do not believe the all clear has been sounded just yet, and with spreads close to historical lows, we see no reason to move to an overweight on high yield at this time. However, we are closely monitoring high yield issuer’s earnings and free cash flow as well as overall economic conditions to ascertain whether a continued cautious outlook is warranted.
Relative Performance
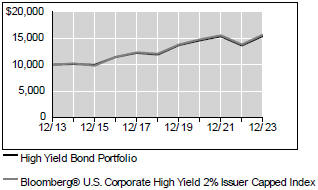
| | | | | | |
Average Annual Total Returns For Periods Ended December 31, 2023 |
| | | 1 Year | | 5 Years | | 10 Years |
High Yield Bond Portfolio | | 13.24% | | 5.33% | | 4.42% |
Bloomberg® U.S. Corporate High Yield 2% Issuer Capped Index | | 13.44% | | 5.35% | | 4.59% |
The performance data quoted represents past performance. Past performance is historical and does not guarantee future performance. Investment return and principal value will fluctuate, so that shares, when redeemed, may be worth more or less than their original cost. Current performance may be lower or higher than the performance data quoted. For the most recent month-end performance information visit www.northwesternmutual.com.
This chart assumes an initial investment of $10,000 made on 12/31/13. Returns shown reflect fee waivers, deductions for management and other portfolio expenses, and reinvestment of all dividends. In the absence of fee waivers, total return would be reduced. Returns exclude deductions for separate account sale loads and account fees. Please refer to the Benchmark Definitions section of this report for information about the indices cited in the above chart and graph.
Top 10 Holdings 12/31/23
| | | | | | | | |
| | | | |
| | | Security Description | | % of Net Assets | | | | |
| | | | |
| | | Ford Motor Credit Co. LLC, Various | | 2.5% | | | | |
| | | | |
| | | CCO Holdings LLC / CCO Holdings Capital Corp., Various | | 1.9% | | | | |
| | | | |
| | | HUB International, Ltd., Various | | 1.8% | | | | |
| | | | |
| | | CSC Holdings LLC, Various | | 1.6% | | | | |
| | | | |
| | | TransDigm, Inc., Various | | 1.6% | | | | |
| | | | |
| | | Tenet Healthcare Corp., Various | | 1.2% | | | | |
| | | | |
| | | NFP Corp., Various | | 1.2% | | | | |
| | | | |
| | | Allied Universal Holdco LLC, Various | | 1.1% | | | | |
| | | | |
| | | Mozart Debt Merger Sub, Inc., Various | | 1.1% | | | | |
| | | | |
| | | EQM Midstream Partners LP, Various | | 1.1% | | | | |
Sector Allocation 12/31/23
| | | | | | | | |
| | | | |
| | | Sector | | % of Net Assets | | | | |
| | | | |
| | | Consumer, Cyclical | | 19.0% | | | | |
| | | | |
| | | Communications | | 14.4% | | | | |
| | | | |
| | | Industrial | | 12.8% | | | | |
| | | | |
| | | Consumer, Non-Cyclical | | 12.4% | | | | |
| | | | |
| | | Energy | | 11.9% | | | | |
| | | | |
| | | Financial | | 9.8% | | | | |
| | | | |
| | | Technology | | 9.1% | | | | |
| | | | |
| | | Short-Term Investments & Other Net Assets | | 5.2% | | | | |
| | | | |
| | | Basic Materials | | 2.9% | | | | |
| | | | |
| | | Utilities | | 2.3% | | | | |
| | | | |
| | | Diversified | | 0.2% | | | | |
| | | | |
| | | Communication Services | | 0.0% | | | | |
Sector Allocation and Top 10 Holdings are subject to change.
156
High Yield Bond Portfolio
SCHEDULE OF INVESTMENTS
December 31, 2023
| | | | | | | | |
| Common Stocks (0.3%) | | Shares/ Par + | | | Value $ (000’s) | |
Communication Services (0.0%) | | | | | | | | |
iHeartMedia, Inc. * | | | 22,266 | | | | 60 | |
| | | | | | | | |
Total | | | | | | | 60 | |
| | | | | | | | |
| | |
Energy (0.3%) | | | | | | | | |
Superior Energy Services, Inc. * | | | 28,873 | | | | 2,223 | |
| | | | | | | | |
Total | | | | | | | 2,223 | |
| | | | | | | | |
| | |
Total Common Stocks (Cost: $1,027) | | | | | | | 2,283 | |
| | | | | | | | |
| | |
Corporate Bonds (94.5%) | | | | | | | | |
Basic Materials (2.9%) | | | | | | | | |
Ashland LLC
3.375%, 9/1/31 144A | | | 825,000 | | | | 711 | |
Axalta Coating Systems Dutch Holding BV
7.250%, 2/15/31 144A | | | 425,000 | | | | 446 | |
Axalta Coating Systems LLC
3.375%, 2/15/29 144A | | | 875,000 | | | | 785 | |
Axalta Coating Systems LLC / Axalta Coating Systems Dutch Holding
4.750%, 6/15/27 144A | | | 600,000 | | | | 583 | |
Cheever Escrow Issuer LLC
7.125%, 10/1/27 144A | | | 875,000 | | | | 876 | |
Cleveland-Cliffs, Inc.
4.625%, 3/1/29 144A | | | 1,525,000 | | | | 1,409 | |
4.875%, 3/1/31 144A | | | 425,000 | | | | 384 | |
6.750%, 4/15/30 144A | | | 375,000 | | | | 380 | |
Coeur Mining, Inc.
5.125%, 2/15/29 144A | | | 1,750,000 | | | | 1,610 | |
Element Solutions, Inc.
3.875%, 9/1/28 144A | | | 1,650,000 | | | | 1,519 | |
H.B. Fuller Co.
4.250%, 10/15/28 | | | 525,000 | | | | 491 | |
Herens Holdco SARL
4.750%, 5/15/28 144A | | | 3,775,000 | | | | 3,097 | |
Illuminate Buyer LLC / Illuminate Holdings IV, Inc.
9.000%, 7/1/28 144A | | | 725,000 | | | | 693 | |
Olympus Water US Holding Corp.
4.250%, 10/1/28 144A | | | 1,500,000 | | | | 1,350 | |
6.250%, 10/1/29 144A | | | 1,975,000 | | | | 1,754 | |
9.750%, 11/15/28 144A | | | 2,125,000 | | | | 2,256 | |
Polar US Borrower LLC
6.750%, 5/15/26 144A | | | 1,725,000 | | | | 552 | |
SPCM SA
3.375%, 3/15/30 144A | | | 425,000 | | | | 365 | |
WR Grace Holdings LLC
4.875%, 6/15/27 144A | | | 675,000 | | | | 650 | |
5.625%, 8/15/29 144A | | | 1,200,000 | | | | 1,056 | |
7.375%, 3/1/31 144A | | | 325,000 | | | | 325 | |
| | | | | | | | |
Total | | | | | | | 21,292 | |
| | | | | | | | |
| | | | | | | | |
| Corporate Bonds (94.5%) | | Shares/ Par + | | | Value
$ (000’s) | |
Communications (14.4%) | | | | | | | | |
Audacy Capital Corp.
6.500%, 5/1/27 144A j | | | 2,250,000 | | | | 39 | |
6.750%, 3/31/29 144A j | | | 1,650,000 | | | | 25 | |
Cars.com, Inc.
6.375%, 11/1/28 144A | | | 2,125,000 | | | | 2,049 | |
CCO Holdings LLC / CCO Holdings Capital Corp.
4.250%, 2/1/31 144A | | | 325,000 | | | | 284 | |
4.250%, 1/15/34 144A | | | 1,200,000 | | | | 975 | |
4.500%, 8/15/30 144A | | | 1,500,000 | | | | 1,352 | |
4.500%, 5/1/32 | | | 1,050,000 | | | | 899 | |
4.500%, 6/1/33 144A | | | 1,175,000 | | | | 994 | |
4.750%, 3/1/30 144A | | | 3,400,000 | | | | 3,107 | |
4.750%, 2/1/32 144A | | | 450,000 | | | | 397 | |
5.000%, 2/1/28 144A | | | 2,000,000 | | | | 1,914 | |
5.125%, 5/1/27 144A | | | 2,975,000 | | | | 2,874 | |
5.375%, 6/1/29 144A | | | 1,350,000 | | | | 1,272 | |
5.500%, 5/1/26 144A | | | 275,000 | | | | 273 | |
Ciena Corp.
4.000%, 1/31/30 144A | | | 325,000 | | | | 296 | |
CSC Holdings LLC
3.375%, 2/15/31 144A | | | 825,000 | | | | 602 | |
4.125%, 12/1/30 144A | | | 950,000 | | | | 723 | |
4.500%, 11/15/31 144A | | | 2,750,000 | | | | 2,079 | |
4.625%, 12/1/30 144A | | | 1,375,000 | | | | 828 | |
5.250%, 6/1/24 | | | 700,000 | | | | 685 | |
5.500%, 4/15/27 144A | | | 2,275,000 | | | | 2,103 | |
5.750%, 1/15/30 144A | | | 4,200,000 | | | | 2,615 | |
6.500%, 2/1/29 144A | | | 1,100,000 | | | | 971 | |
7.500%, 4/1/28 144A | | | 1,925,000 | | | | 1,440 | |
Cumulus Media New Holdings, Inc.
6.750%, 7/1/26 144A | | | 750,000 | | | | 505 | |
Diamond Sports Group LLC / Diamond Sports Finance Co.
5.375%, 8/15/26 144A j | | | 675,000 | | | | 34 | |
6.625%, 8/15/27 144A j | | | 1,900,000 | | | | 95 | |
DIRECTV Holdings LLC / DIRECTV Financing Co., Inc.
5.875%, 8/15/27 144A | | | 1,175,000 | | | | 1,104 | |
DISH DBS Corp.
5.125%, 6/1/29 | | | 2,950,000 | | | | 1,520 | |
5.750%, 12/1/28 144A | | | 1,100,000 | | | | 877 | |
7.375%, 7/1/28 | | | 750,000 | | | | 448 | |
7.750%, 7/1/26 | | | 1,350,000 | | | | 940 | |
DISH Network Corp.
11.750%, 11/15/27 144A | | | 1,600,000 | | | | 1,670 | |
Go Daddy Operating Co. LLC / GD Finance Co., Inc.
5.250%, 12/1/27 144A | | | 1,625,000 | | | | 1,592 | |
Gray Escrow II, Inc.
5.375%, 11/15/31 144A | | | 975,000 | | | | 736 | |
Gray Television, Inc.
5.875%, 7/15/26 144A | | | 2,575,000 | | | | 2,505 | |
7.000%, 5/15/27 144A | | | 1,050,000 | | | | 998 | |
iHeartCommunications, Inc.
4.750%, 1/15/28 144A | | | 425,000 | | | | 327 | |
The Accompanying Notes are an Integral Part of the Financial Statements.
157
High Yield Bond Portfolio
| | | | | | | | |
| Corporate Bonds (94.5%) | | Shares/ Par + | | | Value $ (000’s) | |
Communications continued | | | | | | | | |
5.250%, 8/15/27 144A | | | 1,075,000 | | | | 854 | |
6.375%, 5/1/26 | | | 375,901 | | | | 320 | |
8.375%, 5/1/27 | | | 4,928,194 | | | | 3,199 | |
Lamar Media Corp.
3.625%, 1/15/31 | | | 425,000 | | | | 378 | |
4.000%, 2/15/30 | | | 100,000 | | | | 92 | |
4.875%, 1/15/29 | | | 675,000 | | | | 652 | |
Logan Merger Sub, Inc.
5.500%, 9/1/27 144A | | | 2,875,000 | | | | 1,391 | |
Match Group, Inc.
4.125%, 8/1/30 144A | | | 2,175,000 | | | | 1,974 | |
4.625%, 6/1/28 144A | | | 1,450,000 | | | | 1,388 | |
5.000%, 12/15/27 144A | | | 525,000 | | | | 513 | |
Midas OpCo Holdings LLC
5.625%, 8/15/29 144A | | | 5,975,000 | | | | 5,496 | |
Millennium Escrow Corp.
6.625%, 8/1/26 144A | | | 1,425,000 | | | | 1,012 | |
Nexstar Broadcasting, Inc.
4.750%, 11/1/28 144A | | | 1,700,000 | | | | 1,567 | |
5.625%, 7/15/27 144A | | | 2,500,000 | | | | 2,417 | |
Outfront Media Capital LLC / Outfront Media Capital Corp.
4.250%, 1/15/29 144A | | | 1,150,000 | | | | 1,038 | |
4.625%, 3/15/30 144A | | | 1,100,000 | | | | 981 | |
7.375%, 2/15/31 144A | | | 150,000 | | | | 158 | |
Scripps Escrow II, Inc.
5.375%, 1/15/31 144A | | | 300,000 | | | | 220 | |
Scripps Escrow, Inc.
5.875%, 7/15/27 144A | | | 1,425,000 | | | | 1,266 | |
Sinclair Television Group, Inc.
4.125%, 12/1/30 144A | | | 150,000 | | | | 106 | |
5.125%, 2/15/27 144A | | | 1,900,000 | | | | 1,696 | |
5.500%, 3/1/30 144A | | | 1,175,000 | | | | 881 | |
Sirius XM Radio, Inc.
3.125%, 9/1/26 144A | | | 1,075,000 | | | | 1,010 | |
3.875%, 9/1/31 144A | | | 3,025,000 | | | | 2,588 | |
4.000%, 7/15/28 144A | | | 725,000 | | | | 671 | |
4.125%, 7/1/30 144A | | | 1,775,000 | | | | 1,582 | |
5.500%, 7/1/29 144A | | | 925,000 | | | | 894 | |
Sprint Corp.
7.625%, 2/15/25 | | | 700,000 | | | | 712 | |
TEGNA, Inc.
4.625%, 3/15/28 | | | 450,000 | | | | 420 | |
5.000%, 9/15/29 | | | 2,325,000 | | | | 2,130 | |
Telenet Finance Luxembourg Notes SARL
5.500%, 3/1/28 144A | | | 4,400,000 | | | | 4,114 | |
Terrier Media Buyer, Inc.
8.875%, 12/15/27 144A | | | 3,700,000 | | | | 2,935 | |
Univision Communications, Inc.
4.500%, 5/1/29 144A | | | 1,400,000 | | | | 1,249 | |
7.375%, 6/30/30 144A | | | 1,025,000 | | | | 1,022 | |
8.000%, 8/15/28 144A | | | 925,000 | | | | 954 | |
UPC Broadband Finco BV
4.875%, 7/15/31 144A | | | 3,450,000 | | | | 3,036 | |
Urban One, Inc.
7.375%, 2/1/28 144A | | | 2,175,000 | | | | 1,849 | |
Viavi Solutions, Inc.
3.750%, 10/1/29 144A | | | 350,000 | | | | 306 | |
Virgin Media Finance PLC
5.000%, 7/15/30 144A | | | 2,700,000 | | | | 2,380 | |
| | | | | | | | |
| Corporate Bonds (94.5%) | | Shares/ Par + | | | Value $ (000’s) | |
Communications continued | | | | | | | | |
Virgin Media Secured Finance PLC
5.500%, 5/15/29 144A | | | 475,000 | | | | 459 | |
Virgin Media Vendor Financing Notes IV
5.000%, 7/15/28 144A | | | 2,050,000 | | | | 1,925 | |
VMED O2 UK Financing I PLC
4.250%, 1/31/31 144A | | | 600,000 | | | | 524 | |
4.750%, 7/15/31 144A | | | 1,475,000 | | | | 1,317 | |
VZ Secured Financing BV
5.000%, 1/15/32 144A | | | 1,225,000 | | | | 1,046 | |
Ziggo Bond Co. BV
5.125%, 2/28/30 144A | | | 1,125,000 | | | | 941 | |
6.000%, 1/15/27 144A | | | 3,050,000 | | | | 2,968 | |
Ziggo BV
4.875%, 1/15/30 144A | | | 200,000 | | | | 178 | |
| | | | | | | | |
Total | | | | | | | 106,956 | |
| | | | | | | | |
| | |
Consumer, Cyclical (19.0%) | | | | | | | | |
1011778 BC ULC / New Red Finance, Inc.
3.500%, 2/15/29 144A | | | 525,000 | | | | 484 | |
3.875%, 1/15/28 144A | | | 1,125,000 | | | | 1,063 | |
4.000%, 10/15/30 144A | | | 5,775,000 | | | | 5,180 | |
4.375%, 1/15/28 144A | | | 1,175,000 | | | | 1,122 | |
Academy, Ltd.
6.000%, 11/15/27 144A | | | 1,850,000 | | | | 1,817 | |
Acushnet Co.
7.375%, 10/15/28 144A | | | 300,000 | | | | 313 | |
Adient Global Holdings, Ltd.
4.875%, 8/15/26 144A | | | 3,300,000 | | | | 3,227 | |
7.000%, 4/15/28 144A | | | 350,000 | | | | 362 | |
8.250%, 4/15/31 144A | | | 350,000 | | | | 371 | |
Affinity Gaming
6.875%, 12/15/27 144A | | | 2,375,000 | | | | 2,117 | |
American Airlines, Inc. / AAdvantage Loyalty IP, Ltd.
5.500%, 4/20/26 144A | | | 1,375,000 | | | | 1,365 | |
5.750%, 4/20/29 144A | | | 200,000 | | | | 195 | |
American Builders & Contractors Supply Co., Inc.
3.875%, 11/15/29 144A | | | 275,000 | | | | 245 | |
4.000%, 1/15/28 144A | | | 2,050,000 | | | | 1,940 | |
Aramark Services, Inc.
5.000%, 2/1/28 144A | | | 225,000 | | | | 218 | |
Asbury Automotive Group, Inc.
4.625%, 11/15/29 144A | | | 1,850,000 | | | | 1,712 | |
5.000%, 2/15/32 144A | | | 450,000 | | | | 409 | |
BCPE Empire Holdings, Inc.
7.625%, 5/1/27 144A | | | 5,000,000 | | | | 4,821 | |
Beacon Roofing Supply, Inc.
6.500%, 8/1/30 144A | | | 425,000 | | | | 435 | |
Boyd Gaming Corp.
4.750%, 12/1/27 | | | 1,650,000 | | | | 1,587 | |
4.750%, 6/15/31 144A | | | 575,000 | | | | 528 | |
Caesars Entertainment, Inc.
4.625%, 10/15/29 144A | | | 825,000 | | | | 744 | |
5.750%, 7/1/25 144A | | | 1,750,000 | | | | 1,750 | |
6.250%, 7/1/25 144A | | | 2,175,000 | | | | 2,181 | |
7.000%, 2/15/30 144A | | | 275,000 | | | | 282 | |
8.125%, 7/1/27 144A | | | 2,325,000 | | | | 2,383 | |
Carnival Corp.
7.000%, 8/15/29 144A | | | 375,000 | | | | 392 | |
The Accompanying Notes are an Integral Part of the Financial Statements.
158
High Yield Bond Portfolio
| | | | | | | | |
| Corporate Bonds (94.5%) | | Shares/ Par + | | | Value $ (000’s) | |
Consumer, Cyclical continued | | | | | | | | |
CCM Merger, Inc.
6.375%, 5/1/26 144A | | | 425,000 | | | | 414 | |
Churchill Downs, Inc.
5.500%, 4/1/27 144A | | | 225,000 | | | | 223 | |
6.750%, 5/1/31 144A | | | 1,575,000 | | | | 1,599 | |
Clarios Global LP
6.750%, 5/15/25 144A | | | 135,000 | | | | 136 | |
6.750%, 5/15/28 144A | | | 625,000 | | | | 638 | |
Clarios Global LP / Clarios US Finance Co.
6.250%, 5/15/26 144A | | | 270,000 | | | | 270 | |
8.500%, 5/15/27 144A | | | 7,550,000 | | | | 7,576 | |
Dana Financing Luxembourg SARL
5.750%, 4/15/25 144A | | | 325,000 | | | | 323 | |
Dana, Inc.
4.500%, 2/15/32 | | | 675,000 | | | | 587 | |
5.375%, 11/15/27 | | | 150,000 | | | | 149 | |
5.625%, 6/15/28 | | | 175,000 | | | | 173 | |
Dornoch Debt Merger Sub, Inc.
6.625%, 10/15/29 144A | | | 3,450,000 | | | | 3,110 | |
Ford Motor Credit Co. LLC
2.700%, 8/10/26 | | | 725,000 | | | | 671 | |
3.375%, 11/13/25 | | | 3,250,000 | | | | 3,110 | |
4.000%, 11/13/30 | | | 1,975,000 | | | | 1,772 | |
4.063%, 11/1/24 | | | 1,700,000 | | | | 1,670 | |
4.125%, 8/17/27 | | | 1,350,000 | | | | 1,278 | |
4.271%, 1/9/27 | | | 1,675,000 | | | | 1,606 | |
4.389%, 1/8/26 | | | 2,725,000 | | | | 2,650 | |
5.113%, 5/3/29 | | | 2,950,000 | | | | 2,869 | |
5.125%, 6/16/25 | | | 2,250,000 | | | | 2,220 | |
6.800%, 5/12/28 | | | 700,000 | | | | 731 | |
Foundation Building Materials, Inc.
6.000%, 3/1/29 144A | | | 3,375,000 | | | | 3,035 | |
The Gap, Inc.
3.625%, 10/1/29 144A | | | 1,475,000 | | | | 1,261 | |
3.875%, 10/1/31 144A | | | 475,000 | | | | 391 | |
GYP Holdings III Corp.
4.625%, 5/1/29 144A | | | 2,475,000 | | | | 2,259 | |
H&E Equipment Services, Inc.
3.875%, 12/15/28 144A | | | 2,775,000 | | | | 2,523 | |
Hilton Domestic Operating Co., Inc.
3.625%, 2/15/32 144A | | | 700,000 | | | | 611 | |
3.750%, 5/1/29 144A | | | 1,150,000 | | | | 1,066 | |
4.875%, 1/15/30 | | | 500,000 | | | | 485 | |
5.750%, 5/1/28 144A | | | 800,000 | | | | 800 | |
IHO Verwaltungs GmbH
4.750%, 9/15/26 144A | | | 2,375,000 | | | | 2,274 | |
6.000%, 5/15/27 144A | | | 1,650,000 | | | | 1,608 | |
6.375%, 5/15/29 144A | | | 2,350,000 | | | | 2,306 | |
Interface, Inc.
5.500%, 12/1/28 144A | | | 1,350,000 | | | | 1,248 | |
JB Poindexter & Co., Inc.
8.750%, 12/15/31 144A | | | 975,000 | | | | 994 | |
KFC Holding Co. / Pizza Hut Holdings LLC / Taco Bell of America LLC
4.750%, 6/1/27 144A | | | 550,000 | | | | 542 | |
Kontoor Brands, Inc.
4.125%, 11/15/29 144A | | | 575,000 | | | | 519 | |
LCM Investments Holdings II LLC
8.250%, 8/1/31 144A | | | 1,500,000 | | | | 1,566 | |
| | | | | | | | |
| Corporate Bonds (94.5%) | | Shares/ Par + | | | Value $ (000’s) | |
Consumer, Cyclical continued | | | | | | | | |
Light and Wonder International, Inc.
7.500%, 9/1/31 144A | | | 725,000 | | | | 756 | |
Midwest Gaming Borrower LLC
4.875%, 5/1/29 144A | | | 1,275,000 | | | | 1,186 | |
Mohegan Gaming & Entertainment
8.000%, 2/1/26 144A | | | 3,800,000 | | | | 3,586 | |
NCL Corp., Ltd.
5.875%, 3/15/26 144A | | | 1,450,000 | | | | 1,417 | |
7.750%, 2/15/29 144A | | | 250,000 | | | | 251 | |
8.125%, 1/15/29 144A | | | 575,000 | | | | 601 | |
NCL Finance, Ltd.
6.125%, 3/15/28 144A | | | 750,000 | | | | 718 | |
Ontario Gaming GTA LP
8.000%, 8/1/30 144A | | | 2,025,000 | | | | 2,088 | |
Penn National Gaming, Inc.
4.125%, 7/1/29 144A | | | 1,975,000 | | | | 1,689 | |
5.625%, 1/15/27 144A | | | 250,000 | | | | 242 | |
Raptor Acquisition Corp. / Raptor Co-Issuer LLC
4.875%, 11/1/26 144A | | | 575,000 | | | | 548 | |
Real Hero Merger Sub 2, Inc.
6.250%, 2/1/29 144A | | | 3,375,000 | | | | 2,910 | |
Ritchie Bros Auctioneers, Inc.
6.750%, 3/15/28 144A | | | 325,000 | | | | 335 | |
Royal Caribbean Cruises, Ltd.
5.375%, 7/15/27 144A | | | 750,000 | | | | 742 | |
5.500%, 8/31/26 144A | | | 750,000 | | | | 743 | |
Scientific Games Holdings LP / Scientific Games US FinCo, Inc.
6.625%, 3/1/30 144A | | | 1,875,000 | | | | 1,773 | |
Scientific Games International, Inc.
7.250%, 11/15/29 144A | | | 1,250,000 | | | | 1,280 | |
SeaWorld Parks & Entertainment, Inc.
5.250%, 8/15/29 144A | | | 2,675,000 | | | | 2,501 | |
Six Flags Entertainment Corp.
5.500%, 4/15/27 144A | | | 475,000 | | | | 464 | |
7.250%, 5/15/31 144A | | | 1,250,000 | | | | 1,254 | |
SRS Distribution, Inc.
6.000%, 12/1/29 144A | | | 2,925,000 | | | | 2,727 | |
6.125%, 7/1/29 144A | | | 3,350,000 | | | | 3,176 | |
Station Casinos LLC
4.500%, 2/15/28 144A | | | 2,000,000 | | | | 1,886 | |
4.625%, 12/1/31 144A | | | 1,300,000 | | | | 1,172 | |
Suburban Propane Partners LP / Suburban Energy Finance Corp.
5.000%, 6/1/31 144A | | | 2,525,000 | | | | 2,289 | |
5.875%, 3/1/27 | | | 900,000 | | | | 895 | |
White Cap Buyer LLC
6.875%, 10/15/28 144A | | | 1,825,000 | | | | 1,767 | |
White Cap Parent LLC
8.250%, 3/15/26 144A | | | 1,650,000 | | | | 1,642 | |
The William Carter Co.
5.625%, 3/15/27 144A | | | 800,000 | | | | 790 | |
WMG Acquisition Corp.
3.750%, 12/1/29 144A | | | 800,000 | | | | 728 | |
3.875%, 7/15/30 144A | | | 325,000 | | | | 294 | |
Yum! Brands, Inc.
4.625%, 1/31/32 | | | 1,625,000 | | | | 1,520 | |
4.750%, 1/15/30 144A | | | 725,000 | | | | 703 | |
5.375%, 4/1/32 | | | 625,000 | | | | 614 | |
The Accompanying Notes are an Integral Part of the Financial Statements.
159
High Yield Bond Portfolio
| | | | | | | | |
| Corporate Bonds (94.5%) | | Shares/ Par + | | | Value $ (000’s) | |
Consumer, Cyclical continued | | | | | | | | |
ZF North America Capital, Inc.
6.875%, 4/14/28 144A | | | 1,000,000 | | | | 1,036 | |
7.125%, 4/14/30 144A | | | 550,000 | | | | 586 | |
| | | | | | | | |
Total | | | | | | | 141,415 | |
| | | | | | | | |
| | |
Consumer, Non-cyclical (12.4%) | | | | | | | | |
AHP Health Partners, Inc.
5.750%, 7/15/29 144A | | | 1,025,000 | | | | 892 | |
Albertsons Cos., Inc. / Safeway, Inc. / New Albertson’s LP / Albertson’s LLC
3.250%, 3/15/26 144A | | | 350,000 | | | | 330 | |
3.500%, 3/15/29 144A | | | 1,650,000 | | | | 1,498 | |
5.875%, 2/15/28 144A | | | 700,000 | | | | 700 | |
6.500%, 2/15/28 144A | | | 1,200,000 | | | | 1,214 | |
7.500%, 3/15/26 144A | | | 625,000 | | | | 637 | |
Allied Universal Holdco LLC
6.000%, 6/1/29 144A | | | 2,225,000 | | | | 1,814 | |
6.625%, 7/15/26 144A | | | 1,425,000 | | | | 1,418 | |
9.750%, 7/15/27 144A | | | 5,050,000 | | | | 4,948 | |
Avantor Funding, Inc.
3.875%, 11/1/29 144A | | | 1,825,000 | | | | 1,657 | |
4.625%, 7/15/28 144A | | | 2,350,000 | | | | 2,271 | |
Bausch Health Cos., Inc.
4.875%, 6/1/28 144A | | | 350,000 | | | | 211 | |
5.000%, 1/30/28 144A | | | 425,000 | | | | 193 | |
5.000%, 2/15/29 144A | | | 625,000 | | | | 269 | |
5.250%, 1/30/30 144A | | | 1,900,000 | | | | 876 | |
5.250%, 2/15/31 144A | | | 300,000 | | | | 129 | |
5.750%, 8/15/27 144A | | | 775,000 | | | | 500 | |
6.125%, 2/1/27 144A | | | 300,000 | | | | 203 | |
6.250%, 2/15/29 144A | | | 1,450,000 | | | | 642 | |
7.250%, 5/30/29 144A | | | 1,700,000 | | | | 775 | |
8.500%, 1/31/27 144A | | | 1,450,000 | | | | 796 | |
Bellring Brands, Inc.
7.000%, 3/15/30 144A | | | 2,050,000 | | | | 2,122 | |
Centene Corp.
4.250%, 12/15/27 | | | 1,900,000 | | | | 1,831 | |
4.625%, 12/15/29 | | | 2,425,000 | | | | 2,325 | |
CHS / Community Health Systems, Inc.
5.250%, 5/15/30 144A | | | 1,000,000 | | | | 836 | |
5.625%, 3/15/27 144A | | | 750,000 | | | | 697 | |
6.000%, 1/15/29 144A | | | 550,000 | | | | 495 | |
6.125%, 4/1/30 144A | | | 1,275,000 | | | | 825 | |
6.875%, 4/15/29 144A | | | 2,825,000 | | | | 1,823 | |
8.000%, 3/15/26 144A | | | 556,000 | | | | 554 | |
Edgewell Personal Care Co.
4.125%, 4/1/29 144A | | | 1,000,000 | | | | 910 | |
5.500%, 6/1/28 144A | | | 875,000 | | | | 859 | |
Embecta Corp.
5.000%, 2/15/30 144A | | | 525,000 | | | | 445 | |
6.750%, 2/15/30 144A | | | 1,850,000 | | | | 1,610 | |
Garda World Security Corp.
4.625%, 2/15/27 144A | | | 875,000 | | | | 844 | |
6.000%, 6/1/29 144A | | | 2,375,000 | | | | 2,129 | |
7.750%, 2/15/28 144A | | | 600,000 | | | | 621 | |
Garden Spinco Corp.
8.625%, 7/20/30 144A | | | 675,000 | | | | 721 | |
Gartner, Inc.
4.500%, 7/1/28 144A | | | 250,000 | | | | 237 | |
| | | | | | | | |
| Corporate Bonds (94.5%) | | Shares/ Par + | | | Value $ (000’s) | |
Consumer, Non-cyclical continued | | | | | | | | |
Grifols Escrow Issuer SA
4.750%, 10/15/28 144A | | | 3,775,000 | | | | 3,423 | |
GTCR W-2 Merger Sub LLC
7.500%, 1/15/31 144A | | | 1,600,000 | | | | 1,691 | |
GW B-CR Security Corp.
9.500%, 11/1/27 144A | | | 4,969,000 | | | | 5,010 | |
HCA, Inc.
5.375%, 2/1/25 | | | 1,250,000 | | | | 1,248 | |
5.875%, 2/15/26 | | | 825,000 | | | | 832 | |
HealthEquity, Inc.
4.500%, 10/1/29 144A | | | 2,225,000 | | | | 2,066 | |
IQVIA, Inc.
5.000%, 10/15/26 144A | | | 1,375,000 | | | | 1,362 | |
5.000%, 5/15/27 144A | | | 750,000 | | | | 736 | |
6.500%, 5/15/30 144A | | | 200,000 | | | | 205 | |
Jazz Securities DAC
4.375%, 1/15/29 144A | | | 1,825,000 | | | | 1,700 | |
LifePoint Health, Inc.
4.375%, 2/15/27 144A | | | 625,000 | | | | 577 | |
Mozart Debt Merger Sub, Inc.
3.875%, 4/1/29 144A | | | 1,625,000 | | | | 1,469 | |
5.250%, 10/1/29 144A | | | 7,000,000 | | | | 6,598 | |
MPH Acquisition Holdings LLC
5.750%, 11/1/28 144A | | | 500,000 | | | | 406 | |
Organon Finance 1 LLC
4.125%, 4/30/28 144A | | | 425,000 | | | | 391 | |
5.125%, 4/30/31 144A | | | 1,800,000 | | | | 1,539 | |
Performance Food Group, Inc.
4.250%, 8/1/29 144A | | | 1,425,000 | | | | 1,307 | |
5.500%, 10/15/27 144A | | | 725,000 | | | | 714 | |
Post Holdings, Inc.
5.500%, 12/15/29 144A | | | 900,000 | | | | 867 | |
5.625%, 1/15/28 144A | | | 975,000 | | | | 966 | |
5.750%, 3/1/27 144A | | | 1,405,000 | | | | 1,394 | |
Prestige Brands, Inc.
3.750%, 4/1/31 144A | | | 650,000 | | | | 568 | |
Teleflex, Inc.
4.250%, 6/1/28 144A | | | 250,000 | | | | 237 | |
4.625%, 11/15/27 | | | 450,000 | | | | 437 | |
Tenet Healthcare Corp.
4.250%, 6/1/29 | | | 225,000 | | | | 209 | |
4.625%, 6/15/28 | | | 125,000 | | | | 119 | |
4.875%, 1/1/26 | | | 1,525,000 | | | | 1,508 | |
5.125%, 11/1/27 | | | 1,800,000 | | | | 1,760 | |
6.125%, 10/1/28 | | | 2,450,000 | | | | 2,443 | |
6.125%, 6/15/30 | | | 775,000 | | | | 784 | |
6.250%, 2/1/27 | | | 1,125,000 | | | | 1,131 | |
6.750%, 5/15/31 144A | | | 775,000 | | | | 792 | |
United Rentals North America, Inc.
4.875%, 1/15/28 | | | 1,225,000 | | | | 1,196 | |
5.250%, 1/15/30 | | | 425,000 | | | | 418 | |
5.500%, 5/15/27 | | | 400,000 | | | | 401 | |
6.000%, 12/15/29 144A | | | 375,000 | | | | 381 | |
US Foods, Inc.
4.625%, 6/1/30 144A | | | 700,000 | | | | 652 | |
4.750%, 2/15/29 144A | | | 1,500,000 | | | | 1,425 | |
6.875%, 9/15/28 144A | | | 775,000 | | | | 798 | |
The Accompanying Notes are an Integral Part of the Financial Statements.
160
High Yield Bond Portfolio
| | | | | | | | |
| Corporate Bonds (94.5%) | | Shares/ Par + | | | Value $ (000’s) | |
Consumer, Non-cyclical continued | | | | | | | | |
ZipRecruiter, Inc.
5.000%, 1/15/30 144A | | | 975,000 | | | | 851 | |
| | | | | | | | |
Total | | | | | | | 92,468 | |
| | | | | | | | |
| | |
Diversified (0.2%) | | | | | | | | |
Stena International SA
6.125%, 2/1/25 144A | | | 1,325,000 | | | | 1,317 | |
| | | | | | | | |
Total | | | | | | | 1,317 | |
| | | | | | | | |
| | |
Energy (11.6%) | | | | | | | | |
Antero Midstream Partners LP / Antero Midstream Finance Corp.
5.375%, 6/15/29 144A | | | 1,975,000 | | | | 1,899 | |
5.750%, 3/1/27 144A | | | 2,375,000 | | | | 2,357 | |
5.750%, 1/15/28 144A | | | 2,600,000 | | | | 2,574 | |
7.875%, 5/15/26 144A | | | 1,000,000 | | | | 1,024 | |
Antero Resources Corp.
5.375%, 3/1/30 144A | | | 925,000 | | | | 887 | |
7.625%, 2/1/29 144A | | | 244,000 | | | | 250 | |
Archrock Partners LP
6.250%, 4/1/28 144A | | | 1,975,000 | | | | 1,945 | |
6.875%, 4/1/27 144A | | | 3,275,000 | | | | 3,283 | |
Ascent Resources Utica Holdings LLC / ARU Finance Corp.
5.875%, 6/30/29 144A | | | 600,000 | | | | 558 | |
7.000%, 11/1/26 144A | | | 1,375,000 | | | | 1,384 | |
8.250%, 12/31/28 144A | | | 575,000 | | | | 578 | |
9.000%, 11/1/27 144A | | | 400,000 | | | | 504 | |
Berry Petroleum Co. LLC
7.000%, 2/15/26 144A | | | 875,000 | | | | 847 | |
Callon Petroleum Co.
6.375%, 7/1/26 | | | 900,000 | | | | 896 | |
7.500%, 6/15/30 144A | | | 450,000 | | | | 454 | |
Centennial Resource Production LLC
5.375%, 1/15/26 144A | | | 825,000 | | | | 814 | |
6.875%, 4/1/27 144A | | | 1,725,000 | | | | 1,724 | |
Cheniere Energy Partners LP
4.000%, 3/1/31 | | | 1,250,000 | | | | 1,136 | |
4.500%, 10/1/29 | | | 1,150,000 | | | | 1,100 | |
Cheniere Energy, Inc.
4.625%, 10/15/28 | | | 975,000 | | | | 952 | |
Chesapeake Energy Corp.
5.875%, 2/1/29 144A | | | 225,000 | | | | 220 | |
Chesapeake Energy Corp. Escrow
7.000%, 10/1/24 * | | | 1,000,000 | | | | 19 | |
Civitas Resources, Inc.
8.375%, 7/1/28 144A | | | 1,375,000 | | | | 1,435 | |
8.625%, 11/1/30 144A | | | 575,000 | | | | 610 | |
8.750%, 7/1/31 144A | | | 300,000 | | | | 319 | |
CNX Midstream Partners LP
4.750%, 4/15/30 144A | | | 2,250,000 | | | | 2,020 | |
Comstock Resources, Inc.
5.875%, 1/15/30 144A | | | 475,000 | | | | 412 | |
6.750%, 3/1/29 144A | | | 2,400,000 | | | | 2,195 | |
Crestwood Midstream Partners LP / Crestwood Midstream Finance Corp.
7.375%, 2/1/31 144A | | | 750,000 | | | | 788 | |
8.000%, 4/1/29 144A | | | 1,825,000 | | | | 1,899 | |
CrownRock LP / CrownRock Finance, Inc.
5.625%, 10/15/25 144A | | | 3,025,000 | | | | 3,021 | |
| | | | | | | | |
| Corporate Bonds (94.5%) | | Shares/ Par + | | | Value $ (000’s) | |
Energy continued | | | | | | | | |
DT Midstream, Inc.
4.375%, 6/15/31 144A | | | 1,450,000 | | | | 1,308 | |
Endeavor Energy Resources LP / EER Finance, Inc.
5.750%, 1/30/28 144A | | | 850,000 | | | | 851 | |
Enviva Partners LP / Enviva Partners Finance Corp.
6.500%, 1/15/26 144A | | | 2,235,000 | | | | 1,101 | |
EQM Midstream Partners LP
4.500%, 1/15/29 144A | | | 1,050,000 | | | | 992 | |
4.750%, 1/15/31 144A | | | 1,325,000 | | | | 1,233 | |
5.500%, 7/15/28 | | | 1,925,000 | | | | 1,907 | |
6.000%, 7/1/25 144A | | | 331,000 | | | | 331 | |
6.500%, 7/1/27 144A | | | 1,825,000 | | | | 1,858 | |
6.500%, 7/15/48 | | | 375,000 | | | | 384 | |
7.500%, 6/1/27 144A | | | 975,000 | | | | 1,005 | |
7.500%, 6/1/30 144A | | | 175,000 | | | | 188 | |
Hess Midstream Operations LP
4.250%, 2/15/30 144A | | | 625,000 | | | | 575 | |
5.500%, 10/15/30 144A | | | 475,000 | | | | 460 | |
Hess Midstream Partners LP
5.125%, 6/15/28 144A | | | 1,300,000 | | | | 1,254 | |
HF Sinclair Corp.
5.000%, 2/1/28 144A | | | 1,725,000 | | | | 1,673 | |
6.375%, 4/15/27 144A | | | 425,000 | | | | 428 | |
Nabors Industries, Ltd.
7.250%, 1/15/26 144A | | | 1,200,000 | | | | 1,153 | |
7.375%, 5/15/27 144A | | | 225,000 | | | | 220 | |
7.500%, 1/15/28 144A | | | 800,000 | | | | 692 | |
9.125%, 1/31/30 144A | | | 100,000 | | | | 100 | |
Oasis Petroleum, Inc.
6.375%, 6/1/26 144A | | | 525,000 | | | | 525 | |
Occidental Petroleum Corp.
5.875%, 9/1/25 | | | 1,000,000 | | | | 1,006 | |
6.375%, 9/1/28 | | | 125,000 | | | | 131 | |
8.875%, 7/15/30 | | | 1,100,000 | | | | 1,287 | |
PDC Energy, Inc.
5.750%, 5/15/26 | | | 1,175,000 | | | | 1,173 | |
Precision Drilling Corp.
6.875%, 1/15/29 144A | | | 375,000 | | | | 362 | |
7.125%, 1/15/26 144A | | | 1,507,000 | | | | 1,500 | |
Range Resources Corp.
4.750%, 2/15/30 144A | | | 475,000 | | | | 439 | |
4.875%, 5/15/25 | | | 350,000 | | | | 346 | |
8.250%, 1/15/29 | | | 875,000 | | | | 906 | |
Rockcliff Energy II LLC
5.500%, 10/15/29 144A | | | 1,025,000 | | | | 969 | |
Sitio Royalties Operating Partnership LP / Sitio Finance Corp.
7.875%, 11/1/28 144A | | | 600,000 | | | | 622 | |
SM Energy Co.
5.625%, 6/1/25 | | | 1,000,000 | | | | 988 | |
6.500%, 7/15/28 | | | 200,000 | | | | 200 | |
6.625%, 1/15/27 | | | 250,000 | | | | 249 | |
6.750%, 9/15/26 | | | 1,100,000 | | | | 1,097 | |
Southwestern Energy Co.
4.750%, 2/1/32 | | | 725,000 | | | | 671 | |
5.375%, 3/15/30 | | | 300,000 | | | | 293 | |
8.375%, 9/15/28 | | | 1,100,000 | | | | 1,138 | |
The Accompanying Notes are an Integral Part of the Financial Statements.
161
High Yield Bond Portfolio
| | | | | | | | |
| Corporate Bonds (94.5%) | | Shares/ Par + | | | Value $ (000’s) | |
Energy continued | | | | | | | | |
Targa Resources Partners LP / Targa Resources Partners Finance Corp.
5.000%, 1/15/28 | | | 1,675,000 | | | | 1,654 | |
5.500%, 3/1/30 | | | 2,250,000 | | | | 2,250 | |
6.500%, 7/15/27 | | | 300,000 | | | | 304 | |
TerraForm Power Operating LLC
4.750%, 1/15/30 144A | | | 1,725,000 | | | | 1,604 | |
5.000%, 1/31/28 144A | | | 1,775,000 | | | | 1,724 | |
TransMontaigne Partners LP / TLP Finance Corp.
6.125%, 2/15/26 | | | 1,175,000 | | | | 1,060 | |
USA Compression Finance Corp.
6.875%, 4/1/26 | | | 3,550,000 | | | | 3,535 | |
USA Compression Partners LP / USA Compression Finance Corp.
6.875%, 9/1/27 | | | 1,475,000 | | | | 1,458 | |
Western Midstream Operating LP
4.050%, 2/1/30 | | | 325,000 | | | | 304 | |
4.500%, 3/1/28 | | | 1,100,000 | | | | 1,064 | |
4.650%, 7/1/26 | | | 175,000 | | | | 172 | |
5.300%, 3/1/48 | | | 1,775,000 | | | | 1,545 | |
| | | | | | | | |
Total | | | | | | | 86,393 | |
| | | | | | | | |
| | |
Financial (9.8%) | | | | | | | | |
Alliant Holdings Intermediate LLC / Alliant Holdings Co-Issuer
7.000%, 1/15/31 144A | | | 575,000 | | | | 607 | |
Ally Financial, Inc.
5.750%, 11/20/25 | | | 1,475,000 | | | | 1,466 | |
AmWINS Group, Inc.
4.875%, 6/30/29 144A | | | 2,575,000 | | | | 2,352 | |
Ardonagh Midco 2 PLC
11.500%, 1/15/27 144A | | | 3,483,937 | | | | 3,430 | |
AssuredPartners, Inc.
5.625%, 1/15/29 144A | | | 1,500,000 | | | | 1,400 | |
7.000%, 8/15/25 144A | | | 3,375,000 | | | | 3,381 | |
BroadStreet Partners, Inc.
5.875%, 4/15/29 144A | | | 6,075,000 | | | | 5,671 | |
GTCR AP Finance, Inc.
8.000%, 5/15/27 144A | | | 1,925,000 | | | | 1,944 | |
HUB International, Ltd.
5.625%, 12/1/29 144A | | | 3,075,000 | | | | 2,933 | |
7.000%, 5/1/26 144A | | | 9,300,000 | | | | 9,336 | |
7.250%, 6/15/30 144A | | | 1,100,000 | | | | 1,162 | |
Iron Mountain, Inc.
7.000%, 2/15/29 144A | | | 3,125,000 | | | | 3,212 | |
Jones Deslauriers Insurance Management, Inc.
8.500%, 3/15/30 144A | | | 1,800,000 | | | | 1,890 | |
10.500%, 12/15/30 144A | | | 1,750,000 | | | | 1,844 | |
Navient Corp. 5.000%, 3/15/27 | | | 675,000 | | | | 652 | |
5.500%, 3/15/29 | | | 1,650,000 | | | | 1,522 | |
6.750%, 6/25/25 | | | 1,300,000 | | | | 1,315 | |
6.750%, 6/15/26 | | | 1,250,000 | | | | 1,271 | |
NFP Corp.
6.875%, 8/15/28 144A | | | 7,125,000 | | | | 7,243 | |
7.500%, 10/1/30 144A | | | 1,300,000 | | | | 1,384 | |
RHP Hotel Properties LP / RHP Finance Corp.
7.250%, 7/15/28 144A | | | 600,000 | | | | 624 | |
| | | | | | | | |
| Corporate Bonds (94.5%) | | Shares/ Par + | | | Value $ (000’s) | |
Financial continued | | | | | | | | |
Rocket Mortgage LLC / Rocket Mortgage Co- Issuer, Inc.
2.875%, 10/15/26 144A | | | 1,800,000 | | | | 1,660 | |
3.625%, 3/1/29 144A | | | 1,475,000 | | | | 1,335 | |
3.875%, 3/1/31 144A | | | 1,525,000 | | | | 1,341 | |
4.000%, 10/15/33 144A | | | 1,200,000 | | | | 1,019 | |
Ryan Specialty Group LLC
4.375%, 2/1/30 144A | | | 800,000 | | | | 742 | |
United Shore Financial Services LLC
5.500%, 11/15/25 144A | | | 3,450,000 | | | | 3,428 | |
United Wholesale Mortgage LLC
5.500%, 4/15/29 144A | | | 1,725,000 | | | | 1,633 | |
5.750%, 6/15/27 144A | | | 1,250,000 | | | | 1,225 | |
USI, Inc.
7.500%, 1/15/32 144A | | | 2,725,000 | | | | 2,790 | |
VICI Properties LP / VICI Note Co., Inc.
3.500%, 2/15/25 144A | | | 125,000 | | | | 122 | |
3.875%, 2/15/29 144A | | | 200,000 | | | | 184 | |
4.250%, 12/1/26 144A | | | 1,125,000 | | | | 1,083 | |
4.500%, 9/1/26 144A | | | 450,000 | | | | 436 | |
4.625%, 6/15/25 144A | | | 400,000 | | | | 393 | |
4.625%, 12/1/29 144A | | | 600,000 | | | | 565 | |
5.625%, 5/1/24 144A | | | 475,000 | | | | 473 | |
5.750%, 2/1/27 144A | | | 225,000 | | | | 226 | |
| | | | | | | | |
Total | | | | | | | 73,294 | |
| | | | | | | | |
| | |
Industrial (12.8%) | | | | | | | | |
ARD Finance SA
6.500%, 6/30/27 144A | | | 3,357,214 | | | | 1,568 | |
Ardagh Packaging Finance PLC / Ardagh Holdings USA, Inc.
4.000%, 9/1/29 144A | | | 2,250,000 | | | | 1,905 | |
5.250%, 8/15/27 144A | | | 6,825,000 | | | | 5,302 | |
Ball Corp.
2.875%, 8/15/30 | | | 1,575,000 | | | | 1,351 | |
3.125%, 9/15/31 | | | 300,000 | | | | 259 | |
6.000%, 6/15/29 | | | 750,000 | | | | 766 | |
6.875%, 3/15/28 | | | 675,000 | | | | 701 | |
Berry Global Escrow Corp.
4.875%, 7/15/26 144A | | | 1,125,000 | | | | 1,106 | |
5.625%, 7/15/27 144A | | | 1,150,000 | | | | 1,141 | |
Camelot Return Merger Sub, Inc.
8.750%, 8/1/28 144A | | | 1,575,000 | | | | 1,599 | |
Clearwater Paper Corp.
4.750%, 8/15/28 144A | | | 150,000 | | | | 139 | |
Clydesdale Acquisition Holdings, Inc.
8.750%, 4/15/30 144A | | | 7,350,000 | | | | 6,853 | |
Cornerstone Building Brands, Inc.
6.125%, 1/15/29 144A | | | 900,000 | | | | 738 | |
CP Atlas Buyer, Inc.
7.000%, 12/1/28 144A | | | 3,500,000 | | | | 3,047 | |
Crown Americas LLC
5.250%, 4/1/30 | | | 400,000 | | | | 394 | |
Crown Americas LLC / Crown Americas Capital Corp. VI
4.750%, 2/1/26 | | | 1,175,000 | | | | 1,164 | |
Emerald Debt Merger Sub LLC
6.625%, 12/15/30 144A | | | 3,375,000 | | | | 3,447 | |
Energizer Holdings, Inc.
4.375%, 3/31/29 144A | | | 2,525,000 | | | | 2,260 | |
The Accompanying Notes are an Integral Part of the Financial Statements.
162
High Yield Bond Portfolio
| | | | | | | | |
| Corporate Bonds (94.5%) | | Shares/ Par + | | | Value $ (000’s) | |
Industrial continued | | | | | | | | |
4.750%, 6/15/28 144A | | | 1,400,000 | | | | 1,294 | |
6.500%, 12/31/27 144A | | | 1,650,000 | | | | 1,650 | |
Gates Global LLC / Gates Global Co.
6.250%, 1/15/26 144A | | | 5,050,000 | | | | 5,025 | |
Graphic Packaging International LLC
3.500%, 3/15/28 144A | | | 425,000 | | | | 394 | |
3.500%, 3/1/29 144A | | | 450,000 | | | | 405 | |
3.750%, 2/1/30 144A | | | 175,000 | | | | 158 | |
4.750%, 7/15/27 144A | | | 500,000 | | | | 485 | |
II-VI, Inc.
5.000%, 12/15/29 144A | | | 2,425,000 | | | | 2,303 | |
Madison IAQ LLC
4.125%, 6/30/28 144A | | | 250,000 | | | | 227 | |
5.875%, 6/30/29 144A | | | 4,800,000 | | | | 4,229 | |
Mauser Packaging Solutions Holding Co.
7.875%, 8/15/26 144A | | | 1,425,000 | | | | 1,450 | |
9.250%, 4/15/27 144A | | | 1,500,000 | | | | 1,472 | |
MIWD Holdco II LLC / MIWD Finance Corp.
5.500%, 2/1/30 144A | | | 875,000 | | | | 774 | |
OI European Group BV
4.750%, 2/15/30 144A | | | 450,000 | | | | 421 | |
Owens-Brockway Glass Container, Inc.
6.375%, 8/15/25 144A | | | 1,125,000 | | | | 1,128 | |
6.625%, 5/13/27 144A | | | 1,425,000 | | | | 1,425 | |
7.250%, 5/15/31 144A | | | 1,475,000 | | | | 1,495 | |
Redwood Star Merger Sub, Inc.
8.750%, 4/1/30 144A | | | 2,325,000 | | | | 2,325 | |
Sealed Air Corp.
5.000%, 4/15/29 144A | | | 550,000 | | | | 532 | |
6.125%, 2/1/28 144A | | | 550,000 | | | | 555 | |
7.250%, 2/15/31 144A | | | 575,000 | | | | 610 | |
Sensata Technologies BV
5.875%, 9/1/30 144A | | | 1,700,000 | | | | 1,689 | |
Sensata Technologies, Inc.
3.750%, 2/15/31 144A | | | 225,000 | | | | 198 | |
Standard Industries, Inc.
3.375%, 1/15/31 144A | | | 725,000 | | | | 624 | |
4.375%, 7/15/30 144A | | | 1,200,000 | | | | 1,102 | |
4.750%, 1/15/28 144A | | | 1,325,000 | | | | 1,276 | |
5.000%, 2/15/27 144A | | | 3,000,000 | | | | 2,925 | |
TK Elevator Holdco GmbH
7.625%, 7/15/28 144A | | | 800,000 | | | | 786 | |
TK Elevator US Newco, Inc.
5.250%, 7/15/27 144A | | | 1,800,000 | | | | 1,768 | |
TransDigm, Inc.
4.625%, 1/15/29 | | | 1,950,000 | | | | 1,831 | |
4.875%, 5/1/29 | | | 275,000 | | | | 257 | |
5.500%, 11/15/27 | | | 1,250,000 | | | | 1,225 | |
6.250%, 3/15/26 144A | | | 3,025,000 | | | | 3,020 | |
6.750%, 8/15/28 144A | | | 1,000,000 | | | | 1,023 | |
6.875%, 12/15/30 144A | | | 3,850,000 | | | | 3,965 | |
7.500%, 3/15/27 | | | 675,000 | | | | 678 | |
Trivium Packaging Finance BV
5.500%, 8/15/26 144A | | | 525,000 | | | | 515 | |
8.500%, 8/15/27 144A | | | 4,775,000 | | | | 4,682 | |
TTM Technologies, Inc.
4.000%, 3/1/29 144A | | | 1,675,000 | | | | 1,522 | |
Watco Cos. LLC / Watco Finance Corp.
6.500%, 6/15/27 144A | | | 2,150,000 | | | | 2,150 | |
| | | | | | | | |
| Corporate Bonds (94.5%) | | Shares/ Par + | | | Value $ (000’s) | |
Industrial continued | | | | | | | | |
WESCO Distribution, Inc.
7.125%, 6/15/25 144A | | | 975,000 | | | | 982 | |
7.250%, 6/15/28 144A | | | 1,075,000 | | | | 1,105 | |
| | | | | | | | |
Total | | | | | | | 95,420 | |
| | | | | | | | |
| | |
Technology (9.1%) | | | | | | | | |
ams-OSRAM AG
12.250%, 3/30/29 144A | | | 925,000 | | | | 1,029 | |
Black Knight InfoServ LLC
3.625%, 9/1/28 144A | | | 850,000 | | | | 804 | |
Boxer Parent Co., Inc.
9.125%, 3/1/26 144A | | | 2,100,000 | | | | 2,095 | |
Capstone Borrower, Inc.
8.000%, 6/15/30 144A | | | 1,825,000 | | | | 1,899 | |
Central Parent LLC / CDK Global II LLC / CDK Financing Co., Inc.
8.000%, 6/15/29 144A | | | 775,000 | | | | 809 | |
Central Parent, Inc. / Central Merger Sub, Inc.
7.250%, 6/15/29 144A | | | 3,050,000 | | | | 3,111 | |
Clarivate Science Holdings Corp.
3.875%, 7/1/28 144A | | | 350,000 | | | | 330 | |
4.875%, 7/1/29 144A | | | 3,100,000 | | | | 2,909 | |
Cloud Software Group, Inc.
9.000%, 9/30/29 144A | | | 2,200,000 | | | | 2,091 | |
Condor Merger Sub, Inc.
7.375%, 2/15/30 144A | | | 6,600,000 | | | | 6,028 | |
Consensus Cloud Solutions, Inc.
6.000%, 10/15/26 144A | | | 1,550,000 | | | | 1,474 | |
6.500%, 10/15/28 144A | | | 2,225,000 | | | | 2,018 | |
The Dun & Bradstreet Corp.
5.000%, 12/15/29 144A | | | 2,375,000 | | | | 2,215 | |
Elastic NV
4.125%, 7/15/29 144A | | | 2,500,000 | | | | 2,296 | |
Entegris Escrow Corp.
4.750%, 4/15/29 144A | | | 850,000 | | | | 819 | |
5.950%, 6/15/30 144A | | | 2,300,000 | | | | 2,286 | |
Entegris, Inc.
3.625%, 5/1/29 144A | | | 725,000 | | | | 655 | |
Fair Isaac Corp.
4.000%, 6/15/28 144A | | | 625,000 | | | | 592 | |
Helios Software Holdings, Inc.
4.625%, 5/1/28 144A | | | 2,300,000 | | | | 2,098 | |
Minerva Merger Sub, Inc.
6.500%, 2/15/30 144A | | | 6,875,000 | | | | 6,237 | |
NCR Atleos Escrow Corp.
9.500%, 4/1/29 144A | | | 1,500,000 | | | | 1,594 | |
NCR Corp.
5.000%, 10/1/28 144A | | | 1,375,000 | | | | 1,300 | |
5.125%, 4/15/29 144A | | | 1,475,000 | | | | 1,402 | |
5.250%, 10/1/30 144A | | | 1,425,000 | | | | 1,309 | |
Open Text Corp.
3.875%, 2/15/28 144A | | | 1,675,000 | | | | 1,556 | |
3.875%, 12/1/29 144A | | | 125,000 | | | | 112 | |
4.125%, 2/15/30 144A | | | 1,250,000 | | | | 1,131 | |
4.125%, 12/1/31 144A | | | 300,000 | | | | 265 | |
6.900%, 12/1/27 144A | | | 450,000 | | | | 468 | |
Picard Midco, Inc.
6.500%, 3/31/29 144A | | | 3,125,000 | | | | 2,976 | |
Rackspace Technology Global, Inc.
3.500%, 2/15/28 144A | | | 1,825,000 | | | | 733 | |
The Accompanying Notes are an Integral Part of the Financial Statements.
163
High Yield Bond Portfolio
| | | | | | | | |
| Corporate Bonds (94.5%) | | Shares/ Par + | | | Value $ (000’s) | |
Technology continued | | | | | | | | |
Roblox Corp.
3.875%, 5/1/30 144A | | | 1,650,000 | | | | 1,471 | |
Rocket Software, Inc.
6.500%, 2/15/29 144A | | | 3,675,000 | | | | 3,197 | |
Science Applications International Corp.
4.875%, 4/1/28 144A | | | 500,000 | | | | 476 | |
Seagate HDD Cayman
8.250%, 12/15/29 144A | | | 75,000 | | | | 81 | |
8.500%, 7/15/31 144A | | | 700,000 | | | | 760 | |
9.625%, 12/1/32 | | | 2,477,125 | | | | 2,833 | |
SS&C Technologies, Inc.
5.500%, 9/30/27 144A | | | 3,850,000 | | | | 3,795 | |
Synaptics, Inc.
4.000%, 6/15/29 144A | | | 725,000 | | | | 650 | |
| | | | | | | | |
Total | | | | | | | 67,904 | |
| | | | | | | | |
| | |
Utilities (2.3%) | | | | | | | | |
AmeriGas Partners LP / AmeriGas Finance Corp.
5.500%, 5/20/25 | | | 300,000 | | | | 296 | |
5.750%, 5/20/27 | | | 550,000 | | | | 535 | |
5.875%, 8/20/26 | | | 2,525,000 | | | | 2,500 | |
Calpine Corp.
3.750%, 3/1/31 144A | | | 1,250,000 | | | | 1,096 | |
4.500%, 2/15/28 144A | | | 1,575,000 | | | | 1,498 | |
4.625%, 2/1/29 144A | | | 350,000 | | | | 325 | |
5.000%, 2/1/31 144A | | | 200,000 | | | | 183 | |
5.125%, 3/15/28 144A | | | 1,075,000 | | | | 1,031 | |
5.250%, 6/1/26 144A | | | 299,000 | | | | 295 | |
NextEra Energy Operating Partners LP
7.250%, 1/15/29 144A | | | 975,000 | | | | 1,021 | |
NRG Energy, Inc.
3.875%, 2/15/32 144A | | | 207,000 | | | | 177 | |
5.250%, 6/15/29 144A | | | 775,000 | | | | 751 | |
5.750%, 1/15/28 | | | 400,000 | | | | 399 | |
6.625%, 1/15/27 | | | 625,000 | | | | 626 | |
Solaris Midstream Holdings LLC
7.625%, 4/1/26 144A | | | 775,000 | | | | 785 | |
TransAlta Corp.
7.750%, 11/15/29 | | | 350,000 | | | | 372 | |
Vistra Operations Co. LLC
5.000%, 7/31/27 144A | | | 1,100,000 | | | | 1,071 | |
| | | | | | | | |
| Corporate Bonds (94.5%) | | Shares/ Par + | | | Value $ (000’s) | |
Utilities continued | | | | | | | | |
5.500%, 9/1/26 144A | | | 1,400,000 | | | | 1,382 | |
5.625%, 2/15/27 144A | | | 1,925,000 | | | | 1,899 | |
7.750%, 10/15/31 144A | | | 750,000 | | | | 779 | |
| | | | | | | | |
Total | | | | | | | 17,021 | |
| | | | | | | | |
| | |
Total Corporate Bonds (Cost: $753,956) | | | | | | | 703,480 | |
| | | | | | | | |
| | |
Total Investments (94.8%)
(Cost: $754,983)@ | | | | | | | 705,763 | |
| | | | | | | | |
| | |
Other Assets, Less Liabilities (5.2%) | | | | | | | 38,581 | |
| | | | | | | | |
| | |
Net Assets (100.0%) | | | | | | | 744,344 | |
| | | | | | | | |
| + | All par is stated in U.S. Dollar unless otherwise noted. |
| 144A | Security exempt from registration under Rule 144A of the Securities Act of 1933. These securities may be resold as transactions exempt from registration, normally to qualified institutional buyers. At December 31, 2023 the value of these securities (in thousands) was $597,727 representing 80.3% of the net assets. |
| @ | At December 31, 2023, the aggregate cost of investments, including derivatives, for federal tax purposes (in thousands) was $754,537 and the net unrealized depreciation of investments based on that cost was $48,774 which is comprised of $7,963 aggregate gross unrealized appreciation and $56,737 aggregate gross unrealized depreciation. |
The Accompanying Notes are an Integral Part of the Financial Statements.
164
High Yield Bond Portfolio
The following is a summary of the inputs used in valuing the Portfolio’s Investments at December 31, 2023. See Note 3 for additional information on portfolio valuation.
| | | | | | | | | | | | |
| | | Valuation Inputs | |
| Description | | Level 1 - Quoted
Prices | | | Level 2 - Other
Significant
Observable Inputs | | | Level 3 - Significant
Unobservable
Inputs | |
| | | (Amounts in thousands) | |
Assets: | | | | | | | | | | | | |
Common Stocks | | | | | | | | | | | | |
Communication Services | | $ | 60 | | | $ | — | | | $ | — | |
Energy | | | — | | | | 2,223 | | | | — | |
Corporate Bonds | | | — | | | | 703,480 | | | | — | |
| | | | |
Total Assets: | | $ | 60 | | | $ | 705,703 | | | $ | — | |
| | | | |
For the period ended December 31, 2023, there was a transfer from Level 3 to Level 2 in the amount of $2,223 (in thousands). This transfer was the result of an increase in the quantity of observable inputs for the security that was previously not priced by a third party vendor.
The Accompanying Notes are an Integral Part of the Financial Statements.
165
Multi-Sector Bond Portfolio (unaudited)
| | | | |
| | |
| Objective: | | Portfolio Strategy: | | Net Assets: |
| Maximum total return, consistent with prudent investment management. | | Invest in a diversified portfolio of fixed income instruments of varying maturities and quality, and in derivatives designed to replicate such securities. | | $1.2 billion |
PORTFOLIO OVERVIEW
Mason Street Advisors, LLC (“Mason Street Advisors”), the investment adviser for the Multi-Sector Bond Portfolio (the “Portfolio”), has engaged Pacific Investment Management Company LLC (“PIMCO”) to act as sub-adviser for the Portfolio. Normally, the Portfolio invests in a diversified portfolio of fixed income instruments of varying maturities, which may be represented by forwards or derivatives such as options, futures contracts or swap agreements. The average portfolio duration (a measure of the sensitivity of the Portfolio’s fixed income portfolio securities to changes in interest rates) of the Portfolio normally varies from three to eight years, based on the Portfolio’s forecast for interest rates. The Portfolio may invest all of its assets in high yield securities subject to a maximum of 10% of its total assets in securities rated below B by Moody’s or equivalently rated by S&P or Fitch or, if unrated, determined to be of comparable quality (so called “junk bonds”). The Portfolio may invest, without limitation, in securities denominated in foreign currencies and U.S. dollar denominated securities of foreign issuers. In addition, the Portfolio may invest without limit in fixed income securities of issuers that are economically tied to emerging securities markets.
MARKET OVERVIEW
Despite the collapse of Silicon Valley Bank and financial sector concerns, risk assets rose in early 2023. Bond yields fell, the yield curve inverted further, and market volatility increased due to instability in Credit Suisse Group and its takeover by UBS Group. Fears of financial contagion led to a drop in global stock indices and a rally in bond yields.
In the second quarter of 2023, risk assets improved despite banking sector stress and potential U.S. debt default fears. Bond yields rose due to resilient growth and persistent inflation, and central banks resumed hawkish guidance. Despite U.S. debt default concerns, market optimism continued due to positive debt ceiling negotiations, leading the S&P 500® Index to a 9-month high. The U.S. Federal Reserve (the “Fed”) signaled two additional rate hikes due to resilient growth and swift banking sector stress resolution.
The third quarter saw a decline in risk sentiment due to economic data surprises and fears of prolonged high rates. Bond yields rose due to resilient growth and sticky inflation, and central banks maintained hawkish guidance. 10-year U.S. Treasury real yields increased to an approximately 15-year high, while U.S. core inflation cooled.
Signs of slowing inflation and a cooling labor market in the fourth quarter led to an accelerated path of rate cuts for 2024, prompting a global bond market rally. Risk sentiment rebounded, with the MSCI World® Index rising sizably, while the U.S. dollar weakened. In December 2023, the Fed paused rate hikes for the third consecutive time, while signally the potential for 75 bps of cuts in 2024. Global developed central banks maintained hawkish stances, with both the European Central Bank and the Bank of England signaling that rates would remain restrictive for longer. The Bank of Japan maintained its negative interest rate policy and left its dovish guidance unchanged.
PORTFOLIO RESULTS
The Portfolio returned 9.71% for the twelve months ended December 31, 2023. By comparison, the Portfolio’s benchmark, the Bloomberg® Global Credit Hedged USD Index returned 9.36%. The Portfolio’s custom benchmark, comprised of 1/3 each: Bloomberg® Global Aggregate - Credit Component ex Emerging Markets, Hedged USD; ICE BofA® Global High Yield BB-B Rated Constrained Developed Markets Index, Hedged USD; J.P. Morgan® EMBI Global, returned 10.84%. (These Indices are unmanaged, cannot be invested in directly and do not incur expenses.)
The largest contributor to the Portfolio’s relative performance was an overweight exposure to high yield credit, particularly via credit default indices. Positioning within investment grade and high yield financials also contributed. Within duration strategies, positioning within U.S. and Canadian interest rates supported the Portfolio’s relative return.
The primary detractor from the Portfolio’s relative performance was positioning within emerging markets debt, particularly exposure to Chinese property developers, which continued to face headwinds. Additionally, exposure to investment grade and high yield Industrials detracted.
166
Multi-Sector Bond Portfolio (unaudited)
PORTFOLIO MANAGER OUTLOOK
The following forward-looking comments are the opinion of PIMCO, the Portfolio’s sub-adviser.
After major economies showed surprising resilience in 2023, we anticipate a downshift toward stagnation or mild contraction in 2024. The standout strength of the U.S. is likely to fade over our six- to twelve-month cyclical horizon, and countries with more rate-sensitive markets will likely slow more markedly. With inflation easing, developed market central banks have likely reached the end of their hiking cycles. This has shifted attention toward the timing and pace of eventual rate cuts. We believe the Fed and other central banks have scope to cut rates aggressively if growth slows. However, there are also scenarios in which the recent market-based easing of financial conditions has done much of the work for central banks. That easing, alongside continued consumer and corporate sector strength could potentially prompt inflation to rise again.
We expect fiscal concerns will continue, both in the U.S. and globally. We see potential for further bouts of long-end curve weakness amid anxiety about elevated supply, stemming from the increased bond issuance needed to fund large fiscal deficits. We therefore expect to have a curve-steepening bias in our portfolios, with overweight positions in the 5- to 10-year part of the curve globally and underweights in the 30-year area. At current valuations, we continue to find bonds attractive relative to equities, while fixed income offers correlation and diversification benefits in portfolios. Furthermore, bond returns tend to be less dependent on a positive economic outcome.
Relative Performance
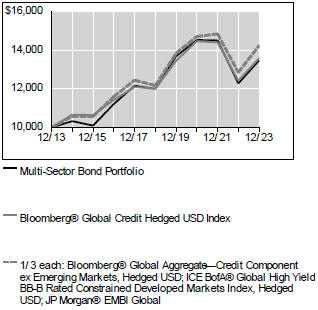
| | | | | | |
Average Annual Total Returns For Periods Ended December 31, 2023 |
| | | 1 Year | | 5 Years | | 10 Years |
Multi-Sector Bond Portfolio | | 9.71% | | 2.34% | | 3.02% |
Bloomberg® Global Credit Hedged USD Index | | 9.36% | | 2.51% | | 3.11% |
1/3 each: Bloomberg® Global Aggregate — Credit Component ex Emerging Markets, Hedged USD; ICE BofA® Global High Yield BB-B Rated Constrained Developed Markets Index, Hedged USD; JP Morgan® EMBI Global | | 10.84% | | 3.19% | | 3.60% |
The performance data quoted represents past performance. Past performance is historical and does not guarantee future performance. Investment return and principal value will fluctuate, so that shares, when redeemed, may be worth more or less than their original cost. Current performance may be lower or higher than the performance data quoted. For the most recent month-end performance information visit www.northwesternmutual.com.
This chart assumes an initial investment of $10,000 made on 12/31/13. Returns shown reflect fee waivers, deductions for management and other portfolio expenses, and reinvestment of all dividends. In the absence of fee waivers, total return would be reduced. Returns exclude deductions for separate account sale loads and account fees. Please refer to the Benchmark Definitions section of this report for information about the indices cited in the above chart and graph.
Top 10 Holdings 12/31/23
| | | | | | | | |
| | | | |
| | | Security Description | | % of Net Assets | | | | |
| | | | |
| | | Uniform Mortgage Backed Security TBA, Various | | 7.5% | | | | |
| | | | |
| | | US Treasury, Various | | 6.0% | | | | |
| | | | |
| | | Federal Home Loan Mortgage Corp., Various | | 3.4% | | | | |
| | | | |
| | | Petroleos Mexicanos, Various | | 1.6% | | | | |
| | | | |
| | | Republic of Indonesia, Various | | 1.2% | | | | |
| | | | |
| | | Deutsche Bank AG, Various | | 0.9% | | | | |
| | | | |
| | | Colombia Government International Bond, Various | | 0.8% | | | | |
| | | | |
| | | Oman Government International Bond, Various | | 0.7% | | | | |
| | | | |
| | | Ford Motor Credit Co. LLC, Various | | 0.7% | | | | |
| | | | |
| | | Saudi International Bond, 4.5%, 10/26/46 | | 0.7% | | | | |
167
Multi-Sector Bond Portfolio (unaudited)
Sector Allocation 12/31/23
| | | | | | | | |
| | | | |
| | | Sector | | % of Net Assets | | | | |
| | | | |
| | | Corporate Bonds | | 42.7% | | | | |
| | | | |
| | | Structured Products | | 22.6% | | | | |
| | | | |
| | | Governments | | 17.7% | | | | |
| | | | |
| | | Short-Term Investments & Other Net Assets | | 13.7% | | | | |
| | | | |
| | | Bank Loan Obligations | | 2.4% | | | | |
| | | | |
| | | Municipal Bonds | | 0.6% | | | | |
| | | | |
| | | Convertible Corporate Bonds | | 0.1% | | | | |
| | | | |
| | | Financials | | 0.1% | | | | |
| | | | |
| | | Real Estate | | 0.1% | | | | |
| | | | |
| | | Health Care | | 0.0% | | | | |
| | | | |
| | | Telecommunications | | 0.0% | | | | |
| | | | |
| | | Energy | | 0.0% | | | | |
Sector Allocation and Top 10 Holdings are subject to change.
168
Multi-Sector Bond Portfolio
SCHEDULE OF INVESTMENTS
December 31, 2023
| | | | | | |
| Common Stocks (0.2%) | | Shares/ Par + | | | Value $ (000’s) |
Energy (0.0%) | | | | | | |
Constellation Oil - Class B *,Æ,d | | | 112,235 | | | 12 |
| | | | | | |
Total | | | | | | 12 |
| | | | | | |
| | |
Financials (0.1%) | | | | | | |
DrillCo Holding Lux SA - Class B *,Æ,d | | | 2,686 | | | 67 |
DrillCo Holding Lux SA - Class C *,Æ,d | | | 24,180 | | | 600 |
| | | | | | |
Total | | | | | | 667 |
| | | | | | |
| | |
Health Care (0.0%) | | | | | | |
AmSurg Corp. *,Æ,d | | | 9,484 | | | 486 |
| | | | | | |
Total | | | | | | 486 |
| | | | | | |
| | |
Real Estate (0.1%) | | | | | | |
ADLER Group SA *,Æ | | | 19,539 | | | 11 |
ADLER Group SA * | | | 43,265 | | | 25 |
Corestate Capital Holding SA *,Æ,d | | | 421,967 | | | –π |
Sunac Services Holdings, Ltd. | | | 2,015,508 | | | 483 |
| | | | | | |
Total | | | | | | 519 |
| | | | | | |
| | |
Telecommunications (0.0%) | | | | | | |
Intelsat Emergence SA *,Æ | | | 9,447 | | | 269 |
| | | | | | |
Total | | | | | | 269 |
| | | | | | |
| | |
Total Common Stocks (Cost: $5,239) | | | | | | 1,953 |
| | | | | | |
| | |
| Corporate Bonds (42.7%) | | | | | |
Basic Materials (0.8%) | | | | | | |
ALROSA Finance SA
3.100%, 6/25/27 144A j,Æ | | | 8,500,000 | | | 425 |
4.650%, 4/9/24 144A j,Æ | | | 500,000 | | | 25 |
Georgia-Pacific LLC
8.875%, 5/15/31 | | | 200,000 | | | 249 |
INEOS Styrolution Group GmbH
2.250%, 1/16/27 EUR §,∞ | | | 3,400,000 | | | 3,450 |
MMK International Capital DAC
4.375%, 6/13/24 144A j,Æ | | | 1,400,000 | | | 70 |
Sasol Financing USA LLC
6.500%, 9/27/28 | | | 2,000,000 | | | 1,905 |
Syngenta Finance NV
4.892%, 4/24/25 144A | | | 3,209,000 | | | 3,165 |
| | | | | | |
Total | | | | | | 9,289 |
| | | | | | |
| | |
Communications (4.7%) | | | | | | |
Altice Financing SA
3.000%, 1/15/28 EUR §,∞ | | | 200,000 | | | 196 |
5.750%, 8/15/29 144A | | | 3,600,000 | | | 3,195 |
Altice France Holding SA
6.000%, 2/15/28 144A | | | 1,700,000 | | | 816 |
8.000%, 5/15/27 EUR §,∞ | | | 1,000,000 | | | 626 |
Altice France SA
4.000%, 7/15/29 EUR §,∞ | | | 3,250,000 | | | 2,785 |
4.250%, 10/15/29 EUR §,∞ | | | 400,000 | | | 350 |
5.500%, 10/15/29 144A | | | 800,000 | | | 627 |
| | | | | | | | |
| Corporate Bonds (42.7%) | | Shares/ Par + | | | Value $ (000’s) | |
Communications continued | | | | | | | | |
8.125%, 2/1/27 144A | | | 3,200,000 | | | | 2,950 | |
AT&T, Inc.
3.500%, 9/15/53 | | | 237,000 | | | | 172 | |
3.650%, 9/15/59 | | | 6,663,000 | | | | 4,775 | |
3.800%, 12/1/57 | | | 115,000 | | | | 85 | |
CCO Holdings LLC / CCO Holdings Capital Corp.
4.250%, 2/1/31 144A | | | 2,500,000 | | | | 2,185 | |
4.500%, 6/1/33 144A | | | 800,000 | | | | 677 | |
Charter Communications Operating LLC / Charter Communications Operating Capital Corp.
3.700%, 4/1/51 | | | 300,000 | | | | 195 | |
4.200%, 3/15/28 | | | 1,700,000 | | | | 1,633 | |
5.125%, 7/1/49 | | | 3,300,000 | | | | 2,680 | |
5.375%, 4/1/38 | | | 100,000 | | | | 90 | |
CommScope, Inc.
4.750%, 9/1/29 144A | | | 1,100,000 | | | | 739 | |
Connect Finco SARL / Connect US Finco LLC
6.750%, 10/1/26 144A | | | 1,800,000 | | | | 1,789 | |
Deutsche Telekom International Finance
8.750%, 6/15/30 | | | 475,000 | | | | 572 | |
DISH DBS Corp.
5.750%, 12/1/28 144A | | | 1,200,000 | | | | 957 | |
Intelsat Jackson Holdings SA
6.500%, 3/15/30 144A | | | 703,000 | | | | 670 | |
Lumen Technologies, Inc.
4.000%, 2/15/27 144A | | | 100,000 | | | | 65 | |
Prosus NV
3.257%, 1/19/27 144A | | | 500,000 | | | | 462 | |
Sirius XM Radio, Inc.
3.125%, 9/1/26 144A | | | 1,100,000 | | | | 1,034 | |
Sprint Corp.
7.125%, 6/15/24 | | | 100,000 | | | | 100 | |
Sprint Spectrum Co. LLC / Sprint Spectrum Co. II LLC / Sprint Spectrum Co. III LLC
5.152%, 3/20/28 144A | | | 1,105,000 | | | | 1,100 | |
Telecom Italia SpA
7.875%, 7/31/28 EUR §,∞ | | | 1,400,000 | | | | 1,714 | |
Time Warner Cable LLC
5.875%, 11/15/40 | | | 300,000 | | | | 272 | |
6.750%, 6/15/39 | | | 200,000 | | | | 198 | |
T-Mobile USA, Inc.
5.050%, 7/15/33 | | | 750,000 | | | | 756 | |
5.650%, 1/15/53 | | | 1,000,000 | | | | 1,041 | |
United Group BV
5.250%, 2/1/30 EUR §,∞ | | | 1,000,000 | | | | 1,043 | |
UPC Broadband Finco BV
4.875%, 7/15/31 144A | | | 4,800,000 | | | | 4,225 | |
Verizon Communications, Inc.
2.355%, 3/15/32 | | | 3,500,000 | | | | 2,911 | |
Virgin Media Secured Finance PLC
4.125%, 8/15/30 GBP §,∞ | | | 1,200,000 | | | | 1,310 | |
4.250%, 1/15/30 GBP §,∞ | | | 3,200,000 | | | | 3,555 | |
VMED O2 UK Financing I PLC
3.250%, 1/31/31 EUR §,∞ | | | 1,200,000 | | | | 1,215 | |
The Accompanying Notes are an Integral Part of the Financial Statements.
169
Multi-Sector Bond Portfolio
| | | | | | | | |
| Corporate Bonds (42.7%) | | Shares/ Par + | | | Value
$ (000’s) | |
Communications continued | | | | | | | | |
4.000%, 1/31/29 GBP §,∞ | | | 3,100,000 | | | | 3,492 | |
4.500%, 7/15/31 GBP §,∞ | | | 400,000 | | | | 440 | |
4.750%, 7/15/31 144A | | | 1,100,000 | | | | 982 | |
Vodafone Group PLC
7.000%, (USD 5 Year Swap Rate plus | | | | | | | | |
4.873%), 4/4/79 α | | | 1,700,000 | | | | 1,753 | |
| | | | | | | | |
Total | | | | | | | 56,432 | |
| | | | | | | | |
| | |
Consumer, Cyclical (6.4%) | | | | | | | | |
Adient Global Holdings, Ltd.
3.500%, 8/15/24 EUR §,∞ | | | 59,781 | | | | 65 | |
Air Canada Pass-Through Trust, Series
2020-2, Class A
5.250%, 10/1/30 144A | | | 622,890 | | | | 610 | |
Alaska Airlines Pass-Through Trust, Series
2020-1, Class A
4.800%, 2/15/29 144A | | | 152,967 | | | | 149 | |
American Airlines Pass-Through Trust, Series
2014-1, Class A
3.700%, 4/1/28 | | | 158,444 | | | | 147 | |
American Airlines Pass-Through Trust, Series
2015-1, Class A
3.375%, 11/1/28 | | | 287,631 | | | | 263 | |
American Airlines Pass-Through Trust, Series
2016-1, Class AA
3.575%, 7/15/29 | | | 733,581 | | | | 684 | |
American Airlines Pass-Through Trust, Series
2017-2, Class AA
3.350%, 4/15/31 | | | 140,466 | | | | 127 | |
British Airways Pass-Through Trust, Series
2020-1, Class A
2.900%, 9/15/36 144A | | | 369,943 | | | | 316 | |
4.250%, 5/15/34 144A | | | 100,043 | | | | 93 | |
Caesars Entertainment, Inc.
5.750%, 7/1/25 144A | | | 7,300,000 | | | | 7,299 | |
Carnival Corp.
4.000%, 8/1/28 144A | | | 2,300,000 | | | | 2,138 | |
Ford Motor Co.
5.291%, 12/8/46 | | | 50,000 | | | | 44 | |
Ford Motor Credit Co. LLC
1.744%, 7/19/24 EUR ∞ | | | 200,000 | | | | 218 | |
2.330%, 11/25/25 EUR ∞ | | | 100,000 | | | | 107 | |
2.386%, 2/17/26 EUR ∞ | | | 100,000 | | | | 107 | |
2.748%, 6/14/24 GBP ∞ | | | 700,000 | | | | 879 | |
3.021%, 3/6/24 EUR ∞ | | | 900,000 | | | | 990 | |
3.250%, 9/15/25 EUR ∞ | | | 300,000 | | | | 327 | |
3.625%, 6/17/31 | | | 2,900,000 | | | | 2,500 | |
3.815%, 11/2/27 | | | 300,000 | | | | 280 | |
4.134%, 8/4/25 | | | 200,000 | | | | 194 | |
4.389%, 1/8/26 | | | 800,000 | | | | 778 | |
4.535%, 3/6/25 GBP ∞ | | | 100,000 | | | | 126 | |
4.675%, (Euribor 3 Month ACT/360 plus 0.700%), 12/1/24 EUR ∞ | | | 1,300,000 | | | | 1,436 | |
5.584%, 3/18/24 | | | 250,000 | | | | 250 | |
7.200%, 6/10/30 | | | 25,000 | | | | 27 | |
7.350%, 11/4/27 | | | 50,000 | | | | 53 | |
7.350%, 3/6/30 | | | 25,000 | | | | 27 | |
General Motors Financial Co., Inc.
5.100%, 1/17/24 | | | 1,200,000 | | | | 1,200 | |
| | | | | | | | |
| Corporate Bonds (42.7%) | | Shares/ Par + | | | Value
$ (000’s) | |
Consumer, Cyclical continued | | | | | | | | |
IHO Verwaltungs GmbH
3.750%, 9/15/26 EUR §,∞ | | | 3,250,000 | | | | 3,533 | |
Jaguar Land Rover Automotive PLC
4.500%, 7/15/28 EUR §,∞ | | | 200,000 | | | | 215 | |
JetBlue Airways Corp.
4.000%, 5/15/34 | | | 723,320 | | | | 662 | |
John Lewis PLC
4.250%, 12/18/34 GBP §,∞ | | | 1,000,000 | | | | 916 | |
Las Vegas Sands Corp.
3.900%, 8/8/29 | | | 100,000 | | | | 92 | |
Marks & Spencer PLC
4.500%, 7/10/27 GBP §,∞ | | | 300,000 | | | | 369 | |
6.000%, 6/12/25 GBP §,∞ | | | 1,000,000 | | | | 1,280 | |
Mattel, Inc.
3.375%, 4/1/26 144A | | | 100,000 | | | | 95 | |
Melco Resorts Finance, Ltd.
4.875%, 6/6/25 144A | | | 5,700,000 | | | | 5,529 | |
5.375%, 12/4/29 144A | | | 700,000 | | | | 616 | |
Mitchells & Butlers Finance PLC
5.134%, (SONIO plus 0.569%), 12/15/30
GBP §,∞ | | | 784,630 | | | | 911 | |
6.040%, (US SOFR plus 0.712%), 12/15/30 § | | | 142,660 | | | | 131 | |
6.469%, 9/15/32 GBP §,∞ | | | 200,000 | | | | 231 | |
NCL Corp., Ltd.
8.125%, 1/15/29 144A | | | 1,200,000 | | | | 1,254 | |
Nissan Motor Acceptance Corp.
2.000%, 3/9/26 144A | | | 400,000 | | | | 368 | |
Nissan Motor Co., Ltd.
3.201%, 9/17/28 EUR §,∞ | | | 500,000 | | | | 530 | |
4.345%, 9/17/27 144A | | | 3,500,000 | | | | 3,348 | |
Pinnacle Bidco PLC
1.000%, 10/11/28 144A GBP ∞ | | | 1,500,000 | | | | 1,983 | |
Renault SA
2.375%, 5/25/26 EUR §,∞ | | | 3,900,000 | | | | 4,163 | |
Ritchie Bros Auctioneers, Inc.
7.750%, 3/15/31 144A | | | 1,500,000 | | | | 1,599 | |
Royal Caribbean Cruises, Ltd.
7.250%, 1/15/30 144A | | | 1,000,000 | | | | 1,044 | |
Sands China, Ltd.
2.800%, 3/8/27 | | | 400,000 | | | | 364 | |
3.750%, 8/8/31 | | | 1,100,000 | | | | 921 | |
4.300%, 1/8/26 | | | 1,700,000 | | | | 1,632 | |
5.650%, 8/8/28 | | | 3,200,000 | | | | 3,173 | |
Spirit Loyalty Cayman, Ltd. / Spirit IP Cayman, Ltd.
8.000%, 9/20/25 144A | | | 775,000 | | | | 557 | |
United Airlines Pass-Through Trust, Series 2014-1, Class A
4.000%, 10/11/27 | | | 535,056 | | | | 511 | |
United Airlines Pass-Through Trust, Series 2019-2, Class A
2.900%, 11/1/29 | | | 82,768 | | | | 72 | |
United Airlines Pass-Through Trust, Series 2020-1, Class A
5.875%, 4/15/29 | | | 1,876,252 | | | | 1,900 | |
United Airlines, Inc.
5.800%, 7/15/37 | | | 3,700,000 | | | | 3,752 | |
The Accompanying Notes are an Integral Part of the Financial Statements.
170
Multi-Sector Bond Portfolio
| | | | | | | | |
| Corporate Bonds (42.7%) | | Shares/ Par + | | | Value
$ (000’s) | |
Consumer, Cyclical continued | | | | | | | | |
US Airways Pass-Through Trust, Series 2012- 1, Class A
5.900%, 4/1/26 | | | 509,794 | | | | 510 | |
Viking Cruises, Ltd.
9.125%, 7/15/31 144A | | | 425,000 | | | | 453 | |
Walgreens Boots Alliance, Inc.
3.600%, 11/20/25 GBP ∞ | | | 900,000 | | | | 1,093 | |
Wynn Macau, Ltd.
5.500%, 1/15/26 144A | | | 200,000 | | | | 195 | |
5.500%, 1/15/26 § | | | 500,000 | | | | 488 | |
Wynn Resorts Finance LLC / Wynn Resorts Capital Corp.
5.125%, 10/1/29 144A | | | 800,000 | | | | 755 | |
7.125%, 2/15/31 144A | | | 1,000,000 | | | | 1,041 | |
ZF Europe Finance BV
2.000%, 2/23/26 EUR §,∞ | | | 2,000,000 | | | | 2,103 | |
ZF Finance GmbH
2.750%, 5/25/27 EUR §,∞ | | | 4,300,000 | | | | 4,510 | |
3.750%, 9/21/28 EUR §,∞ | | | 2,000,000 | | | | 2,127 | |
| | | | | | | | |
Total | | | | | | | 76,460 | |
| | | | | | | | |
| | |
Consumer, Non-cyclical (4.8%) | | | | | | | | |
Abertis Infraestructuras SA
1.625%, 7/15/29 EUR §,∞ | | | 500,000 | | | | 501 | |
1.875%, 3/26/32 EUR §,∞ | | | 600,000 | | | | 574 | |
3.000%, 3/27/31 EUR §,∞ | | | 600,000 | | | | 631 | |
3.375%, 11/27/26 GBP §,∞ | | | 2,100,000 | | | | 2,553 | |
Albion Financing 1 SARL / Aggreko Holdings, Inc.
5.250%, 10/15/26 EUR §,∞ | | | 1,600,000 | | | | 1,762 | |
6.125%, 10/15/26 144A | | | 300,000 | | | | 297 | |
Allied Universal Holdco LLC / Allied Universal Finance Corp. / Atlas Luxco 4 SARL
3.625%, 6/1/28 EUR §,∞ | | | 1,400,000 | | | | 1,354 | |
Amgen, Inc.
5.650%, 3/2/53 | | | 1,000,000 | | | | 1,052 | |
Bacardi, Ltd.
4.700%, 5/15/28 144A | | | 2,900,000 | | | | 2,841 | |
BAT Capital Corp.
3.222%, 8/15/24 | | | 58,000 | | | | 57 | |
3.557%, 8/15/27 | | | 132,000 | | | | 126 | |
Bausch & Lomb Escrow Corp.
8.375%, 10/1/28 144A | | | 700,000 | | | | 738 | |
Bellis Acquisition Co. PLC
3.250%, 2/16/26 GBP §,∞ | | | 3,400,000 | | | | 4,013 | |
Boels Topholding BV
6.250%, 2/15/29 144A EUR ∞ | | | 1,200,000 | | | | 1,381 | |
Centene Corp.
4.250%, 12/15/27 | | | 200,000 | | | | 193 | |
4.625%, 12/15/29 | | | 500,000 | | | | 479 | |
Cheplapharm Arzneimittel GmbH
7.500%, 5/15/30 144A EUR ∞ | | | 1,000,000 | | | | 1,174 | |
CHS / Community Health Systems, Inc.
6.000%, 1/15/29 144A | | | 700,000 | | | | 630 | |
8.000%, 3/15/26 144A | | | 346,000 | | | | 345 | |
Constellation Brands, Inc.
3.700%, 12/6/26 | | | 200,000 | | | | 195 | |
Coty, Inc./HFC Prestige Products, Inc./HFC Prestige International US LLC
6.625%, 7/15/30 144A | | | 2,300,000 | | | | 2,363 | |
| | | | | | | | |
| Corporate Bonds (42.7%) | | Shares/ Par + | | | Value
$ (000’s) | |
Consumer, Non-cyclical continued | | | | | | | | |
CVS Pass-Through Trust
4.704%, 1/10/36 144A | | | 336,127 | | | | 312 | |
5.926%, 1/10/34 144A | | | 555,099 | | | | 562 | |
7.507%, 1/10/32 144A | | | 54,531 | | | | 57 | |
Elevance Health, Inc.
4.750%, 2/15/33 | | | 900,000 | | | | 900 | |
Fortrea Holdings, Inc.
7.500%, 7/1/30 144A | | | 900,000 | | | | 924 | |
GTCR W-2 Merger Sub LLC
7.500%, 1/15/31 144A | | | 2,000,000 | | | | 2,113 | |
HCA, Inc.
5.200%, 6/1/28 | | | 2,000,000 | | | | 2,021 | |
Imperial Brands Finance PLC
3.500%, 7/26/26 144A | | | 200,000 | | | | 191 | |
6.125%, 7/27/27 144A | | | 2,200,000 | | | | 2,259 | |
IQVIA, Inc.
5.700%, 5/15/28 144A | | | 1,700,000 | | | | 1,732 | |
LifePoint Health, Inc.
11.000%, 10/15/30 144A | | | 1,600,000 | | | | 1,685 | |
Loxam SAS
2.875%, 4/15/26 EUR §,∞ | | | 100,000 | | | | 107 | |
Market Bidco Finco PLC
4.750%, 11/4/27 EUR §,∞ | | | 1,898,000 | | | | 1,868 | |
Mundys SpA
1.625%, 2/3/25 EUR §,∞ | | | 1,200,000 | | | | 1,285 | |
1.875%, 7/13/27 EUR §,∞ | | | 400,000 | | | | 412 | |
1.875%, 2/12/28 EUR §,∞ | | | 5,500,000 | | | | 5,556 | |
Nexi SpA
2.125%, 4/30/29 EUR §,∞ | | | 3,700,000 | | | | 3,597 | |
Organon & Co. / Organon Foreign Debt Co- Issuer BV
2.875%, 4/30/28 EUR §,∞ | | | 3,900,000 | | | | 3,949 | |
Organon Finance 1 LLC
4.125%, 4/30/28 144A | | | 1,100,000 | | | | 1,013 | |
Perrigo Finance Unlimited Co.
4.650%, 6/15/30 | | | 200,000 | | | | 182 | |
Star Parent, Inc.
9.000%, 10/1/30 144A | | | 1,300,000 | | | | 1,370 | |
Teva Pharmaceutical Finance Netherlands II BV
4.375%, 5/9/30 EUR ∞ | | | 2,000,000 | | | | 2,068 | |
4.500%, 3/1/25 EUR ∞ | | | 137,000 | | | | 151 | |
| | | | | | | | |
Total | | | | | | | 57,573 | |
| | | | | | | | |
| | |
Diversified (0.0%) | | | | | | | | |
Stena International SA
6.125%, 2/1/25 144A | | | 400,000 | | | | 397 | |
| | | | | | | | |
Total | | | | | | | 397 | |
| | | | | | | | |
| | |
Energy (7.6%) | | | | | | | | |
Aker BP ASA
3.750%, 1/15/30 144A | | | 400,000 | | | | 367 | |
Blue Racer Midstream LLC / Blue Racer Finance Corp.
6.625%, 7/15/26 144A | | | 100,000 | | | | 99 | |
7.625%, 12/15/25 144A | | | 1,500,000 | | | | 1,519 | |
Boardwalk Pipelines LP
3.400%, 2/15/31 | | | 200,000 | | | | 179 | |
CGG SA
8.750%, 4/1/27 144A | | | 300,000 | | | | 273 | |
The Accompanying Notes are an Integral Part of the Financial Statements.
171
Multi-Sector Bond Portfolio
| | | | | | | | |
| Corporate Bonds (42.7%) | | Shares/ Par + | | | Value
$ (000’s) | |
Energy continued | | | | | | | | |
Cheniere Corpus Christi Holdings LLC
5.125%, 6/30/27 | | | 100,000 | | | | 100 | |
Cheniere Energy Partners LP
4.000%, 3/1/31 | | | 1,400,000 | | | | 1,273 | |
Continental Resources, Inc.
4.375%, 1/15/28 | | | 1,400,000 | | | | 1,356 | |
El Paso Natural Gas Co. LLC
8.375%, 6/15/32 | | | 200,000 | | | | 233 | |
Enbridge, Inc.
5.700%, 3/8/33 | | | 900,000 | | | | 935 | |
Energy Transfer LP
2.900%, 5/15/25 | | | 100,000 | | | | 97 | |
3.750%, 5/15/30 | | | 200,000 | | | | 186 | |
4.950%, 5/15/28 | | | 1,200,000 | | | | 1,194 | |
5.000%, 5/15/50 | | | 200,000 | | | | 178 | |
5.250%, 4/15/29 | | | 100,000 | | | | 101 | |
6.050%, 6/1/41 | | | 100,000 | | | | 101 | |
6.500%, 2/1/42 | | | 300,000 | | | | 317 | |
6.625%, 10/15/36 | | | 500,000 | | | | 538 | |
7.500%, 7/1/38 | | | 1,700,000 | | | | 1,966 | |
EQM Midstream Partners LP
4.500%, 1/15/29 144A | | | 1,500,000 | | | | 1,417 | |
EQT Corp.
6.625%, 2/1/25 | | | 3,044,000 | | | | 3,058 | |
Genesis Energy LP / Genesis Energy Finance Corp.
8.250%, 1/15/29 | | | 800,000 | | | | 823 | |
Gray Oak Pipeline LLC
3.450%, 10/15/27 144A | | | 500,000 | | | | 465 | |
Howard Midstream Energy Partners LLC
8.875%, 7/15/28 144A | | | 1,800,000 | | | | 1,889 | |
KazMunayGas National Co. JSC
5.375%, 4/24/30 § | | | 600,000 | | | | 594 | |
5.750%, 4/19/47 § | | | 1,200,000 | | | | 1,049 | |
Kinder Morgan Energy Partners LP
6.550%, 9/15/40 | | | 2,382,000 | | | | 2,512 | |
Kinder Morgan, Inc.
7.750%, 1/15/32 | | | 1,216,000 | | | | 1,382 | |
Midwest Connector Capital Co. LLC
3.900%, 4/1/24 144A | | | 200,000 | | | | 199 | |
MPLX LP
4.250%, 12/1/27 | | | 100,000 | | | | 98 | |
NGPL PipeCo LLC
7.768%, 12/15/37 144A | | | 3,900,000 | | | | 4,337 | |
Noble Finance II LLC
8.000%, 4/15/30 144A | | | 1,400,000 | | | | 1,457 | |
NuStar Logistics LP
5.625%, 4/28/27 | | | 1,400,000 | | | | 1,394 | |
6.000%, 6/1/26 | | | 200,000 | | | | 200 | |
Occidental Petroleum Corp.
5.875%, 9/1/25 | | | 700,000 | | | | 704 | |
Odebrecht Oil & Gas Finance, Ltd.
0.000%, 2/16/24 §,µ PO | | | 782,000 | | | | 26 | |
Permian Resources Operating LLC
7.000%, 1/15/32 144A | | | 1,300,000 | | | | 1,341 | |
Pertamina Persero PT
6.500%, 11/7/48 144A | | | 3,800,000 | | | | 4,238 | |
Petroleos de Venezuela SA
5.375%, 4/12/27 §,j | | | 6,500,000 | | | | 692 | |
5.500%, 4/12/37 §,j | | | 4,300,000 | | | | 462 | |
| | | | | | | | |
| Corporate Bonds (42.7%) | | Shares/ Par + | | | Value
$ (000’s) | |
Energy continued | | | | | | | | |
Petroleos Mexicanos
2.750%, 4/21/27 EUR §,∞ | | | 1,100,000 | | | | 1,020 | |
4.750%, 2/26/29 EUR §,∞ | | | 3,000,000 | | | | 2,722 | |
5.625%, 1/23/46 | | | 378,000 | | | | 229 | |
5.950%, 1/28/31 | | | 4,300,000 | | | | 3,434 | |
6.350%, 2/12/48 | | | 1,700,000 | | | | 1,079 | |
6.625%, 6/15/35 | | | 4,200,000 | | | | 3,221 | |
6.625%, 6/15/38 | | | 2,000,000 | | | | 1,411 | |
6.700%, 2/16/32 | | | 2,836,000 | | | | 2,353 | |
6.750%, 9/21/47 | | | 2,900,000 | | | | 1,898 | |
7.690%, 1/23/50 | | | 2,580,000 | | | | 1,835 | |
Petrorio Luxembourg SARL
6.125%, 6/9/26 144A | | | 200,000 | | | | 196 | |
Plains All American Pipeline LP / PAA Finance Corp.
4.900%, 2/15/45 | | | 1,100,000 | | | | 948 | |
6.650%, 1/15/37 | | | 277,000 | | | | 296 | |
Ras Laffan Liquefied Natural Gas Co., Ltd. III
5.838%, 9/30/27 144A | | | 1,590,220 | | | | 1,616 | |
Rio Oil Finance Trust
9.750%, 1/6/27 § | | | 240,221 | | | | 249 | |
Sabine Pass Liquefaction LLC
4.500%, 5/15/30 | | | 700,000 | | | | 684 | |
5.625%, 3/1/25 | | | 4,900,000 | | | | 4,909 | |
5.750%, 5/15/24 | | | 131,000 | | | | 131 | |
5.875%, 6/30/26 | | | 400,000 | | | | 407 | |
Santos Finance, Ltd.
3.649%, 4/29/31 144A | | | 700,000 | | | | 610 | |
Seadrill Finance, Ltd.
8.375%, 8/1/30 144A | | | 1,500,000 | | | | 1,565 | |
Sitio Royalties Operating Partnership LP / Sitio Finance Corp.
7.875%, 11/1/28 144A | | | 1,100,000 | | | | 1,140 | |
Southwestern Energy Co.
5.375%, 2/1/29 | | | 100,000 | | | | 98 | |
Tallgrass Energy Partners LP
5.500%, 1/15/28 144A | | | 7,400,000 | | | | 6,993 | |
Targa Resources Partners LP / Targa Resources Partners Finance Corp.
5.500%, 3/1/30 | | | 1,200,000 | | | | 1,200 | |
TMS Issuer SARL
5.780%, 8/23/32 144A | | | 3,400,000 | | | | 3,544 | |
Transocean Aquila, Ltd.
8.000%, 9/30/28 144A | | | 1,100,000 | | | | 1,116 | |
Valaris, Ltd.
8.375%, 4/30/30 144A | | | 1,000,000 | | | | 1,025 | |
Venture Global Calcasieu Pass LLC
3.875%, 8/15/29 144A | | | 2,100,000 | | | | 1,905 | |
Venture Global LNG, Inc.
8.375%, 6/1/31 144A | | | 2,700,000 | | | | 2,699 | |
Western Midstream Operating, LP
3.350%, 2/1/25 | | | 1,200,000 | | | | 1,168 | |
| | | | | | | | |
Total | | | | | | | 91,050 | |
| | | | | | | | |
| | |
Financial (12.2%) | | | | | | | | |
ADLER Group SA
4.625%, 1/14/26 EUR §,∞ | | | 3,000,000 | | | | 1,144 | |
5.500%, 11/13/26 EUR §,∞ | | | 5,100,000 | | | | 1,942 | |
The Accompanying Notes are an Integral Part of the Financial Statements.
172
Multi-Sector Bond Portfolio
| | | | | | | | |
| Corporate Bonds (42.7%) | | Shares/ Par + | | | Value
$ (000’s) | |
Financial continued | | | | | | | | |
AerCap Ireland Capital DAC / AerCap Global Aviation Trust
3.150%, 2/15/24 | | | 3,600,000 | | | | 3,586 | |
3.650%, 7/21/27 | | | 500,000 | | | | 475 | |
4.450%, 4/3/26 | | | 900,000 | | | | 884 | |
4.625%, 10/15/27 | | | 500,000 | | | | 490 | |
4.875%, 1/16/24 | | | 1,200,000 | | | | 1,199 | |
Aircastle, Ltd.
2.850%, 1/26/28 144A | | | 600,000 | | | | 535 | |
4.250%, 6/15/26 | | | 300,000 | | | | 290 | |
5.250%, 8/11/25 144A | | | 2,400,000 | | | | 2,366 | |
Alliant Holdings Intermediate LLC / Alliant Holdings Co-Issuer
7.000%, 1/15/31 144A | | | 1,200,000 | | | | 1,266 | |
Ally Financial, Inc.
6.848%, (US SOFR plus 2.820%),
1/3/30 α | | | 1,000,000 | | | | 1,027 | |
8.000%, 11/1/31 | | | 1,371,000 | | | | 1,502 | |
American Tower Corp.
5.900%, 11/15/33 | | | 2,500,000 | | | | 2,647 | |
Antares Holdings LP
2.750%, 1/15/27 144A | | | 250,000 | | | | 221 | |
Athora Netherlands NV
2.375%, 5/17/24 EUR §,∞ | | | 700,000 | | | | 758 | |
7.000%, (5 Year EUR Annual Swap Rate plus 6.463%), 6/19/25 EUR §,µ,∞,α,Y | | | 200,000 | | | | 215 | |
Aviation Capital Group LLC
5.500%, 12/15/24 144A | | | 1,000,000 | | | | 994 | |
Avolon Holdings Funding, Ltd.
2.528%, 11/18/27 144A | | | 2,173,000 | | | | 1,925 | |
Banca Monte dei Paschi di Siena SpA
1.875%, 1/9/26 EUR §,∞ | | | 300,000 | | | | 314 | |
2.625%, 4/28/25 EUR §,∞ | | | 1,600,000 | | | | 1,720 | |
5.375%, (5 Year EUR Annual Swap Rate plus 5.005%), 1/18/28 EUR §,∞,α | | | 3,800,000 | | | | 4,175 | |
8.000%, (5 Year EUR Annual Swap Rate plus 8.149%), 1/22/30 EUR §,∞,α | | | 500,000 | | | | 553 | |
8.500%, (5 Year EUR Annual Swap Rate plus 8.917%), 9/10/30 EUR §,∞,α | | | 800,000 | | | | 884 | |
Banco Bilbao Vizcaya Argentaria SA | | | | | | | | |
6.000%, (5 Year EUR Annual Swap Rate plus 6.039%), 3/29/24 EUR §,µ,∞,α,Y | | | 1,600,000 | | | | 1,761 | |
6.138%, (US Treasury Yield Curve Rate
T Note Constant Maturity 1 Year plus
2.700%), 9/14/28 α | | | 2,300,000 | | | | 2,362 | |
Banco BTG Pactual SA
4.500%, 1/10/25 144A | | | 500,000 | | | | 491 | |
Banco de Sabadell SA
1.125%, (1 Year EUR Annual Swap Rate plus 1.550%), 3/11/27 EUR §,∞,α | | | 200,000 | | | | 209 | |
Banco do Brasil SA
8.500%, 7/29/26 MXN §,∞ | | | 22,000,000 | | | | 1,216 | |
Banco Votorantim SA
4.500%, 9/24/24 § | | | 200,000 | | | | 197 | |
Bank of America Corp. 3.419%, (US SOFR 3 Month plus 1.302%), 12/20/28 α | | | 973,000 | | | | 916 | |
5.875%, (US SOFR 3 Month plus 3.193%), 3/15/28 µ,α | | | 3,700,000 | | | | 3,542 | |
| | | | | | | | |
| Corporate Bonds (42.7%) | | Shares/ Par + | | | Value
$ (000’s) | |
Financial continued | | | | | | | | |
Bank of Ireland Group PLC 6.253%, (US Treasury Yield Curve Rate T Note Constant Maturity 1 Year plus 2.650%), 9/16/26 144A α | | | 600,000 | | | | 606 | |
7.500%, (5 Year EUR Annual Swap Rate plus 7.924%), 5/19/25 EUR §,µ,∞,α,Y | | | 1,700,000 | | | | 1,900 | |
Barclays PLC 5.501%, (US Treasury Yield Curve Rate T Note Constant Maturity 1 Year plus 2.650%), 8/9/28 ∞ | | | 3,000,000 | | | | 3,014 | |
6.125%, (US Treasury Yield Curve Rate | | | | | | | | |
T Note Constant Maturity 5 year plus
5.867%), 12/15/25 µ,α,Y | | | 500,000 | | | | 478 | |
7.437%, (US Treasury Yield Curve Rate T Note Constant Maturity 1 Year plus 3.500%), 11/2/33 α | | | 500,000 | | | | 560 | |
BNP Paribas SA 1.904%, (US SOFR plus 1.609%), 9/30/28 144A α | | | 1,700,000 | | | | 1,510 | |
CaixaBank SA 6.750%, (5 Year EUR Annual Swap Rate plus 6.498%), 6/13/24 EUR §,µ,∞,α,Y | | | 200,000 | | | | 221 | |
Cantor Fitzgerald LP
4.875%, 5/1/24 144A | | | 100,000 | | | | 99 | |
7.200%, 12/12/28 144A | | | 1,200,000 | | | | 1,230 | |
Chubb INA Holdings, Inc.
0.875%, 6/15/27 EUR ∞ | | | 200,000 | | | | 206 | |
Citigroup, Inc.
3.400%, 5/1/26 | | | 400,000 | | | | 386 | |
Corestate Capital Holding SA
8.000%, 12/31/26 EUR §,∞,Þ | | | 151,239 | | | | 83 | |
10.000%, 12/31/26 EUR ∞,Æ,Þ | | | 200,000 | | | | 221 | |
CPI Property Group SA
1.625%, 4/23/27 EUR §,∞ | | | 700,000 | | | | 565 | |
Credicorp Capital Sociedad Titulizadora SA
10.100%, 12/15/43 144A PEN §,∞,Æ | | | 11,300,000 | | | | 3,082 | |
Credit Acceptance Corp.
9.250%, 12/15/28 144A | | | 1,200,000 | | | | 1,279 | |
Crown Castle International Corp.
2.100%, 4/1/31 | | | 1,700,000 | | | | 1,385 | |
5.000%, 1/11/28 | | | 1,700,000 | | | | 1,693 | |
DAE Sukuk DIFC, Ltd.
3.750%, 2/15/26 144A | | | 1,000,000 | | | | 960 | |
Deutsche Bank AG 1.375%, (Euribor 3 Month ACT/360 plus 1.500%), 2/17/32 EUR §,∞,α | | | 2,500,000 | | | | 2,265 | |
1.750%, (Euribor 3 Month ACT/360 plus 2.050%), 11/19/30 EUR §,∞,α | | | 3,700,000 | | | | 3,547 | |
3.035%, (US SOFR plus 1.718%),
5/28/32 α | | | 200,000 | | | | 167 | |
3.547%, (US SOFR plus 3.043%),
9/18/31 α | | | 1,300,000 | | | | 1,141 | |
3.729%, (US SOFR plus 2.757%),
1/14/32 α | | | 3,300,000 | | | | 2,766 | |
3.742%, (US SOFR plus 2.257%),
1/7/33 α | | | 700,000 | | | | 575 | |
5.882%, (US SOFR plus 5.438%),
7/8/31 α | | | 400,000 | | | | 388 | |
DrillCo Holding Lux SA
7.500%, 6/15/30 § | | | 277,407 | | | | 256 | |
Fairfax Financial Holdings, Ltd.
2.750%, 3/29/28 EUR §,∞ | | | 1,700,000 | | | | 1,788 | |
Fidelity National Financial, Inc.
3.400%, 6/15/30 | | | 200,000 | | | | 178 | |
Freedom Mortgage Corp.
6.625%, 1/15/27 144A | | | 500,000 | | | | 477 | |
The Accompanying Notes are an Integral Part of the Financial Statements.
173
Multi-Sector Bond Portfolio
| | | | | | | | |
| Corporate Bonds (42.7%) | | Shares/Par + | | | Value
$ (000’s) | |
Financial continued | | | | | | | | |
7.625%, 5/1/26 144A | | | 2,100,000 | | | | 2,073 | |
12.000%, 10/1/28 144A | | | 1,000,000 | | | | 1,092 | |
G City Europe, Ltd.
4.250%, 9/11/25 EUR §,∞ | | | 3,039,000 | | | | 3,064 | |
GLP Capital LP / GLP Financing II, Inc.
3.350%, 9/1/24 | | | 100,000 | | | | 99 | |
5.750%, 6/1/28 | | | 400,000 | | | | 404 | |
goeasy, Ltd.
9.250%, 12/1/28 144A | | | 1,100,000 | | | | 1,175 | |
The Goldman Sachs Group, Inc.
3.375%, 3/27/25 EUR §,∞ | | | 200,000 | | | | 220 | |
6.484%, (US SOFR plus 1.770%), 10/24/29 α | | | 1,500,000 | | | | 1,592 | |
HAT Holdings I LLC / HAT Holdings II LLC
8.000%, 6/15/27 144A | | | 1,250,000 | | | | 1,302 | |
HSBC Holdings PLC 1.645%, (US SOFR plus 1.538%),
4/18/26 α | | | 200,000 | | | | 190 | |
2.099%, (US SOFR plus 1.929%),
6/4/26 α | | | 200,000 | | | | 190 | |
2.804%, (US SOFR plus 1.187%),
5/24/32 α | | | 3,300,000 | | | | 2,755 | |
3.973%, (US SOFR 3 Month plus 1.872%), 5/22/30 α | | | 4,900,000 | | | | 4,577 | |
ING Groep NV
5.750%, (US Treasury Yield Curve Rate T Note Constant Maturity 5 year plus
4.342%), 11/16/26 µ,α,y | | | 1,800,000 | | | | 1,680 | |
6.750%, (5 Year ICE Swap Rate plus 4.204%), 4/16/24 §,µ,α,y | | | 900,000 | | | | 894 | |
Intesa Sanpaolo SpA
3.250%, 9/23/24 144A | | | 300,000 | | | | 295 | |
4.000%, 9/23/29 144A | | | 200,000 | | | | 182 | |
5.500%, (5 Year EUR Annual Swap Rate plus 5.848%), 3/1/28 EUR §,µ,∞,α,y | | | 2,025,000 | | | | 2,068 | |
5.875%, (5 Year EUR Annual Swap Rate plus 6.086%), 9/1/31 EUR §,µ,∞,α,y | | | 450,000 | | | | 447 | |
Jefferies Finance LLC / JFIN Co-Issuer Corp.
5.000%, 8/15/28 144A | | | 1,500,000 | | | | 1,343 | |
Kaisa Group Holdings, Ltd.
9.375%, 6/30/24 §,j | | | 400,000 | | | | 13 | |
9.750%, 9/28/23 §,j | | | 600,000 | | | | 20 | |
10.500%, 1/15/25 §,j | | | 1,100,000 | | | | 36 | |
10.875%, 7/23/23 §,j | | | 400,000 | | | | 11 | |
11.250%, 4/16/25 §,j | | | 3,500,000 | | | | 101 | |
11.650%, 6/1/26 §,j | | | 1,000,000 | | | | 29 | |
Kennedy Wilson, Inc.
4.750%, 2/1/30 | | | 1,800,000 | | | | 1,459 | |
LeasePlan Corp. NV
2.875%, 10/24/24 144A | | | 300,000 | | | | 293 | |
Liberty Mutual Finance Europe DAC
1.750%, 3/27/24 EUR §,∞ | | | 100,000 | | | | 110 | |
Lloyds Banking Group PLC 4.976%, (US Treasury Yield Curve Rate T Note Constant Maturity 1 Year plus 2.300%), 8/11/33 α | | | 200,000 | | | | 195 | |
Logicor Financing SARL
3.250%, 11/13/28 EUR §,∞ | | | 600,000 | | | | 629 | |
Marsh & McLennan Cos., Inc.
1.349%, 9/21/26 EUR ∞ | | | 100,000 | | | | 106 | |
NatWest Group PLC
4.800%, 4/5/26 | | | 2,800,000 | | | | 2,774 | |
4.892%, (ICE LIBOR USD 3 Month plus 1.754%), 5/18/29 α | | | 3,700,000 | | | | 3,632 | |
| | | | | | | | |
| Corporate Bonds (42.7%) | | Shares/Par + | | | Value
$ (000’s) | |
Financial continued | | | | | | | | |
6.000%, (US Treasury Yield Curve Rate T Note Constant Maturity 5 year plus 5.625%), 12/29/25 µ,α,y | | | 500,000 | | | | 483 | |
NN Group NV 4.500%, (Euribor 3 Month ACT/360 plus 4.000%), 7/15/49 EUR §,µ,∞,α | | | 2,600,000 | | | | 2,856 | |
OMEGA Healthcare Investors, Inc.
4.500%, 1/15/25 | | | 100,000 | | | | 98 | |
4.950%, 4/1/24 | | | 100,000 | | | | 100 | |
OneMain Finance Corp.
3.500%, 1/15/27 | | | 1,100,000 | | | | 1,018 | |
4.000%, 9/15/30 | | | 700,000 | | | | 599 | |
6.875%, 3/15/25 | | | 1,900,000 | | | | 1,923 | |
7.125%, 3/15/26 | | | 1,400,000 | | | | 1,426 | |
Pacific Life Global Funding II
1.200%, 6/24/25 144A | | | 200,000 | | | | 190 | |
Park Aerospace Holdings, Ltd.
5.500%, 2/15/24 144A | | | 112,000 | | | | 112 | |
PennyMac Financial Services, Inc.
7.875%, 12/15/29 144A | | | 1,800,000 | | | | 1,853 | |
PRA Group, Inc.
8.375%, 2/1/28 144A | | | 1,300,000 | | | | 1,252 | |
RLJ Lodging Trust LP
3.750%, 7/1/26 144A | | | 200,000 | | | | 189 | |
Santander UK Group Holdings PLC 2.896%, (US SOFR plus 1.475%),
3/15/32 α | | | 800,000 | | | | 683 | |
3.823%, (ICE LIBOR USD 3 Month plus 1.400%), 11/3/28 α | | | 4,000,000 | | | | 3,758 | |
6.750%, (GBP Swap Semi-Annual 5 Year plus 6.069%), 6/24/24 GBP §,µ,∞,α,y | | | 1,390,000 | | | | 1,766 | |
Sberbank of Russia Via SB Capital SA
5.250%, 5/23/23 §,j,y,Æ | | | 4,500,000 | | | | 225 | |
Sunac China Holdings, Ltd.
6.000%, 9/30/26 144A | | | 249,801 | | | | 29 | |
6.250%, 9/30/26 144A | | | 249,801 | | | | 22 | |
6.500%, 9/30/27 144A | | | 499,604 | | | | 45 | |
6.750%, 9/30/28 144A | | | 749,407 | | | | 43 | |
7.000%, 9/30/29 144A | | | 749,407 | | | | 50 | |
7.250%, 9/30/30 144A | | | 352,037 | | | | 18 | |
Tesco Property Finance 3 PLC
5.744%, 4/13/40 GBP §,∞ | | | 90,046 | | | | 116 | |
Tesco Property Finance 6 PLC
5.411%, 7/13/44 GBP §,∞ | | | 2,506,778 | | | | 3,095 | |
Trust Fibra Uno
6.390%, 1/15/50 144A | | | 100,000 | | | | 81 | |
UBS Group AG 4.703%, (US Treasury Yield Curve Rate T Note Constant Maturity 1 Year plus 2.050%), 8/5/27 144A α | | | 400,000 | | | | 394 | |
6.327%, (US Treasury Yield Curve Rate T Note Constant Maturity 1 Year plus 1.600%), 12/22/27 144A α | | | 3,000,000 | | | | 3,092 | |
UniCredit SpA 7.296%, (USD 5 Year Swap Rate plus 4.914%), 4/2/34 144A α | | | 5,700,000 | | | | 5,860 | |
The Unique Pub Finance Co. PLC
7.395%, 3/28/24 GBP §,∞ | | | 36,800 | | | | 47 | |
Virgin Money UK PLC 3.125%, (SONIA Interest Rate Benchmark plus 2.569%), 6/22/25 GBP §,∞,α | | | 100,000 | | | | 125 | |
The Accompanying Notes are an Integral Part of the Financial Statements.
174
Multi-Sector Bond Portfolio
| | | | | | | | |
| Corporate Bonds (42.7%) | | Shares/Par + | | | Value
$ (000’s) | |
Financial continued | | | | | | | | |
3.375%, (1 Year GBP Swap Rate plus 2.145%), 4/24/26 GBP §,∞,α | | | 100,000 | | | | 122 | |
4.000%, (1 Year UK Gilts plus 2.800%), 9/25/26 GBP §,∞,α | | | 500,000 | | | | 612 | |
4.000%, (1 Year UK Gilts plus 3.750%), 9/3/27 GBP §,∞,α | | | 200,000 | | | | 242 | |
Wells Fargo & Co.
1.000%, 2/2/27 EUR §,∞ | | | 1,500,000 | | | | 1,537 | |
4.808%, (US SOFR plus 1.980%),
7/25/28 α | | | 200,000 | | | | 199 | |
5.574%, (US SOFR plus 1.740%),
7/25/29 α | | | 1,500,000 | | | | 1,532 | |
Weyerhaeuser Co.
7.375%, 3/15/32 | | | 424,000 | | | | 492 | |
Yango Justice International, Ltd.
7.500%, 4/15/24 §,j | | | 4,200,000 | | | | 2 | |
7.875%, 9/4/24 §,j | | | 600,000 | | | | – | π |
| | | | | | | | |
Total | | | | | | | 146,168 | |
| | | | | | | | |
| | |
Industrial (2.7%) | | | | | | | | |
Berry Global, Inc.
1.570%, 1/15/26 | | | 100,000 | | | | 93 | |
The Boeing Co.
3.950%, 8/1/59 | | | 2,000,000 | | | | 1,530 | |
Constellation Oil Services Holding SA
3.000%, 12/31/26 Þ | | | 103,110 | | | | 75 | |
DAE Funding LLC
1.550%, 8/1/24 144A | | | 1,700,000 | | | | 1,656 | |
1.625%, 2/15/24 144A | | | 1,000,000 | | | | 995 | |
2.625%, 3/20/25 144A | | | 500,000 | | | | 479 | |
3.375%, 3/20/28 144A | | | 700,000 | | | | 644 | |
3.375%, 3/20/28 § | | | 200,000 | | | | 184 | |
Empresa de Transporte de Pasajeros Metro SA
4.700%, 5/7/50 § | | | 1,400,000 | | | | 1,155 | |
Flex, Ltd.
3.750%, 2/1/26 | | | 700,000 | | | | 677 | |
Fortress Transportation & Infrastructure
5.500%, 5/1/28 144A | | | 400,000 | | | | 385 | |
6.500%, 10/1/25 144A | | | 4,818,000 | | | | 4,803 | |
Forward Air Corp.
9.500%, 10/15/31 144A | | | 1,200,000 | | | | 1,171 | |
GE Capital UK Funding Unlimited Co.
5.875%, 1/18/33 GBP ∞ | | | 800,000 | | | | 1,093 | |
General Electric Co.
4.125%, 9/19/35 EUR §,∞ | | | 500,000 | | | | 590 | |
Lima Metro Line 2 Finance, Ltd.
5.875%, 7/5/34 144A | | | 266,544 | | | | 263 | |
The Manitowoc Co., Inc.
9.000%, 4/1/26 144A | | | 6,200,000 | | | | 6,218 | |
Rolls-Royce PLC
4.625%, 2/16/26 EUR §,∞ | | | 1,600,000 | | | | 1,794 | |
5.750%, 10/15/27 144A | | | 200,000 | | | | 200 | |
5.750%, 10/15/27 GBP §,∞ | | | 100,000 | | | | 128 | |
SMBC Aviation Capital Finance DAC
2.300%, 6/15/28 144A | | | 200,000 | | | | 176 | |
Spirit Aerosystems, Inc.
9.375%, 11/30/29 144A | | | 100,000 | | | | 109 | |
9.750%, 11/15/30 144A | | | 1,500,000 | | | | 1,612 | |
Standard Industries, Inc.
2.250%, 11/21/26 EUR §,∞ | | | 2,600,000 | | | | 2,705 | |
| | | | | | | | |
| Corporate Bonds (42.7%) | | Shares/Par + | | | Value
$ (000’s) | |
Industrial continued | | | | | | | | |
TransDigm, Inc.
7.125%, 12/1/31 144A | | | 1,600,000 | | | | 1,677 | |
XPO, Inc.
6.250%, 6/1/28 144A | | | 1,200,000 | | | | 1,214 | |
7.125%, 2/1/32 144A | | | 1,300,000 | | | | 1,342 | |
| | | | | | | | |
Total | | | | | | | 32,968 | |
| | | | | | | | |
| | |
Technology (1.5%) | | | | | | | | |
Booz Allen Hamilton, Inc.
3.875%, 9/1/28 144A | | | 1,200,000 | | | | 1,130 | |
Broadcom, Inc.
2.450%, 2/15/31 144A | | | 700,000 | | | | 599 | |
3.137%, 11/15/35 144A | | | 1,500,000 | | | | 1,231 | |
Dell International LLC / EMC Corp.
5.300%, 10/1/29 | | | 4,300,000 | | | | 4,428 | |
6.020%, 6/15/26 | | | 209,000 | | | | 214 | |
8.100%, 7/15/36 | | | 162,000 | | | | 199 | |
Marvell Technology, Inc.
5.750%, 2/15/29 | | | 1,300,000 | | | | 1,343 | |
NCR Atleos Escrow Corp.
9.500%, 4/1/29 144A | | | 1,600,000 | | | | 1,700 | |
NXP BV / NXP Funding LLC
4.875%, 3/1/24 | | | 1,700,000 | | | | 1,697 | |
5.350%, 3/1/26 | | | 1,600,000 | | | | 1,608 | |
Seagate HDD Cayman
4.125%, 1/15/31 | | | 650,000 | | | | 581 | |
9.625%, 12/1/32 | | | 920,000 | | | | 1,052 | |
Ubisoft Entertainment SA
0.878%, 11/24/27 EUR §,∞ | | | 800,000 | | | | 742 | |
VMware, Inc.
4.500%, 5/15/25 | | | 300,000 | | | | 297 | |
4.650%, 5/15/27 | | | 1,400,000 | | | | 1,388 | |
4.700%, 5/15/30 | | | 100,000 | | | | 99 | |
| | | | | | | | |
Total | | | | | | | 18,308 | |
| | | | | | | | |
| | |
Utilities (2.0%) | | | | | | | | |
American Electric Power Co., Inc.
5.625%, 3/1/33 | | | 1,000,000 | | | | 1,042 | |
Centrais Eletricas Brasileiras SA
4.625%, 2/4/30 144A | | | 300,000 | | | | 273 | |
Chile Electricity Lux MPC SARL
6.010%, 1/20/33 144A | | | 1,100,000 | | | | 1,127 | |
Constellation Energy Generation, LLC
6.500%, 10/1/53 | | | 1,000,000 | | | | 1,128 | |
Edison International
5.750%, 6/15/27 | | | 100,000 | | | | 102 | |
Electricite de France SA
4.500%, 9/21/28 144A | | | 900,000 | | | | 887 | |
6.250%, 5/23/33 144A | | | 1,200,000 | | | | 1,299 | |
9.125%, (US Treasury Yield Curve Rate T Note Constant Maturity 5 year plus 5.411%), 3/15/33 144A µ,α | | | 1,500,000 | | | | 1,675 | |
FEL Energy VI SARL
5.750%, 12/1/40 § | | | 2,985,409 | | | | 2,694 | |
Monongahela Power Co.
5.850%, 2/15/34 144A | | | 900,000 | | | | 944 | |
Nakilat, Inc.
6.067%, 12/31/33 § | | | 862,690 | | | | 888 | |
6.267%, 12/31/33 144A | | | 435,792 | | | | 454 | |
The Accompanying Notes are an Integral Part of the Financial Statements.
175
Multi-Sector Bond Portfolio
| | | | | | | | |
| Corporate Bonds (42.7%) | | Shares/ Par + | | | Value
$ (000’s) | |
Utilities continued | | | | | | | | |
National Fuel Gas Co.
5.200%, 7/15/25 | | | 300,000 | | | | 298 | |
NextEra Energy Operating Partners LP
7.250%, 1/15/29 144A | | | 1,000,000 | | | | 1,047 | |
NPC Ukrenergo
6.875%, 11/9/28 §,j | | | 800,000 | | | | 210 | |
Pacific Gas & Electric Co.
2.100%, 8/1/27 | | | 100,000 | | | | 90 | |
2.500%, 2/1/31 | | | 100,000 | | | | 82 | |
2.950%, 3/1/26 | | | 100,000 | | | | 95 | |
3.150%, 1/1/26 | | | 1,600,000 | | | | 1,535 | |
3.300%, 3/15/27 | | | 200,000 | | | | 187 | |
3.300%, 12/1/27 | | | 500,000 | | | | 467 | |
3.300%, 8/1/40 | | | 2,700,000 | | | | 1,976 | |
3.450%, 7/1/25 | | | 300,000 | | | | 290 | |
3.500%, 6/15/25 | | | 1,500,000 | | | | 1,453 | |
3.750%, 7/1/28 | | | 100,000 | | | | 94 | |
4.200%, 6/1/41 | | | 100,000 | | | | 80 | |
4.250%, 3/15/46 | | | 100,000 | | | | 77 | |
4.450%, 4/15/42 | | | 300,000 | | | | 242 | |
4.550%, 7/1/30 | | | 500,000 | | | | 476 | |
Perusahaan Listrik Negara PT
3.000%, 6/30/30 144A | | | 1,500,000 | | | | 1,337 | |
Southern California Edison Co.
5.650%, 10/1/28 | | | 1,250,000 | | | | 1,303 | |
| | | | | | | | |
Total | | | | | | | 23,852 | |
| | | | | | | | |
| |
Total Corporate Bonds (Cost: $580,179) | | | | 512,497 | |
| | | | | | | | |
| | |
| Convertible Corporate Bonds (0.1%) | | | | | | |
Financial (0.1%) | | | | | | | | |
Corestate Capital Holding SA
8.000%, 12/31/26 EUR §,∞,Þ | | | 1,231,517 | | | | 676 | |
Sunac China Holdings, Ltd.
1.000%, 9/30/32 144A | | | 752,116 | | | | 57 | |
| | | | | | | | |
Total | | | | | | | 733 | |
| | | | | | | | |
| |
Total Convertible Corporate Bonds (Cost: $6,584) | | | | 733 | |
| | | | | | | | |
| | |
| Governments (17.7%) | | | | | | |
Governments (17.7%) | | | | | | | | |
Abu Dhabi Government International Bond
2.700%, 9/2/70 144A | | | 3,700,000 | | | | 2,339 | |
2.700%, 9/2/70 § | | | 900,000 | | | | 569 | |
3.875%, 4/16/50 § | | | 1,500,000 | | | | 1,256 | |
Albania Government International Bond
3.500%, 6/16/27 144A EUR ∞ | | | 1,400,000 | | | | 1,491 | |
Angolan Government International Bond
9.125%, 11/26/49 § | | | 1,600,000 | | | | 1,304 | |
Arab Republic of Egypt
7.500%, 2/16/61 144A | | | 1,900,000 | | | | 1,106 | |
Argentine Republic Government International Bond
0.750%, 7/9/30 | | | 800,857 | | | | 320 | |
1.000%, 7/9/29 | | | 405,455 | | | | 161 | |
3.500%, 7/9/41 | | | 13,493,196 | | | | 4,571 | |
3.625%, 7/9/35 | | | 5,922,164 | | | | 2,005 | |
Australian Government
4.250%, 4/21/26 AUD §,∞ | | | 2,400,000 | | | | 1,657 | |
| | | | | | | | |
| Governments (17.7%) | | Shares/ Par + | | | Value
$ (000’s) | |
Governments continued | | | | | | | | |
Banque Ouest Africaine de Developpement
2.750%, 1/22/33 144A EUR ∞ | | | 500,000 | | | | 421 | |
Brazilian Government International Bond
5.000%, 1/27/45 | | | 1,000,000 | | | | 815 | |
Colombia Government International Bond
4.500%, 3/15/29 | | | 3,800,000 | | | | 3,557 | |
5.000%, 6/15/45 | | | 6,000,000 | | | | 4,650 | |
5.200%, 5/15/49 | | | 200,000 | | | | 156 | |
8.000%, 11/14/35 | | | 1,000,000 | | | | 1,093 | |
Costa Rica Government International Bond
7.300%, 11/13/54 144A | | | 800,000 | | | | 868 | |
Dominican Republic International Bond
4.875%, 9/23/32 144A | | | 550,000 | | | | 500 | |
4.875%, 9/23/32 § | | | 1,700,000 | | | | 1,546 | |
6.500%, 2/15/48 144A | | | 2,800,000 | | | | 2,670 | |
6.500%, 2/15/48 § | | | 2,800,000 | | | | 2,670 | |
6.875%, 1/29/26 § | | | 500,000 | | | | 508 | |
Ecuador Government International Bond
0.000%, 7/31/30 144A PO | | | 323,958 | | | | 92 | |
2.500%, 7/31/40 144A | | | 1,225,800 | | | | 386 | |
3.500%, 7/31/35 144A | | | 2,674,620 | | | | 948 | |
3.500%, 7/31/35 § | | | 2,961,000 | | | | 1,052 | |
6.000%, 7/31/30 § | | | 4,500,000 | | | | 2,083 | |
Egypt Government International Bond
6.375%, 4/11/31 EUR §,∞ | | | 6,550,000 | | | | 4,625 | |
7.500%, 2/16/61 § | | | 800,000 | | | | 466 | |
Federal Republic of Nigeria
7.625%, 11/28/47 § | | | 700,000 | | | | 554 | |
7.696%, 2/23/38 § | | | 600,000 | | | | 491 | |
7.875%, 2/16/32 § | | | 2,800,000 | | | | 2,513 | |
Ghana Government International Bond
8.125%, 3/26/32 §,j | | | 400,000 | | | | 173 | |
8.950%, 3/26/51 §,j | | | 800,000 | | | | 343 | |
Guatemala Government Bond
6.600%, 6/13/36 144A | | | 1,700,000 | | | | 1,749 | |
Hungary Government International Bond
5.375%, 9/12/33 EUR §,∞ | | | 3,100,000 | | | | 3,654 | |
6.125%, 5/22/28 144A | | | 1,200,000 | | | | 1,246 | |
Ivory Coast Government International Bond
5.250%, 3/22/30 EUR §,∞ | | | 500,000 | | | | 494 | |
5.875%, 10/17/31 144A EUR | | | 300,000 | | | | 296 | |
6.625%, 3/22/48 144A EUR ∞ | | | 900,000 | | | | 790 | |
6.625%, 3/22/48 EUR §,∞ | | | 800,000 | | | | 702 | |
6.875%, 10/17/40 144A EUR | | | 400,000 | | | | 369 | |
6.875%, 10/17/40 EUR §,∞ | | | 100,000 | | | | 92 | |
Kingdom of Jordan
4.950%, 7/7/25 144A | | | 300,000 | | | | 293 | |
5.850%, 7/7/30 144A | | | 400,000 | | | | 372 | |
7.500%, 1/13/29 144A | | | 800,000 | | | | 809 | |
Morocco Government International Bond
4.000%, 12/15/50 144A | | | 500,000 | | | | 360 | |
5.500%, 12/11/42 § | | | 800,000 | | | | 726 | |
North Macedonia
3.675%, 6/3/26 144A EUR ∞ | | | 500,000 | | | | 535 | |
Oman Government International Bond
6.000%, 8/1/29 § | | | 900,000 | | | | 932 | |
6.250%, 1/25/31 144A | | | 2,300,000 | | | | 2,418 | |
6.500%, 3/8/47 § | | | 500,000 | | | | 509 | |
6.750%, 1/17/48 § | | | 4,800,000 | | | | 5,017 | |
The Accompanying Notes are an Integral Part of the Financial Statements.
176
Multi-Sector Bond Portfolio
| | | | | | | | |
| Governments (17.7%) | | Shares/ Par + | | | Value
$ (000’s) | |
Governments continued | | | | | | | | |
Panama Government International Bond
6.700%, 1/26/36 | | | 1,900,000 | | | | 1,879 | |
6.853%, 3/28/54 | | | 2,600,000 | | | | 2,429 | |
8.125%, 4/28/34 | | | 100,000 | | | | 105 | |
Provincia de Buenos Aires 37.463%, (Argentina Private Banks Deposit Rates Index plus 3.750%), 4/12/25 144A ARS §,∞ | | | 740,000 | | | | 1 | |
Republic of Angola
8.000%, 11/26/29 § | | | 1,200,000 | | | | 1,064 | |
Republic of Indonesia
0.900%, 2/14/27 EUR ∞ | | | 1,700,000 | | | | 1,720 | |
1.400%, 10/30/31 EUR ∞ | | | 1,900,000 | | | | 1,775 | |
1.450%, 9/18/26 EUR ∞ | | | 700,000 | | | | 727 | |
3.375%, 7/30/25 144A EUR ∞ | | | 800,000 | | | | 877 | |
3.750%, 6/14/28 144A EUR ∞ | | | 1,900,000 | | | | 2,110 | |
3.750%, 6/14/28 EUR §,∞ | | | 2,200,000 | | | | 2,443 | |
4.625%, 4/15/43 § | | | 2,700,000 | | | | 2,632 | |
5.125%, 1/15/45 § | | | 1,800,000 | | | | 1,856 | |
Republic of Paraguay
5.600%, 3/13/48 § | | | 600,000 | | | | 546 | |
6.100%, 8/11/44 § | | | 300,000 | | | | 294 | |
Republic of Peru
3.300%, 3/11/41 | | | 2,700,000 | | | | 2,097 | |
Republic of Serbia
1.650%, 3/3/33 144A EUR ∞ | | | 700,000 | | | | 570 | |
6.500%, 9/26/33 § | | | 1,500,000 | | | | 1,537 | |
Republic of South Africa Government International Bond
4.850%, 9/30/29 | | | 1,200,000 | | | | 1,124 | |
4.875%, 4/14/26 | | | 600,000 | | | | 592 | |
5.000%, 10/12/46 | | | 500,000 | | | | 369 | |
5.750%, 9/30/49 | | | 4,500,000 | | | | 3,587 | |
Romanian Government International Bond
2.000%, 4/14/33 144A EUR ∞ | | | 1,400,000 | | | | 1,153 | |
2.875%, 4/13/42 144A EUR ∞ | | | 500,000 | | | | 372 | |
4.125%, 3/11/39 EUR §,∞ | | | 1,500,000 | | | | 1,377 | |
6.375%, 9/18/33 144A EUR ∞ | | | 2,500,000 | | | | 2,911 | |
Russian Federation
5.250%, 6/23/47 144A j | | | 200,000 | | | | 66 | |
5.250%, 6/23/47 §,j | | | 200,000 | | | | 66 | |
Saudi International Bond
4.500%, 10/26/46 § | | | 9,300,000 | | | | 8,221 | |
Serbia International Bond
1.500%, 6/26/29 EUR §,∞ | | | 2,000,000 | | | | 1,860 | |
Sri Lanka Government International Bond
7.550%, 3/28/30 §,j | | | 1,600,000 | | | | 798 | |
7.850%, 3/14/29 §,j | | | 500,000 | | | | 249 | |
State Agency of Roads of Ukraine
6.250%, 6/24/30 §,j | | | 600,000 | | | | 150 | |
State of Minas Gerais
5.333%, 2/15/28 § | | | 100,000 | | | | 98 | |
State of Qatar
4.400%, 4/16/50 144A | | | 1,200,000 | | | | 1,104 | |
4.400%, 4/16/50 § | | | 2,400,000 | | | | 2,208 | |
4.817%, 3/14/49 § | | | 800,000 | | | | 778 | |
5.103%, 4/23/48 § | | | 1,200,000 | | | | 1,214 | |
Turkey Government International Bond
4.875%, 4/16/43 | | | 2,800,000 | | | | 2,039 | |
5.750%, 5/11/47 | | | 4,400,000 | | | | 3,441 | |
| | | | | | | | |
| Governments (17.7%) | | Shares/ Par + | | | Value
$ (000’s) | |
Governments continued | | | | | | | | |
Ukraine Government International Bond
4.375%, 1/27/32 144A EUR ∞,j | | | 1,600,000 | | | | 355 | |
4.375%, 1/27/32 EUR §,∞,j | | | 1,700,000 | | | | 377 | |
6.750%, 6/20/28 144A EUR ∞,j | | | 600,000 | | | | 156 | |
6.876%, 5/21/31 144A j | | | 900,000 | | | | 204 | |
7.375%, 9/25/34 §,j | | | 300,000 | | | | 70 | |
8.994%, 2/1/26 144A j | | | 1,000,000 | | | | 293 | |
United Mexican States
2.125%, 10/25/51 EUR ∞ | | | 1,000,000 | | | | 666 | |
3.771%, 5/24/61 | | | 5,400,000 | | | | 3,658 | |
4.500%, 1/31/50 | | | 2,300,000 | | | | 1,877 | |
6.350%, 2/9/35 | | | 1,700,000 | | | | 1,781 | |
US Treasury
1.875%, 8/31/24 b | | | 7,310,000 | | | | 7,160 | |
2.125%, 3/31/24 b | | | 3,970,000 | | | | 3,938 | |
2.125%, 11/30/24 b | | | 3,400,000 | | | | 3,317 | |
2.250%, 11/15/24 | | | 15,910,000 | | | | 15,554 | |
2.375%, 8/15/24 b | | | 3,700,000 | | | | 3,640 | |
2.500%, 1/31/24 | | | 10,590,000 | | | | 10,566 | |
2.750%, 2/15/24 b | | | 8,700,000 | | | | 8,673 | |
4.000%, 11/15/42 | | | 19,800,000 | | | | 19,242 | |
Venezuela Government International Bond
6.000%, 12/9/49 §,j | | | 32,000 | | | | 4 | |
7.000%, 3/31/38 §,j | | | 204,000 | | | | 30 | |
7.650%, 4/21/25 §,j | | | 1,955,000 | | | | 293 | |
8.250%, 10/13/24 §,j | | | 356,000 | | | | 53 | |
9.000%, 5/7/23 §,j | | | 32,000 | | | | 5 | |
9.250%, 5/7/28 §,j | | | 1,241,000 | | | | 207 | |
9.375%, 1/13/34 j | | | 1,400,000 | | | | 242 | |
| | | | | | | | |
Total | | | | | | | 212,122 | |
| | | | | | | | |
| |
Total Governments (Cost: $245,308) | | | | 212,122 | |
| | | | | | | | |
| | |
| Municipal Bonds (0.6%) | | | | | | |
Municipal Bonds (0.6%) | | | | | | | | |
American Municipal Power, Inc.
7.834%, 2/15/41 RB | | | 100,000 | | | | 125 | |
Bay Area Toll Authority, California, Series 2010
6.918%, 4/1/40 RB | | | 200,000 | | | | 233 | |
City of Riverside California Electric Revenue
7.605%, 10/1/40 RB | | | 200,000 | | | | 250 | |
Golden State Tobacco Securitization Corp.
3.850%, 6/1/50 RB | | | 2,695,000 | | | | 2,493 | |
Irvine Ranch California Water District
6.622%, 5/1/40 RB | | | 100,000 | | | | 114 | |
Los Angeles County California Public Works Financing Authority
7.618%, 8/1/40 RB | | | 200,000 | | | | 247 | |
Metropolitan Government of Nashville & Davidson County Tennessee
6.568%, 7/1/37 RB | | | 100,000 | | | | 111 | |
Municipal Electric Authority of Georgia
6.655%, 4/1/57 RB | | | 95,000 | | | | 108 | |
New York City Transitional Finance Authority
5.508%, 8/1/37 RB | | | 300,000 | | | | 309 | |
New York State Urban Development Corp.
5.770%, 3/15/39 RB | | | 100,000 | | | | 103 | |
The Accompanying Notes are an Integral Part of the Financial Statements.
177
Multi-Sector Bond Portfolio
| | | | | | | | |
| Municipal Bonds (0.6%) | | Shares/ Par + | | | Value
$ (000’s) | |
Municipal Bonds continued | | | | | | | | |
Port Authority of New York & New Jersey, Series
165 5.647%, 11/1/40 RB | | | 1,100,000 | | | | 1,173 | |
Port Authority of New York & New Jersey, Series 168
4.926%, 10/1/51 RB | | | 200,000 | | | | 201 | |
State of Illinois
6.630%, 2/1/35 GO | | | 226,154 | | | | 237 | |
6.725%, 4/1/35 GO | | | 87,692 | | | | 92 | |
7.350%, 7/1/35 GO | | | 171,429 | | | | 186 | |
Triborough Bridge & Tunnel Authority
5.550%, 11/15/40 RB | | | 800,000 | | | | 836 | |
| | | | | | | |
| | | | | | | | |
Total Municipal Bonds (Cost: $6,529) | | | | 6,818 | |
| | | | | | | | |
| | |
| Structured Products (22.6%) | | | | | | |
Asset Backed Securities (8.1%) | | | | | | | | |
ABFC Trust, Series 2007-WMC1,
Class A1A 6.720%, (US SOFR 1 Month plus 1.365%), 6/25/37 | | | 7,895,418 | | | | 5,520 | |
Accredited Mortgage Loan Trust,
Series 2005- 3, Class M3 6.190%, (US SOFR 1 Month plus 0.835%), 9/25/35 | | | 13,501 | | | | 13 | |
ACE Securities Corp. Home Equity Loan Trust, Series 2004-HE4, Class M1 6.370%, (US SOFR 1 Month plus 1.015%), 12/25/34 | | | 151,534 | | | | 137 | |
ACE Securities Corp. Home Equity Loan Trust, Series 2004-RM2, Class M2 6.265%, (US SOFR 1 Month plus 0.910%), 1/25/35 | | | 34,379 | | | | 32 | |
ACE Securities Corp. Home Equity Loan Trust, Series 2006-FM1, Class A2C 5.770%, (US SOFR 1 Month plus 0.415%), 7/25/36 | | | 7,004,994 | | | | 1,602 | |
ACHV ABS Trust, Series 2023-4CP, Class A
6.810%, 11/25/30 144A | | | 1,689,863 | | | | 1,692 | |
ACHV ABS Trust, Series 2023-4CP,
Class B
7.240%, 11/25/30 144A | | | 1,600,000 | | | | 1,615 | |
ACHV ABS Trust, Series 2023-4CP,
Class C
7.710%, 11/25/30 144A | | | 700,000 | | | | 712 | |
Aegis Asset Backed Securities Trust, Series 2004-6, Class M2 6.470%, (US SOFR 1 Month plus 1.115%), (AFC), 3/25/35 | | | 59,474 | | | | 55 | |
Ameriquest Mortgage Securities, Inc., Series 2004-R5, Class M1 6.340%, (US SOFR 1 Month plus 0.985%), 7/25/34 | | | 6,763 | | | | 7 | |
Ares European CLO VI DAC, Series 2013-6A, Class ARR 4.575%, (Euribor 3 Month ACT/360 plus 0.610%), 4/15/30 144A EUR ∞ | | | 479,338 | | | | 524 | |
Ares European CLO, Series 10A, Class AR 4.745%, (Euribor 3 Month ACT/360 plus 0.780%), 10/15/31 144A EUR ∞ | | | 1,085,718 | | | | 1,186 | |
| | | | | | | | |
| Structured Products (22.6%) | | Shares/ Par + | | | Value
$ (000’s) | |
Asset Backed Securities continued | | | | | | | | |
Asset Backed Securities Corp. Home Equity Loan Trust, Series 2005-HE5, Class M4 6.370%, (US SOFR 1 Month plus 1.015%), 6/25/35 | | | 77,804 | | | | 75 | |
Aurium CLO I DAC, Series 2019-1A,
Class ARR 4.966%, (Euribor 3 Month ACT/360 plus 1.050%), 3/23/32 144A EUR ∞ | | | 250,000 | | | | 274 | |
Babson CLO, Ltd., Series 2018-1A,
Class A1 6.605%, (US SOFR 3 Month plus 1.212%), 4/15/31 144A | | | 4,777,336 | | | | 4,767 | |
Bain Capital Euro CLO, Series 2018-2A, Class AR 4.733%, (Euribor 3 Month ACT/360 plus 0.740%), 1/20/32 144A EUR ∞ | | | 295,112 | | | | 321 | |
Bear Stearns Asset Backed Securities I Trust, Series 2007-HE6, Class 1A1 6.720%, (US SOFR 1 Month plus 1.365%), 8/25/37 | | | 33,606 | | | | 33 | |
Cairn CLO BV, Series 2014-A4, Class ARRR 4.552%, (Euribor 3 Month ACT/360 plus 0.600%), 4/30/31 144A EUR ∞ | | | 283,891 | | | | 309 | |
Cairn CLO X BV, Series 2018-10A, Class AR 4.745%, (Euribor 3 Month ACT/360 plus 0.780%), 10/15/31 144A EUR ∞ | | | 699,537 | | | | 758 | |
Carlyle Global Market Strategies Euro CLO, Series 2017-3A, Class A1R 4.665%, (Euribor 3 Month ACT/360 plus 0.700%), 1/15/31 144A EUR ∞ | | | 892,452 | | | | 973 | |
Carrington Mortgage Loan Trust,
Series 2005- FRE1, Class M3 6.235%, (US SOFR 1 Month plus 0.880%), 12/25/35 | | | 8,016,000 | | | | 5,919 | |
Citigroup Mortgage Loan Trust,
Series 2007- AHL1, Class A2C 5.890%, (US SOFR 1 Month plus 0.535%), 12/25/36 | | | 80,333 | | | | 78 | |
Countrywide Alternative Loan Trust,
Series 2006-5, Class M1 5.995%, (US SOFR 1 Month plus 0.640%), 8/25/36 | | | 1,401,008 | | | | 1,349 | |
Countrywide Asset-Backed Certificates, Series 2004-9, Class MV4 7.045%, (US SOFR 1 Month plus 1.690%), 11/25/34 | | | 58,645 | | | | 58 | |
Countrywide Asset-Backed Certificates, Series 2005-AB4, Class 2A4 6.170%, (US SOFR 1 Month plus 0.815%), 3/25/36 | | | 67,913 | | | | 59 | |
Countrywide Asset-Backed Certificates, Series 2006-1, Class AF5
4.512%, (AFC), 7/25/36 Σ | | | 78,450 | | | | 70 | |
Countrywide Asset-Backed Certificates, Series 2006-26, Class 1A 5.610%, (US SOFR 1 Month plus 0.255%), 6/25/37 | | | 339,257 | | | | 311 | |
Countrywide Asset-Backed Certificates, Series 2006-BC3, Class M2 5.950%, (US SOFR 1 Month plus 0.595%), 2/25/37 | | | 900,000 | | | | 812 | |
The Accompanying Notes are an Integral Part of the Financial Statements.
178
Multi-Sector Bond Portfolio
| | | | | | | | |
| Structured Products (22.6%) | | Shares/ Par + | | | Value
$ (000’s) | |
Asset Backed Securities continued | | | | | | | | |
Countrywide Asset-Backed Certificates, Series 2007-1, Class 2A3 5.610%, (US SOFR 1 Month plus 0.255%), 7/25/37 | | | 4,907 | | | | 5 | |
Countrywide Asset-Backed Certificates, Series 2007-13, Class 1A 6.310%, (US SOFR 1 Month plus 0.955%), 10/25/47 | | | 1,016,561 | | | | 968 | |
Countrywide Asset-Backed Certificates, Series 2007-9, Class 1A 5.670%, (US SOFR 1 Month plus 0.315%), 6/25/47 | | | 706,264 | | | | 628 | |
Countrywide Asset-Backed Certificates, Series 2007-SEA1, Class 1A1 6.570%, (US SOFR 1 Month plus 1.215%), (AFC), 5/25/47 144A | | | 949,642 | | | | 742 | |
CRB Securitization Trust, Series 2023-1, Class A
6.960%, 10/20/33 144A | | | 1,417,367 | | | | 1,434 | |
Credit Suisse First Boston Mortgage Securities Corp., Series 2001-HE17, Class A1 5.077%, (US SOFR 1 Month plus 0.735%), 1/25/32 | | | 1,916 | | | | 2 | |
CVC Cordatus Loan Fund XI DAC,
Series 2011-A, Class AR 4.615%, (Euribor 3 Month ACT/360 plus 0.650%), 10/15/31 144A EUR ∞ | | | 798,273 | | | | 869 | |
Ellington Loan Acquisition Trust,
Series 2007- 2, Class A1 6.520%, (US SOFR 1 Month plus 1.165%), 5/25/37 144A | | | 177,119 | | | | 172 | |
Euro-Galaxy III CLO BV, Series 2013-3A, Class ARRR 4.589%, (Euribor 3 Month ACT/360 plus 0.620%), 4/24/34 144A EUR ∞ | | | 299,690 | | | | 324 | |
Ford Auto Securitization Trust,
Series 2023- BA, Class A1 5.889%, 5/15/26 144A CAD ∞,Æ | | | 2,442,546 | | | | 1,856 | |
Fremont Home Loan Trust, Series 2005-2, Class M4 6.400%, (US SOFR 1 Month plus 1.045%), 6/25/35 | | | 300,000 | | | | 258 | |
GLS Auto Select Receivables Trust,
Series 2023-2A, Class B 6.670%, 12/17/29 144A | | | 2,000,000 | | | | 2,054 | |
GSAA Home Equity Trust, Series 2006-17, Class A1 5.590%, (US SOFR 1 Month plus 0.235%), 11/25/36 | | | 45,625 | | | | 10 | |
GSAMP Trust, Series 2004-WF, Class M2 7.120%, (US SOFR 1 Month plus 1.765%), 10/25/34 | | | 12,172 | | | | 12 | |
GSAMP Trust, Series 2007-FM2,
Class A2B 5.560%, (US SOFR 1 Month plus 0.205%), 1/25/37 | | | 146,155 | | | | 83 | |
GSAMP Trust, Series 2007-NC1,
Class A2A 5.520%, (US SOFR 1 Month plus 0.165%), 12/25/46 | | | 11,839 | | | | 6 | |
| | | | | | | | |
| Structured Products (22.6%) | | Shares/ Par + | | | Value
$ (000’s) | |
Asset Backed Securities continued | | | | | | | | |
Harvest CLO XX DAC, Series 2020-A, Class AR 4.673%, (Euribor 3 Month ACT/360 plus 0.680%), 10/20/31 144A EUR ∞ | | | 590,343 | | | | 640 | |
Hertz Vehicle Financing III LLC,
Series 2022- 1A, Class A
1.990%, 6/25/26 144A | | | 1,350,000 | | | | 1,290 | |
Hertz Vehicle Financing III LLC,
Series 2023- 1A, Class A
5.490%, 6/25/27 144A | | | 2,600,000 | | | | 2,609 | |
Home Equity Loan Trust, Series 2007-FRE1, Class 2AV4 5.810%, (US SOFR 1 Month plus 0.455%), 4/25/37 | | | 500,000 | | | | 414 | |
HSI Asset Securitization Corp. Trust,
Series 2005-I1, Class 2A4 6.250%, (US SOFR 1 Month plus 0.895%), 11/25/35 | | | 122,997 | | | | 112 | |
IndyMac Residential Asset Backed Trust, Series 2007-B, Class 2A2 5.630%, (US SOFR 1 Month plus 0.275%), 7/25/37 | | | 308,412 | | | | 164 | |
Invesco Euro CLO III DAC, Series 3A, Class A 4.885%, (Euribor 3 Month ACT/360 plus 0.920%), 7/15/32 144A EUR ∞ | | | 500,000 | | | | 543 | |
JP Morgan Mortgage Acquisition Trust, Series 2007-CH3, Class M1 5.770%, (US SOFR 1 Month plus 0.415%), 3/25/37 | | | 400,000 | | | | 366 | |
KKR Financial CLO, Ltd., Series 9,
Class AR2 6.605%, (US SOFR 3 Month plus 1.212%), 7/15/30 144A | | | 1,492,643 | | | | 1,489 | |
Laurelin DAC, Series 2016-1A, Class ARR 4.713%, (Euribor 3 Month ACT/360 plus 0.720%), 10/20/31 144A EUR ∞ | | | 380,024 | | | | 414 | |
LCM XV LP, Series 2015-A, Class AR2 6.677%, (US SOFR 3 Month plus 1.262%), 7/20/30 144A | | | 1,047,779 | | | | 1,045 | |
Long Beach Mortgage Loan Trust,
Series 2006-1, Class 2A4 6.070%, (US SOFR 1 Month plus 0.715%), 2/25/36 | | | 51,739 | | | | 41 | |
Long Beach Mortgage Loan Trust,
Series 2006-3, Class 2A4 6.010%, (US SOFR 1 Month plus 0.655%), 5/25/46 | | | 275,450 | | | | 81 | |
Long Beach Mortgage Loan Trust,
Series 2006-4, Class 1A 5.770%, (US SOFR 1 Month plus 0.415%), 5/25/36 | | | 984,334 | | | | 522 | |
Madison Park Euro Funding XIV DAC, Series 14A, Class A1R 4.765%, (Euribor 3 Month ACT/360 plus 0.800%), 7/15/32 144A EUR ∞ | | | 300,000 | | | | 326 | |
Man GLG EURO CLO DAC, Series 2021-3A, Class AR 4.645%, (Euribor 3 Month ACT/360 plus 0.680%), 10/15/30 144A EUR ∞ | | | 204,269 | | | | 224 | |
The Accompanying Notes are an Integral Part of the Financial Statements.
179
Multi-Sector Bond Portfolio
| | | | | | | | |
| Structured Products (22.6%) | | Shares/ Par + | | | Value
$ (000’s) | |
Asset Backed Securities continued | | | | | | | | |
Man GLG EURO CLO DAC, Series 2022-6A, Class AR 4.775%, (Euribor 3 Month ACT/360 plus 0.810%), 10/15/32 144A EUR ∞ | | | 286,451 | | | | 312 | |
Marathon CLO, Ltd., Series 2017-9A, Class A1AR 6.805%, (US SOFR 3 Month plus 1.412%), 4/15/29 144A | | | 504,942 | | | | 505 | |
Marble Point CLO X, Ltd., Series 2017-1A, Class AR 6.695%, (US SOFR 3 Month plus 1.302%), 10/15/30 144A | | | 3,610,029 | | | | 3,608 | |
MASTR Asset Backed Securities Trust, Series 2004-OPT1, Class M1 6.250%, (US SOFR 1 Month plus 0.895%), 2/25/34 | | | 652,364 | | | | 656 | |
MASTR Asset Backed Securities Trust, Series 2004-WMC2, Class M1 6.370%, (US SOFR 1 Month plus 1.015%), 4/25/34 | | | 68,785 | | | | 65 | |
MASTR Asset Backed Securities Trust, Series 2006-FRE2, Class A1 5.770%, (US SOFR 1 Month plus 0.415%), 3/25/36 | | | 8,340,100 | | | | 7,494 | |
MASTR Asset Backed Securities Trust, Series 2006-HE3, Class A2 5.670%, (US SOFR 1 Month plus 0.315%), 8/25/36 | | | 1,950,805 | | | | 589 | |
MASTR Asset Backed Securities Trust, Series 2006-WMC4, Class A5 5.620%, (US SOFR 1 Month plus 0.265%), 10/25/36 | | | 823,790 | | | | 267 | |
Merrill Lynch Mortgage Investors Trust, Series 2007-SD1, Class A1 6.370%, (US SOFR 1 Month plus 1.015%), 2/25/47 | | | 680,735 | | | | 396 | |
MF1, Series 2022-FL8, Class A 6.706%, (US SOFR 1 Month plus 1.350%), 2/19/37 144A | | | 1,000,000 | | | | 983 | |
Morgan Stanley ABS Capital I, Inc. Trust, Series 2005-HE5, Class M4 6.340%, (US SOFR 1 Month plus 0.985%), 9/25/35 | | | 6,045,709 | | | | 4,882 | |
Morgan Stanley ABS Capital I, Inc. Trust, Series 2005-NC1, Class A2MZ 6.050%, (US SOFR 1 Month plus 0.695%), 1/25/35 | | | 784,058 | | | | 781 | |
Morgan Stanley ABS Capital I, Inc. Trust, Series 2005-NC1, Class M2 6.175%, (US SOFR 1 Month plus 0.820%), 1/25/35 | | | 162,120 | | | | 156 | |
Morgan Stanley ABS Capital I, Inc. Trust, Series 2005-WMC5, Class M5 6.460%, (US SOFR 1 Month plus 1.105%), 6/25/35 | | | 91,609 | | | | 89 | |
Morgan Stanley ABS Capital I, Inc. Trust, Series 2006-HE7, Class A2C 5.790%, (US SOFR 1 Month plus 0.435%), 9/25/36 | | | 58,064 | | | | 24 | |
| | | | | | | | |
| Structured Products (22.6%) | | Shares/ Par + | | | Value
$ (000’s) | |
Asset Backed Securities continued | | | | | | | | |
Morgan Stanley ABS Capital I, Inc. Trust, Series 2006-HE8, Class A2C 5.610%, (US SOFR 1 Month plus 0.255%), 10/25/36 | | | 52,419 | | | | 22 | |
Morgan Stanley ABS Capital I, Inc. Trust, Series 2007-HE5, Class A2C 5.720%, (US SOFR 1 Month plus 0.365%), 3/25/37 | | | 52,731 | | | | 22 | |
Morgan Stanley Dean Witter Capital I, Inc., Series 2003-NC1, Class M1 7.032%, (US SOFR 1 Month plus 1.690%), 11/25/32 | | | 56 | | | | –π | |
Morgan Stanley Dean Witter Capital I, Inc., Series 2003-NC2, Class M1 6.820%, (US SOFR 1 Month plus 1.465%), 2/25/33 | | | 13,176 | | | | 13 | |
Morgan Stanley Home Equity Loan Trust, Series 2007-2, Class A3 5.700%, (US SOFR 1 Month plus 0.345%), 4/25/37 | | | 2,818,499 | | | | 1,444 | |
NovaStar Mortgage Funding Trust, Series 2007-2, Class A2B 5.630%, (US SOFR 1 Month plus 0.275%), (AFC), 9/25/37 | | | 90,318 | | | | 89 | |
Oak Hill Euro Credit Partners VII DAC, Series 2021-7A, Class AR 4.733%, (Euribor 3 Month ACT/360 plus 0.740%), 10/20/31 144A EUR ∞ | | | 1,196,899 | | | | 1,303 | |
Popular Mortgage Pass-Through Trust, Series 2006-A, Class M1 6.055%, (US SOFR 1 Month plus 0.700%), (AFC), 2/25/36 | | | 15,365 | | | | 15 | |
RAAC Series, Series 2007-RP4, Class A 6.170%, (US SOFR 1 Month plus 0.465%), (AFC), 11/25/46 144A | | | 151,946 | | | | 142 | |
Renaissance Home Equity Loan Trust, Series 2006-4, Class AF6 5.340%, 1/25/37 Σ | | | 1,514,158 | | | | 502 | |
Residential Asset Securities Corp., Series 2007-KS3, Class AI4 5.810%, (US SOFR 1 Month plus 0.455%), (AFC), 4/25/37 | | | 1,162,314 | | | | 1,094 | |
Santander Drive Auto Receivables Trust, Series 2023-5, Class B 6.160%, 12/17/29 | | | 1,400,000 | | | | 1,431 | |
Santander Drive Auto Receivables Trust, Series 2023-5, Class C 6.430%, 2/18/31 | | | 1,600,000 | | | | 1,640 | |
Santander Drive Auto Receivables Trust, Series 2023-6, Class A3 5.930%, 7/17/28 | | | 975,000 | | | | 993 | |
Santander Drive Auto Receivables Trust, Series 2023-6, Class B 5.980%, 4/16/29 | | | 812,500 | | | | 827 | |
Santander Drive Auto Receivables Trust, Series 2023-6, Class C 6.400%, 3/17/31 | | | 812,500 | | | | 834 | |
Saranac CLO, Ltd., Series 2018-6A, Class A1R 6.781%, (US SOFR 3 Month plus 1.402%), 8/13/31 144A | | | 2,759,794 | | | | 2,757 | |
The Accompanying Notes are an Integral Part of the Financial Statements.
180
Multi-Sector Bond Portfolio
| | | | | | | | |
| Structured Products (22.6%) | | Shares/ Par + | | | Value
$ (000’s) | |
Asset Backed Securities continued | | | | | | | | |
Saxon Asset Securities Trust, Series 2006-1, Class M1 5.935%, (US SOFR 1 Month plus 0.580%), (AFC), 3/25/36 | | | 162,748 | | | | 155 | |
Securitized Asset Backed Receivables LLC Trust, Series 2005-FR4, Class M2 6.430%, (US SOFR 1 Month plus 1.075%), 1/25/36 | | | 29,681 | | | | 27 | |
Sound Point CLO XIV, Ltd., Series 2017-2A, Class AR 6.620%, (US SOFR 3 Month plus 1.242%), 7/25/30 144A | | | 2,981,654 | | | | 2,974 | |
Soundview Home Loan Trust, Series 2006-2, Class M2 5.995%, (US SOFR 1 Month plus 0.640%), 3/25/36 | | | 99,159 | | | | 98 | |
Soundview Home Loan Trust, Series 2006- OPT2, Class A4 6.030%, (US SOFR 1 Month plus 0.675%), 5/25/36 | | | 94,813 | | | | 91 | |
Soundview Home Loan Trust, Series 2006- OPT3, Class M1 5.935%, (US SOFR 1 Month plus 0.580%), 6/25/36 | | | 6,672,609 | | | | 5,521 | |
Specialty Underwriting & Residential Finance Trust, Series 2005-BC2, Class M3 6.445%, (US SOFR 1 Month plus 1.090%), 12/25/35 | | | 71,232 | | | | 70 | |
Structured Asset Investment Loan Trust, Series 2005-7, Class M2 6.235%, (US SOFR 1 Month plus 0.880%), 8/25/35 | | | 226,274 | | | | 216 | |
Structured Asset Investment Loan Trust, Series 2006-BNC3, Class A3 5.620%, (US SOFR 1 Month plus 0.265%), 9/25/36 | | | 4,066 | | | | 4 | |
Structured Asset Securities Corp. Mortgage Loan Trust, Series 2006-BC4, Class A4 5.810%, (US SOFR 1 Month plus 0.455%), 12/25/36 | | | 106,039 | | | | 101 | |
Structured Asset Securities Corp. Mortgage Loan Trust, Series 2007-WF1, Class A6 5.890%, (US SOFR 1 Month plus 0.535%), 2/25/37 | | | 41,457 | | | | 40 | |
Toro European CLO DAC, Series 6A, Class AR 4.908%, (Euribor 3 Month ACT/360 plus 0.920%), 1/12/32 144A EUR ∞ | | | 500,000 | | | | 546 | |
Toro European CLO DAC, Series 7A , Class ARE 4.812%, (Euribor 3 Month ACT/360 plus 0.810%), 2/15/34 144A EUR ∞ | | | 250,000 | | | | 272 | |
Truman Capital Mortgage Loan Trust, Series 2006-1, Class A 5.730%, (US SOFR 1 Month plus 0.375%), 3/25/36 144A | | | 234,554 | | | | 232 | |
Venture CDO, Ltd., Series 2018-33A, Class A1LR 6.715%, (US SOFR 3 Month plus 1.322%), 7/15/31 144A | | | 984,750 | | | | 984 | |
| | | | | | | | |
| Structured Products (22.6%) | | Shares/ Par + | | | Value
$ (000’s) | |
Asset Backed Securities continued | | | | | | | | |
Venture XIV CLO, Ltd., Series 2013-14A, Class ARR 6.678%, (US SOFR 3 Month plus 1.292%), 8/28/29 144A | | | 705,330 | | | | 705 | |
Venture XXV CLO, Ltd., Series 2016-25A, Class ARR 6.697%, (US SOFR 3 Month plus 1.282%), 4/20/29 144A | | | 620,011 | | | | 620 | |
Venture XXVIII CLO, Ltd., Series 2017-28A, Class A1R 6.667%, (US SOFR 3 Month plus 1.252%), 7/20/30 144A | | | 174,629 | | | | 174 | |
Vibrant CLO VII, Ltd., Series 2017-7A, Class A1R 6.717%, (US SOFR 3 Month plus 1.302%), 9/15/30 144A | | | 176,371 | | | | 176 | |
WaMu Asset-Backed Certificates, Series 2007- HE1, Class 1A 5.620%, (US SOFR 1 Month plus 0.265%), 1/25/37 | | | 99,229 | | | | 83 | |
Wellfleet CLO, Ltd., Series 2015-1A, Class AR4 6.567%, (US SOFR 3 Month plus 1.152%), 7/20/29 144A | | | 480,046 | | | | 479 | |
Wellfleet CLO, Ltd., Series 2017-1, Class 1A 6.567%, (US SOFR 3 Month plus 1.152%), 4/20/29 144A | | | 650,134 | | | | 650 | |
| | | | | | | | |
Total | | | | | | | 97,117 | |
| | | | | | | | |
|
Mortgage Securities (14.5%) | |
BAMLL Commercial Mortgage Securities Trust, Series 2020-BOC, Class A 2.627%, 1/15/32 144A | | | 2,350,000 | | | | 1,822 | |
Banc of America Funding Trust, Series 2005- H, Class 5A1 6.245%, (CSTR), 11/20/35 | | | 69,687 | | | | 62 | |
Banc of America Funding Trust, Series 2006-J, Class 4A1 5.061%, (CSTR), 1/20/47 | | | 25,755 | | | | 22 | |
Banc of America Funding Trust, Series 2007-6, Class A1 6.050%, (US SOFR 1 Month plus 0.695%), 7/25/37 | | | 36,189 | | | | 34 | |
BCAP LLC Trust, Series 2009-RR14, Class 2A2 3.586%, (CSTR), 7/26/36 144A | | | 15,358 | | | | 13 | |
BCAP LLC Trust, Series 2009-RR5, Class 3A3 6.250%, (CSTR), 8/26/36 144A | | | 2,053,363 | | | | 889 | |
Bear Stearns Adjustable Rate Mortgage Trust, Series 2004-3, Class 4A 5.099%, (CSTR), 7/25/34 | | | 786 | | | | 1 | |
Bear Stearns ALT-A Trust, Series 2006-6, Class 2A1 4.196%, (CSTR), 11/25/36 | | | 115,179 | | | | 51 | |
Bear Stearns ARM Trust, Series 2007-4, Class 22A1 4.067%, (CSTR), 6/25/47 | | | 50,048 | | | | 45 | |
Chase Home Lending Mortgage Trust, Series 2023-RPL3, Class A1 3.250%, (AFC), 9/25/63 144A | | | 6,917,949 | | | | 6,055 | |
The Accompanying Notes are an Integral Part of the Financial Statements.
181
Multi-Sector Bond Portfolio
| | | | | | | | |
| Structured Products (22.6%) | | Shares/ Par + | | | Value
$ (000’s) | |
Mortgage Securities continued | | | | | | | | |
Citicorp Mortgage Securities Trust, Series 2007-8, Class 1A3 6.000%, 9/25/37 | | | 1,264 | | | | 1 | |
Citigroup Mortgage Loan Trust, Series 2007- 10, Class 22AA 4.523%, (CSTR), 9/25/37 | | | 5,996 | | | | 5 | |
Citigroup Mortgage Loan Trust, Series 2007- 10, Class 2A3A 4.783%, (CSTR), 9/25/37 | | | 10,123 | | | | 9 | |
Citigroup Mortgage Loan Trust, Series 2007- AR4, Class 2A2A 3.840%, (CSTR), 3/25/37 | | | 245,372 | | | | 210 | |
Countrywide Alternative Loan Trust, Series 2004-28CB, Class 5A1 5.750%, 1/25/35 | | | 8,702 | | | | 8 | |
Countrywide Alternative Loan Trust, Series 2005-1CB, Class 2A1 6.000%, 3/25/35 | | | 257,298 | | | | 119 | |
Countrywide Alternative Loan Trust, Series 2005-59, Class 1A1 6.132%, (US SOFR 1 Month plus 0.775%), 11/20/35 | | | 3,560 | | | | 3 | |
Countrywide Alternative Loan Trust, Series 2005-76, Class 1A1 6.492%, (Federal Reserve US 12 Month Cumulative Avg 1 year CMT plus 1.480%), 1/25/36 | | | 9,938 | | | | 9 | |
Countrywide Alternative Loan Trust, Series 2005-79CB, Class A3
5.500%, 1/25/36 | | | 102,400 | | | | 59 | |
Countrywide Alternative Loan Trust, Series 2005-J1, Class 1A8
5.500%, 2/25/35 | | | 84,695 | | | | 78 | |
Countrywide Alternative Loan Trust, Series 2005-J1, Class 3A1
6.500%, 8/25/32 | | | 727 | | | | 1 | |
Countrywide Alternative Loan Trust, Series 2005-J11, Class 1A13
5.500%, 11/25/35 | | | 148,842 | | | | 86 | |
Countrywide Alternative Loan Trust, Series 2006-45T1, Class 1A13
6.000%, 2/25/37 | | | 103,871 | | | | 41 | |
Countrywide Alternative Loan Trust, Series 2006-5T2, Class A1 5.970%, (US SOFR 1 Month plus 0.615%), 4/25/36 | | | 336,791 | | | | 135 | |
Countrywide Alternative Loan Trust, Series 2006-HY10, Class 2A1 4.295%, (CSTR), 5/25/36 | | | 5,406 | | | | 5 | |
Countrywide Alternative Loan Trust, Series 2006-OA12, Class A1B 5.662%, (US SOFR 1 Month plus 0.305%), 9/20/46 | | | 5,414 | | | | 5 | |
Countrywide Alternative Loan Trust, Series 2006-OA17, Class 1A1A 5.667%, (US SOFR 1 Month plus 0.310%), 12/20/46 | | | 19,459 | | | | 17 | |
Countrywide Alternative Loan Trust, Series 2006-OA2, Class A1 5.892%, (US SOFR 1 Month plus 0.535%), 5/20/46 | | | 262,747 | | | | 220 | |
| | | | | | | | |
| Structured Products (22.6%) | | Shares/ Par + | | | Value
$ (000’s) | |
Mortgage Securities continued | | | | | | | | |
Countrywide Alternative Loan Trust, Series 2006-OA9, Class 2A1A 5.682%, (US SOFR 1 Month plus 0.325%), 7/20/46 | | | 5,889 | | | | 5 | |
Countrywide Alternative Loan Trust, Series 2007-9T1, Class 2A2
6.000%, 5/25/37 | | | 216,700 | | | | 100 | |
Countrywide Alternative Loan Trust, Series 2007-AL1, Class A1 5.720%, (US SOFR 1 Month plus 0.365%), 6/25/37 | | | 3,193,822 | | | | 2,537 | |
Countrywide Alternative Loan Trust, Series 2007-OA3, Class 1A1 5.750%, (US SOFR 1 Month plus 0.395%), 4/25/47 | | | 22,824 | | | | 20 | |
Countrywide Home Loan Mortgage Pass- Through Trust, Series 2005-22, Class 3A1
4.301%, (CSTR), 10/25/35 | | | 8,640 | | | | 7 | |
Countrywide Home Loan Mortgage Pass- Through Trust, Series 2005-HYB8, Class 1A1
4.488%, (CSTR), 12/20/35 | | | 1,229 | | | | 1 | |
Countrywide Home Loan Mortgage Pass- Through Trust, Series 2006-16, Class 2A1
6.500%, 11/25/36 | | | 13,764 | | | | 5 | |
Countrywide Home Loan Mortgage Pass- Through Trust, Series 2006-9, Class A1
6.000%, 5/25/36 | | | 95,900 | | | | 43 | |
Countrywide Home Loan Mortgage Pass- Through Trust, Series 2006-OA4, Class A1 5.972%, (Federal Reserve US 12 Month Cumulative Avg 1 year CMT plus 0.960%), 4/25/46 | | | 33,963 | | | | 10 | |
Countrywide Home Loan Mortgage Pass- Through Trust, Series 2006-OA4, Class A2 6.010%, (US SOFR 1 Month plus 0.655%), 4/25/46 | | | 900,007 | | | | 256 | |
Countrywide Home Loan Mortgage Pass- Through Trust, Series 2007-HYB1, Class 3A1
4.377%, (CSTR), 3/25/37 | | | 4,833 | | | | 4 | |
Credit Suisse First Boston Mortgage Securities Corp., Series 2003-8, Class 5A1
6.500%, 4/25/33 | | | 241 | | | | –π | |
Credit Suisse Mortgage Trust, Series 2014-6R, Class 3A2
4.817%, (CSTR), 9/27/35 144A | | | 151,982 | | | | 127 | |
Deutsche ALT-A Securities, Inc. Mortgage Loan Trust, Series 2005-6, Class 2A3
5.500%, 12/25/35 | | | 272,503 | | | | 225 | |
EMF-NL BV, Series 2008-APRX, Class A2 4.785%, (Euribor 3 Month ACT/360 plus 0.800%), 4/17/41 EUR §,∞ | | | 54,149 | | | | 57 | |
Eurosail-NL BV, Series 2007-NL2X, Class A 5.485%, (Euribor 3 Month ACT/360 plus 1.500%), 10/17/40 EUR §,∞ | | | 3,758 | | | | 4 | |
Federal Home Loan Mortgage Corp.
5.000%, 11/1/52 | | | 20,576,717 | | | | 20,383 | |
5.500%, 12/1/52 | | | 19,844,333 | | | | 19,964 | |
The Accompanying Notes are an Integral Part of the Financial Statements.
182
Multi-Sector Bond Portfolio
| | | | | | | | |
| Structured Products (22.6%) | | Shares/ Par + | | | Value
$ (000’s) | |
Mortgage Securities continued | | | | | | | | |
Federal National Mortgage Association, Series 2003-W6, Class F 5.802%, (US 30 Day Average SOFR plus 0.465%), 9/25/42 | | | 12,717 | | | | 13 | |
First Horizon Mortgage Pass-Through Trust, Series 2007-2, Class 1A5 5.750%, 5/25/37 | | | 160,894 | | | | 71 | |
Fontainebleau Miami Beach Trust, Series 2019-FBLU, Class A 3.144%, 12/10/36 144A | | | 1,000,000 | | | | 969 | |
GSR Mortgage Loan Trust, Series 2005-AR6, Class 1A1
5.778%, (CSTR), 9/25/35 | | | 680 | | | | 1 | |
GSR Mortgage Loan Trust, Series 2006-2F, Class 3A6
6.000%, 2/25/36 | | | 69,920 | | | | 32 | |
GSR Mortgage Loan Trust, Series 2006-AR1, Class 2A1
4.630%, (CSTR), 1/25/36 | | | 823 | | | | 1 | |
GSR Mortgage Loan Trust, Series 2007-AR1, Class 2A1
4.285%, (CSTR), 3/25/47 | | | 6,426 | | | | 4 | |
HarborView Mortgage Loan Trust, Series 2005-10, Class 2A1A 6.090%, (US SOFR 1 Month plus 0.735%), (AFC), 11/19/35 | | | 3,343 | | | | 2 | |
HarborView Mortgage Loan Trust, Series 2005-3, Class 2A1A 5.950%, (US SOFR 1 Month plus 0.595%), (AFC), 6/19/35 | | | 7,805 | | | | 7 | |
HomeBanc Mortgage Trust, Series 2005-1, Class A1 5.970%, (US SOFR 1 Month plus 0.615%), 3/25/35 | | | 2,692 | | | | 2 | |
HSI Asset Securitization Corp. Trust, Series 2006-NC1, Class 2A 5.910%, (US SOFR 1 Month plus 0.555%), 11/25/35 | | | 737,909 | | | | 696 | |
IndyMac INDX Mortgage Loan Trust, Series 2004-AR6, Class 5A1 4.995%, (CSTR), 10/25/34 | | | 13,494 | | | | 13 | |
IndyMac INDX Mortgage Loan Trust, Series 2005-AR12, Class 2A1A 5.950%, (US SOFR 1 Month plus 0.595%), (AFC), 7/25/35 | | | 1,077 | | | | 1 | |
IndyMac INDX Mortgage Loan Trust, Series 2005-AR14, Class 2A1A 6.070%, (US SOFR 1 Month plus 0.715%), 7/25/35 | | | 7,632 | | | | 6 | |
JP Morgan Mortgage Trust, Series 2005-ALT1, Class 2A1 4.852%, (CSTR), 10/25/35 | | | 5,559 | | | | 4 | |
JP Morgan Mortgage Trust, Series 2007-A1, Class 6A1 4.642%, (CSTR), 7/25/35 | | | 3,094 | | | | 3 | |
JP Morgan Mortgage Trust, Series 2007-A4, Class 3A1 4.354%, (CSTR), 6/25/37 | | | 28,871 | | | | 22 | |
| | | | | | | | |
| Structured Products (22.6%) | | Shares/ Par + | | | Value
$ (000’s) | |
Mortgage Securities continued | | | | | | | | |
Luminent Mortgage Trust, Series 2006-6, Class A1 5.870%, (US SOFR 1 Month plus 0.515%), 10/25/46 | | | 638,022 | | | | 557 | |
Merrill Lynch Mortgage Investors Trust, Series 2006-1, Class 1A
4.015%, (CSTR), 2/25/36 | | | 427 | | | | –π | |
Merrill Lynch Mortgage Investors Trust, Series 2006-A3, Class 6A1
4.347%, (CSTR), 5/25/36 | | | 5,691 | | | | 5 | |
Mill City Mortgage Loan Trust, Series 2018-1, Class A1
3.250%, (AFC), 5/25/62 144A | | | 551,619 | | | | 538 | |
New Residential Mortgage Loan Trust, Series 2021-NQM1R, Class A3
1.198%, (AFC), 7/25/55 144A | | | 700,046 | | | | 601 | |
New Residential Mortgage Loan Trust, Series 2023-NQM1, Class A1A
6.864%, (AFC), 10/25/63 144A Σ | | | 3,861,624 | | | | 3,918 | |
Nomura Asset Acceptance Corp. Alternative Loan Trust, Series 2005-AR4, Class 3A1
5.470%, (CSTR), 8/25/35 | | | 835 | | | | 1 | |
OBX Trust, Series 2023-NQM8, Class A1
7.045%, (AFC), 9/25/63 144A Σ | | | 2,604,587 | | | | 2,657 | |
Onslow Bay Financial LLC, Series 2023- NQM9, Class A1
7.159%, (AFC), 10/25/63 144A Σ | | | 5,046,162 | | | | 5,170 | |
OPEN Trust, Series 2023-AIR, Class A 8.451%, (US SOFR 1 Month plus 3.089%), 10/15/28 144A | | | 3,555,081 | | | | 3,562 | |
Preston Ridge Partners Mortgage Trust, Series 2023-NQM2, Class A1
6.250%, (AFC), 8/25/68 144A Σ | | | 2,974,741 | | | | 2,982 | |
Residential Accredit Loans, Inc., Series 2006- QA7, Class 1A1 5.850%, (US SOFR 1 Month plus 0.495%), 8/25/36 | | | 3,573 | | | | 4 | |
Residential Accredit Loans, Inc., Series 2006- QA8, Class A1 5.850%, (US SOFR 1 Month plus 0.495%), 9/25/36 | | | 10,976 | | | | 11 | |
Residential Accredit Loans, Inc., Series 2007- QA1, Class A1 5.750%, (US SOFR 1 Month plus 0.395%), 1/25/37 | | | 1,788 | | | | 2 | |
Residential Asset Securitization Trust, Series 2007-A2, Class 2A2
6.500%, 4/25/37 | | | 3,309,576 | | | | 879 | |
Structured Adjustable Rate Mortgage Loan Trust, Series 2005-19XS, Class 1A1 5.790%, (US SOFR 1 Month plus 0.435%), 10/25/35 | | | 30,737 | | | | 28 | |
Structured Asset Mortgage Investments II Trust, Series 2005-AR8, Class A2 3.907%, (Federal Reserve US 12 Month Cumulative Avg 1 year CMT plus 1.480%), 2/25/36 | | | 210,270 | | | | 176 | |
Structured Asset Mortgage Investments II Trust, Series 2006-AR6, Class 1A1 5.830%, (US SOFR 1 Month plus 0.475%), (AFC), 7/25/46 | | | 129,874 | | | | 107 | |
The Accompanying Notes are an Integral Part of the Financial Statements.
183
Multi-Sector Bond Portfolio
| | | | | | | | |
| Structured Products (22.6%) | | Shares/ Par + | | | Value
$ (000’s) | |
Mortgage Securities continued | | | | | | | | |
Suntrust Alternative Loan Trust, Series 2005- 1F, Class 1A1 5.750%, (US SOFR 1 Month plus 0.765%), 12/25/35 | | | 4,420 | | | | 4 | |
Towd Point Mortgage Funding, Series 2019- GR4A, Class A1 6.358%, (SONIO/N plus 1.144%), 10/20/51 144A GBP ∞ | | | 855,296 | | | | 1,091 | |
Towd Point Mortgage Trust, Series 2017-2, Class M1 3.750%, (AFC), 4/25/57 144A | | | 2,500,000 | | | | 2,393 | |
Uniform Mortgage Backed Security TBA
5.000%, 1/16/54 | | | 15,000,000 | | | | 14,839 | |
5.500%, 2/13/54 | | | 18,700,000 | | | | 18,783 | |
6.000%, 2/13/54 | | | 22,200,000 | | | | 22,541 | |
6.500%, 2/13/54 | | | 32,800,000 | | | | 33,608 | |
Verus Securitization Trust, Series 2023-4, Class A1 5.811%, (AFC), 5/25/68 144A Σ | | | 1,027,053 | | | | 1,026 | |
Verus Securitization Trust, Series 2023-7, Class A1 7.070%, (AFC), 10/25/68 144A Σ | | | 2,947,009 | | | | 3,002 | |
WaMu Mortgage Pass-Through Certificates, Series 2002-AR19, Class A6
4.745%, (CSTR, AFC), 2/25/33 | | | 458 | | | | – | π |
WaMu Mortgage Pass-Through Certificates, Series 2006-AR12, Class 3A3
3.972%, (CSTR), 10/25/36 | | | 13,371 | | | | 12 | |
WaMu Mortgage Pass-Through Certificates, Series 2006-AR2, Class 1A1
3.864%, (CSTR), 3/25/36 | | | 90,742 | | | | 82 | |
WaMu Mortgage Pass-Through Certificates, Series 2006-AR8, Class 2A1
4.485%, (CSTR), 8/25/36 | | | 5,630 | | | | 5 | |
WaMu Mortgage Pass-Through Certificates, Series 2007-HY1, Class 3A1
3.704%, (CSTR), 2/25/37 | | | 2,228 | | | | 2 | |
WaMu Mortgage Pass-Through Certificates, Series 2007-OA3, Class 4A2 5.712%, (Federal Reserve US 12 Month Cumulative Avg 1 year CMT plus 0.700%), 4/25/47 | | | 225,178 | | | | 173 | |
Wells Fargo Alternative Loan Trust, Series 2007-PA4, Class 2A1
5.332%, (CSTR), 7/25/37 | | | 21,362 | | | | 19 | |
Wells Fargo Mortgage Backed Securities Trust, Series 2006-AR5, Class 2A1
4.674%, (CSTR), 4/25/36 | | | 21,543 | | | | 20 | |
Wells Fargo Mortgage Backed Securities Trust, Series 2007-AR8, Class A1
5.924%, (CSTR), 11/25/37 | | | 17,290 | | | | 15 | |
| | | | | | | | |
Total | | | | | | | 174,413 | |
| | | | | | | | |
| |
Total Structured Products (Cost: $275,028) | | | | 271,530 | |
| | | | | | | | |
| | | | | | | | |
| Bank Loan Obligations (2.4%) | | Shares/ Par + | | | Value
$ (000’s) | |
Bank Loan Obligations (2.4%) | | | | | | | | |
Albion Financing 3 SARL, 9.252%, (Euribor3 Month ACT/360 plus
5.250%), 8/17/26 EUR∞ | | | 1,400,000 | | | | 1,548 | |
Altice Financing SA, 8.406%, (US SOFR 3 Month plus 2.750%), 1/31/26 | | | 1,148,092 | | | | 1,132 | |
Altice France SA, 10.894%, (CME Term SOFR 1 Month plus 5.500%), 8/15/28 | | | 190,898 | | | | 171 | |
AmSurg Corp. First Out, 10.110%, (US SOFR 3 Month plus 4.750%), 11/3/26Æ | | | 281,436 | | | | 281 | |
AmSurg Corp. Last Out, 13.258%, (US SOFR 3 Month plus 7.880%), 9/15/28Æ | | | 986,556 | | | | 987 | |
Avolon TLB Borrower 1 LLC, 7.707%, (US SOFR 1 Month plus 2.250%), 12/1/27 | | | 1,167,000 | | | | 1,167 | |
Charter Communications Operating LLC, 7.133%, (US SOFR 1 Month plus 1.750%), 2/1/27 | | | 3,311,992 | | | | 3,310 | |
CommScope, Inc., 8.720%, (US SOFR 1 Month plus 3.250%), 4/6/26 | | | 478,750 | | | | 427 | |
Connect Finco SARL, 8.856%, (US SOFR 1 Month plus 3.500%), 12/11/26 | | | 1,158,000 | | | | 1,157 | |
Grifols SA, 6.223%, (Euribor 3 Month ACT/360 plus 2.250%), 11/15/27 EUR∞ | | | 1,846,008 | | | | 2,010 | |
INEOS Quattro Holdings UK, Ltd., 6.593%, (Euribor 3 Month ACT/360 plus 2.750%), 1/29/26 EUR∞ | | | 1,100,000 | | | | 1,215 | |
INEOS US Petrochem LLC, 8.220%, (US SOFR 1 Month plus 2.750%), 1/29/26 | | | 2,131,578 | | | | 2,131 | |
Lumen Technologies, Inc., 7.720%, (US SOFR 1 Month plus 2.250%), 3/15/27 | | | 2,976,032 | | | | 2,034 | |
Setanta Aircraft Leasing DAC, 7.610%, (US SOFR 3 Month plus 2.000%), 11/5/28 | | | 4,000,000 | | | | 4,010 | |
SOCAR Turkey Energy, Inc., 7.387%, (Euribor 3 Month ACT/360 plus 3.450%), 8/11/26 EUR∞ | | | 5,800,000 | | | | 6,291 | |
Standard Industries, Inc., 7.721%, (US SOFR 1 Month plus 2.500%), 9/22/28 | | | 1,178,475 | | | | 1,180 | |
| | | | | | | | |
| | | | | | | |
Total Bank Loan Obligations (Cost: $30,402) | | | | 29,051 | |
| | | | | | | | |
| | |
| Short-Term Investments (35.0%) | | | | | | |
Financial (0.4%) | | | | | | | | |
National Bank of Hungary
0.000%, 1/4/24 HUF∞ PO | | | 1,911,000,000 | | | | 5,509 | |
| | | | | | | | |
Total | | | | | | | 5,509 | |
| | | | | | | | |
| | |
Governments (0.0%) | | | | | | | | |
Argentina Treasury Bond BONCER
3.750%, 5/20/24 ARS∞ | | | 3,858,000 | | | | 10 | |
US Treasury
0.000%, 3/28/24b PO | | | 61,000 | | | | 60 | |
| | | | | | | | |
Total | | | | | | | 70 | |
| | | | | | | | |
The Accompanying Notes are an Integral Part of the Financial Statements.
184
Multi-Sector Bond Portfolio
| | | | | | | | |
| Short-Term Investments (35.0%) | | Shares/ Par + | | | Value
$ (000’s) | |
Repurchase Agreements (34.6%) | | | | | | | | |
BNP Paribas SA repurchase (Purchased on 12/28/23, to be repurchased at $193,120,089, collateralized by US Treasury Note, 1.875%, due 2/15/32, par and fair value of $226,637,300 and $194,961,196,respectively)
5.600%, 1/2/24 | | | 193,000,000 | | | | 193,000 | |
Citigroup Global Markets, Inc. repurchase (Purchased on 12/29/23, to be repurchased at $193,529,455, collateralized by US Treasury Note, 0.375%, due 7/15/24,par and fair value of $202,326,000 and $197,342,932, respectively)
5.480%, 1/3/24 | | | 193,500,000 | | | | 193,500 | |
| | | | | | | | |
| Short-Term Investments (35.0%) | | Shares/ Par + | | | Value
$ (000’s) | |
Repurchase Agreements continued | | | | | | | | |
Citigroup Global Markets, Inc. repurchase (Purchased on 12/29/23, to be repurchased at $27,916,740, collateralized by US Treasury Note, 1.125%, due 10/31/26,par and fair value of $30,815,000 and $28,442,486, respectively) 5.400%, 1/2/24 | | | 27,900,000 | | | | 27,900 | |
JP Morgan Securities LLC repurchase (Purchased on 12/29/23, to be repurchased at $100,015, collateralized by US Treasury Note, 0.75%, due 5/31/26, par and fair value of $111,000 and $102,510, respectively) 5.490%, 1/3/24 | | | 100,000 | | | | 100 | |
| | | | | | | | |
Total | | | | | | | 414,500 | |
| | | | | | | | |
| |
Total Short-Term Investments (Cost: $420,107) | | | | 420,079 | |
| | | | | | | | |
| |
Total Investments (121.3%) (Cost: $1,569,376)@ | | | | 1,454,783 | |
| | | | | | | | |
| | |
Other Assets, Less Liabilities (-21.3%) | | | | | | | (255,104 | ) |
| | | | | | | | |
| | |
Net Assets (100.0%) | | | | | | | 1,199,679 | |
| | | | | | | | |
Reverse Repurchase Agreements
| | | | | | | | | | | | | | | | | | | | | | | | | | |
| Reference Entity | | Counterparty | | Interest
Rate | | Borrowing
Date | | Maturity
Date | | | Currency | | | Amount
Borrowed
(000’s) | | | Payable for
Reverse
Repurchase
Agreements
(000s) | |
INEOS Styrolution Group GmbH | | BNP Paribas SA | | | 2.900% | | | | 9/26/23 | | | | Open | | | | EUR | | | | (175 | ) | | $ | (193 | ) |
Nexi SpA | | Barclays Bank PLC | | | 2.500% | | | | 9/20/23 | | | | Open | | | | EUR | | | | (846 | ) | | | (934 | ) |
Nexi SpA | | JP Morgan Securities PLC | | | 2.750% | | | | 8/22/23 | | | | Open | | | | EUR | | | | (513 | ) | | | (566 | ) |
Republic of Indonesia | | Morgan Stanley & Co. | | | 4.650% | | | | 10/25/23 | | | | Open | | | | USD | | | | (1,595 | ) | | | (1,595 | ) |
| | International PLC | | | | | | | | | | | | | | | | | | | | | | | | |
Ubisoft Entertainment | | Barclays Bank PLC | | | 3.250% | | | | 11/29/23 | | | | Open | | | | EUR | | | | (326 | ) | | | (360 | ) |
| | | | | | | | | | | | | | | | | | | | | | | | $ | (3,648 | ) |
Exchange Traded or Centrally Cleared Derivatives
Futures
| | | | | | | | | | | | | | | | | | | | | | | | | | | | | | | | |
| Issuer | | Long/
Short | | | Currency | | | Notional Par
(000’s) | | | Number
of
Contracts | | | Expiration
Date | | | Notional Value
(000’s) | | | Unrealized
Appreciation/
(Depreciation)
(000’s) | | | Variation Margin
(000’s) | |
Euro-Bund Future | | | Long | | | | EUR | | | | 5,400 | | | | 54 | | | | 3/24 | | | $ | 8,180 | | | $ | 247 | | | $ | (66 | ) |
Five-Year US Treasury Note Future | | | Long | | | | USD | | | | 76,200 | | | | 762 | | | | 3/24 | | | | 82,885 | | | | 2,032 | | | | 66 | |
Long Gilt Future | | | Short | | | | GBP | | | | 1,700 | | | | 17 | | | | 3/24 | | | | 2,224 | | | | (151 | ) | | | 16 | |
Ten-Year US Treasury Note Future | | | Long | | | | USD | | | | 60,200 | | | | 602 | | | | 3/24 | | | | 67,960 | | | | 2,296 | | | | – | |
Two-Year US Treasury Note Future | | | Long | | | | USD | | | | 46,400 | | | | 232 | | | | 3/24 | | | | 47,772 | | | | 498 | | | | 29 | |
Ultra Long Term US Treasury Bond Future | | | Long | | | | USD | | | | 21,000 | | | | 210 | | | | 3/24 | | | | 28,055 | | | | 2,405 | | | | (112 | ) |
Ultra Ten-Year US Treasury Note Future | | | Long | | | | USD | | | | 11,200 | | | | 112 | | | | 3/24 | | | | 13,218 | | | | 626 | | | | (10 | ) |
| | | | | | | | | | | | | | | | | | | | | | | | | | $ | 7,953 | | | $ | (77 | ) |
The Accompanying Notes are an Integral Part of the Financial Statements.
185
Multi-Sector Bond Portfolio
Centrally Cleared Interest Rate Swaps - Receive Floating Rate
| | | | | | | | | | | | | | | | | | | | | | | | | | | | | | | | |
| Floating Rate Index | | Fixed
Rate | | | Expiration
Date | | | Notional
Amount
(000’s) | | | Currency | | | Upfront
Premium Paid/
(Received)
(000’s) | | | Unrealized Appreciation/ (Depreciation)
(000’s) | | | Market Value
(000’s) | | | Variation
Margin(000’s) | |
1-Day JPY - MUTKCALM Compounded-OIS | | | 0.400% | | | | 6/32 | | | | 1,460,000 | | | | JPY | | | $ | 118 | | | $ | 183 | | | $ | 301 | | | $ | 23 | |
1-Day JPY - MUTKCALM Compounded-OIS | | | 0.850% | | | | 9/33 | | | | 370,000 | | | | JPY | | | | 10 | | | | (14 | ) | | | (4 | ) | | | 7 | |
6-Month Euribor | | | 2.750% | | | | 3/54 | | | | 6,900 | | | | EUR | | | | (749 | ) | | | 32 | | | | (717 | ) | | | 111 | |
| | | | | | | | | | | | | | | | | | $ | (621 | ) | | $ | 201 | | | $ | (420 | ) | | $ | 141 | |
Centrally Cleared Interest Rate Swaps - Pay Floating Rate
| | | | | | | | | | | | | | | | | | | | | | | | | | | | | | | | |
| Floating Rate Index | | Fixed
Rate | | | Expiration
Date | | | Notional
Amount
(000’s) | | | Currency | | | Upfront Premium Paid/
(Received)
(000’s) | | | Unrealized Appreciation/
(Depreciation)
(000’s) | | | Market Value
(000’s) | | | Variation
Margin(000’s) | |
1-Day GBP-SONIO Compounded-OIS | | | 4.500% | | | | 3/34 | | | | 2,900 | | | | GBP | | | $ | 75 | | | $ | 312 | | | $ | 387 | | | $ | (14 | ) |
1-Day GBP-SONIO Compounded-OIS | | | 4.250% | | | | 3/54 | | | | 1,100 | | | | GBP | | | | 54 | | | | 184 | | | | 238 | | | | (11 | ) |
3-Month Canada Bankers Acceptances | | | 0.880% | | | | 3/24 | | | | 12,600 | | | | CAD | | | | – | | | | (78 | ) | | | (78 | ) | | | 1 | |
3-Month Canada Bankers Acceptances | | | 2.500% | | | | 6/29 | | | | 8,000 | | | | CAD | | | | 96 | | | | (371 | ) | | | (275 | ) | | | 11 | |
6-Month AUD-BBR-BBSW | | | 4.750% | | | | 12/33 | | | | 23,300 | | | | AUD | | | | (198 | ) | | | 356 | | | | 158 | | | | (7 | ) |
6-Month Euribor | | | 3.500% | | | | 3/26 | | | | 4,500 | | | | EUR | | | | 5 | | | | 83 | | | | 88 | | | | (4 | ) |
6-Month Euribor | | | 3.250% | | | | 3/29 | | | | 2,200 | | | | EUR | | | | 14 | | | | 87 | | | | 101 | | | | (6 | ) |
6-Month Euribor | | | 3.000% | | | | 3/34 | | | | 38,300 | | | | EUR | | | | 778 | | | | 1,244 | | | | 2,022 | | | | (267 | ) |
Canadian Overnight Repo Rate Average | | | 3.750% | | | | 12/25 | | | | 29,100 | | | | CAD | | | | (411 | ) | | | 365 | | | | (46 | ) | | | 16 | |
| | | | | | | | | | | | | | | | | | $ | 413 | | | $ | 2,182 | | | $ | 2,595 | | | $ | (281 | ) |
Centrally Cleared Credit Default Swaps on Credit Indices - Sell Protection
| | | | | | | | | | | | | | | | | | | | | | | | | | | | |
| Reference Entity | | Receive
Fixed
Rate | | Expiration
Date | | Implied
Credit
Spread | | Notional
Amount
(000’s) | | | Currency | | Upfront
Premium Paid/
(Received)
(000’s) | | | Unrealized Appreciation/ (Depreciation)
(000’s) | | | Market
Value(000’s) | | | Variation
Margin(000’s) | |
Markit CDX Emerging Markets Index, Series 34 | | 1.000% | | 12/25 | | 2.072% | | | 5,336 | | | USD | | $ | (95 | ) | | $ | (11 | ) | | $ | (106 | ) | | $ | (2 | ) |
Markit CDX Emerging Markets Index, Series 36 | | 1.000% | | 12/26 | | 1.230% | | | 35,236 | | | USD | | | (1,193 | ) | | | 970 | | | | (223 | ) | | | (23 | ) |
Markit CDX Emerging Markets Index, Series 37 | | 1.000% | | 6/27 | | 1.441% | | | 490 | | | USD | | | (29 | ) | | | 22 | | | | (7 | ) | | | – | π |
Markit CDX Emerging Markets Index, Series 38 | | 1.000% | | 12/27 | | 1.447% | | | 4,200 | | | USD | | | (268 | ) | | | 201 | | | | (67 | ) | | | (2 | ) |
Markit CDX Emerging Markets Index, Series 39 | | 1.000% | | 6/28 | | 1.506% | | | 2,100 | | | USD | | | (122 | ) | | | 80 | | | | (42 | ) | | | (1 | ) |
Markit CDX Emerging Markets Index, Series 40 | | 1.000% | | 12/28 | | 1.667% | | | 20,800 | | | USD | | | (979 | ) | | | 377 | | | | (602 | ) | | | (12 | ) |
Markit CDX North America High Yield Index, Series 38 | | 5.000% | | 6/27 | | 2.793% | | | 582 | | | USD | | | (12 | ) | | | 51 | | | | 39 | | | | – | π |
The Accompanying Notes are an Integral Part of the Financial Statements.
186
Multi-Sector Bond Portfolio
Centrally Cleared Credit Default Swaps on Credit Indices - Sell Protection (continued)
| | | | | | | | | | | | | | | | | | | | | | | | | | | | | | | | | | | | |
| Reference Entity | | Receive
Fixed
Rate | | | Expiration
Date | | | Implied
Credit
Spread | | | Notional Amount
(000’s) | | | Currency | | | Upfront
Premium Paid/
(Received)
(000’s) | | | Unrealized Appreciation/ (Depreciation)
(000’s) | | | Market
Value(000’s) | | | Variation
Margin(000’s) | |
Markit CDX North America High Yield Index, Series 40 | | | 5.000% | | | | 6/28 | | | | 3.362% | | | | 594 | | | | USD | | | $ | 1 | | | $ | 35 | | | $ | 36 | | | $ | – | π |
Markit CDX North America High Yield Index, Series 41 | | | 5.000% | | | | 12/28 | | | | 3.562% | | | | 90,090 | | | | USD | | | | 1,067 | | | | 4,188 | | | | 5,255 | | | | (42 | ) |
Markit CDX North America Investment Grade Index, Series 36 | | | 1.000% | | | | 6/26 | | | | 0.305% | | | | 800 | | | | USD | | | | 10 | | | | 3 | | | | 13 | | | | – | π |
Markit CDX North America Investment Grade Index, Series 37 | | | 1.000% | | | | 12/26 | | | | 0.378% | | | | 900 | | | | USD | | | | 8 | | | | 8 | | | | 16 | | | | – | π |
Markit CDX North America Investment Grade Index, Series 38 | | | 1.000% | | | | 6/27 | | | | 0.405% | | | | 300 | | | | USD | | | | 2 | | | | 4 | | | | 6 | | | | – | π |
Markit CDX North America Investment Grade Index, Series 39 | | | 1.000% | | | | 12/27 | | | | 0.478% | | | | 100 | | | | USD | | | | 1 | | | | 1 | | | | 2 | | | | – | π |
Markit CDX North America Investment Grade Index, Series 40 | | | 1.000% | | | | 6/28 | | | | 0.508% | | | | 800 | | | | USD | | | | 11 | | | | 5 | | | | 16 | | | | – | π |
Markit CDX North America Investment Grade Index, Series 41 | | | 1.000% | | | | 12/28 | | | | 0.567% | | | | 67,200 | | | | USD | | | | 805 | | | | 498 | | | | 1,303 | | | | (18 | ) |
| | | | | | | | | | | | | | | | | | | | | | $ | (793 | ) | | $ | 6,432 | | | $ | 5,639 | | | $ | (100 | ) |
Centrally Cleared Credit Default Swaps on Corporate or Sovereign Issues - Sell Protection
| | | | | | | | | | | | | | | | | | | | | | | | | | | | | | | | | | | | |
| Reference Entity | | Receive
Fixed
Rate | | | Expiration Date | | | Implied Credit Spread | | | Notional Amount (000’s) | | | Currency | | | Upfront Premium Paid/ (Received) (000’s) | | | Unrealized Appreciation/ (Depreciation) (000’s) | | | Market
Value(000’s) | | | Variation Margin(000’s) | |
AT&T, Inc. | | | 1.000% | | | | 6/24 | | | | 0.400% | | | | 200 | | | | USD | | | $ | – | | | $ | 1 | | | $ | 1 | | | $ | – | π |
AT&T, Inc. | | | 1.000% | | | | 6/25 | | | | 0.535% | | | | 100 | | | | USD | | | | (1 | ) | | | 2 | | | | 1 | | | | – | π |
AT&T, Inc. | | | 1.000% | | | | 6/26 | | | | 0.608% | | | | 100 | | | | USD | | | | 1 | | | | – | | | | 1 | | | | – | π |
Carnival Corp. | | | 1.000% | | | | 12/28 | | | | 3.543% | | | | 600 | | | | USD | | | | (132 | ) | | | 70 | | | | (62 | ) | | | (1 | ) |
Ford Motor Co. | | | 5.000% | | | | 6/25 | | | | 0.846% | | | | 200 | | | | USD | | | | 4 | | | | 8 | | | | 12 | | | | – | π |
Ford Motor Co. | | | 5.000% | | | | 12/25 | | | | 0.967% | | | | 400 | | | | USD | | | | 8 | | | | 22 | | | | 30 | | | | – | π |
Ford Motor Co. | | | 5.000% | | | | 6/26 | | | | 1.145% | | | | 1,000 | | | | USD | | | | 26 | | | | 64 | | | | 90 | | | | – | π |
Ford Motor Co. | | | 5.000% | | | | 6/27 | | | | 1.562% | | | | 300 | | | | USD | | | | 20 | | | | 13 | | | | 33 | | | | – | π |
Ford Motor Co. | | | 5.000% | | | | 6/27 | | | | 1.460% | | | | 900 | | | | USD | | | | 44 | | | | 57 | | | | 101 | | | | – | π |
General Electric Co. | | | 1.000% | | | | 6/24 | | | | 0.145% | | | | 900 | | | | USD | | | | (1 | ) | | | 5 | | | | 4 | | | | – | π |
General Electric Co. | | | 1.000% | | | | 12/26 | | | | 0.313% | | | | 400 | | | | USD | | | | 3 | | | | 5 | | | | 8 | | | | – | π |
General Electric Co. | | | 1.000% | | | | 6/26 | | | | 0.286% | | | | 3,800 | | | | USD | | | | 21 | | | | 43 | | | | 64 | | | | – | π |
Glencore Finance Europe, Ltd. | | | 5.000% | | | | 12/25 | | | | 0.550% | | | | 2,700 | | | | EUR | | | | 280 | | | | (25 | ) | | | 255 | | | | 1 | |
Glencore Finance Europe, Ltd. | | | 5.000% | | | | 12/27 | | | | 1.049% | | | | 1,600 | | | | EUR | | | | 281 | | | | (20 | ) | | | 261 | | | | – | π |
Glencore Finance Europe, Ltd. | | | 5.000% | | | | 12/26 | | | | 0.714% | | | | 700 | | | | EUR | | | | 94 | | | | – | | | | 94 | | | | – | π |
Marks & Spencer PLC | | | 1.000% | | | | 12/24 | | | | 0.209% | | | | 2,900 | | | | EUR | | | | (27 | ) | | | 52 | | | | 25 | | | | – | π |
Marks & Spencer PLC | | | 1.000% | | | | 6/27 | | | | 0.670% | | | | 100 | | | | EUR | | | | (5 | ) | | | 6 | | | | 1 | | | | – | π |
Marks & Spencer PLC | | | 1.000% | | | | 12/28 | | | | 0.982% | | | | 500 | | | | EUR | | | | (27 | ) | | | 28 | | | | 1 | | | | – | π |
Volkswagen International Finance NV | | | 1.000% | | | | 12/26 | | | | 0.635% | | | | 3,100 | | | | EUR | | | | 39 | | | | (4 | ) | | | 35 | | | | – | π |
| | | | | | | | | | | | | | | | | | | | | | $ | 628 | | | $ | 327 | | | $ | 955 | | | $ | – | π |
The Accompanying Notes are an Integral Part of the Financial Statements.
187
Multi-Sector Bond Portfolio
| | | | | | | | | | | | | | | | | | | | | | | | | | | | |
| | | Financial Derivative Assets | | | Financial Derivative Liabilities | |
| | | Variation Margin (000’s) | | | Variation Margin (000’s) | | | Market Value
(000’s) | |
| | | Swaps | | | Futures | | | Total | | | Swaps | | | Futures | | | Total | | | Options | |
| | | | |
| Total Exchange-Traded or Centrally Cleared Derivatives | | $ | 170 | | | $ | 111 | | | $ | 281 | | | $ | | (410) | | $ | | (188) | | $ | | (598) | | $ | – | |
| | | | |
Over the Counter Derivatives
Forward Foreign Currency Contracts
| | | | | | | | | | | | | | | | | | | | | | | | | | | | | | |
| Type | | Counterparty | | Currency | | | Foreign Principal Amount Covered by Contract (000s) | | | USD Principal Amount Covered by Contract (000’s) | | | Settlement Date | | | Unrealized Appreciation (000’s) | | | Unrealized (Depreciation) (000’s) | | | Net Unrealized Appreciation/ (Depreciation) (000’s) |
Sell | | BNP Paribas SA | | | AUD | | | | 246 | | | | 168 | | | | 1/9/24 | | | $ | — | | | $ | (5) | | | $ | (5) | |
Sell | | HSBC Bank PLC | | | AUD | | | | 1,222 | | | | 833 | | | | 1/9/24 | | | | — | | | | (23) | | | | (23) | |
Sell | | UBS AG | | | AUD | | | | 988 | | | | 673 | | | | 1/9/24 | | | | — | | | | (18) | | | | (18) | |
Sell | | Goldman Sachs Bank USA | | | CAD | | | | 2,481 | | | | 1,873 | | | | 1/9/24 | | | | — | | | | (39) | | | | (39) | |
Sell | | JP Morgan Chase Bank NA | | | CNH | | | | 587 | | | | 83 | | | | 3/26/24 | | | | — | | | | (1) | | | | (1) | |
Buy | | Bank of America NA | | | EUR | | | | 3,694 | | | | 4,079 | | | | 1/9/24 | | | | 41 | | | | — | | | | 41 | |
Buy | | BNP Paribas SA | | | EUR | | | | 858 | | | | 947 | | | | 1/9/24 | | | | 9 | | | | — | | | | 9 | |
Buy | | Goldman Sachs Bank USA | | | EUR | | | | 4,751 | | | | 5,246 | | | | 1/9/24 | | | | 32 | | | | — | | | | 32 | |
Sell | | Barclays Bank PLC | | | EUR | | | | 42,152 | | | | 46,544 | | | | 1/9/24 | | | | — | | | | (187) | | | | (187) | |
Sell | | BNP Paribas SA | | | EUR | | | | 5,529 | | | | 6,105 | | | | 1/9/24 | | | | — | | | | (70) | | | | (70) | |
Sell | | UBS AG | | | EUR | | | | 103,501 | | | | 114,287 | | | | 1/9/24 | | | | — | | | | (439) | | | | (439) | |
Sell | | Bank of America NA | | | GBP | | | | 899 | | | | 1,146 | | | | 1/9/24 | | | | — | | | | (4) | | | | (4) | |
Sell | | Barclays Bank PLC | | | GBP | | | | 1,512 | | | | 1,928 | | | | 1/9/24 | | | | — | | | | (9) | | | | (9) | |
Sell | | BNP Paribas SA | | | GBP | | | | 3,427 | | | | 4,368 | | | | 1/9/24 | | | | — | | | | (21) | | | | (21) | |
Sell | | UBS AG | | | GBP | | | | 18,617 | | | | 23,730 | | | | 1/9/24 | | | | — | | | | (171) | | | | (171) | |
Buy | | BNP Paribas SA | | | HUF | | | | 459 | | | | 1 | | | | 1/4/24 | | | | — | | | | —π | | | | —π | |
Sell | | BNP Paribas SA | | | HUF | | | | 368,243 | | | | 1,061 | | | | 1/4/24 | | | | — | | | | (13) | | | | (13) | |
Sell | | HSBC Bank PLC | | | HUF | | | | 419,560 | | | | 1,209 | | | | 1/4/24 | | | | — | | | | (17) | | | | (17) | |
Sell | | JP Morgan Chase Bank NA | | | HUF | | | | 1,117,117 | | | | 3,219 | | | | 1/4/24 | | | | — | | | | (38) | | | | (38) | |
Sell | | Goldman Sachs Bank USA | | | JPY | | | | 41,500 | | | | 294 | | | | 1/9/24 | | | | — | | | | (13) | | | | (13) | |
Sell | | Goldman Sachs Bank USA | | | MXN | | | | 21,308 | | | | 1,249 | | | | 1/31/24 | | | | — | | | | (35) | | | | (35) | |
Sell | | Royal Bank of Canada | | | MXN | | | | 31 | | | | 2 | | | | 4/19/24 | | | | — | | | | —π | | | | —π | |
Sell | | Bank of America NA | | | PEN | | | | 10,817 | | | | 2,922 | | | | 1/22/24 | | | | — | | | | (7) | | | | (7) | |
Sell | | BNP Paribas SA | | | PEN | | | | 521 | | | | 141 | | | | 1/22/24 | | | | — | | | | (1) | | | | (1) | |
Buy | | Barclays Bank PLC | | | TRY | | | | 37,232 | | | | 1,136 | | | | 4/24/24 | | | | — | | | | (14) | | | | (14) | |
| | | | | | | | | |
| | | | | | | | | | | | | | | | | | | | $ | 82 | | | $ | (1,125) | | | $ | (1,043) | |
| | | | | | | | | |
Credit Default Swaps on Corporate or Sovereign Issues - Sell Protection
| | | | | | | | | | | | | | | | | | | | | | | | | | |
| Reference Entity | | Counterparty | | Receive Fixed Rate | | Expiration Date | | Implied Credit Spread | | Currency | | Notional Amount (000’s) | | | Upfront Premium Paid/ (Received) (000’s) | | | Unrealized Appreciation/ (Depreciation) (000’s) | | | Market Value (000’s) | |
Intrum AB | | Barclays Bank PLC | | 5.000% | | 12/24 | | 6.009% | | EUR | | | 100 | | | $ | 2 | | | $ | (3 | ) | | $ | (1 | ) |
Intrum AB | | Goldman Sachs International | | 5.000% | | 12/24 | | 6.009% | | EUR | | | 200 | | | | 4 | | | | (6 | ) | | | (2 | ) |
Intrum AB | | Goldman Sachs International | | 5.000% | | 12/24 | | 6.009% | | EUR | | | 200 | | | | 3 | | | | (5 | ) | | | (2 | ) |
Intrum AB | | Goldman Sachs International | | 5.000% | | 12/24 | | 6.009% | | EUR | | | 200 | | | | 3 | | | | (5 | ) | | | (2 | ) |
Intrum AB | | Goldman Sachs International | | 5.000% | | 12/24 | | 6.009% | | EUR | | | 300 | | | | 6 | | | | (9 | ) | | | (3 | ) |
Intrum AB | | Goldman Sachs International | | 5.000% | | 12/24 | | 6.009% | | EUR | | | 300 | | | | 7 | | | | (10 | ) | | | (3 | ) |
Intrum AB | | Goldman Sachs International | | 5.000% | | 12/24 | | 6.009% | | EUR | | | 400 | | | | 9 | | | | (13 | ) | | | (4 | ) |
Intrum AB | | Goldman Sachs International | | 5.000% | | 12/24 | | 6.009% | | EUR | | | 400 | | | | 9 | | | | (13 | ) | | | (4 | ) |
The Accompanying Notes are an Integral Part of the Financial Statements.
188
Multi-Sector Bond Portfolio
Credit Default Swaps on Corporate or Sovereign Issues - Sell Protection (continued)
| | | | | | | | | | | | | | | | | | | | | | | | | | | | | | | | | | |
| Reference Entity | | Counterparty | | Receive Fixed Rate | | | Expiration Date | | | Implied Credit Spread | | | Currency | | | Notional Amount (000’s) | | | Upfront
Premium
Paid/
(Received)
(000’s) | | | Unrealized
Appreciation/
(Depreciation)
(000’s) | | | Market
Value
(000’s) | |
Intrum AB | | Goldman Sachs International | | | 5.000% | | | | 12/24 | | | | 6.009% | | | | EUR | | | | 500 | | | $ | 8 | | | $ | (13 | ) | | $ | (5 | ) |
Intrum AB | | Goldman Sachs International | | | 5.000% | | | | 12/24 | | | | 6.009% | | | | EUR | | | | 600 | | | | 13 | | | | (19 | ) | | | (6 | ) |
Intrum AB | | Goldman Sachs International | | | 5.000% | | | | 12/24 | | | | 6.009% | | | | EUR | | | | 600 | | | | 10 | | | | (16 | ) | | | (6 | ) |
Intrum AB | | JP Morgan Chase Bank NA | | | 5.000% | | | | 12/24 | | | | 6.009% | | | | EUR | | | | 800 | | | | 12 | | | | (20 | ) | | | (8 | ) |
Intrum AB | | Morgan Stanley Capital Services LLC | | | 5.000% | | | | 12/24 | | | | 6.009% | | | | EUR | | | | 100 | | | | 2 | | | | (3 | ) | | | (1 | ) |
Intrum AB | | Morgan Stanley Capital Services LLC | | | 5.000% | | | | 12/24 | | | | 6.009% | | | | EUR | | | | 100 | | | | 2 | | | | (3 | ) | | | (1 | ) |
Intrum AB | | Morgan Stanley Capital Services LLC | | | 5.000% | | | | 12/24 | | | | 6.009% | | | | EUR | | | | 200 | | | | 4 | | | | (6 | ) | | | (2 | ) |
Republic of Indonesia | | Barclays Bank PLC | | | 1.000% | | | | 6/31 | | | | 1.046% | | | | USD | | | | 5,700 | | | | (180 | ) | | | 163 | | | | (17 | ) |
Republic of Turkey | | Morgan Stanley Capital Services LLC | | | 1.000% | | | | 12/28 | | | | 2.796% | | | | USD | | | | 3,000 | | | | (230 | ) | | | (1 | ) | | | (231 | ) |
United Mexican States | | Morgan Stanley Capital Services LLC | | | 1.000% | | | | 12/26 | | | | 0.438% | | | | USD | | | | 300 | | | | – | π | | | 5 | | | | 5 | |
United Mexican States | | Morgan Stanley Capital Services LLC | | | 1.000% | | | | 6/27 | | | | 0.563% | | | | USD | | | | 100 | | | | – | π | | | 1 | | | | 1 | |
United Mexican States | | Morgan Stanley Capital Services LLC | | | 1.000% | | | | 6/28 | | | | 0.783% | | | | USD | | | | 100 | | | | (2 | ) | | | 3 | | | | 1 | |
United Mexican States | | Morgan Stanley Capital Services LLC | | | 1.000% | | | | 12/28 | | | | 0.883% | | | | USD | | | | 300 | | | | (3 | ) | | | 5 | | | | 2 | |
| | | | | | | | | | | | | | | | | | | | | | | | $ | (321 | ) | | $ | 32 | | | $ | (289 | ) |
| | | | | | | | | | | | | | | | | | | | | | | | | | | | | | | | |
| | | Financial Derivative Assets (000’s) | | | Financial Derivative Liabilities (000’s) | |
| | | Forward
Foreign
Currency
Contracts | | | Swaps | | | Total | | | Forward
Foreign
Currency
Contracts | | | | | | Options | | | Swaps | | | Total | |
Total Over the Counter Derivatives | | $ | 82 | | | $ | 9 | | | $ | 91 | | | $ | (1,125 | ) | | | | | | | — | | | $ | (298 | ) | | $ | (1,423 | ) |
Restricted Securities
| | | | | | | | | | | | | | |
| Description | | Acquisition
Date | | Cost (000’s) | | | Value (000’s) | | | Value as a
Percentage of Net
Assets | |
Corestate Capital Holding SA | | 8/22/23 | | $ | – | | | $ | – | π | | | – | %π |
AmSurg Corp. | | 11/2/23 | | | 396 | | | | 486 | | | | 0.04 | % |
Constellation Oil - Class B | | 6/10/22 | | | 12 | | | | 12 | | | | – | %π |
DrillCo Holding Lux SA - Class B | | 6/8/23 | | | 54 | | | | 67 | | | | 0.01 | % |
DrillCo Holding Lux SA - Class C | | 6/8/23 | | | 484 | | | | 600 | | | | 0.05 | % |
| + | All par is stated in U.S. Dollar unless otherwise noted. |
| Æ | Security valued using significant unobservable inputs. |
The Accompanying Notes are an Integral Part of the Financial Statements.
189
Multi-Sector Bond Portfolio
| d | Restricted security – see accompanying table for additional details |
| π | Amount is less than one thousand. |
| 144A | Security exempt from registration under Rule 144A of the Securities Act of 1933. These securities may be resold as transactions exempt from registration, normally to qualified institutional buyers. At December 31, 2023 the value of these securities (in thousands) was $306,861 representing 25.5% of the net assets. |
| ∞ | Foreign Bond — par value is foreign denominated. |
| § | Security was purchased pursuant to Regulation S under the Securities Act of 1933, which exempts from registration securities offered and sold outside of the United States. At December 31, 2023, the aggregate value of these securities was $198,100 (in thousands), representing 16.6% of net assets. |
| α | Rate shown is the rate as of the period end. The rate may be based on a fixed rate, a capped rate or a floor rate and may convert to a variable or floating rate in the future. |
| µ | Perpetual maturity, date shown, if applicable, represents next contractual call date. |
| y | Contingent convertible security |
| Þ | PIK - Payment In Kind. PIK rate of Constellation Oil Services Holding SA is 4.00%, Corestate Capital Holding SA with Par of 1,231,517 and 151,239 is 9.00%, and Corestate Capital Holding SA with Par of 200,000 is 11.00%. |
| b | Part or all of the security has been pledged as collateral. |
| Σ | Stepped coupon bond for which the coupon rate of interest adjusts on specified date(s); rate shown is effective rate at period-end. |
| @ | At December 31, 2023, the aggregate cost of investments, including derivatives, for federal tax purposes (in thousands) was $1,566,256 and the net unrealized depreciation of investments based on that cost was $99,731 which is comprised of $33,141 aggregate gross unrealized appreciation and $132,872 aggregate gross unrealized depreciation. |
The Accompanying Notes are an Integral Part of the Financial Statements.
190
Multi-Sector Bond Portfolio
The following is a summary of the inputs used in valuing the Portfolio’s Investments at December 31, 2023. See Note 3 for additional information on portfolio valuation.
| | | | | | | | | | | | | | | | |
| | | Valuation Inputs | |
Description | | | | | Level 1 - Quoted
Prices | | | Level 2 - Other
Significant
Observable Inputs | | | Level 3 - Significant
Unobservable
Inputs | |
| |
| | | | | | (Amounts in thousands) | |
Assets: | | | | | | | | | | | | | | | | |
Bank Loan Obligations | | | | | | | | | | | | | | | | |
Bank Loan Obligations | | | | | | $ | — | | | $ | 27,783 | | | $ | 1,268 | |
Common Stocks | | | | | | | | | | | | | | | | |
Real Estate | | | | | | | 508 | | | | — | | | | 11 | |
All Others | | | | | | | — | | | | — | | | | 1,434 | |
Convertible Corporate Bonds | | | | | | | — | | | | 733 | | | | — | |
Municipal Bonds | | | | | | | — | | | | 6,818 | | | | — | |
Corporate Bonds | | | | | | | | | | | | | | | | |
Basic Materials | | | | | | | — | | | | 8,769 | | | | 520 | |
Financial | | | | | | | — | | | | 142,640 | | | | 3,528 | |
All Others | | | | | | | — | | | | 357,040 | | | | — | |
Governments | | | | | | | — | | | | 212,122 | | | | — | |
Structured Products | | | | | | | | | | | | | | | | |
Asset Backed Securities | | | | | | | — | | | | 95,261 | | | | 1,856 | |
Mortgage Securities | | | | | | | — | | | | 174,413 | | | | — | |
Short-Term Investments | | | | | | | — | | | | 420,079 | | | | — | |
Other Financial Instruments^ | | | | | | | | | | | | | | | | |
Futures | | | | | | | 8,104 | | | | — | | | | — | |
Forward Foreign Currency Contracts | | | | | | | — | | | | 82 | | | | — | |
Interest Rate Swaps | | | | | | | — | | | | 3,295 | | | | — | |
Credit Default Swaps | | | | | | | — | | | | 7,712 | | | | — | |
| | | | | | | | |
Total Assets: | | | | | | $ | 8,612 | | | $ | 1,456,747 | | | $ | 8,617 | |
| | | | | | | | |
Liabilities: | | | | | | | | | | | | | | | | |
Other Financial Instruments^ | | | | | | | | | | | | | | | | |
Futures | | | | | | | (151 | ) | | | — | | | | — | |
Forward Foreign Currency Contracts | | | | | | | — | | | | (1,125 | ) | | | — | |
Interest Rate Swaps | | | | | | | — | | | | (1,120 | ) | | | — | |
Credit Default Swaps | | | | | | | — | | | | (1,407 | ) | | | — | |
Reverse Repurchase Agreements | | | | | | | — | | | | (3,648 | ) | | | — | |
| | | | | | | | |
Total Liabilities: | | | | | | $ | (151 | ) | | $ | (7,300 | ) | | $ | — | |
| | | | | | | | |
^ Other financial instruments are derivative instruments such as futures and forward foreign currency contracts, which are valued at the unrealized appreciation (depreciation) on the instrument, and securities sold short, reverse repurchase agreements, written options and swaps contracts, which are valued at market value.
Management has determined that the amount of Level 3 securities compared to total net assets is not material; therefore, the reconciliation of Level 3 securities and assumptions is not shown for the period ended December 31, 2023.
The Accompanying Notes are an Integral Part of the Financial Statements.
191
Balanced Portfolio (unaudited)
| | | | |
| Objective: | | Portfolio Strategy: | | Net Assets: |
| Realize as high a level of total return as is consistent with prudent investment risk, through income and capital appreciation. | | Invest in equity, fixed income and cash asset classes, attempting to capitalize on the variation in return potential produced by the interaction of changing financial markets and economic conditions. | | $2.0 billion |
PORTFOLIO OVERVIEW
Mason Street Advisors, LLC is the investment adviser for the Balanced Portfolio (the “Portfolio”). The Portfolio is tactically and strategically managed to capitalize on changing financial markets and economic conditions following a flexible policy for allocating assets across the equity, fixed income and cash asset classes. The Portfolio operates primarily as a “fund of funds” to gain the Portfolio’s equity, fixed income and cash asset class exposure. The Portfolio may invest in the underlying portfolios of Northwestern Mutual Series Fund, Inc. (each an “Underlying Portfolio”) and exchange-traded funds (“ETFs”) which are not portfolios of Northwestern Mutual Series Fund, Inc. The adviser allocates the Portfolio’s assets among the Underlying Portfolios and ETFs based on the adviser’s economic and market outlook and the investment objectives and strategies of the Underlying Portfolios and ETFs. Under normal market conditions, the Portfolio will typically hold between 35-55% of assets in equity investments, 40-60% of assets in fixed income investments, and 0-20% of assets in cash equivalent investments.
MARKET OVERVIEW
The U.S. equity market climbed a wall of worry in 2023 - stock prices jumped double digits despite a year filled with extraordinary events that had the potential to give any investor pause, including the Silicon Valley Bank crisis, U.S. debt default fears, as well as geopolitical tensions in the Middle East. In the end, investors focused on the U.S.’s resilient economic growth, rapidly declining inflation reports, and the widely held expectation late in the year that the U.S. Federal Reserve (the “Fed”) would prove successful in soft landing the economy in 2024.
In this environment, large-cap stocks, as represented by the S&P 500® Index, posted a return of 26.29%, outperforming the S&P MidCap 400® and the S&P SmallCap 600® Indices, which returned 16.44% and 16.05%, respectively. Meanwhile, the broader bond market, as represented by the Bloomberg® U.S. Aggregate Index, returned 5.53%, while the Bloomberg® U.S. Corporate High Yield Index returned 13.45%.
PORTFOLIO RESULTS
The Portfolio returned 13.07% for the twelve months ended December 31, 2023, trailing the 26.29% return of the broad stock market, as measured by the S&P 500® Index, but outpacing the Bloomberg® U.S. Aggregate Index return of 5.53%. The Portfolio underperformed the Balanced Portfolio Blended Composite Benchmark return of 13.98% (the “Blended Benchmark”). (The benchmark weights are detailed in the “Benchmark Definitions” section of this annual report.) (These indices are unmanaged, cannot be invested in directly and do not incur expenses.)
Security selection within the Underlying Portfolios was the largest detractor to the Portfolio, driving underperformance relative to the Blended Benchmark. In particular, style differences and stock selection weighed on the Large Cap Blend Portfolio, the Domestic Equity Portfolio, the Mid Cap Growth Stock Portfolio and the Mid Cap Value Portfolio. On the upside, the Focused Appreciation Portfolio and the Select Bond Portfolio outperformed their respective benchmarks.
Tactical asset allocation relative to the Blended Benchmark was a modest detractor. Overweights to small and mid capitalization U.S. equities, and the resulting underweight to large cap U.S. equities, proved detrimental in a year where a few of the largest companies in the market had an outsized contribution to overall market results.
PORTFOLIO MANAGER OUTLOOK
Although economic events are incredibly difficult to time with precision even during “normal economic times”, the many twists and turns that have buffeted the economy during the four years since COVID-19 first appeared added another degree of difficulty for forecasting.
While the U.S. economy’s resilience in the face of an aggressive Fed tightening cycle has led many investors to position for a soft landing, we believe the U.S. economy is in the late stages of an economic cycle and history suggests that a recession will arrive in the near term. We believe that at the end of a business cycle, investors should pay greater heed to risk.
192
Balanced Portfolio (unaudited)
In contrast to the prior ten years that were characterized by low bond yields, we believe today’s higher yields, especially high-quality investment grade yields, offer an attractive alternative to equity market risk. We believe fixed income has once again returned to its historic role as an income-generation vehicle that can provide risk mitigation against falling equity prices.
Elsewhere, we favor U.S. small caps and mid caps given their historically significant valuation discounts. Within international markets, we favor neutral positioning in developed international but an underweight in emerging markets given currency and geopolitical risks.
Relative Performance
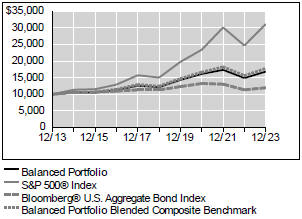
| | | | | | |
Average Annual Total Returns For Periods Ended December 31, 2023 |
| | | 1 Year | | 5 Years | | 10 Years |
Balanced Portfolio | | 13.07% | | 6.73% | | 5.34% |
S&P 500® Index | | 26.29% | | 15.70% | | 12.03% |
Bloomberg® U.S. Aggregate Bond Index | | 5.53% | | 1.10% | | 1.81% |
Balanced Portfolio Blended Composite Benchmark | | 13.98% | | 7.43% | | 5.92% |
The performance data quoted represents past performance. Past performance is historical and does not guarantee future performance. Investment return and principal value will fluctuate, so that shares, when redeemed, may be worth more or less than their original cost. Current performance may be lower or higher than the performance data quoted. For the most recent month-end performance information visit www.northwesternmutual.com.
This chart assumes an initial investment of $10,000 made on 12/31/13. Returns shown reflect fee waivers, deductions for management and other portfolio expenses, and reinvestment of all dividends. In the absence of fee waivers, total return would be reduced. Returns exclude deductions for separate account sale loads and account fees. Please refer to the Benchmark Definitions section of this report for information about the indices cited in the above chart and graph.
Top 10 Holdings 12/31/23
| | | | | | | | |
| | | | |
| | | Security Description | | % of Net Assets | | | | |
| | | | |
| | | Northwestern Mutual Series Fund, Inc., Select Bond Portfolio | | 33.4% | | | | |
| | | | |
| | | iShares Core S&P 500 ETF | | 12.1% | | | | |
| | | | |
| | | Northwestern Mutual Series Fund, Inc., Multi- Sector Bond Portfolio | | 5.7% | | | | |
| | | | |
| | | iShares Core U.S. Aggregate Bond ETF | | 5.2% | | | | |
| | | | |
| | | Northwestern Mutual Series Fund, Inc., Domestic Equity Portfolio | | 4.3% | | | | |
| | | | |
| | | Northwestern Mutual Series Fund, Inc., Large Cap Blend Portfolio | | 4.3% | | | | |
| | | | |
| | | Northwestern Mutual Series Fund, Inc., Focused Appreciation Portfolio | | 4.3% | | | | |
| | | | |
| | | Northwestern Mutual Series Fund, Inc., Mid Cap Value Portfolio | | 4.2% | | | | |
| | | | |
| | | Northwestern Mutual Series Fund, Inc., Mid Cap Growth Stock Portfolio | | 4.2% | | | | |
| | | | |
| | | Northwestern Mutual Series Fund, Inc., International Growth Portfolio | | 3.6% | | | | |
Sector Allocation 12/31/23
| | | | | | | | | | |
| | | | |
| | | Sector | | | % of Net Assets | | | | | |
| | | | |
| | | Fixed Income | | | 48.3% | | | | | |
| | | | |
| | | Domestic Equity | | | 37.4% | | | | | |
| | | | |
| | | Foreign Equity | | | 10.1% | | | | | |
| | | | |
| | | Short-Term Investments & Other Net Assets | | | 4.2% | | | | | |
Sector Allocation and Top 10 Holdings are subject to change.
193
Balanced Portfolio
SCHEDULE OF INVESTMENTS
December 31, 2023
| | | | | | | | |
| Investment Companies (95.8%) | | Shares/ Par + | | | Value $ (000’s) | |
Domestic Equity (37.4%) | |
iShares Core S&P 500 ETF | | | 497,300 | | | | 237,525 | |
iShares Core S&P Mid-Cap ETF | | | 59,350 | | | | 16,449 | |
iShares Core S&P Small-Cap ETF | | | 174,500 | | | | 18,890 | |
Northwestern Mutual Series Fund, Inc., Domestic Equity Portfolio £ | | | 53,558,467 | | | | 84,676 | |
Northwestern Mutual Series Fund, Inc., Focused Appreciation Portfolio £ | | | 21,744,497 | | | | 84,064 | |
Northwestern Mutual Series Fund, Inc., Large Cap Blend Portfolio £ | | | 71,069,969 | | | | 84,360 | |
Northwestern Mutual Series Fund, Inc., Mid Cap Growth Stock Portfolio £ | | | 26,322,018 | | | | 81,861 | |
Northwestern Mutual Series Fund, Inc., Mid Cap Value Portfolio £ | | | 55,824,014 | | | | 82,620 | |
Northwestern Mutual Series Fund, Inc., Small Cap Growth Stock Portfolio £ | | | 8,956,771 | | | | 20,072 | |
Northwestern Mutual Series Fund, Inc., Small Cap Value Portfolio £ | | | 12,364,188 | | | | 23,628 | |
| | | | | | | | |
Total | | | | | | | 734,145 | |
| | | | | | | | |
|
Fixed Income (48.3%) | |
iShares Core U.S. Aggregate Bond ETF | | | 1,036,500 | | | | 102,873 | |
Northwestern Mutual Series Fund, Inc., High Yield Bond Portfolio £ | | | 78,594,240 | | | | 52,658 | |
Northwestern Mutual Series Fund, Inc., Multi- Sector Bond Portfolio £ | | | 114,291,071 | | | | 111,320 | |
Northwestern Mutual Series Fund, Inc., Select Bond Portfolio £ | | | 594,369,954 | | | | 656,184 | |
| | | | | | | | |
| Investment Companies (95.8%) | | Shares/ Par + | | | Value $ (000’s) | |
Fixed Income continued | |
Northwestern Mutual Series Fund, Inc., Short- Term Bond Portfolio £ | | | 23,532,136 | | | | 24,026 | |
| | | | | | | | |
Total | | | | | | | 947,061 | |
| | | | | | | | |
|
Foreign Equity (10.1%) | |
iShares Core MSCI EAFE ETF | | | 744,800 | | | | 52,397 | |
Northwestern Mutual Series Fund, Inc., Emerging Markets Equity Portfolio £ | | | 6,063,015 | | | | 5,669 | |
Northwestern Mutual Series Fund, Inc., International Equity Portfolio £ | | | 44,391,265 | | | | 70,049 | |
Northwestern Mutual Series Fund, Inc., International Growth Portfolio £ | | | 37,014,430 | | | | 70,476 | |
| | | | | | | | |
Total | | | | | | | 198,591 | |
| | | | | | | | |
| | |
Total Investment Companies (Cost: $1,937,360) | | | | | | | 1,879,797 | |
| | | | | | | | |
| | |
Short-Term Investments (2.3%) | | | | | | | | |
Investment Companies (2.3%) | |
JPMorgan Ultra-Short Income ETF | | | 452,950 | | | | 22,752 | |
PIMCO Enhanced Short Maturity Active ETF | | | 225,400 | | | | 22,492 | |
| | | | | | | | |
Total | | | | | | | 45,244 | |
| | | | | | | | |
| |
Total Short-Term Investments (Cost: $45,999) | | | | 45,244 | |
| | | | | | | | |
| |
Total Investments (98.1%) (Cost: $1,983,359)@ | | | | 1,925,041 | |
| | | | | | | | |
| |
Other Assets, Less Liabilities (1.9%) | | | | 37,401 | |
| | | | | | | | |
| |
Net Assets (100.0%) | | | | 1,962,442 | |
| | | | | | | | |
| + | All par is stated in U.S. Dollar unless otherwise noted. |
| @ | At December 31, 2023, the aggregate cost of investments, including derivatives, for federal tax purposes (in thousands) was $1,988,520 and the net unrealized depreciation of investments based on that cost was $63,479 which is comprised of $78,459 aggregate gross unrealized appreciation and $141,938 aggregate gross unrealized depreciation. |
The following is a summary of the inputs used in valuing the Portfolio’s Investments at December 31, 2023. See Note 3 for additional information on portfolio valuation.
| | | | | | | | | | | | |
| | | Valuation Inputs | |
| Description | | Level 1 - Quoted
Prices | | | Level 2 - Other
Significant
Observable Inputs | | | Level 3
- Significant
Unobservable
Inputs | |
| | | (Amounts in thousands) | |
Assets: | | | | | | | | | | | | |
Investment Companies | | $ | 1,879,797 | | | $ | — | | | $ | — | |
Short-Term Investments | | | 45,244 | | | | — | | | | — | |
| | | | |
Total Assets: | | $ | 1,925,041 | | | $ | — | | | $ | — | |
| | | | |
The Accompanying Notes are an Integral Part of the Financial Statements.
194
Asset Allocation Portfolio (unaudited)
| | | | |
| Objective: | | Portfolio Strategy: | | Net Assets: |
| Realize as high a level of total return as is consistent with reasonable investment risk. | | Invest in equity, fixed income and cash asset classes, attempting to capitalize on the variation in return potential produced by the interaction of changing financial markets and economic conditions. | | $274 million |
PORTFOLIO OVERVIEW
Mason Street Advisors, LLC is the investment adviser for the Asset Allocation Portfolio (the “Portfolio”). The Portfolio is tactically and strategically managed to capitalize on changing financial markets and economic conditions following a flexible policy for allocating assets across the equity, fixed income and cash asset classes. The Portfolio operates primarily as a “fund of funds” to gain the Portfolio’s equity, fixed income and cash asset exposure. The Portfolio may invest in underlying portfolios of Northwestern Mutual Series Fund, Inc. (each, an “Underlying Portfolio”) and exchange-traded funds (“ETFs”) which are not portfolios of Northwestern Mutual Series Fund, Inc. The adviser allocates the Portfolio’s assets among the Underlying Portfolios and ETFs based on the adviser’s economic and market outlook and the investment objectives and strategies of the Underlying Portfolios and ETFs. Under normal market conditions, the Portfolio will typically hold between 55-75% of assets in equity investments, 25-45% of assets in fixed income investments, and 0-15% of assets in cash equivalent investments.
MARKET OVERVIEW
The U.S. equity market climbed a wall of worry in 2023 - stock prices jumped double digits despite a year filled with extraordinary events that had the potential to give any investor pause, including the Silicon Valley Bank crisis, U.S. debt default fears, as well as geopolitical tensions in the Middle East. In the end, investors focused on the U.S.’s resilient economic growth, rapidly declining inflation reports, and the widely held expectation late in the year that the U.S. Federal Reserve (the “Fed”) would prove successful in soft landing the economy in 2024.
In this environment, large-cap stocks, as represented by the S&P 500® Index, posted a return of 26.29%, outperforming the S&P MidCap 400® and the S&P SmallCap 600® Indices, which returned 16.44% and 16.05%, respectively. Meanwhile, the broader bond market, as represented by the Bloomberg® U.S. Aggregate Index, returned 5.53%, while the Bloomberg® U.S. Corporate High Yield Index returned 13.45%.
PORTFOLIO RESULTS
The Portfolio returned 15.24% for the twelve months ended December 31, 2023, trailing the 26.29% return of the broad stock market, as measured by the S&P 500® Index, but outpacing the Bloomberg® U.S. Aggregate Index return of 5.53%. The Portfolio underperformed the Asset Allocation Portfolio Blended Composite Benchmark return of 16.69% (the “Blended Benchmark”). (The benchmark weights are detailed in the “Benchmark Definitions” section of this annual report.) (These indices are unmanaged, cannot be invested in directly and do not incur expenses.)
Security selection within the Underlying Portfolios was the largest detractor to the Portfolio, driving underperformance relative to the Blended Benchmark. In particular, style differences and stock selection weighed on the Large Cap Blend Portfolio, the Domestic Equity Portfolio, the Mid Cap Growth Stock Portfolio and the Mid Cap Value Portfolio. On the upside, the Focused Appreciation Portfolio and the Select Bond Portfolio outperformed their respective benchmarks.
Tactical asset allocation relative to the Blended Benchmark was a modest detractor. Overweights to small and mid capitalization U.S. equities, and the resulting underweight to large cap U.S. equities, proved detrimental in a year where a few of the largest companies in the market had an outsized contribution to overall market results.
PORTFOLIO MANAGER OUTLOOK
Although economic events are incredibly difficult to time with precision even during “normal economic times”, the many twists and turns that have buffeted the economy during the four years since COVID-19 first appeared added another degree of difficulty for forecasting.
While the U.S. economy’s resilience in the face of an aggressive Fed tightening cycle has led many investors to position for a soft landing, we believe the U.S. economy is in the late stages of an economic cycle and history suggests that a recession will arrive in the near term. We believe that at the end of a business cycle, investors should pay greater heed to risk.
195
Asset Allocation Portfolio (unaudited)
In contrast to the prior ten years that were characterized by low bond yields, we believe today’s higher yields, especially high-quality investment grade yields, offer an attractive alternative to equity market risk. We believe fixed income has once again returned to its historic role as an income-generation vehicle that can provide risk mitigation against falling equity prices.
Elsewhere, we favor U.S. small caps and mid caps given their historically significant valuation discounts. Within international markets, we favor neutral positioning in developed international but an underweight in emerging markets given currency and geopolitical risks.
Relative Performance
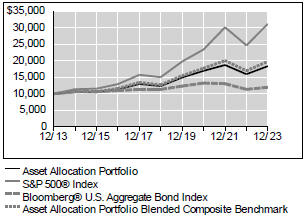
| | | | | | |
Average Annual Total Returns For Periods Ended December 31, 2023 |
| | | 1 Year | | 5 Years | | 10 Years |
Asset Allocation Portfolio | | 15.24% | | 8.28% | | 6.26% |
S&P 500® Index | | 26.29% | | 15.70% | | 12.03% |
Bloomberg® U.S. Aggregate Bond Index | | 5.53% | | 1.10% | | 1.81% |
Asset Allocation Portfolio Blended Composite Benchmark | | 16.69% | | 9.25% | | 7.06% |
The performance data quoted represents past performance. Past performance is historical and does not guarantee future performance. Investment return and principal value will fluctuate, so that shares, when redeemed, may be worth more or less than their original cost. Current performance may be lower or higher than the performance data quoted. For the most recent month-end performance information visit www.northwesternmutual.com.
This chart assumes an initial investment of $10,000 made on 12/31/13. Returns shown reflect fee waivers, deductions for management and other portfolio expenses, and reinvestment of all dividends. In the absence of fee waivers, total return would be reduced. Returns exclude deductions for separate account sale loads and account fees. Please refer to the Benchmark Definitions section of this report for information about the indices cited in the above chart and graph.
Top 10 Holdings 12/31/23
| | | | | | | | |
| | | | |
| | | Security Description | | % of Net Assets | | | | |
| | | | |
| | | Northwestern Mutual Series Fund, Inc., Select Bond Portfolio | | 16.6% | | | | |
| | | | |
| | | iShares Core S&P 500 ETF | | 14.1% | | | | |
| | | | |
| | | Northwestern Mutual Series Fund, Inc., Domestic Equity Portfolio | | 6.0% | | | | |
| | | | |
| | | Northwestern Mutual Series Fund, Inc., Focused Appreciation Portfolio | | 6.0% | | | | |
| | | | |
| | | Northwestern Mutual Series Fund, Inc., Large Cap Blend Portfolio | | 5.9% | | | | |
| | | | |
| | | Northwestern Mutual Series Fund, Inc., Multi- Sector Bond Portfolio | | 5.4% | | | | |
| | | | |
| | | iShares Core U.S. Aggregate Bond ETF | | 5.4% | | | | |
| | | | |
| | | Northwestern Mutual Series Fund, Inc., International Growth Portfolio | | 5.3% | | | | |
| | | | |
| | | Northwestern Mutual Series Fund, Inc., Mid Cap Value Portfolio | | 5.2% | | | | |
| | | | |
| | | Northwestern Mutual Series Fund, Inc., International Equity Portfolio | | 5.2% | | | | |
Sector Allocation 12/31/23
| | | | | | | | |
| | | | |
| | | Sector | | % of Net Assets | | | | |
| | | | |
| | | Domestic Equity | | 48.4% | | | | |
| | | | |
| | | Fixed Income | | 33.3% | | | | |
| | | | |
| | | Foreign Equity | | 15.1% | | | | |
| | | | |
| | | Short-Term Investments & Other Net Assets | | 3.2% | | | | |
Sector Allocation and Top 10 Holdings are subject to change.
196
Asset Allocation Portfolio
SCHEDULE OF INVESTMENTS
December 31, 2023
| | | | | | | | |
| Investment Companies (96.8%) | | Shares/ Par + | | | Value $ (000’s) | |
Domestic Equity (48.4%) | |
iShares Core S&P 500 ETF | | | 80,850 | | | | 38,616 | |
iShares Core S&P Mid-Cap ETF | | | 7,750 | | | | 2,148 | |
iShares Core S&P Small-Cap ETF | | | 18,700 | | | | 2,024 | |
Northwestern Mutual Series Fund, Inc., Domestic Equity Portfolio £ | | | 10,450,209 | | | | 16,522 | |
Northwestern Mutual Series Fund, Inc., Focused Appreciation Portfolio £ | | | 4,255,773 | | | | 16,453 | |
Northwestern Mutual Series Fund, Inc., Large Cap Blend Portfolio £ | | | 13,555,613 | | | | 16,091 | |
Northwestern Mutual Series Fund, Inc., Mid Cap Growth Stock Portfolio £ | | | 4,583,686 | | | | 14,255 | |
Northwestern Mutual Series Fund, Inc., Mid Cap Value Portfolio £ | | | 9,679,091 | | | | 14,325 | |
Northwestern Mutual Series Fund, Inc., Small Cap Growth Stock Portfolio £ | | | 2,656,345 | | | | 5,953 | |
Northwestern Mutual Series Fund, Inc., Small Cap Value Portfolio £ | | | 3,286,023 | | | | 6,280 | |
| | | | | | | | |
Total | | | | | | | 132,667 | |
| | | | | | | | |
|
Fixed Income (33.3%) | |
iShares Core U.S. Aggregate Bond ETF | | | 148,000 | | | | 14,689 | |
Northwestern Mutual Series Fund, Inc., High Yield Bond Portfolio £ | | | 19,151,403 | | | | 12,832 | |
Northwestern Mutual Series Fund, Inc., Multi- Sector Bond Portfolio £ | | | 15,285,762 | | | | 14,888 | |
Northwestern Mutual Series Fund, Inc., Select Bond Portfolio £ | | | 41,173,283 | | | | 45,455 | |
| | | | | | | | |
| Investment Companies (96.8%) | | Shares/ Par + | | | Value $ (000’s) | |
Fixed Income continued | |
Northwestern Mutual Series Fund, Inc., Short- Term Bond Portfolio £ | | | 3,216,199 | | | | 3,284 | |
| | | | | | | | |
Total | | | | | | | 91,148 | |
| | | | | | | | |
|
Foreign Equity (15.1%) | |
iShares Core MSCI EAFE ETF | | | 139,600 | | | | 9,821 | |
Northwestern Mutual Series Fund, Inc., Emerging Markets Equity Portfolio £ | | | 2,939,849 | | | | 2,749 | |
Northwestern Mutual Series Fund, Inc., International Equity Portfolio £ | | | 9,036,199 | | | | 14,259 | |
Northwestern Mutual Series Fund, Inc., International Growth Portfolio £ | | | 7,554,455 | | | | 14,383 | |
| | | | | | | | |
Total | | | | | | | 41,212 | |
| | | | | | | | |
| |
Total Investment Companies (Cost: $266,266) | | | | 265,027 | |
| | | | | | | | |
| | |
Short-Term Investments (1.5%) | | | | | | | | |
Investment Companies (1.5%) | |
JPMorgan Ultra-Short Income ETF | | | 40,300 | | | | 2,024 | |
PIMCO Enhanced Short Maturity Active ETF | | | 20,100 | | | | 2,006 | |
| | | | | | | | |
Total | | | | | | | 4,030 | |
| | | | | | | | |
| |
Total Short-Term Investments (Cost: $4,097) | | | | 4,030 | |
| | | | | | | | |
| |
Total Investments (98.3%) (Cost: $270,363)@ | | | | 269,057 | |
| | | | | | | | |
| |
Other Assets, Less Liabilities (1.7%) | | | | 4,766 | |
| | | | | | | | |
| |
Net Assets (100.0%) | | | | 273,823 | |
| | | | | | | | |
| + | All par is stated in U.S. Dollar unless otherwise noted. |
| @ | At December 31, 2023, the aggregate cost of investments, including derivatives, for federal tax purposes (in thousands) was $271,119 and the net unrealized depreciation of investments based on that cost was $2,062 which is comprised of $12,737 aggregate gross unrealized appreciation and $14,799 aggregate gross unrealized depreciation. |
The following is a summary of the inputs used in valuing the Portfolio’s Investments at December 31, 2023. See Note 3 for additional information on portfolio valuation.
| | | | | | | | | | | | |
| | | Valuation Inputs | |
| Description | | Level 1 - Quoted
Prices | | | Level 2 - Other
Significant
Observable Inputs | | | Level 3
- Significant
Unobservable
Inputs | |
| | | (Amounts in thousands) | |
Assets: | | | | | | | | | | | | |
Investment Companies | | $ | 265,027 | | | $ | — | | | $ | — | |
Short-Term Investments | | | 4,030 | | | | — | | | | — | |
| | | | |
Total Assets: | | $ | 269,057 | | | $ | — | | | $ | — | |
| | | | |
The Accompanying Notes are an Integral Part of the Financial Statements.
197
Benchmark Definitions (unaudited)
The following indices are used to illustrate investment market, sector or style performance or to serve as Portfolio performance comparisons. Unlike the Portfolios, the indices are not professionally managed and do not incur fees or expenses. It is not possible to invest directly in an index.
1/3 each: Bloomberg® Global Aggregate — Credit Component ex Emerging Markets, Hedged USD; ICE BofA® Global High Yield BB-B Rated Constrained Developed Markets Index, Hedged USD; JPMorgan® EMBI Global — The Bloomberg® Global Aggregate - Credit Component ex Emerging Markets, Hedged USD provides a broad-based measure of the global developed markets investment grade fixed income markets. The ICE BofA Global High Yield BB-B Rated Constrained Developed Markets Index, Hedged USD tracks the performance of below investment grade bonds of corporate issuers domiciled in developed market countries rated BB1 through B3, based on an average of Moody’s, S&P and Fitch. Qualifying bonds are capitalization weighted provided the total allocation to an individual issuer (defined by Bloomberg tickers) does not exceed 2%. Issuers that exceed the limit are reduced to 2% and the face value of each of their bonds is adjusted on a pro-rata basis. Similarly, the face value of bonds of all other issuers that fall below the 2% cap are increased on a pro-rata basis. The index is rebalanced on the last calendar day of the month. The JPMorgan EMBI Global tracks total returns for U.S. dollar-denominated debt instruments issued by emerging market sovereign and quasi-sovereign entities, Brady bonds, loans, Eurobonds and local market instruments. It is not possible to invest in an unmanaged index.
Asset Allocation Portfolio Blended Composite Benchmark — The Asset Allocation Portfolio Blended Composite Benchmark is an unmanaged, hypothetical combination of unmanaged indices that correspond to the Asset Allocation Portfolio’s model allocation and consists of the Russell 1000® Index (33%), the Russell MidCap Index (11%), the Russell 2000® Index (5%), the MSCI EAFE® (Europe-Australasia-Far-East) Index (13%), the MSCI® Emerging Markets Index (3%), the Bloomberg® U.S. Aggregate Bond Index (24%), the Bloomberg® U.S. Corporate High Yield 2% Issuer Capped Bond Index (8%), and the ICE BofA® US 3-Month Treasury Bill Index (3%).
Balanced Portfolio Blended Composite Benchmark — The Balanced Portfolio Blended Composite Benchmark is an unmanaged, hypothetical combination of unmanaged indices that correspond to the Balanced Portfolio’s model allocation and consists of the Russell 1000® Index (26%), the Russell® MidCap Index (9%), the Russell 2000® Index (3%), the MSCI EAFE® (Europe-Australasia-Far-East) Index (9%), the MSCI® Emerging Markets Index (2%), the Bloomberg® U.S. Aggregate Bond Index (41%), the Bloomberg® U.S. Corporate High Yield 2% Issuer Capped Bond Index (6%), and the ICE BofA® US 3-Month Treasury Bill Index (4%).
Bloomberg® 1-3 Year U.S. Government/Credit Bond Index — The Bloomberg® 1-3 Year U.S. Government/Credit Bond Index is an unmanaged index of publicly issued medium and larger issues of U.S. Government, investment-grade corporate and investment-grade international dollar denominated bonds that have maturities of between one and three years.
Bloomberg® U.S. Aggregate Bond Index — The Bloomberg® U.S. Aggregate Index is an unmanaged index of publicly issued investment-grade fixed-rate debt securities including corporate, U.S. Treasury and government agency securities, mortgage pass-through and asset-backed securities with remaining maturities of at least one year regardless of call features.
Bloomberg® U.S. Corporate High Yield 2% Issuer Capped Bond Index — The Bloomberg® U. S. Corporate High Yield 2% Issuer Capped Index is an unmanaged index of U.S. Dollar-denominated, non-convertible, fixed-rate, noninvestment-grade debt. Issuers are capped at 2% of the Index. Index holdings must have at least one year to final maturity, at least $150 million par amount outstanding, and be publicly issued with a rating of Ba1 or lower.
Bloomberg® Global Credit Hedged USD Index — The Bloomberg® Global Credit Hedged USD Index is an unmanaged index composed of investment-grade and high yield credit securities from the Multiverse represented in U.S. dollars on a hedged basis (Multiverse is the merger of two groups: the Global Aggregate and the Global High Yield).
Bloomberg® Long-Term U.S. Treasury Index — The Bloomberg® Long-Term U.S. Treasury Index is an unmanaged index comprised of fixed-income securities with various maturities greater than 10 years.
198
Benchmark Definitions (unaudited)
Bloomberg® U.S. Treasury Inflation Protected Securities (TIPS) Index — The Bloomberg® U.S. Treasury Inflation Protected Securities (TIPS) Index is an unmanaged index of inflation-protected public obligations of the U.S. Treasury. The index is market capitalization weighted and includes all publicly-issued U.S. Treasury Inflation-Protected Securities that have at least one year remaining to maturity and have $250 million or more of outstanding face value.
ICE BofA® US 3-Month Treasury Bill Index — The ICE BofA® US 3-Month Treasury Bill Index is comprised of a single issue purchased at the beginning of the month and held for a full month. At the end of the month that issue is sold and rolled into a newly selected issue. The issue selected at each month-end rebalancing is the outstanding Treasury Bill that matures closest to, but not beyond, three months from the rebalancing date. To qualify for selection, an issue must have settled on or before the month-end rebalancing date.
MSCI® All Country World (ex-US) Index — The MSCI® All Country World (ex-US) Index is an unmanaged, free float-adjusted market capitalization-weighted index that is designed to measure equity performance of companies in the developed and emerging markets, excluding the U.S.
MSCI® All Country World (ex-US) Growth Index — The MSCI® All Country World (ex-US) Growth Index is an unmanaged, free float-adjusted market capitalization-weighted index that is designed to measure equity performance of companies in the developed and emerging markets, excluding the U.S., with higher historical and forecasted growth characteristics.
MSCI® All Country World (ex-US) Value Index — The MSCI® All Country World (ex-US) Value Index is an unmanaged, free float-adjusted market capitalization-weighted index that is designed to measure equity performance of companies in the developed and emerging markets, excluding the U.S., which captures large and mid cap securities exhibiting overall value style characteristics.
MSCI EAFE® (Europe-Australasia-Far-East) Index — The MSCI EAFE® (“Europe-Australasia-Far East”) Index is an unmanaged, free float-adjusted, market capitalization-weighted index that is designed to measure equity performance of companies in the developed markets, excluding the U.S. & Canada.
MSCI EAFE® (Europe-Australasia-Far-East) Growth Index — The MSCI EAFE® (“Europe-Australasia-Far East”) Index is an unmanaged, free float-adjusted, market capitalization-weighted index that is designed to measure equity performance of companies in the developed markets, excluding the U.S. & Canada, with higher historical and forecasted growth characteristics.
MSCI® Emerging Markets Index — The MSCI® Emerging Markets Index is an unmanaged, free float-adjusted, market capitalization-weighted index that is designed to measure equity market performance in the global emerging markets.
Russell 1000® Index — The Russell 1000® Index is an unmanaged, market capitalization-weighted, large cap index that measures the performance of the 1000 largest companies in the Russell 3000® Index.
Russell 1000® Growth Index — The Russell 1000® Growth Index is an unmanaged index that measures the performance of those companies in the Russell 1000® Index with higher price-to-book ratios and higher forecasted growth values.
Russell 1000® Value Index — The Russell 1000® Value Index is an unmanaged index that measures the performance of those companies in the Russell 1000® Index with lower price-to-book ratios and lower forecasted growth values.
Russell 2000® Index — The Russell 2000® Index is an unmanaged, market capitalization-weighted index that measures the performance of the 2000 companies in the Russell 3000® Index and represents approximately 10% of the total market capitalization of the Russell 3000® Index.
Russell 2000® Growth Index — The Russell 2000® Growth Index is an unmanaged index that measures the performance of those companies in the Russell 2000® Index with higher price-to-book ratios and higher forecasted growth values.
Russell 2000® Value Index — The Russell 2000® Value Index is an unmanaged index measures the performance of those companies in the Russell 2000® Index with lower price-to-book ratios and lower forecasted growth values.
Russell 3000® Index — The Russell 3000® Index measures the performance of the 3000 largest U.S. companies representing approximately 98% of the investable U.S. equity market.
199
Benchmark Definitions (unaudited)
Russell MidCap® Index — The Russell MidCap® Index is an unmanaged index that measures the performance of the 800 smallest companies in the Russell 1000® Index, which represents approximately 25% of the total market capitalization of the Russell 1000® Index.
Russell MidCap® Growth Index — The Russell MidCap® Growth Index is an unmanaged index that measures the performance of the Russell MidCap® companies with higher price-to-book ratios and higher forecasted growth values.
Russell MidCap® Value Index — The Russell MidCap® Value Index is an unmanaged index that measures the performance of the Russell MidCap® companies with lower price-to-book and lower forecasted growth values.
S&P 500® Index — The S&P 500® Composite Stock Price Index is an unmanaged, capitalization-weighted index of 500 selected common stocks designed to measure the performance of the broad domestic economy.
S&P MidCap 400® Index — The S&P MidCap 400® Index is an unmanaged, capitalization-weighted index that measures the performance of the mid-range sector of the U.S. stock market.
S&P SmallCap 600® Index — The S&P SmallCap 600® Index is an unmanaged index of 600 selected common stocks of U.S.-based companies with small market capitalizations.
200
Statements of Assets and Liabilities
NORTHWESTERN MUTUAL SERIES FUND, INC.
December 31, 2023 (in thousands)
| | | | | | | | | | | | | | | | | | | | |
| | | Growth Stock
Portfolio | | | Focused
Appreciation
Portfolio | | | Large Cap
Core Stock
Portfolio | | | Large Cap
Blend Portfolio | | | Index 500 Stock Portfolio | |
| | | | | |
Assets | | | | | | | | | | | | | | | | | | | | |
Unaffiliated Investments, at Value (1) | | $ | 1,065,893 | | | $ | 1,263,170 | | | $ | 664,461 | | | $ | 190,783 | | | $ | 5,427,329 | |
Cash | | | 1,613 | | | | 18,849 | | | | 4,690 | | | | 1,048 | | | | 51,298 | |
Collateral with Counterparty | | | — | | | | — | | | | — | | | | — | | | | 2,848 | |
Receivable for Portfolio Shares Sold | | | 20 | | | | 336 | | | | 41 | | | | 17 | | | | 884 | |
Receivable for Investment Securities Sold | | | — | | | | — | | | | 1,413 | | | | 909 | | | | — | |
Prepaid Expenses and Other Assets | | | 8 | | | | 9 | | | | 5 | | | | 1 | | | | 50 | |
Dividends and Interest Receivable | | | 173 | | | | 720 | | | | 444 | | | | 142 | | | | 5,059 | |
| | | | | | | | | | | | | | | | | | | | |
Total Assets | | | 1,067,707 | | | | 1,283,084 | | | | 671,054 | | | | 192,900 | | | | 5,487,468 | |
| | | | | | | | | | | | | | | | | | | | |
| | | | | |
Liabilities | | | | | | | | | | | | | | | | | | | | |
Payable for Portfolio Shares Redeemed | | | 202 | | | | 3,294 | | | | 44 | | | | 3,763 | | | | 1,323 | |
Payable for Investment Securities Purchased | | | — | | | | — | | | | 1,853 | | | | 1,260 | | | | — | |
Variation Margin Payable | | | — | | | | — | | | | — | | | | — | | | | 145 | |
Investment Advisory Fees Payable | | | 370 | | | | 642 | | | | 232 | | | | 119 | | | | 858 | |
Compliance Fees Payable | | | 3 | | | | 3 | | | | 3 | | | | 2 | | | | 6 | |
Accrued Expenses | | | 29 | | | | 26 | | | | 26 | | | | 23 | | | | 55 | |
| | | | | | | | | | | | | | | | | | | | |
Total Liabilities | | | 604 | | | | 3,965 | | | | 2,158 | | | | 5,167 | | | | 2,387 | |
| | | | | | | | | | | | | | | | | | | | |
Net Assets | | $ | 1,067,103 | | | $ | 1,279,119 | | | $ | 668,896 | | | $ | 187,733 | | | $ | 5,485,081 | |
| | | | | | | | | | | | | | | | | | | | |
| | | | | |
Represented By: | | | | | | | | | | | | | | | | | | | | |
Aggregate Paid in Capital (10) (11) | | $ | 688,742 | | | $ | 594,358 | | | $ | 492,575 | | | $ | 134,558 | | | $ | 1,691,270 | |
Total Distributable Earnings (Loss) | | | 378,361 | | | | 684,761 | | | | 176,321 | | | | 53,175 | | | | 3,793,811 | |
| | | | | | | | | | | | | | | | | | | | |
Net Assets for Shares Outstanding (10) (11) | | $ | 1,067,103 | | | $ | 1,279,119 | | | $ | 668,896 | | | $ | 187,733 | | | $ | 5,485,081 | |
| | | | | | | | | | | | | | | | | | | | |
Net Asset Value, Offering and Redemption Price per Share | | $ | 3.06 | | | $ | 3.87 | | | $ | 1.66 | | | $ | 1.19 | | | $ | 7.88 | |
| | | | | | | | | | | | | | | | | | | | |
(1) Unaffiliated Investments, at Cost | | $ | 645,913 | | | $ | 693,361 | | | $ | 524,439 | | | $ | 177,089 | | | $ | 1,810,073 | |
(10) Shares Outstanding | | | 349,044 | | | | 330,808 | | | | 403,771 | | | | 158,083 | | | | 695,921 | |
(11) Shares Authorized, $.01 Par Value | | | 2,000,000 | | | | 2,000,000 | | | | 2,000,000 | | | | 2,000,000 | | | | 2,000,000 | |
The Accompanying Notes are an Integral Part of the Financial Statements.
201
Statements of Assets and Liabilities
NORTHWESTERN MUTUAL SERIES FUND, INC.
December 31, 2023 (in thousands)
| | | | | | | | | | | | | | | | | | | | |
| | | Large
Company
Value Portfolio | | | Domestic Equity Portfolio | | | Equity Income
Portfolio | | | Mid Cap
Growth Stock
Portfolio | | | Index 400
Stock Portfolio | |
| | | | | |
Assets | | | | | | | | | | | | | | | | | | | | |
Unaffiliated Investments, at Value (1) | | $ | 148,485 | | | $ | 1,042,633 | | | $ | 709,525 | | | $ | 1,081,378 | | | $ | 1,277,509 | |
Cash | | | 3,406 | | | | 13,089 | | | | 6,165 | | | | 863 | | | | 12,826 | |
Collateral with Counterparty | | | 12 | | | | — | | | | — | | | | — | | | | 30 | |
Receivable for Portfolio Shares Sold | | | 20 | | | | 289 | | | | 412 | | | | 125 | | | | 317 | |
Receivable for Investment Securities Sold | | | 169 | | | | 5,164 | | | | 8 | | | | 5,610 | | | | 1,152 | |
Receivable for Foreign Currency | | | 1 | | | | — | | | | — | | | | — | | | | — | |
Prepaid Expenses and Other Assets | | | 1 | | | | 8 | | | | 5 | | | | 8 | | | | 27 | |
Dividends and Interest Receivable | | | 388 | | | | 1,586 | | | | 1,843 | | | | 216 | | | | 1,671 | |
| | | | | | | | | | | | | | | | | | | | |
Total Assets | | | 152,482 | | | | 1,062,769 | | | | 717,958 | | | | 1,088,200 | | | | 1,293,532 | |
| | | | | | | | | | | | | | | | | | | | |
| | | | | |
Liabilities | | | | | | | | | | | | | | | | | | | | |
Payable for Portfolio Shares Redeemed | | | 35 | | | | 696 | | | | 105 | | | | 5,725 | | | | 606 | |
Payable for Investment Securities Purchased | | | 212 | | | | 4,551 | | | | — | | | | — | | | | 1,638 | |
Variation Margin Payable | | | — | | | | — | | | | — | | | | — | | | | 173 | |
Payable for Foreign Currency | | | 121 | | | | — | | | | — | | | | — | | | | — | |
Investment Advisory Fees Payable | | | 83 | | | | 426 | | | | 329 | | | | 468 | | | | 235 | |
Compliance Fees Payable | | | 3 | | | | 3 | | | | 3 | | | | 3 | | | | 3 | |
Accrued Expenses | | | 30 | | | | 27 | | | | 30 | | | | 30 | | | | 63 | |
| | | | | | | | | | | | | | | | | | | | |
Total Liabilities | | | 484 | | | | 5,703 | | | | 467 | | | | 6,226 | | | | 2,718 | |
| | | | | | | | | | | | | | | | | | | | |
Net Assets | | $ | 151,998 | | | $ | 1,057,066 | | | $ | 717,491 | | | $ | 1,081,974 | | | $ | 1,290,814 | |
| | | | | | | | | | | | | | | | | | | | |
| | | | | |
Represented By: | | | | | | | | | | | | | | | | | | | | |
Aggregate Paid in Capital (10) (11) | | $ | 140,383 | | | $ | 812,103 | | | $ | 522,221 | | | $ | 951,016 | | | $ | 890,821 | |
Total Distributable Earnings (Loss) | | | 11,615 | | | | 244,963 | | | | 195,270 | | | | 130,958 | | | | 399,993 | |
| | | | | | | | | | | | | | | | | | | | |
Net Assets for Shares Outstanding (10) (11) | | $ | 151,998 | | | $ | 1,057,066 | | | $ | 717,491 | | | $ | 1,081,974 | | | $ | 1,290,814 | |
| | | | | | | | | | | | | | | | | | | | |
Net Asset Value, Offering and Redemption Price per Share | | $ | 0.80 | | | $ | 1.58 | | | $ | 1.66 | | | $ | 3.11 | | | $ | 2.17 | |
| | | | | | | | | | | | | | | | | | | | |
(1) Unaffiliated Investments, at Cost | | $ | 144,538 | | | $ | 899,773 | | | $ | 554,711 | | | $ | 906,899 | | | $ | 938,993 | |
(10) Shares Outstanding | | | 189,484 | | | | 668,734 | | | | 433,422 | | | | 347,884 | | | | 595,919 | |
(11) Shares Authorized, $.01 Par Value | | | 2,000,000 | | | | 2,000,000 | | | | 2,000,000 | | | | 2,000,000 | | | | 2,000,000 | |
The Accompanying Notes are an Integral Part of the Financial Statements.
202
Statements of Assets and Liabilities
NORTHWESTERN MUTUAL SERIES FUND, INC.
December 31, 2023 (in thousands)
| | | | | | | | | | | | | | | | | | | | |
| | | Mid Cap Value
Portfolio | | | Small Cap
Growth Stock
Portfolio | | | Index 600
Stock Portfolio | | | Small Cap Value Portfolio | | | International
Growth
Portfolio | |
| | | | | |
Assets | | | | | | | | | | | | | | | | | | | | |
Unaffiliated Investments, at Value (1) | | $ | 651,524 | | | $ | 683,368 | | | $ | 436,281 | | | $ | 556,248 | | | $ | 993,947 | |
Cash | | | 15,031 | | | | 3,835 | | | | 1,447 | | | | 20,140 | | | | 19,856 | |
Collateral with Counterparty | | | 430 | | | | — | | | | 53 | | | | — | | | | — | |
Receivable for Portfolio Shares Sold | | | 237 | | | | 112 | | | | 106 | | | | 32 | | | | 263 | |
Receivable for Investment Securities Sold | | | 3,310 | | | | 808 | | | | 1,608 | | | | 98 | | | | 3,939 | |
Receivable for Foreign Currency | | | 2 | | | | — | | | | — | | | | — | | | | 1 | |
Prepaid Expenses and Other Assets | | | 5 | | | | 5 | | | | 8 | | | | 4 | | | | 8 | |
Dividends and Interest Receivable | | | 1,527 | | | | 159 | | | | 559 | | | | 617 | | | | 2,028 | |
| | | | | | | | | | | | | | | | | | | | |
Total Assets | | | 672,066 | | | | 688,287 | | | | 440,062 | | | | 577,139 | | | | 1,020,042 | |
| | | | | | | | | | | | | | | | | | | | |
| | | | | |
Liabilities | | | | | | | | | | | | | | | | | | | | |
Payable for Portfolio Shares Redeemed | | | 3,498 | | | | 173 | | | | 73 | | | | 581 | | | | 307 | |
Payable for Investment Securities Purchased | | | 2,100 | | | | 1,114 | | | | 2,239 | | | | 276 | | | | — | |
Accrued Foreign Capital Gains Tax | | | — | | | | — | | | | — | | | | — | | | | 304 | |
Variation Margin Payable | | | — | | | | — | | | | 81 | | | | — | | | | — | |
Payable for Foreign Currency | | | 494 | | | | — | | | | — | | | | — | | | | — | |
Investment Advisory Fees Payable | | | 385 | | | | 301 | | | | 80 | | | | 402 | | | | 494 | |
Compliance Fees Payable | | | 3 | | | | 3 | | | | 3 | | | | 3 | | | | 3 | |
Accrued Expenses | | | 43 | | | | 27 | | | | 40 | | | | 28 | | | | 62 | |
| | | | | | | | | | | | | | | | | | | | |
Total Liabilities | | | 6,523 | | | | 1,618 | | | | 2,516 | | | | 1,290 | | | | 1,170 | |
| | | | | | | | | | | | | | | | | | | | |
Net Assets | | $ | 665,543 | | | $ | 686,669 | | | $ | 437,546 | | | $ | 575,849 | | | $ | 1,018,872 | |
| | | | | | | | | | | | | | | | | | | | |
| | | | | |
Represented By: | | | | | | | | | | | | | | | | | | | | |
Aggregate Paid in Capital (10) (11) | | $ | 629,855 | | | $ | 615,734 | | | $ | 347,187 | | | $ | 430,718 | | | $ | 733,882 | |
Total Distributable Earnings (Loss) | | | 35,688 | | | | 70,935 | | | | 90,359 | | | | 145,131 | | | | 284,990 | |
| | | | | | | | | | | | | | | | | | | | |
Net Assets for Shares Outstanding (10) (11) | | $ | 665,543 | | | $ | 686,669 | | | $ | 437,546 | | | $ | 575,849 | | | $ | 1,018,872 | |
| | | | | | | | | | | | | | | | | | | | |
Net Asset Value, Offering and Redemption Price per Share | | $ | 1.48 | | | $ | 2.24 | | | $ | 1.53 | | | $ | 1.91 | | | $ | 1.90 | |
| | | | | | | | | | | | | | | | | | | | |
(1) Unaffiliated Investments, at Cost | | $ | 645,869 | | | $ | 570,185 | | | $ | 360,596 | | | $ | 434,023 | | | $ | 742,022 | |
(10) Shares Outstanding | | | 449,599 | | | | 306,371 | | | | 286,743 | | | | 301,356 | | | | 534,992 | |
(11) Shares Authorized, $.01 Par Value | | | 2,000,000 | | | | 2,000,000 | | | | 2,000,000 | | | | 2,000,000 | | | | 2,000,000 | |
The Accompanying Notes are an Integral Part of the Financial Statements.
203
Statements of Assets and Liabilities
NORTHWESTERN MUTUAL SERIES FUND, INC.
December 31, 2023 (in thousands)
| | | | | | | | | | | | | | | | | | | | |
| | | Research
International
Core Portfolio | | | International
Equity Portfolio | | | Emerging Markets Equity
Portfolio | | Government Money Market Portfolio | | | Short-Term
Bond Portfolio |
| | | | | |
Assets | | | | | | | | | | | | | | | | | | | | |
Unaffiliated Investments, at Value (1) | | $ | 815,228 | | | $ | 1,841,187 | | | $ | 910,032 | | | $ | 290,028 | | | $ | 378,718 | |
Investments in Repurchase Agreements, at Value (3) | | | — | | | | — | | | | — | | | | 236,000 | | | | — | |
Cash | | | 13,190 | | | | 26,590 | | | | 15,937 | | | | 299 | | | | 7,242 | |
Foreign Currency, at Value (4) | | | — | | | | 5,085 | | | | 378 | | | | — | | | | — | |
Receivable for Portfolio Shares Sold | | | 323 | | | | 353 | | | | 483 | | | | 639 | | | | 72 | |
Receivable for Investment Securities Sold | | | — | | | | 5,172 | | | | 165 | | | | — | | | | 1 | |
Variation Margin Receivable | | | — | | | | — | | | | — | | | | — | | | | 71 | |
Receivable for Foreign Currency | | | 2 | | | | 1,345 | | | | — | | | | — | | | | — | |
Prepaid Expenses and Other Assets | | | 6 | | | | 14 | | | | 7 | | | | 4 | | | | 3 | |
Dividends and Interest Receivable | | | 2,417 | | | | 5,988 | | | | 1,266 | | | | 1,174 | | | | 3,080 | |
| | | | | | | | | | | | | | | | | | | | |
Total Assets | | | 831,166 | | | | 1,885,734 | | | | 928,268 | | | | 528,144 | | | | 389,187 | |
| | | | | | | | | | | | | | | | | | | | |
| | | | | |
Liabilities | | | | | | | | | | | | | | | | | | | | |
Payable for Portfolio Shares Redeemed | | | 289 | | | | 390 | | | | 138 | | | | 480 | | | | 70 | |
Payable for Investment Securities Purchased | | | 1,380 | | | | 3,093 | | | | — | | | | 1,115 | | | | 3,727 | |
Accrued Foreign Capital Gains Tax | | | 298 | | | | 2,150 | | | | 5,566 | | | | — | | | | — | |
Variation Margin Payable | | | — | | | | — | | | | — | | | | — | | | | 1 | |
Payable for Foreign Currency | | | — | | | | 350 | | | | — | | | | — | | | | — | |
Collateral from Counterparty | | | — | | | | 1,360 | | | | — | | | | — | | | | — | |
Investment Advisory Fees Payable | | | 488 | | | | 1,023 | | | | 645 | | | | 134 | | | | 106 | |
Compliance Fees Payable | | | 3 | | | | 4 | | | | 3 | | | | 3 | | | | 3 | |
Accrued Expenses | | | 57 | | | | 89 | | | | 99 | | | | 28 | | | | 48 | |
| | | | | | | | | | | | | | | | | | | | |
Total Liabilities | | | 2,515 | | | | 8,459 | | | | 6,451 | | | | 1,760 | | | | 3,955 | |
| | | | | | | | | | | | | | | | | | | | |
Net Assets | | $ | 828,651 | | | $ | 1,877,275 | | | $ | 921,817 | | | $ | 526,384 | | | $ | 385,232 | |
| | | | | | | | | | | | | | | | | | | | |
| | | | | |
Represented By: | | | | | | | | | | | | | | | | | | | | |
Aggregate Paid in Capital (10) (11) | | $ | 672,727 | | | $ | 1,827,424 | | | $ | 936,358 | | | $ | 526,382 | | | $ | 391,987 | |
Total Distributable Earnings (Loss) | | | 155,924 | | | | 49,851 | | | | (14,541 | ) | | | 2 | | | | (6,755 | ) |
| | | | | | | | | | | | | | | | | | | | |
Net Assets for Shares Outstanding (10) (11) | | $ | 828,651 | | | $ | 1,877,275 | | | $ | 921,817 | | | $ | 526,384 | | | $ | 385,232 | |
| | | | | | | | | | | | | | | | | | | | |
Net Asset Value, Offering and Redemption Price per Share | | $ | 1.07 | | | $ | 1.58 | | | $ | 0.93 | | | $ | 1.00 | | | $ | 1.02 | |
| | | | | | | | | | | | | | | | | | | | |
(1) Unaffiliated Investments, at Cost | | $ | 675,492 | | | $ | 1,816,768 | | | $ | 874,347 | | | $ | 290,028 | | | $ | 385,729 | |
(3) Investments in Repurchase Agreements, at Cost | | | — | | | | — | | | | — | | | | 236,000 | | | | — | |
(4) Foreign Currency, at Cost | | | — | | | | 4,804 | | | | 591 | | | | — | | | | — | |
(10) Shares Outstanding | | | 773,317 | | | | 1,189,053 | | | | 986,173 | | | | 526,380 | | | | 377,351 | |
(11) Shares Authorized, $.01 Par Value | | | 2,000,000 | | | | 3,000,000 | | | | 2,000,000 | | | | 2,000,000 | | | | 2,000,000 | |
The Accompanying Notes are an Integral Part of the Financial Statements.
204
Statements of Assets and Liabilities
NORTHWESTERN MUTUAL SERIES FUND, INC.
December 31, 2023 (in thousands)
| | | | | | | | | | | | | | | | | | | | |
| | | Select Bond Portfolio | | Long-Term U.S.
Government
Bond Portfolio | | Inflation
Protection
Portfolio | | High Yield
Bond Portfolio | | Multi-Sector Bond Portfolio |
| | | | | |
Assets | | | | | | | | | | | | | | | | | | | | |
Unaffiliated Investments, at Value (1) | | $ | 2,948,774 | | | $ | 164,862 | | | $ | 410,904 | | | $ | 705,763 | | | $ | 1,040,283 | |
Investments in Repurchase Agreements, at Value (3) | | | — | | | | — | | | | — | | | | — | | | | 414,500 | |
Cash | | | 44,684 | | | | 1,229 | | | | 9,742 | | | | 26,162 | | | | 5,918 | |
Foreign Currency, at Value (4) | | | — | | | | — | | | | — | | | | — | | | | 1,772 | |
Collateral with Counterparty | | | — | | | | 1,137 | | | | 9,586 | | | | — | | | | 11,744 | |
Receivable for Portfolio Shares Sold | | | 618 | | | | 47 | | | | 132 | | | | 190 | | | | 376 | |
Receivable for Investment Securities Sold | | | 109,120 | | | | 6,838 | | | | 108 | | | | — | | | | 76,985 | |
Receivable for Financing Transactions | | | — | | | | 142,759 | | | | — | | | | — | | | | — | |
Variation Margin Receivable | | | — | | | | 44 | | | | 32 | | | | — | | | | 281 | |
Outstanding Swap Contracts, at Value (8) | | | — | | | | — | | | | 6,214 | | | | — | | | | 9 | |
Receivable for Foreign Currency | | | — | | | | — | | | | — | | | | — | | | | 87 | |
Deferred Expense for Financing Transactions | | | — | | | | 53 | | | | — | | | | — | | | | — | |
Prepaid Expenses and Other Assets | | | 23 | | | | 2 | | | | 10 | | | | 5 | | | | 10 | |
Dividends and Interest Receivable | | | 17,948 | | | | 1,190 | | | | 2,061 | | | | 12,623 | | | | 12,898 | |
| | | | | | | | | | | | | | | | | | | | |
Total Assets | | | 3,121,167 | | | | 318,161 | | | | 438,789 | | | | 744,743 | | | | 1,564,863 | |
| | | | | | | | | | | | | | | | | | | | |
| | | | | |
Liabilities | | | | | | | | | | | | | | | | | | | | |
Payable for Portfolio Shares Redeemed | | | 317 | | | | 29 | | | | 58 | | | | 95 | | | | 135 | |
Payable for Investment Securities Purchased | | | 215,890 | | | | 18,659 | | | | 7,222 | | | | — | | | | 357,447 | |
Payable for Financing Transactions | | | — | | | | 176,261 | | | | — | | | | — | | | | — | |
Variation Margin Payable | | | — | | | | 27 | | | | 86 | | | | — | | | | 598 | |
Outstanding Options Written, at Value (6) | | | — | | | | 10 | | | | — | | | | — | | | | — | |
Payable for Reverse Repurchase Agreements | | | — | | | | — | | | | — | | | | — | | | | 3,648 | |
Outstanding Swap Contracts, at Value (9) | | | — | | | | — | | | | 350 | | | | — | | | | 298 | |
Payable for Foreign Currency | | | — | | | | — | | | | 517 | | | | — | | | | 1,125 | |
Collateral from Counterparty | | | 450 | | | | 2,041 | | | | 13,087 | | | | — | | | | 1,165 | |
Investment Advisory Fees Payable | | | 716 | | | | 52 | | | | 140 | | | | 262 | | | | 681 | |
Compliance Fees Payable | | | 4 | | | | 2 | | | | 3 | | | | 3 | | | | 3 | |
Accrued Expenses | | | 93 | | | | 31 | | | | 37 | | | | 39 | | | | 84 | |
| | | | | | | | | | | | | | | | | | | | |
Total Liabilities | | | 217,470 | | | | 197,112 | | | | 21,500 | | | | 399 | | | | 365,184 | |
| | | | | | | | | | | | | | | | | | | | |
Net Assets | | $ | 2,903,697 | | | $ | 121,049 | | | $ | 417,289 | | | $ | 744,344 | | | $ | 1,199,679 | |
| | | | | | | | | | | | | | | | | | | | |
| | | | | |
Represented By: | | | | | | | | | | | | | | | | | | | | |
Aggregate Paid in Capital (10) (11) | | $ | 3,281,619 | | | $ | 183,354 | | | $ | 453,188 | | | $ | 773,902 | | | $ | 1,325,381 | |
Total Distributable Earnings (Loss) | | | (377,922 | ) | | | (62,305 | ) | | | (35,899 | ) | | | (29,558 | ) | | | (125,702 | ) |
| | | | | | | | | | | | | | | | | | | | |
Net Assets for Shares Outstanding (10) (11) | | $ | 2,903,697 | | | $ | 121,049 | | | $ | 417,289 | | | $ | 744,344 | | | $ | 1,199,679 | |
| | | | | | | | | | | | | | | | | | | | |
Net Asset Value, Offering and Redemption Price per Share | | $ | 1.10 | | | $ | 0.66 | | | $ | 1.04 | | | $ | 0.67 | | | $ | 0.97 | |
| | | | | | | | | | | | | | | | | | | | |
(1) Unaffiliated Investments, at Cost | | $ | 3,005,235 | | | $ | 184,589 | | | $ | 452,544 | | | $ | 754,983 | | | $ | 1,154,876 | |
(3) Investments in Repurchase Agreements, at Cost | | | — | | | | — | | | | — | | | | — | | | | 414,500 | |
(4) Foreign Currency, at Cost | | | — | | | | — | | | | — | | | | — | | | | 1,794 | |
(6) Premiums Received on Options Written | | | — | | | | 12 | | | | — | | | | — | | | | — | |
(8) Premiums Paid on Swap Contracts | | | — | | | | 155 | | | | 5 | | | | — | | | | 3,970 | |
(9) Premiums Received from Swap Contracts | | | — | | | | 7 | | | | 1 | | | | — | | | | 4,664 | |
(10) Shares Outstanding | | | 2,630,454 | | | | 184,782 | | | | 402,912 | | | | 1,111,056 | | | | 1,231,187 | |
(11) Shares Authorized, $.01 Par Value | | | 6,000,000 | | | | 2,000,000 | | | | 2,000,000 | | | | 3,000,000 | | | | 2,000,000 | |
The Accompanying Notes are an Integral Part of the Financial Statements.
205
Statements of Assets and Liabilities
NORTHWESTERN MUTUAL SERIES FUND, INC.
December 31, 2023 (in thousands)
| | | | | | | | |
| | | Balanced
Portfolio | | | Asset
Allocation
Portfolio | |
| | |
Assets | | | | | | | | |
Unaffiliated Investments, at Value (1) | | $ | 473,378 | | | $ | 71,328 | |
Affiliated Investments, at Value (2) | | | 1,451,663 | | | | 197,729 | |
Cash | | | 15,180 | | | | 2,114 | |
Receivable for Portfolio Shares Sold | | | 106 | | | | 11 | |
Receivable for Investment Securities Sold | | | 22,538 | | | | 3,230 | |
Prepaid Expenses and Other Assets | | | 15 | | | | 2 | |
Dividends and Interest Receivable | | | 211 | | | | 18 | |
| | | | | | | | |
Total Assets | | | 1,963,091 | | | | 274,432 | |
| | | | | | | | |
| | |
Liabilities | | | | | | | | |
Payable for Portfolio Shares Redeemed | | | 533 | | | | 175 | |
Payable for Investment Securities Purchased | | | — | | | | 397 | |
Investment Advisory Fees Payable | | | 82 | | | | 11 | |
Compliance Fees Payable | | | 4 | | | | 3 | |
Accrued Expenses | | | 30 | | | | 23 | |
| | | | | | | | |
Total Liabilities | | | 649 | | | | 609 | |
| | | | | | | | |
Net Assets | | $ | 1,962,442 | | | $ | 273,823 | |
| | | | | | | | |
| | |
Represented By: | | | | | | | | |
Aggregate Paid in Capital (10) (11) | | $ | 1,944,742 | | | $ | 262,179 | |
Total Distributable Earnings (Loss) | | | 17,700 | | | | 11,644 | |
| | | | | | | | |
Net Assets for Shares Outstanding (10) (11) | | $ | 1,962,442 | | | $ | 273,823 | |
| | | | | | | | |
Net Asset Value, Offering and Redemption Price per Share | | $ | 1.29 | | | $ | 1.08 | |
| | | | | | | | |
(1) Unaffiliated Investments, at Cost | | $ | 418,615 | | | $ | 62,918 | |
(2) Affiliated Investments, at Cost | | | 1,564,744 | | | | 207,445 | |
(10) Shares Outstanding | | | 1,524,855 | | | | 254,643 | |
(11) Shares Authorized, $.01 Par Value | | | 4,000,000 | | | | 2,000,000 | |
The Accompanying Notes are an Integral Part of the Financial Statements.
206
Statements of Operations
NORTHWESTERN MUTUAL SERIES FUND, INC.
For the Year Ended December 31, 2023 (in thousands)
| | | | | | | | | | | | | | | | | | | | |
| | | Growth Stock Portfolio | | Focused Appreciation Portfolio | | Large Cap Core Stock Portfolio | | Large Cap Blend Portfolio | | Index 500 Stock Portfolio |
| | | | | |
Investment Income | | | | | | | | | | | | | | | | | | | | |
Income | | | | | | | | | | | | | | | | | | | | |
Interest (1) | | $ | 129 | | | $ | 723 | | | $ | 194 | | | $ | 263 | | | $ | 2,295 | |
Unaffiliated Dividends (1) | | | 5,142 | | | | 5,319 | | | | 7,545 | | | | 2,548 | | | | 80,803 | |
| | | | | | | | | | | | | | | | | | | | |
Total Income | | | 5,271 | | | | 6,042 | | | | 7,739 | | | | 2,811 | | | | 83,098 | |
| | | | | | | | | | | | | | | | | | | | |
| | | | | |
Expenses | | | | | | | | | | | | | | | | | | | | |
Investment Advisory Fees | | | 3,867 | | | | 8,424 | | | | 2,611 | | | | 1,414 | | | | 9,934 | |
Custodian Fees | | | 11 | | | | 5 | | | | 12 | | | | 5 | | | | 12 | |
Shareholder Reporting Fees | | | 26 | | | | 28 | | | | 25 | | | | 26 | | | | 42 | |
Audit Fees | | | 29 | | | | 27 | | | | 31 | | | | 26 | | | | 36 | |
Valuation Services | | | 1 | | | | — | | | | 2 | | | | 1 | | | | 6 | |
Compliance Fees | | | 12 | | | | 13 | | | | 11 | | | | 10 | | | | 24 | |
Directors Fees | | | 38 | | | | 41 | | | | 36 | | | | 32 | | | | 77 | |
Professional Fees | | | 13 | | | | 17 | | | | 12 | | | | 16 | | | | 23 | |
Trade Name Fees | | | — | | | | — | | | | — | | | | — | | | | 119 | |
Other Expenses | | | 15 | | | | 17 | | | | 11 | | | | 5 | | | | 73 | |
| | | | | | | | | | | | | | | | | | | | |
Total Expenses | | | 4,012 | | | | 8,572 | | | | 2,751 | | | | 1,535 | | | | 10,346 | |
| | | | | | | | | | | | | | | | | | | | |
| | | | | |
Less Waived Fees: | | | | | | | | | | | | | | | | | | | | |
Paid by Affiliate | | | (1 | ) | | | (1,409 | ) | | | (34 | ) | | | (124 | ) | | | (593 | ) |
| | | | | | | | | | | | | | | | | | | | |
Net Expenses | | | 4,011 | | | | 7,163 | | | | 2,717 | | | | 1,411 | | | | 9,753 | |
| | | | | | | | | | | | | | | | | | | | |
Net Investment Income (Loss) | | | 1,260 | | | | (1,121 | ) | | | 5,022 | | | | 1,400 | | | | 73,345 | |
| | | | | |
Realized and Unrealized Gain (Loss) on Investments | | | | | | | | | | | | | | | | | | | | |
| | | | | |
Net Realized Gain (Loss) on: | | | | | | | | | | | | | | | | | | | | |
Unaffiliated Investment Securities | | | 19,895 | | | | 117,334 | | | | 42,459 | | | | 38,892 | | | | 97,736 | |
Futures Contracts | | | — | | | | — | | | | — | | | | — | | | | 5,101 | |
| | | | | | | | | | | | | | | | | | | | |
Net Realized Gain (Loss) on Investments | | | 19,895 | | | | 117,334 | | | | 42,459 | | | | 38,892 | | | | 102,837 | |
| | | | | | | | | | | | | | | | | | | | |
| | | | | |
Net Unrealized Appreciation (Depreciation) of: | | | | | | | | | | | | | | | | | | | | |
Unaffiliated Investment Securities | | | 344,106 | | | | 350,354 | | | | 93,947 | | | | (4,799 | ) | | | 972,011 | |
Futures Contracts | | | — | | | | — | | | | — | | | | — | | | | 2,763 | |
| | | | | | | | | | | | | | | | | | | | |
Net Change in Unrealized Appreciation (Depreciation) of Investments | | | 344,106 | | | | 350,354 | | | | 93,947 | | | | (4,799 | ) | | | 974,774 | |
| | | | | | | | | | | | | | | | | | | | |
Net Gain (Loss) on Investments | | | 364,001 | | | | 467,688 | | | | 136,406 | | | | 34,093 | | | | 1,077,611 | |
| | | | | | | | | | | | | | | | | | | | |
Net Increase (Decrease) in Net Assets Resulting from Operations | | $ | 365,261 | | | $ | 466,567 | | | $ | 141,428 | | | $ | 35,493 | | | $ | 1,150,956 | |
| | | | | | | | | | | | | | | | | | | | |
(1) Net of Foreign Witholding Tax | | $ | 34 | | | $ | 425 | | | $ | 5 | | | $ | 28 | | | $ | 22 | |
The Accompanying Notes are an Integral Part of the Financial Statements.
207
Statements of Operations
NORTHWESTERN MUTUAL SERIES FUND, INC.
For the Year Ended December 31, 2023 (in thousands)
| | | | | | | | | | | | | | | | | | | | |
| | | Large
Company
Value Portfolio | | Domestic
Equity
Portfolio | | Equity Income
Portfolio | | Mid Cap Growth Stock Portfolio | | Index 400
Stock Portfolio |
| | | | | |
Investment Income | | | | | | | | | | | | | | | | | | | | |
Income | | | | | | | | | | | | | | | | | | | | |
Interest (1) | | $ | 181 | | | $ | 647 | | | $ | 355 | | | $ | 58 | | | $ | 640 | |
Unaffiliated Dividends (1) | | | 4,042 | | | | 25,261 | | | | 19,049 | | | | 6,436 | | | | 19,162 | |
| | | | | | | | | | | | | | | | | | | | |
Total Income | | | 4,223 | | | | 25,908 | | | | 19,404 | | | | 6,494 | | | | 19,802 | |
| | | | | | | | | | | | | | | | | | | | |
| | | | | |
Expenses | | | | | | | | | | | | | | | | | | | | |
Investment Advisory Fees | | | 1,053 | | | | 5,332 | | | | 4,383 | | | | 5,394 | | | | 2,971 | |
Custodian Fees | | | 21 | | | | 3 | | | | 20 | | | | 19 | | | | 23 | |
Shareholder Reporting Fees | | | 24 | | | | 32 | | | | 27 | | | | 27 | | | | 36 | |
Audit Fees | | | 30 | | | | 27 | | | | 28 | | | | 30 | | | | 32 | |
Valuation Services | | | 8 | | | | 1 | | | | 1 | | | | 1 | | | | 5 | |
Compliance Fees | | | 10 | | | | 12 | | | | 11 | | | | 12 | | | | 13 | |
Directors Fees | | | 32 | | | | 41 | | | | 37 | | | | 41 | | | | 42 | |
Professional Fees | | | 11 | | | | 14 | | | | 13 | | | | 13 | | | | 14 | |
Trade Name Fees | | | — | | | | — | | | | — | | | | — | | | | 115 | |
Other Expenses | | | 13 | | | | 16 | | | | 12 | | | | 17 | | | | 26 | |
| | | | | | | | | | | | | | | | | | | | |
Total Expenses | | | 1,202 | | | | 5,478 | | | | 4,532 | | | | 5,554 | | | | 3,277 | |
| | | | | | | | | | | | | | | | | | | | |
| | | | | |
Less Waived Fees: | | | | | | | | | | | | | | | | | | | | |
Paid by Affiliate | | | (75 | ) | | | (371 | ) | | | (582 | ) | | | (4 | ) | | | (344 | ) |
| | | | | | | | | | | | | | | | | | | | |
Net Expenses | | | 1,127 | | | | 5,107 | | | | 3,950 | | | | 5,550 | | | | 2,933 | |
| | | | | | | | | | | | | | | | | | | | |
Net Investment Income (Loss) | | | 3,096 | | | | 20,801 | | | | 15,454 | | | | 944 | | | | 16,869 | |
| | | | | |
Realized and Unrealized Gain (Loss) on Investments | | | | | | | | | | | | | | | | | | | | |
| | | | | |
Net Realized Gain (Loss) on: | | | | | | | | | | | | | | | | | | | | |
Unaffiliated Investment Securities | | | 6,077 | | | | 81,380 | | | | 26,664 | | | | (24,840 | ) | | | 43,433 | |
Futures Contracts | | | — | | | | — | | | | — | | | | — | | | | 1,146 | |
Foreign Currency Transactions | | | (169 | ) | | | — | | | | (22 | ) | | | — | | | | — | |
| | | | | | | | | | | | | | | | | | | | |
Net Realized Gain (Loss) on Investments | | | 5,908 | | | | 81,380 | | | | 26,642 | | | | (24,840 | ) | | | 44,579 | |
| | | | | | | | | | | | | | | | | | | | |
| | | | | |
Net Unrealized Appreciation (Depreciation) of: | | | | | | | | | | | | | | | | | | | | |
Unaffiliated Investment Securities | | | (3,448 | ) | | | (64,424 | ) | | | 22,318 | | | | 169,115 | | | | 119,782 | |
Futures Contracts | | | — | | | | — | | | | — | | | | — | | | | 697 | |
Foreign Currency Transactions | | | (64 | ) | | | — | | | | — | | | | — | | | | — | |
| | | | | | | | | | | | | | | | | | | | |
Net Change in Unrealized Appreciation (Depreciation) of Investments | | | (3,512 | ) | | | (64,424 | ) | | | 22,318 | | | | 169,115 | | | | 120,479 | |
| | | | | | | | | | | | | | | | | | | | |
Net Gain (Loss) on Investments | | | 2,396 | | | | 16,956 | | | | 48,960 | | | | 144,275 | | | | 165,058 | |
| | | | | | | | | | | | | | | | | | | | |
Net Increase (Decrease) in Net Assets Resulting from Operations | | $ | 5,492 | | | $ | 37,757 | | | $ | 64,414 | | | $ | 145,219 | | | $ | 181,927 | |
| | | | | | | | | | | | | | | | | | | | |
(1) Net of Foreign Witholding Tax | | $ | 76 | | | $ | — | | | $ | 506 | | | $ | 18 | | | $ | — | |
The Accompanying Notes are an Integral Part of the Financial Statements.
208
Statements of Operations
NORTHWESTERN MUTUAL SERIES FUND, INC.
For the Year Ended December 31, 2023 (in thousands)
| | | | | | | | | | | | | | | | | | | | |
| | | Mid Cap Value Portfolio | | Small Cap Growth Stock Portfolio | | Index 600
Stock Portfolio | | Small Cap Value Portfolio | | International
Growth
Portfolio |
| | | | | |
Investment Income | | | | | | | | | | | | | | | | | | | | |
Income | | | | | | | | | | | | | | | | | | | | |
Interest (1) | | $ | 731 | | | $ | 398 | | | $ | 111 | | | $ | 752 | | | $ | 940 | |
Unaffiliated Dividends (1) | | | 17,895 | | | | 4,191 | | | | 6,625 | | | | 8,426 | | | | 14,363 | |
| | | | | | | | | | | | | | | | | | | | |
Total Income | | | 18,626 | | | | 4,589 | | | | 6,736 | | | | 9,178 | | | | 15,303 | |
| | | | | | | | | | | | | | | | | | | | |
| | | | | |
Expenses | | | | | | | | | | | | | | | | | | | | |
Investment Advisory Fees | | | 5,466 | | | | 3,393 | | | | 880 | | | | 4,596 | | | | 5,586 | |
Custodian Fees | | | 48 | | | | 11 | | | | 44 | | | | 19 | | | | 126 | |
Shareholder Reporting Fees | | | 34 | | | | 33 | | | | 31 | | | | 30 | | | | 36 | |
Audit Fees | | | 31 | | | | 28 | | | | 31 | | | | 27 | | | | 32 | |
Valuation Services | | | 9 | | | | 2 | | | | 7 | | | | 2 | | | | 13 | |
Compliance Fees | | | 11 | | | | 11 | | | | 10 | | | | 11 | | | | 12 | |
Directors Fees | | | 37 | | | | 37 | | | | 34 | | | | 36 | | | | 40 | |
Professional Fees | | | 13 | | | | 12 | | | | 7 | | | | 12 | | | | 22 | |
Trade Name Fees | | | — | | | | — | | | | 31 | | | | — | | | | — | |
Other Expenses | | | 19 | | | | 11 | | | | 16 | | | | 10 | | | | 15 | |
| | | | | | | | | | | | | | | | | | | | |
Total Expenses | | | 5,668 | | | | 3,538 | | | | 1,091 | | | | 4,743 | | | | 5,882 | |
| | | | | | | | | | | | | | | | | | | | |
| | | | | |
Less Waived Fees: | | | | | | | | | | | | | | | | | | | | |
Paid by Affiliate | | | (1,021 | ) | | | — | | | | — | | | | (21 | ) | | | — | |
| | | | | | | | | | | | | | | | | | | | |
Net Expenses | | | 4,647 | | | | 3,538 | | | | 1,091 | | | | 4,722 | | | | 5,882 | |
| | | | | | | | | | | | | | | | | | | | |
Net Investment Income (Loss) | | | 13,979 | | | | 1,051 | | | | 5,645 | | | | 4,456 | | | | 9,421 | |
| | | | | |
Realized and Unrealized Gain (Loss) on Investments | | | | | | | | | | | | | | | | | | | | |
| | | | | |
Net Realized Gain (Loss) on: | | | | | | | | | | | | | | | | | | | | |
Unaffiliated Investment Securities | | | 20,117 | | | | 33,134 | | | | 9,389 | | | | 21,102 | | | | 27,433 | |
Futures Contracts | | | — | | | | — | | | | (86 | ) | | | — | | | | — | |
Foreign Currency Transactions | | | (489 | ) | | | — | | | | — | | | | — | | | | (34 | ) |
| | | | | | | | | | | | | | | | | | | | |
Net Realized Gain (Loss) on Investments | | | 19,628 | | | | 33,134 | | | | 9,303 | | | | 21,102 | | | | 27,399 | |
| | | | | | | | | | | | | | | | | | | | |
| | | | | |
Net Unrealized Appreciation (Depreciation) of: | | | | | | | | | | | | | | | | | | | | |
Unaffiliated Investment Securities | | | 6,910 | | | | 74,030 | | | | 44,706 | | | | 46,170 | | | | 144,323 | |
Futures Contracts | | | — | | | | — | | | | 112 | | | | — | | | | — | |
Foreign Currency Transactions | | | (188 | ) | | | — | | | | — | | | | — | | | | 118 | |
| | | | | | | | | | | | | | | | | | | | |
Net Change in Unrealized Appreciation (Depreciation) of Investments | | | 6,722 | | | | 74,030 | | | | 44,818 | | | | 46,170 | | | | 144,441 | |
| | | | | | | | | | | | | | | | | | | | |
Net Gain (Loss) on Investments | | | 26,350 | | | | 107,164 | | | | 54,121 | | | | 67,272 | | | | 171,840 | |
| | | | | | | | | | | | | | | | | | | | |
Net Increase (Decrease) in Net Assets Resulting from Operations | | $ | 40,329 | | | $ | 108,215 | | | $ | 59,766 | | | $ | 71,728 | | | $ | 181,261 | |
| | | | | | | | | | | | | | | | | | | | |
(1) Net of Foreign Witholding Tax | | $ | 275 | | | $ | — | | | $ | 6 | | | $ | 43 | | | $ | 176 | |
The Accompanying Notes are an Integral Part of the Financial Statements.
209
Statements of Operations
NORTHWESTERN MUTUAL SERIES FUND, INC.
For the Year Ended December 31, 2023 (in thousands)
| | | | | | | | | | | | | | | | | | | | |
| | | Research International Core Portfolio | | International Equity Portfolio | | Emerging Markets Equity
Portfolio | | Government Money Market Portfolio | | Short-Term
Bond Portfolio |
| | | | | |
Investment Income | | | | | | | | | | | | | | | | | | | | |
Income | | | | | | | | | | | | | | | | | | | | |
Interest (1) | | $ | 472 | | | $ | 667 | | | $ | 804 | | | $ | 26,901 | | | $ | 14,488 | |
Unaffiliated Dividends (1) | | | 20,073 | | | | 59,299 | | | | 23,921 | | | | — | | | | — | |
| | | | | | | | | | | | | | | | | | | | |
Total Income | | | 20,545 | | | | 59,966 | | | | 24,725 | | | | 26,901 | | | | 14,488 | |
| | | | | | | | | | | | | | | | | | | | |
| | | | | |
Expenses | | | | | | | | | | | | | | | | | | | | |
Investment Advisory Fees | | | 5,981 | | | | 11,825 | | | | 9,236 | | | | 1,599 | | | | 1,250 | |
Custodian Fees | | | 107 | | | | 214 | | | | 283 | | | | 42 | | | | 34 | |
Shareholder Reporting Fees | | | 34 | | | | 42 | | | | 36 | | | | 10 | | | | 32 | |
Audit Fees | | | 32 | | | | 33 | | | | 32 | | | | 29 | | | | 36 | |
Valuation Services | | | 19 | | | | 13 | | | | 13 | | | | 4 | | | | 55 | |
Compliance Fees | | | 11 | | | | 15 | | | | 12 | | | | 11 | | | | 10 | |
Directors Fees | | | 38 | | | | 48 | | | | 39 | | | | 36 | | | | 34 | |
Professional Fees | | | 19 | | | | 6 | | | | 19 | | | | 10 | | | | 11 | |
Other Expenses | | | 13 | | | | 33 | | | | 14 | | | | 7 | | | | 17 | |
| | | | | | | | | | | | | | | | | | | | |
Total Expenses | | | 6,254 | | | | 12,229 | | | | 9,684 | | | | 1,748 | | | | 1,479 | |
| | | | | | | | | | | | | | | | | | | | |
| | | | | |
Less Waived Fees: | | | | | | | | | | | | | | | | | | | | |
Paid by Affiliate | | | (392 | ) | | | — | | | | (1,665 | ) | | | (4 | ) | | | — | |
| | | | | | | | | | | | | | | | | | | | |
Net Expenses | | | 5,862 | | | | 12,229 | | | | 8,019 | | | | 1,744 | | | | 1,479 | |
| | | | | | | | | | | | | | | | | | | | |
Net Investment Income (Loss) | | | 14,683 | | | | 47,737 | | | | 16,706 | | | | 25,157 | | | | 13,009 | |
| | | | | |
Realized and Unrealized Gain (Loss) on Investments | | | | | | | | | | | | | | | | | | | | |
| | | | | |
Net Realized Gain (Loss) on: | | | | | | | | | | | | | | | | | | | | |
Unaffiliated Investment Securities | | | 5,750 | | | | (15,117 | ) | | | (24,003 | ) | | | 6 | | | | (4,186 | ) |
Futures Contracts | | | — | | | | — | | | | — | | | | — | | | | (1,274 | ) |
Swap Contracts | | | — | | | | — | | | | — | | | | — | | | | 11 | |
Foreign Currency Transactions | | | (105 | ) | | | 8,889 | | | | (772 | ) | | | — | | | | — | |
| | | | | | | | | | | | | | | | | | | | |
Net Realized Gain (Loss) on Investments | | | 5,645 | | | | (6,228 | ) | | | (24,775 | ) | | | 6 | | | | (5,449 | ) |
| | | | | | | | | | | | | | | | | | | | |
| | | | | |
Net Unrealized Appreciation (Depreciation) of: | | | | | | | | | | | | | | | | | | | | |
Unaffiliated Investment Securities | | | 75,747 | | | | 229,626 | | | | 66,796 | | | | — | | | | 11,894 | |
Futures Contracts | | | — | | | | — | | | | — | | | | — | | | | (43 | ) |
Foreign Currency Transactions | | | 306 | | | | (952 | ) | | | 298 | | | | — | | | | — | |
| | | | | | | | | | | | | | | | | | | | |
Net Change in Unrealized Appreciation (Depreciation) of Investments | | | 76,053 | | | | 228,674 | | | | 67,094 | | | | — | | | | 11,851 | |
| | | | | | | | | | | | | | | | | | | | |
Net Gain (Loss) on Investments | | | 81,698 | | | | 222,446 | | | | 42,319 | | | | 6 | | | | 6,402 | |
| | | | | | | | | | | | | | | | | | | | |
Net Increase (Decrease) in Net Assets Resulting from Operations | | $ | 96,381 | | | $ | 270,183 | | | $ | 59,025 | | | $ | 25,163 | | | $ | 19,411 | |
| | | | | | | | | | | | | | | | | | | | |
(1) Net of Foreign Witholding Tax | | $ | 831 | | | $ | 1,633 | | | $ | 1,512 | | | $ | — | | | $ | — | |
The Accompanying Notes are an Integral Part of the Financial Statements.
210
Statements of Operations
NORTHWESTERN MUTUAL SERIES FUND, INC.
For the Year Ended December 31, 2023 (in thousands)
| | | | | | | | | | | | | | | | | | | | |
| | | Select Bond
Portfolio | | Long- Term U.S. Government Bond Portfolio | | Inflation
Protection
Portfolio | | High Yield
Bond Portfolio | | Multi-Sector Bond Portfolio |
| | | | | |
Investment Income | | | | | | | | | | | | | | | | | | | | |
Income | | | | | | | | | | | | | | | | | | | | |
Interest (1) | | $ | 117,288 | | | $ | 5,404 | | | $ | 15,079 | | | $ | 46,890 | | | $ | 59,869 | |
| | | | | | | | | | | | | | | | | | | | |
Total Income | | | 117,288 | | | | 5,404 | | | | 15,079 | | | | 46,890 | | | | 59,869 | |
| | | | | | | | | | | | | | | | | | | | |
| | | | | |
Expenses | | | | | | | | | | | | | | | | | | | | |
Investment Advisory Fees | | | 8,444 | | | | 616 | | | | 2,241 | | | | 3,005 | | | | 8,802 | |
Custodian Fees | | | 101 | | | | 17 | | | | 17 | | | | 4 | | | | 116 | |
Shareholder Reporting Fees | | | 40 | | | | 24 | | | | 33 | | | | 37 | | | | 40 | |
Audit Fees | | | 42 | | | | 41 | | | | 41 | | | | 41 | | | | 52 | |
Valuation Services | | | 64 | | | | 13 | | | | 17 | | | | 37 | | | | 86 | |
Compliance Fees | | | 18 | | | | 9 | | | | 10 | | | | 11 | | | | 12 | |
Directors Fees | | | 58 | | | | 31 | | | | 34 | | | | 37 | | | | 42 | |
Professional Fees | | | 18 | | | | 10 | | | | 11 | | | | 13 | | | | 15 | |
Interest Expense | | | — | | | | 1,694 | | | | — | | | | — | | | | 226 | |
Other Expenses | | | 52 | | | | 16 | | | | 28 | | | | 14 | | | | 24 | |
| | | | | | | | | | | | | | | | | | | | |
Total Expenses | | | 8,837 | | | | 2,471 | | | | 2,432 | | | | 3,199 | | | | 9,415 | |
| | | | | | | | | | | | | | | | | | | | |
| | | | | |
Less Waived Fees: | | | | | | | | | | | | | | | | | | | | |
Paid by Affiliate | | | (163 | ) | | | (50 | ) | | | (224 | ) | | | — | | | | (1,066 | ) |
| | | | | | | | | | | | | | | | | | | | |
Net Expenses | | | 8,674 | | | | 2,421 | | | | 2,208 | | | | 3,199 | | | | 8,349 | |
| | | | | | | | | | | | | | | | | | | | |
Net Investment Income (Loss) | | | 108,614 | | | | 2,983 | | | | 12,871 | | | | 43,691 | | | | 51,520 | |
| | | | | |
Realized and Unrealized Gain (Loss) on Investments | | | | | | | | | | | | | | | | | | | | |
| | | | | |
Net Realized Gain (Loss) on: | | | | | | | | | | | | | | | | | | | | |
Unaffiliated Investment Securities | | | (135,060 | ) | | | (28,110 | ) | | | (9,159 | ) | | | (15,561 | ) | | | (19,211 | ) |
Futures Contracts | | | — | | | | 2,921 | | | | (1,948 | ) | | | — | | | | (16,313 | ) |
Options Written | | | — | | | | 82 | | | | — | | | | — | | | | — | |
Short Sales | | | — | | | | (66 | ) | | | — | | | | — | | | | — | |
Swap Contracts | | | — | | | | (167 | ) | | | 2,525 | | | | — | | | | 7,779 | |
Foreign Currency Transactions | | | — | | | | — | | | | 363 | | | | — | | | | (6,268 | ) |
Reverse Repurchase Agreements | | | — | | | | — | | | | — | | | | — | | | | (18 | ) |
| | | | | | | | | | | | | | | | | | | | |
Net Realized Gain (Loss) on Investments | | | (135,060 | ) | | | (25,340 | ) | | | (8,219 | ) | | | (15,561 | ) | | | (34,031 | ) |
| | | | | | | | | | | | | | | | | | | | |
| | | | | |
Net Unrealized Appreciation (Depreciation) of: | | | | | | | | | | | | | | | | | | | | |
Unaffiliated Investment Securities | | | 197,145 | | | | 28,570 | | | | 12,845 | | | | 60,484 | | | | 68,054 | |
Futures Contracts | | | — | | | | (2,135 | ) | | | 816 | | | | — | | | | 9,893 | |
Options Written | | | — | | | | 7 | | | | — | | | | — | | | | — | |
Short Sales | | | — | | | | (30 | ) | | | — | | | | — | | | | — | |
Swap Contracts | | | — | | | | 145 | | | | (2,071 | ) | | | — | | | | 9,185 | |
Foreign Currency Transactions | | | — | | | | — | | | | (505 | ) | | | — | | | | 2,798 | |
Reverse Repurchase Agreements | | | — | | | | — | | | | — | | | | — | | | | (15 | ) |
| | | | | | | | | | | | | | | | | | | | |
Net Change in Unrealized Appreciation (Depreciation) of Investments | | | 197,145 | | | | 26,557 | | | | 11,085 | | | | 60,484 | | | | 89,915 | |
| | | | | | | | | | | | | | | | | | | | |
Net Gain (Loss) on Investments | | | 62,085 | | | | 1,217 | | | | 2,866 | | | | 44,923 | | | | 55,884 | |
| | | | | | | | | | | | | | | | | | | | |
Net Increase (Decrease) in Net Assets Resulting from Operations | | $ | 170,699 | | | $ | 4,200 | | | $ | 15,737 | | | $ | 88,614 | | | $ | 107,404 | |
| | | | | | | | | | | | | | | | | | | | |
(1) Net of Foreign Witholding Tax | | $ | 1 | | | $ | — | | | $ | — | | | $ | — | | | $ | — | |
The Accompanying Notes are an Integral Part of the Financial Statements.
211
Statements of Operations
NORTHWESTERN MUTUAL SERIES FUND, INC.
For the Year Ended December 31, 2023 (in thousands)
| | | | | | | | |
| | | Balanced
Portfolio | | Asset
Allocation
Portfolio |
| | |
Investment Income | | | | | | | | |
Income | | | | | | | | |
Interest (1) | | $ | 1,159 | | | $ | 138 | |
Unaffiliated Dividends (1) | | | 10,792 | | | | 1,520 | |
Affiliated Dividends | | | 30,140 | | | | 3,755 | |
| | | | | | | | |
Total Income | | | 42,091 | | | | 5,413 | |
| | | | | | | | |
| | |
Expenses | | | | | | | | |
Investment Advisory Fees | | | 5,726 | | | | 1,409 | |
Custodian Fees | | | 2 | | | | 2 | |
Shareholder Reporting Fees | | | 26 | | | | 23 | |
Audit Fees | | | 36 | | | | 34 | |
Valuation Services | | | 1 | | | | — | |
Compliance Fees | | | 15 | | | | 10 | |
Directors Fees | | | 49 | | | | 33 | |
Professional Fees | | | 15 | | | | 12 | |
Other Expenses | | | 28 | | | | 6 | |
| | | | | | | | |
Total Expenses | | | 5,898 | | | | 1,529 | |
| | | | | | | | |
| | |
Less Waived Fees: | | | | | | | | |
Paid by Affiliate | | | (4,772 | ) | | | (1,277 | ) |
| | | | | | | | |
Net Expenses | | | 1,126 | | | | 252 | |
| | | | | | | | |
Net Investment Income (Loss) | | | 40,965 | | | | 5,161 | |
| | |
Realized and Unrealized Gain (Loss) on Investments | | | | | | | | |
| | |
Net Realized Gain (Loss) on: | | | | | | | | |
Unaffiliated Investment Securities | | | 4,816 | | | | (8 | ) |
Affiliated Investment Securities | | | 6,813 | | | | 2,954 | |
Distributions of Realized Gains by Affiliated Investment Companies | | | 28,468 | | | | 5,471 | |
| | | | | | | | |
Net Realized Gain (Loss) on Investments | | | 40,097 | | | | 8,417 | |
| | | | | | | | |
| | |
Net Unrealized Appreciation (Depreciation) of: | | | | | | | | |
Unaffiliated Investment Securities | | | 54,119 | | | | 9,103 | |
Affiliated Investment Securities | | | 100,074 | | | | 14,925 | |
| | | | | | | | |
Net Change in Unrealized Appreciation (Depreciation) of Investments | | | 154,193 | | | | 24,028 | |
| | | | | | | | |
Net Gain (Loss) on Investments | | | 194,290 | | | | 32,445 | |
| | | | | | | | |
Net Increase (Decrease) in Net Assets Resulting from Operations | | $ | 235,255 | | | $ | 37,606 | |
| | | | | | | | |
The Accompanying Notes are an Integral Part of the Financial Statements.
212
Statements of Changes in Net Assets
NORTHWESTERN MUTUAL SERIES FUND, INC.
(in thousands)
| | | | | | | | | | | | | | | | | | | | | | | | |
| | | Growth Stock Portfolio | | Focused Appreciation Portfolio | | Large Cap Core Stock Portfolio |
| | | For the Year Ended December 31,
2023 | | For the Year Ended December 31,
2022 | | For the Year Ended December 31,
2023 | | For the Year Ended December 31,
2022 | | For the Year Ended December 31,
2023 | | For the Year Ended December 31,
2022 |
| | | | | | |
Change in Net Assets | | | | | | | | | | | | | | | | | | | | | | | | |
| | | | | | |
Operations | | | | | | | | | | | | | | | | | | | | | | | | |
Net Investment Income (Loss) | | $ | 1,260 | | | $ | 392 | | | $ | (1,121 | ) | | $ | (270 | ) | | $ | 5,022 | | | $ | 6,282 | |
Net Realized Gain (Loss) on Investments | | | 19,895 | | | | (61,676 | ) | | | 117,334 | | | | 75,764 | | | | 42,459 | | | | 39,905 | |
Net Change in Unrealized Appreciation (Depreciation) of Investments | | | 344,106 | | | | (462,439 | ) | | | 350,354 | | | | (439,271 | ) | | | 93,947 | | | | (202,614 | ) |
| | | | | | | | | | | | | | | | | | | | | | | | |
Net Increase (Decrease) in Net Assets Resulting from Operations | | | 365,261 | | | | (523,723 | ) | | | 466,567 | | | | (363,777 | ) | | | 141,428 | | | | (156,427 | ) |
| | | | | | | | | | | | | | | | | | | | | | | | |
| | | | | | |
Distributions to Shareholders from: | | | | | | | | | | | | | | | | | | | | | | | | |
Net Investment Income & Net Realized Gain on Investments | | | (392 | ) | | | (151,353 | ) | | | (73,702 | ) | | | (127,992 | ) | | | (55,199 | ) | | | (115,717 | ) |
| | | | | | | | | | | | | | | | | | | | | | | | |
Net Decrease in Net Assets Resulting from Distributions to Shareholders | | | (392 | ) | | | (151,353 | ) | | | (73,702 | ) | | | (127,992 | ) | | | (55,199 | ) | | | (115,717 | ) |
| | | | | | | | | | | | | | | | | | | | | | | | |
| | | | | | |
Capital Transactions: | | | | | | | | | | | | | | | | | | | | | | | | |
Shares Sold | | | 31,596 | | | | 33,413 | | | | 45,950 | | | | 96,235 | | | | 15,414 | | | | 16,142 | |
Reinvestment of Distributions Paid | | | 392 | | | | 151,353 | | | | 73,702 | | | | 127,992 | | | | 55,199 | | | | 115,717 | |
Shares Redeemed | | | (80,457 | ) | | | (148,886 | ) | | | (197,327 | ) | | | (95,890 | ) | | | (54,141 | ) | | | (136,326 | ) |
| | | | | | | | | | | | | | | | | | | | | | | | |
Net Increase (Decrease) in Net Assets Resulting from Capital Transactions | | | (48,469 | ) | | | 35,880 | | | | (77,675 | ) | | | 128,337 | | | | 16,472 | | | | (4,467 | ) |
| | | | | | | | | | | | | | | | | | | | | | | | |
Total Increase (Decrease) in Net Assets | | | 316,400 | | | | (639,196 | ) | | | 315,190 | | | | (363,432 | ) | | | 102,701 | | | | (276,611 | ) |
| | | | | | |
Net Assets | | | | | | | | | | | | | | | | | | | | | | | | |
Beginning of Period | �� | | 750,703 | | | | 1,389,899 | | | | 963,929 | | | | 1,327,361 | | | | 566,195 | | | | 842,806 | |
| | | | | | | | | | | | | | | | | | | | | | | | |
End of Period | | $ | 1,067,103 | | | $ | 750,703 | | | $ | 1,279,119 | | | $ | 963,929 | | | $ | 668,896 | | | $ | 566,195 | |
| | | | | | | | | | | | | | | | | | | | | | | | |
| | | | | | |
Portfolio Share Transactions: | | | | | | | | | | | | | | | | | | | | | | | | |
Shares Sold | | | 12,321 | | | | 12,510 | | | | 13,468 | | | | 30,292 | | | | 9,820 | | | | 8,975 | |
Reinvestment of Distributions Paid | | | 138 | | | | 65,014 | | | | 20,337 | | | | 45,052 | | | | 35,681 | | | | 77,924 | |
Shares Redeemed | | | (30,806 | ) | | | (53,936 | ) | | | (56,929 | ) | | | (28,735 | ) | | | (34,495 | ) | | | (75,581 | ) |
| | | | | | | | | | | | | | | | | | | | | | | | |
Net Increase (Decrease) in Shares Resulting from Portfolio Share Transactions | | | (18,347 | ) | | | 23,588 | | | | (23,124 | ) | | | 46,609 | | | | 11,006 | | | | 11,318 | |
| | | | | | | | | | | | | | | | | | | | | | | | |
The Accompanying Notes are an Integral Part of the Financial Statements.
213
Statements of Changes in Net Assets
NORTHWESTERN MUTUAL SERIES FUND, INC.
(in thousands)
| | | | | | | | | | | | | | | | | | | | | | | | |
| | | Large Cap Blend Portfolio | | Index 500 Stock Portfolio | | Large Company Value Portfolio |
| | | For the Year Ended
December 31, 2023 | | For the Year Ended
December 31, 2022 | | For the Year Ended
December 31, 2023 | | For the Year Ended
December 31, 2022 | | For the Year Ended
December 31, 2023 | | For the Year Ended
December 31, 2022 |
| | | | | | |
Change in Net Assets | | | | | | | | | | | | | | | | | | | | | | | | |
| | | | | | |
Operations | | | | | | | | | | | | | | | | | | | | | | | | |
Net Investment Income (Loss) | | $ | 1,400 | | | $ | 1,511 | | | $ | 73,345 | | | $ | 67,102 | | | $ | 3,096 | | | $ | 3,460 | |
Net Realized Gain (Loss) on Investments | | | 38,892 | | | | 14,078 | | | | 102,837 | | | | 38,550 | | | | 5,908 | | | | 21,152 | |
Net Change in Unrealized Appreciation (Depreciation) of Investments | | | (4,799 | ) | | | (42,548 | ) | | | 974,774 | | | | (1,107,970 | ) | | | (3,512 | ) | | | (29,517 | ) |
| | | | | | | | | | | | | | | | | | | | | | | | |
Net Increase (Decrease) in Net Assets Resulting from Operations | | | 35,493 | | | | (26,959 | ) | | | 1,150,956 | | | | (1,002,318 | ) | | | 5,492 | | | | (4,905 | ) |
| | | | | | | | | | | | | | | | | | | | | | | | |
| | | | | | |
Distributions to Shareholders from: | | | | | | | | | | | | | | | | | | | | | | | | |
Net Investment Income & Net Realized Gain on Investments | | | (16,333 | ) | | | (19,367 | ) | | | (102,966 | ) | | | (208,620 | ) | | | (24,155 | ) | | | (32,410 | ) |
| | | | | | | | | | | | | | | | | | | | | | | | |
Net Decrease in Net Assets Resulting from Distributions to Shareholders | | | (16,333 | ) | | | (19,367 | ) | | | (102,966 | ) | | | (208,620 | ) | | | (24,155 | ) | | | (32,410 | ) |
| | | | | | | | | | | | | | | | | | | | | | | | |
| | | | | | |
Capital Transactions: | | | | | | | | | | | | | | | | | | | | | | | | |
Shares Sold | | | 4,962 | | | | 41,532 | | | | 307,603 | | | | 306,887 | | | | 15,882 | | | | 22,204 | |
Reinvestment of Distributions Paid | | | 16,333 | | | | 19,367 | | | | 102,966 | | | | 208,620 | | | | 24,155 | | | | 32,410 | |
Shares Redeemed | | | (48,649 | ) | | | (21,772 | ) | | | (439,392 | ) | | | (343,625 | ) | | | (21,790 | ) | | | (92,445 | ) |
| | | | | | | | | | | | | | | | | | | | | | | | |
Net Increase (Decrease) in Net Assets Resulting from Capital Transactions | | | (27,354 | ) | | | 39,127 | | | | (28,823 | ) | | | 171,882 | | | | 18,247 | | | | (37,831 | ) |
| | | | | | | | | | | | | | | | | | | | | | | | |
Total Increase (Decrease) in Net Assets | | | (8,194 | ) | | | (7,199 | ) | | | 1,019,167 | | | | (1,039,057 | ) | | | (416 | ) | | | (75,146 | ) |
| | | | | | |
Net Assets | | | | | | | | | | | | | | | | | | | | | | | | |
Beginning of Period | | | 195,927 | | | | 203,126 | | | | 4,465,914 | | | | 5,504,971 | | | | 152,414 | | | | 227,560 | |
| | | | | | | | | | | | | | | | | | | | | | | | |
End of Period | | $ | 187,733 | | | $ | 195,927 | | | $ | 5,485,081 | | | $ | 4,465,914 | | | $ | 151,998 | | | $ | 152,414 | |
| | | | | | | | | | | | | | | | | | | | | | | | |
| | | | | | |
Portfolio Share Transactions: | | | | | | | | | | | | | | | | | | | | | | | | |
Shares Sold | | | 4,348 | | | | 35,594 | | | | 43,380 | | | | 44,050 | | | | 17,828 | | | | 20,292 | |
Reinvestment of Distributions Paid | | | 14,688 | | | | 18,515 | | | | 13,944 | | | | 31,701 | | | | 31,617 | | | | 37,082 | |
Shares Redeemed | | | (42,245 | ) | | | (19,365 | ) | | | (61,421 | ) | | | (48,998 | ) | | | (25,066 | ) | | | (83,073 | ) |
| | | | | | | | | | | | | | | | | | | | | | | | |
Net Increase (Decrease) in Shares Resulting from Portfolio Share Transactions | | | (23,209 | ) | | | 34,744 | | | | (4,097 | ) | | | 26,753 | | | | 24,379 | | | | (25,699 | ) |
| | | | | | | | | | | | | | | | | | | | | | | | |
The Accompanying Notes are an Integral Part of the Financial Statements.
214
Statements of Changes in Net Assets
NORTHWESTERN MUTUAL SERIES FUND, INC.
(in thousands)
| | | | | | | | | | | | | | | | | | | | | | | | |
| | | Domestic Equity Portfolio | | Equity Income Portfolio | | Mid Cap Growth Stock Portfolio |
| | | For the Year Ended
December 31,
2023 | | For the Year Ended
December 31,
2022 | | For the Year Ended
December 31,
2023 | | For the Year Ended
December 31,
2022 | | For the Year Ended
December 31,
2023 | | For the Year Ended
December 31,
2022 |
Change in Net Assets | | | | | | | | | | | | | | | | | | | | | | | | |
| | | | | | |
Operations | | | | | | | | | | | | | | | | | | | | | | | | |
Net Investment Income (Loss) | | $ | 20,801 | | | $ | 19,196 | | | $ | 15,454 | | | $ | 16,735 | | | $ | 944 | | | $ | 2,534 | |
Net Realized Gain (Loss) on Investments | | | 81,380 | | | | 47,213 | | | | 26,642 | | | | 56,377 | | | | (24,840 | ) | | | (13,699 | ) |
Net Change in Unrealized Appreciation (Depreciation) of Investments | | | (64,424 | ) | | | (95,306 | ) | | | 22,318 | | | | (103,767 | ) | | | 169,115 | | | | (311,849 | ) |
| | | | | | | | | | | | | | | | | | | | | | | | |
Net Increase (Decrease) in Net Assets Resulting from Operations | | | 37,757 | | | | (28,897 | ) | | | 64,414 | | | | (30,655 | ) | | | 145,219 | | | | (323,014 | ) |
| | | | | | | | | | | | | | | | | | | | | | | | |
| | | | | | |
Distributions to Shareholders from: | | | | | | | | | | | | | | | | | | | | | | | | |
Net Investment Income & Net Realized Gain on Investments | | | (65,750 | ) | | | (136,599 | ) | | | (73,266 | ) | | | (94,476 | ) | | | (2,522 | ) | | | (100,047 | ) |
| | | | | | | | | | | | | | | | | | | | | | | | |
Net Decrease in Net Assets Resulting from Distributions to Shareholders | | | (65,750 | ) | | | (136,599 | ) | | | (73,266 | ) | | | (94,476 | ) | | | (2,522 | ) | | | (100,047 | ) |
| | | | | | | | | | | | | | | | | | | | | | | | |
| | | | | | |
Capital Transactions: | | | | | | | | | | | | | | | | | | | | | | | | |
Shares Sold | | | 79,014 | | | | 132,917 | | | | 24,796 | | | | 29,320 | | | | 19,633 | | | | 28,886 | |
Reinvestment of Distributions Paid | | | 65,750 | | | | 136,599 | | | | 73,266 | | | | 94,476 | | | | 2,522 | | | | 100,047 | |
Shares Redeemed | | | (119,824 | ) | | | (140,578 | ) | | | (74,095 | ) | | | (164,225 | ) | | | (91,652 | ) | | | (72,666 | ) |
| | | | | | | | | | | | | | | | | | | | | | | | |
Net Increase (Decrease) in Net Assets Resulting from Capital Transactions | | | 24,940 | | | | 128,938 | | | | 23,967 | | | | (40,429 | ) | | | (69,497 | ) | | | 56,267 | |
| | | | | | | | | | | | | | | | | | | | | | | | |
Total Increase (Decrease) in Net Assets | | | (3,053 | ) | | | (36,558 | ) | | | 15,115 | | | | (165,560 | ) | | | 73,200 | | | | (366,794 | ) |
| | | | | | |
Net Assets | | | | | | | | | | | | | | | | | | | | | | | | |
Beginning of Period | | | 1,060,119 | | | | 1,096,677 | | | | 702,376 | | | | 867,936 | | | | 1,008,774 | | | | 1,375,568 | |
| | | | | | | | | | | | | | | | | | | | | | | | |
End of Period | | $ | 1,057,066 | | | $ | 1,060,119 | | | $ | 717,491 | | | $ | 702,376 | | | $ | 1,081,974 | | | $ | 1,008,774 | |
| | | | | | | | | | | | | | | | | | | | | | | | |
| | | | | | |
Portfolio Share Transactions: | | | | | | | | | | | | | | | | | | | | | | | | |
Shares Sold | | | 50,536 | | | | 75,132 | | | | 14,994 | | | | 15,597 | | | | 6,883 | | | | 9,486 | |
Reinvestment of Distributions Paid | | | 44,098 | | | | 87,228 | | | | 47,699 | | | | 56,708 | | | | 869 | | | | 36,079 | |
Shares Redeemed | | | (75,951 | ) | | | (79,436 | ) | | | (44,900 | ) | | | (87,588 | ) | | | (31,776 | ) | | | (23,199 | ) |
| | | | | | | | | | | | | | | | | | | | | | | | |
Net Increase (Decrease) in Shares Resulting from Portfolio Share Transactions | | | 18,683 | | | | 82,924 | | | | 17,793 | | | | (15,283 | ) | | | (24,024 | ) | | | 22,366 | |
| | | | | | | | | | | | | | | | | | | | | | | | |
The Accompanying Notes are an Integral Part of the Financial Statements.
215
Statements of Changes in Net Assets
NORTHWESTERN MUTUAL SERIES FUND, INC.
(in thousands)
| | | | | | | | | | | | | | | | | | | | | | | | |
| | | Index 400 Stock Portfolio | | Mid Cap Value Portfolio | | Small Cap Growth Stock Portfolio |
| | | For the Year Ended
December 31,
2023 | | For the Year Ended
December 31,
2022 | | For the Year Ended
December 31,
2023 | | For the Year Ended
December 31,
2022 | | For the Year Ended
December 31,
2023 | | For the Year Ended
December 31,
2022 |
Change in Net Assets | | | | | | | | | | | | | | | | | | | | | | | | |
| | | | | | |
Operations | | | | | | | | | | | | | | | | | | | | | | | | |
Net Investment Income (Loss) | | $ | 16,869 | | | $ | 15,756 | | | $ | 13,979 | | | $ | 14,003 | | | $ | 1,051 | | | $ | 331 | |
Net Realized Gain (Loss) on Investments | | | 44,579 | | | | 50,041 | | | | 19,628 | | | | 84,236 | | | | 33,134 | | | | (75,603 | ) |
Net Change in Unrealized Appreciation (Depreciation) of Investments | | | 120,479 | | | | (242,957 | ) | | | 6,722 | | | | (107,181 | ) | | | 74,030 | | | | (161,243 | ) |
| | | | | | | | | | | | | | | | | | | | | | | | |
Net Increase (Decrease) in Net Assets Resulting from Operations | | | 181,927 | | | | (177,160 | ) | | | 40,329 | | | | (8,942 | ) | | | 108,215 | | | | (236,515 | ) |
| | | | | | | | | | | | | | | | | | | | | | | | |
| | | | | | |
Distributions to Shareholders from: | | | | | | | | | | | | | | | | | | | | | | | | |
Net Investment Income & Net Realized Gain on Investments | | | (65,023 | ) | | | (133,498 | ) | | | (94,795 | ) | | | (109,209 | ) | | | (192 | ) | | | (110,736 | ) |
| | | | | | | | | | | | | | | | | | | | | | | | |
Net Decrease in Net Assets Resulting from Distributions to Shareholders | | | (65,023 | ) | | | (133,498 | ) | | | (94,795 | ) | | | (109,209 | ) | | | (192 | ) | | | (110,736 | ) |
| | | | | | | | | | | | | | | | | | | | | | | | |
| | | | | | |
Capital Transactions: | | | | | | | | | | | | | | | | | | | | | | | | |
Shares Sold | | | 78,609 | | | | 75,177 | | | | 48,106 | | | | 41,682 | | | | 35,093 | | | | 46,128 | |
Reinvestment of Distributions Paid | | | 65,023 | | | | 133,498 | | | | 94,795 | | | | 109,209 | | | | 192 | | | | 110,736 | |
Shares Redeemed | | | (107,432 | ) | | | (96,244 | ) | | | (73,856 | ) | | | (86,631 | ) | | | (51,516 | ) | | | (44,750 | ) |
| | | | | | | | | | | | | | | | | | | | | | | | |
Net Increase (Decrease) in Net Assets Resulting from Capital Transactions | | | 36,200 | | | | 112,431 | | | | 69,045 | | | | 64,260 | | | | (16,231 | ) | | | 112,114 | |
| | | | | | | | | | | | | | | | | | | | | | | | |
Total Increase (Decrease) in Net Assets | | | 153,104 | | | | (198,227 | ) | | | 14,579 | | | | (53,891 | ) | | | 91,792 | | | | (235,137 | ) |
| | | | | | |
Net Assets | | | | | | | | | | | | | | | | | | | | | | | | |
Beginning of Period | | | 1,137,710 | | | | 1,335,937 | | | | 650,964 | | | | 704,855 | | | | 594,877 | | | | 830,014 | |
| | | | | | | | | | | | | | | | | | | | | | | | |
End of Period | | $ | 1,290,814 | | | $ | 1,137,710 | | | $ | 665,543 | | | $ | 650,964 | | | $ | 686,669 | | | $ | 594,877 | |
| | | | | | | | | | | | | | | | | | | | | | | | |
| | | | | | |
Portfolio Share Transactions: | | | | | | | | | | | | | | | | | | | | | | | | |
Shares Sold | | | 38,677 | | | | 34,219 | | | | 30,757 | | | | 22,814 | | | | 17,413 | | | | 19,429 | |
Reinvestment of Distributions Paid | | | 32,560 | | | | 68,007 | | | | 68,444 | | | | 69,076 | | | | 92 | | | | 56,182 | |
Shares Redeemed | | | (52,277 | ) | | | (44,442 | ) | | | (46,611 | ) | | | (47,794 | ) | | | (25,232 | ) | | | (19,130 | ) |
| | | | | | | | | | | | | | | | | | | | | | | | |
Net Increase (Decrease) in Shares Resulting from Portfolio Share Transactions | | | 18,960 | | | | 57,784 | | | | 52,590 | | | | 44,096 | | | | (7,727 | ) | | | 56,481 | |
| | | | | | | | | | | | | | | | | | | | | | | | |
The Accompanying Notes are an Integral Part of the Financial Statements.
216
Statements of Changes in Net Assets
NORTHWESTERN MUTUAL SERIES FUND, INC.
(in thousands)
| | | | | | | | | | | | | | | | | | | | | | | | |
| | | Index 600 Stock Portfolio | | Small Cap Value Portfolio | | International Growth Portfolio |
| | | For the Year Ended
December 31,
2023 | | For the Year Ended
December 31,
2022 | | For the Year Ended
December 31,
2023 | | For the Year Ended
December 31,
2022 | | For the Year Ended
December 31,
2023 | | For the Year Ended
December 31,
2022 |
Change in Net Assets | | | | | | | | | | | | | | | | | | | | | | | | |
| | | | | | |
Operations | | | | | | | | | | | | | | | | | | | | | | | | |
Net Investment Income (Loss) | | $ | 5,645 | | | $ | 4,348 | | | $ | 4,456 | | | $ | 2,893 | | | $ | 9,421 | | | $ | 7,520 | |
Net Realized Gain (Loss) on Investments | | | 9,303 | | | | 15,997 | | | | 21,102 | | | | 36,712 | | | | 27,399 | | | | 19,007 | |
Net Change in Unrealized Appreciation (Depreciation) of Investments | | | 44,818 | | | | (92,090 | ) | | | 46,170 | | | | (165,134 | ) | | | 144,441 | | | | (273,775 | ) |
| | | | | | | | | | | | | | | | | | | | | | | | |
Net Increase (Decrease) in Net Assets Resulting from Operations | | | 59,766 | | | | (71,745 | ) | | | 71,728 | | | | (125,529 | ) | | | 181,261 | | | | (247,248 | ) |
| | | | | | | | | | | | | | | | | | | | | | | | |
| | | | | | |
Distributions to Shareholders from: | | | | | | | | | | | | | | | | | | | | | | | | |
Net Investment Income & Net Realized Gain on Investments | | | (20,110 | ) | | | (37,396 | ) | | | (39,232 | ) | | | (77,602 | ) | | | (28,510 | ) | | | (101,272 | ) |
| | | | | | | | | | | | | | | | | | | | | | | | |
Net Decrease in Net Assets Resulting from Distributions to Shareholders | | | (20,110 | ) | | | (37,396 | ) | | | (39,232 | ) | | | (77,602 | ) | | | (28,510 | ) | | | (101,272 | ) |
| | | | | | | | | | | | | | | | | | | | | | | | |
| | | | | | |
Capital Transactions: | | | | | | | | | | | | | | | | | | | | | | | | |
Shares Sold | | | 49,586 | | | | 44,672 | | | | 23,020 | | | | 23,597 | | | | 68,224 | | | | 138,892 | |
Reinvestment of Distributions Paid | | | 20,110 | | | | 37,396 | | | | 39,232 | | | | 77,602 | | | | 28,510 | | | | 101,272 | |
Shares Redeemed | | | (43,358 | ) | | | (35,801 | ) | | | (54,517 | ) | | | (47,754 | ) | | | (123,661 | ) | | | (66,828 | ) |
| | | | | | | | | | | | | | | | | | | | | | | | |
Net Increase (Decrease) in Net Assets Resulting from Capital Transactions | | | 26,338 | | | | 46,267 | | | | 7,735 | | | | 53,445 | | | | (26,927 | ) | | | 173,336 | |
| | | | | | | | | | | | | | | | | | | | | | | | |
Total Increase (Decrease) in Net Assets | | | 65,994 | | | | (62,874 | ) | | | 40,231 | | | | (149,686 | ) | | | 125,824 | | | | (175,184 | ) |
| | | | | | |
Net Assets | | | | | | | | | | | | | | | | | | | | | | | | |
Beginning of Period | | | 371,552 | | | | 434,426 | | | | 535,618 | | | | 685,304 | | | | 893,048 | | | | 1,068,232 | |
| | | | | | | | | | | | | | | | | | | | | | | | |
End of Period | | $ | 437,546 | | | $ | 371,552 | | | $ | 575,849 | | | $ | 535,618 | | | $ | 1,018,872 | | | $ | 893,048 | |
| | | | | | | | | | | | | | | | | | | | | | | | |
| | | | | | |
Portfolio Share Transactions: | | | | | | | | | | | | | | | | | | | | | | | | |
Shares Sold | | | 35,240 | | | | 28,438 | | | | 12,711 | | | | 11,049 | | | | 38,455 | | | | 76,043 | |
Reinvestment of Distributions Paid | | | 14,733 | | | | 26,826 | | | | 22,599 | | | | 41,521 | | | | 16,414 | | | | 64,959 | |
Shares Redeemed | | | (30,488 | ) | | | (23,153 | ) | | | (29,716 | ) | | | (22,515 | ) | | | (69,164 | ) | | | (36,768 | ) |
| | | | | | | | | | | | | | | | | | | | | | | | |
Net Increase (Decrease) in Shares Resulting from Portfolio Share Transactions | | | 19,485 | | | | 32,111 | | | | 5,594 | | | | 30,055 | | | | (14,295 | ) | | | 104,234 | |
| | | | | | | | | | | | | | | | | | | | | | | | |
The Accompanying Notes are an Integral Part of the Financial Statements.
217
Statements of Changes in Net Assets
NORTHWESTERN MUTUAL SERIES FUND, INC.
(in thousands)
| | | | | | | | | | | | | | | | | | | | | | | | |
| | | Research International Core
Portfolio | | International Equity Portfolio | | Emerging Markets Equity
Portfolio |
| | | For the Year Ended
December 31,
2023 | | For the Year Ended
December 31,
2022 | | For the Year Ended
December 31,
2023 | | For the Year Ended
December 31,
2022 | | For the Year Ended
December 31,
2023 | | For the Year Ended
December 31,
2022 |
Change in Net Assets | | | | | | | | | | | | | | | | | | | | | | | | |
| | | | | | |
Operations | | | | | | | | | | | | | | | | | | | | | | | | |
Net Investment Income (Loss) | | $ | 14,683 | | | $ | 14,428 | | | $ | 47,737 | | | $ | 46,675 | | | $ | 16,706 | | | $ | 11,102 | |
Net Realized Gain (Loss) on Investments | | | 5,645 | | | | 14,900 | | | | (6,228 | ) | | | 4,035 | | | | (24,775 | ) | | | (27,311 | ) |
Net Change in Unrealized Appreciation (Depreciation) of Investments | | | 76,053 | | | | (197,850 | ) | | | 228,674 | | | | (174,257 | ) | | | 67,094 | | | | (242,918 | ) |
| | | | | | | | | | | | | | | | | | | | | | | | |
Net Increase (Decrease) in Net Assets Resulting from Operations | | | 96,381 | | | | (168,522 | ) | | | 270,183 | | | | (123,547 | ) | | | 59,025 | | | | (259,127 | ) |
| | | | | | | | | | | | | | | | | | | | | | | | |
| | | | | | |
Distributions to Shareholders from: | | | | | | | | | | | | | | | | | | | | | | | | |
Net Investment Income & Net Realized Gain on Investments | | | (28,569 | ) | | | (54,639 | ) | | | (54,274 | ) | | | (88,599 | ) | | | (19,064 | ) | | | (78,273 | ) |
| | | | | | | | | | | | | | | | | | | | | | | | |
Net Decrease in Net Assets Resulting from Distributions to Shareholders | | | (28,569 | ) | | | (54,639 | ) | | | (54,274 | ) | | | (88,599 | ) | | | (19,064 | ) | | | (78,273 | ) |
| | | | | | | | | | | | | | | | | | | | | | | | |
| | | | | | |
Capital Transactions: | | | | | | | | | | | | | | | | | | | | | | | | |
Shares Sold | | | 75,096 | | | | 110,188 | | | | 80,865 | | | | 127,200 | | | | 100,737 | | | | 188,456 | |
Reinvestment of Distributions Paid | | | 28,569 | | | | 54,639 | | | | 54,274 | | | | 88,599 | | | | 19,064 | | | | 78,273 | |
Shares Redeemed | | | (86,899 | ) | | | (160,696 | ) | | | (199,969 | ) | | | (142,665 | ) | | | (92,183 | ) | | | (68,584 | ) |
| | | | | | | | | | | | | | | | | | | | | | | | |
Net Increase (Decrease) in Net Assets Resulting from Capital Transactions | | | 16,766 | | | | 4,131 | | | | (64,830 | ) | | | 73,134 | | | | 27,618 | | | | 198,145 | |
| | | | | | | | | | | | | | | | | | | | | | | | |
Total Increase (Decrease) in Net Assets | | | 84,578 | | | | (219,030 | ) | | | 151,079 | | | | (139,012 | ) | | | 67,579 | | | | (139,255 | ) |
| | | | | | |
Net Assets | | | | | | | | | | | | | | | | | | | | | | | | |
Beginning of Period | | | 744,073 | | | | 963,103 | | | | 1,726,196 | | | | 1,865,208 | | | | 854,238 | | | | 993,493 | |
| | | | | | | | | | | | | | | | | | | | | | | | |
End of Period | | $ | 828,651 | | | $ | 744,073 | | | $ | 1,877,275 | | | $ | 1,726,196 | | | $ | 921,817 | | | $ | 854,238 | |
| | | | | | | | | | | | | | | | | | | | | | | | |
| | | | | | |
Portfolio Share Transactions: | | | | | | | | | | | | | | | | | | | | | | | | |
Shares Sold | | | 72,218 | | | | 104,902 | | | | 53,847 | | | | 88,308 | | | | 109,838 | | | | 183,940 | |
Reinvestment of Distributions Paid | | | 28,008 | | | | 58,940 | | | | 36,038 | | | | 67,325 | | | | 21,229 | | | | 88,544 | |
Shares Redeemed | | | (83,330 | ) | | | (154,216 | ) | | | (133,003 | ) | | | (96,849 | ) | | | (100,009 | ) | | | (68,782 | ) |
| | | | | | | | | | | | | | | | | | | | | | | | |
Net Increase (Decrease) in Shares Resulting from Portfolio Share Transactions | | | 16,896 | | | | 9,626 | | | | (43,118 | ) | | | 58,784 | | | | 31,058 | | | | 203,702 | |
| | | | | | | | | | | | | | | | | | | | | | | | |
The Accompanying Notes are an Integral Part of the Financial Statements.
218
Statements of Changes in Net Assets
NORTHWESTERN MUTUAL SERIES FUND, INC.
(in thousands)
| | | | | | | | | | | | | | | | | | | | | | | | |
| | | Government Money Market
Portfolio | | Short-Term Bond Portfolio | | Select Bond Portfolio |
| | | For the Year Ended
December 31,
2023 | | For the Year Ended
December 31,
2022 | | For the Year Ended
December 31,
2023 | | For the Year Ended
December 31,
2022 | | For the Year Ended
December 31,
2023 | | For the Year Ended
December 31,
2022 |
Change in Net Assets | | | | | | | | | | | | | | | | | | | | | | | | |
| | | | | | |
Operations | | | | | | | | | | | | | | | | | | | | | | | | |
Net Investment Income (Loss) | | $ | 25,157 | | | $ | 7,236 | | | $ | 13,009 | | | $ | 7,535 | | | $ | 108,614 | | | $ | 69,568 | |
Net Realized Gain (Loss) on Investments | | | 6 | | | | 7 | | | | (5,449 | ) | | | (6,684 | ) | | | (135,060 | ) | | | (279,626 | ) |
Net Change in Unrealized Appreciation (Depreciation) of Investments | | | — | | | | — | | | | 11,851 | | | | (19,193 | ) | | | 197,145 | | | | (241,265 | ) |
| | | | | | | | | | | | | | | | | | | | | | | | |
Net Increase (Decrease) in Net Assets Resulting from Operations | | | 25,163 | | | | 7,243 | | | | 19,411 | | | | (18,342 | ) | | | 170,699 | | | | (451,323 | ) |
| | | | | | | | | | | | | | | | | | | | | | | | |
| | | | | | |
Distributions to Shareholders from: | | | | | | | | | | | | | | | | | | | | | | | | |
Net Investment Income & Net Realized Gain on Investments | | | (25,161 | ) | | | (7,243 | ) | | | (7,807 | ) | | | (6,405 | ) | | | (73,967 | ) | | | (55,391 | ) |
| | | | | | | | | | | | | | | | | | | | | | | | |
Net Decrease in Net Assets Resulting from Distributions to Shareholders | | | (25,161 | ) | | | (7,243 | ) | | | (7,807 | ) | | | (6,405 | ) | | | (73,967 | ) | | | (55,391 | ) |
| | | | | | | | | | | | | | | | | | | | | | | | |
| | | | | | |
Capital Transactions: | | | | | | | | | | | | | | | | | | | | | | | | |
Shares Sold | | | 243,145 | | | | 341,118 | | | | 38,609 | | | | 50,070 | | | | 187,783 | | | | 167,116 | |
Reinvestment of Distributions Paid | | | 25,161 | | | | 7,243 | | | | 7,807 | | | | 6,405 | | | | 73,967 | | | | 55,391 | |
Shares Redeemed | | | (284,441 | ) | | | (294,702 | ) | | | (55,526 | ) | | | (61,274 | ) | | | (241,401 | )�� | | | (357,593 | ) |
| | | | | | | | | | | | | | | | | | | | | | | | |
Net Increase (Decrease) in Net Assets Resulting from Capital Transactions | | | (16,135 | ) | | | 53,659 | | | | (9,110 | ) | | | (4,799 | ) | | | 20,349 | | | | (135,086 | ) |
| | | | | | | | | | | | | | | | | | | | | | | | |
Total Increase (Decrease) in Net Assets | | | (16,133 | ) | | | 53,659 | | | | 2,494 | | | | (29,546 | ) | | | 117,081 | | | | (641,800 | ) |
| | | | | | |
Net Assets | | | | | | | | | | | | | | | | | | | | | | | | |
Beginning of Period | | | 542,517 | | | | 488,858 | | | | 382,738 | | | | 412,284 | | | | 2,786,616 | | | | 3,428,416 | |
| | | | | | | | | | | | | | | | | | | | | | | | |
End of Period | | $ | 526,384 | | | $ | 542,517 | | | $ | 385,232 | | | $ | 382,738 | | | $ | 2,903,697 | | | $ | 2,786,616 | |
| | | | | | | | | | | | | | | | | | | | | | | | |
| | | | | | |
Portfolio Share Transactions: | | | | | | | | | | | | | | | | | | | | | | | | |
Shares Sold | | | 243,145 | | | | 341,119 | | | | 38,413 | | | | 49,323 | | | | 173,529 | | | | 146,687 | |
Reinvestment of Distributions Paid | | | 25,161 | | | | 7,243 | | | | 7,862 | | | | 6,418 | | | | 70,445 | | | | 50,817 | |
Shares Redeemed | | | (284,441 | ) | | | (294,703 | ) | | | (55,337 | ) | | | (60,598 | ) | | | (223,248 | ) | | | (318,256 | ) |
| | | | | | | | | | | | | | | | | | | | | | | | |
Net Increase (Decrease) in Shares Resulting from Portfolio Share Transactions | | | (16,135 | ) | | | 53,659 | | | | (9,062 | ) | | | (4,857 | ) | | | 20,726 | | | | (120,752 | ) |
| | | | | | | | | | | | | | | | | | | | | | | | |
The Accompanying Notes are an Integral Part of the Financial Statements.
219
Statements of Changes in Net Assets
NORTHWESTERN MUTUAL SERIES FUND, INC.
(in thousands)
| | | | | | | | | | | | | | | | | | | | | | | | |
| | | Long-Term U.S. Government
Bond Portfolio | | Inflation Protection Portfolio | | High Yield Bond Portfolio |
| | | For the Year Ended
December 31,
2023 | | For the Year Ended
December 31,
2022 | | For the Year Ended
December 31,
2023 | | For the Year Ended
December 31,
2022 | | For the Year Ended
December 31,
2023 | | For the Year Ended
December 31,
2022 |
Change in Net Assets | | | | | | | | | | | | | | | | | | | | | | | | |
| | | | | | |
Operations | | | | | | | | | | | | | | | | | | | | | | | | |
Net Investment Income (Loss) | | $ | 2,983 | | | $ | 2,816 | | | $ | 12,871 | | | $ | 20,661 | | | $ | 43,691 | | | $ | 40,826 | |
Net Realized Gain (Loss) on Investments | | | (25,340 | ) | | | (2,039 | ) | | | (8,219 | ) | | | (11,350 | ) | | | (15,561 | ) | | | (3,804 | ) |
Net Change in Unrealized Appreciation (Depreciation) of Investments | | | 26,557 | | | | (41,935 | ) | | | 11,085 | | | | (74,754 | ) | | | 60,484 | | | | (129,365 | ) |
| | | | | | | | | | | | | | | | | | | | | | | | |
Net Increase (Decrease) in Net Assets Resulting from Operations | | | 4,200 | | | | (41,158 | ) | | | 15,737 | | | | (65,443 | ) | | | 88,614 | | | | (92,343 | ) |
| | | | | | | | | | | | | | | | | | | | | | | | |
| | | | | | |
Distributions to Shareholders from: | | | | | | | | | | | | | | | | | | | | | | | | |
Net Investment Income & Net Realized Gain on Investments | | | (2,679 | ) | | | (1,876 | ) | | | (20,508 | ) | | | (25,627 | ) | | | (40,679 | ) | | | (40,651 | ) |
| | | | | | | | | | | | | | | | | | | | | | | | |
Net Decrease in Net Assets Resulting from Distributions to Shareholders | | | (2,679 | ) | | | (1,876 | ) | | | (20,508 | ) | | | (25,627 | ) | | | (40,679 | ) | | | (40,651 | ) |
| | | | | | | | | | | | | | | | | | | | | | | | |
| | | | | | |
Capital Transactions: | | | | | | | | | | | | | | | | | | | | | | | | |
Shares Sold | | | 32,371 | | | | 18,929 | | | | 33,814 | | | | 41,715 | | | | 49,592 | | | | 44,090 | |
Reinvestment of Distributions Paid | | | 2,679 | | | | 1,876 | | | | 20,508 | | | | 25,627 | | | | 40,679 | | | | 40,651 | |
Shares Redeemed | | | (15,679 | ) | | | (16,483 | ) | | | (55,810 | ) | | | (66,655 | ) | | | (83,267 | ) | | | (104,674 | ) |
| | | | | | | | | | | | | | | | | | | | | | | | |
Net Increase (Decrease) in Net Assets Resulting from Capital Transactions | | | 19,371 | | | | 4,322 | | | | (1,488 | ) | | | 687 | | | | 7,004 | | | | (19,933 | ) |
| | | | | | | | | | | | | | | | | | | | | | | | |
Total Increase (Decrease) in Net Assets | | | 20,892 | | | | (38,712 | ) | | | (6,259 | ) | | | (90,383 | ) | | | 54,939 | | | | (152,927 | ) |
| | | | | | |
Net Assets | | | | | | | | | | | | | | | | | | | | | | | | |
Beginning of Period | | | 100,157 | | | | 138,869 | | | | 423,548 | | | | 513,931 | | | | 689,405 | | | | 842,332 | |
| | | | | | | | | | | | | | | | | | | | | | | | |
End of Period | | $ | 121,049 | | | $ | 100,157 | | | $ | 417,289 | | | $ | 423,548 | | | $ | 744,344 | | | $ | 689,405 | |
| | | | | | | | | | | | | | | | | | | | | | | | |
| | | | | | |
Portfolio Share Transactions: | | | | | | | | | | | | | | | | | | | | | | | | |
Shares Sold | | | 50,464 | | | | 25,388 | | | | 32,100 | | | | 35,489 | | | | 76,343 | | | | 65,171 | |
Reinvestment of Distributions Paid | | | 4,349 | | | | 2,679 | | | | 20,406 | | | | 23,383 | | | | 64,163 | | | | 64,731 | |
Shares Redeemed | | | (24,015 | ) | | | (21,977 | ) | | | (53,249 | ) | | | (57,454 | ) | | | (128,893 | ) | | | (154,215 | ) |
| | | | | | | | | | | | | | | | | | | | | | | | |
Net Increase (Decrease) in Shares Resulting from Portfolio Share Transactions | | | 30,798 | | | | 6,090 | | | | (743 | ) | | | 1,418 | | | | 11,613 | | | | (24,313 | ) |
| | | | | | | | | | | | | | | | | | | | | | | | |
The Accompanying Notes are an Integral Part of the Financial Statements.
220
Statements of Changes in Net Assets
NORTHWESTERN MUTUAL SERIES FUND, INC.
(in thousands)
| | | | | | | | | | | | | | | | | | | | | | | | |
| | | Multi-Sector Bond Portfolio | | Balanced Portfolio | | Asset Allocation Portfolio |
| | | For the Year Ended
December 31,
2023 | | For the Year Ended
December 31,
2022 | | For the Year Ended
December 31,
2023 | | For the Year Ended
December 31,
2022 | | For the Year Ended
December 31,
2023 | | For the Year Ended
December 31,
2022 |
Change in Net Assets | | | | | | | | | | | | | | | | | | | | | | | | |
| | | | | | |
Operations | | | | | | | | | | | | | | | | | | | | | | | | |
Net Investment Income (Loss) | | $ | 51,520 | | | $ | 40,263 | | | $ | 40,965 | | | $ | 31,413 | | | $ | 5,161 | | | $ | 4,021 | |
Net Realized Gain (Loss) on Investments | | | (34,031 | ) | | | (58,886 | ) | | | 40,097 | | | | 75,927 | | | | 8,417 | | | | 16,723 | |
Net Change in Unrealized Appreciation (Depreciation) of Investments | | | 89,915 | | | | (185,968 | ) | | | 154,193 | | | | (438,806 | ) | | | 24,028 | | | | (67,978 | ) |
| | | | | | | | | | | | | | | | | | | | | | | | |
Net Increase (Decrease) in Net Assets Resulting from Operations | | | 107,404 | | | | (204,591 | ) | | | 235,255 | | | | (331,466 | ) | | | 37,606 | | | | (47,234 | ) |
| | | | | | | | | | | | | | | | | | | | | | | | |
| | | | | | |
Distributions to Shareholders from: | | | | | | | | | | | | | | | | | | | | | | | | |
Net Investment Income & Net Realized Gain on Investments | | | (29,062 | ) | | | (47,671 | ) | | | (111,419 | ) | | | (204,366 | ) | | | (21,214 | ) | | | (27,192 | ) |
| | | | | | | | | | | | | | | | | | | | | | | | |
Net Decrease in Net Assets Resulting from Distributions to Shareholders | | | (29,062 | ) | | | (47,671 | ) | | | (111,419 | ) | | | (204,366 | ) | | | (21,214 | ) | | | (27,192 | ) |
| | | | | | | | | | | | | | | | | | | | | | | | |
| | | | | | |
Capital Transactions: | | | | | | | | | | | | | | | | | | | | | | | | |
Shares Sold | | | 94,136 | | | | 98,697 | | | | 60,580 | | | | 64,833 | | | | 12,637 | | | | 13,330 | |
Reinvestment of Distributions Paid | | | 29,062 | | | | 47,671 | | | | 111,419 | | | | 204,366 | | | | 21,214 | | | | 27,192 | |
Shares Redeemed | | | (114,440 | ) | | | (98,178 | ) | | | (216,520 | ) | | | (231,813 | ) | | | (34,119 | ) | | | (29,134 | ) |
| | | | | | | | | | | | | | | | | | | | | | | | |
Net Increase (Decrease) in Net Assets Resulting from Capital Transactions | | | 8,758 | | | | 48,190 | | | | (44,521 | ) | | | 37,386 | | | | (268 | ) | | | 11,388 | |
| | | | | | | | | | | | | | | | | | | | | | | | |
Total Increase (Decrease) in Net Assets | | | 87,100 | | | | (204,072 | ) | | | 79,315 | | | | (498,446 | ) | | | 16,124 | | | | (63,038 | ) |
| | | | | | |
Net Assets | | | | | | | | | | | | | | | | | | | | | | | | |
Beginning of Period | | | 1,112,579 | | | | 1,316,651 | | | | 1,883,127 | | | | 2,381,573 | | | | 257,699 | | | | 320,737 | |
| | | | | | | | | | | | | | | | | | | | | | | | |
End of Period | | $ | 1,199,679 | | | $ | 1,112,579 | | | $ | 1,962,442 | | | $ | 1,883,127 | | | $ | 273,823 | | | $ | 257,699 | |
| | | | | | | | | | | | | | | | | | | | | | | | |
| | | | | | |
Portfolio Share Transactions: | | | | | | | | | | | | | | | | | | | | | | | | |
Shares Sold | | | 100,853 | | | | 100,385 | | | | 48,196 | | | | 47,449 | | | | 11,941 | | | | 11,640 | |
Reinvestment of Distributions Paid | | | 31,692 | | | | 52,850 | | | | 91,778 | | | | 169,037 | | | | 20,984 | | | | 26,949 | |
Shares Redeemed | | | (122,889 | ) | | | (101,784 | ) | | | (173,156 | ) | | | (171,879 | ) | | | (32,410 | ) | | | (25,974 | ) |
| | | | | | | | | | | | | | | | | | | | | | | | |
Net Increase (Decrease) in Shares Resulting from Portfolio Share Transactions | | | 9,656 | | | | 51,451 | | | | (33,182 | ) | | | 44,607 | | | | 515 | | | | 12,615 | |
| | | | | | | | | | | | | | | | | | | | | | | | |
The Accompanying Notes are an Integral Part of the Financial Statements.
221
Statement of Cash Flows
NORTHWESTERN MUTUAL SERIES FUND, INC.
For the Year Ended December 31, 2023 (in thousands)
| | | | | | | | |
| | | | | Long-Term U.S. |
| | | Government Bond Portfolio |
| | |
Cash Flows from Operating Activities | | | | | | | | |
Net Increase (Decrease) in Net Assets Resulting from Operations | | | | | | $ | 4,200 | |
Adjustments to Reconcile Net Increase (Decrease) in Net Assets Resulting from Operations to Net Cash from Operating Activities | | | | | | | | |
Purchase of Investment Securities | | | | | | | (220,484) | |
Proceeds from Disposition of Investment Securities | | | | | | | 185,314 | |
Proceeds from (Payments for) Closed Futures Contracts and Cleared Swaps | | | | | | | 766 | |
Proceeds from Securities Sold Short | | | | | | | 5,450 | |
Cash Paid for Terminated Options Written | | | | | | | (34) | |
Premiums Received for Options Written | | | | | | | 86 | |
Amortization (Accretion) of Premium/Discount, net | | | | | | | (1,071) | |
(Increase) Decrease in: | | | | | | | | |
Receivable for Investment Securities Sold | | | | | | | 2,041 | |
Dividends and Interest Receivable | | | | | | | (321) | |
Increase (Decrease) in: | | | | | | | | |
Directors Fees Payable | | | | | | | (3) | |
Compliance Fees Payable | | | | | | | (1) | |
Collateral from Counterparty | | | | | | | 2,041 | |
Investment Advisory Fees Payable | | | | | | | 10 | |
Accrued Expenses | | | | | | | (3) | |
Change in Net Unrealized (Appreciation) Depreciation of: | | | | | | | | |
Investment Securities | | | | | | | (28,570) | |
Futures Contracts | | | | | | | 2,135 | |
Options Written | | | | | | | (7) | |
Short Sales | | | | | | | 30 | |
Swap Contracts | | | | | | | (145) | |
Net Realized (Gain) Loss from: | | | | | | | | |
Investment Securities | | | | | | | 28,110 | |
Futures Contracts | | | | | | | (2,921) | |
Options Written | | | | | | | (82) | |
Short Sales | | | | | | | 66 | |
Swap Contracts | | | | | | | 167 | |
| | | | | | | | |
Total Adjustments | | | | | | | (27,426) | |
| | | | | | | | |
Net Cash (Used in) Provided by Operating Activities | | | | | | | (23,226) | |
| | | | | | | | |
| | |
Cash Flows from Financing Activities | | | | | | | | |
Cash Received from Financing Transactions | | | | | | | 1,426,055 | |
Cash (Used for) Financing Transactions | | | | | | | (1,419,046) | |
Proceeds from Reverse Repurchase Agreements | | | | | | | 1,700 | |
Payments on Reverse Repurchase Agreements | | | | | | | (1,700) | |
Proceeds from Portfolio Shares Sold | | | | | | | 32,361 | |
Payment on Portfolio Shares Redeemed | | | | | | | (15,662) | |
| | | | | | | | |
Net Cash (Used in) Provided by Financing Activities | | | | | | | 23,708 | |
| | | | | | | | |
| | |
Net Increase (Decrease) in Cash and Cash Equivalents | | | | | | | 482 | |
Cash and Restricted Cash, Beginning of Period | | | | | | | 1,884 | |
| | | | | | | | |
Cash and Restricted Cash, End of Period | | | | | | $ | 2,366 | |
| | | | | | | | |
The Accompanying Notes are an Integral Part of the Financial Statements.
222
Statement of Cash Flows
NORTHWESTERN MUTUAL SERIES FUND, INC.
For the Year Ended December 31, 2023 (in thousands)
Cash and Restricted Cash is the sum of Cash and Collateral with Counterparty from the Statement of Assets and Liabilities.
Supplemental disclosure of cash flow information:
Non-cash financing activities not included herein consist of reinvestment of dividends and distributions of $2,679.
Interest paid was $1,728 for the period ended December 31, 2023.
The Accompanying Notes are an Integral Part of the Financial Statements.
223
Financial Highlights
NORTHWESTERN MUTUAL SERIES FUND, INC.
(For a share outstanding through the period)
| | | | | | | | | | | | | | | | | | | | | | | | | | | | | | | | | | | | | | | | | | | | | | | | | | | | | | | | |
| | | Net Asset Value, Beginning of Period | | | Net Investment Income (Loss) | | | Net Realized and Unrealized Gain (Loss) on Investments | | | Total from Investment Operations | | | Distributions
from Net
Investment
Income | | | Distributions from Realized Gains on Investments | | | Total Distributions | | | Net Asset Value, End of Period | | | Total Return* | | | Net Assets, End of Period (thousands) | | | Ratio of Gross Expenses to Average Net Assets† | | | Ratio of Net Expenses to Average Net Assets† | | | Ratio of Net Investment Income (Loss) to Average Net Assets | | | Portfolio Turnover Rate | |
Growth Stock Portfolio | | | | | | | | | | | | | | | | | | | | | | | | | | | | | | | | | | | | | | | | | | | | | |
2023 | | $ | 2.04 | | | $ | 0.00 | ‡ | | $ | 1.02 | | | $ | 1.02 | | | $ | (0.00 | )‡ | | $ | — | | | $ | (0.00 | )‡ | | $ | 3.06 | | | | 49.69 | % | | $ | 1,067,103 | | | | 0.43 | % | | | 0.43 | % | | | 0.14 | % | | | 9 | % |
2022 | | | 4.04 | | | | 0.00 | ‡ | | | (1.50 | ) | | | (1.50 | ) | | | — | | | | (0.50 | ) | | | (0.50 | ) | | | 2.04 | | | | (38.70 | ) | | | 750,703 | | | | 0.43 | | | | 0.43 | | | | 0.04 | | | | 14 | |
2021 | | | 3.60 | | | | 0.00 | ‡ | | | 0.61 | | | | 0.61 | | | | (0.00 | )‡ | | | (0.17 | ) | | | (0.17 | ) | | | 4.04 | | | | 16.67 | | | | 1,389,899 | | | | 0.42 | | | | 0.42 | | | | (0.10 | ) | | | 36 | |
2020 | | | 3.18 | | | | 0.00 | ‡ | | | 1.04 | | | | 1.04 | | | | (0.02 | ) | | | (0.60 | ) | | | (0.62 | ) | | | 3.60 | | | | 34.97 | | | | 1,286,403 | | | | 0.43 | | | | 0.42 | | | | 0.00 | | | | 24 | |
2019 | | | 2.75 | | | | 0.02 | | | | 0.77 | | | | 0.79 | | | | (0.02 | ) | | | (0.34 | ) | | | (0.36 | ) | | | 3.18 | | | | 29.68 | | | | 1,083,324 | | | | 0.43 | | | | 0.42 | | | | 0.71 | | | | 116 | |
Focused Appreciation Portfolio | | | | | | | | | | | | | | | | | | | | | | | | | | | | | | | | | | | | | | | | | | | | | |
2023 | | $ | 2.72 | | | $ | 0.00 | ‡ | | $ | 1.38 | | | $ | 1.38 | | | $ | — | | | $ | (0.23 | ) | | $ | (0.23 | ) | | $ | 3.87 | | | | 50.99 | % | | $ | 1,279,119 | | | | 0.74 | % | | | 0.62 | % | | | (0.10 | )% | | | 7 | % |
2022 | | | 4.32 | | | | 0.00 | ‡ | | | (1.19 | ) | | | (1.19 | ) | | | (0.00 | )‡ | | | (0.41 | ) | | | (0.41 | ) | | | 2.72 | | | | (27.83 | ) | | | 963,929 | | | | 0.74 | | | | 0.62 | | | | (0.03 | ) | | | 18 | |
2021 | | | 4.02 | | | | 0.00 | ‡ | | | 0.76 | | | | 0.76 | | | | (0.01 | ) | | | (0.45 | ) | | | (0.46 | ) | | | 4.32 | | | | 18.90 | | | | 1,327,361 | | | | 0.74 | | | | 0.62 | | | | (0.01 | ) | | | 11 | |
2020 | | | 3.17 | | | | 0.01 | | | | 1.02 | | | | 1.03 | | | | (0.02 | ) | | | (0.16 | ) | | | (0.18 | ) | | | 4.02 | | | | 32.55 | | | | 1,186,696 | | | | 0.75 | | | | 0.62 | | | | 0.19 | | | | 21 | |
2019 | | | 2.57 | | | | 0.02 | | | | 0.78 | | | | 0.80 | | | | (0.02 | ) | | | (0.18 | ) | | | (0.20 | ) | | | 3.17 | | | | 31.97 | | | | 1,012,624 | | | | 0.75 | | | | 0.63 | | | | 0.58 | | | | 7 | |
Large Cap Core Stock Portfolio | | | | | | | | | | | | | | | | | | | | | | | | | | | | | | | | | | | | | | | | | | | | | |
2023 | | $ | 1.44 | | | $ | 0.01 | | | $ | 0.36 | | | $ | 0.37 | | | $ | (0.02 | ) | | $ | (0.13 | ) | | $ | (0.15 | ) | | $ | 1.66 | | | | 25.78 | % | | $ | 668,896 | | | | 0.45 | % | | | 0.44 | % | | | 0.82 | % | | | 63 | % |
2022 | | | 2.21 | | | | 0.02 | | | | (0.43 | ) | | | (0.41 | ) | | | (0.02 | ) | | | (0.34 | ) | | | (0.36 | ) | | | 1.44 | | | | (18.88 | ) | | | 566,195 | | | | 0.44 | | | | 0.44 | | | | 0.94 | | | | 55 | |
2021 | | | 1.91 | | | | 0.01 | | | | 0.47 | | | | 0.48 | | | | (0.02 | ) | | | (0.16 | ) | | | (0.18 | ) | | | 2.21 | | | | 25.10 | | | | 842,806 | | | | 0.44 | | | | 0.43 | | | | 0.70 | | | | 56 | |
2020 | | | 1.62 | | | | 0.02 | | | | 0.34 | | | | 0.36 | | | | (0.02 | ) | | | (0.05 | ) | | | (0.07 | ) | | | 1.91 | | | | 22.74 | | | | 719,977 | | | | 0.45 | | | | 0.44 | | | | 0.98 | | | | 72 | |
2019 | | | 1.31 | | | | 0.02 | | | | 0.39 | | | | 0.41 | | | | (0.02 | ) | | | (0.08 | ) | | | (0.10 | ) | | | 1.62 | | | | 31.19 | | | | 633,208 | | | | 0.45 | | | | 0.44 | | | | 1.19 | | | | 54 | |
Large Cap Blend Portfolio | | | | | | | | | | | | | | | | | | | | | | | | | | | | | | | | | | | | | | | | | | | | | |
2023 | | $ | 1.08 | | | $ | 0.01 | | | $ | 0.21 | | | $ | 0.22 | | | $ | (0.01 | ) | | $ | (0.10 | ) | | $ | (0.11 | ) | | $ | 1.19 | | | | 20.61 | % | | $ | 187,733 | | | | 0.82 | % | | | 0.75 | % | | | 0.75 | % | | | 119 | % |
2022 | | | 1.39 | | | | 0.01 | | | | (0.21 | ) | | | (0.20 | ) | | | (0.01 | ) | | | (0.10 | ) | | | (0.11 | ) | | | 1.08 | | | | (13.78 | ) | | | 195,927 | | | | 0.81 | | | | 0.76 | | | | 0.78 | | | | 38 | |
2021 | | | 1.25 | | | | 0.01 | | | | 0.22 | | | | 0.23 | | | | (0.01 | ) | | | (0.08 | ) | | | (0.09 | ) | | | 1.39 | | | | 18.46 | | | | 203,126 | | | | 0.81 | | | | 0.78 | | | | 0.68 | | | | 19 | |
2020 | | | 1.22 | | | | 0.01 | | | | 0.10 | | | | 0.11 | | | | (0.06 | ) | | | (0.02 | ) | | | (0.08 | ) | | | 1.25 | | | | 10.05 | | | | 180,564 | | | | 0.83 | | | | 0.80 | | | | 0.77 | | | | 28 | |
2019 | | | 1.09 | | | | 0.06 | | | | 0.20 | | | | 0.26 | | | | (0.01 | ) | | | (0.12 | ) | | | (0.13 | ) | | | 1.22 | | | | 23.97 | | | | 174,953 | | | | 0.82 | | | | 0.82 | | | | 4.92 | | | | 24 | |
| * | Total Return includes deductions for management and other fund expenses; excludes deductions for sales loads and account fees, not annualized for periods less than one year. |
| † | Expense ratios are based upon the direct and allocated expenses of the Portfolio and do not include the effect of underlying funds’ expenses. For additional information on underlying funds’ expenses, please refer to the Fee and Expense table in the Prospectus. |
| ‡ | Amount is less than $0.005. |
The Accompanying Notes are an Integral Part of the Financial Statements.
224
Financial Highlights
NORTHWESTERN MUTUAL SERIES FUND, INC.
(For a share outstanding through the period)
| | | | | | | | | | | | | | | | | | | | | | | | | | | | | | | | | | | | | | | | | | | | | | | | | | | | | | | | |
| | | Net Asset Value, Beginning of Period | | | Net Investment Income (Loss) | | | Net Realized and Unrealized Gain (Loss) on Investments | | | Total from Investment Operations | | | Distributions
from Net
Investment
Income | | | Distributions from Realized Gains on Investments | | | Total Distributions | | | Net Asset Value, End of Period | | | Total Return* | | | Net Assets, End of Period (thousands) | | | Ratio of Gross Expenses to Average Net Assets† | | | Ratio of Net Expenses to Average Net Assets† | | | Ratio of Net Investment Income (Loss) to Average Net Assets | | | Portfolio Turnover Rate | |
Index 500 Stock Portfolio | | | | | | | | | | | | | | | | | | | | | | | | | | | | | | | | | | | | | | | | | | | | | |
2023 | | $ | 6.38 | | | $ | 0.11 | | | $ | 1.54 | | | $ | 1.65 | | | $ | (0.10 | ) | | $ | (0.05 | ) | | $ | (0.15 | ) | | $ | 7.88 | | | | 26.04 | % | | $ | 5,485,081 | | | | 0.21 | % | | | 0.20 | % | | | 1.48 | % | | | 2 | % |
2022 | | | 8.18 | | | | 0.10 | | | | (1.59 | ) | | | (1.49 | ) | | | (0.09 | ) | | | (0.22 | ) | | | (0.31 | ) | | | 6.38 | | | | (18.28 | ) | | | 4,465,914 | | | | 0.21 | | | | 0.20 | | | | 1.41 | | | | 2 | |
2021 | | | 6.60 | | | | 0.09 | | | | 1.77 | | | | 1.86 | | | | (0.09 | ) | | | (0.19 | ) | | | (0.28 | ) | | | 8.18 | | | | 28.45 | | | | 5,504,970 | | | | 0.21 | | | | 0.19 | | | | 1.19 | | | | 3 | |
2020 | | | 5.79 | | | | 0.09 | | | | 0.94 | | | | 1.03 | | | | (0.10 | ) | | | (0.12 | ) | | | (0.22 | ) | | | 6.60 | | | | 18.18 | | | | 4,419,729 | | | | 0.21 | | | | 0.20 | | | | 1.63 | | | | 5 | |
2019 | | | 4.59 | | | | 0.10 | | | | 1.32 | | | | 1.42 | | | | (0.09 | ) | | | (0.13 | ) | | | (0.22 | ) | | | 5.79 | | | | 31.18 | | | | 3,867,280 | | | | 0.21 | | | | 0.20 | | | | 1.81 | | | | 4 | |
Large Company Value Portfolio | | | | | | | | | | | | | | | | | | | | | | | | | | | | | | | | | | | | | | | | | | | | | |
2023 | | $ | 0.92 | | | $ | 0.02 | | | $ | 0.01 | | | $ | 0.03 | | | $ | (0.03 | ) | | $ | (0.12 | ) | | $ | (0.15 | ) | | $ | 0.80 | | | | 3.80 | % | | $ | 151,998 | | | | 0.80 | % | | | 0.75 | % | | | 2.07 | % | | | 36 | % |
2022 | | | 1.19 | | | | 0.02 | | | | (0.03 | ) | | | (0.01 | ) | | | (0.04 | ) | | | (0.22 | ) | | | (0.26 | ) | | | 0.92 | | | | (0.34 | ) | | | 152,414 | | | | 0.78 | | | | 0.74 | | | | 1.87 | | | | 37 | |
2021 | | | 1.00 | | | | 0.02 | | | | 0.19 | | | | 0.21 | | | | (0.01 | ) | | | (0.01 | ) | | | (0.02 | ) | | | 1.19 | | | | 21.92 | | | | 227,560 | | | | 0.76 | | | | 0.74 | | | | 1.63 | | | | 40 | |
2020 | | | 1.03 | | | | 0.02 | | | | 0.00 | ‡ | | | 0.02 | | | | (0.02 | ) | | | (0.03 | ) | | | (0.05 | ) | | | 1.00 | | | | 2.64 | | | | 211,998 | | | | 0.78 | | | | 0.76 | | | | 2.02 | | | | 84 | |
2019 | | | 0.89 | | | | 0.02 | | | | 0.21 | | | | 0.23 | | | | (0.02 | ) | | | (0.07 | ) | | | (0.09 | ) | | | 1.03 | | | | 27.66 | | | | 205,550 | | | | 0.77 | | | | 0.75 | | | | 1.86 | | | | 62 | |
Domestic Equity Portfolio | | | | | | | | | | | | | | | | | | | | | | | | | | | | | | | | | | | | | | | | | | | | | |
2023 | | $ | 1.63 | | | $ | 0.03 | | | $ | 0.02 | | | $ | 0.05 | | | $ | (0.03 | ) | | $ | (0.07 | ) | | $ | (0.10 | ) | | $ | 1.58 | | | | 3.71 | % | | $ | 1,057,066 | | | | 0.54 | % | | | 0.50 | % | | | 2.04 | % | | | 23 | % |
2022 | | | 1.93 | | | | 0.03 | | | | (0.10 | ) | | | (0.07 | ) | | | (0.03 | ) | | | (0.20 | ) | | | (0.23 | ) | | | 1.63 | | | | (2.99 | ) | | | 1,060,119 | | | | 0.53 | | | | 0.50 | | | | 1.84 | | | | 12 | |
2021 | | | 1.64 | | | | 0.03 | | | | 0.33 | | | | 0.36 | | | | (0.03 | ) | | | (0.04 | ) | | | (0.07 | ) | | | 1.93 | | | | 22.71 | | | | 1,096,677 | | | | 0.53 | | | | 0.50 | | | | 1.77 | | | | 29 | |
2020 | | | 1.75 | | | | 0.03 | | | | (0.04 | ) | | | (0.01 | ) | | | (0.03 | ) | | | (0.07 | ) | | | (0.10 | ) | | | 1.64 | | | | 0.73 | | | | 946,072 | | | | 0.55 | | | | 0.53 | | | | 2.25 | | | | 33 | |
2019 | | | 1.55 | | | | 0.03 | | | | 0.28 | | | | 0.31 | | | | (0.03 | ) | | | (0.08 | ) | | | (0.11 | ) | | | 1.75 | | | | 20.77 | | | | 920,776 | | | | 0.54 | | | | 0.53 | | | | 2.08 | | | | 12 | |
Equity Income Portfolio | | | | | | | | | | | | | | | | | | | | | | | | | | | | | | | | | | | | | | | | | | | | | |
2023 | | $ | 1.69 | | | $ | 0.04 | | | $ | 0.11 | | | $ | 0.15 | | | $ | (0.04 | ) | | $ | (0.14 | ) | | $ | (0.18 | ) | | $ | 1.66 | | | | 9.68 | % | | $ | 717,491 | | | | 0.66 | % | | | 0.57 | % | | | 2.24 | % | | | 18 | % |
2022 | | | 2.01 | | | | 0.04 | | | | (0.10 | ) | | | (0.06 | ) | | | (0.04 | ) | | | (0.22 | ) | | | (0.26 | ) | | | 1.69 | | | | (3.22 | ) | | | 702,376 | | | | 0.65 | | | | 0.57 | | | | 2.17 | | | | 15 | |
2021 | | | 1.63 | | | | 0.03 | | | | 0.39 | | | | 0.42 | | | | (0.04 | ) | | | — | | | | (0.04 | ) | | | 2.01 | | | | 25.70 | | | | 867,936 | | | | 0.65 | | | | 0.57 | | | | 1.74 | | | | 18 | |
2020 | | | 1.78 | | | | 0.04 | | | | (0.05 | ) | | | (0.01 | ) | | | (0.07 | ) | | | (0.07 | ) | | | (0.14 | ) | | | 1.63 | | | | 1.20 | | | | 787,521 | | | | 0.66 | | | | 0.59 | | | | 2.48 | | | | 30 | |
2019 | | | 1.53 | | | | 0.07 | | | | 0.33 | | | | 0.40 | | | | (0.04 | ) | | | (0.11 | ) | | | (0.15 | ) | | | 1.78 | | | | 26.61 | | | | 814,252 | | | | 0.65 | | | | 0.61 | | | | 4.21 | | | | 18 | |
| * | Total Return includes deductions for management and other fund expenses; excludes deductions for sales loads and account fees, not annualized for periods less than one year. |
| † | Expense ratios are based upon the direct and allocated expenses of the Portfolio and do not include the effect of underlying funds’ expenses. For additional information on underlying funds’ expenses, please refer to the Fee and Expense table in the Prospectus. |
| ‡ | Amount is less than $0.005. |
The Accompanying Notes are an Integral Part of the Financial Statements.
225
Financial Highlights
NORTHWESTERN MUTUAL SERIES FUND, INC.
(For a share outstanding through the period)
| | | | | | | | | | | | | | | | | | | | | | | | | | | | | | | | | | | | | | | | | | | | | | | | | | | | | | | | |
| | | Net Asset Value, Beginning of Period | | | Net Investment Income (Loss) | | | Net Realized and Unrealized Gain (Loss) on Investments | | | Total from Investment Operations | | | Distributions
from Net
Investment
Income | | | Distributions from Realized Gains on Investments | | | Total Distributions | | | Net Asset Value, End of Period | | | Total Return* | | | Net Assets, End of Period (thousands) | | | Ratio of Gross Expenses to Average Net Assets† | | | Ratio of Net Expenses to Average Net Assets† | | | Ratio of Net Investment Income (Loss) to Average Net Assets | | | Portfolio Turnover Rate | |
Mid Cap Growth Stock Portfolio | | | | | | | | | | | | | | | | | | | | | | | | | | | | | | | | | | | | | | | | | |
2023 | | $ | 2.71 | | | $ | 0.00 | ‡ | | $ | 0.41 | | | $ | 0.41 | | | $ | (0.01 | ) | | $ | — | | | $ | (0.01 | ) | | $ | 3.11 | | | | 14.96 | % | | $ | 1,081,974 | | | | 0.54 | % | | | 0.54 | % | | | 0.09 | % | | | 39 | % |
2022 | | | 3.94 | | | | 0.01 | | | | (0.95 | ) | | | (0.94 | ) | | | (0.00 | )‡ | | | (0.29 | ) | | | (0.29 | ) | | | 2.71 | | | | (23.77 | ) | | | 1,008,774 | | | | 0.53 | | | | 0.53 | | | | 0.23 | | | | 46 | |
2021 | | | 4.09 | | | | 0.01 | | | | 0.41 | | | | 0.42 | | | | (0.01 | ) | | | (0.56 | ) | | | (0.57 | ) | | | 3.94 | | | | 10.18 | | | | 1,375,568 | | | | 0.53 | | | | 0.52 | | | | 0.13 | | | | 30 | |
2020 | | | 3.42 | | | | 0.01 | | | | 0.82 | | | | 0.83 | | | | (0.01 | ) | | | (0.15 | ) | | | (0.16 | ) | | | 4.09 | | | | 25.41 | | | | 1,344,564 | | | | 0.54 | | | | 0.54 | | | | 0.18 | | | | 47 | |
2019 | | | 2.69 | | | | 0.01 | | | | 0.87 | | | | 0.88 | | | | (0.01 | ) | | | (0.14 | ) | | | (0.15 | ) | | | 3.42 | | | | 33.01 | | | | 1,153,757 | | | | 0.54 | | | | 0.54 | | | | 0.28 | | | | 30 | |
Index 400 Stock Portfolio | | | | | | | | | | | | | | | | | | | | | | | | | | | | | | | | | | | | | | | | | |
2023 | | $ | 1.97 | | | $ | 0.03 | | | $ | 0.29 | | | $ | 0.32 | | | $ | (0.03 | ) | | $ | (0.09 | ) | | $ | (0.12 | ) | | $ | 2.17 | | | | 16.15 | % | | $ | 1,290,814 | | | | 0.28 | % | | | 0.25 | % | | | 1.42 | % | | | 19 | % |
2022 | | | 2.57 | | | | 0.03 | | | | (0.38 | ) | | | (0.35 | ) | | | (0.02 | ) | | | (0.23 | ) | | | (0.25 | ) | | | 1.97 | | | | (13.26 | ) | | | 1,137,710 | | | | 0.28 | | | | 0.25 | | | | 1.34 | | | | 14 | |
2021 | | | 2.15 | | | | 0.03 | | | | 0.49 | | | | 0.52 | | | | (0.02 | ) | | | (0.08 | ) | | | (0.10 | ) | | | 2.57 | | | | 24.46 | | | | 1,335,937 | | | | 0.27 | | | | 0.24 | | | | 1.03 | | | | 20 | |
2020 | | | 2.02 | | | | 0.02 | | | | 0.23 | | | | 0.25 | | | | (0.03 | ) | | | (0.09 | ) | | | (0.12 | ) | | | 2.15 | | | | 13.37 | | | | 1,115,469 | | | | 0.28 | | | | 0.26 | | | | 1.31 | | | | 18 | |
2019 | | | 1.74 | | | | 0.03 | | | | 0.40 | | | | 0.43 | | | | (0.02 | ) | | | (0.13 | ) | | | (0.15 | ) | | | 2.02 | | | | 25.88 | | | | 993,290 | | | | 0.28 | | | | 0.26 | | | | 1.38 | | | | 16 | |
Mid Cap Value Portfolio | | | | | | | | | | | | | | | | | | | | | | | | | | | | | | | | | | | | | | | | | |
2023 | | $ | 1.64 | | | $ | 0.03 | | | $ | 0.06 | | | $ | 0.09 | | | $ | (0.04 | ) | | $ | (0.21 | ) | | $ | (0.25 | ) | | $ | 1.48 | | | | 6.26 | % | | $ | 665,543 | | | | 0.88 | % | | | 0.72 | % | | | 2.17 | % | | | 50 | % |
2022 | | | 2.00 | | | | 0.04 | | | | (0.08 | ) | | | (0.04 | ) | | | (0.04 | ) | | | (0.28 | ) | | | (0.32 | ) | | | 1.64 | | | | (1.15 | ) | | | 650,964 | | | | 0.88 | | | | 0.72 | | | | 2.10 | | | | 74 | |
2021 | | | 1.65 | | | | 0.03 | | | | 0.35 | | | | 0.38 | | | | (0.02 | ) | | | (0.01 | ) | | | (0.03 | ) | | | 2.00 | | | | 23.27 | | | | 704,855 | | | | 0.88 | | | | 0.72 | | | | 1.54 | | | | 54 | |
2020 | | | 1.65 | | | | 0.03 | | | | — | | | | 0.03 | | | | (0.03 | ) | | | — | | | | (0.03 | ) | | | 1.65 | | | | 1.67 | | | | 600,403 | | | | 0.89 | | | | 0.75 | | | | 1.79 | | | | 76 | |
2019 | | | 1.43 | | | | 0.03 | | | | 0.37 | | | | 0.40 | | | | (0.03 | ) | | | (0.15 | ) | | | (0.18 | ) | | | 1.65 | | | | 29.21 | | | | 591,514 | | | | 0.89 | | | | 0.75 | | | | 1.74 | | | | 44 | |
Small Cap Growth Stock Portfolio | | | | | | | | | | | | | | | | | | | | | | | | | | | | | | | | | | | | | | | | | |
2023 | | $ | 1.89 | | | $ | 0.00 | ‡ | | $ | 0.35 | | | $ | 0.35 | | | $ | (0.00 | )‡ | | $ | — | | | $ | (0.00 | )‡ | | $ | 2.24 | | | | 18.36 | % | | $ | 686,669 | | | | 0.56 | % | | | 0.56 | % | | | 0.17 | % | | | 64 | % |
2022 | | | 3.22 | | | | 0.00 | ‡ | | | (0.90 | ) | | | (0.90 | ) | | | — | | | | (0.43 | ) | | | (0.43 | ) | | | 1.89 | | | | (28.49 | ) | | | 594,877 | | | | 0.56 | | | | 0.56 | | | | 0.05 | | | | 52 | |
2021 | | | 3.42 | | | | 0.00 | ‡ | | | 0.15 | | | | 0.15 | | | | (0.00 | )‡ | | | (0.35 | ) | | | (0.35 | ) | | | 3.22 | | | | 4.11 | | | | 830,014 | | | | 0.54 | | | | 0.54 | | | | (0.06 | ) | | | 43 | |
2020 | | | 2.72 | | | | 0.00 | ‡ | | | 0.86 | | | | 0.86 | | | | (0.00 | )‡ | | | (0.16 | ) | | | (0.16 | ) | | | 3.42 | | | | 33.47 | | | | 840,446 | | | | 0.56 | | | | 0.56 | | | | 0.10 | | | | 60 | |
2019 | | | 2.35 | | | | 0.00 | ‡ | | | 0.79 | | | | 0.79 | | | | (0.00 | )‡ | | | (0.42 | ) | | | (0.42 | ) | | | 2.72 | | | | 35.69 | | | | 671,870 | | | | 0.56 | | | | 0.56 | | | | 0.13 | | | | 42 | |
| * | Total Return includes deductions for management and other fund expenses; excludes deductions for sales loads and account fees, not annualized for periods less than one year. |
| † | Expense ratios are based upon the direct and allocated expenses of the Portfolio and do not include the effect of underlying funds’ expenses. For additional information on underlying funds’ expenses, please refer to the Fee and Expense table in the Prospectus. |
| ‡ | Amount is less than $0.005. |
The Accompanying Notes are an Integral Part of the Financial Statements.
226
Financial Highlights
NORTHWESTERN MUTUAL SERIES FUND, INC.
(For a share outstanding through the period)
| | | | | | | | | | | | | | | | | | | | | | | | | | | | | | | | | | | | | | | | | | | | | | | | | | | | | | | | |
| | | Net Asset Value, Beginning of Period | | | Net Investment Income (Loss) | | | Net Realized and Unrealized Gain (Loss) on Investments | | | Total from Investment Operations | | | Distributions
from Net
Investment
Income | | | Distributions from Realized Gains on Investments | | | Total Distributions | | | Net Asset Value, End of Period | | | Total Return* | | | Net Assets, End of Period (thousands) | | | Ratio of Gross Expenses to Average Net Assets† | | | Ratio of Net Expenses to Average Net Assets† | | | Ratio of Net Investment Income (Loss) to Average Net Assets | | | Portfolio Turnover Rate | |
Index 600 Stock Portfolio | | | | | | | | | | | | | | | | | | | | | | | | | | | | | | | | | | | | | | | | | | | | | |
2023 | | $ | 1.39 | | | $ | 0.02 | | | $ | 0.20 | | | $ | 0.22 | | | $ | (0.02 | ) | | $ | (0.06 | ) | | $ | (0.08 | ) | | $ | 1.53 | | | | 15.76 | % | | $ | 437,546 | | | | 0.28 | % | | | 0.28 | % | | | 1.45 | % | | | 25 | % |
2022 | | | 1.85 | | | | 0.02 | | | | (0.32 | ) | | | (0.30 | ) | | | (0.02 | ) | | | (0.14 | ) | | | (0.16 | ) | | | 1.39 | | | | (16.37 | ) | | | 371,552 | | | | 0.28 | | | | 0.28 | | | | 1.12 | | | | 16 | |
2021 | | | 1.50 | | | | 0.02 | | | | 0.37 | | | | 0.39 | | | | (0.01 | ) | | | (0.03 | ) | | | (0.04 | ) | | | 1.85 | | | | 26.22 | | | | 434,426 | | | | 0.27 | | | | 0.27 | | | | 1.28 | | | | 22 | |
2020 | | | 1.43 | | | | 0.01 | | | | 0.13 | | | | 0.14 | | | | (0.02 | ) | | | (0.05 | ) | | | (0.07 | ) | | | 1.50 | | | | 10.93 | | | | 344,102 | | | | 0.31 | | | | 0.31 | | | | 1.10 | | | | 28 | |
2019 | | | 1.26 | | | | 0.02 | | | | 0.25 | | | | 0.27 | | | | (0.00 | )‡ | | | (0.10 | ) | | | (0.10 | ) | | | 1.43 | | | | 22.44 | | | | 290,111 | | | | 0.31 | | | | 0.31 | | | | 1.25 | | | | 33 | |
Small Cap Value Portfolio | | | | | | | | | | | | | | | | | | | | | | | | | | | | | | | | | | | | | | | | | | | | | |
2023 | | $ | 1.81 | | | $ | 0.02 | | | $ | 0.22 | | | $ | 0.24 | | | $ | (0.01 | ) | | $ | (0.13 | ) | | $ | (0.14 | ) | | $ | 1.91 | | | | 13.85 | % | | $ | 575,849 | | | | 0.88 | % | | | 0.87 | % | | | 0.82 | % | | | 29 | % |
2022 | | | 2.58 | | | | 0.01 | | | | (0.48 | ) | | | (0.47 | ) | | | (0.01 | ) | | | (0.29 | ) | | | (0.30 | ) | | | 1.81 | | | | (18.53 | ) | | | 535,618 | | | | 0.88 | | | | 0.87 | | | | 0.50 | | | | 27 | |
2021 | | | 2.20 | | | | 0.01 | | | | 0.49 | | | | 0.50 | | | | (0.01 | ) | | | (0.11 | ) | | | (0.12 | ) | | | 2.58 | | | | 23.00 | | | | 685,304 | | | | 0.87 | | | | 0.86 | | | | 0.27 | | | | 22 | |
2020 | | | 2.17 | | | | 0.01 | | | | 0.15 | | | | 0.16 | | | | (0.01 | ) | | | (0.12 | ) | | | (0.13 | ) | | | 2.20 | | | | 9.29 | | | | 615,079 | | | | 0.88 | | | | 0.88 | | | | 0.50 | | | | 28 | |
2019 | | | 2.04 | | | | 0.01 | | | | 0.50 | | | | 0.51 | | | | (0.01 | ) | | | (0.37 | ) | | | (0.38 | ) | | | 2.17 | | | | 25.89 | | | | 605,534 | | | | 0.88 | | | | 0.87 | | | | 0.48 | | | | 25 | |
International Growth Portfolio | | | | | | | | | | | | | | | | | | | | | | | | | | | | | | | | | | | | | | | | | | | | | |
2023 | | $ | 1.63 | | | $ | 0.02 | | | $ | 0.31 | | | $ | 0.33 | | | $ | (0.02 | ) | | $ | (0.04 | ) | | $ | (0.06 | ) | | $ | 1.90 | | | | 20.77 | % | | $ | 1,018,872 | | | | 0.62 | % | | | 0.62 | % | | | 0.99 | % | | | 21 | % |
2022 | | | 2.40 | | | | 0.02 | | | | (0.58 | ) | | | (0.56 | ) | | | (0.01 | ) | | | (0.20 | ) | | | (0.21 | ) | | | 1.63 | | | | (23.13 | ) | | | 893,048 | | | | 0.62 | | | | 0.62 | | | | 0.84 | | | | 15 | |
2021 | | | 2.14 | | | | 0.01 | | | | 0.33 | | | | 0.34 | | | | (0.01 | ) | | | (0.07 | ) | | | (0.08 | ) | | | 2.40 | | | | 15.92 | | | | 1,068,232 | | | | 0.62 | | | | 0.61 | | | | 0.51 | | | | 25 | |
2020 | | | 1.85 | | | | 0.01 | | | | 0.32 | | | | 0.33 | | | | (0.03 | ) | | | (0.01 | ) | | | (0.04 | ) | | | 2.14 | | | | 17.91 | | | | 924,242 | | | | 0.63 | | | | 0.63 | | | | 0.64 | | | | 21 | |
2019 | | | 1.39 | | | | 0.03 | | | | 0.46 | | | | 0.49 | | | | (0.02 | ) | | | (0.01 | ) | | | (0.03 | ) | | | 1.85 | | | | 34.80 | | | | 816,113 | | | | 0.64 | | | | 0.64 | | | | 1.79 | | | | 21 | |
Research International Core Portfolio | | | | | | | | | | | | | | | | | | | | | | | | | | | | | | | | | | | | | | | | | | | | | |
2023 | | $ | 0.98 | | | $ | 0.02 | | | $ | 0.11 | | | $ | 0.13 | | | $ | (0.02 | ) | | $ | (0.02 | ) | | $ | (0.04 | ) | | $ | 1.07 | | | | 12.95 | % | | $ | 828,651 | | | | 0.80 | % | | | 0.75 | % | | | 1.87 | % | | | 15 | % |
2022 | | | 1.29 | | | | 0.02 | | | | (0.25 | ) | | | (0.23 | ) | | | (0.02 | ) | | | (0.06 | ) | | | (0.08 | ) | | | 0.98 | | | | (17.16 | ) | | | 744,073 | | | | 0.80 | | | | 0.75 | | | | 1.83 | | | | 25 | |
2021 | | | 1.18 | | | | 0.02 | | | | 0.12 | | | | 0.14 | | | | (0.01 | ) | | | (0.02 | ) | | | (0.03 | ) | | | 1.29 | | | | 12.07 | | | | 963,103 | | | | 0.78 | | | | 0.73 | | | | 1.37 | | | | 18 | |
2020 | | | 1.08 | | | | 0.01 | | | | 0.13 | | | | 0.14 | | | | (0.02 | ) | | | (0.02 | ) | | | (0.04 | ) | | | 1.18 | | | | 13.46 | | | | 891,001 | | | | 0.81 | | | | 0.76 | | | | 1.36 | | | | 25 | |
2019 | | | 0.88 | | | | 0.02 | | | | 0.23 | | | | 0.25 | | | | (0.02 | ) | | | (0.03 | ) | | | (0.05 | ) | | | 1.08 | | | | 28.25 | | | | 784,885 | | | | 0.82 | | | | 0.77 | | | | 2.32 | | | | 18 | |
| * | Total Return includes deductions for management and other fund expenses; excludes deductions for sales loads and account fees, not annualized for periods less than one year. |
| † | Expense ratios are based upon the direct and allocated expenses of the Portfolio and do not include the effect of underlying funds’ expenses. For additional information on underlying funds’ expenses, please refer to the Fee and Expense table in the Prospectus. |
| ‡ | Amount is less than $0.005. |
The Accompanying Notes are an Integral Part of the Financial Statements.
227
Financial Highlights
NORTHWESTERN MUTUAL SERIES FUND, INC.
(For a share outstanding through the period)
| | | | | | | | | | | | | | | | | | | | | | | | | | | | | | | | | | | | | | | | | | | | | | | | | | | | | | | | |
| | | Net Asset Value, Beginning of Period | | | Net Investment Income (Loss) | | | Net Realized and Unrealized Gain (Loss) on Investments | | Total from Investment Operations | | Distributions from Net Investment Income | | Distributions from Realized Gains on Investments | | Total Distributions | | Net Asset Value, End of Period | | Total Return* | | Net Assets, End of Period (thousands) | | Ratio of Gross Expenses to Average Net Assets† | | Ratio of Net Expenses to Average Net Assets† | | Ratio of Net Investment Income (Loss) to Average Net Assets | | Portfolio Turnover Rate | |
International Equity Portfolio | | | | | | | | | | | | | | | | | | | | | | | | | | | | | | | | | | | | | | | | | | | | | |
2023 | | $ | 1.40 | | | $ | 0.04 | | | $ | 0.19 | | | $ | 0.23 | | | $ | (0.05 | ) | | $ | — | | | $ | (0.05 | ) | | $ | 1.58 | | | | 16.09 | % | | $ | 1,877,275 | | | | 0.68 | % | | | 0.68 | % | | | 2.65 | % | | | 14 | % |
2022 | | | 1.59 | | | | 0.04 | | | | (0.15 | ) | | | (0.11 | ) | | | (0.04 | ) | | | (0.04 | ) | | | (0.08 | ) | | | 1.40 | | | | (6.83 | ) | | | 1,726,196 | | | | 0.69 | | | | 0.63 | | | | 2.69 | | | | 13 | |
2021 | | | 1.55 | | | | 0.04 | | | | 0.04 | | | | 0.08 | | | | (0.04 | ) | | | — | | | | (0.04 | ) | | | 1.59 | | | | 5.00 | | | | 1,865,208 | | | | 0.68 | | | | 0.51 | | | | 2.30 | | | | 118 | |
2020 | | | 1.65 | | | | 0.04 | | | | (0.09 | ) | | | (0.05 | ) | | | (0.05 | ) | | | — | | | | (0.05 | ) | | | 1.55 | | | | (2.71 | ) | | | 1,779,819 | | | | 0.68 | | | | 0.54 | | | | 2.59 | | | | 65 | |
2019 | | | 1.58 | | | | 0.05 | | | | 0.14 | | | | 0.19 | | | | (0.04 | ) | | | (0.08 | ) | | | (0.12 | ) | | | 1.65 | | | | 12.60 | | | | 1,793,034 | | | | 0.68 | | | | 0.54 | | | | 3.33 | | | | 43 | |
Emerging Markets Equity Portfolio | | | | | | | | | | | | | | | | | | | | | | | | | | | | | | | | | | | | | | | | | | | | | |
2023 | | $ | 0.89 | | | $ | 0.02 | | | $ | 0.04 | | | $ | 0.06 | | | $ | (0.02 | ) | | $ | — | | | $ | (0.02 | ) | | $ | 0.93 | | | | 6.91 | % | | $ | 921,817 | | | | 1.10 | % | | | 0.91 | % | | | 1.89 | % | | | 24 | % |
2022 | | | 1.32 | | | | 0.01 | | | | (0.35 | ) | | | (0.34 | ) | | | (0.01 | ) | | | (0.08 | ) | | | (0.09 | ) | | | 0.89 | | | | (25.28 | ) | | | 854,238 | | | | 1.09 | | | | 0.91 | | | | 1.29 | | | | 33 | |
2021 | | | 1.39 | | | | 0.02 | | | | (0.08 | ) | | | (0.06 | ) | | | (0.01 | ) | | | — | | | | (0.01 | ) | | | 1.32 | | | | (4.55 | ) | | | 993,493 | | | | 1.06 | | | | 0.91 | | | | 1.14 | | | | 33 | |
2020 | | | 1.12 | | | | 0.01 | | | | 0.28 | | | | 0.29 | | | | (0.02 | ) | | | — | | | | (0.02 | ) | | | 1.39 | | | | 26.86 | | | | 1,024,098 | | | | 1.10 | | | | 0.95 | | | | 0.67 | | | | 31 | |
2019 | | | 0.94 | | | | 0.02 | | | | 0.17 | | | | 0.19 | | | | (0.01 | ) | | | — | | | | (0.01 | ) | | | 1.12 | | | | 20.60 | | | | 834,010 | | | | 1.11 | | | | 0.99 | | | | 2.40 | | | | 22 | |
Government Money Market Portfolio | | | | | | | | | | | | | | | | | | | | | | | | | | | | | | | | | | | | | | | | | | | | | |
2023 | | $ | 1.00 | | | $ | 0.05 | | | $ | — | | | $ | 0.05 | | | $ | (0.05 | ) | | $ | (0.00 | )‡ | | $ | (0.05 | ) | | $ | 1.00 | | | | 4.83 | % | | $ | 526,384 | | | | 0.33 | % | | | 0.33 | % | | | 4.72 | % | | | — | % |
2022 | | | 1.00 | | | | 0.01 | | | | — | | | | 0.01 | | | | (0.01 | ) | | | (0.00 | )‡ | | | (0.01 | ) | | | 1.00 | | | | 1.36 | | | | 542,517 | | | | 0.33 | | | | 0.28 | ** | | | 1.40 | | | | — | |
2021 | | | 1.00 | | | | 0.00 | ‡ | | | — | | | | 0.00 | ‡ | | | (0.00 | )‡ | | | (0.00 | )‡ | | | (0.00 | )‡ | | | 1.00 | | | | — | | | | 488,858 | | | | 0.33 | | | | 0.08 | ** | | | 0.00 | | | | — | |
2020 | | | 1.00 | | | | 0.00 | ‡ | | | — | | | | 0.00 | ‡ | | | (0.00 | )‡ | | | (0.00 | )‡ | | | (0.00 | )‡ | | | 1.00 | | | | 0.31 | | | | 582,312 | | | | 0.33 | | | | 0.25 | ** | | | 0.26 | | | | — | |
2019 | | | 1.00 | | | | 0.02 | | | | — | | | | 0.02 | | | | (0.02 | ) | | | (0.00 | )‡ | | | (0.02 | ) | | | 1.00 | | | | 1.94 | | | | 446,517 | | | | 0.33 | | | | 0.33 | | | | 1.91 | | | | — | |
Short-Term Bond Portfolio | | | | | | | | | | | | | | | | | | | | | | | | | | | | | | | | | | | | | | | | | | | | | |
2023 | | $ | 0.99 | | | $ | 0.03 | | | $ | 0.02 | | | $ | 0.05 | | | $ | (0.02 | ) | | $ | — | | | $ | (0.02 | ) | | $ | 1.02 | | | | 5.26 | % | | $ | 385,232 | | | | 0.38 | % | | | 0.38 | % | | | 3.38 | % | | | 56 | %§ |
2022 | | | 1.05 | | | | 0.02 | | | | (0.07 | ) | | | (0.05 | ) | | | (0.01 | ) | | | (0.00 | )‡ | | | (0.01 | ) | | | 0.99 | | | | (4.52 | ) | | | 382,738 | | | | 0.38 | | | | 0.38 | | | | 1.90 | | | | 54 | § |
2021 | | | 1.08 | | | | 0.01 | | | | (0.02 | ) | | | (0.01 | ) | | | (0.02 | ) | | | (0.00 | )‡ | | | (0.02 | ) | | | 1.05 | | | | (0.10 | ) | | | 412,284 | | | | 0.38 | | | | 0.38 | | | | 1.27 | | | | 46 | § |
2020 | | | 1.06 | | | | 0.02 | | | | 0.02 | | | | 0.04 | | | | (0.02 | ) | | | — | | | | (0.02 | ) | | | 1.08 | | | | 4.29 | | | | 383,608 | | | | 0.39 | | | | 0.39 | | | | 1.96 | | | | 49 | § |
2019 | | | 1.03 | | | | 0.03 | | | | 0.02 | | | | 0.05 | | | | (0.02 | ) | | | — | | | | (0.02 | ) | | | 1.06 | | | | 4.38 | | | | 334,574 | | | | 0.39 | | | | 0.39 | | | | 2.47 | | | | 56 | § |
| * | Total Return includes deductions for management and other fund expenses; excludes deductions for sales loads and account fees, not annualized for periods less than one year. |
| † | Expense ratios are based upon the direct and allocated expenses of the Portfolio and do not include the effect of underlying funds’ expenses. For additional information on underlying funds’ expenses, please refer to the Fee and Expense table in the Prospectus. |
| ‡ | Amount is less than $0.005. |
| ** | During the years ended December 31, 2022, 2021 and 2020, MSA voluntarily agreed to waive a portion of its advisory fee to maintain a positive yield in the Government Money Market Portfolio. The Government Money Market Portfolio’s net expense ratio would increase by an amount of 0.04%, 0.25% and 0.08%, respectively, if such voluntary waiver were excluded for the years ended December 31, 2022, 2021 and 2020. See Note 7 - Investment Advisory, Sub-Advisory and Compliance Fees for more information. |
| § | Portfolio Turnover Rate excludes the impact of TBA transactions. |
The Accompanying Notes are an Integral Part of the Financial Statements.
228
Financial Highlights
NORTHWESTERN MUTUAL SERIES FUND, INC.
(For a share outstanding through the period)
| | | | | | | | | | | | | | | | | | | | | | | | | | | | | | | | | | | | | | | | | | | | | | | | | | | | | | | | |
| | | Net Asset Value, Beginning of Period | | Net Investment Income (Loss) | | Net Realized and Unrealized Gain (Loss) on Investments | | Total from Investment Operations | | Distributions from Net Investment Income | | Distributions from Realized Gains on Investments | | Total Distributions | | Net Asset Value, End of Period | | Total Return* | | Net Assets, End of Period (thousands) | | Ratio of Gross Expenses to Average Net Assets† | | Ratio of Net Expenses to Average Net Assets† | | Ratio of Net Investment Income (Loss) to Average Net Assets | | Portfolio Turnover Rate | |
Select Bond Portfolio | | | | | | | | | | | | | | | | | | | | | | | | | | | | | | | | | | | | | | | | | |
2023 | | $ | 1.07 | | | $ | 0.04 | | | $ | 0.02 | | | $ | 0.06 | | | $ | (0.03 | ) | | $ | — | | | $ | (0.03 | ) | | $ | 1.10 | | | | 6.19 | % | | $ | 2,903,697 | | | | 0.31 | % | | | 0.31 | % | | | 3.86 | % | | | 248 | %§ |
2022 | | | 1.26 | | | | 0.03 | | | | (0.20 | ) | | | (0.17 | ) | | | (0.02 | ) | | | (0.00 | )‡ | | | (0.02 | ) | | | 1.07 | | | | (13.33 | ) | | | 2,786,616 | | | | 0.31 | | | | 0.31 | | | | 2.30 | | | | 275 | § |
2021 | | | 1.37 | | | | 0.02 | | | | (0.04 | ) | | | (0.02 | ) | | | (0.03 | ) | | | (0.06 | ) | | | (0.09 | ) | | | 1.26 | | | | (1.59 | ) | | | 3,428,416 | | | | 0.31 | | | | 0.30 | | | | 1.15 | | | | 272 | § |
2020 | | | 1.30 | | | | 0.02 | | | | 0.10 | | | | 0.12 | | | | (0.04 | ) | | | (0.01 | ) | | | (0.05 | ) | | | 1.37 | | | | 8.98 | | | | 3,404,268 | | | | 0.31 | | | | 0.30 | | | | 1.75 | | | | 340 | § |
2019 | | | 1.23 | | | | 0.04 | | | | 0.07 | | | | 0.11 | | | | (0.04 | ) | | | — | | | | (0.04 | ) | | | 1.30 | | | | 8.65 | | | | 3,192,050 | | | | 0.31 | | | | 0.30 | | | | 2.76 | | | | 403 | § |
Long-Term U.S. Government Bond Portfolio | | | | | | | | | | | | | | | | | | | | | | | | | | | | | | | | | | | | | | | | | |
2023 | | $ | 0.65 | | | $ | 0.02 | | | $ | 0.01 | | | $ | 0.03 | | | $ | (0.02 | ) | | $ | — | | | $ | (0.02 | ) | | $ | 0.66 | | | | 3.33 | % | | $ | 121,049 | | | | 2.21 | %** | | | 2.16 | %** | | | 2.67 | % | | | 32 | %§ |
2022 | | | 0.94 | | | | 0.02 | | | | (0.30 | ) | | | (0.28 | ) | | | (0.01 | ) | | | — | | | | (0.01 | ) | | | 0.65 | | | | (29.53 | ) | | | 100,157 | | | | 1.02 | ** | | | 0.98 | ** | | | 2.49 | | | | 27 | § |
2021 | | | 1.21 | | | | 0.02 | | | | (0.08 | ) | | | (0.06 | ) | | | (0.01 | ) | | | (0.20 | ) | | | (0.21 | ) | | | 0.94 | | | | (5.37 | ) | | | 138,869 | | | | 0.67 | ** | | | 0.67 | ** | | | 1.73 | | | | 28 | § |
2020 | | | 1.12 | | | | 0.02 | | | | 0.17 | | | | 0.19 | | | | (0.02 | ) | | | (0.08 | ) | | | (0.10 | ) | | | 1.21 | | | | 17.37 | | | | 153,933 | | | | 0.94 | ** | | | 0.94 | ** | | | 1.61 | | | | 157 | § |
2019 | | | 1.01 | | | | 0.02 | | | | 0.11 | | | | 0.13 | | | | (0.02 | ) | | | — | | | | (0.02 | ) | | | 1.12 | | | | 13.17 | | | | 122,854 | | | | 1.25 | ** | | | 1.23 | ** | | | 2.06 | | | | 5 | § |
Inflation Protection Portfolio | | | | | | | | | | | | | | | | | | | | | | | | | | | | | | | | | | | | | | | | | | | | | |
2023 | | $ | 1.05 | | | $ | 0.03 | | | $ | 0.01 | | | $ | 0.04 | | | $ | (0.05 | ) | | $ | — | | | $ | (0.05 | ) | | $ | 1.04 | | | | 3.90 | % | | $ | 417,289 | | | | 0.58 | % | | | 0.52 | % | | | 3.06 | % | | | 41 | %§ |
2022 | | | 1.28 | | | | 0.05 | | | | (0.21 | ) | | | (0.16 | ) | | | (0.04 | ) | | | (0.03 | ) | | | (0.07 | ) | | | 1.05 | | | | (12.96 | ) | | | 423,548 | | | | 0.57 | | | | 0.54 | | | | 4.44 | | | | 51 | |
2021 | | | 1.21 | | | | 0.04 | | | | 0.04 | | | | 0.08 | | | | (0.01 | ) | | | (0.00 | )‡ | | | (0.01 | ) | | | 1.28 | | | | 6.61 | | | | 513,931 | | | | 0.56 | | | | 0.53 | | | | 3.17 | | | | 78 | |
2020 | | | 1.13 | | | | 0.02 | | | | 0.08 | | | | 0.10 | | | | (0.02 | ) | | | — | | | | (0.02 | ) | | | 1.21 | | | | 9.57 | | | | 423,389 | | | | 0.58 | | | | 0.55 | | | | 1.34 | | | | 56 | |
2019 | | | 1.06 | | | | 0.02 | | | | 0.08 | | | | 0.10 | | | | (0.03 | ) | | | — | | | | (0.03 | ) | | | 1.13 | | | | 9.02 | | | | 381,132 | | | | 0.59 | | | | 0.55 | | | | 2.13 | | | | 40 | |
High Yield Bond Portfolio | | | | | | | | | | | | | | | | | | | | | | | | | | | | | | | | | | | | | | | | | |
2023 | | $ | 0.63 | | | $ | 0.04 | | | $ | 0.04 | | | $ | 0.08 | | | $ | (0.04 | ) | | $ | — | | | $ | (0.04 | ) | | $ | 0.67 | | | | 13.24 | % | | $ | 744,344 | | | | 0.45 | % | | | 0.45 | % | | | 6.12 | % | | | 17 | % |
2022 | | | 0.75 | | | | 0.04 | | | | (0.12 | ) | | | (0.08 | ) | | | (0.04 | ) | | | — | | | | (0.04 | ) | | | 0.63 | | | | (11.33 | ) | | | 689,405 | | | | 0.45 | | | | 0.45 | | | | 5.54 | | | | 19 | |
2021 | | | 0.75 | | | | 0.04 | | | | — | | | | 0.04 | | | | (0.04 | ) | | | — | | | | (0.04 | ) | | | 0.75 | | | | 5.31 | | | | 842,332 | | | | 0.44 | | | | 0.44 | | | | 4.87 | | | | 35 | |
2020 | | | 0.75 | | | | 0.04 | | | | — | | | | 0.04 | | | | (0.04 | ) | | | — | | | | (0.04 | ) | | | 0.75 | | | | 6.64 | | | | 825,203 | | | | 0.45 | | | | 0.45 | | | | 5.36 | | | | 42 | |
2019 | | | 0.69 | | | | 0.04 | | | | 0.06 | | | | 0.10 | | | | (0.04 | ) | | | — | | | | (0.04 | ) | | | 0.75 | | | | 14.97 | | | | 846,127 | | | | 0.45 | | | | 0.45 | | | | 5.73 | | | | 33 | |
| * | Total Return includes deductions for management and other fund expenses; excludes deductions for sales loads and account fees, not annualized for periods less than one year. |
| † | Expense ratios are based upon the direct and allocated expenses of the Portfolio and do not include the effect of underlying funds’ expenses. For additional information on underlying funds’ expenses, please refer to the Fee and Expense table in the Prospectus. |
| § | Portfolio Turnover Rate excludes the impact of TBA transactions. |
| ‡ | Amount is less than $0.005. |
| ** | The ratios of gross expenses to average net assets and net expenses to average net assets include interest expense. Excluding interest expense, the ratios would be 0.69% and 0.65% respectively for the period ended December 31, 2023, 0.68% and 0.65% respectively in 2022, 0.65% and 0.65% respectively in 2021, 0.64% and 0.64% respectively in 2020 and 0.67% and 0.65% respectively in 2019. |
The Accompanying Notes are an Integral Part of the Financial Statements.
229
Financial Highlights
NORTHWESTERN MUTUAL SERIES FUND, INC.
(For a share outstanding through the period)
| | | | | | | | | | | | | | | | | | | | | | | | | | | | | | | | | | | | | | | | | | | | | | | | | | | | | | | | |
| | | Net Asset Value, Beginning of Period | | Net Investment Income (Loss) | | Net Realized and Unrealized Gain (Loss) on Investments | | Total from Investment Operations | | Distributions from Net Investment Income | | Distributions from Realized Gains on Investments | | Total Distributions | | Net Asset Value, End of Period | | Total Return* | | Net Assets, End of Period (thousands) | | Ratio of Gross Expenses to Average Net Assets† | | Ratio of Net Expenses to Average Net Assets† | | Ratio of Net Investment Income (Loss) to Average Net Assets | | Portfolio Turnover Rate | |
Multi-Sector Bond Portfolio | | | | | | | | | | | | | | | | | | | | | | | | | | | | | | | | | | | | | | | | | |
2023 | | $ | 0.91 | | | $ | 0.04 | | | $ | 0.04 | | | $ | 0.08 | | | $ | (0.02 | ) | | $ | — | | | $ | (0.02 | ) | | $ | 0.97 | | | | 9.71 | % | | $ | 1,199,679 | | | | 0.83 | %** | | | 0.73 | %** | | | 4.53 | % | | | 26 | %§ |
2022 | | | 1.13 | | | | 0.03 | | | | (0.21 | ) | | | (0.18 | ) | | | (0.04 | ) | | | (0.00 | )‡ | | | (0.04 | ) | | | 0.91 | | | | (15.39 | ) | | | 1,112,579 | | | | 0.81 | ** | | | 0.72 | ** | | | 3.48 | | | | 18 | |
2021 | | | 1.16 | | | | 0.03 | | | | (0.03 | ) | | | 0.00 | ‡ | | | (0.02 | ) | | | (0.01 | ) | | | (0.03 | ) | | | 1.13 | | | | (0.08 | ) | | | 1,316,651 | | | | 0.81 | ** | | | 0.71 | ** | | | 2.90 | | | | 21 | |
2020 | | | 1.14 | | | | 0.04 | | | | 0.03 | | | | 0.07 | | | | (0.05 | ) | | | (0.00 | )‡ | | | (0.05 | ) | | | 1.16 | | | | 6.13 | | | | 1,148,511 | | | | 0.82 | ** | | | 0.73 | ** | | | 3.23 | | | | 30 | § |
2019 | | | 1.05 | | | | 0.04 | | | | 0.10 | | | | 0.14 | | | | (0.05 | ) | | | — | | | | (0.05 | ) | | | 1.14 | | | | 14.04 | | | | 1,021,824 | | | | 0.83 | ** | | | 0.74 | ** | | | 3.53 | | | | 30 | § |
Balanced Portfolio | | | | | | | | | | | | | | | | | | | | | | | | | | | | | | | | | | | | | | | | | |
2023 | | $ | 1.21 | | | $ | 0.03 | | | $ | 0.13 | | | $ | 0.16 | | | $ | (0.03 | ) | | $ | (0.05 | ) | | $ | (0.08 | ) | | $ | 1.29 | | | | 13.07 | % | | $ | 1,962,442 | | | | 0.31 | % | | | 0.06 | % | | | 2.15 | % | | | 9 | % |
2022 | | | 1.57 | | | | 0.02 | | | | (0.24 | ) | | | (0.22 | ) | | | (0.05 | ) | | | (0.09 | ) | | | (0.14 | ) | | | 1.21 | | | | (14.14 | ) | | | 1,883,127 | | | | 0.31 | | | | 0.06 | | | | 1.54 | | | | 30 | |
2021 | | | 1.57 | | | | 0.02 | | | | 0.10 | | | | 0.12 | | | | (0.04 | ) | | | (0.08 | ) | | | (0.12 | ) | | | 1.57 | | | | 7.56 | | | | 2,381,573 | | | | 0.31 | | | | 0.06 | | | | 1.51 | | | | 20 | |
2020 | | | 1.49 | | | | 0.04 | | | | 0.13 | | | | 0.17 | | | | (0.04 | ) | | | (0.05 | ) | | | (0.09 | ) | | | 1.57 | | | | 12.49 | | | | 2,367,387 | | | | 0.31 | | | | 0.06 | | | | 2.40 | | | | 28 | |
2019 | | | 1.36 | | | | 0.03 | | | | 0.21 | | | | 0.24 | | | | (0.04 | ) | | | (0.08 | ) | | | (0.11 | ) | | | 1.49 | | | | 17.92 | | | | 2,254,235 | | | | 0.31 | | | | 0.06 | | | | 2.14 | | | | 17 | |
Asset Allocation Portfolio | | | | | | | | | | | | | | | | | | | | | | | | | | | | | | | | | | | | | | | | | |
2023 | | $ | 1.01 | | | $ | 0.02 | | | $ | 0.14 | | | $ | 0.16 | | | $ | (0.02 | ) | | $ | (0.07 | ) | | $ | (0.09 | ) | | $ | 1.08 | | | | 15.24 | % | | $ | 273,823 | | | | 0.58 | % | | | 0.10 | % | | | 1.95 | % | | | 11 | % |
2022 | | | 1.33 | | | | 0.02 | | | | (0.23 | ) | | | (0.21 | ) | | | (0.03 | ) | | | (0.08 | ) | | | (0.11 | ) | | | 1.01 | | | | (14.83 | ) | | | 257,699 | | | | 0.57 | | | | 0.09 | | | | 1.46 | | | | 35 | |
2021 | | | 1.29 | | | | 0.02 | | | | 0.12 | | | | 0.14 | | | | (0.03 | ) | | | (0.07 | ) | | | (0.10 | ) | | | 1.33 | | | | 10.45 | | | | 320,737 | | | | 0.55 | | | | 0.09 | | | | 1.37 | | | | 18 | |
2020 | | | 1.22 | | | | 0.03 | | | | 0.12 | | | | 0.15 | | | | (0.03 | ) | | | (0.05 | ) | | | (0.08 | ) | | | 1.29 | | | | 13.43 | | | | 306,692 | | | | 0.57 | | | | 0.09 | | | | 2.32 | | | | 29 | |
2019 | | | 1.10 | | | | 0.02 | | | | 0.20 | | | | 0.22 | | | | (0.03 | ) | | | (0.08 | ) | | | (0.10 | ) | | | 1.22 | | | | 21.08 | | | | 287,738 | | | | 0.57 | | | | 0.09 | | | | 1.96 | | | | 15 | |
| * | Total Return includes deductions for management and other fund expenses; excludes deductions for sales loads and account fees, not annualized for periods less than one year. |
| † | Expense ratios are based upon the direct and allocated expenses of the Portfolio and do not include the effect of underlying funds’ expenses. For additional information on underlying funds’ expenses, please refer to the Fee and Expense table in the Prospectus. |
| ** | The ratios of gross expenses to average net assets and net expenses to average net assets include interest expense. Excluding interest expense, the ratios would be 0.83% and 0.73% for the period ended December 31, 2023, 0.81% and 0.71% respectively in 2022, 0.80% and 0.71% respectively in 2021, 0.81% and 0.72% respectively in 2020, and 0.82% and 0.73% respectively in 2019. |
| § | Portfolio Turnover Rate excludes the impact of TBA transactions. |
| ‡ | Amount is less than $0.005. |
The Accompanying Notes are an Integral Part of the Financial Statements.
230
Notes to Financial Statements
NOTE 1. ORGANIZATION
Northwestern Mutual Series Fund, Inc. (the “Series Fund”) is registered as an open-end management investment company under the Investment Company Act of 1940, as amended (“1940 Act”). The Series Fund is also considered an investment company following the accounting and reporting guidance in Financial Accounting Standards Board (“FASB”) Accounting Standards Codification (“ASC”) Topic 946. The Series Fund consists of the Growth Stock Portfolio, Focused Appreciation Portfolio, Large Cap Core Stock Portfolio, Large Cap Blend Portfolio, Index 500 Stock Portfolio, Large Company Value Portfolio, Domestic Equity Portfolio, Equity Income Portfolio, Mid Cap Growth Stock Portfolio, Index 400 Stock Portfolio, Mid Cap Value Portfolio, Small Cap Growth Stock Portfolio, Index 600 Stock Portfolio, Small Cap Value Portfolio, International Growth Portfolio, Research International Core Portfolio, International Equity Portfolio, Emerging Markets Equity Portfolio, Government Money Market Portfolio, Short-Term Bond Portfolio, Select Bond Portfolio, Long-Term U.S. Government Bond Portfolio, Inflation Protection Portfolio, High Yield Bond Portfolio, Multi-Sector Bond Portfolio, Balanced Portfolio and Asset Allocation Portfolio (each, a “Portfolio” or collectively, the “Portfolios”). All of the outstanding shares of each Portfolio are held by an affiliate, The Northwestern Mutual Life Insurance Company (“Northwestern Mutual”), for its segregated asset accounts (either directly or indirectly through one or more underlying Portfolios operating as affiliated fund of funds). The Government Money Market Portfolio is a government money market fund under Rule 2a-7 of the 1940 Act.
NOTE 2. SIGNIFICANT ACCOUNTING POLICIES
The following is a summary of significant accounting policies consistently followed by the Series Fund in the preparation of its financial statements.
A. Use of Estimates — The preparation of financial statements in conformity with accounting principles generally accepted in the United States of America (“U.S. GAAP”) requires management to make estimates and assumptions that affect the reported amounts of assets and liabilities at the date of the financial statements and the reported amounts of revenues and expenses during the reporting period. Actual results could differ from those estimates.
B. Foreign Income and Capital Gains Taxes — The Portfolios may be subject to income taxes imposed by certain countries in which they invest. Foreign withholding taxes on dividends and interest are netted against income and separately disclosed in the Statements of Operations.
Some of the Portfolios may be subject to capital gains taxes imposed by certain countries in which they invest. Any applicable foreign capital gains tax is accrued daily based upon net unrealized gains, and may be payable following the sale of any applicable investments.
C. Federal Income Taxes — The Portfolios’ policy is to continue to comply with the requirements of the Internal Revenue Code that are applicable to regulated investment companies and to distribute all of their taxable income to their respective shareholders. The Portfolios also intend to distribute sufficient net investment income and net capital gains, if any, so that they will not be subject to excise tax, as applicable, on distributable income and gains.
In accordance with the authoritative guidance for uncertainty in income taxes, management of the Series Fund has reviewed all open tax years (2020 to 2023) for major jurisdictions and concluded there was no material impact to the Portfolios’ net assets or results of operations. There is no material tax liability relating to uncertain income tax positions taken or expected to be taken in future tax returns. The Portfolios are also not aware of any tax positions for which it is reasonably possible that the total amounts of unrecognized tax benefits will significantly change in the next 12 months.
D. Distributions — Dividends from net investment income and net realized capital gains are declared and paid each business day for the Government Money Market Portfolio and at least annually for the remaining Portfolios, when applicable.
E. Other — The Portfolios record security transactions on trade date. The basis for determining cost on sale of securities is identified cost. Interest income is recorded daily on the accrual basis and dividend income is recorded on the ex-dividend date or as soon as information from issuers is available. Where applicable, dividends are recorded net of foreign withholding tax. Discounts and premiums on securities purchased are amortized or accreted using the effective interest method. Expenses directly attributable to a Portfolio are incurred by the respective Portfolio. Expenses that are not directly attributable to one
231
Notes to Financial Statements
or more Portfolios are allocated among applicable Portfolios on an equitable and consistent basis considering such things as the nature and type of expenses and the relative net assets of the Portfolios. The Portfolios consider highly liquid temporary cash investments purchased with an original maturity of less than three months to be cash equivalents. Cash equivalents are included in the short-term investments on the Schedule of Investments as well as in investments on the Statements of Assets and Liabilities. Temporary cash overdrafts are reported as a payable to custodian.
F. New Accounting Pronouncements — In March 2020, the FASB issued Accounting Standards Update (“ASU”) 2020-04, “Reference Rate Reform (Topic 848): Facilitation of the Effects of Reference Rate Reform on Financial Reporting.” In January 2021 and December 2022, the FASB issued ASU 2021-01 and ASU 2022-06, respectively. ASU 2021-01 and 2022-06 provide further amendments to Topic 848. Collectively, these ASUs provide optional guidance to ease the potential accounting burden associated with transitioning away from the London Interbank Offered Rate (“LIBOR”) and other reference rates that have been discontinued. The ASUs are effective through December 31, 2024. Management evaluated this guidance in connection with the preparation of the financial statements in light of investments by the Portfolios in securities relying on LIBOR reference rates. Management does not anticipate the effect of this guidance will have a material impact on financial statements of the Series Fund.
In June 2022, the FASB issued ASU 2022-03, “Fair Value Measurement (Topic 820): Fair Value Measurement of Equity Securities Subject to Contractual Sale Restrictions.” The ASU clarifies that a contractual restriction on the sale of an equity security is not considered part of the unit of account of the equity security and, therefore, is not considered in measuring the fair value. The ASU also requires additional disclosures related to equity securities subject to contractual sale restrictions. The ASU is effective for fiscal years beginning after December 15, 2023 and interim periods within those fiscal years. Management does not anticipate the effect of this guidance will have a material impact on financial statements of the Series Fund.
NOTE 3. SECURITY VALUATION
For purposes of calculating a net asset value, Portfolio securities and other assets are valued as of the close of trading on the New York Stock Exchange (“Exchange”) on each day during which the Exchange is open for trading.
The Fair Value Measurements and Disclosures Topic of the Financial Accounting Standards Codification defines fair value as the price that a fund would receive to sell an asset or pay to transfer a liability in an orderly transaction between market participants at the measurement date. It establishes and requires disclosure of a fair value hierarchy, separately for each major category of asset and liability, which segregates fair value measurements into levels. A summary of the fair value hierarchy is described below:
| | ● | | Level 1 — fair value is determined by unadjusted quoted prices in active markets for identical securities or derivatives |
| | ● | | Level 2 — fair value is determined by other significant observable inputs (including quoted prices for similar securities, interest rates, prepayment speeds, credit risk, and other data used in fair valuation) |
| | ● | | Level 3 — fair value is determined by significant unobservable inputs (including the Portfolios’ own assumptions in determining fair value) |
The categorization of a value determined for a financial instrument within the hierarchy is based upon the pricing transparency of the instrument and does not necessarily correspond to the Portfolios’ perceived risk of that instrument.
The following is a description of the valuation techniques and significant inputs used in determining the value of the Portfolios’ investments classified as Level 1 and Level 2 in the fair value hierarchy:
| | ● | | Equity securities (common and preferred stock) and exchange traded funds (“ETFs”) for which market quotations are readily available are valued at the last sale or, when available, official closing price as reported by an independent pricing service on the primary market or exchange on which they are traded. In the event there were no sales during the day or closing prices are not available, securities are generally valued at the last quoted bid price. Equity securities traded only in the over-the-counter market and not on a securities exchange are valued at the last sale price or closing bid price, if no sales have occurred. To the extent these securities are actively traded and valuation |
232
Notes to Financial Statements
| | adjustments are not applied, they are categorized as Level 1 of the fair value hierarchy. Additionally, for foreign securities, fair value procedures are used if a significant event occurs between the close of the foreign market and the U.S. market close. The fair value price is reflected as Level 2 in the fair value hierarchy when such fair value procedures are applied. |
| | ● | | Fixed income securities, including corporate, convertible and municipal bonds and notes, U.S. government agencies, U.S. treasury obligations, sovereign issues, bank loans, and non-U.S. bonds are generally valued on the basis of service provider prices that use broker dealer quotations or valuation estimates from internal pricing models. The service providers’ internal models use inputs that are observable such as issuer details, interest rates, yield curves, call features, maturities, credit risks/spreads and default rates. Securities that use similar valuation techniques and inputs as described above are categorized as Level 2 in the fair value hierarchy. |
| | ● | | Fixed income securities purchased on a delayed delivery basis are marked to market daily until settlement at the forward settlement date and are categorized as Level 2 in the fair value hierarchy. |
| | ● | | Mortgage related and asset backed securities are generally issued as separate tranches, or classes, of securities within each deal. These securities are normally valued by pricing service providers that use broker dealer quotations or valuation estimates from their internal pricing models. The pricing models for these securities usually consider tranche level attributes, current market data, estimated cash flows and market-based yield spreads for each tranche, and incorporate deal collateral performance, as available. Mortgage related and asset backed securities that use similar valuation techniques and inputs as described above are categorized as Level 2 in the fair value hierarchy. |
| | ● | | Investments in open-end mutual funds (including other Portfolios and excluding ETFs) are valued at the mutual fund’s closing net asset value per share and are categorized as Level 1 in the fair value hierarchy. |
| | ● | | Short-term investments, other than in the Government Money Market Portfolio, are generally valued by a pricing service. All securities in the Government Money Market Portfolio are valued using amortized cost, unless the current market value differs substantially from the amortized cost, at which time the securities are marked to market. Because the value is not obtained from a quoted price in an active market, such securities are reflected as Level 2 in the fair value hierarchy. |
| | ● | | Listed derivatives, such as futures or option contracts, which are actively traded on a national securities exchange, are stated at the last reported sale or settlement price on the day of valuation and are categorized as Level 1 in the fair value hierarchy. |
| | ● | | Centrally-cleared swaps and over-the-counter financial derivatives, such as foreign currency contracts, options contracts, or swap agreements derive their value from underlying asset prices, indices, reference rates, and other inputs or a combination of these factors. These derivatives are normally valued on the basis of quotes obtained from brokers and dealers or pricing services. Depending on the product and the terms of the transaction, the value of the derivatives can be estimated using a series of techniques, including simulation pricing models. The pricing models use inputs that are observed from actively quoted markets such as issuer details, indices, spreads, interest rates, curves, dividends and exchange rates. Financial derivatives that use similar valuation techniques and inputs as described above are categorized as Level 2 in the fair value hierarchy. |
The following is a description of the valuation techniques and significant inputs used in determining the value the Portfolios’ investments classified as Level 3 in the fair value hierarchy:
| | ● | | Securities and other assets for which market quotes are not readily available are valued at fair market value as determined in good faith in accordance with procedures adopted by the Series Fund’s Board of Directors (“Board”). Market quotes are considered not readily available in circumstances where there is an absence of current or reliable market-based data (e.g. trade information or broker quotes). The factors considered in reaching these values at December 31, 2023 included, but were not limited to, broker quotes, liquidity, prepayment speed, duration, geopolitical events and recoverability. |
233
Notes to Financial Statements
A table summarizing each Portfolio’s investments under this hierarchy is included following each Portfolio’s Schedule of Investments. Transfers between investment levels may occur as markets fluctuate and/or the availability of data used in investments’ valuation changes. For fair valuations using significant unobservable inputs, U.S. GAAP requires a reconciliation of the beginning to ending balances for reported fair values that presents changes attributable to total realized and unrealized gains or losses, purchases and sales, and transfers in or out of the Level 3 category during the period. Additionally, U.S GAAP requires quantitative information regarding the significant unobservable inputs used in the determination of fair value of assets categorized as Level 3 in the fair value hierarchy. In accordance with the requirements, a Level 3 reconciliation and details of significant unobservable inputs have been included in the notes to the Schedule of Investments for Portfolios that have a material amount of Level 3 investments. As of December 31, 2023, there were no Portfolios that owned a material amount of Level 3 securities.
The day-to-day responsibility for pricing Portfolio securities and other investments has been delegated to State Street Bank and Trust Company in its capacity as fund accountant, subject to the oversight of MSA. Securities for which market quotations are readily available are priced at market value and all other securities and assets are valued at fair value as determined in good faith by the Board of Directors (the “Board”) of the Series Fund. The Board has designated MSA, the Portfolios’ investment adviser, as “valuation designee” under Rule 2a-5 of the 1940 Act to perform fair value determinations for the Portfolios’ investments that do not have readily available market quotations, subject to the Board’s oversight. MSA has adopted Valuation Policies and Procedures that govern MSA’s responsibilities for executing the fair valuation process. While the Board has designated MSA as valuation designee, the Board oversees MSA in its role as valuation designee.
NOTE 4. SECURITIES AND OTHER INVESTMENTS
A. Delayed Delivery Transactions and When-Issued Securities — Certain Portfolios may engage in securities transactions on a when-issued or delayed delivery basis. In these transactions, the securities’ prices and yields are fixed on the date of the commitment, with payment and delivery scheduled for a future date. During this period, the securities are subject to market fluctuations, and the Portfolios post collateral to meet margin requirements. A Portfolio may dispose of or renegotiate a delayed delivery transaction, which may result in a capital gain or loss.
B. Repurchase Agreements — Certain Portfolios may engage in repurchase transactions. Under the terms of a typical repurchase agreement, a Portfolio takes possession of an underlying debt obligation subject to an obligation of the seller to repurchase, and a Portfolio to resell, the obligation at an agreed upon price and time. The underlying securities for all repurchase agreements are held in safekeeping at the Portfolio’s custodian or designated sub-custodians under tri-party repurchase agreements. The market value of the collateral must be equal to or exceed at all times the total amount of the repurchase obligations, including interest. Securities purchased under repurchase agreements are reflected as an asset on the Statements of Assets and Liabilities. Generally, in the event of counterparty default, a Portfolio has the right to use the collateral to offset losses incurred. If the counterparty should default, a Portfolio will seek to sell the securities which it holds as collateral. This could involve procedural costs or delays in addition to a loss on the securities if their value should fall below their repurchase price.
C. Restricted Securities — Certain Portfolios may invest in securities that are subject to legal or contractual restrictions on resale. These securities may be sold privately, but are required to be registered or exempted from registration before being sold to the public. Disposal of these securities may involve time-consuming negotiations and expense, and prompt sale at an acceptable price may be difficult.
D. Foreign Currency Transactions — Certain Portfolios may have securities and other assets and liabilities denominated in foreign currencies which are translated into U.S. dollar amounts on the date of valuation. Purchases and sales of securities and income items denominated in foreign currencies are translated into U.S. dollar amounts on the respective dates of such transactions. When the Portfolios purchase or sell a foreign security they may enter into a foreign currency exchange contract to minimize exchange rate risk from the trade date to the settlement date of such transaction. Such foreign currency exchange contracts are marked to market daily.
The Portfolios do not separately report the results of operations due to fluctuations in foreign exchange rates on investments from the changes arising from changes in market prices of securities held. Such fluctuations are included with the net realized or unrealized gain or loss from investments.
234
Notes to Financial Statements
Net realized foreign exchange gains or losses arise from sales of foreign currencies, currency gains or losses realized between the trade date and the settlement date on security transactions, and the differences between the amounts of income and foreign withholding taxes recorded on the Portfolios’ books and the U.S. dollar equivalent of the amounts actually received or paid.
E. Mortgage Backed and Asset Backed Securities — Certain Portfolios may invest in mortgage backed securities, including collateralized mortgage obligations, and asset backed securities. Mortgage backed securities are interests in pools of residential or commercial mortgage loans and asset backed securities are interests in pools of other assets, including various types of loans and credit card receivables. These securities provide a monthly payment, consisting of both a principal and interest component. Interest payments may be based on either fixed rates or adjustable rates. Receipt of principal payment reduces the outstanding par amount of the security and may generate realized gains or losses. Yields on mortgage backed securities are affected by interest and prepayment rates, which, in turn, are influenced by a variety of economic, geographical, social and other factors. Maturities on mortgage backed securities represent stated maturity dates. Actual maturity dates may differ based on prepayment rates. Unlike mortgage backed securities issued or guaranteed by the U.S. government or one of its sponsored entities, mortgage backed securities and asset backed securities issued by private issuers do not have a government or government sponsored entity guarantee. These issuers may provide credit enhancements through external entities such as financial institutions or through the structuring of the transaction itself. There is no guarantee that credit enhancements, if any, will be sufficient to prevent losses.
F. Inflation-Indexed Bonds — Certain Portfolios may invest in inflation-indexed bonds. Inflation-indexed bonds are fixed income securities whose principal value is periodically adjusted to the rate of inflation. The interest rate on these bonds is generally fixed at issuance at a rate lower than typical bonds. Over the life of an inflation-indexed bond, interest will be paid based on a principal value, which is adjusted for inflation. Any increase or decrease in the principal amount of an inflation-indexed bond will be included as interest income in the applicable Portfolio’s Statements of Operations even though investors do not receive their principal until maturity.
G. Short Sales — Certain Portfolios may enter into short sale transactions. A short sale is a transaction in which a Portfolio sells a security it does not own in anticipation of a decline in the market price of the security. Securities sold in short sale transactions and the interest payable on such securities, if any, are reflected as a liability on the Statements of Assets and Liabilities. A Portfolio is obligated to deliver the security at the market price at the time the short position is closed. The risk of loss on a short sale transaction is theoretically unlimited, because there is no limit to the cost of replacing the security sold short, whereas losses from purchase transactions cannot exceed the total amount invested.
H. Financing Transactions — Certain Portfolios may enter into financing transactions. In a financing transaction, the Portfolio transfers a security to a counterparty with a simultaneous agreement to repurchase the same security at an agreed upon price and future settlement date. For U.S. GAAP purposes, a financing transaction is accounted for as a secured borrowing and not as a purchase or sale. During the term of the borrowing, the Portfolio is entitled to the interest on the security. The difference between the sale price and repurchase price is included in net investment income with the cost of the secured borrowing transaction being recorded in interest expense over the term of the borrowing. The Portfolio will benefit from the transaction if the income earned on the investment purchased with the cash received in the financing transaction exceeds the interest expense incurred by the Portfolio. If the interest expense exceeds the income earned, the Portfolio’s net investment income and dividends to shareholders may be adversely impacted. Financing transactions involve the risk that the market value of the securities that the Portfolio is required to repurchase may decline below the agreed upon repurchase price of those securities. For the year ended December 31, 2023, the Long-Term U.S. Government Bond Portfolio entered into financing transactions utilizing various U.S. Treasury bonds.
I. Loan Participation and Assignments — Certain Portfolios may invest in direct debt instruments which are interests in amounts owed to lenders or lending syndicates by corporate, governmental, or other borrowers. The Portfolios’ investments in a loan may be in the form of either actual participation in loans or assignments of all or part of the loans from third parties. A loan is often administered by a bank or other financial institution that acts as an agent for all holders. The agent administers the terms of the loan which are specified in the loan agreement. The Portfolios may invest in multiple series or tranches of a loan, each of which can have different terms and associated risks. The Portfolios generally do not have a right to enforce compliance with the terms of the loan agreement and as a result, the Portfolios may be subject to the credit risk
235
Notes to Financial Statements
of the borrower and lender that is selling the loan agreement. When the Portfolios purchase assignments from lenders they acquire direct rights against the borrower of the loan.
The Portfolios may also enter into unfunded loan commitments, which are contractual obligations for future funding. Unfunded loan commitments can include lines of credit, which may require the Portfolios to grant additional cash to the borrower upon demand from the borrower. These unfunded loan commitments are in fact a future obligation in full, although a percentage of the loan amount may not be utilized by the borrower. When investing in a loan, the Portfolios have the right to receive principal, interest and any fees from the lender selling the loan agreement and only when the payments are received by the lender from the borrower. There may also be a commitment fee due to the Portfolios based on the unused portion of the line of credit of the floating rate loan. In certain cases, the Portfolios may be entitled to a penalty fee if there was a prepayment of a floating rate loan by the borrower. Fees that are earned or paid will be reflected as interest income or interest expense on the Statements of Operations. Unfunded loan commitments are reflected as a liability on the Statements of Assets and Liabilities.
J. Reverse Repurchase Agreements — Certain Portfolios may enter into reverse repurchase agreements. In a reverse repurchase agreement, a Portfolio delivers a security in exchange for cash to a financial institution, the counterparty, with a simultaneous agreement to repurchase the same or substantially the same security at an agreed upon price and date. The Portfolio is entitled to receive principal and interest payments, if any, made on the security delivered to the counterparty during the term of the agreement. Cash received in exchange for securities delivered plus accrued interest payments to be made by the Portfolio to counterparties are reflected as a liability on the Statements of Assets and Liabilities. Interest payments made by a Portfolio to counterparties are recorded as a component of interest expense on the Statements of Operations. In periods of increased demand for the security, a Portfolio may receive a fee for use of the security by the counterparty, which may result in interest income to the Portfolio. When effecting reverse repurchase transactions, the Portfolio will hold securities of a dollar amount equal in value to the securities subject to the reverse repurchase agreement in a segregated account.
NOTE 5. DERIVATIVE INSTRUMENTS
The Portfolios may use derivative instruments for various purposes, including as a cash management strategy, to earn income and enhance returns, to increase or decrease exposure to a particular market, to manage or adjust the risk profile of the Portfolio, to hedge exposure to a foreign currency, or as an alternative to direct investments. Because the Portfolios are required to account for derivative instruments at fair value and recognize changes in fair value through the Statements of Operations, the Portfolios’ derivatives do not qualify for hedge accounting treatment.
Certain Portfolios segregate cash to cover margin requirements for derivative positions. These amounts are denoted as “Cash Collateral for Derivative Positions” on the Statements of Assets and Liabilities.
A. Futures Contracts — Certain Portfolios invest in futures contracts as an alternative to investing in individual securities and could be exposed to market risk due to changes in the value of the underlying securities or due to an illiquid secondary market. Futures contracts are marked to market daily based upon quoted settlement prices. The Portfolios receive from or pay to brokers an amount of cash equal to the daily fluctuation in the value of the contracts. Such receipts or payments, known as the “variation margin,” are recorded by the Portfolios as unrealized gains or losses. When a contract is closed, the Portfolios record a realized gain or loss equal to the difference between the value of the contract at the time it was opened and the value at the time it was closed.
B. Forward Foreign Currency Contracts — The Portfolios may enter into forward foreign currency contracts to hedge against exchange rate risk arising from investments in securities denominated in foreign currencies or as part of an investment strategy. Contracts are valued at the contractual forward rate and are marked to market daily, with the change in market value recorded as an unrealized gain or loss. When the contracts are closed, a realized gain or loss is recorded. Risks may arise from changes in market value of the underlying instruments and from the possible inability of counterparties to meet the terms of their contracts.
C. Options — Certain Portfolios may write call and put options on futures, swaps, securities or currencies they own or in which they may invest. Writing put options tends to increase a Portfolio’s exposure to the underlying instrument. Writing
236
Notes to Financial Statements
call options tends to decrease a Portfolio’s exposure to the underlying instrument. The Portfolio receives a premium on the sale of a call option but gives up the opportunity to profit from any increase in the value of the security above the exercise price of the option. When a Portfolio writes a put option, it is exposed to a decline in the price of the underlying security. When a Portfolio writes a call or put option, an amount equal to the premium received is recorded as a liability and subsequently marked to market to reflect the current value of the option written. These liabilities are reflected as written options outstanding in the Statements of Assets and Liabilities. Payments received or made, if any, from writing options with premiums to be determined on a future date are reflected as such on the Statements of Assets and Liabilities. Premiums received from writing options which expire are treated as realized gains. Premiums received from writing options which are exercised or closed are added to the proceeds or offset against amounts paid on the underlying future, swap, security or currency transaction to determine the realized gain or loss. A Portfolio as a writer of an option has no control over whether the underlying future, swap, security or currency may be sold (called) or purchased (put) and as a result bears the market risk of an unfavorable change in the price of the future, swap, security or currency underlying the written option. There is a risk a Portfolio may not be able to enter into a closing transaction because of an illiquid market.
Certain Portfolios may also purchase call and put options on futures, swaps, securities or currencies they own or in which they may invest. Purchasing call options tends to increase a Portfolio’s exposure to the underlying instrument. Purchasing put options tends to decrease a Portfolio’s exposure to the underlying instrument. The Portfolio pays a premium on the purchase of a put option but receives the opportunity to profit from any increase in the value of the security above the exercise price of the option. When a Portfolio purchases a call option, it is exposed to a decline in the price of the underlying security. Premiums paid are reflected in the Statements of Assets and Liabilities as an investment and are subsequently marked to market to reflect the current value of the option. Premiums paid from purchasing options which expire are treated as realized losses. Premiums paid for purchasing options which are exercised or closed are added to the amount paid or offset against the proceeds on the underlying future, swap, security or currency transaction to determine realized gain or loss. The risk associated with a Portfolio purchasing call or put options is limited to the premium paid.
D. Swap Agreements — The Portfolios may enter into swap agreements on interest rate, total return and credit default to manage their exposure to interest rates, foreign currencies, investment style risk and credit risk or as an alternative to direct investing. In connection with these agreements, securities may be identified as collateral in accordance with the terms of the respective swap agreements. Swap agreements are privately negotiated in the over-the-counter market (“OTC swaps”) and may be executed in a multilateral or other trade facility platform, such as a registered commodities exchange (“centrally cleared swaps”).
Swaps are marked to market daily based upon quotations from market makers or values from third party vendors, which may include a registered commodities exchange, and the change in value, if any, is recorded as unrealized gain or loss in the Statements of Operations. Daily changes in the valuation of centrally cleared swaps, if any, are recorded as a receivable or payable for the change in value as appropriate (“variation margin”) on the Statements of Assets and Liabilities. OTC swap payments received or made at the beginning of the measurement period of the swap are reflected on the Statements of Assets and Liabilities. Upfront payments are amortized to realized gain or loss. Upon termination of the swap, unamortized upfront payments are recorded as realized gain or loss in the Statements of Operations. A liquidation payment received or made at the termination of the swap is recorded as realized gain or loss in the Statements of Operations. Net periodic payments received by the Portfolios are included as part of realized gain (loss) on the Statements of Operations. Entering into these agreements involves, to varying degrees, elements of credit and market risk in excess of the amounts recognized on the Statements of Assets and Liabilities. Such risks involve the possibility that there will be no liquid market for these agreements, that the counterparty to the agreements may default on its obligation to perform and that there may be unfavorable changes in interest rates.
Interest Rate Swaps — Interest rate swap agreements involve the exchange by a Portfolio with another party to pay or receive a set of cash flows, e.g., an exchange of floating rate payments for fixed rate payments based on a notional amount of principal.
Total Return Swaps — Total return swap agreements involve commitments to pay or receive a financing rate in exchange for the total return of an underlying reference entity, both based on notional amounts. To the extent the total return of the security or index underlying the transaction exceeds or falls short of the offsetting interest rate obligation, a Portfolio will receive a payment from or make a payment to the counterparty.
237
Notes to Financial Statements
Credit Default Swaps — Credit default swap agreements involve one party making a series of payments to another party in exchange for the right to receive a cash payment equal to the notional value of the swap in the event of a default by a third party, typically corporate issues or sovereign issues of an emerging market country. A Portfolio may use credit default swaps to provide a measure of protection against defaults of the issuers where the Portfolio owns or has exposure to the corporate or sovereign issue or to take an active long or short position on the likelihood of a particular issuer’s default.
As a seller of protection, the Portfolio generally receives an upfront payment and/or a fixed rate of income throughout the term of the swap provided that there is no credit event. As the seller, the Portfolio adds leverage to its investments because the Portfolio has investment exposure on the notional amount of the swap. As a buyer of protection, the Portfolio generally makes an upfront payment or pays a fixed rate of interest throughout the term of the swap provided that there is no credit event. The Portfolio generally receives an amount up to the notional value of the swap if a credit event occurs.
Implied credit spreads, represented in absolute terms, utilized in determining the market value of credit default swap agreements on corporate issues or sovereign issues of an emerging market country serve as an indicator of the current status of the payment/performance risk and represent the likelihood of a credit event occurring. The implied credit spread of a particular referenced entity reflects the cost of selling protection and may include upfront payments required to be made to enter into the agreement. For credit default swap agreements on credit indices, the quoted market prices and resulting values serve as the indicator of the current status of the payment/performance risk. Wider credit spreads and increasing market values, in absolute terms when compared to the notional amount of the swap, represent a deterioration of the referenced entity’s credit soundness and indicate a greater likelihood a credit event could occur as defined under the terms of the agreement. Open credit default swaps on corporate or sovereign issues and credit indices are disclosed in the Schedules of Investments.
If the Portfolio is a seller of protection and a credit event occurs, the Portfolio will either pay to the buyer of the protection an amount equal to the notional value of the swap and may take delivery of the obligation or pay a net settlement amount in the form of cash or securities equal to the notional amount of the swap less the recovery value of the referenced obligation. The maximum potential amount of future payments (undiscounted) that a Portfolio as a seller of protection could be required to make under a credit default swap agreement would be equal to the notional amount of the agreement. Notional amounts and fair market value of all credit default swap agreements outstanding for each Portfolio are disclosed in the Schedules of Investments. These maximum potential amounts would be partially offset by any recovery values of the referenced obligations, upfront payments received upon entering into the agreement, or net amounts received by the Portfolio from the settlement of credit default swap agreements purchasing protection for the same referenced obligation.
E. Derivative Disclosures — Derivative positions held by the Portfolios by contract type and primary risk exposure, including location on the Statement of Assets and Liabilities and value as of December 31, 2023, are (amounts in thousands):
| | | | | | | | | | | | | | | | |
| | | Asset Derivatives | | | | | | Liability Derivatives | |
| Portfolio | | Statement of Assets and Liabilities Location | | Value | | | | | | Statement of Assets and Liabilities Location | | Value | |
Index 500 Stock Portfolio | | | | | | | | | | | | | | | | |
Equity contracts | | Receivables – Variation Margin (Futures) | | $ | - | | | | | | | Payables –Variation Margin (Futures) | | $ | 145 | |
Large Company Value Portfolio | | | | | | | | | | | | | | | | |
Forward foreign
currency contracts | | Receivables – Foreign Currency | | | 1 | | | | | | | Payables – Foreign Currency | | | 121 | |
| Index 400 Stock Portfolio | | | | | | | | | | | | | | | | |
Equity contracts | | Receivables – Variation Margin (Futures) | | | - | | | | | | | Payables – Variation Margin (Futures) | | | 173 | |
Mid Cap Value Portfolio | | | | | | | | | | | | | | | | |
Forward foreign
currency contracts | | Receivables – Foreign Currency | | | 2 | | | | | | | Payables – Foreign Currency | | | 494 | |
| Index 600 Portfolio | | | | | | | | | | | | | | | | |
Equity contracts | | Receivables – Variation Margin (Futures) | | | - | | | | | | | Payables – Variation Margin (Futures) | | | 81 | |
238
Notes to Financial Statements
| | | | | | | | | | | | | | | | | | |
| | | Asset Derivatives | | | | | | Liability Derivatives | |
| Portfolio | | Statement of Assets and Liabilities
Location | | | | Value | | | | | | Statement of Assets and Liabilities
Location | | Value | |
International Growth Portfolio | | | | | | | | | | | | | | | | |
| | | | | | |
Forward foreign currency contracts | | Receivables – Foreign Currency | | | | $ | 1 | | | | | | | Payables – Foreign Currency | | $ | - | |
Research International Portfolio | | | | | | | | | | | | | | | | |
| | | | | | |
Forward foreign currency contracts | | Receivables – Foreign Currency | | | | | 2 | | | | | | | Payables – Foreign Currency | | | - | |
International Equity Portfolio | | | | | | | | | | | | | | | | |
| | | | | | |
Forward foreign currency contracts | | Receivables – Foreign Currency | | | | | 1,345 | | | | | | | Payables – Foreign Currency | | | 350 | |
Short-Term Bond Portfolio | | | | | | | | | | | | | | | | |
| | | | | | |
Interest rate contracts | | Receivables – Variation Margin (Futures) | | | | | 71 | | | | | | | Payables – Variation Margin (Futures) | | | 1 | |
Long-Term U.S. Government Bond Portfolio | | | | | | | | | | | | | | | | |
| | | | | | |
Interest rate contracts | | Receivables – Variation Margin (Futures) | | | | | 32 | | | | | | | Payables – Variation Margin (Futures) | | | 27 | |
| | | | | | |
Interest rate contracts | | Receivables – Variation Margin (Cleared Swap) | | | | | 12 | | | | | | | Payables – Variation Margin (Cleared Swap) | | | - | |
| | | | | | |
Interest rate contracts | | Receivables – Outstanding Options Written, at Value | | | | | - | | | | | | | Payables – Outstanding Options Written, at Value | | | 10 | |
Inflation Protection Portfolio | | | | | | | | | | | | | | | | |
| | | | | | |
Forward foreign currency contracts | | Receivables – Foreign Currency | | | | | - | | | | | | | Payables – Foreign Currency | | | 517 | |
| | | | | | |
Interest rate contracts | | Receivables – Variation Margin (Futures) | | | | | 9 | | | | | | | Payables – Variation Margin (Futures) | | | 84 | |
| | | | | | |
Inflation contracts | | Receivables –Variation Margin (Cleared Swap) | | | | | 23 | | | | | | | Payables – Variation Margin (Cleared Swap) | | | 2 | |
| | | | | | |
Inflation contracts | | Receivables – Outstanding Swaps Contracts, at Value | | | | | 6,214 | | | | | | | Payables – Outstanding Swaps Contracts, at Value | | | 350 | |
Multi-Sector Bond Portfolio | | | | | | | | | | | | | | | | |
| | | | | | |
Credit contracts | | Receivables – Outstanding Swaps Contracts, at Value | | | | | 9 | | | | | | | Payables – Outstanding Swaps Contracts, at Value | | | 298 | |
| | | | | | |
Credit contracts | | Receivables – Variation Margin (Cleared Swap) | | | | | 1 | | | | | | | Payables – Variation Margin (Cleared Swap) | | | 101 | |
| | | | | | |
Forward foreign currency contracts | | Receivables – Foreign Currency | | | | | 87 | | | | | | | Payables – Foreign Currency | | | 1,125 | |
| | | | | | |
Interest rate contracts | | Receivables – Variation Margin (Futures) | | | | | 111 | | | | | | | Payables – Variation Margin (Futures) | | | 188 | |
| | | | | | |
Interest rate contracts | | Receivables – Variation Margin (Cleared Swap) | | | | | 169 | | | | | | | Payables – Variation Margin (Cleared Swap) | | | 309 | |
Realized gains and losses on derivative instruments, by contract type and primary risk exposure, for the year ended December 31, 2023 are (amounts in thousands):
| | | | | | | | | | | | | | | | | | | | |
| | | Realized Gain (Loss) on Derivatives Instruments | |
| Portfolio | | Options
Written | | | Futures | | | Forward
Foreign
Currency
Contracts | | | Swaps | | | Total | |
Index 500 Stock Portfolio | | | | | | | | | | | | | | | | | | | | |
Equity contracts | | $ | – | | | $ | 5,101 | | | | $ – | | | $ | – | | | | $ 5,101 | |
Large Company Value Portfolio | | | | | | | | | | | | | | | | | | | | |
Forward foreign currency contracts | | | – | | | | – | | | | (169) | | | | – | | | | (169) | |
Equity Income Portfolio | | | | | | | | | | | | | | | | | | | | |
Forward foreign currency contracts | | | – | | | | – | | | | (22) | | | | – | | | | (22) | |
Index 400 Stock Portfolio | | | | | | | | | | | | | | | | | | | | |
Equity contracts | | | – | | | | 1,146 | | | | – | | | | – | | | | 1,146 | |
Mid Cap Value Portfolio | | | | | | | | | | | | | | | | | | | | |
Forward foreign currency contracts | | | – | | | | – | | | | (489) | | | | – | | | | (489) | |
239
Notes to Financial Statements
| | | | | | | | | | | | | | | | | | | | |
| | | Realized Gain (Loss) on Derivatives Instruments | |
| Portfolio | | Options
Written | | | Futures | | | Forward
Foreign
Currency
Contracts | | | Swaps | | | Total | |
Index 600 Stock Portfolio | | | | | | | | | | | | | | | | | | | | |
Equity contracts | | | $ – | | | | $ (86) | | | | $ – | | | | $ – | | | | $ (86) | |
International Growth Portfolio | | | | | | | | | | | | | | | | | | | | |
Forward foreign currency contracts | | | – | | | | – | | | | (34) | | | | – | | | | (34) | |
Research International Core Portfolio | | | | | | | | | | | | | | | | | | | | |
Forward foreign currency contracts | | | – | | | | – | | | | (105) | | | | – | | | | (105) | |
International Equity Portfolio | | | | | | | | | | | | | | | | | | | | |
Forward foreign currency contracts | | | – | | | | – | | | | 8,889 | | | | – | | | | 8,889 | |
Emerging Markets Equity Portfolio | | | | | | | | | | | | | | | | | | | | |
Forward foreign currency contracts | | | – | | | | – | | | | (772) | | | | – | | | | (772) | |
Short-Term Bond Portfolio | | | | | | | | | | | | | | | | | | | | |
Credit contracts | | | – | | | | – | | | | – | | | | 11 | | | | 11 | |
Interest rate contracts | | | – | | | | (1,274) | | | | – | | | | – | | | | (1,274) | |
Long-Term U.S. Government Bond Portfolio | | | | | | | | | | | | | | | | | | | | |
Interest rate contracts | | | 82 | | | | 2,921 | | | | – | | | | (167) | | | | 2,836 | |
Inflation Protection Portfolio | | | | | | | | | | | | | | | | | | | | |
Forward foreign currency contracts | | | – | | | | – | | | | 363 | | | | – | | | | 363 | |
Interest rate contracts | | | – | | | | (1,948) | | | | – | | | | – | | | | (1,948) | |
Inflation contracts | | | – | | | | – | | | | – | | | | 2,525 | | | | 2,525 | |
Multi-Sector Bond Portfolio | | | | | | | | | | | | | | | | | | | | |
Credit contracts | | | – | | | | – | | | | – | | | | 10,460 | | | | 10,460 | |
Forward foreign currency contracts | | | – | | | | – | | | | (6,268) | | | | – | | | | (6,268) | |
Interest rate contracts | | | – | | | | (16,313) | | | | – | | | | (2,681) | | | | (18,994) | |
Change in unrealized appreciation and depreciation on derivative instruments, by contract type and primary risk exposure for the year ended December 31, 2023 are (amounts in thousands):
| | | | | | | | | | | | | | | | | | | | |
| | | Change in Unrealized Appreciation (Depreciation) on Derivative Instruments | |
| Portfolio | | Options
Written | | | Futures | | | Forward
Foreign
Currency
Contracts | | | Swaps | | | Total | |
Index 500 Stock Portfolio | | | | | | | | | | | | | | | | | | | | |
Equity contracts | | | $ – | | | | $ 2,763 | | | | $ – | | | | $ – | | | | $ 2,763 | |
Large Company Value Portfolio | | | | | | | | | | | | | | | | | | | | |
Forward foreign currency contracts | | | – | | | | – | | | | (64) | | | | – | | | | (64) | |
Equity Income Portfolio | | | | | | | | | | | | | | | | | | | | |
Forward foreign currency contracts | | | – | | | | – | | | | – | | | | – | | | | – | |
Index 400 Stock Portfolio | | | | | | | | | | | | | | | | | | | | |
Equity contracts | | | – | | | | 697 | | | | – | | | | – | | | | 697 | |
Mid Cap Value Portfolio | | | | | | | | | | | | | | | | | | | | |
Forward foreign currency contracts | | | – | | | | – | | | | (188) | | | | – | | | | (188) | |
Index 600 Stock Portfolio | | | | | | | | | | | | | | | | | | | | |
Equity Contracts | | | – | | | | 112 | | | | – | | | | – | | | | 112 | |
International Growth Portfolio | | | | | | | | | | | | | | | | | | | | |
Forward foreign currency contracts | | | – | | | | – | | | | 118 | | | | – | | | | 118 | |
Research International Core Portfolio | | | | | | | | | | | | | | | | | | | | |
Forward foreign currency contracts | | | – | | | | – | | | | 306 | | | | – | | | | 306 | |
International Equity Portfolio | | | | | | | | | | | | | | | | | | | | |
Forward foreign currency contracts | | | – | | | | – | | | | (952) | | | | – | | | | (952) | |
Emerging Markets Equity Portfolio | | | | | | | | | | | | | | | | | | | | |
Forward foreign currency contracts | | | – | | | | – | | | | 298 | | | | – | | | | 298 | |
Short-Term Bond Portfolio | | | | | | | | | | | | | | | | | | | | |
Interest rate contracts | | | – | | | | (43) | | | | – | | | | – | | | | (43) | |
240
Notes to Financial Statements
| | | | | | | | | | | | | | | | | | | | |
| | | Change in Unrealized Appreciation (Depreciation) on Derivative Instruments | |
| Portfolio | | Options
Written | | | Futures | | | Forward
Foreign
Currency
Contracts | | | Swaps | | | Total | |
Long-Term U.S. Government Bond Portfolio | | | | | | | | | | | | | | | | | | | | |
Interest rate contracts | | | $ 7 | | | | $ (2,135) | | | | $ – | | | | $ 145 | | | | $ (1,983) | |
Inflation Protection Portfolio | | | | | | | | | | | | | | | | | | | | |
Forward foreign currency contracts | | | – | | | | – | | | | (505) | | | | – | | | | (505) | |
Interest rate contracts | | | – | | | | 816 | | | | – | | | | – | | | | 816 | |
Inflation contracts | | | – | | | | – | | | | – | | | | (2,071) | | | | (2,071) | |
Multi-Sector Bond Portfolio | | | | | | | | | | | | | | | | | | | | |
Credit contracts | | | – | | | | – | | | | – | | | | 5,150 | | | | 5,150 | |
Forward foreign currency contracts | | | – | | | | – | | | | 2,798 | | | | – | | | | 2,798 | |
Interest rate contracts | | | – | | | | 9,893 | | | | – | | | | 4,035 | | | | 13,928 | |
Volumes on derivative instruments by contract type and primary risk exposure, for the year ended December 31, 2023 are:
| | | | | | | | | | | | | | | | | | | | | | | | |
| | | Volume of Derivative Instruments Held | |
| | | Average Number of
Contracts | | | | | | Average Notional
(Amounts in Thousands) | |
| Portfolio | | Exchange Traded
Options | | | Futures | | | | | | Forward Foreign Currency Contracts | | | Swaps | | | Over the
Counter
Options | |
Index 500 Stock Portfolio | | | | | | | | | | | | | | | | | | | | | | | | |
Equity contracts | | | – | | | | 226 | | | | | | | | – | | | | – | | | | – | |
Large Company Value Portfolio | | | | | | | | | | | | | | | | | | | | | | | | |
Forward foreign currency contracts | | | – | | | | – | | | | | | | | 12,529 | | | | – | | | | – | |
Equity Income Portfolio | | | | | | | | | | | | | | | | | | | | | | | | |
Forward foreign currency contracts | | | – | | | | – | | | | | | | | – | | | | – | | | | – | |
Index 400 Stock Portfolio | | | | | | | | | | | | | | | | | | | | | | | | |
Equity contracts | | | – | | | | 51 | | | | | | | | – | | | | – | | | | – | |
Mid Cap Value Portfolio | | | | | | | | | | | | | | | | | | | | | | | | |
Forward foreign currency contracts | | | – | | | | – | | | | | | | | 56,053 | | | | – | | | | – | |
Index 600 Stock Portfolio | | | | | | | | | | | | | | | | | | | | | | | | |
Equity contracts | | | – | | | | 24 | | | | | | | | – | | | | – | | | | – | |
International Growth Portfolio | | | | | | | | | | | | | | | | | | | | | | | | |
Forward foreign currency contracts | | | – | | | | – | | | | | | | | – | | | | – | | | | – | |
Research International Core Portfolio | | | | | | | | | | | | | | | | | | | | | | | | |
Forward foreign currency contracts | | | – | | | | – | | | | | | | | – | | | | – | | | | – | |
International Equity Portfolio | | | | | | | | | | | | | | | | | | | | | | | | |
Forward foreign currency contracts | | | – | | | | – | | | | | | | | 140,720 | | | | – | | | | – | |
Emerging Markets Equity Portfolio | | | | | | | | | | | | | | | | | | | | | | | | |
Forward foreign currency contracts | | | – | | | | – | | | | | | | | 7 | | | | – | | | | – | |
Short-Term Bond Portfolio | | | | | | | | | | | | | | | | | | | | | | | | |
Credit contracts | | | – | | | | – | | | | | | | | – | | | | 159 | | | | – | |
Interest rate contracts | | | – | | | | 590 | | | | | | | | – | | | | – | | | | – | |
Long-Term U.S. Government Bond Portfolio | | | | | | | | | | | | | | | | | | | | | | | | |
Interest rate contracts | | | 14 | | | | 476 | | | | | | | | – | | | | 22,674 | | | | 1,400 | |
Inflation Protection Portfolio | | | | | | | | | | | | | | | | | | | | | | | | |
Forward foreign currency contracts | | | – | | | | – | | | | | | | | 12,720 | | | | – | | | | – | |
Interest rate contracts | | | – | | | | 294 | | | | | | | | – | | | | – | | | | – | |
Inflation contracts | | | – | | | | – | | | | | | | | – | | | | 179,008 | | | | – | |
Multi-Sector Bond Portfolio | | | | | | | | | | | | | | | | | | | | | | | | |
Credit contracts | | | – | | | | – | | | | | | | | – | | | | 270,832 | | | | – | |
Forward foreign currency contracts | | | – | | | | – | | | | | | | | 585,285 | | | | – | | | | – | |
Interest rate contracts | | | – | | | | 2,369 | | | | | | | | – | | | | 1,631,440 | | | | – | |
241
Notes to Financial Statements
NOTE 6. PORTFOLIO RISK
In the normal course of business, the Portfolios trade financial instruments and enter into financial transactions where risk of potential loss exists. Security values fluctuate (market risk) and may decline due to factors affecting securities markets in general, particular industries represented in the securities markets or conditions specifically related to a particular company. Failure of the other party to a transaction to perform (credit risk), for example by not making principal and interest payments when due, reduces the value of the issuer’s debt and could reduce the Portfolios’ income. Similar to credit risk, the Portfolios may be exposed to counterparty risk, or the risk that an institution or other entity with which the Portfolios have unsettled or open transactions will fail to make required payments or otherwise comply with the terms of the instrument, transaction or contract. The potential loss could exceed the value of the financial assets recorded in the financial statements. Some of the Portfolios’ investments may be illiquid and the Portfolios may not be able to vary the portfolio investments in response to changes in economic and other conditions. If a Portfolio is required to liquidate all or a portion of its investments quickly, the Portfolio may realize significantly less than the value at which it previously recorded those investments.
The value of a Portfolio’s investments may decline because of economic changes or other events, such as inflation (or expectations for inflation), deflation (or expectations for deflation), interest rates, global demand for particular products or resources, market instability, debt crises and downgrades, embargoes, tariffs, sanctions and other trade barriers, regulatory events, other governmental trade or market control programs and related geopolitical events. The global economies and financial markets are becoming increasingly interconnected, which increases the possibility that conditions in one country or region might adversely impact issuers in a different country or region. Local and global markets and normal market operations can be adversely affected by significant market disruptions. Market disruptions can be caused by local, regional or global events such as war, military conflict, political instability, acts of terrorism, social unrest, environmental disasters, natural disasters or events, trade disputes, supply chain disruptions, spread of infectious diseases or other public health issues, climate change, recessions, or other events. Climate change, the outbreak of infectious diseases or other public health issues may exacerbate other pre-existing political, social, economic, market and financial risks. Certain illnesses spread rapidly and have the potential to significantly and adversely affect the global economy. The impact of infectious diseases in developing or emerging market countries may be greater due to less established health care systems. The impact of any such events could negatively affect the global economy as well as the economies of individual countries, the financial performance of individual companies, sectors and industries, and the markets in general in significant and unforeseen ways. Such events may affect certain sectors, industries, businesses, geographic regions or countries more significantly than others. In addition, any of such circumstances could result in disruptions in the trading markets and could result in increased market volatility. Such events could adversely affect the prices and liquidity of a Portfolio’s securities and could have a materially negative impact on the value of a Portfolio. Such events also could impact the ability of the Fund to process transactions or perform other operational activities. The Fund cannot predict the effects of geopolitical or other events in the future on the U.S. and other economies, the securities markets, or the Portfolios.
LIBOR
Instruments in which certain Portfolios of the Series Fund invests may, pursuant to their original terms, pay interest at floating rates based on the London Interbank Offered Rate (“LIBOR”) or may be subject to interest caps or floors based on LIBOR. The maintenance of LIBOR reference rates, including rates for all U.S. dollar LIBOR settings, was discontinued in 2023. (U.S. dollar LIBOR 1-, 3- and 6-month settings continue to be published under an unrepresentative synthetic methodology until September 30, 2024, following which date the publication of all U. S. dollar settings will cease permanently.) Replacement reference rates for all LIBOR currencies have been established and are being employed with respect to new issuances. In cases where existing instruments held in the Portfolios rely upon LIBOR interest rates, such instruments may contain an explicit designation of an alternative “fall-back” reference rate or procedures for the determination of a replacement rate, in the event of the discontinuation of LIBOR. In instances where such instruments do not provide for the determination of a replacement reference rate, uncertainty may exist as the designation of an applicable rate will be contingent upon the agreement of the parties to the instrument.
Master Netting Arrangements
The Portfolios are subject to various Master Agreements that govern the terms of certain transactions. Master Repurchase Agreements and Global Master Repurchase Agreements are in place that governs repurchase, reverse repurchase, and sale-
242
Notes to Financial Statements
buyback financing transactions. Master Securities Forward Transaction Agreements are in place that govern the settlement of certain forward settling transactions including to-be-announced securities, delayed-delivery or sale-buyback financing transactions. Customer Account Agreements and related addenda are in place that govern certain cleared derivative transactions including futures and cleared OTC derivatives. International Swaps and Derivatives Association, Inc. Master Agreements and Credit Support Annexes (“ISDA agreements”) are in place that governs certain OTC financial derivative transactions. ISDA agreements maintain provisions for general obligations, representations, agreements, collateral and events of default or termination. Events of termination include conditions that may entitle counterparties to elect to terminate early and cause settlement of all outstanding transactions under the applicable ISDA agreement. The terms of Master Agreements may reduce counterparty risk with respect to transactions governed by the Master Agreement under certain circumstances. Certain Portfolios have agreements with counterparties that contain provisions, or contingency features, that allow net settlement in the event of contract termination and permit termination by either party prior to maturity upon the occurrence of certain stated events, such as failure to pay or bankruptcy. In addition, certain agreements specify other events, the occurrence of which would allow one of the parties to terminate. For example, a downgrade in credit rating of a counterparty would allow the Portfolio to terminate while a decline in the Portfolio’s net assets of more than a certain percentage would allow the counterparty to terminate. In such a situation, the counterparty involved would have the option to waive the triggering event or liquidate the affected positions pursuant to the terms of the related agreement. The aggregate amount of derivatives in a liability position is disclosed in Note 5.
Offsetting Assets and Liabilities
Certain Portfolios are parties to enforceable master netting or similar agreements which provide for the right of offset under certain circumstances. The Portfolios have made an accounting policy election not to offset qualifying financial and derivative instruments on the Statements of Assets and Liabilities. As such, all financial and derivative instruments are presented on a gross basis on the Statements of Assets and Liabilities. The impacts of netting arrangements that provide the right to offset are detailed below (amounts in thousands). The net amount represents the net receivable or payable that would be due from or to the counterparty in the event of default. Exposure from borrowings and other financing transactions such as repurchase agreements and certain forward settling transactions can only be netted across transactions governed under the same Master Agreement with the same legal entity. For certain Portfolios, derivative amounts do not reconcile to the Statements of Assets and Liabilities due to the Statements of Assets and Liabilities including derivatives that are not covered under master netting or similar agreements. The amount of collateral, for the year ended December 31, 2023, has been limited such that the net amount cannot be less than zero.
The following is a summary by counterparty of the market value of OTC financial derivative instruments and collateral as of period end:
Large Company Value Portfolio
| | | | | | | | | | | | | | | | | | | | | | | | | | | | | | | | | | | | |
| | | Derivative Assets (000’s) | | | Derivative Liabilities (000’s) | | | | | | | | | | |
| Counterparty | | Forward Foreign Currency Contracts | | | Swaps | | | Total Assets | | | Forward Foreign Currency Contracts | | | Swaps | | | Total Liabilities | | | Net Market Value | | | Collateral Pledged/ (Received) | | | Net Exposure | |
| |
Bank of America NA | | $ | 1 | | | $ | – | | | $ | 1 | | | $ | (59 | ) | | $ | – | | | $ | (59 | ) | | $ | (58 | ) | | $ | – | | | $ | (58) | |
Goldman Sachs International | | | – | | | | – | | | | – | | | | (20 | ) | | | – | | | | (20 | ) | | | (20 | ) | | | 10 | | | | (10) | |
Morgan Stanley Capital Services LLC | | | – | | | | – | | | | – | | | | (42 | ) | | | – | | | | (42 | ) | | | (42 | ) | | | – | | | | (42) | |
| |
| | | | | | | | | |
Total | | $ | 1 | | | $ | – | | | $ | 1 | | | $ | (121 | ) | | $ | – | | | $ | (121 | ) | | $ | (120 | ) | | $ | 10 | | | $ | (110) | |
| |
| | | | | | | |
| Mid Cap Value Portfolio | | | | | | | | | | | | | | | | | | | | | | | | | | | | | |
| | | Derivative Assets (000’s) | | | Derivative Liabilities (000’s) | | | | | | | | | | |
| Counterparty | | Forward
Foreign
Currency
Contracts | | | Swaps | | | Total
Assets | | | Forward
Foreign
Currency
Contracts | | | Swaps | | | Total
Liabilities | | | Net
Market
Value | | | Collateral
Pledged/
(Received) | | | Net Exposure | |
| |
Bank of America NA | | $ | 2 | | | $ | – | | | $ | 2 | | | $ | (438 | ) | | $ | – | | | $ | (438 | ) | | $ | (436 | ) | | $ | 436 | | | $ | – | |
Goldman Sachs International | | | – | | | | – | | | | – | | | | (56 | ) | | | – | | | | (56 | ) | | | (56 | ) | | | 56 | | | | – | |
| |
| | | | | | | | | |
Total | | $ | 2 | | | $ | – | | | $ | 2 | | | $ | (494 | ) | | $ | – | | | $ | (494 | ) | | $ | (492 | ) | | $ | 492 | | | $ | – | |
| |
243
Notes to Financial Statements
International Equity Portfolio
| | | | | | | | | | | | | | | | | | | | | | | | | | | | | | | | | | | | |
| | | Derivative Assets (000’s) | | | Derivative Liabilities (000’s) | | | | | | | | | | |
| Counterparty | | Forward Foreign Currency Contracts | | | Swaps | | | Total Assets | | | Forward Foreign Currency Contracts | | | Swaps | | | Total Liabilities | | | Net Market Value | | | Collateral Pledged/ (Received) | | | Net Exposure | |
| |
Bank of America NA | | $ | 218 | | | $ | – | | | $ | 218 | | | $ | (21) | | | $ | – | | | $ | (21) | | | $ | 197 | | | $ | (180) | | | $ | 17 | |
Barclays Bank PLC | | | 17 | | | | – | | | | 17 | | | | (1) | | | | – | | | | (1) | | | | 16 | | | | – | | | | 16 | |
Citibank NA | | | 28 | | | | – | | | | 28 | | | | – | | | | – | | | | – | | | | 28 | | | | – | | | | 28 | |
Goldman Sachs Bank USA | | | 13 | | | | – | | | | 13 | | | | – | | | | – | | | | – | | | | 13 | | | | (13) | | | | – | |
HSBC Bank USA | | | 460 | | | | – | | | | 460 | | | | (188) | | | | – | | | | (188) | | | | 272 | | | | (260) | | | | 12 | |
JP Morgan Chase Bank NA | | | 564 | | | | – | | | | 564 | | | | (9) | | | | – | | | | (9) | | | | 555 | | | | (555) | | | | – | |
State Street Bank And Trust | | | | | | | | | | | | | | | | | | | | | | | | | | | | | | | | | | | | |
Company | | | – | | | | – | | | | – | | | | (30) | | | | – | | | | (30) | | | | (30) | | | | – | | | | (30) | |
UBS AG | | | 45 | | | | – | | | | 45 | | | | (101) | | | | – | | | | (101 | | | | (56) | | | | – | | | | (56) | |
| |
| | | | | | | | | |
Total | | $ | 1,345 | | | $ | – | | | $ | 1,345 | | | $ | (350) | | | $ | – | | | $ | (350) | | | $ | 995 | | | $ | (1,008) | | | $ | (13) | |
| |
| | | | | | | |
| Long–Term Government Bond Portfolio | | | | | | | | | | | | | | | | | | | | | | | | | | | | | |
| | | Derivative Assets (000’s) | | | Derivative Liabilities (000’s) | | | | | | | | | | |
| Counterparty | | Forward Foreign Currency Contracts | | | Purchased Options | | | Total Assets | | | Forward Foreign Currency Contracts | | | Written Options | | | Total Liabilities | | | Net Market Value | | | Collateral Pledged/ (Received) | | | Net Exposure | |
| |
JP Morgan Chase Bank NA | | $ | – | | | $ | – | | | $ | – | | | $ | – | | | $ | (10 | ) | | $ | (10) | | | $ | (10) | | | $ | – | | | $ | (10) | |
| |
| | | | | | | | | |
Total | | $ | – | | | $ | – | | | $ | – | | | $ | – | | | $ | (10 | ) | | $ | (10) | | | $ | (10) | | | $ | – | | | $ | (10) | |
| |
| | | | | | | |
| Inflation Protection Portfolio | | | | | | | | | | | | | | | | | | | | | | | | | | | | | |
| | | Derivative Assets (000’s) | | | Derivative Liabilities (000’s) | | | | | | | | | | |
| Counterparty | | Forward Foreign Currency Contracts | | | Swaps | | | Total Assets | | | Forward Foreign Currency Contracts | | | Swaps | | | Total Liabilities | | | Net Market Value | | | Collateral Pledged/ (Received) | | | Net Exposure | |
| |
Bank of America NA | | $ | – | | | $ | 1,775 | | | $ | 1,775 | | | $ | – | | | $ | – | | | $ | – | | | $ | 1,775 | | | $ | (1,775) | | | $ | – | |
Barclays Bank PLC | | | – | | | | 374 | | | | 374 | | | | – | | | | (350 | ) | | | (350) | | | | 24 | | | | – | | | | 24 | |
Goldman Sachs International | | | – | | | | 4,065 | | | | 4,065 | | | | (517) | | | | – | | | | (517) | | | | 3,548 | | | | (3,548) | | | | – | |
| |
| | | | | | | | | |
Total | | $ | – | | | $ | 6,214 | | | $ | 6,214 | | | $ | (517) | | | $ | (350 | ) | | $ | (867) | | | $ | 5,347 | | | $ | (5,323) | | | $ | 24 | |
| |
| | | | | | | |
| Multi–Sector Bond Portfolio | | | | | | | | | | | | | | | | | | | | | | | | | | | | | |
| | | Derivative Assets (000’s) | | | Derivative Liabilities (000’s) | | | | | | | | | | |
| Counterparty | | Forward Foreign Currency Contracts | | | Swaps | | | Total Assets | | | Forward Foreign Currency Contracts | | | Swaps | | | Total Liabilities | | | Net Market Value | | | Collateral Pledged/ (Received) | | | Net Exposure | |
| |
Bank of America NA | | $ | 41 | | | $ | – | | | $ | 41 | | | $ | (11) | | | $ | – | | | $ | (11) | | | $ | 30 | | | $ | – | | | $ | 30 | |
Barclays Bank PLC | | | – | | | | – | | | | – | | | | (210) | | | | (18 | ) | | | (228) | | | | (228) | | | | 228 | | | | – | |
BNP Paribas SA | | | 9 | | | | – | | | | 9 | | | | (110) | | | | – | | | | (110) | | | | (101) | | | | – | | | | (101) | |
Goldman Sachs International | | | – | | | | – | | | | – | | | | – | | | | (37 | ) | | | (37) | | | | (37) | | | | – | | | | (37) | |
Goldman Sachs Bank USA | | | 32 | | | | – | | | | 32 | | | | (87) | | | | – | | | | (87) | | | | (55) | | | | – | | | | (55) | |
HSBC Bank USA NA | | | – | | | | – | | | | – | | | | (40) | | | | – | | | | (40) | | | | (40) | | | | 40 | | | | – | |
JP Morgan Chase Bank NA | | | – | | | | – | | | | – | | | | (39) | | | | (8 | ) | | | (47) | | | | (47) | | | | 47 | | | | – | |
Morgan Stanley Capital Services LLC | | | 5 | | | | 9 | | | | 14 | | | | – | | | | (235 | ) | | | (235) | | | | (221) | | | | – | | | | (221) | |
Royal Bank of Canada | | | – | | | | – | | | | – | | | | –π | | | | – | | | | –π | | | | –π | | | | – | | | | –π | |
UBS AG | | | – | | | | – | | | | – | | | | (628) | | | | – | | | | (628) | | | | (628) | | | | 628 | | | | – | |
| |
| | | | | | | | | |
Total | | $ | 87 | | | $ | 9 | | | $ | 96 | | | $ | (1,125) | | | $ | (298 | ) | | $ | (1,423) | | | $ | (1,327) | | | $ | 943 | | | $ | (384) | |
| |
244
Notes to Financial Statements
The following is a summary by counterparty of the market value of repurchase agreements, financing transactions, collateral and net exposure as of period end:
Government Money Market Portfolio
| | | | | | | | | | | | | | | | | | | | | | | | |
| Counterparty | | Investment in
Repurchase
Agreements | | | Payable for
Reverse
Repurchase
Agreements | | | Payable for
Financing
Transactions | | | Net Market
Value | | | Collateral
Pledged/
(Received) | | | Net Exposure | |
Bank of Montreal | | $ | 20,000 | | | $ | - | | | $ | - | | | $ | 20,000 | | | $ | (20,000) | | | $ | - | |
Bank of Nova Scotia | | | 20,000 | | | | - | | | | - | | | | 20,000 | | | | (20,000) | | | | - | |
BNP Paribas | | | 20,000 | | | | - | | | | - | | | | 20,000 | | | | (20,000) | | | | - | |
Citigroup Global Markets, Inc. | | | 20,000 | | | | - | | | | - | | | | 20,000 | | | | (20,000) | | | | - | |
Goldman Sachs Group LP | | | 30,000 | | | | - | | | | - | | | | 30,000 | | | | (30,000) | | | | - | |
Mitsubishi UFJ | | | 30,000 | | | | - | | | | - | | | | 30,000 | | | | (30,000) | | | | - | |
Mizuho Securities | | | 30,000 | | | | - | | | | - | | | | 30,000 | | | | (30,000) | | | | - | |
Morgan Stanley | | | 30,000 | | | | - | | | | - | | | | 30,000 | | | | (30,000) | | | | - | |
Natixis S.A. | | | 20,000 | | | | - | | | | - | | | | 20,000 | | | | (20,000) | | | | - | |
TD Securities | | | 16,000 | | | | - | | | | - | | | | 16,000 | | | | (16,000) | | | | - | |
Total | | $ | 236,000 | | | $ | - | | | $ | - | | | $ | 236,000 | | | $ | (236,000) | | | $ | - | |
Long-Term U.S. Government Bond Portfolio | | | | | | | | | | | | | |
| Counterparty | | Investment in
Repurchase
Agreements | | | Payable for Short Sales | | | Payable for Financing Transactions | | | Net Market
Value | | | Collateral
Pledged/
(Received) | | | Net Exposure | |
Barclays Capital, Inc. | | $ | - | | | $ | - | | | $ | (21,488) | | | $ | (21,488 | ) | | $ | 21,322 | | | $ | (166) | |
Goldman Sachs International | | | - | | | | - | | | | (82,091) | | | | (82,091 | ) | | | 82,071 | | | | (20) | |
Morgan Stanley Capital | | | | | | | | | | | | | | | | | | | | | | | | |
Services | | | - | | | | - | | | | (72,682) | | | | (72,682 | ) | | | 72,639 | | | | (43) | |
Total | | $ | - | | | $ | - | | | | $(176,261) | | | $ | (176,261 | ) | | $ | 176,032 | | | $ | (229) | |
The Long-Term U.S. Government Bond Portfolio average amount of borrowings outstanding during the year ended December 31, 2023 was $47,877 (amount in thousands) at a weighted average interest rate of 5.046%. Average borrowings include reverse repurchase agreements and sale-buyback transactions, if held during the period.
Multi- Sector Bond Portfolio
| | | | | | | | | | | | | | | | | | | | | | | | |
| Counterparty | | Investment in
Repurchase
Agreements | | | Payable for
Reverse
Repurchase
Agreements | | | Payable for
Financing
Transactions | | | Net Market
Value | | | Collateral
Pledged/
(Received) | | | Net Exposure | |
Barclays Bank PLC | | $ | - | | | $ | (1,294) | | | $ | - | | | $ | (1,294) | | | $ | 1,294 | | | $ | - | |
BNP Paribas SA | | | 193,000 | | | | (193) | | | | - | | | | 192,807 | | | | (192,807) | | | | - | |
Citigroup Global Markets, Inc. | | | 221,400 | | | | - | | | | - | | | | 221,400 | | | | (221,400) | | | | - | |
JP Morgan Securities LLC | | | 100 | | | | - | | | | - | | | | 100 | | | | (100) | | | | - | |
JP Morgan Securities PLC | | | - | | | | (566) | | | | - | | | | (566) | | | | 566 | | | | - | |
Morgan Stanley & Co. | | | | | | | | | | | | | | | | | | | | | | | | |
International PLC | | | - | | | | (1,595) | | | | - | | | | (1,595 | ) | | | 1,595 | | | | - | |
Total | | $ | 414,500 | | | $ | (3,648) | | | $ | - | | | $ | 410,852 | | | $ | (410,852) | | | $ | - | |
The Multi- Sector Bond Portfolio average amount of borrowings outstanding during the year ended December 31, 2023 was $2,601 (amount in thousands) at a weighted average interest rate of 2.652%. Average borrowings include reverse repurchase agreements, if held during the period.
NOTE 7. INVESTMENT ADVISORY, SUB-ADVISORY, AND COMPLIANCE FEES
The Series Fund and its Portfolios are parties to annually renewable contracts pursuant to which each Portfolio pays a charge for investment management and administrative services to MSA, an affiliate and wholly-owned subsidiary of Northwestern Mutual. Certain Portfolios, listed below, pay a fixed annual rate based on the average daily net asset values of the Portfolio.
245
Notes to Financial Statements
| | |
Portfolio | | Fee |
Index 500 Stock Portfolio | | 0.20% |
Index 400 Stock Portfolio | | 0.25% |
Mid Cap Value Portfolio | | 0.85% |
Small Cap Value Portfolio | | 0.85% |
Government Money Market Portfolio | | 0.30% |
Select Bond Portfolio | | 0.30% |
Balanced Portfolio | | 0.30% |
For the other Portfolios, the rate for the investment advisory fee is graded by the asset size of the Portfolio according to the following schedules:
| | | | | | | | |
Portfolio | | First $50 Million | | Next $50 Million | | Excess Over $100 Million | | |
Growth Stock Portfolio | | 0.60% | | 0.50% | | 0.40% |
Large Cap Core Stock Portfolio | | 0.60% | | 0.50% | | 0.40% |
Mid Cap Growth Stock Portfolio | | 0.80% | | 0.65% | | 0.50% |
Small Cap Growth Stock Portfolio | | 0.80% | | 0.65% | | 0.50% |
High Yield Bond Portfolio | | 0.60% | | 0.50% | | 0.40% |
| | | | | | | |
Portfolio | | First $100 Million | | Next $400 Million | | Excess Over $500 Million |
Focused Appreciation Portfolio | | 0.80% | | 0.75% | | 0.70% |
| | | | | | | |
Portfolio | | First $100 Million | | Next $150 Million | | Excess Over $250 Million |
Large Company Value Portfolio | | 0.72% | | 0.67% | | 0.62% |
Domestic Equity Portfolio | | 0.65% | | 0.55% | | 0.50% |
International Growth Portfolio | | 0.75% | | 0.65% | | 0.55% |
Short-Term Bond Portfolio | | 0.35% | | 0.33% | | 0.30% |
Long-Term U.S. Government Bond Portfolio | | 0.555% | | 0.515% | | 0.495% |
Inflation Protection Portfolio | | 0.58% | | 0.55% | | 0.49% |
Multi-Sector Bond Portfolio | | 0.79% | | 0.78% | | 0.77% |
Asset Allocation Portfolio | | 0.60% | | 0.50% | | 0.40% |
| | | | |
Portfolio | | First $150 Million | | Next $150 Million | | Next $200 Million | | Excess Over $500 Million |
Large Cap Blend Portfolio | | 0.77% | | 0.70% | | 0.62% | | 0.56% |
Research International Core Portfolio | | 0.88% | | 0.82% | | 0.75% | | 0.68% |
| | | |
Portfolio | | First $500 Million | | Excess Over $500 Million | | |
Equity Income Portfolio | | 0.65% | | 0.60% |
| | | | | |
Portfolio | | First $200 Million | | Excess Over $200 Million |
Index 600 Stock Portfolio | | 0.25% | | 0.20% |
| | | | | |
Portfolio | | First $50 Million | | Excess Over $50 Million |
International Equity Portfolio | | 0.85% | | 0.65% |
| | | | |
Portfolio | | First $250 Million | | Next $250 Million | | Next $500 Million | | Excess Over $1.0 Billion |
Emerging Markets Equity Portfolio | | 1.14% | | 1.08% | | 0.96% | | 0.78% |
246
Notes to Financial Statements
For certain Portfolios, MSA contractually agreed to waive the management fee and absorb certain other operating expenses to the extent necessary so that Total Operating Expenses (excluding taxes, brokerage, other investment-related costs, interest and dividend expenses and charges, acquired fund fees, fees for class actions, other passive securities litigation and antitrust claim filing services and such non-recurring and extraordinary expenses as they may arise) will not exceed the following amounts:
| | | | | | | | |
Portfolio | | | | | Expiration | |
Focused Appreciation Portfolio | | | 0.90 | % | | | April 30, 2024 | |
Large Cap Blend Portfolio | | | 0.85 | % | | | April 30, 2024 | |
Large Company Value Portfolio | | | 0.80 | % | | | April 30, 2024 | |
Domestic Equity Portfolio | | | 0.75 | % | | | April 30, 2024 | |
Equity Income Portfolio | | | 0.75 | % | | | April 30, 2024 | |
Mid Cap Value Portfolio | | | 1.00 | % | | | April 30, 2024 | |
Index 600 Stock Portfolio | | | 0.35 | % | | | April 30, 2024 | |
Small Cap Value Portfolio | | | 1.00 | % | | | April 30, 2024 | |
International Growth Portfolio | | | 1.10 | % | | | April 30, 2024 | |
Research International Core Portfolio | | | 1.15 | % | | | April 30, 2024 | |
Emerging Markets Equity Portfolio | | | 1.50 | % | | | April 30, 2024 | |
Short-Term Bond Portfolio | | | 0.45 | % | | | April 30, 2024 | |
Long-Term U.S. Government Bond Portfolio | | | 0.65 | % | | | April 30, 2024 | |
Inflation Protection Portfolio | | | 0.65 | % | | | April 30, 2024 | |
Multi-Sector Bond Portfolio | | | 0.90 | % | | | April 30, 2024 | |
Asset Allocation Portfolio | | | 0.75 | % | | | April 30, 2024 | |
Growth Stock Portfolio – MSA has agreed to waive a portion of its management fee such that the management fee is 0.60% on the Portfolio’s first $50 million of average net assets, 0.50% on the next $50 million, 0.40% on the next $900 million, and 0.38% on average net assets in excess of $1 billion. MSA may terminate this fee waiver agreement at any time after April 30, 2024.
Focused Appreciation Portfolio – MSA has agreed to waive a portion of its management fee such that the management fee is 0.66% on the Portfolio’s first $100 million of average net assets, 0.61% on the next $400 million, 0.60% on the next $500 million, and 0.57% on average net assets in excess of $1 billion. MSA may terminate this fee waiver agreement at any time after April 30, 2024.
Large Cap Core Stock Portfolio – MSA has agreed to waive a portion of its management fee such that the management fee is 0.60% on the Portfolio’s first $50 million of average net assets, 0.50% on the next $50 million, 0.40% on the next $400 million, and 0.37% on average net assets in excess of $500 million. MSA may terminate this fee waiver agreement at any time after April 30, 2024.
Large Cap Blend Portfolio – MSA has agreed to waive a portion of its management fee such that the management fee is 0.70% on the Portfolio’s first $150 million of average net assets, 0.65% on the next $150 million, 0.62% on the next $200 million, and 0.56% on average net assets in excess of $500 million. MSA may terminate this fee waiver agreement at any time after April 30, 2024.
Index 500 Stock Portfolio – MSA has agreed to waive a portion of its management fee such that the management fee is 0.20% on the Portfolio’s first $2 billion of average net assets, and 0.18% on average net assets in excess of $2 billion. MSA may terminate this fee waiver agreement at any time after April 30, 2024.
Large Company Value Portfolio – MSA has agreed to waive a portion of its management fee such that the management fee is 0.67% on the Portfolio’s first $100 million of average net assets, 0.62% on the next $150 million, 0.59% on the next $250 million, and 0.57% on the average net assets in excess of $500 million. MSA may terminate this fee waiver agreement at any time after April 30, 2024.
Domestic Equity Portfolio – MSA has agreed to waive a portion of its management fee such that the management fee is 0.65% on the Portfolio’s first $100 million of average net assets, 0.55% on the next $150 million, 0.50% on the next $250 million, 0.43% on the next $500 million, and 0.41% on the average net assets in excess of $1 billion. MSA may terminate this fee
247
Notes to Financial Statements
waiver agreement at any time after April 30, 2024.
Equity Income Portfolio – MSA has agreed to waive a portion of its management fee such that the management fee is 0.56% on the Portfolio’s first $500 million of average net assets, 0.53% on the next $1 billion, and 0.52% on the average net assets in excess of $1.5 billion. MSA may terminate this fee waiver agreement at any time after April 30, 2024.
Mid Cap Growth Stock Portfolio – MSA has agreed to waive a portion of its management fee such that the management fee is 0.80% on the Portfolio’s first $50 million, 0.65% on the next $50 million, 0.50% on the next $900 million, and 0.49% on average net assets in excess of $1 billion. MSA may terminate this fee waiver agreement at any time after April 30, 2024.
Index 400 Stock Portfolio – MSA has agreed to waive a portion of its management fee such that the management fee is 0.25% on the Portfolio’s first $500 million and 0.20% on average net assets in excess of $500 million. MSA may terminate this fee waiver agreement at any time after April 30, 2024.
Mid Cap Value Portfolio – MSA has agreed to waive a portion of its management fee such that the management fee is 0.79% on the Portfolio’s first $150 million of average net assets, 0.67% on the next $350 million, and 0.64% on the average net assets in excess of $500 million. MSA may terminate this fee waiver agreement at any time after April 30, 2024.
Small Cap Value Portfolio – MSA has agreed to waive a portion of its management fee such that the management fee is 0.85% on the Portfolio’s first $500 million of average net assets, and 0.80% on average net assets in excess of $500 million. MSA may terminate this fee waiver agreement at any time after April 30, 2024.
International Growth Portfolio – MSA has agreed to waive a portion of its management fee such that the management fee is 0.75% on the Portfolio’s first $100 million of average net assets, 0.65% on the next $150 million, 0.55% on the next $750 million, and 0.54% on average net assets in excess of $1 billion. MSA may terminate this fee waiver agreement at any time after April 30, 2024.
Research International Core Portfolio – MSA has agreed to waive a portion of its management fee such that the management fee is 0.83% on the Portfolio’s first $150 million of average net assets, 0.77% on the next $150 million, 0.70% on the next $200 million, and 0.63% on average net assets in excess of $500 million. MSA may terminate this fee waiver agreement at any time after April 30, 2024.
International Equity Portfolio – MSA has agreed to waive a portion of its management fee such that the management fee is 0.85% on the Portfolio’s first $50 million of average net assets, 0.65% on the next $1,950 million, and 0.63% on the average net assets in excess of $2 billion. MSA may terminate this fee waiver agreement at any time after April 30, 2024.
Emerging Markets Equity Portfolio – For the period from January 1, 2023 through April 30, 2023, MSA agreed to waive a portion of its management fee such that its management fee was 0.95% on the Portfolio’s first $250 million of average net assets, 0.87% on the next $250 million, 0.80% on the next $500 million, and 0.75% on average net assets in excess of $1 billion. Effective May 1, 2023, MSA has agreed to waive a portion of its management fee such that its management fee is 0.95% on the Portfolio’s first $250 million of average net assets, 0.87% on the next $250 million, 0.78% on the next $500 million, and 0.75% on average net assets in excess of $1 billion. MSA may terminate this fee waiver agreement at any time after April 30, 2024.
Government Money Market Portfolio – MSA has agreed to waive a portion of its management fee such that the management fee is 0.30% on the Portfolio’s first $500 million of average net assets, 0.29% on the next $500 million, and 0.28% in excess of $1 billion. MSA may terminate this fee waiver agreement at any time after April 30, 2024.
Short-Term Bond Portfolio – MSA has agreed to waive a portion of its management fee such that the management fee is 0.35% on the Portfolio’s first $100 million of average net assets, 0.33% on the next $150 million, 0.30% on the next $250 million, and 0.28% on average net assets in excess of $500 million. MSA may terminate this fee waiver agreement at any time after April 30, 2024.
Select Bond Portfolio – MSA has agreed to waive a portion of its management fee such that the management fee is 0.30%
248
Notes to Financial Statements
on the Portfolio’s first $2 billion of average net assets, and 0.28% on average net assets in excess of $2 billion. MSA may terminate this fee waiver agreement at any time after April 30, 2024.
Long-Term U.S. Government Bond Portfolio – MSA has agreed to waive a portion of its management fee such that the management fee is 0.555% on the Portfolio’s first $100 million of average net assets, 0.515% on the next $150 million, 0.495% of the next $250 million, and 0.445% on average net assets in excess of $500 million. MSA may terminate this fee waiver agreement at any time after April 30, 2024.
Inflation Protection Portfolio – For the period from January 1, 2023 through October 31, 2023, MSA agreed to waive a portion of its management fee such that the management fee was 0.55% on the Portfolio’s first $100 million of average net assets, 0.50% on the next $150 million, and 0.46% on average net assets in excess of $250 million. Effective November 1, 2023, MSA has agreed to waive a portion of its management fee such that its management fee is 0.42% on the Portfolio’s first $100 million of average net assets, 0.40% on the next $150 million, and 0.38% on average net assets in excess of $250 million. MSA may terminate this fee waiver agreement at any time after April 30, 2024.
High Yield Bond Portfolio – MSA agreed to waive a portion of its management fee such that the management fee is 0.60% on the Portfolio’s first $50 million of average net assets, 0.50% on the next $50 million, 0.40% on the next $900 million, and 0.30% on average net assets in excess of $1 billion. MSA may terminate this fee waiver agreement at any time after April 30, 2024.
Multi-Sector Bond Portfolio – MSA has agreed to waive a portion of its management fee such that the management fee is 0.74% on the Portfolio’s first $100 million of average net assets, 0.73% on the next $150 million, 0.70% on the next $250 million, and 0.65% on average net assets in excess of $500 million. MSA may terminate this fee waiver agreement at any time after April 30, 2024.
Balanced Portfolio – MSA has agreed to waive a portion of its management fee such that the management fee is 0.05% on all average net assets. MSA may terminate this fee waiver agreement at any time after April 30, 2024.
Asset Allocation Portfolio – MSA has agreed to waive a portion of its management fee such that the management fee is 0.05% on all average net assets. MSA may terminate this fee waiver agreement at any time after April 30, 2024.
Waivers are not recoupable in future periods.
With respect to certain Portfolios, MSA has engaged and oversees unaffiliated sub-advisers who manage the day-to-day investment operations of such Portfolios. MSA pays each sub-adviser a fee based on the average daily net assets of each such Portfolio out of its investment management fee.
Compliance fees are paid to Northwestern Mutual, an affiliate of the Series Fund. The compliance fees paid are for the compensation, benefits and expenses of the Chief Compliance Officer and compliance staff. The amounts paid relate only to the Chief Compliance Officer and compliance staffs’ duties and functions performed for the Series Fund.
NOTE 8. FEDERAL INCOME TAX MATTERS
Taxable distributions from net investment income and realized capital gains in the Portfolios may differ from book amounts earned during the period due to differences in the timing of capital gains recognition and due to the reclassification of certain gains or losses between capital and income. The differences between cost amounts for book purposes and tax purposes are primarily due to the tax treatment of deferred losses, passive foreign investment companies, and financing transactions.
It is the policy of the Portfolios to reclassify the net effect of permanent differences between book and taxable income to capital accounts on the Statements of Assets and Liabilities. Permanent differences primarily relate to character differences with respect to income on swaps, foreign currency transactions, foreign bond sales, passive foreign investment companies and paydowns on structured product investments.
249
Notes to Financial Statements
A summary of the Portfolios’ capital loss carryovers as of December 31, 2023 is provided below:
| | | | | | | | | | | | |
| | | Short- Term Loss
Carryover | | | Long-
Term Loss
Carryover | | | Losses
Utilized | |
| |
| | | (Amounts in thousands) | |
Growth Stock Portfolio | | $ | 31,267 | | | $ | 3,430 | | | $ | 19,875 | |
Mid Cap Growth Stock Portfolio | | | 8,931 | | | | 30,596 | | | | 6,916 | |
Small Cap Growth Stock Portfolio | | | 34,846 | | | | 5,658 | | | | 34,731 | |
International Equity Portfolio | | | 847 | | | | 14,870 | | | | 181 | |
Emerging Markets Equity Portfolio | | | 41,440 | | | | 10,165 | | | | – | |
Short-Term Bond Portfolio | | | 6,934 | | | | 5,911 | | | | – | |
Select Bond Portfolio | | | 253,310 | | | | 169,562 | | | | – | |
Long-Term U.S. Government Bond Portfolio | | | – | | | | 16,860 | | | | – | |
Inflation Protection Portfolio | | | 10,133 | | | | 11,292 | | | | – | |
High Yield Bond Portfolio | | | 1,229 | | | | 23,390 | | | | – | |
Multi-Sector Bond Portfolio | | | 45,944 | | | | 45,169 | | | | – | |
Capital losses are carried forward indefinitely and retain the character of the original loss. These losses are deferred to the first day of the next fiscal year.
When applicable, each of the Portfolios made distributions during the year of ordinary income and long-term capital gains. The tax character of distributions paid for the years ended December 31, 2023 and 2022 was as follows:
| | | | | | | | | | | | | | | | |
| | | 2023 Distributions Paid From: | | | 2022 Distributions Paid From: | |
Portfolio | | Ordinary
Income | | | Long-term
Capital Gain | | | Ordinary
Income | | | Long-term
Capital Gain | |
| | | | | |
| | | | | | (Amounts in thousands) | |
Growth Stock Portfolio | | $ | 392 | | | $ | — | | | $ | 8,528 | | | $ | 142,825 | |
Focused Appreciation Portfolio | | | 2,059 | | | | 71,643 | | | | 2,197 | | | | 125,795 | |
Large Cap Core Stock Portfolio | | | 6,286 | | | | 48,913 | | | | 34,391 | | | | 81,325 | |
Large Cap Blend Portfolio | | | 1,503 | | | | 14,830 | | | | 1,337 | | | | 18,030 | |
Index 500 Stock Portfolio | | | 67,110 | | | | 35,856 | | | | 64,069 | | | | 144,551 | |
Large Company Value Portfolio | | | 5,077 | | | | 19,079 | | | | 12,442 | | | | 19,968 | |
Domestic Equity Portfolio | | | 19,196 | | | | 46,554 | | | | 30,154 | | | | 106,445 | |
Equity Income Portfolio | | | 18,100 | | | | 55,166 | | | | 22,774 | | | | 71,701 | |
Mid Cap Growth Stock Portfolio | | | 2,521 | | | | — | | | | 1,611 | | | | 98,437 | |
Index 400 Stock Portfolio | | | 15,588 | | | | 49,435 | | | | 31,873 | | | | 101,625 | |
Mid Cap Value Portfolio | | | 22,489 | | | | 72,306 | | | | 44,485 | | | | 64,725 | |
Small Cap Growth Stock Portfolio | | | 192 | | | | — | | | | 3,020 | | | | 107,716 | |
Index 600 Stock Portfolio | | | 4,166 | | | | 15,944 | | | | 11,797 | | | | 25,599 | |
Small Cap Value Portfolio | | | 2,800 | | | | 36,433 | | | | 12,120 | | | | 65,482 | |
International Growth Portfolio | | | 8,162 | | | | 20,348 | | | | 8,194 | | | | 93,077 | |
Research International Core Portfolio | | | 13,421 | | | | 15,148 | | | | 20,345 | | | | 34,292 | |
International Equity Portfolio | | | 54,274 | | | | — | | | | 41,796 | | | | 46,803 | |
Emerging Markets Equity Portfolio | | | 19,064 | | | | — | | | | 19,997 | | | | 58,276 | |
Government Money Market Portfolio | | | 25,157 | | | | 5 | | | | 7,243 | | | | — | |
Short-Term Bond Portfolio | | | 7,807 | | | | — | | | | 6,234 | | | | 172 | |
Select Bond Portfolio | | | 73,967 | | | | — | | | | 51,441 | | | | 3,949 | |
Long-Term U.S. Government Bond Portfolio | | | 2,679 | | | | — | | | | 1,876 | | | | — | |
Inflation Protection Portfolio | | | 20,508 | | | | — | | | | 16,642 | | | | 8,985 | |
High Yield Bond Portfolio | | | 40,679 | | | | — | | | | 40,651 | | | | — | |
Multi-Sector Bond Portfolio | | | 29,062 | | | | — | | | | 47,671 | | | | — | |
Balanced Portfolio | | | 38,818 | | | | 72,601 | | | | 82,626 | | | | 121,740 | |
Asset Allocation Portfolio | | | 5,321 | | | | 15,893 | | | | 9,305 | | | | 17,887 | |
250
Notes to Financial Statements
As of December 31, 2023, the components of distributable earnings on a tax basis were as follows:
| | | | | | | | | | | | | | | | |
Portfolio | | Undistributed
Ordinary
Income | | | Undistributed
Long-Term
Gains | | | Accumulated
Losses | | | Unrealized
Appreciation
(Depreciation) | |
| | | (Amounts in thousands) | |
Growth Stock Portfolio | | $ | 1,260 | | | $ | – | | | $ | (34,697 | ) | | $ | 411,798 | |
Focused Appreciation Portfolio | | | – | | | | 121,060 | | | | – | | | | 565,419 | |
Large Cap Core Stock Portfolio | | | 5,581 | | | | 34,308 | | | | – | | | | 136,449 | |
Large Cap Blend Portfolio | | | 6,985 | | | | 32,889 | | | | – | | | | 13,332 | |
Index 500 Stock Portfolio | | | 76,400 | | | | 102,494 | | | | – | | | | 3,614,917 | |
Large Company Value Portfolio | | | 3,951 | | | | 4,950 | | | | – | | | | 2,758 | |
Domestic Equity Portfolio | | | 21,990 | | | | 80,191 | | | | – | | | | 142,782 | |
Equity Income Portfolio | | | 18,569 | | | | 23,224 | | | | – | | | | 153,556 | |
Mid Cap Growth Stock Portfolio | | | 944 | | | | – | | | | (39,527 | ) | | | 169,541 | |
Index 400 Stock Portfolio | | | 18,319 | | | | 44,002 | | | | – | | | | 337,717 | |
Mid Cap Value Portfolio | | | 19,072 | | | | 13,789 | | | | – | | | | 2,834 | |
Small Cap Growth Stock Portfolio | | | 2,635 | | | | – | | | | (40,505 | ) | | | 108,801 | |
Index 600 Stock Portfolio | | | 5,645 | | | | 9,994 | | | | – | | | | 74,728 | |
Small Cap Value Portfolio | | | 5,076 | | | | 19,521 | | | | – | | | | 120,534 | |
International Growth Portfolio | | | 9,209 | | | | 26,315 | | | | – | | | | 250,446 | |
Research International Core Portfolio | | | 15,799 | | | | 5,020 | | | | – | | | | 136,835 | |
International Equity Portfolio | | | 55,095 | | | | – | | | | (15,718 | ) | | | 15,277 | |
Emerging Markets Equity Portfolio | | | 15,666 | | | | – | | | | (51,606 | ) | | | 27,165 | |
Government Money Market Portfolio | | | 1 | | | | – | | | | – | | | | – | |
Short-Term Bond Portfolio | | | 13,119 | | | | – | | | | (12,845 | ) | | | (7,010 | ) |
Select Bond Portfolio | | | 110,410 | | | | – | | | | (422,872 | ) | | | (65,458 | ) |
Long-Term U.S. Government Bond Portfolio | | | 3,761 | | | | – | | | | (16,860 | ) | | | (48,944 | ) |
Inflation Protection Portfolio | | | 12,928 | | | | – | | | | (21,425 | ) | | | (27,408 | ) |
High Yield Bond Portfolio | | | 43,835 | | | | – | | | | (24,619 | ) | | | (48,774 | ) |
Multi-Sector Bond Portfolio | | | 65,432 | | | | – | | | | (91,113 | ) | | | (99,731 | ) |
Balanced Portfolio | | | 42,536 | | | | 38,644 | | | | – | | | | (63,479 | ) |
Asset Allocation Portfolio | | | 5,504 | | | | 8,203 | | | | – | | | | (2,062 | ) |
NOTE 9. VOLUNTARY REIMBURSEMENTS
Northwestern Mutual voluntarily reimburses foreign equity portfolios for the benefit Northwestern Mutual receives from foreign dividend taxes charged against the Portfolios. The amounts reimbursed represent approximately 79% of the foreign dividend taxes withheld attributable to the portion of the Portfolio owned by Northwestern Mutual. Reimbursements, included in Unaffiliated Dividends on the Statements of Operations, are recorded when foreign dividend taxes are accrued.
Voluntary reimbursements for the year ended December 31, 2023 are summarized below (amounts in thousands):
| | | | |
Portfolio | | 2023
Reimbursements | |
International Growth Portfolio | | $ | 1,034 | |
International Equity Portfolio | | | 4,182 | |
Research International Core Portfolio | | | 1,262 | |
Emerging Markets Equity Portfolio | | | 1,412 | |
NOTE 10. GUARANTEES
In the normal course of business, the Portfolios enter into contracts that contain a variety of representations which provide general indemnifications. The Portfolios’ maximum exposure under these arrangements is unknown as this would involve future claims that may be made against the Portfolios that have not yet occurred. However, the Portfolios expect the risk of material loss to be remote.
251
Notes to Financial Statements
NOTE 11. INVESTMENT INCOME AND SECURITIES TRANSACTIONS
For the year ended December 31, 2023, transactions in securities other than short term investments were:
| | | | | | | | | | | | | | | | |
Portfolios | | Non-U.S.
Govt.
Security
Purchases | | | U.S. Govt.
Security
Purchases | | | Non-U.S.
Govt.
Security
Sales/
Maturities | | | U.S. Govt.
Security
Sales/
Maturities | |
| | | (Amounts in thousands) | |
Growth Stock Portfolio | | $ | 86,319 | | | $ | — | | | $ | 130,892 | | | $ | — | |
Focused Appreciation Portfolio | | | 78,987 | | | | — | | | | 243,391 | | | | — | |
Large Cap Core Stock Portfolio | | | 387,954 | | | | — | | | | 421,742 | | | | — | |
Large Cap Blend Portfolio | | | 216,007 | | | | — | | | | 246,274 | | | | — | |
Index 500 Stock Portfolio | | | 106,360 | | | | — | | | | 161,450 | | | | — | |
Large Company Value Portfolio | | | 52,777 | | | | — | | | | 57,679 | | | | — | |
Domestic Equity Portfolio | | | 228,267 | | | | — | | | | 250,278 | | | | — | |
Equity Income Portfolio | | | 124,611 | | | | — | | | | 155,031 | | | | — | |
Mid Cap Growth Stock Portfolio | | | 406,980 | | | | — | | | | 477,478 | | | | — | |
Index 400 Stock Portfolio | | | 224,626 | | | | — | | | | 231,299 | | | | — | |
Mid Cap Value Portfolio | | | 316,545 | | | | — | | | | 330,087 | | | | — | |
Small Cap Growth Stock Portfolio | | | 401,691 | | | | — | | | | 416,509 | | | | — | |
Index 600 Stock Portfolio | | | 111,035 | | | | — | | | | 96,722 | | | | — | |
Small Cap Value Portfolio | | | 154,109 | | | | — | | | | 181,230 | | | | — | |
International Growth Portfolio | | | 200,106 | | | | — | | | | 253,990 | | | | — | |
Research International Core Portfolio | | | 116,977 | | | | — | | | | 114,620 | | | | — | |
International Equity Portfolio | | | 253,168 | | | | — | | | | 329,373 | | | | — | |
Emerging Markets Equity Portfolio | | | 238,604 | | | | — | | | | 212,496 | | | | — | |
Short-Term Bond Portfolio | | | 114,517 | | | | 99,597 | | | | 108,195 | | | | 101,684 | |
Select Bond Portfolio | | | 2,285,937 | | | | 4,758,037 | | | | 2,104,687 | | | | 4,777,961 | |
Long-Term U.S. Government Bond Portfolio | | | 575 | | | | 72,555 | | | | 3,659 | | | | 41,410 | |
Inflation Protection Portfolio | | | 116,638 | | | | 41,329 | | | | 135,144 | | | | 38,196 | |
High Yield Bond Portfolio | | | 117,713 | | | | — | | | | 119,968 | | | | — | |
Multi-Sector Bond Portfolio | | | 240,088 | | | | — | | | | 228,999 | | | | 4,230 | |
Balanced Portfolio | | | 172,894 | | | | — | | | | 273,252 | | | | — | |
Asset Allocation Portfolio | | | 27,608 | | | | — | | | | 40,298 | | | | — | |
Transactions with Affiliated Companies
An affiliated company is a company in which a Portfolio has ownership of at least 5% of the voting securities or which the Portfolio controls, is controlled by or with which the Portfolio is under common control. Transactions with affiliated companies during the year ended December 31, 2023 are as follows:
Balanced Portfolio
| | | | | | | | | | | | | | | | | | | | | | | | | | | | | | | | | | | | |
| Portfolio | | Value at 12/31/2022 | | | Purchases | | | Sales | | | Value at 12/31/2023 | | | Change in Unrealized Appreciation/ (Depreciation) | | | Realized Gain (Loss) | | | Income Dividends | | | Capital Gain Distributions | | | % Ownership, 12/31/2023 | |
| | | | | | | | | | | | | | | | | | | | | | | | | | | | |
| | | (amount in thousands) | |
Domestic Equity | | $ | 107,539 | | | $ | 5,220 | | | $ | 25,890 | | | $ | 84,676 | | | $ | (3,413 | ) | | $ | 1,220 | | | $ | 1,524 | | | $ | 3,696 | | | | 8.0 | % |
Emerging Markets | | | 13,059 | | | | 118 | | | | 8,000 | | | | 5,669 | | | | 3,473 | | | | (2,981 | ) | | | 118 | | | | – | | | | 0.6 | % |
Focused Appreciation | | | 95,215 | | | | 4,860 | | | | 50,210 | | | | 84,064 | | | | 24,652 | | | | 9,547 | | | | – | | | | 4,860 | | | | 6.6 | % |
High Yield Bond | | | 54,560 | | | | 3,036 | | | | 8,500 | | | | 52,658 | | | | 4,659 | | | | (1,097 | ) | | | 3,036 | | | | – | | | | 7.1 | % |
International Equity | | | 81,108 | | | | 2,063 | | | | 22,550 | | | | 70,049 | | | | 14,599 | | | | (5,171 | ) | | | 2,063 | | | | – | | | | 3.7 | % |
International Growth | | | 75,895 | | | | 2,020 | | | | 19,660 | | | | 70,476 | | | | 6,444 | | | | 5,777 | | | | 578 | | | | 1,441 | | | | 6.9 | % |
Large Cap Blend | | | 100,037 | | | | 7,577 | | | | 32,610 | | | | 84,360 | | | | 5,022 | | | | 4,334 | | | | 697 | | | | 6,880 | | | | 45.0 | % |
Mid Cap Growth Stock | | | 81,889 | | | | 197 | | | | 11,920 | | | | 81,861 | | | | 12,494 | | | | (799 | ) | | | 197 | | | | – | | | | 7.6 | % |
Mid Cap Value | | | 91,365 | | | | 12,071 | | | | 14,190 | | | | 82,620 | | | | (7,199 | ) | | | 573 | | | | 1,939 | | | | 10,133 | | | | 12.4 | % |
Multi-Sector Bond | | | 101,469 | | | | 2,667 | | | | – | | | | 111,320 | | | | 7,184 | | | | – | | | | 2,667 | | | | – | | | | 9.3 | % |
252
Notes to Financial Statements
| | | | | | | | | | | | | | | | | | | | | | | | | | | | | | | | | | | | | | | | |
| Portfolio | | Value at 12/31/2022 | | | Purchases | | | Sales | | | Value at 12/31/2023 | | | Change in Unrealized Appreciation/ (Depreciation) | | | Realized Gain (Loss) | | | Income Dividends | | | Capital Gain Distributions | | | | | | % Ownership, 12/31/2023 | |
| | | | | | | | | | | | | | | | | | | | | | | | | | | | | | | |
| | | (amount in thousands) | |
Select Bond | | $ | 643,027 | | | $ | 16,731 | | | $ | 25,770 | | | $ | 656,184 | | | $ | 26,129 | | | $ | (3,933 | ) | | $ | 16,730 | | | $ | – | | | | | | | | 22.6 | % |
Short-Term Bond | | | 22,825 | | | | 473 | | | | – | | | | 24,026 | | | | 728 | | | | – | | | | 473 | | | | – | | | | | | | | 6.2 | % |
Small Cap Growth Stock | | | 16,959 | | | | 6 | | | | – | | | | 20,072 | | | | 3,107 | | | | – | | | | 6 | | | | – | | | | | | | | 2.9 | % |
Small Cap Value | | | 22,920 | | | | 1,570 | | | | 2,400 | | | | 23,628 | | | | 2,195 | | | | (657 | ) | | | 112 | | | | 1,458 | | | | | | | | 4.1 | % |
| | | | | | | | |
| | $ | 1,507,867 | | | $ | 58,609 | | | $ | 221,700 | | | $ | 1,451,663 | | | $ | 100,074 | | | $ | 6,813 | | | $ | 30,140 | | | $ | 28,468 | | | | | | | | | |
| | | | | | | | |
Asset Allocation Portfolio | |
| Portfolio | | Value at 12/31/2022 | | | Purchases | | | Sales | | | Value at 12/31/2023 | | | Change in Unrealized Appreciation/ (Depreciation) | | | Realized Gain (Loss) | | | Income Dividends | | | Capital Gain Distributions | | | | | | % Ownership, 12/31/2023 | |
| | | | | | | | | | | | | | | | | | | | | | | | | | | | | | | |
| | | (amount in thousands) | |
Domestic Equity | | $ | 19,880 | | | $ | 1,089 | | | $ | 3,960 | | | $ | 16,522 | | | $ | (1,122 | ) | | $ | 635 | | | $ | 318 | | | $ | 771 | | | | | | | | 1.6 | % |
Emerging Markets | | | 2,959 | | | | 57 | | | | 400 | | | | 2,749 | | | | 217 | | | | (84 | ) | | | 57 | | | | – | | | | | | | | 0.3 | % |
Focused Appreciation | | | 18,098 | | | | 1,016 | | | | 9,240 | | | | 16,453 | | | | 4,637 | | | | 1,942 | | | | – | | | | 1,016 | | | | | | | | 1.3 | % |
High Yield Bond | | | 12,776 | | | | 739 | | | | 1,520 | | | | 12,832 | | | | 1,022 | | | | (185 | ) | | | 739 | | | | – | | | | | | | | 1.7 | % |
International Equity | | | 15,799 | | | | 428 | | | | 3,820 | | | | 14,259 | | | | 2,591 | | | | (739 | ) | | | 428 | | | | – | | | | | | | | 0.8 | % |
International Growth | | | 15,020 | | | | 411 | | | | 3,490 | | | | 14,383 | | | | 1,436 | | | | 1,006 | | | | 118 | | | | 293 | | | | | | | | 1.4 | % |
Large Cap Blend | | | 18,947 | | | | 1,350 | | | | 5,970 | | | | 16,091 | | | | 940 | | | | 824 | | | | 124 | | | | 1,226 | | | | | | | | 8.6 | % |
Mid Cap Growth Stock | | | 13,540 | | | | 34 | | | | 1,280 | | | | 14,255 | | | | 2,013 | | | | (52 | ) | | | 34 | | | | – | | | | | | | | 1.3 | % |
Mid Cap Value | | | 14,985 | | | | 2,087 | | | | 1,570 | | | | 14,325 | | | | (1,158 | ) | | | (19 | ) | | | 335 | | | | 1,752 | | | | | | | | 2.2 | % |
Multi-Sector Bond | | | 13,571 | | | | 357 | | | | – | | | | 14,888 | | | | 960 | | | | – | | | | 357 | | | | – | | | | | | | | 1.2 | % |
Select Bond | | | 44,162 | | | | 1,147 | | | | 1,400 | | | | 45,455 | | | | 1,707 | | | | (161 | ) | | | 1,147 | | | | – | | | | | | | | 1.6 | % |
Short-Term Bond | | | 3,120 | | | | 65 | | | | – | | | | 3,284 | | | | 99 | | | | – | | | | 64 | | | | – | | | | | | | | 0.9 | % |
Small Cap Growth Stock | | | 5,312 | | | | 2 | | | | 330 | | | | 5,953 | | | | 998 | | | | (29 | ) | | | 2 | | | | – | | | | | | | | 0.9 | % |
Small Cap Value | | | 6,174 | | | | 445 | | | | 740 | | | | 6,280 | | | | 585 | | | | (184 | ) | | | 32 | | | | 413 | | | | | | | | 1.1 | % |
| | | | | | | | |
| | $ | 204,343 | | | $ | 9,227 | | | $ | 33,720 | | | $ | 197,729 | | | $ | 14,925 | | | $ | 2,954 | | | $ | 3,755 | | | $ | 5,471 | | | | | | | | | |
| | | | | | | | |
The Series Fund and its Portfolios are permitted to purchase securities from, and sell securities to (so called “cross-trades”), (i) other Portfolios, (ii) any registered investment company which is an affiliate, or an affiliate of an affiliate, or (iii) any person which is an affiliate, or an affiliate of an affiliate, of the Series Fund or the Portfolio solely by reason of having a common investment adviser or sub-adviser (or affiliated investment advisers) or common directors and/or officers, pursuant to procedures adopted by the Board under Rule 17a-7 of the 1940 Act (“Procedures”). These Procedures have been designed to ensure that any cross-trade of securities by a Portfolio complies with Rule 17a-7 of the 1940 Act. Each cross-trade is effected at the current market price as defined under the Procedures. Pursuant to the Procedures, for the year ended December 31, 2023, the Series Fund Portfolios engaged in the following cross-trades (amounts in thousands):
| | | | |
| |
| Portfolio | | Cross Trade
Purchases | |
| |
International Growth Portfolio | | | $6,642 | |
Mid Cap Value Portfolio | | | 102 | |
Small Cap Growth Stock Portfolio | | | 937 | |
| | | | | | | | |
| | | Cross Trade Sales | |
| Portfolio | | Proceeds | | | Net Realized Gain
(Loss) on Sales | |
| |
International Growth Portfolio | | | $2,431 | | | | $831 | |
Mid Cap Value Portfolio | | | 99 | | | | 20 | |
253
Report of Independent Registered Public Accounting Firm
To the Board of Directors of Northwestern Mutual Series Fund, Inc. and Shareholders of Growth Stock Portfolio, Focused Appreciation Portfolio, Large Cap Core Stock Portfolio, Large Cap Blend Portfolio, Index 500 Stock Portfolio, Large Company Value Portfolio, Domestic Equity Portfolio, Equity Income Portfolio, Mid Cap Growth Stock Portfolio, Index 400 Stock Portfolio, Mid Cap Value Portfolio, Small Cap Growth Stock Portfolio, Index 600 Stock Portfolio, Small Cap Value Portfolio, International Growth Portfolio, Research International Core Portfolio, International Equity Portfolio, Emerging Markets Equity Portfolio, Government Money Market Portfolio, Short-Term Bond Portfolio, Select Bond Portfolio, Long-Term U.S. Government Bond Portfolio, Inflation Protection Portfolio, High Yield Bond Portfolio, Multi-Sector Bond Portfolio, Balanced Portfolio and Asset Allocation Portfolio
Opinions on the Financial Statements
We have audited the accompanying statements of assets and liabilities, including the schedules of investments, of Growth Stock Portfolio, Focused Appreciation Portfolio, Large Cap Core Stock Portfolio, Large Cap Blend Portfolio, Index 500 Stock Portfolio, Large Company Value Portfolio, Domestic Equity Portfolio, Equity Income Portfolio, Mid Cap Growth Stock Portfolio, Index 400 Stock Portfolio, Mid Cap Value Portfolio, Small Cap Growth Stock Portfolio, Index 600 Stock Portfolio, Small Cap Value Portfolio, International Growth Portfolio, Research International Core Portfolio, International Equity Portfolio, Emerging Markets Equity Portfolio, Government Money Market Portfolio, Short-Term Bond Portfolio, Select Bond Portfolio, Long-Term U.S. Government Bond Portfolio, Inflation Protection Portfolio, High Yield Bond Portfolio, Multi-Sector Bond Portfolio, Balanced Portfolio and Asset Allocation Portfolio (constituting Northwestern Mutual Series Fund, Inc., hereafter collectively referred to as the “Funds”) as of December 31, 2023, the related statements of operations for the year ended December 31, 2023, the statements of changes in net assets for each of the two years in the period ended December 31, 2023, and for Long-Term U.S. Government Bond Portfolio the statement of cash flows for the year ended December 31, 2023, including the related notes, and the financial highlights for each of the five years in the period ended December 31, 2023 (collectively referred to as the “financial statements”). In our opinion, the financial statements present fairly, in all material respects, the financial position of each of the Funds as of December 31, 2023, the results of each of their operations for the year then ended, the changes in each of their net assets for each of the two years in the period ended December 31, 2023, for Long-Term U.S. Government Bond Portfolio, the results of its cash flows for the year then ended, and each of the financial highlights for each of the five years in the period ended December 31, 2023 in conformity with accounting principles generally accepted in the United States of America.
Basis for Opinions
These financial statements are the responsibility of the Funds’ management. Our responsibility is to express an opinion on the Funds’ financial statements based on our audits. We are a public accounting firm registered with the Public Company Accounting Oversight Board (United States) (PCAOB) and are required to be independent with respect to the Funds in accordance with the U.S. federal securities laws and the applicable rules and regulations of the Securities and Exchange Commission and the PCAOB.
We conducted our audits of these financial statements in accordance with the standards of the PCAOB. Those standards require that we plan and perform the audit to obtain reasonable assurance about whether the financial statements are free of material misstatement, whether due to error or fraud.
254
Report of Independent Registered Public Accounting Firm
Our audits included performing procedures to assess the risks of material misstatement of the financial statements, whether due to error or fraud, and performing procedures that respond to those risks. Such procedures included examining, on a test basis, evidence regarding the amounts and disclosures in the financial statements. Our audits also included evaluating the accounting principles used and significant estimates made by management, as well as evaluating the overall presentation of the financial statements. Our procedures included confirmation of securities owned as of December 31, 2023, by correspondence with the custodian, transfer agent and brokers; when replies were not received from brokers, we performed other auditing procedures. We believe that our audits provide a reasonable basis for our opinions.

Milwaukee, WI
February 16, 2024
We have served as the auditor of one or more investment companies in Northwestern Mutual Series Fund, Inc. since 1984.
255
Abbreviations (unaudited)
Abbreviations that may be used in the preceding statements
| | |
ADR | | American Depositary Receipt |
AFC | | Available Funds Cap security - Security accrues interest at an assumed or uncapped rate. If the interest rate on the |
| | underlying loans is lower than the uncapped rate, then the security will pay at the lower rate. |
CSTR | | Collateral Strip Rate security - interest is based on the weighted net interest rate of the collateral. |
IO | | Interest Only Security |
PO | | Principal Only Security |
GDR | | Global Depositary Receipt |
GO | | General Obligation |
RB | | Revenue Bond |
CPURNSA | | U.S. Consumer Price Index - All Urban Consumers - Not Seasonally Adjusted |
IBOR | | Interbank Offered Rate |
LIBOR | | London Interbank Offered Rate |
SOFR | | Secured Overnight Financing Rate |
ICE | | Intercontinental Exchange |
SONIA | | Sterling Overnight Index Average Rate |
SONIO | | Sterling Overnight Interbank Average Rate |
MUTKCALM | | Bank of Japan Unsecured Overnight Call Rate |
DAC | | Designated Activity Company |
TBA | | To Be Announced |
CMT | | Constant Maturity Treasury |
OIS | | Overnight Index Swaps |
BBR | | Bank Bill Rate |
BBSW | | Bank Bill Swap Reference Rate |
BONCER | | National Treasury Bond in Pesos with Adjustment for CER |
DIFC | | Dubai International Financial Centre |
EURIBOR | | Euro Interbank Offered Rate |
SDR | | Swedish Depository Receipt |
ETF | | Exchange Traded Fund |
|
| Currency Abbreviations |
ARS | | Argentine Peso |
AUD | | Australian Dollar |
BRL | | Brazilian Real |
CAD | | Canadian Dollar |
CHF | | Swiss Franc |
CNH | | Chinese Yuan Renminbi - Offshore |
CNY | | Chinese Yuan Renminbi |
DKK | | Danish Krone |
EUR | | Euro |
GBP | | British Pound |
HKD | | Hong Kong Dollar |
HUF | | Hungarian Forint |
IDR | | Indonesian Rupiah |
INR | | Indian Rupee |
JPY | | Japanese Yen |
KRW | | South Korean Won |
MXN | | Mexican New Peso |
NOK | | Norwegian Krone |
PEN | | Peruvian Sol |
RUB | | Russian Ruble |
SAR | | Saudi Riyal |
SEK | | Swedish Krona |
SGD | | Singapore Dollar |
THB | | Thai Baht |
TRY | | Turkish Lira |
TWD | | Taiwan Dollar |
USD | | United States Dollar |
ZAR | | South African Rand |
256
Proxy Voting and Portfolio Holdings (unaudited)
Proxy Voting Guidelines
A description of the policies and procedures that the Portfolios use to determine how to vote proxies relating to portfolio securities is available without charge, upon request, by calling toll free 1-888-455-2232. It is also available on the Securities and Exchange Commission’s website at http://www.sec.gov.
Information regarding how the Portfolios voted proxies relating to portfolio securities during the most recent twelve-month period ended June 30 is available without charge, upon request, by calling toll free 1-888-455-2232. It is also available on the Securities and Exchange Commission’s website at http://www.sec.gov.
Quarterly Filing of Portfolio Holdings
Each Portfolio, other than the Government Money Market Portfolio, files its complete schedule of portfolio holdings on a monthly basis with the Securities and Exchange Commission (SEC) as an exhibit to its reports on Form N-PORT. Each Portfolio’s holdings reported on Form N-PORT for the first and third quarters of the fiscal year are available on the SEC’s website at http://www.sec.gov. Portfolios that file their holdings on Form N-PORT also make their complete schedule of portfolio holdings for the most recent quarter of their fiscal year available on the Internet at www.northwesternmutual.com.
The Government Money Market Portfolio files its complete schedule of portfolio holdings on a monthly basis with the SEC on Form N-MFP. Form N-MFP is available on the SEC’s website at http://www.sec.gov. The Government Money Market Portfolio also makes its complete schedule of portfolio holdings for the most recent month available on the Internet at www. northwesternmutual.com.
257
Director and Officer Information (unaudited)
Northwestern Mutual Series Fund, Inc.
The name, address and year of birth of the directors, as well as their affiliations, positions held with the Series Fund, principal occupations during the past five years and the number of portfolios overseen in the Northwestern Mutual fund complex, are shown below as of December 31, 2023, except as otherwise noted. Each director (whenever elected) shall hold office until the next annual meeting of shareholders and until his or her successor is elected and qualifies or until his or her earlier death, resignation or removal. A director shall retire at the end of the calendar year in which the first of the two events occurs: (i) he or she attains the age of seventy-three (73), or (ii) he or she has served a term or successive terms totaling fifteen (15) years, commencing on the date of his or her election or appointment to the Board. The statement of additional information contains additional information about Series Fund directors and is available without charge, upon request, by calling 1-888-455-2232.
Independent Directors
| | | | | | | | |
Name, Address, and Year of Birth | | Position | | Length of Time Served | | Number of Portfolios in Fund Complex
Overseen by Director | | Other Directorships Held1 |
| | | | |
| Gail L. Hanson | | Director | | Since 2012 | | 27 | | Director of Artisan Partner |
| 720 East Wisconsin Avenue | | | | | | | | Funds (17 portfolios) |
| Milwaukee, WI 53202 | | | | | | | | |
| 1955 | | | | | | | | |
Principal Occupation During Past 5 Years: Retired. From February 2011 to April 2018, Chief Financial Officer, Aurora Health Care. Prior thereto, Deputy Executive Director, State of Wisconsin Investment Board.
| | | | | | | | |
| Christy L. Brown | | Director | | Since 2012 | | 27 | | None |
| 720 East Wisconsin Avenue | | | | | | | | |
| Milwaukee, WI 53202 | | | | | | | | |
| 1965 | | | | | | | | |
Principal Occupation During Past 5 Years: Since July 2023, President of Alverno College (Milwaukee, Wisconsin). From 2012 to 2023, Chief Executive Officer, Girl Scouts of Wisconsin Southeast. From 2007 to 2012, Vice Chancellor, Finance and Administrative Affairs, University of
Wisconsin, Milwaukee.
| | | | | | | | |
| William J. Gerber | | Director | | Since 2017 | | 27 | | Director of Ballantyne |
| 720 East Wisconsin Avenue | | | | | | | | Strong, Inc., a developer of |
Milwaukee, WI 53202 1958 | | | | | | | | technology solutions for digital applications (2015 to present) |
Principal Occupation During Past 5 Years: Retired. From 2006 to 2015, Chief Financial Officer, and from 2007 to 2015, Executive Vice President, of TD Ameritrade Holdings Corporation.
| | | | | | | | |
| David Ribbens | | Director | | Since 2017 | | 27 | | None |
| 720 East Wisconsin Avenue | | | | | | | | |
| Milwaukee, WI 53202 | | | | | | | | |
| 1961 | | | | | | | | |
Principal Occupation During Past 5 Years: Since March of 2018, Member and Partner of DOMO Capital Management, LLC, a Wisconsin registered investment adviser. Founder and President of Distribution Team Alpha LLC, founded in 2016. From 2015 to 2016, President, Managing Partner, and Director of Heartland Advisors, Inc. From 2008 to 2015, Executive Vice President and Head of Distribution, Managing Partner, and Director of Heartland Advisors, Inc.
| | | | | | | | |
| Donald M. Ullmann | | Director | | Since 2017 | | 27 | | None |
| 720 East Wisconsin Avenue | | | | | | | | |
| Milwaukee, WI 53202 | | | | | | | | |
| 1957 | | | | | | | | |
Principal Occupation During Past 5 Years: Since 2015, Principal of DMU Financial Consulting, LLC. From 2013 to 2015, Managing Director, Head of Product Development, Fixed Income at Guggenheim Securities. From 2012 to 2013, Executive Managing Director, Co-head, MBS and Rates Division at Gleacher & Co. From 2009 to 2011, Executive Vice President, Head of Fixed Income Trading and Co-Head of Fixed Income Sales at Keefe, Bruyette and Woods, Inc.
258
Director and Officer Information (unaudited)
1. This column includes only directorships of companies required to report to the Securities and Exchange Commission (SEC) under the Securities Exchange Act of 1934, as amended (i.e., “public companies”) or other investment companies registered under the Investment Company Act of 1940, as amended.
Other Directors
| | | | | | | | |
Name, Address, and Year of Birth | | Position | | Length of Time Served | | Number of Portfolios in Fund Complex Overseen by Director | | Other Directorships Held |
| | | | |
| Michael G. Carter2 | | Chairman of the | | Since 2023 | | 27 | | None |
| 720 East Wisconsin Avenue | | Board | | | | | | |
| Milwaukee, WI 53202 | | | | | | | | |
| 1961 | | | | | | | | |
Principal Occupation During Past 5 Years: Since January 2023, Executive Vice President and Chief of Staff to the Chief Executive Officer. From 2019, Executive Vice President, Chief Financial Officer and Chief Risk Officer of The Northwestern Mutual Life Insurance Company. From 2008 through 2019, Executive Vice President and Chief Financial Officer of The Northwestern Mutual Life Insurance Company.
| | | | | | | | |
| Rosanne L. Kropp3 | | Chairman of the | | Since 2024 | | 27 | | None |
| 720 East Wisconsin Avenue | | Board | | | | | | |
| Milwaukee, WI 53202 | | | | | | | | |
| 1973 | | | | | | | | |
Principal Occupation During Past 5 Years: Since January 2022, Vice President and Head of Public Investments, The Northwestern Mutual Life Insurance Company. From November 2019 to December 2021, Vice President and Head of Investment Strategy Department at The Northwestern Mutual Life Insurance Company. From April 2016 to October 2019, Managing Director, Head of Investment Strategy at Allianz Investment Management.
2. Michael G. Carter served as a director and Chairman of the Board of Directors of the Series Fund during 2023. He resigned as a director and Chairman of the board with the Series Fund, effective January 31, 2024.
3. Rosanne L. Kropp was elected to serve as a director and Chairman of the Board of Directors of the Series Fund by resolution of the Board, effective February 1, 2024.
Northwestern Mutual Series Fund, Inc.
Executive Officers
| | | | |
Name, Address, and Year of Birth | | Position | | Length of Time Served |
| | |
| Paul A. Mikelson | | President | | Since 2022 |
| 720 East Wisconsin Avenue | | | | |
| Milwaukee, WI 53202 | | | | |
| 1970 | | | | |
Principal Occupation During Past 5 Years: Since January 2022, Vice President – Product and Administration of Mason Street Advisors. From 2013 - December 31, 2021, Vice President, Multi-Manager Investment Solutions at Columbia Threadneedle Investments, an Ameriprise Financial affiliate.
| | | | |
| Matthew P. Sullivan | | Vice President; | | Since 2023 |
| 720 East Wisconsin Avenue | | Chief Financial Officer & Treasurer | | |
| Milwaukee, WI 53202 | | | | |
| 1979 | | | | |
Since October 2023, Vice President Financial Planning and Analysis of Northwestern Mutual. From January 2023 to October 2023, Vice President and Controller of Northwestern Mutual. From June 2019 to December 2022, Vice President – Planning Experience Readiness & Adoption and from May 2016 to May 2019 Vice President of Product Finance, Northwestern Mutual and Treasurer of Northwestern Mutual Wealth Management Company.
259
Director and Officer Information (unaudited)
| | | | |
Name, Address, and Year of Birth | | Position | | Length of Time Served |
| | |
| Phil J. Rinzel | | Controller & | | Since 2021 |
| 720 East Wisconsin Avenue | | Chief Accounting Officer | | |
| Milwaukee, WI 53202 | | | | |
| 1979 | | | | |
Principal Occupation During Past 5 Years: Since 2016, Senior Director – Investment Accounting of Northwestern Mutual.
| | | | |
| Michael J. Conmey | | Chief Compliance Officer | | Since 2020 |
| 720 East Wisconsin Avenue | | | | |
| Milwaukee, WI 53202 | | | | |
| 1980 | | | | |
Principal Occupation During Past 5 Years: Vice President – Managed Investments Compliance of Northwestern Mutual and Chief Compliance Officer of Mason Street Advisors and Northwestern Mutual Investment Management Company since June 2020. Assistant General Counsel and Assistant Secretary of Northwestern Mutual from 2011 - 2020.
| | | | |
| David B. Kennedy | | Secretary | | Since 2023 |
| 720 East Wisconsin Avenue | | | | |
| Milwaukee, WI 53202 | | | | |
| 1959 | | | | |
Principal Occupation During Past 5 Years: Assistant General Counsel and Assistant Secretary of Northwestern Mutual since 2016. Secretary of Mason Street Advisors since 2020.
| | | | |
| James E. Fleming | | Vice President - Investments | | Since 2020 |
| 720 East Wisconsin Avenue | | | | |
| Milwaukee, WI 53202 | | | | |
| 1975 | | | | |
Principal Occupation During Past 5 Years: Vice President of Mason Street Advisors since 2015.
| | | | |
| Rodney A. Schmucker | | Vice President - Investments | | Since 2020 |
| 720 East Wisconsin Avenue | | | | |
| Milwaukee, WI 53202 | | | | |
| 1966 | | | | |
Principal Occupation During Past 5 Years: Vice President of Mason Street Advisors since 2015.
| | | | |
| Brent G. Schutte | | Vice President - Investments | | Since 2022 |
| 720 East Wisconsin Avenue | | | | |
| Milwaukee, WI 53202 | | | | |
| 1973 | | | | |
Principal Occupation During Past 5 Years: Since 2015, Chief Investment Officer of Northwestern Mutual Wealth Management Company
| | | | |
| Garrett D. Aird | | Vice President - Investments | | Since 2022 |
| 720 East Wisconsin Avenue | | | | |
| Milwaukee, WI 53202 | | | | |
| 1978 | | | | |
Principal Occupation During Past 5 Years: Since November 2021, Vice President – Investment Management & Research of Northwestern Mutual Wealth Management Company (NMWMC). From 2017 to November 2021, Senior Director – Research at NMWMC. Prior thereto, Assistant Director – Investments at NMWMC.
260
Approval and Continuance of Investment Advisory and Sub-Advisory Agreements (unaudited)
Northwestern Mutual Series Fund, Inc.
Annual Contract Review Process
Under Section 15(c) of the Investment Company Act of 1940, as amended (the “1940 Act”), contracts for investment advisory services are required to be reviewed, evaluated and approved by a majority of an investment company’s independent directors each year. In addition, each investment company is required to disclose in its annual or semi-annual report, as applicable, the material factors and conclusions that formed the basis for the board’s approval or renewal of any investment advisory agreements within the investment company’s most recently completed fiscal half-year period.
At least annually, the Board of Directors (the “Board”) of Northwestern Mutual Series Fund, Inc. (the “Series Fund”) considers and votes upon the renewal of the investment sub-advisory agreements between Mason Street Advisors, LLC (“Mason Street Advisors”) and each of the sub-advisers of those portfolios of the Series Fund (each, a “Portfolio” and collectively, the “Portfolios”) for which Mason Street Advisors and the Board have appointed a sub-adviser. In order to afford the Board the opportunity to focus on a smaller number of relationships at any one meeting, the Board considers the annual continuation of the sub-advisory agreements on a staggered basis during the course of the year.
Board Approvals During the Six-Month Period Ended December 31, 2023
At its September 7, 2023 meeting, the Board, including the Directors who are not “interested persons” (as that term is defined in the 1940 Act) of the Series Fund or Mason Street Advisors (the “Independent Directors” or “Directors”), unanimously approved the following Investment Sub-Advisory Agreements: (1) a Fourth Amended and Restated Investment Sub-Advisory Agreement between Mason Street Advisors and American Century Investment Management, Inc. (“American Century”), relating to the Series Fund’s Mid Cap Value, Large Company Value and Inflation Protection Portfolios, (2) a Third Amended and Restated Investment Sub-Advisory Agreement between Mason Street Advisors and Delaware Investments Fund Advisers, a series of Macquarie Investment Management Business Trust (“Delaware”) relating to the Series Fund’s Domestic Equity Portfolio, (3) a Third Amended and Restated Investment Sub-Advisory Agreement between Mason Street Advisors and Federated Investment Management Company (“Federated”) relating to the Series Fund’s High Yield Bond Portfolio, and (4) a Third Amended and Restated Investment Sub-Advisory Agreement between Mason Street Advisors and Loomis, Sayles & Company, L.P. (“Loomis Sayles”) relating to the Series Fund’s Focused Appreciation Portfolio. Each of the foregoing Investment Sub-Advisory Agreements approved by the Board at its September 7, 2023 meeting continued the existing sub-advisory contract relationship with the named sub-advisers. The existing Investment Sub-Advisory Agreements were amended and restated to reflect modifications to incorporate certain updated terms and conditions.
At its November 30, 2023 meeting, the Board, including the Independent Directors, unanimously approved the continuance of: (1) the Amended and Restated Investment Sub-Advisory Agreement between Mason Street Advisors and T. Rowe Price Investment Management, Inc. (“TRPIM”) dated November 30, 2022, relating to the Small Cap Value Portfolio; (2) the Sixth Amended and Restated Investment Sub-Advisory Agreement between Mason Street Advisors and T. Rowe Price Associates, Inc. (“TRPA”) dated November 30, 2022, relating to the Equity Income, Growth Stock and Short-Term Bond Portfolios; (3) the Fourth Amended and Restated Investment Sub-Advisory Agreement between Mason Street Advisors and Pacific Investment Management Company LLC (“PIMCO”) dated November 30, 2022, relating to the Long-Term U.S. Government Bond and Multi-Sector Bond Portfolios, together with an amendment thereto incorporating a sub-advisory fee reduction with respect to the Multi-Sector Bond Portfolio; (4) the Third Amended and Restated Investment Sub-Advisory Agreement between Mason Street Advisors and BlackRock Advisors, LLC (“BlackRock”), dated November 30, 2022, relating to the Government Money Market Portfolio (together with an amendment thereto incorporating a sub-advisory fee reduction with respect to the Government Money Market Portfolio) and the Amended and Restated Investment Sub-Advisory Agreement between Mason Street Advisors and BlackRock, dated November 30, 2022 related to the Index 500 Stock Portfolio; and (5) the Amended and Restated Investment Sub-Advisory Agreement between Mason Street Advisors and Allspring Global Investments, LLC (“Allspring”) dated November 30, 2022, relating to the Select Bond Portfolio (together with an amendment thereto incorporating a fee reduction related to the Select Bond Portfolio).
261
Approval and Continuance of Investment Advisory and Sub-Advisory Agreements (unaudited)
American Century, Delaware, Federated, Loomis Sayles, TRPIM, TRPA, PIMCO, BlackRock and Allspring are sometimes collectively referred to hereinafter as the “Sub-Advisers,” and their respective sub-advised Portfolios are collectively referred to herein as the “Sub-Advised Portfolios.” The respective Investment Sub-Advisory Agreements with the Sub-Advisers are collectively referred to herein as the “Sub-Advisory Agreements.”
In determining whether to approve the Sub-Advisory Agreements on behalf of the Series Fund, the Board requested and received detailed information from Mason Street Advisors and the Sub-Advisers in advance of each of the foregoing meetings to assist them in their evaluation, including information compiled by certain independent providers of evaluative data. With respect to the approval and continuation of the Sub-Advisory Agreements, while particular focus was given to an evaluation of the services, performance, fees, costs, and certain other relevant information under such Agreements at the meeting at which their approval was formally considered, the evaluation process with respect to the Sub-Advisers and the nature, extent and quality of the services they provide to the Sub-Advised Portfolios pursuant to the terms of the Sub-Advisory Agreements is an ongoing one. As a result, the Board’s consideration of such services, and the performance, fees, costs and other relevant factors was informed by information provided and deliberations that occurred at other meetings throughout the year.
The Independent Directors received a memorandum from their counsel advising them of their responsibilities in connection with the consideration of continuance and approval of the Sub-Advisory Agreements and summarizing the legal standards governing the review and approval of these Agreements. The Independent Directors reviewed these standards with their counsel during the course of the meetings, including how these standards should be applied to the review of information relating to the Sub-Advisers under the Series Fund’s manager of managers structure. During the course of their deliberations, the Independent Directors had the opportunity to meet privately without representatives of Mason Street Advisors or the Sub-Advisers present, and were represented throughout the process by legal counsel.
Approval and Continuation of the Sub-Advisory Agreements between Mason Street Advisors and Certain Sub-Advisors
At its September 7, 2023 and November 30, 2023 meetings, the Board, including the Independent Directors, unanimously approved the Sub-Advisory Agreements. In connection with those meetings, the Directors received a presentation from representatives of each Sub-Adviser involved in the management of the respective Sub-Advised Portfolios. In addition to the information presented by and about the Sub-Advisers during the course of those meetings, the Directors also had available for consideration each Sub-Adviser’s Section 15(c) Report, which contained responses to the information request letter prepared by counsel to the Independent Directors requesting certain information from the Sub-Advisers designed to assist the Directors in fulfilling their responsibilities when considering the approval of the Sub-Advisory Agreements. The Directors also had available Mason Street Advisors’ Executive Summary and Overview regarding each of the Sub-Advisers, and other materials prepared by Mason Street Advisors. The materials contained detailed information on performance over multiple time periods, expenses, brokerage commissions, portfolio turnover, style consistency, key portfolio statistics and metrics, and other factors with respect to each of the Sub-Advised Portfolios. The materials also contained an analysis of the Sub-Advisers’ responses to the compliance questions contained in the Section 15(c) Report and the observations of the Series Fund’s Chief Compliance Officer regarding the compliance structure and practices of each of the Sub-Advisers. The Directors also considered their experience with and knowledge of the nature and quality of the services provided by the Sub-Advisers and their ongoing discussions with representatives of Mason Street Advisors, its affiliates and each Sub-Adviser.
The material factors and conclusions that formed the basis for the Board’s approval of each of the Sub-Advisory Agreements include those discussed below. No one particular factor was identified as determinative, but rather it was a combination of all the factors and conclusions that formed the basis for the determinations made by the Board. Further, different Directors may have placed greater weight on certain factors than did other Directors.
Nature, Extent and Quality of Services. In considering the nature, extent and quality of each Sub-Adviser’s services the Directors reviewed each Sub-Adviser’s financial strength, assets under management, and overall reputation. The Directors evaluated the investment strategies employed by each Sub-Adviser, as well as the personnel providing such services with respect to each Sub-Advised Portfolio. With respect to TRPIM, the Directors considered the additions to the investment team, including a therapeutics sector analyst and a technology analyst. With respect to the Short-Term Bond Portfolio
262
Approval and Continuance of Investment Advisory and Sub-Advisory Agreements (unaudited)
managed by TRPA, the Directors considered the addition of a co-portfolio manager with a strong background in securitized products. With respect to the Multi-Sector Bond Portfolio managed by PIMCO, the Directors cited favorably the replacement of the portfolio manager, the changes made in the positioning of the Portfolio as well as the addition of investment team members. With respect to BlackRock, the Directors noted that the firm benefitted from its substantial resources and top class technology. The Directors considered informational updates given by the portfolio managers associated with each Sub-Adviser, which included reports regarding how the Sub-Advised Portfolios were being positioned in the current market environment. The Directors also considered Mason Street Advisors’ reports on due diligence visits and conference calls that had been conducted with certain of the Sub-Advisers.
The Directors also considered and expressed satisfaction with each Sub-Adviser’s investment philosophy and process and the scope of services provided by the Sub-Advisers. Consideration was also given to the Sub-Advisers’ respective reputations and experience in providing investment management services and the performance of each Sub-Advised Portfolio. Based on their review of these factors, their discussions with the Sub-Advisers, and their experience with the services provided by the Sub-Advisers for their respective Sub-Advised Portfolios, the Board concluded, within the context of their overall determinations regarding the Sub-Advisory Agreements, that they were satisfied with the nature, extent and quality of services, and the resources committed by each Sub-Adviser in providing those services, and were satisfied with the experience and capabilities of the Sub-Advisers and the personnel associated with the Sub-Advised Portfolios.
Investment Performance. The Directors reviewed the investment performance of each of the Sub-Advised Portfolios over a variety of time periods. In addition to reviewing the performance of each Sub-Advised Portfolio for both short-term and long-term periods, the Directors considered (i) a comparison of each Sub-Advised Portfolio’s one-, three- and five-year (as applicable) performance to the returns of appropriate benchmarks and indices, and to the performance averages of each Sub-Advised Portfolio’s respective Morningstar and Lipper peer groups for the same periods, (ii) the Morningstar overall star rating and Lipper quintile rating for each Sub-Advised Portfolio and (iii) the Morningstar and the Lipper performance rankings for one-, three- and five-year time periods (as applicable). The Directors evaluated each Sub-Advised Portfolio’s performance against these peer groups and industry benchmarks and indices, and viewed this information as providing an objective comparative benchmark against which they could assess the performance of the Sub-Advised Portfolios. The Directors further considered the performance of accounts managed in a similar manner by each of the Sub-Advisers and information from the Sub-Advisers regarding any significant differences in the performance of those accounts from that of the Sub-Advised Portfolios.
With respect to American Century, the Directors considered that the Large Company Value and the Mid Cap Value Portfolios had experienced near-term performance challenges, arising in part through stock selection. The Directors observed that the portfolio managers for these Portfolios had provided thoughtful answers to the questions posed by Board members during their presentations and that in each case the American Century investment team had been disciplined in consistently adhering to the investment style applicable to Portfolio’s investment strategy. The Directors affirmed that on a long-term basis American Century had delivered solid performance for these Portfolios. With respect to the Inflation Protection Portfolio, the Directors were satisfied with the Portfolio’s performance, expressed a high level of confidence in the portfolio manager for the Portfolio, and cited no concerns.
With respect to Federated, the Directors commented on the very positive long-term performance record and observed favorably that the portfolio manager had been consistent in adhering to the firm’s investment strategy applied to the High Yield Portfolio. With respect to Loomis Sayles, the Directors noted that performance returns for the Focused Appreciation Portfolio had been strong in the near-term and affirmed there were no current concerns with respect to performance of the Portfolio.
With respect to Delaware and the Domestic Equity Portfolio, the Directors expressed concerns regarding multiple periods of challenged performance returns. The Directors also expressed concerns with regard to the portfolio manager’s security selection, but noted that the portfolio manager from Delaware provided cogent and well-reasoned responses with respect to inquiries made by the Directors regarding individual stock decisions made for the Domestic Equity Portfolio. Additionally, the Directors also commented that Delaware had been experiencing asset outflows from the firm’s domestic equity strategy.
263
Approval and Continuance of Investment Advisory and Sub-Advisory Agreements (unaudited)
With respect to the Small Cap Value Portfolio managed by TRPIM, the Directors considered the Small Cap Value Portfolio’s performance in light of the investment team’s fundamentally-driven strategy, noting that the firm’s analytical work and research process was very robust. With regard to the Growth Stock Portfolio, the Directors considered that the portfolio managers demonstrated a thoughtful understanding of risk factors and noted that recently-implemented risk management tools showed positive initial results. With respect to the Multi-Sector Bond Portfolio managed by PIMCO, the Directors considered enhancements made to its process around credit analysis and cited positively the firm’s research capabilities. With respect to the Government Money Market Portfolio managed by BlackRock, the Directors expressed high confidence that the firm would correctly implement the new money market fund reforms. With respect to the Select Bond Portfolio managed by Allspring, the Directors expressed satisfaction with the investment performance, noting that results were very solid and that the firm excelled in finding value within sectors.
The Directors observed that the portfolio managers for each of the Sub-Advised Portfolios had provided thoughtful answers to the questions posed by the Directors and that in each case the Sub-Advisers firm had been disciplined in consistently adhering to the investment style applicable to the individual Portfolio.
In addition to performance information presented at the meeting, the Directors considered the performance information, market commentary, portfolio analysis and portfolio manager presentations they received periodically throughout the year. Generally speaking, while attentive to the short-term performance results because of the trend that such performance might signal, the Directors placed greater weight on longer-term performance. For the reasons summarized above, the Board concluded that, considering the investment performance within the context of its overall determinations regarding the Sub-Advisory Agreements, it was satisfied with the relative investment performance of the Sub-Advised Portfolios.
Management Fees and Other Expenses. The Directors evaluated the reasonableness of the management fees and total expenses paid by the Sub-Advised Portfolios under the Sub-Advisory Agreements. The Directors considered the actual and contractual fees paid by each Sub-Advised Portfolio. The Directors also considered the sub-advisory fees paid by Mason Street Advisors out of its management fee, including a comparison of those fees with fees charged by the respective Sub-Advisers for similarly managed accounts. In considering the level of management fees, the Directors also considered the size of the Sub-Advised Portfolios, expenses assumed by Mason Street Advisors, and the applicable expense limitation and/or fee waiver arrangements agreed to by Mason Street Advisors with respect to each Sub-Advised Portfolio.
As part of their evaluation, the Directors received and reviewed an independent analysis prepared by Broadridge of comparative expense data for each Sub-Advised Portfolio. Broadridge provided data as of December 31, 2022 comparing each Sub-Advised Portfolio’s net and total expenses with those in a category of funds underlying variable insurance products. Categories were selected by Broadridge based upon having similar investment classifications, objectives, and asset allocations. The Directors considered the comparative data as a guide to help assess the reasonableness of each Sub-Advised Portfolio’s net and total expense ratios. The Directors considered that the Broadridge expense rankings of the Mid Cap Value Portfolio sub-advised by American Century, the Domestic Equity Portfolio sub-advised by Delaware, the High Yield Bond Portfolio sub-advised by Federated, the Focused Appreciation Portfolio sub-advised by Loomis Sayles, the Short-Term Bond, Equity Income and Growth Stock Portfolios sub-advised by TRPA, the Select Bond Portfolio sub-advised by Allspring, and the Index 500 Stock Portfolio sub-advised by BlackRock, were in the top Broadridge quartile (meaning lowest net expenses) of their respective categories. The Directors considered that the expense rankings of the Large Company Value and Inflation Protection Portfolios sub-advised by American Century, the Small Cap Value Portfolio sub-advised by TRPIM, the Long-Term U.S. Government Bond and Multi-Sector Bond Portfolios sub-advised by PIMCO, and the Government Money Market Portfolio sub-advised by BlackRock were within the second quartile of their respective categories. The Directors also considered that reduced sub-advisory fee schedules would be put into place for: (i) the Mid Cap Value, Large Company Value and Inflation Protection Portfolios in connection with the approval of the amended and restated Sub-Advisory Agreement with American Century; (ii) the Domestic Equity Portfolio in connection with the approval of the amended and restated Sub-Advisory Agreement with Delaware; (iii) the Multi-Sector Bond Portfolio in connection with the renewal of the Sub-Advisory Agreement with PIMCO; (iv) the Government Money Market Portfolio in connection with the renewal of the Sub-Advisory Agreement with BlackRock; and (v) the Select Bond Portfolio in connection with the renewal of the Sub-Advisory Agreement with Allspring.
264
Approval and Continuance of Investment Advisory and Sub-Advisory Agreements (unaudited)
Based on their review of the above information and other factors deemed relevant by the Directors, the Board concluded that the management fees and total operating expenses of each of the Sub-Advised Portfolios were reasonable in relation to the nature, scope and quality of services provided and the performance of the Sub-Advised Portfolios over time and the expense limitation and fee waivers that are in place.
Costs and Profitability. The Directors reviewed information provided by Mason Street Advisors regarding the profitability realized by Mason Street Advisors from the Sub-Advised Portfolios. The Directors considered Mason Street Advisors’ fee and expense analysis regarding fees, expenses and profit margins related to the Sub-Advised Portfolios on a per Portfolio basis, and Mason Street Advisors’ allocation methodology with respect to expenses. The profitability information presented for the Directors’ consideration was supplemented by the aforementioned information regarding the expense-based ranking of each Sub-Advised Portfolio within the Portfolio’s respective Broadridge peer group category. The Directors recognized that the sub-advisory fees were the result of arm’s-length negotiations between Mason Street Advisors and such Sub-Advisers. The Directors also recognized that there are limitations inherent in allocating costs and calculating profitability for organizations such as the Sub-Advisers, and that it is difficult to make comparisons of profitability among investment advisers because comparative information is not generally publicly available and, when available, such information may have been developed using a variety of assumptions and other factors. The Directors concluded that they had received sufficient information to evaluate the issues related to costs and profitability.
The Directors considered certain fall-out benefits that may be realized by Mason Street Advisors and its affiliates due to their relationship with the Sub-Advised Portfolios, including the participation of mutual fund families advised by certain Sub-Advisers to the Sub-Advised Portfolios on the brokerage platform maintained by a brokerage affiliate of Mason Street Advisors, the participation of such fund families in mutual fund partner programs offered by such brokerage affiliate, and the payment of fees by the fund families based upon participation on the brokerage platform and the mutual fund partner program maintained by the brokerage affiliate of Mason Street Advisors. The Directors reviewed information concerning certain of the Sub-Advisers’ soft dollar arrangements and any other benefits to the Sub-Advisers arising from their relationships with the Sub-Advised Portfolios. Based on their review, the Board concluded, within the context of their overall determinations regarding the Sub-Advisory Agreements, that they were satisfied that the fees paid by each of the Sub-Advised Portfolios, and the profits realized by Mason Street Advisors and the Sub-Advisers due to their relationship with the Sub-Advised Portfolios, were not excessive.
Economies of Scale. The Directors considered whether each Sub-Advised Portfolio’s expense structure permitted economies of scale to be shared with the Sub-Advised Portfolio’s investors. The Directors considered the breakpoints contained in the advisory fee schedules for the Sub-Advised Portfolios, as applicable, and the extent to which each Sub-Advised Portfolio may benefit from economies of scale through those breakpoints. The Directors took into account the expense limitation arrangements in place for the Mid Cap Value, Large Company Value, Inflation Protection, Domestic Equity, Focused Appreciation, Short-Term Bond, Small Cap Value, Equity Income, Long-Term U.S. Government Bond and Multi-Sector Bond Portfolios, and the fee waiver arrangements in place with respect to the Mid Cap Value, Large Company Value, Inflation Protection, Domestic Equity, High Yield Bond, Focused Appreciation, Short-Term Bond, Small Cap Value, Equity Income, Growth Stock, Select Bond, Long-Term U.S. Government Bond, Multi-Sector Bond, Government Money Market, and Index 500 Stock Portfolios. The Directors also considered the total assets and expense ratio of each Sub-Advised Portfolio. Based on this information, the Board concluded, within the context of its overall determinations regarding the Sub-Advisory Agreements, that each Sub-Advised Portfolio’s fee structure reflected appropriate economies of scale for the benefit of such Portfolio’s investors.
Other Information. The Directors were presented with other information intended to assist them in their consideration of the continuation of the Sub-Advisory Agreements, including information about the services provided by affiliates of Mason Street Advisors to the Sub-Advised Portfolios and information regarding Mason Street Advisors’ and the Sub-Advisers’ brokerage practices and commissions. The Directors took into consideration reports from Mason Street Advisors on its review of the respective compliance programs of the Sub-Advisers, including any recent compliance exceptions noted and the applicable Sub-Adviser’s response. Also considered were key affiliations and business relationships between the Sub-Advisers and their affiliates and Mason Street Advisors’ parent company and affiliates. Their review further included information relating to each
265
Approval and Continuance of Investment Advisory and Sub-Advisory Agreements (unaudited)
Sub-Adviser’s risk management infrastructure, pending or recent litigation or regulatory actions to which an Sub-Adviser or its affiliates may have been a party, and the applicable Sub-Adviser’s responses to those actions. The Directors also considered information regarding each Sub-Adviser’s code of ethics, approach to portfolio manager compensation, succession planning, as well as information supplied by the Sub-Advisers related to their cybersecurity programs and business continuity plans, and other matters they deemed relevant.
Conclusions of the Directors. Based on a consideration of all information deemed relevant in its totality, the Board, including the Independent Directors, and assisted by the advice of legal counsel independent of Mason Street Advisors, in the exercise of their reasonable business judgment concluded that the terms of the Sub-Advisory Agreements were fair and reasonable and approved each Sub-Advisory Agreement as being in the best interests of each Portfolio.
266
(b) Not applicable.
(a)(2) Separate certifications for the Registrant’s principal executive officer and principal financial officer, as required by Section 302 of the Sarbanes-Oxley Act of 2002 and Rule 30a-2(a) under the Investment Company Act of 1940, are attached as exhibit EX-99.CERT.
(a)(3) Not applicable.
(a)(4) Not applicable.
(b) Separate certifications for the Registrant’s principal executive officer and principal financial officer, as required by 18 U.S.C. Section 1350, as adopted pursuant to Section 906 of the Sarbanes-Oxley Act of 2002, and Rule 30a-2(b) under the Investment Company Act of 1940, are attached as exhibit EX-99.906CERT. The certifications furnished pursuant to this paragraph are not deemed to be “filed” for purposes of Section 18 of the Securities Exchange Act of 1934, or otherwise subject to the liability of that section. Such certifications are not deemed to be incorporated by reference into any filing under the Securities Act of 1933 or the Securities Exchange Act of 1934, except to the extent that the Registrant specifically incorporates them by reference.
Pursuant to the requirements of the Securities Exchange Act of 1934 and the Investment Company Act of 1940, the Registrant has duly caused this report to be signed on its behalf by the undersigned, thereunto duly authorized.
| | |
| NORTHWESTERN MUTUAL SERIES FUND, INC. |
| |
| By: | | /s/ Paul A. Mikelson |
| | Paul A. Mikelson, President |
| |
| Date: | | March 14, 2024 |
Pursuant to the requirements of the Securities and Exchange Act of 1934 and the Investment Company Act of 1940, this report has been signed below by the following persons on behalf of the registrant and in the capacities and on the dates indicated.
| | |
| |
| By: | | /s/ Paul A. Mikelson |
| | Paul A. Mikelson, President |
| |
| Date: | | March 14, 2024 |
| |
| By: | | /s/ Matthew P. Sullivan |
| | Matthew P. Sullivan, Vice President, |
| | Chief Financial Officer and Treasurer |
| |
| Date: | | March 14, 2024 |