UNITED STATES
SECURITIES AND EXCHANGE COMMISSION
Washington, D.C. 20549
FORM N-CSR
CERTIFIED SHAREHOLDER REPORT OF REGISTERED
MANAGEMENT INVESTMENT COMPANIES
Investment Company Act file number 811-3990
Northwestern Mutual Series Fund, Inc.
(Exact name of registrant as specified in charter)
720 East Wisconsin Avenue,
Milwaukee Wisconsin 53202
(Address of principal executive offices) (Zip code)
Barbara E. Courtney, Controller and Chief Accounting Officer Northwestern Mutual Series Fund, Inc.
(Name and address of agent for service)
Registrant’s telephone number, including area code: 414-271-1444
Date of fiscal year end: December 31
Date of reporting period: December 31, 2016
Form N-CSR is to be used by management investment companies to file reports with the Commission not later than 10 days after the transmission to stockholders of any report that is required to be transmitted to stockholders under Rule 30e-1 under the Investment Company Act of 1940 (17 CFR 270.30e-1). The Commission may use the information provided on Form N-CSR in its regulatory, disclosure review, inspection, and policymaking roles.
A registrant is required to disclose the information specified by Form N-CSR, and the Commission will make this information public. A registrant is not required to respond to the collection of information contained in Form N-CSR unless the Form displays a currently valid Office of Management and Budget (“OMB”) control number. Please direct comments concerning the accuracy of the information collection burden estimate and any suggestions for reducing the burden to Secretary, Securities and Exchange Commission, 450 Fifth Street, NW, Washington, DC 20549-0609. The OMB has reviewed this collection of information under the clearance requirements of 44 U.S.C. § 3507.
| Item 1. | Reports to Stockholders |
Annual Report December 31, 2016
Northwestern Mutual Series Fund, Inc.
A Series Fund Offering 27 Portfolios
| | · | | Focused Appreciation Portfolio |
| | · | | Large Cap Core Stock Portfolio |
| | · | | Large Cap Blend Portfolio |
| | · | | Index 500 Stock Portfolio |
| | · | | Large Company Value Portfolio |
| | · | | Domestic Equity Portfolio |
| | · | | Equity Income Portfolio |
| | · | | Mid Cap Growth Stock Portfolio |
| | · | | Index 400 Stock Portfolio |
| | · | | Mid Cap Value Portfolio |
| | · | | Small Cap Growth Stock Portfolio |
| | · | | Index 600 Stock Portfolio |
| | · | | Small Cap Value Portfolio |
| | · | | International Growth Portfolio |
| | · | | Research International Core Portfolio |
| | · | | International Equity Portfolio |
| | · | | Emerging Markets Equity Portfolio |
| | · | | Government Money Market Portfolio |
| | · | | Short-Term Bond Portfolio |
| | · | | Long-Term U.S. Government Bond Portfolio |
| | · | | Inflation Protection Portfolio |
| | · | | High Yield Bond Portfolio |
| | · | | Multi-Sector Bond Portfolio |
| | · | | Asset Allocation Portfolio |
Letter to Contract Holders
December 31, 2016
The U.S. stock and bond markets delivered positive returns for 2016, as U.S. stocks extended the second longest bull market since 1929 to nearly eight years. A sharp selloff early in the year, relatively large swings in commodities prices and the U.S. dollar, and shifting political currents in the U.S. and abroad rippled beneath the surface of the broad market returns. In short, the year demonstrated the resiliency of capital markets in the face of significant change.
Markets experienced a sharp selloff early in 2016, as U.S. oil and gas production downshifted from their all-time record highs amid the lowest oil prices in 13 years, which led to concerns of a broader contagion in energy-related debt, banking, and commodity currencies. Ultimately, slower production helped commodities prices rebound from their lows, and market participants breathed a collective sigh of relief. The equity market steadily climbed the wall of worry for the remainder of the year, finishing the year at record highs.
Within the U.S. equity market, as measured by the various Standard & Poor’s® Indices1, small and mid cap stocks posted the best returns, while large cap multinationals lagged somewhat, reflecting investors’ preference for riskier assets during the year.
The bond market, as defined by various Bloomberg Barclays® Indices, delivered a relatively stable return, benefitting from the combination of decelerating economic growth and low inflation. The year’s performance was characterized by strong demand for yield in the low yielding environment. High yield corporate bonds led the market, followed by strong performance from high quality corporate bonds. Lower risk and lower yield government debt lagged the higher yielding sectors of the bond market, as short term interest rates rose and longer term interest rates fell for the year.
U.S. stocks and bonds outperformed their global counterparts, as the trade-weighted U.S. dollar hit a 13-year high. For U.S. investors, a rising dollar decreases the return of foreign investments, while a declining dollar increases the return of foreign assets. Diverging monetary policy—rising short term interest rates in the U.S. and accommodative monetary policy abroad—amid low inflation and comparatively stronger U.S. economic growth were among the drivers of the U.S. dollar’s strong performance.
Despite expectations of multiple Fed rate increases in 2016, the sluggish economic environment and lack of inflationary pressure led the Fed to hold short-term interest rates steady for most of the year, citing inflation well below its 2.0% target and the need for stronger employment growth. In December, the Board of Governors voted to raise the overnight lending rate by a quarter point, or 0.25%, as advancing stock prices and rising bond yields in the wake of the U.S. presidential election gave the Fed reason for caution.
During 2016, the U.S. economy’s continued below-average economic growth, led to policy debates about how best to diagnose and revive the sluggish global economy. And unexpected political surprises like the U.S. Presidential election and the United Kingdom’s vote to leave the European Union, commonly called “Brexit”, became new sources of political uncertainty. These events exemplified the difficulty of timing the markets. Even if an investor effectively called the outcomes of the political events, the sustained market response often differed from the initial reaction. In the case of Brexit, sharp volatility in the United Kingdom was felt strongest by the British pound, while the initial downturn of the equity market was followed by a steady rebound in British stocks. Similarly, in the U.S., few would have predicted that Donald Trump’s win would have been followed by a sustained rally in the equity market. As such, we continue to see more opportunity in maintaining a diversified portfolio over time, rather than trying to predict sudden swings in market performance.
The volatility that markets experienced in early 2016 also serves as a reminder for investors to assess whether their portfolios remain adequately diversified in accordance with their long term investment goals and risk tolerance. Portfolios tend to become unbalanced over time, as the outperformance of a certain asset class can lead to a higher concentration of that asset class in an investor’s portfolio. Unbalanced portfolios can create unnecessary risks for financial planning.
In light of this, an investor might consider whether it would be appropriate to return to his or her previously established asset class allocation levels by reallocating the gains of higher performing classes.2 Similar to all financial decisions, an investor should approach rebalancing with the guidance of a financial professional to pinpoint the appropriate allocation for his or her individual portfolio, current financial situation and overall financial plan. As always, we encourage you to work closely with your financial professional through the ups and downs of the financial markets in 2017, as they can help you develop and adhere to a plan that will be guided by your long term goals, rather than the short term fluctuations of the market.

Kate M. Fleming
President of Northwestern Mutual Series Fund, Inc.
1 All indices and/or benchmarks referenced are unmanaged and cannot be invested in directly.
2 A strategy involving portfolio rebalancing cannot assure a profit or protect against loss in a declining market. Not intended to be investment advice.
Northwestern Mutual Series Fund, Inc.
Table of Contents
| | | | |
Expense Examples | | | i | |
Series Fund Overviews and Schedules of Investments: | | | | |
Growth Stock Portfolio | | | 1 | |
Focused Appreciation Portfolio | | | 5 | |
Large Cap Core Stock Portfolio | | | 8 | |
Large Cap Blend Portfolio | | | 11 | |
Index 500 Stock Portfolio | | | 14 | |
Large Company Value Portfolio | | | 22 | |
Domestic Equity Portfolio | | | 27 | |
Equity Income Portfolio | | | 30 | |
Mid Cap Growth Stock Portfolio | | | 35 | |
Index 400 Stock Portfolio | | | 39 | |
Mid Cap Value Portfolio | | | 46 | |
Small Cap Growth Stock Portfolio | | | 51 | |
Index 600 Stock Portfolio | | | 56 | |
Small Cap Value Portfolio | | | 66 | |
International Growth Portfolio | | | 70 | |
Research International Core Portfolio | | | 74 | |
International Equity Portfolio | | | 79 | |
Emerging Markets Equity Portfolio | | | 84 | |
Government Money Market Portfolio | | | 90 | |
Short-Term Bond Portfolio | | | 94 | |
Select Bond Portfolio | | | 107 | |
Long-Term U.S. Government Bond Portfolio | | | 124 | |
Inflation Protection Portfolio | | | 130 | |
High Yield Bond Portfolio | | | 142 | |
Multi-Sector Bond Portfolio | | | 152 | |
Balanced Portfolio | | | 170 | |
Asset Allocation Portfolio | | | 175 | |
Benchmark Definitions | | | 180 | |
Statements of Assets and Liabilities | | | 182 | |
Statements of Operations | | | 186 | |
Statements of Changes in Net Assets | | | 190 | |
Statement of Cash Flows | | | 197 | |
Financial Highlights | | | 198 | |
Notes to Financial Statements | | | 206 | |
Report of Independent Registered Public Accounting Firm | | | 231 | |
Proxy Voting and Portfolio Holdings | | | 232 | |
Director and Officer Information | | | 233 | |
Special Meeting of Shareholders | |
| 236
|
|
Approval and Continuance of Investment Advisory and Sub-Advisory Agreements | | | 238 | |
Mason Street Advisors, LLC (“Mason Street Advisors”), adviser to the Northwestern Mutual Series Fund, Inc., is a wholly owned subsidiary of The Northwestern Mutual Life Insurance Company. Mason Street Advisors is the principal investment adviser for all the Portfolios of the Northwestern Mutual Series Fund, Inc., and has engaged and oversees sub-advisers who provide day-to-day management for certain of the Portfolios. Each sub-adviser may be replaced without the approval of shareholders. Please see the Series Fund prospectus for more information.
The views expressed in the portfolio manager commentaries set forth in the following pages reflect those of the portfolio managers only through the end of the period covered by this report and do not necessarily represent the views of any affiliated organization. The views expressed are not guarantees of future performance or economic results and involve certain risks, uncertainties and assumptions that could cause actual outcomes and results to differ materially from the views expressed herein. These views are subject to change at any time based upon market conditions or other events and should not be relied upon as investment advice. Mason Street Advisors disclaims any responsibility to update these views.
Expense Examples (unaudited)
Example
As a shareholder of each Portfolio, you incur two types of costs: (1) transaction costs and (2) ongoing costs, including management fees and other Portfolio expenses. This Example is intended to help you understand your ongoing costs (in dollars) of investing in the Portfolios and to compare these costs with the ongoing costs of investing in other mutual funds.
The Example is based on an investment of $1,000 invested at the beginning of the period and held for the entire period (July 1, 2016 to December 31, 2016).
Actual Expenses
The first line of the table below provides information about actual account values and actual expenses. You may use the information in this line, together with the amount you invested, to estimate the expenses that you paid over the period. Simply divide your account value by $1,000 (for example, an $8,600 account value divided by $1,000 = 8.6), then multiply the result by the number in the first line under the heading entitled “Expenses Paid During Period” to estimate the expenses you paid on your account during this period.
Hypothetical Example for Comparison Purposes
The second line of the table below for each Portfolio provides information about hypothetical account values and hypothetical expenses based on each Portfolio’s actual expense ratio and an assumed rate of return of 5% per year before expenses, which is not the Portfolio’s actual return. The hypothetical account values and expenses may not be used to estimate the actual ending account balance or expenses you paid for the period. You may use this information to compare the ongoing costs of investing in a Portfolio and other funds. To do so, compare this 5% hypothetical example with the 5% hypothetical examples that appear in the shareholder reports of the other funds.
Please note that the expenses shown in the table are meant to highlight your ongoing costs only and do not reflect any transactional costs or separate account charges. Therefore, the second line of the table is useful in comparing ongoing costs only, and will not help you determine the relative total costs of owning different funds. In addition, if these transactional costs or separate account charges were included, your costs would have been higher.
| | | | | | | | | | | | | | | | |
| | | Beginning Account Value July 1, 2016 | | | Ending Account Value December 31, 2016 | | | Expenses Paid During
Period July 1, 2016 to December 31, 2016* | | | Annualized
Expense Ratio | |
| | | | |
Growth Stock Portfolio | | | | | | | | | | | | | | | | |
Actual | | | $1,000.00 | | | | $1,025.04 | | | | $2.19 | | | | 0.43 | % |
Hypothetical (5% return before expenses) | | | 1,000.00 | | | | 1,022.97 | | | | 2.19 | | | | 0.43 | |
| | | | |
Focused Appreciation Portfolio | | | | | | | | | | | | | | | | |
Actual | | | 1,000.00 | | | | 1,034.79 | | | | 3.22 | | | | 0.63 | |
Hypothetical (5% return before expenses) | | | 1,000.00 | | | | 1,021.97 | | | | 3.20 | | | | 0.63 | |
| | | | |
Large Cap Core Stock Portfolio | | | | | | | | | | | | | | | | |
Actual | | | 1,000.00 | | | | 1,042.58 | | | | 2.31 | | | | 0.45 | |
Hypothetical (5% return before expenses) | | | 1,000.00 | | | | 1,022.87 | | | | 2.29 | | | | 0.45 | |
| | | | |
Large Cap Blend Portfolio | | | | | | | | | | | | | | | | |
Actual | | | 1,000.00 | | | | 1,080.02 | | | | 4.24 | | | | 0.81 | |
Hypothetical (5% return before expenses) | | | 1,000.00 | | | | 1,021.06 | | | | 4.12 | | | | 0.81 | |
| | | | |
Index 500 Stock Portfolio | | | | | | | | | | | | | | | | |
Actual | | | 1,000.00 | | | | 1,077.11 | | | | 1.10 | | | | 0.21 | |
Hypothetical (5% return before expenses) | | | 1,000.00 | | | | 1,024.08 | | | | 1.07 | | | | 0.21 | |
| | | | |
Large Company Value Portfolio | | | | | | | | | | | | | | | | |
Actual | | | 1,000.00 | | | | 1,109.71 | | | | 3.87 | | | | 0.73 | |
Hypothetical (5% return before expenses) | | | 1,000.00 | | | | 1,021.47 | | | | 3.71 | | | | 0.73 | |
Expense Examples (unaudited)
| | | | | | | | | | | | | | | | |
| | | Beginning Account Value July 1, 2016 | | | Ending Account Value
December 31, 2016 | | | Expenses Paid During
Period July 1, 2016 to
December 31, 2016* | | | Annualized
Expense Ratio | |
| | | | |
Domestic Equity Portfolio | | | | | | | | | | | | | | | | |
Actual | | | $1,000.00 | | | | $1,036.21 | | | | $2.82 | | | | 0.55 | % |
Hypothetical (5% return before expenses) | | | 1,000.00 | | | | 1,022.37 | | | | 2.80 | | | | 0.55 | |
| | | | |
Equity Income Portfolio | | | | | | | | | | | | | | | | |
Actual | | | 1,000.00 | | | | 1,117.11 | | | | 3.41 | | | | 0.64 | |
Hypothetical (5% return before expenses) | | | 1,000.00 | | | | 1,021.92 | | | | 3.25 | | | | 0.64 | |
| | | | |
Mid Cap Growth Stock Portfolio | | | | | | | | | | | | | | | | |
Actual | | | 1,000.00 | | | | 1,012.86 | | | | 2.73 | | | | 0.54 | |
Hypothetical (5% return before expenses) | | | 1,000.00 | | | | 1,022.42 | | | | 2.75 | | | | 0.54 | |
| | | | |
Index 400 Stock Portfolio | | | | | | | | | | | | | | | | |
Actual | | | 1,000.00 | | | | 1,116.88 | | | | 1.44 | | | | 0.27 | |
Hypothetical (5% return before expenses) | | | 1,000.00 | | | | 1,023.78 | | | | 1.37 | | | | 0.27 | |
| | | | |
Mid Cap Value Portfolio | | | | | | | | | | | | | | | | |
Actual | | | 1,000.00 | | | | 1,112.32 | | | | 4.09 | | | | 0.77 | |
Hypothetical (5% return before expenses) | | | 1,000.00 | | | | 1,021.27 | | | | 3.91 | | | | 0.77 | |
| | | | |
Small Cap Growth Stock Portfolio | | | | | | | | | | | | | | | | |
Actual | | | 1,000.00 | | | | 1,124.86 | | | | 3.04 | | | | 0.57 | |
Hypothetical (5% return before expenses) | | | 1,000.00 | | | | 1,022.27 | | | | 2.90 | | | | 0.57 | |
| | | | |
Index 600 Stock Portfolio | | | | | | | | | | | | | | | | |
Actual | | | 1,000.00 | | | | 1,188.90 | | | | 1.93 | | | | 0.35 | |
Hypothetical (5% return before expenses) | | | 1,000.00 | | | | 1,023.38 | | | | 1.78 | | | | 0.35 | |
| | | | |
Small Cap Value Portfolio | | | | | | | | | | | | | | | | |
Actual | | | 1,000.00 | | | | 1,213.74 | | | | 4.90 | | | | 0.88 | |
Hypothetical (5% return before expenses) | | | 1,000.00 | | | | 1,020.71 | | | | 4.47 | | | | 0.88 | |
| | | | |
International Growth Portfolio | | | | | | | | | | | | | | | | |
Actual | | | 1,000.00 | | | | 976.47 | | | | 3.53 | | | | 0.71 | |
Hypothetical (5% return before expenses) | | | 1,000.00 | | | | 1,021.57 | | | | 3.61 | | | | 0.71 | |
| | | | |
Research International Core Portfolio | | | | | | | | | | | | | | | | |
Actual | | | 1,000.00 | | | | 1,027.28 | | | | 4.43 | | | | 0.87 | |
Hypothetical (5% return before expenses) | | | 1,000.00 | | | | 1,020.76 | | | | 4.42 | | | | 0.87 | |
| | | | |
International Equity Portfolio | | | | | | | | | | | | | | | | |
Actual | | | 1,000.00 | | | | 1,095.55 | | | | 3.27 | | | | 0.62 | |
Hypothetical (5% return before expenses) | | | 1,000.00 | | | | 1,022.02 | | | | 3.15 | | | | 0.62 | |
| | | | |
Emerging Markets Equity Portfolio | | | | | | | | | | | | | | | | |
Actual | | | 1,000.00 | | | | 1,040.25 | | | | 5.74 | | | | 1.12 | |
Hypothetical (5% return before expenses) | | | 1,000.00 | | | | 1,019.51 | | | | 5.69 | | | | 1.12 | |
Expense Examples (unaudited)
| | | | | | | | | | | | | | | | |
| | | Beginning Account Value July 1, 2016 | | | Ending Account Value
December 31, 2016 | | | Expenses Paid During
Period July 1, 2016 to
December 31, 2016* | | | Annualized
Expense Ratio | |
| | | | |
Government Money Market Portfolio | | | | | | | | | | | | | | | | |
Actual | | | $1,000.00 | | | | $1,000.66 | | | | $1.61 | | | | 0.32 | % |
Hypothetical (5% return before expenses) | | | 1,000.00 | | | | 1,023.53 | | | | 1.63 | | | | 0.32 | |
| | | | |
Short-Term Bond Portfolio | | | | | | | | | | | | | | | | |
Actual | | | 1,000.00 | | | | 999.23 | | | | 2.16 | | | | 0.43 | |
Hypothetical (5% return before expenses) | | | 1,000.00 | | | | 1,022.97 | | | | 2.19 | | | | 0.43 | |
| | | | |
Select Bond Portfolio | | | | | | | | | | | | | | | | |
Actual | | | 1,000.00 | | | | 978.85 | | | | 1.54 | | | | 0.31 | |
Hypothetical (5% return before expenses) | | | 1,000.00 | | | | 1,023.58 | | | | 1.58 | | | | 0.31 | |
| | | | |
Long-Term U.S. Government Bond Portfolio | | | | | | | | | | | | | | | | |
Actual | | | 1,000.00 | | | | 879.74 | | | | 3.92 | | | | 0.83 | |
Hypothetical (5% return before expenses) | | | 1,000.00 | | | | 1,020.96 | | | | 4.22 | | | | 0.83 | |
| | | | |
Inflation Protection Portfolio | | | | | | | | | | | | | | | | |
Actual | | | 1,000.00 | | | | 992.94 | | | | 3.01 | | | | 0.60 | |
Hypothetical (5% return before expenses) | | | 1,000.00 | | | | 1,022.12 | | | | 3.05 | | | | 0.60 | |
| | | | |
High Yield Bond Portfolio | | | | | | | | | | | | | | | | |
Actual | | | 1,000.00 | | | | 1,062.98 | | | | 2.44 | | | | 0.47 | |
Hypothetical (5% return before expenses) | | | 1,000.00 | | | | 1,022.77 | | | | 2.39 | | | | 0.47 | |
| | | | |
Multi-Sector Bond Portfolio | | | | | | | | | | | | | | | | |
Actual | | | 1,000.00 | | | | 1,020.92 | | | | 3.91 | | | | 0.77 | |
Hypothetical (5% return before expenses) | | | 1,000.00 | | | | 1,021.27 | | | | 3.91 | | | | 0.77 | |
| | | | |
Balanced Portfolio | | | | | | | | | | | | | | | | |
Actual | | | 1,000.00 | | | | 1,026.43 | | | | 0.31 | | | | 0.06 | |
Hypothetical (5% return before expenses) | | | 1,000.00 | | | | 1,024.83 | | | | 0.31 | | | | 0.06 | |
| | | | |
Asset Allocation Portfolio | | | | | | | | | | | | | | | | |
Actual | | | 1,000.00 | | | | 1,042.99 | | | | 0.46 | | | | 0.09 | |
Hypothetical (5% return before expenses) | | | 1,000.00 | | | | 1,024.68 | | | | 0.46 | | | | 0.09 | |
| * | Expenses are equal to the Portfolio’s annualized expense ratio, multiplied by the average account value over the period, multiplied by 184/366 (to reflect the one-half year period). |
Growth Stock Portfolio (unaudited)
| | | | |
| Objective: | | Portfolio Strategy: | | Net Assets: |
| Long-term growth of capital. Current income is a secondary objective. | | Invest in the equity securities of medium and large capitalization companies exhibiting the potential for earnings growth or share price appreciation. | | $838 million |
Portfolio Overview
Mason Street Advisors, LLC (“Mason Street Advisors”), the investment adviser for the Growth Stock Portfolio (the “Portfolio”), has engaged The Boston Company Asset Management, LLC (“The Boston Company”) to act as sub-adviser for the Portfolio. The Portfolio invests in the equity securities of medium and large capitalization companies. The Portfolio invests in stocks selected by a team of global research analysts, with each analyst responsible for investments in his or her area of expertise. These analysts use a fundamental research process to identify investments for the Portfolio. The Portfolio invests in those companies in which the analysts have the highest degree of conviction or have identified the potential for strong earnings growth or share price appreciation in the near-term.
Market Overview
U.S. equities were broadly positive in 2016 despite increased volatility. In the first half of the year, GDP growth and inflation targets remained elusive amid mixed economic data and volatility triggered by the unexpected vote of the United Kingdom to leave the European Union, or “Brexit.” Trends began to reverse in the third quarter with the highest GDP growth in two years. In December, the U.S. Federal Reserve Bank raised its benchmark rate by a quarter of a point for the first time since 2015, citing increased inflation expectations and near full employment. Meanwhile, U.S. equities rallied upon Republican Donald Trump’s election, as investors expect steeper inflation in coming years due to Trump’s policies.
Portfolio Results
The Portfolio delivered a total return of 2.47% for the twelve months ending December 31, 2016, trailing the Russell 1000 Growth® Index (the “Index”), which returned 7.08%. (This Index is unmanaged, cannot be invested in directly and does not include administrative expenses or sales charges.) According to Lipper® Analytical Services, Inc., an independent mutual fund ranking agency, the average return of the Large Cap Growth Funds peer group was 2.23% for 2016.
Overall, the Information Technology and Healthcare sectors detracted the most from the Index’s relative return. Stock selection worked well in the Financials, Real Estate and Industrials sectors. Holdings in Information Technology, specifically in the IT services and the technology hardware, storage and peripherals industries, weighed on relative returns for the year. In IT services, an investment in Cognizant Technology Solutions Corp. weighed most on relative returns. Shares declined following an announcement in September that the company president was resigning abruptly, and the company was launching an internal investigation into a possible violation of the U.S. Foreign Corrupt Practices Act. Given this unexpected news, the Portfolio exited the position. In technology hardware, storage and peripherals, a position in Apple, Inc. fell following a reported miss in iPhone sales and much worse-than-expected implied iPhone guidance for June. Given this less than enthusiastic view for the iPhone 7, the Portfolio exited the position.
In Health Care, positioning in the pharmaceuticals and health care providers and services industries drove underperformance. Shares of the pharmaceuticals company Eli Lilly and Co. detracted from Portfolio returns following a third-quarter earnings miss on slightly weaker revenue and disappointing results from two key products. Nonetheless, in mid-December the new CEO released strong earnings guidance going into 2017. An investment in Bristol-Myers Squibb Co. detracted as investors responded negatively to an announcement that its lung cancer treatment, Opdivo, did not meet trial expectations. Given these results and lack of a near-term catalyst, the Portfolio exited the position in August. In health care providers and services, an investment in Centene Corp. suffered from ongoing volatility and risks related to health insurance exchanges and historically higher Medicaid margins. Ultimately, the Portfolio sold its position in Centene Corp. based on price strength.
At the other end of the spectrum, the Portfolio’s Financials sector performed well due to positioning in the capital markets and consumer finance industries. Specifically, a position in The Goldman Sachs Group, Inc. moved higher following third-quarter earnings ahead of consensus expectations, as the company benefited from a low tax rate. In consumer finance, shares of Synchrony Financial drove the Portfolio’s returns higher following the release of solid third quarter earnings. Additionally, the company benefited from continued capital strength and benign credit trends.
Portfolio Manager Outlook
The following forward-looking comments are the opinion of The Boston Company, the Portfolio’s sub-adviser.
Heading into 2017, the U.S. economy should continue to exhibit solid macroeconomic characteristics. U.S. home prices are rising, while the unemployment rate is currently below five percent, which is considered full employment. We are expecting
Growth Stock Portfolio (unaudited)
fiscal stimulus, increased inflation and higher interest rates, although ten-year Treasury yields have already moved higher by over 50 basis points. The correlation among stocks has declined sharply over recent months, which we feel bodes well for active management. We expect to see higher levels of dispersion between winners and losers as interest rates rise. We also expect that the surging U.S. dollar, if persistent, could pressure corporate profits, especially in commodities-related industries. In this environment, stock selection will be critical in identifying those companies poised to benefit from strong underlying fundamentals and/or the effect of Trump policies.
Relative Performance
| | | | | | | | | | | | |
Average Annual Total Returns
For Periods Ended December 31, 2016 | |
| | | 1 Year | | | 5 Years | | | 10 Years | |
Growth Stock Portfolio | | | 2.47 | % | | | 12.69 | % | | | 6.32 | % |
Russell 1000® Growth Index | | | 7.08 | % | | | 14.50 | % | | | 8.33 | % |
Lipper® Variable Insurance Products (VIP) Large Cap Growth Funds Average | | | 2.23 | % | | | 13.30 | % | | | 7.16 | % |
The performance data quoted represents past performance. Past performance is historical and does not guarantee future performance. Investment return and principal value will fluctuate, so that shares, when redeemed, may be worth more or less than their original cost. Current performance may be lower or higher than the performance data quoted. For the most recent month-end performance information visit www.northwesternmutual.com.
This chart assumes an initial investment of $10,000 made on 12/31/06. Returns shown reflect fee waivers, deductions for management and other portfolio expenses, and reinvestment of all dividends. In the absence of fee waivers, total return would be reduced. Returns exclude deductions for separate account sale loads and account fees. Please refer to the Benchmark Definitions section of this report for information about the indices cited in the above chart and graph.
The Portfolio may invest a relatively high percentage of its assets in a particular sector. The Portfolio will have greater exposure to the risks associated with that sector and its performance will be tied more closely to the performance of the sector.
Top 10 Equity Holdings 12/31/16
| | | | |
Security Description | | | % of Net Assets | |
Alphabet, Inc. Various | | | 5.9 | % |
Microsoft Corp. | | | 5.1 | % |
Facebook, Inc. - Class A | | | 3.5 | % |
UnitedHealth Group, Inc. | | | 3.4 | % |
Amazon.com, Inc. | | | 3.3 | % |
iShares Russell 1000 Growth Index Fund | | | 3.2 | % |
Texas Instruments, Inc. | | | 2.9 | % |
Union Pacific Corp. | | | 2.8 | % |
The Home Depot, Inc. | | | 2.6 | % |
Honeywell International, Inc. | | | 2.5 | % |
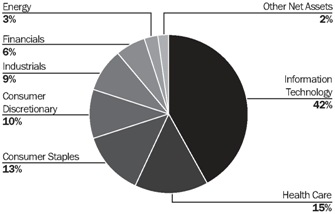
Sector Allocation 12/31/16
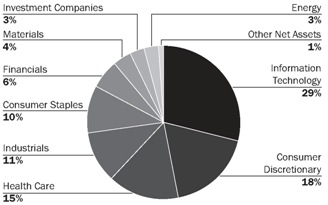
Sector Allocation is based on Net Assets.
Sector Allocation and Top 10 Holdings are subject to change.
Growth Stock Portfolio
Schedule of Investments
December 31, 2016
| | | | | | | | | | |
| | | Common Stocks (95.9%) | | Shares/
$ Par | | | Value
$(000’s) | |
| |
| | Consumer Discretionary (18.4%) | |
| * | | Amazon.com, Inc. | | | 37,156 | | | | 27,862 | |
| | CBS Corp. - Class B | | | 212,341 | | | | 13,509 | |
| * | | Charter Communications, Inc. | | | 44,797 | | | | 12,898 | |
| | Comcast Corp. - Class A | | | 293,205 | | | | 20,246 | |
| | Delphi Automotive PLC | | | 62,955 | | | | 4,240 | |
| | The Home Depot, Inc. | | | 163,576 | | | | 21,932 | |
| | The Interpublic Group of Cos., Inc. | | | 193,654 | | | | 4,533 | |
| * | | The Priceline Group, Inc. | | | 11,277 | | | | 16,533 | |
| | The TJX Cos., Inc. | | | 231,472 | | | | 17,391 | |
| * | | Ulta Salon, Cosmetics & Fragrance, Inc. | | | 58,178 | | | | 14,832 | |
| | | | | | | | | | |
| | Total | | | | | | | 153,976 | |
| | | | | | | | | | |
| |
| | Consumer Staples (10.1%) | |
| | The Coca-Cola Co. | | | 451,358 | | | | 18,713 | |
| | ConAgra Brands, Inc. | | | 200,634 | | | | 7,935 | |
| | Costco Wholesale Corp. | | | 117,257 | | | | 18,774 | |
| | Kellogg Co. | | | 124,929 | | | | 9,209 | |
| | The Kraft Heinz Co. | | | 134,562 | | | | 11,750 | |
| | Molson Coors Brewing Co. - Class B | | | 114,582 | | | | 11,150 | |
| | Walgreens Boots Alliance, Inc. | | | 89,544 | | | | 7,411 | |
| | | | | | | | | | |
| | Total | | | | | | | 84,942 | |
| | | | | | | | | | |
| |
| | Energy (2.4%) | |
| | Pioneer Natural Resources Co. | | | 39,042 | | | | 7,030 | |
| | Schlumberger, Ltd. | | | 60,646 | | | | 5,091 | |
| | Superior Energy Services, Inc. | | | 493,986 | | | | 8,339 | |
| | | | | | | | | | |
| | Total | | | | | | | 20,460 | |
| | | | | | | | | | |
| | | | | | | | | | |
| | | Common Stocks (95.9%) | | Shares/ $ Par | | | Value $(000’s) | |
| |
| | Financials (6.4%) | |
| | CME Group, Inc. | | | 130,998 | | | | 15,111 | |
| | The Goldman Sachs Group, Inc. | | | 56,773 | | | | 13,594 | |
| | JPMorgan Chase & Co. | | | 125,109 | | | | 10,796 | |
| | Synchrony Financial | | | 379,086 | | | | 13,749 | |
| | | | | | | | | | |
| | Total | | | | | | | 53,250 | |
| | | | | | | | | | |
| |
| | Health Care (14.9%) | |
| | Aetna, Inc. | | | 56,979 | | | | 7,066 | |
| * | | BioMarin Pharmaceutical, Inc. | | | 124,351 | | | | 10,301 | |
| * | | Boston Scientific Corp. | | | 574,479 | | | | 12,426 | |
| * | | Celgene Corp. | | | 152,880 | | | | 17,696 | |
| | Danaher Corp. | | | 156,392 | | | | 12,174 | |
| | DENTSPLY SIRONA, Inc. | | | 127,325 | | | | 7,351 | |
| | Eli Lilly and Co. | | | 195,531 | | | | 14,381 | |
| * | | Neurocrine Biosciences, Inc. | | | 78,637 | | | | 3,043 | |
| * | | Tesaro, Inc. | | | 42,128 | | | | 5,665 | |
| | UnitedHealth Group, Inc. | | | 177,176 | | | | 28,355 | |
| | Zoetis, Inc. | | | 124,790 | | | | 6,680 | |
| | | | | | | | | | |
| | Total | | | | | | | 125,138 | |
| | | | | | | | | | |
| |
| | Industrials (10.8%) | |
| | Eaton Corp. PLC | | | 93,026 | | | | 6,241 | |
| | Fortive Corp. | | | 126,835 | | | | 6,802 | |
| | Honeywell International, Inc. | | | 182,417 | | | | 21,133 | |
| * | | Quanta Services, Inc. | | | 182,910 | | | | 6,375 | |
| | Raytheon Co. | | | 105,354 | | | | 14,960 | |
| | Union Pacific Corp. | | | 225,069 | | | | 23,335 | |
| | United Technologies Corp. | | | 103,340 | | | | 11,328 | |
| | | | | | | | | | |
| | Total | | | | | | | 90,174 | |
| | | | | | | | | | |
| | | | | | | | | | |
| | | Common Stocks (95.9%) | | Shares/ $ Par | | | Value $(000’s) | |
| |
| | Information Technology (29.2%) | |
| * | | Alphabet, Inc. - Class A | | | 26,596 | | | | 21,076 | |
| * | | Alphabet, Inc. - Class C | | | 37,178 | | | | 28,695 | |
| | Broadcom, Ltd. | | | 108,197 | | | | 19,126 | |
| | Cisco Systems, Inc. | | | 216,506 | | | | 6,543 | |
| * | | Citrix Systems, Inc. | | | 144,062 | | | | 12,866 | |
| * | | Facebook, Inc. - Class A | | | 258,024 | | | | 29,686 | |
| * | | Fortinet, Inc. | | | 143,348 | | | | 4,318 | |
| | Intuit, Inc. | | | 111,250 | | | | 12,750 | |
| | Microsoft Corp. | | | 691,993 | | | | 43,000 | |
| | Oracle Corp. | | | 373,205 | | | | 14,350 | |
| * | | salesforce.com, Inc. | | | 124,784 | | | | 8,543 | |
| * | | ServiceNow, Inc. | | | 63,962 | | | | 4,755 | |
| * | | Splunk, Inc. | | | 78,090 | | | | 3,994 | |
| * | | Teradata Corp. | | | 146,077 | | | | 3,969 | |
| | Texas Instruments, Inc. | | | 331,974 | | | | 24,224 | |
| | Western Digital Corp. | | | 92,891 | | | | 6,312 | |
| | | | | | | | | | |
| | Total | | | | | | | 244,207 | |
| | | | | | | | | | |
| |
| | Materials (3.7%) | |
| | The Dow Chemical Co. | | | 212,309 | | | | 12,148 | |
| | Nucor Corp. | | | 165,477 | | | | 9,849 | |
| | Vulcan Materials Co. | | | 72,080 | | | | 9,021 | |
| | | | | | | | | | |
| | Total | | | | | | | 31,018 | |
| | | | | | | | | | |
| | Total Common Stocks | | | | | | | | |
| | (Cost: $672,573) | | | | | | | 803,165 | |
| | | | | | | | | | |
| | | |
| | | Investment Companies (3.2%) | | | | | | |
| | | |
| | Investment
Companies (3.2%) | | | | | | | | |
| | iShares Russell 1000 Growth Index Fund | | | 257,487 | | | | 27,010 | |
| | | | | | | | | | |
| | Total Investment Companies | | | | | | | | |
| | (Cost: $26,552) | | | | | | | 27,010 | |
| | | | | | | | | | |
| | | |
| | Total Investments (99.1%) | | | | | | | | |
| | (Cost: $699,125)(a) | | | | | | | 830,175 | |
| | | | | | | | | | |
| | Other Assets, Less | | | | | | | | |
| | Liabilities (0.9%) | | | | | | | 7,805 | |
| | | | | | | | | | |
| | Net Assets (100.0%) | | | | | | | 837,980 | |
| | | | | | | | | | |
| (a) | At December 31, 2016, the aggregate cost of securities for federal tax purposes (in thousands) was $699,127 and the net unrealized appreciation of investments based on that cost was $131,048 which is comprised of $142,835 aggregate gross unrealized appreciation and $11,787 aggregate gross unrealized depreciation. |
The Accompanying Notes are an Integral Part of the Financial Statements.
Growth Stock Portfolio
The following is a summary of the inputs used in valuing the Portfolio’s assets and liabilities at December 31, 2016. See Note 3 for additional information on portfolio valuation.
| | | | | | | | | | | | | | |
| | | Valuation Inputs | | | |
| Description | | Level 1 –
Quoted Prices | | | Level 2 –
Other Significant
Observable Inputs | | | Level 3 – Significant Unobservable Inputs | | | |
| | | (Amounts in thousands) | | | |
Assets: | | | | | | | | | | | | | | |
Domestic Common Stocks | | $ | 803,165 | | | $ | - | | | $ | - | | | |
Investment Companies | | | 27,010 | | | | - | | | | - | | | |
Total Assets: | | $ | 830,175 | | | $ | - | | | $ | - | | | |
The Accompanying Notes are an Integral Part of the Financial Statements.
Focused Appreciation Portfolio (unaudited)
| | | | |
| Objective: | | Portfolio Strategy: | | Net Assets: |
| Long-term growth of capital. | | Invest in equity securities selected for their growth potential. | | $772 million |
Portfolio Overview
Mason Street Advisors, LLC (“Mason Street Advisors”), the investment adviser for the Focused Appreciation Portfolio (the “Portfolio”), has engaged Loomis, Sayles & Co., L.P. (“Loomis Sayles”) to act as sub-adviser for the Portfolio. The Portfolio invests primarily in the equity securities of companies selected for their growth potential. The Portfolio focuses on equity securities of large capitalization companies, but may invest in companies of any size. The Portfolio employs a growth style of equity management that emphasizes companies with sustainable competitive advantages, long-term structural growth drivers, profitable cash flow returns, and management teams focused on creating long-term value for shareholders. The Portfolio invests primarily in a core group of 30-40 securities.
Market Overview
Despite several bouts of volatility, U.S. stocks continued to rally, posting gains this year. Anticipation surrounding the Federal Reserve’s (the “Fed”) strategy for monetary policy normalization – combined with sluggish U.S. economic growth, slowing growth in China, and plunging oil prices – triggered some month-to-month volatility. In June, U.K. citizens voted to exit the European Union (E.U.), sparking a brief selloff among stocks and other riskier assets. But cooler heads ultimately prevailed and a recovery rally ensued. Volatility resurfaced late in the year, primarily due to anxiety ahead of the U.S. presidential election, continued economic weakness outside the U.S. and Fed rate hike uncertainty. However, U.S. stocks ended the year on an upbeat note, as Donald Trump’s surprising presidential election victory elicited a market rally. Expectations for the Trump administration to implement a pro-growth agenda drove U.S. stocks and the U.S. dollar higher.
Portfolio Results
The Portfolio returned 5.87% for the twelve months ended December 31, 2016. By comparison, the Portfolio’s benchmark, the Russell 1000® Growth Index (the “Index”), returned 7.08%. (The Index is unmanaged, cannot be invested in directly and does not include administrative expenses or sales charges.) According to Lipper® Analytical Services, Inc., the average return of the Large Cap Growth Funds peer group was 2.23% for 2016.
Stock selection in the Consumer Staples, Healthcare and Financials sectors detracted from relative performance, as did the allocation effect to the Industrials sector. In terms of individual stocks, Novo Nordisk A/S, Monster Beverage Corp. and Cerner Corp. were among the largest detractors to performance.
Stock selection in the Information Technology, Industrials and Consumer Discretionary sectors and the allocation effect to Information Technology, Energy and Healthcare sectors contributed to relative performance. QUALCOMM, Inc., ARM Holdings plc and Cisco Systems, Inc. were among the top contributors to Portfolio performance.
During the period, the portfolio manager purchased shares of Regeneron Pharmaceuticals, Inc., a biopharmaceutical company, and Deere & Co., which manufactures and distributes worldwide equipment used in agriculture, construction, forestry and turf care. The portfolio manager also acquired a position in Yum China Holdings, Inc. that was a spin-off from existing portfolio holding Yum! Brands, Inc. The portfolio manager took advantage of price weakness to add to several of the high quality growth companies in the Portfolio including Alibaba Group Holding, Ltd., Oracle Corp., Cerner Corp., ARM Holdings plc, QUALCOMM, Inc. and Novo Nordisk A/S. The purchases were funded by trimming Portfolio positions in Amazon.com, Inc., Lowe’s Companies, Inc., Greenhill & Co., Inc., ARM Holdings plc (late in the period) and SABMiller. The portfolio manager ultimately sold the position in Lowe’s Companies, Inc. as the share price approached its intrinsic value and the position in Greenhill & Co. as the investment thesis failed to materialize.
Portfolio Manager Outlook
The following forward-looking comments are the opinion of Loomis Sayles, the Portfolio’s sub-adviser.
Our investment process is characterized by bottom-up fundamental research and a long-term investment time horizon. All aspects of our quality-growth-valuation investment thesis must be present simultaneously for us to make an investment. Often our research is completed well in advance of the opportunity to invest. We are patient investors and maintain coverage of high quality businesses in order to take advantage of meaningful price dislocations if and when they occur. The nature of the process leads to a lower turnover portfolio where sector positioning is the result of stock selection. Compared to the Index, we are currently overweight in the Information Technology, Consumer Staples, Financials and Energy sectors, and underweight in the Consumer Discretionary, Industrials and Healthcare sectors. We currently hold no positions in the Materials, Real Estate, Telecommunication Services and Utilities sectors.
| | | | | | |
| | Focused Appreciation Portfolio | | | 5 | |
Focused Appreciation Portfolio (unaudited)
Relative Performance
| | | | | | | | | | | | |
Average Annual Total Returns
For Periods Ended December 31, 2016 | |
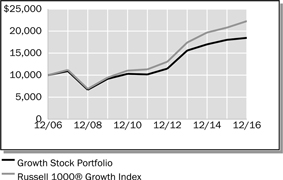
| | | 1 Year | | | 5 Years | | | 10 Years | |
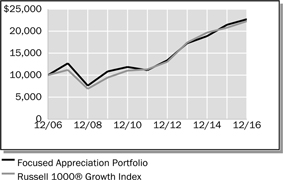
Focused Appreciation Portfolio | | | 5.87 | % | | | 15.33 | % | | | 8.55 | % |
Russell 1000® Growth Index | | | 7.08 | % | | | 14.50 | % | | | 8.33 | % |
Lipper® Variable Insurance Products (VIP) Large Cap Growth Funds Average | | | 2.23 | % | | | 13.30 | % | | | 7.16 | % |
The performance data quoted represents past performance. Past performance is historical and does not guarantee future performance. Investment return and principal value will fluctuate, so that shares, when redeemed, may be worth more or less than their original cost. Current performance may be lower or higher than the performance data quoted. For the most recent month-end performance information visit www.northwesternmutual.com.
This chart assumes an initial investment of $10,000 made on 12/31/06. Returns shown reflect fee waivers, deductions for management and other portfolio expenses, and reinvestment of all dividends. In the absence of fee waivers, total return would be reduced. Returns exclude deductions for separate account sale loads and account fees. Please refer to the Benchmark Definitions section of this report for information about the indices cited in the above chart and graph.
As a non-diversified portfolio, the Portfolio may hold fewer securities because of its focused investment strategy. Holding fewer securities increases the risk that the value of the Portfolio could go down because of the poor performance of a single investment.
The Portfolio may invest a relatively high percentage of its assets in a particular sector. The Portfolio will have greater exposure to the risks associated with that sector and its performance will be tied more closely to the performance of the sector.
Top 10 Equity Holdings 12/31/16
| | | | |
Security Description | | | % of Net Assets | |
Amazon.com, Inc. | | | 6.8 | % |
Facebook, Inc. - Class A | | | 6.0 | % |
Alphabet, Inc. - Various | | | 5.8 | % |
Cisco Systems, Inc. | | | 5.0 | % |
Visa, Inc. - Class A | | | 5.0 | % |
Alibaba Group Holding, Ltd., ADR | | | 4.6 | % |
QUALCOMM, Inc. | | | 4.5 | % |
Oracle Corp. | | | 4.2 | % |
Monster Beverage Corp. | | | 3.8 | % |
The Procter & Gamble Co. | | | 3.3 | % |
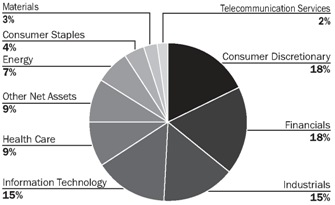
Sector Allocation 12/31/16
Sector Allocation is based on Net Assets.
Sector Allocation and Top 10 Holdings are subject to change.
| | | | |
| 6 | | Focused Appreciation Portfolio | | |
Focused Appreciation Portfolio
Schedule of Investments
December 31, 2016
| | | | | | | | | | |
| | | Common Stocks (98.3%) | | Shares/
$ Par | | | Value
$(000’s) | |
| | Consumer Discretionary (9.8%) | |
| * | | Amazon.com, Inc. | | | 70,124 | | | | 52,584 | |
| * | | Yum China Holdings, Inc. | | | 331,290 | | | | 8,653 | |
| | Yum! Brands, Inc. | | | 224,818 | | | | 14,238 | |
| | | | | | | | | | |
| | Total | | | | | | | 75,475 | |
| | | | | | | | | | |
| |
| | Consumer Staples (13.4%) | |
| | The Coca-Cola Co. | | | 602,682 | | | | 24,987 | |
| | Danone SA, ADR | | | 1,914,269 | | | | 24,082 | |
| * | | Monster Beverage Corp. | | | 653,158 | | | | 28,961 | |
| | The Procter & Gamble Co. | | | 302,449 | | | | 25,430 | |
| | | | | | | | | | |
| | Total | | | | | | | 103,460 | |
| | | | | | | | | | |
| |
| | Energy (2.7%) | |
| | Schlumberger, Ltd. | | | 246,483 | | | | 20,692 | |
| | | | | | | | | | |
| | Total | | | | | | | 20,692 | |
| | | | | | | | | | |
| |
| | Financials (6.3%) | |
| | American Express Co. | | | 154,119 | | | | 11,417 | |
| | FactSet Research Systems, Inc. | | | 88,665 | | | | 14,491 | |
| | SEI Investments Co. | | | 461,006 | | | | 22,755 | |
| | | | | | | | | | |
| | Total | | | | | | | 48,663 | |
| | | | | | | | | | |
| | | | | | | | | | |
| | | Common Stocks (98.3%) | | Shares/
$ Par | | | Value
$(000’s) | |
| |
| | Health Care (15.4%) | |
| | Amgen, Inc. | | | 100,919 | | | | 14,755 | |
| * | | Cerner Corp. | | | 333,059 | | | | 15,777 | |
| | Merck & Co., Inc. | | | 174,699 | | | | 10,285 | |
| | Novartis AG, ADR | | | 213,676 | | | | 15,564 | |
| | Novo Nordisk A/S, ADR | | | 654,874 | | | | 23,484 | |
| * | | Regeneron Pharmaceuticals, Inc. | | | 57,678 | | | | 21,173 | |
| * | | Varian Medical Systems, Inc. | | | 198,287 | | | | 17,802 | |
| | | | | | | | | | |
| | Total | | | | | | | 118,840 | |
| | | | | | | | | | |
| |
| | Industrials (8.5%) | |
| | Deere & Co. | | | 196,780 | | | | 20,276 | |
| | Expeditors International of Washington, Inc. | | | 444,268 | | | | 23,529 | |
| | United Parcel Service, Inc. - Class B | | | 189,649 | | | | 21,741 | |
| | | | | | | | | | |
| | Total | | | | | | | 65,546 | |
| | | | | | | | | | |
| |
| | Information Technology (42.2%) | |
| * | | Alibaba Group Holding, Ltd., ADR | | | 407,809 | | | | 35,810 | |
| | | | | | | | | | |
| | | Common Stocks (98.3%) | | Shares/
$ Par | | | Value
$(000’s) | |
| |
| | Information Technology continued | |
| * | | Alphabet, Inc. - Class A | | | 28,397 | | | | 22,503 | |
| * | | Alphabet, Inc. - Class C | | | 28,471 | | | | 21,974 | |
| | Analog Devices, Inc. | | | 49,228 | | | | 3,575 | |
| * | | Autodesk, Inc. | | | 312,437 | | | | 23,123 | |
| | Automatic Data Processing, Inc. | | | 72,932 | | | | 7,496 | |
| | Cisco Systems, Inc. | | | 1,286,822 | | | | 38,888 | |
| * | | Facebook, Inc. - Class A | | | 401,164 | | | | 46,154 | |
| | Microsoft Corp. | | | 339,325 | | | | 21,086 | |
| | Oracle Corp. | | | 848,407 | | | | 32,621 | |
| | QUALCOMM, Inc. | | | 527,087 | | | | 34,366 | |
| | Visa, Inc. - Class A | | | 491,516 | | | | 38,348 | |
| | | | | | | | | | |
| | Total | | | | | | | 325,944 | |
| | | | | | | | | | |
| | Total Common Stocks | | | | | | | | |
| | (Cost: $722,510) | | | | | | | 758,620 | |
| | | | | | | | | | |
| | | |
| | Total Investments (98.3%) | | | | | | | | |
| | (Cost: $722,510)(a) | | | | | | | 758,620 | |
| | | | | | | | | | |
| | Other Assets, Less | | | | | | | | |
| | Liabilities (1.7%) | | | | | | | 13,180 | |
| | | | | | | | | | |
| | Net Assets (100.0%) | | | | | | | 771,800 | |
| | | | | | | | | | |
| | ADR after the name of a security represents—American Depositary Receipt. |
| (a) | At December 31, 2016, the aggregate cost of securities for federal tax purposes (in thousands) was $723,286 and the net unrealized appreciation of investments based on that cost was $35,334 which is comprised of $74,194 aggregate gross unrealized appreciation and $38,860 aggregate gross unrealized depreciation. |
The following is a summary of the inputs used in valuing the Portfolio’s assets and liabilities at December 31, 2016. See Note 3 for additional information on portfolio valuation.
| | | | | | | | | | | | | | |
| | | Valuation Inputs | | | |
| Description | | Level 1 – Quoted Prices | | | Level 2 –
Other Significant
Observable Inputs | | | Level 3 – Significant
Unobservable Inputs | | | |
| | | (Amounts in thousands) | | | |
Assets: | | | | | | | | | | | | | | |
Domestic Common Stocks | | $ | 758,620 | | | $ | - | | | $ | - | | | |
Total Assets: | | $ | 758,620 | | | $ | - | | | $ | - | | | |
The Accompanying Notes are an Integral Part of the Financial Statements.
| | | | | | |
| | Focused Appreciation Portfolio | | | 7 | |
Large Cap Core Stock Portfolio (unaudited)
| | | | |
| Objective: | | Portfolio Strategy: | | Net Assets: |
| Long-term growth of capital and income. | | Invest primarily in common stocks of large capitalization U.S. and foreign based companies listed on U.S. exchanges. | | $514 million |
Portfolio Overview
Mason Street Advisors, LLC (“Mason Street Advisors”), the investment adviser for the Large Cap Core Stock Portfolio (the “Portfolio”), has engaged Fayez Sarofim & Co. (“Sarofim & Co.”) to act as sub-adviser for the Portfolio. In choosing securities, the Portfolio’s portfolio managers first identify economic sectors they believe can support longer term profit growth. Using fundamental analysis, the Portfolio’s portfolio managers then seek companies within these sectors that have dominant positions and sustainable competitive advantages in their industries, superior management that productively reinvests cash flow, sustainable profitability, strong balance sheets, expanding global presence and the potential to achieve predictable, above-average earnings and dividend growth over the next three to five years or longer. The Portfolio may also invest in companies that the portfolio managers consider undervalued in terms of earnings, assets or growth prospects.
Market Overview
U.S. equities started 2016 on a fraught note. Diverging monetary policies, collapsing commodity prices and worries about a slowdown in China stoked recession fears and sent stock markets on a record-setting nosedive. The prospect for stronger global growth was a key inflection point in the first quarter that saw risk appetites return as well as a broad-based market rotation towards cyclicality that persisted through year-end. The S&P 500® Index rebounded in response to the improving growth outlook, and quickly recovered from wild swings brought by the U.K. vote to leave the European Union and the U.S. presidential election to end the year with a respectable low-teens gain. Energy was the best performing sector, followed by Telecommunication Services and Financials. Healthcare was the weakest sector, and the only one to decline. The S&P SmallCap 600® Index outperformed the S&P 500® Index and the S&P MidCap 400® Index, reflecting the risk-on environment that prevailed in 2016.
Portfolio Results
The Large Cap Core Stock Portfolio returned 7.57% for the twelve months ended December 31, 2016. By comparison, the S&P 500® Index (the “Index”) returned 11.96% for the year. (The Index is unmanaged, cannot be invested in directly, and does not include administrative expenses or sales charges.) According to Lipper® Analytical Services, Inc., an independent mutual fund ranking company, the average return in 2016 for the Large Cap Core Funds peer group was 9.96%.
The primary factor that detracted from relative and absolute performance was stock selection in the Health Care sector. Widespread weakness in pharmaceutical and equipment holdings proved to be costly, and offset favorable selection decisions in the providers segment. The Portfolio’s underweight exposure, however, provided an ameliorative effect on relative results as increasing political and regulatory scrutiny over drug pricing exerted downward pressure on the sector throughout much of the year. The overweight in Consumer Staples and weakness in key holdings in the beverages, food products and personal products segments of the sector also pressured relative performance. Finally, stock selection in the Financials sector weighed on relative results, largely due to positioning in the capital markets and consumer finance industries of the sector.
The Portfolio’s largest individual security detractors in 2016 were Novo Nordisk A/S Sponsored ADR, Alexion Pharmaceuticals, Inc., Gilead Sciences, Inc., Roche Holding Sponsored ADR and Abbott Laboratories.
The largest contributor to the Portfolio’s relative performance was the strategic avoidance of Real Estate stocks, which struggled amid rising interest rates. An underweight to the Consumer Discretionary sector also added value relative to the index. The lack of exposure to holdings in the specialty retail segment was particularly advantageous. The overweight to the Energy sector was likewise beneficial. The sector rebounded as the world’s largest producers agreed to curb production and crude oil prices found firmer footing.
The Portfolio’s largest individual security contributors in 2016 were Chevron Corp., Exxon Mobil Corp., JPMorgan Chase & Co., Texas Instruments, Inc. and Altria Group, Inc.
Portfolio Manager Outlook
The following forward-looking comments are the opinion of Sarofim & Co., the Portfolio’s sub-adviser.
| | | | |
| 8 | | Large Cap Core Stock Portfolio | | |
Large Cap Core Stock Portfolio (unaudited)
Though secular forces continue to restrain the global economy’s capacity for rapid expansion, rising consumption and a healthy housing market indicate a modest uptick in U.S. growth in 2017. Our forecast calls for modest but positive equity gains in 2017 as an improving economic climate and stimulative fiscal policies support self-reinforcing capital spending and profit growth.
As investors navigate a major shift in political regime and a return to monetary tightening, bouts of volatility are expected to precipitate a renewed focus on high quality companies that are less vulnerable to market fluctuations. Our investment approach emphasizes financially sound companies with stable earnings streams and disciplined capital redeployment policies. These global industry leaders have the scale and financial resources to pursue their growth initiatives and protect their margins as labor and interest costs rise. Furthermore, sustainable cash flows and lower levels of debt enable these companies to maintain or increase payouts to shareholders without harming their balance sheets, offering a degree of downside protection in adverse market conditions.
Relative Performance

| | | | | | | | | | | | |
Average Annual Total Returns
For Periods Ended December 31, 2016 | |
| | | 1 Year | | | 5 Years | | | 10 Years | |
Large Cap Core Stock Portfolio | | | 7.57 | % | | | 10.20 | % | | | 4.59 | % |
S&P 500® Index | | | 11.96 | % | | | 14.66 | % | | | 6.95 | % |
Lipper® Variable Insurance Products (VIP) Large Cap Core Funds Average | | | 9.96 | % | | | 13.28 | % | | | 6.02 | % |
The performance data quoted represents past performance. Past performance is historical and does not guarantee future performance. Investment return and principal value will fluctuate, so that shares, when redeemed, may be worth more or less than their original cost. Current performance may be lower or higher than the performance data quoted. For the most recent month-end performance information visit www.northwesternmutual.com.
This chart assumes an initial investment of $10,000 made on 12/31/06. Returns shown reflect fee waivers, deductions for management and other portfolio expenses, and reinvestment of all dividends. In the absence of fee waivers, total return would be reduced. Returns exclude deductions for separate account sale loads and account fees. Please refer to the Benchmark Definitions section of this report for information about the indices cited in the above chart and graph.
The Portfolio may invest a relatively high percentage of its assets in a particular sector. The Portfolio will have greater exposure to the risks associated with that sector and its performance will be tied more closely to the performance of the sector.
Top 10 Equity Holdings 12/31/16
| | | | |
Security Description | | | % of Net Assets | |
Apple, Inc. | | | 5.4 | % |
Philip Morris International, Inc. | | | 5.1 | % |
Exxon Mobil Corp. | | | 4.0 | % |
Facebook, Inc. - Class A | | | 3.5 | % |
Microsoft Corp. | | | 3.5 | % |
JPMorgan Chase & Co. | | | 3.4 | % |
The Coca-Cola Co. | | | 3.4 | % |
Altria Group, Inc. | | | 3.3 | % |
Alphabet, Inc. - Class C | | | 3.1 | % |
Chevron Corp. | | | 3.0 | % |
Sector Allocation 12/31/16

Sector Allocation is based on Net Assets.
Sector Allocation and Top 10 Holdings are subject to change.
| | | | | | |
| | Large Cap Core Stock Portfolio | | | 9 | |
Large Cap Core Stock Portfolio
Schedule of Investments
December 31, 2016
| | | | | | | | | | |
| | | Common Stocks (99.7%) | | Shares/
$ Par | | | Value
$(000’s) | |
| |
| | Consumer Discretionary (8.5%) | |
| | Comcast Corp. - Class A | | | 166,952 | | | | 11,528 | |
| | McDonald’s Corp. | | | 56,078 | | | | 6,826 | |
| | NIKE, Inc. - Class B | | | 92,260 | | | | 4,689 | |
| | Target Corp. | | | 33,003 | | | | 2,384 | |
| | Twenty-First Century Fox, Inc. | | | 238,110 | | | | 6,677 | |
| | Twenty-First Century Fox, Inc. - Class B | | | 18,900 | | | | 515 | |
| | The Walt Disney Co. | | | 106,183 | | | | 11,066 | |
| | | | | | | | | | |
| | Total | | | | | | | 43,685 | |
| | | | | | | | | | |
| |
| | Consumer Staples (23.0%) | |
| | Altria Group, Inc. | | | 250,608 | | | | 16,946 | |
| | Anheuser-Busch InBev NV, ADR | | | 58,750 | | | | 6,195 | |
| | The Coca-Cola Co. | | | 418,485 | | | | 17,350 | |
| | Constellation Brands,
Inc. - Class A | | | 19,950 | | | | 3,059 | |
| | The Estee Lauder Cos.,
Inc. - Class A | | | 114,861 | | | | 8,786 | |
| | Nestle SA, ADR | | | 181,932 | | | | 13,052 | |
| | PepsiCo, Inc. | | | 102,575 | | | | 10,732 | |
| | Philip Morris International, Inc. | | | 286,128 | | | | 26,178 | |
| | The Procter & Gamble Co. | | | 77,872 | | | | 6,547 | |
| | Walgreens Boots Alliance, Inc. | | | 112,208 | | | | 9,286 | |
| | | | | | | | | | |
| | Total | | | | | | | 118,131 | |
| | | | | | | | | | |
| |
| | Energy (11.1%) | |
| | Chevron Corp. | | | 131,097 | | | | 15,430 | |
| | ConocoPhillips | | | 153,370 | | | | 7,690 | |
| | Exxon Mobil Corp. | | | 226,181 | | | | 20,415 | |
| | | | | | | | | | |
| | | Common Stocks (99.7%) | | Shares/
$ Par | | | Value
$(000’s) | |
| |
| | Energy continued | |
| | Occidental Petroleum Corp. | | | 125,040 | | | | 8,907 | |
| | TOTAL SA, ADR | | | 95,607 | | | | 4,873 | |
| | | | | | | | | | |
| | Total | | | | | | | 57,315 | |
| | | | | | | | | | |
| |
| | Financials (14.8%) | |
| | American Express Co. | | | 121,617 | | | | 9,009 | |
| | BlackRock, Inc. | | | 30,753 | | | | 11,703 | |
| | Chubb, Ltd. | | | 112,744 | | | | 14,896 | |
| | Intercontinental Exchange, Inc. | | | 117,500 | | | | 6,629 | |
| | JPMorgan Chase & Co. | | | 203,605 | | | | 17,569 | |
| | State Street Corp. | | | 107,300 | | | | 8,339 | |
| | Wells Fargo & Co. | | | 141,873 | | | | 7,819 | |
| | | | | | | | | | |
| | Total | | | | | | | 75,964 | |
| | | | | | | | | | |
| |
| | Health Care (11.3%) | |
| | Abbott Laboratories | | | 202,688 | | | | 7,785 | |
| | AbbVie, Inc. | | | 174,222 | | | | 10,910 | |
| * | | Celgene Corp. | | | 49,850 | | | | 5,770 | |
| | Gilead Sciences, Inc. | | | 62,650 | | | | 4,486 | |
| * | | Intuitive Surgical, Inc. | | | 4,000 | | | | 2,537 | |
| | Novartis AG, ADR | | | 87,853 | | | | 6,399 | |
| | Novo Nordisk A/S, ADR | | | 232,235 | | | | 8,328 | |
| | Roche Holding AG, ADR | | | 281,764 | | | | 8,039 | |
| | UnitedHealth Group, Inc. | | | 24,000 | | | | 3,841 | |
| | | | | | | | | | |
| | Total | | | | | | | 58,095 | |
| | | | | | | | | | |
| |
| | Industrials (4.9%) | |
| | Canadian Pacific Railway, Ltd. | | | 49,654 | | | | 7,089 | |
| | Union Pacific Corp. | | | 69,600 | | | | 7,216 | |
| | United Technologies Corp. | | | 101,026 | | | | 11,075 | |
| | | | | | | | | | |
| | Total | | | | | | | 25,380 | |
| | | | | | | | | | |
| | | | | | | | | | |
| | | Common Stocks (99.7%) | | Shares/
$ Par | | | Value
$(000’s) | |
| |
| | Information Technology (24.0%) | |
| * | | Alphabet, Inc. - Class C | | | 20,930 | | | | 16,154 | |
| | Apple, Inc. | | | 239,889 | | | | 27,784 | |
| | ASML Holding NV | | | 54,650 | | | | 6,132 | |
| | Automatic Data Processing, Inc. | | | 31,940 | | | | 3,283 | |
| * | | Facebook, Inc. - Class A | | | 158,250 | | | | 18,207 | |
| | Microsoft Corp. | | | 291,150 | | | | 18,092 | |
| | Oracle Corp. | | | 144,874 | | | | 5,570 | |
| | Texas Instruments, Inc. | | | 205,583 | | | | 15,001 | |
| * | | VeriSign, Inc. | | | 41,950 | | | | 3,191 | |
| | Visa, Inc. - Class A | | | 104,300 | | | | 8,137 | |
| | Xilinx, Inc. | | | 35,144 | | | | 2,122 | |
| | | | | | | | | | |
| | Total | | | | | | | 123,673 | |
| | | | | | | | | | |
| |
| | Materials (2.1%) | |
| | Air Products &
Chemicals, Inc. | | | 35,797 | | | | 5,149 | |
| | Praxair, Inc. | | | 49,426 | | | | 5,792 | |
| | | | | | | | | | |
| | Total | | | | | | | 10,941 | |
| | | | | | | | | | |
| | | |
| | Total Common Stocks | | | | | | | | |
| | (Cost: $410,160) | | | | | | | 513,184 | |
| | | | | | | | | | |
| | | |
| | Total Investments (99.7%) | | | | | | | | |
| | (Cost: $410,160)(a) | | | | | | | 513,184 | |
| | | | | | | | | | |
| | Other Assets, Less | | | | | | | | |
| | Liabilities (0.3%) | | | | | | | 1,311 | |
| | | | | | | | | | |
| | Net Assets (100.0%) | | | | | | | 514,495 | |
| | | | | | | | | | |
ADR after the name of a security represents—American Depositary Receipt.
| (a) | At December 31, 2016, the aggregate cost of securities for federal tax purposes (in thousands) was $410,177 and the net unrealized appreciation of investments based on that cost was $103,007 which is comprised of $109,892 aggregate gross unrealized appreciation and $6,885 aggregate gross unrealized depreciation. |
The following is a summary of the inputs used in valuing the Portfolio’s assets and liabilities at December 31, 2016. See Note 3 for additional information on portfolio valuation.
| | | | | | | | | | | | | | |
| | | Valuation Inputs | | | |
| Description | | Level 1 –
Quoted Prices | | | Level 2 –
Other Significant
Observable Inputs | | | Level 3 –
Significant
Unobservable Inputs | | | |
| | | (Amounts in thousands) | | | |
Assets: | | | | | | | | | | | | | | |
Domestic Common Stocks | | $ | 513,184 | | | $ | - | | | $ | - | | | |
Total Assets: | | $ | 513,184 | | | $ | - | | | $ | - | | | |
The Accompanying Notes are an Integral Part of the Financial Statements.
| | | | |
| 10 | | Large Cap Core Stock Portfolio | | |
Large Cap Blend Portfolio (unaudited)
| | | | |
| Objective: | | Portfolio Strategy: | | Net Assets: |
| Long-term growth of capital and income. | | Invest primarily in equity securities of U.S. large capitalization companies listed or traded on U.S. securities exchanges. | | $165 million |
Portfolio Overview
Mason Street Advisors, LLC (“Mason Street Advisors”), the investment adviser for the Large Cap Blend Portfolio (the “Portfolio”), has engaged Fiduciary Management, Inc. (“FMI”) to act as sub-adviser for the Portfolio. Normally, the Portfolio invests in equity securities of large capitalization companies listed or traded on U.S. securities exchanges. In selecting investments, greater consideration is given to potential appreciation and future dividends than to current income. The Portfolio uses fundamental analysis to look for stocks of good businesses that are selling at value prices. The Portfolio employs a focused investment strategy, typically investing in a core group of 20-30 large capitalization common stocks and ADRs.
Market Overview
The current bull market (with just one near-20% correction in the large cap universe) is long in the tooth, having started in March of 2009. The S&P 500® Index is up 290%, which is more than double the average bull market return, and the third greatest move since 1929. Investor confidence appears to be high that the party will continue. In fact, the recent elections have emboldened investors even more, despite the fact that the stock market’s valuation at the beginning of an administration has been a much greater determinant of future stock returns than who is president. Investor expectations seem to be far ahead of the likely fundamentals.
Regarding the economy, the final tally for 2016 nominal GDP is expected to be between 2% and 3%. Inflation-adjusted growth remains meager. The past decade’s growth has been equally unimpressive at a 3.3% nominal rate, compared to an average of 4.5% over the past 25 years, and 6.6% over the past 50 years. There has been a growth problem and the culprit appears to be a combination of too many workers on the sidelines, low fixed business investment, insufficient research & development expenditure, and weak productivity growth (which is partly related to the latter two).
Portfolio Results
The Portfolio returned 13.99% for the twelve months ended December 31, 2016. By comparison, the Portfolio’s benchmark, the S&P 500® Index (the “Index”), returned 11.96%. (This Index is unmanaged, cannot be invested in directly and does not include administrative expenses or sales charges.) According to Lipper® Analytical Services, Inc., an independent mutual fund ranking agency, the average return of the Large Cap Core Funds peer group was 9.96% for 2016.
2016 was a solid year for the Portfolio on an absolute and relative return basis. The standouts for the year were found in the Health Care (UnitedHealth Group, Inc. and underweight pharmaceuticals), Manufacturing (PACCAR, Inc.) and Consumer (Comcast Corp. - Class A) sectors. Overall, stock selection in the Portfolio was strong, with the exception of stock selection in the Information Technology sector.
The Portfolio’s largest detractor for the year was AmerisourceBergen Corp. In 2016, generic drug prices fell, but not as much as the market expected and there have been fewer generic launches. This impacts resale margins for AmerisourceBergen Corp. and put pressure on the stock. In addition, they also had a handful of key client contract renewals which added to the volatility in the stock. For some perspective, the portfolio management team trimmed the stock three times on valuation in 2015. With the cheaper valuation in 2016, the team added to the Portfolio’s AmerisourceBergen Corp. position.
Portfolio Manager Outlook
The following forward looking comments are the opinion of FMI, the Portfolio’s sub-adviser.
The market has appreciated dramatically over the past eight years despite relatively mediocre fundamentals. This has resulted in valuations that are very elevated. The longer an environment remains essentially constant, the more investors believe it will persist. History shows this belief is 100% misplaced. Great investors tend to shy away from popular themes as they gather momentum, but most investors do the opposite. What looks smart in the short run almost always becomes spectacularly wrong in the end. We are highly confident that the rush into index funds in recent years will end with the same result: locking in poor returns.
The good news is going to have to wait until true values resurface in the market. We have some hope that through rolling sector declines we can reload the Portfolio with great values without a generalized bear market, but the odds are against this. All we can say for certain is that we think we have a portfolio of strong franchises that are cheaper than the market averages.
| | | | | | |
| | Large Cap Blend Portfolio | | | 11 | |
Large Cap Blend Portfolio (unaudited)
Our hope is that these stocks will hold their value better than the market when rocky times come, which has been our historical pattern. As the small print always says, past performance is not a guarantee of future results.
Relative Performance
| | | | | | | | | | | | |
Average Annual Total Returns
For Periods Ended December 31, 2016 | |
| | | 1 Year | | | 5 Years | | | Since
Inception* | |
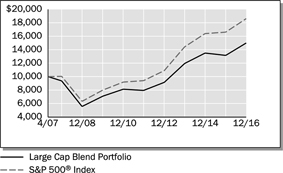
Large Cap Blend Portfolio | | | 13.99 | % | | | 13.55 | % | | | 4.28 | % |
S&P 500® Index | | | 11.96 | % | | | 14.66 | % | | | 6.63 | % |
Lipper® Variable Insurance Products (VIP) Large Cap Core Funds Average | | | 9.96 | % | | | 13.28 | % | | | – | |
| * | Inception date of 4/30/07 |
The performance data quoted represents past performance. Past performance is historical and does not guarantee future performance. Investment return and principal value will fluctuate, so that shares, when redeemed, may be worth more or less than their original cost. Current performance may be lower or higher than the performance data quoted. For the most recent month-end performance information visit www.northwesternmutual.com.
This chart assumes an initial investment of $10,000 made on 4/30/07 (commencement of the Portfolio’s operations). Returns shown reflect fee waivers, deductions for management and other portfolio expenses, and reinvestment of all dividends. In the absence of fee waivers, total return would be reduced.
Returns exclude deductions for separate account sale loads and account fees. Please refer to the Benchmark Definitions section of this report for information about the indices cited in the above chart and graph.
The Portfolio may hold fewer securities than other diversified portfolios because of its more focused investment strategy. Holding fewer securities increases the risk that the value of the Portfolio could go down because of the poor performance of a single investment.
Top 10 Equity Holdings 12/31/16
| | | | |
Security Description | | | % of Net Assets | |
Berkshire Hathaway, Inc. - Class B | | | 5.0 | % |
Comcast Corp. - Class A | | | 4.8 | % |
UnitedHealth Group, Inc. | | | 4.4 | % |
Dollar General Corp. | | | 4.2 | % |
Honeywell International, Inc. | | | 4.1 | % |
Accenture PLC - Class A | | | 4.0 | % |
Schlumberger, Ltd. | | | 3.9 | % |
JPMorgan Chase & Co. | | | 3.9 | % |
The Bank of New York Mellon Corp. | | | 3.5 | % |
TE Connectivity, Ltd. | | | 3.5 | % |
Sector Allocation 12/31/16
Sector Allocation is based on Net Assets.
Sector Allocation and Top 10 Holdings are subject to change.
| | | | |
| 12 | | Large Cap Blend Portfolio | | |
Large Cap Blend Portfolio
Schedule of Investments
December 31, 2016
| | | | | | | | | | |
| | | Common Stocks (91.2%) | | Shares/
$ Par | | | Value
$ (000’s) | |
| |
| | Consumer Discretionary (18.3%) | |
| | Comcast Corp. - Class A | | | 114,900 | | | | 7,934 | |
| | Dollar General Corp. | | | 94,325 | | | | 6,987 | |
| | Omnicom Group, Inc. | | | 63,025 | | | | 5,364 | |
| | Ross Stores, Inc. | | | 47,225 | | | | 3,098 | |
| | Twenty-First Century Fox, Inc. | | | 80,200 | | | | 2,249 | |
| | Twenty-First Century Fox, Inc. - Class B | | | 167,350 | | | | 4,560 | |
| | | | | | | | | | |
| | Total | | | | | | | 30,192 | |
| | | | | | | | | | |
| |
| | Consumer Staples (3.8%) | |
| | Nestle SA, ADR | | | 42,225 | | | | 3,029 | |
| | Unilever PLC, ADR | | | 78,900 | | | | 3,211 | |
| | | | | | | | | | |
| | Total | | | | | | | 6,240 | |
| | | | | | | | | | |
| |
| | Energy (6.8%) | |
| | Devon Energy Corp. | | | 105,800 | | | | 4,832 | |
| | Schlumberger, Ltd. | | | 76,575 | | | | 6,428 | |
| | | | | | | | | | |
| | Total | | | | | | | 11,260 | |
| | | | | | | | | | |
| | | | | | | | | | |
| | | Common Stocks (91.2%) | | Shares/
$ Par | | | Value
$ (000’s) | |
| |
| | Financials (18.0%) | |
| | American Express Co. | | | 58,825 | | | | 4,358 | |
| | The Bank of New York Mellon Corp. | | | 121,875 | | | | 5,774 | |
* | | Berkshire Hathaway,
Inc. - Class B | | | 50,375 | | | | 8,210 | |
| | JPMorgan Chase & Co. | | | 74,250 | | | | 6,407 | |
| | The Progressive Corp. | | | 139,950 | | | | 4,968 | |
| | | | | | | | | | |
| | Total | | | | | | | 29,717 | |
| | | | | | | | | | |
| |
| | Health Care (9.1%) | |
| | AmerisourceBergen Corp. | | | 63,450 | | | | 4,961 | |
* | | Cerner Corp. | | | 58,075 | | | | 2,751 | |
| | UnitedHealth Group, Inc. | | | 45,200 | | | | 7,234 | |
| | | | | | | | | | |
| | Total | | | | | | | 14,946 | |
| | | | | | | | | | |
| |
| | Industrials (15.0%) | |
| | Expeditors International of Washington, Inc. | | | 105,825 | | | | 5,604 | |
| | Honeywell International, Inc. | | | 58,825 | | | | 6,815 | |
| | PACCAR, Inc. | | | 84,725 | | | | 5,414 | |
| | Rockwell Automation, Inc. | | | 14,775 | | | | 1,986 | |
| | Stanley Black & Decker, Inc. | | | 43,200 | | | | 4,955 | |
| | | | | | | | | | |
| | Total | | | | | | | 24,774 | |
| | | | | | | | | | |
| | | | | | | | | | |
| | | Common Stocks (91.2%) | | Shares/
$ Par | | | Value
$ (000’s) | |
| |
| | Information Technology (14.7%) | |
| | Accenture PLC - Class A | | | 55,475 | | | | 6,498 | |
* | | eBay, Inc. | | | 188,900 | | | | 5,608 | |
| | Microsoft Corp. | | | 52,250 | | | | 3,247 | |
| | Oracle Corp. | | | 80,100 | | | | 3,080 | |
| | TE Connectivity, Ltd. | | | 82,300 | | | | 5,702 | |
| | | | | | | | | | |
| | Total | | | | | | | 24,135 | |
| | | | | | | | | | |
| |
| | Materials (3.3%) | |
| | Potash Corp. of Saskatchewan, Inc. | | | 300,400 | | | | 5,434 | |
| | | | | | | | | | |
| | Total | | | | | | | 5,434 | |
| | | | | | | | | | |
| |
| | Telecommunication Services (2.2%) | |
* | | Level 3 Communications, Inc. | | | 64,175 | | | | 3,617 | |
| | | | | | | | | | |
| | Total | | | | | | | 3,617 | |
| | | | | | | | | | |
| | | |
| | Total Common Stocks | | | | | | | | |
| | (Cost: $127,625) | | | | | | | 150,315 | |
| | | | | | | | | | |
| | | |
| | Total Investments (91.2%) | | | | | | | | |
| | (Cost: $127,625)(a) | | | | | | | 150,315 | |
| | | | | | | | | | |
| | Other Assets, Less | | | | | | | | |
| | Liabilities (8.8%) | | | | | | | 14,437 | |
| | | | | | | | | | |
| | Net Assets (100.0%) | | | | | | | 164,752 | |
| | | | | | | | | | |
ADR after the name of a security represents—American Depositary Receipt.
| (a) | At December 31, 2016, the aggregate cost of securities for federal tax purposes (in thousands) was $128,243 and the net unrealized appreciation of investments based on that cost was $22,072 which is comprised of $27,847 aggregate gross unrealized appreciation and $5,775 aggregate gross unrealized depreciation. |
The following is a summary of the inputs used in valuing the Portfolio’s assets and liabilities at December 31, 2016. See Note 3 for additional information on portfolio valuation.
| | | | | | | | | | | | | | |
| | | Valuation Inputs | | | |
| Description | | Level 1 –
Quoted Prices | | | Level 2 –
Other Significant
Observable Inputs | | | Level 3 – Significant
Unobservable Inputs | | | |
| | | (Amounts in thousands) | | | |
Assets: | | | | | | | | | | | | | | |
Domestic Common Stocks | | $ | 150,315 | | | $ | - | | | $ | - | | | |
Total Assets: | | $ | 150,315 | | | $ | - | | | $ | - | | | |
The Accompanying Notes are an Integral Part of the Financial Statements.
| | | | | | |
| | Large Cap Blend Portfolio | | | 13 | |
Index 500 Stock Portfolio (unaudited)
| | | | |
| Objective: | | Portfolio Strategy: | | Net Assets: |
| Investment results that approximate the performance of the S&P 500® Index. | | Invest in stocks that make up the S&P 500® Index, holding each stock in approximately the same proportion as its weighting in the Index. | | $2.7 billion |
Portfolio Overview
Mason Street Advisors is the investment adviser for the Index 500 Stock Portfolio (the “Portfolio”). The Portfolio seeks investment results that approximate the performance of the S&P 500® Index, which is composed of the stocks of primarily large capitalization companies that represent a broad spectrum of the U.S. economy and a substantial part of the U.S. stock market’s total capitalization. The Portfolio attempts to achieve its objective by investing all, or substantially all, of its assets in the stocks that make up the S&P 500® Index, holding each stock in approximately the same proportion as its weighting in the Index. This is known as a full replication strategy. The Portfolio may also invest in S&P 500® Index stock futures and, to a lesser extent, purchase (long) total return equity swap agreements to help achieve full replication.
Market Overview
U.S. equities posted strong performance during the year. Investors generally embraced higher-risk equities with greater exposure to the economic cycle, particularly after the U.S. election. Earnings growth remained subdued until the second half of the year, reflecting the drag from the Energy sector. Meanwhile, corporations continued buying back their stocks and acquiring other companies at a relatively robust pace. Consumer spending remained relatively steady, as job growth and rising stock prices helped improve consumer sentiment. Business spending remained muted, as many companies preferred to strengthen their balance sheets or buy back stock in lieu of large-scale investment in physical assets. The broader fixed income market posted a modest positive return, while higher-yielding corporate bonds logged large gains.
Altogether, the U.S. economy grew at a relatively slow pace of approximately 2.0% during the year, but growth was relatively stable, extending the U.S. economy’s streak to ten consecutive quarters of positive economic growth. The Fed was expected to raise interest rates for most of the year, but inflation well below the Fed’s 2.0% target and global uncertainty meant the Fed waited until December of 2016 to raise rates by a quarter of a point, marking only the second time the Fed has raised interest rates in the last eight years.
In that environment, small- and medium-sized stocks, as represented by the S&P SmallCap 600® and S&P MidCap 400® Indices, returned 26.56% and 20.74%, respectively, while the large-capitalization S&P 500® Index lagged despite its 11.96% return in 2016. Meanwhile, the Bloomberg Barclays U.S. Corporate High Yield Index posted a return of 17.13%, substantially outperforming the 2.65% return of the broader bond market, as represented by the Bloomberg Barclays® U.S. Aggregate Index.
Portfolio Results
The Index 500 Stock Portfolio delivered a total return of 11.73% for the twelve months ended December 31, 2016, trailing the S&P 500® Index (the “Index”), which returned 11.96%. (The Index is unmanaged, cannot be invested in directly and does not include administrative expenses or sales charges.) Portfolio performance slightly lagged the Index due to transaction costs, administrative expenses, cash flow effects and costs associated with the use of stock index futures contracts. The Portfolio outperformed the 11.51% average return for its peer group, S&P 500® Index Funds, according to Lipper® Analytical Services, Inc.
Ten out of the Index’s eleven sectors delivered positive returns for the year. The Financials sector delivered the strongest performance, led by the banking industry, as financial stocks performed in line with the broader stock market for most of the year, then rose sharply following the unexpected Trump win in the U.S. presidential election. Many market observers were expecting deregulation and other finance-friendly policy shifts from the incoming Trump administration. The Information Technology sector also delivered solid results, as semiconductor stocks benefited from several industry themes, including growth in demand for servers and data centers and innovation in smart technology. Hardware and software stocks added to performance in the Information Technology sector. The Industrials sector also performed well, as industrial production improved with economic growth during the second half of the year. Rebounding oil and gas prices helped the Energy sector’s performance, while consumer-oriented stocks benefited from steady job growth and rising confidence.
At the other end of the spectrum, the Healthcare sector declined, as biotechnology and pharmaceutical stocks fell after posting strong performance for several years. Drug pricing came under political scrutiny throughout the year, and uncertainty about the Healthcare sector’s competitive landscape grew following Donald Trump’s win, as Trump and the Republican-majority Congress voiced opposition to key components of the Affordable Care Act.
| | | | |
| 14 | | Index 500 Stock Portfolio | | |
Index 500 Stock Portfolio (unaudited)
Relative Performance
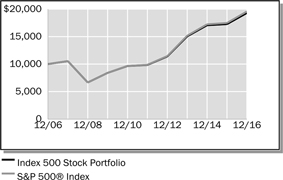
| | | | | | | | | | | | |
Average Annual Total Returns
For Periods Ended December 31, 2016 | |
| | | 1 Year | | | 5 Years | | | 10 Years | |
Index 500 Stock Portfolio | | | 11.73 | % | | | 14.41 | % | | | 6.79 | % |
S&P 500® Index | | | 11.96 | % | | | 14.66 | % | | | 6.95 | % |
Lipper® Variable Insurance Products (VIP) S&P 500 Index Objective Funds Average | | | 11.51 | % | | | 14.20 | % | | | 6.59 | % |
The performance data quoted represents past performance. Past performance is historical and does not guarantee future performance. Investment return and principal value will fluctuate, so that shares, when redeemed, may be worth more or less than their original cost. Current performance may be lower or higher than the performance data quoted. For the most recent month-end performance information visit www.northwesternmutual.com.
This chart assumes an initial investment of $10,000 made on 12/31/06. Returns shown reflect fee waivers, deductions for management and other portfolio expenses, and reinvestment of all dividends. In the absence of fee waivers, total return would be reduced. Returns exclude deductions for separate account sale loads and account fees. Please refer to the Benchmark Definitions section of this report for information about the indices cited in the above chart and graph.
“Standard & Poor’s®”, “S&P®”, “S&P 500” and “Standard & Poor’s 500” are trademarks of The McGraw-Hill Companies, Inc. and have been licensed for use by Northwestern Mutual Life Insurance Company. The Portfolio is not sponsored, endorsed, sold or promoted by Standard & Poor’s, and Standard & Poor’s makes no representation regarding the advisability of investing in the Portfolio.
The Portfolio may invest in derivative instruments for cash management purposes or to hedge foreign currency exposure. Use of these instruments may involve certain costs and imposes certain risks such as liquidity risk, market risk, credit risk, management risk and the risk of mispricing or improper valuation. Certain derivatives involve leverage, which could magnify losses, and portfolios investing in derivatives could lose more than the principal amount invested in those instruments.
Top 10 Equity Holdings 12/31/16
| | | | |
Security Description | | | % of Net Assets | |
Apple, Inc. | | | 3.2 | % |
Microsoft Corp. | | | 2.5 | % |
Alphabet, Inc. Various | | | 2.4 | % |
Exxon Mobil Corp. | | | 1.9 | % |
Johnson & Johnson | | | 1.6 | % |
Berkshire Hathaway, Inc. - Class B | | | 1.6 | % |
JPMorgan Chase & Co. | | | 1.6 | % |
Amazon.com, Inc. | | | 1.5 | % |
General Electric Co. | | | 1.4 | % |
Facebook, Inc. - Class A | | | 1.4 | % |
Sector Allocation 12/31/16
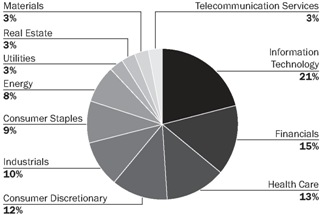
Sector Allocation is based on Net Assets.
Sector Allocation and Top 10 Holdings are subject to change.
| | | | | | |
| | Index 500 Stock Portfolio | | | 15 | |
Index 500 Stock Portfolio
Schedule of Investments
December 31, 2016
| | | | | | | | | | |
| | | Common Stocks (98.4%) | | Shares/
$ Par | | | Value
$ (000’s) | |
| |
| | Consumer Discretionary (12.0%) | |
| | Advance Auto Parts, Inc. | | | 10,075 | | | | 1,704 | |
| * | | Amazon.com, Inc. | | | 53,951 | | | | 40,456 | |
| * | | AutoNation, Inc. | | | 8,984 | | | | 437 | |
| * | | AutoZone, Inc. | | | 3,948 | | | | 3,118 | |
| | Bed Bath & Beyond, Inc. | | | 20,804 | | | | 846 | |
| | Best Buy Co., Inc. | | | 37,349 | | | | 1,594 | |
| | BorgWarner, Inc. | | | 27,388 | | | | 1,080 | |
| * | | CarMax, Inc. | | | 26,036 | | | | 1,677 | |
| | Carnival Corp. | | | 57,362 | | | | 2,986 | |
| | CBS Corp. - Class B | | | 53,620 | | | | 3,411 | |
| * | | Charter Communications, Inc. | | | 29,621 | | | | 8,529 | |
| * | | Chipotle Mexican Grill, Inc. | | | 3,960 | | | | 1,494 | |
| | Coach, Inc. | | | 38,352 | | | | 1,343 | |
| | Comcast Corp. - Class A | | | 326,036 | | | | 22,513 | |
| | D.R. Horton, Inc. | | | 46,423 | | | | 1,269 | |
| | Darden Restaurants, Inc. | | | 16,837 | | | | 1,224 | |
| | Delphi Automotive PLC | | | 37,049 | | | | 2,495 | |
| * | | Discovery Communications, Inc. | | | 30,175 | | | | 808 | |
| * | | Discovery Communications, Inc. - Class A | | | 20,785 | | | | 570 | |
| | Dollar General Corp. | | | 34,768 | | | | 2,575 | |
| * | | Dollar Tree, Inc. | | | 32,294 | | | | 2,492 | |
| | Expedia, Inc. | | | 16,520 | | | | 1,871 | |
| | Foot Locker, Inc. | | | 18,510 | | | | 1,312 | |
| | Ford Motor Co. | | | 533,894 | | | | 6,476 | |
| | The Gap, Inc. | | | 30,011 | | | | 673 | |
| | Garmin, Ltd. | | | 15,725 | | | | 763 | |
| | General Motors Co. | | | 189,756 | | | | 6,611 | |
| | Genuine Parts Co. | | | 20,347 | | | | 1,944 | |
| | The Goodyear Tire & Rubber Co. | | | 35,711 | | | | 1,102 | |
| | H&R Block, Inc. | | | 28,371 | | | | 652 | |
| | Hanesbrands, Inc. | | | 51,701 | | | | 1,115 | |
| | Harley-Davidson, Inc. | | | 24,182 | | | | 1,411 | |
| | Harman International Industries, Inc. | | | 9,537 | | | | 1,060 | |
| | Hasbro, Inc. | | | 15,363 | | | | 1,195 | |
| | The Home Depot, Inc. | | | 166,639 | | | | 22,343 | |
| | The Interpublic Group of Cos., Inc. | | | 54,309 | | | | 1,271 | |
| | Johnson Controls International PLC | | | 128,139 | | | | 5,278 | |
| | Kohl’s Corp. | | | 24,141 | | | | 1,192 | |
| | L Brands, Inc. | | | 32,859 | | | | 2,163 | |
| | | | | | | | | | |
| | | Common Stocks (98.4%) | | Shares/
$ Par | | | Value
$ (000’s) | |
| |
| | Consumer Discretionary continued | |
| | Leggett & Platt, Inc. | | | 18,287 | | | | 894 | |
| | Lennar Corp. - Class A | | | 26,880 | | | | 1,154 | |
| * | | LKQ Corp. | | | 42,066 | | | | 1,289 | |
| | Lowe’s Cos., Inc. | | | 118,991 | | | | 8,463 | |
| | Macy’s, Inc. | | | 41,814 | | | | 1,497 | |
| | Marriott International, Inc. - Class A | | | 43,801 | | | | 3,622 | |
| | Mattel, Inc. | | | 46,790 | | | | 1,289 | |
| | McDonald’s Corp. | | | 113,601 | | | | 13,828 | |
| * | | Michael Kors Holdings, Ltd. | | | 22,468 | | | | 966 | |
| * | | Mohawk Industries, Inc. | | | 8,624 | | | | 1,722 | |
| * | | Netflix, Inc. | | | 58,706 | | | | 7,268 | |
| | Newell Brands, Inc. | | | 65,990 | | | | 2,946 | |
| | News Corp. - Class A | | | 52,246 | | | | 599 | |
| | News Corp. - Class B | | | 16,386 | | | | 193 | |
| | NIKE, Inc. - Class B | | | 182,784 | | | | 9,291 | |
| | Nordstrom, Inc. | | | 15,887 | | | | 762 | |
| | Omnicom Group, Inc. | | | 32,268 | | | | 2,746 | |
| * | | O’Reilly Automotive, Inc. | | | 12,922 | | | | 3,598 | |
| * | | The Priceline Group, Inc. | | | 6,750 | | | | 9,896 | |
| | PulteGroup, Inc. | | | 40,720 | | | | 748 | |
| | PVH Corp. | | | 10,843 | | | | 979 | |
| | Ralph Lauren Corp. | | | 7,704 | | | | 696 | |
| | Ross Stores, Inc. | | | 54,250 | | | | 3,559 | |
| | Royal Caribbean Cruises, Ltd. | | | 22,896 | | | | 1,878 | |
| | Scripps Networks Interactive - Class A | | | 13,031 | | | | 930 | |
| | Signet Jewelers, Ltd. | | | 9,518 | | | | 897 | |
| | Staples, Inc. | | | 88,991 | | | | 805 | |
| | Starbucks Corp. | | | 199,092 | | | | 11,054 | |
| | Target Corp. | | | 76,837 | | | | 5,550 | |
| | TEGNA, Inc. | | | 29,331 | | | | 627 | |
| | Tiffany & Co. | | | 14,642 | | | | 1,134 | |
| | Time Warner, Inc. | | | 105,487 | | | | 10,183 | |
| | The TJX Cos., Inc. | | | 89,177 | | | | 6,700 | |
| | Tractor Supply Co. | | | 17,954 | | | | 1,361 | |
| * | | TripAdvisor, Inc. | | | 15,635 | | | | 725 | |
| | Twenty-First Century Fox, Inc. | | | 144,840 | | | | 4,061 | |
| | Twenty-First Century Fox, Inc. - Class B | | | 66,633 | | | | 1,816 | |
| * | | Ulta Salon, Cosmetics & Fragrance, Inc. | | | 8,020 | | | | 2,045 | |
| * | | Under Armour, Inc. | | | 25,135 | | | | 730 | |
| * | | Under Armour, Inc. - Class C | | | 25,276 | | | | 636 | |
| * | | Urban Outfitters, Inc. | | | 12,084 | | | | 344 | |
| | | | | | | | | | |
| | | Common Stocks (98.4%) | | Shares/
$ Par | | | Value
$ (000’s) | |
| |
| | Consumer Discretionary continued | |
| | VF Corp. | | | 45,275 | | | | 2,415 | |
| | Viacom, Inc. - Class B | | | 47,520 | | | | 1,668 | |
| | The Walt Disney Co. | | | 200,288 | | | | 20,874 | |
| | Whirlpool Corp. | | | 10,274 | | | | 1,868 | |
| | Wyndham Worldwide Corp. | | | 14,743 | | | | 1,126 | |
| | Wynn Resorts, Ltd. | | | 10,856 | | | | 939 | |
| | Yum! Brands, Inc. | | | 47,694 | | | | 3,021 | |
| | | | | | | | | | |
| | Total | | | | | | | 322,445 | |
| | | | | | | | | | |
| | | |
| | Consumer Staples (9.2%) | | | | | | | | |
| | Altria Group, Inc. | | | 266,788 | | | | 18,040 | |
| | Archer-Daniels-Midland Co. | | | 78,712 | | | | 3,593 | |
| | Brown-Forman Corp. - Class B | | | 24,951 | | | | 1,121 | |
| | Campbell Soup Co. | | | 26,505 | | | | 1,603 | |
| (p),* | | Casa Ley SA de CV | | | 29,556 | | | | 30 | |
| | Church & Dwight Co., Inc. | | | 35,376 | | | | 1,563 | |
| | The Clorox Co. | | | 17,612 | | | | 2,114 | |
| | The Coca-Cola Co. | | | 530,994 | | | | 22,015 | |
| | Colgate-Palmolive Co. | | | 121,590 | | | | 7,957 | |
| | Conagra Brands, Inc. | | | 56,890 | | | | 2,250 | |
| | Constellation Brands, Inc. - Class A | | | 24,311 | | | | 3,727 | |
| | Costco Wholesale Corp. | | | 59,797 | | | | 9,574 | |
| | Coty, Inc. - Class A | | | 64,319 | | | | 1,178 | |
| | CVS Health Corp. | | | 145,884 | | | | 11,512 | |
| | Dr. Pepper Snapple Group, Inc. | | | 25,131 | | | | 2,279 | |
| | The Estee Lauder Cos., Inc. - Class A | | | 30,407 | | | | 2,326 | |
| | General Mills, Inc. | | | 80,898 | | | | 4,997 | |
| | The Hershey Co. | | | 19,080 | | | | 1,973 | |
| | Hormel Foods Corp. | | | 36,920 | | | | 1,285 | |
| | The J.M. Smucker Co. | | | 15,928 | | | | 2,040 | |
| | Kellogg Co. | | | 34,562 | | | | 2,548 | |
| | Kimberly-Clark Corp. | | | 48,994 | | | | 5,591 | |
| | The Kraft Heinz Co. | | | 81,593 | | | | 7,125 | |
| | The Kroger Co. | | | 129,159 | | | | 4,457 | |
| | McCormick & Co., Inc. | | | 15,671 | | | | 1,463 | |
| | Mead Johnson Nutrition Co. | | | 25,269 | | | | 1,788 | |
| | Molson Coors Brewing Co. - Class B | | | 25,210 | | | | 2,453 | |
| | Mondelez International, Inc. | | | 211,269 | | | | 9,365 | |
| * | | Monster Beverage Corp. | | | 55,456 | | | | 2,459 | |
| | PepsiCo, Inc. | | | 196,190 | | | | 20,527 | |
The Accompanying Notes are and Integral Part of the Financial Statements.
| | | | |
| 16 | | Index 500 Stock Portfolio | | |
Index 500 Stock Portfolio
| | | | | | | | | | |
| | | Common Stocks (98.4%) | | Shares/
$ Par | | | Value
$ (000’s) | |
| |
| | Consumer Staples continued | |
| | Philip Morris International, Inc. | | | 212,218 | | | | 19,416 | |
| | The Procter & Gamble Co. | | | 366,064 | | | | 30,779 | |
| (p),* | | Property Development Centers LLC | | | 29,556 | | | | 1 | |
| | Reynolds American, Inc. | | | 113,124 | | | | 6,339 | |
| | Sysco Corp. | | | 68,832 | | | | 3,811 | |
| | Tyson Foods, Inc. - Class A | | | 39,747 | | | | 2,452 | |
| | Walgreens Boots Alliance, Inc. | | | 117,069 | | | | 9,689 | |
| | Wal-Mart Stores, Inc. | | | 205,995 | | | | 14,238 | |
| | Whole Foods Market, Inc. | | | 43,557 | | | | 1,340 | |
| | | | | | | | | | |
| | Total | | | | | | | 247,018 | |
| | | | | | | | | | |
| | |
| | Energy (7.4%) | | | | | |
| | Anadarko Petroleum Corp. | | | 76,455 | | | | 5,331 | |
| | Apache Corp. | | | 51,904 | | | | 3,294 | |
| | Baker Hughes, Inc. | | | 57,836 | | | | 3,758 | |
| | Cabot Oil & Gas Corp. | | | 63,631 | | | | 1,486 | |
| * | | Chesapeake Energy Corp. | | | 101,969 | | | | 716 | |
| | Chevron Corp. | | | 258,238 | | | | 30,395 | |
| | Cimarex Energy Co. | | | 12,991 | | | | 1,766 | |
| * | | Concho Resources, Inc. | | | 19,979 | | | | 2,649 | |
| | ConocoPhillips | | | 169,493 | | | | 8,498 | |
| | Devon Energy Corp. | | | 71,626 | | | | 3,271 | |
| | EOG Resources, Inc. | | | 78,857 | | | | 7,973 | |
| | EQT Corp. | | | 23,633 | | | | 1,546 | |
| | Exxon Mobil Corp. | | | 567,248 | | | | 51,200 | |
| * | | FMC Technologies, Inc. | | | 30,875 | | | | 1,097 | |
| | Halliburton Co. | | | 118,253 | | | | 6,396 | |
| | Helmerich & Payne, Inc. | | | 14,798 | | | | 1,145 | |
| | Hess Corp. | | | 36,478 | | | | 2,272 | |
| | Kinder Morgan, Inc. | | | 262,625 | | | | 5,439 | |
| | Marathon Oil Corp. | | | 115,895 | | | | 2,006 | |
| | Marathon Petroleum Corp. | | | 72,203 | | | | 3,635 | |
| | Murphy Oil Corp. | | | 22,143 | | | | 689 | |
| | National Oilwell Varco, Inc. | | | 51,666 | | | | 1,934 | |
| * | | Newfield Exploration Co. | | | 26,982 | | | | 1,093 | |
| | Noble Energy, Inc. | | | 58,641 | | | | 2,232 | |
| | Occidental Petroleum Corp. | | | 104,537 | | | | 7,446 | |
| | ONEOK, Inc. | | | 28,799 | | | | 1,653 | |
| | Phillips 66 | | | 60,562 | | | | 5,233 | |
| | Pioneer Natural Resources Co. | | | 23,217 | | | | 4,181 | |
| | | | | | | | | | |
| | | Common Stocks (98.4%) | | Shares/
$ Par | | | Value
$ (000’s) | |
| |
| | Energy continued | |
| | Range Resources Corp. | | | 25,694 | | | | 883 | |
| | Schlumberger, Ltd. | | | 190,324 | | | | 15,978 | |
| * | | Southwestern Energy Co. | | | 67,137 | | | | 727 | |
| | Spectra Energy Corp. | | | 95,965 | | | | 3,943 | |
| | Tesoro Corp. | | | 15,988 | | | | 1,398 | |
| * | | Transocean, Ltd. | | | 53,254 | | | | 785 | |
| | Valero Energy Corp. | | | 61,922 | | | | 4,231 | |
| | The Williams Companies, Inc. | | | 93,467 | | | | 2,911 | |
| | | | | | | | | | |
| | Total | | | | | | | 199,190 | |
| | | | | | | | | | |
| | |
| | Financials (14.6%) | | | | | |
| * | | Affiliated Managers Group, Inc. | | | 7,499 | | | | 1,090 | |
| | Aflac, Inc. | | | 55,827 | | | | 3,886 | |
| | The Allstate Corp. | | | 50,375 | | | | 3,734 | |
| | American Express Co. | | | 105,170 | | | | 7,791 | |
| | American International Group, Inc. | | | 133,482 | | | | 8,718 | |
| | Ameriprise Financial, Inc. | | | 21,620 | | | | 2,398 | |
| | Aon PLC | | | 35,990 | | | | 4,014 | |
| | Arthur J. Gallagher & Co. | | | 24,342 | | | | 1,265 | |
| | Assurant, Inc. | | | 7,799 | | | | 724 | |
| | Bank of America Corp. | | | 1,382,324 | | | | 30,549 | |
| | The Bank of New York Mellon Corp. | | | 144,639 | | | | 6,853 | |
| | BB&T Corp. | | | 110,999 | | | | 5,219 | |
| * | | Berkshire Hathaway, Inc. - Class B | | | 259,756 | | | | 42,335 | |
| | BlackRock, Inc. | | | 16,628 | | | | 6,328 | |
| | Capital One Financial Corp. | | | 65,977 | | | | 5,756 | |
| | The Charles Schwab Corp. | | | 165,024 | | | | 6,513 | |
| | Chubb, Ltd. | | | 63,656 | | | | 8,410 | |
| | Cincinnati Financial Corp. | | | 20,509 | | | | 1,553 | |
| | Citigroup, Inc. | | | 389,830 | | | | 23,168 | |
| | Citizens Financial Group, Inc. | | | 70,022 | | | | 2,495 | |
| | CME Group, Inc. | | | 46,422 | | | | 5,355 | |
| | Comerica, Inc. | | | 23,565 | | | | 1,605 | |
| | Discover Financial Services | | | 53,952 | | | | 3,889 | |
| * | | E*TRADE Financial Corp. | | | 37,447 | | | | 1,297 | |
| | Fifth Third Bancorp | | | 103,364 | | | | 2,788 | |
| | Franklin Resources, Inc. | | | 47,464 | | | | 1,879 | |
| | The Goldman Sachs Group, Inc. | | | 50,589 | | | | 12,113 | |
| | The Hartford Financial Services Group, Inc. | | | 51,672 | | | | 2,462 | |
| | | | | | | | | | |
| | | Common Stocks (98.4%) | | Shares/
$ Par | | | Value
$ (000’s) | |
| |
| | Financials continued | |
| | Huntington Bancshares, Inc. | | | 148,394 | | | | 1,962 | |
| | Intercontinental Exchange, Inc. | | | 81,486 | | | | 4,597 | |
| | Invesco, Ltd. | | | 55,886 | | | | 1,696 | |
| | JPMorgan Chase & Co. | | | 489,490 | | | | 42,238 | |
| | KeyCorp | | | 147,837 | | | | 2,701 | |
| | Leucadia National Corp. | | | 44,324 | | | | 1,030 | |
| | Lincoln National Corp. | | | 31,266 | | | | 2,072 | |
| | Loews Corp. | | | 37,798 | | | | 1,770 | |
| | M&T Bank Corp. | | | 21,210 | | | | 3,318 | |
| | Marsh & McLennan Cos., Inc. | | | 70,531 | | | | 4,767 | |
| | MetLife, Inc. | | | 150,356 | | | | 8,103 | |
| | Moody’s Corp. | | | 22,755 | | | | 2,145 | |
| | Morgan Stanley | | | 197,269 | | | | 8,335 | |
| | Nasdaq, Inc. | | | 15,593 | | | | 1,047 | |
| | Navient Corp. | | | 41,463 | | | | 681 | |
| | Northern Trust Corp. | | | 29,116 | | | | 2,593 | |
| | People’s United Financial, Inc. | | | 42,596 | | | | 825 | |
| | PNC Financial Services Group, Inc. | | | 66,551 | | | | 7,784 | |
| | Principal Financial Group, Inc. | | | 36,599 | | | | 2,118 | |
| | The Progressive Corp. | | | 79,382 | | | | 2,818 | |
| | Prudential Financial, Inc. | | | 58,822 | | | | 6,121 | |
| | Regions Financial Corp. | | | 168,392 | | | | 2,418 | |
| | S&P Global, Inc. | | | 35,444 | | | | 3,812 | |
| | State Street Corp. | | | 49,601 | | | | 3,855 | |
| | SunTrust Banks, Inc. | | | 67,139 | | | | 3,683 | |
| | Synchrony Financial | | | 107,274 | | | | 3,891 | |
| | T. Rowe Price Group, Inc. | | | 33,300 | | | | 2,506 | |
| | Torchmark Corp. | | | 15,095 | | | | 1,113 | |
| | The Travelers Cos., Inc. | | | 38,858 | | | | 4,757 | |
| | U.S. Bancorp | | | 218,557 | | | | 11,227 | |
| | Unum Group | | | 31,753 | | | | 1,395 | |
| | Wells Fargo & Co. | | | 618,325 | | | | 34,076 | |
| | Willis Towers Watson PLC | | | 17,584 | | | | 2,150 | |
| | XL Group, Ltd. | | | 36,806 | | | | 1,371 | |
| | Zions Bancorporation | | | 27,868 | | | | 1,199 | |
| | | | | | | | | | |
| | Total | | | | | | | 390,361 | |
| | | | | | | | | | |
| | |
| | Health Care (13.2%) | | | | | |
| | Abbott Laboratories | | | 201,405 | | | | 7,736 | |
| | AbbVie, Inc. | | | 222,306 | | | | 13,921 | |
| | Aetna, Inc. | | | 48,002 | | | | 5,953 | |
| | Agilent Technologies, Inc. | | | 44,374 | | | | 2,022 | |
| * | | Alexion Pharmaceuticals, Inc. | | | 30,676 | | | | 3,753 | |
| * | | Allergan PLC | | | 51,309 | | | | 10,775 | |
The Accompanying Notes are and Integral Part of the Financial Statements.
| | | | | | |
| | Index 500 Stock Portfolio | | | 17 | |
Index 500 Stock Portfolio
| | | | | | | | | | |
| | | Common Stocks (98.4%) | | Shares/
$ Par | | | Value
$ (000’s) | |
| |
| | Health Care continued | |
| | AmerisourceBergen Corp. | | | 22,883 | | | | 1,789 | |
| | Amgen, Inc. | | | 101,765 | | | | 14,879 | |
| | Anthem, Inc. | | | 36,037 | | | | 5,181 | |
| | Baxter International, Inc. | | | 66,965 | | | | 2,969 | |
| | Becton, Dickinson and Co. | | | 29,044 | | | | 4,808 | |
| * | | Biogen, Inc. | | | 29,763 | | | | 8,440 | |
| * | | Boston Scientific Corp. | | | 186,270 | | | | 4,029 | |
| | Bristol-Myers Squibb Co. | | | 228,616 | | | | 13,360 | |
| | C.R. Bard, Inc. | | | 10,058 | | | | 2,260 | |
| | Cardinal Health, Inc. | | | 43,783 | | | | 3,151 | |
| * | | Celgene Corp. | | | 106,044 | | | | 12,275 | |
| * | | Centene Corp. | | | 23,377 | | | | 1,321 | |
| * | | Cerner Corp. | | | 41,333 | | | | 1,958 | |
| | Cigna Corp. | | | 35,121 | | | | 4,685 | |
| | The Cooper Cos., Inc. | | | 6,668 | | | | 1,166 | |
| * | | DaVita, Inc. | | | 21,603 | | | | 1,387 | |
| | DENTSPLY SIRONA, Inc. | | | 31,583 | | | | 1,823 | |
| * | | Edwards Lifesciences Corp. | | | 29,249 | | | | 2,741 | |
| | Eli Lilly and Co. | | | 132,893 | | | | 9,774 | |
| * | | Endo International PLC | | | 27,134 | | | | 447 | |
| * | | Envision Healthcare Corp. | | | 16,049 | | | | 1,016 | |
| * | | Express Scripts Holding Co. | | | 84,351 | | | | 5,803 | |
| | Gilead Sciences, Inc. | | | 180,222 | | | | 12,906 | |
| * | | HCA Holdings, Inc. | | | 39,979 | | | | 2,959 | |
| * | | Henry Schein, Inc. | | | 11,011 | | | | 1,671 | |
| * | | Hologic, Inc. | | | 38,059 | | | | 1,527 | |
| | Humana, Inc. | | | 20,396 | | | | 4,161 | |
| * | | Illumina, Inc. | | | 20,095 | | | | 2,573 | |
| * | | Intuitive Surgical, Inc. | | | 5,300 | | | | 3,361 | |
| | Johnson & Johnson | | | 372,156 | | | | 42,876 | |
| * | | Laboratory Corp. of America Holdings | | | 14,090 | | | | 1,809 | |
| * | | Mallinckrodt PLC | | | 14,481 | | | | 721 | |
| | McKesson Corp. | | | 30,928 | | | | 4,344 | |
| | Medtronic PLC | | | 187,827 | | | | 13,379 | |
| | Merck & Co., Inc. | | | 377,164 | | | | 22,204 | |
| * | | Mettler-Toledo International, Inc. | | | 3,589 | | | | 1,502 | |
| * | | Mylan NV | | | 62,952 | | | | 2,402 | |
| | Patterson Cos., Inc. | | | 11,399 | | | | 468 | |
| | PerkinElmer, Inc. | | | 14,985 | | | | 781 | |
| | Perrigo Co. PLC | | | 19,613 | | | | 1,632 | |
| | Pfizer, Inc. | | | 830,123 | | | | 26,962 | |
| | Quest Diagnostics, Inc. | | | 18,965 | | | | 1,743 | |
| * | | Regeneron Pharmaceuticals, Inc. | | | 10,341 | | | | 3,796 | |
| | | | | | | | | | |
| | | Common Stocks (98.4%) | | Shares/
$ Par | | | Value
$ (000’s) | |
| |
| | Health Care continued | |
| | St. Jude Medical, Inc. | | | 39,085 | | | | 3,134 | |
| | Stryker Corp. | | | 42,515 | | | | 5,094 | |
| | Thermo Fisher Scientific, Inc. | | | 54,038 | | | | 7,625 | |
| | UnitedHealth Group, Inc. | | | 130,204 | | | | 20,838 | |
| | Universal Health Services, Inc. - Class B | | | 12,266 | | | | 1,305 | |
| * | | Varian Medical Systems, Inc. | | | 12,778 | | | | 1,147 | |
| * | | Vertex Pharmaceuticals, Inc. | | | 33,930 | | | | 2,500 | |
| * | | Waters Corp. | | | 11,023 | | | | 1,481 | |
| | Zimmer Biomet Holdings, Inc. | | | 27,400 | | | | 2,828 | |
| | Zoetis, Inc. | | | 67,554 | | | | 3,616 | |
| | | | | | | | | | |
| | Total | | | | | | | 352,767 | |
| | | | | | | | | | |
| |
| | Industrials (10.2%) | |
| | 3M Co. | | | 82,278 | | | | 14,692 | |
| | Acuity Brands, Inc. | | | 6,030 | | | | 1,392 | |
| | Alaska Air Group, Inc. | | | 16,863 | | | | 1,496 | |
| | Allegion PLC | | | 13,118 | | | | 840 | |
| | American Airlines Group, Inc. | | | 70,877 | | | | 3,309 | |
| | AMETEK, Inc. | | | 31,659 | | | | 1,539 | |
| | Arconic, Inc. | | | 59,982 | | | | 1,112 | |
| | The Boeing Co. | | | 78,516 | | | | 12,223 | |
| | C.H. Robinson Worldwide, Inc. | | | 19,372 | | | | 1,419 | |
| | Caterpillar, Inc. | | | 80,035 | | | | 7,422 | |
| | Cintas Corp. | | | 11,771 | | | | 1,360 | |
| | CSX Corp. | | | 128,131 | | | | 4,604 | |
| | Cummins, Inc. | | | 21,090 | | | | 2,882 | |
| | Danaher Corp. | | | 83,267 | | | | 6,482 | |
| | Deere & Co. | | | 39,571 | | | | 4,077 | |
| | Delta Air Lines, Inc. | | | 100,734 | | | | 4,955 | |
| | Dover Corp. | | | 21,251 | | | | 1,592 | |
| | The Dun & Bradstreet Corp. | | | 5,032 | | | | 610 | |
| | Eaton Corp. PLC | | | 61,790 | | | | 4,146 | |
| | Emerson Electric Co. | | | 87,929 | | | | 4,902 | |
| | Equifax, Inc. | | | 16,383 | | | | 1,937 | |
| | Expeditors International of Washington, Inc. | | | 24,675 | | | | 1,307 | |
| | Fastenal Co. | | | 39,538 | | | | 1,858 | |
| | FedEx Corp. | | | 33,446 | | | | 6,228 | |
| | Flowserve Corp. | | | 17,845 | | | | 857 | |
| | Fluor Corp. | | | 19,049 | | | | 1,000 | |
| | Fortive Corp. | | | 41,147 | | | | 2,207 | |
| | Fortune Brands Home & Security, Inc. | | | 21,108 | | | | 1,128 | |
| | General Dynamics Corp. | | | 39,158 | | | | 6,761 | |
| | General Electric Co. | | | 1,210,145 | | | | 38,241 | |
| | | | | | | | | | |
| | | Common Stocks (98.4%) | | Shares/
$ Par | | | Value
$ (000’s) | |
| |
| | Industrials continued | |
| | Honeywell International, Inc. | | | 104,255 | | | | 12,078 | |
| | Illinois Tool Works, Inc. | | | 43,214 | | | | 5,292 | |
| | Ingersoll-Rand PLC | | | 35,338 | | | | 2,652 | |
| | J.B. Hunt Transport Services, Inc. | | | 11,970 | | | | 1,162 | |
| * | | Jacobs Engineering Group, Inc. | | | 16,518 | | | | 942 | |
| | Kansas City Southern | | | 14,716 | | | | 1,249 | |
| | L-3 Communications Holdings, Inc. | | | 10,576 | | | | 1,609 | |
| | Lockheed Martin Corp. | | | 34,467 | | | | 8,615 | |
| | Masco Corp. | | | 44,911 | | | | 1,420 | |
| | Nielsen Holdings PLC | | | 45,961 | | | | 1,928 | |
| | Norfolk Southern Corp. | | | 39,936 | | | | 4,316 | |
| | Northrop Grumman Corp. | | | 24,112 | | | | 5,608 | |
| | PACCAR, Inc. | | | 47,952 | | | | 3,064 | |
| | Parker Hannifin Corp. | | | 18,248 | | | | 2,555 | |
| | Pentair PLC | | | 22,872 | | | | 1,282 | |
| | Pitney Bowes, Inc. | | | 25,410 | | | | 386 | |
| * | | Quanta Services, Inc. | | | 20,684 | | | | 721 | |
| | Raytheon Co. | | | 40,170 | | | | 5,704 | |
| | Republic Services, Inc. | | | 31,623 | | | | 1,804 | |
| | Robert Half International, Inc. | | | 17,631 | | | | 860 | |
| | Rockwell Automation, Inc. | | | 17,541 | | | | 2,358 | |
| | Rockwell Collins, Inc. | | | 17,819 | | | | 1,653 | |
| | Roper Technologies, Inc. | | | 13,876 | | | | 2,540 | |
| | Ryder System, Inc. | | | 7,314 | | | | 544 | |
| | Snap-on, Inc. | | | 7,938 | | | | 1,360 | |
| | Southwest Airlines Co. | | | 84,211 | | | | 4,197 | |
| | Stanley Black & Decker, Inc. | | | 20,614 | | | | 2,364 | |
| * | | Stericycle, Inc. | | | 11,639 | | | | 897 | |
| | Textron, Inc. | | | 36,963 | | | | 1,795 | |
| | TransDigm Group, Inc. | | | 6,860 | | | | 1,708 | |
| | Union Pacific Corp. | | | 112,735 | | | | 11,688 | |
| * | | United Continental Holdings, Inc. | | | 39,497 | | | | 2,879 | |
| | United Parcel Service, Inc. - Class B | | | 94,301 | | | | 10,811 | |
| * | | United Rentals, Inc. | | | 11,521 | | | | 1,216 | |
| | United Technologies Corp. | | | 104,753 | | | | 11,483 | |
| * | | Verisk Analytics, Inc. | | | 21,303 | | | | 1,729 | |
| | W.W. Grainger, Inc. | | | 7,497 | | | | 1,741 | |
| | Waste Management, Inc. | | | 55,627 | | | | 3,945 | |
| | Xylem, Inc. | | | 24,540 | | | | 1,215 | |
| | | | | | | | | | |
| | Total | | | | | | | 271,948 | |
| | | | | | | | | | |
The Accompanying Notes are and Integral Part of the Financial Statements.
| | | | |
| 18 | | Index 500 Stock Portfolio | | |
Index 500 Stock Portfolio
| | | | | | | | | | |
| | | Common Stocks (98.4%) | | Shares/
$ Par | | | Value $ (000’s) | |
| |
| | Information Technology (20.4%) | |
| | Accenture PLC - Class A | | | 84,855 | | | | 9,939 | |
| | Activision Blizzard, Inc. | | | 93,535 | | | | 3,378 | |
| * | | Adobe Systems, Inc. | | | 68,018 | | | | 7,002 | |
| * | | Akamai Technologies, Inc. | | | 23,707 | | | | 1,581 | |
| | Alliance Data Systems Corp. | | | 7,901 | | | | 1,805 | |
| * | | Alphabet, Inc. - Class A | | | 40,503 | | | | 32,097 | |
| * | | Alphabet, Inc. - Class C | | | 40,598 | | | | 31,334 | |
| | Amphenol Corp. - Class A | | | 42,198 | | | | 2,836 | |
| | Analog Devices, Inc. | | | 42,156 | | | | 3,061 | |
| | Apple, Inc. | | | 729,436 | | | | 84,483 | |
| | Applied Materials, Inc. | | | 147,861 | | | | 4,771 | |
| * | | Autodesk, Inc. | | | 26,791 | | | | 1,983 | |
| | Automatic Data Processing, Inc. | | | 61,718 | | | | 6,343 | |
| | Broadcom, Ltd. | | | 54,353 | | | | 9,608 | |
| | CA, Inc. | | | 42,869 | | | | 1,362 | |
| | Cisco Systems, Inc. | | | 686,680 | | | | 20,751 | |
| * | | Citrix Systems, Inc. | | | 21,336 | | | | 1,906 | |
| * | | Cognizant Technology Solutions Corp. - Class A | | | 82,994 | | | | 4,650 | |
| | Corning, Inc. | | | 130,123 | | | | 3,158 | |
| | CSRA, Inc. | | | 19,897 | | | | 634 | |
| * | | eBay, Inc. | | | 142,222 | | | | 4,223 | |
| * | | Electronic Arts, Inc. | | | 41,280 | | | | 3,251 | |
| * | | F5 Networks, Inc. | | | 8,935 | | | | 1,293 | |
| * | | Facebook, Inc. - Class A | | | 320,214 | | | | 36,841 | |
| | Fidelity National Information Services, Inc. | | | 44,900 | | | | 3,396 | |
| * | | First Solar, Inc. | | | 10,661 | | | | 342 | |
| * | | Fiserv, Inc. | | | 29,692 | | | | 3,156 | |
| | FLIR Systems, Inc. | | | 18,622 | | | | 674 | |
| | Global Payments, Inc. | | | 21,025 | | | | 1,459 | |
| | Harris Corp. | | | 17,000 | | | | 1,742 | |
| | Hewlett Packard Enterprise Co. | | | 227,902 | | | | 5,274 | |
| | HP, Inc. | | | 234,041 | | | | 3,473 | |
| | Intel Corp. | | | 648,274 | | | | 23,513 | |
| | International Business Machines Corp. | | | 118,366 | | | | 19,648 | |
| | Intuit, Inc. | | | 33,356 | | | | 3,823 | |
| | Juniper Networks, Inc. | | | 52,027 | | | | 1,470 | |
| | KLA-Tencor Corp. | | | 21,384 | | | | 1,682 | |
| | Lam Research Corp. | | | 22,274 | | | | 2,355 | |
| | Linear Technology Corp. | | | 32,880 | | | | 2,050 | |
| | Mastercard, Inc. - Class A | | | 130,209 | | | | 13,444 | |
| | Microchip Technology, Inc. | | | 29,551 | | | | 1,896 | |
| | | | | | | | | | |
| | | Common Stocks (98.4%) | | Shares/
$ Par | | | Value $ (000’s) | |
| |
| | Information Technology continued | |
| * | | Micron Technology, Inc. | | | 141,170 | | | | 3,094 | |
| | Microsoft Corp. | | | 1,063,632 | | | | 66,094 | |
| | Motorola Solutions, Inc. | | | 22,703 | | | | 1,882 | |
| | NetApp, Inc. | | | 37,671 | | | | 1,329 | |
| | NVIDIA Corp. | | | 73,733 | | | | 7,870 | |
| | Oracle Corp. | | | 409,985 | | | | 15,764 | |
| | Paychex, Inc. | | | 44,030 | | | | 2,681 | |
| * | | PayPal Holdings, Inc. | | | 153,509 | | | | 6,059 | |
| * | | Qorvo, Inc. | | | 17,473 | | | | 921 | |
| | QUALCOMM, Inc. | | | 202,031 | | | | 13,172 | |
| * | | Red Hat, Inc. | | | 24,568 | | | | 1,712 | |
| * | | salesforce.com, Inc. | | | 87,323 | | | | 5,978 | |
| | Seagate Technology PLC | | | 40,289 | | | | 1,538 | |
| | Skyworks Solutions, Inc. | | | 25,419 | | | | 1,898 | |
| | Symantec Corp. | | | 85,281 | | | | 2,037 | |
| | TE Connectivity, Ltd. | | | 48,609 | | | | 3,368 | |
| * | | Teradata Corp. | | | 17,769 | | | | 483 | |
| | Texas Instruments, Inc. | | | 136,725 | | | | 9,977 | |
| | Total System Services, Inc. | | | 22,631 | | | | 1,110 | |
| * | | VeriSign, Inc. | | | 12,445 | | | | 947 | |
| | Visa, Inc. - Class A | | | 255,477 | | | | 19,932 | |
| | Western Digital Corp. | | | 39,052 | | | | 2,654 | |
| | Western Union Co. | | | 66,326 | | | | 1,441 | |
| | Xerox Corp. | | | 116,493 | | | | 1,017 | |
| | Xilinx, Inc. | | | 34,542 | | | | 2,085 | |
| * | | Yahoo!, Inc. | | | 120,078 | | | | 4,643 | |
| | | | | | | | | | |
| | Total | | | | | | | 547,373 | |
| | | | | | | | | | |
| | |
| | Materials (2.8%) | | | | | |
| | Air Products and Chemicals, Inc. | | | 29,736 | | | | 4,277 | |
| | Albemarle Corp. | | | 15,386 | | | | 1,324 | |
| | Avery Dennison Corp. | | | 12,173 | | | | 855 | |
| | Ball Corp. | | | 23,913 | | | | 1,795 | |
| | CF Industries Holdings, Inc. | | | 31,889 | | | | 1,004 | |
| | The Dow Chemical Co. | | | 153,400 | | | | 8,777 | |
| | E.I. du Pont de Nemours and Co. | | | 118,922 | | | | 8,729 | |
| | Eastman Chemical Co. | | | 20,075 | | | | 1,510 | |
| | Ecolab, Inc. | | | 35,895 | | | | 4,208 | |
| | FMC Corp. | | | 18,309 | | | | 1,036 | |
| * | | Freeport-McMoRan, Inc. | | | 171,372 | | | | 2,260 | |
| | International Flavors & Fragrances, Inc. | | | 10,865 | | | | 1,280 | |
| | International Paper Co. | | | 56,252 | | | | 2,985 | |
| | LyondellBasell Industries NV - Class A | | | 45,713 | | | | 3,921 | |
| | | | | | | | | | |
| | | Common Stocks (98.4%) | | Shares/
$ Par | | | Value $ (000’s) | |
| | |
| | Materials continued | | | | | |
| | Martin Marietta Materials, Inc. | | | 8,682 | | | | 1,923 | |
| | Monsanto Co. | | | 59,914 | | | | 6,304 | |
| | The Mosaic Co. | | | 47,911 | | | | 1,405 | |
| | Newmont Mining Corp. | | | 72,604 | | | | 2,474 | |
| | Nucor Corp. | | | 43,567 | | | | 2,593 | |
| | PPG Industries, Inc. | | | 36,113 | | | | 3,422 | |
| | Praxair, Inc. | | | 39,040 | | | | 4,575 | |
| | Sealed Air Corp. | | | 26,443 | | | | 1,199 | |
| | The Sherwin-Williams Co. | | | 11,057 | | | | 2,971 | |
| | Vulcan Materials Co. | | | 18,099 | | | | 2,265 | |
| | WestRock Co. | | | 34,350 | | | | 1,744 | |
| | | | | | | | | | |
| | Total | | | | | | | 74,836 | |
| | | | | | | | | | |
| |
| | Real Estate (2.9%) | |
| | American Tower Corp. | | | 58,232 | | | | 6,154 | |
| | Apartment Investment & Management Co. - Class A | | | 21,462 | | | | 975 | |
| | AvalonBay Communities, Inc. | | | 18,786 | | | | 3,328 | |
| | Boston Properties, Inc. | | | 21,035 | | | | 2,646 | |
| * | | CBRE Group, Inc. | | | 41,063 | | | | 1,293 | |
| | Crown Castle International Corp. | | | 49,329 | | | | 4,280 | |
| | Digital Realty Trust, Inc. | | | 21,742 | | | | 2,136 | |
| | Equinix, Inc. | | | 9,764 | | | | 3,490 | |
| | Equity Residential | | | 50,021 | | | | 3,219 | |
| | Essex Property Trust, Inc. | | | 8,962 | | | | 2,084 | |
| | Extra Space Storage, Inc. | | | 17,210 | | | | 1,329 | |
| | Federal Realty Investment Trust | | | 9,820 | | | | 1,396 | |
| | General Growth Properties, Inc. | | | 79,878 | | | | 1,995 | |
| | HCP, Inc. | | | 63,963 | | | | 1,901 | |
| | Host Hotels & Resorts, Inc. | | | 101,209 | | | | 1,907 | |
| | Iron Mountain, Inc. | | | 33,516 | | | | 1,089 | |
| | Kimco Realty Corp. | | | 58,142 | | | | 1,463 | |
| | The Macerich Co. | | | 16,515 | | | | 1,170 | |
| | Mid-America Apartment Communities, Inc. | | | 15,530 | | | | 1,521 | |
| | Prologis, Inc. | | | 72,312 | | | | 3,817 | |
| | Public Storage | | | 20,404 | | | | 4,560 | |
| | Realty Income Corp. | | | 35,375 | | | | 2,033 | |
| | Simon Property Group, Inc. | | | 42,985 | | | | 7,637 | |
| | SL Green Realty Corp. | | | 13,860 | | | | 1,491 | |
| | UDR, Inc. | | | 36,559 | | | | 1,334 | |
| | Ventas, Inc. | | | 48,440 | | | | 3,029 | |
The Accompanying Notes are and Integral Part of the Financial Statements.
| | | | | | |
| | Index 500 Stock Portfolio | | | 19 | |
Index 500 Stock Portfolio
| | | | | | | | | | |
| | | Common Stocks (98.4%) | | Shares/
$ Par | | | Value
$ (000’s) | |
| |
| | Real Estate continued | |
| | Vornado Realty Trust | | | 23,526 | | | | 2,455 | |
| | Welltower, Inc. | | | 49,593 | | | | 3,319 | |
| | Weyerhaeuser Co. | | | 102,331 | | | | 3,079 | |
| | | | | | | | | | |
| | Total | | | | | | | 76,130 | |
| | | | | | | | | | |
| | |
| | Telecommunication Services (2.6%) | | | | | |
| | AT&T, Inc. | | | 840,060 | | | | 35,728 | |
| | CenturyLink, Inc. | | | 74,785 | | | | 1,778 | |
| | Frontier Communications Corp. | | | 160,466 | | | | 542 | |
| * | | Level 3 Communications, Inc. | | | 39,882 | | | | 2,248 | |
| | Verizon Communications, Inc. | | | 557,665 | | | | 29,768 | |
| | | | | | | | | | |
| | Total | | | | | | | 70,064 | |
| | | | | | | | | | |
| | |
| | Utilities (3.1%) | | | | | |
| | The AES Corp. | | | 90,173 | | | | 1,048 | |
| | Alliant Energy Corp. | | | 31,121 | | | | 1,179 | |
| | Ameren Corp. | | | 33,191 | | | | 1,741 | |
| | American Electric Power Co., Inc. | | | 67,264 | | | | 4,235 | |
| | American Water Works Co., Inc. | | | 24,350 | | | | 1,762 | |
| | CenterPoint Energy, Inc. | | | 58,916 | | | | 1,452 | |
| | CMS Energy Corp. | | | 38,181 | | | | 1,589 | |
| | Consolidated Edison, Inc. | | | 41,685 | | | | 3,071 | |
| | Dominion Resources, Inc. | | | 85,736 | | | | 6,566 | |
| | DTE Energy Co. | | | 24,546 | | | | 2,418 | |
| | Duke Energy Corp. | | | 94,244 | | | | 7,315 | |
| | Edison International | | | 44,569 | | | | 3,209 | |
| | | | | | | | | | |
| | | Common Stocks (98.4%) | | Shares/
$ Par | | | Value $ (000’s) | |
| |
| | Utilities continued | |
| | Entergy Corp. | | | 24,504 | | | | 1,800 | |
| | Eversource Energy | | | 43,392 | | | | 2,397 | |
| | Exelon Corp. | | | 126,299 | | | | 4,482 | |
| | FirstEnergy Corp. | | | 58,239 | | | | 1,804 | |
| | NextEra Energy, Inc. | | | 63,920 | | | | 7,636 | |
| | NiSource, Inc. | | | 44,149 | | | | 977 | |
| | NRG Energy, Inc. | | | 43,150 | | | | 529 | |
| | PG&E Corp. | | | 69,173 | | | | 4,204 | |
| | Pinnacle West Capital Corp. | | | 15,226 | | | | 1,188 | |
| | PPL Corp. | | | 92,970 | | | | 3,166 | |
| | Public Service Enterprise Group, Inc. | | | 69,204 | | | | 3,037 | |
| | SCANA Corp. | | | 19,550 | | | | 1,433 | |
| | Sempra Energy | | | 34,207 | | | | 3,443 | |
| | The Southern Co. | | | 134,059 | | | | 6,594 | |
| | WEC Energy Group, Inc. | | | 43,175 | | | | 2,532 | |
| | Xcel Energy, Inc. | | | 69,486 | | | | 2,828 | |
| | | | | | | | | | |
| | Total | | | | | | | 83,635 | |
| | | | | | | | | | |
| | | |
| | Total Common Stocks | | | | | | | | |
| | (Cost: $1,402,493) | | | | | | | 2,635,767 | |
| | | | | | | | | | |
| |
| | Short-Term Investments (1.1%) | |
| |
| | Commercial Paper (0.7%) | |
| (r) | | Apple, Inc., 0.600%, 2/2/17 144A | | | 3,000,000 | | | | 2,999 | |
| | Bank Of America NA, 0.970%, 1/4/17 144A | | | 5,000,000 | | | | 5,000 | |
| (r) | | Microsoft Corp., 0.600%, 1/10/17 144A | | | 2,000,000 | | | | 2,000 | |
| (r) | | Microsoft Corp., 0.620%, 1/17/17 144A | | | 1,000,000 | | | | 1,000 | |
| | | | | | | | | | |
| | | Short-Term
Investments (1.1%) | | Shares/
$ Par | | | Value
$ (000’s) | |
| |
| | Commercial Paper continued | |
| (r) | | Roche Holdings, Inc., 0.480%, 1/31/17 144A | | | 3,000,000 | | | | 2,998 | |
| (r) | | Societe Generale, 0.810%, 2/2/17 144A | | | 1,000,000 | | | | 999 | |
| (r) | | Societe Generale, 0.940%, 2/27/17 144A | | | 2,000,000 | | | | 1,998 | |
| (r) | | The Walt Disney Co., 0.580%, 1/20/17 144A | | | 1,500,000 | | | | 1,500 | |
| (r) | | The Walt Disney Co., 0.580%, 1/30/17 144A | | | 1,500,000 | | | | 1,499 | |
| | | | | | | | | | |
| | Total | | | | | | | 19,993 | |
| | | | | | | | | | |
| | |
| | US Government & Agencies (0.4%) | | | | | |
| (b,r) | | Federal Home Loan Bank, 0.384%, 2/1/17 | | | 1,000,000 | | | | 1,000 | |
| (r) | | Federal Home Loan Bank, 0.500%, 2/3/17 | | | 1,500,000 | | | | 1,499 | |
| (r) | | Federal Home Loan Bank, 0.490%, 2/9/17 | | | 1,500,000 | | | | 1,499 | |
| (r) | | Federal Home Loan Bank, 0.485%, 2/21/17 | | | 2,000,000 | | | | 1,999 | |
| (r) | | Federal Home Loan Bank, 0.510%, 2/22/17 | | | 1,500,000 | | | | 1,499 | |
| (r) | | Federal Home Loan Bank, 0.440%, 2/24/17 | | | 2,500,000 | | | | 2,498 | |
| | | | | | | | | | |
| | Total | | | | | | | 9,994 | |
| | | | | | | | | | |
| | | |
| | Total Short-Term Investments | | | | | | | | |
| | (Cost: $29,986) | | | | | | | 29,987 | |
| | | | | | | | | | |
| | | |
| | Total Investments (99.5%) | | | | | | | | |
| | (Cost: $1,432,479)(a) | | | | | | | 2,665,754 | |
| | | | | | | | | | |
| | Other Assets, Less | | | | | | | | |
| | Liabilities (0.5%) | | | | | | | 13,160 | |
| | | | | | | | | | |
| | Net Assets (100.0%) | | | | | | | 2,678,914 | |
| | | | | | | | | | |
| | 144A after the name of a security represents a security exempt from registration under Rule 144A of the Securities Act of 1933. These securities may be resold as transactions exempt from registration, normally to qualified institutional buyers. At December 31, 2016 the value of these securities (in thousands) was $19,993 representing 0.7% of the net assets. |
| (a) | At December 31, 2016, the aggregate cost of securities for federal tax purposes (in thousands) was $1,445,198 and the net unrealized appreciation of investments based on that cost was $1,220,556 which is comprised of $1,283,503 aggregate gross unrealized appreciation and $62,947 aggregate gross unrealized depreciation. |
| (b) | All or a portion of the securities have been pledged as collateral for open futures positions. Information regarding open futures contracts as of period end is summarized below. |
| | | | | | | | |
| Issuer (000’s) | | Number of Contracts | | Expiration Date | | Unrealized
Appreciation/
(Depreciation)
(000’s) | |
S&P 500 Mini Index Futures (Long) (Total Notional Value at December 31, 2016, $36,593) | | 326 | | 3/17 | | $ | (144) | |
The Accompanying Notes are and Integral Part of the Financial Statements.
| | | | |
| 20 | | Index 500 Stock Portfolio | | |
Index 500 Stock Portfolio
| (p) | Restricted securities (excluding 144A issues) on December 31, 2016. |
| | | | | | | | | | | | | | |
| Description | | Acquisition
Date | | Cost (000’s) | | | Value (000’s) | | | Value as a
Percentage of
Net Assets | |
Property Development Centers LLC | | 2/2/15 | | $ | 1 | | | $ | 1 | | | | 0.00 | % |
Casa Ley SA de CV | | 2/2/15 | | | 30 | | | | 30 | | | | 0.00 | % |
| (r) | Rates are discount rates at the time of purchase. |
The following is a summary of the inputs used in valuing the Portfolio’s assets and liabilities at December 31, 2016. See Note 3 for additional information on portfolio valuation.
| | | | | | | | | | | | | | |
| | | Valuation Inputs | | | |
| Description | | Level 1 –
Quoted Prices | | | Level 2 –
Other Significant
Observable Inputs | | | Level 3 – Significant
Unobservable Inputs | | | |
| | | (Amounts in thousands) | | | |
Assets: | | | | | | | | | | | | | | |
Domestic Common Stocks | | | | | | | | | | | | | | |
Consumer Staples | | $ | 246,987 | | | $ | - | | | $ | 31 | | | |
All Others | | | 2,388,749 | | | | - | | | | - | | | |
Short-Term Investments | | | - | | | | 29,987 | | | | - | | | |
Total Assets: | | $ | 2,635,736 | | | $ | 29,987 | | | $ | 31 | | | |
Liabilities: | | | | | | | | | | | | | | |
Other Financial Instruments^ | | | | | | | | | | | | | | |
Futures | | | (144 | ) | | | - | | | | - | | | |
Total Liabilities: | | $ | (144 | ) | | $ | - | | | $ | - | | | |
^ Other financial instruments are derivative instruments such as futures, forwards, written options and swaps contracts, which are valued at the unrealized appreciation (depreciation) on the instrument and short sales, which are valued at market value.
The Accompanying Notes are and Integral Part of the Financial Statements.
| | | | | | |
| | Index 500 Stock Portfolio | | | 21 | |
Large Company Value Portfolio (unaudited)
| | | | |
| Objective: | | Portfolio Strategy: | | Net Assets: |
| Long-term of capital growth. Income is a secondary objective. | | Invest primarily in equity securities of larger companies considered to be undervalued. | | $196 million |
Portfolio Overview
Mason Street Advisors, LLC (“Mason Street Advisors”), the investment adviser for the Large Company Value Portfolio (the “Portfolio”), has engaged American Century Investment Management, Inc. (“American Century”) to act as sub-adviser for the Portfolio. The Portfolio looks for stocks of companies that it believes are undervalued at the time of purchase. The Portfolio attempts to purchase the stocks of these undervalued companies and hold each stock until it has returned to favor in the market and the price has increased to, or is higher than, a level the Portfolio believes more accurately reflects the fair value of the company. Companies may be undervalued due to market declines, poor economic conditions, actual or anticipated bad news regarding the issuer or its industry, or because they have been overlooked by the market.
Market Overview
After a tumultuous first quarter of the year, U.S. stocks delivered solid returns in 2016. This was attributable to positive U.S. economic news, healthy corporate earnings performance, and a pickup in mergers and acquisitions activity. Despite this backdrop, factors such as international economic weakness, shifting commodity prices, global political concerns, particularly in the wake of the U.K. vote to leave the European Union, or “Brexit,” and uncertainty over the timing of the Fed’s next interest rate hike contributed to periods of volatility. Ultimately, however, the central bank’s more gradual-than-expected approach to monetary tightening aided market performance over the period. In the fourth quarter, the market staged a strong rally after Trump’s election raised expectations for corporate tax cuts and regulation rollbacks. The energy market also stabilized later in the year, after the OPEC nations announced plans to reduce oil production in late November. This news helped boost oil prices and energy stocks. The Fed finally raised its target rate by 25 basis points in mid-December, and policymakers hinted at additional rate hikes in 2017. As a result, the yield curve steepened in the fourth quarter, which was a boon for banks. Against the backdrop, all 11 sectors in the Russell 1000® Value Index generated positive returns, led by the Materials and Energy sectors.
Portfolio Results
The Portfolio returned 15.36% for the twelve months ended December 31, 2016. By comparison, its benchmark, the Russell 1000® Value Index (the “Index”), returned 17.34%. (The Index is unmanaged, cannot be invested in directly and does not include administrative expenses or sales charges.) According to Lipper® Analytical Services, Inc., an independent mutual fund ranking agency, the average return of the Large Cap Value Funds peer group for 2016 was 15.59%.
The Health Care sector was one of the weakest performing areas of the Index for the twelve-month period, as a number of negative factors impacted the sector. As a result, the Portfolio’s overweight in Health Care detracted from relative performance. Stock selection, especially in the pharmaceuticals industry, was also detrimental. This was due in part to a position in Teva Pharmaceutical Industries, Ltd., which declined due to generic drug pricing worries and negative sentiment surrounding pharmaceuticals stocks.
Security selection in the Financials sector also weighed on performance, as the Portfolio’s relatively conservative positioning, including exposure to higher-quality, lower-beta stocks, dampened relative performance. An overweight in the sector was also a negative for relative returns. In particular, a lack of exposure to capital markets company Goldman Sachs detracted from results. The stock rallied as interest rates and capital markets rose in the fourth quarter.
Stock selection in the Industrials sector provided a positive offset to the Portfolio’s relative underperformance. In particular, Portfolio holdings in the industrial conglomerates and aerospace and defense industries added to relative results. Key contributors included a position in diversified industrial company Ingersoll-Rand PLC, which helped relative performance early in the year.
Positioning in the Information Technology sector also added to relative returns, reflecting both positive stock selection, especially in semiconductors and software, and a Portfolio overweight.
Portfolio Manager Outlook
The following forward looking comments are the opinion of American Century, the Portfolio’s sub-adviser.
As of December 31, 2016, the portfolio’s largest overweights were in the Health Care, Energy, and Industrials sectors. The team added to the Health Care position in the fourth quarter after political rhetoric around health care, including around the
| | | | |
| 22 | | Large Company Value Portfolio | | |
Large Company Value Portfolio (unaudited)
Affordable Care Act and the threat of mandated lower drug pricing, pressured stocks in the sector. This provided an opportunity to add exposure to companies the team believes will fare well in the future. In the Energy sector, the team likes well-managed, higher-quality companies, including integrated oil companies with strong balance sheets, and higher-quality companies in the energy equipment and services industry.
The Portfolio’s largest underweights were in the Real Estate, Telecommunication Services, and Utilities sectors. The team believes that Real Estate has generally been overvalued for some time, leading to the Portfolio’s continued underweight in the sector. In the Telecommunication Services and Utilities sectors, the team believes that valuations are overextended after the sectors previously outperformed due to heavy interest from yield-seeking investors.
Relative Performance
| | | | | | | | | | | | |
Average Annual Total Returns
For Periods Ended December 31, 2016 | |
| | | 1 Year | | | 5 Years | | | Since
Inception* | |
Large Company Value Portfolio | | | 15.36 | % | | | 13.90 | % | | | 4.55 | % |
Russell 1000® Value Index | | | 17.34 | % | | | 14.80 | % | | | 5.39 | % |
Lipper® Variable Insurance Products (VIP) Large Cap Value Funds Average | | | 15.59 | % | | | 13.80 | % | | | – | |
| * | Inception date of 4/30/07 |
The performance data quoted represents past performance. Past performance is historical and does not guarantee future performance. Investment return and principal value will fluctuate, so that shares, when redeemed, may be worth more or less than their original cost. Current performance may be lower or higher than the performance data quoted. For the most recent month-end performance information visit www.northwesternmutual.com.
This chart assumes an initial investment of $10,000 made on 4/30/07 (commencement of the Portfolio’s operations). Returns shown reflect fee waivers, deductions for management and other portfolio expenses, and reinvestment of all dividends. In the absence of fee waivers, total return would be reduced. Returns exclude deductions for separate account sale loads and account fees.
Please refer to the Benchmark Definitions section of this report for information about the indices cited in the above chart and graph.
The Portfolio may invest in derivative instruments for cash management purposes or to hedge foreign currency exposure. Use of these instruments may involve certain costs and imposes certain risks such as liquidity risk, market risk, credit risk, management risk and the risk of mispricing or improper valuation. Certain derivatives involve leverage, which could magnify losses, and portfolios investing in derivatives could lose more than the principal amount invested in those instruments.
Top 10 Equity Holdings 12/31/16
| | | | |
Security Description | | | % of Net Assets | |
Wells Fargo & Co. | | | 3.5 | % |
Pfizer, Inc. | | | 3.3 | % |
Schlumberger, Ltd. | | | 3.0 | % |
Total SA, ADR | | | 2.8 | % |
The Procter & Gamble Co. | | | 2.7 | % |
Chevron Corp. | | | 2.6 | % |
Bank of America Corp. | | | 2.5 | % |
Johnson Controls International PLC | | | 2.4 | % |
Oracle Corp. | | | 2.4 | % |
US Bancorp | | | 2.4 | % |
Sector Allocation 12/31/16
Sector Allocation is based on Net Assets.
Sector Allocation and Top 10 Holdings are subject to change.
| | | | | | |
| | Large Company Value Portfolio | | | 23 | |
Large Company Value Portfolio
Schedule of Investments
December 31, 2016
| | | | | | | | | | |
| | | Common Stocks (96.3%) | | Shares/
$ Par | | | Value
$ (000’s) | |
| |
| | Consumer Discretionary (7.7%) | |
| | Advance Auto Parts, Inc. | | | 10,030 | | | | 1,696 | |
| | BorgWarner, Inc. | | | 16,000 | | | | 631 | |
| | Carnival Corp. | | | 18,550 | | | | 966 | |
| | Delphi Automotive PLC | | | 33,990 | | | | 2,289 | |
| | Ford Motor Co. | | | 69,290 | | | | 841 | |
| | Johnson Controls International PLC | | | 115,970 | | | | 4,777 | |
| | Lowe’s Cos., Inc. | | | 10,450 | | | | 743 | |
| | Marriott International, Inc. - Class A | | | 8,020 | | | | 663 | |
| | Target Corp. | | | 20,750 | | | | 1,499 | |
| | The Walt Disney Co. | | | 9,320 | | | | 971 | |
| | | | | | | | | | |
| | Total | | | | | | | 15,076 | |
| | | | | | | | | | |
| |
| | Consumer Staples (8.0%) | |
| | CVS Health Corp. | | | 38,060 | | | | 3,003 | |
| | Mondelez International, Inc. | | | 42,670 | | | | 1,892 | |
| | PepsiCo, Inc. | | | 13,320 | | | | 1,394 | |
| | The Procter & Gamble Co. | | | 62,850 | | | | 5,284 | |
| | Wal-Mart Stores, Inc. | | | 58,950 | | | | 4,075 | |
| | | | | | | | | | |
| | Total | | | | | | | 15,648 | |
| | | | | | | | | | |
| |
| | Energy (14.1%) | |
| | Anadarko Petroleum Corp. | | | 26,150 | | | | 1,823 | |
| | Baker Hughes, Inc. | | | 30,280 | | | | 1,967 | |
| | Chevron Corp. | | | 43,200 | | | | 5,085 | |
| | Exxon Mobil Corp. | | | 20,020 | | | | 1,807 | |
| | Occidental Petroleum Corp. | | | 58,110 | | | | 4,139 | |
| | Royal Dutch Shell PLC - Class B, ADR | | | 25,770 | | | | 1,494 | |
| | Schlumberger, Ltd. | | | 69,680 | | | | 5,850 | |
| | Total SA, ADR | | | 106,840 | | | | 5,446 | |
| | | | | | | | | | |
| | Total | | | | | | | 27,611 | |
| | | | | | | | | | |
| |
| | Financials (24.9%) | |
| | Aflac, Inc. | | | 14,500 | | | | 1,009 | |
| | The Allstate Corp. | | | 20,480 | | | | 1,518 | |
| | Ameriprise Financial, Inc. | | | 10,930 | | | | 1,213 | |
| | Bank of America Corp. | | | 219,230 | | | | 4,845 | |
| | The Bank of New York Mellon Corp. | | | 83,950 | | | | 3,978 | |
| | BB&T Corp. | | | 82,880 | | | | 3,897 | |
| | BlackRock, Inc. | | | 6,580 | | | | 2,504 | |
| | Chubb, Ltd. | | | 33,190 | | | | 4,385 | |
| | Invesco, Ltd. | | | 80,090 | | | | 2,430 | |
| | JPMorgan Chase & Co. | | | 46,860 | | | | 4,043 | |
| | M&T Bank Corp. | | | 17,070 | | | | 2,670 | |
| | MetLife, Inc. | | | 36,310 | | | | 1,957 | |
| | PNC Financial Services Group, Inc. | | | 25,120 | | | | 2,938 | |
| | US Bancorp | | | 89,940 | | | | 4,620 | |
| | Wells Fargo & Co. | | | 123,150 | | | | 6,787 | |
| | | | | | | | | | |
| | Total | | | | | | | 48,794 | |
| | | | | | | | | | |
| |
| | Health Care (15.7%) | |
| | Abbott Laboratories | | | 66,040 | | | | 2,537 | |
| | AbbVie, Inc. | | | 22,920 | | | | 1,435 | |
| | | | | | | | | | |
| | | Common Stocks (96.3%) | | Shares/ $ Par | | | Value
$ (000’s) | |
| |
| | Health Care continued | |
| * | | Allergan PLC | | | 7,710 | | | | 1,619 | |
| | Anthem, Inc. | | | 10,540 | | | | 1,515 | |
| | Baxter International, Inc. | | | 17,150 | | | | 760 | |
| * | | HCA Holdings, Inc. | | | 23,240 | | | | 1,720 | |
| | Johnson & Johnson | | | 23,270 | | | | 2,681 | |
| | McKesson Corp. | | | 9,750 | | | | 1,369 | |
| | Medtronic PLC | | | 42,000 | | | | 2,992 | |
| | Merck & Co., Inc. | | | 69,840 | | | | 4,112 | |
| | Pfizer, Inc. | | | 195,880 | | | | 6,362 | |
| | Teva Pharmaceutical Industries, Ltd., ADR | | | 27,630 | | | | 1,002 | |
| | Zimmer Biomet Holdings, Inc. | | | 25,380 | | | | 2,619 | |
| | | | | | | | | | |
| | Total | | | | | | | 30,723 | |
| | | | | | | | | | |
| |
| | Industrials (8.5%) | |
| | The Boeing Co. | | | 6,290 | | | | 979 | |
| | General Electric Co. | | | 70,360 | | | | 2,223 | |
| | Honeywell International, Inc. | | | 8,780 | | | | 1,017 | |
| | Ingersoll-Rand PLC | | | 40,400 | | | | 3,032 | |
| | Rockwell Automation, Inc. | | | 9,800 | | | | 1,317 | |
| | Textron, Inc. | | | 37,380 | | | | 1,815 | |
| | Union Pacific Corp. | | | 20,080 | | | | 2,082 | |
| | United Technologies Corp. | | | 38,220 | | | | 4,190 | |
| | | | | | | | | | |
| | Total | | | | | | | 16,655 | |
| | | | | | | | | | |
| |
| | Information Technology (10.1%) | |
| | Apple, Inc. | | | 21,520 | | | | 2,492 | |
| | Applied Materials, Inc. | | | 89,470 | | | | 2,887 | |
| | Cisco Systems, Inc. | | | 137,820 | | | | 4,165 | |
| | Intel Corp. | | | 42,540 | | | | 1,543 | |
| | Lam Research Corp. | | | 15,300 | | | | 1,618 | |
| | Oracle Corp. | | | 121,170 | | | | 4,659 | |
| | TE Connectivity, Ltd. | | | 34,570 | | | | 2,395 | |
| | | | | | | | | | |
| | Total | | | | | | | 19,759 | |
| | | | | | | | | | |
| |
| | Materials (1.6%) | |
| | The Dow Chemical Co. | | | 36,350 | | | | 2,080 | |
| | WestRock Co. | | | 18,420 | | | | 935 | |
| | | | | | | | | | |
| | Total | | | | | | | 3,015 | |
| | | | | | | | | | |
| |
| | Real Estate (0.7%) | |
| | Boston Properties, Inc. | | | 11,380 | | | | 1,431 | |
| | | | | | | | | | |
| | Total | | | | | | | 1,431 | |
| | | | | | | | | | |
| |
| | Telecommunication Services (1.4%) | |
| | Verizon Communications, Inc. | | | 51,620 | | | | 2,756 | |
| | | | | | | | | | |
| | Total | | | | | | | 2,756 | |
| | | | | | | | | | |
| |
| | Utilities (3.6%) | |
| | Edison International | | | 33,300 | | | | 2,397 | |
| | PG&E Corp. | | | 21,130 | | | | 1,284 | |
| | PPL Corp. | | | 33,630 | | | | 1,145 | |
The Accompanying Notes are an Integral Part of the Financial Statements.
| | | | |
| 24 | | Large Company Value Portfolio | | |
Large Company Value Portfolio
| | | | | | | | | | | | | | |
| | | Common Stocks (96.3%) | | | | | Shares/
$ Par | | | Value
$ (000’s) | |
| |
| | Utilities Continued | |
| | Xcel Energy, Inc. | | | | | | | 56,060 | | | | 2,282 | |
| | | | | | | | | | | | | | |
| | Total | | | | | | | | | | | 7,108 | |
| | | | | | | | | | | | | | |
| | | | |
| | Total Common Stocks | | | | | | | | | | | | |
| | (Cost: $170,613) | | | | | | | | | | | 188,576 | |
| | | | | | | | | | | | | | |
| | | | |
| | | Foreign Common Stocks (1.7%) | | Country | | | | | | | |
| | | | |
| | Energy (1.7%) | | | | | | | | | | | | |
| | Imperial Oil, Ltd. | | | Canada | | | | 94,510 | | | | 3,288 | |
| | | | | | | | | | | | | | |
| | |
| | Total Foreign Common Stocks | | | | | |
| | (Cost: $3,247) | | | | 3,288 | |
| | | | | | | | | | | | | | |
| | | | | | | | | | |
| | | Investment Companies (0.6%) | | Shares/
$ Par | | | Value
$ (000’s) | |
| |
| | Investment Companies (0.6%) | |
| | iShares Russell 1000 Value Index Fund | | | 10,490 | | | | 1,175 | |
| | | | | | | | | | |
| | | |
| | Total Investment Companies | | | | | | | | |
| | (Cost: $1,188) | | | | | | | 1,175 | |
| | | | | | | | | | |
| | | |
| | | Short-Term Investments (1.3%) | | | | | | |
| |
| | Commercial Paper (1.3%) | |
| (r) | | Credit Agricole Cib, 0.520%, 1/3/17 | | | 2,510,000 | | | | 2,510 | |
| | | | | | | | | | |
| | | |
| | Total Short-Term Investments | | | | | | | | |
| | (Cost: $2,510) | | | | | | | 2,510 | |
| | | | | | | | | | |
| | | |
| | Total Investments (99.9%) | | | | | | | | |
| | (Cost: $177,558)(a) | | | | | | | 195,549 | |
| | | | | | | | | | |
| | Other Assets, Less | | | | | | | | |
| | Liabilities (0.1%) | | | | | | | 224 | |
| | | | | | | | | | |
| | Net Assets (100.0%) | | | | | | | 195,773 | |
| | | | | | | | | | |
ADR after the name of a security represents—American Depositary Receipt.
| (a) | At December 31, 2016, the aggregate cost of securities for federal tax purposes (in thousands) was $179,920 and the net unrealized appreciation of investments based on that cost was $15,629 which is comprised of $20,703 aggregate gross unrealized appreciation and $5,074 aggregate gross unrealized depreciation. |
| (h) | Forward foreign currency contracts outstanding on December 31, 2016. |
| | | | | | | | | | | | | | | | | | | | | | |
| Type | | Counterparty | | Currency | | Foreign
Principal
Amount
Covered by
Contract (000s) | | USD Principal
Amount
Covered by
Contract (000’s) | | Settlement
Month | | Unrealized
Appreciation
(000’s) | | | Unrealized
(Depreciation)
(000’s) | | | Net Unrealized
Appreciation/
(Depreciation)
(000’s) | |
Sell | | HSBC Bank USA NA | | CAD | | 3,854 | | 2,873 | | 3/17 | | $ | 8 | | | $ | - | | | $ | 8 | |
Buy | | HSBC Bank USA NA | | EUR | | 130 | | 137 | | 3/17 | | | - | | | | - | (m) | | | - | (m) |
Sell | | HSBC Bank USA NA | | EUR | | 4,576 | | 4,840 | | 3/17 | | | - | | | | (61 | ) | | | (61 | ) |
Sell | | HSBC Bank USA NA | | GBP | | 1,028 | | 1,269 | | 3/17 | | | 9 | | | | - | | | | 9 | |
| | | | | | | | | | | | | | | | | | | | | | |
| | | | | | | | | | | | $ | 17 | | | $ | (61 | ) | | $ | (44 | ) |
| | | | | | | | | | | | | | | | | | | | | | |
CAD — Canadian Dollar
EUR — Euro
GBP — British Pound
| (m) | Amount is less than one thousand. |
| (r) | Rates are discount rates at the time of purchase. |
The Accompanying Notes are an Integral Part of the Financial Statements.
| | | | | | |
| | Large Company Value Portfolio | | | 25 | |
Large Company Value Portfolio
The following is a summary of the inputs used in valuing the Portfolio’s assets and liabilities at December 31, 2016. See Note 3 for additional information on portfolio valuation.
| | | | | | | | | | | | | | |
| | | Valuation Inputs | | | |
| Description | | Level 1 –
Quoted Prices | | | Level 2 –
Other Significant
Observable Inputs | | | Level 3 – Significant
Unobservable Inputs | | | |
| | | (Amounts in thousands) | | | |
Assets: | | | | | | | | | | | | | | |
Domestic Common Stocks | | $ | 188,576 | | | $ | - | | | $ | - | | | |
Foreign Common Stocks | | | 3,288 | | | | - | | | | - | | | |
Investment Companies | | | 1,175 | | | | - | | | | - | | | |
Short-Term Investments | | | - | | | | 2,510 | | | | - | | | |
Other Financial Instruments^ | | | | | | | | | | | | | | |
Forward Currency Contracts | | | - | | | | 17 | | | | - | | | |
Total Assets: | | $ | 193,039 | | | $ | 2,527 | | | $ | - | | | |
Liabilities: | | | | | | | | | | | | | | |
Other Financial Instruments^ | | | | | | | | | | | | | | |
Forward Currency Contracts | | | - | | | | (61 | ) | | | - | | | |
Total Liabilities: | | $ | - | | | $ | (61 | ) | | $ | - | | | |
^ Other financial instruments are derivative instruments such as futures, forwards, written options and swaps contracts, which are valued at the unrealized appreciation (depreciation) on the instrument and short sales, which are valued at market value.
The Accompanying Notes are an Integral Part of the Financial Statements.
| | | | |
| 26 | | Large Company Value Portfolio | | |
Domestic Equity Portfolio (unaudited)
| | | | |
| Objective: | | Portfolio Strategy: | | Net Assets: |
| Long-term growth of capital and income. | | Invest primarily in equity securities of U.S. issuers that are selling at attractive prices relative to their intrinsic value. | | $721 million |
Portfolio Overview
Mason Street Advisors, LLC (“Mason Street Advisors”), the investment adviser for the Domestic Equity Portfolio (the “Portfolio”), has engaged Delaware Investments Fund Advisers, a series of Delaware Management Business Trust (“Delaware”), to act as sub-adviser for the Portfolio. The Portfolio primarily invests in common stocks of large-capitalization companies that are believed to have long-term capital appreciation potential. Typically, the Portfolio seeks securities that are believed to be undervalued in relation to their intrinsic value, as indicated by multiple factors, including the earnings and cash flow potential or the asset valuation of the respective issuers. The Portfolio invests in a core group of 30-40 securities.
Market Overview
The year brought a number of reversals and surprises. The market pendulum swung from growth to value and from defensives to cyclicals. It even swung from fear to greed as stocks generally posted strong gains for the year following a very weak start. The U.K. vote to leave the European Union surprised the markets, as did Donald Trump’s victory in the U.S. presidential election. The election results, which put the executive branch and both houses of Congress under Republican leadership, boosted expectations for economic growth given the new administration’s pledges to lower taxes, increase government spending and reduce regulation. In December, the Federal Open Market Committee (FOMC) followed through on its well-telegraphed plan to raise short-term interest rates by 0.25%. Citing “…realized and expected labor-market conditions and inflation,” for the move, the FOMC also indicated that the pace of increases could quicken in 2017.
Portfolio Results
The Portfolio returned 14.98% for the twelve months ended December 31, 2016. By comparison, the Portfolio’s benchmark, the Russell 1000® Value Index (the “Index”), returned 17.34%. (The Index is unmanaged, cannot be invested in directly, and does not include administrative expenses or sales charges.) According to Lipper® Analytical Services, Inc., an independent mutual fund ranking company, the average return in 2016 for the Portfolio’s peer group, Large-Cap Value Funds, was 15.59%.
Investments in the Information Technology and Health Care sectors detracted most from relative returns. The Portfolio’s four Information Technology stocks rose 7.4% compared to 18.5% for the sector in the Index. Xerox Corp., a provider of document technology and business processing outsourcing services, was the laggard in the group. Its shares fell (15.2%). Although the sale of the position began late in the period, it was still the largest detractor in the sector. The company was preparing to split into two separately traded businesses at the end of the year. Following the split, each company would have a market capitalization well below $10 billion. Given the investment team’s preference for larger companies with more trading liquidity, it voted to sell the position. In Health Care, the Portfolio’s seven stocks gained 4.8% compared to 3.3% for the sector in the Index. Negative attribution resulted from the Portfolio’s overweight allocation. Express Scripts Holding Co. was the weakest stock in the group, down (21.3%). The company is in an ongoing dispute with one of its largest clients related to their long-term contract. The stock will likely be range-bound until there is some resolution.
Investments in the Telecommunication Services and Real Estate sectors contributed most to relative returns. The Portfolio’s two Telecommunication Services stocks rose 25.3%, on average, versus 23.9% for those in the Index. AT&T, Inc. had the higher return of the two holdings, up 29.9%. Several developments appeared to boost the shares including investor expectations for lower corporate taxes, a more-friendly regulatory environment, and the potential for more deal activity in the sector. A position in the new Real Estate sector was added to the Portfolio beginning in December. Real Estate became the eleventh sector in the Index at the end of August. The sector underperformed the Index owing to rising interest rates. The Portfolio’s underweight allocation to Real Estate was the main source of positive attribution in that sector.
Portfolio Manager Outlook
The following forward-looking comments are the opinion of Delaware, the Portfolio’s sub-adviser.
Looking ahead, stronger economic growth seems plausible if tax cuts and regulatory reforms are enacted. We have questions about the timing and implementation of these changes, as it may be a while before their effects are realized. We remain focused on valuation and fundamentals. It’s still difficult to find compelling investments that meet our criteria for attractive valuation and sound quality. We’re staying open to opportunities in more-cyclical segments of the market. As always, it’s about what’s priced in. The recent surge in cyclical shares makes us less inclined to take action now. We’re watching policy developments in Washington, D.C., assessing their potential impact on the Portfolio’s holdings as well as the opportunities that could be created by them. As long-term investors, we are optimistic for the future. However, in an environment of high valuations and ongoing government policy uncertainty, we believe it’s best to maintain a defensive tilt in the Portfolio.
| | | | | | |
| | Domestic Equity Portfolio | | | 27 | |
Domestic Equity Portfolio (unaudited)
Relative Performance
| | | | | | | | | | | | |
Average Annual Total Returns
For Periods Ended December 31, 2016 | |
| | | 1 Year | | | 5 Years | | | 10 Years | |
Domestic Equity Portfolio | | | 14.98 | % | | | 14.92 | % | | | 5.64 | % |
Russell 1000® Value Index | | | 17.34 | % | | | 14.80 | % | | | 5.72 | % |
Lipper® Variable Insurance Products (VIP) Large Cap Value Funds Average | | | 15.59 | % | | | 13.80 | % | | | 5.54 | % |
The performance data quoted represents past performance. Past performance is historical and does not guarantee future performance. Investment return and principal value will fluctuate, so that shares, when redeemed, may be worth more or less than their original cost. Current performance may be lower or higher than the performance data quoted. For the most recent month-end performance information visit www.northwesternmutual.com.
This chart assumes an initial investment of $10,000 made on 12/31/06. Returns shown reflect fee waivers, deductions for management and other portfolio expenses, and reinvestment of all dividends. In the absence of fee waivers, total return would be reduced. Returns exclude deductions for separate account sale loads and account fees. Please refer to the Benchmark Definitions section of this report for information about the indices cited in the above chart and graph.
The Portfolio may hold fewer securities than other diversified portfolios because of its more focused investment strategy. Holding fewer securities increases the risk that the value of the Portfolio could go down because of the poor performance of a single investment.
Top 10 Equity Holdings 12/31/16
| | | | |
Security Description | | | % of Net Assets | |
BB&T Corp. | | | 3.9 | % |
Halliburton Co. | | | 3.7 | % |
ConocoPhillips | | | 3.6 | % |
E.I. du Pont de Nemours & Co. | | | 3.4 | % |
Waste Management, Inc. | | | 3.4 | % |
Northrop Grumman Corp. | | | 3.3 | % |
Quest Diagnostics, Inc. | | | 3.3 | % |
The Bank of New York Mellon Corp. | | | 3.3 | % |
Chevron Corp. | | | 3.3 | % |
Archer-Daniels-Midland Co. | | | 3.2 | % |
Sector Allocation 12/31/16
Sector Allocation is based on Net Assets.
Sector Allocation and Top 10 Holdings are subject to change.
| | | | |
| 28 | | Domestic Equity Portfolio | | |
Domestic Equity Portfolio
Schedule of Investments
December 31, 2016
| | | | | | | | | | |
| | | Common Stocks (96.3%) | | Shares/ $ Par | | | Value
$ (000’s) | |
| |
| | Consumer Discretionary (2.7%) | |
| | Lowe’s Cos., Inc. | | | 273,300 | | | | 19,437 | |
| | | | | | | | | | |
| | Total | | | | | | | 19,437 | |
| | | | | | | | | | |
| |
| | Consumer Staples (12.2%) | |
| | Archer-Daniels-Midland Co. | | | 501,500 | | | | 22,894 | |
| | CVS Health Corp. | | | 284,000 | | | | 22,410 | |
| | The Kraft Heinz Co. | | | 248,866 | | | | 21,731 | |
| | Mondelez International, Inc. | | | 465,900 | | | | 20,653 | |
| | | | | | | | | | |
| | Total | | | | | | | 87,688 | |
| | | | | | | | | | |
| |
| | Energy (14.5%) | |
| | Chevron Corp. | | | 202,146 | | | | 23,793 | |
| | ConocoPhillips | | | 509,700 | | | | 25,556 | |
| | Halliburton Co. | | | 499,300 | | | | 27,007 | |
| | Marathon Oil Corp. | | | 558,100 | | | | 9,661 | |
| | Occidental Petroleum Corp. | | | 263,500 | | | | 18,769 | |
| | | | | | | | | | |
| | Total | | | | | | | 104,786 | |
| | | | | | | | | | |
| |
| | Financials (13.3%) | |
| | The Allstate Corp. | | | 296,500 | | | | 21,977 | |
| | The Bank of New York Mellon Corp. | | | 504,400 | | | | 23,899 | |
| | | | | | | | | | |
| | | Common Stocks (96.3%) | | Shares/ $ Par | | | Value
$ (000’s) | |
| |
| | Financials continued | |
| | BB&T Corp. | | | 599,200 | | | | 28,174 | |
| | Marsh & McLennan Cos., Inc. | | | 319,900 | | | | 21,622 | |
| | | | | | | | | | |
| | Total | | | | | | | 95,672 | |
| | | | | | | | | | |
| |
| | Health Care (19.7%) | |
| | Abbott Laboratories | | | 483,900 | | | | 18,587 | |
| | Cardinal Health, Inc. | | | 257,900 | | | | 18,561 | |
| * | | Express Scripts Holding Co. | | | 287,784 | | | | 19,797 | |
| | Johnson & Johnson | | | 180,300 | | | | 20,772 | |
| | Merck & Co., Inc. | | | 361,500 | | | | 21,281 | |
| | Pfizer, Inc. | | | 581,300 | | | | 18,881 | |
| | Quest Diagnostics, Inc. | | | 261,100 | | | | 23,995 | |
| | | | | | | | | | |
| | Total | | | | | | | 141,874 | |
| | | | | | | | | | |
| |
| | Industrials (9.8%) | |
| | Northrop Grumman Corp. | | | 103,600 | | | | 24,095 | |
| | Raytheon Co. | | | 158,000 | | | | 22,436 | |
| | Waste Management, Inc. | | | 343,600 | | | | 24,365 | |
| | | | | | | | | | |
| | Total | | | | | | | 70,896 | |
| | | | | | | | | | |
| |
| | Information Technology (8.9%) | |
| | CA, Inc. | | | 654,287 | | | | 20,787 | |
| | Cisco Systems, Inc. | | | 689,200 | | | | 20,827 | |
| | Intel Corp. | | | 613,400 | | | | 22,248 | |
| | | | | | | | | | |
| | Total | | | | | | | 63,862 | |
| | | | | | | | | | |
| | | | | | | | | | |
| | | Common Stocks (96.3%) | | Shares/ $ Par | | | Value
$ (000’s) | |
| |
| | Materials (3.4%) | |
| | E.I. du Pont de Nemours & Co. | | | 333,900 | | | | 24,508 | |
| | | | | | | | | | |
| | Total | | | | | | | 24,508 | |
| | | | | | | | | | |
| |
| | Real Estate (3.0%) | |
| | Equity Residential | | | 330,532 | | | | 21,273 | |
| | | | | | | | | | |
| | Total | | | | | | | 21,273 | |
| | | | | | | | | | |
| |
| | Telecommunication Services (5.9%) | |
| | AT&T, Inc. | | | 516,900 | | | | 21,984 | |
| | Verizon Communications, Inc. | | | 391,500 | | | | 20,898 | |
| | | | | | | | | | |
| | Total | | | | | | | 42,882 | |
| | | | | | | | | | |
| |
| | Utilities (2.9%) | |
| | Edison International | | | 294,600 | | | | 21,208 | |
| | | | | | | | | | |
| | Total | | | | | | | 21,208 | |
| | | | | | | | | | |
| | | |
| | Total Common Stocks | | | | | | | 694,086 | |
| | | | | | | | | | |
| | (Cost: $516,319) | | | | | | | | |
| | | |
| | Total Investments (96.3%) | | | | | | | | |
| | (Cost: $516,319)(a) | | | | | | | 694,086 | |
| | | | | | | | | | |
| | Other Assets, Less | | | | | | | | |
| | Liabilities (3.7%) | | | | | | | 26,854 | |
| | | | | | | | | | |
| | Net Assets (100.0%) | | | | | | | 720,940 | |
| | | | | | | | | | |
| (a) | At December 31, 2016, the aggregate cost of securities for federal tax purposes (in thousands) was $517,536 and the net unrealized appreciation of investments based on that cost was $176,550 which is comprised of $194,905 aggregate gross unrealized appreciation and $18,355 aggregate gross unrealized depreciation. |
The following is a summary of the inputs used in valuing the Portfolio’s assets and liabilities at December 31, 2016. See Note 3 for additional information on portfolio valuation.
| | | | | | | | | | | | | | |
| | | Valuation Inputs | | | |
| Description | | Level 1 –
Quoted Prices | | | Level 2 – Other Significant
Observable Inputs | | | Level 3 – Significant
Unobservable Inputs | | | |
| | | (Amounts in thousands) | | | |
Assets: | | | | | | | | | | | | | | |
Domestic Common Stocks | | $ | 694,086 | | | $ | - | | | $ | - | | | |
Total Assets: | | $ | 694,086 | | | $ | - | | | $ | - | | | |
The Accompanying Notes are an Integral Part of the Financial Statements.
| | | | | | |
| | Domestic Equity Portfolio | | | 29 | |
Equity Income Portfolio (unaudited)
| | | | |
| Objective: | | Portfolio Strategy: | | Net Assets: |
| Long-term growth of capital and income. | | Invest in common stocks with a focus on larger capitalization stocks with a strong track record of paying dividends, or that are believed to be undervalued. | | $798 million |
Portfolio Overview
Mason Street Advisors, LLC (“Mason Street Advisors”), the investment adviser for the Equity Income Portfolio (the “Portfolio”), has engaged T. Rowe Price Associates, Inc. (“T. Rowe Price”) to act as sub-adviser for the Portfolio. Normally, the Portfolio invests in common stocks, with an emphasis on larger capitalization stocks with a strong track record of paying dividends or that are believed to be undervalued. The Portfolio’s yield, which reflects the level of dividends paid by the Portfolio, is expected to normally exceed the yield of the S&P 500® Stock Index. The Portfolio will typically employ a value approach in selecting investments. The Portfolio’s in-house research team seeks to identify companies that appear to be undervalued, as measured by price to earnings ratio, dividend yield and enterprise value to sales, among other metrics, or which may be temporarily out of favor but have good prospects for capital appreciation and dividend growth.
Market Overview
Despite a sharp sell-off at the beginning of the year, U.S. stocks rose in 2016, with major Indices reaching record highs near year-end. The Russell 1000® Value Index posted a double-digit positive return during the period. As measured by the various Russell indices, large-cap shares underperformed their small-cap and mid-cap counterparts, while value stocks outperformed growth stocks across the capitalization spectrum. Within the Russell 1000® Value Index, the Materials sector led performance, followed by Energy and Financials. Real Estate and Health Care were the weakest performers.
Portfolio Results
The Portfolio returned 19.17% for the twelve months ended December 31, 2016. By comparison, the Portfolio’s benchmark, the Russell 1000® Value Index (the “Index”), returned 17.34%. (The Index is unmanaged, cannot be invested in directly and does not include administrative expenses or sales charges.) According to Lipper® Analytical Services, Inc., an independent mutual fund ranking agency, the average return of the Equity Income Funds peer group was 14.21% for 2016.
Sector weightings contributed to relative performance, as did stock selection. Leading contributors to relative results were the Information Technology and Consumer Staples sectors. The Information Technology sector largely contributed to relative performance due to stock selection. For example, Applied Materials, Inc. benefited from a surge in spending on the latest memory chip technology for mobile devices and displays, as well as from stronger demand in China. The portfolio manager trimmed the position on strength but expected to see continued value in the company.
An underweight allocation and stock selection in the Consumer Staples sector boosted relative results. For example, agricultural processor Archer-Daniels-Midland Co. performed well, driven by a robust U.S. harvest, higher U.S. exports and higher ethanol margins. The portfolio manager remained positive on the company given its best-in-class management team and leading position in an industry that is expected to benefit from a positive fundamental grain backdrop.
Conversely, the Telecommunication Services, Financials and Consumer Discretionary sectors detracted from performance, mostly due to stock selection. In the Telecommunication Services sector, Vodafone Group declined, driven by concern that the vote in the United Kingdom to leave the European Union, or “Brexit,” could lead to higher regulatory hurdles for a potentially synergistic deal with Liberty Global PLC, as well as from negative currency effects. The portfolio manager continued to see value in Vodafone Group, given its solid fundamental outlook, which was driven by the improvement in European mobile service revenue and acceleration in high-speed broadband.
In the Financials sector, Royal Bank of Scotland suffered from additional provisions for litigation claims, persistently low U.K. interest rates and higher macroeconomic uncertainty following the “Brexit” vote. The portfolio manager remained positive on the bank as he expected management’s plan, focused on cutting expenses while reducing non-core assets and expanding its U.K. retail and commercial bank businesses, will benefit shareholders over the longer term.
Portfolio Manager Outlook
The following forward-looking comments are the opinion of T. Rowe Price, the Portfolio’s sub-adviser.
Despite facing many geopolitical events during the year, the market performed surprisingly well. Issues such as Russia’s activity in Syria, tensions in the Middle East and provocative actions from North Korea have introduced uncertainties that have the potential to escalate into a crisis. Additionally, electorates in many countries have exhibited levels of responsiveness to
| | | | |
| 30 | | Equity Income Portfolio | | |
Equity Income Portfolio (unaudited)
populist messages not seen in decades. In the U.S., the market repositioned itself for expected policy initiatives of the incoming Trump presidential administration, but significant uncertainty remains as to whether actual policy will match expectations. The U.S. dollar has remained strong, and the U.S. Federal Reserve Bank, in addition to a December rate hike, communicated expectations for additional rate increases, as increasing wage pressure and fiscal stimulus could result in higher inflation.
We therefore expect increased volatility and modest equity returns in the coming months as future U.S. policy is finalized, allowing market participants to assess the longer-term impact to the global economy. Following recent strength, valuations appear more stretched to us, although they have fallen in traditionally defensive sectors in anticipation of rising U.S. interest rates. Given the environment, we are finding more opportunities to sell than buy. However, the cross-currents in the market continue to provide us with select opportunities to purchase quality companies trading at relatively attractive valuations.
|
Relative Performance |
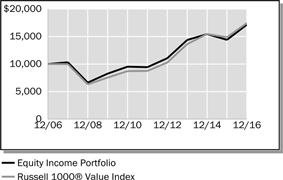 |
| | | | | | | | | | | | |
Average Annual Total Returns For Periods
Ended December 31, 2016 | |
| | | 1 Year | | | 5 Years | | | 10 Years | |
Equity Income Portfolio | | | 19.17 | % | | | 12.71 | % | | | 5.55 | % |
Russell 1000® Value Index | | | 17.34 | % | | | 14.80 | % | | | 5.72 | % |
Lipper® Variable Insurance Products (VIP) Equity Income Funds Average | | | 14.21 | % | | | 12.55 | % | | | 5.72 | % |
The performance data quoted represents past performance. Past performance is historical and does not guarantee future performance. Investment return and principal value will fluctuate, so that shares, when redeemed, may be worth more or less than their original cost. Current performance may be lower or higher than the performance data quoted. For the most recent month-end performance information visit www.northwesternmutual.com.
This chart assumes an initial investment of $10,000 made on 12/31/06. Returns shown reflect fee waivers, deductions for management and other portfolio expenses, and reinvestment of all dividends. In the absence of fee waivers, total return would be reduced. Returns exclude deductions for separate account sale loads and account fees. Please refer to the Benchmark Definitions section of this report for information about the indices cited in the above chart and graph.
The Portfolio invests with an emphasis on larger capitalization stocks with a strong track record of paying dividends or that are believed to be undervalued. The Portfolio may underperform similar funds that invest without an emphasis on dividend-paying stocks. Dividend-paying stocks may not participate in a broad market advance to the same degree as other stocks.
Currently, interest rates are near unprecedented historically low levels, and a sharp rise in interest rates or economic downturn could cause a company to unexpectedly reduce or eliminate its dividend.
Top 10 Equity Holdings 12/31/16
| | |
| Security Description | | % of Net Assets |
JPMorgan Chase & Co. | | 3.5% |
Exxon Mobil Corp. | | 2.7% |
Microsoft Corp. | | 2.1% |
Morgan Stanley | | 2.0% |
Pfizer, Inc. | | 2.0% |
The Boeing Co. | | 2.0% |
General Electric Co. | | 1.9% |
Total SA, ADR | | 1.8% |
Wells Fargo & Co. | | 1.8% |
Johnson & Johnson | | 1.7% |
|
Sector Allocation 12/31/16 |
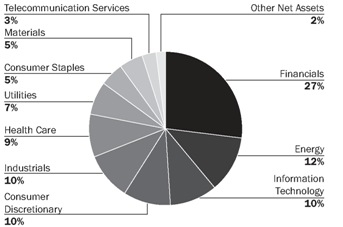
Sector Allocation is based on Net Assets.
Sector Allocation and Top 10 Holdings are subject to change.
| | | | | | |
| | Equity Income Portfolio | | | 31 | |
Equity Income Portfolio
Schedule of Investments
December 31, 2016
| | | | | | | | | | |
| | | Common Stocks (94.6%) | | Shares/
$ Par | | | Value
$ (000’s) | |
| | | |
| | Consumer Discretionary (10.2%) | | | | | | | | |
| * | | Adient PLC | | | 81,145 | | | | 4,755 | |
| | Carnival Corp. | | | 105,400 | | | | 5,487 | |
| | Comcast Corp. - Class A | | | 137,200 | | | | 9,474 | |
| | Ford Motor Co. | | | 170,600 | | | | 2,069 | |
| | General Motors Co. | | | 35,933 | | | | 1,252 | |
| | Johnson Controls International PLC | | | 310,859 | | | | 12,804 | |
| | Kohl’s Corp. | | | 121,800 | | | | 6,015 | |
| | Las Vegas Sands Corp. | | | 141,400 | | | | 7,552 | |
| | Macy’s, Inc. | | | 114,700 | | | | 4,107 | |
| | Mattel, Inc. | | | 242,000 | | | | 6,667 | |
| | News Corp. - Class A | | | 464,700 | | | | 5,325 | |
| | Staples, Inc. | | | 43,800 | | | | 396 | |
| | Time Warner, Inc. | | | 10,500 | | | | 1,014 | |
| | Twenty-First Century Fox, Inc. - Class B | | | 368,900 | | | | 10,053 | |
| | The Walt Disney Co. | | | 43,300 | | | | 4,513 | |
| | | | | | | | | | |
| | Total | | | | | | | 81,483 | |
| | | | | | | | | | |
| | | |
| | Consumer Staples (4.8%) | | | | | | | | |
| | Archer-Daniels-Midland Co. | | | 207,500 | | | | 9,472 | |
| * | | Avon Products, Inc. | | | 274,500 | | | | 1,383 | |
| | Coty, Inc. - Class A | | | 196,097 | | | | 3,591 | |
| | The Hershey Co. | | | 10,100 | | | | 1,045 | |
| | Kellogg Co. | | | 53,400 | | | | 3,936 | |
| | PepsiCo, Inc. | | | 84,500 | | | | 8,841 | |
| | Philip Morris International, Inc. | | | 34,800 | | | | 3,184 | |
| | Wal-Mart Stores, Inc. | | | 96,800 | | | | 6,691 | |
| | | | | | | | | | |
| | Total | | | | | | | 38,143 | |
| | | | | | | | | | |
| | | |
| | Energy (11.1%) | | | | | | | | |
| | Apache Corp. | | | 124,056 | | | | 7,874 | |
| | Canadian Natural Resources, Ltd. | | | 113,300 | | | | 3,612 | |
| | Chevron Corp. | | | 77,300 | | | | 9,098 | |
| | EQT Corp. | | | 34,990 | | | | 2,288 | |
| | Exxon Mobil Corp. | | | 238,300 | | | | 21,509 | |
| | Hess Corp. | | | 155,100 | | | | 9,661 | |
| | Occidental Petroleum Corp. | | | 105,100 | | | | 7,486 | |
| | Royal Dutch Shell PLC - Class A, ADR | | | 213,900 | | | | 11,632 | |
| | Targa Resources Corp. | | | 12,200 | | | | 684 | |
| | Total SA, ADR | | | 283,100 | | | | 14,430 | |
| | | | | | | | | | |
| | Total | | | | | | | 88,274 | |
| | | | | | | | | | |
| | | |
| | Financials (26.3%) | | | | | | | | |
| | American Express Co. | | | 132,900 | | | | 9,845 | |
| | Ameriprise Financial, Inc. | | | 92,200 | | | | 10,229 | |
| | Bank of America Corp. | | | 344,723 | | | | 7,618 | |
| | The Bank of New York Mellon Corp. | | | 147,100 | | | | 6,970 | |
| | Chubb, Ltd. | | | 11,075 | | | | 1,463 | |
| | Citigroup, Inc. | | | 195,200 | | | | 11,601 | |
| | Equity Residential | | | 73,600 | | | | 4,737 | |
| | Fifth Third Bancorp | | | 263,900 | | | | 7,117 | |
| | JPMorgan Chase & Co. | | | 322,388 | | | | 27,819 | |
| | KeyCorp | | | 333,700 | | | | 6,097 | |
| | Loews Corp. | | | 278,500 | | | | 13,042 | |
| | | | | | | | | | |
| | | Common Stocks (94.6%) | | Shares/
$ Par | | | Value
$ (000’s) | |
| | | |
| | Financials continued | | | 137,800 | | | | 9,314 | |
| | MetLife, Inc. | | | 249,300 | | | | 13,435 | |
| | Morgan Stanley | | | 386,900 | | | | 16,347 | |
| | Northern Trust Corp. | | | 111,500 | | | | 9,929 | |
| * | | Och-Ziff Capital Management Group - Class A | | | 220,400 | | | | 729 | |
| | PNC Financial Services Group, Inc. | | | 61,000 | | | | 7,135 | |
| | Rayonier, Inc. | | | 177,900 | | | | 4,732 | |
| | State Street Corp. | | | 147,500 | | | | 11,464 | |
| | U.S. Bancorp | | | 77,400 | | | | 3,976 | |
| | Wells Fargo & Co. | | | 257,800 | | | | 14,207 | |
| | Weyerhaeuser Co. | | | 200,535 | | | | 6,034 | |
| | Willis Towers Watson PLC | | | 30,616 | | | | 3,744 | |
| | XL Group, Ltd. | | | 61,600 | | | | 2,295 | |
| | | | | | | | | | |
| | Total | | | | | | | 209,879 | |
| | | | | | | | | | |
| | | |
| | Health Care (8.4%) | | | | | | | | |
| | Anthem, Inc. | | | 74,449 | | | | 10,704 | |
| | Becton, Dickinson and Co. | | | 34,600 | | | | 5,728 | |
| | Bristol-Myers Squibb Co. | | | 108,300 | | | | 6,329 | |
| | Gilead Sciences, Inc. | | | 51,500 | | | | 3,688 | |
| | Johnson & Johnson | | | 118,800 | | | | 13,687 | |
| | Medtronic PLC | | | 63,700 | | | | 4,537 | |
| | Merck & Co., Inc. | | | 117,300 | | | | 6,905 | |
| | Pfizer, Inc. | | | 488,326 | | | | 15,861 | |
| | | | | | | | | | |
| | Total | | | | | | | 67,439 | |
| | | | | | | | | | |
| | | |
| | Industrials (9.7%) | | | | | | | | |
| | The Boeing Co. | | | 101,000 | | | | 15,724 | |
| | Cummins, Inc. | | | 34,300 | | | | 4,688 | |
| | Emerson Electric Co. | | | 139,900 | | | | 7,799 | |
| | Flowserve Corp. | | | 84,521 | | | | 4,061 | |
| | General Electric Co. | | | 488,600 | | | | 15,440 | |
| | Illinois Tool Works, Inc. | | | 67,400 | | | | 8,254 | |
| | Pentair PLC | | | 80,700 | | | | 4,525 | |
| | Southwest Airlines Co. | | | 59,200 | | | | 2,950 | |
| | Union Pacific Corp. | | | 50,200 | | | | 5,205 | |
| | United Parcel Service, Inc. - Class B | | | 63,000 | | | | 7,222 | |
| | United Technologies Corp. | | | 16,900 | | | | 1,853 | |
| | | | | | | | | | |
| | Total | | | | | | | 77,721 | |
| | | | | | | | | | |
| | | |
| | Information Technology (10.4%) | | | | | | | | |
| | Analog Devices, Inc. | | | 98,900 | | | | 7,182 | |
| | Apple, Inc. | | | 24,800 | | | | 2,872 | |
| | Applied Materials, Inc. | | | 253,500 | | | | 8,180 | |
| | CA, Inc. | | | 42,800 | | | | 1,360 | |
| | Cisco Systems, Inc. | | | 322,300 | | | | 9,740 | |
| | Harris Corp. | | | 109,973 | | | | 11,269 | |
| | Microsoft Corp. | | | 273,600 | | | | 17,002 | |
| | QUALCOMM, Inc. | | | 155,600 | | | | 10,145 | |
| | TE Connectivity, Ltd. | | | 37,800 | | | | 2,619 | |
| | Texas Instruments, Inc. | | | 102,400 | | | | 7,472 | |
| | Western Digital Corp. | | | 72,700 | | | | 4,940 | |
| | | | | | | | |
Total | | | | 82,781 | |
| | | | | |
The Accompanying Notes are an Integral Part of the Financial Statements.
| | | | |
| 32 | | Equity Income Portfolio | | |
Equity Income Portfolio
| | | | | | | | | | | | | | |
| | | Common Stocks (94.6%) | | | Shares/
$ Par | | | Value
$ (000’s) | |
| |
| | Materials (4.9%) | |
| | CF Industries Holdings, Inc. | | | | 191,100 | | | | 6,016 | |
| | E.I. du Pont de Nemours and Co. | | | | 162,900 | | | | 11,957 | |
| | International Paper Co. | | | | 170,500 | | | | 9,047 | |
| | Nucor Corp. | | | | 89,300 | | | | 5,315 | |
| | Vulcan Materials Co. | | | | 51,700 | | | | 6,470 | |
| | | | | | | | | | | |
| | Total | | | | 38,805 | |
| | | | | | | |
| |
| | Telecommunication Services (2.1%) | |
| | CenturyLink, Inc. | | | | 133,590 | | | | 3,177 | |
| | Verizon Communications, Inc. | | | | 253,908 | | | | 13,553 | |
| | | | | | | | | | | |
| | Total | | | | 16,730 | |
| | | | | | | |
| |
| | Utilities (6.7%) | |
| | The AES Corp. | | | | 612,300 | | | | 7,115 | |
| | Edison International | | | | 98,900 | | | | 7,120 | |
| | Eversource Energy | | | | 6,903 | | | | 381 | |
| | Exelon Corp. | | | | 206,900 | | | | 7,343 | |
| | FirstEnergy Corp. | | | | 153,354 | | | | 4,749 | |
| | Great Plains Energy, Inc. | | | | 15,620 | | | | 427 | |
| | NiSource, Inc. | | | | 381,000 | | | | 8,435 | |
| | PG&E Corp. | | | | 164,300 | | | | 9,985 | |
| | The Southern Co. | | | | 43,000 | | | | 2,115 | |
| | Xcel Energy, Inc. | | | | 147,700 | | | | 6,012 | |
| | | | | | | | | | | |
| | Total | | | | 53,682 | |
| | | | | | | |
| | | | |
| | Total Common Stocks | | | | | | | | | | | | |
| | (Cost: $628,789) | | | | 754,937 | |
| | | | | | | |
| | | | |
| | | Foreign Common Stocks (2.0%) | | Country | | | | | | | |
| |
| | Consumer Staples (0.5%) | |
| | Diageo PLC | | | United Kingdom | | | | 168,023 | | | | 4,369 | |
| | | | | | | | | | | | | | |
| | Total | | | | 4,369 | |
| | | | | | | |
| |
| | Financials (0.4%) | |
| * | | Royal Bank of Scotland Group PLC | | | United Kingdom | | | | 1,189,951 | | | | 3,294 | |
| | | | | | | | | | | | | | |
| | Total | | | | 3,294 | |
| | | | | | | |
| | | | | | | | | | | | | | |
| | | Foreign Common Stocks (2.0%) | | Country | | | Shares/
$ Par | | | Value
$(000’s) | |
| |
| | Health Care (0.5%) | |
| | GlaxoSmithKline PLC | | | United Kingdom | | | | 215,737 | | | | 4,153 | |
| | | | | | | | | | | | | | |
| | Total | | | | | | | | | | | 4,153 | |
| | | | | | | | | | | | | | |
| | | |
| | Telecommunication Services (0.6%) | | | | | | | | | |
| | Telefonica SA | | | Spain | | | | 267,609 | | | | 2,485 | |
| | Vodafone Group PLC | | | United Kingdom | | | | 875,815 | | | | 2,157 | |
| | | | | | | | | | | | | | |
| | Total | | | | | | | | | | | 4,642 | |
| | | | | | | | | | | | | | |
| | | |
| | Total Foreign Common Stocks | | | | | | | | | |
| | (Cost: $22,712) | | | | | | | | | | | 16,458 | |
| | | | | | | | | | | | | | |
| |
| | | Convertible Preferred Stocks (1.1%) | |
| | | | |
| | Energy (1.1%) | | | | | | | | | | | | |
| | DTE Energy Co.,
6.500%, 10/1/19 | | | | | | | 25,217 | | | | 1,337 | |
| | Great Plains Energy,
7.000%, 9/15/19 | | | | | | | 41,247 | | | | 2,087 | |
| | NextEra Energy, Inc.,
6.123%, 9/1/19 | | | | | | | 105,113 | | | | 5,148 | |
| | | | | | | | | | | | | | |
| | | |
| | Total Convertible Preferred Stocks | | | | | | | | | |
| | (Cost: $8,463) | | | | | | | | | | | 8,572 | |
| | | | | | | | | | | | | | |
| | | | |
| | | Corporate Bonds (0.2%) | | | | | | | | | |
| | | | |
| | Pharmaceuticals (0.0%) | | | | | | | | | | | | |
| | Valeant Pharmaceuticals International, Inc.,
6.375%, 10/15/20 144A | | | | | | | 87,000 | | | | 74 | |
| | | | | | | | | | | | | | |
| | Total | | | | | | | | | | | 74 | |
| | | | | | | | | | | | | | |
| | | | |
| | Technology (0.2%) | | | | | | | | | | | | |
| | Western Digital Corp.,
10.500%, 4/1/24 144A | | | | | | | 1,150,000 | | | | 1,360 | |
| | | | | | | | | | | | | | |
| | Total | | | | | | | | | | | 1,360 | |
| | | | | | | | | | | | | | |
| | | | |
| | Total Corporate Bonds | | | | | | | | | | | | |
| | (Cost: $1,207) | | | | | | | | | | | 1,434 | |
| | | | | | | | | | | | | | |
| | | |
| | Total Investments (97.9%) | | | | | | | | | |
| | (Cost: $661,171)(a) | | | | | | | | | | | 781,401 | |
| | | | | | | | | | | | | | |
| | Other Assets, Less | | | | | | | | | | | | |
| | Liabilities (2.1%) | | | | | | | | | | | 16,766 | |
| | | | | | | | | | | | | | |
| | Net Assets (100.0%) | | | | | | | | | | | 798,167 | |
| | | | | | | | | | | | | | |
ADR after the name of a security represents—American Depositary Receipt.
144A after the name of a security represents a security exempt from registration under Rule 144A of the Securities Act of 1933. These securities may be resold as transactions exempt from registration, normally to qualified institutional buyers. At December 31, 2016 the value of these securities (in thousands) was $1,434 representing 0.2% of the net assets.
| (a) | At December 31, 2016, the aggregate cost of securities for federal tax purposes (in thousands) was $663,227 and the net unrealized appreciation of investments based on that cost was $118,174 which is comprised of $140,060 aggregate gross unrealized appreciation and $21,886 aggregate gross unrealized depreciation. |
The Accompanying Notes are an Integral Part of the Financial Statements.
| | | | | | |
| | Equity Income Portfolio | | | 33 | |
Equity Income Portfolio
The following is a summary of the inputs used in valuing the Portfolio’s assets and liabilities at December 31, 2016. See Note 3 for additional information on portfolio valuation.
| | | | | | | | | | | | | | |
| | | Valuation Inputs | | | |
| Description | | Level 1 –
Quoted Prices | | | Level 2 –
Other Significant
Observable Inputs | | | Level 3 –
Significant
Unobservable Inputs | | | |
| | | (Amounts in thousands) | | | |
Assets: | | | | | | | | | | | | | | |
Domestic Common Stocks | | $ | 754,937 | | | $ | - | | | $ | - | | | |
Foreign Common Stocks | | | 16,458 | | | | - | | | | - | | | |
Convertible Preferred Stocks | | | 8,572 | | | | - | | | | - | | | |
Corporate Bonds | | | - | | | | 1,434 | | | | - | | | |
Total Assets: | | $ | 779,967 | | | $ | 1,434 | | | $ | - | | | |
The Accompanying Notes are an Integral Part of the Financial Statements.
| | | | |
| 34 | | Equity Income Portfolio | | |
Mid Cap Growth Stock Portfolio (unaudited)
| | | | |
| Objective: | | Portfolio Strategy: | | Net Assets: |
| Long-term growth of capital. | | Invest primarily in common stocks of mid cap domestic companies that are expected to experience solid growth in earnings. | | $983 million |
Portfolio Overview
Mason Street Advisors, LLC (“Mason Street Advisors”), the investment adviser for the Mid Cap Growth Stock Portfolio (the “Portfolio”), has engaged William Blair Investment Management, LLC (“William Blair”) to act as sub-adviser for the Portfolio. The Portfolio invests primarily in common stocks of mid-cap domestic growth companies that are expected to experience solid growth in earnings. In choosing investments, the Portfolio evaluates the extent to which a company meets one or more of the following criteria, relative to the valuation of the security: (a) the company should have or should have the expectation of becoming, a significant provider in the primary markets it serves, (b) the company should have some distinctive attribute relative to present or potential competitors, (c) the prices of the company’s products or services should be based to some degree upon their value to the customer, rather than their production cost, (d) the company should participate in an industry expected to grow rapidly due to economic factors or technological change or grow through market share gains in its industry and (e) the company should have a strong management team.
Market Overview
The strength of U.S. equity market returns in 2016 masks some sharp but short-lived downdrafts. In the first six weeks of 2016, the market declined precipitously, driven by concern that the U.S. could be headed into a recession. Equity investors gravitated toward the perceived safety of high dividend yielding stocks in this environment until the mid-February market reversal, when leadership shifted to more cyclical companies. The market was generally flat following a post-“Brexit” rally in July until the surprise election of Donald Trump to the U.S. presidency late in the year. The election of Trump – whose proposed policies are generally perceived as reflationary and pro-U.S. growth – along with positively trending macroeconomic data points, provided a tailwind for more economically sensitive areas of the market.
Portfolio Results
The Portfolio returned 0.83% for the twelve months ended December 31, 2016. By comparison, the Portfolio’s benchmark, the Russell Midcap® Growth Index (the “Index”), returned 7.33%. (The Index is unmanaged, cannot be invested in directly, and does not include administrative expenses or sales charges.) According to Lipper® Analytical Services Inc., an independent mutual fund ranking agency, the average return in 2016 of the Mid Cap Growth Funds peer group was 6.61%.
Underperformance for the year was due to a combination of style and stock-specific factors. From a style perspective, there were headwinds early in the year when investor preference for high dividend-yielding stocks dominated the market. While the preference for dividend yield was most pronounced at the beginning of the year, relative performance of high dividend-yielding stocks did not revert for the remainder of 2016 and high dividend-yielding stocks materially outperformed low dividend-yielding stocks. Cyclical and more economically sensitive areas of the market also outperformed for the year, particularly in the third quarter and following the U.S. presidential election. The Portfolio tends to be significantly underweight high dividend yielders and more economically sensitive companies, as the portfolio managers prefer sustainable growth companies with substantial reinvestment opportunities that enable superior, durable long-term growth.
From a stock-specific perspective, the largest detractor was apparel company Hanesbrands, Inc. The stock underperformed for the year as issues related to inventory restocking and soft organic growth were exacerbated by concerns late in the year regarding risks related to international manufacturing. Drug maker Perrigo Co. PLC was also a top detractor for the year. Turnover at its CEO position and weakness in its European consumer healthcare business were the primary causes for the stock lagging in 2016. Other top detractors were Cerner Corp. (Health Care), Mead Johnson Nutrition Co. (Consumer Staples) and Red Hat, Inc. (Information Technology).
Top contributors for the year were trucking company Old Dominion Freight Line, Inc. and aggregates producer Vulcan Materials Co. Old Dominion Freight Line, Inc. outperformed after better-than-expected earnings in the latter half of the year and as investors gravitated towards more economically sensitive stocks following the U.S presidential election. Vulcan Materials Co. outperformed after reporting strong volumes and pricing mid-year and amid investor optimism late in 2016 that infrastructure spending in the U.S will likely rise in the short to intermediate term. Other top contributors were Akamai Technologies, Inc. (Information Technology), Vantiv, Inc. (Information Technology) and Align Technology, Inc. (Health Care).
| | | | | | |
| | Mid Cap Growth Stock Portfolio | | | 35 | |
Mid Cap Growth Stock Portfolio (unaudited)
Portfolio Manager Outlook
The following forward-looking comments are the opinion of William Blair, the Portfolio’s sub-adviser.
The new administration will take office with the U.S. economy moving into the latter half of its eighth year of expansion, and the U.S. Federal Reserve Bank is poised to enact further interest rate increases. In terms of Republican initiatives, lower regulatory burden, higher fiscal spending and lower taxes are generally considered to be favorable for economic growth. While expectations for growth have risen, it remains to be seen whether the new administration’s proposed policies can be implemented quickly enough to further extend the cycle. As always, we believe broad investor focus on near-term events creates opportunities for investors such as ourselves who analyze companies over a long-term time horizon to achieve excess returns. We remain focused on identifying companies with durable growth drivers, independent of policy outcomes, whose stocks present compelling risk/reward opportunities.
Relative Performance
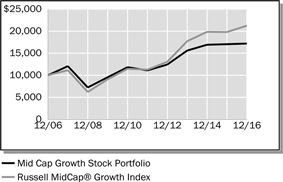
| | | | | | | | | | | | |
Average Annual Total Returns
For Periods Ended December 31, 2016 | |
| | | 1 Year | | | 5 Years | | | 10 Years | |
Mid Cap Growth Stock Portfolio | | | 0.83 | % | | | 9.14 | % | | | 5.57 | % |
Russell MidCap® Growth Index | | | 7.33 | % | | | 13.51 | % | | | 7.83 | % |
Lipper® Variable Insurance Products (VIP) Mid Cap Growth Funds Average | | | 6.61 | % | | | 12.52 | % | | | 7.02 | % |
The performance data quoted represents past performance. Past performance is historical and does not guarantee future performance. Investment return and principal value will fluctuate, so that shares, when redeemed, may be worth more or less than their original cost. Current performance may be lower or higher than the performance data quoted. For the most recent month-end performance information visit www.northwesternmutual.com.
This chart assumes an initial investment of $10,000 made on 12/31/06. Returns shown reflect fee waivers, deductions for management and other portfolio expenses, and reinvestment of all dividends. In the absence of fee waivers, total return would be reduced. Returns exclude deductions for separate account sale loads and account fees. Please refer to the Benchmark Definitions section of this report for information about the indices cited in the above chart and graph.
Investing in small and medium-sized companies involves a greater degree of risk than investing in large company stocks.
The Portfolio may invest a relatively high percentage of its assets in a particular sector. The Portfolio will have greater exposure to the risks associated with that sector and its performance will be tied more closely to the performance of that sector.
Top 10 Equity Holdings 12/31/16
| | | | |
| Security Description | | % of Net Assets | |
Red Hat, Inc. | | | 3.3 | % |
Vantiv, Inc. - Class A | | | 3.1 | % |
Signature Bank / New York NY | | | 3.0 | % |
CoStar Group, Inc. | | | 2.9 | % |
Ross Stores, Inc. | | | 2.9 | % |
Verisk Analytics, Inc. | | | 2.8 | % |
Newell Brands, Inc. | | | 2.8 | % |
Tractor Supply Co. | | | 2.7 | % |
Akamai Technologies, Inc. | | | 2.7 | % |
Ball Corp. | | | 2.6 | % |
Sector Allocation 12/31/16
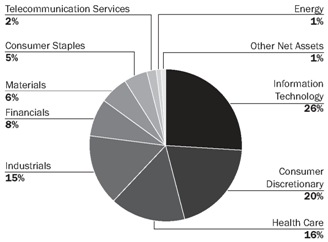
Sector Allocation is based on Net Assets.
Sector Allocation and Top 10 Holdings are subject to change.
| | | | |
| 36 | | Mid Cap Growth Stock Portfolio | | |
Mid Cap Growth Stock Portfolio
Schedule of Investments
December 31, 2016
| | | | | | | | | | |
| | | Common Stocks (99.2%) | | Shares/ $ Par | | | Value
$ (000’s) | |
| |
| | Consumer Discretionary (20.2%) | |
| | BorgWarner, Inc. | | | 316,756 | | | | 12,493 | |
| | Dollar General Corp. | | | 217,925 | | | | 16,142 | |
| | Hanesbrands, Inc. | | | 1,004,439 | | | | 21,666 | |
| | Newell Brands, Inc. | | | 607,492 | | | | 27,124 | |
| * | | O’Reilly Automotive, Inc. | | | 91,431 | | | | 25,455 | |
| * | | Panera Bread Co. - Class A | | | 46,256 | | | | 9,487 | |
| | Ross Stores, Inc. | | | 434,613 | | | | 28,511 | |
| | Six Flags Entertainment Corp. | | | 403,633 | | | | 24,202 | |
| | Tractor Supply Co. | | | 354,075 | | | | 26,842 | |
| | Vail Resorts, Inc. | | | 39,037 | | | | 6,297 | |
| | | | | | | | | | |
| | Total | | | | | | | 198,219 | |
| | | | | | | | | | |
| | |
| | Consumer Staples (4.9%) | | | | | |
| * | | Herbalife, Ltd. | | | 129,418 | | | | 6,230 | |
| | Mead Johnson Nutrition Co. | | | 279,118 | | | | 19,751 | |
| | Tyson Foods, Inc. - Class A | | | 364,109 | | | | 22,458 | |
| | | | | | | | | | |
| | Total | | | | | | | 48,439 | |
| | | | | | | | | | |
| | |
| | Energy (0.9%) | | | | | |
| * | | Concho Resources, Inc. | | | 69,538 | | | | 9,221 | |
| | | | | | | | | | |
| | Total | | | | | | | 9,221 | |
| | | | | | | | | | |
| | |
| | Financials (8.6%) | | | | | |
| * | | Affiliated Managers Group, Inc. | | | 65,166 | | | | 9,468 | |
| | East West Bancorp, Inc. | | | 194,466 | | | | 9,885 | |
| | Intercontinental Exchange, Inc. | | | 195,810 | | | | 11,047 | |
| | Nasdaq, Inc. | | | 186,273 | | | | 12,503 | |
| * | | Signature Bank / New York NY | | | 193,528 | | | | 29,068 | |
| | Willis Towers Watson PLC | | | 102,143 | | | | 12,490 | |
| | | | | | | | | | |
| | Total | | | | | | | 84,461 | |
| | | | | | | | | | |
| | | | | | | | | | |
| | | Common Stocks (99.2%) | | Shares/
$ Par | | | Value
$ (000’s) | |
| |
| | Health Care (16.2%) | |
| * | | ABIOMED, Inc. | | | 70,544 | | | | 7,949 | |
| * | | Align Technology, Inc. | | | 107,205 | | | | 10,306 | |
| * | | BioMarin Pharmaceutical, Inc. | | | 186,671 | | | | 15,464 | |
| * | | Centene Corp. | | | 369,904 | | | | 20,903 | |
| * | | Cerner Corp. | | | 256,550 | | | | 12,153 | |
| | DENTSPLY SIRONA, Inc. | | | 186,632 | | | | 10,774 | |
| | HealthSouth Corp. | | | 248,212 | | | | 10,236 | |
| * | | MEDNAX, Inc. | | | 375,348 | | | | 25,021 | |
| * | | Mettler-Toledo International, Inc. | | | 34,923 | | | | 14,617 | |
| | Perrigo Co. PLC | | | 106,239 | | | | 8,842 | |
| | Zoetis, Inc. | | | 425,921 | | | | 22,800 | |
| | | | | | | | | | |
| | Total | | | | | | | 159,065 | |
| | | | | | | | | | |
| | |
| | Industrials (14.7%) | | | | | |
| * | | Copart, Inc. | | | 454,273 | | | | 25,171 | |
| | The Dun & Bradstreet Corp. | | | 100,213 | | | | 12,158 | |
| | Equifax, Inc. | | | 75,796 | | | | 8,961 | |
| * | | The Middleby Corp. | | | 127,486 | | | | 16,422 | |
| * | | Old Dominion Freight Line, Inc. | | | 250,582 | | | | 21,497 | |
| | TransDigm Group, Inc. | | | 67,317 | | | | 16,759 | |
| * | | Verisk Analytics, Inc. | | | 338,032 | | | | 27,438 | |
| | Wabtec Corp. | | | 199,091 | | | | 16,529 | |
| | | | | | | | | | |
| | Total | | | | | | | 144,935 | |
| | | | | | | | | | |
| | |
| | Information Technology (26.1%) | | | | | |
| * | | Akamai Technologies, Inc. | | | 394,526 | | | | 26,307 | |
| * | | Arista Networks, Inc. | | | 77,211 | | | | 7,472 | |
| | Booz Allen Hamilton Holding Corp. | | | 501,898 | | | | 18,103 | |
| | | | | | | | | | |
| | | Common Stocks (99.2%) | | Shares/
$ Par | | | Value
$ (000’s) | |
| |
| | Information Technology continued | |
| * | | Check Point Software Technologies, Ltd. | | | 218,669 | | | | 18,469 | |
| * | | CoStar Group, Inc. | | | 153,769 | | | | 28,984 | |
| | CSRA, Inc. | | | 792,342 | | | | 25,228 | |
| * | | Genpact, Ltd. | | | 729,841 | | | | 17,764 | |
| * | | Guidewire Software, Inc. | | | 313,887 | | | | 15,484 | |
| * | | IPG Photonics Corp. | | | 88,854 | | | | 8,771 | |
| | MAXIMUS, Inc. | | | 308,556 | | | | 17,214 | |
| * | | Red Hat, Inc. | | | 465,803 | | | | 32,467 | |
| * | | Vantiv, Inc. - Class A | | | 517,363 | | | | 30,845 | |
| * | | Veeva Systems, Inc. - Class A | | | 236,001 | | | | 9,605 | |
| | | | | | | | | | |
| | Total | | | | | | | 256,713 | |
| | | | | | | | | | |
| |
| | Materials (5.8%) | |
| * | | Axalta Coating Systems, Ltd. | | | 434,613 | | | | 11,821 | |
| | Ball Corp. | | | 344,793 | | | | 25,884 | |
| | Vulcan Materials Co. | | | 151,253 | | | | 18,929 | |
| | | | | | | | | | |
| | Total | | | | | | | 56,634 | |
| | | | | | | | | | |
| |
| | Telecommunication Services (1.8%) | |
| * | | SBA Communications Corp. - Class A | | | 173,299 | | | | 17,895 | |
| | | | | | | | | | |
| | Total | | | | | | | 17,895 | |
| | | | | | | | | | |
| | |
| | Total Common Stocks | | | | | |
| | (Cost: $917,498) | | | | | | | 975,582 | |
| | | | | | | | | | |
| | |
| | Total Investments (99.2%) | | | | | |
| | (Cost: $917,498)(a) | | | | | | | 975,582 | |
| | | | | | | | | | |
| | Other Assets, Less | | | | | | | | |
| | Liabilities (0.8%) | | | | | | | 7,813 | |
| | | | | | | | | | |
| | Net Assets (100.0%) | | | | | | | 983,395 | |
| | | | | | | | | | |
| (a) | At December 31, 2016, the aggregate cost of securities for federal tax purposes (in thousands) was $918,716 and the net unrealized appreciation of investments based on that cost was $56,866 which is comprised of $96,584 aggregate gross unrealized appreciation and $39,718 aggregate gross unrealized depreciation. |
The Accompanying Notes are an Integral Part of the Financial Statements.
| | | | | | |
| | Mid Cap Growth Stock Portfolio | | | 37 | |
Mid Cap Growth Stock Portfolio
The following is a summary of the inputs used in valuing the Portfolio’s assets and liabilities at December 31, 2016. See Note 3 for additional information on portfolio valuation.
| | | | | | | | | | | | | | |
| | | Valuation Inputs | | | |
| Description | | Level 1 – Quoted Prices | | | Level 2 – Other Significant
Observable Inputs | | | Level 3 – Significant Unobservable Inputs | | | |
| | | (Amounts in thousands) | | | |
Assets: | | | | | | | | | | | | | | |
Domestic Common Stocks | | $ | 975,582 | | | $ | - | | | $ | - | | | |
Total Assets: | | $ | 975,582 | | | $ | - | | | $ | - | | | |
The Accompanying Notes are an Integral Part of the Financial Statements.
| | | | |
| 38 | | Mid Cap Growth Stock Portfolio | | |
Index 400 Stock Portfolio (unaudited)
| | | | |
| Objective: | | Portfolio Strategy: | | Net Assets: |
| Investment results that approximate the performance of the S&P MidCap 400® Index. | | Invest in stocks that make up the S&P MidCap 400® Index, holding each stock in approximately the same proportion as its weighting in the Index. | | $773 Million |
Portfolio Overview
Mason Street Advisors is the investment adviser for the Index 400 Stock Portfolio (the “Portfolio”). The Portfolio seeks investment results that approximate the performance of the S&P MidCap 400® Index, which is composed of the stocks of companies whose capitalizations generally are smaller than those of companies that comprise the S&P 500® Index. The S&P MidCap 400® Index does not include the stocks of the very large companies that account for most of the weighting in the S&P 500® Index. The Portfolio attempts to achieve its objective by investing all, or substantially all, of its assets in the stocks that make up the S&P MidCap 400® Index, holding each stock in approximately the same proportion as its weighting in the Index. This is known as a full replication strategy. The Portfolio may also invest in S&P MidCap 400® Index stock futures and, to a lesser extent, purchase (long) total return equity swap agreements to help achieve full replication.
Market Overview
U.S. equities posted strong performance during the year. Investors generally embraced higher-risk equities with greater exposure to the economic cycle, particularly after the U.S. election. Earnings growth remained subdued until the second half of the year, reflecting the drag from the Energy sector. Meanwhile, corporations continued buying back their stocks and acquiring other companies at a relatively robust pace. Consumer spending remained relatively steady, as job growth and rising stock prices helped improve consumer sentiment. Business spending remained muted, as many companies preferred to strengthen their balance sheets or buy back stock in lieu of large-scale investment in physical assets. The broader fixed income market posted a modest positive return, while higher-yielding corporate bonds logged large gains.
Altogether, the U.S. economy grew at a relatively slow pace of approximately 2.0% during the year, but growth was relatively stable, extending the U.S. economy’s streak to ten consecutive quarters of positive economic growth. The Fed was expected to raise interest rates for most of the year, but inflation well below the Fed’s 2.0% target and global uncertainty meant the Fed waited until December of 2016 to raise rates by a quarter of a point, marking only the second time the Fed has raised interest rates in the last eight years.
In that environment, small- and medium-sized stocks, as represented by the S&P SmallCap 600® and S&P MidCap 400® Indices, returned 26.56% and 20.74%, respectively, while the large-capitalization S&P 500® Index lagged despite its 11.96% return in 2016. Meanwhile, the Bloomberg Barclays U.S. Corporate High Yield Index posted a return of 17.13%, substantially outperforming the 2.65% return of the broader bond market, as represented by the Bloomberg Barclays® U.S. Aggregate Index.
Portfolio Results
The Index 400 Stock Portfolio delivered a total return of 20.38% for the twelve months ended December 31, 2016, trailing the S&P MidCap 400® Index (the “Index”), which returned 20.74%. (The Index is unmanaged, cannot be invested in directly, and does not include administrative expenses or sales charges.) Portfolio performance slightly lagged the Index due to transaction costs, administrative expenses, cash flow effects and costs associated with the use of stock index futures contracts. The Portfolio significantly outperformed the 16.86% average return for its peer group, Mid Cap Core Funds, according to Lipper® Analytical Services, Inc. However, the Mid Cap Core Funds peer group is not strictly comparable to the Portfolio because many of the funds in the group are actively managed.
All eleven of the Index’s sectors delivered positive returns for the year. The Industrials and Financials sectors were the top contributors to the Index’s total return for the year. The Industrials sector performed well, led by mid-cap machinery stocks, as industrial production improved with economic growth during the second half of the year. The Financials sector was led by the banking industry, as financial stocks performed in line with the broader stock market for most of the year, then rose sharply following the unexpected Trump win in the U.S. presidential election. Many market observers were expecting deregulation and other finance-friendly policy shifts from the incoming Trump administration. The Information Technology sector’s solid results were attributable to the IT services, electronic equipment and semiconductor industries, which benefited from several fundamental themes, including growth in cloud computing, demand for servers and data centers and innovation in smart technology. The Materials sector benefited from the rebound in commodities prices, which drove abnormally strong returns in the metals and mining industry. The Consumer Discretionary sector also posted solid results, as steady job growth and rising confidence led to relatively strong consumer spending.
At the other end of the spectrum, the Healthcare sector posted a positive return, but lagged other sectors in the Index, as biotechnology and pharmaceutical stocks fell after posting strong performance for several years. Drug pricing came under
| | | | | | |
| | Index 400 Stock Portfolio | | | 39 | |
Index 400 Stock Portfolio (unaudited)
political scrutiny throughout the year, and uncertainty about the Healthcare sector’s competitive landscape grew following Donald Trump’s win, as the President elect and the Republican-controlled Congress voiced opposition to key components of the Affordable Care Act.
Relative Performance
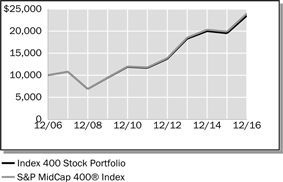
| | | | | | | | | | | | |
Average Annual Total Returns
For Periods Ended December 31, 2016 | |
| | | 1 Year | | | 5 Years | | | 10 Years | |
Index 400 Stock Portfolio | | | 20.38 | % | | | 15.03 | % | | | 8.92 | % |
S&P MidCap 400® Index | | | 20.74 | % | | | 15.33 | % | | | 9.16 | % |
Lipper® Variable Insurance Products (VIP) Mid Cap Core Funds Average | | | 16.86 | % | | | 13.97 | % | | | 7.43 | % |
The performance data quoted represents past performance. Past performance is historical and does not guarantee future performance. Investment return and principal value will fluctuate, so that shares, when redeemed, may be worth more or less than their original cost. Current performance may be lower or higher than the performance data quoted. For the most recent month-end performance information visit www.northwesternmutual.com.
This chart assumes an initial investment of $10,000 made on 12/31/06. Returns shown reflect fee waivers, deductions for management and other portfolio expenses, and reinvestment of all dividends. In the absence of fee waivers, total return would be reduced. Returns exclude deductions for separate account sale loads and account fees. Please refer to the Benchmark Definitions section of this report for information about the indices cited in the above chart and graph.
Investing in small and medium-sized companies involves a greater degree of risk than investing in large company stocks.
“Standard & Poor’s®”, “S&P®”, “S&P MidCap 400 Index” and “Standard & Poor’s MidCap 400 Index” are trademarks of The McGraw-Hill Companies, Inc. and have been licensed for use by Northwestern Mutual Life Insurance Company. The Portfolio is not sponsored, endorsed, sold or promoted by Standard & Poor’s, and Standard & Poor’s makes no representation regarding the advisability of investing in the Portfolio.
The Portfolio may invest in derivative instruments such as futures and, to a lesser extent, swap agreements to help achieve full replication. Use of these instruments may involve certain costs and imposes certain risks such as liquidity risk, market risk, credit risk, management risk and the risk of mispricing or improper valuation. Certain derivatives involve leverage, which could magnify losses, and portfolios investing in derivatives could lose more than the principal amount invested in those instruments.
Top 10 Equity Holdings 12/31/16
| | | | |
Security Description | | | % of Net Assets | |
IDEXX Laboratories, Inc. | | | 0.6 | % |
The WhiteWave Foods Co. | | | 0.6 | % |
Duke Realty Corp. | | | 0.6 | % |
Alleghany Corp. | | | 0.6 | % |
Ingredion, Inc. | | | 0.5 | % |
SVB Financial Group | | | 0.5 | % |
CDK Global, Inc. | | | 0.5 | % |
Synopsys, Inc. | | | 0.5 | % |
Everest Re Group, Ltd. | | | 0.5 | % |
Alexandria Real Estate Equities, Inc. | | | 0.5 | % |
Sector Allocation 12/31/16

Sector Allocation is based on Net Assets.
Sector Allocation and Top 10 Holdings are subject to change.
| | | | |
| 40 | | Index 400 Stock Portfolio | | |
Index 400 Stock Portfolio
Schedule of Investments
December 31, 2016
| | | | | | | | | | |
| | | Common Stocks (98.0%) | | Shares/
$ Par | | | Value
$ (000’s) | |
| | |
| | Consumer Discretionary (11.0%) | | | | | |
| | Aaron’s, Inc. | | | 29,666 | | | | 949 | |
| * | | AMC Networks, Inc. - Class A | | | 27,509 | | | | 1,440 | |
| | American Eagle Outfitters, Inc. | | | 79,793 | | | | 1,210 | |
| | Big Lots, Inc. | | | 20,777 | | | | 1,043 | |
| | Brinker International, Inc. | | | 23,175 | | | | 1,148 | |
| | Brunswick Corp. | | | 41,860 | | | | 2,283 | |
| * | | Buffalo Wild Wings, Inc. | | | 8,495 | | | | 1,312 | |
| * | | Cabela’s, Inc. | | | 23,971 | | | | 1,404 | |
| | Cable One, Inc. | | | 2,186 | | | | 1,359 | |
| | CalAtlantic Group, Inc. | | | 34,119 | | | | 1,160 | |
| | Carter’s, Inc. | | | 23,042 | | | | 1,991 | |
| | The Cheesecake Factory, Inc. | | | 20,587 | | | | 1,233 | |
| | Chico’s FAS, Inc. | | | 60,303 | | | | 868 | |
| | Churchill Downs, Inc. | | | 5,813 | | | | 875 | |
| | Cinemark Holdings, Inc. | | | 49,352 | | | | 1,893 | |
| | Cracker Barrel Old Country Store, Inc. | | | 11,219 | | | | 1,873 | |
| | CST Brands, Inc. | | | 35,327 | | | | 1,701 | |
| | Dana, Inc. | | | 67,125 | | | | 1,274 | |
| * | | Deckers Outdoor Corp. | | | 14,975 | | | | 829 | |
| | DeVry Education Group, Inc. | | | 26,597 | | | | 830 | |
| | Dick’s Sporting Goods, Inc. | | | 41,043 | | | | 2,179 | |
| | Domino’s Pizza, Inc. | | | 22,440 | | | | 3,573 | |
| | Dunkin’ Brands Group, Inc. | | | 42,812 | | | | 2,245 | |
| * | | Fossil Group, Inc. | | | 19,544 | | | | 505 | |
| | GameStop Corp. - Class A | | | 47,547 | | | | 1,201 | |
| | Gentex Corp. | | | 133,720 | | | | 2,633 | |
| | Graham Holdings Co. | | | 2,170 | | | | 1,111 | |
| * | | Helen of Troy, Ltd. | | | 13,010 | | | | 1,099 | |
| | HSN, Inc. | | | 14,858 | | | | 510 | |
| | International Speedway Corp. - Class A | | | 12,073 | | | | 444 | |
| * | | J.C. Penney Co., Inc. | | | 143,890 | | | | 1,196 | |
| | Jack in the Box, Inc. | | | 15,091 | | | | 1,685 | |
| | John Wiley & Sons, Inc. - Class A | | | 20,972 | | | | 1,143 | |
| * | | Kate Spade & Co. | | | 59,801 | | | | 1,116 | |
| | KB Home | | | 38,826 | | | | 614 | |
| * | | Live Nation Entertainment, Inc. | | | 61,717 | | | | 1,642 | |
| | Meredith Corp. | | | 17,048 | | | | 1,008 | |
| * | | Murphy USA, Inc. | | | 16,934 | | | | 1,041 | |
| | The New York Times Co. - Class A | | | 56,853 | | | | 756 | |
| * | | NVR, Inc. | | | 1,645 | | | | 2,746 | |
| | | | | | | | | | |
| | | Common Stocks (98.0%) | | Shares/
$ Par | | | Value
$ (000’s) | |
| |
| | Consumer Discretionary continued | |
| | Office Depot, Inc. | | | 246,607 | | | | 1,115 | |
| * | | Panera Bread Co. - Class A | | | 10,190 | | | | 2,090 | |
| | Papa John’s International, Inc. | | | 12,396 | | | | 1,061 | |
| | Polaris Industries, Inc. | | | 27,808 | | | | 2,291 | |
| | Pool Corp. | | | 19,294 | | | | 2,013 | |
| * | | Restoration Hardware Holdings, Inc. | | | 17,861 | | | | 548 | |
| * | | Sally Beauty Co., Inc. | | | 67,258 | | | | 1,777 | |
| | Service Corp. International | | | 88,905 | | | | 2,525 | |
| * | | Skechers U.S.A., Inc. - Class A | | | 62,228 | | | | 1,530 | |
| * | | Sotheby’s | | | 21,507 | | | | 857 | |
| * | | Tempur Sealy International, Inc. | | | 23,510 | | | | 1,605 | |
| | Texas Roadhouse, Inc. | | | 29,951 | | | | 1,445 | |
| | Thor Industries, Inc. | | | 22,334 | | | | 2,235 | |
| | Time, Inc. | | | 46,234 | | | | 825 | |
| * | | Toll Brothers, Inc. | | | 69,651 | | | | 2,159 | |
| * | | TRI Pointe Group, Inc. | | | 67,982 | | | | 780 | |
| | Tupperware Brands Corp. | | | 23,598 | | | | 1,242 | |
| * | | Vista Outdoor, Inc. | | | 27,447 | | | | 1,013 | |
| | The Wendy’s Co. | | | 93,569 | | | | 1,265 | |
| | Williams-Sonoma, Inc. | | | 38,012 | | | | 1,839 | |
| | | | | | | | | | |
| | Total | | | | | | | 85,337 | |
| | | | | | | | | | |
| |
| | Consumer Staples (4.2%) | |
| * | | Avon Products, Inc. | | | 204,198 | | | | 1,029 | |
| * | | The Boston Beer Co., Inc. - Class A | | | 4,218 | | | | 717 | |
| | Casey’s General Stores, Inc. | | | 18,286 | | | | 2,174 | |
| | Dean Foods Co. | | | 42,236 | | | | 920 | |
| * | | Edgewell Personal Care Co. | | | 27,029 | | | | 1,973 | |
| | Energizer Holdings, Inc. | | | 28,814 | | | | 1,285 | |
| | Flowers Foods, Inc. | | | 85,278 | | | | 1,703 | |
| * | | The Hain Celestial Group, Inc. | | | 48,281 | | | | 1,884 | |
| | Ingredion, Inc. | | | 33,791 | | | | 4,223 | |
| * | | Lamb Weston Holdings, Inc. | | | 64,734 | | | | 2,450 | |
| | Lancaster Colony Corp. | | | 9,088 | | | | 1,285 | |
| * | | Post Holdings, Inc. | | | 30,280 | | | | 2,434 | |
| | Snyder’s-Lance, Inc. | | | 39,943 | | | | 1,532 | |
| * | | Sprouts Farmers Market, Inc. | | | 62,442 | | | | 1,181 | |
| | Tootsie Roll Industries, Inc. | | | 8,110 | | | | 322 | |
| * | | TreeHouse Foods, Inc. | | | 26,477 | | | | 1,911 | |
| | | | | | | | | | |
| | | Common Stocks (98.0%) | | Shares/
$ Par | | | Value
$ (000’s) | |
| |
| | Consumer Staples continued | |
| * | | United Natural Foods, Inc. | | | 23,571 | | | | 1,125 | |
| * | | The WhiteWave Foods Co. | | | 82,716 | | | | 4,599 | |
| | | | | | | | | | |
| | Total | | | | | | | 32,747 | |
| | | | | | | | | | |
| |
| | Energy (3.9%) | |
| | CONSOL Energy, Inc. | | | 82,455 | | | | 1,503 | |
| * | | Denbury Resources, Inc. | | | 185,944 | | | | 684 | |
| * | | Diamond Offshore Drilling, Inc. | | | 30,089 | | | | 533 | |
| * | | Dril-Quip, Inc. | | | 17,540 | | | | 1,053 | |
| * | | Energen Corp. | | | 45,306 | | | | 2,613 | |
| * | | Ensco PLC | | | 2,019 | | | | 20 | |
| | Ensco PLC - Class A | | | 139,454 | | | | 1,356 | |
| * | | Gulfport Energy Corp. | | | 72,079 | | | | 1,560 | |
| | HollyFrontier Corp. | | | 82,052 | | | | 2,688 | |
| | Nabors Industries, Ltd. | | | 132,281 | | | | 2,169 | |
| | Noble Corp. PLC | | | 113,522 | | | | 672 | |
| | Oceaneering International, Inc. | | | 45,769 | | | | 1,291 | |
| * | | Oil States International, Inc. | | | 23,978 | | | | 935 | |
| | Patterson-UTI Energy, Inc. | | | 69,126 | | | | 1,861 | |
| * | | QEP Resources, Inc. | | | 111,807 | | | | 2,058 | |
| * | | Rowan Cos., PLC - Class A | | | 58,545 | | | | 1,106 | |
| | SM Energy Co. | | | 44,977 | | | | 1,551 | |
| | Superior Energy Services, Inc. | | | 70,820 | | | | 1,196 | |
| | Western Refining, Inc. | | | 36,943 | | | | 1,398 | |
| | World Fuel Services Corp. | | | 32,886 | | | | 1,510 | |
| * | | WPX Energy, Inc. | | | 160,767 | | | | 2,342 | |
| | | | | | | | | | |
| | Total | | | | | | | 30,099 | |
| | | | | | | | | | |
| |
| | Financials (16.8%) | |
| * | | Alleghany Corp. | | | 7,196 | | | | 4,376 | |
| | American Financial Group, Inc. | | | 34,048 | | | | 3,000 | |
| | Aspen Insurance Holdings, Ltd. | | | 28,104 | | | | 1,546 | |
| | Associated Banc-Corp. | | | 69,108 | | | | 1,707 | |
| | BancorpSouth, Inc. | | | 39,775 | | | | 1,235 | |
| | Bank of Hawaii Corp. | | | 19,926 | | | | 1,767 | |
| | Bank of the Ozarks, Inc. | | | 42,407 | | | | 2,230 | |
| | Brown & Brown, Inc. | | | 53,659 | | | | 2,407 | |
| | Cathay General Bancorp | | | 34,610 | | | | 1,316 | |
| | CBOE Holdings, Inc. | | | 37,937 | | | | 2,803 | |
| | Chemical Financial Corp. | | | 32,926 | | | | 1,784 | |
| | | | | | |
| | Index 400 Stock Portfolio | | | 41 | |
Index 400 Stock Portfolio
| | | | | | | | | | |
| | | Common Stocks (98.0%) | | Shares/
$ Par | | | Value
$ (000’s) | |
| | |
| | Financials continued | | | | | |
| | CNO Financial Group, Inc. | | | 80,999 | | | | 1,551 | |
| | Commerce Bancshares, Inc. | | | 40,709 | | | | 2,353 | |
| | Cullen/Frost Bankers, Inc. | | | 26,152 | | | | 2,307 | |
| | East West Bancorp, Inc. | | | 67,282 | | | | 3,420 | |
| | Eaton Vance Corp. | | | 52,938 | | | | 2,217 | |
| | Endurance Specialty Holdings, Ltd. | | | 29,974 | | | | 2,770 | |
| | Everest Re Group, Ltd. | | | 19,077 | | | | 4,128 | |
| | F.N.B. Corp. | | | 97,395 | | | | 1,561 | |
| | FactSet Research Systems, Inc. | | | 18,638 | | | | 3,046 | |
| | Federated Investors, Inc. - Class B | | | 43,410 | | | | 1,228 | |
| | First American Financial Corp. | | | 51,256 | | | | 1,878 | |
| | First Horizon National Corp. | | | 108,855 | | | | 2,178 | |
| | Fulton Financial Corp. | | | 80,869 | | | | 1,520 | |
| * | | Genworth Financial, Inc. - Class A | | | 232,599 | | | | 886 | |
| | Hancock Holding Co. | | | 38,765 | | | | 1,671 | |
| | Hanover Insurance Group, Inc. | | | 19,856 | | | | 1,807 | |
| | International Bancshares Corp. | | | 27,092 | | | | 1,105 | |
| | Janus Capital Group, Inc. | | | 66,479 | | | | 882 | |
| | Kemper Corp. | | | 22,695 | | | | 1,005 | |
| | Legg Mason, Inc. | | | 41,956 | | | | 1,255 | |
| | MarketAxess Holdings, Inc. | | | 17,539 | | | | 2,577 | |
| | MB Financial, Inc. | | | 33,156 | | | | 1,566 | |
| | Mercury General Corp. | | | 17,025 | | | | 1,025 | |
| | MSCI, Inc. | | | 43,930 | | | | 3,461 | |
| | New York Community Bancorp, Inc. | | | 227,319 | | | | 3,617 | |
| | Old Republic International Corp. | | | 113,981 | | | | 2,166 | |
| | PacWest Bancorp | | | 56,137 | | | | 3,056 | |
| | Primerica, Inc. | | | 21,376 | | | | 1,478 | |
| | PrivateBancorp, Inc. | | | 37,188 | | | | 2,015 | |
| | Prosperity Bancshares, Inc. | | | 32,430 | | | | 2,328 | |
| | Raymond James Financial, Inc. | | | 58,972 | | | | 4,085 | |
| | Reinsurance Group of America, Inc. | | | 29,968 | | | | 3,771 | |
| | RenaissanceRe Holdings, Ltd. | | | 19,208 | | | | 2,617 | |
| | SEI Investments Co. | | | 62,727 | | | | 3,096 | |
| * | | Signature Bank / New York NY | | | 25,055 | | | | 3,763 | |
| * | | SLM Corp. | | | 199,881 | | | | 2,203 | |
| | | | | | | | | | |
| | | Common Stocks (98.0%) | | Shares/
$ Par | | | Value
$ (000’s) | |
| | |
| | Financials continued | | | | | |
| * | | Stifel Financial Corp. | | | 30,922 | | | | 1,545 | |
| * | | SVB Financial Group | | | 24,311 | | | | 4,173 | |
| | Synovus Financial Corp. | | | 57,079 | | | | 2,345 | |
| | TCF Financial Corp. | | | 79,809 | | | | 1,564 | |
| | Trustmark Corp. | | | 31,563 | | | | 1,125 | |
| | UMB Financial Corp. | | | 20,356 | | | | 1,570 | |
| | Umpqua Holdings Corp. | | | 102,776 | | | | 1,930 | |
| | Valley National Bancorp | | | 118,794 | | | | 1,383 | |
| | Waddell & Reed Financial, Inc. - Class A | | | 38,649 | | | | 754 | |
| | Washington Federal, Inc. | | | 41,576 | | | | 1,428 | |
| | Webster Financial Corp. | | | 42,810 | | | | 2,324 | |
| | WisdomTree Investments, Inc. | | | 53,472 | | | | 596 | |
| | WR Berkley Corp. | | | 45,317 | | | | 3,014 | |
| | | | | | | | | | |
| | Total | | | | | | | 129,514 | |
| | | | | | | | | | |
| |
| | Health Care (7.4%) | |
| * | | ABIOMED, Inc. | | | 18,829 | | | | 2,122 | |
| * | | Akorn, Inc. | | | 40,917 | | | | 893 | |
| * | | Align Technology, Inc. | | | 34,961 | | | | 3,361 | |
| * | | Allscripts Healthcare Solutions, Inc. | | | 86,385 | | | | 882 | |
| * | | Bio-Rad Laboratories, Inc. - Class A | | | 9,688 | | | | 1,766 | |
| | Bio-Techne Corp. | | | 17,413 | | | | 1,791 | |
| * | | Catalent, Inc. | | | 58,222 | | | | 1,570 | |
| * | | Charles River Laboratories International, Inc. | | | 22,089 | | | | 1,683 | |
| * | | Globus Medical, Inc. - Class A | | | 33,570 | | | | 833 | |
| * | | Halyard Health, Inc. | | | 21,784 | | | | 806 | |
| | HealthSouth Corp. | | | 41,910 | | | | 1,728 | |
| | Hill-Rom Holdings, Inc. | | | 27,910 | | | | 1,567 | |
| (b)* | | IDEXX Laboratories, Inc. | | | 41,845 | | | | 4,907 | |
| * | | LifePoint Health, Inc. | | | 18,742 | | | | 1,064 | |
| * | | LivaNova PLC | | | 20,420 | | | | 918 | |
| * | | MEDNAX, Inc. | | | 43,230 | | | | 2,882 | |
| * | | Molina Healthcare, Inc. | | | 19,890 | | | | 1,079 | |
| * | | NuVasive, Inc. | | | 23,498 | | | | 1,583 | |
| | Owens & Minor, Inc. | | | 28,707 | | | | 1,013 | |
| * | | PAREXEL International Corp. | | | 24,861 | | | | 1,634 | |
| * | | Prestige Brands Holdings, Inc. | | | 24,705 | | | | 1,287 | |
| | ResMed, Inc. | | | 65,792 | | | | 4,082 | |
| | STERIS PLC | | | 39,764 | | | | 2,680 | |
| | Teleflex, Inc. | | | 20,560 | | | | 3,313 | |
| * | | Tenet Heathcare Corp. | | | 37,202 | | | | 552 | |
| * | | United Therapeutics Corp. | | | 19,796 | | | | 2,839 | |
| * | | VCA, Inc. | | | 37,869 | | | | 2,600 | |
| | | | | | | | | | |
| | | Common Stocks (98.0%) | | Shares/
$ Par | | | Value
$ (000’s) | |
| | |
| | Health Care continued | | | | | |
| * | | WellCare Health Plans, Inc. | | | 20,671 | | | | 2,834 | |
| | West Pharmaceutical Services, Inc. | | | 34,156 | | | | 2,897 | |
| | | | | | | | | | |
| | Total | | | | | | | 57,166 | |
| | | | | | | | | | |
| |
| | Industrials (14.6%) | |
| | A.O. Smith Corp. | | | 68,935 | | | | 3,264 | |
| * | | AECOM | | | 71,851 | | | | 2,613 | |
| | AGCO Corp. | | | 31,468 | | | | 1,821 | |
| * | | Avis Budget Group, Inc. | | | 41,020 | | | | 1,505 | |
| | B/E Aerospace, Inc. | | | 47,420 | | | | 2,854 | |
| | Carlisle Cos., Inc. | | | 30,103 | | | | 3,320 | |
| | CEB, Inc. | | | 15,041 | | | | 912 | |
| | CLARCOR, Inc. | | | 22,690 | | | | 1,871 | |
| * | | Clean Harbors, Inc. | | | 24,376 | | | | 1,357 | |
| * | | Copart, Inc. | | | 47,597 | | | | 2,637 | |
| | Crane Co. | | | 23,270 | | | | 1,678 | |
| | Curtiss-Wright Corp. | | | 20,643 | | | | 2,030 | |
| | Deluxe Corp. | | | 22,681 | | | | 1,624 | |
| | Donaldson Co., Inc. | | | 61,634 | | | | 2,594 | |
| * | | Dycom Industries, Inc. | | | 14,686 | | | | 1,179 | |
| | EMCOR Group, Inc. | | | 28,305 | | | | 2,003 | |
| | EnerSys | | | 20,270 | | | | 1,583 | |
| * | | Esterline Technologies Corp. | | | 13,803 | | | | 1,231 | |
| * | | FTI Consulting, Inc. | | | 19,778 | | | | 892 | |
| | GATX Corp. | | | 18,622 | | | | 1,147 | |
| * | | Genesee & Wyoming, Inc. - Class A | | | 28,611 | | | | 1,986 | |
| | Graco, Inc. | | | 25,989 | | | | 2,159 | |
| | Granite Construction, Inc. | | | 18,484 | | | | 1,017 | |
| | Herman Miller, Inc. | | | 27,993 | | | | 957 | |
| | HNI Corp. | | | 20,786 | | | | 1,162 | |
| | Hubbell, Inc. | | | 24,028 | | | | 2,804 | |
| | Huntington Ingalls Industries, Inc. | | | 21,640 | | | | 3,986 | |
| | IDEX Corp. | | | 35,584 | | | | 3,205 | |
| | ITT, Inc. | | | 41,165 | | | | 1,588 | |
| * | | JetBlue Airways Corp. | | | 151,092 | | | | 3,387 | |
| | Joy Global, Inc. | | | 45,815 | | | | 1,283 | |
| | KBR, Inc. | | | 66,586 | | | | 1,111 | |
| | Kennametal, Inc. | | | 37,307 | | | | 1,166 | |
| * | | Kirby Corp. | | | 25,135 | | | | 1,671 | |
| * | | KLX, Inc. | | | 24,590 | | | | 1,109 | |
| | Landstar System, Inc. | | | 19,500 | | | | 1,663 | |
| | Lennox International, Inc. | | | 18,082 | | | | 2,770 | |
| | Lincoln Electric Holdings, Inc. | | | 28,968 | | | | 2,221 | |
| | ManpowerGroup, Inc. | | | 31,298 | | | | 2,781 | |
| | MSA Safety, Inc. | | | 14,562 | | | | 1,010 | |
| | MSC Industrial Direct Co., Inc. - Class A | | | 20,839 | | | | 1,925 | |
| | Nordson Corp. | | | 24,824 | | | | 2,782 | |
The Accompanying Notes are an Integral Part of the Financial Statements.
| | | | |
| 42 | | Index 400 Stock Portfolio | | |
Index 400 Stock Portfolio
| | | | | | | | | | |
| | | Common Stocks (98.0%) | | Shares/
$ Par | | | Value
$ (000’s) | |
| | |
| | Industrials continued | | | | | |
| * | | NOW, Inc. | | | 50,160 | | | | 1,027 | |
| * | | Old Dominion Freight Line, Inc. | | | 32,320 | | | | 2,773 | |
| | Orbital ATK, Inc. | | | 27,330 | | | | 2,398 | |
| | Oshkosh Corp. | | | 34,754 | | | | 2,245 | |
| | Regal Beloit Corp. | | | 20,891 | | | | 1,447 | |
| | Rollins, Inc. | | | 44,733 | | | | 1,511 | |
| * | | Teledyne Technologies, Inc. | | | 16,308 | | | | 2,006 | |
| | Terex Corp. | | | 49,426 | | | | 1,558 | |
| | The Timken Co. | | | 32,686 | | | | 1,298 | |
| | The Toro Co. | | | 51,019 | | | | 2,855 | |
| | Trinity Industries, Inc. | | | 71,061 | | | | 1,973 | |
| | Triumph Group, Inc. | | | 23,126 | | | | 613 | |
| | Valmont Industries, Inc. | | | 10,506 | | | | 1,480 | |
| | Wabtec Corp. | | | 41,572 | | | | 3,451 | |
| | Watsco, Inc. | | | 12,040 | | | | 1,783 | |
| | Werner Enterprises, Inc. | | | 20,852 | | | | 562 | |
| | Woodward, Inc. | | | 25,885 | | | | 1,787 | |
| | | | | | | | | | |
| | Total | | | | | | | 112,625 | |
| | | | | | | | | | |
| |
| | Information Technology (17.3%) | |
| * | | 3D Systems Corp. | | | 49,819 | | | | 662 | |
| * | | ACI Worldwide, Inc. | | | 54,741 | | | | 994 | |
| * | | Acxiom Corp. | | | 36,156 | | | | 969 | |
| * | | Advanced Micro Devices, Inc. | | | 354,722 | | | | 4,023 | |
| * | | ANSYS, Inc. | | | 40,385 | | | | 3,735 | |
| * | | ARRIS International PLC | | | 88,992 | | | | 2,681 | |
| * | | Arrow Electronics, Inc. | | | 41,812 | | | | 2,981 | |
| | Avnet, Inc. | | | 59,568 | | | | 2,836 | |
| | Belden, Inc. | | | 19,669 | | | | 1,471 | |
| | Broadridge Financial Solutions, Inc. | | | 55,576 | | | | 3,685 | |
| | Brocade Communications Systems, Inc. | | | 187,771 | | | | 2,345 | |
| * | | Cadence Design Systems, Inc. | | | 133,816 | | | | 3,375 | |
| | CDK Global, Inc. | | | 69,775 | | | | 4,165 | |
| * | | Ciena Corp. | | | 65,033 | | | | 1,587 | |
| * | | Cirrus Logic, Inc. | | | 29,735 | | | | 1,681 | |
| | Cognex Corp. | | | 39,982 | | | | 2,544 | |
| * | | CommVault Systems, Inc. | | | 19,659 | | | | 1,010 | |
| | Computer Sciences Corp. | | | 65,721 | | | | 3,905 | |
| * | | comScore, Inc. | | | 21,081 | | | | 666 | |
| | Convergys Corp. | | | 44,511 | | | | 1,093 | |
| * | | CoreLogic, Inc. | | | 40,309 | | | | 1,485 | |
| * | | Cree, Inc. | | | 46,534 | | | | 1,228 | |
| | Cypress Semiconductor Corp. | | | 149,902 | | | | 1,715 | |
| | Diebold, Inc. | | | 35,069 | | | | 882 | |
| | DST Systems, Inc. | | | 14,929 | | | | 1,600 | |
| | Fair Isaac Corp. | | | 14,441 | | | | 1,722 | |
| | | | | | | | | | |
| | | Common Stocks (98.0%) | | Shares/
$ Par | | | Value
$ (000’s) | |
| |
| | Information Technology continued | |
| * | | Fortinet, Inc. | | | 68,647 | | | | 2,068 | |
| * | | Gartner, Inc. | | | 38,556 | | | | 3,897 | |
| * | | Integrated Device Technology, Inc. | | | 62,559 | | | | 1,474 | |
| | InterDigital, Inc. | | | 16,001 | | | | 1,462 | |
| | Intersil Corp. - Class A | | | 63,885 | | | | 1,425 | |
| * | | IPG Photonics Corp. | | | 17,350 | | | | 1,713 | |
| | j2 Global, Inc. | | | 22,408 | | | | 1,833 | |
| | Jabil Circuit, Inc. | | | 86,614 | | | | 2,050 | |
| | Jack Henry & Associates, Inc. | | | 36,452 | | | | 3,236 | |
| * | | Keysight Technologies, Inc. | | | 79,313 | | | | 2,900 | |
| * | | Knowles Corp. | | | 41,410 | | | | 692 | |
| | Leidos Holdings, Inc. | | | 66,669 | | | | 3,409 | |
| | Littelfuse, Inc. | | | 10,516 | | | | 1,596 | |
| * | | Manhattan Associates, Inc. | | | 33,225 | | | | 1,762 | |
| | MAXIMUS, Inc. | | | 30,233 | | | | 1,687 | |
| | Mentor Graphics Corp. | | | 51,116 | | | | 1,886 | |
| * | | Microsemi Corp. | | | 53,509 | | | | 2,888 | |
| | Monolithic Power Systems, Inc. | | | 17,465 | | | | 1,431 | |
| | National Instruments Corp. | | | 49,339 | | | | 1,521 | |
| * | | NCR Corp. | | | 57,920 | | | | 2,349 | |
| * | | NetScout Systems, Inc. | | | 42,739 | | | | 1,346 | |
| * | | NeuStar, Inc. - Class A | | | 25,470 | | | | 851 | |
| | Plantronics, Inc. | | | 15,537 | | | | 851 | |
| * | | PTC, Inc. | | | 53,955 | | | | 2,496 | |
| | Science Applications International Corp. | | | 20,921 | | | | 1,774 | |
| * | | Silicon Laboratories, Inc. | | | 19,485 | | | | 1,266 | |
| * | | Synaptics, Inc. | | | 16,288 | | | | 873 | |
| | SYNNEX Corp. | | | 13,553 | | | | 1,640 | |
| * | | Synopsys, Inc. | | | 70,633 | | | | 4,157 | |
| * | | Tech Data Corp. | | | 16,438 | | | | 1,392 | |
| | Teradyne, Inc. | | | 93,914 | | | | 2,385 | |
| * | | Trimble, Inc. | | | 116,952 | | | | 3,526 | |
| * | | Tyler Technologies, Inc. | | | 15,556 | | | | 2,221 | |
| * | | The Ultimate Software Group, Inc. | | | 13,535 | | | | 2,468 | |
| * | | VeriFone Systems, Inc. | | | 51,792 | | | | 918 | |
| * | | Versum Materials, Inc. | | | 50,721 | | | | 1,424 | |
| * | | ViaSat, Inc. | | | 24,040 | | | | 1,592 | |
| | Vishay Intertechnology, Inc. | | | 62,470 | | | | 1,012 | |
| * | | WebMD Health Corp. | | | 17,257 | | | | 855 | |
| * | | WEX, Inc. | | | 17,951 | | | | 2,003 | |
| * | | Zebra Technologies Corp. - Class A | | | 24,638 | | | | 2,113 | |
| | | | | | | | | | |
| | Total | | | | | | | 133,482 | |
| | | | | | | | | | |
| | | | | | | | | | |
| | | Common Stocks (98.0%) | | Shares/
$ Par | | | Value
$ (000’s) | |
| | |
| | Materials (7.2%) | | | | | |
| | Allegheny Technologies, Inc. | | | 50,839 | | | | 810 | |
| | AptarGroup, Inc. | | | 29,259 | | | | 2,149 | |
| | Ashland Global Holdings, Inc. | | | 29,018 | | | | 3,171 | |
| | Bemis Co., Inc. | | | 43,737 | | | | 2,092 | |
| | Cabot Corp. | | | 29,092 | | | | 1,470 | |
| | Carpenter Technology Corp. | | | 21,757 | | | | 787 | |
| | Commercial Metals Co. | | | 53,927 | | | | 1,175 | |
| | Compass Minerals International, Inc. | | | 15,769 | | | | 1,235 | |
| | Domtar Corp. | | | 29,210 | | | | 1,140 | |
| | Eagle Materials, Inc. | | | 22,505 | | | | 2,217 | |
| | Grief, Inc. - Class A | | | 12,033 | | | | 617 | |
| * | | Louisiana-Pacific Corp. | | | 66,379 | | | | 1,257 | |
| | Minerals Technologies, Inc. | | | 16,305 | | | | 1,260 | |
| | NewMarket Corp. | | | 4,314 | | | | 1,828 | |
| | Olin Corp. | | | 77,136 | | | | 1,975 | |
| * | | Owens-Illinois, Inc. | | | 75,701 | | | | 1,318 | |
| | Packaging Corp. of America | | | 43,585 | | | | 3,697 | |
| | PolyOne Corp. | | | 39,102 | | | | 1,253 | |
| | Reliance Steel & Aluminum Co. | | | 33,867 | | | | 2,694 | |
| | Royal Gold, Inc. | | | 30,484 | | | | 1,931 | |
| | RPM International, Inc. | | | 62,250 | | | | 3,351 | |
| | The Scotts Miracle-Gro Co. - Class A | | | 20,752 | | | | 1,983 | |
| | Sensient Technologies Corp. | | | 20,789 | | | | 1,634 | |
| | Silgan Holdings, Inc. | | | 17,465 | | | | 894 | |
| | Sonoco Products Co. | | | 46,602 | | | | 2,456 | |
| | Steel Dynamics, Inc. | | | 113,795 | | | | 4,049 | |
| | United States Steel Corp. | | | 80,490 | | | | 2,657 | |
| | The Valspar Corp. | | | 34,073 | | | | 3,530 | |
| | Worthington Industries, Inc. | | | 20,448 | | | | 970 | |
| | | | | | | | | | |
| | Total | | | | | | | 55,600 | |
| | | | | | | | | | |
| |
| | Real Estate (10.2%) | |
| | Alexander & Baldwin, Inc. | | | 21,506 | | | | 965 | |
| | Alexandria Real Estate Equities, Inc. | | | 37,064 | | | | 4,119 | |
| | American Campus Communities, Inc. | | | 61,654 | | | | 3,069 | |
| | Camden Property Trust | | | 40,829 | | | | 3,432 | |
| | Care Capital Properties, Inc. | | | 39,186 | | | | 980 | |
| | Communications Sales & Leasing, Inc. | | | 65,439 | | | | 1,663 | |
| | CoreCivic, Inc. | | | 54,864 | | | | 1,342 | |
The Accompanying Notes are an Integral Part of the Financial Statements.
| | | | | | |
| | Index 400 Stock Portfolio | | | 43 | |
Index 400 Stock Portfolio
| | | | | | | | | | |
| | | Common Stocks (98.0%) | | Shares/
$ Par | | | Value
$ (000’s) | |
| | |
| | Real Estate continued | | | | | |
| | Corporate Office Properties Trust | | | 44,227 | | | | 1,381 | |
| | Cousins Properties, Inc. | | | 159,732 | | | | 1,359 | |
| | DCT Industrial Trust, Inc. | | | 42,484 | | | | 2,034 | |
| | Douglas Emmett, Inc. | | | 67,184 | | | | 2,456 | |
| | Duke Realty Corp. | | | 165,542 | | | | 4,397 | |
| | Education Realty Trust, Inc. | | | 34,092 | | | | 1,442 | |
| | EPR Properties | | | 29,697 | | | | 2,131 | |
| | Equity One, Inc. | | | 43,353 | | | | 1,330 | |
| | First Industrial Realty Trust, Inc. | | | 54,568 | | | | 1,531 | |
| | Healthcare Realty Trust, Inc. | | | 54,083 | | | | 1,640 | |
| | Highwoods Properties, Inc. | | | 46,772 | | | | 2,386 | |
| | Hospitality Properties Trust | | | 76,668 | | | | 2,433 | |
| | Jones Lang LaSalle, Inc. | | | 21,099 | | | | 2,132 | |
| | Kilroy Realty Corp. | | | 43,036 | | | | 3,151 | |
| | Lamar Advertising Co. - Class A | | | 38,603 | | | | 2,596 | |
| | LaSalle Hotel Properties | | | 52,780 | | | | 1,608 | |
| | Liberty Property Trust | | | 68,605 | | | | 2,710 | |
| | Life Storage, Inc. | | | 21,656 | | | | 1,846 | |
| | Mack-Cali Realty Corp. | | | 41,859 | | | | 1,215 | |
| | Medical Properties Trust, Inc. | | | 149,466 | | | | 1,838 | |
| | National Retail Properties, Inc. | | | 68,666 | | | | 3,035 | |
| | Omega Healthcare Investors, Inc. | | | 91,077 | | | | 2,847 | |
| | Potlatch Corp. | | | 18,911 | | | | 788 | |
| * | | Quality Care Properties, Inc. | | | 43,682 | | | | 677 | |
| | Rayonier, Inc. | | | 57,186 | | | | 1,521 | |
| | Regency Centers Corp. | | | 48,769 | | | | 3,363 | |
| | Senior Housing Properties Trust | | | 110,867 | | | | 2,099 | |
| | Tanger Factory Outlet Centers, Inc. | | | 44,837 | | | | 1,604 | |
| | | | | | | | |
| | | Common Stocks (98.0%) | | Shares/
$ Par | | Value
$ (000’s) | |
| |
| | Real Estate continued | |
| | Taubman Centers, Inc. | | 28,204 | | | 2,085 | |
| | Urban Edge Properties | | 42,828 | | | 1,178 | |
| | Washington Prime Group, Inc. | | 86,543 | | | 901 | |
| | Weingarten Realty Investors | | 54,989 | | | 1,968 | |
| | | | | | | | |
| | Total | | | | | 79,252 | |
| | | | | | | | |
| |
| | Telecommunication Services (0.2%) | |
| | Telephone and Data Systems, Inc. | | 43,627 | | | 1,259 | |
| | | | | | | | |
| | Total | | | | | 1,259 | |
| | | | | | | | |
| |
| | Utilities (5.2%) | |
| | Aqua America, Inc. | | 82,776 | | | 2,487 | |
| | Atmos Energy Corp. | | 48,523 | | | 3,598 | |
| | Black Hills Corp. | | 24,805 | | | 1,521 | |
| | Great Plains Energy, Inc. | | 100,482 | | | 2,748 | |
| | Hawaiian Electric Industries, Inc. | | 50,650 | | | 1,675 | |
| | IDACORP, Inc. | | 23,524 | | | 1,895 | |
| | MDU Resources Group, Inc. | | 91,152 | | | 2,622 | |
| | National Fuel Gas Co. | | 39,747 | | | 2,251 | |
| | New Jersey Resources Corp. | | 40,186 | | | 1,427 | |
| | NorthWestern Corp. | | 22,556 | | | 1,283 | |
| | OGE Energy Corp. | | 93,205 | | | 3,118 | |
| | ONE Gas, Inc. | | 24,384 | | | 1,560 | |
| | PNM Resources, Inc. | | 37,176 | | | 1,275 | |
| | Southwest Gas Corp. | | 22,161 | | | 1,698 | |
| | UGI Corp. | | 80,735 | | | 3,720 | |
| | Vectren Corp. | | 38,676 | | | 2,017 | |
| | Westar Energy, Inc. | | 66,174 | | | 3,729 | |
| | WGL Holdings, Inc. | | 23,890 | | | 1,822 | |
| | | | | | | | |
| | Total | | | | | 40,446 | |
| | | | | | | | |
| | | |
| | Total Common Stocks | | | | | | |
| | (Cost: $551,235) | | | | | 757,527 | |
| | | | | | | | |
| | | | | | | | |
| | | Short-Term Investments (1.4%) | | Shares/
$ Par | | Value
$ (000’s) | |
| | |
| | Commercial Paper (1.0%) | | | | |
| (b,r) | | Apple, Inc., 0.600%, 2/2/17144A | | 1,500,000 | | | 1,499 | |
| (b,r) | | Microsoft Corp., 0.600%, 1/10/17144A | | 1,500,000 | | | 1,500 | |
| (b,r) | | Pfizer, Inc., 0.680%, 2/13/17144A | | 1,000,000 | | | 999 | |
| (b,r) | | Pfizer, Inc., 0.700%, 2/21/17144A | | 500,000 | | | 500 | |
| (b,r) | | Roche Holdings, Inc., 0.480%, 1/31/17144A | | 1,500,000 | | | 1,499 | |
| (b,r) | | Societe Generale, 0.940%, 2/27/17144A | | 1,000,000 | | | 999 | |
| (b,r) | | The Walt Disney Co., 0.580%, 1/30/17144A | | 1,000,000 | | | 999 | |
| | | | | | | | |
| | Total | | | | | 7,995 | |
| | | | | | | | |
| |
| | US Government & Agencies (0.4%) | |
| (b,r) | | Federal Home Loan Bank, 0.440%, 2/24/17 | | 1,200,000 | | | 1,199 | |
| (b,r) | | Federal Home Loan Bank, 0.470%, 2/9/17 | | 1,500,000 | | | 1,499 | |
| | | | | | | | |
| | Total | | | | | 2,698 | |
| | | | | | | | |
| | | |
| | Total Short-Term Investments | | | | | | |
| | (Cost: $10,693) | | | | | 10,693 | |
| | | | | | | | |
| | | |
| | Total Investments (99.4%) | | | | | | |
| | (Cost: $561,928)(a) | | | | | 768,220 | |
| | | | | | | | |
| | Other Assets, Less | | | | | | |
| | Liabilities (0.6%) | | | | | 4,937 | |
| | | | | | | | |
| | Net Assets (100.0%) | | | | | 773,157 | |
| | | | | | | | |
| | 144A after the name of a security represents a security exempt from registration under Rule 144A of the Securities Act of 1933. These securities may be resold as transactions exempt from registration, normally to qualified institutional buyers. At December 31, 2016 the value of these securities (in thousands) was $7,995 representing 1.0% of the net assets. |
| (a) | At December 31, 2016, the aggregate cost of securities for federal tax purposes (in thousands) was $562,316 and the net unrealized appreciation of investments based on that cost was $205,904 which is comprised of $236,929 aggregate gross unrealized appreciation and $31,025 aggregate gross unrealized depreciation. |
| | | | |
| 44 | | Index 400 Stock Portfolio | | |
Index 400 Stock Portfolio
| (b) | All or a portion of the securities have been pledged as collateral for open futures positions. Information regarding open futures contracts as of period end is summarized below. |
| | | | | | |
| Issuer (000’s) | | Number of
Contracts | | Expiration Date | | Unrealized
Appreciation/
(Depreciation)
(000’s) |
S&P 400 Mini Index Futures (Long) (Total Notional Value at December 31, 2016, $15,234) | | 90 | | 3/17 | | $(302) |
| (r) | Rates are discount rates at the time of purchase. |
The following is a summary of the inputs used in valuing the Portfolio’s assets and liabilities at December 31, 2016. See Note 3 for additional information on portfolio valuation.
| | | | | | | | | | | | | | |
| | | Valuation Inputs | | | |
| Description | | Level 1 –
Quoted Prices | | | Level 2 –
Other Significant
Observable Inputs | | | Level 3 –
Significant
Unobservable Inputs | | | |
| | | (Amounts in thousands) | | | |
Assets: | | | | | | | | | | | | | | |
Domestic Common Stocks | | $ | 757,527 | | | $ | - | | | $ | - | | | |
Short-Term Investments | | | - | | | | 10,693 | | | | - | | | |
Total Assets: | | $ | 757,527 | | | $ | 10,693 | | | $ | - | | | |
Liabilities: | | | | | | | | | | | | | | |
Other Financial Instruments^ | | | | | | | | | | | | | | |
Futures | | | (302 | ) | | | - | | | | - | | | |
Total Liabilities: | | $ | (302 | ) | | $ | - | | | $ | - | | | |
^ Other financial instruments are derivative instruments such as futures, forwards, written options and swaps contracts, which are valued at the unrealized appreciation (depreciation) on the instrument and short sales, which are valued at market value.
The Accompanying Notes are an Integral Part of the Financial Statements.
| | | | | | |
| | Index 400 Stock Portfolio | | | 45 | |
Mid Cap Value Portfolio (unaudited)
| | | | |
| Objective: | | Portfolio Strategy: | | Net Assets: |
| Long-term capital growth. Current income is a secondary objective. | | Invest primarily in equity securities of mid-sized companies that are determined to be undervalued. | | $518 million |
Portfolio Overview
Mason Street Advisors, LLC (“Mason Street Advisors”), the investment adviser for the Mid Cap Value Portfolio (the “Portfolio”), has engaged American Century Investment Management, Inc. (“American Century”) to act as sub-adviser for the Portfolio. The Portfolio invests primarily in a diversified portfolio of equity securities of mid-sized companies that are determined to be undervalued at the time of purchase. In selecting securities, the Portfolio attempts to identify companies whose long-term earnings, cash flows and/or assets are not reflected in the current market price of their securities and hold each security until it has returned to favor in the market and the price has increased to, or is higher than a level believed to more accurately reflect the fair value of the company.
Market Overview
After a tumultuous first quarter of the year, U.S. stocks delivered solid returns in 2016. This was attributable to positive U.S. economic news, healthy corporate earnings performance, and a pickup in mergers and acquisitions activity. Despite this backdrop, factors such as international economic weakness, shifting commodity prices, global political concerns, particularly in the wake of the U.K. vote to leave the European Union, or “Brexit,” and uncertainty over the timing of the Fed’s next interest rate hike contributed to periods of volatility. Ultimately, however, the central bank’s more gradual-than-expected approach to monetary tightening aided market performance over the period. In the fourth quarter, the market staged a strong rally after Trump’s election raised expectations for corporate tax cuts and regulation rollbacks. The energy market also stabilized later in the year, after the OPEC nations announced plans to reduce oil production in late November. This news helped boost oil prices and energy stocks. The Fed finally raised its target rate by 25 basis points in mid-December, and policymakers hinted at additional rate hikes in 2017. As a result, the yield curve steepened in the fourth quarter, which was a boon for banks.
Portfolio Results
The Portfolio returned 23.23% for the twelve months ended December 31, 2016. By comparison, its benchmark, the Russell Midcap® Value Index (the “Index”), returned 20.00%. (The Index is unmanaged, cannot be invested in directly and does not include administrative expenses or sales charges.) According to Lipper® Analytical Services, Inc., an independent mutual fund ranking agency, the average return of the Mid Cap Value Funds peer group for 2016 was 19.06%.
The Portfolio’s relative outperformance was driven primarily by security selection, with a smaller benefit from sector allocation decisions. Stock selection was especially positive in the Financials and Industrials sectors, while overweights in both sectors also added to relative returns.
In the Information Technology sector, Applied Materials, Inc. advanced on strong orders for its equipment used to manufacture semiconductors and was a top contributing stock for the year. In the Consumer Staples sector, Sysco Corp., a marketer and distributor of food products, rose after reporting strong earnings due to improved operations.
On a negative note, an underweight in the Materials sector detracted from relative performance, as the sector outperformed on rising commodity prices and increased expectations for infrastructure spending following the election. Stock selection in the Energy sector also hindered relative performance, due to the Portfolio’s focus on higher-quality names that underperformed lower-quality benchmark names as oil stocks rallied late in the year.
While the Portfolio’s overall holdings in the Health Care and Financials sectors aided relative returns, several individual investments in these areas were detractors. A key detractor in the Health Care sector was LifePoint Health, Inc., a hospital company with facilities in rural and non-urban communities. In the Financials sector, shares of capital markets company LPL Financial Holdings dropped in early 2016.
Portfolio Manager Outlook
The following forward looking comments are the opinion of American Century, the Portfolio’s sub-adviser.
As of December 31, 2016, the Portfolio’s largest overweights were in the Financials, Health Care, and Consumer Staples sectors. In the Financials sector, the Portfolio is overweight banks, which benefited in the fourth quarter from higher interest rates, a steeper yield curve, the potential for lower corporate tax rates, optimism for economic growth and better credit, and the prospect of an easing regulatory burden. The Portfolio also has select overweight positions in the capital markets industry. The
| | | | |
| 46 | | Mid Cap Value Portfolio | | |
Mid Cap Value Portfolio (unaudited)
team added to its Health Care sector weighting after political rhetoric, including around the potential repeal of the Affordable Care Act, pressured health care stocks.
The Portfolio’s largest underweights were in the Real Estate, Materials, and Utilities sectors. In the Real Estate sector, the team continues to believe that REITs are generally overvalued, and maintained an underweight in the sector. In the Materials sector, the Portfolio holds a few names in the containers and packaging industry and has very limited exposure to metals and mining, since many stocks in that industry don’t meet the team’s quality criteria. In the Utilities sector, the team believes valuations are overextended after utilities previously outperformed due to heavy interest from yield-seeking investors.
Relative Performance
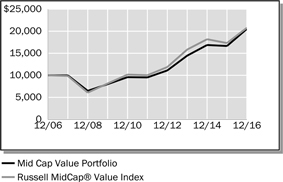
| | | | | | | | | | | | |
Average Annual Total Returns
For Periods Ended December 31, 2016 | |
| | | 1 Year | | | 5 Years | | | 10 Years | |
Mid Cap Value Portfolio | | | 23.23% | | | | 16.59% | | | | 7.45% | |
Russell MidCap® Value Index | | | 20.00% | | | | 15.70% | | | | 7.59% | |
Lipper® Variable Insurance Products (VIP) Mid Cap Value Funds Average | | | 19.06% | | | | 14.49% | | | | 6.39% | |
The performance data quoted represents past performance. Past performance is historical and does not guarantee future performance. Investment return and principal value will fluctuate, so that shares, when redeemed, may be worth more or less than their original cost. Current performance may be lower or higher than the performance data quoted. For the most recent month-end performance information visit www.northwesternmutual.com.
This chart assumes an initial investment of $10,000 made on 12/31/06. Returns shown reflect fee waivers, deductions for management and other portfolio expenses, and reinvestment of all dividends. In the absence of fee waivers, total return would be reduced. Returns exclude deductions for separate account sale loads and account fees. Please refer to the Benchmark Definitions section of this report for information about the indices cited in the above chart and graph.
Investing in small and medium-sized companies involves a greater degree of risk than investing in large company stocks. The value of securities acquired in an IPO may rise or fall more rapidly than investments in more established issuers.
The Portfolio may invest in derivative instruments for cash management purposes or to hedge foreign currency exposure. Use of these instruments may involve certain costs and imposes certain risks such as liquidity risk, market risk, credit risk, management risk and the risk of mispricing or improper valuation. Certain derivatives involve leverage, which could magnify losses, and portfolios investing in derivatives could lose more than the principal amount invested in those instruments.
Top 10 Equity Holdings 12/31/16
| | |
Security Description | | % of Net Assets |
Northern Trust Corp. | | 3.1% |
iShares Russell Midcap Value Index Fund | | 2.7% |
Johnson Controls International PLC | | 2.7% |
Zimmer Biomet Holdings, Inc. | | 1.8% |
Imperial Oil, Ltd. | | 1.8% |
Applied Materials, Inc. | | 1.6% |
EQT Corp. | | 1.6% |
Baker Hughes, Inc. | | 1.6% |
Noble Energy, Inc. | | 1.5% |
LifePoint Health, Inc. | | 1.5% |
Sector Allocation 12/31/16
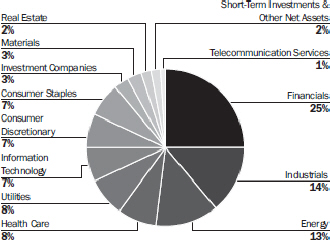
Sector Allocation is based on Net Assets.
Sector Allocation and Top 10 Holdings are subject to change.
| | | | | | |
| | Mid Cap Value Portfolio | | | 47 | |
Mid Cap Value Portfolio
Schedule of Investments
December 31, 2016
| | | | | | | | | | |
| | | Common Stocks (92.4%) | | Shares/
$ Par | | | Value
$ (000’s) | |
| |
| | Consumer Discretionary (7.0%) | |
| | Advance Auto Parts, Inc. | | | 33,216 | | | | 5,617 | |
| | Carnival Corp. | | | 69,637 | | | | 3,625 | |
| | CST Brands, Inc. | | | 88,056 | | | | 4,240 | |
| | Delphi Automotive PLC | | | 77,070 | | | | 5,191 | |
| | Honda Motor Co., Ltd., ADR | | | 152,973 | | | | 4,465 | |
| | Mattel, Inc. | | | 69,276 | | | | 1,909 | |
| | PulteGroup, Inc. | | | 202,511 | | | | 3,722 | |
| | Ralph Lauren Corp. | | | 28,477 | | | | 2,572 | |
| | Target Corp. | | | 68,671 | | | | 4,960 | |
| | | | | | | | | | |
| | Total | | | | | | | 36,301 | |
| | | | | | | | | | |
| |
| | Consumer Staples (6.6%) | |
| | Conagra Brands, Inc. | | | 181,660 | | | | 7,185 | |
| | General Mills, Inc. | | | 64,420 | | | | 3,979 | |
| | The J.M. Smucker Co. | | | 26,736 | | | | 3,424 | |
| | Kellogg Co. | | | 58,279 | | | | 4,296 | |
| * | | Lamb Weston Holdings, Inc. | | | 49,997 | | | | 1,892 | |
| | Mead Johnson Nutrition Co. | | | 38,036 | | | | 2,691 | |
| | Mondelez International, Inc. | | | 145,456 | | | | 6,448 | |
| | Sysco Corp. | | | 79,408 | | | | 4,397 | |
| | | | | | | | | | |
| | Total | | | | | | | 34,312 | |
| | | | | | | | | | |
| |
| | Energy (11.2%) | |
| | Anadarko Petroleum Corp. | | | 97,786 | | | | 6,819 | |
| | Baker Hughes, Inc. | | | 125,221 | | | | 8,136 | |
| | Cimarex Energy Co. | | | 14,791 | | | | 2,010 | |
| | Devon Energy Corp. | | | 109,506 | | | | 5,001 | |
| | EQT Corp. | | | 127,782 | | | | 8,357 | |
| * | | FMC Technologies, Inc. | | | 34,572 | | | | 1,228 | |
| | Frank’s International NV | | | 182,234 | | | | 2,243 | |
| | Halliburton Co. | | | 75,595 | | | | 4,089 | |
| | National Oilwell Varco, Inc. | | | 121,651 | | | | 4,555 | |
| | Noble Energy, Inc. | | | 210,304 | | | | 8,004 | |
| | Occidental Petroleum Corp. | | | 86,437 | | | | 6,157 | |
| | Spectra Energy Partners LP | | | 27,513 | | | | 1,261 | |
| | | | | | | | | | |
| | Total | | | | | | | 57,860 | |
| | | | | | | | | | |
| |
| | Financials (25.2%) | |
| | Aflac, Inc. | | | 35,271 | | | | 2,455 | |
| | The Allstate Corp. | | | 28,118 | | | | 2,084 | |
| | Ameriprise Financial, Inc. | | | 41,699 | | | | 4,626 | |
| | Bank of Hawaii Corp. | | | 41,240 | | | | 3,658 | |
| | BB&T Corp. | | | 145,885 | | | | 6,860 | |
| | Brown & Brown, Inc. | | | 99,770 | | | | 4,476 | |
| | Capitol Federal Financial, Inc. | | | 333,860 | | | | 5,495 | |
| | Chubb, Ltd. | | | 56,364 | | | | 7,447 | |
| | Comerica, Inc. | | | 60,563 | | | | 4,125 | |
| | Commerce Bancshares, Inc. | | | 99,178 | | | | 5,733 | |
| | Empire State Realty Trust, Inc. | | | 101,575 | | | | 2,051 | |
| | Invesco, Ltd. | | | 183,697 | | | | 5,573 | |
| | M&T Bank Corp. | | | 36,956 | | | | 5,781 | |
| | MetLife, Inc. | | | 71,468 | | | | 3,851 | |
| | | | | | | | | | |
| | | Common Stocks (92.4%) | | Shares/
$ Par | | | Value
$ (000’s) | |
| |
| | Financials continued | |
| | MGM Growth Properties LLC - Class A | | | 109,488 | | | | 2,771 | |
| | Northern Trust Corp. | | | 182,940 | | | | 16,291 | |
| | Piedmont Office Realty Trust, Inc. - Class A | | | 205,034 | | | | 4,287 | |
| | PNC Financial Services Group, Inc. | | | 59,200 | | | | 6,924 | |
| | ProAssurance Corp. | | | 50,879 | | | | 2,859 | |
| | Reinsurance Group of America, Inc. | | | 47,082 | | | | 5,924 | |
| | State Street Corp. | | | 54,963 | | | | 4,272 | |
| | SunTrust Banks, Inc. | | | 71,259 | | | | 3,909 | |
| | T. Rowe Price Group, Inc. | | | 49,641 | | | | 3,736 | |
| | Torchmark Corp. | | | 24,906 | | | | 1,837 | |
| | UMB Financial Corp. | | | 41,997 | | | | 3,239 | |
| | Unum Group | | | 121,083 | | | | 5,319 | |
| | Westamerica Bancorporation | | | 81,051 | | | | 5,101 | |
| | | | | | | | | | |
| | Total | | | | | | | 130,684 | |
| | | | | | | | | | |
| |
| | Health Care (8.2%) | |
| | Abbott Laboratories | | | 81,606 | | | | 3,134 | |
| | Baxter International, Inc. | | | 76,904 | | | | 3,410 | |
| | Cardinal Health, Inc. | | | 52,697 | | | | 3,793 | |
| * | | Express Scripts Holding Co. | | | 38,660 | | | | 2,659 | |
| * | | HCA Holdings, Inc. | | | 21,222 | | | | 1,571 | |
| * | | LifePoint Health, Inc. | | | 140,070 | | | | 7,956 | |
| | McKesson Corp. | | | 20,205 | | | | 2,838 | |
| | Quest Diagnostics, Inc. | | | 47,896 | | | | 4,402 | |
| | STERIS PLC | | | 51,790 | | | | 3,490 | |
| | Zimmer Biomet Holdings, Inc. | | | 91,183 | | | | 9,410 | |
| | | | | | | | | | |
| | Total | | | | | | | 42,663 | |
| | | | | | | | | | |
| |
| | Industrials (12.9%) | |
| * | | Clean Harbors, Inc. | | | 23,537 | | | | 1,310 | |
| | CSX Corp. | | | 131,670 | | | | 4,731 | |
| | Cummins, Inc. | | | 31,973 | | | | 4,370 | |
| | Emerson Electric Co. | | | 67,807 | | | | 3,780 | |
| | Heartland Express, Inc. | | | 271,845 | | | | 5,535 | |
| | Hubbell, Inc. | | | 54,214 | | | | 6,327 | |
| | Ingersoll-Rand PLC | | | 85,270 | | | | 6,399 | |
| | ITT, Inc. | | | 31,179 | | | | 1,202 | |
| | Johnson Controls International PLC | | | 340,806 | | | | 14,038 | |
| | Oshkosh Corp. | | | 15,059 | | | | 973 | |
| | Parker Hannifin Corp. | | | 20,560 | | | | 2,878 | |
| | Republic Services, Inc. | | | 114,455 | | | | 6,530 | |
| | Rockwell Automation, Inc. | | | 20,187 | | | | 2,713 | |
| | Textron, Inc. | | | 126,509 | | | | 6,143 | |
| | | | | | | | | | |
| | Total | | | | | | | 66,929 | |
| | | | | | | | | | |
| |
| | Information Technology (7.5%) | |
| | Applied Materials, Inc. | | | 261,091 | | | | 8,426 | |
| * | | Keysight Technologies, Inc. | | | 163,022 | | | | 5,962 | |
| | Lam Research Corp. | | | 48,915 | | | | 5,172 | |
| | Maxim Integrated Products, Inc. | | | 163,390 | | | | 6,302 | |
| | NetApp, Inc. | | | 78,034 | | | | 2,752 | |
| | TE Connectivity, Ltd. | | | 74,354 | | | | 5,151 | |
The Accompanying Notes are an Integral Part of the Financial Statements.
| | | | |
| 48 | | Mid Cap Value Portfolio | | |
Mid Cap Value Portfolio
| | | | | | | | | | | | |
| | | Common Stocks (92.4%) | | | | Shares/
$ Par | | | Value
$ (000’s) | |
| | | |
| | Information Technology continued | | | | | | | | |
| | Teradyne, Inc. | | | | | 207,883 | | | | 5,280 | |
| | | | | | | | | | | | |
| | Total | | | | | | | | | 39,045 | |
| | | | | | | | | | | | |
| | | | |
| | Materials (2.6%) | | | | | | | | | | |
| | Bemis Co., Inc. | | | | | 41,783 | | | | 1,998 | |
| | Nucor Corp. | | | | | 16,187 | | | | 964 | |
| | Sonoco Products Co. | | | | | 67,046 | | | | 3,533 | |
| | WestRock Co. | | | | | 135,285 | | | | 6,868 | |
| | | | | | | | | | | | |
| | Total | | | | | | | | | 13,363 | |
| | | | | | | | | | | | |
| | | | |
| | Real Estate (2.4%) | | | | | | | | | | |
| | Boston Properties, Inc. | | | | | 3,226 | | | | 406 | |
| | Host Hotels & Resorts, Inc. | | | | | 183,594 | | | | 3,459 | |
| | Welltower, Inc. | | | | | 6,729 | | | | 450 | |
| | Weyerhaeuser Co. | | | | | 264,140 | | | | 7,948 | |
| | | | | | | | | | | | |
| | Total | | | | | | | | | 12,263 | |
| | | | | | | | | | | | |
| | | |
| | Telecommunication Services (0.8%) | | | | | | | | |
| * | | Level 3 Communications, Inc. | | | | | 68,105 | | | | 3,838 | |
| | | | | | | | | | | | |
| | Total | | | | | | | | | 3,838 | |
| | | | | | | | | | | | |
| | | | |
| | Utilities (8.0%) | | | | | | | | | | |
| | Ameren Corp. | | | | | 72,944 | | | | 3,827 | |
| | Atmos Energy Corp. | | | | | 41,403 | | | | 3,070 | |
| | Consolidated Edison, Inc. | | | | | 44,073 | | | | 3,247 | |
| | Edison International | | | | | 109,391 | | | | 7,875 | |
| | Eversource Energy | | | | | 40,704 | | | | 2,248 | |
| | NorthWestern Corp. | | | | | 56,124 | | | | 3,192 | |
| | PG&E Corp. | | | | | 119,036 | | | | 7,234 | |
| | Spire, Inc. | | | | | 60,365 | | | | 3,897 | |
| | Xcel Energy, Inc. | | | | | 170,599 | | | | 6,943 | |
| | | | | | | | | | | | |
| | Total | | | | | | | | | 41,533 | |
| | | | | | | | | | | | |
| | | | |
| | Total Common Stocks | | | | | | | | | | |
| | (Cost: $410,276) | | | | | | | | | 478,791 | |
| | | | | | | | | | | | |
| | | | | | | | | | | | |
| | | Foreign Common Stocks (2.9%) | | Country | | Shares/
$ Par | | | Value
$ (000’s) | |
| | | | |
| | Energy (1.8%) | | | | | | | | | | |
| | Imperial Oil, Ltd. | | Canada | | | 262,013 | | | | 9,115 | |
| | | | | | | | | | | | |
| | Total | | | | | | | | | 9,115 | |
| | | | | | | | | | | | |
| |
| | Industrials (1.1%) | |
| | Royal Philips Electronics NV | | Netherlands | | | 191,847 | | | | 5,857 | |
| | | | | | | | | | | | |
| | Total | | | | | | | | | 5,857 | |
| | | | | | | | | | | | |
| | |
| | Total Foreign Common Stocks | | | | | |
| | (Cost: $13,802) | | | | 14,972 | |
| | | | | | | | | | | | |
| | | | |
| | | Investment Companies (2.7%) | | | | | | | | |
| | | |
| | Investment Companies (2.7%) | | | | | | | | |
| | iShares Russell Midcap Value Index Fund | | | 176,808 | | | | 14,221 | |
| | | |
| | Total Investment Companies | | | | | | | | |
| | (Cost: $13,292) | | | | | | | | | 14,221 | |
| | | | | | | | | | | | |
| | | | |
| | | Short-Term Investments (2.2%) | | | | | | | | |
| | | |
| | Commercial Paper (2.2%) | | | | | | | | |
| (r) | | Credit Agricole Cib,
0.520%, 1/3/17 | | | 11,507,000 | | | | 11,506 | |
| | | | | | | | | | | | |
| | | |
| | Total Short-Term Investments | | | | | | | | |
| | (Cost: $11,507) | | | | | | | | | 11,506 | |
| | | | | | | | | | | | |
| | | |
| | Total Investments (100.2%) | | | | | | | | |
| | (Cost: $448,877)(a) | | | | | | | | | 519,490 | |
| | | | | | | | | | | | |
| | Other Assets, Less | | | | | | | | | | |
| | Liabilities (-0.2%) | | | | | | | | | (1,273 | ) |
| | | | | | | | | | | | |
| | Net Assets (100.0%) | | | | | | | | | 518,217 | |
| | | | | | | | | | | | |
| | ADR after the name of a security represents—American Depositary Receipt. |
| (a) | At December 31, 2016, the aggregate cost of securities for federal tax purposes (in thousands) was $453,013 and the net unrealized appreciation of investments based on that cost was $66,477 which is comprised of $77,135 aggregate gross unrealized appreciation and $10,658 aggregate gross unrealized depreciation. |
| (h) | Forward foreign currency contracts outstanding on December 31, 2016. |
| | | | | | | | | | | | | | | | | | | | | | |
| Type | | Counterparty | | Currency | | Foreign
Principal
Amount
Covered by
Contract (000s) | | USD Principal
Amount
Covered by
Contract (000’s) | | Settlement
Month | | Unrealized
Appreciation
(000’s) | | | Unrealized
(Depreciation)
(000’s) | | | Net Unrealized
Appreciation/
(Depreciation)
(000’s) | |
Buy | | HSBC Bank USA NA | | CAD | | 361 | | 269 | | 3/17 | | $ | 3 | | | $ | - | | | $ | 3 | |
Sell | | HSBC Bank USA NA | | CAD | | 11,057 | | 8,244 | | 3/17 | | | 23 | | | | - | | | | 23 | |
Sell | | HSBC Bank USA NA | | EUR | | 4,694 | | 4,965 | | 3/17 | | | - | | | | (63 | ) | | | (63 | ) |
Sell | | HSBC Bank USA NA | | JPY | | 312,298 | | 2,685 | | 3/17 | | | - | | | | (39 | ) | | | (39 | ) |
| | | | | | | | | | | | | | | | | | | | | | |
| | | | | | | | | | | | $ | 26 | | | $ | (102 | ) | | $ | (76 | ) |
| | | | | | | | | | | | | | | | | | | | | | |
CAD — Canadian Dollar
EUR — Euro
JPY — Japanese Yen
The Accompanying Notes are an Integral Part of the Financial Statements.
| | | | | | |
| | Mid Cap Value Portfolio | | | 49 | |
Mid Cap Value Portfolio
| (r) | Rates are discount rates at the time of purchase. |
The following is a summary of the inputs used in valuing the Portfolio’s assets and liabilities at December 31, 2016. See Note 3 for additional information on portfolio valuation.
| | | | | | | | | | | | | | |
| | | Valuation Inputs | | | |
| Description | | Level 1 –
Quoted Prices | | | Level 2 –
Other Significant
Observable Inputs | | | Level 3 –
Significant
Unobservable Inputs | | | |
| | | (Amounts in thousands) | | | |
Assets: | | | | | | | | | | | | | | |
Domestic Common Stocks | | $ | 478,791 | | | $ | - | | | $ | - | | | |
Foreign Common Stocks | | | 14,972 | | | | - | | | | - | | | |
Investment Companies | | | 14,221 | | | | - | | | | - | | | |
Short-Term Investments | | | - | | | | 11,506 | | | | - | | | |
Other Financial Instruments^ | | | | | | | | | | | | | | |
Forward Currency Contracts | | | - | | | | 26 | | | | - | | | |
Total Assets: | | $ | 507,984 | | | $ | 11,532 | | | $ | - | | | |
Liabilities: | | | | | | | | | | | | | | |
Other Financial Instruments^ | | | | | | | | | | | | | | |
Forward Currency Contracts | | | - | | | | (102 | ) | | | - | | | |
Total Liabilities: | | $ | - | | | $ | (102 | ) | | $ | - | | | |
^ Other financial instruments are derivative instruments such as futures, forwards, written options and swaps contracts, which are valued at the unrealized appreciation (depreciation) on the instrument and short sales, which are valued at market value.
The Accompanying Notes are an Integral Part of the Financial Statements.
| | | | |
| 50 | | Mid Cap Value Portfolio | | |
Small Cap Growth Stock Portfolio (unaudited)
| | | | |
| Objective: | | Portfolio Strategy: | | Net Assets: |
| Long-term growth of capital. | | Invest primarily in common stocks of small capitalization companies. | | $545 million |
Portfolio Overview
Mason Street Advisors, LLC (“Mason Street Advisors”), the investment adviser for the Small Cap Growth Stock Portfolio (the “Portfolio”), has engaged Wellington Management Company LLP (“Wellington”) to act as sub-adviser for the Portfolio. Normally, the Portfolio invests in common stocks of small capitalization companies. The Portfolio’s investment process is derived from the observation that the quality and persistence of a company’s business is often not reflected in its current stock price. Central to the investment process is intense, fundamental research focused on uncovering companies with improving quality metrics, business momentum and attractive relative valuations.
Market Overview
U.S. equities rose over the period, as measured by the S&P 500® Index, notwithstanding significant volatility during the year. Early in the first quarter of 2016, stocks plunged and moved in virtual lockstep with the price of oil as fears of a recession and weakness in China weighed on investors’ minds. However, equities advanced thereafter, as solid economic data, stabilization in oil prices and accommodative commentary from the U.S. Federal Reserve Bank (the “Fed”) helped to calm the market’s early-year jitters. Stocks also rose following Donald Trump’s victory on hopes of increased fiscal stimulus, reduced regulatory restrictions and lower corporate taxes. Economic data released during the year was generally encouraging, as third-quarter GDP growth was revised slightly higher and the U.S. housing market continued to display healthy trends. In December, the Fed raised interest rates by a quarter point, only the second rate hike in the last decade.
Portfolio Results
The Portfolio returned 12.25% for the twelve months ended December 31, 2016. By comparison, the Portfolio’s benchmark, the Russell 2000® Growth Index (the “Index”) returned 11.32%. (The Index is unmanaged, cannot be invested in directly, and does not include administrative expenses or sales charges.) According to Lipper® Analytical Services, Inc., an independent mutual fund ranking agency, the average return in 2016 of the Small Cap Growth Funds peer group was 9.97%.
The Portfolio’s outperformance during the period was driven by strong stock selection, particularly in the Health Care and Financials sectors. This strong selection was partially offset by weak selection within the Information Technology sector.
Top contributors to relative performance during the period included Tesaro, Inc. (Health Care), Burlington Stores, Inc. (Consumer Discretionary), and RSP Permian, Inc. (Energy). Tesaro, Inc., an oncology-focused biopharmaceutical company, was the top relative contributor for the period. The stock surged after the company posted positive Phase 3 test results for their ovarian cancer drug. Burlington Stores, an off-price apparel retailer, outperformed as the company continued to post solid results. Shares of RSP Permian, Inc., an oil and gas exploration and production company, rallied in the second half of the period as crude oil prices rebounded sharply. The Portfolio continued to hold each of these positions at the end of the period.
Top detractors from relative returns during the period included Portola Pharmaceutical, Inc. (Health Care), G-III Apparel (Consumer Discretionary) and Natural Grocers (Consumer Staples). Portola Pharmaceuticals, Inc., a biopharmaceutical company, suffered after the company announced disappointing data for the Phase 3 study for their anti-coagulant Betrixaban. The Portfolio continued to hold Portola at the end of the period. G-III Apparel, a manufacturer and marketer of men’s and women’s apparel, was challenged as investors honed in on the firm’s capital allocation decisions. Management made, what the portfolio manager believed to be, an overpriced offer for Donna Karan (a division of LVMH). As such, the Portfolio’s position was eliminated. Another top detractor for the period was Natural Grocers, a specialty retailer of natural and organic groceries and dietary supplements. The stock underperformed after management reduced same store sales guidance for the second quarter of 2016. The Portfolio eliminated the position during the period.
Portfolio Manager Outlook
The following forward-looking comments are the opinion of Wellington, the Portfolio’s sub-adviser.
We believe the global reflation theme remains intact as we expect stronger global growth and higher inflation in 2017. Under a Trump administration, there is a reasonable likelihood of corporate and individual tax reform, both of which would be good for reinvestment and consumption. Trump’s policies are likely to be inflationary and induce a stronger U.S. dollar. We expect that tax cuts will be a centerpiece of the new administration. Corporate tax cuts, including the repatriation of foreign earnings at a lower tax rate, will mean a boost for corporate earnings. Several questions remain on implementation and cost. Another boost to the U.S. economy may come from deregulation in areas such as health care, financial services and energy drilling, which would increase business confidence, lower the cost of doing business and increase incentives to hire more workers.
| | | | | | |
| | Small Cap Growth Stock Portfolio | | | 51 | |
Small Cap Growth Stock Portfolio (unaudited)
However, a risk under a Trump presidency is that we end up with trade tensions, which would be a hindrance for the U.S. economy, as well as the global economy. There is also the risk of increased geopolitical uncertainty. The reaction of the rest of the world to Trump’s policies regarding trade and other relationships remains a wild card until we see his policies unfold.
Relative Performance
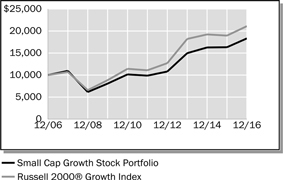
| | | | | | | | | | | | |
Average Annual Total Returns
For Periods Ended December 31, 2016 | |
| | | 1 Year | | | 5 Years | | | 10 Years | |
Small Cap Growth Stock Portfolio | | | 12.25 | % | | | 13.17 | % | | | 6.24 | % |
Russell 2000® Growth Index | | | 11.32 | % | | | 13.74 | % | | | 7.76 | % |
Lipper® Variable Insurance Products (VIP) Small Cap Growth Funds Average | | | 9.97 | % | | | 12.46 | % | | | 7.29 | % |
The performance data quoted represents past performance. Past performance is historical and does not guarantee future performance. Investment return and principal value will fluctuate, so that shares, when redeemed, may be worth more or less than their original cost. Current performance may be lower or higher than the performance data quoted. For the most recent month-end performance information visit www.northwesternmutual.com.
This chart assumes an initial investment of $10,000 made on 12/31/06. Returns shown reflect fee waivers, deductions for management and other portfolio expenses, and reinvestment of all dividends. In the absence of fee waivers, total return would be reduced. Returns exclude deductions for separate account sale loads and account fees. Please refer to the Benchmark Definitions section of this report for information about the indices cited in the above chart and graph.
Stocks of smaller or newer companies, such as those held in this Portfolio, are more likely to realize more substantial growth as well as suffer more significant losses than larger or more established issuers. Investments in such companies can be both more volatile and more speculative. Investing in small company stocks involves a greater degree of risk than investing in medium or large company stocks.
The Portfolio may invest in exchange traded funds as a cash management strategy. Investing in ETFs may expose the Portfolio to greater risk of loss and price fluctuation than investing directly in a comparable portfolio of stocks due to lack of liquidity, the additional expenses incurred as a stockholder in another investment company, and tracking error.
The Portfolio may invest a relatively high percentage of its assets in a particular sector. The Portfolio will have greater exposure to the risks associated with that sector and its performance will be tied more closely to the performance of that sector.
| | | | |
| 52 | | Small Cap Growth Stock Portfolio | | |
Small Cap Growth Stock Portfolio (unaudited)
Top 10 Equity Holdings 12/31/16
| | |
| Security Description | | % of Net Assets |
iShares Russell 2000 Growth Index Fund | | 4.4% |
Cardtronics PLC | | 1.4% |
j2 Global, Inc. | | 1.3% |
Tenneco, Inc. | | 1.3% |
First Merchants Corp. | | 1.2% |
MKS Instruments, Inc. | | 1.1% |
WellCare Health Plans, Inc. | | 1.1% |
Vascular Solutions, Inc. | | 1.1% |
Evercore Partners, Inc. | | 1.1% |
CoreSite Realty Corp. | | 1.1% |
Sector Allocation 12/31/16
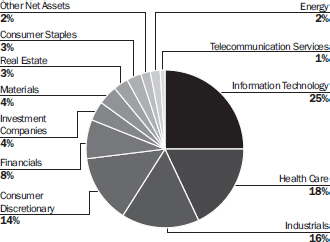
Sector Allocation is based on Net Assets.
Sector Allocation and Top 10 Holdings are subject to change.
| | | | | | |
| | Small Cap Growth Stock Portfolio | | | 53 | |
Small Cap Growth Stock Portfolio
Schedule of Investments
December 31, 2016
| | | | | | | | | | |
| | | Common Stocks (93.5%) | | Shares/ $ Par | | | Value
$ (000’s) | |
| |
| | Consumer Discretionary (14.4%) | |
| | Bloomin’ Brands, Inc. | | | 259,647 | | | | 4,681 | |
| * | | Burlington Stores, Inc. | | | 49,050 | | | | 4,157 | |
| | Carter’s, Inc. | | | 38,510 | | | | 3,327 | |
| | Core-Mark Holding Co., Inc. | | | 104,795 | | | | 4,514 | |
| | DSW, Inc. - Class A | | | 54,855 | | | | 1,242 | |
| | Dunkin’ Brands Group, Inc. | | | 86,572 | | | | 4,540 | |
| * | | Five Below, Inc. | | | 87,098 | | | | 3,480 | |
| | HSN, Inc. | | | 63,480 | | | | 2,177 | |
| * | | Kate Spade & Co. | | | 243,998 | | | | 4,555 | |
| * | | La Quinta Holdings, Inc. | | | 267,536 | | | | 3,802 | |
| | Marriott Vacations Worldwide Corp. | | | 65,078 | | | | 5,522 | |
| | Monro Muffler Brake, Inc. | | | 66,477 | | | | 3,803 | |
| | Papa John’s International, Inc. | | | 39,415 | | | | 3,373 | |
| * | | Steven Madden, Ltd. | | | 143,266 | | | | 5,122 | |
| * | | Tenneco, Inc. | | | 115,085 | | | | 7,189 | |
| * | | TopBuild Corp. | | | 122,040 | | | | 4,345 | |
| * | | Vista Outdoor, Inc. | | | 93,822 | | | | 3,462 | |
| | Visteon Corp. | | | 33,320 | | | | 2,677 | |
| * | | Wayfair, Inc. | | | 82,704 | | | | 2,899 | |
| | Wingstop, Inc. | | | 123,187 | | | | 3,645 | |
| | | | | | | | | | |
| | Total | | | | | | | 78,512 | |
| | | | | | | | | | |
| | |
| | Consumer Staples (3.0%) | | | | | |
| | Casey’s General Stores, Inc. | | | 36,967 | | | | 4,395 | |
| * | | Post Holdings, Inc. | | | 55,517 | | | | 4,463 | |
| | PriceSmart, Inc. | | | 52,063 | | | | 4,347 | |
| * | | TreeHouse Foods, Inc. | | | 42,322 | | | | 3,055 | |
| | | | | | | | | | |
| | Total | | | | | | | 16,260 | |
| | | | | | | | | | |
| | | | | | | | | | |
| | |
| | Energy (2.1%) | | | | | |
| | PBF Energy, Inc. | | | 90,770 | | | | 2,531 | |
| * | | PDC Energy, Inc. | | | 34,475 | | | | 2,502 | |
| * | | RSP Permian, Inc. | | | 86,817 | | | | 3,874 | |
| * | | WildHorse Resource Development Corp. | | | 159,100 | | | | 2,323 | |
| | | | | | | | | | |
| | Total | | | | | | | 11,230 | |
| | | | | | | | | | |
| | |
| | Financials (8.3%) | | | | | |
| | AMERISAFE, Inc. | | | 71,292 | | | | 4,445 | |
| | Enterprise Financial Services Corp. | | | 11,600 | | | | 499 | |
| | Evercore Partners, Inc. | | | 84,543 | | | | 5,808 | |
| * | | FCB Financial Holdings, Inc. - Class A | | | 57,967 | | | | 2,765 | |
| | First Hawaiian, Inc. | | | 96,600 | | | | 3,364 | |
| | First Merchants Corp. | | | 171,890 | | | | 6,472 | |
| | Great Western Bancorp, Inc. | | | 71,793 | | | | 3,129 | |
| | IBERIABANK Corp. | | | 47,608 | | | | 3,987 | |
| | | | | | | | | | |
| | | Common Stocks (93.5%) | | Shares/ $ Par | | | Value
$ (000’s) | |
| |
| | Financials continued | |
| | James River Group Holdings, Ltd. | | | 85,536 | | | | 3,554 | |
| * | | MGIC Investment Corp. | | | 317,390 | | | | 3,234 | |
| * | | OneMain Holdings, Inc. | | | 55,500 | | | | 1,229 | |
| | Sandy Spring Bancorp, Inc. | | | 67,970 | | | | 2,718 | |
| | Sterling Bancorp | | | 177,740 | | | | 4,159 | |
| | | | | | | | | | |
| | Total | | | | | | | 45,363 | |
| | | | | | | | | | |
| | |
| | Health Care (18.0%) | | | | | |
| * | | Acadia Healthcare Co., Inc. | | | 55,558 | | | | 1,839 | |
| * | | Aerie Pharmaceuticals, Inc. | | | 92,524 | | | | 3,502 | |
| * | | Agios Pharmaceuticals, Inc. | | | 27,997 | | | | 1,168 | |
| * | | Alder Biopharmaceuticals, Inc. | | | 110,860 | | | | 2,306 | |
| * | | Amicus Therapeutics, Inc. | | | 179,400 | | | | 892 | |
| * | | Anika Therapeutics, Inc. | | | 80,603 | | | | 3,946 | |
| * | | Aratana Therapeutics, Inc. | | | 193,000 | | | | 1,386 | |
| * | | ARIAD Pharmaceuticals, Inc. | | | 135,270 | | | | 1,683 | |
| | Atrion Corp. | | | 8,666 | | | | 4,395 | |
| * | | Bluebird Bio, Inc. | | | 38,621 | | | | 2,383 | |
| * | | Cardiovascular Systems, Inc. | | | 90,433 | | | | 2,189 | |
| * | | Coherus Biosciences, Inc. | | | 94,374 | | | | 2,657 | |
| * | | Cynosure, Inc. - Class A | | | 85,248 | | | | 3,887 | |
| * | | Five Prime Therapeutics, Inc. | | | 69,976 | | | | 3,506 | |
| * | | Flexion Therapeutics, Inc. | | | 103,150 | | | | 1,962 | |
| * | | Globus Medical, Inc. - Class A | | | 171,123 | | | | 4,246 | |
| * | | GlycoMimetics, Inc. | | | 101,985 | | | | 622 | |
| * | | ICU Medical, Inc. | | | 37,040 | | | | 5,458 | |
| * | | Integra LifeSciences Holdings Corp. | | | 41,982 | | | | 3,602 | |
| * | | Intersect ENT, Inc. | | | 114,952 | | | | 1,391 | |
| * | | Ionis Pharmaceuticals, Inc. | | | 66,428 | | | | 3,177 | |
| * | | Ironwood Pharmaceuticals, Inc. | | | 25,900 | | | | 396 | |
| * | | The Medicines Co. | | | 89,770 | | | | 3,047 | |
| * | | Natus Medical, Inc. | | | 103,456 | | | | 3,600 | |
| * | | Neurocrine Biosciences, Inc. | | | 59,737 | | | | 2,312 | |
| * | | Omnicell, Inc. | | | 101,755 | | | | 3,449 | |
| * | | Otonomy, Inc. | | | 125,474 | | | | 1,995 | |
| * | | Portola Pharmaceuticals, Inc. | | | 90,800 | | | | 2,038 | |
| * | | PTC Therapeutics, Inc. | | | 80,324 | | | | 876 | |
| * | | Tesaro, Inc. | | | 42,448 | | | | 5,708 | |
| * | | Trevena, Inc. | | | 15,304 | | | | 90 | |
| | U.S. Physical Therapy, Inc. | | | 52,189 | | | | 3,664 | |
| * | | Ultragenyx Pharmaceutical, Inc. | | | 42,819 | | | | 3,011 | |
| * | | Vascular Solutions, Inc. | | | 104,579 | | | | 5,867 | |
| * | | WellCare Health Plans, Inc. | | | 42,875 | | | | 5,877 | |
| | | | | | | | | | |
| | Total | | | | | | | 98,127 | |
| | | | | | | | | | |
| | | | | | | | | | |
| | | Common Stocks (93.5%) | | Shares/ $ Par | | | Value
$ (000’s) | |
| |
| | Industrials (15.4%) | |
| | AAON, Inc | | | 130,483 | | | | 4,312 | |
| | Altra Industrial Motion Corp. | | | 117,340 | | | | 4,330 | |
| * | | American Woodmark Corp. | | | 42,333 | | | | 3,186 | |
| * | | Armstrong World Industries, Inc. | | | 76,733 | | | | 3,207 | |
| * | | Astronics Corp. | | | 89,573 | | | | 3,031 | |
| | AZZ, Inc. | | | 69,113 | | | | 4,416 | |
| | Celadon Group, Inc. | | | 142,239 | | | | 1,017 | |
| | Deluxe Corp. | | | 62,590 | | | | 4,482 | |
| * | | Esterline Technologies Corp. | | | 40,558 | | | | 3,618 | |
| | Exponent, Inc. | | | 75,924 | | | | 4,578 | |
| * | | Generac Holdings, Inc. | | | 109,919 | | | | 4,478 | |
| * | | Genesee & Wyoming, Inc. - Class A | | | 45,377 | | | | 3,150 | |
| * | | GP Strategies Corp. | | | 45,312 | | | | 1,296 | |
| | HEICO Corp. - Class A | | | 52,102 | | | | 3,538 | |
| * | | Huron Consulting Group, Inc. | | | 58,580 | | | | 2,967 | |
| | Knight Transportation, Inc. | | | 161,125 | | | | 5,325 | |
| | Lennox International, Inc. | | | 23,722 | | | | 3,634 | |
| * | | Manitowoc Foodservice, Inc. | | | 104,866 | | | | 2,027 | |
| | Marten Transport, Ltd. | | | 91,980 | | | | 2,143 | |
| * | | On Assignment, Inc. | | | 105,025 | | | | 4,638 | |
| * | | SiteOne Landscape Supply, Inc. | | | 72,822 | | | | 2,529 | |
| * | | Teledyne Technologies, Inc. | | | 39,600 | | | | 4,871 | |
| | The Toro Co. | | | 55,148 | | | | 3,086 | |
| * | | WageWorks, Inc. | | | 58,900 | | | | 4,270 | |
| | | | | | | | | | |
| | Total | | | | | | | 84,129 | |
| | | | | | | | | | |
| | |
| | Information Technology (24.7%) | | | | | |
| * | | Aspen Technology, Inc. | | | 75,801 | | | | 4,145 | |
| | Blackbaud, Inc. | | | 61,662 | | | | 3,946 | |
| * | | Blackhawk Network Holdings, Inc. | | | 112,530 | | | | 4,240 | |
| * | | Bottomline Technologies, Inc. | | | 57,936 | | | | 1,450 | |
| * | | BroadSoft, Inc. | | | 64,625 | | | | 2,666 | |
| * | | CACI International, Inc. - Class A | | | 30,640 | | | | 3,809 | |
| * | | Cardtronics PLC | | | 142,284 | | | | 7,764 | |
| | Cass Information Systems, Inc. | | | 43,229 | | | | 3,180 | |
| * | | Ciena Corp. | | | 146,494 | | | | 3,576 | |
| * | | Cirrus Logic, Inc. | | | 64,880 | | | | 3,668 | |
| * | | comScore, Inc. | | | 47,951 | | | | 1,514 | |
| * | | Envestnet, Inc. | | | 152,144 | | | | 5,363 | |
| * | | EPAM Systems, Inc. | | | 26,939 | | | | 1,732 | |
| * | | ePlus, Inc. | | | 32,710 | | | | 3,768 | |
| * | | Exlservice Holdings, Inc. | | | 87,916 | | | | 4,435 | |
| | Fair Isaac Corp. | | | 43,831 | | | | 5,226 | |
| * | | Five9, Inc. | | | 209,748 | | | | 2,976 | |
The Accompanying Notes are an Integral Part of the Financial Statements.
| | | | |
| 54 | | Small Cap Growth Stock Portfolio | | |
Small Cap Growth Stock Portfolio
| | | | | | | | | | |
| | | Common Stocks (93.5%) | | Shares/
$ Par | | | Value
$ (000’s) | |
| |
| | Information Technology continued | |
| * | | GrubHub, Inc. | | | 111,693 | | | | 4,202 | |
| * | | Guidewire Software, Inc. | | | 47,763 | | | | 2,356 | |
| * | | HubSpot, Inc. | | | 74,463 | | | | 3,500 | |
| * | | Integrated Device Technology, Inc. | | | 212,983 | | | | 5,018 | |
| * | | Itron, Inc. | | | 43,613 | | | | 2,741 | |
| | j2 Global, Inc. | | | 88,477 | | | | 7,237 | |
| * | | MACOM Technology Solutions Holdings, Inc. | | | 77,861 | | | | 3,603 | |
| | MAXIMUS, Inc. | | | 71,132 | | | | 3,968 | |
| * | | MaxLinear, Inc. - Class A | | | 156,326 | | | | 3,408 | |
| | MKS Instruments, Inc. | | | 100,370 | | | | 5,962 | |
| * | | NetScout Systems, Inc. | | | 75,487 | | | | 2,378 | |
| | Pegasystems, Inc. | | | 91,796 | | | | 3,305 | |
| * | | PTC, Inc. | | | 65,152 | | | | 3,015 | |
| * | | Q2 Holdings, Inc. | | | 44,105 | | | | 1,272 | |
| * | | Rogers Corp. | | | 48,402 | | | | 3,718 | |
| * | | Take-Two Interactive Software, Inc. | | | 77,665 | | | | 3,828 | |
| * | | Tyler Technologies, Inc. | | | 19,155 | | | | 2,735 | |
| | | | | | | | | | |
| | | Common Stocks (93.5%) | | Shares/
$ Par | | | Value
$ (000’s) | |
| |
| | Information Technology continued | |
| * | | WebMD Health Corp. | | | 37,429 | | | | 1,855 | |
| * | | WEX, Inc. | | | 41,520 | | | | 4,634 | |
| * | | Zendesk, Inc. | | | 117,400 | | | | 2,489 | |
| | | | | | | | | | |
| | Total | | | | | | | 134,682 | |
| | | | | | | | | | |
| |
| | Materials (3.8%) | |
| * | | Boise Cascade Co. | | | 140,438 | | | | 3,160 | |
| | Graphic Packaging Holding Co. | | | 345,060 | | | | 4,306 | |
| * | | Headwaters, Inc. | | | 139,459 | | | | 3,280 | |
| * | | Louisiana-Pacific Corp. | | | 111,154 | | | | 2,104 | |
| * | | Omnova Solutions, Inc. | | | 300,217 | | | | 3,002 | |
| | PolyOne Corp. | | | 146,734 | | | | 4,702 | |
| | | | | | | | | | |
| | Total | | | | | | | 20,554 | |
| | | | | | | | | | |
| |
| | Real Estate (3.1%) | |
| | CoreSite Realty Corp. | | | 73,110 | | | | 5,803 | |
| | HFF, Inc. - Class A | | | 129,593 | | | | 3,920 | |
| | LaSalle Hotel Properties | | | 123,068 | | | | 3,750 | |
| | Sunstone Hotel Investors, Inc. | | | 242,184 | | | | 3,693 | |
| | | | | | | | | | |
| | Total | | | | | | | 17,166 | |
| | | | | | | | | | |
| | | | | | | | | | |
| | | Common Stocks (93.5%) | | Shares/
$ Par | | | Value
$ (000’s) | |
| |
| | Telecommunication Services (0.7%) | |
| * | | ORBCOMM, Inc. | | | 215,741 | | | | 1,784 | |
| * | | Vonage Holdings Corp. | | | 292,300 | | | | 2,002 | |
| | | | | | | | | | |
| | Total | | | | | | | 3,786 | |
| | | | | | | | | | |
| | | |
| | Total Common Stocks
| | | | | | | | |
| | (Cost: $417,045) | | | | | | | 509,809 | |
| | | | | | | | | | |
| |
| | | Investment Companies (4.4%) | |
| |
| | Investment Companies (4.4%) | |
| | iShares Russell 2000 Growth Index Fund | | | 154,792 | | | | 23,829 | |
| | | | | | | | | | |
| | | |
| | Total Investment Companies
| | | | | | | | |
| | (Cost: $21,651) | | | | | | | 23,829 | |
| | | | | | | | | | |
| | | |
| | Total Investments (97.9%)
| | | | | | | | |
| | (Cost: $438,696)(a) | | | | | | | 533,638 | |
| | | | | | | | | | |
| | Other Assets, Less | | | | | | | | |
| | Liabilities (2.1%) | | | | | | | 11,414 | |
| | | | | | | | | | |
| | Net Assets (100.0%) | | | | | | | 545,052 | |
| | | | | | | | | | |
| (a) | At December 31, 2016, the aggregate cost of securities for federal tax purposes (in thousands) was $439,425 and the net unrealized appreciation of investments based on that cost was $94,213 which is comprised of $124,680 aggregate gross unrealized appreciation and $30,467 aggregate gross unrealized depreciation. |
The following is a summary of the inputs used in valuing the Portfolio’s assets and liabilities at December 31, 2016. See Note 3 for additional information on portfolio valuation.
| | | | | | | | | | | | | | |
| | | Valuation Inputs | | | |
| Description | | Level 1 – Quoted Prices | | | Level 2 –
Other Significant
Observable Inputs | | | Level 3 – Significant
Unobservable Inputs | | | |
| | | (Amounts in thousands) | | | |
Assets: | | | | | | | | | | | | | | |
Domestic Common Stocks | | $ | 509,809 | | | $ | - | | | $ | - | | | |
Investment Companies | | | 23,829 | | | | - | | | | - | | | |
Total Assets: | | $ | 533,638 | | | $ | - | | | $ | - | | | |
The Accompanying Notes are an Integral Part of the Financial Statements.
| | | | | | |
| | Small Cap Growth Stock Portfolio | | | 55 | |
Index 600 Stock Portfolio
| | | | |
| Objective: | | Portfolio Strategy: | | Net Assets: |
| Investment results that approximate the performance of the S&P SmallCap 600® Index. | | Invest in stocks that make up the S&P SmallCap 600® Index, holding each stock in approximately the same proportion as its weighting in the Index. | | $174 million |
Portfolio Overview
Mason Street Advisors is the investment adviser for the Index 600 Stock Portfolio (the “Portfolio”). The Portfolio seeks investment results that approximate the performance of the S&P SmallCap 600® Index. The Portfolio attempts to achieve its objective by investing all, or substantially all, of its assets in stocks that make up the S&P SmallCap 600® Index, holding each stock in approximately the same proportion as its weighting in the Index. This is known as a full replication strategy. The Portfolio may also purchase (long) total return equity swap agreements and invest in exchange traded funds and, to a lesser extent, futures contracts, for cash management purposes and to help achieve full replication.
Market Overview
U.S. equities posted strong performance during the year. Investors generally embraced higher-risk equities with greater exposure to the economic cycle, particularly after the U.S. election. Earnings growth remained subdued until the second half of the year, reflecting the drag from the Energy sector. Meanwhile, corporations continued buying back their stocks and acquiring other companies at a relatively robust pace. Consumer spending remained relatively steady, as job growth and rising stock prices helped improve consumer sentiment. Business spending remained muted, as many companies preferred to strengthen their balance sheets or buy back stock in lieu of large-scale investment in physical assets. The broader fixed income market posted a modest positive return, while higher-yielding corporate bonds logged large gains.
Altogether, the U.S. economy grew at a relatively slow pace of approximately 2.0% during the year, but growth was relatively stable, extending the U.S. economy’s streak to ten consecutive quarters of positive economic growth. The Fed was expected to raise interest rates for most of the year, but inflation well below the Fed’s 2.0% target and global uncertainty meant the Fed waited until December of 2016 to raise rates by a quarter of a point, marking only the second time the Fed has raised interest rates in the last eight years.
In that environment, small- and medium-sized stocks, as represented by the S&P SmallCap 600® and S&P MidCap 400® Indices, returned 26.56% and 20.74%, respectively, while the large-capitalization S&P 500® Index lagged despite its 11.96% return in 2016. Meanwhile, the Bloomberg Barclays U.S. Corporate High Yield Index posted a return of 17.13%, substantially outperforming the 2.65% return of the broader bond market, as represented by the Bloomberg Barclays® U.S. Aggregate Index.
Portfolio Results
The Index 600 Stock Portfolio delivered a total return of 26.12% for the twelve months ended December 31, 2016, trailing the S&P SmallCap 600® Index (the “Index”), which returned 26.56%. (The Index is unmanaged, cannot be invested in directly, and does not include administrative expenses or sales charges.) Portfolio performance slightly lagged the Index due to transaction costs, administrative expenses, cash flow effects and costs associated with the use of total return equity swap agreements and exchange traded funds. The Portfolio significantly outperformed the 21.76% average return for its peer group, Small Cap Core Funds, according to Lipper® Analytical Services, Inc. However, the Small Cap Core Funds peer group is not strictly comparable to the Portfolio because many of the funds in the group are actively managed.
All eleven of the Index’s sectors delivered positive returns for the year. The Industrials and Information Technology sectors were the top contributors to the Index’s total return for the year. The Industrials sector also performed well, led by small-cap machinery stocks, as industrial production improved with economic growth during the second half of the year. The Information Technology’s solid results were attributable to the semiconductor and electronic equipment industries, which benefited from several fundamental themes, including increased demand for servers and data centers and innovation in smart technology. Communications equipment and software stocks added to performance in the Information Technology sector. The Financials sector also posted strong performance, led by the banking industry, as financial stocks performed in line with the broader stock market for most of the year, then rose sharply following the unexpected Trump win in the U.S. presidential election. Many market observers were expecting deregulation and other finance-friendly policy shifts from the incoming Trump administration. The Consumer Discretionary sector also posted solid results, as steady job growth and rising confidence led to relatively strong consumer spending.
At the other end of the spectrum, the Health Care sector posted a positive return, but lagged other sectors in the Index, as biotechnology and pharmaceutical stocks fell after posting strong performance for several years. Drug pricing came under
| | | | |
| 56 | | Index 600 Stock Portfolio | | |
Index 600 Stock Portfolio
political scrutiny throughout the year, and uncertainty about the Health Care sector’s competitive landscape grew following Donald Trump’s win, as Trump and the Republican-controlled Congress voiced opposition to key components of the Affordable Care Act.
Relative Performance
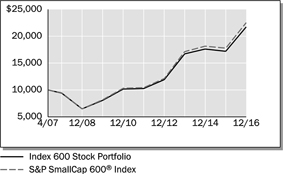
| | | | | | | | | | | | |
Average Annual Total Returns
For Periods Ended December 31, 2016 | |
| | | 1 Year | | | 5 Years | | | Since
Inception* | |
Index 600 Stock Portfolio | | | 26.12 | % | | | 16.14 | % | | | 8.35 | % |
S&P SmallCap 600® Index | | | 26.56 | % | | | 16.62 | % | | | 8.74 | % |
Lipper® Variable Insurance Products (VIP) Small Cap Core Funds Average | | | 21.76 | % | | | 14.29 | % | | | – | |
| |
* Inception date of 4/30/07 | | | | | |
The performance data quoted represents past performance. Past performance is historical and does not guarantee future performance. Investment return and principal value will fluctuate, so that shares, when redeemed, may be worth more or less than their original cost. Current performance may be lower or higher than the performance data quoted. For the most recent month-end performance information visit www.northwesternmutual.com.
This chart assumes an initial investment of $10,000 made on 4/30/07 (commencement of the Portfolio’s operations). Returns shown reflect fee waivers, deductions for management and other portfolio expenses, and reinvestment of all dividends. In the absence of fee waivers, total return would be reduced. Returns exclude deductions for separate account sale loads and account fees. Please refer to the Benchmark Definitions section of this report for information about the indices cited in the above chart and graph.
“Standard & Poor’s®”, “S&P®”, “S&P SmallCap 600” and “Standard & Poor’s SmallCap 600” are trademarks of The McGraw-Hill Companies, Inc. and have been licensed for use by Northwestern Mutual Life Insurance Company. The Portfolio is not sponsored, endorsed, sold or promoted by Standard & Poor’s, and Standard & Poor’s makes no representation regarding the advisability of investing in the Portfolio.
Stocks of smaller or newer companies, such as those held in this Portfolio, are more likely to realize more substantial growth as well as suffer more significant losses than larger or more established issuers. Investments in such companies can be both more volatile and more speculative. Investing in small company stocks involves a greater degree of risk than investing in medium or large company stocks.
The Portfolio may invest in exchange-traded funds and derivative instruments such as swap agreements and, to a lesser extent, futures contracts, for cash management purposes and to help achieve full replication. Use of these instruments may involve certain costs and imposes certain risks such as liquidity risk, market risk, credit risk, management risk and the risk of mispricing or improper valuation. Certain derivatives involve leverage, which could magnify losses, and portfolios investing in derivatives could lose more than the principal amount invested in those instruments.
| | | | | | |
| | Index 600 Stock Portfolio | | | 57 | |
Index 600 Stock Portfolio
Top 10 Equity Holdings 12/31/16
| | | | | | |
| | | Security Description | | | % of Net Assets | |
| | | iShares Core S&P Small-Cap ETF | | | 1.9 | % |
| | | Take-Two Interactive Software, Inc. | | | 0.5 | % |
| | | US Silica Holdings, Inc. | | | 0.5 | % |
| | | PDC Energy, Inc. | | | 0.5 | % |
| | | The Chemours Co. | | | 0.5 | % |
| | | Texas Capital Bancshares, Inc. | | | 0.5 | % |
| | | Wintrust Financial Corp. | | | 0.5 | % |
| | | United Bankshares, Inc. | | | 0.5 | % |
| | | Home BancShares, Inc. | | | 0.4 | % |
| | | Coherent, Inc. | | | 0.4 | % |
Sector Allocation 12/31/16
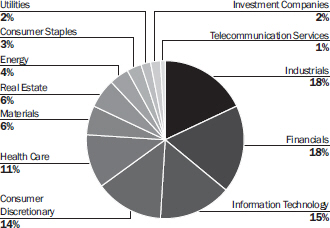
Sector Allocation is based on Net Assets.
Sector Allocation and Top 10 Holdings are subject to change.
| | | | |
| 58 | | Index 600 Stock Portfolio | | |
Index 600 Stock Portfolio
Schedule of Investments
December 31, 2016
| | | | | | | | | | |
| | | Common Stocks (91.1%) | | Shares/
$ Par | | | Value
$ (000’s) | |
| |
| | Consumer Discretionary (12.8%) | |
| | Abercrombie & Fitch Co. - Class A | | | 14,788 | | | | 177 | |
| * | | American Axle & Manufacturing Holdings, Inc. | | | 16,710 | | | | 323 | |
| * | | American Public Education, Inc. | | | 3,517 | | | | 86 | |
| * | | Arctic Cat, Inc. | | | 2,851 | | | | 43 | |
| * | | Asbury Automotive Group, Inc. | | | 4,309 | | | | 266 | |
| * | | Ascena Retail Group, Inc. | | | 37,027 | | | | 229 | |
| * | | Barnes & Noble Education, Inc. | | | 8,393 | | | | 96 | |
| | Barnes & Noble, Inc. | | | 12,071 | | | | 135 | |
| * | | Belmond, Ltd. | | | 18,457 | | | | 246 | |
| | Big 5 Sporting Goods Corp. | | | 3,876 | | | | 67 | |
| * | | Biglari Holdings, Inc. | | | 221 | | | | 105 | |
| * | | BJ’s Restaurants, Inc. | | | 4,218 | | | | 166 | |
| | Blue Nile, Inc. | | | 2,556 | | | | 104 | |
| | Bob Evans Farms, Inc. | | | 4,319 | | | | 230 | |
| * | | Boyd Gaming Corp. | | | 17,944 | | | | 362 | |
| | The Buckle, Inc. | | | 6,097 | | | | 139 | |
| | Caleres, Inc. | | | 9,483 | | | | 311 | |
| | Callaway Golf Co. | | | 20,566 | | | | 225 | |
| | Capella Education Co. | | | 2,505 | | | | 220 | |
| * | | Career Education Corp. | | | 14,068 | | | | 142 | |
| | The Cato Corp. - Class A | | | 5,483 | | | | 165 | |
| * | | Cavco Industries, Inc. | | | 1,847 | | | | 184 | |
| | The Children’s Place, Inc. | | | 3,941 | | | | 398 | |
| * | | Chuy’s Holdings, Inc. | | | 3,676 | | | | 119 | |
| * | | Cooper-Standard Holding, Inc. | | | 3,858 | | | | 399 | |
| | Core-Mark Holding Co., Inc. | | | 10,085 | | | | 434 | |
| * | | Crocs, Inc. | | | 16,071 | | | | 110 | |
| * | | Dave & Buster’s Entertainment, Inc. | | | 8,178 | | | | 460 | |
| | DineEquity, Inc. | | | 3,717 | | | | 286 | |
| * | | Dorman Products, Inc. | | | 6,630 | | | | 484 | |
| | Drew Industries, Inc. | | | 5,381 | | | | 580 | |
| * | | The E.W. Scripps Co. - Class A | | | 12,407 | | | | 240 | |
| * | | El Pollo Loco Holdings, Inc. | | | 4,708 | | | | 58 | |
| | Ethan Allen Interiors, Inc. | | | 5,559 | | | | 205 | |
| * | | Express, Inc. | | | 17,133 | | | | 184 | |
| * | | Fiesta Restaurant Group, Inc. | | | 5,845 | | | | 174 | |
| | The Finish Line, Inc. - Class A | | | 8,864 | | | | 167 | |
| * | | Five Below, Inc. | | | 11,993 | | | | 479 | |
| | | | | | | | | | |
| | | Common Stocks (91.1%) | | Shares/
$ Par | | | Value
$ (000’s) | |
| |
| | Consumer Discretionary continued | |
| * | | Fox Factory Holding Corp. | | | 6,283 | | | | 174 | |
| * | | Francesca’s Holdings Corp. | | | 8,286 | | | | 149 | |
| | Fred’s, Inc. - Class A | | | 7,672 | | | | 142 | |
| * | | FTD Companies, Inc. | | | 3,748 | | | | 89 | |
| | Gannett Co., Inc. | | | 25,481 | | | | 247 | |
| * | | Genesco, Inc. | | | 4,507 | | | | 280 | |
| * | | Gentherm, Inc. | | | 7,978 | | | | 270 | |
| * | | G-III Apparel Group, Ltd. | | | 9,566 | | | | 283 | |
| | Group 1 Automotive, Inc. | | | 4,343 | | | | 339 | |
| | Guess?, Inc. | | | 13,457 | | | | 163 | |
| | Haverty Furniture Cos., Inc. | | | 4,172 | | | | 99 | |
| * | | Hibbett Sports, Inc. | | | 4,890 | | | | 182 | |
| * | | Iconix Brand Group, Inc. | | | 12,265 | | | | 115 | |
| | ILG, Inc. | | | 23,162 | | | | 421 | |
| * | | Installed Building Products, Inc. | | | 4,335 | | | | 179 | |
| * | | iRobot Corp. | | | 5,929 | | | | 347 | |
| * | | Kirkland’s, Inc. | | | 3,195 | | | | 50 | |
| | La-Z-Boy, Inc. | | | 10,691 | | | | 332 | |
| * | | LGI Homes, Inc. | | | 3,721 | | | | 107 | |
| | Lithia Motors, Inc. - Class A | | | 5,116 | | | | 495 | |
| * | | Lumber Liquidators Holdings, Inc. | | | 5,954 | | | | 94 | |
| | M.D.C. Holdings, Inc. | | | 9,001 | | | | 231 | |
| * | | M/I Homes, Inc. | | | 5,391 | | | | 136 | |
| | The Marcus Corp. | | | 4,137 | | | | 130 | |
| * | | MarineMax, Inc. | | | 5,394 | | | | 104 | |
| | Marriott Vacations Worldwide Corp. | | | 5,309 | | | | 450 | |
| * | | Meritage Homes Corp. | | | 8,221 | | | | 286 | |
| * | | Monarch Casino & Resort, Inc. | | | 2,391 | | | | 62 | |
| | Monro Muffler Brake, Inc. | | | 7,058 | | | | 404 | |
| * | | Motorcar Parts of America, Inc. | | | 4,079 | | | | 110 | |
| | Movado Group, Inc. | | | 3,346 | | | | 96 | |
| * | | Nautilus, Inc. | | | 6,802 | | | | 126 | |
| | New Media Investment Group, Inc. | | | 11,444 | | | | 183 | |
| | Nutrisystem, Inc. | | | 6,417 | | | | 222 | |
| * | | Ollie’s Bargain Outlet Holdings, Inc. | | | 10,398 | | | | 296 | |
| | Oxford Industries, Inc. | | | 3,261 | | | | 196 | |
| * | | Perry Ellis International, Inc. | | | 2,642 | | | | 66 | |
| | PetMed Express, Inc. | | | 4,486 | | | | 104 | |
| * | | Popeyes Louisiana Kitchen, Inc. | | | 4,529 | | | | 274 | |
| * | | Red Robin Gourmet Burgers, Inc. | �� | | 2,810 | | | | 158 | |
| | | | | | | | | | |
| | | Common Stocks (91.1%) | | Shares/
$ Par | | | Value
$ (000’s) | |
| |
| | Consumer Discretionary continued | |
| * | | Regis Corp. | | | 7,664 | | | | 111 | |
| | Rent-A-Center, Inc. | | | 11,614 | | | | 131 | |
| * | | Ruby Tuesday, Inc. | | | 13,154 | | | | 43 | |
| | Ruth’s Hospitality Group, Inc. | | | 6,480 | | | | 119 | |
| | Scholastic Corp. | | | 5,888 | | | | 280 | |
| * | | Scientific Games Corp. - Class A | | | 11,099 | | | | 155 | |
| * | | Select Comfort Corp. | | | 9,820 | | | | 222 | |
| | Shoe Carnival, Inc. | | | 2,898 | | | | 78 | |
| | Sonic Automotive, Inc. - Class A | | | 5,741 | | | | 131 | |
| | Sonic Corp. | | | 9,999 | | | | 265 | |
| | Stage Stores, Inc. | | | 5,520 | | | | 24 | |
| | Standard Motor Products, Inc. | | | 4,391 | | | | 234 | |
| | Stein Mart, Inc. | | | 6,764 | | | | 37 | |
| * | | Steven Madden, Ltd. | | | 11,923 | | | | 426 | |
| * | | Strayer Education, Inc. | | | 2,279 | | | | 184 | |
| | Sturm, Ruger & Co., Inc. | | | 4,146 | | | | 219 | |
| | Superior Industries International, Inc. | | | 5,004 | | | | 132 | |
| | Tailored Brands, Inc. | | | 10,641 | | | | 272 | |
| * | | The Tile Shop Holdings, Inc. | | | 7,216 | | | | 141 | |
| * | | TopBuild Corp. | | | 8,313 | | | | 296 | |
| * | | Tuesday Morning Corp. | | | 9,853 | | | | 53 | |
| * | | Unifi, Inc. | | | 3,312 | | | | 108 | |
| * | | Universal Electronics, Inc. | | | 3,184 | | | | 206 | |
| * | | Vera Bradley, Inc. | | | 4,273 | | | | 50 | |
| * | | Vitamin Shoppe, Inc. | | | 5,203 | | | | 124 | |
| * | | WCI Communities, Inc. | | | 4,777 | | | | 112 | |
| | Wingstop, Inc. | | | 6,282 | | | | 186 | |
| | Winnebago Industries, Inc. | | | 5,780 | | | | 183 | |
| | Wolverine World Wide, Inc. | | | 21,559 | | | | 473 | |
| | World Wrestling Entertainment, Inc. - Class A | | | 8,403 | | | | 155 | |
| * | | Zumiez, Inc. | | | 3,808 | | | | 83 | |
| | | | | | | | | | |
| | Total | | | | | | | 22,222 | |
| | | | | | | | | | |
| |
| | Consumer Staples (2.6%) | |
| | The Andersons, Inc. | | | 5,679 | | | | 254 | |
| | B&G Foods, Inc. | | | 14,512 | | | | 636 | |
| | Calavo Growers, Inc. | | | 3,353 | | | | 206 | |
| | Cal-Maine Foods, Inc. | | | 6,498 | | | | 287 | |
| * | | Central Garden & Pet Co. | | | 2,202 | | | | 73 | |
| * | | Central Garden & Pet Co. - Class A | | | 7,322 | | | | 226 | |
| * | | Darling Ingredients, Inc. | | | 35,969 | | | | 464 | |
| | Inter Parfums, Inc. | | | 3,738 | | | | 122 | |
The Accompanying Notes are an Integral Part of the Financial Statements.
| | | | | | |
| | Index 600 Stock Portfolio | | | 59 | |
Index 600 Stock Portfolio
| | | | | | | | | | |
| | | Common Stocks (91.1%) | | Shares/
$ Par | | | Value
$ (000’s) | |
| |
| | Consumer Staples continued | |
| | J & J Snack Foods Corp. | | | 3,266 | | | | 436 | |
| | Medifast, Inc. | | | 2,434 | | | | 101 | |
| | Sanderson Farms, Inc. | | | 4,342 | | | | 409 | |
| * | | Seneca Foods Corp. - Class A | | | 1,361 | | | | 55 | |
| | SpartanNash Co. | | | 8,190 | | | | 324 | |
| * | | SUPERVALU, INC. | | | 58,144 | | | | 272 | |
| | Universal Corp. | | | 4,979 | | | | 317 | |
| | WD-40 Co. | | | 3,098 | | | | 362 | |
| | | | | | | | | | |
| | Total | | | | | | | 4,544 | |
| | | | | | | | | | |
| |
| | Energy (3.2%) | |
| | Archrock, Inc. | | | 15,215 | | | | 201 | |
| | Atwood Oceanics, Inc. | | | 13,170 | | | | 173 | |
| * | | Bill Barrett Corp. | | | 16,482 | | | | 115 | |
| | Bristow Group, Inc. | | | 6,979 | | | | 143 | |
| * | | CARBO Ceramics, Inc. | | | 4,585 | | | | 48 | |
| * | | Carrizo Oil & Gas, Inc. | | | 13,378 | | | | 500 | |
| * | | Cloud Peak Energy, Inc. | | | 13,429 | | | | 75 | |
| * | | Contango Oil & Gas Co. | | | 4,968 | | | | 46 | |
| * | | Era Group, Inc. | | | 4,256 | | | | 72 | |
| * | | Exterran Corp. | | | 6,834 | | | | 163 | |
| * | | Geospace Technologies Corp. | | | 2,912 | | | | 59 | |
| | Green Plains, Inc. | | | 7,797 | | | | 217 | |
| | Gulf Island Fabrication, Inc. | | | 2,942 | | | | 35 | |
| * | | Helix Energy Solutions Group, Inc. | | | 24,499 | | | | 216 | |
| * | | Hornbeck Offshore Services, Inc. | | | 7,074 | | | | 51 | |
| * | | Matrix Service Co. | | | 5,798 | | | | 132 | |
| * | | Newpark Resources, Inc. | | | 18,499 | | | | 139 | |
| * | | Northern Oil and Gas, Inc. | | | 9,503 | | | | 26 | |
| * | | PDC Energy, Inc. | | | 12,179 | | | | 884 | |
| * | | Pioneer Energy Services Corp. | | | 16,745 | | | | 115 | |
| * | | REX American Resources Corp. | | | 1,237 | | | | 122 | |
| * | | SEACOR Holdings, Inc. | | | 3,523 | | | | 251 | |
| * | | Synergy Resources Corp. | | | 43,830 | | | | 391 | |
| * | | Tesco Corp. | | | 10,140 | | | | 84 | |
| * | | TETRA Technologies, Inc. | | | 25,078 | | | | 126 | |
| * | | Tidewater, Inc. | | | 10,285 | | | | 35 | |
| * | | Unit Corp. | | | 11,251 | | | | 302 | |
| | US Silica Holdings, Inc. | | | 15,662 | | | | 888 | |
| | | | | | | | | | |
| | Total | | | | | | | 5,609 | |
| | | | | | | | | | |
| |
| | Financials (16.7%) | |
| | American Equity Investment Life Holding Co. | | | 19,252 | | | | 434 | |
| | Ameris Bancorp | | | 7,631 | | | | 333 | |
| | AMERISAFE, Inc. | | | 4,202 | | | | 262 | |
| | Astoria Financial Corp. | | | 19,928 | | | | 372 | |
| | | | | | | | | | |
| | | Common Stocks (91.1%) | | Shares/
$ Par | | | Value
$ (000’s) | |
| |
| | Financials continued | |
| | Banc of California, Inc. | | | 10,823 | | | | 188 | |
| | Bank Mutual Corp. | | | 9,182 | | | | 87 | |
| | Banner Corp. | | | 5,770 | | | | 322 | |
| * | | BofI Holding, Inc. | | | 12,587 | | | | 359 | |
| | Boston Private Financial Holdings, Inc. | | | 18,165 | | | | 301 | |
| | Brookline Bancorp, Inc. | | | 15,413 | | | | 253 | |
| | Calamos Asset Management, Inc. | | | 3,634 | | | | 31 | |
| | Capstead Mortgage Corp. | | | 20,976 | | | | 214 | |
| | Cardinal Financial Corp. | | | 7,169 | | | | 235 | |
| | Central Pacific Financial Corp. | | | 6,737 | | | | 212 | |
| | City Holding Co. | | | 3,279 | | | | 222 | |
| | Columbia Banking System, Inc. | | | 12,683 | | | | 567 | |
| | Community Bank System, Inc. | | | 9,698 | | | | 599 | |
| * | | Customers Bancorp, Inc. | | | 6,154 | | | | 220 | |
| | CVB Financial Corp. | | | 21,976 | | | | 504 | |
| | Dime Community Bancshares | | | 6,809 | | | | 137 | |
| * | | Donnelley Financial Solutions, Inc. | | | 5,753 | | | | 132 | |
| * | | eHealth, Inc. | | | 3,647 | | | | 39 | |
| | Employers Holdings, Inc. | | | 7,012 | | | | 278 | |
| * | | Encore Capital Group, Inc. | | | 5,133 | | | | 147 | |
| * | | Enova International, Inc. | | | 5,081 | | | | 64 | |
| | Evercore Partners, Inc. | | | 8,504 | | | | 584 | |
| * | | EZCORP, Inc. - Class A | | | 10,589 | | | | 113 | |
| | Fidelity Southern Corp. | | | 4,627 | | | | 110 | |
| | Financial Engines, Inc. | | | 11,634 | | | | 428 | |
| * | | First BanCorp/Puerto Rico | | | 29,457 | | | | 195 | |
| | First Commonwealth Financial Corp. | | | 19,446 | | | | 276 | |
| | First Financial Bancorp. | | | 13,539 | | | | 385 | |
| | First Financial Bankshares, Inc. | | | 14,436 | | | | 652 | |
| | First Midwest Bancorp, Inc. | | | 17,771 | | | | 448 | |
| * | | First NBC Bank Holding, Co. | | | 3,488 | | | | 25 | |
| | FirstCash, Inc. | | | 10,600 | | | | 498 | |
| | Glacier Bancorp, Inc. | | | 16,722 | | | | 606 | |
| | Great Western Bancorp, Inc. | | | 12,830 | | | | 559 | |
| * | | Green Dot Corp. - Class A | | | 9,652 | | | | 227 | |
| | Greenhill & Co., Inc. | | | 5,943 | | | | 165 | |
| | Hanmi Financial Corp. | | | 7,048 | | | | 246 | |
| | HCI Group, Inc. | | | 1,847 | | | | 73 | |
| | Home BancShares, Inc. | | | 27,006 | | | | 750 | |
| * | | HomeStreet, Inc. | | | 5,102 | | | | 161 | |
| | Hope Bancorp, Inc. | | | 27,778 | | | | 608 | |
| | Horace Mann Educators Corp. | | | 8,786 | | | | 376 | |
| | | | | | | | | | |
| | | Common Stocks (91.1%) | | Shares/
$ Par | | | Value
$ (000’s) | |
| |
| | Financials continued | |
| | Independent Bank Corp./Rockland MA | | | 5,900 | | | | 416 | |
| | Infinity Property & Casualty Corp. | | | 2,416 | | | | 212 | |
| | Interactive Brokers Group, Inc. - Class A | | | 14,856 | | | | 542 | |
| * | | INTL FCStone, Inc. | | | 3,259 | | | | 129 | |
| | Investment Technology Group, Inc. | | | 6,761 | | | | 133 | |
| | LegacyTexas Financial Group, Inc. | | | 9,082 | | | | 391 | |
| * | | LendingTree, Inc. | | | 1,572 | | | | 159 | |
| | Maiden Holdings, Ltd. | | | 15,998 | | | | 279 | |
| | National Bank Holding Corp. | | | 5,673 | | | | 181 | |
| | The Navigators Group, Inc. | | | 2,418 | | | | 285 | |
| | NBT Bancorp, Inc. | | | 9,431 | | | | 395 | |
| | Northfield Bancorp, Inc. | | | 9,813 | | | | 196 | |
| | Northwest Bancshares, Inc. | | | 22,137 | | | | 399 | |
| | OFG Bancorp | | | 9,596 | | | | 126 | |
| | Old National Bancorp | | | 29,497 | | | | 535 | |
| | Opus Bank | | | 3,971 | | | | 119 | |
| | Oritani Financial Corp. | | | 8,305 | | | | 156 | |
| | Pinnacle Financial Partners, Inc. | | | 9,486 | | | | 657 | |
| * | | Piper Jaffray Cos., Inc. | | | 3,108 | | | | 225 | |
| * | | PRA Group, Inc. | | | 10,127 | | | | 396 | |
| | ProAssurance Corp. | | | 11,635 | | | | 654 | |
| | Provident Financial Services, Inc. | | | 13,133 | | | | 372 | |
| | RLI Corp. | | | 8,347 | | | | 527 | |
| | S&T Bancorp, Inc. | | | 7,629 | | | | 298 | |
| | Safety Insurance Group, Inc. | | | 3,112 | | | | 229 | |
| | Selective Insurance Group, Inc. | | | 12,643 | | | | 544 | |
| | ServisFirst Bancshares, Inc. | | | 9,656 | | | | 361 | |
| | Simmons First National Corp. - Class A | | | 6,492 | | | | 403 | |
| | Southside Bancshares, Inc. | | | 5,728 | | | | 216 | |
| | Sterling Bancorp/DE | | | 28,583 | | | | 669 | |
| | Stewart Information Services Corp. | | | 5,107 | | | | 235 | |
| * | | Texas Capital Bancshares, Inc. | | | 10,710 | | | | 840 | |
| | Tompkins Financial Corp. | | | 2,665 | | | | 252 | |
| | TrustCo Bank Corp. NY | | | 20,913 | | | | 183 | |
| | United Bankshares, Inc. | | | 17,627 | | | | 815 | |
| | United Community Banks, Inc. | | | 15,485 | | | | 459 | |
| | United Fire Group, Inc. | | | 4,710 | | | | 232 | |
| | United Insurance Holdings Corp. | | | 3,878 | | | | 59 | |
The Accompanying Notes are an Integral Part of the Financial Statements.
| | | | |
| 60 | | Index 600 Stock Portfolio | | |
Index 600 Stock Portfolio
| | | | | | | | | | |
| | | Common Stocks (91.1%) | | Shares/
$ Par | | | Value
$ (000’s) | |
| |
| | Financials continued | |
| | Universal Insurance Holdings, Inc. | | | 7,122 | | | | 202 | |
| | Virtus Investment Partners, Inc. | | | 1,223 | | | | 144 | |
| * | | Walker & Dunlop, Inc. | | | 6,058 | | | | 189 | |
| | Westamerica Bancorporation | | | 5,609 | | | | 353 | |
| | Wintrust Financial Corp. | | | 11,313 | | | | 821 | |
| * | | World Acceptance Corp. | | | 1,309 | | | | 84 | |
| | | | | | | | | | |
| | Total | | | | | | | 29,069 | |
| | | | | | | | | | |
| |
| | Health Care (10.4%) | |
| | Abaxis, Inc. | | | 4,924 | | | | 260 | |
| | Aceto Corp. | | | 6,567 | | | | 144 | |
| * | | Acorda Therapeutics, Inc. | | | 10,077 | | | | 189 | |
| * | | Adeptus Health, Inc., Class A | | | 3,296 | | | | 25 | |
| * | | Air Methods Corp. | | | 7,237 | | | | 231 | |
| * | | Albany Molecular Research, Inc. | | | 4,874 | | | | 91 | |
| * | | Almost Family, Inc. | | | 1,949 | | | | 86 | |
| * | | AMAG Pharmaceuticals, Inc. | | | 7,476 | | | | 260 | |
| * | | Amedisys, Inc. | | | 6,089 | | | | 260 | |
| * | | AMN Healthcare Services, Inc. | | | 10,500 | | | | 404 | |
| * | | Amphastar Pharmaceuticals, Inc. | | | 7,845 | | | | 145 | |
| | Analogic Corp. | | | 2,721 | | | | 226 | |
| * | | AngioDynamics, Inc. | | | 6,886 | | | | 116 | |
| * | | ANI Pharmaceuticals, Inc. | | | 1,746 | | | | 106 | |
| * | | Anika Therapeutics, Inc. | | | 3,195 | | | | 156 | |
| * | | BioTelemetry, Inc. | | | 6,169 | | | | 138 | |
| * | | Cambrex Corp. | | | 7,025 | | | | 379 | |
| | Cantel Medical Corp. | | | 7,931 | | | | 625 | |
| | Chemed Corp. | | | 3,545 | | | | 569 | |
| * | | Community Health Systems, Inc. | | | 24,844 | | | | 139 | |
| | Computer Programs and Systems, Inc. | | | 2,336 | | | | 55 | |
| | CONMED Corp. | | | 5,411 | | | | 239 | |
| * | | CorVel Corp. | | | 2,172 | | | | 79 | |
| * | | Cross Country Healthcare, Inc. | | | 7,214 | | | | 113 | |
| * | | CryoLife, Inc. | | | 5,886 | | | | 113 | |
| * | | Cynosure, Inc. - Class A | | | 5,213 | | | | 238 | |
| * | | Depomed, Inc. | | | 13,457 | | | | 242 | |
| * | | Diplomat Pharmacy, Inc. | | | 9,365 | | | | 118 | |
| * | | Eagle Pharmaceuticals, Inc./DE | | | 1,720 | | | | 136 | |
| * | | Emergent Biosolutions, Inc. | | | 7,523 | | | | 247 | |
| * | | Enanta Pharmaceuticals, Inc. | | | 3,037 | | | | 102 | |
| | Ensign Group, Inc. | | | 10,402 | | | | 231 | |
| | | | | | | | | | |
| | | Common Stocks (91.1%) | | Shares/
$ Par | | | Value
$ (000’s) | |
| |
| | Health Care continued | |
| * | | Haemonetics Corp. | | | 11,288 | | | | 454 | |
| * | | HealthEquity, Inc. | | | 9,393 | | | | 381 | |
| * | | HealthStream, Inc. | | | 5,549 | | | | 139 | |
| * | | Healthways, Inc. | | | 7,270 | | | | 165 | |
| * | | HMS Holdings Corp. | | | 18,500 | | | | 336 | |
| * | | ICU Medical, Inc. | | | 3,212 | | | | 473 | |
| * | | Impax Laboratories, Inc. | | | 16,144 | | | | 214 | |
| * | | Innoviva, Inc. | | | 16,870 | | | | 181 | |
| * | | Inogen, Inc. | | | 3,498 | | | | 235 | |
| * | | Integer Holdings Corp. | | | 6,001 | | | | 177 | |
| * | | Integra LifeSciences Holdings Corp. | | | 6,536 | | | | 561 | |
| | Invacare Corp. | | | 6,934 | | | | 90 | |
| | Kindred Healthcare, Inc. | | | 18,609 | | | | 146 | |
| | Landauer, Inc. | | | 2,099 | | | | 101 | |
| * | | Lannett Co., Inc. | | | 6,388 | | | | 141 | |
| * | | LHC Group, Inc. | | | 3,257 | | | | 149 | |
| * | | Ligand Pharmaceuticals, Inc. - Class B | | | 4,156 | | | | 422 | |
| * | | Luminex Corp. | | | 8,667 | | | | 175 | |
| * | | Magellan Health, Inc. | | | 5,079 | | | | 382 | |
| * | | Masimo Corp. | | | 9,661 | | | | 651 | |
| * | | The Medicines Co. | | | 15,202 | | | | 516 | |
| * | | Medidata Solutions, Inc. | | | 11,957 | | | | 594 | |
| | Meridian Bioscience, Inc. | | | 9,201 | | | | 163 | |
| * | | Merit Medical Systems, Inc. | | | 9,743 | | | | 258 | |
| * | | MiMedx Group, Inc. | | | 22,017 | | | | 195 | |
| * | | Momenta Pharmaceuticals, Inc. | | | 13,968 | | | | 210 | |
| * | | Natus Medical, Inc. | | | 7,192 | | | | 250 | |
| * | | Nektar Therapeutics | | | 33,397 | | | | 410 | |
| * | | Neogen Corp. | | | 8,240 | | | | 544 | |
| * | | Omnicell, Inc. | | | 7,980 | | | | 271 | |
| * | | PharMerica Corp. | | | 6,726 | | | | 169 | |
| | Phibro Animal Health Corp. - Class A | | | 4,047 | | | | 119 | |
| * | | The Providence Service Corp. | | | 2,662 | | | | 101 | |
| * | | Quality Systems, Inc. | | | 10,041 | | | | 132 | |
| * | | Quorum Health Corp. | | | 6,443 | | | | 47 | |
| * | | Repligen Corp. | | | 7,393 | | | | 228 | |
| * | | SciClone Pharmaceuticals, Inc. | | | 11,156 | | | | 120 | |
| * | | Select Medical Holdings Corp. | | | 23,422 | | | | 310 | |
| * | | Spectrum Pharmaceuticals, Inc. | | | 15,298 | | | | 68 | |
| * | | Supernus Pharmaceuticals, Inc. | | | 10,818 | | | | 273 | |
| * | | Surgical Care Affiliates, Inc. | | | 6,091 | | | | 282 | |
| * | | Surmodics, Inc. | | | 2,886 | | | | 73 | |
| | U.S. Physical Therapy, Inc. | | | 2,736 | | | | 192 | |
| * | | Vascular Solutions, Inc. | | | 3,831 | | | | 215 | |
| | | | | | | | | | |
| | | Common Stocks (91.1%) | | Shares/
$ Par | | | Value
$ (000’s) | |
| |
| | Health Care continued | |
| * | | Zeltiq Aesthetics, Inc. | | | 7,862 | | | | 342 | |
| | | | | | | | | | |
| | Total | | | | | | | 18,117 | |
| | | | | | | | | | |
| |
| | Industrials (16.8%) | |
| | AAON, Inc. | | | 8,646 | | | | 286 | |
| | AAR Corp. | | | 6,945 | | | | 230 | |
| | ABM Industries, Inc. | | | 12,184 | | | | 498 | |
| | Actuant Corp. - Class A | | | 12,884 | | | | 334 | |
| * | | Aegion Corp. | | | 7,422 | | | | 176 | |
| * | | Aerojet Rocketdyne Holdings, Inc. | | | 15,296 | | | | 275 | |
| * | | Aerovironment, Inc. | | | 4,497 | | | | 121 | |
| | Alamo Group, Inc. | | | 2,063 | | | | 157 | |
| | Albany International Corp. - Class A | | | 6,315 | | | | 292 | |
| | Allegiant Travel Co. | | | 2,857 | | | | 475 | |
| * | | American Woodmark Corp. | | | 3,054 | | | | 230 | |
| | Apogee Enterprises, Inc. | | | 6,315 | | | | 338 | |
| | Applied Industrial Technologies, Inc. | | | 8,524 | | | | 506 | |
| | ArcBest Corp. | | | 5,207 | | | | 144 | |
| | Astec Industries, Inc. | | | 4,180 | | | | 282 | |
| * | | Atlas Air Worldwide Holdings, Inc. | | | 5,465 | | | | 285 | |
| | AZZ, Inc. | | | 5,684 | | | | 363 | |
| | Barnes Group, Inc. | | | 10,936 | | | | 519 | |
| | Brady Corp. - Class A | | | 10,346 | | | | 388 | |
| | Briggs & Stratton Corp. | | | 9,355 | | | | 208 | |
| | The Brink’s Co. | | | 9,812 | | | | 405 | |
| * | | CDI Corp. | | | 3,017 | | | | 22 | |
| | Celadon Group, Inc. | | | 6,164 | | | | 44 | |
| * | | Chart Industries, Inc. | | | 6,686 | | | | 241 | |
| | CIRCOR International, Inc. | | | 3,589 | | | | 233 | |
| | Comfort Systems USA, Inc. | | | 8,067 | | | | 269 | |
| | Cubic Corp. | | | 5,445 | | | | 261 | |
| * | | DXP Enterprises, Inc. | | | 3,372 | | | | 117 | |
| * | | Echo Global Logistics, Inc. | | | 6,003 | | | | 150 | |
| | Encore Wire Corp. | | | 4,529 | | | | 196 | |
| * | | Engility Holdings, Inc. | | | 3,857 | | | | 130 | |
| | EnPro Industries, Inc. | | | 4,668 | | | | 314 | |
| | ESCO Technologies, Inc. | | | 5,620 | | | | 318 | |
| | Essendant, Inc. | | | 8,078 | | | | 169 | |
| | Exponent, Inc. | | | 5,593 | | | | 337 | |
| | Federal Signal Corp. | | | 13,090 | | | | 204 | |
| | Forward Air Corp. | | | 6,670 | | | | 316 | |
| | Franklin Electric Co., Inc. | | | 8,398 | | | | 327 | |
| | G & K Services, Inc. - Class A | | | 4,310 | | | | 416 | |
| | General Cable Corp. | | | 10,772 | | | | 205 | |
| * | | Gibraltar Industries, Inc. | | | 6,841 | | | | 285 | |
| | The Greenbrier Cos., Inc. | | | 6,199 | | | | 258 | |
| | Griffon Corp. | | | 6,496 | | | | 170 | |
The Accompanying Notes are an Integral Part of the Financial Statements.
| | | | | | |
| | Index 600 Stock Portfolio | | | 61 | |
Index 600 Stock Portfolio
| | | | | | | | | | |
| | | Common Stocks (91.1%) | | Shares/
$ Par | | | Value
$ (000’s) | |
| |
| | Industrials continued | |
| | Harsco Corp. | | | 17,520 | | | | 238 | |
| * | | Hawaiian Holdings, Inc. | | | 11,675 | | | | 665 | |
| | Healthcare Services Group, Inc. | | | 15,862 | | | | 621 | |
| | Heartland Express, Inc. | | | 9,464 | | | | 193 | |
| | Heidrick & Struggles International, Inc. | | | 4,061 | | | | 98 | |
| | Hillenbrand, Inc. | | | 13,779 | | | | 528 | |
| * | | Hub Group, Inc. - Class A | | | 7,254 | | | | 317 | |
| | Insperity, Inc. | | | 4,138 | | | | 294 | |
| | Insteel Industries, Inc. | | | 3,815 | | | | 136 | |
| | Interface, Inc. | | | 14,158 | | | | 263 | |
| | John Bean Technologies Corp. | | | 6,371 | | | | 548 | |
| | Kaman Corp. | | | 5,924 | | | | 290 | |
| | Kelly Services, Inc. - Class A | | | 6,388 | | | | 146 | |
| | Knight Transportation, Inc. | | | 14,516 | | | | 480 | |
| | Korn / Ferry International | | | 12,653 | | | | 372 | |
| | Lindsay Corp. | | | 2,323 | | | | 173 | |
| | LSC Communications, Inc. | | | 5,805 | | | | 172 | |
| * | | Lydall, Inc. | | | 3,749 | | | | 232 | |
| | Marten Transport, Ltd. | | | 5,053 | | | | 118 | |
| | Matson, Inc. | | | 9,361 | | | | 331 | |
| | Matthews International Corp. - Class A | | | 7,024 | | | | 540 | |
| * | | Mercury Systems, Inc. | | | 8,963 | | | | 271 | |
| | Mobile Mini, Inc. | | | 9,716 | | | | 294 | |
| * | | Moog, Inc. - Class A | | | 7,024 | | | | 461 | |
| | Mueller Industries, Inc. | | | 12,538 | | | | 501 | |
| | Multi-Color Corp. | | | 2,886 | | | | 224 | |
| * | | MYR Group, Inc. | | | 3,511 | | | | 132 | |
| | National Presto Industries, Inc. | | | 1,078 | | | | 115 | |
| * | | Navigant Consulting, Inc. | | | 10,284 | | | | 269 | |
| * | | On Assignment, Inc. | | | 10,642 | | | | 470 | |
| * | | Orion Group Holdings, Inc. | | | 6,049 | | | | 60 | |
| * | | Patrick Industries, Inc. | | | 3,183 | | | | 243 | |
| * | | PGT, Inc. | | | 10,707 | | | | 123 | |
| | Powell Industries, Inc. | | | 1,867 | | | | 73 | |
| * | | Proto Labs, Inc. | | | 5,314 | | | | 273 | |
| | Quanex Building Products Corp. | | | 7,477 | | | | 152 | |
| | Raven Industries, Inc. | | | 7,901 | | | | 199 | |
| | Resources Connection, Inc. | | | 6,451 | | | | 124 | |
| * | | Roadrunner Transportation Systems, Inc. | | | 6,619 | | | | 69 | |
| | RR Donnelley & Sons Co. | | | 15,253 | | | | 249 | |
| * | | Saia, Inc. | | | 5,472 | | | | 242 | |
| | Simpson Manufacturing Co., Inc. | | | 8,831 | | | | 386 | |
| | SkyWest, Inc. | | | 11,307 | | | | 412 | |
| * | | SPX Corp. | | | 9,153 | | | | 217 | |
| * | | SPX FLOW, Inc. | | | 9,155 | | | | 294 | |
| | | | | | | | | | |
| | | Common Stocks (91.1%) | | Shares/
$ Par | | | Value
$ (000’s) | |
| |
| | Industrials continued | |
| | Standex International Corp. | | | 2,785 | | | | 245 | |
| * | | TASER International, Inc. | | | 11,425 | | | | 277 | |
| * | | Team, Inc. | | | 6,445 | | | | 253 | |
| | Tennant Co. | | | 3,853 | | | | 274 | |
| | Tetra Tech, Inc. | | | 12,469 | | | | 538 | |
| | Titan International, Inc. | | | 9,568 | | | | 107 | |
| * | | Trex Co., Inc. | | | 6,423 | | | | 414 | |
| * | | TrueBlue, Inc. | | | 9,282 | | | | 229 | |
| | UniFirst Corp. | | | 3,370 | | | | 484 | |
| | Universal Forest Products, Inc. | | | 4,443 | | | | 454 | |
| | US Ecology, Inc. | | | 4,759 | | | | 234 | |
| * | | Veritiv Corp. | | | 2,057 | | | | 111 | |
| | Viad Corp. | | | 4,438 | | | | 196 | |
| * | | Vicor Corp. | | | 3,494 | | | | 53 | |
| | Wabash National Corp. | | | 13,556 | | | | 214 | |
| * | | WageWorks, Inc. | | | 8,007 | | | | 580 | |
| | Watts Water Technologies, Inc. - Class A | | | 6,086 | | | | 397 | |
| �� | | | | | | | | | |
| | Total | | | | | | | 29,162 | |
| | | | | | | | | | |
| |
| | Information Technology (13.9%) | |
| * | | 8x8, Inc. | | | 19,787 | | | | 283 | |
| | ADTRAN, Inc. | | | 10,576 | | | | 236 | |
| * | | Advanced Energy Industries, Inc. | | | 8,673 | | | | 475 | |
| * | | Agilysys, Inc. | | | 3,323 | | | | 34 | |
| * | | Anixter International, Inc. | | | 6,212 | | | | 504 | |
| | Badger Meter, Inc. | | | 6,361 | | | | 235 | |
| | Bel Fuse, Inc. - Class B | | | 1,898 | | | | 59 | |
| * | | Benchmark Electronics, Inc. | | | 10,681 | | | | 326 | |
| | Black Box Corp. | | | 3,310 | | | | 50 | |
| | Blackbaud, Inc. | | | 10,398 | | | | 665 | |
| * | | Blucora, Inc. | | | 8,387 | | | | 124 | |
| * | | Bottomline Technologies, Inc. | | | 7,987 | | | | 200 | |
| | Brooks Automation, Inc. | | | 15,082 | | | | 257 | |
| | Cabot Microelectronics Corp. | | | 5,294 | | | | 334 | |
| * | | CACI International, Inc. - Class A | | | 5,327 | | | | 662 | |
| * | | CalAmp Corp. | | | 7,939 | | | | 115 | |
| * | | Cardtronics PLC | | | 9,899 | | | | 540 | |
| * | | CEVA, Inc. | | | 4,639 | | | | 156 | |
| * | | Ciber, Inc. | | | 16,235 | | | | 10 | |
| * | | Coherent, Inc. | | | 5,365 | | | | 737 | |
| | Cohu, Inc. | | | 5,428 | | | | 75 | |
| | Comtech Telecommunications Corp. | | | 5,141 | | | | 61 | |
| * | | Cray, Inc. | | | 8,904 | | | | 184 | |
| | CSG Systems International, Inc. | | | 7,054 | | | | 341 | |
| | | | | | | | | | |
| | | Common Stocks (91.1%) | | Shares/
$ Par | | | Value
$ (000’s) | |
| |
| | Information Technology continued | |
| | CTS Corp. | | | 7,159 | | | | 160 | |
| | Daktronics, Inc. | | | 8,755 | | | | 94 | |
| * | | DHI Group, Inc. | | | 10,878 | | | | 68 | |
| * | | Digi International, Inc. | | | 5,673 | | | | 78 | |
| * | | Diodes, Inc. | | | 8,442 | | | | 217 | |
| * | | DSP Group, Inc. | | | 4,725 | | | | 62 | |
| | Ebix, Inc. | | | 4,887 | | | | 279 | |
| * | | Electro Scientific Industries, Inc. | | | 7,094 | | | | 42 | |
| * | | Electronics for Imaging, Inc. | | | 10,220 | | | | 448 | |
| * | | ePlus, Inc. | | | 1,439 | | | | 166 | |
| * | | Exar Corp. | | | 9,205 | | | | 99 | |
| * | | Exlservice Holdings, Inc. | | | 7,322 | | | | 369 | |
| * | | Fabrinet | | | 8,054 | | | | 325 | |
| * | | FARO Technologies, Inc. | | | 3,644 | | | | 131 | |
| | Forrester Research, Inc. | | | 2,190 | | | | 94 | |
| * | | Gerber Scientific, Inc. | | | 2,359 | | | | - | |
| * | | Harmonic, Inc. | | | 17,120 | | | | 86 | |
| * | | II-VI, Inc. | | | 11,840 | | | | 351 | |
| * | | Insight Enterprises, Inc. | | | 7,753 | | | | 314 | |
| * | | Itron, Inc. | | | 7,273 | | | | 457 | |
| * | | Ixia | | | 13,817 | | | | 222 | |
| * | | Kopin Corp. | | | 13,277 | | | | 38 | |
| * | | Kulicke and Soffa Industries, Inc. | | | 15,489 | | | | 247 | |
| * | | Liquidity Services, Inc. | | | 5,333 | | | | 52 | |
| * | | LivePerson, Inc. | | | 11,654 | | | | 88 | |
| | LogMeIn, Inc. | | | 5,569 | | | | 538 | |
| * | | Lumentum Holdings, Inc. | | | 11,957 | | | | 462 | |
| | ManTech International Corp. - Class A | | | 5,540 | | | | 234 | |
| | Methode Electronics, Inc. - Class A | | | 8,074 | | | | 334 | |
| * | | MicroStrategy, Inc. - Class A | | | 2,053 | | | | 405 | |
| | MKS Instruments, Inc. | | | 11,710 | | | | 696 | |
| | Monotype Imaging Holdings, Inc. | | | 9,096 | | | | 181 | |
| | MTS Systems Corp. | | | 3,644 | | | | 207 | |
| * | | Nanometrics, Inc. | | | 5,445 | | | | 136 | |
| * | | NETGEAR, Inc. | | | 7,228 | | | | 393 | |
| | NIC, Inc. | | | 13,553 | | | | 324 | |
| * | | OSI Systems, Inc. | | | 3,958 | | | | 301 | |
| | Park Electrochemical Corp. | | | 4,156 | | | | 78 | |
| * | | Perficient, Inc. | | | 7,879 | | | | 138 | |
| * | | Plexus Corp. | | | 7,324 | | | | 396 | |
| | Power Integrations, Inc. | | | 6,368 | | | | 432 | |
| | Progress Software Corp. | | | 10,618 | | | | 339 | |
| * | | Qualys, Inc. | | | 6,318 | | | | 200 | |
| * | | QuinStreet, Inc. | | | 7,899 | | | | 30 | |
| * | | Rambus, Inc. | | | 24,136 | | | | 332 | |
| * | | Rogers Corp. | | | 3,927 | | | | 302 | |
The Accompanying Notes are an Integral Part of the Financial Statements.
| | | | |
| 62 | | Index 600 Stock Portfolio | | |
Index 600 Stock Portfolio
| | | | | | | | | | |
| | | Common Stocks (91.1%) | | Shares/
$ Par | | | Value
$ (000’s) | |
| |
| | Information Technology continued | |
| * | | Rudolph Technologies, Inc. | | | 6,778 | | | | 158 | |
| * | | Sanmina Corp. | | | 16,044 | | | | 588 | |
| * | | ScanSource, Inc. | | | 5,496 | | | | 222 | |
| * | | Semtech Corp. | | | 14,343 | | | | 453 | |
| * | | Shutterstock, Inc. | | | 4,222 | | | | 201 | |
| * | | SPS Commerce, Inc. | | | 3,723 | | | | 260 | |
| * | | Stamps.com, Inc. | | | 3,465 | | | | 397 | |
| * | | Super Micro Computer, Inc. | | | 8,178 | | | | 229 | |
| * | | Sykes Enterprises, Inc. | | | 8,624 | | | | 249 | |
| * | | Synchronoss Technologies, Inc. | | | 9,209 | | | | 353 | |
| * | | Take-Two Interactive Software, Inc. | | | 18,915 | | | | 932 | |
| * | | Tangoe, Inc. | | | 5,084 | | | | 40 | |
| | TeleTech Holdings, Inc. | | | 3,453 | | | | 105 | |
| | Tessera Holding Corp. | | | 10,617 | | | | 469 | |
| * | | TiVo Corp. | | | 26,125 | | | | 546 | |
| * | | TTM Technologies, Inc. | | | 18,428 | | | | 251 | |
| * | | Ultratech, Inc. | | | 5,167 | | | | 124 | |
| * | | VASCO Data Security International, Inc. | | | 6,588 | | | | 90 | |
| * | | Veeco Instruments, Inc. | | | 8,874 | | | | 259 | |
| * | | Viavi Solutions, Inc. | | | 50,287 | | | | 411 | |
| * | | Virtusa Corp. | | | 6,023 | | | | 151 | |
| * | | XO Group, Inc. | | | 5,435 | | | | 106 | |
| | | | | | | | | | |
| | Total | | | | | | | 24,202 | |
| | | | | | | | | | |
| |
| | Materials (5.8%) | |
| | A. Schulman, Inc. | | | 6,411 | | | | 214 | |
| * | | AdvanSix, Inc. | | | 6,661 | | | | 147 | |
| * | | AK Steel Holding Corp. | | | 68,401 | | | | 698 | |
| | American Vanguard Corp. | | | 5,646 | | | | 108 | |
| | Balchem Corp. | | | 6,932 | | | | 582 | |
| * | | Boise Cascade Co. | | | 8,468 | | | | 191 | |
| | Calgon Carbon Corp. | | | 11,064 | | | | 188 | |
| * | | Century Aluminum Co. | | | 10,846 | | | | 93 | |
| | The Chemours Co. | | | 39,734 | | | | 878 | |
| * | | Clearwater Paper Corp. | | | 3,654 | | | | 240 | |
| | Deltic Timber Corp. | | | 2,312 | | | | 178 | |
| * | | Flotek Industries, Inc. | | | 11,771 | | | | 111 | |
| | FutureFuel Corp. | | | 4,968 | | | | 69 | |
| | H.B. Fuller Co. | | | 10,990 | | | | 531 | |
| | Hawkins, Inc. | | | 2,087 | | | | 113 | |
| | Haynes International, Inc. | | | 2,730 | | | | 117 | |
| * | | Headwaters, Inc. | | | 16,205 | | | | 381 | |
| * | | Ingevity Corp. | | | 9,203 | | | | 505 | |
| | Innophos Holdings, Inc. | | | 4,229 | | | | 221 | |
| | Innospec, Inc. | | | 5,241 | | | | 359 | |
| | Kaiser Aluminum Corp. | | | 3,914 | | | | 304 | |
| | KapStone Paper & Packaging Corp. | | | 19,215 | | | | 424 | |
| * | | Koppers Holdings, Inc. | | | 4,515 | | | | 182 | |
| | | | | | | | | | |
| | | Common Stocks (91.1%) | | Shares/
$ Par | | | Value
$ (000’s) | |
| |
| | Materials continued | |
| * | | Kraton Corp. | | | 6,756 | | | | 192 | |
| * | | LSB Industries, Inc. | | | 4,391 | | | | 37 | |
| | Materion Corp. | | | 4,357 | | | | 173 | |
| | Myers Industries, Inc. | | | 4,773 | | | | 68 | |
| | Neenah Paper, Inc. | | | 3,660 | | | | 312 | |
| | Olympic Steel, Inc. | | | 1,988 | | | | 48 | |
| | P.H. Glatfelter | | | 9,516 | | | | 227 | |
| | Quaker Chemical Corp. | | | 2,897 | | | | 371 | |
| | Rayonier Advanced Materials, Inc. | | | 9,455 | | | | 146 | |
| | Schweitzer-Mauduit International, Inc. | | | 6,673 | | | | 304 | |
| | Stepan Co. | | | 4,259 | | | | 347 | |
| * | | Stillwater Mining Co. | | | 26,458 | | | | 426 | |
| * | | SunCoke Energy, Inc. | | | 14,032 | | | | 159 | |
| * | | TimkenSteel Corp. | | | 8,504 | | | | 132 | |
| | Tredegar Corp. | | | 5,494 | | | | 132 | |
| * | | US Concrete, Inc. | | | 3,106 | | | | 203 | |
| | | | | | | | | | |
| | Total | | | | | | | 10,111 | |
| | | | | | | | | | |
| |
| | Real Estate (5.6%) | |
| | Acadia Realty Trust | | | 17,670 | | | | 577 | |
| | Agree Realty Corp. | | | 5,715 | | | | 263 | |
| | American Assets Trust, Inc. | | | 8,777 | | | | 378 | |
| | CareTrust REIT, Inc. | | | 14,074 | | | | 216 | |
| | Cedar Realty Trust, Inc. | | | 16,592 | | | | 108 | |
| | Chesapeake Lodging Trust | | | 13,133 | | | | 340 | |
| | CoreSite Realty Corp. | | | 7,407 | | | | 588 | |
| | DiamondRock Hospitality Co. | | | 43,773 | | | | 505 | |
| | EastGroup Properties, Inc. | | | 7,155 | | | | 528 | |
| * | | Forestar Group, Inc. | | | 5,802 | | | | 77 | |
| | Four Corners Property Trust, Inc. | | | 13,087 | | | | 269 | |
| | Franklin Street Properties Corp. | | | 23,432 | | | | 304 | |
| | The GEO Group, Inc. | | | 16,392 | | | | 589 | |
| | Getty Realty Corp. | | | 5,785 | | | | 147 | |
| | Government Properties Income Trust | | | 15,554 | | | | 296 | |
| | HFF, Inc. - Class A | | | 7,657 | | | | 232 | |
| | Kite Realty Group Trust | | | 18,256 | | | | 429 | |
| | Lexington Realty Trust | | | 46,628 | | | | 504 | |
| | LTC Properties, Inc. | | | 8,571 | | | | 403 | |
| * | | Parkway, Inc. | | | 9,337 | | | | 208 | |
| | Pennsylvania Real Estate Investment Trust | | | 15,195 | | | | 288 | |
| | PS Business Parks, Inc. | | | 4,267 | | | | 497 | |
| | RE/MAX Holdings, Inc. | | | 3,856 | | | | 216 | |
| | Retail Opportunity Investments Corp. | | | 23,884 | | | | 505 | |
| | Sabra Health Care REIT, Inc. | | | 14,261 | | | | 348 | |
| | Saul Centers, Inc. | | | 2,572 | | | | 171 | |
| | | | | | | | | | |
| | | Common Stocks (91.1%) | | Shares/
$ Par | | | Value
$ (000’s) | |
| |
| | Real Estate continued | |
| | Summit Hotel Properties, Inc. | | | 19,089 | | | | 306 | |
| | Universal Health Realty Income Trust | | | 2,734 | | | | 179 | |
| | Urstadt Biddle Properties, Inc. - Class A | | | 6,301 | | | | 152 | |
| | | | | | | | | | |
| | Total | | | | | | | 9,623 | |
| | | | | | | | | | |
| |
| | Telecommunication Services (1.0%) | |
| | ATN International, Inc. | | | 2,323 | | | | 186 | |
| * | | Cincinnati Bell, Inc. | | | 9,183 | | | | 205 | |
| | Cogent Communications Holdings, Inc. | | | 8,946 | | | | 370 | |
| | Consolidated Communications Holdings, Inc. | | | 11,069 | | | | 297 | |
| * | | General Communication, Inc. - Class A | | | 5,807 | | | | 113 | |
| | Inteliquent, Inc. | | | 7,522 | | | | 172 | |
| * | | Iridium Communications, Inc. | | | 17,579 | | | | 169 | |
| * | | Lumos Networks Corp. | | | 5,152 | | | | 81 | |
| | Spok Holdings, Inc. | | | 4,488 | | | | 93 | |
| | | | | | | | | | |
| | Total | | | | | | | 1,686 | |
| | | | | | | | | | |
| |
| | Utilities (2.3%) | |
| | ALLETE, Inc. | | | 10,808 | | | | 694 | |
| | American States Water Co. | | | 7,991 | | | | 364 | |
| | Avista Corp. | | | 14,025 | | | | 561 | |
| | California Water Service Group | | | 10,482 | | | | 355 | |
| | El Paso Electric Co. | | | 8,855 | | | | 412 | |
| | Northwest Natural Gas Co. | | | 6,243 | | | | 373 | |
| | South Jersey Industries, Inc. | | | 17,322 | | | | 584 | |
| | Spire, Inc. | | | 9,977 | | | | 644 | |
| | | | | | | | | | |
| | Total | | | | | | | 3,987 | |
| | | | | | | | | | |
| | | |
| | Total Common Stocks | | | | | | | | |
| | (Cost: $124,593) | | | | | | | 158,332 | |
| | | | | | | | | | |
| |
| | Investment Companies (1.9%) | |
| |
| | Investment Companies (1.9%) | |
| | iShares Core S&P Small-Cap ETF | | | 24,347 | | | | 3,348 | |
| | | | | | | | | | |
| | Total | | | | | | | 3,348 | |
| | | | | | | | | | |
| | |
| | Total Investment Companies | | | | | |
| | (Cost: $3,372) | | | | | | | 3,348 | |
| | | | | | | | | | |
The Accompanying Notes are an Integral Part of the Financial Statements.
| | | | | | |
| | Index 600 Stock Portfolio | | | 63 | |
Index 600 Stock Portfolio
| | | | | | | | | | |
| | | Short-Term Investments (4.6%) | | Shares/
$ Par | | | Value
$ (000’s) | |
| |
| | Commercial Paper (4.0%) | |
| (r) | | Apple, Inc., 0.600%, 2/2/17 144A | | | 1,000,000 | | | | 999 | |
| | Bank of America NA, 0.970%, 1/4/17 144A | | | 1,000,000 | | | | 1,000 | |
| (r) | | Microsoft Corp., 0.580%, 1/4/17 144A | | | 500,000 | | | | 500 | |
| (r) | | Microsoft Corp., 0.600%, 1/10/17 144A | | | 500,000 | | | | 500 | |
| (r) | | Pfizer, Inc., 0.700%, 2/21/17 144A | | | 500,000 | | | | 500 | |
| | | | | | | | | | |
| | | Short-Term Investments (4.6%) | | Shares/
$ Par | | | Value
$ (000’s) | |
| |
| | Commercial Paper continued | |
| (r) | | Pfizer, Inc., 0.740%, 3/9/17 144A | | | 500,000 | | | | 499 | |
| (r) | | Roche Holdings, Inc., 0.480%, 1/31/17 144A | | | 1,000,000 | | | | 999 | |
| (r) | | Societe Generale, 0.940%, 2/27/17 144A | | | 1,000,000 | | | | 999 | |
| (r) | | The Walt Disney Co., 0.580%, 1/20/17 144A | | | 500,000 | | | | 500 | |
| (r) | | The Walt Disney Co., 0.580%, 1/30/17 144A | | | 500,000 | | | | 500 | |
| | | | | | | | | | |
| | Total | | | | | | | 6,996 | |
| | | | | | | | | | |
| | | | | | | | | | |
| | | Short-Term Investments
(4.6%) | | Shares/
$ Par | | | Value
$ (000’s) | |
| |
| | US Government & Agencies (0.6%) | |
| (k,r) | | Federal Home Loan Bank,
0.490%, 2/9/17 | | | 500,000 | | | | 500 | |
| (r) | | Federal Home Loan Bank,
0.510%, 2/22/13 | | | 500,000 | | | | 500 | |
| | | | | | | | | | |
| | Total | | | | | | | 1,000 | |
| | | | | | | | | | |
| |
| | Total Short-Term Investments | |
| | (Cost: $7,995) | | | | | | | 7,996 | |
| | | | | | | | | | |
| |
| | Total Investments (97.6%) | |
| | (Cost: $135,960)(a) | | | | 169,676 | |
| | | | | | | | | | |
| | Other Assets, Less | | | | | |
| | Liabilities (2.4%) | | | | 4,207 | |
| | | | | | | | | | |
| | Net Assets (100.0%) | | | | 173,883 | |
| | | | | | | | | | |
| | 144A after the name of a security represents a security exempt from registration under Rule 144A of the Securities Act of 1933. These securities may be resold as transactions exempt from registration, normally to qualified institutional buyers. At December 31, 2016 the value of these securities (in thousands) was $6,996 representing 4.0% of the net assets. |
| (a) | At December 31, 2016, the aggregate cost of securities for federal tax purposes (in thousands) was $136,248 and the net unrealized appreciation of investments based on that cost was $33,428 which is comprised of $39,942 aggregate gross unrealized appreciation and $6,514 aggregate gross unrealized depreciation. |
| (j) | Swap agreements outstanding on December 31, 2016. |
Total Return Swaps
| | | | | | | | | | | | | | |
| Reference Entity | | Counterparty | | Payment Made
by the Fund | | Payment
Received by the
Fund | | Expiration Date | | Notional
Amount (000’s) | | Unrealized
Appreciation/
(Depreciation)
(000’s) | |
S&P SmallCap 600 Index | | JP Morgan Chase London | | 1-Month USD Libor +1 Basis Point (Bps) | | S&P SmallCap 600 Index | | 5/17 | | 11,927 | | $ | (50 | ) |
| (k) | Cash or securities with an aggregate value of $500 (in thousands) has been pledged as collateral for swap contracts outstanding, short sales or written options on December 31, 2016. |
| (r) | Rates are discount rates at the time of purchase. |
The Accompanying Notes are an Integral Part of the Financial Statements.
| | | | |
| 64 | | Index 600 Stock Portfolio | | |
Index 600 Stock Portfolio
The following is a summary of the inputs used in valuing the Portfolio’s assets and liabilities at December 31, 2016. See Note 3 for additional information on portfolio valuation.
| | | | | | | | | | | | | | |
| | | Valuation Inputs | | | |
| Description | | Level 1 – Quoted Prices | | | Level 2 –
Other Significant
Observable Inputs | | | Level 3 – Significant
Unobservable Inputs | | | |
| | | | | | (Amounts in thousands) | | | | | | |
Assets: | | | | | | | | | | | | | | |
Domestic Common Stocks | | $ | 158,332 | | | $ | - | | | $ | - | | | |
Investment Companies | | | 3,348 | | | | - | | | | - | | | |
Short-Term Investments | | | - | | | | 7,996 | | | | - | | | |
Total Assets: | | $ | 161,680 | | | $ | 7,996 | | | $ | - | | | |
Liabilities: | | | | | | | | | | | | | | |
Other Financial Instruments^ | | | | | | | | | | | | | | |
Total Return Swaps | | | - | | | | (50 | ) | | | - | | | |
Total Liabilities: | | $ | - | | | $ | (50 | ) | | $ | - | | | |
^ Other financial instruments are derivative instruments such as futures, forwards, written options and swaps contracts, which are valued at the unrealized appreciation (depreciation) on the instrument and short sales, which are valued at market value.
The Accompanying Notes are an Integral Part of the Financial Statements.
| | | | | | |
| | Index 600 Stock Portfolio | | | 65 | |
Small Cap Value Portfolio
| | | | |
| Objective: | | Portfolio Strategy: | | Net Assets: |
| Long-term growth of capital. | | Invest primarily in common stocks of small-sized companies believed to be undervalued. | | $648 million |
Portfolio Overview
Mason Street Advisors, LLC, the investment adviser for the Small Cap Value Portfolio (“the Portfolio”), has engaged T. Rowe Price Associates, Inc. (“T. Rowe Price”) to act as sub-adviser for the Portfolio. Normally, the Portfolio invests in common stocks of companies with market capitalizations that do not exceed the maximum market capitalization of any security in the Russell 2000® Index at the time of purchase. Reflecting a value approach to investing, the Portfolio will seek the stocks of companies whose current stock prices do not appear to adequately reflect their underlying value as measured by assets, earnings, cash flow or business franchises.
Market Overview
Despite a sharp sell-off at the beginning of the year, U.S. stocks rose in 2016, with major indices reaching record highs near year-end. As measured by the various Russell indices, small- and mid-cap stocks substantially outperformed large-caps.
U.S. economic growth picked up in the second half of 2016 after a sluggish first half. According to the Commerce Department’s latest estimate, third quarter gross domestic product grew at an annualized pace of 3.5%, following readings of 0.8% and 1.4% in the first and second quarters, respectively. Although the pace of employment growth moderated, the labor market remained strong, wage growth accelerated and overall inflation pressures firmed as commodity prices rebounded from early-2016 lows.
Portfolio Results
The Portfolio returned 32.39% for the twelve months ended December 31, 2016. By comparison, the Portfolio’s benchmark, the Russell 2000® Value Index (the “Index”), returned 31.74%. (The Index is unmanaged, cannot be invested in directly and does not include administrative expenses or sales charges.) According to Lipper® Analytical Services, Inc., an independent mutual fund ranking agency, the average return of the Small Cap Value Funds peer group was 27.76% for 2016.
The Portfolio’s outperformance of the Index was primarily due to stock selection. The Consumer Discretionary sector added the most value to relative performance, driven by stock choices that more than made up for a detrimental overweight to the group. Lippert Components, Inc., a supplier of components for recreational vehicles and manufactured housing, saw a turn in financial status, as dealers became more comfortable maintaining inventory and the manufactured housing market saw a marked improvement.
Stock selection made the Health Care sector another source of relative strength, offsetting the negative effect of an overweight allocation to the sector. WellCare Health Plans, Inc., a large Medicaid managed care company, benefited from health care policy continuing to move in a direction that seeks to expand patient access to care while reducing costs and improving quality.
Information Technology, Industrials and Business Services were also sources of relative strength, due primarily to stock selection.
The Materials sector detracted the most from relative performance due to weak stock selection, which was partially offset by its overweight position. Myers Industries, Inc., a polymer manufacturer, suffered amid slow industrial activity, low agricultural commodity pricing and weak tire shipments. Improvements in upcoming years were expected due to a new chief executive officer and streamlined business processes.
Stock selection and underweighting in the Financials sector also detracted from relative results. For BankUnited, Inc., shares had performed strongly for several years through the end of 2015, but the continuance of a low interest rate environment, exacerbated by the fallout from the recent vote by the United Kingdom to leave the European Union, or “Brexit,” and its impact on the U.S. Federal Reserve Bank’s ability to raise key rates, negatively impacted interest rate-sensitive industries like regional banks. The final quarter of 2016 did show a turnaround in the banking industry, including for BankUnited, Inc.
Portfolio Manager Outlook
The following forward-looking comments are the opinion of T. Rowe Price, the Portfolio’s sub-adviser.
We are still assessing the effects the new Trump administration will have on U.S. stocks. On the policy side, we are carefully watching actions by Congress and cabinet appointments to ascertain the policies and priorities of the new administration. The possibility of a sharp rise in interest rates is another concern for stock investors. Higher coupon returns from bonds could draw assets away from equities, and higher rates would mean increased borrowing costs and lower profits for corporations.
| | | | |
| 66 | | Small Cap Value Portfolio | | |
Small Cap Value Portfolio
However, we believe that a moderate increase does not necessarily pose a threat to equity valuations. Stock prices have historically been able to rise alongside interest rates, particularly when yields have remained under five percent (the yield on the ten-year Treasury note was 2.45% on December 31st).
Relative Performance
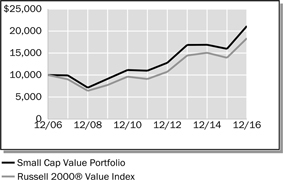
| | | | | | | | | | | | |
Average Annual Total Returns
For Periods Ended December 31, 2016 | |
| | | 1 Year | | | 5 Years | | | 10 Years | |
Small Cap Value Portfolio | | | 32.39 | % | | | 13.97 | % | | | 7.77 | % |
Russell 2000® Value Index | | | 31.74 | % | | | 15.07 | % | | | 6.26 | % |
Lipper® Variable Insurance Products (VIP) Small Cap Value Funds Average | | | 27.76 | % | | | 14.61 | % | | | 7.10 | % |
The performance data quoted represents past performance. Past performance is historical and does not guarantee future performance. Investment return and principal value will fluctuate, so that shares, when redeemed, may be worth more or less than their original cost. Current performance may be lower or higher than the performance data quoted. For the most recent month-end performance information visit www.northwesternmutual.com.
This chart assumes an initial investment of $10,000 made on 12/31/06. Returns shown reflect fee waivers, deductions for management and other portfolio expenses, and reinvestment of all dividends. In the absence of fee waivers, total return would be reduced. Returns exclude deductions for separate account sale loads and account fees. Please refer to the Benchmark Definitions section of this report for information about the indices cited in the above chart and graph.
Stocks of smaller or newer companies, such as those held in this Portfolio, are more likely to realize more substantial growth as well as suffer more significant losses than larger or more established issuers. Investments in such companies can be both more volatile and more speculative. Investing in small company stocks involves a greater degree of risk than investing in medium or large company stocks.
The Portfolio may invest a apportion of its assets in other investment companies, including open-end and closed-end funds, exchange-traded funds (“ETFs”), and business development companies (“BDCs”), and will bear its pro rata portion of such expenses. The market prices of ETFs, closed-end funds and BDCs may trade at a premium or discount to their net asset values and may be subject to a trading halts by the applicable exchange, which may negatively impact the Portfolio. BDCs in particular may be less liquid and more adversely affected by poor economic or market conditions.
The Portfolio may invest a relatively high percentage of its assets in a particular sector. The Portfolio will have greater exposure to the risks associated with that sector and its performance will be tied more closely to the performance of the sector.
Top 10 Equity Holdings 12/31/16
| | | | | | |
| | | Security Description | | | % of Net Assets | |
| | | Home BancShares, Inc. | | | 2.3 | % |
| | | East West Bancorp, Inc. | | | 1.6 | % |
| | | Landstar System, Inc. | | | 1.6 | % |
| | | Littelfuse, Inc. | | | 1.4 | % |
| | | SVB Financial Group | | | 1.4 | % |
| | | Belden, Inc. | | | 1.4 | % |
| | | West Pharmaceutical Services, Inc. | | | 1.2 | % |
| | | Prosperity Bancshares, Inc. | | | 1.2 | % |
| | | BankUnited, Inc. | | | 1.2 | % |
| | | Columbia Banking System, Inc. | | | 1.2 | % |
Sector Allocation 12/31/16
Sector Allocation is based on Net Assets.
Sector Allocation and Top 10 Holdings are subject to change.
| | | | | | |
| | Small Cap Value Portfolio | | | 67 | |
Small Cap Value Portfolio
Schedule of Investments
December 31, 2016
| | | | | | | | | | |
| | | Common Stocks (98.2%) | | Shares/
$ Par | | | Value
$ (000’s) | |
| |
| | Consumer Discretionary (12.4%) | |
| | Aaron’s, Inc. | | | 173,900 | | | | 5,563 | |
| * | | American Public Education, Inc. | | | 99,700 | | | | 2,448 | |
| | BankUnited, Inc. | | | 210,700 | | | | 7,941 | |
| | Cable One, Inc. | | | 4,900 | | | | 3,046 | |
| | Capella Education Co. | | | 61,800 | | | | 5,426 | |
| * | | Cavco Industries, Inc. | | | 36,700 | | | | 3,664 | |
| * | | Crocs, Inc. | | | 113,200 | | | | 777 | |
| | Culp, Inc. | | | 95,500 | | | | 3,548 | |
| * | | Dorman Products, Inc. | | | 75,600 | | | | 5,523 | |
| | Drew Industries, Inc. | | | 72,000 | | | | 7,758 | |
| | Ethan Allen Interiors, Inc. | | | 81,200 | | | | 2,992 | |
| | Fred’s, Inc. - Class A | | | 124,359 | | | | 2,308 | |
| * | | Genesco, Inc. | | | 30,300 | | | | 1,882 | |
| | ILG, Inc. | | | 134,100 | | | | 2,437 | |
| * | | Lumber Liquidators Holdings, Inc. | | | 125,600 | | | | 1,977 | |
| | New Media Investment Group, Inc. | | | 211,400 | | | | 3,380 | |
| * | | Party City Holdco, Inc. | | | 102,200 | | | | 1,451 | |
| | Pier 1 Imports, Inc. | | | 117,272 | | | | 1,002 | |
| | Pool Corp. | | | 65,000 | | | | 6,782 | |
| * | | Red Robin Gourmet Burgers, Inc. | | | 43,000 | | | | 2,425 | |
| | Scholastic Corp. | | | 51,900 | | | | 2,465 | |
| * | | Sportsman’s Warehouse Holdings, Inc. | | | 170,668 | | | | 1,603 | |
| * | | Steven Madden, Ltd. | | | 103,400 | | | | 3,697 | |
| | | | | | | | | | |
| | Total | | | | | | | 80,095 | |
| | | | | | | | | | |
| |
| | Consumer Staples (3.6%) | |
| | Energizer Holdings, Inc. | | | 73,500 | | | | 3,279 | |
| * | | Nomad Foods, Ltd. | | | 351,500 | | | | 3,364 | |
| | Pinnacle Foods, Inc. | | | 56,100 | | | | 2,999 | |
| * | | Post Holdings, Inc. | | | 40,200 | | | | 3,232 | |
| | PriceSmart, Inc. | | | 45,822 | | | | 3,826 | |
| | SpartanNash Co. | | | 112,200 | | | | 4,436 | |
| | Vector Group, Ltd. | | | 98,248 | | | | 2,234 | |
| | | | | | | | | | |
| | Total | | | | | | | 23,370 | |
| | | | | | | | | | |
| |
| | Energy (4.1%) | |
| * | | Matador Resources Co. | | | 214,500 | | | | 5,525 | |
| | Oceaneering International, Inc. | | | 90,900 | | | | 2,564 | |
| * | | Parsley Energy, Inc. - Class A | | | 106,400 | | | | 3,750 | |
| * | | Rice Energy, Inc. | | | 113,800 | | | | 2,430 | |
| * | | Tesco Corp. | | | 292,000 | | | | 2,409 | |
| * | | TETRA Technologies, Inc. | | | 337,800 | | | | 1,696 | |
| | Western Refining, Inc. | | | 93,400 | | | | 3,535 | |
| * | | WPX Energy, Inc. | | | 334,200 | | | | 4,869 | |
| | | | | | | | | | |
| | Total | | | | | | | 26,778 | |
| | | | | | | | | | |
| | | | | | | | | | |
| | | Common Stocks (98.2%) | | Shares/
$ Par | | | Value
$ (000’s) | |
| |
| | Financials (29.7%) | |
| | Assured Guaranty, Ltd. | �� | | 99,100 | | | | 3,743 | |
| | Bats Global Markets, Inc. | | | 101,629 | | | | 3,406 | |
| | Beneficial Bancorp, Inc. | | | 271,039 | | | | 4,987 | |
| | CoBiz Financial, Inc. | | | 207,300 | | | | 3,501 | |
| | Columbia Banking System, Inc. | | | 175,500 | | | | 7,841 | |
| | Compass Diversified Holdings | | | 149,400 | | | | 2,674 | |
| * | | Conyers Park Acquisition Corp. | | | 95,100 | | | | 1,032 | |
| | East West Bancorp, Inc. | | | 209,098 | | | | 10,628 | |
| | Employers Holdings, Inc. | | | 93,200 | | | | 3,691 | |
| | First Hawaiian, Inc. | | | 76,585 | | | | 2,667 | |
| | Glacier Bancorp, Inc. | | | 169,600 | | | | 6,145 | |
| * | | Green Dot Corp. - Class A | | | 143,000 | | | | 3,368 | |
| | Hannon Armstrong Sustainable Infrastructure Capital, Inc. | | | 177,600 | | | | 3,373 | |
| | Hercules Capital, Inc. | | | 313,300 | | | | 4,421 | |
| | Home BancShares, Inc. | | | 532,900 | | | | 14,799 | |
| | Hope Bancorp, Inc. | | | 225,600 | | | | 4,938 | |
| | Houlihan Lokey, Inc. | | | 57,275 | | | | 1,782 | |
| | Janus Capital Group, Inc. | | | 191,400 | | | | 2,540 | |
| | Kinsale Capital Group, Inc. | | | 62,524 | | | | 2,126 | |
| | Main Street Capital Corp. | | | 68,500 | | | | 2,519 | |
| | McGrath RentCorp | | | 97,708 | | | | 3,829 | |
| | Meridian Bancorp, Inc. | | | 109,500 | | | | 2,070 | |
| | National Bank Holdings Corp. - Class A | | | 162,200 | | | | 5,173 | |
| | Pinnacle Financial Partners, Inc. | | | 46,800 | | | | 3,243 | |
| | Popular, Inc. | | | 155,500 | | | | 6,814 | |
| | ProAssurance Corp. | | | 124,700 | | | | 7,008 | |
| | Prosperity Bancshares, Inc. | | | 110,800 | | | | 7,953 | |
| | Radian Group, Inc. | | | 313,700 | | | | 5,640 | |
| | Redwood Trust, Inc. | | | 164,300 | | | | 2,499 | |
| | RenaissanceRe Holdings, Ltd. | | | 11,800 | | | | 1,607 | |
| * | | Safeguard Scientifics, Inc. | | | 114,500 | | | | 1,540 | |
| | Safety Insurance Group, Inc. | | | 34,100 | | | | 2,513 | |
| | Sandy Spring Bancorp, Inc. | | | 46,100 | | | | 1,844 | |
| | State Auto Financial Corp. | | | 105,400 | | | | 2,826 | |
| * | | Stifel Financial Corp. | | | 37,900 | | | | 1,893 | |
| * | | SVB Financial Group | | | 52,300 | | | | 8,978 | |
| | Synovus Financial Corp. | | | 62,400 | | | | 2,563 | |
| * | | Texas Capital Bancshares, Inc. | | | 56,700 | | | | 4,445 | |
| | Towne Bank | | | 216,600 | | | | 7,202 | |
| | TPG Specialty Lending, Inc. | | | 129,700 | | | | 2,423 | |
| | | | | | | | | | |
| | | Common Stocks (98.2%) | | Shares/
$ Par | | | Value
$ (000’s) | |
| |
| | Financials continued | |
| | United Financial Bancorp, Inc. | | | 265,600 | | | | 4,823 | |
| | Webster Financial Corp. | | | 101,533 | | | | 5,511 | |
| | Wintrust Financial Corp. | | | 73,600 | | | | 5,341 | |
| | WSFS Financial Corp. | | | 91,000 | | | | 4,218 | |
| | | | | | | | | | |
| | Total | | | | | | | 192,137 | |
| | | | | | | | | | |
| |
| | Health Care (6.6%) | |
| | Analogic Corp. | | | 32,300 | | | | 2,679 | |
| | Atrion Corp. | | | 13,200 | | | | 6,695 | |
| | Ensign Group, Inc. | | | 49,000 | | | | 1,088 | |
| * | | Haemonetics Corp. | | | 115,410 | | | | 4,640 | |
| * | | Halyard Health, Inc. | | | 132,240 | | | | 4,890 | |
| | National HealthCare Corp. | | | 30,800 | | | | 2,334 | |
| * | | Quidel Corp. | | | 158,900 | | | | 3,404 | |
| * | | Select Medical Holdings Corp. | | | 191,300 | | | | 2,535 | |
| * | | Triple-S Management Corp. - Class B | | | 83,000 | | | | 1,718 | |
| * | | WellCare Health Plans, Inc. | | | 34,300 | | | | 4,702 | |
| | West Pharmaceutical Services, Inc. | | | 94,000 | | | | 7,974 | |
| | | | | | | | | | |
| | Total | | | | | | | 42,659 | |
| | | | | | | | | | |
| |
| | Industrials (13.1%) | |
| * | | Aegion Corp. | | | 194,700 | | | | 4,614 | |
| | Applied Industrial Technologies, Inc. | | | 62,000 | | | | 3,683 | |
| * | | Beacon Roofing Supply, Inc. | | | 105,500 | | | | 4,860 | |
| | Brady Corp. - Class A | | | 88,500 | | | | 3,323 | |
| | CIRCOR International, Inc. | | | 59,000 | | | | 3,828 | |
| * | | Colfax Corp. | | | 67,300 | | | | 2,418 | |
| | CSS Industries, Inc. | | | 89,100 | | | | 2,412 | |
| | ESCO Technologies, Inc. | | | 109,000 | | | | 6,175 | |
| * | | FTI Consulting, Inc. | | | 69,200 | | | | 3,119 | |
| * | | Genesee & Wyoming, Inc. - Class A | | | 63,300 | | | | 4,394 | |
| | Hillenbrand, Inc. | | | 59,790 | | | | 2,293 | |
| | Kaman Corp. | | | 50,900 | | | | 2,491 | |
| * | | Kirby Corp. | | | 40,400 | | | | 2,687 | |
| | KMG Chemicals, Inc. | | | 97,200 | | | | 3,780 | |
| | Landstar System, Inc. | | | 119,000 | | | | 10,151 | |
| | Matthews International Corp. - Class A | | | 36,200 | | | | 2,782 | |
| | MSA Safety, Inc. | | | 35,500 | | | | 2,461 | |
| * | | Navigant Consulting, Inc. | | | 192,700 | | | | 5,045 | |
| * | | RBC Bearings, Inc. | | | 37,900 | | | | 3,517 | |
| | Sun Hydraulics Corp. | | | 73,800 | | | | 2,950 | |
| | Triumph Group, Inc. | | | 82,200 | | | | 2,178 | |
| | Universal Forest Products, Inc. | | | 40,700 | | | | 4,159 | |
The Accompanying Notes are an Integral Part of the Financial Statements.
| | | | |
| 68 | | Small Cap Value Portfolio | | |
Small Cap Value Portfolio
| | | | | | | | | | |
| | | Common Stocks (98.2%) | | Shares/
$ Par | | | Value
$ (000’s) | |
| |
| | Industrials continued | |
| | Universal Logistics Holdings, Inc. | | | 116,593 | | | | 1,906 | |
| | | | | | | | | | |
| | Total | | | | | | | 85,226 | |
| | | | | | | | | | |
| |
| | Information Technology (10.5%) | |
| * | | Advanced Energy Industries, Inc. | | | 80,600 | | | | 4,413 | |
| | Badger Meter, Inc. | | | 83,400 | | | | 3,082 | |
| | Belden, Inc. | | | 118,800 | | | | 8,883 | |
| | Brooks Automation, Inc. | | | 155,000 | | | | 2,646 | |
| | Cabot Microelectronics Corp. | | | 56,900 | | | | 3,594 | |
| * | | Callidus Software, Inc. | | | 151,600 | | | | 2,547 | |
| | CSRA, Inc. | | | 111,600 | | | | 3,553 | |
| * | | Harmonic, Inc. | | | 506,200 | | | | 2,531 | |
| | Intersil Corp. - Class A | | | 171,700 | | | | 3,829 | |
| * | | Ixia | | | 239,700 | | | | 3,859 | |
| * | | Knowles Corp. | | | 281,600 | | | | 4,705 | |
| | Littelfuse, Inc. | | | 59,300 | | | | 9,000 | |
| | Methode Electronics, Inc. - Class A | | | 84,600 | | | | 3,498 | |
| | Progress Software Corp. | | | 120,700 | | | | 3,854 | |
| * | | Rightside Group, Ltd. | | | 102,586 | | | | 848 | |
| * | | Rudolph Technologies, Inc. | | | 80,800 | | | | 1,887 | |
| | SYNNEX Corp. | | | 44,700 | | | | 5,410 | |
| | | | | | | | | | |
| | Total | | | | | | | 68,139 | |
| | | | | | | | | | |
| |
| | Materials (4.3%) | |
| | American Vanguard Corp. | | | 132,400 | | | | 2,535 | |
| | Carpenter Technology Corp. | | | 107,500 | | | | 3,888 | |
| | | | | | | | | | |
| | | Common Stocks (98.2%) | | Shares/
$ Par | | | Value
$ (000’s) | |
| |
| | Materials continued | |
| * | | Clearwater Paper Corp. | | | 81,900 | | | | 5,369 | |
| | Innospec, Inc. | | | 39,195 | | | | 2,685 | |
| | Minerals Technologies, Inc. | | | 85,700 | | | | 6,620 | |
| | Myers Industries, Inc. | | | 266,937 | | | | 3,817 | |
| | Reliance Steel & Aluminum Co. | | | 35,500 | | | | 2,824 | |
| | | | | | | | | | |
| | Total | | | | | | | 27,738 | |
| | | | | | | | | | |
| |
| | Real Estate (8.0%) | |
| | Acadia Realty Trust | | | 145,000 | | | | 4,739 | |
| | American Assets Trust, Inc. | | | 36,600 | | | | 1,577 | |
| | American Campus Communities, Inc. | | | 60,000 | | | | 2,986 | |
| | Cedar Realty Trust, Inc. | | | 699,605 | | | | 4,568 | |
| | Douglas Emmett, Inc. | | | 89,500 | | | | 3,272 | |
| | EastGroup Properties, Inc. | | | 60,300 | | | | 4,453 | |
| | First Potomac Realty Trust | | | 380,060 | | | | 4,169 | |
| | Healthcare Realty Trust, Inc. | | | 91,200 | | | | 2,765 | |
| | Kilroy Realty Corp. | | | 54,900 | | | | 4,020 | |
| | Potlatch Corp. | | | 93,000 | | | | 3,873 | |
| | PS Business Parks, Inc. | | | 37,800 | | | | 4,404 | |
| | Retail Opportunity Investments Corp. | | | 104,900 | | | | 2,217 | |
| | Saul Centers, Inc. | | | 69,400 | | | | 4,623 | |
| | Washington Real Estate Investment Trust | | | 131,400 | | | | 4,296 | |
| | | | | | | | | | |
| | Total | | | | | | | 51,962 | |
| | | | | | | | | | |
| | | | | | | | | | |
| | | Common Stocks (98.2%) | | Shares/
$ Par | | | Value
$ (000’s) | |
| |
| | Utilities (5.9%) | |
| | Atmos Energy Corp. | | | 35,500 | | | | 2,632 | |
| | California Water Service Group | | | 44,600 | | | | 1,512 | |
| | Chesapeake Utilities Corp. | | | 80,800 | | | | 5,410 | |
| | El Paso Electric Co. | | | 68,300 | | | | 3,176 | |
| | NorthWestern Corp. | | | 91,200 | | | | 5,187 | |
| | NRG Energy, Inc. | | | 193,900 | | | | 2,377 | |
| | ONE Gas, Inc. | | | 105,900 | | | | 6,773 | |
| | PNM Resources, Inc. | | | 205,200 | | | | 7,038 | |
| | Portland General Electric Co. | | | 89,500 | | | | 3,878 | |
| | | | | | | | | | |
| | Total | | | | | | | 37,983 | |
| | | | | | | | | | |
| | Total Common Stocks | | | | | | | | |
| | (Cost: $425,941) | | | | | | | 636,087 | |
| | | | | | | | | | |
| | |
| | Total Investments (98.2%) | | | | | |
| | (Cost: $425,941)(a) | | | | | | | 636,087 | |
| | | | | | | | | | |
| | Other Assets, Less | | | | | | | 11,743 | |
| | Liabilities (1.8%) | | | | | | | | |
| | | | | | | | | | |
| | Net Assets (100.0%) | | | | | | | 647,830 | |
| | | | | | | | | | |
| (a) | At December 31, 2016, the aggregate cost of securities for federal tax purposes (in thousands) was $426,682 and the net unrealized appreciation of investments based on that cost was $209,405 which is comprised of $219,18,5 aggregate gross unrealized appreciation and $9,780 aggregate gross unrealized depreciation. |
The following is a summary of the inputs used in valuing the Portfolio’s assets and liabilities at December 31, 2016. See Note 3 for additional information on portfolio valuation.
| | | | | | | | | | | | | | |
| | | Valuation Inputs | | | |
| Description | | Level 1 –
Quoted Prices | | | Level 2 – Other Significant
Observable Inputs | | | Level 3 –
Significant
Unobservable Inputs | | | |
| | | (Amounts in thousands) | | | |
Assets: | | | | | | | | | | | | | | |
Domestic Common Stocks | | $ | 636,087 | | | $ | - | | | $ | - | | | |
Total Assets: | | $ | 636,087 | | | $ | - | | | $ | - | | | |
The Accompanying Notes are an Integral Part of the Financial Statements.
| | | | | | |
| | Small Cap Value Portfolio | | | 69 | |
International Growth Portfolio (unaudited)
| | | | |
| Objective: | | Portfolio Strategy: | | Net Assets: |
| Long-term growth of capital. | | Invest in securities of issuers from countries outside the U.S. that have above average growth potential. | | $523 million |
Portfolio Overview
Mason Street Advisors, LLC (“Mason Street Advisors”), the investment adviser for the International Growth Portfolio (the “Portfolio”), has engaged FIAM LLC (“FIAM”) to act as sub-adviser for the Portfolio. FIAM is an indirect, wholly owned subsidiary of FMR LLC (along with its affiliates, “Fidelity Investments”). Normally, the Portfolio will invest in the securities of issuers from countries outside the United States. The Portfolio invests in companies it believes operate in a market environment, or with a competitive advantage, that make it difficult for competition to disrupt current and future profitability, in combination with growth drivers that may offer above-average growth potential measured by factors such as earnings or revenue. In buying and selling securities for the Portfolio, the portfolio manager relies on fundamental analysis, which involves a “bottom-up” assessment of a company’s potential for success in light of factors such as its financial condition, earnings outlook, strategy, management, industry position and economic and market conditions.
Market Overview
Following the November election of Donald Trump as the next U.S. president, the biggest winners worldwide were more economically-sensitive companies with very cheap stock prices, a relatively high level of debt on their balance sheets and above-average volatility—the kind of companies the Portfolio tends not to invest in. In addition, many overseas equity markets faced political uncertainties and currency headwinds from the strong U.S. dollar. Within the MSCI EAFE® Growth Index, U.K. stocks posted a modest decline in U.S. dollar terms, as the country continued to struggle with the after-effects of its June vote to leave the European Union, or Brexit. Returns in Japan were basically flat and returns in continental Europe were modestly negative. Central banks remained accommodative, with ultra-low and negative interest rates amid a stabilizing but still sluggish economic backdrop. However, stocks in many emerging markets declined, hurt by the strong U.S. dollar and the prospect of higher U.S. interest rates.
Portfolio Results
The Portfolio returned (3.41%) for the twelve months ended December 31, 2016. By comparison, the Portfolio’s benchmark, the MSCI EAFE® Growth Index (the “Index”), returned (2.66%). (The Index is unmanaged, cannot be invested in directly and does not include administrative expenses or sales charges.) According to Lipper® Analytical Services, Inc., an independent mutual fund ranking agency, the average return of the International Multi-Cap Growth Funds peer group was (1.09%) for 2016.
Underweights in the Industrials and Materials sectors hurt relative results during the year. These sectors, which were heavily populated by cyclical businesses with higher debt loads, are not typically favored by the Portfolio’s investment process. Stock selection in the Industrials and Consumer Staples sectors also weighed down relative returns.
Weak performance in the Industrials sector was driven by an out-of-benchmark position in Berendsen PLC, a provider of uniform and linen services to hospitals, hotels and restaurants in the U.K. and several other European countries. After the “Brexit” vote, the company issued its first profit warning since 2008. The sharply negative market reaction appeared overdone given that Berendsen PLC’s business mix had become less cyclical over the past several years. The portfolio manager continued to monitor the company for signs that pricing power may be waning.
Within the Consumer Staples sector, overweights in Associated British Foods PLC, Anheuser-Busch Inbev NV and Japan Tobacco, Inc. hurt. Associated British Foods PLC, the parent company of value apparel retailer Primark Stores Limited, was hit hard by the “Brexit” vote. The retailer relies on overseas manufacturing and favorable E.U. trade regulations. Margins in the company’s food business were also squeezed by rising input costs during the year. Anheuser-Busch Inbev NV and Japan Tobacco, Inc. both lagged the Index as investors moved out of high dividend stocks and into more cyclical fare after the U.S. Federal Reserve Bank increased interest rates.
On the positive side, stock selection in the Consumer Discretionary and Financials sectors helped offset much of the negative performance elsewhere. A sizeable overweighting in InterContinental Hotels Group PLC did well after the Chinese economy showed signs of stabilization mid-year.
In the Financials sector, an out-of-benchmark stake in Berkshire Hathaway, Inc., one of the world’s highest quality insurers, benefited from strength in the U.S. economy as well as higher interest rates.
Portfolio Manager Outlook
The following forward-looking comments are the opinion of FIAM, the Portfolio’s sub-adviser.
| | | | |
| 70 | | International Growth Portfolio | | |
International Growth Portfolio (unaudited)
In general, the Portfolio generates very low turnover. Regardless of the macro-environment, we look for companies with multiyear structural growth drivers, pricing power and attractive valuations. Europe continues to be an important source of new ideas for the Portfolio. Following significant underperformance over the last twelve months within many peripheral European markets, coupled with improved economic prospects, we are once again finding incremental opportunities in countries such as Spain and Italy.
We also remain enthusiastic about Japanese small-caps. The government’s push toward corporate governance reform is beginning to take hold within select Japanese companies. If this continues, one might reasonably expect the Portfolio’s Japan underweight to narrow.
Relative Performance
| | | | | | | | | | | | |
Average Annual Total Returns
For Periods Ended December 31, 2016 | |
| | | 1 Year | | | 5 Years | | | 10 Years | |
International Growth Portfolio | | | -3.41 | % | | | 5.08 | % | | | -0.34 | % |
MSCI EAFE® Growth Index (Gross) | | | -2.66 | % | | | 7.06 | % | | | 2.01 | % |
MSCI® All Country World (ex-US) Growth Index (Gross) | | | 0.49 | % | | | 5.71 | % | | | 1.87 | % |
Lipper® Variable Insurance Products (VIP) International Multi-Cap Growth Funds Average | | | -1.09 | % | | | 6.18 | % | | | 1.35 | % |
The performance data quoted represents past performance. Past performance is historical and does not guarantee future performance. Investment return and principal value will fluctuate, so that shares, when redeemed, may be worth more or less than their original cost. Current performance may be lower or higher than the performance data quoted. For the most recent month-end performance information visit www.northwesternmutual.com.
This chart assumes an initial investment of $10,000 made on 12/31/06. Returns shown include deductions for management and other portfolio expenses, and reinvestment of all dividends. Returns exclude deductions for separate account sale loads and account fees. Please refer to the Benchmark Definitions section of this report for information about the indices cited in the above chart and graph.
Investors should be aware of the risks of investments in foreign securities, particularly investments in securities of companies in developing nations. These include the
the risks of currency fluctuation, of political and economic instability and of less well-developed government supervision and regulation of business and industry practices, as well as differences in accounting standards.
Investments in the securities of companies in developing nations impose risks different from, and greater than, risks of investing in developed countries.
The Portfolio may invest a relatively large percentage of its assets in issuers located in a single country, a small number of countries, or a particular geographic region. The Portfolio’s performance may be more volatile than that of a more geographically diversified fund, and may be tied more closely to the performance of a single country or region.
Top 10 Equity Holdings 12/31/16
| | |
Security Description | | % of Net Assets |
Nestle SA | | 5.7% |
Anheuser-Busch InBev SA/NV | | 3.5% |
CSL, Ltd. | | 3.0% |
Roche Holding AG | | 2.9% |
Industria de Diseno Textil SA | | 2.8% |
Novartis AG | | 2.5% |
SAP SE | | 2.4% |
Visa, Inc. | | 2.3% |
Reckitt Benckiser Group PLC | | 2.3% |
Mastercard, Inc. | | 2.1% |
Sector Allocation 12/31/16
Sector Allocation is based on Net Assets.
Sector Allocation and Top 10 Holdings are subject to change.
| | | | | | |
| | International Growth Portfolio | | | 71 | |
International Growth Portfolio
Schedule of Investments
December 31, 2016
| | | | | | | | | | | | |
| | | Common Stocks (95.8%) | | Country | | Shares/
$ Par | | | Value
$ (000’s) | |
| | |
| | Consumer Discretionary (12.7%) | | | | | |
| | Autoliv, Inc. | | United
States | | | 57,200 | | | | 6,472 | |
| | DENSO Corp. | | Japan | | | 146,500 | | | | 6,346 | |
| | Domino’s Pizza, Inc. | | United
States | | | 27,714 | | | | 4,413 | |
| | Industria de Diseno Textil SA | | Spain | | | 429,311 | | | | 14,656 | |
| | Informa PLC | | United
Kingdom | | | 601,912 | | | | 5,044 | |
| | InterContinental Hotels Group PLC, ADR | | United
Kingdom | | | 234,716 | | | | 10,405 | |
| * | | Mohawk Industries, Inc. | | United
States | | | 26,400 | | | | 5,272 | |
| | Naspers, Ltd. - Class N | | South
Africa | | | 44,600 | | | | 6,541 | |
| | USS Co., Ltd. | | Japan | | | 455,200 | | | | 7,252 | |
| | | | | | | | | | | | |
| | Total | | | | 66,401 | |
| | | | | | | | | | | | |
| | |
| | Consumer Staples (19.2%) | | | | | |
| | Alimentation Couche-Tard, Inc. | | Canada | | | 48,700 | | | | 2,208 | |
| | Anheuser-Busch InBev SA/NV | | Belgium | | | 174,700 | | | | 18,491 | |
| | BGF retail Co., Ltd. | | South
Korea | | | 47,305 | | | | 3,204 | |
| | Clicks Group, Ltd. | | South
Africa | | | 275,469 | | | | 2,317 | |
| | Fomento Economico Mexicano SAB de CV, ADR | | Mexico | | | 36,700 | | | | 2,797 | |
| | Japan Tobacco, Inc. | | Japan | | | 212,300 | | | | 6,982 | |
| | Molson Coors Brewing Co. | | United
States | | | 30,800 | | | | 2,997 | |
| | Nestle SA | | Switzerland | | | 419,100 | | | | 30,065 | |
| | Philip Morris International, Inc. | | United
States | | | 79,700 | | | | 7,292 | |
| | PriceSmart, Inc. | | United
States | | | 24,600 | | | | 2,054 | |
| | Reckitt Benckiser Group PLC | | United
Kingdom | | | 140,133 | | | | 11,892 | |
| | Reynolds American, Inc. | | United
States | | | 108,100 | | | | 6,058 | |
| | Svenska Cellulosa AB SCA | | Sweden | | | 144,000 | | | | 4,067 | |
| | | | | | | | | | | | |
| | Total | | | | 100,424 | |
| | | | | | | | | | | | |
| | |
| | Energy (0.3%) | | | | | |
| | Pason Systems, Inc. | | Canada | | | 116,400 | | | | 1,703 | |
| | | | | | | | | | | | |
| | Total | | | | 1,703 | |
| | | | | | | | | | | | |
| | |
| | Financials (9.4%) | | | | | |
| | AIA Group, Ltd. | | Hong Kong | | | 1,823,288 | | | | 10,287 | |
| | Azimut Holding SpA | | Italy | | | 70,500 | | | | 1,177 | |
| * | | Berkshire Hathaway, Inc. | | United
States | | | 40,400 | | | | 6,584 | |
| | Housing Development Finance Corp., Ltd. | | India | | | 204,659 | | | | 3,804 | |
| | Jyske Bank A/S | | Denmark | | | 57,900 | | | | 2,760 | |
| | KBC Group NV | | Belgium | | | 43,667 | | | | 2,704 | |
| | Moody’s Corp. | | United
States | | | 33,200 | | | | 3,130 | |
| | MSCI, Inc. | | United
States | | | 38,700 | | | | 3,049 | |
| | Prudential PLC | | United
Kingdom | | | 413,159 | | | | 8,287 | |
| | S&P Global, Inc. | | United
States | | | 34,700 | | | | 3,731 | |
| | Svenska Handelsbanken AB | | Sweden | | | 269,300 | | | | 3,742 | |
| | | | | | | | | | | | |
| | Total | | | | 49,255 | |
| | | | | | | | | | | | |
| | |
| | Health Care (16.4%) | | | | | |
| | Astellas Pharma, Inc. | | Japan | | | 478,600 | | | | 6,648 | |
| | Bayer AG | | Germany | | | 95,105 | | | | 9,924 | |
| | | | | | | | | | | | |
| | | Common Stocks (95.8%) | | Country | | Shares/
$ Par | | | Value
$ (000’s) | |
| | |
| | Health Care continued | | | | | |
| * | | China Biologic Products, Inc. | | United
States | | | 26,700 | | | | 2,871 | |
| | CSL, Ltd. | | Australia | | | 213,120 | | | | 15,443 | |
| | Essilor International SA | | France | | | 46,437 | | | | 5,247 | |
| | Hoya Corp. | | Japan | | | 115,200 | | | | 4,841 | |
| | Novartis AG | | Switzerland | | | 176,517 | | | | 12,845 | |
| | Novo Nordisk A/S, ADR | | Denmark | | | 130,599 | | | | 4,683 | |
| | Olympus Corp. | | Japan | | | 140,300 | | | | 4,850 | |
| | ResMed, Inc. | | United
States | | | 54,700 | | | | 3,394 | |
| | Roche Holding AG | | Switzerland | | | 66,513 | | | | 15,193 | |
| | | | | | | | | | | | |
| | Total | | | | 85,939 | |
| | | | | | | | | | | | |
| | |
| | Industrials (12.1%) | | | | | |
| | ANDRITZ AG | | Austria | | | 125,354 | | | | 6,294 | |
| | Assa Abloy AB | | Sweden | | | 541,800 | | | | 10,056 | |
| | Atlas Copco AB | | Sweden | | | 177,700 | | | | 5,413 | |
| | Auckland International Airport, Ltd. | | New
Zealand | | | 350,000 | | | | 1,520 | |
| | BAE Systems PLC | | United
Kingdom | | | 593,700 | | | | 4,328 | |
| | Berendsen PLC | | United
Kingdom | | | 247,600 | | | | 2,656 | |
| | East Japan Railway Co. | | Japan | | | 60,500 | | | | 5,228 | |
| | Fagerhult AB | | Sweden | | | 119,200 | | | | 3,055 | |
| | Howden Joinery Group PLC | | United
Kingdom | | | 247,700 | | | | 1,172 | |
| | Interpump Group SpA | | Italy | | | 180,400 | | | | 2,953 | |
| | MISUMI Group, Inc. | | Japan | | | 192,800 | | | | 3,174 | |
| | OSG Corp. | | Japan | | | 138,600 | | | | 2,730 | |
| | Prosegur Cia de Seguridad SA | | Spain | | | 378,400 | | | | 2,366 | |
| | Schindler Holding AG | | Switzerland | | | 36,705 | | | | 6,463 | |
| | SHO-BOND Holdings Co., Ltd. | | Japan | | | 62,000 | | | | 2,583 | |
| | Transurban Group | | Australia | | | 454,641 | | | | 3,386 | |
| | | | | | | | | | | | |
| | Total | | | | 63,377 | |
| | | | | | | | | | | | |
| | |
| | Information Technology (16.5%) | | | | | |
| * | | 58.com, Inc., ADR | | Cayman
Islands | | | 48,200 | | | | 1,350 | |
| * | | Alibaba Group Holding, Ltd., ADR | | China | | | 31,179 | | | | 2,738 | |
| * | | Alphabet, Inc. | | United
States | | | 10,400 | | | | 8,241 | |
| | Amadeus IT Group SA | | Spain | | | 170,700 | | | | 7,757 | |
| | ASML Holding NV | | Netherlands | | | 73,500 | | | | 8,251 | |
| | Keyence Corp. | | Japan | | | 14,300 | | | | 9,813 | |
| | Mastercard, Inc. | | United
States | | | 107,100 | | | | 11,058 | |
| | Nintendo Co., Ltd. | | Japan | | | 10,900 | | | | 2,289 | |
| | Playtech PLC | | Isle Of Man | | | 219,967 | | | | 2,239 | |
| | Rightmove PLC | | United
Kingdom | | | 27,400 | | | | 1,318 | |
| | SAP SE | | Germany | | | 141,392 | | | | 12,325 | |
| | Spectris PLC | | United
Kingdom | | | 50,000 | | | | 1,425 | |
| | SS&C Technologies Holdings, Inc. | | United
States | | | 42,600 | | | | 1,218 | |
| | Taiwan Semiconductor Manufacturing Co., Ltd. | | Taiwan | | | 744,000 | | | | 4,190 | |
| | Visa, Inc. | | United
States | | | 156,825 | | | | 12,236 | |
| | | | | | | | | | | | |
| | Total | | | | 86,448 | |
| | | | | | | | | | | | |
The Accompanying Notes are an Integral Part of the Financial Statements.
| | | | |
| 72 | | International Growth Portfolio | | |
International Growth Portfolio
| | | | | | | | | | | | |
| | | Common Stocks (95.8%) | | Country | | Shares/
$ Par | | | Value
$ (000’s) | |
| | |
| | Materials (6.3%) | | | | | |
| | CRH PLC, ADR | | Ireland | | | 295,400 | | | | 10,156 | |
| | Elementis PLC | | United
Kingdom | | | 360,000 | | | | 1,231 | |
| | Franco-Nevada Corp. | | Canada | | | 39,400 | | | | 2,356 | |
| | James Hardie Industries PLC | | Ireland | | | 508,640 | | | | 8,064 | |
| | Martin Marietta Materials, Inc. | | United
States | | | 24,200 | | | | 5,361 | |
| | The Sherwin-Williams Co. | | United
States | | | 15,100 | | | | 4,058 | |
| | Tikkurila Oyj | | Finland | | | 84,300 | | | | 1,669 | |
| | | | | | | | | | | | |
| | Total | | | | | | | | | 32,895 | |
| | | | | | | | | | | | |
| | |
| | Real Estate (2.5%) | | | | | |
| | Azrieli Group, Ltd. | | Israel | | | 38,000 | | | | 1,648 | |
| | BUWOG AG | | Austria | | | 102,653 | | | | 2,387 | |
| | Hispania Activos Inmobiliarios SOCIMI SA | | Spain | | | 103,060 | | | | 1,215 | |
| | | | | | | | | | | | |
| | | Common Stocks (95.8%) | | Country | | Shares/
$ Par | | | Value
$ (000’s) | |
| | |
| | Real Estate continued | | | | | |
| | Merlin Properties Socimi SA | | Spain | | | 126,400 | | | | 1,374 | |
| | Mitsui Fudosan Co., Ltd. | | Japan | | | 208,000 | | | | 4,814 | |
| | Shaftesbury PLC | | United
Kingdom | | | 115,800 | | | | 1,297 | |
| | | | | | | | | | | | |
| | Total | | | | | | | | | 12,735 | |
| | | | | | | | | | | | |
| | |
| | Telecommunication Services (0.4%) | | | | | |
| | Safaricom, Ltd. | | Kenya | | | 11,909,500 | | | | 2,226 | |
| | | | | | | | | | | | |
| | Total | | | | | | | | | 2,226 | |
| | | | | | | | | | | | |
| | |
| | Total Common Stocks | | | | | |
| | (Cost: $514,030) | | | | 501,403 | |
| | | | | | | | | | | | |
| | | |
| | Total Investments (95.8%) | | | | | | | | |
| | (Cost: $514,030)(a) | | | | | | | | | 501,403 | |
| | | | | | | | | | | | |
| | Other Assets, Less | | | | | | | | | | |
| | Liabilities (4.2%) | | | | | | | | | 21,719 | |
| | | | | | | | | | | | |
| | Net Assets (100.0%) | | | | | | | | | 523,122 | |
| | | | | | | | | | | | |
ADR after the name of a security represents—American Depositary Receipt.
| (a) | At December 31, 2016, the aggregate cost of securities for federal tax purposes (in thousands) was $515,854 and the net unrealized depreciation of investments based on that cost was $14,451 which is comprised of $20,190 aggregate gross unrealized appreciation and $34,641 aggregate gross unrealized depreciation. |
| | | | | | |
Investments Percentage by Country is based on Net Assets: | | | | | | |
United States | | | 19.0% | | | |
Japan | | | 12.9% | | | |
Switzerland | | | 12.3% | | | |
United Kingdom | | | 9.4% | | | |
Spain | | | 5.2% | | | |
Sweden | | | 5.0% | | | |
Other | | | 32.0% | | | |
Total | | | 95.8% | | | |
The following is a summary of the inputs used in valuing the Portfolio’s assets and liabilities at December 31, 2016. See Note 3 for additional information on portfolio valuation.
| | | | | | | | | | | | | | |
| | | Valuation Inputs | | | |
| Description | | Level 1 –
Quoted Prices | | | Level 2 –
Other Significant
Observable Inputs | | | Level 3 – Significant
Unobservable Inputs | | | |
| | | (Amounts in thousands) | | | |
Assets: | | | | | | | | | | | | | | |
Common Stocks | | $ | 501,403 | | | $ | - | | | $ | - | | | |
Total Assets: | | $ | 501,403 | | | $ | - | | | $ | - | | | |
The Accompanying Notes are an Integral Part of the Financial Statements.
| | | | | | |
| | International Growth Portfolio | | | 73 | |
Research International Core Portfolio (unaudited)
| | | | |
| Objective: | | Portfolio Strategy: | | Net Assets: |
| Capital appreciation. | | Invest primarily in foreign equity securities, including emerging markets. | | $500 million |
Portfolio Overview
Mason Street Advisors, LLC (“Mason Street Advisors”), the investment adviser for the Research International Core Portfolio (the “Portfolio”), has engaged Massachusetts Financial Services Company (“MFS®”) to act as sub-adviser for the Portfolio. The Portfolio normally invests in foreign equity securities, including emerging market equity securities. A team of research analysts selects investments for the Portfolio using a “bottom up” investment approach. MFS® allocates the Portfolio’s assets to analysts by broad market sectors, which generally approximate the sector weightings in the MSCI EAFE® Index. The Portfolio may invest in the stocks of companies it believes to have above average earnings growth potential compared to other companies (growth companies), in the stocks of companies it believes are undervalued compared to their perceived worth (value companies), or in a combination of growth and value companies. The Portfolio also may invest in companies of any size.
Market Overview
Sluggish global growth weighed on both developed and emerging market (“EM”) economies during much of the reporting period, though signs of improved growth became evident in late 2016. The U.S. Federal Reserve Bank increased interest rates by 25 basis points at the end of the period, the second hike of the cycle, which began in December 2015. However, central bank policy remained highly accommodative on the global stage, which forced many government – and even some corporate – bond yields into negative territory during the period. During the first half, the U.K. voted to leave the European Union (“E.U.”). While markets initially reacted to the vote with alarm, the spillover to European and EM economies was relatively short-lived, although risks of further hits to E.U. cohesiveness could re-emerge. Late in the period, the surprising U.S. presidential election outcome prompted a significant rally in equities and a rise in bond yields in anticipation of a reflationary policy mix from the incoming Trump administration.
Portfolio Results
The Portfolio returned (1.12%) for the twelve months ended December 31, 2016. By comparison, the Portfolio’s primary and secondary benchmarks, the MSCI® All Country World (ex-US) Index (the “Index”) and the MSCI EAFE® Index, returned 5.01% and 1.51%, respectively. (These Indices are unmanaged, cannot be invested in directly, and do not include administrative expenses or sales charges.) According to Lipper® Analytical Services, Inc., an independent mutual fund ranking company, the average return of the International Multi-Cap Core Funds peer group was 0.95% for 2016.
Weak stock selection in the Financials sector detracted from performance relative to the Index. Within this sector, the timing of the portfolio’s ownership in shares of financial services companies Mitsubishi UFJ Financial Group (Japan) and HSBC (U.K.) weighed on relative results. Additionally, overweight positions in financial services firm Lloyds Banking Group (U.K.) and investment management and banking firm UBS Group (Switzerland) also hurt relative returns.
Stock selection in both the Capital Goods and Energy sectors also held back relative returns. Within the Capital Goods sector, an overweight position in Japanese-based automotive component manufacturer Denso weighed on relative performance. Within the Energy sector, the Portfolio’s timing of ownership in shares of global energy and petrochemicals company Royal Dutch Shell (U.K.) hampered relative results.
A combination of weak stock selection and an overweight allocation to the Health Care sector were additional factors that weighed on relative performance. Within this sector, the Portfolio’s overweight positions in pharmaceutical companies Roche Holding (Switzerland), Santen Pharmaceuticals Co. (Japan) and Novartis (Switzerland) dampened relative returns.
Strong stock selection in the Information Technology sector boosted relative performance. Within this sector, the Portfolio’s overweight positions in digital products manufacturer ARM (U.K.) and semiconductor manufacturer Taiwan Semiconductor Manufacturing Co., Ltd. (Taiwan) aided relative performance.
Elsewhere, overweight positions in electrical distribution equipment manufacturer Schneider Electric (France), mining operator Rio Tinto (Australia), mining giant BHP Billiton (U.K.), integrated oil company BP PLC (U.K.), air conditioning system manufacturer Daikin Industries, Ltd. (Japan), medical products and equipment manufacturer Terumo Corp. (Japan) and financial services group DNB (Norway) bolstered relative performance. Additionally, not owning shares of pharmaceutical company Novo Nordisk (Denmark) also supported relative results.
| | | | |
| 74 | | Research International Core Portfolio | | |
Research International Core Portfolio (unaudited)
Portfolio Manager Outlook
The following forward looking comments are the opinion of MFS®, the Portfolio’s sub-adviser.
Regardless of changing economic and market conditions, we will continue to adhere to our investment process, building a Portfolio of fundamentally sound companies. The Portfolio is a sector-neutral portfolio that emphasizes bottom-up fundamental research. Because of this approach, the Portfolio’s sector weightings vary only modestly from those of the general foreign market. Instead, we attempt to outperform the Index by holding what we believe to be the most attractive opportunities among growth and value companies within each sector of the market without regard to market capitalization.
Relative Performance
| | | | | | | | | | | | |
Average Annual Total Returns
For Periods Ended December 31, 2016 | |
| | | 1 Year | | | 5 Years | | | Since
Inception* | |
Research International Core Portfolio | | | -1.12 | % | | | 4.84 | % | | | -0.01 | % |
MSCI® All Country World (ex-US) Index (Gross) | | | 5.01 | % | | | 5.48 | % | | | 0.60 | % |
MSCI EAFE® Index (Gross) | | | 1.51 | % | | | 7.02 | % | | | 0.38 | % |
Lipper® Variable Insurance Products (VIP) International Multi-Cap Core Funds Average | | | 0.95 | % | | | 5.85 | % | | | – | |
| * | Inception date of 4/30/07 |
The performance data quoted represents past performance. Past performance is historical and does not guarantee future performance. Investment return and principal value will fluctuate, so that shares, when redeemed, may be worth more or less than their original cost. Current performance may be lower or higher than the performance data quoted. For the most recent month-end performance information visit www.northwesternmutual.com.
This chart assumes an initial investment of $10,000 made on 4/30/07 (commencement of the Portfolio’s operations). Returns shown reflect fee waivers, deductions for management and other portfolio expenses, and reinvestment of all dividends. In the absence of fee waivers, total return would be reduced. Returns exclude deductions for separate account sale loads and account fees. Please refer to the Benchmark Definitions section of this report for information about the indices cited in the above chart and graph.
Investors should be aware of the risks of investments in foreign securities, particularly investments in securities of companies in developing nations. These include the risks of currency fluctuation, of political and economic instability and of less well-developed government supervision and regulation of business and industry practices, as well as differences in accounting standards.
Investments in the securities of companies in developing nations impose risks different from, and greater than, risks of investing in developed countries.
The Portfolio may invest a relatively large percentage of its assets in issuers located in a single country, a small number of countries, or a particular geographic region. The Portfolio’s performance may be more volatile than that of a more geographically diversified fund, and may be tied more closely to the performance of a single country or region.
Top 10 Equity Holdings 12/31/16
| | | | |
| Security Description | | % of Net Assets | |
Nestle SA | | | 3.5% | |
Novartis AG | | | 3.1% | |
Roche Holding AG | | | 3.0% | |
Bayer AG | | | 2.3% | |
Schneider Electric SE | | | 2.1% | |
KDDI Corp. | | | 1.7% | |
BP PLC | | | 1.7% | |
BNP Paribas SA | | | 1.7% | |
Linde AG | | | 1.6% | |
Danone SA | | | 1.6% | |
Sector Allocation 12/31/16
Sector Allocation is based on Net Assets.
Sector Allocation and Top 10 Holdings are subject to change.
| | | | | | |
| | Research International Core Portfolio | | | 75 | |
Research International Core Portfolio
Schedule of Investments
December 31, 2016
| | | | | | | | | | | | |
| | | Common Stocks (98.9%) | | Country | | Shares/
$ Par | | | Value
$ (000’s) | |
| |
| | Consumer Discretionary (9.1%) | |
| * | | Dufry AG | | Switzerland | | | 17,367 | | | | 2,166 | |
| * | | Esprit Holdings, Ltd. | | Hong Kong | | | 1,250,500 | | | | 982 | |
| | GKN PLC | | United Kingdom | | | 1,693,486 | | | | 6,923 | |
| | Koito Manufacturing Co., Ltd. | | Japan | | | 89,400 | | | | 4,735 | |
| | LVMH Moet Hennessy Louis Vuitton SE | | France | | | 33,426 | | | | 6,383 | |
| | Paddy Power Betfair PLC | | Ireland | | | 22,058 | | | | 2,385 | |
| | Ryohin Keikaku Co., Ltd. | | Japan | | | 11,100 | | | | 2,176 | |
| | Techtronic Industries Co., Ltd. | | Hong Kong | | | 1,037,500 | | | | 3,719 | |
| | USS Co., Ltd. | | Japan | | | 372,100 | | | | 5,928 | |
| | Whitbread PLC | | United Kingdom | | | 54,355 | | | | 2,529 | |
| | WPP PLC | | United Kingdom | | | 233,131 | | | | 5,218 | |
| * | | Yum China Holdings, Inc. | | United States | | | 82,792 | | | | 2,163 | |
| | | | | | | | | | | | |
| | Total | | | | 45,307 | |
| | | | | | | | | | | | |
| |
| | Consumer Staples (11.3%) | |
| | Ambev SA, ADR | | Brazil | | | 472,332 | | | | 2,319 | |
| | Danone SA | | France | | | 127,013 | | | | 8,049 | |
| | Japan Tobacco, Inc. | | Japan | | | 199,100 | | | | 6,548 | |
| | L’Oreal SA | | France | | | 42,468 | | | | 7,752 | |
| | Nestle SA | | Switzerland | | | 240,482 | | | | 17,252 | |
| | PriceSmart, Inc. | | United States | | | 26,363 | | | | 2,201 | |
| | Reckitt Benckiser Group PLC | | United Kingdom | | | 92,802 | | | | 7,875 | |
| | Sundrug Co., Ltd. | | Japan | | | 62,900 | | | | 4,354 | |
| | | | | | | | | | | | |
| | Total | | | | 56,350 | |
| | | | | | | | | | | | |
| |
| | Energy (5.7%) | |
| | BP PLC | | United Kingdom | | | 1,337,595 | | | | 8,401 | |
| * | | Cairn Energy PLC | | United Kingdom | | | 685,975 | | | | 1,994 | |
| | Enbridge, Inc. | | Canada | | | 72,201 | | | | 3,038 | |
| | Eni SPA | | Italy | | | 379,000 | | | | 6,172 | |
| | Galp Energia SGPS SA | | Portugal | | | 268,853 | | | | 4,016 | |
| | Oil Search, Ltd. | | Australia | | | 560,890 | | | | 2,902 | |
| | Technip SA | | France | | | 26,086 | | | | 1,862 | |
| | | | | | | | | | | | |
| | Total | | | | 28,385 | |
| | | | | | | | | | | | |
| |
| | Financials (20.9%) | |
| | ABN AMRO Group NV | | Netherlands | | | 151,667 | | | | 3,361 | |
| | AEON Financial Service Co., Ltd. | | Japan | | | 328,100 | | | | 5,831 | |
| | AIA Group, Ltd. | | Hong Kong | | | 1,278,000 | | | | 7,210 | |
| | AMP, Ltd. | | Australia | | | 1,061,106 | | | | 3,859 | |
| | Aon PLC | | United Kingdom | | | 49,226 | | | | 5,490 | |
| | Barclays PLC | | United Kingdom | | | 2,212,324 | | | | 6,092 | |
| | BNP Paribas SA | | France | | | 131,561 | | | | 8,385 | |
| | Cerved Information Solutions SPA | | Italy | | | 147,477 | | | | 1,225 | |
| | DNB ASA | | Norway | | | 334,867 | | | | 4,979 | |
| | Element Fleet Management Corp. | | Canada | | | 231,909 | | | | 2,152 | |
| | HDFC Bank, Ltd., ADR | | India | | | 75,560 | | | | 4,585 | |
| | Hiscox, Ltd. | | Bermuda | | | 252,221 | | | | 3,161 | |
| | Intesa Sanpaolo SPA | | Italy | | | 2,780,965 | | | | 7,102 | |
| | | | | | | | | | | | |
| | | Common Stocks (98.9%) | | Country | | Shares/
$ Par | | | Value
$ (000’s) | |
| |
| | Financials continued | |
| * | | Julius Baer Group, Ltd. | | Switzerland | | | 73,054 | | | | 3,245 | |
| | KBC Group NV | | Belgium | | | 86,191 | | | | 5,338 | |
| | Lloyds Banking Group PLC | | United Kingdom | | | 8,672,285 | | | | 6,681 | |
| | Sumitomo Mitsui Financial Group, Inc. | | Japan | | | 174,700 | | | | 6,667 | |
| | Swiss Re AG | | Switzerland | | | 46,939 | | | | 4,448 | |
| | UBS Group AG | | Switzerland | | | 508,417 | | | | 7,964 | |
| * | | Zurich Insurance Group AG | | Switzerland | | | 24,649 | | | | 6,787 | |
| | | | | | | | | | | | |
| | Total | | | | 104,562 | |
| | | | | | | | | | | | |
| |
| | Health Care (10.5%) | |
| | Bayer AG | | Germany | | | 108,088 | | | | 11,279 | |
| | Novartis AG | | Switzerland | | | 209,583 | | | | 15,251 | |
| | Roche Holding AG | | Switzerland | | | 65,678 | | | | 15,002 | |
| | Santen Pharmaceutical Co., Ltd. | | Japan | | | 528,500 | | | | 6,467 | |
| | Shionogi & Co., Ltd. | | Japan | | | 60,200 | | | | 2,884 | |
| | Terumo Corp. | | Japan | | | 42,500 | | | | 1,569 | |
| | | | | | | | | | | | |
| | Total | | | | 52,452 | |
| | | | | | | | | | | | |
| |
| | Industrials (13.1%) | |
| | Aena SA | | Spain | | | 14,494 | | | | 1,978 | |
| | Brambles, Ltd. | | Australia | | | 691,679 | | | | 6,189 | |
| | Daikin Industries, Ltd. | | Japan | | | 72,700 | | | | 6,677 | |
| | GEA Group AG | | Germany | | | 120,410 | | | | 4,846 | |
| | Kubota Corp. | | Japan | | | 464,100 | | | | 6,625 | |
| | Legrand SA | | France | | | 42,498 | | | | 2,413 | |
| | Mitsubishi Corp. | | Japan | | | 131,700 | | | | 2,806 | |
| | RELX NV | | Netherlands | | | 447,363 | | | | 7,530 | |
| | Schindler Holding AG | | Switzerland | | | 30,127 | | | | 5,314 | |
| | Schneider Electric SE | | France | | | 147,887 | | | | 10,292 | |
| | TOTO, Ltd. | | Japan | | | 150,400 | | | | 5,952 | |
| | Yamato Holdings Co., Ltd. | | Japan | | | 240,300 | | | | 4,886 | |
| | | | | | | | | | | | |
| | Total | | | | 65,508 | |
| | | | | | | | | | | | |
| |
| | Information Technology (9.7%) | |
| * | | Alibaba Group Holding, Ltd., ADR | | Cayman Islands | | | 44,450 | | | | 3,903 | |
| | Amadeus IT Group SA - Class A | | Spain | | | 89,663 | | | | 4,075 | |
| | Broadcom, Ltd. | | Singapore | | | 18,988 | | | | 3,357 | |
| * | | Check Point Software Technologies, Ltd. | | Israel | | | 40,450 | | | | 3,416 | |
| * | | Cognizant Technology Solutions Corp. - Class A | | United States | | | 123,801 | | | | 6,937 | |
| * | | Just Eat PLC | | United Kingdom | | | 338,264 | | | | 2,432 | |
| | Mastercard, Inc. | | United States | | | 62,542 | | | | 6,457 | |
| * | | Mellanox Technologies, Ltd. | | Israel | | | 53,308 | | | | 2,180 | |
| | NAVER Corp. | | South Korea | | | 4,630 | | | | 2,971 | |
| | Nomura Research Institute, Ltd. | | Japan | | | 64,759 | | | | 1,973 | |
| | Samsung Electronics Co., Ltd. | | South Korea | | | 2,712 | | | | 4,046 | |
| | Taiwan Semiconductor Manufacturing Co., Ltd. | | Taiwan | | | 1,187,189 | | | | 6,686 | |
| | | | | | | | | | | | |
| | Total | | | | 48,433 | |
| | | | | | | | | | | | |
The Accompanying Notes are an Integral Part of the Financial Statements.
| | | | |
| 76 | | Research International Core Portfolio | | |
Research International Core Portfolio
| | | | | | | | | | | | |
| | | Common Stocks (98.9%) | | Country | | Shares/
$ Par | | | Value
$ (000’s) | |
| | | |
| | Materials (8.8%) | | | | | | | | |
| | Akzo Nobel NV | | Netherlands | | | 116,885 | | | | 7,307 | |
| | Croda International PLC | | United Kingdom | | | 133,843 | | | | 5,272 | |
| | Iluka Resources, Ltd. | | Australia | | | 464,570 | | | | 2,437 | |
| | Linde AG | | Germany | | | 49,496 | | | | 8,133 | |
| | Nippon Paint Holdings Co., Ltd. | | Japan | | | 110,000 | | | | 2,998 | |
| | Orica, Ltd. | | Australia | | | 273,383 | | | | 3,488 | |
| | Rio Tinto PLC | | United Kingdom | | | 160,841 | | | | 6,261 | |
| | Sika AG | | Switzerland | | | 870 | | | | 4,180 | |
| | Symrise AG | | Germany | | | 67,763 | | | | 4,125 | |
| | | | | | | | | | | | |
| | Total | | | | | | | | | 44,201 | |
| | | | | | | | | | | | |
| | |
| | Real Estate (2.4%) | | | | | |
| * | | LEG Immobilien AG | | Germany | | | 86,001 | | | | 6,681 | |
| | Mitsui Fudosan Co., Ltd. | | Japan | | | 224,000 | | | | 5,184 | |
| | | | | | | | | | | | |
| | Total | | | | | | | | | 11,865 | |
| | | | | | | | | | | | |
| | |
| | Telecommunication Services (4.4%) | | | | | |
| | BT Group PLC | | United Kingdom | | | 924,507 | | | | 4,180 | |
| | Hellenic Telecommunications Organization SA | | Greece | | | 94,556 | | | | 889 | |
| | KDDI Corp. | | Japan | | | 336,100 | | | | 8,511 | |
| | SoftBank Group Corp. | | Japan | | | 76,400 | | | | 5,076 | |
| | Vodafone Group PLC | | United Kingdom | | | 1,360,370 | | | | 3,350 | |
| | | | | | | | | | | | |
| | Total | | | | | | | | | 22,006 | |
| | | | | | | | | | | | |
| | | | | | | | | | | | |
| | | Common Stocks (98.9%) | | Country | | Shares/
$ Par | | | Value
$ (000’s) | |
| | | |
| | Utilities (3.0%) | | | | | | | | |
| | APA Group | | Australia | | | 560,200 | | | | 3,464 | |
| | China Resources Gas Group, Ltd. | | Hong Kong | | | 1,082,000 | | | | 3,042 | |
| | Enel SPA | | Italy | | | 1,131,511 | | | | 4,988 | |
| | Engie SA | | France | | | 281,358 | | | | 3,590 | |
| | | | | | | | | | | | |
| | Total | | | | | | | | | 15,084 | |
| | | | | | | | | | | | |
| | |
| | Total Common Stocks | | | | | |
| | (Cost: $498,496) | | | | | | | | | 494,153 | |
| | | | | | | | | | | | |
| | | | |
| | | Short-Term Investments (0.3%) | | | | | | | | |
| | | |
| | US Government & Agencies (0.3%) | | | | | | | | |
| (r) | | Federal Home Loan Bank,
0.300%, 1/3/17 | | United
States | | | 1,500,000 | | | | 1,500 | |
| | | | | | | | | | | | |
| | | |
| | Total Short-Term Investments | | | | | | | | |
| | (Cost: $1,500) | | | | | | | 1,500 | |
| | | | | | | | | | | | |
| | | |
| | Total Investments (99.2%) | | | | | | | | |
| | (Cost: $499,996)(a) | | | | | | | 495,653 | |
| | | | | | | | | | | | |
| | Other Assets, Less | | | | | | | | | | |
| | Liabilities (0.8%) | | | | | | | | | 3,996 | |
| | | | | | | | | | | | |
| | Net Assets (100.0%) | | | | | | | | | 499,649 | |
| | | | | | | | | | | | |
| | ADR after the name of a security represents—American Depositary Receipt. |
| (a) | At December 31, 2016, the aggregate cost of securities for federal tax purposes (in thousands) was $504,606 and the net unrealized depreciation of investments based on that cost was $8,953 which is comprised of $27,404 aggregate gross unrealized appreciation and $36,357 aggregate gross unrealized depreciation. |
| | | | | | |
Investments Percentage by Country is based on Net Assets: | | | | | | |
Japan | | | 19.6% | | | |
Switzerland | | | 16.3% | | | |
United Kingdom | | | 14.5% | | | |
France | | | 9.8% | | | |
Germany | | | 7.0% | | | |
Other | | | 32.0% | | | |
Total | | | 99.2% | | | |
| (r) | Rates are discount rates at the time of purchase. |
The following is a summary of the inputs used in valuing the Portfolio’s assets and liabilities at December 31, 2016. See Note 3 for additional information on portfolio valuation.
| | | | | | | | | | | | | | |
| | | Valuation Inputs | | | |
| Description | | Level 1 –
Quoted Prices | | | Level 2 –
Other Significant
Observable Inputs | | | Level 3 – Significant
Unobservable Inputs | | | |
| | | (Amounts in thousands) | | | |
Assets: | | | | | | | | | | | | | | |
Common Stocks | | $ | 494,153 | | | $ | - | | | $ | - | | | |
Short-Term Investments | | | - | | | | 1,500 | | | | - | | | |
Total Assets: | | $ | 494,153 | | | $ | 1,500 | | | $ | - | | | |
The Accompanying Notes are an Integral Part of the Financial Statements.
| | | | | | |
| | Research International Core Portfolio | | | 77 | |
International Equity Portfolio (unaudited)
| | | | |
| Objective: | | Portfolio Strategy: | | Net Assets: |
Long-term growth of capital. Any income realized will be incidental. | | Invests primarily in equity securities of issuers outside of the U.S. with favorable long-term potential relative to current market values. | | $1.6 billion |
Portfolio Overview
Mason Street Advisors, LLC (“Mason Street Advisors”), the investment adviser for the International Equity Portfolio (“the Portfolio”), has engaged Templeton Investment Counsel, LLC (“Templeton”) to act as sub-adviser for the Portfolio. The Portfolio may purchase securities in any foreign country, including those with developed markets and emerging markets. The Portfolio’s investments in equity securities may include small, medium and large capitalization issues that are believed to be undervalued. The Portfolio’s strategy reflects a “bottom up”, value oriented and long-term investment philosophy. In choosing equity investments, the Portfolio will focus on the market price of a company’s securities in relation to the company’s long-term earnings (typically 5 years), asset value and cash flow potential. A company’s historical value measures, including price/earnings ratio, profit margins and liquidation value, will also be considered.
Market Overview
The global economy grew moderately during 2016 despite slower growth in some countries. In this environment, global developed and emerging market stocks, as measured by the MSCI® All Country World Index, rose. Global markets were aided by accommodative monetary policies of various global central banks, improved commodity prices after 2016’s first quarter, finalization of Greece’s new debt deal, generally encouraging global economic data, expectations of higher interest rates and inflation in the U.S. driven by talk of expansionary fiscal policies under new U.S. President Donald Trump, and an Organization of the Petroleum Exporting Countries (OPEC) deal to curb oil production. However, these factors were partially offset by a slowdown in China’s economy and declining commodity prices early in the period, geopolitical tensions in certain regions, uncertainty about the U.S. Federal Reserve’s timing for raising interest rates and worries about the health of European banks. In addition, global economic concerns and the U.K.’s historic referendum to leave the European Union (also known as “Brexit”) contributed to volatility in global stock markets.
Portfolio Results
The Portfolio returned 2.89% for the twelve months ended December 31, 2016. By comparison, the Portfolio’s benchmark, the MSCI® All Country World (ex-US) Index (the “Index”), returned 5.01%. (The Index is unmanaged, cannot be invested in directly and does not include administrative expenses or sales charges.) According to Lipper® Analytical Services, Inc., an independent mutual fund rating agency, the average return for the International Multi-Cap Value Funds peer group was 5.52% for 2016.
Stocks in the Financials sector rebounded strongly near period-end as interest rates rose and growth expectations improved, though the late recovery failed to overcome earlier weakness. Stock selection in the sector detracted from the Portfolio’s relative performance. European banks lagged but remained abundantly cheap in the assessment of the portfolio manager, relative to U.S. peers.
An overweighting in the Health Care sector detracted amid a sharp and sustained decline following political criticism during the U.S. election cycle. Israeli drug manufacturer Teva Pharmaceutical Industries performed poorly, though the portfolio manager believed the stock remained potentially well positioned for growth over a long-term horizon. Sector fundamentals more broadly continued to impress, characterized by high returns on equity, strong cash flows and low leverage.
During the period, the U.S. dollar appreciated against most foreign currencies, which also hurt the Portfolio’s performance because investments in securities with non-U.S. currency exposure lost value as the dollar rose.
Turning to contributors, stock selection in the Information Technology sector benefited the Portfolio’s relative results, led by South Korean semiconductor and consumer electronics manufacturer Samsung Electronics. The company’s shares rose as the firm recovered from a high-profile product recall and introduced more shareholder-friendly governance initiatives.
The Portfolio’s significantly overweighted Energy sector position benefited relative results amid rebounding oil prices, and U.K. oil major Royal Dutch Shell performed well. Holdings in the Materials sector also contributed to relative performance, led by Swiss miner Glencore.
Regionally, an underweighting in North America detracted from results, while stock selection in Europe and Asia contributed.
Portfolio Manager Outlook
The following forward looking comments are the opinion of Templeton, the Portfolio’s sub-adviser.
Value oriented stocks have been bouncing off an extremely low base and, notwithstanding the risk of temporary consolidation should stocks periodically get ahead of themselves, the longer-term prospects for our investment philosophy remain attractive
| | | | |
| 78 | | International Equity Portfolio | | |
International Equity Portfolio (unaudited)
to us. We are watching specifically for any meaningful improvements in the earnings of value stocks, which could drive the next leg of performance for a style that has thus far benefited primarily from higher valuation multiples. Conversely, economic and interest-rate normalization represent significant challenges for bondholders with nominally fixed returns. Real assets that can adjust for, or pass through, price increases and sustainably generate cash flows—like equities—appear to us far better positioned.
Relative Performance
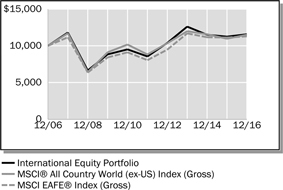
| | | | | | | | | | | | |
Average Annual Total Returns
For Periods Ended December 31, 2016 | |
| | | 1 Year | | | 5 Years | | | 10 Years | |
International Equity Portfolio | | | 2.89 | % | | | 6.24 | % | | | 1.47 | % |
MSCI® All Country World (ex-US) Index (Gross) | | | 5.01 | % | | | 5.48 | % | | | 1.42 | % |
MSCI EAFE® Index (Gross) | | | 1.51 | % | | | 7.02 | % | | | 1.22 | % |
Lipper® Variable Insurance Products (VIP) International Multi-Cap Value Funds Average | | | 5.52 | % | | | 6.54 | % | | | 0.86 | % |
The performance data quoted represents past performance. Past performance is historical and does not guarantee future performance. Investment return and principal value will fluctuate, so that shares, when redeemed, may be worth more or less than their original cost. Current performance may be lower or higher than the performance data quoted. For the most recent month-end performance information visit www.northwesternmutual.com.
This chart assumes an initial investment of $10,000 made on 12/31/06. Returns shown reflect fee waivers, deductions for management and other portfolio expenses, and reinvestment of all dividends. In the absence of fee waivers, total return would be reduced. Returns exclude deductions for separate account sale loads and account fees. Please refer to the Benchmark Definitions section of this report for information about the indices cited in the above chart and graph.
Investors should be aware of the risks of investments in foreign securities, particularly investments in securities of companies in developing nations. These include the
risks of currency fluctuation, of political and economic instability and of less well-developed government supervision and regulation of business and industry practices, as well as differences in accounting standards.
Investments in the securities of companies in developing nations impose risks different from, and greater than, risks of investing in developed countries.
The Portfolio may invest a relatively large percentage of its assets in issuers located in a single country, a small number of countries, or a particular geographic region. The Portfolio’s performance may be more volatile than that of a more geographically diversified fund, and may be tied more closely to the performance of a single country or region.
Top 10 Equity Holdings 12/31/16
| | |
Security Description | | % of Net Assets |
Samsung Electronics Co., Ltd. | | 2.8% |
BP PLC | | 2.0% |
Royal Dutch Shell PLC - Class B | | 1.9% |
Credit Agricole SA | | 1.8% |
Teva Pharmaceutical Industries, Ltd., ADR | | 1.8% |
Galp Energia SGPS SA | | 1.7% |
HSBC Holdings PLC | | 1.7% |
Singapore Telecommunications, Ltd. | | 1.6% |
Merck KGaA | | 1.6% |
Eni SpA | | 1.6% |
Sector Allocation 12/31/16
Sector Allocation is based on Net Assets.
Sector Allocation and Top 10 Holdings are subject to change.
| | | | | | |
| | International Equity Portfolio | | | 79 | |
International Equity Portfolio
Schedule of Investments
December 31, 2016
| | | | | | | | | | | | |
| | | Common Stocks (97.8%) | | Country | | Shares/
$ Par | | | Value
$(000’s) | |
| |
| | Consumer Discretionary (8.5%) | |
| | Cie Generale des Etablissements Michelin | | France | | | 157,858 | | | | 17,564 | |
| | Haier Electronics Group Co., Ltd. | | China | | | 7,494,550 | | | | 11,791 | |
| * | | Hyundai Mobis Co., Ltd. | | South Korea | | | 82,150 | | | | 17,956 | |
| | Hyundai Motor Co. | | South Korea | | | 154,950 | | | | 18,731 | |
| | Kingfisher PLC | | United Kingdom | | | 4,233,390 | | | | 18,276 | |
| | Nissan Motor Co., Ltd. | | Japan | | | 2,477,990 | | | | 24,923 | |
| | Panasonic Corp. | | Japan | | | 777,380 | | | | 7,912 | |
| | Sky PLC | | United Kingdom | | | 1,290,860 | | | | 15,765 | |
| | Toyota Motor Corp. | | Japan | | | 98,220 | | | | 5,780 | |
| | | | | | | | | | | | |
| | Total | | | | | | | | | 138,698 | |
| | | | | | | |
| |
| | Consumer Staples (2.3%) | |
| | Kirin Holdings Co., Ltd. | | Japan | | | 863,000 | | | | 14,041 | |
| | METRO AG | | Germany | | | 216,890 | | | | 7,211 | |
| | Suntory Beverage & Food, Ltd. | | Japan | | | 401,300 | | | | 16,670 | |
| | | | | | | | | | | | |
| | Total | | | | | | | | | 37,922 | |
| | | | | | | |
| |
| | Energy (13.8%) | |
| | BP PLC | | United Kingdom | | | 5,217,670 | | | | 32,769 | |
| | Eni SpA | | Italy | | | 1,605,485 | | | | 26,144 | |
| | Galp Energia SGPS SA | | Portugal | | | 1,849,900 | | | | 27,632 | |
| | Inpex Corp. | | Japan | | | 952,120 | | | | 9,539 | |
| | Kunlun Energy Co., Ltd. | | China | | | 13,549,350 | | | | 10,134 | |
| | Petrofac, Ltd. | | United Kingdom | | | 1,304,120 | | | | 13,967 | |
| * | | Precision Drilling Corp. | | Canada | | | 2,444,630 | | | | 13,328 | |
| | PTT Exploration & Production PCL | | Thailand | | | 1,876,300 | | | | 5,043 | |
| | Royal Dutch Shell PLC - Class B | | United Kingdom | | | 1,055,335 | | | | 30,616 | |
| | SBM Offshore NV | | Netherlands | | | 1,371,290 | | | | 21,530 | |
| | Suncor Energy, Inc. | | Canada | | | 255,440 | | | | 8,352 | |
| | TOTAL SA | | France | | | 485,560 | | | | 24,902 | |
| | | | | | | | | | | | |
| | Total | | | | | | | | | 223,956 | |
| | | | | | | |
| |
| | Financials (21.1%) | |
| | Aegon NV | | Netherlands | | | 3,999,610 | | | | 22,011 | |
| | AIA Group, Ltd. | | Hong Kong | | | 2,679,820 | | | | 15,119 | |
| | AXA SA | | France | | | 744,155 | | | | 18,788 | |
| | Bangkok Bank PCL | | Thailand | | | 3,425,000 | | | | 15,255 | |
| | Barclays PLC | | United Kingdom | | | 9,127,140 | | | | 25,134 | |
| | BNP Paribas SA | | France | | | 371,430 | | | | 23,674 | |
| | China Life Insurance Co., Ltd. | | China | | | 5,246,010 | | | | 13,665 | |
| | Credit Agricole SA | | France | | | 2,406,300 | | | | 29,839 | |
| | DBS Group Holdings, Ltd. | | Singapore | | | 2,175,000 | | | | 26,043 | |
* | | Deutsche Boerse AG | | Germany | | | 89,700 | | | | 7,322 | |
| | Hana Financial Group, Inc. | | South Korea | | | 344,710 | | | | 8,919 | |
| | HSBC Holdings PLC | | United Kingdom | | | 3,420,937 | | | | 27,462 | |
| | ING Groep NV | | Netherlands | | | 1,729,712 | | | | 24,344 | |
* | | KB Financial Group, Inc., ADR | | South Korea | | | 237,530 | | | | 8,382 | |
* | | Standard Chartered PLC | | United Kingdom | | | 3,117,162 | | | | 25,493 | |
| | | | | | | | | | | | |
| | | Common Stocks (97.8%) | | Country | | Shares/
$ Par | | | Value
$(000’s) | |
| |
| | Financials continued | |
| | Swiss Re AG | | Switzerland | | | 182,382 | | | | 17,284 | |
| | UBS Group AG | | Switzerland | | | 1,171,840 | | | | 18,355 | |
| | UNIQA Insurance Group AG | | Austria | | | 1,268,484 | | | | 9,614 | |
| | United Overseas Bank, Ltd. | | Singapore | | | 477,240 | | | | 6,723 | |
| | | | | | | | | | | | |
| | Total | | | | | | | | | 343,426 | |
| | | | | | | |
| |
| | Health Care (13.6%) | |
| | Bayer AG | | Germany | | | 209,050 | | | | 21,814 | |
| | Draegerwerk AG & Co. KGaA | | Germany | | | 92,710 | | | | 7,758 | |
| | Getinge AB - Class B | | Sweden | | | 591,650 | | | | 9,488 | |
| | GlaxoSmithKline PLC | | United Kingdom | | | 749,200 | | | | 14,422 | |
| | Merck KGaA | | Germany | | | 251,030 | | | | 26,200 | |
| * | | MorphoSys AG | | Germany | | | 256,240 | | | | 13,149 | |
| * | | QIAGEN NV | | Netherlands | | | 393,320 | | | | 11,046 | |
| | Roche Holding AG | | Switzerland | | | 96,190 | | | | 21,972 | |
| | Sanofi | | France | | | 304,975 | | | | 24,687 | |
| | Shanghai Pharmaceuticals Holding Co., Ltd. | | China | | | 5,366,610 | | | | 12,305 | |
| | Sinopharm Group Co., Ltd. | | China | | | 2,825,200 | | | | 11,640 | |
| | Teva Pharmaceutical Industries, Ltd., ADR | | Israel | | | 795,050 | | | | 28,821 | |
| | UCB SA | | Belgium | | | 275,350 | | | | 17,655 | |
| | | | | | | | | | | | |
| | Total | | | | | | | | | 220,957 | |
| | | | | | | |
| |
| | Industrials (9.5%) | |
| * | | ABB, Ltd. | | Switzerland | | | 828,830 | | | | 17,483 | |
| | BAE Systems PLC | | United Kingdom | | | 2,178,300 | | | | 15,879 | |
| | Cie de Saint-Gobain | | France | | | 497,070 | | | | 23,156 | |
| | CK Hutchison Holdings, Ltd. | | Cayman Islands | | | 2,040,070 | | | | 23,125 | |
| | CRRC Corp., Ltd. | | China | | | 18,229,000 | | | | 16,361 | |
| | Deutsche Lufthansa AG | | Germany | | | 1,149,900 | | | | 14,852 | |
| | Siemens AG | | Germany | | | 141,290 | | | | 17,372 | |
| | Siemens AG, ADR | | Germany | | | 50,780 | | | | 6,217 | |
| * | | Toshiba Corp. | | Japan | | | 5,980,020 | | | | 14,485 | |
| | Weichai Power Co., Ltd. | | China | | | 3,813,400 | | | | 5,872 | |
| | | | | | | | | | | | |
| | Total | | | | | | | | | 154,802 | |
| | | | | | | |
| |
| | Information Technology (9.5%) | |
| * | | Baidu, Inc., ADR | | China | | | 72,720 | | | | 11,956 | |
| | Catcher Technology Co., Ltd. | | Taiwan | | | 605,330 | | | | 4,207 | |
| * | | GCL-Poly Energy Holdings, Ltd. | | China | | | 39,247,930 | | | | 4,707 | |
| | Infineon Technologies AG | | Germany | | | 1,081,590 | | | | 18,797 | |
| | Konica Minolta, Inc. | | Japan | | | 2,077,820 | | | | 20,641 | |
| | Omron Corp. | | Japan | | | 119,700 | | | | 4,594 | |
| | Quanta Computer, Inc. | | Taiwan | | | 4,807,820 | | | | 8,995 | |
| | Samsung Electronics Co., Ltd. | | South Korea | | | 30,140 | | | | 44,968 | |
| | SAP SE | | Germany | | | 157,730 | | | | 13,749 | |
| | Taiwan Semiconductor Manufacturing Co., Ltd. | | Taiwan | | | 4,068,665 | | | | 22,913 | |
| | | | | | | | | | | | |
| | Total | | | | | | | | | 155,527 | |
| | | | | | | |
The Accompanying Notes are an Integral Part of the Financial Statements.
| | | | |
| 80 | | International Equity Portfolio | | |
International Equity Portfolio
| | | | | | | | | | | | |
| | | Common Stocks (97.8%) | | Country | | Shares/
$ Par | | | Value
$ (000’s) | |
| |
| | Materials (8.2%) | |
| | Akzo Nobel NV | | Netherlands | | | 336,140 | | | | 21,014 | |
| | CRH PLC | | Ireland | | | 558,050 | | | | 19,463 | |
| * | | Glencore PLC | | Switzerland | | | 3,927,240 | | | | 13,424 | |
| | HeidelbergCement AG | | Germany | | | 249,870 | | | | 23,312 | |
| | LANXESS AG | | Germany | | | 334,970 | | | | 21,985 | |
| | Sumitomo Metal Mining Co., Ltd. | | Japan | | | 1,034,700 | | | | 13,342 | |
| | thyssenkrupp AG | | Germany | | | 378,970 | | | | 9,032 | |
| | Yara International ASA | | Norway | | | 287,569 | | | | 11,322 | |
| | | | | | | | | | | | |
| | Total | | | | 132,894 | |
| | | | | | | |
| |
| | Real Estate (1.4%) | |
| | Cheung Kong Property Holdings, Ltd. | | Hong Kong | | | 2,040,070 | | | | 12,509 | |
| | Mitsui Fudosan Co., Ltd. | | Japan | | | 448,000 | | | | 10,369 | |
| | | | | | | | | | | | |
| | Total | | | | 22,878 | |
| | | | | | | |
| |
| | Telecommunication Services (8.9%) | |
| | China Mobile, Ltd. | | China | | | 1,336,200 | | | | 14,164 | |
| | China Telecom Corp., Ltd. - Class H | | China | | | 45,412,160 | | | | 20,965 | |
| | Singapore Telecommunications, Ltd. | | Singapore | | | 10,531,850 | | | | 26,545 | |
| | SoftBank Group Corp. | | Japan | | | 362,440 | | | | 24,080 | |
| | Telefonica Deutschland Holding AG | | Germany | | | 1,447,650 | | | | 6,202 | |
| | | | | | | | | | | | |
| | | Common Stocks (97.8%) | | Country | | Shares/
$ Par | | | Value
$ (000’s) | |
| |
| | Telecommunication Services continued | |
| | Telefonica SA | | Spain | | | 1,849,605 | | | | 17,173 | |
| | Telenor ASA | | Norway | | | 1,440,340 | | | | 21,517 | |
| | Vodafone Group PLC | | United Kingdom | | | 5,878,824 | | | | 14,479 | |
| | | | | | | | | | | | |
| | Total | | | | 145,125 | |
| | | | | | | |
| |
| | Utilities (1.0%) | |
| * | | Innogy SE | | Germany | | | 453,620 | | | | 15,762 | |
| | | | | | | | | | | | |
| | Total | | | | 15,762 | |
| | | | | | | |
| | |
| | Total Common Stocks | | | | | |
| | (Cost: $1,529,241) | | | | 1,591,947 | |
| | | | | | | |
| |
| | | Short-Term Investments (2.1%) | |
| |
| | US Government & Agencies (2.1%) | |
| (r) | | Federal Agricultural Mortgage Corp., 0.175%, 1/3/17 | | United States | | | 22,800,000 | | | | 22,800 | |
| (r) | | Federal Home Loan Mortgage Corp., 0.225%, 1/3/17 | | United States | | | 11,400,000 | | | | 11,400 | |
| | | | | | | | | | | | |
| | Total | | | | 34,200 | |
| | | | | | | |
| | |
| | Total Short-Term Investments | | | | | |
| | (Cost: $34,199) | | | | 34,200 | |
| | | | | | | |
| | |
| | Total Investments (99.9%) | | | | | |
| | (Cost: $1,563,440)(a) | | | | 1,626,147 | |
| | | | | | | |
| | Other Assets, Less | | | | | |
| | Liabilities (0.1%) | | | | 2,120 | |
| | | | | | | |
| | Net Assets (100.0%) | | | | 1,628,267 | |
| | | | | | | |
| | ADR after the name of a security represents—American Depositary Receipt. |
| (a) | At December 31, 2016, the aggregate cost of securities for federal tax purposes (in thousands) was $1,564,947 and the net unrealized appreciation of investments based on that cost was $61,200 which is comprised of $214,087 aggregate gross unrealized appreciation and $152,887 aggregate gross unrealized depreciation. |
| | | | | | |
Investments Percentage by Country is based on Net Assets: | | | | | | |
United Kingdom | | | 14.4% | | | |
Germany | | | 14.2% | | | |
Japan | | | 10.2% | | | |
France | | | 10.0% | | | |
China | | | 8.2% | | | |
Netherlands | | | 6.1% | | | |
South Korea | | | 6.1% | | | |
Switzerland | | | 5.4% | | | |
Other | | | 25.3% | | | |
Total | | | 99.9% | | | |
| (r) | Rates are discount rates at the time of purchase. |
The Accompanying Notes are an Integral Part of the Financial Statements.
| | | | | | |
| | International Equity Portfolio | | | 81 | |
International Equity Portfolio
The following is a summary of the inputs used in valuing the Portfolio’s assets and liabilities at December 31, 2016. See Note 3 for additional information on portfolio valuation.
| | | | | | | | | | | | | | |
| | | Valuation Inputs | | | |
| Description | | Level 1 –
Quoted Prices | | | Level 2 –
Other Significant
Observable Inputs | | | Level 3 – Significant
Unobservable Inputs | | | |
| | | (Amounts in thousands) | | | |
Assets: | | | | | | | | | | | | | | |
Common Stocks | | | | | | | | | | | | | | |
Energy | | $ | 218,913 | | | $ | 5,043 | | | $ | - | | | |
All Others | | | 1,367,991 | | | | - | | | | - | | | |
Short-Term Investments | | | - | | | | 34,200 | | | | - | | | |
Total Assets: | | $ | 1,586,904 | | | $ | 39,243 | | | $ | - | | | |
The Accompanying Notes are an Integral Part of the Financial Statements.
| | | | |
| 82 | | International Equity Portfolio | | |
Emerging Markets Equity Portfolio (unaudited)
| | | | |
| Objective: | | Portfolio Strategy: | | Net Assets: |
| Capital Appreciation. | | Invest in equity securities of issuers that are tied economically to emerging market countries. | | $522 million |
Portfolio Overview
Mason Street Advisors, LLC (“Mason Street Advisors”), the investment adviser for the Emerging Markets Equity Portfolio (“the Portfolio”), has engaged Massachusetts Financial Services Company (“MFS®”) to act as sub-adviser for the Portfolio. The Portfolio normally invests in equity securities of issuers that are tied economically to emerging market countries. Emerging market countries include countries determined by the Portfolio’s portfolio managers to have emerging market economies, taking into account a number of factors that demonstrate that the country’s financial and capital markets are in the development phase. The Portfolio may invest in companies of any size. Investments are selected primarily based on fundamental analysis of individual issuers and their potential in light of their financial condition, and market, economic, political, and regulatory conditions.
Market Overview
Sluggish global growth weighed on both developed and emerging market (“EM”) economies during much of the year, though signs of improved growth became evident in late 2016. The U.S. Federal Reserve increased interest rates by 25 basis points at the end of the period, the second hike of the cycle which began in December 2015. Globally, however, central bank policy remained highly accommodative, which forced many government, and even some corporate, bond yields into negative territory during the period. During the first half of the period, the United Kingdom voted to leave the European Union (“EU”), beginning a multi-year process of negotiation in order to achieve “Brexit.” While markets initially reacted to the vote with alarm, the spillover to European and EM economies was relatively short-lived. Late in the period, the surprising U.S. presidential election outcome prompted a significant rally in equities and a rise in bond yields in anticipation of a reflationary policy mix from the incoming Trump administration.
Portfolio Results
The Portfolio returned 9.06% for the twelve months ended December 31, 2016. By comparison, the Portfolio’s benchmark, the MSCI® Emerging Markets Index (the “Index”) returned 11.60%. (This Index is unmanaged, cannot be invested in directly and does not include administrative expenses or sales charges.) According to Lipper® Analytical Services, Inc., an independent mutual fund ranking agency, the average return of the Emerging Markets Funds peer group was 9.09% for 2016.
Weak stock selection within the Consumer Discretionary sector detracted from relative performance. The Portfolio’s holdings of footwear retailer Stella International Holdings, Ltd. (China), apparel retailer Global Brands Group Holding, Ltd. (China) and electrical and electronic products manufacturer Techtronic Industries Co., Ltd. (China) weighed on relative returns.
The Portfolio’s underweight allocation to the Materials sector also hindered relative results. Within this sector, not holding shares of strong-performing mining company Vale (Brazil) held back relative performance.
The Financials sector was also an area of weakness for the Portfolio. Within this sector, underweight positions in Brazilian banking firm Banco Bradesco and Russian bank Sberbank of Russia, and not holding shares of Brazilian bank Itau Unibanco, dampened relative returns.
Elsewhere, the Portfolio’s overweight position in personal hygiene products maker Hengan International Group Co., Ltd. (China), not holding shares of oil and gas producer Petroleo Brasileiro (Brazil) and ownership of IT company Cognizant Technology Solutions Corp. further weighed on relative performance.
During the reporting period, the Portfolio’s relative currency exposure, resulting primarily from differences between the Portfolio’s and the Index’s exposures to holdings of securities denominated in foreign currencies, was also a detractor from relative performance. All of the Portfolio’s investment decisions are driven by the fundamentals of each individual opportunity and as such, it is common for the Portfolio to have different currency exposure than the Index.
Security selection and an overweight position in the Information Technology sector aided results relative to the Index. Within this sector, the Portfolio’s overweight positions in Taiwanese semiconductor manufacturer Taiwan Semiconductor Manufacturing Co., Ltd. and optoelectronic components manufacturer Largan Precision (Taiwan), combined with holding shares of semiconductor equipment manufacturer ASM Pacific Technology (China), lifted relative returns.
Strong stock selection in the Health Care sector also supported relative performance. An overweight position in Brazilian insurance and health care provider Qualicorp lifted returns within this sector.
An underweight position and security selection in the Industrials sector further benefited relative returns. However, there were no individual stocks within this sector that were among the top relative contributors for the reporting period.
| | | | | | |
| | Emerging Markets Equity Portfolio | | | 83 | |
Emerging Markets Equity Portfolio (unaudited)
Portfolio Manager Outlook
The following forward looking comments are the opinion of MFS®, the Portfolio’s sub-adviser.
Regardless of changing economic and market conditions, we will continue to adhere to our investment process, basing our investment decisions primarily on fundamental analysis and our view of their potential in light of the broader market environment, including economic, political and regulatory conditions. As a result, the Portfolio’s sector and industry allocations will reflect where we are finding what we believe to be the best investment opportunities at any given time.
Relative Performance
| | | | | | | | | | | | |
Average Annual Total Returns
For Periods Ended December 31, 2016 | |
| | | 1 Year | | | 5 Years | | | Since
Inception* | |
Emerging Markets Equity Portfolio | | | 9.06 | % | | | 0.23 | % | | | -0.34 | % |
MSCI® Emerging Markets Index (Gross) | | | 11.60 | % | | | 1.64 | % | | | 1.52 | % |
Lipper® Variable Insurance Products (VIP) Emerging Markets Funds Average | | | 9.09 | % | | | 1.56 | % | | | – | |
| * | Inception date of 4/30/07 |
The performance data quoted represents past performance. Past performance is historical and does not guarantee future performance. Investment return and principal value will fluctuate, so that shares, when redeemed, may be worth more or less than their original cost. Current performance may be lower or higher than the performance data quoted. For the most recent month-end performance information visit www.northwesternmutual.com.
This chart assumes an initial investment of $10,000 made on 4/30/07 (commencement of the Portfolio’s operations). Returns shown reflect fee waivers, deductions for management and other portfolio expenses, and reinvestment of all dividends. In the absence of fee waivers, total return would be reduced. Returns exclude deductions for separate account sale loads and account fees. Please refer to the Benchmark Definitions section of this report for information about the indices cited in the above chart and graph.
Investors should be aware of the risks of investments in foreign securities, particularly investments in securities of companies in developing nations. These include the risks of currency fluctuation, of political and economic instability and of less well-developed government supervision and regulation of business and industry practices, as well as differences in accounting standards.
Investments in the securities of companies in developing nations impose risks different from, and greater than, risks of investing in developed countries.
The Portfolio may invest a relatively large percentage of its assets in issuers located in a single country, a small number of countries, or a particular geographic region. The Portfolio’s performance may be more volatile than that of a more geographically diversified fund, and may be tied more closely to the performance of a single country or region.
The Portfolio may invest a relatively high percentage of its assets in a particular sector. The Portfolio will have greater exposure to the risks associated with that sector and its performance will be tied more closely to the performance of that sector.
Top 10 Equity Holdings 12/31/16
| | |
| Security Description | | % of Net Assets |
Samsung Electronics Co., Ltd. | | 5.5% |
Taiwan Semiconductor Manufacturing Co., Ltd. | | 5.2% |
Alibaba Group Holding, Ltd., ADR | | 3.7% |
LUKOIL PJSC, ADR | | 2.9% |
Housing Development Finance Corp., Ltd. | | 2.8% |
China Construction Bank Corp. - Class H | | 2.5% |
Tencent Holdings, Ltd. | | 2.1% |
Dufry AG | | 2.0% |
Yum China Holdings, Inc. | | 1.9% |
Cognizant Technology Solutions Corp. | | 1.8% |
Sector Allocation 12/31/16
Sector Allocation is based on Net Assets.
Sector Allocation and Top 10 Holdings are subject to change.
| | | | |
| 84 | | Emerging Markets Equity Portfolio | | |
Emerging Markets Equity Portfolio
Schedule of Investments
December 31, 2016
| | | | | | | | | | | | |
| | | Common Stocks (97.7%) | | Country | | Shares/
$ Par | | | Value
$ (000’s) | |
| |
| | Consumer Discretionary (18.0%) | |
| | Alsea SAB de CV | | Mexico | | | 700,167 | | | | 2,000 | |
| | China Maple Leaf Educational Systems, Ltd. | | Cayman Islands | | | 4,578,000 | | | | 3,040 | |
| * | | Coway Co., Ltd. | | South Korea | | | 91,384 | | | | 6,681 | |
| * | | Ctrip.com International, Ltd., ADR | | China | | | 139,963 | | | | 5,598 | |
| * | | Dufry AG | | Switzerland | | | 81,689 | | | | 10,188 | |
| | Ford Otomotiv Sanayi AS | | Turkey | | | 314,194 | | | | 2,724 | |
| * | | Global Brands Group Holding, Ltd. | | Bermuda | | | 43,290,000 | | | | 5,750 | |
| | Imperial Holdings, Ltd. | | South Africa | | | 472,869 | | | | 6,282 | |
| | Jollibee Foods Corp. | | Philippines | | | 574,700 | | | | 2,243 | |
| | Kia Motors Corp. | | South Korea | | | 120,881 | | | | 3,928 | |
| | Kroton Educacional SA | | Brazil | | | 980,300 | | | | 4,015 | |
| * | | MakeMyTrip, Ltd. | | India | | | 172,148 | | | | 3,822 | |
| | Naspers, Ltd. - Class N | | South Africa | | | 50,286 | | | | 7,375 | |
| | SACI Falabella | | Chile | | | 563,673 | | | | 4,476 | |
| | Stella International Holdings, Ltd. | | Hong Kong | | | 2,885,000 | | | | 4,651 | |
| | Techtronic Industries Co., Ltd. | | Hong Kong | | | 2,378,500 | | | | 8,527 | |
| | Titan Co., Ltd. | | India | | | 608,166 | | | | 2,921 | |
| * | | Yum China Holdings, Inc. | | United States | | | 376,788 | | | | 9,842 | |
| | | | | | | | | | | | |
| | Total | | | | 94,063 | |
| | | | | | | | | | | | |
| |
| | Consumer Staples (14.2%) | |
| | Ambev SA, ADR | | Brazil | | | 1,639,453 | | | | 8,050 | |
| | Astra Agro Lestari Tbk PT | | Indonesia | | | 3,492,000 | | | | 4,348 | |
| | AVI, Ltd. | | South Africa | | | 1,120,074 | | | | 7,451 | |
| | BRF SA | | Brazil | | | 323,056 | | | | 4,789 | |
| * | | China Resources Beer Holdings Co., Ltd. | | Hong Kong | | | 3,044,000 | | | | 6,045 | |
| | Clicks Group, Ltd. | | South Africa | | | 449,696 | | | | 3,782 | |
| | Dabur India, Ltd. | | India | | | 1,203,694 | | | | 4,899 | |
| | Dairy Farm International Holdings, Ltd. | | Hong Kong | | | 472,500 | | | | 3,397 | |
| | Eurocash SA | | Poland | | | 437,446 | | | | 4,112 | |
| | Hanjaya Mandala Sampoerna Tbk PT | | Indonesia | | | 11,547,300 | | | | 3,283 | |
| | Hengan International Group Co., Ltd. | | China | | | 1,079,500 | | | | 7,928 | |
| | ITC, Ltd. | | India | | | 2,177,349 | | | | 7,725 | |
| * | | Lenta, Ltd. GDR 144A | | Virgin Islands (British) | | | 339,837 | | | | 2,787 | |
| | PriceSmart, Inc. | | United States | | | 10,886 | | | | 909 | |
| | Tingyi Cayman Islands Holding Corp. | | Cayman Islands | | | 3,636,000 | | | | 4,422 | |
| | | | | | | | | | | | |
| | Total | | | | 73,927 | |
| | | | | | | | | | | | |
| |
| | Energy (5.1%) | |
| * | | Gran Tierra Energy, Inc. | | United States | | | 1,655,983 | | | | 5,007 | |
| | | | | | | | | | | | |
| | | Common Stocks (97.7%) | | Country | | Shares/
$ Par | | | Value
$ (000’s) | |
| |
| | Energy continued | |
| * | | Lamprell PLC | | United Arab
Emirates | | | 3,444,718 | | | | 3,906 | |
| | LUKOIL PJSC, ADR | | Russia | | | 266,503 | | | | 14,951 | |
| | Ultrapar Participacoes SA | | Brazil | | | 128,113 | | | | 2,694 | |
| | | | | | | | | | | | |
| | Total | | | | 26,558 | |
| | | | | | | | | | | | |
| |
| | Financials (21.3%) | |
| | AIA Group, Ltd. | | Hong Kong | | | 1,582,800 | | | | 8,930 | |
| | Banco Bradesco SA, ADR | | Brazil | | | 536,121 | | | | 4,670 | |
| | Banco Santander Chile, ADR | | Chile | | | 95,221 | | | | 2,082 | |
| | Bancolombia SA, ADR | | Colombia | | | 101,518 | | | | 3,724 | |
| | Bank Central Asia Tbk PT | | Indonesia | | | 2,696,000 | | | | 3,102 | |
| | BB Seguridade Participacoes SA | | Brazil | | | 379,273 | | | | 3,298 | |
| * | | BR Insurance Corretora de Seguros SA | | Brazil | | | 37,068 | | | | 229 | |
| | China Construction Bank Corp. - Class H | | China | | | 16,647,020 | | | | 12,816 | |
| | Credicorp, Ltd. | | Bermuda | | | 18,516 | | | | 2,923 | |
| | E.Sun Financial Holding Co., Ltd. | | Taiwan | | | 10,489,547 | | | | 5,972 | |
| | Grupo Financiero Banorte SAB de CV | | Mexico | | | 563,111 | | | | 2,774 | |
| | Grupo Financiero Inbursa SAB de CV | | Mexico | | | 3,484,447 | | | | 5,281 | |
| | Housing Development Finance Corp., Ltd. | | India | | | 798,063 | | | | 14,832 | |
| | Industrial & Commercial Bank of China, Ltd. | | China | | | 11,553,000 | | | | 6,928 | |
| | Kasikornbank PCL | | Thailand | | | 1,099,000 | | | | 5,447 | |
| | Komercni Banka AS | | Czech
Republic | | | 55,561 | | | | 1,916 | |
| | Kotak Mahindra Bank, Ltd. | | India | | | 830,183 | | | | 8,776 | |
| | Public Bank Bhd | | Malaysia | | | 1,102,400 | | | | 4,846 | |
| | Samsung Fire & Marine Insurance Co., Ltd. | | South Korea | | | 13,111 | | | | 2,915 | |
| | Sberbank of Russia PJSC | | Russia | | | 1,163,719 | | | | 3,287 | |
| | Shriram Transport Finance Co., Ltd. | | India | | | 309,249 | | | | 3,882 | |
| | Turkiye Sinai Kalkinma Bankasi AS | | Turkey | | | 6,044,409 | | | | 2,416 | |
| | | | | | | | | | | | |
| | Total | | | | 111,046 | |
| | | | | | | | | | | | |
| |
| | Health Care (2.6%) | |
| * | | Genomma Lab Internacional SAB de CV - Class B | | Mexico | | | 5,869,627 | | | | 6,090 | |
| | OdontoPrev SA | | Brazil | | | 812,157 | | | | 3,144 | |
| | Qualicorp SA | | Brazil | | | 712,607 | | | | 4,215 | |
| | | | | | | | | | | | |
| | Total | | | | 13,449 | |
| | | | | | | | | | | | |
| |
| | Industrials (2.8%) | |
| * | | 51job, Inc., ADR | | China | | | 184,536 | | | | 6,237 | |
| | Grupo Aeroportuario del Sureste SAB de CV, ADR | | Mexico | | | 13,834 | | | | 1,990 | |
The Accompanying Notes are an Integral Part of the Financial Statements.
| | | | | | |
| | Emerging Markets Equity Portfolio | | | 85 | |
Emerging Markets Equity Portfolio
| | | | | | | | | | | | |
| | | Common Stocks (97.7%) | | Country | | Shares/
$ Par | | | Value
$ (000’s) | |
| | |
| | Industrials continued | | | | | |
| * | | Mills Estruturas e Servicos de Engenharia SA | | Brazil | | | 1,534,704 | | | | 1,844 | |
| | SEEK, Ltd. | | Australia | | | 423,518 | | | | 4,548 | |
| | | | | | | | | | | | |
| | Total | | | | 14,619 | |
| | | | | | | | | | | | |
| |
| | Information Technology (25.1%) | |
| * | | Alibaba Group Holding, Ltd., ADR | | Cayman Islands | | | 218,385 | | | | 19,177 | |
| | ASM Pacific Technology, Ltd. | | Cayman Islands | | | 680,800 | | | | 7,212 | |
| * | | Baidu, Inc., ADR | | China | | | 31,215 | | | | 5,132 | |
| * | | Cognizant Technology Solutions Corp. | | United States | | | 170,469 | | | | 9,552 | |
| * | | EPAM Systems, Inc. | | United States | | | 78,721 | | | | 5,063 | |
| * | | Globant SA | | Luxembourg | | | 157,731 | | | | 5,260 | |
| | Linx SA | | Brazil | | | 552,400 | | | | 2,945 | |
| | NAVER Corp. | | South Korea | | | 8,642 | | | | 5,545 | |
| | Samsung Electronics Co., Ltd. | | South Korea | | | 19,085 | | | | 28,474 | |
| | Taiwan Semiconductor Manufacturing Co., Ltd. | | Taiwan | | | 4,843,290 | | | | 27,275 | |
| | Tencent Holdings, Ltd. | | Cayman Islands | | | 444,100 | | | | 10,864 | |
| | VTech Holdings, Ltd. | | Bermuda | | | 348,700 | | | | 4,663 | |
| | | | | | | | | | | | |
| | Total | | | | 131,162 | |
| | | | | | | | | | | | |
| |
| | Materials (3.6%) | |
| | Fibria Celulose SA | | Brazil | | | 288,977 | | | | 2,831 | |
| | Grupo Mexico SAB de CV - Series B | | Mexico | | | 865,867 | | | | 2,351 | |
| | Iluka Resources, Ltd. | | Australia | | | 967,326 | | | | 5,075 | |
| | PTT Global Chemical PCL | | Thailand | | | 2,233,600 | | | | 3,930 | |
| | Suzano Papel e Celulose SA | | Brazil | | | 992,100 | | | | 4,329 | |
| | | | | | | | | | | | |
| | Total | | | | 18,516 | |
| | | | | | | | | | | | |
| |
| | Real Estate (1.6%) | |
| | Concentradora Fibra Hotelera Mexicana SA de CV | | Mexico | | | 3,039,330 | | | | 2,057 | |
| | Hang Lung Properties, Ltd. | | Hong Kong | | | 2,974,000 | | | | 6,305 | |
| | | | | | | | | | | | |
| | Total | | | | 8,362 | |
| | | | | | | | | | | | |
| |
| | Telecommunication Services (0.8%) | |
| | Hellenic Telecommunications Organization SA | | Greece | | | 172,829 | | | | 1,625 | |
| * | | XL Axiata Tbk PT | | Indonesia | | | 15,721,000 | | | | 2,695 | |
| | | | | | | | | | | | |
| | Total | | | | 4,320 | |
| | | | | | | | | | | | |
| | | | | | | | | | | | | | |
| | | Common Stocks (97.7%) | | Country | | | Shares/
$ Par | | | Value
$ (000’s) | |
| | | | |
| | Utilities (2.6%) | | | | | | | | | | | | |
| | CESC, Ltd. | | | India | | | | 641,121 | | | | 6,054 | |
| | China Resources Gas Group, Ltd. | | | Hong Kong | | | | 2,176,000 | | | | 6,118 | |
| | Infraestructura Energetica Nova SAB de CV | | | Mexico | | | | 329,925 | | | | 1,437 | |
| | | | | | | | | | | | | | |
| | Total | | | | | | | | | | | 13,609 | |
| | | | | | | | | | | | | | |
| | | |
| | Total Common Stocks | | | | | | | | | |
| | (Cost: $509,359) | | | | | | | | | | | 509,631 | |
| | | | | | | | | | | | | | |
| | | | |
| | | Warrants (1.2%) | | | | | | | | | |
| | | | |
| | Financials (0.6%) | | | | | | | | | | | | |
| * | | Deutsche Bank AG London (Union National Bank - Zero Strike Warrant) (1 share for 1 warrant) (Expiration Date 5/15/17) 144A | | | Netherlands | | | | 2,562,675 | | | | 3,167 | |
| | | | | | | | | | | | | | |
| | Total | | | | | | | | | | | 3,167 | |
| | | | | | | | | | | | | | |
| | | | |
| | Real Estate (0.6%) | | | | | | | | | | | | |
| * | | Merrill Lynch Intl & Co. (Aldar Properties - .00001 AED Strike Warrant) (1 share for 1 warrant) (Expiration Date 9/6/18) 144A | | | United Kingdom | | | | 4,902,231 | | | | 3,432 | |
| | | | | | | | | | | | | | |
| | Total | | | | | | | | | | | 3,432 | |
| | | | | | | | | | | | | | |
| | | |
| | Total Warrants | | | | | | | | | |
| | (Cost: $7,135) | | | | | | | | | | | 6,599 | |
| | | | | | | | | | | | | | |
| | | | |
| | Short-Term Investments (0.5%) | | | | | | | | | | | | |
| | | |
| | | | |
| | US Government & Agencies (0.5%) | | | | | | | | | | | | |
| (r) | | Federal Home Loan Bank, 0.300%, 1/3/17 | | | United States | | | | 2,500,000 | | | | 2,500 | |
| | | | | | | | | | | | | | |
| | Total | | | | | | | | | | | 2,500 | |
| | | | | | | | | | | | | | |
| | | |
| | Total Short-Term Investments | | | | | | | | | |
| | (Cost: $2,500) | | | | | | | | | | | 2,500 | |
| | | | | | | | | | | | | | |
| | | |
| | Total Investments (99.4%) | | | | | | | | 518,730 | |
| | | | | | | | | | | | | | |
| | (Cost: $518,994)(a) | | | | | | | | | | | | |
| | Other Assets, Less | | | | | | | | | | | | |
| | Liabilities (0.6%) | | | | | | | | | | | 3,070 | |
| | | | | | | | | | | | | | |
| | Net Assets (100.0%) | | | | | | | | | | | 521,800 | |
| | | | | | | | | | | | | | |
| | ADR after the name of a security represents—American Depositary Receipt. |
| | AED – United Arab Emirates Dirham |
| | GDR after the name of a security represents—Global Depositary Receipt. |
| | 144A after the name of a security represents a security exempt from registration under Rule 144A of the Securities Act of 1933. These securities may be resold as transactions exempt from registration, normally to qualified institutional buyers. At December 31, 2016 the value of these securities (in thousands) was $9,386 representing 1.8% of the net assets. |
The Accompanying Notes are an Integral Part of the Financial Statements.
| | | | |
| 86 | | Emerging Markets Equity Portfolio | | |
Emerging Markets Equity Portfolio
| (a) | At December 31, 2016, the aggregate cost of securities for federal tax purposes (in thousands) was $523,188 and the net unrealized depreciation of investments based on that cost was $4,458 which is comprised of $43,656 aggregate gross unrealized appreciation and $48,114 aggregate gross unrealized depreciation. |
| | | | | | |
Investments Percentage by Country is based on Net Assets: | | | | | | |
India | | | 10.1% | | | |
South Korea | | | 9.1% | | | |
Brazil | | | 9.0% | | | |
Cayman Islands | | | 8.6% | | | |
China | | | 8.6% | | | |
Hong Kong | | | 8.4% | | | |
Taiwan | | | 6.4% | | | |
Other | | | 39.2% | | | |
Total | | | 99.4% | | | |
| (r) | Rates are discount rates at the time of purchase. |
The following is a summary of the inputs used in valuing the Portfolio’s assets and liabilities at December 31, 2016. See Note 3 for additional information on portfolio valuation.
| | | | | | | | | | | | | | |
| | | Valuation Inputs | | | |
| Description | | Level 1 – Quoted Prices | | | Level 2 –
Other Significant
Observable Inputs | | | Level 3 –
Significant
Unobservable Inputs | | | |
| | | (Amounts in thousands) | | | |
Assets: | | | | | | | | | | | | | | |
Common Stocks | | | | | | | | | | | | | | |
Financials | | $ | 107,759 | | | $ | 3,287 | | | $ | - | | | |
Materials | | | 14,586 | | | | 3,930 | | | | - | | | |
All Others | | | 380,069 | | | | - | | | | - | | | |
Warrants | | | | | | | 6,599 | | | | - | | | |
Short-Term Investments | | | - | | | | 2,500 | | | | - | | | |
Total Assets: | | $ | 502,414 | | | $ | 16,316 | | | $ | - | | | |
The Accompanying Notes are an Integral Part of the Financial Statements.
| | | | | | |
| | Emerging Markets Equity Portfolio | | | 87 | |
Government Money Market Portfolio (unaudited)
| | | | |
| Objective: | | Portfolio Strategy: | | Net Assets: |
| Maximum current income to the extent consistent with liquidity and stability of capital. | | Invest in short-term fixed income obligations issued or guaranteed by the U.S Government, its agencies or instrumentalities. | | $502 million |
Portfolio Overview
Mason Street Advisors, LLC (“Mason Street Advisors”), the investment adviser for the Government Money Market Portfolio (the “Portfolio”), has engaged BlackRock Advisors, LLC (“BlackRock”) to act as sub-adviser for the Portfolio. The Portfolio invests at least 99.5% of its total assets in cash, U.S. Treasury bills, notes and other obligations issued or guaranteed as to principal and interest by the U.S. Government, its agencies or instrumentalities, and repurchase agreements secured by such obligations or cash. The Portfolio invests in a portfolio of securities maturing in 397 days or less (with certain exceptions) that will have a dollar-weighted average maturity of 60 days or less and a dollar-weighted average life of 120 days or less. The Portfolio seeks to maintain a net asset value of $1.00 per share.
Market Overview
The major market themes for 2016 included the Federal Open Market Committee’s (“FOMC”) evolving monetary policy framework, intensified Quantitative Easing efforts across global markets, and the growing supply scarcity of U.S. government securities as a result of the SEC’s money market fund reforms. The FOMC struggled with its communication strategy throughout the year, while messaging its intention to normalize rates and prepare markets for a potential rate hike in July, September and December. Ultimately, there were too many headwinds (the United Kingdom’s vote to leave the European Union, or “Brexit,” U.S. election results, money market fund reforms) to support a smooth transition to substantially higher policy rates. Central banks around the globe remained committed to negative interest rate policies, which ended up influencing the FOMC’s own policy stance due to the potential impacts on financial conditions and the U.S. dollar. Meanwhile, the vast majority of shareholders invested in U.S. prime money market funds exhibited an overwhelming preference to move their cash into constant net asset value U.S. government money market funds in the lead-up to October’s money market reform implementation. The result was an epic migration of one trillion dollars of assets under management from prime money market funds to government money market funds. This structural change in the money market space occurred as smoothly as anyone could have anticipated. In the process, the gradual transition resulted in a steady climb for LIBOR (London Interbank Offered Rate) and higher structural demand for U.S. government paper. Increases in T-bill supply and tri-party repurchase agreements helped to alleviate the possibility of extreme stresses in the money markets; however, the net supply of investable assets was not enough to bridge the emerging supply-demand gap for short maturity U.S. government securities. The increased demand from U.S. government money market funds resulted in short-maturity government yields being pressured lower in the context of the FOMC’s target range.
Portfolio Results
The Portfolio returned 0.13% for the twelve months ended December 31, 2016. By comparison, the Portfolio’s benchmark, the Merrill Lynch® 3-Month Treasury Bill Index (the “Index”), returned 0.33%. (The Index is unmanaged, cannot be invested in directly and does not include administrative expenses or sales charges.) The Portfolio outperformed the 0.05% average return of the Money Market Funds peer group tracked by Lipper® Analytical Services, Inc., an independent mutual fund ranking agency.
In 2016, the Portfolio’s exposure to floating rate notes contributed positively to the Portfolio’s performance. The Portfolio’s allocation to floating rate notes represented approximately 16-24% of the Portfolio’s net asset value during the year. The other notable security type held within the Portfolio was ultra-short maturity repurchase agreements. These holdings satisfied the Portfolio’s liquidity management requirements while providing relative yields that modestly contributed to overall performance.
In terms of duration and yield curve management, the Portfolio’s duration exposure was modestly longer than its peer group during the majority of the year and contributed to performance given that the Fed Funds Futures market priced in a greater than 50% probability of a 0.25% rate hike numerous times during the period. Regarding market rate structure, at no point did the Fed Funds Futures fully price in a 0.25% hike throughout the year, despite the FOMC’s steady message of their desire to begin normalizing interest rates in 2016. With the cash markets increasingly doubtful of the FOMC’s intentions, the portfolio manager contended with market participants that largely refused to price in adequate compensation (term premiums) for longer maturity bullets. This dynamic resulted in the Portfolio favoring floating rate exposure (when spreads were attractive) and limiting exposure to fixed rate securities with maturities longer than eight months.
| | | | |
| 88 | | Government Money Market Portfolio | | |
Government Money Market Portfolio (unaudited)
Portfolio Manager Outlook
The following forward looking comments are the opinion of BlackRock, the Portfolio’s sub-adviser.
In the post money market fund reform world, we do not expect a full retracement of the widening between U.S. Libor rates and U.S. government benchmark yields. Overall demand for short maturity safe assets is not likely to show signs of immediate improvement, and the significant structural changes from these reforms will affect the way shareholders invest in money market funds for years to come. The likely outcome is for short U.S. government rates that remain low despite the potential for multiple FOMC rate hikes in 2017.
Effective May 1, 2016 the Money Market Portfolio was renamed the Government Money Market Portfolio. Prior to May 1, 2016, the Government Money Market Portfolio operated as a “prime” money market fund, which allowed it to invest in certain types of securities that the Portfolio is no longer permitted to hold as a “government” money market fund. As a government money market portfolio, the Portfolio invests at least 99.5% of its total assets in cash, U.S. Treasury bills, notes and other obligations issued or guaranteed as to principal and interest by the U.S. Government, its agencies or instrumentalities, and repurchase agreements secured by such obligations or cash.
Not all obligations of the U.S. government, its agencies and instrumentalities are backed by the full faith and credit of the U.S. Treasury. Some obligations are backed only by the credit of the issuing agency or instrumentality, and in some cases there may be some risk of default by the issuer. Any guarantee by the U.S. government or its agencies or instrumentalities of a security held by the Portfolio does not apply to the market value of such security or to shares of the Portfolio itself.
If the other party to a repurchase agreement defaults on its obligation under the agreement, the Portfolio may suffer delays and incur costs or lose money in exercising its rights under the agreement. These risks may be heightened if the other party is located outside the U.S. If the seller fails to repurchase the security and the market value of the security declines, the Portfolio may lose money.
You could lose money investing in the Government Money Market Portfolio. Although the Portfolio seeks to preserve the value of your investment at $1.00 per share, it cannot guarantee it will do so. An investment in the Portfolio is not insured or guaranteed by the Federal Deposit Insurance Corporation or any other government agency. The Portfolio’s sponsor has no legal obligation to provide financial support to the Portfolio, and you should not expect that the sponsor will provide financial support to the Portfolio at any time.
| | | | | | |
| | Government Money Market Portfolio | | | 89 | |
Government Money Market Portfolio
Schedule of Investments
December 31, 2016
| | | | | | | | | | |
| | | Money Market Investments (101.5%) | |
$ Par | | | Value
$ (000’s) | |
| |
| | Repurchase Agreements (32.0%) | |
| | Tri-Party Bank of Montreal, 0.500%, 1/3/17
(Purchased on 12/30/16, to be repurchased at $20,001,111, collateralized by various US Treasury obligations, 0.000% to 2.750%, due from 3/31/18 to 2/15/46, aggregate par and fair value of $24,853,928 and $20,462,560, respectively) | | | 20,000,000 | | | | 20,000 | |
| | Tri-Party Bank of Nova Scotia, 0.500%, 1/3/17
(Purchased on 12/30/16, to be repurchased at $20,001,111, collateralized by various US Treasury obligations, 1.375% to 1.750%, due from 5/31/20 to 12/31/20, aggregate par and fair value of $20,543,074 and $20,427,492, respectively) | | | 20,000,000 | | | | 20,000 | |
| | Tri-Party Citigroup, 0.510%, 1/3/17
(Purchased on 12/30/16, to be repurchased at $10,000,567, collateralized by US Treasury Note, 1.625%, due 8/15/22, par and fair value of $10,480,863 and $10,224,501, respectively) | | | 10,000,000 | | | | 10,000 | |
| | Tri-Party Citigroup, 0.530%, 1/3/17
(Purchased on 12/30/16, to be repurchased at $5,000,294, collateralized by US Treasury Note, 0.750%, due 7/15/19, par and fair value of $5,178,034 and $5,102,849, respectively) | | | 5,000,000 | | | | 5,000 | |
| | Tri-Party HSBC Securities, 0.449%, 1/3/17
(Purchased on 12/30/16, to be repurchased at $2,500,125, collateralized by US Treasury Inflation Index Bond, 2.625%, due 7/15/17, par and fair value of $2,488,528 and $2,548,842, respectively) | | | 2,500,000 | | | | 2,500 | |
| | Tri-Party HSBC Securities, 0.450%, 1/3/17
(Purchased on 12/30/16, to be repurchased at $20,001,000, collateralized by US Treasury Inflation Index Bond, 2.625%, due 7/15/17, par and fair value of $19,930,644 and $20,413,703, respectively) | | | 20,000,000 | | | | 20,000 | |
| | Tri-Party Mitsubishi UFJ, 0.500%, 1/3/17
(Purchased on 12/30/16, to be repurchased at $20,001,111, collateralized by various US government sponsored agency obligations, 2.740% to 4.500%, due from 11/1/23 to 12/1/46, aggregate par and fair value of $19,692,944 and $20,642,439, respectively) | | | 20,000,000 | | | | 20,000 | |
| | Tri-Party Mizuho Securities, 0.500%, 1/3/17
(Purchased on 12/30/16, to be repurchased at $7,000,389, collateralized by US Treasury Inflation Index Bond, 0.125%, due 4/15/20, par and fair value of $7,076,824 and $7,153,346, respectively) | | | 7,000,000 | | | | 7,000 | |
| | Tri-Party Morgan Stanley, 0.510%, 1/3/17
(Purchased on 12/30/16, to be repurchased at $20,001,133, collateralized by various US Treasury obligations, 0.000% to 2.125%, due from 4/13/17 to 12/31/21, aggregate par and fair value of $20,422,511 and $20,403,359, respectively) | | | 20,000,000 | | | | 20,000 | |
| | | | | | | | | | |
| | | Money Market Investments (101.5%) | |
$ Par | | | Value
$ (000’s) | |
| |
| | Repurchase Agreements continued | |
| | Tri-Party RBC Capital Markets, 0.450%, 1/3/17
(Purchased on 12/30/16, to be repurchased at $20,001,000, collateralized by US Treasury Note, 1.500%, due 2/28/19, par and fair value of $20,299,353 and $20,409,781, respectively) | | | 20,000,000 | | | | 20,000 | |
| | Tri-Party TD Securities, 0.530%, 1/3/17
(Purchased on 12/30/16, to be repurchased at $16,000,942, collateralized by US Treasury Bond, 3.000%, due 11/15/45, par and fair value of $16,646,162 and $16,425,933, respectively) | | | 16,000,000 | | | | 16,000 | |
| | | | | | | | | | |
| | Total | | | | | | | 160,500 | |
| | | | | | | | | | |
| |
| | US Government & Agencies (69.5%) | |
| (r) | | Federal Farm Credit Bank, 0.590%, 3/30/17 | | | 1,535,000 | | | | 1,533 | |
| (r) | | Federal Farm Credit Bank, 0.600%, 1/3/17 | | | 1,460,000 | | | | 1,460 | |
| (r) | | Federal Farm Credit Bank, 0.600%, 7/11/17 | | | 3,115,000 | | | | 3,105 | |
| | Federal Farm Credit Bank, 0.675%, 9/5/17 | | | 5,060,000 | | | | 5,059 | |
| (r) | | Federal Farm Credit Bank, 0.690%, 9/29/17 | | | 2,380,000 | | | | 2,368 | |
| | Federal Farm Credit Bank, 0.759%, 9/22/17 | | | 4,500,000 | | | | 4,500 | |
| | Federal Farm Credit Bank, 0.794%, 4/20/17 | | | 4,000,000 | | | | 4,000 | |
| | Federal Farm Credit Bank, 0.815%, 4/4/18 | | | 2,065,000 | | | | 2,065 | |
| (r) | | Federal Home Loan Bank, 0.344%, 1/6/17 | | | 5,000,000 | | | | 5,000 | |
| (r) | | Federal Home Loan Bank,
0.355% to 0.486%, 1/25/17 | | | 21,400,000 | | | | 21,394 | |
| (r) | | Federal Home Loan Bank,
0.360% to 0.411%, 1/13/17 | | | 5,070,000 | | | | 5,069 | |
| (r) | | Federal Home Loan Bank, 0.360%, 1/20/17 | | | 5,500,000 | | | | 5,499 | |
| (r) | | Federal Home Loan Bank,
0.374% to 0.441%, 1/11/17 | | | 9,055,000 | | | | 9,054 | |
| (r) | | Federal Home Loan Bank, 0.375%, 1/4/17 | | | 2,700,000 | | | | 2,700 | |
| (r) | | Federal Home Loan Bank,
0.384% to 0.485%, 2/1/17 | | | 18,100,000 | | | | 18,093 | |
| (r) | | Federal Home Loan Bank, 0.410%, 1/17/17 | | | 3,000,000 | | | | 2,999 | |
| (r) | | Federal Home Loan Bank, 0.430%, 1/11/17 | | | 3,500,000 | | | | 3,500 | |
| (r) | | Federal Home Loan Bank, 0.435%, 2/3/17 | | | 6,040,000 | | | | 6,038 | |
| (r) | | Federal Home Loan Bank,
0.364% to 0.455%, 1/27/17 | | | 17,280,000 | | | | 17,275 | |
| (r) | | Federal Home Loan Bank, 0.458%, 2/8/17 | | | 7,625,000 | | | | 7,621 | |
| | Federal Home Loan Bank, 0.455%, 5/4/17 | | | 2,535,000 | | | | 2,535 | |
| (r) | | Federal Home Loan Bank, 0.460%, 2/2/17 | | | 5,500,000 | | | | 5,498 | |
| (r) | | Federal Home Loan Bank,
0.460% to 0.550%, 3/24/17 | | | 28,525,000 | | | | 28,490 | |
| (r) | | Federal Home Loan Bank, 0.470%, 2/10/17 | | | 3,335,000 | | | | 3,333 | |
| (r) | | Federal Home Loan Bank, 0.479%, 2/15/17 | | | 4,900,000 | | | | 4,897 | |
| (r) | | Federal Home Loan Bank, 0.480%, 4/6/17 | | | 2,655,000 | | | | 2,652 | |
| (r) | | Federal Home Loan Bank, 0.490%, 4/11/17 | | | 4,300,000 | | | | 4,294 | |
| | Federal Home Loan Bank, 0.494%, 5/10/17 | | | 4,500,000 | | | | 4,500 | |
| (r) | | Federal Home Loan Bank, 0.501%, 5/15/17 | | | 5,340,000 | | | | 5,330 | |
| (r) | | Federal Home Loan Bank, 0.510%, 2/17/17 | | | 3,135,000 | | | | 3,133 | |
| (r) | | Federal Home Loan Bank, 0.510%, 2/27/17 | | | 4,190,000 | | | | 4,187 | |
The Accompanying Notes are an Integral Part of the Financial Statements.
| | | | |
| 90 | | Government Money Market Portfolio | | |
Government Money Market Portfolio
| | | | | | | | | | |
| | | Money Market Investments (101.5%) | | $ Par | | | Value $ (000’s) | |
| |
| | US Government & Agencies continued | |
| (r) | | Federal Home Loan Bank, 0.520%, 2/22/17 | | | 6,540,000 | | | | 6,535 | |
| (r) | | Federal Home Loan Bank, 0.520%, 3/10/17 | | | 3,000,000 | | | | 2,997 | |
| (r) | | Federal Home Loan Bank, 0.521%, 5/10/17 | | | 4,030,000 | | | | 4,022 | |
| (r) | | Federal Home Loan Bank, 0.530%, 3/3/17 | | | 4,000,000 | | | | 3,996 | |
| (r) | | Federal Home Loan Bank,
0.480% to 0.551%, 3/22/17 | | | 4,865,000 | | | | 4,859 | |
| (r) | | Federal Home Loan Bank, 0.550%, 3/29/17 | | | 3,000,000 | | | | 2,996 | |
| (r) | | Federal Home Loan Bank, 0.550%, 5/1/17 | | | 3,000,000 | | | | 2,995 | |
| (r) | | Federal Home Loan Bank, 0.600%, 2/21/17 | | | 3,160,000 | | | | 3,157 | |
| | Federal Home Loan Bank, 0.625%, 5/30/17 | | | 4,240,000 | | | | 4,238 | |
| | Federal Home Loan Bank, 0.684%, 8/22/17 | | | 2,500,000 | | | | 2,500 | |
| | Federal Home Loan Bank, 0.685%, 8/25/17 | | | 2,750,000 | | | | 2,750 | |
| | Federal Home Loan Bank, 0.705%, 3/14/17 | | | 4,000,000 | | | | 4,000 | |
| | Federal Home Loan Bank, 0.707%, 7/7/17 | | | 6,000,000 | | | | 6,000 | |
| | Federal Home Loan Bank, 0.708%, 11/8/17 | | | 1,400,000 | | | | 1,400 | |
| | Federal Home Loan Bank, 0.710%, 1/17/17 | | | 2,250,000 | | | | 2,254 | |
| | Federal Home Loan Bank, 0.724%, 3/15/17 | | | 3,000,000 | | | | 3,000 | |
| | Federal Home Loan Bank, 0.746%, 2/7/17 | | | 3,000,000 | | | | 2,999 | |
| | Federal Home Loan Bank, 0.771%, 2/5/18 | | | 3,000,000 | | | | 3,000 | |
| | Federal Home Loan Bank, 0.792%, 10/16/17 | | | 3,600,000 | | | | 3,600 | |
| | Federal Home Loan Bank, 0.796%, 3/22/18 | | | 2,500,000 | | | | 2,500 | |
| | Federal Home Loan Bank, 0.806%, 10/27/17 | | | 2,300,000 | | | | 2,300 | |
| | Federal Home Loan Bank, 0.807%, 10/27/17 | | | 4,755,000 | | | | 4,755 | |
| | Federal Home Loan Mortgage Corp.,
0.730%, 9/29/17 | | | 3,180,000 | | | | 3,186 | |
| | Federal Home Loan Mortgage Corp.,
0.842%, 1/8/18 | | | 2,145,000 | | | | 2,145 | |
| | Federal Home Loan Mortgage Corp.,
0.844%, 1/12/18 | | | 2,145,000 | | | | 2,145 | |
| | Federal Home Loan Mortgage Corp.,
0.874%, 7/21/17 | | | 3,400,000 | | | | 3,399 | |
| | | | | | | | | | |
| | | Money Market Investments (101.5%) | | $ Par | | | Value
$ (000’s) | |
| |
| | US Government & Agencies continued | |
| | Federal Home Loan Mortgage Corp., 0.971%, 3/8/18 | | | 4,000,000 | | | | 4,000 | |
| | Federal National Mortgage Association, 0.490%, 2/13/17 | | | 890,000 | | | | 895 | |
| (r) | | Federal National Mortgage Association, 0.630%, 6/1/17 | | | 1,175,000 | | | | 1,172 | |
| (r) | | Federal National Mortgage Association, 0.760%, 6/1/17 | | | 6,500,000 | | | | 6,480 | |
| | Federal National Mortgage Association, 0.875%, 10/26/17 | | | 6,215,000 | | | | 6,222 | |
| (r) | | US Treasury Bill, 0.480%, 3/2/17 | | | 7,000,000 | | | | 6,994 | |
| (r) | | US Treasury Bill, 0.540%, 3/16/17 | | | 5,000,000 | | | | 4,994 | |
| (r) | | US Treasury Bill, 0.605%, 4/27/17 | | | 4,500,000 | | | | 4,491 | |
| | US Treasury Floating Rate Note, 0.630%, 4/30/17 | | | 3,000,000 | | | | 3,000 | |
| | US Treasury Floating Rate Note, 0.633%, 7/31/17 | | | 8,000,000 | | | | 7,997 | |
| | US Treasury Floating Rate Note, 0.640%, 1/31/17 | | | 10,000,000 | | | | 10,000 | |
| | US Treasury Floating Rate Note, 0.724%, 10/31/17 | | | 5,554,400 | | | | 5,554 | |
| | US Treasury Floating Rate Note, 0.828%, 1/31/18 | | | 2,120,000 | | | | 2,120 | |
| | | | | | | | | | |
| | Total | | | | 348,828 | |
| | | | | | | | | | |
| | |
| | Total Money Market Investments | | | | | |
| | (Cost: $509,328) | | | | 509,328 | |
| | | | | | | | | | |
| | |
| | Total Investments (101.5%) | | | | | |
| | (Cost: $509,328) | | | | 509,328 | |
| | | | | | | | | | |
| | Other Assets, Less | | | | | |
| | Liabilities (-1.5%) | | | | (7,693) | |
| | | | | | | | | | |
| | Net Assets (100.0%) | | | | 501,635 | |
| | | | | | | | | | |
| (r) | Rates are discount rates or a range of discount rates at the time of purchase. |
The following is a summary of the inputs used in valuing the Portfolio’s assets and liabilities at December 31, 2016. See Note 3 for additional information on portfolio valuation.
| | | | | | | | | | | | | | |
| | | Valuation Inputs | | | |
| Description | | Level 1 – Quoted Prices | | | Level 2 – Other Significant
Observable Inputs | | | Level 3 – Significant
Unobservable Inputs | | | |
| | | (Amounts in thousands) | | | |
Assets: | | | | | | | | | | | | | | |
Short-Term Investments | | $ | - | | | $ | 509,328 | | | $ | - | | | |
Total Assets: | | $ | - | | | $ | 509,328 | | | $ | - | | | |
See above Schedule of Investments for values of each security.
The Accompanying Notes are an Integral Part of the Financial Statements.
| | | | | | |
| | Government Money Market Portfolio | | | 91 | |
Short-Term Bond Portfolio (unaudited)
| | | | |
| Objective: | | Portfolio Strategy: | | Net Assets: |
Provide as high a level of current income as is consistent with prudent investment risk. | | Invest in a diversified portfolio of investment grade debt securities. | | $270 million |
Portfolio Overview
Mason Street Advisors, LLC (“Mason Street Advisors”), the investment adviser for the Short-Term Bond Portfolio (the “Portfolio”), has engaged T. Rowe Price Associates, Inc. (“T. Rowe Price”) to act as sub-adviser for the Portfolio. Normally, the Portfolio invests in a diversified portfolio of investment grade debt securities. The Portfolio may also invest up to 10% of net assets in non-investment grade, high yield/high risk bonds (so called “junk bonds”). Also, the Portfolio may invest up to 20% of net assets in foreign securities. Debt securities may be of any maturity, but under normal market conditions the Portfolio’s average effective maturity will not exceed three years. The Portfolio primarily invests in corporate, government and mortgage- and asset-backed securities. The Portfolio uses both a “top-down” and “bottom-up” investment approach to construct the portfolio of investments. The top-down investment approach involves an evaluation of the overall macroeconomic environment and its potential impact on the level and direction of interest rates. The bottom-up investment approach focuses on fundamental research of individual issuers.
Market Overview
For most of 2016, yields on U.S. Treasurys generally declined, as they offered an attractive alternative to low or negative yields available globally. Near the end of the period, rates increased sharply across all maturity periods, though more notably for intermediate- and longer-maturity securities, amid an increase in inflation and growth expectations domestically. Expectations for higher U.S. inflation increased following Donald Trump’s surprise victory in the U.S. presidential election. Adding to inflation expectations, OPEC formally agreed to its first output cut since 2008. News of the agreement sent oil prices sharply higher. In December, the U.S. Federal Reserve Bank (the “Fed”) raised its benchmark rate by a quarter of a point for the first time since 2015. Credit spreads on investment-grade corporate bonds narrowed significantly over the period, especially as Treasury yields rose after the election, a result of vigorous demand from yield-hungry investors (particularly those in Asia) for easily digested new bond supply.
U.S. economic growth picked up in the second half of 2016 after a sluggish first half. According to the Commerce Department’s latest estimate, third quarter gross domestic product grew at an annualized pace of 3.5%, following readings of 0.8% and 1.4% in the first and second quarters, respectively. Although the pace of employment growth moderated, the labor market remained strong, wage growth accelerated and overall inflation pressures firmed as commodity prices rebounded from early-2016 lows.
Portfolio Results
The Portfolio returned 1.67% for the twelve months ended December 31, 2016. By comparison, the Portfolio’s benchmark, the Bloomberg Barclays® 1–3 Year U.S. Government/Credit Index (the “Index”), returned 1.28%. (The Index is unmanaged, cannot be invested in directly and does not include administrative expenses or sales charges.) According to Lipper® Analytical Services, Inc., an independent mutual fund ranking agency, the average return of the Short Investment Grade Debt Funds peer group was 1.12% for 2016.
Sector allocation decisions drove positive relative performance. Corporate bonds, both investment-grade and crossover bonds, contributed to relative results for the year. Solid demand from investors looking for additional yield provided support for short-maturity corporate bonds. Furthermore, risk sentiment was stronger heading into the second half of the year on the back of stronger economic data, the OPEC deal and the election outcome. As a result, the Portfolio’s significant overweight to corporate debt provided a meaningful contribution to relative results. The Portfolio’s out-of-benchmark exposure to securitized sectors also helped relative performance. Asset-backed securities, mortgage-backed securities and commercial mortgage-backed securities supported relative returns, as they provide an incremental yield advantage over Treasurys. The securitized space continued to be supported by positive fundamentals on the heels of a strengthening U.S. economy, housing data and positive consumer sentiment. The Portfolio’s corresponding underweight to U.S. Treasury securities helped relative returns, as U.S. Treasury yields increased during the year.
At the other end of the spectrum, security selection within investment-grade corporates detracted from performance. Select credits with ties to commodity prices continued to struggle amid the lower-for-longer commodity price environment that dominated most of the year. Yield curve positioning also modestly weighed on results. An overweight allocation to the intermediate portion of the curve and modest out-of-benchmark exposure to longer maturities underperformed, as the curve modestly steepened over the period on increased inflation expectations.
| | | | |
| 92 | | Short-Term Bond Portfolio | | |
Short-Term Bond Portfolio (unaudited)
Portfolio Manager Outlook
The following forward-looking comments are the opinion of T. Rowe Price, the Portfolio’s sub-adviser.
The beginning months of the incoming Trump administration will be important for the overall fixed income market. While the proposed fiscal policies from the president elect have largely fueled optimism in equity markets, they could have mixed results for fixed income investors if implemented. A heavy dose of stimulus this late in the economic cycle risks overheating the economy and triggering inflation, which could elicit a more forceful tightening response from the Fed than markets currently anticipate.
Having said that, the changing political and growth environment may actually benefit corporate bonds. The prospect of lower corporate taxes, infrastructure spending and deregulation has lengthened the runway for corporate debt by holding out the potential for improved fundamentals. In particular, we believe higher rates and steeper yield curves, along with the decline in regulatory burdens, should help industries, such as banks and insurance. Furthermore, tax policy may reduce the attractiveness of corporate debt issuance, leading to less new supply. With developed market yields anchored at extremely low levels, the demand for spread continues and should be a tailwind for the investment-grade sector. Given the uncertainties, we will exercise patience before increasing risk and will continue to focus on higher-quality companies with shorter maturities.
Relative Performance
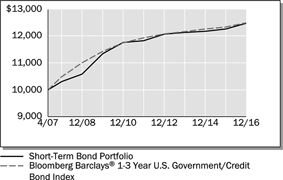
| | | | | | | | | | | | |
Average Annual Total Returns For Periods Ended December 31, 2016 | |
| | | 1 Year | | | 5 Years | | | Since
Inception* | |
Short-Term Bond Portfolio | | | 1.67 | % | | | 1.07 | % | | | 2.32 | % |
Bloomberg Barclays® 1-3 Year U.S. Government/Credit Bond Index | | | 1.28 | % | | | 0.92 | % | | | 2.34 | % |
Lipper® Variable Insurance Products (VIP) Short Investment Grade Debt Funds Average | | | 1.12 | % | | | 0.70 | % | | | – | |
| * | Inception date of 4/30/07 |
The performance data quoted represents past performance. Past performance is historical and does not guarantee future performance. Investment return and principal value will fluctuate, so that shares, when redeemed, may be worth more or less than their original cost. Current performance may be lower or higher than the performance data quoted. For the most recent month-end performance information visit www.northwesternmutual.com.
This chart assumes an initial investment of $10,000 made on 4/30/07 (commencement of the Portfolio’s operations). Returns shown reflect fee waivers, deductions for management and other portfolio expenses, and reinvestment of all dividends. In the absence of fee waivers, total return would be reduced. Returns exclude deductions for separate account sale loads and account fees. Please refer to the Benchmark Definitions section of this report for information about the indices cited in the above chart and graph.
Return of principal is not guaranteed. Bond funds have the same interest rate, inflation and credit risks that are associated with the underlying bonds owned by the Portfolio. When interest rates rise, bond prices fall. With a fixed income fund, when interest rates rise, the value of the fund’s existing bonds drops, which could negatively affect overall fund performance. A portion of the Portfolio’s assets may be invested in lower quality debt securities which may present a significant risk for loss of principal and interest. High yield bonds generally have greater price swings and higher default risks than investment grade bonds.
Investing in bonds issued by foreign corporations and governments carries additional risk, including foreign currency risk, and may increase the volatility of the Portfolio’s performance.
The Portfolio may invest in derivative instruments to adjust the Portfolio’s duration and yield curve exposure, to hedge foreign currency exposure or for any other permissible purpose keeping with its investment objective. Use of these instruments may involve certain costs and imposes certain risks such as liquidity risk, market risk, credit risk, management risk and the risk of mispricing or improper valuation. Certain derivatives involve leverage, which could magnify losses, and portfolios investing in derivatives could lose more than the principal amount invested in those instruments.
| | | | | | |
| | Short-Term Bond Portfolio | | | 93 | |
Short-Term Bond Portfolio (unaudited)
Currently, interest rates are near unprecedented historically low levels. A significant rise in interest rates over a short period of time could cause significant losses in the market value of the Portfolio’s fixed income investments.
Top 10 Fixed Income Holdings 12/31/16
| | | | |
Security Description | | | % of Net Assets | |
US Treasury, Various | | | 10.5 | % |
Federal National Mortgage Association, Various | | | 6.1 | % |
Hyundai Capital America, Various | | | 1.1 | % |
Bank of America Corp., Various | | | 1.1 | % |
Citigroup, Inc., Various | | | 1.0 | % |
Morgan Stanley, Various | | | 0.9 | % |
The Goldman Sachs Group, Inc., Various | | | 0.9 | % |
SBA Tower Trust, Various | | | 0.7 | % |
Newell Rubbermaid, Inc., Various | | | 0.7 | % |
Exxon Mobil Corp., Various | | | 0.7 | % |
Sector Allocation 12/31/16
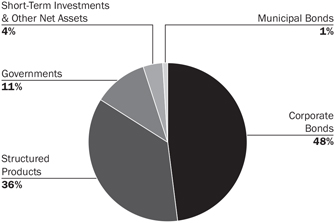
Sector Allocation is based on Net Assets.
Sector Allocation and Top 10 Holdings are subject to change.
Consistent with the Portfolio’s stated parameters, no more than 20% of the Portfolio is invested in foreign securities, and no more than 10% is invested in high yield securities.
| | | | |
| 94 | | Short-Term Bond Portfolio | | |
Short-Term Bond Portfolio
Schedule of Investments
December 31, 2016
| | | | | | | | | | |
| | | Corporate Bonds (47.8%) | | Shares/ $ Par | | | Value
$ (000’s) | |
| | | |
| | Aerospace & Defense (0.3%) | | | | | | | | |
| | Harris Corp., 1.999%, 4/27/18 | | | 755,000 | | | | 756 | |
| | | | | | | | | | |
| | Total | | | | | | | 756 | |
| | | | | | | | | | |
| | | |
| | Autos & Vehicle Parts (4.4%) | | | | | | | | |
| | American Honda Finance Corp., 1.200%, 7/14/17 | | | 750,000 | | | | 751 | |
| | American Honda Finance Corp., 2.125%, 10/10/18 | | | 250,000 | | | | 252 | |
| | Daimler Finance North America LLC, 1.746%, 8/1/18 144A | | | 850,000 | | | | 855 | |
| | Daimler Finance North America LLC,
1.750%, 10/30/19 144A | | | 480,000 | | | | 474 | |
| | Daimler Finance North America LLC, 2.375%, 8/1/18 144A | | | 125,000 | | | | 126 | |
| | Delphi Automotive PLC, 3.150%, 11/19/20 | | | 630,000 | | | | 640 | |
| | Ford Motor Credit Co. LLC, 1.684%, 9/8/17 | | | 1,160,000 | | | | 1,158 | |
| | Ford Motor Credit Co. LLC, 2.021%, 5/3/19 | | | 255,000 | | | | 253 | |
| | Ford Motor Credit Co. LLC, 2.375%, 1/16/18 | | | 250,000 | | | | 251 | |
| | General Motors Financial Co., Inc., 3.100%, 1/15/19 | | | 295,000 | | | | 298 | |
| | General Motors Financial Co., Inc., 3.150%, 1/15/20 | | | 665,000 | | | | 669 | |
| | General Motors Financial Co., Inc., 3.500%, 7/10/19 | | | 140,000 | | | | 142 | |
| | General Motors Financial Co., Inc., 4.750%, 8/15/17 | | | 330,000 | | | | 336 | |
| | Hyundai Capital America, 1.450%, 2/6/17 144A | | | 1,000,000 | | | | 1,000 | |
| | Hyundai Capital America, 2.000%, 7/1/19 144A | | | 215,000 | | | | 213 | |
| | Hyundai Capital America, 2.400%, 10/30/18 144A | | | 400,000 | | | | 402 | |
| | Hyundai Capital America, 2.500%, 3/18/19 144A | | | 630,000 | | | | 632 | |
| | Hyundai Capital Services, Inc., 3.500%, 9/13/17 144A | | | 600,000 | | | | 606 | |
| | Nissan Motor Acceptance Corp., 1.550%, 9/13/19 144A | | | 340,000 | | | | 335 | |
| | Nissan Motor Acceptance Corp., 1.950%, 9/12/17 144A | | | 550,000 | | | | 552 | |
| | Toyota Motor Credit Corp., 1.450%, 1/12/18 | | | 395,000 | | | | 395 | |
| | Toyota Motor Credit Corp., 2.050%, 1/12/17 | | | 750,000 | | | | 750 | |
| | Volkswagen Group of America Finance LLC,
1.250%, 5/23/17 144A | | | 750,000 | | | | 749 | |
| | | | | | | | | | |
| | Total | | | | | | | 11,839 | |
| | | | | | | | | | |
| | | |
| | Banking (12.3%) | | | | | | | | |
| | Ally Financial, Inc., 2.750%, 1/30/17 | | | 250,000 | | | | 250 | |
| | Ally Financial, Inc., 3.250%, 11/5/18 | | | 610,000 | | | | 611 | |
| | American Express Credit Corp., 2.375%, 3/24/17 | | | 250,000 | | | | 251 | |
| | Banco de Credito del Peru / Panama, 2.250%, 10/25/19 144A | | | 200,000 | | | | 197 | |
| | Bank of America Corp., 2.000%, 1/11/18 | | | 600,000 | | | | 601 | |
| | Bank of America Corp., 2.503%, 10/21/22 | | | 280,000 | | | | 271 | |
| | Bank of America Corp., 2.600%, 1/15/19 | | | 765,000 | | | | 772 | |
| | Bank of America Corp., 2.625%, 4/19/21 | | | 500,000 | | | | 497 | |
| | Bank of America Corp., 2.650%, 4/1/19 | | | 190,000 | | | | 192 | |
| | Bank of America Corp., 6.000%, 9/1/17 | | | 500,000 | | | | 514 | |
| | The Bank of New York Mellon Corp., 1.350%, 3/6/18 | | | 250,000 | | | | 249 | |
| | The Bank of New York Mellon Corp., 2.200%, 3/4/19 | | | 125,000 | | | | 126 | |
| | The Bank of Tokyo-Mitsubishi UFJ, Ltd.,
1.700%, 3/5/18 144A | | | 1,145,000 | | | | 1,141 | |
| | | | | | | | | | |
| | | Corporate Bonds (47.8%) | | Shares/
$ Par | | | Value
$ (000’s) | |
| | | |
| | Banking continued | | | | | | | | |
| | Banque Federative du Credit Mutuel SA,
1.700%, 1/20/17 144A | | | 465,000 | | | | 465 | |
| | Banque Federative du Credit Mutuel SA,
2.000%, 4/12/19 144A | | | 795,000 | | | | 792 | |
| | Barclays Bank PLC, 6.050%, 12/4/17 144A | | | 610,000 | | | | 630 | |
| | BB&T Corp., 1.823%, 6/15/18 | | | 450,000 | | | | 452 | |
| | BPCE SA, 2.500%, 12/10/18 | | | 1,200,000 | | | | 1,211 | |
| | Canadian Imperial Bank of Commerce, 1.550%, 1/23/18 | | | 415,000 | | | | 415 | |
| | Capital One NA, 1.850%, 9/13/19 | | | 655,000 | | | | 648 | |
| | Capital One NA, 2.350%, 8/17/18 | | | 260,000 | | | | 261 | |
| | Citigroup, Inc., 1.550%, 8/14/17 | | | 520,000 | | | | 520 | |
| | Citigroup, Inc., 1.750%, 5/1/18 | | | 350,000 | | | | 349 | |
| | Citigroup, Inc., 1.850%, 11/24/17 | | | 860,000 | | | | 862 | |
| | Citigroup, Inc., 2.050%, 6/7/19 | | | 235,000 | | | | 234 | |
| | Citigroup, Inc., 2.900%, 12/8/21 | | | 675,000 | | | | 673 | |
| | Citizens Bank NA, 2.500%, 3/14/19 | | | 525,000 | | | | 529 | |
| | Citizens Bank NA, 2.550%, 5/13/21 | | | 250,000 | | | | 248 | |
| | Citizens Financial Group, Inc., 2.375%, 7/28/21 | | | 35,000 | | | | 34 | |
| | Commonwealth Bank of Australia, 1.750%, 11/2/18 | | | 918,000 | | | | 916 | |
| | Credit Suisse AG, 1.375%, 5/26/17 | | | 300,000 | | | | 300 | |
| | Credit Suisse AG, 1.753%, 9/12/17 | | | 650,000 | | | | 651 | |
| | Discover Bank, 2.000%, 2/21/18 | | | 515,000 | | | | 515 | |
| | Discover Bank, 2.600%, 11/13/18 | | | 325,000 | | | | 328 | |
| | Discover Financial Services, 6.450%, 6/12/17 | | | 735,000 | | | | 750 | |
| | The Goldman Sachs Group, Inc., 2.300%, 12/13/19 | | | 370,000 | | | | 370 | |
| | The Goldman Sachs Group, Inc., 2.750%, 9/15/20 | | | 95,000 | | | | 95 | |
| | The Goldman Sachs Group, Inc., 5.950%, 1/18/18 | | | 610,000 | | | | 635 | |
| | The Goldman Sachs Group, Inc., 6.150%, 4/1/18 | | | 1,195,000 | | | | 1,257 | |
| | HSBC Bank USA NA, 6.000%, 8/9/17 | | | 250,000 | | | | 257 | |
| | HSBC USA, Inc., 1.500%, 11/13/17 | | | 900,000 | | | | 899 | |
| | The Huntington National Bank, 2.200%, 11/6/18 | | | 1,175,000 | | | | 1,178 | |
| | JPMorgan Chase & Co., 1.625%, 5/15/18 | | | 250,000 | | | | 250 | |
| | JPMorgan Chase & Co., 1.800%, 1/25/18 | | | 850,000 | | | | 851 | |
| | JPMorgan Chase & Co., 2.350%, 1/28/19 | | | 250,000 | | | | 252 | |
| | Mizuho Bank, 2.150%, 10/20/18 144A | | | 245,000 | | | | 245 | |
| | Morgan Stanley, 2.125%, 4/25/18 | | | 1,890,000 | | | | 1,898 | |
| | Morgan Stanley, 6.625%, 4/1/18 | | | 325,000 | | | | 344 | |
| | Morgan Stanley, 7.300%, 5/13/19 | | | 250,000 | | | | 279 | |
| | Nationwide Building Society, 2.350%, 1/21/20 144A | | | 340,000 | | | | 339 | |
| | Nordea Bank AB, 3.125%, 3/20/17 144A | | | 325,000 | | | | 326 | |
| | PNC Bank NA, 4.875%, 9/21/17 | | | 250,000 | | | | 256 | |
| | Regions Bank, 7.500%, 5/15/18 | | | 250,000 | | | | 268 | |
| | Santander Bank NA, 2.000%, 1/12/18 | | | 500,000 | | | | 500 | |
| | Santander UK Group Holdings PLC.,
2.875%, 10/16/20 | | | 145,000 | | | | 144 | |
| | Santander UK PLC, 1.375%, 3/13/17 | | | 500,000 | | | | 500 | |
| | Skandinaviska Enskilda Banken AB, 1.500%, 9/13/19 | | | 680,000 | | | | 669 | |
| | Standard Chartered PLC, 2.100%, 8/19/19 144A | | | 200,000 | | | | 198 | |
| | Sumitomo Mitsui Banking Corp., 1.762%, 10/19/18 | | | 250,000 | | | | 249 | |
| | SunTrust Banks, Inc., 2.350%, 11/1/18 | | | 465,000 | | | | 469 | |
| | Swedbank AB, 1.750%, 3/12/18 144A | | | 1,100,000 | | | | 1,100 | |
The Accompanying Notes are an Integral Part of the Financial Statements.
| | | | | | |
| | Short-Term Bond Portfolio | | | 95 | |
Short-Term Bond Portfolio
| | | | | | | | | | |
| | | Corporate Bonds (47.8%) | | Shares/ $ Par | | | Value $ (000’s) | |
| | | |
| | Banking continued | | | | | | | | |
| | The Toronto-Dominion Bank, 1.400%, 4/30/18 | | | 170,000 | | | | 170 | |
| | The Toronto-Dominion Bank, 2.625%, 9/10/18 | | | 350,000 | | | | 355 | |
| | UBS Group Funding Jersey, Ltd., 2.950%, 9/24/20 144A | | | 255,000 | | | | 255 | |
| | UBS Group Funding Jersey, Ltd., 3.000%, 4/15/21 144A | | | 385,000 | | | | 385 | |
| | Wells Fargo & Co., 5.625%, 12/11/17 | | | 600,000 | | | | 622 | |
| | | | | | | | | | |
| | Total | | | | | | | 33,070 | |
| | | | | | | | | | |
| |
| | Basic Materials (0.4%) | |
| | Hutchinson Whampoa International 14, Ltd., 1.625%, 10/31/17 144A | | | 1,100,000 | | | | 1,097 | |
| | | | | | | | | | |
| | Total | | | | | | | 1,097 | |
| | | | | | | | | | |
| |
| | Builders & Building Materials (0.6%) | |
| | Martin Marietta Materials, Inc., 2.098%, 6/30/17 | | | 480,000 | | | | 481 | |
| | Stanley Black & Decker, Inc., 1.622%, 11/17/18 | | | 65,000 | | | | 64 | |
| | Stanley Black & Decker, Inc., 2.451%, 11/17/18 | | | 1,155,000 | | | | 1,165 | |
| | | | | | | | | | |
| | Total | | | | | | | 1,710 | |
| | | | | | | | | | |
| | | |
| | Chemicals (0.5%) | | | | | | | | |
| | INVISTA Finance LLC, 4.250%, 10/15/19 144A | | | 515,000 | | | | 511 | |
| | LyondellBasell Industries NV, 5.000%, 4/15/19 | | | 400,000 | | | | 423 | |
| | Solvay Finance America LLC, 3.400%, 12/3/20 144A | | | 415,000 | | | | 422 | |
| | | | | | | | | | |
| | Total | | | | | | | 1,356 | |
| | | | | | | | | | |
| |
| | Conglomerate & Diversified Manufacturing (0.5%) | |
| | Fortive Corp., 1.800%, 6/15/19 144A | | | 65,000 | | | | 65 | |
| | General Electric Co., 6.000%, 8/7/19 | | | 72,000 | | | | 79 | |
| | Roper Technologies, Inc., 2.050%, 10/1/18 | | | 865,000 | | | | 868 | |
| | Roper Technologies, Inc., 2.800%, 12/15/21 | | | 205,000 | | | | 205 | |
| | Roper Technologies, Inc., 3.000%, 12/15/20 | | | 90,000 | | | | 91 | |
| | | | | | | | | | |
| | Total | | | | | | | 1,308 | |
| | | | | | | | | | |
| |
| | Consumer Products & Retailing (2.8%) | |
| | AutoZone, Inc., 1.625%, 4/21/19 | | | 65,000 | | | | 64 | |
| | Brinker International, Inc., 2.600%, 5/15/18 | | | 735,000 | | | | 737 | |
| | CVS Health Corp., 1.900%, 7/20/18 | | | 460,000 | | | | 462 | |
| | CVS Health Corp., 2.250%, 12/5/18 | | | 250,000 | | | | 252 | |
| | Dollar General Corp., 4.125%, 7/15/17 | | | 550,000 | | | | 558 | |
| | Dollar Tree, Inc., 5.250%, 3/1/20 | | | 125,000 | | | | 129 | |
| | Imperial Brands Finance PLC, 2.050%, 2/11/18 144A | | | 1,100,000 | | | | 1,101 | |
| | Newell Brands, Inc., 2.050%, 12/1/17 | | | 815,000 | | | | 818 | |
| | Newell Brands, Inc., 2.150%, 10/15/18 | | | 375,000 | | | | 377 | |
| | Newell Brands, Inc., 2.600%, 3/29/19 | | | 705,000 | | | | 713 | |
| | Philip Morris International, Inc., 1.250%, 11/9/17 | | | 1,110,000 | | | | 1,109 | |
| | Reynolds American, Inc., 2.300%, 6/12/18 | | | 355,000 | | | | 357 | |
| | Reynolds American, Inc., 8.125%, 6/23/19 | | | 160,000 | | | | 182 | |
| | Walgreens Boots Alliance, Inc., 1.750%, 5/30/18 | | | 450,000 | | | | 450 | |
| | Whirlpool Corp., 1.350%, 3/1/17 | | | 350,000 | | | | 350 | |
| | | | | | | | | | |
| | Total | | | | | | | 7,659 | |
| | | | | | | | | | |
| |
| | Electric Utilities (3.0%) | |
| | Commonwealth Edison Co., 2.150%, 1/15/19 | | | 250,000 | | | | 251 | |
| | Commonwealth Edison Co., 6.150%, 9/15/17 | | | 250,000 | | | | 258 | |
| | Dominion Resources, Inc., 1.500%, 9/30/18 144A | | | 315,000 | | | | 312 | |
| | Dominion Resources, Inc., 2.125%, 2/15/18 144A | | | 465,000 | | | | 466 | |
| | Dominion Resources, Inc., 2.962%, 7/1/19 | | | 145,000 | | | | 147 | |
| | | | | | | | | | |
| | | Corporate Bonds (47.8%) | | Shares/ $ Par | | | Value
$ (000’s) | |
| | | |
| | Electric Utilities continued | | | | | | | | |
| | Dominion Resources, Inc., 5.200%, 8/15/19 | | | 150,000 | | | | 161 | |
| | Duke Energy Corp., 2.100%, 6/15/18 | | | 115,000 | | | | 116 | |
| | Eversource Energy, 1.450%, 5/1/18 | | | 105,000 | | | | 105 | |
| | Exelon Generation Co. LLC, 2.950%, 1/15/20 | | | 205,000 | | | | 207 | |
| | FirstEnergy Corp., 2.750%, 3/15/18 | | | 545,000 | | | | 550 | |
| | MidAmerican Energy Co., 2.400%, 3/15/19 | | | 500,000 | | | | 506 | |
| | NextEra Energy Capital Holding, Inc., 2.300%, 4/1/19 | | | 165,000 | | | | 166 | |
| | NextEra Energy Capital Holdings, Inc., 1.649%, 9/1/18 | | | 190,000 | | | | 189 | |
| | NextEra Energy Capital Holdings, Inc., 2.056%, 9/1/17 | | | 135,000 | | | | 136 | |
| | Origin Energy Finance, Ltd., 3.500%, 10/9/18 144A | | | 585,000 | | | | 592 | |
| | PPL Capital Funding, Inc., 1.900%, 6/1/18 | | | 590,000 | | | | 590 | |
| | Public Service Electric & Gas Co., 2.300%, 9/15/18 | | | 400,000 | | | | 404 | |
| | San Diego Gas & Electric Co., 1.914%, 2/1/22 | | | 168,929 | | | | 167 | |
| | The Southern Co., 1.550%, 7/1/18 | | | 165,000 | | | | 164 | |
| | The Southern Co., 1.850%, 7/1/19 | | | 575,000 | | | | 573 | |
| | The Southern Co., 2.350%, 7/1/21 | | | 125,000 | | | | 123 | |
| | Southern Electric Generating Co., 2.200%, 12/1/18 144A | | | 140,000 | | | | 141 | |
| | Southern Power Co., 1.850%, 12/1/17 | | | 125,000 | | | | 125 | |
| | TECO Finance, Inc., 1.476%, 4/10/18 | | | 590,000 | | | | 590 | |
| | Zhejiang Energy Group Hong Kong, Ltd., 2.300%, 9/30/17 | | | 1,065,000 | | | | 1,064 | |
| | | | | | | | | | |
| | Total | | | | | | | 8,103 | |
| | | | | | | | | | |
| | | |
| | Energy (1.7%) | | | | | | | | |
| | Cameron International Corp., 1.400%, 6/15/17 | | | 300,000 | | | | 300 | |
| | Canadian Natural Resources, Ltd., 1.750%, 1/15/18 | | | 265,000 | | | | 264 | |
| | Canadian Natural Resources, Ltd., 5.700%, 5/15/17 | | | 600,000 | | | | 609 | |
| | CenterPoint Energy Resources Corp., 6.000%, 5/15/18 | | | 250,000 | | | | 262 | |
| | China Shenhua Overseas Captial Co., Ltd., 2.500%, 1/20/18 | | | 595,000 | | | | 596 | |
| | China Shenhua Overseas Captial Co., Ltd., 3.125%, 1/20/20 | | | 785,000 | | | | 788 | |
| | ConocoPhillips, 5.200%, 5/15/18 | | | 65,000 | | | | 68 | |
| | ConocoPhillips Co., 1.050%, 12/15/17 | | | 335,000 | | | | 333 | |
| | Encana Corp., 6.500%, 5/15/19 | | | 65,000 | | | | 70 | |
| | Marathon Oil Corp., 6.000%, 10/1/17 | | | 355,000 | | | | 366 | |
| | Murphy Oil Corp., 3.500%, 12/1/17 | | | 500,000 | | | | 502 | |
| | National Oilwell Varco, Inc., 1.350%, 12/1/17 | | | 105,000 | | | | 105 | |
| | Sempra Energy, 6.150%, 6/15/18 | | | 250,000 | | | | 265 | |
| | | | | | | | | | |
| | Total | | | | | | | 4,528 | |
| | | | | | | | | | |
| | | |
| | Finance (1.3%) | | | | | | | | |
| | AerCap Aviation Solutions BV, 6.375%, 5/30/17 | | | 205,000 | | | | 209 | |
| | AerCap Ireland Capital Ltd / AerCap Global Aviation Trust, 3.950%, 2/1/22 | | | 475,000 | | | | 479 | |
| | Air Lease Corp., 2.125%, 1/15/18 | | | 185,000 | | | | 185 | |
| | Air Lease Corp., 2.125%, 1/15/20 | | | 570,000 | | | | 561 | |
| | GATX Corp., 1.250%, 3/4/17 | | | 575,000 | | | | 575 | |
| | GATX Corp., 2.600%, 3/30/20 | | | 380,000 | | | | 375 | |
| | GE Capital International Funding Co. Unlimited Co., 2.342%, 11/15/20 | | | 208,000 | | | | 208 | |
The Accompanying Notes are an Integral Part of the Financial Statements.
| | | | |
| 96 | | Short-Term Bond Portfolio | | |
Short-Term Bond Portfolio
| | | | | | | | | | |
| | | Corporate Bonds (47.8%) | | Shares/
$ Par | | | Value
$ (000’s) | |
| | | |
| | Finance continued | | | | | | | | |
| | NiSource Finance Corp., 6.400%, 3/15/18 | | | 10,000 | | | | 11 | |
| | NiSource Finance Corp., 6.800%, 1/15/19 | | | 505,000 | | | | 551 | |
| | Seagate HDD Cayman, 3.750%, 11/15/18 | | | 285,000 | | | | 292 | |
| | | | | | | | | | |
| | Total | | | | | | | 3,446 | |
| | | | | | | | | | |
| | | |
| | Food & Beverage (1.7%) | | | | | | | | |
| | Anheuser-Busch InBev Finance, Inc., 1.900%, 2/1/19 | | | 960,000 | | | | 961 | |
| | Bunge, Ltd. Finance Corp., 3.200%, 6/15/17 | | | 1,145,000 | | | | 1,154 | |
| | Bunge, Ltd. Finance Corp., 3.500%, 11/24/20 | | | 235,000 | | | | 239 | |
| | Bunge, Ltd. Finance Corp., 8.500%, 6/15/19 | | | 50,000 | | | | 57 | |
| | Coca-Cola Femsa SAB de CV, 2.375%, 11/26/18 | | | 325,000 | | | | 327 | |
| | Danone SA, 1.691%, 10/30/19 144A | | | 1,070,000 | | | | 1,057 | |
| | Heineken NV, 1.400%, 10/1/17 144A | | | 280,000 | | | | 280 | |
| | Mead Johnson Nutrition Co., 3.000%, 11/15/20 | | | 130,000 | | | | 132 | |
| | Pernod Ricard SA, 2.950%, 1/15/17 144A | | | 250,000 | | | | 250 | |
| | | | | | | | | | |
| | Total | | | | | | | 4,457 | |
| | | | | | | | | | |
| | | |
| | Gaming/Leisure/Lodging (0.2%) | | | | | | | | |
| | GLP Capital LP / GLP Financing II, Inc.,
4.375%, 11/1/18 | | | 450,000 | | | | 466 | |
| | Wyndham Worldwide Corp., 2.950%, 3/1/17 | | | 175,000 | | | | 175 | |
| | | | | | | | | | |
| | Total | | | | | | | 641 | |
| | | | | | | | | | |
| | | |
| | Healthcare (1.1%) | | | | | | | | |
| | Abbott Laboratories, 2.350%, 11/22/19 | | | 1,115,000 | | | | 1,116 | |
| | Abbott Laboratories, 2.900%, 11/30/21 | | | 480,000 | | | | 479 | |
| | AmerisourceBergen Corp., 1.150%, 5/15/17 | | | 250,000 | | | | 250 | |
| | Express Scripts Holding Co., 1.250%, 6/2/17 | | | 400,000 | | | | 399 | |
| | Express Scripts Holding Co., 2.250%, 6/15/19 | | | 70,000 | | | | 70 | |
| | Express Scripts Holding Co., 3.300%, 2/25/21 | | | 15,000 | | | | 15 | |
| | McKesson Corp., 1.400%, 3/15/18 | | | 275,000 | | | | 274 | |
| | Medco Health Solutions, Inc., 4.125%, 9/15/20 | | | 325,000 | | | | 341 | |
| | Thermo Fisher Scientific, Inc., 2.400%, 2/1/19 | | | 65,000 | | | | 65 | |
| | | | | | | | | | |
| | Total | | | | | | | 3,009 | |
| | | | | | | | | | |
| | | |
| | Insurance (2.9%) | | | | | | | | |
| | Aetna, Inc., 1.500%, 11/15/17 | | | 110,000 | | | | 110 | |
| | Aetna, Inc., 1.900%, 6/7/19 | | | 890,000 | | | | 888 | |
| | AIA Group, Ltd., 2.250%, 3/11/19 144A | | | 200,000 | | | | 201 | |
| | Anthem, Inc., 1.875%, 1/15/18 | | | 100,000 | | | | 100 | |
| | Anthem, Inc., 2.250%, 8/15/19 | | | 500,000 | | | | 499 | |
| | Anthem, Inc., 2.300%, 7/15/18 | | | 435,000 | | | | 438 | |
| | Aon PLC, 2.800%, 3/15/21 | | | 570,000 | | | | 570 | |
| | Chubb INA Holdings, Inc., 5.800%, 3/15/18 | | | 250,000 | | | | 263 | |
| | CNA Financial Corp., 6.950%, 1/15/18 | | | 130,000 | | | | 137 | |
| | CNA Financial Corp., 7.350%, 11/15/19 | | | 155,000 | | | | 176 | |
| | Fidelity National Financial, Inc., 6.600%, 5/15/17 | | | 1,090,000 | | | | 1,109 | |
| | Humana, Inc., 2.625%, 10/1/19 | | | 190,000 | | | | 191 | |
| | Marsh & McLennan Cos., Inc., 2.550%, 10/15/18 | | | 160,000 | | | | 161 | |
| | Metropolitan Life Global Funding I,
1.500%, 1/10/18 144A | | | 250,000 | | | | 250 | |
| | New York Life Global Funding,
1.550%, 11/2/18 144A | | | 525,000 | | | | 523 | |
| | Principal Life Global Funding II,
1.500%, 4/18/19 144A | | | 240,000 | | | | 237 | |
| | | | | | | | | | |
| | | Corporate Bonds (47.8%) | | Shares/
$ Par | | | Value
$ (000’s) | |
| | | |
| | Insurance continued | | | | | | | | |
| | Principal Life Global Funding II, 2.200%, 4/8/20 144A | | | 445,000 | | | | 442 | |
| | Principal Life Global Funding II, 2.250%, 10/15/18 144A | | | 250,000 | | | | 252 | |
| | Reinsurance Group of America, Inc., 6.450%, 11/15/19 | | | 115,000 | | | | 128 | |
| | Trininty Acquisition PLC, 3.500%, 9/15/21 | | | 145,000 | | | | 146 | |
| | UNUM Group, 3.000%, 5/15/21 | | | 620,000 | | | | 618 | |
| | XLIT, Ltd., 2.300%, 12/15/18 | | | 380,000 | | | | 382 | |
| | | | | | | | | | |
| | Total | | | | | | | 7,821 | |
| | | | | | | | | | |
| | | |
| | Media (1.2%) | | | | | | | | |
| | Charter Communications Operating LLC / Charter Communications Operating Capital Corp., 3.579%, 7/23/20 | | | 390,000 | | | | 398 | |
| | The Interpublic Group of Companies, Inc., 2.250%, 11/15/17 | | | 850,000 | | | | 855 | |
| | Omnicom Group, Inc., 4.450%, 8/15/20 | | | 55,000 | | | | 59 | |
| | S&P Global, Inc., 2.500%, 8/15/18 | | | 105,000 | | | | 106 | |
| | SES Global Americas Holdings GP, 2.500%, 3/25/19 144A | | | 50,000 | | | | 50 | |
| | Time Warner Cable LLC, 5.850%, 5/1/17 | | | 650,000 | | | | 659 | |
| | Time Warner Cable LLC, 6.750%, 7/1/18 | | | 270,000 | | | | 288 | |
| | Time Warner Cable LLC, 8.250%, 4/1/19 | | | 445,000 | | | | 500 | |
| | Time Warner, Inc., 2.100%, 6/1/19 | | | 250,000 | | | | 250 | |
| | | | | | | | | | |
| | Total | | | | | | | 3,165 | |
| | | | | | | | | | |
| | | |
| | Metals & Mining (0.3%) | | | | | | | | |
| | Goldcorp, Inc., 2.125%, 3/15/18 | | | 825,000 | | | | 825 | |
| | | | | | | | | | |
| | Total | | | | | | | 825 | |
| | | | | | | | | | |
| | | |
| | Oil & Gas (1.2%) | | | | | | | | |
| | BP Capital Markets PLC, 1.846%, 5/5/17 | | | 500,000 | | | | 501 | |
| | Exxon Mobil Corp., 1.305%, 3/6/18 | | | 780,000 | | | | 780 | |
| | Exxon Mobil Corp., 1.316%, 3/6/22 | | | 1,110,000 | | | | 1,102 | |
| | Shell International Finance BV, 1.900%, 8/10/18 | | | 250,000 | | | | 252 | |
| | Total Capital Canada, Ltd., 1.450%, 1/15/18 | | | 250,000 | | | | 250 | |
| | Total Capital SA, 2.125%, 8/10/18 | | | 250,000 | | | | 252 | |
| | | | | | | | | | |
| | Total | | | | | | | 3,137 | |
| | | | | | | | | | |
| | | |
| | Pharmaceuticals (3.1%) | | | | | | | | |
| | AbbVie, Inc., 1.800%, 5/14/18 | | | 575,000 | | | | 575 | |
| | AbbVie, Inc., 2.300%, 5/14/21 | | | 375,000 | | | | 367 | |
| | Actavis Funding SCS, 1.850%, 3/1/17 | | | 310,000 | | | | 310 | |
| | Actavis Funding SCS, 2.350%, 3/12/18 | | | 625,000 | | | | 629 | |
| | Actavis Funding SCS, 2.450%, 6/15/19 | | | 100,000 | | | | 100 | |
| | Actavis, Inc., 1.875%, 10/1/17 | | | 445,000 | | | | 446 | |
| | Baxalta, Inc., 1.776%, 6/22/18 | | | 225,000 | | | | 225 | |
| | Baxalta, Inc., 2.000%, 6/22/18 | | | 80,000 | | | | 80 | |
| | Bayer US Finance LLC, 2.375%, 10/8/19 144A | | | 440,000 | | | | 441 | |
| | Biogen, Inc., 2.900%, 9/15/20 | | | 230,000 | | | | 233 | |
| | Celgene Corp., 1.900%, 8/15/17 | | | 500,000 | | | | 502 | |
| | Celgene Corp., 2.125%, 8/15/18 | | | 10,000 | | | | 10 | |
| | Celgene Corp., 2.250%, 5/15/19 | | | 340,000 | | | | 340 | |
| | Celgene Corp., 2.300%, 8/15/18 | | | 85,000 | | | | 86 | |
| | Merck & Co., Inc., 1.300%, 5/18/18 | | | 250,000 | | | | 250 | |
| | Perrigo Co. PLC, 2.300%, 11/8/18 | | | 435,000 | | | | 434 | |
The Accompanying Notes are an Integral Part of the Financial Statements.
| | | | | | |
| | Short-Term Bond Portfolio | | | 97 | |
Short-Term Bond Portfolio
| | | | | | | | | | |
| | | Corporate Bonds (47.8%) | | Shares/
$ Par | | | Value
$ (000’s) | |
| | | |
| | Pharmaceuticals continued | | | | | | | | |
| | Perrigo Finance Unlimited Co., 3.500%, 3/15/21 | | | 200,000 | | | | 202 | |
| | Shire Acquisitions Investments Ireland Designated Activity Co., 1.900%, 9/23/19 | | | 965,000 | | | | 953 | |
| | Takeda Pharmaceutical Co., Ltd., 1.625%,
3/17/17 144A | | | 750,000 | | | | 751 | |
| | Teva Pharmaceutical Finance Netherlands III BV, 1.400%, 7/20/18 | | | 650,000 | | | | 645 | |
| | Teva Pharmaceutical Finance Netherlands III BV, 1.700%, 7/19/19 | | | 675,000 | | | | 663 | |
| | Teva Pharmaceutical Finance Netherlands III BV, 2.200%, 7/21/21 | | | 270,000 | | | | 258 | |
| | | | | | | | | | |
| | Total | | | | | | | 8,500 | |
| | | | | | | | | | |
| | | |
| | Pipelines (1.1%) | | | | | | | | |
| | Columbia Pipeline Group, Inc., 2.450%, 6/1/18 | | | 210,000 | | | | 211 | |
| | Energy Transfer Partners LP, 6.125%, 2/15/17 | | | 550,000 | | | | 553 | |
| | Enterprise Products Operating LLC, 6.500%, 1/31/19 | | | 250,000 | | | | 273 | |
| | Kinder Morgan Energy Partners LP, 5.950%, 2/15/18 | | | 205,000 | | | | 214 | |
| | Kinder Morgan Energy Partners LP, 6.000%, 2/1/17 | | | 150,000 | | | | 150 | |
| | Kinder Morgan Finance Co. LLC, 6.000%,
1/15/18 144A | | | 255,000 | | | | 266 | |
| | ONEOK Partners LP, 3.200%, 9/15/18 | | | 250,000 | | | | 255 | |
| | Panhandle Eastern Pipe Line Co. LP,
6.200%, 11/1/17 | | | 50,000 | | | | 51 | |
| | Spectra Energy Partners LP, 2.950%, 9/25/18 | | | 255,000 | | | | 259 | |
| | Williams Partners LP / Williams Partners Financial Corp., 7.250%, 2/1/17 | | | 750,000 | | | | 753 | |
| | | | | | | | | | |
| | Total | | | | | | | 2,985 | |
| | | | | | | | | | |
| | | |
| | Real Estate Investment Trusts (1.0%) | | | | | | | | |
| | American Campus Communities Operating Partnership LP, 3.350%, 10/1/20 | | | 390,000 | | | | 397 | |
| | DDR Corp., 4.750%, 4/15/18 | | | 250,000 | | | | 257 | |
| | Kimco Realty Corp., 6.875%, 10/1/19 | | | 90,000 | | | | 101 | |
| | Simon Property Group LP, 1.500%, 2/1/18 144A | | | 250,000 | | | | 250 | |
| | Simon Property Group LP, 2.350%, 1/30/22 | | | 290,000 | | | | 286 | |
| | Ventas Realty LP, 1.250%, 4/17/17 | | | 500,000 | | | | 500 | |
| | Ventas Realty LP / Ventas Capital Corp.,
4.000%, 4/30/19 | | | 50,000 | | | | 52 | |
| | WEA Finance LLC / Westfield UK & Europe Finance PLC, 1.750%, 9/15/17 144A | | | 300,000 | | | | 300 | |
| | WEA Finance LLC / Westfield UK & Europe Finance PLC, 2.700%, 9/17/19 144A | | | 205,000 | | | | 207 | |
| | WEA Finance LLC / Westfield UK & Europe Finance PLC, 3.250%, 10/5/20 144A | | | 240,000 | | | | 244 | |
| | | | | | | | | | |
| | Total | | | | | | | 2,594 | |
| | | | | | | | | | |
| | | |
| | Services (0.9%) | | | | | | | | |
| | Alibaba Group Holding, Ltd., 2.500%, 11/28/19 | | | 870,000 | | | | 874 | |
| | JD.com, Inc., 3.125%, 4/29/21 | | | 1,215,000 | | | | 1,201 | |
| | Republic Services, Inc., 5.500%, 9/15/19 | | | 250,000 | | | | 272 | |
| | | | | | | | | | |
| | Total | | | | | | | 2,347 | |
| | | | | | | | | | |
| | | |
| | Technology (2.2%) | | | | | | | | |
| | Amphenol Corp., 1.550%, 9/15/17 | | | 515,000 | | | | 515 | |
| | Anstock II, Ltd., 2.125%, 7/24/17 | | | 725,000 | | | | 724 | |
| | Apple, Inc., 1.700%, 2/22/19 | | | 290,000 | | | | 291 | |
| | Baidu, Inc., 2.750%, 6/9/19 | | | 590,000 | | | | 596 | |
| | | | | | | | | | |
| | | Corporate Bonds (47.8%) | | Shares/
$ Par | | | Value
$ (000’s) | |
| | | |
| | Technology continued | | | | | | | | |
| | Fidelity National Information Services, Inc., 1.450%, 6/5/17 | | | 250,000 | | | | 250 | |
| | Fidelity National Information Services, Inc., 2.250%, 8/15/21 | | | 490,000 | | | | 478 | |
| | Hewlett Packard Enterprise Co., 2.450%, 10/5/17 | | | 1,210,000 | | | | 1,217 | |
| | Hewlett Packard Enterprise Co., 2.850%, 10/5/18 | | | 60,000 | | | | 61 | |
| | Keysight Technologies, Inc., 3.300%, 10/30/19 | | | 850,000 | | | | 863 | |
| | Oracle Corp., 2.375%, 1/15/19 | | | 250,000 | | | | 253 | |
| | Oracle Corp., 5.750%, 4/15/18 | | | 250,000 | | | | 264 | |
| | Tencent Holdings, Ltd., 2.000%, 5/2/17 144A | | | 350,000 | | | | 350 | |
| | Tencent Holdings, Ltd., 2.875%, 2/11/20 144A | | | 200,000 | | | | 201 | |
| | | | | | | | | | |
| | Total | | | | | | | 6,063 | |
| | | | | | | | | | |
| | | |
| | Telecommunications (1.3%) | | | | | | | | |
| | AT&T, Inc., 2.300%, 3/11/19 | | | 625,000 | | | | 627 | |
| | British Telecommunications PLC, 2.350%, 2/14/19 | | | 250,000 | | | | 251 | |
| | Crown Castle International Corp., 2.250%, 9/1/21 | | | 195,000 | | | | 189 | |
| | Crown Castle International Corp., 3.400%, 2/15/21 | | | 385,000 | | | | 391 | |
| | Crown Castle Towers LLC, 6.113%, 1/15/20 144A | | | 815,000 | | | | 883 | |
| | Verizon Communications, Inc., 1.100%, 11/1/17 | | | 200,000 | | | | 200 | |
| | Verizon Communications, Inc., 3.650%, 9/14/18 | | | 1,055,000 | | | | 1,090 | |
| | | | | | | | | | |
| | Total | | | | | | | 3,631 | |
| | | | | | | | | | |
| | | |
| | Transportation (1.8%) | | | | | | | | |
| | Burlington Northern Santa Fe LLC,
5.750%, 3/15/18 | | | 750,000 | | | | 788 | |
| | ERAC USA Finance LLC, 2.800%, 11/1/18 144A | | | 325,000 | | | | 329 | |
| | ERAC USA Finance LLC, 6.375%, 10/15/17 144A | | | 385,000 | | | | 399 | |
| | HPHT Finance 15, Ltd., 2.250%, 3/17/18 144A | | | 644,000 | | | | 644 | |
| | Kansas City Southern, 2.350%, 5/15/20 | | | 450,000 | | | | 444 | |
| | Penske Truck Leasing Co. / PTL Finance Corp., 3.750%, 5/11/17 144A | | | 130,000 | | | | 131 | |
| | Penske Truck Leasing Co. LP / PTL Finance Corp., 2.875%, 7/17/18 144A | | | 835,000 | | | | 846 | |
| | Penske Truck Leasing Co. LP / PTL Finance Corp., 3.375%, 3/15/18 144A | | | 705,000 | | | | 717 | |
| | Southwest Airlines Co., 2.750%, 11/6/19 | | | 280,000 | | | | 285 | |
| | Southwest Airlines Co., 5.125%, 3/1/17 | | | 175,000 | | | | 176 | |
| | Union Pacific Corp., 2.250%, 2/15/19 | | | 85,000 | | | | 86 | |
| | | | | | | | | | |
| | Total | | | | | | | 4,845 | |
| | | | | | | | | | |
| | | |
| | Total Corporate Bonds | | | | | | | | |
| | (Cost: $128,752) | | | | | | | 128,892 | |
| | | | | | | | | | |
| | | |
| | | Governments (11.0%) | | | | | | |
| | | |
| | Foreign Agencies (0.5%) | | | | | | | | |
| | CNOOC Nexen Finance 2014 ULC,
1.625%, 4/30/17 | | | 350,000 | | | | 349 | |
| | Electricite de France SA, 1.150%, 1/20/17 144A | | | 450,000 | | | | 450 | |
| | Petroleos Mexicanos, 3.500%, 7/23/20 | | | 580,000 | | | | 568 | |
| | | | | | | | | | |
| | Total | | | | | | | 1,367 | |
| | | | | | | | | | |
| | | |
| | US Governments and Agencies (10.5%) | | | | | | | | |
| (b) | | US Treasury, 0.750%, 8/31/18 | | | 1,250,000 | | | | 1,242 | |
| (b) | | US Treasury, 0.750%, 10/31/18 | | | 1,300,000 | | | | 1,291 | |
| (b) | | US Treasury, 0.875%, 5/31/18 | | | 2,540,000 | | | | 2,535 | |
| (b) | | US Treasury, 0.875%, 7/15/18 | | | 3,545,000 | | | | 3,534 | |
| (b) | | US Treasury, 0.875%, 6/15/19 | | | 1,715,000 | | | | 1,697 | |
| (b) | | US Treasury, 1.000%, 11/15/19 | | | 14,050,000 | | | | 13,881 | |
| (b) | | US Treasury, 1.250%, 12/31/18 | | | 2,610,000 | | | | 2,613 | |
The Accompanying Notes are an Integral Part of the Financial Statements.
| | | | |
| 98 | | Short-Term Bond Portfolio | | |
Short-Term Bond Portfolio
| | | | | | | | | | |
| | | Governments (11.0%) | | Shares/
$ Par | | | Value
$ (000’s) | |
| | | |
| | US Governments and Agencies continued | | | | | | | | |
| | US Treasury, 1.375%, 5/31/21 | | | 1,000,000 | | | | 980 | |
| (b) | | US Treasury, 1.750%, 9/30/19 | | | 450,000 | | | | 454 | |
| | | | | | | | | | |
| | Total | | | | | | | 28,227 | |
| | | | | | | | | | |
| | | |
| | Total Governments | | | | | | | | |
| | (Cost: $29,700) | | | | | | | 29,594 | |
| | | | | | | | | | |
| | | |
| | | Municipal Bonds (0.7%) | | | | | | |
| | | |
| | Municipal Bonds (0.7%) | | | | | | | | |
| | Province of Ontario Canada, 2.000%, 9/27/18 RB | | | 1,000,000 | | | | 1,008 | |
| | State Board of Administration Finance Corp., Series 2013A, 2.107%, 7/1/18 RB | | | 190,000 | | | | 191 | |
| | State Board of Administration Finance Corp., 2.163%, 7/1/19 RB | | | 475,000 | | | | 479 | |
| | University of California, Series 2011Y-1, 1.272%, 7/1/41 RB | | | 270,000 | | | | 270 | |
| | | | | | | | | | |
| | | |
| | Total Municipal Bonds | | | | | | | | |
| | (Cost: $1,935) | | | | | | | 1,948 | |
| | | | | | | | | | |
| | | |
| | | Structured Products (36.5%) | | | | | | |
| | | |
| | Structured Products (36.5%) | | | | | | | | |
| | AEP Texas Central Transition Funding II LLC, 5.170%, 1/1/18 | | | 370,292 | | | | 377 | |
| | Ally Master Owner Trust, Series 2014-4, Class A2, 1.430%, 6/17/19 | | | 1,045,000 | | | | 1,046 | |
| | Ally Master Owner Trust, Series 2015-3, Class A, 1.630%, 5/15/20 | | | 1,195,000 | | | | 1,194 | |
| | American Express Credit Account Master Trust, Series 2014-2, Class A, 1.260%, 1/15/20 | | | 1,000,000 | | | | 1,001 | |
| | American Express Credit Account Master Trust, Series 2014-3, Class A, 1.490%, 4/15/20 | | | 1,775,000 | | | | 1,779 | |
| | AmeriCredit Automobile Receivables, Series 2016-1, Class A3, 1.810%, 10/8/20 | | | 75,000 | | | | 75 | |
| | Americredit Automobile Receivables Trust, Series 2016-4, Class A3, 1.530%, 7/8/21 | | | 385,000 | | | | 382 | |
| | AmeriCredit Automobile Receivables Trust, Series 2015-1, Class A3, 1.260%, 11/8/19 | | | 492,918 | | | | 493 | |
| | AmeriCredit Automobile Receivables Trust, Series 2015-2, Class A3, 1.270%, 1/8/20 | | | 396,803 | | | | 397 | |
| | AmeriCredit Automobile Receivables Trust, Series 2015-4, Class A3, 1.700%, 7/8/20 | | | 220,000 | | | | 221 | |
| | AmeriCredit Automobile Receivables Trust, Series 2014-4, Class C, 2.470%, 11/9/20 | | | 220,000 | | | | 222 | |
| | AmeriCredit Automobile Receivables Trust, Series 2014-3, Class C, 2.580%, 9/8/20 | | | 520,000 | | | | 526 | |
| | ARI Fleet Lease Trust, Series 2015-A, Class A2, 1.110%, 11/15/18 144A | | | 233,852 | | | | 233 | |
| | ARI Fleet Lease Trust, Series 2015-A, Class A3, 1.670%, 9/15/23 144A | | | 520,000 | | | | 518 | |
| | ARI Fleet Lease Trust, Series 2016-A, Class A2, 1.820%, 7/15/24 144A | | | 590,000 | | | | 590 | |
| | Ascentium Equipment Receivables LLC, Series 2015-2A, Class A3, 1.930%, 3/11/19 144A | | | 710,000 | | | | 712 | |
| | Ascentium Equipment Receivables Trust, Series 2016-2A, Class A2, 1.460%, 4/10/19 144A | | | 150,000 | | | | 150 | |
| | | | | | | | | | |
| | | Structured Products (36.5%) | | Shares/
$ Par | | | Value
$ (000’s) | |
| | | |
| | Structured Products continued | | | | | | | | |
| | Ascentium Equipment Receivables Trust, Series 2016-1A, Class A2, 1.750%, 11/13/18 144A | | | 224,435 | | | | 225 | |
| | Avis Budget Rental Car Funding AESOP LLC, Series 2014-2A, Class A, 2.500%, 2/20/21 144A | | | 135,000 | | | | 134 | |
| | Avis Budget Rental Car Funding AESOP LLC, Series 2013-2A, Class B, 3.660%, 2/20/20 144A | | | 670,000 | | | | 679 | |
| | BAMLL Commercial Mortgage Securities Trust, Series 2014-IP, Class A, 2.717%, 6/15/28 144A | | | 475,000 | | | | 478 | |
| | BMW Vehicle Lease Trust, Series 2016-2, Class A3, 1.430%, 9/20/19 | | | 215,000 | | | | 215 | |
| | Capital Auto Receivables Asset Trust, Series 2016-3, Class A3, 1.540%, 8/20/20 | | | 120,000 | | | | 120 | |
| | Capital Auto Receivables Asset Trust, Series 2015-4, Class A2, 1.620%, 3/20/19 | | | 320,000 | | | | 321 | |
| | Capital Auto Receivables Asset Trust, Series 2016-2, Class A4, 1.630%, 1/20/21 | | | 175,000 | | | | 173 | |
| | Capital Auto Receivables Asset Trust, Series 2015-3, Class A2, 1.720%, 1/22/19 | | | 930,000 | | | | 932 | |
| | Capital Auto Receivables Asset Trust, Series 2015-2, Class A3, 1.730%, 9/20/19 | | | 250,000 | | | | 251 | |
| | Capital Auto Receivables Asset Trust, Series 2016-1, Class A3, 1.730%, 4/20/20 | | | 240,000 | | | | 240 | |
| | Capital Auto Receivables Asset Trust, Series 2013-4, Class D, 3.220%, 5/20/19 | | | 170,000 | | | | 172 | |
| | Capital One Multi-Asset Execution Trust, Series 2014-A2, Class A2, 1.260%, 1/15/20 | | | 470,000 | | | | 470 | |
| | CarMax Auto Owner Trust, Series 2013-2, Class A4, 0.840%, 11/15/18 | | | 307,337 | | | | 307 | |
| | CarMax Auto Owner Trust, Series 2015-2, Class A3, 1.370%, 3/16/20 | | | 350,000 | | | | 350 | |
| | CarMax Auto Owner Trust, Series 2015-1, Class A3, 1.380%, 11/15/19 | | | 240,672 | | | | 241 | |
| | CarMax Auto Owner Trust, Series 2016-4, Class A3, 1.400%, 8/15/21 | | | 400,000 | | | | 396 | |
| | CarMax Auto Owner Trust, Series 2016-2, Class A3, 1.520%, 2/16/21 | | | 315,000 | | | | 314 | |
| | CarMax Auto Owner Trust, Series 2016-1, Class A3, 1.610%, 11/16/20 | | | 500,000 | | | | 500 | |
| | CarMax Auto Owner Trust, Series 2014-4, Class A4, 1.810%, 7/15/20 | | | 250,000 | | | | 251 | |
| | CCG Receivables Trust, Series 2015-1, Class A2, 1.460%, 11/14/18 144A | | | 245,280 | | | | 245 | |
| | CCG Receivables Trust, Series 2016-1, Class A2, 1.690%, 9/14/22 144A | | | 200,000 | | | | 200 | |
| | CD 2007-CD5 Mortgage Trust, Series 2007-CD5, Class AMA, 6.116%, 11/15/44 | | | 565,000 | | | | 583 | |
| | CD 2016-CD2 Mortgage Trust, Series 2016-CD2, Class A1, 1.848%, 11/10/49 | | | 670,000 | | | | 667 | |
| | Chase Issuance Trust, Series 2016-A2, Class A, 1.370%, 6/15/21 | | | 985,000 | | | | 975 | |
| | Chrysler Capital Auto Receivables Trust, Series 2016-BA, Class A2, 1.360%, 1/15/20 144A | | | 130,000 | | | | 130 | |
The Accompanying Notes are an Integral Part of the Financial Statements.
| | | | | | |
| | Short-Term Bond Portfolio | | | 99 | |
Short-Term Bond Portfolio
| | | | | | | | | | |
| | | Structured Products (36.5%) | | Shares/
$ Par | | | Value
$ (000’s) | |
| | | |
| | Structured Products continued | | | | | | | | |
| | Chrysler Capital Auto Receivables Trust, Series 2016-BA, Class A3, 1.640%, 7/15/21 144A | | | 125,000 | | | | 124 | |
| | Citigroup Commercial Mortgage Trust, Series 2015-GC27, Class A1, 1.353%, 2/10/48 | | | 147,452 | | | | 147 | |
| | Citigroup Commercial Mortgage Trust, Series 2014-GC25, Class A1, 1.485%, 10/10/47 | | | 189,746 | | | | 190 | |
| | Citigroup Commercial Mortgage Trust, Series 2015-GC31, Class A1, 1.637%, 6/10/48 | | | 395,339 | | | | 395 | |
| | Citigroup Commercial Mortgage Trust, Series 2015-GC33, Class A11, 1.643%, 9/10/58 | | | 363,910 | | | | 362 | |
| | Citigroup Commercial Mortgage Trust, Series 2015-P1, Class A1, 1.648%, 9/15/48 | | | 146,323 | | | | 146 | |
| | CNH Equipment Trust, Series 2013-B, Class A4, 0.990%, 11/15/18 | | | 845,000 | | | | 845 | |
| | CNH Equipment Trust, Series 2015-B, Class A3, 1.370%, 7/15/20 | | | 595,000 | | | | 595 | |
| | CNH Equipment Trust, Series 2016-C, Class A3, 1.440%, 12/15/21 | | | 260,000 | | | | 257 | |
| | CNH Equipment Trust, Series 2016-A, Class A3, 1.480%, 4/15/21 | | | 350,000 | | | | 348 | |
| | CNH Equipment Trust, Series 2014-B, Class A4, 1.610%, 5/17/21 | | | 1,150,000 | | | | 1,151 | |
| | CNH Equipment Trust, Series 2015-C, Class B, 2.400%, 2/15/23 | | | 570,000 | | | | 572 | |
| | COMM 2014-CCRE21 Mortgage Trust, Series 2014-CR21, Class A1, 1.494%, 12/10/47 | | | 62,761 | | | | 63 | |
| | COMM 2014-CCRE22 Mortgage Trust, Series 2015-CR22, Class A1, 1.569%, 3/10/48 | | | 62,516 | | | | 62 | |
| | COMM 2014-UBS6 Mortgage Trust, Series 2014-UBS6, Class A1, 1.445%, 12/10/47 | | | 123,772 | | | | 124 | |
| | COMM 2015-CCRE25 Mortgage Trust, Series 2015-CR25, Class A1, 1.737%, 8/10/48 | | | 287,833 | | | | 288 | |
| | COMM 2015-CCRE26 Mortgage Trust, Series 2015-CR26, Class A1, 1.604%, 10/10/48 | | | 313,478 | | | | 312 | |
| | COMM 2015-LC23 Mortgage Trust, Series 2015-LC23, Class A2, 3.221%, 10/10/53 | | | 605,000 | | | | 623 | |
| | COMM 2015-PC1 Mortgage Trust, Series 2015-PC1, Class A1, 1.667%, 7/10/50 | | | 478,418 | | | | 479 | |
| | COMM 2016-CCRE28 Mortgage Trust, Series 2016-CR28, Class A1, 1.770%, 2/10/49 | | | 31,479 | | | | 31 | |
| | Commercial Mortgage Trust 2006-GG7, Series 2006-GG7, Class AM, 5.758%, 7/10/38 | | | 215,338 | | | | 215 | |
| | CSAIL Commercial Mortgage Trust, Series 2015-C2, Class A1, 1.454%, 6/15/57 | | | 663,046 | | | | 660 | |
| | CSAIL Commercial Mortgage Trust, Series 2015-C1, Class A1, 1.684%, 4/15/50 | | | 57,099 | | | | 57 | |
| | CSAIL Commercial Mortgage Trust, Series 2015-C3, Class A1, 1.717%, 8/15/48 | | | 278,872 | | | | 278 | |
| | CSAIL Commercial Mortgage Trust, Series 2016-C5, Class A1, 1.747%, 11/15/48 | | | 80,731 | | | | 80 | |
| | DB Master Finance LLC, Series 2015-1A, Class A2I, 3.262%, 2/20/45 144A | | | 648,450 | | | | 649 | |
| | DBRR Trust, Series 2013-EZ3, Class A, 1.636%, 12/18/49 144A | | | 107,163 | | | | 107 | |
| | | | | | | | | | |
| | | Structured Products (36.5%) | | Shares/
$ Par | | | Value
$ (000’s) | |
| | | |
| | Structured Products continued | | | | | | | | |
| | Diamond Resorts Owner Trust, Series 2014-1, Class A, 2.540%, 5/20/27 144A | | | 142,159 | | | | 141 | |
| | Diamond Resorts Owner Trust, Series 2015-1, Class A, 2.730%, 7/20/27 144A | | | 123,427 | | | | 123 | |
| | Diamond Resorts Owner Trust, Series 2015-2, Class A, 2.990%, 5/22/28 144A | | | 141,906 | | | | 141 | |
| | Discover Card Execution Note Trust, Series 2016-A4, Class A4, 1.390%, 3/15/22 | | | 370,000 | | | | 366 | |
| | Discover Card Execution Note Trust, Series 2015-A3, Class A, 1.450%, 3/15/21 | | | 1,155,000 | | | | 1,153 | |
| | Discover Card Execution Note Trust, Series 2016-A1, Class A1, 1.640%, 7/15/21 | | | 1,230,000 | | | | 1,230 | |
| | Domino’s Pizza Master Issuer LLC, Series 2012-1A, Class A2, 5.216%, 1/25/42 144A | | | 689,670 | | | | 703 | |
| | Enterprise Fleet Financing LLC, Series 2015-1, Class A2, 1.300%, 9/20/20 144A | | | 232,654 | | | | 232 | |
| | Enterprise Fleet Financing LLC, Series 2015-2, Class A2, 1.590%, 2/22/21 144A | | | 410,590 | | | | 410 | |
| | Enterprise Fleet Financing LLC, Series 2016-2, Class A2, 1.740%, 2/22/22 144A | | | 605,000 | | | | 603 | |
| | Enterprise Fleet Financing LLC, Series 2016-1, 1.830%, 9/20/21 144A | | | 1,087,607 | | | | 1,088 | |
| | Fannie Mae Connecticut Avenue Securities,
2.056%, 4/25/29 | | | 332,863 | | | | 333 | |
| | Fannie Mae Connecticut Avenue Securities,
2.856%, 11/25/24 | | | 1,930 | | | | 2 | |
| | Fannie Mae Connecticut Avenue Securities, Series 2016-C01, Class 2M1, 2.856%, 8/25/28 | | | 581,395 | | | | 587 | |
| | Fannie Mae Connecticut Avenue Securities, Series 2016-C02, Class 1M1, 2.906%, 9/25/28 | | | 156,274 | | | | 158 | |
| | FDIC Guaranteed Notes Trust 2012-S2, Series 2010-S2, Class 2A, 2.570%, 7/29/47 144A | | | 207,896 | | | | 208 | |
| | Federal Home Loan Mortgage Corp., Series 4092, Class CL, 1.250%, 6/15/27 | | | 1,773,860 | | | | 1,716 | |
| | Federal Home Loan Mortgage Corp., Series 2015-DNA1, Class M1, 1.656%, 10/25/27 | | | 163,058 | | | | 163 | |
| | Federal Home Loan Mortgage Corp., Series 2015-HQ2, Class M1, 1.856%, 5/25/25 | | | 98,562 | | | | 99 | |
| | Federal Home Loan Mortgage Corp.,
1.906%, 5/25/28 | | | 26,378 | | | | 26 | |
| | Federal Home Loan Mortgage Corp., Series 3718, Class BC, 2.000%, 2/15/25 | | | 608,563 | | | | 608 | |
| | Federal Home Loan Mortgage Corp., Series 2015-DNA3, Class M1, 2.106%, 4/25/28 | | | 38,181 | | | | 38 | |
| | Federal Home Loan Mortgage Corp., Series 2016-DNA1, Class M1, 2.206%, 7/25/28 | | | 375,707 | | | | 377 | |
| | Federal Home Loan Mortgage Corp., 2.500%, 1/1/24 | | | 367,303 | | | | 374 | |
| | Federal Home Loan Mortgage Corp., Series 2016-HQA1, Class M1, 2.506%, 9/25/28 | | | 194,185 | | | | 195 | |
| | Federal Home Loan Mortgage Corp., 3.500%, 3/1/46 | | | 115,774 | | | | 119 | |
| | Federal Home Loan Mortgage Corp., 5.000%, 4/1/18 | | | 14,728 | | | | 15 | |
| | Federal Home Loan Mortgage Corp., 5.500%, 5/1/22 | | | 172,542 | | | | 184 | |
| | Federal Home Loan Mortgage Corp.,
6.000%, 12/1/28 | | | 12,336 | | | | 14 | |
The Accompanying Notes are an Integral Part of the Financial Statements.
| | | | |
| 100 | | Short-Term Bond Portfolio | | |
Short-Term Bond Portfolio
| | | | | | | | | | |
| | | Structured Products (36.5%) | | Shares/
$ Par | | | Value
$ (000’s) | |
| | | |
| | Structured Products continued | | | | | | | | |
| | Federal Home Loan Mortgage Corp., 6.000%, 9/1/34 | | | 4,824 | | | | 6 | |
| | Federal Home Loan Mortgage Corp., 6.000%, 2/1/35 | | | 74,080 | | | | 84 | |
| | Federal Home Loan Mortgage Corp., 6.000%, 9/1/35 | | | 25,808 | | | | 30 | |
| | Federal Home Loan Mortgage Corp., 6.000%, 1/1/38 | | | 6,022 | | | | 7 | |
| | Federal National Mortgage Association,
1.256%, 11/25/46 | | | 1,414,192 | | | | 1,414 | |
| | Federal National Mortgage Association, Series 2010-95, Class BK, 1.500%, 2/25/20 | | | 353,841 | | | | 355 | |
| | Federal National Mortgage Association, Series 2013-74, Class AD, 2.000%, 7/25/23 | | | 524,311 | | | | 525 | |
| | Federal National Mortgage Association,
2.500%, 10/1/22 | | | 891,385 | | | | 910 | |
| | Federal National Mortgage Association,
2.500%, 12/1/22 | | | 223,107 | | | | 228 | |
| | Federal National Mortgage Association, Series 2011-113, Class AG, 2.500%, 11/25/26 | | | 329,392 | | | | 333 | |
| | Federal National Mortgage Association,
3.000%, 6/1/22 | | | 257,282 | | | | 265 | |
| | Federal National Mortgage Association,
3.000%, 4/1/24 | | | 577,918 | | | | 596 | |
| | Federal National Mortgage Association,
3.000%, 8/1/28 | | | 563,751 | | | | 579 | |
| | Federal National Mortgage Association,
3.000%, 2/1/30 | | | 161,167 | | | | 166 | |
| | Federal National Mortgage Association,
3.000%, 4/1/30 | | | 269,782 | | | | 277 | |
| | Federal National Mortgage Association,
3.000%, 7/1/30 | | | 642,774 | | | | 661 | |
| | Federal National Mortgage Association,
3.000%, 9/1/30 | | | 335,382 | | | | 345 | |
| | Federal National Mortgage Association,
3.500%, 5/1/27 | | | 1,119,859 | | | | 1,169 | |
| | Federal National Mortgage Association,
3.500%, 11/1/44 | | | 1,220,478 | | | | 1,256 | |
| (b) | | Federal National Mortgage Association,
3.500%, 4/1/46 | | | 3,146,429 | | | | 3,227 | |
| | Federal National Mortgage Association,
4.000%, 2/1/29 | | | 1,347,206 | | | | 1,422 | |
| | Federal National Mortgage Association,
4.500%, 5/1/40 | | | 209,866 | | | | 226 | |
| | Federal National Mortgage Association,
4.500%, 9/1/40 | | | 199,744 | | | | 215 | |
| | Federal National Mortgage Association,
5.000%, 10/1/33 | | | 268,207 | | | | 294 | |
| | Federal National Mortgage Association,
5.500%, 8/1/37 | | | 151,770 | | | | 170 | |
| | Federal National Mortgage Association,
5.500%, 2/1/38 | | | 575,183 | | | | 645 | |
| | Federal National Mortgage Association,
6.000%, 8/1/22 | | | 90,500 | | | | 97 | |
| | Federal National Mortgage Association,
6.000%, 3/1/34 | | | 125,056 | | | | 144 | |
| | Federal National Mortgage Association,
6.000%, 8/1/34 | | | 346,473 | | | | 398 | |
| | | | | | | | | | |
| | | Structured Products (36.5%) | | Shares/
$ Par | | | Value
$ (000’s) | |
| | | |
| | Structured Products continued | | | | | | | | |
| | Federal National Mortgage Association,
6.000%, 11/1/34 | | | 13,913 | | | | 16 | |
| | Federal National Mortgage Association,
6.000%, 12/1/34 | | | 4,295 | | | | 5 | |
| | Federal National Mortgage Association,
6.000%, 4/1/35 | | | 8,231 | | | | 9 | |
| | Federal National Mortgage Association,
6.000%, 5/1/38 | | | 6,152 | | | | 7 | |
| | Federal National Mortgage Association,
6.000%, 10/1/40 | | | 308,939 | | | | 350 | |
| | Federal National Mortgage Association,
6.500%, 7/1/32 | | | 40,510 | | | | 47 | |
| | Federal National Mortgage Association,
6.500%, 12/1/32 | | | 46,490 | | | | 54 | |
| | Fifth Third Auto Trust, Series 2014-2, Class A4, 1.380%, 12/15/20 | | | 500,000 | | | | 500 | |
| | Ford Credit Auto Owner Trust, Series 2014-A, Class A3, 0.790%, 5/15/18 | | | 26,916 | | | | 27 | |
| | Ford Credit Auto Owner Trust, Series 2015-B, Class A3, 1.160%, 11/15/19 | | | 774,857 | | | | 774 | |
| | Ford Credit Auto Owner Trust, Series 2014-A, Class A4, 1.290%, 4/15/19 | | | 425,000 | | | | 425 | |
| | Ford Credit Auto Owner Trust, Series 2016-A, Class A3, 1.390%, 7/15/20 | | | 175,000 | | | | 175 | |
| | Ford Credit Auto Owner Trust, Series 2014-B, Class A4, 1.420%, 8/15/19 | | | 400,000 | | | | 400 | |
| | Ford Credit Auto Owner Trust, Series 2013-C, Class D, 2.500%, 1/15/20 | | | 575,000 | | | | 578 | |
| | Ford Credit Floorplan Master Owner Trust, Series 2014-1, Class A1, 1.200%, 2/15/19 | | | 500,000 | | | | 500 | |
| | Ford Credit Floorplan Master Owner Trust, Series 2014-4, Class A1, 1.400%, 8/15/19 | | | 1,150,000 | | | | 1,151 | |
| | Ford Credit Floorplan Master Owner Trust, Series 2016-3, Class A1, 1.550%, 7/15/21 | | | 490,000 | | | | 485 | |
| | Ford Credit Floorplan Master Owner Trust, Series 2016-3, Class B, 1.750%, 7/15/21 | | | 190,000 | | | | 188 | |
| | Ford Credit Floorplan Master Owner Trust A, Series 2013-4, Class C, 2.290%, 6/15/20 | | | 1,070,000 | | | | 1,075 | |
| | GM Financial Automobile Leasing Trust, Series 2016-2, Class A3, 1.620%, 9/20/19 | | | 415,000 | | | | 415 | |
| | GMF Floorplan Owner Revolving Trust, Series 2015-1, Class A1, 1.650%, 5/15/20 144A | | | 290,000 | | | | 290 | |
| | GMF Floorplan Owner Revolving Trust, Series 2016-1, 1.960%, 5/17/21 144A | | | 395,000 | | | | 394 | |
| | GMF Floorplan Owner Revolving Trust, Series 2016-1, 2.410%, 5/17/21 144A | | | 125,000 | | | | 125 | |
| | GMF Floorplan Owner Revolving Trust, Series 2016-1, 2.850%, 5/17/21 144A | | | 100,000 | | | | 99 | |
| | Government National Mortgage Association, 3.500%, 12/20/42 | | | 12,829 | | | | 13 | |
| | Government National Mortgage Association, 3.500%, 9/20/43 | | | 189,892 | | | | 198 | |
| | Government National Mortgage Association, 5.000%, 3/20/34 | | | 711,822 | | | | 793 | |
The Accompanying Notes are an Integral Part of the Financial Statements.
| | | | | | |
| | Short-Term Bond Portfolio | | | 101 | |
Short-Term Bond Portfolio
| | | | | | | | | | |
| | | Structured Products (36.5%) | | Shares/
$ Par | | | Value
$ (000’s) | |
| | | |
| | Structured Products continued | | | | | | | | |
| | Government National Mortgage Association, 5.500%, 6/20/37 | | | 170,500 | | | | 189 | |
| | GreatAmerica Leasing Receivables Funding LLC, Series 2016-1, Class A3, 1.730%, 6/20/19 144A | | | 350,000 | | | | 350 | |
| | GS Mortgage Securities Trust, Series 2016-GS3, Class A1, 1.429%, 10/10/49 | | | 86,727 | | | | 86 | |
| | GS Mortgage Securities Trust, Series 2015-GC28, Class A1, 1.528%, 2/10/48 | | | 239,807 | | | | 239 | |
| | GS Mortgage Securities Trust, Series 2015-GC32, Class A1, 1.593%, 7/10/48 | | | 204,454 | | | | 204 | |
| | GS Mortgage-Backed Securities Trust, Series 2014-EB1A, Class 2A1, 2.480%, 7/25/44 144A | | | 86,334 | | | | 86 | |
| | Honda Auto Receivables Owner Trust, Series 2013-4, Class A4, 1.040%, 2/18/20 | | | 74,503 | | | | 75 | |
| | Huntington Auto Trust, Series 2016-1, Class A4, 1.930%, 4/15/22 | | | 325,000 | | | | 324 | |
| | Hyundai Auto Lease Securitization Trust, Series 2015-B, Class A3, 1.400%, 11/15/18 144A | | | 330,000 | | | | 330 | |
| | Hyundai Auto Lease Securitization Trust, Series 2016-B, Class A3, 1.520%, 10/15/19 144A | | | 150,000 | | | | 150 | |
| | Hyundai Auto Lease Securitization Trust, Series 2016-A, Class A3, 1.600%, 7/15/19 144A | | | 175,000 | | | | 175 | |
| | Hyundai Auto Lease Securitization Trust, Series 2016-C, Class A4, 1.650%, 7/15/20 144A | | | 290,000 | | | | 288 | |
| | Hyundai Auto Lease Securitization Trust, Series 2016-B, Class A4, 1.680%, 4/15/20 144A | | | 100,000 | | | | 100 | |
| | Hyundai Auto Lease Securitization Trust, Series 16-C, Class B, 1.860%, 5/17/21 144A | | | 285,000 | | | | 282 | |
| | Hyundai Auto Receivables Trust, Series 2015-A, Class A3, 1.050%, 4/15/19 | | | 206,552 | | | | 206 | |
| | Hyundai Auto Receivables Trust, Series 2016-A, Class A3, 1.560%, 9/15/20 | | | 80,000 | | | | 80 | |
| | John Deere Owner Trust, Series 2016-B, Class A3, 1.250%, 6/15/20 | | | 215,000 | | | | 214 | |
| | John Deere Owner Trust, Series 2015-A, Class A3, 1.320%, 6/17/19 | | | 160,000 | | | | 160 | |
| | John Deere Owner Trust, Series 2016-A, Class A3, 1.360%, 4/15/20 | | | 345,000 | | | | 344 | |
| | John Deere Owner Trust, Series 2016-B, Class A4, 1.490%, 5/15/23 | | | 105,000 | | | | 104 | |
| | JP Morgan Chase Commercial Mortgage Securities Corp., Series 2016-JP3, Class A1,
1.462%, 8/15/49 | | | 261,255 | | | | 258 | |
| | JPMBB Commercial Mortgage Securities Trust, Series 2015-C27, Class A1,
1.414%, 2/15/48 | | | 196,496 | | | | 195 | |
| | JPMBB Commercial Mortgage Securities Trust, Series 2015-C28, Class A1,
1.445%, 10/15/48 | | | 396,764 | | | | 395 | |
| | JPMBB Commercial Mortgage Securities Trust, Series 2014-C26, Class A1,
1.596%, 1/15/48 | | | 400,591 | | | | 400 | |
| | JPMBB Commercial Mortgage Securities Trust, Series 2015-C29, Class A1,
1.626%, 5/15/48 | | | 156,786 | | | | 156 | |
| | JPMBB Commercial Mortgage Securities Trust, Series 2015-C30, Class A1,
1.738%, 7/15/48 | | | 642,146 | | | | 641 | |
| | | | | | | | | | |
| | | Structured Products (36.5%) | | Shares/
$ Par | | | Value
$ (000’s) | |
| | | |
| | Structured Products continued | | | | | | | | |
| | JPMorgan Chase Commercial Mortgage Securities Trust, Series 2006-LDP7, Class AM,
5.925%, 4/17/45 | | | 85,161 | | | | 85 | |
| | Kubota Credit Owner Trust, Series 2016-1A, Class A3, 1.500%, 7/15/20 144A | | | 605,000 | | | | 599 | |
| | Kubota Credit Owner Trust, Series 2014-1A, Class A4, 1.670%, 7/15/20 144A | | | 1,500,000 | | | | 1,503 | |
| | MASTR Asset Securitization Trust, Series 2003-10, Class 1A1, 5.250%, 11/25/23 | | | 8,913 | | | | 9 | |
| | Mercedes-Benz Auto Lease Trust, Series 2015-A, Class A3, 1.100%, 8/15/17 | | | 27,883 | | | | 28 | |
| | Mercedes-Benz Auto Lease Trust, Series 2016-B, Class A3, 1.350%, 8/15/19 | | | 160,000 | | | | 160 | |
| | Mercedes-Benz Auto Lease Trust, Series 2016-A, Class A3, 1.520%, 3/15/19 | | | 400,000 | | | | 401 | |
| | Mill City Mortgage Loan Trust, Series 2016-1, Class A1, 2.500%, 4/25/57 144A | | | 130,820 | | | | 130 | |
| | MMAF Equipment Finance LLC, Series 2015-AA, Class A3, 1.390%, 10/16/19 144A | | | 216,970 | | | | 217 | |
| | MMAF Equipment Finance LLC, Series 2016-AA, Class A3, 1.480%, 6/15/20 144A | | | 305,000 | | | | 303 | |
| | Morgan Stanley Bank of America Merrill Lynch Trust, Series 2016-C30, Class A1, 1.389%, 9/15/49 | | | 135,690 | | | | 134 | |
| | Morgan Stanley Bank of America Merrill Lynch Trust, Series 2015-C24, Class A1, 1.706%, 5/15/48 | | | 249,771 | | | | 249 | |
| | Morgan Stanley Bank of American Merrill Lynch Trust, Series 2014-C19, Class A1,
1.573%, 12/15/47 | | | 243,733 | | | | 243 | |
| | Morgan Stanley Capital I, Inc., Series 2015-MS1, Class A1, 1.638%, 5/15/48 | | | 270,313 | | | | 270 | |
| | MVW Owner Trust, Series 2015-1A, Class A, 2.520%, 12/20/32 144A | | | 458,972 | | | | 456 | |
| | Nationstar HECM Loan Trust, Series 2016-3A, Class A, 2.013%, 8/25/26 144A | | | 83,000 | | | | 83 | |
| | Nationstar HECM Loan Trust, Series 2016-2A, Class A, 2.239%, 6/25/26 144A | | | 139,078 | | | | 140 | |
| | Nationstar HECM Loan Trust, Series 2016-1A, Class A, 2.981%, 2/25/26 144A | | | 55,228 | | | | 55 | |
| | Nissan Auto Lease Trust, Series 2016-B, Class A4, 1.610%, 1/18/22 | | | 370,000 | | | | 368 | |
| | Nissan Auto Receivables Owner Trust, Series 2016-B, Class A3, 1.320%, 1/15/21 | | | 100,000 | | | | 99 | |
| | Nissan Auto Receivables Owner Trust,
1.340%, 10/15/20 | | | 300,000 | | | | 299 | |
| | Nissan Master Owner Trust Receivables, Series 2015-A, Class A2, 1.440%, 1/15/20 | | | 400,000 | | | | 400 | |
| | Nissan Master Owner Trust Receivables, Series 2016-A, Class A2, 1.540%, 6/15/21 | | | 335,000 | | | | 333 | |
| | Santander Drive Auto Receivables Trust, Series 2014-3, Class D, 2.650%, 8/17/20 | | | 55,000 | | | | 56 | |
| | Santander Drive Auto Receivables Trust, Series 2015-5, Class D, 3.650%, 12/15/21 | | | 80,000 | | | | 82 | |
| | SBA Tower Trust, 2.240%, 4/16/18 144A | | | 180,000 | | | | 180 | |
| | SBA Tower Trust, 2.877%, 7/15/21 144A | | | 155,000 | | | | 154 | |
The Accompanying Notes are an Integral Part of the Financial Statements.
| | | | |
| 102 | | Short-Term Bond Portfolio | | |
Short-Term Bond Portfolio
| | | | | | | | | | |
| | | Structured Products (36.5%) | | Shares/
$ Par | | | Value
$ (000’s) | |
| | | |
| | Structured Products continued | | | | | | | | |
| | SBA Tower Trust, 2.933%, 12/11/17 144A | | | 945,000 | | | | 946 | |
| | SBA Tower Trust, 3.156%, 10/15/20 144A | | | 635,000 | | | | 639 | |
| | Sierra Timeshare 2015-1 Receivables Funding LLC, Series 2015-1A, Class A, 2.400%, 3/22/32 144A | | | 409,094 | | | | 407 | |
| | Sierra Timeshare 2015-2 Receivables Funding LLC, Series 2015-2A, Class A, 2.430%, 6/20/32 144A | | | 204,169 | | | | 204 | |
| | Sierra Timeshare 2015-3 Receivables Funding LLC, Series 2015-3A, Class A, 2.580%, 9/20/32 144A | | | 388,081 | | | | 386 | |
| | Sierra Timeshare 2016-2 Receivables Funding LLC, Series 2016-2A, Class A, 2.330%, 7/20/33 144A | | | 181,172 | | | | 178 | |
| | Sierra Timeshare 2016-3 Receivables Funding LLC, Series 2016-3A, Class A, 2.430%, 10/20/33 144A | | | 594,896 | | | | 585 | |
| | SLM Student Loan Trust, Series 2008-9, Class A, 2.382%, 4/25/23 | | | 182,375 | | | | 183 | |
| | SLM Student Loan Trust, Series 2008-4, Class A4, 2.532%, 7/25/22 | | | 94,726 | | | | 95 | |
| | SLM Student Loan Trust, Series 2008-5, Class A4, 2.582%, 7/25/23 | | | 253,210 | | | | 255 | |
| | SMART ABS Trust, series 2016-2US, Class A2A, 1.450%, 8/14/19 | | | 740,000 | | | | 738 | |
| | SMART ABS Trust, Series 2015-3US, Class A3A, 1.660%, 8/14/19 | | | 550,000 | | | | 548 | |
| | Springleaf Funding Trust, Series 2016-AA, Class A, 2.900%, 11/15/29 144A | | | 180,000 | | | | 180 | |
| | Synchrony Credit Card Master Note Trust, Series 2012-6, Class A, 1.360%, 8/17/20 | | | 1,145,000 | | | | 1,146 | |
| | Synchrony Credit Card Master Note Trust, Series 2015-2, Class A, 1.600%, 4/15/21 | | | 595,000 | | | | 596 | |
| | Synchrony Credit Card Master Note Trust, Series 2014-1, Class A, 1.610%, 11/15/20 | | | 1,155,000 | | | | 1,157 | |
| | Synchrony Credit Card Master Note Trust, Series 2013-1, Class B, 1.690%, 3/15/21 | | | 465,000 | | | | 464 | |
| | Synchrony Credit Card Master Note Trust, Series 2015-4, Class B, 2.620%, 9/15/23 | | | 200,000 | | | | 199 | |
| | Synchrony Credit Card Master Note Trust, Series 2015-1, Class B, 2.640%, 3/15/23 | | | 250,000 | | | | 250 | |
| | TIAA Seasoned Commercial Mortgage Trust, Series 2007-C4, Class AJ, 5.474%, 8/15/39 | | | 75,992 | | | | 77 | |
| | Towd Point Mortgage Trust, Series 2016-3, Class A1, 2.250%, 8/25/55 144A | | | 123,574 | | | | 123 | |
| | Towd Point Mortgage Trust, Series 2016-1, Class A1B, 2.750%, 2/25/55 144A | | | 196,891 | | | | 197 | |
| | Towd Point Mortgage Trust, Series 2015-4, Class A1B, 2.750%, 4/25/55 144A | | | 367,990 | | | | 369 | |
| | Towd Point Mortgage Trust, Series 2016-2, Class A1A, 2.750%, 8/25/55 144A | | | 152,534 | | | | 152 | |
| | Towd Point Mortgage Trust, Series 2015-5, Class A1B, 2.750%, 5/25/55 144A | | | 337,652 | | | | 338 | |
| | | | | | | | | | |
| | | Structured Products (36.5%) | | Shares/
$ Par | | | Value
$ (000’s) | |
| | | |
| | Structured Products continued | | | | | | | | |
| | Towd Point Mortgage Trust, Series 2016-1, Class A3B, 3.000%, 2/25/55 144A | | | 241,970 | | | | 242 | |
| | Toyota Auto Receivables Owner Trust, Series 2014-B, Class A4, 1.310%, 9/16/19 | | | 1,500,000 | | | | 1,501 | |
| | Toyota Auto Receivables Owner Trust, Series 2015-C, Class A4, 1.690%, 12/15/20 | | | 610,000 | | | | 611 | |
| | Verizon Owner Trust, Series 2016-2A, Class A, 1.680%, 5/20/21 144A | | | 500,000 | | | | 498 | |
| | Verizon Owner Trust, Series 2016-2A, Class B, 2.150%, 5/20/21 144A | | | 340,000 | | | | 337 | |
| | Verizon Owner Trust, Series 2016-2A, Class C, 2.360%, 5/20/21 144A | | | 270,000 | | | | 268 | |
| | Volkswagen Auto Loan Enhanced Trust, Series 2014-1, Class A3, 0.910%, 10/22/18 | | | 35,855 | | | | 36 | |
| | Volkswagen Auto Loan Enhanced Trust, Series 2013-2, Class A4, 1.160%, 3/20/20 | | | 1,150,000 | | | | 1,149 | |
| | Volkswagen Auto Loan Enhanced Trust, Series 2014-1, Class A4, 1.450%, 9/21/20 | | | 425,000 | | | | 425 | |
| | Volvo Financial Equipment LLC, Series 2016-1A, Class A3, 1.670%, 2/18/20 144A | | | 175,000 | | | | 175 | |
| | Volvo Financial Equipment LLC, Series 2014-1A, Class C, 1.940%, 11/15/21 144A | | | 265,000 | | | | 265 | |
| | Wells Fargo Commercial Mortgage Trust, Series 2014-LC18, Class A1, 1.437%, 12/15/47 | | | 289,720 | | | | 289 | |
| | Wells Fargo Commercial Mortgage Trust, Series 2016-LC24, Class A1, 1.441%, 10/15/49 | | | 153,054 | | | | 152 | |
| | Wells Fargo Commercial Mortgage Trust, Series 2015-C26, Class A1, 1.454%, 2/15/48 | | | 132,515 | | | | 132 | |
| | Wells Fargo Commercial Mortgage Trust, Series 2015-LC20, Class A1, 1.471%, 4/15/50 | | | 158,961 | | | | 158 | |
| | Wells Fargo Commercial Mortgage Trust, Series 2015-C28, Class A1, 1.531%, 5/15/48 | | | 204,340 | | | | 204 | |
| | Wells Fargo Commercial Mortgage Trust, Series 2016-C32, Class A1, 1.577%, 1/15/59 | | | 307,868 | | | | 306 | |
| | Wells Fargo Commercial Mortgage Trust, Series 2015-C27, Class A1, 1.730%, 2/15/48 | | | 348,523 | | | | 348 | |
| | Wells Fargo Commercial Mortgage Trust, Series 2015-NXS2, Class A2, 3.020%, 7/15/58 | | | 530,000 | | | | 543 | |
| | Wells Fargo Mortgage Backed Securities Trust, Series 2004-EE, Class 2A2, 3.034%, 12/25/34 | | | 365,951 | | | | 373 | |
| | Wendys Funding LLC, Series 2015-1A, Class A2I, 3.371%, 6/15/45 144A | | | 824,563 | | | | 823 | |
| | Wheels SPV 2 LLC, 1.590%, 5/20/25 144A | | | 200,000 | | | | 199 | |
| | Wheels SPV LLC, Series 2015-1A, Class A2, 1.270%, 4/22/24 144A | | | 121,450 | | | | 121 | |
| | World Omni Auto Receivables Trust, Series 2015-A, Class A3, 1.340%, 5/15/20 | | | 141,650 | | | | 142 | |
| | World Omni Automobile Lease Securitization Trust, Series 2016-A, Class A3, 1.450%, 8/15/19 | | | 480,000 | | | | 479 | |
| | | | | | | | | | |
| | | |
| | Total Structured Products | | | | | | | | |
| | (Cost: $98,454) | | | | | | | 98,443 | |
| | | | | | | | | | |
The Accompanying Notes are an Integral Part of the Financial Statements.
| | | | | | |
| | Short-Term Bond Portfolio | | | 103 | |
Short-Term Bond Portfolio
| | | | | | | | | | |
| | | Short-Term Investments (2.9%) | | Shares/ $ Par | | | Value
$ (000’s) | |
| | | |
| | Commercial Paper (2.9%) | | | | | | | | |
| (b,r) | | Anheuser-Busch InBev Worldwide, Inc., 1.450%, 9/5/17 144A | | | 390,000 | | | | 387 | |
| (b,r) | | Anheuser-Busch InBev Worldwide, Inc., 1.512%, 10/10/17 144A | | | 250,000 | | | | 247 | |
| (b,r) | | Enbridge Energy Partners, 1.950%, 5/9/17 | | | 1,325,000 | | | | 1,317 | |
| (b,r) | | Energy Transfer Partners, 1.600%, 1/24/17 | | | 720,000 | | | | 720 | |
| (b,r) | | Ford Motor Credit Co. LLC,
1.750%, 9/1/17 144A | | | 1,285,000 | | | | 1,269 | |
| (b,r) | | Manhattan Asset Funding, 1.520%, 9/6/17 144A | | | 1,280,000 | | | | 1,266 | |
| | | | | | | | | | |
| | | Short-Term Investments (2.9%) | | Shares/ $ Par | | | Value
$ (000’s) | |
| |
| | Commercial Paper continued | |
| (b,r) | | Plains All American Pipeline, 1.550%, 2/15/17 | | | 1,425,000 | | | | 1,423 | |
| | | | | | | | | | |
| | Total | | | | | | | 7,855 | |
| | | | | | | | | | |
| | | |
| | Total Short-Term Investments | | | | | | | | |
| | (Cost: $7,851) | | | | | | | 7,855 | |
| | | | | | | | | | |
| | | |
| | Total Investments (98.9%) | | | | | | | | |
| | (Cost: $266,692)(a) | | | | | | | 266,732 | |
| | | | | | | | | | |
| | Other Assets, Less | | | | | | | | |
| | Liabilities (1.1%) | | | | | | | 3,101 | |
| | | | | | | | | | |
| | Net Assets (100.0%) | | | | | | | 269,833 | |
| | | | | | | | | | |
144A after the name of a security represents a security exempt from registration under Rule 144A of the Securities Act of 1933. These securities may be resold as transactions exempt from registration, normally to qualified institutional buyers. At December 31, 2016 the value of these securities (in thousands) was $55,014 representing 20.4% of the net assets.
RB — Revenue Bond
| (a) | At December 31, 2016, the aggregate cost of securities for federal tax purposes (in thousands) was $266,696 and the net unrealized appreciation of investments based on that cost was $36 which is comprised of $753 aggregate gross unrealized appreciation and $717 aggregate gross unrealized depreciation. |
| (b) | All or a portion of the securities have been pledged as collateral for open futures positions or when-issued securities. Information regarding open futures contracts as of period end is summarized below. |
| | | | | | | | |
| Issuer (000’s) | | Number of
Contracts | | Expiration Date | | Unrealized
Appreciation/
(Depreciation)
(000’s) | |
US Ten Year Treasury Note Futures (Short) (Total Notional Value at December 31, 2016, $9,089) | | 73 | | 3/17 | | $ | 16 | |
US Two Year Treasury Note Futures (Long) (Total Notional Value at December 31, 2016, $29,049) | | 134 | | 3/17 | | | (13 | ) |
| (r) | Rates are discount rates at the time of purchase. |
The following is a summary of the inputs used in valuing the Portfolio’s assets and liabilities at December 31, 2016. See Note 3 for additional information on portfolio valuation.
| | | | | | | | | | | | | | |
| | | Valuation Inputs | | | |
| Description | | Level 1 –
Quoted Prices | | | Level 2 –
Other Significant
Observable Inputs | | | Level 3 –
Significant
Unobservable Inputs | | | |
| | | (Amounts in thousands) | | | |
Assets: | | | | | | | | | | | | | | |
Governments | | $ | - | | | $ | 29,594 | | | $ | - | | | |
Municipal Bonds | | | - | | | | 1,948 | | | | - | | | |
Corporate Bonds | | | - | | | | 128,892 | | | | - | | | |
Structured Products | | | - | | | | 98,303 | | | | 140 | | | |
Short-Term Investments | | | - | | | | 7,855 | | | | - | | | |
Other Financial Instruments^ | | | | | | | | | | | | | | |
Futures | | | 16 | | | | - | | | | - | | | |
Total Assets: | | $ | 16 | | | $ | 266,592 | | | $ | 140 | | | |
Liabilities: | | | | | | | | | | | | | | |
Other Financial Instruments^ | | | | | | | | | | | | | | |
Futures | | | (13 | ) | | | - | | | | - | | | |
Total Liabilities: | | $ | (13 | ) | | $ | - | | | $ | - | | | |
^ Other financial instruments are derivative instruments such as futures, forwards, written options and swaps contracts, which are valued at the unrealized appreciation (depreciation) on the instrument and short sales, which are valued at market value.
For the period ended December 31, 2016, there were transfers from Level 3 to Level 2 in the amount of $887 (in thousands). These transfers were the result of an increase in the quantity of observable inputs for securities that was previously priced by a third party vendor utilizing a broker quote.
The Accompanying Notes are an Integral Part of the Financial Statements.
| | | | |
| 104 | | Short-Term Bond Portfolio | | |
Select Bond Portfolio (unaudited)
| | | | |
| Objective: | | Portfolio Strategy: | | Net Assets: |
Provide as high a level of total return as is consistent with prudent investment risk. A secondary objective is to seek preservation of shareholders’ capital. | | Invest in a diversified portfolio of investment grade debt securities with maturities exceeding one year. | | $2.8 billion |
Portfolio Overview
Mason Street Advisors, LLC (“Mason Street Advisors”), the investment adviser for the Select Bond Portfolio (the “Portfolio”), has engaged Wells Capital Management, Inc. (“Wells Capital”) to act as sub-adviser for the Portfolio. Normally, the Portfolio invests in a diversified portfolio of investment grade debt securities with maturities exceeding one year. The Portfolio may also invest up to 10% of net assets in non-investment grade, high yield/high risk bonds (so called “junk bonds”) and up to 20% of net assets in foreign securities. Debt securities may be of any maturity or duration, but under normal market conditions, the Portfolio attempts to maintain an overall dollar-weighted average effective duration (an aggregate measure of the sensitivity of the Portfolio’s fixed income securities to changes in interest rates) that is within 10% of the Bloomberg Barclays® U.S. Aggregate Index. The Portfolio uses a fundamental, relative value investment approach to construct the portfolio of investments. The Portfolio invests in debt securities that it believes offer competitive returns and are undervalued, offering additional income and/or price appreciation potential relative to other debt securities of similar credit quality and interest rate sensitivity. The Portfolio may engage in active and frequent trading of portfolio securities to achieve its investment objectives.
Market Overview
Financial markets started the year under severe stress, with risk assets trading in v-shaped fashion throughout the first quarter. After a mostly subdued second quarter, the third quarter saw risk assets bounce back from the initial fallout of the United Kingdom’s vote to leave the European Union, or “Brexit,” and the vast majority of risk assets finished higher than pre-“Brexit” levels. The last quarter of the year was characterized by rising sovereign yields in the midst of firming growth and inflation outlooks along with a changing political landscape in the U.S. In December, the U.S. Federal Reserve Bank delivered a much-anticipated quarter of a point rise in its benchmark rate for the first time since 2015. For the year, within the Bloomberg Barclays® U.S. Aggregate Index components, credit had strong positive excess returns, followed by commercial mortgage-backed securities, asset-backed securities, Agencies and hybrid adjustable-rate mortgages, while mortgage-backed securities underperformed Treasurys.
Portfolio Results
The Portfolio returned 3.06% for the twelve months ended December 31, 2016. By comparison, the Portfolio’s benchmark, the Bloomberg Barclays® U.S. Aggregate Index (the “Index”), returned 2.65%. (The Index is unmanaged, cannot be invested in directly and does not include administrative expenses or sales charges.) According to Lipper® Analytical Services, Inc., an independent mutual fund ranking agency, the average return of the Core Bond Funds peer group was 3.23% for 2016.
In credit, both a modest sector overweight and security selection contributed to performance during the year. Individual contributors were varied, with the largest coming from the Information Technology, Consumer-Non-cyclical and Health Care sectors. Examples included overweights to Apple, Inc., Anheuser-Busch Inbev NV and not holding Stryker Corp., respectively. Within consumer-oriented sectors overweights to Newell Brands, Inc. also contributed. Other notable contributors were from the energy sector, including overweights to The Williams Companies, Inc. and Energy Transfer Partners.
In the Financials sector, Agency mortgages, security selection and sector positioning contributed to performance. The Portfolio’s sector positioning moved from underweight to overweight and back to underweight as the year progressed. The Portfolio’s overweight to specified pools within 15-years and 30-years was the largest contributor within mortgages. The Portfolio also generated positive performance from security selection and relative value trading in Agency hybrid adjustable-rate mortgages.
The biggest detractors from performance were the Portfolio’s positions in the Basic Industry, Energy and Bank and Finance groups. Examples include an underweight to Vale S.A. and overweights to Repsol S.A. and Morgan Stanley, Inc., respectively. Other notable detractors in the Energy sector included an underweight to Enterprise Product Partners L.P. and overweights to EnLink Midstream Partners L.P. and Weatherford. In the Financials sector, the Portfolio’s positioning in higher coupon 30-years and collateralized mortgage obligations was a slight detractor.
Portfolio Manager Outlook
The following forward-looking comments are the opinion of Wells Capital, the Portfolio’s sub-adviser.
| | | | | | |
| | Select Bond Portfolio | | | 105 | |
Select Bond Portfolio (unaudited)
Expectations for U.S. and global growth are rising as we enter 2017. Enthusiasm is also mounting that the incoming U.S. Congress and administration could bring additional resources to the economy in the form of repatriation of overseas cash, tax simplification, regulatory relief and increased infrastructure spending. In somewhat of a surprise, the summary of economic projections hinted that three rate hikes could occur in 2017, the first lift in expectations in two years. To inform the next step, we will closely watch incoming data, policy developments, as well as the possibility that growth can strengthen sufficiently to break the “secular stagnation” seen in recent years.
Consistent with our bottom-up relative value process, we typically maintain a Portfolio duration in line with the duration of the Index. In December, we increased our overweight to credit, identifying additional security selection opportunities. We moved more underweight U.S. Agency mortgage-backed securities as mortgage valuations remain somewhat vulnerable, in our view, as market participants adjust to higher yields and volatility. We are maintaining an overweight to asset-backed securities on stable fundamentals in core sectors and attractive risk-adjusted valuations, while maintaining a tempered overweight in commercial mortgage-backed securities. We remain nimble and agile and stand ready to take advantage of security selection opportunities as they arise.
Relative Performance
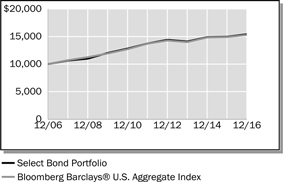
| | | | | | | | | | | | |
Average Annual Total Returns
For Periods Ended December 31, 2016 | |
| | | 1 Year | | | 5 Years | | | 10 Years | |
Select Bond Portfolio | | | 3.06 | % | | | 2.35 | % | | | 4.42 | % |
Bloomberg Barclays® U.S. Aggregate Index | | | 2.65 | % | | | 2.23 | % | | | 4.34 | % |
Lipper® Variable Insurance Products (VIP) Core Bond Funds Average | | | 3.23 | % | | | 2.49 | % | | | 4.05 | % |
The performance data quoted represents past performance. Past performance is historical and does not guarantee future performance. Investment return and principal value will fluctuate, so that shares, when redeemed, may be worth more or less than their original cost. Current performance may be lower or higher than the performance data quoted. For the most recent month-end performance information visit www.northwesternmutual.com.
This chart assumes an initial investment of $10,000 made on 12/31/06. Returns shown reflect fee waivers, deductions for management and other portfolio expenses, and reinvestment of all dividends. In the absence of fee waivers, total return would be reduced. Returns exclude deductions for separate account sale loads and account fees. Please refer to the Benchmark Definitions section of this report for information about the indices cited in the above chart and graph.
Return of principal is not guaranteed. Bond funds have the same interest rate, inflation and credit risks that are associated with the underlying bonds owned by the Portfolio. When interest rates rise, bond prices fall. With a fixed income fund, when interest rates rise, the value of the fund’s existing bonds drops, which could negatively affect overall fund performance. A portion of the Portfolio’s assets may be invested in lower quality debt securities which may present a significant risk for loss of principal and interest. High yield bonds generally have greater price swings and higher default risks than investment grade bonds.
Investing in bonds issued by foreign corporations and governments carries additional risk, including foreign currency risk, and may increase the volatility of the Portfolio’s performance.
Currently, interest rates are near unprecedented historically low levels. A significant rise in interest rates over a short period of time could cause significant losses in the market value of the Portfolio’s fixed income investments.
The Portfolio may engage in active and frequent trading of portfolio securities to achieve its investment objectives. Active and frequent trading may cause higher brokerage expenses and other transaction costs, which may adversely affect performance.
| | | | |
| 106 | | Select Bond Portfolio | | |
Select Bond Portfolio (unaudited)
Top 10 Fixed Income Holdings 12/31/16
| | | | |
Security Description | | | % of Market Value | |
US Treasury, Various | | | 28.5 | % |
Federal National Mortgage Association, Various | | | 16.3 | % |
Federal Home Loan Mortgage Corp., Various | | | 6.5 | % |
Government National Mortgage Association, Various | | | 3.6 | % |
AT&T, Inc., Various | | | 0.8 | % |
JPMorgan Chase & Co., Various | | | 0.8 | % |
Bank of America Corp., Various | | | 0.7 | % |
The Goldman Sachs Group, Inc., Various | | | 0.6 | % |
Morgan Stanley, Various | | | 0.6 | % |
Cisco Systems, Inc., Various | | | 0.6 | % |
Sector Allocation 12/31/16
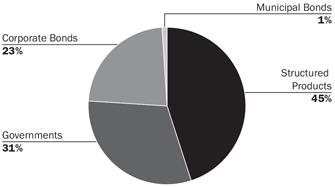
Sector Allocation is based on fixed income investments.
Sector Allocation and Top 10 Holdings are subject to change. Consistent with the Portfolio’s stated parameters, no more than 20% of the Portfolio is invested in foreign securities, and no more than 10% is invested in high yield securities.
| | | | | | |
| | Select Bond Portfolio | | | 107 | |
Select Bond Portfolio
Schedule of Investments
December 31, 2016
| | | | | | | | | | |
| | | Corporate Bonds (23.8%) | | Shares/
$ Par | | | Value
$ (000’s) | |
| | |
| | Aerospace & Defense (0.3%) | | | | | |
| | Northrop Grumman Corp., 3.200%, 2/1/27 | | | 4,350,000 | | | | 4,304 | |
| | Northrop Grumman Corp., 3.250%, 8/1/23 | | | 3,375,000 | | | | 3,441 | |
| | Northrop Grumman Corp., 3.850%, 4/15/45 | | | 1,085,000 | | | | 1,029 | |
| | | | | | | | | | |
| | Total | | | | | | | 8,774 | |
| | | | | | | | | | |
| | |
| | Auto Manufacturing (0.2%) | | | | | |
| | Ford Motor Co., 4.346%, 12/8/26 | | | 1,540,000 | | | | 1,556 | |
| | Ford Motor Co., 5.291%, 12/8/46 | | | 2,925,000 | | | | 2,963 | |
| | | | | | | | | | |
| | Total | | | | | | | 4,519 | |
| | | | | | | | | | |
| | |
| | Autos & Vehicle Parts (0.4%) | | | | | |
| | General Motors Co., 6.750%, 4/1/46 | | | 715,000 | | | | 839 | |
| | General Motors Financial Co., 3.700%, 5/9/23 | | | 4,220,000 | | | | 4,152 | |
| | General Motors Financial Co., 4.200%, 3/1/21 | | | 5,835,000 | | | | 6,020 | |
| | General Motors Financial Co., 5.250%, 3/1/26 | | | 405,000 | | | | 426 | |
| | | | | | | | | | |
| | Total | | | | | | | 11,437 | |
| | | | | | | | | | |
| | | |
| | Banking (6.5%) | | | | | | | | |
| | Bank of America Corp., 2.503%, 10/21/22 | | | 5,750,000 | | | | 5,561 | |
| | Bank of America Corp., 3.248%, 10/21/27 | | | 9,005,000 | | | | 8,597 | |
| | Bank of America Corp., 4.183%, 11/25/27 | | | 3,470,000 | | | | 3,472 | |
| | Bank of America Corp., 4.450%, 3/3/26 | | | 1,745,000 | | | | 1,798 | |
| | Bank of America Corp., 6.000%, 9/1/17 | | | 3,550,000 | | | | 3,653 | |
| | BPCE SA, 2.750%, 12/2/21 | | | 4,200,000 | | | | 4,154 | |
| | Capital One Financial Corp., 3.750%, 7/28/26 | | | 1,835,000 | | | | 1,779 | |
| | Capital One Financial Corp., 4.200%, 10/29/25 | | | 2,651,000 | | | | 2,660 | |
| | Citigroup, Inc., 1.550%, 8/14/17 | | | 5,035,000 | | | | 5,039 | |
| | Citigroup, Inc., 3.200%, 10/21/26 | | | 3,140,000 | | | | 3,003 | |
| | Citigroup, Inc., 4.450%, 9/29/27 | | | 6,275,000 | | | | 6,374 | |
| | Credit Suisse Group Funding Guernsey, Ltd.,
3.450%, 4/16/21 | | | 2,051,000 | | | | 2,064 | |
| | Credit Suisse Group Funding Guernsey, Ltd.,
3.800%, 6/9/23 | | | 5,670,000 | | | | 5,664 | |
| | Deutsche Bank AG, 4.250%, 10/14/21 144A | | | 5,237,000 | | | | 5,257 | |
| | The Goldman Sachs Group, Inc., 2.300%, 12/13/19 | | | 7,785,000 | | | | 7,776 | |
| | The Goldman Sachs Group, Inc., 2.350%, 11/15/21 | | | 5,515,000 | | | | 5,358 | |
| | The Goldman Sachs Group, Inc., 3.500%, 11/16/26 | | | 4,055,000 | | | | 3,962 | |
| | The Goldman Sachs Group, Inc., 4.750%, 10/21/45 | | | 2,336,000 | | | | 2,466 | |
| | The Goldman Sachs Group, Inc., 6.750%, 10/1/37 | | | 2,485,000 | | | | 3,069 | |
| | HSBC Holdings PLC, 2.650%, 1/5/22 | | | 6,845,000 | | | | 6,682 | |
| | HSBC Holdings PLC, 4.375%, 11/23/26 | | | 5,525,000 | | | | 5,566 | |
| | JP Morgan Chase & Co., 2.295%, 8/15/21 | | | 5,515,000 | | | | 5,413 | |
| | JP Morgan Chase & Co., 2.950%, 10/1/26 | | | 4,826,000 | | | | 4,606 | |
| | JP Morgan Chase & Co., 2.972%, 1/15/23 | | | 9,385,000 | | | | 9,354 | |
| | JP Morgan Chase & Co., 3.625%, 12/1/27 | | | 5,200,000 | | | | 5,045 | |
| | Lazard Group LLC, 3.750%, 2/13/25 | | | 3,580,000 | | | | 3,496 | |
| | Mitsubishi UFJ Financial Group, Inc.,
2.757%, 9/13/26 | | | 4,410,000 | | | | 4,142 | |
| | Morgan Stanley, 2.500%, 4/21/21 | | | 6,230,000 | | | | 6,162 | |
| | Morgan Stanley, 2.625%, 11/17/21 | | | 8,315,000 | | | | 8,215 | |
| | Morgan Stanley, 3.125%, 7/27/26 | | | 3,590,000 | | | | 3,430 | |
| | Morgan Stanley, 3.950%, 4/23/27 | | | 1,040,000 | | | | 1,029 | |
| | Murray Street Investment Trust I, 4.647%, 3/9/17 | | | 5,415,000 | | | | 5,443 | |
| | | | | | | | | | |
| | | Corporate Bonds (23.8%) | | Shares/
$ Par | | | Value
$ (000’s) | |
| | |
| | Banking continued | | | | | |
| | National Australia Bank, Ltd., 2.400%, 12/7/21 144A | | | 4,495,000 | | | | 4,471 | |
| | Skandinaviska Enskilda Banken AB,
1.875%, 9/13/21 | | | 3,955,000 | | | | 3,825 | |
| | Sumitomo Mitsui Financial Group, Inc.,
3.010%, 10/19/26 | | | 4,725,000 | | | | 4,522 | |
| | Svenska Handelsbanken AB, 1.875%, 9/7/21 | | | 3,455,000 | | | | 3,337 | |
| | Synchrony Financial, 3.700%, 8/4/26 | | | 3,320,000 | | | | 3,191 | |
| | The Toronto-Dominion Bank,
2.250%, 3/15/21 144A | | | 7,335,000 | | | | 7,291 | |
| | UBS Group Funding Jersey, Ltd.,
2.650%, 2/1/22 144A | | | 5,200,000 | | | | 5,054 | |
| | UBS Group Funding Jersey, Ltd.,
4.125%, 4/15/26 144A | | | 2,300,000 | | | | 2,352 | |
| | | | | | | | | | |
| | Total | | | | | | | 184,332 | |
| | | | | | | | | | |
| | |
| | Basic Materials (0.1%) | | | | | |
| | International Paper Co., 5.150%, 5/15/46 | | | 2,485,000 | | | | 2,591 | |
| | | | | | | | | | |
| | Total | | | | | | | 2,591 | |
| | | | | | | | | | |
| | |
| | Chemicals (0.8%) | | | | | |
| | Air Liquide Finance SA, 1.750%, 9/27/21 144A | | | 2,820,000 | | | | 2,708 | |
| | Air Liquide Finance SA, 2.250%, 9/27/23 144A | | | 2,405,000 | | | | 2,290 | |
| | Air Liquide Finance SA, 2.500%, 9/27/26 144A | | | 2,405,000 | | | | 2,258 | |
| | CF Industries, Inc., 3.400%, 12/1/21 144A | | | 2,255,000 | | | | 2,231 | |
| | CF Industries, Inc., 4.500%, 12/1/26 144A | | | 2,820,000 | | | | 2,772 | |
| | Chevron Phillips Chemical Co. LLC / Chevron Phillips Chemical Co. LP, 3.400%, 12/1/26 144A | | | 1,665,000 | | | | 1,662 | |
| | Equate Petrochemical BV, 3.000%, 3/3/22 144A | | | 3,020,000 | | | | 2,877 | |
| | Equate Petrochemical BV, 4.250%, 11/3/26 144A | | | 2,315,000 | | | | 2,209 | |
| | Potash Corp. of Saskatchewan, Inc.,
4.000%, 12/15/26 | | | 4,275,000 | | | | 4,302 | |
| | | | | | | | | | |
| | Total | | | | | | | 23,309 | |
| | | | | | | | | | |
| | |
| | Conglomerate & Diversified Manufacturing (0.2%) | | | | | |
| | General Electric Capital Corp., 5.875%, 1/14/38 | | | 985,000 | | | | 1,240 | |
| | Valmont Industries, Inc., 5.250%, 10/1/54 | | | 1,570,000 | | | | 1,375 | |
| | Wabtec Corp., 3.450%, 11/15/26 144A | | | 2,500,000 | | | | 2,403 | |
| | | | | | | | | | |
| | Total | | | | | | | 5,018 | |
| | | | | | | | | | |
| | |
| | Consumer Products & Retailing (0.6%) | | | | | |
| | McDonald’s Corp., 2.750%, 12/9/20 | | | 1,470,000 | | | | 1,486 | |
| | McDonald’s Corp., 4.875%, 12/9/45 | | | 3,205,000 | | | | 3,433 | |
| | Newell Rubbermaid, Inc., 4.200%, 4/1/26 | | | 2,405,000 | | | | 2,510 | |
| | Newell Rubbermaid, Inc., 5.500%, 4/1/46 | | | 1,510,000 | | | | 1,734 | |
| | Reynolds American, Inc., 5.700%, 8/15/35 | | | 1,395,000 | | | | 1,602 | |
| | Reynolds American, Inc., 5.850%, 8/15/45 | | | 1,951,000 | | | | 2,310 | |
| | Walgreens Boots Alliance, Inc., 3.450%, 6/1/26 | | | 5,405,000 | | | | 5,306 | |
| | | | | | | | | | |
| | Total | | | | | | | 18,381 | |
| | | | | | | | | | |
| | |
| | Electric Utilities (2.0%) | | | | | |
| | American Electric Power Co., 1.650%, 12/15/17 | | | 3,755,000 | | | | 3,756 | |
| | Commonwealth Edison Co., 3.700%, 3/1/45 | | | 600,000 | | | | 564 | |
| | Consolidated Edison Co. of New York, Inc.,
3.850%, 6/15/46 | | | 985,000 | | | | 940 | |
The Accompanying Notes are an Integral Part of the Financial Statements.
| | | | |
| 108 | | Select Bond Portfolio | | |
Select Bond Portfolio
| | | | | | | | | | |
| | | Corporate Bonds (23.8%) | | Shares/
$ Par | | | Value
$ (000’s) | |
| | | |
| | Electric Utilities continued | | | | | | | | |
| | Dominion Resources, Inc., 1.600%, 8/15/19 | | | 2,110,000 | | | | 2,078 | |
| | Dominion Resources, Inc., 2.000%, 8/15/21 | | | 1,585,000 | | | | 1,537 | |
| | Dominion Resources, Inc., 2.962%, 7/1/19 | | | 1,130,000 | | | | 1,144 | |
| | Dominion Resources, Inc., 4.700%, 12/1/44 | | | 795,000 | | | | 817 | |
| | Duke Energy Carolinas LLC, 2.500%, 3/15/23 | | | 2,200,000 | | | | 2,181 | |
| | Duke Energy Carolinas LLC, 3.875%, 3/15/46 | | | 1,115,000 | | | | 1,091 | |
| | Duke Energy Corp., 1.800%, 9/1/21 | | | 2,445,000 | | | | 2,355 | |
| | Duke Energy Corp., 2.650%, 9/1/26 | | | 3,055,000 | | | | 2,851 | |
| | Duke Energy Corp., 3.750%, 9/1/46 | | | 1,330,000 | | | | 1,197 | |
| | Duke Energy Corp., 4.800%, 12/15/45 | | | 540,000 | | | | 571 | |
| | Duke Energy Florida LLC, 3.400%, 10/1/46 | | | 1,050,000 | | | | 934 | |
| | Fortis, Inc., 2.100%, 10/4/21 144A | | | 1,890,000 | | | | 1,827 | |
| | Fortis, Inc., 3.055%, 10/4/26 144A | | | 3,785,000 | | | | 3,540 | |
| | Indiana Michigan Power Co., 4.550%, 3/15/46 | | | 1,135,000 | | | | 1,177 | |
| | MidAmerican Energy Co., 3.500%, 10/15/24 | | | 1,540,000 | | | | 1,592 | |
| | MidAmerican Energy Co., 4.250%, 5/1/46 | | | 1,540,000 | | | | 1,586 | |
| | Pacific Gas & Electric Co., 2.950%, 3/1/26 | | | 1,886,000 | | | | 1,848 | |
| | PECO Energy Co., 3.150%, 10/15/25 | | | 2,885,000 | | | | 2,883 | |
| | PPL Electric Utilities Corp., 4.150%, 10/1/45 | | | 1,895,000 | | | | 1,926 | |
| | Sierra Pacific Power Co., 2.600%, 5/1/26 | | | 2,420,000 | | | | 2,315 | |
| | The Southern Co., 4.400%, 7/1/46 | | | 2,185,000 | | | | 2,161 | |
| | The Southern Co., 5.500%, 3/15/57 | | | 2,480,000 | | | | 2,507 | |
| | Southern Power Co., 4.950%, 12/15/46 | | | 2,125,000 | | | | 2,071 | |
| | Southwestern Electric Power Co., 3.900%, 4/1/45 | | | 1,570,000 | | | | 1,462 | |
| | Virginia Electric & Power Co., 2.950%, 11/15/26 | | | 1,560,000 | | | | 1,517 | |
| | Virginia Electric & Power Co., 3.150%, 1/15/26 | | | 1,685,000 | | | | 1,673 | |
| | Virginia Electric & Power Co., 4.000%, 11/15/46 | | | 1,560,000 | | | | 1,555 | |
| | Xcel Energy, Inc., 2.600%, 3/15/22 | | | 2,350,000 | | | | 2,341 | |
| | | | | | | | | | |
| | Total | | | | 55,997 | |
| | | | | | | | | | |
| | | |
| | Energy (0.7%) | | | | | | | | |
| | Anadarko Petroleum Corp., 4.850%, 3/15/21 | | | 345,000 | | | | 370 | |
| | Anadarko Petroleum Corp., 6.600%, 3/15/46 | | | 1,165,000 | | | | 1,437 | |
| | Apache Corp., 4.250%, 1/15/44 | | | 1,515,000 | | | | 1,494 | |
| | Canadian Natural Resources, Ltd., 6.750%, 2/1/39 | | | 935,000 | | | | 1,091 | |
| | Cimarex Energy Co., 4.375%, 6/1/24 | | | 2,045,000 | | | | 2,127 | |
| | Encana Corp., 6.500%, 2/1/38 | | | 1,040,000 | | | | 1,124 | |
| | Halliburton Co., 5.000%, 11/15/45 | | | 2,195,000 | | | | 2,367 | |
| | Hess Corp., 4.300%, 4/1/27 | | | 700,000 | | | | 697 | |
| | Hess Corp., 5.800%, 4/1/47 | | | 1,000,000 | | | | 1,038 | |
| | Marathon Oil Corp., 3.850%, 6/1/25 | | | 590,000 | | | | 572 | |
| | Marathon Oil Corp., 5.200%, 6/1/45 | | | 1,594,000 | | | | 1,502 | |
| | Noble Energy, Inc., 6.000%, 3/1/41 | | | 331,000 | | | | 367 | |
| | Occidental Petroleum Corp., 3.000%, 2/15/27 | | | 1,640,000 | | | | 1,587 | |
| | Southern California Gas Co., 2.600%, 6/15/26 | | | 3,065,000 | | | | 2,942 | |
| | Southern Co. Gas Capital Corp., 2.450%, 10/1/23 | | | 1,050,000 | | | | 1,007 | |
| | | | | | | | | | |
| | Total | | | | 19,722 | |
| | | | | | | | | | |
| | | |
| | Finance (0.2%) | | | | | | | | |
| | GE Capital International Funding Co. Unlimited Co., 4.418%, 11/15/35 | | | 3,124,000 | | | | 3,274 | |
| | Stadshypotek AB, 1.875%, 10/2/19 144A | | | 3,190,000 | | | | 3,173 | |
| | | | | | | | | | |
| | Total | | | | 6,447 | |
| | | | | | | | | | |
| | | | | | | | | | |
| | | Corporate Bonds (23.8%) | | Shares/
$ Par | | | Value
$ (000’s) | |
| |
| | Food & Beverage (1.1%) | |
| | Anheuser-Busch InBev Finance, Inc.,
3.650%, 2/1/26 | | | 2,849,000 | | | | 2,892 | |
| | Anheuser-Busch InBev Finance, Inc.,
4.900%, 2/1/46 | | | 8,278,000 | | | | 8,947 | |
| | Kraft Heinz Foods Co., 4.375%, 6/1/46 | | | 2,495,000 | | | | 2,348 | |
| | Kraft Heinz Foods Co., 2.800%, 7/2/20 | | | 4,455,000 | | | | 4,497 | |
| | Kraft Heinz Foods Co., 3.000%, 6/1/26 | | | 2,715,000 | | | | 2,549 | |
| | WM Wrigley Jr. Co., 2.000%, 10/20/17 144A | | | 1,080,000 | | | | 1,085 | |
| | WM Wrigley Jr. Co., 2.400%, 10/21/18 144A | | | 1,450,000 | | | | 1,463 | |
| | WM Wrigley Jr. Co., 2.900%, 10/21/19 144A | | | 3,185,000 | | | | 3,241 | |
| | WM Wrigley Jr. Co., 3.375%, 10/21/20 144A | | | 3,845,000 | | | | 3,953 | |
| | | | | | | | | | |
| | Total | | | | 30,975 | |
| | | | | | | | | | |
| | | |
| | Healthcare (0.4%) | | | | | | | | |
| | Abbott Laboratories, 2.900%, 11/30/21 | | | 2,605,000 | | | | 2,598 | |
| | Abbott Laboratories, 3.750%, 11/30/26 | | | 3,120,000 | | | | 3,098 | |
| | Abbott Laboratories, 4.900%, 11/30/46 | | | 520,000 | | | | 534 | |
| | Express Scripts Holding Co., 4.800%, 7/15/46 | | | 1,689,000 | | | | 1,617 | |
| | Thermo Fisher Scientific, Inc., 2.950%, 9/19/26 | | | 3,140,000 | | | | 2,965 | |
| | | | | | | | | | |
| | Total | | | | 10,812 | |
| | | | | | | | | | |
| | | |
| | Insurance (1.2%) | | | | | | | | |
| | AIG Global Funding, 2.700%, 12/15/21 144A | | | 1,695,000 | | | | 1,691 | |
| | American International Group, Inc.,
3.900%, 4/1/26 | | | 1,194,000 | | | | 1,215 | |
| | American International Group, Inc.,
4.375%, 1/15/55 | | | 415,000 | | | | 380 | |
| | American International Group, Inc.,
6.250%, 5/1/36 | | | 1,675,000 | | | | 2,003 | |
| | Berkshire Hathaway, Inc., 3.125%, 3/15/26 | | | 5,725,000 | | | | 5,688 | |
| | Chubb INA Holdings, Inc., 3.350%, 5/3/26 | | | 2,681,000 | | | | 2,716 | |
| | Chubb INA Holdings, Inc., 4.350%, 11/3/45 | | | 2,075,000 | | | | 2,192 | |
| | Lincoln National Corp., 3.625%, 12/12/26 | | | 4,070,000 | | | | 4,060 | |
| | Marsh & McLennan Cos., 3.750%, 3/14/26 | | | 2,590,000 | | | | 2,639 | |
| | MetLife, Inc., 4.600%, 5/13/46 | | | 1,825,000 | | | | 1,921 | |
| | Metropolitan Life Global Funding I,
1.550%, 9/13/19 144A | | | 2,535,000 | | | | 2,497 | |
| | Metropolitan Life Global Funding I,
1.950%, 9/15/21 144A | | | 3,775,000 | | | | 3,670 | |
| | Metropolitan Life Global Funding I,
3.450%, 12/18/26 144A | | | 2,650,000 | | | | 2,674 | |
| | Teachers Insurance & Annuity Association of America, 4.900%, 9/15/44 144A | | | 965,000 | | | | 1,044 | |
| | | | | | | | | | |
| | Total | | | | | | | 34,390 | |
| | | | | | | | | | |
| | | |
| | Media (0.6%) | | | | | | | | |
| | Charter Communications Operating LLC / Charter Communications Operating Capital Corp.,
6.484%, 10/23/45 | | | 3,873,000 | | | | 4,478 | |
| | Cox Communications, Inc., 4.800%, 2/1/35 144A | | | 580,000 | | | | 540 | |
| | Discovery Communications LLC, 4.875%, 4/1/43 | | | 1,295,000 | | | | 1,197 | |
| | Discovery Communications LLC,
4.950%, 5/15/42 | | | 625,000 | | | | 576 | |
| | Grupo Televisa SAB, 5.000%, 5/13/45 | | | 1,105,000 | | | | 938 | |
| | Grupo Televisa SAB, 6.125%, 1/31/46 | | | 1,385,000 | | | | 1,374 | |
| | Time Warner Cable, Inc., 6.550%, 5/1/37 | | | 785,000 | | | | 889 | |
| | Time Warner, Inc., 3.800%, 2/15/27 | | | 2,945,000 | | | | 2,928 | |
| | Time Warner, Inc., 4.650%, 6/1/44 | | | 175,000 | | | | 167 | |
| | Time Warner, Inc., 4.850%, 7/15/45 | | | 1,345,000 | | | | 1,346 | |
| | Viacom, Inc., 2.250%, 2/4/22 | | | 1,770,000 | | | | 1,663 | |
The Accompanying Notes are an Integral Part of the Financial Statements.
| | | | | | |
| | Select Bond Portfolio | | | 109 | |
Select Bond Portfolio
| | | | | | | | | | |
| | | Corporate Bonds (23.8%) | | Shares/
$ Par | | | Value
$ (000’s) | |
| |
| | Media continued | |
| | Viacom, Inc., 3.450%, 10/4/26 | | | 1,180,000 | | | | 1,091 | |
| | Viacom, Inc., 4.850%, 12/15/34 | | | 1,485,000 | | | | 1,324 | |
| | | | | | | | | | |
| | Total | | | | | | | 18,511 | |
| | | | | | | | | | |
| |
| | Metals & Mining (0.3%) | |
| | Barrick Gold Corp., 5.250%, 4/1/42 | | | 1,145,000 | | | | 1,115 | |
| | Barrick North America Finance LLC, 4.400%, 5/30/21 | | | 503,000 | | | | 529 | |
| | Barrick North America Finance LLC, 5.700%, 5/30/41 | | | 1,555,000 | | | | 1,587 | |
| | BHP Billiton Finance USA, Ltd., 5.000%, 9/30/43 | | | 1,315,000 | | | | 1,469 | |
| | Vale Overseas, Ltd., 5.875%, 6/10/21 | | | 1,225,000 | | | | 1,283 | |
| | Vale Overseas, Ltd., 6.250%, 8/10/26 | | | 1,170,000 | | | | 1,217 | |
| | | | | | | | | | |
| | Total | | | | | | | 7,200 | |
| | | | | | | | | | |
| |
| | Oil & Gas (0.8%) | |
| | BP Capital Markets PLC, 3.216%, 11/28/23 | | | 3,645,000 | | | | 3,681 | |
| | BP Capital Markets PLC, 3.723%, 11/28/28 | | | 2,055,000 | | | | 2,088 | |
| | Chevron Corp., 2.100%, 5/16/21 | | | 5,085,000 | | | | 5,041 | |
| | HollyFrontier Corp., 5.875%, 4/1/26 | | | 2,115,000 | | | | 2,161 | |
| | Marathon Petroleum Corp., 5.000%, 9/15/54 | | | 290,000 | | | | 246 | |
| | Marathon Petroleum Corp., 5.850%, 12/15/45 | | | 715,000 | | | | 711 | |
| | Shell International Finance BV, 2.875%, 5/10/26 | | | 3,330,000 | | | | 3,220 | |
| | Shell International Finance BV, 4.000%, 5/10/46 | | | 2,511,000 | | | | 2,401 | |
| | Valero Energy Corp., 3.400%, 9/15/26 | | | 2,975,000 | | | | 2,850 | |
| | | | | | | | | | |
| | Total | | | | | | | 22,399 | |
| | | | | | | | | | |
| | | |
| | Pharmaceuticals (1.4%) | | | | | | | | |
| | AbbVie, Inc., 2.500%, 5/14/20 | | | 4,310,000 | | | | 4,311 | |
| | AbbVie, Inc., 3.200%, 5/14/26 | | | 1,915,000 | | | | 1,822 | |
| | AbbVie, Inc., 4.450%, 5/14/46 | | | 2,420,000 | | | | 2,317 | |
| | Actavis Funding SCS, 4.550%, 3/15/35 | | | 1,570,000 | | | | 1,554 | |
| | Actavis Funding SCS, 4.750%, 3/15/45 | | | 2,735,000 | | | | 2,685 | |
| | Amgen, Inc., 2.600%, 8/19/26 | | | 2,445,000 | | | | 2,249 | |
| | Amgen, Inc., 4.400%, 5/1/45 | | | 1,835,000 | | | | 1,759 | |
| | Amgen, Inc., 4.563%, 6/15/48 144A | | | 1,085,000 | | | | 1,050 | |
| | Biogen, Inc., 5.200%, 9/15/45 | | | 1,496,000 | | | | 1,601 | |
| | Celgene Corp., 5.000%, 8/15/45 | | | 3,500,000 | | | | 3,639 | |
| | Perrigo Finance Unlimited Co., 4.375%, 3/15/26 | | | 1,965,000 | | | | 1,967 | |
| | Shire Acquisitions Investments Ireland Designated Activity Co., 2.875%, 9/23/23 | | | 2,720,000 | | | | 2,585 | |
| | Shire Acquisitions Investments Ireland Designated Activity Co., 3.200%, 9/23/26 | | | 6,005,000 | | | | 5,611 | |
| | Teva Pharmaceutical Finance Netherlands III BV,
3.150%, 10/1/26 | | | 6,505,000 | | | | 5,997 | |
| | | | | | | | | | |
| | Total | | | | | | | 39,147 | |
| | | | | | | | | | |
| |
| | Pipelines (1.1%) | |
| | Buckeye Partners LP, 3.950%, 12/1/26 | | | 2,610,000 | | | | 2,540 | |
| | Colorado Interstate Gas Co. LLC / Colorado Interstate Issuing Corp., 4.150%, 8/15/26 144A | | | 2,635,000 | | | | 2,561 | |
| | Enbridge, Inc., 4.250%, 12/1/26 | | | 1,760,000 | | | | 1,802 | |
| | Enbridge, Inc., 5.500%, 12/1/46 | | | 1,410,000 | | | | 1,509 | |
| | Enbridge, Inc., 6.000%, 1/15/77 | | | 700,000 | | | | 698 | |
| | Energy Transfer Partners LP, 2.500%, 6/15/18 | | | 2,365,000 | | | | 2,374 | |
| | Energy Transfer Partners LP, 4.750%, 1/15/26 | | | 1,285,000 | | | | 1,328 | |
| | Energy Transfer Partners LP, 6.125%, 12/15/45 | | | 1,720,000 | | | | 1,830 | |
| | | | | | | | | | |
| | Corporate Bonds (23.8%) | |
| Shares/
$ Par |
| |
| Value
$ (000’s) |
|
| |
| | Pipelines continued | |
| | Enterprise Products Operating LLC, 5.100%, 2/15/45 | | | 1,085,000 | | | | 1,144 | |
| | Enterprise Products Operating LLC, 5.950%, 2/1/41 | | | 525,000 | | | | 593 | |
| | Enterprise Products Operating LLC, 6.450%, 9/1/40 | | | 325,000 | | | | 386 | |
| | Kinder Morgan Energy Partners LP, 5.400%, 9/1/44 | | | 1,190,000 | | | | 1,186 | |
| | Kinder Morgan, Inc., 5.550%, 6/1/45 | | | 1,775,000 | | | | 1,867 | |
| | Phillips 66 Partners LP, 3.550%, 10/1/26 | | | 1,180,000 | | | | 1,142 | |
| | Phillips 66 Partners LP, 4.900%, 10/1/46 | | | 1,180,000 | | | | 1,133 | |
| | Sabine Pass Liquefaction LLC, 5.000%, 3/15/27 144A | | | 2,470,000 | | | | 2,491 | |
| | Transcontinental Gas Pipe Line Co. LLC,
7.850%, 2/1/26 144A | | | 2,930,000 | | | | 3,695 | |
| | Williams Partners LP, 4.000%, 9/15/25 | | | 1,135,000 | | | | 1,122 | |
| | Williams Partners LP, 4.500%, 11/15/23 | | | 1,760,000 | | | | 1,808 | |
| | Williams Partners LP, 5.100%, 9/15/45 | | | 350,000 | | | | 333 | |
| | | | | | | | | | |
| | Total | | | | | | | 31,542 | |
| | | | | | | | | | |
| |
| | Real Estate Investment Trusts (0.5%) | |
| | DDR Corp., 3.375%, 5/15/23 | | | 3,180,000 | | | | 3,091 | |
| | DDR Corp., 4.625%, 7/15/22 | | | 3,737,000 | | | | 3,957 | |
| | Mid-America Apartments LP, 3.750%, 6/15/24 | | | 2,705,000 | | | | 2,713 | |
| | Mid-America Apartments LP, 4.000%, 11/15/25 | | | 1,440,000 | | | | 1,460 | |
| | Mid-America Apartments LP, 4.300%, 10/15/23 | | | 1,255,000 | | | | 1,309 | |
| | Tanger Properties LP, 3.750%, 12/1/24 | | | 1,340,000 | | | | 1,337 | |
| | Tanger Properties LP, 3.875%, 12/1/23 | | | 1,565,000 | | | | 1,587 | |
| | | | | | | | | | |
| | Total | | | | 15,454 | |
| | | | | | | |
| |
| | Technology (2.4%) | |
| | Analog Devices, Inc., 2.500%, 12/5/21 | | | 2,355,000 | | | | 2,333 | |
| | Analog Devices, Inc., 3.125%, 12/5/23 | | | 3,535,000 | | | | 3,535 | |
| | Analog Devices, Inc., 3.500%, 12/5/26 | | | 4,485,000 | | | | 4,444 | |
| | Apple, Inc., 3.850%, 8/4/46 | | | 2,615,000 | | | | 2,506 | |
| | Cisco Systems, Inc., 1.400%, 9/20/19 | | | 6,505,000 | | | | 6,434 | |
| | Cisco Systems, Inc., 1.850%, 9/20/21 | | | 7,120,000 | | | | 6,949 | |
| | Cisco Systems, Inc., 2.200%, 9/20/23 | | | 5,340,000 | | | | 5,137 | |
| | Diamond 1 Finance Corp. / Diamond 2 Finance Corp.,
6.020%, 6/15/26 144A | | | 1,895,000 | | | | 2,053 | |
| | Fidelity National Information Services, Inc.,
2.250%, 8/15/21 | | | 1,835,000 | | | | 1,789 | |
| | Fidelity National Information Services, Inc.,
2.850%, 10/15/18 | | | 3,230,000 | | | | 3,286 | |
| | Fidelity National Information Services, Inc.,
3.625%, 10/15/20 | | | 2,545,000 | | | | 2,635 | |
| | Fidelity National Information Services, Inc.,
4.500%, 8/15/46 | | | 1,139,000 | | | | 1,084 | |
| | Hewlett Packard Enterprise Co., 4.900%, 10/15/25 144A | | | 1,455,000 | | | | 1,497 | |
| | Hewlett Packard Enterprise Co., 6.350%, 10/15/45 144A | | | 4,145,000 | | | | 4,187 | |
| | Microsoft Corp., 2.000%, 8/8/23 | | | 2,830,000 | | | | 2,705 | |
| | Microsoft Corp., 3.450%, 8/8/36 | | | 1,655,000 | | | | 1,573 | |
| | Microsoft Corp., 3.700%, 8/8/46 | | | 3,435,000 | | | | 3,234 | |
| | Microsoft Corp., 3.950%, 8/8/56 | | | 1,075,000 | | | | 1,015 | |
| | Oracle Corp., 1.900%, 9/15/21 | | | 3,195,000 | | | | 3,122 | |
| | Oracle Corp., 2.400%, 9/15/23 | | | 7,005,000 | | | | 6,786 | |
The Accompanying Notes are an Integral Part of the Financial Statements.
| | | | |
| 110 | | Select Bond Portfolio | | |
Select Bond Portfolio
| | | | | | | | |
| Corporate Bonds (23.8%) | | Shares/
$ Par | | | Value
$ (000’s) | |
|
Technology continued | |
Oracle Corp., 3.850%, 7/15/36 | | | 1,370,000 | | | | 1,337 | |
| | | | | | | | |
Total | | | | | | | 67,641 | |
| | | | | | | | |
|
Telecommunications (1.4%) | |
AT&T, Inc., 3.000%, 6/30/22 | | | 5,050,000 | | | | 4,957 | |
AT&T, Inc., 3.400%, 5/15/25 | | | 6,391,000 | | | | 6,160 | |
AT&T, Inc., 3.800%, 3/15/22 | | | 2,085,000 | | | | 2,137 | |
AT&T, Inc., 3.950%, 1/15/25 | | | 3,960,000 | | | | 3,967 | |
AT&T, Inc., 4.450%, 4/1/24 | | | 6,605,000 | | | | 6,885 | |
AT&T, Inc., 4.750%, 5/15/46 | | | 550,000 | | | | 521 | |
Sprint Spectrum Co. LLC / Sprint Spectrum Co. II LLC, 3.360%, 9/20/21 144A | | | 3,420,000 | | | | 3,426 | |
Verizon Communications, Inc., 4.125%, 8/15/46 | | | 2,950,000 | | | | 2,670 | |
Verizon Communications, Inc., 4.272%, 1/15/36 | | | 1,878,000 | | | | 1,798 | |
Verizon Communications, Inc., 4.400%, 11/1/34 | | | 3,494,000 | | | | 3,449 | |
Verizon Communications, Inc., 4.862%, 8/21/46 | | | 3,715,000 | | | | 3,764 | |
| | | | | | | | |
Total | | | | | | | 39,734 | |
| | | | | | | | |
|
Transportation (0.6%) | |
ERAC USA Finance LLC, 3.300%, 12/1/26 144A | | | 3,290,000 | | | | 3,157 | |
ERAC USA Finance LLC, 4.500%, 2/15/45 144A | | | 550,000 | | | | 525 | |
FedEx Corp., 4.550%, 4/1/46 | | | 2,770,000 | | | | 2,791 | |
Penske Truck Leasing Co. LP / PTL Finance Corp., 3.200%, 7/15/20 144A | | | 2,515,000 | | | | 2,543 | |
Penske Truck Leasing Co. LP / PTL Finance Corp., 3.375%, 2/1/22 144A | | | 2,000,000 | | | | 2,017 | |
Penske Truck Leasing Co. LP / PTL Finance Corp., 3.400%, 11/15/26 144A | | | 4,595,000 | | | | 4,396 | |
Union Pacific Corp., 4.050%, 3/1/46 | | | 2,040,000 | | | | 2,046 | |
| | | | | | | | |
Total | | | | | | | 17,475 | |
| | | | | | | | |
| | |
Total Corporate Bonds | | | | | | | | |
(Cost: $684,870) | | | | | | | 675,807 | |
| | | | | | | | |
| | |
| Governments (34.9%) | | | | | | |
|
Foreign Agencies (1.7%) | |
Comision Federal de Electricidad, 4.750%, 2/23/27 144A | | | 2,975,000 | | | | 2,856 | |
Electricite de France SA, 5.250%, 10/13/55 144A | | | 665,000 | | | | 662 | |
Electricite de France SA, 6.000%, 1/22/2114 144A | | | 515,000 | | | | 500 | |
Japan Bank for International Cooperation, 1.875%, 4/20/21 | | | 3,548,000 | | | | 3,466 | |
Japan Bank for International Cooperation, 2.000%, 11/4/21 | | | 1,668,000 | | | | 1,626 | |
Japan Bank of International Cooperation, 1.500%, 7/21/21 | | | 5,246,000 | | | | 5,030 | |
Kreditanstalt Fuer Wiederaufbau, 1.000%, 7/15/19 | | | 15,920,000 | | | | 15,677 | |
Kreditanstalt Fuer Wiederaufbau, 4.000%, 1/27/20 | | | 2,615,000 | | | | 2,787 | |
Petroleos Mexicanos, 2.460%, 12/15/25 | | | 5,777,100 | | | | 5,785 | |
Petroleos Mexicanos, 5.375%, 3/13/22 144A | | | 1,650,000 | | | | 1,689 | |
Petroleos Mexicanos, 5.625%, 1/23/46 | | | 2,065,000 | | | | 1,714 | |
Petroleos Mexicanos, 6.500%, 3/13/27 144A | | | 3,365,000 | | | | 3,471 | |
Petroleos Mexicanos, 6.750%, 9/21/47 144A | | | 2,850,000 | | | | 2,693 | |
Petroleos Mexicanos, 6.875%, 8/4/26 144A | | | 600,000 | | | | 633 | |
| | | | | | | | |
Total | | | | | | | 48,589 | |
| | | | | | | | |
| | | | | | | | |
| Governments (34.9%) | | Shares/
$ Par | | | Value
$ (000’s) | |
|
US Government and Agencies (31.7%) | |
Federal National Mortgage Association, 0.000%, 10/9/19 | | | 14,300,000 | | | | 13,561 | |
US Treasury, 0.750%, 10/31/18 | | | 89,625,000 | | | | 88,981 | |
US Treasury, 0.875%, 7/15/18 | | | 8,472,000 | | | | 8,445 | |
US Treasury, 1.000%, 11/30/18 | | | 791,000 | | | | 789 | |
US Treasury, 1.000%, 11/15/19 | | | 57,721,000 | | | | 57,027 | |
US Treasury, 1.125%, 6/15/18 | | | 9,311,000 | | | | 9,320 | |
US Treasury, 1.125%, 7/31/21 | | | 24,276,000 | | | | 23,466 | |
US Treasury, 1.125%, 9/30/21 | | | 34,104,000 | | | | 32,896 | |
US Treasury, 1.250%, 12/31/18 | | | 56,426,000 | | | | 56,483 | |
US Treasury, 1.250%, 10/31/21 | | | 26,213,000 | | | | 25,418 | |
US Treasury, 1.375%, 12/15/19 | | | 149,672,000 | | | | 149,315 | |
US Treasury, 1.375%, 1/31/21 | | | 30,359,000 | | | | 29,874 | |
US Treasury, 1.500%, 8/15/26 | | | 46,010,000 | | | | 42,317 | |
US Treasury, 1.625%, 6/30/20 | | | 8,147,000 | | | | 8,151 | |
US Treasury, 1.750%, 11/30/21 | | | 6,844,000 | | | | 6,793 | |
US Treasury, 2.000%, 8/31/21 | | | 18,424,000 | | | | 18,497 | |
US Treasury, 2.000%, 10/31/21 | | | 32,523,000 | | | | 32,617 | |
US Treasury, 2.000%, 12/31/21 | | | 30,879,000 | | | | 30,992 | |
US Treasury, 2.000%, 11/15/26 | | | 73,928,000 | | | | 71,130 | |
US Treasury, 2.125%, 8/15/21 | | | 67,712,000 | | | | 68,355 | |
US Treasury, 2.125%, 9/30/21 | | | 9,012,000 | | | | 9,092 | |
US Treasury, 2.125%, 11/30/23 | | | 9,858,000 | | | | 9,793 | |
US Treasury, 2.250%, 8/15/46 | | | 25,889,000 | | | | 21,768 | |
US Treasury, 2.500%, 2/15/46 | | | 27,903,000 | | | | 24,794 | |
US Treasury, 2.500%, 5/15/46 | | | 25,816,000 | | | | 22,942 | |
US Treasury, 2.875%, 11/15/46 | | | 11,889,000 | | | | 11,478 | |
US Treasury, 3.000%, 11/15/45 | | | 24,338,000 | | | | 24,005 | |
| | | | | | | | |
Total | | | | | | | 898,299 | |
| | | | | | | | |
|
Yankee Sovereign (1.5%) | |
Abu Dhabi Government International Bond, 2.125%, 5/3/21 144A | | | 2,855,000 | | | | 2,796 | |
Indonesia Government International Bond, 3.700%, 1/8/22 144A | | | 1,305,000 | | | | 1,308 | |
Indonesia Government International Bond, 4.350%, 1/8/27 144A | | | 3,440,000 | | | | 3,447 | |
Israel Government International Bond, 4.500%, 1/30/43 | | | 2,390,000 | | | | 2,383 | |
Mexico Government International Bond, 4.000%, 10/2/23 | | | 4,685,000 | | | | 4,696 | |
Mexico Government International Bond,
4.350%, 1/15/47 | | | 1,575,000 | | | | 1,350 | |
Mexico Government International Bond,
5.750%, 10/12/2110 | | | 3,460,000 | | | | 3,192 | |
Paraguay Government International Bond, 6.100%, 8/11/44 144A | | | 1,660,000 | | | | 1,685 | |
Qatar Government International Bond,
2.375%, 6/2/21 144A | | | 3,820,000 | | | | 3,737 | |
Qatar Government International Bond,
3.250%, 6/2/26 144A | | | 2,320,000 | | | | 2,238 | |
Slovenia Government International Bond, 5.250%, 2/18/24 144A | | | 6,530,000 | | | | 7,154 | |
Slovenia Government International Bond, 5.500%, 10/26/22 144A | | | 2,970,000 | | | | 3,282 | |
The Accompanying Notes are an Integral Part of the Financial Statements.
| | | | | | |
| | Select Bond Portfolio | | | 111 | |
Select Bond Portfolio
| | | | | | | | | | |
| | | Governments (34.9%) | | Shares/
$ Par | | | Value
$ (000’s) | |
| |
| | Yankee Sovereign continued | |
| | Slovenia Government International Bond,
5.850%, 5/10/23 144A | | | 2,743,000 | | | | 3,090 | |
| | South Africa Government International Bond,
4.300%, 10/12/28 | | | 2,765,000 | | | | 2,564 | |
| | | | | | | | | | |
| | Total | | | | 42,922 | |
| | | | | | | |
| | |
| | Total Governments | | | | | |
| | (Cost: $1,008,019) | | | | 989,810 | |
| | | | | | | |
| | | |
| | | Municipal Bonds (0.9%) | | | | | | |
| |
| | Municipal Bonds (0.9%) | |
| | County of Clark Department of Aviation, 6.820%, 7/1/45 RB | | | 2,495,000 | | | | 3,516 | |
| | Los Angeles Community College District, Series 2010-E, 6.750%, 8/1/49 GO | | | 2,635,000 | | | | 3,794 | |
| | New Jersey Turnpike Authority, Series 2010, 7.102%, 1/1/41 RB | | | 2,192,000 | | | | 3,067 | |
| | North Texas Tollway Authority, Series 2009-B, 6.718%, 1/1/49 RB | | | 3,125,000 | | | | 4,385 | |
| | Ohio State University, 4.800%, 6/1/11 RB | | | 1,090,000 | | | | 1,073 | |
| | Port Authority of New York & New Jersey, 4.458%, 10/1/62 RB | | | 3,665,000 | | | | 3,707 | |
| | Province of Ontario, 1.625%, 1/18/19 GO | | | 4,715,000 | | | | 4,714 | |
| | State of California, Series 2010,
7.600%, 11/1/40 GO | | | 1,925,000 | | | | 2,900 | |
| | | | | | | | | | |
| | |
| | Total Municipal Bonds | | | | | |
| | (Cost: $27,618) | | | | 27,156 | |
| | | | | | | |
| | | |
| | | Structured Products (49.6%) | | | | | | |
| |
| | Structured Products (49.6%) | |
| | Ally Master Owner Trust, Series 2014-1, Class A2, 1.290%, 1/15/19 | | | 1,300,000 | | | | 1,300 | |
| | Ally Master Owner Trust, Series 2014-3, Class A, 1.330%, 3/15/19 | | | 5,446,000 | | | | 5,447 | |
| | Ally Master Owner Trust, Series 2012-5, Class A, 1.540%, 9/15/19 | | | 3,664,000 | | | | 3,669 | |
| | American Express Credit Account Master Trust, Series 2013-2, Class A, 1.124%, 5/17/21 | | | 2,101,000 | | | | 2,107 | |
| | AmeriCredit Automobile Receivables Trust, Series 2016-4, Class A3, 1.530%, 7/8/21 | | | 3,638,000 | | | | 3,613 | |
| | AmeriCredit Automobile Receivables Trust, Series 2016-3, Class A2A,
1.370%, 11/8/19 | | | 1,773,000 | | | | 1,774 | |
| | Asset Securitization Corp., Series 1997-D5, Class PS1, 1.538%, 2/14/43 IO | | | 2,249,567 | | | | 1 | |
| | Avis Budget Rental Car Funding AESOP LLC, Series 2012-3A, Class A,
2.100%, 3/20/19 144A | | | 3,483,000 | | | | 3,487 | |
| | Avis Budget Rental Car Funding AESOP LLC, Series 2014-1A, Class A,
2.460%, 7/20/20 144A | | | 4,105,000 | | | | 4,095 | |
| | Avis Budget Rental Car Funding AESOP LLC, Series 2014-2A, Class A,
2.500%, 2/20/21 144A | | | 4,789,000 | | | | 4,769 | |
| | Avis Budget Rental Car Funding AESOP LLC, Series 2016-2A, Class A,
2.720%, 11/20/22 144A | | | 4,532,000 | | | | 4,438 | |
| | | | | | | | | | |
| | | Structured Products (49.6%) | | Shares/
$ Par | | | Value
$��(000’s) | |
| |
| | Structured Products continued | |
| | Bank of The West Auto Trust, Series 2014-1, Class A3, 1.090%, 3/15/19 144A | | | 1,067,939 | | | | 1,068 | |
| | California Republic Auto Receivables Trust, Series 2015-4, Class A2, 1.600%, 9/17/18 144A | | | 776,679 | | | | 777 | |
| | California Republic Auto Receivables Trust, Series 2015-1, Class A4, 1.820%, 9/15/20 | | | 2,888,000 | | | | 2,898 | |
| | California Republic Auto Receivables Trust, Series 2016-2, Class A4, 1.830%, 12/15/21 | | | 3,169,000 | | | | 3,149 | |
| | California Republic Auto Receivables Trust, Series 2016-1, Class A3, 1.890%, 5/15/20 | | | 3,536,000 | | | | 3,553 | |
| | California Republic Auto Receivables Trust, Series 2016-1, Class A4, 2.240%, 10/15/21 | | | 1,969,000 | | | | 1,979 | |
| | California Republic Auto Receivables Trust, Series 2015-4, Class A4, 2.580%, 6/15/21 144A | | | 3,085,000 | | | | 3,113 | |
| | Capital Auto Receivables Asset Trust, Series 2016-2, Class A2A, 1.320%, 1/22/19 | | | 1,109,000 | | | | 1,109 | |
| | Capital Auto Receivables Asset Trust, Series 2016-3, Class A2A, 1.360%, 4/22/19 | | | 1,891,000 | | | | 1,892 | |
| | Capital Auto Receivables Asset Trust, Series 2015-2, Class A2, 1.390%, 9/20/18 | | | 1,707,000 | | | | 1,708 | |
| | Capital Auto Receivables Asset Trust, Series 2016-2, Class A3, 1.460%, 6/22/20 | | | 2,662,000 | | | | 2,651 | |
| | Capital Auto Receivables Asset Trust, Series 2016-1, Class A2A, 1.500%, 11/20/18 | | | 3,199,691 | | | | 3,204 | |
| | Capital Auto Receivables Asset Trust, Series 2016-3, Class A3, 1.540%, 8/20/20 | | | 1,628,000 | | | | 1,622 | |
| | Capital Auto Receivables Asset Trust, Series 2015-4, Class A2, 1.620%, 3/20/19 | | | 2,289,000 | | | | 2,293 | |
| | Capital Auto Receivables Asset Trust, Series 2014-1, Class A4, 1.690%, 10/22/18 | | | 3,432,000 | | | | 3,436 | |
| | Capital Auto Receivables Asset Trust, Series 2016-3, Class A4, 1.690%, 3/20/21 | | | 1,365,000 | | | | 1,353 | |
| | Capital Auto Receivables Asset Trust, Series 2015-2, Class A3, 1.730%, 9/20/19 | | | 3,384,000 | | | | 3,393 | |
| | Capital Auto Receivables Asset Trust, Series 2016-1, Class A, 1.730%, 4/20/20 | | | 3,740,000 | | | | 3,743 | |
| | Capital Auto Receivables Asset Trust, Series 2015-4, Class A3, 1.830%, 3/20/20 | | | 3,631,000 | | | | 3,637 | |
| | Capital Auto Receivables Asset Trust, Series 2015-3, Class A3, 1.940%, 1/21/20 | | | 3,714,000 | | | | 3,733 | |
| | Capital Auto Receivables Asset Trust, Series 2015-2, Class A4, 1.970%, 1/21/20 | | | 5,017,000 | | | | 5,032 | |
| | Capital Auto Receivables Asset Trust, Series 2016-1, Class A4, 1.980%, 10/20/20 | | | 1,690,000 | | | | 1,689 | |
| | Capital Auto Receivables Asset Trust, Series 2015-4, Class A4, 2.010%, 7/20/20 | | | 1,879,000 | | | | 1,882 | |
| | Capital One Multi-Asset Execution Trust, Series 2016-A7, Class A7, 1.116%, 9/16/24 | | | 5,156,000 | | | | 5,158 | |
| | Capital One Multi-Asset Execution Trust, Series 2016-A2, Class A2, 1.334%, 2/15/24 | | | 2,789,000 | | | | 2,806 | |
| | Capital One Multi-Asset Execution Trust, Series 2015-A1, Class A, 1.390%, 1/15/21 | | | 340,000 | | | | 340 | |
| | CFCRE Commercial Mortgage Trust, Series 2016-C3, Class A1, 1.793%, 1/10/48 | | | 1,550,796 | | | | 1,546 | |
The Accompanying Notes are an Integral Part of the Financial Statements.
| | | | |
| 112 | | Select Bond Portfolio | | |
Select Bond Portfolio
| | | | | | | | | | |
| | | Structured Products (49.6%) | | Shares/ $ Par | | | Value $ (000’s) | |
| | | |
| | Structured Products continued | | | | | | | | |
| | CFCRE Commercial Mortgage Trust, Series 2016-C7, Class A3, 3.839%, 12/10/54 | | | 1,179,000 | | | | 1,218 | |
| | CFCRE Commercial Mortgage Trust, Series 2011-C1, Class A4, 4.961%, 4/15/44 144A | | | 2,290,000 | | | | 2,469 | |
| | Chrysler Capital Auto Receivables Trust, Series 2016-AA, Class A3, 1.770%, 10/15/20 144A | | | 5,770,000 | | | | 5,775 | |
| | Citibank Credit Card Issuance Trust, Series 2014-A8, Class A8, 1.730%, 4/9/20 | | | 1,864,000 | | | | 1,871 | |
| | Citigroup / Deutsche Bank Commercial Mortgage Trust, Series 2016-CD1, Class A1, 1.443%, 8/10/49 | | | 900,694 | | | | 888 | |
| | Citigroup / Deutsche Bank Commercial Mortgage Trust, Series 2016-CD1, Class ASB,
2.622%, 8/10/49 | | | 2,660,000 | | | | 2,604 | |
| | Citigroup Commercial Mortgage Trust, Series 2013-GC11, Class A2, 1.987%, 4/10/46 | | | 2,415,000 | | | | 2,424 | |
| | Citigroup Commercial Mortgage Trust, Series 2016-GC36, Class A5, 3.616%, 2/10/49 | | | 2,857,000 | | | | 2,934 | |
| | Citigroup Mortgage Loan Trust, Inc., Series 2005-1, Class 3A1, 6.500%, 4/25/35 | | | 252,602 | | | | 252 | |
| | Commercial Mortgage Trust Pass Through Certificates, Series 2013-CR6, Class A1,
0.719%, 3/10/46 | | | 351,367 | | | | 350 | |
| | Commercial Mortgage Trust Pass Through Certificates, Series 2013-CR12, Class A1,
1.295%, 10/10/46 | | | 185,490 | | | | 185 | |
| | Commercial Mortgage Trust Pass Through Certificates, Series 2013-CR11, Class A1,
1.468%, 10/10/46 | | | 542,992 | | | | 543 | |
| | Commercial Mortgage Trust Pass Through Certificates, Series 2012-CR4, Class A2,
1.801%, 10/15/45 | | | 955,000 | | | | 958 | |
| | Commercial Mortgage Trust Pass Through Certificates, Series 2013-CR6, Class A2,
2.122%, 3/10/46 | | | 4,725,000 | | | | 4,755 | |
| | Commercial Mortgage Trust Pass Through Certificates, Series 2012-CR1, Class A2,
2.350%, 5/15/45 | | | 2,505,804 | | | | 2,506 | |
| | Commercial Mortgage Trust Pass Through Certificates, Series 2016-C0R1, Class ASB,
2.972%, 10/10/49 | | | 1,155,000 | | | | 1,143 | |
| | Commercial Mortgage Trust Pass Through Certificates, Series 2015-CR26, Class ASB,
3.373%, 10/10/48 | | | 1,137,000 | | | | 1,168 | |
| | Commercial Mortgage Trust Pass Through Certificates, Series 2014-CR19, Class A5,
3.796%, 8/10/47 | | | 3,070,000 | | | | 3,216 | |
| | Commercial Mortgage Trust Pass Through Certificates, Series 2010-C1, Class A2,
3.830%, 7/10/46 144A | | | 420,247 | | | | 428 | |
| | Commercial Mortgage Trust Pass Through Certificates, Series 2014-UBS6, Class AM,
4.048%, 12/10/47 | | | 2,400,000 | | | | 2,458 | |
| | | | | | | | | | |
| | | Structured Products (49.6%) | | Shares/
$ Par | | | Value $ (000’s) | |
| | | |
| | Structured Products continued | | | | | | | | |
| | Commercial Mortgage Trust Pass Through Certificates, Series 2013-CR10, Class A2,
2.972%, 8/10/46 | | | 1,137,000 | | | | 1,161 | |
| | Credit Suisse Mortgage Capital Certificates, Series 2013-IVR4, Class A6, 2.500%, 7/25/43 144A | | | 4,486,041 | | | | 4,389 | |
| | Credit Suisse Mortgage Capital Certificates Trust, Series 2016-NXSR, Class A4,
3.795%, 12/15/49 | | | 1,166,000 | | | | 1,199 | |
| | CSAIL Commercial Mortgage Trust, Series 2016-C7, Class A5, 3.502%, 11/15/49 | | | 3,017,000 | | | | 3,025 | |
| | CSAIL Commercial Mortgage Trust, Series 2016-C5, Class ASB, 3.533%, 11/15/48 | | | 582,000 | | | | 600 | |
| | CSAIL Commercial Mortgage Trust, Series 2015-C4, Class A4, 3.808%, 11/15/48 | | | 1,097,000 | | | | 1,142 | |
| | Discover Card Execution Note Trust, Series 2016-A2, Class A2, 1.244%, 9/15/21 | | | 2,359,000 | | | | 2,373 | |
| | DLJ Commercial Mortgage Corp., Series 1998-CF1, Class S, 1.348%, 2/15/31 IO | | | 5,694,898 | | | | 26 | |
| | Federal Home Loan Mortgage Corp., 2.541%, 7/1/42 | | | 2,017,414 | | | | 2,076 | |
| | Federal Home Loan Mortgage Corp., 2.793%, 12/1/41 | | | 500,104 | | | | 518 | |
| | Federal Home Loan Mortgage Corp., 2.808%, 5/1/45 | | | 1,624,919 | | | | 1,667 | |
| | Federal Home Loan Mortgage Corp., 3.000%, 2/1/27 | | | 1,233,835 | | | | 1,269 | |
| | Federal Home Loan Mortgage Corp., 3.000%, 3/1/30 | | | 1,460,468 | | | | 1,509 | |
| | Federal Home Loan Mortgage Corp., 3.000%, 4/1/31 | | | 2,052,857 | | | | 2,122 | |
| | Federal Home Loan Mortgage Corp., 3.000%, 5/1/31 | | | 1,160,677 | | | | 1,194 | |
| | Federal Home Loan Mortgage Corp., 3.000%, 6/1/31 | | | 892,027 | | | | 917 | |
| | Federal Home Loan Mortgage Corp., 3.000%, 7/1/31 | | | 3,145,972 | | | | 3,234 | |
| | Federal Home Loan Mortgage Corp., 3.000%, 9/1/31 | | | 2,501,764 | | | | 2,571 | |
| | Federal Home Loan Mortgage Corp., 3.000%, 11/1/31 | | | 4,134,883 | | | | 4,252 | |
| | Federal Home Loan Mortgage Corp., 3.000%, 1/15/43 | | | 1,223,192 | | | | 1,217 | |
| | Federal Home Loan Mortgage Corp., 3.097%, 2/1/45 | | | 1,990,122 | | | | 2,043 | |
| | Federal Home Loan Mortgage Corp., 3.500%, 12/1/25 | | | 38,623 | | | | 41 | |
| | Federal Home Loan Mortgage Corp., 3.500%, 1/1/26 | | | 32,416 | | | | 34 | |
| | Federal Home Loan Mortgage Corp., 3.500%, 9/1/26 | | | 205,235 | | | | 215 | |
| | Federal Home Loan Mortgage Corp., 3.500%, 10/15/28 | | | 1,171,134 | | | | 1,187 | |
| | Federal Home Loan Mortgage Corp., 3.500%, 1/15/29 | | | 1,737,407 | | | | 1,770 | |
The Accompanying Notes are an Integral Part of the Financial Statements.
| | | | | | |
| | Select Bond Portfolio | | | 113 | |
Select Bond Portfolio
| | | | | | | | | | |
| | | Structured Products (49.6%) | | Shares/
$ Par | | | Value
$ (000’s) | |
| |
| | Structured Products continued | |
| | Federal Home Loan Mortgage Corp.,
3.500%, 11/1/29 | | | 781,814 | | | | 818 | |
| | Federal Home Loan Mortgage Corp.,
3.500%, 12/1/29 | | | 20,389,249 | | | | 21,443 | |
| | Federal Home Loan Mortgage Corp., 3.500%, 1/1/30 | | | 305,654 | | | | 321 | |
| | Federal Home Loan Mortgage Corp., 3.500%, 4/1/30 | | | 6,461,335 | | | | 6,808 | |
| | Federal Home Loan Mortgage Corp., 3.500%, 6/1/30 | | | 1,895,839 | | | | 1,996 | |
| | Federal Home Loan Mortgage Corp., 3.500%, 7/1/30 | | | 4,435,417 | | | | 4,671 | |
| | Federal Home Loan Mortgage Corp., 3.500%, 8/1/30 | | | 3,076,340 | | | | 3,240 | |
| | Federal Home Loan Mortgage Corp., 3.500%, 9/1/30 | | | 318,711 | | | | 335 | |
| | Federal Home Loan Mortgage Corp.,
3.500%, 10/1/30 | | | 3,176,723 | | | | 3,344 | |
| | Federal Home Loan Mortgage Corp.,
3.500%, 11/1/30 | | | 6,845,500 | | | | 7,208 | |
| | Federal Home Loan Mortgage Corp.,
3.500%, 12/1/30 | | | 4,068,147 | | | | 4,273 | |
| | Federal Home Loan Mortgage Corp., 3.500%, 1/1/31 | | | 7,324,482 | | | | 7,716 | |
| | Federal Home Loan Mortgage Corp., 3.500%, 2/1/31 | | | 705,006 | | | | 743 | |
| | Federal Home Loan Mortgage Corp., 3.500%, 4/1/31 | | | 2,246,000 | | | | 2,368 | |
| | Federal Home Loan Mortgage Corp., 3.500%, 6/1/31 | | | 1,313,970 | | | | 1,387 | |
| | Federal Home Loan Mortgage Corp., 3.500%, 7/1/31 | | | 835,546 | | | | 882 | |
| | Federal Home Loan Mortgage Corp., 3.500%, 7/1/32 | | | 9,303,177 | | | | 9,648 | |
| | Federal Home Loan Mortgage Corp., 3.500%, 5/1/34 | | | 431,767 | | | | 447 | |
| | Federal Home Loan Mortgage Corp.,
3.500%, 11/1/35 | | | 167,839 | | | | 175 | |
| | Federal Home Loan Mortgage Corp.,
3.500%, 12/1/35 | | | 1,638,314 | | | | 1,708 | |
| | Federal Home Loan Mortgage Corp.,
3.500%, 12/1/45 | | | 453,493 | | | | 466 | |
| | Federal Home Loan Mortgage Corp.,
4.000%, 10/1/29 | | | 10,513,354 | | | | 11,304 | |
| | Federal Home Loan Mortgage Corp., 4.000%, 6/1/39 | | | 121,265 | | | | 129 | |
| | Federal Home Loan Mortgage Corp.,
4.000%, 9/15/40 | | | 3,720,262 | | | | 3,936 | |
| | Federal Home Loan Mortgage Corp.,
4.000%, 9/15/43 | | | 11,347,000 | | | | 11,828 | |
| | Federal Home Loan Mortgage Corp., 4.000%, 8/1/44 | | | 854,429 | | | | 904 | |
| | Federal Home Loan Mortgage Corp., 4.000%, 2/1/45 | | | 1,328,585 | | | | 1,407 | |
| | Federal Home Loan Mortgage Corp., 4.000%, 9/1/45 | | | 572,085 | | | | 601 | |
| | | | | | | | | | |
| | Structured Products (49.6%) | |
| Shares/
$ Par |
| |
| Value
$ (000’s) |
|
| |
| | Structured Products continued | |
| | Federal Home Loan Mortgage Corp.,
4.000%, 10/1/45 | | | 1,635,249 | | | | 1,722 | |
| | Federal Home Loan Mortgage Corp.,
4.000%, 11/1/45 | | | 2,451,985 | | | | 2,587 | |
| | Federal Home Loan Mortgage Corp.,
4.000%, 12/1/45 | | | 2,195,560 | | | | 2,317 | |
| | Federal Home Loan Mortgage Corp., 4.000%, 2/1/46 | | | 1,307,641 | | | | 1,380 | |
| | Federal Home Loan Mortgage Corp., 4.000%, 4/1/46 | | | 604,086 | | | | 638 | |
| | Federal Home Loan Mortgage Corp., 4.000%, 6/1/46 | | | 3,106,384 | | | | 3,279 | |
| | Federal Home Loan Mortgage Corp., 4.500%, 8/1/20 | | | 5,359,333 | | | | 5,499 | |
| | Federal Home Loan Mortgage Corp., 4.500%, 6/1/39 | | | 135,667 | | | | 145 | |
| | Federal Home Loan Mortgage Corp., 4.500%, 2/1/42 | | | 297,029 | | | | 320 | |
| | Federal Home Loan Mortgage Corp., 4.500%, 6/1/44 | | | 1,646,293 | | | | 1,779 | |
| | Federal Home Loan Mortgage Corp., 4.500%, 7/1/39 | | | 148,118 | | | | 158 | |
| | Federal Home Loan Mortgage Corp., 5.000%, 5/1/44 | | | 676,317 | | | | 750 | |
| | Federal Home Loan Mortgage Corp., 5.000%, 6/1/44 | | | 2,913,576 | | | | 3,245 | |
| | Federal Home Loan Mortgage Corp., Series 2439, Class LH, 6.000%, 4/15/32 | | | 631,132 | | | | 720 | |
| | Federal Home Loan Mortgage Corp. TBA,
3.000%, 1/1/47 | | | 29,700,000 | | | | 29,491 | |
| | Federal Home Loan Mortgage Corp. TBA,
3.500%, 1/1/47 | | | 13,500,000 | | | | 13,823 | |
| | Federal Home Loan Mortgage Corp. TBA,
4.000%, 1/1/47 | | | 21,300,000 | | | | 22,372 | |
| | Federal National Mortgage Association, Series 2015-M3, Class FA, 0.748%, 6/25/18 | | | 4,769,901 | | | | 4,771 | |
| | Federal National Mortgage Association,
1.705%, 4/1/43 | | | 2,348,711 | | | | 2,423 | |
| | Federal National Mortgage Association,
2.414%, 6/1/42 | | | 1,773,823 | | | | 1,824 | |
| | Federal National Mortgage Association,
2.653%, 1/1/42 | | | 2,302,832 | | | | 2,380 | |
| | Federal National Mortgage Association,
2.749%, 1/1/45 | | | 3,770,805 | | | | 3,861 | |
| | Federal National Mortgage Association,
2.768%, 1/1/45 | | | 113,037 | | | | 116 | |
| | Federal National Mortgage Association,
2.817%, 2/1/42 | | | 4,822,339 | | | | 5,060 | |
| | Federal National Mortgage Association,
2.841%, 5/1/43 | | | 1,087,542 | | | | 1,114 | |
| | Federal National Mortgage Association,
2.982%, 6/1/41 | | | 3,540,920 | | | | 3,740 | |
| | Federal National Mortgage Association,
3.000%, 11/1/26 | | | 1,318,343 | | | | 1,356 | |
| | Federal National Mortgage Association,
3.000%, 9/1/27 | | | 2,354,445 | | | | 2,422 | |
The Accompanying Notes are an Integral Part of the Financial Statements.
| | | | |
| 114 | | Select Bond Portfolio | | |
Select Bond Portfolio
| | | | | | | | | | |
| | | Structured Products (49.6%) | | Shares/
$ Par | | | Value
$ (000’s) | |
| |
| | Structured Products continued | |
| | Federal National Mortgage Association, 3.000%, 3/1/28 | | | 957,387 | | | | 985 | |
| | Federal National Mortgage Association, 3.000%, 11/1/28 | | | 5,553,855 | | | | 5,712 | |
| | Federal National Mortgage Association, 3.000%, 9/1/30 | | | 676,058 | | | | 695 | |
| | Federal National Mortgage Association, 3.000%, 4/1/31 | | | 1,266,022 | | | | 1,308 | |
| | Federal National Mortgage Association, 3.000%, 5/1/31 | | | 1,593,500 | | | | 1,646 | |
| | Federal National Mortgage Association, 3.000%, 6/1/31 | | | 8,017,368 | | | | 8,260 | |
| | Federal National Mortgage Association, 3.000%, 8/1/31 | | | 3,241,798 | | | | 3,334 | |
| | Federal National Mortgage Association, 3.000%, 9/1/31 | | | 9,648,028 | | | | 9,955 | |
| | Federal National Mortgage Association, 3.000%, 10/1/31 | | | 13,059,875 | | | | 13,435 | |
| | Federal National Mortgage Association, 3.000%, 11/1/31 | | | 19,067,204 | | | | 19,603 | |
| | Federal National Mortgage Association, Series 2012-134, Class LC, 3.000%, 12/25/42 | | | 243,334 | | | | 243 | |
| | Federal National Mortgage Association, 3.185%, 10/1/43 | | | 2,068,732 | | | | 2,120 | |
| | Federal National Mortgage Association, 3.500%, 7/1/30 | | | 5,821,872 | | | | 6,109 | |
| | Federal National Mortgage Association, 3.500%, 5/1/30 | | | 2,409,731 | | | | 2,528 | |
| | Federal National Mortgage Association, 3.500%, 8/1/28 | | | 66,460 | | | | 70 | |
| | Federal National Mortgage Association, 3.500%, 12/25/28 | | | 2,197,076 | | | | 2,228 | |
| | Federal National Mortgage Association, 3.500%, 10/1/29 | | | 674,311 | | | | 709 | |
| | Federal National Mortgage Association, 3.500%, 11/1/29 | | | 405,017 | | | | 425 | |
| | Federal National Mortgage Association, 3.500%, 12/1/29 | | | 2,424,468 | | | | 2,549 | |
| | Federal National Mortgage Association, 3.500%, 1/1/30 | | | 3,845,064 | | | | 4,045 | |
| | Federal National Mortgage Association, 3.500%, 2/1/30 | | | 3,863,578 | | | | 4,055 | |
| | Federal National Mortgage Association, 3.500%, 7/1/30 | | | 4,117,269 | | | | 4,335 | |
| | Federal National Mortgage Association, 3.500%, 8/1/30 | | | 9,223,603 | | | | 9,686 | |
| | Federal National Mortgage Association, 3.500%, 9/1/30 | | | 4,546,521 | | | | 4,770 | |
| | Federal National Mortgage Association, 3.500%, 11/1/30 | | | 2,070,378 | | | | 2,174 | |
| | Federal National Mortgage Association, 3.500%, 1/1/31 | | | 5,310,158 | | | | 5,570 | |
| | Federal National Mortgage Association, 3.500%, 2/1/31 | | | 5,704,697 | | | | 6,003 | |
| | Federal National Mortgage Association, 3.500%, 3/1/31 | | | 1,872,697 | | | | 1,969 | |
| | | | | | | | | | |
| | | Structured Products (49.6%) | | Shares/
$ Par | | | Value
$ (000’s) | |
| |
| | Structured Products continued | |
| | Federal National Mortgage Association, 3.500%, 4/1/31 | | | 1,262,649 | | | | 1,332 | |
| | Federal National Mortgage Association, 3.500%, 5/1/31 | | | 1,006,008 | | | | 1,060 | |
| | Federal National Mortgage Association, 3.500%, 4/1/31 | | | 14,954,646 | | | | 15,743 | |
| | Federal National Mortgage Association, 3.500%, 7/1/31 | | | 2,854,977 | | | | 3,013 | |
| | Federal National Mortgage Association, 3.500%, 8/1/31 | | | 16,562,569 | | | | 17,444 | |
| | Federal National Mortgage Association, 3.500%, 8/1/31 | | | 10,002,000 | | | | 10,523 | |
| | Federal National Mortgage Association, 3.500%, 1/1/32 | | | 2,450,000 | | | | 2,585 | |
| | Federal National Mortgage Association, 3.500%, 9/1/32 | | | 3,191,094 | | | | 3,339 | |
| | Federal National Mortgage Association, 3.500%, 9/1/33 | | | 640,301 | | | | 670 | |
| | Federal National Mortgage Association, 3.500%, 1/1/35 | | | 1,138,021 | | | | 1,184 | |
| | Federal National Mortgage Association, 3.500%, 6/1/43 | | | 764,395 | | | | 788 | |
| | Federal National Mortgage Association, Series 2016-59, Class CA, 3.500%, 9/25/43 | | | 8,508,522 | | | | 8,869 | |
| | Federal National Mortgage Association, 3.500%, 1/1/46 | | | 868,056 | | | | 892 | |
| | Federal National Mortgage Association, 3.500%, 2/1/46 | | | 722,966 | | | | 743 | |
| | Federal National Mortgage Association, 3.500%, 3/1/46 | | | 1,846,870 | | | | 1,898 | |
| | Federal National Mortgage Association, 3.500%, 4/1/46 | | | 1,241,656 | | | | 1,277 | |
| | Federal National Mortgage Association, 3.500%, 6/1/46 | | | 1,043,970 | | | | 1,073 | |
| | Federal National Mortgage Association, 3.500%, 7/1/46 | | | 994,284 | | | | 1,022 | |
| | Federal National Mortgage Association, 3.500%, 8/1/46 | | | 1,877,375 | | | | 1,931 | |
| | Federal National Mortgage Association, 4.000%, 5/1/45 | | | 1,129,473 | | | | 1,195 | |
| | Federal National Mortgage Association, 4.000%, 4/1/24 | | | 2,009,775 | | | | 2,113 | |
| | Federal National Mortgage Association, 4.000%, 7/1/24 | | | 1,415,666 | | | | 1,485 | |
| | Federal National Mortgage Association, 4.000%, 1/1/25 | | | 2,975,991 | | | | 3,143 | |
| | Federal National Mortgage Association, 4.000%, 4/1/25 | | | 1,762,082 | | | | 1,858 | |
| | Federal National Mortgage Association, 4.000%, 11/1/29 | | | 9,945,586 | | | | 10,626 | |
| | Federal National Mortgage Association, 4.000%, 11/1/39 | | | 479,883 | | | | 518 | |
| | Federal National Mortgage Association, 4.000%, 11/1/40 | | | 3,620,141 | | | | 3,825 | |
| | Federal National Mortgage Association, 4.000%, 9/1/41 | | | 161,162 | | | | 173 | |
The Accompanying Notes are an Integral Part of the Financial Statements.
| | | | | | |
| | Select Bond Portfolio | | | 115 | |
Select Bond Portfolio
| | | | | | | | | | |
| | | Structured Products (49.6%) | | Shares/
$ Par | | | Value
$ (000’s) | |
| |
| | Structured Products continued | |
| | Federal National Mortgage Association, 4.000%, 10/1/41 | | | 365,642 | | | | 393 | |
| | Federal National Mortgage Association, 4.000%, 11/1/41 | | | 268,671 | | | | 289 | |
| | Federal National Mortgage Association, 4.000%, 12/1/41 | | | 348,371 | | | | 374 | |
| | Federal National Mortgage Association, 4.000%, 7/1/42 | | | 143,183 | | | | 154 | |
| | Federal National Mortgage Association, 4.000%, 10/1/43 | | | 3,942,531 | | | | 4,154 | |
| | Federal National Mortgage Association, 4.000%, 4/1/44 | | | 3,767,953 | | | | 4,000 | |
| | Federal National Mortgage Association, 4.000%, 12/1/44 | | | 156,981 | | | | 168 | |
| | Federal National Mortgage Association, 4.000%, 5/1/45 | | | 5,117,952 | | | | 5,420 | |
| | Federal National Mortgage Association, 4.000%, 7/1/45 | | | 1,018,477 | | | | 1,090 | |
| | Federal National Mortgage Association, 4.000%, 8/1/45 | | | 3,133,953 | | | | 3,324 | |
| | Federal National Mortgage Association, 4.000%, 9/1/45 | | | 6,739,840 | | | | 7,145 | |
| | Federal National Mortgage Association, 4.000%, 10/1/45 | | | 1,311,517 | | | | 1,389 | |
| | Federal National Mortgage Association, 4.000%, 11/1/45 | | | 2,500,100 | | | | 2,650 | |
| | Federal National Mortgage Association, 4.000%, 12/1/45 | | | 1,316,461 | | | | 1,388 | |
| | Federal National Mortgage Association, 4.000%, 1/1/46 | | | 2,272,208 | | | | 2,401 | |
| | Federal National Mortgage Association, 4.000%, 2/1/46 | | | 1,233,461 | | | | 1,318 | |
| | Federal National Mortgage Association, 4.000%, 3/1/46 | | | 2,191,402 | | | | 2,331 | |
| | Federal National Mortgage Association, 4.000%, 7/1/46 | | | 942,184 | | | | 997 | |
| | Federal National Mortgage Association, 4.000%, 11/1/46 | | | 524,023 | | | | 554 | |
| | Federal National Mortgage Association, 4.369%, 4/1/40 | | | 1,573,011 | | | | 1,636 | |
| | Federal National Mortgage Association, 4.500%, 1/1/20 | | | 2,369,428 | | | | 2,435 | |
| | Federal National Mortgage Association, 4.500%, 1/1/39 | | | 4,274,373 | | | | 4,582 | |
| | Federal National Mortgage Association, 4.500%, 11/1/43 | | | 172,036 | | | | 185 | |
| | Federal National Mortgage Association, 4.500%, 12/1/43 | | | 91,953 | | | | 99 | |
| | Federal National Mortgage Association, 4.500%, 1/1/44 | | | 987,601 | | | | 1,068 | |
| | Federal National Mortgage Association, 4.500%, 2/1/44 | | | 16,734,403 | | | | 18,338 | |
| | Federal National Mortgage Association, 4.500%, 3/1/44 | | | 2,305,178 | | | | 2,538 | |
| | Federal National Mortgage Association, 4.500%, 4/1/44 | | | 6,462,430 | | | | 7,082 | |
| | | | | | | | | | |
| | | Structured Products (49.6%) | | Shares/
$ Par | | | Value
$ (000’s) | |
| |
| | Structured Products continued | |
| | Federal National Mortgage Association, 4.500%, 6/1/44 | | | 2,774,716 | | | | 3,037 | |
| | Federal National Mortgage Association, 4.500%, 10/1/44 | | | 208,227 | | | | 226 | |
| | Federal National Mortgage Association, 4.500%, 6/1/45 | | | 438,722 | | | | 482 | |
| | Federal National Mortgage Association, 4.500%, 8/1/45 | | | 917,077 | | | | 1,006 | |
| | Federal National Mortgage Association, 4.500%, 9/1/45 | | | 292,806 | | | | 321 | |
| | Federal National Mortgage Association, 4.500%, 12/1/45 | | | 415,795 | | | | 451 | |
| | Federal National Mortgage Association, 4.500%, 2/1/46 | | | 497,857 | | | | 544 | |
| | Federal National Mortgage Association, 4.500%, 3/1/46 | | | 8,236,538 | | | | 8,932 | |
| | Federal National Mortgage Association, 4.500%, 4/1/46 | | | 555,364 | | | | 606 | |
| | Federal National Mortgage Association, 4.500%, 6/1/46 | | | 9,112,139 | | | | 9,915 | |
| | Federal National Mortgage Association, 5.000%, 12/1/39 | | | 1,333,616 | | | | 1,485 | |
| | Federal National Mortgage Association, 5.000%, 1/1/40 | | | 2,607,550 | | | | 2,903 | |
| | Federal National Mortgage Association, 5.000%, 7/1/44 | | | 477,407 | | | | 525 | |
| | Federal National Mortgage Association, Series 2007-108, Class AN, 8.114%, 11/25/37 | | | 614,985 | | | | 739 | |
| | Federal National Mortgage Association TBA, 3.000%, 1/1/47 | | | 32,400,000 | | | | 32,187 | |
| | Federal National Mortgage Association TBA, 3.500%, 1/1/47 | | | 56,000,000 | | | | 57,396 | |
| | Federal National Mortgage Association TBA, 3.500%, 2/1/47 | | | 19,900,000 | | | | 20,365 | |
| | Federal National Mortgage Association TBA, 4.000%, 1/1/47 | | | 21,500,000 | | | | 22,603 | |
| | Federal National Mortgage Association TBA, 4.000%, 3/1/47 | | | 9,800,000 | | | | 10,268 | |
| | Flagship Credit Auto Trust, Series 2016-3, Class A2, 2.050%, 11/15/20 144A | | | 1,820,000 | | | | 1,814 | |
| | Ford Credit Auto Owner Trust, Series 2014-1, Class A, 2.260%, 11/15/25 144A | | | 5,150,000 | | | | 5,194 | |
| | Ford Credit Auto Owner Trust, Series 2015-2, Class A, 2.440%, 1/15/27 144A | | | 5,493,000 | | | | 5,541 | |
| | Ford Credit Floorplan Master Owner Trust, Series 2014-1, Class A1, 1.200%, 2/15/19 | | | 1,643,000 | | | | 1,643 | |
| | Ford Credit Floorplan Master Owner Trust, Series 2015-2, Class A2, 1.274%, 1/15/22 | | | 1,679,000 | | | | 1,680 | |
| | Ford Credit Floorplan Master Owner Trust, Series 2012-2, Class A, 1.920%, 1/15/19 | | | 2,734,000 | | | | 2,735 | |
| | Ford Credit Floorplan Master Owner Trust A, Series 2016-5, Class A1, 1.950%, 11/15/21 | | | 5,186,000 | | | | 5,168 | |
| | Government National Mortgage Association, 3.000%, 1/1/47 | | | 26,400,000 | | | | 26,731 | |
The Accompanying Notes are an Integral Part of the Financial Statements.
| | | | |
| 116 | | Select Bond Portfolio | | |
Select Bond Portfolio
| | | | | | | | | | |
| | | Structured Products (49.6%) | | Shares/
$ Par | | | Value
$ (000’s) | |
| |
| | Structured Products continued | |
| | Government National Mortgage Association, 3.500%, 1/1/47 | | | 35,000,000 | | | | 36,383 | |
| | Government National Mortgage Association, 3.500%, 6/15/46 | | | 973,387 | | | | 1,016 | |
| | Government National Mortgage Association, 3.500%, 7/15/46 | | | 821,776 | | | | 858 | |
| | Government National Mortgage Association, 4.000%, 12/15/40 | | | 173,021 | | | | 188 | |
| | Government National Mortgage Association, 4.000%, 10/15/41 | | | 460,184 | | | | 499 | |
| | Government National Mortgage Association, 4.000%, 2/15/42 | | | 727,978 | | | | 791 | |
| | Government National Mortgage Association, 4.000%, 10/15/43 | | | 502,647 | | | | 546 | |
| | Government National Mortgage Association, 4.000%, 1/1/47 | | | 3,800,000 | | | | 4,035 | |
| | Government National Mortgage Association, 4.000%, 3/15/45 | | | 1,484,512 | | | | 1,614 | |
| | Government National Mortgage Association, 4.000%, 5/15/45 | | | 333,077 | | | | 362 | |
| | Government National Mortgage Association, 4.000%, 7/15/45 | | | 531,023 | | | | 572 | |
| | Government National Mortgage Association, 4.000%, 8/15/45 | | | 1,187,101 | | | | 1,290 | |
| | Government National Mortgage Association, 4.000%, 9/15/45 | | | 1,301,919 | | | | 1,401 | |
| | Government National Mortgage Association, 4.000%, 9/15/45 | | | 425,001 | | | | 462 | |
| | Government National Mortgage Association, 4.000%, 9/20/45 | | | 2,727,417 | | | | 2,939 | |
| | Government National Mortgage Association, 4.000%, 10/15/45 | | | 2,839,788 | | | | 3,065 | |
| | Government National Mortgage Association, 4.000%, 10/20/45 | | | 1,553,727 | | | | 1,682 | |
| | Government National Mortgage Association, 4.000%, 11/15/45 | | | 1,039,451 | | | | 1,131 | |
| | Government National Mortgage Association, 4.000%, 11/20/45 | | | 1,446,003 | | | | 1,573 | |
| | Government National Mortgage Association, 4.000%, 1/20/46 | | | 468,101 | | | | 509 | |
| | Government National Mortgage Association, 4.000%, 2/20/46 | | | 4,042,775 | | | | 4,358 | |
| | Government National Mortgage Association, 4.000%, 3/20/46 | | | 3,788,212 | | | | 4,084 | |
| | Government National Mortgage Association, 4.000%, 4/15/46 | | | 529,839 | | | | 576 | |
| | Government National Mortgage Association, 4.000%, 4/20/46 | | | 664,178 | | | | 723 | |
| | Government National Mortgage Association, 4.000%, 5/20/46 | | | 2,864,835 | | | | 3,088 | |
| | Government National Mortgage Association, 4.000%, 6/15/46 | | | 320,971 | | | | 349 | |
| | Government National Mortgage Association, 4.000%, 7/20/46 | | | 1,368,138 | | | | 1,475 | |
| | Government National Mortgage Association, 4.000%, 8/15/46 | | | 230,456 | | | | 251 | |
| | | | | | | | | | |
| | | Structured Products (49.6%) | | Shares/
$ Par | | | Value
$ (000’s) | |
| |
| | Structured Products continued | |
| | Government National Mortgage Association, 4.000%, 8/20/46 | | | 244,071 | | | | 266 | |
| | Government National Mortgage Association, 4.500%, 3/15/41 | | | 829,558 | | | | 917 | |
| | Government National Mortgage Association, 4.500%, 4/15/45 | | | 117,775 | | | | 129 | |
| | Government National Mortgage Association, 4.500%, 5/20/45 | | | 901,170 | | | | 982 | |
| | Government National Mortgage Association, 4.500%, 6/20/45 | | | 1,939,404 | | | | 2,150 | |
| | Government National Mortgage Association, 4.500%, 7/20/45 | | | 1,361,234 | | | | 1,481 | |
| | Government National Mortgage Association, 4.500%, 8/20/45 | | | 823,304 | | | | 891 | |
| | Government National Mortgage Association, 4.500%, 9/20/45 | | | 288,543 | | | | 319 | |
| | Government National Mortgage Association, 4.500%, 10/20/45 | | | 143,543 | | | | 157 | |
| | Government National Mortgage Association, 4.500%, 1/15/46 | | | 224,252 | | | | 243 | |
| | Government National Mortgage Association, 4.500%, 1/20/46 | | | 264,772 | | | | 290 | |
| | Government National Mortgage Association, 4.500%, 2/20/46 | | | 253,983 | | | | 278 | |
| | Government National Mortgage Association, 4.500%, 6/20/46 | | | 176,434 | | | | 193 | |
| | Government National Mortgage Association, 4.500%, 9/20/46 | | | 172,044 | | | | 189 | |
| | Government National Mortgage Association, 5.000%, 12/20/39 | | | 219,731 | | | | 247 | |
| | Government National Mortgage Association, 5.000%, 11/20/45 | | | 421,709 | | | | 471 | |
| | GS Mortgage Securities Corp. II., Series 2016-GS4, Class A4, 3.442%, 11/10/49 | | | 1,503,000 | | | | 1,530 | |
| | GS Mortgage Securities Trust, Series 2013-GC16, Class A1, 1.264%, 11/10/46 | | | 59,195 | | | | 59 | |
| | GS Mortgage Securities Trust, Series 2012-GCJ7, Class A2, 2.318%, 5/10/45 | | | 1,365,451 | | | | 1,367 | |
| | GS Mortgage Securities Trust, Series 2016-GS3, Class AAB, 2.777%, 10/10/49 | | | 1,740,000 | | | | 1,723 | |
| | GS Mortgage Securities Trust, Series 2016-GS3, Class A4, 2.850%, 10/10/49 | | | 1,160,000 | | | | 1,127 | |
| | GS Mortgage Securities Trust, Series 2012-GCJ7, Class AAB, 2.935%, 5/10/45 | | | 423,000 | | | | 430 | |
| | GS Mortgage Securities Trust, Series 2011-GC5, Class A2, 2.999%, 8/10/44 | | | 147,419 | | | | 147 | |
| | GS Mortgage Securities Trust, Series 2013-GC16, Class A2, 3.033%, 11/10/46 | | | 1,026,000 | | | | 1,047 | |
| | Hertz Vehicle Financing II LP, Series 2015-1A, Class A, 2.730%, 3/25/21 144A | | | 1,743,000 | | | | 1,730 | |
| | Hertz Vehicle Financing LLC, Series 2013-1A, Class A2, 1.830%, 8/25/19 144A | | | 1,498,000 | | | | 1,488 | |
| | Hertz Vehicle Financing LLC, Series 2016-3A, Class A, 2.270%, 7/25/20 144A | | | 3,577,000 | | | | 3,542 | |
The Accompanying Notes are an Integral Part of the Financial Statements.
| | | | | | |
| | Select Bond Portfolio | | | 117 | |
Select Bond Portfolio
| | | | | | | | | | |
| | | Structured Products (49.6%) | | Shares/
$ Par | | | Value
$ (000’s) | |
| |
| | Structured Products continued | |
| | Hertz Vehicle Financing LLC, Series 2016-4, Class A, 2.650%, 7/25/22 144A | | | 3,207,000 | | | | 3,108 | |
| | Hyundai Auto Receivables Trust, Series 2014-A, Class A4, 1.320%, 8/15/19 | | | 3,548,000 | | | | 3,552 | |
| | Impact Funding Affordable Multifamily Housing Mortgage Loan Trust, Series 2010-1, Class A1, 5.314%, 1/25/51 144A | | | 5,501,804 | | | | 6,075 | |
| | JP Morgan Chase Commercial Mortgage Securities Corp., Series 2016-JP2, Class A1, 1.324%, 8/15/49 | | | 1,171,309 | | | | 1,154 | |
| | JP Morgan Chase Commercial Mortgage Securities Corp., Series 2012-LC9, Class A2, 1.677%, 12/15/47 | | | 986,058 | | | | 987 | |
| | JP Morgan Chase Commercial Mortgage Securities Corp., Series 2013-C13, Class A2, 2.665%, 1/15/46 | | | 629,000 | | | | 638 | |
| | JP Morgan Chase Commercial Mortgage Securities Corp., Series 2016-JP2, Class ASB, 2.713%, 8/15/49 | | | 1,805,000 | | | | 1,780 | |
| | JP Morgan Chase Commercial Mortgage Securities Corp., Series 2014-C20, Class A2, 2.872%, 7/15/47 | | | 1,052,000 | | | | 1,074 | |
| | JP Morgan Chase Commercial Mortgage Securities Corp., Series 2015-JP1, Class ASB, 3.733%, 1/15/49 | | | 666,000 | | | | 696 | |
| | JP Morgan Chase Commercial Mortgage Securities Trust, Series 2013-C13, Class ASB, 3.414%, 1/15/46 | | | 1,666,000 | | | | 1,728 | |
| | JP Morgan Chase Commercial Mortgage Securities Trust, Series 2010-C2, Class A2, 3.616%, 11/15/43 144A | | | 816,622 | | | | 829 | |
| | JP Morgan Chase Commercial Mortgage Securities Trust, Series 2011-C4, Class A3, 4.106%, 7/15/46 144A | | | 4,784,031 | | | | 4,923 | |
| | JP Morgan Chase Commercial Mortgage Securities Trust, Series 2010-CNTR, Class A2, 4.311%, 8/5/32 144A | | | 4,104,000 | | | | 4,308 | |
| | JP Morgan Chase Commercial Mortgage Securities Trust, Series 2007-CB18, Class A4, 5.440%, 6/12/47 | | | 227,694 | | | | 228 | |
| | JP Morgan Chase Commercial Mortgage Securities Trust, Series 2007-C1, Class ASB, 5.857%, 2/15/51 | | | 200,729 | | | | 201 | |
| | JPMBB Commercial Mortgage Securities Trust, Series 2015-C28, Class A2, 2.773%, 10/15/48 | | | 1,089,000 | | | | 1,109 | |
| | JPMBB Commercial Mortgage Securities Trust, Series 2015-C28, Class A3, 2.912%, 10/15/48 | | | 4,608,000 | | | | 4,539 | |
| | JPMBB Commercial Mortgage Securities Trust, Series 2013-C15, Class A2, 2.977%, 11/15/45 | | | 1,097,184 | | | | 1,118 | |
| | JPMBB Commercial Mortgage Securities Trust, Series 2016-C1, Class ASB, 3.316%, 3/15/49 | | | 2,385,000 | | | | 2,434 | |
| | | | | | | | | | |
| | | Structured Products (49.6%) | | Shares/
$ Par | | | Value
$ (000’s) | |
| |
| | Structured Products continued | |
| | JPMBB Commercial Mortgage Securities Trust, Series 2013-C14, Class ASB, 3.761%, 8/15/46 | | | 840,000 | | | | 883 | |
| | JPMBB Commercial Mortgage Securities Trust, Series 2014-C21, Class A5, 3.775%, 8/15/47 | | | 1,700,000 | | | | 1,781 | |
| | JPMBB Commercial Mortgage Securities Trust, Series 2015-C30, Class AS, 4.226%, 7/15/48 | | | 2,640,000 | | | | 2,777 | |
| | JPMDB Commercial Mortgage Securities Trust, Series 2016-C2, Class ASB, 2.954%, 6/15/49 | | | 2,331,000 | | | | 2,324 | |
| | MASTR Asset Securitization Trust, Series 2004-9, Class 6A1, 5.000%, 9/25/19 | | | 35,948 | | | | 36 | |
| | MASTR Asset Securitization Trust, Series 2003-10, Class 1A1, 5.250%, 11/25/23 | | | 166,396 | | | | 169 | |
| | MASTR Asset Securitization Trust, Series 2003-12, Class 1A1, 5.250%, 12/25/24 | | | 246,382 | | | | 250 | |
| | Mid-State Trust, Series 6, Class A3, 7.540%, 7/1/35 | | | 135,693 | | | | 142 | |
| | Morgan Stanley Bank of America Merrill Lynch Trust, Series 2013-C9, Class A2, 1.970%, 5/15/46 | | | 1,089,963 | | | | 1,095 | |
| | Morgan Stanley Bank of America Merrill Lynch Trust, Series 2016-C30, Class ASB, 2.729%, 9/15/49 | | | 5,519,000 | | | | 5,403 | |
| | Morgan Stanley Bank of America Merrill Lynch Trust, Series 2013-C10, Class A2, 2.964%, 7/15/46 | | | 715,000 | | | | 725 | |
| | Morgan Stanley Bank of America Merrill Lynch Trust, Series 2016-C28, Class ASB, 3.288%, 1/15/49 | | | 1,079,000 | | | | 1,103 | |
| | Morgan Stanley Capital I Trust, Series 2016-UBS9, Class A1, 1.711%, 3/15/49 | | | 1,587,313 | | | | 1,571 | |
| | Morgan Stanley Capital I Trust, Series 2011-C2, Class A2, 3.476%, 6/15/44 144A | | | 401,544 | | | | 402 | |
| | Morgan Stanley Capital I, Trust, Series 2016-UB11, Class A1, 1.445%, 8/15/49 | | | 2,750,063 | | | | 2,720 | |
| | Morgan Stanley Capital I, Trust, Series 2016-UB11, Class ASB, 2.606%, 8/15/49 | | | 1,289,000 | | | | 1,257 | |
| | Navient Private Education Loan Trust, Series 2014-CTA, Class A, 1.404%, 9/16/24 144A | | | 2,594,161 | | | | 2,593 | |
| | Navient Private Education Loan Trust, Series 2015-AA, Class A2B, 1.904%, 12/15/28 144A | | | 1,156,000 | | | | 1,167 | |
| | Navient Private Education Loan Trust, Series 2014-AA, Class A2B, 1.954%, 2/15/29 144A | | | 2,617,078 | | | | 2,637 | |
| | Navient Private Education Loan Trust, Series 2015-AA, Class A2A, 2.650%, 12/15/28 144A | | | 10,107,000 | | | | 10,103 | |
| | Navient Private Education Loan Trust, Series 2015-CA, Class B, 3.250%, 5/15/40 144A | | | 2,181,000 | | | | 2,164 | |
| | Navient Private Education Loan Trust, Series 2016-AA, Class A2A, 3.910%, 12/15/45 144A | | | 4,972,000 | | | | 5,161 | |
| | Navient Student Loan Trust, Series 2014-8, Class A2, 1.196%, 4/25/23 | | | 1,932,886 | | | | 1,933 | |
| | Navient Student Loan Trust, Series 2014-1, Class A3, 1.266%, 6/25/31 | | | 2,186,000 | | | | 2,136 | |
The Accompanying Notes are an Integral Part of the Financial Statements.
| | | | | | |
| 118 | | Select Bond Portfolio | | | | |
Select Bond Portfolio
| | | | | | | | | | |
| | | Structured Products (49.6%) | | Shares/
$ Par | | | Value
$ (000’s) | |
| |
| | Structured Products continued | |
| | Navient Student Loan Trust, Series 2016-7A, Class A, 1.906%, 3/25/66 144A | | | 3,714,965 | | | | 3,753 | |
| | Navient Student Loan Trust, Series 2014-8, Class B, 2.256%, 7/26/49 | | | 2,092,000 | | | | 1,890 | |
| | Nelnet Student Loan Trust, Series 2005-1, Class A5, 0.992%, 10/25/33 | | | 1,705,255 | | | | 1,657 | |
| | Nelnet Student Loan Trust, Series 2004-4, Class A5, 1.042%, 1/25/37 | | | 3,700,963 | | | | 3,636 | |
| | Nelnet Student Loan Trust, Series 2004-3, Class A5, 1.062%, 10/27/36 | | | 358,152 | | | | 351 | |
| | Nelnet Student Loan Trust, Series 2005-2, Class A5, 1.096%, 3/23/37 | | | 3,907,541 | | | | 3,794 | |
| | Nelnet Student Loan Trust, Series 2005-3, Class A5, 1.116%, 12/24/35 | | | 4,001,930 | | | | 3,891 | |
| | Nelnet Student Loan Trust, Series 2005-4, Class A4, 1.176%, 3/22/32 | | | 1,731,000 | | | | 1,597 | |
| | Nelnet Student Loan Trust, Series 2016-1A, Class A, 1.556%, 9/25/65 | | | 6,892,224 | | | | 6,892 | |
| | Nissan Auto Receivables Owner Trust, Series 2016-C, Class A2A, 1.070%, 5/15/19 | | | 4,350,000 | | | | 4,343 | |
| | Nissan Auto Receivables Owner Trust, Series 2016-C, Class A3, 1.180%, 1/15/21 | | | 2,770,000 | | | | 2,744 | |
| | Residential Funding Mortgage Securities I, Series 2003-S18, Class A1, 4.500%, 10/25/18 | | | 34,075 | | | | 34 | |
| | Santander Drive Auto Receivables Trust, Series 2016-2, Class A2A, 1.380%, 7/15/19 | | | 3,526,594 | | | | 3,528 | |
| | Sequoia Mortgage Trust, Series 2013-5, Class A2, 3.000%, 5/25/43 144A | | | 2,758,241 | | | | 2,719 | |
| | SLC Student Loan Trust, Series 07-1, Class A4, 0.966%, 5/15/29 | | | 4,822,994 | | | | 4,696 | |
| | SLC Student Loan Trust, Series 05-3, Class A3, 1.083%, 6/15/29 | | | 2,215,000 | | | | 2,172 | |
| | SLM Private Education Loan Trust, Series 2013-B, Class A1, 1.354%, 7/15/22 144A | | | 684,871 | | | | 685 | |
| | SLM Private Education Loan Trust, Series 2013-A, Class A2B, 1.754%, 5/17/27 144A | | | 2,834,000 | | | | 2,855 | |
| | SLM Private Education Loan Trust, Series 2013-A, Class A2A, 1.770%, 5/17/27 144A | | | 1,313,000 | | | | 1,309 | |
| | SLM Private Education Loan Trust, Series 2013-B, Class A2B, 1.804%, 6/17/30 144A | | | 650,000 | | | | 654 | |
| | SLM Private Education Loan Trust, Series 2013-B, Class A2A, 1.850%, 6/17/30 144A | | | 4,040,000 | | | | 4,019 | |
| | SLM Private Education Loan Trust, Series 2014-A, Class A2B, 1.854%, 1/15/26 144A | | | 1,226,000 | | | | 1,236 | |
| | SLM Private Education Loan Trust, Series 2014-A, Class A2A, 2.590%, 1/15/26 144A | | | 1,388,000 | | | | 1,391 | |
| | SLM Private Education Loan Trust, Series 2013-C, Class A2A, 2.940%, 10/15/31 144A | | | 1,977,000 | | | | 2,000 | |
| | SLM Private Education Loan Trust, Series 2012-D, Class A2, 2.950%, 2/15/46 144A | | | 4,789,321 | | | | 4,833 | |
| | SLM Private Education Loan Trust, Series 2012-B, Class A2, 3.480%, 10/15/30 144A | | | 534,488 | | | | 542 | |
| | | | | | | | | | |
| | | Structured Products (49.6%) | | Shares/
$ Par | | | Value
$ (000’s) | |
| |
| | Structured Products continued | |
| | SLM Private Education Loan Trust, Series 2011-B, Class A2, 3.740%, 2/15/29 144A | | | 3,108,378 | | | | 3,171 | |
| | SLM Student Loan Trust, Series 2007-2, Class A3, 0.922%, 1/25/19 | | | 1,953,288 | | | | 1,936 | |
| | SLM Student Loan Trust, Series 2007-3, Class A3, 0.922%, 4/25/19 | | | 5,957,997 | | | | 5,895 | |
| | SLM Student Loan Trust, Series 2007-2, Class A4, 0.942%, 7/25/22 | | | 6,060,000 | | | | 5,731 | |
| | SLM Student Loan Trust, Series 2007-5, Class A5, 0.962%, 1/25/24 | | | 2,799,868 | | | | 2,791 | |
| | SLM Student Loan Trust, Series 2006-3, Class A5, 0.982%, 1/25/21 | | | 4,956,000 | | | | 4,797 | |
| | SLM Student Loan Trust, Series 2005-5, Class A3, 0.982%, 4/25/25 | | | 771,610 | | | | 768 | |
| | SLM Student Loan Trust, Series 2005-5, Class A4, 1.022%, 10/25/28 | | | 6,078,000 | | | | 5,918 | |
| | SLM Student Loan Trust, Series 2005-6, Class A6, 1.022%, 10/27/31 | | | 7,331,000 | | | | 7,149 | |
| | SLM Student Loan Trust, Series 2005-7, Class A4, 1.032%, 10/25/29 | | | 802,000 | | | | 781 | |
| | SLM Student Loan Trust, Series 2004-3, Class A5, 1.052%, 7/25/23 | | | 3,799,286 | | | | 3,785 | |
| | SLM Student Loan Trust, Series 2007-2, Class B, 1.052%, 7/25/25 | | | 1,426,000 | | | | 1,162 | |
| | SLM Student Loan Trust, Series 2014-2, Class A2, 1.106%, 10/25/21 | | | 3,306,258 | | | | 3,301 | |
| | SLM Student Loan Trust, Series 2014-2, Class A3, 1.346%, 3/25/55 | | | 3,219,000 | | | | 3,193 | |
| | SLM Student Loan Trust, Series 2013-6, Class A3, 1.406%, 6/25/55 | | | 5,102,000 | | | | 5,060 | |
| | SLM Student Loan Trust, Series 2004-10, Class A6A, 1.432%, 4/27/26 144A | | | 6,682,000 | | | | 6,654 | |
| | SLM Student Loan Trust, Series 2012-2, Class A, 1.456%, 1/25/29 | | | 3,858,691 | | | | 3,785 | |
| | SLM Student Loan Trust, Series 2012-6, Class A3, 1.506%, 5/26/26 | | | 3,807,000 | | | | 3,687 | |
| | SLM Student Loan Trust, Series 2001-10, Class A7A, 1.632%, 10/25/29 144A | | | 2,863,000 | | | | 2,753 | |
| | SLM Student Loan Trust, Series 2012-1, Class A3, 1.706%, 9/25/28 | | | 884,000 | | | | 874 | |
| | SLM Student Loan Trust, Series 2012-6, Class B, 1.756%, 4/27/43 | | | 1,467,000 | | | | 1,303 | |
| | SLM Student Loan Trust, Series 2012-7, Class B, 2.556%, 9/25/43 | | | 4,250,000 | | | | 3,880 | |
| | SMB Private Education Loan Trust, Series 2015-A, Class A2B, 1.704%, 6/15/27 144A | | | 3,752,000 | | | | 3,768 | |
| | SMB Private Education Loan Trust, Series 2016-C, Class A2B, 1.804%, 9/15/34 | | | 5,766,000 | | | | 5,797 | |
| | SMB Private Education Loan Trust, Series 2015-B, Class A2B, 1.904%, 7/15/27 144A | | | 4,050,000 | | | | 4,110 | |
| | SMB Private Education Loan Trust, Series 2015-C, Class A2B, 2.104%, 7/15/27 144A | | | 2,048,000 | | | | 2,084 | |
| | SMB Private Education Loan Trust, Series 2016-B, Class A2B, 2.154%, 2/17/32 144A | | | 4,312,000 | | | | 4,415 | |
The Accompanying Notes are an Integral Part of the Financial Statements.
| | | | |
| | Select Bond Portfolio | | 119 |
Select Bond Portfolio
| | | | | | | | | | |
| | | Structured Products (49.6%) | | Shares/
$ Par | | | Value
$ (000’s) | |
| |
| | Structured Products continued | |
| | SMB Private Education Loan Trust, Series 2016-A, Class A2B, 2.204%, 5/15/31 144A | | | 5,299,000 | | | | 5,437 | |
| | SMB Private Education Loan Trust, Series 2016-C, Class A2A, 2.340%, 9/15/34 | | | 8,175,000 | | | | 8,039 | |
| | SMB Private Education Loan Trust, Series 2016-B, Class A2A, 2.430%, 2/17/32 144A | | | 7,479,000 | | | | 7,318 | |
| | SMB Private Education Loan Trust, Series 2015-A, Class A2A, 2.490%, 6/15/27 144A | | | 5,101,000 | | | | 5,044 | |
| | SMB Private Education Loan Trust, Series 2016-A, Class A2A, 2.700%, 5/15/31 144A | | | 6,939,000 | | | | 6,889 | |
| | SMB Private Education Loan Trust, Series 2015-C, Class A2A, 2.750%, 7/15/27 144A | | | 2,431,000 | | | | 2,434 | |
| | SMB Private Education Loan Trust, Series 2015-B, Class A2A, 2.980%, 7/15/27 144A | | | 1,677,000 | | | | 1,696 | |
| | SoFi Professional Loan Program, Series 2016-E, Class A1, 1.380%, 7/25/39 | | | 5,385,000 | | | | 5,393 | |
| | SoFi Professional Loan Program, Series 2016-E, Class A2A, 1.630%, 1/25/36 | | | 2,144,000 | | | | 2,139 | |
| | SoFi Professional Loan Program, Series 2016-D, Class A2A, 1.530%, 4/25/33 144A | | | 2,259,141 | | | | 2,256 | |
| | SoFi Professional Loan Program, Series 2016-D, Class A2B, 2.340%, 4/25/33 144A | | | 2,419,000 | | | | 2,370 | |
| | SoFi Professional Loan Program LLC, Series 2016-A, Class A2, 2.760%, 12/26/36 | | | 2,968,042 | | | | 2,985 | |
| | SoFi Professional Loan Program LLC, Series 2016-D, Class A1, 1.706%, 1/25/39 144A | | | 1,135,042 | | | | 1,135 | |
| | Synchrony Credit Card Master Note Trust, Series 2016-3, Class A, 1.580%, 9/15/22 | | | 3,643,000 | | | | 3,597 | |
| | Synchrony Credit Card Master Note Trust, Series 2016-2, Class A, 2.210%, 5/15/24 | | | 2,886,000 | | | | 2,870 | |
| | TCF Auto Receivables Owner Trust, Series 2016-1A, Class A2, 1.390%, 11/15/19 144A | | | 3,157,000 | | | | 3,155 | |
| | TCF Auto Receivables Owner Trust, Series 2016-1A, Class A3, 1.710%, 4/15/21 144A | | | 1,263,000 | | | | 1,256 | |
| | | | | | | | | | |
| | | Structured Products (49.6%) | | Shares/
$ Par | | | Value
$ (000’s) | |
| |
| | Structured Products continued | |
| | TCF Auto Receivables Owner Trust, Series 2016-PT1, Class A, 1.930%, 6/15/22 144A | | | 6,022,000 | | | | 6,015 | |
| | TCF Auto Receivables Owner Trust, Series 2016-1A, Class A4, 2.030%, 2/15/22 144A | | | 941,000 | | | | 933 | |
| | Toyota Auto Receivables Trust, Series 2016-C, Class A2A, 1.000%, 1/15/19 | | | 2,575,000 | | | | 2,571 | |
| | Toyota Auto Receivables Trust, Series 2016-C, Class A3, 1.140%, 8/17/20 | | | 3,434,000 | | | | 3,411 | |
| | UBS-Barclays Commercial Mortgage Trust, Series 2012-C4, Class A2, 1.712%, 12/10/45 | | | 1,814,000 | | | | 1,816 | |
| | UBS-Barclays Commercial Mortgage Trust, Series 2012-C2, Class A2, 2.113%, 5/10/63 | | | 1,925,508 | | | | 1,928 | |
| | Verizon Owner Trust, Series 2016-1A, Class A, 1.420%, 1/20/21 144A | | | 5,120,000 | | | | 5,084 | |
| | Verizon Owner Trust, Series 2016-2A, Class A, 1.680%, 5/20/21 144A | | | 7,606,000 | | | | 7,575 | |
| | World Financial Network Credit Card Master Trust, Series 2016-B, Class A, 1.440%, 6/15/22 | | | 3,819,000 | | | | 3,806 | |
| | World Financial Network Credit Card Master Trust, Series 2014-C, Class A, 1.540%, 8/16/21 | | | 569,000 | | | | 570 | |
| | World Financial Network Credit Card Master Trust, Series 2016-C, Class A, 1.720%, 8/15/23 | | | 4,967,000 | | | | 4,925 | |
| | World Financial Network Credit Card Master Trust, Series 2012-B, Class A, 1.760%, 5/17/21 | | | 2,426,000 | | | | 2,431 | |
| | World Financial Network Credit Card Master Trust, Series 2016-A, Class A, 2.030%, 4/15/25 | | | 4,488,000 | | | | 4,396 | |
| | World Omni Auto Receivables Trust, Series 2016-B, Class A3, 1.300%, 2/15/22 | | | 3,114,000 | | | | 3,072 | |
| | | | | | | | | | |
| | |
| | Total Structured Products | | | | | |
| | (Cost: $1,415,346) | | | | 1,408,141 | |
| | | | | | | | | | |
| | |
| | Total Investments (109.2%) | | | | | |
| | (Cost: $3,135,854)(a) | | | | 3,100,914 | |
| | | | | | | | | | |
| | Other Assets, Less | | | | | |
| | Liabilities (-9.2%) | | | | (261,869) | |
| | | | | | | | | | |
| | Net Assets (100.0%) | | | | 2,839,045 | |
| | | | | | | | | | |
144A after the name of a security represents a security exempt from registration under Rule 144A of the Securities Act of 1933. These securities may be resold as transactions exempt from registration, normally to qualified institutional buyers. At December 31, 2016 the value of these securities (in thousands) was $360,207 representing 12.7% of the net assets.
IO — Interest Only Security
GO — General Obligation
RB — Revenue Bond
| (a) | At December 31, 2016, the aggregate cost of securities for federal tax purposes (in thousands) was $3,152,816 and the net unrealized depreciation of investments based on that cost was $51,902 which is comprised of $10,060 aggregate gross unrealized appreciation and $61,962 aggregate gross unrealized depreciation. |
The Accompanying Notes are an Integral Part of the Financial Statements.
| | | | | | |
| 120 | | Select Bond Portfolio | | | | |
Select Bond Portfolio
The following is a summary of the inputs used in valuing the Portfolio’s assets and liabilities at December 31, 2016. See Note 3 for additional information on portfolio valuation.
| | | | | | | | | | | | | | |
| | | Valuation Inputs | | | |
| Description | | Level 1 –
Quoted Prices | | | Level 2 –
Other Significant
Observable Inputs | | | Level 3 – Significant
Unobservable Inputs | | | |
| | | (Amounts in thousands) | | | |
Assets: | | | | | | | | | | | | | | |
Governments | | $ | - | | | $ | 989,810 | | | $ | - | | | |
Municipal Bonds | | | - | | | | 27,156 | | | | - | | | |
Corporate Bonds | | | - | | | | 675,807 | | | | - | | | |
Structured Products | | | - | | | | 1,408,141 | | | | - | | | |
Total Assets: | | $ | - | | | $ | 3,100,914 | | | $ | - | | | |
The Accompanying Notes are an Integral Part of the Financial Statements.
| | | | |
| | Select Bond Portfolio | | 121 |
Long-Term U.S. Government Bond Portfolio (unaudited)
| | | | |
| Objective: | | Portfolio Strategy: | | Net Assets: |
Maximum total return, consistent with preservation of capital and prudent investment management. | | Invest in a diversified portfolio of fixed income securities that are issued or guaranteed by the U.S. Government, its agencies or government sponsored enterprises, and in derivatives designed to replicate such securities. | | $110 million |
Portfolio Overview
Mason Street Advisors, LLC (“Mason Street Advisors”), the investment adviser for the Long-Term U.S. Government Bond Portfolio (the “Portfolio”), has engaged Pacific Investment Management Company LLC (“PIMCO”) to act as sub-adviser for the Portfolio. The Portfolio primarily invests in a diversified portfolio of fixed income securities that are issued or guaranteed by the U.S. Government, its agencies or government sponsored enterprises (“U.S. Government Securities”), which may be represented by forwards or derivatives such as options, futures contracts or interest rate swap agreements. Assets not invested in U.S. Government Securities may be invested in other types of non-government related investment grade fixed income instruments, such as corporate debt securities of U.S. issuers and mortgage- and asset-backed securities, or in preferred stocks. The Portfolio will normally have a minimum average portfolio duration (an aggregate measure of the sensitivity of the Portfolio’s fixed income portfolio securities to changes in interest rates) of eight years and, for point of reference, the dollar weighted average maturity of the Portfolio is expected to be more than ten years. The Portfolio’s investments in fixed income securities are limited to investment grade U.S. dollar denominated securities of U.S. issuers that are rated at least A by Moody’s or equivalently rated by S&P or Fitch, or, if unrated, determined by PIMCO to be of comparable quality.
Market Overview
Markets in 2016 were peppered by bouts of volatility induced by brief periods of uncertainty and unexpected political global outcomes; however, on the whole, global markets as well as the global economy seemed relatively resilient. While recession fears gripped markets early in the year, sentiment started to improve sharply on the back of dovish central banks and a turn higher in oil prices. Uncertainty surrounding the United Kingdom’s vote to leave the European Union, or “Brexit,” coupled with tepid U.S. economic data spawned a short-lived and relatively contained selloff. While in the U.S., a surprising presidential election and strong economic fundamentals prompted investors to price in expectations for pro-growth reflationary policies under President-elect Donald Trump. This supported the Fed’s case to continue their rate hike cycle in December, with a 25 basis point hike.
In response to this year’s events, U.S. yields rose across the curve while rising oil prices and OPEC’s production cut agreement prompted breakeven levels to push higher as inflation expectations continued to rise. In addition, risk assets returned higher this year, as investment grade and high yield corporate spreads narrowed. Globally, yields in most developed countries fell amid continued monetary policy actions in those regions.
Portfolio Results
The Portfolio returned 1.09% for the twelve months ended December 31, 2016. By comparison, the Portfolio’s benchmark, the Bloomberg Barclays® Long-Term U.S. Treasury Index (the “Index”), returned 1.33%. (This Index is unmanaged, cannot be invested in directly and does not include administrative expenses or sales charges.) The Portfolio outperformed the 0.60% average return of the Long Government peer group tracked by Morningstar® Inc., an independent mutual fund ranking agency.
An overweight to the intermediate portion of the U.S. Treasury yield curve was the primary detractor due to rising rates during the year. The Portfolio’s duration positioning was partially implemented through the use of futures, interest rate swaps, and options.
Within spread sectors, an allocation to Treasury Inflation Protected Securities (TIPS) was a primary contributor for returns as inflation expectations rose. In addition, security selection within Agency debentures, as well as an allocation to the securitized sector, was additive for performance.
Portfolio Manager Outlook
The following forward looking comments are the opinion of PIMCO, the Portfolio’s sub-adviser.
PIMCO’s baseline forecast for 2017 calls for real global growth to remain in the 2.5%–3.0% range that has held for the past five years. Headline inflation should pick up in developed market economies while high inflation in emerging economies like
| | | | | | |
| 122 | | Long-Term U.S. Government Bond Portfolio | | | | |
Long-Term U.S. Government Bond Portfolio (unaudited)
Brazil and Russia is likely to ebb. Growth in the U.S. and eurozone should remain above trend, but policy and political uncertainty remains. In emerging markets, domestic conditions have improved but the evolution of trade and central bank policy in places like the United States may serve as a headwind.
Relative Performance
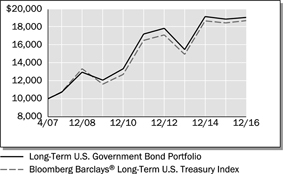
| | | | | | | | | | | | |
Average Annual Total Returns
For Periods Ended December 31, 2016 | |
| | | 1 Year | | | 5 Years | | | Since
Inception* | |
Long-Term U.S. Government Bond Portfolio | | | 1.09 | % | | | 2.09% | | | | 6.92% | |
Bloomberg Barclays® Long-Term U.S. Treasury Index | | | 1.33 | % | | | 2.52% | | | | 6.70% | |
Morningstar® US Insurance Fund Long Government Average | | | 0.60 | % | | | 1.71% | | | | – | |
| *Inception date | of 4/30/07 |
The performance data quoted represents past performance. Past performance is historical and does not guarantee future performance. Investment return and principal value will fluctuate, so that shares, when redeemed, may be worth more or less than their original cost. Current performance may be lower or higher than the performance data quoted. For the most recent month-end performance information visit www.northwesternmutual.com.
This chart assumes an initial investment of $10,000 made on 4/30/07 (commencement of the Portfolio’s operations). Returns shown reflect fee waivers, deductions for management and other portfolio expenses, and reinvestment of all dividends. In the absence of fee waivers, total return would be reduced. Returns exclude deductions for separate account sale loads and account fees. Please refer to the Benchmark Definitions section of this report for information about the indices cited in the above chart and graph.
Return of principal is not guaranteed. Bond funds have the same interest rate, inflation and credit risks that are associated with the underlying bonds owned by the Portfolio. When interest rates rise, bond prices fall. With a fixed income fund, when interest rates rise, the value of the fund’s existing bonds drops, which could negatively affect overall fund performance.
The Portfolio may invest in securities that are issued or guaranteed by the U.S. Government or its agencies, and in derivatives designed to replicate such securities. This guarantee is to timely repayment of the principal and interest if held to maturity, and does not apply to derivative securities held by the Portfolio. Guarantee does not eliminate market risk. The Portfolio may use derivative instruments for hedging or other purposes as part of its investment strategy. Use of these instruments may involve certain costs and risks such as liquidity risk, interest rate risk, market risk, credit risk, management risk and the risk that the Portfolio could not close out a position when it would be most advantageous to do so. The potential leverage created by use of derivatives may cause the Portfolio to be more sensitive to interest rate movements and thus more volatile than other long-term U.S. Government bond funds that do not use derivatives. Portfolios investing in derivatives could lose more than the principal amount invested in those instruments.
Currently, interest rates are near unprecedented historically low levels. A significant rise in interest rates over a short period of time could cause significant losses in the market value of the Portfolio’s fixed income investments.
| | | | |
| | Long-Term U.S. Government Bond Portfolio | | 123 |
Long-Term U.S. Government Bond Portfolio (unaudited)
Top 10 Fixed Income Holdings 12/31/16
| | | | |
| Security Description | | % of Market Value | |
US Treasury, Various | | | 77.2 | % |
Federal National Mortgage Association, Various | | | 8.5 | % |
Residual Funding Stripped, Various | | | 3.8 | % |
Federal Home Loan Mortgage Corp., 4.00%, 9/15/44 | | | 1.7 | % |
Federal Home Loan Mortgage Corp. Series 4092, Class AY, 3.00%, 8/15/32 | | | 1.6 | % |
DBWF Mortgage Trust, Series 2016-85T, Class A, 3.791%, 12/10/36 | | | 0.6 | % |
Federal National Mortgage Association Series 2016-61, 3.00%, 9/25/46 | | | 0.6 | % |
VNDO Trust, Series 2016-350P, Class A, 3.805%, 1/10/35 | | | 0.6 | % |
Morgan Stanley Bank of America Merrill Lynch Trust, Series 2016-C32, Class ASB3, 3.514%, 12/15/49 | | | 0.5 | % |
Commercial Mortgage Pass Through Certificates, Series 2016-667M, Class A, 3.14%, 10/10/36 | | | 0.5 | % |
Sector Allocation 12/31/16
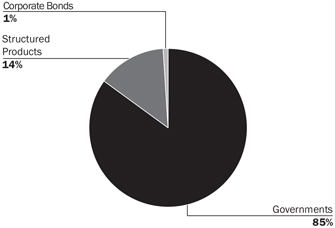
Sector Allocation is based on fixed income investments.
Sector Allocation and Top 10 Holdings are subject to change.
Consistent with the Portfolio’s stated parameters, no more than 10% of the Portfolio is invested in securities rated A by Moody’s or S&P and no more than 25% of the Portfolio is invested in securities rated Aa by Moody’s or AA by S&P.
| | | | | | |
| 124 | | Long-Term U.S. Government Bond Portfolio | | | | |
Long-Term U.S. Government Bond Portfolio
Schedule of Investments
December 31, 2016
| | | | | | | | | | |
| | | Corporate Bonds (0.9%) | | Shares/
$ Par | | | Value
$ (000’s) | |
| |
| | Electric Utilities (0.5%) | |
| | Consolidated Edison Co. of New York, Inc., 3.850%, 6/15/46 | | | 600,000 | | | | 572 | |
| | | | | | | | | | |
| | Total | | | | | | | 572 | |
| | | | | | | | | | |
| |
| | Transportation (0.4%) | |
| | United Airlines, Series 2016-2, Class A, Pass Through Trust, 3.100%, 10/7/28 | | | 200,000 | | | | 192 | |
| | United Airlines, Series 2016-2, Class AA, Pass Through Trust, 2.875%, 10/7/28 | | | 200,000 | | | | 190 | |
| | | | | | | | | | |
| | Total | | | | | | | 382 | |
| | | | | | | | | | |
| | |
| | Total Corporate Bonds | | | | | |
| | (Cost: $999) | | | | | | | 954 | |
| | | | | | | | | | |
| | | Purchased Options (0.0%) | | # of
Contracts | | | | |
| |
| | Purchased Options (0.0%) | |
| | US Bond Future Option, Strike Price $95.00, Exp. 2/24/17 | | | 54 | | | | – | (m) |
| | | | | | | | | | |
| | |
| | Total Purchased Options | | | | | |
| | (Cost: $0) | | | | | | | – | (m) |
| | | | | | | | | | |
| | | |
| | | Governments (106.4%) | | Shares/
$ Par | | | | |
| |
| | US Government & Agencies (106.4%) | |
| | Federal National Mortgage Association,
5.625%, 4/17/28 | | | 100,000 | | | | 125 | |
| | Federal National Mortgage Association,
6.250%, 5/15/29 | | | 2,000,000 | | | | 2,651 | |
| | Federal National Mortgage Association,
7.125%, 1/15/30 | | | 700,000 | | | | 999 | |
| | Israel Government AID Bond, 5.500%, 9/18/33 | | | 300,000 | | | | 388 | |
| | Residual Funding Corp. Stripped, 0.000%, 10/15/20 | | | 2,000,000 | | | | 1,869 | |
| | Residual Funding Corp. Stripped, 0.000%, 4/15/30 | | | 4,800,000 | | | | 3,109 | |
| | Resolution Funding Corp. Stripped, 0.000%, 4/15/28 | | | 400,000 | | | | 279 | |
| | Tennessee Valley Authority, 4.625%, 9/15/60 | | | 200,000 | | | | 222 | |
| | Tennessee Valley Authority Stripped,
0.000%, 5/1/30 | | | 500,000 | | | | 309 | |
| | US Treasury, 2.000%, 10/31/21 | | | 5,800,000 | | | | 5,817 | |
| | US Treasury, 2.125%, 8/15/21 | | | 3,500,000 | | | | 3,533 | |
| | US Treasury, 2.125%, 11/30/23 | | | 330,000 | | | | 328 | |
| | US Treasury, 2.250%, 7/31/21 | | | 1,700,000 | | | | 1,727 | |
| | US Treasury, 2.500%, 2/15/45 | | | 5,860,000 | | | | 5,220 | |
| | US Treasury, 2.750%, 8/15/42 | | | 1,100,000 | | | | 1,039 | |
| | US Treasury, 2.875%, 5/15/43 | | | 4,200,000 | | | | 4,057 | |
| | US Treasury, 2.875%, 8/15/45 | | | 3,800,000 | | | | 3,657 | |
| | US Treasury, 3.000%, 11/15/44 | | | 2,800,000 | | | | 2,766 | |
| | US Treasury, 3.125%, 2/15/43 | | | 8,250,000 | | | | 8,359 | |
| | US Treasury, 3.375%, 5/15/44 | | | 9,300,000 | | | | 9,862 | |
| | US Treasury, 3.625%, 8/15/43 | | | 2,600,000 | | | | 2,883 | |
| | US Treasury, 3.625%, 2/15/44 | | | 11,830,000 | | | | 13,112 | |
| | US Treasury, 3.750%, 11/15/43 | | | 3,000,000 | | | | 3,401 | |
| | US Treasury, 3.875%, 8/15/40 | | | 800,000 | | | | 919 | |
| | US Treasury, 4.250%, 11/15/40 | | | 1,400,000 | | | | 1,700 | |
| (k) | | US Treasury, 4.375%, 11/15/39 | | | 19,000,000 | | | | 23,455 | |
| | US Treasury, 4.375%, 5/15/40 | | | 100,000 | | | | 124 | |
| | US Treasury, 4.625%, 2/15/40 | | | 200,000 | | | | 256 | |
| | | | | | | | | | |
| | | Governments (106.4%) | | Shares/
$ Par | | | Value
$ (000’s) | |
| |
| | US Government & Agencies Continued | |
| | US Treasury Inflation Index Bond, 0.125%, 4/15/20 | | | 1,145,420 | | | | 1,157 | |
| | US Treasury Inflation Index Bond, 0.125%, 7/15/24 | | | 569,918 | | | | 560 | |
| | US Treasury Inflation Index Bond, 0.375%, 7/15/23 | | | 613,185 | | | | 619 | |
| | US Treasury Inflation Index Bond, 1.375%, 2/15/44 | | | 341,687 | | | | 373 | |
| | US Treasury Inflation Index Bond, 2.500%, 1/15/29 | | | 405,259 | | | | 489 | |
| | US Treasury Inflation Index Bond, 3.625%, 4/15/28 | | | 149,363 | | | | 196 | |
| | US Treasury Stripped, 0.000%, 5/15/33 | | | 1,000,000 | | | | 618 | |
| | US Treasury Stripped, 0.000%, 5/15/36 | | | 1,200,000 | | | | 669 | |
| | US Treasury Stripped, 0.000%, 5/15/37 | | | 3,000,000 | | | | 1,610 | |
| | US Treasury Stripped, 0.000%, 5/15/40 | | | 8,900,000 | | | | 4,344 | |
| | US Treasury Stripped, 0.000%, 5/15/42 | | | 800,000 | | | | 361 | |
| | US Treasury Stripped, 0.000%, 8/15/42 | | | 1,400,000 | | | | 625 | |
| | US Treasury Stripped, 0.000%, 11/15/42 | | | 600,000 | | | | 266 | |
| | US Treasury Stripped, 0.000%, 5/15/43 | | | 700,000 | | | | 305 | |
| | US Treasury Stripped, 0.000%, 11/15/43 | | | 1,700,000 | | | | 739 | |
| | US Treasury Stripped, 0.000%, 2/15/44 | | | 400,000 | | | | 167 | |
| | US Treasury Stripped, 0.000%, 11/15/44 | | | 600,000 | | | | 250 | |
| | US Treasury Stripped, 0.000%, 2/15/45 | | | 200,000 | | | | 82 | |
| | US Treasury Stripped, 0.000%, 8/15/45 | | | 3,400,000 | | | | 1,378 | |
| | Vessel Management Services, Inc., 3.432%, 8/15/36 | | | 557,000 | | | | 539 | |
| | | | | | | | | | |
| | |
| | Total Governments | | | | | |
| | (Cost: $123,860) | | | | | | | 117,513 | |
| | | | | | | | | | |
| | | |
| | | Municipal Bonds (0.1%) | | | | | | |
| |
| | Municipal Bonds (0.1%) | |
| | Massachusetts Educational Financing Authority, Series 2008-1, 1.832%, 4/25/38 RB | | | 90,676 | | | | 90 | |
| | | | | | | | | | |
| | |
| | Total Municipal Bonds | | | | | |
| | (Cost: $91) | | | | | | | 90 | |
| | | | | | | | | | |
| | | |
| | | Structured Products (18.2%) | | | | | | |
| |
| | Structured Products (18.2%) | |
| | CityLine Commercial Mortgage Trust, Series 2016-CLNE, Class A, 2.778%, 11/10/31 144A | | | 600,000 | | | | 593 | |
| | Commerical Mortgage Pass Through Certificates, Series 2016-667M, Class A, 3.140%, 10/10/36 144A | | | 700,000 | | | | 687 | |
| | Core Industrial Trust, Series 2015-West, Class C, 3.494%, 2/10/37 144A | | | 300,000 | | | | 295 | |
| | Credit Suisse First Boston Mortgage Securities Corp., Series 2003-AR18, Class 2A3, 2.799%, 7/25/33 | | | 1,607 | | | | 2 | |
| | Credit Suisse First Boston Mortgage Securities Corp., Series 2003-AR20, Class 2A1, 3.044%, 8/25/33 | | | 1,697 | | | | 2 | |
| | DBWF Mortgage Trust, Series 2016-85T, Class A, 3.791%, 12/10/36 144A | | | 800,000 | | | | 826 | |
| | Federal Home Loan Mortgage Corp., Series 3346, Class FA, 0.934%, 2/15/19 | | | 2,630 | | | | 3 | |
| | Federal Home Loan Mortgage Corp., Series T61, Class 1A1, 1.941%, 7/25/44 | | | 15,324 | | | | 15 | |
| | Federal Home Loan Mortgage Corp., Series 4092, Class AY, 3.000%, 8/15/32 | | | 2,200,000 | | | | 2,158 | |
The Accompanying Notes are an Integral Part of the Financial Statements.
| | | | |
| | Long-Term U.S. Government Bond Portfolio | | 125 |
Long-Term U.S. Government Bond Portfolio
| | | | | | | | | | |
| | | Structured Products (18.2%) | | Shares/
$ Par | | | Value
$ (000’s) | |
| |
| | Structured Products Continued | |
| | Federal Home Loan Mortgage Corp., Series 4830, Class ZG, 3.000%, 4/15/53 | | | 643,449 | | | | 602 | |
| | Federal Home Loan Mortgage Corp., 4.000%, 9/15/44 | | | 2,180,752 | | | | 2,298 | |
| | Federal Home Loan Mortgage Corp., 4.000%, 9/15/54 | | | 654,226 | | | | 680 | |
| | Federal Home Loan Mortgage Corp., Series 2752, Class EZ, 5.500%, 2/15/34 | | | 429,870 | | | | 479 | |
| | Federal National Mortgage Association, Series 2007-114, Class A6, 0.956%, 10/27/37 | | | 10,578 | | | | 11 | |
| | Federal National Mortgage Association, 2.750%, 11/1/31 | | | 499,362 | | | | 477 | |
| | Federal National Mortgage Association, 3.000%, 9/25/46 | | | 900,000 | | | | 824 | |
| | Federal National Mortgage Association, 3.040%, 12/1/30 | | | 371,917 | | | | 363 | |
| | Federal National Mortgage Association, 3.090%, 12/1/36 | | | 600,000 | | | | 573 | |
| | Federal National Mortgage Association, 3.600%, 2/1/40 | | | 671,821 | | | | 668 | |
| | Federal National Mortgage Association, 3.700%, 9/1/34 | | | 675,407 | | | | 688 | |
| | Federal National Mortgage Association, 3.765%, 12/1/25 | | | 900,000 | | | | 951 | |
| | Federal National Mortgage Association, 3.950%, 12/1/45 | | | 1,300,000 | | | | 1,314 | |
| | Federal National Mortgage Association, Series 2007-39, Class NZ, 4.250%, 5/25/37 | | | 301,396 | | | | 313 | |
| | Federal National Mortgage Association, 5.000%, 6/1/35 | | | 90,878 | | | | 99 | |
| | Federal National Mortgage Association, 5.000%, 2/1/36 | | | 140,689 | | | | 154 | |
| | Federal National Mortgage Association TBA, 3.000%, 6/4/18 | | | 1,600,000 | | | | 1,589 | |
| | GS Mortgage Securities Trust, Series 2015-590M, 3.805%, 10/10/35 144A | | | 300,000 | | | | 295 | |
| | | | | | | | | | |
| | | Structured Products (18.2%) | | Shares/
$ Par | | | Value
$ (000’s) | |
| |
| | Structured Products Continued | |
| | Hilton USA Trust, Series 2016-HHV, Class A, 3.719%, 11/5/38 144A | | | 300,000 | | | | 306 | |
| | Hilton USA Trust, Series 2016-HHV, Class C, 4.194%, 11/5/38 144A | | | 400,000 | | | | 391 | |
| | Hudsons Bay Simon JV Trust, Series 2015-HB10, Class C10, 5.447%, 8/5/34 144A | | | 300,000 | | | | 289 | |
| | Merrill Lynch Mortgage Investors, Inc., Series 2003-A4, Class 3A, 3.368%, 5/25/33 | | | 2,028 | | | | 2 | |
| | Morgan Stanley Bank of America Merrill Lynch Trust, Series 2016-C32, Class ASB3, 3.514%, 12/15/49 | | | 700,000 | | | | 717 | |
| | SLM Student Loan Trust, Series 2003-7A, Class A5A, 2.163%, 12/15/33 144A | | | 157,717 | | | | 153 | |
| | SLM Student Loan Trust, Series 2008-9, Class A, 2.382%, 4/25/23 | | | 216,684 | | | | 217 | |
| | Structured Asset Mortgage Investments, Inc., Series 2004-AR5, Class 1A1, 1.396%, 10/19/34 | | | 7,066 | | | | 7 | |
| | Sunset Mortgage Loan Co., Series 2015-NPL1, Class A, 4.459%, 9/18/45 144A | | | 158,920 | | | | 158 | |
| | VNDO Trust, Series 2016-350P, Class A, 3.805%, 1/10/35 144A | | | 800,000 | | | | 824 | |
| | Washington Mutual Mortgage Pass-Through Certificates, Series 2004-AR1, Class A, 2.795%, 3/25/34 | | | 18,125 | | | | 18 | |
| | | | | | | | | | |
| | | |
| | Total Structured Products | | | | | | | | |
| | (Cost: $20,541) | | | | | | | 20,041 | |
| | | | | | | | | | |
| | | |
| | Total Investments (125.6%) | | | | | | | | |
| | (Cost: $145,491)(a) | | | | | | | 138,598 | |
| | | | | | | | | | |
| | Other Assets, Less | | | | | | | | |
| | Liabilities (-25.6%) | | | | | | | (28,207 | ) |
| | | | | | | | | | |
| | Net Assets (100.0%) | | | | | | | 110,391 | |
| | | | | | | | | | |
144A after the name of a security represents a security exempt from registration under Rule 144A of the Securities Act of 1933. These securities may be resold as transactions exempt from registration, normally to qualified institutional buyers. At December 31, 2016 the value of these securities (in thousands) was $4,817 representing 4.4% of the net assets.
RB — Revenue Bond
| (a) | At December 31, 2016, the aggregate cost of securities for federal tax purposes (in thousands) was $149,105 and the net unrealized depreciation of investments based on that cost was $10,507 which is comprised of $1,796 aggregate gross unrealized appreciation and $12,303 aggregate gross unrealized depreciation. |
| (j) | Swap agreements outstanding on December 31, 2016. |
Centrally Cleared Interest Rate Swaps – Receive Floating Rate
| | | | | | | | | | | | | | | | |
| Floating Rate Index | | | | Fixed
Rate | | Expiration
Date | | Notional
Amount
(000’s) | | Currency | | | Unrealized
Appreciation/
(Depreciation)
(000’s) | |
3-Month USD-LIBOR | | | | 1.75% | | 12/26 | | 2,500 | | | USD | | | $ | 152 | |
3-Month USD-LIBOR | | | | 1.75% | | 12/26 | | 7,410 | | | USD | | | | 604 | |
3-Month USD-LIBOR | | | | 1.50% | | 6/27 | | 1,700 | | | USD | | | | (6 | ) |
3-Month USD-LIBOR | | | | 2.50% | | 6/46 | | 3,200 | | | USD | | | | 274 | |
| | | | | | | | | | | | | | | | |
| | | | | | | | | | | | | | $ | 1,024 | |
| | | | | | | | | | | | | | | | |
The Accompanying Notes are an Integral Part of the Financial Statements.
| | | | | | |
| 126 | | Long-Term U.S. Government Bond Portfolio | | | | |
Long-Term U.S. Government Bond Portfolio
| (k) | Cash or securities with an aggregate value of $23,455 (in thousands) has been pledged as collateral for swap contracts outstanding, short sales or written options on December 31, 2016. |
| (m) | Amount is less than one thousand. |
The following is a summary of the inputs used in valuing the Portfolio’s assets and liabilities at December 31, 2016. See Note 3 for additional information on portfolio valuation.
| | | | | | | | | | | | | | |
| | | Valuation Inputs | | | |
| Description | | Level 1 –
Quoted Prices | | | Level 2 –
Other Significant
Observable Inputs | | | Level 3 –Significant
Unobservable Inputs | | | |
| | | (Amounts in thousands) | | | |
Assets: | | | | | | | | | | | | | | |
Governments | | $ | - | | | $ | 117,513 | | | $ | - | | | |
Municipal Bonds | | | - | | | | 90 | | | | - | | | |
Corporate Bonds | | | - | | | | 954 | | | | - | | | |
Structured Products | | | - | | | | 20,041 | | | | - | | | |
Purchased Options | | | - | | | | - | (m) | | | - | | | |
Other Financial Instruments^ | | | | | | | | | | | | | | |
Interest Rate Swaps | | | - | | | | 1,030 | | | | - | | | |
Total Assets: | | $ | - | | | $ | 139,628 | | | $ | - | | | |
Liabilities: | | | | | | | | | | | | | | |
Other Financial Instruments^ | | | | | | | | | | | | | | |
Interest Rate Swaps | | $ | - | | | $ | (6 | ) | | $ | - | | | |
Total Assets: | | $ | - | | | $ | (6 | ) | | $ | - | | | |
^ Other financial instruments are derivative instruments such as futures, forwards, written options and swaps contracts, which are valued at the unrealized appreciation (depreciation) on the instrument and short sales, which are valued at market value.
The Accompanying Notes are an Integral Part of the Financial Statements.
| | | | |
| | Long-Term U.S. Government Bond Portfolio | | 127 |
Inflation Protection Portfolio (unaudited)
| | | | |
| Objective: | | Portfolio Strategy: | | Net Assets: |
| Total return using a strategy that seeks to protect against U.S. inflation. | | Invest substantially all assets in investment grade debt securities, with a majority in inflation-indexed debt securities. | | $327 million |
Portfolio Overview
Mason Street Advisors, LLC (“Mason Street Advisors”), the investment adviser for the Inflation Protection Portfolio (the “Portfolio”), has engaged American Century Investment Management, Inc. (“American Century”) to act as sub-adviser for the Portfolio. The Portfolio invests substantially all of its assets in investment grade debt securities. To help protect against U.S. inflation, under normal conditions, the Portfolio will invest more than 50% of its net assets in inflation-indexed debt securities. These securities include inflation-indexed U.S. Treasury Securities, inflation-indexed securities issued by U.S. government agencies and instrumentalities other than the U.S. Treasury, and inflation-indexed securities issued by domestic and foreign corporations and governments. The Portfolio also may invest in fixed income securities that are not inflation-indexed, including mortgage- and asset-backed securities. Due to Internal Revenue Code provisions governing insurance product funds, no more than 55% of the Portfolio’s assets may be invested in securities issued by the same entity, such as the U.S. Treasury.
Market Overview
Investor concerns about global growth, central bank monetary decisions and U.S. presidential election results led to sharp volatility in 2016. The U.S. economy continued to exhibit modest growth, but for most of the year the U.S. Federal Reserve Bank (the “Fed”) remained focused on the sluggish global landscape and its potential risks to the U.S. economy. This triggered ongoing investor speculation regarding the timing and magnitude of Fed interest rate “normalization” and contributed to the volatile climate.
Investors generally expected the Fed to follow up its December 2015 rate hike with additional increases in 2016. But as the year unfolded, the next Fed rate hike remained elusive. The Fed cited concerns about the health of the global economy, the uncertainty triggered by the United Kingdom’s vote in late June to leave the European Union, or “Brexit,” and weaker-than-expected U.S. economic growth as reasons to pursue a “lower for longer” rate strategy. The Fed’s dovish stance drove longer-term inflation expectations higher, which generally aided Treasury Inflation Protected Securities (“TIPS”) performance. Meanwhile, central banks in the U.K., Europe and Japan continued to pursue aggressive stimulus programs. This action increased the relative attractiveness and returns of the U.S. Treasury market, where yields were generally higher.
Market sentiment shifted swiftly and sharply in the fourth quarter, largely due to Donald Trump’s election victory, which triggered a severe bond market sell-off. Expectations for stronger U.S. economic growth, higher interest rates, a rallying U.S. dollar and mounting inflation related to anticipated Trump administration policies drove U.S. nominal Treasury yields sharply higher. In addition, select U.S. economic data were stronger, and the Fed finally raised rates in December. TIPS returns declined along with the broad Treasury market in the fourth quarter, but higher inflation helped keep the sector ahead of nominal Treasurys.
Overall, modest gains in the broad U.S. Treasury market for the twelve month period, combined with mounting current inflation and rising longer-term inflation expectations, caused TIPS returns to advance and outperform nominal Treasurys. TIPS also outperformed the broad investment grade bond market for the one-year period.
Portfolio Results
The Portfolio returned 4.68% for the twelve months ended December 31, 2016. By comparison, the Portfolio’s benchmark, the Bloomberg Barclays® U.S. TIPS Index (the “Index”), returned 4.68%. (The Index is unmanaged, cannot be invested in directly, and does not include administrative expenses or sales charges.) According to Lipper® Analytical Services, Inc., an independent mutual fund ranking company, the average return for the Inflation Protected Bonds Funds peer group was 4.96% for 2016.
The Portfolio was nearly as fully invested in TIPS as allowed by the Internal Revenue Service (“IRS”) portfolio diversification regulations for insurance products (53% of assets versus the IRS maximum of 55%). The remainder was primarily invested in investment grade securitized and corporate bonds. The team reduced exposure to non-dollar inflation-linked securities (hedged against currency fluctuations) in favor of inflation swaps, corporate bonds and securitized securities. The non-dollar securities advanced, but not as much as TIPS.
The investment team used inflation swaps to create an inflation overlay for the non-inflation-linked corporate and securitized securities. This strategy, combined with the team’s preference for longer-maturity TIPS, positioned the Portfolio with greater sensitivity to inflation versus the benchmark for most of the period, which aided relative performance as breakeven rates increased. Security selection among corporate and securitized holdings also contributed to relative results.
| | | | | | |
| 128 | | Inflation Protection Portfolio | | | | |
Inflation Protection Portfolio (unaudited)
Portfolio Manager Outlook
The following forward-looking comments are the opinion of American Century, the Portfolio’s sub-adviser.
The Portfolio positioning reflects our observations that headline U.S. inflation is gradually moving higher, while short- and long-term core Consumer Price Index (CPI) trends have been increasing for more than twelve months. We believe headline inflation eventually will converge with core inflation, and stabilization in commodities prices coupled with a shift to pro-growth policies and potential protectionist actions from the Trump administration eventually will create higher inflation than is currently priced into the bond market.
Relative Performance
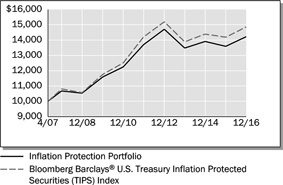
| | | | | | | | | | | | |
Average Annual Total Returns
For Periods Ended December 31, 2016 | |
| | | 1 Year | | | 5 Years | | | Since
Inception* | |
Inflation Protection Portfolio | | | 4.68 | % | | | 0.77 | % | | | 3.71 | % |
Bloomberg Barclays® U.S. Treasury Inflation Protected Securities (TIPS) Index | | | 4.68 | % | | | 0.89 | % | | | 4.17 | % |
Lipper® Variable Insurance Products (VIP) Inflation Protected Bonds Funds Average | | | 4.96 | % | | | 0.76 | % | | | – | |
| * Inception | date of 4/30/07 |
The performance data quoted represents past performance. Past performance is historical and does not guarantee future performance. Investment return and principal value will fluctuate, so that shares, when redeemed, may be worth more or less than their original cost. Current performance may be lower or higher than the performance data quoted. For the most recent month-end performance information visit www.northwesternmutual.com.
This chart assumes an initial investment of $10,000 made on 4/30/07 (commencement of the Portfolio’s operations.) Returns shown reflect fee waivers, deductions for management and other portfolio expenses, and reinvestment of all dividends. In the absence of fee waivers, total return would be reduced. Returns exclude deductions for separate account sale loads and account fees. Please refer to the Benchmark Definitions section of this report for information about the indices cited in the above chart and graph.
Return of principal is not guaranteed. Bond funds have the same interest rate, inflation and credit risks that are associated with the underlying bonds owned by the Portfolio. When interest rates rise, bond prices fall. With a fixed income fund, when interest rates rise, the value of the fund’s existing bonds drops, which could negatively affect overall fund performance.
Currently, interest rates are near unprecedented historically low levels. A significant rise in interest rates over a short period of time could cause significant losses in the market value of the Portfolio’s fixed income investments.
Investing in bonds issued by foreign corporations and governments carries additional risk, including foreign currency risk, and may increase the volatility of the Portfolio’s performance.
As a non-diversified portfolio, the Portfolio may hold fewer securities because of its focused investment strategy. Holding fewer securities increases the risk that the value of the Portfolio could go down because of the poor performance of a single investment.
| | | | |
| | Inflation Protection Portfolio | | 129 |
Inflation Protection Portfolio (unaudited)
This Portfolio invests over 50% of its assets in inflation-linked bonds. Inflation-linked bonds issued by the U.S. Government, known as TIPs, are fixed income securities whose principal value is periodically adjusted according to the rate of inflation. Neither the current market value of the inflation-linked bonds nor the share value of the fund that invests in them is guaranteed, and either or both may fluctuate. Those portions of the Portfolio which are not invested in inflation linked securities will not be automatically protected from inflation. The Portfolio may use derivative instruments for hedging or other purposes as part of its investment strategy. Use of these instruments may involve certain costs and risks such as liquidity risk, interest rate risk, market risk, credit risk, management risk and the risk that the Portfolio could not close out a position when it would be most advantageous to do so. Portfolios investing in derivatives could lose more than the principal amount invested in those instruments.
Top 10 Fixed Income Holdings 12/31/16
| | |
| Security Description | | % of Net Assets |
US Treasury Inflation Index Bond, Various | | 51.7% |
Federal National Mortgage Association, Various | | 7.4% |
Federal Home Loan Mortgage Corp., Various | | 3.1% |
Italy Buoni Poliennali Del Tesoro EUR, Various | | 1.9% |
Canadian Government Bond, Various | | 0.7% |
Citigroup, Inc., Various | | 0.6% |
The Goldman Sachs Group, Inc., Various | | 0.6% |
Agate Bay Mortgage Trust Series 2015-7, Series 2015-7, Class A3, 3.50%, 10/25/45 | | 0.5% |
JP Morgan Mortgage Trust Series 2016-1, Series 2016-1, Class A7, 3.50%, 5/25/46 | | 0.5% |
General Electric Capital Corp., Various | | 0.3% |
Sector Allocation 12/31/16
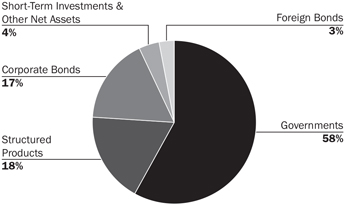
Sector Allocation is based on Net Assets.
Sector Allocation and Top 10 Holdings are subject to change.
Consistent with the Portfolio’s stated parameters, no more than 20% of the Portfolio is invested in foreign securities.
| | | | | | |
| 130 | | Inflation Protection Portfolio | | | | |
Inflation Protection Portfolio
Schedule of Investments
December 31, 2016
| | | | | | | | |
| Corporate Bonds (16.8%) | | Shares/
$ Par | | | Value
$ (000’s) | |
|
Aerospace & Defense (0.2%) | |
Lockheed Martin Corp., 3.550%, 1/15/26 | | | 100,000 | | | | 102 | |
Lockheed Martin Corp., 3.800%, 3/1/45 | | | 200,000 | | | | 190 | |
Lockheed Martin Corp., 4.250%, 11/15/19 | | | 200,000 | | | | 213 | |
| | | | | | | | |
Total | | | | | | | 505 | |
| | | | | | | | |
|
Autos & Vehicle Parts (0.4%) | |
Daimler Finance North America LLC, 1.875%, 1/11/18 144A | | | 200,000 | | | | 200 | |
Ford Motor Credit Co. LLC, 2.375%, 1/16/18 | | | 200,000 | | | | 201 | |
Ford Motor Credit Co. LLC, 4.389%, 1/8/26 | | | 300,000 | | | | 304 | |
Ford Motor Credit Co. LLC, 5.000%, 5/15/18 | | | 100,000 | | | | 104 | |
General Motors Co., 5.000%, 4/1/35 | | | 300,000 | | | | 293 | |
General Motors Financial Co., 5.250%, 3/1/26 | | | 80,000 | | | | 84 | |
| | | | | | | | |
Total | | | | | | | 1,186 | |
| | | | | | | | |
|
Banking (4.4%) | |
American Express Co., 1.550%, 5/22/18 | | | 350,000 | | | | 349 | |
American Express Credit Corp., 2.250%, 5/5/21 | | | 200,000 | | | | 198 | |
Bank of America Corp., 3.248%, 10/21/27 | | | 545,000 | | | | 520 | |
Bank of America Corp., 3.300%, 1/11/23 | | | 350,000 | | | | 351 | |
Bank of America Corp., 5.750%, 12/1/17 | | | 650,000 | | | | 673 | |
BNP Paribas SA, 2.400%, 12/12/18 | | | 150,000 | | | | 151 | |
Branch Banking & Trust Co., 3.800%, 10/30/26 | | | 200,000 | | | | 206 | |
Capital One Bank USA NA, 2.300%, 6/5/19 | | | 250,000 | | | | 251 | |
Capital One Financial Corp., 2.450%, 4/24/19 | | | 100,000 | | | | 101 | |
Capital One Financial Corp., 4.200%, 10/29/25 | | | 150,000 | | | | 150 | |
Capital One NA, 1.650%, 2/5/18 | | | 250,000 | | | | 250 | |
Citigroup, Inc., 2.350%, 8/2/21 | | | 300,000 | | | | 293 | |
Citigroup, Inc., 3.200%, 10/21/26 | | | 500,000 | | | | 478 | |
Citigroup, Inc., 4.000%, 8/5/24 | | | 250,000 | | | | 252 | |
Citigroup, Inc., 4.050%, 7/30/22 | | | 300,000 | | | | 310 | |
Citigroup, Inc., 4.450%, 9/29/27 | | | 575,000 | | | | 584 | |
Cooperatieve Centrale Raiffeisen-Boerenleenbank BA/Netherlands, 3.875%, 2/8/22 | | | 200,000 | | | | 211 | |
Credit Suisse, 3.625%, 9/9/24 | | | 250,000 | | | | 252 | |
Discover Bank of Greenwood Delaware, 3.450%, 7/27/26 | | | 300,000 | | | | 290 | |
Discover Financial Services, 3.750%, 3/4/25 | | | 200,000 | | | | 196 | |
Fifth Third Bancorp, 4.300%, 1/16/24 | | | 60,000 | | | | 62 | |
Fifth Third Bank, 2.875%, 10/1/21 | | | 250,000 | | | | 253 | |
The Goldman Sachs Group, Inc., 2.300%, 12/13/19 | | | 300,000 | | | | 300 | |
The Goldman Sachs Group, Inc., 3.500%, 11/16/26 | | | 200,000 | | | | 195 | |
The Goldman Sachs Group, Inc., 3.750%, 5/22/25 | | | 850,000 | | | | 852 | |
The Goldman Sachs Group, Inc., 4.250%, 10/21/25 | | | 200,000 | | | | 203 | |
The Goldman Sachs Group, Inc., 5.750%, 1/24/22 | | | 230,000 | | | | 259 | |
HSBC Holdings PLC, 2.950%, 5/25/21 | | | 200,000 | | | | 200 | |
HSBC Holdings PLC, 4.300%, 3/8/26 | | | 200,000 | | | | 207 | |
Huntington Bancshares, Inc., 2.300%, 1/14/22 | | | 200,000 | | | | 194 | |
JPMorgan Chase & Co., 3.875%, 9/10/24 | | | 250,000 | | | | 253 | |
JPMorgan Chase & Co., 4.500%, 1/24/22 | | | 500,000 | | | | 539 | |
JPMorgan Chase & Co., 4.625%, 5/10/21 | | | 250,000 | | | | 269 | |
JPMorgan Chase & Co., 4.950%, 6/1/45 | | | 385,000 | | | | 411 | |
KeyBank NA, 3.400%, 5/20/26 | | | 250,000 | | | | 243 | |
| | | | | | | | |
| Corporate Bonds (16.8%) | | Shares/
$ Par | | | Value
$ (000’s) | |
|
Banking continued | |
Morgan Stanley, 3.875%, 1/27/26 | | | 400,000 | | | | 404 | |
Morgan Stanley, 5.000%, 11/24/25 | | | 670,000 | | | | 716 | |
Morgan Stanley, 5.950%, 12/28/17 | | | 200,000 | | | | 208 | |
PNC Bank NA, 6.000%, 12/7/17 | | | 200,000 | | | | 208 | |
Suntrust Bank, 3.300%, 5/15/26 | | | 200,000 | | | | 193 | |
Synchrony Financial, 2.600%, 1/15/19 | | | 100,000 | | | | 100 | |
Synchrony Financial, 3.000%, 8/15/19 | | | 250,000 | | | | 253 | |
U.S. Bancorp, 3.600%, 9/11/24 | | | 400,000 | | | | 408 | |
Wells Fargo & Co., 3.000%, 4/22/26 | | | 200,000 | | | | 191 | |
Wells Fargo & Co., 3.550%, 9/29/25 | | | 175,000 | | | | 175 | |
Wells Fargo & Co., 4.125%, 8/15/23 | | | 100,000 | | | | 103 | |
Wells Fargo & Co., 4.400%, 6/14/46 | | | 200,000 | | | | 191 | |
Wells Fargo & Co., 4.750%, 12/7/46 | | | 300,000 | | | | 304 | |
Wells Fargo & Co., 5.625%, 12/11/17 | | | 400,000 | | | | 415 | |
| | | | | | | | |
Total | | | | | | | 14,375 | |
| | | | | | | | |
|
Basic Materials (0.2%) | |
Georgia-Pacific LLC, 2.539%, 11/15/19 144A | | | 100,000 | | | | 101 | |
Georgia-Pacific LLC, 5.400%, 11/1/20 144A | | | 140,000 | | | | 154 | |
International Paper Co., 4.400%, 8/15/47 | | | 200,000 | | | | 189 | |
International Paper Co., 6.000%, 11/15/41 | | | 150,000 | | | | 168 | |
| | | | | | | | |
Total | | | | | | | 612 | |
| | | | | | | | |
|
Capital Goods (0.1%) | |
Deere & Co., 2.600%, 6/8/22 | | | 60,000 | | | | 60 | |
John Deere Capital Corp., 3.150%, 10/15/21 | | | 290,000 | | | | 297 | |
| | | | | | | | |
Total | | | | | | | 357 | |
| | | | | | | | |
|
Chemicals (0.3%) | |
The Dow Chemical Co., 3.500%, 10/1/24 | | | 200,000 | | | | 202 | |
E.I. du Pont de Nemours & Co., 4.150%, 2/15/43 | | | 200,000 | | | | 188 | |
Eastman Chemical Co., 3.600%, 8/15/22 | | | 69,000 | | | | 71 | |
Ecolab, Inc., 4.350%, 12/8/21 | | | 360,000 | | | | 389 | |
LyondellBasell Industries NV, 4.625%, 2/26/55 | | | 100,000 | | | | 93 | |
LyondellBasell Industries NV, 5.000%, 4/15/19 | | | 75,000 | | | | 79 | |
The Mosaic Co., 5.625%, 11/15/43 | | | 100,000 | | | | 96 | |
| | | | | | | | |
Total | | | | | | | 1,118 | |
| | | | | | | | |
|
Conglomerate & Diversified Manufacturing (0.5%) | |
General Electric Capital Corp., 2.100%, 12/11/19 | | | 250,000 | | | | 252 | |
General Electric Capital Corp., 4.375%, 9/16/20 | | | 100,000 | | | | 107 | |
General Electric Capital Corp., 4.650%, 10/17/21 | | | 100,000 | | | | 110 | |
General Electric Co., 4.125%, 10/9/42 | | | 620,000 | | | | 625 | |
Ingersoll-Rand Luxembourg Finance SA, 3.550%, 11/1/24 | | | 200,000 | | | | 203 | |
United Technologies Corp. 3.75%, 3.750%, 11/1/46 | | | 395,000 | | | | 376 | |
| | | | | | | | |
Total | | | | | | | 1,673 | |
| | | | | | | | |
|
Consumer Products & Retailing (0.9%) | |
CVS Health Corp., 2.750%, 12/1/22 | | | 500,000 | | | | 493 | |
Dollar General Corp., 3.250%, 4/15/23 | | | 200,000 | | | | 197 | |
The Home Depot, Inc., 4.200%, 4/1/43 | | | 200,000 | | | | 206 | |
The Kroger Co., 3.875%, 10/15/46 | | | 200,000 | | | | 182 | |
Macy’s Retail Holdings, Inc., 2.875%, 2/15/23 | | | 60,000 | | | | 57 | |
McDonald’s Corp., 3.250%, 6/10/24 | | | 150,000 | | | | 152 | |
The Accompanying Notes are an Integral Part of the Financial Statements.
| | | | | | |
| | Inflation Protection Portfolio | | | 131 | |
Inflation Protection Portfolio
| | | | | | | | | | |
| | | Corporate Bonds (16.8%) | | Shares/
$ Par | | | Value
$ (000’s) | |
| |
| | Consumer Products & Retailing continued | |
| | NIKE, Inc., 3.375%, 11/1/46 | | | 315,000 | | | | 285 | |
| | Reynolds American, Inc., 4.450%, 6/12/25 | | | 250,000 | | | | 264 | |
| | Unilever Capital Corp., 2.200%, 3/6/19 | | | 200,000 | | | | 202 | |
| | Wal-Mart Stores, Inc., 3.250%, 10/25/20 | | | 600,000 | | | | 625 | |
| | Wal-Mart Stores, Inc., 5.625%, 4/15/41 | | | 300,000 | | | | 373 | |
| | | | | | | | | | |
| | Total | | | | | | | 3,036 | |
| | | | | | | | | | |
| |
| | Electric Utilities (0.7%) | |
| | CMS Energy Corp., 6.250%, 2/1/20 | | | 100,000 | | | | 111 | |
| | Dominion Resources, Inc., 4.900%, 8/1/41 | | | 250,000 | | | | 263 | |
| | Dominion Resources, Inc., 3.625%, 12/1/24 | | | 200,000 | | | | 201 | |
| | Dominion Resources, Inc., 6.400%, 6/15/18 | | | 340,000 | | | | 361 | |
| | Duke Energy Corp., 3.550%, 9/15/21 | | | 150,000 | | | | 155 | |
| | Duke Energy Progress LLC, 3.700%, 10/15/46 | | | 600,000 | | | | 568 | |
| | Exelon Generation Co. LLC, 5.600%, 6/15/42 | | | 200,000 | | | | 185 | |
| | Georgia Power Co., 4.300%, 3/15/42 | | | 100,000 | | | | 101 | |
| | Pacific Gas & Electric Co., 4.000%, 12/1/46 | | | 300,000 | | | | 296 | |
| | Potomac Electric Power Co., 3.600%, 3/15/24 | | | 80,000 | | | | 83 | |
| | Virginia Electric and Power Co., 3.450%, 2/15/24 | | | 50,000 | | | | 51 | |
| | | | | | | | | | |
| | Total | | | | | | | 2,375 | |
| | | | | | | | | | |
| |
| | Energy (0.5%) | |
| | Apache Corp., 4.750%, 4/15/43 | | | 225,000 | | | | 232 | |
| | ConocoPhillips Co., 2.400%, 12/15/22 | | | 400,000 | | | | 387 | |
| | Noble Energy, Inc., 4.150%, 12/15/21 | | | 330,000 | | | | 343 | |
| | Occidental Petroleum Corp., 4.100%, 2/15/47 | | | 330,000 | | | | 321 | |
| | Southern Co. Gas Capital Corp., 3.950%, 10/1/46 | | | 200,000 | | | | 185 | |
| | | | | | | | | | |
| | Total | | | | | | | 1,468 | |
| | | | | | | | | | |
| |
| | Finance (0.2%) | |
| | GE Capital International Funding Co. Unlimited Co., 2.342%, 11/15/20 | | | 550,000 | | | | 550 | |
| | International Lease Finance Corp., 5.875%, 8/15/22 | | | 200,000 | | | | 217 | |
| | | | | | | | | | |
| | Total | | | | | | | 767 | |
| | | | | | | | | | |
| |
| | Food & Beverage (0.7%) | |
| | Anheuser-Busch InBev Finance, Inc., 3.650%, 2/1/26 | | | 820,000 | | | | 832 | |
| | Anheuser-Busch InBev Finance, Inc., 4.900%, 2/1/46 | | | 200,000 | | | | 216 | |
| | Anheuser-Busch InBev Worldwide, Inc., 7.750%, 1/15/19 | | | 100,000 | | | | 111 | |
| | Diageo Capital PLC, 2.625%, 4/29/23 | | | 200,000 | | | | 198 | |
| | General Mills, Inc., 3.150%, 12/15/21 | | | 450,000 | | | | 460 | |
| | Kraft Heinz Foods Co., 3.950%, 7/15/25 | | | 200,000 | | | | 203 | |
| | PepsiCo., 3.450%, 10/6/46 | | | 320,000 | | | | 292 | |
| | | | | | | | | | |
| | Total | | | | | | | 2,312 | |
| | | | | | | | | | |
| |
| | Healthcare (0.4%) | |
| | Abbott Laboratories, 4.900%, 11/30/46 | | | 300,000 | | | | 308 | |
| | Catholic Health Initiatives, 2.950%, 11/1/22 | | | 100,000 | | | | 97 | |
| | Express Scripts Holding Co., 4.500%, 2/25/26 | | | 200,000 | | | | 206 | |
| | Medtronic, Inc., 2.500%, 3/15/20 | | | 100,000 | | | | 101 | |
| | Medtronic, Inc., 3.500%, 3/15/25 | | | 80,000 | | | | 83 | |
| | Thermo Fisher Scientific, Inc., 2.950%, 9/19/26 | | | 250,000 | | | | 236 | |
| | Zimmer Biomet Holdings, Inc., 2.700%, 4/1/20 | | | 150,000 | | | | 150 | |
| | | | | | | | | | |
| | Total | | | | | | | 1,181 | |
| | | | | | | | | | |
| |
| | Insurance (0.9%) | |
| | ACE INA Holdings, Inc., 3.150%, 3/15/25 | | | 200,000 | | | | 199 | |
| | | | | | | | | | |
| | | Corporate Bonds (16.8%) | | Shares/
$ Par | | | Value
$ (000’s) | |
| |
| | Insurance continued | |
| | Aetna, Inc., 2.750%, 11/15/22 | | | 100,000 | | | | 98 | |
| | Aetna, Inc., 3.200%, 6/15/26 | | | 200,000 | | | | 198 | |
| | The Allstate Corp., 4.200%, 12/15/46 | | | 150,000 | | | | 153 | |
| | American International Group, Inc., 4.125%, 2/15/24 | | | 250,000 | | | | 260 | |
| | American International Group, Inc., 4.500%, 7/16/44 | | | 150,000 | | | | 148 | |
| | American International Group, Inc., 5.850%, 1/16/18 | | | 100,000 | | | | 104 | |
| | Berkshire Hathaway, Inc., 4.500%, 2/11/43 | | | 335,000 | | | | 356 | |
| | The Hartford Financial Services Group, Inc., 5.125%, 4/15/22 | | | 150,000 | | | | 166 | |
| | Liberty Mutual Group, Inc., 4.250%, 6/15/23 144A | | | 100,000 | | | | 105 | |
| | Prudential Financial, Inc., 2.300%, 8/15/18 | | | 100,000 | | | | 101 | |
| | Prudential Financial, Inc., 5.625%, 5/12/41 | | | 195,000 | | | | 225 | |
| | TIAA Asset Management Finance Co. LLC, 4.125%, 11/1/24 144A | | | 200,000 | | | | 202 | |
| | The Travelers Companies, Inc., 3.750%, 5/15/46 | | | 200,000 | | | | 189 | |
| | UnitedHealth Group, Inc., 4.250%, 3/15/43 | | | 150,000 | | | | 153 | |
(e) | | Voya Financial, Inc., 2.900%, 2/15/18 | | | 153,000 | | | | 155 | |
| | XLIT, Ltd., 2.300%, 12/15/18 | | | 100,000 | | | | 101 | |
| | | | | | | | | | |
| | Total | | | | | | | 2,913 | |
| | | | | | | | | | |
| |
| | Media (0.9%) | |
| | 21st Century Fox America, Inc., 4.750%, 11/15/46 144A | | | 150,000 | | | | 151 | |
| | 21st Century Fox America, Inc., 6.900%, 8/15/39 | | | 235,000 | | | | 295 | |
| | CBS Corp., 3.500%, 1/15/25 | | | 200,000 | | | | 198 | |
| | Comcast Corp., 6.500%, 11/15/35 | | | 200,000 | | | | 256 | |
| | NBCUniversal Media LLC, 4.375%, 4/1/21 | | | 340,000 | | | | 367 | |
| | Time Warner Cable, Inc., 4.500%, 9/15/42 | | | 295,000 | | | | 267 | |
| | Time Warner, Inc., 3.600%, 7/15/25 | | | 200,000 | | | | 199 | |
| | Time Warner, Inc., 3.800%, 2/15/27 | | | 300,000 | | | | 298 | |
| | Time Warner, Inc., 4.050%, 12/15/23 | | | 150,000 | | | | 155 | |
| | Time Warner, Inc., 4.700%, 1/15/21 | | | 100,000 | | | | 107 | |
| | Viacom, Inc., 4.250%, 9/1/23 | | | 250,000 | | | | 250 | |
| | The Walt Disney Co., 2.350%, 12/1/22 | | | 500,000 | | | | 492 | |
| | | | | | | | | | |
| | Total | | | | | | | 3,035 | |
| | | | | | | | | | |
| |
| | Oil & Gas (0.8%) | |
| | BP Capital Markets PLC, 2.500%, 11/6/22 | | | 60,000 | | | | 59 | |
| | BP Capital Markets PLC, 2.750%, 5/10/23 | | | 200,000 | | | | 196 | |
| | Chevron Corp., 2.100%, 5/16/21 | | | 200,000 | | | | 198 | |
| | Chevron Corp., 2.427%, 6/24/20 | | | 100,000 | | | | 101 | |
| | Exxon Mobil Corp., 3.043%, 3/1/26 | | | 200,000 | | | | 200 | |
| | Hess Corp., 6.000%, 1/15/40 | | | 300,000 | | | | 310 | |
| | Marathon Petroleum Corp., 3.625%, 9/15/24 | | | 250,000 | | | | 247 | |
| | Phillips 66, 4.650%, 11/15/34 | | | 200,000 | | | | 208 | |
| | Shell International Finance BV, 2.375%, 8/21/22 | | | 900,000 | | | | 884 | |
| | Total Capital SA, 2.125%, 8/10/18 | | | 100,000 | | | | 101 | |
| | | | | | | | | | |
| | Total | | | | | | | 2,504 | |
| | | | | | | | | | |
| |
| | Pharmaceuticals (1.2%) | |
| | AbbVie, Inc., 2.900%, 11/6/22 | | | 200,000 | | | | 198 | |
| | AbbVie, Inc., 4.450%, 5/14/46 | | | 350,000 | | | | 335 | |
| | Actavis Funding SCS, 3.450%, 3/15/22 | | | 600,000 | | | | 609 | |
| | Actavis Funding SCS, 3.850%, 6/15/24 | | | 150,000 | | | | 151 | |
| | Amgen, Inc., 1.850%, 8/19/21 | | | 200,000 | | | | 192 | |
The Accompanying Notes are an Integral Part of the Financial Statements.
| | | | |
| 132 | | Inflation Protection Portfolio | | |
Inflation Protection Portfolio
| | | | | | | | |
| Corporate Bonds (16.8%) | | Shares/
$ Par | | | Value
$ (000’s) | |
|
Pharmaceuticals continued | |
Amgen, Inc., 3.625%, 5/22/24 | | | 140,000 | | | | 142 | |
Celgene Corp., 3.625%, 5/15/24 | | | 50,000 | | | | 50 | |
Gilead Sciences, Inc., 3.650%, 3/1/26 | | | 200,000 | | | | 203 | |
Gilead Sciences, Inc., 4.150%, 3/1/47 | | | 165,000 | | | | 157 | |
Gilead Sciences, Inc., 4.400%, 12/1/21 | | | 260,000 | | | | 280 | |
GlaxoSmithKline Capital PLC, 2.850%, 5/8/22 | | | 200,000 | | | | 202 | |
Merck & Co., Inc., 2.400%, 9/15/22 | | | 200,000 | | | | 196 | |
Mylan NV, 3.950%, 6/15/26 144A | | | 200,000 | | | | 187 | |
Mylan, Inc., 2.550%, 3/28/19 | | | 100,000 | | | | 100 | |
Mylan, Inc., 2.600%, 6/24/18 | | | 70,000 | | | | 70 | |
Roche Holdings, Inc., 3.350%, 9/30/24 144A | | | 400,000 | | | | 409 | |
Shire Acquisitions Investments Ireland Designated Activity Co., 3.200%, 9/23/26 | | | 160,000 | | | | 150 | |
Teva Pharmaceutical Finance IV LLC, 2.250%, 3/18/20 | | | 170,000 | | | | 167 | |
| | | | | | | | |
Total | | | | | | | 3,798 | |
| | | | | | | | |
|
Pipelines (0.7%) | |
Enbridge, Inc., 3.500%, 6/10/24 | | | 150,000 | | | | 146 | |
Energy Transfer Partners LP, 3.600%, 2/1/23 | | | 100,000 | | | | 98 | |
Energy Transfer Partners LP, 4.050%, 3/15/25 | | | 200,000 | | | | 198 | |
Energy Transfer Partners LP, 4.150%, 10/1/20 | | | 100,000 | | | | 104 | |
Enterprise Products Operating LLC, 3.750%, 2/15/25 | | | 200,000 | | | | 203 | |
Enterprise Products Operating LLC, 4.850%, 3/15/44 | | | 100,000 | | | | 101 | |
Kinder Morgan Energy Partners LP, 5.300%, 9/15/20 | | | 270,000 | | | | 290 | |
Magellan Midstream Partners LP, 5.150%, 10/15/43 | | | 150,000 | | | | 156 | |
MPLX LP, 4.875%, 6/1/25 | | | 200,000 | | | | 206 | |
Plains All American Pipeline LP / PAA Finance Corp., 3.650%, 6/1/22 | | | 200,000 | | | | 201 | |
Sunoco Logistics Partners Operations LP, 3.450%, 1/15/23 | | | 200,000 | | | | 195 | |
TransCanada PipeLines, Ltd., 2.500%, 8/1/22 | | | 100,000 | | | | 98 | |
Williams Partners LP, 4.125%, 11/15/20 | | | 80,000 | | | | 83 | |
Williams Partners LP, 4.300%, 3/4/24 | | | 200,000 | | | | 202 | |
| | | | | | | | |
Total | | | | | | | 2,281 | |
| | | | | | | | |
|
Real Estate Investment Trusts (0.4%) | |
Boston Properties, 3.650%, 2/1/26 | | | 150,000 | | | | 148 | |
DDR Corp., 4.750%, 4/15/18 | | | 60,000 | | | | 62 | |
Essex Portfolio LP, 3.625%, 8/15/22 | | | 100,000 | | | | 102 | |
Host Hotels & Resorts LP, 3.750%, 10/15/23 | | | 100,000 | | | | 98 | |
Kilroy Realty LP, 3.800%, 1/15/23 | | | 130,000 | | | | 131 | |
Kilroy Realty LP, 4.375%, 10/1/25 | | | 40,000 | | | | 41 | |
Simon Property Group LP, 4.250%, 11/30/46 | | | 300,000 | | | | 295 | |
Ventas Realty LP / Ventas Capital Corp., 3.250%, 8/15/22 | | | 250,000 | | | | 253 | |
Welltower, Inc., 3.750%, 3/15/23 | | | 300,000 | | | | 306 | |
| | | | | | | | |
Total | | | | | | | 1,436 | |
| | | | | | | | |
|
Services (0.1%) | |
Republic Services, Inc., 3.800%, 5/15/18 | | | 100,000 | | | | 103 | |
Waste Management, Inc., 3.125%, 3/1/25 | | | 150,000 | | | | 150 | |
Waste Management, Inc., 3.500%, 5/15/24 | | | 100,000 | | | | 103 | |
| | | | | | | | |
Total | | | | | | | 356 | |
| | | | | | | | |
|
Technology (0.8%) | |
Apple, Inc., 1.000%, 5/3/18 | | | 100,000 | | | | 100 | |
| | | | | | | | |
| Corporate Bonds (16.8%) | | Shares/
$ Par | | | Value
$ (000’s) | |
|
Technology continued | |
Apple, Inc., 3.250%, 2/23/26 | | | 200,000 | | | | 200 | |
Cisco Systems, Inc., 1.600%, 2/28/19 | | | 200,000 | | | | 200 | |
Cisco Systems, Inc., 5.900%, 2/15/39 | | | 165,000 | | | | 210 | |
Diamond 1 Finance Corp. / Diamond 2 Finance Corp., 6.020%, 6/15/26 144A | | | 140,000 | | | | 152 | |
Fidelity National Information Services, Inc., 3.000%, 8/15/26 | | | 200,000 | | | | 188 | |
Fidelity National Information Services, Inc., 3.500%, 4/15/23 | | | 100,000 | | | | 101 | |
Hewlett Packard Enterprise Co., 3.600%, 10/15/20 144A | | | 130,000 | | | | 132 | |
Intuit, Inc., 5.750%, 3/15/17 | | | 140,000 | | | | 141 | |
Microsoft Corp., 2.125%, 11/15/22 | | | 180,000 | | | | 175 | |
Microsoft Corp., 3.450%, 8/8/36 | | | 400,000 | | | | 380 | |
Oracle Corp., 2.500%, 10/15/22 | | | 300,000 | | | | 297 | |
Oracle Corp., 2.650%, 7/15/26 | | | 150,000 | | | | 142 | |
Oracle Corp., 5.750%, 4/15/18 | | | 300,000 | | | | 317 | |
| | | | | | | | |
Total | | | | | | | 2,735 | |
| | | | | | | | |
|
Telecommunications (1.0%) | |
American Tower Corp., 3.375%, 10/15/26 | | | 400,000 | | | | 379 | |
AT&T, Inc., 3.400%, 5/15/25 | | | 450,000 | | | | 434 | |
AT&T, Inc., 3.600%, 2/17/23 | | | 250,000 | | | | 252 | |
AT&T, Inc., 4.450%, 4/1/24 | | | 100,000 | | | | 104 | |
AT&T, Inc., 4.800%, 6/15/44 | | | 280,000 | | | | 265 | |
AT&T, Inc., 6.550%, 2/15/39 | | | 77,000 | | | | 89 | |
British Telecommunications PLC, 5.950%, 1/15/18 | | | 100,000 | | | | 104 | |
Charter Communications Operating LLC / Charter Communications Operating Capital Corp., 6.484%, 10/23/45 | | | 330,000 | | | | 382 | |
Crown Castle International Corp., 4.450%, 2/15/26 | | | 240,000 | | | | 248 | |
Deutsche Telekom International Finance BV, 6.750%, 8/20/18 | | | 130,000 | | | | 140 | |
Orange SA, 2.750%, 2/6/19 | | | 100,000 | | | | 101 | |
Verizon Communications, Inc., 4.125%, 8/15/46 | | | 300,000 | | | | 272 | |
Verizon Communications, Inc., 4.400%, 11/1/34 | | | 150,000 | | | | 148 | |
Verizon Communications, Inc., 5.150%, 9/15/23 | | | 250,000 | | | | 276 | |
| | | | | | | | |
Total | | | | | | | 3,194 | |
| | | | | | | | |
|
Transportation (0.5%) | |
Burlington Northern Santa Fe LLC, 3.000%, 4/1/25 | | | 200,000 | | | | 200 | |
Burlington Northern Santa Fe LLC, 3.750%, 4/1/24 | | | 200,000 | | | | 210 | |
Burlington Northern Santa Fe LLC, 4.950%, 9/15/41 | | | 100,000 | | | | 112 | |
CSX Corp., 3.800%, 11/1/46 | | | 200,000 | | | | 185 | |
Norfolk Southern Corp., 3.850%, 1/15/24 | | | 75,000 | | | | 78 | |
Norfolk Southern Corp., 5.750%, 4/1/18 | | | 100,000 | | | | 105 | |
Penske Truck Leasing Co. LP / PTL Finance Corp., 2.875%, 7/17/18 144A | | | 100,000 | | | | 101 | |
Union Pacific Corp., 2.750%, 4/15/23 | | | 100,000 | | | | 99 | |
Union Pacific Corp., 3.350%, 8/15/46 | | | 165,000 | | | | 148 | |
United Parcel Service, Inc., 3.400%, 11/15/46 | | | 300,000 | | | | 277 | |
| | | | | | | | |
Total | | | | | | | 1,515 | |
| | | | | | | | |
| | |
Total Corporate Bonds | | | | | | | | |
(Cost: $55,094) | | | | | | | 54,732 | |
| | | | | | | | |
The Accompanying Notes are an Integral Part of the Financial Statements.
| | | | | | |
| | Inflation Protection Portfolio | | | 133 | |
Inflation Protection Portfolio
| | | | | | | | | | |
| | | Governments (61.3%) | | Shares/
Par | | | Value
$ (000’s) | |
| |
| | Foreign Agencies (0.3%) | |
| | CNOOC Nexen Finance 2014 ULC, 1.625%, 4/30/17 | | | 100,000 | | | | 100 | |
| | Petroleos Mexicanos, 3.500%, 1/30/23 | | | 130,000 | | | | 119 | |
| | Petroleos Mexicanos, 4.625%, 9/21/23 144A | | | 200,000 | | | | 194 | |
| | Petroleos Mexicanos, 4.875%, 1/18/24 | | | 400,000 | | | | 388 | |
| | Statoil ASA, 2.450%, 1/17/23 | | | 250,000 | | | | 244 | |
| | | | | | | | | | |
| | Total | | | | | | | 1,045 | |
| | | | | | | | | | |
| |
| | Foreign Governments (2.8%) | |
| (f) | | Australia Government Bond, 4.000%, 8/20/20 AUD | | | 715,000 | | | | 962 | |
| (f) | | Canadian Government Bond, 4.250%, 12/1/21 CAD | | | 745,795 | | | | 674 | |
| (f) | | Canadian Government Bond, 4.250%, 12/1/26 CAD | | | 1,469,740 | | | | 1,527 | |
| (f) | | Italy Buoni Poliennali Del Tesoro, 2.350%, 9/15/24 EUR | | | 2,963,900 | | | | 3,560 | |
| (f) | | Italy Buoni Poliennali Del Tesoro, 3.100%, 9/15/26 EUR | | | 1,995,889 | | | | 2,567 | |
| | | | | | | | | | |
| | Total | | | | | | | 9,290 | |
| | | | | | | | | | |
| |
| | Governments (58.0%) | |
| | Federal Home Loan Mortgage Corp., 6.250%, 7/15/32 | | | 750,000 | | | | 1,032 | |
| (b) | | Federal National Mortgage Association, 6.625%, 11/15/30 | | | 12,200,000 | | | | 16,971 | |
| | US Treasury, 0.125%, 7/15/26 | | | 2,823,464 | | | | 2,730 | |
| | US Treasury Inflation Index Bond, 0.125%, 4/15/19 | | | 1,495,733 | | | | 1,514 | |
| | US Treasury Inflation Index Bond, 0.125%, 4/15/21 | | | 3,314,480 | | | | 3,333 | |
| | US Treasury Inflation Index Bond, 0.125%, 1/15/22 | | | 507,267 | | | | 508 | |
| (b) | | US Treasury Inflation Index Bond, 0.125%, 7/15/22 | | | 9,985,260 | | | | 10,011 | |
| | US Treasury Inflation Index Bond, 0.125%, 1/15/23 | | | 3,665,095 | | | | 3,638 | |
| | US Treasury Inflation Index Bond, 0.125%, 7/15/24 | | | 1,781,430 | | | | 1,750 | |
| | US Treasury Inflation Index Bond, 0.250%, 1/15/25 | | | 7,143,500 | | | | 7,026 | |
| | US Treasury Inflation Index Bond, 0.375%, 7/15/23 | | | 2,596,600 | | | | 2,620 | |
| | US Treasury Inflation Index Bond, 0.375%, 7/15/25 | | | 6,523,200 | | | | 6,488 | |
| | US Treasury Inflation Index Bond, 0.625%, 2/15/43 | | | 6,728,448 | | | | 6,160 | |
| (b) | | US Treasury Inflation Index Bond, 0.625%, 7/15/21 | | | 10,188,212 | | | | 10,513 | |
| (b) | | US Treasury Inflation Index Bond, 0.625%, 1/15/24 | | | 13,104,262 | | | | 13,335 | |
| | US Treasury Inflation Index Bond, 0.750%, 2/15/42 | | | 8,370,403 | | | | 7,924 | |
| | US Treasury Inflation Index Bond, 0.750%, 2/15/45 | | | 3,181,995 | | | | 2,994 | |
| | US Treasury Inflation Index Bond, 1.125%, 1/15/21 | | | 6,395,451 | | | | 6,709 | |
| | US Treasury Inflation Index Bond, 1.250%, 7/15/20 | | | 1,108,427 | | | | 1,171 | |
| | US Treasury Inflation Index Bond, 1.375%, 2/15/44 | | | 8,691,066 | | | | 9,485 | |
| | US Treasury Inflation Index Bond, 1.375%, 1/15/20 | | | 1,788,400 | | | | 1,881 | |
| | US Treasury Inflation Index Bond, 1.750%, 1/15/28 | | | 4,609,271 | | | | 5,146 | |
| | US Treasury Inflation Index Bond, 1.875%, 7/15/19 | | | 1,132,030 | | | | 1,205 | |
| | US Treasury Inflation Index Bond, 2.000%, 1/15/26 | | | 2,009,403 | | | | 2,264 | |
| | US Treasury Inflation Index Bond, 2.125%, 2/15/40 | | | 2,124,770 | | | | 2,632 | |
| | US Treasury Inflation Index Bond, 2.125%, 2/15/41 | | | 5,943,640 | | | | 7,399 | |
| (b) | | US Treasury Inflation Index Bond, 2.375%, 1/15/25 | | | 24,556,045 | | | | 28,195 | |
| (k) | | US Treasury Inflation Index Bond, 2.375%, 1/15/27 | | | 2,666,818 | | | | 3,124 | |
| | US Treasury Inflation Index Bond, 2.500%, 1/15/29 | | | 6,996,847 | | | | 8,439 | |
| (b) | | US Treasury Inflation Index Bond, 3.375%, 4/15/32 | | | 4,173,733 | | | | 5,770 | |
| | US Treasury Inflation Index Bond, 3.625%, 4/15/28 | | | 2,241,645 | | | | 2,948 | |
| | US Treasury Inflation Index Bond, 3.875%, 4/15/29 | | | 3,528,744 | | | | 4,825 | |
| | | | | | | | | | |
| | Total | | | | | | | 189,740 | |
| | | | | | | | | | |
| |
| | Yankee Sovereign (0.2%) | |
| | Mexico Government International Bond, 4.750%, 3/8/44 | | | 200,000 | | | | 182 | |
| | | | | | | | | | |
| | | Governments (61.3%) | | Shares/
$ Par | | | Value
$ (000’s) | |
| | | |
| | Yankee Sovereign continued | | | | | | | | |
| | Saudi Government International Bond, 2.375%, 10/26/21 144A | | | 300,000 | | | | 291 | |
| | | | | | | | | | |
| | Total | | | | 473 | |
| | | | | | | | | | |
| | |
| | Total Governments | | | | | |
| | (Cost: $203,748) | | | | 200,548 | |
| | | | | | | | | | |
| | | |
| | | Municipal Bonds (0.5%) | | | | | | |
| |
| | Municipal Bonds (0.5%) | |
| | Bay Area Toll Authority, Series S-1, 6.918%, 4/1/40 RB | | | 35,000 | | | | 47 | |
| | City of San Francisco CA Public Utilities Commission Water Revenue, 6.950%, 11/1/50 RB | | | 25,000 | | | | 35 | |
| | City Public Service Board of San Antonio TX, 5.985%, 2/1/39 RB | | | 150,000 | | | | 189 | |
| | Los Angeles Community College District/CA, Series 2010-E, 6.750%, 8/1/49 GO | | | 95,000 | | | | 137 | |
| | Los Angeles Department of Water & Power, 5.716%, 7/1/39 RB | | | 15,000 | | | | 18 | |
| | Metropolitan Transportation Authority, Series 2010-E, 6.814%, 11/15/40 RB | | | 50,000 | | | | 66 | |
| | Missouri Highway & Transportation Commission, 5.445%, 5/1/33 RB | | | 100,000 | | | | 118 | |
| | New Jersey Turnpike Authority, Series 2010, 7.102%, 1/1/41 RB | | | 100,000 | | | | 140 | |
| | Port Authority of New York & New Jersey, Series 168, 4.926%, 10/1/51 RB, GO OF AUTH | | | 50,000 | | | | 55 | |
| | Rutgers - The State University of New Jersey, 5.665%, 5/1/40 RB | | | 55,000 | | | | 65 | |
| | Santa Clara Valley Transportation Authority, 5.876%, 4/1/32 RB | | | 50,000 | | | | 60 | |
| | State of California, Series 2009, 7.550%, 4/1/39 GO | | | 250,000 | | | | 370 | |
| | State of llinois, 5.100%, 6/1/33 GO | | | 150,000 | | | | 133 | |
| | State of Texas, Series 2009A, 5.517%, 4/1/39 GO | | | 30,000 | | | | 38 | |
| | | | | | | | | | |
| | | |
| | Total Municipal Bonds | | | | | | | | |
| | (Cost: $1,526) | | | | | | | 1,471 | |
| | | | | | | | | | |
| |
| | | Structured Products (17.7%) | |
| |
| | Structured Products (17.7%) | |
| | Agate Bay Mortgage Trust, Series 2014-1, Class 1A6, 3.500%, 7/25/44 144A | | | 1,466,292 | | | | 1,478 | |
| | Agate Bay Mortgage Trust, Series 2014-3, Class A2, 3.500%, 11/25/44 144A | | | 1,020,797 | | | | 1,019 | |
| | Agate Bay Mortgage Trust, Series 2015-7, Class A3, 3.500%, 10/25/45 144A | | | 1,796,055 | | | | 1,787 | |
| | Agate Bay Mortgage Trust, Series 2016-1, Class A3, 3.500%, 12/25/45 144A | | | 1,406,922 | | | | 1,405 | |
| | Agate Bay Mortgage Trust, Series 2016-2, Class A3, 3.500%, 3/25/46 144A | | | 1,049,629 | | | | 1,059 | |
| | Agate Bay Mortgage Trust, Series 2016-3, Class A3, 3.500%, 8/25/46 144A | | | 901,543 | | | | 902 | |
| | American Homes 4 Rent, Series 2014-SFR1, Class A, 1.736%, 6/17/31 144A | | | 1,589,676 | | | | 1,584 | |
| | Avis Budget Rental Car Funding AESOP LLC, Series 2013-1A, Class A, 1.920%, 9/20/19 144A | | | 625,000 | | | | 622 | |
The Accompanying Notes are an Integral Part of the Financial Statements.
| | | | |
| 134 | | Inflation Protection Portfolio | | |
Inflation Protection Portfolio
| | | | | | | | | | |
| | | Structured Products (17.7%) | | Shares/
$ Par | | | Value
$ (000’s) | |
| |
| | Structured Products continued | |
| | Avis Budget Rental Car Funding AESOP LLC, Series 2012-3A, Class A, 2.100%, 3/20/19 144A | | | 750,000 | | | | 751 | |
| | BAMLL Commercial Mortgage Securities Trust, Series 2015-200P, Class A, 3.218%, 4/14/33 144A | | | 825,000 | | | | 828 | |
| | BB-UBS Trust, Series 2012-SHOW, Class A, 3.430%, 11/5/36 144A | | | 1,000,000 | | | | 1,012 | |
| | CD Mortgage Trust, Series 2016-CD2, Class A4, 3.526%, 11/10/49 | | | 700,000 | | | | 720 | |
| | Chesapeake Funding LLC, Series 2014-1A, Class A, 1.072%, 3/7/26 144A | | | 354,517 | | | | 353 | |
| | Citicorp Mortgage Securities Trust, Series 2007-8, Class 1A3, 6.000%, 9/25/37 | | | 48,970 | | | | 51 | |
| | Citigroup / Deutsche Bank Mortgage Trust, Series 2016-CD1, Class AM, 2.926%, 8/10/49 | | | 1,000,000 | | | | 959 | |
| | Commercial Mortgage Pass Through Certificates, Series 2016-CR28, Class B, 4.647%, 2/10/49 | | | 880,000 | | | | 926 | |
| | Commercial Mortgage Trust Pass Through Certificates, Series 2015-CR22, Class AM, 3.603%, 3/10/48 | | | 900,000 | | | | 905 | |
| | Commercial Mortgage Trust Pass Through Certificates, Series 2014-UBS5, Class AM, 4.193%, 9/10/47 | | | 850,000 | | | | 879 | |
| | Commercial Mortgage Trust Pass Through Certificates, Series 2014-CR15, Class AM, 4.426%, 2/10/47 | | | 1,000,000 | | | | 1,067 | |
| | Commercial Mortgage Trust Pass-Through Certificates, Series 2015-3BP, Class A, 3.178%, 2/10/35 144A | | | 875,000 | | | | 875 | |
| | Core Industrial Trust, Series 2015-WEST, Class A, 3.292%, 2/10/37 144A | | | 950,000 | | | | 951 | |
| | Core Industrial Trust, Series 2015-TEXW, Class B, 3.329%, 2/10/34 144A | | | 725,000 | | | | 729 | |
| | Credit Suisse Mortgage Trust, Series 2015-WIN1, Class A10, 3.500%, 12/25/44 144A | | | 300,000 | | | | 295 | |
| | Federal Home Loan Mortgage Corp., 4.000%, 5/1/42 | | | 5,044,480 | | | | 5,331 | |
| | Federal Home Loan Mortgage Corp., 4.500%, 4/1/41 | | | 3,566,640 | | | | 3,867 | |
| | Federal National Mortgage Association, 4.000%, 2/1/46 | | | 6,839,076 | | | | 7,196 | |
| | GS Mortgage Securities Trust, Series 2015-GC28, Class A5, 3.396%, 2/10/48 | | | 1,000,000 | | | | 1,017 | |
| | GS Mortgage Securities Trust, Series 2016-GS2, Class B, 3.759%, 5/10/49 | | | 750,000 | | | | 757 | |
| | Hilton Grand Vacations Trust, Series 2014-AA, Class A, 1.770%, 11/25/26 144A | | | 372,361 | | | | 365 | |
| | Hudson Yards Mortgage Trust, Series 2016-10HY, Class B, 2.977%, 8/10/38 144A | | | 1,175,000 | | | | 1,128 | |
| | Invitation Homes Trust, Series 2014-SFR3, Class A, 1.936%, 12/17/31 144A | | | 561,992 | | | | 562 | |
| | Irvine Core Office Trust, Series 2013-IRV, Class A2, 3.173%, 5/15/48 144A | | | 950,000 | | | | 962 | |
| | JP Morgan Chase Commercial Mortgage Securities Corp., Series 2016-JP2, Class A4, 2.822%, 8/15/49 | | | 600,000 | | | | 582 | |
| | | | | | | | | | |
| | | Structured Products (17.7%) | | Shares/
$ Par | | | Value
$ (000’s) | |
| |
| | Structured Products continued | |
| | JP Morgan Chase Commercial Mortgage Securities Corp., Series 2016-JP3, Class AS, 3.144%, 8/15/49 | | | 675,000 | | | | 658 | |
| | JP Morgan Mortgage Trust, Series 2013-1, Class 2A2, 2.500%, 3/25/43 144A | | | 1,185,121 | | | | 1,169 | |
| | JP Morgan Mortgage Trust, Series 2014-5, Class A1, 3.000%, 10/25/29 144A | | | 1,163,027 | | | | 1,174 | |
| | JP Morgan Mortgage Trust, Series 2016-1, Class A7, 3.500%, 5/25/46 144A | | | 1,750,000 | | | | 1,690 | |
| | JPMBB Commercial Mortgage Securities Trust, Series 2014-C21, Class B, 4.341%, 8/15/47 | | | 700,000 | | | | 731 | |
| | JPMorgan Chase Commercial Mortgage Securities Trust, Series 2013-C16, Class A4, 4.166%, 12/15/46 | | | 600,000 | | | | 645 | |
| | Morgan Stanley Capital I Trust, Series 2016-UB11, Class A4, 2.782%, 8/15/49 | | | 1,575,000 | | | | 1,519 | |
| | Morgan Stanley Capital I Trust, Series 2014-CPT, Class C, 3.446%, 7/13/29 144A | | | 600,000 | | | | 604 | |
| | MVW Owner Trust, Series 2016-1A, Class A, 2.250%, 12/20/33 144A | | | 614,845 | | | | 603 | |
| | MVW Owner Trust, Series 2015-1A, Class A, 2.520%, 12/20/32 144A | | | 781,583 | | | | 777 | |
| | PHHMC Mortgage Pass-Through Certificates, Series 2007-6, Class A1, 5.633%, 12/18/37 | | | 23,413 | | | | 24 | |
| | Sequoia Mortgage Trust, Series 2014-3, Class A14, 3.000%, 10/25/44 144A | | | 361,202 | | | | 364 | |
| | Sequoia Mortgage Trust, Series 2014-4, Class A2, 3.500%, 11/25/44 144A | | | 303,726 | | | | 307 | |
| | Sequoia Mortgage Trust, Series 2013-12, Class A1, 4.000%, 12/25/43 144A | | | 224,997 | | | | 232 | |
| | Sierra Receivables Funding LLC, Series 2015-1A, Class A, 2.400%, 3/22/32 144A | | | 231,388 | | | | 230 | |
| | Sierra Receivables Funding LLC, Series 2016-1A, Class A, 3.080%, 3/21/33 144A | | | 709,003 | | | | 716 | |
| | Structured Adjustable Rate Mortgage Loan Trust, Series 2004-6, Class 3A2, 3.147%, 6/25/34 | | | 556,836 | | | | 576 | |
| | Thornburg Morgage Securities Trust, Series 2004-3, Class A, 1.496%, 9/25/44 | | | 404,028 | | | | 369 | |
| | Towd Point Mortgage Trust, Series 2016-1, Class A1, 3.500%, 2/25/55 144A | | | 787,566 | | | | 803 | |
| | Wells Fargo Mortgage Backed Securities Trust, Series 2005-AR10, Class 2A15, 3.010%, 6/25/35 | | | 1,031,349 | | | | 1,060 | |
| | Wells Fargo Mortgage Backed Securities Trust, Series 2005-AR10, Class 1A1, 3.022%, 6/25/35 | | | 336,302 | | | | 348 | |
| | Wells Fargo Mortgage Backed Securities Trust, Series 2005-17, Class 1A1, 5.500%, 1/25/36 | | | 49,164 | | | | 48 | |
| | Wells Fargo Mortgage Backed Securities Trust, Series 2006-10, Class A4, 6.000%, 8/25/36 | | | 70,087 | | | | 70 | |
| | Wells Fargo Mortgage Backed Securities Trust, Series 2007-AR10, Class 1A1, 6.310%, 1/25/38 | | | 74,482 | | | | 72 | |
| | WinWater Mortgage Loan Trust, Series 2014-1, Class A4, 3.500%, 6/20/44 144A | | | 301,847 | | | | 304 | |
| | | | | | | | | | |
| | | |
| | Total Structured Products | | | | | | | | |
| | (Cost: $58,446) | | | | | | | 58,017 | |
| | | | | | | | | | |
The Accompanying Notes are an Integral Part of the Financial Statements.
| | | | | | |
| | Inflation Protection Portfolio | | | 135 | |
Inflation Protection Portfolio
| | | | | | | | | | |
| | | Short-Term Investments (4.5%) | | Shares/
$ Par | | | Value
$ (000’s) | |
| |
| | Commercial Paper (4.5%) | |
| (r) | | Credit Agricole Cib, 0.520%, 1/3/17 | | | 14,774,000 | | | | 14,773 | |
| | | | | | | | | | |
| | Total | | | | | | | 14,773 | |
| | | | | | | | | | |
| | |
| | Total Short-Term Investments | | | | | |
| | (Cost: $14,773) | | | | | | | 14,773 | |
| | | | | | | | | | |
| | |
| | Total Investments (100.8%) | | | | | |
| | (Cost: $333,647)(a) | | | | | | | 329,541 | |
| | | | | | | | | | |
| | Other Assets, Less | | | | | | | | |
| | Liabilities (-0.8%) | | | | (2,614 | ) |
| | | | | | | | | | |
| | Net Assets (100.0%) | | | | 326,927 | |
| | | | | | | | | | |
144A after the name of a security represents a security exempt from registration under Rule 144A of the Securities Act of 1933. These securities may be resold as transactions exempt from registration, normally to qualified institutional buyers. At December 31, 2016 the value of these securities (in thousands) was $30,019 representing 9.2% of the net assets.
GO — General Obligation
RB — Revenue Bond
AUD — Australian Dollar
CAD — Canadian Dollar
EUR — Euro
JPY — Japanese Yen
| (a) | At December 31, 2016, the aggregate cost of securities for federal tax purposes (in thousands) was $333,670 and the net unrealized depreciation of investments based on that cost was $4,129 which is comprised of $3,180 aggregate gross unrealized appreciation and $7,309 aggregate gross unrealized depreciation. |
| (b) | All or a portion of the securities have been pledged as collateral for open futures positions. Information regarding open futures contracts as of period end is summarized below. |
| | | | | | | | |
| Issuer (000’s) | | Number of Contracts | | Expiration Date | | Unrealized
Appreciation/
(Depreciation)
(000’s) | |
US Five Year Treasury Note Futures (Long) (Total Notional Value at December 31, 2016, $23,078) | | 196 | | 3/17 | | $ | (16 | ) |
US Long Treasury Bond Futures (Short) (Total Notional Value at December 31, 2016, $13,724) | | 91 | | 3/17 | | | 14 | |
US Ten Year Treasury Note Futures (Short) (Total Notional Value at December 31, 2016, $3,984) | | 32 | | 3/17 | | | 7 | |
US Two Year Treasury Note Futures (Long) (Total Notional Value at December 31, 2016, $24,274) | | 112 | | 3/17 | | | (6 | ) |
US Ultra Long Treasury Bond Futures (Short) (Total Notional Value at December 31, 2016, $7,702) | | 48 | | 3/17 | | | 10 | |
US Ultra Treasury Bond Future (Short) (Total Notional Value at December 31, 2016, $11,913) | | 89 | | 3/17 | | | (19 | ) |
| (e) | Step bond security that presently receives no coupon payments. At the predetermined date the stated coupon rate becomes effective. |
| (f) | Foreign Bond — par value is foreign denominated |
| (h) | Forward foreign currency contracts outstanding on December 31, 2016. |
| | | | | | | | | | | | | | | | | | | | | | |
| Type | | Counterparty | | Currency | | Foreign
Principal
Amount Covered by
Contract (000s) | | USD Principal
Amount Covered by Contract (000’s) | | Settlement
Month | | Unrealized
Appreciation
(000’s) | | | Unrealized
(Depreciation)
(000’s) | | | Net Unrealized
Appreciation/
(Depreciation)
(000’s) | |
Sell | | HSBC Bank USA NA | | AUD | | 1,308 | | 942 | | 3/17 | | $ | 30 | | | $ | - | | | $ | 30 | |
Buy | | HSBC Bank USA NA | | CAD | | 45 | | 34 | | 3/17 | | | - | | | | - | (m) | | | - | (m) |
Sell | | HSBC Bank USA NA | | CAD | | 2,926 | | 2,181 | | 3/17 | | | 21 | | | | - | | | | 21 | |
Sell | | HSBC Bank USA NA | | EUR | | 5,732 | | 6,057 | | 3/17 | | | 114 | | | | - | | | | 114 | |
Buy | | HSBC Bank USA NA | | JPY | | 53,628 | | 460 | | 3/17 | | | - | | | | (7 | ) | | | (7 | ) |
Sell | | HSBC Bank USA NA | | JPY | | 53,628 | | 461 | | 3/17 | | | 12 | | | | - | | | | 12 | |
| | | | | | | | | | | | | | | | | | | | | | |
| | | | | | | | | | | | $ | 178 | | | $ | (8 | ) | | $ | 170 | |
| | | | | | | | | | | | | | | | | | | | | | |
The Accompanying Notes are an Integral Part of the Financial Statements.
| | | | | | |
| 136 | | Inflation Protection Portfolio | | | | |
Inflation Protection Portfolio
| (j) | Swap agreements outstanding on December 31, 2016. |
Total Return Swaps
| | | | | | | | | | | | | | |
| | |
| Reference Entity | | Counterparty | | Payment Made
by the Fund | | Payment
Received by the Fund | | Expiration Date | | Notional
Amount
(000’s) | | Unrealized
Appreciation/
(Depreciation)
(000’s) | |
U.S. Consumer Price Index - All Urban Consumers - Not Seasonally Adjusted (CPURNSA) | | Bank of America, N.A. | | 2.420% | | CPURNSA Index Total Return at Maturity | | 4/18 | | 2,000 | | $ | (135 | ) |
U.S. Consumer Price Index - All Urban Consumers - Not Seasonally Adjusted (CPURNSA) | | Bank of America, N.A. | | 2.223% | | CPURNSA Index Total Return at Maturity | | 5/18 | | 2,500 | | | (111 | ) |
U.S. Consumer Price Index - All Urban Consumers - Not Seasonally Adjusted (CPURNSA) | | Bank of America, N.A. | | 2.210% | | CPURNSA Index Total Return at Maturity | | 3/19 | | 6,500 | | | (222 | ) |
U.S. Consumer Price Index - All Urban Consumers - Not Seasonally Adjusted (CPURNSA) | | Bank of America, N.A. | | 2.640% | | CPURNSA Index Total Return at Maturity | | 3/19 | | 4,500 | | | (316 | ) |
U.S. Consumer Price Index - All Urban Consumers - Not Seasonally Adjusted (CPURNSA) | | Bank of America, N.A. | | 2.510% | | CPURNSA Index Total Return at Maturity | | 3/19 | | 2,000 | | | (164 | ) |
U.S. Consumer Price Index - All Urban Consumers - Not Seasonally Adjusted (CPURNSA) | | Bank of America, N.A. | | 2.640% | | CPURNSA Index Total Return at Maturity | | 2/20 | | 2,800 | | | (287 | ) |
U.S. Consumer Price Index - All Urban Consumers - Not Seasonally Adjusted (CPURNSA) | | Bank of America, N.A. | | 2.670% | | CPURNSA Index Total Return at Maturity | | 4/22 | | 3,000 | | | (352 | ) |
U.S. Consumer Price Index - All Urban Consumers - Not Seasonally Adjusted (CPURNSA) | | Bank of America, N.A. | | 2.763% | | CPURNSA Index Total Return at Maturity | | 3/23 | | 700 | | | (73 | ) |
U.S. Consumer Price Index - All Urban Consumers - Not Seasonally Adjusted (CPURNSA) | | Bank of America, N.A. | | 2.140% | | CPURNSA Index Total Return at Maturity | | 7/25 | | 2,900 | | | - | (m) |
U.S. Consumer Price Index - All Urban Consumers - Not Seasonally Adjusted (CPURNSA) | | Bank of America, N.A. | | 2.528% | | CPURNSA Index Total Return at Maturity | | 8/24 | | 2,750 | | | (193 | ) |
U.S. Consumer Price Index - All Urban Consumers - Not Seasonally Adjusted (CPURNSA) | | Bank of America, N.A. | | 1.790% | | CPURNSA Index Total Return at Maturity | | 8/25 | | 1,500 | | | 47 | |
U.S. Consumer Price Index - All Urban Consumers - Not Seasonally Adjusted (CPURNSA) | | Barclays Bank PLC | | 2.720% | | CPURNSA Index Total Return at Maturity | | 8/17 | | 2,000 | | | (254 | ) |
U.S. Consumer Price Index - All Urban Consumers - Not Seasonally Adjusted (CPURNSA) | | Barclays Bank PLC | | 2.345% | | CPURNSA Index Total Return at Maturity | | 9/17 | | 13,000 | | | (635 | ) |
U.S. Consumer Price Index - All Urban Consumers - Not Seasonally Adjusted (CPURNSA) | | Barclays Bank PLC | | 1.710% | | CPURNSA Index Total Return at Maturity | | 2/20 | | 1,000 | | | 3 | |
U.S. Consumer Price Index - All Urban Consumers - Not Seasonally Adjusted (CPURNSA) | | Barclays Bank PLC | | 2.526% | | CPURNSA Index Total Return at Maturity | | 5/23 | | 5,500 | | | (442 | ) |
U.S. Consumer Price Index - All Urban Consumers - Not Seasonally Adjusted (CPURNSA) | | Barclays Bank PLC | | 2.535% | | CPURNSA Index Total Return at Maturity | | 5/23 | | 1,000 | | | (81 | ) |
U.S. Consumer Price Index - All Urban Consumers - Not Seasonally Adjusted (CPURNSA) | | Barclays Bank PLC | | 2.589% | | CPURNSA Index Total Return at Maturity | | 7/24 | | 1,400 | | | (107 | ) |
U.S. Consumer Price Index - All Urban Consumers - Not Seasonally Adjusted (CPURNSA) | | Barclays Bank PLC | | 2.385% | | CPURNSA Index Total Return at Maturity | | 9/24 | | 4,000 | | | (214 | ) |
The Accompanying Notes are an Integral Part of the Financial Statements.
| | | | | | |
| | Inflation Protection Portfolio | | | 137 | |
Inflation Protection Portfolio
| | | | | | | | | | | | | | |
| Reference Entity | | Counterparty | | Payment Made
by the Fund | | Payment
Received by the
Fund | | Expiration Date | | Notional
Amount (000’s) | | Unrealized
Appreciation/
(Depreciation)
(000’s) | |
U.S. Consumer Price Index - All Urban Consumers - Not Seasonally Adjusted (CPURNSA) | | Barclays Bank PLC | | 2.363% | | CPURNSA Index Total Return at Maturity | | 9/24 | | 3,500 | | $ | (177 | ) |
U.S. Consumer Price Index - All Urban Consumers - Not Seasonally Adjusted (CPURNSA) | | Barclays Bank PLC | | 2.310% | | CPURNSA Index Total Return at Maturity | | 9/24 | | 1,400 | | | (63 | ) |
U.S. Consumer Price Index - All Urban Consumers - Not Seasonally Adjusted (CPURNSA) | | Barclays Bank PLC | | 2.895% | | CPURNSA Index Total Return at Maturity | | 12/27 | | 1,700 | | | (377 | ) |
U.S. Consumer Price Index - All Urban Consumers - Not Seasonally Adjusted (CPURNSA) | | Barclays Bank PLC | | 2.784% | | CPURNSA Index Total Return at Maturity | | 7/44 | | 1,400 | | | (261 | ) |
U.S. Consumer Price Index - All Urban Consumers - Not Seasonally Adjusted (CPURNSA) | | Goldman Sachs International | | 1.870% | | CPURNSA Index Total Return at Maturity | | 5/26 | | 17,000 | | | 731 | |
U.S. Consumer Price Index - All Urban Consumers - Not Seasonally Adjusted (CPURNSA) | | Goldman Sachs International | | 1.920% | | CPURNSA Index Total Return at Maturity | | 5/26 | | 7,000 | | | 263 | |
U.S. Consumer Price Index - All Urban Consumers - Not Seasonally Adjusted (CPURNSA) | | Goldman Sachs International | | 1.770% | | CPURNSA Index Total Return at Maturity | | 6/26 | | 6,000 | | | 313 | |
U.S. Consumer Price Index - All Urban Consumers - Not Seasonally Adjusted (CPURNSA) | | Goldman Sachs International | | 2.245% | | CPURNSA Index Total Return at Maturity | | 11/26 | | 3,000 | | | 19 | |
U.S. Consumer Price Index - All Urban Consumers - Not Seasonally Adjusted (CPURNSA) | | Goldman Sachs International | | 2.280% | | CPURNSA Index Total Return at Maturity | | 11/26 | | 3,000 | | | 8 | |
U.S. Consumer Price Index - All Urban Consumers - Not Seasonally Adjusted (CPURNSA) | | Goldman Sachs International | | 2.280% | | CPURNSA Index Total Return at Maturity | | 11/26 | | 4,000 | | | 11 | |
| | | | | | | | | | | | | | |
| | | | | | | | | | | | $ | (3,069 | ) |
| | | | | | | | | | | | | | |
| (k) | Cash or securities with an aggregate value of $3,124 (in thousands) has been pledged as collateral for swap contracts outstanding, short sales or written options on December 31, 2016. |
| (m) | Amount is less than one thousand. |
| (r) | Rates are discount rates at the time of purchase. |
The following is a summary of the inputs used in valuing the Portfolio’s assets and liabilities at December 31, 2016. See Note 3 for additional information on portfolio valuation.
| | | | | | | | | | | | | | |
| | | Valuation Inputs | | | |
| Description | | Level 1 – Quoted Prices | | | Level 2 – Other Significant
Observable Inputs | | | Level 3 – Significant
Unobservable Inputs | | | |
| | | (Amounts in thousands) | | | |
Assets: | | | | | | | | | | | | | | |
Governments | | $ | - | | | $ | 200,548 | | | $ | - | | | |
Municipal Bonds | | | - | | | | 1,471 | | | | - | | | |
Corporate Bonds | | | - | | | | 54,732 | | | | - | | | |
Structured Products | | | - | | | | 58,017 | | | | - | | | |
Short-Term Investments | | | - | | | | 14,773 | | | | - | | | |
Other Financial Instruments^ | | | | | | | | | | | | | | |
Futures | | | 31 | | | | - | | | | - | | | |
Forward Currency Contracts | | | - | | | | 178 | | | | - | | | |
Total Return Swaps | | | - | | | | 1,395 | | | | - | | | |
Total Assets: | | $ | 31 | | | $ | 331,114 | | | $ | - | | | |
The Accompanying Notes are an Integral Part of the Financial Statements.
| | | | |
| 138 | | Inflation Protection Portfolio | | |
Inflation Protection Portfolio
| | | | | | | | | | | | | | |
| | | Valuation Inputs | | | |
| Description | | Level 1 – Quoted Prices | | | Level 2 –
Other Significant
Observable Inputs | | | Level 3 – Significant
Unobservable Inputs | | | |
Liabilities: | | | | | | | | | | | | | | |
Other Financial Instruments^ | | | | | | | | | | | | | | |
Futures | | | (41 | ) | | | - | | | | - | | | |
Forward Currency Contracts | | | - | | | | (8 | ) | | | - | | | |
Total Return Swaps | | | - | | | | (4,464 | ) | | | - | | | |
Total Liabilities: | | $ | (41 | ) | | $ | (4,472 | ) | | $ | - | | | |
^ Other financial instruments are derivative instruments such as futures, forwards, written options and swaps contracts, which are valued at the unrealized appreciation (depreciation) on the instrument and short sales, which are valued at market value.
The Accompanying Notes are an Integral Part of the Financial Statements.
| | | | | | |
| | Inflation Protection Portfolio | | | 139 | |
High Yield Bond Portfolio (unaudited)
| | | | |
| Objective: | | Portfolio Strategy: | | Net Assets: |
High current income and capital appreciation. | | Invest in non-investment grade debt securities. | | $757 million |
Portfolio Overview
Mason Street Advisors, LLC (“Mason Street Advisors”), the investment adviser for the High Yield Bond Portfolio (the “Portfolio”), has engaged Federated Investment Management Company (“Federated”) to act as sub-adviser for the Portfolio. Normally, the Portfolio invests in non-investment grade debt securities, which are securities rated below investment grade by major credit rating agencies, or if unrated, determined by Federated to be of comparable quality. The Portfolio may invest up to 30% of net assets in foreign securities. The securities in which the Portfolio primarily invests are considered speculative and are sometimes known as “junk bonds.” These securities tend to offer higher yields than higher rated securities of comparable maturities primarily because of the market’s greater uncertainty about the issuer’s ability to make all required interest and principal payments, and therefore about the returns that will in fact be realized by the Portfolio. Federated selects securities that it believes have attractive investment characteristics and seeks to minimize default risk and other risks through careful security selection and diversification. Federated’s securities selection process consists of a credit-intensive, fundamental analysis of the issuer. Federated does not limit the Portfolio’s investments to securities of a particular maturity range.
Market Overview
High yield bonds posted strong returns, and outperformed the broader bond market by a wide margin. For example, the Bloomberg Barclays® U.S. Corporate High Yield 2% Issuer Capped Index returned 17.13% for the year, while the Bloomberg Barclays® U.S. Aggregate Bond Index, a measure of high quality bond performance, returned 2.65% for the period.
The primary driver of the high yield market’s performance was the global rebound in commodity prices. The rally in commodity prices led to a substantial rebound in the bonds of commodity-oriented companies as the independent energy, oil field service and metals segments were the best performers in 2016 after being the worst performers in 2015. Slow and stable growth in the broader U.S. economy also helped the high yield market’s performance. Although geopolitical events such as the United Kingdom’s vote to leave the European Union, or “Brexit,” unrest in Syria and the U.S. presidential election threatened to derail the market’s recovery, fundamental credit stability and strength in commodities allayed these concerns.
Within the high yield market, major industries that substantially outperformed the broader high yield market included: metals and mining, independent energy, oil field services, midstream and industrial other. Major industries that substantially underperformed the broader high yield market included: pharmaceuticals, leisure, home construction, healthcare and transportation services. From a credit quality perspective, the lower-rated CCC-rated sector returned 31.46% while the higher-rated B-rated and BB-rated sectors returned 15.80% and 12.78%, respectively.
Portfolio Results
The Portfolio returned 14.59% for the twelve months ended December 31, 2016. By comparison, the Portfolio’s benchmark, the Bloomberg Barclays® U.S. Corporate High Yield 2% Issuer Capped Index (the “Index”), returned 17.13%. (The Index is unmanaged, cannot be invested in directly and does not include administrative expenses or sales charges.) According to Lipper® Analytical Services, Inc., an independent mutual fund rating agency, the average return for the High Yield Funds peer group was 13.08% for 2016.
The Portfolio was negatively affected by its sector allocation during the period under review. The Portfolio’s underweight, relative to the Index, to the strong performing metals and mining, independent energy and oil field services industries were among the largest detractors to relative performance. The Portfolio’s overweight in the underperforming healthcare, packaging and pharmaceutical segments negatively affected performance. Given the strong overall market performance, the Portfolio’s cash holding was also a drag on performance. The Portfolio did benefit from its underweight to the weak performing financials and home construction segments and its overweight to the strong performing midstream industry.
The Portfolio was positively affected by its security selection during the period. The Portfolio benefited from strong security selection in the technology and wireless telecommunication segments. Also strong security selection in the healthcare, pharmaceutical and packaging segments helped offset some of the negative impact from being overweight in these weak performing sectors. The Portfolio’s holdings in the industrial-other and gaming segments negatively impacted performance. Specific Portfolio holdings that substantially outperformed the Index included: Chesapeake Energy Corp., Legacy Reserves LP, Oasis Petroleum, Inc., Advanced Micro Devices, Inc. and EP Energy LLC. Specific Portfolio holdings that substantially underperformed the Index included: Intelsat (Luxembourg) S.A., Community Health Systems, Inc., Valeant Pharmaceuticals International, Inc., Endo Finance LLC and Hertz Corp.
| | | | |
| 140 | | High Yield Bond Portfolio | | |
High Yield Bond Portfolio (unaudited)
Portfolio Manager Outlook
The following forward-looking comments are the opinion of Federated, the Portfolio’s sub-adviser.
As we close out 2016, the picture looks much brighter than a year ago. Business, consumer and market confidence are improving, as an apparently more business-friendly administration gets ready to take control in Washington. Looking forward, we expect credit conditions to remain favorable as free cash flow generation improves, commodity prices stabilize well off early 2016 lows and default rates fall. Unfortunately, valuations for high yield bonds already reflect much of this optimism as credit spreads have moved below historical medians. Fortunately, we expect additional tightening to occur in 2017 perhaps as rates move higher in the U.S. Treasury market. This could lead to positive absolute returns below the lofty levels of 2016, but perhaps higher than most other fixed income instruments.
Relative Performance
| | | | | | | | | | | | |
Average Annual Total Returns
For Periods Ended December 31, 2016 | |
| | | 1 Year | | | 5 Years | | | 10 Years | |
High Yield Bond Portfolio | | | 14.59 | % | | | 6.63 | % | | | 6.82 | % |
Bloomberg Barclays® U.S. Corporate High Yield 2% Issuer Capped Index | | | 17.13 | % | | | 7.36 | % | | | 7.55 | % |
Lipper® Variable Insurance Products (VIP) High Yield Funds Average | | | 13.08 | % | | | 6.20 | % | | | 6.06 | % |
The performance data quoted represents past performance. Past performance is historical and does not guarantee future performance. Investment return and principal value will fluctuate, so that shares, when redeemed, may be worth more or less than their original cost. Current performance may be lower or higher than the performance data quoted. For the most recent month-end performance information visit www.northwesternmutual.com.
This chart assumes an initial investment of $10,000 made on 12/31/06. Returns shown reflect fee waivers, deductions for management and other portfolio expenses, and reinvestment of all dividends. In the absence of fee waivers, total return would be reduced. Returns exclude deductions for separate account sale loads and account fees. Please refer to the Benchmark Definitions section of this report for information about the indices cited in the above chart and graph.
The Portfolio invests in lower quality securities, which may represent a significant risk for loss of principal and interest. Bonds and other debt obligations are affected by changes in interest rates, inflation risk and the creditworthiness of their issuers. High yield bonds generally have greater price swings and higher default risks than investment grade bonds. Return of principal is not guaranteed. When interest rates rise, bond prices fall. With a fixed income fund, when interest rates rise, the value of the fund’s existing bonds drops, which could negatively affect overall fund performance.
Investing in bonds issued by foreign corporations and governments carries additional risk, including foreign currency risk, and may increase the volatility of the Portfolio’s performance.
Currently, interest rates are near unprecedented historically low levels. A significant rise in interest rates over a short period of time could cause significant losses in the market value of the Portfolio’s fixed income investments.
| | | | |
| | High Yield Bond Portfolio | | 141 |
High Yield Bond Portfolio (unaudited)
Top 10 Fixed Income Holdings 12/31/16
| | | | |
Security Description | | | % of Net Assets | |
HCA, Inc., Various | | | 2.3 | % |
Sprint Corp., Various | | | 1.8 | % |
T-Mobile USA, Inc., Various | | | 1.4 | % |
First Data Corp., Various | | | 1.4 | % |
Tenet Healthcare Corp., Various | | | 1.2 | % |
CCO Holdings LLC / CCO Holdings Capital Corp., Various | | | 1.2 | % |
Ally Financial, Inc., Various | | | 1.1 | % |
Infor US, Inc., Various | | | 1.1 | % |
Valeant Pharmaceuticals International, Various | | | 1.1 | % |
Altice, Various | | | 1.0 | % |
Sector Allocation 12/31/16
Sector Allocation is based on Net Assets.
Sector Allocation and Top 10 Holdings are subject to change.
| | | | |
| 142 | | High Yield Bond Portfolio | | |
High Yield Bond Portfolio
Schedule of Investments
December 31, 2016
| | | | | | | | | | |
| | | Bonds (96.7%) | | Shares/
$ Par | | | Value
$ (000’s) | |
| |
| | Aerospace & Defense (1.1%) | |
| | Engility Corp., 8.875%, 9/1/24 144A | | | 1,050,000 | | | | 1,100 | |
| | TransDigm, Inc., 6.000%, 7/15/22 | | | 520,000 | | | | 541 | |
| | TransDigm, Inc., 6.375%, 6/15/26 144A | | | 1,575,000 | | | | 1,617 | |
| | TransDigm, Inc., 6.500%, 7/15/24 | | | 4,725,000 | | | | 4,944 | |
| | TransDigm, Inc., 6.500%, 5/15/25 | | | 300,000 | | | | 314 | |
| | | | | | | | | | |
| | Total | | | | | | | 8,516 | |
| | | | | | | | | | |
| |
| | Autos & Vehicle Parts (3.3%) | |
| | Adient Global Holdings, Ltd., 4.875%, 8/15/26 144A | | | 1,225,000 | | | | 1,200 | |
| | Allison Transmission, Inc., 5.000%, 10/1/24 144A | | | 900,000 | | | | 909 | |
| | American Axle & Manufacturing, Inc., 6.250%, 3/15/21 | | | 960,000 | | | | 991 | |
| | BCD Acquisition, Inc., 9.625%, 9/15/23 144A | | | 1,500,000 | | | | 1,605 | |
| | Cooper-Standard Automotive, Inc., 5.625%, 11/15/26 144A | | | 425,000 | | | | 420 | |
| | Dana Financing Luxembourg Sarl, 6.500%, 6/1/26 144A | | | 1,800,000 | | | | 1,881 | |
| | Gates Global LLC / Gates Global Co., 6.000%, 7/15/22 144A | | | 3,642,000 | | | | 3,562 | |
| | The Goodyear Tire & Rubber Co., 5.000%, 5/31/26 | | | 1,150,000 | | | | 1,145 | |
| | The Goodyear Tire & Rubber Co., 5.125%, 11/15/23 | | | 625,000 | | | | 644 | |
| | International Automotive Components Group SA, 9.125%, 6/1/18 144A | | | 1,975,000 | | | | 1,926 | |
| | JB Poindexter & Co., Inc., 9.000%, 4/1/22 144A | | | 1,800,000 | | | | 1,890 | |
| | MPG Holdco I, Inc., 7.375%, 10/15/22 | | | 2,025,000 | | | | 2,116 | |
| | Schaeffler Finance BV, 4.750%, 5/15/23 144A | | | 375,000 | | | | 381 | |
| | Schaeffler Verwaltung Zwei GmbH, 4.125%, 9/15/21 144A | | | 350,000 | | | | 353 | |
| | Schaeffler Verwaltung Zwei GmbH, 4.500%, 9/15/23 144A | | | 375,000 | | | | 366 | |
| | Schaeffler Verwaltung Zwei GmbH, 4.750%, 9/15/26 144A | | | 1,725,000 | | | | 1,665 | |
| | Tenneco, Inc., 5.000%, 7/15/26 | | | 350,000 | | | | 343 | |
| | Tenneco, Inc., 5.375%, 12/15/24 | | | 750,000 | | | | 775 | |
| | TI Group Automotive Systems LLC, 8.750%, 7/15/23 144A | | | 1,750,000 | | | | 1,829 | |
| | ZF North America Capital, Inc., 4.750%, 4/29/25 144A | | | 900,000 | | | | 916 | |
| | | | | | | | | | |
| | Total | | | | | | | 24,917 | |
| | | | | | | | | | |
| | | |
| | Banking (1.1%) | | | | | | | | |
| | Ally Financial, Inc., 2.750%, 1/30/17 | | | 475,000 | | | | 475 | |
| | Ally Financial, Inc., 3.500%, 1/27/19 | | | 895,000 | | | | 899 | |
| | Ally Financial, Inc., 3.750%, 11/18/19 | | | 3,450,000 | | | | 3,465 | |
| | Ally Financial, Inc., 4.125%, 2/13/22 | | | 800,000 | | | | 793 | |
| | Ally Financial, Inc., 5.750%, 11/20/25 | | | 2,975,000 | | | | 2,968 | |
| | | | | | | | | | |
| | Total | | | | | | | 8,600 | |
| | | | | | | | | | |
| |
| | Basic Materials (7.5%) | |
| | Anixter, Inc., 5.125%, 10/1/21 | | | 1,800,000 | | | | 1,872 | |
| | Anixter, Inc., 5.500%, 3/1/23 | | | 275,000 | | | | 285 | |
| | ARD Finance SA, 7.125%, 9/15/23 144A | | | 2,975,000 | | | | 2,938 | |
| | Ardagh Packaging Finance PLC / Ardagh Holdings USA, 7.250%, 5/15/24 144A | | | 2,000,000 | | | | 2,107 | |
| | | | | | | | | | |
| | | Bonds (96.7%) | | Shares/
$ Par | | | Value
$ (000’s) | |
| |
| | Basic Materials continued | |
| | Ardagh Packaging Finance PLC / Ardagh Holdings USA, Inc., 4.625%, 5/15/23 144A | | | 525,000 | | | | 521 | |
| | Ardagh Packaging Finance PLC / Ardagh MP Holdings USA, Inc., 6.000%, 6/30/21 144A | | | 1,475,000 | | | | 1,501 | |
| | Ardagh Packaging Finance PLC / Ardagh MP Holdings USA, Inc., 6.250%, 1/31/19 144A | | | 1,640,000 | | | | 1,667 | |
| | Ball Corp., 5.250%, 7/1/25 | | | 1,675,000 | | | | 1,750 | |
| | Belden, Inc., 5.250%, 7/15/24 144A | | | 325,000 | | | | 327 | |
| | Belden, Inc., 5.500%, 9/1/22 144A | | | 3,450,000 | | | | 3,553 | |
| | Berry Plastics Corp., 5.125%, 7/15/23 | | | 1,150,000 | | | | 1,170 | |
| | Berry Plastics Corp., 5.500%, 5/15/22 | | | 4,205,000 | | | | 4,373 | |
| | Berry Plastics Corp., 6.000%, 10/15/22 | | | 275,000 | | | | 291 | |
| | BWAY Holding Co., 9.125%, 8/15/21 144A | | | 3,965,000 | | | | 4,183 | |
| | Clearwater Paper Corp., 5.375%, 2/1/25 144A | | | 2,675,000 | | | | 2,648 | |
| | Cleaver-Brooks, Inc., 8.750%, 12/15/19 144A | | | 1,300,000 | | | | 1,354 | |
| | Crown Americas LLC / Crown Americas Capital Corp. IV, 4.500%, 1/15/23 | | | 875,000 | | | | 892 | |
| | Crown Americas LLC / Crown Americas Capital Corp. V, 4.250%, 9/30/26 144A | | | 375,000 | | | | 353 | |
| | Garda World Security Corp., 7.250%, 11/15/21 144A | | | 520,000 | | | | 484 | |
| | The Hillman Group, Inc., 6.375%, 7/15/22 144A | | | 3,200,000 | | | | 3,008 | |
| | Multi-Color Corp., 6.125%, 12/1/22 144A | | | 3,125,000 | | | | 3,266 | |
| | Owens-Brockway Glass Container, Inc., 5.375%, 1/15/25 144A | | | 2,350,000 | | | | 2,368 | |
| | Owens-Brockway Glass Container, Inc., 5.875%, 8/15/23 144A | | | 500,000 | | | | 521 | |
| | Owens-Brockway Glass Container, Inc., 6.375%, 8/15/25 144A | | | 600,000 | | | | 633 | |
| | Reynolds Group Issuer, Inc. / Reynolds Group Issuer LLC / Reynolds Group Issuer LU, 5.750%, 10/15/20 | | | 2,405,000 | | | | 2,480 | |
| | Reynolds Group Issuer, Inc. / Reynolds Group Issuer LLC / Reynolds Group Issuer LU, 6.875%, 2/15/21 | | | 502,305 | | | | 517 | |
| | Reynolds Group Issuer, Inc. / Reynolds Group Issuer LLC / Reynolds Group Issuer LU, 7.000%, 7/15/24 144A | | | 1,950,000 | | | | 2,073 | |
| | Reynolds Group Issuer, Inc. / Reynolds Group Issuer LLC / Reynolds Group Issuer LU, 8.250%, 2/15/21 | | | 1,269,264 | | | | 1,310 | |
| | Sealed Air Corp., 4.875%, 12/1/22 144A | | | 1,375,000 | | | | 1,413 | |
| | Sealed Air Corp., 5.125%, 12/1/24 144A | | | 1,950,000 | | | | 2,004 | |
| | Sealed Air Corp., 5.500%, 9/15/25 144A | | | 325,000 | | | | 336 | |
| | Signode Industrial Group Lux SA / Signode Industrial Group US, Inc., 6.375%, 5/1/22 144A | | | 3,650,000 | | | | 3,641 | |
| | Unifrax I LLC / Unifrax Holding Co., 7.500%, 2/15/19 144A | | | 1,325,000 | | | | 1,318 | |
| | | | | | | | | | |
| | Total | | | | | | | 57,157 | |
| | | | | | | | | | |
| | | |
| | Builders & Building Materials (1.8%) | | | | | | | | |
| | Allegion PLC, 5.875%, 9/15/23 | | | 550,000 | | | | 583 | |
| | American Builders & Contractors Supply Co., Inc., 5.625%, 4/15/21 144A | | | 2,725,000 | | | | 2,807 | |
| | American Builders & Contractors Supply Co., Inc., 5.750%, 12/15/23 144A | | | 125,000 | | | | 129 | |
| | Beacon Roofing Supply, Inc., 6.375%, 10/1/23 | | | 625,000 | | | | 667 | |
| | HD Supply, Inc., 5.250%, 12/15/21 144A | | | 1,125,000 | | | | 1,187 | |
The Accompanying Notes are an Integral Part of the Financial Statements.
| | | | |
| | High Yield Bond Portfolio | | 143 |
High Yield Bond Portfolio
| | | | | | | | | | |
| | | Bonds (96.7%) | | Shares/
$ Par | | | Value
$ (000’s) | |
| |
| | Builders & Building Materials continued | |
| | HD Supply, Inc., 5.750%, 4/15/24 144A | | | 375,000 | | | | 396 | |
| | Masonite International Corp., 5.625%, 3/15/23 144A | | | 725,000 | | | | 748 | |
| | NCI Building Systems, Inc., 8.250%, 1/15/23 144A | | | 1,675,000 | | | | 1,809 | |
| | Ply Gem Industries, Inc., 6.500%, 2/1/22 | | | 1,100,000 | | | | 1,136 | |
| | RSI Home Products, Inc., 6.500%, 3/15/23 144A | | | 2,825,000 | | | | 2,952 | |
| | Standard Industries, Inc., 6.000%, 10/15/25 144A | | | 825,000 | | | | 868 | |
| | | | | | | | | | |
| | Total | | | | | | | 13,282 | |
| | | | | | | | | | |
| | | |
| | Capital Goods (0.1%) | | | | | | | | |
| | Cloud Crane LLC, 10.125%, 8/1/24 144A | | | 425,000 | | | | 455 | |
| | United Rentals North America, Inc., 5.500%, 7/15/25 | | | 475,000 | | | | 484 | |
| | | | | | | | | | |
| | Total | | | | | | | 939 | |
| | | | | | | | | | |
| | | |
| | Chemicals (2.4%) | | | | | | | | |
| | Axalta Coating Systems LLC, 4.875%, 8/15/24 144A | | | 625,000 | | | | 625 | |
| | Compass Minerals International, Inc., 4.875%, 7/15/24 144A | | | 2,050,000 | | | | 1,937 | |
| | Eco Services Operations LLC / Eco Finance Corp., 8.500%, 11/1/22 144A | | | 1,225,000 | | | | 1,302 | |
| | Hexion US Finance Corp. / Hexion Nova Scotia Finance ULC, 8.875%, 2/1/18 | | | 1,290,000 | | | | 1,284 | |
| | Hexion, Inc., 6.625%, 4/15/20 | | | 2,650,000 | | | | 2,345 | |
| | Huntsman International LLC, 4.875%, 11/15/20 | | | 2,630,000 | | | | 2,725 | |
| | Huntsman International LLC, 5.125%, 11/15/22 | | | 375,000 | | | | 382 | |
| | Platform Specialty Products Corp., 6.500%, 2/1/22 144A | | | 5,000,000 | | | | 5,038 | |
| | Platform Specialty Products Corp., 10.375%, 5/1/21 144A | | | 675,000 | | | | 748 | |
| | PQ Corp., 6.750%, 11/15/22 144A | | | 450,000 | | | | 482 | |
| | Versum Materials, Inc., 5.500%, 9/30/24 144A | | | 550,000 | | | | 562 | |
| | W.R. Grace & Co., 5.625%, 10/1/24 144A | | | 605,000 | | | | 635 | |
| | | | | | | | | | |
| | Total | | | | | | | 18,065 | |
| | | | | | | | | | |
| | | |
| | Conglomerate & Diversified Manufacturing (1.4%) | | | | | | | | |
| | Entegris, Inc., 6.000%, 4/1/22 144A | | | 2,950,000 | | | | 3,068 | |
| | Gardner Denver, Inc., 6.875%, 8/15/21 144A | | | 1,120,000 | | | | 1,115 | |
| | Milacron LLC / Mcron Finance Corp. 144A, 7.750%, 2/15/21 144A | | | 1,475,000 | | | | 1,516 | |
| | WESCO Distribution, Inc., 5.375%, 12/15/21 | | | 2,780,000 | | | | 2,870 | |
| | WESCO Distribution, Inc., 5.375%, 6/15/24 144A | | | 1,750,000 | | | | 1,754 | |
| | | | | | | | | | |
| | Total | | | | | | | 10,323 | |
| | | | | | | | | | |
| |
| | Consumer Products & Retailing (5.6%) | |
| | 1011778 BC ULC / New Red Finance, Inc., 6.000%, 4/1/22 144A | | | 4,275,000 | | | | 4,467 | |
| | Albertsons Cos LLC / Safeway, 5.750%, 3/15/25 144A | | | 1,725,000 | | | | 1,708 | |
| | Albertsons Cos LLC / Safeway, 6.625%, 6/15/24 144A | | | 1,600,000 | | | | 1,668 | |
| | Aramark Services, Inc., 5.125%, 1/15/24 | | | 100,000 | | | | 103 | |
| | Argos Merger Sub, Inc., 7.125%, 3/15/23 144A | | | 4,650,000 | | | | 4,743 | |
| | FGI Operating Co. LLC / FGI Finance, Inc., 7.875%, 5/1/20 | | | 2,125,000 | | | | 1,806 | |
| | First Quality Finance Co., Inc., 4.625%, 5/15/21 144A | | | 3,235,000 | | | | 3,203 | |
| | Hanesbrands, Inc., 4.875%, 5/15/26 144A | | | 725,000 | | | | 709 | |
| | JC Penney Corp., Inc., 5.875%, 7/1/23 144A | | | 525,000 | | | | 541 | |
| | KFC Holding Co. / Pizza Hut Holdings LLC / Taco Bell of America, 5.250%, 6/1/26 144A | | | 1,600,000 | | | | 1,624 | |
| | KFC Holding Co. / Pizza Hut Holdings LLC / Taco Bell of America LLC, 5.000%, 6/1/24 144A | | | 800,000 | | | | 817 | |
| | Michaels Stores, Inc., 5.875%, 12/15/20 144A | | | 1,875,000 | | | | 1,931 | |
| | | | | | | | | | |
| | | Bonds (96.7%) | | Shares/
$ Par | | | Value
$ (000’s) | |
| |
| | Consumer Products & Retailing continued | |
| (c) | | Neiman Marcus Group, Ltd. LLC, 8.750%, 10/15/21 144A | | | 700,000 | | | | 495 | |
| | Party City Holdings, Inc., 6.125%, 8/15/23 144A | | | 1,775,000 | | | | 1,855 | |
| | Performance Food Group, Inc., 5.500%, 6/1/24 144A | | | 325,000 | | | | 327 | |
| | Prestige Brands, Inc., 5.375%, 12/15/21 144A | | | 3,475,000 | | | | 3,579 | |
| | Prestige Brands, Inc., 6.375%, 3/1/24 144A | | | 1,050,000 | | | | 1,103 | |
| | Ritchie Bros. Auctioneers, Inc., 5.375%, 1/15/25 144A | | | 575,000 | | | | 587 | |
| | Rite Aid Corp., 6.125%, 4/1/23 144A | | | 2,600,000 | | | | 2,795 | |
| | Sally Holdings LLC / Sally Capital, Inc., 5.625%, 12/1/25 | | | 375,000 | | | | 390 | |
| | Spectrum Brands, Inc., 5.750%, 7/15/25 | | | 725,000 | | | | 752 | |
| | Spectrum Brands, Inc., 6.125%, 12/15/24 | | | 3,450,000 | | | | 3,640 | |
| | Springs Industries, Inc., 6.250%, 6/1/21 | | | 1,450,000 | | | | 1,501 | |
| | Tempur Sealy International, Inc., 5.500%, 6/15/26 | | | 625,000 | | | | 628 | |
| | Valvoline Finco Two LLC, 5.500%, 7/15/24 144A | | | 325,000 | | | | 336 | |
| | Vista Outdoor, Inc., 5.875%, 10/1/23 | | | 700,000 | | | | 733 | |
| | | | | | | | | | |
| | Total | | | | | | | 42,041 | |
| | | | | | | | | | |
| |
| | Electric Utilities (2.0%) | |
| | Calpine Corp., 5.375%, 1/15/23 | | | 2,800,000 | | | | 2,737 | |
| | Calpine Corp., 5.750%, 1/15/25 | | | 1,375,000 | | | | 1,327 | |
| | Calpine Corp., 6.000%, 1/15/22 144A | | | 455,000 | | | | 476 | |
| | Enviva Partners LP / Enviva Partners Finance Corp., 8.500%, 11/1/21 144A | | | 2,125,000 | | | | 2,215 | |
| | NRG Energy, Inc., 6.250%, 7/15/22 | | | 1,450,000 | | | | 1,454 | |
| | NRG Energy, Inc., 6.250%, 5/1/24 | | | 1,750,000 | | | | 1,702 | |
| | NRG Energy, Inc., 6.625%, 3/15/23 | | | 750,000 | | | | 752 | |
| | NRG Energy, Inc., 6.625%, 1/15/27 144A | | | 925,000 | | | | 874 | |
| | NRG Energy, Inc., 7.250%, 5/15/26 144A | | | 1,150,000 | | | | 1,144 | |
| | TerraForm Power Operating LLC, 6.125%, 6/15/25 144A | | | 950,000 | | | | 983 | |
| | TerraForm Power Operating LLC, 6.375%, 2/1/23 144A | | | 1,125,000 | | | | 1,139 | |
| | | | | | | | | | |
| | Total | | | | | | | 14,803 | |
| | | | | | | | | | |
| |
| | Energy (7.0%) | |
| | Antero Resources Corp., 5.000%, 3/1/25 144A | | | 375,000 | | | | 367 | |
| | Antero Resources Corp., 5.125%, 12/1/22 | | | 840,000 | | | | 848 | |
| | Antero Resources Corp., 5.375%, 11/1/21 | | | 1,305,000 | | | | 1,334 | |
| | Antero Resources Corp., 5.625%, 6/1/23 | | | 1,225,000 | | | | 1,254 | |
| | Callon Petroleum Co., 6.125%, 10/1/24 144A | | | 425,000 | | | | 438 | |
| | Carrizo Oil & Gas, Inc., 6.250%, 4/15/23 | | | 1,725,000 | | | | 1,768 | |
| | Carrizo Oil & Gas, Inc., 7.500%, 9/15/20 | | | 620,000 | | | | 642 | |
| | CGG SA, 6.875%, 1/15/22 | | | 965,000 | | | | 444 | |
| | Chesapeake Energy Corp., 5.375%, 6/15/21 | | | 1,140,000 | | | | 1,069 | |
| | Chesapeake Energy Corp., 6.125%, 2/15/21 | | | 950,000 | | | | 926 | |
| | Chesapeake Energy Corp., 8.000%, 12/15/22 144A | | | 1,400,000 | | | | 1,510 | |
| | Chesapeake Energy Corp., 8.000%, 1/15/25 144A | | | 425,000 | | | | 433 | |
| | Continental Resources, Inc., 4.500%, 4/15/23 | | | 2,050,000 | | | | 2,009 | |
| | CrownRock LP / CrownRock Finance, Inc., 7.125%, 4/15/21 144A | | | 275,000 | | | | 286 | |
| | CrownRock LP / CrownRock Finance, Inc., 7.750%, 2/15/23 144A | | | 525,000 | | | | 567 | |
| | Diamondback Energy, Inc., 4.750%, 11/1/24 144A | | | 600,000 | | | | 588 | |
| | Diamondback Energy, Inc., 5.375%, 5/31/25 144A | | | 800,000 | | | | 805 | |
| | EP Energy LLC / Everest Acquisition Finance, Inc., 6.375%, 6/15/23 | | | 700,000 | | | | 553 | |
The Accompanying Notes are an Integral Part of the Financial Statements.
| | | | |
| 144 | | High Yield Bond Portfolio | | |
High Yield Bond Portfolio
| | | | | | | | | | |
| | | Bonds (96.7%) | | Shares/
$ Par | | | Value
$ (000’s) | |
| |
| | Energy continued | |
| | EP Energy LLC / Everest Acquisition Finance, Inc., 8.000%, 11/29/24 144A | | | 875,000 | | | | 940 | |
| | Gulfport Energy Corp., 6.000%, 10/15/24 144A | | | 550,000 | | | | 560 | |
| | Gulfport Energy Corp., 6.375%, 5/15/25 144A | | | 650,000 | | | | 658 | |
| | Gulfport Energy Corp., 6.625%, 5/1/23 | | | 725,000 | | | | 758 | |
| | Halcon Resources Corp., 8.625%, 2/1/20 144A | | | 1,150,000 | | | | 1,196 | |
| | Laredo Petroleum, Inc., 5.625%, 1/15/22 | | | 1,250,000 | | | | 1,259 | |
| | Laredo Petroleum, Inc., 6.250%, 3/15/23 | | | 400,000 | | | | 414 | |
| | Laredo Petroleum, Inc., 7.375%, 5/1/22 | | | 575,000 | | | | 596 | |
| | Legacy Reserves LP / Legacy Reserves Finance Corp., 6.625%, 12/1/21 | | | 460,000 | | | | 315 | |
| | MPLX LP, 4.875%, 12/1/24 | | | 1,100,000 | | | | 1,133 | |
| | MPLX LP, 4.875%, 6/1/25 | | | 1,075,000 | | | | 1,105 | |
| | Newfield Exploration Co., 5.375%, 1/1/26 | | | 650,000 | | | | 663 | |
| | Northern Oil and Gas, Inc., 8.000%, 6/1/20 | | | 2,455,000 | | | | 2,029 | |
| | Oasis Petroleum, Inc., 6.500%, 11/1/21 | | | 1,645,000 | | | | 1,676 | |
| | Oasis Petroleum, Inc., 6.875%, 3/15/22 | | | 1,170,000 | | | | 1,199 | |
| | Parsley Energy LLC / Parsley Finance Corp., 5.375%, 1/15/25 144A | | | 450,000 | | | | 452 | |
| | Parsley Energy LLC / Parsley Finance Corp., 6.250%, 6/1/24 144A | | | 300,000 | | | | 316 | |
| | PDC Energy, Inc., 6.125%, 9/15/24 144A | | | 300,000 | | | | 307 | |
| | PDC Energy, Inc., 7.750%, 10/15/22 | | | 350,000 | | | | 373 | |
| | Precision Drilling Corp., 7.750%, 12/15/23 144A | | | 850,000 | | | | 897 | |
| | QEP Resources, Inc., 5.250%, 5/1/23 | | | 575,000 | | | | 576 | |
| | QEP Resources, Inc., 6.875%, 3/1/21 | | | 1,300,000 | | | | 1,381 | |
| | Range Resources Corp., 4.875%, 5/15/25 | | | 1,000,000 | | | | 969 | |
| | Range Resources Corp., 5.000%, 3/15/23 144A | | | 225,000 | | | | 223 | |
| | Range Resources Corp., 5.750%, 6/1/21 144A | | | 955,000 | | | | 1,000 | |
| | Rice Energy, Inc., 6.250%, 5/1/22 | | | 2,225,000 | | | | 2,286 | |
| | RSP Permian, Inc., 5.250%, 1/15/25 144A | | | 750,000 | | | | 754 | |
| | RSP Permian, Inc., 6.625%, 10/1/22 | | | 925,000 | | | | 978 | |
| | SM Energy Co., 5.625%, 6/1/25 | | | 525,000 | | | | 507 | |
| | SM Energy Co., 6.500%, 11/15/21 | | | 1,205,000 | | | | 1,229 | |
| | SM Energy Co., 6.500%, 1/1/23 | | | 965,000 | | | | 981 | |
| | SM Energy Co., 6.750%, 9/15/26 | | | 350,000 | | | | 360 | |
| | Southwestern Energy Co., 4.100%, 3/15/22 | | | 2,150,000 | | | | 2,031 | |
| | Weatherford International, 7.000%, 3/15/38 | | | 1,400,000 | | | | 1,166 | |
| | Weatherford International LLC, 6.800%, 6/15/37 | | | 400,000 | | | | 328 | |
| | Weatherford International, Ltd., 8.250%, 6/15/23 | | | 1,375,000 | | | | 1,399 | |
| | Weatherford International, Ltd., 9.875%, 2/15/24 144A | | | 100,000 | | | | 107 | |
| | Whiting Petroleum Corp., 5.000%, 3/15/19 | | | 885,000 | | | | 888 | |
| | Whiting Petroleum Corp., 5.750%, 3/15/21 | | | 960,000 | | | | 956 | |
| | Whiting Petroleum Corp., 6.250%, 4/1/23 | | | 925,000 | | | | 925 | |
| | WPX Energy, Inc., 5.250%, 9/15/24 | | | 275,000 | | | | 267 | |
| | WPX Energy, Inc., 6.000%, 1/15/22 | | | 375,000 | | | | 384 | |
| | WPX Energy, Inc., 7.500%, 8/1/20 | | | 125,000 | | | | 134 | |
| | WPX Energy, Inc., 8.250%, 8/1/23 | | | 350,000 | | | | 391 | |
| | | | | | | | | | |
| | Total | | | | | | | 52,907 | |
| | | | | | | | | | |
| | | |
| | Entertainment (0.7%) | | | | | | | | |
| | AMC Entertainment Holdings, Inc., 5.875%, 11/15/26 144A | | | 725,000 | | | | 741 | |
| | Cedar Fair LP / Canada’s Wonderland Co. / Magnum Management Corp., 5.375%, 6/1/24 | | | 2,280,000 | | | | 2,349 | |
| | | | | | | | | | |
| | | Bonds (96.7%) | | Shares/
$ Par | | | Value
$ (000’s) | |
| |
| | Entertainment continued | |
| | Live Nation Entertainment, Inc., 4.875%, 11/1/24 144A | | | 600,000 | | | | 602 | |
| | Regal Entertainment Group, 5.750%, 3/15/22 | | | 660,000 | | | | 691 | |
| | Regal Entertainment Group, 5.750%, 2/1/25 | | | 1,025,000 | | | | 1,040 | |
| | | | | | | | | | |
| | Total | | | | | | | 5,423 | |
| | | | | | | | | | |
| | | |
| | Finance (1.2%) | | | | | | | | |
| | Navient Corp., 5.500%, 1/25/23 | | | 350,000 | | | | 340 | |
| | Navient Corp., 5.875%, 10/25/24 | | | 2,050,000 | | | | 1,948 | |
| | Navient Corp., 6.125%, 3/25/24 | | | 1,175,000 | | | | 1,141 | |
| | Navient Corp., 6.625%, 7/26/21 | | | 350,000 | | | | 370 | |
| | Navient Corp., 7.250%, 9/25/23 | | | 1,025,000 | | | | 1,053 | |
| | Quicken Loans, Inc., 5.750%, 5/1/25 144A | | | 4,350,000 | | | | 4,230 | |
| | RHP Hotel Properties LP / RHP Finance Corp., 5.000%, 4/15/23 | | | 325,000 | | | | 328 | |
| | | | | | | | | | |
| | Total | | | | | | | 9,410 | |
| | | | | | | | | | |
| | | |
| | Food & Beverage (2.2%) | | | | | | | | |
| | Acosta, Inc., 7.750%, 10/1/22 144A | | | 4,000,000 | | | | 3,360 | |
| | AdvancePierre Foods Holdings, Inc., 5.500%, 12/15/24 144A | | | 850,000 | | | | 858 | |
| | Aramark Services, Inc., 5.125%, 1/15/24 144A | | | 1,425,000 | | | | 1,470 | |
| | Lamb Weston Holdings, Inc., 4.875%, 11/1/26 144A | | | 1,225,000 | | | | 1,212 | |
| | Pinnacle Foods Finance LLC / Pinnacle Foods Finance Corp., 5.875%, 1/15/24 | | | 500,000 | | | | 530 | |
| | Post Holdings, Inc., 5.000%, 8/15/26 144A | | | 1,825,000 | | | | 1,747 | |
| | Post Holdings, Inc., 6.000%, 12/15/22 144A | | | 300,000 | | | | 313 | |
| | Post Holdings, Inc., 7.750%, 3/15/24 144A | | | 1,400,000 | | | | 1,554 | |
| | Post Holdings, Inc., 8.000%, 7/15/25 144A | | | 2,525,000 | | | | 2,828 | |
| | US Foods, Inc., 5.875%, 6/15/24 144A | | | 2,500,000 | | | | 2,587 | |
| | | | | | | | | | |
| | Total | | | | | | | 16,459 | |
| | | | | | | | | | |
| | | |
| | Gaming/Leisure/Lodging (3.7%) | | | | | | | | |
| | Boyd Gaming Corp., 6.375%, 4/1/26 144A | | | 775,000 | | | | 835 | |
| | Boyd Gaming Corp., 6.875%, 5/15/23 | | | 2,050,000 | | | | 2,204 | |
| | Chester Downs & Marina LLC / Chester Downs Finance Corp., 9.250%, 2/1/20 144A | | | 2,000,000 | | | | 1,920 | |
| | GLP Capital LP / GLP Financing II, Inc., 5.375%, 11/1/23 | | | 375,000 | | | | 401 | |
| | GLP Capital LP / GLP Financing II, Inc., 5.375%, 4/15/26 | | | 500,000 | | | | 521 | |
| | MGM Growth Properties Operating Partnership LP / MGP Escrow Co-Issuer, Inc., 5.625%, 5/1/24 144A | | | 475,000 | | | | 498 | |
| | MGM Resorts International, 6.000%, 3/15/23 | | | 2,525,000 | | | | 2,727 | |
| | MGM Resorts International, 6.625%, 12/15/21 | | | 1,040,000 | | | | 1,162 | |
| | MGM Resorts International, 6.750%, 10/1/20 | | | 510,000 | | | | 567 | |
| | MGM Resorts International, 7.750%, 3/15/22 | | | 345,000 | | | | 397 | |
| | Mohegan Tribal Gaming Authority, 7.875%, 10/15/24 144A | | | 1,950,000 | | | | 1,989 | |
| | Penn National Gaming, Inc., 5.875%, 11/1/21 | | | 2,825,000 | | | | 2,945 | |
| | Pinnacle Entertainment, Inc., 5.625%, 5/1/24 144A | | | 2,225,000 | | | | 2,231 | |
| | Rivers Pittsburgh Borrower LP / Rivers Pittsburgh Finance Corp., 6.125%, 8/15/21 144A | | | 1,900,000 | | | | 1,943 | |
| | Seminole Hard Rock Entertainment, Inc. / Seminole Hard Rock International LLC, 5.875%, 5/15/21 144A | | | 3,865,000 | | | | 3,826 | |
| | Seminole Tribe of Florida, Inc., 7.804%, 10/1/20 144A | | | 1,705,000 | | | | 1,696 | |
The Accompanying Notes are an Integral Part of the Financial Statements.
| | | | |
| | High Yield Bond Portfolio | | 145 |
High Yield Bond Portfolio
| | | | | | | | | | |
| | | Bonds (96.7%) | | Shares/
$ Par | | | Value
$ (000’s) | |
| |
| | Gaming/Leisure/Lodging continued | |
| | Station Casinos LLC, 7.500%, 3/1/21 | | | 2,175,000 | | | | 2,278 | |
| | | | | | | | | | |
| | Total | | | | | | | 28,140 | |
| | | | | | | | | | |
| |
| | Healthcare (10.4%) | |
| | Acadia Healthcare Co., 5.625%, 2/15/23 | | | 400,000 | | | | 400 | |
| | Acadia Healthcare Co., 6.500%, 3/1/24 | | | 2,625,000 | | | | 2,684 | |
| | Air Medical Merger Sub Corp., 6.375%, 5/15/23 144A | | | 2,750,000 | | | | 2,640 | |
| | AmSurg Corp., 5.625%, 7/15/22 | | | 1,525,000 | | | | 1,572 | |
| | Change Healthcare Holdings, Inc., 6.000%, 2/15/21 144A | | | 900,000 | | | | 940 | |
| | Change Healthcare Holdings, Inc., 11.000%, 12/31/19 | | | 1,550,000 | | | | 1,600 | |
| | CHS / Community Health Systems, Inc., 5.125%, 8/1/21 | | | 625,000 | | | | 580 | |
| | CHS / Community Health Systems, Inc., 6.875%, 2/1/22 | | | 3,160,000 | | | | 2,196 | |
| | CHS / Community Health Systems, Inc., 7.125%, 7/15/20 | | | 715,000 | | | | 544 | |
| | CHS / Community Health Systems, Inc., 8.000%, 11/15/19 | | | 1,115,000 | | | | 925 | |
| | Crimson Merger Sub, Inc., 6.625%, 5/15/22 144A | | | 6,650,000 | | | | 5,902 | |
| | DaVita HealthCare Partners, Inc., 5.000%, 5/1/25 | | | 775,000 | | | | 762 | |
| | DaVita HealthCare Partners, Inc., 5.750%, 8/15/22 | | | 1,350,000 | | | | 1,411 | |
| | Envision Healthcare Corp., 5.125%, 7/1/22 144A | | | 3,555,000 | | | | 3,542 | |
| | HCA Holdings, Inc., 6.250%, 2/15/21 | | | 1,385,000 | | | | 1,491 | |
| | HCA, Inc., 4.500%, 2/15/27 | | | 1,050,000 | | | | 1,032 | |
| | HCA, Inc., 5.000%, 3/15/24 | | | 2,575,000 | | | | 2,649 | |
| | HCA, Inc., 5.250%, 6/15/26 | | | 675,000 | | | | 698 | |
| | HCA, Inc., 5.375%, 2/1/25 | | | 2,250,000 | | | | 2,256 | |
| | HCA, Inc., 5.875%, 3/15/22 | | | 3,225,000 | | | | 3,475 | |
| | HCA, Inc., 5.875%, 5/1/23 | | | 2,520,000 | | | | 2,677 | |
| | HCA, Inc., 5.875%, 2/15/26 | | | 1,250,000 | | | | 1,287 | |
| | HCA, Inc., 6.500%, 2/15/20 | | | 1,485,000 | | | | 1,624 | |
| | IASIS Healthcare LLC / IASIS Capital Corp., 8.375%, 5/15/19 | | | 2,975,000 | | | | 2,588 | |
| | LifePoint Health, Inc., 5.375%, 5/1/24 144A | | | 925,000 | | | | 906 | |
| | LifePoint Health, Inc., 5.500%, 12/1/21 | | | 1,415,000 | | | | 1,472 | |
| | LifePoint Health, Inc., 5.875%, 12/1/23 | | | 250,000 | | | | 253 | |
| | MEDNAX, Inc., 5.250%, 12/1/23 144A | | | 425,000 | | | | 438 | |
| | MPH Acquisition Holdings LLC, 7.125%, 6/1/24 144A | | | 4,625,000 | | | | 4,868 | |
| | New Amethyst Corp., 6.250%, 12/1/24 144A | | | 900,000 | | | | 949 | |
| | Sterigenics-Nordion Holdings LLC, 6.500%, 5/15/23 144A | | | 3,500,000 | | | | 3,561 | |
| | Sterigenics-Nordion Topco LLC, 8.125%, 11/1/21 144A | | | 2,050,000 | | | | 2,040 | |
| | Surgical Care Affiliates, Inc., 6.000%, 4/1/23 144A | | | 2,400,000 | | | | 2,478 | |
| | Team Health, Inc., 7.250%, 12/15/23 144A | | | 2,100,000 | | | | 2,389 | |
| | Teleflex, Inc., 5.250%, 6/15/24 | | | 1,750,000 | | | | 1,796 | |
| | Tenet Healthcare Corp., 4.500%, 4/1/21 | | | 830,000 | | | | 822 | |
| | Tenet Healthcare Corp., 6.000%, 10/1/20 | | | 1,285,000 | | | | 1,346 | |
| | Tenet Healthcare Corp., 6.750%, 6/15/23 | | | 3,500,000 | | | | 3,089 | |
| | Tenet Healthcare Corp., 7.500%, 1/1/22 144A | | | 700,000 | | | | 730 | |
| | Tenet Healthcare Corp., 8.125%, 4/1/22 | | | 3,430,000 | | | | 3,236 | |
| | Vizient, Inc., 10.375%, 3/1/24 144A | | | 2,775,000 | | | | 3,143 | |
| | | | | | | | | | |
| | Total | | | | | | | 78,991 | |
| | | | | | | | | | |
| | | | | | | | | | |
| | | Bonds (96.7%) | | Shares/
$ Par | | | Value
$ (000’s) | |
| |
| | Insurance (0.9%) | |
| (c) | | Hub Holdings LLC / Hub Holdings Finance, Inc., 8.125%, 7/15/19 144A | | | 760,000 | | | | 758 | |
| | HUB International, Ltd., 7.875%, 10/1/21 144A | | | 5,615,000 | | | | 5,932 | |
| | HUB International, Ltd., 9.250%, 2/15/21 144A | | | 225,000 | | | | 233 | |
| | | | | | | | | | |
| | Total | | | | | | | 6,923 | |
| | | | | | | | | | |
| |
| | Materials (0.1%) | |
| | HudBay Minerals, Inc., 7.250%, 1/15/23 144A | | | 175,000 | | | | 181 | |
| | HudBay Minerals, Inc., 7.625%, 1/15/25 144A | | | 550,000 | | | | 572 | |
| | The Scotts Miracle-Grow Co., 5.250%, 12/15/26 144A | | | 125,000 | | | | 125 | |
| | | | | | | | | | |
| | Total | | | | | | | 878 | |
| | | | | | | | | | |
| |
| | Media (13.6%) | |
| | Altice US Finance I Corp., 5.375%, 7/15/23 144A | | | 1,100,000 | | | | 1,141 | |
| | Altice US Finance I Corp., 5.500%, 5/15/26 144A | | | 350,000 | | | | 357 | |
| | AMC Networks, Inc., 5.000%, 4/1/24 | | | 1,875,000 | | | | 1,884 | |
| | Cablevision Systems Corp., 5.875%, 9/15/22 | | | 1,275,000 | | | | 1,243 | |
| | CBS Radio, Inc., 7.250%, 11/1/24 144A | | | 1,125,000 | | | | 1,181 | |
| | CCO Holdings LLC / CCO Holdings Capital Corp., 5.250%, 9/30/22 | | | 1,350,000 | | | | 1,397 | |
| | CCO Holdings LLC / CCO Holdings Capital Corp., 5.375%, 5/1/25 144A | | | 650,000 | | | | 670 | |
| | CCO Holdings LLC / CCO Holdings Capital Corp., 5.500%, 5/1/26 144A | | | 550,000 | | | | 561 | |
| | CCO Holdings LLC / CCO Holdings Capital Corp., 5.750%, 9/1/23 | | | 1,000,000 | | | | 1,045 | |
| | CCO Holdings LLC / CCO Holdings Capital Corp., 5.750%, 1/15/24 | | | 3,050,000 | | | | 3,187 | |
| | CCO Holdings LLC / CCO Holdings Capital Corp., 5.750%, 2/15/26 144A | | | 1,825,000 | | | | 1,889 | |
| | CCO Holdings LLC / CCO Holdings Capital Corp., 5.875%, 5/1/27 144A | | | 425,000 | | | | 441 | |
| | Cequel Communications Holdings I LLC / Cequel Capital Corp., 5.125%, 12/15/21 144A | | | 2,935,000 | | | | 2,986 | |
| | Cequel Communications Holdings I LLC / Cequel Capital Corp., 7.750%, 7/15/25 144A | | | 1,325,000 | | | | 1,457 | |
| | Clear Channel International BV, 8.750%, 12/15/20 144A | | | 675,000 | | | | 710 | |
| | Clear Channel Worldwide Holdings, Inc., 6.500%, 11/15/22 | | | 2,675,000 | | | | 2,735 | |
| | CSC Holdings LLC, 6.625%, 10/15/25 144A | | | 1,250,000 | | | | 1,366 | |
| | CSC Holdings LLC, 10.125%, 1/15/23 144A | | | 1,675,000 | | | | 1,935 | |
| | CSC Holdings LLC, 10.875%, 10/15/25 144A | | | 2,275,000 | | | | 2,707 | |
| | DISH DBS Corp., 5.000%, 3/15/23 | | | 1,360,000 | | | | 1,353 | |
| | DISH DBS Corp., 5.875%, 7/15/22 | | | 1,080,000 | | | | 1,137 | |
| | DISH DBS Corp., 5.875%, 11/15/24 | | | 2,700,000 | | | | 2,778 | |
| | DISH DBS Corp., 7.750%, 7/1/26 | | | 500,000 | | | | 564 | |
| | EMI Music Publishing Group North America Holdings, Inc., 7.625%, 6/15/24 144A | | | 2,300,000 | | | | 2,484 | |
| | Gray Television, Inc., 5.125%, 10/15/24 144A | | | 525,000 | | | | 508 | |
| | Gray Television, Inc., 5.875%, 7/15/26 144A | | | 1,750,000 | | | | 1,737 | |
| | iHeartCommunications, Inc., 9.000%, 3/1/21 | | | 600,000 | | | | 444 | |
| | iHeartCommunications, Inc., 9.000%, 9/15/22 | | | 1,515,000 | | | | 1,114 | |
| | Intelsat Jackson Holdings SA, 5.500%, 8/1/23 | | | 2,700,000 | | | | 1,819 | |
| | Intelsat Jackson Holdings SA, 7.250%, 10/15/20 | | | 1,490,000 | | | | 1,155 | |
| | Intelsat Jackson Holdings SA, 7.500%, 4/1/21 | | | 1,550,000 | | | | 1,182 | |
| | Intelsat Jackson Holdings SA, 8.000%, 2/15/24 144A | | | 1,125,000 | | | | 1,156 | |
The Accompanying Notes are an Integral Part of the Financial Statements.
| | | | |
| 146 | | High Yield Bond Portfolio | | |
High Yield Bond Portfolio
| | | | | | | | | | |
| | | Bonds (96.7%) | | Shares/ $ Par | | | Value $ (000’s) | |
| |
| | Media continued | |
| | Intelsat Luxembourg SA, 7.750%, 6/1/21 | | | 2,660,000 | | | | 871 | |
| | Lamar Media Corp., 5.875%, 2/1/22 | | | 1,725,000 | | | | 1,777 | |
| | LIN Television Corp., 5.875%, 11/15/22 | | | 2,000,000 | | | | 2,030 | |
| | LIN Television Corp., 6.375%, 1/15/21 | | | 840,000 | | | | 867 | |
| | Match Group, Inc., 6.375%, 6/1/24 | | | 925,000 | | | | 976 | |
| | Match Group, Inc., 6.750%, 12/15/22 | | | 1,975,000 | | | | 2,084 | |
| | McGraw-Hill Global Education Holdings LLC, 7.875%, 5/15/24 144A | | | 1,000,000 | | | | 1,008 | |
| | Nexstar Broadcasting, Inc., 6.125%, 2/15/22 144A | | | 1,850,000 | | | | 1,915 | |
| | Nexstar Escrow Corp., 5.625%, 8/1/24 144A | | | 875,000 | | | | 868 | |
| | Nielsen Finance LLC / Nielsen Finance Co., 5.000%, 4/15/22 144A | | | 4,000,000 | | | | 4,075 | |
| | Outdoor Americas Capital LLC / Outfront Media Capital Corp., 5.875%, 3/15/25 | | | 1,500,000 | | | | 1,571 | |
| | Radio One, Inc., 7.375%, 4/15/22 144A | | | 1,900,000 | | | | 1,881 | |
| | Radio One, Inc., 9.250%, 2/15/20 144A | | | 1,450,000 | | | | 1,316 | |
| | Sinclair Television Group, Inc., 5.125%, 2/15/27 144A | | | 950,000 | | | | 903 | |
| | Sinclair Television Group, Inc., 5.375%, 4/1/21 | | | 1,370,000 | | | | 1,411 | |
| | Sinclair Television Group, Inc., 5.625%, 8/1/24 144A | | | 450,000 | | | | 460 | |
| | Sinclair Television Group, Inc., 5.875%, 3/15/26 144A | | | 325,000 | | | | 326 | |
| | Sinclair Television Group, Inc., 6.125%, 10/1/22 | | | 990,000 | | | | 1,032 | |
| | Sirius XM Radio, Inc., 4.625%, 5/15/23 144A | | | 550,000 | | | | 545 | |
| | Sirius XM Radio, Inc., 5.375%, 4/15/25 144A | | | 1,100,000 | | | | 1,095 | |
| | Sirius XM Radio, Inc., 5.375%, 7/15/26 144A | | | 1,675,000 | | | | 1,637 | |
| | Sirius XM Radio, Inc., 5.750%, 8/1/21 144A | | | 1,045,000 | | | | 1,088 | |
| | Sirius XM Radio, Inc., 6.000%, 7/15/24 144A | | | 2,185,000 | | | | 2,283 | |
| | Southern Graphics, Inc., 8.375%, 10/15/20 144A | | | 2,375,000 | | | | 2,411 | |
| | TEGNA, Inc., 5.125%, 7/15/20 | | | 980,000 | | | | 1,017 | |
| | TEGNA, Inc., 5.500%, 9/15/24 144A | | | 195,000 | | | | 197 | |
| | TEGNA, Inc., 6.375%, 10/15/23 | | | 700,000 | | | | 741 | |
| | Townsquare Media, Inc., 6.500%, 4/1/23 144A | | | 1,850,000 | | | | 1,767 | |
| | Tribune Media Co., 5.875%, 7/15/22 | | | 3,275,000 | | | | 3,328 | |
| | Unitymedia GmbH, 6.125%, 1/15/25 144A | | | 3,250,000 | | | | 3,339 | |
| | Unitymedia Hessen GmbH & Co. KG / Unitymedia NRW GmbH, 5.000%, 1/15/25 144A | | | 1,525,000 | | | | 1,517 | |
| | Virgin Media Finance PLC, 5.750%, 1/15/25 144A | | | 2,100,000 | | | | 2,105 | |
| | Virgin Media Secured Finance PLC, 5.250%, 1/15/26 144A | | | 3,175,000 | | | | 3,135 | |
| | Virgin Media Secured Finance PLC, 5.500%, 8/15/26 144A | | | 425,000 | | | | 424 | |
| | WMG Acquisition Corp., 5.000%, 8/1/23 144A | | | 250,000 | | | | 251 | |
| | WMG Aquisition Corp., 4.875%, 11/1/24 144A | | | 450,000 | | | | 448 | |
| | Ziggo Bond Finance BV, 5.875%, 1/15/25 144A | | | 625,000 | | | | 625 | |
| | Ziggo Bond Finance BV, 6.000%, 1/15/27 144A | | | 1,225,000 | | | | 1,188 | |
| | Ziggo Secured Finance BV, 5.500%, 1/15/27 144A | | | 2,275,000 | | | | 2,218 | |
| | | | | | | | | | |
| | Total | | | | | | | 103,053 | |
| | | | | | | | | | |
| |
| | Metals & Mining (1.9%) | |
| | ArcelorMittal, 6.125%, 6/1/25 | | | 2,775,000 | | | | 3,039 | |
| | Freeport-McMoRan, Inc., 3.875%, 3/15/23 | | | 2,500,000 | | | | 2,294 | |
| | Freeport-McMoRan, Inc., 5.400%, 11/14/34 | | | 3,400,000 | | | | 2,856 | |
| | Steel Dynamics, Inc., 5.000%, 12/15/26 144A | | | 525,000 | | | | 523 | |
| | Steel Dynamics, Inc., 5.125%, 10/1/21 | | | 620,000 | | | | 647 | |
| | Steel Dynamics, Inc., 5.500%, 10/1/24 | | | 930,000 | | | | 986 | |
| | Steel Dynamics, Inc., 6.375%, 8/15/22 | | | 540,000 | | | | 563 | |
| | Teck Resources, Ltd., 6.000%, 8/15/40 | | | 850,000 | | | | 807 | |
| | Teck Resources, Ltd., 6.125%, 10/1/35 | | | 1,075,000 | | | | 1,045 | |
| | | | | | | | | | |
| | | Bonds (96.7%) | | Shares/ $ Par | | | Value $ (000’s) | |
| |
| | Metals & Mining continued | |
| | Teck Resources, Ltd., 8.500%, 6/1/24 144A | | | 1,275,000 | | | | 1,469 | |
| | | | | | | | | | |
| | Total | | | | | | | 14,229 | |
| | | | | | | | | | |
| | | |
| | Oil & Gas (1.0%) | | | | | | | | |
| | CVR Refining LLC / Coffeyville Finance, Inc., 6.500%, 11/1/22 | | | 2,450,000 | | | | 2,432 | |
| | Northern Tier Energy LLC / Northern Tier Finance Corp., 7.125%, 11/15/20 | | | 1,450,000 | | | | 1,506 | |
| | Tervita Escrow Corp., 7.625%, 12/1/21 144A | | | 800,000 | | | | 816 | |
| | Tesoro Corp., 5.125%, 4/1/24 | | | 1,725,000 | | | | 1,764 | |
| | Tesoro Corp., 5.125%, 12/15/26 144A | | | 375,000 | | | | 379 | |
| | Tesoro Corp., 5.375%, 10/1/22 | | | 555,000 | | | | 576 | |
| | | | | | | | | | |
| | Total | �� | | | | | | 7,473 | |
| | | | | | | | | | |
| |
| | Other Holdings (–%) | |
| (d),* | | General Motors Co. Escrow, 7.200%, 1/15/15 | | | 610,000 | | | | — | |
| (d),* | | General Motors Co. Escrow, 8.375%, 7/15/33 | | | 4,865,000 | | | | — | |
| | | | | | | | | | |
| | Total | | | | | | | — | |
| | | | | | | | | | |
| |
| | Pharmaceuticals (3.4%) | |
| | Endo Finance LLC / Endo Finco, Inc., 6.000%, 2/1/25 144A | | | 2,525,000 | | | | 2,115 | |
| | Endo Finance LLC / Endo, Ltd. / Endo Finco, Inc., 6.000%, 7/15/23 144A | | | 1,850,000 | | | | 1,621 | |
| | Grifols Worldwide Operations, Ltd., 5.250%, 4/1/22 | | | 2,200,000 | | | | 2,277 | |
| | Jaguar Holding Co. II / Pharmaceutical Product Development LLC, 6.375%, 8/1/23 144A | | | 5,750,000 | | | | 6,152 | |
| | Mallinckrodt International Finance SA / Mallinckrodt CB LLC, 4.750%, 4/15/23 | | | 1,850,000 | | | | 1,609 | |
| | Mallinckrodt International Finance SA / Mallinckrodt CB LLC, 5.500%, 4/15/25 144A | | | 2,525,000 | | | | 2,260 | |
| | Mallinckrodt International Finance SA / Mallinckrodt CD LLC, 5.625%, 10/15/23 144A | | | 1,300,000 | | | | 1,212 | |
| | Valeant Pharmaceuticals International, 7.250%, 7/15/22 144A | | | 500,000 | | | | 409 | |
| | Valeant Pharmaceuticals International, Inc., 5.500%, 3/1/23 144A | | | 2,075,000 | | | | 1,556 | |
| | Valeant Pharmaceuticals International, Inc., 5.625%, 12/1/21 144A | | | 1,055,000 | | | | 818 | |
| | Valeant Pharmaceuticals International, Inc., 5.875%, 5/15/23 144A | | | 2,450,000 | | | | 1,850 | |
| | Valeant Pharmaceuticals International, Inc., 6.125%, 4/15/25 144A | | | 4,800,000 | | | | 3,606 | |
| | | | | | | | | | |
| | Total | | | | | | | 25,485 | |
| | | | | | | | | | |
| |
| | Pipelines (6.2%) | |
| | AmeriGas Partners LP / AmeriGas Finance Corp., 5.500%, 5/20/25 | | | 350,000 | | | | 353 | |
| | AmeriGas Partners LP / AmeriGas Finance Corp., 5.625%, 5/20/24 | | | 1,025,000 | | | | 1,048 | |
| | AmeriGas Partners LP / AmeriGas Finance Corp., 5.875%, 8/20/26 | | | 2,775,000 | | | | 2,817 | |
| | Antero Midstream Partners LP / Antero Midstream Finance Corp., 5.375%, 9/15/24 144A | | | 1,150,000 | | | | 1,161 | |
| | Cheniere Corpus Christi Holdings, 5.875%, 3/31/25 144A | | | 1,725,000 | | | | 1,760 | |
| | Cheniere Corpus Christi Holdings LLC, 7.000%, 6/30/24 144A | | | 750,000 | | | | 812 | |
The Accompanying Notes are an Integral Part of the Financial Statements.
| | | | |
| | High Yield Bond Portfolio | | 147 |
High Yield Bond Portfolio
| | | | | | | | | | |
| | | Bonds (96.7%) | | Shares/
$ Par | | | Value
$ (000’s) | |
| |
| | Pipelines continued | |
| | Crestwood Midstream Partners LP / Crestwood Midstream Finance Corp., 6.000%, 12/15/20 | | | 425,000 | | | | 436 | |
| | Energy Transfer Equity LP, 5.500%, 6/1/27 | | | 225,000 | | | | 219 | |
| | Energy Transfer Equity LP, 5.875%, 1/15/24 | | | 2,300,000 | | | | 2,375 | |
| | Energy Transfer Equity LP, 7.500%, 10/15/20 | | | 1,195,000 | | | | 1,332 | |
| | Ferrellgas LP / Ferrellgas Finance Corp., 6.500%, 5/1/21 | | | 850,000 | | | | 846 | |
| | Ferrellgas LP / Ferrellgas Finance Corp., 6.750%, 1/15/22 | | | 2,350,000 | | | | 2,321 | |
| | Ferrellgas LP / Ferrellgas Finance Corp., 6.750%, 6/15/23 | | | 1,075,000 | | | | 1,056 | |
| | Holly Energy Partners LP / Holly Energy Finance Corp., 6.000%, 8/1/24 144A | | | 1,500,000 | | | | 1,564 | |
| | Holly Energy Partners LP / Holly Energy Finance Corp., 6.500%, 3/1/20 | | | 1,675,000 | | | | 1,729 | |
| | Sabine Pass Liquefaction LLC, 5.000%, 3/15/27 144A | | | 1,000,000 | | | | 1,009 | |
| | Sabine Pass Liquefaction LLC, 5.625%, 2/1/21 | | | 425,000 | | | | 455 | |
| | Sabine Pass Liquefaction LLC, 5.625%, 4/15/23 | | | 1,755,000 | | | | 1,865 | |
| | Sabine Pass Liquefaction LLC, 5.625%, 3/1/25 | | | 700,000 | | | | 749 | |
| | Sabine Pass Liquefaction LLC, 6.250%, 3/15/22 | | | 2,285,000 | | | | 2,502 | |
| | Suburban Propane Partners LP / Suburban Energy Finance Corp., 5.500%, 6/1/24 | | | 3,425,000 | | | | 3,468 | |
| | Suburban Propane Partners LP / Suburban Energy Finance Corp., 5.750%, 3/1/25 | | | 275,000 | | | | 279 | |
| | Summit Midstream Holdings LLC / Summit Midstream Finance Corp., 5.500%, 8/15/22 | | | 2,355,000 | | | | 2,296 | |
| | Summit Midstream Holdings LLC / Summit Midstream Finance Corp., 7.500%, 7/1/21 | | | 825,000 | | | | 866 | |
| | Targa Resources Partners LP / Targa Resources Partners Finance Corp., 5.125%, 2/1/25 144A | | | 1,025,000 | | | | 1,017 | |
| | Targa Resources Partners LP / Targa Resources Partners Finance Corp., 5.375%, 2/1/27 144A | | | 1,950,000 | | | | 1,931 | |
| | Tesoro Logistics LP / Tesoro Finance Corp., 5.250%, 1/15/25 | | | 725,000 | | | | 740 | |
| | Tesoro Logistics LP / Tesoro Logistics Finance Corp., 5.875%, 10/1/20 | | | 967,000 | | | | 997 | |
| | Tesoro Logistics LP / Tesoro Logistics Finance Corp., 6.125%, 10/15/21 | | | 1,140,000 | | | | 1,197 | |
| | Tesoro Logistics LP / Tesoro Logistics Finance Corp., 6.250%, 10/15/22 | | | 1,350,000 | | | | 1,431 | |
| | Tesoro Logistics LP / Tesoro Logistics Finance Corp., 6.375%, 5/1/24 | | | 825,000 | | | | 883 | |
| | Western Refining Logistics LP / WNRL Finance Corp., 7.500%, 2/15/23 | | | 1,925,000 | | | | 2,079 | |
| | The Williams Cos., 4.550%, 6/24/24 | | | 900,000 | | | | 893 | |
| | Williams Partners LP / ACMP Finance Corp., 4.875%, 3/15/24 | | | 1,600,000 | | | | 1,616 | |
| | Williams Partners LP / ACMP Finance Corp., 6.125%, 7/15/22 | | | 890,000 | | | | 918 | |
| | | | | | | | | | |
| | Total | | | | 47,020 | |
| | | | | | | | | | |
| |
| | Services (1.1%) | |
| | Garda World Security Corp., 7.250%, 11/15/21 144A | | | 2,350,000 | | | | 2,186 | |
| | Hearthside Group Holdings LLC / Hearthside Finance Co., 6.500%, 5/1/22 144A | | | 3,175,000 | | | | 3,155 | |
| | IHS Markit, Ltd., 5.000%, 11/1/22 144A | | | 350,000 | | | | 363 | |
| | | | | | | | | | |
| | | Bonds (96.7%) | | Shares/
$ Par | | | Value
$ (000’s) | |
| |
| | Services continued | |
| | The ServiceMaster Co. LLC, 5.125%, 11/15/24 144A | | | 2,525,000 | | | | 2,563 | |
| | | | | | | | | | |
| | Total | | | | 8,267 | |
| | | | | | | | | | |
| |
| | Technology (10.7%) | |
| | Advanced Micro Devices, Inc., 7.000%, 7/1/24 | | | 325,000 | | | | 337 | |
| | BMC Software Finance, Inc., 8.125%, 7/15/21 144A | | | 4,275,000 | | | | 3,994 | |
| | CDW LLC / CDW Finance Corp., 5.500%, 12/1/24 | | | 2,075,000 | | | | 2,122 | |
| | CDW LLC / CDW Finance Corp., 6.000%, 8/15/22 | | | 1,900,000 | | | | 2,009 | |
| | CommScope Technologies Finance LLC, 6.000%, 6/15/25 144A | | | 650,000 | | | | 689 | |
| | CommScope, Inc., 5.500%, 6/15/24 144A | | | 2,150,000 | | | | 2,225 | |
| | Diamond 1 Finance Corp. / Diamond 2 Finance Corp., 5.875%, 6/15/21 144A | | | 450,000 | | | | 479 | |
| | Diamond 1 Finance Corp. / Diamond 2 Finance Corp., 7.125%, 6/15/24 144A | | | 3,025,000 | | | | 3,358 | |
| | First Data Corp., 5.375%, 8/15/23 144A | | | 3,275,000 | | | | 3,398 | |
| | First Data Corp., 5.750%, 1/15/24 144A | | | 4,600,000 | | | | 4,747 | |
| | First Data Corp., 7.000%, 12/1/23 144A | | | 2,400,000 | | | | 2,556 | |
| | IMS Health, Inc., 5.000%, 10/15/26 144A | | | 1,250,000 | | | | 1,253 | |
| | Inception Merger Sub, Inc. / Rackspace Hosting, Inc., 8.625%, 11/15/24 144A | | | 3,325,000 | | | | 3,519 | |
| (c) | | Infor Software Parent LLC / Infor Software Parent, Inc., 7.125%, 5/1/21 144A | | | 4,760,000 | | | | 4,903 | |
| | Infor US, Inc., 6.500%, 5/15/22 | | | 3,325,000 | | | | 3,466 | |
| | Informatica LLC, 7.125%, 7/15/23 144A | | | 3,325,000 | | | | 3,175 | |
| | Iron Mountain, Inc., 5.750%, 8/15/24 | | | 425,000 | | | | 437 | |
| | JDA Escrow LLC / JDA Bond Finance, Inc., 7.375%, 10/15/24 144A | | | 1,950,000 | | | | 2,023 | |
| | Micron Technology, Inc., 5.250%, 8/1/23 144A | | | 1,250,000 | | | | 1,255 | |
| | Micron Technology, Inc., 5.250%, 1/15/24 144A | | | 650,000 | | | | 647 | |
| | Micron Technology, Inc., 5.500%, 2/1/25 | | | 250,000 | | | | 249 | |
| | Microsemi Corp., 9.125%, 4/15/23 144A | | | 1,375,000 | | | | 1,602 | |
| | MSCI, Inc., 4.750%, 8/1/26 144A | | | 325,000 | | | | 323 | |
| | MSCI, Inc., 5.250%, 11/15/24 144A | | | 300,000 | | | | 315 | |
| | MSCI, Inc., 5.750%, 8/15/25 144A | | | 1,100,000 | | | | 1,169 | |
| | NCR Corp., 4.625%, 2/15/21 | | | 675,000 | | | | 687 | |
| | NCR Corp., 5.000%, 7/15/22 | | | 635,000 | | | | 648 | |
| | NCR Corp., 5.875%, 12/15/21 | | | 2,150,000 | | | | 2,252 | |
| | NCR Corp., 6.375%, 12/15/23 | | | 520,000 | | | | 559 | |
| | Nuance Communications, Inc., 5.375%, 8/15/20 144A | | | 2,500,000 | | | | 2,572 | |
| | Nuance Communications, Inc., 5.625%, 12/15/26 144A | | | 1,675,000 | | | | 1,647 | |
| | Nuance Communications, Inc., 6.000%, 7/1/24 144A | | | 1,375,000 | | | | 1,420 | |
| | PTC, Inc., 6.000%, 5/15/24 | | | 425,000 | | | | 448 | |
| | Qorvo, Inc., 7.000%, 12/1/25 | | | 1,775,000 | | | | 1,966 | |
| | Riverbed Technology, Inc., 8.875%, 3/1/23 144A | | | 1,750,000 | | | | 1,846 | |
| | Sabre GLBL, Inc., 5.250%, 11/15/23 144A | | | 250,000 | | | | 257 | |
| | Sabre GLBL, Inc., 5.375%, 4/15/23 144A | | | 1,775,000 | | | | 1,810 | |
| | Sensata Technologies BV, 5.625%, 11/1/24 144A | | | 1,900,000 | | | | 1,981 | |
| | Sensata Technologies UK Financing Co. PLC, 6.250%, 2/15/26 144A | | | 425,000 | | | | 444 | |
| | Solera LLC / Solera Finance, Inc., 10.500%, 3/1/24 144A | | | 3,075,000 | | | | 3,459 | |
| | Sophia LP / Sophia Finance, Inc., 9.000%, 9/30/23 144A | | | 2,275,000 | | | | 2,417 | |
| | SS&C Technologies Holdings, Inc., 5.875%, 7/15/23 | | | 1,500,000 | | | | 1,554 | |
| | VeriSign, Inc., 4.625%, 5/1/23 | | | 950,000 | | | | 960 | |
| | VeriSign, Inc., 5.250%, 4/1/25 | | | 350,000 | | | | 359 | |
The Accompanying Notes are an Integral Part of the Financial Statements
| | | | | | | | |
| | 148 | | | High Yield Bond Portfolio | | | | |
High Yield Bond Portfolio
| | | | | | | | | | |
| | | Bonds (96.7%) | | Shares/
$ Par | | | Value
$ (000’s) | |
| |
| | Technology continued | |
| | Zebra Technologies Corp., 7.250%, 10/15/22 | | | 3,150,000 | | | | 3,426 | |
| | | | | | | | | | |
| | Total | | | | | | | 80,962 | |
| | | | | | | | | | |
| | | |
| | Telecommunications (5.3%) | | | | | | | | |
| | Altice SA, 7.625%, 2/15/25 144A | | | 3,875,000 | | | | 4,069 | |
| | Altice SA, 7.750%, 5/15/22 144A | | | 700,000 | | | | 747 | |
| | Digicel Group, Ltd., 6.000%, 4/15/21 144A | | | 1,260,000 | | | | 1,140 | |
| | Digicel Group, Ltd., 7.125%, 4/1/22 144A | | | 525,000 | | | | 407 | |
| | Digicel Group, Ltd., 8.250%, 9/30/20 144A | | | 1,200,000 | | | | 1,030 | |
| | Level 3 Communications, Inc., 5.750%, 12/1/22 | | | 2,724,000 | | | | 2,799 | |
| | Level 3 Financing, Inc., 5.375%, 1/15/24 | | | 250,000 | | | | 252 | |
| | Numericable-SFR SA, 6.000%, 5/15/22 144A | | | 1,045,000 | | | | 1,072 | |
| | Numericable-SFR SA, 6.250%, 5/15/24 144A | | | 1,300,000 | | | | 1,306 | |
| | Numericable-SFR SA, 7.375%, 5/1/26 144A | | | 2,575,000 | | | | 2,639 | |
| | Sprint Capital Corp., 6.875%, 11/15/28 | | | 2,000,000 | | | | 1,975 | |
| | Sprint Communications, Inc., 6.000%, 11/15/22 | | | 1,675,000 | | | | 1,688 | |
| | Sprint Corp., 7.125%, 6/15/24 | | | 650,000 | | | | 670 | |
| | Sprint Corp., 7.250%, 9/15/21 | | | 2,610,000 | | | | 2,773 | |
| | Sprint Corp., 7.875%, 9/15/23 | | | 6,190,000 | | | | 6,608 | |
| | T-Mobile USA, Inc., 6.000%, 3/1/23 | | | 775,000 | | | | 819 | |
| | T-Mobile USA, Inc., 6.125%, 1/15/22 | | | 575,000 | | | | 607 | |
| | T-Mobile USA, Inc., 6.250%, 4/1/21 | | | 2,740,000 | | | | 2,850 | |
| | T-Mobile USA, Inc., 6.375%, 3/1/25 | | | 1,035,000 | | | | 1,106 | |
| | T-Mobile USA, Inc., 6.500%, 1/15/24 | | | 425,000 | | | | 456 | |
| | T-Mobile USA, Inc., 6.500%, 1/15/26 | | | 875,000 | | | | 946 | |
| | | | | | | | | | |
| | | Bonds (96.7%) | | Shares/
$ Par | | | Value
$ (000’s) | |
| |
| | Telecommunications continued | |
| | T-Mobile USA, Inc., 6.625%, 11/15/20 | | | 1,810,000 | | | | 1,851 | |
| | T-Mobile USA, Inc., 6.625%, 4/1/23 | | | 1,000,000 | | | | 1,060 | |
| | T-Mobile USA, Inc., 6.633%, 4/28/21 | | | 785,000 | | | | 819 | |
| | T-Mobile USA, Inc., 6.731%, 4/28/22 | | | 365,000 | | | | 381 | |
| | | | | | | | | | |
| | Total | | | | | | | 40,070 | |
| | | | | | | | | | |
| |
| | Transportation (1.0%) | |
| | Avis Budget Car Rental LLC / Avis Budget Finance, Inc., 5.250%, 3/15/25 144A | | | 1,050,000 | | | | 979 | |
| | Avis Budget Car Rental LLC / Avis Budget Finance, Inc., 5.500%, 4/1/23 | | | 450,000 | | | | 442 | |
| | Avis Budget Car Rental LLC / Avis Budget Finance, Inc., 6.375%, 4/1/24 144A | | | 2,275,000 | | | | 2,272 | |
| | The Hertz Corp., 5.500%, 10/15/24 144A | | | 1,100,000 | | | | 961 | |
| | The Hertz Corp., 6.250%, 10/15/22 | | | 3,050,000 | | | | 2,860 | |
| | | | | | | | | | |
| | Total | | | | 7,514 | |
| | | | | | | | | | |
| | | |
| | Total Bonds | | | | | | | | |
| | (Cost: $723,163) | | | | 731,847 | |
| | | | | | | | | | |
| | |
| | Total Investments (96.7%) | | | | | |
| | (Cost: $723,163)(a) | | | | 731,847 | |
| | | | | | | | | | |
| | Other Assets, | | | | | |
| | Less Liabilities (3.3%) | | | | 25,100 | |
| | | | | | | | | | |
| | Net Assets (100.0%) | | | | 756,947 | |
| | | | | | | | | | |
144A after the name of a security represents a security exempt from registration under Rule 144A of the Securities Act of 1933. These securities may be resold as transactions exempt from registration, normally to qualified institutional buyers. At December 31, 2016 the value of these securities (in thousands) was $405,183 representing 53.5% of the net assets.
| (a) | At December 31, 2016, the aggregate cost of securities for federal tax purposes (in thousands) was $723,163 and the net unrealized appreciation of investments based on that cost was $8,684 which is comprised of $23,183 aggregate gross unrealized appreciation and $14,499 aggregate gross unrealized depreciation. |
The following is a summary of the inputs used in valuing the Portfolio’s assets and liabilities at December 31, 2016. See Note 3 for additional information on portfolio valuation.
| | | | | | | | | | | | | | |
| | | Valuation Inputs | | | |
| Description | | Level 1 – Quoted Prices | | | Level 2 – Other Significant Observable Inputs | | | Level 3 – Significant
Unobservable Inputs | | | |
| | | (Amounts in thousands) | | | |
Assets: | | | | | | | | | | | | | | |
Corporate Bonds | | $ | - | | | $ | 731,847 | | | $ | - | | | |
Total Assets: | | $ | - | | | $ | 731,847 | | | $ | - | | | |
The Accompanying Notes are an Integral Part of the Financial Statements.
| | | | |
| | High Yield Bond Portfolio | | 149 |
Multi-Sector Bond Portfolio (unaudited)
| | | | |
| Objective: | | Portfolio Strategy: | | Net Assets: |
| Maximum total return, consistent with prudent investment management. | | Invest in a diversified portfolio of fixed income instruments of varying maturities and quality, and in derivatives designed to replicate such securities. | | $690 million |
Portfolio Overview
Mason Street Advisors, LLC (“Mason Street Advisors”), the investment adviser for the Multi-Sector Bond Portfolio (the “Portfolio”), has engaged Pacific Investment Management Company LLC (“PIMCO”) to act as sub-adviser for the Portfolio. Normally, the Portfolio invests in a diversified portfolio of fixed income instruments of varying maturities, which may be represented by forwards or derivatives such as options, futures contracts or swap agreements. The average portfolio duration (an aggregate measure of the sensitivity of the Portfolio’s fixed income portfolio securities to changes in interest rates) of the Portfolio normally varies from three to eight years, based on PIMCO’s forecast for interest rates. The Portfolio may invest all of its assets in high yield securities subject to a maximum of 10% of its total assets in securities rated below B by Moody’s or equivalently rated by S&P or Fitch or, if unrated, determined by PIMCO to be of comparable quality (so called “junk bonds”). The Portfolio may invest, without limitation, in securities denominated in foreign currencies and U.S. dollar denominated securities of foreign issuers. In addition, the Portfolio may invest without limit in fixed income securities of issuers that are economically tied to emerging securities markets.
Market Overview
Markets in 2016 were peppered by bouts of volatility induced by brief periods of uncertainty and unexpected political global outcomes; however, on the whole, global markets as well as the global economy seemed relatively resilient. While recession fears gripped markets early in the year, sentiment started to improve sharply on the back of dovish central banks and a turn higher in oil prices. Uncertainty surrounding the United Kingdom’s vote to leave the European Union, or “Brexit,” coupled with tepid U.S. economic data spawned a short-lived and relatively contained selloff. While in the U.S., a surprising presidential election and strong economic fundamentals prompted investors to price in expectations for pro-growth reflationary policies under President-elect Donald Trump. This supported the Fed’s case to continue their rate hike cycle in December, with a 25 basis point hike.
In response to this year’s events, U.S. yields rose across the curve while rising oil prices and OPEC’s production cut agreement prompted breakeven levels to push higher as inflation expectations continued to rise. In addition, risk assets returned higher this year, as investment grade and high yield corporate spreads narrowed. Globally, yields in most developed countries fell amid continued monetary policy actions in those regions.
Portfolio Results
The Portfolio returned 11.09% for the twelve months ended December 31, 2016. By comparison, the Portfolio’s benchmark, the Bloomberg Barclays® Global Credit Hedged USD Index returned 7.33%. The Portfolio’s custom benchmark, comprised of 1/3 each: Bloomberg Barclays® Global Aggregate - Credit Component ex Emerging Markets, Hedged USD; BofA Merrill Lynch® Global High Yield BB-B Rated Constrained Developed Markets Index, Hedged USD; J.P. Morgan® EMBI Global (the “Equal Weighted Composite Index”), returned 9.81%. (These Indices are unmanaged, cannot be invested in directly and does not include administrative expenses or sales charges.) The Portfolio outperformed the 7.44% average return of the Multisector Bond peer group tracked by Morningstar® Inc., an independent mutual fund ranking agency.
When compared to the Equal Weighted Composite Index, the Portfolio’s emerging market exposure to Brazilian quasi-sovereign and corporate debt, which was partially obtained through the use of credit default swaps, contributed to performance, as select energy issuers outperformed due to stabilizing commodity prices. In addition, tactical exposure to non-Agency mortgage backed securities was also additive, due to continued strength in the U.S. housing market. Last, an overweight to investment grade pipelines was positive for performance as this sector outperformed.
The primary detractor was an underweight to high yield raw materials, which outperformed due to stabilizing commodity prices. In addition, a tactical long U.S. dollar exposure against the Japanese yen and Brazilian real, partially implemented through the use of forward currency contracts, also detracted, as those currencies appreciated relative to the U.S. dollar.
Portfolio Manager Outlook
The following forward looking comments are the opinion of PIMCO, the Portfolio’s sub-adviser.
PIMCO’s baseline forecast for 2017 calls for real global growth to remain in the 2.5%–3.0% range that has held for the past five years. Headline inflation should pick up in developed market economies, while high inflation in emerging economies like
| | | | | | | | |
| | 150 | | | Multi-Sector Bond Portfolio | | | | |
Multi-Sector Bond Portfolio (unaudited)
Brazil and Russia is likely to ebb. Growth in the U.S. and eurozone should remain above trend, but policy and political uncertainty remains. In emerging markets, domestic conditions have improved but the evolution of trade and central bank policy in places like the United States may serve as a headwind.
Relative Performance
| | | | | | | | | | | | |
Average Annual Total Returns For Periods Ended December 31, 2016 | |
| | | 1 Year | | | 5 Years | | | Since
Inception* | |
Multi-Sector Bond Portfolio | | | 11.09 | % | | | 4.88 | % | | | 5.85 | % |
Bloomberg Barclays® Global Credit Hedged USD Index | | | 7.33 | % | | | 5.13 | % | | | 5.28 | % |
1/3 each: Bloomberg Barclays® Global Aggregate — Credit Component ex Emerging Markets, Hedged USD; BofA Merrill Lynch® Global High Yield BB-B Rated Constrained Developed Markets Index, Hedged USD; JP Morgan® EMBI Global | | | 9.81 | % | | | 5.99 | % | | | 6.32 | % |
Morningstar® US Insurance Fund Multisector Bond Average | | | 7.44 | % | | | 4.48 | % | | | – | |
| * | Inception date of 4/30/07 |
The performance data quoted represents past performance. Past performance is historical and does not guarantee future performance. Investment return and principal value will fluctuate, so that shares, when redeemed, may be worth more or less than their original cost. Current performance may be lower or higher than the performance data quoted. For the most recent month-end performance information visit www.northwesternmutual.com.
This chart assumes an initial investment of $10,000 made on 4/30/07 (commencement of the Portfolio’s operations). Returns shown reflect fee waivers, deductions for management and other portfolio expenses, and reinvestment of all dividends. In the absence of fee waivers, total return would be reduced. Returns exclude deductions for separate account sale loads and account fees. Please refer to the Benchmark Definitions section of this report for information about the indices cited in the above chart and graph.
The Portfolio invests in lower-quality securities, which may present a significant risk for loss of principal and interest. Bonds and other debt obligations are affected by changes in interest rates, inflation risk and the creditworthiness of their issuers. High yield bonds generally have greater price swings and higher default risks than investment grade bonds. Return of principal is not guaranteed. When interest rates rise, bond prices fall. With a fixed income fund, when interest rates rise, the value of the fund’s existing bonds drops, which could negatively affect overall fund performance.
Investing in bonds issued by foreign corporations and governments carries additional risk, including foreign currency risk, and may increase the volatility of the Portfolio’s performance.
The Portfolio may use derivative instruments for hedging purposes or as alternatives to direct investments. Use of these instruments may involve certain costs and risks such as liquidity risk, interest rate risk, market risk, credit risk, management risk and the risk of mispricing or improper valuation. Certain derivatives involve leverage, which could magnify losses, and portfolios investing in derivatives could lose more than the principal amount invested in those instruments.
The Portfolio may also invest in municipal securities, which may be more sensitive to certain adverse conditions than other fixed income securities, may be or become illiquid, and may have yields which move differently and adversely compared to the yields of the overall debt securities markets.
Currently, interest rates are near unprecedented historically low levels. A significant rise in interest rates over a short period of time could cause significant losses in the market value of the Portfolio’s fixed income investments.
| | | | |
| | Multi-Sector Bond Portfolio | | 151 |
Multi-Sector Bond Portfolio (unaudited)
Top 10 Fixed Income Holdings 12/31/16
| | | | |
Security Description | | | % of Net Assets | |
Petroleos Mexicanos, Various | | | 1.9 | % |
Republic of Turkey, Various | | | 1.7 | % |
Barclays Bank PLC, Various | | | 1.7 | % |
Republic of Indonesia, Various | | | 1.5 | % |
Petrobras Global Finance BV, Various | | | 1.4 | % |
Credit Suisse AG, Various | | | 1.4 | % |
Ally Financial, Inc., Various | | | 1.4 | % |
Credit Agricole SA, Various | | | 1.3 | % |
Wind Acquisition Finance SA EUR, Various | | | 1.3 | % |
Altice SA EUR, Various | | | 1.3 | % |
Sector Allocation 12/31/16
Sector Allocation is based on Net Assets.
Sector Allocation and Top 10 Holdings are subject to change.
| | | | | | |
| 152 | | Multi-Sector Bond Portfolio | | | | |
Multi-Sector Bond Portfolio
Schedule of Investments
December 31, 2016
| | | | | | | | | | |
| | | Corporate Bonds (48.0%) | | Shares/
Par | | | Value
$ (000’s) | |
| | | |
| | Autos & Vehicle Parts (1.5%) | | | | | | | | |
| | Ford Motor Credit Co. LLC, 4.134%, 8/4/25 | | | 800,000 | | | | 801 | |
| | General Motors Financial Co., Inc., 2.625%, 7/10/17 | | | 800,000 | | | | 804 | |
| | General Motors Financial Co., Inc., 3.450%, 4/10/22 | | | 500,000 | | | | 494 | |
| (c,f) | | IHO Verwaltungs Gmbh, 3.750%, 9/15/26 EUR | | | 3,100,000 | | | | 3,261 | |
| | Magna International, Inc., 3.625%, 6/15/24 | | | 700,000 | | | | 705 | |
| | Volkswagen Group of America Finance LLC, 1.351%, 11/20/17 144A | | | 200,000 | | | | 200 | |
| | Volkswagen Group of America Finance LLC, 2.125%, 5/23/19 144A | | | 200,000 | | | | 199 | |
| (f) | | ZF North America Capital, Inc., 2.750%, 4/27/23 EUR | | | 2,200,000 | | | | 2,441 | |
| | ZF North America Capital, Inc., 4.500%, 4/29/22 144A | | | 800,000 | | | | 825 | |
| | ZF North America Capital, Inc., 4.750%, 4/29/25 144A | | | 700,000 | | | | 712 | |
| | | | | | | | | | |
| | Total | | | | | | | 10,442 | |
| | | | | | | | | | |
| | | |
| | Banking (13.9%) | | | | | | | | |
| (b) | | Ally Financial, Inc., 3.250%, 2/13/18 | | | 1,500,000 | | | | 1,507 | |
| | Ally Financial, Inc., 3.250%, 11/5/18 | | | 100,000 | | | | 100 | |
| | Ally Financial, Inc., 3.500%, 1/27/19 | | | 210,000 | | | | 211 | |
| | Ally Financial, Inc., 3.600%, 5/21/18 | | | 100,000 | | | | 101 | |
| (b) | | Ally Financial, Inc., 3.750%, 11/18/19 | | | 5,200,000 | | | | 5,222 | |
| (b) | | Ally Financial, Inc., 4.125%, 3/30/20 | | | 1,000,000 | | | | 1,010 | |
| | Ally Financial, Inc., 4.750%, 9/10/18 | | | 100,000 | | | | 103 | |
| | Ally Financial, Inc., 5.125%, 9/30/24 | | | 800,000 | | | | 814 | |
| | Ally Financial, Inc., 8.000%, 11/1/31 | | | 800,000 | | | | 928 | |
| | Banco Continental SA via Continental Senior Trustee II Cayman, Ltd., 5.750%, 1/18/17 144A | | | 600,000 | | | | 600 | |
| (f) | | Banco Santander SA, 6.250%, 9/11/49 EUR | | | 3,000,000 | | | | 2,958 | |
| (b) | | Bank of America Corp., 4.000%, 4/1/24 | | | 2,000,000 | | | | 2,063 | |
| (b) | | Barclays Bank PLC, 7.625%, 11/21/22 | | | 2,000,000 | | | | 2,195 | |
| (b) | | Barclays Bank PLC, 7.750%, 4/10/23 | | | 3,200,000 | | | | 3,364 | |
| (f) | | Barclays Bank PLC, 14.000%, 11/29/49 GBP | | | 800,000 | | | | 1,209 | |
| (b) | | Barclays PLC, 2.875%, 6/8/20 | | | 5,200,000 | | | | 5,156 | |
| | BPCE SA, 4.500%, 3/15/25 144A | | | 1,600,000 | | | | 1,559 | |
| | BPCE SA, 4.625%, 7/11/24 144A | | | 1,600,000 | | | | 1,581 | |
| | Cantor Fitzgerald LP, 6.500%, 6/17/22 144A | | | 200,000 | | | | 214 | |
| | Cantor Fitzgerald LP, 7.875%, 10/15/19 144A | | | 1,500,000 | | | | 1,661 | |
| | Citigroup, Inc., 1.700%, 4/27/18 | | | 600,000 | | | | 599 | |
| (b) | | Credit Agricole SA, 8.125%, 9/19/33 | | | 6,500,000 | | | | 6,992 | |
| | Credit Suisse AG, 6.500%, 8/8/23 144A | | | 7,400,000 | | | | 7,861 | |
| (b) | | Credit Suisse AG, 6.500%, 8/8/23 | | | 1,700,000 | | | | 1,806 | |
| | Deutsche Bank AG, 4.250%, 10/14/21 144A | | | 2,800,000 | | | | 2,811 | |
| (b) | | The Goldman Sachs Group, Inc., 3.750%, 5/22/25 | | | 2,700,000 | | | | 2,707 | |
| (b) | | The Goldman Sachs Group, Inc., 3.850%, 7/8/24 | | | 1,000,000 | | | | 1,021 | |
| | The Goldman Sachs Group, Inc., 4.000%, 3/3/24 | | | 400,000 | | | | 415 | |
| | The Goldman Sachs Group, Inc., 5.750%, 1/24/22 | | | 400,000 | | | | 450 | |
| | The Goldman Sachs Group, Inc., 7.500%, 2/15/19 | | | 400,000 | | | | 443 | |
| (f) | | HBOS PLC, 5.374%, 6/30/21 EUR | | | 600,000 | | | | 736 | |
| (b) | | HSBC Holdings PLC, 3.600%, 5/25/23 | | | 2,100,000 | | | | 2,112 | |
| | | | | | | | | | |
| | | Corporate Bonds (48.0%) | | Shares/
Par | | | Value
$ (000’s) | |
| | | |
| | Banking continued | | | | | | | | |
| | ING Bank NV, 5.800%, 9/25/23 144A | | | 3,000,000 | | | | 3,296 | |
| | Intesa Sanpaolo SPA, 5.017%, 6/26/24 144A | | | 2,700,000 | | | | 2,495 | |
| | Intesa Sanpaolo SPA, 6.500%, 2/24/21 144A | | | 4,100,000 | | | | 4,496 | |
| | Jefferies Finance LLC / JFIN Co-Issuer Corp., 6.875%, 4/15/22 144A | | | 800,000 | | | | 772 | |
| | Jefferies Finance LLC / JFIN Co-Issuer Corp., 7.375%, 4/1/20 144A | | | 900,000 | | | | 900 | |
| | Jefferies Finance LLC / JFIN Co-Issuer Corp., 7.500%, 4/15/21 144A | | | 500,000 | | | | 495 | |
| (f) | | Lloyds Bank PLC, 7.625%, 4/22/25 GBP | | | 1,200,000 | | | | 1,903 | |
| | Macquarie Group, Ltd., 6.250%, 1/14/21 144A | | | 300,000 | | | | 332 | |
| (b) | | Morgan Stanley, 4.000%, 7/23/25 | | | 3,600,000 | | | | 3,690 | |
| | Morgan Stanley, 5.500%, 1/26/20 | | | 500,000 | | | | 542 | |
| | Morgan Stanley, 7.300%, 5/13/19 | | | 400,000 | | | | 446 | |
| (f) | | Novo Banco SA, 5.000%, 4/4/19 EUR | | | 100,000 | | | | 72 | |
| (f) | | Novo Banco SA, 5.000%, 4/23/19 EUR | | | 1,200,000 | | | | 859 | |
| (f) | | Novo Banco SA, 5.000%, 5/14/19 EUR | | | 1,169,000 | | | | 837 | |
| (f) | | Novo Banco SA, 5.000%, 5/21/19 EUR | | | 300,000 | | | | 215 | |
| (f) | | Novo Banco SA, 5.000%, 5/23/19 EUR | | | 800,000 | | | | 573 | |
| (f) | | Royal Bank of Scotland Group PLC, 2.500%, 3/22/23 EUR | | | 100,000 | | | | 107 | |
| | Royal Bank of Scotland Group PLC, 4.800%, 4/5/26 | | | 600,000 | | | | 601 | |
| (b) | | Royal Bank of Scotland Group PLC, 6.400%, 10/21/19 | | | 1,500,000 | | | | 1,633 | |
| (b) | | Royal Bank of Scotland PLC, 9.500%, 3/16/22 | | | 3,200,000 | | | | 3,249 | |
| | Societe Generale SA, 4.250%, 4/14/25 144A | | | 400,000 | | | | 388 | |
| (b) | | UBS AG, 4.750%, 5/22/23 | | | 2,300,000 | | | | 2,346 | |
| (b) | | UBS AG, 7.625%, 8/17/22 | | | 4,400,000 | | | | 4,989 | |
| | | | | | | | | | |
| | Total | | | | | | | 95,745 | |
| | | | | | | | | | |
| | | |
| | Basic Materials (1.0%) | | | | | | | | |
| (f) | | Ball Corp, 4.375%, 12/15/23 EUR | | | 1,900,000 | | | | 2,209 | |
| (f) | | Crown European Holdings SA, 3.375%, 5/15/25 144A EUR | | | 500,000 | | | | 532 | |
| | Georgia-Pacific LLC, 8.875%, 5/15/31 | | | 200,000 | | | | 296 | |
| | Hamilton College, 4.750%, 7/1/13 | | | 100,000 | | | | 85 | |
| (f) | | Kloeckner Pentaplast of America, Inc., 7.125%, 11/1/20 EUR | | | 1,300,000 | | | | 1,438 | |
| | Weyerhaeuser Co., 7.375%, 10/1/19 | | | 400,000 | | | | 449 | |
| (b) | | Weyerhaeuser Co., 7.375%, 3/15/32 | | | 1,500,000 | | | | 1,900 | |
| | | | | | | | | | |
| | Total | | | | | | | 6,909 | |
| | | | | | | | | | |
| | | |
| | Builders & Building Materials (0.2%) | | | | | | | | |
| (f) | | Cemex SAB de CV, 4.375%, 3/5/23 144A EUR | | | 1,400,000 | | | | 1,510 | |
| | | | | | | | | | |
| | Total | | | | | | | 1,510 | |
| | | | | | | | | | |
| | | |
| | Chemicals (0.1%) | | | | | | | | |
| | Ashland, Inc., 3.875%, 4/15/18 | | | 500,000 | | | | 513 | |
| | Solvay Finance America LLC, 4.450%, 12/3/25 144A | | | 200,000 | | | | 208 | |
| | | | | | | | | | |
| | Total | | | | | | | 721 | |
| | | | | | | | | | |
The Accompanying Notes are an Integral Part of the Financial Statements.
| | | | | | |
| | Multi-Sector Bond Portfolio | | | 153 | |
Multi-Sector Bond Portfolio
| | | | | | | | | | |
| | | Corporate Bonds (48.0%) | | Shares/
Par | | | Value
$ (000’s) | |
| | | |
| | Consumer Products & Retailing (1.0%) | | | | | | | | |
| (f) | | Casino Guichard Perrachon SA, 2.330%, 2/7/25 EUR | | | 200,000 | | | | 210 | |
| (e,f) | | Co-operative Group Holdings 2011, Ltd., 6.875%, 7/8/20 GBP | | | 1,300,000 | | | | 1,807 | |
| (e,f) | | Co-operative Group Holdings 2011, Ltd., 7.500%, 7/8/26 GBP | | | 1,700,000 | | | | 2,474 | |
| | CVS Pass-Through Trust, 4.704%, 1/10/36 144A | | | 459,440 | | | | 484 | |
| | CVS Pass-Through Trust, 5.926%, 1/10/34 144A | | | 786,253 | | | | 898 | |
| | CVS Pass-Through Trust, 7.507%, 1/10/32 144A | | | 83,613 | | | | 102 | |
| (f) | | Tesco PLC, 5.000%, 3/24/23 GBP | | | 400,000 | | | | 532 | |
| | | | | | | | | | |
| | Total | | | | | | | 6,507 | |
| | | | | | | | | | |
| | | |
| | Electric Utilities (0.9%) | | | | | | | | |
| | Bruce Mansfield Unit 1 2007 Pass Through Trust, 6.850%, 6/1/34 | | | 1,876,539 | | | | 563 | |
| | Dynegy, Inc., 7.375%, 11/1/22 | | | 400,000 | | | | 382 | |
| (b) | | Dynegy, Inc., 7.625%, 11/1/24 | | | 1,875,000 | | | | 1,730 | |
| | Exelon Generation Co. LLC, 4.250%, 6/15/22 | | | 500,000 | | | | 517 | |
| (b) | | FirstEnergy Corp., 7.375%, 11/15/31 | | | 800,000 | | | | 1,031 | |
| | Puget Energy, Inc., 5.625%, 7/15/22 | | | 200,000 | | | | 221 | |
| (b) | | SSE PLC, 5.625%, 9/29/49 | | | 1,600,000 | | | | 1,628 | |
| | | | | | | | | | |
| | Total | | | | | | | 6,072 | |
| | | | | | | | | | |
| | | |
| | Energy (2.8%) | | | | | | | | |
| (b) | | Borets Finance, Ltd., 7.625%, 9/26/18 | | | 2,700,000 | | | | 2,673 | |
| | California Resources Corp., 8.000%, 12/15/22 144A | | | 2,202,000 | | | | 1,960 | |
| (f) | | Chesapeake Energy Corp., 6.250%, 1/15/17 EUR | | | 400,000 | | | | 418 | |
| | Harvest Operations Corp., 2.330%, 4/14/21 144A | | | 2,970,000 | | | | 2,912 | |
| (b) | | Newfield Exploration Co., 5.625%, 7/1/24 | | | 2,100,000 | | | | 2,189 | |
| (b) | | Novatek OAO via Novatek Finance, Ltd., 4.422%, 12/13/22 | | | 1,690,000 | | | | 1,668 | |
| (b) | | Novatek OAO via Novatek Finance, Ltd., 6.604%, 2/3/21 | | | 1,600,000 | | | | 1,736 | |
| (b) | | Odebrecht Drilling Norbe VIII/IX, Ltd., 6.350%, 6/30/21 | | | 2,431,000 | | | | 1,088 | |
| | Petrofac, Ltd., 3.400%, 10/10/18 144A | | | 400,000 | | | | 405 | |
| | Pride International, Inc., 8.500%, 6/15/19 | | | 500,000 | | | | 557 | |
| | Southwestern Energy Co., 5.050%, 1/23/18 | | | 100,000 | | | | 101 | |
| (b) | | Southwestern Energy Co., 5.800%, 1/23/20 | | | 1,900,000 | | | | 1,957 | |
| | Transocean, Inc., 9.000%, 7/15/23 144A | | | 1,100,000 | | | | 1,127 | |
| | Weatherford International, Ltd., 7.000%, 3/15/38 | | | 500,000 | | | | 416 | |
| | | | | | | | | | |
| | Total | | | | | | | 19,207 | |
| | | | | | | | | | |
| | | |
| | Finance (5.1%) | | | | | | | | |
| (k) | | AerCap Ireland Capital, Ltd. / AerCap Global Aviation Trust, 2.750%, 5/15/17 | | | 3,300,000 | | | | 3,304 | |
| | AerCap Ireland Capital, Ltd. / AerCap Global Aviation Trust, 4.250%, 7/1/20 | | | 150,000 | | | | 154 | |
| (k) | | AerCap Ireland Capital, Ltd. / AerCap Global Aviation Trust, 5.000%, 10/1/21 | | | 1,500,000 | | | | 1,577 | |
| | Aviation Capital Group Corp., 4.625%, 1/31/18 144A | | | 1,900,000 | | | | 1,955 | |
| (k) | | CIT Group, Inc., 3.875%, 2/19/19 | | | 1,000,000 | | | | 1,021 | |
| | CIT Group, Inc., 4.250%, 8/15/17 | | | 400,000 | | | | 406 | |
| (k) | | CIT Group, Inc., 5.250%, 3/15/18 | | | 2,800,000 | | | | 2,901 | |
| | CIT Group, Inc., 5.375%, 5/15/20 | | | 500,000 | | | | 531 | |
| | | | | | | | | | |
| | | Corporate Bonds (48.0%) | | Shares/
Par | | | Value
$ (000’s) | |
| | | |
| | Finance continued | | | | | | | | |
| | CIT Group, Inc., 5.500%, 2/15/19 144A | | | 300,000 | | | | 316 | |
| | CIT Group, Inc., 6.625%, 4/1/18 144A | | | 3,300,000 | | | | 3,477 | |
| (k) | | International Lease Finance Corp., 5.875%, 4/1/19 | | | 1,400,000 | | | | 1,487 | |
| | International Lease Finance Corp., 5.875%, 8/15/22 | | | 400,000 | | | | 434 | |
| | International Lease Finance Corp., 6.250%, 5/15/19 | | | 450,000 | | | | 484 | |
| (k) | | International Lease Finance Corp., 8.250%, 12/15/20 | | | 2,000,000 | | | | 2,330 | |
| | International Lease Finance Corp., 8.625%, 1/15/22 | | | 400,000 | | | | 481 | |
| (f) | | Lincoln Finance, Ltd., 6.875%, 4/15/21 EUR | | | 2,000,000 | | | | 2,285 | |
| | Navient Corp., 4.625%, 9/25/17 | | | 200,000 | | | | 203 | |
| (k) | | Navient Corp., 4.875%, 6/17/19 | | | 2,700,000 | | | | 2,795 | |
| | Navient Corp., 5.500%, 1/15/19 | | | 700,000 | | | | 726 | |
| (k) | | Navient Corp., 6.625%, 7/26/21 | | | 1,100,000 | | | | 1,163 | |
| | OneMain Financial Holdings LLC, 6.750%, 12/15/19 144A | | | 300,000 | | | | 313 | |
| | OneMain Financial Holdings LLC, 7.250%, 12/15/21 144A | | | 400,000 | | | | 417 | |
| (k) | | PHH Corp., 6.375%, 8/15/21 | | | 1,500,000 | | | | 1,500 | |
| (k) | | PHH Corp., 7.375%, 9/1/19 | | | 1,700,000 | | | | 1,828 | |
| | Springleaf Finance Corp., 5.250%, 12/15/19 | | | 100,000 | | | | 101 | |
| | Springleaf Finance Corp., 6.500%, 9/15/17 | | | 700,000 | | | | 717 | |
| (k) | | Springleaf Finance Corp., 6.900%, 12/15/17 | | | 2,200,000 | | | | 2,294 | |
| | | | | | | | | | |
| | Total | | | | | | | 35,200 | |
| | | | | | | | | | |
| | | |
| | Food & Beverage (0.3%) | | | | | | | | |
| | Anheuser-Busch InBev Finance, Inc., 4.700%, 2/1/36 | | | 500,000 | | | | 526 | |
| (k) | | Anheuser-Busch InBev Finance, Inc., 4.900%, 2/1/46 | | | 1,500,000 | | | | 1,621 | |
| | | | | | | | | | |
| | Total | | | | | | | 2,147 | |
| | | | | | | | | | |
| | | |
| | Gaming/Leisure/Lodging (0.9%) | | | | | | | | |
| | Wynn Las Vegas LLC / Wynn Las Vegas Capital Corp., 5.500%, 3/1/25 144A | | | 6,250,000 | | | | 6,200 | |
| | | | | | | | | | |
| | Total | | | | | | | 6,200 | |
| | | | | | | | | | |
| | | |
| | Healthcare (1.4%) | | | | | | | | |
| | CHS / Community Health Systems, Inc., 5.125%, 8/1/21 | | | 200,000 | | | | 186 | |
| | HCA, Inc., 4.500%, 2/15/27 | | | 100,000 | | | | 98 | |
| (b) | | HCA, Inc., 4.750%, 5/1/23 | | | 2,655,000 | | | | 2,718 | |
| (b) | | HCA, Inc., 6.500%, 2/15/20 | | | 2,000,000 | | | | 2,188 | |
| | Tenet Healthcare Corp., 4.500%, 4/1/21 | | | 300,000 | | | | 297 | |
| (f) | | Valeant Pharmaceuticals International, Inc., 4.500%, 5/15/23 EUR | | | 5,700,000 | | | | 4,322 | |
| | | | | | | | | | |
| | Total | | | | | | | 9,809 | |
| | | | | | | | | | |
| | | |
| | Industrials (0.0%) | | | | | | | | |
| | DP World Sukuk, Ltd., 6.250%, 7/2/17 | | | 200,000 | | | | 204 | |
| | | | | | | | | | |
| | Total | | | | | | | 204 | |
| | | | | | | | | | |
| | | |
| | Insurance (1.1%) | | | | | | | | |
| (f) | | Credit Agricole Assurances SA, 4.250%, 1/29/49 EUR | | | 2,000,000 | | | | 2,071 | |
| | The Doctors Co., 6.500%, 10/15/23 144A | | | 300,000 | | | | 333 | |
The Accompanying Notes are an Integral Part of the Financial Statements.
| | | | | | |
| 154 | | Multi-Sector Bond Portfolio | | | | |
Multi-Sector Bond Portfolio
| | | | | | | | | | |
| | | Corporate Bonds (48.0%) | | Shares/
Par | | | Value
$ (000’s) | |
| | | |
| | Insurance continued | | | | | | | | |
| (f) | | La Mondiale SAM, 5.050%, 12/29/49 EUR | | | 2,400,000 | | | | 2,527 | |
| (f) | | NN Group NV, 4.500%, 7/15/49 EUR | | | 2,600,000 | | | | 2,731 | |
| | | | | | | | | | |
| | Total | | | | | | | 7,662 | |
| | | | | | | | | | |
| | | |
| | Materials (0.3%) | | | | | | | | |
| (f) | | Ardagh Packaging Finance PLC / Ardagh Holdings USA, Inc., 4.125%, 5/15/23 144A EUR | | | 100,000 | | | | 110 | |
| (f) | | Ineos Finance PLC, 4.000%, 5/1/23 144A EUR | | | 1,500,000 | | | | 1,632 | |
| | | | | | | | | | |
| | Total | | | | | | | 1,742 | |
| | | | | | | | | | |
| | | |
| | Media (2.6%) | | | | | | | | |
| (f) | | Altice Financing SA, 5.250%, 2/15/23 EUR | | | 2,800,000 | | | | 3,124 | |
| | Altice Financing SA, 7.500%, 5/15/26 144A | | | 1,200,000 | | | | 1,248 | |
| (b) | | DISH DBS Corp., 5.125%, 5/1/20 | | | 3,800,000 | | | | 3,933 | |
| | Time Warner Cable, Inc., 5.875%, 11/15/40 | | | 300,000 | | | | 320 | |
| | Time Warner Cable, Inc., 6.750%, 6/15/39 | | | 200,000 | | | | 233 | |
| (f) | | Unitymedia Hessen GmbH & Co. KG / Unitymedia NRW GmbH, 3.500%, 1/15/27 EUR | | | 700,000 | | | | 722 | |
| (f) | | Unitymedia Hessen GmbH & Co. KG / Unitymedia NRW GmbH, 5.750%, 1/15/23 EUR | | | 162,000 | | | | 182 | |
| (f) | | UPCB Finance IV, Ltd., 4.000%, 1/15/27 EUR | | | 350,000 | | | | 368 | |
| (f) | | Virgin Media Secured Finance PLC, 4.875%, 1/15/27 GBP | | | 3,100,000 | | | | 3,744 | |
| (f) | | Virgin Media Secured Finance PLC, 5.125%, 1/15/25 144A GBP | | | 700,000 | | | | 882 | |
| (f) | | Ziggo Secured Finance BV, 3.750%, 1/15/25 EUR | | | 2,200,000 | | | | 2,343 | |
| (f) | | Ziggo Secured Finance BV, 4.250%, 1/15/27 144A EUR | | | 500,000 | | | | 525 | |
| (f) | | Ziggo Secured Finance BV, 4.250%, 1/15/27 EUR | | | 200,000 | | | | 210 | |
| | | | | | | | | | |
| | Total | | | | | | | 17,834 | |
| | | | | | | | | | |
| | | |
| | Metals & Mining (0.5%) | | | | | | | | |
| (b) | | Gold Fields Orogen Holding BVI, Ltd., 4.875%, 10/7/20 | | | 3,400,000 | | | | 3,342 | |
| | | | | | | | | | |
| | Total | | | | | | | 3,342 | |
| | | | | | | | | | |
| | | |
| | Oil & Gas (0.2%) | | | | | | | | |
| | BG Energy Capital PLC, 6.500%, 11/30/72 | | | 700,000 | | | | 723 | |
| | Reliance Holdings USA, Inc., 4.500%, 10/19/20 | | | 300,000 | | | | 317 | |
| | | | | | | | | | |
| | Total | | | | | | | 1,040 | |
| | | | | | | | | | |
| | | |
| | Pharmaceuticals (1.0%) | | | | | | | | |
| | Amgen, Inc., 4.663%, 6/15/51 144A | | | 1,041,000 | | | | 1,001 | |
| | Endo Finance LLC, 5.750%, 1/15/22 144A | | | 2,900,000 | | | | 2,559 | |
| | Mallinckrodt International Finance SA / Mallinckrodt CB LLC, 5.750%, 8/1/22 144A | | | 400,000 | | | | 385 | |
| | Mallinckrodt International Finance SA / Mallinckrodt CD LLC, 5.625%, 10/15/23 144A | | | 3,200,000 | | | | 2,984 | |
| | Pfizer, Inc., 5.800%, 8/12/23 | | | 200,000 | | | | 236 | |
| | | | | | | | | | |
| | Total | | | | | | | 7,165 | |
| | | | | | | | | | |
| | | |
| | Pipelines (4.1%) | | | | | | | | |
| | Cheniere Corpus Christi Holdings LLC, 7.000%, 6/30/24 144A | | | 2,100,000 | | | | 2,273 | |
| | Energy Transfer Partners LP, 3.600%, 2/1/23 | | | 100,000 | | | | 98 | |
| | Energy Transfer Partners LP, 4.150%, 10/1/20 | | | 400,000 | | | | 414 | |
| | Energy Transfer Partners LP, 4.650%, 6/1/21 | | | 200,000 | | | | 208 | |
| | | | | | | | | | |
| | | Corporate Bonds (48.0%) | | Shares/
Par | | | Value
$ (000’s) | |
| | | |
| | Pipelines continued | | | | | | | | |
| | Hiland Partners LP / Hiland Partners Finance Corp., 5.500%, 5/15/22 144A | | | 100,000 | | | | 105 | |
| (b) | | Kinder Morgan Energy Partners LP, 6.550%, 9/15/40 | | | 2,382,000 | | | | 2,619 | |
| (k) | | Kinder Morgan, Inc., 7.750%, 1/15/32 | | | 1,216,000 | | | | 1,490 | |
| | Midcontinent Express Pipeline LLC, 6.700%, 9/15/19 144A | | | 1,700,000 | | | | 1,785 | |
| | MPLX LP, 4.875%, 12/1/24 | | | 150,000 | | | | 154 | |
| | National Fuel Gas Co., 5.200%, 7/15/25 | | | 300,000 | | | | 312 | |
| | ONEOK Partners LP, 2.000%, 10/1/17 | | | 400,000 | | | | 401 | |
| | Regency Energy Partners LP / Regency Energy Finance Corp., 4.500%, 11/1/23 | | | 300,000 | | | | 304 | |
| (k) | | Regency Energy Partners LP / Regency Energy Finance Corp., 5.000%, 10/1/22 | | | 1,100,000 | | | | 1,166 | |
| | Regency Energy Partners LP / Regency Energy Finance Corp., 5.750%, 9/1/20 | | | 300,000 | | | | 324 | |
| | Regency Energy Partners LP / Regency Energy Finance Corp., 5.875%, 3/1/22 | | | 800,000 | | | | 880 | |
| | Rockies Express Pipeline LLC, 5.625%, 4/15/20 144A | | | 1,000,000 | | | | 1,053 | |
| | Rockies Express Pipeline LLC, 6.850%, 7/15/18 144A | | | 4,200,000 | | | | 4,436 | |
| (k) | | Sabine Pass Liquefaction LLC, 5.625%, 2/1/21 | | | 1,100,000 | | | | 1,177 | |
| | Sabine Pass Liquefaction LLC, 5.625%, 4/15/23 | | | 100,000 | | | | 106 | |
| (b) | | Sabine Pass Liquefaction LLC, 5.625%, 3/1/25 | | | 4,900,000 | | | | 5,243 | |
| | Sabine Pass Liquefaction LLC, 5.750%, 5/15/24 | | | 700,000 | | | | 751 | |
| | Sabine Pass Liquefaction LLC, 5.875%, 6/30/26 144A | | | 200,000 | | | | 216 | |
| (d)* | | Selectica, 8.750%, 11/15/19 | | | 500,000 | | | | – | |
| | The Williams Cos., Inc., 7.500%, 1/15/31 | | | 200,000 | | | | 226 | |
| (b) | | Williams Partners LP, 3.600%, 3/15/22 | | | 2,500,000 | | | | 2,513 | |
| | | | | | | | | | |
| | Total | | | | | | | 28,254 | |
| | | | | | | | | | |
| | | |
| | Real Estate Investment Trusts (0.4%) | | | | | | | | |
| | Goodman Funding Pty., Ltd., 6.375%, 4/15/21 144A | | | 1,000,000 | | | | 1,129 | |
| | OMEGA Healthcare Investors, Inc., 4.500%, 1/15/25 | | | 100,000 | | | | 98 | |
| | OMEGA Healthcare Investors, Inc., 4.950%, 4/1/24 | | | 100,000 | | | | 101 | |
| (k) | | SL Green Realty Corp., 5.000%, 8/15/18 | | | 1,100,000 | | | | 1,146 | |
| | VEREIT Operating Partnership LP, 4.125%, 6/1/21 | | | 100,000 | | | | 102 | |
| | Vonovia Finance BV, 5.000%, 10/2/23 144A | | | 300,000 | | | | 313 | |
| | | | | | | | | | |
| | Total | | | | | | | 2,889 | |
| | | | | | | | | | |
| | | |
| | Services (0.6%) | | | | | | | | |
| | Experian Finance PLC, 2.375%, 6/15/17 144A | | | 900,000 | | | | 903 | |
| (k) | | QVC, Inc., 4.375%, 3/15/23 | | | 2,000,000 | | | | 1,985 | |
| | QVC, Inc., 4.850%, 4/1/24 | | | 100,000 | | | | 101 | |
| | QVC, Inc., 5.450%, 8/15/34 | | | 800,000 | | | | 728 | |
| | QVC, Inc., 5.950%, 3/15/43 | | | 600,000 | | | | 540 | |
| | | | | | | | | | |
| | Total | | | | | | | 4,257 | |
| | | | | | | | | | |
| | | |
| | Technology (0.7%) | | | | | | | | |
| | Alliance Data Systems Corp., 5.250%, 12/1/17 144A | | | 600,000 | | | | 608 | |
The Accompanying Notes are an Integral Part of the Financial Statements.
| | | | | | |
| | Multi-Sector Bond Portfolio | | | 155 | |
Multi-Sector Bond Portfolio
| | | | | | | | | | |
| | | Corporate Bonds (48.0%) | | Shares/ Par | | | Value
$ (000’s) | |
| |
| | Technology continued | |
| | Alliance Data Systems Corp., 5.875%, 11/1/21 144A | | | 100,000 | | | | 102 | |
| | CommScope, Inc., 4.375%, 6/15/20 144A | | | 100,000 | | | | 102 | |
| | Diamond 1 Finance Corp. / Diamond 2 Finance Corp.,
5.450%, 6/15/23 144A | | | 1,400,000 | | | | 1,485 | |
| | Diamond 1 Finance Corp. / Diamond 2 Finance Corp.,
8.100%, 7/15/36 144A | | | 300,000 | | | | 357 | |
| | Diamond 1 Finance Corp. / Diamond 2 Finance Corp.,
8.350%, 7/15/46 144A | | | 200,000 | | | | 246 | |
| | Fidelity National Information Services, Inc., 4.500%, 10/15/22 | | | 800,000 | | | | 851 | |
| | Fidelity National Information Services, Inc., 5.000%, 10/15/25 | | | 700,000 | | | | 763 | |
| | Flextronics International, Ltd., 4.625%, 2/15/20 | | | 200,000 | | | | 210 | |
| | NXP BV / NXP Funding LLC, 4.625%, 6/1/23 144A | | | 200,000 | | | | 210 | |
| | | | | | | | | | |
| | Total | | | | | | | 4,934 | |
| | | | | | | | | | |
| |
| | Telecommunications (6.6%) | |
| (f) | | Altice Luxembourg SA, 6.250%, 2/15/25 EUR | | | 700,000 | | | | 770 | |
| (f) | | Altice Luxembourg SA, 7.250%, 5/15/22 EUR | | | 3,200,000 | | | | 3,600 | |
| (b) | | American Tower Corp., 7.250%, 5/15/19 | | | 1,500,000 | | | | 1,648 | |
| | AT&T, Inc., 3.400%, 5/15/25 | | | 1,000,000 | | | | 964 | |
| (b) | | Charter Communications Operating LLC / Charter Communications Operating Capital Corp., 4.464%, 7/23/22 | | | 2,400,000 | | | | 2,508 | |
| (k) | | Deutsche Telekom International Finance BV, 8.750%, 6/15/30 | | | 700,000 | | | | 1,029 | |
| | Digicel Group, Ltd., 8.250%, 9/30/20 144A | | | 600,000 | | | | 515 | |
| (f) | | Koninklijke KPN NV, 5.750%, 9/17/29 GBP | | | 750,000 | | | | 1,180 | |
| | Numericable-SFR SA, 6.250%, 5/15/24 144A | | | 2,400,000 | | | | 2,412 | |
| | Numericable-SRF SA, 7.375%, 5/1/26 144A | | | 6,000,000 | | | | 6,150 | |
| | Qwest Corp., 7.250%, 9/15/25 | | | 500,000 | | | | 536 | |
| | Sprint Communications, Inc., 7.000%, 8/15/20 | | | 700,000 | | | | 742 | |
| | Sprint Communications, Inc., 8.375%, 8/15/17 | | | 900,000 | | | | 934 | |
| | Sprint Corp., 7.875%, 9/15/23 | | | 300,000 | | | | 320 | |
| (f) | | TDC A/S, 5.625%, 2/23/23 GBP | | | 100,000 | | | | 141 | |
| (b) | | Telecom Italia Capital SA, 7.721%, 6/4/38 | | | 2,200,000 | | | | 2,287 | |
| | Telecom Italia SPA, 5.303%, 5/30/24 144A | | | 2,500,000 | | | | 2,444 | |
| (b) | | T-Mobile USA, Inc., 6.250%, 4/1/21 | | | 2,700,000 | | | | 2,808 | |
| | T-Mobile USA, Inc., 6.542%, 4/28/20 | | | 600,000 | | | | 618 | |
| | Verizon Communications, Inc., 4.522%, 9/15/48 | | | 100,000 | | | | 96 | |
| (b) | | Verizon Communications, Inc., 4.672%, 3/15/55 | | | 2,150,000 | | | | 2,019 | |
| (b) | | Verizon Communications, Inc., 6.550%, 9/15/43 | | | 2,291,000 | | | | 2,861 | |
| (f) | | Wind Acquisition Finance SA, 4.000%, 7/15/20 EUR | | | 1,400,000 | | | | 1,501 | |
| (f) | | Wind Acquisition Finance SA, 7.000%, 4/23/21��EUR | | | 5,700,000 | | | | 6,242 | |
| | Wind Acquisition Finance SA, 7.375%, 4/23/21 144A | | | 1,000,000 | | | | 1,040 | |
| | | | | | | | | | |
| | Total | | | | | | | 45,365 | |
| | | | | | | | | | |
| |
| | Transportation (0.6%) | |
| | American Airlines Pass Through Trust, 3.700%, 10/1/26 | | | 531,236 | | | | 526 | |
| | | | | | | | | | |
| | | Corporate Bonds (48.0%) | | Shares/ Par | | | Value
$ (000’s) | |
| |
| | Transportation continued | |
| | American Airlines Pass Through Trust, 5.250%, 1/31/21 | | | 118,592 | | | | 126 | |
| | Asciano Finance, Ltd., 4.625%, 9/23/20 144A | | | 500,000 | | | | 518 | |
| | Asciano Finance, Ltd., 5.000%, 4/7/18 144A | | | 800,000 | | | | 822 | |
| | Continental Airlines Pass Through Trust, 4.750%, 1/12/21 | | | 69,290 | | | | 73 | |
| | Continental Airlines Pass Through Trust, 7.250%, 11/10/19 | | | 201,486 | | | | 225 | |
| | Lima Metro Line 2 Finance, Ltd., 5.875%, 7/5/34 144A | | | 600,000 | | | | 633 | |
| | United Airlines Pass Through Trust, 4.300%, 8/15/25 | | | 90,216 | | | | 93 | |
| (k) | | US Airways Pass-Through Trust, 5.900%, 10/1/24 | | | 1,160,673 | | | | 1,294 | |
| | Virgin Australia Trust, 5.000%, 10/23/23 144A | | | 60,428 | | | | 63 | |
| | | | | | | | | | |
| | Total | | | | | | | 4,373 | |
| | | | | | | | | | |
| |
| | Utilities (0.2%) | |
| (k) | | Nakilat, Inc., 6.067%, 12/31/33 | | | 1,400,000 | | | | 1,624 | |
| | | | | | | | | | |
| | Total | | | | | | | 1,624 | |
| | | | | | | | | | |
| | |
| | Total Corporate Bonds | | | | | |
| | (Cost: $334,650) | | | | 331,154 | |
| | | | | | | | | | |
| | | |
| | | Governments (17.1%) | | | | | | |
| | |
| | Foreign Agencies (4.6%) | | | | | |
| (b) | | Banco do Brasil SA, 3.875%, 10/10/22 | | | 3,094,000 | | | | 2,870 | |
| | Dolphin Energy, Ltd., 5.500%, 12/15/21 144A | | | 1,000,000 | | | | 1,100 | |
| (b) | | Gazprom Neft OAO Via GPN Capital SA,
6.000%, 11/27/23 | | | 3,000,000 | | | | 3,180 | |
| (f) | | KAF Kaerntner Ausgleichszahlungs-Fonds,
0.000%, 1/14/32 144A EUR | | | 6,237,148 | | | | 5,691 | |
| | Nakilat, Inc., 6.267%, 12/31/33 144A | | | 603,736 | | | | 687 | |
| | Pertamina Persero PT, 4.300%, 5/20/23 144A | | | 600,000 | | | | 597 | |
| | Peru Enhanced Pass-Through Finance, Ltd.,
0.000%, 5/31/18 144A | | | 40,344 | | | | 39 | |
| | Petrobras Global Finance BV, 3.000%, 1/15/19 | | | 187,000 | | | | 182 | |
| (b) | | Petrobras Global Finance BV, 5.375%, 1/27/21 | | | 5,100,000 | | | | 4,988 | |
| (b) | | Petrobras Global Finance BV, 8.375%, 5/23/21 | | | 4,200,000 | | | | 4,526 | |
| (b) | | Petroleos de Venezuela SA, 5.375%, 4/12/27 | | | 6,500,000 | | | | 2,421 | |
| (k) | | Petroleos de Venezuela SA, 5.500%, 4/12/37 | | | 4,300,000 | | | | 1,580 | |
| | Ras Laffan Liquefied Natural Gas Co., Ltd. III,
5.838%, 9/30/27 144A | | | 3,500,000 | | | | 3,903 | |
| | | | | | | | | | |
| | Total | | | | | | | 31,764 | |
| | | | | | | | | | |
| |
| | Foreign Governments (1.4%) | |
| (f) | | Autonomous Community of Catalonia,
4.750%, 6/4/18 EUR | | | 1,650,000 | | | | 1,811 | |
| (f) | | Autonomous Community of Catalonia,
4.900%, 9/15/21 EUR | | | 300,000 | | | | 337 | |
| (f) | | Autonomous Community of Catalonia,
4.950%, 2/11/20 EUR | | | 200,000 | | | | 225 | |
| (f) | | Indonesia Government International Bond,
3.375%, 7/30/25 144A EUR | | | 3,300,000 | | | | 3,557 | |
| (f) | | Indonesia Government International Bond,
3.750%, 6/14/28 144A EUR | | | 1,900,000 | | | | 2,033 | |
| (f) | | Mexico Government International Bond,
4.000%, 3/15/2115 EUR | | | 700,000 | | | | 617 | |
The Accompanying Notes are an Integral Part of the Financial Statements.
| | | | | | | | |
| | 156 | | | Multi-Sector Bond Portfolio | | | | |
Multi-Sector Bond Portfolio
| | | | | | | | | | |
| | | Governments (17.1%) | | Shares/ Par | | | Value $ (000’s) | |
| |
| | Foreign Governments continued | |
| (f) | | Romanian Government International Bond,
2.875%, 10/28/24 EUR | | | 900,000 | | | | 1,006 | |
| | | | | | | | | | |
| | Total | | | | | | | 9,586 | |
| | | | | | | | | | |
| |
| | Foreign Municipal Bonds (0.4%) | |
| (f) | | Province of Ontario, 2.400%, 6/2/26 CAD | | | 1,900,000 | | | | 1,404 | |
| (f) | | Province of Quebec, 2.750%, 9/1/25 CAD | | | 2,400,000 | | | | 1,835 | |
| | | | | | | | | | |
| | Total | | | | | | | 3,239 | |
| | | | | | | | | | |
| |
| | Oil & Gas (1.9%) | |
| (f) | | Petroleos Mexicanos, 2.750%, 4/21/27 EUR | | | 1,100,000 | | | | 1,018 | |
| (f) | | Petroleos Mexicanos, 5.125%, 3/15/23 EUR | | | 1,000,000 | | | | 1,137 | |
| (b) | | Petroleos Mexicanos, 5.625%, 1/23/46 | | | 5,000,000 | | | | 4,150 | |
| (b) | | Petroleos Mexicanos, 6.500%, 6/2/41 | | | 2,000,000 | | | | 1,873 | |
| | Petroleos Mexicanos, 6.500%, 3/13/27 144A | | | 1,700,000 | | | | 1,754 | |
| (b) | | Petroleos Mexicanos, 6.625%, 6/15/38 | | | 1,800,000 | | | | 1,741 | |
| | Petroleos Mexicanos, 6.750%, 9/21/47 144A | | | 500,000 | | | | 472 | |
| | Petroleos Mexicanos, 6.750%, 9/21/47 | | | 900,000 | | | | 850 | |
| | | | | | | | | | |
| | Total | | | | | | | 12,995 | |
| | | | | | | | | | |
| |
| | Yankee Sovereign (8.8%) | |
| (f) | | Argentine Republic Government International Bond,
3.875%, 1/15/22 EUR | | | 1,000,000 | | | | 1,007 | |
| | Argentine Republic Government International Bond,
6.875%, 4/22/21 144A | | | 900,000 | | | | 958 | |
| | Argentine Republic Government International Bond,
7.500%, 4/22/26 144A | | | 2,100,000 | | | | 2,205 | |
| | Argentine Republic Government International Bond,
7.625%, 4/22/46 144A | | | 500,000 | | | | 500 | |
| (k) | | Brazilian Government International Bond, 5.000%, 1/27/45 | | | 2,700,000 | | | | 2,190 | |
| (k) | | Columbia Government International Bond, 5.000%, 6/15/45 | | | 6,000,000 | | | | 5,692 | |
| | Costa Rica Government International Bond, 7.000%, 4/4/44 | | | 700,000 | | | | 640 | |
| | Costa Rica Government International Bond, 7.158%, 3/12/45 | | | 500,000 | | | | 463 | |
| | Dominican Republic International Bond, 6.850%, 1/27/45 | | | 900,000 | | | | 850 | |
| | Dominican Republic International Bond, 6.875%, 1/29/26 144A | | | 500,000 | | | | 520 | |
| | Dominican Republic International Bond, 7.450%, 4/30/44 | | | 400,000 | | | | 404 | |
| | Ecuador Government International Bond,
10.750%, 3/28/22 144A | | | 1,300,000 | | | | 1,411 | |
| | El Salvador Government International Bond, 7.625%, 2/1/41 | | | 900,000 | | | | 817 | |
| | El Salvador Government International Bond, 7.650%, 6/15/35 | | | 300,000 | | | | 278 | |
| | Export-Import Bank of India, 3.375%, 8/5/26 144A | | | 600,000 | | | | 560 | |
| | Ghana Government International Bond, 9.250%, 9/15/22 144A | | | 200,000 | | | | 214 | |
| (f) | | Hellenic Republic Government Bond,
3.375%, 7/17/17 144A EUR | | | 1,400,000 | | | | 1,444 | |
| (k) | | Indonesia Government International Bond, 5.125%, 1/15/45 | | | 1,450,000 | | | | 1,447 | |
| | | | | | | | | | |
| | | Governments (17.1%) | | Shares/ Par | | | Value $ (000’s) | |
| |
| | Yankee Sovereign continued | |
| (k) | | Indonesia Government International Bond, 6.750%, 1/15/44 | | | 2,900,000 | | | | 3,510 | |
| (k) | | Kazakhstan Government International Bond,
5.125%, 7/21/25 | | | 5,200,000 | | | | 5,556 | |
| (k) | | Kazakhstan Government International Bond,
6.500%, 7/21/45 | | | 1,100,000 | | | | 1,260 | |
| (k) | | Mexico Government International Bond, 4.600%, 1/23/46 | | | 5,800,000 | | | | 5,205 | |
| (k) | | Mexico Government International Bond, 4.750%, 3/8/44 | | | 1,800,000 | | | | 1,637 | |
| (k) | | Panama Government International Bond, 6.700%, 1/26/36 | | | 1,900,000 | | | | 2,306 | |
| | Panama Government International Bond, 8.125%, 4/28/34 | | | 100,000 | | | | 130 | |
| (f) | | Romanian Government International Bond,
3.625%, 4/24/24 EUR | | | 700,000 | | | | 821 | |
| (k) | | Russian Federation, 5.625%, 4/4/42 | | | 2,000,000 | | | | 2,151 | |
| | South Africa Government International Bond,
5.875%, 9/16/25 | | | 500,000 | | | | 533 | |
| | Trinidad & Tobago Government International Bond,
4.500%, 8/4/26 144A | | | 400,000 | | | | 393 | |
| (k) | | Turkey Government International Bond, 4.875%, 10/9/26 | | | 4,000,000 | | | | 3,701 | |
| (k) | | Turkey Government International Bond, 5.125%, 3/25/22 | | | 6,000,000 | | | | 5,954 | |
| (k) | | Turkey Government International Bond, 5.750%, 3/22/24 | | | 2,400,000 | | | | 2,407 | |
| (k) | | Uruguay Government International Bond, 5.100%, 6/18/50 | | | 2,100,000 | | | | 1,890 | |
| | Venezuela Government International Bond,
7.650%, 4/21/25 | | | 800,000 | | | | 364 | |
| | Venezuela Government International Bond,
8.250%, 10/13/24 | | | 200,000 | | | | 93 | |
| | Venezuela Government International Bond,
9.250%, 5/7/28 | | | 1,100,000 | | | | 506 | |
| | Venezuela Government International Bond,
9.375%, 1/13/34 | | | 1,400,000 | | | | 647 | |
| | | | | | | | | | |
| | Total | | | | | | | 60,664 | |
| | | | | | | | | | |
| | |
| | Total Governments | | | | | |
| | (Cost: $125,307) | | | | 118,248 | |
| | | | | | | | | | |
| | | |
| | | Municipal Bonds (1.9%) | | | | | | |
| | |
| | Municipal Bonds (1.9%) | | | | | |
| | Alameda County Joint Powers Authority, Series 2010-A, 7.046%, 12/1/44 RB | | | 100,000 | | | | 138 | |
| | American Municipal Power, Inc., Series 2010-B, 7.834%, 2/15/41 RB | | | 100,000 | | | | 142 | |
| | Bay Area Toll Authority, Series 2010-S1, 6.918%, 4/1/40 RB | | | 200,000 | | | | 271 | |
| | City of Chicago IL, 7.750%, 1/1/42 GO | | | 1,300,000 | | | | 1,319 | |
| | City of Riverside CA Electric Revenue, Series 2010-A, 7.605%, 10/1/40 RB | | | 200,000 | | | | 274 | |
| | Illinois State, 6.630%, 2/1/35 GO | | | 245,000 | | | | 250 | |
| | Illinois State, 6.725%, 4/1/35 GO | | | 95,000 | | | | 97 | |
| | Illinois State, 7.350%, 7/1/35 GO | | | 200,000 | | | | 216 | |
The Accompanying Notes are an Integral Part of the Financial Statements.
| | | | | | |
| | Multi-Sector Bond Portfolio | | | 157 | |
Multi-Sector Bond Portfolio
| | | | | | | | | | |
| | | Municipal Bonds (1.9%) | | Shares/ Par | | | Value
$ (000’s) | |
| | |
| | Municipal Bond continued | | | | | |
| | Indiana Finance Authority,
Series 2009-B, 6.596%, 2/1/39 RB | | | 300,000 | | | | 380 | |
| | Irvine Ranch Water District,
Series 2010-B, 6.622%, 5/1/40 GO | | | 100,000 | | | | 129 | |
| | Los Angeles County Public Works Financing Authority,
Series 2010-B, 7.618%, 8/1/40 RB | | | 200,000 | | | | 285 | |
| | Metropolitan Government of Nashville & Davidson County TN Water & Sewer Revenue, Series 2010-B, 6.568%, 7/1/37 RB | | | 100,000 | | | | 126 | |
| | Metropolitan Transportation Authority,
Series 2010-A2, 6.089%, 11/15/40 RB | | | 500,000 | | | | 631 | |
| | Municipal Electric Authority of Georgia, 6.655%, 4/1/57 RB | | | 200,000 | | | | 244 | |
| | New York City Transitional Finance Authority Future Tax Secured Revenue, Series 2011-A1, 5.508%, 8/1/37 RB | | | 300,000 | | | | 362 | |
| | New York State Urban Development Corp.,
Series 2009-E, 5.770%, 3/15/39 RB | | | 100,000 | | | | 121 | |
| | Orange County Local Transportation Authority,
Series 2010-A, 6.908%, 2/15/41 RB | | | 200,000 | | | | 269 | |
| | Port Authority of New York & New Jersey,
Series 168, 4.926%, 10/1/51 RB, GO OF AUTH | | | 200,000 | | | | 221 | |
| | Port Authority of New York & New Jersey,
Series 2010, 5.647%, 11/1/40 RB, GO OF AUTH | | | 1,100,000 | | | | 1,325 | |
| | Regents of the University of California Medical Center Pooled Revenue, Series 2010-H, 6.548%, 5/15/48 RB | | | 100,000 | | | | 133 | |
| | San Diego County Regional Airport Authority,
Series 2010-C, 6.628%, 7/1/40 RB | | | 100,000 | | | | 113 | |
| | San Diego Redevelopment Agency Successor Agency,
Series 2010-A, 7.625%, 9/1/30 TRAN | | | 100,000.0 | | | | 114 | |
| | State of California, Series 2010, 7.950%, 3/1/36 GO | | | 900,000 | | | | 1,049 | |
| | Tobacco Settlement Finance Authority,
Series 2007-A, 7.467%, 6/1/47 RB | | | 1,135,000 | | | | 1,024 | |
| | Tobacco Settlement Financing Corp.,
Series 2007-A, 6.706%, 6/1/46 RB | | | 3,340,000 | | | | 2,660 | |
| | Triborough Bridge & Tunnel Authority,
Series 2010-A2, 5.550%, 11/15/40 RB, GO OF AUTH | | | 800,000 | | | | 947 | |
| | | | | | | | | | |
| | |
| | Total Municipal Bonds | | | | | |
| | (Cost: $11,102) | | | | 12,840 | |
| | | | | | | | | | |
| | | |
| | | Structured Products (8.7%) | | | | | | |
| | |
| | Structured Products (8.7%) | | | | | |
| | ACE Securities Corp. Home Equity Loan Trust,
Series 2006-FM1, Class A2C, 0.906%, 7/25/36 | | | 8,593,942 | | | | 3,173 | |
| | ACE Securities Corp. Home Equity Loan Trust,
Series 2004-RM2, Class M2, 1.551%, 1/25/35 | | | 69,711 | | | | 65 | |
| | ACE Securities Corp. Home Equity Loan Trust,
Series 2004-HE4, Class M1, 1.656%, 12/25/34 | | | 94,900 | | | | 87 | |
| | | | | | | | | | |
| | | Structured Products (8.7%) | | Shares/ Par | | | Value
$ (000’s) | |
| | |
| | Structured Products continued | | | | | |
| | ACE Securities Corp. Home Equity Loan Trust,
Series 2005-HE4, Class M4, 1.731%, 7/25/35 | | | 100,000 | | | | 87 | |
| | Aegis Asset Backed Securities Trust,
Series 2004-6, Class M2, 1.756%, 3/25/35 | | | 233,935 | | | | 217 | |
| | Aircraft Certificate Owner Trust,
Series 2003-1A, Class E, 7.001%, 9/20/22 144A | | | 190,896 | | | | 201 | |
| | American Home Mortgage Investment Trust,
Series 2005-2, Class 4A1, 2.778%, 9/25/45 | | | 5,346 | | | | 5 | |
| | Ameriquest Mortgage Securities, Inc.,
Series 2004-R5, Class M1, 1.626%, 7/25/34 | | | 45,880 | | | | 42 | |
| | Asset Backed Securities Corp. Home Equity Loan Trust,
Series WMC 2005-HE5, Class M4, 1.656%, 6/25/35 | | | 200,000 | | | | 174 | |
| | Asset Backed Securities Corp. Home Equity Loan Trust,
Series 2003-HE4, Class M1, 1.783%, 8/15/33 | | | 40,091 | | | | 38 | |
| | Banc of America Commercial Mortgage Trust,
Series 2007-3, Class A4, 5.548%, 6/10/49 | | | 42,598 | | | | 43 | |
| | Banc of America Commercial Mortgage Trust,
Series 2007-4, Class A4, 5.747%, 2/10/51 | | | 60,096 | | | | 61 | |
| | Banc of America Funding Trust,
Series 2007-D, Class 1A4, 0.969%, 6/20/47 | | | 93,547 | | | | 91 | |
| | Banc of America Funding Trust,
Series 2007-6, Class A1, 1.046%, 7/25/37 | | | 114,082 | | | | 97 | |
| | Banc of America Funding Trust,
Series 2005-H, Class 5A1, 3.425%, 11/20/35 | | | 221,684 | | | | 196 | |
| | Barclays Capital LLC,
Series 2009-RR14, Class 2A2, 3.240%, 7/26/36 144A | | | 62,675 | | | | 51 | |
| | Bear Stearns Adjustable Rate Mortgage Trust,
Series 2004-3, Class 4A, 3.229%, 7/25/34 | | | 17,672 | | | | 17 | |
| | Bear Stearns ALT-A Trust,
Series 2006-6, Class 2A1, 3.217%, 11/25/36 | | | 270,363 | | | | 227 | |
| | Bear Stearns Asset Backed Securities I Trust,
Series 07-AQ1, Class A1, 0.866%, 4/25/31 | | | 14,788 | | | | 15 | |
| | Bear Stearns Asset Backed Securities I Trust,
Series 2006-HE10, Class 1A2, 0.956%, 12/25/36 | | | 64,574 | | | | 61 | |
| | Bear Stearns Asset Backed Securities I Trust,
Series 2007-HE3, Class 1A2, 0.956%, 4/25/37 | | | 295,420 | | | | 315 | |
| | Bear Stearns Asset Backed Securities I Trust,
Series 2005-HE11, Class M1, 1.014%, 11/25/35 | | | 67,288 | | | | 66 | |
| | Bear Stearns Asset Backed Securities I Trust,
Series 2007-HE6, Class 1A1, 2.006%, 8/25/37 | | | 300,765 | | | | 287 | |
| | Bear Stearns Asset Backed Securities Trust,
Series 2005-SD3, Class 1A, 1.246%, 7/25/35 | | | 40,774 | | | | 40 | |
| | Citi Held For Asset Issuance,
Series 2016-PM1, Class A, 4.650%, 4/15/25 144A | | | 1,111,317 | | | | 1,130 | |
| | Citicorp Mortgage Securities Trust,
Series 2007-8, Class 1A3, 6.000%, 9/25/37 | | | 8,162 | | | | 8 | |
The Accompanying Notes are an Integral Part of the Financial Statements.
| | | | |
| 158 | | Multi-Sector Bond Portfolio | | |
Multi-Sector Bond Portfolio
| | | | | | | | | | |
| | | Structured Products (8.7%) | | Shares/ Par | | | Value
$ (000’s) | |
| | | |
| | Structured Products continued | | | | | | | | |
| | Citigroup Mortgage Loan Trust, Series 2007-AHL1, Class A2C, 0.966%, 12/25/36 | | | 100,000 | | | | 75 | |
| | Citigroup Mortgage Loan Trust, Series 2007-10, Class 22AA, 3.395%, 9/25/37 | | | 27,875 | | | | 24 | |
| | Citigroup Mortgage Loan Trust, Series 2007-10, Class 2A3A, 3.532%, 9/25/37 | | | 105,632 | | | | 86 | |
| | Citigroup Mortgage Loan Trust, Inc., Series 2005-HE3, Class M2, 1.476%, 9/25/35 | | | 204,340 | | | | 199 | |
| | Countrywide Alternative Loan Trust, Series 2007-OA3, Class 1A1, 0.896%, 4/25/47 | | | 61,517 | | | | 51 | |
| | Countrywide Alternative Loan Trust, Series 2006-OC9, Class A2A, 0.916%, 12/25/46 | | | 23,424 | | | | 22 | |
| | Countrywide Alternative Loan Trust, Series 2006-OA12, Class A1B, 0.929%, 9/20/46 | | | 37,896 | | | | 28 | |
| | Countrywide Alternative Loan Trust, Series 2006-OA17, Class 1A1A, 0.934%, 12/20/46 | | | 54,230 | | | | 39 | |
| | Countrywide Alternative Loan Trust, Series 2006-OA2, Class A1, 0.949%, 5/20/46 | | | 637,458 | | | | 475 | |
| | Countrywide Alternative Loan Trust, Series 2006-OA9, Class 2A1A, 0.949%, 7/20/46 | | | 18,210 | | | | 10 | |
| | Countrywide Alternative Loan Trust, Series 2005-59, Class 1A1, 1.069%, 11/20/35 | | | 11,001 | | | | 9 | |
| | Countrywide Alternative Loan Trust, Series 2005-76, Class 1A1, 2.047%, 1/25/36 | | | 32,144 | | | | 30 | |
| | Countrywide Alternative Loan Trust, Series 2006-HY10, Class 2A1, 2.943%, 5/25/36 | | | 25,005 | | | | 20 | |
| | Countrywide Alternative Loan Trust, Series 2006-OA6, Class 2A, 3.240%, 7/25/46 | | | 4,029 | | | | 4 | |
| | Countrywide Alternative Loan Trust, Series 2003-19CB, Class 2A1, 4.500%, 9/25/18 | | | 2,273 | | | | 2 | |
| | Countrywide Alternative Loan Trust, Series 2005-79CB, Class A3, 5.500%, 1/25/36 | | | 388,465 | | | | 323 | |
| | Countrywide Alternative Loan Trust, Series 2004-28CB, Class 5A1, 5.750%, 1/25/35 | | | 37,123 | | | | 37 | |
| | Countrywide Alternative Loan Trust, Series 2007-9T1, Class 2A2, 6.000%, 5/25/37 | | | 372,896 | | | | 273 | |
| | Countrywide Alternative Loan Trust, Series 2005-J1, Class 3A1, 6.500%, 8/25/32 | | | 24,026 | | | | 24 | |
| | Countrywide Asset-Backed Certificates, Series 2006-26, Class 1A, 0.896%, 6/25/37 | | | 776,303 | | | | 635 | |
| | Countrywide Asset-Backed Certificates, Series 2007-1, Class 2A3, 0.896%, 7/25/37 | | | 62,650 | | | | 52 | |
| | Countrywide Asset-Backed Certificates, Series 2006-23, Class 2A3, 0.926%, 5/25/37 | | | 231,297 | | | | 218 | |
| | Countrywide Asset-Backed Certificates, Series 2007-9, Class 1A, 0.956%, 6/25/47 | | | 1,384,022 | | | | 1,056 | |
| | Countrywide Asset-Backed Certificates, Series 2006-4, Class 2A3, 1.046%, 7/25/36 | | | 94,635 | | | | 91 | |
| | Countrywide Asset-Backed Certificates, Series 2006-5, Class 2A3, 1.046%, 8/25/36 | | | 174,337 | | | | 162 | |
| | Countrywide Asset-Backed Certificates, Series 2005-AB, Class 2A4, 1.106%, 3/25/36 | | | 98,682 | | | | 79 | |
| | Countrywide Asset-Backed Certificates, Series 2007-SEA1, Class 1A1, 1.306%, 5/25/47 144A | | | 3,352,428 | | | | 2,220 | |
| | | | | | | | | | |
| | | Structured Products (8.7%) | | Shares/ Par | | | Value
$ (000’s) | |
| | | |
| | Structured Products continued | | | | | | | | |
| | Countrywide Asset-Backed Certificates, Series 04-AB2, Class M1, 1.536%, 5/25/36 | | | 906,251 | | | | 905 | |
| | Countrywide Asset-Backed Certificates, Series 2007-13, Class 1A, 1.596%, 10/25/47 | | | 3,636,074 | | | | 3,157 | |
| (e) | | Countrywide Asset-Backed Certificates, Series 2006-1, Class AF5, 4.825%, 7/25/36 | | | 100,000 | | | | 82 | |
| | Countrywide Asset-Backed Certificates Trust, Series 2006-7, Class 2A3, 0.906%, 4/25/46 | | | 44,065 | | | | 43 | |
| | Countrywide Asset-Backed Certificates Trust, Series 2005-14, Class 3A3, 1.106%, 4/25/36 | | | 16,158 | | | | 16 | |
| | Countrywide Asset-Backed Certificates Trust, Series 2005-4, Class AF6, 4.740%, 10/25/35 | | | 22,970 | | | | 23 | |
| | Countrywide Home Loan Mortgage Pass Through Trust, Series 2006-OA4, 1.026%, 4/25/46 | | | 1,276,225 | | | | 535 | |
| | Countrywide Home Loan Mortgage Pass Through Trust, Series 2006-OA4, Class A1, 1.527%, 4/25/46 | | | 48,159 | | | | 23 | |
| | Countrywide Home Loan Mortgage Pass Through Trust, Series 2005-22, Class 3A1, 3.080%, 10/25/35 | | | 28,989 | | | | 23 | |
| | Countrywide Home Loan Mortgage Pass Through Trust, Series 2005-HYB8, Class 1A1X, 3.112%, 12/20/35 | | | 17,735 | | | | 14 | |
| | Countrywide Home Loan Mortgage Pass Through Trust, Series 2006-9, Class A1, 6.000%, 5/25/36 | | | 243,499 | | | | 206 | |
| | Countrywide Home Loan Mortgage Pass Through Trust, Series 2006-16, Class 2A1, 6.500%, 11/25/36 | | | 34,772 | | | | 29 | |
| | Credit Suisse Commercial Mortgage Trust, Series 2007-C4, Class A4, 5.935%, 9/15/39 | | | 120,974 | | | | 123 | |
| | Dryden XXII Senior Loan Fund, Series 2011-22A, Class A1R, 2.050%, 1/15/22 144A | | | 336,270 | | | | 336 | |
| (f) | | EMF-NL BV, 0.489%, 4/17/41 EUR | | | 227,617 | | | | 212 | |
| (f) | | Enterprise Inns PLC, 6.875%, 5/9/25 GBP | | | 1,000,000 | | | | 1,291 | |
| (f) | | Eurosail-NL BV, 1.189%, 10/17/40 EUR | | | 153,817 | | | | 162 | |
| | Federal National Mortgage Association, Series 2003-W6, Class F, 1.106%, 9/25/42 | | | 33,373 | | | | 33 | |
| | First Franklin Mortgage Loan Trust, Series 2006-FF12, Class A4, 0.896%, 9/25/36 | | | 121,499 | | | | 115 | |
| | First Franklin Mortgage Loan Trust, Series 2006-FF10, Class A4, 0.906%, 7/25/36 | | | 24,244 | | | | 24 | |
| | First Franklin Mortgage Loan Trust, Series 2005-FF12, Class A2B, 1.016%, 11/25/36 | | | 503,742 | | | | 500 | |
| | First Horizon Mortgage Pass-Through Trust, Series 2005-5, Class 2A1, 5.000%, 10/25/20 | | | 10,689 | | | | 11 | |
| | First Horizon Mortgage Pass-Through Trust, Series 2007-2, Class 1A5, 5.750%, 5/25/37 | | | 500,253 | | | | 403 | |
| | GE Commercial Mortgage Corp. Trust, Series 2007-C1, Class A4, 5.543%, 12/10/49 | | | 47,433 | | | | 48 | |
| (e,f) | | Greene King Finance PLC, 2.453%, 3/15/36 GBP | | | 450,000 | | | | 394 | |
| | GSAA Home Equity Trust, Series 2006-4, Class 4A2,
0.986%, 3/25/36 | | | 4,094 | | | | 4 | |
The Accompanying Notes are an Integral Part of the Financial Statements.
| | | | | | |
| | Multi-Sector Bond Portfolio | | | 159 | |
Multi-Sector Bond Portfolio
| | | | | | | | | | |
| | | Structured Products (8.7%) | | Shares/ Par | | | Value $ (000’s) | |
| | | |
| | Structured Products continued | | | | | | | | |
| | GSAMP Trust, Series 2007-NC1, Class A2A,
0.806%, 12/25/46 | | | 19,677 | | | | 12 | |
| | GSAMP Trust, Series 2007-FM2, Class A2B,
0.846%, 1/25/37 | | | 230,641 | | | | 139 | |
| | GSAMP Trust, Series 2004-WF, Class M2,
2.406%, 10/25/34 | | | 91,399 | | | | 86 | |
| | GSR Mortgage Loan Trust, Series 2005-AR6, Class 1A1,
3.070%, 9/25/35 | | | 17,240 | | | | 18 | |
| | GSR Mortgage Loan Trust, Series 2007-AR1, Class 2A1,
3.228%, 3/25/47 | | | 23,170 | | | | 21 | |
| | GSR Mortgage Loan Trust, Series 2006-AR1, Class 2A1,
3.289%, 1/25/36 | | | 4,712 | | | | 4 | |
| | GSR Mortgage Loan Trust, Series 2006-2F, Class 3A6,
6.000%, 2/25/36 | | | 203,396 | | | | 167 | |
| | HarborView Mortgage Loan Trust, Series 2005-3,
Class 2A1A, 0.976%, 6/19/35 | | | 41,600 | | | | 37 | |
| | HarborView Mortgage Loan Trust, Series 2005-10,
Class 2A1A, 1.046%, 11/19/35 | | | 19,539 | | | | 16 | |
| | Home Equity Loan Trust, Series 2007-FRE1,
Class 2AV4, 1.096%, 4/25/37 | | | 500,000 | | | | 296 | |
| | HomeBanc Mortgage Trust, Series 2005-1,
Class A1, 1.006%, 3/25/35 | | | 14,185 | | | | 12 | |
| | HSI Asset Securitization Corp. Trust, Series 2005-I1,
Class 2A4, 1.146%, 11/25/35 | | | 300,000 | | | | 221 | |
| | Impac Secured Assets Trust, Series 2007-1,
Class A2, 0.916%, 3/25/37 | | | 191,230 | | | | 160 | |
| | IndyMac Index Mortgage Loan Trust, Series 2005-AR12,
Class 2A1A, 0.996%, 7/25/35 | | | 3,710 | | | | 3 | |
| | IndyMac Index Mortgage Loan Trust, Series 2005-AR14,
Class 2A1A, 1.056%, 7/25/35 | | | 21,210 | | | | 18 | |
| | IndyMac Index Mortgage Loan Trust, Series 2004-AR6,
Class 5A1, 3.067%, 10/25/34 | | | 44,572 | | | | 43 | |
| | IndyMac Residential Asset Backed Trust, Series 2007-B,
Class 2A2, 0.916%, 7/25/37 | | | 473,774 | | | | 292 | |
| | IXIS Real Estate Capital Trust, Series 2005-HE1,
Class M3, 1.536%, 6/25/35 | | | 5,235 | | | | 5 | |
| | JP Morgan Mortgage Trust, Series 2007-A1,
Class 6A1, 3.046%, 7/25/35 | | | 26,903 | | | | 27 | |
| | JP Morgan Mortgage Trust, Series 2005-ALT1,
Class 2A1, 3.125%, 10/25/35 | | | 21,159 | | | | 19 | |
| | JP Morgan Mortgage Trust, Series 2007-A4,
Class 3A1, 4.613%, 6/25/37 | | | 141,076 | | | | 123 | |
| | JP Morgan Resecuritization Trust, Series 2009-10,
Class 4A1, 1.033%, 3/26/37 144A | | | 53,474 | | | | 53 | |
| | Lehman XS Trust, Series 2005-4, Class 1A3,
1.556%, 10/25/35 | | | 29,791 | | | | 29 | |
| | Lendmark Funding Trust, Series 2016-A2,
Class A, 3.260%, 4/21/25 144A | | | 400,000 | | | | 397 | |
| | Long Beach Mortgage Loan Trust, Series 2006-4,
Class 1A, 0.906%, 5/25/36 | | | 1,853,848 | | | | 1,124 | |
| | Long Beach Mortgage Loan Trust, Series 2006-3,
Class 2A4, 1.026%, 5/25/46 | | | 383,671 | | | | 165 | |
| | Mastr Asset Backed Securities Trust, Series 2006-HE3,
Class A2, 0.856%, 8/25/36 | | | 2,632,292 | | | | 1,176 | |
| | | | | | | | | | |
| | | Structured Products (8.7%) | | Shares/ Par | | | Value
$ (000’s) | |
| | | |
| | Structured Products continued | | | | | | | | |
| | Mastr Asset Backed Securities Trust, Series 2006-WMC4,
Class A5, 0.906%, 10/25/36 | | | 1,096,072 | | | | 487 | |
| | Merrill Lynch Alternative Note Asset Trust,
Series 2007-OAR1, Class A1, 0.926%, 2/25/37 | | | 20,084 | | | | 19 | |
| | Merrill Lynch Mortgage Investors Trust,
Series 2005-A6, Class 2A3, 1.136%, 8/25/35 | | | 62,697 | | | | 60 | |
| | Merrill Lynch Mortgage Investors Trust, Series 2007-SD1, Class A1, 1.206%, 2/25/47 | | | 1,202,340 | | | | 726 | |
| | Merrill Lynch Mortgage Investors Trust, Series 2005-A9, Class 5A1, 2.774%, 12/25/35 | | | 379,973 | | | | 348 | |
| | Merrill Lynch Mortgage Investors Trust, Series MLCC 2006-1, Class 1A, 3.014%, 2/25/36 | | | 11,315 | | | | 10 | |
| | Merrill Lynch Mortgage Investors Trust, Series 2006-A3, Class 6A1, 3.275%, 5/25/36 | | | 34,991 | | | | 32 | |
| (f) | | Mitchells & Butlers Finance PLC, 0.823%, 12/15/30 GBP | | | 74,594 | | | | 78 | |
| | Morgan Stanley ABS Capital I, Series 05-NC1, Class M2, 1.461%, 1/25/35 | | | 188,002 | | | | 153 | |
| | Morgan Stanley ABS Capital I, Inc., Series 2006-HE7, Class A2C, 0.916%, 9/25/36 | | | 87,618 | | | | 48 | |
| | Morgan Stanley ABS Capital I, Inc. Trust, Series 2006-HE8, Class A2C, 0.896%, 10/25/36 | | | 81,335 | | | | 46 | |
| | Morgan Stanley ABS Capital I, Inc. Trust, Series 2007-HE5, Class A2C, 1.006%, 3/25/37 | | | 79,768 | | | | 42 | |
| | Morgan Stanley ABS Capital I, Inc. Trust, Series 2005-HE7, Class A2C, 1.076%, 11/25/35 | | | 27,973 | | | | 28 | |
| | Morgan Stanley ABS Capital I, Inc. Trust, Series 2005-WMC5, Class M5, 1.746%, 6/25/35 | | | 300,000 | | | | 278 | |
| | Morgan Stanley Dean Witter Capital I, Inc., Series 2002-HE1, Class M1, 1.656%, 7/25/32 | | | 12,871 | | | | 12 | |
| | Morgan Stanley Dean Witter Capital I, Inc., Series 2003-NC2, Class M1, 2.106%, 2/25/33 | | | 50,917 | | | | 49 | |
| | Morgan Stanley Mortgage Loan Trust, Series 2005-5AR, Class 1A1, 1.026%, 9/25/35 | | | 3,147 | | | | 3 | |
| | Morgan Stanley Mortgage Loan Trust, Series 2005-3AR, Class 4A, 3.139%, 7/25/35 | | | 193,057 | | | | 165 | |
| | Nomura Asset Acceptance Corp. Alternative Loan Trust, Series 2005-AR4, Class 3A1, 3.553%, 8/25/35 | | | 25,622 | | | | 25 | |
| | NovaStar Mortgage Funding Trust, Series 2007-2,
Class A2B, 0.916%, 9/25/37 | | | 1,029,793 | | | | 829 | |
| | OneMain Financial Issuance Trust, Series 2016-2A,
Class A, 4.100%, 3/20/28 144A | | | 1,000,000 | | | | 1,020 | |
| | Park Place Securities, Inc. Asset-Backed Pass-Through Certificates, Series 2005-WCW2,
Class M1, 1.256%, 7/25/35 | | | 78,476 | | | | 78 | |
| | People’s Choice Home Loan Securities Trust, Series 2005-3, Class M2, 1.379%, 8/25/35 | | | 276,271 | | | | 263 | |
| (f) | | RAC Bond Co. PLC, 4.870%, 5/6/26 GBP | | | 400,000 | | | | 545 | |
| | Residential Accredit Loans, Inc., Series 2007-QA1,
Class A1, 0.896%, 1/25/37 | | | 40,939 | | | | 33 | |
| | Residential Accredit Loans, Inc., Series 2006-QA7,
Class 1A1, 0.946%, 8/25/36 | | | 18,270 | | | | 14 | |
The Accompanying Notes are an Integral Part of the Financial Statements.
| | | | |
| 160 | | Multi-Sector Bond Portfolio | | |
Multi-Sector Bond Portfolio
| | | | | | | | | | |
| | | Structured Products (8.7%) | | Shares/ Par | | | Value
$ (000’s) | |
| | | |
| | Structured Products continued | | | | | | | | |
| | Residential Accredit Loans, Inc., Series 2006-QA8,
Class A1, 0.946%, 9/25/36 | | | 41,618 | | | | 35 | |
| | Residential Accredit Loans, Inc., Series 2005-QA3,
Class NB2, 3.201%, 3/25/35 | | | 291,626 | | | | 250 | |
| | Residential Accredit Loans, Inc., Series 2005-QR1,
Class A, 6.000%, 10/25/34 | | | 350,788 | | | | 366 | |
| | Residential Asset Mortgage Products, Series 2007-RP4,
Class A, 0.934%, 11/25/46 144A | | | 357,462 | | | | 308 | |
| | Residential Asset Mortgage Products, Series 2006-NC2,
Class A2, 0.946%, 2/25/36 | | | 13,121 | | | | 13 | |
| | Residential Asset Mortgage Products, Series 2005-EFC4,
Class M3, 1.236%, 9/25/35 | | | 300,000 | | | | 292 | |
| | Residential Asset Securities Corp., Series 2007-KS1,
Class A3, 0.906%, 1/25/37 | | | 320,511 | | | | 298 | |
| | Residential Asset Securities Corp., Series 2007-KS3,
Class AI4, 1.096%, 4/25/37 | | | 1,600,000 | | | | 1,222 | |
| | Residential Asset Securities Corp., Series 06-EMX1,
Class M1, 1.166%, 1/25/36 | | | 200,000 | | | | 183 | |
| | Residential Asset Securitization Trust, Series 2007-A2,
Class 2A2, 6.500%, 4/25/37 | | | 4,068,468 | | | | 2,429 | |
| | Rio Oil Finance, 9.250%, 7/6/24 | | | 459,316 | | | | 432 | |
| | Rio Oil Finance Trust, 9.250%, 7/6/24 144A | | | 2,204,716 | | | | 2,072 | |
| | Saxon Asset Securities Trust, Series 2006-1,
Class M1, 1.221%, 3/25/36 | | | 400,000 | | | | 313 | |
| | Securitized Asset Backed Receivables LLC Trust,
Series 2005-FR4, Class M2, 1.716%, 1/25/36 | | | 152,116 | | | | 99 | |
| | SLM Private Education Loan Trust, Series 2011-B,
Class A3, 2.954%, 6/16/42 144A | | | 100,000 | | | | 104 | |
| | SLM Private Education Loan Trust, Series 2010-A,
Class 1A, 3.450%, 5/16/44 144A | | | 32,189 | | | | 33 | |
| | Soundview Home Loan Trust, Series 2006-3,
Class A3, 0.916%, 11/25/36 | | | 412,679 | | | | 380 | |
| | Soundview Home Loan Trust, Series 2006-OPT2,
Class A4, 1.036%, 5/25/36 | | | 200,000 | | | | 174 | |
| | Soundview Home Loan Trust, Series 2006-OPT3,
Class M1, 1.066%, 6/25/36 | | | 7,385,510 | | | | 3,341 | |
| | Soundview Home Loan Trust, Series 2006-2,
Class M2, 1.106%, 3/25/36 | | | 400,000 | | | | 334 | |
| | Soundview Home Loan Trust, Series 2005-3,
Class M3, 1.581%, 6/25/35 | | | 232,701 | | | | 214 | |
| | Specialty Underwriting & Residential Finance Trust,
Series 2005-BC2, Class M3, 1.731%, 12/25/35 | | | 497,626 | | | | 449 | |
| (f) | | Spirit Issuer PLC, 6.582%, 12/28/27 GBP | | | 1,100,000 | | | | 1,471 | |
| | Structured Adjustable Rate Mortgage Loan Trust,
Series 2005-19XS, Class 1A1, 1.076%, 10/25/35 | | | 114,897 | | | | 96 | |
| | Structured Asset Investment Loan Trust, Series 2006-BNC3, Class A3, 0.906%, 9/25/36 | | | 47,484 | | | | 41 | |
| | Structured Asset Investment Loan Trust, Series 2005-5,
Class M2, 1.446%, 6/25/35 | | | 76,558 | | | | 75 | |
| | | | | | | | | | |
| | | Structured Products (8.7%) | | Shares/ Par | | | Value
$ (000’s) | |
| | Structured Asset Investment Loan Trust, Series 2005-7,
Class M2, 1.521%, 8/25/35 | | | 500,000 | | | | 415 | |
| | | Structured Products (8.7%) | | Shares/ Par | | | Value
$ (000’s) | |
| | | |
| | Structured Products continued | | | | | | | | |
| | Structured Asset Mortgage Investments II Trust,
Series 2006-AR6, Class 1A1, 0.936%, 7/25/46 | | | 420,077 | | | | 346 | |
| | Structured Asset Mortgage Investments II Trust,
Series 2005-AR8, Class A2, 1.765%, 2/25/36 | | | 840,274 | | | | 766 | |
| | Structured Asset Securities Corp. Mortgage Loan Trust,
Series 2007-BC3, Class 2A2, 0.896%, 5/25/47 | | | 116,969 | | | | 115 | |
| | Structured Asset Securities Corp. Mortgage Loan Trust,
Series 2006-BC4, Class A4, 0.926%, 12/25/36 | | | 620,863 | | | | 546 | |
| | Structured Asset Securities Corp. Mortgage Loan Trust,
Series 2007-WF1, Class A6, 0.966%, 2/25/37 | | | 177,087 | | | | 150 | |
| | Structured Asset Securities Corp. Mortgage Loan Trust,
Series 2006-GEL2, Class M1, 1.126%, 4/25/36 144A | | | 100,000 | | | | 90 | |
| | Structured Asset Securities Corp. Trust, Series 2005-1,
Class 1A1, 1.106%, 2/25/35 | | | 50,091 | | | | 47 | |
| | Structured Asset Securitization Corp. Mortgage Pass Through Certificates, Series 2004-3,
Class 4A1, 5.615%, 3/25/34 | | | 10,499 | | | | 11 | |
| | Suntrust Alternative Loan Trust, Series 2005-1F,
Class 1A1, 1.406%, 12/25/35 | | | 29,919 | | | | 23 | |
| (f) | | Tesco Property Finance 2 PLC,
6.052%, 10/13/39 GBP | | | 1,162,956 | | | | 1,476 | |
| (f) | | Tesco Property Finance 6 PLC,
5.411%, 7/13/44 GBP | | | 2,266,252 | | | | 2,591 | |
| | Truman Capital Mortgage Loan Trust, Series 2006-1,
Class A, 1.016%, 3/25/36 144A | | | 2,114,302 | | | | 1,925 | |
| (f) | | The Unique Pub Finance Co. PLC, 5.659%, 6/30/27 GBP | | | 164,519 | | | | 213 | |
| (f) | | The Unique Pub Finance Co. PLC, 6.542%, 3/30/21 GBP | | | 812,240 | | | | 1,083 | |
| | Vericrest Opportunity Loan Transferee, Series 2015-NP13,
Class A1, 4.125%, 10/25/45 144A | | | 204,665 | | | | 206 | |
| | Vericrest Opportunity Loan Transferee, Series 2015-NP14,
Class A1, 4.375%, 11/27/45 144A | | | 1,371,529 | | | | 1,382 | |
| | WaMu Asset-Backed Certificates, Series 2007-HE1,
Class 1A, 0.906%, 1/25/37 | | | 231,500 | | | | 170 | |
| | WaMu Mortgage Pass Through Certificates,
Series 2006-AR2, Class 1A1, 2.504%, 3/25/36 | | | 444,055 | | | | 411 | |
| | WaMu Mortgage Pass Through Certificates,
Series 2002-AR19, Class A6, 2.635%, 2/25/33 | | | 2,631 | | | | 3 | |
| | WaMu Mortgage Pass Through Certificates,
Series 2006-AR8, Class 2A1, 2.731%, 8/25/36 | | | 21,806 | | | | 20 | |
| | WaMu Mortgage Pass Through Certificates,
Series 2007-HY1, Class 3A1, 4.211%, 2/25/37 | | | 7,569 | | | | 7 | |
| | WaMu Mortgage Pass Through Certificates,
Series 2006-AR12, Class 3A3, 5.972%, 10/25/36 | | | 45,751 | | | | 36 | |
| | Washington Mutual Mortgage Pass-Through Certificates,
Series 2007-OA3, Class 4A2, 1.267%, 4/25/47 | | | 605,185 | | | | 434 | |
The Accompanying Notes are an Integral Part of the Financial Statements.
| | | | |
| | Multi-Sector Bond Portfolio | | 161 |
Multi-Sector Bond Portfolio
| | | | | | | | | | |
| | | Structured Products (8.7%) | | Shares/ Par | | | Value $
(000’s) | |
| |
| | Structured Products (8.7%) continued | |
| | Wells Fargo Alternative Loan Trust, Series 2007-PA4, Class 2A1,
3.139%, 7/25/37 | | | 115,842 | | | | 98 | |
| | Wells Fargo Mortgage Backed Securities Trust, Series 2005-AR2, Class 1A1, 2.925%, 3/25/35 | | | 40,557 | | | | 41 | |
| | Wells Fargo Mortgage Backed Securities Trust, Series 2006-AR10, Class 4A1, 2.945%, 7/25/36 | | | 320,899 | | | | 301 | |
| | Wells Fargo Mortgage Backed Securities Trust, Series 2007-AR8, Class A1, 3.150%, 11/25/37 | | | 135,803 | | | | 121 | |
| | Wells Fargo Mortgage Backed Securities Trust, Series 2006-AR5, Class 2A1, 3.154%, 4/25/36 | | | 162,260 | | | | 152 | |
| | | | | | | | | | |
| | Total Structured Products | | | | | | | | |
| | (Cost: $62,970) | | | | | | | 60,007 | |
| | | | | | | | | | |
| | | |
| | | Bank Loan Obligations (1.9%) | | | | | | |
| | |
| | Bank Loan Obligations (1.9%) | | | | | |
| | Charter Communications Operating LLC, 3.500%, 1/24/23 | | | 2,824,321 | | | | 2,833 | |
| | Chesapeake Energy Corp., 8.500%, 8/23/21 | | | 700,000 | | | | 761 | |
| | Commscope, Inc., 3.250%, 5/21/22 | | | 197,500 | | | | 199 | |
| | Endo Luxembourg Finance, 3.750%, 9/25/22 | | | 1,188,000 | | | | 1,191 | |
| | Fortescue Metals Group, 4.250%, 6/30/19 | | | 926,886 | | | | 928 | |
| | Grifols Worldwide Operations USA, Inc., 3.000%, 2/27/21 | | | 680,750 | | | | 684 | |
| | | | | | | | | | |
| | | Bank Loan Obligations (1.9%) | | Shares/ Par | | | Value $
(000’s) | |
| |
| | Bank Loan Obligations continued | |
| | Hilton Worldwide Finance LLC, 3.500%, 10/26/20 | | | 1,421,835 | | | | 1,436 | |
| | Intelsat Jackson Holdings SA, 3.750%, 6/30/19 | | | 1,900,000 | | | | 1,835 | |
| | Las Vegas Sands LLC, 3.250%, 12/19/20 | | | 689,384 | | | | 693 | |
| | Rise, Ltd., 4.750%, 2/15/39 | | | 660,291 | | | | 655 | |
| | Valeant Pharmaceuticals International, Inc.,
4.750%, 8/5/20 | | | 953,802 | | | | 953 | |
| (f) | | Ziggo Secured Finance BV, 3.750%, 8/31/24 EUR | | | 1,000,000 | | | | 1,056 | |
| | | | | | | | | | |
| | | |
| | Total Bank Loan Obligations | | | | | | | | |
| | (Cost: $13,041) | | | | | | | 13,224 | |
| | | | | | | | | | |
| | | |
| | | Short-Term Investments (9.6%) | | | | | | |
| | | |
| | US Governments & Agencies (9.6%) | | | | | | | | |
| (b,r) | | Federal Home Loan Bank Corp., 0.490%, 1/11/17 | | | 23,300,000 | | | | 23,298 | |
| (b,r) | | Federal Home Loan Bank Corp., 0.490%, 1/5/17 | | | 25,300,000 | | | | 25,300 | |
| (b,r) | | Federal Home Loan Bank Corp., 0.500%, 1/18/17 | | | 3,200,000 | | | | 3,199 | |
| (b,r) | | US Treasury Bill, 0.3585%, 2/2/17 | | | 1,933,000 | | | | 1,932 | |
| (b,r) | | US Treasury Bill, 0.442% to 0.445%, 2/23/17 | | | 1,867,000 | | | | 1,866 | |
| (b,r) | | US Treasury Bill, 0.465% to 0.485%, 3/2/17 | | | 2,151,000 | | | | 2,149 | |
| (b,r) | | US Treasury Bill, 0.470%, 3/9/17 | | | 707,000 | | | | 707 | |
| (b,r) | | US Treasury Bill, 0.875%, 1/31/17 | | | 7,600,000 | | | | 7,603 | |
| | | | | | | | | | |
| | | |
| | Total Short-Term Investments | | | | | | | | |
| | (Cost: $66,051) | | | | | | | 66,054 | |
| | | | | | | | | | |
| | | |
| | Total Investments (87.2%) | | | | | | | | |
| | (Cost: $613,121)(a) | | | | | | | 601,527 | |
| | | | | | | | | | |
| | Other Assets, | | | | | |
| | Less Liabilities (12.8%) | | | | | | | 88,322 | |
| | | | | | | | | | |
| | Net Assets (100.0%) | | | | | | | 689,849 | |
| | | | | | | | | | |
144A after the name of a security represents a security exempt from registration under Rule 144A of the Securities Act of 1933. These securities may be resold as transactions exempt from registration, normally to qualified institutional buyers. At December 31, 2016 the value of these securities (in thousands) was $135,358 representing 19.6% of the net assets.
GO — General Obligation
RB — Revenue Bond
TRAN — Tax Allocation Bond
AUD — Australian Dollar
CAD — Canadian Dollar
CNY — China Yuan Renminbi
EUR — Euro
GBP — British Pound
INR — Indian Rupee
KRW — South Korean Won
MXN — Mexican New Peso
MYR — Malaysian Ringgit
RUB — Russian Ruble
SGD — Singapore Dollar
TRY — Turkish Lira
TWD — TWD
| (a) | At December 31, 2016, the aggregate cost of securities for federal tax purposes (in thousands) was $613,514 and the net unrealized depreciation of investments based on that cost was $11,987 which is comprised of $13,391 aggregate gross unrealized appreciation and $25,378 aggregate gross unrealized depreciation. |
The Accompanying Notes are an Integral Part of the Financial Statements.
| | | | |
| 162 | | Multi-Sector Bond Portfolio | | |
Multi-Sector Bond Portfolio
| (b) | All or a portion of the securities have been pledged as collateral for open futures positions or when-issued securities. Information regarding open futures contracts as of period end is summarized below. |
| | | | | | | | |
| Issuer (000’s) | | Number of
Contracts | | Expiration Date | | Unrealized
Appreciation/
(Depreciation)
(000’s) | |
Euro Bund Future (Short) (Total Notional Value at December 31, 2016, $2,242) | | 13 | | 3/17 | | $ | (33 | ) |
Euro Schatz Future (Long) (Total Notional Value at December 31, 2016, $7,092) | | 59 | | 3/17 | | | 10 | |
Euro-Bobl Future Medium-Term (Long) (Total Notional Value at December 31, 2016, $19,406) | | 138 | | 3/17 | | | 136 | |
Long Gilt Future (Long) (Total Notional Value at December 31, 2016, $3,534) | | 23 | | 3/17 | | | 59 | |
US Five Year Treasury Note Futures (Long) (Total Notional Value at December 31, 2016, $9,305) | | 79 | | 3/17 | | | (9 | ) |
US Ten Year Treasury Note Futures (Long) (Total Notional Value at December 31, 2016, $97,094) | | 778 | | 3/17 | | | (404 | ) |
US Two Year Treasury Note Futures (Long) (Total Notional Value at December 31, 2016, $49,227) | | 227 | | 3/17 | | | (40 | ) |
US Ultra Long Treasury Bond Futures (Long) (Total Notional Value at December 31, 2016, $9,153) | | 58 | | 3/17 | | | 141 | |
| (e) | Step bond security that presently receives no coupon payments. At the predetermined date the stated coupon rate becomes effective. |
| (f) | Foreign Bond — par value is foreign denominated |
| (h) | Forward foreign currency contracts outstanding on December 31, 2016. |
| | | | | | | | | | | | | | | | | | | | | | |
| Type | | Counterparty | | Currency | | Foreign
Principal
Amount
Covered by
Contract (000s) | | USD Principal
Amount
Covered by
Contract (000’s) | | Settlement
Month | | Unrealized
Appreciation
(000’s) | | | Unrealized
(Depreciation)
(000’s) | | | Net Unrealized
Appreciation/
(Depreciation)
(000’s) | |
Sell | | HSBC Bank USA NA | | AUD | | 4,642 | | 3,349 | | 1/17 | | $ | 76 | | | $ | - | | | $ | 76 | |
Buy | | HSBC Bank USA NA | | CAD | | 4,834 | | 3,601 | | 1/17 | | | - | | | | (85 | ) | | | (85 | ) |
Sell | | Bank of America NA | | CAD | | 9,166 | | 6,827 | | 1/17 | | | 8 | | | | - | | | | 8 | |
Buy | | Bank of America NA | | CNY | | 21,140 | | 3,039 | | 1/17 | | | - | | | | (105 | ) | | | (105 | ) |
Buy | | UBS AG | | CNY | | 45,226 | | 6,503 | | 1/17 | | | - | | | | (227 | ) | | | (227 | ) |
Buy | | UBS AG | | CNY | | 47,437 | | 6,813 | | 2/17 | | | 48 | | | | - | | | | 48 | |
Sell | | BNP Paribas | | CNY | | 7,949 | | 1,143 | | 1/17 | | | 30 | | | | - | | | | 30 | |
Sell | | HSBC Bank USA NA | | CNY | | 20,831 | | 2,995 | | 1/17 | | | 29 | | | | - | | | | 29 | |
Sell | | JP Morgan Chase Bank NA | | CNY | | 37,586 | | 5,404 | | 1/17 | | | 79 | | | | - | | | | 79 | |
Sell | | Barclays Bank PLC | | CNY | | 22,718 | | 3,263 | | 2/17 | | | 75 | | | | - | | | | 75 | |
Sell | | JP Morgan Chase Bank NA | | CNY | | 24,720 | | 3,550 | | 2/17 | | | 43 | | | | - | | | | 43 | |
Sell | | UBS AG | | CNY | | 47,437 | | 6,769 | | 12/17 | | | - | | | | (207 | ) | | | (207 | ) |
Buy | | Bank of America NA | | EUR | | 72,767 | | 76,638 | | 1/17 | | | 960 | | | | - | | | | 960 | |
Buy | | BNP Paribas | | EUR | | 4,363 | | 4,595 | | 1/17 | | | - | | | | (58 | ) | | | (58 | ) |
Buy | | HSBC Bank USA NA | | EUR | | 395 | | 416 | | 1/17 | | | - | | | | (11 | ) | | | (11 | ) |
Buy | | JP Morgan Chase Bank NA | | EUR | | 1,616 | | 1,702 | | 1/17 | | | - | | | | (19 | ) | | | (19 | ) |
Sell | | BNP Paribas | | EUR | | 77,881 | | 82,025 | | 1/17 | | | 580 | | | | - | | | | 580 | |
Sell | | Goldman Sachs International | | EUR | | 1,260 | | 1,327 | | 1/17 | | | - | | | | (8 | ) | | | (8 | ) |
Sell | | Bank of America NA | | EUR | | 72,767 | | 76,738 | | 2/17 | | | - | | | | (954 | ) | | | (954 | ) |
Sell | | BNP Paribas | | GBP | | 19,147 | | 23,602 | | 1/17 | | | 339 | | | | - | | | | 339 | |
Buy | | Goldman Sachs International | | INR | | 228,183 | | 3,356 | | 1/17 | | | - | | | | (18 | ) | | | (18 | ) |
Sell | | JP Morgan Chase Bank NA | | INR | | 229,603 | | 3,377 | | 1/17 | | | 21 | | | | - | | | | 21 | |
Buy | | UBS AG | | KRW | | 3,387,053 | | 2,804 | | 1/17 | | | - | | | | (184 | ) | | | (184 | ) |
Sell | | JP Morgan Chase Bank NA | | KRW | | 3,388,562 | | 2,806 | | 1/17 | | | - | | | | (9 | ) | | | (9 | ) |
Buy | | Goldman Sachs International | | MXN | | 11,415 | | 547 | | 2/17 | | | - | | | | (5 | ) | | | (5 | ) |
Buy | | HSBC Bank USA NA | | MXN | | 59,192 | | 2,837 | | 2/17 | | | - | | | | (252 | ) | | | (252 | ) |
Buy | | Goldman Sachs International | | MYR | | 15,134 | | 3,371 | | 1/17 | | | - | | | | (14 | ) | | | (14 | ) |
Sell | | Barclays Bank PLC | | MYR | | 15,024 | | 3,347 | | 1/17 | | | 108 | | | | - | | | | 108 | |
Buy | | JP Morgan Chase Bank NA | | RUB | | 222,537 | | 3,587 | | 2/17 | | | 229 | | | | - | | | | 229 | |
Buy | | Goldman Sachs International | | SGD | | 4,863 | | 3,358 | | 1/17 | | | - | | | | - | (m) | | | - | (m) |
Buy | | HSBC Bank USA NA | | SGD | | 4,070 | | 2,810 | | 1/17 | | | - | | | | (109 | ) | | | (109 | ) |
The Accompanying Notes are an Integral Part of the Financial Statements.
| | | | | | |
| | Multi-Sector Bond Portfolio | | | 163 | |
Multi-Sector Bond Portfolio
| | | | | | | | | | | | | | | | | | | | | | |
| Type | | Counterparty | | Currency | | Foreign
Principal
Amount
Covered by
Contract (000s) | | USD Principal
Amount
Covered by
Contract (000’s) | | Settlement
Month | | Unrealized
Appreciation
(000’s) | | | Unrealized
(Depreciation)
(000’s) | | | Net Unrealized
Appreciation/
(Depreciation)
(000’s) | |
Sell | | Goldman Sachs International | | SGD | | 8,933 | | 6,167 | | 1/17 | | $ | 95 | | | $- | | | | $ | 95 | |
Sell | | Goldman Sachs International | | SGD | | 4,863 | | 3,357 | | 3/17 | | | - | | | | - | (m) | | | - | (m) |
Buy | | BNP Paribas | | TRY | | 11,384 | | 3,209 | | 1/17 | | | - | | | | (38 | ) | | | (38 | ) |
Sell | | HSBC Bank USA NA | | TRY | | 6,872 | | 1,937 | | 1/17 | | | 121 | | | | - | | | | 121 | |
Sell | | JP Morgan Chase Bank NA | | TRY | | 4,480 | | 1,263 | | 1/17 | | | 79 | | | | - | | | | 79 | |
Buy | | BNP Paribas | | TWD | | 95,376 | | 2,962 | | 1/17 | | | - | | | | - | (m) | | | - | (m) |
Buy | | UBS AG | | TWD | | 96,135 | | 2,994 | | 3/17 | | | - | | | | (52 | ) | | | (52 | ) |
Sell | | BNP Paribas | | TWD | | 95,353 | | 2,961 | | 1/17 | | | - | | | | (126 | ) | | | (126 | ) |
Sell | | BNP Paribas | | TWD | | 205,018 | | 6,385 | | 3/17 | | | 32 | | | | - | | | | 32 | |
| | | | | | | | | | | | | | | | | | | | | | |
| | | | | | | | | | | | $ | 2,952 | | | $ | (2,481 | ) | | $ | 471 | |
| | | | | | | | | | | | | | | | | | | | | | |
| (i) | Written options outstanding on December 31, 2016. |
| | | | | | | | | | |
| Description | | Exercise Price | | Expiration
Date | | Number of
Contracts | | Value
(000’s) | |
Call — CBOT US Ten Year Treasury Note | | 127.000 | | 1/17 | | 95 | | $ | (6 | ) |
Put — CBOT US Ten Year Treasury Note | | 121.000 | | 1/17 | | 95 | | | (5 | ) |
| | | | | | | | | | |
(Premiums Received $60) | | | | | | | | $ | (11 | ) |
| | | | | | | | | | |
| | | | | | | | | | |
| Description | | Exercise Price | | Expiration
Date | | Notional Amount
(000’s) | | Value
(000’s) | |
Call — OTC Interest Rate Swaption - Call | | 1.950 | | 2/27 | | 17,100 | | $ | (14 | ) |
Put — OTC Interest Rate Swaption - Put | | 2.400 | | 2/27 | | 17,100 | | | (142 | ) |
| | | | | | | | | | |
(Premiums Received $259) | | | | | | | | $ | (156 | ) |
| | | | | | | | | | |
CBOT — Chicago Board of Trade
OTC — Over-the-Counter
| (j) | Swap agreements outstanding on December 31, 2016. |
Credit Default Swaps on Corporate or Sovereign Issues - Sell Protection
| | | | | | | | | | | | | | | | | | | | | | | | | | |
| Reference Entity | | Counterparty | | Receive
Fixed
Rate | | Expiration
Date | | Implied
Credit
Spread | | Notional
Amount
(000’s) | | Upfront
Premium Paid/
(Received)
(000’s) | | | Unrealized
Appreciation/
(Depreciation)
(000’s) | | | Market
Value
(000’s) | |
Deutsche Bank AG,
0.763%, 12/20/21 | | BNP Paribas | | 1.00% | | 12/21 | | 3.416% | | | 700 | | | EUR | | $ | (114 | ) | | $ | 91 | | | $ | (23 | ) |
Deutsche Bank AG,
1.448%, 12/20/21 | | Goldman Sachs International | | 1.00% | | 12/21 | | 3.416% | | | 500 | | | EUR | | | (78 | ) | | | 62 | | | | (16 | ) |
Deutsche Bank AG,
1.448%, 12/20/21 | | JP Morgan Chase Bank NA | | 1.00% | | 12/21 | | 3.416% | | | 700 | | | EUR | | | (117 | ) | | | 94 | | | | (23 | ) |
Federal Republic of Brazil,
4.25%, 1/7/25 | | Barclays Bank PLC | | 1.00% | | 6/20 | | 1.936% | | | 1,900 | | | USD | | | (79 | ) | | | 21 | | | | (58 | ) |
Novo Banco SA,
5.00%, 4/23/19 | | BNP Paribas | | 5.00% | | 12/21 | | 19.064% | | | 300 | | | EUR | | | (84 | ) | | | (19 | ) | | | (103 | ) |
Novo Banco SA,
5.00%, 4/23/19 | | JP Morgan Chase Bank NA | | 5.00% | | 12/21 | | 19.064% | | | 300 | | | EUR | | | (81 | ) | | | (22 | ) | | | (103 | ) |
Novo Banco,
5.00%, 12/20/21 | | Morgan Stanley Capital Services | | 5.00% | | 12/21 | | 19.064% | | | 100 | | | EUR | | | (27 | ) | | | (7 | ) | | | (34 | ) |
Republic of Peru,
8.75%, 11/21/33 | | Barclays Bank PLC | | 1.00% | | 3/23 | | 1.330% | | | 1,100 | | | USD | | | (19 | ) | | | (1 | ) | | | (20 | ) |
Republic of Turkey,
11.875%, 1/15/30 | | JP Morgan Chase Bank NA | | 1.00% | | 6/21 | | 2.544% | | | 2,100 | | | USD | | | (169 | ) | | | 36 | | | | (133 | ) |
Republic of Turkey,
11.875%, 1/15/30 | | JP Morgan Chase Bank NA | | 1.00% | | 12/21 | | 2.735% | | | 1,300 | | | USD | | | (100 | ) | | | (1 | ) | | | (101 | ) |
Republic of Venezuela,
9.25%, 9/15/27 | | BNP Paribas | | 5.00% | | 9/20 | | 43.415% | | | 300 | | | USD | | | (149 | ) | | | (24 | ) | | | (173 | ) |
Republic of Venezuela,
9.25%, 9/15/27 | | Citigroup Financial Products | | 5.00% | | 6/20 | | 44.051% | | | 5,900 | | | USD | | | (2,278 | ) | | | (914 | ) | | | (3,192 | ) |
The Accompanying Notes are an Integral Part of the Financial Statements.
| | | | |
| 164 | | Multi-Sector Bond Portfolio | | |
Multi-Sector Bond Portfolio
Credit Default Swaps on Corporate or Sovereign Issues - Sell Protection (continued)
| | | | | | | | | | | | | | | | | | | | | | | | | | |
| Reference Entity | | Counterparty | | Receive
Fixed
Rate | | Expiration
Date | | Implied
Credit
Spread | | Notional
Amount
(000’s) | | Upfront
Premium Paid/
(Received)
(000’s) | | | Unrealized
Appreciation/
(Depreciation)
(000’s) | | | Market
Value
(000’s) | |
Republic of Venezuela,
9.25%, 9/15/27 | | HSBC Bank USA NA | | 5.00% | | 6/20 | | 44.051% | | | 100 | | | USD | | $ | (40 | ) | | $ | (14 | ) | | $ | (54 | ) |
Republic Of Venezuela,
9.25%, 9/15/27 | | Goldman Sachs International | | 5.00% | | 12/21 | | 41.247% | | | 100 | | | USD | | | (52 | ) | | | (5 | ) | | | (57 | ) |
Republic Of Venezuela,
9.25%, 9/15/27 | | JP Morgan Chase Bank NA | | 5.00% | | 12/21 | | 41.247% | | | 220 | | | USD | | | (114 | ) | | | (12 | ) | | | (126 | ) |
Russian Federation,
7.50%, 3/31/30 | | Barclays Bank PLC | | 1.00% | | 6/20 | | 1.230% | | | 1,400 | | | USD | | | (90 | ) | | | 80 | | | | (10 | ) |
Russian Federation,
7.50%, 3/31/30 | | Goldman Sachs International | | 1.00% | | 6/20 | | 1.230% | | | 700 | | | USD | | | (46 | ) | | | 40 | | | | (6 | ) |
Russian Federation,
7.50%, 3/31/30 | | Goldman Sachs International | | 1.00% | | 9/20 | | 1.323% | | | 400 | | | USD | | | (32 | ) | | | 27 | | | | (5 | ) |
Russian Federation,
7.50%, 3/31/30 | | Goldman Sachs International | | 1.00% | | 9/20 | | 1.323% | | | 900 | | | USD | | | (64 | ) | | | 54 | | | | (10 | ) |
Russian Federation,
7.50%, 3/31/30 | | HSBC Bank USA NA | | 1.00% | | 6/21 | | 1.622% | | | 4,200 | | | USD | | | (268 | ) | | | 159 | | | | (109 | ) |
Russian Federation,
7.50%, 3/31/30 | | JP Morgan Chase Bank NA | | 1.00% | | 9/20 | | 1.323% | | | 1,500 | | | USD | | | (121 | ) | | | 104 | | | | (17 | ) |
Russian Federation,
7.50%, 3/31/30 | | JP Morgan Chase Bank NA | | 1.00% | | 12/20 | | 1.403% | | | 800 | | | USD | | | (72 | ) | | | 60 | | | | (12 | ) |
Santander International Debt SAU,
4.00%, 3/27/17 | | JP Morgan Chase Bank NA | | 1.00% | | 6/21 | | 1.131% | | | 1,200 | | | EUR | | | (30 | ) | | | 23 | | | | (7 | ) |
United Mexican States,
5.95%, 3/19/19 | | BNP Paribas | | 1.00% | | 12/22 | | 1.755% | | | 1,500 | | | USD | | | (59 | ) | | | (2 | ) | | | (61 | ) |
United Mexican States,
5.95%, 3/19/19 | | JP Morgan Chase Bank NA | | 1.00% | | 12/22 | | 1.755% | | | 3,800 | | | USD | | | (154 | ) | | | (1 | ) | | | (155 | ) |
Venezuela Government International Bond,
9.25%, 9/15/27 | | Barclays Bank PLC | | 5.00% | | 12/21 | | 41.247% | | | 100 | | | USD | | | (53 | ) | | | (5 | ) | | | (58 | ) |
| | | | | | | | | | | | | | | | | | | | | | | | | | |
| | | | | | | | | | | | | | | | $ | (4,490 | ) | | $ | (176 | ) | | $ | (4,666 | ) |
| | | | | | | | | | | | | | | | | | | | | | | | | | |
Centrally Cleared Interest Rate Swaps - Pay Floating Rate
| | | | | | | | | | | | | | | | |
| Floating Rate Index | | | | Fixed
Rate | | Expiration
Date | | Notional
Amount (000’s) | | Currency | | | Unrealized
Appreciation/
(Depreciation)(000’s) | |
6-Month Australian Bank Bill | | | | 3.00% | | 12/20 | | 3,400 | | | AUD | | | $ | (4 | ) |
6-Month GBP-LIBOR | | | | 1.75% | | 3/47 | | 700 | | | GBP | | | | (138 | ) |
| | | | | | | | | | | | | | | | |
| | | | | | | | | | | | | | $ | (142 | ) |
| | | | | | | | | | | | | | | | |
Centrally Cleared Interest Rate Swaps - Receive Floating Rate
| | | | | | | | | | | | | | | | |
Floating Rate Index | | | | Fixed
Rate | | Expiration
Date | | Notional
Amount (000’s) | | Currency | | | Unrealized
Appreciation/
(Depreciation)(000’s) | |
3-Month USD-LIBOR | | | | 0.97% | | 12/18 | | 7,600 | | | USD | | | $ | (15 | ) |
6-Month GBP-LIBOR | | | | 0.60% | | 3/27 | | 2,200 | | | GBP | | | | 86 | |
6-Month GBP-LIBOR | | | | 0.60% | | 3/22 | | 4,700 | | | GBP | | | | 84 | |
| | | | | | | | | | | | | | | | |
| | | | | | | | | | | | | | $ | 155 | |
| | | | | | | | | | | | | | | | |
The Accompanying Notes are an Integral Part of the Financial Statements.
| | | | | | |
| | Multi-Sector Bond Portfolio | | | 165 | |
Multi-Sector Bond Portfolio
Centrally Cleared Credit Default Swaps on Corporate or Sovereign Issues - Sell Protection
| | | | | | | | | | | | | | |
| Reference Entity | | Receive Fixed
Rate | | Expiration Date | | Implied Credit Spread | | Notional
Amount (000’s) | | Currency | | Unrealized Appreciation/ (Depreciation) (000’s) | |
Casino Guichard Perrachon SA, 3.157%, 8/6/19 | | 1.00% | | 12/21 | | 2.402% | | 4,200 | | EUR | | $ | 47 | |
Chesapeake Energy Corp., 5.00%, 8/15/20 | | 5.00% | | 6/20 | | 4.880% | | 2,200 | | USD | | | 108 | |
Ford Motor Co., 6.50%, 8/1/18 | | 5.00% | | 12/23 | | 1.900% | | 200 | | USD | | | 2 | |
Marks & Spencer PLC, 6.125%, 12/2/19 | | 1.00% | | 6/21 | | 1.402% | | 3,200 | | EUR | | | 15 | |
Navient Corp., 5.50%, 1/25/23 | | 5.00% | | 12/21 | | 3.595% | | 650 | | USD | | | 21 | |
Repsol International Finance BV, 4.875%, 2/19/19 | | 1.00% | | 12/21 | | 1.254% | | 200 | | EUR | | | 2 | |
Sprint Communications, Inc., 7.00%, 8/15/20 | | 5.00% | | 12/21 | | 3.462% | | 3,300 | | USD | | | 182 | |
Sprint Communications, Inc., 8.375%, 8/15/17 | | 5.00% | | 12/19 | | 2.190% | | 300 | | USD | | | 7 | |
Telefonica Emisiones SAU, 2.736%, 5/29/19 | | 1.00% | | 6/21 | | 1.082% | | 4,500 | | EUR | | | 17 | |
Volkswagen International Finance NV, 5.375%, 5/22/18 | | 1.00% | | 12/21 | | 1.056% | | 1,200 | | EUR | | | 5 | |
Volkswagen International Finance NV, 5.375%, 5/22/18 | | 1.00% | | 6/21 | | 0.961% | | 200 | | EUR | | | 1 | |
Volkswagen International Finance NV, 5.375%, 5/22/18 | | 1.00% | | 12/20 | | 0.842% | | 1,900 | | EUR | | | 9 | |
| | | | | | | | | | | | | | |
| | $ | 416 | |
| | | | | | | | | | | | | | |
Centrally Cleared Credit Default Swaps on Credit Indices - Sell Protection
| | | | | | | | | | | | | | |
| Reference Entity | | Receive Fixed Rate | | Expiration
Date | | Implied
Credit
Spread | | Notional
Amount
(000’s) | | Currency | | Unrealized
Appreciation/
(Depreciation) (000’s) | |
Markit CDX North America High Yield Index | | 5.00% | | 12/21 | | 3.542% | | 25,900 | | USD | | $ | (26 | ) |
| | | | | | | | | | | | | | |
| | $ | (26 | ) |
| | | | | | | | | | | | | | |
| (k) | Cash or securities with an aggregate value of $81,218 (in thousands) has been pledged as collateral for swap contracts outstanding, short sales or written options on December 31, 2016. |
| (m) | Amount is less than one thousand. |
| (r) | Rates are discount rates or a range of discount rates at the time of purchase. |
The Accompanying Notes are an Integral Part of the Financial Statements.
| | | | |
| 166 | | Multi-Sector Bond Portfolio | | |
Multi-Sector Bond Portfolio
The following is a summary of the inputs used in valuing the Portfolio’s assets and liabilities at December 31, 2016. See Note 3 for additional information on portfolio valuation.
| | | | | | | | | | | | | | |
| | | Valuation Inputs | | | |
| Description | | Level 1 – Quoted Prices | | | Level 2 – Other Significant
Observable Inputs | | | Level 3 – Significant
Unobservable Inputs | | | |
| | | (Amounts in thousands) | | | |
Assets: | | | | | | | | | | | | | | |
Bank Loan Obligations | | $ | - | | | $ | 12,569 | | | $ | 655 | | | |
Governments | | | - | | | | 118,248 | | | | - | | | |
Municipal Bonds | | | - | | | | 12,840 | | | | - | | | |
Corporate Bonds | | | - | | | | 331,154 | | | | - | (m) | | |
Structured Products | | | - | | | | 60,007 | | | | - | | | |
Short-Term Investments | | | - | | | | 66,054 | | | | - | | | |
Other Financial Instruments^ | | | | | | | | | | | | | | |
Futures | | | 346 | | | | - | | | | - | | | |
Forward Currency Contracts | | | - | | | | 2,952 | | | | - | | | |
Interest Rate Swaps | | | - | | | | 170 | | | | - | | | |
Credit Default Swaps | | | - | | | | 1,267 | | | | - | | | |
Total Assets: | | $ | 346 | | | $ | 605,261 | | | $ | 655 | | | |
Liabilities: | | | | | | | | | | | | | | |
Futures | | | (486 | ) | | | - | | | | - | | | |
Forward Currency Contracts | | | - | | | | (2,481 | ) | | | - | | | |
Options Written | | | - | | | | (167 | ) | | | - | | | |
Interest Rate Swaps | | | - | | | | (157 | ) | | | - | | | |
Credit Default Swaps | | | - | | | | (1,039 | ) | | | - | | | |
Total Liabilities: | | $ | (486 | ) | | $ | (3,844 | ) | | $ | - | | | |
^ Other financial instruments are derivative instruments such as futures, forwards, written options and swaps contracts, which are valued at the unrealized appreciation (depreciation) on the instrument and short sales, which are valued at market value.
For the period ended December 31, 2016, there were transfers from Level 3 to Level 2 in the amount of $201 (in thousands). These transfers were the result of an increase in the quantity of observable inputs for a security that was previously not priced by a third party vendor.
The Accompanying Notes are an Integral Part of the Financial Statements.
| | | | | | |
| | Multi-Sector Bond Portfolio | | | 167 | |
Balanced Portfolio (unaudited)
| | | | |
| Objective: | | Portfolio Strategy: | | Net Assets: |
Realize as high a level of total return as is consistent with prudent investment risk, through income and capital appreciation. | | Invest in the stock, bond and money market sectors, attempting to capitalize on the variation in return potential produced by the interaction of changing financial markets and economic conditions. | | $2.2 billion |
Portfolio Overview
Mason Street Advisors, LLC is the investment adviser for the Balanced Portfolio (the “Portfolio”). The Portfolio invests in the stock, bond and money market sectors. The Portfolio is tactically and strategically managed to capitalize on changing financial markets and economic conditions following a flexible policy for allocating assets across the stock, bond and money market sectors. The Portfolio operates primarily as a “fund of funds” to gain the Portfolio’s equity and fixed income exposure by investing in one or more of the portfolios of Northwestern Mutual Series Fund, Inc. (each an “Underlying Portfolio”). The adviser allocates the Portfolio’s assets among the Underlying Portfolios based on the adviser’s economic and market outlook and the investment objectives and strategies of the Underlying Portfolios. Under normal market conditions, the Portfolio will typically hold between 35-55% of assets in equity investments, 40-60% of assets in fixed income investments, and 0-20% of assets in cash equivalent investments.
Market Overview
U.S. equities posted strong performance during the year. Investors generally embraced higher-risk equities with greater exposure to the economic cycle, particularly after the U.S. election. Earnings growth remained subdued until the second half of the year, reflecting the drag from the Energy sector. Meanwhile, corporations continued buying back their stocks and acquiring other companies at a relatively robust pace. Consumer spending remained relatively steady, as job growth and rising stock prices helped improve consumer sentiment. Business spending remained muted, as many companies preferred to strengthen their balance sheets or buy back stock in lieu of large-scale investment in physical assets. The broader fixed income market posted a modest positive return, while higher-yielding corporate bonds logged large gains.
Altogether, the U.S. economy grew at a relatively slow pace of approximately 2.0% during the year, but growth was relatively stable, extending the U.S. economy’s streak to ten consecutive quarters of positive economic growth. The Fed was expected to raise interest rates for most of the year, but inflation well below the Fed’s 2.0% target and global uncertainty meant the Fed waited until December of 2016 to raise rates by a quarter of a point, marking only the second time the Fed has raised interest rates in the last eight years.
In that environment, small- and medium-sized stocks, as represented by the S&P SmallCap 600® and S&P MidCap 400® Indices, returned 26.56% and 20.74%, respectively, while the large-capitalization S&P 500® Index lagged despite its 11.96% return in 2016. Meanwhile, the Bloomberg Barclays U.S. Corporate High Yield Index posted a return of 17.13%, substantially outperforming the 2.65% return of the broader bond market, as represented by the Bloomberg Barclays® U.S. Aggregate Index.
Portfolio Results
The Portfolio returned 6.58% for the twelve months ended December 31, 2016, trailing the 11.96% return of the broad stock market, as measured by the S&P 500® Index, but outstripping the Bloomberg Barclays® U.S. Aggregate Index return of 2.65%. The Portfolio underperformed the Balanced Portfolio Blended Composite Benchmark return of 7.74%. (The benchmark weights are detailed in the “Benchmark Definitions” section of this annual report.) The Portfolio outperformed the Mixed-Asset Target Allocation Moderate Funds peer group, which had an average return of 6.14% in 2016, according to Lipper® Analytical Services, Inc., an independent mutual fund ranking agency.
The Portfolio’s underperformance relative to the blended benchmark reflects the performance of the Portfolio’s Underlying Portfolios, as many of the Underlying Portfolios underperformed their respective benchmarks. Relative performance was mixed for the domestic equity managers, but all of the Portfolio’s international equity portfolios trailed their respective benchmarks. On the upside, the Portfolio’s fixed income managers performed relatively well for the year.
Overall, asset allocation decisions were a positive contributor to relative performance, as tactical allocations were well positioned to benefit from the contours in market performance and risk. Entering the year with a cautious stance—underweight equities and high yield bonds, and overweight high quality bonds—helped the Portfolio’s performance, as economic weakness, a five-quarter recession in earnings, and plummeting oil prices led to a sharp correction in U.S. equity markets. However, during the first quarter, meaningful cuts to U.S. oil production helped oil prices rebound from a 13-year low. Identifying the potential for a short-term bottom in oil prices, the Portfolio shifted to overweight equities and high yield bonds in the second quarter, which helped capture additional performance on the upside when stocks rallied with oil prices. The Portfolio’s
Balanced Portfolio (unaudited)
overweight position in U.S. equities prior to the U.S. presidential election helped the Portfolio capitalize on the fourth quarter’s rally in stock prices. The Portfolio also benefited from an overweight to U.S. equities relative to international stocks during the year, as the stronger U.S. dollar weighed on international stock returns for U.S. investors.
During the year, equity futures contracts were used for cash management purposes. The Portfolio’s use of futures did not have a significant effect on the Portfolio’s relative results during 2016.
Portfolio Manager Outlook
Heading into 2017, we will maintain an overweight in U.S. equities and an underweight in fixed income. We believe the U.S. economy will continue to grow at a relatively slow pace with a modest increase in inflation. We see the potential for tightening monetary policy in the U.S. and abroad in 2017, as the Fed takes additional steps toward normalizing interest rate policy, while the European Central Bank and the Bank of Japan make modest moves to reduce the stimulus provided through their bond purchasing programs. Despite slow growth and less stimulative monetary policy, the new administration’s proposed corporate and individual tax cuts are likely to be a strong catalyst for earnings growth.
While the recent equity rally reflected rising expectations for pro-business policy, the proposed tax cuts are widely seen as only a modest increase to economic growth. Nevertheless, the tax cuts may be somewhat underestimated for their direct, immediate and lasting boost to earnings, buybacks and capital spending. We will closely monitor political and economic developments during the year and seek an optimal mix of the most attractive asset classes from a risk and return perspective.
|
Relative Performance |
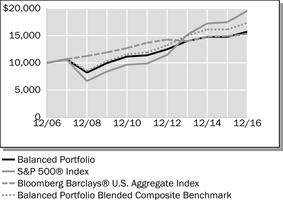 |
| | | | | | | | | | | | |
Average Annual Total Returns
For Periods Ended December 31, 2016 | |
| | | 1 Year | | | 5 Years | | | 10 Years | |
Balanced Portfolio | | | 6.58% | | | | 6.68% | | | | 4.64% | |
S&P 500® Index | | | 11.96% | | | | 14.66% | | | | 6.95% | |
Bloomberg Barclays® U.S. Aggregate Index | | | 2.65% | | | | 2.23% | | | | 4.34% | |
Balanced Portfolio Blended Composite Benchmark | | | 7.74% | | | | 7.84% | | | | 5.68% | |
Lipper® Variable Insurance Products (VIP) Mixed Asset Target Allocation Moderate Funds Average | | | 6.14% | | | | 7.37% | | | | 4.76% | |
The performance data quoted represents past performance. Past performance is historical and does not guarantee future performance. Investment return and principal value will fluctuate, so that shares, when redeemed, may be worth more or less than their original cost. Current performance may be lower or higher than the performance data quoted. For the most recent month-end performance information visit www.northwesternmutual.com.
This chart assumes an initial investment of $10,000 made on 12/31/06. Returns shown reflect fee waivers, deductions for management and other portfolio expenses, and reinvestment of all dividends. In the absence of fee waivers, total return would be reduced. Returns exclude deductions for separate account sale loads and account fees. In the graph and chart, the Portfolio is compared against various indices representing the three major components of the Portfolio: equities, fixed income and cash equivalent instruments. Please refer to the Benchmark Definitions section of this report for information about the indices cited in the above chart and graph.
Balanced Portfolio (unaudited)
Investors should be aware of the risks of investments in foreign securities, particularly investments in securities of companies in developing nations. These include the risks of currency fluctuation, of political and economic instability and of less well-developed government supervision and regulation of business and industry practices, as well as differences in accounting standards. Small cap stocks also may carry additional risk. Smaller or newer issuers are more likely to realize more substantial growth as well as suffer more significant losses than larger or more established issuers. Investments in such companies can be both volatile and more speculative. Bonds and other debt obligations are affected by changes in interest rates, inflation risk and the creditworthiness of their issuers. High yield bonds generally have greater price swings and higher default risks than investment grade bonds.
The Portfolio obtains its exposure to equity and fixed income securities by investing in other Series Fund portfolios (Underlying Portfolios). Each of the Underlying Portfolios has its own investment risks, and the Portfolio is indirectly exposed to all the risks of the Underlying Portfolios in which it invests, including that risk that an Underlying Portfolio will not perform as expected. To the extent that the Portfolio invests a significant portion of its assets in a single Underlying Portfolio, it will be particularly sensitive to the risks associated with that Underlying Portfolio may have a significant effect on the Portfolio’s net asset value. The Portfolio will bear a pro rata share of the Underlying Portfolio’s expenses.
The Portfolio may use derivative instruments to gain exposure to certain markets, sectors or regions as alternatives to direct investments, to adjust the Portfolio duration, to provide increased flexibility in asset allocation, to earn income and to otherwise seek to enhance returns or to hedge foreign currency exposure. Use of these instruments may involve certain costs and risks such as liquidity risk, interest rate risk, mispricing or improper valuation. Certain derivatives involve leverage, which could magnify losses, and portfolios investing in derivatives could lose more than the principal amount invested in those investments.
Currently, interest rates are near unprecedented historically low levels. A significant rise in interest rates over a short period of time could cause significant losses in the market value of the Portfolio’s fixed income investments.
Top 10 Equity Holdings 12/31/16
| | | | |
| Security Description | | % of Net Assets | |
Northwestern Mutual Series Fund, Inc., Select Bond Portfolio | | | 37.8 | % |
Northwestern Mutual Series Fund, Inc., Growth Stock Portfolio | | | 6.6 | % |
Northwestern Mutual Series Fund, Inc., High Yield Bond Portfolio | | | 6.1 | % |
Northwestern Mutual Series Fund, Inc., Mid Cap Value Portfolio | | | 5.1 | % |
Northwestern Mutual Series Fund, Inc., Mid Cap Growth Stock Portfolio | | | 4.7 | % |
Northwestern Mutual Series Fund, Inc., Research International Core Portfolio | | | 4.6 | % |
Northwestern Mutual Series Fund, Inc., Equity Income Portfolio | | | 3.6 | % |
Northwestern Mutual Series Fund, Inc., Large Company Value Portfolio | | | 3.6 | % |
Northwestern Mutual Series Fund, Inc., Domestic Equity Portfolio | | | 3.5 | % |
Northwestern Mutual Series Fund, Inc., Large Cap Blend Portfolio | | | 3.4 | % |
Sector Allocation 12/31/16
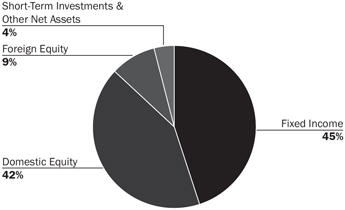
Sector Allocation is based on Net Assets.
Sector Allocation and Top 10 Holdings are subject to change.
Balanced Portfolio
Schedule of Investments
December 31, 2016
| | | | | | | | | | |
| | | Investment Companies (95.6%) | | Shares/
$ Par | | | Value
$ (000’s) | |
| | | |
| | Domestic Equity (41.7%) | | | | | | | | |
| | iShares Russell 2000 ETF | | | 122,700 | | | | 16,546 | |
| | iShares Russell Mid-Cap ETF | | | 60,600 | | | | 10,839 | |
| (q) | | Northwestern Mutual Series Fund, Inc., Domestic Equity Portfolio | | | 50,755,240 | | | | 78,011 | |
| (q) | | Northwestern Mutual Series Fund, Inc., Equity Income Portfolio | | | 46,479,371 | | | | 80,130 | |
| (q) | | Northwestern Mutual Series Fund, Inc., Focused Appreciation Portfolio | | | 33,697,064 | | | | 70,124 | |
| (q) | | Northwestern Mutual Series Fund, Inc., Growth Stock Portfolio | | | 56,296,860 | | | | 145,302 | |
| (q) | | Northwestern Mutual Series Fund, Inc., Large Cap Blend Portfolio | | | 70,336,806 | | | | 75,542 | |
| (q) | | Northwestern Mutual Series Fund, Inc., Large Cap Core Stock Portfolio | | | 45,544,650 | | | | 72,644 | |
| (q) | | Northwestern Mutual Series Fund, Inc., Large Company Value Portfolio | | | 77,092,851 | | | | 78,481 | |
| (q) | | Northwestern Mutual Series Fund, Inc., Mid Cap Growth Stock Portfolio | | | 35,655,601 | | | | 102,724 | |
| (q) | | Northwestern Mutual Series Fund, Inc., Mid Cap Value Portfolio | | | 65,046,000 | | | | 112,334 | |
| (q) | | Northwestern Mutual Series Fund, Inc., Small Cap Growth Stock Portfolio | | | 15,243,656 | | | | 36,493 | |
| (q) | | Northwestern Mutual Series Fund, Inc., Small Cap Value Portfolio | | | 16,549,409 | | | | 40,066 | |
| | | | | | | | | | |
| | Total | | | | | | | 919,236 | |
| | | | | | | |
| | | |
| | Fixed Income (44.7%) | | | | | | | | |
| (q) | | Northwestern Mutual Series Fund, Inc., High Yield Bond Portfolio | | | 183,059,109 | | | | 135,098 | |
| (q) | | Northwestern Mutual Series Fund, Inc., Inflation Protection Portfolio | | | 15,249,538 | | | | 16,561 | |
| (q) | | Northwestern Mutual Series Fund, Inc., Select Bond Portfolio | | | 663,572,563 | | | | 833,447 | |
| | | | | | | | | | |
| | Total | | | | | | | 985,106 | |
| | | | | | | |
| | | |
| | Foreign Equity (9.2%) | | | | | | | | |
| | iShares Core MSCI Emerging Markets ETF | | | 120,500 | | | | 5,115 | |
| | iShares MSCI EAFE ETF | | | 138,500 | | | | 7,996 | |
| (q) | | Northwestern Mutual Series Fund, Inc., Emerging Markets Equity Portfolio | | | 6,142,515 | | | | 5,356 | |
| (q) | | Northwestern Mutual Series Fund, Inc., International Equity Portfolio | | | 28,208,308 | | | | 45,218 | |
| (q) | | Northwestern Mutual Series Fund, Inc., International Growth Portfolio | | | 29,552,780 | | | | 36,675 | |
| (q) | | Northwestern Mutual Series Fund, Inc., Research International Core Portfolio | | | 123,396,274 | | | | 101,555 | |
| | | | | | | | | | |
| | Total | | | | | | | 201,915 | |
| | | | | | | |
| | | |
| | Total Investment Companies (Cost: $2,086,944) | | | | | | | 2,106,257 | |
| | | | | | | | | | |
| | | | | | | | | | |
| | | Short-Term Investments (2.3%) | | Shares/
$ Par | | | Value
$ (000’s) | |
| |
| | Commercial Paper (1.7%) | |
| | Bank of America NA, 0.970%, 1/4/17 144A | | | 5,000,000 | | | | 5,000 | |
| (r) | | Microsoft Corp., 0.600%, 1/10/17 144A | | | 9,000,000 | | | | 8,999 | |
| (r) | | Microsoft Corp., 0.690%, 1/24/17 144A | | | 1,000,000 | | | | 1,000 | |
| (r) | | Pfizer, Inc., 0.600%, 1/26/17 144A | | | 5,070,000 | | | | 5,068 | |
| (r) | | Pfizer, Inc., 0.750%, 3/20/17 144A | | | 2,800,000 | | | | 2,796 | |
| (r) | | Societe Generale, 0.940%, 3/1/17 144A | | | 5,000,000 | | | | 4,993 | |
| (r) | | The Walt Disney Co., 0.580%, 1/20/17 144A | | | 10,000,000 | | | | 9,997 | |
| | | | | | | | | | |
| | Total | | | | | | | 37,853 | |
| | | | | | | | | | |
| |
| | US Government & Agencies (0.6%) | |
| (r) | | Federal Home Loan Bank, 0.384%, 2/1/17 | | | 10,000,000 | | | | 9,996 | |
| (r) | | Federal Home Loan Bank, 0.440%, 2/24/17 | | | 2,000,000 | | | | 1,998 | |
| | | | | | | | | | |
| | Total | | | | | | | 11,994 | |
| | | | | | | | | | |
| | | |
| | Total Short-Term Investments (Cost: $49,846) | | | | | | | 49,847 | |
| | | | | | | | | | |
| | | |
| | Total Investments (97.9%) (Cost: $2,136,790)(a) | | | | | | | 2,156,104 | |
| | | | | | | | | | |
| | Other Assets, Less | | | | | | | | |
| | Liabilities (2.1%) | | | | | | | 46,730 | |
| | | | | | | | | | |
| | Net Assets (100.0%) | | | | | | | 2,202,834 | |
| | | | | | | | | | |
The Accompanying Notes are an Integral Part of the Financial Statements.
Balanced Portfolio
144A after the name of a security represents a security exempt from registration under Rule 144A of the Securities Act of 1933. These securities may be resold as transactions exempt from registration, normally to qualified institutional buyers. At December 31, 2016 the value of these securities (in thousands) was $37,853 representing 1.7% of the net assets.
| (a) | At December 31, 2016, the aggregate cost of securities for federal tax purposes (in thousands) was $2,137,184 and the net unrealized appreciation of investments based on that cost was $18,920 which is comprised of $54,975 aggregate gross unrealized appreciation and $36,055 aggregate gross unrealized depreciation. |
| (r) | Rates are discount rates at the time of purchase. |
The following is a summary of the inputs used in valuing the Portfolio’s assets and liabilities at December 31, 2016. See Note 3 for additional information on portfolio valuation.
| | | | | | | | | | | | | | |
| | | Valuation Inputs | | | |
| Description | | Level 1 – Quoted Prices | | | Level 2 –
Other Significant
Observable Inputs | | | Level 3 –
Significant
Unobservable Inputs | | | |
| | | (Amounts in thousands) | | | |
Assets: | | | | | | | | | | | | | | |
Investment Companies | | $ | 2,106,257 | | | $ | - | | | $ | - | | | |
Short-Term Investments | | | - | | | | 49,847 | | | | - | | | |
Total Assets: | | $ | 2,106,257 | | | $ | 49,847 | | | $ | - | | | |
The Accompanying Notes are an Integral Part of the Financial Statements.
Asset Allocation Portfolio (unaudited)
| | | | |
| Objective: | | Portfolio Strategy: | | Net Assets: |
Realize as high a level of total return as is consistent with reasonable investment risk. | | Invest in the stock, bond and money market sectors, attempting to capitalize on the variation in return potential produced by the interaction of changing financial markets and economic conditions. | | $250 million |
Portfolio Overview
Mason Street Advisors, LLC is the investment adviser for the Asset Allocation Portfolio (the “Portfolio”). The Portfolio invests in the stock, bond and money market sectors. The Portfolio is tactically and strategically managed to capitalize on changing financial markets and economic conditions following a flexible policy for allocating assets across the stock, bond and money market sectors. The Portfolio operates primarily as a “fund of funds” to gain the Portfolio’s equity and fixed income exposure by investing in one or more of the portfolios of Northwestern Mutual Series Fund, Inc. (each an “Underlying Portfolio”). The adviser allocates the Portfolio’s assets among the Underlying Portfolios based on the adviser’s economic and market outlook and the investment objectives and strategies of the Underlying Portfolios. Under normal market conditions, the Portfolio will typically hold between 55-75% of assets in equity investments, 25-45% of assets in fixed income investments, and 0-15% of assets in cash equivalent investments.
Market Overview
U.S. equities posted strong performance during the year. Investors generally embraced higher-risk equities with greater exposure to the economic cycle, particularly after the U.S. election. Earnings growth remained subdued until the second half of the year, reflecting the drag from the Energy sector. Meanwhile, corporations continued buying back their stocks and acquiring other companies at a relatively robust pace. Consumer spending remained relatively steady, as job growth and rising stock prices helped improve consumer sentiment. Business spending remained muted, as many companies preferred to strengthen their balance sheets or buy back stock in lieu of large-scale investment in physical assets. The broader fixed income market posted a modest positive return, while higher-yielding corporate bonds logged large gains.
Altogether, the U.S. economy grew at a relatively slow pace of approximately 2.0% during the year, but growth was relatively stable, extending the U.S. economy’s streak to ten consecutive quarters of positive economic growth. The Fed was expected to raise interest rates for most of the year, but inflation well below the Fed’s 2.0% target and global uncertainty meant the Fed waited until December of 2016 to raise rates by a quarter of a point, marking only the second time the Fed has raised interest rates in the last eight years.
In that environment, small- and medium-sized stocks, as represented by the S&P SmallCap 600® and S&P MidCap 400® Indices, returned 26.56% and 20.74%, respectively, while the large-capitalization S&P 500® Index lagged despite its 11.96% return in 2016. Meanwhile, the Bloomberg Barclays U.S. Corporate High Yield Index posted a return of 17.13%, substantially outperforming the 2.65% return of the broader bond market, as represented by the Bloomberg Barclays® U.S. Aggregate Index.
Portfolio Results
The Portfolio returned 7.79% for the twelve months ended December 31, 2016, trailing the 11.96% return of the broad stock market, as measured by the S&P 500® Index, but outstripping the Bloomberg Barclays® U.S. Aggregate Index return of 2.65%. The Portfolio underperformed the Asset Allocation Portfolio Blended Composite Benchmark return of 9.58%. (The benchmark weights are detailed in the “Benchmark Definitions” section of this annual report.) The Portfolio outperformed the Mixed-Asset Target Allocation Growth Funds peer group, which had an average return of 6.93% in 2016, according to Lipper® Analytical Services, Inc., an independent mutual fund ranking agency.
The Portfolio’s underperformance relative to the blended benchmark reflects the performance of the Portfolio’s Underlying Portfolios, as many of the Underlying Portfolios underperformed their respective benchmarks. Relative performance was mixed for the domestic equity managers, but all of the Portfolio’s international equity portfolios trailed their respective benchmarks. On the upside, the Portfolio’s fixed income managers performed relatively well for the year.
Overall, asset allocation decisions were a positive contributor to relative performance, as tactical allocations were well positioned to benefit from the contours in market performance and risk. Entering the year with a cautious stance—underweight equities and high yield bonds, and overweight high quality bonds—helped the Portfolio’s performance, as economic weakness, a five-quarter recession in earnings, and plummeting oil prices led to a sharp correction in U.S. equity markets. However, during the first quarter, meaningful cuts to U.S. oil production helped oil prices rebound from a 13-year low. Identifying the potential for a short-term bottom in oil prices, the Portfolio shifted to overweight equities and high yield bonds in the second quarter, which helped capture additional performance on the upside when stocks rallied with oil prices. The Portfolio’s
| | | | | | |
| | Asset Allocation Portfolio | | | 173 | |
Asset Allocation Portfolio (unaudited)
overweight position in U.S. equities prior to the U.S. presidential election helped the Portfolio capitalize on the fourth quarter’s rally in stock prices. The Portfolio also benefited from an overweight to U.S. equities relative to international stocks during the year, as the stronger U.S. dollar weighed on international stock returns for U.S. investors.
During the year, equity futures contracts were used for cash management purposes. The Portfolio’s use of futures did not have a significant effect on the Portfolio’s relative results during 2016.
Portfolio Manager Outlook
Heading into 2017, we will maintain an overweight in U.S. equities and an underweight in fixed income. We believe the U.S. economy will continue to grow at a relatively slow pace with a modest increase in inflation. We see the potential for tightening monetary policy in the U.S. and abroad in 2017, as the Fed takes additional steps toward normalizing interest rate policy, while the European Central Bank and the Bank of Japan make modest moves to reduce the stimulus provided through their bond purchasing programs. Despite slow growth and less stimulative monetary policy, the new administration’s proposed corporate and individual tax cuts are likely to be a strong catalyst for earnings growth.
While the recent equity rally reflected rising expectations for pro-business policy, the proposed tax cuts are widely seen as only a modest increase to economic growth. Nevertheless, the tax cuts may be somewhat underestimated for their direct, immediate and lasting boost to earnings, buybacks and capital spending. We will closely monitor political and economic developments during the year and seek an optimal mix of the most attractive asset classes from a risk and return perspective.
Relative Performance
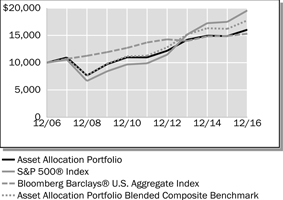
| | | | | | | | | | | | |
Average Annual Total Returns
For Periods Ended December 31, 2016 | |
| | | 1 Year | | | 5 Years | | | 10 Years | |
Asset Allocation Portfolio | | | 7.79% | | | | 7.89% | | | | 4.84% | |
S&P 500® Index | | | 11.96% | | | | 14.66% | | | | 6.95% | |
Bloomberg Barclays® U.S. Aggregate Index | | | 2.65% | | | | 2.23% | | | | 4.34% | |
Asset Allocation Portfolio Blended Composite Benchmark | | | 9.56% | | | | 9.49% | | | | 5.91% | |
Lipper® Variable Insurance Products (VIP) Mixed Asset Target Allocation Growth Funds Average | | | 6.93% | | | | 8.81% | | | | 5.21% | |
The performance data quoted represents past performance. Past performance is historical and does not guarantee future performance. Investment return and principal value will fluctuate, so that shares, when redeemed, may be worth more or less than their original cost. Current performance may be lower or higher than the performance data quoted. For the most recent month-end performance information visit www.northwesternmutual.com.
This chart assumes an initial investment of $10,000 made on 12/31/06. Returns shown reflect fee waivers, deductions for management and other portfolio expenses, and reinvestment of all dividends. In the absence of fee waivers, total return would be reduced. Returns exclude deductions for separate account sale loads and account fees. In the graph and chart, the Portfolio is compared against various indices representing the three major components of the Portfolio: equities, fixed income and cash equivalent instruments. Please refer to the Benchmark Definitions section of this report for information about the indices cited in the above chart and graph.
| | | | |
| 174 | | Asset Allocation Portfolio | | |
Asset Allocation Portfolio (unaudited)
Investors should be aware of the risks of investments in foreign securities, particularly investments in securities of companies in developing nations. These include the risks of currency fluctuation, of political and economic instability and of less well-developed government supervision and regulation of business and industry practices, as well as differences in accounting standards. Small cap stocks also may carry additional risk. Smaller or newer issuers are more likely to realize more substantial growth as well as suffer more significant losses than larger or more established issuers. Investments in such companies can be both volatile and more speculative. Bonds and other debt obligations are affected by changes in interest rates, inflation risk and the creditworthiness of their issuers. High yield bonds generally have greater price swings and higher default risks than investment grade bonds.
The Portfolio obtains its exposure to equity and fixed income securities by investing in other Series Fund portfolios (Underlying Portfolios). Each of the Underlying Portfolios has its own investment risks, and the Portfolio is indirectly exposed to all the risks of the Underlying Portfolios in which it invests, including that risk that an Underlying Portfolio will not perform as expected. To the extent that the Portfolio invests a significant portion of its assets in a single Underlying Portfolio, it will be particularly sensitive to the risks associated with that Underlying Portfolio may have a significant effect on the Portfolio’s net asset value. The Portfolio will bear a pro rata share of the Underlying Portfolio’s expenses.
The Portfolio may use derivative instruments to gain exposure to certain markets, sectors or regions as alternatives to direct investments, to adjust the Portfolio duration, to provide increased flexibility in asset allocation, to earn income and to otherwise seek to enhance returns or to hedge foreign currency exposure. Use of these instruments may involve certain costs and risks such as liquidity risk, interest rate risk, mispricing or improper valuation. Certain derivatives involve leverage, which could magnify losses, and portfolios investing in derivatives could lose more than the principal amount invested in those investments.
Currently, interest rates are near unprecedented historically low levels. A significant rise in interest rates over a short period of time could cause significant losses in the market value of the Portfolio’s fixed income investments.
Top 10 Equity Holdings 12/31/16
| | |
| Security Description | | % of Net Assets |
Northwestern Mutual Series Fund, Inc., Select Bond Portfolio | | 20.2% |
Northwestern Mutual Series Fund, Inc., High Yield Bond Portfolio | | 8.1% |
Northwestern Mutual Series Fund, Inc., Growth Stock Portfolio | | 7.9% |
Northwestern Mutual Series Fund, Inc., Research International Core Portfolio | | 6.4% |
Northwestern Mutual Series Fund, Inc., Mid Cap Value Portfolio | | 6.1% |
Northwestern Mutual Series Fund, Inc., Mid Cap Growth Stock Portfolio | | 5.6% |
Northwestern Mutual Series Fund, Inc., Large Cap Blend Portfolio | | 4.7% |
Northwestern Mutual Series Fund, Inc., Large Cap Core Stock Portfolio | | 4.5% |
Northwestern Mutual Series Fund, Inc., Equity Income Portfolio | | 4.5% |
Northwestern Mutual Series Fund, Inc., Large Company Value Portfolio | | 4.4% |
Sector Allocation 12/31/16
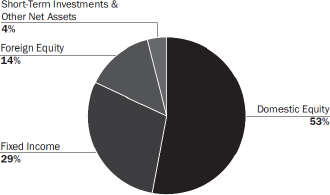
Sector Allocation is based on Net Assets.
Sector Allocation and Top 10 Holdings are subject to change.
| | | | | | |
| | Asset Allocation Portfolio | | | 175 | |
Asset Allocation Portfolio
Schedule of Investments
December 31, 2016
| | | | | | | | | | |
| | | Investment Companies (95.9%) | | Shares/
$ Par | | | Value
$ (000’s) | |
| | | |
| | Domestic Equity (53.1%) | | | | | | | | |
| | iShares Russell 2000 ETF | | | 15,000 | | | | 2,023 | |
| | iShares Russell Mid-Cap ETF | | | 11,950 | | | | 2,137 | |
| (q) | | Northwestern Mutual Series Fund, Inc., Domestic Equity Portfolio | | | 7,005,946 | | | | 10,768 | |
| (q) | | Northwestern Mutual Series Fund, Inc., Equity Income Portfolio | | | 6,468,568 | | | | 11,152 | |
| (q) | | Northwestern Mutual Series Fund, Inc., Focused Appreciation Portfolio | | | 4,598,057 | | | | 9,569 | |
| (q) | | Northwestern Mutual Series Fund, Inc., Growth Stock Portfolio | | | 7,705,398 | | | | 19,888 | |
| (q) | | Northwestern Mutual Series Fund, Inc., Large Cap Blend Portfolio | | | 10,901,646 | | | | 11,708 | |
| (q) | | Northwestern Mutual Series Fund, Inc., Large Cap Core Stock Portfolio | | | 7,059,126 | | | | 11,259 | |
| (q) | | Northwestern Mutual Series Fund, Inc., Large Company Value Portfolio | | | 10,894,697 | | | | 11,091 | |
| (q) | | Northwestern Mutual Series Fund, Inc., Mid Cap Growth Stock Portfolio | | | 4,827,317 | | | | 13,907 | |
| (q) | | Northwestern Mutual Series Fund, Inc., Mid Cap Value Portfolio | | | 8,775,801 | | | | 15,156 | |
| (q) | | Northwestern Mutual Series Fund, Inc., Small Cap Growth Stock Portfolio | | | 2,828,503 | | | | 6,771 | |
| (q) | | Northwestern Mutual Series Fund, Inc., Small Cap Value Portfolio | | | 3,066,565 | | | | 7,424 | |
| | | | | | | | | | |
| | Total | | | | | | | 132,853 | |
| | | | | | | |
| | | |
| | Fixed Income (29.0%) | | | | | | | | |
| (q) | | Northwestern Mutual Series Fund, Inc., High Yield Bond Portfolio | | | 27,370,905 | | | | 20,200 | |
| (q) | | Northwestern Mutual Series Fund, Inc., Inflation Protection Portfolio | | | 1,848,429 | | | | 2,007 | |
| (q) | | Northwestern Mutual Series Fund, Inc., Select Bond Portfolio | | | 40,180,444 | | | | 50,467 | |
| | | | | | | | | | |
| | Total | | | | | | | 72,674 | |
| | | | | | | |
| | | | | | | | | | |
| | | Investment Companies (95.9%) | | Shares/
$ Par | | | Value
$ (000’s) | |
| | | |
| | Foreign Equity (13.8%) | | | | | | | | |
| | iShares MSCI EAFE ETF | | | 46,290 | | | | 2,672 | |
| | iShares MSCI Emerging Markets ETF | | | 6,425 | | | | 225 | |
| (q) | | Northwestern Mutual Series Fund, Inc., Emerging Markets Equity Portfolio | | | 2,757,354 | | | | 2,404 | |
| (q) | | Northwestern Mutual Series Fund, Inc., International Equity Portfolio | | | 4,815,906 | | | | 7,720 | |
| (q) | | Northwestern Mutual Series Fund, Inc., International Growth Portfolio | | | 4,597,629 | | | | 5,706 | |
| (q) | | Northwestern Mutual Series Fund, Inc., Research International Core Portfolio | | | 19,360,222 | | | | 15,934 | |
| | | | | | | | | | |
| | Total | | | | | | | 34,661 | |
| | | | | | | |
| | | |
| | Total Investment Companies | | | | | | | | |
| | (Cost: $236,750) | | | | 240,188 | |
| | | | | | | |
| | | |
| | | Short-Term Investments (2.8%) | | | | | | |
| |
| | Commercial Paper (2.0%) | |
| | Bank of America NA, 0.970%, 1/4/17 144A | | | 1,000,000 | | | | 1,000 | |
| (r) | | Microsoft Corp., 0.730%, 2/7/17 144A | | | 1,000,000 | | | | 999 | |
| (r) | | Pfizer, Inc., 0.530%, 1/23/17 144A | | | 1,003,000 | | | | 1,003 | |
| (r) | | Societe Generale, 0.940%, 3/3/17 144A | | | 1,000,000 | | | | 999 | |
| (r) | | The Walt Disney Co., 0.580%, 1/20/17 144A | | | 1,000,000 | | | | 1,000 | |
| | | | | | | | | | |
| | Total | | | | | | | 5,001 | |
| | | | | | | |
| |
| | US Government & Agencies (0.8%) | |
| (b,r) | | Federal Home Loan Bank, 0.384%, 2/1/17 | | | 1,000,000 | | | | 1,000 | |
| (r) | | Federal Home Loan Bank, 0.440%, 2/24/17 | | | 1,000,000 | | | | 999 | |
| | | | | | | | | | |
| | Total | | | | | | | 1,999 | |
| | | | | | | |
| | | |
| | Total Short-Term Investments (Cost: $6,999) | | | | | | | 7,000 | |
| | | | | | | | | | |
| | | |
| | Total Investments (98.7%) | | | | | | | | |
| | (Cost: $243,749)(a) | | | | | | | 247,188 | |
| | | | | | | | | | |
| | Other Assets, Less | | | | | | | | |
| | Liabilities (1.3%) | | | | | | | 3,211 | |
| | | | | | | | | | |
| | Net Assets (100.0%) | | | | | | | 250,399 | |
| | | | | | | |
| | 144A after the name of a security represents a security exempt from registration under Rule 144A of the Securities Act of 1933. These securities may be resold as transactions exempt from registration, normally to qualified institutional buyers. At December 31, 2016 the value of these securities (in thousands) was $5,001 representing 2.0% of the net assets. |
| (a) | At December 31, 2016, the aggregate cost of securities for federal tax purposes (in thousands) was $243,789 and the net unrealized appreciation of investments based on that cost was $3,399 which is comprised of $8,369 aggregate gross unrealized appreciation and $4,970 aggregate gross unrealized depreciation. |
| (b) | All or a portion of the securities have been pledged as collateral for open futures positions. Information regarding open futures contracts as of period end is summarized below. |
| | | | | | |
| Issuer (000’s) | | Number of
Contracts | | Expiration
Date | | Unrealized
Appreciation/
(Depreciation)
(000’s) |
S&P 500 Mini Index Futures (Long) (Total Notional Value at December 31, 2016, $562) | | 5 | | 3/17 | | $(3) |
The Accompanying Notes are an Integral Part of the Financial Statements.
| | | | |
| 176 | | Asset Allocation Portfolio | | |
Asset Allocation Portfolio
| (r) | Rates are discount rates at the time of purchase. |
The following is a summary of the inputs used in valuing the Portfolio’s assets and liabilities at December 31, 2016. See Note 3 for additional information on portfolio valuation.
| | | | | | | | | | | | | | |
| | | Valuation Inputs | | | |
| Description | | Level 1 –
Quoted Prices | | | Level 2 –
Other Significant
Observable Inputs | | | Level 3 –
Significant
Unobservable Inputs | | | |
| | | (Amounts in thousands) | | | |
Assets: | | | | | | | | | | | | | | |
Investment Companies | | $ | 240,188 | | | $ | - | | | $ | - | | | |
Short-Term Investments | | | - | | | | 7,000 | | | | - | | | |
Total Assets: | | $ | 240,188 | | | $ | 7,000 | | | $ | - | | | |
Liabilities: | | | | | | | | | | | | | | |
Other Financial Instruments^ | | | | | | | | | | | | | | |
Futures | | $ | (3 | ) | | $ | - | | | $ | - | | | |
Total Liabilities: | | $ | (3 | ) | | $ | - | | | $ | - | | | |
^ Other financial instruments are derivative instruments such as futures, forwards, written options and swaps contracts, which are valued at the unrealized appreciation (depreciation) on the instrument and short sales, which are valued at market value.
The Accompanying Notes are an Integral Part of the Financial Statements.
| | | | | | |
| | Asset Allocation Portfolio | | | 177 | |
Benchmark Definitions (unaudited)
The following indices are used to illustrate investment market, sector or style performance or to serve as Portfolio performance comparisons. Unlike the Portfolios, the indices are not professionally managed and do not incur fees or expenses. It is not possible to invest directly in an index.
1/3 each: Bloomberg Barclays® Global Aggregate — Credit Component ex Emerging Markets , Hedged USD; BofA Merrill Lynch® Global High Yield BB-B Rated Constrained Developed Markets Index, Hedged USD; JPMorgan® EMBI Global — The Bloomberg Barclays Global Aggregate — Credit Component ex Emerging Markets, Hedged USD provides a broad-based measure of the global developed markets investment grade fixed income markets. The BofA Merrill Lynch Global High Yield BB-B Rated Constrained Developed Markets Index, Hedged USD tracks the performance of below investment grade bonds of corporate issuers domiciled in developed market countries rated BB1 through B3, based on an average of Moody’s, S&P and Fitch. Qualifying bonds are capitalization weighted provided the total allocation to an individual issuer (defined by Bloomberg tickers) does not exceed 2%. Issuers that exceed the limit are reduced to 2% and the face value of each of their bonds is adjusted on a pro-rata basis. Similarly, the face value of bonds of all other issuers that fall below the 2% cap are increased on a pro-rata basis. The index is rebalanced on the last calendar day of the month. The JPMorgan EMBI Global tracks total returns for U.S. dollar-denominated debt instruments issued by emerging market sovereign and quasi-sovereign entities, Brady bonds, loans, Eurobonds and local market instruments. It is not possible to invest in an unmanaged index.
Asset Allocation Portfolio Blended Composite — The Asset Allocation Portfolio Blended Composite Benchmark is an unmanaged, hypothetical combination of unmanaged indices that correspond to the Asset Allocation Portfolio’s model allocation and consists of the Russell 3000® Index (50%), the MSCI® All Country World (ex-US) Index (15%), the Bloomberg Barclays® U.S. Aggregate Index (25%), and the Bloomberg Barclays® U.S. Corporate High Yield 2% Issuer Capped Index (10%).
Balanced Portfolio Blended Composite — The Balanced Portfolio Blended Composite Benchmark is an unmanaged, hypothetical combination of unmanaged indices that correspond to the Balanced Portfolio’s model allocation and consists of the Russell 3000® Index (40%), the MSCI® All Country World (ex-US) Index (10%), the Bloomberg Barclays® U.S. Aggregate Index (45%) and the Bloomberg Barclays® U.S. Corporate High Yield 2% Issuer Capped Index (5%).
Bloomberg Barclays® 1-3 Year U.S. Government/Credit Bond Index — The Bloomberg Barclays® 1-3 Year U.S. Government/Credit Bond Index is an unmanaged index of publicly issued medium and larger issues of U.S. Government, investment-grade corporate and investment-grade international dollar denominated bonds that have maturities of between one and three years.
Bloomberg Barclays® U.S. Aggregate Index — The Bloomberg Barclays® U.S. Aggregate Index is an unmanaged index of publicly issued investment-grade fixed-rate debt securities including corporate, U.S. Treasury and government agency securities, mortgage pass-through and asset-backed securities with remaining maturities of at least one year regardless of call features.
Bloomberg Barclays® U.S. Corporate High Yield 2% Issuer Capped Index — The Bloomberg Barclays® U. S. Corporate High Yield 2% Issuer Capped Index is an unmanaged index of U.S. Dollar-denominated, non-convertible, fixed-rate, noninvestment-grade debt. Issuers are capped at 2% of the Index. Index holdings must have at least one year to final maturity, at least $150 million par amount outstanding, and be publicly issued with a rating of Ba1 or lower.
Bloomberg Barclays® Global Credit Hedged USD Index — The Bloomberg Barclays® Global Credit Hedged USD Index is an unmanaged index composed of investment-grade and high yield credit securities from the Multiverse represented in U.S. dollars on a hedged basis (Multiverse is the merger of two groups: the Global Aggregate and the Global High Yield).
Bloomberg Barclays® Long-Term U.S. Treasury Index — The Bloomberg Barclays® Long-Term U.S. Treasury Index is an unmanaged index comprised of fixed-income securities with various maturities greater than 10 years.
Bloomberg Barclays® U.S. Treasury Inflation Protected Securities (TIPS) Index — The Bloomberg Barclays® U.S. Treasury Inflation Protected Securities (TIPS) Index is an unmanaged index of inflation-protected public obligations of the U.S. Treasury. The index is market capitalization weighted and includes all publicly-issued U.S. Treasury Inflation-Protected Securities that have at least one year remaining to maturity and have $250 million or more of outstanding face value.
Lipper® Variable Insurance Products (VIP) Average — Each Lipper® Variable Insurance Products (VIP) Average is calculated by Lipper® Analytical Services, Inc. and reflects the investment return of certain portfolios underlying variable life and annuity products. Source: Lipper®, Inc.
Morningstar® Insurance Fund Category Averages — Each Morningstar® category average is an equal-weighted category return. The calculation is simply the average of the returns at the end of the period for all the underlying variable insurance funds in a given category. Source: Morningstar®, Inc.
| | | | |
| 178 | | Benchmark Definitions | | |
Benchmark Definitions (unaudited)
MSCI® All Country World (ex-US) Index — The MSCI® All Country World (ex-US) Index is an unmanaged, free float-adjusted market capitalization-weighted index that is designed to measure equity performance of companies in the developed and emerging markets, excluding the U.S.
MSCI® All Country World (ex-US) Growth Index — The MSCI® All Country World (ex-US) Growth Index is an unmanaged, free float-adjusted market capitalization-weighted index that is designed to measure equity performance of companies in the developed and emerging markets, excluding the U.S., with higher historical and forecasted growth characteristics.
MSCI EAFE® (Europe-Australasia-Far-East) Index — The MSCI EAFE® (“Europe-Australasia-Far East”) Index is an unmanaged, free float-adjusted, market capitalization-weighted index that is designed to measure equity performance of companies in the developed markets, excluding the U.S. & Canada.
MSCI EAFE® (Europe-Australasia-Far-East) Growth Index — The MSCI EAFE® (“Europe-Australasia-Far East”) Index is an unmanaged, free float-adjusted, market capitalization-weighted index that is designed to measure equity performance of companies in the developed markets, excluding the U.S. & Canada, with higher historical and forecasted growth characteristics.
MSCI® Emerging Markets Index — The MSCI® Emerging Markets Index is an unmanaged, free float-adjusted, market capitalization-weighted index that is designed to measure equity market performance in the global emerging markets.
Russell 1000® Growth Index — The Russell 1000® Growth Index is an unmanaged index that measures the performance of those companies in the Russell 1000® Index with higher price-to-book ratios and higher forecasted growth values. The Russell 1000® Index is an unmanaged, market capitalization-weighted, large cap index that measures the performance of the 1000 largest companies in the Russell 3000® Index.
Russell 1000® Value Index — The Russell 1000® Value Index is an unmanaged index that measures the performance of those companies in the Russell 1000® Index with lower price-to-book ratios and lower forecasted growth values. The Russell 1000® Index is an unmanaged, market capitalization-weighted, large cap index that measures the performance of the 1000 largest companies in the Russell 3000® Index.
Russell 2000® Index — The Russell 2000® Index is an unmanaged, market capitalization-weighted index that measures the performance of the 2000 smallest of the 3000 largest publicly traded U.S. companies, based on total market capitalization.
Russell 2000® Growth Index — The Russell 2000® Growth Index is an unmanaged index that measures the performance of those companies in the Russell 2000® Index with higher price-to-book ratios and higher forecasted growth values. The Russell 2000® Index is an unmanaged, market capitalization-weighted index that measures the performance of the 2000 smallest of the 3000 largest publicly traded U.S. companies, based on total market capitalization.
Russell 2000® Value Index — The Russell 2000® Value Index is an unmanaged index measures the performance of those companies in the Russell 2000® Index with lower price-to-book ratios and lower forecasted growth values. The Russell 2000® Index is an unmanaged, market-capitalization weighted index that measures the performance of the 2000 smallest of the 3000 largest publicly traded U.S. companies, based on total market capitalization.
Russell 3000® Index — The Russell 3000® Index measures the performance of the largest 3000 U.S. companies representing approximately 98% of the investable U.S. equity market.
Russell MidCap® Growth Index — The Russell MidCap® Growth Index is an unmanaged index that measures the performance of the Russell MidCap® companies with higher price-to-book ratios and higher forecasted growth values. The Russell MidCap® Index is an unmanaged index that measures the performance of the 800 smallest companies in the Russell 1000® Index, which represents approximately 25% of the total market capitalization of the Russell 1000® Index.
Russell MidCap® Value Index — The Russell MidCap® Value Index is an unmanaged index that measures the performance of the Russell MidCap® companies with lower price-to-book and lower forecasted growth values. The Russell MidCap® Index is an unmanaged index that measures the performance of the 800 smallest companies in the Russell 1000® Index, which represents approximately 25% of the total market capitalization of the Russell 1000® Index.
S&P 500® Index — The S&P 500® Composite Stock Price Index is an unmanaged, capitalization-weighted index of 500 selected common stocks designed to measure the performance of the broad domestic economy.
S&P MidCap 400® Index — The S&P MidCap 400® Index is an unmanaged, capitalization-weighted index that measures the performance of the mid-range sector of the U.S. stock market.
S&P SmallCap 600® Index — The S&P SmallCap 600® Index is an unmanaged index of 600 selected common stocks of U.S.-based companies with small market capitalizations.
| | | | | | |
| | Benchmark Definitions | | | 179 | |
| | | | |
| 180 | | Benchmark Definitions | | |
Statements of Assets and Liabilities
Northwestern Mutual Series Fund, Inc.
December 31, 2016 (in thousands)
| | | | | | | | | | | | | | | | | | | | |
| | | Growth
Stock
Portfolio | | | Focused
Appreciation
Portfolio | | | Large Cap
Core Stock
Portfolio | | | Large Cap
Blend
Portfolio | | | Index 500
Stock
Portfolio | |
Assets | | | | | | | | | | | | | | | | | | | | |
Unaffiliated Investments, at Value (1) | | $ | 830,175 | | | $ | 758,620 | | | $ | 513,184 | | | $ | 150,315 | | | $ | 2,665,754 | |
Cash | | | 8,025 | | | | 9,069 | | | | 740 | | | | 14,358 | | | | 6,712 | |
Receivable for Portfolio Shares Sold | | | 49 | | | | 4,208 | | | | 27 | | | | 29 | | | | 4,352 | |
Receivable for Investment Securities Sold | | | - | | | | - | | | | - | | | | - | | | | 29 | |
Receivable for Foreign Currency | | | - | | | | - | | | | - | | | | - | | | | - | |
Prepaid Expenses and Other Assets | | | 7 | | | | 6 | | | | 4 | | | | 1 | | | | 29 | |
Dividends and Interest Receivable | | | 888 | | | | 496 | | | | 998 | | | | 179 | | | | 3,365 | |
| | | | | | | | | | | | | | | | | | | | |
Total Assets | | | 839,144 | | | | 772,399 | | | | 514,953 | | | | 164,882 | | | | 2,680,241 | |
| | | | | | | | | | | | | | | | | | | | |
Liabilities | | | | | | | | | | | | | | | | | | | | |
Payable for Portfolio Shares Redeemed | | | 844 | | | | 163 | | | | 249 | | | | 10 | | | | 675 | |
Payable for Investment Securities Purchased | | | - | | | | - | | | | - | | | | - | | | | - | |
Futures Variation Margin | | | - | | | | - | | | | - | | | | - | | | | 146 | |
Outstanding Swap Contracts, at Value | | | - | | | | - | | | | - | | | | - | | | | - | |
Payable for Foreign Currency | | | - | | | | - | | | | - | | | | - | | | | - | |
Collateral from Counterparty | | | - | | | | - | | | | - | | | | - | | | | - | |
Investment Advisory Fees | | | 293 | | | | 403 | | | | 186 | | | | 107 | | | | 442 | |
Accrued Expenses | | | 27 | | | | 33 | | | | 23 | | | | 13 | | | | 64 | |
| | | | | | | | | | | | | | | | | | | | |
Total Liabilities | | | 1,164 | | | | 599 | | | | 458 | | | | 130 | | | | 1,327 | |
| | | | | | | | | | | | | | | | | | | | |
Net Assets | | $ | 837,980 | | | $ | 771,800 | | | $ | 514,495 | | | $ | 164,752 | | | $ | 2,678,914 | |
| | | | | | | | | | | | | | | | | | | | |
Represented By: | | | | | | | | | | | | | | | | | | | | |
Aggregate Paid in Capital (10) (11) | | $ | 657,980 | | | $ | 714,019 | | | $ | 402,421 | | | $ | 132,946 | | | $ | 1,375,081 | |
Undistributed Net Investment Income (Loss) | | | 8,019 | | | | 6,369 | | | | 9,903 | | | | 1,520 | | | | 52,559 | |
Undistributed Accumulated Net Realized Gain (Loss) | | | 40,931 | | | | 15,302 | | | | (854 | ) | | | 7,595 | | | | 18,143 | |
Net Unrealized Appreciation (Depreciation) | | | 131,050 | | | | 36,110 | | | | 103,025 | | | | 22,691 | | | | 1,233,131 | |
| | | | | | | | | | | | | | | | | | | | |
Net Assets for Shares Outstanding (10) (11) | | $ | 837,980 | | | $ | 771,800 | | | $ | 514,495 | | | $ | 164,752 | | | $ | 2,678,914 | |
| | | | | | | | | | | | | | | | | | | | |
Net Asset Value, Offering and Redemption Price per Share | | $ | 2.58 | | | $ | 2.08 | | | $ | 1.60 | | | $ | 1.07 | | | $ | 4.17 | |
| | | | | | | | | | | | | | | | | | | | |
(1) Unaffiliated Investments, at Cost | | $ | 699,125 | | | $ | 722,510 | | | $ | 410,160 | | | $ | 127,625 | | | $ | 1,432,479 | |
(10) Shares Outstanding | | | 324,680 | | | | 370,881 | | | | 322,488 | | | | 153,340 | | | | 642,278 | |
(11) Shares Authorized, $.01 Par Value | | | 2,000,000 | | | | 2,000,000 | | | | 2,000,000 | | | | 2,000,000 | | | | 2,000,000 | |
The Accompanying Notes are an Integral Part of the Financial Statements.
| | | | |
| | Statements of Assets and Liabilities | | 181 |
| | | | | | | | | | | | | | | | | | | | | | | | | | | | | | | | | | |
Large
Company
Value
Portfolio | | | Domestic
Equity
Portfolio | | | Equity
Income
Portfolio | | | Mid Cap
Growth
Stock Portfolio | | | Index 400
Stock
Portfolio | | | Mid Cap
Value
Portfolio | | | Small Cap
Growth
Stock
Portfolio | | | Index 600
Stock Portfolio | | | Small Cap Value
Portfolio | |
| | | | | | | | | | | | | | | | | | | | | | | | | | | | | | | | | | |
| $ | 195,549 | | | $ | 694,086 | | | $ | 781,401 | | | $ | 975,582 | | | $ | 768,220 | | | $ | 519,490 | | | $ | 533,638 | | | $ | 169,676 | | | $ | 636,087 | |
| | 1 | | | | 26,432 | | | | 15,619 | | | | 11,101 | | | | 4,341 | | | | 1 | | | | 10,428 | | | | 4,314 | | | | 11,238 | |
| | 40 | | | | 241 | | | | 105 | | | | 58 | | | | 102 | | | | 125 | | | | 75 | | | | 184 | | | | 49 | |
| | 364 | | | | - | | | | 133 | | | | 3,375 | | | | - | | | | 922 | | | | 2,312 | | | | 162 | | | | - | |
| | 17 | | | | - | | | | - | | | | - | | | | - | | | | 26 | | | | - | | | | - | | | | - | |
| | 2 | | | | 6 | | | | 6 | | | | 8 | | | | 8 | | | | 4 | | | | 4 | | | | 404 | | | | 5 | |
| | 454 | | | | 1,183 | | | | 1,491 | | | | 375 | | | | 896 | | | | 1,145 | | | | 373 | | | | 200 | | | | 1,305 | |
| | | | | | | | | | | | | | | | | | | | | | | | | | | | | | | | | | |
| | 196,427 | | | | 721,948 | | | | 798,755 | | | | 990,499 | | | | 773,567 | | | | 521,713 | | | | 546,830 | | | | 174,940 | | | | 648,684 | |
| | | | | | | | | | | | | | | | | | | | | | | | | | | | | | | | | | |
| | | | | | | | | | | | | | | | | | | | | | | | | | | | | | | | | | |
| | 1 | | | | 253 | | | | 138 | | | | 508 | | | | 153 | | | | 109 | | | | 261 | | | | 7 | | | | 219 | |
| | 304 | | | | 409 | | | | - | | | | 6,123 | | | | - | | | | 2,249 | | | | 1,235 | | | | 588 | | | | 135 | |
| | - | | | | - | | | | - | | | | - | | | | 63 | | | | - | | | | - | | | | - | | | | - | |
| | - | | | | - | | | | - | | | | - | | | | - | | | | - | | | | - | | | | 50 | | | | - | |
| | 61 | | | | - | | | | - | | | | - | | | | - | | | | 102 | | | | - | | | | - | | | | - | |
| | 160 | | | | - | | | | - | | | | - | | | | - | | | | 680 | | | | - | | | | 360 | | | | - | |
| | 110 | | | | 320 | | | | 417 | | | | 441 | | | | 152 | | | | 320 | | | | 252 | | | | 31 | | | | 460 | |
| | 18 | | | | 26 | | | | 33 | | | | 32 | | | | 42 | | | | 36 | | | | 30 | | | | 21 | | | | 40 | |
| | | | | | | | | | | | | | | | | | | | | | | | | | | | | | | | | | |
| | 654 | | | | 1,008 | | | | 588 | | | | 7,104 | | | | 410 | | | | 3,496 | | | | 1,778 | | | | 1,057 | | | | 854 | |
| | | | | | | | | | | | | | | | | | | | | | | | | | | | | | | | | | |
| $ | 195,773 | | | $ | 720,940 | | | $ | 798,167 | | | $ | 983,395 | | | $ | 773,157 | | | $ | 518,217 | | | $ | 545,052 | | | $ | 173,883 | | | $ | 647,830 | |
| | | | | | | | | | | | | | | | | | | | | | | | | | | | | | | | | | |
| | | | | | | | | | | | | | | | | | | | | | | | | | | | | | | | | | |
| $ | 168,376 $ | | | $ | 513,229 | | | $ | 623,958 | | | $ | 941,001 | | | $ | 510,882 | | | $ | 424,641 | | | $ | 443,757 | | | $ | 129,736 | | | $ | 400,344 | |
| | 3,987 | | | | 12,655 | | | | 18,215 | | | | 2,582 | | | | 8,968 | | | | 8,105 | | | | 625 | | | | 3,844 | | | | 5,105 | |
| | 5,465 | | | | 17,288 | | | | 35,766 | | | | (18,273 | ) | | | 47,317 | | | | 14,934 | | | | 5,728 | | | | 6,637 | | | | 32,236 | |
| | 17,945 | | | | 177,768 | | | | 120,228 | | | | 58,085 | | | | 205,990 | | | | 70,537 | | | | 94,942 | | | | 33,666 | | | | 210,145 | |
| | | | | | | | | | | | | | | | | | | | | | | | | | | | | | | | | | |
| $ | 195,773 | | | $ | 720,940 | | | $ | 798,167 | | | $ | 983,395 | | | $ | 773,157 | | | $ | 518,217 | | | $ | 545,052 | | | $ | 173,883 | | | $ | 647,830 | |
| | | | | | | | | | | | | | | | | | | | | | | | | | | | | | | | | | |
| $ | 1.02 | | | $ | 1.54 $ | | | | 1.72 | | | $ | 2.88 | | | $ | 1.96 | | | $ | 1.73 | | | $ | 2.39 | | | $ | 1.36 | | | $ | 2.42 | |
| | | | | | | | | | | | | | | | | | | | | | | | | | | | | | | | | | |
| $ | 177,558 | | | $ | 516,319 | | | $ | 661,171 | | | $ | 917,498 | | | $ | 561,928 | | | $ | 448,877 | | | $ | 438,696 | | | $ | 135,960 | | | $ | 425,941 | |
| | 192,319 | | | | 469,041 | | | | 462,988 | | | | 341,316 | | | | 395,396 | | | | 300,098 | | | | 227,672 | | | | 127,811 | | | | 267,642 | |
| | 2,000,000 | | | | 2,000,000 | | | | 2,000,000 | | | | 2,000,000 | | | | 2,000,000 | | | | 2,000,000 | | | | 2,000,000 | | | | 2,000,000 | | | | 2,000,000 | |
The Accompanying Notes are an Integral Part of the Financial Statements.
| | | | | | |
| 182 | | Statements of Assets and Liabilities | | | | |
Statements of Assets and Liabilities
Northwestern Mutual Series Fund, Inc.
December 31, 2016 (in thousands)
| | | | | | | | | | | | | | | | | | | | |
| | | International
Growth
Portfolio | | | Research
International
Core Portfolio | | | International
Equity Portfolio | | | Emerging
Markets Equity
Portfolio | | | Government
Money Market
Portfolio | |
Assets | | | | | | | | | | | | | | | | | | | | |
Unaffiliated Investments, at Value (1) | | $ | 501,403 | | | $ | 495,653 | | | $ | 1,626,147 | | | $ | 518,730 | | | $ | 348,828 | |
Affiliated Investments, at Value (2) | | | - | | | | - | | | | - | | | | - | | | | - | |
Investments in Repurchase Agreements, at Value (3) | | | - | | | | - | | | | - | | | | - | | | | 160,500 | |
Cash | | | 20,833 | | | | - | | | | 211 | | | | 3,212 | | | | 551 | |
Foreign Currency, at Value (4) | | | 18 | | | | 769 | | | | 281 | | | | 27 | | | | - | |
Cash Collateral for Derivative Positions | | | - | | | | - | | | | - | | | | - | | | | - | |
Receivable for Portfolio Shares Sold | | | 195 | | | | 5,193 | | | | 250 | | | | 209 | | | | 245 | |
Receivable for Investment Securities Sold | | | - | | | | 6,855 | | | | 417 | | | | 52 | | | | - | |
Receivable for Financing Transactions | | | - | | | | - | | | | - | | | | - | | | | - | |
Futures Variation Margin | | | - | | | | - | | | | - | | | | - | | | | - | |
Outstanding Swap Contracts, at Value (8) | | | - | | | | - | | | | - | | | | - | | | | - | |
Receivable for Foreign Currency | | | - | | | | 1 | | | | - | | | | - | | | | - | |
Prepaid Expenses and Other Assets | | | 4 | | | | 4 | | | | 12 | | | | 4 | | | | 3 | |
Dividends and Interest Receivable | | | 1,452 | | | | 1,560 | | | | 3,282 | | | | 502 | | | | 170 | |
| | | | | | | | | | | | | | | | | | | | |
Total Assets | | | 523,905 | | | | 510,035 | | | | 1,630,600 | | | | 522,736 | | | | 510,297 | |
| | | | | | | | | | | | | | | | | | | | |
Liabilities | | | | | | | | | | | | | | | | | | | | |
Payable for Portfolio Shares Redeemed | | | 119 | | | | 107 | | | | 330 | | | | 108 | | | | 8,514 | |
Payable for Investment Securities Purchased | | | - | | | | 1,919 | | | | 741 | | | | 342 | | | | - | |
Payable for Repurchase Agreements | | | - | | | | - | | | | - | | | | - | | | | - | |
Payable for Financing Transactions | | | - | | | | - | | | | - | | | | - | | | | - | |
Payable to Custodian | | | - | | | | 7,710 | | | | - | | | | - | | | | - | |
Futures Variation Margin | | | - | | | | - | | | | - | | | | - | | | | - | |
Outstanding Options Written, at Value (6) | | | - | | | | - | | | | - | | | | - | | | | - | |
Outstanding Swap Contracts, at Value (9) | | | - | | | | - | | | | - | | | | - | | | | - | |
Payable for Foreign Currency | | | - | | | | - | | | | 2 | | | | - | | | | - | |
Collateral from Counterparty | | | - | | | | - | | | | - | | | | - | | | | - | |
Investment Advisory Fees | | | 270 | | | | 321 | | | | 765 | | | | 423 | | | | 128 | |
Deferred Income for Financing Transactions | | | - | | | | - | | | | - | | | | - | | | | - | |
Accrued Expenses | | | 394 | | | | 329 | | | | 495 | | | | 63 | | | | 20 | |
| | | | | | | | | | | | | | | | | | | | |
Total Liabilities | | | 783 | | | | 10,386 | | | | 2,333 | | | | 936 | | | | 8,662 | |
| | | | | | | | | | | | | | | | | | | | |
Net Assets | | $ | 523,122 | | | $ | 499,649 | | | $ | 1,628,267 | | | $ | 521,800 | | | $ | 501,635 | |
| | | | | | | | | | | | | | | | | | | | |
Represented By: | | | | | | | | | | | | | | | | | | | | |
Aggregate Paid in Capital (10) (11) | | $ | 554,940 | | | $ | 515,916 | | | $ | 1,591,823 | | | $ | 565,772 | | | $ | 501,632 | |
Undistributed Net Investment Income (Loss) | | | 8,041 | | | | 9,557 | | | | 42,171 | | | | 5,746 | | | | 3 | |
Undistributed Accumulated Net Realized Gain (Loss) | | | (26,948 | ) | | | (21,351 | ) | | | (68,252 | ) | | | (49,486 | ) | | | - | |
Net Unrealized Appreciation (Depreciation) | | | (12,911 | ) | | | (4,473 | ) | | | 62,525 | | | | (232 | ) | | | - | |
| | | | | | | | | | | | | | | | | | | | |
Net Assets for Shares Outstanding (10) (11) | | $ | 523,122 | | | $ | 499,649 | | | $ | 1,628,267 | | | $ | 521,800 | | | $ | 501,635 | |
| | | | | | | | | | | | | | | | | | | | |
Net Asset Value, Offering and Redemption Price per Share | | $ | 1.24 | | | $ | 0.82 | | | $ | 1.60 | | | $ | 0.87 | | | $ | 1.00 | |
| | | | | | | | | | | | | | | | | | | | |
(1) Unaffiliated Investments, at Cost | | $ | 514,030 | | | $ | 499,996 | | | $ | 1,563,440 | | | $ | 518,994 | | | $ | 348,828 | |
(2) Affiliated Investments, at Cost | | | - | | | | - | | | | - | | | | - | | | | - | |
(3) Investments in Repurchase Agreements, at Cost | | | - | | | | - | | | | - | | | | - | | | | 160,500 | |
(4) Foreign Currency, at Cost | | | 19 | | | | 769 | | | | 282 | | | | 27 | | | | - | |
(6) Premiums Received on Options Written | | | - | | | | - | | | | - | | | | - | | | | - | |
(8) Premiums Paid on Swap Contracts | | | - | | | | - | | | | - | | | | - | | | | - | |
(9) Premiums Received on Swap Contracts | | | - | | | | - | | | | - | | | | - | | | | - | |
(10) Shares Outstanding | | | 421,476 | | | | 606,772 | | | | 1,016,078 | | | | 598,580 | | | | 501,633 | |
(11) Shares Authorized, $.01 Par Value | | | 2,000,000 | | | | 2,000,000 | | | | 3,000,000 | | | | 2,000,000 | | | | 2,000,000 | |
The Accompanying Notes are an Integral Part of the Financial Statements.
| | | | |
| | Statements of Assets and Liabilities | | 183 |
| | | | | | | | | | | | | | | | | | | | | | | | | | | | | | |
Short-Term
Bond
Portfolio | | | Select Bond
Portfolio | | | Long-Term U.S.
Government
Bond Portfolio | | | Inflation
Protection
Portfolio | | | High Yield
Bond
Portfolio | | | Multi-Sector
Bond
Portfolio | | | Balanced
Portfolio | | | Asset
Allocation
Portfolio | |
| | | | | | | | | | | | | | | | | | | | | | | | | | | | | | |
| $ | 266,732 | | | $ | 3,100,914 | | | $ | 138,598 | | | $ | 329,541 | | | $ | 731,847 | | | $ | 601,527 | | | $ | 90,343 | | | $ | 14,057 | |
| | - | | | | - | | | | - | | | | - | | | | - | | | | - | | | | 2,065,761 | | | | 233,131 | |
| | - | | | | - | | | | - | | | | - | | | | - | | | | - | | | | - | | | | - | |
| | 4,883 | | | | 72,030 | | | | 6,228 | | | | 4 | | | | 13,714 | | | | 79,410 | | | | 48,995 | | | | 3,306 | |
| | - | | | | - | | | | - | | | | - | | | | - | | | | 1,155 | | | | - | | | | - | |
| | - | | | | - | | | | 1,080 | | | | - | | | | - | | | | 5,611 | | | | - | | | | - | |
| | 56 | | | | 7,028 | | | | 85 | | | | 106 | | | | 101 | | | | 227 | | | | 472 | | | | 113 | |
| | - | | | | 174,311 | | | | 14,342 | | | | - | | | | - | | | | 63 | | | | 7,786 | | | | 1,001 | |
| | - | | | | - | | | | 77,375 | | | | - | | | | - | | | | - | | | | - | | | | - | |
| | 8 | | | | - | | | | - | | | | 39 | | | | - | | | | 373 | | | | - | | | | - | |
| | - | | | | - | | | | 77 | | | | 1,395 | | | | - | | | | 43 | | | | - | | | | - | |
| | - | | | | - | | | | - | | | | 178 | | | | - | | | | 2,967 | | | | - | | | | - | |
| | 2 | | | | 23 | | | | 1 | | | | 4 | | | | 6 | | | | 230 | | | | 18 | | | | 2 | |
| | 1,095 | | | | 12,585 | | | | 838 | | | | 1,702 | | | | 12,123 | | | | 7,899 | | | | 18 | | | | 4 | |
| | | | | | | | | | | | | | | | | | | | | | | | | | | | | | |
| | 272,776 | | | | 3,366,891 | | | | 238,624 | | | | 332,969 | | | | 757,791 | | | | 699,505 | | | | 2,213,393 | | | | 251,614 | |
| | | | | | | | | | | | | | | | | | | | | | | | | | | | | | |
| | | | | | | | | | | | | | | | | | | | | | | | | | | | | | |
| | 62 | | | | 646 | | | | 20 | | | | 93 | | | | 115 | | | | 271 | | | | 560 | | | | 5 | |
| | 2,745 | | | | 526,420 | | | | 12,239 | | | | - | | | | 402 | | | | - | | | | 9,801 | | | | 1,178 | |
| | - | | | | - | | | | 1,568 | | | | - | | | | - | | | | - | | | | - | | | | - | |
| | - | | | | - | | | | 114,158 | | | | - | | | | - | | | | - | | | | - | | | | - | |
| | - | | | | - | | | | - | | | | - | | | | - | | | | - | | | | - | | | | - | |
| | 25 | | | | - | | | | - | | | | 177 | | | | - | | | | 15 | | | | 67 | | | | 2 | |
| | - | | | | - | | | | - | | | | - | | | | - | | | | 167 | | | | - | | | | - | |
| | - | | | | - | | | | 155 | | | | 4,464 | | | | - | | | | 4,750 | | | | - | | | | - | |
| | - | | | | - | | | | - | | | | 8 | | | | - | | | | 2,496 | | | | - | | | | - | |
| | - | | | | - | | | | - | | | | 1,120 | | | | - | | | | 1,480 | | | | - | | | | - | |
| | 76 | | | | 705 | | | | 52 | | | | 136 | | | | 267 | | | | 407 | | | | 93 | | | | 11 | |
| | - | | | | - | | | | 18 | | | | - | | | | - | | | | - | | | | - | | | | - | |
| | 35 | | | | 75 | | | | 23 | | | | 44 | | | | 60 | | | | 70 | | | | 38 | | | | 19 | |
| | | | | | | | | | | | | | | | | | | | | | | | | | | | | | |
| | 2,943 | | | | 527,846 | | | | 128,233 | | | | 6,042 | | | | 844 | | | | 9,656 | | | | 10,559 | | | | 1,215 | |
| | | | | | | | | | | | | | | | | | | | | | | | | | | | | | |
| $ | 269,833 | | | $ | 2,839,045 | | | $ | 110,391 | | | $ | 326,927 | | | $ | 756,947 | | | $ | 689,849 | | | $ | 2,202,834 | | | $ | 250,399 | |
| | | | | | | | | | | | | | | | | | | | | | | | | | | | | | |
| | | | | | | | | | | | | | | | | | | | | | | | | | | | | | |
| $ | 268,280 | | | $ | 2,792,227 | | | $ | 113,595 | | | $ | 332,979 | | | $ | 735,338 | | | $ | 692,078 | | | $ | 2,052,496 | | | $ | 230,164 | |
| | 3,730 | | | | 59,282 | | | | 2,138 | | | | 2,241 | | | | 43,156 | | | | 29,247 | | | | 49,621 | | | | 5,486 | |
| | (2,220 | ) | | | 22,475 | | | | 527 | | | | (1,276 | ) | | | (30,231 | ) | | | (20,528 | ) | | | 81,403 | | | | 11,313 | |
| | 43 | | | | (34,939 | ) | | | (5,869 | ) | | | (7,017 | ) | | | 8,684 | | | | (10,948 | ) | | | 19,314 | | | | 3,436 | |
| | | | | | | | | | | | | | | | | | | | | | | | | | | | | | |
| $ | 269,833 | | | $ | 2,839,045 | | | $ | 110,391 | | | $ | 326,927 | | | $ | 756,947 | | | $ | 689,849 | | | $ | 2,202,834 | | | $ | 250,399 | |
| | | | | | | | | | | | | | | | | | | | | | | | | | | | | | |
$ |
1.03 |
| | $ | 1.26 | | | $ | 1.06 | | | $ | 1.09 | | | $ | 0.74 | | | $ | 1.05 | | | $ | 1.40 | | | $ | 1.12 | |
| | | | | | | | | | | | | | | | | | | | | | | | | | | | | | |
| $ | 266,692 | | | $ | 3,135,854 | | | $ | 145,491 | | | $ | 333,647 | | | $ | 723,163 | | | $ | 613,121 | | | $ | 90,976 | | | $ | 14,088 | |
| | - | | | | - | | | | - | | | | - | | | | - | | | | - | | | | 2,045,814 | | | | 229,661 | |
| | - | | | | - | | | | - | | | | - | | | | - | | | | - | | | | - | | | | - | |
| | - | | | | - | | | | - | | | | - | | | | - | | | | 1,155 | | | | - | | | | - | |
| | - | | | | - | | | | - | | | | - | | | | - | | | | 319 | | | | - | | | | - | |
| | - | | | | - | | | | - | | | | - | | | | - | | | | 2,074 | | | | - | | | | - | |
| | - | | | | - | | | | - | | | | - | | | | - | | | | 5,072 | | | | - | | | | - | |
| | 261,254 | | | | 2,260,842 | | | | 104,566 | | | | 300,950 | | | | 1,025,435 | | | | 657,813 | | | | 1,574,683 | | | | 223,170 | |
| | 2,000,000 | | | | 6,000,000 | | | | 2,000,000 | | | | 2,000,000 | | | | 3,000,000 | | | | 2,000,000 | | | | 4,000,000 | | | | 2,000,000 | |
The Accompanying Notes are an Integral Part of the Financial Statements.
| | | | | | |
| 184 | | Statements of Assets and Liabilities | | | | |
Statements of Operations
Northwestern Mutual Series Fund, Inc.
For the Year Ended December 31, 2016 (in thousands)
| | | | | | | | | | | | | | | | | | | | | | | | |
| | | Growth Stock
Portfolio | | | Focused
Appreciation
Portfolio | | | Large Cap
Core Stock
Portfolio | | | Large Cap
Blend
Portfolio | | | Index 500
Stock Portfolio | | | Large
Company
Value
Portfolio | |
Investment Income | | | | | | | | | | | | | | | | | | | | | | | | |
Income | | | | | | | | | | | | | | | | | | | | | | | | |
Interest (1) | | $ | 22 | | | $ | 15 | | | $ | - | | | $ | 32 | | | $ | 145 | | | $ | 5 | |
Unaffiliated Dividends (1) | | | 11,583 | | | | 11,233 | | | | 12,186 | | | | 2,759 | | | | 53,817 | | | | 5,033 | |
| | | | | | | | | | | | | | | | | | | | | | | | |
Total Income | | | 11,605 | | | | 11,248 | | | | 12,186 | | | | 2,791 | | | | 53,962 | | | | 5,038 | |
| | | | | | | | | | | | | | | | | | | | | | | | |
Expenses | | | | | | | | | | | | | | | | | | | | | | | | |
Investment Advisory Fees | | | 3,481 | | | | 5,684 | | | | 2,173 | | | | 1,197 | | | | 4,944 | | | | 1,258 | |
Custodian Fees | | | 4 | | | | 3 | | | | 3 | | | | 2 | | | | 18 | | | | 22 | |
Shareholder Reporting Fees | | | 31 | | | | 48 | | | | 24 | | | | 7 | | | | 71 | | | | 8 | |
Audit Fees | | | 25 | | | | 25 | | | | 24 | | | | 23 | | | | 28 | | | | 23 | |
Valuation Services | | | 1 | | | | 1 | | | | 1 | | | | 1 | | | | 5 | | | | 2 | |
Compliance Fees | | | 10 | | | | 10 | | | | 9 | | | | 8 | | | | 15 | | | | 8 | |
Directors Fees | | | 31 | | | | 29 | | | | 28 | | | | 24 | | | | 48 | | | | 25 | |
Professional Fees | | | 25 | | | | 41 | | | | 20 | | | | 9 | | | | 55 | | | | 10 | |
Trade Name Fees | | | - | | | | - | | | | - | | | | - | | | | 44 | | | | - | |
Other Expenses | | | 12 | | | | 11 | | | | 7 | | | | 2 | | | | 33 | | | | 2 | |
| | | | | | | | | | | | | | | | | | | | | | | | |
Total Expenses | | | 3,620 | | | | 5,852 | | | | 2,289 | | | | 1,273 | | | | 5,261 | | | | 1,358 | |
| | | | | | | | | | | | | | | | | | | | | | | | |
Less Waived Fees: | | | | | | | | | | | | | | | | | | | | | | | | |
Paid by Affiliate | | | (66 | ) | | | (969 | ) | | | (5 | ) | | | - | | | | (73 | ) | | | (56 | ) |
Paid Indirectly | | | (3 | ) | | | (3 | ) | | | (1 | ) | | | (2 | ) | | | (14 | ) | | | (2 | ) |
| | | | | | | | | | | | | | | | | | | | | | | | |
Net Expenses | | | 3,551 | | | | 4,880 | | | | 2,283 | | | | 1,271 | | | | 5,174 | | | | 1,300 | |
| | | | | | | | | | | | | | | | | | | | | | | | |
Net Investment Income (Loss) | | | 8,054 | | | | 6,368 | | | | 9,903 | | | | 1,520 | | | | 48,788 | | | | 3,738 | |
Realized and Unrealized Gain (Loss) on Investments | | | | | | | | | | | | | | | | | | | | | | | | |
Net Realized Gain (Loss) on: | | | | | | | | | | | | | | | | | | | | | | | | |
Unaffiliated Investment Securities | | | 41,844 | | | | 16,541 | | | | (830 | ) | | | 8,220 | | | | 28,827 | | | | 7,109 | |
Futures Contracts | | | - | | | | - | | | | - | | | | - | | | | 2,676 | | | | - | |
Swap Contracts | | | - | | | | - | | | | - | | | | - | | | | - | | | | - | |
Foreign Currency Transactions | | | - | | | | - | | | | - | | | | - | | | | - | | | | 292 | |
| | | | | | | | | | | | | | | | | | | | | | | | |
Net Realized Gain (Loss) on Investments | | | 41,844 | | | | 16,541 | | | | (830 | ) | | | 8,220 | | | | 31,503 | | | | 7,401 | |
| | | | | | | | | | | | | | | | | | | | | | | | |
Net Unrealized Appreciation (Depreciation) of: | | | | | | | | | | | | | | | | | | | | | | | | |
Investment Securities | | | (29,832 | ) | | | 21,209 | | | | 28,134 | | | | 10,948 | | | | 200,216 | | | | 15,268 | |
Futures Contracts | | | - | | | | - | | | | - | | | | - | | | | 451 | | | | - | |
Swap Contracts | | | - | | | | - | | | | - | | | | - | | | | - | | | | - | |
Foreign Currency Transactions | | | - | | | | - | | | | - | | | | - | | | | - | | | | (57 | ) |
| | | | | | | | | | | | | | | | | | | | | | | | |
Net Change in Unrealized Appreciation (Depreciation) of Investments | | | (29,832 | ) | | | 21,209 | | | | 28,134 | | | | 10,948 | | | | 200,667 | | | | 15,211 | |
| | | | | | | | | | | | | | | | | | | | | | | | |
Net Gain (Loss) on Investments | | | 12,012 | | | | 37,750 | | | | 27,304 | | | | 19,168 | | | | 232,170 | | | | 22,612 | |
| | | | | | | | | | | | | | | | | | | | | | | | |
Net Increase (Decrease) in Net Assets Resulting from Operations | | $ | 20,066 | | | $ | 44,118 | | | $ | 37,207 | | | $ | 20,688 | | | $ | 280,958 | | | $ | 26,350 | |
| | | | | | | | | | | | | | | | | | | | | | | | |
(1) Net of Foreign Tax | | $ | - | | | $ | 585 | | | $ | 621 | | | $ | 180 | | | $ | - | | | $ | 53 | |
The Accompanying Notes are an Integral Part of the Financial Statements.
| | | | |
| | Statements of Operations | | 185 |
| | | | | | | | | | | | | | | | | | | | | | | | | | | | | | | | | | | | | | |
Domestic
Equity
Portfolio | | | Equity Income
Portfolio | | | Mid Cap
Growth Stock
Portfolio | | | Index 400
Stock Portfolio | | | Mid Cap
Value
Portfolio | | | Small Cap
Growth Stock
Portfolio | | | Index 600
Stock Portfolio | | | Small Cap
Value Portfolio | | | International
Growth
Portfolio | | | Research
International
Core
Portfolio | |
| | | | | | | | | | | | | | | | | | | | | | | | | | | | | | | | | | | | | | |
| | | | | | | | | | | | | | | | | | | | | | | | | | | | | | | | | | | | | | |
| $ | 45 | | | $ | 107 | | | $ | 55 | | | $ | 58 | | | $ | 36 | | | $ | 6 | | | $ | 40 | | | $ | - | | | $ | 21 | | | $ | 14 | |
| | 16,839 | | | | 22,749 | | | | 8,097 | | | | 10,787 | | | | 11, 248 | | | | 3,758 | | | | 1,798 | | | | 10,016 | | | | 11,897 | | | | 14,144 | |
| | | | | | | | | | | | | | | | | | | | | | | | | | | | | | | | | | | | | | |
| | 16,884 | | | | 23,856 | | | | 8,152 | | | | 10,845 | | | | 11,284 | | | | 3,764 | | | | 1,838 | | | | 10,016 | | | | 11,918 | | | | 14,158 | |
| | | | | | | | | | | | | | | | | | | | | | | | | | | | | | | | | | | | | | |
| | | | | | | | | | | | | | | | | | | | | | | | | | | | | | | | | | | | | | |
| | 3,532 | | | | 4,728 | | | | 5,148 | | | | 1,710 | | | | 3,857 | | | | 2,686 | | | | 340 | | | | 4,691 | | | | 3,098 | | | | 3,995 | |
| | 2 | | | | 35 | | | | 5 | | | | 17 | | | | 28 | | | | 7 | | | | 35 | | | | 22 | | | | 268 | | | | 317 | |
| | 32 | | | | 46 | | | | 41 | | | | 42 | | | | 49 | | | | 43 | | | | 20 | | | | 64 | | | | 59 | | | | 44 | |
| | 24 | | | | 25 | | | | 26 | | | | 23 | | | | 23 | | | | 24 | | | | 21 | | | | 24 | | | | 26 | | | | 26 | |
| | 1 | | | | 5 | | | | 1 | | | | 5 | | | | 3 | | | | 1 | | | | 6 | | | | 2 | | | | - | | | | - | |
| | 9 | | | | 10 | | | | 10 | | | | 9 | | | | 8 | | | | 9 | | | | 8 | | | | 9 | | | | 9 | | | | 9 | |
| | 29 | | | | 30 | | | | 34 | | | | 29 | | | | 27 | | | | 28 | | | | 24 | | | | 28 | | | | 24 | | | | 24 | |
| | 28 | | | | 40 | | | | 32 | | | | 34 | | | | 42 | | | | 33 | | | | 17 | | | | 51 | | | | 76 | | | | 92 | |
| | - | | | | - | | | | - | | | | 66 | | | | - | | | | - | | | | 15 | | | | - | | | | - | | | | - | |
| | 9 | | | | 10 | | | | 14 | | | | 9 | | | | 6 | | | | 7 | | | | 1 | | | | 8 | | | | 9 | | | | 9 | |
| | | | | | | | | | | | | | | | | | | | | | | | | | | | | | | | | | | | | | |
| | 3,666 | | | | 4,929 | | | | 5,311 | | | | 1,944 | | | | 4,043 | | | | 2,838 | | | | 487 | | | | 4,899 | | | | 3,569 | | | | 4,516 | |
| | | | | | | | | | | | | | | | | | | | | | | | | | | | | | | | | | | | | | |
| | | | | | | | | | | | | | | | | | | | | | | | | | | | | | | | | | | | | | |
| | (32 | ) | | | (88 | ) | | | (1 | ) | | | (92 | ) | | | (546 | ) | | | - | | | | (11 | ) | | | (27 | ) | | | - | | | | (160 | ) |
| | (2 | ) | | | (31 | ) | | | (3 | ) | | | (11 | ) | | | - | | | | (7 | ) | | | (5 | ) | | | (22 | ) | | | - | | | | - | |
| | | | | | | | | | | | | | | | | | | | | | | | | | | | | | | | | | | | | | |
| | 3,632 | | | | 4,810 | | | | 5,307 | | | | 1,841 | | | | 3,497 | | | | 2,831 | | | | 471 | | | | 4,850 | | | | 3,569 | | | | 4,356 | |
| | | | | | | | | | | | | | | | | | | | | | | | | | | | | | | | | | | | | | |
| | 13,252 | | | | 18,046 | | | | 2,845 | | | | 9,004 | | | | 7,787 | | | | 933 | | | | 1,367 | | | | 5,166 | | | | 8,349 | | | | 9,802 | |
| | | | | | | | | | | | | | | | | | | | | | | | | | | | | | | | | | | | | | |
| | | | | | | | | | | | | | | | | | | | | | | | | | | | | | | | | | | | | | |
| | 18,505 | | | | 37,934 | | | | (17,881 | ) | | | 45,698 | | | | 18,315 | | | | 5,988 | | | | 7,086 | | | | 32,549 | | | | (16,127 | ) | | | (18,256 | ) |
| | - | | | | - | | | | - | | | | 2,395 | | | | - | | | | - | | | | - | | | | - | | | | - | | | | - | |
| | - | | | | - | | | | - | | | | - | | | | - | | | | - | | | | 2,365 | | | | - | | | | - | | | | - | |
| | - | | | | (35 | ) | | | - | | | | - | | | | 305 | | | | - | | | | - | | | | - | | | | (143 | ) | | | (295 | ) |
| | | | | | | | | | | | | | | | | | | | | | | | | | | | | | | | | | | | | | |
| | 18,505 | | | | 37,899 | | | | (17,881 | ) | | | 48,093 | | | | 18,620 | | | | 5,988 | | | | 9,451 | | | | 32,549 | | | | (16,270 | ) | | | (18,551 | ) |
| | | | | | | | | | | | | | | | | | | | | | | | | | | | | | | | | | | | | | |
| | | | | | | | | | | | | | | | | | | | | | | | | | | | | | | | | | | | | | |
| | 61,502 | | | | 76,954 | | | | 22,418 | | | | 73,864 | | | | 69,918 | | | | 52,886 | | | | 23,611 | | | | 123,684 | | | | (9,361 | ) | | | 4,544 | |
| | - | | | | - | | | | - | | | | (180 | ) | | | - | | | | - | | | | - | | | | - | | | | - | | | | - | |
| | - | | | | - | | | | - | | | | - | | | | - | | | | - | | | | 76 | | | | - | | | | - | | | | - | |
| | - | | | | 1 | | | | - | | | | - | | | | (54 | ) | | | - | | | | - | | | | - | | | | (46 | ) | | | (45 | ) |
| | | | | | | | | | | | | | | | | | | | | | | | | | | | | | | | | | | | | | |
|
61,502 |
| | | 76,955 | | | | 22,418 | | | | 73,684 | | | | 69,864 | | | | 52,886 | | | | 23,687 | | | | 123,684 | | | | (9,407 | ) | | | 4,499 | |
| | | | | | | | | | | | | | | | | | | | | | | | | | | | | | | | | | | | | | |
| | 80,007 | | | | 114,854 | | | | 4,537 | | | | 121,177 | | | | 88,484 | | | | 58,874 | | | | 33,138 | | | | 156,233 | | | | (25,677 | ) | | | (14,052 | ) |
| | | | | | | | | | | | | | | | | | | | | | | | | | | | | | | | | | | | | | |
$ |
93,259 |
| | $ | 132,900 | | | $ | 7,382 | | | $ | 130,781 | | | $ | 96,271 | | | $ | 59,807 | | | $ | 34,505 | | | $ | 161,399 | | | $ | (17,328 | ) | | $ | (4,250 | ) |
| | | | | | | | | | | | | | | | | | | | | | | | | | | | | | | | | | | | | | |
| $ | - | | | $ | 195 | | | $ | - | | | $ | - | | | $ | 26 | | | $ | - | | | $ | - | | | $ | 10 | | | $ | 358 | | | $ | 528 | |
The Accompanying Notes are an Integral Part of the Financial Statements.
| | | | | | |
| 186 | | Statements of Operations | | | | |
Statements of Operations
Northwestern Mutual Series Fund, Inc.
For the Year Ended December 31, 2016 (in thousands)
| | | | | | | | | | | | | | | | | | | | | | | | |
| | | International
Equity
Portfolio | | | Emerging
Markets Equity
Portfolio | | | Government
Money Market
Portfolio | | | Short-Term
Bond Portfolio | | | Select Bond
Portfolio | | | Long-Term
U.S.
Government
Bond Portfolio | |
Investment Income | | | | | | | | | | | | | | | | | | | | | | | | |
Income | | | | | | | | | | | | | | | | | | | | | | | | |
Interest (1) | | $ | 74 | | | $ | (42 | ) | | $ | 2,050 | | | $ | 4,485 | | | $ | 63,854 | | | $ | 3,604 | |
Unaffiliated Dividends (1) | | | 50,986 | | | | 11,718 | | | | - | | | | (4 | ) | | | - | | | | - | |
Affiliated Dividends | | | - | | | | - | | | | - | | | | - | | | | - | | | | - | |
| | | | | | | | | | | | | | | | | | | | | | | | |
Total Income | | | 51,060 | | | | 11,676 | | | | 2,050 | | | | 4,481 | | | | 63,854 | | | | 3,604 | |
| | | | | | | | | | | | | | | | | | | | | | | | |
Expenses | | | | | | | | | | | | | | | | | | | | | | | | |
Investment Advisory Fees | | | 10,253 | | | | 5,385 | | | | 1,401 | | | | 861 | | | | 8,618 | | | | 667 | |
Custodian Fees | | | 570 | | | | 442 | | | | 13 | | | | 21 | | | | 50 | | | | 8 | |
Shareholder Reporting Fees | | | 105 | | | | 58 | | | | 19 | | | | 27 | | | | 80 | | | | 10 | |
Audit Fees | | | 29 | | | | 26 | | | | 22 | | | | 27 | | | | 41 | | | | 36 | |
Valuation Services | | | - | | | | - | | | | 3 | | | | 106 | | | | 127 | | | | 14 | |
Compliance Fees | | | 12 | | | | 9 | | | | 9 | | | | 8 | | | | 16 | | | | 7 | |
Directors Fees | | | 36 | | | | 24 | | | | 28 | | | | 25 | | | | 47 | | | | 24 | |
Professional Fees | | | 108 | | | | 135 | | | | 14 | | | | 23 | | | | 65 | | | | 13 | |
Interest Expense | | | - | | | | - | | | | - | | | | - | | | | - | | | | 156 | |
Other Expenses | | | 26 | | | | 8 | | | | 6 | | | | 3 | | | | 40 | | | | 1 | |
| | | | | | | | | | | | | | | | | | | | | | | | |
Total Expenses | | | 11,139 | | | | 6,087 | | | | 1,515 | | | | 1,101 | | | | 9,084 | | | | 936 | |
| | | | | | | | | | | | | | | | | | | | | | | | |
Less Waived Fees: | | | | | | | | | | | | | | | | | | | | | | | | |
Paid by Affiliate | | | (1,479 | ) | | | (450 | ) | | | - | | | | - | | | | (118 | ) | | | - | |
Paid Indirectly | | | - | | | | - | | | | (1 | ) | | | (10 | ) | | | (11 | ) | | | (2 | ) |
| | | | | | | | | | | | | | | | | | | | | | | | |
Net Expenses | | | 9,660 | | | | 5,637 | | | | 1,514 | | | | 1,091 | | | | 8,955 | | | | 934 | |
| | | | | | | | | | | | | | | | | | | | | | | | |
Net Investment Income (Loss) | | | 41,400 | | | | 6,039 | | | | 536 | | | | 3,390 | | | | 54,899 | | | | 2,670 | |
Realized and Unrealized Gain (Loss) on Investments | | | | | | | | | | | | | | | | | | | | | | | | |
Net Realized Gain (Loss) on: | | | | | | | | | | | | | | | | | | | | | | | | |
Unaffiliated Investment Securities | | | (66,746 | ) | | | (21,091 | ) | | | 39 | | | | 36 | | | | 33,412 | | | | 6,371 | |
Affiliated Investment Securities | | | - | | | | - | | | | - | | | | - | | | | - | | | | - | |
Futures Contracts | | | - | | | | - | | | | - | | | | (303 | ) | | | - | | | | 55 | |
Options Written | | | - | | | | - | | | | - | | | | - | | | | - | | | | 5 | |
Swap Contracts | | | - | | | | - | | | | - | | | | - | | | | - | | | | (145 | ) |
Foreign Currency Transactions | | | (487 | ) | | | (65 | ) | | | - | | | | - | | | | - | | | | - | |
| | | | | | | | | | | | | | | | | | | | | | | | |
Net Realized Gain (Loss) on Investments | | | (67,233 | ) | | | (21,156 | ) | | | 39 | | | | (267 | ) | | | 33,412 | | | | 6,286 | |
| | | | | | | | | | | | | | | | | | | | | | | | |
Net Unrealized Appreciation (Depreciation) of: | | | | | | | | | | | | | | | | | | | | | | | | |
Investment Securities | | | 72,280 | | | | 59,469 | | | | - | | | | 1,016 | | | | (4,066 | ) | | | (9,782 | ) |
Futures Contracts | | | - | | | | - | | | | - | | | | (7 | ) | | | - | | | | (12 | ) |
Options Written | | | - | | | | - | | | | - | | | | - | | | | - | | | | - | |
Swap Contracts | | | - | | | | - | | | | - | | | | - | | | | - | | | | 1,024 | |
Foreign Currency Transactions | | | (42 | ) | | | 1 | | | | - | | | | - | | | | - | | | | - | |
| | | | | | | | | | | | | | | | | | | | | | | | |
Net Change in Unrealized Appreciation (Depreciation) of Investments | | | 72,238 | | | | 59,470 | | | | - | | | | 1,009 | | | | (4,066 | ) | | | (8,770 | ) |
| | | | | | | | | | | | | | | | | | | | | | | | |
Net Gain (Loss) on Investments | | | 5,005 | | | | 38,314 | | | | 39 | | | | 742 | | | | 29,346 | | | | (2,484 | ) |
| | | | | | | | | | | | | | | | | | | | | | | | |
Net Increase (Decrease) in Net Assets Resulting from Operations | | $ | 46,405 | | | $ | 44,353 | | | $ | 575 | | | $ | 4,132 | | | $ | 84,245 | | | $ | 186 | |
| | | | | | | | | | | | | | | | | | | | | | | | |
(1) Net of Foreign Tax | | $ | 1,984 | | | $ | 416 | | | $ | - | | | $ | 4 | | | $ | - | | | $ | - | |
The Accompanying Notes are an Integral Part of the Financial Statements.
| | | | |
| | Statements of Operations | | 187 |
| | | | | | | | | | | | | | | | | | |
Inflation
Protection
Portfolio | | | High Yield
Bond
Portfolio | | | Multi-Sector
Bond Portfolio | | | Balanced
Portfolio | | | Asset
Allocation
Portfolio | |
| | | | | | | | | | | | | | | | | | |
| | | | | | | | | | | | | | | | | | |
| $ | 6,432 | | | $ | 46,467 | | | $ | 29,744 | | | $ | 428 | | | $ | 47 | |
| | 3 | | | | - | | | | (172 | ) | | | 1,280 | | | | 250 | |
| | - | | | | - | | | | - | | | | 37,877 | | | | 4,110 | |
| | | | | | | | | | | | | | | | | | |
| | 6,435 | | | | 46,467 | | | | 29,572 | | | | 39,585 | | | | 4,407 | |
| | | | | | | | | | | | | | | | | | |
| | | | | | | | | | | | | | | | | | |
| | 1,644 | | | | 3,103 | | | | 4,952 | | | | 6,609 | | | | 1,336 | |
| | 27 | | | | 11 | | | | 63 | | | | 67 | | | | 26 | |
| | 46 | | | | 68 | | | | 53 | | | | 30 | | | | 9 | |
| | 25 | | | | 39 | | | | 41 | | | | 33 | | | | 26 | |
| | 80 | | | | 115 | | | | 179 | | | | 4 | | | | 3 | |
| | 8 | | | | 9 | | | | 9 | | | | 14 | | | | 8 | |
| | 26 | | | | 29 | | | | 28 | | | | 47 | | | | 25 | |
| | 38 | | | | 55 | | | | 50 | | | | 29 | | | | 10 | |
| | - | | | | - | | | | (1 | ) | | | - | | | | - | |
| | 4 | | | | 10 | | | | 8 | | | | 32 | | | | 3 | |
| | | | | | | | | | | | | | | | | | |
| | 1,898 | | | | 3,439 | | | | 5,382 | | | | 6,865 | | | | 1,446 | |
| | | | | | | | | | | | | | | | | | |
| | | | | | | | | | | | | | | | | | |
| | (120 | ) | | | - | | | | (430 | ) | | | (5,356 | ) | | | (1,213 | ) |
| | (1 | ) | | | (10 | ) | | | - | | | | (25 | ) | | | (4 | ) |
| | | | | | | | | | | | | | | | | | |
| | 1,777 | | | | 3,429 | | | | 4,952 | | | | 1,484 | | | | 229 | |
| | | | | | | | | | | | | | | | | | |
| | 4,658 | | | | 43,038 | | | | 24,620 | | | | 38,101 | | | | 4,178 | |
| | | | |
| | | | | | | | | | | | | | | | | | |
| | | | | | | | | | | | | | | | | | |
| | (428 | ) | | | (9,145 | ) | | | (8,778 | ) | | | (4,594 | ) | | | (507 | ) |
| | - | | | | - | | | | - | | | | 96,809 | | | | 13,164 | |
| | 591 | | | | - | | | | (197 | ) | | | 2,229 | | | | 257 | |
| | - | | | | - | | | | 149 | | | | - | | | | - | |
| | (586 | ) | | | - | | | | 4,116 | | | | - | | | | - | |
| | 62 | | | | - | | | | 6,186 | | | | - | | | | - | |
| | | | | | | | | | | | | | | | | | |
|
(361 |
) | | | (9,145 | ) | | | 1,476 | | | | 94,444 | | | | 12,914 | |
| | | | | | | | | | | | | | | | | | |
| | | | | | | | | | | | | | | | | | |
| | 6,496 | | | | 66,202 | | | | 31,941 | | | | 7,765 | | | | 1,491 | |
| | (26 | ) | | | - | | | | 17 | | | | (1 | ) | | | 2 | |
| | - | | | | - | | | | 152 | | | | - | | | | - | |
| | 3,241 | | | | - | | | | 5,836 | | | | - | | | | - | |
| | (641 | ) | | | - | | | | 582 | | | | - | | | | - | |
| | | | | | | | | | | | | | | | | | |
|
9,070 |
| | | 66,202 | | | | 38,528 | | | | 7,764 | | | | 1,493 | |
| | | | | | | | | | | | | | | | | | |
| | 8,709 | | | | 57,057 | | | | 40,004 | | | | 102,208 | | | | 14,407 | |
| | | | | | | | | | | | | | | | | | |
$ |
13,367 |
| | $ | 100,095 | | | $ | 64,624 | | | $ | 140,309 | | | $ | 18,585 | |
| | | | | | | | | | | | | | | | | | |
| $ | (3 | ) | | $ | - | | | $ | 171 | | | $ | - | | | $ | - | |
The Accompanying Notes are an Integral Part of the Financial Statements.
| | | | |
| 188 | | Statements of Operations | | |
Statements of Changes in Net Assets
Northwestern Mutual Series Fund, Inc.
(in thousands)
| | | | | | | | | | | | | | | | | | | | | | | | |
| | | Growth Stock Portfolio | | | Focused Appreciation
Portfolio | | | Large Cap Core Stock
Portfolio | |
| | | For the Year
Ended
December 31,
2016 | | | For the Year
Ended
December 31,
2015 | | | For the Year
Ended
December 31,
2016 | | | For the Year
Ended
December 31,
2015 | | | For the Year
Ended
December 31,
2016 | | | For the Year
Ended
December 31,
2015 | |
Change in Net Assets | | | | | | | | | | | | | | | | | | | | | | | | |
Operations | | | | | | | | | | | | | | | | | | | | | | | | |
Net Investment Income (Loss) | | $ | 8,054 | | | $ | 7,243 | | | $ | 6,368 | | | $ | 2,084 | | | $ | 9,903 | | | $ | 10,934 | |
Net Realized Gain (Loss) on Investments | | | 41,844 | | | | 82,086 | | | | 16,541 | | | | 213,306 | | | | (830 | ) | | | 9,213 | |
Net Change in Unrealized Appreciation (Depreciation) of Investments | | | (29,832 | ) | | | (37,357 | ) | | | 21,209 | | | | (117,967 | ) | | | 28,134 | | | | (36,239 | ) |
| | | | | | | | | | | | | | | | | | | | | | | | |
Net Increase (Decrease) in Net Assets Resulting from Operations | | | 20,066 | | | | 51,972 | | | | 44,118 | | | | 97,423 | | | | 37,207 | | | | (16,092 | ) |
| | | | | | | | | | | | | | | | | | | | | | | | |
Distributions to Shareholders from: | | | | | | | | | | | | | | | | | | | | | | | | |
Net Investment Income | | | (7,202 | ) | | | (6,518 | ) | | | (1,814 | ) | | | - | | | | (10,934 | ) | | | (11,360 | ) |
Net Realized Gain on Investments | | | (80,811 | ) | | | (63,239 | ) | | | (214,229 | ) | | | (82,508 | ) | | | (9,149 | ) | | | (8,026 | ) |
| | | | | | | | | | | | | | | | | | | | | | | | |
Net Decrease in Net Assets Resulting from Distributions to Shareholders | | | (88,013 | ) | | | (69,757 | ) | | | (216,043 | ) | | | (82,508 | ) | | | (20,083 | ) | | | (19,386 | ) |
| | | | | | | | | | | | | | | | | | | | | | | | |
Capital Transactions: | | | | | | | | | | | | | | | | | | | | | | | | |
Shares Sold | | | 31,187 | | | | 22,327 | | | | 47,940 | | | | 77,750 | | | | 14,623 | | | | 16,004 | |
Reinvestment of Distributions Paid | | | 88,014 | | | | 69,757 | | | | 216,043 | | | | 82,508 | | | | 20,083 | | | | 19,386 | |
Shares Redeemed | | | (73,622 | ) | | | (99,831 | ) | | | (99,095 | ) | | | (118,715 | ) | | | (46,746 | ) | | | (46,140 | ) |
| | | | | | | | | | | | | | | | | | | | | | | | |
Net Increase (Decrease) in Net Assets Resulting from Capital Transactions | | | 45,579 | | | | (7,747 | ) | | | 164,888 | | | | 41,543 | | | | (12,040 | ) | | | (10,750 | ) |
| | | | | | | | | | | | | | | | | | | | | | | | |
Total Increase (Decrease) in Net Assets | | | (22,368 | ) | | | (25,532 | ) | | | (7,037 | ) | | | 56,458 | | | | 5,084 | | | | (46,228 | ) |
Net Assets | | | | | | | | | | | | | | | | | | | | | | | | |
Beginning of Period | | | 860,348 | | | | 885,880 | | | | 778,837 | | | | 722,379 | | | | 509,411 | | | | 555,639 | |
| | | | | | | | | | | | | | | | | | | | | | | | |
End of Period | | $ | 837,980 | | | $ | 860,348 | | | $ | 771,800 | | | $ | 778,837 | | | $ | 514,495 | | | $ | 509,411 | |
| | | | | | | | | | | | | | | | | | | | | | | | |
Undistributed Net Investment Income (Loss) | | $ | 8,019 | | | $ | 7,243 | | | $ | 6,369 | | | $ | 1,814 | | | $ | 9,903 | | | $ | 10,934 | |
| | | | | | | | | | | | | | | | | | | | | | | | |
Portfolio Share Transactions: | | | | | | | | | | | | | | | | | | | | | | | | |
Shares Sold | | | 11,811 | | | | 7,734 | | | | 20,183 | | | | 27,916 | | | | 9,409 | | | | 9,957 | |
Reinvestment of Distributions Paid | | | 33,503 | | | | 25,366 | | | | 99,881 | | | | 32,179 | | | | 12,663 | | | | 12,712 | |
Shares Redeemed | | | (27,288 | ) | | | (34,629 | ) | | | (40,065 | ) | | | (43,469 | ) | | | (29,869 | ) | | | (28,592 | ) |
| | | | | | | | | | | | | | | | | | | | | | | | |
Net Increase (Decrease) in Shares Resulting from Portfolio Share Transactions | | | 18,026 | | | | (1,529 | ) | | | 79,999 | | | | 16,626 | | | | (7,797 | ) | | | (5,923 | ) |
| | | | | | | | | | | | | | | | | | | | | | | | |
The Accompanying Notes are an Integral Part of the Financial Statements.
| | | | |
| | Statements of Changes in Net Assets | | 189 |
| | | | | | | | | | | | | | | | | | | | | | | | | | | | | | | | | | | | | | |
| Large Cap Blend Portfolio | | | Index 500 Stock Portfolio | | | Large Company Value
Portfolio | | | Domestic Equity Portfolio | | | Equity Income Portfolio | |
For the Year
Ended
December 31,
2016 | | | For the Year
Ended
December 31,
2015 | | | For the Year
Ended
December 31,
2016 | | | For the Year
Ended
December 31,
2015 | | | For the Year
Ended
December 31,
2016 | | | For the Year
Ended
December 31,
2015 | | | For the Year
Ended
December 31,
2016 | | | For the Year
Ended
December 31,
2015 | | | For the Year
Ended
December 31,
2016 | | | For the Year
Ended
December 31,
2015 | |
| | | | | | | | | | | | | | | | | | | | | | | | | | | | | | | | | | | | | | | |
| | | | | | | | | | | | | | | | | | | | | | | | | | | | | | | | | | | | | | | |
| $ | 1,520 | | | $ | 1,635 | | | $ | 48,788 | | | $ | 44,606 | | | $ | 3,738 | | | $ | 2,772 | | | $ | 13,252 | | | $ | 12,650 | | | $ | 18,046 | | | $ | 15,984 | |
| | 8,220 | | | | 11,805 | | | | 31,503 | | | | 49,071 | | | | 7,401 | | | | 16,494 | | | | 18,505 | | | | 32,433 | | | | 37,899 | | | | 38,083 | |
|
10,948 |
| | | (17,147 | ) | | | 200,667 | | | | (65,023 | ) | | | 15,211 | | | | (26,362 | ) | | | 61,502 | | | | (45,329 | ) | | | 76,955 | | | | (107,614 | ) |
| | | | | | | | | | | | | | | | | | | | | | | | | | | | | | | | | | | | | | |
|
20,688 |
| | | (3,707 | ) | | | 280,958 | | | | 28,654 | | | | 26,350 | | | | (7,096 | ) | | | 93,259 | | | | (246 | ) | | | 132,900 | | | | (53,547 | ) |
| | | | | | | | | | | | | | | | | | | | | | | | | | | | | | | | | | | | | | |
| | | | | | | | | | | | | | | | | | | | | | | | | | | | | | | | | | | | | | | |
| | (1,635 | ) | | | (1,436 | ) | | | (46,095 | ) | | | (40,224 | ) | | | (3,178 | ) | | | (2,968 | ) | | | (12,521 | ) | | | (11,101 | ) | | | (15,268 | ) | | | (13,075 | ) |
| | (12,029 | ) | | | (8,735 | ) | | | (52,413 | ) | | | (42,223 | ) | | | (16,812 | ) | | | (16,360 | ) | | | (25,926 | ) | | | - | | | | (39,660 | ) | | | (30,184 | ) |
| | | | | | | | | | | | | | | | | | | | | | | | | | | | | | | | | | | | | | |
|
(13,664 |
) | | | (10,171 | ) | | | (98,508 | ) | | | (82,447 | ) | | | (19,990 | ) | | | (19,328 | ) | | | (38,447 | ) | | | (11,101 | ) | | | (54,928 | ) | | | (43,259 | ) |
| | | | | | | | | | | | | | | | | | | | | | | | | | | | | | | | | | | | | | |
| | | | | | | | | | | | | | | | | | | | | | | | | | | | | | | | | | | | | | | |
| | 5,156 | | | | 8,152 | | | | 226,962 | | | | 174,698 | | | | 15,169 | | | | 11,819 | | | | 84,306 | | | | 51,702 | | | | 35,008 | | | | 79,427 | |
| | 13,664 | | | | 10,171 | | | | 98,507 | | | | 82,447 | | | | 19,989 | | | | 19,328 | | | | 38,447 | | | | 11,101 | | | | 54,929 | | | | 43,259 | |
| | (14,933 | ) | | | (17,552 | ) | | | (215,258 | ) | | | (187,397 | ) | | | (20,174 | ) | | | (21,248 | ) | | | (67,083 | ) | | | (61,019 | ) | | | (102,523 | ) | | | (74,834 | ) |
| | | | | | | | | | | | | | | | | | | | | | | | | | | | | | | | | | | | | | |
|
3,887 |
| | | 771 | | | | 110,211 | | | | 69,748 | | | | 14,984 | | | | 9,899 | | | | 55,670 | | | | 1,784 | | | | (12,586 | ) | | | 47,852 | |
| | | | | | | | | | | | | | | | | | | | | | | | | | | | | | | | | | | | | | |
| | 10,911 | | | | (13,107 | ) | | | 292,661 | | | | 15,955 | | | | 21,344 | | | | (16,525 | ) | | | 110,482 | | | | (9,563 | ) | | | 65,386 | | | | (48,954 | ) |
| | | | | | | | | | | | | | | | | | | | | | | | | | | | | | | | | | | | | | | |
| | 153,841 | | | | 166,948 | | | | 2,386,253 | | | | 2,370,298 | | | | 174,429 | | | | 190,954 | | | | 610,458 | | | | 620,021 | | | | 732,781 | | | | 781,735 | |
| | | | | | | | | | | | | | | | | | | | | | | | | | | | | | | | | | | | | | |
| $ | 164,752 | | | $ | 153,841 | | | $ | 2,678,914 | | | $ | 2,386,253 | | | $ | 195,773 | | | $ | 174,429 | | | $ | 720,940 | | | $ | 610,458 | | | $ | 798,167 | | | $ | 732,781 | |
| | | | | | | | | | | | | | | | | | | | | | | | | | | | | | | | | | | | | | |
| $ | 1,520 | | | $ | 1,635 | | | $ | 52,559 | | | $ | 46,349 | | | $ | 3,987 | | | $ | 3,260 | | | $ | 12,655 | | | $ | 12,521 | | | $ | 18,215 | | | $ | 15,947 | |
| | | | | | | | | | | | | | | | | | | | | | | | | | | | | | | | | | | | | | |
| | | | | | | | | | | | | | | | | | | | | | | | | | | | | | | | | | | | | | | |
| | 4,918 | | | | 7,310 | | | | 57,360 | | | | 44,321 | | | | 15,262 | | | | 10,853 | | | | 57,076 | | | | 36,389 | | | | 21,719 | | | | 46,128 | |
| | 13,126 | | | | 9,577 | | | | 24,401 | | | | 21,481 | | | | 20,909 | | | | 19,328 | | | | 25,563 | | | | 7,929 | | | | 34,309 | | | | 27,379 | |
| | (14,175 | ) | | | (15,948 | ) | | | (54,324 | ) | | | (47,158 | ) | | | (20,739 | ) | | | (19,755 | ) | | | (45,433 | ) | | | (42,338 | ) | | | (63,374 | ) | | | (44,441 | ) |
| | | | | | | | | | | | | | | | | | | | | | | | | | | | | | | | | | | | | | |
|
3,869 |
| | | 939 | | | | 27,437 | | | | 18,644 | | | | 15,432 | | | | 10,426 | | | | 37,206 | | | | 1,980 | | | | (7,346 | ) | | | 29,066 | |
| | | | | | | | | | | | | | | | | | | | | | | | | | | | | | | | | | | | | | |
The Accompanying Notes are an Integral Part of the Financial Statements.
| | | | |
| 190 | | Statements of Changes in Net Assets | | |
Statements of Changes in Net Assets
Northwestern Mutual Series Fund, Inc.
(in thousands)
| | | | | | | | | | | | | | | | | | | | | | | | |
| | | Mid Cap Growth Stock
Portfolio | | | Index 400 Stock Portfolio | | | Mid Cap Value Portfolio | |
| | | For the Year
Ended
December 31,
2016 | | | For the Year
Ended
December 31,
2015 | | | For the Year
Ended
December 31,
2016 | | | For the Year
Ended
December 31,
2015 | | | For the Year
Ended
December 31,
2016 | | | For the Year
Ended
December 31,
2015 | |
Change in Net Assets | | | | | | | | | | | | | | | | | | | | | | | | |
Operations | | | | | | | | | | | | | | | | | | | | | | | | |
Net Investment Income (Loss) | | $ | 2,845 | | | $ | 1,888 | | | $ | 9,004 | | | $ | 8,083 | | | $ | 7,787 | | | $ | 5,886 | |
Net Realized Gain (Loss) on Investments | | | (17,881 | ) | | | 79,837 | | | | 48,093 | | | | 52,857 | | | | 18,620 | | | | 35,998 | |
Net Change in Unrealized Appreciation (Depreciation) of Investments | | | 22,418 | | | | (71,466 | ) | | | 73,684 | | | | (75,822 | ) | | | 69,864 | | | | (47,295 | ) |
| | | | | | | | | | | | | | | | | | | | | | | | |
Net Increase (Decrease) in Net Assets Resulting from Operations | | | 7,382 | | | | 10,259 | | | | 130,781 | | | | (14,882 | ) | | | 96,271 | | | | (5,411 | ) |
| | | | | | | | | | | | | | | | | | | | | | | | |
Distributions to Shareholders from: | | | | | | | | | | | | | | | | | | | | | | | | |
Net Investment Income | | | (1,831 | ) | | | (441 | ) | | | (8,024 | ) | | | (7,094 | ) | | | (7,853 | ) | | | (6,929 | ) |
Net Realized Gain on Investments | | | (79,591 | ) | | | (99,208 | ) | | | (52,210 | ) | | | (40,512 | ) | | | (35,261 | ) | | | (42,406 | ) |
| | | | | | | | | | | | | | | | | | | | | | | | |
Net Decrease in Net Assets Resulting from Distributions to Shareholders | | | (81,422 | ) | | | (99,649 | ) | | | (60,234 | ) | | | (47,606 | ) | | | (43,114 | ) | | | (49,335 | ) |
| | | | | | | | | | | | | | | | | | | | | | | | |
Capital Transactions: | | | | | | | | | | | | | | | | | | | | | | | | |
Shares Sold | | | 44,302 | | | | 26,696 | | | | 68,624 | | | | 52,800 | | | | 61,280 | | | | 44,895 | |
Reinvestment of Distributions Paid | | | 81,422 | | | | 99,649 | | | | 60,234 | | | | 47,606 | | | | 43,114 | | | | 49,335 | |
Shares Redeemed | | | (93,440 | ) | | | (109,959 | ) | | | (60,649 | ) | | | (55,921 | ) | | | (49,567 | ) | | | (57,104 | ) |
| | | | | | | | | | | | | | | | | | | | | | | | |
Net Increase (Decrease) in Net Assets Resulting from Capital Transactions | | | 32,284 | | | | 16,386 | | | | 68,209 | | | | 44,485 | | | | 54,827 | | | | 37,126 | |
| | | | | | | | | | | | | | | | | | | | | | | | |
Total Increase (Decrease) in Net Assets | | | (41,756 | ) | | | (73,004 | ) | | | 138,756 | | | | (18,003 | ) | | | 107,984 | | | | (17,620 | ) |
Net Assets | | | | | | | | | | | | | | | | | | | | | | | | |
Beginning of Period | | | 1,025,151 | | | | 1,098,155 | | | | 634,401 | | | | 652,404 | | | | 410,233 | | | | 427,853 | |
| | | | | | | | | | | | | | | | | | | | | | | | |
End of Period | | $ | 983,395 | | | $ | 1,025,151 | | | $ | 773,157 | | | $ | 634,401 | | | $ | 518,217 | | | $ | 410,233 | |
| | | | | | | | | | | | | | | | | | | | | | | | |
Undistributed Net Investment Income (Loss) | | $ | 2,582 | | | $ | 1,888 | | | $ | 8,968 | | | $ | 8,031 | | | $ | 8,105 | | | $ | 7,770 | |
| | | | | | | | | | | | | | | | | | | | | | | | |
Portfolio Share Transactions: | | | | | | | | | | | | | | | | | | | | | | | | |
Shares Sold | | | 14,709 | | | | 7,808 | | | | 37,613 | | | | 27,622 | | | | 37,185 | | | | 26,333 | |
Reinvestment of Distributions Paid | | | 27,884 | | | | 31,346 | | | | 33,169 | | | | 25,900 | | | | 27,014 | | | | 31,870 | |
Shares Redeemed | | | (31,349 | ) | | | (32,152 | ) | | | (33,113 | ) | | | (28,625 | ) | | | (30,646 | ) | | | (33,201 | ) |
| | | | | | | | | | | | | | | | | | | | | | | | |
Net Increase (Decrease) in Shares Resulting from Portfolio Share Transactions | | | 11,244 | | | | 7,002 | | | | 37,669 | | | | 24,897 | | | | 33,553 | | | | 25,002 | |
| | | | | | | | | | | | | | | | | | | | | | | | |
The Accompanying Notes are an Integral Part of the Financial Statements.
| | | | |
| | Statements of Changes in Net Assets | | 191 |
| | | | | | | | | | | | | | | | | | | | | | | | | | | | | | | | | | | | | | |
Small Cap Growth Stock
Portfolio | | | Index 600 Stock Portfolio | | | Small Cap Value Portfolio | | | International Growth
Portfolio | | | Research International Core
Portfolio | |
For the Year
Ended
December 31,
2016 | | | For the Year
Ended
December 31,
2015 | | | For the Year
Ended
December 31,
2016 | | | For the Year
Ended
December 31,
2015 | | | For the Year
Ended
December 31,
2016 | | | For the Year
Ended
December 31,
2015 | | | For the Year
Ended
December 31,
2016 | | | For the Year
Ended
December 31,
2015 | | | For the Year
Ended
December 31,
2016 | | | For the Year
Ended
December 31,
2015 | |
| | |
| | | | | | | | | | | | | | | | | | | | | | | | | | | | | | | | | | | | | | | |
| | | | | | | | | | | | | | | | | | | | | | | | | | | | | | | | | | | | | | | |
| $ | 933 | | | $ | 1,158 | | | $ | 1,367 | | | $ | 1,021 | | | $ | 5,166 | | | $ | 5,601 | | | $ | 8,349 | | | $ | 5,230 | | | $ | 9,802 | | | $ | 8,950 | |
| | 5,988 | | | | 51,302 | | | | 9,451 | | | | 6,290 | | | | 32,549 | | | | 69,763 | | | | (16,270 | ) | | | (2,331 | ) | | | (18,551 | ) | | | 4,564 | |
|
52,886 |
| | | (49,079 | ) | | | 23,687 | | | | (10,033 | ) | | | 123,684 | | | | (105,517 | ) | | | (9,407 | ) | | | (11,161 | ) | | | 4,499 | | | | (21,212 | ) |
| | | | | | | | | | | | | | | | | | | | | | | | | | | | | | | | | | | | | | |
|
59,807 |
| | | 3,381 | | | | 34,505 | | | | (2,722 | ) | | | 161,399 | | | | (30,153 | ) | | | (17,328 | ) | | | (8,262 | ) | | | (4,250 | ) | | | (7,698 | ) |
| | | | | | | | | | | | | | | | | | | | | | | | | | | | | | | | | | | | | | |
| | | | | | | | | | | | | | | | | | | | | | | | | | | | | | | | | | | | | | |
| | (1,158 | ) | | | (551 | ) | | | (793 | ) | | | - | | | | (5,244 | ) | | | (3,773 | ) | | | (5,957 | ) | | | (7,804 | ) | | | (8,773 | ) | | | (10,556 | )�� |
| | (51,660 | ) | | | (26,456 | ) | | | (6,350 | ) | | | (339 | ) | | | (70,226 | ) | | | (32,571 | ) | | | - | | | | - | | | | (4,342 | ) | | | (10,976 | ) |
| | | | | | | | | | | | | | | | | | | | | | | | | | | | | | | | | | | | | | |
|
(52,818 |
) | | | (27,007 | ) | | | (7,143 | ) | | | (339 | ) | | | (75,470 | ) | | | (36,344 | ) | | | (5,957 | ) | | | (7,804 | ) | | | (13,115 | ) | | | (21,532 | ) |
| | | | | | | | | | | | | | | | | | | | | | | | | | | | | | | | | | | | | | |
| | | | | | | | | | | | | | | | | | | | | | | | | | | | | | | | | | | | | | |
| | 40,765 | | | | 28,349 | | | | 40,201 | | | | 26,636 | | | | 39,601 | | | | 36,595 | | | | 96,384 | | | | 95,507 | | | | 79,725 | | | | 84,026 | |
| | 52,818 | | | | 27,007 | | | | 7,143 | | | | 339 | | | | 75,470 | | | | 36,344 | | | | 5,957 | | | | 7,804 | | | | 13,118 | | | | 21,532 | |
| | (50,452 | ) | | | (66,346 | ) | | | (14,816 | ) | | | (11,207 | ) | | | (68,140 | ) | | | (74,839 | ) | | | (41,247 | ) | | | (38,863 | ) | | | (74,224 | ) | | | (34,941 | ) |
| | | | | | | | | | | | | | | | | | | | | | | | | | | | | | | | | | | | | | |
|
43,131 |
| | | (10,990 | ) | | | 32,528 | | | | 15,768 | | | | 46,931 | | | | (1,900 | ) | | | 61,094 | | | | 64,448 | | | | 18,619 | | | | 70,617 | |
| | | | | | | | | | | | | | | | | | | | | | | | | | | | | | | | | | | | | | |
| | 50,120 | | | | (34,616 | ) | | | 59,890 | | | | 12,707 | | | | 132,860 | | | | (68,397 | ) | | | 37,809 | | | | 48,382 | | | | 1,254 | | | | 41,387 | |
| | | | | | | | | | | | | | | | | | | | | | | | | | | | | | | | | | | | | | |
| | 494,932 | | | | 529,548 | | | | 113,993 | | | | 101,286 | | | | 514,970 | | | | 583,367 | | | | 485,313 | | | | 436,931 | | | | 498,395 | | | | 457,008 | |
| | | | | | | | | | | | | | | | | | | | | | | | | | | | | | | | | | | | | | |
| $ | 545,052 | | | $ | 494,932 | | | $ | 173,883 | | | $ | 113,993 | | | $ | 647,830 | | | $ | 514,970 | | | $ | 523,122 | | | $ | 485,313 | | | $ | 499,649 | | | $ | 498,395 | |
| | | | | | | | | | | | | | | | | | | | | | | | | | | | | | | | | | | | | | |
| $ | 625 | | | $ | 1,158 | | | $ | 3,844 | | | $ | 923 | | | $ | 5,105 | | | $ | 5,485 | | | $ | 8,041 | | | $ | 5,848 | | | $ | 9,557 | | | $ | 8,638 | |
| | | | | | | | | | | | | | | | | | | | | | | | | | | | | | | | | | | | | | |
| | | | | | | | | | | | | | | | | | | | | | | | | | | | | | | | | | | | | | |
| | 17,728 | | | | 11,133 | | | | 33,773 | | | | 22,797 | | | | 17,863 | | | | 15,735 | | | | 75,878 | | | | 70,874 | | | | 97,427 | | | | 91,301 | |
| | 23,495 | | | | 10,951 | | | | 5,943 | | | | 294 | | | | 35,887 | | | | 16,710 | | | | 4,493 | | | | 5,962 | | | | 15,430 | | | | 24,139 | |
| | (22,126 | ) | | | (25,726 | ) | | | (12,440 | ) | | | (9,516 | ) | | | (30,845 | ) | | | (32,453 | ) | | | (32,466 | ) | | | (28,304 | ) | | | (89,855 | ) | | | (38,344 | ) |
| | | | | | | | | | | | | | | | | | | | | | | | | | | | | | | | | | | | | | |
|
19,097 |
| | | (3,642 | ) | | | 27,276 | | | | 13,575 | | | | 22,905 | | | | (8 | ) | | | 47,905 | | | | 48,532 | | | | 23,002 | | | | 77,096 | |
| | | | | | | | | | | | | | | | | | | | | | | | | | | | | | | | | | | | | | |
The Accompanying Notes are an Integral Part of the Financial Statements.
| | | | | | |
| 192 | | Statements of Changes in Net Assets | | | | |
Statements of Changes in Net Assets
Northwestern Mutual Series Fund, Inc.
(in thousands)
| | | | | | | | | | | | | | | | | | | | | | | | |
| | | International Equity
Portfolio | | | Emerging Markets Equity
Portfolio | | | Government Money Market
Portfolio | |
| | | For the Year
Ended
December 31,
2016 | | | For the Year
Ended
December 31,
2015 | | | For the Year
Ended
December 31,
2016 | | | For the Year
Ended
December 31,
2015 | | | For the Year
Ended
December 31,
2016 | | | For the Year
Ended
December 31,
2015 | |
Change in Net Assets | | | | | | | | | | | | | | | | | | | | | | | | |
Operations | | | | | | | | | | | | | | | | | | | | | | | | |
Net Investment Income (Loss) | | $ | 41,400 | | | $ | 34,950 | | | $ | 6,039 | | | $ | 4,052 | | | $ | 536 | | | $ | 58 | |
Net Realized Gain (Loss) on Investments | | | (67,233 | ) | | | 19,594 | | | | (21,156 | ) | | | (17,062 | ) | | | 39 | | | | 19 | |
Net Change in Unrealized Appreciation (Depreciation) of Investments | | | 72,238 | | | | (90,090 | ) | | | 59,470 | | | | (44,907 | ) | | | - | | | | - | |
| | | | | | | | | | | | | | | | | | | | | | | | |
Net Increase (Decrease) in Net Assets Resulting from Operations | | | 46,405 | | | | (35,546 | ) | | | 44,353 | | | | (57,917 | ) | | | 575 | | | | 77 | |
| | | | | | | | | | | | | | | | | | | | | | | | |
Distributions to Shareholders from: | | | | | | | | | | | | | | | | | | | | | | | | |
Net Investment Income | | | (33,744 | ) | | | (50,077 | ) | | | (3,683 | ) | | | (3,916 | ) | | | (562 | ) | | | (31 | ) |
Net Realized Gain on Investments | | | (20,770 | ) | | | (67,503 | ) | | | - | | | | - | | | | (39 | ) | | | (14 | ) |
| | | | | | | | | | | | | | | | | | | | | | | | |
Net Decrease in Net Assets Resulting from Distributions to Shareholders | | | (54,514 | ) | | | (117,580 | ) | | | (3,683 | ) | | | (3,916 | ) | | | (601 | ) | | | (45 | ) |
| | | | | | | | | | | | | | | | | | | | | | | | |
Capital Transactions: | | | | | | | | | | | | | | | | | | | | | | | | |
Shares Sold | | | 130,094 | | | | 141,789 | | | | 96,382 | | | | 118,416 | | | | 280,259 | | | | 210,290 | |
Reinvestment of Distributions Paid | | | 54,514 | | | | 117,581 | | | | 3,683 | | | | 3,916 | | | | 601 | | | | 45 | |
Shares Redeemed | | | (154,180 | ) | | | (135,674 | ) | | | (63,232 | ) | | | (33,199 | ) | | | (224,486 | ) | | | (203,832 | ) |
| | | | | | | | | | | | | | | | | | | | | | | | |
Net Increase (Decrease) in Net Assets Resulting from Capital Transactions | | | 30,428 | | | | 123,696 | | | | 36,833 | | | | 89,133 | | | | 56,374 | | | | 6,503 | |
| | | | | | | | | | | | | | | | | | | | | | | | |
Total Increase (Decrease) in Net Assets | | | 22,319 | | | | (29,430 | ) | | | 77,503 | | | | 27,300 | | | | 56,348 | | | | 6,535 | |
Net Assets | | | | | | | | | | | | | | | | | | | | | | | | |
Beginning of Period | | | 1,605,948 | | | | 1,635,378 | | | | 444,297 | | | | 416,997 | | | | 445,287 | | | | 438,752 | |
| | | | | | | | | | | | | | | | | | | | | | | | |
End of Period | | $ | 1,628,267 | | | $ | 1,605,948 | | | $ | 521,800 | | | $ | 444,297 | | | $ | 501,635 | | | $ | 445,287 | |
| | | | | | | | | | | | | | | | | | | | | | | | |
Undistributed Net Investment Income (Loss) | | $ | 42,171 | | | $ | 33,496 | | | $ | 5,746 | | | $ | 3,680 | | | $ | 3 | | | $ | 42 | |
| | | | | | | | | | | | | | | | | | | | | | | | |
Portfolio Share Transactions: | | | | | | | | | | | | | | | | | | | | | | | | |
Shares Sold | | | 84,805 | | | | 79,342 | | | | 116,570 | | | | 133,996 | | | | 280,259 | | | | 210,290 | |
Reinvestment of Distributions Paid | | | 34,678 | | | | 69,989 | | | | 4,084 | | | | 4,841 | | | | 601 | | | | 44 | |
Shares Redeemed | | | (99,670 | ) | | | (74,721 | ) | | | (74,182 | ) | | | (37,294 | ) | | | (224,486 | ) | | | (203,832 | ) |
| | | | | | | | | | | | | | | | | | | | | | | | |
Net Increase (Decrease) in Shares Resulting from Portfolio Share Transactions | | | 19,813 | | | | 74,610 | | | | 46,472 | | | | 101,543 | | | | 56,374 | | | | 6,502 | |
| | | | | | | | | | | | | | | | | | | | | | | | |
The Accompanying Notes are an Integral Part of the Financial Statements.
| | | | | | |
| | Statements of Changes in Net Assets | | | 193 | |
| | | | | | | | | | | | | | | | | | | | | | | | | | | | | | | | | | | | | | |
| Short-Term Bond Portfolio | | | Select Bond Portfolio | | | Long-Term U.S.
Government Bond Portfolio | | | Inflation Protection
Portfolio | | | High Yield Bond Portfolio | |
For the Year
Ended
December 31,
2016 | | | For the Year
Ended
December 31,
2015 | | | For the Year
Ended
December 31,
2016 | | | For the Year
Ended
December 31,
2015 | | | For the Year
Ended
December 31,
2016 | | | For the Year
Ended
December 31,
2015 | | | For the Year
Ended
December 31,
2016 | | | For the Year Ended
December 31, 2015 | | | For the Year
Ended
December 31,
2016 | | | For the Year
Ended
December 31,
2015 | |
| | |
| | | | | | | | | | | | | | | | | | | | | | | | | | | | | | | | | | | | | | | |
| | | | | | | | | | | | | | | | | | | | | | | | | | | | | | | | | | | | | | | |
| $ | 3,390 | | | $ | 2,803 | | | $ | 54,899 | | | $ | 50,821 | | | $ | 2,670 | | | $ | 2,486 | | | $ | 4,658 | | | $ | 1,517 | | | $ | 43,038 | | | $ | 39,838 | |
| | (267 | ) | | | (380 | ) | | | 33,412 | | | | 16,634 | | | | 6,286 | | | | 714 | | | | (361 | ) | | | 1,636 | | | | (9,145 | ) | | | 1,461 | |
|
1,009 |
| | | (906 | ) | | | (4,066 | ) | | | (52,103 | ) | | | (8,770 | ) | | | (5,023 | ) | | | 9,070 | | | | (9,760 | ) | | | 66,202 | | | | (50,539 | ) |
| | | | | | | | | | | | | | | | | | | | | | | | | | | | | | | | | | | | | | |
|
4,132 |
| | | 1,517 | | | | 84,245 | | | | 15,352 | | | | 186 | | | | (1,823 | ) | | | 13,367 | | | | (6,607 | ) | | | 100,095 | | | | (9,240 | ) |
| | | | | | | | | | | | | | | | | | | | | | | | | | | | | | | | | | | | | | |
| | | | | | | | | | | | | | | | | | | | | | | | | | | | | | | | | | | | | | | |
| | (3,014 | ) | | | (1,717 | ) | | | (54,600 | ) | | | (43,246 | ) | | | (2,240 | ) | | | (2,212 | ) | | | (3,649 | ) | | | (6,992 | ) | | | (39,861 | ) | | | (32,590 | ) |
| | - | | | | - | | | | (15,134 | ) | | | (13,060 | ) | | | (2,060 | ) | | | - | | | | - | | | | - | | | | - | | | | - | |
| | | | | | | | | | | | | | | | | | | | | | | | | | | | | | | | | | | | | | |
|
(3,014 |
) | | | (1,717 | ) | | | (69,734 | ) | | | (56,306 | ) | | | (4,300 | ) | | | (2,212 | ) | | | (3,649 | ) | | | (6,992 | ) | | | (39,861 | ) | | | (32,590 | ) |
| | | | | | | | | | | | | | | | | | | | | | | | | | | | | | | | | | | | | | |
| | | | | | | | | | | | | | | | | | | | | | | | | | | | | | | | | | | | | | | |
| | 55,068 | | | | 42,639 | | | | 306,188 | | | | 323,737 | | | | 31,985 | | | | 22,244 | | | | 64,335 | | | | 45,610 | | | | 90,495 | | | | 61,618 | |
| | 3,014 | | | | 1,717 | | | | 69,734 | | | | 56,306 | | | | 4,300 | | | | 2,212 | | | | 3,649 | | | | 6,992 | | | | 39,861 | | | | 32,590 | |
| | (33,571 | ) | | | (34,439 | ) | | | (408,346 | ) | | | (323,287 | ) | | | (26,293 | ) | | | (25,158 | ) | | | (37,864 | ) | | | (37,599 | ) | | | (121,767 | ) | | | (66,242 | ) |
| | | | | | | | | | | | | | | | | | | | | | | | | | | | | | | | | | | | | | |
|
24,511 |
| | | 9,917 | | | | (32,424 | ) | | | 56,756 | | | | 9,992 | | | | (702 | ) | | | 30,120 | | | | 15,003 | | | | 8,589 | | | | 27,966 | |
| | | | | | | | | | | | | | | | | | | | | | | | | | | | | | | | | | | | | | |
| | 25,629 | | | | 9,717 | | | | (17,913 | ) | | | 15,802 | | | | 5,878 | | | | (4,737 | ) | | | 39,838 | | | | 1,404 | | | | 68,823 | | | | (13,864 | ) |
| | | | | | | | | | | | | | | | | | | | | | | | | | | | | | | | | | | | | | | |
| | 244,204 | | | | 234,487 | | | | 2,856,958 | | | | 2,841,156 | | | | 104,513 | | | | 109,250 | | | | 287,089 | | | | 285,685 | | | | 688,124 | | | | 701,988 | |
| | | | | | | | | | | | | | | | | | | | | | | | | | | | | | | | | | | | | | |
| $ | 269,833 | | | $ | 244,204 | | | $ | 2,839,045 | | | $ | 2,856,958 | | | $ | 110,391 | | | $ | 104,513 | | | $ | 326,927 | | | $ | 287,089 | | | $ | 756,947 | | | $ | 688,124 | |
| | | | | | | | | | | | | | | | | | | | | | | | | | | | | | | | | | | | | | |
| $ | 3,730 | | | $ | 3,014 | | | $ | 59,282 | | | $ | 53,984 | | | $ | 2,138 | | | $ | 2,240 | | | $ | 2,241 | | | $ | 2,579 | | | $ | 43,156 | | | $ | 39,861 | |
| | | | | | | | | | | | | | | | | | | | | | | | | | | | | | | | | | | | | | |
| | | | | | | | | | | | | | | | | | | | | | | | | | | | | | | | | | | | | | | |
| | 53,074 | | | | 41,288 | | | | 238,149 | | | | 255,007 | | | | 27,499 | | | | 19,847 | | | | 59,146 | | | | 41,819 | | | | 126,073 | | | | 84,838 | |
| | 2,912 | | | | 1,669 | | | | 54,056 | | | | 44,899 | | | | 3,571 | | | | 1,989 | | | | 3,314 | | | | 6,572 | | | | 55,133 | | | | 46,491 | |
| | (32,380 | ) | | | (33,351 | ) | | | (319,391 | ) | | | (254,987 | ) | | | (23,311 | ) | | | (22,701 | ) | | | (34,953 | ) | | | (34,661 | ) | | | (169,484 | ) | | | (91,775 | ) |
| | | | | | | | | | | | | | | | | | | | | | | | | | | | | | | | | | | | | | |
|
23,606 |
| | | 9,606 | | | | (27,186 | ) | | | 44,919 | | | | 7,759 | | | | (865 | ) | | | 27,507 | | | | 13,730 | | | | 11,722 | | | | 39,554 | |
| | | | | | | | | | | | | | | | | | | | | | | | | | | | | | | | | | | | | | |
The Accompanying Notes are an Integral Part of the Financial Statements.
| | | | |
| 194 | | Statements of Changes in Net Assets | | |
Statements of Changes in Net Assets
Northwestern Mutual Series Fund, Inc.
(in thousands)
| | | | | | | | | | | | | | | | | | | | | | | | |
| | | Multi-Sector Bond Portfolio | | | Balanced Portfolio | | | Asset Allocation Portfolio | |
| | | For the Year
Ended
December 31,
2016 | | | For the Year
Ended
December 31,
2015 | | | For the Year
Ended
December 31,
2016 | | | For the Year
Ended
December 31,
2015 | | | For the Year
Ended
December 31,
2016 | | | For the Year
Ended
December 31,
2015 | |
Change in Net Assets | | | | | | | | | | | | | | | | | | | | | | | | |
Operations | | | | | | | | | | | | | | | | | | | | | | | | |
Net Investment Income (Loss) | | $ | 24,620 | | | $ | 23,703 | | | $ | 38,101 | | | $ | 33,262 | | | $ | 4,178 | | | $ | 3,847 | |
Net Realized Gain (Loss) on Investments | | | 1,476 | | | | (6,301 | ) | | | 94,444 | | | | 79,503 | | | | 12,914 | | | | 11,210 | |
Net Change in Unrealized Appreciation (Depreciation) of Investments | | | 38,528 | | | | (30,933 | ) | | | 7,764 | | | | (113,850 | ) | | | 1,493 | | | | (16,023 | ) |
| | | | | | | | | | | | | | | | | | | | | | | | |
Net Increase (Decrease) in Net Assets Resulting from Operations | | | 64,624 | | | | (13,531 | ) | | | 140,309 | | | | (1,085 | ) | | | 18,585 | | | | (966 | ) |
| | | | | | | | | | | | | | | | | | | | | | | | |
Distributions to Shareholders from: | | | | | | | | | | | | | | | | | | | | | | | | |
Net Investment Income | | | (29,034 | ) | | | (31,813 | ) | | | (49,667 | ) | | | (45,681 | ) | | | (5,868 | ) | | | (5,056 | ) |
Net Realized Gain on Investments | | | – | | | | (8,342 | ) | | | (62,181 | ) | | | (106,535 | ) | | | (9,122 | ) | | | (13,061 | ) |
Net Decrease in Net Assets Resulting from Distributions to Shareholders | | | (29,034 | ) | | | (40,155 | ) | | | (111,848 | ) | | | (152,216 | ) | | | (14,990 | ) | | | (18,117 | ) |
| | | | | | | | | | | | | | | | | | | | | | | | |
Capital Transactions: | | | | | | | | | | | | | | | | | | | | | | | | |
Shares Sold | | | 124,597 | | | | 105,917 | | | | 112,327 | | | | 107,510 | | | | 12,710 | | | | 15,615 | |
Reinvestment of Distributions Paid | | | 29,034 | | | | 40,155 | | | | 111,848 | | | | 152,217 | | | | 14,990 | | | | 18,117 | |
Shares Redeemed | | | (80,006 | ) | | | (57,811 | ) | | | (269,268 | ) | | | (254,087 | ) | | | (30,309 | ) | | | (31,645 | ) |
| | | | | | | | | | | | | | | | | | | | | | | | |
Net Increase (Decrease) in Net Assets Resulting from Capital Transactions | | | 73,625 | | | | 88,261 | | | | (45,093 | ) | | | 5,640 | | | | (2,609 | ) | | | 2,087 | |
| | | | | | | | | | | | | | | | | | | | | | | | |
Total Increase (Decrease) in Net Assets | | | 109,215 | | | | 34,575 | | | | (16,632 | ) | | | (147,661 | ) | | | 986 | | | | (16,996 | ) |
Net Assets | | | | | | | | | | | | | | | | | | | | | | | | |
Beginning of Period | | | 580,634 | | | | 546,059 | | | | 2,219,466 | | | | 2,367,127 | | | | 249,413 | | | | 266,409 | |
| | | | | | | | | | | | | | | | | | | | | | | | |
End of Period | | $ | 689,849 | | | $ | 580,634 | | | $ | 2,202,834 | | | $ | 2,219,466 | | | $ | 250,399 | | | $ | 249,413 | |
| | | | | | | | | | | | | | | | | | | | | | | | |
Undistributed Net Investment Income (Loss) | | $ | 29,247 | | | $ | 28,842 | | | $ | 49,621 | | | $ | 49,668 | | | $ | 5,486 | | | $ | 5,868 | |
| | | | | | | | | | | | | | | | | | | | | | | | |
Portfolio Share Transactions: | | | | | | | | | | | | | | | | | | | | | | | | |
Shares Sold | | | 119,181 | | | | 99,579 | | | | 80,453 | | | | 73,136 | | | | 11,471 | | | | 13,139 | |
Reinvestment of Distributions Paid | | | 27,365 | | | | 39,757 | | | | 79,834 | | | | 109,271 | | | | 13,456 | | | | 16,190 | |
Shares Redeemed | | | (77,141 | ) | | | (54,336 | ) | | | (193,183 | ) | | | (173,529 | ) | | | (27,323 | ) | | | (26,610 | ) |
| | | | | | | | | | | | | | | | | | | | | | | | |
Net Increase (Decrease) in Shares Resulting from Portfolio Share Transactions | | | 69,405 | | | | 85,000 | | | | (32,896 | ) | | | 8,878 | | | | (2,396 | ) | | | 2,719 | |
| | | | | | | | | | | | | | | | | | | | | | | | |
The Accompanying Notes are an Integral Part of the Financial Statements.
| | | | | | |
| | Statements of Changes in Net Assets | | | 195 | |
Statement of Cash Flows
Northwestern Mutual Series Fund, Inc.
For the Year Ended December 31, 2016 (in thousands)
| | | | |
| | | Long-Term U.S.
Government
Bond Portfolio | |
Cash Flows from Operating Activities | | | | |
Net Increase (Decrease) in Net Assets Resulting from Operations | | $ | 186 | |
Adjustments to Reconcile Net Increase (Decrease) in Net Assets Resulting from Operations to Net Cash from Operating Activities | | | | |
Purchase of Investment Securities | | | (210,024 | ) |
Proceeds from Disposition of Investment Securities | | | 174,096 | |
Proceeds from Disposition (Purchase) of Short-Term Investments, net | | | 2,400 | |
Proceeds from (Payments for) Closed Futures Contracts | | | 37 | |
Proceeds from (Payments for) Swap Contracts | | | 957 | |
Premiums Received for Options Written | | | 5 | |
Amortization (Accretion) of Premium/Discount, net | | | 113 | |
(Increase) Decrease in: | | | | |
Cash Collateral for Derivative Positions | | | (980 | ) |
Receivable for Investment Securities Sold | | | 38,968 | |
Dividends and Interest Receivable | | | (166 | ) |
Increase (Decrease) in: | | | | |
Payable for Investment Securities Purchased | | | 12,239 | |
Payable for Reverse Repurchase Agreement | | | 1,568 | |
Payable for Investment Advisory Fees | | | 3 | |
Accrued Expenses | | | 2 | |
Change in Net Unrealized (Appreciation) Depreciation of: | | | | |
Investment Securities | | | 9,782 | |
Futures Contracts | | | 12 | |
Swap Contracts | | | (1,024 | ) |
Net Realized (Gain) Loss from: | | | | |
Investment Securities | | | (6,371 | ) |
Futures Contracts | | | (55 | ) |
Options Written | | | (5 | ) |
Paydowns | | | (4 | ) |
Swap Contracts | | | 145 | |
| | | | |
Total Adjustments | | | 21,698 | |
| | | | |
Net Cash (Used in) Provided by Operating Activities | | | 21,884 | |
| | | | |
Cash Flows from Financing Activities | | | | |
Cash Received from Financing Transactions | | | 1,011,148 | |
Cash (Used for) Financing Transactions | | | (1,033,361 | ) |
Proceeds from Capital Shares Sold | | | 31,915 | |
Payment on Capital Shares Redeemed | | | (26,294 | ) |
| | | | |
Net Cash (Used in) Provided by Financing Activities | | | (16,592 | ) |
| | | | |
Net Increase (Decrease) in Cash and Cash Equivalents | | | 5,292 | |
Cash and Cash Equivalents, Beginning of Period | | | 936 | |
| | | | |
Cash and Cash Equivalents, End of Period | | $ | 6,228 | |
| | | | |
Supplemental disclosure of cash flow information:
Non-cash financing activities not included herein consist of reinvestment of dividends and distributions of $4,300.
Interest paid was $156 for the period ended December 31, 2016.
The Accompanying Notes are an Integral Part of the Financial Statements.
| | | | |
| 196 | | Statement of Cash Flows | | |
Financial Highlights
(For a share outstanding throughout the period)
| | | | | | | | | | | | | | | | | | | | | | | | | | | | | | | | |
| | | Net Asset Value,
Beginning
of Period | | | Net Investment
Income (Loss) | | | Net Realized and
Unrealized Gain
(Loss) on
Investments | | | Total from
Investment
Operations | | | Distributions
from Net
Investment
Income | | | Distributions
from Realized
Gains on
Investments | | | Total
Distributions | | | Net Asset Value,
End of Period | |
Growth Stock Portfolio | |
2016 | | $ | 2.81 | | | $ | 0.03 | | | $ | 0.04 | | | $ | 0.07 | | | $ | (0.02 | ) | | $ | (0.28 | ) | | $ | (0.30 | ) | | $ | 2.58 | |
2015 | | | 2.87 | | | | 0.02 | | | | 0.15 | | | | 0.17 | | | | (0.02 | ) | | | (0.21 | ) | | | (0.23 | ) | | | 2.81 | |
2014 | | | 2.94 | | | | 0.02 | | | | 0.22 | | | | 0.24 | | | | (0.02 | ) | | | (0.29 | ) | | | (0.31 | ) | | | 2.87 | |
2013 | | | 2.35 | | | | 0.02 | | | | 0.78 | | | | 0.80 | | | | (0.02 | ) | | | (0.19 | ) | | | (0.21 | ) | | | 2.94 | |
2012 | | | 2.09 | | | | 0.02 | | | | 0.25 | | | | 0.27 | | | | (0.01 | ) | | | – | | | | (0.01 | ) | | | 2.35 | |
Focused Appreciation Portfolio | |
2016 | | $ | 2.68 | | | $ | 0.02 | | | $ | 0.17 | | | $ | 0.19 | | | $ | (0.01 | )(e) | | $ | (0.78 | ) | | $ | (0.79 | ) | | $ | 2.08 | |
2015 | | | 2.63 | | | | 0.01 | | | | 0.34 | | | | 0.35 | | | | – | | | | (0.30 | ) | | | (0.30 | ) | | | 2.68 | |
2014 | | | 2.69 | | | | 0.00 | (e) | | | 0.22 | | | | 0.22 | | | | (0.00 | )(e) | | | (0.28 | ) | | | (0.28 | ) | | | 2.63 | |
2013 | | | 2.09 | | | | 0.00 | (e) | | | 0.61 | | | | 0.61 | | | | (0.01 | ) | | | – | | | | (0.01 | ) | | | 2.69 | |
2012 | | | 1.75 | | | | 0.01 | | | | 0.34 | | | | 0.35 | | | | (0.01 | ) | | | – | | | | (0.01 | ) | | | 2.09 | |
Large Cap Core Stock Portfolio | |
2016 | | $ | 1.54 | | | $ | 0.03 | | | $ | 0.09 | | | $ | 0.12 | | | $ | (0.03 | ) | | $ | (0.03 | ) | | $ | (0.06 | ) | | $ | 1.60 | |
2015 | | | 1.65 | | | | 0.03 | | | | (0.08 | ) | | | (0.05 | ) | | | (0.04 | ) | | | (0.02 | ) | | | (0.06 | ) | | | 1.54 | |
2014 | | | 1.70 | | | | 0.04 | | | | 0.10 | | | | 0.14 | | | | (0.03 | ) | | | (0.16 | ) | | | (0.19 | ) | | | 1.65 | |
2013 | | | 1.34 | | | | 0.03 | | | | 0.35 | | | | 0.38 | | | | (0.02 | ) | | | – | | | | (0.02 | ) | | | 1.70 | |
2012 | | | 1.21 | | | | 0.02 | | | | 0.13 | | | | 0.15 | | | | (0.02 | ) | | | – | | | | (0.02 | ) | | | 1.34 | |
Large Cap Blend Portfolio | |
2016 | | $ | 1.03 | | | $ | 0.01 | | | $ | 0.12 | | | $ | 0.13 | | | $ | (0.01 | ) | | $ | (0.08 | ) | | $ | (0.09 | ) | | $ | 1.07 | |
2015 | | | 1.12 | | | | 0.01 | | | | (0.03 | ) | | | (0.02 | ) | | | (0.01 | ) | | | (0.06 | ) | | | (0.07 | ) | | | 1.03 | |
2014 | | | 1.04 | | | | 0.01 | | | | 0.11 | | | | 0.12 | | | | (0.00 | )(e) | | | (0.04 | ) | | | (0.04 | ) | | | 1.12 | |
2013 | | | 0.83 | | | | 0.01 | | | | 0.25 | | | | 0.26 | | | | (0.01 | ) | | | (0.04 | ) | | | (0.05 | ) | | | 1.04 | |
2012 | | | 0.76 | | | | 0.01 | | | | 0.10 | | | | 0.11 | | | | (0.01 | ) | | | (0.03 | ) | | | (0.04 | ) | | | 0.83 | |
Index 500 Stock Portfolio | |
2016 | | $ | 3.88 | | | $ | 0.08 | | | $ | 0.37 | | | $ | 0.45 | | | $ | (0.07 | ) | | $ | (0.09 | ) | | $ | (0.16 | ) | | $ | 4.17 | |
2015 | | | 3.98 | | | | 0.07 | | | | (0.03 | ) | | | 0.04 | | | | (0.07 | ) | | | (0.07 | ) | | | (0.14 | ) | | | 3.88 | |
2014 | | | 3.61 | | | | 0.07 | | | | 0.41 | | | | 0.48 | | | | (0.06 | ) | | | (0.05 | ) | | | (0.11 | ) | | | 3.98 | |
2013 | | | 2.84 | | | | 0.06 | | | | 0.84 | | | | 0.90 | | | | (0.06 | ) | | | (0.07 | ) | | | (0.13 | ) | | | 3.61 | |
2012 | | | 2.54 | | | | 0.06 | | | | 0.34 | | | | 0.40 | | | | (0.05 | ) | | | (0.05 | ) | | | (0.10 | ) | | | 2.84 | |
Large Company Value Portfolio | |
2016 | | $ | 0.99 | | | $ | 0.02 | | | $ | 0.12 | | | $ | 0.14 | | | $ | (0.02 | ) | | $ | (0.09 | ) | | $ | (0.11 | ) | | $ | 1.02 | |
2015 | | | 1.15 | | | | 0.02 | | | | (0.06 | ) | | | (0.04 | ) | | | (0.02 | ) | | | (0.10 | ) | | | (0.12 | ) | | | 0.99 | |
2014 | | | 1.07 | | | | 0.02 | | | | 0.12 | | | | 0.14 | | | | – | | | | (0.06 | ) | | | (0.06 | ) | | | 1.15 | |
2013 | | | 0.84 | | | | 0.02 | | | | 0.24 | | | | 0.26 | | | | (0.01 | ) | | | (0.02 | ) | | | (0.03 | ) | | | 1.07 | |
2012 | | | 0.73 | | | | 0.02 | | | | 0.11 | | | | 0.13 | | | | (0.02 | ) | | | – | | | | (0.02 | ) | | | 0.84 | |
Domestic Equity Portfolio | |
2016 | | $ | 1.41 | | | $ | 0.03 | | | $ | 0.19 | | | $ | 0.22 | | | $ | (0.03 | ) | | $ | (0.06 | ) | | $ | (0.09 | ) | | $ | 1.54 | |
2015 | | | 1.44 | | | | 0.03 | | | | (0.03 | ) | | | – | | | | (0.03 | ) | | | – | | | | (0.03 | ) | | | 1.41 | |
2014 | | | 1.29 | | | | 0.03 | | | | 0.14 | | | | 0.17 | | | | (0.02 | ) | | | – | | | | (0.02 | ) | | | 1.44 | |
2013 | | | 0.98 | | | | 0.02 | | | | 0.31 | | | | 0.33 | | | | (0.02 | ) | | | – | | | | (0.02 | ) | | | 1.29 | |
2012 | | | 0.87 | | | | 0.02 | | | | 0.11 | | | | 0.13 | | | | (0.02 | ) | | | – | | | | (0.02 | ) | | | 0.98 | |
| (e) | Amount is less than $0.005. |
The Accompanying Notes are an Integral Part of the Financial Statements.
| | | | | | | | | | | | | | | | | | | | | | |
| Total Return(d) | | | Net Assets, End
of Period
(thousands) | | | Ratio of Gross
Expenses to
Average Net
Assets | | | Ratio of Net
Expenses to
Average Net
Assets | | | Ratio of Net
Investment
Income (Loss) to
Average Net
Assets | | | Portfolio
Turnover Rate | |
| | | | | | | | | | | | | | | | | | | | | | |
| | 2.47 | % | | $ | 837,980 | | | | 0.43 | % | | | 0.43 | % | | | 0.97 | % | | | 65.66 | % |
| | 6.01 | | | | 860,348 | | | | 0.43 | | | | 0.42 | | | | 0.82 | | | | 50.12 | |
| | 9.02 | | | | 885,880 | | | | 0.43 | | | | 0.41 | | | | 0.76 | | | | 42.36 | |
| | 35.86 | | | | 847,384 | | | | 0.44 | | | | 0.43 | | | | 0.79 | | | | 85.54 | |
| | 12.94 | | | | 533,815 | | | | 0.45 | | | | 0.44 | | | | 0.90 | | | | 68.40 | |
| | | | | | | | | | | | | | | | | | | | | | |
| | 5.87 | % | | $ | 771,800 | | | | 0.76 | % | | | 0.63 | % | | | 0.83 | % | | | 9.38 | % |
| | 13.64 | | | | 778,837 | | | | 0.76 | | | | 0.63 | | | | 0.27 | | | | 131.33 | |
| | 9.43 | | | | 722,379 | | | | 0.77 | | | | 0.64 | | | | (0.02 | ) | | | 54.58 | |
| | 29.01 | | | | 624,512 | | | | 0.79 | | | | 0.71 | | | | 0.04 | | | | 63.90 | |
| | 20.14 | | | | 388,620 | | | | 0.79 | | | | 0.73 | | | | 0.71 | | | | 15.65 | |
| | | | | | | | | | | | | | | | | | | | | | |
| | 7.57 | % | | $ | 514,495 | | | | 0.45 | % | | | 0.45 | % | | | 1.96 | % | | | 6.83 | % |
| | (3.06 | ) | | | 509,411 | | | | 0.45 | | | | 0.44 | | | | 2.04 | | | | 13.36 | |
| | 8.56 | | | | 555,639 | | | | 0.45 | | | | 0.44 | | | | 2.08 | | | | 5.92 | |
| | 28.58 | | | | 538,368 | | | | 0.46 | | | | 0.46 | | | | 1.78 | | | | 72.60 | |
| | 11.63 | | | | 384,679 | | | | 0.46 | | | | 0.46 | | | | 1.43 | | | | 74.09 | |
| | | | | | | | | | | | | | | | | | | | | | |
| | 13.99 | % | | $ | 164,752 | | | | 0.82 | % | | | 0.81 | % | | | 0.97 | % | | | 21.12 | % |
| | (2.42 | ) | | | 153,841 | | | | 0.81 | | | | 0.81 | | | | 0.99 | | | | 16.11 | |
| | 12.58 | | | | 166,948 | | | | 0.82 | | | | 0.82 | | | | 0.91 | | | | 27.31 | |
| | 30.86 | | | | 151,099 | | | | 0.83 | | | | 0.83 | | | | 1.01 | | | | 55.43 | |
| | 15.20 | | | | 78,700 | | | | 0.87 | | | | 0.84 | | | | 1.05 | | | | 132.66 | |
| | | | | | | | | | | | | | | | | | | | | | |
| | 11.73 | % | | $ | 2,678,914 | | | | 0.21 | % | | | 0.21 | % | | | 1.97 | % | | | 3.28 | % |
| | 1.17 | | | | 2,386,253 | | | | 0.21 | | | | 0.21 | | | | 1.87 | | | | 4.17 | |
| | 13.46 | | | | 2,370,298 | | | | 0.22 | | | | 0.22 | | | | 1.84 | | | | 2.65 | |
| | 32.05 | | | | 2,164,501 | | | | 0.22 | | | | 0.22 | | | | 1.90 | | | | 3.76 | |
| | 15.76 | | | | 1,704,471 | | | | 0.22 | | | | 0.21 | | | | 2.12 | | | | 2.77 | |
| | | | | | | | | | | | | | | | | | | | | | |
| | 15.36 | % | | $ | 195,773 | | | | 0.75 | % | | | 0.72 | % | | | 2.07 | % | | | 79.86 | % |
| | (3.85 | ) | | | 174,429 | | | | 0.74 | | | | 0.71 | | | | 1.49 | | | | 52.53 | |
| | 13.03 | | | | 190,954 | | | | 0.75 | | | | 0.72 | | | | 1.55 | | | | 55.92 | |
| | 31.29 | | | | 170,062 | | | | 0.78 | | | | 0.76 | | | | 1.73 | | | | 49.12 | |
| | 16.47 | | | | 86,915 | | | | 0.82 | | | | 0.79 | | | | 1.99 | | | | 34.71 | |
| | | | | | | | | | | | | | | | | | | | | | |
| | 14.98 | % | | $ | 720,940 | | | | 0.55 | % | | | 0.55 | % | | | 2.00 | % | | | 12.24 | % |
| | (0.09 | ) | | | 610,458 | | | | 0.56 | | | | 0.55 | | | | 2.06 | | | | 14.15 | |
| | 13.87 | | | | 620,021 | | | | 0.56 | | | | 0.56 | | | | 1.92 | | | | 7.97 | |
| | 34.03 | | | | 570,648 | | | | 0.57 | | | | 0.57 | | | | 2.10 | | | | 17.09 | |
| | 14.35 | | | | 400,058 | | | | 0.58 | | | | 0.58 | | | | 2.23 | | | | 134.18 | |
| (d) | Total Return includes deductions for management and other fund expenses; excludes deductions for sales loads and account fees, not annualized for periods less than one year. |
The Accompanying Notes are an Integral Part of the Financial Statements.
Financial Highlights
(For a share outstanding throughout the period)
| | | | | | | | | | | | | | | | | | | | | | | | | | | | | | | | |
| | | Net Asset Value,
Beginning of Period | | | Net Investment
Income (Loss) | | | Net Realized and
Unrealized Gain
(Loss) on
Investments | | | Total from
Investment
Operations | | | Distributions
from Net
Investment
Income | | | Distributions
from Realized
Gains on
Investments | | | Total
Distributions | | | Net Asset Value,
End of Period | |
Equity Income Portfolio | |
2016 | | $ | 1.56 | | | $ | 0.04 | | | $ | 0.24 | | | $ | 0.28 | | | $ | (0.03 | ) | | $ | (0.09 | ) | | $ | (0.12 | ) | | $ | 1.72 | |
2015 | | | 1.77 | | | | 0.03 | | | | (0.14 | ) | | | (0.11 | ) | | | (0.03 | ) | | | (0.07 | ) | | | (0.10 | ) | | | 1.56 | |
2014 | | | 1.72 | | | | 0.03 | | | | 0.10 | | | | 0.13 | | | | (0.02 | ) | | | (0.06 | ) | | | (0.08 | ) | | | 1.77 | |
2013 | | | 1.34 | | | | 0.03 | | | | 0.37 | | | | 0.40 | | | | (0.02 | ) | | | - | | | | (0.02 | ) | | | 1.72 | |
2012 | | | 1.16 | | | | 0.03 | | | | 0.17 | | | | 0.20 | | | | (0.02 | ) | | | - | | | | (0.02 | ) | | | 1.34 | |
Mid Cap Growth Stock Portfolio | |
2016 | | $ | 3.11 | | | $ | 0.01 | | | $ | 0.02 | | | $ | 0.03 | | | $ | (0.01 | ) | | $ | (0.25 | ) | | $ | (0.26 | ) | | $ | 2.88 | |
2015 | | | 3.40 | | | | 0.01 | | | | 0.02 | | | | 0.03 | | | | (0.00 | )(e) | | | (0.32 | ) | | | (0.32 | ) | | | 3.11 | |
2014 | | | 3.92 | | | | 0.01 | | | | 0.27 | | | | 0.28 | | | | (0.01 | ) | | | (0.79 | ) | | | (0.80 | ) | | | 3.40 | |
2013 | | | 3.26 | | | | 0.02 | | | | 0.80 | | | | 0.82 | | | | (0.01 | ) | | | (0.15 | ) | | | (0.16 | ) | | | 3.92 | |
2012 | | | 2.92 | | | | 0.01 | | | | 0.33 | | | | 0.34 | | | | (0.00 | )(e) | | | - | | | | (0.00 | )(e) | | | 3.26 | |
Index 400 Stock Portfolio | |
2016 | | $ | 1.77 | | | $ | 0.02 | | | $ | 0.33 | | | $ | 0.35 | | | $ | (0.02 | ) | | $ | (0.14 | ) | | $ | (0.16 | ) | | $ | 1.96 | |
2015 | | | 1.96 | | | | 0.02 | | | | (0.07 | ) | | | (0.05 | ) | | | (0.02 | ) | | | (0.12 | ) | | | (0.14 | ) | | | 1.77 | |
2014 | | | 1.90 | | | | 0.02 | | | | 0.15 | | | | 0.17 | | | | (0.02 | ) | | | (0.09 | ) | | | (0.11 | ) | | | 1.96 | |
2013 | | | 1.49 | | | | 0.02 | | | | 0.47 | | | | 0.49 | | | | (0.02 | ) | | | (0.06 | ) | | | (0.08 | ) | | | 1.90 | |
2012 | | | 1.34 | | | | 0.02 | | | | 0.21 | | | | 0.23 | | | | (0.01 | ) | | | (0.07 | ) | | | (0.08 | ) | | | 1.49 | |
Mid Cap Value Portfolio | |
2016 | | $ | 1.54 | | | $ | 0.03 | | | $ | 0.32 | | | $ | 0.35 | | | $ | (0.03 | ) | | $ | (0.13 | ) | | $ | (0.16 | ) | | $ | 1.73 | |
2015 | | | 1.77 | | | | 0.02 | | | | (0.04 | ) | | | (0.02 | ) | | | (0.03 | ) | | | (0.18 | ) | | | (0.21 | ) | | | 1.54 | |
2014 | | | 1.67 | | | | 0.03 | | | | 0.24 | | | | 0.27 | | | | (0.02 | ) | | | (0.15 | ) | | | (0.17 | ) | | | 1.77 | |
2013 | | | 1.30 | | | | 0.02 | | | | 0.37 | | | | 0.39 | | | | (0.01 | ) | | | (0.01 | ) | | | (0.02 | ) | | | 1.67 | |
2012 | | | 1.13 | | | | 0.03 | | | | 0.16 | | | | 0.19 | | | | (0.02 | ) | | | - | | | | (0.02 | ) | | | 1.30 | |
Small Cap Growth Stock Portfolio | |
2016 | | $ | 2.37 | | | $ | 0.00 | (e) | | $ | 0.28 | | | $ | 0.28 | | | $ | (0.01 | ) | | $ | (0.25 | ) | | $ | (0.26 | ) | | $ | 2.39 | |
2015 | | | 2.50 | | | | 0.01 | | | | (0.01 | ) | | | - | | | | (0.00 | )(e) | | | (0.13 | ) | | | (0.13 | ) | | | 2.37 | |
2014 | | | 2.60 | | | | 0.00 | (e) | | | 0.20 | | | | 0.20 | | | | - | | | | (0.30 | ) | | | (0.30 | ) | | | 2.50 | |
2013 | | | 1.88 | | | | 0.00 | (e) | | | 0.73 | | | | 0.73 | | | | (0.01 | ) | | | - | | | | (0.01 | ) | | | 2.60 | |
2012 | | | 1.72 | | | | 0.00 | (e) | | | 0.16 | | | | 0.16 | | | | - | | | | - | | | | - | | | | 1.88 | |
Index 600 Stock Portfolio | |
2016 | | $ | 1.13 | | | $ | 0.01 | | | $ | 0.29 | | | $ | 0.30 | | | $ | (0.01 | ) | | $ | (0.06 | ) | | $ | (0.07 | ) | | $ | 1.36 | |
2015 | | | 1.16 | | | | 0.01 | | | | (0.04 | ) | | | (0.03 | ) | | | - | | | | (0.00 | )(e) | | | (0.00 | )(e) | | | 1.13 | |
2014 | | | 1.33 | | | | 0.01 | | | | 0.06 | | | | 0.07 | | | | (0.02 | ) | | | (0.22 | ) | | | (0.24 | ) | | | 1.16 | |
2013 | | | 1.01 | | | | 0.01 | | | | 0.39 | | | | 0.40 | | | | (0.04 | ) | | | (0.04 | ) | | | (0.08 | ) | | | 1.33 | |
2012 | | | 0.91 | | | | 0.01 | | | | 0.14 | | | | 0.15 | | | | (0.03 | ) | | | (0.02 | ) | | | (0.05 | ) | | | 1.01 | |
Small Cap Value Portfolio | |
2016 | | $ | 2.10 | | | $ | 0.02 | | | $ | 0.61 | | | $ | 0.63 | | | $ | (0.02 | ) | | $ | (0.29 | ) | | $ | (0.31 | ) | | $ | 2.42 | |
2015 | | | 2.38 | | | | 0.02 | | | | (0.14 | ) | | | (0.12 | ) | | | (0.02 | ) | | | (0.14 | ) | | | (0.16 | ) | | | 2.10 | |
2014 | | | 2.45 | | | | 0.02 | | | | (0.02 | ) | | | 0.00 | (e) | | | (0.01 | ) | | | (0.06 | ) | | | (0.07 | ) | | | 2.38 | |
2013 | | | 1.89 | | | | 0.01 | | | | 0.59 | | | | 0.60 | | | | (0.03 | ) | | | (0.01 | ) | | | (0.04 | ) | | | 2.45 | |
2012 | | | 1.65 | | | | 0.03 | | | | 0.24 | | | | 0.27 | | | | (0.01 | ) | | | (0.02 | ) | | | (0.03 | ) | | | 1.89 | |
| (e) | Amount is less than $0.005. |
The Accompanying Notes are an Integral Part of the Financial Statements.
| | | | | | | | | | | | | | | | | | | | | | |
| Total Return(d) | | | Net Assets, End
of Period
(thousands) | | | Ratio of Gross
Expenses to
Average Net
Assets | | | Ratio of Net
Expenses to
Average
Net Assets | | | Ratio of Net
Investment
Income (Loss) to
Average Net Assets | | | Portfolio
Turnover Rate | |
| | | | | | | | | | | | | | | | | | | | | | |
| | 19.17 | % | | $ | 798,167 | | | | 0.66 | % | | | 0.64 | % | | | 2.42 | % | | | 23.09 | % |
| | (6.74 | ) | | | 732,781 | | | | 0.65 | | | | 0.65 | | | | 2.08 | | | | 37.97 | |
| | 7.43 | | | | 781,735 | | | | 0.66 | | | | 0.66 | | | | 1.94 | | | | 13.56 | |
| | 29.94 | | | | 676,031 | | | | 0.67 | | | | 0.67 | | | | 1.77 | | | | 15.98 | |
| | 17.23 | | | | 409,097 | | | | 0.68 | | | | 0.68 | | | | 2.21 | | | | 16.21 | |
| | | | | | | | | | | | | | | | | | | | | | |
| | 0.83 | % | | $ | 983,395 | | | | 0.54 | % | | | 0.54 | % | | | 0.29 | % | | | 57.23 | % |
| | 0.71 | | | | 1,025,151 | | | | 0.53 | | | | 0.52 | | | | 0.17 | | | | 68.54 | |
| | 8.49 | | | | 1,098,155 | | | | 0.54 | | | | 0.51 | | | | 0.25 | | | | 82.51 | |
| | 25.53 | | | | 1,073,332 | | | | 0.54 | | | | 0.52 | | | | 0.44 | | | | 137.80 | |
| | 11.97 | | | | 828,953 | | | | 0.54 | | | | 0.52 | | | | 0.39 | | | | 63.30 | |
| | | | | | | | | | | | | | | | | | | | | | |
| | 20.38 | % | | $ | 773,157 | | | | 0.28 | % | | | 0.27 | % | | | 1.31 | % | | | 19.44 | % |
| | (2.38 | ) | | | 634,401 | | | | 0.28 | | | | 0.27 | | | | 1.23 | | | | 18.70 | |
| | 9.42 | | | | 652,404 | | | | 0.28 | | | | 0.27 | | | | 1.25 | | | | 12.20 | |
| | 33.16 | | | | 624,092 | | | | 0.29 | | | | 0.28 | | | | 1.15 | | | | 11.21 | |
| | 17.64 | | | | 479,041 | | | | 0.28 | | | | 0.28 | | | | 1.27 | | | | 10.91 | |
| | | | | | | | | | | | | | | | | | | | | | |
| | 23.23 | % | | $ | 518,217 | | | | 0.89 | % | | | 0.77 | % | | | 1.71 | % | | | 53.81 | % |
| | (1.33 | ) | | | 410,233 | | | | 0.89 | | | | 0.77 | | | | 1.38 | | | | 71.46 | |
| | 16.69 | | | | 427,853 | | | | 0.90 | | | | 0.78 | | | | 1.56 | | | | 66.16 | |
| | 30.24 | | | | 343,933 | | | | 0.91 | | | | 0.85 | | | | 1.54 | | | | 68.43 | |
| | 16.57 | | | | 163,223 | | | | 0.93 | | | | 0.93 | | | | 2.14 | | | | 75.97 | |
| | | | | | | | | | | | | | | | | | | | | | |
| | 12.25 | % | | $ | 545,052 | | | | 0.58 | % | | | 0.58 | % | | | 0.19 | % | | | 44.26 | % |
| | 0.32 | | | | 494,932 | | | | 0.57 | | | | 0.56 | | | | 0.22 | | | | 48.21 | |
| | 8.66 | | | | 529,548 | | | | 0.57 | | | | 0.57 | | | | 0.12 | | | | 27.07 | |
| | 38.60 | | | | 520,492 | | | | 0.59 | | | | 0.59 | | | | 0.00 | | | | 155.34 | |
| | 9.48 | | | | 376,226 | | | | 0.59 | | | | 0.59 | | | | (0.12 | ) | | | 76.49 | |
| | | | | | | | | | | | | | | | | | | | | | |
| | 26.12 | % | | $ | 173,883 | | | | 0.36 | % | | | 0.35 | % | | | 1.00 | % | | | 52.14 | % |
| | (2.35 | ) | | | 113,993 | | | | 0.36 | | | | 0.34 | | | | 0.95 | | | | 46.59 | |
| | 5.34 | | | | 101,286 | | | | 0.39 | | | | 0.35 | | | | 0.93 | | | | 49.73 | |
| | 40.67 | | | | 123,487 | | | | 0.38 | | | | 0.35 | | | | 0.76 | | | | 47.23 | |
| | 15.80 | | | | 73,722 | | | | 0.42 | | | | 0.35 | | | | 1.36 | | | | 38.47 | |
| | | | | | | | | | | | | | | | | | | | | | |
| | 32.39 | % | | $ | 647,830 | | | | 0.89 | % | | | 0.88 | % | | | 0.93 | % | | | 24.02 | % |
| | (5.45 | ) | | | 514,970 | | | | 0.88 | | | | 0.88 | | | | 1.00 | | | | 35.53 | |
| | 0.22 | | | | 583,367 | | | | 0.88 | | | | 0.88 | | | | 0.81 | | | | 16.29 | |
| | 31.76 | | | | 576,830 | | | | 0.88 | | | | 0.88 | | | | 0.46 | | | | 9.17 | |
| | 16.33 | | | | 409,648 | | | | 0.88 | | | | 0.88 | | | | 1.54 | | | | 5.82 | |
| (d) | Total Return includes deductions for management and other fund expenses; excludes deductions for sales loads and account fees, not annualized for periods less than one year. |
The Accompanying Notes are an Integral Part of the Financial Statements.
Financial Highlights Portfolio
(For a share outstanding throughout the period)
| | | | | | | | | | | | | | | | | | | | | | | | | | | | | | | | |
| | | Net Asset Value,
Beginning
of Period | | | Net Investment
Income (Loss) | | | Net Realized and
Unrealized Gain
(Loss) on
Investments | | | Total from
Investment
Operations | | | Distributions
from Net
Investment
Income | | | Distributions
from Realized
Gains on
Investments | | | Total
Distributions | | | Net Asset Value,
End of Period | |
International Growth Portfolio | |
2016 | | $ | 1.30 | | | $ | 0.02 | | | $ | (0.07 | ) | | $ | (0.05 | ) | | $ | (0.01 | ) | | $ | - | | | $ | (0.01 | ) | | $ | 1.24 | |
2015 | | | 1.34 | | | | 0.02 | | | | (0.04 | ) | | | (0.02 | ) | | | (0.02 | ) | | | - | | | | (0.02 | ) | | | 1.30 | |
2014 | | | 1.43 | | | | 0.02 | | | | (0.09 | ) | | | (0.07 | ) | | | (0.02 | ) | | | - | | | | (0.02 | ) | | | 1.34 | |
2013 | | | 1.21 | | | | 0.02 | | | | 0.22 | | | | 0.24 | | | | (0.02 | ) | | | - | | | | (0.02 | ) | | | 1.43 | |
2012 | | | 1.04 | | | | 0.02 | | | | 0.17 | | | | 0.19 | | | | (0.02 | ) | | | - | | | | (0.02 | ) | | | 1.21 | |
Research International Core Portfolio | |
2016 | | $ | 0.85 | | | $ | 0.02 | | | $ | (0.03 | ) | | $ | (0.01 | ) | | $ | (0.01 | ) | | $ | (0.01 | ) | | $ | (0.02 | ) | | $ | 0.82 | |
2015 | | | 0.90 | | | | 0.02 | | | | (0.03 | ) | | | (0.01 | ) | | | (0.02 | ) | | | (0.02 | ) | | | (0.04 | ) | | | 0.85 | |
2014 | | | 0.99 | | | | 0.02 | | | | (0.09 | ) | | | (0.07 | ) | | | (0.01 | ) | | | (0.01 | ) | | | (0.02 | ) | | | 0.90 | |
2013 | | | 0.83 | | | | 0.01 | | | | 0.15 | | | | 0.16 | | | | (0.00 | )(e) | | | - | | | | (0.00 | )(e) | | | 0.99 | |
2012 | | | 0.72 | | | | 0.01 | | | | 0.11 | | | | 0.12 | | | | (0.01 | ) | | | - | | | | (0.01 | ) | | | 0.83 | |
International Equity Portfolio | |
2016 | | $ | 1.61 | | | $ | 0.04 | | | $ | (0.00 | )(e) | | $ | 0.04 | | | $ | (0.03 | ) | | $ | (0.02 | ) | | $ | (0.05 | ) | | $ | 1.60 | |
2015 | | | 1.77 | | | | 0.04 | | | | (0.08 | ) | | | (0.04 | ) | | | (0.05 | ) | | | (0.07 | ) | | | (0.12 | ) | | | 1.61 | |
2014 | | | 2.13 | | | | 0.06 | | | | (0.24 | ) | | | (0.18 | ) | | | (0.04 | ) | | | (0.14 | ) | | | (0.18 | ) | | | 1.77 | |
2013 | | | 1.79 | | | | 0.04 | | | | 0.34 | | | | 0.38 | | | | (0.04 | ) | | | (0.00 | )(e) | | | (0.04 | ) | | | 2.13 | |
2012 | | | 1.52 | | | | 0.04 | | | | 0.27 | | | | 0.31 | | | | (0.04 | ) | | | - | | | | (0.04 | ) | | | 1.79 | |
Emerging Markets Equity Portfolio | |
2016 | | $ | 0.80 | | | $ | 0.01 | | | $ | 0.07 | | | $ | 0.08 | | | $ | (0.01 | ) | | $ | - | | | $ | (0.01 | ) | | $ | 0.87 | |
2015 | | | 0.93 | | | | 0.01 | | | | (0.13 | ) | | | (0.12 | ) | | | (0.01 | ) | | | - | | | | (0.01 | ) | | | 0.80 | |
2014 | | | 0.99 | | | | 0.01 | | | | (0.06 | ) | | | (0.05 | ) | | | (0.01 | ) | | | (0.00 | )(e) | | | (0.01 | ) | | | 0.93 | |
2013 | | | 1.06 | | | | 0.01 | | | | (0.07 | ) | | | (0.06 | ) | | | (0.01 | ) | | | (0.00 | )(e) | | | (0.01 | ) | | | 0.99 | |
2012 | | | 0.89 | | | | 0.01 | | | | 0.16 | | | | 0.17 | | | | (0.00 | )(e) | | | (0.00 | )(e) | | | (0.00 | )(e) | | | 1.06 | |
Government Money Market Portfolio | |
2016 | | $ | 1.00 | | | $ | 0.00 | (e) | | $ | - | | | $ | 0.00 | (e) | | $ | (0.00 | )(e) | | $ | (0.00 | )(e) | | $ | (0.00 | )(e) | | $ | 1.00 | |
2015 | | | 1.00 | | | | 0.00 | (e) | | | - | | | | 0.00 | (e) | | | (0.00 | )(e) | | | (0.00 | )(e) | | | (0.00 | )(e) | | | 1.00 | |
2014 | | | 1.00 | | | | 0.00 | (e) | | | - | | | | 0.00 | (e) | | | (0.00 | )(e) | | | - | | | | (0.00 | )(e) | | | 1.00 | |
2013 | | | 1.00 | | | | 0.00 | (e) | | | - | | | | 0.00 | (e) | | | (0.00 | )(e) | | | - | | | | (0.00 | )(e) | | | 1.00 | |
2012 | | | 1.00 | | | | 0.00 | (e) | | | - | | | | 0.00 | (e) | | | (0.00 | )(e) | | | - | | | | (0.00 | )(e) | | | 1.00 | |
Short-Term Bond Portfolio | |
2016 | | $ | 1.03 | | | $ | 0.01 | | | $ | - | | | $ | 0.01 | | | $ | (0.01 | ) | | $ | - | | | $ | (0.01 | ) | | $ | 1.03 | |
2015 | | | 1.03 | | | | 0.01 | | | | (0.00 | )(e) | | | 0.01 | | | | (0.01 | ) | | | - | | | | (0.01 | ) | | | 1.03 | |
2014 | | | 1.03 | | | | 0.01 | | | | - | | | | 0.01 | | | | (0.01 | ) | | | - | | | | (0.01 | ) | | | 1.03 | |
2013 | | | 1.03 | | | | 0.01 | | | | (0.01 | ) | | | 0.00 | (e) | | | (0.00 | )(e) | | | - | | | | (0.00 | )(e) | | | 1.03 | |
2012 | | | 1.02 | | | | 0.01 | | | | 0.01 | | | | 0.02 | | | | (0.01 | ) | | | - | | | | (0.01 | ) | | | 1.03 | |
Select Bond Portfolio | |
2016 | | $ | 1.25 | | | $ | 0.02 | | | $ | 0.03 | | | $ | 0.05 | | | $ | (0.03 | ) | | $ | (0.01 | ) | | $ | (0.04 | ) | | $ | 1.26 | |
2015 | | | 1.27 | | | | 0.02 | | | | (0.01 | ) | | | 0.01 | | | | (0.02 | ) | | | (0.01 | ) | | | (0.03 | ) | | | 1.25 | |
2014 | | | 1.23 | | | | 0.02 | | | | 0.05 | | | | 0.07 | | | | (0.03 | ) | | | - | | | | (0.03 | ) | | | 1.27 | |
2013 | | | 1.30 | | | | 0.03 | | | | (0.05 | ) | | | (0.02 | ) | | | (0.03 | ) | | | (0.02 | ) | | | (0.05 | ) | | | 1.23 | |
2012 | | | 1.31 | | | | 0.03 | | | | 0.03 | | | | 0.06 | | | | (0.04 | ) | | | (0.03 | ) | | | (0.07 | ) | | | 1.30 | |
| (e) | Amount is less than $0.005. |
The Accompanying Notes are an Integral Part of the Financial Statements.
| | | | | | | | | | | | | | | | | | | | | | |
| Total Return(d) | | | Net Assets, End
of Period
(thousands) | | | Ratio of Gross
Expenses to
Average Net
Assets | | | Ratio of Net
Expenses to
Average Net
Assets | | | Ratio of Net
Investment
Income (Loss) to
Average Net
Assets | | | Portfolio
Turnover Rate | |
| | | | | | | | | | | | | | | | | | | | | | |
| | (3.41 | )% | | $ | 523,122 | | | | 0.71 | % | | | 0.71 | % | | | 1.67 | % | | | 25.57 | % |
| | (1.73 | ) | | | 485,313 | | | | 0.74 | | | | 0.74 | | | | 1.12 | | | | 134.92 | |
| | (4.52 | ) | | | 436,931 | | | | 0.74 | | | | 0.74 | | | | 1.75 | | | | 64.20 | |
| | 19.81 | | | | 420,218 | | | | 0.76 | | | | 0.76 | | | | 1.20 | | | | 77.33 | |
| | 17.99 | | | | 329,718 | | | | 0.80 | | | | 0.80 | | | | 1.92 | | | | 65.36 | |
| | | | | | | | | | | | | | | | | | | | | | |
| | (1.12 | )% | | $ | 499,649 | | | | 0.92 | % | | | 0.88 | % | | | 1.99 | % | | | 40.80 | % |
| | (1.11 | ) | | | 498,395 | | | | 0.91 | | | | 0.91 | | | | 1.78 | | | | 32.43 | |
| | (6.71 | ) | | | 457,008 | | | | 0.94 | | | | 0.94 | | | | 2.45 | | | | 25.24 | |
| | 18.92 | | | | 412,413 | | | | 0.98 | | | | 0.98 | | | | 1.65 | | | | 30.41 | |
| | 16.76 | | | | 261,268 | | | | 1.11 | | | | 1.11 | | | | 1.83 | | | | 42.10 | |
| | | | | | | | | | | | | | | | | | | | | | |
| | 2.89 | % | | $ | 1,628,267 | | | | 0.71 | % | | | 0.62 | % | | | 2.65 | % | | | 16.25 | % |
| | (2.21 | ) | | | 1,605,948 | | | | 0.73 | | | | 0.64 | | | | 2.05 | | | | 18.80 | |
| | (8.80 | ) | | | 1,635,378 | | | | 0.72 | | | | 0.66 | | | | 2.91 | | | | 17.84 | |
| | 21.38 | | | | 1,778,202 | | | | 0.73 | | | | 0.66 | | | | 2.10 | | | | 34.06 | |
| | 21.52 | | | | 1,485,696 | | | | 0.73 | | | | 0.68 | | | | 2.55 | | | | 41.34 | |
| | | | | | | | | | | | | | | | | | | | | | |
| | 9.06 | % | | $ | 521,800 | | | | 1.25 | % | | | 1.16 | % | | | 1.24 | % | | | 47.33 | % |
| | (12.24 | ) | | | 444,297 | | | | 1.32 | | | | 1.32 | | | | 0.91 | | | | 45.83 | |
| | (6.25 | ) | | | 416,997 | | | | 1.34 | | | | 1.35 | | | | 1.02 | | | | 45.75 | |
| | (5.15 | ) | | | 357,253 | | | | 1.40 | | | | 1.40 | | | | 0.81 | | | | 31.60 | |
| | 18.83 | | | | 256,476 | | | | 1.49 | | | | 1.48 | | | | 1.17 | | | | 27.32 | |
| | | | | | | | | | | | | | | | | | | | | | |
| | 0.13 | % | | $ | 501,635 | | | | 0.32 | % | | | 0.32 | % | | | 0.11 | % | | | - | % |
| | 0.01 | | | | 445,287 | | | | 0.33 | | | | 0.26 | | | | 0.01 | | | | - | |
| | 0.07 | | | | 438,752 | | | | 0.33 | | | | 0.07 | | | | 0.07 | | | | - | |
| | 0.10 | | | | 483,182 | | | | 0.32 | | | | 0.07 | | | | 0.10 | | | | - | |
| | 0.15 | | | | 483,437 | | | | 0.32 | (l) | | | 0.09 | (l) | | | 0.15 | | | | - | |
| | | | | | | | | | | | | | | | | | | | | | |
| | 1.67 | % | | $ | 269,833 | | | | 0.43 | % | | | 0.43 | % | | | 1.33 | % | | | 36.61 | % |
| | 0.72 | | | | 244,204 | | | | 0.43 | | | | 0.42 | | | | 1.17 | | | | 35.76 | |
| | 0.38 | | | | 234,487 | | | | 0.41 | | | | 0.41 | | | | 0.76 | | | | 196.15 | |
| | 0.55 | | | | 196,198 | | | | 0.42 | | | | 0.42 | | | | 0.76 | | | | 199.33 | |
| | 2.07 | | | | 145,036 | | | | 0.41 | | | | 0.40 | | | | 1.18 | | | | 267.65 | |
| | | | | | | | | | | | | | | | | | | | | | |
| | 3.06 | % | | $ | 2,839,045 | | | | 0.32 | % | | | 0.31 | % | | | 1.91 | % | | | 524.79 | %(g) |
| | 0.53 | | | | 2,856,958 | | | | 0.31 | | | | 0.31 | | | | 1.76 | | | | 476.41 | (g) |
| | 5.56 | | | | 2,841,156 | | | | 0.32 | | | | 0.32 | | | | 1.97 | | | | 308.80 | (g) |
| | (2.16 | ) | | | 1,712,896 | | | | 0.32 | | | | 0.32 | | | | 1.99 | | | | 131.49 | (g) |
| | 4.96 | | | | 1,685,293 | | | | 0.32 | | | | 0.31 | | | | 2.32 | | | | 130.37 | (g) |
| (d) | Total Return includes deductions for management and other fund expenses; excludes deductions for sales loads and account fees, not annualized for periods less than one year. |
| (l) | For the Money Market Portfolio, expense ratios reflect total expenses before a management fee waiver effective December 31, 2008, (“Gross Expense Ratio”) and after such waiver (“Net Expense Ratio”). |
| (g) | Portfolio Turnover Rate excludes the impact of mortgage dollar roll transactions. |
The Accompanying Notes are an Integral Part of the Financial Statements.
Financial Highlights
(For a share outstanding throughout the period)
| | | | | | | | | | | | | | | | | | | | | | | | | | | | | | | | |
| | | Net Asset Value,
Beginning
of Period | | | Net Investment
Income (Loss) | | | Net Realized and
Unrealized Gain
(Loss) on
Investments | | | Total from
Investment
Operations | | |
Distributions
from Net
Investment
Income | | | Distributions
from Realized
Gains on
Investments | | | Total
Distributions | | | Net Asset Value,
End of Period | |
Long-Term U.S. Government Bond Portfolio | |
2016 | | $ | 1.08 | | | $ | 0.03 | | | $ | (0.01 | ) | | $ | 0.02 | | | $ | (0.02 | ) | | $ | (0.02 | ) | | $ | (0.04 | ) | | $ | 1.06 | |
2015 | | | 1.12 | | | | 0.03 | | | | (0.05 | ) | | | (0.02 | ) | | | (0.02 | ) | | | - | | | | (0.02 | ) | | | 1.08 | |
2014 | | | 0.92 | | | | 0.03 | | | | 0.19 | | | | 0.22 | | | | (0.02 | ) | | | - | | | | (0.02 | ) | | | 1.12 | |
2013 | | | 1.07 | | | | 0.03 | | | | (0.18 | ) | | | (0.15 | ) | | | (0.00 | )(e) | | | (0.00 | )(e) | | | (0.00 | )(e) | | | 0.92 | |
2012 | | | 1.13 | | | | 0.03 | | | | 0.02 | | | | 0.05 | | | | (0.02 | ) | | | (0.09 | ) | | | (0.11 | ) | | | 1.07 | |
Inflation Protection Portfolio | |
2016 | | $ | 1.05 | | | $ | 0.02 | | | $ | 0.03 | | | $ | 0.05 | | | $ | (0.01 | ) | | $ | - | | | $ | (0.01 | ) | | $ | 1.09 | |
2015 | | | 1.10 | | | | 0.01 | | | | (0.03 | ) | | | (0.02 | ) | | | (0.03 | ) | | | - | | | | (0.03 | ) | | | 1.05 | |
2014 | | | 1.08 | | | | 0.01 | | | | 0.03 | | | | 0.04 | | | | (0.01 | ) | | | (0.01 | ) | | | (0.02 | ) | | | 1.10 | |
2013 | | | 1.22 | | | | 0.01 | | | | (0.12 | ) | | | (0.11 | ) | | | (0.01 | ) | | | (0.02 | ) | | | (0.03 | ) | | | 1.08 | |
2012 | | | 1.18 | | | | 0.02 | | | | 0.06 | | | | 0.08 | | | | (0.03 | ) | | | (0.01 | ) | | | (0.04 | ) | | | 1.22 | |
High Yield Bond Portfolio | |
2016 | | $ | 0.68 | | | $ | 0.04 | | | $ | 0.06 | | | $ | 0.10 | | | $ | (0.04 | ) | | $ | - | | | $ | (0.04 | ) | | $ | 0.74 | |
2015 | | | 0.72 | | | | 0.04 | | | | (0.05 | ) | | | (0.01 | ) | | | (0.03 | ) | | | - | | | | (0.03 | ) | | | 0.68 | |
2014 | | | 0.75 | | | | 0.04 | | | | (0.03 | ) | | | 0.01 | | | | (0.04 | ) | | | - | | | | (0.04 | ) | | | 0.72 | |
2013 | | | 0.75 | | | | 0.04 | | | | - | | | | 0.04 | | | | (0.04 | ) | | | - | | | | (0.04 | ) | | | 0.75 | |
2012 | | | 0.70 | | | | 0.05 | | | | 0.05 | | | | 0.10 | | | | (0.05 | ) | | | - | | | | (0.05 | ) | | | 0.75 | |
Multi-Sector Bond Portfolio | |
2016 | | $ | 0.99 | | | $ | 0.04 | | | $ | 0.07 | | | $ | 0.11 | | | $ | (0.05 | ) | | $ | - | | | $ | (0.05 | ) | | $ | 1.05 | |
2015 | | | 1.08 | | | | 0.04 | | | | (0.05 | ) | | | (0.01 | ) | | | (0.06 | ) | | | (0.02 | ) | | | (0.08 | ) | | | 0.99 | |
2014 | | | 1.08 | | | | 0.04 | | | | (0.01 | ) | | | 0.03 | | | | (0.03 | ) | | | - | | | | (0.03 | ) | | | 1.08 | |
2013 | | | 1.14 | | | | 0.04 | | | | (0.05 | ) | | | (0.01 | ) | | | (0.04 | ) | | | (0.01 | ) | | | (0.05 | ) | | | 1.08 | |
2012 | | | 1.00 | | | | 0.04 | | | | 0.11 | | | | 0.15 | | | | (0.01 | ) | | | (0.00 | )(e) | | | (0.01 | ) | | | 1.14 | |
Balanced Portfolio | |
2016 | | $ | 1.38 | | | $ | 0.02 | | | $ | 0.07 | | | $ | 0.09 | | | $ | (0.03 | ) | | $ | (0.04 | ) | | $ | (0.07 | ) | | $ | 1.40 | |
2015 | | | 1.48 | | | | 0.02 | | | | (0.02 | ) | | | - | | | | (0.03 | ) | | | (0.07 | ) | | | (0.10 | ) | | | 1.38 | |
2014 | | | 1.56 | | | | 0.02 | | | | 0.07 | | | | 0.09 | | | | (0.04 | ) | | | (0.13 | ) | | | (0.17 | ) | | | 1.48 | |
2013 | | | 1.51 | | | | 0.03 | | | | 0.14 | | | | 0.17 | | | | (0.05 | ) | | | (0.07 | ) | | | (0.12 | ) | | | 1.56 | |
2012 | | | 1.39 | | | | 0.03 | | | | 0.11 | | | | 0.14 | | | | (0.02 | ) | | | - | | | | (0.02 | ) | | | 1.51 | |
Asset Allocation Portfolio | |
2016 | | $ | 1.11 | | | $ | 0.02 | | | $ | 0.06 | | | $ | 0.08 | | | $ | (0.03 | ) | | $ | (0.04 | ) | | $ | (0.07 | ) | | $ | 1.12 | |
2015 | | | 1.20 | | | | 0.02 | | | | (0.03 | ) | | | (0.01 | ) | | | (0.02 | ) | | | (0.06 | ) | | | (0.08 | ) | | | 1.11 | |
2014 | | | 1.28 | | | | 0.01 | | | | 0.05 | | | | 0.06 | | | | (0.03 | ) | | | (0.11 | ) | | | (0.14 | ) | | | 1.20 | |
2013 | | | 1.13 | | | | 0.02 | | | | 0.17 | | | | 0.19 | | | | (0.04 | ) | | | - | | | | (0.04 | ) | | | 1.28 | |
2012 | | | 1.02 | | | | 0.02 | | | | 0.09 | | | | 0.11 | | | | 0.00 | (e) | | | - | | | | 0.00 | (e) | | | 1.13 | |
| (e) | Amount is less than $0.005. |
The Accompanying Notes are an Integral Part of the Financial Statements.
| | | | | | | | | | | | | | | | | | | | | | |
| Total Return(d) | | | Net Assets, End
of Period
(thousands) | | | Ratio of Gross
Expenses to
Average Net
Assets | | | Ratio of Net
Expenses to
Average Net
Assets | | | Ratio of Net
Investment
Income (Loss) to
Average Net
Assets | | | Portfolio
Turnover Rate | |
| | | | | | | | | | | | | | | | | | | | | | | |
| | 1.09 | % | | $ | 110,391 | | | | 0.77 | %(s) | | | 0.77 | %(s) | | | 2.19 | % | | | 126.34 | %(g)(t) |
| | (1.47) | | | | 104,513 | | | | 0.69 | (s) | | | 0.67 | (s) | | | 2.32 | | | | 32.93 | (g)(t) |
| | 23.73 | | | | 109,250 | | | | 0.68 | (s) | | | 0.67 | (s) | | | 2.67 | | | | 116.62 | (g)(t) |
| | - | | | | 87,627 | | | | 0.69 | (s) | | | 0.68 | (s) | | | 2.69 | | | | 125.96 | (g)(t) |
| | 3.75 | | | | 113,136 | | | | 0.66 | (s) | | | 0.65 | (s) | | | 2.35 | | | | 164.63 | (g)(t) |
| | | | | | | | | | | | | | | | | | | | | | | |
| | 4.68 | % | | $ | 326,927 | | | | 0.64 | % | | | 0.59 | % | | | 1.54 | % | | | 33.80 | % |
| | (2.20) | | | | 287,089 | | | | 0.63 | | | | 0.59 | | | | 0.52 | | | | 17.29 | |
| | 3.14 | | | | 285,685 | | | | 0.63 | | | | 0.59 | | | | 1.26 | | | | 20.25 | |
| | (8.33) | | | | 252,708 | | | | 0.64 | | | | 0.62 | | | | 0.91 | | | | 31.82 | |
| | 7.35 | | | | 254,176 | | | | 0.63 | | | | 0.62 | | | | 1.92 | | | | 77.11 | |
| | | | | | | | | | | | | | | | | | | | | | | |
| | 14.59 | % | | $ | 756,947 | | | | 0.47 | % | | | 0.46 | % | | | 5.83 | % | | | 35.58 | % |
| | (1.36) | | | | 688,124 | | | | 0.46 | | | | 0.46 | | | | 5.55 | | | | 27.49 | |
| | 1.18 | | | | 701,988 | | | | 0.47 | | | | 0.47 | | | | 5.43 | | | | 96.48 | |
| | 5.84 | | | | 518,387 | | | | 0.48 | | | | 0.48 | | | | 5.70 | | | | 53.07 | |
| | 13.89 | | | | 460,942 | | | | 0.48 | | | | 0.47 | | | | 6.50 | | | | 45.66 | |
| | | | | | | | | | | | | | | | | | | | | | | |
| | 11.09 | % | | $ | 689,849 | | | | 0.84 | % | | | 0.78 | % | | | 3.86 | % | | | 42.81 | % |
| | (2.22) | | | | 580,634 | | | | 0.85 | | | | 0.79 | | | | 4.13 | | | | 58.14 | (g)(t) |
| | 3.25 | | | | 546,059 | | | | 0.86 | | | | 0.81 | | | | 3.89 | | | | 58.51 | (g)(t) |
| | (1.58) | | | | 459,258 | | | | 0.88 | | | | 0.88 | | | | 3.91 | | | | 65.10 | (g) |
| | 14.94 | | | | 372,656 | | | | 0.86 | | | | 0.85 | | | | 4.11 | | | | 41.31 | (g) |
| | | | | | | | | | | | | | | | | | | | | | | |
| | 6.58 | % | | $ | 2,202,834 | | | | 0.31 | %(v) | | | 0.07 | %(v) | | | 1.73 | %(u) | | | 23.64 | % |
| | (0.12) | | | | 2,219,466 | | | | 0.31 | (v) | | | 0.08 | (v) | | | 1.43 | (u) | | | 13.53 | |
| | 5.56 | | | | 2,367,127 | | | | 0.32 | (v) | | | 0.16 | (v) | | | 1.29 | (u) | | | 56.83 | (g)(h) |
| | 12.08 | | | | 2,366,285 | | | | 0.32 | | | | 0.32 | | | | 1.91 | | | | 112.58 | (g) |
| | 9.69 | | | | 2,240,232 | | | | 0.31 | | | | 0.30 | | | | 2.18 | | | | 121.91 | (g) |
| | | | | | | | | | | | | | | | | | | | | | | |
| | 7.79 | % | | $ | 250,399 | | | | 0.58 | %(v) | | | 0.09 | %(v) | | | 1.69 | %(u) | | | 25.59 | % |
| | (0.43) | | | | 249,413 | | | | 0.58 | (v) | | | 0.08 | (v) | | | 1.47 | (u) | | | 15.36 | |
| | 5.15 | | | | 266,409 | | | | 0.62 | (v) | | | 0.23 | (v) | | | 1.13 | (u) | | | 39.50 | (g)(h) |
| | 16.67 | | | | 260,576 | | | | 0.65 | | | | 0.60 | | | | 1.65 | | | | 105.28 | (g) |
| | 11.02 | | | | 235,762 | | | | 0.63 | | | | 0.54 | | | | 1.84 | | | | 119.01 | (g) |
| (d) | Total Return includes deductions for management and other fund expenses; excludes deductions for sales loads and account fees, not annualized for periods less than one year. |
| (g) | Portfolio Turnover Rate excludes the impact of mortgage dollar roll transactions. (h) Portfolio Turnover Rate excludes the impact of in kind transactions. |
| (s) | The ratios of gross expenses to average net assets and net expenses to average net assets include interest expense. Excluding interest expense, the ratios would be 0.64% and 0.64% respectively for the period ended December 31, 2016, 0.67% and 0.64% respectively in 2015, 0.67% and 0.65% respectively in 2014, 0.67% and 0.65% respectively in 2014, 0.67% and 0.65% respectively in 2013, and 0.63% and 0.62% respectively in 2012. |
| (t) | Due to a change in accounting standards effective for 2012, certain financing transactions which were previously accounted for as a sale and subsequent repurchase are now accounted for as secured borrowing. |
| (u) | Net investment income is affected by the timing of dividend declaration by investee funds. |
| (v) | The ratios do not reflect the fund of fund’s proportionate share of income and expenses of the underlying investee funds. |
The Accompanying Notes are an Integral Part of the Financial Statements.
Notes to Financial Statements
Note 1. Organization
Northwestern Mutual Series Fund, Inc. (the “Series Fund”) is registered as an open-end management investment company under the Investment Company Act of 1940, as amended (“1940 Act”). The Series Fund is also considered an investment company following the accounting and reporting guidance in Financial Accounting Standards Board (“FASB”) Accounting Standards Codification (“ASC”) Topic 946. The Series Fund consists of the Growth Stock Portfolio, Focused Appreciation Portfolio, Large Cap Core Stock Portfolio, Large Cap Blend Portfolio, Index 500 Stock Portfolio, Large Company Value Portfolio, Domestic Equity Portfolio, Equity Income Portfolio, Mid Cap Growth Stock Portfolio, Index 400 Stock Portfolio, Mid Cap Value Portfolio, Small Cap Growth Stock Portfolio, Index 600 Stock Portfolio, Small Cap Value Portfolio, International Growth Portfolio, Research International Core Portfolio, International Equity Portfolio, Emerging Markets Equity Portfolio, Government Money Market Portfolio, Short-Term Bond Portfolio, Select Bond Portfolio, Long-Term U.S. Government Bond Portfolio, Inflation Protection Portfolio, High Yield Bond Portfolio, Multi-Sector Bond Portfolio, Balanced Portfolio and Asset Allocation Portfolio (each, a “Portfolio” or collectively, the “Portfolios”). All of the outstanding shares of each Portfolio are held by The Northwestern Mutual Life Insurance Company (“Northwestern Mutual”) for its segregated asset accounts (either directly or indirectly through one or more underlying Portfolios operating as affiliated fund of funds).
Prior to May 1, 2016, the Government Money Market Portfolio was named the Money Market Portfolio, and operated as a prime money market fund. Effective May 1, 2016, the Money Market Portfolio was renamed the Government Money Market Portfolio and began operating as a “government money market fund” as defined in Rule 2a-7 under the 1940 Act.
Note 2. Significant Accounting Policies
The following is a summary of significant accounting policies consistently followed by the Series Fund in the preparation of its financial statements.
A. Use of Estimates — The preparation of financial statements in conformity with accounting principles generally accepted in the United States of America (“U.S. GAAP”) requires management to make estimates and assumptions that affect the reported amounts of assets and liabilities at the date of the financial statements and the reported amounts of revenues and expenses during the reporting period. Actual results could differ from those estimates.
B. Foreign Income and Capital Gains Taxes — The Portfolios may be subject to income taxes imposed by certain countries in which they invest. Foreign withholding taxes on dividends and interest are netted against income and separately disclosed in the Statements of Operations.
Some of the Portfolios may be subject to capital gains taxes imposed by certain countries in which they invest. Any applicable foreign capital gains tax is accrued daily based upon net unrealized gains, and may be payable following the sale of any applicable investments.
C. Federal Income Taxes — The Portfolios’ policy is to continue to comply with the requirements of the Internal Revenue Code that are applicable to regulated investment companies and to distribute all of their taxable income to their respective shareholders. The Portfolios also intend to distribute sufficient net investment income and net capital gains, if any, so that they will not be subject to excise tax, as applicable, on distributable income and gains.
In accordance with the authoritative guidance for uncertainty in income taxes, management of the Series Fund has reviewed all open tax years (2013 to 2016) for major jurisdictions and concluded there was no material impact to the Portfolios’ net assets or results of operations. There is no material tax liability relating to uncertain income tax positions taken or expected to be taken in future tax returns. The Portfolios are also not aware of any tax positions for which it is reasonably possible that the total amounts of unrecognized tax benefits will significantly change in the next 12 months.
D. Distributions — Dividends from net investment income and net realized capital gains are declared and paid each business day for the Government Money Market Portfolio and at least annually for the remaining Portfolios, when applicable. During 2016 and 2015, the Government Money Market Portfolio utilized earnings and profits distributions to shareholders on redemption of shares as part of the dividends paid deduction for income tax purposes.
E. Other — The Portfolios record security transactions on trade date. The basis for determining cost on sale of securities is identified cost. Interest income is recorded daily on the accrual basis and dividend income is recorded on the ex-dividend date
| | | | |
| | Notes to Financial Statements | | 205 |
Notes to Financial Statements
or as soon as information from issuers is available. Where applicable, dividends are recorded net of foreign withholding tax. Discounts and premiums on securities purchased are amortized using the effective interest method. Expenses directly attributable to a Portfolio are incurred by the respective Portfolio. Expenses that are not directly attributable to one or more Portfolios are allocated among applicable Portfolios on an equitable and consistent basis considering such things as the nature and type of expenses and the relative net assets of the Portfolios. The Portfolios consider highly liquid temporary cash investments purchased with an original maturity of less than three months to be cash equivalents. Cash equivalents are included in the short-term investments on the Schedule of Investments as well as in investments on the Statement of Assets and Liabilities. Temporary cash overdrafts are reported as a payable to custodian.
F. New Accounting Pronouncements — In August 2016, the FASB issued an Accounting Standards Update (“ASU”) 2016-15 which amends ASC 230 to clarify guidance on the classification of certain cash receipts and cash payments in the statement of cash flows. The ASU is effective for annual periods beginning after December 15, 2017, and interim periods within those annual periods. At this time, management is evaluating the impact of these changes on the financial statements.
In October 2016, the U.S. Securities and Exchange Commission (“SEC”) adopted new rules and forms, and amendments to certain current rules and forms, to modernize reporting and disclosure of information by registered investment companies. The amendments to Regulation S-X will require standardized, enhanced disclosure about derivatives in investment company financial statements and will also change the rules governing the form and content of such financial statements. The amendments to Regulation S-X have a compliance date of August 1, 2017. At this time, management is assessing the anticipated impact of these regulatory developments.
In November 2016, the FASB issued ASU 2016-18 which amends ASC 230 to provide guidance on the classification and presentation of changes in restricted cash and restricted cash equivalents on the statement of cash flows. The ASU is effective for annual periods beginning after December, 15, 2017, and interim periods within those annual periods. At this time, management is evaluating the impact of these changes on the financial statements.
Note 3. Security Valuation
For purposes of calculating a net asset value, Portfolio securities and other assets are valued as of the close of trading on the New York Stock Exchange (“Exchange”) on each day during which the Exchange is open for trading.
The Fair Value Measurements and Disclosures Topic of the Financial Accounting Standards Codification defines fair value as the price that a fund would receive to sell an asset or pay to transfer a liability in an orderly transaction between market participants at the measurement date. It establishes and requires disclosure of a fair value hierarchy, separately for each major category of asset and liability, which segregates fair value measurements into levels. A summary of the fair value hierarchy is described below:
| | • | | Level 1 — fair value is determined by unadjusted quoted prices in active markets for identical securities or derivatives |
| | • | | Level 2 — fair value is determined by other significant observable inputs (including quoted prices for similar securities, interest rates, prepayment speeds, credit risk, and other data used in fair valuation) |
| | • | | Level 3 — fair value is determined by significant unobservable inputs (including the Portfolios’ own assumptions in determining fair value) |
The categorization of a value determined for a financial instrument within the hierarchy is based upon the pricing transparency of the instrument and does not necessarily correspond to the Portfolios’ perceived risk of that instrument.
The following is a description of the valuation techniques and significant inputs used in determining the value of the Portfolios’ investments classified as Level 1 and Level 2 in the fair value hierarchy:
| | • | | Equity securities (common and preferred stock) for which market quotations are readily available are valued at the last sale or official closing price as reported by an independent pricing service on the primary market or exchange on which they are traded. In the event there were no sales during the day or closing prices are not available, securities are valued at the last quoted bid price. Equity securities traded only in the over-the-counter market and not on a securities exchange are valued at the last sale price or closing bid price, if no sales have occurred. To the extent these securities are actively traded and valuation adjustments are not applied, they are categorized as Level 1 of the fair value hierarchy. Additionally, for foreign securities, fair value procedures are used if a significant event occurs between the close of the foreign market and the U.S. market close. The fair value price is reflected as Level 2 in the fair value hierarchy where applicable. |
| | | | | | | | |
| | 206 | | | Notes to Financial Statements | | | | |
Notes to Financial Statements
| | • | | Fixed income securities, including corporate, convertible and municipal bonds and notes, U.S. government agencies, U.S. treasury obligations, sovereign issues, and non-U.S. bonds are generally valued on the basis of service provider prices that use broker dealer quotations or valuation estimates from internal pricing models. The service providers’ internal models use inputs that are observable such as issuer details, interest rates, yield curves, call features, maturities, credit risks/spreads and default rates. Securities that use similar valuation techniques and inputs as described above are categorized as Level 2 in the fair value hierarchy. |
| | • | | Fixed income securities purchased on a delayed delivery basis are marked to market daily until settlement at the forward settlement date and are categorized as Level 2 in the fair value hierarchy. |
| | • | | Mortgage related and asset backed securities are generally issued as separate tranches, or classes, of securities within each deal. These securities are normally valued by pricing service providers that use broker dealer quotations or valuation estimates from their internal pricing models. The pricing models for these securities usually consider tranche level attributes, current market data, estimated cash flows and market based yield spreads for each tranche, and incorporate deal collateral performance, as available. Mortgage related and asset backed securities that use similar valuation techniques and inputs as described above are categorized as Level 2 in the fair value hierarchy. |
| | • | | Investments in open-end mutual funds (including other Portfolios) are valued at the mutual fund’s closing net asset value per share and are categorized as Level 1 in the fair value hierarchy. Investments in privately held mutual funds are valued at the mutual fund’s closing net asset value per share and are categorized as Level 2 in the fair value hierarchy. |
| | • | | Money market investments, other than in the Government Money Market Portfolio, are generally valued by a pricing service. All securities in the Government Money Market Portfolio are valued using amortized cost, unless the current market value differs substantially from the amortized cost, at which time the securities are marked to market. Because the value is not obtained from a quoted price in an active market, such securities are reflected as Level 2 in the fair value hierarchy. |
| | • | | Listed derivatives, such as futures or option contracts, which are actively traded on a national securities exchange, are stated at the last reported sale or settlement price on the day of valuation and are categorized as Level 1 in the fair value hierarchy. |
| | • | | Centrally cleared swaps are valued at the daily settlement price determined by the respective exchange. For centrally cleared credit default swaps the clearing facility requires its members to provide actionable levels across complete term structures. These levels along with external third party prices are used to produce daily settlement prices. These securities are categorized as Level 2 in the fair value hierarchy. Centrally cleared interest rate swaps are valued using a pricing model that references the underlying rates including the overnight index swap rate and London Interbank Offered Rate forward rate to produce the daily settlement price. These securities are categorized as Level 2 in the fair value hierarchy. |
| | • | | Over-the-counter financial derivatives, such as foreign currency contracts, futures contracts, options contracts, or swap agreements derive their value from underlying asset prices, indices, reference rates, and other inputs or a combination of these factors. These derivatives are normally valued on the basis of quotes obtained from brokers and dealers or pricing services. Depending on the product and the terms of the transaction, the value of the derivatives can be estimated using a series of techniques, including simulation pricing models. The pricing models use inputs that are observed from actively quoted markets such as issuer details, indices, spreads, interest rates, curves, dividends and exchange rates. Financial derivatives that use similar valuation techniques and inputs as described above are categorized as Level 2 in the fair value hierarchy. |
The following is a description of the valuation techniques and significant inputs used in determining the value the Portfolios’ investments classified as Level 3 in the fair value hierarchy:
| | • | | Securities and other assets for which market quotes are not readily available are valued at fair market value as determined in good faith in accordance with procedures adopted by the Series Fund’s Board of Directors (“Board”). Market quotes are considered not readily available in circumstances where there is an absence of current or reliable |
| | | | |
| | Notes to Financial Statements | | 207 |
Notes to Financial Statements
| | market-based data (e.g. trade information or broker quotes). The factors considered in reaching these values at December 31, 2016 included, but were not limited to, broker quotes, analysis of the likely outcome of pending litigation, liquidity, prepayment speed, duration and recoverability. |
A table summarizing each Portfolio’s investments under this hierarchy is included following each Portfolio’s Schedule of Investments. Transfers between investment levels may occur as markets fluctuate and/or the availability of data used in investments’ valuation changes. The Portfolios recognize transfers between levels as of the end of the period. The amounts of transfers between Levels 1 and 2 are disclosed in the Notes to Schedules of Investments for the Portfolio. For fair valuations using significant unobservable inputs, U.S. GAAP requires a reconciliation of the beginning to ending balances for reported fair values that presents changes attributable to total realized and unrealized gains or losses, purchases and sales, and transfers in or out of the Level 3 category during the period. Additionally, U.S GAAP requires quantitative information regarding the significant unobservable inputs used in the determination of fair value of assets categorized as Level 3 in the fair value hierarchy. In accordance with the requirements, a Level 3 reconciliation and details of significant unobservable inputs have been included in the notes to the Schedule of Investments for Portfolios that have a material amount of Level 3 investments.
The Series Fund has adopted policies and procedures which govern the pricing of Portfolio securities. The Board has delegated the day-to-day responsibility for pricing Portfolio securities and other investments to Mason Street Advisors, LLC (“MSA”), the Portfolios’ investment adviser, and Northwestern Mutual in its capacity as fund accountant, subject to the oversight of a Pricing Committee appointed by the Board and comprised of representatives of MSA, Northwestern Mutual and Series Fund officers. The Pricing Committee is charged with the primary and day-to-day operational responsibility for executing the valuation process. The Pricing Committee has been delegated the authority to approve the override of any prices as permitted under the pricing procedures approved by the Board and any variances from these pricing procedures when appropriate. All such actions are subject to further review and approval by the Board at its next regular meeting.
Note 4. Securities and Other Investments
A. Delayed Delivery Transactions and When-Issued Securities — Certain Portfolios may engage in securities transactions on a when-issued or delayed delivery basis. In these transactions, the securities’ prices and yields are fixed on the date of the commitment, with payment and delivery scheduled for a future date. During this period, the securities are subject to market fluctuations. When delayed delivery purchases are outstanding, a Portfolio will earmark liquid assets on its records in amounts sufficient to meet the purchase price. A Portfolio may dispose of or renegotiate a delayed delivery transaction, which may result in a capital gain or loss.
B. Repurchase Agreements — Certain Portfolios may engage in repurchase transactions. Under the terms of a typical repurchase agreement, a Portfolio takes possession of an underlying debt obligation subject to an obligation of the seller to repurchase, and a Portfolio to resell, the obligation at an agreed upon price and time. The underlying securities for all repurchase agreements are held in safekeeping at the Portfolio’s custodian or designated sub-custodians under tri-party repurchase agreements. The market value of the collateral must be equal to or exceed at all times the total amount of the repurchase obligations, including interest. Securities purchased under repurchase agreements are reflected as an asset on the Statements of Assets and Liabilities. Generally, in the event of counterparty default, a Portfolio has the right to use the collateral to offset losses incurred. If the counterparty should default, a Portfolio will seek to sell the securities which it holds as collateral. This could involve procedural costs or delays in addition to a loss on the securities if their value should fall below their repurchase price.
C. Restricted Securities — Certain Portfolios may invest in securities that are subject to legal or contractual restrictions on resale. These securities may be sold privately, but are required to be registered or exempted from registration before being sold to the public. Disposal of these securities may involve time-consuming negotiations and expense, and prompt sale at an acceptable price may be difficult.
D. Foreign Currency Transactions — Certain Portfolios may have securities and other assets and liabilities denominated in foreign currencies which are translated into U.S. dollar amounts on the date of valuation. Purchases and sales of securities and income items denominated in foreign currencies are translated into U.S. dollar amounts on the respective dates of such transactions. When the Portfolios purchase or sell a foreign security they may enter into a foreign currency exchange contract to minimize exchange rate risk from the trade date to the settlement date of such transaction. Such foreign currency exchange contracts are marked to market daily.
| | | | | | | | |
| | 208 | | | Notes to Financial Statements | | | | |
Notes to Financial Statements
The Portfolios do not separately report the results of operations due to fluctuations in foreign exchange rates on investments from the changes arising from changes in market prices of securities held. Such fluctuations are included with the net realized or unrealized gain or loss from investments.
Net realized foreign exchange gains or losses arise from sales of foreign currencies, currency gains or losses realized between the trade date and the settlement date on security transactions, and the differences between the amounts of dividends and foreign withholding taxes recorded on the Portfolios’ books and the U.S. dollar equivalent of the amounts actually received or paid.
E. Mortgage Backed and Asset Backed Securities — Certain Portfolios may invest in mortgage backed securities, including collateralized mortgage obligations, and asset backed securities. Mortgage backed securities are interests in pools of residential or commercial mortgage loans and asset backed securities are interests in pools of other assets, including various types of loans and credit card receivables. These securities provide a monthly payment, consisting of both a principal and interest component. Interest payments may be based on either fixed rates or adjustable rates. Receipt of principal payment reduces the outstanding par amount of the security and may generate realized gains or losses. Yields on mortgage backed securities are affected by interest and prepayment rates, which, in turn, are influenced by a variety of economic, geographical, social and other factors. Maturities on mortgage backed securities represent stated maturity dates. Actual maturity dates may differ based on prepayment rates. Unlike mortgage backed securities issued or guaranteed by the U.S. government or one of its sponsored entities, mortgage backed securities and asset backed securities issued by private issuers do not have a government or government sponsored entity guarantee. These issuers may provide credit enhancements through external entities such as financial institutions or through the structuring of the transaction itself. There is no guarantee that credit enhancements, if any, will be sufficient to prevent losses.
F. Inflation-Indexed Bonds — Certain Portfolios may invest in inflation-indexed bonds. Inflation-indexed bonds are fixed income securities whose principal value is periodically adjusted to the rate of inflation. The interest rate on these bonds is generally fixed at issuance at a rate lower than typical bonds. Over the life of an inflation-indexed bond, interest will be paid based on a principal value, which is adjusted for inflation. Any increase in the principal amount of an inflation-indexed bond will be included as interest income in the applicable Portfolio’s Statement of Operations even though investors do not receive their principal until maturity.
G. Short Sales — Certain Portfolios may enter into short sale transactions. A short sale is a transaction in which a Portfolio sells a security it does not own in anticipation of a decline in the market price of the security. Securities sold in short sale transactions and the interest payable on such securities, if any, are reflected as a liability on the Statements of Assets and Liabilities. A Portfolio is obligated to deliver the security at the market price at the time the short position is closed. The risk of loss on a short sale transaction is theoretically unlimited, because there is no limit to the cost of replacing the security sold short, whereas losses from purchase transactions cannot exceed the total amount invested. As of December 31, 2016, there were no short positions held by any Portfolio.
H. Financing Transactions — Certain Portfolios may enter into financing transactions. In a financing transaction, the Portfolio transfers a security to a counterparty with a simultaneous agreement to repurchase the same security at an agreed upon price and future settlement date. For U.S. GAAP purposes, a financing transaction is accounted for as a secured borrowing and not as a purchase or sale. During the term of the borrowing, the Portfolio is entitled to the interest on the security. The difference between the sale price and repurchase price is included in net investment income with the cost of the secured borrowing transaction being recorded in interest expense over the term of the borrowing. The Portfolio will benefit from the transaction if the income earned on the investment purchased with the cash received in the financing transaction exceeds the interest expense incurred by the Portfolio. If the interest expense exceeds the income earned, the Portfolio’s net investment income and dividends to shareholders may be adversely impacted. Financing transactions involve the risk that the market value of the securities that the Portfolio is required to repurchase may decline below the agreed upon repurchase price of those securities.
I. Loan Participation and Assignments — Certain Portfolios may invest in direct debt instruments which are interests in amounts owed to lenders or lending syndicates by corporate, governmental, or other borrowers. The Portfolios’ investments in a loan may be in the form of either actual participation in loans or assignments of all or part of the loans from third parties. A loan is often administered by a bank or other financial institution that acts as an agent for all holders. The agent administers the terms of the loan which are specified in the loan agreement. The Portfolios may invest in multiple series or tranches of a loan, each of which can have different terms and associated risks. The Portfolios generally do not have a right to enforce compliance
| | | | |
| | Notes to Financial Statements | | 209 |
Notes to Financial Statements
with the terms of the loan agreement and as a result, the Portfolios may be subject to the credit risk of the borrower and lender that is selling the loan agreement. When the Portfolios purchase assignments from lenders they acquire direct rights against the borrower of the loan. The Portfolios may also enter into unfunded loan commitments, which are contractual obligations for future funding. Unfunded loan commitments can include lines of credit, which may require the Portfolios to grant additional cash to the borrower upon demand from the borrower. These unfunded loan commitments are in fact a future obligation in full, although a percentage of the loan amount may not be utilized by the borrower. When investing in a loan, the Portfolios have the right to receive principal, interest and any fees from the lender selling the loan agreement and only when the payments are received by the lender from the borrower. There may also be a commitment fee due to the Portfolios based on the unused portion of the line of credit of the floating rate loan. In certain cases, the Portfolios may be entitled to a penalty fee if there was a prepayment of a floating rate loan by the borrower. Fees that are earned or paid will be reflected as interest income or interest expense on the Statements of Operations. For the period ended December 31, 2016, only the Multi Sector Bond Portfolio invested in loan participations and assignments. At December 31, 2016, there were no unfunded loan commitments outstanding.
J. Reverse Repurchase Agreements — Certain Portfolios may enter into reverse repurchase agreements. In a reverse repurchase agreement, a Portfolio delivers a security in exchange for cash to a financial institution, the counterparty, with a simultaneous agreement to repurchase the same or substantially the same security at an agreed upon price and date. The Portfolio is entitled to receive principal and interest payments, if any, made on the security delivered to the counterparty during the term of the agreement. Cash received in exchange for securities delivered plus accrued interest payments to be made by the Portfolio to counterparties are reflected as a liability on the Statements of Assets and Liabilities. Interest payments made by a Portfolio to counterparties are recorded as a component of interest expense on the Statements of Operations. In periods of increased demand for the security, a Portfolio may receive a fee for use of the security by the counterparty, which may result in interest income to the Portfolio. When effecting reverse repurchase transactions, the Portfolio will hold securities of a dollar amount equal in value to the securities subject to the reverse repurchase agreement in a segregated account.
Reverse repurchase agreements outstanding in the Long Term U.S. Government Bond Portfolio as of December 31, 2016 were as follows:
| | | | | | | | | | | | | | | | | | | | | | |
| Reference Entity | | Counterparty | | Interest
Rate | | | Borrowing
Date | | | Maturity Date | | | Amount Borrowed | | | Payable for Reverse
Repurchase
Agreements | |
US Treasury Bond | | RBS Securities, Inc. | | | 0.93% | | | | 12/20/16 | | | | 3/8/17 | | | | 1,500,000 USD | | | $ | 1,567,945 | |
| | | | | | | | | | | | | | | | | | | | | | |
| | | | | | | | | | | | | | | | | | | | $ | 1,567,945 | |
| | | | | | | | | | | | | | | | | | | | | | |
K. Zero Strike Warrants — Certain Portfolios may invest in low exercise price call warrants (zero strike warrants). Zero strike warrants are issued by banks or broker-dealers and allow the fund to gain exposure to common stocks in markets that place restrictions on direct investments by foreign investors and may or may not be traded on an exchange. Income received from zero strike warrants is recorded as dividend income in the Statement of Operations. To the extent the fund invests in zero strike warrants whose returns correspond to the performance of a foreign stock, investing in zero strike warrants will involve risks similar to the risks of investing in foreign securities. Additional risks associated with zero strike warrants include the potential inability of the counterparty to fulfill their obligations under the warrant, inability to transfer or liquidate the warrants and potential delays or an inability to redeem before expiration under certain market conditions.
Note 5. Derivative Instruments
The Portfolios may use derivative instruments for various purposes, including as a cash management strategy, to earn income and enhance returns, to increase or decrease exposure to a particular market, to manage or adjust the risk profile of the Portfolio, to hedge exposure to a foreign currency, or as an alternative to direct investments. Because the Portfolios are required to account for derivative instruments at fair value and recognize changes in fair value through the Statements of Operations, the Portfolios’ derivatives do not qualify for hedge accounting treatment.
Certain Portfolios segregate cash to cover margin requirements for derivative positions. These amounts are denoted as “Cash Collateral for Derivative Positions” on the Statements of Assets and Liabilities.
A. Futures Contracts — Certain Portfolios invest in futures contracts as an alternative to investing in individual securities and could be exposed to market risk due to changes in the value of the underlying securities or due to an illiquid secondary market. Futures contracts are marked to market daily based upon quoted settlement prices. The Portfolios receive from or pay to
| | | | | | | | |
| | 210 | | | Notes to Financial Statements | | | | |
Notes to Financial Statements
brokers an amount of cash equal to the daily fluctuation in the value of the contracts. Such receipts or payments, known as the “variation margin,” are recorded by the Portfolios as unrealized gains or losses. When a contract is closed, the Portfolios record a realized gain or loss equal to the difference between the value of the contract at the time it was opened and the value at the time it was closed.
B. Forward Foreign Currency Contracts — The Portfolios may enter into forward foreign currency contracts to hedge against exchange rate risk arising from investments in securities denominated in foreign currencies or as part of an investment strategy. Contracts are valued at the contractual forward rate and are marked to market daily, with the change in market value recorded as an unrealized gain or loss. When the contracts are closed, a realized gain or loss is recorded. Risks may arise from changes in market value of the underlying instruments and from the possible inability of counterparties to meet the terms of their contracts.
C. Options — Certain Portfolios may write call and put options on futures, swaps, securities or currencies they own or in which they may invest. Writing put options tends to increase a Portfolio’s exposure to the underlying instrument. Writing call options tends to decrease a Portfolio’s exposure to the underlying instrument. The Portfolio receives a premium on the sale of a call option but gives up the opportunity to profit from any increase in the value of the security above the exercise price of the option. When a Portfolio writes a put option, it is exposed to a decline in the price of the underlying security. When a Portfolio writes a call or put option, an amount equal to the premium received is recorded as a liability and subsequently marked to market to reflect the current value of the option written. These liabilities are reflected as written options outstanding in the Statements of Assets and Liabilities. Payments received or made, if any, from writing options with premiums to be determined on a future date are reflected as such on the Statements of Assets and Liabilities. Premiums received from writing options which expire are treated as realized gains. Premiums received from writing options which are exercised or closed are added to the proceeds or offset against amounts paid on the underlying future, swap, security or currency transaction to determine the realized gain or loss. A Portfolio as a writer of an option has no control over whether the underlying future, swap, security or currency may be sold (called) or purchased (put) and as a result bears the market risk of an unfavorable change in the price of the future, swap, security or currency underlying the written option. There is a risk a Portfolio may not be able to enter into a closing transaction because of an illiquid market.
Transactions in written call and put options for the period ended December 31, 2016 were as follows (amounts in thousands, except number of contracts):
| | | | | | | | | | | | | | | | | | | | | | | | |
| | | Balance at
12/31/2015 | | | Sales | | | Closing
Buys | | | Expirations | | | Exercised | | | Balance at
12/31/2016 | |
Long-Term U.S. Government Bond Portfolio | | | | | | | | | | | | | | | | | | | | | | | | |
# of Contracts | | | - | | | | 2,200,000 | | | | - | | | | (2,200,000 | ) | | | - | | | | - | |
Premium | | $ | - | | | | 5 | | | | - | | | | (5 | ) | | | - | | | $ | - | |
Multi-Sector Bond Portfolio | | | | | | | | | | | | | | | | | | | | | | | | |
# of Contracts | | | - | | | | 349 | | | | - | | | | (140 | ) | | | (19 | ) | | | 190 | |
Notional Amount | | $ | - | | | | 51,600 | | | | - | | | | (17,400 | ) | | | - | | | $ | 34,200 | |
Premium | | $ | - | | | | 481 | | | | - | | | | (153 | ) | | | (9 | ) | | $ | 319 | |
Certain Portfolios may also purchase call and put options on futures, swaps, securities or currencies they own or in which they may invest. Purchasing call options tends to increase a Portfolio’s exposure to the underlying instrument. Purchasing put options tends to decrease a Portfolio’s exposure to the underlying instrument. The Portfolio pays a premium on the purchase of a put option but receives the opportunity to profit from any increase in the value of the security above the exercise price of the option. When a Portfolio purchases a call option, it is exposed to a decline in the price of the underlying security. Premiums paid are reflected in the Statements of Assets and Liabilities as an investment and are subsequently marked to market to reflect the current value of the option. Premiums paid from purchasing options which expire are treated as realized losses. Premiums paid for purchasing options which are exercised or closed are added to the amount paid or offset against the proceeds on the underlying future, swap, security or currency transaction to determine realized gain or loss. The risk associated with a Portfolio purchasing call or put options is limited to the premium paid.
D. Swap Agreements — The Portfolios may enter into swap agreements on interest rate, total return and credit default to manage their exposure to interest rates, foreign currencies, investment style risk and credit risk or as an alternative to direct investing. In connection with these agreements, securities may be identified as collateral in accordance with the terms of the respective swap agreements. Swap agreements are privately negotiated in the over-the-counter market (“OTC swaps”) and may be executed in a multilateral or other trade facility platform, such as a registered commodities exchange (“centrally cleared swaps”).
| | | | |
| | Notes to Financial Statements | | 211 |
Notes to Financial Statements
Swaps are marked to market daily based upon quotations from market makers or values from third party vendors, which may include a registered commodities exchange, and the change in value, if any, is recorded as unrealized gain or loss in the Statements of Operations. Daily changes in the valuation of centrally cleared swaps, if any, are recorded as a receivable or payable for the change in value as appropriate (“variation margin”) on the Statements of Assets and Liabilities. OTC swap payments received or made at the beginning of the measurement period of the swap are reflected on the Statements of Assets and Liabilities. Upfront payments are amortized to realized gain or loss. Upon termination of the swap, unamortized upfront payments are recorded as realized gain or loss in the Statements of Operations. A liquidation payment received or made at the termination of the swap is recorded as realized gain or loss in the Statements of Operations. Net periodic payments received by the Portfolios are included as part of realized gain (loss) on the Statements of Operations. Entering into these agreements involves, to varying degrees, elements of credit and market risk in excess of the amounts recognized on the Statements of Assets and Liabilities. Such risks involve the possibility that there will be no liquid market for these agreements, that the counterparty to the agreements may default on its obligation to perform and that there may be unfavorable changes in interest rates.
Interest Rate Swaps — Interest rate swap agreements involve the exchange by a Portfolio with another party to pay or receive a set of cash flows, e.g., an exchange of floating rate payments for fixed rate payments based on a notional amount of principal.
Total Return Swaps — Total return swap agreements involve commitments to pay or receive a financing rate in exchange for the total return of an underlying reference entity, both based on notional amounts. To the extent the total return of the security or index underlying the transaction exceeds or falls short of the offsetting interest rate obligation, a Portfolio will receive a payment from or make a payment to the counterparty.
Credit Default Swaps — Credit default swap agreements involve one party making a series of payments to another party in exchange for the right to receive a cash payment equal to the notional value of the swap in the event of a default by a third party, typically corporate issues or sovereign issues of an emerging market country. A Portfolio may use credit default swaps to provide a measure of protection against defaults of the issuers where the Portfolio owns or has exposure to the corporate or sovereign issue or to take an active long or short position on the likelihood of a particular issuer’s default.
As a seller of protection, the Portfolio generally receives an upfront payment and/or a fixed rate of income throughout the term of the swap provided that there is no credit event. As the seller, the Portfolio adds leverage to its investments because the Portfolio has investment exposure on the notional amount of the swap. As a buyer of protection, the Portfolio generally makes an upfront payment or pays a fixed rate of interest throughout the term of the swap provided that there is no credit event. The Portfolio generally receives an amount up to the notional value of the swap if a credit event occurs.
Implied credit spreads, represented in absolute terms, utilized in determining the market value of credit default swap agreements on corporate issues or sovereign issues of an emerging market country serve as an indicator of the current status of the payment/performance risk and represent the likelihood of a credit event occurring. The implied credit spread of a particular referenced entity reflects the cost of selling protection and may include upfront payments required to be made to enter into the agreement. For credit default swap agreements on credit indices, the quoted market prices and resulting values serve as the indicator of the current status of the payment/performance risk. Wider credit spreads and increasing market values, in absolute terms when compared to the notional amount of the swap, represent a deterioration of the referenced entity’s credit soundness and indicate a greater likelihood a credit event could occur as defined under the terms of the agreement. Open credit default swaps on corporate or sovereign issues and credit indices are disclosed in the Schedules of Investments.
If the Portfolio is a seller of protection and a credit event occurs, the Portfolio will either pay to the buyer of the protection an amount equal to the notional value of the swap and may take delivery of the obligation or pay a net settlement amount in the form of cash or securities equal to the notional amount of the swap less the recovery value of the referenced obligation. The maximum potential amount of future payments (undiscounted) that a Portfolio as a seller of protection could be required to make under a credit default swap agreement would be equal to the notional amount of the agreement. Notional amounts and fair market value of all credit default swap agreements outstanding for each Portfolio are disclosed in the footnotes to the Schedules of Investments. These maximum potential amounts would be partially offset by any recovery values of the referenced obligations, upfront payments received upon entering into the agreement, or net amounts received by the Portfolio from the settlement of credit default swap agreements purchasing protection for the same referenced obligation.
| | | | | | | | |
| | 212 | | | Notes to Financial Statements | | | | |
Notes to Financial Statements
E. Derivative Disclosures – Derivative positions held by the Portfolios by contract type and primary risk exposure, including location on the Statement of Assets and Liabilities and value as of December 31, 2016, are (amounts in thousands):
| | | | | | | | | | | | |
| | | Asset Derivatives | | | Liability Derivatives | |
| Portfolio | | Statement of Assets and Liabilities Location | | Value | | | Statement of Assets and Liabilities Location | | Value | |
Index 500 Stock Portfolio | | | | | | | | | | | | |
Equity contracts | | Receivables – Futures Variation Margin | | $ | - | | | Payables – Futures Variation Margin | | $ | 146 | |
Large Company Value Portfolio | | | | | | | | | | | | |
Foreign exchange contracts | | Receivables – Foreign Currency Sold | | | 17 | | | Payables – Foreign Currency Purchased | | | 61 | |
Index 400 Stock Portfolio | | | | | | | | | | | | |
Equity contracts | | Receivables – Futures Variation Margin | | | - | | | Payables – Futures Variation Margin | | | 63 | |
Mid Cap Value Portfolio | | | | | | | | | | | | |
Foreign exchange contracts | | Receivables – Foreign Currency Sold | | | 26 | | | Payables – Foreign Currency Purchased | | | 102 | |
Index 600 Portfolio | | | | | | | | | | | | |
Total return contracts | | Receivables – Outstanding Swaps Contracts, at Value | | | - | | | Payables – Outstanding Swaps Contracts, at Value | | | 50 | |
Research International Core Portfolio | | | | | | | | | | | | |
Foreign exchange contracts | | Receivables – Foreign Currency Sold | | | 1 | | | Payables – Foreign Currency Purchased | | | - | |
International Equity Portfolio | | | | | | | | | | | | |
Foreign exchange contracts | | Receivables – Foreign Currency Sold | | | - | | | Payables – Foreign Currency Purchased | | | 2 | |
Short-Term Bond Portfolio | | | | | | | | | | | | |
Interest rate contracts | | Receivables – Futures Variation Margin | | | 8 | | | Payables – Futures Variation Margin | | | 25 | |
Long-Term U.S. Government Bond Portfolio | | | | | | | | | | | | |
Interest rate contracts | | Receivables – Outstanding Swaps Contracts, at Value | | | 77 | | | Payables – Outstanding Swaps Contracts, at Value | | | 155 | |
Inflation Protection Portfolio | | | | | | | | | | | | |
Foreign exchange contracts | | Receivables – Foreign Currency Sold | | | 178 | | | Payables – Foreign Currency Purchased | | | 8 | |
Interest rate contracts | | Receivables – Futures Variation Margin | | | 39 | | | Payables – Futures Variation Margin | | | 177 | |
Other contracts | | Receivables – Outstanding Swaps Contracts, at Value | | | 1,395 | | | Payables – Outstanding Swaps Contracts, at Value | | | 4,464 | |
Multi-Sector Bond Portfolio | | | | | | | | | | | | |
Credit contracts | | Receivables – Outstanding Swaps Contracts, at Value | | | 31 | | | Payables – Outstanding Swaps Contracts, at Value | | | 4,668 | |
Foreign exchange contracts | | Receivables – Foreign Currency Sold | | | 2,967 | | | Payables – Foreign Currency Purchased | | | 2,496 | |
Option contracts | | Receivables – Options | | | - | | | Payables – Options | | | 167 | |
Interest rate contracts | | Receivables – Futures Variation Margin | | | 373 | | | Payables – Futures Variation Margin | | | 15 | |
Interest rate contracts | | Receivables – Outstanding Swaps Contracts, at Value | | | 12 | | | Payables – Outstanding Swaps Contracts, at Value | | | 82 | |
Balanced Portfolio | | | | | | | | | | | | |
Equity contracts | | Receivables – Futures Variation Margin | | | - | | | Payables – Futures Variation Margin | | | 67 | |
Asset Allocation Portfolio | | | | | | | | | | | | |
Equity contracts | | Receivables – Futures Variation Margin | | | - | | | Payables – Futures Variation Margin | | | 2 | |
Realized gains and losses on derivative instruments, by contract type and primary risk exposure, for the period ended December 31, 2016 are (amounts in thousands):
| | | | | | | | | | | | | | | | | | | | |
| | | Realized Gain (Loss) on Derivatives Instruments | |
| Portfolio | | Options | | | Futures | | | Forward
Currency
Contracts | | | Swaps | | | Total | |
Index 500 Stock Portfolio | | | | | | | | | | | | | | | | | | | | |
Equity contracts | | $ | - | | | $ | 2,676 | | | $ | - | | | $ | - | | | $ | 2,676 | |
Large Company Value Portfolio | | | | | | | | | | | | | | | | | | | | |
Foreign currency exchange contracts | | | - | | | | - | | | | 292 | | | | - | | | | 292 | |
Equity Income Portfolio | | | | | | | | | | | | | | | | | | | | |
Foreign currency exchange contracts | | | - | | | | - | | | | (36 | ) | | | - | | | | (36 | ) |
Index 400 Stock Portfolio | | | | | | | | | | | | | | | | | | | | |
Equity contracts | | | - | | | | 2,395 | | | | - | | | | - | | | | 2,395 | |
Mid Cap Value Portfolio | | | | | | | | | | | | | | | | | | | | |
Foreign currency exchange contracts | | | - | | | | - | | | | 305 | | | | - | | | | 305 | |
| | | | |
| | Notes to Financial Statements | | 213 |
Notes to Financial Statements
| | | | | | | | | | | | | | | | | | | | |
| | | Realized Gain (Loss) on Derivatives Instruments | |
| Portfolio | | Options | | | Futures | | | Forward
Currency
Contracts | | | Swaps | | | Total | |
Index 600 Stock Portfolio | | | | | | | | | | | | | | | | | | | | |
Equity contracts | | $ | - | | | $ | - | | | $ | - | | | $ | 2,365 | | | $ | 2,365 | |
International Growth Portfolio | | | | | | | | | | | | | | | | | | | | |
Foreign currency exchange contracts | | | - | | | | - | | | | (143 | ) | | | - | | | | (143 | ) |
Research International Core Portfolio | | | | | | | | | | | | | | | | | | | | |
Foreign currency exchange contracts | | | - | | | | - | | | | (295 | ) | | | - | | | | (295 | ) |
International Equity Portfolio | | | | | | | | | | | | | | | | | | | | |
Foreign currency exchange contracts | | | - | | | | - | | | | (487 | ) | | | - | | | | (487 | ) |
Emerging Markets Equity Portfolio | | | | | | | | | | | | | | | | | | | | |
Foreign currency exchange contracts | | | - | | | | - | | | | (65 | ) | | | - | | | | (65 | ) |
Short-Term Bond Portfolio | | | | | | | | | | | | | | | | | | | | |
Interest rate contracts | | | - | | | | (303 | ) | | | - | | | | - | | | | (303 | ) |
Long-Term U.S. Government Bond Portfolio | | | | | | | | | | | | | | | | | | | | |
Interest rate contracts | | | 5 | | | | 55 | | | | - | | | | (145 | ) | | | (85 | ) |
Inflation Protection Portfolio | | | | | | | | | | | | | | | | | | | | |
Foreign currency exchange contracts | | | - | | | | - | | | | 62 | | | | - | | | | 62 | |
Other contracts | | | - | | | | 591 | | | | - | | | | (586 | ) | | | 5 | |
Multi-Sector Bond Portfolio | | | | | | | | | | | | | | | | | | | | |
Credit contracts | | | - | | | | - | | | | - | | | | 3,998 | | | | 3,998 | |
Foreign currency exchange contracts | | | - | | | | - | | | | 6,186 | | | | - | | | | 6,186 | |
Interest rate contracts | | | 149 | | | | (197 | ) | | | - | | | | 118 | | | | 70 | |
Balanced Portfolio | | | | | | | | | | | | | | | | | | | | |
Equity contracts | | | - | | | | 2,229 | | | | - | | | | - | | | | 2,229 | |
Asset Allocation Portfolio | | | | | | | | | | | | | | | | | | | | |
Equity contracts | | | - | | | | 257 | | | | - | | | | - | | | | 257 | |
Change in unrealized appreciation and depreciation on derivative instruments, by contract type and primary risk exposure for the period ended December 31, 2016 are (amounts in thousands): | |
| | | Change in Unrealized Appreciation (Depreciation) on
Derivative Instruments | |
| Portfolio | | Options | | | Futures | | | Forward
Currency
Contracts | | | Swaps | | | Total | |
Index 500 Stock Portfolio | | | | | | | | | | | | | | | | | | | | |
Equity contracts | | $ | - | | | $ | 451 | | | $ | - | | | $ | - | | | $ | 451 | |
Large Company Value Portfolio | | | | | | | | | | | | | | | | | | | | |
Foreign currency exchange contracts | | | - | | | | - | | | | (57 | ) | | | - | | | | (57 | ) |
Equity Income Portfolio | | | | | | | | | | | | | | | | | | | | |
Foreign currency exchange contracts | | | - | | | | - | | | | 1 | | | | - | | | | 1 | |
Index 400 Stock Portfolio | | | | | | | | | | | | | | | | | | | | |
Equity contracts | | | - | | | | (180 | ) | | | - | | | | - | | | | (180 | ) |
Mid Cap Value Portfolio | | | | | | | | | | | | | | | | | | | | |
Foreign currency exchange contracts | | | - | | | | - | | | | (54 | ) | | | - | | | | (54 | ) |
Index 600 Stock Portfolio | | | | | | | | | | | | | | | | | | | | |
Interest Rate Contracts | | | - | | | | - | | | | - | | | | 76 | | | | 76 | |
International Growth Portfolio | | | | | | | | | | | | | | | | | | | | |
Foreign currency exchange contracts | | | - | | | | - | | | | (46 | ) | | | - | | | | (46 | ) |
Research International Core Portfolio | | | | | | | | | | | | | | | | | | | | |
Foreign currency exchange contracts | | | - | | | | - | | | | (45 | ) | | | - | | | | (45 | ) |
International Equity Portfolio | | | | | | | | | | | | | | | | | | | | |
Foreign currency exchange contracts | | | - | | | | - | | | | (42 | ) | | | - | | | | (42 | ) |
Emerging Markets Equity Portfolio | | | | | | | | | | | | | | | | | | | | |
Foreign currency exchange contracts | | | - | | | | - | | | | 1 | | | | - | | | | 1 | |
Short-Term Bond Portfolio | | | | | | | | | | | | | | | | | | | | |
Interest rate contracts | | | - | | | | (7 | ) | | | - | | | | - | | | | (7 | ) |
Long-Term U.S. Government Bond Portfolio | | | | | | | | | | | | | | | | | | | | |
Interest rate contracts | | | - | | | | (12 | ) | | | - | | | | 1,024 | | | | 1,012 | |
| | | | | | |
| 214 | | Notes to Financial Statements | | | | |
Notes to Financial Statements
| | | | | | | | | | | | | | | | | | | | |
| | | Change in Unrealized Appreciation (Depreciation) on
Derivative Instruments | |
| Portfolio | | Options | | | Futures | | | Forward
Currency
Contracts | | | Swaps | | | Total | |
Inflation Protection Portfolio | | | | | | | | | | | | | | | | | | | | |
Foreign currency exchange contracts | | $ | - | | | $ | - | | | $ | (641 | ) | | $ | - | | | $ | (641 | ) |
Other contracts | | | - | | | | (26 | ) | | | - | | | | 3,241 | | | | 3,215 | |
Multi-Sector Bond Portfolio | | | | | | | | | | | | | | | | | | | | |
Credit contracts | | | - | | | | - | | | | - | | | | 5,792 | | | | 5,792 | |
Foreign currency exchange contracts | | | - | | | | - | | | | 582 | | | | - | | | | 582 | |
Interest rate contracts | | | 152 | | | | 17 | | | | - | | | | 44 | | | | 44 | |
Balanced Portfolio | | | | | | | | | | | | | | | | | | | | |
Equity contracts | | | - | | | | (1 | ) | | | - | | | | - | | | | (1 | ) |
Asset Allocation Portfolio | | | | | | | | | | | | | | | | | | | | |
Equity contracts | | | - | | | | 2 | | | | - | | | | - | | | | 2 | |
Volumes on derivative instruments by contract type and primary risk exposure, for the period ended December 31, 2016 are:
| | | | | | | | | | | | | | | | | | | | |
| | | Volume of Derivative Instruments Held | |
| | | Average Number of Contracts | | | Average Notional
(Amounts in Thousands) | |
| Portfolio | | Exchange
Traded Options | | | Futures | | | Forward
Currency
Contracts | | | Swaps | | | Over the
Counter
Options | |
Index 500 Stock Portfolio | | | | | | | | | | | | | | | | | | | | |
Equity contracts | | | - | | | | 343 | | | $ | - | | | $ | - | | | $ | - | |
Large Company Value Portfolio | | | | | | | | | | | | | | | | | | | | |
Foreign currency exchange contracts | | | - | | | | - | | | | 7,292 | | | | - | | | | - | |
Equity Income Portfolio | | | | | | | | | | | | | | | | | | | | |
Foreign currency exchange contracts | | | - | | | | - | | | | 87 | | | | - | | | | - | |
Index 400 Stock Portfolio | | | | | | | | | | | | | | | | | | | | |
Equity contracts | | | - | | | | 118 | | | | - | | | | - | | | | - | |
Mid Cap Value Portfolio | | | | | | | | | | | | | | | | | | | | |
Foreign currency exchange contracts | | | - | | | | - | | | | 14,751 | | | | - | | | | - | |
Index 600 Stock Portfolio | | | | | | | | | | | | | | | | | | | | |
Interest rate contracts | | | - | | | | - | | | | - | | | | 10,295 | | | | - | |
International Equtiy Portfolio | | | | | | | | | | | | | | | | | | | | |
Foreign currency exchange contracts | | | - | | | | - | | | | - | | | | - | | | | - | |
International Growth Portfolio | | | | | | | | | | | | | | | | | | | | |
Foreign currency exchange contracts | | | - | | | | - | | | | 697 | | | | - | | | | - | |
Research International ortfolio | | | | | | | | | | | | | | | | | | | | |
Foreign currency exchange contracts | | | - | | | | - | | | | - | | | | - | | | | - | |
Emerging Markets Equity Portfolio | | | | | | | | | | | | | | | | | | | | |
Foreign currency exchange contracts | | | - | | | | - | | | | 9 | | | | - | | | | - | |
Short-Term Bond Portfolio | | | | | | | | | | | | | | | | | | | | |
Interest rate contracts | | | - | | | | 124 | | | | - | | | | - | | | | - | |
Long-Term U.S. Government Bond Portfolio | | | | | | | | | | | | | | | | | | | | |
Interest rate contracts | | | 4,411 | | | | 16 | | | | - | | | | 10,144 | | | | - | |
Inflation Protection Portfolio | | | | | | | | | | | | | | | | | | | | |
Foreign currency exchange contracts | | | - | | | | - | | | | 25,190 | | | | - | | | | - | |
Other contracts | | | - | | | | 362 | | | | - | | | | 93,150 | | | | - | |
Multi-Sector Bond Portfolio | | | | | | | | | | | | | | | | | | | | |
Credit contracts | | | - | | | | - | | | | - | | | | 79,190 | | | | - | |
Foreign currency exchange contracts | | | - | | | | - | | | | 379,784 | | | | - | | | | - | |
Interest rate contracts | | | 42 | | | | 1,056 | | | | - | | | | 34,400 | | | | 68 | |
Balanced Portfolio | | | | | | | | | | | | | | | | | | | | |
Equity contracts | | | - | | | | 64 | | | | - | | | | - | | | | - | |
Asset Allocation Portfolio | | | | | | | | | | | | | | | | | | | | |
Equity contracts | | | - | | | | 13 | | | | - | | | | - | | | | - | |
| | | | |
| | Notes to Financial Statements | | 215 |
Notes to Financial Statements
Note 6. Portfolio Risk
In the normal course of business the Portfolios trade financial instruments and enter into financial transactions where risk of potential loss exists. Security values fluctuate (market risk) and may decline due to factors affecting securities markets in general, particular industries represented in the securities markets or conditions specifically related to a particular company. Failure of the other party to a transaction to perform (credit risk), for example by not making principal and interest payments when due, reduces the value of the issuer’s debt and could reduce the Portfolios’ income. Similar to credit risk, the Portfolios may be exposed to counterparty risk, or the risk that an institution or other entity with which the Portfolios have unsettled or open transactions will fail to make required payments or otherwise comply with the terms of the instrument, transaction or contract. The potential loss could exceed the value of the financial assets recorded in the financial statements. Some of the Portfolios’ investments may be illiquid and the Portfolios may not be able to vary the portfolio investments in response to changes in economic and other conditions. If a Portfolio is required to liquidate all or a portion of its investments quickly, the Portfolio may realize significantly less than the value at which it previously recorded those investments.
Master Netting Arrangements
The Portfolios are subject to various Master Agreements that govern the terms of certain transactions. Master Repurchase Agreements and Global Master Repurchase Agreements are in place that governs repurchase, reverse repurchase, and sale-buyback financing transactions. Master Securities Forward Transaction Agreements are in place that govern the settlement of certain forward settling transactions including to-be-announced securities, delayed-delivery or sale-buyback financing transactions. Customer Account Agreements and related addenda are in place that govern certain cleared derivative transactions including futures and cleared OTC derivatives. International Swaps and Derivatives Association, Inc. Master Agreements and Credit Support Annexes (“ISDA agreements”) are in place that governs certain OTC financial derivative transactions. ISDA agreements maintain provisions for general obligations, representations, agreements, collateral and events of default or termination. Events of termination include conditions that may entitle counterparties to elect to terminate early and cause settlement of all outstanding transactions under the applicable ISDA agreement. The terms of Master Agreements may reduce counterparty risk with respect to transactions governed by the Master Agreement under certain circumstances. Certain Portfolios have agreements with counterparties that contain provisions, or contingency features, that allow net settlement in the event of contract termination and permit termination by either party prior to maturity upon the occurrence of certain stated events, such as failure to pay or bankruptcy. In addition, certain agreements specify other events, the occurrence of which would allow one of the parties to terminate. For example, a downgrade in credit rating of a counterparty would allow the fund to terminate while a decline in the Portfolio’s net assets of more than a certain percentage would allow the counterparty to terminate. In such a situation, the counterparty involved would have the option to waive the triggering event or liquidate the affected positions pursuant to the terms of the related agreement. The aggregate amount of derivatives in a liability position is disclosed in Note 5.
Offsetting Assets and Liabilities
Certain Portfolios are parties to enforceable master netting or similar agreements which provide for the right of offset under certain circumstances. The Portfolios have made an accounting policy election not to offset qualifying financial and derivative instruments on the Statements of Assets and Liabilities. As such, all financial and derivative instruments are presented on a gross basis on the Statements of Assets and Liabilities. The impacts of netting arrangements that provide the right to offset are detailed below (amounts in thousands). The net amount represents the net receivable or payable that would be due from or to the counterparty in the event of default. Exposure from borrowings and other financing transactions such as repurchase agreements and certain forward settling transactions can only be netted across transactions governed under the same Master Agreement with the same legal entity. For certain Portfolios, derivative amounts do not reconcile to the Statements of Assets and Liabilities due to the Statements of Assets and Liabilities including derivatives that are not covered under master netting or similar agreements. The amount of collateral, for the period ended December 31, 2016, has been limited such that the net amount cannot be less than zero.
Large Company Value Portfolio
| | | | | | | | | | | | | | | | |
| Offsetting of Financial Assets and Derivative Assets | |
| | | | | | (i) | | | (ii) | | | (iii) = (i) - (ii) | |
| Description | | | | | Gross Amounts of
Recognized Assets | | | Gross Amounts
Offset in the
Statement of Assets
and Liabilities | | | Net Amounts of Assets
Presented in the Statement
of Assets and Liabilities | |
Foreign Currency | | | | | | $ | 17 | | | $ | - | | | $ | 17 | |
| | | | | | |
| 216 | | Notes to Financial Statements | | | | |
Notes to Financial Statements
Large Company Value Portfolio (continued)
| | | | | | | | | | | | | | | | |
| Financial Assets, Derivative Assets, and Collateral Held | |
| | | (iii) | | | (iv) | | | (v) = (iii) - (iv) | |
| | | | | | Gross Amounts Not Offset in the Statement of
Assets and Liabilities | | | | |
| Counterparty | | Net Amounts of
Assets in the
Statement of Assets
and Liabilities | | | Financial Instruments | | | Cash Collateral
Received | | | Net Amount | |
HSBC Bank USA. | | $ | 17 | | | $ | (17) | | | $ | - | | | $ | - | |
|
| Offsetting of Financial Liabilities and Derivative Liabilities | |
| | | | | | (i) | | | (ii) | | | (iii) = (i) - (ii) | |
| Description | | | | | Gross Amounts of
Recognized Liabilities | | | Gross Amounts
Offset in the
Statement of Assets
and Liabilities | | | Net Amounts of Liabilities
Presented in the Statement
of Assets and Liabilities | |
Foreign Currency | | | | | | $ | 62 | | | $ | - | | | $ | 62 | |
|
| Financial Liabilities, Derivative Liabilities, and Collateral Pledged | |
| | | (iii) | | | (iv) | | | (v) = (iii) - (iv) | |
| | | | | | Gross Amounts Not Offset in the Statement of
Assets and Liabilities | | | | |
| Counterparty | | Net Amounts of
Liabilities in the
Statement of Assets
and Liabilities | | | Financial Instruments | | | Cash Collateral
Pledged | | | Net Amount | |
HSBC Bank USA. | | $ | 62 | | | $ | (17) | | | $ | - | | | $ | 45 | |
Mid Cap Value Portfolio
| | | | | | | | | | | | | | | | |
| Offsetting of Financial Assets and Derivative Assets | |
| | | | | | (i) | | | (ii) | | | (iii) = (i) - (ii) | |
| Description | | | | | Gross Amounts of
Recognized Assets | | | Gross Amounts
Offset in the
Statement of Assets
and Liabilities | | | Net Amounts of Assets
Presented in the Statement
of Assets and Liabilities | |
Foreign Currency | | | | | | $ | 26 | | | $ | - | | | $ | 26 | |
|
| Financial Assets, Derivative Assets, and Collateral Held | |
| | | (iii) | | | (iv) | | | (v) = (iii) - (iv) | |
| | | | | | Gross Amounts Not Offset in the Statement of
Assets and Liabilities | | | | |
| Counterparty | | Net Amounts of
Assets in the
Statement of Assets
and Liabilities | | | Financial Instruments | | | Cash Collateral
Received | | | Net Amount | |
HSBC Bank USA. | | $ | 26 | | | $ | (26 | ) | | $ | - | | | $ | - | |
|
| Offsetting of Financial Liabilities and Derivative Liabilities | |
| | | | | | (i) | | | (ii) | | | (iii) = (i) - (ii) | |
| Description | | | | | Gross Amounts of
Recognized Liabilities | | | Gross Amounts
Offset in the
Statement of Assets
and Liabilities | | | Net Amounts of Liabilities
Presented in the Statement
of Assets and Liabilities | |
Foreign Currency | | | | | | $ | 101 | | | $ | - | | | $ | 101 | |
| | | | |
| | Notes to Financial Statements | | 217 |
Notes to Financial Statements
Mid Cap Value Portfolio (continued)
| | | | | | | | | | | | | | | | |
Financial Liabilities, Derivative Liabilities, and Collateral Pledged | |
| | | (iii) | | | (iv) | | | (v) = (iii) - (iv) | |
| | | | | | Gross Amounts Not Offset in the Statement
of Assets and Liabilities | | | | |
| Counterparty | | Net Amounts of Liabilities
in the Statement of
Assets and Liabilities | | | Financial Instruments | | | Cash Collateral
Pledged | | | Net Amount | |
HSBC Bank USA | | $ | 101 | | | $ | (26 | ) | | $ | - | | | $ | 75 | |
Index 600 Stock Portfolio
| | | | | | | | | | | | | | | | |
| Offsetting of Financial Liabilities and Derivative Liabilities | |
| | | | | | (i) | | | (ii) | | | (iii) = (i) - (ii) | |
| Description | | | | | Gross Amounts of
Recognized Liabilities | | | Gross Amounts
Offset in the
Statement of Assets
and Liabilities | | | Net Amounts of Liabilities
Presented in the Statement
of Assets and Liabilities | |
Swaps | | | | | | $ | 50 | | | $ | - | | | $ | 50 | |
|
| Financial Liabilities, Derivative Liabilities, and Collateral Pledged | |
| | | (iii) | | | (iv) | | | (v) = (iii) - (iv) | |
| | | | | | Gross Amounts Not Offset in the Statement
of Assets and Liabilities | | | | |
| Counterparty | | Net Amounts of Liabilities
in the Statement of
Assets and Liabilities | | | Financial Instruments | | | Cash Collateral
Pledged | | | Net Amount | |
Credit Suisse International | | $ | 50 | | | $ | - | | | $ | (50 | ) | | $ | - | |
Government Money Market Portfolio
| | | | | | | | | | | | | | | | |
| Offsetting of Financial Assets and Derivative Assets | |
| | | | | | (i) | | | (ii) | | | (iii) = (i) - (ii) | |
| Description | | | | | Gross Amounts of
Recognized Assets | | | Gross Amounts
Offset in the
Statement of Assets
and Liabilities | | | Net Amounts of Assets
Presented in the Statement
of Assets and Liabilities | |
Repurchase Agreements | | | | | | $ | 160,500 | | | $ | - | | | $ | 160,500 | |
| | | | | | | | | | | | | | | | |
| Financial Assets, Derivative Assets, and Collateral Held | |
| | | (iii) | | | (iv) | | | (v) = (iii) - (iv) | |
| | | | | | Gross Amounts Not Offset in the Statement
of Assets and Liabilities | | | | |
| Counterparty | | Net Amounts of
Assets in the
Statement of Assets
and Liabilities | | | Financial Instruments | | | Cash Collateral
Received | | | Net Amount | |
Bank of Nova Scotia. | | $ | 20,000 | | | $ | (20,000 | ) | | $ | - | | | $ | - | |
Bank of Montreal. | | | 20,000 | | | | (20,000 | ) | | | - | | | | - | |
Citigroup Global Markets. | | | 15,000 | | | | (15,000 | ) | | | - | | | | - | |
HSBC Bank USA. | | | 22,500 | | | | (22,500 | ) | | | - | | | | - | |
Mitsubishi UFJ Securities USA | | | 20,000 | | | | (20,000 | ) | | | - | | | | - | |
Morgan Stanley & Co. | | | 20,000 | | | | (20,000 | ) | | | - | | | | - | |
Mizuho Bank | | | 7,000 | | | | (7,000 | ) | | | - | | | | - | |
RBC Capital Markets | | | 20,000 | | | | (20,000 | ) | | | - | | | | - | |
TD Securities USA | | | 16,000 | | | | (16,000 | ) | | | - | | | | - | |
| | | | | | | | | | | | | | | | |
Total | | $ | 160,500 | | | $ | (160,500 | ) | | $ | - | | | $ | - | |
| | | | | | | | | | | | | | | | |
| | | | | | |
| 218 | | Notes to Financial Statements | | | | |
Notes to Financial Statements
Long-Term U.S. Government Bond Portfolio
| | | | | | | | | | | | | | | | |
| Offsetting of Financial Liabilities and Derivative Liabilities | |
| | | | | | (i) | | | (ii) | | | (iii) = (i) - (ii) | |
| Description | | | | | Gross Amounts of
Recognized Liabilities | | | Gross Amounts
Offset in the
Statement of Assets
and Liabilities | | | Net Amounts of Liabilities
Presented in the Statement
of Assets and Liabilities | |
Financing Transactions | | | | | | $ | 114,158 | | | $ | - | | | $ | 114,158 | |
Reverse Repurchas Agreement | | | | | | | 1,568 | | | | - | | | | 1,568 | |
| | | | | | | | | | | | | | | | |
Total | | | | | | $ | 115,726 | | | $ | - | | | $ | 115,726 | |
| | | | | | | | | | | | | | | | |
|
| Financial Liabilities, Derivative Liabilities, and Collateral Pledged | |
| | | (iii) | | | (iv) | | | (v) = (iii) - (iv) | |
| | | | | | Gross Amounts Not Offset in the Statement
of Assets and Liabilities | | | | |
| Counterparty | | Net Amounts of Liabilities
in the Statement of
Assets and Liabilities | | | Financial Instruments | | | Cash Collateral
Pledged | | | Net Amount | |
Goldman Sachs & Co. | | $ | 82,831 | | | $ | (82,821 | ) | | $ | - | | | $ | 10 | |
Morgan Stanley & Co. | | | 31,327 | | | | (31,327 | ) | | | - | | | | - | |
RBC Securities Inc. | | | 1,568 | | | | (1,500 | ) | | | - | | | | 68 | |
| | | | | | | | | | | | | | | | |
Total | | $ | 115,726 | | | $ | (115,648 | ) | | $ | - | | | $ | 78 | |
| | | | | | | | | | | | | | | | |
Inflation Protection Portfolio
| | | | | | | | | | | | | | | | |
| Offsetting of Financial Assets and Derivative Assets | |
| | | | | | (i) | | | (ii) | | | (iii) = (i) - (ii) | |
| Description | | | | | Gross Amounts of
Recognized Assets | | | Gross Amounts
Offset in the
Statement of Assets
and Liabilities | | | Net Amounts of Assets
Presented in the Statement
of Assets and Liabilities | |
Foreign Currency | | | | | | $ | 178 | | | $ | - | | | $ | 178 | |
Swaps | | | | | | | 1,396 | | | | - | | | | 1,396 | |
| | | | | | | | | | | | | | | | |
Total | | | | | | $ | 1,574 | | | $ | - | | | $ | 1,574 | |
| | | | | | | | | | | | | | | | |
|
| Financial Assets, Derivative Assets, and Collateral Held | |
| | | (iii) | | | (iv) | | | (v) = (iii) - (iv) | |
| | | | | | Gross Amounts Not Offset in the Statement
of Assets and Liabilities | | | | |
| Counterparty | | Net Amounts of Assets
in the Statement of
Assets and Liabilities | | | Financial Instruments | | | Cash Collateral
Received | | | Net Amount | |
Bank of America, N.A. | | $ | 47 | | | $ | (47 | ) | | $ | - | | | $ | - | |
Barclays Bank PLC | | | 3 | | | | (3 | ) | | | - | | | | - | |
Goldman Sachs International | | | 1,346 | | | | - | | | | (1,120 | ) | | | 226 | |
HSBC Bank USA. | | | 178 | | | | (8 | ) | | | - | | | | 170 | |
| | | | | | | | | | | | | | | | |
Total | | $ | 1,574 | | | $ | (58 | ) | | $ | (1,120 | ) | | $ | 396 | |
| | | | | | | | | | | | | | | | |
|
| Offsetting of Financial Liabilities and Derivative Liabilities | |
| | | | | | (i) | | | (ii) | | | (iii) = (i) - (ii) | |
| Description | | | | | Gross Amounts of
Recognized
Liabilities | | | Gross Amounts
Offset in the
Statement of Assets
and Liabilities | | | Net Amounts of Liabilities
Presented in the Statement
of Assets and Liabilities | |
Foreign Currency | | | | | | $ | 8 | | | $ | - | | | $ | 8 | |
Swaps | | | | | | | 4,466 | | | | - | | | | 4,466 | |
| | | | | | | | | | | | | | | | |
Total | | | | | | $ | 4,474 | | | $ | - | | | $ | 4,474 | |
| | | | | | | | | | | | | | | | |
| | | | |
| | Notes to Financial Statements | | 219 |
Notes to Financial Statements
Inflation Protection Portfolio (continued)
| | | | | | | | | | | | | | | | |
Financial Liabilities, Derivative Liabilities, and Collateral Pledged | |
| | | (iii) | | | (iv) | | | (v) = (iii) - (iv) | |
| | | | | | Gross Amounts Not Offset in the Statement
of Assets and Liabilities | | | | |
| Counterparty | | Net Amounts of Liabilities
in the Statement of
Assets and Liabilities | | | Financial Instruments | | | Cash Collateral
Pledged | | | Net Amount | |
Bank of America, N.A. | | $ | 1,854 | | | $ | (1,854 | ) | | $ | - | | | $ | - | |
Barclays Bank PLC | | | 2,612 | | | | (2,612 | ) | | | - | | | | - | |
HSBC Bank USA | | | 8 | | | | (8 | ) | | | - | | | | - | |
| | | | | | | | | | | | | | | | |
Total | | $ | 4,474 | | | $ | (4,474 | ) | | $ | - | | | $ | - | |
| | | | | | | | | | | | | | | | |
Multi-Sector Bond Portfolio
| | | | | | | | | | | | | | | | |
| Offsetting of Financial Assets and Derivative Assets | |
| | | | | | (i) | | | (ii) | | | (iii) = (i) - (ii) | |
| Description | | | | | Gross Amounts of
Recognized Assets | | | Gross Amounts
Offset in the
Statement of Assets
and Liabilities | | | Net Amounts of Assets
Presented in the Statement
of Assets and Liabilities | |
Foreign Currency | | | | | | $ | 2,967 | | | $ | - | | | $ | 2,967 | |
|
| Financial Assets, Derivative Assets, and Collateral Held | |
| | | (iii) | | | (iv) | | | (v) = (iii) - (iv) | |
| | | | | | Gross Amounts Not Offset in the Statement
of Assets and Liabilities | | | | |
| Counterparty | | Net Amounts of Assets
in the Statement of
Assets and Liabilities | | | Financial Instruments | | | Cash Collateral
Received | | | Net Amount | |
Bank of America, N.A. | | $ | 969 | | | $ | (969 | ) | | $ | - | | | $ | - | |
Barclays Bank PLC | | | 183 | | | | (147 | ) | | | - | | | | 36 | |
BNP Paribas SA | | | 993 | | | | (595 | ) | | | (399 | ) | | | - | |
Goldman Sachs International | | | 97 | | | | (97 | ) | | | - | | | | - | |
HSBC Bank USA | | | 226 | | | | (226 | ) | | | - | | | | - | |
JPMorgan Chase Bank, N.A. | | | 450 | | | | (450 | ) | | | - | | | | - | |
UBS AG | | | 48 | | | | (48 | ) | | | - | | | | - | |
| | | | | | | | | | | | | | | | |
Total | | $ | 2,967 | | | $ | (2,532 | ) | | $ | (399 | ) | | $ | 36 | |
| | | | | | | | | | | | | | | | |
|
| Offsetting of Financial Liabilities and Derivative Liabilities | |
| | | | | | (i) | | | (ii) | | | (iii) = (i) - (ii) | |
| Description | | | | | Gross Amounts of
Recognized
Liabilities | | | Gross Amounts
Offset in the
Statement of Assets
and Liabilities | | | Net Amounts of Liabilities
Presented in the Statement
of Assets and Liabilities | |
Foreign Currency | | | | | | $ | 2,497 | | | $ | - | | | $ | 2,497 | |
Options | | | | | | | 11 | | | | - | | | | 11 | |
Swaptions | | | | | | | 156 | | | | - | | | | 156 | |
Swaps | | | | | | | 4,666 | | | | - | | | | 4,666 | |
| | | | | | | | | | | | | | | | |
Total | | | | | | $ | 7,331 | | | $ | - | | | $ | 7,331 | |
| | | | | | | | | | | | | | | | |
| | | | | | |
| 220 | | Notes to Financial Statements | | | | |
Notes to Financial Statements
Multi-Sector Bond Portfolio (continued)
| | | | | | | | | | | | | | | | |
Financial Liabilities, Derivative Liabilities, and Collateral Pledged | |
| | | (iii) | | | (iv) | | | (v) = (iii) - (iv) | |
| | | | | | Gross Amounts Not Offset in the Statement
of Assets and Liabilities | | | | |
| Counterparty | | Net Amounts of
Liabilities in the
Statement of Assets
and Liabilities | | | Financial Instruments | | | Cash Collateral
Pledged | | | Net Amount | |
Bank of America, N.A. | | $ | 1,070 | | | $ | (1,070 | ) | | $ | - | | | $ | - | |
Barclays Bank PLC | | | 147 | | | | (147 | ) | | | - | | | | - | |
BNP Paribas SA | | | 595 | | | | (595 | ) | | | - | | | | - | |
Citibank, N.A. | | | 3,192 | | | | - | | | | - | | | | 3,192 | |
Goldman Sachs International | | | 297 | | | | (97 | ) | | | - | | | | 200 | |
HSBC Bank USA | | | 620 | | | | (543 | ) | | | - | | | | 77 | |
JPMorgan Chase Bank, N.A. | | | 706 | | | | (706 | ) | | | - | | | | - | |
Morgan Stanley Capital Services | | | 34 | | | | - | | | | - | | | | 34 | |
UBS AG | | | 670 | | | | (48 | ) | | | - | | | | 622 | |
| | | | | | | | | | | | | | | | |
Total | | $ | 7,331 | | | $ | (3,206 | ) | | $ | - | | | $ | 4,125 | |
| | | | | | | | | | | | | | | | |
Note 7. Investment Advisory, Sub-Advisory, and Compliance Fees
The Series Fund and its Portfolios are parties to annually renewable contracts pursuant to which each Portfolio pays a charge for investment management and administrative services to MSA, a wholly owned subsidiary of Northwestern Mutual. Certain Portfolios, listed below, pay at a fixed annual rate based on the average daily net asset values of the Portfolio.
| | | | |
Portfolio | | Fee | |
Index 500 Stock Portfolio | | | 0.20% | |
Index 400 Stock Portfolio | | | 0.25% | |
Mid Cap Value Portfolio | | | 0.85% | |
Small Cap Value Portfolio | | | 0.85% | |
Government Money Market Portfolio | | | 0.30% | |
Select Bond Portfolio | | | 0.30% | |
Balanced Portfolio | | | 0.30% | |
For the other Portfolios, the rate for the investment advisory fee is graded by the asset size of the Portfolio according to the following schedules:
| | | | | | | | | | | | | | | | |
Portfolio | | First
$50
Million | | | Next
$50
Million | | | Excess Over
$100
Million | | | | |
Growth Stock Portfolio | | | 0.60% | | | | 0.50% | | | | 0.40% | | | | | |
Large Cap Core Stock Portfolio | | | 0.60% | | | | 0.50% | | | | 0.40% | | | | | |
Mid Cap Growth Stock Portfolio | | | 0.80% | | | | 0.65% | | | | 0.50% | | | | | |
Small Cap Growth Stock Portfolio | | | 0.80% | | | | 0.65% | | | | 0.50% | | | | | |
High Yield Bond Portfolio | | | 0.60% | | | | 0.50% | | | | 0.40% | | | | | |
| | | | |
Portfolio | | First
$100
Million | | | Next
$400
Million | | | Excess Over
$500
Million | | | | |
Focused Appreciation Portfolio | | | 0.80% | | | | 0.75% | | | | 0.70% | | | | | |
| | | | |
Portfolio | | First
$100
Million | | | Next
$150
Million | | | Excess Over
$250
Million | | | | |
Large Company Value Portfolio | | | 0.72% | | | | 0.67% | | | | 0.62% | | | | | |
Domestic Equity Portfolio | | | 0.65% | | | | 0.55% | | | | 0.50% | | | | | |
International Growth Portfolio | | | 0.75% | | | | 0.65% | | | | 0.55% | | | | | |
Short-Term Bond Portfolio | | | 0.35% | | | | 0.33% | | | | 0.30% | | | | | |
Long-Term U.S. Government Bond Portfolio | | | 0.555% | | | | 0.515% | | | | 0.495% | | | | | |
Inflation Protection Portfolio | | | 0.58% | | | | 0.55% | | | | 0.49% | | | | | |
Multi-Sector Bond Portfolio | | | 0.79% | | | | 0.78% | | | | 0.77% | | | | | |
Asset Allocation Portfolio | | | 0.60% | | | | 0.50% | | | | 0.40% | | | | | |
| | | | |
| | Notes to Financial Statements | | 221 |
Notes to Financial Statements
| | | | | | | | | | | | | | | | |
Portfolio | | First
$150
Million | | | Next
$150
Million | | | Next
$200
Million | | | Excess Over
$500
Million | |
Large Cap Blend Portfolio | | | 0.77% | | | | 0.70% | | | | 0.62% | | | | 0.56% | |
Research International Core Portfolio | | | 0.88% | | | | 0.82% | | | | 0.75% | | | | 0.68% | |
| | | | |
Portfolio | | First
$500
Million | | | Excess Over
$500
Million | | | | | | | |
Equity Income Portfolio | | | 0.65% | | | | 0.60% | | | | | | | | | |
| | | | |
Portfolio | | First
$200
Million | | | Excess Over
$200
Million | | | | | | | |
Index 600 Stock Portfolio | | | 0.25% | | | | 0.20% | | | | | | | | | |
| | | | |
Portfolio | | First
$50
Million | | | Excess Over
$50
Million | | | | | | | |
International Equity Portfolio | | | 0.85% | | | | 0.65% | | | | | | | | | |
| | | | |
Portfolio | | First
$250
Million | | | Next
$250
Million | | | Next
$500
Million | | | Excess Over
$1.0
Billion | |
Emerging Markets Equity Portfolio | | | 1.14% | | | | 1.08% | | | | 0.96% | | | | 0.78% | |
MSA, which is the manager and investment adviser of the Series Fund, contractually agreed to waive the management fee and absorb certain other operating expenses to the extent necessary so that Total Operating Expenses (excluding taxes, brokerage, other investment-related costs, interest and dividend expenses and charges, acquired fund fees and expenses and such non-recurring and extraordinary expenses as they may arise) will not exceed the following amounts:
| | | | | | | | |
Portfolio | | | | | Expiration | |
Focused Appreciation Portfolio | | | 0.90 | % | | | April 30, 2017 | |
Large Cap Blend Portfolio | | | 0.85 | % | | | April 30, 2017 | |
Large Company Value Portfolio | | | 0.80 | % | | | April 30, 2017 | |
Domestic Equity Portfolio | | | 0.75 | % | | | April 30, 2017 | |
Equity Income Portfolio | | | 0.75 | % | | | April 30, 2017 | |
Mid Cap Value Portfolio | | | 1.00 | % | | | April 30, 2017 | |
Index 600 Stock Portfolio | | | 0.35 | % | | | April 30, 2017 | |
Small Cap Value Portfolio | | | 1.00 | % | | | April 30, 2017 | |
International Growth Portfolio | | | 1.10 | % | | | April 30, 2017 | |
Research International Core Portfolio | | | 1.15 | % | | | April 30, 2017 | |
Emerging Markets Equity Portfolio | | | 1.50 | % | | | April 30, 2017 | |
Short-Term Bond Portfolio | | | 0.45 | % | | | April 30, 2017 | |
Long-Term U.S. Government Bond Portfolio | | | 0.65 | % | | | April 30, 2017 | |
Inflation Protection Portfolio | | | 0.65 | % | | | April 30, 2017 | |
Multi-Sector Bond Portfolio | | | 0.90 | % | | | April 30, 2017 | |
Asset Allocation Portfolio | | | 0.75 | % | | | April 30, 2017 | |
Growth Stock Portfolio — MSA has agreed to waive a portion of its management fee such that the management fee is 0.60% on the Portfolio’s first $50 million of average net assets, 0.50% on the next $50 million, 0.40% on the next $400 million, and 0.38% on average net assets in excess of $500 million. MSA may terminate this fee waiver agreement at any time after April 30, 2017.
Focused Appreciation Portfolio — MSA has agreed to waive a portion of its management fee such that the management fee is 0.66% on the Portfolio’s first $100 million of average net assets, 0.61% on the next $400 million, 0.60% on the next $500 million, and 0.57% on average net assets in excess of $1 billion. MSA may terminate this fee waiver agreement at any time after April 30, 2017.
Large Cap Core Stock Portfolio — MSA has agreed to waive a portion of its management fee such that the management fee is 0.60% on the Portfolio’s first $50 million of average net assets, 0.50% on the next $50 million, 0.40% on the next $400 million, and 0.35% on average net assets in excess of $500 million. MSA may terminate this fee waiver agreement at any time after April 30, 2017.
| | | | |
| 222 | | Notes to Financial Statements | | |
Notes to Financial Statements
Index 500 Stock Portfolio — Effective May 1, 2016, MSA has agreed to waive a portion of its management fee such that the management fee is 0.20% on the Portfolio’s first $2 billion of average net assets, and 0.18% on average net assets in excess of $2 billion. MSA may terminate this fee waiver agreement at any time after April 30, 2017.
Large Company Value Portfolio — MSA has agreed to waive a portion of its management fee such that the management fee is 0.68% on the Portfolio’s first $100 million of average net assets, 0.65% on the next $150 million, 0.59% on the next $250 million, and 0.57% on average net assets in excess of $500 million. MSA may terminate this fee waiver agreement at any time after April 30, 2017.
Domestic Equity Portfolio — MSA has agreed to waive a portion of its management fee on average net assets over $500 million such that the management fee is 0.65% on the Portfolio’s first $100 million of average net assets, 0.55% on the next $150 million, 0.50% on the next $250 million, and 0.48% on average net assets in excess of $500 million. MSA may terminate this fee waiver agreement at any time after April 30, 2017.
Equity Income Portfolio — For the period from January 1, 2016 through April 30, 2016, MSA agreed to waive a portion of its management fee such that the management fee was 0.65% on the Portfolio’s first $500 million of average net assets, 0.60% on the next $500 million, and 0.57% on average net assets in excess of $1 billion. For the period from May 1, 2016 through November 30, 2016, MSA agreed to waive a portion of its management fee such that the management fee was 0.65% on the Portfolio’s first $500 million of average net assets, and 0.55% on average net assets in excess of $500 million. Effective December 1, 2016, MSA has agreed to waive a portion of is management fee such that the management fee is 0.65% on the Portfolio’s first $500 million of average net assets, 0.55% on the next $1 billion, and 0.52% on average net assets in excess of $1.5 billion. MSA may terminate this fee waiver agreement at any time after April 30, 2017.
Mid Cap Growth Stock Portfolio — Effective May 1, 2016, MSA has agreed to waive a portion of its management fee on average net assets over $1 billion such that the management fee is 0.80% on the Portfolio’s first $50 million, 0.65% on the next $50 million, 0.50% on the next $900 million, and 0.48% on average net assets in excess of $1 billion. MSA may terminate this fee waiver agreement at any time after April 30, 2017.
Index 400 Stock Portfolio — MSA has agreed to waive a portion of its management fee such that the management fee is 0.25% on the Portfolio’s first $500 million and 0.20% on average net assets in excess of $500 million. MSA may terminate this fee waiver agreement at any time after April 30, 2017.
Mid Cap Value Portfolio — For the period from January 1, 2016 through April 30, 2016, MSA agreed to waive a portion of its management fee such that the management fee was 0.79% on the Portfolio’s first $150 million of average net assets, and 0.70% in excess of $150 million. Effective May 1, 2016, MSA has agreed to waive a portion of its management fee such that the management fee is 0.79% on the Portfolio’s first $150 million of average net assets, 0.70% on the next $350 million, and 0.68% in excess of $500 million. MSA may terminate this fee waiver agreement at any time after April 30, 2017.
Small Cap Value Portfolio — MSA has agreed to waive a portion of its management fee such that the management fee is 0.85% on the Portfolio’s first $500 million of average net assets, and 0.80% on average net assets in excess of $500 million. MSA may terminate this fee waiver agreement at any time after April 30, 2017.
Research International Core Portfolio — Effective May 12, 2016, MSA has agreed to waive a portion of its management fee such that the management fee is 0.83% on the Portfolio’s first $150 million of average net assets, 0.77% of the next $150 million, 0.70% on the next $200 million, and 0.63% on average net assets in excess of $500 million. MSA may terminate this fee waiver agreement at any time after April 30, 2017.
International Equity Portfolio — For the period from January 1, 2016 through April 30, 2016, MSA agreed to waive a portion of its management fee such that the management fee for the Portfolio was 0.80% on the Portfolio’s first $50 million of average net assets, 0.60% on the next $950 million, 0.50% on the next $500 million, and 0.45% on average net assets in excess of $1.5 billion. Effective May 1, 2016, MSA has agreed to waive a portion of its management fee such that the management fee is 0.80% on the Portfolio’s first $50 million of average net assets, 0.60% on the next $450 million, 0.57% on the next $500 million, 0.50% on the next $500 million and 0.45% in excess of $1.5 billion. MSA may terminate this fee waiver agreement at any time after April 30, 2017.
| | | | | | |
| | Notes to Financial Statements | | | 223 | |
Notes to Financial Statements
Emerging Markets Equity Portfolio — For the period from May 1, 2016 to May 11, 2016, MSA agreed to waive a portion of its management fee such that its management fee was 1.11% on the Portfolio’s first $250 million of average net assets, 1.08% on the next $250 million, 0.96% on the next $500 million, and 0.78% on average net assets in excess of $1 billion. Effective May 12, 2016, MSA has agreed to waive a portion of its management fee such that its management fee is 1.01% on the Portfolio’s first $250 million of average net assets, 0.93% on the next $250 million, 0.91% on the next $500 million, and 0.78% on average net assets in excess of $1 billion. MSA may terminate this fee waiver agreement at any time after April 30, 2017.
Government Money Market Portfolio — Effective May 1, 2016, MSA has agreed to waive a portion of its management fee such that the management fee is 0.30% on the Portfolio’s first $500 million of average net assets, 0.29% on the next $500 million, and 0.28% in excess of $1 billion. MSA may terminate this fee waiver agreement at any time after April 30, 2017. In addition, MSA has voluntarily agreed to waive its advisory fee and/or reimburse expenses in excess of the Portfolio’s daily yield so as to maintain a zero or positive yield for the Portfolio. This voluntary waiver will be reviewed periodically by MSA in light of market and economic developments and may be revised or discontinued at any time without advance notice.
Short-Term Bond Portfolio — MSA has agreed to waive a portion of its management fee such that the management fee is 0.35% on the Portfolio’s first $100 million of average net assets, 0.33% on the next $150 million, 0.30% on the next $250 million, and 0.28% on average net assets in excess of $500 million. MSA may terminate this fee waiver agreement at any time after April 30, 2017.
Select Bond Portfolio — Effective May 1, 2016, MSA has agreed to waive a portion of its management fee such that the management fee is 0.30% on the Portfolio’s first $2 billion of average net assets, and 0.28% on average net assets in excess of $2 billion. MSA may terminate this fee waiver agreement at any time after April 30, 2017.
Long-Term U.S. Government Bond Portfolio — MSA has agreed to waive a portion of its management fee such that the management fee is 0.555% on the Portfolio’s first $100 million of average net assets, 0.515% on the next $150 million, 0.495% of the next $250 million, and 0.445% on average net assets in excess of $500 million. MSA may terminate this fee waiver agreement at any time after April 30, 2017.
Inflation Protection Portfolio — MSA agreed to waive a portion of its management fee such that the management fee is 0.55% on the Portfolio’s first $100 million of average net assets, 0.50% on the next $150 million, and 0.46% on average net assets in excess of $250 million. MSA may terminate this fee waiver agreement at any time after April 30, 2017.
High Yield Bond Portfolio — MSA agreed to waive a portion of its management fee such that the management fee is 0.60% on the Portfolio’s first $50 million of average net assets, 0.50% on the next $50 million, 0.40% on the next $900 million, and 0.30% on average net assets in excess of $1 billion. MSA may terminate this fee waiver agreement at any time after April 30, 2017.
Multi-Sector Bond Portfolio — For the period from January 1, 2016 through April 30, 2016, MSA agreed to waive a portion of its management fee such that the management fee is 0.74% on the Portfolio’s first $100 million of average net assets, 0.73% on the next $150 million, and 0.70% on average net assets in excess of $250 million. Effective May 1, 2016, MSA has agreed to waive a portion of its management fee such that the management fee is 0.74% on the Portfolio’s first $100 million of average net assets, 0.73% on the next $150 million, 0.70% on the next $250 million, and 0.67% on average net assets in excess of $500 million. MSA may terminate this fee waiver agreement at any time after April 30, 2017.
Balanced Portfolio — For the period from January 1, 2016 through April 30, 2016, MSA agreed to waive a portion of its management fee such that its management fee on assets invested in affiliated companies was 0.05%. Effective May 1, 2016, MSA has agreed to waive a portion of its management fee such that the management fee is 0.05% on all average net assets. MSA may terminate this fee waiver agreement at any time after April 30, 2017.
Asset Allocation Portfolio — For the period from January 1, 2016 through April 30, 2016, MSA agreed to waive a portion of its management fee such that the management fee was 0.55% on the Portfolio’s first $100 million of average net assets, 0.45% on the next $150 million, and 0.35% on average net assets in excess of $250 million. In addition, MSA agreed to waive a portion of its management fee such that its management fee on assets invested in affiliated companies was 0.05%. Effective May 1, 2016, MSA has agreed to waive a portion of its management fee such that the management fee is 0.05% on all average net assets. MSA may terminate this fee waiver agreement at any time after April 30, 2017.
| | | | | | |
| 224 | | Notes to Financial Statements | | | | |
Notes to Financial Statements
Waivers are not recoupable in future periods.
Certain Portfolios pay a portion of their custodian fees indirectly through expense offset arrangements. Custodian fees are reduced for Portfolios that maintain compensating balances in non-interest bearing accounts. These Portfolios could have invested the assets used to pay for the custodian fees, had the assets not been used in the expense offset arrangements. Expense offset arrangements are reflected as Waived Fees Paid Indirectly on the Statements of Operations.
With respect to certain Portfolios, MSA has engaged and oversees sub-advisers who manage the day-to-day investment operations of such Portfolios. MSA pays each sub-adviser a fee based on the average daily net assets of each such Portfolio out of its investment management fee.
Compliance fees are paid to Northwestern Mutual, an affiliate of the Series Fund. The compliance fees paid are for the compensation, benefits and expenses of the Chief Compliance Officer and compliance staff. The amounts paid relate only to the Chief Compliance Officer and compliance staffs’ duties and functions performed for the Series Fund.
Note 8. Federal Income Tax Matters
Taxable distributions from net investment income and realized capital gains in the Portfolios may differ from book amounts earned during the period due to differences in the timing of capital gains recognition and due to the reclassification of certain gains or losses between capital and income. The differences between cost amounts for book purposes and tax purposes are primarily due to the tax treatment of deferred losses, corporate actions, partnerships, passive foreign investment companies, and financing transactions.
It is the policy of the Portfolios to reclassify the net effect of permanent differences between book and taxable income to capital accounts on the Statements of Assets and Liabilities. Permanent differences primarily relate to character differences with respect to income on swaps, foreign currency transactions, foreign bond sales, passive foreign investment companies, corporate actions and paydowns on structured product investments.
A summary of the Portfolios’ capital loss carryovers as of December 31, 2016 is provided below:
| | | | | | | | | | | | | | | | | | | | | | | | |
Portfolio | | Utilized
in 2016 | | | Expired
in 2016 | | | Short-Term
Amount
Subject to
Expiration | | | Expiration | | | Short-Term
Amount Not
Subject to
Expiration | | | Long-Term
Amount Not
Subject to
Expiration | |
| | | (Amounts in thousands) | |
Large Cap Core Stock Portfolio | | $ | - | | | $ | - | | | $ | - | | | | - | | | $ | - | | | $ | 837 | |
Mid Cap Growth Stock Portfolio | | | - | | | | - | | | | - | | | | - | | | | 16,965 | | | | - | |
International Growth Portfolio | | | - | | | | - | | | | 7,111 | | | | 2017 | | | | 16,461 | | | | 1,552 | |
Research International Core Portfolio | | | - | | | | - | | | | - | | | | - | | | | - | | | | 16,726 | |
International Equity Portfolio | | | - | | | | - | | | | - | | | | - | | | | 9,862 | | | | 56,884 | |
Emerging Markets Equity Portfolio | | | 2,496 | | | | - | | | | - | | | | - | | | | 2,850 | | | | 42,441 | |
Short-Term Bond Portfolio | | | - | | | | - | | | | - | | | | - | | | | 987 | | | | 945 | |
Inflation Protection Portfolio | | | 463 | | | | - | | | | - | | | | - | | | | - | | | | - | |
High Yield Bond Portfolio | | | 1,038 | | | | 8,390 | | | | 19,925 | | | | 2017 | | | | - | | | | 10,306 | |
Multi-Sector Bond Portfolio | | | 3,126 | | | | - | | | | - | | | | - | | | | 17,554 | | | | 1,562 | |
Capital losses incurred during fiscal years after 2010 are carried forward indefinitely and retain the character of the original loss. These losses are deferred to the first day of the next fiscal year and must be utilized prior to the losses incurred prior to 2011.
| | | | | | |
| | Notes to Financial Statements | | | 225 | |
Notes to Financial Statements
When applicable, each of the Portfolios made distributions during the year of ordinary income and long-term capital gains. The tax character of distributions paid for the periods ended December 31, 2016 and 2015 was as follows:
| | | | | | | | | | | | | | | | |
| | | 2016 Distributions Paid From: | | | 2015 Distributions Paid From: | |
Portfolio | | Ordinary
Income | | | Long-term
Capital Gain | | | Ordinary
Income | | | Long-term
Capital Gain | |
| | | (Amounts in thousands) | |
Growth Stock Portfolio | | $ | 7,202 | | | $ | 80,811 | | | $ | 20,753 | | | $ | 49,004 | |
Focused Appreciation Portfolio | | | 50,577 | | | | 165,466 | | | | 6,918 | | | | 75,590 | |
Large Cap Core Stock Portfolio | | $ | 10,936 | | | $ | 9,147 | | | $ | 11,360 | | | $ | 8,027 | |
Large Cap Blend Portfolio | | | 3,122 | | | | 10,542 | | | | 3,963 | | | | 6,208 | |
Index 500 Stock Portfolio | | | 46,439 | | | | 52,069 | | | | 41,688 | | | | 40,759 | |
Large Company Value Portfolio | | | 3,858 | | | | 16,132 | | | | 7,419 | | | | 11,909 | |
Domestic Equity Portfolio | | | 12,521 | | | | 25,926 | | | | 11,101 | | | | - | |
Equity Income Portfolio | | | 15,268 | | | | 39,661 | | | | 13,743 | | | | 29,517 | |
Mid Cap Growth Stock Portfolio | | | 3,826 | | | | 77,596 | | | | 25,222 | | | | 74,427 | |
Index 400 Stock Portfolio | | | 8,024 | | | | 52,210 | | | | 8,080 | | | | 39,526 | |
Mid Cap Value Portfolio | | | 17,599 | | | | 25,515 | | | | 22,955 | | | | 26,380 | |
Small Cap Growth Stock Portfolio | | | 3,262 | | | | 49,556 | | | | 12,067 | | | | 14,940 | |
Index 600 Stock Portfolio | | | 1,140 | | | | 6,003 | | | | - | | | | 339 | |
Small Cap Value Portfolio | | | 5,244 | | | | 70,226 | | | | 3,773 | | | | 32,571 | |
International Growth Portfolio | | | 5,957 | | | | - | | | | 7,804 | | | | - | |
Research International Core Portfolio | | | 9,199 | | | | 3,916 | | | | 10,556 | | | | 10,976 | |
International Equity Portfolio | | | 33,744 | | | | 20,770 | | | | 50,077 | | | | 67,503 | |
Emerging Markets Equity Portfolio | | | 3,683 | | | | - | | | | 3,916 | | | | - | |
Govt Money Market Portfolio | | | 611 | | | | 2 | | | | 43 | | | | 3 | |
Short-Term Bond Portfolio | | | 3,014 | | | | - | | | | 1,717 | | | | - | |
Select Bond Portfolio | | | 67,490 | | | | 2,244 | | | | 55,277 | | | | 1,029 | |
Long-Term U.S. Government Bond Portfolio | | | 4,300 | | | | - | | | | 2,212 | | | | - | |
Inflation Protection Portfolio | | | 3,649 | | | | - | | | | 6,992 | | | | - | |
High Yield Bond Portfolio | | | 39,861 | | | | - | | | | 32,590 | | | | - | |
Multi-Sector Bond Portfolio | | | 29,034 | | | | - | | | | 35,421 | | | | 4,734 | |
Balanced Portfolio | | | 49,667 | | | | 62,181 | | | | 66,615 | | | | 85,601 | |
Asset Allocation Portfolio | | | 5,868 | | | | 9,122 | | | | 6,708 | | | | 11,409 | |
As of December 31, 2016, the components of distributable earnings on a tax basis were as follows: | |
Portfolio | | Undistributed
Ordinary
Income | | | Undistributed
Long-Term
Gains | | | Accumulated
Losses | | | Unrealized
Appreciation
(Depreciation) | |
| | | (Amounts in thousands) | |
Growth Stock Portfolio | | $ | 8,019 | | | $ | 41,519 | | | $ | - | | | $ | 131,048 | |
Focused Appreciation Portfolio | | | 7,447 | | | | 15,000 | | | | - | | | | 35,334 | |
Large Cap Core Stock Portfolio | | | 9,904 | | | | - | | | | (837 | ) | | | 103,007 | |
Large Cap Blend Portfolio | | | 1,572 | | | | 8,161 | | | | - | | | | 22,072 | |
Index 500 Stock Portfolio | | | 53,883 | | | | 29,394 | | | | - | | | | 1,220,556 | |
Large Company Value Portfolio | | | 6,538 | | | | 5,231 | | | | - | | | | 15,629 | |
Domestic Equity Portfolio | | | 17,174 | | | | 13,986 | | | | - | | | | 176,550 | |
Equity Income Portfolio | | | 19,521 | | | | 36,517 | | | | - | | | | 118,174 | |
Mid Cap Growth Stock Portfolio | | | 2,583 | | | | - | | | | (16,965 | ) | | | 56,866 | |
Index 400 Stock Portfolio | | | 9,368 | | | | 47,364 | | | | - | | | | 205,904 | |
Mid Cap Value Portfolio | | | 11,854 | | | | 15,246 | | | | - | | | | 66,477 | |
Small Cap Growth Stock Portfolio | | | 625 | | | | 6,457 | | | | - | | | | 94,213 | |
Index 600 Stock Portfolio | | | 5,233 | | | | 5,517 | | | | - | | | | 33,428 | |
Small Cap Value Portfolio | | | 5,104 | | | | 32,976 | | | | - | | | | 209,405 | |
International Growth Portfolio | | | 8,204 | | | | - | | | | (25,124 | ) | | | (14,451 | ) |
Research International Core Portfolio | | | 9,827 | | | | - | | | | (16,726 | ) | | | (8,953 | ) |
International Equity Portfolio | | | 42,550 | | | | - | | | | (66,746 | ) | | | 61,200 | |
Emerging Markets Equity Portfolio | | | 5,748 | | | | - | | | | (45,291 | ) | | | (4,458 | ) |
Govt Money Market Portfolio | | | 3 | | | | - | | | | - | | | | - | |
Short-Term Bond Portfolio | | | 3,730 | | | | - | | | | (1,932 | ) | | | 36 | |
Select Bond Portfolio | | | 98,769 | | | | - | | | | - | | | | (51,902 | ) |
Long-Term U.S. Government Bond Portfolio | | | 4,579 | | | | 1,984 | | | | - | | | | (10,507 | ) |
Inflation Protection Portfolio | | | 3,228 | | | | 186 | | | | - | | | | (4,129 | ) |
High Yield Bond Portfolio | | | 43,155 | | | | - | | | | (30,231 | ) | | | 8,684 | |
Multi-Sector Bond Portfolio | | | 29,811 | | | | - | | | | (19,116 | ) | | | (11,987 | ) |
| | | | | | |
| 226 | | Notes to Financial Statements | | | | |
Notes to Financial Statements
| | | | | | | | | | | | | | | | |
Portfolio | | Undistributed
Ordinary
Income | | | Undistributed
Long-Term
Gains | | | Accumulated
Losses | | | Unrealized
Appreciation
(Depreciation) | |
Balanced Portfolio | | | 56,193 | | | | 76,318 | | | | - | | | | 18,920 | |
Asset Allocation Portfolio | | | 6,212 | | | | 10,742 | | | | - | | | | 3,399 | |
Note 9. Voluntary Reimbursements
Northwestern Mutual voluntarily reimburses foreign equity portfolios for the benefit Northwestern Mutual receives from foreign dividend taxes charged against the Portfolios. The amounts reimbursed represent approximately 65% of the foreign dividend taxes withheld attributable to the portion of the Portfolio owned by Northwestern Mutual. Reimbursements are recorded when foreign dividend taxes are accrued.
Voluntary reimbursements for the periods ended December 31, 2016 and 2015 are summarized below:
| | | | | | | | |
Portfolio | | 2016
Reimbursements | | | 2015
Reimbursements | |
International Growth Portfolio | | $ | 552,098 | | | $ | 473,424 | |
Research International Core Portfolio | | | 726, 889 | | | | 720,001 | |
International Equity Portfolio | | | 3,444,135 | | | | 2,899,989 | |
Emerging Markets Equity Portfolio | | | 736,438 | | | | 600,714 | |
Note 10. Guarantees
In the normal course of business the Portfolios enter into contracts that contain a variety of representations which provide general indemnifications. The Portfolios’ maximum exposure under these arrangements is unknown as this would involve future claims that may be made against the Portfolios that have not yet occurred. However, the Portfolios expect the risk of loss to be remote.
Note 11. Investment Income and Securities Transactions
For the period ended December 31, 2016, transactions in securities other than short term investments were:
| | | | | | | | | | | | | | | | |
Portfolio | | Total
Security
Purchases | | | U.S. Govt.
Security
Purchases | | | Total Security
Sales/Maturities | | | U.S. Govt.
Security
Sales/Maturities | |
| | | (Amount in thousands) | |
Growth Stock Portfolio | | $ | 542,391 | | | $ | - | | | $ | 574,539 | | | $ | - | |
Focused Appreciation Portfolio | | | 71,703 | | | | - | | | | 124,680 | | | | - | |
Large Cap Core Stock Portfolio | | | 34,547 | | | | - | | | | 56,144 | | | | - | |
Large Cap Blend Portfolio | | | 30,132 | | | | - | | | | 39,138 | | | | - | |
Index 500 Stock Portfolio | | | 151,358 | | | | - | | | | 80,152 | | | | - | |
Large Company Value Portfolio | | | 143,013 | | | | - | | | | 144,628 | | | | - | |
Domestic Equity Portfolio | | | 90,945 | | | | - | | | | 78,675 | | | | - | |
Equity Income Portfolio | | | 169,354 | | | | - | | | | 216,354 | | | | - | |
Mid Cap Growth Stock Portfolio | | | 553,781 | | | | - | | | | 595,795 | | | | - | |
Index 400 Stock Portfolio | | | 152,531 | | | | - | | | | 129,999 | | | | - | |
Mid Cap Value Portfolio | | | 259,830 | | | | - | | | | 240,622 | | | | - | |
Small Cap Growth Stock Portfolio | | | 216,353 | | | | - | | | | 232,707 | | | | - | |
Index 600 Stock Portfolio | | | 92,942 | | | | - | | | | 65,851 | | | | - | |
Small Cap Value Portfolio | | | 131,278 | | | | - | | | | 154,049 | | | | - | |
International Growth Portfolio | | | 187,712 | | | | - | | | | 124,656 | | | | - | |
Research International Core Portfolio | | | 218,715 | | | | - | | | | 198,912 | | | | - | |
International Equity Portfolio | | | 270,549 | | | | - | | | | 249,190 | | | | - | |
Emerging Markets Equity Portfolio | | | 267,445 | | | | - | | | | 226,911 | | | | - | |
| | | | | | |
| | Notes to Financial Statements | | | 227 | |
Notes to Financial Statements
| | | | | | | | | | | | | | | | |
Portfolio | | Total
Security
Purchases | | | U.S. Govt.
Security
Purchases | | | Total Security
Sales/Maturities | | | U.S. Govt.
Security
Sales/Maturities | |
| | | (Amount in thousands) | |
Short-Term Bond Portfolio | | | 134,820 | | | | 1,991 | | | | 83,127 | | | | 8,692 | |
Select Bond Portfolio | | | 12,497,555 | | | | 3,366,615 | | | | 12,209,769 | | | | 3,538,788 | |
Long-Term U.S. Government Bond Portfolio | | | 5,691 | | | | 201,107 | | | | 1,871 | | | | 170,233 | |
Inflation Protection Portfolio | | | 135,342 | | | | 9,153 | | | | 96,294 | | | | 4,285 | |
High Yield Bond Portfolio | | | 258,023 | | | | - | | | | 254,049 | | | | - | |
Multi-Sector Bond Portfolio | | | 231,954 | | | | 3,002 | | | | 207,803 | | | | 20,258 | |
Balanced Portfolio | | | 508,070 | | | | - | | | | 494,050 | | | | - | |
Asset Allocation Portfolio | | | 65,336 | | | | - | | | | 60,472 | | | | - | |
Transactions with Affiliated Companies
An affiliated company is a company in which a Portfolio has ownership of at least 5% of the voting securities or which the Portfolio controls, is controlled by or with which the Portfolio is under common control. Transactions with affiliated companies during the period ended December 31, 2016 are as follows:
| | | | | | | | | | | | | | | | | | | | | | | | | | | | | | | | |
Portfolio | | Value at
12/31/2015 | | | Purchases | | | Sales | | | Value at
12/31/2016 | | | Realized
Gain
(Loss) | | | Income
Dividends | | | Capital Gain
Distributions | | | % Ownership,
12/31/2016 | |
| | | | | | | | | | | | (Amount in thousands) | | | | | | | | | | |
Balanced: | | | | | | | | | | | | | | | | | | | | | | | | | | | | | | | | |
Growth Stock | | $ | 138,928 | | | $ | 22,833 | | | $ | 5,500 | | | $ | 145,302 | | | $ | 304 | | | $ | 1,165 | | | $ | 13,068 | | | | 17.3 | % |
Focused Appreciation | | | 69,449 | | | | 21,587 | | | | 5,960 | | | | 70,124 | | | | 938 | | | | 156 | | | | 18,431 | | | | 9.1 | % |
Large Cap Core Stock | | | 69,417 | | | | 2,776 | | | | 1,920 | | | | 72,644 | | | | 53 | | | | 1,511 | | | | 1,265 | | | | 14.1 | % |
Large Cap Blend | | | 69,365 | | | | 6,174 | | | | 3,200 | | | | 75,542 | | | | 318 | | | | 739 | | | | 5,435 | | | | 45.9 | % |
Large Company Value | | | 69,526 | | | | 12,231 | | | | 5,590 | | | | 78,481 | | | | 190 | | | | 1,308 | | | | 6,922 | | | | 40.1 | % |
Domestic Equity | | | 69,361 | | | | 8,368 | | | | 5,545 | | | | 78,011 | | | | 1,162 | | | | 1,423 | | | | 2,945 | | | | 10.8 | % |
Equity Income | | | 68,643 | | | | 9,570 | | | | 5,510 | | | | 80,130 | | | | 155 | | | | 1,548 | | | | 4,022 | | | | 10.0 | % |
Mid Cap Growth Stock | | | 90,382 | | | | 25,010 | | | | 5,250 | | | | 102,724 | | | | 1,022 | | | | 180 | | | | 7,830 | | | | 10.4 | % |
Mid Cap Value | | | 88,033 | | | | 22,641 | | | | 9,250 | | | | 112,334 | | | | 466 | | | | 1,756 | | | | 7,885 | | | | 21.7 | % |
Small Cap Growth Stock | | | 20,199 | | | | 16,529 | | | | 600 | | | | 36,493 | | | | 23 | | | | 77 | | | | 3,452 | | | | 6.7 | % |
Small Cap Value | | | 17,921 | | | | 18,076 | | | | - | | | | 40,066 | | | | - | | | | 311 | | | | 4,165 | | | | 6.2 | % |
International Growth | | | 17,867 | | | | 20,430 | | | | - | | | | 36,675 | | | | - | | | | 430 | | | | - | | | | 7.0 | % |
Research International Core | | | 140,818 | | | | 3,112 | | | | 37,500 | | | | 101,555 | | | | 5,123 | | | | 2,081 | | | | 1,030 | | | | 20.3 | % |
International Equity | | | 63,729 | | | | 1,792 | | | | 19,000 | | | | 45,218 | | | | 453 | | | | 1,109 | | | | 683 | | | | 2.8 | % |
Emerging Markets Equity | | | 8,335 | | | | 8,121 | | | | 12,000 | | | | 5,356 | | | | 829 | | | | 121 | | | | - | | | | 1.0 | % |
Select Bond | | | 912,584 | | | | 91,813 | | | | 176,500 | | | | 833,447 | | | | 2,931 | | | | 15,905 | | | | 4,408 | | | | 29.4 | % |
Inflation Protection | | | - | | | | 16,500 | | | | - | | | | 16,561 | | | | - | | | | - | | | | - | | | | 5.1 | % |
High Yield Bond | | | 124,768 | | | | 45,057 | | | | 46,000 | | | | 135,098 | | | | 1,301 | | | | 8,057 | | | | - | | | | 17.9 | % |
| | | | | | | | | | | | | | | | | | | | | | | | | | | | | | | | |
| | $ | 2,039,325 | | | $ | 352,620 | | | $ | 339,325 | | | $ | 2,065,761 | | | $ | 15,268 | | | $ | 37,877 | | | $ | 81,541 | | | | | |
| | | | | | | | | | | | | | | | | | | | | | | | | | | | | | | | |
| | | | | | | | |
Asset Allocation: | | | | | | | | | | | | | | | | | | | | | | | | | | | | | | | | |
Growth Stock | | $ | 19,223 | | | $ | 2,841 | | | $ | 650 | | | $ | 19,888 | | | $ | 36 | | | $ | 162 | | | $ | 1,819 | | | | 2.4 | % |
Focused Appreciation | | | 9,606 | | | | 2,792 | | | | 751 | | | | 9,569 | | | | 118 | | | | 22 | | | | 2,571 | | | | 1.2 | % |
Large Cap Core Stock | | | 10,801 | | | | 430 | | | | 340 | | | | 11,259 | | | | 9 | | | | 234 | | | | 196 | | | | 2.2 | % |
Large Cap Blend | | | 10,794 | | | | 957 | | | | 540 | | | | 11,708 | | | | 54 | | | | 115 | | | | 842 | | | | 7.1 | % |
Large Company Value | | | 9,617 | | | | 1,628 | | | | 500 | | | | 11,091 | | | | 15 | | | | 179 | | | | 949 | | | | 5.7 | % |
Domestic Equity | | | 9,592 | | | | 1,099 | | | | 730 | | | | 10,768 | | | | 153 | | | | 195 | | | | 404 | | | | 1.5 | % |
Equity Income | | | 9,327 | | | | 1,263 | | | | 470 | | | | 11,152 | | | | 13 | | | | 212 | | | | 551 | | | | 1.4 | % |
Mid Cap Growth Stock | | | 12,707 | | | | 3,134 | | | | 930 | | | | 13,907 | | | | 182 | | | | 24 | | | | 1,059 | | | | 1.4 | % |
Mid Cap Value | | | 12,324 | | | | 2,802 | | | | 1,480 | | | | 15,156 | | | | 76 | | | | 237 | | | | 1,065 | | | | 2.9 | % |
Small Cap Growth Stock | | | 4,537 | | | | 2,144 | | | | - | | | | 6,771 | | | | - | | | | 14 | | | | 629 | | | | 1.2 | % |
Small Cap Value | | | 4,235 | | | | 2,344 | | | | - | | | | 7,424 | | | | - | | | | 59 | | | | 785 | | | | 1.1 | % |
International Growth | | | 1,887 | | | | 4,067 | | | | - | | | | 5,706 | | | | - | | | | 67 | | | | - | | | | 1.1 | % |
Research International Core | | | 20,761 | | | | 431 | | | | 4,500 | | | | 15,934 | | | | 588 | | | | 288 | | | | 143 | | | | 3.2 | % |
International Equity | | | 9,666 | | | | 254 | | | | 2,000 | | | | 7,720 | | | | 38 | | | | 157 | | | | 97 | | | | 0.5 | % |
Emerging Markets Equity | | | 1,376 | | | | 917 | | | | - | | | | 2,404 | | | | - | | | | 17 | | | | - | | | | 0.5 | % |
Select Bond | | | 59,639 | | | | 10,186 | | | | 19,750 | | | | 50,467 | | | | 362 | | | | 929 | | | | 257 | | | | 1.8 | % |
Inflation Protection | | | - | | | | 2,000 | | | | - | | | | 2,007 | | | | - | | | | - | | | | - | | | | 0.6 | % |
High Yield Bond | | | 18,560 | | | | 5,949 | | | | 6,000 | | | | 20,200 | | | | 153 | | | | 1,199 | | | | - | | | | 2.7 | % |
| | | | | | | | | | | | | | | | | | | | | | | | | | | | | | | | |
| | $ | 224,652 | | | $ | 45,238 | | | $ | 38,641 | | | $ | 233,131 | | | $ | 1,797 | | | $ | 4,110 | | | $ | 11,367 | | | | | |
| | | | | | | | | | | | | | | | | | | | | | | | | | | | | | | | |
| | | | |
| 228 | | Notes to Financial Statements | | |
Notes to Financial Statements
The Series Fund and its Portfolios are permitted to purchase securities from, and sell securities to (so called “cross-trades”), (i) other Portfolios, (ii) any registered investment company which is an affiliate, or an affiliate of an affiliate, or (iii) any person which is an affiliate, or an affiliate of an affiliate, of the Series Fund or the Portfolio solely by reason of having a common investment adviser or sub-adviser (or affiliated investment advisers) or common directors and/or officers, pursuant to procedures adopted by the Board under Rule 17a-7 of the 1940 Act (“Procedures”). These Procedures have been designed to ensure that any cross-trade of securities by a Portfolio complies with Rule 17a-7 of the 1940 Act. Each cross-trade is effected at the current market price as defined under the Procedures. Pursuant to the Procedures, for the period ended December 31, 2016, the Series Fund Portfolios engaged in the following cross-trades (amounts in thousands):
| | | | |
| | | | |
Portfolio | | Cross Trade
Purchases | |
Growth Stock Portfolio | | $ | 7,676 | |
Large Company Value Portfolio | | | 224 | |
Equity Income Portfolio | | | 270 | |
Mid Cap Value Portfolio | | | 54 | |
Small Cap Value Portfolio | | $ | 593 | |
International Growth Portfolio | | | 9,790 | |
Research International Core Portfolio | | | 1,671 | |
Emerging Markets Equity Portfolio | | | 3,250 | |
High Yield Bond Portfolio | | | 1,323 | |
| | | | | | | | |
| | | Cross Trade Sales | |
Portfolio | | Proceeds | | | Net Realized Gains
(Losses) on Sales | |
Growth Stock Portfolio | | $ | 3,053 | | | $ | 389 | |
Large Company Value Portfolio | | | 54 | | | | 7 | |
Equity Income Portfolio | | | 279 | | | | 106 | |
Mid Cap Value Portfolio | | | 125 | | | | 3 | |
Small Cap Value Portfolio | | $ | 632 | | | $ | 15 | |
International Growth Portfolio | | | 5,755 | | | | (448 | ) |
Research International Core Portfolio | | | 1,745 | | | | (93 | ) |
Emerging Markets Equity Portfolio | | | 494 | | | | (4 | ) |
High Yield Bond Portfolio | | | 276 | | | | (2 | ) |
Note 12. Litigation
The Index 400 Stock, Index 500 Stock, Small Cap Value and Equity Income Portfolios are among the defendants in lawsuits and/or adversary proceedings (the “Actions”) arising out of investments made by those Portfolios in two separate companies. These Actions seek to recover all payments made to beneficial owners of common stock in 2007 in connection with leveraged buy-out transactions involving each company. The Actions allege no misconduct by the Portfolios or management, and management intends to vigorously defend these Actions. Two of the lawsuits have been dismissed and are on appeal, one of these cases has recently been dismissed and the remaining case is in the discovery stage. The value of the proceeds received by these Portfolios in 2007, and the percentage the proceeds represent of each Portfolio’s net assets as of December 31, 2016, were: Index 400 Stock Portfolio $5,600,000 (0.72% of net assets); Index 500 Stock Portfolio $977,000 (0.04% of net assets); Small Cap Value Portfolio $618,000 (0.10% of net assets); and Equity Income Portfolio $2,873,000 (0.36% of net assets). Management has not concluded that a loss is reasonably likely to occur, and therefore no loss accrual has been recorded.
Note 13. Subsequent Events
Effective January 1, 2017, MSA has agreed to an additional waiver of a portion of its management fee relating to the Growth Stock Portfolio on average net assets over $300 million such that the management fee is 0.60% on the Portfolio’s first $50 million of average net assets, 0.50% on the next $50 million, 0.40% on the next $200 million and 0.38% on average net assets in excess of $300 million. MSA may terminate this fee waiver agreement at any time after April 30, 2017.
On or about March 24, 2017, Aberdeen Asset Managers Limited will replace Massachusetts Financial Services Company (MFS) as the sub-adviser for the Emerging Markets Equity Portfolio.
At a Special Meeting of Shareholders of the Series Fund held on November 9, 2016, Messrs. Gerber, Ribbens, and Ullmann were elected to serve as independent directors effective January 1, 2017.
| | | | | | |
| | Notes to Financial Statements | | | 229 | |
Report of Independent Registered Public Accounting Firm
To the Board of Directors and Shareholders of
Northwestern Mutual Series Fund, Inc.
In our opinion, the accompanying statements of assets and liabilities, including the schedules of investments, and the related statements of operations, of changes in net assets, and of cash flows for the Long-Term U.S. Government Bond Portfolio, and the financial highlights present fairly, in all material respects, the financial position of Growth Stock Portfolio, Focused Appreciation Portfolio, Large Cap Core Stock Portfolio, Large Cap Blend Portfolio, Index 500 Stock Portfolio, Large Company Value Portfolio, Domestic Equity Portfolio, Equity Income Portfolio, Mid Cap Growth Stock Portfolio, Index 400 Stock Portfolio, Mid Cap Value Portfolio, Small Cap Growth Stock Portfolio, Index 600 Stock Portfolio, Small Cap Value Portfolio, International Growth Portfolio, Research International Core Portfolio, International Equity Portfolio, Emerging Markets Equity Portfolio, Government Money Market Portfolio, Short-Term Bond Portfolio, Select Bond Portfolio, Long-Term U.S. Government Bond Portfolio, Inflation Protection Portfolio, High Yield Bond Portfolio, Multi-Sector Bond Portfolio, Balanced Portfolio and Asset Allocation Portfolio (constituting Northwestern Mutual Series Fund, Inc., hereafter referred to as the “Fund”) at December 31, 2016, the results of each of their operations for the year then ended, the changes in each of their net assets for each of the two years in the period then ended, the cash flows for the Long-Term U.S. Government Bond Portfolio for the year then ended, and the financial highlights for each of the five years in the period then ended, in conformity with accounting principles generally accepted in the United States of America. These financial statements and financial highlights (hereafter referred to as “financial statements”) are the responsibility of the Fund’s management. Our responsibility is to express an opinion on these financial statements based on our audits. We conducted our audits of these financial statements in accordance with the standards of the Public Company Accounting Oversight Board (United States). Those standards require that we plan and perform the audit to obtain reasonable assurance about whether the financial statements are free of material misstatement. An audit includes examining, on a test basis, evidence supporting the amounts and disclosures in the financial statements, assessing the accounting principles used and significant estimates made by management, and evaluating the overall financial statement presentation. We believe that our audits, which included confirmation of securities at December 31, 2016 by correspondence with the custodians and brokers, provide a reasonable basis for our opinion.
Milwaukee, WI
February 23, 2017
| | | | | | |
| 230 | | Report of Independent Registered Public Accounting Firm | | | | |
Proxy Voting and Portfolio Holdings (unaudited)
Proxy Voting Guidelines
A description of the policies and procedures that the Portfolios use to determine how to vote proxies relating to portfolio securities is available without charge, upon request, by calling toll free 1-888-455-2232. It is also available on the Securities and Exchange Commission’s website at http://www.sec.gov.
Information regarding how the Portfolios voted proxies relating to portfolio securities during the most recent twelve-month period ended June 30 is available without charge, upon request, by calling toll free 1-888-455-2232. It is also available on the Securities and Exchange Commission’s website at http://www.sec.gov.
Quarterly Filing of Portfolio Holdings
Each Portfolio files its complete schedule of portfolio holdings with the Securities and Exchange Commission (SEC) for the first and third quarters of each fiscal year on Form N-Q. The Portfolio’s Form N-Q filings are available (i) on the SEC website at http://www.sec.gov, and may be reviewed and copied at the SEC’s Public Reference Room in Washington, DC. Information on the Public Reference Room may be obtained by calling 1-800-SEC-0330. The Portfolios also make their complete schedule of portfolio holdings for the most recent quarter of their fiscal year available on the Internet at www.northwesternmutual.com.
| | | | | | |
| | Proxy Voting and Portfolio Holdings | | | 231 | |
Director and Officer Information (unaudited)
Northwestern Mutual Series Fund, Inc.
The name, address and year of birth of the directors, as well as their affiliations, positions held with the Series Fund, principal occupations during the past five years and the number of portfolios overseen in the Northwestern Mutual fund complex, are shown below as of December 31, 2016, except as otherwise noted. Each director (whenever elected) shall hold office until the next annual meeting of shareholders and until his or her successor is elected and qualifies or until his or her earlier death, resignation or removal. A director shall retire at the end of the calendar year in which the first of the two events occurs: (i) he or she attains the age of seventy-three (73), or (ii) he or she has served a term or successive terms totaling thirteen (13) years, commencing on the date of his or her election or appointment to the Board. The statement of additional information contains additional information about Series Fund directors and is available without charge, upon request, by calling 1-888-455-2232.
Independent Directors1
| | | | | | | | |
Name, Address, and Year of Birth | | Position | | Length of Time Served | | Number of Portfolios
in Fund Complex
Overseen by Director | | Other Directorships Held2 |
| | | | |
Miriam M. Allison 720 East Wisconsin Avenue Milwaukee, WI 53202 1947 | | Director | | Since 2006 | | 27 | | Director of Wasatch Funds, Inc. (19 portfolios) |
|
| Principal Occupation During Past 5 Years: Rancher since 2004. From 2001 to 2005, Chairman of UMB Fund Services, Inc. (formerly Sunstone Financial Group, Inc.), a mutual fund service provider. |
| | | | |
Robert H. Huffman III 720 East Wisconsin Avenue Milwaukee, WI 53202 1959 | | Director | | Since 2007 | | 27 | | None |
|
| Principal Occupation During Past 5 Years: Since 2004, Co-Founder and Managing Partner of Relative Value Partners, LLC, a registered investment adviser. |
| | | | |
Christy L. Brown 720 East Wisconsin Avenue Milwaukee, WI 53202 1965 | | Director | | Since 2012 | | 27 | | None |
|
| Principal Occupation During Past 5 Years: Since October 2012, Chief Executive Officer, Girl Scouts of Wisconsin Southeast. From 2007 to 2012, Vice Chancellor, Finance and Administrative Affairs, University of Wisconsin, Milwaukee. |
| | | | |
Gail L. Hanson 720 East Wisconsin Avenue Milwaukee, WI 53202 1955 | | Director | | Since 2012 | | 27 | | Director of Artisan Funds, Inc. (14 portfolios) |
|
| Principal Occupation During Past 5 Years: Since February 2011, Chief Financial Officer, Aurora Health Care. Prior thereto, Deputy Executive Director, State of Wisconsin Investment Board. |
| | | | | | |
| 232 | | Director and Officer Information | | | | |
Director and Officer Information (unaudited)
| | | | | | | | |
Name, Address, and Year of Birth | | Position | | Length of Time Served | | Number of Portfolios
in Fund Complex
Overseen by Director | | Other Directorships Held2 |
| | | | |
William Gerber 720 East Wisconsin Avenue Milwaukee, WI 53202 1958 | | Director | | Since 2017 | | 27 | | Director of Ballantyne Strong, Inc., a developer of technology solutions for digital applications (2015 to present) |
|
| Principal Occupation During Past 5 Years: Retired. From 2006 to 2015, Chief Financial Officer, and from 2007 to 2015, Executive Vice President, of TD Ameritrade Holdings Corporation. |
| | | | |
David Ribbens 720 East Wisconsin Avenue Milwaukee, WI 53202 1961 | | Director | | Since 2017 | | 27 | | None |
|
| Principal Occupation During Past 5 Years: Retired. From 2015 to 2016, President, Managing Partner, and Director of Heartland Advisors, Inc. From 2008 to 2015, Executive Vice President and Head of Distribution, Managing Partner, and Director of Heartland Advisors, Inc. |
| | | | |
Donald M. Ullmann 720 East Wisconsin Avenue Milwaukee, WI 53202 1957 | | Director | | Since 2017 | | 27 | | None |
|
| Principal Occupation During Past 5 Years: Since 2015, Principal of DMU Financial Consulting, LLC. From 2013 to 2015, Managing Director, Head of Product Development, Fixed Income at Guggenheim Securities. From 2012 to 2013, Executive Managing Director, Co-head, MBS and Rates Division at Gleacher & Co. From 2009 to 2011, Executive Vice President, Head of Fixed Income Trading and Co-Head of Fixed Income Sales at Keefe, Bruyette and Woods, Inc. |
| 1. | Michael G. Smith served as an independent director during 2016. He retired as an independent director effective December 31, 2016 in accordance with the Series Fund’s By-laws. Accordingly, Mr. Smith’s information is not presented in the table. At a Special Meeting of Shareholders of the Series Fund held on November 9, 2016, Messrs. Gerber, Ribbens, and Ullmann were elected to serve as independent directors effective January 1, 2017. |
| 2. | This column includes only directorships of companies required to report to the Securities and Exchange Commission (SEC) under the Securities Exchange Act of 1934, as amended (i.e., “public companies”) or other investment companies registered under the Investment Company Act of 1940, as amended. |
Other Directors
| | | | | | | | |
Name, Address, and Year of Birth | | Position | | Length of Time Served | | Number of Portfolios
in Fund Complex
Overseen by Director | | Other Directorships Held |
| | | | |
Ronald P. Joelson 720 East Wisconsin Avenue Milwaukee, WI 53202 1958 | | Chairman of the Board | | Since 2015 | | 27 | | None |
|
| Principal Occupation During Past 5 Years: Since 2012, Executive Vice President of The Northwestern Mutual Life Insurance Company (NM) and Chief Investment Officer of NM. Prior thereto, Chief Investment Officer of Genworth Financial from 2009 to 2012. |
| | | | | | |
| | Director and Officer Information | | | 233 | |
Director and Officer Information (unaudited)
Northwestern Mutual Series Fund, Inc.
Executive Officers
| | | | |
Name, Address, and Year of Birth | | Position | | Length of
Time Served |
| | |
Kate M. Fleming 720 East Wisconsin Avenue Milwaukee, WI 53202 1962 | | President | | Since 2013 |
|
Principal Occupation During Past 5 Years: Since January 2015, President of Mason Street Advisors. Since 2014, a member of the Board of Directors of Mason Street Advisors. Prior thereto, Vice President – Operations of Mason Street Advisors from 2004-December 2014 and Treasurer of Mason Street Advisors from 2008-December 2014. |
| | |
Todd M Jones 720 East Wisconsin Avenue Milwaukee, WI 53202 1968 | | Vice President; Chief Financial Officer & Treasurer | | Since 2015 |
|
Principal Occupation During Past 5 Years: Since April 2015, Vice President and Controller of Northwestern Mutual. From November 2012 to April 2015, Vice President and Chief Risk Officer of Northwestern Mutual. From April 2012 to October 2012, Vice President of Product Finance for Northwestern Mutual and Treasurer and Financial and Operations Principal (FINOP) of Northwestern Mutual Investment Services, LLC. |
| | |
Barbara E. Courtney 720 East Wisconsin Avenue Milwaukee, WI 53202 1957 | | Controller & Chief Accounting Officer | | Since 1996 |
|
Principal Occupation During Past 5 Years: Director of Mutual Fund Accounting of Northwestern Mutual since 2002. |
| | |
Randy M. Pavlick 720 East Wisconsin Avenue Milwaukee, WI 53202 1959 | | Chief Compliance Officer | | Since 2014 |
|
Principal Occupation During Past 5 Years: Chief Compliance Officer of Mason Street Advisors since 2014; from 2004 to 2014, Assistant General Counsel of Northwestern Mutual, Secretary of the Fund and Assistant Secretary of Mason Street Advisors. |
| | |
Leslie H. McLinden 720 East Wisconsin Avenue Milwaukee, WI 53202 1962 | | Secretary | | Since 2014 |
|
Principal Occupation During Past 5 Years: Assistant General Counsel of Northwestern Mutual since 2007, Secretary of the Fund and Assistant Secretary of Mason Street Advisors, each since 2014. |
| | | | | | |
| 234 | | Director and Officer Information | | | | |
Special Meeting of Shareholders (unaudited)
Special Meeting of Shareholders
A Special Meeting of Shareholders of Northwestern Mutual Series Fund, Inc. (“Series Fund”) was held on November 9, 2016. Shares of the Series Fund’s Portfolios are sold to separate variable insurance accounts (“Variable Accounts”) of The Northwestern Mutual Life Insurance Company (“Northwestern Mutual”) and to other Portfolios of the Series Fund that operate as affiliated fund of funds to achieve their investment objectives (“Allocation Portfolios”). Accordingly, Northwestern Mutual owns all of the outstanding shares of the Series Fund (either directly or indirectly through the Allocation Portfolios) and therefore is the Series Fund’s only shareholder. Northwestern Mutual holds these shares for its Variable Accounts used for funding its variable annuity contracts and variable life insurance policies. Northwestern Mutual voted the outstanding shares allocated to the Variable Accounts in accordance with the instructions received from variable annuity contract or variable life insurance policy owners and payees. Shares of each Portfolio of the Series Fund as to which no timely instructions were received were voted by Northwestern Mutual in proportion to the instructions from those contract and policy owners and payees who furnished timely instructions with respect to shares of that Portfolio. With respect to the shares of the Portfolios of the Series Fund held by the Allocation Portfolios (“Underlying Portfolios”), Mason Street Advisors, as the Series Fund’s investment adviser, voted in the same proportion as the voting instructions received by Northwestern Mutual from those variable annuity contract or variable life insurance policy owners and payees who furnished timely instructions for each Underlying Portfolio. The results of the shareholders’ vote on the proposals are as follows:
Proposal 1 – To elect eight Directors to Series Fund’s Board of Directors.
(Under Maryland law, the nominees for director receiving the vote of a plurality of the outstanding voting shares of Series Fund cast at a shareholders meeting will be elected.)
| | | | | | |
| Director Name | | Votes For | | Votes Withheld | | Total Votes |
Miriam M. Allison | | 13,821,692,731.898 | | 378,025,956.393 | | 14,199,718,688.291 |
Christy L. Brown | | 13,803,304,077.750 | | 396,414,610.541 | | 14,199,718,688.291 |
William J. Gerber | | 13,848,427,775.536 | | 351,290,912.755 | | 14,199,718,688.291 |
Gail L. Hanson | | 13,848,243,988.165 | | 351,474,700.126 | | 14,199,718,688.291 |
Robert H. Huffman III | | 13,843,178,663.905 | | 356,540,024.386 | | 14,199,718,688.291 |
Ronald P. Joelson | | 13,858,035,914.760 | | 341,682,773.531 | | 14,199,718,688.291 |
David Ribbens | | 13,836,498,350.934 | | 363,220,337.357 | | 14,199,718,688.291 |
Donald M. Ullmann | | 13,847,204,308.996 | | 352,514,379.295 | | 14,199,718,688.291 |
Michael G. Smith retired as a director of the Series Fund effective December 31, 2016 in accordance with the Series Fund’s By-laws. Accordingly, Mr. Smith did not stand for re-election at the Special Meeting of Shareholders.
Proposal 2 – To approve a change in the Portfolios’ fundamental investment policy concerning commodities.
(All Portfolios voted on this Proposal separately.)
| | | | | | | | |
| Portfolio Name | | Votes For | | Votes Against | | Votes Abstained | | Total Votes |
Growth Stock | | 292,878,373.334 | | 12,512,882.395 | | 21,117,904.921 | | 326,509,160.650 |
Focused Appreciation | | 341,607,321.915 | | 12,477,204.673 | | 20,432,766.655 | | 374,517,293.243 |
Large Cap Core Stock | | 289,130,521.093 | | 17,493,678.026 | | 21,845,969.040 | | 328,470,168.159 |
Large Cap Blend | | 135,705,042.301 | | 5,935,063.874 | | 13,696,489.223 | | 155,336,595.398 |
Index 500 Stock | | 572,712,439.056 | | 28,180,469.493 | | 38,238,662.765 | | 639,131,571.314 |
Large Company Value | | 176,398,052.517 | | 7,628,039.027 | | 15,141,103.965 | | 199,167,195.509 |
Domestic Equity | | 424,846,375.641 | | 11,280,710.962 | | 32,704,895.832 | | 468,831,982.435 |
Equity Income | | 435,813,079.125 | | 11,808,004.575 | | 31,431,948.153 | | 479,053,031.853 |
Mid Cap Growth Stock | | 306,631,105.765 | | 17,411,895.741 | | 22,692,176.249 | | 346,735,177.755 |
Index 400 Stock | | 348,883,975.512 | | 21,505,562.344 | | 23,749,473.076 | | 394,139,010.932 |
Mid Cap Value | | 271,752,139.156 | | 10,818,802.510 | | 19,521,214.492 | | 302,092,156.158 |
Small Cap Growth Stock | | 210,305,265.396 | | 9,736,728.491 | | 11,189,434.016 | | 231,231,427.903 |
Index 600 Stock | | 108,398,620.605 | | 7,811,532.804 | | 5,028,166.856 | | 121,238,320.265 |
Small Cap Value | | 244,503,060.005 | | 11,404,735.360 | | 17,529,196.195 | | 273,436,991.560 |
International Growth | | 369,001,460.814 | | 15,754,499.642 | | 25,390,782.922 | | 410,146,743.378 |
Research International Core | | 553,106,186.222 | | 18,073,023.240 | | 30,086,748.658 | | 601,265,958.120 |
International Equity | | 925,145,401.406 | | 36,847,257.668 | | 69,714,965.038 | | 1,031,707,624.112 |
Emerging Markets Equity | | 534,333,640.936 | | 19,393,727.344 | | 33,108,116.693 | | 586,835,484.973 |
Government Money Market | | 413,121,240.553 | | 21,944,989.003 | | 41,507,547.180 | | 476,573,776.736 |
| | | | | | |
| | Special Meeting of Shareholders | | | 235 | |
Special Meeting of Shareholders (unaudited)
| | | | | | | | |
| Portfolio Name | | Votes For | | Votes Against | | Votes Abstained | | Total Votes |
Short-Term Bond | | 219,750,422.306 | | 10,960,268.463 | | 21,391,592.019 | | 252,102,282.788 |
Select Bond | | 2,024,258,422.913 | | 74,646,023.534 | | 175,406,995.617 | | 2,274,311,442.064 |
Long-Term U.S. Government Bond | | 98,029,213.798 | | 2,983,428.320 | | 8,495,343.879 | | 109,507,985.997 |
Inflation Protection | | 245,115,539.870 | | 9,093,144.721 | | 23,165,913.431 | | 277,374,598.022 |
High Yield Bond | | 961,680,400.939 | | 32,593,630.099 | | 74,955,622.708 | | 1,069,229,653.746 |
Multi-Sector Bond | | 565,093,841.059 | | 18,583,550.066 | | 51,053,370.628 | | 634,730,761.753 |
Balanced | | 1,405,782,870.604 | | 66,708,212.858 | | 135,232,847.101 | | 1,607,723,930.563 |
Asset Allocation | | 208,810,391.404 | | 4,154,371.176 | | 15,353,600.325 | | 228,318,362.905 |
Proposal 3 – To approve a change in the classification of the Inflation Protection Portfolio from a “diversified company” to a “non-diversified company” under Section 5(b) of the Investment Company Act of 1940, as amended.
(Only shareholders of the Inflation Protection Portfolio voted on this Proposal.)
| | | | | | | | |
| Portfolio Name | | Votes For | | Votes Against | | Votes Abstained | | Total Votes |
Inflation Protection | | 242,752,126.396 | | 10,424,059.681 | | 24,198,411.945 | | 277,374,598.022 |
| | | | | | |
| 236 | | Special Meeting of Shareholders | | | | |
Approval and Continuance of Investment Advisory and
Sub-Advisory Agreements (unaudited)
Northwestern Mutual Series Fund, Inc.
Annual Contract Review Process
Under Section 15(c) of the Investment Company Act of 1940, as amended (the “1940 Act”), contracts for investment advisory services are required to be reviewed, evaluated and approved by a majority of an investment company’s independent directors each year. In addition, each investment company is required to disclose in its annual or semi-annual report, as applicable, the material factors and conclusions that formed the basis for the board’s approval or renewal of any investment advisory agreements within the investment company’s most recently completed fiscal half-year period.
At least annually, the Board of Directors (the “Board”) of Northwestern Mutual Series Fund, Inc. (the “Series Fund”) considers and votes upon the renewal of the investment sub-advisory agreements between Mason Street Advisors, LLC (“Mason Street Advisors”) and each of the sub-advisers of those portfolios of the Series Fund (each, a “Portfolio” and collectively, the “Portfolios”) for which Mason Street Advisors and the Board have appointed a sub-adviser. In order to afford the Board the opportunity to focus on a smaller number of relationships at any one meeting, the Board considers the annual continuation of the sub-advisory agreements on a staggered basis during the course of the year.
Board Approvals During the Six-Month Period Ended December 31, 2016
At its August 16, 2016 meeting, the Board, including the directors who are not “interested persons” (as that term is defined in the 1940 Act) of the Series Fund or Mason Street Advisors (“Independent Directors”), unanimously approved the continuance of (1) the Investment Sub-Advisory Agreement between Mason Street Advisors and Federated Investment Management Company (“Federated”) relating to the Series Fund’s High Yield Bond Portfolio, (2) the Amended and Restated Investment Sub-Advisory Agreement between Mason Street Advisors and American Century Investment Management, Inc. (“ACI”) relating to the Series Fund’s Large Company Value, Inflation Protection and Mid Cap Value Portfolios, (3) the Restated Investment Sub-Advisory Agreement between Mason Street Advisors and Delaware Investments Fund Advisers, a series of Delaware Management Business Trust (“Delaware”) relating to the Series Fund’s Domestic Equity Portfolio, and (4) the Investment Sub-Advisory Agreement between Mason Street Advisors and Loomis, Sayles & Company, L.P. (“Loomis Sayles”) relating to the Focused Appreciation Portfolio.
At its November 30, 2016 meeting, the Board, including the Independent Directors, unanimously approved a new Investment Sub-Advisory Agreement between Mason Street Advisors and Aberdeen Asset Managers Limited (“Aberdeen”) relating to the Series Fund’s Emerging Markets Equity Portfolio (the “New Sub-Advisory Agreement”).
Also at its November 30, 2016 meeting, the Board, including the Independent Directors, unanimously approved the continuance of (1) the Second Amended and Restated Investment Sub-Advisory Agreement between Mason Street Advisors and T. Rowe Price Associates, Inc. (“T. Rowe Price”) relating to the Series Fund’s Small Cap Value and Equity Income Portfolios, (2) the Investment Sub-Advisory Agreement between Mason Street Advisors and T. Rowe Price relating to the Series Fund’s Short-Term Bond Portfolio, (3) the Investment Sub-Advisory Agreement between Mason Street Advisors and Wells Capital Management, Incorporated (“WellsCap”) relating to the Series Fund’s Select Bond Portfolio, (4) the Amended and Restated Investment Sub-Advisory Agreement between Mason Street Advisors and Pacific Investment Management Company LLC (“PIMCO”) relating to the Series Fund’s Long-Term U.S. Government Bond and Multi-Sector Bond Portfolios, and (5) the Investment Sub-Advisory Agreement between Mason Street Advisors and BlackRock Advisors, LLC (“BlackRock”) relating to the Series Fund’s Government Money Market Portfolio. Federated, ACI, Delaware, Loomis Sayles, T. Rowe Price, WellsCap, PIMCO and BlackRock are sometimes collectively referred to hereinafter as the “Existing Sub-Advisers,” and their respective sub-advised Portfolios are collectively referred to herein as the “Sub-Advised Portfolios.” Each of the foregoing Investment Sub-Advisory Agreements with the Existing Sub-Advisers was, in connection with their continuance, modified to incorporate certain updated terms and conditions which resulted in the Investment Sub-Advisory Agreements being amended and restated, and, in the case of T. Rowe Price, also resulted in the consolidation of the two existing Investment Sub-Advisory Agreements into a single agreement. The respective Investment Sub-Advisory Agreements with the Existing Sub-Advisers, as amended, restated and consolidated as described above, are collectively referred to herein as the “Existing Sub-Advisory Agreements.”
| | | | | | |
| | Approval and Continuance of Investment Advisory and Sub-Advisory Agreements | | | 237 | |
Approval and Continuance of Investment Advisory and
Sub-Advisory Agreements (unaudited)
In determining whether to approve the New Sub-Advisory Agreement and the Existing Sub-Advisory Agreements on behalf of the Series Fund, the Board requested and received detailed information from Mason Street Advisors, Aberdeen and the Existing Sub-Advisers in advance of each meeting to assist them in their evaluation, including information compiled by certain independent providers of evaluative data. With respect to the continuation of the Existing Sub-Advisory Agreements, while particular focus was given to an evaluation of the services, performance, fees, costs, and certain other relevant information under such Agreements at the meeting at which their continuation is formally considered, the evaluation process with respect to the Existing Sub-Advisers and the nature, extent and quality of the services they provide to the Portfolios, together with related information, is an ongoing one. As a result, the Board’s consideration of such services, and the performance, fees, costs and other relevant factors was informed by information provided and deliberations that occurred at other meetings throughout the year.
The Independent Directors also received a memorandum from their counsel advising them of their responsibilities in connection with the approval of the New Sub-Advisory Agreement and the continuance of the Existing Sub-Advisory Agreements, and summarizing the legal standards governing the review and approval of these Agreements. The Independent Directors reviewed these standards with their counsel during the course of the meetings, including how these standards should be applied to the review of information relating to sub-advisers under the Series Fund’s manager of managers structure. In addition, during the course of their deliberations, the Independent Directors had the opportunity to meet privately without representatives of Mason Street Advisors, the Existing Sub-Advisers, and Aberdeen present, and were represented throughout the process by legal counsel.
Continuation of Existing Sub-Advisory Agreements
At its August 16, 2016 and November 30, 2016 meetings, the Board, including the Independent Directors, unanimously approved the continuance of the Existing Sub-Advisory Agreements with respect to the Sub-Advised Portfolios. At those meetings, the directors received a presentation from representatives of each Existing Sub-Adviser involved in the management of the respective Sub-Advised Portfolios. In addition to the information presented by and about the Existing Sub-Advisers during the course of those meetings, the directors also had available for consideration each Existing Sub-Adviser’s Section 15(c) Report, which contained responses to the information request letter prepared by counsel to the Independent Directors requesting certain information from the Existing Sub-Advisers designed to assist the directors in fulfilling their responsibilities when considering the continuation of the Existing Sub-Advisory Agreements. The directors also had available Mason Street Advisors’ Executive Summary and Overview regarding each of the Existing Sub-Advisers and other materials prepared by Mason Street Advisors. The materials contained detailed information concerning management and personnel, expenses, performance, brokerage commissions, portfolio turnover, portfolio construction and investment processes and other factors with respect to each of the Sub-Advised Portfolios, as well as a recap of the Existing Sub-Advisers’ responses to the compliance questions contained in the Section 15(c) Report and the observations of the Series Fund’s Chief Compliance Officer regarding the compliance structure and practices of each of the Existing Sub-Advisers. The directors also considered their experience with and knowledge of the nature and quality of the services provided by the Existing Sub-Advisers and their ongoing discussions with representatives of Mason Street Advisors, its affiliates and each Existing Sub-Adviser.
The material factors and conclusions that formed the basis for the Board’s approval of the continuance of each of the Existing Sub-Advisory Agreements include those discussed below. The directors evaluated a variety of information they deemed relevant on a Portfolio-by-Portfolio basis. No one particular factor was identified as determinative, but rather it was a combination of all the factors and conclusions that formed the basis for the determinations made by the Board. Further, different directors may have placed greater weight on certain factors than did other directors.
Nature, Extent and Quality of Services. In considering the nature, extent and quality of each Existing Sub-Adviser’s services, factors considered by the directors included each Existing Sub-Adviser’s financial strength, assets under management, overall business, organization and management structure. Also included in the directors’ consideration was an evaluation of the services provided, and investment strategies employed, by each of the Existing Sub-Advisers, as well as the personnel providing such services with respect to the Sub-Advised Portfolios. The directors considered firm updates given by the portfolio managers and how the Sub-Advised Portfolios were being positioned in the current market environment. With respect to Federated, the directors noted the addition of analysts to the investment team, while noting that there has been continuity with respect to the personnel on the investment team. With respect to ACI, the directors considered the expanded ability of the Inflation Protection Portfolio to engage in swap transactions, thereby resulting in the decreased use of foreign linkers, and the directors considered this to be a positive development, consistent with ACI’s existing investment process. The directors evaluated the impact of a departure of a co-portfolio manager for the Inflation Protection Portfolio, concluding that they were comfortable in the capabilities of the incumbent and the successor co-manager. The directors commented positively regarding ACI’s merger of its large and mid-cap value research platforms, concluding that this change could deliver improved efficiency
| | | | | | |
| 238 | | Approval and Continuance of Investment Advisory and Sub-Advisory Agreements | | | | |
Approval and Continuance of Investment Advisory and
Sub-Advisory Agreements (unaudited)
and result in greater depth in underlying research capabilities. With respect to Delaware, the directors commented positively on the maintenance of a focused investment strategy for the Domestic Equity Portfolio. The directors observed that certain senior management changes at Delaware were unlikely to impact the investment process employed for the Portfolio. The directors considered the departure of a portfolio management team member and discussed Delaware’s efforts underway to replace the team member. With respect to Loomis Sayles, the directors commented favorably on the maintenance of a clear investment strategy for the Focused Appreciation Portfolio. With respect to T. Rowe Price, the directors expressed satisfaction with the portfolio manager for the Equity Income Portfolio and the improved performance results of the Portfolio during his tenure. The directors discussed the use of mortgage-backed securities in the Short-Term Bond Portfolio. With respect to PIMCO, the directors expressed confidence in the depth of the PIMCO investment team assigned to the Multi-Sector Bond Portfolio. The directors expressed their satisfaction with the investment process utilized for the Multi-Sector Bond Portfolio. The directors considered the reliance on a single portfolio manager for the Multi-Sector Bond Portfolio, but concluded that the extensive strength of the investment team mitigated any concerns regarding key man and succession risk. The directors commented favorably on the investment strategies utilized for the Long-Term U.S. Government Bond Portfolio and the consistency of their application as well as the positive performance results achieved. The directors noted in particular the effective use of derivatives by PIMCO in the Portfolio. The directors expressed their continued satisfaction regarding the recent selection of BlackRock to serve as sub-adviser for the Government Money Market Portfolio. The directors also considered and expressed satisfaction with each Existing Sub-Adviser’s investment philosophy and process and the scope of services provided by the Existing Sub-Advisers. Consideration was also given to the Existing Sub-Advisers’ respective reputations and experience in providing investment management services and the performance of each Sub-Advised Portfolio. Also considered were recent organizational and other firm developments. Based on their review of these factors, their discussions with the Existing Sub-Advisers and their experience with the services provided by the Existing Sub-Advisers for the respective Sub-Advised Portfolios, the Board concluded, within the context of their overall determinations regarding the Existing Sub-Advisory Agreements, that they were satisfied with the nature, extent and quality of services, and the resources committed by each Existing Sub-Adviser in providing those services.
Investment Performance. The directors reviewed the investment performance of each of the Sub-Advised Portfolios over a variety of time periods. In addition to reviewing the performance of each Sub-Advised Portfolio for both short and long term periods, the directors considered (i) a comparison of each Sub-Advised Portfolio’s one-, three- and five-year (as applicable) performance to the returns of appropriate benchmarks and indices, and to the performance averages of each Sub-Advised Portfolio’s respective Morningstar and Lipper categories for the same periods, (ii) the Morningstar overall star rating for each Sub-Advised Portfolio and (iii) the Morningstar and the Lipper rankings for the one-, three- and five-year periods. The directors evaluated each Sub-Advised Portfolio’s performance against these peer groups and industry benchmarks and indices, and viewed this information as providing an objective comparative benchmark against which they could assess the performance of the Sub-Advised Portfolios. The directors also considered the performance of accounts managed in a similar manner by each of the Existing Sub-Advisers and information from the Existing Sub-Advisers regarding any significant differences in the performance of those accounts from that of the Sub-Advised Portfolios. In connection with the review of investment performance of the Sub-Advised Portfolios over the time periods identified herein, the directors also considered investment performance since the date on which each Existing Sub-Adviser began managing their respective Sub-Advised Portfolio.
In particular, the directors continued to be satisfied with the positive initial performance of Federated with respect to the High Yield Bond Portfolio, Delaware with respect to the Domestic Equity Portfolio, and Loomis Sayles with respect to the Focused Appreciation Portfolio. The directors commented favorably on the overall strong performance of ACI with respect to the Large Company Value, Inflation Protection and Mid Cap Value Portfolios, PIMCO with respect to the Multi-Sector Bond Portfolio, and BlackRock with respect to the Government Money Market Portfolio. The directors expressed satisfaction with the application of a consistent investment process by ACI. They noted the existence of a slight increase in portfolio turnover in the Large Cap Value Portfolio, which was attributed to a recent portfolio manager change. The directors were pleased with the overall performance of each Portfolio managed by T. Rowe Price, noting in particular that the portfolio manager for the Equity Income Portfolio was working closely with his analysts and the positive impact seen in the Portfolio as a result. The directors noted that WellsCap continued to achieve good performance results in the Select Bond Portfolio. The directors discussed the transitioning of money market mutual fund holdings that occurred in the Government Money Market Portfolio during 2016 and concluded that BlackRock handled the transition process in a successful manner.
In addition to performance information presented at the meeting, the directors considered the detailed performance information, market commentary, portfolio analysis and portfolio manager presentations they received periodically throughout the year. Generally speaking, while attentive to short term performance and what it might indicate, the directors provided greater weight
| | | | | | |
| | Approval and Continuance of Investment Advisory and Sub-Advisory Agreements | | | 239 | |
Approval and Continuance of Investment Advisory and
Sub-Advisory Agreements (unaudited)
to longer term performance. For the reasons and based on the discussion summarized above, the Board concluded that, in the totality of circumstances and within the context of its overall determinations regarding the Existing Sub-Advisory Agreements, it was satisfied with the relative investment performance of the Sub-Advised Portfolios.
Management Fees and Other Expenses. The directors evaluated the reasonableness of the management fees and total expenses paid by the Sub-Advised Portfolios under the Existing Sub-Advisory Agreements. The directors considered the actual and contractual fees paid by each Sub-Advised Portfolio. The directors also considered the sub-advisory fees paid by Mason Street Advisors out of its management fee, including a comparison of those fees with fees charged by the respective Existing Sub-Advisers for similarly managed accounts. In considering the level of management fees, the directors also considered the size of the Sub-Advised Portfolios, expenses assumed by Mason Street Advisors, and the existing expense limitation and/or fee waiver arrangements agreed to by Mason Street Advisors with respect to each Sub-Advised Portfolio.
As part of their evaluation, the directors received and reviewed an independent analysis prepared by Morningstar of comparative expense data for each Sub-Advised Portfolio. Morningstar provided data as of December 31, 2015 comparing each Sub-Advised Portfolio’s net and total expenses with those of a peer group of funds underlying variable insurance products, as well as a universe of funds underlying variable insurance products across each fund’s investment classification and objective, each as selected by Morningstar. The directors considered the comparative data as a guide to help assess the reasonableness of each Sub-Advised Portfolio’s net and total expense ratios. The directors considered that the Morningstar expense rankings of the Portfolios sub-advised by Federated, ACI, Delaware, Loomis Sayles, T. Rowe Price and WellsCap (with respect to the High Yield Bond, Mid Cap Value, Domestic Equity, Focused Appreciation, Equity Income, Short Term Bond, and Select Bond Portfolios) were in the top Morningstar quartiles (meaning lowest net expenses) of their respective peer groups. The directors considered the ranking of the Large Company Value and the Inflation Protection Portfolios sub-advised by ACI, the Long-Term U.S. Government Bond Portfolio sub-advised by PIMCO, and the Small Cap Value Portfolio sub-advised by T. Rowe Price within the 2nd quartile of their respective peer groups, and noted the expense limitation arrangements in place for these Portfolios. The directors also considered the nature of the higher total operating expenses of the Multi-Sector Bond Portfolio sub-advised by PIMCO and the Government Money Market Portfolio sub-advised by BlackRock. The Multi-Sector Bond Portfolio was in the 3rd quartile of its Morningstar peer group for net expenses and the 2nd quartile for total expenses. The directors considered that, during 2016, Mason Street Advisors increased the level of its fee waiver. The Government Money Market Portfolio was in the 4th quartile for net expenses and the 1st quartile for total expenses of its Morningstar peer group. The directors noted that this was the result, in part, of the interaction between a floating fee waiver provision and interest rate movements. The directors also considered that, effective May 2016, MSA implemented an additional fee waiver, which resulted in additional breakpoints. In considering the relative expenses of the Multi-Sector Bond and Government Money Market Portfolios, the directors also took into account the expense limitation arrangements in place with respect to those Sub-Advised Portfolios.
Based on their review of the above information and other factors deemed relevant by the directors, the Board concluded that the management fees and total operating expenses of each of the Sub-Advised Portfolios were reasonable in relation to the nature, scope and quality of services provided and the performance of the Sub-Advised Portfolios over time and the expense limitation and fee waivers that are in place.
Costs and Profitability. The directors reviewed information provided by Mason Street Advisors regarding the profitability realized by Mason Street Advisors due to its relationship with the Sub-Advised Portfolios. The directors considered Mason Street Advisors’ quarterly presentation to the directors regarding Mason Street Advisors’ revenues, expenses, income and profit margins allocable to its services to the Sub-Advised Portfolios on an aggregate and a per Portfolio basis, and Mason Street Advisors’ allocation methodology with respect to the revenues and expenses. The profitability information presented for the directors’ consideration was supplemented by the aforementioned information regarding the ranking of each Sub-Advised Portfolio within the Portfolio’s respective Morningstar category. The directors also considered the profitability information related to certain of the Sub-Advised Portfolios where such information had been provided and the financial statements of certain Existing Sub-Advisers or their affiliates who had not provided specific profitability information. In all instances, including those where profitability information had not been provided, the sub-advisory fees were the result of arm’s-length negotiations between Mason Street Advisors and such Existing Sub-Advisers. The directors also recognized that there are limitations inherent in allocating costs and calculating profitability for organizations such as the Existing Sub-Advisers, and that it is difficult to make comparisons of profitability among investment advisers because comparative information is not generally publicly available and, when available, such information had been developed using a variety of assumptions and other factors. The directors concluded that they had received sufficient information to evaluate the Existing Sub-Advisers’ costs and profitability.
| | | | | | |
| 240 | | Approval and Continuance of Investment Advisory and Sub-Advisory Agreements | | | | |
Approval and Continuance of Investment Advisory and
Sub-Advisory Agreements (unaudited)
The directors considered certain fall-out benefits that may be realized by Mason Street Advisors and its affiliates due to their relationship with the Sub-Advised Portfolios, including the participation of fund families advised by certain Existing Sub-Advisers to the Sub-Advised Portfolios in the brokerage platform and/or affinity fund or select fund programs offered by an affiliate of Mason Street Advisors and the payment of fees by those entities to affiliates of Mason Street Advisors. The directors also reviewed information concerning certain of the Existing Sub-Advisers’ soft dollar arrangements and any other benefits to the Existing Sub-Advisers arising from their relationships with the Sub-Advised Portfolios. Based on their review, the Board concluded, within the context of their overall determinations regarding the Existing Sub-Advisory Agreements, that they were satisfied that the fees paid by each of the Sub-Advised Portfolios, and the profits realized by Mason Street Advisors and the Existing Sub-Advisers due to their relationship with the Sub-Advised Portfolios, were not excessive.
Economies of Scale. The directors also considered whether each Sub-Advised Portfolio’s expense structure permitted economies of scale to be shared with the Sub-Advised Portfolio’s investors. The directors considered the breakpoints contained in the advisory fee schedules for the Sub-Advised Portfolios and the extent to which each Sub-Advised Portfolio may benefit from economies of scale through those breakpoints. The directors also took into account the expense limitation arrangements in place for the Large Company Value, Inflation Protection, Mid Cap Value, Domestic Equity, Focused Appreciation, Equity Income, Small Cap Value, Short-Term Bond, Long-Term U.S. Government Bond and Multi-Sector Bond Portfolios, and the fee waiver arrangements in place with respect to the High Yield Bond, Large Company Value, Inflation Protection, Mid Cap Value, Domestic Equity, Focused Appreciation, Equity Income, Small Cap Value, Short-Term Bond, Select Bond, Long-Term U.S. Government Bond, Multi-Sector Bond and Government Money Market Portfolios. The directors also considered the total assets of each Sub-Advised Portfolio and the expense ratios of the Sub-Advised Portfolios. Based on this information, the Board concluded, within the context of its overall determinations regarding the Existing Sub-Advisory Agreements, that each Sub-Advised Portfolio’s fee structure reflected appropriate economies of scale for the benefit of such Portfolio’s investors.
Other Information. The directors were presented with other information intended to assist them in their consideration of the continuation of the Existing Sub-Advisory Agreements, including information about the services provided by affiliates of Mason Street Advisors to the Portfolios and information regarding Mason Street Advisors’ and the Existing Sub-Advisers’ brokerage practices and commissions. The directors took into consideration reports from Mason Street Advisors on its review of the respective compliance programs of the Existing Sub-Advisers, including any recent compliance exceptions noted and the applicable Sub-Adviser’s response. Also considered were key affiliations and business relationships between the Existing Sub-Advisers and their affiliates and Mason Street Advisors’ parent company and affiliates. Their review further included information relating to each Existing Sub-Adviser’s risk management infrastructure, pending or recent litigation or regulatory actions to which an Existing Sub-Adviser or its affiliates may have been a party, and the applicable Sub-Adviser’s responses to those actions. The directors also considered information regarding each Existing Sub-Adviser’s code of ethics and business continuity plans, portfolio manager compensation, portfolio turnover, succession planning and other matters they deemed relevant.
Conclusions of the Directors. Based on a consideration of all information deemed relevant in its totality, the Board, including the Independent Directors, and assisted by the advice of legal counsel independent of Mason Street Advisors, in the exercise of their reasonable business judgment concluded that the terms of the Existing Sub-Advisory Agreements were fair and reasonable and approved the continuation of each Agreement for another year as being in the best interests of each Portfolio.
Approval of New Investment Sub-Advisory Agreement
At its November 30, 2016 meeting, the Board, including the Independent Directors, unanimously approved the New Sub-Advisory Agreement between Mason Street Advisors and Aberdeen, pursuant to which Aberdeen was appointed to serve as sub-adviser to the Emerging Markets Equity Portfolio effective on or about March 24, 2017. Until such time, the Portfolio’s current sub-adviser will continue to manage the assets of the Portfolio.
The Board’s determination to appoint Aberdeen was based on several meetings, including the meeting on November 29, 2016, at which Aberdeen representatives met in person with the Board. The in-person presentation with Aberdeen and the other candidates considered by the Board were the culmination of an extensive process that began a number of months prior to the meeting at which Aberdeen was selected, beginning with the creation of a significant universe of prospects that the directors narrowed down over several meetings and a number of months to four finalists. A variety of screening criteria was used to select potential candidates. In addition to the analysis and information compiled by Mason Street Advisors and presented at the Board’s meeting held August 16, 2016, the directors considered a detailed analysis conducted by Mason Street Advisors and
| | | | | | |
| | Approval and Continuance of Investment Advisory and Sub-Advisory Agreements | | | 241 | |
Approval and Continuance of Investment Advisory and
Sub-Advisory Agreements (unaudited)
provided to the directors at the November 29, 2016 Board meeting. The analysis was based on Mason Street Advisors’ due diligence visits and interviews of, and review of the detailed information provided by, the candidates. Among other factors, the Board considered details of each candidate’s investment performance and risk/return profiles over various time periods, peer group ratings and rankings, representative holdings, key points of differentiation and competitive advantages, portfolio characteristics, mandate assets under management, investment personnel, process and strategies, proposed sub-advisory fees and breakpoints, and other operational and enterprise issues. Also available for the directors’ consideration was Portfolio information regularly provided at Board meetings, including net expense ratio information, certain comparative peer group data, and other Portfolio information.
The due diligence reports of Mason Street Advisors were based on the candidate’s responses to the requests for proposals as well as interviews with compliance and/or legal representatives of each candidate. The responses to the request for proposals included information about each candidate’s compliance structure, compliance policies and procedures, brokerage practices and use of soft dollars, trading policies and procedures, codes of ethics and proxy voting procedures, recent SEC exams, pricing practices, derivatives practices, to the extent applicable, information about material business relationships with Northwestern Mutual, if any, and other matters. The directors also had available for consideration each candidate’s responses to the investment, compliance and operations information requests. In addition to these written materials provided by the candidates and by Mason Street Advisors, the directors considered in-person interviews with each candidate to have been of particular assistance in gaining an understanding of the candidates’ investment philosophies and portfolio construction processes. No one particular factor was identified as controlling, but rather it was a combination of all the factors and conclusions that formed the basis for the determinations made by the directors.
Nature, Extent and Quality of Services. The directors evaluated the nature, scope, extent and quality of services to be provided by Aberdeen with respect to the Emerging Markets Portfolio. The directors considered the information developed from the extensive process utilized to identify potential sub-advisers for the Portfolio, as well as the observations and analysis provided by Mason Street Advisors. The directors also considered the breadth and depth of experience of Aberdeen in managing accounts, including accounts for other mutual funds, using similar investment strategies. The directors’ consideration included information about Aberdeen’s organization and ownership structure, and the tenure, experience and performance of the firm’s investment management team. The directors also considered the resources available to Aberdeen provided by certain personnel employed by foreign affiliates. In addition, the directors considered the in-person presentation by Aberdeen, including the firm’s description of its investment process.
In particular, the directors put considerable weight on the fact that Aberdeen had strong risk-adjusted performance. The director’s considered Mason Street Advisor’s positive assessment of Aberdeen, based upon the strength and consistency of the investment processes in place at the firm. The directors discussed Aberdeen’s capacity in its emerging markets mandate, noting favorably Aberdeen’s approach to managing capacity and expressing confidence in Aberdeen’s ability to continue to manage capacity efffectively in future periods. The directors noted favorably the benefits derived from the uniform training policy developed by Aberdeen, which is administered across all employee levels.
The directors also considered the different investment approaches utilized by each candidate, and the positive and negative considerations of each. The directors also took into consideration the suitability of each candidate’s respective mandate with respect to Northwestern Mutual’s variable products. Finally, the directors took into consideration Aberdeen’s general reputation and the resources available to be committed in managing the Emerging Markets Portfolio. Based on their review of these factors and other factors deemed relevant, the Board concluded that they were satisfied with the nature, extent and quality of the services to be provided by Aberdeen with respect to the Portfolio, and the resources to be committed by Aberdeen in providing such services.
Investment Performance. As a newly appointed sub-adviser, the directors could not consider Aberdeen’s investment performance in managing the Emerging Markets Portfolio as a factor in evaluating the New Sub-Advisory Agreement, but did consider Aberdeen’s performance record for a composite of other accounts, including mutual fund accounts, with investment objectives, investment policies and strategies substantially similar to the Emerging Markets Portfolio. The directors considered performance returns (including performance analytics reports evaluating, among other things, standard deviation, information ratio and tracking errors) for these similar accounts for both short- and long-term periods. The directors also evaluated the similar accounts’ relative performance versus the appropriate index and considered independent Morningstar rankings and ratings of the candidates to provide an objective comparative benchmark against which they could assess the experience and ability of the candidates in managing similar accounts. The directors also took into consideration information presented regarding the composition of portfolios managed by the candidates in a similar mandate, including (as applicable) sector and industry weightings, number of holdings, portfolio turnover, country exposure, total firm ownership, and top ten holdings percentage, among other things.
| | | | | | |
| 242 | | Approval and Continuance of Investment Advisory and Sub-Advisory Agreements | | | | |
Approval and Continuance of Investment Advisory and
Sub-Advisory Agreements (unaudited)
Based on these and other factors deemed relevant, the Board concluded that they were satisfied with the experience and capabilities of Aberdeen and the personnel to be associated with the management of the Portfolio.
Management Fees and Other Expenses. In evaluating the management fees paid by the Portfolio, the directors considered the contractual fees and applicable breakpoints paid by the Portfolio under the Advisory Agreement between Mason Street Advisors and the Series Fund with respect to the Portfolio. The directors also considered the sub-advisory fees and applicable breakpoints to be paid by Mason Street Advisors to Aberdeen out of its management fee. The directors also separately considered the proposed allocation between Mason Street Advisors and Aberdeen of the respective Portfolio’s investment advisory fee (i.e., the amount of the advisory fee retained by Mason Street Advisors relative to that paid to Aberdeen as a sub-advisory fee). They determined that the allocation was reasonable in light of the nature, scope and quality of services to be provided and was the product of an arm’s length negotiation between Mason Street Advisors and Aberdeen.
The directors considered the existing structure, size, and total operating expenses of the Portfolio. They also considered the existing expense limitation agreement in place for the Portfolio as well as the advisory fee waiver arrangement that was in place.
In evaluating Aberdeen’s proposed fees, the directors considered information relating to amounts Aberdeen charged under other advisory contracts involving a similar investment mandate. As part of this review, the Board considered that an affiliate of Aberdeen had been engaged to sub-advise certain assets associated with a Northwestern Mutual Group Annuity Separate Account advised by an affiliate of Mason Street Advisors, although the directors determined that the engagement was not directly comparable and therefore not particularly relevant in assessing the fees charged by Aberdeen for the Series Fund’s Emerging Markets Portfolio.
Based on their review of the management and other expenses, comparative data and other factors deemed relevant by the directors, the Board concluded that the management fees, proposed sub-advisory fees and total operating expenses of the Portfolio were reasonable in relation to the nature, scope and quality of the services to be provided and the experience of Aberdeen.
Costs and Profitability. The directors also considered Mason Street Advisors’ pricing methodology for its services as investment adviser for the products of which the Portfolio is an investment option. Also considered was the financial condition of Mason Street Advisors and information concerning Mason Street Advisors’ costs and profitability with respect to its relationship with the Portfolio in general as well as in light of the sub-advisory fees negotiated with Aberdeen. Mason Street Advisors provided comparative information regarding the proposed sub-advisory fees of each of the candidates, and projections regarding Mason Street Advisors’ advisory fee spread. Mason Street Advisors also provided a profitability analysis for the Portfolio based on certain assumptions and metrics. In connection with its review of the profitability of Mason Street Advisors’ services to the Portfolio, the directors also considered services provided by affiliates of Mason Street Advisors.
The directors recognized that there are limitations inherent in allocating costs and calculating profitability for an organization such as Mason Street Advisors, and that it is difficult to make comparisons of profitability among investment advisers and clients because comparative information is not generally publicly available and, when available, such information has been developed using a variety of assumptions and other factors. Based on their review of the profitability analysis for the Portfolio, the Board concluded that they were satisfied that Mason Street Advisors’ level of profitability from its relationship with the Portfolio was not excessive.
Economies of Scale. The directors considered whether the Portfolio’s expense structure permitted economies of scale to be shared with the Portfolio’s investors. They also took into consideration the total assets and expense ratios of the Portfolio. The directors considered the breakpoints contained in the management fee schedules for the Portfolio, as well as the breakpoints contained in the proposed sub-advisory fee schedules negotiated with the candidates for the Portfolio, and the extent to which the Portfolio may benefit from economies of scale through those breakpoints. The directors also considered the expense limitation and fee waiver agreements in place for the Portfolio. Based on this information, the Board concluded that the Portfolio’s fee structure reflected appropriate economies of scale between the Portfolio and Mason Street Advisors.
| | | | | | |
| | Approval and Continuance of Investment Advisory and Sub-Advisory Agreements | | | 243 | |
Approval and Continuance of Investment Advisory and
Sub-Advisory Agreements (unaudited)
Other Information. The directors were presented with other information intended to assist them in their consideration of the approval of the New Sub-Advisory Agreement, including information regarding Aberdeen’s risk management structure, any pending or recent litigation or regulatory actions to which Aberdeen or its affiliates may have been a party, and responses to those actions. The directors also received information regarding business continuity and portfolio manager compensation.
Conclusions of the Directors. Based on a consideration of all information deemed relevant in its totality, the Board, including the Independent Directors, and assisted by the advice of legal counsel independent of Mason Street Advisors, in the exercise of its business judgment concluded that it was in the best interest of the Emerging Markets Portfolio to approve the New Sub-Advisory Agreement between Mason Street Advisors and Aberdeen.
| | | | | | |
| 244 | | Approval and Continuance of Investment Advisory and Sub-Advisory Agreements | | | | |
REPORT ON FORM N-CSR
RESPONSES FOR NORTHWESTERN MUTUAL SERIES FUND, INC.
As of the end of the period covered by this report, the Registrant has adopted a code of ethics that applies to the Registrant’s principal executive officer, principal financial officer and principal accounting officer or controller.
| Item 3. | Audit Committee Financial Expert |
The Registrant’s board of directors has determined that the Registrant has three audit committee financial experts serving on its audit committee. The names of the audit committee financial experts are Miriam M. Allison and Gail L. Hanson. Each of the audit committee financial experts is independent.
| Item 4. | Principal Accountant Fees and Services |
| | | | | | | | |
(a) Audit Fees | | | | | | | | |
| | |
Audit Fees and Expenses of Registrant | | | | | | | | |
| | |
| | | 2015 | | | 2016 | |
| | $ | 716,300 | | | $ | 738,730 | |
| | |
(b) Audit Related Fees | | | | | | | | |
| | |
Audit-Related Fees and Expenses of Registrant | | | | | | | | |
| | |
| | | 2015 | | | 2016 | |
| | $ | 0 | | | $ | 0 | |
| | |
(c) Tax Fees | | | | | | | | |
| | |
| | | 2015 | | | 2016 | |
| | $ | 75,250 | | | $ | 75,720 | |
| | |
Review of dividend declarations | | | | | | | | |
Review of excise tax calculations | | | | | | | | |
Non-U.S. tax compliance | | | | | | | | |
| | |
(d) All Other Fees | | | | | | | | |
| | |
| | | 2015 | | | 2016 | |
| | $ | 0 | | | $ | 0 | |
(e)(1) It is the audit committee’s policy to pre-approve all audit and non-audit service engagements for the Registrant; and any non-audit service engagement of the Registrant’s auditor by (1) the Registrant’s investment adviser and (2) any other entity in a control relationship with the investment adviser that provides ongoing services to the Registrant if, in each of (1) and (2) above, the non-audit service engagement relates directly to the operations and financial reporting of the Registrant. (2) Not applicable.
(f) Not applicable.
| | | | | | | | |
(g) Aggregate non-audit fees of Registrant and related service providers | | | | | | | | |
| | |
| | | 2015 | | | 2016 | |
| | $ | 123,875 | | | $ | 375,220 | |
(h) The Registrant’s audit committee has considered whether the auditor’s provision of non-audit services to the Registrant’s related service providers is compatible with the auditor’s independence.
| Item 5. | Audit Committee of Listed Registrants |
Not applicable.
| Item 6. | Schedule of Investments |
Full Schedule of Investments is included in Item 1.
| Item 7. | Disclosure of Proxy Voting Policies and Procedures for Closed-End Management Investment Companies |
Not applicable.
| Item 8. | Portfolio Managers of Closed-End Management Investment Companies |
Not applicable.
| Item 9. | Purchases of Equity Securities by Closed-End Management Investment Company and Affiliated Purchasers |
Not applicable.
| Item 10. | Submission of Matters to a Vote of Security Holders |
Not applicable.
| Item 11. | Disclosure Controls and Procedures |
(a) The Registrant’s Principal Executive Officer and Principal Financial Officer have evaluated the Registrant’s disclosure controls and procedures within 90 days of this filing and have concluded that the Registrant’s disclosure controls and procedures were effective, as of that date, in ensuring that information required to be disclosed by the Registrant in this filing was recorded, processed, summarized, and reported timely.
(b) There was no change in the Registrant’s internal control over financial reporting (as defined in Rule 30a-3(d) under the Investment Company Act of 1940) that occurred during the Registrant’s last fiscal half-year that has materially affected, or is reasonably likely to materially affect, the Registrant’s internal control over financial reporting.
(a)(1) The code of ethics referred to in the response to Item 2 above is attached as exhibit EX-99.12(a)(1).
(a)(2) Separate certifications for the Registrant’s principal executive officer and principal financial officer, as required by Section 302 of the Sarbanes-Oxley Act of 2002 and Rule 30a-2(a) under the Investment Company Act of 1940, are attached as exhibit EX-99.CERT.
(b) Separate certifications for the Registrant’s principal executive officer and principal financial officer, as required by 18 U.S.C. Section 1350, as adopted pursuant to Section 906 of the Sarbanes-Oxley Act of 2002, and Rule 30a-2(b) under the Investment Company Act of 1940, are attached as exhibit EX-99.906CERT. The certifications furnished pursuant to this paragraph are not deemed to be “filed” for purposes of Section 18 of the Securities Exchange Act of 1934, or otherwise subject to the liability of that section. Such certifications are not deemed to be incorporated by reference into any filing under the Securities Act of 1933 or the Securities Exchange Act of 1934, except to the extent that the Registrant specifically incorporates them by reference.
Pursuant to the requirements of the Securities Exchange Act of 1934 and the Investment Company Act of 1940, the Registrant has duly caused this report to be signed on its behalf by the undersigned, thereunto duly authorized.
NORTHWESTERN MUTUAL SERIES FUND, INC.
| | |
| By: | | /s/ Kate M. Fleming |
| | Kate M. Fleming, President |
|
| Date: February 16, 2017 |
| | |
| |
| By: | | /s/ Todd M. Jones |
| | Todd M. Jones, Vice-President, |
| | Chief Financial Officer and |
| | Treasurer |
|
| Date: February 16, 2017 |