Exhibit 99.3

| Armstrong World Industries Investor Presentation February 2012 |
| Safe Harbor Statement Our disclosures in this presentation and in our other public documents and comments contain forward-looking statements within the meaning of the Private Securities Litigation Reform Act. Those statements provide our future expectations or forecasts and can be identified by our use of words such as "anticipate," "estimate," "expect," "project," "intend," "plan," "believe," "outlook," and other words or phrases of similar meaning in connection with any discussion of future operating or financial performance. Forward-looking statements, by their nature, address matters that are uncertain and involve risks because they relate to events and depend on circumstances that may or may not occur in the future. A more detailed discussion of the risks and uncertainties that may affect our ability to achieve the projected performance is included in the "Risk Factors" and "Management's Discussion and Analysis" sections of our recent reports on Forms 10-K and 10-Q filed with the SEC. As a result, our actual results may differ materially from our expected results and from those expressed in our forward-looking statements. Forward-looking statements speak only as of the date they are made. We undertake no obligation to update any forward-looking statements beyond what is required under applicable securities law.In addition, we will be referring to non-GAAP financial measures within the meaning of SEC Regulation G. A reconciliation of the differences between these measures with the most directly comparable financial measures calculated in accordance with GAAP are included within this presentation and available on the Investor Relations of our website at www.armstrong.com.The guidance in this presentation is only effective as of the date given, February 27, 2012, and will not be updated or affirmed unless and until we publicly announce updated or affirmed guidance. 2 |

| All figures throughout the presentation are in $ millions unless otherwise noted. Figures may not add due to rounding. Basis of Presentation Explanation When reporting our financial results within this presentation, we make several adjustments. Management uses the non-GAAP measures below in managing the business and believes the adjustments provide meaningful comparisons of operating performance between periods. As reported results will be footnoted throughout the presentation. 3 We report in comparable dollars to remove the effects of currency translation on the P&L. The budgeted exchange rate for the current year is used for all currency translations in the current year and prior years. We remove the impact of discrete expenses and income. Examples include plant closures, restructuring actions, and other large unusual items. Taxes for normalized Net Income and EPS for all periods presented are calculated using a constant 42%, which is based on the full year historical tax rate. Comparable Dollars Other Adjustments Net Sales Yes No Gross Profit Yes Yes SG&A Expense Yes Yes Equity Earnings Yes Yes Operating Income Yes Yes Net Income Yes Yes Cash Flow No No Return on Capital Yes Yes EBITDA Yes Yes What Items Are Adjusted |
| Investment Highlights |
| Investment Highlights Diversified $3 billion global building products company with leading positions in all key markets and productsNew leadership team successfully executing strategy to achieve competitive cost structure and lay foundation for growthSignificant opportunities for investment and growth in emerging markets and product adjacenciesLeadership in innovation driving future growth 5 |

| Global 6 |

| Diversified Global Building Products Company Leading global manufacturer of floors and ceilings for use in renovation and new construction. $2.9 billion in sales in 2011Market leader in businesses representing 80% of salesSales profile 70% domestic, 30% international70% renovation, 30% new construction32 manufacturing locations in 8 countriesApproximately 9,100 employees 7 |
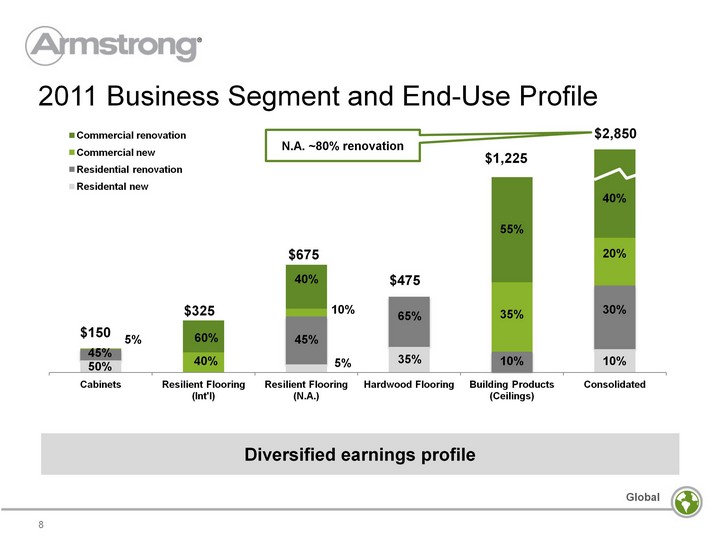
| 2011 Business Segment and End-Use Profile 8 Diversified earnings profile (CHART) N.A. ~80% renovation $150 $325 $675 $475 $1,225 $2,850 40% 20% 30% 10% 55% 35% 10% 65% 35% 40% 45% 10% 5% 60% 40% 5% 45% 50% |

| 2010 & 2011 EBITDA 9 EBITDA growth in all businesses in 2011 Excludes unallocated corporate expense (CHART) (CHART) 2010 Total EBITDA: $303M 2011 Total EBITDA: $377M |
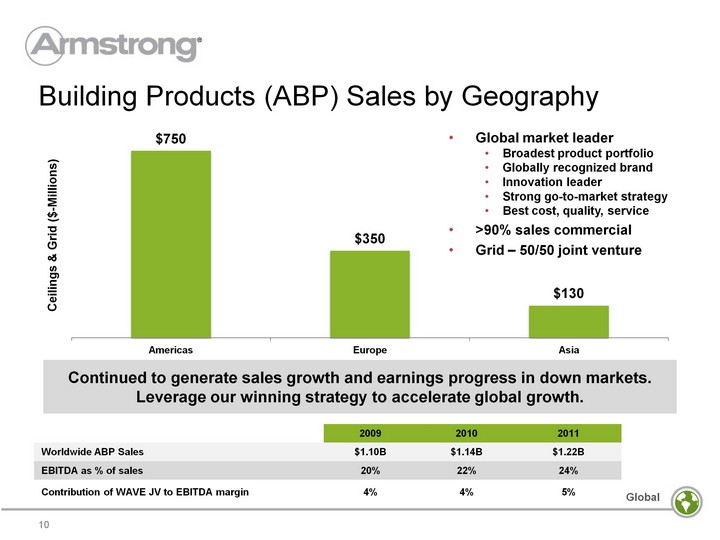
| Building Products (ABP) Sales by Geography 10 Continued to generate sales growth and earnings progress in down markets. Leverage our winning strategy to accelerate global growth. (CHART) Global market leaderBroadest product portfolioGlobally recognized brandInnovation leaderStrong go-to-market strategyBest cost, quality, service>90% sales commercialGrid - 50/50 joint venture 2009 2010 2011 Worldwide ABP Sales $1.10B $1.14B $1.22B EBITDA as % of sales 20% 22% 24% Contribution of WAVE JV to EBITDA margin 4% 4% 5% |
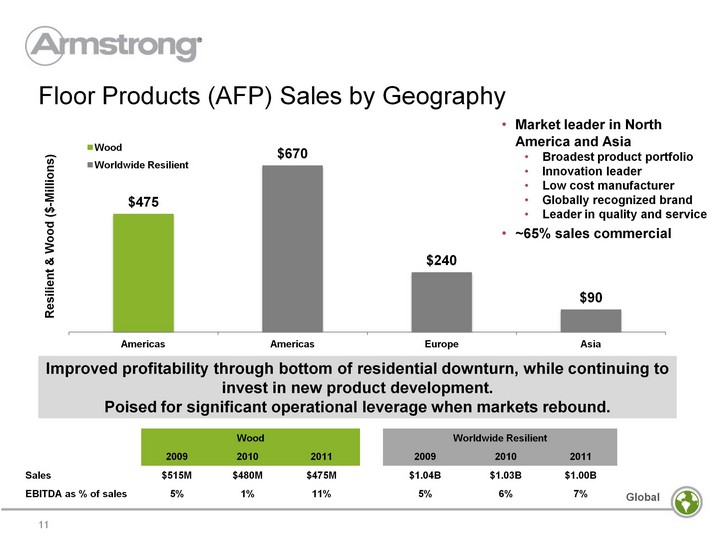
| Floor Products (AFP) Sales by Geography 11 Improved profitability through bottom of residential downturn, while continuing to invest in new product development. Poised for significant operational leverage when markets rebound. (CHART) Market leader in North America and AsiaBroadest product portfolioInnovation leaderLow cost manufacturerGlobally recognized brandLeader in quality and service~65% sales commercial Wood Wood Wood Worldwide Resilient Worldwide Resilient Worldwide Resilient 2009 2010 2011 2009 2010 2011 Sales $515M $480M $475M $1.04B $1.03B $1.00B EBITDA as % of sales 5% 1% 11% 5% 6% 7% |

| Global Presence, Worldwide Market Leader 12 North America North America North America Ceilings Floors Commercial 1 1 Residential 1 1 Wood NA 1 Europe, Africa, Middle-East Europe, Africa, Middle-East Europe, Africa, Middle-East Ceilings Floors Western 1 NA Central 1 1 Eastern 1 <5 Africa / Mid-East 1 <5 Asia, Australia Asia, Australia Asia, Australia Ceilings Floors China 1 3 Australia 1 1 India 1 1 SE Asia 1 1 |

| Leadership 13 |

| New Management Successfully Executing Majority of senior leadership team joined Armstrong after January 2010Maintained profitability and positive cash flow through downturnBuilt competitive cost structureEurope turnaroundGrowth through organic investments, tactical acquisitions and product adjacenciesInnovation initiatives 14 |

| Key Milestones 15 TPG invests in Armstrong New CEO and CFOLeverage recap. and $800M special dividendAnnounce $150M cost out initiative New CEO of global ceilings businessCost out initiative raised to $165 millionOrganic growth in emerging marketsConstruction of three plants in ChinaFix underperforming businesses Cost out initiative raised to $185 millionEuropean flooring products profitable in 2012Organic growth in priority emerging marketsCompletion of three plants in ChinaConstruction of ceilings plant in RussiaIncrease in sales and marketing resourcesProfitable growth in core markets through focus on innovation, product adjacency opportunities, design and environmental leadershipImplement Organization Vitality and create a globally aligned organization 2009 2010 2011 2012 2013 2014 Idle: Montreal, MobileClose: Auburn, Nashville Close: St. Gallen, Oneida,Center, Montreal, Teeside Idle: StatesvilleClose: Beaver Falls, Holmsund 2006 2007 2008 2009 2010 2011 2012 Est. Sales $3.50B $3.54B $3.21B $2.85B $2.83B $2.86B $2.9B - $3.0B EBITDA $407M $439M $384M $296M $303M $377M $420 - $460 11.6% 12.4% 12.0% 10.4% 10.7% 13.2% ~14.9% Housing starts 1,801 1,355 906 554 587 609 700 |

| 2011 Accomplishments Achieved highest worldwide EBITDA margin by ~100bps over previous record (2007) on 20% lower salesLowest worldwide SG&A% (16.7% in 2011), an improvement of ~30 bps over previous record (2008)Improvement in worldwide working capital turns of ~5% over previous record (2007)Highest ROIC (7.4%) since emergence Roll out of Organizational Vitality program to build winning team and align staffing globally 16 |

| Profitable and cash flow positive through downturn Focus on cost control / productivityAchieve price to cover inflationStrong free cash flowContinuing to fully invest in the businessStrong balance sheet: leverage, liquidity and maturity profileOverfunded US pension plan Positioned for considerable operational leverage on modest market recovery 17 Continue to work toward achieving ROIC greater than our cost of capital |
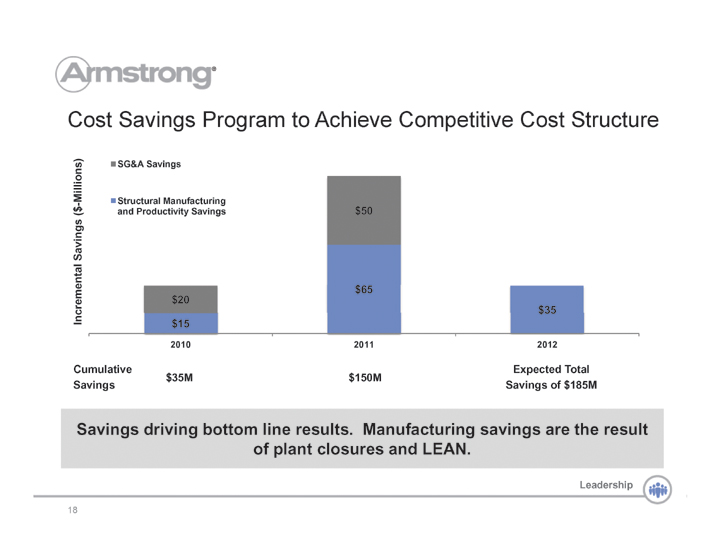
| (CHART) Cost Savings Program to Achieve Competitive Cost Structure 18 Savings net of inflation and investments, driving bottom line results. Manufacturing savings are the result of plant closures and LEAN. Cumulative Savings $35M $150M Expected TotalSavings of $185M |

| European Floor Products 19 Business to be profitable in 2012. (CHART) Transform the Business (CHART) Sales(1) $360M EBITDA(2) ($15M) Sales(1) $270M EBITDA(2) ($3M) (1)Includes intercompany sales. Sales shown on a comparable foreign exchange basis (2)Excludes restructuring expense Commercial - 87% Commercial - 100% Exited Residential segmentSimplified Commercial business ... country and product participation, reduction in # of SKU'sClosed Teesside and Holmsund plantsSG&A restructuring ... reduced headcount by over one- third |

| Strategy 20 1. Optimize Product Portfolio Broad product offering and availabilityDrive mixNew product pipelineQuality leader 2. Drive Emerging Market Growth Build manufacturing capacity to produce products for local consumptionConstruction of four plants underway, three in China and one in RussiaIncrease in sales and marketing resources to cultivate demand 3. Build Innovation Leadership Bridge to future growth"New to World" productsCustom solutionsDesign, performance and installation"Sustainability" leadership 4. Emphasis on Operational Excellence Competitive Cost StructureContinued LEAN deploymentContinue to drive mix and share gainBest on-time delivery performanceLowest claims rate |

| Growth 21 |

| Emerging Markets Growth Manufacturing investments in priority markets to make products designed for local consumptionBuilding four plants; three in China and one in RussiaAdded over 100 sales and marketing resources in these markets during 2011, primarily in China, to cultivate demandSales to emerging markets ~11% of total sales in 2011, an increase of over 50% since 2009. 22 |
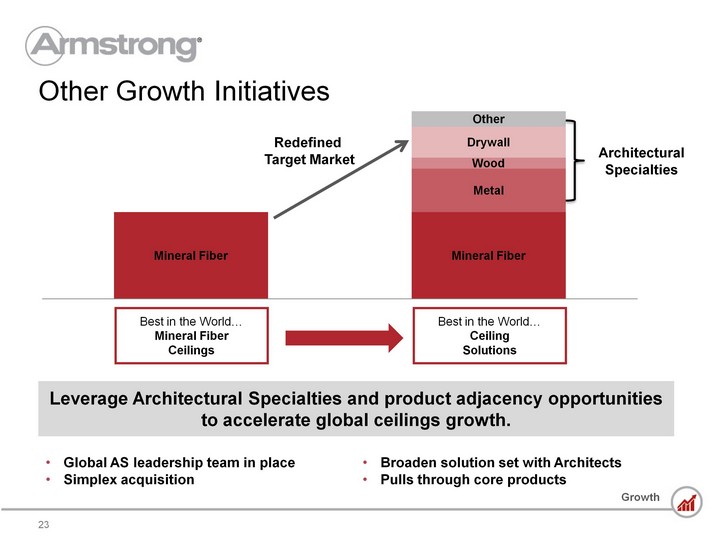
| Other Growth Initiatives 23 Leverage Architectural Specialties and product adjacency opportunities to accelerate global ceilings growth. (CHART) Redefined Target Market Global AS leadership team in placeSimplex acquisition Broaden solution set with ArchitectsPulls through core products Best in the World...Mineral Fiber Ceilings Best in the World...CeilingSolutions Architectural Specialties |
| Innovation 24 |

| Leadership in Innovation Bridge to future growth"New to the World" productsHigh performance wood (acrylic infused) DC FlexZone ceiling systemsAirGuard ceiling tiles (Removes formaldehyde)Open Innovation and collaborationSustainability and Life Cycle Analysis (LCA)Investment in technology center in Shanghai 25 |

| Investment Highlights Diversified $3 billion global building products company with leading positions in all key markets and productsNew leadership team successfully executing strategy to achieve competitive cost structure and lay foundation for growthSignificant opportunities for investment and growth in emerging markets and product adjacenciesLeadership in innovation driving future growth 26 |

| Financial Overview 27 |

| EBITDA Bridge (2006-2010) 28 Cost reduction actions and improved price / mix significantly offset dramatic volume declines during the worst of the downturn. Figures rounded to nearest $5 million (CHART) $305 |
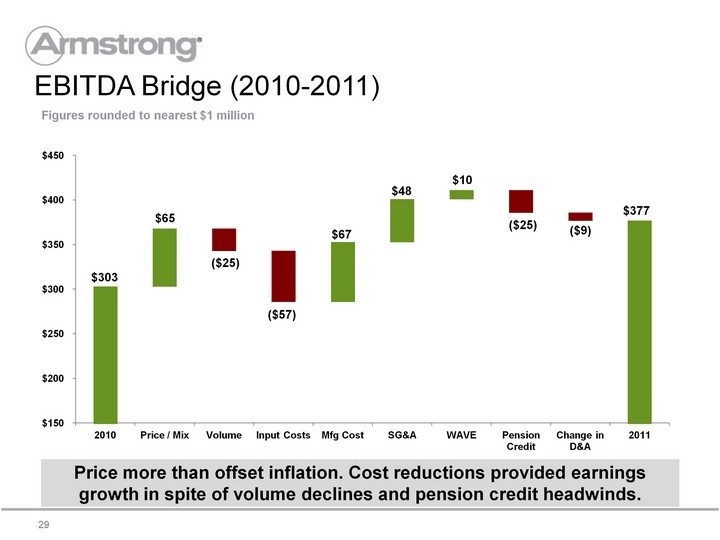
| EBITDA Bridge (2010-2011) 29 Price more than offset inflation. Cost reductions provided earnings growth in spite of volume declines and pension credit headwinds. Figures rounded to nearest $1 million (CHART) $65 ($25) $67 $48 $10 |
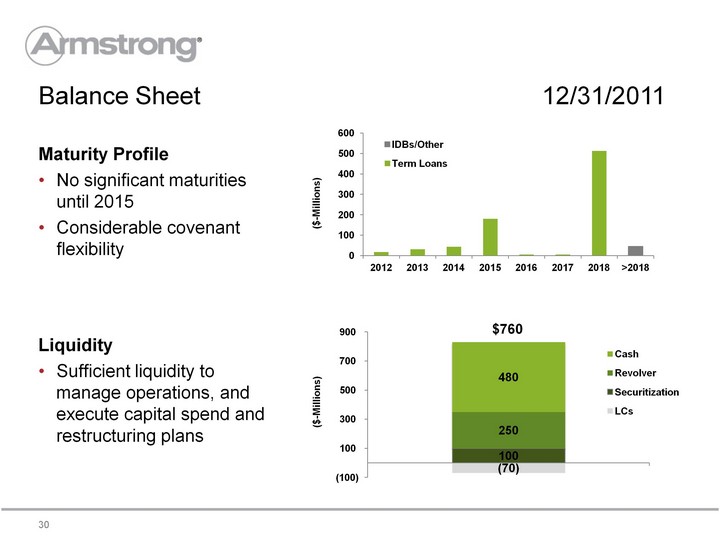
| Balance Sheet 12/31/2011 30 Maturity ProfileNo significant maturities until 2015Considerable covenant flexibility LiquiditySufficient liquidity to manage operations, and execute capital spend and restructuring plans (CHART) (CHART) $760 |
| Financial Overview Appendix 31 |
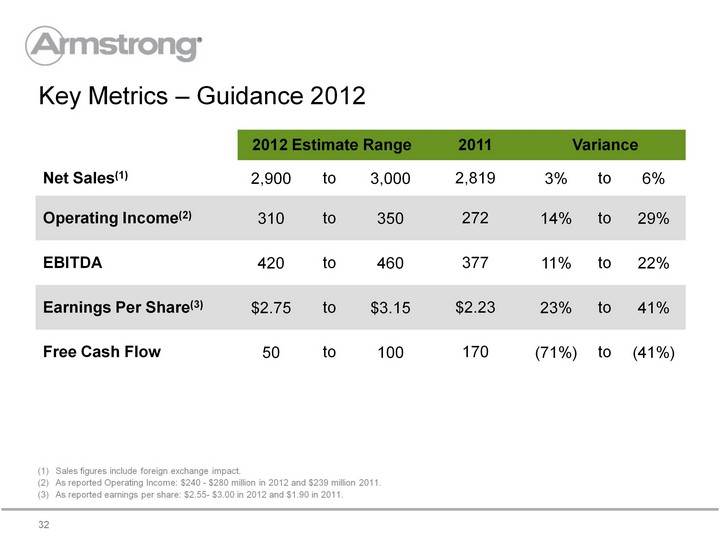
| 2012 Estimate Range 2012 Estimate Range 2012 Estimate Range 2011 Variance Variance Variance Net Sales(1) 2,900 to 3,000 2,819 3% to 6% Operating Income(2) 310 to 350 272 14% to 29% EBITDA 420 to 460 377 11% to 22% Earnings Per Share(3) $2.75 to $3.15 $2.23 23% to 41% Free Cash Flow 50 to 100 170 (71%) to (41%) Sales figures include foreign exchange impact. As reported Operating Income: $240 - $280 million in 2012 and $239 million 2011.As reported earnings per share: $2.55- $3.00 in 2012 and $1.90 in 2011. Key Metrics - Guidance 2012 32 |

| 2012 Financial Outlook $25 - $35 million increase Adjusted Gross Margin +100 to +150 bps vs. 2011 $15 - $25 million; 60% manufacturing, 40% SG&A $0 - $5 million vs. 2011 $10 - $20 million. Adjusted ETR of ~40% Sales $670 - $710 million EBITDA $75 - $90 million $240 - $270 million $5 - $10 million associated with already announced actions Raw Material & Energy Inflation Manufacturing Productivity U.S. Pension Credit Earnings from WAVE Cash Taxes/ETR Q1 Capital Spending Exclusions from EBITDA 33 |
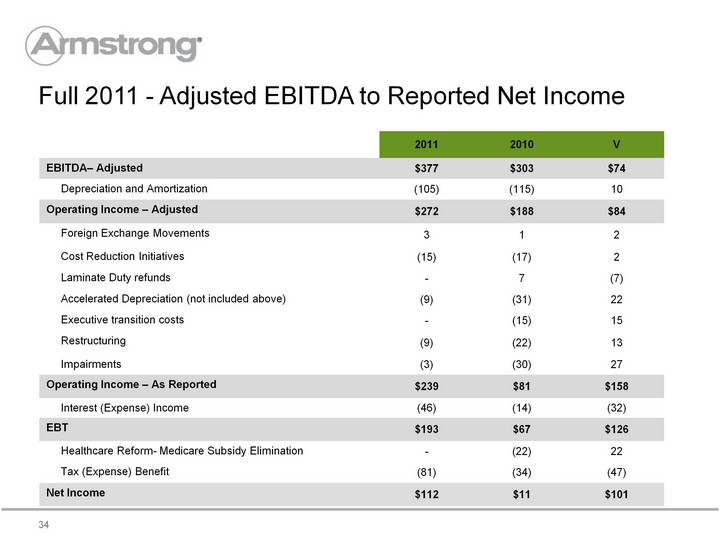
| 2011 2010 V EBITDA- Adjusted $377 $303 $74 Depreciation and Amortization (105) (115) 10 Operating Income - Adjusted $272 $188 $84 Foreign Exchange Movements 3 1 2 Cost Reduction Initiatives (15) (17) 2 Laminate Duty refunds - 7 (7) Accelerated Depreciation (not included above) (9) (31) 22 Executive transition costs - (15) 15 Restructuring (9) (22) 13 Impairments (3) (30) 27 Operating Income - As Reported $239 $81 $158 Interest (Expense) Income (46) (14) (32) EBT $193 $67 $126 Healthcare Reform- Medicare Subsidy Elimination - (22) 22 Tax (Expense) Benefit (81) (34) (47) Net Income $112 $11 $101 Full 2011 - Adjusted EBITDA to Reported Net Income 34 |

| Management Team 35 |

| Matthew J. Espe, Chief Executive Officer and President In July 2010, Matthew J. Espe was appointed CEO of Armstrong World Industries, Inc., in Lancaster, Pennsylvania. He brings 30 years of experience in sales, marketing, distribution and management in global manufacturing businesses to Armstrong from his previous position at Ricoh Americas Corporation, a subsidiary of Ricoh Company, Ltd., where he served as Chairman and CEO. Prior to this role, Mr. Espe was Chairman and CEO of IKON Office Solutions, Inc., a $4 billion office equipment distributor and services provider with 24,000 employees. The company was acquired by Ricoh in 2008. Before joining IKON in 2002, Mr. Espe was president and CEO of GE Lighting. In a career that spanned 22 years there, he managed multiple functional areas, including sales, marketing, distribution and manufacturing as well as management within several business units. Along with a wealth of experience, he also brings a finely-tuned global perspective, having led businesses in Europe, Asia and North America.Mr. Espe is also a member of the board of Unisys Corporation. He is an active volunteer and member of the board of United Way of Southeastern Pennsylvania. He graduated from the University of Idaho and has an MBA from Whittier College. 36 |

| Thomas B. Mangas, Senior Vice President and Chief Financial Officer Thomas B. Mangas is senior vice president and CFO of Armstrong World Industries, Inc., in Lancaster, Pennsylvania. Mr. Mangas joined Armstrong in February 2010. Prior, he was vice president and CFO of the $28 billion beauty and grooming business of Procter & Gamble Co. after a steady progression of finance roles at that company. He has broad domestic and international experience including implementing tough cost management initiatives, exploiting new growth opportunities, acquisition integration, strategic planning, resource allocation, cost accounting, Sarbanes-Oxley implementation and controls, tax compliance and organization development. He earned his bachelor's degree in Economics and History from the University of Virginia in 1990 where he was elected to the Phi Beta Kappa honorary society. 37 |

| Victor Grizzle, Executive Vice President, CEO, Armstrong Building Products Victor "Vic" Grizzle is executive vice president and CEO, Armstrong Building Products, in Lancaster, Pennsylvania. Mr. Grizzle has 23 years of experience in process improvement, sales, marketing and global business leadership. He comes to Armstrong from Valmont Industries, a $2 billion global leader of infrastructure support structures for utility, telecom and lighting markets, and manufacturer of mechanized irrigation equipment for large scale farming, where he was group president of Global Structures, Coatings and Tubing since 2005. Prior to Valmont, Mr. Grizzle was president of the commercial power division of EaglePicher Corporation, a $700 million diversified manufacturer and marketer of advanced technology and industrial products for space, defense, automotive, filtration, pharmaceutical, environmental and commercial applications. Before that, he spent 16 years at General Electric Corporation. Mr. Grizzle graduated from California Polytechnic University with a Bachelor of Science in Mechanical Engineering. 38 |

| Frank J. Ready, Executive Vice President, CEO, Armstrong Floor Products Worldwide Frank J. Ready is executive vice president and CEO of Armstrong Floor Products Worldwide, in Lancaster, Pennsylvania. Mr. Ready joined Armstrong in 1983 in Building Products Operations Sales and progressed through positions in Marketing before moving to the company's flooring business in 1996. He served in positions of increasing responsibility including senior vice president of Sales and Marketing - Armstrong Floor Products, where he worked with "Big Box" customers, builders and independent retailers. He also briefly managed flooring manufacturing operations. Mr. Ready is a member of the board of directors of the Tropical Forest Foundation, a coalition of industry, conservation and scientific leaders who work together to achieve sustainable management of tropical timber in the major producing regions. He is also a member of the board of directors of the National Association of Manufacturers. A native of Cherry Hill, New Jersey, Mr. Ready earned a bachelor's degree in Business Administration from Franklin & Marshall College. 39 |

| Thomas J. Waters, Vice President Treasury & Investor Relations Thomas J. Waters is Vice President, Treasury and Investor Relations of Armstrong World Industries, Inc. Mr. Waters joined Armstrong in 1998 as Manager, Capital Markets. Since then he has held the positions of Director of Investor Relations, General Manager of Finance and IT for Building Products Europe, General Manager Financial Planning and Analysis for North American Floor Products. He was named Treasurer in 2008, and added investor relations responsibilities in 2010. Prior to Armstrong, Mr. Waters worked for American Airlines in Dallas, TX in both Treasury and Operational Finance roles. Mr. Waters earned a BA from Binghamton University, and a MBA from the Walter A. Haas School of Business at the University of California, Berkeley. 40 |