ARMSTRONG WORLD INDUSTRIES INVESTOR PRESENTATION October 30, 2017 Exhibit 99.3
Safe Harbor Statement Our disclosures in this presentation, including without limitation, those relating to future financial results guidance, and in our other public documents and comments contain forward-looking statements within the meaning of the Private Securities Litigation Reform Act. Those statements provide our future expectations or forecasts and can be identified by our use of words such as "anticipate," "estimate," "expect," "project," "intend," "plan," "believe," "outlook," "target," "predict," "may," "will," "would," "could," "should," "seek," and other words or phrases of similar meaning in connection with any discussion of future operating or financial performance. Forward-looking statements, by their nature, address matters that are uncertain and involve risks because they relate to events and depend on circumstances that may or may not occur in the future. A more detailed discussion of the risks and uncertainties that may affect our ability to achieve the projected performance is included in the “Risk Factors” and “Management’s Discussion and Analysis” sections of our recent reports on Forms 10-K and 10-Q filed with the U.S. Securities and Exchange Commission (“SEC”). As a result, our actual results may differ materially from our expected results and from those expressed in our forward-looking statements. Forward-looking statements speak only as of the date they are made. We undertake no obligation to update any forward-looking statements beyond what is required under applicable securities law. The information in this presentation is only effective as of the date given October 30, 2017, and is subject to change. Any distribution of this presentation after October 30, 2017 is not intended and will not be construed as updating or confirming such information. In addition, we will be referring to “non-GAAP financial measures” within the meaning of SEC Regulation G. A reconciliation of the differences between these measures with the most directly comparable financial measures calculated in accordance with GAAP can be found in the appendix to this presentation, in our SEC filings and on the Investor Relations section of our website at www.armstrongceilings.com. Armstrong World Industries competes globally in many diverse markets. References to "market" or "share" data are simply estimations based on a combination of internal and external sources and assumptions. They are intended only to assist discussion of the relative performance of product segments and categories for marketing and related purposes. No conclusion has been reached or should be reached regarding a "product market," a "geographic market" or “market share,” as such terms may be used or defined for any economic, legal or other purpose.
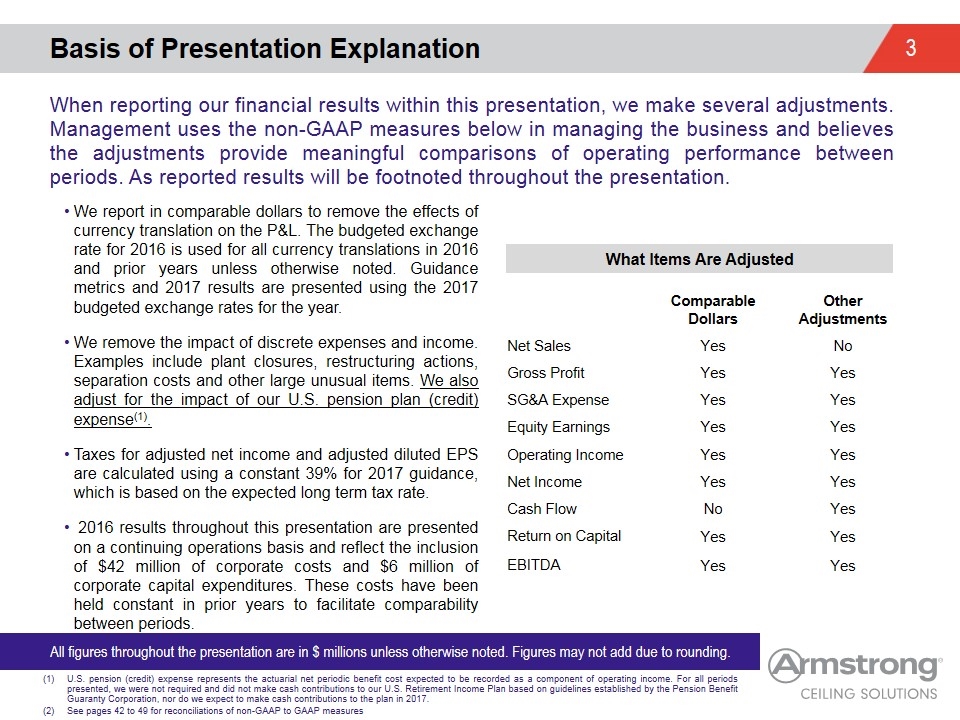
When reporting our financial results within this presentation, we make several adjustments. Management uses the non-GAAP measures below in managing the business and believes the adjustments provide meaningful comparisons of operating performance between periods. As reported results will be footnoted throughout the presentation. Basis of Presentation Explanation All figures throughout the presentation are in $ millions unless otherwise noted. Figures may not add due to rounding. We report in comparable dollars to remove the effects of currency translation on the P&L. The budgeted exchange rate for 2016 is used for all currency translations in 2016 and prior years unless otherwise noted. Guidance metrics and 2017 results are presented using the 2017 budgeted exchange rates for the year. We remove the impact of discrete expenses and income. Examples include plant closures, restructuring actions, separation costs and other large unusual items. We also adjust for the impact of our U.S. pension plan (credit) expense(1). Taxes for adjusted net income and adjusted diluted EPS are calculated using a constant 39% for 2017 guidance, which is based on the expected long term tax rate. 2016 results throughout this presentation are presented on a continuing operations basis and reflect the inclusion of $42 million of corporate costs and $6 million of corporate capital expenditures. These costs have been held constant in prior years to facilitate comparability between periods. Comparable Dollars Other Adjustments Net Sales Yes No Gross Profit Yes Yes SG&A Expense Yes Yes Equity Earnings Yes Yes Operating Income Yes Yes Net Income Yes Yes Cash Flow No Yes Return on Capital Yes Yes EBITDA Yes Yes What Items Are Adjusted U.S. pension (credit) expense represents the actuarial net periodic benefit cost expected to be recorded as a component of operating income. For all periods presented, we were not required and did not make cash contributions to our U.S. Retirement Income Plan based on guidelines established by the Pension Benefit Guaranty Corporation, nor do we expect to make cash contributions to the plan in 2017. See pages 42 to 49 for reconciliations of non-GAAP to GAAP measures
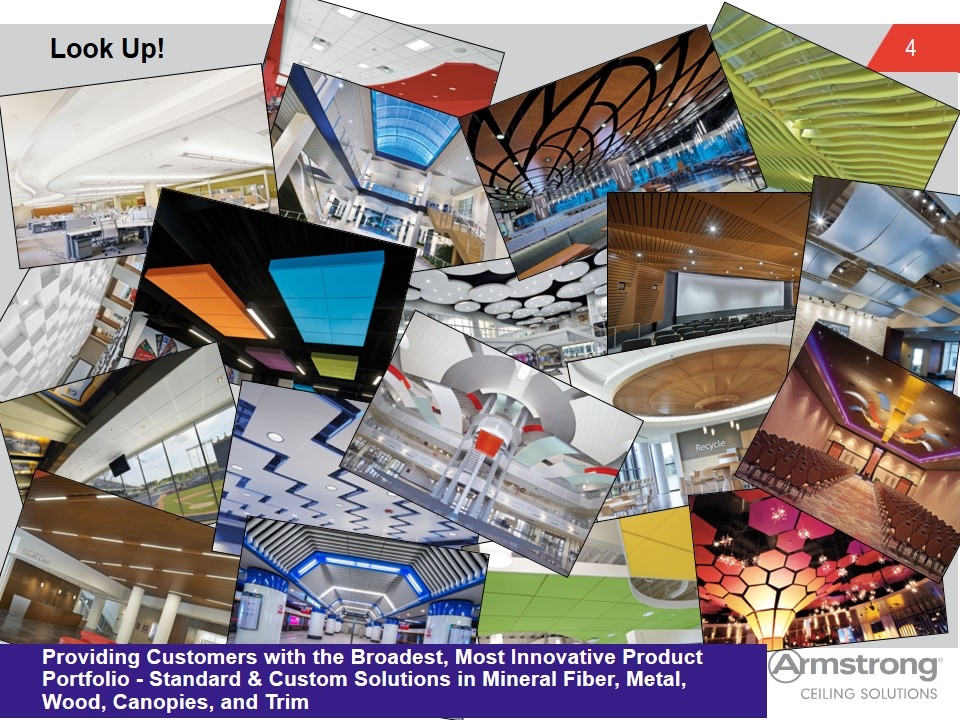
Look Up! Providing Customers with the Broadest, Most Innovative Product Portfolio - Standard & Custom Solutions in Mineral Fiber, Metal, Wood, Canopies, and Trim
The AWI Investment Thesis Standout Global Leader in Attractive Ceilings Industry 1 Best-in-Class, Stable Cash Flow Through the Cycle Attractive, Multi-Faceted Growth Opportunities Additional Levers to Create Shareholder Value 1 Standout Leader 2 3 4 2 3 4 Best-in-Class Cash Flow 1 3 4 2 Growth Levers 1 2 4 3 Additional Profit Drivers 1 2 3 4 4 Levers for Value 1 2 3 2 Robust Cash Flow 3 4 1 3 Attractive Growth 4 1 2
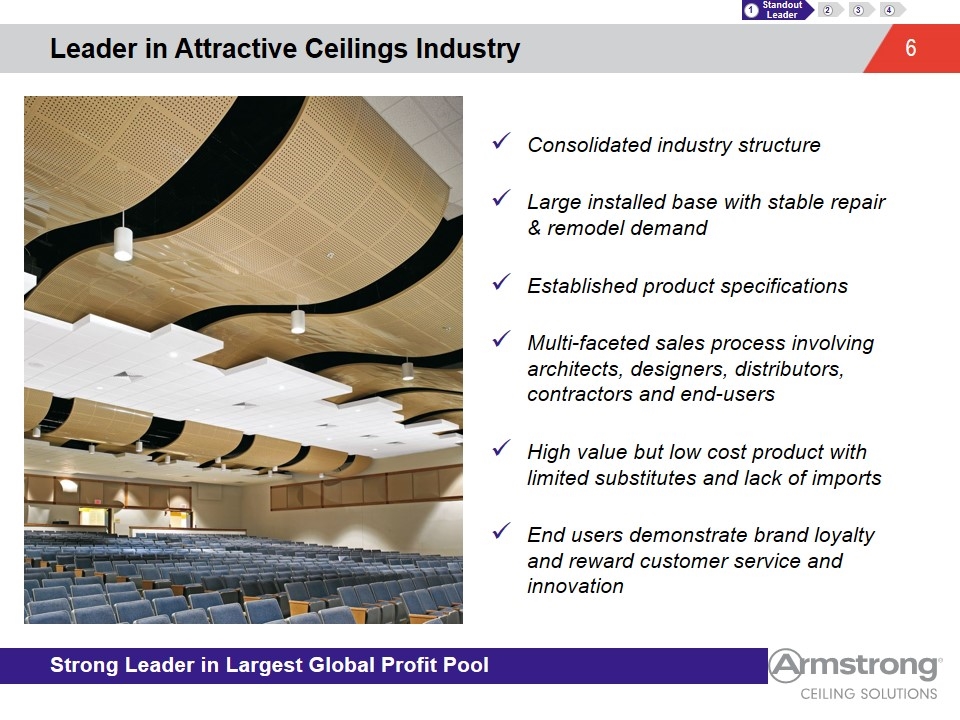
Leader in Attractive Ceilings Industry Strong Leader in Largest Global Profit Pool Consolidated industry structure Large installed base with stable repair & remodel demand Established product specifications Multi-faceted sales process involving architects, designers, distributors, contractors and end-users High value but low cost product with limited substitutes and lack of imports End users demonstrate brand loyalty and reward customer service and innovation 1 Standout Leader 2 3 4
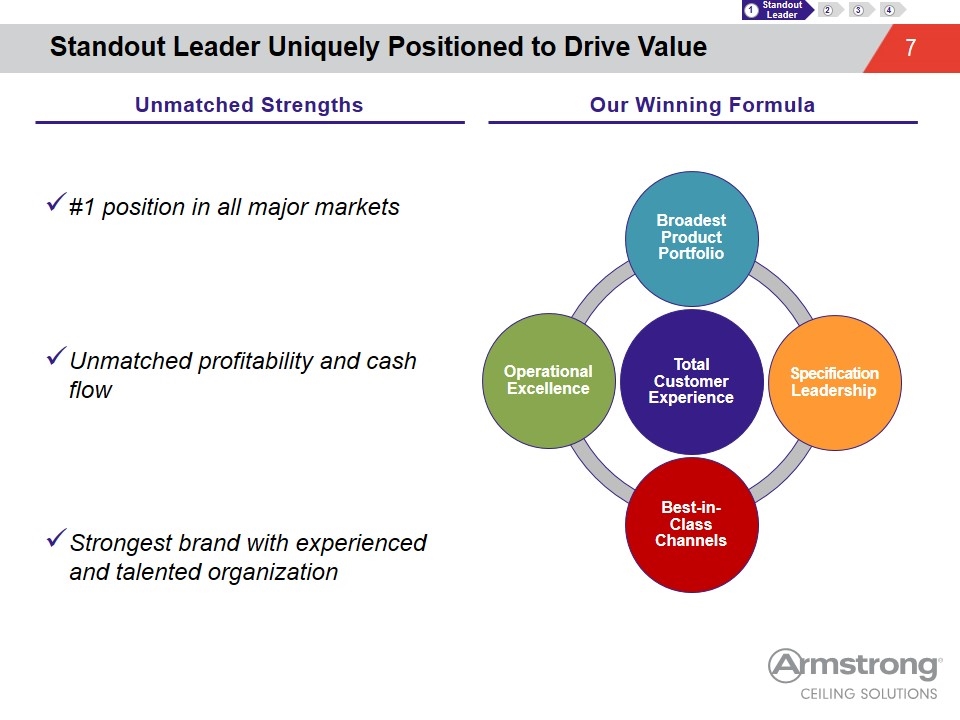
#1 position in all major markets Unmatched profitability and cash flow Strongest brand with experienced and talented organization Standout Leader Uniquely Positioned to Drive Value Unmatched Strengths Our Winning Formula 1 Standout Leader 2 3 4 Total Customer Experience Broadest Product Portfolio Specification Leadership Best-in-Class Channels Operational Excellence
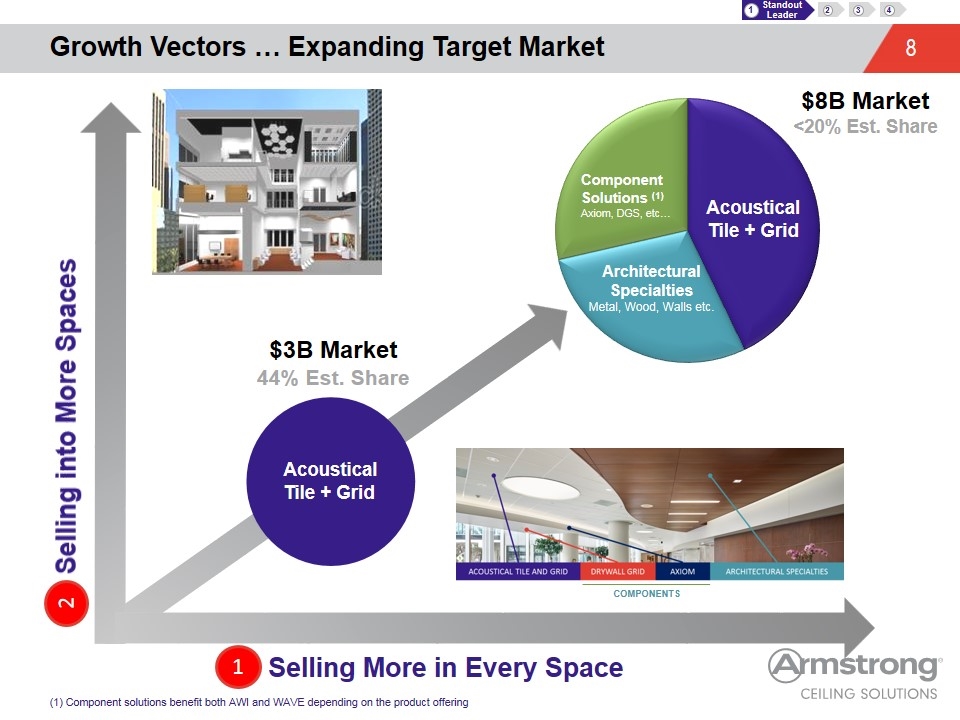
Growth Vectors … Expanding Target Market Selling into More Spaces Selling More in Every Space $3B Market 44% Est. Share Acoustical Tile + Grid Specialty Ceilings Metal, Wood, etc… $8B Market <20% Est. Share Components(1) Axiom, DGS, etc… Acoustical Tile + Grid COMPONENTS 1 2 (1) Component solutions benefit both AWI and WAVE depending on the product offering Specialty Walls N.A. 1 Standout Leader 2 3 4 Acoustical Tile + Grid Architectural Specialties Metal, Wood, Walls etc.
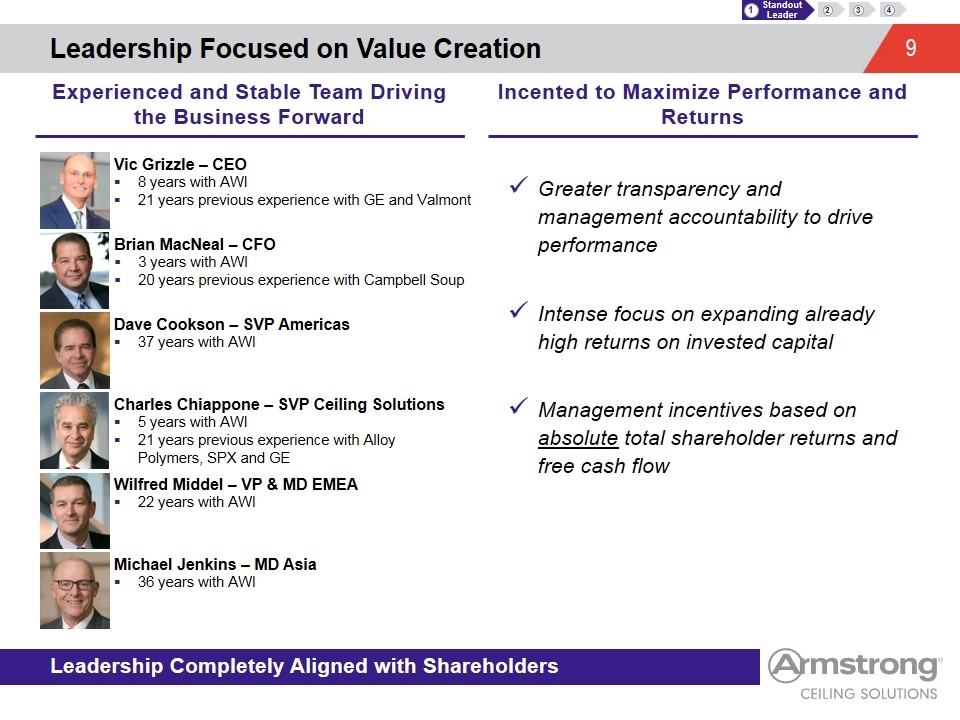
Leadership Focused on Value Creation Leadership Completely Aligned with Shareholders Greater transparency and management accountability to drive performance Intense focus on expanding already high returns on invested capital Management incentives based on absolute total shareholder returns and free cash flow Vic Grizzle – CEO 8 years with AWI 21 years previous experience with GE and Valmont Brian MacNeal – CFO 3 years with AWI 20 years previous experience with Campbell Soup Dave Cookson – SVP Americas 37 years with AWI Charles Chiappone – SVP Ceiling Solutions 5 years with AWI 21 years previous experience with Alloy Polymers, SPX and GE Wilfred Middel – VP & MD EMEA 22 years with AWI Michael Jenkins – MD Asia 36 years with AWI Experienced and Stable Team Driving the Business Forward Incented to Maximize Performance and Returns 1 Standout Leader 2 3 4
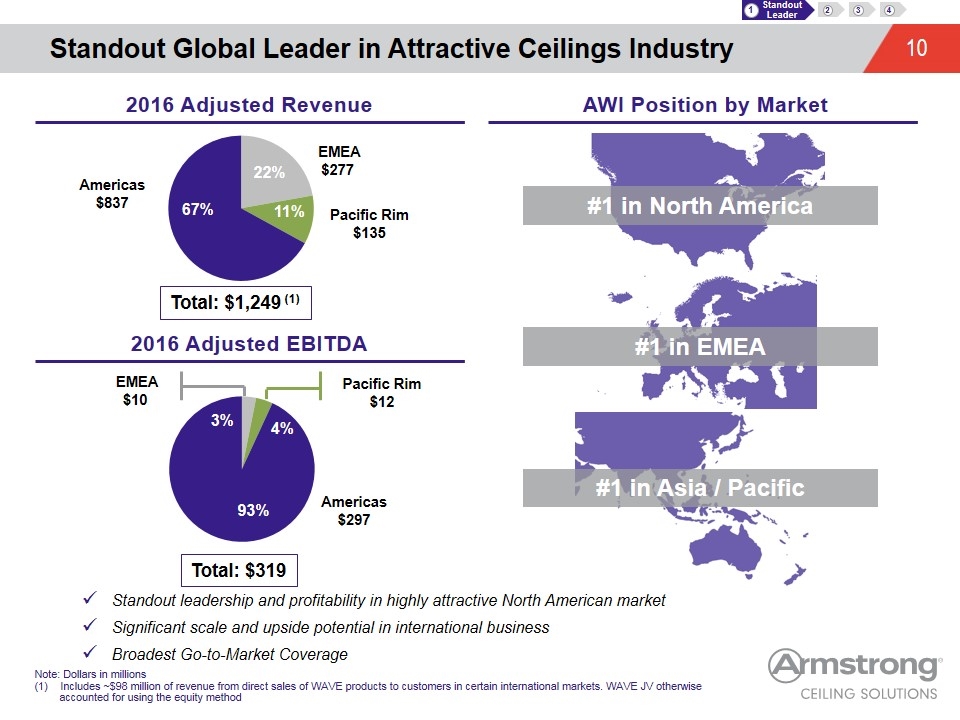
Standout Global Leader in Attractive Ceilings Industry 1 Standout Leader 2 3 4 Total: $1,249 (1) Standout leadership and profitability in highly attractive North American market Significant scale and upside potential in international business Broadest Go-to-Market Coverage Total: $319 #1 in North America #1 in EMEA #1 in Asia / Pacific 2016 Adjusted Revenue AWI Position by Market 2016 Adjusted EBITDA Note: Dollars in millions Includes ~$98 million of revenue from direct sales of WAVE products to customers in certain international markets. WAVE JV otherwise accounted for using the equity method Pacific Rim $12 Americas$297 EMEA $10 EMEA $277 Americas $837
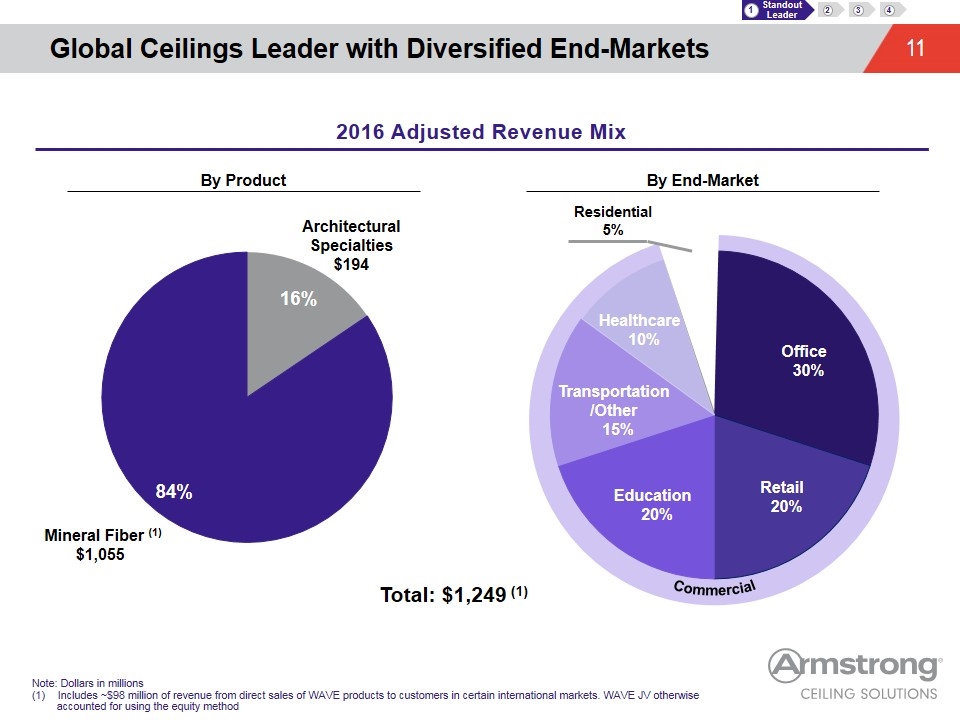
Global Ceilings Leader with Diversified End-Markets Commercial Total: $1,249 (1) 1 Standout Leader 2 3 4 2016 Adjusted Revenue Mix By End-Market By Product Note: Dollars in millions Includes ~$98 million of revenue from direct sales of WAVE products to customers in certain international markets. WAVE JV otherwise accounted for using the equity method Mineral Fiber (1) $1,055 Architectural Specialties $194 Office 30% Transportation/Other 15% Education 20% Retail 20% Healthcare 10% Residential 5%
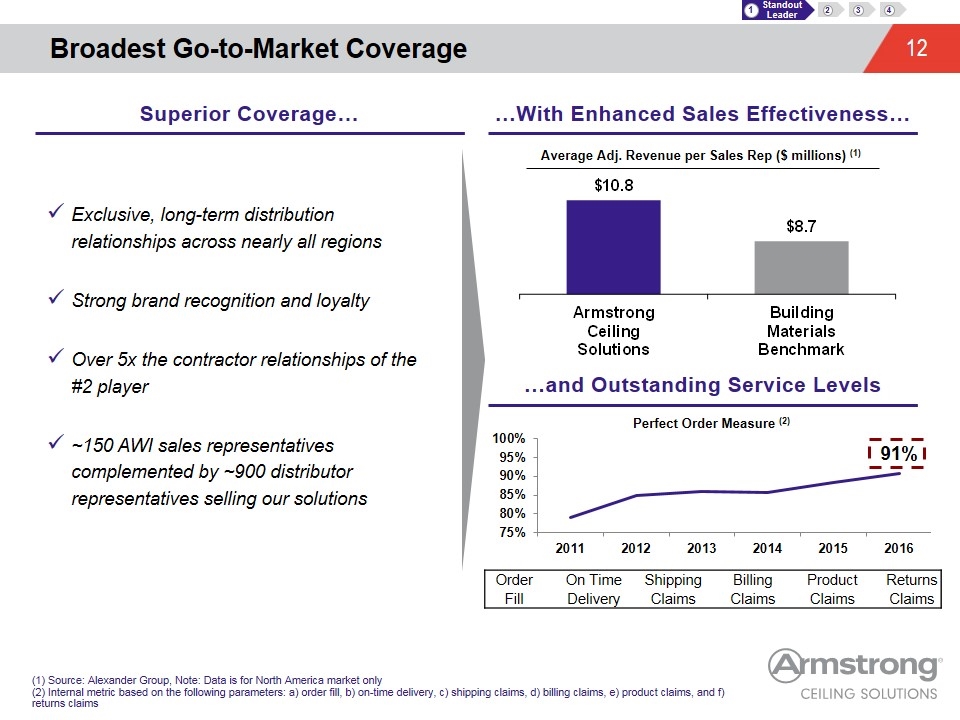
Perfect Order Measure (2) Broadest Go-to-Market Coverage Exclusive, long-term distribution relationships across nearly all regions Strong brand recognition and loyalty Over 5x the contractor relationships of the #2 player ~150 AWI sales representatives complemented by ~900 distributor representatives selling our solutions 1 Standout Leader 2 3 4 Superior Coverage… …With Enhanced Sales Effectiveness… …and Outstanding Service Levels Average Adj. Revenue per Sales Rep ($ millions) (1) (1) Source: Alexander Group, Note: Data is for North America market only (2) Internal metric based on the following parameters: a) order fill, b) on-time delivery, c) shipping claims, d) billing claims, e) product claims, and f) returns claims Order On Time Shipping Billing Product Returns Fill Delivery Claims Claims Claims Claims 97.2% 91.3% 97.5% 98.9% 98.9% 99.3%
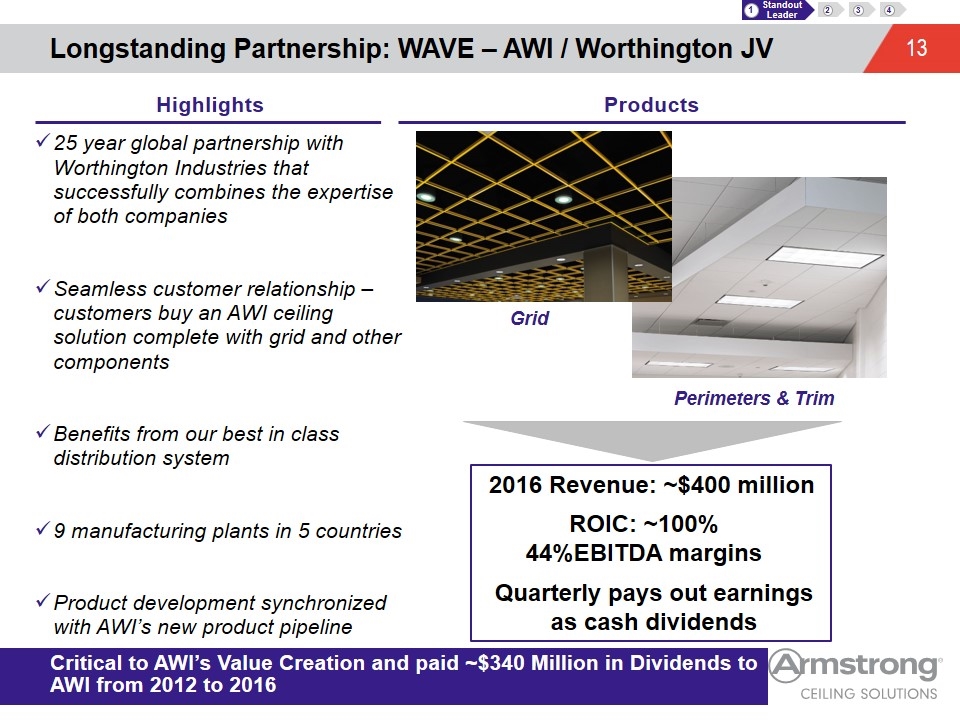
Longstanding Partnership: WAVE – AWI / Worthington JV Critical to AWI’s Value Creation and paid ~$340 Million in Dividends to AWI from 2012 to 2016 25 year global partnership with Worthington Industries that successfully combines the expertise of both companies Seamless customer relationship – customers buy an AWI ceiling solution complete with grid and other components Benefits from our best in class distribution system 9 manufacturing plants in 5 countries Product development synchronized with AWI’s new product pipeline Grid Perimeters & Trim 2016 Revenue: ~$400 million Quarterly pays out earnings as cash dividends ROIC: ~100% 44%EBITDA margins 1 Standout Leader 2 3 4 Highlights Products
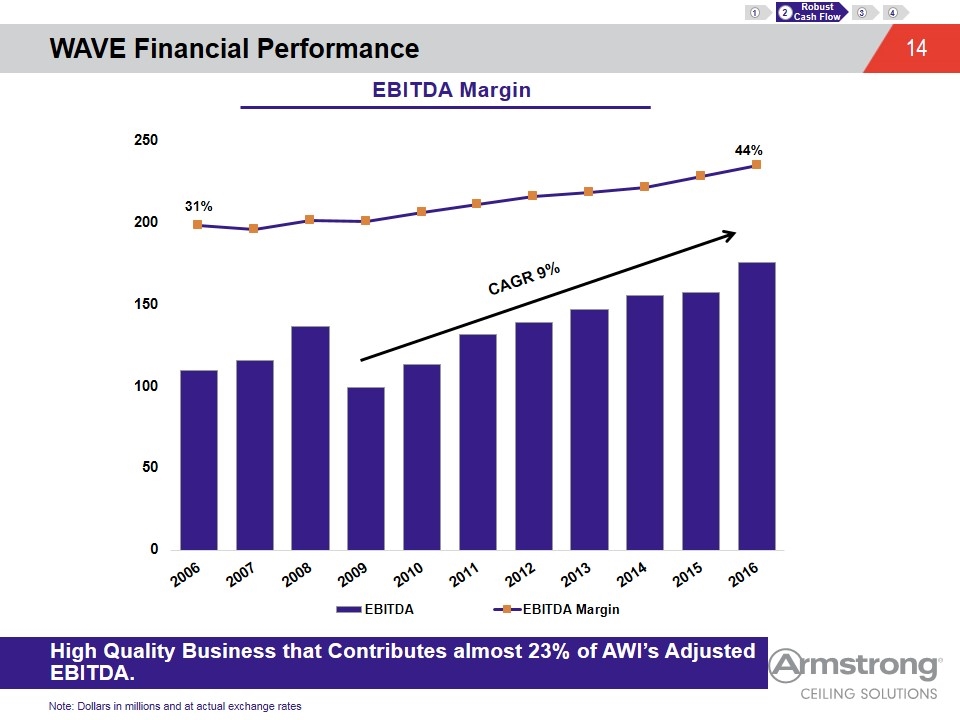
WAVE Financial Performance EBITDA Margin Note: Dollars in millions and at actual exchange rates 2 Robust Cash Flow 3 4 1 CAGR 9% High Quality Business that Contributes almost 23% of AWI’s Adjusted EBITDA.
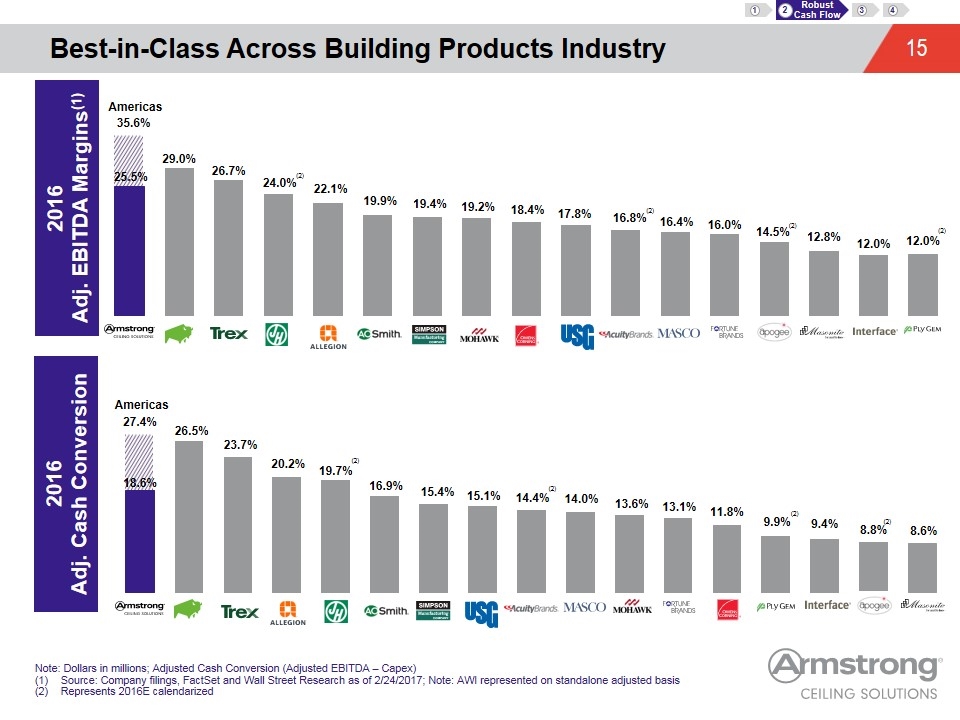
Best-in-Class Across Building Products Industry Note: Dollars in millions; Adjusted Cash Conversion (Adjusted EBITDA – Capex) Source: Company filings, FactSet and Wall Street Research as of 2/24/2017; Note: AWI represented on standalone adjusted basis Represents 2016E calendarized 2 Robust Cash Flow 3 4 1 2016 Adj. EBITDA Margins(1) (2) (2) (2) 2016 Adj. Cash Conversion 27.4% Americas Americas 35.6% (2) (2) (2) (2) (2)
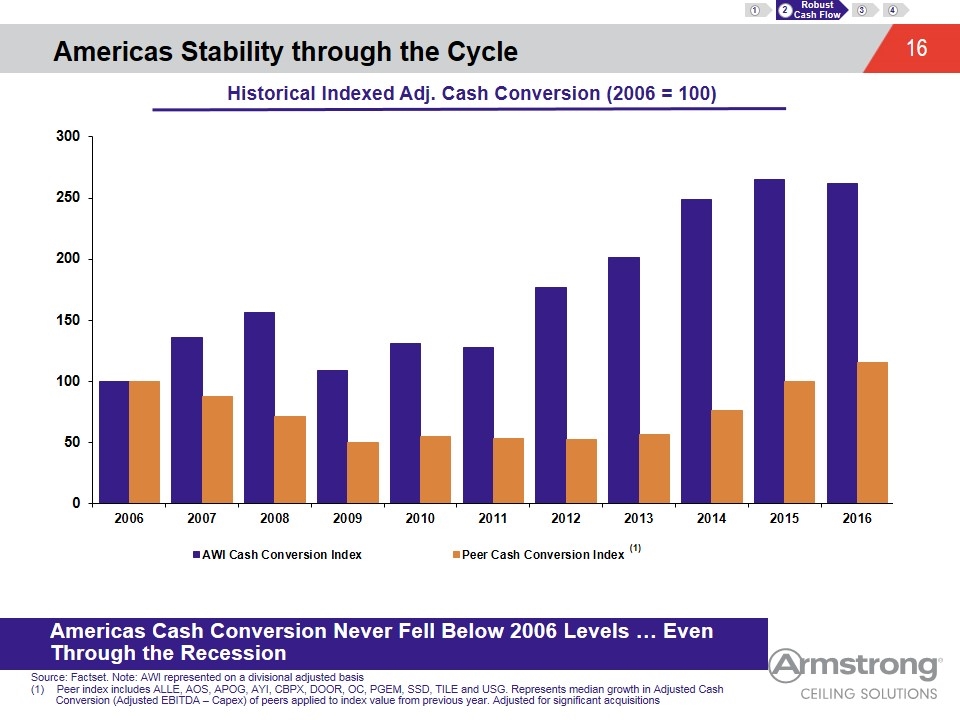
Historical Indexed Adj. Cash Conversion (2006 = 100) Americas Stability through the Cycle 2 Robust Cash Flow 3 4 1 Source: Factset. Note: AWI represented on a divisional adjusted basis Peer index includes ALLE, AOS, APOG, AYI, CBPX, DOOR, OC, PGEM, SSD, TILE and USG. Represents median growth in Adjusted Cash Conversion (Adjusted EBITDA – Capex) of peers applied to index value from previous year. Adjusted for significant acquisitions Americas Cash Conversion Never Fell Below 2006 Levels … Even Through the Recession
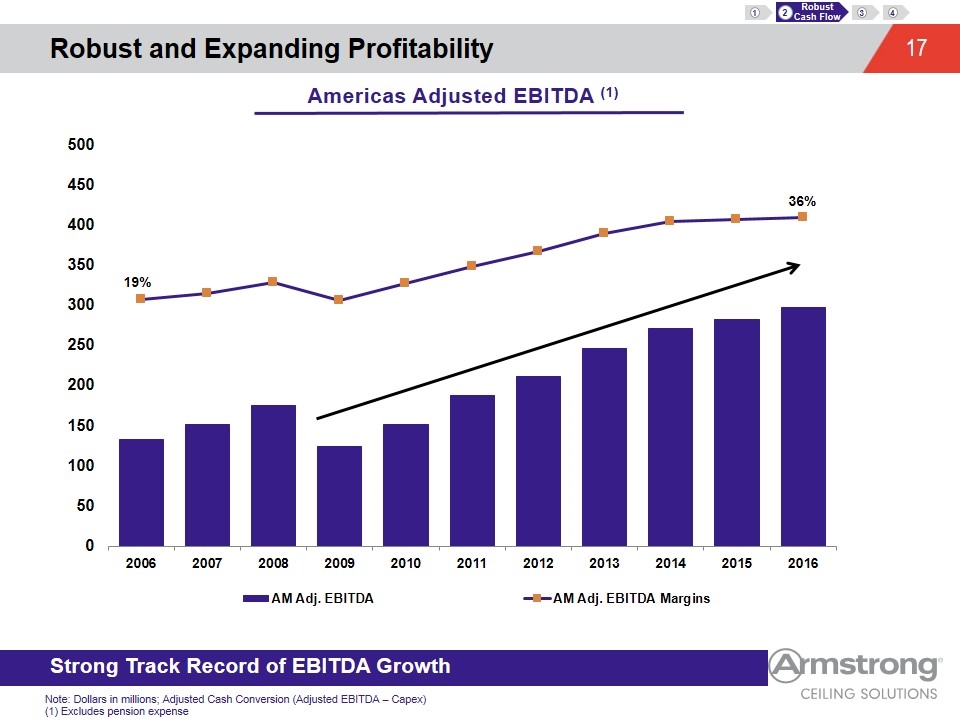
Robust and Expanding Profitability Americas Adjusted EBITDA (1) Note: Dollars in millions; Adjusted Cash Conversion (Adjusted EBITDA – Capex) (1) Excludes pension expense 2 Robust Cash Flow 3 4 1 Strong Track Record of EBITDA Growth
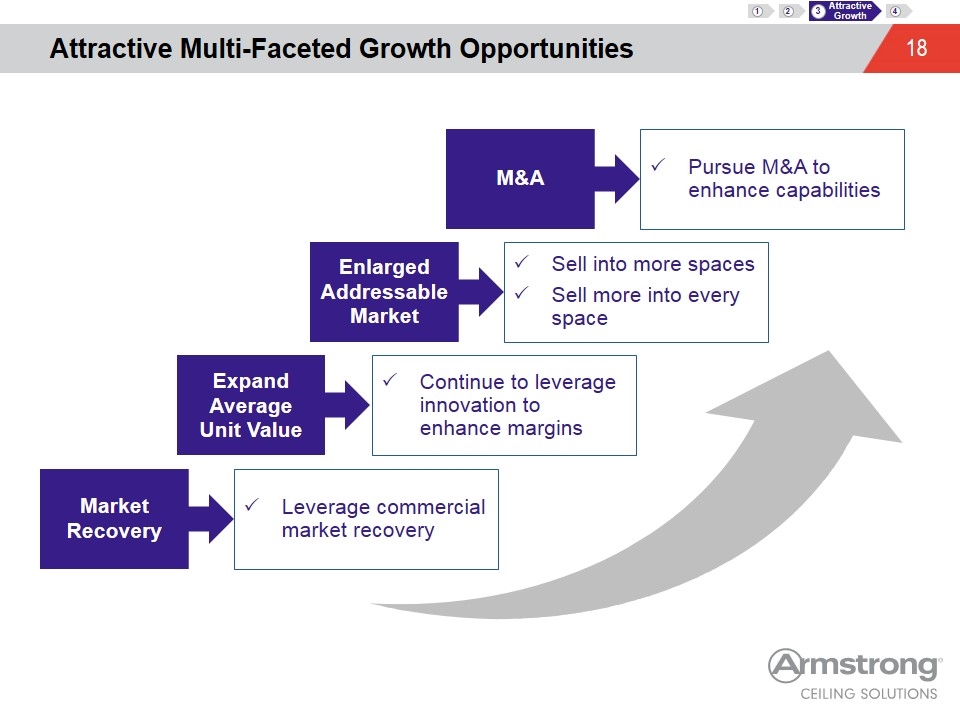
Attractive Multi-Faceted Growth Opportunities 3 Attractive Growth 4 1 2 Market Recovery Leverage commercial market recovery Expand Average Unit Value Continue to leverage innovation to enhance margins Enlarged Addressable Market Sell into more spaces Sell more into every space Pursue M&A to enhance capabilities M&A Expansion of overall market and Armstrong share
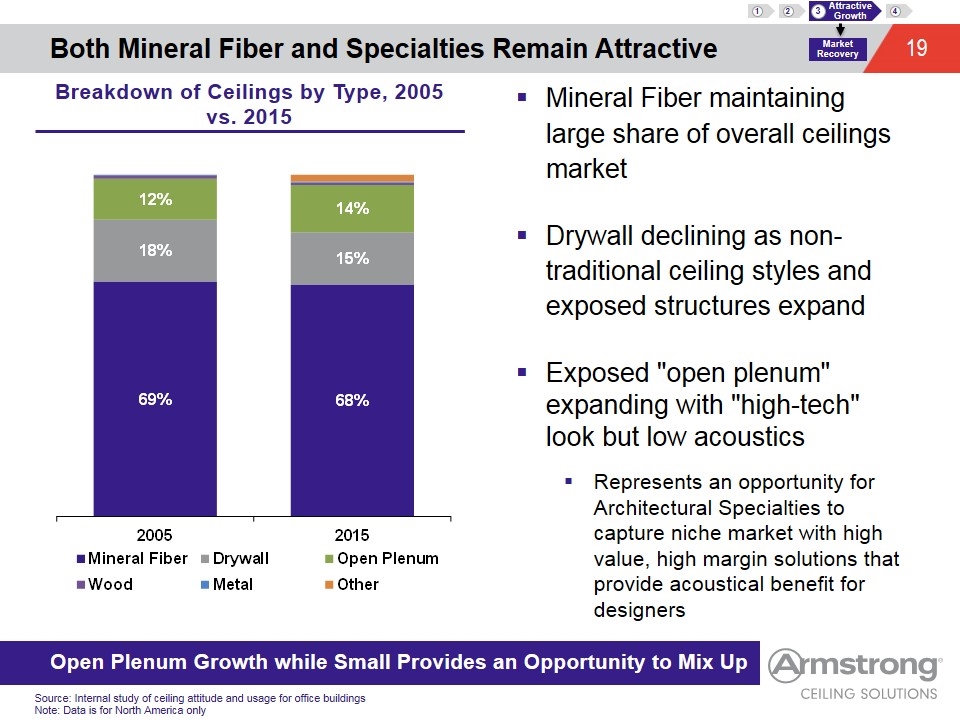
Both Mineral Fiber and Specialties Remain Attractive Source: Internal study of ceiling attitude and usage for office buildings Note: Data is for North America only Mineral Fiber maintaining large share of overall ceilings market Drywall declining as non-traditional ceiling styles and exposed structures expand Exposed "open plenum" expanding with "high-tech" look but low acoustics Represents an opportunity for Architectural Specialties to capture niche market with high value, high margin solutions that provide acoustical benefit for designers Market Recovery 3 Attractive Growth 4 1 2 Breakdown of Ceilings by Type, 2005 vs. 2015 Open Plenum Growth while Small Provides an Opportunity to Mix Up
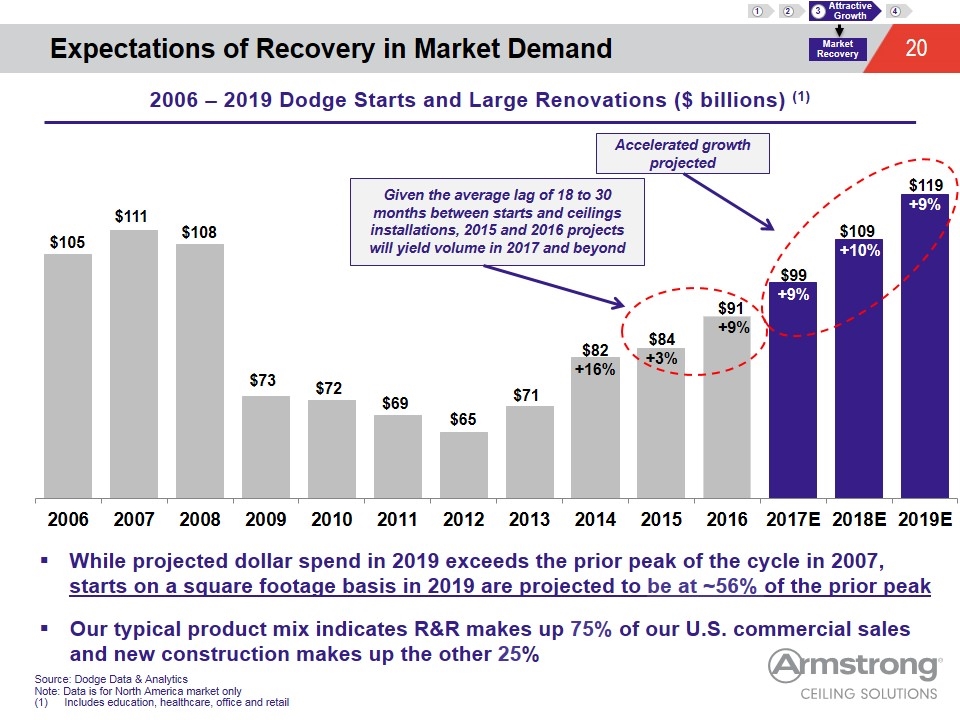
Expectations of Recovery in Market Demand Market Recovery 3 Attractive Growth 4 1 2 2006 – 2019 Dodge Starts and Large Renovations ($ billions) (1) Source: Dodge Data & Analytics Note: Data is for North America market only Includes education, healthcare, office and retail Accelerated growth projected Given the average lag of 18 to 30 months between starts and ceilings installations, 2015 and 2016 projects will yield volume in 2017 and beyond $69 $65 $71 $111 $105 $91 +9% $99 +9% $109 +10% $84 +3% $82 +16% $72 $73 $108 While projected dollar spend in 2019 exceeds the prior peak of the cycle in 2007, starts on a square footage basis in 2019 are projected to be at ~56% of the prior peak Our typical product mix indicates R&R makes up 75% of our U.S. commercial sales and new construction makes up the other 25% $119+9%
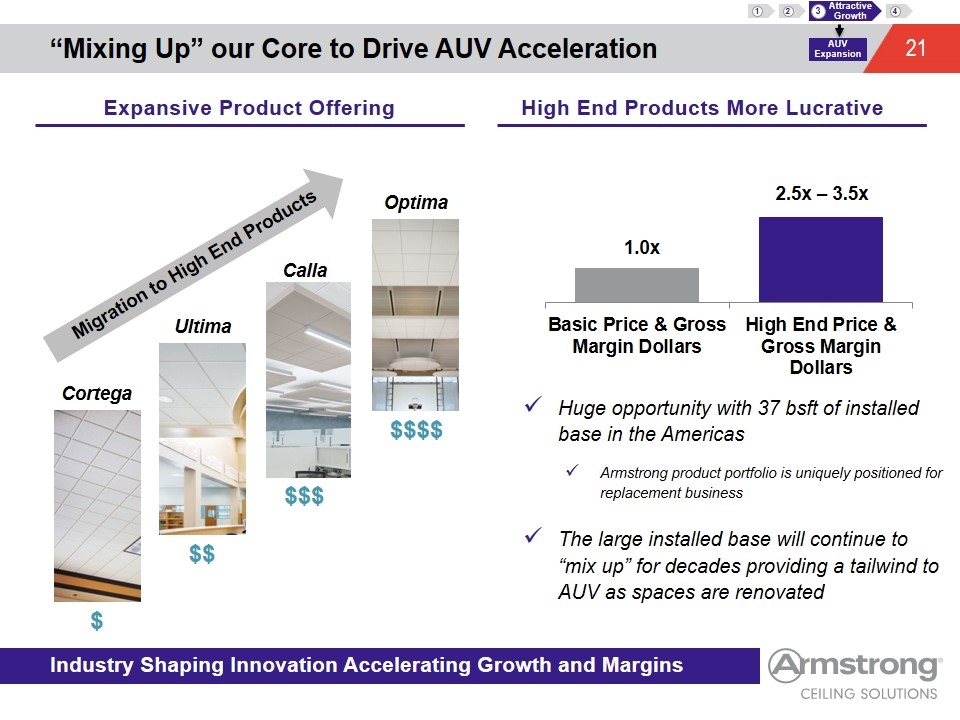
Huge opportunity with 37 bsft of installed base in the Americas Armstrong product portfolio is uniquely positioned for replacement business The large installed base will continue to “mix up” for decades providing a tailwind to AUV as spaces are renovated “Mixing Up” our Core to Drive AUV Acceleration Industry Shaping Innovation Accelerating Growth and Margins Cortega $ Ultima $$ Optima $$$$ $$$ Calla Migration to High End Products AUV Expansion 3 Attractive Growth 4 1 2 Expansive Product Offering High End Products More Lucrative 2.5x – 3.5x 1.0x
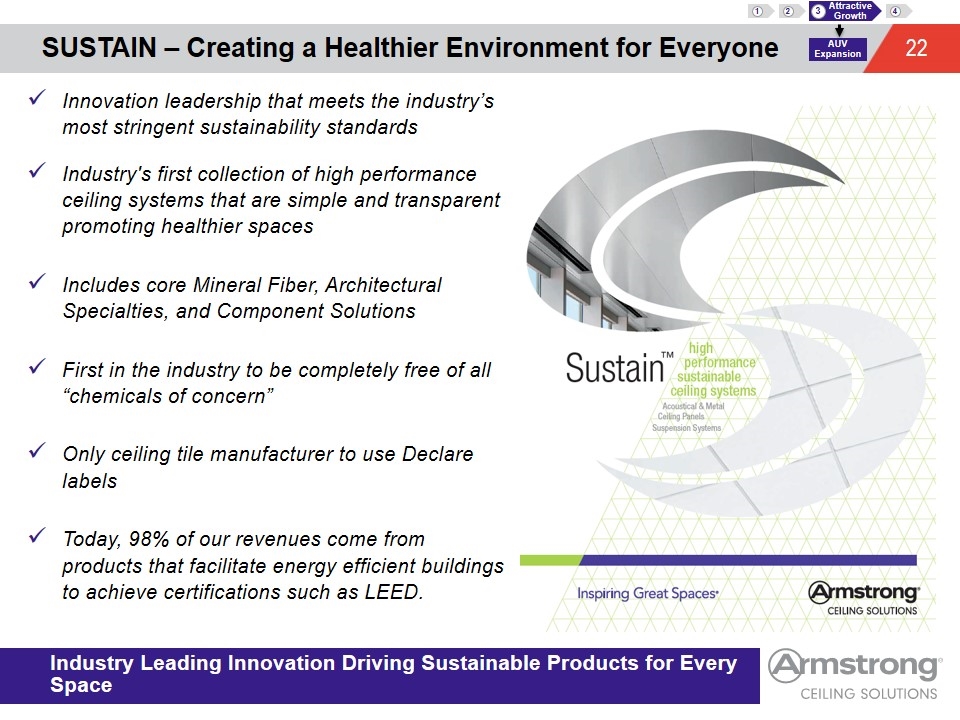
Innovation leadership that meets the industry’s most stringent sustainability standards Industry's first collection of high performance ceiling systems that are simple and transparent promoting healthier spaces Includes core Mineral Fiber, Architectural Specialties, and Component Solutions First in the industry to be completely free of all “chemicals of concern” Only ceiling tile manufacturer to use Declare labels Today, 98% of our revenues come from products that facilitate energy efficient buildings to achieve certifications such as LEED. Industry Leading Innovation Driving Sustainable Products for Every Space SUSTAIN – Creating a Healthier Environment for Everyone AUV Expansion 3 Attractive Growth 4 1 2
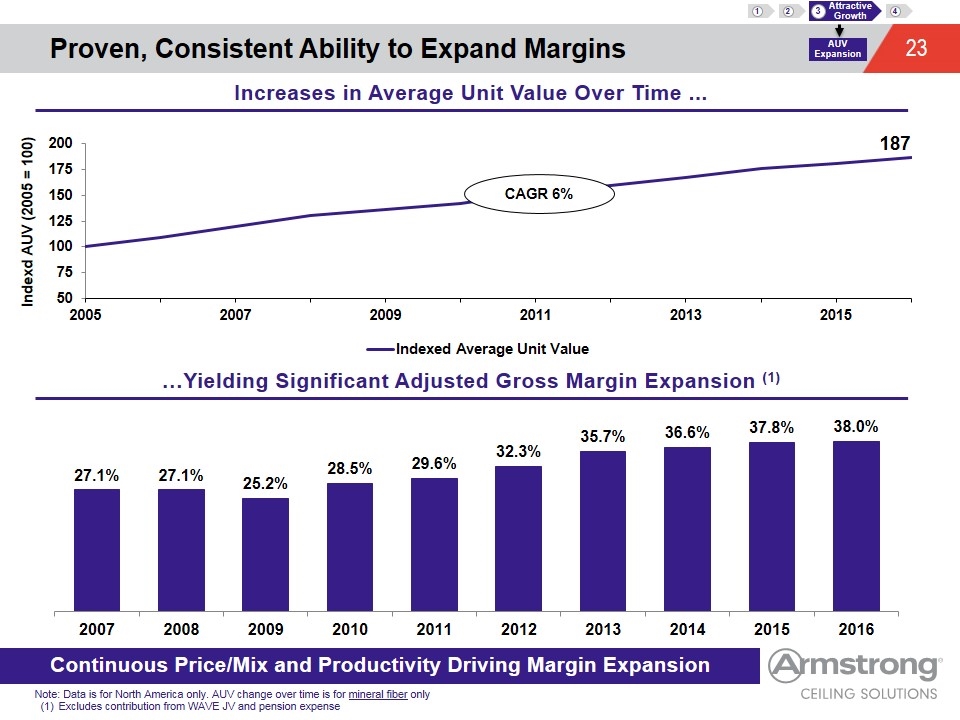
Proven, Consistent Ability to Expand Margins Continuous Price/Mix and Productivity Driving Margin Expansion Note: Data is for North America only. AUV change over time is for mineral fiber only Excludes contribution from WAVE JV and pension expense Increases in Average Unit Value Over Time ... …Yielding Significant Adjusted Gross Margin Expansion (1) AUV Expansion 3 Attractive Growth 4 1 2
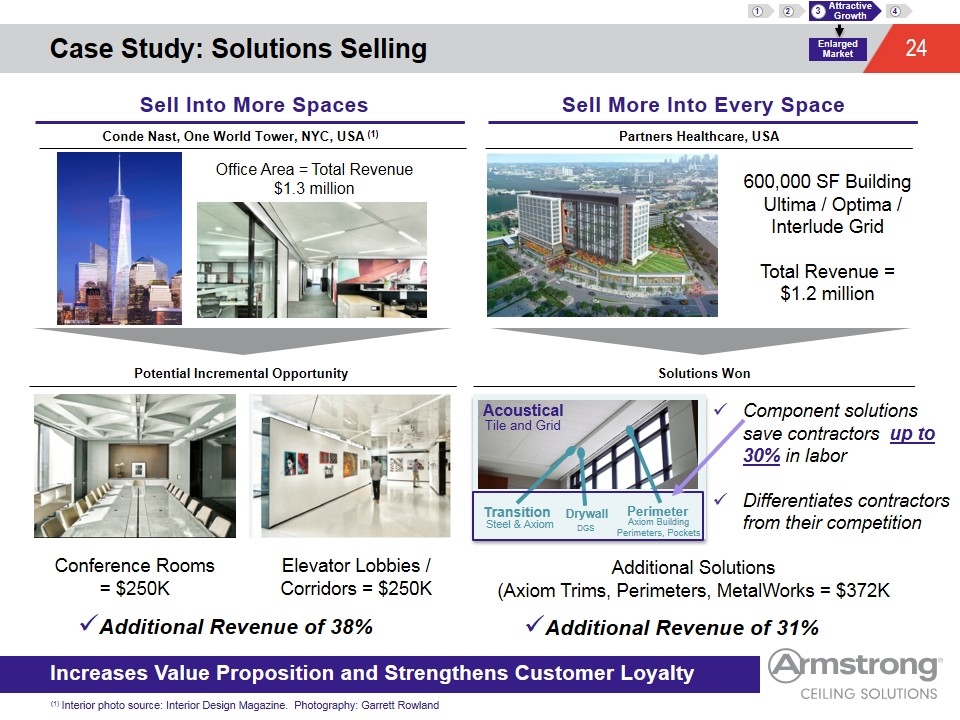
Case Study: Solutions Selling Office Area = Total Revenue $1.3 million Conference Rooms = $250K Elevator Lobbies / Corridors = $250K Partners Healthcare, USA Additional Solutions (Axiom Trims, Perimeters, MetalWorks = $372K Additional Revenue of 31% 600,000 SF Building Ultima / Optima / Interlude Grid Total Revenue = $1.2 million Additional Revenue of 38% Potential Incremental Opportunity Solutions Won Transition Drywall Perimeter Steel & Axiom DGS Axiom Building Perimeters, Pockets Acoustical Tile and Grid Enlarged Market 3 Attractive Growth 4 1 2 Sell More Into Every Space Sell Into More Spaces Conde Nast, One World Tower, NYC, USA (1) (1) Interior photo source: Interior Design Magazine. Photography: Garrett Rowland Increases Value Proposition and Strengthens Customer Loyalty Component solutions save contractors up to 30% in labor Differentiates contractors from their competition
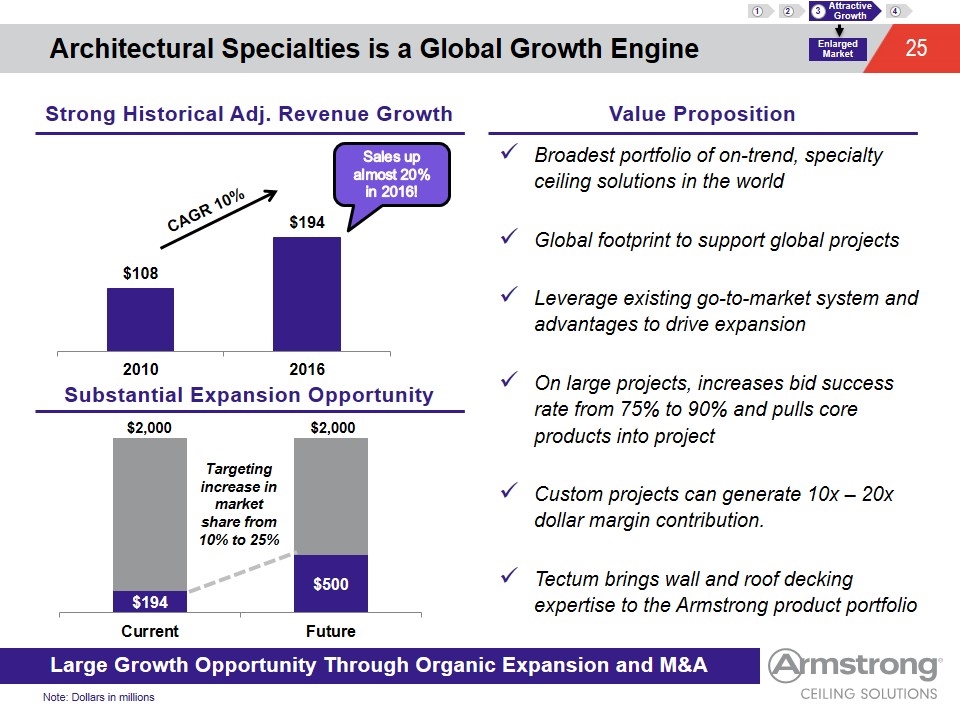
Architectural Specialties is a Global Growth Engine Large Growth Opportunity Through Organic Expansion and M&A Broadest portfolio of on-trend, specialty ceiling solutions in the world Global footprint to support global projects Leverage existing go-to-market system and advantages to drive expansion On large projects, increases bid success rate from 75% to 90% and pulls core products into project Custom projects can generate 10x – 20x dollar margin contribution. Tectum brings wall and roof decking expertise to the Armstrong product portfolio $2,000 Targeting increase in market share from 10% to 25% $2,000 Enlarged Market 3 Attractive Growth 4 1 2 Strong Historical Adj. Revenue Growth Value Proposition Substantial Expansion Opportunity Note: Dollars in millions CAGR 10% Sales up almost 20% in 2016!
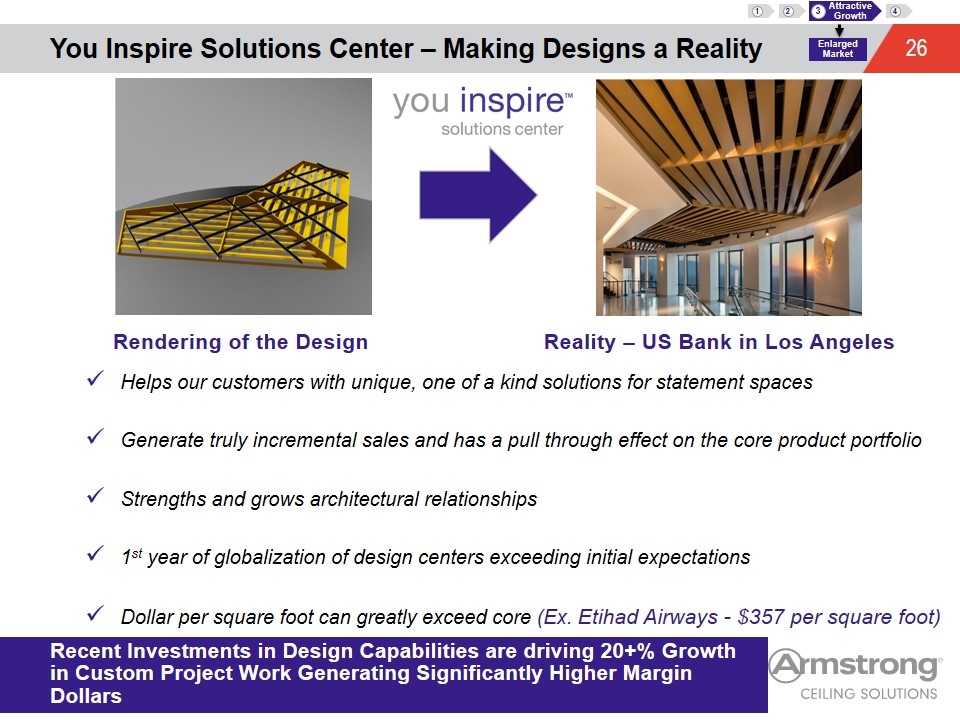
You Inspire Solutions Center – Making Designs a Reality Recent Investments in Design Capabilities are driving 20+% Growth in Custom Project Work Generating Significantly Higher Margin Dollars Helps our customers with unique, one of a kind solutions for statement spaces Generate truly incremental sales and has a pull through effect on the core product portfolio Strengths and grows architectural relationships 1st year of globalization of design centers exceeding initial expectations Dollar per square foot can greatly exceed core (Ex. Etihad Airways - $357 per square foot) Enlarged Market 3 Attractive Growth 4 1 2 Reality – US Bank in Los Angeles Rendering of the Design
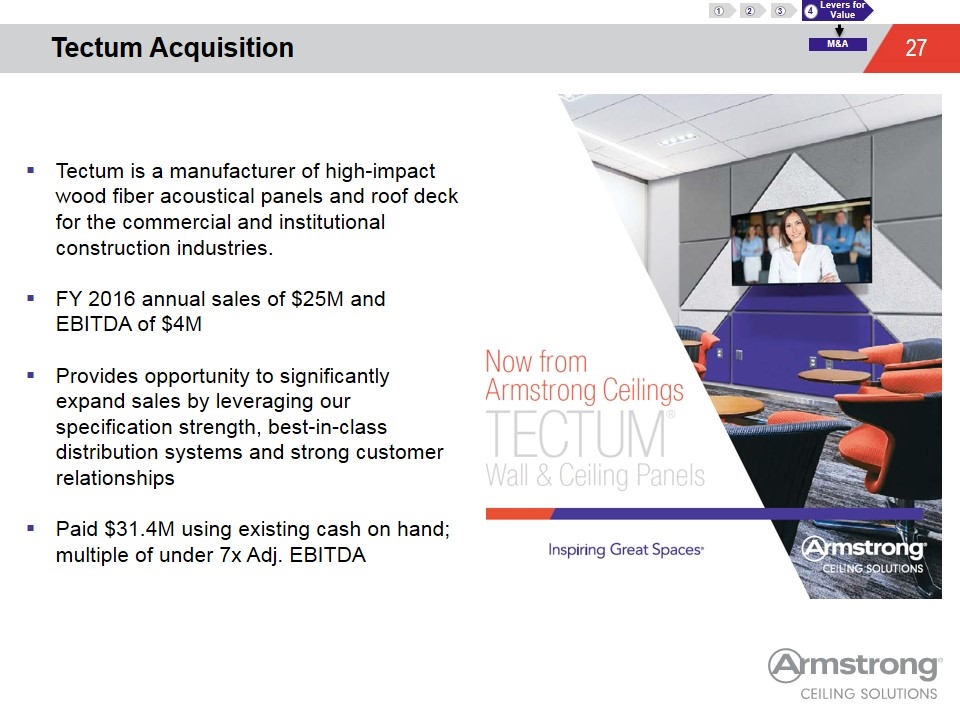
Tectum Acquisition Tectum is a manufacturer of high-impact wood fiber acoustical panels and roof deck for the commercial and institutional construction industries. FY 2016 annual sales of $25M and EBITDA of $4M Provides opportunity to significantly expand sales by leveraging our specification strength, best-in-class distribution systems and strong customer relationships Paid $31.4M using existing cash on hand; multiple of under 7x Adj. EBITDA 4 Levers for Value 1 2 3 M&A
Improved Performance Across Europe and Asia Investments and Initiatives Designed to Drive Future Profits Sales and profits have been challenged in EMEA and Asia/Pacific over the past several years Business impacted by market demand, political instability, FX and cost inefficiencies China and Russia represent ~7% of consolidated sales We believe markets will recover and profitability can be restored In 2016, international markets improved by $5M in adjusted EBITDA or 29% from 2015 Right-sizing SG&A organization and cost structure Idled China plant in response to market conditions Completed France investment in production capabilities to significantly reduce manufacturing costs Leveraging new Russia plant to reduce imports from Continental Europe - reduced input costs through localization and lower freight / duties No significant international capital investments planned in the near-term 4 Levers for Value 1 2 3 Overview Decisive Actions To Drive Improvement
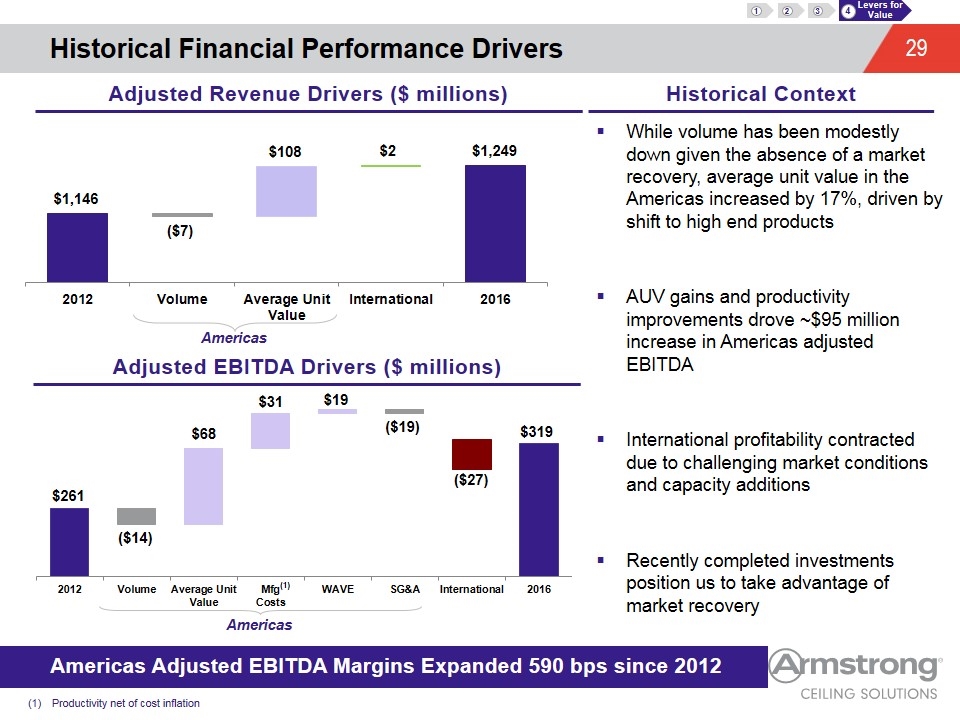
Historical Financial Performance Drivers While volume has been modestly down given the absence of a market recovery, average unit value in the Americas increased by 17%, driven by shift to high end products AUV gains and productivity improvements drove ~$95 million increase in Americas adjusted EBITDA International profitability contracted due to challenging market conditions and capacity additions Recently completed investments position us to take advantage of market recovery $261 Productivity net of cost inflation Americas Americas Adjusted Revenue Drivers ($ millions) Historical Context Adjusted EBITDA Drivers ($ millions) (1) ($7) $108 $1,249 $2 $1,146 $319 ($14) $68 $31 $19 ($19) ($27) 4 Levers for Value 1 2 3 Americas Adjusted EBITDA Margins Expanded 590 bps since 2012
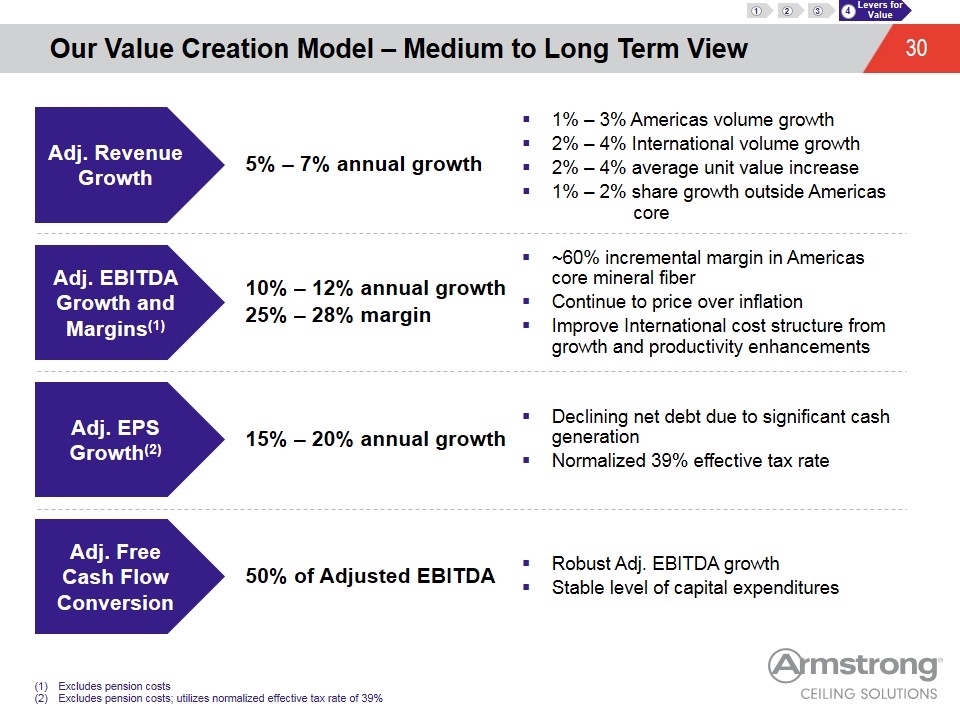
Our Value Creation Model – Medium to Long Term View Excludes pension costs Excludes pension costs; utilizes normalized effective tax rate of 39% Adj. Revenue Growth 5% – 7% annual growth Adj. EBITDA Growth and Margins(1) 10% – 12% annual growth 25% – 28% margin Adj. EPS Growth(2) 15% – 20% annual growth Adj. Free Cash Flow Conversion 50% of Adjusted EBITDA 1% – 3% Americas volume growth 2% – 4% International volume growth 2% – 4% average unit value increase 1% – 2% share growth outside Americas core ~60% incremental margin in Americas core mineral fiber Continue to price over inflation Improve International cost structure from growth and productivity enhancements Declining net debt due to significant cash generation Normalized 39% effective tax rate Robust Adj. EBITDA growth Stable level of capital expenditures 4 Levers for Value 1 2 3
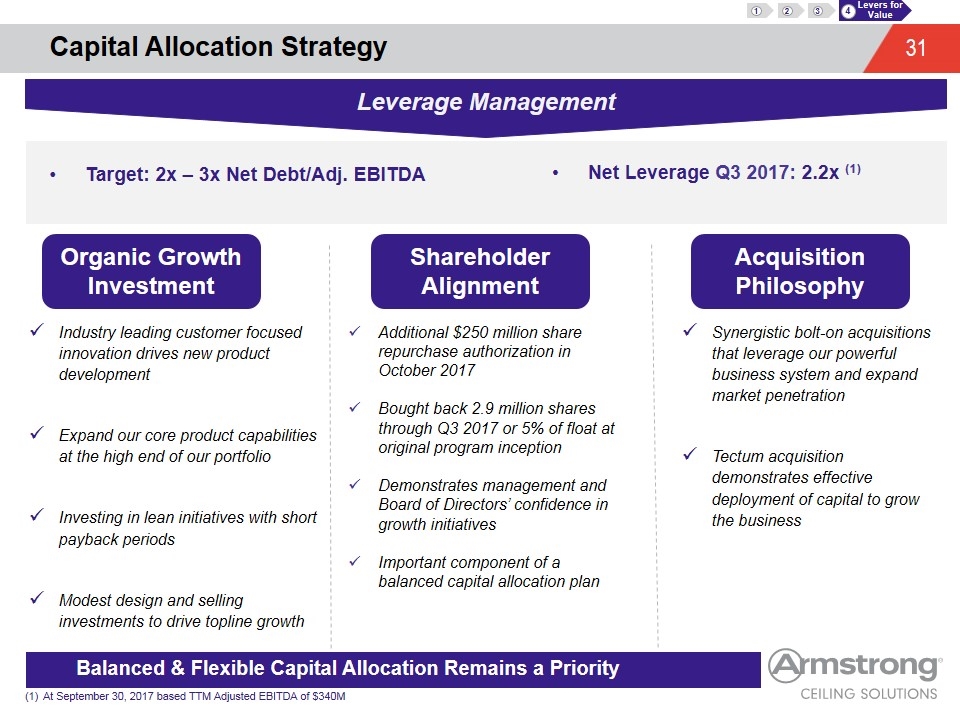
Capital Allocation Strategy Balanced & Flexible Capital Allocation Remains a Priority Organic Growth Investment Acquisition Philosophy Shareholder Alignment Industry leading customer focused innovation drives new product development Expand our core product capabilities at the high end of our portfolio Investing in lean initiatives with short payback periods Modest design and selling investments to drive topline growth Synergistic bolt-on acquisitions that leverage our powerful business system and expand market penetration Tectum acquisition demonstrates effective deployment of capital to grow the business Leverage Management Target: 2x – 3x Net Debt/Adj. EBITDA Net Leverage Q3 2017: 2.2x (1) At September 30, 2017 based TTM Adjusted EBITDA of $340M 4 Levers for Value 1 2 3 Additional $250 million share repurchase authorization in October 2017 Bought back 2.9 million shares through Q3 2017 or 5% of float at original program inception Demonstrates management and Board of Directors’ confidence in growth initiatives Important component of a balanced capital allocation plan
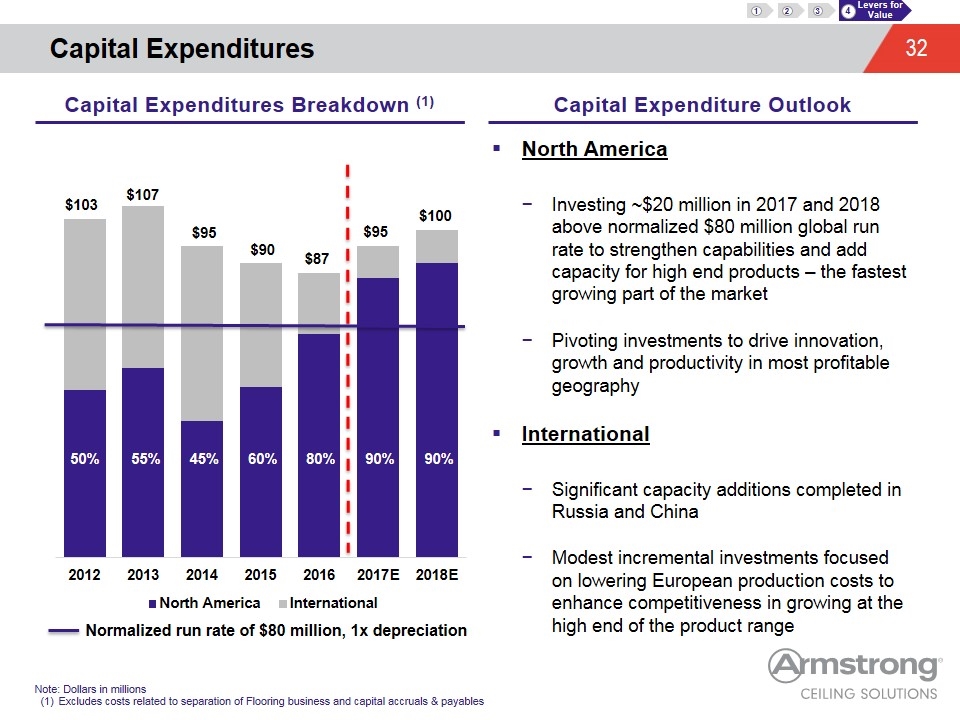
Capital Expenditures North America Investing ~$20 million in 2017 and 2018 above normalized $80 million global run rate to strengthen capabilities and add capacity for high end products – the fastest growing part of the market Pivoting investments to drive innovation, growth and productivity in most profitable geography International Significant capacity additions completed in Russia and China Modest incremental investments focused on lowering European production costs to enhance competitiveness in growing at the high end of the product range Note: Dollars in millions Excludes costs related to separation of Flooring business and capital accruals & payables $103 $107 $95 $90 $87 50% 55% 45% 60% 80% Normalized run rate of $80 million, 1x depreciation Capital Expenditures Breakdown (1) Capital Expenditure Outlook 90% $100 $95 90% 4 Levers for Value 1 2 3
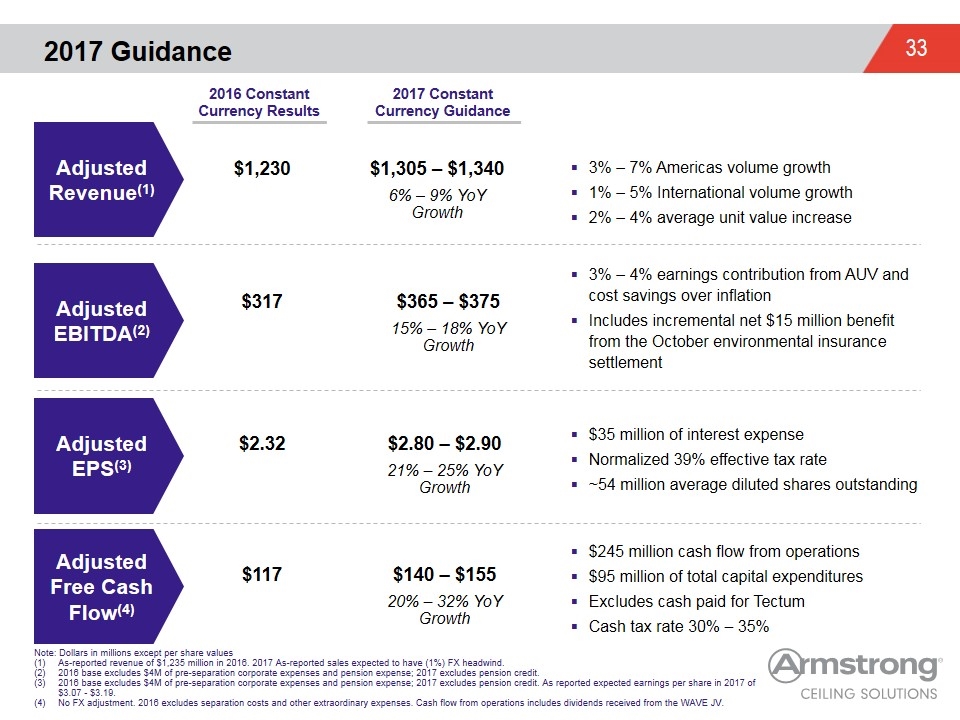
2017 Guidance $2.80 – $2.90 21% – 25% YoY Growth $2.32 Adjusted EBITDA(2) Adjusted EPS(3) Adjusted Free Cash Flow(4) Adjusted Revenue(1) $1,230 $317 $1,305 – $1,340 6% – 9% YoY Growth $365 – $375 15% – 18% YoY Growth $140 – $155 20% – 32% YoY Growth $117 Note: Dollars in millions except per share values As-reported revenue of $1,235 million in 2016. 2017 As-reported sales expected to have (1%) FX headwind. 2016 base excludes $4M of pre-separation corporate expenses and pension expense; 2017 excludes pension credit. 2016 base excludes $4M of pre-separation corporate expenses and pension expense; 2017 excludes pension credit. As reported expected earnings per share in 2017 of $3.07 - $3.19. No FX adjustment. 2016 excludes separation costs and other extraordinary expenses. Cash flow from operations includes dividends received from the WAVE JV. 3% – 7% Americas volume growth 1% – 5% International volume growth 2% – 4% average unit value increase 3% – 4% earnings contribution from AUV and cost savings over inflation Includes incremental net $15 million benefit from the October environmental insurance settlement $245 million cash flow from operations $95 million of total capital expenditures Excludes cash paid for Tectum Cash tax rate 30% – 35% 2016 Constant Currency Results 2017 Constant Currency Guidance $35 million of interest expense Normalized 39% effective tax rate ~54 million average diluted shares outstanding
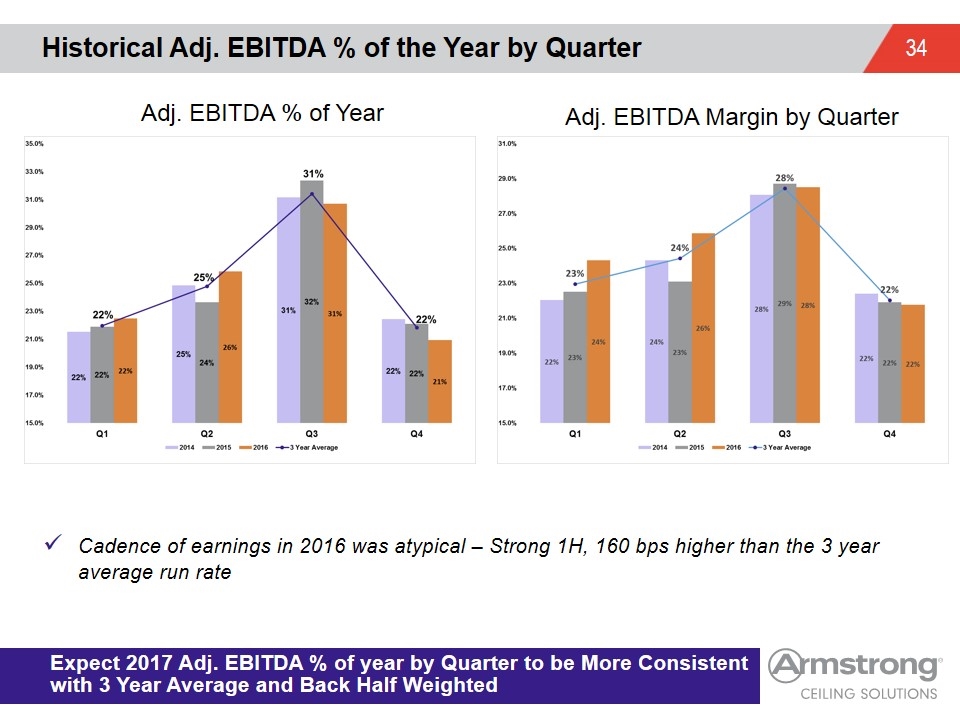
Cadence of earnings in 2016 was atypical – Strong 1H, 160 bps higher than the 3 year average run rate Expect 2017 Adj. EBITDA % of year by Quarter to be More Consistent with 3 Year Average and Back Half Weighted Historical Adj. EBITDA % of the Year by Quarter Adj. EBITDA % of Year Adj. EBITDA Margin by Quarter
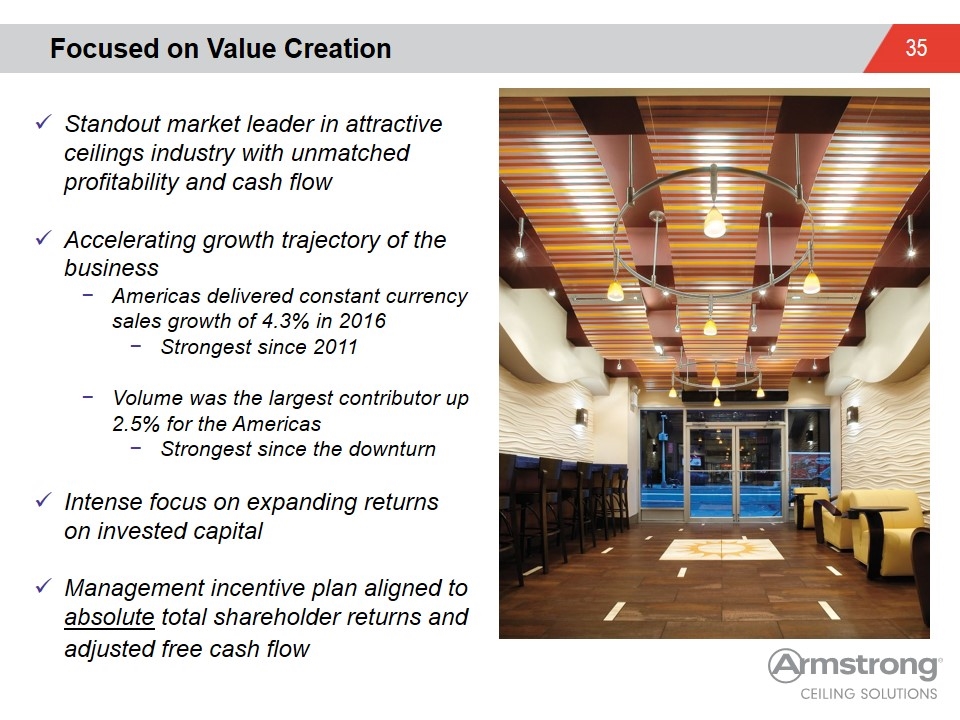
Focused on Value Creation Standout market leader in attractive ceilings industry with unmatched profitability and cash flow Accelerating growth trajectory of the business Americas delivered constant currency sales growth of 4.3% in 2016 Strongest since 2011 Volume was the largest contributor up 2.5% for the Americas Strongest since the downturn Intense focus on expanding returns on invested capital Management incentive plan aligned to absolute total shareholder returns and adjusted free cash flow
Appendix Reconciliation of Non-GAAP Financial Measures Executive Compensation Management Biographies
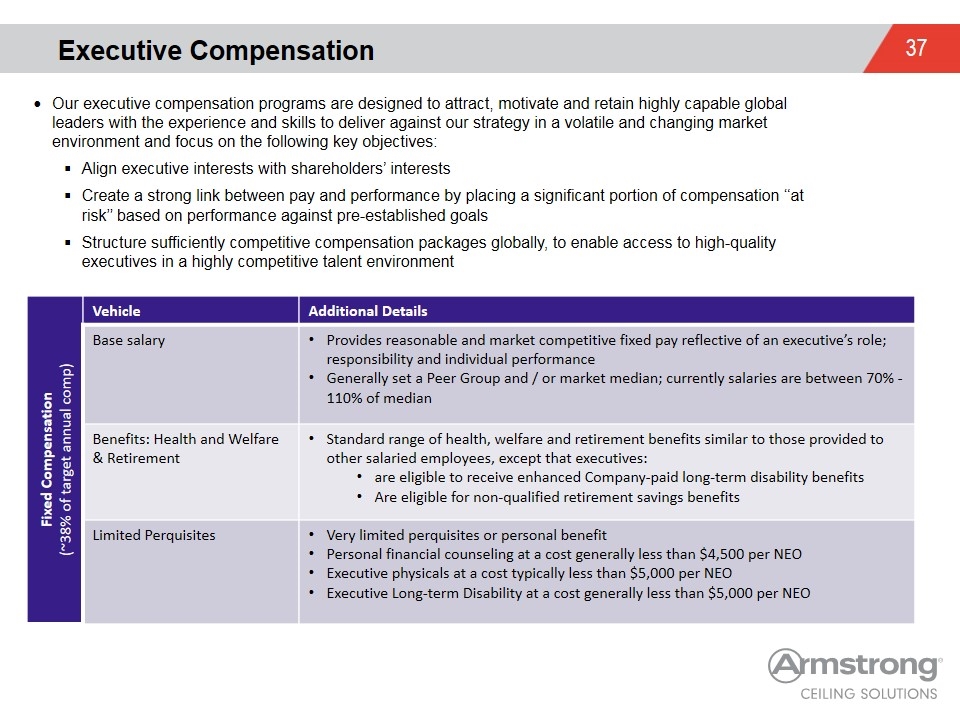
Executive Compensation Our executive compensation programs are designed to attract, motivate and retain highly capable global leaders with the experience and skills to deliver against our strategy in a volatile and changing market environment and focus on the following key objectives: Align executive interests with shareholders’ interests Create a strong link between pay and performance by placing a significant portion of compensation ‘‘at risk’’ based on performance against pre-established goals Structure sufficiently competitive compensation packages globally, to enable access to high-quality executives in a highly competitive talent environment Fixed Compensation (~38% of target annual comp) Vehicle Additional Details Base salary Provides reasonable and market competitive fixed pay reflective of an executive’s role; responsibility and individual performance Generally set a Peer Group and / or market median; currently salaries are between 70% - 110% of median Benefits: Health and Welfare & Retirement Standard range of health, welfare and retirement benefits similar to those provided to other salaried employees, except that executives: are eligible to receive enhanced Company-paid long-term disability benefits Are eligible for non-qualified retirement savings benefits Limited Perquisites Very limited perquisites or personal benefit Personal financial counseling at a cost generally less than $4,500 per NEO Executive physicals at a cost typically less than $5,000 per NEO Executive Long-term Disability at a cost generally less than $5,000 per NEO
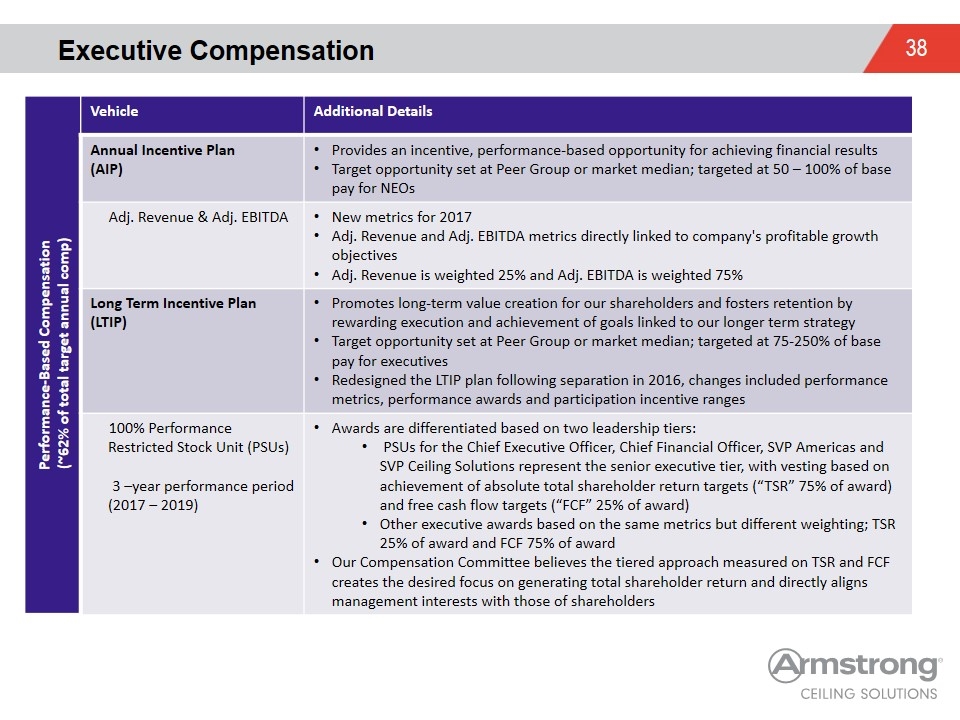
Executive Compensation Performance-Based Compensation (~62% of total target annual comp) Vehicle Additional Details Annual Incentive Plan (AIP) Provides an incentive, performance-based opportunity for achieving financial results Target opportunity set at Peer Group or market median; targeted at 50 – 100% of base pay for NEOs Adj. Revenue & Adj. EBITDA New metrics for 2017 Adj. Revenue and Adj. EBITDA metrics directly linked to company's profitable growth objectives Adj. Revenue is weighted 25% and Adj. EBITDA is weighted 75% Long Term Incentive Plan (LTIP) Promotes long-term value creation for our shareholders and fosters retention by rewarding execution and achievement of goals linked to our longer term strategy Target opportunity set at Peer Group or market median; targeted at 75-250% of base pay for executives Redesigned the LTIP plan following separation in 2016, changes included performance metrics, performance awards and participation incentive ranges 100% Performance Restricted Stock Unit (PSUs) 3 –year performance period (2017 – 2019) Awards are differentiated based on two leadership tiers: PSUs for the Chief Executive Officer, Chief Financial Officer, SVP Americas and SVP Ceiling Solutions represent the senior executive tier, with vesting based on achievement of absolute total shareholder return targets (“TSR” 75% of award) and free cash flow targets (“FCF” 25% of award) Other executive awards based on the same metrics but different weighting; TSR 25% of award and FCF 75% of award Our Compensation Committee believes the tiered approach measured on TSR and FCF creates the desired focus on generating total shareholder return and directly aligns management interests with those of shareholders
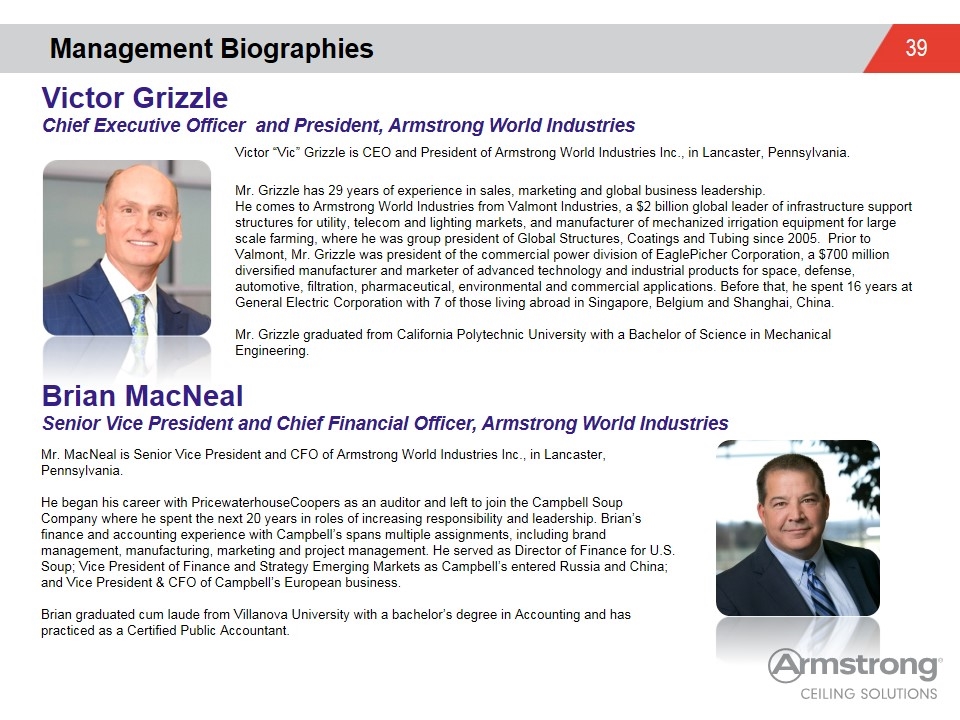
Management Biographies Brian MacNeal Senior Vice President and Chief Financial Officer, Armstrong World Industries Victor “Vic” Grizzle is CEO and President of Armstrong World Industries Inc., in Lancaster, Pennsylvania. Mr. Grizzle has 29 years of experience in sales, marketing and global business leadership. He comes to Armstrong World Industries from Valmont Industries, a $2 billion global leader of infrastructure support structures for utility, telecom and lighting markets, and manufacturer of mechanized irrigation equipment for large scale farming, where he was group president of Global Structures, Coatings and Tubing since 2005. Prior to Valmont, Mr. Grizzle was president of the commercial power division of EaglePicher Corporation, a $700 million diversified manufacturer and marketer of advanced technology and industrial products for space, defense, automotive, filtration, pharmaceutical, environmental and commercial applications. Before that, he spent 16 years at General Electric Corporation with 7 of those living abroad in Singapore, Belgium and Shanghai, China. Mr. Grizzle graduated from California Polytechnic University with a Bachelor of Science in Mechanical Engineering. Mr. MacNeal is Senior Vice President and CFO of Armstrong World Industries Inc., in Lancaster, Pennsylvania. He began his career with PricewaterhouseCoopers as an auditor and left to join the Campbell Soup Company where he spent the next 20 years in roles of increasing responsibility and leadership. Brian’s finance and accounting experience with Campbell’s spans multiple assignments, including brand management, manufacturing, marketing and project management. He served as Director of Finance for U.S. Soup; Vice President of Finance and Strategy Emerging Markets as Campbell’s entered Russia and China; and Vice President & CFO of Campbell’s European business. Brian graduated cum laude from Villanova University with a bachelor’s degree in Accounting and has practiced as a Certified Public Accountant. Victor Grizzle Chief Executive Officer and President, Armstrong World Industries
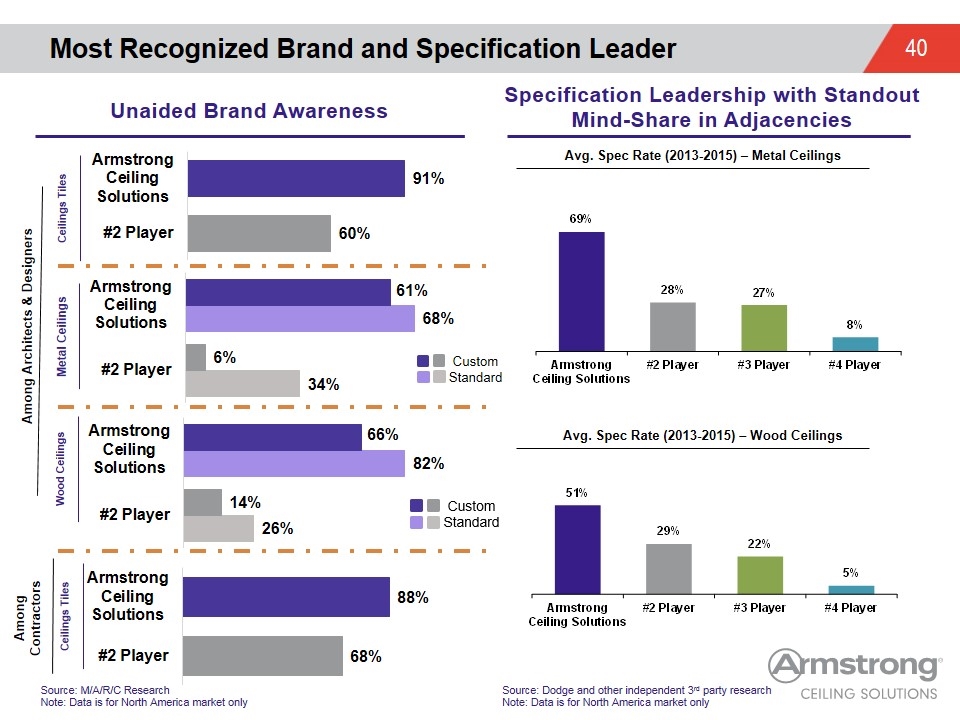
Most Recognized Brand and Specification Leader Unaided Brand Awareness Specification Leadership with Standout Mind-Share in Adjacencies Avg. Spec Rate (2013-2015) – Metal Ceilings Avg. Spec Rate (2013-2015) – Wood Ceilings Source: Dodge and other independent 3rd party research Note: Data is for North America market only Source: M/A/R/C Research Note: Data is for North America market only Wood Ceilings Among Architects & Designers Metal Ceilings Among Contractors Ceilings Tiles Ceilings Tiles Custom Standard
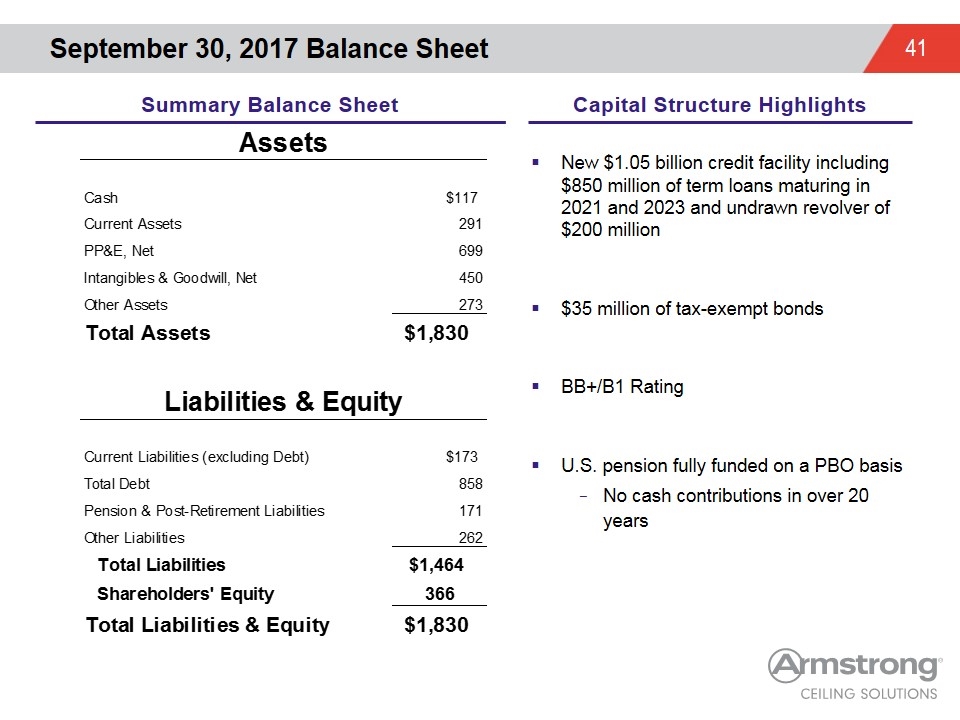
September 30, 2017 Balance Sheet New $1.05 billion credit facility including $850 million of term loans maturing in 2021 and 2023 and undrawn revolver of $200 million $35 million of tax-exempt bonds BB+/B1 Rating U.S. pension fully funded on a PBO basis No cash contributions in over 20 years Summary Balance Sheet Capital Structure Highlights
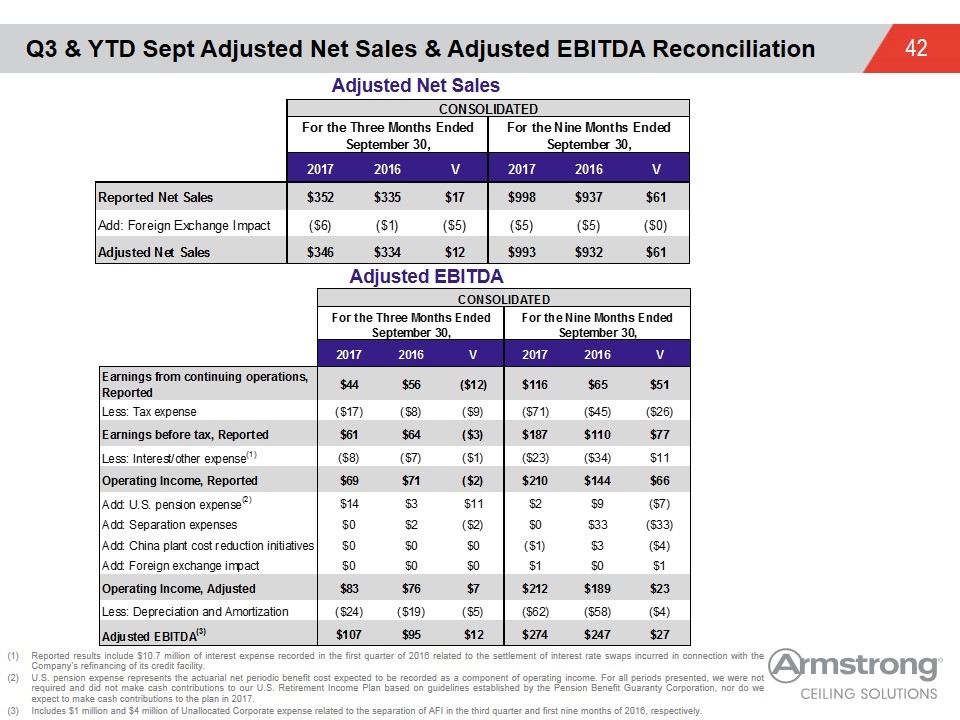
Q3 & YTD Sept Adjusted Net Sales & Adjusted EBITDA Reconciliation Adjusted Net Sales Adjusted EBITDA Reported results include $10.7 million of interest expense recorded in the first quarter of 2016 related to the settlement of interest rate swaps incurred in connection with the Company’s refinancing of its credit facility. U.S. pension expense represents the actuarial net periodic benefit cost expected to be recorded as a component of operating income. For all periods presented, we were not required and did not make cash contributions to our U.S. Retirement Income Plan based on guidelines established by the Pension Benefit Guaranty Corporation, nor do we expect to make cash contributions to the plan in 2017. Includes $1 million and $4 million of Unallocated Corporate expense related to the separation of AFI in the third quarter and first nine months of 2016, respectively. CONSOLIDATED For the Three Months Ended September 30, For the Nine Months Ended September 30, 2017 2016 V 2017 2016 V Reported Net Sales $351.9 $334.9 $17 $998.1 $936.6 $61 Add: Foreign Exchange Impact $-5.8017993050299879 $-1.2399779218097819 $-4.5618213832202059 $-5.0229894794395022 $-4.997770416030562 $-2.5219063408940201E-2 Adjusted Net Sales $346.09820069496999 $333.6600220781902 $12.438178616779794 $993.07701052056052 $931.60222958396946 $61.47478093659106 CONSOLIDATED For the Three Months Ended September 30, For the Nine Months Ended September 30, qtr YTD 2017 2016 V 2017 2016 V Earnings from continuing operations, Reported $43.499999999999986 $55.899999999999984 $-12.399999999999999 $115.80000000000007 $65.400000000000006 $51 rounding Less: Tax expense $-17 $-8 $-9 $-71 $-45 $-26 Earnings before tax, Reported $61.199999999999982 $63.599999999999987 $-3 $186.70000000000007 $109.80000000000001 $76.900000000000063 rounding Less: Interest/other expense(1) $-8 $-7 $-1 $-23 $-34 $11 Operating Income, Reported $68.999999999999986 $70.999999999999986 $-2 $210.40000000000006 $144.30000000000001 $66.100000000000051 Add: U.S. pension expense(2) $14 $3 $11 $2 $9 $-7 Add: Separation expenses $0 $2 $-2 $0 $33 $-33 Add: China plant cost reduction initiatives $0 $0 $0 $-1 $3 $-4 Add: Foreign exchange impact $0 $0 $0 $1 $0 $1 Operating Income, Adjusted $82.915223927443193 $75.8209733689812 $7.0942505584619937 $212 $188.97454092911602 $23.025459070883983 Less: Depreciation and Amortization $-23.845760832079804 $-18.556291660420101 $-5.2894691716597038 $-62.192377682201993 $-58.114519819289995 $-4.0778578629119977 Adjusted EBITDA(3) $106.760984759523 $95.3772650294013 $12 $274.19237768220199 $247.08906074840601 $27.103316933795981 rounding
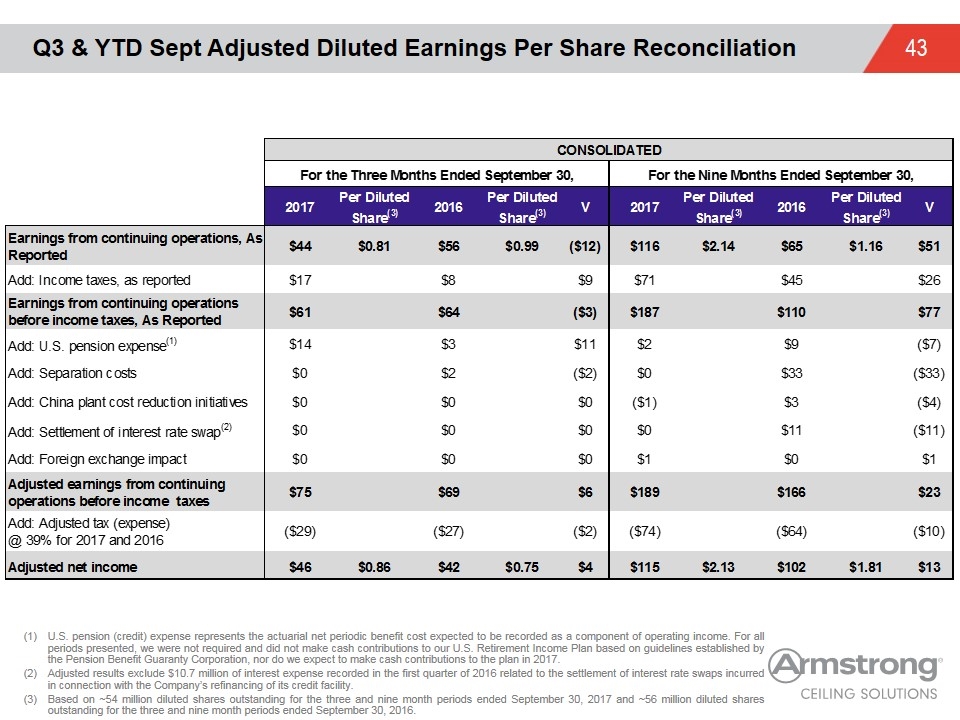
Q3 & YTD Sept Adjusted Diluted Earnings Per Share Reconciliation U.S. pension (credit) expense represents the actuarial net periodic benefit cost expected to be recorded as a component of operating income. For all periods presented, we were not required and did not make cash contributions to our U.S. Retirement Income Plan based on guidelines established by the Pension Benefit Guaranty Corporation, nor do we expect to make cash contributions to the plan in 2017. Adjusted results exclude $10.7 million of interest expense recorded in the first quarter of 2016 related to the settlement of interest rate swaps incurred in connection with the Company’s refinancing of its credit facility. Based on ~54 million diluted shares outstanding for the three and nine month periods ended September 30, 2017 and ~56 million diluted shares outstanding for the three and nine month periods ended September 30, 2016. CONSOLIDATED For the Three Months Ended September 30, For the Nine Months Ended September 30, 2017 Per DilutedShare(3) 2016 Per DilutedShare(3) V 2017 Per DilutedShare(3) 2016 Per DilutedShare(3) V Qtr YTD Earnings from continuing operations, As Reported $43.499999999999986 $0.81 $55.899999999999984 $0.99 $-12.399999999999999 $115.80000000000007 $2.14 $65.400000000000006 $1.1599999999999999 $51 rounding Add: Income taxes, as reported $17 $7.7 $9.3000000000000007 $70.900000000000006 $45.4 $25.500000000000007 Earnings from continuing operations before income taxes, As Reported $61.199999999999982 $63.599999999999987 $-3 $186.70000000000007 $109.80000000000001 $77 rounding rounding Add: U.S. pension expense(1) $14 $3 $11 $2 $9 $-7 Add: Separation costs $0 $2 $-2 $0 $33 $-33 Add: China plant cost reduction initiatives $0 $0 $0 $-1 $3 $-4 Add: Settlement of interest rate swap(2) $0 $0 $0 $0 $11 $-11 Add: Foreign exchange impact $0 $0 $0 $1 $0 $1 Adjusted earnings from continuing operations before income taxes $75.100000000000009 $69.200000000000017 $5.8999999999999915 $189.4658093473775 $166.40000000000003 $23.065809347377467 Add: Adjusted tax (expense) @ 39% for 2017 and 2016 $-29 $-27 $-2 $-74 $-64 $-10 Adjusted net income $45.811000000000007 $0.8562803738317758 $42.21200000000001 $0.7537857142857145 $3.5989999999999966 $114.86414370190028 $2.1310601799981499 $101.50400000000002 $1.81 $13.360143701900256
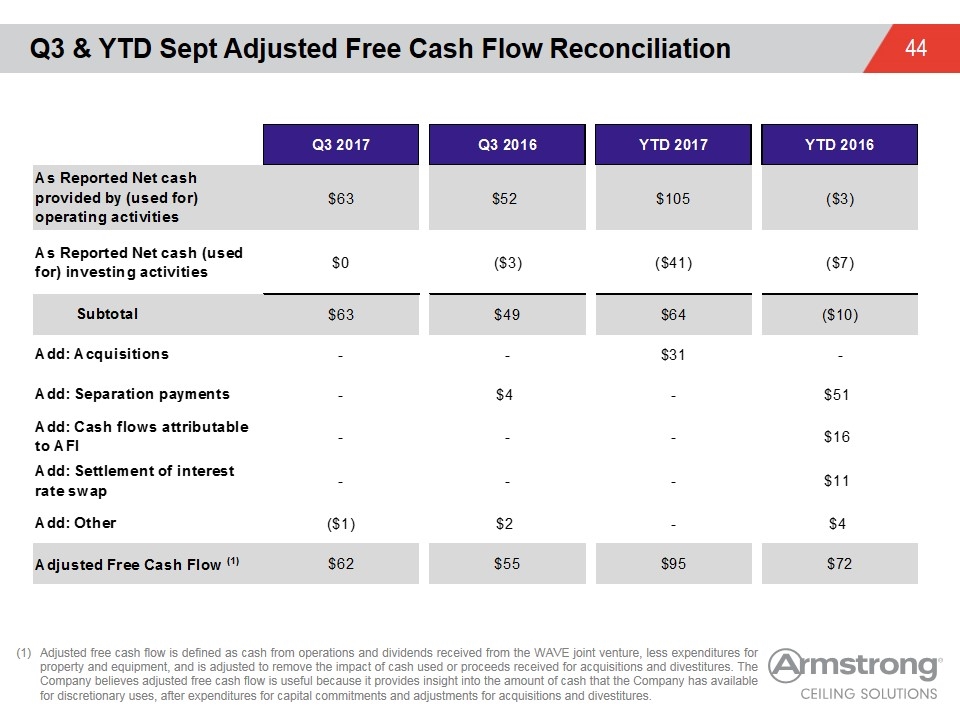
Q3 & YTD Sept Adjusted Free Cash Flow Reconciliation Adjusted free cash flow is defined as cash from operations and dividends received from the WAVE joint venture, less expenditures for property and equipment, and is adjusted to remove the impact of cash used or proceeds received for acquisitions and divestitures. The Company believes adjusted free cash flow is useful because it provides insight into the amount of cash that the Company has available for discretionary uses, after expenditures for capital commitments and adjustments for acquisitions and divestitures. Q3 2017 Q3 2016 YTD 2017 YTD 2016 As Reported Net cash provided by (used for) operating activities $63 $52 $104.89999999999998 $-2.6000000000000423 As Reported Net cash (used for) investing activities $0 $-3 $-41.300000000000004 $-6.900000000000003 Subtotal $63 $49 $63.599999999999973 $-9.5000000000000462 Add: Acquisitions - - $31 - Add: Separation payments - $4 - $51 Add: Cash flows attributable to AFI - - - $16 Add: Settlement of interest rate swap - - - $11 Add: Other $-1 $2 - $4 Adjusted Free Cash Flow (1) $62 $55 $95 $72
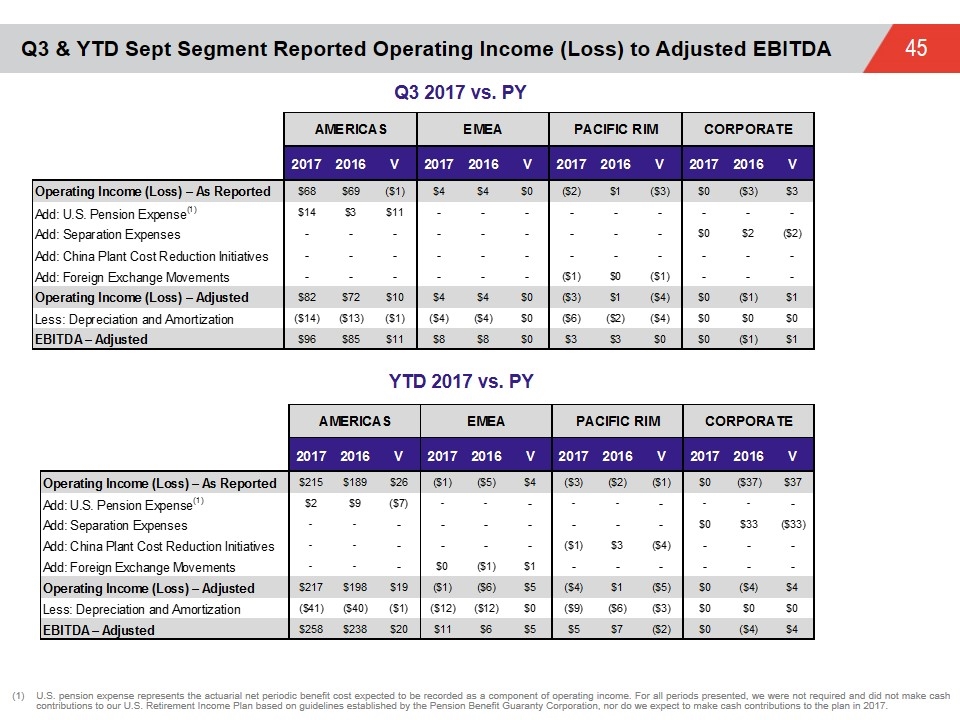
Q3 & YTD Sept Segment Reported Operating Income (Loss) to Adjusted EBITDA Q3 2017 vs. PY YTD 2017 vs. PY U.S. pension expense represents the actuarial net periodic benefit cost expected to be recorded as a component of operating income. For all periods presented, we were not required and did not make cash contributions to our U.S. Retirement Income Plan based on guidelines established by the Pension Benefit Guaranty Corporation, nor do we expect to make cash contributions to the plan in 2017. AMERICAS EMEA PACIFIC RIM CORPORATE 2016 V 2017 2016 V 2017 2016 V 2017 2016 V 2017 2016 V Operating Income (Loss) – As Reported $214.7 $189 $25.699999999999989 $-1.1000000000000001 $-5.2 $4.0999999999999996 $-3.2 $-2.4 $-1 $0 $-37.1 $37.1 Add: U.S. Pension Expense(1) $2 $9 $-7 - - - - - - - - - Add: Separation Expenses - - - - - - - - - $0 $33 $-33 Add: China Plant Cost Reduction Initiatives - - - - - - $-1 $3 $-4 - - - Add: Foreign Exchange Movements - - - $0 $-1 $1 - - - - - - Operating Income (Loss) – Adjusted $217.34194657190002 $198.49007641370613 $18.85187015819389 $-1.0992581127599044 $-6.0121536066070984 $4.912895493847194 $-4.1926468827478587 $0.58936338841084557 $-4.782010271158704 $0 $-4.0999999999999996 $4.0999999999999996 Less: Depreciation and Amortization $-40.837027946199981 $-39.734596099299864 $-1.1024318469001173 $-11.943056558279991 $-12.360032625560013 $0 $-9.4159096013300108 $-6.019891094430009 $-3.3960185069000017 $0 $0 $0 EBITDA – Adjusted $258.17897451810001 $238.224672513006 $19.954302005094007 $10.843798445520086 $6.3478790189529137 $5 $5.223262718582153 $6.6092544828408544 $-2 $0 $-4.0999999999999996 $4.0999999999999996 AMERICAS EMEA PACIFIC RIM CORPORATE rounding factor 2016 V 2017 2016 V 2017 2016 V 2017 2016 V 2017 2016 V Operating Income (Loss) – As Reported $67.599999999999994 $68.599999999999994 $-1 $3.8 $4.0999999999999996 $0 $-2.4 $1 $-3.4 $0 $-2.7 $2.7 Add: U.S. Pension Expense(1) $14 $3 $11 - - - - - - - - - Add: Separation Expenses - - - - - - - - - $0 $2 $-2 Add: China Plant Cost Reduction Initiatives - - - - - - - - - - - - Add: Foreign Exchange Movements - - - - - - $-1 $0 $-1 - - - Operating Income (Loss) – Adjusted $81.943180698600003 $71.685253354272717 $10 $3.683889517600071 $3.6224925568197688 $0 $-2.6377356210731762 $1.3220499763848554 $-3.9597855974580316 $0 $-0.8 $0.8 Less: Depreciation and Amortization $-14.051226478999894 $-13 $-1.0512264789998937 $-4.0600797623399876 $-3.9251214511200074 $0 $-5.7344545907400111 $-2.0207511200000061 $-3.713703470740005 $0 $0 $0 EBITDA – Adjusted $95.994407177599896 $85.295672443572755 $11 $7.7439692799400586 $7.5476140079397762 $0 $3.0967189696668345 $3.3428010963848616 $0 $0 $-0.8 $0.8
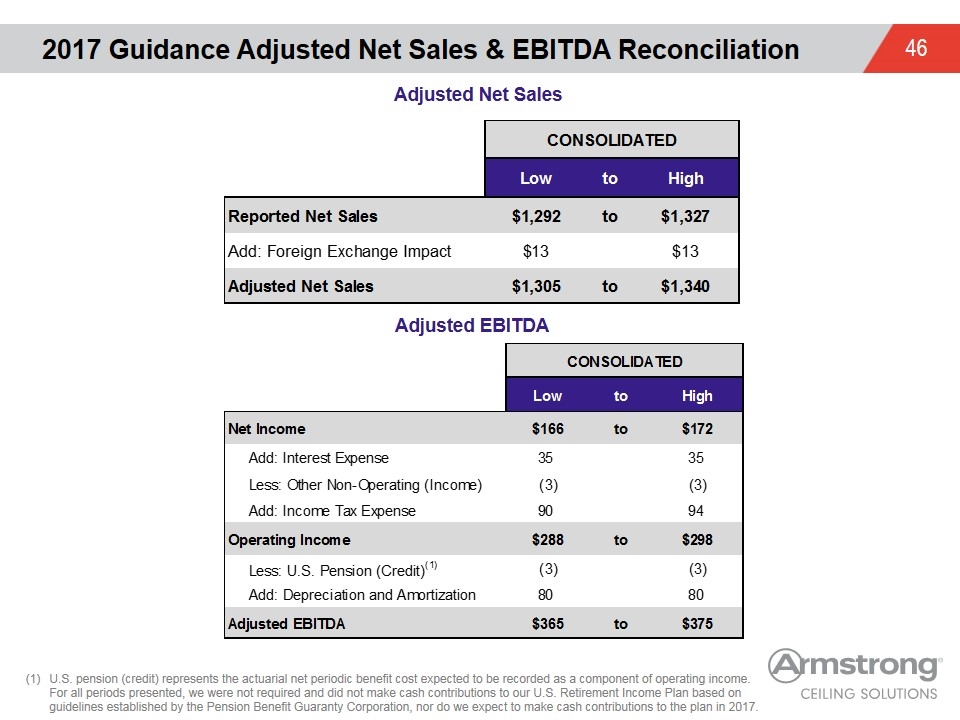
2017 Guidance Adjusted Net Sales & EBITDA Reconciliation Adjusted Net Sales Adjusted EBITDA U.S. pension (credit) represents the actuarial net periodic benefit cost expected to be recorded as a component of operating income. For all periods presented, we were not required and did not make cash contributions to our U.S. Retirement Income Plan based on guidelines established by the Pension Benefit Guaranty Corporation, nor do we expect to make cash contributions to the plan in 2017. CONSOLIDATED Low to High Reported Net Sales $1,292 to $1,327 Add: Foreign Exchange Impact $13 $13 Adjusted Net Sales $1,305 to $1,340 CONSOLIDATED Low to High Net Income $166 to $172 Add: Interest Expense 35 35 Less: Other Non-Operating (Income) -3 -3 Add: Income Tax Expense 90 94 Operating Income $288 to $298 Less: U.S. Pension (Credit)(1) -3 -3 Add: Depreciation and Amortization 80 80 Adjusted EBITDA $365 to $375
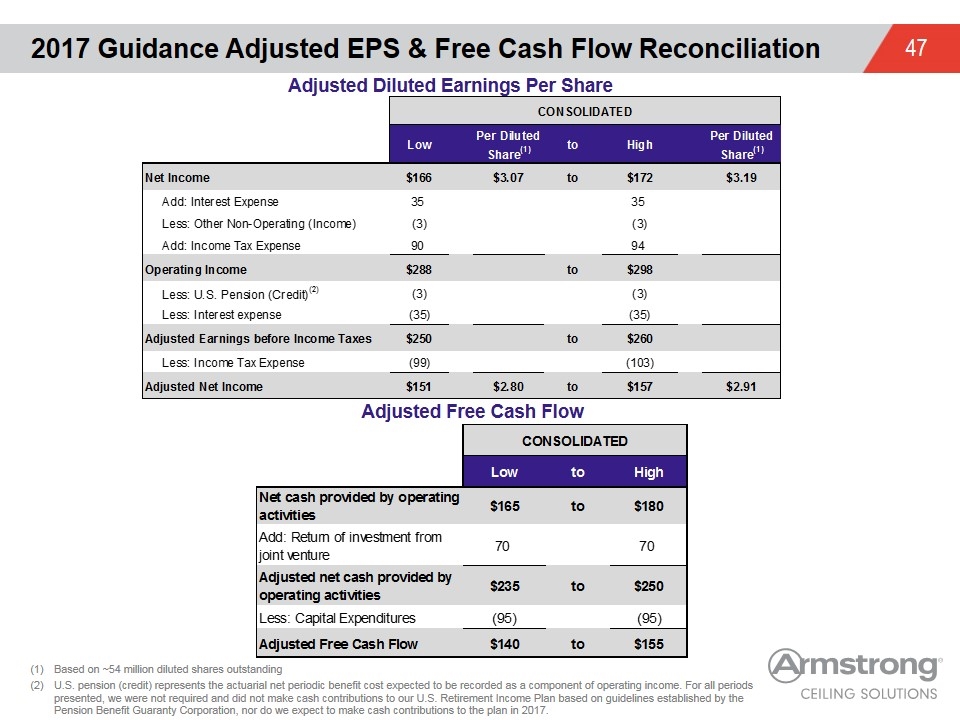
2017 Guidance Adjusted EPS & Free Cash Flow Reconciliation Adjusted Diluted Earnings Per Share Adjusted Free Cash Flow Based on ~54 million diluted shares outstanding U.S. pension (credit) represents the actuarial net periodic benefit cost expected to be recorded as a component of operating income. For all periods presented, we were not required and did not make cash contributions to our U.S. Retirement Income Plan based on guidelines established by the Pension Benefit Guaranty Corporation, nor do we expect to make cash contributions to the plan in 2017. CONSOLIDATED Low Per DilutedShare(1) to High Per DilutedShare(1) Net Income $166 $3.07 to $172 $3.19 Add: Interest Expense 35 35 Less: Other Non-Operating (Income) -3 -3 Add: Income Tax Expense 90 94 Operating Income $288 to $298 Less: U.S. Pension (Credit)(2) -3 -3 Less: Interest expense -35 -35 Adjusted Earnings before Income Taxes $250 to $260 Less: Income Tax Expense -99 -103 Adjusted Net Income $151 $2.8 to $157 $2.91 CONSOLIDATED Low to High Net cash provided by operating activities $165 to $180 Add: Return of investment from joint venture 70 70 Adjusted net cash provided by operating activities $235 to $250 Less: Capital Expenditures -95 -95 Adjusted Free Cash Flow $140 to $155
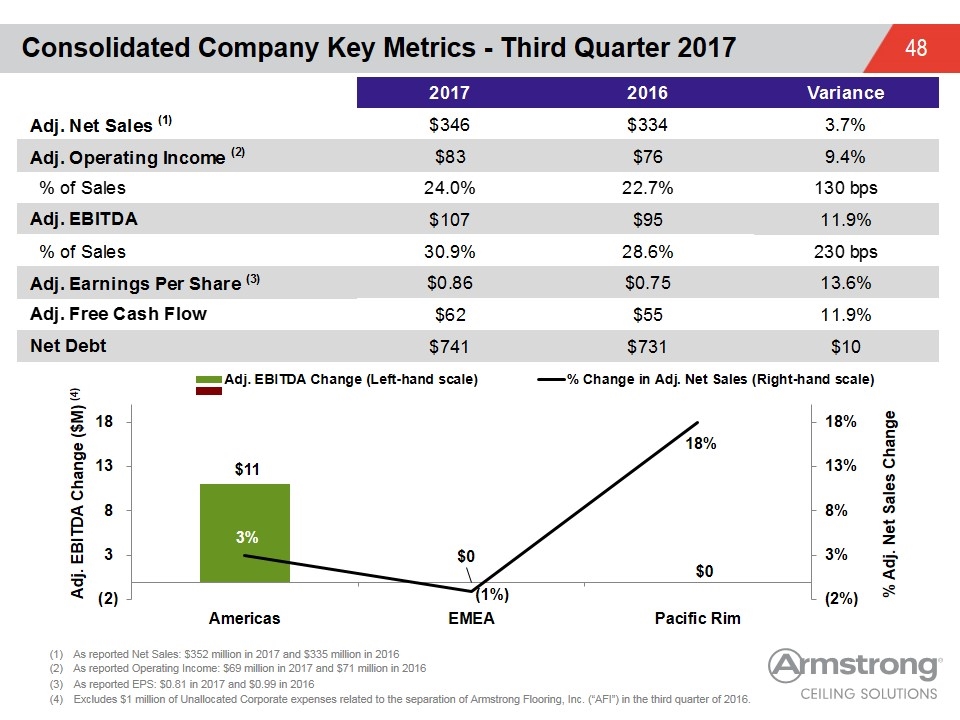
Consolidated Company Key Metrics - Third Quarter 2017 As reported Net Sales: $352 million in 2017 and $335 million in 2016 As reported Operating Income: $69 million in 2017 and $71 million in 2016 As reported EPS: $0.81 in 2017 and $0.99 in 2016 Excludes $1 million of Unallocated Corporate expenses related to the separation of Armstrong Flooring, Inc. (“AFI”) in the third quarter of 2016. 2017 2016 Variance Adj. Net Sales (1) $346.09820069496999 $333.6600220781902 3.7% Adj. Operating Income (2) $82.915223927443193 $75.8209733689812 9.4% % of Sales 0.23957138107319909 0.22724020965032857 130 10 Adj. EBITDA $106.760984759523 64 $95.3772650294013 0.1193546462735382 % of Sales 0.30947021031934135 0.28585164154622789 230 1E-3 Adj. Earnings Per Share (3) $0.8562803738317758 $0.7537857142857145 0.13597320512127903 Adj. Free Cash Flow $61.9 $55.3 0.11934900542495483 Net Debt $741.3 $731.2 $10.099999999999909

Adj. EBITDA and Adj. Free Cash Flow Bridges – Q3 2017 vs. PY $3 $5 $0 ($5) $5 Adjusted EBITDA – Q3 2017 vs. PY Adjusted Free Cash Flow – Q3 2017 vs. PY $0 ($2) $5 ($4) $4 $3 $5 $0


