Earnings Call Presentation 4th Quarter 2018 February 25, 2019 Exhibit 99.2
Our disclosures in this presentation, including without limitation, those relating to future financial results market conditions and guidance, and in our other public documents and comments contain forward-looking statements within the meaning of the Private Securities Litigation Reform Act. Those statements provide our future expectations or forecasts and can be identified by our use of words such as “anticipate,” “estimate,” “expect,” “project,” “intend,” “plan,” “believe,” “outlook,” “target,” “predict,” “may,” “will,” “would,” “could,” “should,” “seek,” and other words or phrases of similar meaning in connection with any discussion of future operating or financial performance. Forward-looking statements, by their nature, address matters that are uncertain and involve risks because they relate to events and depend on circumstances that may or may not occur in the future. As a result, our actual results may differ materially from our expected results and from those expressed in our forward-looking statements. A more detailed discussion of the risks and uncertainties that may affect our ability to achieve the projected performance is included in the “Risk Factors” and “Management’s Discussion and Analysis” sections of our reports on Forms 10-K and 10-Q filed with the U.S. Securities and Exchange Commission (“SEC”). Forward-looking statements speak only as of the date they are made. We undertake no obligation to update any forward-looking statements beyond what is required under applicable securities law. In addition, we will be referring to non-GAAP financial measures within the meaning of SEC Regulation G. A reconciliation of the differences between these measures with the most directly comparable financial measures calculated in accordance with GAAP are included within this presentation and available on the Investor Relations page of our website at www.armstrongceilings.com. The guidance in this presentation is only effective as of the date given, February 25, 2019 and will not be updated or affirmed unless and until we publicly announce updated or affirmed guidance. Safe Harbor Statement
All figures throughout the presentation are in $ millions unless otherwise noted. Figures may not add due to rounding. When reporting our financial results within this presentation, we make several adjustments. Management uses these non-GAAP measures in managing the business and believes the adjustments provide meaningful comparisons of operating performance between periods. As reported results will be footnoted throughout the presentation. Basis of Presentation Explanation Results throughout this presentation are presented on a continuing operations basis with the exception of cash flow. With the pending sale of our EMEA and Pacific Rim businesses, we no longer adjust our sales for movements in foreign exchange rates as we expect these to have minimal impact on revenue. We remove the impact of certain discrete expenses and income. Examples include plant closures, restructuring actions, separation costs, environmental site expenses and related insurance recoveries, and other large unusual items. We also adjust for our U.S. pension plan (credit) expense(1). Book taxes for adjusted net income and adjusted diluted EPS are calculated using a constant 25% rate for 2017 and 2018, as well as 2019 guidance. 2018 actual book tax rate was 22%. During 2019 we will report current and prior year results at actual tax rates. U.S. pension (credit) expense represents the actuarial net periodic benefit cost expected to be recorded as a component of operating income. For all periods presented, we were not required and did not make cash contributions to our U.S. Retirement Income Plan based on guidelines established by the Pension Benefit Guaranty Corporation.
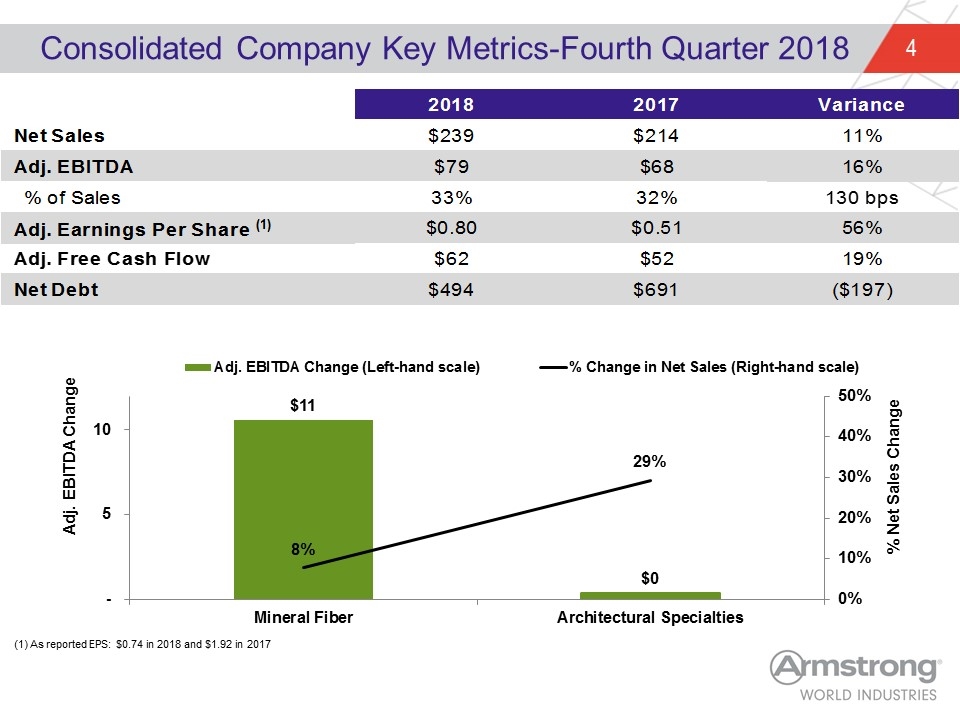
Consolidated Company Key Metrics-Fourth Quarter 2018 (1) As reported EPS: $0.74 in 2018 and $1.92 in 2017 2018 2017 Variance Net Sales $238.89999999999998 $0 $214.36 0.11448031349132282 Adj. EBITDA $78.94 $0 $68 $0 0.16088235294117648 % of Sales 0.33043114273754709 0.31722336256764322 130 Adj. Earnings Per Share (1) $0.79687872763419487 $0.50985046728971983 0.56296557276934434 Adj. Free Cash Flow $62 $52 0.19230769230769232 Net Debt $494.09999999999997 $690.6 $-,196.50000000000006
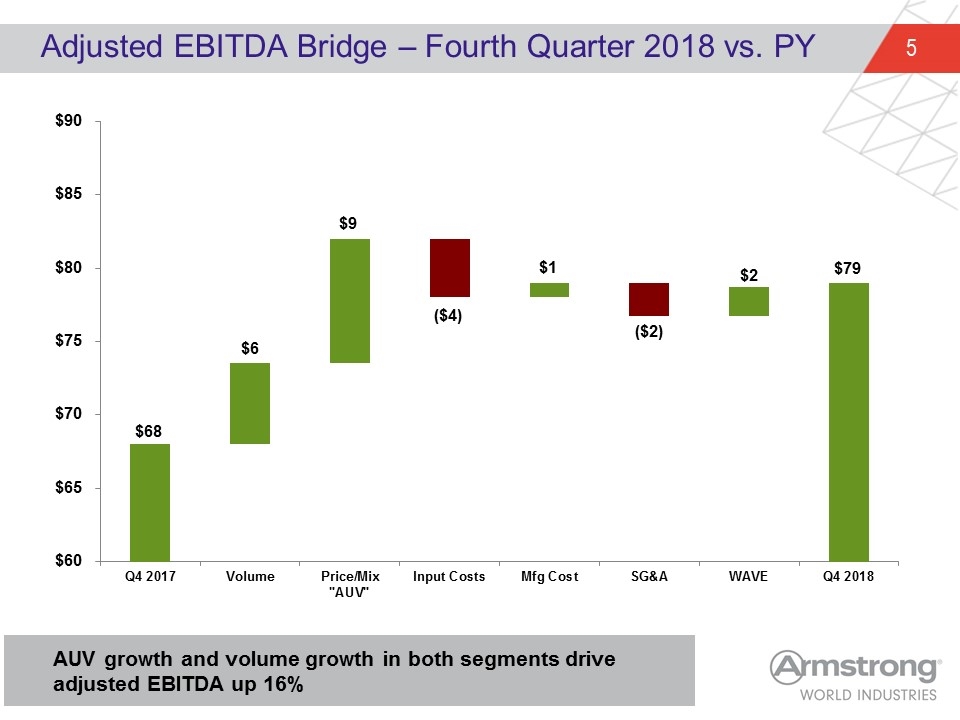
Adjusted EBITDA Bridge – Fourth Quarter 2018 vs. PY $6 $9 ($4) ($2) $1 $2 AUV growth and volume growth in both segments drive adjusted EBITDA up 16%
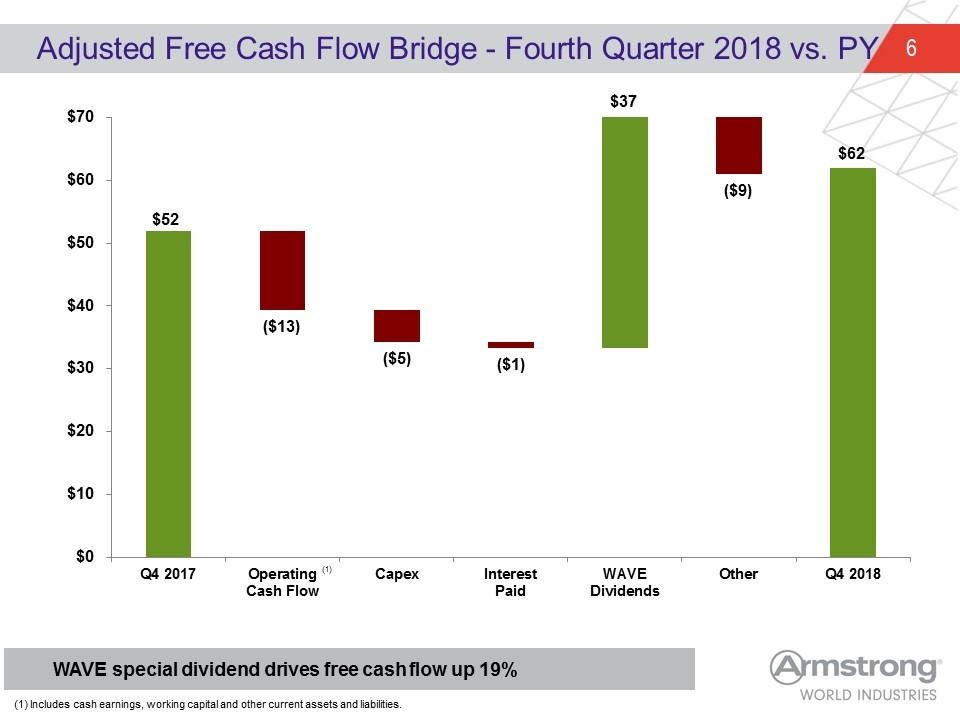
Adjusted Free Cash Flow Bridge - Fourth Quarter 2018 vs. PY ($5) WAVE special dividend drives free cash flow up 19% ($13) ($1) $37 ($9) (1) (1) Includes cash earnings, working capital and other current assets and liabilities. $62
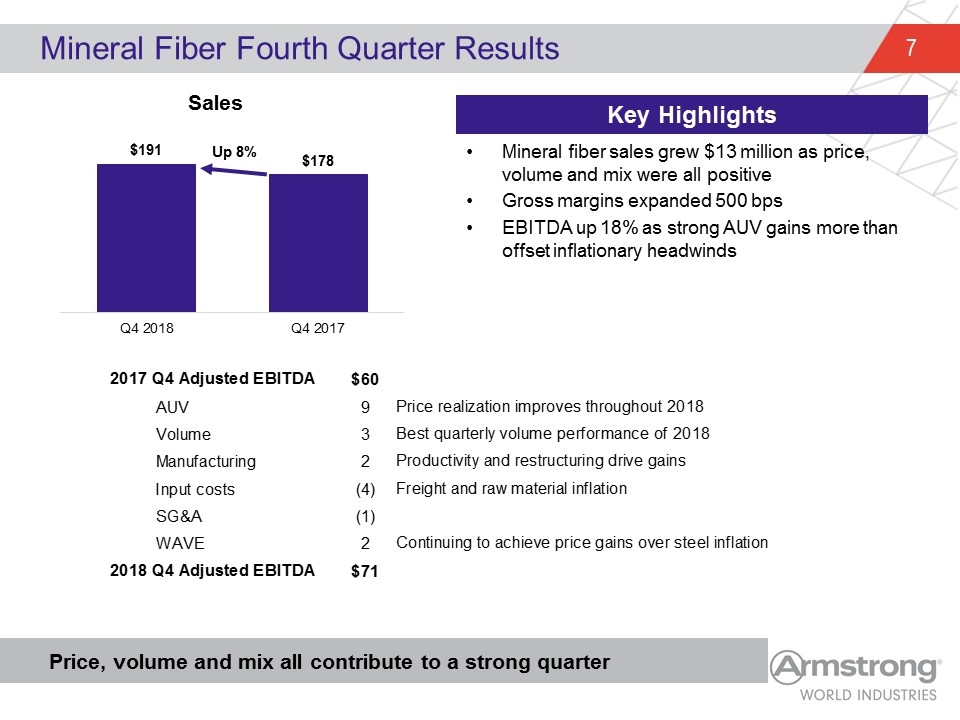
Mineral fiber sales grew $13 million as price, volume and mix were all positive Gross margins expanded 500 bps EBITDA up 18% as strong AUV gains more than offset inflationary headwinds Mineral Fiber Fourth Quarter Results Price, volume and mix all contribute to a strong quarter Key Highlights 2017 Q4 Adjusted EBITDA $60 AUV 9 Price realization improves throughout 2018 Volume 3 Best quarterly volume performance of 2018 Manufacturing 2 Productivity and restructuring drive gains Input costs -4 Freight and raw material inflation SG&A -1 WAVE 2 Continuing to achieve price gains over steel inflation 2018 Q4 Adjusted EBITDA $71
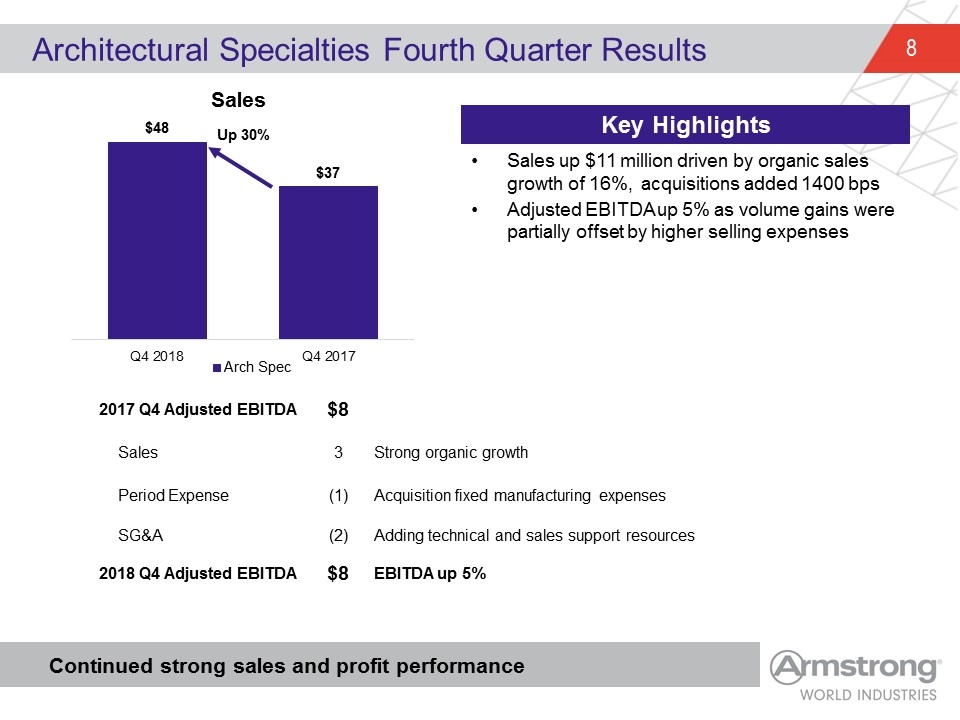
Sales up $11 million driven by organic sales growth of 16%, acquisitions added 1400 bps Adjusted EBITDA up 5% as volume gains were partially offset by higher selling expenses Architectural Specialties Fourth Quarter Results Continued strong sales and profit performance Key Highlights 2017 Q4 Adjusted EBITDA $8 Sales 3 Strong organic growth Period Expense (1) Acquisition fixed manufacturing expenses SG&A (2) Adding technical and sales support resources 2018 Q4 Adjusted EBITDA $8 EBITDA up 5%
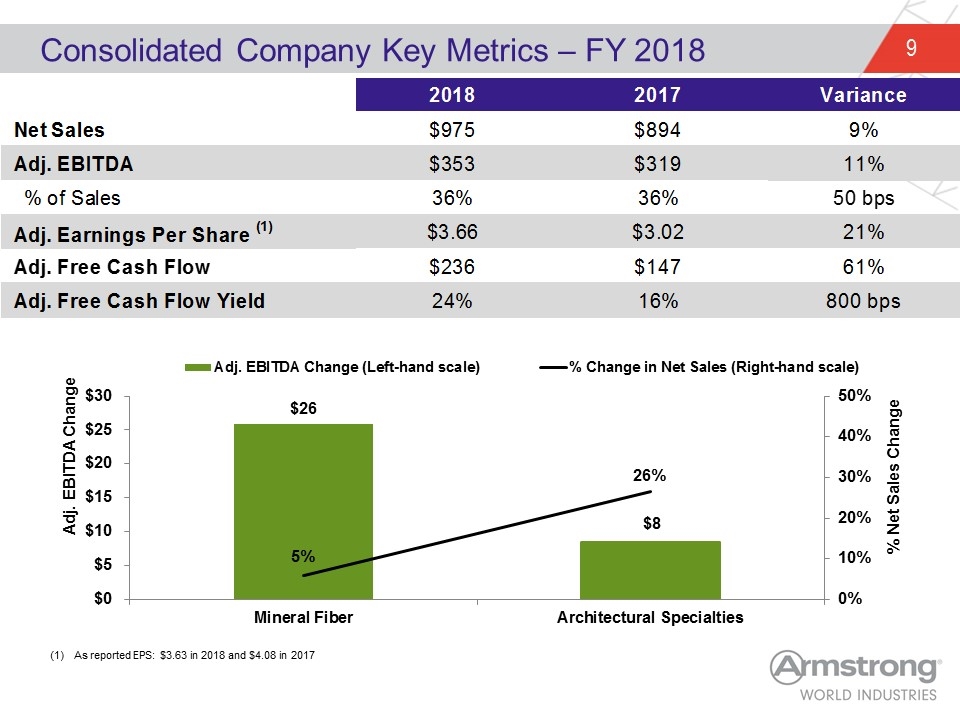
Consolidated Company Key Metrics – FY 2018 As reported EPS: $3.63 in 2018 and $4.08 in 2017 2018 2017 Variance Net Sales $975.3 $893.59999999999991 9.1427931960608833E-2 Adj. EBITDA $353.03699999999998 64 $318.815 0.1073412480592193 % of Sales 0.36197785296831742 0.35677596239928383 50 Adj. Earnings Per Share (1) $3.66 $3.02 0.21192052980132448 Adj. Free Cash Flow $236 $147.39999999999998 0.61 Adj. Free Cash Flow Yield 0.24 0.16 800 61% hardcoded to match CFO Deck due to rounding error.
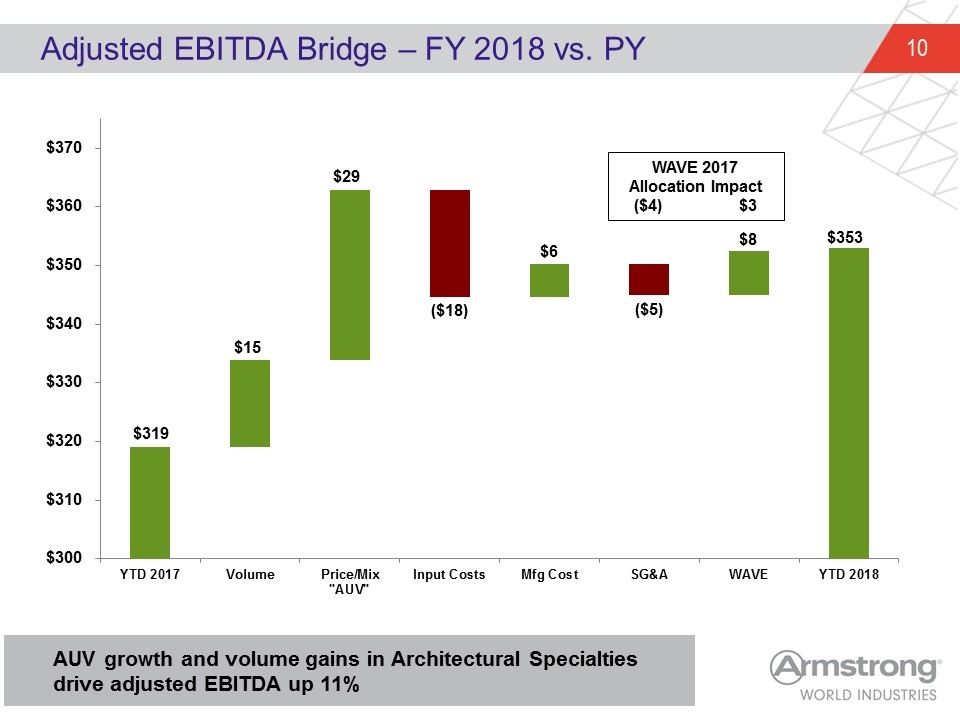
Adjusted EBITDA Bridge – FY 2018 vs. PY $15 $29 ($18) ($5) $6 AUV growth and volume gains in Architectural Specialties drive adjusted EBITDA up 11% $8 WAVE 2017 Allocation Impact ($4) $3
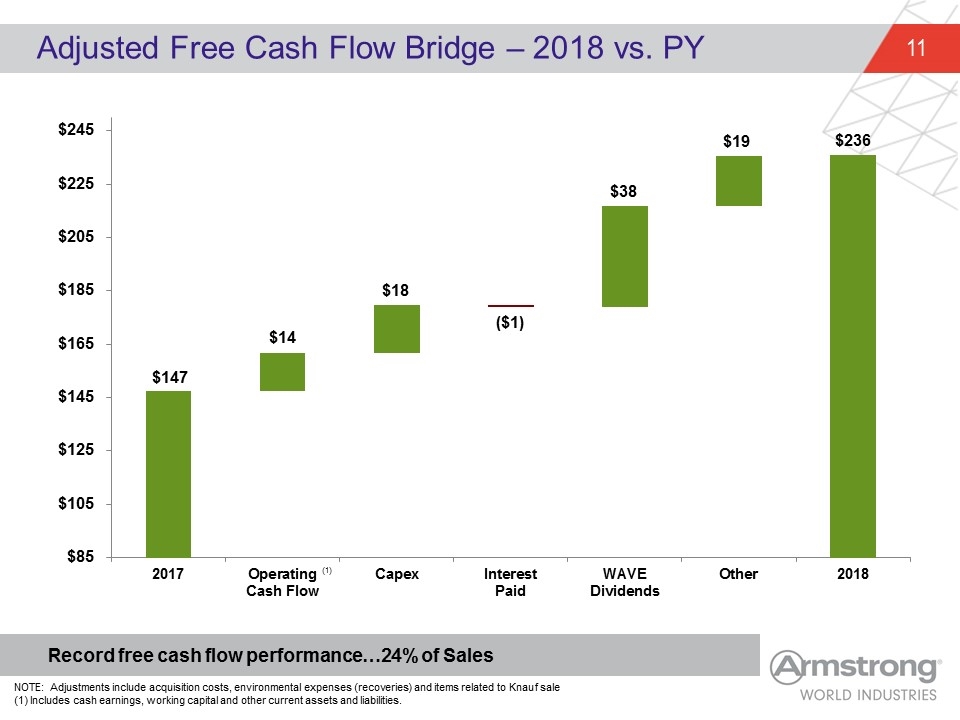
Adjusted Free Cash Flow Bridge – 2018 vs. PY $14 Record free cash flow performance…24% of Sales $18 ($1) $38 $19 (1) NOTE: Adjustments include acquisition costs, environmental expenses (recoveries) and items related to Knauf sale (1) Includes cash earnings, working capital and other current assets and liabilities.
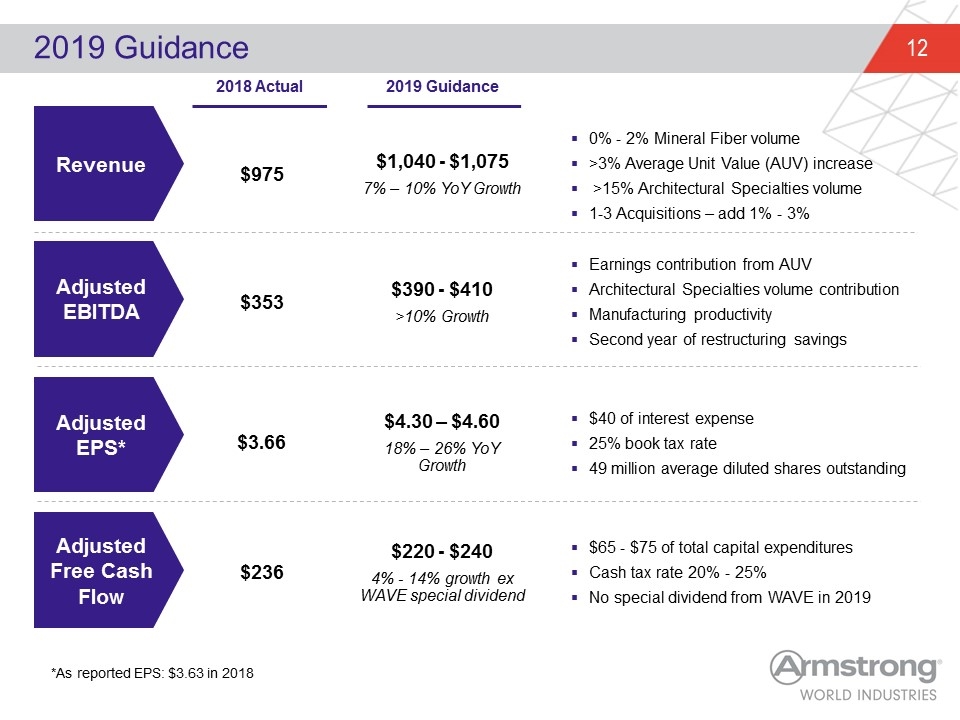
2019 Guidance $4.30 – $4.60 18% – 26% YoY Growth $3.66 Adjusted EBITDA Adjusted EPS* Adjusted Free Cash Flow Revenue $975 $353 $1,040 - $1,075 7% – 10% YoY Growth $390 - $410 >10% Growth 0% - 2% Mineral Fiber volume >3% Average Unit Value (AUV) increase >15% Architectural Specialties volume 1-3 Acquisitions – add 1% - 3% Earnings contribution from AUV Architectural Specialties volume contribution Manufacturing productivity Second year of restructuring savings $65 - $75 of total capital expenditures Cash tax rate 20% - 25% No special dividend from WAVE in 2019 2018 Actual 2019 Guidance $40 of interest expense 25% book tax rate 49 million average diluted shares outstanding $220 - $240 4% - 14% growth ex WAVE special dividend $236 *As reported EPS: $3.63 in 2018
Appendix
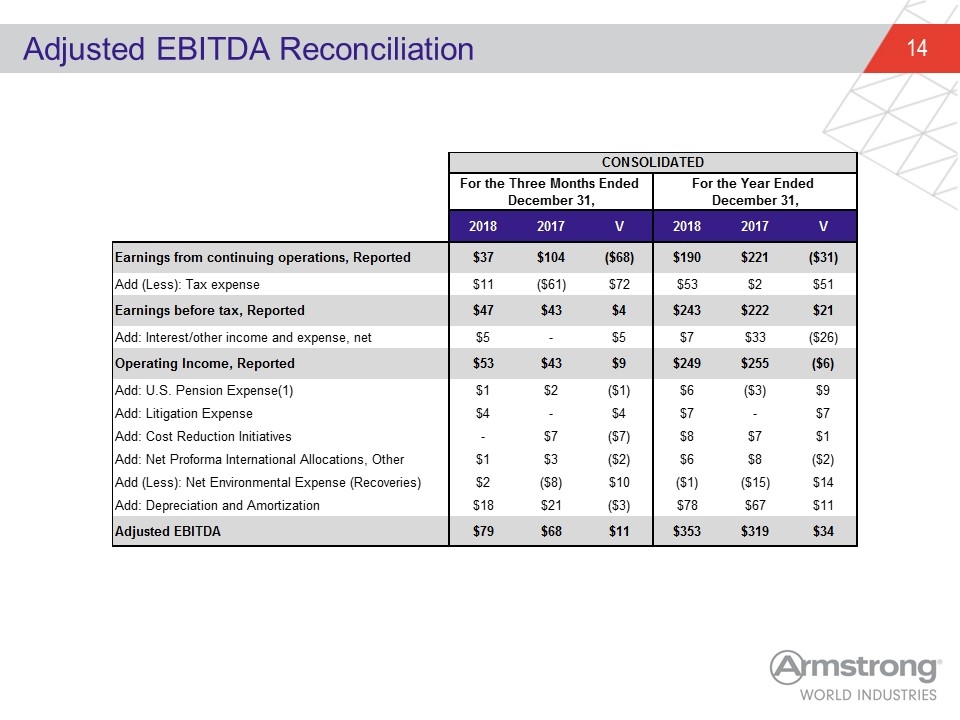
Adjusted EBITDA Reconciliation CONSOLIDATED For the Three Months Ended December 31, For the Year Ended December 31, qtr YTD 2018 2017 V 2018 2017 V Earnings from continuing operations, Reported 36.599999999999994 104.10000000000001 -67.500000000000014 189.6 220.59999999999997 -30.999999999999972 rounding Add (Less): Tax expense 10.800000000000004 -60.7 71.5 53 2 51 Earnings before tax, Reported 47.400000000000006 43.400000000000006 4 243 222 21 rounding Add: Interest/other income and expense, net 5.100000000000005 0 5.100000000000005 7 33 -26 Operating Income, Reported 52.5 43.3 9.2000000000000028 249 255 -6 Add: U.S. Pension Expense(1) 1.4346810000000001 2 -0.5653189999999999 6 -3 9 Add: Litigation Expense 3.8 0 3.8 7 0 7 Add: Cost Reduction Initiatives 0 6.7489999999999997 -6.7489999999999997 8 7 1 changed c12 to a dash from $0 (redo formula) Add: Net Proforma International Allocations, Other 1 3 -2 6 8 -2 Add (Less): Net Environmental Expense (Recoveries) 2 -8 10 -1 -15 14 Add: Depreciation and Amortization 18 21 -3 78 67 11 Adjusted EBITDA 79 68 11 353 319 34 rounding
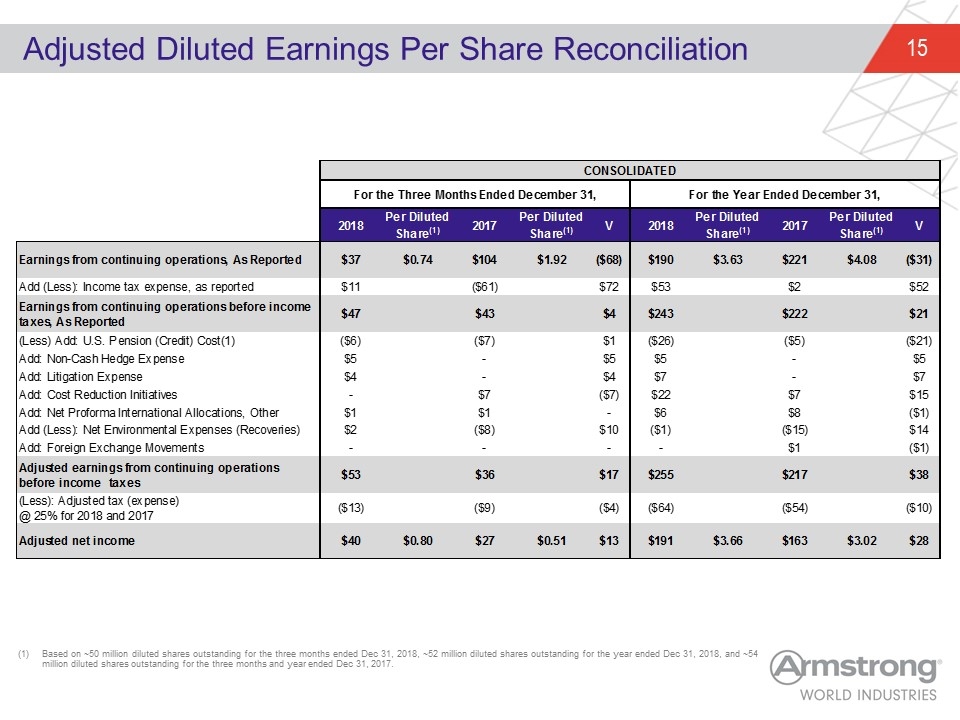
Adjusted Diluted Earnings Per Share Reconciliation Based on ~50 million diluted shares outstanding for the three months ended Dec 31, 2018, ~52 million diluted shares outstanding for the year ended Dec 31, 2018, and ~54 million diluted shares outstanding for the three months and year ended Dec 31, 2017. CONSOLIDATED For the Three Months Ended December 31, For the Year Ended December 31, 2018 Per DilutedShare(1) 2017 Per DilutedShare(1) V 2018 Per DilutedShare(1) 2017 Per DilutedShare(1) V Qtr YTD Earnings from continuing operations, As Reported 36.599999999999994 $0.73999999999999977 104.10000000000001 $1.92 -67.500000000000014 189.6 $3.63 220.59999999999997 $4.08 -30.999999999999972 rounding Add (Less): Income tax expense, as reported 10.800000000000004 -60.7 71.5 53.1 1.5 51.6 Earnings from continuing operations before income taxes, As Reported 47.4 43.400000000000006 3.9999999999999929 242.7 222.09999999999997 20.600000000000023 rounding rounding (Less) Add: U.S. Pension (Credit) Cost(1) -6 -7 1 -26.3 -5 -21.3 Add: Non-Cash Hedge Expense 4.5999999999999996 0 4.5999999999999996 4.5999999999999996 0 4.5999999999999996 Add: Litigation Expense 3.8 0 3.8 6.5 0 6.5 Add: Cost Reduction Initiatives 0 6.7489999999999997 -6.7489999999999997 21.954000000000001 6.7492400000000004 15.20476 changed c11 to zero from $0 Add: Net Proforma International Allocations, Other 1.125 1.1280000000000001 0 6.3159999999999998 7.6199999999999992 -1.3039999999999994 Add (Less): Net Environmental Expenses (Recoveries) 1.7 -8 9.6999999999999993 -1.17 -14.766999999999999 13.597 Add: Foreign Exchange Movements 0 0 0 0 1.02 -1.02 Adjusted earnings from continuing operations before income taxes 53.082999999999998 36.277000000000008 16.80599999999999 254.6 216.70223999999996 37.897760000000034 (Less): Adjusted tax (expense) @ 25% for 2018 and 2017 -13 -9 -4 -64 -54 -10 Adjusted net income 40.082999999999998 $0.79687872763419487 27.277000000000008 $0.50985046728971983 12.80599999999999 190.6 $3.66 162.70223999999996 $3.02 27.897760000000034
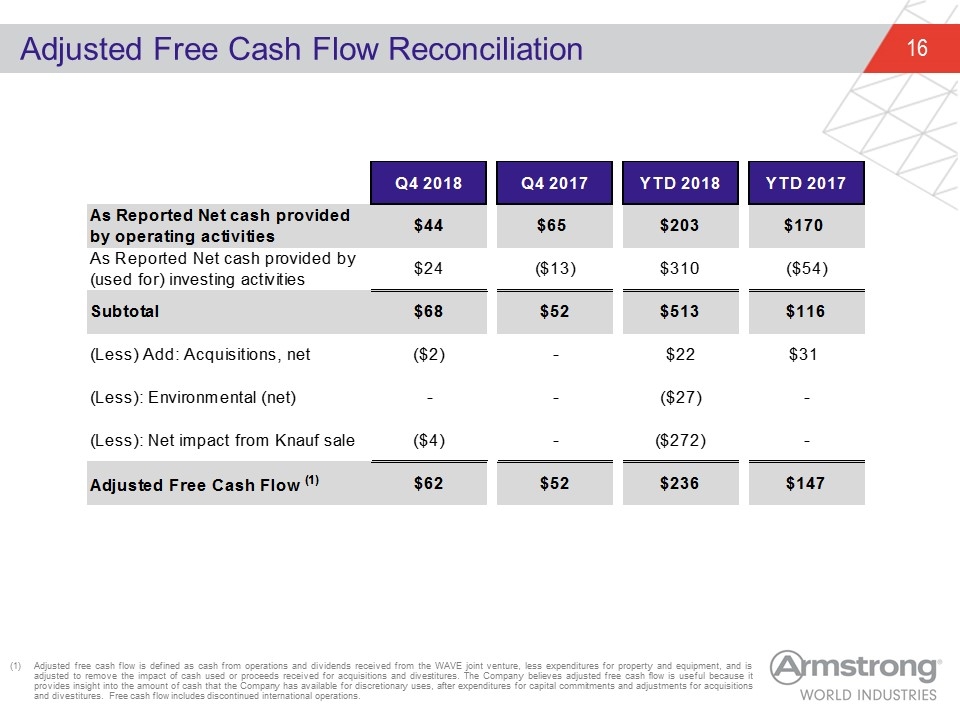
Adjusted Free Cash Flow Reconciliation Adjusted free cash flow is defined as cash from operations and dividends received from the WAVE joint venture, less expenditures for property and equipment, and is adjusted to remove the impact of cash used or proceeds received for acquisitions and divestitures. The Company believes adjusted free cash flow is useful because it provides insight into the amount of cash that the Company has available for discretionary uses, after expenditures for capital commitments and adjustments for acquisitions and divestitures. Free cash flow includes discontinued international operations. Q4 2018 Q4 2017 YTD 2018 YTD 2017 As Reported Net cash provided by operating activities $44 $65 $203 $170 As Reported Net cash provided by (used for) investing activities $24 $-13 $310 $-54 Subtotal $68 $52 $513 $116 (Less) Add: Acquisitions, net $-2 - $22 $31.4 (Less): Environmental (net) - - $-27 - (Less): Net impact from Knauf sale $-4 - $-,272 - Adjusted Free Cash Flow (1) $62 $52 $236 $147.4
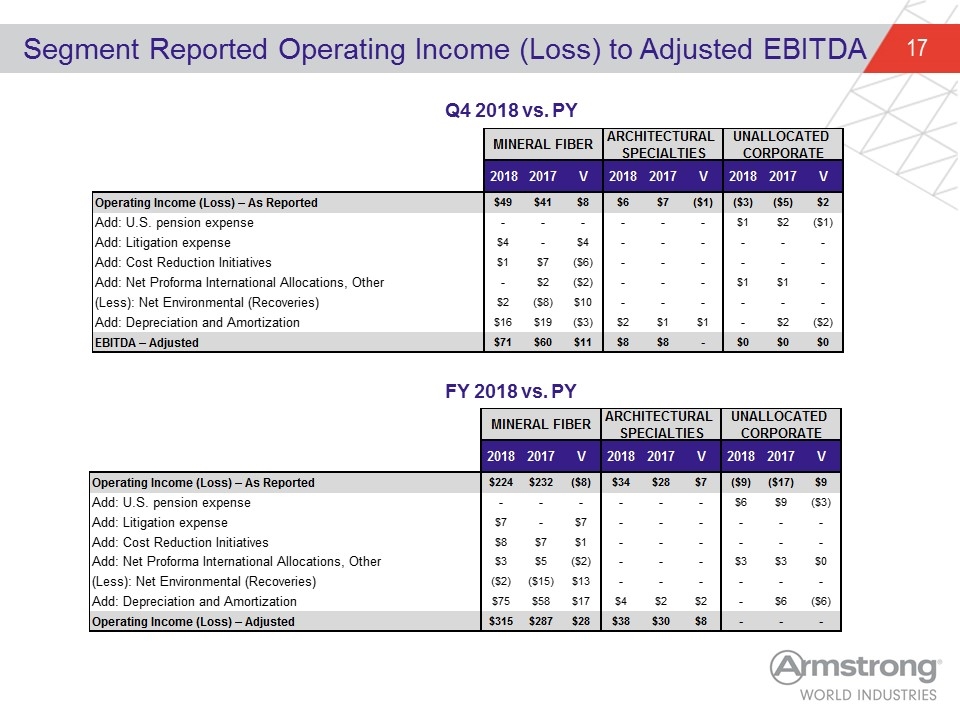
Segment Reported Operating Income (Loss) to Adjusted EBITDA Q4 2018 vs. PY FY 2018 vs. PY MINERAL FIBER ARCHITECTURAL SPECIALTIES UNALLOCATED CORPORATE rounding factor 2016 V 2018 2017 V 2018 2017 V 2018 2017 V Operating Income (Loss) – As Reported 48.9 40.799999999999997 8.1000000000000014 6.1 7.1 -1 -2.5 -4.5999999999999996 2.0999999999999996 Add: U.S. pension expense 0 0 0 0 0 0 1 2.2000000000000002 -1.2000000000000002 Add: Litigation expense 3.8 0 3.8 0 0 0 0 0 0 Add: Cost Reduction Initiatives 0.5 6.6 -6.1 0 0 0 0 0 0 Add: Net Proforma International Allocations, Other 0 2.2999999999999998 -2.2999999999999998 0 0 0 1 0.5 - check cell n12, was not working properly (Less): Net Environmental (Recoveries) 1.8 -8 9.8000000000000007 0 0 0 0 0 0 Add: Depreciation and Amortization 15.8 18.5 -2.6999999999999993 2 1 1 0 1.6 -1.6 EBITDA – Adjusted 71.099999999999994 60 11.099999999999994 8.1 8.1 0 0.10640799999999995 0.37500000000000067 0.37500000000000067 MINERAL FIBER ARCHITECTURAL SPECIALTIES UNALLOCATED CORPORATE rounding factor 2016 V 2018 2017 V 2018 2017 V 2018 2017 V Operating Income (Loss) – As Reported 223.8 232 -8.1999999999999886 34.299999999999997 27.7 6.5999999999999979 -8.6999999999999993 -17.399999999999999 8.6999999999999993 Add: U.S. pension expense 0 0 0 0 0 0 5.74 8.5 -2.76 Add: Litigation expense 6.5 0 6.5 0 0 0 0 0 0 Add: Cost Reduction Initiatives 7.95 6.62 1.33 0 0 0 0 0 0 Add: Net Proforma International Allocations, Other 2.9 4.54 -1.6400000000000001 0 0 0 2.92 2.7 0.21999999999999975 check cell n12, was not working properly (Less): Net Environmental (Recoveries) -1.63 -14.77 13.14 0 0 0 0 0 0 Add: Depreciation and Amortization 75.349999999999994 58.4 16.949999999999996 3.53 1.87 1.6599999999999997 0 5.8 -5.8 Operating Income (Loss) – Adjusted 314.87 286.78999999999996 28.080000000000041 37.83 29.57 8.259999999999998 0 0 0
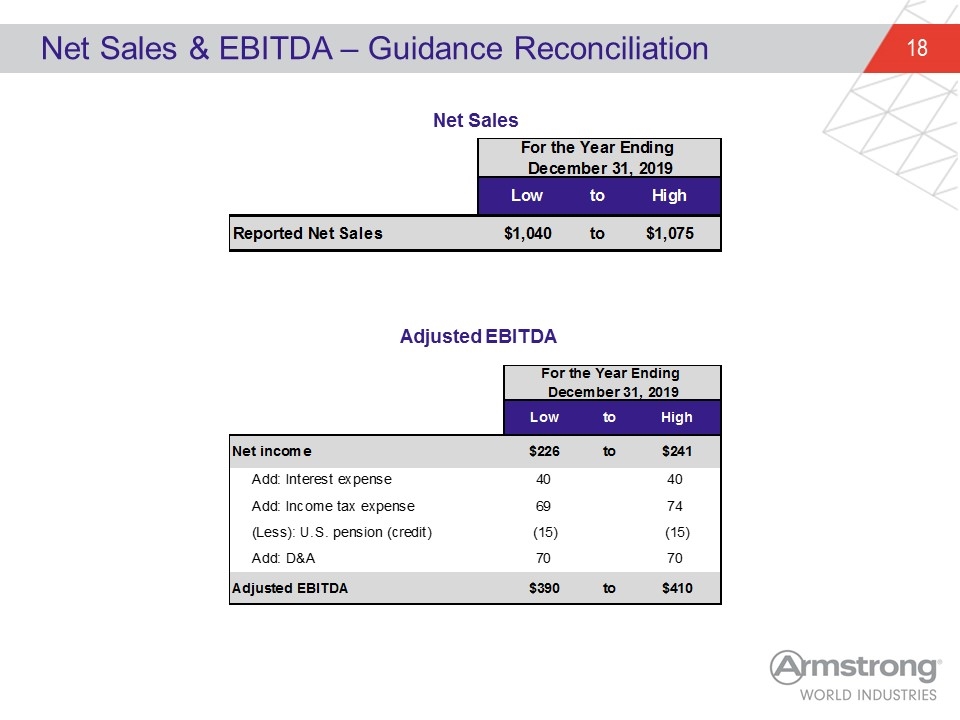
Net Sales & EBITDA – Guidance Reconciliation Net Sales Adjusted EBITDA For the Year Ending December 31, 2019 Low to High Reported Net Sales $1,040 to $1,075 For the Year Ending December 31, 2019 Low to High Net income $226 to $241 Add: Interest expense 40 40 Add: Income tax expense 69 74 (Less): U.S. pension (credit) -15 -15 Add: D&A 70 70 Adjusted EBITDA $390 to $410
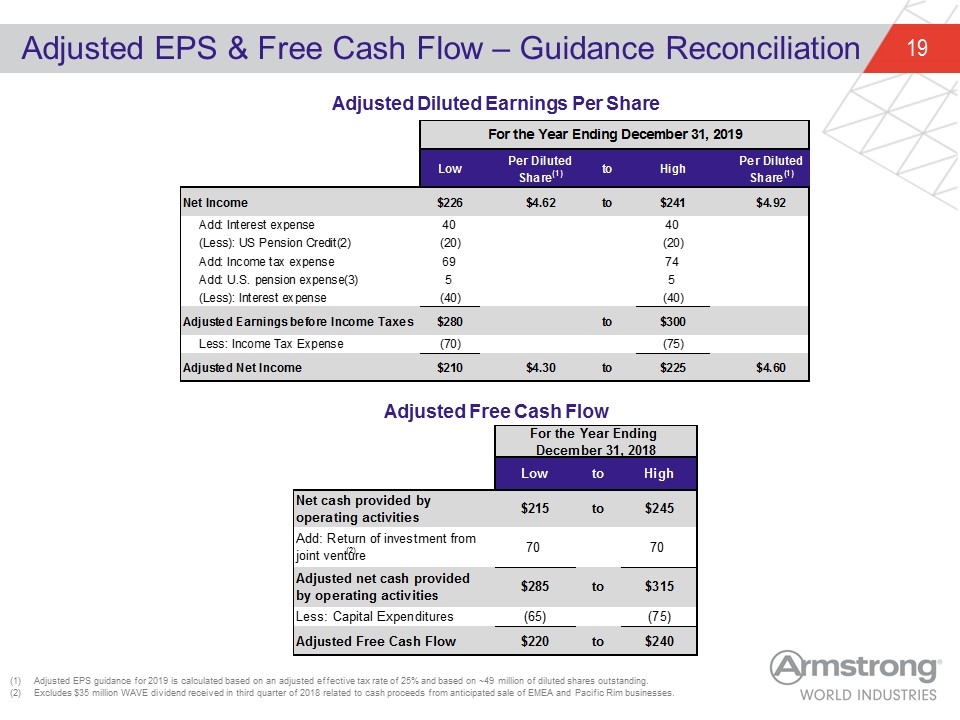
Adjusted EPS & Free Cash Flow – Guidance Reconciliation Adjusted Diluted Earnings Per Share Adjusted Free Cash Flow Adjusted EPS guidance for 2019 is calculated based on an adjusted effective tax rate of 25% and based on ~49 million of diluted shares outstanding. Excludes $35 million WAVE dividend received in third quarter of 2018 related to cash proceeds from anticipated sale of EMEA and Pacific Rim businesses. (2) For the Year Ending December 31, 2018 Low to High Net cash provided by operating activities $215 to $245 Add: Return of investment from joint venture 70 70 Adjusted net cash provided by operating activities $285 to $315 Less: Capital Expenditures -65 -75 Adjusted Free Cash Flow $220 to $240 For the Year Ending December 31, 2019 Low Per DilutedShare(1) to High Per DilutedShare(1) Net Income $226 $4.62 to $241 $4.92 Add: Interest expense 40 40 (Less): US Pension Credit(2) -20 -20 Add: Income tax expense 69 74 Add: U.S. pension expense(3) 5 5 (Less): Interest expense -40 -40 Adjusted Earnings before Income Taxes $280 to $300 Less: Income Tax Expense -70 -75 Adjusted Net Income $210 $4.3 to $225 $4.5999999999999996


