Armstrong World Industries Investor Presentation What’s Next February 25, 2019 Exhibit 99.3
Safe Harbor Statement Our disclosures in this presentation, including without limitation, those relating to future financial results, dividends, share repurchases, acquisitions and capital deployment and in our other public documents and comments contain forward-looking statements within the meaning of the Private Securities Litigation Reform Act. Those statements provide our future expectations or forecasts and can be identified by our use of words such as "anticipate," "estimate," "expect," "project," "intend," "plan," "believe," "outlook," "target," "predict," "may," "will," "would," "could," "should," "seek," and other words or phrases of similar meaning in connection with any discussion of future operating or financial performance. Forward-looking statements, by their nature, address matters that are uncertain and involve risks because they relate to events and depend on circumstances that may or may not occur in the future. A more detailed discussion of the risks and uncertainties that may affect our ability to achieve the projected performance is included in the “Risk Factors” and “Management’s Discussion and Analysis” sections of our recent reports on Forms 10-K and 10-Q filed with the U.S. Securities and Exchange Commission (“SEC”). As a result, our actual results may differ materially from our expected results and from those expressed in our forward-looking statements. Forward-looking statements speak only as of the date they are made. We undertake no obligation to update any forward-looking statements beyond what is required under applicable securities law. The information in this presentation is only effective as of the date given February 25, 2019 and is subject to change. Any distribution of this presentation after February 25, 2019 is not intended and will not be construed as updating or confirming such information. In addition, we will be referring to “non-GAAP financial measures” within the meaning of SEC Regulation G. A reconciliation of the differences between these measures with the most directly comparable financial measures calculated in accordance with GAAP can be found in the appendix to this presentation, in our SEC filings and on the Investor Relations section of our website at www.armstrongceilings.com. Armstrong World Industries competes in many diverse markets. References to "market" or "share" data are simply estimations based on a combination of internal and external sources and assumptions. They are intended only to assist discussion of the relative performance of product segments and categories for marketing and related purposes. No conclusion has been reached or should be reached regarding a "product market," a "geographic market" or “market share,” as such terms may be used or defined for any economic, legal or other purpose.
All dollar figures throughout the presentation are in $ millions (except for earnings per share) unless otherwise noted. Figures may not add due to rounding. When reporting our financial results within this presentation, we make several adjustments. Management uses the non-GAAP measures in managing the business and believes the adjustments provide meaningful comparisons of operating performance between periods. As reported results will be footnoted throughout the presentation. Basis of Presentation Explanation U.S. pension (credit) expense represents the actuarial net periodic benefit cost expected to be recorded as a component of operating income. For all periods presented, we were not required and did not make cash contributions to our U.S. Retirement Income Plan based on guidelines established by the Pension Benefit Guaranty Corporation. Results throughout this presentation are presented on a continuing operations basis with the exception of cash flow. With the pending sale of our EMEA and Pacific Rim businesses, we no longer adjust our sales for movements in foreign exchange rates as we expect these to have minimal impact on revenue. We remove the impact of certain discrete expenses and income. Examples include plant closures, restructuring actions, separation costs, environmental site expenses and related insurance recoveries, and other large unusual items. We also adjust for our U.S. pension plan (credit) expense(1). Book taxes for adjusted net income and adjusted diluted EPS are calculated using a constant 25% rate for 2017 and 2018, as well as 2019 guidance. 2018 actual book tax rate was 22%. During 2019 we will report current and prior year results at actual tax rates.

The Armstrong Purpose It matters to us, and it matters to our customers
Founded in 1860…One of the most adaptive companies in building products ü Undisputed category leader for more than 50 years ü One of the strongest & most trusted brands in the industry ü Strong strategic position…differentiating profitability & cash flow attributes ü AWI - One of the Most Unique Companies in Building Products Unmatched scale in an industry where it matters ü
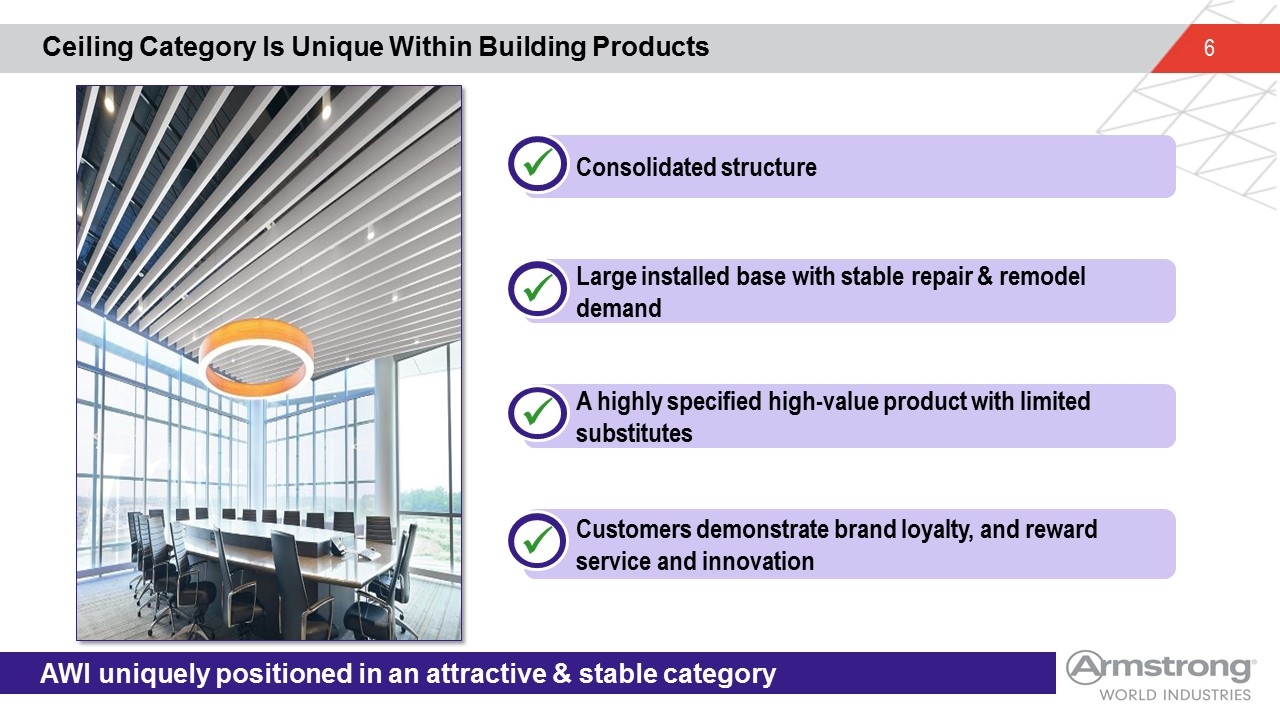
Ceiling Category Is Unique Within Building Products AWI uniquely positioned in an attractive & stable category Consolidated structure ü Large installed base with stable repair & remodel demand ü A highly specified high-value product with limited substitutes ü Customers demonstrate brand loyalty, and reward service and innovation ü
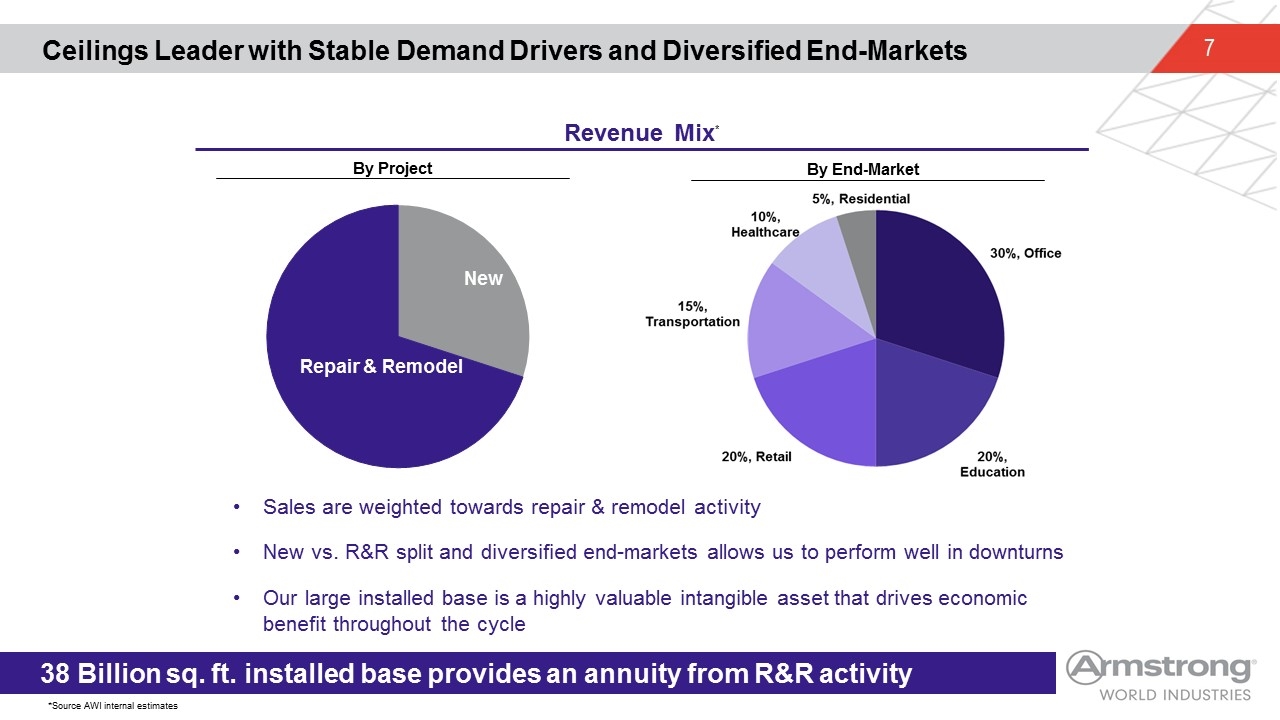
Ceilings Leader with Stable Demand Drivers and Diversified End-Markets 38 Billion sq. ft. installed base provides an annuity from R&R activity Revenue Mix* By End-Market By Project Office 30% Education 20% Retail 20% Sales are weighted towards repair & remodel activity New vs. R&R split and diversified end-markets allows us to perform well in downturns Our large installed base is a highly valuable intangible asset that drives economic benefit throughout the cycle *Source AWI internal estimates
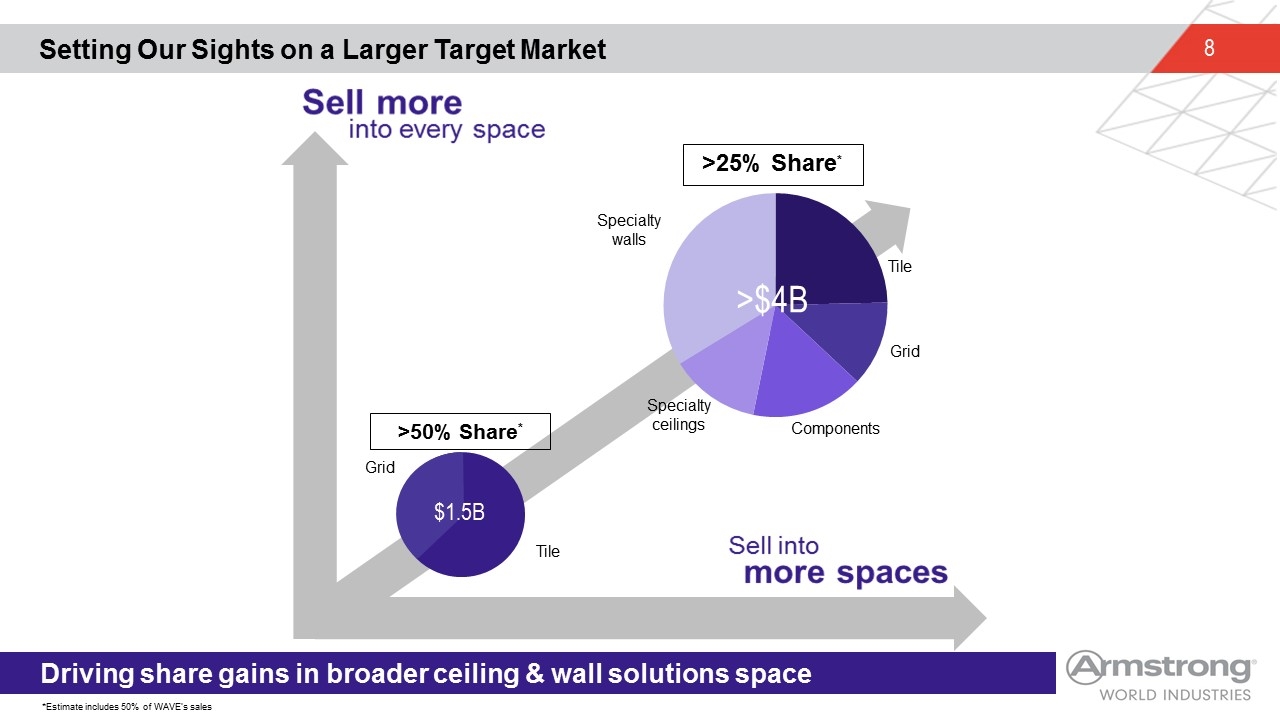
Setting Our Sights on a Larger Target Market *Estimate includes 50% of WAVE’s sales Components Tile >25% Share* Specialty walls Specialty ceilings Grid $1.5B Tile >$4B Grid >50% Share* Driving share gains in broader ceiling & wall solutions space
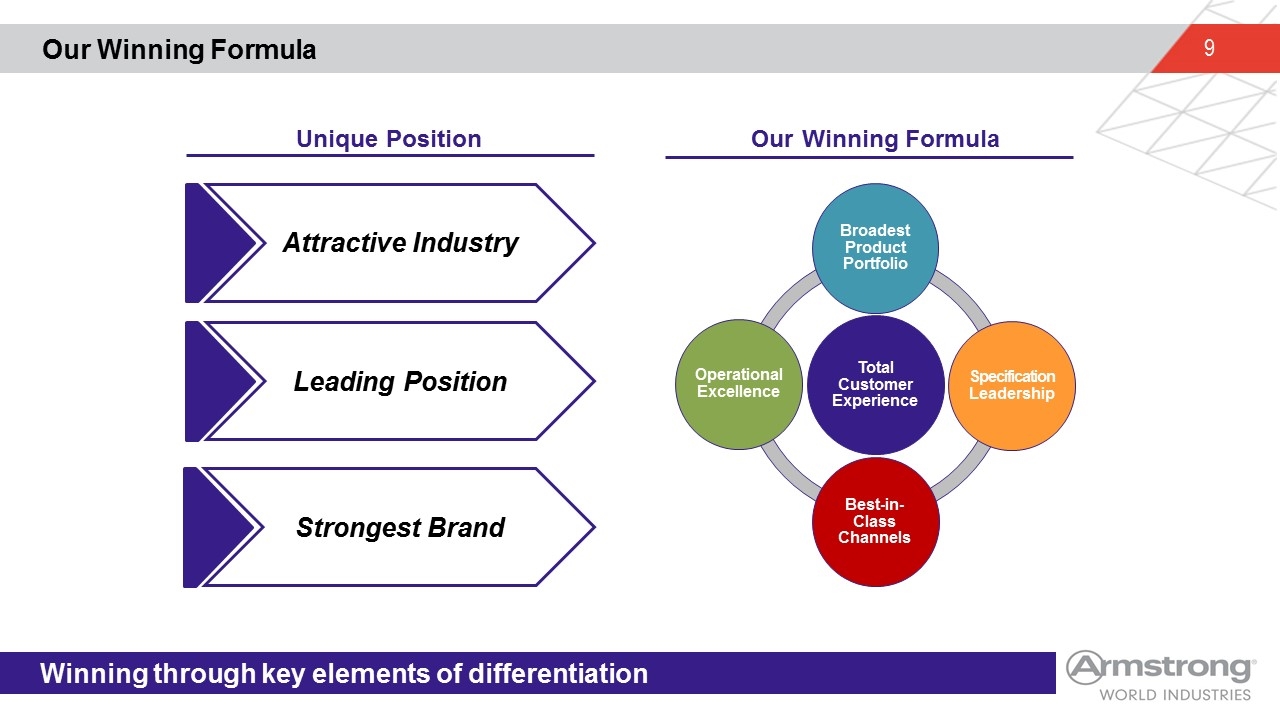
Our Winning Formula Unique Position Our Winning Formula Attractive Industry Leading Position Strongest Brand Winning through key elements of differentiation Total Customer Experience Broadest Product Portfolio Specification Leadership Best-in-Class Channels Operational Excellence
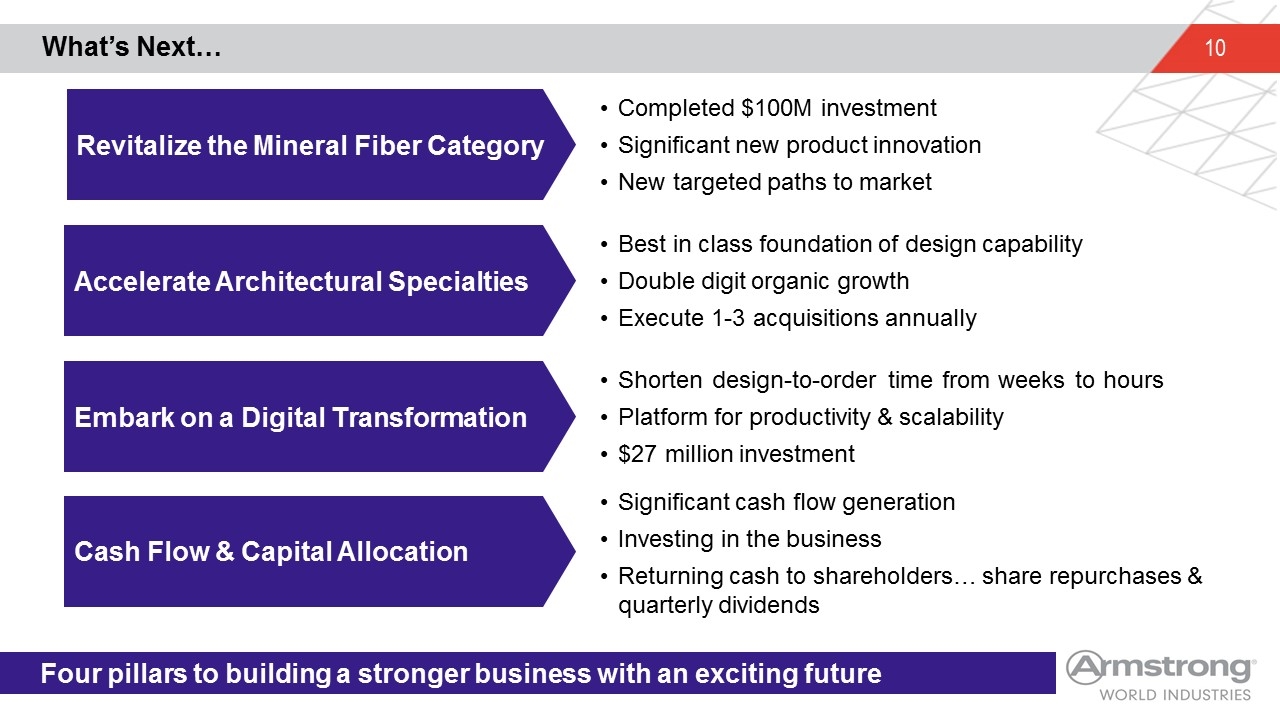
Four pillars to building a stronger business with an exciting future Revitalize the Mineral Fiber Category Accelerate Architectural Specialties Embark on a Digital Transformation Cash Flow & Capital Allocation Completed $100M investment Significant new product innovation New targeted paths to market Best in class foundation of design capability Double digit organic growth Execute 1-3 acquisitions annually Shorten design-to-order time from weeks to hours Platform for productivity & scalability $27 million investment Significant cash flow generation Investing in the business Returning cash to shareholders… share repurchases & quarterly dividends What’s Next…
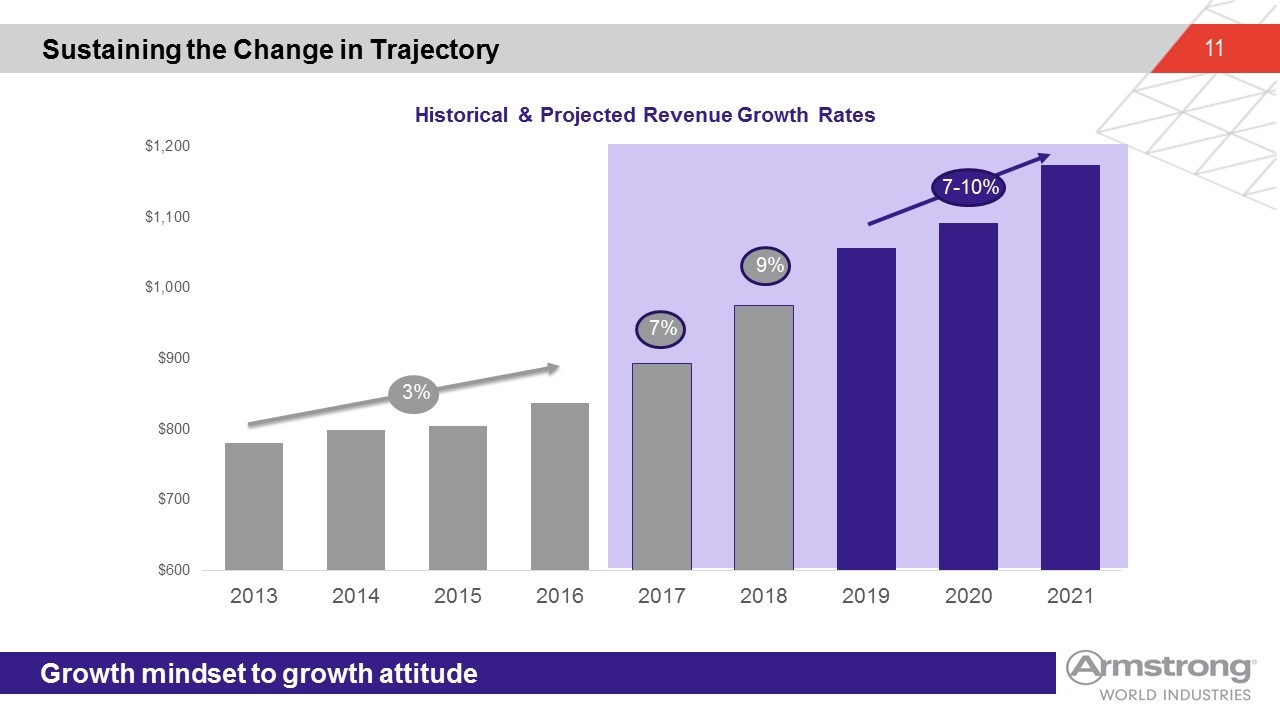
Sustaining the Change in Trajectory Growth mindset to growth attitude Historical & Projected Revenue Growth Rates 3% 7% 9% 7-10%
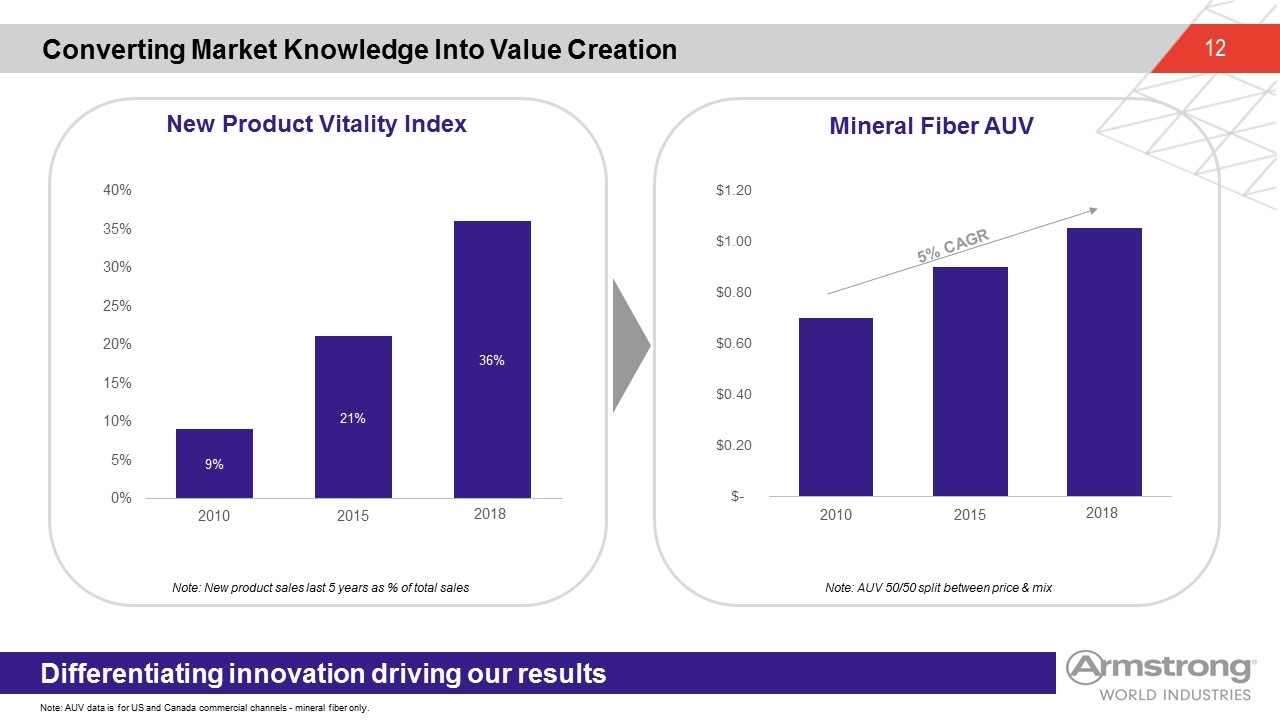
Converting Market Knowledge Into Value Creation Mineral Fiber AUV New Product Vitality Index Note: New product sales last 5 years as % of total sales Differentiating innovation driving our results Note: AUV 50/50 split between price & mix 5% CAGR Note: AUV data is for US and Canada commercial channels - mineral fiber only. 2018 2018
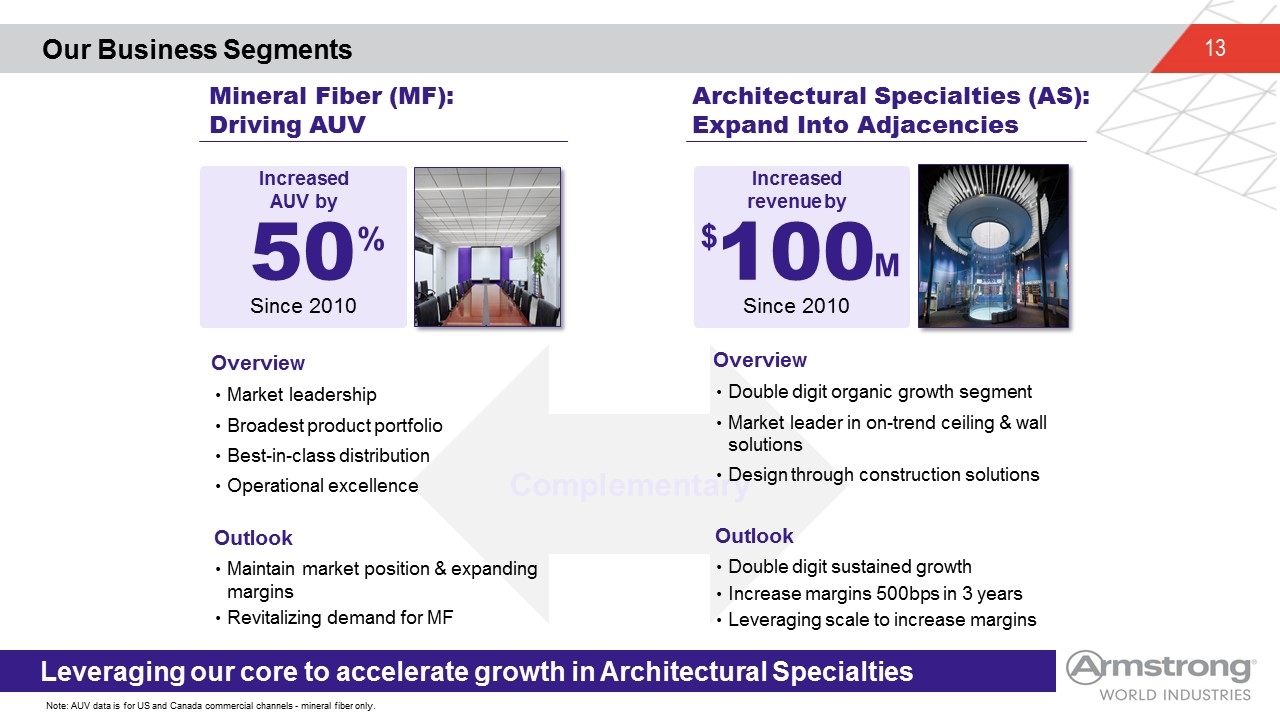
Our Business Segments Mineral Fiber (MF): Driving AUV Architectural Specialties (AS): Expand Into Adjacencies % Increased AUV by 50 Since 2010 Increased revenue by 100 Since 2010 $ M Leveraging our core to accelerate growth in Architectural Specialties Complementary Double digit organic growth segment Market leader in on-trend ceiling & wall solutions Design through construction solutions Overview Double digit sustained growth Increase margins 500bps in 3 years Leveraging scale to increase margins Outlook Market leadership Broadest product portfolio Best-in-class distribution Operational excellence Overview Maintain market position & expanding margins Revitalizing demand for MF Outlook Note: AUV data is for US and Canada commercial channels - mineral fiber only.
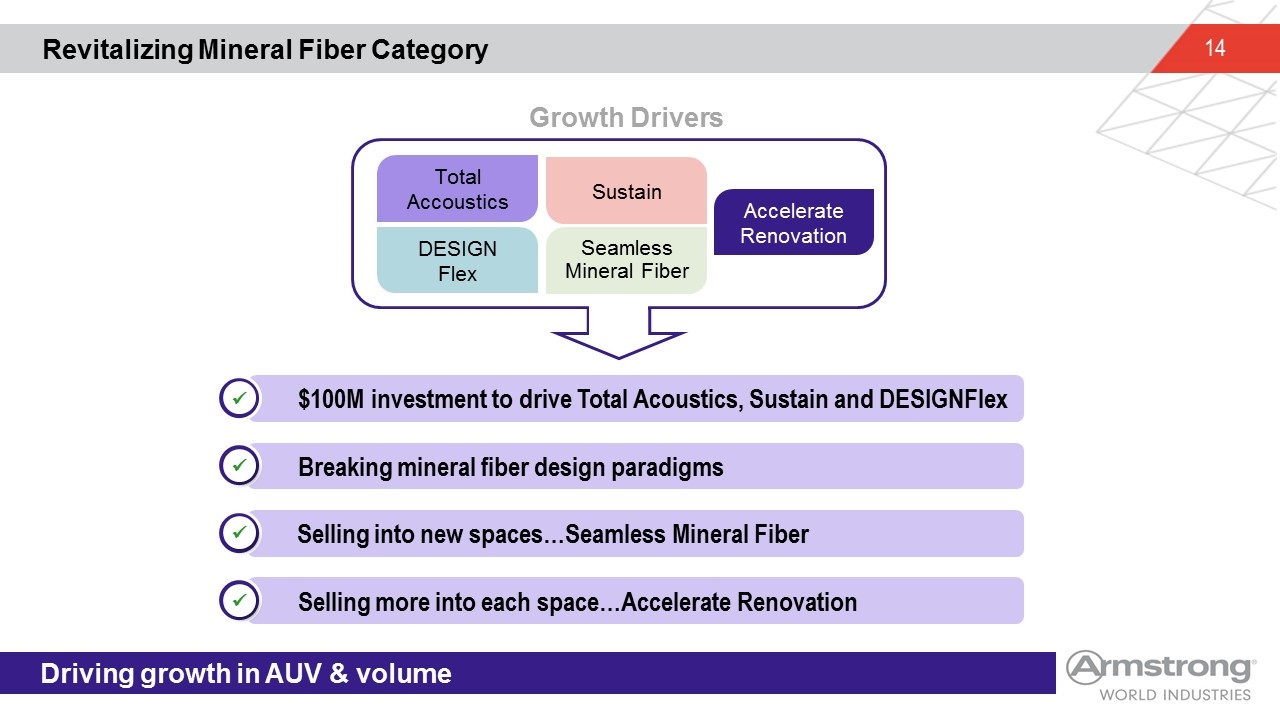
Revitalizing Mineral Fiber Category Driving growth in AUV & volume $100M investment to drive Total Acoustics, Sustain and DESIGNFlex ü Total Accoustics Seamless Mineral Fiber DESIGN Flex Accelerate Renovation Sustain Breaking mineral fiber design paradigms ü Selling into new spaces…Seamless Mineral Fiber ü Selling more into each space…Accelerate Renovation ü Growth Drivers
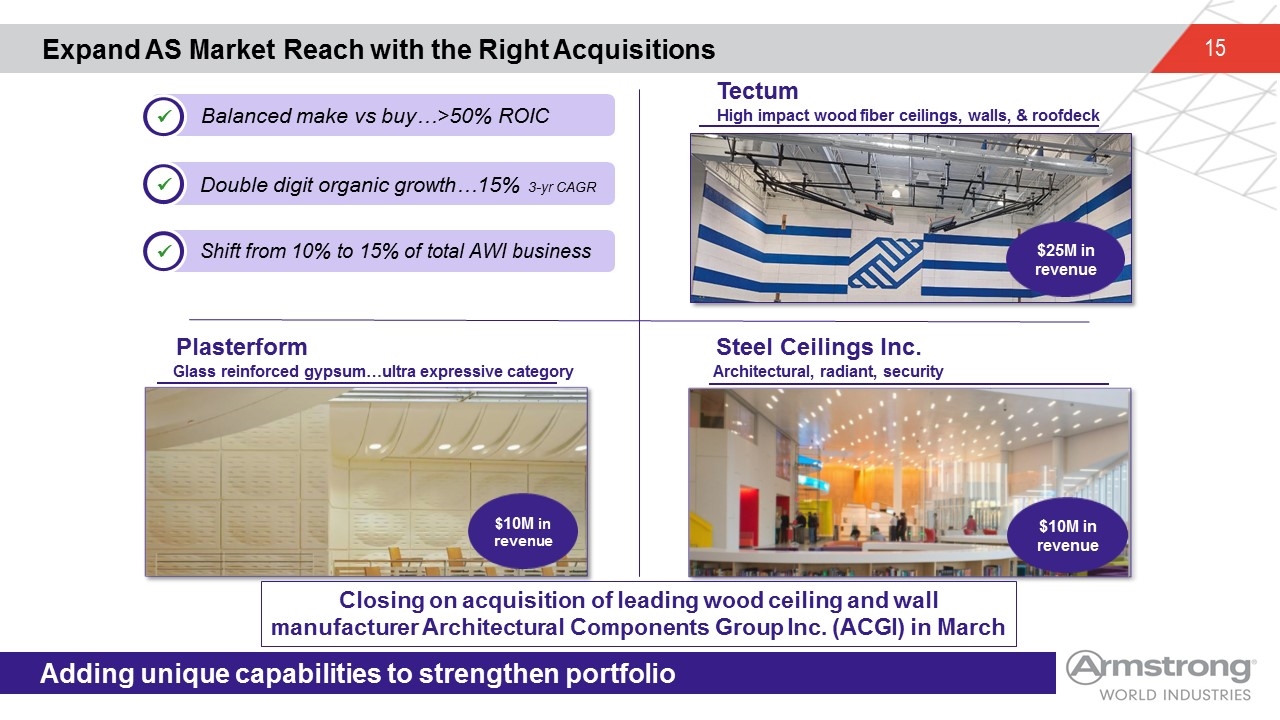
Expand AS Market Reach with the Right Acquisitions Adding unique capabilities to strengthen portfolio Tectum High impact wood fiber ceilings, walls, & roofdeck Plasterform Glass reinforced gypsum…ultra expressive category Steel Ceilings Inc. Architectural, radiant, security $10M in revenue $10M in revenue Balanced make vs buy…>50% ROIC ü Double digit organic growth…15% 3-yr CAGR ü Shift from 10% to 15% of total AWI business ü $25M in revenue Closing on acquisition of leading wood ceiling and wall manufacturer Architectural Components Group Inc. (ACGI) in March
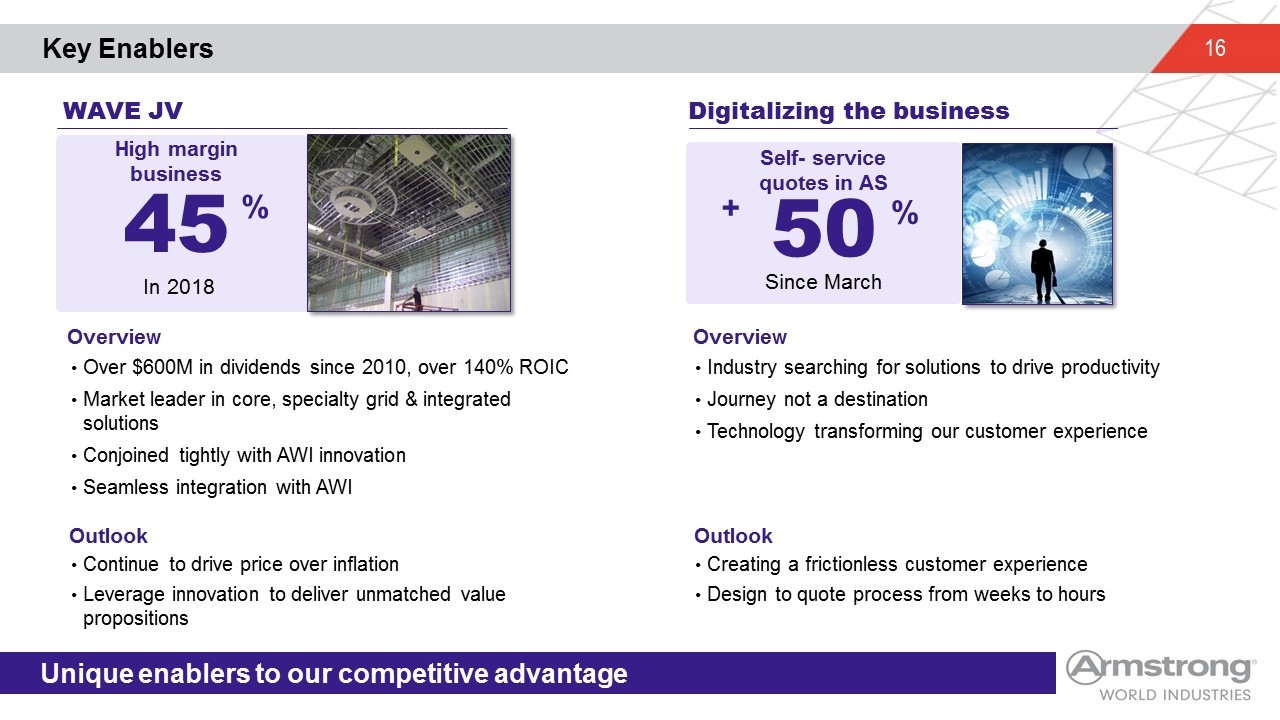
Key Enablers WAVE JV Digitalizing the business 45 % High margin business In 2018 Self- service quotes in AS 50 Since March + % Over $600M in dividends since 2010, over 140% ROIC Market leader in core, specialty grid & integrated solutions Conjoined tightly with AWI innovation Seamless integration with AWI Overview Continue to drive price over inflation Leverage innovation to deliver unmatched value propositions Outlook Industry searching for solutions to drive productivity Journey not a destination Technology transforming our customer experience Overview Creating a frictionless customer experience Design to quote process from weeks to hours Outlook Unique enablers to our competitive advantage
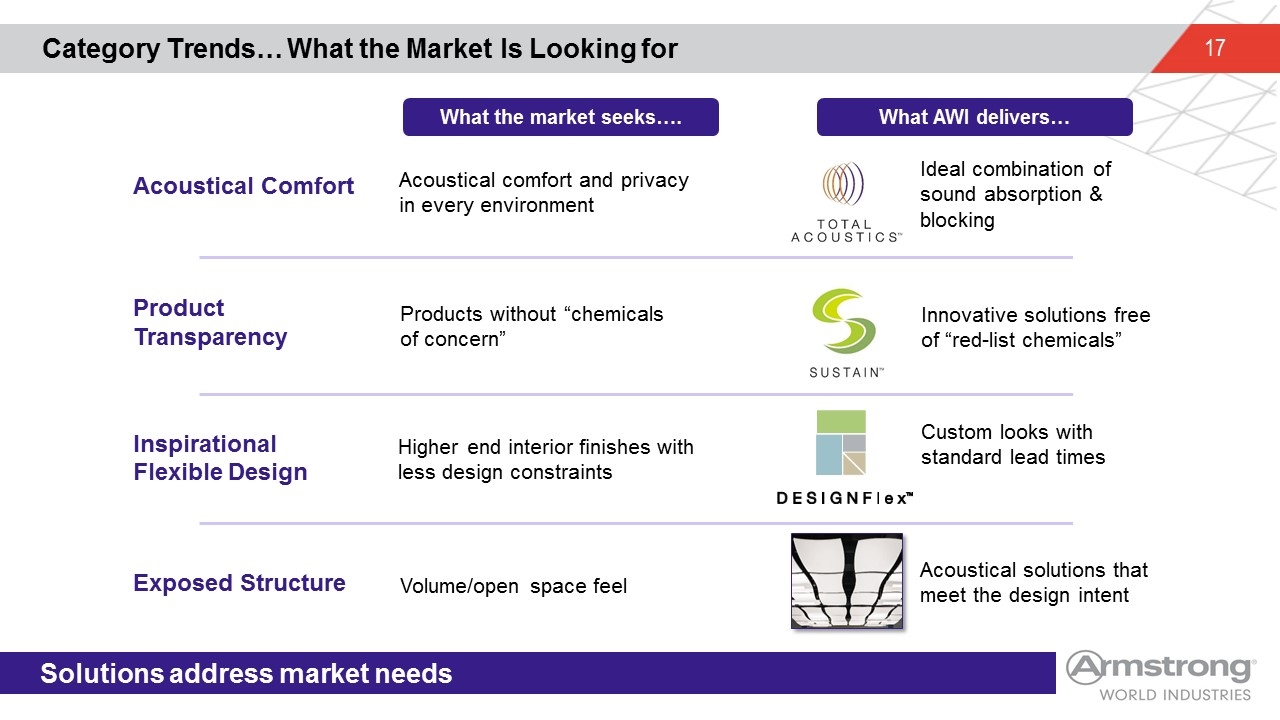
Category Trends… What the Market Is Looking for Solutions address market needs Volume/open space feel Acoustical solutions that meet the design intent Higher end interior finishes with less design constraints Product Transparency Inspirational Flexible Design Exposed Structure Products without “chemicals of concern” Innovative solutions free of “red-list chemicals” Custom looks with standard lead times Acoustical Comfort Acoustical comfort and privacy in every environment Ideal combination of sound absorption & blocking What the market seeks…. What AWI delivers…
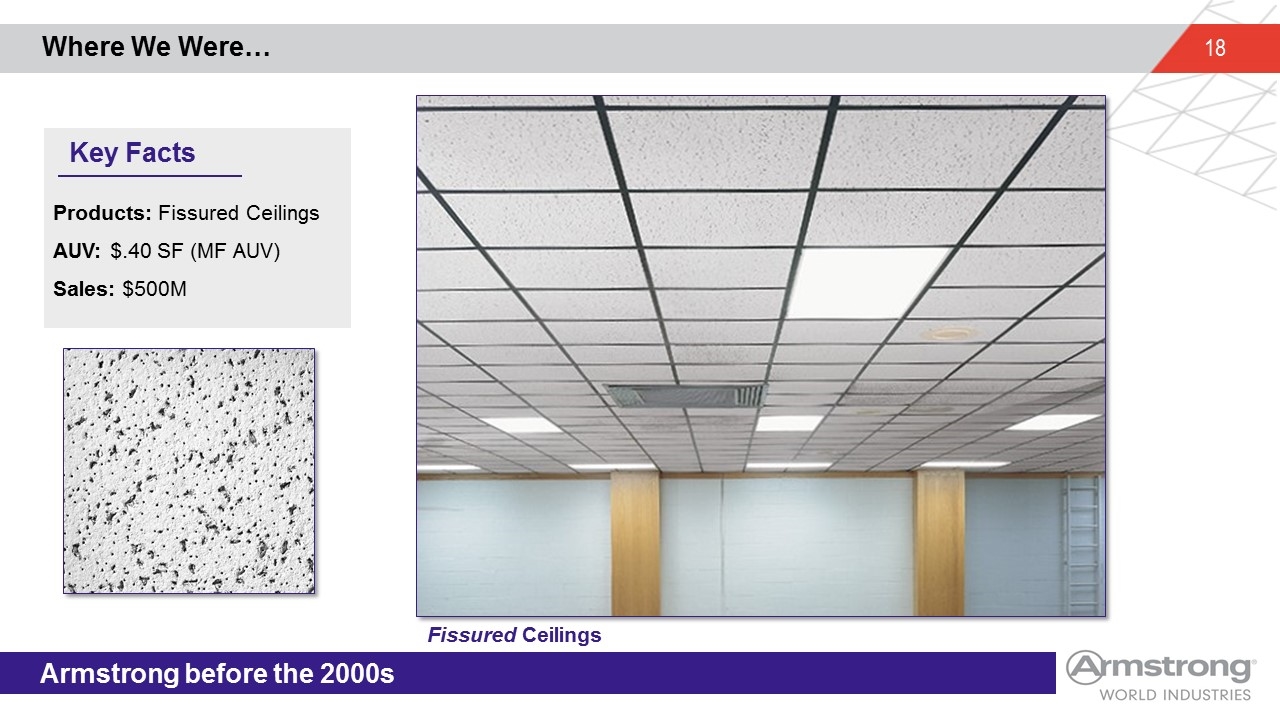
Where We Were… Armstrong before the 2000s Products: Fissured Ceilings AUV: $.40 SF (MF AUV) Sales: $500M Key Facts Fissured Ceilings
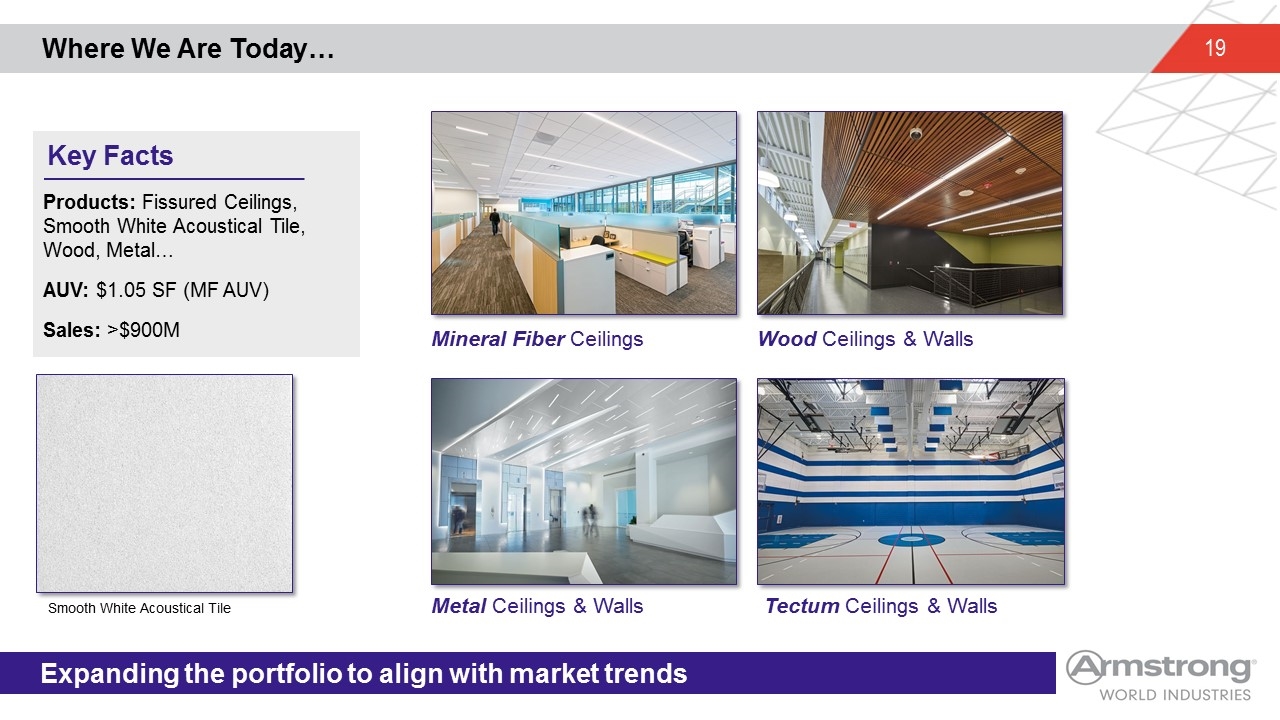
Where We Are Today… Expanding the portfolio to align with market trends Mineral Fiber Ceilings Tectum Ceilings & Walls Wood Ceilings & Walls Metal Ceilings & Walls Products: Fissured Ceilings, Smooth White Acoustical Tile, Wood, Metal… AUV: $1.05 SF (MF AUV) Sales: >$900M Key Facts Smooth White Acoustical Tile
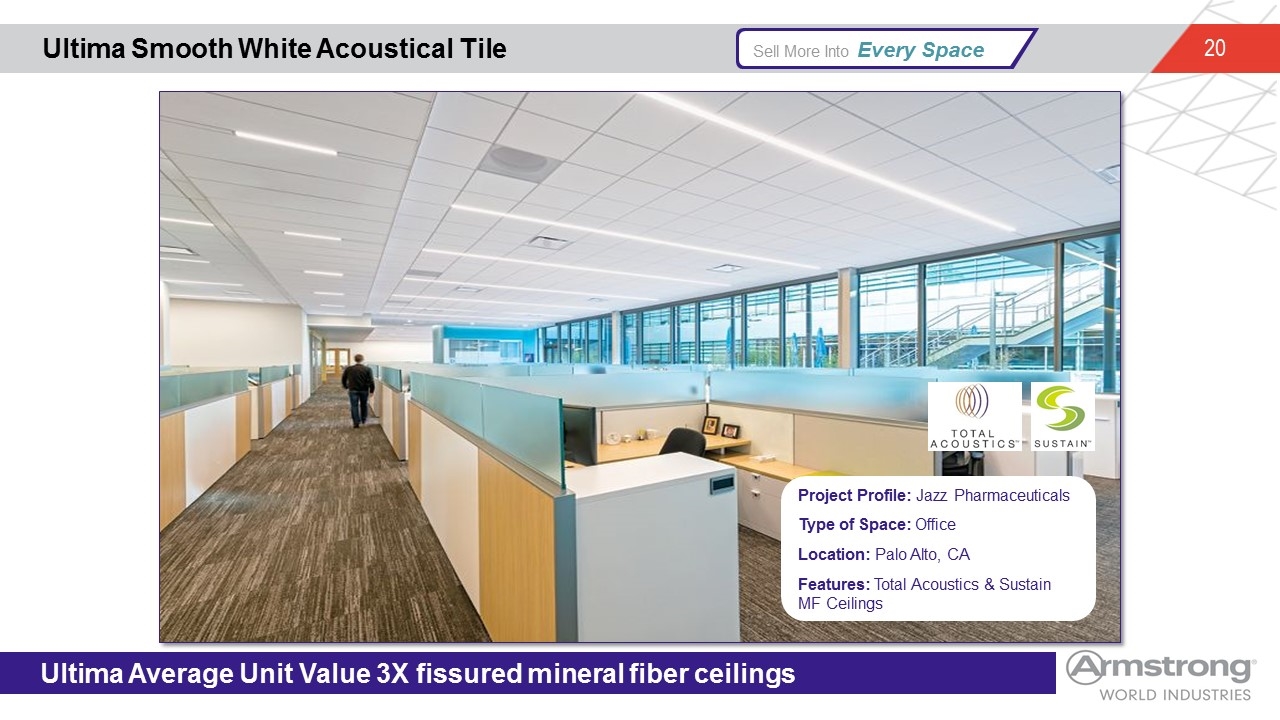
Ultima Smooth White Acoustical Tile Ultima Average Unit Value 3X fissured mineral fiber ceilings j Sell More Into Every Space Project Profile: Jazz Pharmaceuticals Type of Space: Office Location: Palo Alto, CA Features: Total Acoustics & Sustain MF Ceilings
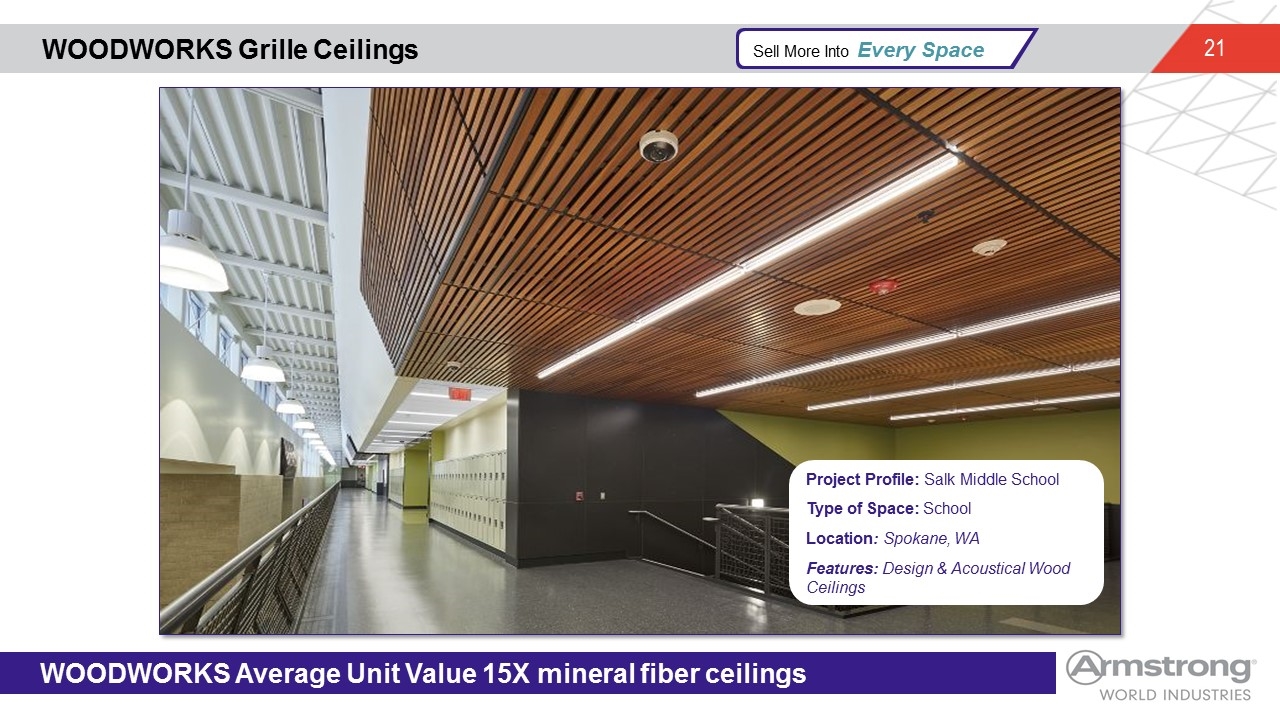
WOODWORKS Grille Ceilings WOODWORKS Average Unit Value 15X mineral fiber ceilings j Sell More Into Every Space Project Profile: Salk Middle School Type of Space: School Location: Spokane, WA Features: Design & Acoustical Wood Ceilings
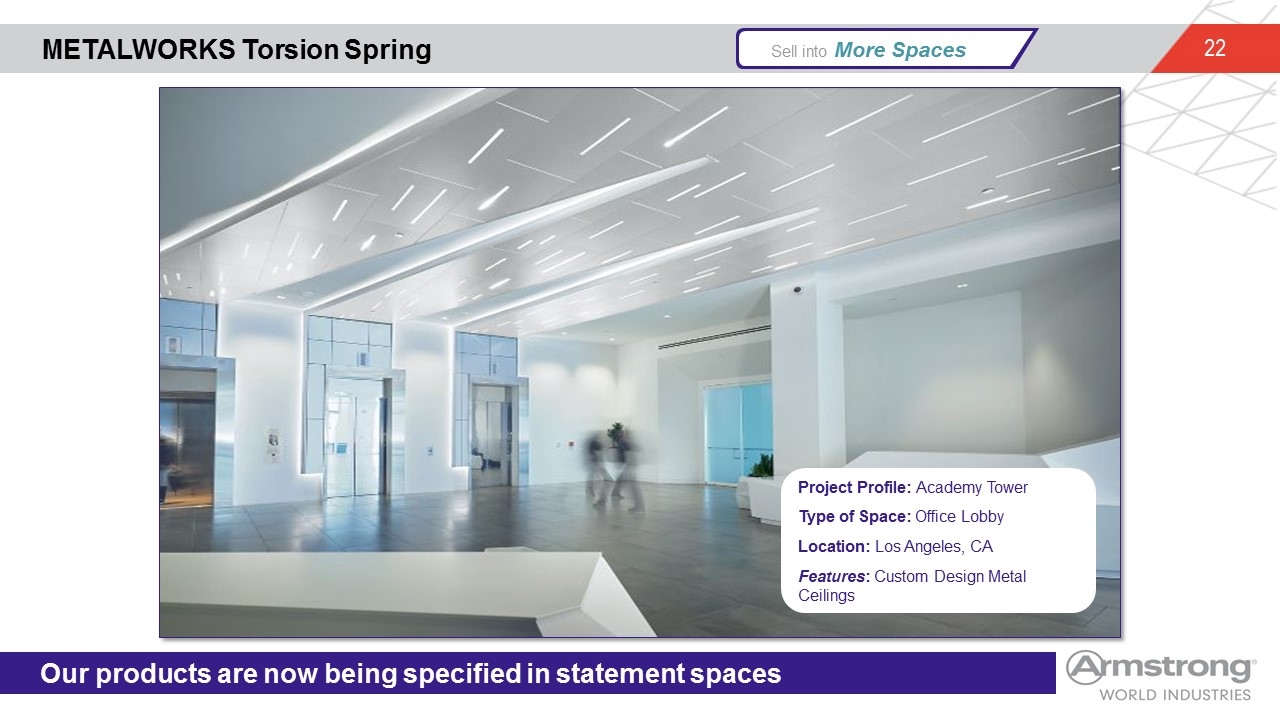
METALWORKS Torsion Spring Our products are now being specified in statement spaces j Sell into More Spaces Project Profile: Academy Tower Type of Space: Office Lobby Location: Los Angeles, CA Features: Custom Design Metal Ceilings
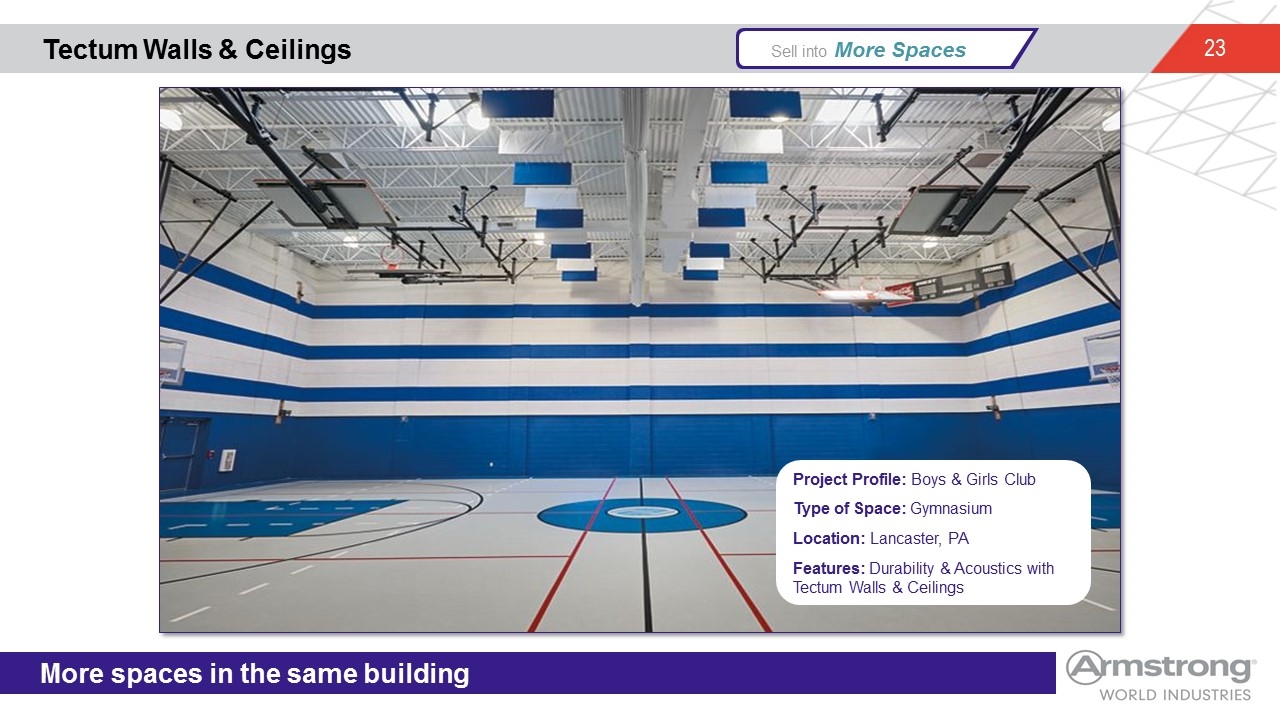
Tectum Walls & Ceilings More spaces in the same building j Sell into More Spaces Project Profile: Boys & Girls Club Type of Space: Gymnasium Location: Lancaster, PA Features: Durability & Acoustics with Tectum Walls & Ceilings
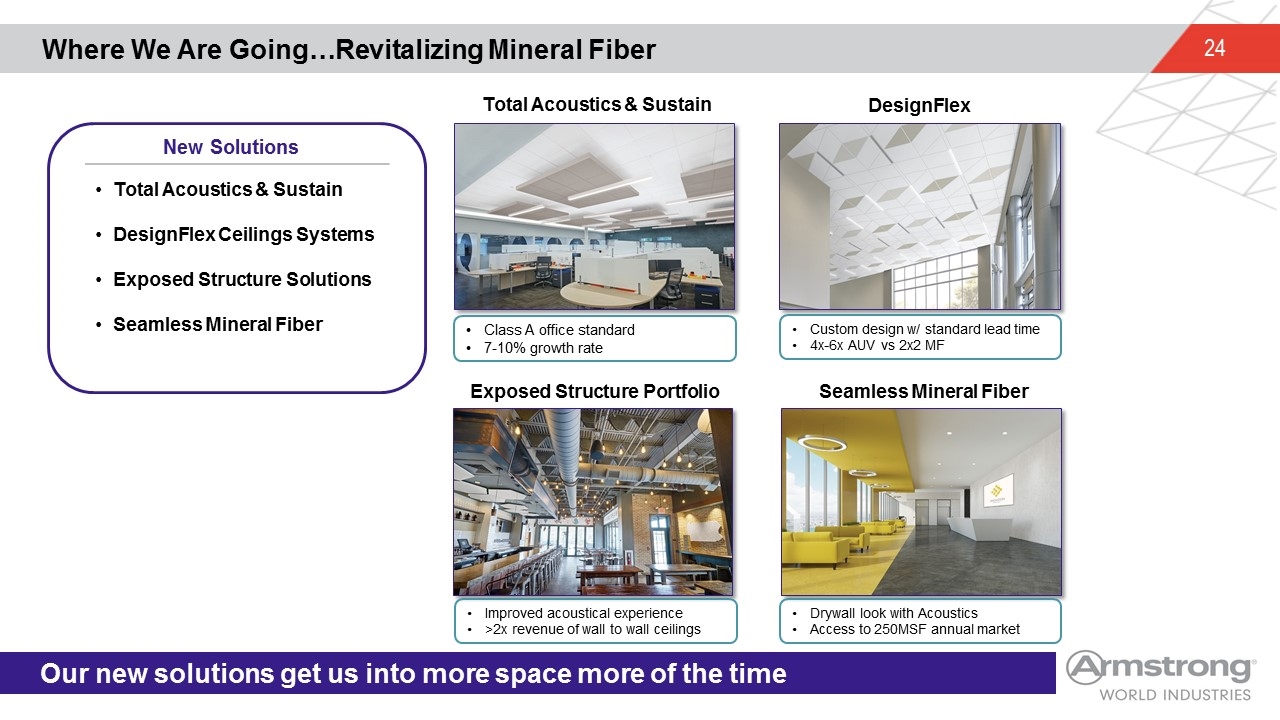
Where We Are Going…Revitalizing Mineral Fiber Our new solutions get us into more space more of the time Total Acoustics & Sustain DesignFlex Ceilings Systems Exposed Structure Solutions Seamless Mineral Fiber New Solutions Custom design w/ standard lead time 4x-6x AUV vs 2x2 MF DesignFlex Exposed Structure Portfolio Seamless Mineral Fiber Total Acoustics & Sustain Improved acoustical experience >2x revenue of wall to wall ceilings Drywall look with Acoustics Access to 250MSF annual market Class A office standard 7-10% growth rate
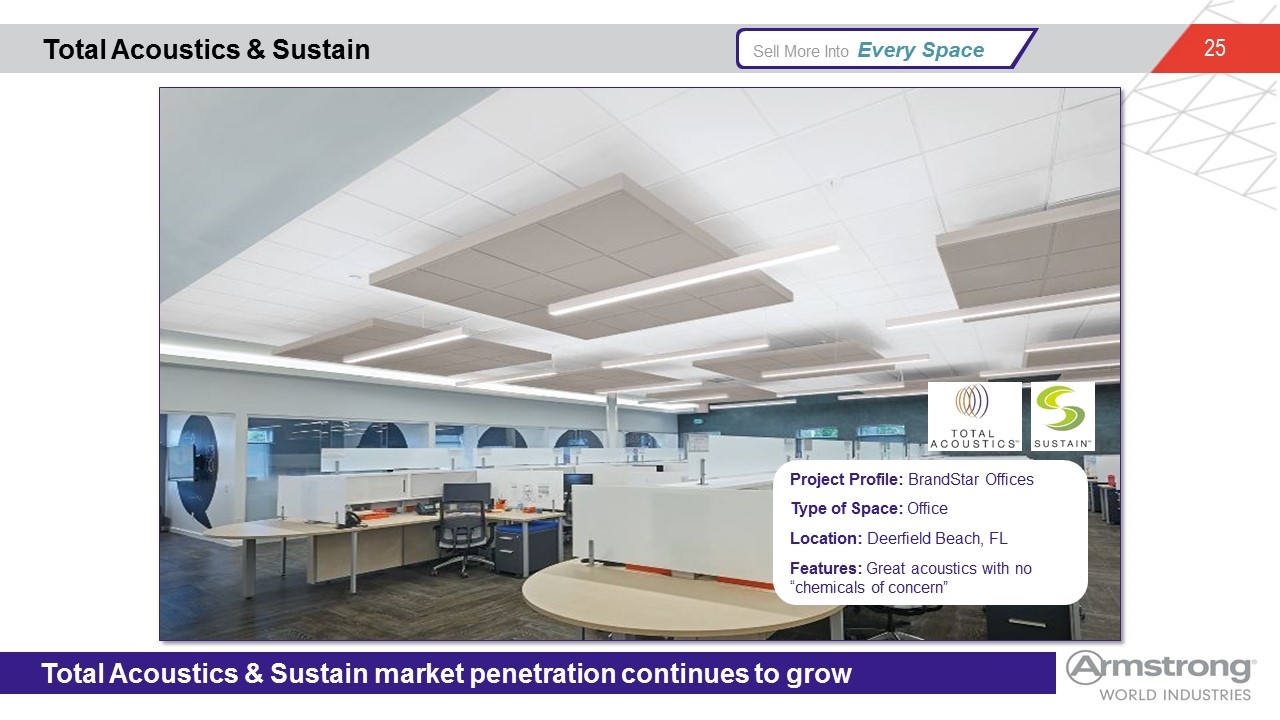
Total Acoustics & Sustain Total Acoustics & Sustain market penetration continues to grow j Sell More Into Every Space Project Profile: BrandStar Offices Type of Space: Office Location: Deerfield Beach, FL Features: Great acoustics with no “chemicals of concern”
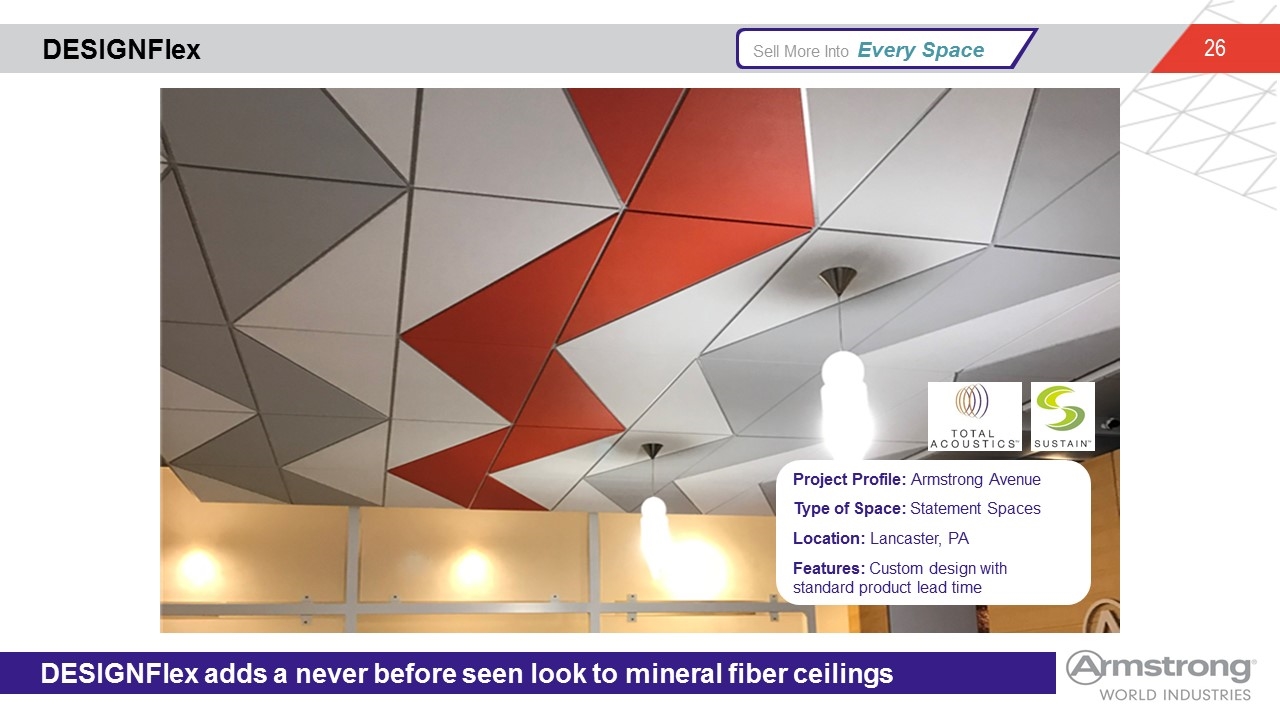
DESIGNFlex DESIGNFlex adds a never before seen look to mineral fiber ceilings j Sell More Into Every Space Project Profile: Armstrong Avenue Type of Space: Statement Spaces Location: Lancaster, PA Features: Custom design with standard product lead time
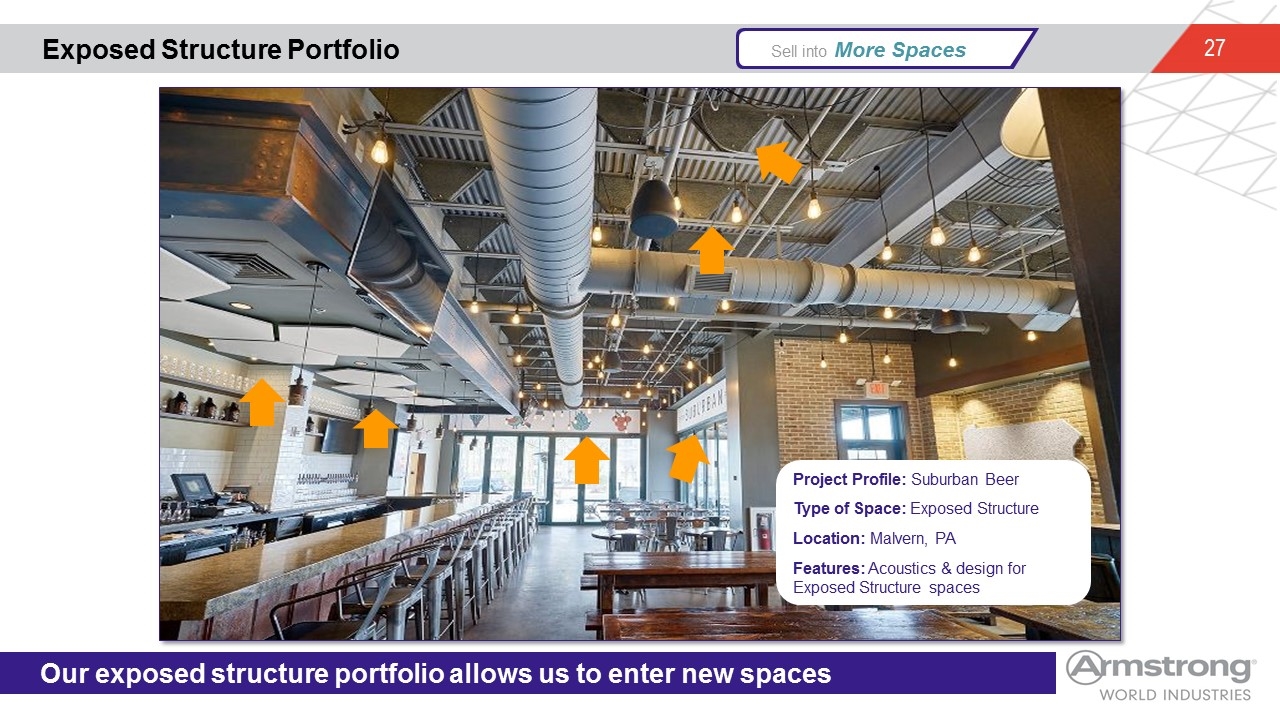
Exposed Structure Portfolio Our Exposed Structure portfolio allows us to enter new spaces j Sell into More Spaces Project Profile: Suburban Beer Type of Space: Exposed Structure Location: Malvern, PA Features: Acoustics & design for Exposed Structure spaces Our exposed structure portfolio allows us to enter new spaces
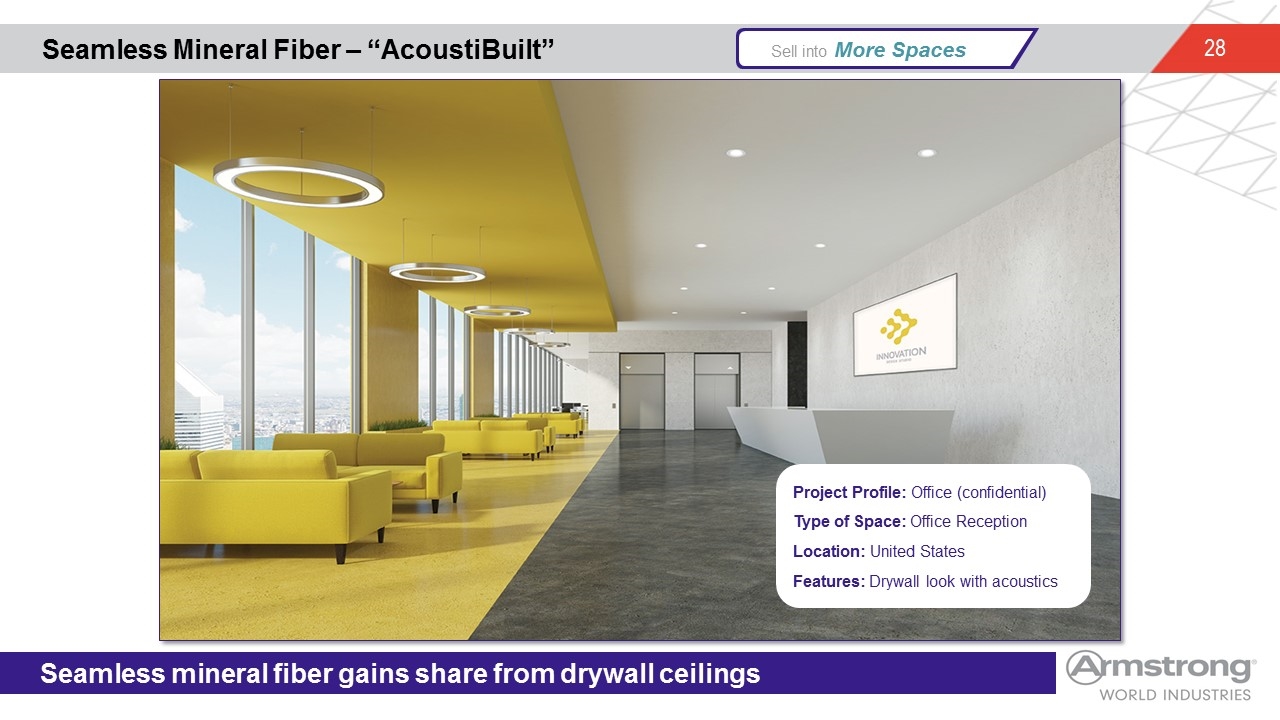
Seamless Mineral Fiber – “AcoustiBuilt” Seamless mineral fiber gains share from drywall ceilings j Sell into More Spaces Project Profile: Office (confidential) Type of Space: Office Reception Location: United States Features: Drywall look with acoustics
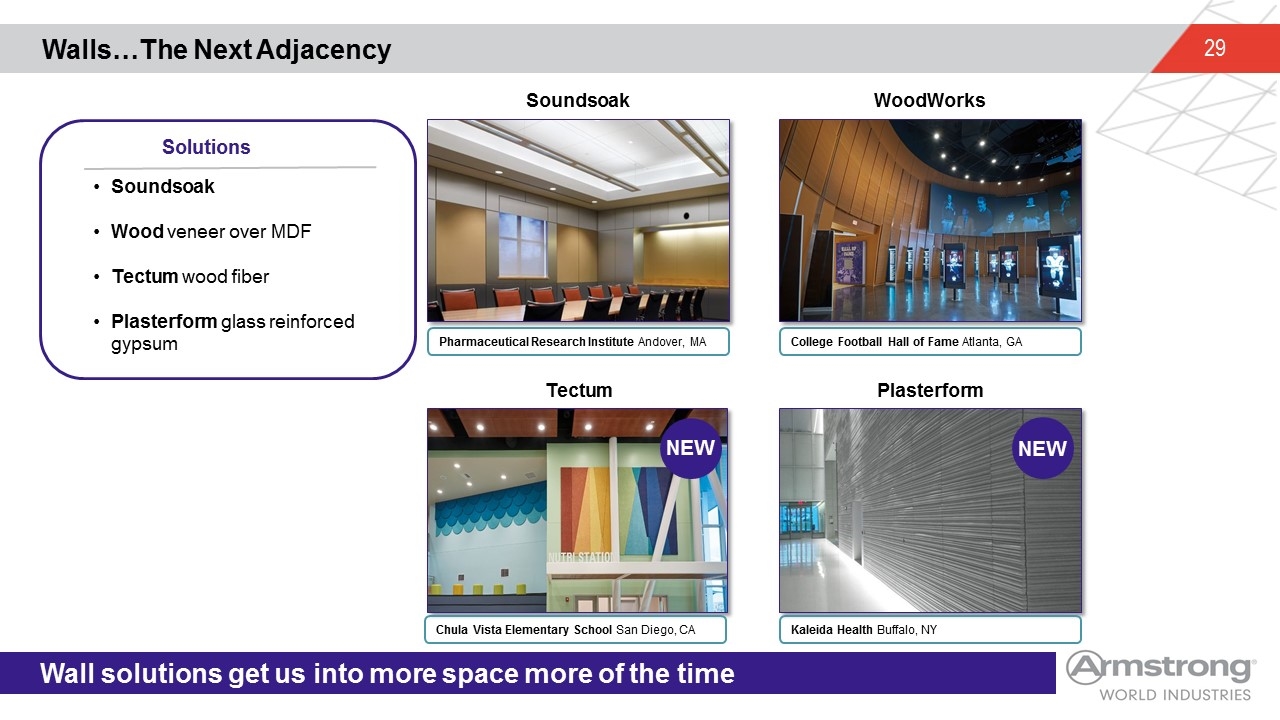
Walls…The Next Adjacency Wall solutions get us into more space more of the time Solutions NEW Soundsoak Wood veneer over MDF Tectum wood fiber Plasterform glass reinforced gypsum Soundsoak WoodWorks Tectum Plasterform Pharmaceutical Research Institute Andover, MA College Football Hall of Fame Atlanta, GA Chula Vista Elementary School San Diego, CA Kaleida Health Buffalo, NY NEW
Financial Review & Value Creation Model Expanding AUV and Margins Cash Flow Generation Capital Deployment
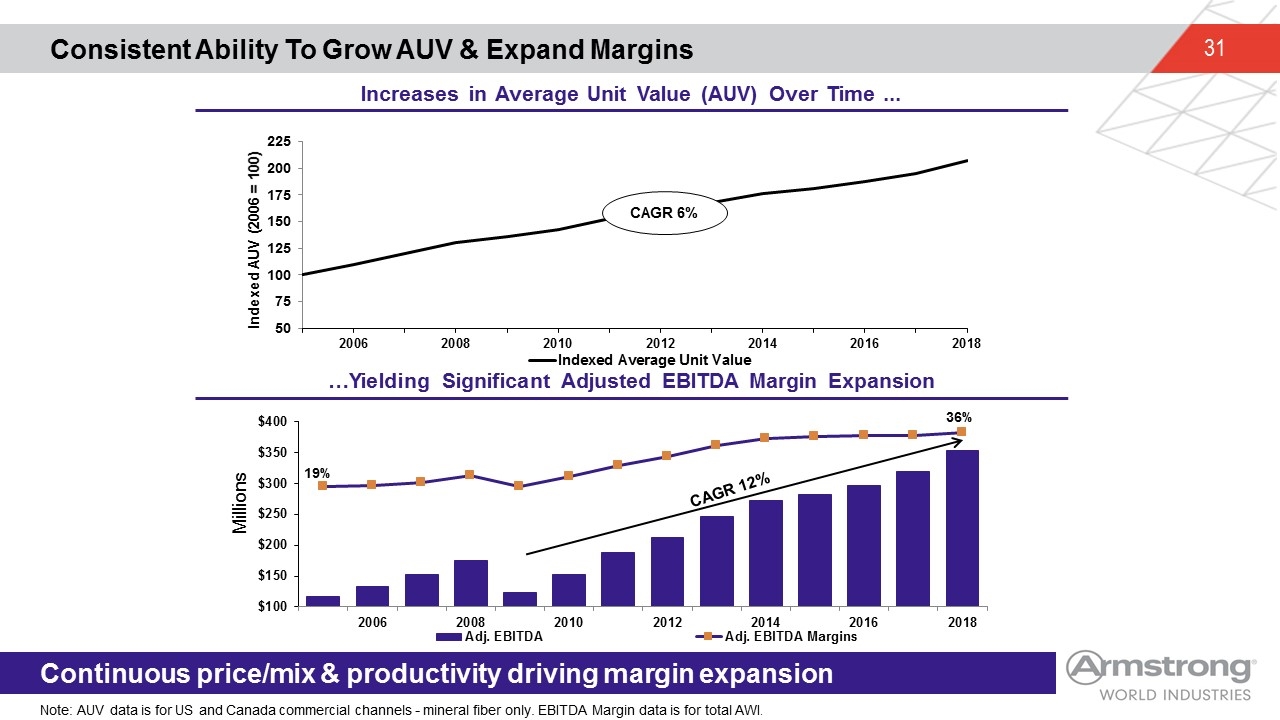
Consistent Ability To Grow AUV & Expand Margins Continuous price/mix and productivity driving margin expansion Note: AUV data is for US and Canada commercial channels - mineral fiber only. EBITDA Margin data is for total AWI. Increases in Average Unit Value (AUV) Over Time ... …Yielding Significant Adjusted EBITDA Margin Expansion 36% 19% Millions Continuous price/mix & productivity driving margin expansion

Performance Through the Downturn Continuous price/mix and productivity driving margin expansion Resilience through bad economic conditions Volume declined 20% in 2009 AUV increased every year Price exceeded inflation every year Manufacturing footprint restructured SG&A was right-sized Capital spending was tightened Margins were restored by 2010 2011 adjusted EBITDA 40% above 2008 Note: Margin data is adjusted for standard exclusions as well as for stranded overhead costs associate with the separation from flooring and the sale of our international businesses. This provides consistent year to year comparability.
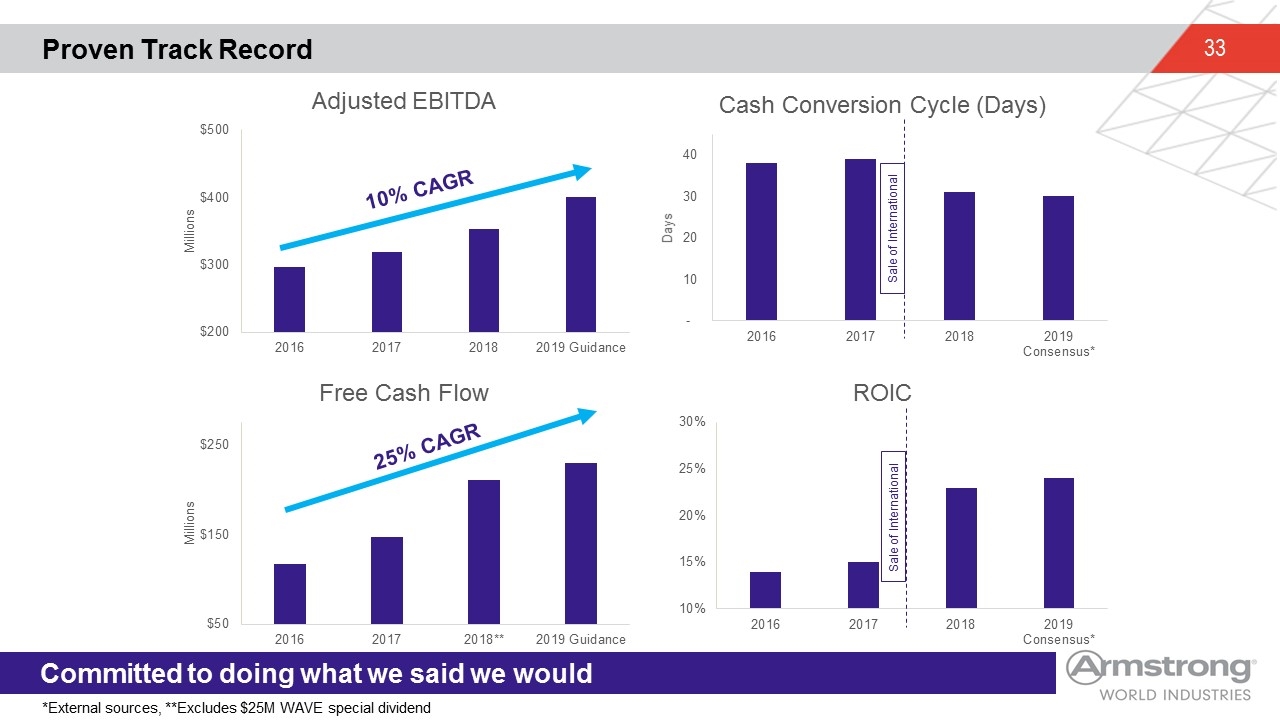
Proven Track Record Committed to doing what we said we would 25% CAGR *External sources, **Excludes $25M WAVE special dividend 10% CAGR Sale of International Sale of International
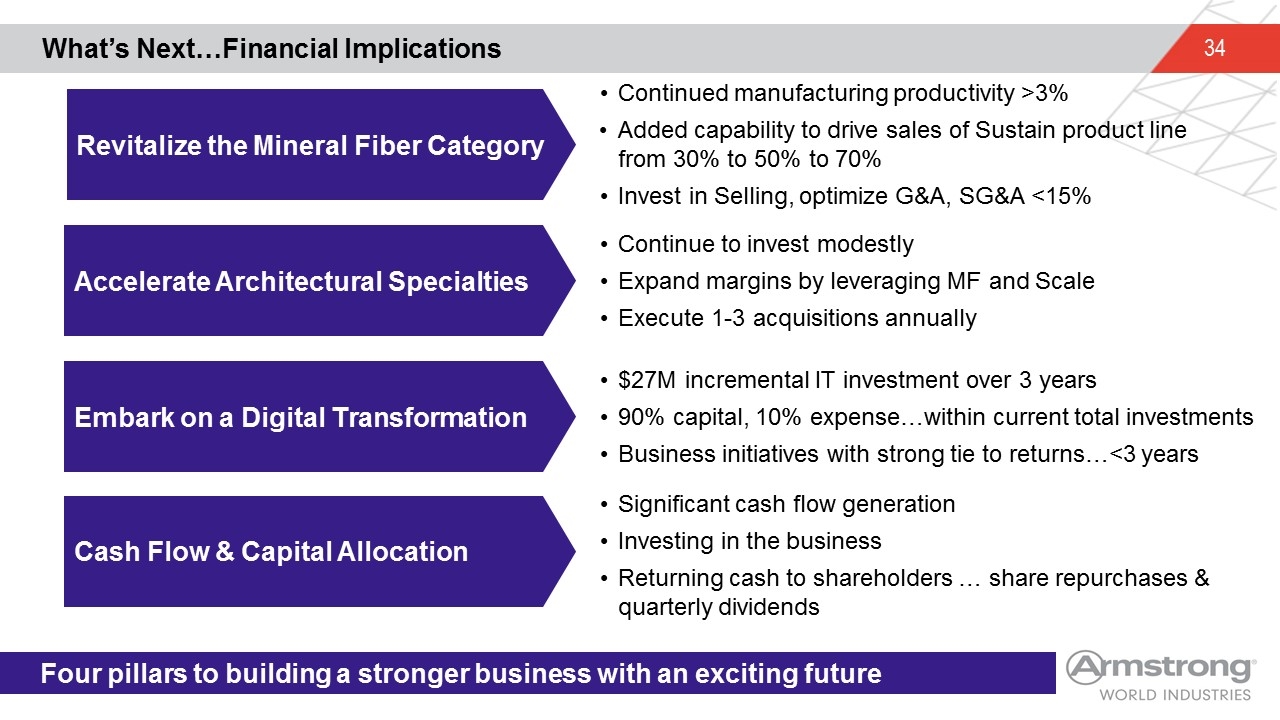
What’s Next…Financial Implications Four pillars to building a stronger business with an exciting future Revitalize the Mineral Fiber Category Accelerate Architectural Specialties Embark on a Digital Transformation Cash Flow & Capital Allocation Continued manufacturing productivity >3% Added capability to drive sales of Sustain product line from 30% to 50% to 70% Invest in Selling, optimize G&A, SG&A <15% Continue to invest modestly Expand margins by leveraging MF and Scale Execute 1-3 acquisitions annually $27M incremental IT investment over 3 years 90% capital, 10% expense…within current total investments Business initiatives with strong tie to returns…<3 years Significant cash flow generation Investing in the business Returning cash to shareholders … share repurchases & quarterly dividends
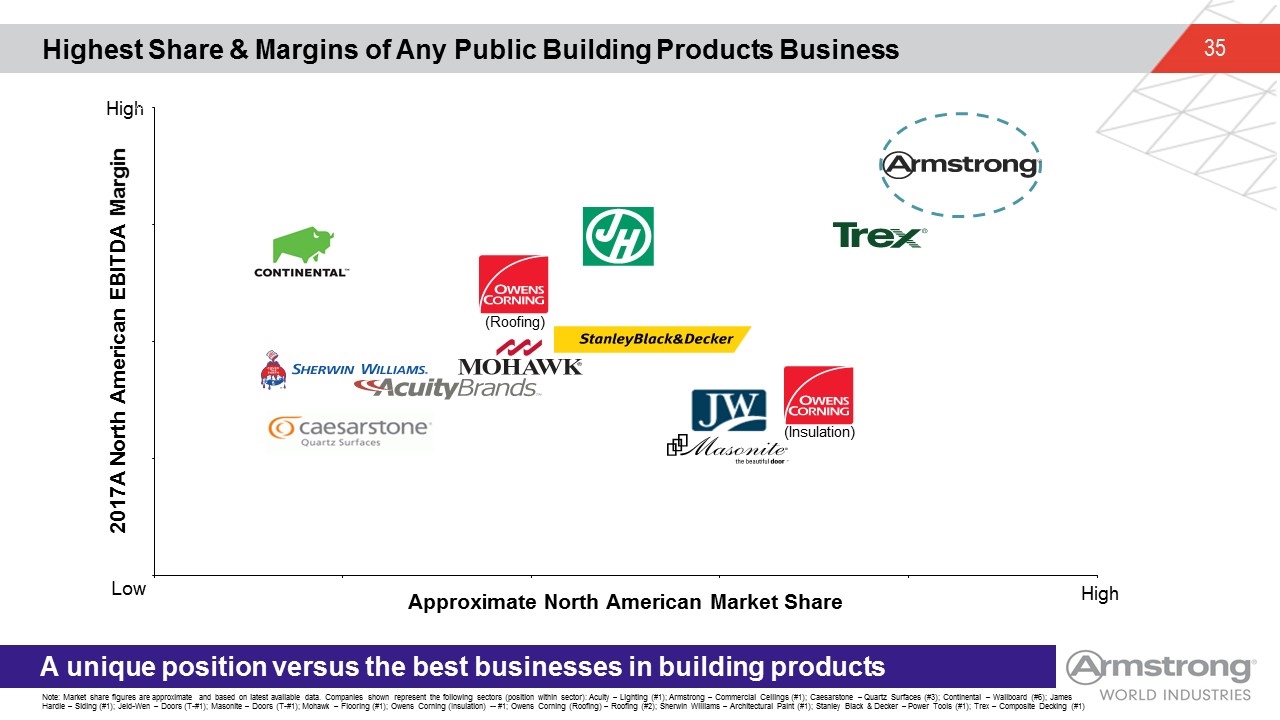
Highest Share & Margins of Any Public Building Products Business A unique position versus the best businesses in building products Note: Market share figures are approximate and based on latest available data. Companies shown represent the following sectors (position within sector): Acuity – Lighting (#1); Armstrong – Commercial Ceilings (#1); Caesarstone – Quartz Surfaces (#3); Continental – Wallboard (#6); James Hardie – Siding (#1); Jeld-Wen – Doors (T-#1); Masonite – Doors (T-#1); Mohawk – Flooring (#1); Owens Corning (Insulation) -- #1; Owens Corning (Roofing) – Roofing (#2); Sherwin Williams – Architectural Paint (#1); Stanley Black & Decker – Power Tools (#1); Trex – Composite Decking (#1) Low High High
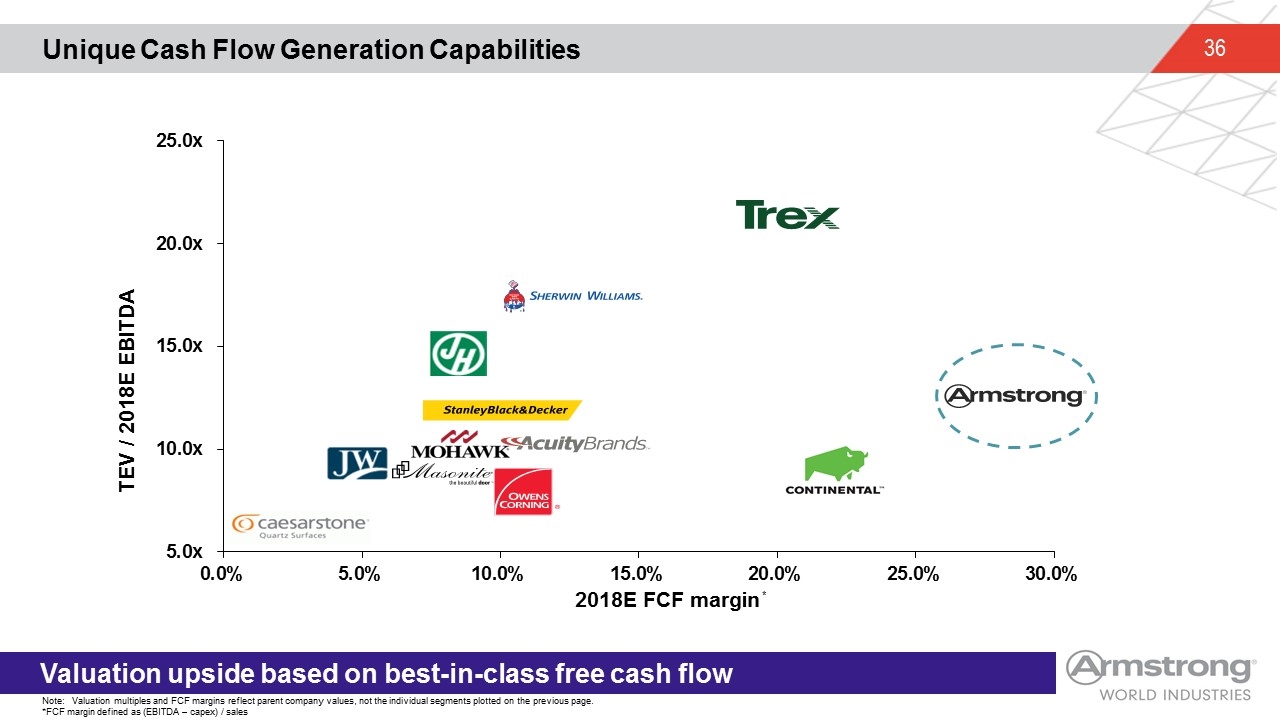
Unique Cash Flow Generation Capabilities Valuation upside based on best-in-class free cash flow Note: Valuation multiples and FCF margins reflect parent company values, not the individual segments plotted on the previous page. *FCF margin defined as (EBITDA – capex) / sales *
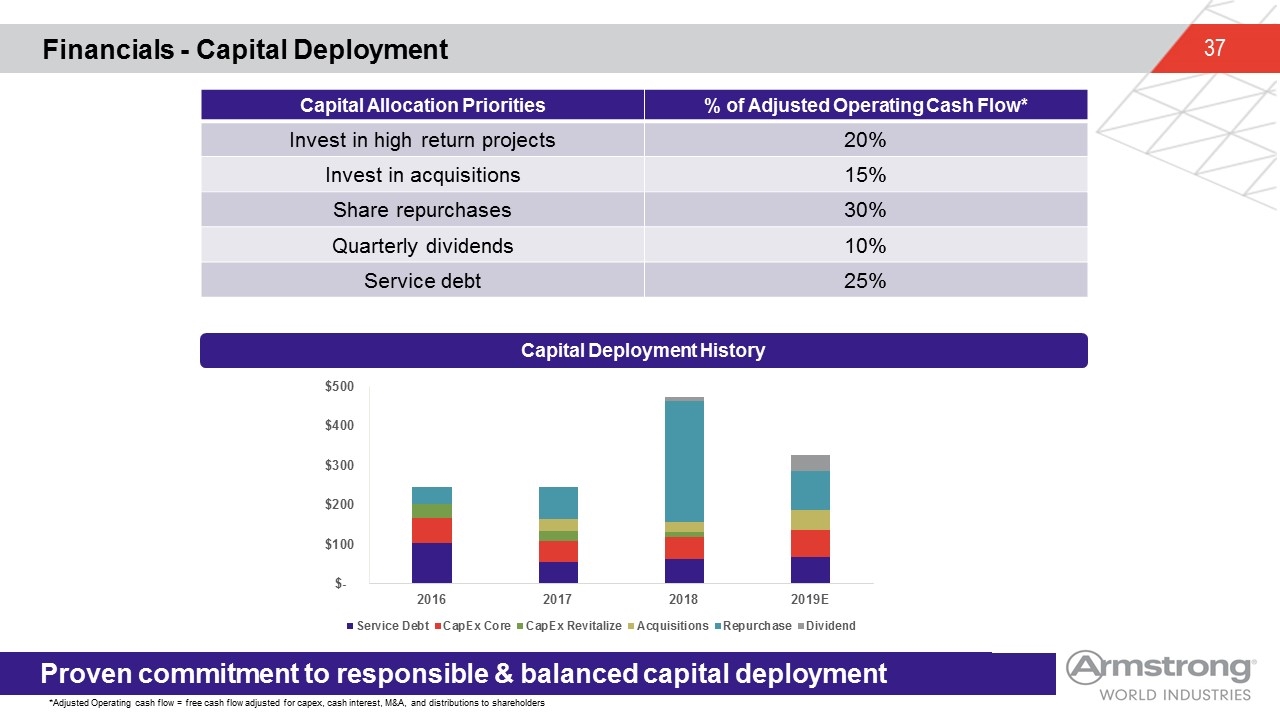
Financials - Capital Deployment Proven commitment to responsible & balanced capital deployment Capital Deployment History Capital Allocation Priorities % of Adjusted Operating Cash Flow* Invest in high return projects 20% Invest in acquisitions 15% Share repurchases 30% Quarterly dividends 10% Service debt 25% *Adjusted Operating cash flow = free cash flow adjusted for capex, cash interest, M&A, and distributions to shareholders
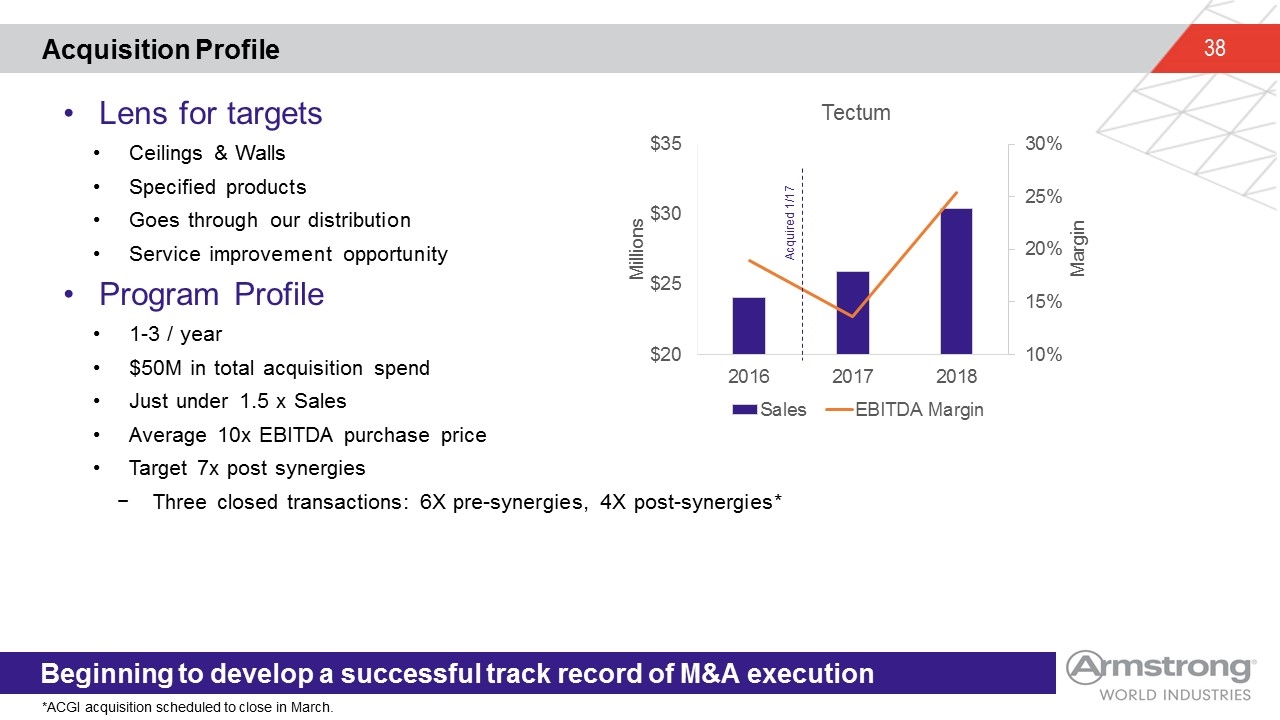
Lens for targets Ceilings & Walls Specified products Goes through our distribution Service improvement opportunity Program Profile 1-3 / year $50M in total acquisition spend Just under 1.5 x Sales Average 10x EBITDA purchase price Target 7x post synergies Three closed transactions: 6X pre-synergies, 4X post-synergies* Acquisition Profile Beginning to develop a successful track record of M&A execution Acquired 1/17 *ACGI acquisition scheduled to close in March.
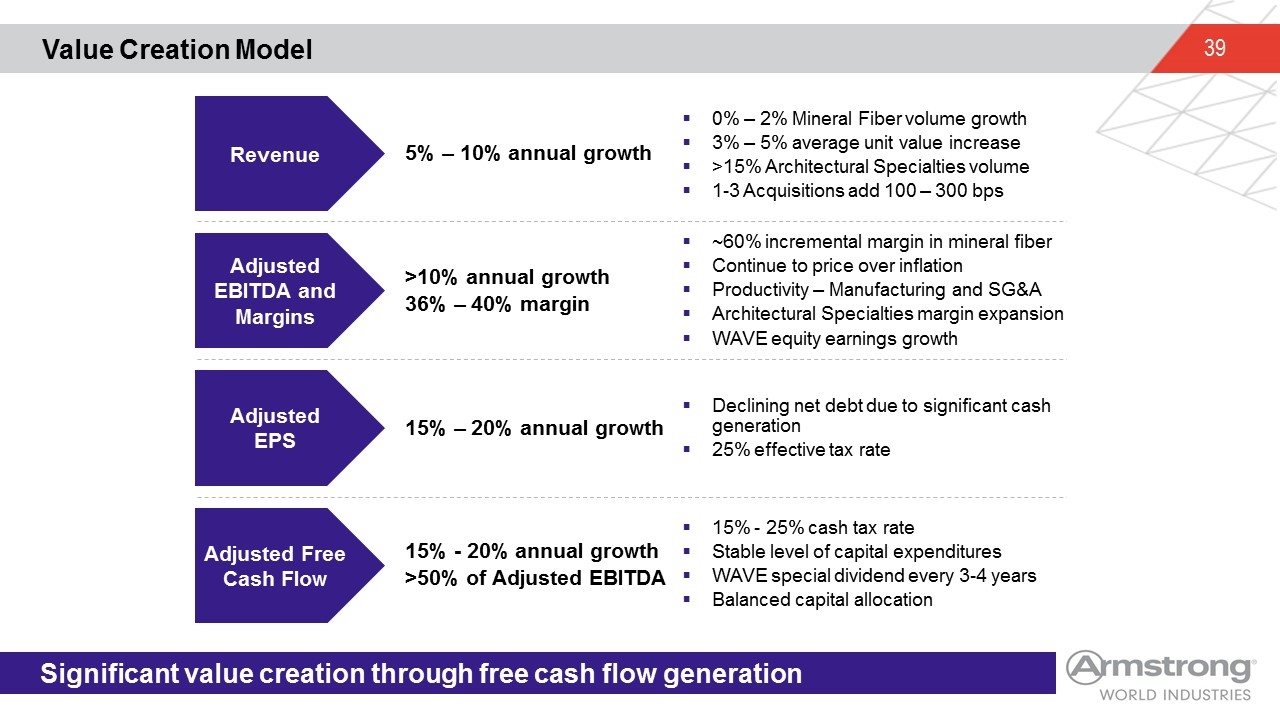
Value Creation Model Significant value creation through free cash flow generation Revenue 5% – 10% annual growth Adjusted EBITDA and Margins >10% annual growth 36% – 40% margin Adjusted EPS 15% – 20% annual growth Adjusted Free Cash Flow 15% - 20% annual growth >50% of Adjusted EBITDA 0% – 2% Mineral Fiber volume growth 3% – 5% average unit value increase >15% Architectural Specialties volume 1-3 Acquisitions add 100 – 300 bps ~60% incremental margin in mineral fiber Continue to price over inflation Productivity – Manufacturing and SG&A Architectural Specialties margin expansion WAVE equity earnings growth Declining net debt due to significant cash generation 25% effective tax rate 15% - 25% cash tax rate Stable level of capital expenditures WAVE special dividend every 3-4 years Balanced capital allocation
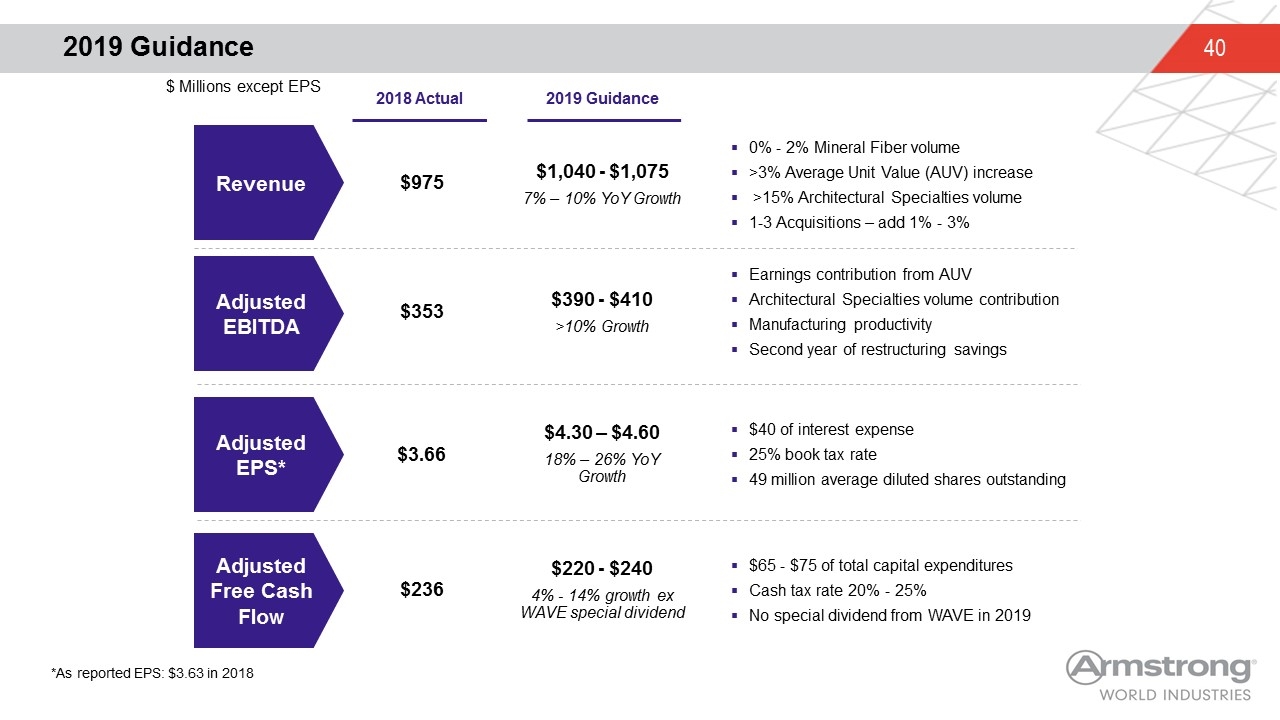
$4.30 – $4.60 18% – 26% YoY Growth $3.66 Adjusted EBITDA Adjusted EPS* Adjusted Free Cash Flow Revenue $975 $353 $1,040 - $1,075 7% – 10% YoY Growth $390 - $410 >10% Growth 0% - 2% Mineral Fiber volume >3% Average Unit Value (AUV) increase >15% Architectural Specialties volume 1-3 Acquisitions – add 1% - 3% Earnings contribution from AUV Architectural Specialties volume contribution Manufacturing productivity Second year of restructuring savings $65 - $75 of total capital expenditures Cash tax rate 20% - 25% No special dividend from WAVE in 2019 2018 Actual 2019 Guidance $40 of interest expense 25% book tax rate 49 million average diluted shares outstanding $220 - $240 4% - 14% growth ex WAVE special dividend $236 2019 Guidance $ Millions except EPS *As reported EPS: $3.63 in 2018
Appendix Management Biographies Balance Sheet Data Reconciliations to GAAP
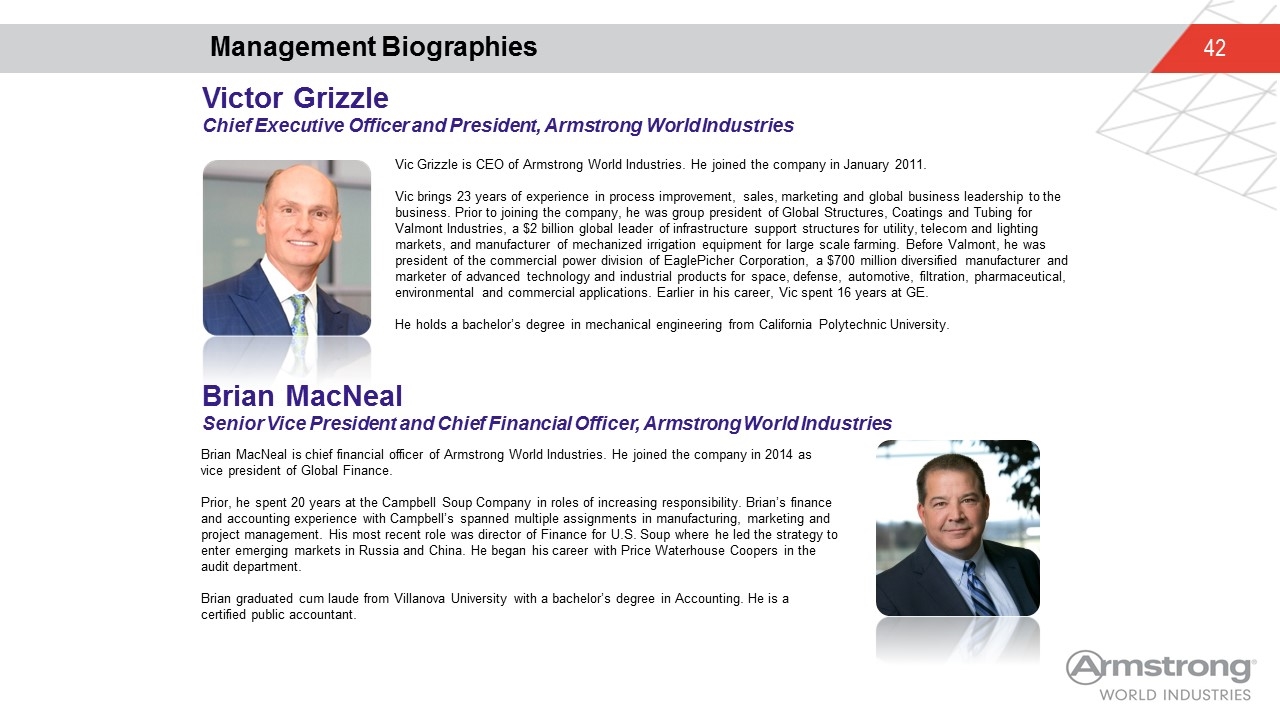
Management Biographies Brian MacNeal Senior Vice President and Chief Financial Officer, Armstrong World Industries Vic Grizzle is CEO of Armstrong World Industries. He joined the company in January 2011. Vic brings 23 years of experience in process improvement, sales, marketing and global business leadership to the business. Prior to joining the company, he was group president of Global Structures, Coatings and Tubing for Valmont Industries, a $2 billion global leader of infrastructure support structures for utility, telecom and lighting markets, and manufacturer of mechanized irrigation equipment for large scale farming. Before Valmont, he was president of the commercial power division of EaglePicher Corporation, a $700 million diversified manufacturer and marketer of advanced technology and industrial products for space, defense, automotive, filtration, pharmaceutical, environmental and commercial applications. Earlier in his career, Vic spent 16 years at GE. He holds a bachelor’s degree in mechanical engineering from California Polytechnic University. Brian MacNeal is chief financial officer of Armstrong World Industries. He joined the company in 2014 as vice president of Global Finance. Prior, he spent 20 years at the Campbell Soup Company in roles of increasing responsibility. Brian’s finance and accounting experience with Campbell’s spanned multiple assignments in manufacturing, marketing and project management. His most recent role was director of Finance for U.S. Soup where he led the strategy to enter emerging markets in Russia and China. He began his career with Price Waterhouse Coopers in the audit department. Brian graduated cum laude from Villanova University with a bachelor’s degree in Accounting. He is a certified public accountant. Victor Grizzle Chief Executive Officer and President, Armstrong World Industries
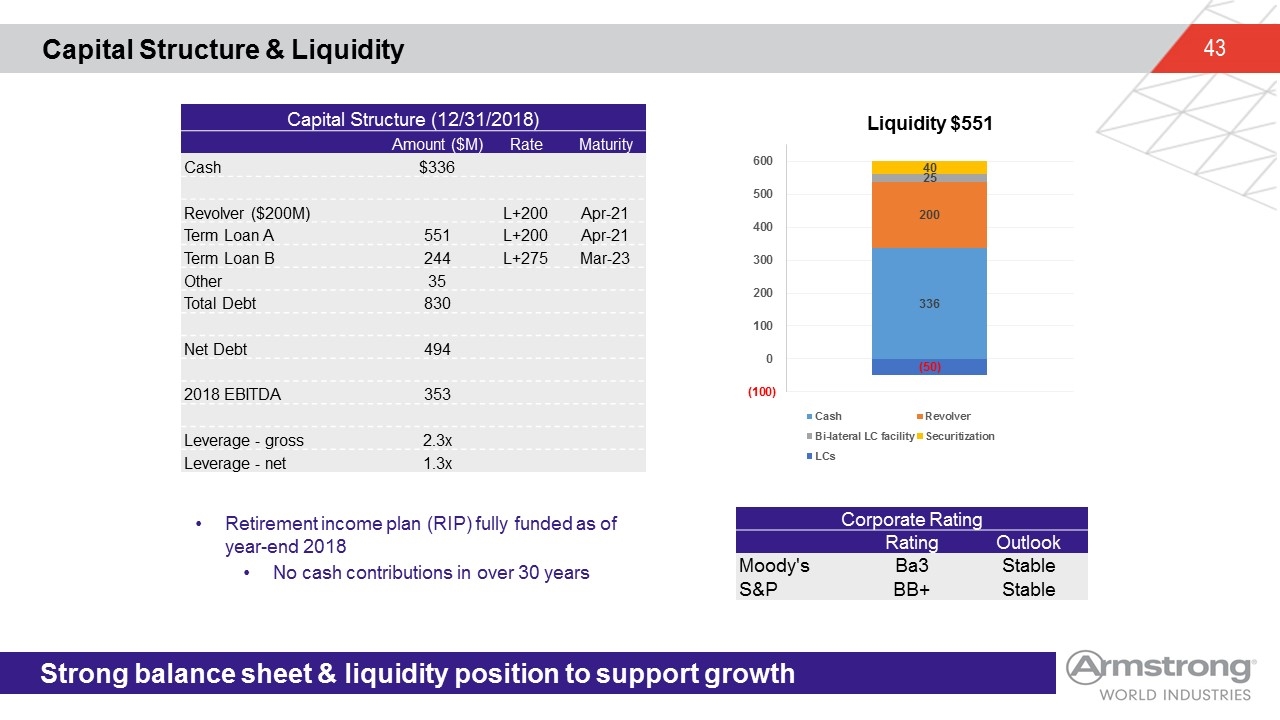
Capital Structure & Liquidity Strong balance sheet & liquidity position to support growth Capital Structure (12/31/2018) Amount ($M) Rate Maturity Cash $336 Revolver ($200M) L+200 Apr-21 Term Loan A 551 L+200 Apr-21 Term Loan B 244 L+275 Mar-23 Other 35 Total Debt 830 Net Debt 494 2018 EBITDA 353 Leverage - gross 2.3x Leverage - net 1.3x Corporate Rating Rating Outlook Moody's Ba3 Stable S&P BB+ Stable Retirement income plan (RIP) fully funded as of year-end 2018 No cash contributions in over 30 years Liquidity $551
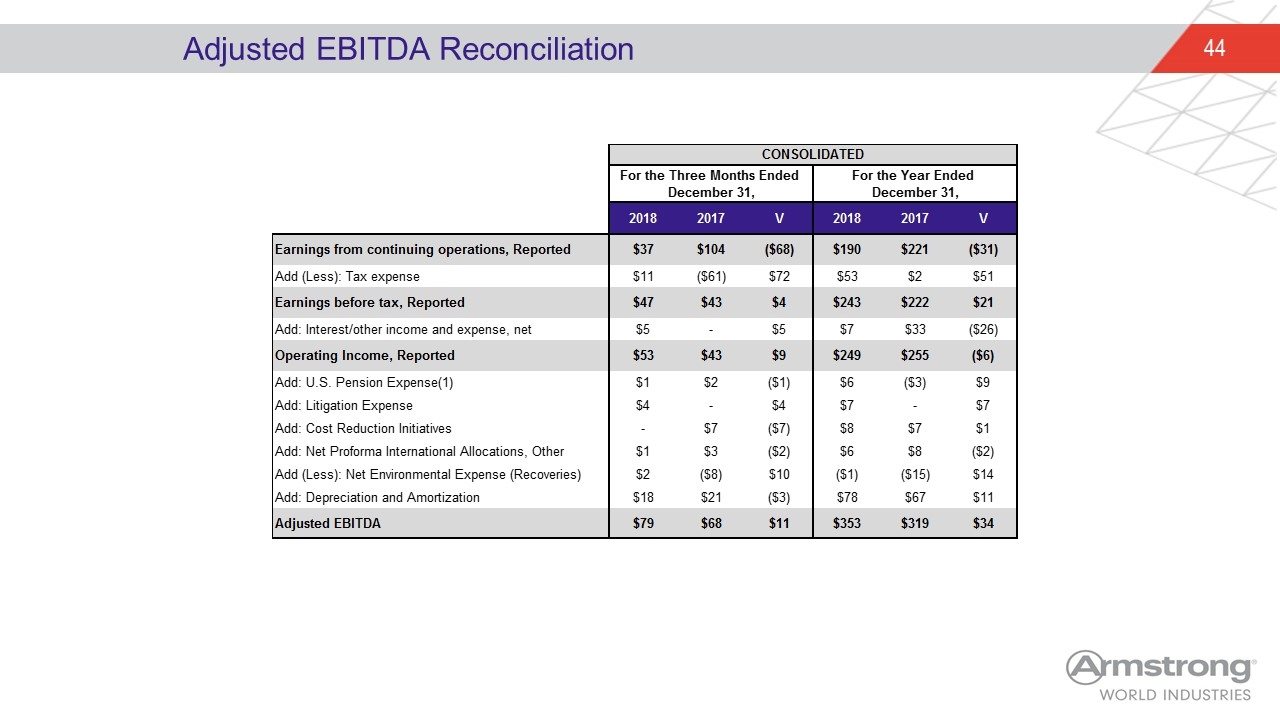
Adjusted EBITDA Reconciliation CONSOLIDATED For the Three Months Ended December 31, For the Year Ended December 31, qtr YTD 2018 2017 V 2018 2017 V Earnings from continuing operations, Reported 36.599999999999994 104.10000000000001 -67.500000000000014 189.6 220.59999999999997 -30.999999999999972 rounding Add (Less): Tax expense 10.800000000000004 -60.7 71.5 53 2 51 Earnings before tax, Reported 47.400000000000006 43.400000000000006 4 243 222 21 rounding Add: Interest/other income and expense, net 5.100000000000005 0 5.100000000000005 7 33 -26 Operating Income, Reported 52.5 43.3 9.2000000000000028 249 255 -6 Add: U.S. Pension Expense(1) 1.4346810000000001 2 -0.5653189999999999 6 -3 9 Add: Litigation Expense 3.8 0 3.8 7 0 7 Add: Cost Reduction Initiatives 0 6.7489999999999997 -6.7489999999999997 8 7 1 changed c12 to a dash from $0 (redo formula) Add: Net Proforma International Allocations, Other 1 3 -2 6 8 -2 Add (Less): Net Environmental Expense (Recoveries) 2 -8 10 -1 -15 14 Add: Depreciation and Amortization 18 21 -3 78 67 11 Adjusted EBITDA 79 68 11 353 319 34 rounding
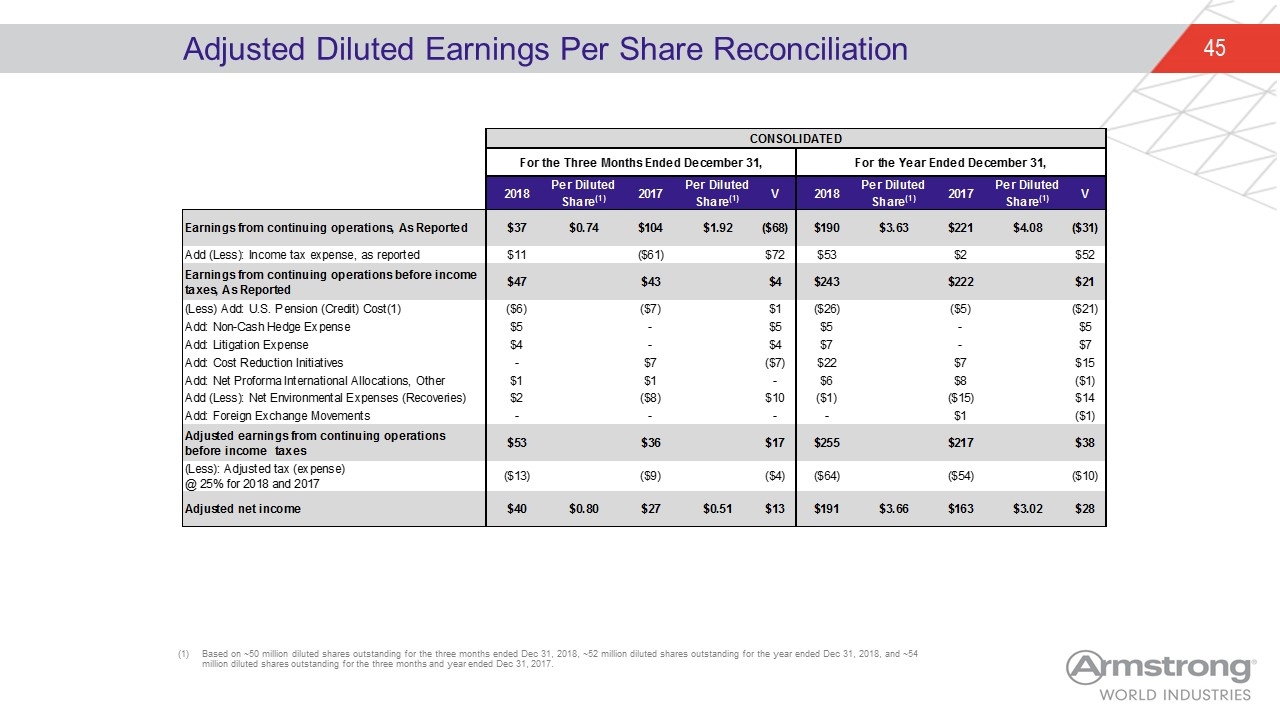
Adjusted Diluted Earnings Per Share Reconciliation Based on ~50 million diluted shares outstanding for the three months ended Dec 31, 2018, ~52 million diluted shares outstanding for the year ended Dec 31, 2018, and ~54 million diluted shares outstanding for the three months and year ended Dec 31, 2017. CONSOLIDATED For the Three Months Ended December 31, For the Year Ended December 31, 2018 Per DilutedShare(1) 2017 Per DilutedShare(1) V 2018 Per DilutedShare(1) 2017 Per DilutedShare(1) V Qtr YTD Earnings from continuing operations, As Reported 36.599999999999994 $0.73999999999999977 104.10000000000001 $1.92 -67.500000000000014 189.6 $3.63 220.59999999999997 $4.08 -30.999999999999972 rounding Add (Less): Income tax expense, as reported 10.800000000000004 -60.7 71.5 53.1 1.5 51.6 Earnings from continuing operations before income taxes, As Reported 47.4 43.400000000000006 3.9999999999999929 242.7 222.09999999999997 20.600000000000023 rounding rounding (Less) Add: U.S. Pension (Credit) Cost(1) -6 -7 1 -26.3 -5 -21.3 Add: Non-Cash Hedge Expense 4.5999999999999996 0 4.5999999999999996 4.5999999999999996 0 4.5999999999999996 Add: Litigation Expense 3.8 0 3.8 6.5 0 6.5 Add: Cost Reduction Initiatives 0 6.7489999999999997 -6.7489999999999997 21.954000000000001 6.7492400000000004 15.20476 changed c11 to zero from $0 Add: Net Proforma International Allocations, Other 1.125 1.1280000000000001 0 6.3159999999999998 7.6199999999999992 -1.3039999999999994 Add (Less): Net Environmental Expenses (Recoveries) 1.7 -8 9.6999999999999993 -1.17 -14.766999999999999 13.597 Add: Foreign Exchange Movements 0 0 0 0 1.02 -1.02 Adjusted earnings from continuing operations before income taxes 53.082999999999998 36.277000000000008 16.80599999999999 254.6 216.70223999999996 37.897760000000034 (Less): Adjusted tax (expense) @ 25% for 2018 and 2017 -13 -9 -4 -64 -54 -10 Adjusted net income 40.082999999999998 $0.79687872763419487 27.277000000000008 $0.50985046728971983 12.80599999999999 190.6 $3.66 162.70223999999996 $3.02 27.897760000000034
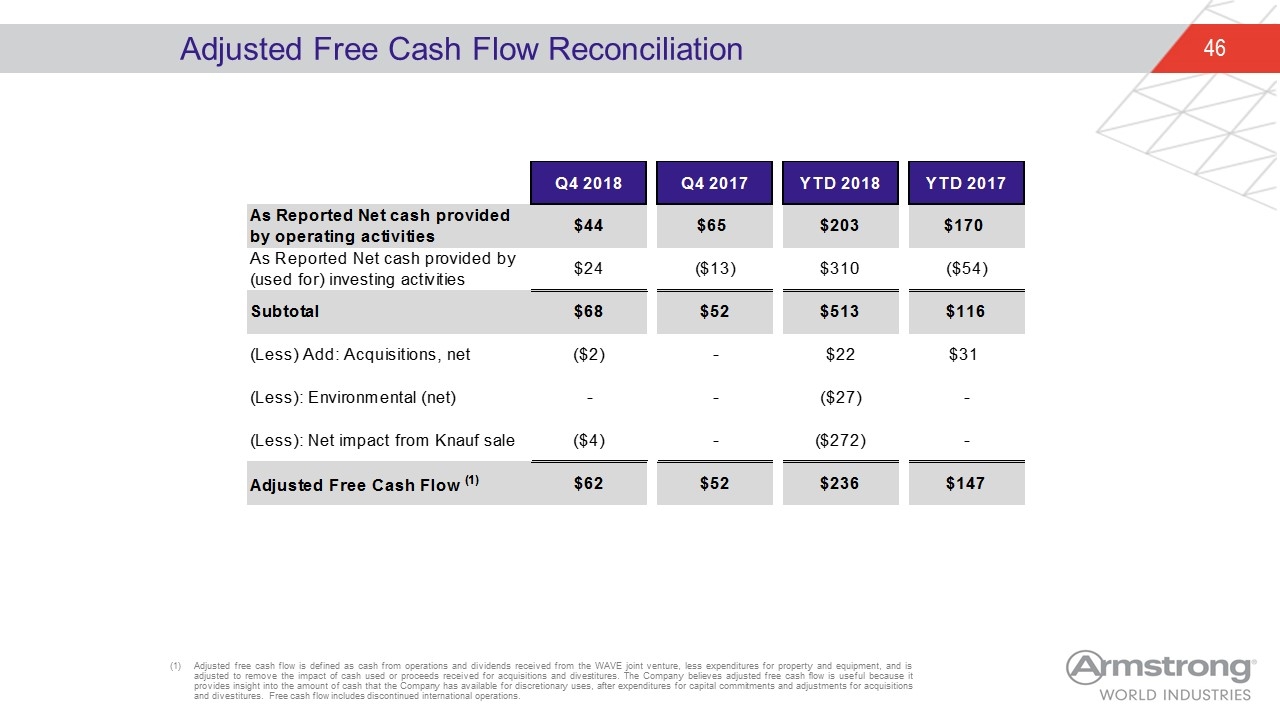
Adjusted Free Cash Flow Reconciliation Adjusted free cash flow is defined as cash from operations and dividends received from the WAVE joint venture, less expenditures for property and equipment, and is adjusted to remove the impact of cash used or proceeds received for acquisitions and divestitures. The Company believes adjusted free cash flow is useful because it provides insight into the amount of cash that the Company has available for discretionary uses, after expenditures for capital commitments and adjustments for acquisitions and divestitures. Free cash flow includes discontinued international operations. Q4 2018 Q4 2017 YTD 2018 YTD 2017 As Reported Net cash provided by operating activities $44 $65 $203 $170 As Reported Net cash provided by (used for) investing activities $24 $-13 $310 $-54 Subtotal $68 $52 $513 $116 (Less) Add: Acquisitions, net $-2 - $22 $31.4 (Less): Environmental (net) - - $-27 - (Less): Net impact from Knauf sale $-4 - $-,272 - Adjusted Free Cash Flow (1) $62 $52 $236 $147.4
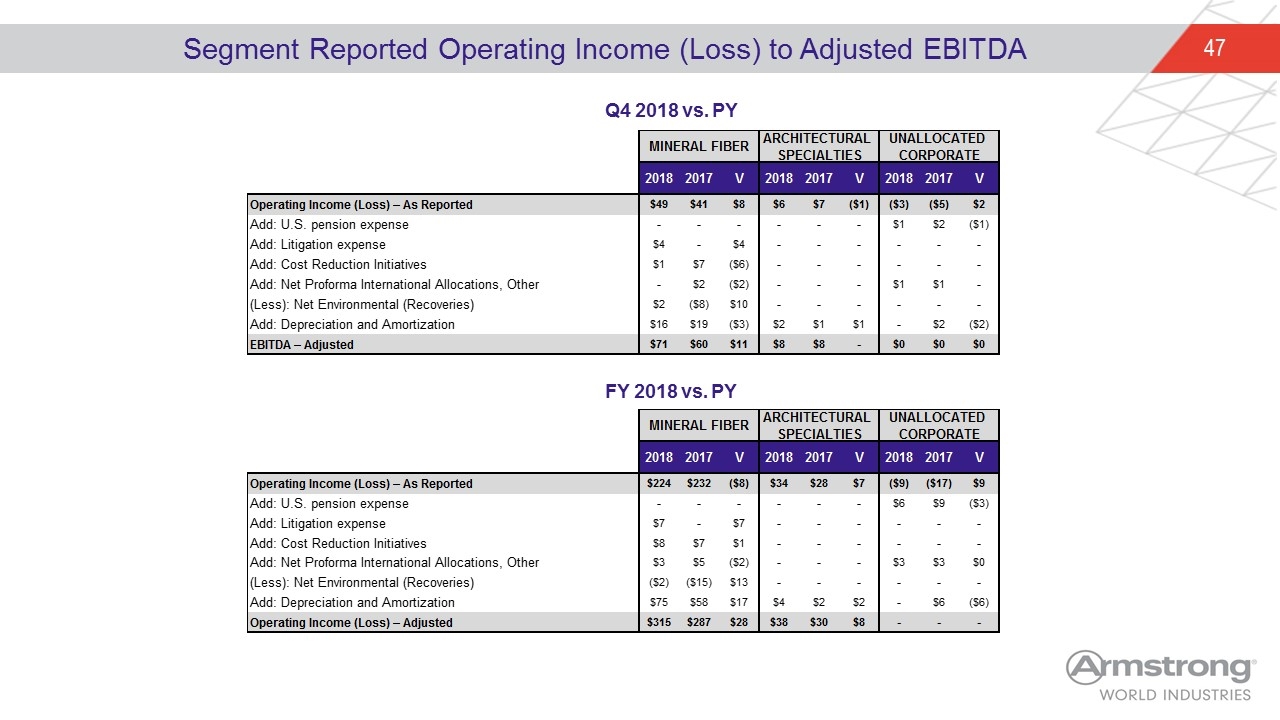
Segment Reported Operating Income (Loss) to Adjusted EBITDA Q4 2018 vs. PY FY 2018 vs. PY MINERAL FIBER ARCHITECTURAL SPECIALTIES UNALLOCATED CORPORATE rounding factor 2016 V 2018 2017 V 2018 2017 V 2018 2017 V Operating Income (Loss) – As Reported 223.8 232 -8.1999999999999886 34.299999999999997 27.7 6.5999999999999979 -8.6999999999999993 -17.399999999999999 8.6999999999999993 Add: U.S. pension expense 0 0 0 0 0 0 5.74 8.5 -2.76 Add: Litigation expense 6.5 0 6.5 0 0 0 0 0 0 Add: Cost Reduction Initiatives 7.95 6.62 1.33 0 0 0 0 0 0 Add: Net Proforma International Allocations, Other 2.9 4.54 -1.6400000000000001 0 0 0 2.92 2.7 0.21999999999999975 check cell n12, was not working properly (Less): Net Environmental (Recoveries) -1.63 -14.77 13.14 0 0 0 0 0 0 Add: Depreciation and Amortization 75.349999999999994 58.4 16.949999999999996 3.53 1.87 1.6599999999999997 0 5.8 -5.8 Operating Income (Loss) – Adjusted 314.87 286.78999999999996 28.080000000000041 37.83 29.57 8.259999999999998 0 0 0 MINERAL FIBER ARCHITECTURAL SPECIALTIES UNALLOCATED CORPORATE rounding factor 2016 V 2018 2017 V 2018 2017 V 2018 2017 V Operating Income (Loss) – As Reported 48.9 40.799999999999997 8.1000000000000014 6.1 7.1 -1 -2.5 -4.5999999999999996 2.0999999999999996 Add: U.S. pension expense 0 0 0 0 0 0 1 2.2000000000000002 -1.2000000000000002 Add: Litigation expense 3.8 0 3.8 0 0 0 0 0 0 Add: Cost Reduction Initiatives 0.5 6.6 -6.1 0 0 0 0 0 0 Add: Net Proforma International Allocations, Other 0 2.2999999999999998 -2.2999999999999998 0 0 0 1 0.5 - check cell n12, was not working properly (Less): Net Environmental (Recoveries) 1.8 -8 9.8000000000000007 0 0 0 0 0 0 Add: Depreciation and Amortization 15.8 18.5 -2.6999999999999993 2 1 1 0 1.6 -1.6 EBITDA – Adjusted 71.099999999999994 60 11.099999999999994 8.1 8.1 0 0.10640799999999995 0.37500000000000067 0.37500000000000067
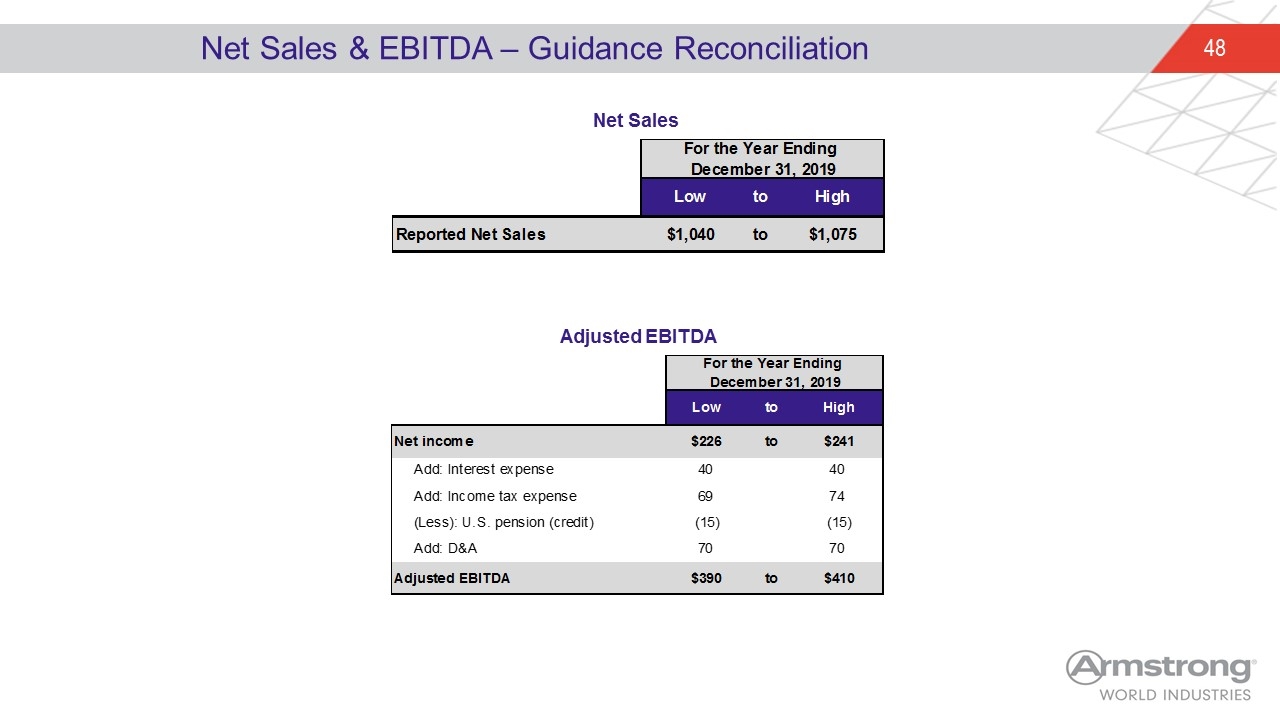
Net Sales & EBITDA – Guidance Reconciliation Net Sales Adjusted EBITDA For the Year Ending December 31, 2019 Low to High Reported Net Sales $1,040 to $1,075 For the Year Ending December 31, 2019 Low to High Net income $226 to $241 Add: Interest expense 40 40 Add: Income tax expense 69 74 (Less): U.S. pension (credit) -15 -15 Add: D&A 70 70 Adjusted EBITDA $390 to $410
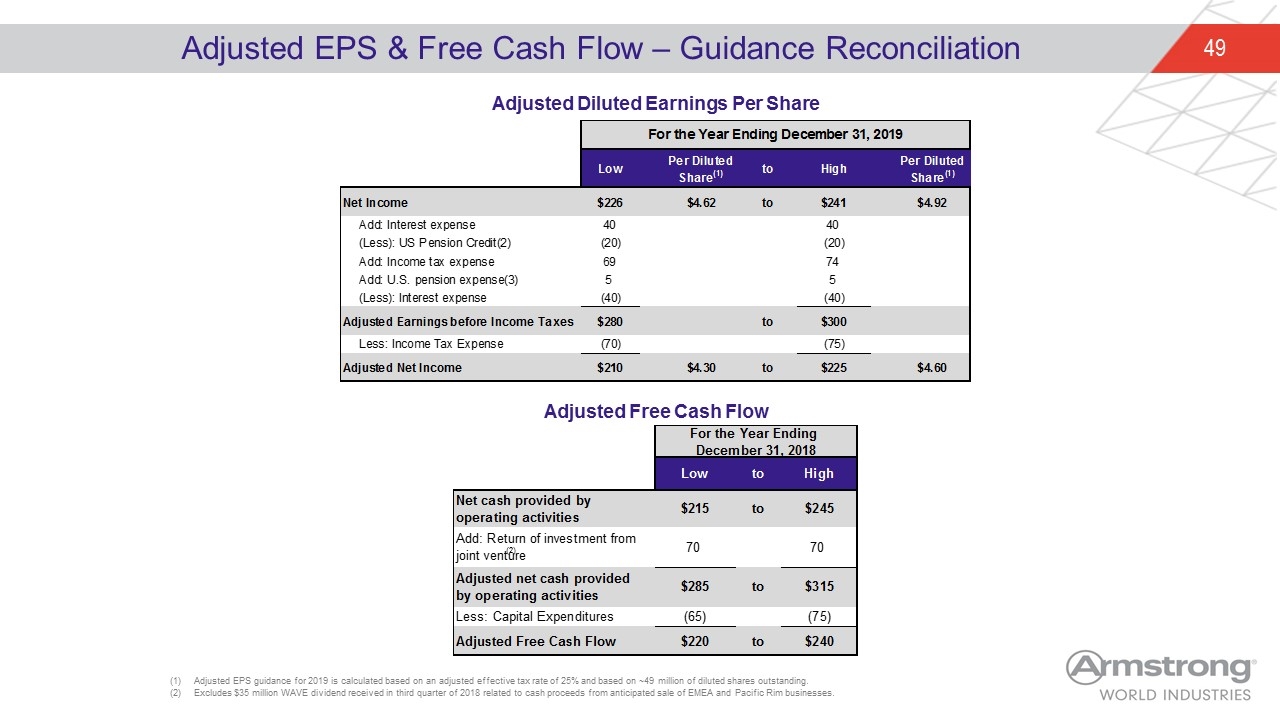
Adjusted EPS & Free Cash Flow – Guidance Reconciliation Adjusted Diluted Earnings Per Share Adjusted Free Cash Flow Adjusted EPS guidance for 2019 is calculated based on an adjusted effective tax rate of 25% and based on ~49 million of diluted shares outstanding. Excludes $35 million WAVE dividend received in third quarter of 2018 related to cash proceeds from anticipated sale of EMEA and Pacific Rim businesses. (2) For the Year Ending December 31, 2018 Low to High Net cash provided by operating activities $215 to $245 Add: Return of investment from joint venture 70 70 Adjusted net cash provided by operating activities $285 to $315 Less: Capital Expenditures -65 -75 Adjusted Free Cash Flow $220 to $240 For the Year Ending December 31, 2019 Low Per DilutedShare(1) to High Per DilutedShare(1) Net Income $226 $4.62 to $241 $4.92 Add: Interest expense 40 40 (Less): US Pension Credit(2) -20 -20 Add: Income tax expense 69 74 Add: U.S. pension expense(3) 5 5 (Less): Interest expense -40 -40 Adjusted Earnings before Income Taxes $280 to $300 Less: Income Tax Expense -70 -75 Adjusted Net Income $210 $4.3 to $225 $4.5999999999999996


