UNITED STATES
SECURITIES AND EXCHANGE COMMISSION
Washington, D.C. 20549
FORM N-CSR
CERTIFIED SHAREHOLDER REPORT OF REGISTERED MANAGEMENT INVESTMENT COMPANIES
Investment Company Act file number: 811-4000
Summit Mutual Funds, Inc.
(Exact name of registrant as specified in charter)
312 Walnut Street, Suite 2500, Cincinnati, Ohio 45202
(Address of principal executive offices) (Zip code)
John F. Labmeier, Esq.
Summit Investment Partners, Inc.
312 Walnut Street, Suite 2500
Cincinnati, Ohio 45202
(Name and address of agent for service)
(513) 632-1600
Registrant's telephone number, including area code
Date of fiscal year end: September 30, 2007
Date of reporting period: September 30, 2007
Item 1. Report to Stockholders.

Summit Mutual Funds, Inc. – Apex Series |
| Message from the President | 1 |
Fund Expenses | 2 |
| | |
| Portfolio Managers’ Reports and Financial Statements: | |
Nasdaq-100 Index Fund | 3 |
Everest Fund | 10 |
Bond Fund | 16 |
Short-term Government Fund | 25 |
High Yield Bond Fund | 31 |
Money Market Fund | 38 |
Large Cap Growth Fund | 45 |
| | |
| Notes to Financial Statements | 51 |
| | |
| Report of Independent Registered Public Accounting Firm | 55 |
Important Considerations about Investing in Summit Mutual Funds
A description of the policies and procedures that the Funds use to determine how to vote proxies relating to portfolio securities and information regarding how the Funds voted portfolio securities during the most recent 12 month period ended September 30 is available without charge, upon request, by calling 1-877-546-FUND, or on the Funds’ website at www.summitfunds.com, or on the Securities and Exchange Commission’s website at www.sec.gov.
This Fund files a complete Schedule of Investments in Securities with the SEC for the first and third quarters of each fiscal year on Form N-Q. The Funds’ Form N-Q is available on the Fund’s or SEC’s website. The Funds’ Form N-Q may also be reviewed and copied at the SEC’s Public Reference Room in Washington, DC. Information on the operation of the Public Reference Room may be obtained by calling 1-800-SEC-0330.
This report has been prepared for the information of shareholders and is not authorized for distribution to prospective purchasers of shares unless it is preceded or accompanied by an effective prospectus for Summit Mutual Funds, Inc.
Mutual fund investing involves risk. Principal loss is possible.
The Short-term Government Fund, Money Market Fund, High Yield Bond Fund, and Bond Fund invest in debt securities. Investments in debt securities typically decrease in value when interest rates rise. This risk is usually greater for longer-term debt securities.
Investments by the High Yield Bond Fund and Bond Fund in lower-rated and non-rated securities present a greater risk of loss to principal and interest than higher-rated securities.
An investment in the Money Market Fund is not insured or guaranteed by the Federal Deposit Insurance Corporation or any other government agency. Although the Fund seeks to preserve the value of your investment at $1.00 per share, it is possible to lose money by investing in the Fund.
Because the Nasdaq-100 Index Fund has expenses, and the Nasdaq-100 Index does not, the Fund may be unable to replicate precisely the performance of the Index. While the Fund remains small, it may have a greater risk that its performance will not match that of the Index.
All indexes listed in the report are unmanaged, and are not available for direct investment.
The Manager Comments provided in this report reflect the opinions of the Fund’s Portfolio Managers and are not intended to be a forecast of future events, a guarantee of future results, nor investment advice.
Summit Mutual Funds, Inc. MESSAGE FROM THE PRESIDENT |
We are pleased to send you Summit Mutual Funds’ 2007 Annual Report for the twelve-month period ended September 30, 2007. We welcome new and thank existing investors in the Summit Funds as we strive to help you reach your financial goals. Financial markets performed well over the last year, providing positive returns in all of the major domestic stock and bond indexes. Large cap growth equities, as measured by the Nasdaq 100 Index, lead the major market indexes over the last 12 months, providing a return of 27.01%. International equities also performed well, with the EAFE International index providing a return of 24.86% (in U.S. dollars and net of foreign taxes) over the same period. In the fixed income markets, high yield indexes outperformed broader, investment grade fixed income indexes, such as the Lehman Aggregate Bond Index. Economic indicators continue to provide mixed signals, but it appears that the economy may slow going into 2008. The fallout from poorly underwritten sub-prime mortgage loans continues to negatively affect the housing market and is slowly spreading to other sectors of the economy. In addition, tightening credit standards will negatively impact the economy, although to what degree is still up for debate. As always, employment and the consumer’s willingness and ability to spend will play a major role in the magnitude and duration of any slowdown. International growth remains strong, and a weaker U.S. dollar should benefit exporters and producers of commodities that are denominated in U.S. dollars, such as oil. Oil prices remain at very high levels, and continue to increase as of this writing, with no immediate end in sight. Higher energy prices will put a further drag on the economy. | The Federal Reserve Board reacted to the tightening credit markets and the prospect for slower growth by cutting the Fed Funds rate 0.50% in September 2007 to 4.75%. Given the current structure of U.S. Treasury Securities interest rates over all maturities, the marketplace is anticipating further cuts in the Fed Funds Rate. Chairman Bernanke continues to weigh the risks of slowing growth and tighter credit against a weaker dollar and long term inflation risks. For now, it appears that Chairman Bernanke is more concerned about the former than the latter. Hence, the direction of short-term rates is downward for now. Equity markets have mostly ignored the issues in the credit markets and have instead chosen to focus on price to earnings multiples and the possibility of improved earnings in the future. For the fiscal year ended September 30th, the large cap S&P 500 Index advanced 16.44%, the S&P MidCap 400 Index improved 18.76% and the small cap Russell 2000 Index rose 12.34%. Small cap stocks lagged for the first time in several years. In addition, growth stocks outperformed value stocks for the year, which suggests the market may be changing its focus. “Maintain the proper perspective (and) have realistic expectations . . .” Fixed income markets provided positive returns over the last twelve months, as well. Short and intermediate term interest rates declined materially, while longer term interest rates were mostly unchanged. The 2 year Treasury yield declined 0.70% to 3.98%, while the 10 year Treasury rate remained mostly unchanged at 4.59%. Credit spreads (the interest rate difference between risk-free U.S. Treasury securities and other fixed income securities) generally widened during the period, as market participants began repricing risk in June 2007. In this environment, the Lehman Aggregate Bond Index provided a positive return of 5.14% over the last twelve months. The high yield market provided an even higher return of 7.75% as measured by the Merrill Lynch High Yield Master II Index during the same period. | “Proper diversification of your investments . . . is an important component of achieving your long-term investment goals.” Looking out into 2008, there is much uncertainty regarding the rate of U.S. economic growth, corporate profitability and interest rates. The Federal Reserve, through its actions, has made it clear that it will provide liquidity to the market when needed. However, it has also made it clear that it is not their job to bail out investors who simply made bad investments. Our message remains the same though, as we enter 2008. Maintain the proper perspective, have realistic expectations and ensure that your investment strategy is appropriate for your risk tolerance and time horizon. Concepts such as asset allocation and portfolio rebalancing are critical. Proper diversification of your investments, both within and across asset sectors, is an important component of achieving your long-term investment goals. Summit Mutual Funds provides a solid foundation for diversified investment planning with choices across equity and fixed income styles. Thank you for choosing Summit Funds and for the trust that you have placed in us. Steven R. Sutermeister President |
Summit Mutual Funds, Inc. – Apex Series 2007 ANNUAL REPORT – FUND EXPENSES (UNAUDITED) |
As a shareholder of the Fund, you incur two types of costs: (1) transaction costs, including sales charges (loads) on purchase payments, and (2) ongoing costs, including management fees, distribution and/or service (12b-1) fees, and other Fund expenses. The following Example is intended to help you understand your ongoing costs (in dollars) of investing in the Fund and to compare these costs with the ongoing costs of investing in other mutual funds. Please note that the expenses shown in the Example do not reflect transactional costs. If transactional costs were included, your costs would have been higher.
The Example is based on an investment of $1,000 invested at the beginning of the period and held for the entire period April 1, 2007 through September 30, 2007.
Actual Expenses
The first section of the table below provides information about actual account values and actual net expenses. You may use the information in this section, together with the amount you invested, to estimate the expenses that you paid over the period. Simply divide your account value by $1,000 (for example, an $8,600 account value divided by $1,000 = 8.6), then multiply the result by the number in the first section under the heading entitled “Expenses Paid” to estimate the expenses you paid on your account during this period.
Hypothetical Example for Comparison Purposes
The second section of the table below provides information about hypothetical account values and hypothetical expenses based on the Fund’s actual expense ratio, net of fee waivers and expense reimbursements, and an assumed rate of return of 5% per year before expenses, which is not the Fund’s actual return. The hypothetical account values and expenses cannot be used to estimate the actual ending account balance or expenses you paid for the period. You may use this information to compare the ongoing costs of investing in the Fund with those of other funds. To do so, compare this 5% hypothetical example with the 5% hypothetical examples that appear in the shareholder reports of other funds.
The information below is net of any applicable fee waivers and/or expense reductions, which lower expenses and increase performance. Please note that the second section of the table is useful in comparing ongoing costs only, and will not help you determine the relative total costs of owning different funds.
| | | | | |
| | | | | Expenses Paid* |
| | Beginning | Ending | Annualized | During Period |
| | Account Value | Account Value | Expense | April 1, 2007 to |
| Fund | April 1, 2007 | September 30, 2007 | Ratio | September 30, 2007 |
| | | | | |
Based on Actual Return | | | | |
| Nasdaq-100 Index Fund | $1,000.00 | $1,178.50 | 0.65% | $3.55 |
| Everest Fund Class I | 1,000.00 | 1,044.30 | 0.90% | 4.61 |
| Everest Fund Class A | 1,000.00 | 1,042.90 | 1.15% | 5.89 |
| Bond Fund Class I | 1,000.00 | 1,006.00 | 0.79% | 3.97 |
| Bond Fund Class A | 1,000.00 | 1,004.80 | 1.05% | 5.28 |
| Short-term Government Fund Class I | 1,000.00 | 1,026.20 | 0.73% | 3.71 |
| Short-term Government Fund Class A | 1,000.00 | 1,024.90 | 0.98% | 4.97 |
| High Yield Bond Fund Class I | 1,000.00 | 1,001.60 | 1.30% | 6.52 |
| High Yield Bond Fund Class A | 1,000.00 | 1,000.40 | 1.57% | 7.87 |
| Money Market Fund | 1,000.00 | 1,025.10 | 0.45% | 2.28 |
| Large Cap Growth Fund Class I | 1,000.00 | 1,103.10 | 1.10% | 5.80 |
| Large Cap Growth Fund Class A | 1,000.00 | 1,102.60 | 1.35% | 7.12 |
| | | | | |
Based on Hypothetical Return | | | | |
| (5% return before expenses) | | | | |
| Nasdaq-100 Index Fund | $1,000.00 | $1,021.81 | 0.65% | $3.29 |
| Everest Fund Class I | 1,000.00 | 1,020.51 | 0.90% | 4.56 |
| Everest Fund Class A | 1,000.00 | 1,019.25 | 1.15% | 5.82 |
| Bond Fund Class I | 1,000.00 | 1,021.26 | 0.79% | 4.00 |
| Bond Fund Class A | 1,000.00 | 1,019.90 | 1.05% | 5.32 |
| Short-term Government Fund Class I | 1,000.00 | 1,021.41 | 0.73% | 3.70 |
| Short-term Government Fund Class A | 1,000.00 | 1,020.16 | 0.98% | 4.96 |
| High Yield Bond Fund Class I | 1,000.00 | 1,018.80 | 1.30% | 6.58 |
| High Yield Bond Fund Class A | 1,000.00 | 1,017.35 | 1.57% | 7.94 |
| Money Market Fund | 1,000.00 | 1,022.81 | 0.45% | 2.28 |
| Large Cap Growth Fund Class I | 1,000.00 | 1,019.55 | 1.10% | 5.57 |
| Large Cap Growth Fund Class A | 1,000.00 | 1,018.30 | 1.35% | 6.83 |
* Expenses are equal to the Fund’s annualized net expense ratio, multiplied by the average account value over the period, multiplied by 183/365 (to reflect the one-half year period).
Summit Mutual Funds, Inc. – Apex Series |
Summit Nasdaq-100 Index Fund - Average Annual Total Return |
1-Y ear | 5-Year | Since Inception |
| | |
Past performance is not predictive of future results. Performance does not reflect the deduction of taxes that a shareholder would pay on fund distributions or redemption of fund shares. Absent limitation of expenses during certain of the periods shown, performance would have been lower.
| Managers: | Gary R. Rodmaker Nick J. Kotsonis Kevin P. Aug |
| Inception Date: | December 28, 1999 |
| Total Net Assets: | $24.1 Million |
| Number Of Equity Holdings: | 101 |
| Median Cap Size: | $10,033 Million |
Top 10 Equity Holdings | | Sector Allocations |
| | (% of net assets) | | |
Apple, Inc.Microsoft Corp. | | | 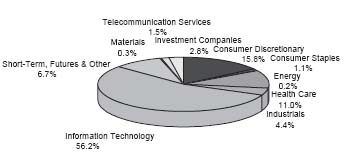 |
“Nasdaq” and related marks are trademarks or service marks of The Nasdaq Stock Market, Inc. and have been licensed for use for certain purposes by Summit Mutual Funds, Inc. and the Nasdaq-100 Index Fund. Nasdaq makes no warranty, express or implied, and bears no liability with respect to Summit Mutual Funds, its use of The Index, or any data include therein.
Summit Mutual Funds, Inc. – Apex Series |
Objective – Seeks investment results that correspond to the investment performance of U.S. common stocks, as represented by the Nasdaq-100 Index (the “Index”).
Strategy – The Nasdaq-100 Index Fund (the “Fund”) will attempt to achieve, in both rising and falling markets, a correlation of at least 95% between the total return of its net assets before expenses and the total return of the Index.
Managers’ Comments:
For the year ended September 30, 2007, the Summit Nasdaq-100 Index Fund’s total return for Class I shares was 26.16% (after waivers and reimbursements). This compares to a 27.01% total return for the Nasdaq-100 Index. The difference of 0.85% is referred to as “tracking error” and is largely attributed to the Fund’s operating expenses. These expenses represent the Fund’s costs for advisory, administration, accounting, custody and other services. The remaining difference can be caused by a number of factors, including the timing and size of shareholder subscriptions and redemptions into and out of the Fund, broker’s commissions or other trading costs, and holding security positions in amounts that are different than the weightings in the Index, among others. While an exact replication of the capitalization weightings of securities in the Index is not feasible, the Fund’s objectives and strategies call for a correlation of at least 95% between the Fund’s pre-expense total return and that of the Index. The Fund achieved this level of correlation for the period presented.
A correlation coefficient is a measure of the interdependence of two random variables that ranges in value from -1 to +1, indicating perfect negative correlation at -1, absence of correlation at zero, and perfect positive correlation at +1.
Summit Mutual Funds, Inc. – Apex Series |
| NASDAQ-100 INDEX FUND | FINANCIAL HIGHLIGHTS |
FINANCIAL HIGHLIGHTS | | | | | | | | | | | | | | | |
| Computed on the basis of a share of capital stock outstanding throughout the period. | | | | | | | | | | | | | | | |
| | | | | | | | | | | | | | | | |
| | | | | | | | | | | | | | | | |
| | | | | | | | | | | | | | | | |
| | | Fiscal Year Ended September 30, |
| | | 2007 | | | 2006 | | | 2005 | | | 2004 | | | 2003 | |
| Net asset value, beginning of period | | $ | 21.68 | | | $ | 21.09 | | | $ | 18.71 | | | $ | 17.35 | | | $ | 11.18 | |
| INVESTMENT ACTIVITIES: | | | | | | | | | | | | | | | | | | | | |
| Net investment income / (loss) | | | 0.01 | | | | 0.05 | (2) | | | 0.16 | | | | (0.07 | ) | | | (0.04 | ) |
| Net realized and unrealized gains / (losses) | | | 5.64 | | | | 0.61 | | | | 2.31 | | | | 1.43 | | | | 6.21 | |
| Total from Investment Activities | | | 5.65 | | | | 0.66 | | | | 2.47 | | | | 1.36 | | | | 6.17 | |
| DISTRIBUTIONS: | | | | | | | | | | | | | | | | | | | | |
| Net investment income | | | (0.06 | ) | | | (0.07 | ) | | | (0.09 | ) | | | — | | | | — | |
| Total Distributions | | | (0.06 | ) | | | (0.07 | ) | | | (0.09 | ) | | | — | | | | — | |
| Net asset value, end of period | | $ | 27.27 | | | $ | 21.68 | | | $ | 21.09 | | | $ | 18.71 | | | $ | 17.35 | |
| | | | | | | | | | | | | | | | | | | | | |
| Total return | | | 26.16 | % | | | 3.08 | % | | | 13.20 | % | | | 7.84 | % | | | 55.19 | % |
| | | | | | | | | | | | | | | | | | | | | |
| RATIOS/SUPPLEMENTAL DATA: | | | | | | | | | | | | | | | | | | | | |
Ratio of expenses to average net assets – net(1) | | | 0.65 | % | | | 0.65 | % | | | 0.65 | % | | | 0.65 | % | | | 0.65 | % |
| Ratio of expenses to average net assets – gross | | | 1.10 | % | | | 1.09 | % | | | 1.13 | % | | | 1.13 | % | | | 1.38 | % |
| Ratio of net investment income / (loss) to average net assets | | | 0.06 | % | | | 0.25 | % | | | 0.79 | % | | | -0.33 | % | | | -0.33 | % |
| Portfolio turnover rate | | | 15.20 | % | | | 12.89 | % | | | 10.60 | % | | | 4.92 | % | | | 7.68 | % |
| Net assets, end of period (000’s) | | $ | 24,130 | | | $ | 15,644 | | | $ | 17,040 | | | $ | 16,874 | | | $ | 15,847 | |
(1) Net expenses represent gross expenses reduced by fees waived and/or reimbursed by the Adviser.
(2) Per share amounts are based on average shares outstanding.
The accompanying notes are an integral part of the financial statements.
Summit Mutual Funds, Inc. – Apex Series |
| SCHEDULE OF INVESTMENTS | NASDAQ-100 INDEX FUND |
September 30, 2007 | | | | | | |
| | | SHARES | | | VALUE | |
COMMON STOCKS - 90.5% | | | | | | |
Consumer Discretionary - 15.8% | | | | | | |
Amazon.Com, Inc. (a) | | | 3,415 | | | $ | 318,107 | |
Apollo Group, Inc. - Class A(a)(c) | | | 2,178 | | | | 131,007 | |
Bed Bath & Beyond, Inc. (a) | | | 4,540 | | | | 154,905 | |
Comcast Corp. (a) | | | 18,018 | | | | 435,675 | |
Discovery Holding Co. (a) | | | 2,965 | | | | 85,540 | |
eBay, Inc. (a) | | | 12,651 | | | | 493,642 | |
EchoStar Communications Corp. - Class A (a) | | | 2,674 | | | | 125,170 | |
Expedia, Inc. (a)(c) | | | 3,416 | | | | 108,902 | |
Garmin Ltd. (c) | | | 2,494 | | | | 297,784 | |
IAC/InterActiveCorp (a) | | | 3,721 | | | | 110,402 | |
Lamar Advertising Co. - Class A(c) | | | 987 | | | | 48,333 | |
Liberty Global, Inc. (a) (c) | | | 2,412 | | | | 98,940 | |
Liberty Media Corp. - Interactive(a) | | | 7,224 | | | | 138,773 | |
PetSmart, Inc. (c) | | | 1,676 | | | | 53,464 | |
| Ross Stores, Inc. | | | 1,701 | | | | 43,614 | |
Sears Holdings Corporation(a)(c) | | | 1,853 | | | | 235,702 | |
Sirius Satellite Radio, Inc. (a)(c) | | | 19,748 | | | | 68,920 | |
| Staples, Inc. | | | 5,973 | | | | 128,360 | |
Starbucks Corp. (a) | | | 12,911 | | | | 338,268 | |
Virgin Media, Inc. (c) | | | 4,443 | | | | 107,832 | |
Wynn Resorts Ltd. (c) | | | 1,487 | | | | 234,292 | |
XM Satellite Radio Holdings, Inc. - Class A (a) (c) | | | 3,927 | | | | 55,646 | |
| | | | | | | | 3,813,278 | |
Consumer Staples - 1.1% | | | | | | | | |
| Costco Wholesale Corp. | | | 2,870 | | | | 176,132 | |
Whole Foods Market, Inc. (c) | | | 1,724 | | | | 84,407 | |
| | | | | | | | 260,539 | |
Energy - 0.2% | | | | | | | | |
Patterson-UTI Energy, Inc. (c) | | | 1,969 | | | | 44,440 | |
Health Care - 11.0% | | | | | | | | |
Amgen, Inc. (a) | | | 6,312 | | | | 357,070 | |
Amylin Pharmaceuticals, Inc. (a)(c) | | | 1,577 | | | | 78,850 | |
Biogen Idec, Inc. (a) | | | 3,876 | | | | 257,095 | |
Celgene Corp. (a)(c) | | | 4,722 | | | | 336,726 | |
Cephalon, Inc. (a) | | | 801 | | | | 58,521 | |
| Dentsply International, I nc. | | | 1,814 | | | | 75,535 | |
Express Scripts, Inc. (a) | | | 2,863 | | | | 159,813 | |
Genzyme Corp. (a) | | | 4,117 | | | | 255,089 | |
Gilead Sciences, Inc. (a) | | | 11,351 | | | | 463,915 | |
Intuitive Surgical, Inc. (a) | | | 466 | | | | 107,180 | |
Patterson Companies, Inc. (a) | | | 1,659 | | | | 64,054 | |
Sepracor, Inc. (a) | | | 1,285 | | | | 35,338 | |
Teva Pharmaceutical Industries Ltd. - ADR (c) | | | 7,609 | | | | 338,372 | |
Vertex Pharmaceuticals, Inc. (a) (c) | | | 1,702 | | | | 65,374 | |
| | | | | | | | 2,652,932 | |
Industrials - 4.4% | | | | | | | | |
C.H. Robinson Worldwide, Inc. (c) | | | 2,122 | | | | 115,203 | |
| Cintas Corp. | | | 2,368 | | | | 87,853 | |
| Expeditors International Washington, Inc. | | | 2,603 | | | | 123,122 | |
Fastenal Co. (c) | | | 1,797 | | | | 81,602 | |
Foster Wheeler Ltd (a) | | | 915 | | | | 120,121 | |
Joy Global, Inc. (c) | | | 1,326 | | | | 67,440 | |
Monster Worldwide, Inc. (a)(c) | | | 1,661 | | | | 56,574 | |
| | | SHARES | | | VALUE | |
Industrials - 4.4% (Continued) | | | | | | |
| Paccar, Inc. | | | 3,465 | | | $ | 295,391 | |
Ryanair Holdings PLC - ADR(a)(c) | | | 1,447 | | | | 60,065 | |
UAL Corp. (a) (c) | | | 1,217 | | | | 56,627 | |
| | | | | | | | 1,063,998 | |
Information Technology - 56.2% | | | | | | | | |
Activision, Inc. (a)(c) | | | 3,148 | | | | 67,965 | |
Adobe Systems, Inc. (a) | | | 7,167 | | | | 312,911 | |
Akamai Technologies, Inc. (a)(c) | | | 1,964 | | | | 56,426 | |
| Altera Corp. | | | 6,026 | | | | 145,106 | |
Apple, Inc. (a) | | | 15,092 | | | | 2,317,226 | |
| Applied Materials, Inc. | | | 8,890 | | | | 184,023 | |
Autodesk, Inc. (a) | | | 2,998 | | | | 149,810 | |
BEA Systems, Inc. (a)(c) | | | 4,522 | | | | 62,720 | |
Broadcom Corp. - Class A (a) | | | 5,311 | | | | 193,533 | |
Cadence Design Systems, Inc. (a) | | | 3,629 | | | | 80,528 | |
CDW Corp. (a) | | | 1,027 | | | | 89,554 | |
Check Point Software Technologies(a) | | | 2,772 | | | | 69,799 | |
Checkfree Corp. (a)(c) | | | 1,042 | | | | 48,495 | |
Cisco Systems, Inc. (a) | | | 26,979 | | | | 893,275 | |
Citrix Systems, Inc. (a) | | | 2,667 | | | | 107,534 | |
Cognizant Technology Solutions Corp. - Class A (a) | | | 1,742 | | | | 138,959 | |
Dell, Inc. (a) | | | 10,391 | | | | 286,792 | |
Electronic Arts, Inc. (a) | | | 3,904 | | | | 218,585 | |
Fiserv, Inc. (a) | | | 2,568 | | | | 130,609 | |
Flextronics International Ltd. (a)(c) | | | 8,217 | | | | 91,866 | |
Google, Inc. - Class A (a) | | | 1,763 | | | | 1,000,097 | |
Infosys Technologies Ltd - ADR(c) | | | 1,385 | | | | 67,020 | |
| Intel Corp. | | | 25,444 | | | | 657,982 | |
Intuit, Inc. (a) | | | 5,276 | | | | 159,863 | |
Juniper Networks, Inc. (a) | | | 4,202 | | | | 153,835 | |
| Kla-Tencor Corp. | | | 2,887 | | | | 161,037 | |
Lam Research Corp. (a)(c) | | | 1,586 | | | | 84,470 | |
Linear Technology Corp. (c) | | | 3,690 | | | | 129,113 | |
Logitech International S.A. (a)(c) | | | 2,213 | | | | 65,394 | |
Marvell Technology Group Ltd. (a) | | | 6,947 | | | | 113,722 | |
| Maxim Integrated Products, Inc. | | | 5,589 | | | | 164,037 | |
Microchip Technology, Inc. (c) | | | 2,257 | | | | 81,974 | |
| Microsoft Corp. | | | 40,147 | | | | 1,182,731 | |
Network Appliance, Inc. (a) | | | 4,629 | | | | 124,566 | |
Nvidia Corp. (a) | | | 6,705 | | | | 242,989 | |
Oracle Corp. (a) | | | 26,526 | | | | 574,288 | |
| Paychex, Inc. | | | 4,506 | | | | 184,746 | |
| Qualcomm, Inc. | | | 25,124 | | | | 1,061,740 | |
Research In Motion Ltd. (a) | | | 6,968 | | | | 686,697 | |
SanDisk Corp. (a)(c) | | | 2,603 | | | | 143,425 | |
Sun Microsystems, Inc. (a) | | | 19,347 | | | | 108,537 | |
Symantec Corp. (a) | | | 11,482 | | | | 222,521 | |
Telefonaktiebolaget LM Ericsson - ADR (c) | | | 1,764 | | | | 70,207 | |
Tellabs, Inc. (a)(c) | | | 3,105 | | | | 29,560 | |
VeriSign, Inc. (a) | | | 2,923 | | | | 98,622 | |
| Xilinx, Inc. | | | 4,915 | | | | 128,478 | |
Yahoo!, Inc. (a) | | | 8,035 | | | | 215,659 | |
| | | | | | | | 13,559,026 | |
Materials - 0.3% | | | | | | | | |
Sigma-Aldrich Corp. (c) | | | 1,568 | | | | 76,424 | |
The accompanying notes are an integral part of the financial statements.
Summit Mutual Funds, Inc. – Apex Series |
| NASDAQ-100 INDEX FUND | SCHEDULE OF INVESTMENTS |
| | | SHARES | | | VALUE | |
Telecommunication Services - 1.5% | | | | | | |
Level 3 Communications, Inc. (a)(c) | | | 18,581 | | | $ | 86,402 | |
Millicom International Cellular S.A. (a)(c) | | | 1,214 | | | | 101,854 | |
NII Holdings, Inc. (a) (c) | | | 2,088 | | | | 171,529 | |
| | | | | | | | 359,785 | |
| TOTAL COMMON STOCKS | | | | | | | | |
| (Cost $13,971,398) | | | | | | | 21,830,422 | |
| | | | | | | | | |
INVESTMENT COMPANIES - 2.8% | | | | | | | | |
Powershares QQQ Trust (c) | | | 13,240 | | | | 680,668 | |
| TOTAL INVESTMENT COMPANIES | | | | | | | | |
| (Cost $646,147) | | | | | | | 680,668 | |
| | | | | | | | | |
SHORT TERM INVESTMENTS (e) - 6.3% | | | | | | | | |
Money Market Funds - 5.1% | | | | | | | | |
| Northern Institutional Diversified Assets Portfolio | | | 1,231,532 | | | | 1,231,532 | |
| | | PRINCIPAL | | | | |
| | | AMOUNT | | | VALUE | |
U.S. Treasury Bills - 1.2% | | | | | | |
| 4.010%, 12/13/2007 | | $ | 300,000 | | | $ | 297,781 | |
| TOTAL SHORT TERM | | | | | | | | |
| INVESTMENTS (Cost $1,529,117) | | | | | | | 1,529,313 | |
Total Investments | | | | | | | | |
(Cost $16,146,662) (b) - 99.6% | | | | | | | 24,040,403 | |
Northern Institutional Liquid | | | | | | | | |
Assets Portfolio (d) - 16.3% | | | | | | | 3,921,718 | |
Liabilities in Excess of Other Assets - (15.9)% | | | | | | | (3,832,130 | ) |
TOTAL NET ASSETS - 100.0% | | | | | | $ | 24,129,991 | |
| ADR American Depository Receipt |
(a) | Non-income producing security. |
(b) | For federal income tax purposes, cost is $16,513,147 and gross unrealized appreciation and depreciation of securities as of September 30, 2007 was $8,533,363, and ($1,006,107), respectively, with a net appreciation / (depreciation) of $7,527,256. |
(c) | All or a portion of the security is out on loan. |
(d) | This security was purchased with cash collateral held from securities lending. The market values of the securities on loan, the collateral purchased with cash, and the noncash collateral accepted are $4,140,052, $3,921,718, and $323,288, respectively. |
(e) | Securities and other assets with an aggregate value of $1,479,800 have been segregated with the custodian or designated to cover margin requirements for the following open futures contracts as of September 30, 2007: |
| | | Unrealized | |
| | | Appreciation/ | |
Type | Contracts | (Depreciation) | |
| Nasdaq 100 E-Mini (12/07) | 20 | $28,986 | |
| Nasdaq 100 Futures (12/07) | 3 | $27,666 | |
The accompanying notes are an integral part of the financial statements.
Summit Mutual Funds, Inc. – Apex Series |
| FINANCIAL STATEMENTS | NASDAQ-100 INDEX FUND |
STATEMENT OF ASSETS AND LIABILITIES | | | |
September 30, 2007 | | | |
| | | | |
| ASSETS | | | |
| Investments in securities, at value | | $ | 24,040,403 | |
| Collateral for securities loaned, | | | | |
| at fair value | | | 3,921,718 | |
| Receivables: | | | | |
| Shares sold | | | 116,053 | |
| Interest and dividends | | | 5,207 | |
| Receivable from adviser | | | 809 | |
| Prepaid expenses and other | | | 8,009 | |
| | | | 28,092,199 | |
| LIABILITIES | | | | |
| Payables: | | | | |
| Payable upon return of securities loaned | | | 3,921,718 | |
| Variation margin | | | 5,425 | |
| Shares redeemed | | | 2,593 | |
| Professional fees | | | 18,829 | |
| Fund accounting fees | | | 4,496 | |
| Custodian fees | | | 3,448 | |
| Directors’ fees | | | 39 | |
| Other accrued expenses | | | 5,660 | |
| | | | 3,962,208 | |
| NET ASSETS* | | | | |
| Paid-in capital | | | 28,419,065 | |
| Accumulated undistributed net | | | | |
| investment income / (loss) | | | 10,650 | |
| Accumulated net realized gain / (loss) | | | | |
| on investments and futures contracts | | | (12,250,117 | ) |
| Net unrealized appreciation / (depreciation) | | | | |
| on investments and futures contracts | | | 7,950,393 | |
| | | $ | 24,129,991 | |
| Investments at cost | | $ | 16,146,662 | |
| Shares authorized - Class I ($.10 par value) | | | 20,000,000 | |
| NET ASSET VALUE (NAV) BY SHARE CLASS | | | | | |
| | | | | | |
| Share Class | Net Assets | Outstanding | | per share | |
| Class I | $24,129,991 | 884,946 | | $ | 27.27 | |
| | | | | | | |
| * | FEDERAL TAX DATA AS OF SEPTEMBER 30, 2007 | | |
| | Percentage of ordinary distributions designated as | | |
| | qualified dividend income | | 100.00% |
| | Dividends received deduction for corporate shareholders | | 99.00% |
| | Undistributed ordinary income | $ | 10,650 |
| | Unrealized appreciation | $ | 7,583,908 |
Capital Loss Carryforward |
Expiring September 30: |
2009 | 2010 | 2012 | 2013 | 2014 | 2015 |
| $(3,158,440) | $(2,454,653) | $(1,364,110) | $(1,719,950) | $(2,359,145) | $(770,682) |
STATEMENT OF OPERATIONS | | | |
For the year ended September 30, 2007 | | | |
| | | | |
| INVESTMENT INCOME | | | |
| Interest | | $ | 10,681 | |
| Dividends | | | 114,216 | |
| Foreign dividend taxes withheld | | | (423 | ) |
| Other income | | | 5,809 | |
| | | | 130,283 | |
| EXPENSES | | | | |
| Advisory fees | | | 64,239 | |
| Transfer agent fees | | | 27,695 | |
| Registration fees | | | 26,823 | |
| Professional fees | | | 21,890 | |
| Fund accounting fees | | | 19,624 | |
| Administration fees | | | 18,354 | |
| Custodian fees | | | 12,837 | |
| Royalty fee | | | 4,751 | |
| Directors’ fees | | | 2,248 | |
| Shareholder reporting fees | | | 1,271 | |
12b-1 fees - Class A (1) | | | 332 | |
| Other expenses | | | 2,532 | |
| | | | 202,596 | |
| Reimbursements and waivers | | | (82,963 | ) |
| | | | 119,633 | |
| NET INVESTMENT INCOME / (LOSS) | | | 10,650 | |
| | | | | |
| REALIZED AND UNREALIZED GAIN / (LOSS) | | | | |
| Net realized gain / (loss) on investments | | | (102,039 | ) |
| Net realized gain / (loss) | | | | |
| on futures contracts | | | 31,243 | |
| | | | (70,796 | ) |
| Net change in unrealized | | | | |
| appreciation / (depreciation) on | | | | |
| investments and futures contracts | | | 4,481,638 | |
| NET REALIZED AND UNREALIZED | | | | |
| GAIN / (LOSS) | | | 4,410,842 | |
| NET INCREASE / (DECREASE) | | | | |
| IN NET ASSETS FROM OPERATIONS | | $ | 4,421,492 | |
| TRANSACTIONS WITH AFFILIATES: | | | |
| Percent of Current | |
| Net Asset Value | |
| Advisory | Administration | Expense | Reimbursements |
| Fee | Fee | Limit | and Waivers |
| 0.35% | 0.10% | 0.65% | $82,963 |
| | |
(1) | Effective February 28, 2007 the Nasdaq-100 Index Fund converted its |
| | Class A shares into Class I shares. Class A shares no longer exist. |
The accompanying notes are an integral part of the financial statements.
Summit Mutual Funds, Inc. – Apex Series |
| NASDAQ-100 INDEX FUND | FINANCIAL STATEMENTS |
STATEMENTS OF CHANGES IN NET ASSETS | | | | | | |
Fiscal Year Ended September 30, | | | | | | |
| | | 2007 | | | 2006 | |
| OPERATIONS | | | | | | |
| Net investment income / (loss) | | $ | 10,650 | | | $ | 42,705 | |
| Net realized gain / (loss) on investments and futures | | | (70,796 | ) | | | (902,593 | ) |
| Net change in unrealized appreciation / (depreciation) | | | | | | | | |
| on investments and futures contracts | | | 4,481,638 | | | | 1,321,046 | |
| | | | 4,421,492 | | | | 461,158 | |
| DISTRIBUTIONS TO SHAREHOLDERS* | | | | | | | | |
| Class I | | | | | | | | |
| Net investment income | | | (42,315 | ) | | | (56,989 | ) |
Class A (1) | | | | | | | | |
| Net investment income | | | (388 | ) | | | (285 | ) |
| | | | (42,703 | ) | | | (57,274 | ) |
| FUND SHARE TRANSACTIONS | | | | | | | | |
| Class I | | | | | | | | |
| Proceeds from shares sold | | | 9,431,036 | | | | 4,338,298 | |
| Reinvestment of distributions | | | 42,311 | | | | 56,984 | |
| Payments for shares redeemed | | | (6,113,390 | ) | | | (6,191,574 | ) |
Transfer in from Class A (1) | | | 750,651 | | | | — | |
| | | | 4,110,608 | | | | (1,796,292 | ) |
| Class A | | | | | | | | |
| Proceeds from shares sold | | | 526,589 | | | | 73,328 | |
| Reinvestment of distributions | | | 388 | | | | 285 | |
| Payments for shares redeemed | | | (36,384 | ) | | | (67,780 | ) |
Transfer out to Class I (1) | | | (750,651 | ) | | | — | |
| | | | (260,058 | ) | | | 5,833 | |
| NET INCREASE / (DECREASE) IN NET ASSETS | | | 8,229,339 | | | | (1,386,575 | ) |
| NET ASSETS | | | | | | | | |
| Beginning of period | | | 15,900,652 | | | | 17,287,227 | |
| End of period | | $ | 24,129,991 | | | $ | 15,900,652 | |
| | | | | | | | | |
| ACCUMULATED UNDISTRIBUTED NET INVESTMENT INCOME | | $ | 10,650 | | | $ | 42,703 | |
| FUND SHARE TRANSACTIONS CLASS I | | | | | | |
| Sold | | | 385,765 | | | | 200,560 | |
| Reinvestment of distributions | | | 1,808 | | | | 2,610 | |
| Redeemed | | | (256,999 | ) | | | (289,473 | ) |
Transfer in from Class A (1) | | | 32,608 | | | | — | |
| Net increase / (decrease) from fund share transactions | | | 163,182 | | | | (86,303 | ) |
| FUND SHARE TRANSACTIONS Class A | | | | | | | | |
| Sold | | | 22,485 | | | | 3,513 | |
| Reinvestment of distributions | | | 17 | | | | 13 | |
| Redeemed | | | (1,568 | ) | | | (3,394 | ) |
Transfer out to Class I (1) | | | (32,851 | ) | | | — | |
| Net increase / (decrease) from fund share transactions | | | (11,917 | ) | | | 132 | |
| | | | | | | | | |
| TOTAL COST OF PURCHASES OF: | | | | | | | | |
| Common Stocks | | $ | 5,265,840 | | | $ | 2,032,570 | |
| | | $ | | | | $ | 2,032,570 | |
| TOTAL POCEEDS FROM SALES OF: | | | | | | | | |
| Common Stocks | | $ | 2,207,003 | | | $ | 2,431,155 | |
| | | $ | | | | $ | 2,431,155 | |
| | | | | | | | | |
| *TAX CHARACTER OF DISTRIBUTIONS PAID | | | | | | | | |
| Ordinary income | | $ | 42,703 | | | $ | 57,274 | |
| | | $ | 42,703 | | | $ | 57,274 | |
| | | | | | | | | |
(1) | Effective February 28, 2007, the Nasdaq-100 Index Fund converted its Class A shares into Class I shares. | | |
| | Class A shares no longer exist. | | |
The accompanying notes are an integral part of the financial statements.
Summit Mutual Funds, Inc. – Apex Series |
Summit Everest Fund Class I - Average Annual Total Return |
1-Y ear | 5-Year | Since Inception |
| 14.88% | 18.08% | 9.59% |
Summit Everest Fund Class A - Average Annual Total Return |
1-Y ear | 5-Year | Since Inception |
| 7.99% | 16.47% | 8.48% |
Past performance is not predictive of future results. Performance does not reflect the deduction of taxes that a shareholder would pay on fund distributions or redemption of fund shares. Prior to July 1, 2002, Class A share performance is based on Class I performance, adjusted to reflect Class A sales charges and expenses.
| Managers: | |
| Inception Date: | December 29, 1999 |
| Total Net Assets: | $102.7 Million |
| Number Of Equity Holdings: | 58 |
| Median Cap Size: | $50,095 Million |
| Average Price-to-earnings Ratio: | 14.4x |
| Average Price-to-book Ratio: | 2.10x |
Top 10 Equity Holdings | | Sector Allocations |
| | (% of net assets) | | |
Devon Energy Corp. Motorola, Inc. Altria Group, Inc. Wal-Mart Stores, Inc. 3M Co. | | | 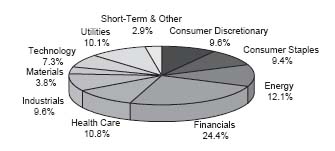 |
Summit Mutual Funds, Inc. – Apex Series |
Objective – Seeks primarily long-term appreciation of capital, without incurring unduly high risk, by investing primarily in common stocks and other equity securities. Current income is a secondary objective.
Strategy – The Everest Fund (the “Fund”) seeks special opportunities in securities that are selling at discount from theoretical price/earnings ratios and that seem capable of recovering from their temporarily out-of-favor status (a “value” investment style).
Managers’ Comments:
The Everest Fund’s Class I total return performance for the year ended September 30, 2007 was 14.88% versus 14.45% for the Russell 1000 Value Index (the “Index”) and 16.44% for the S&P 500 Stock Index.
Widely reported credit problems with sub-prime residential mortgages intensified during the most recent quarter and culminated with the Federal Reserve Bank (the Fed) cutting interest rates 0.50% fearing that diminishing liquidity in the financial markets would threaten the overall economy more than inflation. The Fed had waited until weakness in the housing sector started to affect broader markets and confidence on Main Street. By summer’s end, the credit contagion had spread to money market funds, foreign banks, other sectors of the fixed income markets, as well as the equity markets. As seems to be the case based on recent history, when the equity markets weaken because of financial fears, the Fed “rides to the rescue” with lower interest rates to facilitate deal making that hopes to mitigate a crisis. The shouts of “moral hazard” (bailing out bad lenders) fall on deaf ears when weakness threatens the overall economy.
Contributors to Performance
Underweighting the Financial Services sector was the top contributor to Fund performance during the fiscal year. A significant underweight of the sector at 25% versus 35% for the Index was maintained as we believed a 35% concentration in any one sector was too high. Sub-sector selection and stock selection drove positive returns as the portfolio overweighted Investment Managers, underweighted Banks, and had no exposure to real estate investment trusts (REITS). Positive returns were also attributable to stock selection in Technology. Nokia and Cisco were top ten contributors to return. Finally, superior stock selection in the Producer Durables sector boosted returns. The portfolio concentrated on global infrastructure plays with exposure to Caterpillar, Tyco, Honeywell, and Ingersoll-Rand, with the latter three being top contributors to returns. Investors moved to these stocks as concerns mounted about an economic slowdown in the U.S.
Detractors to Performance
Underweighting the Energy sector was the biggest detractor to performance. This sector had the largest gains as volatile oil prices moved from lows of $50 to highs over $80 a barrel. Returns in this sector were also hurt by the Fund’s position in Nabors Industries as it suffered from a slowdown in U.S. and Canadian natural gas drilling. Consumer Discretionary sector returns lagged mainly due to a holding in Gannett. This sub-sector underperformed as real estate and auto advertising dollars fell and circulation declined. Lastly, an underweighting of Utilities along with poor stock selection was a drag on relative return as the sector outperformed the Index.
The last twelve months witnessed a domestic housing slowdown coupled with rising energy prices and a devaluing dollar. The fear is that the American consumer will be forced to retrench by the inability to “cash-out” from refinancing the equity on a house and paying higher prices for imported goods - especially energy and other industrial goods. The Federal Reserve is trying to ease this sharp pain by reducing interest rates. Even so, the American consumer’s finances may be stretched as the excesses of the past few years work their way out of the economy.
Industries directly involved with housing have been hurt severely already. Energy company values have risen to reflect some of the price changes and the Fund has taken profits here. Conversely, some financial and media companies’ values are overly discounted from the housing damage, and the Fund is considering adding exposure here. Another sector that appears to offer attractive opportunities is Healthcare, which could actually benefit from the political year 2008 instead of coming under attack as in the past.
Summit Everest Fund will continue to invest in companies that are temporarily out of favor and pare those that reach full valuation in light of the Federal Reserve’s attempts to resuscitate the American consumer.
Summit Mutual Funds, Inc. – Apex Series |
| FINANCIAL HIGHLIGHTS | EVEREST FUND |
FINANCIAL HIGHLIGHTS | | | | | | | | | | | | | | | |
| Computed on the basis of a share of capital stock outstanding throughout the period. | | | | | | | | | | | | | |
| | | | | | | | | | | | | | | | |
| | | Class I |
| | | Year Ended September 30, |
| | | 2007 | | | 2006 | | | 2005 | | | 2004 | | | 2003 | |
| Net asset value, beginning of period | | $ | 63.81 | | | $ | 61.56 | | | $ | 58.15 | | | $ | 49.88 | | | $ | 39.85 | |
| INVESTMENT ACTIVITIES: | | | | | | | | | | | | | | | | | | | | |
| Net investment income / (loss) | | | 0.93 | (1) | | | 0.96 | (1) | | | 0.90 | | | | 0.80 | | | | 0.74 | |
| Net realized and unrealized gains / (losses) | | | 8.32 | | | | 8.13 | | | | 6.97 | | | | 8.27 | | | | 10.13 | |
| Total from Investment Activities | | | 9.25 | | | | 9.09 | | | | 7.87 | | | | 9.07 | | | | 10.87 | |
| DISTRIBUTIONS: | | | | | | | | | | | | | | | | | | | | |
| Net investment income | | | (0.99 | ) | | | (0.65 | ) | | | (0.79 | ) | | | (0.80 | ) | | | (0.80 | ) |
| Net realized gains | | | (3.51 | ) | | | (6.19 | ) | | | (3.67 | ) | | | — | | | | (0.04 | ) |
| Total Distributions | | | (4.50 | ) | | | (6.84 | ) | | | (4.46 | ) | | | (0.80 | ) | | | (0.84 | ) |
| Net asset value, end of period | | $ | 68.56 | | | $ | 63.81 | | | $ | 61.56 | | | $ | 58.15 | | | $ | 49.88 | |
| | | | | | | | | | | | | | | | | | | | | |
| Total return | | | 14.88 | % | | | 16.13 | % | | | 13.96 | % | | | 18.29 | % | | | 27.63 | % |
| | | | | | | | | | | | | | | | | | | | | |
| RATIOS / SUPPLEMENTAL DATA: | | | | | | | | | | | | | | | | | | | | |
| Ratio of expenses to average net assets | | | 0.91 | % | | | 0.92 | % | | | 0.97 | % | | | 0.97 | % | | | 0.98 | % |
| Ratio of net investment income / (loss) to average net assets | | | 1.38 | % | | | 1.59 | % | | | 1.51 | % | | | 1.46 | % | | | 1.64 | % |
Portfolio turnover rate (2) | | | 50.86 | % | | | 54.89 | % | | | 63.46 | % | | | 73.43 | % | | | 58.23 | % |
| Net assets, end of period (000’s) | | $ | 95,460 | | | $ | 80,383 | | | $ | 65,755 | | | $ | 61,042 | | | $ | 48,821 | |
| | | | | | | | | | | | | | | | | | | | | |
| | | Class A |
| | | Fiscal Year Ended September 30, |
| | | 2007 | | | 2006 | | | 2005 | | | 2004 | | | 2003 | |
| Net asset value, beginning of period | | $ | 63.25 | | | $ | 61.14 | | | $ | 58.62 | | | $ | 50.34 | | | $ | 39.84 | |
| INVESTMENT ACTIVITIES: | | | | | | | | | | | | | | | | | | | | |
| Net investment income / (loss) | | | 0.75 | (1) | | | 0.80 | (1) | | | 1.26 | | | | 0.66 | | | | 0.61 | |
| Net realized and unrealized gains / (losses) | | | 8.24 | | | | 8.09 | | | | 6.46 | | | | 8.35 | | | | 10.22 | |
| Total from Investment Activities | | | 8.99 | | | | 8.89 | | | | 7.72 | | | | 9.01 | | | | 10.83 | |
| DISTRIBUTIONS: | | | | | | | | | | | | | | | | | | | | |
| Net investment income | | | (0.87 | ) | | | (0.59 | ) | | | (1.53 | ) | | | (0.73 | ) | | | (0.29 | ) |
| Net realized gains | | | (3.51 | ) | | | (6.19 | ) | | | (3.67 | ) | | | — | | | | (0.04 | ) |
| Total Distributions | | | (4.38 | ) | | | (6.78 | ) | | | (5.20 | ) | | | (0.73 | ) | | | (0.33 | ) |
| Net asset value, end of period | | $ | 67.86 | | | $ | 63.25 | | | $ | 61.14 | | | $ | 58.62 | | | $ | 50.34 | |
| | | | | | | | | | | | | | | | | | | | | |
Total return (3) | | | 14.58 | % | | | 15.87 | % | | | 13.65 | % | | | 17.99 | % | | | 27.32 | % |
| | | | | | | | | | | | | | | | | | | | | |
| RATIOS / SUPPLEMENTAL DATA: | | | | | | | | | | | | | | | | | | | | |
| Ratio of expenses to average net assets | | | 1.16 | % | | | 1.17 | % | | | 1.22 | % | | | 1.22 | % | | | 1.23 | % |
| Ratio of net investment income / (loss) to average net assets | | | 1.13 | % | | | 1.34 | % | | | 1.03 | % | | | 1.17 | % | | | 1.39 | % |
Portfolio turnover rate (2) | | | 50.86 | % | | | 54.89 | % | | | 63.46 | % | | | 73.43 | % | | | 58.23 | % |
| Net assets, end of period (000’s) | | $ | 7,201 | | | $ | 2,903 | | | $ | 875 | | | $ | 16 | | | $ | 5 | |
| | | | | | | | | | | | | | | | | | | | | |
(1) Per share amounts are based on average shares outstanding.
(2) Portfolio Turnover is calculated on the basis of the Fund as a whole without distinguishing between the classes of shares issued.
(3) Total return calculations do not include any sales charges.
The accompanying notes are an integral part of the financial statements.
Summit Mutual Funds, Inc. – Apex Series |
| EVEREST FUND | SCHEDULE OF INVESTMENTS |
September 30, 2007 | | | | | | |
| | | SHARES | | | VALUE | |
COMMON STOCKS - 97.1% | | | | | | |
Consumer Discretionary - 9.6% | | | | | | |
| CBS Corporation - Class B | | | 41,474 | | | $ | 1,306,431 | |
| Gannett Co, Inc. | | | 38,800 | | | | 1,695,560 | |
| Honda Motor Co. Ltd. - ADR | | | 62,000 | | | | 2,068,320 | |
| News Corp. - Class B | | | 43,900 | | | | 1,026,821 | |
| Sony Corp. - ADR | | | 26,200 | | | | 1,259,172 | |
| Time Warner, Inc. | | | 67,600 | | | | 1,241,136 | |
Viacom, Inc. - Class B (a) | | | 31,674 | | | | 1,234,336 | |
| | | | | | | | 9,831,776 | |
Consumer Staples - 9.4% | | | | | | | | |
| Altria Group, Inc. | | | 34,700 | | | | 2,412,691 | |
| CVS Caremark Corp. | | | 40,500 | | | | 1,605,015 | |
| Kraft Foods, Inc. | | | 57,301 | | | | 1,977,458 | |
| Unilever NV - ADR | | | 39,100 | | | | 1,206,235 | |
| Wal-Mart Stores, Inc. | | | 55,200 | | | | 2,409,480 | |
| | | | | | | | 9,610,879 | |
Energy - 12.1% | | | | | | | | |
| Chevron Corp. | | | 23,606 | | | | 2,209,049 | |
| ConocoPhillips | | | 24,854 | | | | 2,181,436 | |
| Devon Energy Corp. | | | 31,400 | | | | 2,612,480 | |
Nabors Industries Ltd. (a) | | | 39,400 | | | | 1,212,338 | |
| Royal Dutch Shell PLC - ADR | | | 26,600 | | | | 2,185,988 | |
| Spectra Energy Corp. | | | 80,824 | | | | 1,978,572 | |
| | | | | | | | 12,379,863 | |
Financials - 24.4% | | | | | | | | |
| AllianceBernstein Holding LP | | | 22,000 | | | | 1,937,540 | |
| The Allstate Corp. | | | 31,500 | | | | 1,801,485 | |
| Bank of America Corp. | | | 48,292 | | | | 2,427,639 | |
| The Bank Of New York Mellon Corp | | | 34,434 | | | | 1,519,917 | |
| Capital One Financial Corp. | | | 15,100 | | | | 1,003,093 | |
| Citigroup, Inc. | | | 52,900 | | | | 2,468,843 | |
| Discover Financial Services | | | 41,700 | | | | 867,360 | |
| Genworth Financial, Inc. - Class A | | | 65,200 | | | | 2,003,596 | |
| Hartford Financial Services Group, Inc. | | | 17,200 | | | | 1,591,860 | |
| JPMorgan Chase & Co. | | | 43,664 | | | | 2,000,684 | |
| Legg Mason, Inc. | | | 27,600 | | | | 2,326,404 | |
| Metlife, Inc. | | | 15,700 | | | | 1,094,761 | |
| Morgan Stanley | | | 22,000 | | | | 1,386,000 | |
| The Travelers Companies, Inc. | | | 20,600 | | | | 1,037,004 | |
| Wells Fargo & Co. | | | 45,700 | | | | 1,627,834 | |
| | | | | | | | 25,094,020 | |
Health Care - 10.8% | | | | | | | | |
Covidien Ltd (a) | | | 26,325 | | | | 1,092,487 | |
| GlaxoSmithKline PLC - ADR | | | 38,500 | | | | 2,048,200 | |
| Johnson & Johnson | | | 29,900 | | | | 1,964,430 | |
| Pfizer, Inc. | | | 98,800 | | | | 2,413,684 | |
| UnitedHealth Group, Inc. | | | 39,700 | | | | 1,922,671 | |
Wellpoint, Inc. (a) | | | 20,300 | | | | 1,602,076 | |
| | | | | | | | 11,043,548 | |
Industrials - 9.6% | | | | | | | | |
| 3M Co. | | | 25,400 | | | | 2,376,932 | |
| Caterpillar, Inc. | | | 16,900 | | | | 1,325,467 | |
| FedEx Corp. | | | 16,700 | | | | 1,749,325 | |
| Ingersoll-Rand Co. Ltd. - Class A | | | 19,400 | | | | 1,056,718 | |
| | | SHARES | | | VALUE | |
Industrials - 9.6% (Continued) | | | | | | |
| Southwest Airlines Co. | | | 141,900 | | | $ | 2,100,120 | |
| Tyco International Ltd | | | 27,825 | | | | 1,233,760 | |
| | | | | | | | 9,842,322 | |
Materials - 3.8% | | | | | | | | |
| The Dow Chemical Co. | | | 45,400 | | | | 1,954,924 | |
| Newmont Mining Corp. | | | 44,700 | | | | 1,999,431 | |
| | | | | | | | 3,954,355 | |
Technology - 7.3% | | | | | | | | |
Cisco Systems, Inc. (a) | | | 44,500 | | | | 1,473,395 | |
| International Business Machines Corp. | | | 10,100 | | | | 1,189,780 | |
| Motorola, Inc. | | | 136,100 | | | | 2,521,933 | |
| Nokia OYJ - ADR | | | 33,000 | | | | 1,251,690 | |
| Tyco Electronics Ltd | | | 30,925 | | | | 1,095,673 | |
| | | | | | | | 7,532,471 | |
Utilities - 10.1% | | | | | | | | |
| AT&T, Inc. | | | 47,100 | | | | 1,992,801 | |
| Citizens Communications Co. | | | 96,100 | | | | 1,376,152 | |
| Duke Energy Corporation | | | 104,648 | | | | 1,955,871 | |
| Southern Co. | | | 55,500 | | | | 2,013,540 | |
| Sprint Nextel Corp. | | | 73,000 | | | | 1,387,000 | |
| Verizon Communications, Inc. | | | 37,200 | | | | 1,647,216 | |
| | | | | | | | 10,372,580 | |
| TOTAL COMMON STOCKS | | | | | | | | |
| (Cost $86,539,843) | | | | | | | 99,661,814 | |
| | | | | | | | | |
SHORT TERM INVESTMENTS - 1.6% | | | | | | | | |
Money Market Funds - 1.6% | | | | | | | | |
| Northern Institutional Diversified Assets Portfolio | | | 1,695,522 | | | | 1,695,522 | |
| TOTAL SHORT TERM INVESTMENTS | | | | | | | | |
| (Cost $1,695,522) | | | | | | | 1,695,522 | |
Total Investments | | | | | | | | |
(Cost $88,235,365) (b) - 98.7% | | | | | | | 101,357,336 | |
Other Assets in Excess of Liabilities - 1.3% | | | | | | | 1,303,737 | |
TOTAL NET ASSETS - 100.0% | | | | | | $ | 102,661,073 | |
| ADR | American Depository Receipt |
| (a) | Non-income producing security. |
| (b) | For federal income tax purposes, cost is $88,322,076 and gross unrealized appreciation |
| | and depreciation of securities as of September 30, 2007 was $15,872,992 and |
| | ($2,837,732), respectively, with a net appreciation / (depreciation) of $13,035,260. |
The accompanying notes are an integral part of the financial statements.
Summit Mutual Funds, Inc. – Apex Series |
| FINANCIAL STATEMENTS | EVEREST FUND |
STATEMENT OF ASSETS AND LIABILITIES | | | |
September 30, 2007 | | | |
| | | | |
| ASSETS | | | |
| Investments in securities, at value | | $ | 101,357,336 | |
| Cash | | | 11,579 | |
| Receivables: | | | | |
| Securities sold | | | 1,737,463 | |
| Shares sold | | | 120,862 | |
| Interest and dividends | | | 162,334 | |
| Prepaid expenses and other | | | 9,702 | |
| | | | 103,399,276 | |
| LIABILITIES | | | | |
| Payables: | | | | |
| Shares redeemed | | | 625,653 | |
| Advisory fees | | | 54,027 | |
| Professional fees | | | 23,652 | |
| Administration fees | | | 8,442 | |
| Fund accounting fees | | | 7,922 | |
| 12b-1 fees | | | 3,189 | |
| Custodian fees | | | 1,982 | |
| Directors’ fees | | | 200 | |
| Other accrued expenses | | | 13,136 | |
| | | | 738,203 | |
| NET ASSETS* | | | | |
| Paid-in capital | | | 81,934,473 | |
| Accumulated undistributed net | | | | |
| investment income / (loss) | | | 1,050,130 | |
| Accumulated net realized gain / (loss) | | | | |
| on investments and futures contracts | | | 6,554,499 | |
| Net unrealized appreciation / (depreciation) | | | | |
| on investments | | | 13,121,971 | |
| | | $ | 102,661,073 | |
| Investments at cost | | $ | 88,235,365 | |
| Shares authorized - Class I ($.10 par value) | | | 20,000,000 | |
| Shares authorized - Class A ($.10 par value) | | | 20,000,000 | |
| NET ASSET VALUE (NAV) BY SHARE CLASS | | | | | |
| | | | | | |
| Share Class | Net Assets | Outstanding | | per share | |
| Class I | $95,460,136 | | | $ | 68.56 | |
| Class A | $7,200,937 | 106,107 | | $ | 67.86 | |
| Class A maximum offering price per share | | | | | |
| (net asset value plus sales charge of 5.75% | | | | | |
| of offering price) | | | $ | 72.00 | |
| * | FEDERAL TAX DATA AS OF SEPTEMBER 30, 2007 | | |
| | Percentage of ordinary distributions designated as | | |
| | qualified dividend income | | 71.17% |
| | Dividends received deduction for corporate shareholders | | 43.80% |
| | Undistributed ordinary income | $ | 4,030,885 |
| | Undistributed long-term income | $ | 3,660,457 |
| | Unrealized appreciation | $ | 13,035,260 |
STATEMENT OF OPERATIONS | | | |
For the year ended September 30, 2007 | | | |
| | | | |
| INVESTMENT INCOME | | | |
| Dividends | | $ | 2,370,042 | |
| Foreign dividend taxes withheld | | | (33,020 | ) |
| | | | 2,337,022 | |
| EXPENSES | | | | |
| Advisory fees | | | 654,623 | |
| Administration fees | | | 102,285 | |
| Transfer agent fees | | | 43,316 | |
| Professional fees | | | 36,019 | |
| Fund accounting fees | | | 34,615 | |
| 12b-1 fees - Class A | | | 13,952 | |
| Directors’ fees | | | 13,582 | |
| Custodian fees | | | 8,598 | |
| Shareholder reporting fees | | | 7,757 | |
| Other expenses | | | 25,775 | |
| | | | 940,522 | |
| NET INVESTMENT INCOME / (LOSS) | | | 1,396,500 | |
| | | | | |
| REALIZED AND UNREALIZED GAIN / (LOSS) | | | | |
| Net realized gain / (loss) on investments | | | 6,739,020 | |
| Net change in unrealized appreciation / | | | | |
| (depreciation) on investments | | | 5,038,638 | |
| | | | | |
| NET REALIZED AND UNREALIZED | | | | |
| GAIN / (LOSS) | | | 11,777,658 | |
| | | | | |
| NET INCREASE / (DECREASE) IN | | | | |
| NET ASSETS FROM OPERATIONS | | $ | 13,174,158 | |
| TRANSACTIONS WITH AFFILIATES: | | |
| Percent of Current | |
Net Asset Value | |
| Advisory | Administration | |
| Fee | Fee | |
| 0.64% | 0.10% | |
The accompanying notes are an integral part of the financial statements.
Summit Mutual Funds, Inc. – Apex Series |
| EVEREST FUND | FINANCIAL STATEMENTS |
STATEMENTS OF CHANGES IN NET ASSETS | | | | | | |
Fiscal Year Ended September 30, | | | | | | |
| | | 2007 | | | 2006 | |
| OPERATIONS | | | | | | |
| Net investment income / (loss) | | $ | 1,396,500 | | | $ | 1,152,406 | |
| Net realized gain / (loss) on investments | | | 6,739,020 | | | | 5,437,897 | |
| Net change in unrealized appreciation / (depreciation) on investments | | | 5,038,638 | | | | 4,330,169 | |
| | | | 13,174,158 | | | | 10,920,472 | |
| DISTRIBUTIONS TO SHAREHOLDERS* | | | | | | | | |
| Class I | | | | | | | | |
| Net investment income | | | (1,386,540 | ) | | | (696,479 | ) |
| Net realized gain on investments | | | (4,945,799 | ) | | | (6,582,347 | ) |
| Class A | | | | | | | | |
| Net investment income | | | (42,835 | ) | | | (11,177 | ) |
| Net realized gain on investments | | | (173,103 | ) | | | (117,031 | ) |
| | | | (6,548,277 | ) | | | (7,407,034 | ) |
| FUND SHARE TRANSACTIONS | | | | | | | | |
| Class I | | | | | | | | |
| Proceeds from shares sold | | | 22,370,635 | | | | 12,448,983 | |
| Reinvestment of distributions | | | 6,321,707 | | | | 7,275,015 | |
| Payments for shares redeemed | | | (19,842,615 | ) | | | (8,483,868 | ) |
| | | | 8,849,727 | | | | 11,240,130 | |
| Class A | | | | | | | | |
| Proceeds from shares sold | | | 5,073,833 | | | | 1,919,862 | |
| Reinvestment of distributions | | | 177,053 | | | | 127,861 | |
| Payments for shares redeemed | | | (1,351,151 | ) | | | (145,468 | ) |
| | | | 3,899,735 | | | | 1,902,255 | |
| NET INCREASE / (DECREASE) IN NET ASSETS | | | 19,375,343 | | | | 16,655,823 | |
| NET ASSETS | | | | | | | | |
| Beginning of period | | | 83,285,730 | | | | 66,629,907 | |
| End of period | | $ | 102,661,073 | | | $ | 83,285,730 | |
| ACCUMULATED UNDISTRIBUTED NET INVESTMENT INCOME | | $ | 1,050,130 | | | $ | 1,081,013 | |
| FUND SHARE TRANSACTIONS | | | | | | |
| Class I | | | | | | |
| Sold | | | 332,151 | | | | 205,063 | |
| Reinvestment of distributions | | | 97,422 | | | | 127,744 | |
| Redeemed | | | (296,831 | ) | | | (141,309 | ) |
| Net increase / (decrease) from fund share transactions | | | 132,742 | | | | 191,498 | |
| | | | | | | | | |
| Class A | | | | | | | | |
| Sold | | | 77,555 | | | | 31,794 | |
| Reinvestment of distributions | | | 2,751 | | | | 2,261 | |
| Redeemed | | | (20,087 | ) | | | (2,477 | ) |
| Net increase / (decrease) from fund share transactions | | | 60,219 | | | | 31,578 | |
| TOTAL COST OF PURCHASES OF: | | | | | | | | |
| Common Stocks | | $ | 55,685,468 | | | $ | 46,885,635 | |
| | | $ | 55,685,468 | | | $ | 46,885,635 | |
| TOTAL PROCEEDS FROM SALES OF: | | | | | | | | |
| Common Stocks | | $ | 49,963,165 | | | $ | 38,920,524 | |
| | | $ | | | | $ | 38,920,524 | |
| | | | | | | | | |
| *TAX CHARACTER OF DISTRIBUTIONS PAID | | | | | | | | |
| | $ | 2,627,688 | | | $ | 707,656 | |
| Long-term capital gains | | | 3,920,589 | | | | 6,699,378 | |
| | | $ | 6,548,277 | | | $ | 7,407,034 | |
| | | | | | | | | |
| ** The percentage of taxable ordinary income distributions that are designated as short-term capital gain | | | | | | | | |
| distributions under Internal Revenue Section 871 (k)(2)(C) is 45.60% | | | | | | | | |
The accompanying notes are an integral part of the financial statements.
Summit Mutual Funds, Inc. – Apex Series |
Summit Bond Fund Class I - Average Annual Total Return |
1-Y ear | 5-Year | Since Inception |
| 4.12% | 5.08% | 5.66% |
Summit Bond Fund Class A - Average Annual Total Return |
1-Y ear | 5-Year | Since Inception |
| -0.54% | 3.91% | 4.80% |
Past performance is not predictive of future results. Performance does not reflect the deduction of taxes that a shareholder would pay on fund distributions or redemption of fund shares. Prior to February 1, 2007, Class A share performance is based on Class I performance, adjusted to reflect Class A sales charges and expenses.
| Managers: | |
| Inception Date: | |
| Total Net Assets: | $92.5 Million |
Number Of Fixed Income Holdings: | 158 |
| Average Duration: | 4.80 years |
| Average Maturity: | 12.27 years |
| Weighted Average Maturity: | 6.09 years |
| Average Credit Quality: | A1/A+ |
| 30-day SEC Yield - Class I: | 5.14% |
| 30-day SEC Yield - Class A: | 4.68% |
Quality Breakdown | | Sector Allocations |
| | (% of portfolio) | | |
| | |  |
Summit Mutual Funds, Inc. – Apex Series |
Objective – Seeks a high level of current income, as is consistent with a reasonable investment risk, by investing primarily in long-term, fixed-income, investment-grade corporate bonds.
Strategy – Under normal circumstances, the Bond Fund (the “Fund”) will invest at least 80% of the value of its assets in fixed income securities. Further, the Fund normally will invest at least 75% of the value of its assets in publicly-traded straight debt securities which have a rating within the four highest grades as rated by a national rating agency. Up to 25% of the portfolio may be invested in below investment grade debt securities or convertible debt securities.
Managers’ Comments:
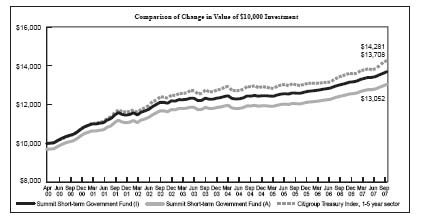
For the year ended September 30, 2007, the Summit Bond Fund – Class I shares provided a total return of 4.12% compared to 5.14% for the Lehman Brothers Aggregate Bond Index (Index).
The Bond Fund’s underweighting of Treasury bonds, which outperformed corporate bonds over the last year, detracted from performance. Also, the Fund’s non-agency mortgage-backed securities underperformed the broad indices, while the Fund’s high yield exposure outperformed.
Short-term interest rates declined during the period, as the Federal Reserve Board (Fed) cut the Fed Funds rate by 0.50% on September 18, 2007, to 4.75%. Meanwhile, longer term interest rates remained relatively unchanged from September 2006 levels. The current slope of the U.S. Treasury yield curve suggests that the Fed may cut short-term rates further, as the yields on all Treasury securities with maturities from 1 to 10 years are below the Fed Funds rate of 4.75%. For example, the 2 year Treasury yield was 3.98% and the 10 year Treasury yield was 4.59% at September 30, 2007.
The Federal Reserve’s recent decision to cut interest rates after 17 consecutive 0.25% rate increases since January 2003 came in response to a material change in the credit markets during the third quarter of 2007 and concerns of a slowing overall economy. Continued weakness in the housing market and the fear that sub-prime loan defaults would spread to other sectors of the economy caused credit markets to seize-up during the third quarter of 2007. Borrowed capital has generally become more costly, and more importantly, more scarce. Credit spreads (the interest rate difference between risk-free U.S. Treasury securities and other fixed income securities) that started the summer at historically tight levels have widened across the entire quality spectrum, as market participants re-evaluate and re-price risk in their portfolios. In this environment, corporate and non-agency mortgage-backed securities underperformed U.S. Treasury and agency securities.
The outlook for the economy remains cloudy as we enter into 2008. Tightening credit will almost certainly slow economic growth, as will the continued slump in housing and the decline in household net worth that results from declining home prices. In addition, the relentless rise in energy prices will continue to cause a drag on consumer demand. However, these items are partially offset by lower interest rates, strong economic growth internationally and the declining value of the U.S. dollar, which makes exports more competitive. In this environment, Summit believes that caution is in order, but that investment managers must be willing to take advantage of opportunities as they arise.
Summit Mutual Funds, Inc. – Apex Series |
| FINANCIAL HIGHLIGHTS | BOND FUND |
FINANCIAL HIGHLIGHTS | | | | | | | | | | | | | | | |
| Computed on the basis of a share of capital stock outstanding throughout the period. | | | | | | | | | | | | | |
| | | Class I |
| | | Fiscal Year Ended September 30, |
| | | 2007 | | | 2006 | | | 2005 | | | 2004 | | | 2003 | |
| Net asset value, beginning of period | | $ | 49.88 | | | $ | 50.18 | | | $ | 51.40 | | | $ | 51.73 | | | $ | 50.35 | |
| INVESTMENT ACTIVITIES: | | | | | | | | | | | | | | | | | | | | |
| Net investment income / (loss) | | | 2.55 | | | | 2.59 | | | | 2.47 | | | | 2.44 | | | | 3.34 | |
| Net realized and unrealized gains / (losses) | | | (0.54 | ) | | | (0.44 | ) | | | (1.15 | ) | | | 0.06 | | | | 1.12 | |
| Total from Investment Activities | | | 2.01 | | | | 2.15 | | | | 1.32 | | | | 2.50 | | | | 4.46 | |
| DISTRIBUTIONS: | | | | | | | | | | | | | | | | | | | | |
| Net investment income | | | (2.60 | ) | | | (2.45 | ) | | | (2.54 | ) | | | (2.83 | ) | | | (3.08 | ) |
| Total Distributions | | | (2.60 | ) | | | (2.45 | ) | | | (2.54 | ) | | | (2.83 | ) | | | (3.08 | ) |
| Net asset value, end of period | | $ | 49.29 | | | $ | 49.88 | | | $ | 50.18 | | | $ | 51.40 | | | $ | 51.73 | |
| | | | | | | | | | | | | | | | | | | | | |
| Total return | | | 4.12 | % | | | 4.46 | % | | | 2.64 | % | | | 5.05 | % | | | 9.22 | % |
| | | | | | | | | | | | | | | | | | | | | |
| RATIOS / SUPPLEMENTAL DATA: | | | | | | | | | | | | | | | | | | | | |
| Ratio of expenses to average net assets | | | 0.76 | % | | | 0.71 | % | | | 0.74 | % | | | 0.72 | % | | | 0.69 | % |
| Ratio of net investment income / (loss) to average net assets | | | 5.08 | % | | | 5.17 | % | | | 4.82 | % | | | 4.82 | % | | | 6.53 | % |
Portfolio turnover rate (3) | | | 87.91 | % | | | 62.28 | % | | | 46.97 | % | | | 79.28 | % | | | 125.15 | % |
| Net assets, end of period (000’s) | | $ | 92,451 | | | $ | 94,666 | | | $ | 97,119 | | | $ | 92,148 | | | $ | 91,745 | |
| | Class A | |
| | Period from | |
| | February 1, 2007(2) | |
| | to September 30, | |
| | 2007 | |
| Net asset value, beginning of period | | $ | 49.75 | | |
| | | | | | |
| INVESTMENT ACTIVITIES: | | | | | |
| Net investment income / (loss) | | | 1.33 | | |
| Net realized and unrealized gains / (losses) | | | (0.38 | ) | |
| Total from Investment Activities | | | 0.95 | | |
| | | | | | |
| DISTRIBUTIONS: | | | | | |
| Net investment income | | | (1.24 | ) | |
| Total Distributions | | | (1.24 | ) | |
| Net asset value, end of period | | $ | 49.46 | | |
Total return(4) | | | 1.92 | % | |
| | | | | | |
| RATIOS / SUPPLEMENTAL DATA: | | | | | |
| Ratio of expenses to average net assets | | | 1.03 | %(1) | |
| Ratio of net investment income / (loss) to average net assets | | | 4.84 | %(1) | |
Portfolio turnover rate(3) | | | 87.91 | % | |
| Net assets, end of period (000’s) | | $ | 77 | | |
(1) Annualized.
(2) Commencement of operations.
(3) Portfolio Turnover is calculated on the basis of the Fund as a whole without distinguishing between the classes of shares issued.
(4) Total return calculations do not include any sales charges.
The accompanying notes are an integral part of the financial statements.
Summit Mutual Funds, Inc. – Apex Series |
| BOND FUND | SCHEDULE OF INVESTMENTS |
September 30, 2007 | | | | | | |
| | | SHARES | | | VALUE | |
COMMON STOCKS - 0.0% | | | | | | |
Consumer Discretionary - 0.0% | | | | | | |
Avado Brands, Inc. (a) (g) (i) | | | 4,803 | | | $ | 48 | |
Intermet Corp. (a) (g) (i) | | | 4,772 | | | | 4,772 | |
| | | | | | | | 4,820 | |
| TOTAL COMMON STOCKS | | | | | | | | |
| (Cost $184,387) | | | | | | | 4,820 | |
| | | | | | | | | |
PREFERRED STOCKS - 0.0% | | | | | | | | |
Consumer Discretionary - 0.0% | | | | | | | | |
| ION Media Networks, Inc. 12.0% Payment-in-Kind Dividend | | | 2 | | | | 3,260 | |
| TOTAL PREFERRED STOCKS | | | | | | | | |
| (Cost $0) | | | | | | | 3,260 | |
| | | | | | | | | |
| | | PRINCIPAL | | | | |
| | | AMOUNT | | | VALUE | |
ASSET BACKED SECURITIES - 1.7% | | | | | | |
| America West Airlines, Inc. - AMBAC Insured | | | | | | |
| 7.100%, 10/02/2022 | | $ | 590,064 | | | $ | 613,666 | |
| Asset Backed Funding Certificates | | | | | | | | |
| Series 2005-AQ1, 5.240%, 11/25/2034 | | | 400,000 | | | | 347,265 | |
| Centex Home Equity | | | | | | | | |
| Series 2001-B, 7.360%, 07/25/2032 | | | 131,575 | | | | 113,390 | |
| First Franklin Mortgage Loan Asset Backed Certificates | | | | | | | | |
| Series 2003-FF2, 7.795%, 07/25/2033 | | | 236,923 | | | | 226,139 | |
| JET Equipment Trust | | | | | | | | |
Series 1995-B, 7.630%, 02/15/2015 (b) (h) (i) | | | 234,360 | | | | 119,772 | |
| Residential Asset Mortgage Products, Inc. | | | | | | | | |
| Series 2003-RZ3, 4.120%, 06/25/2033 | | | 205,526 | | | | 192,250 | |
| TOTAL ASSET BACKED SECURITIES | | | | | | | | |
| (Cost $1,784,193) | | | | | | | 1,612,482 | |
| | | | | | | | | |
CORPORATE BONDS - 39.9% | | | | | | | | |
Consumer Discretionary - 5.9% | | | | | | | | |
| COX Communications, Inc. | | | | | | | | |
| 5.450%, 12/15/2014 | | | 770,000 | | | | 746,988 | |
| Daimler Finance North America LLC | | | | | | | | |
| 6.500%, 11/15/2013 | | | 750,000 | | | | 777,693 | |
| Echostar DBS Corporation | | | | | | | | |
| 6.625%, 10/01/2014 | | | 375,000 | | | | 376,875 | |
| General Motors Corp. | | | | | | | | |
7.700%, 04/15/2016 (e) | | | 150,000 | | | | 134,625 | |
| Idearc, Inc. | | | | | | | | |
| 8.000%, 11/15/2016 | | | 300,000 | | | | 299,250 | |
| Intcomex, Inc. | | | | | | | | |
11.750%, 01/15/2011 (e) | | | 375,000 | | | | 382,500 | |
| ION Media Networks, Inc. | | | | | | | | |
11.000%, 07/31/2013 (e) | | | 325,940 | | | | 260,752 | |
| MDC Holdings, Inc. | | | | | | | | |
| 5.500%, 05/15/2013 | | | 350,000 | | | | 328,998 | |
| NVR, Inc. | | | | | | | | |
5.000%, 06/15/2010 (e) | | | 490,000 | | | | 489,474 | |
| R.H. Donnelley Corp. | | | | | | | | |
6.875%, 01/15/2013 (e) | | | 375,000 | | | | 354,375 | |
| Radio One, Inc. | | | | | | | | |
8.875%, 07/01/2011 (e) | | | 93,000 | | | | 92,070 | |
| | | PRINCIPAL | | | | |
| | | AMOUNT | | | VALUE | |
Consumer Discretionary - 5.9% (Continued) | | | | | | |
| TCI Communications, Inc. | | | | | | |
| 8.750%, 08/01/2015 | | $ | 770,000 | | | $ | 892,621 | |
| Yankee Acquisition Corp. | | | | | | | | |
9.750%, 02/15/2017 (e) | | | 300,000 | | | | 283,500 | |
| | | | | | | | 5,419,721 | |
Consumer Staples - 0.6% | | | | | | | | |
| Constellation Brands, Inc. | | | | | | | | |
7.250%, 09/01/2016 (e) | | | 375,000 | | | | 375,000 | |
| Del Monte Corp. | | | | | | | | |
6.750%, 02/15/2015 (e) | | | 188,000 | | | | 180,480 | |
| | | | | | | | 555,480 | |
Energy - 4.8% | | | | | | | | |
| Canadian Oil Sands Ltd. | | | | | | | | |
5.800%, 08/15/2013 (b) | | | 700,000 | | | | 693,818 | |
| Chesapeake Energy Corp. | | | | | | | | |
| 6.625%, 01/15/2016 | | | 375,000 | | | | 373,125 | |
| Complete Production Services Inc. | | | | | | | | |
| 8.000%, 12/15/2016 | | | 375,000 | | | | 370,781 | |
| Encore Acquisition Co. | | | | | | | | |
| 7.250%, 12/01/2017 | | | 125,000 | | | | 118,437 | |
| Enterprise Products Operating LP | | | | | | | | |
| 6.300%, 09/15/2017 | | | 500,000 | | | | 500,683 | |
| Nexen, Inc. | | | | | | | | |
| 5.875%, 03/10/2035 | | | 100,000 | | | | 91,590 | |
| Peabody Energy Corp. | | | | | | | | |
| 7.375%, 11/01/2016 | | | 200,000 | | | | 211,000 | |
| Pioneer Natural Resources Co. | | | | | | | | |
| 6.650%, 03/15/2017 | | | 375,000 | | | | 350,574 | |
| Plains All American Pipeline LP | | | | | | | | |
| 4.750%, 08/15/2009 | | | 750,000 | | | | 747,151 | |
| Range Resources Corp. | | | | | | | | |
| 7.375%, 07/15/2013 | | | 90,000 | | | | 91,350 | |
7.500%, 05/15/2016 (e) | | | 125,000 | | | | 127,500 | |
| Transcanada Pipelines Ltd | | | | | | | | |
6.350%, 05/15/2067 (c) | | | 770,000 | | | | 739,003 | |
| | | | | | | | 4,415,012 | |
Financials - 13.0% | | | | | | | | |
| AXA SA | | | | | | | | |
| 5.362%, 02/06/2049 | | | 1,050,000 | | | | 861,000 | |
| Capmark Financial Group, Inc. | | | | | | | | |
6.300%, 05/10/2017 (b) | | | 770,000 | | | | 670,130 | |
| Colonial Realty LP | | | | | | | | |
| 6.050%, 09/01/2016 | | | 770,000 | | | | 743,620 | |
| Conocophillips Australia Funding Co. | | | | | | | | |
| 5.500%, 04/15/2013 | | | 770,000 | | | | 772,991 | |
| Ford Motor Credit Co. LLC | | | | | | | | |
| 5.800%, 01/12/2009 | | | 281,000 | | | | 271,408 | |
8.105%, 01/13/2012 (c) | | | 187,000 | | | | 176,698 | |
8.000%, 12/15/2016 (e) | | | 94,000 | | | | 87,937 | |
| Health Care REIT, Inc. | | | | | | | | |
| 8.000%, 09/12/2012 | | | 750,000 | | | | 822,811 | |
| Host Marriott LP | | | | | | | | |
6.750%, 06/01/2016 (e) | | | 375,000 | | | | 371,250 | |
| iStar Financial, Inc. | | | | | | | | |
| 5.950%, 10/15/2013 | | | 770,000 | | | | 722,650 | |
The accompanying notes are an integral part of the financial statements.
Summit Mutual Funds, Inc. – Apex Series |
| SCHEDULE OF INVESTMENTS | BOND FUND |
| | | PRINCIPAL | | | | |
| | | AMOUNT | | | VALUE | |
Financials - 13.0% (Continued) | | | | | | |
| Landsbanki Islands HF | | | | | | |
6.100%, 08/25/2011 (b) | | $ | 770,000 | | | $ | 780,112 | |
| Lincoln National Corp. | | | | | | | | |
6.050%, 04/20/2067 (c) | | | 760,000 | | | | 731,798 | |
| Nationwide Health Properties, Inc. | | | | | | | | |
| 6.000%, 05/20/2015 | | | 700,000 | | | | 706,009 | |
| NXP BV/NXP Funding LLC | | | | | | | | |
7.875%, 10/15/2014 (e) | | | 175,000 | | | | 168,437 | |
| Prime Property Fund, Inc. | | | | | | | | |
5.500%, 01/15/2014 (b) | | | 500,000 | | | | 497,886 | |
| R.H. Donnelley Finance Corp. I | | | | | | | | |
10.875%, 12/15/2012 (b) | | | 187,000 | | | | 199,155 | |
| Rabobank Capital Funding II | | | | | | | | |
5.260%, 12/29/2049 (b) (c) | | | 750,000 | | | | 709,182 | |
| Swiss Re Capital I | | | | | | | | |
6.854%, 05/29/2049 (b) (c) | | | 750,000 | | | | 756,001 | |
| Vale Overseas Ltd | | | | | | | | |
| 6.250%, 01/23/2017 | | | 750,000 | | | | 758,399 | |
| Ventas Realty LP | | | | | | | | |
| 7.125%, 06/01/2015 | | | 113,000 | | | | 115,260 | |
| WMC Finance USA Ltd | | | | | | | | |
| 5.125%, 05/15/2013 | | | 750,000 | | | | 739,043 | |
| Xstrata Finance Canada Ltd. | | | | | | | | |
5.800%, 11/15/2016 (b) | | | 350,000 | | | | 348,044 | |
| | | | | | | | 12,009,821 | |
Health Care - 0.7% | | | | | | | | |
| Community Health Systems, Inc. | | | | | | | | |
8.875%, 07/15/2015 (b) (e) | | | 187,000 | | | | 192,142 | |
| DaVita, Inc. | | | | | | | | |
7.250%, 03/15/2015 (e) | | | 94,000 | | | | 94,235 | |
| HCA, Inc. | | | | | | | | |
9.250%, 11/15/2016 (b) | | | 375,000 | | | | 398,438 | |
| | | | | | | | 684,815 | |
Industrials - 4.3% | | | | | | | | |
| American Railcar Industries, Inc. | | | | | | | | |
7.500%, 03/01/2014 (e) | | | 75,000 | | | | 74,625 | |
| Ametek, Inc. | | | | | | | | |
| 7.200%, 07/15/2008 | | | 750,000 | | | | 757,619 | |
| Aramark Corp. | | | | | | | | |
| 8.500%, 02/01/2015 | | | 300,000 | | | | 306,000 | |
| Caterpillar, Inc. | | | | | | | | |
| 5.700%, 08/15/2016 | | | 770,000 | | | | 768,351 | |
| DRS Technologies, Inc. | | | | | | | | |
7.625%, 02/01/2018 (e) | | | 93,000 | | | | 94,860 | |
| Dynegy Holdings, Inc. | | | | | | | | |
7.750%, 06/01/2019 (b) | | | 150,000 | | | | 143,437 | |
| Joy Global, Inc. | | | | | | | | |
| 6.000%, 11/15/2016 | | | 750,000 | | | | 748,380 | |
| Kansas City Southern De Mexico | | | | | | | | |
7.375%, 06/01/2014 (b) | | | 150,000 | | | | 146,625 | |
| Mueller Water Products, Inc. | | | | | | | | |
7.375%, 06/01/2017 (b) | | | 150,000 | | | | 139,500 | |
| Raytheon Co. | | | | | | | | |
| 5.500%, 11/15/2012 | | | 770,000 | | | | 778,606 | |
| | | | | | | | 3,958,003 | |
| | | PRINCIPAL | | | | |
| | | AMOUNT | | | VALUE | |
Information Technology - 1.4% | | | | | | |
| Intuit, Inc. | | | | | | |
| 5.750%, 03/15/2017 | | $ | 770,000 | | | $ | 734,886 | |
| Iron Mountain, Inc. | | | | | | | | |
7.750%, 01/15/2015 (e) | | | 225,000 | | | | 224,437 | |
| Sanmina SCI Corp. | | | | | | | | |
8.110%, 06/15/2010 (b) (c) (e) | | | 300,000 | | | | 297,000 | |
| | | | | | | | 1,256,323 | |
Materials - 4.5% | | | | | | | | |
| Boise Cascade LLC | | | | | | | | |
8.231%, 10/15/2012 (c) | | | 93,000 | | | | 93,000 | |
| Consol Energy, Inc. | | | | | | | | |
| 7.875%, 03/01/2012 | | | 150,000 | | | | 156,375 | |
| Freeport-McMoRan Copper & Gold, Inc. | | | | | | | | |
| 8.375%, 04/01/2017 | | | 300,000 | | | | 327,750 | |
| Georgia-Pacific Corp. | | | | | | | | |
7.125%, 01/15/2017 (b) (e) | | | 375,000 | | | | 362,812 | |
| Lubrizol Corp. | | | | | | | | |
| 7.250%, 06/15/2025 | | | 700,000 | | | | 734,997 | |
| Lyondell Chemical Co. | | | | | | | | |
| 8.250%, 09/15/2016 | | | 375,000 | | | | 422,813 | |
| The Mosaic Co. | | | | | | | | |
7.625%, 12/01/2016 (b) (c) (e) | | | 300,000 | | | | 319,875 | |
| Pactiv Corp. | | | | | | | | |
| 5.875%, 07/15/2012 | | | 385,000 | | | | 389,814 | |
| Petroplus Finance Ltd | | | | | | | | |
7.000%, 05/01/2017 (b) | | | 300,000 | | | | 285,000 | |
| Stone Container SSCC | | | | | | | | |
8.000%, 03/15/2017 (e) | | | 300,000 | | | | 294,750 | |
| United States Steel Corp. | | | | | | | | |
| 6.500%, 06/01/2017 | | | 500,000 | | | | 478,460 | |
| Warnaco, Inc. | | | | | | | | |
| 8.875%, 06/15/2013 | | | 300,000 | | | | 315,000 | |
| | | | | | | | 4,180,646 | |
Telecommunication Services - 2.1% | | | | | | | | |
| Intelsat Bermuda Ltd | | | | | | | | |
| 11.250%, 06/15/2016 | | | 300,000 | | | | 321,375 | |
| iPCS, Inc. | | | | | | | | |
7.480%, 05/01/2013 (b)(c) | | | 475,000 | | | | 460,750 | |
| Qwest Communications International, Inc. | | | | | | | | |
7.500%, 02/15/2014 (c) (e) | | | 375,000 | | | | 379,688 | |
| TELUS Corp. | | | | | | | | |
| 8.000%, 06/01/2011 | | | 450,000 | | | | 486,998 | |
| Windstream Corp. | | | | �� | | | | |
| 8.625%, 08/01/2016 | | | 300,000 | | | | 319,875 | |
| | | | | | | | 1,968,686 | |
Utilities - 2.6% | | | | | | | | |
| Calpine Corp. | | | | | | | | |
9.875%, 12/01/2011 (b) (h) | | | 375,000 | | | | 399,375 | |
| Edison Mission Energy | | | | | | | | |
| 7.500%, 06/15/2013 | | | 375,000 | | | | 384,375 | |
| Exelon Corp. | | | | | | | | |
| 6.750%, 05/01/2011 | | | 770,000 | | | | 800,401 | |
FPL Group Capital, Inc. (c) | | | | | | | | |
| 6.350%, 10/01/2066 | | | 770,000 | | | | 730,665 | |
The accompanying notes are an integral part of the financial statements.
Summit Mutual Funds, Inc. – Apex Series |
| BOND FUND | SCHEDULE OF INVESTMENTS |
| | | PRINCIPAL | | | | |
| | | AMOUNT | | | VALUE | |
Utilities - 2.6% (Continued) | | | | | | |
| Kern River Funding Corp. | | | | | | |
6.676%, 07/31/2016 (b) | | $ | 108,726 | | | $ | 116,158 | |
| | | | | | | | 2,430,974 | |
| CORPORATE BONDS | | | | | | | | |
| (Cost $37,387,078) | | | | | | | 36,879,481 | |
| | | | | | | | | |
MORTGAGE BACKED SECURITIES - 39.6% | | | | | | | | |
| Banc of America Alternative Loan Trust | | | | | | | | |
| Series 2003-5, 5.000%, 07/25/2018 | | | 508,360 | | | | 458,300 | |
| Series 2003-8, 4.750%, 10/25/2018 | | | 549,898 | | | | 485,386 | |
| Banc of America Funding Corp. | | | | | | | | |
| Series 2004-4, 4.686%, 10/25/2019 | | | 158,240 | | | | 146,105 | |
| Series 2004-4, 4.686%, 10/25/2019 | | | 95,285 | | | | 84,367 | |
| Series 2003-2, 6.382%, 06/25/2032 | | | 596,741 | | | | 594,741 | |
| Banc of America Mortgage Securities | | | | | | | | |
| Series 2003-10, 5.000%, 01/25/2019 | | | 340,350 | | | | 335,298 | |
Series 2003-10, 5.000%, 01/25/2019 (b) | | | 80,143 | | | | 67,708 | |
| Series 2004-3, 4.875%, 04/25/2019 | | | 162,675 | | | | 146,056 | |
| Series 2004-7, 4.797%, 08/25/2019 | | | 350,649 | | | | 325,495 | |
| Series 2005-6, 5.000%, 07/25/2020 | | | 354,265 | | | | 336,155 | |
| Series 2003-5, 7.500%, 02/25/2031 | | | 401,364 | | | | 418,338 | |
| Series 2003-8, 5.500%, 11/25/2033 | | | 125,800 | | | | 125,777 | |
| Series 2004-4, 5.422%, 05/25/2034 | | | 1,012,768 | | | | 881,978 | |
| Series 2004-6, 5.500%, 07/25/2034 | | | 651,591 | | | | 647,434 | |
| Cendant Mortgage Corporation | | | | | | | | |
Series 2002-11P, 5.595%, 12/25/2032 (b) | | | 79,280 | | | | 67,954 | |
| Chase Commercial Mortgage Securities Corp. | | | | | | | | |
| Series 97-2, 6.600%, 12/19/2029 | | | 1,982,000 | | | | 1,980,514 | |
| Chase Mortgage Finance Corporation | | | | | | | | |
Series 2002-S8, 5.448%, 08/25/2029 (b) | | | 227,971 | | | | 220,022 | |
| Citicorp Mortgage Securities, Inc. | | | | | | | | |
| Series 2003-10 A1, 4.500%, 11/25/2018 | | | 1,837,873 | | | | 1,763,785 | |
Series 2003-2 B4, 5.630%, 02/25/2033 (b) | | | 1,346,807 | | | | 1,049,643 | |
| Citigroup Mortgage Loan Trust, Inc. | | | | | | | | |
| Series 2005-5, 5.690%, 08/25/2035 | | | 292,855 | | | | 236,682 | |
| Countrywide Home Loans | | | | | | | | |
| Series 2003-58, 4.574%, 02/19/2034 | | | 1,257,557 | | | | 1,253,534 | |
| Series 2006-6, 6.000%, 04/25/2036 | | | 984,796 | | | | 911,730 | |
| Series 2007-5, 5.750%, 05/25/2037 | | | 1,295,054 | | | | 1,190,250 | |
| Credit Suisse Mortgage Capital Corporation | | | | | | | | |
| Series 2006-4, 5.741%, 05/25/2036 | | | 724,501 | | | | 627,172 | |
| Fannie Mae Pool | | | | | | | | |
| Pool #254190, 5.500%, 02/01/2009 | | | 483,196 | | | | 486,396 | |
| Pool #254273, 5.000%, 03/01/2009 | | | 346,301 | | | | 345,969 | |
| Pool #254340, 5.500%, 05/01/2012 | | | 261,425 | | | | 263,204 | |
| Pool #545015, 6.000%, 06/01/2016 | | | 367,108 | | | | 372,828 | |
| Pool #727360, 5.500%, 08/01/2018 | | | 1,971,377 | | | | 1,971,128 | |
| Pool #481582, 6.500%, 02/01/2029 | | | 145,316 | | | | 149,285 | |
| Series 2002-48B, 6.500%, 10/25/2031 | | | 1,322,315 | | | | 1,338,569 | |
| First Horizon Alternative Mortgage Securities | | | | | | | | |
| Series 2005-FA11, 5.730%, 02/25/2036 | | | 443,457 | | | | 290,490 | |
| | | PRINCIPAL | | | | |
| | | AMOUNT | | | VALUE | |
MORTGAGE BACKED SECURITIES - 39.6% (Continued) | | | | | | |
| Freddie Mac | | | | | | |
| Series 2931, 5.000%, 11/15/2028 | | $ | 2,227,218 | | | $ | 2,231,823 | |
| Freddie Mac (Gold) Pool | | | | | | | | |
| Pool #M8-0866, 5.000%, 11/01/2010 | | | 683,347 | | | | 682,233 | |
| Pool #E9-1818, 5.000%, 10/01/2017 | | | 2,451,029 | | | | 2,411,451 | |
| Pool #E9-6460, 5.000%, 05/01/2018 | | | 333,538 | | | | 327,868 | |
| Pool #E9-9160, 4.500%, 09/01/2018 | | | 2,244,643 | | | | 2,166,304 | |
| Pool #C7-6658, 5.000%, 02/01/2033 | | | 296,872 | | | | 284,168 | |
| Ginnie Mae I Pool | | | | | | | | |
| Pool #446760, 6.500%, 10/15/2028 | | | 173,141 | | | | 177,669 | |
| GMAC Mortgage Corp Loan Trust | | | | | | | | |
Series 2003-J3, 5.000%, 05/25/2018 (b) | | | 231,289 | | | | 202,587 | |
| Series 2004-J1, 5.250%, 04/25/2034 | | | 290,976 | | | | 289,991 | |
| Lehman Mortgage Trust | | | | | | | | |
| Series 2005-2, 5.573%, 12/25/2035 | | | 1,087,026 | | | | 859,535 | |
| MASTR Asset Securitization Trust | | | | | | | | |
| Series 2003-9, 5.500%, 10/25/2033 | | | 160,974 | | | | 160,981 | |
| MASTR Seasoned Securities Trust | | | | | | | | |
| Series 2004-1, 6.235%, 08/25/2017 | | | 436,653 | | | | 440,768 | |
| Series 2004-1, 6.500%, 08/25/2032 | | | 774,070 | | | | 750,979 | |
| Morgan Stanley Capital I | | | | | | | | |
| Series 2007-IQ14, 5.497%, 04/15/2049 | | | 1,000,000 | | | | 1,001,774 | |
| Morgan Stanley Mortgage Loan Trust | | | | | | | | |
| Series 2004-1, 5.170%, 11/25/2033 | | | 476,080 | | | | 429,969 | |
| Residential Accredit Loans, Inc. | | | | | | | | |
| Series 2002-QS16, 5.750%, 10/25/2017 | | | 242,901 | | | | 238,990 | |
| Series 2002-QS16, 5.750%, 10/25/2017 | | | 242,901 | | | | 230,475 | |
| Residential Asset Securitization Trust | | | | | | | | |
| Series 2003-A12 Class B2, 5.000%, 11/25/2018 | | | 199,340 | | | | 188,567 | |
| Series 2003-A12 Class B3, 5.000%, 11/25/2018 | | | 265,282 | | | | 237,483 | |
| Residential Funding Mortgage Securities I | | | | | | | | |
| Series 2004-S3, 4.750%, 03/25/2019 | | | 281,416 | | | | 251,795 | |
| Salomon Brothers Mortgage Securities VII | | | | | | | | |
| Series 2003-HYB1, 4.190%, 09/25/2033 | | | 471,241 | | | | 451,584 | |
| Structured Asset Securities Corp. | | | | | | | | |
| Series 2003-20, 5.387%, 07/25/2033 | | | 659,304 | | | | 597,605 | |
| Washington Mutual Mortgage Pass-Through Certificates | | | | | | | | |
| Series 2002-MS11, 5.250%, 12/25/2017 | | | 1,187,561 | | | | 1,184,040 | |
| Series 2003-MS6, 5.966%, 03/25/2033 | | | 634,779 | | | | 598,692 | |
| Wells Fargo Mortgage Backed Securities Trust | | | | | | | | |
| Series 2005-4, 5.500%, 04/25/2035 | | | 871,464 | | | | 694,555 | |
| TOTAL MORTGAGE BACKED SECURITIES | | | | | | | | |
| (Cost $38,091,014) | | | | | | | 36,664,179 | |
U.S. TREASURY OBLIGATIONS - 18.1% | | | | | | | | |
U.S. Treasury Bonds - 0.7% | | | | | | | | |
4.500%, 02/15/2036 (e) | | | 650,000 | | | | 616,231 | |
| | | | | | | | 616,231 | |
The accompanying notes are an integral part of the financial statements.
Summit Mutual Funds, Inc. – Apex Series |
| SCHEDULE OF INVESTMENTS | BOND FUND |
| | | PRINCIPAL | | | | |
| | | AMOUNT | | | VALUE | |
U.S. Treasury Notes - 17.4% | | | | | | |
5.000%, 08/15/2011 (e) | | $ | 1,000,000 | | | $ | 1,033,203 | |
4.750%, 01/31/2012 (e) | | | 500,000 | | | | 511,445 | |
4.625%, 02/29/2012 (e) | | | 2,000,000 | | | | 2,035,468 | |
4.000%, 11/15/2012 (e) | | | 2,000,000 | | | | 1,983,124 | |
3.875%, 02/15/2013 (e) | | | 3,425,000 | | | | 3,368,005 | |
4.250%, 11/15/2014 (e) | | | 4,825,000 | | | | 4,778,637 | |
4.875%, 08/15/2016 (e) | | | 2,320,000 | | | | 2,374,376 | |
| | | | | | | | 16,084,258 | |
| TOTAL U.S. TREASURY OBLIGATIONS | | | | | | | | |
| (Cost $16,394,380) | | | | | | | 16,700,489 | |
Total Investments | | | | | | | | |
(Cost $93,841,052) (d) - 99.3% | | | | | | | 91,864,711 | |
Northern Institutional Liquid Assets Portfolio (f) - 24.2% | | | | | | | 22,388,429 | |
Liabilities in Excess of Other Assets - (23.5)% | | | | | | | (21,725,558 | ) |
TOTAL NET ASSETS - 100.0% | | | | | | $ | 92,527,582 | |
| (a) | Non-income producing security. |
| (b) | Security exempt from registration under the Securities Act of 1933. These securities may be resold in transactions exempt under Rule 144A of the Securities Act of 1933, normally to qualified institutional buyers. |
| (c) | Variable rate security. |
| (d) | For federal income tax purposes, cost is $93,923,346 and gross unrealized appreciation and depreciation of securities as of Septemper 30, 2007 was $785,880 and ($2,844,515), respectively, with a net appreciation / (depreciation) of ($2,058,635). |
| (e) | All or a portion of the security is out on loan. |
| (f) | This security was purchased with cash collateral held from securities lending. The market values of the securities on loan, the collateral purchased with cash, and the noncash collateral accepted are $21,885,589, $22,388,429, and $195,258, respectively. |
| (g) | Security is considered illiquid. The aggregate value of such securities is $4,820 or 0.0% of total net assets. |
(h) | Security in default. |
| (i) | Valued in good faith under procedures adopted by the Board of Directors. |
The accompanying notes are an integral part of the financial statements.
Summit Mutual Funds, Inc. – Apex Series |
| BOND FUND | FINANCIAL STATEMENTS |
STATEMENT OF ASSETS AND LIABILITIES | | | |
September 30, 2007 | | | |
| ASSETS | | | |
| Investments in securities, at value | | $ | 91,864,711 | |
| Collateral for securities loaned, | | | | |
| at fair value | | | 22,388,429 | |
| Receivables: | | | | |
| Shares sold | | | 149,726 | |
| Interest and dividends | | | 1,024,108 | |
| Prepaid expenses and other | | | 13,115 | |
| | | $ | 115,440,089 | |
| LIABILITIES | | | | |
| Payables: | | | | |
| Payable upon return of securities loaned | | | 22,388,429 | |
| Shared redeemed | | | 381,899 | |
| Bank overdraft | | | 51,676 | |
| Advisory fees | | | 35,745 | |
| Fund accounting fees | | | 9,882 | |
| Professional fees | | | 21,982 | |
| Administration fees | | | 7,605 | |
| Custodian fees | | | 2,744 | |
| Directors’ fees | | | 198 | |
| 12b-1 fees | | | 78 | |
| Other accrued expenses | | | 12,269 | |
| | | | 22,912,507 | |
| NET ASSETS* | | | | |
| Paid-in capital | | | 94,748,695 | |
| Accumulated undistributed net invesment | | | | |
| income / (loss) | | | 567,176 | |
| Accumulated net realized gain / (loss) | | | | |
| on investments | | | (811,948 | ) |
| Net unrealized appreciation / (depreciation) | | | | |
| on investments | | | (1,976,341 | ) |
| | | $ | 92,527,582 | |
| Investments at cost | | $ | 93,841,052 | |
| Shares authorized - Class I ($.10 par value) | | | 20,000,000 | |
| Shares authorized - Class A ($.10 par value) | | | 20,000,000 | |
| NET ASSET VALUE (NAV) BY SHARE CLASS | | | | | |
| | | | | | |
| Share Class | Net Assets | Outstanding | | per share | |
| Class I | $92,450,501 | | | $ | 49.29 | |
| Class A | $77,081 | 1,559 | | $ | 49.46 | ** |
| Class A maximum offering price per share | | | | | |
| (net asset value plus sales charge of 4.25% | | | | | |
| of offering price) | | | $ | 51.66 | |
| * | FEDERAL TAX DATA AS OF SEPTEMBER 30, 2006 | | |
| | Percentage of ordinary distributions designated as | | |
| | qualified dividend income | 0.21 | % |
| | Dividends received deduction for corporate shareholders | 0.20 | % |
| | Undistributed ordinary income | $567,176 | |
Capital Loss Carryforward Expiring September 30: |
| | 2011 | 2014 | 2015 | |
| $(251,589) | $(141,901) | $(336,178) | |
| ** | Net Asset Value does not recalculate due to fractional shares outstanding. |
STATEMENT OF OPERATIONS | | | |
For the year ended September 30, 2007 | | | |
| INVESTMENT INCOME | | | |
| Interest | | $ | 5,424,615 | |
| Dividends | | | 55,786 | |
| Other income | | | 24,255 | |
| | | | 5,504,656 | |
| EXPENSES | | | | |
| Advisory fees | | | 442,732 | |
| Administration fees | | | 94,198 | |
| Fund accounting fees | | | 41,738 | |
| Transfer agent fees | | | 37,186 | |
| Professional fees | | | 33,167 | |
| Directors’ fees | | | 12,030 | |
| Custodian fees | | | 11,036 | |
| Shareholder reporting fees | | | 6,595 | |
| 12b-1 fees - Class A | | | 86 | |
| Other expenses | | | 40,015 | |
| | | | 718,783 | |
| NET INVESTMENT INCOME / (LOSS) | | | 4,785,873 | |
| | | | | |
| REALIZED AND UNREALIZED GAIN / (LOSS) | | | | |
| Net realized gain / (loss) on investments | | | (14,366 | ) |
| Net change in unrealized appreciation / | | | | |
| (depreciation) on investments | | | (1,022,044 | ) |
| | | | | |
| NET REALIZED AND UNREALIZED | | | | |
| GAIN / (LOSS) | | | (1,036,410 | ) |
| | | | | |
| NET INCREASE / (DECREASE) IN | | | | |
| NET ASSETS FROM OPERATIONS | | $ | 3,749,463 | |
| TRANSACTIONS WITH AFFILIATES: | | |
| Percent of Current | |
Net Asset Value | |
| Advisory | Administration | |
| Fee | Fee | |
| 0.47% | 0.10% | |
The accompanying notes are an integral part of the financial statements.
Summit Mutual Funds, Inc. – Apex Series |
| FINANCIAL STATEMENTS | BOND FUND |
STATEMENTS OF CHANGES IN NET ASSETS | | | | | | |
Year Ended September 30, | | | | | | |
| | | 2007 | | | 2006 | |
| OPERATIONS | | | | | | |
| Net investment income / (loss) | | $ | 4,785,873 | | | $ | 4,950,633 | |
| Net realized gain / (loss) on investments | | | (14,366 | ) | | | (425,015 | ) |
| Net change in unrealized appreciation / (depreciation) on investments | | | (1,022,044 | ) | | | (413,765 | ) |
| | | | 3,749,463 | | | | 4,111,853 | |
| DISTRIBUTIONS TO SHAREHOLDERS* | | | | | | | | |
| Class I | | | | | | | | |
| Net investment income | | | (4,890,397 | ) | | | (4,706,848 | ) |
Class A(1) | | | | | | | | |
| Net investment income | | | (1,521 | ) | | | — | |
| | | | (4,891,918 | ) | | | (4,706,848 | ) |
| FUND SHARE TRANSACTIONS | | | | | | | | |
| Class I | | | | | | | | |
| Proceeds from shares sold | | | 13,135,327 | | | | 9,432,367 | |
| Reinvestment of distributions | | | 4,889,397 | | | | 4,706,848 | |
| Payments for shares redeemed | | | (19,098,684 | ) | | | (15,996,559 | ) |
| | | | (1,073,960 | ) | | | (1,857,344 | ) |
| FUND SHARE TRANSACTIONS | | | | | | | | |
Class A(1) | | | | | | | | |
| Proceeds from shares sold | | | 77,052 | | | | — | |
| Reinvestment of distributions | | | 570 | | | | — | |
| Payments for shares redeemed | | | (1 | ) | | | — | |
| | | | 77,621 | | | | — | |
| NET INCREASE / (DECREASE) IN NET ASSETS | | | (2,138,794 | ) | | | (2,452,339 | ) |
| NET ASSETS | | | | | | | | |
| Beginning of period | | | 94,666,376 | | | | 97,118,715 | |
| End of period | | $ | 92,527,582 | | | $ | 94,666,376 | |
| | | | | | | | | |
| ACCUMULATED UNDISTRIBUTED NET INVESTMENT INCOME | | $ | 567,176 | | | $ | 683,873 | |
| FUND SHARE TRANSACTIONS | | | | | | |
| Class I | | | | | | |
| Sold | | | 263,016 | | | | 191,336 | |
| Reinvestment of distributions | | | 98,743 | | | | 95,940 | |
| Redeemed | | | (383,665 | ) | | | (324,884 | ) |
| Net increase / (decrease) from fund share transactions | | | (21,906 | ) | | | 37,608 | |
| FUND SHARE TRANSACTIONS | | | | | | | | |
Class A(1) | | | | | | | | |
| Sold | | | 1,547 | | | | | |
| Reinvestment of distributions | | | | | | | | |
| Redeemed | | | — | | | | — | |
| Net increase / (decrease) from fund share transactions | | | 1,559 | | | | | |
| TOTAL COST OF PURCHASES OF: | | | | | | | | |
| Preferred and Common Stocks | | $ | 87,400 | | | $ | 6,285,962 | |
| U.S. Government Securities | | | 33,334,821 | | | | 11,734,377 | |
| Corporate Bonds | | | 49,120,669 | | | | 39,888,595 | |
| | | $ | 82,542,890 | | | $ | 57,908,934 | |
| TOTAL PROCEEDS FROM SALES OF: | | | | | | | | |
| Preferred and Common Stocks | | $ | 848,475 | | | $ | 1,070,073 | |
| U.S. Government Securities | | | 26,975,812 | | | | 18,668,373 | |
| Corporate Bonds | | | 53,363,214 | | | | 39,044,556 | |
| | | $ | 81,187,501 | | | $ | 58,783,002 | |
| *TAX CHARACTER OF DISTRIBUTIONS PAID | | | | | | | | |
| Ordinary income | | $ | 4,891,918 | | | $ | 4,076,848 | |
| | | $ | | | | $ | | |
(1) Class A shares have been offered since February 1, 2007. | | | | | | | | |
The accompanying notes are an integral part of the financial statements.
Summit Mutual Funds, Inc. – Apex Series SHORT-TERM GOVERNMENT FUND |
Summit Short-term Government Fund Class I - Average Annual Total Return |
1-Y ear | 5-Year | Since Inception |
| 5.06% | 2.49% | 4.30% |
Summit Short-term Government Fund Class A - Average Annual Total Return |
1-Y ear | 5-Year | Since Inception |
| 1.67% | 1.62% | 3.62% |
Past performance is not predictive of future results. Performance does not reflect the deduction of taxes that a shareholder would pay on fund distributions or redemption of fund shares. Prior to February 1, 2007, Class A share performance is based on Class I performance, adjusted to reflect Class A sales charges and expenses. Absent limitation of expenses during certain of the periods shown, performance would have been lower.
Fund Data | | Sector Allocations |
Manager: Number Of Fixed Income Holdings: Average Duration: Average Maturity: Average Credit Quality: 30-day SEC Yield - Class I: 30-day SEC Yield - Class A: | Michael J. Schultz April 3, 2000 $27.3 Million 29 1.38 years 2.18 years GOV/GOV 4.22% 4.07% | | 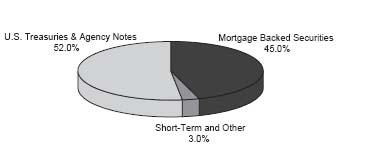 |
Summit Mutual Funds, Inc. – Apex Series SHORT-TERM GOVERNMENT FUND |
Objective – Seeks to provide a high level of current income and preservation of capital by investing 100% of its total assets in bonds issued by the U.S. government or its agencies or instrumentalities.
Strategy – Under normal market conditions, the Short-term Government Fund (the “Fund”) will invest 100% of the value of its assets in bonds issued by the U.S. government or its agencies or instrumentalities.
Manager’s Comments:
The Summit Short-term Government Fund Class I had a total return of 5.06% (after waivers and reimbursements) for the fiscal year ended September 30, 2007 compared to a total return of 5.93% for the Citicorp 1-5 Year Treasury Index (the “Index”), formerly known as Salomon 1-5 Year Treasury Index.
It was a very wild ride for the fixed income market over the last year. At the start of the period, the yield curve was inverted but by the end of the period interest rates had returned to a more normal positively sloped curve with most of the movement coming from shorter-term interest rates. Liquidity and credit concerns emerged during the later part of the reporting period as fear spread through the global financial markets as a result of subprime mortgage exposure and the potential consequences. Liquidity in the mortgage-backed securities market became extremely limited leading to a wider liquidity crisis in other financial markets. At the same time, investors became increasingly concerned about future economic growth, particularly the extent to which the housing downturn would spill over into other areas of the economy. Amid the uncertainty, fixed income investors abandoned higher risk assets and moved into Treasuries in a flight to quality trade resulting in significantly lower Treasury rates by the end of September. As a result of the turmoil in the financial markets, the Federal Reserve Bank (Fed) aggressively cut short-term interest rates to restore some measure of stability to the financial markets. Further rate cuts may be needed to foster price stability, sustain economic growth and provide liquidity to the financial markets. The steeper, more normally shaped yield curve that evolved during the third quarter is likely to continue until the financial uncertainty abates. The housing market should remain under pressure, probably through 2008 resulting in continued caution for higher risk assets.
The Fund’s under performance to the Index was primarily a result of maintaining a shorter duration and unfavorable asset allocation. During the period, the Fund’s exposure to mortgage-backed securities provided the largest incremental return. The Fund’s holdings in this sector included fixed rate pass through and collateralized mortgage obligations (CMOs) that performed well as interest rates declined and the yield curve became positively sloped. The 3-5 year Treasury sector was the best performing segment of the investment grade fixed income market over the past year. Unfortunately, the Fund was underexposed to the 3-5 year sector of the Treasury market and did not fully participate in the massive rally in the Treasury sector during the year. The sectors that provided the largest negative contribution to the Fund included floating rate CMOs and adjustable rates mortgage securities. The Fund was also over-weighted in the shorter maturity U.S. Treasury and Agency sectors versus the Index resulting in under performance during the period.
Summit Mutual Funds, Inc. – Apex Series |
| SHORT-TERM GOVERNMENT FUND | FINANCIAL HIGHLIGHTS |
FINANCIAL HIGHLIGHTS | | | | | | | | | | | | | | | |
| Computed on the basis of a share of capital stock outstanding throughout the period. | | | | | | | | | | | | | |
| | | Class I |
| | | Fiscal Year Ended September 30, |
| | | 2007 | | | 2006 | | | 2005 | | | 2004 | | | 2003 | |
| Net asset value, beginning of period | | $ | 51.10 | | | $ | 51.05 | | | $ | 51.84 | | | $ | 52.56 | | | $ | 53.48 | |
| INVESTMENT ACTIVITIES: | | | | | | | | | | | | | | | | | | | | |
| Net investment income / (loss) | | | 2.09 | | | | 1.84 | | | | 1.41 | | | | 1.30 | | | | 1.37 | |
| Net realized and unrealized gains / (losses) | | | 0.44 | | | | (0.05 | ) | | | (0.78 | ) | | | (0.87 | ) | | | (0.42 | ) |
| Total from Investment Activities | | | 2.53 | | | | 1.79 | | | | 0.63 | | | | 0.43 | | | | 0.95 | |
| DISTRIBUTIONS: | | | | | | | | | | | | | | | | | | | | |
| Net investment income | | | (2.13 | ) | | | (1.74 | ) | | | (1.42 | ) | | | (1.15 | ) | | | (1.58 | ) |
| Net realized gains | | | — | | | | — | | | | — | | | | — | | | | (0.29 | ) |
| Total Distributions | | | (2.13 | ) | | | (1.74 | ) | | | (1.42 | ) | | | (1.15 | ) | | | (1.87 | ) |
| Net asset value, end of period | | $ | 51.50 | | | $ | 51.10 | | | $ | 51.05 | | | $ | 51.84 | | | $ | 52.56 | |
| | | | | | | | | | | | | | | | | | | | | |
| Total return | | | 5.06 | % | | | 3.58 | % | | | 1.24 | % | | | 0.83 | % | | | 1.81 | % |
| RATIOS / SUPPLEMENTAL DATA: | | | | | | | | | | | | | | | | | | | | |
Ratio of expenses to average net assets - net(2) | | | 0.73 | % | | | 0.73 | % | | | 0.73 | % | | | 0.73 | % | | | 0.73 | % |
| Ratio of expenses to average net assets - gross | | | 0.96 | % | | | 0.84 | % | | | 0.88 | % | | | 0.85 | % | | | 0.81 | % |
| Ratio of net investment income / (loss) to average net assets | | | 4.11 | % | | | 3.55 | % | | | 2.59 | % | | | 2.16 | % | | | 2.00 | % |
Portfolio turnover rate(4) | | | 32.26 | % | | | 41.95 | % | | | 15.98 | % | | | 32.31 | % | | | 55.57 | % |
| Net assets, end of period (000’s) | | $ | 27,270 | | | $ | 28,013 | | | $ | 28,368 | | | $ | 28,981 | | | $ | 31,664 | |
| | Class A | |
| | Period from | |
| | February 1, 2007(1) | |
| | to September 30, | |
| | 2007 | |
| Net asset value, beginning of period | | $ | 50.99 | | |
| | | | | | |
| INVESTMENT ACTIVITIES: | | | | | |
| Net investment income / (loss) | | | 1.37 | | |
| Net realized and unrealized gains / (losses) | | | 0.43 | | |
| Total from Investment Activities | | | 1.80 | | |
| | | | | | |
| DISTRIBUTIONS: | | | | | |
| Net investment income | | | (1.14 | ) | |
| | | — | | |
| Total Distributions | | | (1.14 | ) | |
| Net asset value, end of period | | $ | 51.65 | | |
Total return(5) | | | 3.57 | % | |
| | | | | | |
| RATIOS / SUPPLEMENTAL DATA: | | | | | |
Ratio of expenses to average net assets - net (2) | | | 0.98 | %(3) | |
Ratio of expenses to average net assets - gross | | | 1.25 | %(3) | |
Ratio of net investment income / (loss) to average net assets | | | 4.73 | %(3) | |
Portfolio turnover rate(4) | | | 32.26 | % | |
| Net assets, end of period (000’s) | | $ | 10 | | |
| | | | | | |
(1) Commencement of operations.
(2) Net expenses represent gross expenses reduced by fees waived and/or reimbursed by the Adviser.
(3) Annualized.
(4) Portfolio Turnover is calculated on the basis of the Fund as a whole without distinguishing between the classes of shares issued.
(5) Total return calculations do not include any sales charges.
The accompanying notes are an integral part of the financial statements.
Summit Mutual Funds, Inc. – Apex Series |
| SCHEDULE OF INVESTMENTS | SHORT-TERM GOVERNMENT FUND |
September 30, 2007 | | | | | | |
| | | PRINCIPAL | | | | |
| | | AMOUNT | | | VALUE | |
MORTGAGE BACKED SECURITIES - 45.0% | | | | | | |
| Fannie Mae | | | | | | |
| Pool #254177, 5.000%, 12/01/2008 | | $ | 110,684 | | | $ | 110,407 | |
| Pool #254187, 5.000%, 01/01/2009 | | | 240,111 | | | | 239,510 | |
| Pool #254227, 5.000%, 02/01/2009 | | | 80,209 | | | | 80,132 | |
| Pool #254340, 5.500%, 05/01/2012 | | | 188,807 | | | | 190,092 | |
| Series 2003-122, 4.000%, 05/25/2016 | | | 548,277 | | | | 544,712 | |
| Pool #546478, 7.000%, 12/01/2029 | | | 610,675 | | | | 635,519 | |
| Pool #576455, 6.498%, 03/01/2031 | | | 137,517 | | | | 140,256 | |
| Series 2005-105-1, 5.500%, 11/25/2031 | | | 1,449,634 | | | | 1,456,768 | |
| Pool #653686, 6.774%, 08/01/2032 | | | 325,589 | | | | 332,145 | |
| Freddie Mac | | | | | | | | |
| Series 2742, 4.000%, 09/15/2012 | | | 142,817 | | | | 142,584 | |
| Series 2639, 4.000%, 10/15/2016 | | | 1,222,820 | | | | 1,195,354 | |
| Series 2858, 4.000%, 03/15/2020 | | | 115,271 | | | | 115,011 | |
| Series 2557, 4.500%, 01/15/2026 | | | 180,127 | | | | 179,346 | |
| Series 2931, 5.000%, 11/15/2028 | | | 1,633,293 | | | | 1,636,670 | |
| Series 2534, 6.150%, 09/15/2030 | | | 45,435 | | | | 45,450 | |
| Series 2550, 6.100%, 11/15/2032 | | | 627,524 | | | | 628,831 | |
| Series 2877, 6.150%, 10/15/2034 | | | 639,410 | | | | 632,016 | |
| Series 2950, 6.050%, 03/15/2035 | | | 1,395,067 | | | | 1,385,899 | |
| Series 3003, 6.000%, 07/15/2035 | | | 2,124,329 | | | | 2,108,469 | |
| Freddie Mac (Gold) Pool | | | | | | | | |
| Pool #M9-0805, 4.500%, 04/01/2008 | | | 162,579 | | | | 161,548 | |
| Pool #E9-6460, 5.000%, 05/01/2018 | | | 311,302 | | | | 306,010 | |
| TOTAL MORTGAGE BACKED SECURITIES | | | | | | | | |
| (Cost $12,283,792) | | | | | | | 12,266,729 | |
| | | | | | | | | |
U.S. GOVERNMENT AGENCY ISSUES - 7.3% | | | | | | | | |
| Federal Home Loan Bank | | | | | | | | |
| 3.700%, 12/24/2007 | | | 2,000,000 | | | | 1,994,152 | |
| TOTAL U.S. GOVERNMENT AGENCY ISSUES | | | | | | | | |
| (Cost $2,000,000) | | | | | | | 1,994,152 | |
| | | | | | | | | |
U.S. TREASURY OBLIGATIONS - 44.7% | | | | | | | | |
U.S. Treasury Notes - 44.7% | | | | | | | | |
3.625%, 01/15/2008 (c) (d) | | | 1,934,025 | | | | 1,931,608 | |
4.625%, 02/29/2008 (d) | | | 2,000,000 | | | | 2,003,750 | |
4.875%, 08/31/2008 (d) | | | 1,250,000 | | | | 1,258,105 | |
3.000%, 02/15/2009 (d) | | | 2,000,000 | | | | 1,973,594 | |
4.875%, 08/15/2009 (d) | | | 2,000,000 | | | | 2,032,188 | |
3.875%, 09/15/2010 (d) | | | 2,000,000 | | | | 1,992,188 | |
4.625%, 10/31/2011 (d) | | | 1,000,000 | | | | 1,017,812 | |
| TOTAL U.S. TREASURY OBLIGATIONS | | | | | | | | |
| (Cost $12,215,958) | | | | | | | 12,209,245 | |
| | | SHARES | | | VALUE | |
SHORT TERM INVESTMENTS - 2.6% | | | | | | |
Money Market Funds - 2.6% | | | | | | |
| Northern Institutional Government Select Portfolio | | | 701,935 | | | $ | 701,935 | |
| TOTAL SHORT TERM INVESTMENTS | | | | | | | | |
| (Cost $701,935) | | | | | | | 701,935 | |
Total Investments (Cost $27,201,685) (a) - 99.6% | | | | | | | 27,172,061 | |
Northern Institutional Liquid Assets Portfolio (b) - 37.8% | | | | | | | 10,304,448 | |
Liabilities in Excess of Other Assets - (37.4)% | | | | | | | (10,196,741 | ) |
TOTAL NET ASSETS - 100.0% | | | | | | $ | 27,279,768 | |
(a) | For federal income tax purposes, cost is $27,201,685 and gross unrealized appreciation and depreciation of securities as of September 30, 2007 was $140,272 and $(169,896) respectively, with a net appreciation/(depreciation) of $(29,624). |
(b) | This security was purchased with cash collateral held from securities lending. The market values of the securities on loan, the collateral purchased with cash, and the noncash collateral accepted are $11,600,538, $10,304,448, and $2,041,016, respectively. |
(c) | Inflation protected security. |
(d) | All or a portion of the security is out on loan. |
The accompanying notes are an integral part of the financial statements.
Summit Mutual Funds, Inc. – Apex Series |
| SHORT-TERM GOVERNMENT FUND | FINANCIAL STATEMENTS |
STATEMENT OF ASSETS AND LIABILITIES | | | |
September 30, 2007 | | | |
| | | | |
| ASSETS | | | |
| Investments in securities, at value | | $ | 27,172,061 | |
| Collateral for securities loaned, at fair value | | | 10,304,448 | |
| Receivables: | | | | |
| Shares sold | | | 13 | |
| Interest and dividends | | | 138,010 | |
| Prepaid expenses and other | | | 14,813 | |
| | | | 37,629,345 | |
| LIABILITIES | | | | |
| Payables: | | | | |
| Payable upon return of securities loaned | | | 10,304,448 | |
| Shares redeemed | | | 5,655 | |
| Professional fees | | | 16,786 | |
| Advisory fees | | | 5,844 | |
| Fund accounting fees | | | 4,953 | |
| Administration fees | | | 2,247 | |
| Custodian fees | | | 733 | |
| Directors’ fees | | | 199 | |
| 12b-1 fees | | | 10 | |
| Other accrued expenses | | | 8,702 | |
| | | | 10,349,577 | |
| NET ASSETS* | | | | |
| Paid-in capital | | | 27,445,698 | |
| Accumulated undistributed net | | | | |
| investment income | | | 135,889 | |
| Accumulated net realized gain / (loss) | | | | |
| on investments | | | (272,195 | ) |
| Net unrealized appreciation / (depreciation) | | | | |
| on investments | | | (29,624 | ) |
| | | $ | 27,279,768 | |
| | | | | |
| Investments at cost | | $ | 27,201,685 | |
| Shares authorized - Class I ($.10 par value) | | | 20,000,000 | |
| Shares authorized - Class A ($.10 par value) | | | 20,000,000 | |
| NET ASSET VALUE (NAV) BY SHARE CLASS | | | | | |
| | | | | | |
| Share Class | Net Assets | Outstanding | | per share | |
| Class I | $27,269,560 | | | $ | 51.50 | |
| Class A | $10,208 | 198 | | $ | 51.65 | ** |
| Class A maximum offering price per share | | | | | |
| (net asset value plus sales charge of 3.00% | | | | | |
| of offering price) | | | $ | 53.25 | |
| * | FEDERAL TAX DATA AS OF SEPTEMBER 30, 2007 | | |
| | Undistributed ordinary income | $ | 135,889 |
Capital Loss Carryforward |
Expiring September 30: |
2011 | 2012 | 2013 | 2014 |
| $(14,885) | $(192,583) | $(23,304) | $(41,423) |
** Net Asset Value does not recalculate due to fractional shares outstanding. |
STATEMENT OF OPERATIONS | | | |
For the year ended September, 2007 | | | |
| | | | |
| INVESTMENT INCOME | | | |
| Interest | | $ | 1,263,664 | |
| Dividends | | | 37,350 | |
| Other income | | | 8,729 | |
| | | | 1,309,743 | |
| EXPENSES | | | | |
| Advisory fees | | | 121,877 | |
| Transfer agent fees | | | 29,422 | |
| Registration fees | | | 29,044 | |
| Administration fees | | | 27,084 | |
| Fund accounting fees | | | 21,133 | |
| Professional fees | | | 20,621 | |
| Directors’ fees | | | 3,430 | |
| Custodian fees | | | 3,156 | |
| Shareholder reporting fees | | | 1,803 | |
| 12b-1 fees - Class A | | | 11 | |
| Other expenses | | | 3,498 | |
| | | | 261,079 | |
| Reimbursements and waivers | | | (63,356 | ) |
| | | | 197,723 | |
| NET INVESTMENT INCOME / (LOSS) | | | 1,112,020 | |
| | | | | |
| REALIZED AND UNREALIZED GAIN / (LOSS) | | | | |
| Net realized gain / (loss) on investments | | | (85 | ) |
| Net change in unrealized appreciation / | | | | |
| (depreciation) on investments | | | 214,993 | |
| | | | | |
| NET REALIZED AND UNREALIZED | | | | |
| GAIN / (LOSS) | | | 214,908 | |
| | | | | |
| NET INCREASE / (DECREASE) IN | | | | |
| NET ASSETS FROM OPERATIONS | | $ | 1,326,928 | |
| TRANSACTIONS WITH AFFILIATES: | | | |
| Percent of Current | |
Net Asset Value | |
| Advisory | Administration | Class I | Class A | Reimbursements |
| Fee | Fee | Expense Limit | Expense Limit | and Waivers |
| 0.45% | 0.10% | 0.73% | 0.98% | $63,356 |
The accompanying notes are an integral part of the financial statements.
Summit Mutual Funds, Inc. – Apex Series |
| FINANCIAL STATEMENTS | SHORT-TERM GOVERNMENT FUND |
STATEMENTS OF CHANGES IN NET ASSETS | | | | | | |
Year Ended September 30, | | | | | | |
| | | 2007 | | | 2006 | |
| OPERATIONS | | | | | | |
| Net investment income / (loss) | | $ | 1,112,020 | | | $ | 1,003,016 | |
| Net realized gain / (loss) on investments | | | (85 | ) | | | 7,129 | |
| Net change in unrealized appreciation / (depreciation) on investments | | | 214,993 | | | | (12,936 | ) |
| | | | 1,326,928 | | | | 997,209 | |
| DISTRIBUTIONS TO SHAREHOLDERS | | | | | | | | |
| Class I | | | | | | | | |
| Net investment income | | | (1,124,214 | ) | | | (962,068 | ) |
Class A (1) | | | | | | | | |
| Net investment income | | | (162 | ) | | | — | |
| | | | (1,124,376 | ) | | | (962,068 | ) |
| FUND SHARE TRANSACTIONS | | | | | | | | |
| Class I | | | | | | | | |
| Proceeds from shares sold | | | 5,285,030 | | | | 4,706,549 | |
| Reinvestment of distributions | | | 1,124,214 | | | | 961,289 | |
| Payments for shares redeemed | | | (7,354,831 | ) | | | (6,058,184 | ) |
| | | | (945,587 | ) | | | (390,346 | ) |
| FUND SHARE TRANSACTIONS | | | | | | | | |
Class A(1) | | | | | | | | |
| Proceeds from shares sold | | | 12,603 | | | | — | |
| Reinvestment of distributions | | | 162 | | | | — | |
| Payments for shares redeemed | | | (2,637 | ) | | | — | |
| | | | 10,128 | | | | — | |
| NET INCREASE / (DECREASE) IN NET ASSETS | | | (732,907 | ) | | | (355,205 | ) |
| NET ASSETS | | | | | | | | |
| Beginning of period | | | 28,012,675 | | | | 28,367,880 | |
| End of period | | $ | 27,279,768 | | | $ | 28,012,675 | |
| | | | | | | | | |
| ACCUMULATED UNDISTRIBUTED NET INVESTMENT INCOME | | $ | 135,889 | | | $ | 160,301 | |
| FUND SHARE TRANSACTIONS | | | | | | |
| Class I | | | | | | |
| Sold | | | 103,100 | | | | 92,474 | |
| Reinvestment of distributions | | | 22,070 | | | | 18,958 | |
| Redeemed | | | (143,772 | ) | | | (118,966 | ) |
| Net increase / (decrease) from fund share transactions | | | (18,602 | ) | | | (7,534 | ) |
| FUND SHARE TRANSACTIONS | | | | | | | | |
Class A (1) | | | | | | | | |
| Sold | | | 246 | | | | — | |
| Reinvestment of distributions | | | 3 | | | | — | |
| Redeemed | | | (51 | ) | | | — | |
| Net increase / (decrease) from fund share transactions | | | 198 | | | | — | |
| TOTAL COST OF PURCHASES OF: | | | | | | | | |
| U.S. Government Securities | | $ | 10,403,991 | | | $ | 10,596,714 | |
| | | $ | | | | $ | 10,596,714 | |
| TOTAL PROCEEDS FROM SALES OF: | | | | | | | | |
| U.S. Government Securities | | $ | 7,762,459 | | | $ | 14,036,352 | |
| | | $ | | | | $ | 14,036,352 | |
| *TAX CHARACTER OF DISTRIBUTIONS PAID | | | | | | | | |
| Ordinary income | | $ | 1,124,376 | | | $ | 962,068 | |
| | | $ | | | | $ | 962,068 | |
(1) Class A shares have been offered since February 1, 2007. | | | | | | | | |
The accompanying notes are an integral part of the financial statements.
Summit Mutual Funds, Inc. – Apex Series |
Summit High Yield Bond Fund Class I - Average Annual Total Return |
1-Y ear | 5-Year | Since Inception |
| 5.40% | 11.73% | 6.63% |
Summit High Yield Bond Fund Class A - Average Annual Total Return |
1-Y ear | 5-Year | Since Inception |
| 0.66% | 10.49% | 5.62% |
Past performance is not predictive of future results. Performance does not reflect the deduction of taxes that a shareholder would pay on fund distributions or redemption of fund shares. Prior to February 1, 2007, Class A share performance is based on Class I performance, adjusted to reflect Class A sales charges and expenses.
| Managers: | |
| Inception Date: | |
| Total Net Assets: | $24.5 Million |
Number Of Fixed Income Holdings: | 60 |
| Average Duration: | 4.63 years |
| Average Maturity: | 7.46 years |
| Average Credit Quality: | B1/B+ |
| 30-day SEC Yield - Class I: | 6.74% |
| 30-day SEC Yield - Class A: | 6.22% |
Quality Breakdown | | Sector Allocations |
Summit Mutual Funds, Inc. – Apex Series |
Objective – Seeks high current income and capital appreciation, secondarily.
Strategy – Under normal circumstances, the High Yield Bond Fund (the “Fund”) will invest at least 80% of its assets in high yield, high risk bonds, also known as “junk” bonds, with intermediate maturities.
Manager’s Comments:
For the twelve month period ending September 30, 2007, the Summit High Yield Bond Fund – Class I shares provided a total return of 5.40% compared to 7.75% for the Merrill Lynch High Yield Master II Index (the “Index”). The high yield market continued to provide excellent returns to investors and performed better than the broad investment grade indexes, such as the Lehman Brothers Aggregate Bond Index, which provided a 5.14% return for the same period. The primary reason the fund underperformed the Index is because the Fund on average was positioned in higher quality high yield bonds throughout the year compared to the Index. Until late in the year, lower quality high yield bonds significantly outperformed higher quality bonds. Summit positioned the Fund’s portfolio in higher quality securities to better weather looming market and economic uncertainty.
High yield spreads (the interest rate difference between risk-free U.S. Treasury securities and high yield fixed income securities) substantially increased during the period. Using the Index as a guide, spreads widened approximately 0.75% between September 30, 2006 and September 30, 2007, with virtually all of the spread widening occurring during the last quarter of the Fund’s fiscal year. However, even with this late movement, lower quality bonds materially outperformed higher quality bonds over the course of the entire period. For example, while the higher quality BB-rated sector of the market provided a return of 6.47% over the last 12 months, the lower quality, CCC-rated sector of the market provided a return of 10.60% for the same time period.
Beginning in June and extending through the Fund’s fiscal year-end, the dynamics of the high yield marketplace changed substantially. The seemingly bottomless pool of liquidity that had flooded the market over the last several years suddenly dried-up, as investors became unwilling to finance many of the very large, highly-leveraged buyout deals that had been announced; especially at the prices that prevailed in the marketplace when the deals were structured. These market conditions created a large backlog of announced high yield debt issues waiting to close. As always, when supply and demand become imbalanced, price is the ultimate arbitrator. Prices have declined, spreads have widened, and the backlog is starting to clear. Current spread levels appear much more attractive than levels seen just a few months ago.
While the technicals of the marketplace are outlined above, the fundamental outlook for the economy has soured slightly. The likelihood of a slowdown in the economy, and the possibility of an outright recession, has given some market participants pause. Default rates are likely to rise next year, coming off a 25 year low, and corporate profit growth could slow or turn negative. Therefore, even though spreads in the marketplace are much wider and more attractive, Summit remains only neutral on the high yield market going forward and will continue the Fund’s conservative quality posture. Clearly, we believe opportunities will present themselves in this type of market, and Summit will continue to position the Fund in an attempt to take advantage of them.
Summit Mutual Funds, Inc. – Apex Series |
| HIGH YIELD BOND FUND | FINANCIAL HIGHLIGHTS |
FINANCIAL HIGHLIGHTS | | | | | | | | | | | | | | | |
| Computed on the basis of a share of capital stock outstanding throughout the period. | | | | | | | | | | | | | |
| | | | | | | | | | | | | | | | |
| | | Class I |
| | | Fiscal Year Ended September 30, |
| | | 2007 | | | 2006 | | | 2005 | | | 2004 | | | 2003 | |
| Net asset value, beginning of period | | $ | 28.75 | | | $ | 28.69 | | | $ | 27.59 | | | $ | 26.67 | | | $ | 23.48 | |
| INVESTMENT ACTIVITIES: | | | | | | | | | | | | | | | | | | | | |
| Net investment income / (loss) | | | 1.81 | | | | 1.94 | | | | 1.93 | | | | 1.90 | | | | 2.20 | |
| Net realized and unrealized gains / (losses) | | | (0.30 | ) | | | 0.13 | | | | 1.00 | | | | 1.08 | | | | 3.13 | |
| Total from Investment Activities | | | 1.51 | | | | 2.07 | | | | 2.93 | | | | 2.98 | | | | 5.33 | |
| DISTRIBUTIONS: | | | | | | | | | | | | | | | | | | | | |
| Net investment income | | | (1.83 | ) | | | (2.01 | ) | | | (1.83 | ) | | | (2.06 | ) | | | (2.14 | ) |
| Total Distributions | | | (1.83 | ) | | | (2.01 | ) | | | (1.83 | ) | | | (2.06 | ) | | | (2.14 | ) |
| Net asset value, end of period | | $ | 28.43 | | | $ | 28.75 | | | $ | 28.69 | | | $ | 27.59 | | | $ | 26.67 | |
| | | | | | | | | | | | | | | | | | | | | |
| Total return | | | 5.40 | % | | | 7.52 | % | | | 11.03 | % | | | 11.64 | % | | | 23.92 | % |
| | | | | | | | | | | | | | | | | | | | | |
| RATIOS / SUPPLEMENTAL DATA: | | | | | | | | | | | | | | | | | | | | |
| Ratio of expenses to average net assets | | | 1.25 | % | | | 1.17 | % | | | 1.22 | % | | | 1.21 | % | | | 1.18 | % |
| Ratio of net investment income / (loss) to average net assets | | | 6.68 | % | | | 7.17 | % | | | 6.81 | % | | | 6.93 | % | | | 8.80 | % |
Portfolio turnover rate(2) | | | 97.01 | % | | | 100.17 | % | | | 99.09 | % | | | 162.69 | % | | | 214.02 | % |
| Net assets, end of period (000’s) | | $ | 24,300 | | | $ | 19,942 | | | $ | 19,094 | | | $ | 18,777 | | | $ | 18,519 | |
| | Class A | |
| | Period from | |
| | February 1, 2007(1) | |
| | to September 30, | |
| | 2007 | |
| Net asset value, beginning of period | | $ | 29.18 | | |
| | | | | | |
| INVESTMENT ACTIVITIES: | | | | | |
| Net investment income / (loss) | | | 0.96 | | |
| Net realized and unrealized gains / (losses) | | | (0.63 | ) | |
| Total from Investment Activities | | | 0.33 | | |
| | | | | | |
| DISTRIBUTIONS: | | | | | |
| Net investment income | | | (0.96 | ) | |
| Total Distributions | | | (0.96 | ) | |
| Net asset value, end of period | | $ | 28.55 | | |
Total return(3) | | | 1.16 | % | |
| | | | | | |
| RATIOS / SUPPLEMENTAL DATA: | | | | | |
Ratio of expenses to average net assets | | | 1.54 | %(4) | |
Ratio of expenses to average net assets | | | 6.50 | %(4) | |
Portfolio turnover rate(2) | | | 97.01 | % | |
| Net assets, end of period (000’s) | | $ | 225 | | |
| | | | | | |
(1) Commencement of operations.
(2) Portfolio Turnover is calculated on the basis of the Fund as a whole without distinguishing between the classes of shares issued.
(3) Total return calculations do not include any sales charges.
(4) Annualized.
The accompanying notes are an integral part of the financial statements.
Summit Mutual Funds, Inc. – Apex Series |
| SCHEDULE OF INVESTMENTS | HIGH YIELD BOND FUND |
September 30, 2007 | | | | | | |
| | | SHARES | | | VALUE | |
COMMON STOCKS - 2.1% | | | | | | |
Consumer Discretionary - 1.1% | | | | | | |
Avado Brands, Inc. (a) (f) (h) | | | 9,462 | | | $ | 95 | |
| Harrah’s Entertainment, Inc. | | | 3,000 | | | | 260,790 | |
Intermet Corp. (a) (f) (h) | | | 6,346 | | | | 6,346 | |
| | | | | | | | 267,231 | |
Materials - 0.3% | | | | | | | | |
Simonds Industries, Inc. (a) (f) (h) | | | 2,746 | | | | 84,961 | |
| | | | | | | | | |
Telecommunication Services - 0.7% | | | | | | | | |
Qwest Communications International (a) | | | 17,500 | | | | 160,300 | |
| TOTAL COMMON STOCKS | | | | | | | | |
| (Cost $1,680,621) | | | | | | | 512,492 | |
PREFERRED STOCKS - 0.0% | | | | | | | | |
Consumer Discretionary - 0.0% | | | | | | | | |
| ION Media Networks, Inc. 12.0% Payment-in-Kind Dividend | | | 3 | | | | 4,938 | |
| TOTAL PREFERRED STOCKS | | | | | | | | |
| (Cost $0) | | | | | | | 4,938 | |
| | | | | | | | | |
| | | PRINCIPAL | | | | | |
| | | AMOUNT | | | VALUE | |
ASSET BACKED SECURITIES - 0.5% | | | | | | | | |
| JET Equipment Trust | | | | | | | | |
Series 1995-B, 7.630%, 02/15/2015 (b) (g) (h) | | $ | 234,360 | | | $ | 119,772 | |
| TOTAL ASSET BACKED SECURITIES | | | | | | | | |
| (Cost $193,676) | | | | | | | 119,772 | |
CORPORATE BONDS - 92.8% | | | | | | | | |
Consumer Discretionary - 21.3% | | | | | | | | |
| Echostar DBS Corporation | | | | | | | | |
| 6.625%, 10/01/2014 | | | 500,000 | | | | 502,500 | |
| General Motors Corp. | | | | | | | | |
7.700%, 04/15/2016 (i) | | | 300,000 | | | | 269,250 | |
| Hanesbrands, Inc. | | | | | | | | |
8.735%, 12/15/2014 (c) | | | 500,000 | | | | 497,500 | |
| Idearc, Inc. | | | | | | | | |
| 8.000%, 11/15/2016 | | | 600,000 | | | | 598,500 | |
| Intcomex, Inc. | | | | | | | | |
11.750%, 01/15/2011 (i) | | | 500,000 | | | | 510,000 | |
| ION Media Networks, Inc. | | | | | | | | |
11.000%, 07/31/2013 (i) | | | 493,849 | | | | 395,079 | |
| Jarden Corp. | | | | | | | | |
7.500%, 05/01/2017 (i) | | | 250,000 | | | | 241,875 | |
| MGM Mirage, Inc. | | | | | | | | |
6.750%, 09/01/2012 (i) | | | 500,000 | | | | 491,875 | |
| OSI Restaurant Partners, LLC | | | | | | | | |
9.625%, 05/15/2015 (b) (i) | | | 100,000 | | | | 88,500 | |
| R.H. Donnelley Corp. | | | | | | | | |
6.875%, 01/15/2013 (b) (i) | | | 500,000 | | | | 472,500 | |
| Radio One, Inc. | | | | | | | | |
8.875%, 07/01/2011 (i) | | | 125,000 | | | | 123,750 | |
| Station Casinos, Inc. | | | | | | | | |
| 6.000%, 04/01/2012 | | | 500,000 | | | | 475,000 | |
| Yankee Acquisition Corp. | | | | | | | | |
9.750%, 02/15/2017 (i) | | | 600,000 | | | | 567,000 | |
| | | | | | | | 5,233,329 | |
| | | PRINCIPAL | | | | |
| | | AMOUNT | | | VALUE | |
Consumer Staples - 3.0% | | | | | | |
| Constellation Brands, Inc. | | | | | | |
7.250%, 09/01/2016 (i) | | $ | 500,000 | | | $ | 500,000 | |
| Del Monte Corp. | | | | | | | | |
6.750%, 02/15/2015 (i) | | | 250,000 | | | | 240,000 | |
| | | | | | | | 740,000 | |
Energy - 10.0% | | | | | | | | |
| Chesapeake Energy Corp. | | | | | | | | |
| 6.625%, 01/15/2016 | | | 500,000 | | | | 497,500 | |
| Complete Production Services Inc. | | | | | | | | |
8.000%, 12/15/2016 (i) | | | 500,000 | | | | 494,375 | |
| Encore Acquisition Co. | | | | | | | | |
| 7.250%, 12/01/2017 | | | 300,000 | | | | 284,250 | |
| Peabody Energy Corp. | | | | | | | | |
| 7.375%, 11/01/2016 | | | 250,000 | | | | 263,750 | |
| Pioneer Natural Resources Co. | | | | | | | | |
| 6.650%, 03/15/2017 | | | 500,000 | | | | 467,433 | |
| Range Resources Corp. | | | | | | | | |
| 7.375%, 07/15/2013 | | | 178,000 | | | | 180,670 | |
7.500%, 05/15/2016 (i) | | | 250,000 | | | | 255,000 | |
| | | | | | | | 2,442,978 | |
Financials - 7.6% | | | | | | | | |
| Ford Motor Credit Co. LLC | | | | | | | | |
| 5.800%, 01/12/2009 | | | 375,000 | | | | 362,199 | |
8.110%, 01/13/2012 (c) | | | 250,000 | | | | 236,228 | |
8.000%, 12/15/2016 (i) | | | 125,000 | | | | 116,938 | |
| Host Marriott LP | | | | | | | | |
6.750%, 06/01/2016 (i) | | | 500,000 | | | | 495,000 | |
| NXP BV/NXP Funding LLC | | | | | | | | |
| 7.875%, 10/15/2014 | | | 250,000 | | | | 240,625 | |
| R.H. Donnelley Finance Corp. I | | | | | | | | |
10.875%, 12/15/2012 (b) | | | 250,000 | | | | 266,250 | |
| Ventas Realty LP | | | | | | | | |
| 7.125%, 06/01/2015 | | | 150,000 | | | | 153,000 | |
| | | | | | | | 1,870,240 | |
Health Care - 3.7% | | | | | | | | |
| Community Health Systems, Inc. | | | | | | | | |
8.875%, 07/15/2015 (b) (i) | | | 250,000 | | | | 256,875 | |
| DaVita, Inc. | | | | | | | | |
7.250%, 03/15/2015 (i) | | | 125,000 | | | | 125,313 | |
| HCA, Inc. | | | | | | | | |
9.250%, 11/15/2016 (b) | | | 500,000 | | | | 531,250 | |
| | | | | | | | 913,438 | |
Industrials - 7.8% | | | | | | | | |
| American Railcar Industries, Inc. | | | | | | | | |
7.500%, 03/01/2014 (i) | | | 150,000 | | | | 149,250 | |
| Aramark Corp. | | | | | | | | |
8.500%, 02/01/2015 (i) | | | 600,000 | | | | 612,000 | |
| DRS Technologies, Inc. | | | | | | | | |
7.625%, 02/01/2018 (i) | | | 125,000 | | | | 127,500 | |
| Dynegy Holdings, Inc. | | | | | | | | |
7.750%, 06/01/2019 (b) | | | 250,000 | | | | 239,062 | |
| Harland Clarke Holdings Corp. | | | | | | | | |
9.500%, 05/15/2015 (i) | | | 250,000 | | | | 223,125 | |
| Kansas City Southern De Mexico | | | | | | | | |
7.375%, 06/01/2014 (b) | | | 300,000 | | | | 293,250 | |
The accompanying notes are an integral part of the financial statements.
Summit Mutual Funds, Inc. – Apex Series |
| HIGH YIELD BOND FUND | SCHEDULE OF INVESTMENTS |
| | | PRINCIPAL | | | | |
| | | AMOUNT | | | VALUE | |
Industrials - 7.8% (Continued) | | | | | | |
| Mueller Water Products, Inc. | | | | | | |
7.375%, 06/01/2017 (b) | | $ | 300,000 | | | $ | 279,000 | |
| | | | | | | | 1,923,187 | |
Information Technology - 3.7% | | | | | | | | |
| Iron Mountain, Inc. | | | | | | | | |
7.750%, 01/15/2015 (i) | | | 300,000 | | | | 299,250 | |
| Sanmina SCI Corp. | | | | | | | | |
8.110%, 06/15/2010 (b) (c) (i) | | | 600,000 | | | | 594,000 | |
| | | | | | | | 893,250 | |
Materials - 20.2% | | | | | | | | |
| Boise Cascade LLC | | | | | | | | |
8.236%, 10/15/2012 (c) | | | 125,000 | | | | 125,000 | |
| Consol Energy, Inc. | | | | | | | | |
| 7.875%, 03/01/2012 | | | 300,000 | | | | 312,750 | |
| Freeport-McMoRan Copper & Gold, Inc. | | | | | | | | |
| 8.375%, 04/01/2017 | | | 600,000 | | | | 655,500 | |
| Georgia-Pacific Corp. | | | | | | | | |
7.125%, 01/15/2017 (b) (i) | | | 500,000 | | | | 483,750 | |
| Huntsman LLC | | | | | | | | |
| 11.625%, 10/15/2010 | | | 130,000 | | | | 137,800 | |
| Lyondell Chemical Co. | | | | | | | | |
| 8.250%, 09/15/2016 | | | 500,000 | | | | 563,750 | |
| Momentive Performance Materials, Inc. | | | | | | | | |
9.750%, 12/01/2014 (b) | | | 250,000 | | | | 247,500 | |
| Mosaic Co. | | | | | | | | |
7.625%, 12/01/2016 (b) (c) | | | 600,000 | | | | 639,750 | |
| Petroplus Finance Ltd | | | | | | | | |
7.000%, 05/01/2017 (b) | | | 600,000 | | | | 570,000 | |
| Stone Container SSCC | | | | | | | | |
8.000%, 03/15/2017 (i) | | | 600,000 | | | | 589,500 | |
| Warnaco, Inc. | | | | | | | | |
| 8.875%, 06/15/2013 | | | 600,000 | | | | 630,000 | |
| | | | | | | | 4,955,300 | |
Telecommunication Services - 9.7% | | | | | | | | |
| Intelsat Bermuda Ltd | | | | | | | | |
11.250%, 06/15/2016 (i) | | | 600,000 | | | | 642,750 | |
| iPCS, Inc. | | | | | | | | |
7.480%, 05/01/2013 (b)(c) | | | 600,000 | | | | 582,000 | |
| | | PRINCIPAL | | | | |
| | | AMOUNT | | | VALUE | |
Telecommunication Services - 9.7% (Continued) | | | | | | |
| Qwest Communications International, Inc. | | | | | | |
7.500%, 02/15/2014 (c) (i) | | $ | 500,000 | | | $ | 506,250 | |
| Windstream Corp. | | | | | | | | |
| 8.625%, 08/01/2016 | | | 600,000 | | | | 639,750 | |
| | | | | | | | 2,370,750 | |
Utilities - 5.8% | | | | | | | | |
| Calpine Corp. | | | | | | | | |
9.875%, 12/01/2011 (b) (g) | | | 500,000 | | | | 532,500 | |
| Edison Mission Energy | | | | | | | | |
| 7.500%, 06/15/2013 | | | 500,000 | | | | 512,500 | |
| FPL Group Capital, Inc. | | | | | | | | |
6.350%, 10/01/2066 (c) | | | 400,000 | | | | 379,566 | |
| | | | | | | | 1,424,566 | |
| TOTAL CORPORATE BONDS | | | | | | | | |
| (Cost $22,921,073) | | | | | | | 22,767,038 | |
| | | | | | | | | |
| | | SHARES | | | VALUE | |
INVESTMENT COMPANIES - 1.9% | | | | | | | | |
| Pioneer Floating Rate Trust | | | 25,000 | | | $ | 451,500 | |
| TOTAL INVESTMENT COMPANIES | | | | | | | | |
| (Cost $473,734) | | | | | | | 451,500 | |
SHORT TERM INVESTMENTS - 1.0% | | | | | | | | |
Money Market Funds - 1.0% | | | | | | | | |
| Northern Institutional Diversified Assets Portfolio | | | 254,879 | | | | 254,879 | |
| TOTAL SHORT TERM INVESTMENTS | | | | | | | | |
| (Cost $254,879) | | | | | | | 254,879 | |
Total Investments (Cost $25,523,983) (d) - 98.3% | | | | | | | 24,110,619 | |
Northern Institutional Liquid Assets Portfolio (e) - 32.2% | | | | | | | 7,906,680 | |
Liabilities in Excess of Other Assets - (30.5)% | | | | | | | (7,492,697 | ) |
TOTAL NET ASSETS - 100.0% | | | | | | $ | 24,524,602 | |
(a) | Non-income producing security. |
(b) | Security exempt from registration under the Securities Act of 1933. These securities may be resold only in transactions exempt under Rule 144A under the Securities Act of 1933, normally to qualified institutional buyers. |
(c) | Variable rate security. |
(d) | For federal income tax purposes, cost is $25,524,345 and gross unrealized appreciation and depreciation of securities as of September 30, 2007 was $362,838 and ($1,776,564), respectively, with a net appreciation / (depreciation) of ($1,413,726). |
(e) | This security was purchased with cash collateral held from securities lending. The market values of the securities on loan, the value of the collateral purchased with cash, and the noncash collateral accepted are $7,732,720, $7,906,860, and $122,317, respectively. |
(f) | Security is considered illiquid. The aggregate value of such securities is $91,402, or 0.4% of total net assets. |
(g) | Security in default. |
(h) | Valued in good faith under procedures adopted by the Board of Directors. |
(i) | All or a portion of the security is out on loan. |
The accompanying notes are an integral part of the financial statements.
Summit Mutual Funds, Inc. – Apex Series |
| FINANCIAL STATEMENTS | HIGH YIELD BOND FUND |
STATEMENT OF ASSETS AND LIABILITIES | | | |
September 30, 2007 | | | |
| | | | |
| ASSETS | | | |
| Investments in securities, at value | | $ | 24,110,619 | |
| Collateral for securities loaned, at fair value | | | 7,906,680 | |
| Receivables: | | | | |
| Shares sold | | | 1,043 | |
| Interest and dividends | | | 466,184 | |
| Prepaid expenses and other | | | 11,826 | |
| | | | 32,496,352 | |
| LIABILITIES | | | | |
| Payables: | | | | |
| Payable upon return of securities loaned | | | 7,906,680 | |
| Shares redeemed | | | 16,598 | |
| Professional fees | | | 18,067 | |
| Advisory fees | | | 13,243 | |
| Fund accounting fees | | | 5,556 | |
| Administration fees | | | 2,037 | |
| Custodian fees | | | 791 | |
| Directors’ fees | | | 51 | |
| 12b-1 fees | | | 177 | |
| Other accrued expenses | | | 8,550 | |
| | | | 7,971,750 | |
| NET ASSETS* | | | | |
| Paid-in capital | | | 47,037,746 | |
| Accumulated undistributed net investment | | | | |
| income / (loss) | | | 186,112 | |
| Accumulated net realized gain / (loss) | | | | |
| on investments | | | (21,285,892 | ) |
| Net unrealized appreciation / (depreciation) | | | | |
| on investments | | | (1,413,364 | ) |
| | | $ | 24,524,602 | |
| | | | | |
| Investments at cost | | $ | 25,523,983 | |
| Shares authorized - Class I ($.10 par value) | | | 20,000,000 | |
| Shares authorized - Class A ($.10 par value) | | | 20,000,000 | |
| NET ASSET VALUE (NAV) BY SHARE CLASS | | | | | |
| | | | | | |
| Share Class | Net Assets | Outstanding | | per share | |
| Class I | $24,299,912 | | | $ | 28.43 | |
| Class A | $224,690 | | | $ | 28.55 | |
| Class A maximum offering price per share | | | | | |
(net asset value plus sales charge of 4.25% of offering price) | | | $ | 29.82 | |
| * | FEDERAL TAX DATA AS OF SEPTEMBER 30, 2007 | | |
| | Percentage of ordinary distributions designated as | | |
| | qualified dividend income | | 1.16% |
| | Dividends received deduction for corporate shareholders | | 1.10% |
| | Undistributed ordinary income | $ | 186,112 |
Capital Loss Carryforward |
Expiring September 30: |
2009 | 2010 | 2011 | 2012 | 2015 |
| $(17,464,662) | $(1,527,322) | $(1,025,886) | $(791,075) | $(476,585) |
STATEMENT OF OPERATIONS | | | |
For the year ended September 30, 2007 | | | |
| | | | |
| INVESTMENT INCOME | | | |
| Interest | | $ | 1,839,359 | |
| Dividends | | | 50,876 | |
| Other income | | | 7,109 | |
| | | | 1,897,344 | |
| EXPENSES | | | | |
| Advisory fees | | | 155,454 | |
| Registration fees | | | 31,858 | |
| Transfer agent fees | | | 30,555 | |
| Fund accounting fees | | | 24,215 | |
| Administration fees | | | 23,916 | |
| Professional fees | | | 22,515 | |
| Custodian fees | | | 3,093 | |
| Directors’ fees | | | 3,045 | |
| Shareholder reporting fees | | | 1,704 | |
| 12b-1 fees - Class A | | | 275 | |
| Other expenses | | | 2,788 | |
| | | | 299,418 | |
| NET INVESTMENT INCOME / (LOSS) | | | 1,597,926 | |
| | | | | |
| REALIZED AND UNREALIZED GAIN / (LOSS) | | | | |
| Net realized gain / (loss) on investments | | | 79,041 | |
| Net change in unrealized appreciation / | | | | |
| (depreciation) on investments | | | (506,253 | ) |
| | | | | |
| NET REALIZED AND UNREALIZED | | | | |
| GAIN / (LOSS) | | | (427,212 | ) |
| | | | | |
| NET INCREASE / (DECREASE) IN NET | | | | |
| ASSETS FROM OPERATIONS | | $ | 1,170,714 | |
| TRANSACTIONS WITH AFFILIATES: | | |
| Percent of Current | |
Net Asset Value | |
| Advisory | Administration | |
| Fee | Fee | |
| 0.65% | 0.10% | |
The accompanying notes are an integral part of the financial statements.
Summit Mutual Funds, Inc. – Apex Series |
| HIGH YIELD BOND FUND | FINANCIAL STATEMENTS |
STATEMENTS OF CHANGES IN NET ASSETS | | | | | | |
Year Ended September 30, | | | | | | |
| | | 2007 | | | 2006 | |
| OPERATIONS | | | | | | |
| Net investment income / (loss) | | $ | 1,597,926 | | | $ | 1,341,248 | |
| Net realized gain / (loss) on investments | | | 79,041 | | | | 138,130 | |
| Net change in unrealized appreciation / (depreciation) on investments | | | (506,253 | ) | | | (114,653 | ) |
| | | | 1,170,714 | | | | 1,364,725 | |
| DISTRIBUTIONS TO SHAREHOLDERS* | | | | | | | | |
| Class I | | | | | | | | |
| Net investment income | | | (1,496,841 | ) | | | (1,319,099 | ) |
Class A(1) | | | | | | | | |
| Net investment income | | | (6,901 | ) | | | — | |
| | | | (1,503,742 | ) | | | (1,319,099 | ) |
| FUND SHARE TRANSACTIONS | | | | | | | | |
| Class I | | | | | | | | |
| Proceeds from shares sold | | | 7,780,637 | | | | 3,366,699 | |
| Reinvestment of distributions | | | 661,621 | | | | 405,854 | |
| Payments for shares redeemed | | | (3,758,957 | ) | | | (2,970,070 | ) |
| | | | 4,683,301 | | | | 802,483 | |
| FUND SHARE TRANSACTIONS | | | | | | | | |
Class A(1) | | | | | | | | |
| Proceeds from shares sold | | | 230,750 | | | | — | |
| Reinvestment of distributions | | | 4,214 | | | | — | |
| Payments for shares redeemed | | | (2,411 | ) | | | — | |
| | | | 232,553 | | | | — | |
| NET INCREASE / (DECREASE) IN NET ASSETS | | | 4,582,826 | | | | 848,109 | |
| NET ASSETS | | | | | | | | |
| Beginning of period | | | 19,941,776 | | | | 19,093,667 | |
| End of period | | $ | 24,524,602 | | | $ | 19,941,776 | |
| ACCUMULATED UNDISTRIBUTED NET INVESTMENT INCOME | | $ | 186,112 | | | $ | 165,742 | |
| FUND SHARE TRANSACTIONS | | | | | | |
| Class I | | | | | | |
| Sold | | | 268,523 | | | | 118,629 | |
| Reinvestment of distributions | | | 23,056 | | | | 14,478 | |
| Redeemed | | | (130,542 | ) | | | (104,877 | ) |
| Net increase / (decrease) from fund share transactions | | | 161,037 | | | | 28,230 | |
Class A(1) | | | | | | | | |
| Sold | | | 7,810 | | | | — | |
| Reinvestment of distributions | | | 147 | | | | — | |
| Redeemed | | | (86 | ) | | | — | |
| Net increase / (decrease) from fund share transactions | | | 7,871 | | | | — | |
| TOTAL COST OF PURCHASES OF: | | | | | | | | |
| Preferred and Common Stocks | | $ | 1,658,948 | | | $ | 1,089,927 | |
| U.S. Government Securities | | | 674,105 | | | | — | |
| Corporate Bonds | | | 25,699,230 | | | | 16,712,215 | |
| | | $ | 28,032,283 | | | $ | 17,802,142 | |
| TOTAL PROCEEDS FROM SALES OF: | | | | | | | | |
| Preferred and Common Stocks | | $ | 1,913,795 | | | $ | 2,363,381 | |
| U.S. Government Securities | | | 2,229,834 | | | | — | |
| Corporate Bonds | | | 18,346,995 | | | | 15,610,978 | |
| | | $ | 22,490,624 | | | $ | 17,974,359 | |
| *TAX CHARACTER OF DISTRIBUTIONS PAID | | | | | | | | |
| | $ | 1,503.742 | | | $ | 1,319,099 | |
| | $ | 1,503,742 | | | $ | 1,319,099 | |
(1) | Class A shares have been offered since February 1, 2007. |
The accompanying notes are an integral part of the financial statements.
Summit Mutual Funds, Inc. – Apex Series |
| Managers: | |
| Inception Date: | |
| Total Net Assets: | $137.7 Million |
| 7-day SEC Yield: | 5.11% |
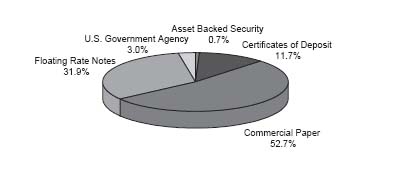
Summit Mutual Funds, Inc. – Apex Series |
Objective – Seeks to maintain stability of capital and to maintain the liquidity of capital and to provide current income.
Strategy – The Money Market Fund intends to invest 100% of the value of its assets in high quality short-term securities.
Manager’s Comments:
In one of the most turbulent times experienced by financial markets in recent memory, investors were held captive as the considerable weakness in the U.S. housing sector and fears of further sub-prime spillover ignited a chain of events that rippled through the markets. An immense appetite for risk dramatically shifted to extreme risk aversion creating wider credit spreads, higher volatilities, reduced liquidity, and severe dislocation in short-term credit markets. The deterioration in credit markets and increased volatility sparked a “flight to quality” rally as investors sought the safe haven of treasuries amidst increasing uncertainty. With the short-term credit markets seizing up, the uncertainty and scrutiny surrounding the credit quality of collateral backing Asset-backed Commercial Paper (“ABCP”) morphed into a widespread liquidity issue causing interest rates to spike. Meanwhile, given liquidity concerns and rising London Interbank Offered Rate (“LIBOR”) levels, the European Central Bank (“ECB”) and Federal Reserve Bank (“Fed”) stepped in to inject significant amounts of liquidity to the system in order to help bring interbank rates back in line with official targets. The tightening of financial conditions heightened the downside risks to economic growth and the market in turn aggressively priced in interest rate easing by year-end.
The Fed left interest rates unchanged throughout much of the past year despite growing uncertainty surrounding the extent of potential sub-prime spillover effects into the broader economy. At its August 7, 2007 meeting, the Federal Open Market Committee (“FOMC”) noted that they were prepared to act as needed to stem further market disruptions as downside risks to economic growth had increased appreciably. In order to alleviate the liquidity issues effecting the short-term debt markets, Fed Chairman Bernanke added liquidity to the banking system and lowered the discount window by 0.50% but market conditions only improved modestly. A surprisingly weak August employment report and big downward revisions to prior months’ employment reports increased recession concerns and made an interest rate ease at the September FOMC meeting all but assured. The debate on Wall Street was whether the Fed would go 0.25% or 0.50%. In a decisive and aggressive move the Fed did not disappoint the markets as they slashed both the Fed Funds and discount rate by 0.50% to 4.75% and 5.00%, respectively. The language in the statement made it clear the Fed wanted to head off restraints to economic growth caused by disruptions in financial markets. Further Fed action will most likely depend on the extent of housing weakness spilling over into consumer spending and the labor market, the performance of incoming economic data, and developments in financial markets.
Market conditions and liquidity in the short-term credit markets have improved somewhat over the past couple weeks of September as investors have increased investment activity further out the maturity spectrum. Despite the market beginning to stabilize, liquidity remains spotty, and we are still far from historic norms on interest rate spreads over Treasury Securities for Commercial Paper (“CP”).
Our strategy over the first 3 Quarters of the fiscal year was to remain consistently short to neutral in weighted average maturity (WAM) of the portfolio as we maximized opportunities in shorter-term securities. Our focus was on 3 month CP where the LIBOR curve peaked, and we maintained a core allocation to floating rate product. As the short-term credit markets seized up and liquidity became scarce during this summer’s meltdown, our investment strategy was to remain cautiously aggressive. Working closely with our credit team, we continued buying the bank-sponsored, multi-seller ABCP programs with which we were comfortable credit-wise. The lion share of August’s purchases were short maturities (1-3 months), but as a hedge to further credit deterioration, we extended the WAM with 6 – 9 month U.S. Treasuries and Agencies. In September as Fed action to lower interest rates seemed imminent, we extended the WAM to 43 – 45 days by purchasing high quality six month bank securities. Also as the dislocation between LIBOR and Fed Funds Rate remains abnormally wide, our floating rate securities have performed well.
Summit Mutual Funds, Inc. – Apex Series |
| FINANCIAL HIGHLIGHTS | MONEY MARKET FUND |
FINANCIAL HIGHLIGHTS | | | | | | | | | | | | | | | |
| Computed on the basis of a share of capital stock outstanding throughout the period. | | | | | | | | | | | | | | | |
| | | | | | | | | | | | | | | | |
| | | | | | | | | | | | | | | | |
| | | Fiscal Year Ended September 30, |
| | | 2007 | | | 2006 | | | 2005 | | | 2004 | | | 2003 | |
| Net asset value, beginning of period | | $ | 1.00 | | | $ | 1.00 | | | $ | 1.00 | | | $ | 1.00 | | | $ | 1.00 | |
| | | | | | | | | | | | | | | | | | | | | |
| INVESTMENT ACTIVITIES: | | | | | | | | | | | | | | | | | | | | |
| Net investment income / (loss) | | | 0.05 | | | | 0.04 | | | | 0.02 | | | | 0.01 | | | | 0.01 | |
| Total from Investment Activities | | | 0.05 | | | | 0.04 | | | | 0.02 | | | | 0.01 | | | | 0.01 | |
| DISTRIBUTIONS: | | | | | | | | | | | | | | | | | | | | |
| Net investment income | | | (0.05 | ) | | | (0.04 | ) | | | (0.02 | ) | | | (0.01 | ) | | | (0.01 | ) |
| Total Distributions | | | (0.05 | ) | | | (0.04 | ) | | | (0.02 | ) | | | (0.01 | ) | | | (0.01 | ) |
| Net asset value, end of period | | $ | 1.00 | | | $ | 1.00 | | | $ | 1.00 | | | $ | 1.00 | | | $ | 1.00 | |
| | | | | | | | | | | | | | | | | | | | | |
| Total return | | | 5.06 | % | | | 4.33 | % | | | 2.33 | % | | | 0.79 | % | | | 0.95 | % |
| | | | | | | | | | | | | | | | | | | | | |
| RATIOS/SUPPLEMENTAL DATA: | | | | | | | | | | | | | | | | | | | | |
Ratio of expenses to average net assets - net(1) | | | 0.45 | % | | | 0.45 | % | | | 0.45 | % | | | 0.45 | % | | | 0.45 | % |
| Ratio of expenses to average net assets - gross | | | 0.58 | % | | | 0.56 | % | | | 0.60 | % | | | 0.59 | % | | | 0.56 | % |
| Ratio of net investment income / (loss) to average net assets | | | 4.96 | % | | | 4.30 | % | | | 2.33 | % | | | 0.79 | % | | | 0.95 | % |
| Net assets, end of period (000’s) | | $ | 137,723 | | | $ | 125,364 | | | $ | 109,406 | | | $ | 103,499 | | | $ | 112,651 | |
(1) | Net expenses represent gross expenses reduced by fees waived and/or reimbursed by the Adviser. |
The accompanying notes are an integral part of the financial statements.
Summit Mutual Funds, Inc. – Apex Series |
| MONEY MARKET FUND | SCHEDULE OF INVESTMENTS |
SEPTEMBER 30, 2007 | | | | | | |
| | | PRINCIPAL | | | | |
| | | AMOUNT | | | VALUE | |
ASSET BACKED SECURITIES - 0.7% | | | | | | |
| Steers Mercury III Trust | | | | | | |
5.149%, 10/29/2007 (a) (c) | | $ | 988,552 | | | $ | 988,552 | |
| TOTAL ASSET BACKED SECURITIES | | | | | | | | |
| (Cost $988,552) | | | | | | | 988,552 | |
CERTIFICATE OF DEPOSIT - 11.9% | | | | | | | | |
| ABN Amro | | | | | | | | |
| 5.650%, 12/17/2007 | | | 1,500,000 | | | | 1,500,472 | |
| Barclays Bank PLC | | | | | | | | |
| 5.500%, 03/12/2008 | | | 1,300,000 | | | | 1,300,000 | |
| Credit Industrial | | | | | | | | |
| 5.380%, 10/29/2007 | | | 1,000,000 | | | | 999,744 | |
| 5.210%, 12/21/2007 | | | 1,400,000 | | | | 1,400,031 | |
| HSH Nordbank AG | | | | | | | | |
| 5.350%, 01/11/2008 | | | 1,000,000 | | | | 999,989 | |
| Mizuho Corporate Bank | | | | | | | | |
| 5.600%, 11/30/2007 | | | 2,000,000 | | | | 2,000,000 | |
| KBC Bank | | | | | | | | |
| 5.70%, 03/06/2008 | | | 1,000,000 | | | | 1,000,421 | |
| Norinchukin Bank | | | | | | | | |
| 5.345%, 11/26/2007 | | | 1,000,000 | | | | 1,000,000 | |
| Societe Generale | | | | | | | | |
| 5.350%, 01/18/2008 | | | 1,500,000 | | | | 1,500,000 | |
| 5.305%, 01/24/2008 | | | 1,800,000 | | | | 1,800,028 | |
| UBS AG | | | | | | | | |
| 5.480%, 03/07/2008 | | | 1,300,000 | | | | 1,300,000 | |
| 5.390%, 03/18/2008 | | | 1,500,000 | | | | 1,500,000 | |
| TOTAL CERTIFICATE OF DEPOSIT | | | | | | | | |
| (Cost $16,300,685) | | | | | | | 16,300,685 | |
COMMERCIAL PAPER - 53.3% | | | | | | | | |
| ANZ National Ltd. | | | | | | | | |
5.790%, 10/05/2007 (b) | | | 2,800,000 | | | | 2,798,199 | |
| Apreco LLC | | | | | | | | |
| 5.300%, 10/01/2007 | | | 1,766,000 | | | | 1,766,000 | |
| AstraZeneca | | | | | | | | |
5.220%, 12/12/2007 (b) | | | 1,000,000 | | | | 989,560 | |
| Cafco LLC | | | | | | | | |
5.800%, 11/16/2007 (b) | | | 3,500,000 | | | | 3,474,061 | |
| Caisse National | | | | | | | | |
5.168%, 11/13/2007 (b) | | | 1,000,000 | | | | 993,827 | |
| Cancara Asset Securitization Ltd. | | | | | | | | |
5.215%, 01/14/2008 (b) | | | 1,400,000 | | | | 1,378,705 | |
6.170%, 12/14/2007 (b) | | | 2,000,000 | | | | 1,974,634 | |
| Cedar Springs Capital | | | | | | | | |
5.270%, 10/19/2007 (b) | | | 1,702,000 | | | | 1,697,515 | |
5.270%, 10/22/2007 (b) | | | 1,000,000 | | | | 996,926 | |
5.275%, 10/17/2007 (b) | | | 1,000,000 | | | | 997,656 | |
| Ciesco LP | | | | | | | | |
5.750%, 11/20/2007 (b) | | | 4,000,000 | | | | 3,968,056 | |
| Dresdner Finance, Inc. | | | | | | | | |
| 5.150%, 10/01/2007 | | | 4,850,000 | | | | 4,850,000 | |
| Giro Funding Corp. | | | | | | | | |
5.275%, 10/19/2007 (b) | | | 1,250,000 | | | | 1,246,703 | |
5.275%, 10/23/2007 (b) | | | 1,000,000 | | | | 996,776 | |
| Grampian Funding LLC | | | | | | | | |
5.175%, 10/10/2007 (b) | | | 1,500,000 | | | | 1,498,059 | |
5.180%, 12/20/2007 (b) | | | 1,400,000 | | | | 1,383,885 | |
| | | PRINCIPAL | | | | |
| | | AMOUNT | | | VALUE | |
COMMERCIAL PAPER - 53.3% (Continued) | | | | | | |
| KBC Financial Products International Ltd. | | | | | | |
5.220%, 12/17/2007 (b) | | $ | 1,250,000 | | | $ | 1,236,044 | |
| Liberty Street Funding | | | | | | | | |
5.40%, 10/25/2007 (b) | | | 1,400,000 | | | | 1,394,960 | |
5.270%, 11/28/2007 (b) | | | 1,400,000 | | | | 1,388,113 | |
| Monument Gardens Funding LLC | | | | | | | | |
| 5.30%, 10/01/2007 | | | 4,000,000 | | | | 4,000,000 | |
| Natixis Corp. | | | | | | | | |
| 5.160%, 10/01/2007 | | | 6,940,000 | | | | 6,940,000 | |
| Nestle Capital Corp. | | | | | | | | |
5.230%, 01/24/2008 (b) | | | 1,000,000 | | | | 983,293 | |
| Old Line Funding Corp. | | | | | | | | |
6.00%, 11/26/2007 (b) | | | 2,000,000 | | | | 1,981,333 | |
| Perry Global Funding LLC | | | | | | | | |
5.170%, 10/25/2007 (b) | | | 700,000 | | | | 697,587 | |
5.230%, 12/21/2007 (b) | | | 1,000,000 | | | | 988,233 | |
| Prudential Funding | | | | | | | | |
5.440%, 11/26/2007 (b) | | | 2,500,000 | | | | 2,478,845 | |
| Ranger Funding Co. | | | | | | | | |
6.250%, 10/29/2007 (b) | | | 2,000,000 | | | | 1,990,278 | |
| Sheffield Receivables Corp. | | | | | | | | |
5.250%, 10/05/2007 (b) | | | 3,000,000 | | | | 2,998,250 | |
6.100%, 12/13/2007 (b) | | | 1,000,000 | | | | 987,631 | |
| Swedbank Corp. | | | | | | | | |
5.190%, 10/11/2007 (b) | | | 750,000 | | | | 748,919 | |
| Swedish National Housing Finance Corp. | | | | | | | | |
5.420%, 11/26/2007 (b) | | | 2,000,000 | | | | 1,983,138 | |
5.80%, 10/12/2007 (b) | | | 4,000,000 | | | | 3,992,911 | |
| Teachers Insurance and Annuity Association | | | | | | | | |
| 5.310%, 11/20/2007 | | | 2,000,000 | | | | 1,985,250 | |
| Total Capital | | | | | | | | |
5.380%, 10/04/2007 (b) | | | 1,400,000 | | | | 1,399,372 | |
| Tulip Funding Corp. | | | | | | | | |
6.250%, 11/13/2007 (b) | | | 2,000,000 | | | | 1,985,069 | |
| UBS Finance LLC | | | | | | | | |
5.190%, 10/05/2007 (b) | | | 1,000,000 | | | | 999,423 | |
| Westpac Banking Corp. | | | | | | | | |
5.230%, 11/20/2007 (b) | | | 1,250,000 | | | | 1,240,920 | |
| TOTAL COMMERCIAL PAPER | | | | | | | | |
| (Cost $73,410,131) | | | | | | | 73,410,131 | |
| | | | | | | | | |
FLOATING RATE NOTES (a) - 32.2% | | | | | | | | |
| American Express Bank | | | | | | | | |
| 5.790%, 10/08/2007 | | | 2,000,000 | | | | 1,999,980 | |
| American Honda Finance Corp. | | | | | | | | |
| 5.330%, 11/09/2007 | | | 2,000,000 | | | | 2,000,000 | |
| Banco Espanol De Credito | | | | | | | | |
5.350%, 10/18/2007 (b) | | | 1,500,000 | | | | 1,500,000 | |
| BBVA US Senior SA Unipersonal | | | | | | | | |
| 5.380%, 10/17/2007 | | | 2,500,000 | | | | 2,500,586 | |
| Bellsouth Corp. | | | | | | | | |
| 5.683%, 11/15/2007 | | | 2,000,000 | | | | 2,000,332 | |
| BNP Paribas | | | | | | | | |
5.119%, 10/26/2007 (b) | | | 1,000,000 | | | | 1,000,000 | |
| Canadian Imperial Bank | | | | | | | | |
| 4.890%, 10/01/2007 | | | 2,000,000 | | | | 1,999,967 | |
| 4.890%, 10/01/2007 | | | 625,000 | | | | 625,000 | |
| 4.910%, 10/18/2007 | | | 1,300,000 | | | | 1,297,985 | |
The accompanying notes are an integral part of the financial statements.
Summit Mutual Funds, Inc. – Apex Series |
| SCHEDULE OF INVESTMENTS | MONEY MARKET FUND |
| | | PRINCIPAL | | | | |
| | | AMOUNT | | | VALUE | |
FLOATING RATE NOTES (a) - 32.2% (Continued) | | | | | | |
| Carrera Capital Finance LLC | | | | | | |
5.678%, 12/06/2007 (b) | | $ | 2,000,000 | | | $ | 2,000,000 | |
| Danske Bank A/S | | | | | | | | |
5.508%, 10/28/2007 (b) | | | 1,200,000 | | | | 1,199,924 | |
| DNB Nor Bank ASA | | | | | | | | |
| 5.131%, 10/25/2007 | | | 3,000,000 | | | | 3,000,000 | |
| General Electric Capital Corp. | | | | | | | | |
| 5.696%, 12/04/2007 | | | 2,000,000 | | | | 1,999,366 | |
| 5.156%, 10/24/2007 | | | 4,000,000 | | | | 4,000,000 | |
| Goldman Sachs Group | | | | | | | | |
| 5.370%, 10/01/2007 | | | 2,000,000 | | | | 2,000,000 | |
| 5.360%, 10/01/2007 | | | 1,000,000 | | | | 1,000,000 | |
| 5.475%, 10/05/2007 | | | 1,000,000 | | | | 1,000,017 | |
| K2 LLC | | | | | | | | |
| 5.320%, 10/02/2007 | | | 1,000,000 | | | | 999,968 | |
5.505%, 11/26/2007 (b) | | | 2,000,000 | | | | 2,000,237 | |
| Links Finance LLC | | | | | | | | |
| 5.315%, 10/27/2007 | | | 1,000,000 | | | | 999,944 | |
5.475%, 11/26/2007 (b) | | | 2,000,000 | | | | 1,999,957 | |
| M&I Bank | | | | | | | | |
| 5.753%, 10/15/2007 | | | 1,000,000 | | | | 1,000,000 | |
| Merrill Lynch and Co. | | | | | | | | |
| 5.342%, 11/23/2007 | | | 1,250,000 | | | | 1,250,000 | |
| Morgan Stanley | | | | | | | | |
| 5.473%, 10/14/2007 | | | 1,000,000 | | | | 1,000,000 | |
| Skandinaviska Enskilda Banken | | | | | | | | |
| 5.634%, 10/18/2007 | | | 3,000,000 | | | | 3,000,000 | |
| Unicredito Italiano Bank Ireland | | | | | | | | |
| 5.840%, 10/09/2007 | | | 1,000,000 | | | | 1,000,000 | |
| TOTAL FLOATING RATE NOTES | | | | | | | | |
| (Cost $44,373,263) | | | | | | | 44,373,263 | |
| | | PRINCIPAL | | | | |
| | | AMOUNT | | | VALUE | |
U.S. GOVERNMENT AGENCY ISSUES - 3.0% | | | | | | |
| Federal Home Loan Banks | | | | | | |
| 4.880%, 02/25/2008 | | $ | 3,000,000 | | | $ | 2,940,220 | |
| U.S. Treasury Note | | | | | | | | |
| 2.625%, 05/15/2008 | | | 1,200,000 | | | | 1,186,741 | |
| TOTAL U.S. GOVERNMENT AGENCY ISSUES | | | | | | | | |
| (Cost $4,126,961) | | | | | | | 4,126,961 | |
| | | | | | | | | |
| | | SHARES | | | VALUE | |
MONEY MARKET FUNDS - 0.0% | | | | | | | | |
| Northern Institutional Diversified Assets Portfolio | | | 1,987 | | | $ | 1,987 | |
| TOTAL MONEY MARKET FUNDS | | | | | | | | |
| (Cost $1,987) | | | | | | | 1,987 | |
Total Investments (Cost $139,201,579) - 101.1% | | | | | | | 139,201,579 | |
Liabilities in Excess of Other Assets - (1.1)% | | | | | | | (1,478,337 | ) |
TOTAL NET ASSETS - 100.0% | | | | | | $ | 137,723,242 | |
(a) | Variable rate security. The coupon rate shown on variable rate securities represents the rate at period end. The due dates on these types of securities reflect the next interest rate reset date or, when applicable, the final maturity date. |
(b) | Security is exempt from registration under the Securities Act of 1933. It may be resold only in transactions that are exempt under Rule 144A under the Securities Act of 1933, normally to qualified institutional buyers. These securities have been determined to be liquid in accordance with procedures adopted by the Fund’s Board for 4(2) paper that requires each security to be rated in one of the two highest rating categories by at least two nationally recognized rating organizations (“NRSO”), or if only one NRSO rates the security, by that NRSO. |
(c) | Security is exempt from registration under the Securities Act of 1933. It may be resold only in transactions that are exempt under Rule 144A under the Securities Act of 1933, normally to qualified institutional buyers. These securities have been determined to be illiquid for not meeting the required criteria adopted by the Fund’s Board to be classified as liquid securities. The aggregate value of such securities is $988,552 or 0.7% of total net assets. |
The accompanying notes are an integral part of the financial statements.
Summit Mutual Funds, Inc. – Apex Series |
| MONEY MARKET FUND | FINANCIAL STATEMENTS |
STATEMENT OF ASSETS AND LIABILITIES | | | |
September 30, 2007 | | | |
| | | | |
| ASSETS | | | |
| Investments in securities, at value | | $ | 139,201,579 | |
| Receivables: | | | | |
| Shares sold | | | 1,805 | |
| Interest and dividends | | | 466,005 | |
| Prepaid expenses and other | | | 3,267 | |
| | | | 139,672,656 | |
| LIABILITIES | | | | |
| Payables: | | | | |
| Shares redeemed | | | 1,859,457 | |
| Bank overdraft | | | 2,245 | |
| Dividends Payable | | | 681 | |
| Advisory fees | | | 27,742 | |
| Professional fees | | | 22,004 | |
| Administration fees | | | 11,499 | |
| Fund accounting fees | | | 9,790 | |
| Custodian fees | | | 4,070 | |
| Directors’ fees | | | 218 | |
| Other accrued expenses | | | 11,708 | |
| | | | 1,949,414 | |
| NET ASSETS | | | | |
| Paid-in capital | | | 137,723,242 | |
| | | $ | 137,723,242 | |
| | | | | |
| Investments at cost | | $ | 139,201,579 | |
| Shares authorized per class ($.10 par value) | | | 200,000,000 | |
| | | | | |
| NET ASSET VALUE (NAV) BY SHARE CLASS | | | | | |
| | | | | | |
| Share Class | Net Assets | Outstanding | | per share | |
| Class I | $137,723,242 | | | $ | 1.00 | |
STATEMENT OF OPERATIONS | | | |
For the year ended September 30, 2007 | | | |
| | | | |
| INVESTMENT INCOME | | | |
| Dividends | | $ | 8,347 | |
| Interest | | | 6,985,390 | |
| | | | 6,993,737 | |
| EXPENSES | | | | |
| Advisory fees | | | 452,232 | |
| Administration fees | | | 129,209 | |
| Fund accounting fees | | | 40,278 | |
| Professional fees | | | 33,133 | |
| Transfer agent fees | | | 32,829 | |
| Directors’ fees | | | 16,104 | |
| Custodian fees | | | 15,079 | |
| Shareholder reporting fees | | | 8,739 | |
| Other expenses | | | 17,260 | |
| | | | 744,863 | |
| Reimbursements and waivers | | | (163,421 | ) |
| | | | 581,442 | |
| NET INVESTMENT INCOME / (LOSS) | | | 6,412,295 | |
| | | | | |
| REALIZED AND UNREALIZED GAIN / (LOSS) | | | | |
| Net realized gain / (loss) on investments | | | — | |
| Net change in unrealized appreciation / | | | | |
| (depreciation) on investments | | | — | |
| | | | | |
| NET REALIZED AND UNREALIZED | | | | |
| GAIN / (LOSS) | | | — | |
| | | | | |
| NET INCREASE / (DECREASE) IN | | | | |
| NET ASSETS FROM OPERATIONS | | $ | 6,412,295 | |
| TRANSACTIONS WITH AFFILIATES: | | | |
Percent of Current | |
Net Asset Value | |
| Advisory | Administration | Expense | Reimbursements |
| Fee | Fee | Limit | and Waivers |
| 0.35% | 0.10% | 0.45% | $163,421 |
The accompanying notes are an integral part of the financial statements.
Summit Mutual Funds, Inc. – Apex Series |
| FINANCIAL STATEMENTS | MONEY MARKET FUND |
STATEMENTS OF CHANGES IN NET ASSETS | | | | | | |
Fiscal Year Ended September 30, | | | | | | |
| | | 2007 | | | 2006 | |
| OPERATIONS | | | | | | |
| Net investment income / (loss) | | $ | 6,412,295 | | | $ | 4,911,087 | |
| Net realized gain / (loss) on investments | | | — | | | | 1,150 | |
| | | | | | | | | |
| | | | 6,412,295 | | | | 4,912,237 | |
| | | | | | | | | |
| DISTRIBUTIONS TO SHAREHOLDERS* | | | | | | | | |
| Net investment income | | | (6,412,295 | ) | | | (4,911,087 | ) |
| Net realized gain on investments | | | — | | | | (1,150 | ) |
| | | | | | | | | |
| | | | (6,412,295 | ) | | | (4,912,237 | ) |
| | | | | | | | | |
| FUND SHARE TRANSACTIONS | | | | | | | | |
| Proceeds from shares sold | | | 109,667,646 | | | | 60,024,006 | |
| Reinvestment of distributions | | | 6,386,542 | | | | 4,904,878 | |
| Payments for shares redeemed | | | (103,694,599 | ) | | | (48,971,288 | ) |
| | | | | | | | | |
| | | | 12,359,589 | | | | 15,957,596 | |
| | | | | | | | | |
| NET INCREASE / (DECREASE) IN NET ASSETS | | | 12,359,589 | | | | 15,957,596 | |
| NET ASSETS | | | | | | | | |
| Beginning of period | | | 125,363,653 | | | | 109,406,057 | |
| | | | | | | | | |
| End of period | | $ | 137,723,242 | | | $ | 125,363,653 | |
| FUND SHARE TRANSACTIONS | | | | | | |
| Sold | | | 109,667,646 | | | | 60,024,006 | |
| Reinvestment of distributions | | | 6,386,542 | | | | 4,904,878 | |
| Redeemed | | | (103,694,599 | ) | | | (48,971,288 | ) |
| Net increase / (decrease) from fund share transactions | | | 12,359,589 | | | | 15,957,596 | |
| *TAX CHARACTER OF DISTRIBUTIONS PAID | | | | | | | | |
| Ordinary income | | $ | 6,412,295 | | | $ | 4,912,237 | |
| | | $ | | | | $ | 4,912,237 | |
The accompanying notes are an integral part of the financial statements.
Summit Mutual Funds, Inc. – Apex Series |
Summit Large Cap Growth Fund Class I - Average Annual Total Return |
| | Calendar | |
Quarter to Date | Year to Date | Since Inception |
| 4.46% | 9.58% | 9.15% |
Summit Large Cap Growth Fund Class A - Average Annual Total Return |
| | Calendar | |
| | Since Inception |
| -1.16% | 3.16% | 2.75% |
Past performance is not predictive of future results. Performance does not reflect the deduction of taxes that a shareholder would pay on fund distributions or redemption of fund shares. Prior to February 1, 2007, Class I share performance is based on Class A performance. Absent limitation of expenses during certain of the periods shown, performance would have been lower.
| Managers: | |
| Inception Date: | December 28, 2006 |
| Total Net Assets: | $1.1 Million |
| Number Of Equity Holdings: | 66 |
| Median Cap Size: | $37,982 (in millions) |
| Average Price-to-earnings Ratio: | 22.1x |
| Average Price-to-book Ratio: | 4.15x |
Top 10 Equity Holdings | | Sector Allocations |
| | (% of net assets) | | |
Microsoft Corp. Apple, Inc. Intel Corp. Materials Select Sector SPDR Trust Cisco Systems, Inc. PepsiCo, Inc. United Technologies Corp. General Electric Co. | | | |
Summit Mutual Funds, Inc. – Apex Series |
Objective – Seeks primarily long-term appreciation of capital, without incurring unduly high risk, by investing primarily in common stocks and other equity securities. Current income is a secondary objective.
Strategy – The Large Cap Growth Fund (the “Fund”) seeks securities that generate targeted sales, earnings, and cash flow growth potential, selling at a discount relative to their potential for growth.
Manager’s Comments:
The Large Cap Growth Fund Class I total return performance since the Fund’s inception beginning December 28, 2006 and ending September 30, 2007 was 9.15%1 versus 12.25% for the Russell 1000 Growth Index (the “Index”) and 8.64% for the S&P 500 Index.
The most notable event during the year was the August credit disruptions and their potential impact on U.S. economic growth. In the short-term the disruptions halted the excess liquidity environment in place since early in the year. Brought on by the slide of the housing market, the financial effects were broad. The widespread effect, coupled with a decline of liquidity, has dampened broader economic growth prospects.
The Federal Reserve Bank’s (Fed) September 18th interest rate cut should soften any economic slowdown. However, the rate cut has raised some inflation concerns, and weakened the U.S. dollar, and in-turn sparked higher oil prices. In the near term, a weaker dollar should spur foreign spending on U.S. goods, and help support the economy. Longer term, inflation and dollar trends may limit the Fed’s capacity to sufficiently support the economy.
Excluding stocks linked to the housing market decline, the domestic large-cap segment of the stock market appears to be attractively valued relative to other asset classes. A slow down in the economy should put a premium on stocks able to continue to grow earnings, as growth becomes scarce. The Large Cap Growth Fund is positioned with investments in these types of companies - those with strong growth prospects in this environment.
Contributors to Performance
Strength was broad based and fairly consistent throughout the year. Healthcare was a strong sector as the Fund overweighted in the sector relative to the Index and had favorable selection among pharmaceutical and biotechnology stocks. Strength was also generated in the technology sector where larger-cap stocks offered returns well above average. The portfolio benefited from exposure to Cisco Systems, Intel, and Apple. Lastly, energy stocks continued their push higher as oil prices reached new highs.
Detractors to Performance
The most significant drag on performance was the portfolio’s limited exposure to mid to smallcap stocks relative to the Index. Early in the year the market favored the smaller companies in the Index and the portfolio was almost exclusively exposed to large-cap stocks. While the trend did not continue, the drag from the first quarter produced year-to-date results trailing the Index where a significant portion of the Index is composed of mid-cap stocks.
On a sector basis, consumer discretionary stocks were relatively weak during the year. Cautious on the general strength and spending power of the consumer, the portfolio was underweight consumer stocks. Despite the underweight, stocks held within the retail and restaurant industries were poor performers on balance. Concerns surfaced as a result of liquidity and the housing market decline and kept pressure on the group. We view these issues with continued concern and have further reduced exposure to these industries.
1 Prior to February 1, 2007 Class I share performance is based on Class A share performance, adjusted to remove the A shares’ Distribution/12b-1 fees. See Note 3.
Summit Mutual Funds, Inc. – Apex Series |
LARGE CAP GROWTH FUND | FINANCIAL HIGHLIGHTS |
FINANCIAL HIGHLIGHTS | | | | |
| Computed on the basis of a share of capital stock outstanding throughout the period. | | | | |
| | | Class I | | |
| | | Period from | | |
| | February 1, 2007(1) | |
| | to September 30, | |
| | | 2007 | | |
| Net asset value, beginning of period | | $ | 50.73 | | |
| INVESTMENT ACTIVITIES: | | | | | |
| Net investment income / (loss) | | | 0.04 | | |
| Net realized and unrealized gains / (losses) | | | 3.83 | | |
| Total from Investment Activities | | | 3.87 | | |
| DISTRIBUTIONS: | | | | | |
| Net investment income | | | — | | |
| Net realized gains | | | — | | |
| Total Distributions | | | — | | |
| Net asset value, end of period | | $ | 54.60 | | |
| | | | | | |
| Total return | | | 7.63 | % | |
| RATIOS / SUPPLEMENTAL DATA: | | | | | |
Ratio of expenses to average net assets - net(2) | | | 1.10 | %(3) | |
| Ratio of expenses to average net assets - gross | | | 14.12 | %(3) | |
| Ratio of net investment income / (loss) to average net assets | | | 0.20 | %(3) | |
Portfolio turnover rate(4) | | | 46.36 | % | |
| Net assets, end of period (000’s) | | $ | 1,050 | | |
FINANCIAL HIGHLIGHTS | | | | |
| Computed on the basis of a share of capital stock outstanding throughout the period. | | | | |
| | | Class A | | |
| | | Period from | | |
| | | |
| | to September 30, | |
| | | 2007 | | |
| Net asset value, beginning of period | | $ | 50.00 | | |
| INVESTMENT ACTIVITIES: | | | | | |
| Net investment income / (loss) | | | (0.05 | ) | |
| Net realized and unrealized gains / (losses) | | | 4.56 | | |
| Total from Investment Activities | | | 4.51 | | |
| DISTRIBUTIONS: | | | | | |
| Net investment income | | | — | | |
| Net realized gains | | | — | | |
| Total Distributions | | | — | | |
| Net asset value, end of period | | $ | 54.51 | | |
| | | | | | |
| | | 7.63 | % | |
| RATIOS / SUPPLEMENTAL DATA: | | | | | |
Ratio of expenses to average net assets - net(2) | | | 1.35 | %(3) | |
| Ratio of expenses to average net assets - gross | | | 16.22 | %(3) | |
| Ratio of net investment income / (loss) to average net assets | | | -0.03 | %(3) | |
Portfolio turnover rate(4) | | | 46.36 | % | |
| Net assets, end of period (000’s) | | $ | 31 | | |
(1) | Commencement of operations. | | |
(2) | Net expenses represent gross expenses reduced by fees waived and/or reimbursed by the Adviser. |
(3) | Annualized. | | |
(4) | Portfolio Turnover is calculated on the basis of the Fund as a whole without distinguishing between the classes of shares issued. |
(5) | Total return calculations do not include any sales charges. | |
The accompanying notes are an integral part of the financial statements.
Summit Mutual Funds, Inc. – Apex Series |
| SCHEDULE OF INVESTMENTS | LARGE CAP GROWTH FUND |
SEPTEMBER 30, 2007 | | | | | | |
| | | SHARES | | | VALUE | |
COMMON STOCKS - 94.5% | | | | | | |
Consumer Discretionary - 13.7% | | | | | | |
Comcast Corp. (a) | | | 640 | | | $ | 15,475 | |
eBay, Inc. (a) | | | 600 | | | | 23,412 | |
Gamestop Corp New (a) | | | 230 | | | | 12,961 | |
| Gentex Corp. | | | 570 | | | | 12,221 | |
| Guess ?, Inc. | | | 270 | | | | 13,238 | |
| International Game Technology | | | 270 | | | | 11,637 | |
Papa John’s International, Inc. (a) | | | 320 | | | | 7,821 | |
Select Comfort Corp. (a) | | | 310 | | | | 4,324 | |
Starbucks Corp. (a) | | | 600 | | | | 15,720 | |
| Target Corp. | | | 340 | | | | 21,614 | |
| Tractor Supply Co. (a) | | | 210 | | | | 9,679 | |
| | | | | | | | 148,102 | |
Consumer Staples - 8.3% | | | | | | | | |
| Anheuser-Busch Companies, Inc. | | | 370 | | | | 18,496 | |
| PepsiCo, Inc. | | | 390 | | | | 28,572 | |
| Procter & Gamble Co. | | | 320 | | | | 22,509 | |
| Wal-Mart Stores, Inc. | | | 220 | | | | 9,603 | |
| Whole Foods Market, Inc. | | | 220 | | | | 10,771 | |
| | | | | | | | 89,951 | |
Energy - 8.2% | | | | | | | | |
| Chevron Corp. | | | 180 | | | | 16,844 | |
| Devon Energy Corp. | | | 140 | | | | 11,648 | |
| ENSCO International, Inc. | | | 170 | | | | 9,537 | |
| Helmerich & Payne, Inc. | | | 300 | | | | 9,849 | |
National-Oilwell Varco, Inc. (a) | | | 130 | | | | 18,785 | |
| Schlumberger Ltd. | | | 210 | | | | 22,050 | |
| | | | | | | | 88,713 | |
| | | | | | | | | |
Financials - 6.0% | | | | | | | | |
| American Express Co. | | | 400 | | | | 23,748 | |
| American International Group, Inc. | | | 150 | | | | 10,147 | |
| Citigroup, Inc. | | | 380 | | | | 17,735 | |
| The Goldman Sachs Group, Inc. | | | 60 | | | | 13,004 | |
| | | | | | | | 64,634 | |
Health Care - 14.6% | | | | | | | | |
| Abbott Laboratories | | | 360 | | | | 19,303 | |
| Baxter International, Inc. | | | 180 | | | | 10,130 | |
Celgene Corp. (a) | | | 170 | | | | 12,123 | |
| The Cooper Cos, Inc. | | | 200 | | | | 10,484 | |
Genentech, Inc. (a) | | | 210 | | | | 16,384 | |
Gilead Sciences, Inc. (a) | | | 420 | | | | 17,165 | |
| Medtronic, Inc. | | | 190 | | | | 10,718 | |
| Novartis AG - ADR | | | 260 | | | | 14,290 | |
| Schering Plough Corporation | | | 650 | | | | 20,560 | |
| UnitedHealth Group, Inc. | | | 310 | | | | 15,013 | |
| Varian Medical Systems, Inc. (a) | | | 270 | | | | 11,310 | |
| | | | | | | | 157,480 | |
| | | SHARES | | | VALUE | |
Industrials - 15.5% | | | | | | |
| 3M Co. | | | 60 | | | $ | 5,615 | |
BE Aerospace, Inc. (a) | | | 370 | | | | 15,366 | |
| Burlington Northern Santa Fe Corp. | | | 120 | | | | 9,740 | |
| FedEx Corp. | | | 165 | | | | 17,284 | |
First Solar, Inc. (a) | | | 50 | | | | 5,887 | |
| General Electric Co. | | | 610 | | | | 25,254 | |
Genesee & Wyoming, Inc. (a) | | | 320 | | | | 9,229 | |
| Illinois Tool Works, Inc. | | | 300 | | | | 17,892 | |
| Ingersoll-Rand Co. | | | 230 | | | | 12,528 | |
Monster Worldwide, Inc. (a) | | | 230 | | | | 7,834 | |
| Raytheon Co. | | | 210 | | | | 13,402 | |
| United Technologies Corp. | | | 345 | | | | 27,766 | |
| | | | | | | | 167,797 | |
Information Technology - 27.0% | | | | | | | | |
Adobe Systems, Inc. (a) | | | 360 | | | | 15,718 | |
Akamai Technologies, Inc. (a) | | | 300 | | | | 8,619 | |
Apple, Inc. (a) | | | 260 | | | | 39,921 | |
Autodesk, Inc. (a) | | | 270 | | | | 13,492 | |
Cisco Systems, Inc. (a) | | | 950 | | | | 31,455 | |
Dell, Inc. (a) | | | 800 | | | | 22,080 | |
Electronic Arts, Inc. (a) | | | 300 | | | | 16,797 | |
Google, Inc. - Class A (a) | | | 20 | | | | 11,345 | |
| Intel Corp. | | | 1,420 | | | | 36,721 | |
| International Business Machines Corp. | | | 100 | | | | 11,780 | |
| Microsoft Corp. | | | 1,370 | | | | 40,360 | |
NAVTEQ Corp. (a) | | | 210 | | | | 16,374 | |
| Qualcomm, Inc. | | | 240 | | | | 10,142 | |
| The Western Union Co. | | | 820 | | | | 17,195 | |
| | | | | | | | 291,999 | |
Utilities - 1.2% | | | | | | | | |
| Exelon Corp. | | | 90 | | | | 6,782 | |
| FPL Group, Inc. | | | 110 | | | | 6,697 | |
| | | | | | | | 13,479 | |
| TOTAL COMMON STOCKS | | | | | | | | |
| (Cost $943,183) | | | | | | | 1,022,155 | |
| | | | | | | | | |
INVESTMENT COMPANIES - 5.1% | | | | | | | | |
| Materials Select Sector SPDR Trust | | | 790 | | | | 33,267 | |
iShares U.S. Dow Jones Medical Device Index (a) | | | 370 | | | | 22,237 | |
| TOTAL INVESTMENT COMPANIES | | | | | | | | |
| (Cost $49,738) | | | | | | | 55,504 | |
SHORT TERM INVESTMENTS - 2.2% | | | | | | | | |
Money Market Funds - 2.2% | | | | | | | | |
| Northern Institutional Diversified Assets Portfolio | | | 24,308 | | | | 24,308 | |
| TOTAL SHORT TERM INVESTMENTS | | | | | | | | |
| (Cost $24,308) | | | | | | | 24,308 | |
Total Investments (Cost $1,017,229) (b) - 101.8% | | | | | | | 1,101,967 | |
Liabilities in Excess of Other Assets - (1.8)% | | | | | | | (20,439 | ) |
TOTAL NET ASSETS - 100.0% | | | | | | $ | 1,081,528 | |
| ADR | American Depository Receipt |
| (a) | Non-income producing security. |
| (b) | For federal income tax purposes, cost is $1,017,318 and gross unrealized appreciation and depreciation of securities as of September 30, 2007 was $119,012 and ($34,363), respectively, with a |
| | net appreciation / (depreciation) of $84,649. |
The accompanying notes are an integral part of the financial statements.
Summit Mutual Funds, Inc. – Apex Series |
| LARGE CAP GROWTH FUND | FINANCIAL STATEMENTS |
STATEMENT OF ASSETS AND LIABILITIES | | | |
September 30, 2007 | | | |
| | | | |
| | | | |
| ASSETS | | | |
| Investments in securities, at value | | $ | 1,101,967 | |
| Receivables: | | | | |
| Securities sold | | | 24,349 | |
| Reimbursement from adviser | | | 8,875 | |
| Interest and dividends | | | 665 | |
| Prepaid expenses and other | | | 6,777 | |
| | | | 1,142,633 | |
| LIABILITIES | | | | |
| Payables: | | | | |
| Investment securities purchased | | | 30,107 | |
| Professional fees | | | 19,135 | |
| Fund accounting fees | | | 3,650 | |
| Custodian fees | | | 553 | |
| 12b-1 fees | | | 249 | |
| Directors’ fees | | | 2 | |
| Other accrued expenses | | | 7,409 | |
| | | | 61,105 | |
| NET ASSETS | | | | |
| Paid-in capital | | | 1,008,003 | |
| Accumulated undistributed net | | | | |
| investment income / (loss) | | | 807 | |
| Accumulated net realized gain / (loss) | | | | |
| on investments | | | (12,020 | ) |
| Net unrealized appreciation / (depreciation) | | | | |
| on investments | | | 84,738 | |
| | | $ | 1,081,528 | |
| | | | | |
| Investments at cost | | $ | 1,017,229 | |
| Shares authorized - Class I ($.10 par value) | | | 20,000,000 | |
| Shares authorized - Class A ($.10 par value) | | | 20,000,000 | |
| NET ASSET VALUE (NAV) BY SHARE CLASS | | | | | |
| | | | | | |
| Share Class | Net Assets | Outstanding | | per share | |
| Class I | $1,050,351 | | | $ | 54.60 | |
| Class A | $31,177 | | | $ | 54.51 | |
| | | | | | |
| Class A maximum offering price per share | | | | | |
(net asset value plus sales charge of 5.75% | | | | | |
| of offering price) | | | $ | 57.84 | |
| * | FEDERAL TAX DATA AS OF SEPTEMBER 30, 2007 | | |
| | Undistributed ordinary income | $ | 807 |
| | Unrealized appreciation | $ | 84,649 |
| | Post October Capital Loss Carryforward | $ | (11,931) |
STATEMENT OF OPERATIONS | | | |
Period from December 28, 2006(1) to | | | |
September 30, 2007 | | | |
| | | | |
| INVESTMENT INCOME | | | |
| Dividends | | $ | 6,944 | |
| Foreign dividend taxes withheld | | | (11 | ) |
| | | | 6,933 | |
| EXPENSES | | | | |
| Transfer agent fees | | | 24,371 | |
| Professional fees | | | 20,402 | |
| Registration fees | | | 14,196 | |
| Fund accounting fees | | | 11,045 | |
| Advisory fees | | | 3,995 | |
| Custodian fees | | | 1,694 | |
| Administration fees | | | 533 | |
| 12b-1 fees - Class A | | | 267 | |
| Directors’ fees | | | 69 | |
| Shareholder reporting fees | | | 68 | |
| Other expenses | | | 889 | |
| | | | 77,529 | |
| Reimbursements and waivers | | | (71,403 | ) |
| | | | 6,126 | |
| NET INVESTMENT INCOME / (LOSS) | | | 807 | |
| REALIZED AND UNREALIZED GAIN / (LOSS) | | | | |
| Net realized gain / (loss) on investments | | | (12,020 | ) |
| Net change in unrealized appreciation / | | | | |
| (depreciation) on investments | | | 84,738 | |
| | | | | |
| NET REALIZED AND UNREALIZED | | | | |
| GAIN / (LOSS) | | | 72,718 | |
| NET INCREASE / (DECREASE) IN | | | | |
| NET ASSETS FROM OPERATIONS | | $ | 73,525 | |
| TRANSACTIONS WITH AFFILIATES: | | | |
| Percent of Current | |
Net Asset Value | |
| Advisory | Administration | Class I | Class A | Reimbursements |
| Fee | Fee | Expense Limit (2) | Expense Limit (2) | and Waivers |
| 0.75% | 0.10% | 1.10% | 1.35% | $71,403 |
(1) | Commencement of operations. |
(2) | The Adviser has voluntarily agreed to waive its fees and/or reimburseexpenses of the Fund to the extent necessary, to limit all expenses to 1.10% of the average daily net assets of the Large Cap Growth Fund -Class I and 1.35% of the Large Cap Growth Fund - Class A until January 31, 2009. |
The accompanying notes are an integral part of the financial statements.
Summit Mutual Funds, Inc. – Apex Series |
| FINANCIAL STATEMENTS | LARGE CAP GROWTH FUND |
STATEMENT OF CHANGES IN NET ASSETS | | | |
Period from December 28, 2006(1) to September 30, | | | |
| | | 2007 | |
| OPERATIONS | | | |
| Net investment income / (loss) | | $ | 807 | |
| Net realized gain / (loss) on investments | | | (12,020 | ) |
| Net change in unrealized appreciation / (depreciation) | | | | |
| on investments | | | 84,738 | |
| | | | 73,525 | |
| DISTRIBUTIONS TO SHAREHOLDERS | | | | |
Class I (2) | | | | |
| Net investment income | | | — | |
| Net realized gain on investments | | | — | |
| Class A | | | | |
| Net investment income | | | — | |
| Net realized gain on investments | | | — | |
| | | | — | |
| FUND SHARE TRANSACTIONS | | | | |
Class I (2) | | | | |
| Proceeds from shares sold | | | 990,765 | |
| Reinvestment of distributions | | | — | |
| Payments for shares redeemed | | | — | |
| | | | 990,765 | |
| Class A | | | | |
| Proceeds from shares sold | | | 288,000 | |
| Reinvestment of distributions | | | — | |
| Payments for shares redeemed | | | (270,762 | ) |
| | | | 17,238 | |
| NET INCREASE / (DECREASE) IN NET ASSETS | | | 1,081,528 | |
| NET ASSETS | | | | |
| Beginning of period | | | — | |
| End of period | | $ | 1,081,528 | |
| ACCUMULATED UNDISTRIBUTED NET INVESTMENT INCOME | | $ | 807 | |
| FUND SHARE TRANSACTIONS | | | |
Class I (2) | | | |
| Sold | | | 1,432 | |
| Reinvestment of distributions | | | — | |
| Redeemed | | | — | |
| Net increase / (decrease) from fund share transactions | | | 1,432 | |
| FUND SHARE TRANSACTIONS | | | | |
| Class A | | | | |
| Sold | | | 5,720 | |
| Reinvestment of distributions | | | — | |
| Redeemed | | | (521 | ) |
| Net increase / (decrease) from fund share transactions | | | 5,199 | |
| TOTAL COST OF PURCHASES OF: | | | | |
| Common Stocks | | $ | 431,610 | |
| | | $ | 431,610 | |
| TOTAL PROCEEDS FROM SALES OF: | | | | |
| Common Stocks | | $ | 97,300 | |
| | | $ | 97,300 | |
| | | | | |
(1) | Commencement of Operations | | |
(2) | Class I shares have been offered since February 1, 2007. | | |
The accompanying notes are an integral part of the financial statements.
Summit Mutual Funds, Inc. – Apex Series NOTES TO FINANCIAL STATEMENTS |
September 30, 2007
NOTE 1 – SIGNIFICANT ACCOUNTING POLICIES
Summit Mutual Funds, Inc. (“Summit Mutual Funds”) is registered, with the Securities and Exchange Commission under the Investment Company Act of 1940, as amended, as an open-end management investment company. Summit Mutual Funds is offered in two series, the Pinnacle Series and the Apex Series. The results of the Apex Series are presented herein. The Apex Series’ shares are offered in seven Funds: Nasdaq-100 Index Fund, Everest Fund, Large Cap Growth Fund, Bond Fund, Short-term Government Fund, High Yield Bond Fund, and Money Market Fund (each individually a “Fund”, collectively the “Funds”). The Nasdaq-100 Index Fund seeks investment results that correspond to the total return performance of U.S. common stocks as represented by the Nasdaq-100 Index. The Everest Fund primarily seeks long-term appreciation of capital, without incurring unduly high risk, by investing primarily in common stocks and other equity securities. The Large Cap Growth Fund seeks primarily long-term appreciation of capital, without incurring unduly high risk, by investing primarily in common stocks and other equity securities. The Bond Fund seeks as high a level of current income as is consistent with reasonable investment risk, by investing primarily in long-term, fixed-income, investment-grade corporate bonds. The Short-term Government Fund seeks to provide a high level of current income and preservation of capital by investing 100% of its total assets in bonds issued by the U.S. government and its agencies. The High Yield Bond Fund seeks high current income and capital appreciation, secondarily, by investing primarily in high yield, high risk bonds, with intermediate maturities. The Money Market Fund seeks to maintain stability of capital and, consistent therewith, to maintain the liquidity of capital and to provide current income. The Class I shares of the Fund are offered without a sales charge to institutional and retail investors. Each Fund, except the Nasdaq-100 Index and Money Market Funds, also offers Class A shares, which are subject to an initial sales charge and a Distribution and Shareholder Service Plan Fee (See Note 3). The Funds are also offered to insurance company exempt separate accounts, including The Union Central Life Insurance Company (parent company of Summit Investment Partners Inc., the Adviser).
The preparation of financial statements in conformity with accounting principles generally accepted in the United States of America (“generally accepted accounting principles”) requires management to make estimates and assumptions that affect the reported amounts of assets and liabilities and disclosure of contingent assets and liabilities at the date of the financial statements and the reported amounts of revenues and expenses during the reporting period. Actual results could differ from those estimates.
Securities valuation – Securities held in each Fund, except for money market instruments maturing in 60 days or less, are valued as follows: Securities traded on stock exchanges (including securities traded in both the over-the-counter market and on an exchange), or listed on the NASDAQ Global Market or NASDAQ Global Select Market, are valued at the last sales price as of the close of the New York Stock Exchange on the day the securities are being valued, or, lacking any sales, at the closing bid prices. Alternatively, NASDAQ listed securities may be valued on the basis of the NASDAQ Official Closing Price. Securities traded only in the over-the-counter market are valued at the last bid price, as of the close of trading on the New York Stock Exchange, quoted by brokers that make markets in the securities. Securities for which market quotations are not readily available are valued at fair value as determined in good faith under procedures adopted by the Board of Directors. Examples of valuation bases and factors used to determine securities’ fair value include: a multiple of earnings, a discounted value from freely-traded similar securities, relative yield to maturity calculations, market values for similar securities, utilization of the fair value information service of FT Interactive Data, or a combination of these or other methods.
Additionally, general market risk, and credit, yield and other risks particular to a given issue, and other factors are considered. Money market instruments maturing in 60 days or less are valued at amortized cost, which approximates market value.
Securities transactions and investment income – Securities transactions are recorded on the trade date (the date the order to buy or sell is executed). Dividend income is recorded on the ex-dividend date and interest income is recorded on an accrual basis. All amortization of discount and premium is recognized currently under the effective interest method. Gains and losses on sales of investments are calculated on the identified cost basis for financial reporting and tax purposes. Paydown gains and losses on mortgage and asset-backed securities as well as inflation adjustments to the face amount of inflation-indexed securities are presented as interest income.
Summit Mutual Funds, Inc. – Apex Series NOTES TO FINANCIAL STATEMENTS |
NOTE 1 – SIGNIFICANT ACCOUNTING POLICIES (continued)
Federal taxes – Each Fund contemplates declaring as dividends each year all, or substantially all, of its taxable income, including net capital gains (the excess of long-term capital gains over short-term capital losses). Capital loss carryforwards may be utilized in future years to offset net realized capital gains, if any, prior to distributing such gains to shareholders. Shareholders will be subject to income taxes on these distributions regardless of whether they are paid in cash or reinvested in additional Fund shares. Distributions attributable to the net capital gains of a Fund will be taxable to a shareholder as long-term capital gains, regardless of how long the shareholder has held the Fund shares. Other Fund distributions will generally be taxable as ordinary income. The one major exception to these tax principles is that distributions on, and sales, exchanges and redemptions of, Fund shares held in an IRA (or other tax-qualified plan) will not be currently taxable.
Shareholders may also be subject to state and local taxes on distributions and redemptions. State income taxes may not apply, however, to the portions of each Fund’s distributions, if any, that are attributable to interest on federal securities or interest on securities of the particular state. Shareholders should consult their tax advisers regarding the tax status of distributions in their state and locality.
It is the intent of Summit Mutual Funds to comply with the requirements under Subchapter M of the Internal Revenue Code applicable to regulated investment companies and to distribute all of its net investment income and any net realized capital gains. Accordingly, no provision for federal or state income taxes has been recorded.
Distributions – Distributions from net investment income, if any, in all fixed income Funds, except the Money Market Fund, are generally declared and paid quarterly. Distributions from net investment income, if any, of the Money Market Fund are declared daily and paid monthly. Equity Funds generally declare and pay dividends annually. Net realized capital gains, if any, are distributed periodically, no less frequently than annually. Distributions are recorded on the ex-dividend date. All distributions are reinvested in additional shares of the respective Fund at the net asset value per share unless you notify Summit Mutual Funds that you elect to receive distributions in cash.
The amounts of distributions are determined in accordance with federal income tax regulations, which may differ from accounting principles generally accepted in the United States of America. These “book/tax” differences are considered either temporary or permanent in nature. To the extent these differences are permanent in nature, such amounts are reclassified within the capital accounts based on their federal tax-basis treatment; temporary differences do not require reclassification. The book/tax differences are primarily related to the tax deferral of losses on wash sales, Section 1256 Mark-to-Market, paydowns on mortgage backed securities, post-October capital losses, Real Estate Investment Trust (REIT), and partnership adjustments. Distributions that exceed net investment income and net realized capital gains for financial reporting purposes but not for tax purposes are reported as distributions in excess of net investment income or distributions in excess of net realized capital gains. To the extent they exceed net investment income and net realized capital gains for tax purposes, they are reported as distributions of paid-in-capital.
Expenses – Allocable expenses of Summit Mutual Funds are charged to each Fund based on the ratio of the net assets of each Fund to the combined net assets of Summit Mutual Funds. Nonallocable expenses are charged to each Fund based on specific identification.
Foreign currency – Summit Mutual Funds’ accounting records are maintained in U.S. dollars. Funds may purchase foreign securities within certain limitations set forth in the Prospectus. Amounts denominated in or expected to settle in foreign currencies are translated into U.S. dollars at the spot rate at the close of the New York Currency Market. Summit Mutual Funds does not isolate the portion of operational results relating to changes in foreign exchange rates on investments from the underlying market price fluctuations. All such results are included in net realized and unrealized gain or loss for investments.
Foreign security and currency transactions may involve certain risks not typically associated with those of U.S. companies, including the level of governmental supervision and regulations of foreign securities markets and the possibility of political and economic instability.
Summit Mutual Funds, Inc. – Apex Series NOTES TO FINANCIAL STATEMENTS |
NOTE 1 – SIGNIFICANT ACCOUNTING POLICIES (continued)
Futures contracts – Certain Funds may for hedging purposes enter into futures contracts including protecting the price or interest rate of securities that the Fund intends to buy, that relate to securities in which they may invest directly and indexes comprised of such securities. Funds may also purchase and write call and put options on such contracts. Each eligible Fund may invest up to 20% of its assets in such futures and/or options. The Nasdaq-100 Index and Short-term Government Funds may invest up to 100% of their assets in such futures and/or options until each Fund reaches $50 million in net assets. These contracts provide for the sale of a specified quantity of a financial instrument at a fixed price at a future date. When the Funds enter into a futures contract, they are required to deposit, or designate and maintain as collateral, such initial margin as is required by the exchange on which the contract is traded. Under terms of such contracts, the Funds agree to receive from or pay to the broker an amount equal to the daily fluctuation in the value of the contract (known as the variation margin). The variation margin is recorded as unrealized gain or loss until the contract expires or is otherwise closed, at which time the gain or loss is realized. The Funds invest in futures as a substitute to investing in the common stock positions in the index that they intend to match. The potential risk to the Funds is that the change in the value in the underlying securities may not correlate to the value of the contracts.
Fund securities lending – The Funds (except the Money Market Funds) lend their securities to approved brokers to earn additional income and receive cash and/or securities as collateral to secure the loans. Income from securities lending is included in “Other Income” on the Statement of Operations. Collateral is maintained at not less than 100% of the current market value of loaned securities. Although the risk of lending is mitigated by the collateral, the Funds could experience a delay in recovering its securities and a possible loss of income or value if the borrower fails to return them. In addition to cash collateral, the Funds may accept noncash collateral consisting of government securities and irrevocable letters of credit from domestically domiciled banks.
NOTE 2 – TRANSACTIONS WITH AFFILIATES
Investment advisory fees – Summit Mutual Funds pays investment advisory fees to Summit Investment Partners, Inc. (the “Adviser”), under terms of an Investment Advisory Agreement (the “Agreement”). Certain officers and directors of the Adviser are affiliated with Summit Mutual Funds. Summit Mutual Funds pays the Adviser, as full compensation for all services and facilities furnished, a monthly fee computed separately for each Fund on a daily basis.
Administration fees – The Funds have entered into an Administrative Services Agreement with the Adviser in which the Adviser, at its expense, maintains certain of the Funds’ books and records and furnishes such office space, facilities, equipment, and clerical help as the Funds may reasonably require in the conduct of business. In addition, the Adviser pays for the services of all executive, administrative, clerical, and other personnel, including officers of the Funds, who are employees of The Union Central Life Insurance Company or its affiliates. Expenses not expressly assumed by the Adviser under the Agreement will be paid by the Funds. A separate administrative service fee of 0.10% of average daily net assets on an annual basis will be imposed for these services.
Directors’ fees – Each director who is not affiliated with the Adviser receives fees from Summit Mutual Funds for service as a director. Members of the Board of Directors who are not affiliated with the Adviser are eligible to participate in a deferred compensation plan. The value of each director’s deferred compensation account will increase or decrease at the same rate as if it were invested in shares of the Summit Money Market Fund.
Other – The Adviser is a wholly-owned subsidiary of The Union Central Life Insurance Company (“Union Central”), an indirect subsidiary of UNIFI Mutual Holding Company. Subject to the direction and authority of Summit Mutual Funds’ board of directors, the Adviser manages the investment and reinvestment of the assets of each Fund and provides administrative services and manages Summit Mutual Funds’ business affairs.
Summit Mutual Funds, Inc. – Apex Series NOTES TO FINANCIAL STATEMENTS |
NOTE 3 – MULTIPLE CLASSES OF SHARES
Effective February 28, 2007, the Nasdaq-100 Index Fund converted its Class A shares into Class I shares. Nasdaq-100 Index Fund Class A shares no longer exist. The Everest, Large Cap Growth, Bond, Short-term Government, and High Yield Bond Funds offer Class A and Class I shares. The Class A shares are subject to a Distribution and Shareholder Service Plan (the “Plan”) in accordance with Rule 12b-1 under the 1940 Act. The Plan provides that each class in the Plan shall pay to the Series’ Distributor, Quasar Distributors, LLC, a fee for payments the Distributor makes to banks, financial planners, retirement plan service providers, broker/dealers and other institutions for distribution assistance and/or shareholder services in connection with the Class A shares. The fee shall be in an amount not to exceed on an annual basis 0.25% of the average daily net asset value attributable to Class A shares. Because the fee is paid out of the assets of the Class A shares on an ongoing basis, over time the fee will increase the cost and reduce the return of an investment. In addition, Class A shares have a front-end sales load.
The two classes of shares represent interests in the same portfolio of investments, have the same rights, and are generally identical in all respects, except that each class bears its separate class-specific expenses, and has exclusive voting rights with respect to any matter on which a separate vote of any class is required. Income, non-class specific expenses, and realized/unrealized gains and losses are allocated to the respective classes on the basis of the relative daily net assets.
NOTE 4 – FUTURE ADOPTION OF NEW ACCOUNTING STANDARDS
On July 13, 2006, the Financial Accounting Standards Board (FASB) released FASB Interpretation No. 48 “Accounting for Uncertainty in Income Taxes” (“FIN 48”). FIN 48 provides guidance for how uncertain tax positions should be recognized, measured, presented and disclosed in the financial statements. FIN 48 requires the evaluation of tax positions taken or expected to be taken in the course of preparing a Fund’s tax returns to determine whether the tax positions are “more-likely-than-not” of being sustained by the applicable tax authority. Tax positions not deemed to meet the more-likely-than-not threshold would be recorded as a tax benefit or expense in the current year. Adoption of FIN 48 is required as of the date of the last Net-Asset Value (“NAV”) calculation in the first required financial statement reporting period for fiscal years beginning after December 15, 2006 and is to be applied to all open tax years as of the effective date. At this time, management is evaluating the implications of FIN 48 and its impact on the financial statements has not yet been determined.
In September 2006, the Financial Accounting Standards Board issued its new Standard No. 157, “Fair Value Measurements” (“FAS 157”). FAS 157 is designed to unify guidance for the measurement of fair value of all types of assets, including financial instruments, and certain liabilities, throughout a number of accounting standards. FAS 157 also establishes a hierarchy for measuring fair value in generally accepted accounting principles and expands financial statement disclosures about fair value measurements that are relevant to mutual funds. FAS 157 is effective for financial statements issued for fiscal years beginning after November 15, 2007, and earlier adoption is permitted. At this time, management is evaluating the implications of FAS 157 and its impact on the financial statements has not yet been determined.
Summit Mutual Funds, Inc. – Apex Series REPORT OF INDEPENDENT REGISTERED PUBLIC ACCOUNTING FIRM |
To the Board of Directors and Shareholders of Summit Mutual Funds, Inc.:
We have audited the accompanying statements of assets and liabilities, including the schedules of investments, of Summit Mutual Funds, Inc. – Apex Series (the “Funds”) comprising the Nasdaq-100 Index Fund, Everest Fund, Bond Fund, Short-term Government Fund, High Yield Bond Fund, Money Market Fund and Large Cap Growth Fund as of September 30, 2007, and the related statements of operations, changes in net assets, and financial highlights for the periods presented. These financial statements and financial highlights are the responsibility of the Funds’ management. Our responsibility is to express an opinion on these financial statements and financial highlights based on our audits.
We conducted our audits in accordance with the standards of the Public Company Accounting Oversight Board (United States). Those standards require that we plan and perform the audit to obtain reasonable assurance about whether the financial statements and financial highlights are free of material misstatement. The Funds are not required to have, nor were we engaged to perform, an audit of their internal control over financial reporting. Our audits included consideration of internal control over financial reporting as a basis for designing audit procedures that are appropriate in the circumstances, but not for the purpose of expressing an opinion on the effectiveness of the Funds’ internal control over financial reporting. Accordingly, we express no such opinion. An audit also includes examining, on a test basis, evidence supporting the amounts and disclosures in the financial statements, assessing the accounting principles used and significant estimates made by management, as well as evaluating the overall financial statement presentation. Our procedures included confirmation of securities owned as of September 30, 2007, by correspondence with the custodian and brokers. We believe that our audits provide a reasonable basis for our opinion.
In our opinion, the financial statements and financial highlights referred to above present fairly, in all material respects, the financial position of each of the funds constituting the Summit Mutual Funds, Inc. – Apex Series as of September 30, 2007, the results of their operations, the changes in their net assets, and the financial highlights for periods presented, in conformity with accounting principles generally accepted in the United States of America.
DELOITTE & TOUCHE LLP
November 21, 2007 Chicago, Illinois
This page intentionally left blank.
This page intentionally left blank.
This page intentionally left blank.
Summit Mutual Funds, Inc. – Apex Series |
Directors and Officers |
Independent Directors | | | | | |
| | | | | Number of | |
| | | Term of | | Portfolios in | Other |
| | Position(s) | Office and | | Fund Complex | Directorships |
| | with the | Length of | Principal Occupation(s) | Overseen by | Held by |
Name, Age and Address(1) | Fund | Time Served | During Past Five Years | Director | Director |
| Theodore H. Emmerich | Director | Indefinite Term | Consultant | 21 | American |
| (81) | and Chairman | Director | | | Financial Group |
| | | since 1987 | | | |
| Yvonne L. Gray | Director | Indefinite Term | Executive Vice President/ CCO, United | 21 | |
| (56) | | Director | Way of Greater Cincinnati (Social Services | | |
| | | since 1999 | Provider); prior thereto, Vice President / | | |
| | | | Trust Operations Officer, Fifth Third Bank; | | |
| | | | former Audit Manager, Price Waterhouse | | |
| | | | (Accounting Firm) | | |
| Michael K. Keating | Director | Indefinite Term | Managing Director, Keating Vollmer & Co. | 21 | |
| (52) | | Director | LLC (Private Equity Investment Firm) | | |
| | | since 2005 | | | |
| David C. Phillips | Director | Indefinite Term | Co-Founder, Cincinnati Works Inc. (Job | 21 | Meridian |
| (69) | | Director | Placement); prior thereto, Chief Executive | | Bioscience, Inc.; |
| | | since 2001 | Officer, Downtown Cincinnati Inc. | | Cintas, Inc. |
| | | | (Economic Revitalization of Cincinnati) | | |
| Mary W. Sullivan | Director | Indefinite Term | Attorney, Peck, Shaffer & Williams LLP | 21 | Franklin Savings and |
| (50) | | Director | (Law Firm) | | Loan Co.; First |
| | | since 2001 | | | Franklin Corporation |
Interested Director and Officers | | | | | |
| | | | | Number of | |
| | | Term of | | Portfolios in | Other |
| | Position(s) | Office and | | Fund Complex | Directorships |
| | with the | Length of | Principal Occupation(s) | Overseen by | Held by |
Name, Age and Address(1) | Fund | Time Served | During Past Five Years | Director | Director |
| Steven R. Sutermeister* | Director, | Indefinite Term | Senior Vice President, Union Central; | 21 | Summit Investment |
| (53) | President and | Director | President and Chief Executive Officer, | | Partners, Inc.; Union |
| | Chief Executive | since 1999 | Adviser. | | Central Mortgage |
| | Officer | | | | Funding, Inc. |
| | | | | | Summit Investment |
| | | | | | Advisers, Inc. |
| John F. Labmeier | Vice President | Indefinite Term | Consultant; prior thereto Vice President, | NA | NA |
| 1876 Waycross Rd | and Secretary | Officer | Associate General Counsel and Assistant | | |
| Cincinnati, OH 45240 | | since 1990 | | | |
| (58) | | | | | |
| Thomas G. Knipper | Vice President, | Indefinite Term | Chief Compliance Officer | NA | NA |
| (50) | Controller and | Officer | and Treasurer, Adviser | | |
| | Chief Compliance | since 1995 | | | |
| | Officer | | | | |
| Gerald Q. Herbert | Treasurer | Indefinite Term | Director of Finance and Accounting, | NA | NA |
| (40) | | Officer | Adviser; prior thereto, Controller, General | | |
| | | since 2005 | Factory Supplies Co. | | |
| John M. Lucas | Assistant | Indefinite Term | Second Vice President, Counsel and | NA | NA |
| 1876 Waycross Rd. | Secretary | Officer | Assistant Secretary, Union Central | | |
| Cincinnati, OH 45240 | | since 1990 | | | |
| (56) | | | | | |
(1) | Except as otherwise indicated, the business address of each listed person is 312 Walnut St., Ste. 2500, Cincinnati, OH 45202 |
| * | Mr. Sutermeister may be considered to be an “interested person” of the Fund (within the meaning of the Investment Company Act of 1940) because of his affiliation with the Adviser. |
Note – The Statement of Additional Information includes additional information about Fund directors and is available without charge, upon request, by calling 1-877-546-FUND.
Item 2. Code of Ethics.
As of the end of the period covered by this report (September 30, 2007), the Registrant has adopted a code of ethics that applies to its principal executive officer and principal financial officer/controller. This code of ethics is posted on the Fund's website, www.summitfunds.com.
Item 3. Audit Committee Financial Expert.
The Audit Committee of the Summit Mutual Funds, Inc. Board of Directors has named the following financial experts:
- Theodore H. Emmerich, Independent Director
- Yvonne L. Gray, Independent Director
- David C. Phillips, Independent Director
Item 4. Principal Accountant Fees and Services.
| | Fiscal Year Ended 09/30 |
| | 2007 | | 2006 |
| | | | |
| | | | |
| (a) Audit Fees | $ 124,469 | | $ 97,242 |
| (b) Audit-related Fees | | | |
| (c) Tax Fees | | | |
| (d) All Other Fees | | | |
| (e) (1) Pre-approval Policy* (see below) | | | |
| (e) (2) % above that were pre-approved | 0% | | 0% |
| (f) If greater than 50%, disclose hrs. | N/A | | N/A |
| (g) Non-audit fees rendered to Adviser | | | |
| (or affiliate that provided services | | | |
| to the Funds). | 139,300 | | 137,100 |
| (h) Disclose whether the Audit Committee | | | |
| has considered whether the provisions | | | |
| of non-audit services rendered to the | | | |
| Adviser that were NOT pre-approved is | | | |
| compatible with maintaining the | | | |
| auditor's independence. | YES | | YES |
*(e) (1) The following discloses the audit committee's pre-approval
policies and procedures, as set forth in the Audit Committee Charter:
"(c) The Committee shall pre-approve all auditing services and permissible non-audit services (e.g., tax services) to be provided to the Fund by the Accountant, including the fees
therefore. The Committee may delegate to one or more of its members the authority to grant pre-approvals. In connection with such delegation, the Committee shall establish pre-approval policies and procedures, including the requirement that the decisions of any member to whom authority is delegated under this section (c) shall be presented to the full Committee at its next scheduled meeting.
(d) Pre-approval for a non-audit service shall not be required if: (1) the aggregate amount of all such non-audit services is not more than 5% of the total revenues paid by the Fund to the Accountant in the fiscal year in which the non-audit services are provided; (2) such services were not recognized by the Fund at the time of the engagement to be non-audit services; and (3) such services are promptly brought to the attention of the Committee and approved prior to the completion of the audit by the Committee or by one or more members of the Committee to whom authority to grant such approvals has been delegated by the Committee.
(e) The Committee shall pre-approve the Accountant's engagements for non-audit services with the Adviser and any affiliate of the Adviser that provides ongoing services to the Fund in
accordance with paragraph (c) above, if the engagement relates directly to the operations and financial reporting of the Fund, unless the aggregate amount of all services provided constitutes no more than 5% of the total amount of revenues paid to the Accountant by the Fund, the Adviser and any affiliate of the Adviser that provides ongoing services to the Fund during the fiscal year in which the services are provided that would have to be pre-approved by the Committee pursuant to this paragraph (without regard to this exception)."
Item 5. Audit Committee of Listed Registrants.
Not Applicable.
Item 6. Schedule of Investments.
Included in Report to Shareholders.
Item 7. Disclosure of Proxy Voting Policies and Procedures for Closed-End Management Investment Companies.
Not applicable.
Item 8. Portfolio Managers of Closed-End Management Investment Companies.
Not applicable.
Item 9. Purchases of Equity Securities by Closed-End Management Investment Company and Affiliated Purchasers.
Not applicable.
Item 10. Submission of Matters to a Vote of Security Holders.
Not applicable.
Item 11. Controls and Procedures.
(a) The Registrant's President and Controller have evaluated the Registrant's disclosure controls and procedures within 90 days of this filing and have concluded that the Registrant's disclosure controls and procedures were effective, as of that date, in ensuring that information required to be disclosed by the Registrant in this form N-CSR was recorded, processed, summarized, and reported timely.
(b) There were no significant changes in Registrant's internal controls or other factors that could significantly affect these controls subsequent to the date of their evaluation, including
any corrective actions with regard to significant deficiencies and material weaknesses.
Item 12. Exhibits.
(1) Code of Ethics, filed herewith.
(2) Certifications pursuant to Rule 30a-2(a) under the Act filed herewith.
(3) Certification pursuant to Section 906 of the Sarbanes-Oxley Act of 2002 filed herewith.
SIGNATURES
Pursuant to the requirements of the Securities Exchange Act of 1934 and the Investment Company Act of 1940, the registrant has duly caused this report to be signed on its behalf by the undersigned, thereunto duly authorized.
(Registrant) Summit Mutual Funds, Inc.
By (Signature and Title) /s/ Steven R. Sutermeister
Steven R. Sutermeister, President
Date 12/6/07
Pursuant to the requirements of the Securities Exchange Act of 1934 and the Investment Company Act of 1940, this report has been signed below by the following persons on behalf of the registrant and in the capacities and on the dates indicated.
By (Signature and Title) /s/ Steven R. Sutermeister
Steven R. Sutermeister, President
Date 12/6/07
By (Signature and Title) /s/ Thomas G. Knipper
Thomas G. Knipper, Controller
Date 12/6/07