UNITED STATES
SECURITIES AND EXCHANGE COMMISSION
Washington, D.C. 20549
FORM N-CSR
CERTIFIED SHAREHOLDER REPORT OF REGISTERED
MANAGEMENT INVESTMENT COMPANIES
Investment Company Act file number: 811-4000
SUMMIT MUTUAL FUNDS, INC.
(Exact name of registrant as specified in charter)
312 Walnut Street Suite 2500, Cincinnati, OH 45202
(Address of principal executive offices) (Zip code)
John F. Labmeier, Esq.
312 Walnut Street Suite 2500
Cincinnati, Ohio 45202
(Name and address of agent for service)
(513) 632-1600
Registrant's telephone number, including area code
Date of fiscal year end: December 31, 2007
Date of reporting period: December 31, 2007
Item 1. Report to Stockholders.
Blank Page
Summit Mutual Funds, Inc. – Pinacle Series |
| Message from the President | 1 |
| Fund Expenses | 2 |
| | |
| Portfolio Managers’ Reports and Financial Statements: | |
| Zenith Portfolio | 3 |
| Bond Portfolio | 9 |
| S&P 500 Index Portfolio | 17 |
| S&P MidCap 400 Index Portfolio | 27 |
| Balanced Index Portfolio | 37 |
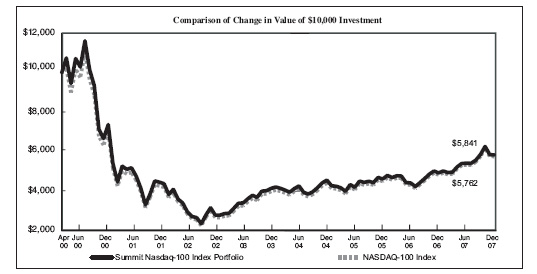
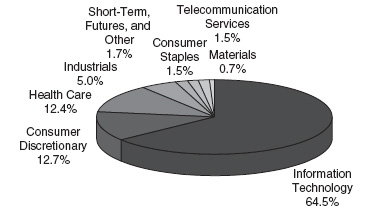
| Nasdaq-100 Index Portfolio | 48 |
| Russell 2000 Small Cap Index Portfolio | 55 |
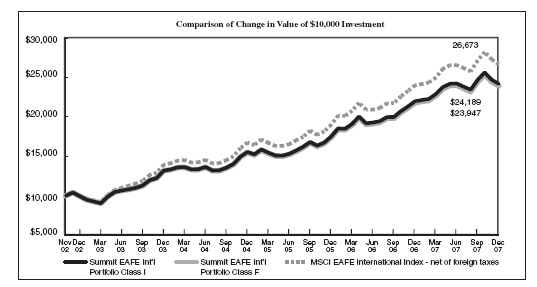
| EAFE International Index Portfolio | 78 |
| Lehman Aggregate Bond Index Portfolio | 92 |
| Inflation Protected Plus Portfolio | 99 |
| Lifestyle ETF Market Strategy Target Portfolio | 105 |
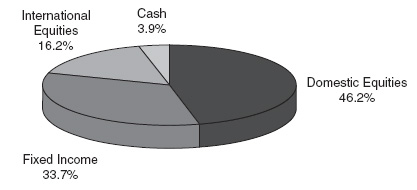
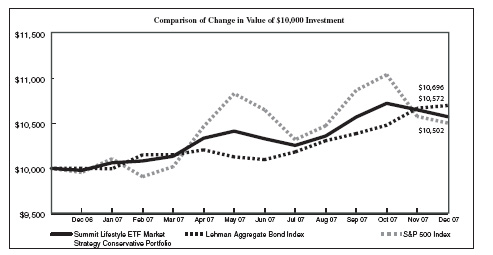
| Lifestyle ETF Market Strategy Conservative Portfolio | 111 |
| Lifestyle ETF Market Strategy Aggressive Portfolio | 117 |
| Natural Resources Portfolio | 123 |
| | |
| Notes to Financial Statements | 129 |
| Report of Independent Registered Public Accounting Firm | 134 |
Important Considerations about Investing in Summit Mutual Funds
A description of the policies and procedures that the Portfolios use to determine how to vote proxies relating to portfolio securities and information regarding how the Portfolios voted portfolio securities during the most recent 12 month period ended December 31 is available without charge, upon request, by calling 1-877-546-FUND, or on the Portfolios’ website at www.summitfunds.com, or on the Securities and Exchange Commission’s website at www.sec.gov.
The Portfolios file a complete Schedule of Investments in Securities with the SEC for the first and third quarters of each fiscal year on Form N-Q. The Portfolios’ Form N-Q is available on the SEC’s website at www.sec.gov. The Portfolios’ Form N-Q may also be reviewed and copied at the SEC’s Public Reference Room in Washington, DC. Information on the operation of the Public Reference Room may be obtained by calling 1-800-SEC-0330.
Mutual fund investing involves risk. Principal loss is possible.
The Bond Portfolio, Balanced Index Portfolio, Lehman Aggregate Bond Index Portfolio, and Inflation Protected Plus Portfolio invest in debt securities. Investments in debt securities typically decrease in value when interest rates rise. This risk is usually greater for longer-term debt securities.
Investments by the Bond Portfolio in lower-rated and non-rated securities present a greater risk of loss of principal and interest than higher-rated securities.
Because the S&P 500 Index Portfolio, S&P MidCap 400 Index Portfolio, Balanced Index Portfolio, Nasdaq-100 Index Portfolio, Russell 2000 Small Cap Index Portfolio, EAFE International Index Portfolio, and Lehman Aggregate Bond Index Portfolio (collectively, the “Index Portfolios”) have expenses, and their corresponding indexes do not, the Index Portfolios may be unable to replicate precisely the performance of their corresponding indexes. While the Index Portfolios remain small, they may have a greater risk that their performance will not match that of the corresponding indexes.
All indexes listed in the report are unmanaged, and are not available for direct investment.
The Manager Comments provided in this report reflect the opinions of the Portfolio’s Managers and are not intended to be a forecast of future events, a guarantee of future results, nor investment advice.
This report has been prepared for the information of Contract owners and is not authorized for distribution to prospective purchasers of contracts unless it is preceded or accompanied by an effective prospectus for Summit Mutual Funds, Inc.
Blank Page
Summit Mutual Funds, Inc. MESSAGE FROM THE PRESIDENT |
We are pleased to send you Summit Mutual Funds’ 2007 Annual Report. We welcome new and thank existing investors in the Summit Funds as we strive to help you reach your financial goals. Financial markets were mixed over the last year, providing mostly positive returns. However, 2007 could clearly be broken into two halves of a year, with the first half providing excellent returns in virtually every asset class, while the second half proved much more challenging. Large cap growth equities, as measured by the Nasdaq-100 Index, lead the major market indexes over the last 12 months, providing a return of 19.24%. International equities also performed well, with the EAFE International index providing a return of 11.17% over the same period. Economic indicators weakened in 2007, and it seems apparent that the economy will slow in 2008, if not enter a recession. The fallout from poorly underwritten sub-prime mortgage loans continues to plague the financial markets and the housing market with the weakness slowly spreading to other sectors of the economy, and pressuring the consumer. Tightening credit standards are negatively impacting the economy, although the severity is still up for debate. As always, employment and the consumer’s willingness and ability to spend will play a major role in magnitude and duration of any slowdown or recession that occurs. Energy and food prices remain at very high levels, with oil hovering around $90/bbl and food inflation statistics nudging 5%, which continues to put a drag on the economy. Congress and the President are reacting to the slowing economy with a large fiscal stimulus package aimed at putting cash in the hands of consumers. While the final details are forthcoming, it is highly likely that a meaningful financial stimulus package will occur. In addition, there have been many initiatives proposed and debated to ease the mortgage crisis. While the US economy is softening, international growth remains reasonably strong, and a weak US dollar should help | buoy the US economy slightly with an advantageous export environment for US goods and services. The Federal Reserve Board (Fed) reacted by shifting its bias away from inflation and toward a more accommodative monetary policy and cutting the Fed Funds rate 1.00% during the second half of 2007 from 5.25% to 4.25%. In addition, they cut the Fed Funds rate an additional 1.25% in January 2008, to 3.00%. Fed Chairman Bernanke has made it clear that he will decrease interest rates in an attempt to stabilize the economy and financial markets. And the markets are anticipating further rate cuts in 2008. Equity markets began to show the stress of a slowing economy during the second half of 2007, as markets reversed course and generally declined. The implications of an ongoing credit crunch, a weakening consumer and slowing corporate profits all weighed heavily on the markets. However, most major indexes remained positive for the year. For the twelve-month period ended December 31st, the large cap S&P 500 Index advanced 5.49%, the S&P MidCap 400 Index improved 7.98%, while the small cap Russell 2000 Index receded and showed a -1.57% return. Small cap stocks lagged large cap stocks in 2007, reversing a trend that has been in place for several years. In addition, growth stocks outperformed value stocks, which is also a reversal of recent trends. “Maintain the proper perspective (and) have realistic expectations . . .” Fixed income markets provided positive returns over the last twelve months, as well. Short and intermediate term interest rates declined substantially reflecting the Fed’s actions, while longer term interest rates declined more modestly. Treasury securities rates benefited from a flight to quality, especially in the latter part of 2007. Credit spreads (the difference between | interest rates on risk-free US Treasuries and other fixed income securities) widened during the period, as investors re-priced risk in the marketplace. In this environment, the Lehman Aggregate Bond Index provided a positive return of 6.97%, while the Lehman U.S. TIPs Index provided a return of 11.64%. “Proper diversification of your investments . . . is an important component of achieving your long-term investment goals.” Looking forward, there is much uncertainty regarding the strength of the US economy, corporate profitability, interest rates and credit spreads. Given this financial backdrop, one should expect choppy markets, in both the equity and fixed income arena. However, choppy markets create opportunities, as well as risks. Now more than ever, our message remains the same. Maintain the proper perspective, have realistic expectations and ensure that your investment strategy is appropriate for your risk tolerance and time horizon. Concepts such as asset allocation and portfolio rebalancing are critical. Proper diversification of your investments, both within and across asset sectors, is an important component of achieving your long-term investment goals. Summit Mutual Funds provides a solid foundation for diversified investment planning with choices across equity and fixed income styles. Thank you for choosing Summit Funds and for the trust that you have placed in us. Best regards, Steven R. Sutermeister President |
Summit Mutual Funds, Inc. – Pinnacle Series 2007 ANNUAL REPORT – PORTFOLIO EXPENSES |
As a contract owner of the Portfolio, you incur ongoing costs, including management fees; distribution and/or service (12b-1) fees; and other Portfolio expenses. This Example is intended to help you understand your ongoing costs (in dollars) of investing in the Portfolio and compare these costs with the ongoing costs of investing in other mutual funds. The Example does not reflect expenses associated with insurance company separate accounts or your insurance contract.
The Example is based on an investment of $1,000 invested at the beginning of the period and held for the entire period from July 1, through December 31, 2007.
Actual Expenses
The first section of the table below provides information about actual account values and actual net expenses. You may use the information in this section, together with the amount you invested, to estimate the expenses that you paid over the period. Simply divide your account value by $1,000 (for example, an $8,600 account value divided by $1,000 = 8.6), then multiply the result by the number in the first section under the heading entitled “Expenses Paid” to estimate the expenses you paid on your account during this period.
Hypothetical Example for Comparison Purposes
The second section of the table below provides information about hypothetical account values and hypothetical expenses based on the Portfolio’s actual expense ratio, net of fee waivers and expense reimbursements, and an assumed rate of return of 5% per year before expenses, which is not the Portfolio’s actual return. The hypothetical account values and expenses can not be used to estimate the actual ending account balance or expenses you paid for the period. You may use this information to compare the ongoing costs of investing in the Portfolio and other funds. To do so, compare this 5% hypothetical example with the 5% hypothetical examples that appear in the shareholder reports of other funds.
The information below is net of any applicable fee waivers and/or expense reductions, which lower expenses and increase performance. Please note that the second section of the table is useful in comparing ongoing costs only, and will not help you determine the relative total costs of owning different funds.
| | | | | | | | | | | | | |
| | | | | | | | | Expenses Paid | | | | |
| | | Beginning | | | Ending | | | Annualized | | | During Period | |
| | | Account Value | | | Account Value | | | Expense | | | July 1, 2007 to | |
| Portfolio | | July 1, 2007 | | December 31, 2007 | | | Ratio | | December 31, 2007 | |
Based on Actual Return | | | | | | | | | | | | |
| Zenith Portfolio | | $ | 1,000.00 | | | $ | 952.30 | | | | 0.88 | % | | $ | 4.33 | * |
| Bond Portfolio | | | 1,000.00 | | | | 1,014.90 | | | | 0.75 | % | | | 3.81 | * |
| S&P 500 Index Portfolio | | | 1,000.00 | | | | 984.80 | | | | 0.39 | % | | | 1.95 | * |
| S&P Midcap 400 Index Portfolio Class I | | | 1,000.00 | | | | 961.80 | | | | 0.52 | % | | | 2.57 | * |
| S&P Midcap 400 Index Portfolio Class F | | | 1,000.00 | | | | 960.90 | | | | 0.71 | % | | | 1.75 | ** |
| Balanced Index Portfolio | | | 1,000.00 | | | | 1,016.90 | | | | 0.60 | % | | | 3.05 | * |
| Nadaq-100 Index Portfolio | | | 1,000.00 | | | | 1,077.10 | | | | 0.65 | % | | | 3.40 | * |
| Russell 2000 Small Cap Index Portfolio Class I | | | 1,000.00 | | | | 921.30 | | | | 0.63 | % | | | 3.05 | * |
| Russell 2000 Small Cap Index Portfolio Class F | | | 1,000.00 | | | | 920.30 | | | | 0.83 | % | | | 4.02 | * |
| EAFE International Index Portfolio Class I | | | 1,000.00 | | | | 998.20 | | | | 0.95 | % | | | 4.78 | * |
| EAFE International Index Portfolio Class F | | | 1,000.00 | | | | 1,005.40 | | | | 1.15 | % | | | 0.47 | *** |
| Lehman Aggregate Bond Index Portfolio | | | 1,000.00 | | | | 1,062.70 | | | | 0.59 | % | | | 3.07 | * |
| Inflation Protected Plus Portfolio | | | 1,000.00 | | | | 1,091.00 | | | | 0.75 | % | | | 3.95 | * |
| Lifestyle ETF Market Strategy Target Portfolio | | | 1,000.00 | | | | 1,005.10 | | | | 0.75 | % | | | 3.79 | * |
| Lifestyle ETF Market Strategy Conservative Portfolio | | | 1,000.00 | | | | 1,023.60 | | | | 0.75 | % | | | 3.83 | * |
| Lifestyle ETF Market Strategy Aggressive Portfolio | | | 1,000.00 | | | | 990.30 | | | | 0.75 | % | | | 3.76 | * |
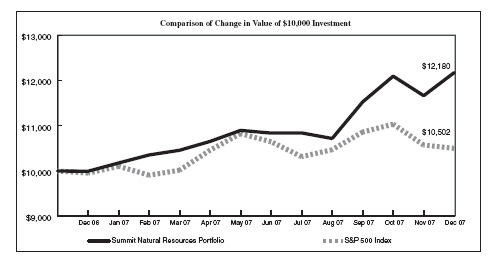
| Natural Resources Portfolio | | | 1,000.00 | | | | 1,123.60 | | | | 0.75 | % | | | 4.01 | * |
Based on Hypothetical Return (5% return before expenses) | | | | | | | | | | | | | | | | |
| Zenith Portfolio | | | 1,000.00 | | | | 1,020.77 | | | | 0.88 | % | | | 4.48 | * |
| Bond Portfolio | | | 1,000.00 | | | | 1,021.42 | | | | 0.75 | % | | | 3.82 | * |
| S&P 500 Index Portfolio | | | 1,000.00 | | | | 1,023.24 | | | | 0.39 | % | | | 1.99 | * |
| S&P Midcap 400 Index Portfolio Class I | | | 1,000.00 | | | | 1,022.58 | | | | 0.52 | % | | | 2.65 | * |
| S&P Midcap 400 Index Portfolio Class F | | | 1,000.00 | | | | 1,021.63 | | | | 0.71 | % | | | 3.62 | * |
| Balanced Index Portfolio | | | 1,000.00 | | | | 1,022.18 | | | | 0.60 | % | | | 3.06 | * |
| Nasdaq-100 Index Portfolio | | | 1,000.00 | | | | 1,021.93 | | | | 0.65 | % | | | 3.31 | * |
| Russell 2000 Small Cap Index Portfolio Class I | | | 1,000.00 | | | | 1,022.03 | | | | 0.63 | % | | | 3.21 | * |
| Russell 2000 Small Cap Index Portfolio Class F | | | 1,000.00 | | | | 1,021.02 | | | | 0.83 | % | | | 4.23 | * |
| EAFE International Index Portfolio Class I | | | 1,000.00 | | | | 1,020.42 | | | | 0.95 | % | | | 4.84 | * |
| EAFE International Index Portfolio Class F | | | 1,000.00 | | | | 1,019.41 | | | | 1.15 | % | | | 5.85 | * |
| Lehman Aggregate Bond Index Portfolio | | | 1,000.00 | | | | 1,022.23 | | | | 0.59 | % | | | 3.01 | * |
| Inflation Protected Plus Portfolio | | | 1,000.00 | | | | 1,021.42 | | | | 0.75 | % | | | 3.82 | * |
| Lifestyle ETF Market Strategy Target Portfolio | | | 1,000.00 | | | | 1,021.42 | | | | 0.75 | % | | | 3.82 | * |
| Lifestyle ETF Market Strategy Conservative Portfolio | | | 1,000.00 | | | | 1,021.42 | | | | 0.75 | % | | | 3.82 | * |
| Lifestyle ETF Market Strategy Aggressive Portfolio | | | 1,000.00 | | | | 1,021.42 | | | | 0.75 | % | | | 3.82 | * |
| Natural Resources Portfolio | | | 1,000.00 | | | | 1,021.42 | | | | 0.75 | % | | | 3.82 | * |
| * | Expenses are equal to the Fund’s annualized net expense ratio, multiplied by the average account value over the period, multiplied by 184/365 (to reflect the one-half year period). |
| ** | Expenses are equal to the Fund’s annualized net expense ratio, multiplied by the average account value over the period, multiplied by 92/365 (to reflect the period October 1, 2007 - December 31, 2007, the Fund’s commencement of operations date to the end of the period) to reflect the Fund’s actual expenses. |
| *** | Expenses are equal to the Fund’s annualized net expense ratio, multiplied by the average account value over the period, multiplied by 15/365 (to reflect the period December 17, 2007 - December 31, 2007, the Fund’s commencement of operations date to the end of the period) to reflect the Fund’s actual expenses. |
Summit Mutual Funds, Inc. – Pinnacle Series |
Summit Zenith Portfolio - Average Annual Total Return |
1-Year | 5-Year | 10-Year |
| 1.40% | 15.74% | 6.46% |
Past performance is not predictive of future results. Performance does not reflect the deduction of taxes that a shareholder would pay on fund distributions or redemption of fund shares. Separate account expenses are not included. Absent limitation of expenses during certain of the periods shown, performance would have been lower.
| | |
| Managers: | James McGlynn |
| | Yvonne M. Bishop |
| Inception Date: | August 15, 1984 |
| Total Net Assets: | $58.16 Million |
| Number of Equity Holdings: | 57 |
| Median Cap Size: | $52,342 (in millions) |
| Average Price-to-book Ratio: | 1.91 x |
| Dividend Yield: | 2.50% |
| Average Price-to-earnings Ratio: | |
| Summit Pinnacle Zenith Portfolio | 14.7 x |
| S&P 500 Index | 16.9 x |
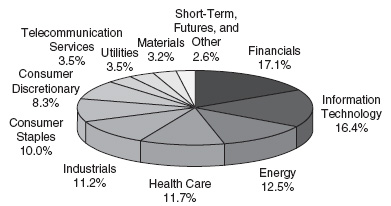
Top 10 Equity Holdings | | Sector Allocations |
| | (% of net assets) | | |
Devon Energy Corp. WellPoint, Inc. Wal-Mart Stores, Inc. | | | |
Summit Mutual Funds, Inc. – Pinnacle Series |
Objective – Seeks long-term appreciation of capital by investing in common stocks and other equity securities with values that are, at present, not fully recognized by the market.
Strategy – The Summit Pinnacle Zenith Portfolio (the “Portfolio”) will remain in a highly invested position ranging from 86% to 98%. The cash position will be held in highly liquid money market instruments to meet redemptions and to provide cash for future stock purchases as new opportunities arise.
Managers’ Comments:
The Zenith Portfolio total return performance for the year ended December 31, 2007 was 1.40% (before the impact of any product or contract-level fees) versus -0.17% for the Russell 1000 Value Index (“benchmark”) and 5.49% for the Standard & Poor’s 500 Stock Index.
The Federal Reserve (Fed) took a hands-off approach regarding interest rates until mid way through the third quarter of 2007 when they began what ended up as a steady stream of interest rate reductions that lasted through year end and beyond. Even as the rise in commodities prices (energy prices specifically) showed no signs of abating, there was enough weakness in housing alone that the Fed decided to lower rates. They also signaled that their bias had changed from being restrictive to somewhat more neutral. This “neutral” stance didn’t last long however. When the housing and credit problems grew in intensity, and a major savings and loan company, Countrywide Financial, appeared to be in serious trouble, the Fed quickly cut interest rates to ensure, at least, a temporary survival. It was becoming apparent that the domestic housing market that had provided so much positive growth to the economy over the past five years was showing signs of rampant over-valuation. The housing market continued to climb as long as easy money fueled demand and drove prices up, but it began to collapse as the creative financing evaporated. Investors rushed for the doors, but there were not enough buyers to bail them out.
Consequently throughout the second half of 2007, the unfortunate holders (or guarantors) of these loans were forced into a series of painful write downs to their balance sheets. In the process, they reduced their ability to make further loans. The CEO’s of major banks and brokers were forced to resign after admitting that they had overindulged in this market. New management made additional write-downs and went cap in hand to foreign investors for capital to replenish their balance sheets. The destruction in capital along with the reduced willingness or ability to lend has led to a credit contraction that the Fed is only now beginning to fully address. Every new head of the Federal Reserve is tested early in his term, and now Ben Bernanke is no exception. When recession is on the horizon, the Federal Reserve will talk tough on inflation but is most concerned with a quick recovery even if inflation rises in the interim.
Contributors to Performance
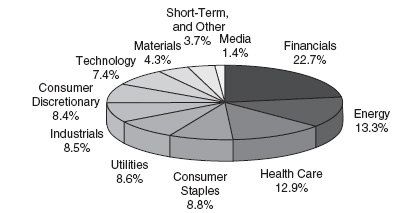
The portfolio’s top three contributors to performance during 2007 were the Financial Services, Technology, and Producer Durables sectors. Financial Services was one of only two sectors in the Index to end the year with a negative return. The portfolio’s strategy was to maintain a significant underweight of Financial Services sector as we believed the benchmark’s concentration was too high. This strategy produced positive relative returns as the sector suffered significant losses. Positive returns were also attributable to superior stock selection in Technology. Nokia Corp was a top performer in the Portfolio and Tyco Electronics benefited after its spin-off from Tyco International. Lack of exposure to the underperforming Semiconductors also improved returns. Finally, superior stock selection in the Producer Durables sector boosted returns. The Portfolio concentrated on global infrastructure positions with exposure to Caterpillar, 3M, Tyco, Honeywell, and Ingersoll-Rand, with the latter two being top contributors to returns. Investors moved to these stocks as concerns mounted about the domestic economy.
Detractors from Performance
The Portfolio’s top three detractors from performance were the Energy, Utilities, and Consumer Discretionary sectors. Energy was the biggest detractor from relative performance because of an underweighting of the sector. Energy gains were driven as volatile oil prices moved from lows of $50 to highs of $100 per barrel. Three of the Portfolio’s top ten contributors to return were Devon, Chevron, and ConocoPhillips. An overweight of outperforming Utilities did not help relative performance due to poor stock selection in Telecom. Positive returns in AT&T and Verizon were not enough to offset the losses from Sprint Nextel and Citizens Communications. Finally, poor subsector selection in Autos & Transportation detracted from returns. The Portfolio was overweight Air Transport, that was burdened with high fuel costs and a slowing economy and lacked exposure to outperforming Railroads.
After the stock market’s decline in the second half and especially after the unusually negative fourth quarter, we see many more attractive valuations in the market. Valuations are much more compelling now that individual investors have started to panic and institutional investors are convinced the U.S is in a recession and that earnings forecasts must reflect a poor economic outlook. While it is true that many financial companies are writing down their balance sheets and other cyclically oriented companies are missing their forecasts, the Federal Reserve has started to pump added liquidity into the system with lower interest rates. The Zenith Portfolio will continue to invest in companies that are temporarily out of favor and pare those which reach full valuation in the current economic environment of an accommodative Federal Reserve.
Summit Mutual Funds, Inc. – Pinnacle Series |
| ZENITH PORTFOLIO | FINANCIAL HIGHLIGHTS |
FINANCIAL HIGHLIGHTS | | | | | | | | | | | | | | | |
| Computed on the basis of a share of capital stock outstanding throughout the period. | | | | | | | | | | | | | | | |
| | | Year Ended December 31, |
| | | 2007 | | | 2006 | | | 2005 | | | 2004 | | | 2003 | |
| Net asset value, beginning of period | | $ | 101.12 | | | $ | 91.78 | | | $ | 91.30 | | | $ | 80.76 | | | $ | 59.67 | |
| INVESTMENT ACTIVITIES: | | | | | | | | | | | | | | | | | | | | |
| Net investment income / (loss) | | | 1.64 | | | | 1.42 | | | | 1.35 | | | | 1.47 | | | | 1.17 | |
| Net realized and unrealized gains / (losses) | | | (0.06 | ) | | | 18.02 | | | | 4.57 | | | | 10.33 | | | | 20.01 | |
| Total from Investment Activities | | | 1.58 | | | | 19.44 | | | | 5.92 | | | | 11.80 | | | | 21.18 | |
| DISTRIBUTIONS: | | | | | | | | | | | | | | | | | | | | |
| Net investment income | | | (1.42 | ) | | | (1.42 | ) | | | (1.43 | ) | | | (1.26 | ) | | | (0.09 | ) |
| Net realized gains | | | (8.32 | ) | | | (8.68 | ) | | | (4.01 | ) | | | — | | | | — | |
| Total Distributions | | | (9.74 | ) | | | (10.10 | ) | | | (5.44 | ) | | | (1.26 | ) | | | (0.09 | ) |
| Net asset value, end of period | | $ | 92.96 | | | $ | 101.12 | | | $ | 91.78 | | | $ | 91.30 | | | $ | 80.76 | |
| | | | | | | | | | | | | | | | | | | | | |
| Total return | | | 1.40 | % | | | 23.12 | % | | | 6.92 | % | | | 14.77 | % | | | 35.56 | % |
| | | | | | | | | | | | | | | | | | | | | |
| RATIOS / SUPPLEMENTAL DATA: | | | | | | | | | | | | | | | | | | | | |
| Ratio of expenses to average net assets – net | | | 0.87 | % | | | 0.88 | % | | | 0.89 | % | | | 0.91 | % | | | 0.93 | % |
| Ratio of net investment income / (loss) to average net assets | | | 1.61 | % | | | 1.57 | % | | | 1.49 | % | | | 1.74 | % | | | 1.68 | % |
| Portfolio turnover rate | | | 41.99 | % | | | 61.14 | % | | | 57.30 | % | | | 68.59 | % | | | 71.70 | % |
| Net assets, end of period (000’s) | | $ | 58,157 | | | $ | 62,428 | | | $ | 52,795 | | | $ | 51,864 | | | $ | 47,104 | |
The accompanying notes are an integral part of the financial statements.
Summit Mutual Funds, Inc. – Pinnacle Series |
| SCHEDULE OF INVESTMENTS | ZENITH PORTFOLIO |
DECEMBER 31, 2007 | | | | | | |
| | | SHARES | | | VALUE | |
COMMON STOCKS - 96.3% | | | | | | |
Consumer Discretionary - 8.4% | | | | | | |
| CBS Corporation | | | 29,174 | | | $ | 794,991 | |
| Gannett Co, Inc. | | | 24,500 | | | | 955,500 | |
| Honda Motor Co. Ltd. - ADR | | | 37,500 | | | | 1,242,750 | |
News Corp. - Class B (d) | | | 29,500 | | | | 626,875 | |
| Sony Corp. - ADR | | | 10,900 | | | | 591,870 | |
| Time Warner, Inc. | | | 41,600 | | | | 686,816 | |
| | | | | | | | 4,898,802 | |
Consumer Staples - 8.8% | | | | | | | | |
| Altria Group, Inc. | | | 15,800 | | | | 1,194,164 | |
| CVS Caremark Corp. | | | 11,800 | | | | 469,050 | |
| Kraft Foods, Inc. - Class A | | | 34,872 | | | | 1,137,873 | |
Unilever NV - ADR (d) | | | 23,800 | | | | 867,748 | |
| Wal-Mart Stores, Inc. | | | 30,400 | | | | 1,444,912 | |
| | | | | | | | 5,113,747 | |
Energy - 13.3% | | | | | | | | |
| Chevron Corp. | | | 14,340 | | | | 1,338,352 | |
| ConocoPhillips | | | 15,442 | | | | 1,363,529 | |
| Devon Energy Corp. | | | 19,400 | | | | 1,724,854 | |
Nabors Industries Ltd. (a) (d) | | | 24,100 | | | | 660,099 | |
Royal Dutch Shell PLC - ADR (d) | | | 16,300 | | | | 1,372,460 | |
| Spectra Energy Corp. | | | 50,072 | | | | 1,292,859 | |
| | | | | | | | 7,752,153 | |
Financials - 22.7% | | | | | | | | |
| AllianceBernstein Holding LP | | | 17,100 | | | | 1,286,775 | |
| The Allstate Corp. | | | 20,800 | | | | 1,086,384 | |
| Bank of America Corp. | | | 29,384 | | | | 1,212,384 | |
| Bank of New York Mellon Corp | | | 18,549 | | | | 904,449 | |
| Capital One Financial Corp. | | | 9,300 | | | | 439,518 | |
| Citigroup, Inc. | | | 32,100 | | | | 945,024 | |
| Discover Financial Services | | | 25,250 | | | | 380,770 | |
| Genworth Financial, Inc. | | | 41,100 | | | | 1,045,995 | |
| Hartford Financial Services Group, Inc. | | | 10,700 | | | | 932,933 | |
| J.P. Morgan Chase & Co. | | | 26,304 | | | | 1,148,170 | |
| Legg Mason, Inc. | | | 17,100 | | | | 1,250,865 | |
| Metlife, Inc. | | | 4,500 | | | | 277,290 | |
| Morgan Stanley | | | 13,600 | | | | 722,296 | |
| The Travelers Companies, Inc. | | | 13,500 | | | | 726,300 | |
| Wells Fargo & Co. | | | 27,800 | | | | 839,282 | |
| | | | | | | | 13,198,435 | |
Health Care - 12.9% | | | | | | | | |
| Covidien Ltd. | | | 16,075 | | | | 711,962 | |
| GlaxoSmithKline PLC - ADR | | | 23,800 | | | | 1,199,282 | |
| Johnson & Johnson | | | 18,200 | | | | 1,213,940 | |
| Pfizer, Inc. | | | 60,200 | | | | 1,368,346 | |
| | | SHARES | | | VALUE | |
Health Care - 12.9% (Continued) | | | | | | |
| UnitedHealth Group, Inc. | | | 25,800 | | | $ | 1,501,560 | |
Wellpoint, Inc. (a) | | | 16,800 | | | | 1,473,864 | |
| | | | | | | | 7,468,954 | |
Industrials - 8.5% | | | | | | | | |
| 3M Co. | | | 15,500 | | | | 1,306,960 | |
| Caterpillar, Inc. | | | 18,300 | | | | 1,327,848 | |
| | | 11,700 | | | | 543,699 | |
| | | 88,100 | | | | 1,074,820 | |
| | | 17,275 | | | | 684,954 | |
| | | | | | | | 4,938,281 | |
Materials - 4.3% | | | | | | | | |
| The Dow Chemical Co. | | | 29,500 | | | | 1,162,890 | |
| Newmont Mining Corp. | | | 27,600 | | | | 1,347,708 | |
| | | | | | | | 2,510,598 | |
Media - 1.4% | | | | | | | | |
Comcast Corp. (a) | | | 44,700 | | | | 816,222 | |
| | | | | | | | | |
Technology - 5.8% | | | | | | | | |
Cisco Systems, Inc. (a) | | | 27,400 | | | | 741,718 | |
| International Business Machines Corp. | | | 6,200 | | | | 670,220 | |
| Motorola, Inc. | | | 85,900 | | | | 1,377,836 | |
| | | 20,500 | | | | 786,995 | |
| | | 19,175 | | | | 711,968 | |
| | | | | | | | 4,288,737 | |
| | | | | | | | | |
Utilities - 8.6% | | | | | | | | |
| | | 22,500 | | | | 935,100 | |
Citizens Communications Co. (d) | | | 58,800 | | | | 748,524 | |
| Duke Energy Corporation | | | 51,244 | | | | 1,033,591 | |
| Southern Co. | | | 26,900 | | | | 1,042,375 | |
| | | 63,800 | | | | 837,694 | |
Verizon Communications, Inc. | | | 9,700 | | | | 423,793 | |
| | | | | | | | 5,021,077 | |
| | | | | | | | | |
| TOTAL COMMON STOCKS | | | | | | | | |
| (Cost $50,947,075) | | | | | | | 56,007,006 | |
| | | | | | | | | |
SHORT TERM INVESTMENTS - 5.3% | | | | | | | | |
Money Market Funds - 5.3% | | | | | | | | |
| Northern Institutional Diversified Assets Portfolio | | | 3,077,226 | | | | | |
| | | | | | | | | |
| TOTAL SHORT TERM INVESTMENTS | | | | | | | | |
(Cost $3,077,226) | | | | | | | | |
| | | | | | | | | |
Total Investments | | | | | | | | |
(Cost $54,110,731) (b) - 101.6% | | | | | | | 59,084,232 | |
Northern Institutional Liquid Assets Portfolio (c) - 6.4% | | | | | | | 3,712,535 | |
Liabilities in Excess of Other Assets - (8.0)% | | | | | | | (4,639,274 | ) |
TOTAL NET ASSETS - 100.0% | | | | | | $ | 58,157,493 | |
| ADR American Depository Receipt |
(a) | Non-income producing security. |
(b) | For federal income tax purposes, cost is $54,119,715 and gross unrealized appreciation and depreciation of securities as of December 31, 2007 was $8,908,346 and ($3,943,829), respectively, with a net appreciation / (depreciation) of $4,964,517. |
| (c) | This security was purchased with cash collateral held from securities lending. The market values of the securities on loan, the collateral purchased with cash, and the noncash collateral accepted are $4,046,721, $3,712,535, and $471,841, respectively. |
(d) | All or a portion of the security is out on loan. |
The accompanying notes are an integral part of the financial statements.
Summit Mutual Funds, Inc. – Pinnacle Series |
| ZENITH PORTFOLIO | FINANCIAL STATEMENTS |
STATEMENT OF ASSETS AND LIABILITIES | | | |
December 31, 2007 | | | |
| | | | |
| ASSETS | | | |
| Investments in securities, at value | | $ | 59,084,232 | |
| Collateral for securities loaned, | | | | |
| at fair value | | | 3,712,535 | |
| Receivables: | | | | |
| Shares sold | | | 3,947 | |
| Interest and dividends | | | 107,571 | |
| Prepaid expenses and other | | | 1,799 | |
| | | | 62,910,084 | |
| LIABILITIES | | | | |
| Payables: | | | | |
| Payable upon return of securities loaned | | | 3,712,535 | |
| Bank overdraft | | | 784 | |
| Shares redeemed | | | 963,634 | |
| Advisory fees | | | 32,542 | |
| Professional fees | | | 17,624 | |
| Fund accounting fees | | | 10,186 | |
| Administration fees | | | 5,085 | |
| Custodian fees | | | 1,368 | |
| Directors’ fees | | | 138 | |
| Other accrued expenses | | | 8,695 | |
| | | | 4,752,591 | |
| | | | | |
| NET ASSETS* | | | | |
| Paid-in capital | | | 47,478,384 | |
| Accumulated undistributed net | | | | |
| investment income / (loss) | | | 891,597 | |
| Accumulated net realized gain / (loss) | | | | |
| on investments | | | 4,814,011 | |
| Net unrealized appreciation / (depreciation) | | | | |
| on investments | | | 4,973,501 | |
| | | $ | 58,157,493 | |
| | | | | |
| Investments at cost | | $ | 54,110,731 | |
| Shares authorized ($.10 par value) | | | 40,000,000 | |
| NET ASSET VALUE (NAV) BY SHARE CLASS | | | | | |
| | | | | | |
| Share Class | Net Assets | Outstanding | | Per Share | |
| Class I | $58,157,493 | | | $ | 92.96 | |
| * | FEDERAL TAX DATA AS OF DECEMBER 31, 2006 | | |
| | Percentage of ordinary distributions designated as | | |
| | qualified dividend income | | 56.79% |
| | Dividends received deduction for corporate shareholders | | 47.90% |
| | Undistributed ordinary income | $ | |
| | Undistributed long-term gains | $ | |
| | Unrealized appreciation | $ | |
STATEMENT OF OPERATIONS | | | |
For the year ended December 31, 2007 | | | |
| | | | |
| INVESTMENT INCOME | | | |
| Dividends | | $ | 1,487,389 | |
| Foreign dividend taxes withheld | | | (19,449 | ) |
| Interest | | | 12,931 | |
| Other income | | | 96,128 | |
| | | | 1,576,999 | |
| EXPENSES | | | | |
| Advisory fees | | | 405,607 | |
| Administration fees | | | 63,376 | |
| Fund accounting fees | | | 24,156 | |
| Professional fees | | | 22,778 | |
| Transfer agent fees | | | 13,114 | |
| Directors’ fees | | | 7,349 | |
| Shareholder reporting fees | | | 6,188 | |
| Custodian fees | | | 5,339 | |
| Other expenses | | | 5,650 | |
| | | | 553,557 | |
| NET INVESTMENT INCOME / (LOSS) | | | 1,023,442 | |
| | | | | |
| REALIZED AND UNREALIZED GAIN / (LOSS) | | | | |
| Net realized gain / (loss) on investments | | | 4,836,335 | |
| Net change in unrealized appreciation / | | | | |
| (depreciation) on investments | | | (4,908,004 | ) |
| NET REALIZED AND UNREALIZED | | | | |
| GAIN / (LOSS) | | | (71,669 | ) |
| NET INCREASE / (DECREASE) IN | | | | |
| NET ASSETS FROM OPERATIONS | | $ | 951,773 | |
| TRANSACTIONS WITH AFFILIATES: | |
| | |
| Percent of Current | |
| Net Asset Value | |
| Advisory | Administration | |
| Fee | Fee | |
| 0.64% | 0.10% | |
The accompanying notes are an integral part of the financial statements.
Summit Mutual Funds, Inc. – Pinnacle Series |
| FINANCIAL STATEMENTS | ZENITH PORTFOLIO |
STATEMENTS OF CHANGES IN NET ASSETS | | | | | | |
For the Year Ended December 31, | | | | | | |
| | | 2007 | | | 2006 | |
| OPERATIONS | | | | | | |
| Net investment income / (loss) | | $ | 1,023,442 | | | $ | 885,141 | |
| Net realized gain / (loss) on investments | | | 4,836,335 | | | | 5,134,324 | |
| Net change in unrealized appreciation / (depreciation) on investments | | | (4,908,004 | ) | | | 5,822,502 | |
| | | | | | | | | |
| | | | 951,773 | | | | 11,841,967 | |
| | | | | | | | | |
| DISTRIBUTIONS TO SHAREHOLDERS* | | | | | | | | |
| Net investment income | | | (876,279 | ) | | | (807,599 | ) |
| Net realized gain on investments | | | (5,128,119 | ) | | | (4,937,705 | ) |
| | | | | | | | | |
| | | | (6,004,398 | ) | | | (5,745,304 | ) |
| | | | | | | | | |
| FUND SHARE TRANSACTIONS | | | | | | | | |
| Proceeds from shares sold | | | 4,039,840 | | | | 3,345,499 | |
| Reinvestment of distributions | | | 6,004,398 | | | | 5,745,304 | |
| Payments for shares redeemed | | | (9,262,372 | ) | | | (5,554,370 | ) |
| | | | | | | | | |
| | | | 781,866 | | | | 3,536,433 | |
| | | | | | | | | |
| | | | | | | | | |
| NET INCREASE / (DECREASE) IN NET ASSETS | | | (4,270,759 | ) | | | 9,633,096 | |
| NET ASSETS | | | | | | | | |
| Beginning of period | | | 62,428,252 | | | | 52,795,156 | |
| | | | | | | | | |
| End of period | | $ | 58,157,493 | | | $ | 62,428,252 | |
| | | | | | | | | |
| ACCUMULATED UNDISTRIBUTED NET INVESTMENT INCOME | | $ | 891,597 | | | $ | 742,912 | |
| FUND SHARE TRANSACTIONS | | | | | | |
| Sold | | $ | | | | | 36,256 | |
| Reinvestment of distributions | | | 63,592 | | | | 66,775 | |
| Redeemed | | | (97,071 | ) | | | (60,922 | ) |
| | | | | | | | | |
| Net increase / (decrease) from fund share transactions | | | | | | | 42,109 | |
| | | | | | | | | |
| TOTAL COST OF PURCHASES OF: | | | | | | | | |
| Common Stocks | | $ | | | | $ | 33,741,714 | |
| | | | | | | | | |
| | | $ | | | | $ | 33,741,714 | |
| | | | | | | | | |
| TOTAL PROCEEDS FROM SALES OF: | | | | | | | | |
| Common Stocks | | $ | | | | $ | 35,520,798 | |
| | | | | | | | | |
| | | $ | | | | $ | 35,520,798 | |
| | | | | | | | | |
| *TAX CHARACTER OF DISTRIBUTIONS PAID | | | | | | | | |
| Ordinary income** | | $ | 2,319,583 | | | $ | 2,263,647 | |
| Long-term capital gains | | | 3,684,815 | | | | 3,481,657 | |
| | | | | | | | | |
| | | $ | 6,004,398 | | | $ | 5,745,304 | |
| | | | | | | | | |
| **The percentage of taxable ordinary income distributions that are designated as short-term capital gain | | | | | | | | |
| distributions under Internal Revenue Section 871 (k)(2)(C) is 62.22% | | | | | | | | |
The accompanying notes are an integral part of the financial statements.
Summit Mutual Funds, Inc. – Pinnacle Series |
Summit Bond Portfolio - Average Annual Total Return |
1-Year | 5-Year | 10-Year |
| 3.46% | 4.65% | 4.84% |
Past performance is not predictive of future results. Performance does not reflect the deduction of taxes that a shareholder would pay on fund distributions or redemption of fund shares. Separate account expenses are not included. Absent limitation of expenses during certain of the periods shown, performance would have been lower.
| Managers: | Michael J. SchultzD. Scott Keller |
| Inception Date: | August 15, 1984 |
| Total Net Assets: | $26.84 Million |
Number Of Fixed Income Holdings: | 132 |
| Effective Duration: | 4.57 years |
| Average Maturity: | 13.51 years |
| Average Credit Quality: | A1/A+ |
| 30-day SEC Yield: | 5.36% |
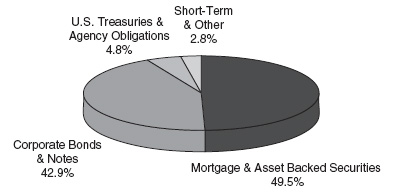
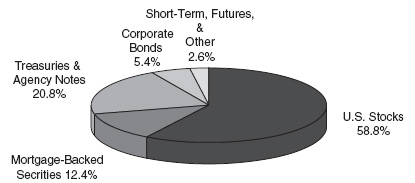
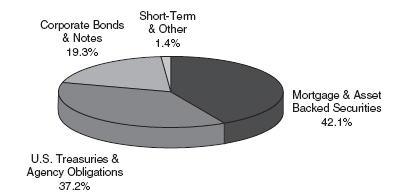
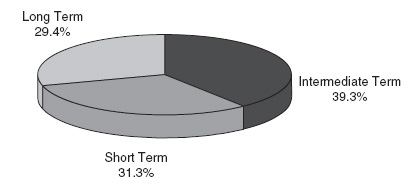
Quality Breakdown | | Sector Allocations |
Summit Mutual Funds, Inc. – Pinnacle Series |
Objective – Seeks a high level of current income, as is consistent with a reasonable investment risk, by investing in long-term, fixed-income, investment-grade corporate bonds.
Strategy – The Summit Pinnacle Bond Portfolio (the “Portfolio”) will invest at least 80% of its asset value in fixed income securities. The Portfolio will normally invest 75% of the value of its assets in publicly traded straight debt securities that fall within the four highest grades as rated by a national rating agency. Up to 25% of the Portfolio may be invested in below investment grade securities, convertible debt, preferred stock and other securities.
Managers’ Comments:
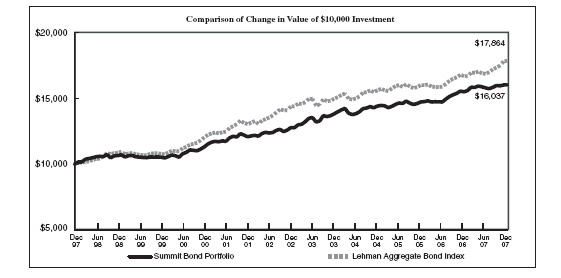
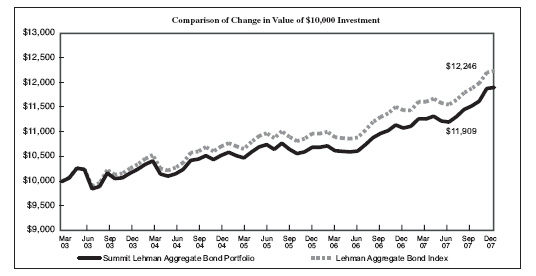
For the year ended December 31, 2007, the Summit Bond Portfolio provided a total return of 3.46% (before the impact of contract or product fees and expenses) compared to 6.97% for the Lehman Brothers Aggregate Bond Index (Index). The Bond Portfolio’s underweighting of Treasury bonds, that outperformed corporate and mortgage-backed securities (“MBS”) over the last year, detracted from performance. In addition, the Portfolio’s non-agency mortgage-backed securities underperformed the broader MBS indices. Lastly, the Portfolio’s exposure to high yield securities detracted from performance during the latter half of the year.
Short-term interest rates declined substantially during the year, as the Federal Reserve Board (Fed) cut the Fed Funds rate by 1.00% during 2007, from 5.25% to 4.25%. The Fed has continued to cut the Fed Funds rate in 2008, in response to a weakening economy. In January 2008, the Fed cut the Fed Funds rate by another 1.25%, to 3.00%. The marketplace currently expects further cuts in the Federal Funds rate. Longer term interest rates also declined during 2007 with the 10 year Treasury yield declining from 4.70% to 4.02% and the 2 year Treasury yield declining from 4.81% to 3.05% throughout the year.
Credit spreads (the interest rate difference between risk-free U.S. Treasury securities and other fixed income securities) widened during the latter half of 2007, as the sub-prime mortgage crisis deepened and spread to other asset classes. In addition, concerns about a slowing overall economy negatively impacted credit spreads. Borrowed capital has become more costly, and more importantly, more scarce. Credit spreads that started the summer of 2007 at historically tight levels have widened across the entire quality spectrum, as market participants re-priced risk in their portfolios. Tighter credit standards and widening spreads helped fuel the flight to quality that the markets experienced in the latter half of 2007. In this environment, corporate and non-agency mortgage-backed securities underperformed US Treasury and agency securities.
The outlook is for a slowing economy in 2008. Tightening credit, a stretched consumer, and a continued slump in the housing market continue to take their toll on the economy. However, Congress and the President are expected to pass a significant fiscal stimulus package, and the Fed, recognizing the problems at hand, have adopted a more accommodative monetary policy. These actions should positively impact the economy in the latter half of 2008. In this environment, Summit believes that caution is in order, but that investment managers must be willing to take advantage of opportunities as they arise.
Summit Mutual Funds, Inc. – Pinnacle Series |
| BOND PORTFOLIO | FINANCIAL HIGHLIGHTS |
FINANCIAL HIGHLIGHTS | | | | | | | | | | | | | | | |
| Computed on the basis of a share of capital stock outstanding throughout the period. | | | | | | | | | | | | | | | |
| | | Year Ended December 31, |
| | | 2007 | | | 2006 | | | 2005 | | | 2004 | | | 2003 | |
| | | | | | | | | | | | | | | | |
| Net asset value, beginning of period | | $ | 47.07 | | | $ | 47.07 | | | $ | 48.26 | | | $ | 48.41 | | | $ | 47.93 | |
| INVESTMENT ACTIVITIES: | | | | | | | | | | | | | | | | | | | | |
| Net investment income / (loss) | | | 2.45 | | | | 2.52 | | | | 2.42 | | | | 1.67 | | | | 3.25 | |
| Net realized and unrealized gains / (losses) | | | (0.84 | ) | | | (0.13 | ) | | | (1.42 | ) | | | 0.36 | | | | 0.56 | |
| Total from Investment Activities | | | 1.61 | | | | 2.39 | | | | 1.00 | | | | 2.03 | | | | 3.81 | |
| DISTRIBUTIONS: | | | | | | | | | | | | | | | | | | | | |
| Net investment income | | | (2.46 | ) | | | (2.39 | ) | | | (2.19 | ) | | | (2.18 | ) | | | (3.33 | ) |
| Total Distributions | | | (2.46 | ) | | | (2.39 | ) | | | (2.19 | ) | | | (2.18 | ) | | | (3.33 | ) |
| Net asset value, end of period | | $ | 46.22 | | | $ | 47.07 | | | $ | 47.07 | | | $ | 48.26 | | | $ | 48.41 | |
| | | | | | | | | | | | | | | | | | | | | |
| Total return | | | 3.46 | % | | | 5.25 | % | | | 2.14 | % | | | 4.29 | % | | | 8.21 | % |
| | | | | | | | | | | | | | | | | | | | | |
| RATIOS / SUPPLEMENTAL DATA: | | | | | | | | | | | | | | | | | | | | |
Ratio of expenses to average net assets – net(1) | | | 0.75 | % | | | 0.75 | % | | | 0.75 | % | | | 0.75 | % | | | 0.75 | % |
| Ratio of expenses to average net assets – gross | | | 0.82 | % | | | 0.81 | % | | | 0.83 | % | | | 0.82 | % | | | 0.81 | % |
| Ratio of net investment income / (loss) to average net assets | | | 5.11 | % | | | 5.23 | % | | | 5.10 | % | | | 4.05 | % | | | 6.72 | % |
| Portfolio turnover rate | | | 106.51 | % | | | 79.22 | % | | | 32.96 | % | | | 66.03 | % | | | 109.52 | % |
| Net assets, end of period (000’s) | | $ | 26,837 | | | $ | 28,349 | | | $ | 30,783 | | | $ | 36,300 | | | $ | 37,197 | |
| | | | | | | | | | | | | | | | | | | | | |
(1) Net expenses represent gross expenses reduced by fees waived and/or reimbursed by the Adviser. | | | | | | | | | | | | | |
The accompanying notes are an integral part of the financial statements.
Summit Mutual Funds, Inc. – Pinnacle Series |
| SCHEDULE OF INVESTMENTS | BOND PORTFOLIO |
DECEMBER 31, 2007 | | | | | | |
| | | SHARES | | | VALUE | |
COMMON STOCKS - 0.0% | | | | | | |
Consumer Discretionary - 0.0% | | | | | | |
Avado Brands, Inc. (a) (g) (i) | | | 1,601 | | | $ | 16 | |
Intermet Corp. (a) (g) (i) | | | 1,574 | | | | 1,574 | |
| | | | | | | | 1,590 | |
| TOTAL COMMON STOCKS | | | | | | | | |
| (Cost $61,180) | | | | | | | 1,590 | |
| | | | | | | | | |
PREFERRED STOCKS - 0.0% | | | | | | | | |
Consumer Discretionary - 0.0% | | | | | | | | |
ION Media Networks, Inc.12% Payment-in-Kind Dividend (i) | | | 1 | | | | 1,679 | |
| TOTAL PREFERRED STOCKS | | | | | | | | |
| (Cost $10,206) | | | | | | | 1,679 | |
| | | | | | | | | |
| | | | PRINCIPAL | | | | | |
| | | AMOUNT | | | VALUE | |
ASSET BACKED SECURITIES - 1.5% | | | | | | | | |
| America West Airlines, Inc. - AMBAC Insured | | | | | | | | |
| 7.100%, 10/02/2022 | | $ | 196,357 | | | $ | 195,375 | |
| Asset Backed Funding Certificates | | | | | | | | |
| Series 2005-AQ1, 5.240%, 11/25/2034 | | | 170,000 | | | | 138,654 | |
| Centex Home Equity | | | | | | | | |
| Series 2001-B, 7.360%, 07/25/2032 | | | 41,058 | | | | 36,233 | |
| First Franklin Mortgage | | | | | | | | |
| Series 2003-FF2, 7.34%, 07/25/2033 | | | 49,519 | | | | 31,005 | |
| JET Equipment Trust | | | | | | | | |
Series 1995-B, 7.630%, 02/15/2015 (b) (h) (i) | | | 27,324 | | | | 151 | |
| TOTAL ASSET BACKED SECURITIES | | | | | | | | |
| (Cost $487,319) | | | | | | | 401,418 | |
| | | | | | | | | |
CORPORATE BONDS - 42.9% | | | | | | | | |
Consumer Discretionary - 4.9% | | | | | | | | |
| General Motors Corp. | | | | | | | | |
7.700%, 04/15/2016 (e) | | | 50,000 | | | | 42,375 | |
| Idearc, Inc. | | | | | | | | |
| 8.000%, 11/15/2016 | | | 100,000 | | | | 91,750 | |
| Intcomex, Inc. | | | | | | | | |
11.750%, 01/15/2011 (e) | | | 125,000 | | | | 128,125 | |
| ION Media Networks, Inc. | | | | | | | | |
| 11.000%, 07/31/2013 | | | 167,909 | | | | 83,955 | |
| MDC Holdings, Inc. | | | | | | | | |
| 5.500%, 05/15/2013 | | | 150,000 | | | | 143,499 | |
| NVR, Inc. | | | | | | | | |
5.000%, 06/15/2010 (e) | | | 210,000 | | | | 210,621 | |
| R. H. Donnelley Corp. | | | | | | | | |
| 6.875%, 01/15/2013 | | | 125,000 | | | | 111,875 | |
| Radio One, Inc. | | | | | | | | |
8.875%, 07/01/2011 (e) | | | 32,000 | | | | 29,960 | |
| TCI Communications, Inc. | | | | | | | | |
| 8.750%, 08/01/2015 | | | 230,000 | | | | 267,537 | |
| The Thomson Corp. | | | | | | | | |
| 6.200%, 01/05/2012 | | | 200,000 | | | | 208,616 | |
| | | | | | | | 1,318,313 | |
Consumer Staples - 1.5% | | | | | | | | |
| Constellation Brands, Inc. | | | | | | | | |
7.250%, 09/01/2016 (e) | | | 125,000 | | | | 117,187 | |
| | | PRINCIPAL | | | | |
| | | AMOUNT | | | VALUE | |
Consumer Staples - 1.5% (Continued) | | | | | | |
| Del Monte Corp. | | | | | | |
6.750%, 02/15/2015 (e) | | $ | 62,000 | | | $ | 58,590 | |
| Tesco PLC | | | | | | | | |
5.500%, 11/15/2017 (b) | | | 230,000 | | | | 229,395 | |
| | | | | | | | 405,172 | |
Energy - 5.3% | | | | | | | | |
| Anadarko Petroleum Corp. | | | | | | | | |
| 5.950%, 09/15/2016 | | | 230,000 | | | | 234,193 | |
| Chesapeake Energy Corp. | | | | | | | | |
6.625%, 01/15/2016 (e) | | | 125,000 | | | | 122,187 | |
| Complete Production Services, Inc. | | | | | | | | |
8.000%, 12/15/2016 (e) | | | 125,000 | | | | 120,938 | |
| Encore Acquisition Co. | | | | | | | | |
7.250%, 12/01/2017 (e) | | | 75,000 | | | | 71,438 | |
| Enterprise Products Operating LP | | | | | | | | |
| 6.300%, 09/15/2017 | | | 150,000 | | | | 153,474 | |
| Peabody Energy Corp. | | | | | | | | |
| 7.375%, 11/01/2016 | | | 50,000 | | | | 51,250 | |
| Pioneer Natural Resources Co. | | | | | | | | |
| 6.650%, 03/15/2017 | | | 125,000 | | | | 120,546 | |
| Plains All American Pipeline LP | | | | | | | | |
| 4.750%, 08/15/2009 | | | 250,000 | | | | 251,192 | |
| Range Resources Corp. | | | | | | | | |
| 7.375%, 07/15/2013 | | | 39,000 | | | | 39,585 | |
| 7.500%, 05/15/2016 | | | 25,000 | | | | 25,500 | |
| TransCanada Pipelines Ltd | | | | | | | | |
6.350%, 05/15/2067 (c) | | | 230,000 | | | | 215,574 | |
| | | | | | | | 1,405,877 | |
Financials - 11.7% | | | | | | | | |
| AXA SA | | | | | | | | |
5.362%, 02/06/2049 (c) (i) | | | 450,000 | | | | 283,500 | |
| Bank of America Corp. | | | | | | | | |
| 5.750%, 12/01/2017 | | | 150,000 | | | | 150,344 | |
| Bank of New York Mellon | | | | | | | | |
| 4.950%, 11/01/2012 | | | 175,000 | | | | 174,998 | |
| ConocoPhillips Australia Funding Co. | | | | | | | | |
| 5.500%, 04/15/2013 | | | 230,000 | | | | 238,075 | |
| Ford Motor Credit Co. | | | | | | | | |
| 5.800%, 01/12/2009 | | | 94,000 | | | | 89,224 | |
7.990%, 01/13/2012 (c) | | | 63,000 | | | | 52,918 | |
| 8.000%, 12/15/2016 | | | 31,000 | | | | 26,332 | |
| Health Care REIT, Inc. | | | | | | | | |
| 8.000%, 09/12/2012 | | | 250,000 | | | | 266,154 | |
| iStar Financial, Inc. | | | | | | | | |
| 5.950%, 10/15/2013 | | | 230,000 | | | | 200,420 | |
| Landsbanki Islands HF | | | | | | | | |
6.100%, 08/25/2011 (b) | | | 230,000 | | | | 226,678 | |
| Lincoln National Corp. | | | | | | | | |
6.050%, 04/20/2017 (c) | | | 225,000 | | | | 210,051 | |
| Prime Property Fund, Inc. | | | | | | | | |
5.500%, 01/15/2014 (b) | | | 150,000 | | | | 149,261 | |
| Rabobank Capital Funding Trust II | | | | | | | | |
5.260%, 12/29/2049 (b) (c) (d) | | | 220,000 | | | | 204,970 | |
| Swiss Re Capital I LP | | | | | | | | |
6.854%, 05/29/2049 (b) (c) (i) | | | 220,000 | | | | 223,728 | |
| Vale Overseas Ltd. | | | | | | | | |
| 6.250%, 01/23/2017 | | | 225,000 | | | | 225,699 | |
The accompanying notes are an integral part of the financial statements.
Summit Mutual Funds, Inc. – Pinnacle Series |
| BOND PORTFOLIO | SCHEDULE OF INVESTMENTS |
| | | PRINCIPAL | | | | |
| | | AMOUNT | | | VALUE | |
Financials - 11.7% (Continued) | | | | | | |
| Ventas Realty LP | | | | | | |
| 7.125%, 06/01/2015 | | $ | 37,000 | | | $ | 37,370 | |
| WMC Finance USA Ltd. | | | | | | | | |
| 5.125%, 05/15/2013 | | | 200,000 | | | | 197,144 | |
| Xstrata Finance Canada Ltd. | | | | | | | | |
5.800%, 11/15/2016 (b) | | | 100,000 | | | | 98,068 | |
| Yankee Acquisition Corp. | | | | | | | | |
9.750%, 02/15/2017 (e) | | | 100,000 | | | | 91,500 | |
| | | | | | | | 3,146,434 | |
Health Care - 2.3% | | | | | | | | |
| Abbott Laboratories | | | | | | | | |
| 5.600%, 11/30/2017 | | | 230,000 | | | | 236,307 | |
| Community Health Systems, Inc. | | | | | | | | |
8.875%, 07/15/2015 (e) | | | 63,000 | | | | 64,181 | |
| DaVita, Inc. | | | | | | | | |
7.250%, 03/15/2015 (e) | | | 31,000 | | | | 31,078 | |
| HCA, Inc. | | | | | | | | |
| 9.250%, 11/15/2016 | | | 125,000 | | | | 131,250 | |
| UnitedHealth Group, Inc. | | | | | | | | |
| 6.000%, 11/15/2017 | | | 150,000 | | | | 151,994 | |
| | | | | | | | 614,810 | |
Industrials - 4.5% | | | | | | | | |
| American Railcar Industries, Inc. | | | | | | | | |
| 7.500%, 03/01/2014 | | | 25,000 | | | | 23,625 | |
| Ametek, Inc. | | | | | | | | |
| 7.200%, 07/15/2008 | | | 250,000 | | | | 252,307 | |
| Aramark Corp. | | | | | | | | |
8.500%, 02/01/2015 (e) | | | 100,000 | | | | 101,250 | |
| Caterpillar, Inc. | | | | | | | | |
5.700%, 08/15/2016 (e) | | | 230,000 | | | | 233,738 | |
| DRS Technologies, Inc. | | | | | | | | |
7.625%, 02/01/2018 (e) | | | 32,000 | | | | 32,400 | |
| Hertz Corp. | | | | | | | | |
| 8.875%, 01/01/2014 | | | 50,000 | | | | 50,687 | |
| Joy Global, Inc. | | | | | | | | |
| 6.000%, 11/15/2016 | | | 225,000 | | | | 233,110 | |
| Kansas City Southern De Mexico | | | | | | | | |
7.375%, 06/01/2014 (b) | | | 50,000 | | | | 48,625 | |
| Raytheon Co. | | | | | | | | |
| 5.500%, 11/15/2012 | | | 230,000 | | | | 239,475 | |
| | | | | | | | 1,215,217 | |
Information Technology - 1.7% | | | | | | | | |
| Cisco Systems, Inc. | | | | | | | | |
| 5.500%, 02/22/2016 | | | 230,000 | | | | 233,903 | |
| Harris Corp. | | | | | | | | |
| 5.950%, 12/01/2017 | | | 150,000 | | | | 149,328 | |
| Iron Mountain, Inc. | | | | | | | | |
7.750%, 01/15/2015 (e) | | | 75,000 | | | | 76,313 | |
| | | | | | | | 459,544 | |
Manufacturing - 0.7% | | | | | | | | |
| Dynegy Holdings, Inc. | | | | | | | | |
| 7.750%, 06/01/2019 | | | 100,000 | | | | 92,250 | |
| Petroplus Finance Ltd | | | | | | | | |
7.000%, 05/01/2017 (b) | | | 100,000 | | | | 91,500 | |
| | | | | | | | 183,750 | |
| | | PRINCIPAL | | | | |
| | | AMOUNT | | | VALUE | |
Materials - 3.3% | | | | | | |
| Freeport-McMoRan Copper & Gold, Inc. | | | | | | |
| 8.375%, 04/01/2017 | | $ | 100,000 | | | $ | 107,250 | |
| Lubrizol Corp. | | | | | | | | |
| 7.250%, 06/15/2025 | | | 300,000 | | | | 327,217 | |
| The Mosaic Co. | | | | | | | | |
7.875%, 12/01/2016 (b) (c) | | | 100,000 | | | | 108,000 | |
| Smurfit-Stone Container Enterprises, Inc. | | | | | | | | |
8.000%, 03/15/2017 (e) | | | 100,000 | | | | 96,625 | |
| United States Steel Corp | | | | | | | | |
| 6.050%, 06/01/2017 | | | 150,000 | | | | 140,975 | |
| Warnaco, Inc. | | | | | | | | |
| 8.875%, 06/15/2013 | | | 100,000 | | | | 101,750 | |
| | | | | | | | 881,817 | |
Telecommunication Services - 3.3% | | | | | | | | |
| America Movil SAB de CV | | | | | | | | |
| 5.625%, 11/15/2017 | | | 230,000 | | | | 224,732 | |
| Intelsat Bermuda Ltd | | | | | | | | |
| 11.250%, 06/15/2016 | | | 100,000 | | | | 103,250 | |
| iPCS, Inc. | | | | | | | | |
7.040%, 05/01/2013 (c) | | | 175,000 | | | | 164,937 | |
| Qwest Communications International, Inc. | | | | | | | | |
7.500%, 02/15/2014 (c) | | | 125,000 | | | | 124,688 | |
| TELUS Corp. | | | | | | | | |
| 8.000%, 06/01/2011 | | | 150,000 | | | | 162,520 | |
| Windstream Corp. | | | | | | | | |
| 8.625%, 08/01/2016 | | | 100,000 | | | | 105,000 | |
| | | | | | | | 885,127 | |
Utilities - 3.7% | | | | | | | | |
| Calpine Corp. | | | | | | | | |
9.875%, 12/01/2011 (b) (h) | | | 125,000 | | | | 130,625 | |
| Centerpoint Energy Resources Corp. | | | | | | | | |
| 6.125%, 11/01/2017 | | | 75,000 | | | | 76,327 | |
| Edison Mission Energy | | | | | | | | |
7.500%, 06/15/2013 (e) | | | 125,000 | | | | 128,125 | |
| Exelon Corp. | | | | | | | | |
| 6.750%, 05/01/2011 | | | 230,000 | | | | 240,386 | |
| FPL Group Capital, Inc. | | | | | | | | |
6.350%, 10/01/2066 (c) | | | 230,000 | | | | 217,531 | |
| Kern River Funding Corp. | | | | | | | | |
6.676%, 07/31/2016 (b) | | | 49,549 | | | | 52,426 | |
| NSTAR Electric Co. | | | | | | | | |
| 5.625%, 11/15/2017 | | | 150,000 | | | | 152,613 | |
| | | | | | | | 998,033 | |
| TOTAL CORPORATE BONDS | | | | | | | | |
| (Cost $11,820,184) | | | | | | | 11,514,094 | |
The accompanying notes are an integral part of the financial statements.
Summit Mutual Funds, Inc. – Pinnacle Series |
| SCHEDULE OF INVESTMENTS | BOND PORTFOLIO |
| | | PRINCIPAL | | | | |
| | | AMOUNT | | | VALUE | |
MORTGAGE BACKED SECURITIES - 48.0% | | | | | | |
| Banc of America Alternative Loan Trust | | | | | | |
| Series 2003-6, 4.750%, 08/25/2018 | | $ | 277,487 | | | $ | 224,657 | |
| Series 2003-8, 4.750%, 10/25/2018 | | | 117,106 | | | | 82,634 | |
| Banc of America Funding Corp. | | | | | | | | |
| Series 2003-2, 6.382%, 06/25/2032 | | | 197,736 | | | | 192,497 | |
| Banc of America Mortgage Securities | | | | | | | | |
| Series 2004-7, 4.797%, 08/25/2019 | | | 258,005 | | | | 226,255 | |
| Series 2001-4, 6.750%, 04/20/2031 | | | 152,923 | | | | 152,611 | |
| Series 2002-G, 7.363%, 07/20/2032 | | | 53,727 | | | | 54,497 | |
| Series 2004-6, 5.500%, 07/25/2034 | | | 151,962 | | | | 151,537 | |
| Citicorp Mortgage Securities, Inc. | | | | | | | | |
| Series 2003-10, 4.500%, 11/25/2018 | | | 762,903 | | | | 747,645 | |
| Countrywide Home Loans | | | | | | | | |
| Series 2003-58, 4.560%, 02/19/2034 | | | 353,130 | | | | 345,697 | |
| Series 2006-6, 6.000%, 04/25/2036 | | | 342,581 | | | | 297,934 | |
| Series 2007-5, 5.750%, 05/25/2037 | | | 397,639 | | | | 358,106 | |
| Credit Suisse Mortgage Capital Corporation | | | | | | | | |
| Series 2006-4, 5.745%, 05/25/2036 | | | 214,990 | | | | 153,545 | |
| CS First Boston Mortgage Securities Corp. | | | | | | | | |
| Series 2004-6, 4.756%, 09/25/2019 | | | 248,891 | | | | 192,932 | |
| Fannie Mae | | | | | | | | |
| Series 94-019, 5.000%, 01/25/2024 | | | 70,811 | | | | 70,832 | |
| Series 2002-48B, 6.500%, 10/25/2031 | | | 905,163 | | | | 918,325 | |
| Fannie Mae Pool | | | | | | | | |
| Pool #254438, 5.500%, 08/01/2009 | | | 78,929 | | | | 79,729 | |
| Pool #555638, 5.000%, 11/01/2009 | | | 207,797 | | | | 208,471 | |
| Pool #254643, 5.500%, 01/01/2010 | | | 124,307 | | | | 125,567 | |
| Pool #555520, 5.500%, 02/01/2010 | | | 41,422 | | | | 41,842 | |
| Pool #254340, 5.500%, 05/01/2012 | | | 79,812 | | | | 81,249 | |
| Pool #545015, 6.000%, 06/01/2016 | | | 90,562 | | | | 92,820 | |
| Pool #727360, 5.500%, 08/01/2018 | | | 621,024 | | | | 630,253 | |
| Pool #481582, 6.500%, 02/01/2029 | | | 45,674 | | | | 47,341 | |
| Freddie Mac | | | | | | | | |
| Series 2931, 5.000%, 11/15/2028 | | | 700,554 | | | | 704,172 | |
| Freddie Mac Pool | | | | | | | | |
| Pool #G0-1740, 5.500%, 12/01/2034 | | | 2,450,145 | | | | 2,447,963 | |
| Freddie Mac (Gold) Pool | | | | | | | | |
| Pool #E9-6460, 5.000%, 05/01/2018 | | | 107,320 | | | | 107,584 | |
| Pool #E9-9160, 4.500%, 09/01/2018 | | | 1,602,618 | | | | 1,575,893 | |
| Pool #C7-6658, 5.000%, 02/01/2033 | | | 73,687 | | | | 72,006 | |
| Ginnie Mae I Pool | | | | | | | | |
| Pool #44670, 6.500%, 10/15/2028 | | | 55,033 | | | | 57,120 | |
| GMAC Mortgage Corp Loan Trust | | | | | | | | |
| Series 2004-J1, 5.250%, 04/25/2034 | | | 108,304 | | | | 108,085 | |
| Lehman Mortgage Trust | | | | | | | | |
| Series 2005-2, 5.573%, 12/25/2035 | | | 394,593 | | | | 215,147 | |
| | | PRINCIPAL | | | | |
| | | AMOUNT | | | VALUE | |
MORTGAGE BACKED SECURITIES - 48.0% (Continued) | | | | | | |
| MASTR Alternative Loans Trust | | | | | | |
| Series 2003-2, 6.080%, 03/25/2033 | | $ | 199,116 | | | $ | 171,810 | |
| MASTR Asset Securitization Trust | | | | | | | | |
| Series 2003-9, 5.500%, 10/25/2033 | | | 52,346 | | | | 52,432 | |
| Morgan Stanley Capital I | | | | | | | | |
| Series 2007-IQ14, 5.692%, 04/15/2049 | | | 300,000 | | | | 305,784 | |
| Residential Accredit Loans, Inc. | | | | | | | | |
| Series 2002-QS16, 5.750%, 10/25/2017 | | | 73,324 | | | | 70,305 | |
| Series 2002-QS16, 5.750%, 10/25/2017 | | | 73,324 | | | | 62,061 | |
Series 2005-QS14, 5.250%, 09/25/2020 (i) | | | 292,284 | | | | 245,519 | |
| Residential Funding Mortgage Securities | | | | | | | | |
| Series 2003-S20, 4.750%, 12/25/2018 | | | 273,375 | | | | 246,739 | |
| Salomon Brothers Mortgage Securities VII | | | | | | | | |
| Series 2003-HYB1, 4.114%, 09/25/2033 | | | 187,302 | | | | 183,089 | |
| Structured Asset Securities Corp. | | | | | | | | |
| Series 2003-20, 5.390%, 07/25/2033 | | | 279,036 | | | | 238,808 | |
| Washington Mutual Mortgage Pass-Through Certificates | | | | | | | | |
| Series 2002-MS11, 5.250%, 12/25/2017 | | | 404,818 | | | | 404,984 | |
Series 2003-MS4, 5.785%, 02/25/2033 (b) | | | 162,604 | | | | 145,792 | |
| TOTAL MORTGAGE BACKED SECURITIES | | | | | | | | |
| (Cost $13,348,663) | | | | | | | 12,892,269 | |
U.S. TREASURY OBLIGATIONS - 4.8% | | | | | | | | |
U.S. Treasury Bonds - 0.8% | | | | | | | | |
4.500%, 02/15/2036 (e) | | | 200,000 | | | | 201,016 | |
U.S. Treasury Notes - 4.0% | | | | | | | | |
3.375%, 11/30/2012 (e) | | | 100,000 | | | | 99,664 | |
3.625%, 05/15/2013 (e) | | | 230,000 | | | | 231,581 | |
4.250%, 11/15/2017 (e) | | | 735,000 | | | | 747,805 | |
| | | | | | | | 1,079,050 | |
| TOTAL U.S. TREASURY OBLIGATIONS | | | | | | | | |
| (Cost $1,258,840) | | | | | | | 1,280,066 | |
| | | | | | | | | |
| | | SHARES | | | VALUE | |
SHORT TERM INVESTMENTS - 4.8% | | | | | | | | |
Money Market Funds - 4.8% | | | | | | | | |
| Northern Institutional Diversified Assets Portfolio | | | 1,273,216 | | | $ | 1,273,216 | |
| TOTAL SHORT TERM INVESTMENTS | | | | | | | | |
| (Cost $1,273,216) | | | | | | | 1,273,216 | |
Total Investments | | | | | | | | |
(Cost $28,259,608) (d)- 102.0% | | | | | | | 27,364,332 | |
Northern Institutional Liquid Assets Portfolio (f)- 10.7% | | | | | | | 2,884,012 | |
Liabilities in Excess of Other Assets - (12.7)% | | | | | | | (3,411,321 | ) |
TOTAL NET ASSETS - 100.0% | | | | | | $ | 26,837,023 | |
| (a) | Non-income producing security. |
| (b) | Security exempt from registration under Rule 144(a) of the Securities Act of 1933. These securities may be resold in transactions exempt from registration, normally to qualified institutional buyers. |
| (c) | Variable rate security. |
| (d) | For federal income tax purposes, cost is $28,267,954 and gross unrealized appreciation and depreciation of securities as of December 31, 2007 was $233,106 and ($1,136,728), respectively, with a net appreciation / (depreciation) of ($903,622). |
| (e) | All or a portion of the security is out on loan. |
| (f) | This security was purchased with cash collateral held from securities lending. The market value of the securities on loan, the collateral purchased with cash, and the noncash collateral accepted is $2,861,197, $2,884,012, and $71,671, respectively. |
| (g) | Security is considered illiquid. The aggregate value of such securities is $1,590 or 0.005% of total net assets. |
| (i) | Valued in good faith under procedures adopted by the Board of Directors. |
The accompanying notes are an integral part of the financial statements.
Summit Mutual Funds, Inc. – Pinnacle Series |
| BOND PORTFOLIO | FINANCIAL STATEMENTS |
STATEMENT OF ASSETS AND LIABILITIES | | | |
December 31, 2007 | | | |
| | | | |
| ASSETS | | | |
| Investments in securities, at value | | $ | 27,364,332 | |
| Collateral for securities loaned, | | | | |
| at fair value | | | 2,884,012 | |
| Receivables: | | | | |
| Interest and dividends | | | 263,678 | |
| Shares sold | | | 26,331 | |
| Prepaid expenses and other | | | 812 | |
| | | | 30,539,165 | |
| LIABILITIES | | | | |
| Payables: | | | | |
| Payable upon return of securities loaned | | | 2,884,012 | |
| Shares redeemed | | | 574,475 | |
| Investment securities purchased | | | 197,161 | |
| Professional fees | | | 16,234 | |
| Fund accounting fees | | | 11,578 | |
| Advisory fees | | | 8,031 | |
| Administration fees | | | 2,305 | |
| Custodian fees | | | 1,236 | |
| Directors’ fees | | | 102 | |
| Other accrued expenses | | | 7,008 | |
| | | | 3,702,142 | |
| NET ASSETS* | | | | |
| Paid-in capital | | | 33,696,255 | |
| Accumulated undistributed net investment | | | | |
| income / (loss) | | | 206,571 | |
| Accumulated net realized gain / (loss) | | | | |
| on investments | | | (6,170,527 | ) |
| Net unrealized appreciation / (depreciation) | | | | |
| on investments | | | (895,276 | ) |
| | | $ | 26,837,023 | |
| | | | | |
| Investments at cost | | $ | 28,259,608 | |
| Shares authorized ($.10 par value) | | | 30,000,000 | |
| NET ASSET VALUE (NAV) BY SHARE CLASS | | | | | |
| | | | | | |
| Share Class | Net Assets | Outstanding | | Per Share | |
| Class I | $26,837,023 | | | $ | 46.22 | |
| * | FEDERAL TAX DATA AS OF DECEMBER 31, 2007 | | |
| | Undistributed ordinary income | $ | 215,068 |
| Capital Loss Carryforward |
| Expiring December 31: |
| | $(4,452,042) | $(119,441) | $(1,273,958) | $(75,650) | $(241,081) |
STATEMENT OF OPERATIONS | | | |
For the year ended December 31, 2007 | | | |
| | | | |
| INVESTMENT INCOME | | | |
| Interest | | $ | 1,599,852 | |
| Dividends | | | 20,695 | |
| Other income | | | 9,105 | |
| | | | 1,629,652 | |
| EXPENSES | | | | |
| Advisory fees | | | 130,789 | |
| Administration fees | | | 27,828 | |
| Fund accounting fees | | | 25,977 | |
| Professional fees | | | 18,354 | |
| Transfer agent fees | | | 12,219 | |
| Custodian fees | | | 5,280 | |
| Directors’ fees | | | 3,152 | |
| Shareholder reporting fees | | | 2,633 | |
| Other expenses | | | 3,038 | |
| | | | 229,270 | |
| Reimbursements and waivers | | | (20,563 | ) |
| | | | 208,707 | |
| NET INVESTMENT INCOME / (LOSS) | | | 1,420,945 | |
| | | | | |
| REALIZED AND UNREALIZED GAIN / (LOSS) | | | | |
| Net realized gain / (loss) on investments | | | 247,103 | |
| Net change in unrealized appreciation / | | | | |
| (depreciation) on investments | | | (705,862 | ) |
| | | | | |
| NET REALIZED AND UNREALIZED | | | | |
| GAIN / (LOSS) | | | (458,759 | ) |
| | | | | |
| NET INCREASE / (DECREASE) IN | | | | |
| NET ASSETS FROM OPERATIONS | | $ | 962,186 | |
| TRANSACTIONS WITH AFFILIATES: | | | |
| Percent of Current | |
| Net Asset Value | |
| | Advisory | Administration | Expense | Reimbursements |
| | Fee | Fee | Limit(1) | and Waivers |
| | 0.47% | 0.10% | 0.75% | $20,563 |
| | | | | |
| (1) | The adviser has agreed to temporarily waive administration fees for the Bond Portfolio, to the extent that the Portfolio’s total expense ratio exceeds 0.75%. |
The accompanying notes are an integral part of the financial statements.
Summit Mutual Funds, Inc. – Pinnacle Series |
| FINANCIAL STATEMENTS | BOND PORTFOLIO |
STATEMENTS OF CHANGES IN NET ASSETS | | | | | | |
For the Year Ended December 31, | | | | | | |
| | | 2007 | | | 2006 | |
| OPERATIONS | | | | | | |
| Net investment income / (loss) | | $ | 1,420,945 | | | $ | 1,502,162 | |
| Net realized gain / (loss) on investments | | | 247,103 | | | | (271,614 | ) |
| Net change in unrealized appreciation / (depreciation) on investments | | | (705,862 | ) | | | 218,274 | |
| | | | | | | | | |
| | | | 962,186 | | | | 1,448,822 | |
| | | | | | | | | |
| DISTRIBUTIONS TO SHAREHOLDERS* | | | | | | | | |
| Net investment income | | | (1,448,294 | ) | | | (1,461,411 | ) |
| | | | | | | | | |
| | | | (1,448,294 | ) | | | (1,461,411 | ) |
| | | | | | | | | |
| FUND SHARE TRANSACTIONS | | | | | | | | |
| Proceeds from shares sold | | | 3,195,195 | | | | 2,205,561 | |
| Reinvestment of distributions | | | 1,448,294 | | | | 1,461,411 | |
| Payments for shares redeemed | | | (5,669,542 | ) | | | (6,087,857 | ) |
| | | | | | | | | |
| | | | (1,026,053 | ) | | | (2,420,885 | ) |
| | | | | | | | | |
| | | | | | | | | |
| NET INCREASE / (DECREASE) IN NET ASSETS | | | (1,512,161 | ) | | | (2,433,474 | ) |
| NET ASSETS | | | | | | | | |
| Beginning of period | | | 28,349,184 | | | | 30,782,658 | |
| | | | | | | | | |
| End of period | | $ | 26,837,023 | | | $ | 28,349,184 | |
| | | | | | | | | |
| ACCUMULATED UNDISTRIBUTED NET INVESTMENT INCOME | | $ | 206,571 | | | $ | 215,068 | |
| FUND SHARE TRANSACTIONS | | | | | | |
| Sold | | | | | | | 47,186 | |
| Reinvestment of distributions | | | | | | | 31,501 | |
| Redeemed | | | (120,796 | ) | | | (130,332 | ) |
| | | | | | | | | |
| Net increase / (decrease) from fund share transactions | | | (21,672 | ) | | | (51,645 | ) |
| | | | | | | | | |
| TOTAL COST OF PURCHASES OF: | | | | | | | | |
| Preferred and Common Stocks | | $ | | | | $ | 208,555 | |
| U.S. Government Securities | | | | | | | 4,426,366 | |
| Corporate Bonds | | | | | | | 17,678,086 | |
| Asset Backed Securities | | | | | | | — | |
| | | | | | | | | |
| | | $ | | | | $ | 22,313,007 | |
| | | | | | | | | |
| TOTAL PROCEEDS FROM SALES OF: | | | | | | | | |
| Preferred and Common Stocks | | $ | | | | $ | 438,209 | |
| U.S. Government Securities | | | | | | | 6,207,390 | |
| Corporate Bonds | | | | | | | 18,009,936 | |
| Asset Backed Securities | | | | | | | — | |
| | | | | | | | | |
| | | $ | | | | $ | 24,655,535 | |
| | | | | | | | | |
| *TAX CHARACTER OF DISTRIBUTIONS PAID | | | | | | | | |
| Ordinary income | | $ | | | | $ | 1,461,411 | |
| | | | | | | | | |
| | | $ | | | | $ | 1,461,411 | |
The accompanying notes are an integral part of the financial statements.
Summit Mutual Funds, Inc. – Pinnacle Series |
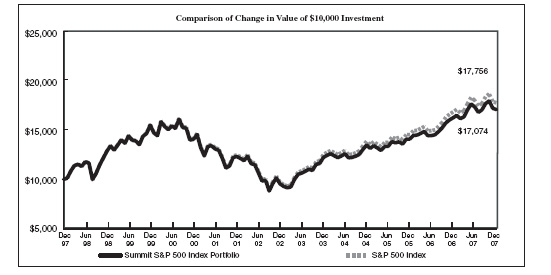
Summit S&P 500 Index Portfolio - Average Annual Total Return |
1-Year | 5-Year | 10-Year |
| 5.16% | 12.36% | 5.50% |
Past performance is not predictive of future results. Performance does not reflect the deduction of taxes that a shareholder would pay on fund distributions or redemption of fund shares. Separate account expenses are not included. Absent limitation of expenses during certain of the periods shown, performance would have been lower.
| Managers: | |
| Inception Date: | |
| Total Net Assets: | $302.82 Million |
| Number of Equity Holdings: | 500 |
| Median Cap Size: | $13,043 (in millions) |
Average Price-to-book Ratio: | 2.77 x |
| 1.97% |
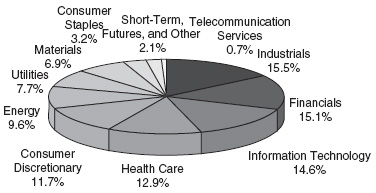
Top 10 Equity Holdings | | Sector Allocations |
| | (% of net assets) | | |
General Electric Co. Microsoft Corp. AT&T, Inc. Procter & Gamble Co. Chevron Corp. Johnson & Johnson Bank of America Corp. Apple, Inc. Cisco Systems, Inc. | | | |
Summit Mutual Funds, Inc. – Pinnacle Series |
Objective – Seeks investment results that correspond to the total return performance of U.S. common stocks, as represented by the Standard & Poor’s 500 Composite Stock Price Index (the “Index”).
Strategy – The Summit Pinnacle S&P 500 Index Portfolio (the “Portfolio”) will attempt to achieve, in both rising and falling markets, a correlation of at least 95% between the total return of its net assets before expenses and the total return of the Index.
Managers’ Comments:
For the period ended December 31, 2007, the Summit S&P 500 Index Portfolio’s total return was 5.16% (after waivers and reimbursements, but before the impact of any product or contract-level fees). This compares to a 5.49% total return for the S&P 500 Index. The difference of 0.33% is referred to as “tracking error” and is largely attributed to the Portfolio’s operating expenses. These expenses represent the Portfolio’s costs for advisory, administration, accounting, custody and other services. The remaining difference can be caused by a number of factors, including the timing and size of cash flows into and out of the Portfolio; brokers’ commissions or other trading costs; and holding security positions in amounts that are different than the weightings in the Index, among others. While an exact replication of the capitalization weightings of securities in the Index is not feasible, the Portfolio’s objectives and strategies call for a correlation of at least 95% between the Portfolio’s pre-expense total return and that of the Index. The Portfolio achieved this level of correlation for the period presented.
“Standard & Poor’s”, “S&P”, “S&P 500”, “Standard & Poor’s 500”, “500”, “S&P MidCap 400 Index”, and “Standard & Poor’s MidCap 400 Index” are trademarks of The McGraw-Hill Companies, Inc. and have been licensed for use by Summit Mutual Funds, Inc. The product is not sponsored, endorsed, sold or promoted by Standard & Poor’s and Standard & Poor’s makes no representation regarding the advisability of investing in the product.
Summit Mutual Funds, Inc. – Pinnacle Series |
| S&P 500 INDEX PORTFOLIO | FINANCIAL HIGHLIGHTS |
FINANCIAL HIGHLIGHTS | | | | | | | | | | | | | | | |
| Computed on the basis of a share of capital stock outstanding throughout the period. | | | | | | | | | | | | | |
| | | | | | | | | | | | | | | | |
| | Year Ended December 31, |
| | | 2007 | | | 2006 | | | 2005 | | | 2004 | | | 2003 | |
| | | | | | | | | | | | | | | | |
| Net asset value, beginning of period | | $ | 94.19 | | | $ | 82.85 | | | $ | 80.48 | | | $ | 73.21 | | | $ | 57.82 | |
| INVESTMENT ACTIVITIES: | | | | | | | | | | | | | | | | | | | | |
| Net investment income / (loss) | | | 1.52 | | | | 1.40 | | | | 1.17 | | | | 1.16 | (2) | | | 0.81 | |
| Net realized and unrealized gains / (losses) | | | 3.31 | | | | 11.19 | | | | 2.39 | | | | 6.41 | | | | 15.17 | |
| Total from Investment Activities | | | 4.83 | | | | 12.59 | | | | 3.56 | | | | 7.57 | | | | 15.98 | |
| DISTRIBUTIONS: | | | | | | | | | | | | | | | | | | | | |
| Net investment income | | | (1.42 | ) | | | (1.25 | ) | | | (1.19 | ) | | | (0.30 | ) | | | (0.59 | ) |
| Net realized gains | | | (0.16 | ) | | | — | | | | — | | | | — | | | | — | |
| Total Distributions | | | (1.58 | ) | | | (1.25 | ) | | | (1.19 | ) | | | (0.30 | ) | | | (0.59 | ) |
| | | | | | | | | | | | | | | | | | | | | |
| Net asset value, end of period | | $ | 97.44 | | | $ | 94.19 | | | $ | 82.85 | | | $ | 80.48 | | | $ | 73.21 | |
| | | | | | | | | | | | | | | | | | | | | |
| Total return | | | 5.16 | % | | | 15.36 | % | | | 4.52 | % | | | 10.37 | % | | | 27.98 | % |
| | | | | | | | | | | | | | | | | | | | | |
| RATIOS/SUPPLEMENTAL DATA: | | | | | | | | | | | | | | | | | | | | |
Ratio of expenses to average net assets – net(1) | | | 0.39 | % | | | 0.39 | % | | | 0.39 | % | | | 0.40 | % | | | 0.52 | % |
| Ratio of expenses to average net assets – gross | | | 0.45 | % | | | 0.43 | % | | | 0.49 | % | | | 0.51 | % | | | 0.54 | % |
| Ratio of net investment income / (loss) to average net assets | | | 1.59 | % | | | 1.56 | % | | | 1.49 | % | | | 1.69 | % | | | 1.25 | % |
| Portfolio turnover rate | | | 3.28 | % | | | 3.42 | % | | | 5.73 | % | | | 1.59 | % | | | 0.84 | % |
| Net assets, end of period (000’s) | | $ | 302,821 | | | $ | 309,019 | | | $ | 290,666 | | | $ | 279,875 | | | $ | 79,766 | |
| | | | | | | | | | | | | | | | | | | | | |
(1) Net expenses represent gross expenses reduced by fees waived and/or reimbursed by the Adviser. | | | | | |
(2) Per share amounts are based on average shares outstanding. | | | | | | | | | | |
The accompanying notes are an integral part of the financial statements.
Summit Mutual Funds, Inc. – Pinnacle Series |
| SCHEDULE OF INVESTMENTS | S&P 500 INDEX PORTFOLIO |
DECEMBER 31, 2007 | | | | | | |
| | | SHARES | | | VALUE | |
COMMON STOCKS - 97.4% | | | | | | |
Consumer Discretionary - 8.3% | | | | | | |
| Abercrombie & Fitch Co. - Class A | | | 1,977 | | | $ | 158,101 | |
Amazon.Com, Inc. (a) | | | 7,040 | | | | 652,186 | |
Apollo Group, Inc. (a) | | | 3,137 | | | | 220,061 | |
AutoNation, Inc. (a) | | | 3,213 | | | | 50,316 | |
Autozone, Inc. (a) (c) | | | 1,013 | | | | 121,469 | |
Bed Bath & Beyond, Inc. (a) | | | 6,073 | | | | 178,485 | |
| Best Buy Co., Inc. | | | 8,049 | | | | 423,780 | |
Big Lots, Inc. (a) (c) | | | 2,075 | | | | 33,179 | |
Black & Decker Corp. (c) | | | 1,434 | | | | 99,878 | |
Brunswick Corp. (c) | | | 2,017 | | | | 34,390 | |
| Carnival Corp. | | | 10,018 | | | | 445,701 | |
| CBS Corporation | | | 15,708 | | | | 428,043 | |
Centex Corp. (c) | | | 2,824 | | | | 71,334 | |
Circuit City Stores, Inc. (c) | | | 3,261 | | | | 13,696 | |
Clear Channel Communications, Inc. (c) | | | 11,418 | | | | 394,149 | |
Coach, Inc. (a) | | | 8,442 | | | | 258,156 | |
Comcast Corp. - Class A (a) | | | 70,506 | | | | 1,287,440 | |
D.R. Horton, Inc. (c) | | | 6,452 | | | | 84,973 | |
| Darden Restaurants, Inc. | | | 3,152 | | | | 87,342 | |
Dillard’s, Inc. - Class A (c) | | | 1,310 | | | | 24,602 | |
The DIRECTV Group, Inc. (a) | | | 16,469 | | | | 380,763 | |
E.W. Scripps Co. (c) | | | 1,973 | | | | 88,805 | |
Eastman Kodak Co. (c) | | | 6,607 | | | | 144,495 | |
Expedia, Inc. (a) | | | 4,800 | | | | 151,776 | |
| Family Dollar Stores, Inc. | | | 3,223 | | | | 61,978 | |
Ford Motor Co. (a) (c) | | | 48,457 | | | | 326,116 | |
| Fortune Brands, Inc. | | | 3,537 | | | | 255,937 | |
GameStop Corp. (a) | | | 3,700 | | | | 229,807 | |
| Gannett Co., Inc. | | | 5,323 | | | | 207,597 | |
| The Gap, Inc. | | | 10,685 | | | | 227,377 | |
General Motors Corp. (c) | | | 12,984 | | | | 323,172 | |
| Genuine Parts Co. | | | 3,853 | | | | 178,394 | |
The Goodyear Tire & Rubber Co. (a) (c) | | | 4,275 | | | | 120,640 | |
| H&R Block, Inc. | | | 7,458 | | | | 138,495 | |
| Harley-Davidson, Inc. | | | 5,538 | | | | 258,680 | |
| Harman International Industries, Inc. | | | 1,387 | | | | 102,236 | |
| Harrah’s Entertainment, Inc. | | | 4,302 | | | | 381,803 | |
| Hasbro, Inc. | | | 3,374 | | | | 86,307 | |
| Home Depot, Inc. | | | 38,697 | | | | 1,042,497 | |
| IAC/InterActiveCorp (a) | | | 4,229 | | | | 113,845 | |
| International Game Technology | | | 7,234 | | | | 317,790 | |
Interpublic Group of Companies, Inc. (a) (c) | | | 10,538 | | | | 85,463 | |
| J.C. Penney Co., Inc. | | | 5,086 | | | | 223,733 | |
| Johnson Controls, Inc. | | | 13,620 | | | | 490,865 | |
Jones Apparel Group, Inc. (c) | | | 1,955 | | | | 31,260 | |
KB Home (c) | | | 1,817 | | | | 39,247 | |
Kohl’s Corp. (a) | | | 7,194 | | | | 329,485 | |
| Leggett & Platt, Inc. | | | 3,903 | | | | 68,068 | |
Lennar Corp. (c) | | | 3,261 | | | | 58,339 | |
| Limited Brands, Inc. | | | 7,126 | | | | 134,895 | |
Liz Claiborne, Inc. (c) | | | 2,283 | | | | 46,459 | |
| Lowe’s Companies, Inc. | | | 33,552 | | | | 758,946 | |
| Macys, Inc. | | | 9,940 | | | | 257,148 | |
| Marriott International, Inc. - Class A | | | 7,173 | | | | 245,173 | |
| Mattel, Inc. | | | 8,412 | | | | 160,164 | |
| McDonald’s Corp. | | | 27,125 | | | | 1,597,934 | |
| The McGraw-Hill Cos., Inc. | | | 7,543 | | | | 330,459 | |
| | | SHARES | | | VALUE | |
Consumer Discretionary - 8.3% (Continued) | | | | | | |
Meredith Corp. (c) | | | 921 | | | $ | 50,637 | |
The New York Times Co. - Class A (c) | | | 3,393 | | | | 59,479 | |
| Newell Rubbermaid, Inc. | | | 6,405 | | | | 165,761 | |
| News Corp. - Class A | | | 53,068 | | | | 1,087,363 | |
Nike, Inc. - Class B (c) | | | 8,810 | | | | 565,954 | |
Nordstrom, Inc. (c) | | | 4,311 | | | | 158,343 | |
Office Depot, Inc. (a) | | | 6,263 | | | | 87,118 | |
OfficeMax, Inc. (c) | | | 1,716 | | | | 35,453 | |
Omnicom Group, Inc. (c) | | | 7,496 | | | | 356,285 | |
| Polo Ralph Lauren Corp. | | | 1,351 | | | | 83,478 | |
Pulte Homes, Inc. (c) | | | 4,878 | | | | 51,414 | |
| RadioShack Corp. | | | 3,006 | | | | 50,681 | |
Sears Holdings Corp. (a) (c) | | | 1,672 | | | | 170,628 | |
| The Sherwin-Williams Co. | | | 2,392 | | | | 138,832 | |
| Snap-On, Inc. | | | 1,366 | | | | 65,896 | |
| The Stanley Works | | | 1,705 | | | | 82,658 | |
| Staples, Inc. | | | 16,214 | | | | 374,057 | |
Starbucks Corp. (a) | | | 16,748 | | | | 342,832 | |
| Starwood Hotels & Resorts Worldwide, Inc. | | | 4,569 | | | | 201,173 | |
| Target Corp. | | | 19,052 | | | | 952,600 | |
Tiffany & Co. (c) | | | 3,199 | | | | 147,250 | |
| Time Warner, Inc. | | | 82,882 | | | | 1,368,382 | |
| TJX Companies, Inc. | | | 10,025 | | | | 288,018 | |
| VF Corp. | | | 2,118 | | | | 145,422 | |
Viacom, Inc. - Class B (a) | | | 15,055 | | | | 661,216 | |
| The Walt Disney Co. | | | 43,607 | | | | 1,407,634 | |
| The Washington Post Co. - Class B | | | 135 | | | | 106,843 | |
| Wendy’s International, Inc. | | | 2,050 | | | | 52,972 | |
| Whirlpool Corp. | | | 1,775 | | | | 144,893 | |
| Wyndham Worldwide Corp. | | | 4,084 | | | | 96,219 | |
| Yum! Brands, Inc. | | | 11,669 | | | | 446,573 | |
| | | | | | | | 25,009,493 | |
Consumer Staples - 10.0% | | | | | | | | |
| Altria Group, Inc. | | | 48,304 | | | | 3,650,816 | |
| Anheuser-Busch Companies, Inc. | | | 16,827 | | | | 880,725 | |
| Archer-Daniels-Midland Co. | | | 14,742 | | | | 684,471 | |
| Avon Products, Inc. | | | 9,839 | | | | 388,936 | |
| Brown-Forman Corp. - Class B | | | 1,864 | | | | 138,141 | |
| Campbell Soup Co. | | | 5,114 | | | | 182,723 | |
Clorox Co. (c) | | | 3,227 | | | | 210,304 | |
| The Coca-Cola Co. | | | 45,586 | | | | 2,797,613 | |
| Coca-Cola Enterprises, Inc. | | | 6,622 | | | | 172,371 | |
| Colgate-Palmolive Co. | | | 11,691 | | | | 911,430 | |
| ConAgra Foods, Inc. | | | 11,164 | | | | 265,592 | |
Constellation Brands, Inc. - Class A (a) (c) | | | 4,446 | | | | 105,103 | |
| Costco Wholesale Corp. | | | 9,955 | | | | 694,461 | |
| CVS Caremark Corp. | | | 33,874 | | | | 1,346,492 | |
| Dean Foods Co. | | | 3,049 | | | | 78,847 | |
| The Estee Lauder Companies, Inc. | | | 2,612 | | | | 113,909 | |
| General Mills, Inc. | | | 7,698 | | | | 438,786 | |
The Hershey Co. (c) | | | 3,853 | | | | 151,808 | |
| HJ Heinz Co. | | | 7,269 | | | | 339,317 | |
| Kellogg Co. | | | 5,878 | | | | 308,184 | |
| Kimberly-Clark Corp. | | | 9,702 | | | | 672,737 | |
| Kraft Foods, Inc. | | | 35,477 | | | | 1,157,615 | |
| The Kroger Co. | | | 15,620 | | | | 417,210 | |
McCormick & Co., Inc. (c) | | | 2,930 | | | | 111,076 | |
| Molson Coors Brewing Co. - Class B | | | 3,228 | | | | 166,629 | |
The accompanying notes are an integral part of the financial statements.
Summit Mutual Funds, Inc. – Pinnacle Series |
| S&P 500 INDEX PORTFOLIO | SCHEDULE OF INVESTMENTS |
| | | SHARES | | | VALUE | |
Consumer Staples - 10.0% (Continued) | | | | | | |
| Pepsi Bottling Group, Inc. | | | 3,107 | | | $ | 122,602 | |
| PepsiCo, Inc. | | | 36,911 | | | | 2,801,545 | |
| Procter & Gamble Co. | | | 71,222 | | | | 5,229,119 | |
Reynolds American, Inc. (c) | | | 3,924 | | | | 258,827 | |
| Safeway, Inc. | | | 10,150 | | | | 347,232 | |
| Sara Lee Corp. | | | 16,606 | | | | 266,692 | |
| Supervalu, Inc. | | | 4,928 | | | | 184,899 | |
| Sysco Corp. | | | 13,945 | | | | 435,223 | |
| Tyson Foods, Inc. - Class A | | | 5,962 | | | | 91,398 | |
UST, Inc. (c) | | | 3,594 | | | | 196,951 | |
| Walgreen Co. | | | 22,744 | | | | 866,092 | |
| Wal-Mart Stores, Inc. | | | 54,180 | | | | 2,575,175 | |
Whole Foods Market, Inc. (c) | | | 3,198 | | | | 130,478 | |
| WM Wrigley Jr. Co. | | | 5,080 | | | | 297,434 | |
| | | | | | | | 30,188,963 | |
Energy - 12.5% | | | | | | | | |
| Anadarko Petroleum Corp. | | | 10,696 | | | | 702,620 | |
| Apache Corp. | | | 7,594 | | | | 816,659 | |
| Baker Hughes, Inc. | | | 7,300 | | | | 592,030 | |
| BJ Services Co. | | | 6,718 | | | | 162,979 | |
Chesapeake Energy Corp. (c) | | | 9,676 | | | | 379,299 | |
| Chevron Corp. | | | 48,420 | | | | 4,519,039 | |
| ConocoPhillips | | | 36,678 | | | | 3,238,667 | |
Consol Energy, Inc. (c) | | | 4,161 | | | | 297,595 | |
| Devon Energy Corp. | | | 10,204 | | | | 907,238 | |
El Paso Corp. (c) | | | 16,072 | | | | 277,081 | |
ENSCO International, Inc. (c) | | | 3,324 | | | | 198,177 | |
| EOG Resources, Inc. | | | 5,641 | | | | 503,459 | |
| Exxon Mobil Corp. | | | 125,280 | | | | 11,737,483 | |
| Halliburton Co. | | | 20,210 | | | | 766,161 | |
Hess Corp. (c) | | | 6,388 | | | | 644,294 | |
| Marathon Oil Corp. | | | 16,290 | | | | 991,409 | |
| Murphy Oil Corp. | | | 4,314 | | | | 366,000 | |
Nabors Industries Ltd. (a) (c) | | | 6,586 | | | | 180,391 | |
National Oilwell Varco, Inc. (a) | | | 8,180 | | | | 600,903 | |
| Noble Energy, Inc. | | | 3,937 | | | | 313,070 | |
| Noble Corp. | | | 6,148 | | | | 347,423 | |
| Occidental Petroleum Corp. | | | 19,000 | | | | 1,462,810 | |
| Peabody Energy Corp. | | | 6,073 | | | | 374,340 | |
Range Resources Corp. (c) | | | 3,420 | | | | 175,651 | |
Rowan Companies, Inc. (c) | | | 2,552 | | | | 100,702 | |
| Schlumberger Ltd. | | | 27,435 | | | | 2,698,781 | |
Smith International, Inc. (c) | | | 4,597 | | | | 339,488 | |
| Spectra Energy Corp. | | | 14,499 | | | | 374,364 | |
| Sunoco, Inc. | | | 2,697 | | | | 195,371 | |
Tesoro Corp. (c) | | | 3,143 | | | | 149,921 | |
Transocean, Inc. (a) | | | 7,358 | | | | 1,053,254 | |
| Valero Energy Corp. | | | 12,622 | | | | 883,919 | |
Weatherford International Ltd. (a) | | | 7,739 | | | | 530,895 | |
| Williams Companies, Inc. | | | 13,614 | | | | 487,109 | |
XTO Energy, Inc. (c) | | | 10,978 | | | | 563,804 | |
| | | | | | | | 37,932,386 | |
Financials - 17.1% | | | | | | | | |
| ACE Ltd. | | | 7,559 | | | | 466,995 | |
| Aflac, Inc. | | | 11,190 | | | | 700,830 | |
| The Allstate Corp. | | | 13,092 | | | | 683,795 | |
AMBAC Financial Group, Inc. (c) | | | 2,419 | | | | 62,338 | |
American Capital Strategies Ltd. (c) | | | 4,140 | | | | 136,454 | |
| | | SHARES | | | VALUE | |
Financials - 17.1% (Continued) | | | | | | |
| American Express Co. | | | 26,830 | | | $ | 1,395,697 | |
| American International Group, Inc. | | | 58,166 | | | | 3,391,078 | |
| Ameriprise Financial, Inc. | | | 5,318 | | | | 293,075 | |
| AON Corp. | | | 6,733 | | | | 321,097 | |
Apartment Investment & Management Co. (c) | | | 2,192 | | | | 76,128 | |
Assurant, Inc. (c) | | | 2,191 | | | | 146,578 | |
AvalonBay Communities, Inc. (c) | | | 1,780 | | | | 167,569 | |
| Bank of America Corp. | | | 101,770 | | | | 4,199,030 | |
| The Bank Of New York Mellon Corp. | | | 26,115 | | | | 1,273,367 | |
| BB&T Corp. | | | 12,603 | | | | 386,534 | |
The Bear Stearns Companies, Inc. (c) | | | 2,648 | | | | 233,686 | |
Boston Properties, Inc. (c) | | | 2,769 | | | | 254,222 | |
| Capital One Financial Corp. | | | 8,950 | | | | 422,977 | |
CB Richard Ellis Group, Inc. (a) (c) | | | 4,400 | | | | 94,820 | |
| The Charles Schwab Corp. | | | 21,488 | | | | 549,018 | |
| Chubb Corp. | | | 8,804 | | | | 480,522 | |
| Cincinnati Financial Corp. | | | 3,808 | | | | 150,568 | |
| CIT Group, Inc. | | | 4,349 | | | | 104,507 | |
| Citigroup, Inc. | | | 114,511 | | | | 3,371,204 | |
| CME Group, Inc. | | | 1,260 | | | | 864,360 | |
| Comerica, Inc. | | | 3,465 | | | | 150,832 | |
| Commerce Bancorp, Inc. | | | 4,441 | | | | 169,380 | |
Countrywide Financial Corp. (c) | | | 13,284 | | | | 118,759 | |
Developers Diversified Realty Corp. (c) | | | 2,818 | | | | 107,901 | |
| Discover Financial Services | | | 10,951 | | | | 165,141 | |
E*Trade Financial Corp. (a) (c) | | | 9,717 | | | | 34,495 | |
| Equity Residential | | | 6,216 | | | | 226,698 | |
| Fannie Mae | | | 22,447 | | | | 897,431 | |
Federated Investors, Inc. (c) | | | 2,037 | | | | 83,843 | |
| Fifth Third Bancorp | | | 12,219 | | | | 307,064 | |
First Horizon National Corp. (c) | | | 2,973 | | | | 53,960 | |
| Franklin Resources, Inc. | | | 3,708 | | | | 424,306 | |
| Freddie Mac | | | 15,138 | | | | 515,752 | |
| General Growth Properties, Inc. | | | 5,592 | | | | 230,279 | |
| Genworth Financial, Inc. | | | 9,857 | | | | 250,861 | |
| Goldman Sachs Group, Inc. | | | 9,122 | | | | 1,961,686 | |
| Hartford Financial Services Group, Inc. | | | 7,197 | | | | 627,506 | |
| Host Hotels & Resorts, Inc. | | | 11,979 | | | | 204,122 | |
Hudson City Bancorp, Inc. (c) | | | 11,413 | | | | 171,423 | |
Huntington Bancshares, Inc. (c) | | | 8,396 | | | | 123,925 | |
Intercontinentalexchange, Inc. (a) | | | 1,650 | | | | 317,625 | |
Janus Capital Group, Inc. (c) | | | 3,518 | | | | 115,566 | |
| JPMorgan Chase & Co. | | | 77,040 | | | | 3,362,796 | |
| KeyCorp | | | 8,919 | | | | 209,151 | |
Kimco Realty Corp. (c) | | | 5,787 | | | | 210,647 | |
| Legg Mason, Inc. | | | 3,140 | | | | 229,691 | |
| Lehman Brothers Holdings, Inc. | | | 12,156 | | | | 795,489 | |
Leucadia National Corp. (c) | | | 3,880 | | | | 182,748 | |
| Lincoln National Corp. | | | 6,190 | | | | 360,382 | |
| Loews Corp. | | | 10,080 | | | | 507,427 | |
| M&T Bank Corp. | | | 1,786 | | | | 145,684 | |
| Marsh & McLennan Companies, Inc. | | | 11,927 | | | | 315,708 | |
| Marshall & Ilsley Corp. | | | 5,896 | | | | 156,126 | |
MBIA, Inc. (c) | | | 2,880 | | | | 53,654 | |
Merrill Lynch & Co., Inc. (c) | | | 19,625 | | | | 1,053,470 | |
| MetLife, Inc. | | | 16,985 | | | | 1,046,616 | |
MGIC Investment Corp. (c) | | | 1,962 | | | | 44,008 | |
Moody’s Corp. (c) | | | 4,917 | | | | 175,537 | |
| Morgan Stanley | | | 24,339 | | | | 1,292,644 | |
The accompanying notes are an integral part of the financial statements.
Summit Mutual Funds, Inc. – Pinnacle Series |
| SCHEDULE OF INVESTMENTS | S&P 500 INDEX PORTFOLIO |
| | | SHARES | | | VALUE | |
Financials - 17.1% (Continued) | | | | | | |
National City Corp. (c) | | | 14,537 | | | $ | 239,279 | |
| Northern Trust Corp. | | | 4,467 | | | | 342,083 | |
| NYSE Euronext | | | 6,090 | | | | 534,519 | |
Plum Creek Timber Co., Inc. (c) | | | 3,953 | | | | 181,996 | |
| PNC Financial Services Group, Inc. | | | 8,017 | | | | 526,316 | |
| Principal Financial Group, Inc. | | | 6,001 | | | | 413,109 | |
| The Progressive Corp. | | | 16,008 | | | | 306,713 | |
| Prologis | | | 5,910 | | | | 374,576 | |
| Prudential Financial, Inc. | | | 10,414 | | | | 968,919 | |
| Public Storage, Inc. | | | 2,938 | | | | 215,679 | |
Regions Financial Corp. (c) | | | 15,945 | | | | 377,099 | |
| Safeco Corp. | | | 2,205 | | | | 122,774 | |
| Simon Property Group, Inc. | | | 5,115 | | | | 444,289 | |
| SLM Corp. | | | 11,793 | | | | 237,511 | |
Sovereign Bancorp, Inc. (c) | | | 8,265 | | | | 94,221 | |
| State Street Corp. | | | 8,857 | | | | 719,188 | |
| SunTrust Banks, Inc. | | | 8,009 | | | | 500,482 | |
| T. Rowe Price Group, Inc. | | | 6,055 | | | | 368,628 | |
| Torchmark Corp. | | | 2,114 | | | | 127,960 | |
| The Travelers Companies, Inc. | | | 14,786 | | | | 795,487 | |
| Unum Group | | | 8,098 | | | | 192,651 | |
| US Bancorp | | | 39,605 | | | | 1,257,063 | |
| Vornado Realty Trust | | | 3,119 | | | | 274,316 | |
| Wachovia Corp. | | | 45,308 | | | | 1,723,063 | |
Washington Mutual, Inc. (c) | | | 19,920 | | | | 271,111 | |
| Wells Fargo & Co. | | | 77,374 | | | | 2,335,921 | |
| XL Capital Ltd. - Class A | | | 4,090 | | | | 205,768 | |
| Zions Bancorporation | | | 2,478 | | | | 115,698 | |
| | | | | | | | 51,893,201 | |
Health Care - 11.7% | | | | | | | | |
| Abbott Laboratories | | | 35,433 | | | | 1,989,563 | |
| Aetna, Inc. | | | 11,478 | | | | 662,625 | |
| Allergan, Inc. | | | 7,041 | | | | 452,314 | |
| AmerisourceBergen Corp. | | | 3,852 | | | | 172,839 | |
Amgen, Inc. (a) | | | 24,940 | | | | 1,158,214 | |
Applera Corp. - Applied Biosystems Group (c) | | | 3,857 | | | | 130,829 | |
Barr Pharmaceuticals, Inc. (a) (c) | | | 2,560 | | | | 135,936 | |
| Baxter International, Inc. | | | 14,542 | | | | 844,163 | |
| Becton, Dickinson & Co. | | | 5,594 | | | | 467,547 | |
Biogen Idec, Inc. (a) | | | 6,752 | | | | 384,324 | |
Boston Scientific Corp. (a) | | | 30,792 | | | | 358,111 | |
| Bristol-Myers Squibb Co. | | | 45,367 | | | | 1,203,133 | |
C.R. Bard, Inc. (c) | | | 2,338 | | | | 221,642 | |
| Cardinal Health, Inc. | | | 8,291 | | | | 478,805 | |
Celgene Corp. (a) | | | 8,848 | | | | 408,866 | |
| CIGNA Corp. | | | 6,403 | | | | 344,033 | |
Coventry Health Care, Inc. (a) | | | 3,554 | | | | 210,575 | |
| Covidien Ltd. | | | 11,420 | | | | 505,792 | |
| Eli Lilly & Co. | | | 22,629 | | | | 1,208,162 | |
Express Scripts, Inc. (a) | | | 5,781 | | | | 422,013 | |
Forest Laboratories, Inc. (a) | | | 7,151 | | | | 260,654 | |
Genzyme Corp. (a) | | | 6,192 | | | | 460,933 | |
Gilead Sciences, Inc. (a) | | | 21,347 | | | | 982,175 | |
Hospira, Inc. (a) (c) | | | 3,687 | | | | 157,214 | |
Humana, Inc. (a) | | | 3,969 | | | | 298,905 | |
| IMS Health, Inc. | | | 4,451 | | | | 102,551 | |
| Johnson & Johnson | | | 65,620 | | | | 4,376,854 | |
King Pharmaceuticals, Inc. (a) | | | 5,611 | | | | 57,457 | |
Laboratory Corp. of America Holdings (a) (c) | | | 2,642 | | | | 199,550 | |
| | | SHARES | | | VALUE | |
Health Care - 11.7% (Continued) | | | | | | |
| McKesson Corp. | | | 6,638 | | | $ | 434,855 | |
Medco Health Solutions, Inc. (a) | | | 6,135 | | | | 622,089 | |
| Medtronic, Inc. | | | 25,936 | | | | 1,303,803 | |
| Merck & Co., Inc. | | | 49,917 | | | | 2,900,677 | |
Millipore Corp. (a) (c) | | | 1,304 | | | | 95,427 | |
Mylan, Inc. (c) | | | 5,072 | | | | 71,312 | |
Patterson Companies, Inc. (a) (c) | | | 3,207 | | | | 108,878 | |
| PerkinElmer, Inc. | | | 2,720 | | | | 70,774 | |
| Pfizer, Inc. | | | 156,674 | | | | 3,561,200 | |
Quest Diagnostics, Inc. (c) | | | 3,597 | | | | 190,281 | |
| Schering-Plough Corp. | | | 37,154 | | | | 989,783 | |
St. Jude Medical, Inc. (a) | | | 7,851 | | | | 319,065 | |
| Stryker Corp. | | | 5,462 | | | | 408,121 | |
Tenet Healthcare Corp. (a) (c) | | | 10,871 | | | | 55,225 | |
Thermo Fisher Scientific, Inc. (a) | | | 9,674 | | | | 557,996 | |
| UnitedHealth Group, Inc. | | | 29,634 | | | | 1,724,699 | |
Varian Medical Systems, Inc. (a) | | | 2,869 | | | | 149,647 | |
Waters Corp. (a) | | | 2,400 | | | | 189,768 | |
Watson Pharmaceuticals, Inc. (a) | | | 2,460 | | | | 66,764 | |
Wellpoint, Inc. (a) | | | 13,101 | | | | 1,149,351 | |
| Wyeth | | | 30,707 | | | | 1,356,942 | |
Zimmer Holdings, Inc. (a) | | | 5,383 | | | | 356,085 | |
| | | | | | | | 35,338,521 | |
Industrials - 11.2% | | | | | | | | |
| 3M Co. | | | 16,357 | | | | 1,379,222 | |
Allied Waste Industries, Inc. (a) (c) | | | 5,518 | | | | 60,808 | |
Avery Dennison Corp. (c) | | | 2,166 | | | | 115,101 | |
| Boeing Co. | | | 17,780 | | | | 1,555,039 | |
| Burlington Northern Santa Fe Corp. | | | 6,834 | | | | 568,794 | |
C.H. Robinson Worldwide, Inc. (c) | | | 3,895 | | | | 210,797 | |
| Caterpillar, Inc. | | | 14,591 | | | | 1,058,723 | |
| Cintas Corp. | | | 3,097 | | | | 104,121 | |
| Cooper Industries Ltd. - Class A | | | 4,133 | | | | 218,553 | |
| CSX Corp. | | | 9,641 | | | | 424,011 | |
| Cummins, Inc. | | | 2,352 | | | | 299,574 | |
| Danaher Corp. | | | 5,682 | | | | 498,539 | |
| Deere & Co. | | | 10,177 | | | | 947,682 | |
Dover Corp. (c) | | | 4,558 | | | | 210,078 | |
| Eaton Corp. | | | 3,455 | | | | 334,962 | |
| Emerson Electric Co. | | | 18,051 | | | | 1,022,770 | |
| Equifax, Inc. | | | 2,951 | | | | 107,298 | |
| Expeditors International Washington, Inc. | | | 4,900 | | | | 218,932 | |
| FedEx Corp. | | | 7,090 | | | | 632,215 | |
| Fluor Corp. | | | 2,113 | | | | 307,906 | |
| General Dynamics Corp. | | | 9,228 | | | | 821,200 | |
| General Electric Co. | | | 231,795 | | | | 8,592,641 | |
| Goodrich Corp. | | | 2,865 | | | | 202,298 | |
| Honeywell International, Inc. | | | 17,124 | | | | 1,054,325 | |
| Illinois Tool Works, Inc. | | | 9,480 | | | | 507,559 | |
| Ingersoll-Rand Company Ltd. - Class A | | | 6,247 | | | | 290,298 | |
| ITT Corp. | | | 4,159 | | | | 274,660 | |
Jacobs Engineering Group, Inc. (a) | | | 2,860 | | | | 273,445 | |
| L-3 Communications Holdings, Inc. | | | 2,887 | | | | 305,849 | |
| Lockheed Martin Corp. | | | 7,957 | | | | 837,554 | |
Manitowoc Co. (c) | | | 2,920 | | | | 142,584 | |
Masco Corp. (c) | | | 8,457 | | | | 182,756 | |
Monster Worldwide, Inc. (a) (c) | | | 2,935 | | | | 95,094 | |
| Norfolk Southern Corp. | | | 8,885 | | | | 448,159 | |
| Northrop Grumman Corp. | | | 7,761 | | | | 610,325 | |
The accompanying notes are an integral part of the financial statements.
Summit Mutual Funds, Inc. – Pinnacle Series |
| S&P 500 INDEX PORTFOLIO | SCHEDULE OF INVESTMENTS |
| | | SHARES | | | VALUE | |
Industrials - 11.2% (Continued) | | | | | | |
| Paccar, Inc. | | | 8,451 | | | $ | 460,410 | |
| Pall Corp. | | | 2,907 | | | | 117,210 | |
| Parker Hannifin Corp. | | | 3,860 | | | | 290,697 | |
| Pitney Bowes, Inc. | | | 4,974 | | | | 189,211 | |
| Precision Castparts Corp. | | | 3,160 | | | | 438,292 | |
| Raytheon Co. | | | 9,844 | | | | 597,531 | |
Robert Half International, Inc. (c) | | | 3,696 | | | | 99,940 | |
| Rockwell Automation, Inc. | | | 3,424 | | | | 236,119 | |
| Rockwell Collins, Inc. | | | 3,739 | | | | 269,096 | |
RR Donnelley & Sons Co. (c) | | | 4,923 | | | | 185,794 | |
Ryder System, Inc. (c) | | | 1,331 | | | | 62,570 | |
| Southwest Airlines Co. | | | 16,845 | | | | 205,509 | |
Terex Corp. (a) (c) | | | 2,354 | | | | 154,352 | |
| Textron, Inc. | | | 5,720 | | | | 407,836 | |
| Trane, Inc. | | | 3,931 | | | | 183,617 | |
| Tyco International Ltd. | | | 11,349 | | | | 449,988 | |
| Union Pacific Corp. | | | 6,022 | | | | 756,484 | |
| United Parcel Service, Inc. - Class B | | | 24,093 | | | | 1,703,857 | |
| United Technologies Corp. | | | 22,670 | | | | 1,735,162 | |
| W.W. Grainger, Inc. | | | 1,545 | | | | 135,218 | |
| Waste Management, Inc. | | | 11,660 | | | | 380,932 | |
| | | | | | | | 33,973,697 | |
Information Technology - 16.4% | | | | | | | | |
Adobe Systems, Inc. (a) | | | 13,160 | | | | 562,327 | |
Advanced Micro Devices, Inc. (a) (c) | | | 13,038 | | | | 97,785 | |
Affiliated Computer Services, Inc. - Class A (a) | | | 2,305 | | | | 103,956 | |
Agilent Technologies, Inc. (a) | | | 8,866 | | | | 325,737 | |
Akamai Technologies, Inc. (a) (c) | | | 3,812 | | | | 131,895 | |
| Altera Corp. | | | 7,702 | | | | 148,803 | |
| Analog Devices, Inc. | | | 6,956 | | | | 220,505 | |
Apple, Inc. (a) | | | 20,078 | | | | 3,977,050 | |
| Applied Materials, Inc. | | | 31,600 | | | | 561,216 | |
Autodesk, Inc. (a) | | | 5,295 | | | | 263,479 | |
| Automatic Data Processing, Inc. | | | 12,069 | | | | 537,433 | |
BMC Software, Inc. (a) | | | 4,490 | | | | 160,024 | |
Broadcom Corp. - Class A (a) | | | 10,789 | | | | 282,024 | |
| CA, Inc. | | | 9,060 | | | | 226,047 | |
Ciena Corp. (a) (c) | | | 2,028 | | | | 69,175 | |
Cisco Systems, Inc. (a) | | | 139,016 | | | | 3,763,163 | |
Citrix Systems, Inc. (a) | | | 4,269 | | | | 162,265 | |
Cognizant Technology Solutions Corp. (a) | | | 6,660 | | | | 226,040 | |
Computer Sciences Corp. (a) | | | 4,082 | | | | 201,937 | |
Compuware Corp. (a) | | | 6,570 | | | | 58,342 | |
Convergys Corp. (a) | | | 2,987 | | | | 49,166 | |
| Corning, Inc. | | | 36,134 | | | | 866,855 | |
Dell, Inc. (a) | | | 51,386 | | | | 1,259,471 | |
eBay, Inc. (a) | | | 26,086 | | | | 865,794 | |
Electronic Arts, Inc. (a) | | | 7,306 | | | | 426,744 | |
| Electronic Data Systems Corp. | | | 11,743 | | | | 243,432 | |
EMC Corp. (a) | | | 48,112 | | | | 891,515 | |
| Fidelity National Information Services, Inc. | | | 3,846 | | | | 159,955 | |
Fiserv, Inc. (a) | | | 3,776 | | | | 209,530 | |
Google, Inc. (a) | | | 5,310 | | | | 3,671,759 | |
| Hewlett-Packard Co. | | | 59,115 | | | | 2,984,125 | |
| Intel Corp. | | | 134,071 | | | | 3,574,333 | |
| International Business Machines Corp. | | | 31,599 | | | | 3,415,852 | |
Intuit, Inc. (a) | | | 7,630 | | | | 241,184 | |
| Jabil Circuit, Inc. | | | 4,296 | | | | 65,600 | |
JDS Uniphase Corp. (a) (c) | | | 4,991 | | | | 66,380 | |
| | | SHARES | | | VALUE | |
Information Technology - 16.4% (Continued) | | | | | | |
Juniper Networks, Inc. (a) | | | 12,000 | | | $ | 398,400 | |
Kla-Tencor Corp. (c) | | | 4,247 | | | | 204,536 | |
Lexmark International, Inc. - Class A (a) | | | 2,228 | | | | 77,668 | |
Linear Technology Corp. (c) | | | 5,175 | | | | 164,720 | |
LSI Corp. (a) (c) | | | 16,217 | | | | 86,112 | |
MEMC Electronic Materials, Inc. (a) (c) | | | 5,300 | | | | 468,997 | |
Microchip Technology, Inc. (c) | | | 4,914 | | | | 154,398 | |
Micron Technology, Inc. (a) | | | 17,437 | | | | 126,418 | |
Microsoft Corp. (e) | | | 184,536 | | | | 6,569,482 | |
| Molex, Inc. | | | 3,347 | | | | 91,373 | |
| Motorola, Inc. | | | 52,411 | | | | 840,672 | |
| National Semiconductor Corp. | | | 5,391 | | | | 122,052 | |
Network Appliance, Inc. (a) (c) | | | 7,893 | | | | 197,009 | |
Novell, Inc. (a) | | | 8,012 | | | | 55,042 | |
Novellus Systems, Inc. (a) | | | 2,665 | | | | 73,474 | |
Nvidia Corp. (a) | | | 12,625 | | | | 429,503 | |
Oracle Corp. (a) | | | 90,461 | | | | 2,042,609 | |
| Paychex, Inc. | | | 7,652 | | | | 277,155 | |
QLogic Corp. (a) | | | 3,191 | | | | 45,312 | |
| Qualcomm, Inc. | | | 37,534 | | | | 1,476,963 | |
SanDisk Corp. (a) | | | 5,299 | | | | 175,768 | |
Sun Microsystems, Inc. (a) | | | 19,000 | | | | 344,470 | |
Symantec Corp. (a) | | | 19,887 | | | | 320,976 | |
Tellabs, Inc. (a) (c) | | | 10,085 | | | | 65,956 | |
Teradata Corp. (a) | | | 4,232 | | | | 115,999 | |
Teradyne, Inc. (a) | | | 3,982 | | | | 41,174 | |
| Texas Instruments, Inc. | | | 32,070 | | | | 1,071,138 | |
Total Sys Svcs, Inc. (a) | | | 4,540 | | | | 127,120 | |
| Tyco Electronics Ltd. | | | 11,413 | | | | 423,765 | |
Unisys Corp. (a) | | | 7,990 | | | | 37,793 | |
VeriSign, Inc. (a) | | | 5,068 | | | | 190,608 | |
| The Western Union Co. | | | 17,226 | | | | 418,247 | |
Xerox Corp. (a) | | | 21,197 | | | | 343,179 | |
| Xilinx, Inc. | | | 6,742 | | | | 147,448 | |
Yahoo!, Inc. (a) | | | 30,657 | | | | 713,082 | |
| | | | | | | | 49,509,516 | |
Materials - 3.2% | | | | | | | | |
| Air Products & Chemicals, Inc. | | | 4,942 | | | | 487,430 | |
| Alcoa, Inc. | | | 19,453 | | | | 711,007 | |
| Allegheny Technologies, Inc. | | | 2,437 | | | | 210,557 | |
| Ashland, Inc. | | | 1,366 | | | | 64,789 | |
Ball Corp. (c) | | | 2,305 | | | | 103,725 | |
Bemis Co. (c) | | | 2,307 | | | | 63,166 | |
| The Dow Chemical Co. | | | 21,661 | | | | 853,877 | |
| Eastman Chemical Co. | | | 1,859 | | | | 113,566 | |
| Ecolab, Inc. | | | 4,006 | | | | 205,147 | |
| EI Du Pont de Nemours & Co. | | | 20,620 | | | | 909,136 | |
| Freeport-McMoRan Copper & Gold, Inc. - Class B | | | 8,858 | | | | 907,414 | |
| Hercules, Inc. | | | 2,743 | | | | 53,077 | |
| International Flavors & Fragrances, Inc. | | | 1,831 | | | | 88,126 | |
| International Paper Co. | | | 9,821 | | | | 318,004 | |
| MeadWestvaco Corp. | | | 4,314 | | | | 135,028 | |
| Monsanto Co. | | | 12,540 | | | | 1,400,593 | |
| Newmont Mining Corp. | | | 10,363 | | | | 506,025 | |
| Nucor Corp. | | | 6,603 | | | | 391,030 | |
Pactiv Corp. (a) (c) | | | 3,072 | | | | 81,807 | |
| PPG Industries, Inc. | | | 3,758 | | | | 263,924 | |
| Praxair, Inc. | | | 7,247 | | | | 642,881 | |
| Rohm & Haas Co. | | | 2,962 | | | | 157,193 | |
The accompanying notes are an integral part of the financial statements.
Summit Mutual Funds, Inc. – Pinnacle Series |
| SCHEDULE OF INVESTMENTS | S&P 500 INDEX PORTFOLIO |
| | | SHARES | | | VALUE | |
Materials - 3.2% (Continued) | | | | | | |
Sealed Air Corp. (c) | | | 3,707 | | | $ | 85,780 | |
Sigma-Aldrich Corp. (c) | | | 2,984 | | | | 162,926 | |
Titanium Metals Corp. (a) (c) | | | 2,040 | | | | 53,958 | |
| United States Steel Corp. | | | 2,725 | | | | 329,480 | |
Vulcan Materials Co. (c) | | | 2,247 | | | | 177,715 | |
| Weyerhaeuser Co. | | | 4,808 | | | | 354,542 | |
| | | | | | | | 9,831,903 | |
Telecommunication Services - 3.5% | | | | | | | | |
American Tower Corp. - Class A (a) | | | 9,283 | | | | 395,456 | |
| AT&T, Inc. | | | 139,097 | | | | 5,780,871 | |
CenturyTel, Inc. (c) | | | 2,532 | | | | 104,977 | |
| Citizens Communications Co. | | | 7,522 | | | | 95,755 | |
| Embarq Corp. | | | 3,597 | | | | 178,159 | |
Qwest Communications International, Inc. (a) (c) | | | 36,056 | | | | 252,753 | |
| Sprint Nextel Corp. | | | 65,263 | | | | 856,903 | |
| Verizon Communications, Inc. | | | 66,275 | | | | 2,895,555 | |
| Windstream Corp. | | | 10,949 | | | | 142,556 | |
| | | | | | | | 10,702,985 | |
Utilities - 3.5% | | | | | | | | |
The AES Corp. (a) | | | 15,346 | | | | 328,251 | |
Allegheny Energy, Inc. (a) | | | 3,812 | | | | 242,481 | |
| Ameren Corp. | | | 4,860 | | | | 263,461 | |
| American Electric Power Co., Inc. | | | 9,173 | | | | 427,095 | |
| Centerpoint Energy, Inc. | | | 7,371 | | | | 126,265 | |
CMS Energy Corp. (c) | | | 5,162 | | | | 89,716 | |
| Consolidated Edison, Inc. | | | 5,921 | | | | 289,241 | |
| Constellation Energy Group, Inc. | | | 4,144 | | | | 424,884 | |
| Dominion Resources, Inc. | | | 13,413 | | | | 636,447 | |
DTE Energy Co. (c) | | | 3,755 | | | | 165,070 | |
| Duke Energy Corporation | | | 28,929 | | | | 583,498 | |
Dynegy, Inc. (a) (c) | | | 11,384 | | | | 81,282 | |
| Edison International | | | 7,471 | | | | 398,727 | |
| Entergy Corp. | | | 4,456 | | | | 532,581 | |
| Exelon Corp. | | | 15,133 | | | | 1,235,458 | |
| FirstEnergy Corp. | | | 6,991 | | | | 505,729 | |
| FPL Group, Inc. | | | 9,337 | | | | 632,862 | |
| Integrys Energy Group, Inc. | | | 1,780 | | | | 92,008 | |
Nicor, Inc. (c) | | | 1,117 | | | | 47,305 | |
| NiSource, Inc. | | | 6,291 | | | | 118,837 | |
| Pepco Holdings, Inc. | | | 4,500 | | | | 131,985 | |
| | | SHARES | | | VALUE | |
Utilities - 3.5% (Continued) | | | | | | |
| PG&E Corp. | | | 8,119 | | | $ | 349,848 | |
Pinnacle West Capital Corp. (c) | | | 2,391 | | | | 101,402 | |
| PPL Corp. | | | 8,535 | | | | 444,588 | |
| Progress Energy, Inc. | | | 5,988 | | | | 289,999 | |
| Public Service Enterprise Group, Inc. | | | 5,832 | | | | 572,936 | |
| Questar Corp. | | | 3,960 | | | | 214,236 | |
| Sempra Energy | | | 5,996 | | | | 371,032 | |
| Southern Co. | | | 17,415 | | | | 674,831 | |
TECO Energy, Inc. (c) | | | 4,834 | | | | 83,193 | |
| Xcel Energy, Inc. | | | 9,640 | | | | 217,575 | |
| | | | | | | | 10,672,823 | |
| TOTAL COMMON STOCKS | | | | | | | | |
| (Cost $202,155,889) | | | | | | | 295,053,488 | |
| | | | | | | | | |
SHORT TERM INVESTMENTS (e) - 1.2% | | | | | | | | |
Money Market Funds - 0.4% | | | | | | | | |
| Northern Institutional Diversified Assets Portfolio | | | 1,308,251 | | | | 1,308,251 | |
| | | | | | | | | |
| | | PRINCIPAL | | | | | |
| | | AMOUNT | | | VALUE | |
U.S. Treasury Bills - 0.8% | | | | | | | | |
| 2.886%, 03/13/2008 | | $ | 2,000,000 | | | $ | 1,987,870 | |
| 2.995%, 03/13/2008 | | | 250,000 | | | | 248,484 | |
| TOTAL SHORT TERM INVESTMENTS | | | | | | | | |
| (Cost $3,545,445) | | | | | | | 3,544,605 | |
Total Investments (Cost $205,701,334) (b) - 98.6% | | | | | | | 298,598,093 | |
Northern Institutional Liquid Assets Portfolio (d) - 6.2% | | | | | | | 18,671,468 | |
Liabilities in Excess of Other Assets - (4.8)% | | | | | | | (14,448,826 | ) |
TOTAL NET ASSETS - 100.0% | | | | | | $ | 302,820,735 | |
| (a) | Non-income producing security. |
| (b) | For federal income tax purposes, cost is $206,330,652 and gross unrealized appreciation and depreciation of securities as of December 31, 2007 was $109,451,818, and ($17,184,377), respectively, with a net appreciation / (depreciation) of $92,267,441. |
| (c) | All or a portion of the security is out on loan. |
| (d) | This security was purchased with cash collateral held from securities lending. The market values of the securities on loan, the collateral purchased with cash, and the noncash collateral accepted are $18,257,935, $18,671,468, and $82,683, respectively. |
| (e) | Securities and other assets with an aggregate value of $9,232,500 have been segregated with the custodian or designated to cover margin requirements for the following open futures contracts as of December 31, 2007: |
| | | Unrealized | |
| | | Appreciation/ | |
| Type | Contracts | (Depreciation) | |
| S&P 500 Index (03/08) | 25 | ($42,512) | |
The accompanying notes are an integral part of the financial statements.
Summit Mutual Funds, Inc. – Pinnacle Series |
| S&P 500 INDEX PORTFOLIO | FINANCIAL STATEMENTS |
STATEMENT OF ASSETS AND LIABILITIES | | | |
December 31, 2007 | | | |
| | | | |
| ASSETS | | | |
| Investments in securities, at value | | $ | 298,598,093 | |
| Collateral for securities loaned, | | | | |
| at fair value | | | 18,671,468 | |
| Receivables: | | | | |
| Securities sold | | | 8,167,607 | |
| Shares sold | | | 41,677 | |
| Interest and dividends | | | 454,422 | |
| Prepaid expenses and other | | | 8,851 | |
| | | | 325,942,118 | |
| LIABILITIES | | | | |
| Payables: | | | | |
| Payable upon return of securities loaned | | | 18,671,468 | |
| Payable for securities purchased | | | 2,273,177 | |
| Shares redeemed | | | 1,925,539 | |
| Variation margin | | | 53,683 | |
| Bank overdraft | | | 103 | |
| Advisory fees | | | 44,478 | |
| Royalty fees | | | 37,457 | |
| Professional fees | | | 29,690 | |
| Fund accounting fees | | | 29,414 | |
| Administration fees | | | 26,216 | |
| Custodian fees | | | 8,472 | |
| Directors’ fees | | | 604 | |
| Other accrued expenses | | | 21,082 | |
| | | | 23,121,383 | |
| NET ASSETS* | | | | |
| Paid-in capital | | | 203,310,066 | |
| Accumulated undistributed net investment | | | | |
| income / (loss) | | | 4,029,732 | |
| Accumulated net realized gain / (loss) | | | | |
| on investments and futures contracts | | | 2,626,690 | |
| Net unrealized appreciation / (depreciation) | | | | |
| on investments and futures contracts | | | 92,854,247 | |
| | | $ | 302,820,735 | |
| Investments at cost | | $ | 205,701,334 | |
| Shares authorized ($.10 par value) | | | 30,000,000 | |
| NET ASSET VALUE (NAV) BY SHARE CLASS | | | | | |
| | | | | | |
| Share Class | Net Assets | Outstanding | | Per Share | |
| Class I | $302,820,735 | | | $ | 97.44 | |
| * | FEDERAL TAX DATA AS OF DECEMBER 31, 2007 | | |
| | Percentage of ordinary distributions designated as | | |
| | qualified dividend income | | 100% |
| | Dividends received deduction for corporate shareholders | | 100% |
| | Undistributed ordinary income | $ | |
| | Undistributed long-term gains | $ | 3,207,788 |
| | Unrealized appreciation | $ | 92,224,929 |
STATEMENT OF OPERATIONS | | | |
For the year ended December 31, 2007 | | | |
| | | | |
| INVESTMENT INCOME | | | |
| Interest | | $ | 11,393 | |
| Dividends | | | 6,182,333 | |
| Other income | | | 27,581 | |
| | | | 6,221,307 | |
| EXPENSES | | | | |
| Advisory fees | | | 786,587 | |
| Administration fees | | | 314,635 | |
| Fund accounting fees | | | 72,309 | |
| Professional fees | | | 53,118 | |
| Royalty fee | | | 38,246 | |
| Directors’ fees | | | 37,802 | |
| Shareholder reporting fees | | | 31,878 | |
| Custodian fees | | | 31,352 | |
| Transfer agent fees | | | 17,717 | |
| Other expenses | | | 30,648 | |
| | | | 1,414,292 | |
| Reimbursements and waivers | | | (187,215 | ) |
| | | | 1,227,077 | |
| NET INVESTMENT INCOME / (LOSS) | | | 4,994,230 | |
| | | | | |
| REALIZED AND UNREALIZED GAIN / (LOSS) | | | | |
| Net realized gain / (loss) on investments | | | 6,330,458 | |
| Net realized gain / (loss) on futures contracts | | | 67,669 | |
| | | | 6,398,127 | |
| Net change in unrealized appreciation / | | | | |
| (depreciation) on investments and | | | | |
| futures contracts | | | 4,451,818 | |
| | | | | |
| NET REALIZED AND UNREALIZED | | | | |
| GAIN / (LOSS) | | | 10,849,945 | |
| | | | | |
| NET INCREASE / (DECREASE) | | | | |
| IN NET ASSETS FROM OPERATIONS | | $ | 15,844,175 | |
| TRANSACTIONS WITH AFFILIATES: | | | |
| Percent of Current | |
| Net Asset Value | |
| | Advisory | Administration | Expense | Reimbursements |
| | Fee | Fee | Limit(1) | and Waivers |
| | 0.25% | 0.10% | 0.60% | $187,215 |
| | | | | |
| (1) | The Adviser has voluntarily agreed to waive its fees and/or reimburse expenses of the Portfolio to the extent necessary, to limit all expenses to 0.39% of the average daily net assets of the Portfolio until May 31, 2009. |
The accompanying notes are an integral part of the financial statements.
Summit Mutual Funds, Inc. – Pinnacle Series |
| FINANCIAL STATEMENTS | S&P 500 INDEX PORTFOLIO |
STATEMENTS OF CHANGES IN NET ASSETS | | | | | | |
For the Year Ended December 31, | | | | | | |
| | | 2007 | | | 2006 | |
| OPERATIONS | | | | | | |
| Net investment income / (loss) | | $ | 4,994,230 | | | $ | 4,624,747 | |
| Net realized gain / (loss) on investments and futures | | | 6,398,127 | | | | 119,132 | |
| Net change in unrealized appreciation / (depreciation) on investments | | | 4,451,818 | | | | 37,598,822 | |
| | | | | | | | | |
| | | | 15,844,175 | | | | 42,342,701 | |
| | | | | | | | | |
| DISTRIBUTIONS TO SHAREHOLDERS* | | | | | | | | |
| Net investment income | | | (4,633,890 | ) | | | (4,336,685 | ) |
| Net realized gain on investments | | | (512,279 | ) | | | — | |
| | | | | | | | | |
| | | | (5,146,169 | ) | | | (4,336,685 | ) |
| | | | | | | | | |
| FUND SHARE TRANSACTIONS | | | | | | | | |
| Proceeds from shares sold | | | 20,116,509 | | | | 18,021,377 | |
| Reinvestment of distributions | | | 5,146,169 | | | | 4,336,685 | |
| Payments for shares redeemed | | | (42,159,091 | ) | | | (42,010,623 | ) |
| | | | (16,896,413 | ) | | | (19,652,561 | ) |
| | | | | | | | | |
| NET INCREASE / (DECREASE) IN NET ASSETS | | | (6,198,407 | ) | | | 18,353,455 | |
| NET ASSETS | | | | | | | | |
| Beginning of period | | | 309,019,142 | | | | 290,665,687 | |
| | | | | | | | | |
| End of period | | $ | 302,820,735 | | | $ | 309,019,142 | |
| | | | | | | | | |
| ACCUMULATED UNDISTRIBUTED NET INVESTMENT INCOME | | $ | 4,029,732 | | | $ | 3,896,516 | |
| FUND SHARE TRANSACTIONS | | | | | | |
| Sold | | $ | 104,665 | | | | | |
| Reinvestment of distributions | | | 54,216 | | | | | |
| Redeemed | | | (201,690 | ) | | | (484,937 | ) |
| | | | | | | | | |
| Net increase / (decrease) from fund share transactions | | | (42,809 | ) | | | (227,447 | ) |
| | | | | | | | | |
| TOTAL COST OF PURCHASES OF: | | | | | | | | |
| Common Stocks | | $ | 3,942,049 | | | $ | | |
| | | | | | | | | |
| | | $ | | | | $ | | |
| | | | | | | | | |
| TOTAL PROCEEDS FROM SALES OF: | | | | | | | | |
| Common Stocks | | $ | | | | $ | | |
| | | | | | | | | |
| | | $ | | | | $ | | |
| | | | | | | | | |
| *TAX CHARACTER OF DISTRIBUTIONS PAID | | | | | | | | |
| Ordinary income | | $ | | | | $ | | |
| Long-term capital gains | | | | | | | | |
| | | | | | | | | |
| | | $ | | | | $ | | |
The accompanying notes are an integral part of the financial statements.
Summit Mutual Funds, Inc. – Pinnacle Series S&P MIDCAP 400 INDEX PORTFOLIO |
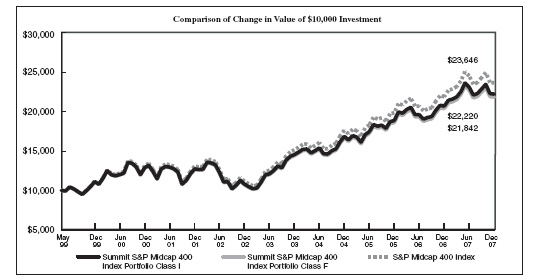
Summit S&P Midcap 400 Index Portfolio Class I - Average Annual Total Return |
1-Year | 5-Year | |
| 7.38% | 15.52% | 9.65% |
Summit S&P Midcap 400 Index Portfolio Class F - Average Annual Total Return |
1-Year | 5-Year | |
| 7.18% | 5.29% | 9.44% |
Past performance is not predictive of future results. Performance does not reflect the deduction of taxes that a shareholder would pay on fund distributions or redemption of fund shares. Prior to October 1, 2007, Class F share performance is based on Class I performance. Separate account expenses are not included. Absent limitation of expenses during certain of the periods shown, performance would have been lower.
| Managers: | |
| Inception Date: | |
| Total Net Assets: | $172.22 Million |
| Number of Equity Holdings: | 402 |
| Median Cap Size: | $2,606 (in millions) |
Average Price-to-book Ratio: | 2.42 x |
| 1.30% |
Top 10 Equity Holdings | | Sector Allocations |
| | (% of net assets) | | |
Intuitive Surgical, Inc. Cameron International Corp. Southwestern Energy Co. Hologic, Inc. Harris Corp. | | | |
Summit Mutual Funds, Inc. – Pinnacle Series S&P MIDCAP 400 INDEX PORTFOLIO |
Objective – Seeks investment results that correspond to the total return performance of U.S. common stocks, as represented by the Standard & Poor’s MidCap 400 Composite Stock Index (the “Index”).
Strategy – The Summit Pinnacle S&P MidCap 400 Index Portfolio (the “Portfolio”) will attempt to achieve, in both rising and falling markets, a correlation of at least 95% between the total return of its net assets before expenses and the total return of the Index.
Managers’ Comments:
For the period ended December 31, 2007, the Summit S&P MidCap 400 Index Portfolio’s (Class I) total return was 7.38% (before the impact of any product or contract-level fees). This compares to an 7.98% total return for the S&P MidCap 400 Index. The difference of 0.60% is referred to as “tracking error” and is largely attributed to the Portfolio’s operating expenses. These expenses represent the Portfolio’s costs for advisory, administration, accounting, custody and other services. The remaining difference can be caused by a number of factors, including the timing and size of cash flows into and out of the Portfolio; brokers’ commissions or other trading costs; and holding security positions in amounts that are different than the weightings in the Index, among others. While an exact replication of the capitalization weightings of securities in the Index is not feasible, the Portfolio’s objectives and strategies call for a correlation of at least 95% between the Portfolio’s pre-expense total return and that of the Index. The Portfolio achieved this level of correlation for the period presented.
Summit Mutual Funds, Inc. – Pinnacle Series |
| S&P MIDCAP 400 INDEX PORTFOLIO | FINANCIAL HIGHLIGHTS |
| | Class I |
| | Year Ended December 31, |
| | | 2007 | | | 2006 | | | 2005 | | | 2004 | | | 2003 | |
| Net asset value, beginning of period | | $ | 69.23 | | | $ | 66.08 | | | $ | 60.76 | | | $ | 52.62 | | | $ | 39.29 | |
| INVESTMENT ACTIVITIES: | | | | | | | | | | | | | | | | | | | | |
| Net investment income / (loss) | | | 0.67 | | | | 0.67 | | | | 0.52 | | | | 0.35 | (5) | | | 0.29 | |
| Net realized and unrealized gains / (losses) | | | 4.44 | | | | 5.64 | | | | 6.50 | | | | 7.93 | | | | 13.28 | |
| Total from Investment Activities | | | 5.11 | | | | 6.31 | | | | 7.02 | | | | 8.28 | | | | 13.57 | |
| DISTRIBUTIONS: | | | | | | | | | | | | | | | | | | | | |
| Net investment income | | | (0.66 | ) | | | (0.59 | ) | | | (0.33 | ) | | | (0.14 | ) | | | (0.24 | ) |
| Net realized gains | | | (2.99 | ) | | | (2.57 | ) | | | (1.37 | ) | | | — | | | | — | |
| Total Distributions | | | (3.65 | ) | | | (3.16 | ) | | | (1.70 | ) | | | (0.14 | ) | | | (0.24 | ) |
| Net asset value, end of period | | $ | 70.69 | | | $ | 69.23 | | | $ | 66.08 | | | $ | 60.76 | | | $ | 52.62 | |
| | | | | | | | | | | | | | | | | | | | | |
| Total return | | | 7.38 | % | | | 9.72 | % | | | 11.94 | % | | | 15.76 | % | | | 34.74 | % |
| RATIOS / SUPPLEMENTAL DATA: | | | | | | | | | | | | | | | | | | | | |
Ratio of expenses to average net assets – net(1) | | | 0.52 | % | | | 0.52 | % | | | 0.54 | % | | | 0.56 | % | | | 0.60 | % |
| Ratio of expenses to average net assets – gross | | | 0.52 | % | | | 0.52 | % | | | 0.54 | % | | | 0.56 | % | | | 0.67 | % |
| Ratio of net investment income / (loss) to average net assets | | | 1.11 | % | | | 1.15 | % | | | 0.91 | % | | | 0.68 | % | | | 0.58 | % |
Portfolio turnover rate(2) | | | 22.63 | % | | | 14.35 | % | | | 19.07 | % | | | 15.08 | % | | | 8.54 | % |
| Net assets, end of period (000’s) | | $ | 172,221 | | | $ | 144,136 | | | $ | 127,372 | | | $ | 99,775 | | | $ | 39,944 | |
| | | Class F | |
| | | Year Ended | |
| | | December 31, | |
| | | 2007(3) | |
| Net asset value, beginning of period | | $ | 73.77 | |
| INVESTMENT ACTIVITIES: | | | | |
| Net investment income / (loss) | | | 0.16 | |
| Net realized and unrealized gains / (losses) | | | (3.27 | ) |
| Total from Investment Activities | | | (3.11 | ) |
| DISTRIBUTIONS: | | | | |
| Net investment income | | | — | |
| Net realized gains | | | — | |
| Total Distributions | | | — | |
| Net asset value, end of period | | $ | 70.66 | |
| | | | | |
| Total return | | | -4.21 | % |
| RATIOS / SUPPLEMENTAL DATA: | | | | |
Ratio of expenses to average net assets – net(1) | | | 0.71 | %(4) |
| Ratio of expenses to average net assets – gross | | | 0.71 | %(4) |
| Ratio of net investment income / (loss) to average net assets | | | 0.89 | %(4) |
Portfolio turnover rate(2) | | | 22.63 | % |
| Net assets, end of period (000’s) | | $ | 1 | |
(1) | Net expenses represent gross expenses reduced by fees waived and/or reimbursed by the Adviser. |
(2) | Portfolio Turnover is calculated on the basis of the Fund as a whole without distinguishing between the classes of shares issued. |
(3) | Portfolio commenced operations on October 1, 2007. |
(4) | Annualized. |
(5) | Per share amounts are based on average shares outstanding. |
The accompanying notes are an integral part of the financial statements.
Summit Mutual Funds, Inc. – Pinnacle Series |
| SCHEDULE OF INVESTMENTS | S&P MIDCAP 400 INDEX PORTFOLIO |
DECEMBER 31, 2007 | | | | | | |
| | | SHARES | | | VALUE | |
COMMON STOCKS - 97.9% | | | | | | |
Consumer Discretionary - 11.7% | | | | | | |
99 Cents Only Stores (a) (c) | | | 6,977 | | | $ | 55,537 | |
| Advance Auto Parts, Inc. | | | 14,885 | | | | 565,481 | |
Aeropostale, Inc. (a) (c) | | | 9,952 | | | | 263,728 | |
| American Eagle Outfitters, Inc. | | | 31,818 | | | | 660,860 | |
American Greetings Corp. - Class A (c) | | | 8,250 | | | | 167,475 | |
AnnTaylor Stores Corp. (a) | | | 9,123 | | | | 233,184 | |
ArvinMeritor, Inc. (c) | | | 10,787 | | | | 126,532 | |
| Barnes & Noble, Inc. | | | 7,157 | | | | 246,559 | |
| Belo Corp. | | | 13,083 | | | | 228,168 | |
| Blyth, Inc. | | | 3,595 | | | | 78,874 | |
Bob Evans Farms, Inc. (c) | | | 4,921 | | | | 132,523 | |
Borders Group, Inc. (c) | | | 8,741 | | | | 93,092 | |
| BorgWarner, Inc. | | | 17,240 | | | | 834,588 | |
Boyd Gaming Corp. (c) | | | 8,351 | | | | 284,519 | |
| Brinker International, Inc. | | | 15,646 | | | | 306,036 | |
Callaway Golf Co. (c) | | | 9,858 | | | | 171,825 | |
Career Education Corp. (a) | | | 13,547 | | | | 340,572 | |
Carmax, Inc. (a) (c) | | | 32,394 | | | | 639,781 | |
CBRL Group, Inc. (c) | | | 3,531 | | | | 114,369 | |
Charming Shoppes (a) (c) | | | 17,345 | | | | 93,836 | |
The Cheesecake Factory, Inc. (a) (c) | | | 10,607 | | | | 251,492 | |
Chico’s FAS, Inc. (a) | | | 26,211 | | | | 236,685 | |
Chipotle Mexican Grill, Inc. (a) (c) | | | 4,905 | | | | 721,378 | |
Coldwater Creek, Inc. (a) (c) | | | 8,912 | | | | 59,621 | |
Collective Brands, Inc. (a) (c) | | | 9,736 | | | | 169,309 | |
Corinthian Colleges, Inc. (a) (c) | | | 12,607 | | | | 194,148 | |
| DeVry, Inc. | | | 8,907 | | | | 462,808 | |
Dick’s Sporting Goods, Inc. (a) (c) | | | 12,374 | | | | 343,502 | |
Dollar Tree Stores, Inc. (a) | | | 13,672 | | | | 354,378 | |
Entercom Communications Corp. (c) | | | 3,918 | | | | 53,637 | |
| Foot Locker, Inc. | | | 22,978 | | | | 313,879 | |
Furniture Brands International, Inc. (c) | | | 7,208 | | | | 72,512 | |
Gentex Corp. (c) | | | 21,491 | | | | 381,895 | |
Getty Images, Inc. (a) (c) | | | 7,081 | | | | 205,349 | |
| Guess ?, Inc. | | | 8,137 | | | | 308,311 | |
Hanesbrands, Inc. (a) | | | 14,167 | | | | 384,917 | |
| Harte-Hanks, Inc. | | | 7,129 | | | | 123,332 | |
Hovnanian Enterprises, Inc. - Class A (a) (c) | | | 5,455 | | | | 39,112 | |
International Speedway Corp. - Class A (c) | | | 4,598 | | | | 189,346 | |
ITT Educational Services, Inc. (a) | | | 4,376 | | | | 373,142 | |
| John Wiley & Sons, Inc. | | | 6,687 | | | | 286,471 | |
Lamar Advertising Co. (c) | | | 11,799 | | | | 567,178 | |
Lear Corp. (a) (c) | | | 11,459 | | | | 316,956 | |
Lee Enterprises, Inc. (c) | | | 5,957 | | | | 87,270 | |
Life Time Fitness, Inc. (a) (c) | | | 4,998 | | | | 248,301 | |
Matthews International Corp. (c) | | | 4,625 | | | | 216,774 | |
MDC Holdings, Inc. (c) | | | 5,180 | | | | 192,333 | |
Media General, Inc. - Class A (c) | | | 3,360 | | | | 71,400 | |
Modine Manufacturing Co. (c) | | | 4,818 | | | | 79,545 | |
Mohawk Industries, Inc. (a) (c) | | | 8,232 | | | | 612,461 | |
NetFlix, Inc. (a) (c) | | | 7,137 | | | | 189,987 | |
NVR, Inc. (a) (c) | | | 764 | | | | 400,336 | |
O’Reilly Automotive, Inc. (a) (c) | | | 17,103 | | | | 554,650 | |
Pacific Sunwear of California, Inc. (a) (c) | | | 10,512 | | | | 148,324 | |
PetSmart, Inc. (c) | | | 19,123 | | | | 449,964 | |
| Phillips-Van Heusen Corp. | | | 8,393 | | | | 309,366 | |
Regis Corp. (c) | | | 6,553 | | | | 183,222 | |
Rent-A-Center, Inc. (a) (c) | | | 9,948 | | | | 144,445 | |
| | | SHARES | | | VALUE | |
Consumer Discretionary - 11.7% (Continued) | | | | | | |
| Ross Stores, Inc. | | | 20,136 | | | $ | 514,878 | |
Ruby Tuesday, Inc. (c) | | | 7,684 | | | | 74,919 | |
Ryland Group, Inc. (c) | | | 6,255 | | | | 172,325 | |
Saks, Inc. (a) (c) | | | 21,078 | | | | 437,579 | |
Scholastic Corp. (a) (c) | | | 3,889 | | | | 135,687 | |
Scientific Games Corp. - Class A (a) (c) | | | 9,659 | | | | 321,162 | |
| Sotheby’s | | | 9,893 | | | | 376,923 | |
Thor Industries, Inc. (c) | | | 5,151 | | | | 195,790 | |
Timberland Co. (a) (c) | | | 7,377 | | | | 133,376 | |
Toll Brothers, Inc. (a) | | | 18,881 | | | | 378,753 | |
| Tupperware Brands Corp. | | | 9,159 | | | | 302,522 | |
Urban Outfitters, Inc. (a) (c) | | | 16,792 | | | | 457,750 | |
Valassis Communications, Inc. (a) (c) | | | 7,130 | | | | 83,350 | |
Warnaco Group, Inc. (a) | | | 6,783 | | | | 236,048 | |
Williams-Sonoma, Inc. (c) | | | 13,096 | | | | 339,186 | |
| | | | | | | | 20,095,523 | |
Consumer Staples - 3.2% | | | | | | | | |
| Alberto-Culver Co. | | | 12,451 | | | | 305,547 | |
BJ’s Wholesale Club, Inc. (a) | | | 9,528 | | | | 322,332 | |
Church & Dwight, Inc. (c) | | | 9,813 | | | | 530,589 | |
| Corn Products International, Inc. | | | 11,123 | | | | 408,770 | |
Energizer Holdings, Inc. (a) | | | 8,537 | | | | 957,254 | |
Hansen Natural Corp. (a) (c) | | | 8,916 | | | | 394,890 | |
| Hormel Foods Corp. | | | 10,755 | | | | 435,362 | |
| The JM Smucker Co. | | | 8,554 | | | | 440,018 | |
Lancaster Colony Corp. (c) | | | 3,201 | | | | 127,080 | |
NBTY, Inc. (a) | | | 8,343 | | | | 228,598 | |
| PepsiAmericas, Inc. | | | 8,900 | | | | 296,548 | |
Ruddick Corp. (c) | | | 5,534 | | | | 191,864 | |
Smithfield Foods, Inc. (a) (c) | | | 17,366 | | | | 502,225 | |
Tootsie Roll Industries, Inc. (c) | | | 4,012 | | | | 110,009 | |
Universal Corp. (c) | | | 4,065 | | | | 208,209 | |
| | | | | | | | 5,459,295 | |
Energy - 9.6% | | | | | | | | |
Arch Coal, Inc. (c) | | | 21,273 | | | | 955,796 | |
Bill Barrett Corp. (a) (c) | | | 5,011 | | | | 209,811 | |
Cameron International Corp. (a) | | | 32,510 | | | | 1,564,706 | |
Cimarex Energy Co. (c) | | | 12,260 | | | | 521,418 | |
Denbury Resources, Inc. (a) | | | 36,331 | | | | 1,080,847 | |
Encore Acquisition Co. (a) (c) | | | 8,066 | | | | 269,162 | |
Exterran Holdings, Inc. (a) (c) | | | 9,776 | | | | 799,677 | |
FMC Technologies, Inc. (a) | | | 19,336 | | | | 1,096,351 | |
Forest Oil Corp. (a) | | | 12,951 | | | | 658,429 | |
| Frontier Oil Corp. | | | 15,674 | | | | 636,051 | |
Grant Prideco, Inc. (a) | | | 18,883 | | | | 1,048,195 | |
Helmerich & Payne, Inc. (c) | | | 15,388 | | | | 616,597 | |
Newfield Exploration Co. (a) | | | 19,457 | | | | 1,025,384 | |
Overseas Shipholding Group, Inc. (c) | | | 4,300 | | | | 320,049 | |
| Patterson-UTI Energy, Inc. | | | 23,042 | | | | 449,780 | |
| Pioneer Natural Resources Co. | | | 17,763 | | | | 867,545 | |
Plains Exploration & Production Co. (a) | | | 17,065 | | | | 921,510 | |
Pride International, Inc. (a) | | | 24,816 | | | | 841,262 | |
Quicksilver Resources, Inc. (a) (c) | | | 7,642 | | | | 455,387 | |
Southwestern Energy Co. (a) (c) | | | 25,365 | | | | 1,413,338 | |
Superior Energy Services (a) (c) | | | 11,968 | | | | 411,939 | |
Tidewater, Inc. (c) | | | 8,163 | | | | 447,822 | |
| | | | | | | | 16,611,056 | |
The accompanying notes are an integral part of the financial statements.
Summit Mutual Funds, Inc. – Pinnacle Series |
| S&P MIDCAP 400 INDEX PORTFOLIO | SCHEDULE OF INVESTMENTS |
| | | SHARES | | | VALUE | |
Financials - 15.1% | | | | | | |
| Alexandria Real Estate Equities, Inc. | | | 4,738 | | | $ | 481,712 | |
| AMB Property Corp. | | | 14,725 | | | | 847,571 | |
| American Financial Group, Inc. | | | 10,807 | | | | 312,106 | |
AmeriCredit Corp. (a) (c) | | | 16,981 | | | | 217,187 | |
Arthur J. Gallagher & Co. (c) | | | 13,962 | | | | 337,741 | |
| Associated Banc-Corp | | | 18,901 | | | | 512,028 | |
| Astoria Financial Corp. | | | 12,138 | | | | 282,451 | |
Bank of Hawaii Corp. (c) | | | 7,288 | | | | 372,708 | |
BRE Properties (c) | | | 7,547 | | | | 305,880 | |
Brown & Brown, Inc. (c) | | | 16,969 | | | | 398,771 | |
| Camden Property Trust | | | 8,259 | | | | 397,671 | |
Cathay General Bancorp (c) | | | 7,410 | | | | 196,291 | |
| City National Corp. | | | 6,013 | | | | 358,074 | |
The Colonial BancGroup, Inc. (c) | | | 23,409 | | | | 316,958 | |
Commerce Group, Inc. (c) | | | 6,434 | | | | 231,495 | |
Cousins Properties, Inc. (c) | | | 5,557 | | | | 122,810 | |
| Cullen/Frost Bankers, Inc. | | | 8,702 | | | | 440,843 | |
| Duke Realty Corp. | | | 21,649 | | | | 564,606 | |
| Eaton Vance Corp. | | | 18,390 | | | | 835,090 | |
Equity One, Inc. (c) | | | 5,488 | | | | 126,389 | |
| Everest Re Group Ltd. | | | 9,394 | | | | 943,158 | |
| Federal Realty Investment Trust | | | 8,417 | | | | 691,457 | |
| Fidelity National Financial, Inc. - Class A | | | 32,080 | | | | 468,689 | |
| First American Corp. | | | 13,624 | | | | 464,851 | |
First Community Bancorp, Inc. (c) | | | 3,746 | | | | 154,485 | |
First Niagara Financial Group, Inc. (c) | | | 15,688 | | | | 188,883 | |
FirstMerit Corp. (c) | | | 11,967 | | | | 239,460 | |
| The Hanover Insurance Group Inc | | | 7,725 | | | | 353,805 | |
| HCC Insurance Holdings, Inc. | | | 17,078 | | | | 489,797 | |
Health Care REIT, Inc. (c) | | | 12,631 | | | | 564,479 | |
Highwoods Properties, Inc. (c) | | | 8,495 | | | | 249,583 | |
| Horace Mann Educators Corp. | | | 6,445 | | | | 122,068 | |
| Hospitality Properties Trust | | | 13,955 | | | | 449,630 | |
IndyMac Bancorp, Inc. (c) | | | 11,963 | | | | 71,180 | |
| Jefferies Group, Inc. | | | 16,611 | | | | 382,884 | |
Jones Lang LaSalle, Inc. (c) | | | 5,506 | | | | 391,807 | |
Liberty Property Trust (c) | | | 13,610 | | | | 392,104 | |
| The Macerich Co. | | | 10,781 | | | | 766,098 | |
| Mack-Cali Realty Corp. | | | 10,100 | | | | 343,400 | |
| Mercury General Corp. | | | 5,299 | | | | 263,943 | |
Nationwide Health Properties, Inc. (c) | | | 13,813 | | | | 433,314 | |
New York Community Bancorp, Inc. (c) | | | 48,099 | | | | 845,580 | |
| Old Republic International Corp. | | | 34,290 | | | | 528,409 | |
The PMI Group, Inc. (c) | | | 12,066 | | | | 160,236 | |
Potlatch Corp. (c) | | | 5,827 | | | | 258,952 | |
| Protective Life Corp. | | | 10,426 | | | | 427,675 | |
Radian Group, Inc. (c) | | | 11,929 | | | | 139,331 | |
| Raymond James Financial, Inc. | | | 14,101 | | | | 460,539 | |
Rayonier, Inc. (c) | | | 11,610 | | | | 548,456 | |
Realty Income Corp. (c) | | | 15,028 | | | | 406,057 | |
| Regency Centers Corp. | | | 10,350 | | | | 667,471 | |
| SEI Investments Co. | | | 18,776 | | | | 604,024 | |
| Stancorp Financial Group, Inc. | | | 7,360 | | | | 370,797 | |
SVB Financial Group (a) (c) | | | 4,935 | | | | 248,724 | |
Synovus Financial Corp. (a) | | | 50,400 | | | | 530,722 | |
| TCF Financial Corp. | | | 16,202 | | | | 290,502 | |
UDR, Inc. (c) | | | 19,953 | | | | 396,067 | |
| Unitrin, Inc. | | | 7,702 | | | | 369,619 | |
| | | SHARES | | | VALUE | |
Financials - 15.1% (Continued) | | | | | | |
Waddell & Reed Financial, Inc. (c) | | | 12,409 | | | $ | 447,841 | |
Washington Federal, Inc. (c) | | | 13,020 | | | | 274,852 | |
Webster Financial Corp. (c) | | | 7,950 | | | | 254,161 | |
Weingarten Realty Investors (c) | | | 11,259 | | | | 353,983 | |
Westamerica Bancorporation (c) | | | 4,363 | | | | 194,372 | |
| Wilmington Trust Corp. | | | 10,220 | | | | 359,744 | |
| WR Berkley Corp. | | | 23,957 | | | | 714,158 | |
| | | | | | | | 25,935,729 | |
Health Care - 12.9% | | | | | | | | |
Advanced Medical Optics, Inc. (a) (c) | | | 8,995 | | | | 220,647 | |
Affymetrix, Inc. (a) (c) | | | 10,260 | | | | 237,416 | |
Apria Healthcare Group, Inc. (a) | | | 6,501 | | | | 140,227 | |
| Beckman Coulter, Inc. | | | 9,324 | | | | 678,787 | |
Cephalon, Inc. (a) | | | 9,969 | | | | 715,375 | |
Cerner Corp. (a) (c) | | | 9,865 | | | | 556,386 | |
Charles River Laboratories International, Inc. (a) | | | 10,095 | | | | 664,251 | |
Community Health Systems, Inc. (a) (c) | | | 14,209 | | | | 523,744 | |
Covance, Inc. (a) | | | 9,501 | | | | 822,977 | |
| Dentsply International, Inc. | | | 22,521 | | | | 1,013,895 | |
Edwards Lifesciences Corp. (a) (c) | | | 8,428 | | | | 387,604 | |
Endo Pharmaceuticals Holdings, Inc. (a) | | | 19,934 | | | | 531,640 | |
Gen-Probe, Inc. (a) | | | 8,001 | | | | 503,503 | |
| Health Management Associates, Inc. - Class A | | | 36,069 | | | | 215,693 | |
Health Net, Inc. (a) | | | 16,398 | | | | 792,023 | |
Henry Schein, Inc. (a) | | | 13,308 | | | | 817,111 | |
| Hillenbrand Industries, Inc. | | | 9,214 | | | | 513,496 | |
Hologic, Inc. (a) (c) | | | 18,630 | | | | 1,278,763 | |
Intuitive Surgical, Inc. (a) | | | 5,687 | | | | 1,845,431 | |
Invitrogen Corp. (a) | | | 6,924 | | | | 646,771 | |
Kindred Healthcare, Inc. (a) (c) | | | 4,439 | | | | 110,886 | |
Kinetic Concepts, Inc. (a) | | | 8,039 | | | | 430,569 | |
LifePoint Hospitals, Inc. (a) (c) | | | 8,639 | | | | 256,924 | |
Lincare Holdings, Inc. (a) (c) | | | 11,916 | | | | 418,967 | |
Medicis Pharmaceutical Corp. (c) | | | 8,359 | | | | 217,083 | |
Millennium Pharmaceuticals, Inc. (a) (c) | | | 48,022 | | | | 719,370 | |
Omnicare, Inc. (c) | | | 18,064 | | | | 412,040 | |
Par Pharmaceutical Companies, Inc. (a) (c) | | | 5,027 | | | | 120,648 | |
PDL BioPharma, Inc. (a) (c) | | | 17,406 | | | | 304,953 | |
Perrigo Co. (c) | | | 11,528 | | | | 403,595 | |
| Pharmaceutical Product Development, Inc. | | | 15,575 | | | | 628,763 | |
Psychiatric Solutions, Inc. (a) (c) | | | 8,180 | | | | 265,850 | |
Resmed, Inc. (a) (c) | | | 11,494 | | | | 603,780 | |
Sepracor, Inc. (a) | | | 16,609 | | | | 435,986 | |
| Service Corp. International | | | 42,823 | | | | 601,663 | |
| STERIS Corp. | | | 9,426 | | | | 271,846 | |
Techne Corp. (a) | | | 5,882 | | | | 388,506 | |
| Universal Health Services, Inc. | | | 8,012 | | | | 410,214 | |
Valeant Pharmaceuticals International (a) (c) | | | 13,535 | | | | 162,014 | |
Varian, Inc. (a) | | | 4,525 | | | | 295,482 | |
VCA Antech, Inc. (a) | | | 12,534 | | | | 554,379 | |
Ventana Medical Systems, Inc. (a) | | | 4,424 | | | | 385,906 | |
Vertex Pharmaceuticals, Inc. (a) (c) | | | 19,672 | | | | 456,981 | |
WellCare Health Plans, Inc. (a) | | | 6,197 | | | | 262,815 | |
| | | | | | | | 22,224,960 | |
The accompanying notes are an integral part of the financial statements.
Summit Mutual Funds, Inc. – Pinnacle Series |
| SCHEDULE OF INVESTMENTS | S&P MIDCAP 400 INDEX PORTFOLIO |
| | | SHARES | | | VALUE | |
Industrials - 15.5% | | | | | | |
AGCO Corp. (a) (c) | | | 13,607 | | | $ | 925,004 | |
Airtran Holdings, Inc. (a) (c) | | | 13,649 | | | | 97,727 | |
Alaska Air Group, Inc. (a) (c) | | | 5,994 | | | | 149,910 | |
| Alexander & Baldwin, Inc. | | | 6,373 | | | | 329,229 | |
Alliant Techsystems, Inc. (a) (c) | | | 4,865 | | | | 553,442 | |
Ametek, Inc. (c) | | | 15,871 | | | | 743,398 | |
Avis Budget Group, Inc. (a) | | | 15,432 | | | | 200,616 | |
BE Aerospace, Inc. (a) | | | 13,760 | | | | 727,904 | |
The Brink’s Co. (c) | | | 7,209 | | | | 430,666 | |
| Carlisle Companies., Inc. | | | 9,229 | | | | 341,750 | |
ChoicePoint, Inc. (a) | | | 10,632 | | | | 387,217 | |
| Con-way Inc. | | | 6,715 | | | | 278,941 | |
Copart, Inc. (a) | | | 10,466 | | | | 445,328 | |
Corporate Executive Board Co. (c) | | | 5,278 | | | | 317,208 | |
| Crane Co. | | | 7,595 | | | | 325,825 | |
| Deluxe Corp. | | | 7,753 | | | | 254,996 | |
| Donaldson Co, Inc. | | | 10,588 | | | | 491,071 | |
DRS Technologies, Inc. (c) | | | 6,131 | | | | 332,729 | |
| Dun & Bradstreet Corp. | | | 8,622 | | | | 764,168 | |
Fastenal Co. (c) | | | 18,749 | | | | 757,835 | |
Federal Signal Corp. (c) | | | 7,122 | | | | 79,909 | |
| Flowserve Corp. | | | 8,499 | | | | 817,604 | |
| GATX Corp. | | | 7,124 | | | | 261,308 | |
Graco, Inc. (c) | | | 9,348 | | | | 348,306 | |
Granite Construction, Inc. (c) | | | 5,236 | | | | 189,438 | |
| Harsco Corp. | | | 12,538 | | | | 803,310 | |
Herman Miller, Inc. (c) | | | 9,084 | | | | 294,231 | |
HNI Corp. (c) | | | 6,840 | | | | 239,810 | |
| Hubbell, Inc. - Class B | | | 8,625 | | | | 445,050 | |
| IDEX Corp. | | | 12,116 | | | | 437,751 | |
JB Hunt Transport Services, Inc. (c) | | | 13,012 | | | | 358,481 | |
JetBlue Airways Corp. (a) (c) | | | 26,794 | | | | 158,085 | |
| Joy Global, Inc. | | | 16,067 | | | | 1,057,530 | |
Kansas City Southern (a) (c) | | | 11,440 | | | | 392,735 | |
KBR, Inc. (a) | | | 25,182 | | | | 977,062 | |
Kelly Services, Inc. (c) | | | 3,445 | | | | 64,284 | |
| Kennametal, Inc. | | | 11,588 | | | | 438,722 | |
Korn/Ferry International (a) (c) | | | 6,940 | | | | 130,611 | |
| Lincoln Electric Holdings, Inc. | | | 6,408 | | | | 456,121 | |
| Manpower, Inc. | | | 12,048 | | | | 685,531 | |
Mine Safety Appliances Co. (c) | | | 4,347 | | | | 225,479 | |
| MSC Industrial Direct Co., Inc. Class A | | | 7,068 | | | | 286,042 | |
Navigant Consulting, Inc. (a) (c) | | | 6,792 | | | | 92,847 | |
Nordson Corp. (c) | | | 5,018 | | | | 290,843 | |
| Oshkosh Truck Corp. | | | 11,033 | | | | 521,420 | |
Pentair, Inc. (c) | | | 14,805 | | | | 515,362 | |
Quanta Services, Inc. (a) | | | 25,444 | | | | 667,651 | |
| Republic Services, Inc. | | | 23,894 | | | | 749,077 | |
Rollins, Inc. (c) | | | 6,323 | | | | 121,402 | |
| Roper Industries, Inc. | | | 13,134 | | | | 821,400 | |
| SPX Corp. | | | 7,787 | | | | 800,893 | |
Stericycle, Inc. (a) | | | 12,917 | | | | 767,270 | |
| Strayer Education, Inc. | | | 2,156 | | | | 367,770 | |
| Teleflex, Inc. | | | 5,870 | | | | 369,869 | |
Thomas & Betts Corp. (a) | | | 7,588 | | | | 372,115 | |
| Timken Co. | | | 14,246 | | | | 467,981 | |
Trinity Industries, Inc. (c) | | | 12,121 | | | | 336,479 | |
| | | SHARES | | | VALUE | |
Industrials - 15.5% (Continued) | | | | | | |
United Rentals, Inc. (a) (c) | | | 11,214 | | | $ | 205,889 | |
URS Corp. (a) | | | 11,863 | | | | 644,517 | |
Werner Enterprises, Inc. (c) | | | 6,713 | | | | 114,322 | |
| Westinghouse Air Brake Technologies Corp. | | | 7,255 | | | | 249,862 | |
YRC Worldwide, Inc. (a) (c) | | | 8,422 | | | | 143,932 | |
| | | | | | | | 26,623,265 | |
Information Technology - 14.6% | | | | | | | | |
3Com Corp. (a) | | | 58,949 | | | | 266,449 | |
ACI Worldwide, Inc. (a) (c) | | | 5,315 | | | | 101,198 | |
Activision, Inc. (a) | | | 43,299 | | | | 1,285,980 | |
| Acxiom Corp. | | | 10,594 | | | | 124,268 | |
ADC Telecommunications, Inc. (a) (c) | | | 17,465 | | | | 271,581 | |
Adtran, Inc. (c) | | | 8,690 | | | | 185,792 | |
Advent Software, Inc. (a) (c) | | | 2,660 | | | | 143,906 | |
Alliance Data Systems Corp. (a) (c) | | | 11,705 | | | | 877,758 | |
| Amphenol Corp. - Class A | | | 26,503 | | | | 1,228,944 | |
Arrow Electronics, Inc. (a) | | | 18,266 | | | | 717,488 | |
Atmel Corp. (a) | | | 66,905 | | | | 289,030 | |
Avnet, Inc. (a) | | | 22,333 | | | | 780,985 | |
Avocent Corp. (a) (c) | | | 7,438 | | | | 173,380 | |
| Broadridge Financial Solutions, Inc. | | | 20,741 | | | | 465,221 | |
Cadence Design Systems, Inc. (a) | | | 39,979 | | | | 680,043 | |
CommScope, Inc. (a) (c) | | | 10,545 | | | | 518,921 | |
Cree, Inc. (a) (c) | | | 12,699 | | | | 348,842 | |
CSG Systems International, Inc. (a) (c) | | | 5,278 | | | | 77,692 | |
Cypress Semiconductor Corp. (a) | | | 23,674 | | | | 852,974 | |
| Diebold, Inc. | | | 9,776 | | | | 283,308 | |
Digital River, Inc. (a) (c) | | | 6,010 | | | | 198,751 | |
DST Systems, Inc. (a) (c) | | | 7,674 | | | | 633,489 | |
Dycom Industries, Inc. (a) (c) | | | 6,091 | | | | 162,325 | |
F5 Networks, Inc. (a) | | | 12,627 | | | | 360,122 | |
Fair Isaac Corp. (c) | | | 7,478 | | | | 240,418 | |
Fairchild Semiconductor International, Inc. (a) | | | 18,493 | | | | 266,854 | |
Foundry Networks, Inc. (a) | | | 22,342 | | | | 391,432 | |
Gartner, Inc. - Class A (a) (c) | | | 10,242 | | | | 179,850 | |
| Global Payments, Inc. | | | 11,733 | | | | 545,819 | |
| Harris Corp. | | | 20,374 | | | | 1,277,042 | |
Imation Corp. (c) | | | 4,848 | | | | 101,808 | |
Ingram Micro, Inc. (a) | | | 21,810 | | | | 393,452 | |
Integrated Device Technology, Inc. (a) | | | 28,285 | | | | 319,903 | |
International Rectifier Corp. (a) | | | 10,778 | | | | 366,129 | |
| Intersil Corp. - Class A | | | 19,467 | | | | 476,552 | |
Jack Henry & Associates, Inc. (c) | | | 11,708 | | | | 284,973 | |
Kemet Corp. (a) (c) | | | 12,481 | | | | 82,749 | |
Lam Research Corp. (a) | | | 20,081 | | | | 868,102 | |
Macrovision Corp. (a) (c) | | | 7,882 | | | | 144,477 | |
McAfee, Inc. (a) | | | 23,671 | | | | 887,663 | |
Mentor Graphics Corp. (a) (c) | | | 13,350 | | | | 143,913 | |
Metavante Technologies, Inc. (c) | | | 12,756 | | | | 297,470 | |
MoneyGram International, Inc. (c) | | | 12,292 | | | | 188,928 | |
MPS Group, Inc. (a) | | | 14,962 | | | | 163,684 | |
National Instruments Corp. (c) | | | 8,524 | | | | 284,105 | |
NCR Corp. (a) | | | 26,903 | | | | 675,265 | |
Neustar, Inc. (a) (c) | | | 11,434 | | | | 327,927 | |
Palm, Inc. (c) | | | 15,583 | | | | 98,796 | |
Parametric Technology Corp. (a) | | | 17,240 | | | | 307,734 | |
The accompanying notes are an integral part of the financial statements.
Summit Mutual Funds, Inc. – Pinnacle Series |
| S&P MIDCAP 400 INDEX PORTFOLIO | SCHEDULE OF INVESTMENTS |
| | | SHARES | | | VALUE | |
Information Technology - 14.6% (Continued) | | | | | | |
Plantronics, Inc. (c) | | | 7,228 | | | $ | 187,928 | |
Polycom, Inc. (a) (c) | | | 13,496 | | | | 374,919 | |
RF Micro Devices, Inc. (a) (c) | | | 43,089 | | | | 246,038 | |
Semtech Corp. (a) | | | 9,552 | | | | 148,247 | |
Silicon Laboratories, Inc. (a) | | | 8,195 | | | | 306,739 | |
SRA International, Inc. - Class A (a) (c) | | | 6,333 | | | | 186,507 | |
Sybase, Inc. (a) (c) | | | 13,333 | | | | 347,858 | |
Synopsys, Inc. (a) | | | 21,549 | | | | 558,766 | |
Tech Data Corp. (a) | | | 8,245 | | | | 311,001 | |
TriQuint Semiconductor, Inc. (a) (c) | | | 21,049 | | | | 139,555 | |
Valueclick, Inc. (a) | | | 14,591 | | | | 319,543 | |
Vishay Intertechnology, Inc. (a) | | | 27,506 | | | | 313,843 | |
Western Digital Corp. (a) | | | 32,726 | | | | 988,652 | |
Wind River Systems, Inc. (a) (c) | | | 11,430 | | | | 102,070 | |
Zebra Technologies Corp. - Class A (a) | | | 10,109 | | | | 350,782 | |
| | | | | | | | 25,225,940 | |
Materials - 6.9% | | | | | | | | |
| Airgas, Inc. | | | 12,228 | | | | 637,201 | |
| Albemarle Corp. | | | 11,828 | | | | 487,905 | |
| Cabot Corp. | | | 9,711 | | | | 323,765 | |
| Carpenter Technology Corp. | | | 7,305 | | | | 549,117 | |
| CF Industries Holdings, Inc. | | | 7,146 | | | | 786,489 | |
| Chemtura Corp. | | | 35,854 | | | | 279,661 | |
Cleveland-Cliffs, Inc. (c) | | | 6,223 | | | | 627,278 | |
| Commercial Metals Co. | | | 17,642 | | | | 519,557 | |
| Cytec Industries, Inc. | | | 6,257 | | | | 385,306 | |
Ferro Corp. (c) | | | 6,477 | | | | 134,268 | |
| FMC Corp. | | | 11,244 | | | | 613,360 | |
Louisiana-Pacific Corp. (c) | | | 15,389 | | | | 210,521 | |
| Lubrizol Corp. | | | 10,198 | | | | 552,324 | |
Martin Marietta Materials, Inc. (c) | | | 6,221 | | | | 824,905 | |
Minerals Technologies, Inc. (c) | | | 2,862 | | | | 191,611 | |
Olin Corp. (c) | | | 11,022 | | | | 213,055 | |
| Packaging Corp. of America | | | 13,814 | | | | 389,555 | |
| Reliance Steel & Aluminum Co. | | | 9,676 | | | | 524,439 | |
| RPM International, Inc. | | | 18,053 | | | | 366,476 | |
| The Scotts Miracle-Gro Co. - Class A | | | 6,590 | | | | 246,598 | |
| Sensient Technologies Corp. | | | 6,992 | | | | 197,734 | |
| Sonoco Products Co. | | | 14,791 | | | | 483,370 | |
| Steel Dynamics, Inc. | | | 14,354 | | | | 855,068 | |
| Temple-Inland, Inc. | | | 16,048 | | | | 334,601 | |
Terra Industries, Inc. (a) (c) | | | 13,800 | | | | 659,088 | |
| Valspar Corp. | | | 14,959 | | | | 337,176 | |
Vulcan Materials Co. (c) | | | 739 | | | | 58,361 | |
Worthington Industries (c) | | | 9,780 | | | | 174,866 | |
| | | | | | | | 11,963,655 | |
Telecommunication Services - 0.7% | | | | | | | | |
Cincinnati Bell, Inc. (a) (c) | | | 36,958 | | | | 175,551 | |
Telephone & Data Systems, Inc. (c) | | | 15,792 | | | | 988,579 | |
| | | | | | | | 1,164,130 | |
Utilities - 7.7% | | | | | | | | |
| AGL Resources, Inc. | | | 11,385 | | | | 428,531 | |
| Alliant Energy Corp. | | | 16,416 | | | | 667,967 | |
Aqua America, Inc. (c) | | | 19,824 | | | | 420,269 | |
Aquila, Inc. (a) | | | 55,874 | | | | 208,410 | |
| | | SHARES | | | VALUE | |
Utilities - 7.7% (Continued) | | | | | | |
Black Hills Corp. (c) | | | 5,612 | | | $ | 247,489 | |
DPL, Inc. (c) | | | 16,878 | | | | 500,433 | |
| Energen Corp. | | | 10,675 | | | | 685,655 | |
Energy East Corp. (c) | | | 23,534 | | | | 640,360 | |
| Equitable Resources, Inc. | | | 18,103 | | | | 964,528 | |
Great Plains Energy, Inc. (c) | | | 12,821 | | | | 375,912 | |
Hawaiian Electric Industries, Inc. (c) | | | 12,348 | | | | 281,164 | |
Idacorp, Inc. (c) | | | 6,691 | | | | 235,657 | |
| MDU Resources Group, Inc. | | | 27,109 | | | | 748,480 | |
National Fuel Gas Co. (c) | | | 12,412 | | | | 579,392 | |
| Northeast Utilities | | | 23,039 | | | | 721,351 | |
| NSTAR | | | 15,893 | | | | 575,644 | |
OGE Energy Corp. (c) | | | 13,643 | | | | 495,105 | |
| Oneok, Inc. | | | 15,419 | | | | 690,309 | |
| PNM Resources, Inc. | | | 11,411 | | | | 244,766 | |
| Puget Energy, Inc. | | | 17,410 | | | | 477,556 | |
| SCANA Corp. | | | 17,340 | | | | 730,881 | |
| Sierra Pacific Resources | | | 34,757 | | | | 590,174 | |
Vectren Corp. (c) | | | 11,381 | | | | 330,163 | |
| Westar Energy, Inc. | | | 13,731 | | | | 356,182 | |
WGL Holdings, Inc. (c) | | | 7,354 | | | | 240,917 | |
| Wisconsin Energy Corp. | | | 17,389 | | | | 847,018 | |
| | | | | | | | 13,284,313 | |
| TOTAL COMMON STOCKS | | | | | | | | |
| (Cost $145,849,315) | | | | | | | 168,587,866 | |
| | | | | | | | | |
UNIT INVESTMENT TRUSTS - 0.3% | | | | | | | | |
| Midcap SPDR Trust Series 1 | | | 3,795 | | | | 588,605 | |
| TOTAL UNIT INVESTMENT TRUSTS | | | | | | | | |
| (Cost $559,573) | | | | | | | 588,605 | |
SHORT TERM INVESTMENTS (e) - 15.3% | | | | | | | | |
Money Market Funds - 14.4% | | | | | | | | |
| Northern Institutional Diversified Assets Portfolio | | | 24,805,988 | | | | 24,805,988 | |
| | | | | | | | | |
| | | PRINCIPAL | | | | | |
| | | AMOUNT | | | VALUE | |
U.S. Treasury Bills - 0.9% | | | | | | | | |
| 2.995%, 03/13/2008 | | $ | 1,500,000 | | | $ | 1,490,902 | |
| TOTAL SHORT TERM INVESTMENTS | | | | | | | | |
| (Cost $26,297,070) | | | | | | | 26,296,890 | |
Total Investments | | | | | | | | |
(Cost $172,705,958) (b) - 113.5% | | | | | | | 195,473,361 | |
Northern Institutional Liquid Assets Portfolio (d) - 26.1% | | | | | | | 44,948,526 | |
Liabilities in Excess of Other Assets - (39.6)% | | | | | | | (68,200,142 | ) |
TOTAL NET ASSETS - 100.0% | | | | | | $ | 172,221,745 | |
The accompanying notes are an integral part of the financial statements.
Summit Mutual Funds, Inc. – Pinnacle Series |
| SCHEDULE OF INVESTMENTS | S&P MIDCAP 400 INDEX PORTFOLIO |
ADR American Depository Receipt |
(a) | Non-income producing security. |
| (b) | For federal income tax purposes, cost is $173,511,589 and gross unrealized appreciation and depreciation of securities as of December 31, 2007 was $38,354,356, and ($16,392,584), respectively, with a net appreciation / (depreciation) of $21,961,772. |
| (c) | All or a portion of the security is out on loan. |
| (d) | This security was purchased with cash collateral held from securities lending. The market values of the securities on loan, the collateral purchased with cash, and the noncash collateral accepted are $43,598,743, $44,948,526, and $193,271, respectively. |
(e) | Securities and other assets with an aggregate value of $3,891,600 have been segregated with the custodian or designated to cover margin requirements for the following open futures contracts as of December 31, 2007: |
| | | Unrealized | |
| | | Appreciation/ | |
| Type | Contracts | (Depreciation) | |
| S&P MidCap 400 Index Mini (03/08) | 10 | $8,900 | |
| S&P MidCap 400 Index (03/08) | 7 | $15,944 | |
The accompanying notes are an integral part of the financial statements.
Summit Mutual Funds, Inc. – Pinnacle Series |
| S&P MIDCAP 400 INDEX PORTFOLIO | FINANCIAL STATEMENTS |
STATEMENT OF ASSETS AND LIABILITIES | |
December 31, 2007 | | | |
| ASSETS | | | |
| Investments in securities, at value | | $ | 195,473,361 | |
| Collateral for securities loaned, | | | | |
| at fair value | | | 44,948,526 | |
| Receivables: | | | | |
| Securities sold | | | 1,194,763 | |
| Shares sold | | | 31,211 | |
| Interest and dividends | | | 108,964 | |
| Prepaid expenses and other | | | 4,140 | |
| | | | 241,760,965 | |
| LIABILITIES | | | | |
| Payables: | | | | |
| Payable upon return of securities loaned | | | 44,948,526 | |
| Investment securities purchased | | | 23,264,072 | |
| Shares redeemed | | | 1,177,480 | |
| Variation margin | | | 15,292 | |
| Bank overdraft | | | 284 | |
| Advisory fees | | | 38,970 | |
| Professional fees | | | 22,863 | |
| Royalty fees | | | 20,667 | |
| Fund accounting fees | | | 18,258 | |
| Administration fees | | | 12,990 | |
| Custodian fees | | | 5,437 | |
| Directors’ fees | | | 300 | |
| Other accrued expenses | | | 14,081 | |
| | | | 69,539,220 | |
| NET ASSETS* | | | | |
| Paid-in capital | | | 137,057,216 | |
| Accumulated undistributed net investment | | | | |
| income / (loss) | | | 1,390,505 | |
| Accumulated net realized gain / (loss) | | | | |
| on investments and futures contracts | | | 10,981,727 | |
| Net unrealized appreciation / (depreciation) | | | | |
| on investments and futures contracts | | | 22,792,297 | |
| | | $ | 172,221,745 | |
| Investments at cost | | $ | 172,705,958 | |
| Shares authorized - Class I ($.10 par value) | | | 20,000,000 | |
| Shares authorized - Class F ($.10 par value) | | | 20,000,000 | |
| NET ASSET VALUE (NAV) BY SHARE CLASS | | | | | |
| | | | | | |
| Share Class | Net Assets | Outstanding | | Per Share | |
| Class I | $172,220,787 | | | $ | | |
| Class F | $958 | 14 | | $ | 70.66 | ** |
| * | FEDERAL TAX DATA AS OF DECEMBER 31, 2007 | | |
| | Percentage of ordinary distributions designated as | | |
| | qualified dividend income | | 99.30% |
| | Dividends received deduction for corporate shareholders | | 99.30% |
| | Undistributed ordinary income | $ | |
| | Undistributed long-term gains | $ | |
| | Unrealized appreciation | $ | |
| ** | NAV does not recalculate due to fractional shares outstanding. | | |
STATEMENT OF OPERATIONS | | | |
For the year ended December 31, 2007 | | | |
| | | | |
| INVESTMENT INCOME | | | |
| Interest | | $ | 78,504 | |
| Dividends | | | 2,405,384 | |
| Other income | | | 78,737 | |
| | | | 2,562,625 | |
| EXPENSES | | | | |
| Advisory fees | | | 470,036 | |
| Administration fees | | | 156,679 | |
| Fund accounting fees | | | 44,816 | |
| Professional fees | | | 35,710 | |
| Custodian fees | | | 22,926 | |
| Royalty fee | | | 20,971 | |
| Directors’ fees | | | 19,832 | |
| Transfer agent fees | | | 17,210 | |
| Shareholder reporting fees | | | 15,810 | |
| Other expenses | | | 14,483 | |
| | | | 818,473 | |
| NET INVESTMENT INCOME / (LOSS) | | | 1,744,152 | |
| | | | | |
| REALIZED AND UNREALIZED GAIN / (LOSS) | | | | |
| Net realized gain / (loss) on investments | | | 11,945,283 | |
| Net realized gain / (loss) on futures contracts | | | (306,568) | |
| | | | 11,638,715 | |
| Net change in unrealized appreciation / | | | | |
| (depreciation) on investments and | | | | |
| futures contracts | | | (2,909,832 | ) |
| | | | | |
| NET REALIZED AND UNREALIZED | | | | |
| GAIN / (LOSS) | | | 8,728,883 | |
| | | | | |
| NET INCREASE / (DECREASE) IN | | | | |
| NET ASSETS FROM OPERATIONS | | $ | 10,473,035 | |
| TRANSACTIONS WITH AFFILIATES: | | |
| Percent of Current | | |
| Net Asset Value | | |
| Advisory | Administration | Class I Expense | Class F Expense | |
| Fee | Fee | Limit | Limit | |
| 0.30% | 0.10% | 0.60% | 0.80% | |
The accompanying notes are an integral part of the financial statements.
Summit Mutual Funds, Inc. – Pinnacle Series |
| FINANCIAL STATEMENTS | S&P MIDCAP 400 INDEX PORTFOLIO |
STATEMENTS OF CHANGES IN NET ASSETS | | | | | | |
For the Year Ended December 31, | | | | | | |
| | | 2007 | | | 2006 | |
| OPERATIONS | | | | | | |
| Net investment income / (loss) | | $ | 1,744,152 | | | $ | 1,588,558 | |
| Net realized gain / (loss) on investments and futures | | | 11,638,715 | | | | 6,115,602 | |
| Net change in unrealized appreciation / (depreciation) on investments | | | | | | | | |
| and futures contracts | | | (2,909,832 | ) | | | 4,849,289 | |
| | | | 10,473,035 | | | | 12,553,449 | |
| DISTRIBUTIONS TO SHAREHOLDERS* | | | | | | | | |
| Class I | | | | | | | | |
| Net investment income | | | (1,394,203 | ) | | | (1,159,032 | ) |
| Net realized gain on investments | | | (6,306,003 | ) | | | (5,058,592 | ) |
Class F(1) | | | | | | | | |
| Net investment income | | | — | | | | — | |
| Net realized gain on investments | | | — | | | | — | |
| | | | (7,700,206 | ) | | | (6,217,624 | ) |
| FUND SHARE TRANSACTIONS | | | | | | | | |
| Class I | | | | | | | | |
| Proceeds from shares sold | | | 45,386,539 | | | | 20,986,992 | |
| Reinvestment of distributions | | | 7,700,206 | | | | 6,217,624 | |
| Payments for shares redeemed | | | (27,774,480 | ) | | | (16,776,702 | ) |
| | | | 25,312,265 | | | | 10,427,914 | |
Class F(1) | | | | | | | | |
| Proceeds from shares sold | | | 1,000 | | | | — | |
| Reinvestment of distributions | | | — | | | | — | |
| Payments for shares redeemed | | | — | | | | — | |
| | | | 1,000 | | | | — | |
| NET INCREASE / (DECREASE) IN NET ASSETS | | | 28,086,094 | | | | 16,763,739 | |
| NET ASSETS | | | | | | | | |
| Beginning of period | | | 144,135,651 | | | | 127,371,912 | |
| End of period | | $ | 172,221,745 | | | $ | 144,135,651 | |
| ACCUMULATED UNDISTRIBUTED NET INVESTMENT INCOME | | $ | 1,390,505 | | | $ | 1,172,500 | |
FUND SHARE TRANSACTIONS Class I | | | | | | |
| Sold | | | | | | | 313,433 | |
| Reinvestment of distributions | | | | | | | 92,870 | |
| Redeemed | | | (388,957 | ) | | | (251,818 | ) |
| Net increase / (decrease) from fund share transactions | | | | | | | 154,485 | |
FUND SHARE TRANSACTIONS Class F(1) | | | | | | | | |
| Sold | | | 14 | | | | — | |
| Reinvestment of distributions | | | — | | | | — | |
| Redeemed | | | — | | | | — | |
| Net increase / (decrease) from fund share transactions | | | 14 | | | | — | |
| | | | | | | | | |
| TOTAL COST OF PURCHASES OF: | | | | | | | | |
| Common Stocks | | $ | | | | $ | 24,438,495 | |
| | | $ | | | | $ | 24,438,495 | |
| TOTAL PROCEEDS FROM SALES OF: | | | | | | | | |
| Common Stocks | | $ | | | | $ | 19,118,277 | |
| | | $ | | | | $ | 19,118,277 | |
| | | | | | | | | |
| *TAX CHARACTER OF DISTRIBUTIONS PAID | | | | | | | | |
| Ordinary income** | | $ | | | | $ | 1,810,900 | |
| Long-term capital gains | | | | | | | 4,406,724 | |
| | | $ | 7,700,206 | | | $ | 6,217,624 | |
| | | | | | | | | |
(1) Class F Shares have been offered since 10/1/07. | | | | | | | | |
** The percentage of taxable ordinary income distributions that are designated as short-term capital gain distributions | | | | | | | | |
| under Internal Revenue Section 871 (k)(2)(C) is 18.25% | | | | | | | | |
The accompanying notes are an integral part of the financial statements.
Summit Mutual Funds, Inc. – Pinnacle Series |
Summit Balanced Index Portfolio - Average Annual Total Return |
1-Year | 5-Year | 10-Year |
| 7.02% | 9.16% | 3.68% |
Past performance is not predictive of future results. Performance does not reflect the deduction of taxes that a shareholder would pay on fund distributions or redemption of fund shares. Separate account expenses are not included. Absent limitation of expenses during certain of the periods shown, performance would have been lower.
| Managers: | |
| Inception Date: | |
| Total Net Assets: | $25.99 Million |
| Number of Equity Holdings: | 500 |
| Median Cap Size: | $13,043 (in millions) |
Average Price-to-book Ratio: | 2.77 x |
| 1.97% |
| Number of Fixed Income Holdings: | 39 |
| Effective Duration | 4.23 years |
| Average Maturity | 11.74 years |
| Average Credit Quality | Aaa/AAA |
| Current Yield | 5.09% |
Top 10 Equity Holdings | | Sector Allocations |
| | (% of net assets) | | |
General Electric Co. Microsoft Corp. AT&T, Inc. Procter & Gamble Co. Chevron Corp. | | | |
Summit Mutual Funds, Inc. – Pinnacle Series |
Objective – Seeks investment results, with respect to 60% of its assets, that correspond to the total return performance of U.S. common stocks, as represented by the Standard & Poor’s 500 Composite Stock Price Index (the “Index”) and, with respect to 40% of its assets, that correspond to the total return performance of investment grade bonds, as represented by the Lehman Brothers Aggregate Bond Index (the “Bond Index”).
Strategy – The Summit Pinnacle Balanced Index Portfolio (the “Portfolio”) will invest approximately 60% of its net assets in a portfolio of stocks included in the Index and in futures of the Index, and approximately 40% of its net assets in a portfolio of investment grade bonds designed to track the Bond Index.
Managers’ Comments:
For the period ended December 31, 2007, the Summit Balanced Index Portfolio’s total return was 7.02% (after waivers and reimbursements, but before the impact of any product or contract-level fees). This compares to a 6.22% total return for the Balanced Index (a hypothetical index composed of 60% of the S&P 500 Index and 40% of the Lehman Aggregate Bond Index, which had total returns of 5.49% and 6.97%, respectively). The difference of 0.80% is referred to as “tracking error” and is attributed to a number of factors, including the Portfolio’s operating expenses. These expenses represent the Portfolio’s costs for advisory, administration, accounting, custody and other services. Other factors include the timing and size of cash flows into and out of the Portfolio and related holdings of cash and cash equivalents; brokers’ commissions or other trading costs; holding security positions in amounts that are different than the weightings in the Index; and maintaining stock and bond portfolio holdings in a ratio different from the 60%/40% default ratio, among others. While an exact replication of the capitalization weightings of securities in the Index is not feasible, the Portfolio’s objectives and strategies call for a correlation of at least 95% between the Portfolio’s pre-expense total return and that of the Index. The Portfolio achieved this level of correlation for the period presented. The primary reasons for the positive variance to the Balanced Index were: a slight overweighting to equities during the first half of 2007 when equities out performed fixed income securities; the recognition of certain litigation settlements from past corporate bond holdings; and holding only a sample of the Lehman Index versus a complete replication of the Index.
Summit Mutual Funds, Inc. – Pinnacle Series |
| BALANCED INDEX PORTFOLIO | FINANCIAL HIGHLIGHTS |
FINANCIAL HIGHLIGHTS | | | | | | | | | | | | | | | |
| Computed on the basis of capital stock outstanding throughout the period. | | | | | | | | | | | | | |
| | | | | | | | | | | | | | | | |
| | Year Ended December 31, |
| | | 2007 | | | 2006 | | | 2005 | | | 2004 | | | 2003 | |
| Net asset value, beginning of period | | $ | 49.58 | | | $ | 45.74 | | | $ | 45.55 | | | $ | 43.05 | | | $ | 37.50 | |
| INVESTMENT ACTIVITIES: | | | | | | | | | | | | | | | | | | | | |
| Net investment income / (loss) | | | 1.33 | | | | 1.16 | | | | 1.07 | | | | 0.95 | (2) | | | 0.95 | |
| Net realized and unrealized gains / (losses) | | | 2.12 | | | | 3.80 | | | | 0.28 | | | | 2.27 | | | | 5.57 | |
| Total from Investment Activities | | | 3.45 | | | | 4.96 | | | | 1.35 | | | | 3.22 | | | | 6.52 | |
| | | | | | | | | | | | | | | | | | | | | |
| DISTRIBUTIONS: | | | | | | | | | | | | | | | | | | | | |
| Net investment income | | | (1.41 | ) | | | (1.12 | ) | | | (1.16 | ) | | | (0.72 | ) | | | (0.97 | ) |
| Total Distributions | | | (1.41 | ) | | | (1.12 | ) | | | (1.16 | ) | | | (0.72 | ) | | | (0.97 | ) |
| Net asset value, end of period | | $ | 51.62 | | | $ | 49.58 | | | $ | 45.74 | | | $ | 45.55 | | | $ | 43.05 | |
| | | | | | | | | | | | | | | | | | | | | |
| Total return | | | 7.02 | % | | | 11.02 | % | | | 3.04 | % | | | 7.59 | % | | | 17.70 | % |
| | | | | | | | | | | | | | | | | | | | | |
| RATIOS/SUPPLEMENTAL DATA: | | | | | | | | | | | | | | | | | | | | |
Ratio of expenses to average net assets – net(1) | | | 0.60 | % | | | 0.60 | % | | | 0.60 | % | | | 0.60 | % | | | 0.60 | % |
| Ratio of expenses to average net assets – gross | | | 0.69 | % | | | 0.69 | % | | | 0.70 | % | | | 0.71 | % | | | 1.01 | % |
| Ratio of net investment income / (loss) to average net assets | | | 2.47 | % | | | 2.36 | % | | | 2.25 | % | | | 2.23 | % | | | 2.31 | % |
| Portfolio turnover rate | | | 15.11 | % | | | 21.19 | % | | | 3.85 | % | | | 21.20 | % | | | 25.45 | % |
| Net assets, end of period (000’s) | | $ | 25,993 | | | $ | 28,784 | | | $ | 29,316 | | | $ | 33,356 | | | $ | 11,667 | |
(1) Net expenses represent gross expenses reduced by fees waived and/or reimbursed by the Adviser. | | | | | |
(2) Per share amounts are based on average shares outstanding. | | | | | | | | | | |
The accompanying notes are an integral part of the financial statements.
Summit Mutual Funds, Inc. – Pinnacle Series |
| SCHEDULE OF INVESTMENTS | BALANCED INDEX PORTFOLIO |
DECEMBER 31, 2007 | | | | | | |
| | | SHARES | | | VALUE | |
COMMON STOCKS - 58.8% | | | | | | |
Consumer Discretionary - 5.1% | | | | | | |
| Abercrombie & Fitch Co. - Class A | | | 120 | | | $ | 9,596 | |
Amazon.Com, Inc. (a) | | | 361 | | | | 33,443 | |
Apollo Group, Inc. (a) | | | 185 | | | | 12,978 | |
AutoNation, Inc. (a) | | | 203 | | | | 3,179 | |
Autozone, Inc. (a) (d) | | | 56 | | | | 6,715 | |
Bed Bath & Beyond, Inc. (a) | | | 318 | | | | 9,346 | |
| Best Buy Co., Inc. | | | 470 | | | | 24,746 | |
Big Lots, Inc. (a) | | | 137 | | | | 2,191 | |
| Black & Decker Corp. | | | 82 | | | | 5,711 | |
| Brunswick Corp. | | | 105 | | | | 1,790 | |
| Carnival Corp. | | | 514 | | | | 22,868 | |
| CBS Corporation | | | 851 | | | | 23,190 | |
Centex Corp. (d) | | | 157 | | | | 3,966 | |
Circuit City Stores, Inc. (d) | | | 161 | | | | 676 | |
| Clear Channel Communications, Inc. | | | 576 | | | | 19,884 | |
Coach, Inc. (a) | | | 431 | | | | 13,180 | |
Comcast Corp. - Class A (a) | | | 3,607 | | | | 65,864 | |
| D.R. Horton, Inc. | | | 341 | | | | 4,491 | |
| Darden Restaurants, Inc. | | | 165 | | | | 4,572 | |
Dillard’s, Inc. - Class A (d) | | | 71 | | | | 1,333 | |
The DIRECTV Group, Inc. (a) | | | 895 | | | | 20,692 | |
| E.W. Scripps Co. | | | 130 | | | | 5,851 | |
Eastman Kodak Co. (d) | | | 359 | | | | 7,851 | |
Expedia, Inc. (a) | | | 240 | | | | 7,589 | |
| Family Dollar Stores, Inc. | | | 175 | | | | 3,365 | |
Ford Motor Co. (a) (d) | | | 2,410 | | | | 16,219 | |
| Fortune Brands, Inc. | | | 190 | | | | 13,748 | |
GameStop Corp. (a) (d) | | | 180 | | | | 11,180 | |
| Gannett Co., Inc. | | | 273 | | | | 10,647 | |
| The Gap, Inc. | | | 615 | | | | 13,087 | |
General Motors Corp. (d) | | | 656 | | | | 16,328 | |
| Genuine Parts Co. | | | 198 | | | | 9,167 | |
The Goodyear Tire & Rubber Co. (a) | | | 263 | | | | 7,422 | |
| H&R Block, Inc. | | | 375 | | | | 6,964 | |
| Harley-Davidson, Inc. | | | 299 | | | | 13,966 | |
| Harman International Industries, Inc. | | | 77 | | | | 5,676 | |
| Harrah’s Entertainment, Inc. | | | 217 | | | | 19,259 | |
| Hasbro, Inc. | | | 217 | | | | 5,551 | |
| Home Depot, Inc. | | | 1,992 | | | | 53,665 | |
IAC/InterActiveCorp (a) | | | 254 | | | | 6,838 | |
| International Game Technology | | | 386 | | | | 16,957 | |
Interpublic Group of Companies, Inc. (a) (d) | | | 544 | | | | 4,412 | |
| J.C. Penney Co., Inc. | | | 261 | | | | 11,481 | |
| Johnson Controls, Inc. | | | 687 | | | | 24,759 | |
Jones Apparel Group, Inc. (d) | | | 136 | | | | 2,175 | |
| KB Home | | | 90 | | | | 1,944 | |
Kohl’s Corp. (a) | | | 375 | | | | 17,175 | |
| Leggett & Platt, Inc. | | | 221 | | | | 3,854 | |
Lennar Corp. (d) | | | 162 | | | | 2,898 | |
| Limited Brands, Inc. | | | 398 | | | | 7,534 | |
Liz Claiborne, Inc. (d) | | | 129 | | | | 2,625 | |
| Lowe’s Companies, Inc. | | | 1,746 | | | | 39,495 | |
| Macys, Inc. | | | 534 | | | | 13,815 | |
| Marriott International, Inc. - Class A | | | 381 | | | | 13,023 | |
| Mattel, Inc. | | | 457 | | | | 8,701 | |
| McDonald’s Corp. | | | 1,385 | | | | 81,590 | |
| | | SHARES | | | VALUE | |
Consumer Discretionary - 5.1% (Continued) | | | | | | |
| The McGraw-Hill Cos., Inc. | | | 399 | | | $ | 17,480 | |
| Meredith Corp. | | | 70 | | | | 3,849 | |
The New York Times Co. - Class A (d) | | | 191 | | | | 3,348 | |
| Newell Rubbermaid, Inc. | | | 346 | | | | 8,954 | |
| News Corp. - Class A | | | 2,702 | | | | 55,364 | |
| Nike, Inc. - Class B | | | 471 | | | | 30,257 | |
Nordstrom, Inc. (d) | | | 261 | | | | 9,587 | |
Office Depot, Inc. (a) | | | 321 | | | | 4,465 | |
| OfficeMax, Inc. | | | 118 | | | | 2,438 | |
| Omnicom Group, Inc. | | | 418 | | | | 19,868 | |
Polo Ralph Lauren Corp. (d) | | | 85 | | | | 5,252 | |
Pulte Homes, Inc. (d) | | | 265 | | | | 2,793 | |
| RadioShack Corp. | | | 170 | | | | 2,866 | |
Sears Holdings Corp. (a) (d) | | | 89 | | | | 9,082 | |
| The Sherwin-Williams Co. | | | 140 | | | | 8,126 | |
| Snap-On, Inc. | | | 97 | | | | 4,679 | |
| The Stanley Works | | | 121 | | | | 5,866 | |
| Staples, Inc. | | | 830 | | | | 19,148 | |
Starbucks Corp. (a) | | | 860 | | | | 17,604 | |
| Starwood Hotels & Resorts Worldwide, Inc. | | | 268 | | | | 11,800 | |
| Target Corp. | | | 988 | | | | 49,400 | |
Tiffany & Co. (d) | | | 183 | | | | 8,424 | |
| Time Warner, Inc. | | | 4,391 | | | | 72,495 | |
| TJX Companies, Inc. | | | 528 | | | | 15,169 | |
| VF Corp. | | | 104 | | | | 7,141 | |
Viacom, Inc. - Class B (a) | | | 800 | | | | 35,136 | |
| The Walt Disney Co. | | | 2,299 | | | | 74,212 | |
| The Washington Post Co. - Class B | | | 6 | | | | 4,749 | |
| Wendy’s International, Inc. | | | 109 | | | | 2,817 | |
| Whirlpool Corp. | | | 92 | | | | 7,510 | |
| Wyndham Worldwide Corp. | | | 236 | | | | 5,560 | |
| Yum! Brands, Inc. | | | 609 | | | | 23,306 | |
| | | | | | | | 1,325,967 | |
Consumer Staples - 6.0% | | | | | | | | |
| Altria Group, Inc. | | | 2,484 | | | | 187,741 | |
| Anheuser-Busch Companies, Inc. | | | 882 | | | | 46,164 | |
| Archer-Daniels-Midland Co. | | | 758 | | | | 35,194 | |
| Avon Products, Inc. | | | 510 | | | | 20,160 | |
| Brown-Forman Corp. - Class B | | | 92 | | | | 6,818 | |
| Campbell Soup Co. | | | 276 | | | | 9,861 | |
| Clorox Co. | | | 163 | | | | 10,623 | |
| The Coca-Cola Co. | | | 2,331 | | | | 143,053 | |
| Coca-Cola Enterprises, Inc. | | | 324 | | | | 8,434 | |
| Colgate-Palmolive Co. | | | 594 | | | | 46,308 | |
| ConAgra Foods, Inc. | | | 579 | | | | 13,774 | |
Constellation Brands, Inc. - Class A (a) | | | 225 | | | | 5,319 | |
| Costco Wholesale Corp. | | | 519 | | | | 36,205 | |
| CVS Caremark Corp. | | | 1,791 | | | | 71,192 | |
| Dean Foods Co. | | | 151 | | | | 3,905 | |
| The Estee Lauder Companies, Inc. | | | 137 | | | | 5,975 | |
| General Mills, Inc. | | | 402 | | | | 22,914 | |
| The Hershey Co. | | | 216 | | | | 8,510 | |
| HJ Heinz Co. | | | 377 | | | | 17,598 | |
| Kellogg Co. | | | 291 | | | | 15,257 | |
| Kimberly-Clark Corp. | | | 495 | | | | 34,323 | |
| Kraft Foods, Inc. | | | 1,862 | | | | 60,757 | |
The accompanying notes are an integral part of the financial statements.
Summit Mutual Funds, Inc. – Pinnacle Series |
| BALANCED INDEX PORTFOLIO | SCHEDULE OF INVESTMENTS |
| | | SHARES | | | VALUE | |
Consumer Staples - 6.0% (Continued) | | | | | | |
| The Kroger Co. | | | 822 | | | $ | 21,956 | |
| McCormick & Co., Inc. | | | 163 | | | | 6,179 | |
| Molson Coors Brewing Co. - Class B | | | 160 | | | | 8,259 | |
| Pepsi Bottling Group, Inc. | | | 180 | | | | 7,103 | |
| PepsiCo, Inc. | | | 1,890 | | | | 143,451 | |
| Procter & Gamble Co. | | | 3,654 | | | | 268,277 | |
Reynolds American, Inc. (d) | | | 227 | | | | 14,973 | |
| Safeway, Inc. | | | 513 | | | | 17,550 | |
| Sara Lee Corp. | | | 853 | | | | 13,699 | |
| Supervalu, Inc. | | | 259 | | | | 9,718 | |
| Sysco Corp. | | | 717 | | | | 22,378 | |
| Tyson Foods, Inc. - Class A | | | 315 | | | | 4,829 | |
UST, Inc. (d) | | | 186 | | | | 10,193 | |
| Walgreen Co. | | | 1,162 | | | | 44,249 | |
| Wal-Mart Stores, Inc. | | | 2,813 | | | | 133,702 | |
Whole Foods Market, Inc. (d) | | | 164 | | | | 6,691 | |
| WM Wrigley Jr. Co. | | | 272 | | | | 15,926 | |
| | | | | | | | 1,559,218 | |
Energy - 7.5% | | | | | | | | |
| Anadarko Petroleum Corp. | | | 539 | | | | 35,407 | |
| Apache Corp. | | | 385 | | | | 41,403 | |
| Baker Hughes, Inc. | | | 372 | | | | 30,169 | |
| BJ Services Co. | | | 340 | | | | 8,248 | |
| Chesapeake Energy Corp. | | | 476 | | | | 18,659 | |
| Chevron Corp. | | | 2,492 | | | | 232,578 | |
| ConocoPhillips | | | 1,895 | | | | 167,329 | |
| Consol Energy, Inc. | | | 228 | | | | 16,307 | |
| Devon Energy Corp. | | | 516 | | | | 45,878 | |
El Paso Corp. (d) | | | 813 | | | | 14,016 | |
| ENSCO International, Inc. | | | 173 | | | | 10,314 | |
| EOG Resources, Inc. | | | 305 | | | | 27,221 | |
| Exxon Mobil Corp. | | | 6,483 | | | | 607,392 | |
| Halliburton Co. | | | 1,061 | | | | 40,223 | |
| Hess Corp. | | | 319 | | | | 32,174 | |
| Marathon Oil Corp. | | | 796 | | | | 48,445 | |
| Murphy Oil Corp. | | | 219 | | | | 18,580 | |
Nabors Industries Ltd. (a) | | | 348 | | | | 9,532 | |
National Oilwell Varco, Inc. (a) | | | 412 | | | | 30,266 | |
| Noble Energy, Inc. | | | 200 | | | | 15,904 | |
| Noble Corp. | | | 336 | | | | 18,987 | |
| Occidental Petroleum Corp. | | | 968 | | | | 74,526 | |
| Peabody Energy Corp. | | | 308 | | | | 18,985 | |
Range Resources Corp. (d) | | | 180 | | | | 9,245 | |
Rowan Companies, Inc. (d) | | | 129 | | | | 5,090 | |
| Schlumberger Ltd. | | | 1,406 | | | | 138,308 | |
| Smith International, Inc. | | | 233 | | | | 17,207 | |
| Spectra Energy Corp. | | | 733 | | | | 18,926 | |
| Sunoco, Inc. | | | 142 | | | | 10,287 | |
| Tesoro Corp. | | | 160 | | | | 7,632 | |
Transocean, Inc. (a) | | | 371 | | | | 53,109 | |
| Valero Energy Corp. | | | 637 | | | | 44,609 | |
Weatherford International Ltd. (a) | | | 392 | | | | 26,891 | |
| Williams Companies, Inc. | | | 695 | | | | 24,867 | |
| XTO Energy, Inc. | | | 556 | | | | 28,569 | |
| | | | | | | | 1,947,283 | |
| | | SHARES | | | VALUE | |
Financials - 10.3% | | | | | | |
| ACE Ltd. | | | 378 | | | $ | 23,353 | |
| Aflac, Inc. | | | 568 | | | | 35,574 | |
| The Allstate Corp. | | | 705 | | | | 36,822 | |
AMBAC Financial Group, Inc. (d) | | | 128 | | | | 3,299 | |
American Capital Strategies Ltd. (d) | | | 230 | | | | 7,581 | |
| American Express Co. | | | 1,379 | | | | 71,736 | |
| American International Group, Inc. | | | 3,008 | | | | 175,366 | |
| Ameriprise Financial, Inc. | | | 298 | | | | 16,423 | |
| AON Corp. | | | 341 | | | | 16,262 | |
Apartment Investment & Management Co. (d) | | | 113 | | | | 3,924 | |
| Assurant, Inc. | | | 130 | | | | 8,697 | |
| AvalonBay Communities, Inc. | | | 100 | | | | 9,414 | |
| Bank of America Corp. | | | 5,235 | | | | 215,996 | |
| The Bank Of New York Mellon Corp. | | | 1,310 | | | | 63,876 | |
| BB&T Corp. | | | 630 | | | | 19,322 | |
The Bear Stearns Companies, Inc. (d) | | | 139 | | | | 12,267 | |
| Boston Properties, Inc. | | | 140 | | | | 12,853 | |
| Capital One Financial Corp. | | | 480 | | | | 22,685 | |
CB Richard Ellis Group, Inc. (a) (d) | | | 250 | | | | 5,387 | |
| The Charles Schwab Corp. | | | 1,095 | | | | 27,977 | |
| Chubb Corp. | | | 466 | | | | 25,434 | |
| Cincinnati Financial Corp. | | | 200 | | | | 7,908 | |
| CIT Group, Inc. | | | 242 | | | | 5,815 | |
| Citigroup, Inc. | | | 5,869 | | | | 172,783 | |
| CME Group, Inc. | | | 63 | | | | 43,218 | |
| Comerica, Inc. | | | 197 | | | | 8,575 | |
| Commerce Bancorp, Inc. | | | 222 | | | | 8,467 | |
Countrywide Financial Corp. (d) | | | 689 | | | | 6,160 | |
| Developers Diversified Realty Corp. | | | 170 | | | | 6,509 | |
| Discover Financial Services | | | 613 | | | | 9,244 | |
E*Trade Financial Corp. (a) (d) | | | 496 | | | | 1,761 | |
| Equity Residential | | | 367 | | | | 13,384 | |
| Fannie Mae | | | 1,130 | | | | 45,177 | |
| Federated Investors, Inc. | | | 103 | | | | 4,239 | |
| Fifth Third Bancorp | | | 639 | | | | 16,058 | |
First Horizon National Corp. (d) | | | 157 | | | | 2,850 | |
| Franklin Resources, Inc. | | | 192 | | | | 21,971 | |
| Freddie Mac | | | 767 | | | | 26,132 | |
| General Growth Properties, Inc. | | | 285 | | | | 11,736 | |
| Genworth Financial, Inc. | | | 486 | | | | 12,369 | |
| Goldman Sachs Group, Inc. | | | 474 | | | | 101,934 | |
| Hartford Financial Services Group, Inc. | | | 368 | | | | 32,086 | |
| Host Hotels & Resorts, Inc. | | | 606 | | | | 10,326 | |
| Hudson City Bancorp, Inc. | | | 563 | | | | 8,456 | |
Huntington Bancshares, Inc. (d) | | | 294 | | | | 4,339 | |
Intercontinentalexchange, Inc. (a) | | | 80 | | | | 15,400 | |
| Janus Capital Group, Inc. | | | 216 | | | | 7,096 | |
| JPMorgan Chase & Co. | | | 3,962 | | | | 172,941 | |
| KeyCorp | | | 456 | | | | 10,693 | |
| Kimco Realty Corp. | | | 264 | | | | 9,610 | |
| Legg Mason, Inc. | | | 153 | | | | 11,192 | |
| Lehman Brothers Holdings, Inc. | | | 618 | | | | 40,442 | |
Leucadia National Corp. (d) | | | 195 | | | | 9,184 | |
| Lincoln National Corp. | | | 315 | | | | 18,339 | |
| Loews Corp. | | | 518 | | | | 26,076 | |
| M&T Bank Corp. | | | 88 | | | | 7,178 | |
| Marsh & McLennan Companies, Inc. | | | 645 | | | | 17,073 | |
The accompanying notes are an integral part of the financial statements.
Summit Mutual Funds, Inc. – Pinnacle Series |
| SCHEDULE OF INVESTMENTS | BALANCED INDEX PORTFOLIO |
| | | SHARES | | | VALUE | |
Financials - 10.3% (Continued) | | | | | | |
| Marshall & Ilsley Corp. | | | 300 | | | $ | 7,944 | |
MBIA, Inc. (d) | | | 168 | | | | 3,130 | |
| Merrill Lynch & Co., Inc. | | | 1,011 | | | | 54,270 | |
| MetLife, Inc. | | | 861 | | | | 53,055 | |
MGIC Investment Corp. (d) | | | 104 | | | | 2,333 | |
Moody’s Corp. (d) | | | 268 | | | | 9,568 | |
| Morgan Stanley | | | 1,223 | | | | 64,954 | |
| National City Corp. | | | 749 | | | | 12,329 | |
| Northern Trust Corp. | | | 219 | | | | 16,771 | |
| NYSE Euronext | | | 300 | | | | 26,331 | |
| Plum Creek Timber Co., Inc. | | | 221 | | | | 10,175 | |
| PNC Financial Services Group, Inc. | | | 434 | | | | 28,492 | |
| Principal Financial Group, Inc. | | | 311 | | | | 21,409 | |
| The Progressive Corp. | | | 855 | | | | 16,382 | |
| Prologis | | | 298 | | | | 18,887 | |
| Prudential Financial, Inc. | | | 543 | | | | 50,521 | |
| Public Storage, Inc. | | | 138 | | | | 10,131 | |
Regions Financial Corp. (d) | | | 818 | | | | 19,346 | |
| Safeco Corp. | | | 154 | | | | 8,575 | |
| Simon Property Group, Inc. | | | 273 | | | | 23,713 | |
| SLM Corp. | | | 608 | | | | 12,245 | |
Sovereign Bancorp, Inc. (d) | | | 420 | | | | 4,788 | |
| State Street Corp. | | | 438 | | | | 35,566 | |
| SunTrust Banks, Inc. | | | 414 | | | | 25,871 | |
| T. Rowe Price Group, Inc. | | | 309 | | | | 18,812 | |
| Torchmark Corp. | | | 123 | | | | 7,445 | |
| The Travelers Companies, Inc. | | | 771 | | | | 41,480 | |
| Unum Group | | | 399 | | | | 9,492 | |
| US Bancorp | | | 2,019 | | | | 64,083 | |
| Vornado Realty Trust | | | 152 | | | | 13,368 | |
| Wachovia Corp. | | | 2,220 | | | | 84,427 | |
Washington Mutual, Inc. (d) | | | 1,031 | | | | 14,032 | |
| Wells Fargo & Co. | | | 4,108 | | | | 124,021 | |
| XL Capital Ltd. - Class A | | | 235 | | | | 11,823 | |
| Zions Bancorporation | | | 151 | | | | 7,050 | |
| | | | | | | | 2,673,788 | |
Health Care - 7.1% | | | | | | | | |
| Abbott Laboratories | | | 1,787 | | | | 100,340 | |
| Aetna, Inc. | | | 599 | | | | 34,580 | |
| Allergan, Inc. | | | 357 | | | | 22,934 | |
| AmerisourceBergen Corp. | | | 222 | | | | 9,961 | |
Amgen, Inc. (a) | | | 1,282 | | | | 59,536 | |
| Applera Corp. - Applied Biosystems Group | | | 242 | | | | 8,209 | |
Barr Pharmaceuticals, Inc. (a) | | | 160 | | | | 8,496 | |
| Baxter International, Inc. | | | 756 | | | | 43,886 | |
| Becton, Dickinson & Co. | | | 285 | | | | 23,820 | |
Biogen Idec, Inc. (a) | | | 364 | | | | 20,719 | |
Boston Scientific Corp. (a) | | | 1,574 | | | | 18,306 | |
| Bristol-Myers Squibb Co. | | | 2,283 | | | | 60,545 | |
| C.R. Bard, Inc. | | | 120 | | | | 11,376 | |
| Cardinal Health, Inc. | | | 447 | | | | 25,814 | |
Celgene Corp. (a) | | | 475 | | | | 21,950 | |
| CIGNA Corp. | | | 334 | | | | 17,946 | |
Coventry Health Care, Inc. (a) | | | 210 | | | | 12,442 | |
| Covidien Ltd. | | | 575 | | | | 25,467 | |
| Eli Lilly & Co. | | | 1,145 | | | | 61,132 | |
| | | SHARES | | | VALUE | |
Health Care - 7.1% (Continued) | | | | | | |
Express Scripts, Inc. (a) | | | 317 | | | $ | 23,141 | |
Forest Laboratories, Inc. (a) | | | 369 | | | | 13,450 | |
Genzyme Corp. (a) | | | 329 | | | | 24,491 | |
Gilead Sciences, Inc. (a) | | | 1,084 | | | | 49,875 | |
Hospira, Inc. (a) | | | 208 | | | | 8,869 | |
Humana, Inc. (a) | | | 218 | | | | 16,418 | |
| IMS Health, Inc. | | | 228 | | | | 5,253 | |
| Johnson & Johnson | | | 3,415 | | | | 227,780 | |
King Pharmaceuticals, Inc. (a) | | | 304 | | | | 3,113 | |
Laboratory Corp. of America Holdings (a) | | | 166 | | | | 12,538 | |
| McKesson Corp. | | | 343 | | | | 22,470 | |
Medco Health Solutions, Inc. (a) | | | 325 | | | | 32,955 | |
| Medtronic, Inc. | | | 1,337 | | | | 67,211 | |
| Merck & Co., Inc. | | | 2,568 | | | | 149,226 | |
Millipore Corp. (a) | | | 86 | | | | 6,293 | |
Mylan, Inc. (d) | | | 289 | | | | 4,063 | |
Patterson Companies, Inc. (a) (d) | | | 162 | | | | 5,500 | |
| PerkinElmer, Inc. | | | 167 | | | | 4,345 | |
| Pfizer, Inc. | | | 8,141 | | | | 185,045 | |
| Quest Diagnostics, Inc. | | | 214 | | | | 11,321 | |
| Schering-Plough Corp. | | | 1,910 | | | | 50,882 | |
St. Jude Medical, Inc. (a) | | | 393 | | | | 15,971 | |
| Stryker Corp. | | | 280 | | | | 20,922 | |
Tenet Healthcare Corp. (a) (d) | | | 549 | | | | 2,789 | |
Thermo Fisher Scientific, Inc. (a) | | | 524 | | | | 30,224 | |
| UnitedHealth Group, Inc. | | | 1,555 | | | | 90,501 | |
Varian Medical Systems, Inc. (a) | | | 175 | | | | 9,128 | |
Waters Corp. (a) | | | 136 | | | | 10,754 | |
Watson Pharmaceuticals, Inc. (a) | | | 119 | | | | 3,230 | |
Wellpoint, Inc. (a) | | | 712 | | | | 62,464 | |
| Wyeth | | | 1,561 | | | | 68,981 | |
Zimmer Holdings, Inc. (a) | | | 296 | | | | 19,580 | |
| | | | | | | | 1,846,242 | |
Industrials - 6.8% | | | | | | | | |
| 3M Co. | | | 836 | | | | 70,492 | |
Allied Waste Industries, Inc. (a) (d) | | | 326 | | | | 3,593 | |
Avery Dennison Corp. (d) | | | 125 | | | | 6,642 | |
| Boeing Co. | | | 914 | | | | 79,938 | |
| Burlington Northern Santa Fe Corp. | | | 354 | | | | 29,463 | |
| C.H. Robinson Worldwide, Inc. | | | 199 | | | | 10,770 | |
| Caterpillar, Inc. | | | 743 | | | | 53,912 | |
| Cintas Corp. | | | 181 | | | | 6,085 | |
| Cooper Industries Ltd. - Class A | | | 228 | | | | 12,057 | |
| CSX Corp. | | | 507 | | | | 22,298 | |
| Cummins, Inc. | | | 121 | | | | 15,412 | |
| Danaher Corp. | | | 297 | | | | 26,059 | |
| Deere & Co. | | | 524 | | | | 48,795 | |
| Dover Corp. | | | 238 | | | | 10,969 | |
| Eaton Corp. | | | 183 | | | | 17,742 | |
| Emerson Electric Co. | | | 923 | | | | 52,297 | |
| Equifax, Inc. | | | 168 | | | | 6,108 | |
| Expeditors International Washington, Inc. | | | 250 | | | | 11,170 | |
| FedEx Corp. | | | 383 | | | | 34,152 | |
| Fluor Corp. | | | 103 | | | | 15,009 | |
| General Dynamics Corp. | | | 470 | | | | 41,825 | |
| General Electric Co. | | | 11,898 | | | | 441,059 | |
| Goodrich Corp. | | | 146 | | | | 10,309 | |
The accompanying notes are an integral part of the financial statements.
Summit Mutual Funds, Inc. – Pinnacle Series |
| BALANCED INDEX PORTFOLIO | SCHEDULE OF INVESTMENTS |
| | | SHARES | | | VALUE | |
Industrials - 6.8% (Continued) | | | | | | |
| Honeywell International, Inc. | | | 904 | | | $ | 55,659 | |
| Illinois Tool Works, Inc. | | | 479 | | | | 25,646 | |
| Ingersoll-Rand Company Ltd. - Class A | | | 350 | | | | 16,265 | |
| ITT Corp. | | | 244 | | | | 16,114 | |
Jacobs Engineering Group, Inc. (a) | | | 140 | | | | 13,385 | |
| L-3 Communications Holdings, Inc. | | | 145 | | | | 15,361 | |
| Lockheed Martin Corp. | | | 412 | | | | 43,367 | |
| Manitowoc Co. | | | 150 | | | | 7,324 | |
| Masco Corp. | | | 439 | | | | 9,487 | |
Monster Worldwide, Inc. (a) | | | 152 | | | | 4,925 | |
| Norfolk Southern Corp. | | | 457 | | | | 23,051 | |
| Northrop Grumman Corp. | | | 401 | | | | 31,535 | |
| Paccar, Inc. | | | 433 | | | | 23,590 | |
| Pall Corp. | | | 154 | | | | 6,209 | |
| Parker Hannifin Corp. | | | 217 | | | | 16,342 | |
| Pitney Bowes, Inc. | | | 275 | | | | 10,461 | |
| Precision Castparts Corp. | | | 170 | | | | 23,579 | |
| Raytheon Co. | | | 516 | | | | 31,321 | |
| Robert Half International, Inc. | | | 193 | | | | 5,219 | |
| Rockwell Automation, Inc. | | | 207 | | | | 14,275 | |
| Rockwell Collins, Inc. | | | 210 | | | | 15,114 | |
| RR Donnelley & Sons Co. | | | 256 | | | | 9,661 | |
| Ryder System, Inc. | | | 71 | | | | 3,338 | |
| Southwest Airlines Co. | | | 906 | | | | 11,053 | |
Terex Corp. (a) | | | 140 | | | | 9,180 | |
| Textron, Inc. | | | 295 | | | | 21,034 | |
| Trane, Inc. | | | 218 | | | | 10,183 | |
| Tyco International Ltd. | | | 576 | | | | 22,838 | |
| Union Pacific Corp. | | | 314 | | | | 39,445 | |
| United Parcel Service, Inc. - Class B | | | 1,229 | | | | 86,915 | |
| United Technologies Corp. | | | 1,154 | | | | 88,327 | |
| W.W. Grainger, Inc. | | | 83 | | | | 7,264 | |
| Waste Management, Inc. | | | 601 | | | | 19,635 | |
| | | | | | | | 1,763,258 | |
Information Technology - 9.8% | | | | | | | | |
Adobe Systems, Inc. (a) | | | 683 | | | | 29,185 | |
Advanced Micro Devices, Inc. (a) (d) | | | 642 | | | | 4,815 | |
Affiliated Computer Services, Inc. - Class A (a) | | | 116 | | | | 5,232 | |
Agilent Technologies, Inc. (a) | | | 460 | | | | 16,900 | |
Akamai Technologies, Inc. (a) (d) | | | 200 | | | | 6,920 | |
| Altera Corp. | | | 412 | | | | 7,960 | |
| Analog Devices, Inc. | | | 380 | | | | 12,046 | |
Apple, Inc. (a) | | | 1,026 | | | | 203,230 | |
| Applied Materials, Inc. | | | 1,604 | | | | 28,487 | |
Autodesk, Inc. (a) | | | 289 | | | | 14,381 | |
| Automatic Data Processing, Inc. | | | 642 | | | | 28,588 | |
BMC Software, Inc. (a) | | | 271 | | | | 9,658 | |
Broadcom Corp. - Class A (a) | | | 540 | | | | 14,116 | |
| CA, Inc. | | | 478 | | | | 11,926 | |
Ciena Corp. (a) (d) | | | 123 | | | | 4,196 | |
Cisco Systems, Inc. (a) | | | 7,186 | | | | 194,525 | |
Citrix Systems, Inc. (a) | | | 210 | | | | 7,982 | |
Cognizant Technology Solutions Corp. (a) | | | 400 | | | | 13,576 | |
Computer Sciences Corp. (a) | | | 216 | | | | 10,686 | |
Compuware Corp. (a) | | | 350 | | | | 3,108 | |
Convergys Corp. (a) | | | 184 | | | | 3,029 | |
| Corning, Inc. | | | 1,826 | | | | 43,806 | |
| | | SHARES | | | VALUE | |
Information Technology - 9.8% (Continued) | | | | | | |
Dell, Inc. (a) | | | 2,631 | | | $ | 64,486 | |
eBay, Inc. (a) | | | 1,312 | | | | 43,545 | |
Electronic Arts, Inc. (a) | | | 387 | | | | 22,605 | |
| Electronic Data Systems Corp. | | | 591 | | | | 12,251 | |
EMC Corp. (a) | | | 2,436 | | | | 45,139 | |
| Fidelity National Information Services, Inc. | | | 220 | | | | 9,150 | |
Fiserv, Inc. (a) | | | 196 | | | | 10,876 | |
Google, Inc. (a) | | | 272 | | | | 188,083 | |
| Hewlett-Packard Co. | | | 3,037 | | | | 153,308 | |
| Intel Corp. | | | 6,890 | | | | 183,687 | |
| International Business Machines Corp. | | | 1,584 | | | | 171,230 | |
Intuit, Inc. (a) | | | 398 | | | | 12,581 | |
| Jabil Circuit, Inc. | | | 208 | | | | 3,176 | |
JDS Uniphase Corp. (a) (d) | | | 278 | | | | 3,697 | |
Juniper Networks, Inc. (a) | | | 658 | | | | 21,846 | |
| KLA-Tencor Corp. | | | 223 | | | | 10,740 | |
Lexmark International, Inc. - Class A (a) | | | 133 | | | | 4,636 | |
Linear Technology Corp. (d) | | | 295 | | | | 9,390 | |
LSI Corp. (a) (d) | | | 894 | | | | 4,747 | |
MEMC Electronic Materials, Inc. (a) | | | 290 | | | | 25,662 | |
Microchip Technology, Inc. (d) | | | 260 | | | | 8,169 | |
Micron Technology, Inc. (a) | | | 878 | | | | 6,365 | |
| Microsoft Corp. | | | 9,512 | | | | 338,627 | |
| Molex, Inc. | | | 187 | | | | 5,105 | |
| Motorola, Inc. | | | 2,687 | | | | 43,099 | |
| National Semiconductor Corp. | | | 324 | | | | 7,335 | |
Network Appliance, Inc. (a) | | | 431 | | | | 10,758 | |
Novell, Inc. (a) | | | 404 | | | | 2,775 | |
Novellus Systems, Inc. (a) | | | 163 | | | | 4,494 | |
Nvidia Corp. (a) | | | 666 | | | | 22,657 | |
Oracle Corp. (a) | | | 4,594 | | | | 103,733 | |
| Paychex, Inc. | | | 395 | | | | 14,307 | |
QLogic Corp. (a) | | | 185 | | | | 2,627 | |
| Qualcomm, Inc. | | | 1,935 | | | | 76,142 | |
SanDisk Corp. (a) (d) | | | 280 | | | | 9,288 | |
Sun Microsystems, Inc. (a) | | | 1,037 | | | | 18,801 | |
Symantec Corp. (a) | | | 1,046 | | | | 16,882 | |
Tellabs, Inc. (a) | | | 509 | | | | 3,329 | |
Teradata Corp. (a) | | | 223 | | | | 6,112 | |
Teradyne, Inc. (a) | | | 237 | | | | 2,451 | |
| Texas Instruments, Inc. | | | 1,663 | | | | 55,544 | |
Total Sys Svcs, Inc. (a) | | | 230 | | | | 6,440 | |
| Tyco Electronics Ltd. | | | 576 | | | | 21,387 | |
Unisys Corp. (a) (d) | | | 404 | | | | 1,911 | |
VeriSign, Inc. (a) | | | 285 | | | | 10,719 | |
| The Western Union Co. | | | 897 | | | | 21,779 | |
Xerox Corp. (a) | | | 1,088 | | | | 17,615 | |
| Xilinx, Inc. | | | 346 | | | | 7,567 | |
Yahoo!, Inc. (a) | | | 1,589 | | | | 36,960 | |
| | | | | | | | 2,558,165 | |
Materials - 2.0% | | | | | | | | |
| Air Products & Chemicals, Inc. | | | 270 | | | | 26,630 | |
| Alcoa, Inc. | | | 1,009 | | | | 36,879 | |
| Allegheny Technologies, Inc. | | | 141 | | | | 12,182 | |
| Ashland, Inc. | | | 70 | | | | 3,320 | |
| Ball Corp. | | | 129 | | | | 5,805 | |
| Bemis Co. | | | 122 | | | | 3,340 | |
The accompanying notes are an integral part of the financial statements.
Summit Mutual Funds, Inc. – Pinnacle Series |
| SCHEDULE OF INVESTMENTS | BALANCED INDEX PORTFOLIO |
| | | SHARES | | | VALUE | |
Materials - 2.0% (Continued) | | | | | | |
| The Dow Chemical Co. | | | 1,104 | | | $ | 43,520 | |
| Eastman Chemical Co. | | | 98 | | | | 5,987 | |
| Ecolab, Inc. | | | 222 | | | | 11,369 | |
| EI Du Pont de Nemours & Co. | | | 1,072 | | | | 47,264 | |
| Freeport-McMoRan Copper & Gold, Inc. - Class B | | | 445 | | | | 45,586 | |
| Hercules, Inc. | | | 136 | | | | 2,632 | |
| International Flavors & Fragrances, Inc. | | | 91 | | | | 4,380 | |
| International Paper Co. | | | 506 | | | | 16,384 | |
| MeadWestvaco Corp. | | | 214 | | | | 6,698 | |
| Monsanto Co. | | | 631 | | | | 70,476 | |
| Newmont Mining Corp. | | | 524 | | | | 25,587 | |
| Nucor Corp. | | | 350 | | | | 20,727 | |
Pactiv Corp. (a) | | | 183 | | | | 4,873 | |
| PPG Industries, Inc. | | | 191 | | | | 13,414 | |
| Praxair, Inc. | | | 370 | | | | 32,823 | |
| Rohm & Haas Co. | | | 190 | | | | 10,083 | |
| Sealed Air Corp. | | | 202 | | | | 4,674 | |
| Sigma-Aldrich Corp. | | | 165 | | | | 9,009 | |
Titanium Metals Corp. (a) (d) | | | 100 | | | | 2,645 | |
| United States Steel Corp. | | | 138 | | | | 16,686 | |
Vulcan Materials Co. (d) | | | 119 | | | | 9,412 | |
| Weyerhaeuser Co. | | | 251 | | | | 18,509 | |
| | | | | | | | 510,894 | |
Telecommunication Services - 2.1% | | | | | | | | |
American Tower Corp. - Class A (a) | | | 480 | | | | 20,448 | |
| AT&T, Inc. | | | 7,152 | | | | 297,237 | |
| CenturyTel, Inc. | | | 154 | | | | 6,385 | |
Citizens Communications Co. (d) | | | 424 | | | | 5,398 | |
| Embarq Corp. | | | 176 | | | | 8,717 | |
Qwest Communications International, Inc. (a) | | | 1,802 | | | | 12,632 | |
| Sprint Nextel Corp. | | | 3,359 | | | | 44,104 | |
| Verizon Communications, Inc. | | | 3,370 | | | | 147,235 | |
| Windstream Corp. | | | 554 | | | | 7,213 | |
| | | | | | | | 549,369 | |
Utilities - 2.1% | | | | | | | | |
The AES Corp. (a) | | | 776 | | | | 16,599 | |
Allegheny Energy, Inc. (a) | | | 193 | | | | 12,277 | |
| Ameren Corp. | | | 240 | | | | 13,010 | |
| American Electric Power Co., Inc. | | | 463 | | | | 21,557 | |
| Centerpoint Energy, Inc. | | | 399 | | | | 6,835 | |
CMS Energy Corp. (d) | | | 261 | | | | 4,536 | |
| Consolidated Edison, Inc. | | | 314 | | | | 15,339 | |
| Constellation Energy Group, Inc. | | | 210 | | | | 21,531 | |
| Dominion Resources, Inc. | | | 680 | | | | 32,266 | |
| DTE Energy Co. | | | 205 | | | | 9,012 | |
| Duke Energy Corporation | | | 1,461 | | | | 29,468 | |
Dynegy, Inc. (a) | | | 500 | | | | 3,570 | |
| Edison International | | | 378 | | | | 20,174 | |
| Entergy Corp. | | | 248 | | | | 29,641 | |
| Exelon Corp. | | | 781 | | | | 63,761 | |
| FirstEnergy Corp. | | | 354 | | | | 25,608 | |
| FPL Group, Inc. | | | 472 | | | | 31,992 | |
| Integrys Energy Group, Inc. | | | 102 | | | | 5,272 | |
Nicor, Inc. (d) | | | 74 | | | | 3,134 | |
| NiSource, Inc. | | | 342 | | | | 6,460 | |
| Pepco Holdings, Inc. | | | 220 | | | | 6,453 | |
| | | SHARES | | | VALUE | |
Utilities - 2.1% (Continued) | | | | | | |
| PG&E Corp. | | | 408 | | | $ | 17,581 | |
| Pinnacle West Capital Corp. | | | 117 | | | | 4,962 | |
| PPL Corp. | | | 447 | | | | 23,284 | |
| Progress Energy, Inc. | | | 321 | | | | 15,546 | |
| Public Service Enterprise Group, Inc. | | | 294 | | | | 28,883 | |
| Questar Corp. | | | 201 | | | | 10,874 | |
| Sempra Energy | | | 328 | | | | 20,297 | |
| Southern Co. | | | 873 | | | | 33,829 | |
| TECO Energy, Inc. | | | 244 | | | | 4,199 | |
| Xcel Energy, Inc. | | | 475 | | | | 10,721 | |
| | | | | | | | 548,671 | |
| TOTAL COMMON STOCKS | | | | | | | | |
| (Cost $11,033,912) | | | | | | | 15,282,855 | |
| | | | | | | | | |
| | | PRINCIPAL | | | | | |
| | | AMOUNT | | | VALUE | |
CORPORATE BONDS - 5.4% | | | | | | | | |
Consumer Staples - 0.4% | | | | | | | | |
| Campbell Soup Co. | | | | | | | | |
5.875%, 10/01/2008 (d) | | $ | 100,000 | | | $ | 100,978 | |
Energy - 2.3% | | | | | | | | |
| Apache Corp. | | | | | | | | |
5.625%, 01/15/2017 (d) | | | 100,000 | | | | 101,875 | |
| Burlington Resources Finance Co. | | | | | | | | |
6.500%, 12/01/2011 (d) | | | 150,000 | | | | 159,105 | |
| Colonial Pipeline Co. | | | | | | | | |
7.750%, 11/01/2010 (b) | | | 125,000 | | | | 135,971 | |
| Conoco Funding Co. | | | | | | | | |
| 6.350%, 10/15/2011 | | | 50,000 | | | | 53,107 | |
| Public Service of North Carolina, Inc. | | | | | | | | |
| 6.625%, 02/15/2011 | | | 150,000 | | | | 156,723 | |
| | | | | | | | 606,781 | |
Financials - 0.7% | | | | | | | | |
| Union Planters Corp. | | | | | | | | |
| 4.375%, 12/01/2010 | | | 190,000 | | | | 186,698 | |
Industrials - 2.0% | | | | | | | | |
| Honeywell International, Inc. | | | | | | | | |
7.500%, 03/01/2010 (d) | | | 125,000 | | | | 133,035 | |
| Masco Corp. | | | | | | | | |
| 5.875%, 07/15/2012 | | | 125,000 | | | | 128,131 | |
| United Technologies Corp. | | | | | | | | |
| 4.375%, 05/01/2010 | | | 250,000 | | | | 250,709 | |
| | | | | | | | 511,875 | |
| TOTAL CORPORATE BONDS | | | | | | | | |
| (Cost $1,408,960) | | | | | | | 1,406,332 | |
The accompanying notes are an integral part of the financial statements.
Summit Mutual Funds, Inc. – Pinnacle Series |
| BALANCED INDEX PORTFOLIO | SCHEDULE OF INVESTMENTS |
| | | PRINCIPAL | | | | |
| | | AMOUNT | | | VALUE | |
MORTGAGE BACKED SECURITIES - 12.4% | | | | | | |
| Fannie Mae Pool | | | | | | |
| Pool #500823, 7.000%, 07/01/2029 | | $ | 256,564 | | | $ | 270,595 | |
| Pool #653650, 6.500%, 08/01/2032 | | | 74,854 | | | | 77,026 | |
| Pool #722267, 5.500%, 07/01/2033 | | | 231,040 | | | | 231,211 | |
| Pool #732114, 6.000%, 08/01/2033 | | | 138,844 | | | | 141,272 | |
| Pool #357457, 5.500%, 11/01/2033 | | | 436,986 | | | | 437,310 | |
| Pool #903724, 7.500%, 11/01/2036 | | | 242,604 | | | | 252,065 | |
| Freddie Mac (Gold) Pool | | | | | | | | |
| Pool #E9-6460, 5.000%, 05/01/2018 | | | 515,136 | | | | 516,405 | |
| Pool #E9-9160, 4.500%, 09/01/2018 | | | 106,841 | | | | 105,060 | |
| Pool #G0-8146, 6.000%, 08/01/2036 | | | 663,282 | | | | 673,255 | |
| Ginnie Mae Pool | | | | | | | | |
| Pool #003583M, 5.500%, 07/20/2034 | | | 513,715 | | | | 514,892 | |
| TOTAL MORTGAGE BACKED SECURITIES | | | | | | | | |
| (Cost $3,251,504) | | | | | | | 3,219,091 | |
| | | | | | | | | |
U.S. GOVERNMENT AGENCY ISSUES - 4.4% | | | | | | | | |
| Federal National Mortgage Association | | | | | | | | |
| 5.050%, 02/07/2011 | | | 1,100,000 | | | | 1,145,178 | |
| TOTAL U.S. GOVERNMENT AGENCY ISSUES | | | | | | | | |
| (Cost $1,105,033) | | | | | | | 1,145,178 | |
| | | | | | | | | |
U.S. TREASURY OBLIGATIONS - 16.4% | | | | | | | | |
U.S. Treasury Bonds - 4.0% | | | | | | | | |
6.250%, 08/15/2023 (d) | | | 250,000 | | | | 299,317 | |
5.250%, 11/15/2028 (d) | | | 450,000 | | | | 495,105 | |
6.125%, 08/15/2029 (d) | | | 195,000 | | | | 238,555 | |
| | | | | | | | 1,032,977 | |
U.S. Treasury Notes - 12.4% | | | | | | | | |
3.375%, 12/15/2008 (d) | | | 84,000 | | | | 84,105 | |
4.500%, 02/15/2009 (d) | | | 200,000 | | | | 203,016 | |
6.000%, 08/15/2009 (d) | | | 50,000 | | | | 52,285 | |
| 5.750%, 08/15/2010 | | | 180,000 | | | | 192,065 | |
4.250%, 01/15/2011 (d) | | | 300,000 | | | | 310,125 | |
| 4.750%, 01/31/2012 | | | 600,000 | | | | 632,437 | |
4.500%, 04/30/2012 (d) | | | 250,000 | | | | 261,152 | |
4.750%, 05/31/2012 (d) | | | 250,000 | | | | 263,848 | |
| | | PRINCIPAL | | | | |
| | | AMOUNT | | | VALUE | |
U.S. TREASURY OBLIGATIONS - 16.4% (Continued) | | | | | | |
U.S. Treasury Notes(Continued) | | | | | | |
4.875%, 06/30/2012 (d) | | $ | 100,000 | | | $ | 106,062 | |
3.625%, 05/15/2013 (d) | | | 234,000 | | | | 235,609 | |
4.750%, 05/15/2014 (d) | | | 250,000 | | | | 265,840 | |
4.125%, 05/15/2015 (d) | | | 300,000 | | | | 305,883 | |
5.125%, 05/15/2016 (d) | | | 300,000 | | | | 324,703 | |
| | | | | | | | 3,237,130 | |
| TOTAL U.S. TREASURY OBLIGATIONS | | | | | | | | |
| (Cost $4,076,168) | | | | | | | 4,270,107 | |
| | | | | | | | | |
| | | SHARES | | | VALUE | |
SHORT TERM INVESTMENTS (f) - 2.4% | | | | | | | | |
Money Market Funds - 2.2% | | | | | | | | |
| Northern Institutional Diversified Assets Portfolio | | | 573,082 | | | $ | 573,082 | |
| | | | | | | | | |
| | | PRINCIPAL | | | | | |
| | | AMOUNT | | | VALUE | |
U.S. Treasury Bills - 0.2% | | | | | | | | |
| 2.995%, 03/13/2008 | | $ | 50,000 | | | $ | 49,697 | |
| TOTAL SHORT TERM INVESTMENTS | | | | | | | | |
| (Cost $622,785) | | | | | | | 622,779 | |
Total Investments (Cost $21,498,362) (c)- 99.8% | | | | | | | 25,946,342 | |
Northern Institutional Liquid Assets Portfolio (e) - 12.1% | | | | | | | 3,145,593 | |
Liabilities in Excess of Other Assets - (11.9)% | | | | | | | (3,098,550 | ) |
TOTAL NET ASSETS - 100.0% | | | | | | $ | 25,993,385 | |
(a) | Non-income producing security. |
| (b) | Security exempt from registration under Rule 144(a) of the Securities Act of 1933. These securities may be resold in transactions exempt from registration, normally to qualified institutional buyers. |
| (c) | For federal income tax purposes, cost is $21,532,230 and gross unrealized appreciation and depreciation of securities as of December 31, 2007 was $5,324,474 and ($910,362), respectively, with a net appreciation / (depreciation) of $4,414,112. |
| All or a portion of the security is out on loan. |
(e) | This security was purchased with cash collateral held from securities lending. The market value of the securities on loan, the collateral purchased with cash, and the noncash collateral accepted is $4,259,414, $3,145,593, and $1,229,505, respectively. |
| (f) | Securities and other assets with an aggregate value of $443,160 have been segregated with the custodian or designated to cover margin requirements for the open futures contracts as of December 31, 2007: |
| | | Unrealized | |
| | | Appreciation/ | |
| Type | Contracts | (Depreciation) | |
| S&P 500 E-Mini Futures (03/08) | 6 | $3,114 | |
The accompanying notes are an integral part of the financial statements.
Summit Mutual Funds, Inc. – Pinnacle Series |
| FINANCIAL STATEMENTS | BALANCED INDEX PORTFOLIO |
STATEMENT OF ASSETS AND LIABILITIES | |
December 31, 2007 | | | |
| ASSETS | | | |
| Investments in securities, at value | | $ | 25,946,342 | |
| Collateral for securities loaned, | | | | |
| at fair value | | | 3,145,593 | |
| Receivables: | | | | |
| Securities sold | | | 13,820 | |
| Shares sold | | | 11,394 | |
| Interest and dividends | | | 131,319 | |
| Prepaid expenses and other | | | 810 | |
| | | | 29,249,278 | |
| LIABILITIES | | | | |
| Payables: | | | | |
| Payable upon return of securities loaned | | | 3,145,593 | |
| Shares redeemed | | | 46,545 | |
| Payable for securities purchased | | | 14,006 | |
| Bank overdraft | | | 63 | |
| Variation margin | | | 2,490 | |
| Professional fees | | | 17,998 | |
| Fund accounting fees | | | 11,229 | |
| Custodian fees | | | 4,406 | |
| Administration fees | | | 2,226 | |
| Advisory fees | | | 2,104 | |
| Royalty fees | | | 1,997 | |
| Directors’ fees | | | 99 | |
| Other accrued expenses | | | 7,137 | |
| | | | 3,255,893 | |
| NET ASSETS* | | | | |
| Paid-in capital | | | 22,123,722 | |
| Accumulated undistributed net investment | | | | |
| income / (loss) | | | 62,818 | |
| Accumulated net realized gain / (loss) | | | | |
| on investments and futures contracts | | | (644,249 | ) |
| Net unrealized appreciation / (depreciation) | | | | |
| on investments and futures contracts | | | 4,451,094 | |
| | | $ | 25,993,385 | |
| Investments at cost | | $ | 21,498,362 | |
| Shares authorized ($.10 par value) | | | 20,000,000 | |
| NET ASSET VALUE (NAV) BY SHARE CLASS | | | | | |
| | | | | | |
| Share Class | Net Assets | Outstanding | | Per Share | |
| Class I | $25,993,385 | | | $ | 51.62 | |
| * | FEDERAL TAX DATA AS OF DECEMBER 31, 2007 | | |
| | Percentage of ordinary distributions designated as | | |
| | qualified dividend income | | 45.83% |
| | Dividends received deduction for corporate shareholders | | 45.30% |
| | Undistributed ordinary income | $ | |
| | Unrealized appreciation | $ | |
| Capital Loss Carryforward Expiring December 31: |
STATEMENT OF OPERATIONS | | | |
For the year ended December 31, 2007 | | | |
| | | | |
| INVESTMENT INCOME | | | |
| Interest | | $ | 500,496 | |
| Dividends | | | 347,530 | |
| Other income | | | 6,962 | |
| | | | 854,988 | |
| EXPENSES | | | | |
| Advisory fees | | | 83,529 | |
| Administration fees | | | 27,843 | |
| Fund accounting fees | | | 26,286 | |
| Professional fees | | | 20,512 | |
| Transfer agent fees | | | 12,887 | |
| Custodian fees | | | 10,453 | |
| Directors’ fees | | | 3,216 | |
| Shareholder reporting fees | | | 2,685 | |
| Royalty fees | | | 1,926 | |
| Other expenses | | | 3,225 | |
| | | | 192,562 | |
| Reimbursements and waivers | | | (25,509 | ) |
| | | | 167,053 | |
| NET INVESTMENT INCOME / (LOSS) | | | 687,935 | |
| | | | | |
| REALIZED AND UNREALIZED GAIN / (LOSS) | | | | |
| Net realized gain / (loss) on investments | | | 907,011 | |
| Net realized gain / (loss) on futures | | | 31,855 | |
| | | | 938,866 | |
| Net change in unrealized appreciation / | | | | |
| (depreciation) on investments and | | | | |
| futures contracts | | | 269,166 | |
| | | | | |
| NET REALIZED AND UNREALIZED | | | | |
| GAIN / (LOSS) | | | 1,208,032 | |
| | | | | |
| NET INCREASE / (DECREASE) IN | | | | |
| NET ASSETS FROM OPERATIONS | | $ | 1,895,967 | |
| TRANSACTIONS WITH AFFILIATES: | | | |
| Percent of Current | |
| Net Asset Value | |
| | Advisory | Administration | Expense | Reimbursements |
| | Fee | Fee | Limit | and Waivers |
| | 0.30% | 0.10% | 0.60% | $25,509 |
The accompanying notes are an integral part of the financial statements.
Summit Mutual Funds, Inc. – Pinnacle Series |
| BALANCED INDEX PORTFOLIO | FINANCIAL STATEMENTS |
STATEMENTS OF CHANGES IN NET ASSETS | | | | | | |
For the Year Ended December 31, | | | | | | |
| | | 2007 | | | 2006 | |
| OPERATIONS | | | | | | |
| Net investment income / (loss) | | $ | 687,935 | | | $ | 679,806 | |
| Net realized gain / (loss) on investments and futures | | | 938,866 | | | | 35,597 | |
| Net change in unrealized appreciation / (depreciation) on investments and futures contracts | | | 269,166 | | | | 2,287,546 | |
| | | | 1,895,967 | | | | 3,002,949 | |
| | | | | | | | | |
| | | | | | | | | |
| DISTRIBUTIONS TO SHAREHOLDERS* | | | | | | | | |
| Net investment income | | | (763,686 | ) | | | (684,111 | ) |
| | | | (763,686 | ) | | | (684,111 | ) |
| | | | | | | | | |
| | | | | | | | | |
| FUND SHARE TRANSACTIONS | | | | | | | | |
| Proceeds from shares sold | | | 2,970,792 | | | | 2,102,410 | |
| Reinvestment of distributions | | | 763,686 | | | | 684,111 | |
| Payments for shares redeemed | | | (7,657,161 | ) | | | (5,637,391 | ) |
| | | | (3,922,683 | ) | | | (2,850,870 | ) |
| | | | | | | | | |
| | | | | | | | | |
| NET INCREASE / (DECREASE) IN NET ASSETS | | | (2,790,402 | ) | | | (532,032 | ) |
| NET ASSETS | | | | | | | | |
| Beginning of period | | | 28,783,787 | | | | 29,315,819 | |
| End of period | | $ | 25,993,385 | | | $ | 28,783,787 | |
| | | | | | | | | |
| ACCUMULATED UNDISTRIBUTED NET INVESTMENT INCOME | | $ | 62,818 | | | $ | 119,128 | |
| FUND SHARE TRANSACTIONS | | | | | | |
| Sold | | | | | | | 44,594 | |
| Reinvestment of distributions | | | | | | | 14,655 | |
| Redeemed | | | (149,994 | ) | | | (119,602 | ) |
| | | | | | | | | |
| Net increase / (decrease) from fund share transactions | | | (77,056 | ) | | | (60,353 | ) |
| | | | | | | | | |
| TOTAL COST OF PURCHASES OF: | | | | | | | | |
| Common Stocks | | $ | | | | $ | 1,578,727 | |
| U.S. Government Securities | | | | | | | 3,916,122 | |
| Asset Backed Securities | | | 511,105 | | | | — | |
| Corporate Bonds | | | | | | | 423,178 | |
| | | | | | | | | |
| | | $ | | | | $ | 5,918,027 | |
| | | | | | | | | |
| TOTAL PROCEEDS FROM SALES OF: | | | | | | | | |
| Common Stocks | | $ | | | | $ | 3,189,054 | |
| U.S. Government Securities | | | | | | | 2,616,941 | |
| Asset Backed Securities | | | 823,696 | | | | — | |
| Corporate Bonds | | | | | | | 1,217,905 | |
| | | | | | | | | |
| | | $ | | | | $ | 7,023,900 | |
| | | | | | | | | |
| *TAX CHARACTER OF DISTRIBUTIONS PAID | | | | | | | | |
| Ordinary income | | $ | | | | $ | 684,111 | |
| | | | | | | | | |
| | | $ | | | | $ | 684,111 | |
The accompanying notes are an integral part of the financial statements.
Summit Mutual Funds, Inc. – Pinnacle Series NASDAQ-100 INDEX PORTFOLIO |
Summit Nasdaq-100 Index Portfolio - Average Annual Total Return |
1-Year | 5-Year | Since Inception |
| 18.50% | 15.94% | -6.76% |
Past performance is not predictive of future results. Performance does not reflect the deduction of taxes that a shareholder would pay on fund distributions or redemption of fund shares. Separate account expenses are not included. Absent limitation of expenses during certain of the periods shown, performance would have been lower.
| Managers: | |
| Inception Date: | |
| Total Net Assets: | $32.82 Million |
| Number of Equity Holdings: | 100 |
| Median Cap Size: | $9,428 (in millions) |
Average Price-to-book Ratio: | 4.81 x |
| 0.37% |
Top 10 Equity Holdings | | Sector Allocations |
| | (% of net assets) | | |
Apple, Inc.Microsoft Corp. Qualcomm, Inc. Research In Motion Ltd. | | | |
Summit Mutual Funds, Inc. – Pinnacle Series NASDAQ-100 INDEX PORTFOLIO |
Objective – Seeks investment results that correspond to the investment performance of U.S. common stocks, as represented by the Nasdaq-100 Index (the “Index”).
Strategy – The Summit Pinnacle Nasdaq-100 Index Portfolio (the “Portfolio”) will attempt to achieve, in both rising and falling markets, a correlation of at least 95% between the total return of its net assets before expenses and the total return of the Index.
Managers’ Comments:
For the period ended December 31, 2007, the Summit Nasdaq-100 Index Portfolio’s total return was 18.50% (after waivers and reimbursements, but before the impact of any product or contract-level fees). This compares to a 19.24% total return for the Nasdaq-100 Index. The difference of 0.74% is referred to as “tracking error” and is largely attributed to the Portfolio’s operating expenses. These expenses represent the Portfolio’s costs for advisory, administration, accounting, custody and other services. The remaining difference can be caused by a number of factors, including the timing and size of cash flows into and out of the Portfolio; brokers’ commissions or other trading costs; and holding security positions in amounts that are different than the weightings in the Index, among others. While an exact replication of the capitalization weightings of securities in the Index is not feasible, the Portfolio’s objectives and strategies call for a correlation of at least 95% between the Portfolio’s pre-expense total return and that of the Index. The Portfolio achieved this level of correlation for the period presented.
“Nasdaq” and related marks are trademarks or service marks of The Nasdaq Stock Market, Inc. and have been licensed for use for certain purposes by Summit Mutual Funds, Inc. and the Nasdaq-100 Index Portfolio. Nasdaq makes no warranty, express or implied, and bears no liability with respect to Summit Mutual Funds, its use, or any data included therein.
Summit Mutual Funds, Inc. – Pinnacle Series |
| FINANCIAL HIGHLIGHTS | NASDAQ-100 INDEX PORTFOLIO |
FINANCIAL HIGHLIGHTS | | | | | | | | | | | | | | | |
| | Year Ended December 31, |
| | | | | | | | | | | | | | | | |
| | | 2007 | | | 2006 | | | 2005 | | | 2004 | | | 2003 | |
| | | | | | | | | | | | | | | | |
| Net asset value, beginning of period | | $ | 24.47 | | | $ | 22.97 | | | $ | 22.81 | | | $ | 20.72 | | | $ | 13.94 | |
| INVESTMENT ACTIVITIES: | | | | | | | | | | | | | | | | | | | | |
| Net investment income / (loss) | | | (0.01 | ) | | | 0.02 | | | | 0.02 | | | | 0.12 | | | | (0.04 | ) |
| Net realized and unrealized gains / (losses) | | | 4.49 | | | | 1.51 | | | | 0.26 | | | | 1.97 | | | | 6.82 | |
| Total from Investment Activities | | | 4.48 | | | | 1.53 | | | | 0.28 | | | | 2.09 | | | | 6.78 | |
| DISTRIBUTIONS: | | | | | | | | | | | | | | | | | | | | |
| Net investment income | | | (0.00 | )(1) | | | (0.03 | ) | | | (0.12 | ) | | | — | | | | — | |
| Return of capital | | | (0.31 | ) | | | — | | | | — | | | | — | | | | — | |
| Total Distributions | | | (0.31 | ) | | | (0.03 | ) | | | (0.12 | ) | | | — | | | | — | |
| | | | | | | | | | | | | | | | | | | | | |
| Net asset value, end of period | | $ | 28.64 | | | $ | 24.47 | | | $ | 22.97 | | | $ | 22.81 | | | $ | 20.72 | |
| | | | | | | | | | | | | | | | | | | | | |
| Total return | | | 18.50 | % | | | 6.67 | % | | | 1.30 | % | | | 10.09 | % | | | 48.64 | % |
| | | | | | | | | | | | | | | | | | | | | |
| RATIOS / SUPPLEMENTAL DATA: | | | | | | | | | | | | | | | | | | | | |
Ratio of expenses to average net assets – net(2) | | | 0.65 | % | | | 0.65 | % | | | 0.65 | % | | | 0.65 | % | | | 0.65 | % |
| Ratio of expenses to average net assets – gross | | | 0.71 | % | | | 0.76 | % | | | 0.76 | % | | | 0.79 | % | | | 0.91 | % |
| Ratio of net investment income / (loss) to average net assets | | | -0.01 | % | | | 0.05 | % | | | 0.09 | % | | | 0.61 | % | | | -0.31 | % |
| Portfolio turnover rate | | | 13.28 | % | | | 8.23 | % | | | 13.86 | % | | | 4.19 | % | | | 3.97 | % |
| Net assets, end of period (000’s) | | $ | 32,822 | | | $ | 26,108 | | | $ | 26,330 | | | $ | 27,607 | | | $ | 23,350 | |
| | | | | | | | | | | | | | | | | | | | | |
(1) Amount is less than $0.005. | | | | | | | | | | |
(2) Net expenses represent gross expenses reduced by fees waived and/or reimbursed by the Adviser. | | | | | |
The accompanying notes are an integral part of the financial statements.
Summit Mutual Funds, Inc. – Pinnacle Series |
| NASDAQ-100 INDEX PORTFOLIO | SCHEDULE OF INVESTMENTS |
December 31, 2007 | | | | | | |
| | | SHARES | | | VALUE | |
COMMON STOCKS - 98.3% | | | | | | |
Consumer Discretionary - 12.7% | | | | | | |
Amazon.Com, Inc. (a) | | | 5,058 | | | $ | 468,573 | |
Apollo Group, Inc. (a) | | | 3,089 | | | | 216,693 | |
Bed Bath & Beyond, Inc. (a) | | | 6,522 | | | | 191,682 | |
Comcast Corp. - Class A (a) | | | 26,784 | | | | 489,076 | |
Discovery Holding Co. (a) | | | 4,394 | | | | 110,465 | |
EchoStar Communications Corp. - Class A (a) | | | 3,980 | | | | 150,126 | |
Expedia, Inc. (a) | | | 5,063 | | | | 160,092 | |
Focus Media Holding Ltd - ADR (a) (c) | | | 1,970 | | | | 111,916 | |
Garmin Ltd. (c) | | | 3,704 | | | | 359,288 | |
| IAC/InterActiveCorp | | | 5,395 | | | | 145,233 | |
Lamar Advertising Co. (a) (c) | | | 1,442 | | | | 69,317 | |
Liberty Global, Inc. (a) | | | 3,463 | | | | 135,715 | |
Liberty Media Corp. - Interactive (a) | | | 10,220 | | | | 194,998 | |
| PetSmart, Inc. | | | 2,334 | | | | 54,919 | |
Sears Holdings Corp. (a) (c) | | | 2,636 | | | | 269,004 | |
Sirius Satellite Radio, Inc. (a) (c) | | | 29,252 | | | | 88,633 | |
| Staples, Inc. | | | 8,699 | | | | 200,686 | |
Starbucks Corp. (a) | | | 18,599 | | | | 380,721 | |
| Virgin Media, Inc. | | | 6,571 | | | | 112,627 | |
Wynn Resorts Ltd (c) | | | 2,282 | | | | 255,881 | |
| | | | | | | | 4,165,645 | |
Consumer Staples - 1.5% | | | | | | | | |
| Costco Wholesale Corp. | | | 4,187 | | | | 292,085 | |
Hansen Natural Corp. (a) (c) | | | 1,672 | | | | 74,053 | |
Whole Foods Market, Inc. (c) | | | 2,559 | | | | 104,407 | |
| | | | | | | | 470,545 | |
Health Care - 12.4% | | | | | | | | |
Amgen, Inc. (a) | | | 9,336 | | | | 433,564 | |
Amylin Pharmaceuticals, Inc. (a) (c) | | | 2,391 | | | | 88,467 | |
Biogen Idec, Inc. (a) | | | 5,841 | | | | 332,470 | |
Celgene Corp. (a) | | | 6,996 | | | | 323,285 | |
Cephalon, Inc. (a) | | | 1,222 | | | | 87,691 | |
| Dentsply International, Inc. | | | 2,663 | | | | 119,888 | |
Express Scripts, Inc. (a) | | | 4,119 | | | | 300,687 | |
Genzyme Corp. (a) | | | 6,080 | | | | 452,595 | |
Gilead Sciences, Inc. (a) | | | 16,815 | | | | 773,658 | |
Henry Schein, Inc. (a) (c) | | | 1,668 | | | | 102,415 | |
Hologic, Inc. (a) (c) | | | 2,425 | | | | 166,452 | |
Intuitive Surgical, Inc. (a) | | | 699 | | | | 226,826 | |
Patterson Companies, Inc. (a) | | | 2,520 | | | | 85,554 | |
Teva Pharmaceutical Industries, Ltd - ADR (c) | | | 11,269 | | | | 523,783 | |
Vertex Pharmaceuticals, Inc. (a) (c) | | | 2,590 | | | | 60,166 | |
| | | | | | | | 4,077,501 | |
Industrials - 5.0% | | | | | | | | |
| C.H. Robinson Worldwide, Inc. | | | 3,073 | | | | 166,311 | |
| Cintas Corp. | | | 3,514 | | | | 118,141 | |
| Expeditors International Washington, Inc. | | | 3,859 | | | | 172,420 | |
Fastenal Co. (c) | | | 2,627 | | | | 106,183 | |
Foster Wheeler Ltd (a) | | | 1,374 | | | | 212,997 | |
| Joy Global, Inc. | | | 1,990 | | | | 130,982 | |
Monster Worldwide, Inc. (a) (c) | | | 2,394 | | | | 77,566 | |
| Paccar, Inc. | | | 7,561 | | | | 411,923 | |
Ryanair Holdings PLC - ADR (a) (c) | | | 2,183 | | | | 86,097 | |
| | | SHARES | | | VALUE | |
Industrials - 5.0% (Continued) | | | | | | |
Stericycle, Inc. (a) | | | 1,672 | | | $ | 99,317 | |
| UAL Corp. (a) (c) | | | 1,407 | | | | 50,174 | |
| | | | | | | | 1,632,111 | |
Information Technology - 64.5% | | | | | | | | |
Activision, Inc. (a) | | | 4,700 | | | | 139,590 | |
Adobe Systems, Inc. (a) | | | 10,299 | | | | 440,076 | |
Akamai Technologies, Inc. (a) (c) | | | 2,979 | | | | 103,073 | |
| Altera Corp. | | | 8,651 | | | | 167,137 | |
Apple, Inc. (a) | | | 22,405 | | | | 4,437,982 | |
| Applied Materials, Inc. | | | 13,140 | | | | 233,366 | |
Autodesk, Inc. (a) | | | 4,416 | | | | 219,740 | |
Baidu.com - ADR (a) | | | 430 | | | | 167,868 | |
BEA Systems, Inc. (a) | | | 6,701 | | | | 105,742 | |
Broadcom Corp. - Class A (a) | | | 7,873 | | | | 205,800 | |
Cadence Design Systems, Inc. (a) | | | 5,158 | | | | 87,738 | |
Check Point Software Technologies (a) | | | 4,052 | | | | 88,982 | |
Cisco Systems, Inc. (a) | | | 39,696 | | | | 1,074,571 | |
Citrix Systems, Inc. (a) | | | 4,155 | | | | 157,932 | |
Cognizant Technology Solutions Corp. (a) | | | 5,195 | | | | 176,318 | |
Dell, Inc. (a) | | | 15,099 | | | | 370,077 | |
eBay, Inc. (a) | | | 18,488 | | | | 613,617 | |
Electronic Arts, Inc. (a) | | | 5,797 | | | | 338,603 | |
Fiserv, Inc. (a) | | | 3,804 | | | | 211,084 | |
Flextronics International Ltd. (a) | | | 16,628 | | | | 200,534 | |
Google, Inc. (a) | | | 2,624 | | | | 1,814,444 | |
Infosys Technologies Ltd. - ADR (a) (c) | | | 2,100 | | | | 95,256 | |
| Intel Corp. | | | 37,497 | | | | 999,670 | |
Intuit, Inc. (a) | | | 7,676 | | | | 242,638 | |
Juniper Networks, Inc. (a) | | | 6,224 | | | | 206,637 | |
Kla-Tencor Corp. (a) (c) | | | 4,070 | | | | 196,011 | |
Lam Research Corp. (a) (c) | | | 2,395 | | | | 103,536 | |
Linear Technology Corp. (c) | | | 5,470 | | | | 174,110 | |
Logitech International S.A. (a) (c) | | | 3,269 | | | | 119,776 | |
Marvell Technology Group Ltd. (a) | | | 10,383 | | | | 145,154 | |
Microchip Technology, Inc. (c) | | | 3,352 | | | | 105,320 | |
| Microsoft Corp. | | | 59,088 | | | | 2,103,533 | |
Network Appliance, Inc. (a) | | | 6,591 | | | | 164,511 | |
Nvidia Corp. (a) | | | 9,938 | | | | 338,091 | |
Oracle Corp. (a) | | | 39,108 | | | | 883,059 | |
| Paychex, Inc. | | | 6,510 | | | | 235,792 | |
| Qualcomm, Inc. | | | 36,147 | | | | 1,422,384 | |
Research In Motion Ltd. (a) | | | 10,257 | | | | 1,163,144 | |
SanDisk Corp. (a) | | | 3,852 | | | | 127,771 | |
Sun Microsystems, Inc. (a) | | | 6,642 | | | | 120,419 | |
Symantec Corp. (a) | | | 16,609 | | | | 268,069 | |
Tellabs, Inc. (a) (c) | | | 4,615 | | | | 30,182 | |
VeriSign, Inc. (a) | | | 3,871 | | | | 145,588 | |
| Xilinx, Inc. | | | 7,143 | | | | 156,217 | |
Yahoo!, Inc. (a) | | | 11,871 | | | | 276,120 | |
| | | | | | | | 21,177,262 | |
Materials - 0.7% | | | | | | | | |
| Sigma-Aldrich Corp. | | | 2,287 | | | | 124,870 | |
| Steel Dynamics, Inc. | | | 1,823 | | | | 108,596 | |
| | | | | | | | 233,466 | |
The accompanying notes are an integral part of the financial statements.
Summit Mutual Funds, Inc. – Pinnacle Series |
| SCHEDULE OF INVESTMENTS | NASDAQ-100 INDEX PORTFOLIO |
| | | SHARES | | | VALUE | |
Telecommunication Services - 1.5% | | | | | | |
Leap Wireless International, Inc. (a) (c) | | | 1,250 | | | $ | 58,300 | |
Level 3 Communications, Inc. (a) (c) | | | 27,648 | | | | 84,050 | |
Millicom International Cellular S.A. (a) (c) | | | 1,794 | | | | 211,584 | |
NII Holdings, Inc. (a) | | | 3,083 | | | | 148,971 | |
| | | | | | | | 502,905 | |
| TOTAL COMMON STOCKS | | | | | | | | |
| (Cost $21,073,499) | | | | | | | 32,259,435 | |
SHORT TERM INVESTMENTS (e) - 2.7% | | | | | | | | |
Money Market Funds - 1.8% | | | | | | | | |
| Northern Institutional Diversified Assets Portfolio | | | 604,018 | | | $ | 604,018 | |
| | | PRINCIPAL | | | | |
| | | AMOUNT | | | VALUE | |
U.S. Treasury Bill - 0.9% | | | | | | |
| 2.995%, 03/13/2008 | | $ | 300,000 | | | $ | 298,180 | |
| TOTAL SHORT TERM INVESTMENTS | | | | | | | | |
| (Cost $902,234) | | | | | | | 902,198 | |
Total Investments (Cost $21,975,733) (b) - 101.0% | | | | | | | 33,161,633 | |
Northern Institutional Liquid Assets Portfolio (d) - 10.4% | | | | | | | 3,417,312 | |
Liabilities in Excess of Other Assets - (11.4)% | | | | | | | (3,756,954 | ) |
TOTAL NET ASSETS - 100.0% | | | | | | $ | 32,821,991 | |
ADR American Depository Receipt |
| (b) | For federal income tax purposes, cost is $22,807,035 and gross unrealized appreciation and depreciation of securities as of December 31, 2007 was $12,699,440 and ($2,344,842), respectively, with a net appreciation / (depreciation) of $10,354,598. |
| (c) | All or a portion of the security is out on loan. |
| (d) | This security was purchased with cash collateral held from securities lending. The market values of the securities on loan, the collateral purchased with cash, and the noncash collateral accepted are $3,304,811, $3,417,312, and $0, respectively. |
(e) | Securities and other assets with an aggregate value of $883,995 have been segregated with the custodian or designated to cover margin requirements for the following open futures contracts as of December 31, 2007: |
| | | Unrealized | |
| | | Appreciation/ | |
| Type | Contracts | (Depreciation) | |
| Nasdaq-100 E Mini (03/08) | 21 | $22,491 | |
The accompanying notes are an integral part of the financial statements.
Summit Mutual Funds, Inc. – Pinnacle Series |
| NASDAQ-100 INDEX PORTFOLIO | FINANCIAL STATEMENTS |
STATEMENT OF ASSETS AND LIABILITIES | |
December 31, 2007 | | | |
| | | | |
| ASSETS | | | |
| Investments in securities, at value | | $ | 33,161,633 | |
| Collateral for securities loaned, | | | | |
| at fair value | | | 3,417,312 | |
| Receivables: | | | | |
| Shares sold | | | 4,854 | |
| Interest and dividends | | | 17,100 | |
| Prepaid expenses and other | | | 773 | |
| | | | 36,601,672 | |
| LIABILITIES | | | | |
| Payables: | | | | |
| Payable upon return of securities loaned | | | 3,417,312 | |
| Shares redeemed | | | 308,893 | |
| Variation Margin | | | 8,505 | |
| Professional fees | | | 16,072 | |
| Fund accounting fees | | | 8,366 | |
| Advisory fees | | | 5,146 | |
| Custodian fees | | | 3,644 | |
| Administration fees | | | 2,836 | |
| Directors’ fees | | | 58 | |
| Other accrued expenses | | | 8,849 | |
| | | | 3,779,681 | |
| NET ASSETS* | | | | |
| Paid-in capital | | | 31,745,363 | |
| Accumulated undistributed net | | | | |
| investment income / (loss) | | | — | |
| Accumulated net realized gain / (loss) | | | | |
| on investments and futures contracts | | | (10,131,763 | ) |
| Net unrealized appreciation / (depreciation) | | | | |
| on investments and futures contracts | | | 11,208,391 | |
| | | $ | 32,821,991 | |
| Investments at cost | | $ | 21,975,733 | |
| Shares authorized ($.10 par value) | | | 20,000,000 | |
| NET ASSET VALUE (NAV) BY SHARE CLASS | | | | | |
| | | | | | |
| Share Class | Net Assets | Outstanding | | Per Share | |
| Class I | $32,821,991 | | | $ | 28.64 | |
| * | FEDERAL TAX DATA AS OF DECEMBER 31, 2006 | | |
| | Percentage of ordinary distributions designated as | | |
| | qualified dividend income | | 0.49% |
| | Dividends received deduction for corporate shareholders | | |
| | | $ | |
| |
| |
| Capital Loss Carryforward Expiring December 31: |
2008 | 2009 | 2010 | 2011 | | 2013 | 2014 | |
| $(905,274) | $(1,618,824) | $(3,618,754) | $(231,064) | | $(1,358,042) | $(708,047) | $(697,707) |
STATEMENT OF OPERATIONS | | | |
For the year ended December 31, 2007 | | | |
| | | | |
| INVESTMENT INCOME | | | |
| Interest | | $ | 14,132 | |
| Dividends | | | 170,495 | |
| Foreign dividend taxes withheld | | | (729 | ) |
| Other income | | | 6,651 | |
| | | | 190,549 | |
| EXPENSES | | | | |
| Advisory fees | | | 103,639 | |
| Administration fees | | | 29,611 | |
| Professional fees | | | 19,107 | |
| Fund accounting fees | | | 19,114 | |
| Transfer agent fees | | | 13,685 | |
| Custodian fees | | | 10,316 | |
| Royalty fees | | | 5,031 | |
| Directors’ fees | | | 3,404 | |
| Shareholder reporting fees | | | 2,998 | |
| Other expenses | | | 2,506 | |
| | | | 209,411 | |
| Reimbursements and waivers | | | (16,937 | ) |
| | | | 192,474 | |
| NET INVESTMENT INCOME / (LOSS) | | | (1,925 | ) |
| | | | | |
| REALIZED AND UNREALIZED GAIN / (LOSS) | | | | |
| Net realized gain / (loss) on investments | | | (572,880 | ) |
| Net realized gain / (loss) on futures contracts | | | 122,528 | |
| | | | (450,352 | ) |
| Net change in unrealized appreciation / | | | | |
| (depreciation) on investments | | | | |
| and futures contracts | | | 5,372,837 | |
| | | | | |
| NET REALIZED AND UNREALIZED | | | | |
| GAIN / (LOSS) | | | 4,922,485 | |
| | | | | |
| NET INCREASE / (DECREASE) IN | | | | |
| NET ASSETS FROM OPERATIONS | | $ | 4,920,560 | |
| TRANSACTIONS WITH AFFILIATES: | | | |
| Percent of Current | |
| Net Asset Value | |
| | Advisory | Administration | Expense | Reimbursements |
| | Fee | Fee | Limit | and Waivers |
| | 0.35% | 0.10% | 0.65% | $16,937 |
The accompanying notes are an integral part of the financial statements.
Summit Mutual Funds, Inc. – Pinnacle Series |
| FINANCIAL STATEMENTS | NASDAQ-100 INDEX PORTFOLIO |
STATEMENTS OF CHANGES IN NET ASSETS | | | | | | |
For the Year Ended December 31, | | | | | | |
| | | 2007 | | | 2006 | |
| OPERATIONS | | | | | | |
| Net investment income / (loss) | | $ | (1,925 | ) | | $ | 13,649 | |
| Net realized gain / (loss) on investments and futures | | | (450,352 | ) | | | (1,016,427 | ) |
| Net change in unrealized appreciation / (depreciation) on investments and futures contracts | | | 5,372,837 | | | | 2,663,588 | |
| | | | | | | | | |
| | | | 4,920,560 | | | | 1,660,810 | |
| | | | | | | | | |
| DISTRIBUTIONS TO SHAREHOLDERS* | | | | | | | | |
| Net investment income | | | (4,349 | ) | | | (33,790 | ) |
| Return of capital | | | (333,534 | ) | | | — | |
| | | | | | | | | |
| | | | (337,883 | ) | | | (33,790 | ) |
| | | | | | | | | |
| FUND SHARE TRANSACTIONS | | | | | | | | |
| Proceeds from shares sold | | | 7,916,212 | | | | 5,005,689 | |
| Reinvestment of distributions | | | 337,883 | | | | 33,790 | |
| Payments for shares redeemed | | | (6,123,115 | ) | | | (6,888,662 | ) |
| | | | | | | | | |
| | | | 2,130,980 | | | | (1,849,183 | ) |
| | | | | | | | | |
| | | | | | | | | |
| NET INCREASE / (DECREASE) IN NET ASSETS | | | 6,713,657 | | | | (222,163 | ) |
| NET ASSETS | | | | | | | | |
| Beginning of period | | | 26,108,334 | | | | 26,330,497 | |
| | | | | | | | | |
| End of period | | $ | 32,821,991 | | | $ | 26,108,334 | |
| | | | | | | | | |
| ACCUMULATED UNDISTRIBUTED NET INVESTMENT INCOME | | $ | — | | | $ | 15,819 | |
| FUND SHARE TRANSACTIONS | | | | | | |
| Sold | | | | | | | 216,002 | |
| Reinvestment of distributions | | | | | | | 1,429 | |
| Redeemed | | | (227,805 | ) | | | (296,572 | ) |
| | | | | | | | | |
| Net increase / (decrease) from fund share transactions | | | | | | | (79,141 | ) |
| | | | | | | | | |
| TOTAL COST OF PURCHASES OF: | | | | | | | | |
| Common Stocks | | $ | | | | $ | 2,032,713 | |
| | | | | | | | | |
| | | $ | | | | $ | 2,032,713 | |
| | | | | | | | | |
| TOTAL PROCEEDS FROM SALES OF: | | | | | | | | |
| Common Stocks | | $ | | | | $ | 2,430,165 | |
| | | | | | | | | |
| | | $ | | | | $ | 2,430,165 | |
| | | | | | | | | |
| *TAX CHARACTER OF DISTRIBUTIONS PAID | | | | | | | | |
| Ordinary income | | $ | 4,349 | | | $ | 33,790 | |
| Return of capital | | | 333,534 | | | | — | |
| | | | | | | | | |
| | | $ | 337,883 | | | $ | 33,790 | |
The accompanying notes are an integral part of the financial statements.
Summit Mutual Funds, Inc. – Pinnacle Series RUSSELL 2000 SMALL CAP INDEX PORTFOLIO |

Summit Russell 2000 Small Cap Index Portfolio Class I - Average Annual Total Return |
1-Year | 5-Year | Since Inception |
| -2.20% | 15.54% | 6.80% |
Summit Russell 2000 Small Cap Index Portfolio Class F - Average Annual Total Return |
1-Year | 5-Year | Since Inception |
| -2.40% | 15.31% | 6.29% |
Past performance is not predictive of future results. Performance does not reflect the deduction of taxes that a shareholder would pay on fund distributions or redemption of fund shares. Separate account expenses are not included. Absent limitation of expenses during certain of the periods shown, performance would have been lower. Prior to October 4, 2005, Class F share performance is based on Class I Performance, adjusted to reflect Class F expenses.
| Managers: | |
| Inception Date: | |
| Total Net Assets: | $92.37 Million |
| Number of Equity Holdings: | 1,931 |
| Median Cap Size: | $588 (in millions) |
Average Price-to-book Ratio: | 2.20 x |
| 1.26% |
Top 10 Equity Holdings | | Sector Allocations |
| | (% of net assets) | | |
CF Industries Holdings, Inc. Exterran Holdings, Inc. Chipolte Mexican Grill, Inc. Flir Systems, Inc. Inverness Medical Innovations, Inc. Bucyrus International, Inc. - Class A Equinix, Inc. | | | |
Summit Mutual Funds, Inc. – Pinnacle Series RUSSELL 2000 SMALL CAP INDEX PORTFOLIO |
Objective – Seeks investment results that correspond to the investment performance of U.S. common stocks, as represented by the Russell 2000 Index (the “Index”).
Strategy – The Summit Pinnacle Russell 2000 Small Cap Index Portfolio (the “Portfolio”) will attempt to achieve, in both rising and falling markets, a correlation of at least 95% between the total return of its net assets before expenses and the total return of the Index.
Managers’ Comments:
For the period ended December 31, 2007, the Summit Russell 2000 Index Portfolio‘s (Class I) total return was -2.20% (before the impact of any product or contract-level fees). This compares to a -1.57% total return for the Russell 2000 Index. The difference of 0.63% is referred to as “tracking error” and is largely attributed to the Portfolio’s operating expenses. These expenses represent the Portfolio’s costs for advisory, administration, accounting, custody and other services. The remaining difference can be caused by a number of factors, including the timing and size of cash flows into and out of the Portfolio; brokers’ commissions or other trading costs; and holding security positions in amounts that are different than the weightings in the Index, among others. While an exact replication of the capitalization weightings of securities in the Index is not feasible, the Portfolio’s objectives and strategies call for a correlation of at least 95% between the Portfolio’s pre-expense total return and that of the Index. The Portfolio achieved this level of correlation for the period presented.
The Russell 2000 Index is a trademark/service mark of the Frank Russell Company. Russell is a trademark of the Frank Russell Company. Summit Mutual Funds and the Russell 2000 Small Cap Index Portfolio are not promoted, sponsored or endorsed by, nor in any way affiliated with Frank Russell Company. Frank Russell is not responsible for and has not reviewed the Prospectus, and Frank Russell makes no representation or warranty, express or implied, as to its accuracy, or completeness, or otherwise.
Summit Mutual Funds, Inc. – Pinnacle Series |
RUSSELL 2000 SMALL CAP INDEX PORTFOLIO | FINANCIAL HIGHLIGHTS |
FINANCIAL HIGHLIGHTS | | | | | | | | | | | | | | | |
| Computed on the basis of a share of capital stock outstanding throughout the period. | | | | | | | | | | | | | |
| | Class I |
| | Year Ended December 31, |
| | | 2007 | | | 2006 | | | 2005 | | | 2004 | | | 2003 | |
| Net asset value, beginning of period | | $ | 74.19 | | | $ | 65.46 | | | $ | 63.92 | | | $ | 54.40 | | | $ | 37.52 | |
| INVESTMENT ACTIVITIES: | | | | | | | | | | | | | | | | | | | | |
| Net investment income / (loss) | | | 0.74 | (4) | | | 0.46 | | | | 0.41 | | | | 0.31 | (4) | | | 0.22 | |
| Net realized and unrealized gains / (losses) | | | (1.98 | ) | | | 10.88 | | | | 2.07 | | | | 9.32 | | | | 16.95 | |
| Total from Investment Activities | | | (1.24 | ) | | | 11.34 | | | | 2.48 | | | | 9.63 | | | | 17.17 | |
| DISTRIBUTIONS: | | | | | | | | | | | | | | | | | | | | |
| Net investment income | | | (0.47 | ) | | | (0.44 | ) | | | (0.31 | ) | | | (0.11 | ) | | | (0.29 | ) |
| Net realized gains | | | (5.48 | ) | | | (2.17 | ) | | | (0.63 | ) | | | — | | | | — | |
| Total Distributions | | | (5.95 | ) | | | (2.61 | ) | | | (0.94 | ) | | | (0.11 | ) | | | (0.29 | ) |
| Net asset value, end of period | | $ | 67.00 | | | $ | 74.19 | | | $ | 65.46 | | | $ | 63.92 | | | $ | 54.40 | |
| | | | | | | | | | | | | | | | | | | | | |
| Total return | | | -2.20 | % | | | 17.60 | % | | | 4.01 | % | | | 17.72 | % | | | 46.19 | % |
| RATIOS / SUPPLEMENTAL DATA: | | | | | | | | | | | | | | | | | | | | |
Ratio of expenses to average net assets – net(2) | | | 0.64 | % | | | 0.65 | % | | | 0.69 | % | | | 0.75 | % | | | 0.75 | % |
| Ratio of expenses to average net assets – gross | | | 0.64 | % | | | 0.65 | % | | | 0.69 | % | | | 0.76 | % | | | 1.12 | % |
| Ratio of net investment income / (loss) to average net assets | | | 1.04 | % | | | 0.84 | % | | | 0.70 | % | | | 0.60 | % | | | 0.57 | % |
Portfolio turnover rate (5) | | | 19.30 | % | | | 24.45 | % | | | 25.20 | % | | | 27.27 | % | | | 23.87 | % |
| Net assets, end of period (000’s) | | $ | 91,676 | | | $ | 95,694 | | | $ | 75,815 | | | $ | 68,770 | | | $ | 25,794 | |
| | | Class F | | | | | | | | |
| | | Year Ended December 31, | | | | | | | | |
| | | 2007 | | | 2006 | | | 2005(1) | | |
| Net asset value, beginning of period | | $ | 74.02 | | | $ | 65.43 | | | $ | 64.41 | | |
| INVESTMENT ACTIVITIES: | | | | | | | | | | | | | |
| Net investment income / (loss) | | | 0.59 | (4) | | | 0.31 | | | | 0.12 | | |
| Net realized and unrealized gains / (losses) | | | (1.97 | ) | | | 10.87 | | | | 0.90 | | |
| Total from Investment Activities | | | (1.38 | ) | | | 11.18 | | | | 1.02 | | |
| DISTRIBUTIONS: | | | | | | | | | | | | | |
| Net investment income | | | (0.38 | ) | | | (0.42 | ) | | | — | | |
| Net realized gains | | | (5.48 | ) | | | (2.17 | ) | | | — | | |
| Total Distributions | | | (5.86 | ) | | | (2.59 | ) | | | — | | |
| Net asset value, end of period | | $ | 66.78 | | | $ | 74.02 | | | $ | 65.43 | | |
| | | | | | | | | | | | | | |
| Total return | | | -2.40 | % | | | 17.35 | % | | | 1.58 | % | |
| RATIOS / SUPPLEMENTAL DATA: | | | | | | | | | | | | | |
Ratio of expenses to average net assets – net(2) | | | 0.84 | % | | | 0.85 | % | | | 0.84 | %(3) | |
| Ratio of expenses to average net assets – gross | | | 0.84 | % | | | 0.85 | % | | | 0.84 | %(3) | |
| Ratio of net investment income / (loss) to average net assets | | | 0.84 | % | | | 0.64 | % | | | 0.74 | %(3) | |
Portfolio turnover rate (5) | | | 19.30 | % | | | 24.45 | % | | | 25.20 | % | |
| Net assets, end of period (000’s) | | $ | 699 | | | $ | 272 | | | $ | 5 | | |
(1) | Portfolio commenced operations on October 4, 2005. |
(2) | Net expenses represent gross expenses reduced by fees waived and/or reimbursed by the Adviser. |
(3) | Annualized |
(4) | Per share amounts are based on average shares outstanding. |
(5) | Portfolio Turnover is calculated on the basis of the Fund as a whole without distinguishing between the classes of shares issued. |
The accompanying notes are an integral part of the financial statements.
Summit Mutual Funds, Inc. – Pinnacle Series |
| FINANCIAL HIGHLIGHTS | RUSSELL 2000 SMALL CAP INDEX PORTFOLIO |
December 31, 2007 | | | | | | |
| | | SHARES | | | VALUE | |
COMMON STOCKS - 93.4% | | | | | | |
Capital Goods - 10.4% | | | | | | |
AAR Corp. (a) (c) | | | 2,562 | | | $ | 97,433 | |
ABX Air, Inc. (a) (c) | | | 4,100 | | | | 17,138 | |
ACCO Brands Corp. (a) (c) | | | 3,577 | | | | 57,375 | |
Accuride Corp. (a) (c) | | | 1,591 | | | | 12,505 | |
Actuant Corp. - Class A (c) | | | 3,836 | | | | 130,462 | |
Advanced Energy Industries, Inc. (a) | | | 2,476 | | | | 32,386 | |
Aerovironment, Inc. (a) (c) | | | 464 | | | | 11,229 | |
Aftermarket Technology Corp. (a) (c) | | | 1,530 | | | | 41,708 | |
Airtran Holdings, Inc. (a) (c) | | | 6,372 | | | | 45,624 | |
Airvana, Inc. (a) (c) | | | 571 | | | | 3,101 | |
Alaska Air Group, Inc. (a) (c) | | | 2,784 | | | | 69,628 | |
Allegiant Travel Co. (a) (c) | | | 348 | | | | 11,185 | |
Altra Holdings, Inc. (a) | | | 692 | | | | 11,508 | |
American Axle & Manufacturing Holdings, Inc. (c) | | | 2,961 | | | | 55,134 | |
American Commercial Lines, Inc. (a) (c) | | | 3,682 | | | | 59,796 | |
| American Ecology Corp. | | | 1,094 | | | | 25,687 | |
American Railcar Industries, Inc. (c) | | | 607 | | | | 11,685 | |
American Superconductor Corp. (a) (c) | | | 2,305 | | | | 63,019 | |
Amerigon, Inc. (a) (c) | | | 1,424 | | | | 30,103 | |
AO Smith Corp. (c) | | | 1,439 | | | | 50,437 | |
Applied Industrial Technologies, Inc. (c) | | | 3,147 | | | | 91,326 | |
Arctic Cat, Inc. (c) | | | 846 | | | | 10,101 | |
ARGON ST, Inc. (a) (c) | | | 898 | | | | 16,667 | |
Arkansas Best Corp. (c) | | | 1,495 | | | | 32,800 | |
Arlington Tankers Ltd (c) | | | 876 | | | | 19,386 | |
Arris Group, Inc. (a) (c) | | | 9,080 | | | | 90,621 | |
ArvinMeritor, Inc. (c) | | | 4,953 | | | | 58,099 | |
Astec Industries, Inc. (a) | | | 1,141 | | | | 42,434 | |
ASV, Inc. (a) (c) | | | 1,469 | | | | 20,346 | |
Asyst Technologies, Inc. (a) (c) | | | 3,403 | | | | 11,094 | |
Atlas Air Worldwide Holdings, Inc. (a) (c) | | | 879 | | | | 47,659 | |
ATMI, Inc. (a) (c) | | | 2,508 | | | | 80,883 | |
Audiovox Corp. (a) (c) | | | 1,164 | | | | 14,434 | |
Axcelis Technologies, Inc. (a) (c) | | | 7,095 | | | | 32,637 | |
Azz, Inc. (a) (c) | | | 772 | | | | 21,886 | |
Badger Meter, Inc. (c) | | | 977 | | | | 43,916 | |
Baldor Electric Co. (c) | | | 3,016 | | | | 101,519 | |
Beazer Homes USA, Inc. (c) | | | 2,595 | | | | 19,281 | |
Belden CDT, Inc. (c) | | | 2,983 | | | | 132,743 | |
Blount International, Inc. (a) (c) | | | 2,668 | | | | 32,843 | |
Briggs & Stratton Corp. (c) | | | 3,276 | | | | 74,234 | |
Bristow Group, Inc. (a) (c) | | | 1,344 | | | | 76,138 | |
Brooks Automation, Inc. (a) | | | 5,243 | | | | 69,260 | |
| Bucyrus International, Inc. - Class A | | | 2,486 | | | | 247,084 | |
Cascade Corp. (c) | | | 882 | | | | 40,978 | |
Celadon Group, Inc. (a) (c) | | | 1,613 | | | | 14,775 | |
Champion Enterprises, Inc. (a) (c) | | | 5,364 | | | | 50,529 | |
Chart Industries, Inc. (a) (c) | | | 949 | | | | 29,324 | |
| Cognex Corp. | | | 3,273 | | | | 65,951 | |
| Cohu, Inc. | | | 1,585 | | | | 24,250 | |
Columbus McKinnon Corp. NY (a) (c) | | | 1,286 | | | | 41,949 | |
Commercial Vehicle Group, Inc. (a) (c) | | | 1,480 | | | | 21,460 | |
CommScope, Inc. (a) | | | 1 | | | | 42 | |
| Cooper Tire & Rubber Co. | | | 4,312 | | | | 71,493 | |
Credence Systems Corp. (a) (c) | | | 7,033 | | | | 17,020 | |
| | | SHARES | | | VALUE | |
Capital Goods - 10.4% (Continued) | | | | | | |
| CTS Corp. | | | 2,523 | | | $ | 25,053 | |
Curtiss-Wright Corp. (c) | | | 3,078 | | | | 154,516 | |
Cymer, Inc. (a) (c) | | | 2,383 | | | | 92,770 | |
Darling International, Inc. (a) | | | 5,719 | | | | 66,112 | |
Dionex Corp. (a) (c) | | | 1,257 | | | | 104,155 | |
Double Hull Tankers, Inc. (c) | | | 1,422 | | | | 17,405 | |
Dynamex, Inc. (a) (c) | | | 725 | | | | 19,618 | |
Eagle Bulk Shipping, Inc. (c) | | | 2,758 | | | | 73,225 | |
Electro Scientific Industries, Inc. (a) (c) | | | 2,038 | | | | 40,454 | |
Energysolutions, Inc. (a) (c) | | | 2,008 | | | | 54,196 | |
EnPro Industries, Inc. (a) | | | 1,481 | | | | 45,393 | |
Entegris, Inc. (a) (c) | | | 7,874 | | | | 67,953 | |
ESCO Technologies, Inc. (a) (c) | | | 1,814 | | | | 72,451 | |
Esterline Technologies Corp. (a) (c) | | | 1,956 | | | | 101,223 | |
ExpressJet Holdings, Inc. (a) (c) | | | 3,474 | | | | 8,616 | |
Faro Technologies, Inc. (a) (c) | | | 974 | | | | 26,473 | |
Federal Signal Corp. (c) | | | 3,394 | | | | 38,081 | |
FEI Co. (a) (c) | | | 2,361 | | | | 58,624 | |
Fleetwood Enterprises, Inc. (a) (c) | | | 4,486 | | | | 26,826 | |
Flow International Corp. (a) (c) | | | 2,483 | | | | 23,142 | |
Force Protection, Inc. (a) (c) | | | 4,608 | | | | 21,565 | |
Forward Air Corp. (c) | | | 2,212 | | | | 68,948 | |
Franklin Electric Co., Inc. (c) | | | 1,272 | | | | 48,679 | |
| Freightcar America, Inc. | | | 883 | | | | 30,905 | |
Fuel-tech N V (a) (c) | | | 1,209 | | | | 27,384 | |
Gehl Co. (a) (c) | | | 708 | | | | 11,356 | |
Genco Shipping & Trading Ltd (c) | | | 1,172 | | | | 64,179 | |
General Maritime Corp. (c) | | | 1,884 | | | | 46,064 | |
Genesee & Wyoming, Inc. (a) | | | 2,544 | | | | 61,488 | |
Genlyte Group, Inc. (a) | | | 1,868 | | | | 177,834 | |
| Golar LNG Ltd. | | | 2,281 | | | | 50,456 | |
The Gorman-Rupp Co. (c) | | | 960 | | | | 29,952 | |
Greenbrier Cos., Inc. (c) | | | 951 | | | | 21,169 | |
Gulfmark Offshore, Inc. (a) (c) | | | 1,505 | | | | 70,419 | |
| Hardinge, Inc. | | | 739 | | | | 12,400 | |
Hayes Lemmerz International, Inc. (a) (c) | | | 6,288 | | | | 28,736 | |
Headwaters, Inc. (a) (c) | | | 2,970 | | | | 34,868 | |
Heartland Express, Inc. (c) | | | 4,255 | | | | 60,336 | |
Heico Corp. (c) | | | 1,684 | | | | 91,744 | |
Herman Miller, Inc. (c) | | | 4,178 | | | | 135,325 | |
Horizon Lines Inc. - Class A (c) | | | 2,218 | | | | 41,344 | |
Hovnanian Enterprises, Inc. (a) (c) | | | 2,492 | | | | 17,868 | |
HUB Group, Inc. (a) (c) | | | 2,812 | | | | 74,743 | |
Hurco Cos, Inc. (a) (c) | | | 371 | | | | 16,194 | |
Intevac, Inc. (a) (c) | | | 1,476 | | | | 21,461 | |
Itron, Inc. (a) (c) | | | 1,952 | | | | 187,333 | |
JetBlue Airways Corp. (a) (c) | | | 12,214 | | | | 72,063 | |
Kadant, Inc. (a) (c) | | | 957 | | | | 28,394 | |
| Kimball International, Inc. | | | 1,735 | | | | 23,769 | |
Knight Transportation, Inc. (c) | | | 4,022 | | | | 59,566 | |
Knightsbridge Tankers Ltd. (c) | | | 1,125 | | | | 27,169 | |
Knoll, Inc. (c) | | | 3,288 | | | | 54,022 | |
Kulicke & Soffa Industries, Inc. (a) (c) | | | 3,986 | | | | 27,344 | |
L-1 Identity Solutions, Inc. (a) (c) | | | 3,780 | | | | 67,851 | |
Ladish Co., Inc. (a) | | | 985 | | | | 42,542 | |
Lear Corp. (a) (c) | | | 5,080 | | | | 140,513 | |
Lindsay Manufacturing Co. (c) | | | 754 | | | | 53,300 | |
The accompanying notes are an integral part of the financial statements.
Summit Mutual Funds, Inc. – Pinnacle Series |
RUSSELL 2000 SMALL CAP INDEX PORTFOLIO | |
| | | SHARES | | | VALUE | |
Capital Goods - 10.4% (Continued) | | | | | | |
Littelfuse, Inc. (a) | | | 1,569 | | | $ | 51,714 | |
LTX Corp. (a) (c) | | | 4,335 | | | | 13,785 | |
M/I Homes, Inc. (c) | | | 845 | | | | 8,872 | |
Marine Products Corp. (c) | | | 813 | | | | 5,699 | |
Marten Transport Ltd. (a) (c) | | | 1,075 | | | | 14,996 | |
MasTec, Inc. (a) (c) | | | 2,831 | | | | 28,791 | |
Mattson Technology, Inc. (a) (c) | | | 3,685 | | | | 31,544 | |
Measurement Specialties, Inc. (a) (c) | | | 925 | | | | 20,442 | |
Meritage Homes Corp. (a) (c) | | | 1,589 | | | | 23,152 | |
Middleby Corp. (a) (c) | | | 868 | | | | 66,506 | |
Midwest Air Group, Inc. (a) (c) | | | 1,631 | | | | 24,139 | |
Miller Industries Inc./TN (a) | | | 622 | | | | 8,515 | |
Mine Safety Appliances Co. (c) | | | 1,860 | | | | 96,478 | |
MKS Instruments, Inc. (a) (c) | | | 3,322 | | | | 63,583 | |
Modine Manufacturing Co. (c) | | | 2,361 | | | | 38,980 | |
Monaco Coach Corp. (c) | | | 1,879 | | | | 16,686 | |
Moog, Inc. (a) (c) | | | 2,585 | | | | 118,419 | |
MTC Technologies, Inc. (a) (c) | | | 679 | | | | 15,956 | |
| MTS Systems Corp. | | | 1,234 | | | | 52,655 | |
| NACCO Industries, Inc. | | | 388 | | | | 38,680 | |
Noble International Ltd. (c) | | | 806 | | | | 13,146 | |
Nordic American Tanker Shipping (c) | | | 1,760 | | | | 57,763 | |
Nordson Corp. (c) | | | 2,067 | | | | 119,803 | |
Odyssey Marine Exploration, Inc. (a) (c) | | | 2,748 | | | | 17,010 | |
Old Dominion Freight Line (a) (c) | | | 1,978 | | | | 45,712 | |
Opnext, Inc. (a) (c) | | | 1,346 | | | | 11,912 | |
Orbital Sciences Corp. (a) | | | 4,194 | | | | 102,837 | |
OYO Geospace Corp. (a) (c) | | | 256 | | | | 19,292 | |
Pacer International, Inc. (c) | | | 2,640 | | | | 38,544 | |
Palm Harbor Homes, Inc. (a) (c) | | | 644 | | | | 6,794 | |
Park-Ohio Holdings Corp. (a) (c) | | | 536 | | | | 13,454 | |
Patriot Transportation Holding, Inc. (a) (c) | | | 102 | | | | 9,407 | |
PHI, Inc. (a) (c) | | | 966 | | | | 29,965 | |
Photronics, Inc. (a) (c) | | | 2,909 | | | | 36,275 | |
Pinnacle Airlines Corp. (a) (c) | | | 1,299 | | | | 19,810 | |
Plantronics, Inc. (c) | | | 3,307 | | | | 85,982 | |
Polaris Industries, Inc. (c) | | | 2,377 | | | | 113,549 | |
Polycom, Inc. (a) (c) | | | 6,130 | | | | 170,291 | |
Powell Industries, Inc. (a) (c) | | | 516 | | | | 22,740 | |
Power-One, Inc. (a) (c) | | | 4,915 | | | | 19,611 | |
Powerwave Technologies, Inc. (a) (c) | | | 9,155 | | | | 36,895 | |
Preformed Line Products Co. (c) | | | 163 | | | | 9,698 | |
Raser Technologies, Inc. (a) (c) | | | 1,429 | | | | 21,221 | |
Regal-Beloit Corp. (c) | | | 2,161 | | | | 97,137 | |
Republic Airways Holdings, Inc. (a) | | | 2,285 | | | | 44,763 | |
Robbins & Myers, Inc. (c) | | | 888 | | | | 67,159 | |
Rofin-Sinar Technologies, Inc. (a) | | | 2,158 | | | | 103,821 | |
Rudolph Technologies, Inc. (a) (c) | | | 1,719 | | | | 19,459 | |
Saia, Inc. (a) | | | 1,029 | | | | 13,686 | |
Sauer-Danfoss, Inc. (c) | | | 690 | | | | 17,284 | |
Semitool, Inc. (a) (c) | | | 1,544 | | | | 13,402 | |
Ship Finance International Ltd. (c) | | | 2,082 | | | | 57,692 | |
Skyline Corp. (c) | | | 480 | | | | 14,088 | |
| Skywest, Inc. | | | 4,474 | | | | 120,127 | |
Sonic Solutions, Inc. (a) (c) | | | 1,805 | | | | 18,754 | |
Spartan Motors, Inc. (c) | | | 2,139 | | | | 16,342 | |
Standard Motor Products, Inc. (c) | | | 1,038 | | | | 8,470 | |
Standard-Pacific Corp. (c) | | | 4,319 | | | | 14,469 | |
| Standex International Corp. | | | 871 | | | | 15,199 | |
| | | SHARES | | | VALUE | |
Capital Goods - 10.4% (Continued) | | | | | | |
Stoneridge, Inc. (a) (c) | | | 944 | | | $ | 7,590 | |
Sun Hydraulics Corp. (c) | | | 745 | | | | 18,796 | |
Superior Industries International (c) | | | 1,615 | | | | 29,345 | |
Symmetricom, Inc. (a) (c) | | | 3,232 | | | | 15,223 | |
TAL International Group, Inc. (c) | | | 1,136 | | | | 25,867 | |
Taser International, Inc. (a) (c) | | | 4,359 | | | | 62,726 | |
Tbs International Limited (a) (c) | | | 329 | | | | 10,877 | |
Team, Inc. (a) | | | 828 | | | | 30,288 | |
Technitrol, Inc. (c) | | | 2,852 | | | | 81,510 | |
Tecumseh Products Co. (a) | | | 1,167 | | | | 27,319 | |
Teledyne Technologies, Inc. (a) | | | 2,405 | | | | 128,259 | |
| Tennant Co. | | | 1,106 | | | | 48,985 | |
Tenneco, Inc. (a) (c) | | | 3,180 | | | | 82,903 | |
Textainer Group Holdings Ltd Shs (c) | | | 462 | | | | 6,713 | |
| Titan International, Inc. | | | 1,605 | | | | 50,172 | |
TransDigm Group, Inc. (a) (c) | | | 720 | | | | 32,522 | |
Triumph Group, Inc. (c) | | | 1,118 | | | | 92,067 | |
TurboChef Technologies, Inc. (a) (c) | | | 908 | | | | 14,982 | |
Twin Disc, Inc. (c) | | | 302 | | | | 21,373 | |
Ultra Clean Holdings (a) | | | 1,255 | | | | 15,311 | |
Ultrapetrol Bahamas Ltd (a) (c) | | | 1,010 | | | | 17,180 | |
Ultratech, Inc. (a) (c) | | | 1,682 | | | | 19,074 | |
Universal Truckload Services, Inc. (a) (c) | | | 417 | | | | 7,990 | |
Veeco Instruments, Inc. (a) (c) | | | 2,126 | | | | 35,504 | |
Vicor Corp. (c) | | | 1,393 | | | | 21,717 | |
Visteon Corp. (a) (c) | | | 9,002 | | | | 39,519 | |
Wabash National Corp. (c) | | | 2,191 | | | | 16,849 | |
Watts Water Technologies, Inc. (c) | | | 2,049 | | | | 61,060 | |
WCI Communities, Inc. (a) (c) | | | 2,348 | | | | 8,875 | |
Werner Enterprises, Inc. (c) | | | 3,065 | | | | 52,197 | |
| Westinghouse Air Brake Technologies Corp. | | | 3,410 | | | | 117,440 | |
Winnebago Industries, Inc. (c) | | | 2,287 | | | | 48,073 | |
| Woodward Governor Co. | | | 2,112 | | | | 143,510 | |
X-Rite, Inc. (a) (c) | | | 2,006 | | | | 23,310 | |
Zygo Corp. (a) (c) | | | 1,269 | | | | 15,812 | |
| | | | | | | | 9,601,967 | |
Consumer Discretionary - 16.2% | | | | | | | | |
1-800-FLOWERS.COM, Inc. (a) (c) | | | 1,763 | | | | 15,391 | |
99 Cents Only Stores (a) (c) | | | 3,325 | | | | 26,467 | |
Aaron Rents, Inc. (c) | | | 3,077 | | | | 59,201 | |
ABM Industries, Inc. (c) | | | 3,075 | | | | 62,699 | |
AC Moore Arts & Crafts, Inc. (a) (c) | | | 1,045 | | | | 14,369 | |
Administaff, Inc. (c) | | | 1,606 | | | | 45,418 | |
The Advisory Board Co. (a) (c) | | | 1,310 | | | | 84,089 | |
Aeropostale, Inc. (a) (c) | | | 5,337 | | | | 141,430 | |
AFC Enterprises (a) (c) | | | 1,805 | | | | 20,433 | |
Ambassadors Group, Inc. (c) | | | 1,026 | | | | 18,786 | |
Ambassadors International, Inc. (c) | | | 465 | | | | 6,780 | |
Amerco, Inc. (a) (c) | | | 667 | | | | 43,809 | |
American Greetings Corp. (c) | | | 3,749 | | | | 76,105 | |
American Public Education Inc Com (a) | | | 356 | | | | 14,874 | |
American Woodmark Corp. (c) | | | 839 | | | | 15,253 | |
Ameristar Casinos, Inc. (c) | | | 1,813 | | | | 49,930 | |
AMN Healthcare Services, Inc. (a) (c) | | | 2,284 | | | | 39,216 | |
Arbitron, Inc. (c) | | | 2,116 | | | | 87,962 | |
Asbury Automotive Group, Inc. (c) | | | 1,695 | | | | 25,510 | |
Bally Technologies, Inc. (a) (c) | | | 3,663 | | | | 182,124 | |
Barrett Business Services, Inc. (c) | | | 454 | | | | 8,177 | |
The accompanying notes are an integral part of the financial statements.
Summit Mutual Funds, Inc. – Pinnacle Series |
SCHEDULE OF INVESTMENTS | RUSSELL 2000 SMALL CAP INDEX PORTFOLIO |
| | | SHARES | | | VALUE | |
Consumer Discretionary - 16.2% (Continued) | | | | | | |
Bauer Eddie Holdings, Inc. (a) (c) | | | 2,017 | | | $ | 12,808 | |
Bebe Stores, Inc. (c) | | | 1,660 | | | | 21,348 | |
| Belo Corp. | | | 5,627 | | | | 98,135 | |
Benihana, Inc. (a) (c) | | | 544 | | | | 6,936 | |
Big 5 Sporting Goods Corp. (c) | | | 1,598 | | | | 23,043 | |
BJ’s Restaurants, Inc. (a) (c) | | | 1,104 | | | | 17,951 | |
Blockbuster, Inc. (a) (c) | | | 13,416 | | | | 52,322 | |
Blue Nile, Inc. (a) (c) | | | 924 | | | | 62,887 | |
| Blyth, Inc. | | | 1,815 | | | | 39,821 | |
Bob Evans Farms, Inc. (c) | | | 2,519 | | | | 67,837 | |
The Bon-Ton Stores Inc. (c) | | | 670 | | | | 6,358 | |
| Books-A-Million, Inc. | | | 998 | | | | 11,896 | |
Borders Group, Inc. (c) | | | 4,340 | | | | 46,221 | |
| Bowne & Co, Inc. | | | 2,057 | | | | 36,203 | |
Bright Horizons Family Solutions, Inc. (a) (c) | | | 1,832 | | | | 63,277 | |
Brightpoint, Inc. (a) | | | 3,532 | | | | 54,252 | |
| Brown Shoe Co, Inc. | | | 2,986 | | | | 45,298 | |
The Buckle, Inc. (c) | | | 1,019 | | | | 33,627 | |
Buffalo Wild Wings, Inc. (a) (c) | | | 984 | | | | 22,848 | |
Build-A-Bear-Workshop, Inc. (a) (c) | | | 1,034 | | | | 14,424 | |
Cabela’s, Inc. (a) (c) | | | 2,251 | | | | 33,923 | |
Cache, Inc. (a) (c) | | | 862 | | | | 8,051 | |
California Pizza Kitchen, Inc. (a) (c) | | | 1,278 | | | | 19,898 | |
| Callaway Golf Co. | | | 4,804 | | | | 83,734 | |
Capella Education Company (a) | | | 705 | | | | 46,149 | |
Carmike Cinemas, Inc. (c) | | | 866 | | | | 6,287 | |
Carrols Restaurant Group Inc. (a) (c) | | | 693 | | | | 6,639 | |
Carter’s, Inc. (a) | | | 3,858 | | | | 74,652 | |
Casella Waste Systems, Inc. (a) | | | 1,547 | | | | 20,173 | |
Casual Male Retail Group, Inc. (a) (c) | | | 2,402 | | | | 12,442 | |
The Cato Corp. (c) | | | 2,148 | | | | 33,638 | |
CBIZ, Inc. (a) (c) | | | 3,945 | | | | 38,700 | |
CBRL Group, Inc. (c) | | | 1,634 | | | | 52,925 | |
CDI Corp. (c) | | | 901 | | | | 21,858 | |
CEC Entertainment, Inc. (a) (c) | | | 1,893 | | | | 49,142 | |
Central European Distribution Corp. (a) (c) | | | 2,233 | | | | 129,693 | |
Central Garden & Pet Co. (a) (c) | | | 4,619 | | | | 24,758 | |
Cenveo, Inc. (a) (c) | | | 3,744 | | | | 65,408 | |
Charlotte Russe Holding, Inc. (a) (c) | | | 1,678 | | | | 27,100 | |
Charming Shoppes, Inc. (a) (c) | | | 8,597 | | | | 46,510 | |
Charter Communications, Inc. (a) (c) | | | 26,956 | | | | 31,539 | |
| Chemed Corp. | | | 1,677 | | | | 93,711 | |
Cherokee, Inc. (c) | | | 520 | | | | 16,780 | |
The Children’s Place Retail Stores, Inc. (a) (c) | | | 1,588 | | | | 41,177 | |
Chipolte Mexican Grill, Inc. (a) (c) | | | 2,235 | | | | 275,017 | |
Christopher & Banks Corp. (c) | | | 2,568 | | | | 29,404 | |
| Churchill Downs, Inc. | | | 585 | | | | 31,572 | |
Cinemark Holdings, Inc. (c) | | | 1,887 | | | | 32,079 | |
Citadel Broadcasting Corp. (c) | | | 12,170 | | | | 25,070 | |
Citi Trends, Inc. (a) (c) | | | 922 | | | | 14,236 | |
CKE Restaurants, Inc. (c) | | | 4,197 | | | | 55,400 | |
CKX, Inc. (a) (c) | | | 2,503 | | | | 30,036 | |
CNET Networks, Inc. (a) (c) | | | 10,544 | | | | 96,372 | |
Coinstar, Inc. (a) (c) | | | 1,958 | | | | 55,118 | |
Collective Brands, Inc. (a) | | | 4,280 | | | | 74,429 | |
Columbia Sportswear Co. (c) | | | 925 | | | | 40,783 | |
Conn’s, Inc. (a) (c) | | | 508 | | | | 8,692 | |
Consolidated Graphics, Inc. (a) | | | 791 | | | | 37,826 | |
| | | SHARES | | | VALUE | |
Consumer Discretionary - 16.2% (Continued) | | | | | | |
Core-Mark Holding Co., Inc. (a) (c) | | | 646 | | | $ | 18,553 | |
Corinthian Colleges, Inc. (a) (c) | | | 6,057 | | | | 93,278 | |
Cornell Cos., Inc. (a) (c) | | | 804 | | | | 18,749 | |
CoStar Group, Inc. (a) (c) | | | 1,125 | | | | 53,156 | |
Courier Corp. (c) | | | 671 | | | | 22,150 | |
Cox Radio, Inc. (a) (c) | | | 2,203 | | | | 26,766 | |
CPI Corp. (c) | | | 345 | | | | 8,125 | |
CRA International, Inc. (a) (c) | | | 796 | | | | 37,898 | |
Cross Country Healthcare, Inc. (a) (c) | | | 2,255 | | | | 32,111 | |
Crown Media Holdings, Inc. (a) (c) | | | 1,039 | | | | 6,754 | |
CSK Auto Corp. (a) (c) | | | 3,079 | | | | 15,426 | |
CSS Industries, Inc. (c) | | | 453 | | | | 16,625 | |
Cumulus Media, Inc. (a) (c) | | | 2,501 | | | | 20,108 | |
Deckers Outdoor Corp. (a) (c) | | | 843 | | | | 130,716 | |
Denny’s Corp. (a) (c) | | | 6,464 | | | | 24,240 | |
| DeVry, Inc. | | | 3,946 | | | | 205,034 | |
DG Fastchannel, Inc. (a) (c) | | | 873 | | | | 22,384 | |
Diamond Management & Technology Consultants, Inc. (c) | | | 2,052 | | | | 14,918 | |
Digital Theater Systems, Inc. (a) (c) | | | 1,234 | | | | 31,553 | |
Dolan Media Co. (a) | | | 747 | | | | 21,790 | |
Dollar Thrifty Automotive Group (a) (c) | | | 1,732 | | | | 41,014 | |
Dominos Pizza, Inc. (c) | | | 2,663 | | | | 35,231 | |
Dover Downs Gaming & Entertainment, Inc. (c) | | | 975 | | | | 10,969 | |
Dress Barn, Inc. (a) (c) | | | 3,233 | | | | 40,445 | |
DSW, Inc. - Class A (a) (c) | | | 1,139 | | | | 21,368 | |
Dyncorp International, Inc. (a) (c) | | | 1,759 | | | | 47,282 | |
Earthlink, Inc. (a) (c) | | | 8,938 | | | | 63,192 | |
Elizabeth Arden, Inc. (a) (c) | | | 1,823 | | | | 37,098 | |
Emmis Communications Corp. (a) (c) | | | 2,314 | | | | 8,909 | |
Entercom Communications Corp. (c) | | | 2,241 | | | | 30,679 | |
Entravision Communications Corp. (a) (c) | | | 4,709 | | | | 36,871 | |
Ethan Allen Interiors, Inc. (c) | | | 1,744 | | | | 49,704 | |
Exponent, Inc. (a) (c) | | | 1,078 | | | | 29,149 | |
Ezcorp, Inc. (a) (c) | | | 2,492 | | | | 28,135 | |
FGX International Holdings Ltd (a) | | | 802 | | | | 9,504 | |
Finish Line (c) | | | 2,991 | | | | 7,238 | |
First Advantage Corp. (a) (c) | | | 479 | | | | 7,889 | |
Fisher Communications, Inc. (a) (c) | | | 510 | | | | 19,360 | |
Forrester Research, Inc. (a) | | | 1,027 | | | | 28,777 | |
Fossil, Inc. (a) | | | 3,023 | | | | 126,906 | |
Fred’s, Inc. (c) | | | 2,806 | | | | 27,022 | |
FTD Group, Inc. (c) | | | 861 | | | | 11,090 | |
FTI Consulting, Inc. (a) (c) | | | 3,215 | | | | 198,173 | |
Furniture Brands International, Inc. (c) | | | 3,169 | | | | 31,880 | |
G&K Services, Inc. (c) | | | 1,494 | | | | 56,055 | |
Gaiam, Inc. - Class A (a) (c) | | | 1,138 | | | | 33,776 | |
Gander Mountain Co. (a) (c) | | | 336 | | | | 1,656 | |
GateHouse Media, Inc. (c) | | | 1,103 | | | | 9,684 | |
Gaylord Entertainment Co. (a) | | | 2,855 | | | | 115,542 | |
Gemstar-TV Guide International, Inc. (a) (c) | | | 17,470 | | | | 83,157 | |
Genesco, Inc. (a) (c) | | | 1,636 | | | | 61,841 | |
The Geo Group Inc. (a) (c) | | | 3,286 | | | | 92,008 | |
| Gevity HR, Inc. | | | 1,842 | | | | 14,165 | |
G-III Apparel Group Ltd (a) | | | 862 | | | | 12,732 | |
Global Sources Ltd (a) (c) | | | 1,142 | | | | 32,222 | |
Glu Mobile, Inc. (a) (c) | | | 484 | | | | 2,526 | |
Gray Television, Inc. (c) | | | 3,019 | | | | 24,212 | |
Great Wolf Resorts, Inc. (a) (c) | | | 1,884 | | | | 18,482 | |
The accompanying notes are an integral part of the financial statements.
Summit Mutual Funds, Inc. – Pinnacle Series |
RUSSELL 2000 SMALL CAP INDEX PORTFOLIO | |
| | | SHARES | | | VALUE | |
Consumer Discretionary - 16.2% (Continued) | | | | | | |
Greenfield Online, Inc. (a) | | | 1,427 | | | $ | 20,848 | |
Group 1 Automotive, Inc. (c) | | | 1,745 | | | | 41,444 | |
GSI Commerce, Inc. (a) (c) | | | 1,317 | | | | 25,682 | |
Gymboree Corp. (a) | | | 2,338 | | | | 71,215 | |
Harris Interactive, Inc. (a) (c) | | | 3,812 | | | | 16,239 | |
Haverty Furniture Cos., Inc. (c) | | | 1,582 | | | | 14,222 | |
Heelys, Inc. (a) (c) | | | 446 | | | | 3,104 | |
| Heidrick & Struggles International, Inc. | | | 1,288 | | | | 47,798 | |
Helen of Troy Ltd. (a) (c) | | | 2,013 | | | | 34,503 | |
hhgregg, Inc. (a) (c) | | | 630 | | | | 8,669 | |
Hibbett Sports, Inc. (a) (c) | | | 2,252 | | | | 44,995 | |
Home Solutions of America, Inc. (a) (c) | | | 3,321 | | | | 3,321 | |
Hooker Furniture Corp. (c) | | | 751 | | | | 15,095 | |
HOT Topic, Inc. (a) | | | 3,105 | | | | 18,071 | |
Houston Wire & Cable Co. (c) | | | 1,107 | | | | 15,653 | |
Hsw International, Inc. (a) (c) | | | 900 | | | | 5,607 | |
Hudson Highland Group, Inc. (a) | | | 1,725 | | | | 14,507 | |
Iconix Brand Group, Inc. (a) (c) | | | 3,367 | | | | 66,195 | |
ICT Group, Inc. (a) | | | 441 | | | | 5,270 | |
Ihop Corp. (c) | | | 1,292 | | | | 47,261 | |
IKON Office Solutions, Inc. (c) | | | 7,085 | | | | 92,247 | |
Infospace, Inc. (c) | | | 2,192 | | | | 41,210 | |
infoUSA, Inc. (c) | | | 2,360 | | | | 21,075 | |
Insight Enterprises, Inc. (a) | | | 3,392 | | | | 61,870 | |
Inter Parfums, Inc. (c) | | | 326 | | | | 5,858 | |
Internap Network Services Corp. (a) (c) | | | 3,263 | | | | 27,181 | |
inVentiv Health, Inc. (a) (c) | | | 2,050 | | | | 63,468 | |
iPass, Inc. (a) (c) | | | 4,571 | | | | 18,558 | |
Isle of Capri Casinos, Inc. (a) (c) | | | 1,050 | | | | 14,459 | |
J Crew Group, Inc. (a) (c) | | | 2,583 | | | | 124,526 | |
Jack in the Box, Inc. (a) | | | 4,394 | | | | 113,233 | |
Jackson Hewitt Tax Service, Inc. (c) | | | 2,266 | | | | 71,945 | |
Jakks Pacific, Inc. (a) (c) | | | 1,933 | | | | 45,638 | |
Jamba, Inc. (a) (c) | | | 3,430 | | | | 12,691 | |
Jo-Ann Stores, Inc. (a) (c) | | | 1,692 | | | | 22,131 | |
JOS A Bank Clothiers, Inc. (a) (c) | | | 1,264 | | | | 35,961 | |
Journal Communications, Inc. (c) | | | 3,074 | | | | 27,482 | |
Kellwood Co. (c) | | | 1,799 | | | | 29,935 | |
Kelly Services, Inc. (c) | | | 1,420 | | | | 26,497 | |
Kenneth Cole Productions, Inc. (c) | | | 615 | | | | 10,756 | |
Kforce, Inc. (a) | | | 2,085 | | | | 20,329 | |
Knology, Inc. (a) (c) | | | 1,755 | | | | 22,429 | |
The Knot, Inc. (a) (c) | | | 1,834 | | | | 29,234 | |
Korn/Ferry International (a) | | | 2,977 | | | | 56,027 | |
Krispy Kreme Doughnuts, Inc. (a) (c) | | | 3,858 | | | | 12,191 | |
K-Swiss, Inc. (c) | | | 1,818 | | | | 32,906 | |
Lakes Entertainment, Inc. (a) (c) | | | 1,609 | | | | 11,150 | |
Landry’s Restaurants, Inc. (c) | | | 1,150 | | | | 22,655 | |
Lawson Products (c) | | | 256 | | | | 9,708 | |
La-Z-Boy, Inc. (c) | | | 3,636 | | | | 28,833 | |
Leapfrog Enterprises, Inc. (a) (c) | | | 2,392 | | | | 16,098 | |
LECG Corp. (a) (c) | | | 1,714 | | | | 25,813 | |
Lee Enterprises, Inc. (c) | | | 3,214 | | | | 47,085 | |
Libbey, Inc. (c) | | | 958 | | | | 15,175 | |
Life Time Fitness, Inc. (a) (c) | | | 2,136 | | | | 106,116 | |
Lifetime Brands, Inc. (c) | | | 756 | | | | 9,813 | |
Lin TV Corp. (a) | | | 1,941 | | | | 23,622 | |
Lincoln Educational Services Corp. (a) | | | 319 | | | | 4,696 | |
| | | SHARES | | | VALUE | |
Consumer Discretionary - 16.2% (Continued) | | | | | | |
Liquidity Services, Inc. (a) (c) | | | 545 | | | $ | 7,031 | |
Lithia Motors, Inc. (c) | | | 1,112 | | | | 15,268 | |
Live Nation, Inc. (a) (c) | | | 4,482 | | | | 65,079 | |
LKQ Corp. (a) (c) | | | 7,542 | | | | 158,533 | |
Lodgenet Entertainment Corp. (a) (c) | | | 1,406 | | | | 24,521 | |
Lodgian, Inc. (a) (c) | | | 1,597 | | | | 17,982 | |
LoJack Corp. (a) (c) | | | 1,323 | | | | 22,240 | |
LoopNet, Inc. (a) (c) | | | 1,777 | | | | 24,967 | |
Lululemon Athletica, Inc. (a) (c) | | | 849 | | | | 40,217 | |
Magna Entertainment Corp. (a) (c) | | | 2,808 | | | | 2,724 | |
Maidenform Brands, Inc. (a) (c) | | | 1,519 | | | | 20,552 | |
Mannatech, Inc. (c) | | | 1,100 | | | | 6,952 | |
Marchex, Inc. (c) | | | 1,620 | | | | 17,593 | |
Marcus Corp. (c) | | | 1,511 | | | | 23,345 | |
MarineMax, Inc. (a) (c) | | | 1,106 | | | | 17,143 | |
Martha Stewart Living Omnimedia (a) (c) | | | 1,778 | | | | 16,482 | |
Marvel Entertainment, Inc. (a) (c) | | | 3,306 | | | | 88,303 | |
Matthews International Corp. (c) | | | 2,259 | | | | 105,879 | |
MAXIMUS, Inc. (c) | | | 1,507 | | | | 58,185 | |
McCormick & Schmick’s Seafood Restaurants, Inc. (a) | | | 837 | | | | 9,985 | |
Media General, Inc. (c) | | | 1,553 | | | | 33,001 | |
Men’s Wearhouse, Inc. (c) | | | 3,576 | | | | 96,480 | |
Midas, Inc. (a) (c) | | | 1,091 | | | | 15,994 | |
Midway Games, Inc. (a) (c) | | | 2,513 | | | | 6,936 | |
Monarch Casino & Resort, Inc. (a) (c) | | | 697 | | | | 16,784 | |
Monro Muffler, Inc. (c) | | | 1,188 | | | | 23,154 | |
Morgans Hotel Group Co. (a) (c) | | | 1,264 | | | | 24,370 | |
Morton’s Restaurant Group, Inc. (a) (c) | | �� | 673 | | | | 6,279 | |
| Movado Group, Inc. | | | 1,243 | | | | 31,435 | |
MPS Group, Inc. (a) | | | 7,254 | | | | 79,359 | |
MTR Gaming Group, Inc. (a) (c) | | | 1,594 | | | | 10,823 | |
Multimedia Games, Inc. (a) (c) | | | 1,907 | | | | 15,904 | |
MWI Veterinary Supply, Inc. (a) (c) | | | 376 | | | | 15,040 | |
National Cinemedia, Inc. (c) | | | 2,910 | | | | 73,361 | |
National Presto Industries, Inc. (c) | | | 333 | | | | 17,536 | |
Nautilus Group, Inc. (c) | | | 2,307 | | | | 11,189 | |
Navigant Consulting, Inc. (a) (c) | | | 3,840 | | | | 52,493 | |
Net 1 UEPS Technologies, Inc. (a) | | | 2,768 | | | | 81,268 | |
NetFlix, Inc. (a) (c) | | | 3,167 | | | | 84,306 | |
New York & Company, Inc. (a) | | | 1,503 | | | | 9,589 | |
Nexstar Broadcasting Group, Inc. (a) (c) | | | 699 | | | | 6,389 | |
NIC, Inc. (c) | | | 2,688 | | | | 22,687 | |
| Nu Skin Enterprises, Inc. | | | 3,332 | | | | 54,745 | |
O’Charleys, Inc. (c) | | | 1,623 | | | | 24,313 | |
On Assignment, Inc. (a) (c) | | | 2,386 | | | | 16,726 | |
Orbitz Worldwide, Inc. (a) (c) | | | 2,276 | | | | 19,346 | |
Overstock.com, Inc. (a) (c) | | | 744 | | | | 11,554 | |
| Oxford Industries, Inc. | | | 1,016 | | | | 26,182 | |
Pacific Sunwear Of California (a) (c) | | | 4,676 | | | | 65,978 | |
The Pantry Inc. (a) | | | 1,593 | | | | 41,625 | |
Papa John’s International, Inc. (a) (c) | | | 1,711 | | | | 38,840 | |
PC Connection, Inc. (a) (c) | | | 615 | | | | 6,980 | |
PeopleSupport, Inc. (a) (c) | | | 1,647 | | | | 22,531 | |
PEP Boys-Manny, Moe & Jack (c) | | | 2,776 | | | | 31,868 | |
Perficient, Inc. (a) (c) | | | 1,929 | | | | 30,362 | |
Perry Ellis International, Inc. (a) (c) | | | 799 | | | | 12,289 | |
PetMed Express, Inc. (a) (c) | | | 1,319 | | | | 15,960 | |
PF Chang’s China Bistro, Inc. (a) (c) | | | 1,862 | | | | 42,528 | |
The accompanying notes are an integral part of the financial statements.
Summit Mutual Funds, Inc. – Pinnacle Series |
SCHEDULE OF INVESTMENTS | RUSSELL 2000 SMALL CAP INDEX PORTFOLIO |
| | | SHARES | | | VALUE | |
Consumer Discretionary - 16.2% (Continued) | | | | | | |
PHH Corp. (a) (c) | | | 3,742 | | | $ | 66,009 | |
Pier 1 Imports, Inc. (a) (c) | | | 6,128 | | | | 32,049 | |
Pinnacle Entertainment, Inc. (a) (c) | | | 3,952 | | | | 93,109 | |
Playboy Enterprises, Inc. (a) (c) | | | 1,495 | | | | 13,634 | |
Premier Exhibitions, Inc. (a) (c) | | | 1,924 | | | | 21,049 | |
Pre-Paid Legal Services, Inc. (a) (c) | | | 656 | | | | 36,310 | |
Prestige Brands Holdings, Inc. (a) (c) | | | 2,340 | | | | 17,503 | |
Priceline.com, Inc. (a) (c) | | | 2,513 | | | | 288,643 | |
Pricesmart, Inc. (c) | | | 518 | | | | 15,571 | |
Primedia, Inc. (c) | | | 2,906 | | | | 24,701 | |
Protection One, Inc. (a) (c) | | | 430 | | | | 5,113 | |
Providence Service Corp. (a) (c) | | | 843 | | | | 23,722 | |
Quiksilver, Inc. (a) | | | 8,574 | | | | 73,565 | |
Radio One, Inc. (a) (c) | | | 5,375 | | | | 12,739 | |
RC2 Corp. (a) | | | 1,462 | | | | 41,038 | |
Red Robin Gourmet Burgers, Inc. (a) (c) | | | 1,162 | | | | 37,172 | |
| Regis Corp. | | | 2,926 | | | | 81,811 | |
Renaissance Learning, Inc. (c) | | | 526 | | | | 7,364 | |
Rent-A-Center, Inc. (a) | | | 4,879 | | | | 70,843 | |
| Resources Connection, Inc. | | | 3,383 | | | | 61,435 | |
Retail Ventures, Inc. (a) (c) | | | 1,489 | | | | 7,579 | |
Revlon, Inc. (a) (c) | | | 13,647 | | | | 16,103 | |
Riviera Holdings Corp. (a) (c) | | | 735 | | | | 22,638 | |
Rollins, Inc. (c) | | | 3,117 | | | | 59,846 | |
RSC Holdings, Inc. (a) (c) | | | 1,374 | | | | 17,244 | |
Ruby Tuesday, Inc. (c) | | | 3,762 | | | | 36,680 | |
Rush Enterprises, Inc. - Class A (a) (c) | | | 2,295 | | | | 41,723 | |
Russ Berrie & Co, Inc. (a) (c) | | | 826 | | | | 13,513 | |
Ruth’s Chris Steak House, Inc. (a) (c) | | | 1,226 | | | | 10,960 | |
Salem Communications Corp. (c) | | | 741 | | | | 4,883 | |
Sally Beauty Holdings, Inc. (a) (c) | | | 6,224 | | | | 56,327 | |
| Schawk, Inc. | | | 1,033 | | | | 16,032 | |
Scholastic Corp. (a) (c) | | | 2,066 | | | | 72,083 | |
School Specialty, Inc. (a) (c) | | | 1,477 | | | | 51,030 | |
Sealy Corp. (c) | | | 2,966 | | | | 33,190 | |
Select Comfort Corp. (a) (c) | | | 3,784 | | | | 26,526 | |
Shoe Carnival, Inc. (a) (c) | | | 562 | | | | 7,930 | |
Shuffle Master, Inc. (a) (c) | | | 2,443 | | | | 29,292 | |
Shutterfly, Inc. (a) (c) | | | 952 | | | | 24,390 | |
Sinclair Broadcast Group, Inc. (c) | | | 3,201 | | | | 26,280 | |
Six Flags, Inc. (a) (c) | | | 5,004 | | | | 10,158 | |
Skechers U.S.A., Inc. (a) | | | 1,348 | | | | 26,299 | |
Smith & Wesson Holding Corp. (a) (c) | | | 2,051 | | | | 12,511 | |
Sohu.com, Inc. (a) (c) | | | 1,815 | | | | 98,954 | |
Sonic Automotive, Inc. (c) | | | 2,117 | | | | 40,985 | |
Sonic Corp. (a) (c) | | | 4,387 | | | | 96,075 | |
Source Interlink Companies, Inc. (a) (c) | | | 2,394 | | | | 6,895 | |
Spanish Broadcasting System (a) (c) | | | 3,131 | | | | 5,792 | |
Spectrum Brands, Inc. (a) (c) | | | 2,594 | | | | 13,826 | |
Speedway Motorsports, Inc. (c) | | | 1,075 | | | | 33,411 | |
Spherion Corp. (a) (c) | | | 4,044 | | | | 29,440 | |
Stage Stores, Inc. (c) | | | 3,064 | | | | 45,347 | |
Stamps.com, Inc. (a) | | | 1,311 | | | | 15,968 | |
Standard Parking Corp. (a) | | | 332 | | | | 16,099 | |
The Steak n Shake Co. (a) (c) | | | 1,979 | | | | 21,571 | |
Stein Mart, Inc. (c) | | | 1,842 | | | | 8,731 | |
Steiner Leisure Ltd. (a) (c) | | | 1,123 | | | | 49,592 | |
| Steinway Musical Instruments | | | 492 | | | | 13,564 | |
| | | SHARES | | | VALUE | |
Consumer Discretionary - 16.2% (Continued) | | | | | | |
Steven Madden Ltd. (a) | | | 1,462 | | | $ | 29,240 | |
Stewart Enterprises, Inc. (c) | | | 7,393 | | | | 65,798 | |
| Strayer Education, Inc. | | | 1,007 | | | | 171,774 | |
Sturm Ruger & Co, Inc. (a) (c) | | | 1,492 | | | | 12,354 | |
Sun-times Media Group, Inc. (a) (c) | | | 4,879 | | | | 10,734 | |
Syms Corp. (c) | | | 458 | | | | 6,916 | |
Systemax, Inc. (c) | | | 647 | | | | 13,147 | |
Take-Two Interactive Software, Inc. (a) (c) | | | 5,028 | | | | 92,767 | |
The Talbots, Inc. (c) | | | 1,581 | | | | 18,687 | |
TeleTech Holdings, Inc. (a) | | | 2,781 | | | | 59,152 | |
Tempur-Pedic International, Inc. (c) | | | 4,887 | | | | 126,915 | |
Tetra Tech, Inc. (a) (c) | | | 4,034 | | | | 86,731 | |
Texas Roadhouse, Inc. (a) (c) | | | 3,663 | | | | 40,513 | |
THQ, Inc. (a) (c) | | | 4,484 | | | | 126,404 | |
Timberland Co. (a) (c) | | | 3,135 | | | | 56,681 | |
Tivo, Inc. (a) (c) | | | 5,968 | | | | 49,773 | |
Town Sports International Holdings, Inc. (a) (c) | | | 1,071 | | | | 10,239 | |
Travelzoo, Inc. (a) (c) | | | 191 | | | | 2,613 | |
Triarc Companies (c) | | | 4,328 | | | | 37,913 | |
True Religion Apparel, Inc. (a) (c) | | | 926 | | | | 19,770 | |
Trueblue, Inc. (a) (c) | | | 3,067 | | | | 44,410 | |
Trump Entertainment Resorts, Inc. (a) (c) | | | 2,176 | | | | 9,357 | |
Tuesday Morning Corp. (c) | | | 2,106 | | | | 10,677 | |
| Tupperware Corp. | | | 4,262 | | | | 140,774 | |
Tween Brands, Inc. (a) (c) | | | 2,154 | | | | 57,038 | |
Ulta Salon Cosmetics & Frag Inc Com (a) (c) | | | 875 | | | | 15,006 | |
Under Armour, Inc. (a) (c) | | | 1,460 | | | | 63,758 | |
| Unifirst Corp. | | | 938 | | | | 35,644 | |
United Natural Foods, Inc. (a) (c) | | | 2,965 | | | | 94,050 | |
United Online, Inc. (c) | | | 4,513 | | | | 53,344 | |
United Stationers, Inc. (a) (c) | | | 1,652 | | | | 76,339 | |
Universal Electronics, Inc. (a) (c) | | | 970 | | | | 32,437 | |
Universal Technical Institute, Inc. (a) (c) | | | 1,612 | | | | 27,404 | |
USANA Health Sciences, Inc. (a) (c) | | | 658 | | | | 24,399 | |
Vail Resorts, Inc. (a) (c) | | | 2,127 | | | | 114,454 | |
Valassis Communications, Inc. (a) (c) | | | 3,359 | | | | 39,267 | |
Valueclick, Inc. (a) (c) | | | 6,736 | | | | 147,518 | |
Valuevision Media, Inc. (a) (c) | | | 2,142 | | | | 13,473 | |
Viad Corp. (c) | | | 1,560 | | | | 49,265 | |
VistaPrint Limited (a) (c) | | | 2,887 | | | | 123,708 | |
Volcom, Inc. (a) (c) | | | 921 | | | | 20,290 | |
Volt Information Sciences, Inc. (a) | | | 834 | | | | 15,229 | |
Warnaco Group, Inc. (a) | | | 3,303 | | | | 114,944 | |
Waste Connections, Inc. (a) | | | 4,695 | | | | 145,075 | |
Waste Industries USA, Inc. (c) | | | 500 | | | | 18,150 | |
Waste Services, Inc. (a) (c) | | | 1,296 | | | | 11,107 | |
| Watson Wyatt & Co. Holdings | | | 2,976 | | | | 138,116 | |
West Marine, Inc. (a) (c) | | | 960 | | | | 8,621 | |
Westwood One, Inc. (c) | | | 4,938 | | | | 9,827 | |
Wet Seal, Inc. (a) (c) | | | 5,484 | | | | 12,778 | |
Weyco Group, Inc. (c) | | | 465 | | | | 12,788 | |
WMS Industries, Inc. (a) (c) | | | 2,845 | | | | 104,241 | |
| Wolverine World Wide, Inc. | | | 3,523 | | | | 86,384 | |
| World Fuel Services Corp. | | | 1,931 | | | | 56,057 | |
| World Wrestling Entertainment, Inc. | | | 1,504 | | | | 22,199 | |
Zale Corp. (a) (c) | | | 3,366 | | | | 54,058 | |
Zumiez, Inc. (a) (c) | | | 1,013 | | | | 24,677 | |
| | | | | | | | 14,920,029 | |
The accompanying notes are an integral part of the financial statements.
Summit Mutual Funds, Inc. – Pinnacle Series |
RUSSELL 2000 SMALL CAP INDEX PORTFOLIO | |
| | | SHARES | | | VALUE | |
Consumer Staples - 2.1% | | | | | | |
Alliance One International, Inc. (a) (c) | | | 6,674 | | | $ | 27,163 | |
American Dairy, Inc. (a) (c) | | | 428 | | | | 5,543 | |
Arden Group, Inc. (c) | | | 73 | | | | 11,292 | |
Boston Beer Co, Inc. (a) (c) | | | 659 | | | | 24,811 | |
Cal-Maine Foods, Inc. (c) | | | 833 | | | | 22,100 | |
Casey’s General Stores, Inc. (c) | | | 3,539 | | | | 104,790 | |
Chiquita Brands International, Inc. (a) (c) | | | 2,957 | | | | 54,379 | |
| Coca-Cola Bottling Co. Consolidated | | | 327 | | | | 19,254 | |
Farmer Bros Co. (c) | | | 470 | | | | 10,805 | |
| Flowers Foods, Inc. | | | 5,448 | | | | 127,538 | |
Fresh Del Monte Produce, Inc. (c) | | | 1,865 | | | | 62,627 | |
Great Atlantic & Pacific Tea Co. (a) (c) | | | 1,627 | | | | 50,974 | |
Green Mountain Coffee Roasters, Inc. (a) (c) | | | 1,008 | | | | 41,026 | |
Hain Celestial Group, Inc. (a) (c) | | | 2,618 | | | | 83,776 | |
Imperial Sugar Co. (c) | | | 736 | | | | 13,815 | |
Ingles Markets, Inc. (c) | | | 827 | | | | 20,998 | |
| J&J Snack Foods Corp. | | | 921 | | | | 28,809 | |
Jones Soda Co. (a) (c) | | | 1,777 | | | | 13,221 | |
| Lance, Inc. | | | 2,128 | | | | 43,454 | |
| Longs Drug Stores Corp. | | | 2,235 | | | | 105,045 | |
M&F Worldwide Corp. (a) | | | 708 | | | | 38,126 | |
Maui Land & Pineapple Co, Inc. (a) (c) | | | 249 | | | | 7,248 | |
Nash Finch Co. (c) | | | 937 | | | | 33,057 | |
National Beverage Corp. (c) | | | 658 | | | | 5,290 | |
Peet’s Coffee & Tea, Inc. (a) (c) | | | 971 | | | | 28,227 | |
Performance Food Group Co. (a) (c) | | | 2,428 | | | | 65,240 | |
Pilgrim’s Pride Corp. (c) | | | 2,843 | | | | 82,305 | |
Ralcorp Holdings, Inc. (a) | | | 1,863 | | | | 113,252 | |
| Reddy Ice Holdings, Inc. | | | 1,172 | | | | 29,663 | |
| Ruddick Corp. | | | 2,795 | | | | 96,903 | |
Sanderson Farms, Inc. (c) | | | 1,193 | | | | 40,300 | |
Schweitzer-Mauduit International, Inc. (c) | | | 1,085 | | | | 28,112 | |
| Seaboard Corp. | | | 23 | | | | 33,810 | |
Sensient Technologies Corp. (c) | | | 3,257 | | | | 92,108 | |
Spartan Stores, Inc. (c) | | | 1,479 | | | | 33,795 | |
Synutra International, Inc. (a) (c) | | | 275 | | | | 8,305 | |
Tiens Biotech Group USA, Inc. (a) (c) | | | 230 | | | | 538 | |
Tootsie Roll Industries, Inc. (c) | | | 2,573 | | | | 70,552 | |
TreeHouse Foods, Inc. (a) (c) | | | 2,184 | | | | 50,210 | |
Universal Corp. (c) | | | 1,808 | | | | 92,606 | |
Vector Group Ltd. (c) | | | 2,023 | | | | 40,581 | |
| Village Super Market, Inc. - Class A | | | 214 | | | | 10,890 | |
Weis Markets, Inc. (c) | | | 621 | | | | 24,803 | |
Winn Dixie Stores, Inc. (a) (c) | | | 2,266 | | | | 38,227 | |
| | | | | | | | 1,935,568 | |
Energy - 5.5% | | | | | | | | |
Allis-Chalmers Energy, Inc. (a) (c) | | | 1,898 | | | | 27,996 | |
Alon USA Energy, Inc. (c) | | | 803 | | | | 21,826 | |
Alpha Natural Resources, Inc. (a) (c) | | | 4,341 | | | | 140,996 | |
Apco Argentina Inc Cayman Is (c) | | | 600 | | | | 16,512 | |
Approach Resources, Inc. (a) | | | 580 | | | | 7,459 | |
Arena Resources, Inc. (a) (c) | | | 1,652 | | | | 68,905 | |
| Atlas America, Inc. | | | 1,491 | | | | 88,237 | |
ATP Oil & Gas Corp. (a) (c) | | | 1,417 | | | | 71,615 | |
Atwood Oceanics, Inc. (a) (c) | | | 1,897 | | | | 190,155 | |
Aventine Renewable Energy Holdings, Inc. (a) (c) | | | 2,126 | | | | 27,128 | |
Basic Energy Services, Inc. (a) (c) | | | 2,687 | | | | 58,980 | |
| | | SHARES | | | VALUE | |
Energy - 5.5% (Continued) | | | | | | |
Berry Petroleum Co. - Class A (c) | | | 2,484 | | | $ | 110,414 | |
Bill Barrett Corp. (a) (c) | | | 2,000 | | | | 83,740 | |
Bois D’Arc Energy, Inc. (a) (c) | | | 1,130 | | | | 22,431 | |
BPZ Energy, Inc. (a) (c) | | | 2,998 | | | | 33,518 | |
Brigham Exploration Co. (a) (c) | | | 3,195 | | | | 24,026 | |
Bronco Drilling Company, Inc. (a) (c) | | | 1,713 | | | | 25,438 | |
Cal Dive International, Inc. (a) (c) | | | 2,893 | | | | 38,303 | |
Callon Petroleum Co. (a) (c) | | | 1,427 | | | | 23,474 | |
CARBO Ceramics, Inc. (c) | | | 1,409 | | | | 52,415 | |
Carrizo Oil & Gas, Inc. (a) (c) | | | 1,558 | | | | 85,301 | |
Clayton Williams Energy, Inc. (a) (c) | | | 371 | | | | 11,560 | |
Clean Energy Fuels Corp. (a) (c) | | | 659 | | | | 9,977 | |
Complete Production Services, Inc. (a) (c) | | | 2,819 | | | | 50,657 | |
Comstock Resources, Inc. (a) | | | 3,017 | | | | 102,578 | |
Concho Resources, Inc. (a) | | | 1,545 | | | | 31,842 | |
Contango Oil & Gas Company (a) (c) | | | 874 | | | | 44,478 | |
Crosstex Energy, Inc. (c) | | | 2,228 | | | | 82,971 | |
CVR Energy, Inc. (a) (c) | | | 1,340 | | | | 33,420 | |
Dawson Geophysical Co. (a) (c) | | | 490 | | | | 35,015 | |
Delek US Holdings, Inc. (c) | | | 670 | | | | 13,554 | |
Delta Petroleum Corp. (a) (c) | | | 4,509 | | | | 84,995 | |
Dril-Quip, Inc. (a) (c) | | | 1,767 | | | | 98,351 | |
Edge Petroleum Corp. (a) (c) | | | 1,883 | | | | 11,166 | |
Encore Acquisition Co. (a) (c) | | | 3,708 | | | | 123,736 | |
Energy Partners Ltd. (a) (c) | | | 2,065 | | | | 24,388 | |
Enernoc, Inc. (a) (c) | | | 250 | | | | 12,275 | |
Evergreen Energy, Inc. (a) (c) | | | 4,986 | | | | 11,119 | |
Evergreen Solar, Inc. (a) (c) | | | 6,200 | | | | 107,074 | |
EXCO Resources, Inc. (a) (c) | | | 3,655 | | | | 56,579 | |
Exterran Holdings, Inc. (a) (c) | | | 4,118 | | | | 336,852 | |
Flotek Inds Inc Del (a) (c) | | | 1,206 | | | | 43,464 | |
FuelCell Energy, Inc. (a) (c) | | | 3,737 | | | | 37,071 | |
FX Energy, Inc. (a) (c) | | | 2,332 | | | | 13,246 | |
GeoGlobal Resources, Inc. (a) (c) | | | 2,105 | | | | 10,420 | |
Geokinetics, Inc. (a) (c) | | | 451 | | | | 8,772 | |
GeoMet, Inc. (a) (c) | | | 692 | | | | 3,598 | |
GMX Resources, Inc. (a) (c) | | | 523 | | | | 16,882 | |
Goodrich Petroleum Corp. (a) (c) | | | 1,003 | | | | 22,688 | |
Grey Wolf, Inc. (a) (c) | | | 12,320 | | | | 65,666 | |
| Gulf Island Fabrication, Inc. | | | 808 | | | | 25,622 | |
Gulfport Energy Corp. (a) (c) | | | 907 | | | | 16,562 | |
Harvest Natural Resources, Inc. (a) (c) | | | 2,612 | | | | 32,650 | |
Hercules Offshore, Inc. (a) (c) | | | 5,559 | | | | 132,193 | |
Hornbeck Offshore Services, Inc. (a) (c) | | | 1,494 | | | | 67,155 | |
International Coal Group, Inc. (a) (c) | | | 7,981 | | | | 42,778 | |
Lufkin Industries, Inc. (c) | | | 993 | | | | 56,889 | |
Mariner Energy, Inc. (a) (c) | | | 5,749 | | | | 131,537 | |
Markwest Hydrocarbon, Inc. (c) | | | 438 | | | | 27,441 | |
Matrix Service Co. (a) (c) | | | 1,617 | | | | 35,283 | |
McMoRan Exploration Co. (a) (c) | | | 1,718 | | | | 22,489 | |
Meridian Resource Corp. (a) (c) | | | 6,107 | | | | 11,054 | |
NATCO Group, Inc. (a) (c) | | | 1,027 | | | | 55,612 | |
Newpark Resources (a) (c) | | | 6,289 | | | | 34,275 | |
Nova Biosource Fuels, Inc. (a) (c) | | | 1,969 | | | | 5,710 | |
Oil States International, Inc. (a) (c) | | | 3,235 | | | | 110,378 | |
Oilsands Quest, Inc. (a) (c) | | | 7,040 | | | | 28,723 | |
Ormat Technologies, Inc. (c) | | | 904 | | | | 49,729 | |
Pacific Ethanol, Inc. (a) (c) | | | 1,930 | | | | 15,845 | |
The accompanying notes are an integral part of the financial statements.
Summit Mutual Funds, Inc. – Pinnacle Series |
SCHEDULE OF INVESTMENTS | RUSSELL 2000 SMALL CAP INDEX PORTFOLIO |
| | | SHARES | | | VALUE | |
Energy - 5.5% (Continued) | | | | | | |
Parallel Petroleum Corp. (a) (c) | | | 2,633 | | | $ | 46,420 | |
Parker Drilling Co. (a) (c) | | | 7,597 | | | | 57,357 | |
| Penn Virginia Corp. | | | 2,620 | | | | 114,311 | |
Petrohawk Energy Corp. (a) (c) | | | 11,241 | | | | 194,582 | |
Petroleum Development Corp. (a) (c) | | | 1,034 | | | | 61,140 | |
Petroquest Energy, Inc. (a) | | | 2,877 | | | | 41,141 | |
Pioneer Drilling Co. (a) (c) | | | 2,906 | | | | 34,523 | |
Rentech, Inc. (a) (c) | | | 9,709 | | | | 17,573 | |
Resource America, Inc. (c) | | | 1,106 | | | | 16,225 | |
Rex Energy Corporation (a) (c) | | | 644 | | | | 7,683 | |
Rosetta Resources, Inc. (a) (c) | | | 3,558 | | | | 70,555 | |
RPC, Inc. (c) | | | 2,247 | | | | 26,312 | |
Stone Energy Corp. (a) (c) | | | 1,917 | | | | 89,926 | |
Sulphco, Inc. (a) (c) | | | 2,450 | | | | 12,789 | |
Superior Offshore International, Inc. (a) (c) | | | 673 | | | | 3,378 | |
Superior Well Services, Inc. (a) (c) | | | 911 | | | | 19,331 | |
Swift Energy Co. (a) (c) | | | 2,049 | | | | 90,218 | |
T-3 Energy Services, Inc. (a) | | | 93 | | | | 4,372 | |
Toreador Resources Corp. (a) (c) | | | 926 | | | | 6,473 | |
Trico Marine Service, Inc. (a) (c) | | | 833 | | | | 30,838 | |
TXCO Resources, Inc. (a) (c) | | | 2,051 | | | | 24,735 | |
Union Drilling, Inc. (a) (c) | | | 942 | | | | 14,855 | |
US Bioenergy Corp. (a) (c) | | | 797 | | | | 9,333 | |
Vaalco Energy, Inc. (a) (c) | | | 4,047 | | | | 18,819 | |
Venoco, Inc. (a) | | | 827 | | | | 16,482 | |
VeraSun Energy Corp. (a) (c) | | | 2,151 | | | | 32,867 | |
Verenium Corporation (a) (c) | | | 2,141 | | | | 10,684 | |
Warren Resources, Inc. (a) (c) | | | 3,751 | | | | 53,002 | |
W-H Energy Services, Inc. (a) | | | 2,072 | | | | 116,467 | |
Whiting Petroleum Corp. (a) (c) | | | 2,598 | | | | 149,801 | |
Willbros Group, Inc. (a) (c) | | | 2,484 | | | | 95,112 | |
| | | | | | | | 5,112,492 | |
Financial - 19.1% | | | | | | | | |
1st Source Corp. (c) | | | 894 | | | | 15,475 | |
Abington Bancorp, Inc. (c) | | | 726 | | | | 6,824 | |
Acadia Realty Trust (c) | | | 2,232 | | | | 57,162 | |
Advance America Cash Advance Centers, Inc. (c) | | | 4,748 | | | | 48,240 | |
Advanta Corp. - Class B (c) | | | 2,447 | | | | 19,747 | |
Advent Software, Inc. (a) (c) | | | 1,429 | | | | 77,309 | |
Agree Realty Corp. (c) | | | 541 | | | | 16,284 | |
| Alabama National Bancorporation | | | 1,159 | | | | 90,182 | |
Alesco Financial, Inc. (c) | | | 3,628 | | | | 11,900 | |
Alexander’s, Inc. (a) (c) | | | 133 | | | | 46,982 | |
Alexandria Real Estate Equities, Inc. (c) | | | 2,131 | | | | 216,659 | |
Alfa Corp. (c) | | | 2,286 | | | | 49,538 | |
Amcore Financial, Inc. (c) | | | 1,537 | | | | 34,890 | |
| American Campus Communities, Inc. | | | 1,609 | | | | 43,202 | |
American Equity Investment Life Holding Co. (c) | | | 3,911 | | | | 32,422 | |
American Financial Realty Trust (c) | | | 9,109 | | | | 73,054 | |
American Physicians Capital, Inc. (c) | | | 685 | | | | 28,400 | |
AmericanWest Bancorp (c) | | | 793 | | | | 13,981 | |
Ameris Bancorp (c) | | | 911 | | | | 15,350 | |
Amerisafe, Inc. (a) (c) | | | 1,236 | | | | 19,170 | |
Ampal American Israel Corp. (a) (c) | | | 1,162 | | | | 8,587 | |
| Amtrust Financial Services, Inc. | | | 1,798 | | | | 24,758 | |
Anchor Bancorp Wisconsin, Inc. (c) | | | 1,473 | | | | 34,645 | |
Anthracite Capital, Inc. (c) | | | 4,014 | | | | 29,061 | |
| | | SHARES | | | VALUE | |
Financial - 19.1% (Continued) | | | | | | |
Anworth Mortgage Asset Corp. (c) | | | 3,187 | | | $ | 26,325 | |
Apollo Investment Corp. (c) | | | 8,056 | | | | 137,355 | |
Arbor Realty Trust, Inc. (c) | | | 801 | | | | 12,904 | |
Ares Capital Corp. (c) | | | 4,841 | | | | 70,824 | |
Argo Group International Holdings Ltd (a) (c) | | | 1,820 | | | | 76,677 | |
Ashford Hospitality Trust, Inc. (c) | | | 7,176 | | | | 51,595 | |
| Aspen Insurance Holdings Ltd | | | 5,768 | | | | 166,349 | |
Asset Acceptance Capital Corp. (c) | | | 1,088 | | | | 11,326 | |
Associated Estates Realty Corp. (c) | | | 1,037 | | | | 9,789 | |
| Assured Guaranty Ltd | | | 4,472 | | | | 118,687 | |
Asta Funding, Inc. (c) | | | 788 | | | | 20,835 | |
Baldwin & Lyons, Inc. (c) | | | 544 | | | | 14,938 | |
Bancfirst Corp. (c) | | | 434 | | | | 18,597 | |
Banco Latinoamericano de Exportaciones SA (c) | | | 1,834 | | | | 29,913 | |
The Bancorp, Inc. (a) (c) | | | 744 | | | | 10,014 | |
| Bank Mutual Corp. | | | 4,280 | | | | 45,240 | |
Bank of the Ozarks, Inc. (c) | | | 831 | | | | 21,772 | |
BankAtlantic Bancorp, Inc. (c) | | | 3,316 | | | | 13,596 | |
BankFinancial Corp. (c) | | | 1,720 | | | | 27,210 | |
Bankrate, Inc. (a) (c) | | | 698 | | | | 33,567 | |
BankUnited Financial Corp. (c) | | | 2,199 | | | | 15,173 | |
Banner Corp. (c) | | | 854 | | | | 24,535 | |
Beneficial Mutual Bancorp Inc Com (a) (c) | | | 2,444 | | | | 23,756 | |
Berkshire Hills Bancorp, Inc. (c) | | | 576 | | | | 14,976 | |
| BioMed Realty Trust, Inc. | | | 4,585 | | | | 106,234 | |
Blackrock Kelso Capital Corp Com (c) | | | 668 | | | | 10,207 | |
Boston Private Financial Holdings, Inc. (c) | | | 2,475 | | | | 67,023 | |
Brookline Bancorp, Inc. (c) | | | 4,330 | | | | 43,993 | |
BRT Realty Trust (c) | | | 463 | | | | 7,084 | |
Calamos Asset Management, Inc. (c) | | | 1,628 | | | | 48,482 | |
Capital City Bank Group, Inc. (c) | | | 875 | | | | 24,692 | |
Capital Corp of the West (c) | | | 634 | | | | 12,319 | |
Capital Southwest Corp. (c) | | | 153 | | | | 18,115 | |
Capital Trust, Inc. - Class A (c) | | | 748 | | | | 22,926 | |
Capitol Bancorp Ltd. (c) | | | 942 | | | | 18,953 | |
Caplease, Inc. (c) | | | 2,331 | | | | 19,627 | |
Cascade Bancorp (c) | | | 1,481 | | | | 20,616 | |
| Cash America International, Inc. | | | 2,080 | | | | 67,184 | |
Cass Information Systems, Inc. (c) | | | 415 | | | | 13,865 | |
Castlepoint Holdings Ltd (c) | | | 522 | | | | 6,264 | |
Cathay General Bancorp (c) | | | 3,621 | | | | 95,920 | |
CBRE Realty Finance, Inc. (c) | | | 1,922 | | | | 10,263 | |
Cedar Shopping Centers, Inc. (c) | | | 3,024 | | | | 30,936 | |
Centennial Bank Holdings Inc. (a) (c) | | | 4,153 | | | | 24,004 | |
| Centerline Holdings Co. | | | 3,656 | | | | 27,859 | |
Center Financial Corp. (c) | | | 815 | | | | 10,041 | |
Central Pacific Financial Corp. (c) | | | 2,143 | | | | 39,560 | |
Chemical Financial Corp. (c) | | | 1,761 | | | | 41,894 | |
Chimera Investment Corp. (a) (c) | | | 2,230 | | | | 39,872 | |
| Chittenden Corp. | | | 3,289 | | | | 117,154 | |
Citizens Banking Corp. (c) | | | 5,298 | | | | 76,874 | |
Citizens, Inc. (a) (c) | | | 2,245 | | | | 12,415 | |
City Bank (c) | | | 867 | | | | 19,438 | |
| City Holding Co. | | | 1,190 | | | | 40,270 | |
Clayton Holdings, Inc. (a) (c) | | | 561 | | | | 2,900 | |
Clifton Savings Bancorp, Inc. (c) | | | 937 | | | | 9,183 | |
CNA Surety Corp. (a) | | | 1,124 | | | | 22,244 | |
CoBiz, Inc. (c) | | | 1,091 | | | | 16,223 | |
The accompanying notes are an integral part of the financial statements.
Summit Mutual Funds, Inc. – Pinnacle Series |
RUSSELL 2000 SMALL CAP INDEX PORTFOLIO | |
| | | SHARES | | | VALUE | |
Financial - 19.1% (Continued) | | | | | | |
Cohen & Steers, Inc. (c) | | | 963 | | | $ | 28,861 | |
| Columbia Banking System, Inc. | | | 1,126 | | | | 33,476 | |
Commerce Group, Inc. (c) | | | 3,530 | | | | 127,009 | |
Community Bancorp (a) (c) | | | 603 | | | | 10,474 | |
Community Bank System, Inc. (c) | | | 2,101 | | | | 41,747 | |
| Community Trust Bancorp, Inc. | | | 1,057 | | | | 29,099 | |
CompuCredit Corp. (a) (c) | | | 1,455 | | | | 14,521 | |
| Corporate Office Properties Trust | | | 2,573 | | | | 81,050 | |
Corus Bankshares, Inc. (c) | | | 2,745 | | | | 29,289 | |
Cousins Properties, Inc. (c) | | | 2,691 | | | | 59,471 | |
Cowen Group, Inc. (a) (c) | | | 1,054 | | | | 10,024 | |
Crawford & Co. (a) (c) | | | 1,640 | | | | 6,806 | |
Credit Acceptance Corp. (a) (c) | | | 635 | | | | 13,125 | |
Crystal River Capital, Inc. (c) | | | 1,647 | | | | 23,783 | |
CVB Financial Corp. (c) | | | 4,715 | | | | 48,753 | |
Cybersource Corp. (a) (c) | | | 4,365 | | | | 77,566 | |
Darwin Professional Underwriters, Inc. (a) (c) | | | 340 | | | | 8,218 | |
Dct Industrial Trust, Inc. (c) | | | 11,659 | | | | 108,545 | |
Deerfield Capital Corp. (c) | | | 3,480 | | | | 27,840 | |
Delphi Financial Group (c) | | | 2,909 | | | | 102,630 | |
| Deluxe Corp. | | | 3,606 | | | | 118,601 | |
DiamondRock Hospitality Co. (c) | | | 6,103 | | | | 91,423 | |
Digital Realty Trust, Inc. (c) | | | 3,474 | | | | 133,297 | |
Dime Community Bancshares (c) | | | 1,727 | | | | 22,054 | |
Dollar Financial Corp. (a) (c) | | | 863 | | | | 26,485 | |
Donegal Group, Inc. (c) | | | 916 | | | | 15,728 | |
Downey Financial Corp. (c) | | | 1,478 | | | | 45,981 | |
Duff & Phelps Corp New (a) | | | 631 | | | | 12,418 | |
Eastgroup Properties (c) | | | 1,660 | | | | 69,471 | |
Education Realty Trust, Inc. (c) | | | 1,856 | | | | 20,861 | |
eHealth, Inc. (a) (c) | | | 368 | | | | 11,816 | |
Electro Rent Corp. (c) | | | 1,281 | | | | 19,023 | |
EMC INS Group, Inc. (c) | | | 416 | | | | 9,847 | |
Employers Holdings, Inc. (c) | | | 3,930 | | | | 65,670 | |
Encore Capital Group, Inc. (a) (c) | | | 1,065 | | | | 10,309 | |
Enstar Group Limited (c) | | | 468 | | | | 57,293 | |
Enterprise Financial Services Corp. (c) | | | 632 | | | | 15,048 | |
Entertainment Properties Trust (c) | | | 1,859 | | | | 87,373 | |
Epoch Holding Corp. (c) | | | 580 | | | | 8,700 | |
| Equity Lifestyle Properties, Inc. | | | 1,364 | | | | 62,294 | |
Equity One, Inc. (c) | | | 2,680 | | | | 61,720 | |
eSpeed, Inc. - Class A (a) (c) | | | 1,440 | | | | 16,272 | |
Euronet Worldwide, Inc. (a) (c) | | | 3,173 | | | | 95,190 | |
Evercore Partners, Inc. (c) | | | 577 | | | | 12,434 | |
ExlService Holdings, Inc. (a) (c) | | | 1,481 | | | | 34,181 | |
Extra Space Storage, Inc. (c) | | | 4,045 | | | | 57,803 | |
FBL Financial Group, Inc. (c) | | | 955 | | | | 32,976 | |
FBR Capital Markets Corp. (a) (c) | | | 2,085 | | | | 19,974 | |
Fcstone Group, Inc. (a) | | | 589 | | | | 27,112 | |
Federal Agricultural Mortgage Corp. (c) | | | 779 | | | | 20,503 | |
| FelCor Lodging Trust, Inc. | | | 4,276 | | | | 66,663 | |
Financial Federal Corp. (c) | | | 1,902 | | | | 42,396 | |
First Acceptance Corp. (a) (c) | | | 1,175 | | | | 4,958 | |
First Bancorp Puerto Rico (c) | | | 4,931 | | | | 35,947 | |
First Bancorp/Troy NC (c) | | | 834 | | | | 15,754 | |
First Busey Corp. (c) | | | 1,779 | | | | 35,331 | |
First Cash Financial Services, Inc. (a) (c) | | | 1,960 | | | | 28,773 | |
First Charter Corp. (c) | | | 2,411 | | | | 71,992 | |
| | | SHARES | | | VALUE | |
Financial - 19.1% (Continued) | | | | | | |
First Commonwealth Financial Corp. (c) | | | 4,963 | | | $ | 52,856 | |
First Community Bancorp/CA (c) | | | 1,618 | | | | 66,726 | |
First Community Bancshares, Inc/VA (c) | | | 669 | | | | 21,334 | |
First Financial Bancorp (c) | | | 2,358 | | | | 26,881 | |
First Financial Bankshares, Inc. (c) | | | 1,459 | | | | 54,931 | |
First Financial Corp/IN (c) | | | 935 | | | | 26,498 | |
First Financial Holdings, Inc. (c) | | | 845 | | | | 23,170 | |
| First Indiana Corp. | | | 896 | | | | 28,672 | |
First Industrial Realty Trust, Inc. (c) | | | 3,143 | | | | 108,748 | |
First Merchants Corp. (c) | | | 1,296 | | | | 28,305 | |
First Mercury Financial Corp. (a) | | | 737 | | | | 17,983 | |
First Midwest Bancorp, Inc/IL (c) | | | 3,505 | | | | 107,253 | |
First Niagara Financial Group, Inc. (c) | | | 7,117 | | | | 85,689 | |
First Place Financial Corp/OH (c) | | | 1,170 | | | | 16,368 | |
First Potomac Realty Trust (c) | | | 1,686 | | | | 29,151 | |
First Regional Bancorp (a) (c) | | | 544 | | | | 10,276 | |
First South Bancorp, Inc. (c) | | | 548 | | | | 12,160 | |
First State Bancorp. (c) | | | 1,430 | | | | 19,877 | |
FirstFed Financial Corp. (a) (c) | | | 1,167 | | | | 41,802 | |
FirstMerit Corp. (c) | | | 5,605 | | | | 112,156 | |
Flagstar Bancorp, Inc. (c) | | | 2,853 | | | | 19,885 | |
Flagstone Reinsurance Holdings Lt (c) | | | 905 | | | | 12,579 | |
Flushing Financial Corp. (c) | | | 1,344 | | | | 21,571 | |
FNB Corp/Hermitage PA (c) | | | 4,245 | | | | 62,401 | |
FPIC Insurance Group, Inc. (a) (c) | | | 700 | | | | 30,086 | |
Franklin Bank Corp/Houston TX (a) (c) | | | 1,646 | | | | 7,094 | |
Franklin Street Properties Corp. (c) | | | 4,104 | | | | 60,739 | |
Fremont General Corp. (c) | | | 4,616 | | | | 16,156 | |
Friedman Billings Ramsey Group, Inc. (c) | | | 10,320 | | | | 32,405 | |
Frontier Financial Corp. (c) | | | 2,796 | | | | 51,922 | |
Gamco Investors, Inc. (c) | | | 394 | | | | 27,265 | |
Getty Realty Corp. (c) | | | 1,233 | | | | 32,896 | |
GFI Group, Inc. (a) (c) | | | 1,064 | | | | 101,846 | |
Glacier Bancorp, Inc. (c) | | | 3,669 | | | | 68,757 | |
Gladstone Capital Corp. (c) | | | 865 | | | | 14,705 | |
Glimcher Realty Trust (c) | | | 2,575 | | | | 36,797 | |
Global Cash Access, Inc. (a) (c) | | | 2,914 | | | | 17,659 | |
| GMH Communities Trust | | | 2,789 | | | | 15,395 | |
Gramercy Capital Corp. (c) | | | 1,313 | | | | 31,919 | |
Great Southern Bancorp, Inc. (c) | | | 702 | | | | 15,416 | |
Greene County Bancshares, Inc. (c) | | | 607 | | | | 11,654 | |
Greenhill & Co, Inc. (c) | | | 1,238 | | | | 82,302 | |
Greenlight Capital RE Ltd (a) (c) | | | 605 | | | | 12,578 | |
H&E Equipment Services, Inc. (a) (c) | | | 1,171 | | | | 22,108 | |
Hallmark Financial Services, Inc. (a) (c) | | | 304 | | | | 4,821 | |
Hancock Holding Co. (c) | | | 1,900 | | | | 72,580 | |
Hanmi Financial Corp. (c) | | | 2,857 | | | | 24,627 | |
| Harleysville Group, Inc. | | | 965 | | | | 34,142 | |
Harleysville National Corp. (c) | | | 2,031 | | | | 29,592 | |
Healthcare Realty Trust, Inc. (c) | | | 3,359 | | | | 85,285 | |
Heartland Financial USA, Inc. (c) | | | 1,017 | | | | 18,886 | |
Heartland Payment Systems, Inc. (c) | | | 1,030 | | | | 27,604 | |
Heckmann Corp. (a) | | | 3,594 | | | | 26,416 | |
Hercules Tech Growth Cap, Inc. (c) | | | 1,523 | | | | 18,916 | |
Heritage Commerce Corp. (c) | | | 834 | | | | 15,337 | |
| Hersha Hospitality Trust | | | 2,220 | | | | 21,090 | |
Highwoods Properties, Inc. (c) | | | 3,801 | | | | 111,673 | |
| Hilb Rogal & Hobbs Co. | | | 2,543 | | | | 103,170 | |
The accompanying notes are an integral part of the financial statements.
Summit Mutual Funds, Inc. – Pinnacle Series |
SCHEDULE OF INVESTMENTS | RUSSELL 2000 SMALL CAP INDEX PORTFOLIO |
| | | SHARES | | | VALUE | |
Financial - 19.1% (Continued) | | | | | | |
Home Bancshares, Inc. (c) | | | 777 | | | $ | 16,294 | |
Home Properties, Inc. (c) | | | 2,195 | | | | 98,446 | |
| Horace Mann Educators Corp. | | | 3,021 | | | | 57,218 | |
Horizon Financial Corp. (c) | | | 830 | | | | 14,475 | |
Huron Consulting Group, Inc. (a) | | | 1,222 | | | | 98,530 | |
Hypercom Corp. (a) (c) | | | 3,775 | | | | 18,800 | |
IBERIABANK Corp. (c) | | | 652 | | | | 30,481 | |
IMPAC Mortgage Holdings, Inc. (c) | | | 5,354 | | | | 2,998 | |
| Imperial Cap Bancorp, Inc. | | | 391 | | | | 7,155 | |
Independence Holding Co. (c) | | | 354 | | | | 4,478 | |
Independent Bank Corp. Massachusetts (c) | | | 1,059 | | | | 28,826 | |
Independent Bank Corp. Michigan (c) | | | 1,611 | | | | 15,305 | |
Infinity Property & Casualty Corp. (c) | | | 1,452 | | | | 52,461 | |
Inland Real Estate Corp. (c) | | | 3,832 | | | | 54,261 | |
Integra Bank Corp. (c) | | | 1,172 | | | | 16,537 | |
Interactive Brokers Group, Inc. (a) (c) | | | 2,655 | | | | 85,810 | |
| Interactive Data Corp. | | | 2,521 | | | | 83,218 | |
International Bancshares Corp. (c) | | | 3,598 | | | | 75,342 | |
INVESTools, Inc. (a) (c) | | | 3,190 | | | | 56,591 | |
Investors Bancorp, Inc. (a) (c) | | | 3,733 | | | | 52,785 | |
Investors Real Estate Trust (c) | | | 3,280 | | | | 29,422 | |
IPC Holdings Ltd (c) | | | 4,183 | | | | 120,763 | |
Irwin Financial Corp. (c) | | | 1,423 | | | | 10,459 | |
Jack Henry & Associates, Inc. (c) | | | 5,203 | | | | 126,641 | |
JER Investors Trust, Inc. (c) | | | 1,804 | | | | 19,429 | |
Kansas City Life Insurance Co. (c) | | | 281 | | | | 12,249 | |
Kayne Anderson Energy Dev Co. (c) | | | 660 | | | | 15,121 | |
KBW, Inc. (a) (c) | | | 1,935 | | | | 49,517 | |
Kearny Financial Corp. (c) | | | 1,535 | | | | 18,282 | |
K-Fed Bancorp (c) | | | 327 | | | | 3,299 | |
| Kite Realty Group Trust | | | 1,384 | | | | 21,134 | |
| KNBT Bancorp, Inc. | | | 2,036 | | | | 31,395 | |
Knight Capital Group, Inc. (a) | | | 7,334 | | | | 105,610 | |
| Kohlberg Capital Corp. | | | 935 | | | | 11,220 | |
LaBranche & Co, Inc. (a) | | | 3,729 | | | | 18,794 | |
Ladenburg Thalman Financial Services, Inc. (a) (c) | | | 6,312 | | | | 13,381 | |
Lakeland Bancorp, Inc. (c) | | | 1,403 | | | | 16,261 | |
Lakeland Financial Corp. (c) | | | 848 | | | | 17,723 | |
LandAmerica Financial Group, Inc. (c) | | | 1,130 | | | | 37,799 | |
LaSalle Hotel Properties (c) | | | 2,805 | | | | 89,480 | |
Lexington Corporate Properties Trust (c) | | | 4,360 | | | | 63,394 | |
| LTC Properties, Inc. | | | 1,643 | | | | 41,157 | |
Luminent Mortgage Capital, Inc. (c) | | | 3,347 | | | | 2,611 | |
Macatawa Bank Corp. (c) | | | 1,071 | | | | 9,200 | |
Maguire Properties, Inc. (c) | | | 2,661 | | | | 78,420 | |
MainSource Financial Group, Inc. (c) | | | 1,327 | | | | 20,648 | |
MarketAxess Holdings, Inc. (a) (c) | | | 2,270 | | | | 29,124 | |
Max RE Capital Ltd Hamilton (c) | | | 3,984 | | | | 111,512 | |
MB Financial Corp. (c) | | | 2,408 | | | | 74,239 | |
MCG Capital Corp. (c) | | | 4,033 | | | | 46,742 | |
Mcgrath Rentcorp (c) | | | 1,542 | | | | 39,707 | |
Meadowbrook Insurance Group, Inc. (a) | | | 1,771 | | | | 16,665 | |
Medical Properties Trust, Inc. (c) | | | 2,816 | | | | 28,695 | |
MFA Mortgage Investments, Inc. (c) | | | 7,088 | | | | 65,564 | |
Mid-America Apartment Communities, Inc. (c) | | | 1,659 | | | | 70,922 | |
| The Midland Co. | | | 780 | | | | 50,458 | |
Midwest Banc Holdings, Inc. (c) | | | 1,334 | | | | 16,568 | |
Mission West Properties (c) | | | 1,300 | | | | 12,363 | |
Montpelier RE Holdings Ltd. (c) | | | 7,275 | | | | 123,748 | |
| | | SHARES | | | VALUE | |
Financial - 19.1% (Continued) | | | | | | |
Morningstar, Inc. (a) (c) | | | 987 | | | $ | 76,739 | |
Move, Inc. (a) (c) | | | 7,040 | | | | 17,248 | |
MVC Capital, Inc. (c) | | | 1,198 | | | | 19,336 | |
Nara Bancorp, Inc. (c) | | | 1,491 | | | | 17,400 | |
NASB Financial, Inc. (c) | | | 278 | | | | 7,334 | |
National Financial Partners Corp. (c) | | | 2,628 | | | | 119,863 | |
| National Health Investors, Inc. | | | 1,655 | | | | 46,175 | |
National Interstate Corp. (c) | | | 350 | | | | 11,585 | |
National Penn Bancshares, Inc. (c) | | | 3,482 | | | | 52,717 | |
National Retail Properties, Inc. (c) | | | 4,562 | | | | 106,660 | |
| National Western Life Insurance Co. | | | 124 | | | | 25,714 | |
Nationwide Health Properties, Inc. (c) | | | 5,939 | | | | 186,306 | |
Navigators Group, Inc. (a) (c) | | | 917 | | | | 59,605 | |
NBT Bancorp, Inc. (c) | | | 2,419 | | | | 55,202 | |
Nelnet, Inc. (c) | | | 1,160 | | | | 14,744 | �� |
NewAlliance Bancshares, Inc. (c) | | | 8,002 | | | | 92,183 | |
Newcastle Investment Corp. (c) | | | 2,738 | | | | 35,484 | |
Newstar Financial, Inc. (a) (c) | | | 957 | | | | 7,924 | |
Nexcen Brands, Inc. (a) (c) | | | 2,815 | | | | 13,625 | |
NGP Capital Resources Co. (c) | | | 1,228 | | | | 19,194 | |
Northfield Bancorp Inc New (a) (c) | | | 1,349 | | | | 14,596 | |
NorthStar Realty Finance Corp. (c) | | | 4,123 | | | | 36,777 | |
Northwest Bancorp, Inc. (c) | | | 1,312 | | | | 34,860 | |
Novastar Financial, Inc. (a) (c) | | | 649 | | | | 1,876 | |
NYMAGIC, Inc. (c) | | | 377 | | | | 8,720 | |
Ocwen Financial Corp. (a) (c) | | | 2,405 | | | | 13,324 | |
Odyssey RE Holdings Corp. (c) | | | 1,865 | | | | 68,464 | |
Old National Bancorp (c) | | | 4,718 | | | | 70,581 | |
Old Second Bancorp, Inc. (c) | | | 953 | | | | 25,531 | |
Omega Financial Corp. (c) | | | 885 | | | | 25,895 | |
Omega Healthcare Investors, Inc. (c) | | | 4,695 | | | | 75,355 | |
Online Resources Corp. (a) (c) | | | 1,582 | | | | 18,857 | |
optionsXpress Holdings, Inc. (c) | | | 2,884 | | | | 97,537 | |
Oriental Financial Group (c) | | | 1,477 | | | | 19,807 | |
Oritani Financial Corp. (a) (c) | | | 844 | | | | 10,381 | |
Pacific Capital Bancorp (c) | | | 3,282 | | | | 66,067 | |
Park National Corp. (c) | | | 835 | | | | 53,857 | |
Parkway Properties, Inc. (c) | | | 1,065 | | | | 39,384 | |
Patriot Capital Funding, Inc. (c) | | | 1,207 | | | | 12,179 | |
| Pennantpark Investment Corp. | | | 1,313 | | | | 13,156 | |
Pennsylvania Real Estate Investment Trust (c) | | | 2,113 | | | | 62,714 | |
Penson Worldwide, Inc. (a) (c) | | | 958 | | | | 13,747 | |
Peoples Bancorp Inc. (c) | | | 707 | | | | 17,597 | |
PFF Bancorp, Inc. (c) | | | 1,721 | | | | 20,721 | |
The Phoenix Cos., Inc. (c) | | | 7,917 | | | | 93,975 | |
Pico Holdings, Inc. (a) (c) | | | 1,010 | | | | 33,956 | |
Pinnacle Financial Partners, Inc. (a) (c) | | | 1,078 | | | | 27,403 | |
Piper Jaffray Companies, Inc. (a) (c) | | | 1,305 | | | | 60,448 | |
| Platinum Underwriters Holdings Ltd | | | 3,936 | | | | 139,964 | |
PMA Capital Corp. (a) (c) | | | 2,270 | | | | 18,659 | |
Portfolio Recovery Associates, Inc. (c) | | | 1,116 | | | | 44,272 | |
| Post Properties, Inc. | | | 3,015 | | | | 105,887 | |
| Potlatch Corp. | | | 2,714 | | | | 120,610 | |
Preferred Bank (c) | | | 445 | | | | 11,579 | |
Presidential Life Corp. (c) | | | 1,508 | | | | 26,405 | |
Primus Guaranty Ltd (a) (c) | | | 2,960 | | | | 20,750 | |
PrivateBancorp, Inc. (c) | | | 1,192 | | | | 38,919 | |
ProAssurance Corp. (a) (c) | | | 2,333 | | | | 128,128 | |
Prospect Capital Corporation (c) | | | 1,315 | | | | 17,161 | |
The accompanying notes are an integral part of the financial statements.
Summit Mutual Funds, Inc. – Pinnacle Series |
RUSSELL 2000 SMALL CAP INDEX PORTFOLIO | |
| | | SHARES | | | VALUE | |
Financial - 19.1% (Continued) | | | | | | |
| Prosperity Bancshares, Inc. | | | 2,448 | | | $ | 71,947 | |
| Provident Bankshares Corp. | | | 2,318 | | | | 49,582 | |
Provident Financial Services, Inc. (c) | | | 4,542 | | | | 65,496 | |
Provident New York Bancorp (c) | | | 2,985 | | | | 38,566 | |
| PS Business Parks, Inc. | | | 1,121 | | | | 58,909 | |
Pzena Investment Mgmt, Inc. (a) (c) | | | 407 | | | | 4,640 | |
QC Holdings, Inc. (c) | | | 410 | | | | 4,612 | |
RAIT Investment Trust (c) | | | 4,369 | | | | 37,661 | |
Ram Holdings Ltd (a) (c) | | | 1,210 | | | | 5,977 | |
| Ramco-Gershenson Properties | | | 1,184 | | | | 25,302 | |
Realty Income Corp. (c) | | | 6,616 | | | | 178,764 | |
Redwood Trust, Inc. (c) | | | 1,364 | | | | 46,703 | |
Renasant Corp. (c) | | | 1,036 | | | | 22,347 | |
Republic Bancorp Inc./KY (c) | | | 555 | | | | 9,174 | |
RLI Corp. (c) | | | 1,391 | | | | 78,995 | |
Rockville Financial, Inc. (c) | | | 616 | | | | 7,515 | |
Roma Financial Corp. (c) | | | 676 | | | | 10,606 | |
Royal Bancshares of Pennsylvania (c) | | | 338 | | | | 3,718 | |
S&T Bancorp, Inc. (c) | | | 1,827 | | | | 50,498 | |
S1 Corp. (a) (c) | | | 3,654 | | | | 26,674 | |
Safety Insurance Group, Inc. (c) | | | 1,000 | | | | 36,620 | |
Sanders Morris Harris Group, Inc. (c) | | | 1,188 | | | | 12,177 | |
Sandy Spring Bancorp, Inc. (c) | | | 1,041 | | | | 28,961 | |
Santander BanCorp (c) | | | 295 | | | | 2,555 | |
Saul Centers, Inc. (c) | | | 735 | | | | 39,271 | |
SCBT Financial Corp. (c) | | | 640 | | | | 20,269 | |
Scottish Re Group Limited (a) (c) | | | 4,501 | | | | 3,263 | |
Seabright Insurance Holdings, Inc. (a) (c) | | | 1,118 | | | | 16,859 | |
Seacoast Banking Corporation of Florida (c) | | | 967 | | | | 9,941 | |
Security Bank Corp. (c) | | | 1,074 | | | | 9,816 | |
Security Capital Assurance (c) | | | 1,562 | | | | 6,076 | |
| Selective Insurance Group | | | 3,640 | | | | 83,684 | |
| Senior Housing Properties Trust | | | 5,489 | | | | 124,491 | |
Sierra Bancorp (c) | | | 402 | | | | 10,006 | |
Signature Bank (a) (c) | | | 2,059 | | | | 69,491 | |
Simmons First National Corp. (c) | | | 1,004 | | | | 26,606 | |
| Smithtown Bancorp, Inc. | | | 1 | | | | 16 | |
| Sotheby’s Holdings | | | 4,476 | | | | 170,536 | |
The South Financial Group, Inc. (c) | | | 4,887 | | | | 76,384 | |
Southside Bancshares, Inc. (c) | | | 777 | | | | 15,897 | |
Southwest Bancorp Inc. (c) | | | 951 | | | | 17,432 | |
Sovran Self Storage, Inc. (c) | | | 1,414 | | | | 56,701 | |
| State Auto Financial Corp. | | | 1,011 | | | | 26,589 | |
Sterling Bancorp (c) | | | 1,319 | | | | 17,991 | |
Sterling Bancshares, Inc. (c) | | | 4,821 | | | | 53,802 | |
Sterling Financial Corp./PA (c) | | | 1,791 | | | | 29,408 | |
Sterling Financial Corp./WA (c) | | | 3,423 | | | | 57,472 | |
Stewart Information Services Corp. (c) | | | 1,208 | | | | 31,517 | |
Stifel Financial Corp. (a) (c) | | | 835 | | | | 43,896 | |
| Strategic Hotels & Resorts, Inc. | | | 5,143 | | | | 86,042 | |
| Suffolk Bancorp | | | 727 | | | | 22,326 | |
Sun Bancorp Inc. (a) (c) | | | 1,063 | | | | 16,774 | |
Sun Communities, Inc. (c) | | | 1,215 | | | | 25,600 | |
| Sunstone Hotel Investors, Inc. | | | 4,071 | | | | 74,459 | |
Superior Bancorp (a) (c) | | | 2,177 | | | | 11,690 | |
Susquehanna Bancshares, Inc (c) | | | 5,625 | | | | 103,725 | |
SVB Financial Group (a) (c) | | | 2,270 | | | | 114,408 | |
SWS Group, Inc. (c) | | | 1,666 | | | | 21,108 | |
SY Bancorp, Inc. (c) | | | 867 | | | | 20,756 | |
| | | SHARES | | | VALUE | |
Financial - 19.1% (Continued) | | | | | | |
Tanger Factory Outlet Centers (c) | | | 2,174 | | | $ | 81,982 | |
Tarragon Corp. (a) (c) | | | 908 | | | | 1,362 | |
| Taylor Capital Group, Inc. | | | 389 | | | | 7,936 | |
Texas Capital Bancshares, Inc. (a) (c) | | | 1,634 | | | | 29,821 | |
TheStreet.Com, Inc. (c) | | | 1,289 | | | | 20,521 | |
Thomas Weisel Partners Group, Inc. (a) (c) | | | 1,424 | | | | 19,552 | |
Ticc Capital Corp. (c) | | | 1,367 | | | | 12,617 | |
| TierOne Corp. | | | 1,276 | | | | 28,263 | |
| TNS, Inc. | | | 1,693 | | | | 30,051 | |
Tompkins Trustco, Inc. (c) | | | 466 | | | | 18,081 | |
Tower Group, Inc. (c) | | | 1,182 | | | | 39,479 | |
TradeStation Group, Inc. (a) (c) | | | 1,806 | | | | 25,663 | |
Triad Guaranty, Inc. (a) (c) | | | 750 | | | | 7,350 | |
Trico Bancshares (c) | | | 928 | | | | 17,910 | |
Trustco Bank Corp. NY (c) | | | 5,277 | | | | 52,348 | |
Trustmark Corp. (c) | | | 3,434 | | | | 87,086 | |
UCBH Holdings, Inc. (c) | | | 6,885 | | | | 97,492 | |
UMB Financial Corp. (c) | | | 2,222 | | | | 85,236 | |
Umpqua Holdings Corp. (c) | | | 3,943 | | | | 60,486 | |
Union Bankshares Corp. (c) | | | 889 | | | | 18,793 | |
United Amer Indemnity Ltd (a) (c) | | | 1,635 | | | | 32,569 | |
United Bankshares, Inc. (c) | | | 2,611 | | | | 73,160 | |
United Community Banks, Inc. (c) | | | 2,379 | | | | 37,588 | |
United Community Financial Corp. (c) | | | 1,905 | | | | 10,516 | |
United Fire & Casualty Co. (c) | | | 1,449 | | | | 42,151 | |
United Security Bancshares/CA (c) | | | 483 | | | | 7,380 | |
Universal American Financial Corp. (a) | | | 3,286 | | | | 84,089 | |
Universal Health Realty Income Trust (c) | | | 827 | | | | 29,309 | |
Univest Corporation of Pennsylvania (c) | | | 808 | | | | 17,057 | |
Urstadt Biddle Properties, Inc. (c) | | | 1,485 | | | | 23,018 | |
US Global Investors, Inc. (a) (c) | | | 786 | | | | 13,095 | |
| USB Holding Co., Inc. | | | 830 | | | | 16,434 | |
| U-Store-It Trust | | | 3,306 | | | | 30,283 | |
Validus Holdings Ltd (a) (c) | | | 1,058 | | | | 27,487 | |
Value Line, Inc. (c) | | | 71 | | | | 2,858 | |
ViewPoint Financial Group (c) | | | 764 | | | | 12,629 | |
Virginia Commerce Bancorp (a) (c) | | | 1,149 | | | | 13,478 | |
W Holding Co, Inc. (c) | | | 7,665 | | | | 9,275 | |
| Waddell & Reed Financial, Inc. | | | 5,557 | | | | 200,552 | |
Washington Real Estate Investment Trust (c) | | | 3,161 | | | | 99,287 | |
Washington Trust Bancorp, Inc. (c) | | | 809 | | | | 20,411 | |
Wauwatosa Holdings, Inc. (a) (c) | | | 734 | | | | 9,410 | |
WesBanco, Inc. (c) | | | 1,541 | | | | 31,745 | |
West Coast Bancorp (c) | | | 1,038 | | | | 19,203 | |
Westamerica Bancorporation (c) | | | 1,989 | | | | 88,610 | |
Western Alliance Bancorp (a) (c) | | | 921 | | | | 17,287 | |
| Westfield Financial Inc. | | | 887 | | | | 8,604 | |
Wilshire Bancorp, Inc. (c) | | | 1,072 | | | | 8,415 | |
Winthrop Realty Trust (c) | | | 2,745 | | | | 14,521 | |
Wintrust Financial Corp. (c) | | | 1,596 | | | | 52,875 | |
World Acceptance Corp. (a) (c) | | | 1,289 | | | | 34,777 | |
WP Stewart & Co Ltd (c) | | | 1,442 | | | | 7,369 | |
Wright Express Corp. (a) (c) | | | 2,837 | | | | 100,685 | |
| WSFS Financial Corp. | | | 415 | | | | 20,833 | |
| Zenith National Insurance Corp. | | | 2,596 | | | | 116,119 | |
| | | | | | | | 17,613,750 | |
The accompanying notes are an integral part of the financial statements.
Summit Mutual Funds, Inc. – Pinnacle Series |
SCHEDULE OF INVESTMENTS | RUSSELL 2000 SMALL CAP INDEX PORTFOLIO |
| | | SHARES | | | VALUE | |
Health Care - 12.9% | | | | | | |
Abaxis, Inc. (a) (c) | | | 1,411 | | | $ | 50,598 | |
Abiomed, Inc. (a) (c) | | | 1,643 | | | | 25,532 | |
Acadia Pharmaceuticals, Inc. (a) (c) | | | 1,703 | | | | 18,852 | |
Accuray, Inc. (a) (c) | | | 1,106 | | | | 16,833 | |
Acorda Therapeutics, Inc. (a) | | | 1,408 | | | | 30,920 | |
Adams Respiratory Therapeutics, Inc. (a) (c) | | | 2,132 | | | | 127,366 | |
Affymax, Inc. (a) | | | 294 | | | | 6,574 | |
Affymetrix, Inc. (a) (c) | | | 4,741 | | | | 109,707 | |
Air Methods Corp. (a) (c) | | | 676 | | | | 33,577 | |
Akorn, Inc. (a) (c) | | | 3,412 | | | | 25,044 | |
Albany Molecular Research, Inc. (a) (c) | | | 1,786 | | | | 25,683 | |
Alexion Pharmaceuticals, Inc. (a) (c) | | | 2,481 | | | | 186,149 | |
Alexza Pharmaceuticals, Inc. (a) (c) | | | 1,305 | | | | 10,557 | |
Align Technology, Inc. (a) (c) | | | 3,982 | | | | 66,420 | |
Alkermes, Inc. (a) (c) | | | 6,793 | | | | 105,903 | |
Alliance Imaging, Inc. (a) (c) | | | 1,021 | | | | 9,822 | |
Allos Therapeutics (a) (c) | | | 2,848 | | | | 17,914 | |
Allscripts Healthcare Solutions, Inc. (a) (c) | | | 3,640 | | | | 70,689 | |
Alnylam Pharmaceuticals, Inc. (a) (c) | | | 2,601 | | | | 75,637 | |
Alpharma, Inc. (a) (c) | | | 2,984 | | | | 60,128 | |
Altus Pharmaceuticals, Inc. (a) (c) | | | 1,405 | | | | 7,278 | |
Amag Pharmaceuticals, Inc. (a) (c) | | | 935 | | | | 56,222 | |
Amedisys, Inc. (a) (c) | | | 1,805 | | | | 87,562 | |
American Dental Partners, Inc. (a) (c) | | | 837 | | | | 8,395 | |
American Medical Systems Holdings, Inc. (a) (c) | | | 4,904 | | | | 70,912 | |
American Oriental Bioengineering, Inc. (a) (c) | | | 3,127 | | | | 34,647 | |
AMERIGROUP Corp. (a) | | | 3,632 | | | | 132,386 | |
Amicus Therapeutics, Inc. (a) (c) | | | 333 | | | | 3,580 | |
Amsurg Corp. (a) | | | 2,092 | | | | 56,610 | |
Analogic Corp. (c) | | | 971 | | | | 65,756 | |
Angiodynamics, Inc. (a) (c) | | | 1,382 | | | | 26,313 | |
Animal Health International (a) (c) | | | 815 | | | | 10,025 | |
Applera Corp - Celera Genomics Group (a) (c) | | | 5,415 | | | | 85,936 | |
Apria Healthcare Group, Inc. (a) | | | 2,950 | | | | 63,631 | |
Arena Pharmaceuticals, Inc. (a) (c) | | | 4,263 | | | | 33,379 | |
Ariad Pharmaceuticals, Inc. (a) (c) | | | 4,590 | | | | 19,507 | |
ArQule, Inc. (a) (c) | | | 2,150 | | | | 12,470 | |
Array Biopharma, Inc. (a) (c) | | | 2,750 | | | | 23,155 | |
Arthrocare Corp. (a) (c) | | | 1,837 | | | | 88,268 | |
Aspect Medical Systems, Inc. (a) (c) | | | 1,145 | | | | 16,030 | |
Assisted Living Concepts, Inc. (a) (c) | | | 3,962 | | | | 29,715 | |
Athenahealth, Inc. (a) | | | 464 | | | | 16,704 | |
Auxilium Pharmaceuticals, Inc. (a) | | | 1,819 | | | | 54,552 | |
Beijing Med Pharm Corp. (a) (c) | | | 1,779 | | | | 19,533 | |
Bentley Pharmaceuticals, Inc. (a) (c) | | | 1,356 | | | | 20,462 | |
Biodel, Inc. (a) (c) | | | 342 | | | | 7,945 | |
Bioform Medical, Inc. (a) | | | 743 | | | | 5,075 | |
BioMarin Pharmaceuticals, Inc. (a) | | | 6,432 | | | | 227,693 | |
Biomimetic Therapeutics, Inc. (a) (c) | | | 709 | | | | 12,315 | |
Bionovo, Inc. (a) (c) | | | 2,810 | | | | 4,805 | |
Bio-Rad Laboratories, Inc. (a) (c) | | | 1,310 | | | | 135,742 | |
Bio-Reference Labs, Inc. (a) (c) | | | 700 | | | | 22,876 | |
Bradley Pharmaceuticals, Inc. (a) | | | 1,023 | | | | 20,153 | |
Bruker BioSciences Corp. (a) | | | 4,284 | | | | 56,977 | |
Cadence Pharmaceuticals, Inc. (a) (c) | | | 470 | | | | 6,984 | |
Cantel Medical Corp. (a) (c) | | | 764 | | | | 11,139 | |
Capital Senior Living Corp. (a) (c) | | | 1,527 | | | | 15,163 | |
Caraco Pharmaceutical Laboratories Ltd. (a) (c) | | | 655 | | | | 11,233 | |
| | | SHARES | | | VALUE | |
Health Care - 12.9% (Continued) | | | | | | |
Cell Genesys, Inc. (a) (c) | | | 3,898 | | | $ | 8,965 | |
Centene Corp. (a) | | | 3,029 | | | | 83,116 | |
Cepheid, Inc. (a) (c) | | | 3,833 | | | | 101,000 | |
Chattem, Inc. (a) (c) | | | 1,231 | | | | 92,990 | |
Computer Programs & Systems, Inc. (c) | | | 609 | | | | 13,849 | |
Conceptus, Inc. (a) (c) | | | 1,601 | | | | 30,803 | |
Conmed Corp. (a) (c) | | | 1,973 | | | | 45,596 | |
Corvel Corp. (a) (c) | | | 512 | | | | 11,775 | |
CryoLife, Inc. (a) | | | 1,524 | | | | 12,116 | |
Cubist Pharmaceuticals, Inc. (a) (c) | | | 3,817 | | | | 78,287 | |
Cutera, Inc. (a) | | | 889 | | | | 13,957 | |
CV Therapeutics, Inc. (a) (c) | | | 4,159 | | | | 37,639 | |
Cyberonics, Inc. (a) (c) | | | 1,515 | | | | 19,937 | |
Cynosure, Inc. (a) (c) | | | 505 | | | | 13,362 | |
Cypress Bioscience, Inc. (a) (c) | | | 2,254 | | | | 24,862 | |
Cytokinetics, Inc. (a) (c) | | | 2,318 | | | | 10,964 | |
Cytrx Corp. (a) (c) | | | 5,724 | | | | 16,256 | |
Datascope Corp. (c) | | | 867 | | | | 31,559 | |
Dendreon Corp. (a) (c) | | | 5,756 | | | | 35,802 | |
Discovery Laboratories, Inc. (a) (c) | | | 5,594 | | | | 12,027 | |
Durect Corp. (a) (c) | | | 4,309 | | | | 27,707 | |
Eclipsys Corp. (a) (c) | | | 3,175 | | | | 80,359 | |
Emergency Medical Services Corp. (a) (c) | | | 614 | | | | 17,978 | |
Emergent Biosolutions, Inc. (a) (c) | | | 330 | | | | 1,670 | |
Emeritus Corp. (a) (c) | | | 322 | | | | 8,098 | |
Encysive Pharmaceuticals, Inc. (a) (c) | | | 4,388 | | | | 3,730 | |
Ensign Group, Inc. (a) (c) | | | 308 | | | | 4,435 | |
Enzo Biochem, Inc. (a) (c) | | | 1,925 | | | | 24,524 | |
Enzon Pharmaceuticals, Inc. (a) (c) | | | 3,074 | | | | 29,295 | |
eResearch Technology, Inc. (a) (c) | | | 3,465 | | | | 40,956 | |
ev3, Inc. (a) (c) | | | 1,535 | | | | 19,510 | |
Exelixis, Inc. (a) (c) | | | 6,609 | | | | 57,036 | |
Genomic Health, Inc. (a) (c) | | | 875 | | | | 19,810 | |
Genoptix, Inc. (a) (c) | | | 383 | | | | 11,758 | |
Gentiva Health Services, Inc. (a) | | | 1,890 | | | | 35,986 | |
Genvec, Inc. (a) (c) | | | 4,336 | | | | 6,374 | |
Geron Corp. (a) (c) | | | 4,631 | | | | 26,304 | |
Greatbatch, Inc. (a) (c) | | | 1,533 | | | | 30,645 | |
GTx, Inc. (a) (c) | | | 990 | | | | 14,207 | |
Haemonetics Corp./Mass (a) | | | 1,869 | | | | 117,784 | |
Halozyme Therapeutics, Inc. (a) (c) | | | 4,245 | | | | 30,182 | |
Hansen Medical, Inc. (a) (c) | | | 413 | | | | 12,365 | |
Healthcare Services Group (c) | | | 2,876 | | | | 60,903 | |
HealthExtras, Inc. (a) | | | 1,909 | | | | 49,787 | |
Healthsouth Corp. (a) (c) | | | 5,210 | | | | 109,410 | |
Healthspring, Inc. (a) | | | 3,149 | | | | 59,988 | |
Healthways, Inc. (a) (c) | | | 2,424 | | | | 141,659 | |
HMS Holdings Corp. (a) (c) | | | 1,387 | | | | 46,062 | |
Hologic, Inc. (a) (c) | | | 8,219 | | | | 564,152 | |
Human Genome Sciences, Inc. (a) (c) | | | 9,234 | | | | 96,403 | |
Hythiam, Inc. (a) (c) | | | 1,842 | | | | 5,397 | |
ICU Medical, Inc. (a) (c) | | | 1,004 | | | | 36,154 | |
Idenix Pharmaceuticals, Inc. (a) (c) | | | 1,734 | | | | 4,682 | |
I-Flow Corp. (a) (c) | | | 1,642 | | | | 25,911 | |
Illumina, Inc. (a) (c) | | | 3,441 | | | | 203,914 | |
Immucor, Inc. (a) (c) | | | 4,762 | | | | 161,860 | |
Immunomedics, Inc. (a) (c) | | | 3,770 | | | | 8,746 | |
Incyte Corp. (a) (c) | | | 5,885 | | | | 59,144 | |
The accompanying notes are an integral part of the financial statements.
Summit Mutual Funds, Inc. – Pinnacle Series |
RUSSELL 2000 SMALL CAP INDEX PORTFOLIO | |
| | | SHARES | | | VALUE | |
Health Care - 12.9% (Continued) | | | | | | |
Indevus Pharmaceuticals, Inc. (a) (c) | | | 3,837 | | | $ | 26,667 | |
Insulet Corp. (a) (c) | | | 521 | | | | 12,233 | |
Integra LifeSciences Holdings Corp. (a) (c) | | | 1,338 | | | | 56,102 | |
InterMune, Inc. (a) (c) | | | 1,827 | | | | 24,354 | |
Invacare Corp. (c) | | | 2,181 | | | | 54,961 | |
Inverness Medical Innovations, Inc. (a) (c) | | | 4,553 | | | | 255,788 | |
Isis Pharmaceuticals, Inc. (a) (c) | | | 5,121 | | | | 80,656 | |
Javelin Pharmaceuticals, Inc. (a) (c) | | | 2,825 | | | | 10,565 | |
Jazz Pharmaceuticals, Inc. (a) (c) | | | 401 | | | | 5,895 | |
Kendle International, Inc. (a) (c) | | | 862 | | | | 42,169 | |
Kensey Nash Corp. (a) | | | 813 | | | | 24,325 | |
Keryx Biopharmaceuticals, Inc. (a) (c) | | | 3,034 | | | | 25,486 | |
Kindred Healthcare, Inc. (a) (c) | | | 2,262 | | | | 56,505 | |
Kosan Biosciences, Inc. (a) (c) | | | 2,888 | | | | 10,397 | |
KV Pharmaceutical Co. (a) (c) | | | 2,339 | | | | 66,755 | |
Landauer, Inc. (c) | | | 608 | | | | 31,525 | |
LCA-Vision, Inc. (c) | | | 1,458 | | | | 29,116 | |
LHC Group, Inc. (a) (c) | | | 826 | | | | 20,633 | |
Lifecell Corp. (a) (c) | | | 2,355 | | | | 101,524 | |
Ligand Pharmaceuticals, Inc. (c) | | | 5,979 | | | | 28,879 | |
Luminex Corp. (a) (c) | | | 2,248 | | | | 36,508 | |
Magellan Health Services, Inc. (a) | | | 2,599 | | | | 121,191 | |
MannKind Corp. (a) (c) | | | 2,214 | | | | 17,623 | |
Map Pharmaceuticals, Inc. (a) | | | 398 | | | | 6,969 | |
Martek Biosciences Corp. (a) (c) | | | 2,255 | | | | 66,703 | |
Masimo Corp. (a) (c) | | | 918 | | | | 36,215 | |
Matria Healthcare, Inc. (a) (c) | | | 1,474 | | | | 35,037 | |
Maxygen, Inc. (a) (c) | | | 2,071 | | | | 16,630 | |
Medarex, Inc. (a) (c) | | | 8,584 | | | | 89,445 | |
Medcath Corp. (a) (c) | | | 621 | | | | 15,252 | |
Medical Action Industries, Inc. (a) (c) | | | 967 | | | | 20,162 | |
Medicines Co. (a) (c) | | | 3,522 | | | | 67,482 | |
Medicis Pharmaceutical (c) | | | 3,824 | | | | 99,309 | |
Medivation, Inc. (a) (c) | | | 1,423 | | | | 20,491 | |
Mentor Corp. (c) | | | 2,553 | | | | 99,822 | |
Meridian Bioscience, Inc. (c) | | | 2,215 | | | | 66,627 | |
Merit Medical Systems, Inc. (a) (c) | | | 1,915 | | | | 26,619 | |
Metabolix, Inc. (a) (c) | | | 954 | | | | 22,705 | |
MGI Pharma, Inc. (a) | | | 5,488 | | | | 222,429 | |
Micrus Endovascular Corp. (a) (c) | | | 985 | | | | 19,385 | |
Minrad International, Inc. (a) (c) | | | 3,054 | | | | 9,926 | |
Molecular Insight Pharmaceuticals, Inc. (a) (c) | | | 346 | | | | 3,135 | |
Molina Healthcare, Inc. (a) (c) | | | 818 | | | | 31,657 | |
Momenta Pharmaceuticals, Inc. (a) (c) | | | 1,755 | | | | 12,531 | |
Myriad Genetics, Inc. (a) (c) | | | 2,773 | | | | 128,723 | |
Nabi Biopharmaceuticals (a) (c) | | | 4,223 | | | | 15,245 | |
Nanosphere, Inc. (a) (c) | | | 488 | | | | 6,827 | |
Nastech Pharmaceutical, Inc. (a) (c) | | | 1,783 | | | | 6,775 | |
National Healthcare Corp. (c) | | | 453 | | | | 23,420 | |
Natus Medical, Inc. (a) (c) | | | 1,494 | | | | 28,909 | |
Nektar Therapeutics (a) (c) | | | 6,294 | | | | 42,233 | |
Neurocrine Biosciences, Inc. (a) (c) | | | 2,648 | | | | 12,022 | |
Neurogen Corp. (a) (c) | | | 2,097 | | | | 7,235 | |
Nighthawk Radiology Holdings, Inc. (a) (c) | | | 1,393 | | | | 29,323 | |
Northstar Neuroscience, Inc. (a) (c) | | | 803 | | | | 7,468 | |
Novacea, Inc. (a) (c) | | | 419 | | | | 1,249 | |
Noven Pharmaceuticals, Inc. (a) (c) | | | 1,664 | | | | 23,096 | |
NuVasive, Inc. (a) (c) | | | 2,324 | | | | 91,844 | |
| | | SHARES | | | VALUE | |
Health Care - 12.9% (Continued) | | | | | | |
Nxstage Medical, Inc. (a) (c) | | | 850 | | | $ | 12,894 | |
Obagi Medical Products, Inc. (a) | | | 369 | | | | 6,749 | |
Odyssey HealthCare, Inc. (a) (c) | | | 2,432 | | | | 26,898 | |
Omnicell, Inc. (a) (c) | | | 1,910 | | | | 51,436 | |
Omrix Biopharmaceuticals, Inc. (a) (c) | | | 908 | | | | 31,544 | |
Onyx Pharmaceuticals, Inc. (a) | | | 3,692 | | | | 205,349 | |
OraSure Technologies, Inc. (a) (c) | | | 3,228 | | | | 28,697 | |
Orexigen Therapeutics, Inc. (a) (c) | | | 481 | | | | 6,854 | |
Orthofix International N V (a) (c) | | | 1,094 | | | | 63,419 | |
OSI Pharmaceuticals, Inc. (a) (c) | | | 3,997 | | | | 193,894 | |
Osiris Therapeutics, Inc. (a) (c) | | | 229 | | | | 2,753 | |
Owens & Minor, Inc. (c) | | | 2,818 | | | | 119,568 | |
Pain Therapeutics, Inc. (a) (c) | | | 2,497 | | | | 26,468 | |
Palomar Medical Technologies, Inc. (a) (c) | | | 1,166 | | | | 17,863 | |
Par Pharmaceutical Cos., Inc. (a) (c) | | | 2,461 | | | | 59,064 | |
Parexel International Corp. (a) (c) | | | 1,908 | | | | 92,156 | |
Penwest Pharmaceuticals Co. (a) (c) | | | 1,605 | | | | 9,389 | |
Perrigo Co. (c) | | | 5,457 | | | | 191,050 | |
PharmaNet Development Group, Inc. (a) | | | 1,275 | | | | 49,993 | |
Pharmerica Corp. (a) (c) | | | 1,814 | | | | 25,178 | |
Pharmion Corp. (a) (c) | | | 1,698 | | | | 106,736 | |
Phase Forward, Inc. (a) (c) | | | 2,383 | | | | 51,830 | |
Poniard Pharmaceuticals, Inc. (a) | | | 1,535 | | | | 6,769 | |
Pozen, Inc. (a) (c) | | | 1,763 | | | | 21,156 | |
Progenics Pharmaceuticals, Inc. (a) (c) | | | 1,566 | | | | 28,298 | |
PSS World Medical, Inc. (a) | | | 4,746 | | | | 92,879 | |
Psychiatric Solutions, Inc. (a) (c) | | | 3,721 | | | | 120,932 | |
Quality Systems, Inc. (c) | | | 1,100 | | | | 33,539 | |
Quidel Corp. (a) (c) | | | 2,113 | | | | 41,140 | |
Radiation Therapy Services, Inc. (a) (c) | | | 826 | | | | 25,532 | |
Regeneration Technologies, Inc. (a) (c) | | | 2,009 | | | | 17,438 | |
Regeneron Pharmaceuticals, Inc. (a) (c) | | | 4,208 | | | | 101,623 | |
RehabCare Group, Inc. (a) | | | 1,192 | | | | 26,892 | |
Res-Care, Inc. (a) (c) | | | 1,552 | | | | 39,048 | |
Rigel Pharmaceuticals, Inc. (a) (c) | | | 1,750 | | | | 44,432 | |
Salix Pharmaceuticals Ltd. (a) (c) | | | 3,271 | | | | 25,775 | |
Santarus, Inc. (a) (c) | | | 3,552 | | | | 9,768 | |
Savient Pharmaceuticals, Inc. (a) (c) | | | 4,150 | | | | 95,325 | |
Sciele Pharma, Inc. (a) (c) | | | 2,046 | | | | 41,841 | |
Seattle Genetics Inc. (a) (c) | | | 2,791 | | | | 31,817 | |
Sirona Dental Systems, Inc. (a) (c) | | | 1,238 | | | | 41,448 | |
Sirtris Pharmaceuticals, Inc. (a) (c) | | | 403 | | | | 5,517 | |
Skilled Healthcare Group, Inc. (a) (c) | | | 1,478 | | | | 21,623 | |
Somaxon Pharmaceuticals, Inc. (a) (c) | | | 351 | | | | 1,829 | |
Sonic Innovations, Inc. (a) (c) | | | 1,753 | | | | 13,533 | |
SonoSite, Inc. (a) (c) | | | 1,092 | | | | 36,768 | |
Spectranetics Corp. (a) | | | 2,151 | | | | 32,975 | |
Stereotaxis, Inc. (a) (c) | | | 1,645 | | | | 20,102 | |
| Steris Corp. | | | 4,294 | | | | 123,839 | |
Sucampo Pharmaceuticals, Inc. (a) | | | 290 | | | | 5,319 | |
Sun Healthcare Group, Inc. (a) (c) | | | 2,229 | | | | 38,272 | |
Sunrise Senior Living, Inc. (a) (c) | | | 3,120 | | | | 95,722 | |
SuperGen, Inc. (a) (c) | | | 3,481 | | | | 12,706 | |
SurModics, Inc. (a) (c) | | | 1,067 | | | | 57,906 | |
Symmetry Medical, Inc. (a) | | | 2,460 | | | | 42,878 | |
Synta Pharmaceuticals Corp. (a) (c) | | | 347 | | | | 2,325 | |
Telik, Inc. (a) (c) | | | 3,671 | | | | 12,738 | |
Tercica, Inc. (a) (c) | | | 2,199 | | | | 14,909 | |
Thoratec Corp. (a) (c) | | | 3,704 | | | | 67,376 | |
The accompanying notes are an integral part of the financial statements.
Summit Mutual Funds, Inc. – Pinnacle Series |
| SCHEDULE OF INVESTMENTS | RUSSELL 2000 SMALL CAP INDEX PORTFOLIO |
| | | SHARES | | | VALUE | |
Health Care - 12.9% (Continued) | | | | | | |
Tomotherapy, Inc. (a) (c) | | | 774 | | | $ | 15,139 | |
Trans1, Inc. (a) | | | 435 | | | | 7,164 | |
Trubion Pharmaceuticals, Inc. (a) (c) | | | 306 | | | | 3,060 | |
United Therapeutics Corp. (a) (c) | | | 1,370 | | | | 133,781 | |
Valeant Pharmaceuticals International (a) (c) | | | 6,516 | | | | 77,997 | |
Vanda Pharmaceuticals, Inc. (a) (c) | | | 1,750 | | | | 12,040 | |
Ventana Medical Systems (a) | | | 2,025 | | | | 176,641 | |
Viropharma, Inc. (a) (c) | | | 4,819 | | | | 38,263 | |
Virtual Radiologic Corporation Com (a) | | | 297 | | | | 6,023 | |
Visicu, Inc. (a) (c) | | | 449 | | | | 5,330 | |
Vital Images, Inc. (a) (c) | | | 1,177 | | | | 21,268 | |
Vital Signs, Inc. (c) | | | 716 | | | | 36,602 | |
Vivus, Inc. (a) (c) | | | 3,832 | | | | 19,850 | |
Volcano Corporation (a) (c) | | | 1,562 | | | | 19,541 | |
West Pharmaceutical Services, Inc. (c) | | | 2,269 | | | | 92,099 | |
Wright Medical Group, Inc. (a) | | | 2,404 | | | | 70,125 | |
Xenoport, Inc. (a) (c) | | | 1,414 | | | | 79,014 | |
XOMA Ltd (a) (c) | | | 8,709 | | | | 29,524 | |
Zoll Medical Corp. (a) (c) | | | 1,290 | | | | 34,469 | |
Zymogenetics, Inc. (a) (c) | | | 2,637 | | | | 30,774 | |
| | | | | | | | 11,898,012 | |
Materials & Processing - 9.3% | | | | | | | | |
AAON, Inc. (c) | | | 942 | | | | 18,670 | |
Abitibibowater, Inc. (a) (c) | | | 3,578 | | | | 73,743 | |
| Acuity Brands, Inc. | | | 2,860 | | | | 128,700 | |
Aecom Technology Corp Delaware (a) (c) | | | 2,689 | | | | 76,825 | |
AEP Industries, Inc. (a) (c) | | | 466 | | | | 14,917 | |
Albany International Corp. (c) | | | 1,877 | | | | 69,637 | |
Alico, Inc. (c) | | | 267 | | | | 9,746 | |
| AM Castle & Co. | | | 656 | | | | 17,837 | |
AMCOL International Corp. (c) | | | 1,543 | | | | 55,594 | |
American Vanguard Corp. (c) | | | 1,186 | | | | 20,577 | |
| Ameron International Corp. | | | 586 | | | | 54,000 | |
Ampco-Pittsburgh Corp. (c) | | | 468 | | | | 17,845 | |
Amrep Corp. (c) | | | 109 | | | | 3,330 | |
Andersons, Inc. (c) | | | 948 | | | | 42,470 | |
Apex Silver Mines Ltd. (a) (c) | | | 3,834 | | | | 58,430 | |
Apogee Enterprises, Inc. (c) | | | 1,979 | | | | 33,861 | |
Aptargroup, Inc. (c) | | | 4,622 | | | | 189,086 | |
Arch Chemicals, Inc. (c) | | | 1,683 | | | | 61,850 | |
Avatar Holdings, Inc. (a) (c) | | | 408 | | | | 17,063 | |
Balchem Corp. (c) | | | 1,223 | | | | 27,371 | |
Barnes Group, Inc. (c) | | | 3,061 | | | | 102,207 | |
Beacon Roofing Supply, Inc. (a) (c) | | | 3,079 | | | | 25,925 | |
Bluegreen Corp. (a) (c) | | | 1,470 | | | | 10,569 | |
BlueLinx Holdings, Inc. (c) | | | 840 | | | | 3,301 | |
| Brady Corp. | | | 3,163 | | | | 110,990 | |
Brookfield Homes Corp. (c) | | | 809 | | | | 12,782 | |
Brush Engineered Materials, Inc. (a) (c) | | | 1,368 | | | | 50,643 | |
Buckeye Technologies, Inc. (a) (c) | | | 2,648 | | | | 33,100 | |
Builders FirstSource, Inc. (a) (c) | | | 1,009 | | | | 7,285 | |
Building Material Holding Corp. (c) | | | 2,034 | | | | 11,248 | |
Cabot Microelectronics Corp. (a) | | | 1,700 | | | | 61,047 | |
Cadiz, Inc. (a) (c) | | | 790 | | | | 16,590 | |
Calgon Carbon Corp. (a) (c) | | | 2,790 | | | | 44,333 | |
| Cambrex Corp. | | | 1,880 | | | | 15,754 | |
Century Aluminum Co. (a) (c) | | | 1,625 | | | | 87,653 | |
| | | SHARES | | | VALUE | |
Materials & Processing - 9.3% (Continued) | | | | | | |
Ceradyne, Inc. (a) | | | 1,889 | | | $ | 88,651 | |
| CF Industries Holdings, Inc. | | | 3,625 | | | | 398,968 | |
Chesapeake Corp. (c) | | | 1,333 | | | | 6,918 | |
China Architectural Engineering, Inc. (a) (c) | | | 342 | | | | 2,958 | |
CIRCOR International, Inc. (c) | | | 1,125 | | | | 52,155 | |
Clarcor, Inc. (c) | | | 3,388 | | | | 128,642 | |
Claymont Steel Holdings, Inc. (a) (c) | | | 603 | | | | 14,080 | |
Clean Harbors, Inc. (a) (c) | | | 1,102 | | | | 56,973 | |
Coeur d’Alene Mines Corp. (a) (c) | | | 31,025 | | | | 153,264 | |
Comfort Systems USA, Inc. (c) | | | 2,831 | | | | 36,180 | |
Compass Minerals International, Inc. (c) | | | 2,246 | | | | 92,086 | |
| CompX International, Inc. | | | 107 | | | | 1,564 | |
Consolidated-Tomoka Land Co. (c) | | | 399 | | | | 25,009 | |
Deltic Timber Corp. (c) | | | 687 | | | | 35,374 | |
Drew Industries, Inc. (a) (c) | | | 1,301 | | | | 35,647 | |
Dupont Fabros Technology, Inc. (a) (c) | | | 2,341 | | | | 45,884 | |
Dycom Industries, Inc. (a) (c) | | | 2,631 | | | | 70,116 | |
Dynamic Materials Corp. (c) | | | 828 | | | | 48,769 | |
EMCOR Group, Inc. (a) | | | 4,418 | | | | 104,397 | |
Encore Wire Corp. (c) | | | 1,634 | | | | 26,013 | |
Energy Conversion Devices, Inc. (a) (c) | | | 2,744 | | | | 92,336 | |
EnerSys (a) | | | 1,422 | | | | 35,493 | |
ENGlobal Corp. (a) (c) | | | 1,133 | | | | 12,871 | |
Ennis, Inc. (c) | | | 1,791 | | | | 32,238 | |
Esmark, Inc. (a) (c) | | | 722 | | | | 10,202 | |
Exide Technologies (a) (c) | | | 4,044 | | | | 32,352 | |
| Ferro Corp. | | | 2,998 | | | | 62,149 | |
General Moly, Inc. (a) (c) | | | 3,216 | | | | 37,531 | |
Georgia Gulf Corp. (c) | | | 2,404 | | | | 15,914 | |
Gibraltar Industries, Inc. (c) | | | 1,702 | | | | 26,245 | |
Glatfelter (c) | | | 3,123 | | | | 47,813 | |
Goodman Global, Inc. (a) (c) | | | 2,510 | | | | 61,595 | |
GrafTech International Ltd. (a) | | | 6,925 | | | | 122,919 | |
Granite Construction, Inc. (c) | | | 2,434 | | | | 88,062 | |
Graphic Packaging Corp. (a) (c) | | | 5,319 | | | | 19,627 | |
Great Lakes Dredge & Dock Corp. (a) (c) | | | 541 | | | | 4,718 | |
| Greif, Inc. | | | 2,318 | | | | 151,528 | |
Griffon Corp. (a) (c) | | | 2,092 | | | | 26,045 | |
Grubb & Ellis Co. (a) (c) | | | 1,063 | | | | 6,814 | |
Haynes International, Inc. (a) (c) | | | 769 | | | | 53,446 | |
HB Fuller Co. (c) | | | 4,132 | | | | 92,763 | |
Hecla Mining Co. (a) (c) | | | 8,385 | | | | 78,400 | |
| Hercules, Inc. | | | 7,983 | | | | 154,471 | |
Hexcel Corp. (a) (c) | | | 6,561 | | | | 159,301 | |
HFF, Inc. (a) (c) | | | 1,138 | | | | 8,808 | |
Hilltop Holdings, Inc. (a) (c) | | | 2,985 | | | | 32,596 | |
Horsehead Holdings Corp. (a) (c) | | | 375 | | | | 6,364 | |
Innerworkings, Inc. (a) (c) | | | 1,543 | | | | 26,632 | |
Innophos Holdings, Inc. (c) | | | 1,370 | | | | 20,386 | |
Innospec, Inc. (c) | | | 1,728 | | | | 29,652 | |
Insituform Technologies, Inc. (a) (c) | | | 1,909 | | | | 28,253 | |
Insteel Industries, Inc. (c) | | | 979 | | | | 11,484 | |
Integrated Electrical Services, Inc. (a) (c) | | | 1,079 | | | | 20,274 | |
Interface, Inc. (c) | | | 3,356 | | | | 54,770 | |
Interline Brands, Inc. (a) (c) | | | 1,905 | | | | 41,739 | |
Kaiser Aluminum Corp. (c) | | | 999 | | | | 79,401 | |
Kaydon Corp. (c) | | | 1,983 | | | | 108,153 | |
| Koppers Holdings, Inc. | | | 1,164 | | | | 50,331 | |
The accompanying notes are an integral part of the financial statements.
Summit Mutual Funds, Inc. – Pinnacle Series |
| RUSSELL 2000 SMALL CAP INDEX PORTFOLIO | SCHEDULE OF INVESTMENTS |
| | | SHARES | | | VALUE | |
Materials & Processing - 9.3% (Continued) | | | | | | |
Kronos Worldwide, Inc. (c) | | | 194 | | | $ | 3,385 | |
Landec Corp. (a) | | | 1,451 | | | | 19,443 | |
Layne Christensen Co. (a) | | | 841 | | | | 41,386 | |
LB Foster Co. - Class A (a) | | | 665 | | | | 34,400 | |
LSB Industries, Inc. (a) (c) | | | 975 | | | | 27,515 | |
LSI Industries, Inc. (c) | | | 1,507 | | | | 27,427 | |
Medis Technologies Ltd. (a) (c) | | | 1,532 | | | | 23,639 | |
Mercer International, Inc. (a) (c) | | | 1,856 | | | | 14,532 | |
Meruelo Maddux Properties, Inc. (a) (c) | | | 3,166 | | | | 12,664 | |
Metal Management, Inc. (c) | | | 1,831 | | | | 83,365 | |
MGP Ingredients, Inc. (c) | | | 622 | | | | 5,859 | |
Michael Baker Corp. (a) (c) | | | 479 | | | | 19,687 | |
Minerals Technologies, Inc. (c) | | | 1,397 | | | | 93,529 | |
Mobile Mini, Inc. (a) | | | 2,477 | | | | 45,924 | |
| Mueller Industries, Inc. | | | 2,592 | | | | 75,142 | |
Mueller Water Products, Inc. - Class A (c) | | | 7,793 | | | | 74,189 | |
Multi Color Corp. (c) | | | 534 | | | | 14,669 | |
Myers Industries, Inc. (c) | | | 1,875 | | | | 27,131 | |
NCI Building Systems, Inc. (a) | | | 1,437 | | | | 41,371 | |
| Neenah Paper, Inc. | | | 1,037 | | | | 30,229 | |
NewMarket Corp. (c) | | | 1,013 | | | | 56,414 | |
NL Industries (c) | | | 532 | | | | 6,081 | |
Northwest Pipe Co. (a) (c) | | | 592 | | | | 23,171 | |
Nuco2, Inc. (a) (c) | | | 1,090 | | | | 27,141 | |
Olin Corp. (c) | | | 5,083 | | | | 98,254 | |
Olympic Steel, Inc. (c) | | | 545 | | | | 17,282 | |
OM Group, Inc. (a) | | | 2,061 | | | | 118,590 | |
Perini Corp. (a) | | | 1,760 | | | | 72,899 | |
PGT, Inc. (a) (c) | | | 683 | | | | 3,251 | |
PolyOne Corp. (a) (c) | | | 6,509 | | | | 42,829 | |
Polypore International, Inc. (a) (c) | | | 1,007 | | | | 17,623 | |
Quadra Realty Trust, Inc. (c) | | | 1,155 | | | | 9,286 | |
| Quanex Corp. | | | 2,443 | | | | 126,792 | |
RBC Bearings, Inc. (a) | | | 1,438 | | | | 62,495 | |
Resource Capital Corporation (c) | | | 1,455 | | | | 13,546 | |
| Rock-Tenn Co. | | | 2,370 | | | | 60,222 | |
Rockwood Holdings, Inc. (a) | | | 2,161 | | | | 71,788 | |
Rogers Corp. (a) (c) | | | 1,224 | | | | 53,085 | |
Royal Gold, Inc. (c) | | | 1,366 | | | | 41,690 | |
RTI International Metals, Inc. (a) | | | 1,601 | | | | 110,357 | |
| Schnitzer Steel Industries, Inc. | | | 1,588 | | | | 109,778 | |
| Schulman A, Inc. | | | 1,987 | | | | 42,820 | |
Senomyx, Inc. (a) (c) | | | 2,095 | | | | 15,692 | |
Shengda Tech, Inc. (a) (c) | | | 1,893 | | | | 27,354 | |
| Silgan Holdings, Inc. | | | 1,635 | | | | 84,922 | |
Simpson Manufacturing Co., Inc. (c) | | | 2,602 | | | | 69,187 | |
| Spartech Corp. | | | 2,252 | | | | 31,753 | |
The Standard Register Co. (c) | | | 1,196 | | | | 13,945 | |
Stepan Co. (c) | | | 412 | | | | 13,402 | |
Stillwater Mining Co. (a) (c) | | | 2,901 | | | | 28,024 | |
Stratus Properties, Inc. (a) (c) | | | 326 | | | | 11,064 | |
Superior Essex, Inc. (a) (c) | | | 1,414 | | | | 33,936 | |
Symyx Technologies, Inc. (a) | | | 2,370 | | | | 18,202 | |
Tejon Ranch Co. (a) (c) | | | 710 | | | | 29,004 | |
Terra Industries, Inc. (a) (c) | | | 5,783 | | | | 276,196 | |
Texas Industries, Inc. (c) | | | 1,883 | | | | 131,998 | |
Thomas Pptys Group, Inc. (c) | | | 1,563 | | | | 16,849 | |
| Tredegar Corp. | | | 2,398 | | | | 38,560 | |
| | | SHARES | | | VALUE | |
Materials & Processing - 9.3% (Continued) | | | | | | |
Trex Co, Inc. (a) (c) | | | 835 | | | $ | 7,106 | |
Trimas Corp. (a) (c) | | | 884 | | | | 9,362 | |
Tronox, Inc. (c) | | | 2,903 | | | | 25,111 | |
UAP Holding Corp. (c) | | | 3,577 | | | | 138,072 | |
| Universal Forest Products, Inc. | | | 1,123 | | | | 33,084 | |
Universal Stainless & Alloy (a) | | | 443 | | | | 15,758 | |
Uranium Resources, Inc. (a) (c) | | | 3,487 | | | | 43,518 | |
US Concrete, Inc. (a) | | | 2,350 | | | | 7,825 | |
Us Gold Corporation (a) (c) | | | 2,956 | | | | 8,750 | |
USEC, Inc. (a) (c) | | | 5,653 | | | | 50,877 | |
Valhi, Inc. (c) | | | 444 | | | | 7,077 | |
Valmont Industries, Inc. (c) | | | 1,271 | | | | 113,272 | |
Watsco, Inc. (c) | | | 1,525 | | | | 56,059 | |
Wausau Paper Corp. (c) | | | 3,154 | | | | 28,354 | |
WD-40 Co. (c) | | | 1,180 | | | | 44,805 | |
Worthington Industries (c) | | | 4,572 | | | | 81,747 | |
WR Grace & Co. (a) (c) | | | 4,767 | | | | 124,800 | |
Xerium Technologies, Inc. (c) | | | 1,385 | | | | 7,202 | |
Zep, Inc. (a) | | | 1,430 | | | | 19,834 | |
Zoltek Companies, Inc. (a) (c) | | | 1,442 | | | | 61,819 | |
| | | | | | | | 8,577,703 | |
Other - 0.6% | | | | | | | | |
Aldabra 2 Acquisition Corp. (a) (c) | | | 2,774 | | | | 27,019 | |
Alternative Asset Management Corp. (a) | | | 2,774 | | | | 25,382 | |
| Compass Diversified Trust | | | 923 | | | | 13,753 | |
Energy Infrastructure Acqui Cp (a) | | | 1,461 | | | | 14,815 | |
GenCorp, Inc. (a) (c) | | | 3,888 | | | | 45,334 | |
GenTek, Inc. (a) (c) | | | 666 | | | | 19,494 | |
Hicks Acquisition Co I, Inc. (a) | | | 3,692 | | | | 33,929 | |
Information Services Group, Inc. (a) (c) | | | 2,261 | | | | 15,488 | |
| Kaman Corp. | | | 1,688 | | | | 62,135 | |
Lancaster Colony Corp. (c) | | | 1,675 | | | | 66,497 | |
Marathon Acquisition Corp. (a) (c) | | | 2,483 | | | | 19,318 | |
NRDC Acquisition Corp. (a) | | | 2,769 | | | | 25,392 | |
NTR Acquisition Co. (a) (c) | | | 1,703 | | | | 16,178 | |
Raven Industries, Inc. (c) | | | 1,078 | | | | 41,384 | |
Triplecrown Acquisition Corp. (a) | | | 3,212 | | | | 29,358 | |
Walter Industries, Inc. (c) | | | 3,448 | | | | 123,887 | |
| | | | | | | | 579,363 | |
Technology - 13.2% | | | | | | | | |
3Com Corp. (a) | | | 27,500 | | | | 124,300 | |
3D Systems Corp. (a) | | | 1,032 | | | | 15,934 | |
3par, Inc. (a) (c) | | | 502 | | | | 6,426 | |
Acacia Research - Acacia Technologies (a) | | | 1,959 | | | | 17,592 | |
Aci Worldwide, Inc. (a) (c) | | | 2,627 | | | | 50,018 | |
Acme Packet, Inc. (a) (c) | | | 936 | | | | 11,784 | |
Actel Corp. (a) (c) | | | 1,819 | | | | 24,848 | |
Actuate Corp. (a) (c) | | | 3,967 | | | | 30,824 | |
Adaptec, Inc. (a) | | | 8,034 | | | | 27,155 | |
ADTRAN, Inc. (c) | | | 3,920 | | | | 83,810 | |
Advanced Analogic Technologies, Inc. (a) (c) | | | 2,588 | | | | 29,193 | |
Agilysys, Inc. (c) | | | 2,146 | | | | 32,448 | |
American Reprographics Co. (a) (c) | | | 1,835 | | | | 30,241 | |
American Science & Engineering, Inc. (c) | | | 611 | | | | 34,674 | |
AMIS Holdings, Inc. (a) (c) | | | 4,414 | | | | 44,228 | |
Amkor Technology, Inc. (a) (c) | | | 7,206 | | | | 61,467 | |
Anadigics, Inc. (a) (c) | | | 3,315 | | | | 38,355 | |
The accompanying notes are an integral part of the financial statements.
Summit Mutual Funds, Inc. – Pinnacle Series |
| SCHEDULE OF INVESTMENTS | RUSSELL 2000 SMALL CAP INDEX PORTFOLIO |
| | | SHARES | | | VALUE | |
Technology - 13.2% (Continued) | | | | | | |
Anaren, Inc. (a) (c) | | | 1,154 | | | $ | 19,029 | |
Anixter International, Inc. (a) (c) | | | 2,057 | | | | 128,089 | |
Ansoft Corp. (a) (c) | | | 1,154 | | | | 29,831 | |
Ansys, Inc. (a) (c) | | | 5,123 | | | | 212,400 | |
Applied Micro Circuits Corp. (a) (c) | | | 5,219 | | | | 45,616 | |
Ariba, Inc. (a) (c) | | | 5,245 | | | | 58,482 | |
Arrowhead Resh Corp. (a) (c) | | | 2,225 | | | | 8,410 | |
Art Technology Group, Inc. (a) | | | 7,864 | | | | 33,972 | |
Aruba Networks, Inc. (a) (c) | | | 529 | | | | 7,887 | |
AsiaInfo Holdings, Inc. (a) (c) | | | 2,127 | | | | 23,397 | |
Aspen Technology, Inc. (a) (c) | | | 5,845 | | | | 94,806 | |
Atheros Communications, Inc. (a) (c) | | | 3,629 | | | | 110,830 | |
Authentec, Inc. (a) (c) | | | 520 | | | | 7,556 | |
Avanex Corp. (a) (c) | | | 11,551 | | | | 11,551 | |
Avid Technology, Inc. (a) (c) | | | 2,967 | | | | 84,085 | |
Avocent Corp. (a) | | | 3,598 | | | | 83,869 | |
BearingPoint, Inc. (a) (c) | | | 13,100 | | | | 37,073 | |
Bel Fuse, Inc. (c) | | | 716 | | | | 20,957 | |
Benchmark Electronics, Inc. (a) | | | 4,954 | | | | 87,834 | |
Bigband Networks, Inc. (a) (c) | | | 823 | | | | 4,230 | |
Black Box Corp. (c) | | | 1,173 | | | | 42,427 | |
Blackbaud, Inc. (c) | | | 3,069 | | | | 86,055 | |
Blackboard, Inc. (a) (c) | | | 1,948 | | | | 78,407 | |
Bladelogic, Inc. (a) | | | 389 | | | | 11,503 | |
Blue Coat Systems, Inc. (a) (c) | | | 1,942 | | | | 63,834 | |
Borland Software Corp. (a) (c) | | | 5,476 | | | | 16,483 | |
Bottomline Technologies, Inc. (a) (c) | | | 1,441 | | | | 20,174 | |
CACI International, Inc. - Class A (a) (c) | | | 2,146 | | | | 96,076 | |
Cavium Networks, Inc. (a) (c) | | | 444 | | | | 10,221 | |
Cbeyond Communications, Inc. (a) (c) | | | 1,156 | | | | 45,072 | |
Checkpoint Systems, Inc. (a) | | | 2,756 | | | | 71,601 | |
Chordiant Software, Inc. (a) (c) | | | 2,234 | | | | 19,101 | |
Ciber, Inc. (a) (c) | | | 3,839 | | | | 23,456 | |
Cirrus Logic, Inc. (a) (c) | | | 6,144 | | | | 32,440 | |
CMGI, Inc. (a) (c) | | | 3,271 | | | | 42,817 | |
Cogent Communications Group, Inc. (a) (c) | | | 3,265 | | | | 77,413 | |
Cogent Inc. (a) (c) | | | 3,041 | | | | 33,907 | |
Coleman Cable, Inc. (a) (c) | | | 552 | | | | 5,216 | |
Commvault Systems, Inc. (a) (c) | | | 2,353 | | | | 49,837 | |
Compellent Technologies, Inc. (a) (c) | | | 442 | | | | 5,317 | |
Comscore, Inc. (a) (c) | | | 401 | | | | 13,085 | |
Comsys IT Partners, Inc. (a) (c) | | | 1,102 | | | | 17,390 | |
Comtech Group, Inc. (a) (c) | | | 1,029 | | | | 16,577 | |
Comtech Telecommunications (a) (c) | | | 1,601 | | | | 86,470 | |
Comverge, Inc. (a) (c) | | | 362 | | | | 11,399 | |
Concur Technologies, Inc. (a) (c) | | | 2,865 | | | | 103,742 | |
Conexant Systems, Inc. (a) (c) | | | 33,941 | | | | 28,171 | |
Constant Contact, Inc. (a) (c) | | | 484 | | | | 10,406 | |
CPI International, Inc. (a) | | | 460 | | | | 7,866 | |
Cray, Inc. (a) (c) | | | 2,174 | | | | 13,022 | |
CSG Systems International (a) | | | 2,843 | | | | 41,849 | |
Cubic Corp. (c) | | | 1,095 | | | | 42,924 | |
Daktronics, Inc. (c) | | | 2,072 | | | | 46,765 | |
Data Domain, Inc. (a) (c) | | | 575 | | | | 15,145 | |
DealerTrack Holdings Inc. (a) (c) | | | 2,200 | | | | 73,634 | |
Deltek, Inc. (a) (c) | | | 602 | | | | 9,168 | |
Dice Holdings, Inc. (a) | | | 1,136 | | | | 9,077 | |
Digi International, Inc. (a) (c) | | | 1,746 | | | | 24,776 | |
| | | SHARES | | | VALUE | |
Technology - 13.2% (Continued) | | | | | | |
Digital River, Inc. (a) | | | 2,780 | | | $ | 91,935 | |
Diodes, Inc. (a) (c) | | | 2,082 | | | | 62,606 | |
Ditech Networks, Inc. (a) (c) | | | 2,275 | | | | 7,894 | |
DivX, Inc. (a) | | | 1,547 | | | | 21,658 | |
Double-take Software, Inc. (a) (c) | | | 566 | | | | 12,294 | |
DSP Group, Inc. (a) (c) | | | 2,128 | | | | 25,962 | |
Eagle Test Systems, Inc. (a) (c) | | | 565 | | | | 7,221 | |
Echelon Corp. (a) (c) | | | 2,165 | | | | 44,686 | |
Electronics for Imaging (a) | | | 3,750 | | | | 84,300 | |
EMS Technologies, Inc. (a) (c) | | | 1,067 | | | | 32,266 | |
Emulex Corp. (a) | | | 5,925 | | | | 96,696 | |
Epicor Software Corp. (a) (c) | | | 4,066 | | | | 47,897 | |
EPIQ Systems, Inc. (a) (c) | | | 1,495 | | | | 26,028 | |
Equinix, Inc. (a) (c) | | | 2,433 | | | | 245,903 | |
Exar Corp. (a) | | | 2,316 | | | | 18,459 | |
Excel Technology, Inc. (a) (c) | | | 848 | | | | 22,981 | |
Extreme Networks, Inc. (a) (c) | | | 8,393 | | | | 29,711 | |
FalconStor Software, Inc. (a) (c) | | | 2,601 | | | | 29,287 | |
Finisar Corp. (a) (c) | | | 16,046 | | | | 23,267 | |
Flir Systems, Inc. (a) (c) | | | 8,726 | | | | 273,124 | |
Formfactor, Inc. (a) (c) | | | 3,216 | | | | 106,450 | |
Foundry Networks, Inc. (a) | | | 9,617 | | | | 168,490 | |
Gartner, Inc. (a) (c) | | | 4,564 | | | | 80,144 | |
Genesis Microchip, Inc. (a) (c) | | | 2,492 | | | | 21,356 | |
Geoeye, Inc. (a) (c) | | | 1,155 | | | | 38,866 | |
Gerber Scientific, Inc. (a) (c) | | | 1,587 | | | | 17,140 | |
Guidance Software, Inc. (a) | | | 224 | | | | 3,123 | |
Harmonic, Inc. (a) | | | 5,211 | | | | 54,611 | |
Harris Stratex Networks, Inc. (a) (c) | | | 1,688 | | | | 28,190 | |
Hittite Microwave Corp. (a) (c) | | | 913 | | | | 43,605 | |
Hughes Communications, Inc. (a) (c) | | | 428 | | | | 23,373 | |
Hutchinson Technology, Inc. (a) (c) | | | 1,802 | | | | 47,429 | |
i2 Technologies, Inc. (a) (c) | | | 995 | | | | 12,537 | |
ICX Technologies, Inc. (a) | | | 334 | | | | 3,213 | |
iGate Corp. (a) (c) | | | 1,552 | | | | 13,145 | |
IHS Inc. (a) | | | 2,081 | | | | 126,025 | |
II-VI, Inc. (a) (c) | | | 1,652 | | | | 50,469 | |
Imation Corp. (c) | | | 2,451 | | | | 51,471 | |
Imergent, Inc. (c) | | | 812 | | | | 8,599 | |
Immersion Corp. (a) (c) | | | 1,709 | | | | 22,132 | |
Infinera Corporation (a) (c) | | | 1,083 | | | | 16,072 | |
Informatica Corp. (a) | | | 6,053 | | | | 109,075 | |
Innovative Solutions & Support, Inc. (a) (c) | | | 833 | | | | 8,072 | |
Integral Systems, Inc. (c) | | | 571 | | | | 13,281 | |
Interactive Intelligence, Inc. (a) (c) | | | 866 | | | | 22,819 | |
Interdigital, Inc. (a) (c) | | | 3,306 | | | | 77,129 | |
Intermec, Inc. (a) (c) | | | 4,003 | | | | 81,301 | |
Internet Brands, Inc. (a) | | | 402 | | | | 2,826 | |
Internet Capital Group, Inc. (a) (c) | | | 2,752 | | | | 32,308 | |
InterVoice, Inc. (a) (c) | | | 2,709 | | | | 21,645 | |
Interwoven, Inc. (a) | | | 3,002 | | | | 42,688 | |
Ion Geophysical Corp. (a) | | | 4,951 | | | | 78,127 | |
Ionatron, Inc. (a) (c) | | | 2,297 | | | | 6,569 | |
IPG Photonics Corp. (a) (c) | | | 715 | | | | 14,293 | |
iRobot Corp. (a) (c) | | | 744 | | | | 13,452 | |
Isilon Systems, Inc. (a) (c) | | | 578 | | | | 2,936 | |
Ixia (a) | | | 3,012 | | | | 28,554 | |
IXYS Corp. (a) (c) | | | 1,911 | | | | 15,326 | |
The accompanying notes are an integral part of the financial statements.
Summit Mutual Funds, Inc. – Pinnacle Series |
| RUSSELL 2000 SMALL CAP INDEX PORTFOLIO | SCHEDULE OF INVESTMENTS |
| | | SHARES | | | VALUE | |
Technology - 13.2% (Continued) | | | | | | |
j2 Global Communications, Inc. (a) (c) | | | 3,489 | | | $ | 73,862 | |
JDA Software Group, Inc. (a) | | | 2,049 | | | | 41,923 | |
Kemet Corp. (a) (c) | | | 6,096 | | | | 40,416 | |
Kenexa Corp. (a) (c) | | | 1,667 | | | | 32,373 | |
Keynote Systems, Inc. (a) (c) | | | 1,035 | | | | 14,542 | |
Lattice Semiconductor Corp. (a) (c) | | | 8,031 | | | | 26,101 | |
Lawson Software, Inc. (a) (c) | | | 8,751 | | | | 89,610 | |
Limelight Networks, Inc. (a) (c) | | | 1,238 | | | | 8,530 | |
Lionbridge Technologies (a) (c) | | | 4,201 | | | | 14,914 | |
Liveperson, Inc. (a) (c) | | | 2,420 | | | | 12,923 | |
Loral Space & Communications, Inc. (a) | | | 741 | | | | 25,379 | |
Macrovision Corp. (a) (c) | | | 3,633 | | | | 66,593 | |
Magma Design Automation, Inc. (a) (c) | | | 2,643 | | | | 32,271 | |
Manhattan Associates, Inc. (a) (c) | | | 1,932 | | | | 50,928 | |
Mantech International Corp. - Class A (a) | | | 1,265 | | | | 55,432 | |
Mentor Graphics Corp. (a) (c) | | | 5,640 | | | | 60,799 | |
Mercadolibre, Inc. (a) (c) | | | 1,078 | | | | 79,643 | |
Mercury Computer Systems, Inc. (a) (c) | | | 1,476 | | | | 23,778 | |
| Methode Electronics, Inc. | | | 2,624 | | | | 43,139 | |
Micrel, Inc. (c) | | | 3,671 | | | | 31,020 | |
MICRO Systems, Inc. (a) (c) | | | 2,731 | | | | 191,607 | |
Microsemi Corp. (a) | | | 5,250 | | | | 116,235 | |
MicroStrategy, Inc. (a) | | | 654 | | | | 62,195 | |
Microtune, Inc. (a) | | | 3,717 | | | | 24,272 | |
MIPS Technologies, Inc. (a) (c) | | | 3,055 | | | | 15,153 | |
Monolithic Power Systems, Inc. (a) (c) | | | 1,534 | | | | 32,935 | |
Monotype Imaging Holdings Inc Com (a) (c) | | | 737 | | | | 11,180 | |
MRV Communications, Inc. (a) (c) | | | 8,801 | | | | 20,418 | |
MSC.Software Corp. (a) (c) | | | 2,916 | | | | 37,879 | |
Multi-Fineline Electronix, Inc. (a) (c) | | | 556 | | | | 9,641 | |
Ness Technologies, Inc. (a) (c) | | | 1,930 | | | | 17,814 | |
Netezza Corp Com (a) (c) | | | 679 | | | | 9,370 | |
Netgear, Inc. (a) (c) | | | 2,332 | | | | 83,182 | |
Netlogic Microsystems, Inc. (a) (c) | | | 1,119 | | | | 36,032 | |
Network Equipment Technologies, Inc. (a) (c) | | | 1,744 | | | | 14,684 | |
Newport Corp. (a) (c) | | | 2,855 | | | | 36,515 | |
Nextwave Wireless, Inc. (a) (c) | | | 1,791 | | | | 9,636 | |
Novatel Wireless, Inc. (a) (c) | | | 2,070 | | | | 33,534 | |
Nuance Communications, Inc. (a) (c) | | | 9,489 | | | | 177,254 | |
Omniture, Inc. (a) (c) | | | 1,843 | | | | 61,353 | |
Omnivision Technologies, Inc. (a) (c) | | | 3,739 | | | | 58,515 | |
ON Semiconductor Corp. (a) (c) | | | 15,988 | | | | 141,973 | |
On2 Technologies, Inc. (a) (c) | | | 7,516 | | | | 7,666 | |
Opentv Corp. (a) (c) | | | 6,148 | | | | 8,115 | |
| Openwave Systems, Inc. | | | 6,638 | | | | 17,259 | |
Oplink Communications, Inc. (a) (c) | | | 1,095 | | | | 16,808 | |
Optium Corp. (a) (c) | | | 398 | | | | 3,136 | |
OSI Systems, Inc. (a) | | | 1,036 | | | | 27,423 | |
Packeteer, Inc. (a) (c) | | | 2,441 | | | | 15,037 | |
Palm, Inc. (c) | | | 6,443 | | | | 40,849 | |
Parametric Technology Corp. (a) (c) | | | 7,827 | | | | 139,712 | |
Park Electrochemical Corp. (c) | | | 1,415 | | | | 39,960 | |
PDF Solutions, Inc. (a) (c) | | | 1,479 | | | | 13,326 | |
Pegasystems, Inc. (c) | | | 962 | | | | 11,477 | |
Pericom Semiconductor Corp. (a) (c) | | | 1,849 | | | | 34,576 | |
Perot Systems Corp. (a) | | | 6,075 | | | | 82,012 | |
Plexus Corp. (a) | | | 3,214 | | | | 84,400 | |
PLX Technology, Inc. (a) (c) | | | 1,759 | | | | 16,359 | |
| | | SHARES | | | VALUE | |
Technology - 13.2% (Continued) | | | | | | |
PMC - Sierra, Inc. (a) (c) | | | 14,533 | | | $ | 95,046 | |
Progress Software Corp. (a) | | | 2,887 | | | | 97,234 | |
Pros Holdings, Inc. (a) (c) | | | 525 | | | | 10,300 | |
QAD, Inc. (c) | | | 1,023 | | | | 9,555 | |
Quantum Corp. (a) (c) | | | 14,100 | | | | 37,929 | |
Quest Software, Inc. (a) (c) | | | 4,708 | | | | 86,816 | |
Rackable Systems, Inc. (a) (c) | | | 1,946 | | | | 19,460 | |
Radiant Systems, Inc. (a) | | | 1,838 | | | | 31,669 | |
Radisys Corp. (a) (c) | | | 1,482 | | | | 19,859 | |
RealNetworks, Inc. (a) (c) | | | 7,512 | | | | 45,748 | |
RF Micro Devices, Inc. (a) (c) | | | 16,989 | | | | 97,007 | |
RightNow Technologies, Inc. (a) (c) | | | 1,055 | | | | 16,722 | |
Rimage Corp. (a) (c) | | | 677 | | | | 17,568 | |
Rubicon Technology, Inc. (a) (c) | | | 435 | | | | 10,331 | |
Safeguard Scientifics, Inc. (a) (c) | | | 8,442 | | | | 15,196 | |
SAIC, Inc. (a) (c) | | | 8,560 | | | | 172,227 | |
Sapient Corp. (a) (c) | | | 5,727 | | | | 50,455 | |
SAVVIS, Inc. (a) (c) | | | 1,815 | | | | 50,657 | |
Scansource, Inc. (a) (c) | | | 1,802 | | | | 58,295 | |
Seachange International, Inc. (a) | | | 1,947 | | | | 14,077 | |
Secure Computing Corp. (a) (c) | | | 3,743 | | | | 35,933 | |
Semtech Corp. (a) | | | 5,078 | | | | 78,811 | |
Shoretel, Inc. (a) (c) | | | 608 | | | | 8,494 | |
SI International, Inc. (a) (c) | | | 859 | | | | 23,597 | |
Sigma Designs, Inc. (a) (c) | | | 1,885 | | | | 104,052 | |
Silicon Graphics, Inc. (a) (c) | | | 429 | | | | 7,842 | |
Silicon Image, Inc. (a) | | | 5,725 | | | | 25,877 | |
Silicon Storage Technology, Inc. (a) (c) | | | 6,368 | | | | 19,040 | |
Sirf Technology Holdings, Inc. (a) (c) | | | 4,050 | | | | 101,776 | |
Skyworks Solutions, Inc. (a) (c) | | | 11,286 | | | | 95,931 | |
Smart Modular Technologies, Inc. (a) (c) | | | 3,339 | | | | 33,991 | |
Smith Micro Software, Inc. (a) (c) | | | 1,684 | | | | 14,263 | |
Solera Holdings, Inc. (a) | | | 1,737 | | | | 43,043 | |
SonicWALL, Inc. (a) | | | 4,531 | | | | 48,572 | |
Sonus Networks, Inc. (a) (c) | | | 17,765 | | | | 103,570 | |
Sourcefire, Inc. (a) (c) | | | 437 | | | | 3,645 | |
Sourceforge, Inc. (a) (c) | | | 4,615 | | | | 11,307 | |
Spansion, Inc. (a) (c) | | | 5,936 | | | | 23,328 | |
SPSS, Inc. (a) (c) | | | 1,361 | | | | 48,873 | |
SRA International, Inc. - Class A (a) | | | 2,691 | | | | 79,250 | |
Standard Microsystems Corp. (a) | | | 1,558 | | | | 60,871 | |
Stanley, Inc. (a) | | | 408 | | | | 13,064 | |
Starent Networks Corp. (a) (c) | | | 817 | | | | 14,910 | |
Stec, Inc. (a) (c) | | | 2,150 | | | | 18,791 | |
Stratasys, Inc. (a) (c) | | | 1,424 | | | | 36,796 | |
Successfactors, Inc. (a) | | | 722 | | | | 8,534 | |
Super Micro Computer, Inc. (a) (c) | | | 613 | | | | 4,702 | |
Supertex, Inc. (a) (c) | | | 843 | | | | 26,377 | |
Switch & Data Facilities Co., Inc. (a) (c) | | | 876 | | | | 14,034 | |
Sybase, Inc. (a) | | | 6,326 | | | | 165,045 | |
Sycamore Networks, Inc. (a) (c) | | | 12,949 | | | | 49,724 | |
SYKES Enterprises, Inc. (a) (c) | | | 2,059 | | | | 37,062 | |
Synaptics, Inc. (a) (c) | | | 1,757 | | | | 72,318 | |
Synchronoss Technologies, Inc. (a) (c) | | | 1,227 | | | | 43,485 | |
Syniverse Holdings, Inc. (a) | | | 1,662 | | | | 25,894 | |
SYNNEX Corp. (a) (c) | | | 877 | | | | 17,189 | |
Syntax Brillian Corp. (a) (c) | | | 3,811 | | | | 11,738 | |
Syntel, Inc. (c) | | | 566 | | | | 21,802 | |
The accompanying notes are an integral part of the financial statements.
Summit Mutual Funds, Inc. – Pinnacle Series |
| SCHEDULE OF INVESTMENTS | RUSSELL 2000 SMALL CAP INDEX PORTFOLIO |
| | | SHARES | | | VALUE | |
Technology - 13.2% (Continued) | | | | | | |
Taleo Corp. (a) (c) | | | 958 | | | $ | 28,529 | |
Techtarget, Inc. (a) (c) | | | 514 | | | | 7,597 | |
Techwell, Inc. (a) (c) | | | 995 | | | | 10,955 | |
Tekelec (a) (c) | | | 4,061 | | | | 50,762 | |
Terremark Worldwide, Inc. (a) (c) | | | 2,750 | | | | 17,875 | |
Tessera Technologies, Inc. (a) (c) | | | 3,243 | | | | 134,909 | |
TIBCO Software, Inc. (a) (c) | | | 13,746 | | | | 110,930 | |
Trident Microsystems, Inc. (a) (c) | | | 4,012 | | | | 26,319 | |
Triquint Semiconductor, Inc. (a) (c) | | | 9,835 | | | | 65,206 | |
Trizetto Group (a) (c) | | | 3,017 | | | | 52,405 | |
TTM Technologies, Inc. (a) (c) | | | 2,936 | | | | 34,234 | |
Tyler Technologies, Inc. (a) (c) | | | 2,752 | | | | 35,473 | |
Ultimate Software Group, Inc. (a) | | | 1,679 | | | | 52,838 | |
Unica Corp. (a) | | | 651 | | | | 6,022 | |
Universal Display Corp. (a) (c) | | | 1,665 | | | | 34,416 | |
UTStarcom, Inc. (a) (c) | | | 8,497 | | | | 23,367 | |
Varian, Inc. (a) (c) | | | 2,171 | | | | 141,766 | |
VASCO Data Security International, Inc. (a) (c) | | | 1,749 | | | | 48,832 | |
Veraz Networks, Inc. (a) (c) | | | 604 | | | | 2,911 | |
Viasat, Inc. (a) (c) | | | 1,557 | | | | 53,607 | |
Vignette Corp. (a) (c) | | | 2,092 | | | | 30,564 | |
Virtusa Corp. (a) | | | 295 | | | | 5,112 | |
Visual Sciences, Inc. (a) (c) | | | 1,229 | | | | 22,712 | |
Vocus, Inc. (a) (c) | | | 860 | | | | 29,696 | |
Volterra Semiconductor Corp. (a) (c) | | | 1,255 | | | | 13,843 | |
Vonage Holdings Corp. (a) (c) | | | 2,203 | | | | 5,067 | |
Websense, Inc. (a) | | | 3,217 | | | | 54,625 | |
Wind River Systems, Inc. (a) | | | 5,302 | | | | 47,347 | |
Zoran Corp. (a) | | | 3,443 | | | | 77,502 | |
| | | | | | | | 12,205,811 | |
Utilities - 4.1% | | | | | | | | |
Alaska Communications Systems Group, Inc. (c) | | | 2,946 | | | | 44,190 | |
Allete, Inc. (c) | | | 1,765 | | | | 69,859 | |
American States Water Co. (c) | | | 1,182 | | | | 44,538 | |
Aquila, Inc. (a) | | | 26,329 | | | | 98,207 | |
Atlantic Tele-Network, Inc. (c) | | | 448 | | | | 15,133 | |
Avista Corp. (c) | | | 3,653 | | | | 78,686 | |
Black Hills Corp. (c) | | | 2,604 | | | | 114,836 | |
| California Water Service Group | | | 1,344 | | | | 49,755 | |
Centennial Communications Corp. (a) | | | 1,605 | | | | 14,910 | |
Central Vermont Public Service Corp. (c) | | | 681 | | | | 21,002 | |
CH Energy Group, Inc. (c) | | | 1,108 | | | | 49,350 | |
Cincinnati Bell, Inc. (a) | | | 17,385 | | | | 82,579 | |
Cleco Corp. (c) | | | 3,974 | | | | 110,477 | |
| Consolidated Communications Holdings, Inc. | | | 1,517 | | | | 30,188 | |
Consolidated Water Co, Inc. (c) | | | 947 | | | | 23,855 | |
El Paso Electric Co. (a) | | | 3,021 | | | | 77,247 | |
The Empire District Electric Co. (c) | | | 2,106 | | | | 47,975 | |
EnergySouth, Inc. (c) | | | 484 | | | | 28,072 | |
Fairpoint Communications, Inc. (c) | | | 1,934 | | | | 25,181 | |
FiberTower Corp. (a) (c) | | | 8,313 | | | | 18,954 | |
General Communication (a) (c) | | | 3,756 | | | | 32,865 | |
| | | SHARES | | | VALUE | |
Utilities - 4.1% (Continued) | | | | | | |
Global Crossing Ltd. (a) (c) | | | 2,405 | | | $ | 53,030 | |
Globalstar, Inc. (a) (c) | | | 1,335 | | | | 10,680 | |
Golden Telecom, Inc. (a) | | | 1,035 | | | | 104,483 | |
Hungarian Telephone & Cable Corp. (a) (c) | | | 239 | | | | 4,228 | |
Ibasis, Inc. (c) | | | 2,191 | | | | 11,240 | |
ICO Global Communications Ltd. (a) (c) | | | 6,798 | | | | 21,618 | |
Idacorp, Inc. (c) | | | 3,006 | | | | 105,871 | |
IDT Corp. (c) | | | 3,504 | | | | 29,609 | |
Iowa Telecommunications Services, Inc. (c) | | | 2,209 | | | | 35,918 | |
iPCS, Inc. (c) | | | 1,173 | | | | 42,216 | |
ITC Holdings Corp. (c) | | | 2,799 | | | | 157,920 | |
The Laclede Group, Inc. (c) | | | 1,500 | | | | 51,360 | |
Mediacom Communications Corp. (a) (c) | | | 3,848 | | | | 17,662 | |
MGE Energy, Inc. (c) | | | 1,438 | | | | 51,006 | |
Neutral Tandem, Inc. (a) (c) | | | 445 | | | | 8,464 | |
New Jersey Resources Corp. (c) | | | 1,969 | | | | 98,489 | |
Nicor, Inc. (c) | | | 3,118 | | | | 132,047 | |
| North Pittsburgh Systems, Inc. | | | 1,057 | | | | 23,983 | |
Northwest Natural Gas Co. (c) | | | 1,940 | | | | 94,400 | |
| Northwestern Corp. | | | 2,495 | | | | 73,602 | |
Ntelos Holdings Corp. (c) | | | 1,841 | | | | 54,659 | |
Orbcomm, Inc. (a) (c) | | | 1,728 | | | | 10,869 | |
Otter Tail Corp. (c) | | | 2,073 | | | | 71,726 | |
Paetec Holding Corp. (a) (c) | | | 4,100 | | | | 39,975 | |
Piedmont Natural Gas Co. (c) | | | 4,918 | | | | 128,655 | |
Pike Electric Corp. (a) (c) | | | 1,050 | | | | 17,598 | |
| PNM Resources, Inc. | | | 5,333 | | | | 114,393 | |
| Portland General Electric Co. | | | 1,889 | | | | 52,476 | |
Premiere Global Services, Inc. (a) (c) | | | 5,000 | | | | 74,250 | |
RCN Corp. (c) | | | 2,047 | | | | 31,913 | |
Rural Cellular Corp. (a) (c) | | | 806 | | | | 35,537 | |
Shenandoah Telecom Co. (c) | | | 1,560 | | | | 37,409 | |
SJW Corp. (c) | | | 1,057 | | | | 36,646 | |
| South Jersey Industries, Inc. | | | 2,050 | | | | 73,985 | |
| Southwest Gas Corp. | | | 2,815 | | | | 83,803 | |
Southwest Water Co. (c) | | | 1,595 | | | | 19,969 | |
SureWest Communications (c) | | | 1,029 | | | | 17,596 | |
Time Warner Telecom, Inc. (a) | | | 9,498 | | | | 192,714 | |
UIL Holdings Corp. (c) | | | 1,725 | | | | 63,739 | |
| Unisource Energy Corp. | | | 2,465 | | | | 77,771 | |
USA Mobility, Inc. (c) | | | 1,531 | | | | 21,893 | |
Virgin Mobile Usa, Inc. (a) (c) | | | 1,838 | | | | 16,340 | |
Westar Energy, Inc. (c) | | | 6,807 | | | | 176,574 | |
| WGL Holdings, Inc. | | | 3,427 | | | | 112,269 | |
| | | | | | | | 3,768,444 | |
| TOTAL COMMON STOCKS | | | | | | | | |
| (Cost $77,746,035) | | | | | | | 86,213,139 | |
The accompanying notes are an integral part of the financial statements.
Summit Mutual Funds, Inc. – Pinnacle Series |
| RUSSELL 2000 SMALL CAP INDEX PORTFOLIO | SCHEDULE OF INVESTMENTS |
| | | SHARES | | | VALUE | |
UNIT INVESTMENT TRUSTS - 1.0% | | | | | | |
iShares Russell 2000 Index Fund (c) | | | 12,700 | | | $ | 964,184 | |
| TOTAL INVESTMENT COMPANIES | | | | | | | | |
| (Cost $999,236) | | | | | | | 964,184 | |
| | | | | | | | | |
| | | PRINCIPAL | | | | | |
| | | AMOUNT | | | VALUE | |
SHORT TERM INVESTMENTS (e) - 5.1% | | | | | | | | |
U.S. Treasury Bills - 2.2% | | | | | | | | |
| 2.995%, 03/13/2008 | | $ | 2,000,000 | | | $ | 1,987,870 | |
| | | | | | | | | |
| | | SHARES | | | VALUE | |
Money Market Funds - 2.9% | | | | | | | | |
| Northern Institutional Diversified Assets Portfolio | | | 2,719,617 | | | $ | 2,719,617 | |
| TOTAL SHORT TERM INVESTMENTS | | | | | | | | |
| (Cost $4,707,727) | | | | | | | 4,707,487 | |
Total Investments (Cost $83,452,998) (b) - 99.5% | | | | | | | 91,884,810 | |
Northern Institutional Diversified Assets Portfolio (d) - 51.5% | | | | | | | 47,542,292 | |
Liabilities in Excess of Other Assets - (51.0)% | | | | | | | (47,052,507 | ) |
TOTAL NET ASSETS - 100.0% | | | | | | $ | 92,374,595 | |
(a) | Non-income producing security. |
(b) | For federal income tax purposes, cost is $84,614,114 and gross unrealized appreciation and depreciation of securities as of December 31, 2007 was $22,287,087 and $(14,016,371) respectively, with a net appreciation / (depreciation) of $8,270,696. |
(c) | All or a portion of the security is out on loan. |
(d) | This security was purchased with cash collateral held from securities lending. The market value of the securities on loan, the collateral purchased with cash, and the noncash collateral accepted is |
| | $45,956,420, $47,542,292, and $104,471, respectively. |
(e) | Securities and other assets with an aggregate value of $4,401,540 have been segregated with the custodian or designated to cover margin requirements for the open futures contracts as of |
| | December 31, 2007: |
| | | Unrealized | |
| | | Appreciation/ | |
Type | Contracts | (Depreciation) | |
| | | | |
| Russell 2000 Index (03/08) | 1 | $6,792 | |
| Russell 2000 Index Mini (03/08) | 52 | 73,528 | |
The accompanying notes are an integral part of the financial statements.
Summit Mutual Funds, Inc. – Pinnacle Series |
| FINANCIAL STATEMENTS | RUSSELL 2000 SMALL CAP INDEX PORTFOLIO |
STATEMENT OF ASSETS AND LIABILITIES | |
December 31, 2007 | | | |
| | | | |
| ASSETS | | | |
| Investments in securities, at value | | $ | 91,884,810 | |
| Collateral for securities loaned, at fair value | | | 47,542,292 | |
| Cash | | | 33 | |
| Receivables: | | | | |
| Shares sold | | | 804,055 | |
| Interest and dividends | | | 137,375 | |
| Investments sold | | | 154,248 | |
| Prepaid expenses and other | | | 2,755 | |
| | | | 140,525,568 | |
| LIABILITIES | | | | |
| Payables: | | | | |
| Payable upon return of securities loaned | | | 47,542,292 | |
| Investment securities purchased | | | 85,080 | |
| Shares redeemed | | | 409,781 | |
| Variation margin | | | 8,928 | |
| Advisory fees | | | 27,622 | |
| Professional fees | | | 25,995 | |
| Fund accounting fees | | | 22,096 | |
| Administration fees | | | 7,892 | |
| Custodian fees | | | 4,678 | |
| Royalty fees | | | 2,500 | |
| 12b-1 fees | | | 329 | |
| Directors’ fees | | | 204 | |
| Other accrued expenses | | | 13,576 | |
| | | | 48,150,973 | |
| NET ASSETS* | | | | |
| Paid-in capital | | | 78,689,606 | |
| Accumulated undistributed net investment | | | | |
| income / (loss) | | | 885,513 | |
| Accumulated net realized gain / (loss) | | | | |
| on investments and futures contracts | | | 4,287,344 | |
| Net unrealized appreciation / (depreciation) | | | | |
| on investments and futures contracts | | | 8,512,132 | |
| | | $ | 92,374,595 | |
| | | | | |
| Investments at cost | | $ | 83,452,998 | |
| Shares authorized - Class I ($.10 par value) | | | 20,000,000 | |
| Shares authorized - Class F ($.10 par value) | | | 20,000,000 | |
| NET ASSET VALUE (NAV) BY SHARE CLASS | | | | |
| | | | | |
| Share Class | Net Assets | Outstanding | | Per Share |
| Class I | $91,675,936 | | | $ | |
| Class F | $698,659 | | | $ | 66.78 |
| * | FEDERAL TAX DATA AS OF DECEMBER 31, 2007 | | |
| | Percentage of ordinary distributions designated as | | |
| | qualified dividend income | | 51.13% |
| | Dividends received deduction for corporate shareholders | | 50.90% |
| | Undistributed ordinary income | $ | |
| | Undistributed long-term gains | $ | |
| | Unrealized appreciation | $ | |
STATEMENT OF OPERATIONS | | | |
For the year ended December 31, 2007 | | | |
| | | | |
| INVESTMENT INCOME | | | |
| Interest | | $ | 62,340 | |
| Dividends | | | 1,466,672 | |
| Other income | | | 126,498 | |
| | | | 1,655,510 | |
| EXPENSES | | | | |
| Advisory fees | | | 343,608 | |
| Administration fees | | | 98,174 | |
| Fund accounting fees | | | 55,819 | |
| Professional fees | | | 36,061 | |
| Custodian fees | | | 32,793 | |
| Transfer agent fees | | | 22,331 | |
| Directors’ fees | | | 11,914 | |
| Royalty fee | | | 10,310 | |
| Shareholder reporting fees | | | 10,072 | |
| 12b-1 fees - Class F | | | 1,160 | |
| Other expenses | | | 8,991 | |
| | | | 631,233 | |
| NET INVESTMENT INCOME / (LOSS) | | | 1,024,277 | |
| | | | | |
| REALIZED AND UNREALIZED GAIN / (LOSS) | | | | |
| Net realized gain / (loss) on investments | | | 4,842,144 | |
| Net realized gain / (loss) on futures contracts | | | (411,468 | ) |
| | | | 4,430,676 | |
| Net change in unrealized appreciation / | | | | |
| (depreciation) on investments and | | | | |
| futures contracts | | | (7,603,496 | ) |
| NET REALIZED AND UNREALIZED | | | | |
| GAIN / (LOSS) | | | (3,172,820 | ) |
| | | | | |
| NET INCREASE / (DECREASE) IN NET | | | | |
| ASSETS FROM OPERATIONS | | $ | (2,148,543 | ) |
| TRANSACTIONS WITH AFFILIATES: | | |
| Percent of Current | | |
| Net Asset Value | | |
| | Class I Expense Limit | Class F Expense Limit | |
| 0.30% | 0.10% | 0.75% | 0.95% | |
The accompanying notes are an integral part of the financial statements.
Summit Mutual Funds, Inc. – Pinnacle Series |
| RUSSELL 2000 SMALL CAP INDEX PORTFOLIO | FINANCIAL STATEMENTS |
STATEMENTS OF CHANGES IN NET ASSETS | | | | | | |
For the Year Ended December 31, | | | | | | |
| | | 2007 | | | 2006 | |
| OPERATIONS | | | | | | |
| Net investment income / (loss) | | $ | 1,024,277 | | | $ | 732,129 | |
| Net realized gain / (loss) on investments and futures | | | 4,430,676 | | | | 6,958,894 | |
| Net change in unrealized appreciation / (depreciation) on investments and futures contracts | | | (7,603,496 | ) | | | 6,109,042 | |
| | | | (2,148,543 | ) | | | 13,800,065 | |
| DISTRIBUTIONS TO SHAREHOLDERS* | | | | | | | | |
| Class I | | | | | | | | |
| Net investment income | | | (602,763 | ) | | | (521,036 | ) |
| Net realized gain on investments | | | (7,077,549 | ) | | | (2,571,112 | ) |
| Class F | | | | | | | | |
| Net investment income | | | (2,328 | ) | | | (153 | ) |
| Net realized gain on investments | | | (33,991 | ) | | | (792 | ) |
| | | | (7,716,631 | ) | | | (3,093,093 | ) |
| FUND SHARE TRANSACTIONS | | | | | | | | |
| Class I | | | | | | | | |
| Proceeds from shares sold | | | 14,888,385 | | | | 21,481,354 | |
| Reinvestment of distributions | | | 7,680,312 | | | | 3,092,148 | |
| Payments for shares redeemed | | | (16,784,215 | ) | | | (15,380,526 | ) |
| | | | 5,784,482 | | | | 9,192,976 | |
| Class F | | | | | | | | |
| Proceeds from shares sold | | | 516,472 | | | | 330,479 | |
| Reinvestment of distributions | | | 36,319 | | | | 945 | |
| Payments for shares redeemed | | | (63,698 | ) | | | (85,352 | ) |
| | | | 489,093 | | | | 246,072 | |
| NET INCREASE / (DECREASE) IN NET ASSETS | | | (3,591,599 | ) | | | 20,146,020 | |
| NET ASSETS | | | | | | | | |
| Beginning of period | | | 95,966,194 | | | | 75,820,174 | |
| End of period | | $ | 92,374,595 | | | $ | 95,966,194 | |
| ACCUMULATED UNDISTRIBUTED NET INVESTMENT INCOME | | $ | 885,513 | | | $ | 529,373 | |
FUND SHARE TRANSACTIONS Class I | �� | | | | | |
| Sold | | | | | | | | |
| Reinvestment of distributions | | | | | | | | |
| Redeemed | | | (238,974 | ) | | | (221,188 | ) |
| Net increase / (decrease) from fund share transactions | | | | | | | | |
FUND SHARE TRANSACTIONS Class F | | | | | | | | |
| Sold | | | | | | | | |
| Reinvestment of distributions | | | | | | | | |
| Redeemed | | | | ) | | | | ) |
| Net increase / (decrease) from fund share transactions | | | | | | | | |
| | | | | | | | | |
| TOTAL COST OF PURCHASES OF: | | | | | | | | |
| Common Stocks | | $ | | | | $ | | |
| | | $ | | | | $ | | |
| TOTAL PROCEEDS FROM SALES OF: | | | | | | | | |
| Common Stocks | | $ | | | | $ | | |
| | | $ | | | | $ | | |
| | | | | | | | | |
| *TAX CHARACTER OF DISTRIBUTIONS PAID | | | | | | | | |
| Ordinary income** | | $ | | | | $ | | |
| Long-term capital gains | | | | | | | | |
| | | $ | | | | $ | | |
| | | | | | | | | |
** The percentage of taxable ordinary income distributions that are designated as short-term capital gain | | | | | | | | |
| distributions under Internal Revenue Section 871 (k)(2)(C) is 60.62% | | | | | | | | |
The accompanying notes are an integral part of the financial statements.
Summit Mutual Funds, Inc. – Pinnacle Series |
| EAFE INTERNATIONAL INDEX PORTFOLIO | |
Summit EAFE International Index Portfolio Class I - Average Annual Total Return
1-Year | 5-Year | Since Inception |
| 10.10% | 19.52% | 18.77% |
Summit EAFE International Index Portfolio Class F - Average Annual Total Return
1-Year | 5-Year | Since Inception |
| 9.90% | 19.29% | 18.54% |
Past performance is not predictive of future results. Performance does not reflect the deduction of taxes that a shareholder would pay on fund distributions or redemption of fund shares. Prior to December 17, 2007, Class F share performance is based on Class I performance. Separate account expenses are not included. Absent limitation of expenses during certain of the periods shown, performance would have been lower.
| Managers: | Subadvised by World Asset Management, LLC A division of Munder Capital Management |
| Inception Date: | November 12, 2000 |
| Total Net Assets: | $118.63 Million |
| Number Of Equity Holdings: | 906 |
| Medium Cap Size: | $2,645 (in millions) |
| Average Price-to-book Ratio: | 2.19 x |
| Divident Yield: | 2.68% |
Top 10 Equity Holdings | | Sector Allocations |
| | (% of net assets) | | |
BP Plc Vodafone Group Plc HSBC Holdings Plc Nestle SA Total SA Royal Dutch Shell Plc - Class A Nokia OYJ Toyota Motor Corp. GlaxoSmithKline Plc Banco Santander Central Hispana SA | | | |
Summit Mutual Funds, Inc. – Pinnacle Series |
| | EAFE INTERNATIONAL INDEX PORTFOLIO |
Objective – Seeks investment results that correspond to the total return performance of common stocks as represented by the Morgan Stanley Capital International (“MSCI”) EAFE Index (the “Index”). The Index emphasizes the stock of companies in major markets in Europe, Australasia, and the Far East.
Strategy – The Summit Pinnacle EAFE International Index Portfolio (the “Portfolio”) will invest primarily in common stocks of the companies that compose the Index.
Managers’ Comments:
For the period ended December 31, 2007, the Summit EAFE International Index Portfolio’s (Class I) total return was 10.10% (after waivers and reimbursements, but before the impact of any product or contract-level fees). This compares to a 11.17% “net” total return for the MSCI EAFE Index (in U.S dollars after the impact of foreign taxes). The difference of 1.07% is referred to as “tracking error.” The largest component of the difference is attributed to the Portfolio’s operating expenses. These expenses represent the Portfolio’s costs for advisory, administration, accounting, custody and other services as well as the impact of foreign taxes. The remaining difference can be caused by a number of factors, including the timing and size of cash flows into and out of the Portfolio; brokers’ commissions or other trading costs; and holding a sample of the security positions in the Index or holding them in amounts that are different than the weightings in the Index, among others. While an exact replication of the capitalization weightings of securities in the Index is not feasible, the Portfolio’s objectives and strategies call for it to seek investment results that correspond to the pre-expense.
Summit Mutual Funds, Inc. – Pinnacle Series |
| FINANCIAL HIGHLIGHTS | EAFE INTERNATIONAL INDEX PORTFOLIO |
FINANCIAL HIGHLIGHTS | | | | | | | | | | | | | | | |
| Computed on the basis of a share of capital stock outstanding throughout the period. | | | | | | | | | | | | | |
| | Class I |
| | Year Ended December 31, |
| | | 2007 | | | 2006 | | | 2005 | | | 2004 | | | 2003 | |
| Net asset value, beginning of period | | $ | 98.66 | | | $ | 81.98 | | | $ | 74.34 | | | $ | 64.41 | | | $ | 49.59 | |
| INVESTMENT ACTIVITIES: | | | | | | | | | | | | | | | | | | | | |
| Net investment income / (loss) | | | 1.00 | | | | 1.46 | | | | 1.59 | | | | 1.00 | (1) | | | 1.34 | |
| Net realized and unrealized gains / (losses) | | | 8.80 | | | | 18.83 | | | | 7.59 | | | | 10.42 | | | | 14.49 | |
| Total from Investment Activities | | | 9.80 | | | | 20.29 | | | | 9.18 | | | | 11.42 | | | | 15.83 | |
| DISTRIBUTIONS: | | | | | | | | | | | | | | | | | | | | |
| Net investment income | | | (1.48 | ) | | | (1.63 | ) | | | (0.72 | ) | | | (0.69 | ) | | | (0.19 | ) |
| Net realized gains | | | (2.21 | ) | | | (1.98 | ) | | | (0.82 | ) | | | (0.80 | ) | | | (0.82 | ) |
| Total Distributions | | | (3.69 | ) | | | (3.61 | ) | | | (1.54 | ) | | | (1.49 | ) | | | (1.01 | ) |
| Net asset value, end of period | | $ | 104.77 | | | $ | 98.66 | | | $ | 81.98 | | | $ | 74.34 | | | $ | 64.41 | |
| | | | | | | | | | | | | | | | | | | | | |
| Total return | | | 10.10 | % | | | 25.56 | % | | | 12.57 | % | | | 18.02 | % | | | 32.79 | % |
| RATIOS / SUPPLEMENTAL DATA: | | | | | | | | | | | | | | | | | | | | |
Ratio of expenses to average net assets – net(2) | | | 0.95 | % | | | 0.95 | % | | | 0.95 | % | | | 0.95 | % | | | 0.65 | % |
| Ratio of expenses to average net assets – gross | | | 1.26 | % | | | 1.29 | % | | | 1.50 | % | | | 1.69 | % | | | 2.46 | % |
| Ratio of net investment income / (loss) to average net assets | | | 1.48 | % | | | 1.66 | % | | | 1.75 | % | | | 1.70 | % | | | 2.14 | % |
Portfolio turnover rate (3) | | | 47.52 | % | | | 44.33 | % | | | 76.61 | % | | | 55.49 | % | | | 75.27 | % |
| Net assets, end of period (000’s) | | $ | 118,631 | | | $ | 58,754 | | | $ | 44,084 | | | $ | 50,938 | | | $ | 16,565 | |
| | | Class F | | |
| | | Year Ended | | |
| | | December 31, | | |
| | | 2007(4) | | |
| Net asset value, beginning of period | | $ | 102.10 | | |
| INVESTMENT ACTIVITIES: | | | | | |
| Net investment income / (loss) | | | 0.01 | | |
| Net realized and unrealized gains / (losses) | | | 2.65 | | |
| Total from Investment Activities | | | 2.66 | | |
| DISTRIBUTIONS: | | | | | |
| Net investment income | | | — | | |
| Net realized gains | | | — | | |
| Total Distributions | | | — | | |
| Net asset value, end of period | | $ | 104.76 | | |
| | | | | | |
| Total return | | | 2.61 | % | |
| RATIOS / SUPPLEMENTAL DATA: | | | | | |
Ratio of expenses to average net assets – net(2) | | | 1.15 | %(5) | |
| Ratio of expenses to average net assets – gross | | | 0.75 | %(5) | |
| Ratio of net investment income / (loss) to average net assets | | | 0.25 | %(5) | |
Portfolio turnover rate (3) | | | 47.52 | % | |
| Net assets, end of period (000’s) | | $ | 1 | | |
(1) | Per share amounts are based on average shares outstanding. |
(2) | Net expenses represent gross expenses reduced by fees waived and/or reimbursed by the Adviser. |
(3) | Portfolio Turnover is calculated on the basis of the Fund as a whole without distinguishing between the classes of shares issued. |
(4) | Portfolio commenced operations on December 17, 2007. |
(5) | Annualized. |
The accompanying notes are an integral part of the financial statements.
Summit Mutual Funds, Inc. – Pinnacle Series |
| EAFE INTERNATIONAL INDEX PORTFOLIO | SCHEDULE OF INVESTMENTS |
DECEMBER 31, 2007 | | | | | | |
| | | SHARES | | | VALUE | |
COMMON STOCKS - 99.2% | | | | | | |
Australia - 6.3% | | | | | | |
| AGL Energy Ltd. | | | 4,193 | | | $ | 49,040 | |
| Alumina Ltd. | | | 10,787 | | | | 60,333 | |
| Amcor Ltd. | | | 7,772 | | | | 47,155 | |
| AMP Ltd. | | | 15,967 | | | | 139,497 | |
| Aristocrat Leisure Ltd. | | | 2,454 | | | | 24,241 | |
| Australia & New Zealand Banking Group Ltd. | | | 15,231 | | | | 367,238 | |
| Australian Stock Exchange Ltd. | | | 1,423 | | | | 75,592 | |
| AXA Asia Pacifica Holdings Ltd. | | | 8,433 | | | | 54,646 | |
| Babcock & Brown Ltd. | | | 2,126 | | | | 50,682 | |
| Bendigo Bank Ltd. | | | 2,465 | | | | 31,946 | |
| BHP Billiton Ltd. | | | 26,658 | | | | 939,557 | |
| Billabong International Ltd. | | | 1,824 | | | | 23,735 | |
| BlueScope Steel Ltd. | | | 7,043 | | | | 59,676 | |
Boart Longyear Group (a) | | | 11,446 | | | | 23,618 | |
| Boral Ltd. | | | 6,513 | | | | 34,999 | |
| Caltex Australia Ltd. | | | 1,232 | | | | 20,954 | |
| Centro Properties Group | | | 9,499 | | | | 8,424 | |
| CFS Retail Property Trust | | | 22,423 | | | | 46,071 | |
| Challenger Financial Services Group Ltd. | | | 4,668 | | | | 20,453 | |
| Coca-Cola Amatil Ltd. | | | 5,406 | | | | 44,999 | |
| Cochlear Ltd. | | | 558 | | | | 36,697 | |
| Commonwealth Bank of Australia | | | 10,568 | | | | 548,401 | |
| Computershare Ltd. | | | 4,023 | | | | 34,900 | |
| Consolidated Media Holdings | | | 15,898 | | | | 58,629 | |
Crown Ltd. (a) | | | 1,182 | | | | 13,954 | |
| CSL Ltd. | | | 4,722 | | | | 150,754 | |
| CSR Ltd. | | | 9,089 | | | | 24,740 | |
DB RREEF Trust (a) | | | 26,689 | | | | 46,868 | |
| Fairfax Media Ltd. | | | 11,567 | | | | 47,532 | |
Fortescue Metals Group (a) | | | 9,770 | | | | 64,339 | |
| Foster’s Group Ltd. | | | 16,992 | | | | 97,725 | |
| Goodman Fielder Ltd. | | | 14,248 | | | | 23,707 | |
Goodman Group (a) | | | 13,454 | | | | 57,767 | |
| GPT Group | | | 18,319 | | | | 64,983 | |
| Harvey Norman Holdings Ltd. | | | 5,999 | | | | 35,818 | |
| Insurance Australia Group Ltd. | | | 15,198 | | | | 54,980 | |
| Leighton Holdings Ltd. | | | 1,151 | | | | 61,851 | |
| Lend Lease Corp. Ltd. | | | 3,544 | | | | 53,834 | |
| Macquarie Airports Management Ltd. | | | 6,483 | | | | 23,054 | |
| Macquarie Gourp Ltd. | | | 2,254 | | | | 150,809 | |
| Macquarie Infrastructure Group | | | 20,115 | | | | 53,516 | |
| Mirvac Group | | | 9,273 | | | | 48,853 | |
| National Australia Bank Ltd. | | | 13,993 | | | | 464,308 | |
| Newcrest Mining Ltd. | | | 4,266 | | | | 123,984 | |
| OneSteel Ltd. | | | 6,392 | | | | 34,517 | |
| Orica Ltd. | | | 2,469 | | | | 68,831 | |
| Origin Energy Ltd. | | | 8,338 | | | | 64,792 | |
| Oxiana Ltd. | | | 10,799 | | | | 32,997 | |
Paladin Energy Ltd. (a) | | | 3,999 | | | | 23,842 | |
| Qantas Airways Ltd. | | | 9,616 | | | | 45,932 | |
| QBE Insurance Group Ltd. | | | 7,292 | | | | 213,467 | |
| Rio Tinto Ltd. | | | 2,198 | | | | 258,517 | |
| Santos Ltd. | | | 5,202 | | | | 64,495 | |
| Sonic Healthcare Ltd. | | | 3,340 | | | | 49,034 | |
| St. George Bank Ltd. | | | 2,302 | | | | 63,852 | |
| Stockland | | | 13,366 | | | | 98,817 | |
| | | SHARES | | | VALUE | |
Australia - 6.3% (Continued) | | | | | | |
| Suncorp-Metway Ltd. | | | 8,003 | | | $ | 118,897 | |
| TABCORP Holdings Ltd. | | | 5,340 | | | | 69,300 | |
| Tatts Group Ltd. | | | 10,389 | | | | 36,397 | |
| Telstra Corporation Ltd. | | | 13,194 | | | | 36,724 | |
| Telstra Corp. | | | 23,583 | | | | 97,116 | |
| Toll Holdings Ltd. | | | 5,127 | | | | 51,545 | |
| Transurban Group | | | 9,446 | | | | 56,731 | |
Wesfarmers Ltd. - PPS (a) | | | 2,525 | | | | 90,236 | |
| Wesfarmers Ltd. | | | 5,733 | | | | 203,872 | |
Westfield Group (a) | | | 14,917 | | | | 275,055 | |
| Westpac Banking Corp. | | | 14,567 | | | | 357,111 | |
| Woodside Petroleum Ltd. | | | 4,015 | | | | 177,643 | |
| Woolworths Ltd. | | | 9,727 | | | | 290,301 | |
| WorleyParsons Ltd. | | | 1,091 | | | | 49,813 | |
| Zinifex Ltd. | | | 4,678 | | | | 50,933 | |
| | | | | | | | 7,445,626 | |
Austria - 0.6% | | | | | | | | |
| Erste Bank der Oesterreichischen Sparkassen AG | | | 1,537 | | | | 108,988 | |
Immoeast AG (a) | | | 3,300 | | | | 35,559 | |
| IMMOFINANZ AG | | | 5,806 | | | | 58,996 | |
Meinl European Land (a) | | | 3,544 | | | | 48,862 | |
| Oesterreischeische Elektrizitaetswirtschafts AG | | | 686 | | | | 48,022 | |
| OMV AG | | | 1,498 | | | | 121,378 | |
| Raiffeisen International Bank-Holding AG | | | 304 | | | | 46,046 | |
| Telekom Austria AG | | | 3,225 | | | | 89,729 | |
| Voestalpine AG | | | 1,041 | | | | 75,263 | |
| Wienerberger AG | | | 901 | | | | 49,966 | |
| | | | | | | | 682,809 | |
Belgium - 1.2% | | | | | | | | |
| Belgacom SA | | | 1,638 | | | | 80,802 | |
| Colruyt SA | | | 155 | | | | 36,492 | |
| Delhaize Group | | | 806 | | | | 70,941 | |
| Dexia | | | 4,593 | | | | 115,703 | |
| Fortis | | | 17,334 | | | | 456,431 | |
| Groupe Bruxelles Lambert SA | | | 857 | | | | 110,100 | |
| Inbev | | | 1,507 | | | | 125,589 | |
| KBC Groep NV | | | 1,483 | | | | 208,583 | |
| Mobistar SA | | | 402 | | | | 36,587 | |
| Solvay SA | | | 575 | | | | 80,453 | |
| UCB SA | | | 1,011 | | | | 45,852 | |
| Umicore | | | 211 | | | | 52,444 | |
| | | | | | | | 1,419,977 | |
China - 0.0% | | | | | | | | |
| C C Land Holdings Ltd. | | | 6,655 | | | | 9,696 | |
| Fosun International (a) | | | 9,839 | | | | 9,211 | |
| | | | | | | | 18,907 | |
The accompanying notes are an integral part of the financial statements.
Summit Mutual Funds, Inc. – Pinnacle Series |
| SCHEDULE OF INVESTMENTS | EAFE INTERNATIONAL INDEX PORTFOLIO |
| | | SHARES | | | VALUE | |
Denmark - 1.0% | | | | | | |
| AP Moller - Maersk A/S | | | 12 | | | $ | 127,999 | |
| Carlsberg A/G | | | 284 | | | | 34,358 | |
Coloplast A/S - B Shares (a) | | | 381 | | | | 33,057 | |
| Danisco A/S | | | 635 | | | | 45,010 | |
| Danske Bank A/S | | | 3,895 | | | | 152,553 | |
| DSV A/S | | | 2,058 | | | | 45,094 | |
| FLSmidth & Co A/S | | | 501 | | | | 51,278 | |
Jyske Bank A/S (a) | | | 612 | | | | 48,239 | |
| Novo-Nordisk A/S - Class B | | | 5,982 | | | | 392,931 | |
| Novozymes A/S | | | 436 | | | | 49,755 | |
| Rockwool International | | | 95 | | | | 22,129 | |
| Sydbank A/S | | | 878 | | | | 37,745 | |
Topdanmark A/S (a) | | | 242 | | | | 34,829 | |
Vestas Wind Systems A/S (a) | | | 1,480 | | | | 160,187 | |
William Demant Holding A/S (a) | | | 255 | | | | 23,650 | |
| | | | | | | | 1,258,814 | |
Finland - 1.9% | | | | | | | | |
| Cargotec Corp. - B Shares | | | 475 | | | | 21,980 | |
| Elisa Corporation | | | 1,567 | | | | 48,112 | |
| Fortum OYJ | | | 3,794 | | | | 170,904 | |
| Kesko OYJ - B Shares | | | 622 | | | | 34,302 | |
| Kone OYJ | | | 664 | | | | 46,531 | |
| Metso OYJ | | | 1,143 | | | | 62,383 | |
| Neste Oil OYJ | | | 1,412 | | | | 49,814 | |
| Nokia OYJ | | | 32,891 | | | | 1,275,304 | |
| Nokian Renkaat OYJ | | | 973 | | | | 34,213 | |
| Oko Bank | | | 1,198 | | | | 22,893 | |
| Orion OYJ | | | 987 | | | | 23,132 | |
| Outokumpu OYJ | | | 1,211 | | | | 37,553 | |
| Rautaruukki OYJ | | | 800 | | | | 34,680 | |
| Sampo OYJ | | | 4,163 | | | | 110,044 | |
| Sanoma Wsoy OYJ | | | 1,286 | | | | 36,908 | |
| Stora Enso OYJ | | | 5,353 | | | | 80,142 | |
| UPM-Kymmene OYJ | | | 4,632 | | | | 93,592 | |
| Wartsila OYJ - B Shares | | | 623 | | | | 47,447 | |
| YIT OYJ | | | 1,560 | | | | 34,189 | |
| | | | | | | | 2,264,123 | |
France - 10.6% | | | | | | | | |
| Accor SA | | | 1,883 | | | | 150,592 | |
| Aeroports de Paris | | | 329 | | | | 33,671 | |
| Air France-KLM | | | 1,416 | | | | 49,790 | |
| Air Liquide | | | 1,966 | | | | 292,585 | |
| Alcatel-Lucent | | | 19,958 | | | | 144,439 | |
| Alstom | | | 891 | | | | 191,495 | |
| ArcelorMittal | | | 7,870 | | | | 612,023 | |
Atos Origin SA (a) | | | 666 | | | | 34,421 | |
| AXA SA | | | 13,205 | | | | 528,802 | |
| BNP Paribas SA | | | 7,010 | | | | 760,680 | |
| Bouygues SA | | | 1,900 | | | | 158,340 | |
Business Objects SA (a) | | | 780 | | | | 47,669 | |
| Cap Gemini SA | | | 1,298 | | | | 81,603 | |
| Carrefour SA | | | 5,198 | | | | 404,991 | |
| Casino Guichard Perrachon SA | | | 438 | | | | 47,638 | |
| Cie de Saint-Gobain | | | 2,654 | | | | 250,240 | |
Cie Generale de Geophysiqu (a) | | | 202 | | | | 57,590 | |
| | | SHARES | | | VALUE | |
France - 10.6% (Continued) | | | | | | |
| CNP Assurances | | | 397 | | | $ | 51,653 | |
| Compagnie Generale des Etablissements Michelin - B Shares | | | 1,288 | | | | 147,825 | |
| Credit Agricole SA | | | 5,277 | | | | 177,991 | |
| Dassault Systemes SA | | | 612 | | | | 36,229 | |
| Eiffage | | | 213 | | | | 20,977 | |
| Electricite de France | | | 697 | | | | 83,032 | |
| Essilor International SA | | | 1,910 | | | | 121,893 | |
| France Telecom SA | | | 15,522 | | | | 558,726 | |
| Gaz de France | | | 1,691 | | | | 98,893 | |
| Groupe Danone | | | 3,781 | | | | 339,420 | |
| Hermes International | | | 665 | | | | 84,043 | |
| Imerys SA | | | 430 | | | | 35,357 | |
| JC Decaux Sa | | | 606 | | | | 23,833 | |
| Klepierre | | | 724 | | | | 37,017 | |
| Lafarge SA | | | 1,245 | | | | 226,622 | |
| Lagardere S.C.A. | | | 1,190 | | | | 89,237 | |
| Legrand SA | | | 334 | | | | 11,402 | |
| L’Oreal SA | | | 2,162 | | | | 309,711 | |
| LVMH Moet Hennessy Louis Vuitton SA | | | 2,083 | | | | 251,798 | |
| Natixis | | | 1,737 | | | | 33,370 | |
| Neopost SA | | | 330 | | | | 34,010 | |
| PagesJaunes Groupe SA | | | 1,702 | | | | 34,116 | |
| Pernod-Ricard SA | | | 750 | | | | 173,363 | |
| Peugeot SA | | | 1,452 | | | | 110,072 | |
| PPR SA | | | 731 | | | | 117,564 | |
| Publicis Groupe | | | 1,336 | | | | 52,309 | |
| Renault SA | | | 1,615 | | | | 229,061 | |
| Safran SA | | | 1,879 | | | | 38,543 | |
| Sanofi-Aventis | | | 8,542 | | | | 786,548 | |
| Schneider Electric SA | | | 1,870 | | | | 253,391 | |
| Scor SE | | | 1,395 | | | | 35,680 | |
| Societe Generale | | | 3,128 | | | | 452,437 | |
| Societe Television Francaise 1 | | | 1,322 | | | | 35,371 | |
| Sodexho Alliance SA | | | 972 | | | | 59,687 | |
| Suez SA | | | 9,142 | | | | 622,458 | |
| Technip SA | | | 914 | | | | 72,829 | |
| Thales SA | | | 815 | | | | 48,557 | |
| Thomson | | | 2,356 | | | | 33,516 | |
| Total SA | | | 18,631 | | | | 1,548,021 | |
| Unibail | | | 585 | | | | 128,227 | |
| Valeo SA | | | 750 | | | | 30,922 | |
| Vallourec SA | | | 438 | | | | 118,566 | |
| Veolia Environnement | | | 2,910 | | | | 265,698 | |
| Vinci SA | | | 2,873 | | | | 212,754 | |
| Vivendi Universal SA | | | 9,803 | | | | 449,754 | |
| Zodiac SA | | | 564 | | | | 36,068 | |
| | | | | | | | 12,565,120 | |
Germany - 8.9% | | | | | | | | |
| Adidas AG | | | 1,943 | | | | 145,618 | |
| Allianz AG | | | 3,829 | | | | 828,254 | |
| BASF AG | | | 4,119 | | | | 610,711 | |
| Bayer AG | | | 6,299 | | | | 575,868 | |
| Bayerische Motoren Werke AG | | | 1,587 | | | | 98,264 | |
| Beiersdorf AG | | | 893 | | | | 69,197 | |
| Bilfinger Berger AG | | | 312 | | | | 24,076 | |
| Celesio AG | | | 825 | | | | 51,263 | |
| Commerzbank AG | | | 4,931 | | | | 189,318 | |
The accompanying notes are an integral part of the financial statements.
Summit Mutual Funds, Inc. – Pinnacle Series |
| EAFE INTERNATIONAL INDEX PORTFOLIO | SCHEDULE OF INVESTMENTS |
| | | SHARES | | | VALUE | |
Germany - 8.9% (Continued) | | | | | | |
| Continental AG | | | 1,422 | | | $ | 185,014 | |
| Daimler AG | | | 7,962 | | | | 774,117 | |
| Deutsche Bank AG | | | 4,256 | | | | 556,291 | |
| Deutsche Boerse AG | | | 1,659 | | | | 329,268 | |
| Deutsche Lufthansa AG | | | 2,273 | | | | 60,550 | |
| Deutsche Post AG | | | 6,636 | | | | 228,098 | |
| Deutsche Postbank AG | | | 820 | | | | 72,832 | |
| Deutsche Telekom AG | | | 24,450 | | | | 536,923 | |
| E.ON AG | | | 5,229 | | | | 1,113,046 | |
| Fresenius Medical Care AG | | | 1,687 | | | | 90,495 | |
| Fresenius SE | | | 417 | | | | 34,691 | |
Gea Group AG (a) | | | 1,363 | | | | 47,428 | |
| HeidelbergCement AG | | | 146 | | | | 22,627 | |
| Hochtief AG | | | 376 | | | | 50,575 | |
| Hypo Real Estate Holding AG | | | 1,781 | | | | 94,001 | |
Infineon Technologies AG (a) | | | 6,027 | | | | 71,111 | |
| IVG Immobilien AG | | | 935 | | | | 32,234 | |
| K&S AG | | | 271 | | | | 64,484 | |
Karstadt Quelle AG (a) | | | 825 | | | | 19,589 | |
| Linde AG | | | 991 | | | | 131,052 | |
| MAN AG | | | 980 | | | | 163,054 | |
| Merck KGaA | | | 546 | | | | 70,488 | |
| Metro AG | | | 1,440 | | | | 120,932 | |
| Muenchener Rueckversicherungs AG | | | 1,765 | | | | 343,055 | |
| Puma AG Rudolf Dassler Sport | | | 59 | | | | 23,549 | |
Q-cells AG (a) | | | 367 | | | | 52,370 | |
| Rheinmetall AG | | | 302 | | | | 24,011 | |
| RWE AG | | | 3,928 | | | | 551,322 | |
| Salzgitter AG | | | 395 | | | | 58,935 | |
| SAP AG | | | 7,550 | | | | 392,198 | |
| Siemens AG | | | 7,062 | | | | 1,123,981 | |
| Solarworld AG | | | 617 | | | | 37,662 | |
| ThyssenKrupp AG | | | 3,017 | | | | 169,162 | |
TUI AG (a) | | | 1,719 | | | | 48,079 | |
| Volkswagen AG | | | 1,383 | | | | 315,637 | |
| | | | | | | | 10,601,430 | |
Greece - 0.8% | | | | | | | | |
| Alpha Bank AE | | | 3,503 | | | | 127,527 | |
| Coca-Cola Hellenic Bottling Co. SA | | | 1,417 | | | | 61,302 | |
| EFG Eurobank Ergasias SA | | | 2,798 | | | | 98,507 | |
| Hellenic Telecommunications Organization SA | | | 2,985 | | | | 109,978 | |
| National Bank of Greece SA | | | 3,286 | | | | 225,706 | |
| OPAP SA | | | 2,141 | | | | 85,832 | |
| Piraeus Bank SA | | | 2,774 | | | | 108,288 | |
| Public Power Corp. | | | 977 | | | | 51,423 | |
| Titan Cement Co SA | | | 797 | | | | 36,356 | |
| | | | | | | | 904,919 | |
Hong Kong - 2.2% | | | | | | | | |
| Bank of East Asia Ltd. | | | 12,579 | | | | 86,066 | |
| Belle International Holdings | | | 17,416 | | | | 26,311 | |
| BOC Hong Kong Holdings Ltd. | | | 27,607 | | | | 77,361 | |
| Cathay Pacific Airways Ltd. | | | 13,804 | | | | 36,115 | |
| Cheung Kong Holdings Ltd. | | | 11,647 | | | | 215,392 | |
| CLP Holdings Ltd. | | | 12,146 | | | | 82,947 | |
| Esprit Holdings Ltd. | | | 8,613 | | | | 128,133 | |
Foxconn International Holdings Ltd. (a) | | | 19,351 | | | | 43,430 | |
| Hang Lung Properties Ltd. | | | 15,508 | | | | 70,207 | |
| | | SHARES | | | VALUE | |
Hong Kong - 2.2% (Continued) | | | | | | |
| Hang Seng Bank Ltd. | | | 5,605 | | | $ | 115,660 | |
| Henderson Land Development Co. Ltd. | | | 7,722 | | | | 72,740 | |
| Hong Kong & China Gas Co. Ltd. | | | 28,235 | | | | 86,544 | |
| Hong Kong Aircraft | | | 804 | | | | 21,880 | |
| Hong Kong Exchanges and Clearing Ltd. | | | 8,249 | | | | 234,011 | |
| HongKong Electric Holdings Ltd. | | | 13,423 | | | | 77,208 | |
| Hopewell Holdings Ltd. | | | 5,085 | | | | 23,477 | |
| Hutchison Telecomunications International Ltd. | | | 16,849 | | | | 25,325 | |
| Hutchison Whampoa Ltd. | | | 17,330 | | | | 196,583 | |
| Kerry Properties Ltd. | | | 5,370 | | | | 43,146 | |
| Kingboard Chemical Holdings Ltd. | | | 6,546 | | | | 38,953 | |
| Lee & Man Paper Manufacturing | | | 2,705 | | | | 11,882 | |
| Li & Fung Ltd. | | | 17,636 | | | | 71,246 | |
| Link REIT | | | 21,924 | | | | 47,462 | |
| MTR Corp. Ltd. | | | 10,710 | | | | 39,420 | |
| New World Development Co. Ltd. | | | 19,244 | | | | 68,240 | |
| Noble Group Ltd. | | | 7,544 | | | | 12,735 | |
| Orient Overseas International Ltd. | | | 1,502 | | | | 11,115 | |
| Pacific Basin Shipping Ltd. | | | 13,105 | | | | 21,143 | |
| PCCW Ltd. | | | 39,904 | | | | 23,695 | |
| Shangri-La Asia Ltd. | | | 11,794 | | | | 37,058 | |
| Shui On Land Ltd. | | | 18,919 | | | | 22,080 | |
| Shun Tak Holdings | | | 7,937 | | | | 12,479 | |
| Sino Land Co. | | | 10,073 | | | | 35,784 | |
| Sun Hung Kai Properties Ltd. | | | 10,037 | | | | 213,164 | |
| Swire Pacific Ltd. - Class A | | | 6,934 | | | | 95,597 | |
| Tencent Holdings Ltd. | | | 6,727 | | | | 50,944 | |
| Tingyi Cayman Islands Holding Corp. | | | 15,503 | | | | 25,052 | |
| Wharf Holdings Ltd. | | | 10,183 | | | | 53,348 | |
| Wing Hang Bank Ltd. | | | 1,880 | | | | 28,137 | |
| | | | | | | | 2,582,070 | |
Ireland (Republic of) - 0.8% | | | | | | | | |
| Allied Irish Banks Plc | | | 7,072 | | | | 162,032 | |
| Anglo Irish Bank Corp Plc | | | 3,059 | | | | 48,928 | |
| Bank of Ireland | | | 8,742 | | | | 130,267 | |
| CRH Plc | | | 4,376 | | | | 152,591 | |
Elan Corp. Plc (a) | | | 4,012 | | | | 86,766 | |
| Experian Group Ltd. | | | 9,717 | | | | 76,791 | |
Invesco Ltd. (a) | | | 2,840 | | | | 89,119 | |
| Irish Life & Permanent Plc | | | 2,535 | | | | 43,771 | |
| Kerry Group Plc | | | 1,585 | | | | 50,287 | |
| Kingspan Group | | | 1,183 | | | | 17,901 | |
Ryanair Holdings Plc (a) | | | 3,628 | | | | 24,755 | |
Smurfit Kappa Group Plc (a) | | | 1,416 | | | | 23,173 | |
| | | | | | | | 906,381 | |
Italy - 4.0% | | | | | | | | |
| Alleanza Assicurazioni SpA | | | 4,511 | | | | 58,632 | |
| Assicurazioni Generali SpA | | | 8,744 | | | | 396,310 | |
| Autostrade SpA | | | 2,191 | | | | 83,063 | |
| Banca Monte dei Paschi di Siena SpA | | | 10,758 | | | | 57,921 | |
| Banca Popolare di Milano Scarl | | | 4,153 | | | | 56,590 | |
Banco Popolare Scarl (a) | | | 5,988 | | | | 132,722 | |
| Bulgari SpA | | | 2,554 | | | | 35,698 | |
| Enel SpA | | | 36,890 | | | | 438,762 | |
| ENI SpA | | | 22,386 | | | | 819,874 | |
| Fiat SpA | | | 6,393 | | | | 165,440 | |
| Finmeccanica SpA | | | 2,860 | | | | 91,867 | |
| Fondiaria - SAI SpA | | | 828 | | | | 34,138 | |
The accompanying notes are an integral part of the financial statements.
Summit Mutual Funds, Inc. – Pinnacle Series |
| SCHEDULE OF INVESTMENTS | EAFE INTERNATIONAL INDEX PORTFOLIO |
| | | SHARES | | | VALUE | |
Italy - 4.0% (Continued) | | | | | | |
Instituto Finanziario Industriale SpA (a) | | | 682 | | | $ | 23,233 | |
| Intesa Sanpaola | | | 70,879 | | | | 560,632 | |
| Luxottica Group SpA | | | 1,500 | | | | 47,678 | |
| Mediaset SpA | | | 7,517 | | | | 75,888 | |
| Mediobanca SpA | | | 4,753 | | | | 98,122 | |
| Parmalat SpA | | | 15,709 | | | | 61,093 | |
Pirelli & Co. (a) | | | 29,948 | | | | 32,970 | |
Prysmian Spa (a) | | | 1,415 | | | | 34,942 | |
| Saipem SpA | | | 1,213 | | | | 48,646 | |
| Snam Rete Gas SpA | | | 9,425 | | | | 60,218 | |
| Telecom Italia SpA - RNC | | | 51,900 | | | | 123,382 | |
| Telecom Italia SpA | | | 93,278 | | | | 289,802 | |
| Terna Rete Electrica Nazionale | | | 14,805 | | | | 59,688 | |
| Unicredito Italiano SpA | | | 79,288 | | | | 658,444 | |
| Unione di Banche Italiane SCPA | | | 5,532 | | | | 152,137 | |
| Unipol | | | 10,348 | | | | 32,793 | |
| | | | | | | | 4,730,685 | |
Japan - 19.4% | | | | | | | | |
| The 77 Bank Ltd. | | | 3,482 | | | | 21,787 | |
| Acom Co. Ltd. | | | 490 | | | | 10,022 | |
| Advantest Corp. | | | 1,257 | | | | 35,781 | |
| Aeon Co. Ltd. | | | 5,450 | | | | 79,910 | |
| Aiful Corp. | | | 604 | | | | 10,792 | |
| Aisin Seiki Co. Ltd. | | | 1,821 | | | | 75,960 | |
| Ajinomoto Co., Inc. | | | 6,496 | | | | 73,906 | |
| Alfresa Holdings | | | 414 | | | | 24,977 | |
| Alps Electric Co. Ltd. | | | 1,878 | | | | 24,359 | |
| Amada Co. Ltd. | | | 3,760 | | | | 33,051 | |
| Asahi Breweries Ltd. | | | 4,042 | | | | 68,455 | |
| Asahi Glass Co. Ltd. | | | 7,758 | | | | 104,097 | |
| Asahi Kasei Corp. | | | 10,351 | | | | 68,936 | |
| Asics Corp. | | | 1,589 | | | | 22,900 | |
| Astellas Pharma, Inc. | | | 4,221 | | | | 184,006 | |
| The Bank of Kyoto Ltd. | | | 2,726 | | | | 32,356 | |
| The Bank of Yokohama Ltd. | | | 9,212 | | | | 64,649 | |
| Benesse Corp. | | | 574 | | | | 24,509 | |
| Bridgestone Corp. | | | 5,031 | | | | 89,528 | |
| Canon, Inc. | | | 8,908 | | | | 414,641 | |
| Casio Computer Co. Ltd. | | | 2,964 | | | | 34,465 | |
| Central Japan Railway Co. | | | 13 | | | | 110,898 | |
| The Chiba Bank Ltd. | | | 6,901 | | | | 56,214 | |
| Chiyoda Corp. | | | 928 | | | | 10,575 | |
| Chubu Electric Power Co., Inc. | | | 5,516 | | | | 143,930 | |
| Chugai Pharmaceutical Co. Ltd. | | | 2,694 | | | | 38,584 | |
| Chuo Mitsui Trust Holdings, Inc. | | | 7,204 | | | | 55,264 | |
| Citizen Watch Co. Ltd. | | | 3,393 | | | | 33,075 | |
| Cosmo Oil Co Ltd. | | | 5,933 | | | | 22,306 | |
| Credit Saison Co. Ltd. | | | 1,649 | | | | 45,168 | |
| CSK Holdings Corp. | | | 718 | | | | 23,266 | |
| Dai Nippon Printing Co. Ltd. | | | 5,676 | | | | 83,477 | |
| Daido Steel Co. | | | 3,171 | | | | 23,815 | |
| Daiichi Sankyo Co. Ltd. | | | 6,279 | | | | 193,347 | |
| Daikin Industries Ltd. | | | 2,354 | | | | 131,907 | |
| Dainippon Ink and Chemicals, Inc. | | | 7,257 | | | | 36,378 | |
| Daito Trust Construction Co. Ltd. | | | 758 | | | | 42,000 | |
| Daiwa House Industry Co. Ltd. | | | 4,438 | | | | 57,325 | |
| Daiwa Securities Group, Inc. | | | 11,572 | | | | 105,242 | |
| | | SHARES | | | VALUE | |
Japan - 19.4% (Continued) | | | | | | |
| Denki Kagaku KK | | | 4,649 | | | $ | 20,266 | |
| Denso Corp. | | | 4,116 | | | | 168,744 | |
| Dentsu, Inc. | | | 18 | | | | 47,693 | |
| East Japan Railway Co. | | | 30 | | | | 247,594 | |
| Eisai Co. Ltd. | | | 2,190 | | | | 86,255 | |
| Electric Power Development Co. Ltd. | | | 1,298 | | | | 48,451 | |
Elpida Memory, Inc. (a) | | | 711 | | | | 24,694 | |
| Fanuc Ltd. | | | 1,654 | | | | 161,084 | |
| Fast Retailing Co. Ltd. | | | 535 | | | | 38,216 | |
| Fuji Electric Holdings Co. Ltd. | | | 6,741 | | | | 23,593 | |
| FUJIFILM Holdings Corp. | | | 3,925 | | | | 166,184 | |
| Fujikura Ltd. | | | 4,742 | | | | 24,110 | |
| Fujitsu Ltd. | | | 17,274 | | | | 116,433 | |
| Fukuoka Financial Group, Inc. | | | 7,460 | | | | 43,672 | |
| The Furukawa Electric Co. | | | 5,701 | | | | 22,148 | |
| The Gunma Bank Ltd. | | | 4,904 | | | | 32,396 | |
| Hachijuni Bank | | | 4,579 | | | | 30,905 | |
| Hankyu Hanshin Holdings, Inc. | | | 10,385 | | | | 44,900 | |
| Haseko Corp. | | | 5,987 | | | | 10,343 | |
| Hirose Electric Co. Ltd. | | | 321 | | | | 37,124 | |
| Hiroshima Bank | | | 6,024 | | | | 32,677 | |
| Hitachi Chemical Co. Ltd. | | | 1,028 | | | | 23,695 | |
| Hitachi Construction Machinery Co. Ltd. | | | 1,066 | | | | 31,966 | |
| Hitachi Ltd. | | | 28,503 | | | | 212,532 | |
| Hokkaido Electric Power Co., Inc. | | | 2,098 | | | | 45,447 | |
| Hokuhoku Financial Group, Inc. | | | 10,747 | | | | 31,265 | |
| Honda Motor Co. Ltd. | | | 13,076 | | | | 438,929 | |
| HOYA Corp. | | | 3,877 | | | | 123,548 | |
| Ibiden Co. Ltd. | | | 1,089 | | | | 75,547 | |
| Idemitsu Kosan Co Ltd. | | | 218 | | | | 23,124 | |
| IHI Corp. | | | 10,972 | | | | 22,884 | |
| Inpex Holdings, Inc. | | | 8 | | | | 86,649 | |
| Isetan Co. Ltd. | | | 2,404 | | | | 32,687 | |
| Isuzu Motors | | | 5,266 | | | | 23,946 | |
| ITOCHU Corp. | | | 13,517 | | | | 132,127 | |
J Front Retailing Co Ltd. (a) | | | 3,697 | | | | 32,663 | |
Japan Airlines Corp. (a) | | | 9,000 | | | | 20,543 | |
| Japan Petroleum Ex | | | 306 | | | | 22,379 | |
| Japan Real Estate Investment Corp. | | | 4 | | | | 50,128 | |
| Japan Retail Fund Investment Corp. | | | 3 | | | | 21,403 | |
| Japan Steel Works Ltd. | | | 3,202 | | | | 47,207 | |
| Japan Tobacco, Inc. | | | 37 | | | | 221,242 | |
| JFE Holdings, Inc. | | | 4,780 | | | | 242,177 | |
| JGC Corp. | | | 1,990 | | | | 34,362 | |
| The Joyo Bank Ltd. | | | 5,951 | | | | 33,293 | |
| JS Group Corp. | | | 2,144 | | | | 34,334 | |
| JSR Corp. | | | 1,459 | | | | 37,678 | |
| JTEKT Corp. | | | 2,094 | | | | 37,676 | |
| Kajima Corp. | | | 7,345 | | | | 23,998 | |
| Kamigumi Co. Ltd. | | | 4,563 | | | | 33,044 | |
| Kaneka Corp. | | | 2,950 | | | | 24,452 | |
| The Kansai Electric Power Co. Inc. | | | 6,362 | | | | 148,351 | |
| Kao Corp. | | | 4,697 | | | | 141,269 | |
| Kawasaki Heavy Industries Ltd. | | | 14,984 | | | | 44,396 | |
| Kawasaki Kisen Kaisha Ltd. | | | 5,537 | | | | 54,421 | |
| KDDI Corp. | | | 21 | | | | 156,398 | |
| Keihin Electric Express Railway Co. Ltd. | | | 5,396 | | | | 33,183 | |
| Keio Corp. | | | 7,355 | | | | 44,638 | |
The accompanying notes are an integral part of the financial statements.
Summit Mutual Funds, Inc. – Pinnacle Series |
| EAFE INTERNATIONAL INDEX PORTFOLIO | SCHEDULE OF INVESTMENTS |
| | | SHARES | | | VALUE | |
Japan - 19.4% (Continued) | | | | | | |
| Keyence Corp. | | | 295 | | | $ | 72,803 | |
| Kikkoman Corp. | | | 1,707 | | | | 23,485 | |
| Kintetsu Corp. | | | 14,251 | | | | 44,265 | |
| Kirin Holdings Co. | | | 6,774 | | | | 99,504 | |
| Kobe Steel Ltd. | | | 22,222 | | | | 72,406 | |
| Komatsu Ltd. | | | 7,564 | | | | 205,832 | |
| Konami Corp. | | | 769 | | | | 25,194 | |
| Konica Minolta Holdings, Inc. | | | 4,412 | | | | 78,157 | |
| Kubota Corp. | | | 9,833 | | | | 66,630 | |
| Kuraray Co. Ltd. | | | 3,940 | | | | 47,930 | |
| Kurita Water Industries Ltd. | | | 1,225 | | | | 37,173 | |
| Kyocera Corp. | | | 1,469 | | | | 130,312 | |
| Kyowa Hakko Kogyo Co. Ltd. | | | 3,132 | | | | 33,475 | |
| Kyushu Electric Power Co., Inc. | | | 3,405 | | | | 83,818 | |
| Lawson, Inc. | | | 661 | | | | 23,431 | |
| Leopalace 21 Corp. | | | 1,237 | | | | 33,329 | |
| Makita Corp. | | | 1,099 | | | | 46,630 | |
| Marubeni Corp. | | | 14,750 | | | | 104,702 | |
| Marui Co. Ltd. | | | 3,469 | | | | 34,251 | |
| Matsushita Electric Industrial Co. Ltd. | | | 16,787 | | | | 347,866 | |
| Matsushita Electric Works Ltd. | | | 3,429 | | | | 37,969 | |
| Mazda Motor Corp. | | | 4,545 | | | | 22,702 | |
| Mediceo Paltac Holdings Co. Ltd. | | | 1,703 | | | | 25,229 | |
| Millea Holdings, Inc. | | | 6,470 | | | | 218,340 | |
| Minebea Co. | | | 3,817 | | | | 24,498 | |
Mitsubishi Chemical Holdings (a) | | | 10,489 | | | | 80,558 | |
| Mitsubishi Electric Corp. | | | 16,054 | | | | 167,847 | |
| Mitsubishi Estate Co. Ltd. | | | 9,527 | | | | 229,828 | |
| Mitsubishi Gas Chemical Co. Ltd. | | | 3,589 | | | | 35,339 | |
| Mitsubishi Heavy Industries Ltd. | | | 28,616 | | | | 123,209 | |
| Mitsubishi Materials Corp. | | | 10,164 | | | | 43,489 | |
Mitsubishi Motors Corp. (a) | | | 12,791 | | | | 21,640 | |
| Mitsubishi Rayon Co. Ltd. | | | 4,313 | | | | 20,964 | |
| Mitsubishi UFJ Financial Group, Inc. | | | 63,102 | | | | 591,396 | |
| Mitsubishi Corp. | | | 11,722 | | | | 321,079 | |
| Mitsui & Co. Ltd. | | | 15,655 | | | | 331,415 | |
| Mitsui Chemicals, Inc. | | | 6,732 | | | | 44,231 | |
| Mitsui Engineering & Shipbuilding Co. | | | 8,369 | | | | 32,662 | |
| Mitsui Fudosan Co. Ltd. | | | 6,615 | | | | 143,888 | |
| Mitsui Mining & Smelting Co. Ltd. | | | 5,676 | | | | 22,762 | |
| Mitsui OSK Lines Ltd. | | | 9,634 | | | | 122,974 | |
| Mitsui Sumitomo Insurance Co. Ltd. | | | 9,817 | | | | 95,608 | |
| Mitsukoshi Ltd. | | | 4,803 | | | | 21,841 | |
| Mitsumi Electric | | | 633 | | | | 21,532 | |
| Mizuho Financial Group, Inc. | | | 76 | | | | 363,282 | |
| Murata Manufacturing Co. Ltd. | | | 1,827 | | | | 105,975 | |
| Namco Bandai Holdings, Inc. | | | 2,161 | | | | 33,794 | |
| NEC Corp. | | | 15,516 | | | | 71,528 | |
| NGK Insulators Ltd. | | | 2,443 | | | | 66,260 | |
| NGK Spark Plug Co. Ltd. | | | 2,056 | | | | 35,998 | |
| Nidec Corp. | | | 961 | | | | 71,227 | |
| Nikko Cordial Corp. | | | 3,173 | | | | 47,205 | |
| Nikon Corp. | | | 3,040 | | | | 105,311 | |
| Nintendo Co. Ltd. | | | 763 | | | | 456,919 | |
| Nippon Building Fund, Inc. | | | 4 | | | | 56,214 | |
| Nippon Electric Glass Co. Ltd. | | | 2,850 | | | | 46,584 | |
| Nippon Express Co. Ltd. | | | 6,913 | | | | 35,581 | |
| Nippon Mining Holdings, Inc. | | | 8,558 | | | | 54,850 | |
| | | SHARES | | | VALUE | |
Japan - 19.4% (Continued) | | | | | | |
| Nippon Oil Corp. | | | 10,537 | | | $ | 85,737 | |
| Nippon Paper Group, Inc. | | | 8 | | | | 24,061 | |
| Nippon Sheet Glass Co. Ltd. | | | 6,480 | | | | 33,121 | |
| Nippon Steel Corp. | | | 46,039 | | | | 285,181 | |
| Nippon Telegraph & Telephone Corp. | | | 44 | | | | 220,167 | |
| Nippon Yusen KK | | | 11,680 | | | | 92,842 | |
| Nipponkoa Insuranance Co. | | | 3,472 | | | | 31,607 | |
| The Nishi-Nippon City Bank Ltd. | | | 8,514 | | | | 21,339 | |
| Nissan Chemical Industries, Ltd. | | | 1,763 | | | | 23,056 | |
| Nissan Motor Co. Ltd. | | | 17,903 | | | | 197,115 | |
| Nisshin Steel Co. | | | 6,396 | | | | 22,500 | |
| Nissin Food Products Co. Ltd. | | | 964 | | | | 31,151 | |
| Nitori Co. Ltd. | | | 482 | | | | 23,126 | |
| Nitto Denko Corp. | | | 1,373 | | | | 72,758 | |
| NOK Corp. | | | 1,195 | | | | 25,405 | |
| Nomura Holdings, Inc. | | | 13,767 | | | | 233,527 | |
| Nomura Real Estate | | | 2 | | | | 18,977 | |
| Nomura Research Institute Ltd. | | | 1,006 | | | | 33,139 | |
| NSK Ltd. | | | 5,019 | | | | 52,385 | |
| NTN Corp. | | | 4,093 | | | | 35,575 | |
| NTT Data Corp. | | | 11 | | | | 48,937 | |
| NTT DoCoMo, Inc. | | | 125 | | | | 208,119 | |
| NTT Urban Development Corp. | | | 12 | | | | 19,442 | |
| Obayashi Corp. | | | 4,691 | | | | 23,599 | |
| Odakyu Electric Railway Co. Ltd. | | | 6,515 | | | | 41,464 | |
| OJI Paper Co. Ltd. | | | 7,271 | | | | 35,732 | |
| Olympus Corp. | | | 2,017 | | | | 83,414 | |
| Omron Corp. | | | 1,876 | | | | 44,753 | |
| Oriental Land Co. Ltd. | | | 578 | | | | 34,872 | |
| ORIX Corp. | | | 761 | | | | 130,041 | |
| Osaka Gas Co. Ltd. | | | 16,492 | | | | 65,103 | |
| OSAKA Titanium Technologies | | | 161 | | | | 12,019 | |
| Otsuka Corp. | | | 132 | | | | 11,331 | |
| Promise Co. Ltd. | | | 851 | | | | 21,177 | |
| Rakuten, Inc. | | | 47 | | | | 23,139 | |
| Resona Holdings, Inc. | | | 50 | | | | 89,961 | |
| Ricoh Co. Ltd. | | | 5,714 | | | | 105,621 | |
| Rohm Co. Ltd. | | | 916 | | | | 79,944 | |
| Sankyo Co. Ltd. | | | 535 | | | | 24,855 | |
Sanyo Electric Co. Ltd. (a) | | | 12,428 | | | | 17,132 | |
| Sapporo Hokuyo Holdings | | | 4 | | | | 35,662 | |
| Sapporo Holdings | | | 2,950 | | | | 23,766 | |
| SBI E*Trade Securities Co. Ltd. | | | 12 | | | | 11,171 | |
| SBI Holdings, Inc. | | | 80 | | | | 21,877 | |
| Secom Co. Ltd. | | | 1,900 | | | | 103,916 | |
| Sega Sammy Holdings, Inc. | | | 1,870 | | | | 23,317 | |
| Seiko Epson Corp. | | | 1,051 | | | | 22,814 | |
| Sekisui Chemical Co. Ltd. | | | 3,459 | | | | 23,315 | |
| Sekisui House Ltd. | | | 4,003 | | | | 43,285 | |
| Seven & I Holdings Co. Ltd. | | | 6,913 | | | | 201,731 | |
| Sharp Corp. | | | 8,721 | | | | 156,910 | |
| Shimamura Co. Ltd. | | | 237 | | | | 20,218 | |
| Shimano, Inc. | | | 623 | | | | 22,586 | |
| Shimizu Corp. | | | 5,532 | | | | 24,165 | |
| Shin-Etsu Chemical Co. Ltd. | | | 3,516 | | | | 220,940 | |
| Shinko Securities Co. Ltd. | | | 5,297 | | | | 21,906 | |
| Shinsei Bank Ltd. | | | 17,072 | | | | 62,350 | |
| Shionogi & Co. Ltd. | | | 2,486 | | | | 43,950 | |
The accompanying notes are an integral part of the financial statements.
Summit Mutual Funds, Inc. – Pinnacle Series |
| SCHEDULE OF INVESTMENTS | EAFE INTERNATIONAL INDEX PORTFOLIO |
| | | SHARES | | | VALUE | |
Japan - 19.4% (Continued) | | | | | | |
| Shiseido Co. Ltd. | | | 3,037 | | | $ | 71,905 | |
| The Shizuoka Bank Ltd. | | | 5,031 | | | | 55,257 | |
| Showa Denko KK | | | 10,659 | | | | 38,165 | |
| SMC Corp. | | | 511 | | | | 60,928 | |
| Softbank Corp. | | | 6,051 | | | | 125,120 | |
| Sojitz Corp. | | | 9,570 | | | | 34,694 | |
| Sompo Japan Insurance, Inc. | | | 7,250 | | | | 65,611 | |
| Sony Financial Holdings | | | 9 | | | | 34,400 | |
| Sony Corp. | | | 7,858 | | | | 436,106 | |
| Stanley Electric Co. Ltd. | | | 1,481 | | | | 36,987 | |
| Sumco Corp. | | | 1,210 | | | | 34,876 | |
| Sumitomo Chemical Co. Ltd. | | | 13,889 | | | | 123,952 | |
| Sumitomo Electric Industries Ltd. | | | 6,953 | | | | 110,598 | |
| Sumitomo Heavy Industries Ltd. | | | 4,768 | | | | 43,960 | |
| Sumitomo Metal Industries Ltd. | | | 36,265 | | | | 168,478 | |
| Sumitomo Metal Mining Co. Ltd. | | | 4,757 | | | | 81,331 | |
| Sumitomo Mitsui Financial Group, Inc. | | | 51 | | | | 382,106 | |
| Sumitomo Realty & Development Co. Ltd. | | | 3,188 | | | | 78,905 | |
| The Sumitomo Trust & Banking Co. Ltd. | | | 10,441 | | | | 69,909 | |
| Sumitomo Corp. | | | 9,251 | | | | 131,418 | |
| Suruga Bank Ltd. | | | 1,942 | | | | 21,173 | |
| Suzuken Co. Ltd. | | | 722 | | | | 25,787 | |
| Suzuki Motor Corp. | | | 1,461 | | | | 44,073 | |
| T&D Holdings, Inc. | | | 1,673 | | | | 86,409 | |
| Taiheiyo Cement Corp. | | | 10,203 | | | | 24,385 | |
| Taisei Corp. | | | 8,093 | | | | 21,878 | |
| Taisho Pharmaceutical Co. Ltd. | | | 1,804 | | | | 34,719 | |
| Takashimaya Co. Ltd. | | | 2,879 | | | | 34,791 | |
| Takeda Pharmaceutical Co. Ltd. | | | 7,487 | | | | 440,313 | |
| Takefuji Corp. | | | 947 | | | | 23,015 | |
| TDK Corp. | | | 1,012 | | | | 75,369 | |
| Teijin Ltd. | | | 8,060 | | | | 34,559 | |
| Terumo Corp. | | | 1,368 | | | | 72,003 | |
| THK Co. Ltd. | | | 1,240 | | | | 25,141 | |
| Tobu Railway Co. Ltd. | | | 9,588 | | | | 44,801 | |
| Toho Co. Ltd. | | | 1,043 | | | | 23,574 | |
| Tohoku Electric Power Co., Inc. | | | 4,003 | | | | 90,297 | |
| Tokuyama Corp. | | | 2,321 | | | | 23,332 | |
| The Tokyo Electric Power Co., Inc. | | | 9,952 | | | | 257,452 | |
| Tokyo Electron Ltd. | | | 1,352 | | | | 83,021 | |
| Tokyo Gas Co. Ltd. | | | 18,730 | | | | 87,686 | |
| Tokyo Steel Manufacturing Co. Ltd. | | | 955 | | | | 10,651 | |
| Tokyo Tatemono Co. Ltd. | | | 3,061 | | | | 28,989 | |
| Tokyu Land Corp. | | | 3,871 | | | | 33,334 | |
| Tokyu Corp. | | | 10,216 | | | | 67,214 | |
| TonenGeneral Sekiyu KK | | | 4,494 | | | | 44,371 | |
| Toppan Printing Co. Ltd. | | | 5,987 | | | | 58,897 | |
| Toray Industries, Inc. | | | 11,590 | | | | 90,778 | |
| Toshiba Corp. | | | 25,768 | | | | 193,061 | |
| Tosoh Corp. | | | 5,072 | | | | 21,838 | |
| Toyo Seikan Kaisha Ltd. | | | 1,334 | | | | 23,667 | |
| Toyoda Gosei Co. Ltd. | | | 666 | | | | 23,668 | |
| Toyota Boshoku Corp. | | | 718 | | | | 23,330 | |
| Toyota Industries Corp. | | | 1,703 | | | | 69,666 | |
| Toyota Motor Corp. | | | 22,458 | | | | 1,214,218 | |
| Toyota Tsusho Corp. | | | 2,122 | | | | 57,554 | |
| Trend Micro, Inc. | | | 896 | | | | 32,082 | |
| Ube Industries Ltd. | | | 10,060 | | | | 34,309 | |
| | | SHARES | | | VALUE | |
Japan - 19.4% (Continued) | | | | | | |
| Unicharm Corp. | | | 543 | | | $ | 34,364 | |
| Urban Corporation | | | 1,484 | | | | 19,859 | |
| Ushio, Inc. | | | 1,125 | | | | 24,773 | |
| West Japan Railway Co. | | | 15 | | | | 74,520 | |
| Yahoo Japan Corp. | | | 121 | | | | 54,156 | |
| Yakult Honsha Co. | | | 964 | | | | 22,306 | |
| Yamada Denki Co. Ltd. | | | 711 | | | | 81,274 | |
| Yamaha Motor Co. | | | 1,748 | | | | 42,325 | |
| Yamaha Corp. | | | 1,481 | | | | 33,872 | |
| Yamato Holdings Co. Ltd. | | | 3,439 | | | | 49,593 | |
| Yamato Kogyo Co. | | | 569 | | | | 23,429 | |
| Yaskawa Electric Corp. | | | 1,785 | | | | 24,351 | |
| Yokogawa Electric Corp. | | | 2,151 | | | | 23,644 | |
| | | | | | | | 23,007,722 | |
Luxembourg - 0.1% | | | | | | | | |
Millicom International Cellular SA (a) | | | 299 | | | | 34,604 | |
| SES-FDR | | | 1,357 | | | | 35,712 | |
| | | | | | | | 70,316 | |
Netherlands - 4.1% | | | | | | | | |
| Aegon NV | | | 12,910 | | | | 228,200 | |
| Akzo Nobel NV | | | 2,331 | | | | 186,727 | |
| ASML Holding NV | | | 3,552 | | | | 112,485 | |
| Corio NV | | | 425 | | | | 34,424 | |
| European Aeronautic Defense and Space Co. | | | 3,084 | | | | 98,431 | |
| Fugro NV | | | 451 | | | | 34,816 | |
| Hagemeyer NV | | | 3,501 | | | | 23,955 | |
| Heineken NV | | | 2,391 | | | | 154,583 | |
| ING Groep NV | | | 15,588 | | | | 609,645 | |
| James Hardie Industries NV | | | 4,448 | | | | 25,191 | |
| Koninklijke Ahold NV | | | 10,753 | | | | 149,825 | |
| Koninklijke DSM NV | | | 1,199 | | | | 56,674 | |
| Koninklijke Philips Electronics NV | | | 10,060 | | | | 434,187 | |
Qiagen NV (a) | | | 1,095 | | | | 23,726 | |
| Randstad Holding NV | | | 568 | | | | 22,439 | |
| Reed Elsevier NV | | | 6,590 | | | | 131,517 | |
| Royal Dutch Shell Plc - Class A | | | 31,778 | | | | 1,335,364 | |
| Royal KPN NV | | | 16,316 | | | | 296,754 | |
| SBM Offshore NV | | | 1,440 | | | | 45,476 | |
| STMicroelectronics NV | | | 6,296 | | | | 90,210 | |
| TNT NV | | | 3,518 | | | | 145,304 | |
Tomtom (a) | | | 412 | | | | 31,022 | |
| Unilever NV | | | 14,511 | | | | 533,578 | |
| Vedior NV | | | 1,341 | | | | 33,762 | |
| Wolters Kluwer NV | | | 2,683 | | | | 88,182 | |
| | | | | | | | 4,926,477 | |
New Zealand - 0.1% | | | | | | | | |
| Asciano Group | | | 5,621 | | | | 34,549 | |
| Auckland International Airport Ltd. | | | 11,077 | | | | 24,806 | |
| Fletcher Building Ltd. | | | 5,457 | | | | 48,293 | |
| Telecom Corporation of New Zealand Ltd. | | | 18,018 | | | | 60,315 | |
| | | | | | | | 167,963 | |
Norway - 1.1% | | | | | | | | |
| Acergy SA | | | 1,780 | | | | 39,748 | |
| Aker Kvearner ASA | | | 1,684 | | | | 44,815 | |
| DNB NOR ASA | | | 7,149 | | | | 109,279 | |
The accompanying notes are an integral part of the financial statements.
Summit Mutual Funds, Inc. – Pinnacle Series |
| EAFE INTERNATIONAL INDEX PORTFOLIO | SCHEDULE OF INVESTMENTS |
| | | SHARES | | | VALUE | |
Norway - 1.1% (Continued) | | | | | | |
Lighthouse Caledon (a) (c) | | | 198 | | | $ | 346 | |
Marine Harvest (a) | | | 19,788 | | | | 12,719 | |
| Norsk Hydro ASA | | | 7,239 | | | | 103,455 | |
| Orkla ASA | | | 7,450 | | | | 144,408 | |
| Petroleum Geo - Services | | | 1,323 | | | | 38,436 | |
Prosafe SE (a) | | | 2,079 | | | | 36,182 | |
| Renewable Energy Corp AS | | | 1,552 | | | | 78,888 | |
| Seadrill Ltd. | | | 2,310 | | | | 56,369 | |
| StatoiHyrdol ASA | | | 11,035 | | | | 343,456 | |
| Storebrand ASA | | | 4,578 | | | | 47,805 | |
| Telenor ASA | | | 7,075 | | | | 169,062 | |
| Yara International ASA | | | 1,539 | | | | 71,283 | |
| | | | | | | | 1,296,251 | |
Portugal - 0.3% | | | | | | | | |
| Banco Comercial Portugues SA | | | 18,788 | | | | 80,210 | |
| Bco Espirito Santo | | | 2,051 | | | | 44,980 | |
| Electricidade de Portugal SA | | | 17,320 | | | | 113,193 | |
| Portugal Telecom SGPS SA | | | 7,870 | | | | 102,752 | |
| PT Multimedia Servicos | | | 2,615 | | | | 36,512 | |
| Sonae SGPS, SA | | | 12,038 | | | | 34,848 | |
| | | | | | | | 412,495 | |
Singapore - 1.0% | | | | | | | | |
| CapitaLand Ltd. | | | 15,244 | | | | 66,400 | |
| Capitamall Trust | | | 16,299 | | | | 39,178 | |
| City Developments Ltd. | | | 4,936 | | | | 48,693 | |
| Comfortdelgro Corp. | | | 18,779 | | | | 23,874 | |
| Cosco Corp Singapore | | | 7,678 | | | | 30,830 | |
| DBS Group Holdings Ltd. | | | 9,270 | | | | 133,307 | |
| Fraser and Neave Ltd. | | | 11,915 | | | | 48,837 | |
| Keppel Corp Ltd. | | | 10,392 | | | | 93,853 | |
| Keppel Land Ltd. | | | 4,577 | | | | 23,148 | |
| Oversea-Chinese Banking Corp. Ltd. | | | 24,248 | | | | 139,648 | |
| Parkway Holdings | | | 13,711 | | | | 37,720 | |
| SembCorp Industries Ltd. | | | 9,339 | | | | 37,630 | |
| Singapore Airlines Ltd. | | | 4,773 | | | | 57,629 | |
| Singapore Exchange Ltd. | | | 5,797 | | | | 54,045 | |
| Singapore Press Holdings Ltd. | | | 18,617 | | | | 58,200 | |
| Singapore Telecommunications Ltd. | | | 63,987 | | | | 177,810 | |
| United Overseas Bank Ltd. | | | 11,119 | | | | 153,717 | |
| Venture Corp. Ltd. | | | 2,618 | | | | 23,280 | |
| | | | | | | | 1,247,799 | |
Spain - 4.4% | | | | | | | | |
| Abertis Infraestructuras SA | | | 2,501 | | | | 80,591 | |
| Acciona SA | | | 250 | | | | 79,262 | |
Acerinox SA (a) | | | 1,818 | | | | 44,734 | |
ACS, Actividades de Construccion y Servicios, SA (a) | | | 1,871 | | | | 111,198 | |
| Altadis SA | | | 2,286 | | | | 166,143 | |
| Banco Bilbao Vizcaya Argentaria SA | | | 31,250 | | | | 765,750 | |
Banco de Sabadell SA (a) | | | 5,066 | | | | 54,884 | |
Banco Popular Espanol SA (a) | | | 7,979 | | | | 136,489 | |
| Banco Santander Central Hispano SA | | | 53,372 | | | | 1,154,103 | |
Cintra Concesiones de Infraestructuras de Transporte SA (a) | | | 2,239 | | | | 33,816 | |
| Fomento de Construcciones y Contratas SA | | | 435 | | | | 32,690 | |
Gamesa Corporacion Tecnologica SA (a) | | | 1,341 | | | | 62,700 | |
| Gas Natural SDG SA | | | 934 | | | | 54,650 | |
Gestevision Telecinco (a) | | | 1,372 | | | | 35,124 | |
| | | SHARES | | | VALUE | |
Spain - 4.4% (Continued) | | | | | | |
| Grupo Ferrovial SA | | | 563 | | | $ | 39,609 | |
Iberdrola SA (a) | | | 33,441 | | | | 508,482 | |
| Iberia Lineas Aereas de Espana SA | | | 5,082 | | | | 22,291 | |
| Inditex SA | | | 2,065 | | | | 126,864 | |
| Indra Sistemas SA | | | 1,767 | | | | 48,001 | |
| Red Electrica de Espana | | | 923 | | | | 58,351 | |
| Repsol YPF SA | | | 7,231 | | | | 257,748 | |
| Sacyr Vallehermoso SA | | | 815 | | | | 31,696 | |
| Sociedad General de Aguas de Barcelona SA | | | 884 | | | | 35,581 | |
Sogecable Sa (a) | | | 705 | | | | 28,243 | |
| Telefonica SA | | | 34,924 | | | | 1,134,569 | |
| Union Fenosa SA | | | 1,013 | | | | 68,410 | |
| Zardoya Otis SA | | | 1,126 | | | | 31,888 | |
| | | | | | | | 5,203,867 | |
Sweden - 2.3% | | | | | | | | |
| Alfa Laval AB | | | 804 | | | | 45,280 | |
| Assa Abloy AB | | | 2,984 | | | | 59,904 | |
| Atlas Copco AB | | | 9,864 | | | | 147,276 | |
| Boliden AB | | | 2,683 | | | | 33,729 | |
| Electrolux AB | | | 2,975 | | | | 49,942 | |
| Getinge AB | | | 1,848 | | | | 49,608 | |
| Hennes & Mauritz AB | | | 4,362 | | | | 265,572 | |
| Husqvarna AB - B Shares | | | 3,351 | | | | 39,793 | |
| Investor AB | | | 2,638 | | | | 59,999 | |
Lundin Petroleum AB (a) | | | 2,170 | | | | 22,663 | |
| Modern Times Group AB | | | 551 | | | | 38,790 | |
| Nordea Bank AB | | | 17,294 | | | | 288,983 | |
| OMX AB | | | 588 | | | | 23,790 | |
| Sandvik AB | | | 8,242 | | | | 141,868 | |
| Scania AB | | | 2,914 | | | | 69,433 | |
| Securitas AB - Class B | | | 3,536 | | | | 49,239 | |
| Skandinaviska Enskilda Banken AB | | | 3,887 | | | | 99,533 | |
| Skanska AB | | | 3,170 | | | | 59,837 | |
| SKF AB | | | 4,226 | | | | 71,597 | |
| SSAB Svenskt Stal AB | | | 2,229 | | | | 60,698 | |
| Svenska Cellulosa AB | | | 4,786 | | | | 84,787 | |
| Svenska Handelsbanken AB | | | 4,257 | | | | 136,341 | |
| Swedbank AB | | | 1,513 | | | | 42,839 | |
| Swedish Match AB | | | 2,580 | | | | 61,674 | |
| Tele2 AB - B Shares | | | 2,694 | | | | 53,978 | |
| Telefonaktiebolaget LM Ericsson - Class B | | | 124,571 | | | | 292,578 | |
| TeliaSonera AB | | | 18,747 | | | | 175,485 | |
| Volvo AB | | | 12,885 | | | | 216,305 | |
| | | | | | | | 2,741,521 | |
Switzerland - 6.7% | | | | | | | | |
| ABB Ltd. | | | 17,912 | | | | 516,088 | |
Actelion Ltd.(a) | | | 768 | | | | 35,308 | |
| Adecco SA | | | 1,100 | | | | 59,511 | |
| Ciba Specialty Chemicals AG | | | 804 | | | | 37,283 | |
| Compagnie Financiere Richemont AG | | | 4,496 | | | | 308,563 | |
| Credit Suisse Group | | | 8,569 | | | | 515,434 | |
| Geberit AG | | | 349 | | | | 47,935 | |
| Givaudan SA | | | 75 | | | | 72,274 | |
| Holcim Ltd. | | | 1,821 | | | | 195,104 | |
| Julius Baer Holding AG | | | 831 | | | | 68,703 | |
| Kuehne & Nagel International AG | | | 482 | | | | 46,193 | |
The accompanying notes are an integral part of the financial statements.
Summit Mutual Funds, Inc. – Pinnacle Series |
| SCHEDULE OF INVESTMENTS | EAFE INTERNATIONAL INDEX PORTFOLIO |
| | | SHARES | | | VALUE | |
Switzerland - 6.7% (Continued) | | | | | | |
| Lindt & Spruengli | | | 10 | | | $ | 34,624 | |
Logitech International SA (a) | | | 1,371 | | | | 50,280 | |
| Lonza Group AG | | | 404 | | | | 49,030 | |
| Nestle SA | | | 3,359 | | | | 1,542,799 | |
| Nobel Biocare Holding AG | | | 214 | | | | 57,273 | |
| Novartis AG | | | 19,763 | | | | 1,084,028 | |
OC Oerlikon Corp. AG (a) | | | 54 | | | | 22,573 | |
| Roche Holding AG | | | 6,261 | | | | 1,081,704 | |
| Schindler Holding AG | | | 581 | | | | 37,462 | |
| SGS SA | | | 49 | | | | 58,385 | |
| Sonova Holding Ag | | | 447 | | | | 50,498 | |
| Straumann Holding AG | | | 84 | | | | 23,168 | |
| Sulzer AG | | | 25 | | | | 36,766 | |
| Swatch Group AG | | | 343 | | | | 103,386 | |
| Swiss Life Holding | | | 314 | | | | 78,490 | |
| Swiss Reinsurance | | | 3,102 | | | | 220,427 | |
| Swisscom AG | | | 217 | | | | 84,719 | |
| Syngenta AG | | | 818 | | | | 208,447 | |
| Synthes, Inc. | | | 558 | | | | 69,297 | |
| UBS AG | | | 16,319 | | | | 755,302 | |
| Zurich Financial Services AG | | | 1,193 | | | | 350,371 | |
| | | | | | | | 7,901,425 | |
United Kingdom - 21.4% | | | | | | | | |
| 3i Group | | | 3,937 | | | | 78,598 | |
| Alliance&leicester | | | 1,686 | | | | 21,748 | |
| AMEC Plc | | | 3,201 | | | | 53,429 | |
| Anglo American | | | 10,806 | | | | 662,531 | |
| Antofagasta | | | 1,565 | | | | 22,337 | |
| ARM Holdings Plc | | | 13,804 | | | | 34,073 | |
| AstraZeneca Plc | | | 12,841 | | | | 553,148 | |
| Aviva Plc | | | 23,006 | | | | 308,206 | |
| BAE Systems Plc | | | 31,081 | | | | 308,113 | |
| Balfour Beatty Plc | | | 3,799 | | | | 37,604 | |
| Barclays Plc | | | 55,017 | | | | 551,966 | |
| Barratt Developments Plc | | | 2,633 | | | | 23,874 | |
Berkeley Group Holdings (a) | | | 916 | | | | 24,616 | |
| BG Group Plc | | | 28,465 | | | | 651,619 | |
| BHP Billiton Plc | | | 19,698 | | | | 606,201 | |
| BP Plc | | | 161,172 | | | | 1,973,103 | |
| Brambles Ltd. | | | 11,941 | | | | 120,889 | |
British Airways Plc (a) | | | 5,404 | | | | 33,321 | |
| British American Tobacco Plc | | | 12,978 | | | | 507,639 | |
| British Energy Group | | | 9,024 | | | | 98,618 | |
| British Land Co. | | | 4,498 | | | | 84,613 | |
| British Sky Broadcasting Group Plc | | | 10,867 | | | | 133,901 | |
| BT Group Plc | | | 70,966 | | | | 385,301 | |
| Bunzl Plc | | | 3,468 | | | | 48,980 | |
| Burberry Group Plc | | | 4,275 | | | | 48,464 | |
| Cable & Wireless Plc | | | 21,980 | | | | 81,382 | |
| Cadbury Schweppes Plc | | | 17,631 | | | | 217,948 | |
| Capita Group Plc | | | 5,695 | | | | 79,133 | |
| Carnival Plc | | | 1,390 | | | | 61,398 | |
| Carphone Warehouse | | | 3,252 | | | | 22,301 | |
| Centrica Plc | | | 30,385 | | | | 216,988 | |
Charter Plc (a) | | | 749 | | | | 11,831 | |
| Cobham Plc | | | 11,780 | | | | 49,009 | |
| Compass Group Plc | | | 16,454 | | | | 101,044 | |
| | | SHARES | | | VALUE | |
United Kingdom - 21.4% (Continued) | | | | | | |
| Daily Mail & General Trust | | | 3,285 | | | $ | 32,483 | |
| De La Rue Plc | | | 1 | | | | 18 | |
| Diageo Plc | | | 22,952 | | | | 493,434 | |
| DSG International Plc | | | 16,003 | | | | 31,617 | |
| Emap Plc | | | 2,080 | | | | 38,092 | |
| Enterprise Inns Plc | | | 5,931 | | | | 57,497 | |
| FirstGroup Plc | | | 4,322 | | | | 70,118 | |
| Friends Provident Plc | | | 15,167 | | | | 49,333 | |
| G4S | | | 10,922 | | | | 53,212 | |
| GKN Plc | | | 5,908 | | | | 33,165 | |
| GlaxoSmithKline Plc | | | 46,455 | | | | 1,182,736 | |
| Hammerson Plc | | | 2,887 | | | | 58,906 | |
| Hays Plc | | | 15,154 | | | | 34,841 | |
| HBOS Plc | | | 31,604 | | | | 462,396 | |
| Home Retail Group Plc | | | 8,370 | | | | 54,649 | |
| HSBC Holdings Plc | | | 102,344 | | | | 1,715,376 | |
| ICAP Plc | | | 4,332 | | | | 62,648 | |
Imperial Chemical Industries Plc (c) | | | 10,467 | | | | 138,974 | |
| Imperial Tobacco Group Plc | | | 5,720 | | | | 308,795 | |
| Inchcape | | | 4,460 | | | | 33,604 | |
| Intercontinental Hotels Group | | | 2,549 | | | | 44,857 | |
| International Power Plc | | | 12,574 | | | | 113,510 | |
Invensys Plc (a) | | | 7,520 | | | | 33,980 | |
| Investec Plc | | | 3,568 | | | | 31,979 | |
| ITV Plc | | | 35,207 | | | | 59,851 | |
| J Sainsbury Plc | | | 13,225 | | | | 111,950 | |
| Johnson Matthey Plc | | | 2,071 | | | | 77,545 | |
| Kazakhmys Plc | | | 894 | | | | 24,398 | |
| Kelda Group Plc | | | 2,694 | | | | 58,185 | |
| Kesa Electricals Plc | | | 7,480 | | | | 34,768 | |
| Kingfisher Plc | | | 23,052 | | | | 66,812 | |
| Ladbrokes Plc | | | 7,650 | | | | 49,225 | |
| Land Securities Group Plc | | | 4,356 | | | | 130,586 | |
| Legal & General Group Plc | | | 56,354 | | | | 146,505 | |
| Liberty International Plc | | | 2,665 | | | | 57,134 | |
| Lloyds TSB Group Plc | | | 47,771 | | | | 448,840 | |
| LogicaCMG Plc | | | 15,089 | | | | 35,368 | |
| London Stock Exchange Group | | | 1,297 | | | | 51,094 | |
| Lonmin | | | 721 | | | | 44,392 | |
| Man Group | | | 14,949 | | | | 169,325 | |
| Marks & Spencer Group Plc | | | 15,943 | | | | 177,723 | |
| Meggitt Plc | | | 7,662 | | | | 50,751 | |
| Mitchells & Butlers Plc | | | 4,486 | | | | 37,863 | |
| Mondi Ltd. | | | 0 | | | | 4 | |
| Mondi Plc | | | 3,027 | | | | 25,604 | |
| Morrison(w)suprmkt | | | 11,100 | | | | 71,148 | |
| National Express Group Plc | | | 1,629 | | | | 40,274 | |
| National Grid Plc | | | 22,205 | | | | 368,639 | |
| Next Plc | | | 2,042 | | | | 66,013 | |
| Old Mutual Plc | | | 46,132 | | | | 153,908 | |
| Pearson Plc | | | 7,182 | | | | 104,651 | |
| Persimmon Plc | | | 3,059 | | | | 48,714 | |
| Provident Financial Plc | | | 1 | | | | 8 | |
| Prudential Plc | | | 21,565 | | | | 305,643 | |
| Punch Taverns Plc | | | 2,954 | | | | 44,955 | |
| Reckitt Benckiser Group PLC | | | 5,030 | | | | 291,771 | |
| Reed Elsevier Plc | | | 10,641 | | | | 143,932 | |
| Rentokil Initial Plc | | | 15,883 | | | | 38,225 | |
The accompanying notes are an integral part of the financial statements.
Summit Mutual Funds, Inc. – Pinnacle Series |
| EAFE INTERNATIONAL INDEX PORTFOLIO | SCHEDULE OF INVESTMENTS |
| | | SHARES | | | VALUE | |
United Kingdom - 21.4% (Continued) | | | | | | |
| Resolution Plc | | | 5,772 | | | $ | 81,807 | |
| Reuters Group Plc | | | 10,932 | | | | 138,619 | |
| Rexam Plc | | | 6,157 | | | | 51,292 | |
| Rio Tinto Plc | | | 8,216 | | | | 869,585 | |
Rolls-Royce Group Plc (a) | | | 15,915 | | | | 172,975 | |
| Royal & Sun Alliance Insurance Group | | | 28,677 | | | | 84,599 | |
| Royal Bank of Scotland Group Plc | | | 81,995 | | | | 724,695 | |
| Royal Dutch Shell Plc - Class B | | | 24,292 | | | | 1,010,635 | |
| SABMiller Plc | | | 7,751 | | | | 218,477 | |
| Sage Group Plc | | | 11,447 | | | | 52,409 | |
| Schroders | | | 1,334 | | | | 34,574 | |
| Scottish & Newcastle Plc | | | 7,070 | | | | 104,356 | |
| Scottish & Southern Energy Plc | | | 7,312 | | | | 238,416 | |
| Segro Plc | | | 4,089 | | | | 38,257 | |
| Serco Group | | | 5,127 | | | | 47,176 | |
| Severn Trent Plc | | | 2,268 | | | | 68,894 | |
| Shire Plc | | | 2,495 | | | | 57,066 | |
| Signet Group Plc | | | 27,662 | | | | 38,407 | |
| Smith & Nephew Plc | | | 8,196 | | | | 94,627 | |
| Smiths Group Plc | | | 3,323 | | | | 67,008 | |
| Stagecoach Group | | | 5,074 | | | | 28,785 | |
| Standard Chartered Plc | | | 5,032 | | | | 184,708 | |
| Standard Life Plc | | | 17,670 | | | | 88,902 | |
| Tate & Lyle Plc | | | 3,947 | | | | 34,963 | |
| Taylor Woodrow Plc | | | 9,295 | | | | 37,607 | |
| Tesco Plc | | | 65,978 | | | | 626,802 | |
Thomas Cook Group Plc (a) | | | 4,538 | | | | 25,474 | |
| Tomkins Plc | | | 9,642 | | | | 33,924 | |
| Travis Perkins Plc | | | 1,413 | | | | 33,865 | |
TUI Travel Plc (a) | | | 6,576 | | | | 38,453 | |
| Tullow Oil | | | 5,342 | | | | 69,279 | |
| Unilever Plc | | | 11,159 | | | | 419,829 | |
| United Business Media Plc | | | 2,835 | | | | 36,653 | |
| United Utilities Plc | | | 7,840 | | | | 117,984 | |
| Vedanta Resources | | | 522 | | | | 21,260 | |
| Vodafone Group Plc | | | 471,529 | | | | 1,762,743 | |
| Whitbread Plc | | | 2,142 | | | | 59,694 | |
| William Hill Plc | | | 3,535 | | | | 36,908 | |
| Wolseley Plc | | | 6,006 | | | | 88,710 | |
| WPP Group Plc | | | 9,682 | | | | 124,697 | |
| Xstrata Plc | | | 4,899 | | | | 346,195 | |
| Yell Group Plc | | | 7,261 | | | | 57,960 | |
| | | | | | | | 25,355,219 | |
| TOTAL COMMON STOCKS | | | | | | | | |
| (Cost $96,929,938) | | | | | | | 117,711,916 | |
| | | SHARES | | | VALUE | |
UNIT INVESTMENT TRUSTS - 0.3% | | | | | | |
| iShares MSCI EAFE Index Fund | | | 4,322 | | | $ | 339,277 | |
| TOTAL UNIT INVESTMENT TRUSTS | | | | | | | | |
| (Cost $305,539) | | | | | | | 339,277 | |
| | | | | | | | | |
PREFERRED STOCKS - 0.4% | | | | | | | | |
Germany - 0.4% | | | | | | | | |
| Henkel KGaA | | | 2,300 | | | | 129,229 | |
| Porsche Automobile Holding AG | | | 75 | | | | 151,968 | |
| ProSiebenSat.1 Media AG | | | 916 | | | | 21,950 | |
| Volkswagen AG | | | 895 | | | | 130,854 | |
| | | | | | | | 434,001 | |
| TOTAL PREFERRED STOCKS | | | | | | | | |
| (Cost $361,152) | | | | | | | 434,001 | |
| | | | | | | | | |
RIGHTS - 0.0% | | | | | | | | |
| Wharf Holdings Ltd. | | | | | | | | |
Issued by Wharf Holdings Ltd., Exp.1/8/2008, Strike $30 (a) | | | 1,273 | | | | 1,747 | |
| Dowa Mining Co. Ltd. | | | | | | | | |
| Issued by Mizuho International Plc, Exp. 1/29/2010, | | | | | | | | |
Strike $1 (a) (c) | | | 1,805 | | | | 632 | |
| TOTAL RIGHTS | | | | | | | | |
| (Cost $1,492) | | | | | | | 2,379 | |
| | | | | | | | | |
SHORT TERM INVESTMENTS - 0.3% | | | | | | | | |
Money Market Funds - 0.3% | | | | | | | | |
| Northern Institutional Diversified Assets Portfolio | | | 412,676 | | | | 412,676 | |
| TOTAL SHORT TERM INVESTMENTS | | | | | | | | |
| (Cost $412,675) | | | | | | | 412,676 | |
Total Investments (Cost $98,010,796) (b) - 100.2% | | | | | | | 118,900,249 | |
Liabilities in Excess of Other Assets - (0.2)% | | | | | | | (268,447 | ) |
TOTAL NET ASSETS - 100.0% | | | | | | $ | 118,631,802 | |
The accompanying notes are an integral part of the financial statements.
Summit Mutual Funds, Inc. – Pinnacle Series |
| FINANCIAL STATEMENTS | EAFE INTERNATIONAL INDEX PORTFOLIO |
STATEMENT OF ASSETS AND LIABILITIES | | | |
December 31, 2007 | | | |
| | | | |
| ASSETS | | | |
| Investments in securities, at value | | $ | 118,900,249 | |
| Cash denominated in foreign currencies | | | 23,605 | |
| Cash | | | 6,628 | |
| Receivables: | | | | |
| Shares sold | | | 70,395 | |
| Interest and dividends | | | 194,884 | |
| Investments sold | | | 573,779 | |
| Prepaid expenses and other | | | 1,694 | |
| | | | 119,771,234 | |
| LIABILITIES | | | | |
| Payables: | | | | |
| Shares redeemed | | | 941,908 | |
| Advisory fees | | | 67,774 | |
| Fund accounting fees | | | 62,392 | |
| Professional fees | | | 21,531 | |
| Royalty fees | | | 12,947 | |
| Custodian fees | | | 11,704 | |
| Administration fees | | | 10,185 | |
| Directors’ fees | | | 125 | |
| Other accrued expenses | | | 10,866 | |
| | | | 1,139,432 | |
| NET ASSETS* | | | | |
| Paid-in capital | | | 95,138,112 | |
| Accumulated undistributed net | | | | |
| investment income / (loss) | | | 1,007,403 | |
| Accumulated net realized gain / (loss) | | | | |
| on investments and foreign | | | | |
| currency translations | | | 1,594,213 | |
| Net unrealized appreciation / (depreciation) | | | | |
| on investments and foreign | | | | |
| currency translations | | | 20,892,074 | |
| | | $ | 118,631,802 | |
| Investments at cost | | $ | 98,010,796 | |
| Cash denominated in foreign currencies at cost | | | 23,831 | |
| Shares authorized - Class I ($.10 par value) | | | 20,000,000 | |
| Shares authorized - Class F ($.10 par value) | | | 20,000,000 | |
| NET ASSET VALUE (NAV) BY SHARE CLASS | | | | | |
| | | | | | |
| Share Class | Net Assets | Outstanding | | Per Share | |
| Class I | $118,630,776 | | | $ | | |
| Class F | $1,026 | 10 | | $ | | ** |
| * | FEDERAL TAX DATA AS OF DECEMBER 31, 2007 | | |
| | Percentage of ordinary distributions designated as | | |
| | qualified dividend income | | 86.82% |
| | Undistributed ordinary income | $ | |
| | Undistributed long-term gains | $ | |
| | Unrealized appreciation | $ | |
| ** | NAV does not recalculate due to fractional shares outstanding. | | |
STATEMENT OF OPERATIONS | | | |
For the year ended December 31, 2007 | | | |
| INVESTMENT INCOME | | | |
| Dividends | | $ | 1,928,158 | |
| Foreign dividend taxes withheld | | | (158,041 | ) |
| Other income | | | 1,051 | |
| | | | 1,771,168 | |
| EXPENSES | | | | |
| Advisory fees | | | 407,759 | |
| Custodian fees | | | 189,733 | |
| Fund accounting fees | | | 156,446 | |
| Administration fees | | | 72,814 | |
| Professional fees | | | 30,321 | |
| Royalty fee | | | 24,267 | |
| Transfer agent fees | | | 15,990 | |
| Directors’ fees | | | 9,407 | |
| Shareholder reporting fees | | | 8,343 | |
| Other expenses | | | 5,571 | |
| | | | 920,651 | �� |
| Reimbursements and waivers | | | (228,917 | ) |
| | | | 691,734 | |
| NET INVESTMENT INCOME / (LOSS) | | | 1,079,434 | |
| | | | | |
| REALIZED AND UNREALIZED GAIN / (LOSS) | | | | |
| Net realized gain / (loss) on investments | | | | |
| and foreign currency translations | | | 2,131,638 | |
| Net change in unrealized appreciation / | | | | |
| (depreciation) on investments and | | | | |
| foreign currency translations | | | (475,273 | ) |
| | | | | |
| NET REALIZED AND UNREALIZED | | | | |
| GAIN / (LOSS) | | | 1,656,365 | |
| | | | | |
| NET INCREASE / (DECREASE) IN | | | | |
| NET ASSETS FROM OPERATIONS | | $ | 2,735,799 | |
| TRANSACTIONS WITH AFFILIATES: | | |
| Percent of Current | | |
| Net Asset Value | | |
| | Class I Expense Limit(1) | Class F Expense Limit(1) | Reimbursements and Waivers |
| 0.30% | 0.10% | 0.60% | 0.80% | |
| | | | | |
| (1) | The Adviser has voluntarily agreed to waive its fees and/or reimburseexpenses of the Portfolio to the extent necessary, to limit all expenses to 0.95% for the I shares and 1.15% for the F shares of the average daily net assets of each respective share class until May 1, 2009. | | | |
The accompanying notes are an integral part of the financial statements.
Summit Mutual Funds, Inc. – Pinnacle Series |
| EAFE INTERNATIONAL INDEX PORTFOLIO | FINANCIAL STATEMENTS |
STATEMENTS OF CHANGES IN NET ASSETS | | | | | | |
Year Ended December 31, | | | | | | |
| | | 2007 | | | 2006 | |
| OPERATIONS | | | | | | |
| Net investment income / (loss) | | $ | 1,079,434 | | | $ | 877,818 | |
| Net realized gain / (loss) on investments and foreign currency translations | | | 2,131,638 | | | | 1,280,245 | |
| Net change in unrealized appreciation / (depreciation) on investments and | | | | | | | | |
| foreign currency translations | | | (475,273 | ) | | | 10,070,223 | |
| | | | 2,735,799 | | | | 12,228,286 | |
DISTRIBUTIONS TO SHAREHOLDERS (1) | | | | | | | | |
| Class I | | | | | | | | |
| Net investment income | | | (895,891 | ) | | | (898,476 | ) |
| Net realized gain on investments | | | (1,341,924 | ) | | | (1,089,408 | ) |
Class F (2) | | | | | | | | |
| Net investment income | | | — | | | | — | |
| Net realized gain on investments | | | — | | | | — | |
| | | | (2,237,815 | ) | | | (1,987,884 | ) |
| FUND SHARE TRANSACTIONS | | | | | | | | |
| Class I | | | | | | | | |
| Proceeds from shares sold | | | 78,722,812 | | | | 16,521,253 | |
| Reinvestment of distributions | | | 2,237,815 | | | | 1,987,884 | |
| Payments for shares redeemed | | | (21,581,983 | ) | | | (14,078,992 | ) |
| | | | 59,378,644 | | | | 4,430,145 | |
Class F (2) | | | | | | | | |
| Proceeds from shares sold | | | 1,000 | | | | — | |
| Reinvestment of distributions | | | — | | | | — | |
| Payments for shares redeemed | | | — | | | | — | |
| | | | 1,000 | | | | — | |
| NET INCREASE / (DECREASE) IN NET ASSETS | | | 59,877,628 | | | | 14,670,547 | |
| NET ASSETS | | | | | | | | |
| Beginning of period | | | 58,754,174 | | | | 44,083,627 | |
| End of period | | $ | 118,631,802 | | | $ | 58,754,174 | |
| ACCUMULATED UNDISTRIBUTED NET INVESTMENT INCOME | | $ | 1,007,403 | | | $ | 807,040 | |
FUND SHARE TRANSACTIONS Class I | | | | | | |
| Sold | | | | | | | | |
| Reinvestment of distributions | | | | | | | | |
| Redeemed | | | (208,760 | ) | | | (150,829 | ) |
| Net increase / (decrease) from fund share transactions | | | | | | | | |
FUND SHARE TRANSACTIONS Class F(2) | | | | | | | | |
| Sold | | | 10 | | | | — | |
| Reinvestment of distributions | | | — | | | | — | |
| Redeemed | | | — | | | | — | |
| Net increase / (decrease) from fund share transactions | | | 10 | | | | — | |
| | | | | | | | | |
| TOTAL COST OF PURCHASES OF: | | | | | | | | |
| Preferred and Common Stocks | | $ | | | | $ | | |
| | | $ | | | | $ | | |
| TOTAL PROCEEDS FROM SALES OF: | | | | | | | | |
| Preferred and Common Stocks | | $ | | | | $ | | |
| | | $ | | | | $ | | |
| | | | | | | | | |
(1)TAX CHARACTER OF DISTRIBUTIONS PAID | | | | | | | | |
Ordinary income(3) | | $ | | | | $ | | |
| Long-term capital gains | | | | | | | | |
| | | $ | | | | $ | | |
| | | | | | | | | |
(2)Class F Shares have been offered since 10/1/07. | | | | | | | | |
(3) The percentage of taxable ordinary income distributions that are designated as short-term capital gain distributions | | | | | | | | |
| under Internal Revenue Section 871 (k)(2)(C) is 46.43% | | | | | | | | |
The accompanying notes are an integral part of the financial statements.
Summit Mutual Funds, Inc. – Pinnacle Series LEHMAN AGGREGATE BOND INDEX PORTFOLIO |
Summit Lehman Aggregate Bond Index Portfolio - Average Annual Total Return |
1-Year | 3-Year | Since Inception |
| 7.43% | 4.18% | 3.74% |
Past performance is not predictive of future results. Performance does not reflect the deduction of taxes that a shareholder would pay on fund distributions or redemption of fund shares. Separate account expenses are not included. Absent limitation of expenses during certain of the periods shown, performance would have been lower.
| Managers: | |
| Inception Date: | |
| Total Net Assets: | $44.50 Million |
Number Of Fixed Income Holdings: | 98 |
| Effective Duration: | 4.43 years |
| 14.70 years |
| Aaa/AAA |
| 30-day SEC Yield: | 4.09% |
Quality Breakdown | | Sector Allocations |
Summit Mutual Funds, Inc. – Pinnacle Series LEHMAN AGGREGATE BOND INDEX PORTFOLIO |
Objective – Seeks investment results that correspond to the total return performance of the bond market, as represented by the Lehman Brothers Aggregate Bond Index (the “Index”).
Strategy – The Summit Pinnacle Lehman Aggregate Bond Index Portfolio (the “Portfolio”) will invest at least 80% of the value of its assets in obligations issued or guaranteed by the U.S. Government, publicly–traded debt securities rated BBB or BAA3 or higher by a national rating agency, or cash and cash equivalents. Up to 20% of the Portfolio’s total assets may be invested in financial futures or options contracts. The Portfolio will not purchase bonds rated below investment grade.
Managers’ Comments:
For the period ended December 31, 2007, the Summit Lehman Aggregate Bond Index Portfolio’s total return was 7.43% (before the impact of any product or contract-level fees). This compares to a 6.97% total return for the Lehman Aggregate Bond Index. The difference of 0.46% is referred to as “tracking error” and is attributed to a number of factors, including the Portfolio’s operating expenses. These expenses represent the Portfolio’s costs for advisory, administration, accounting, custody and other services. Other factors include the fact that the Portfolio is only a sample of the Index verses a complete replication of the Index, the timing and size of cash flows into and out of the Portfolio and related holdings of cash and cash equivalents; and brokers’ commissions or other trading costs, among others. While an exact replication of the capitalization weightings of securities in the Index is not feasible, the Portfolio’s objectives and strategies call for a correlation of at least 95% between the Portfolio’s pre-expense total return and that of the Index. The Portfolio achieved this level of correlation for the period presented.
Summit Mutual Funds, Inc. – Pinnacle Series |
| FINANCIAL HIGHLIGHTS | LEHMAN AGGREGATE BOND INDEX PORTFOLIO |
FINANCIAL HIGHLIGHTS | | | | | | | | | | | | | | | |
| Computed on the basis of a share of capital stock outstanding throughout the period. | | | | | | | | | | | | | |
| | | | | | | | | | | | | | | | |
| | Year Ended December 31, |
| | | 2007 | | | 2006 | | | 2005 | | | 2004 | | | 2003(1) | |
| Net asset value, beginning of period | | $ | 48.85 | | | $ | 49.06 | | | $ | 50.13 | | | $ | 49.78 | | | $ | 50.00 | |
| INVESTMENT ACTIVITIES: | | | | | | | | | | | | | | | | | | | | |
| Net investment income / (loss) | | | 2.13 | | | | 1.97 | | | | 1.83 | | | | 1.71 | (2) | | | 1.32 | |
| Net realized and unrealized gains / (losses) | | | 1.40 | | | | (0.24 | ) | | | (1.06 | ) | | | 0.03 | | | | (0.49 | ) |
| Total from Investment Activities | | | 3.53 | | | | 1.73 | | | | 0.77 | | | | 1.74 | | | | 0.83 | |
| DISTRIBUTIONS: | | | | | | | | | | | | | | | | | | | | |
| Net investment income | | | (2.11 | ) | | | (1.94 | ) | | | (1.84 | ) | | | (1.39 | ) | | | (1.05 | ) |
| Total Distributions | | | (2.11 | ) | | | (1.94 | ) | | | (1.84 | ) | | | (1.39 | ) | | | (1.05 | ) |
| Net asset value, end of period | | $ | 50.27 | | | $ | 48.85 | | | $ | 49.06 | | | $ | 50.13 | | | $ | 49.78 | |
| | | | | | | | | | | | | | | | | | | | | |
| Total return | | | 7.43 | % | | | 3.64 | % | | | 1.57 | % | | | 3.55 | % | | | 1.70 | % |
| | | | | | | | | | | | | | | | | | | | | |
| RATIOS/SUPPLEMENTAL DATA: | | | | | | | | | | | | | | | | | | | | |
Ratio of expenses to average net assets - net(3) | | | 0.59 | % | | | 0.59 | % | | | 0.60 | % | | | 0.60 | % | | | 0.60 | %(4) |
| Ratio of expenses to average net assets - gross | | | 0.59 | % | | | 0.59 | % | | | 0.63 | % | | | 0.71 | % | | | 1.10 | %(4) |
| Ratio of net investment income / (loss) to average net assets | | | 4.24 | % | | | 3.96 | % | | | 3.54 | % | | | 3.26 | % | | | 2.83 | %(4) |
| Portfolio turnover rate | | | 23.61 | % | | | 27.93 | % | | | 15.93 | % | | | 43.24 | % | | | 31.94 | %(4) |
| Net assets, end of period (000’s) | | $ | 44,496 | | | $ | 39,160 | | | $ | 37,657 | | | $ | 32,786 | | | $ | 10,296 | |
| | | | | | | | | | | | | | | | | | | | | |
(1) Portfolio commenced operations on April 1, 2003. | | | | | | | | | | |
(2) Per share amounts are based on average shares outstanding. | | | | | | | | | | |
(3) Net expenses represent gross expenses reduced by fees waived and/or reimbursed by the Adviser. | | | | | |
(4) Annualized. | | | | | | | | | | |
The accompanying notes are an integral part of the financial statements.
Summit Mutual Funds, Inc. – Pinnacle Series |
LEHMAN AGGREGATE BOND INDEX PORTFOLIO | SCHEDULE OF INVESTMENTS |
DECEMBER 31, 2007 | | | | | | |
| | | PRINCIPAL | | | | |
| | | AMOUNT | | | VALUE | |
U.S. TREASURY OBLIGATIONS - 28.9% | | | | | | |
U.S. Treasury Bonds - 7.4% | | | | | | |
6.250%, 08/15/2023 (d) | | $ | 400,000 | | | $ | 478,906 | |
5.500%, 08/15/2028 (d) | | | 500,000 | | | | 566,172 | |
5.250%, 11/15/2028 (d) | | | 1,100,000 | | | | 1,210,257 | |
5.250%, 02/15/2029 (d) | | | 725,000 | | | | 797,557 | |
6.125%, 08/15/2029 (d) | | | 200,000 | | | | 244,672 | |
| | | | | | | | 3,297,564 | |
U.S. Treasury Notes - 21.5% | | | | | | | | |
5.625%, 05/15/2008 (d) | | | 300,000 | | | | 302,414 | |
3.125%, 10/15/2008 (d) | | | 500,000 | | | | 499,141 | |
3.375%, 12/15/2008 (d) | | | 196,000 | | | | 196,245 | |
5.500%, 05/15/2009 (d) | | | 200,000 | | | | 206,500 | |
6.000%, 08/15/2009 (d) | | | 750,000 | | | | 784,277 | |
6.500%, 02/15/2010 (d) | | | 600,000 | | | | 641,578 | |
4.000%, 04/15/2010 (d) | | | 250,000 | | | | 255,078 | |
| 5.750%, 08/15/2010 | | | 300,000 | | | | 320,109 | |
4.250%, 01/15/2011 (d) | | | 950,000 | | | | 982,063 | |
| 4.750%, 01/31/2012 | | | 250,000 | | | | 263,516 | |
4.500%, 04/30/2012 (d) | | | 200,000 | | | | 208,922 | |
4.875%, 06/30/2012 (d) | | | 200,000 | | | | 212,125 | |
4.000%, 11/15/2012 (d) | | | 500,000 | | | | 513,476 | |
3.875%, 02/15/2013 (d) | | | 1,500,000 | | | | 1,530,000 | |
3.625%, 05/15/2013 (d) | | | 300,000 | | | | 302,062 | |
4.000%, 02/15/2014 (d) | | | 500,000 | | | | 510,821 | |
4.000%, 02/15/2015 (d) | | | 650,000 | | | | 659,192 | |
4.875%, 08/15/2016 (d) | | | 750,000 | | | | 798,633 | |
4.625%, 02/15/2017 (d) | | | 350,000 | | | | 365,914 | |
| | | | | | | | 9,552,066 | |
| TOTAL U.S. TREASURY OBLIGATIONS | | | | | | | | |
| (Cost $12,363,714) | | | | | | | 12,849,630 | |
| | | | | | | | | |
SOVEREIGN GOVERNMENT BONDS - 0.7% | | | | | | | | |
| Province of New Brunswick | | | | | | | | |
| 6.750%, 08/15/2013 | | | 100,000 | | | | 113,819 | |
| Republic of Italy | | | | | | | | |
| 2.500%, 07/15/2008 | | | 200,000 | | | | 197,646 | |
| TOTAL FOREIGN GOVERNMENT BONDS | | | | | | | | |
| (Cost $309,880) | | | | | | | 311,465 | |
| | | | | | | | | |
MORTGAGE BACKED SECURITIES - 41.8% | | | | | | | | |
| Bank of America Commercial Mortgage, Inc. | | | | | | | | |
| Series 2006-5, 5.390%, 09/10/2047 | | | 690,000 | | | | 689,821 | |
| Bear Stearns Commercial Mortgage Securities, Inc. | | | | | | | | |
| Series 2000-WF2, 7.110%, 10/15/2032 | | | 54,301 | | | | 54,516 | |
| Series 2003-TOP12, 4.240%, 08/13/2039 | | | 350,000 | | | | 346,894 | |
| Series 2004-PWR5, 4.254%, 07/11/2042 | | | 580,000 | | | | 576,733 | |
| Fannie Mae Pool | | | | | | | | |
| Pool #615009, 5.000%, 12/01/2016 | | | 1,122,985 | | | | 1,125,440 | |
| Pool #639917, 5.000%, 11/01/2017 | | | 167,638 | | | | 168,042 | |
| Pool #727360, 5.500%, 08/01/2018 | | | 422,296 | | | | 428,572 | |
| Pool #828624, 5.000%, 06/01/2020 | | | 525,894 | | | | 526,410 | |
| Pool #211487, 6.500%, 04/01/2023 | | | 67,294 | | | | 70,499 | |
| Pool #653650, 6.500%, 08/01/2032 | | | 407,536 | | | | 419,361 | |
| Pool #555591, 5.500%, 07/01/2033 | | | 664,413 | | | | 664,906 | |
| Pool #722267, 5.500%, 07/01/2033 | | | 837,370 | | | | 837,991 | |
| Pool #732114, 6.000%, 08/01/2033 | | | 113,600 | | | | 115,587 | |
| Pool #357457, 5.500%, 11/01/2033 | | | 764,726 | | | | 765,293 | |
| Pool #840633, 6.000%, 06/01/2034 | | | 599,009 | | | | 610,983 | |
| Pool #801322, 5.000%, 10/01/2034 | | | 964,977 | | | | 942,604 | |
| Pool #824839, 5.500%, 06/01/2035 | | | 1,555,815 | | | | 1,554,865 | |
| Pool #256101, 5.500%, 02/01/2036 | | | 663,520 | | | | 663,116 | |
| Pool #903724, 7.500%, 11/01/2036 | | | 713,651 | | | | 741,481 | |
| | | PRINCIPAL | | | | |
| | | AMOUNT | | | VALUE | |
MORTGAGE BACKED SECURITIES - 41.8% (Continued) | | | | | | |
| Freddie Mac (Gold) Pool | | | | | | |
| Pool #E9-6460, 5.000%, 05/01/2018 | | $ | 1,116,127 | | | $ | 1,118,877 | |
| Pool #E9-9160, 4.500%, 09/01/2018 | | | 427,365 | | | | 420,238 | |
| Pool #G1-1798, 5.000%, 11/01/2020 | | | 731,317 | | | | 732,034 | |
| Pool #C7-6658, 5.000%, 02/01/2033 | | | 1,107,517 | | | | 1,082,257 | |
| Pool #G0-8146, 6.000%, 08/01/2036 | | | 994,923 | | | | 1,009,883 | |
| Pool #A6-6783, 6.000%, 10/01/2037 | | | 1,880,881 | | | | 1,908,970 | |
| Ginnie Mae Pool | | | | | | | | |
| Pool #003583M, 5.500%, 07/20/2034 | | | 833,124 | | | | 835,032 | |
| J.P. Morgan Chase Commercial Mortgage Backed Security Corp. | | | | | | | | |
| Series 2001-C1, 5.464%, 10/12/2035 | | | 183,927 | | | | 185,252 | |
| TOTAL MORTGAGE BACKED SECURITIES | | | | | | | | |
| (Cost $18,656,851) | | | | | | | 18,595,657 | |
| | | | | | | | | |
ASSET BACKED SECURITIES - 0.3% | | | | | | | | |
| Residential Asset Securities Corp. | | | | | | | | |
| Series 2003-KS4, 4.610%, 06/25/2033 | | | 132,750 | | | | 118,201 | |
| TOTAL ASSET BACKED SECURITIES | | | | | | | | |
| (Cost $131,199) | | | | | | | 118,201 | |
| | | | | | | | | |
U.S. GOVERNMENT AGENCY ISSUES - 8.3% | | | | | | | | |
| Fannie Mae | | | | | | | | |
| 5.050%, 02/07/2011 | | | 1,300,000 | | | | 1,353,392 | |
| Federal Farm Credit Bank | | | | | | | | |
| 4.250%, 02/01/2012 | | | 750,000 | | | | 760,627 | |
| Freddie Mac | | | | | | | | |
| 5.750%, 03/15/2009 | | | 200,000 | | | | 204,397 | |
| 7.000%, 03/15/2010 | | | 1,300,000 | | | | 1,393,265 | |
| TOTAL U.S. GOVERNMENT AGENCY ISSUES | | | | | | | | |
| (Cost $3,596,828) | | | | | | | 3,711,681 | |
| | | | | | | | | |
CORPORATE BONDS - 18.6% | | | | | | | | |
Consumer Discretionary - 1.4% | | | | | | | | |
| EW Scripps Co. | | | | | | | | |
| 5.750%, 07/15/2012 | | | 180,000 | | | | 188,151 | |
| Johnson Controls, Inc. | | | | | | | | |
| 5.250%, 01/15/2011 | | | 200,000 | | | | 200,564 | |
| TCI Communications, Inc. | | | | | | | | |
| 8.750%, 08/01/2015 | | | 100,000 | | | | 116,321 | |
| The Thomson Corp. | | | | | | | | |
| 6.200%, 01/05/2012 | | | 100,000 | | | | 104,308 | |
| | | | | | | | 609,344 | |
Consumer Staples - 1.4% | | | | | | | | |
| Campbell Soup Co. | | | | | | | | |
5.875%, 10/01/2008 (d) | | | 230,000 | | | | 232,250 | |
| Cargill Inc. | | | | | | | | |
5.000%, 11/15/2013 (a) (d) | | | 250,000 | | | | 245,782 | |
| Diageo Capital PLC | | | | | | | | |
3.375%, 03/20/2008 (d) | | | 136,000 | | | | 135,743 | |
| | | | | | | | 613,775 | |
Energy - 3.2% | | | | | | | | |
| Apache Corp. | | | | | | | | |
5.625%, 01/15/2017 (d) | | | 100,000 | | | | 101,876 | |
The accompanying notes are an integral part of the financial statements.
Summit Mutual Funds, Inc. – Pinnacle Series |
SCHEDULE OF INVESTMENTS | LEHMAN AGGREGATE LEHMAN AGGREGATE BOND INDEX PORTFOLIO |
| | | PRINCIPAL | | | | |
| | | AMOUNT | | | VALUE | |
Energy - 3.2% (Continued) | | | | | | |
| Colonial Pipeline Co. | | | | | | |
7.750%, 11/01/2010 (a) | | $ | 375,000 | | | $ | 407,913 | |
6.580%, 08/28/2032 (a) | | | 100,000 | | | | 103,957 | |
| Conoco Funding Co. | | | | | | | | |
| 6.350%, 10/15/2011 | | | 80,000 | | | | 84,971 | |
| Devon Financing Corp ULC | | | | | | | | |
| 6.875%, 09/30/2011 | | | 280,000 | | | | 299,849 | |
| Public Service of North Carolina, Inc. | | | | | | | | |
| 6.625%, 02/15/2011 | | | 180,000 | | | | 188,067 | |
| Suncor Energy, Inc. | | | | | | | | |
| 6.500%, 06/15/2038 | | | 250,000 | | | | 267,305 | |
| | | | | | | | 1,453,938 | |
Financials - 1.7% | | | | | | | | |
| American General Finance Corp. | | | | | | | | |
5.375%, 09/01/2009 (d) | | | 210,000 | | | | 213,110 | |
| Camden Property Trust | | | | | | | | |
| 5.875%, 11/30/2012 | | | 100,000 | | | | 101,041 | |
| General Electric Capital Corp. | | | | | | | | |
| 6.125%, 02/22/2011 | | | 250,000 | | | | 261,334 | |
| The Progressive Corp. | | | | | | | | |
| 6.375%, 01/15/2012 | | | 165,000 | | | | 175,900 | |
| | | | | | | | 751,385 | |
Health Care - 1.8% | | | | | | | | |
| AstraZeneca PLC | | | | | | | | |
| 6.450%, 09/15/2037 | | | 350,000 | | | | 383,487 | |
| C.R. Bard, Inc. | | | | | | | | |
| 6.700%, 12/01/2026 | | | 250,000 | | | | 262,975 | |
| Eli Lilly & Co. | | | | | | | | |
2.900%, 03/15/2008 (d) | | | 100,000 | | | | 99,672 | |
| Pharmacia Corp. | | | | | | | | |
5.875%, 12/01/2008 (e) | | | 50,000 | | | | 50,747 | |
| | | | | | | | 796,881 | |
Industrials - 5.0% | | | | | | | | |
| Chevron Phillips Chemical Company LLC | | | | | | | | |
| 7.000%, 03/15/2011 | | | 200,000 | | | | 215,056 | |
| CSX Corp. | | | | | | | | |
| 4.875%, 11/01/2009 | | | 180,000 | | | | 180,492 | |
| Deere & Co. | | | | | | | | |
| 6.550%, 10/01/2028 | | | 250,000 | | | | 269,894 | |
| Eaton Corp. | | | | | | | | |
| 5.750%, 07/15/2012 | | | 439,000 | | | | 451,655 | |
| Emerson Electric Co. | | | | | | | | |
4.750%, 10/15/2015 (d) | | | 200,000 | | | | 194,103 | |
| Honeywell International, Inc. | | | | | | | | |
7.500%, 03/01/2010 (d) | | | 108,000 | | | | 114,943 | |
| Lockheed Martin Corp. | | | | | | | | |
| 7.200%, 05/01/2036 | | | 150,000 | | | | 175,121 | |
| Masco Corp. | | | | | | | | |
| 5.875%, 07/15/2012 | | | 180,000 | | | | 184,508 | |
| | | PRINCIPAL | | | | |
| | | AMOUNT | | | VALUE | |
Industrials - 5.0% (Continued) | | | | | | |
| Pitney Bowes, Inc. | | | | | | |
| 4.625%, 10/01/2012 | | $ | 180,000 | | | $ | 182,089 | |
| United Technologies Corp. | | | | | | | | |
| 4.375%, 05/01/2010 | | | 250,000 | | | | 250,709 | |
| | | | | | | | 2,218,570 | |
Information Technology - 1.1% | | | | | | | | |
| Cisco Systems, Inc. | | | | | | | | |
| 5.250%, 02/22/2011 | | | 250,000 | | | | 256,315 | |
| Oracle Corp / Ozark Holdings, Inc. | | | | | | | | |
| 5.250%, 01/15/2016 | | | 250,000 | | | | 249,509 | |
| | | | | | | | 505,824 | |
Materials - 1.5% | | | | | | | | |
| Alcoa, Inc. | | | | | | | | |
| 5.720%, 02/23/2019 | | | 149,000 | | | | 146,463 | |
| Westvaco Corp. | | | | | | | | |
| 7.950%, 02/15/2031 | | | 500,000 | | | | 529,522 | |
| | | | | | | | 675,985 | |
Telecommunication Services - 1.0% | | | | | | | | |
| GTE Corp. | | | | | | | | |
| 7.510%, 04/01/2009 | | | 180,000 | | | | 185,211 | |
| 6.940%, 04/15/2028 | | | 80,000 | | | | 85,692 | |
| Sprint Capital Corp. | | | | | | | | |
| 6.875%, 11/15/2028 | | | 180,000 | | | | 170,705 | |
| | | | | | | | 441,608 | |
Utilities - 0.5% | | | | | | | | |
| Exelon Generation Co. LLC | | | | | | | | |
| 5.350%, 01/15/2014 | | | 230,000 | | | | 223,835 | |
| TOTAL CORPORATE BONDS | | | | | | | | |
| (Cost $8,412,799) | | | | | | | 8,291,145 | |
| | | | | | | | | |
| | | SHARES | | | VALUE | |
SHORT TERM INVESTMENTS - 0.8% | | | | | | |
Money Market Funds - 0.8% | | | | | | |
| Northern Institutional Diversified Assets Portfolio | | | 363,316 | | | $ | 363,316 | |
| TOTAL SHORT TERM INVESTMENTS | | | | | | | | |
| (Cost $363,316) | | | | | | | 363,316 | |
Total Investments (Cost $43,834,587) (b) - 99.4% | | | | | | | 44,241,095 | |
Northern Institutional Liquid Assets Portfolio (c) - 18.1% | | | | | | | 8,069,433 | |
Liabilities in Excess of Other Assets - (17.5)% | | | | | | | (7,814,906 | ) |
TOTAL NET ASSETS - 100.0% | | | | | | $ | 44,495,622 | |
| (a) | Security exempt from registration under Rule 144(a) of the Securities Act of 1933. These securities may be resold in transactions exempt from registration, normally to qualified institutional buyers. |
| (b) | For federal income tax purposes, cost is $43,834,686 and gross unrealized appreciation and depreciation of securities as of December 31, 2007 was $777,249 and ($370,840), respectively, with a net appreciation / (depreciation) of $406,409. |
| (c) | This security was purchased with cash collateral held from securities lending. The market value of the securities on loan, the collateral purchased with cash, and the noncash collateral accepted is $12,683,650, $8,069,433, and $5,022,246, respectively. |
| (d) | All or a portion of this security is out on loan. |
The accompanying notes are an integral part of the financial statements.
Summit Mutual Funds, Inc. – Pinnacle Series |
LEHMAN AGGREGATE BOND INDEX PORTFOLIO | FINANCIAL STATEMENTS |
STATEMENT OF ASSETS AND LIABILITIES | | | |
December 31, 2007 | | | |
| ASSETS | | | |
| Investments in securities, at value | | $ | 44,241,095 | |
| Collateral for securities loaned, at fair value | | | 8,069,433 | |
| Receivables: | | | | |
| Shares sold | | | 34,195 | |
| Securities sold | | | 577,320 | |
| Interest and dividends | | | 490,811 | |
| Prepaid expenses and other | | | 1,126 | |
| | | | 53,413,980 | |
| LIABILITIES | | | | |
| Payables: | | | | |
| Investment securities purchased | | | 512,423 | |
| Payable upon return of securities loaned | | | 8,069,433 | |
| Shares redeemed | | | 283,594 | |
| Professional fees | | | 16,672 | |
| Fund accounting fees | | | 11,561 | |
| Advisory fees | | | 11,420 | |
| Administration fees | | | 3,807 | |
| Custodian fees | | | 1,084 | |
| Directors’ fees | | | 101 | |
| Other accrued expenses | | | 8,263 | |
| | | | 8,918,358 | |
| NET ASSETS* | | | | |
| Paid-in capital | | | 44,185,685 | |
| Accumulated undistributed net investment | | | | |
| income / (loss) | | | 281,959 | |
| Accumulated net realized gain / (loss) | | | | |
| on investments | | | (378,530 | ) |
| Net unrealized appreciation / (depreciation) | | | | |
| on investments | | | 406,508 | |
| | | $ | 44,495,622 | |
| | | | | |
| Investments at cost | | $ | 43,834,587 | |
| Shares authorized ($.10 par value) | | | 20,000,000 | |
| NET ASSET VALUE (NAV) BY SHARE CLASS | | | | | |
| | | | | | |
| Share Class | Net Assets | Outstanding | | Per Share | |
| Class I | $44,495,622 | | | $ | |
| * | FEDERAL TAX DATA AS OF DECEMBER 31, 2006 | | |
| | Percentage of ordinary distributions designated as | | |
| | qualified dividend income | | 2.08% |
| | Dividends received deduction for corporate shareholders | | 2.10% |
| | Undistributed ordinary income | $ | |
| | | $ | |
| |
| Capital Loss Carryforward Expiring December 31: |
| | $(27,690) | $(58,001) | $(75,489) | $(217,251) | |
STATEMENT OF OPERATIONS | | | |
For the year ended December 31, 2007 | | | |
| | | | |
| INVESTMENT INCOME | | | |
| Interest | | $ | 1,917,658 | |
| Dividends | | | 76,774 | |
| Other income | | | 17,042 | |
| | | | 2,011,474 | |
| EXPENSES | | | | |
| Advisory fees | | | 124,795 | |
| Administration fees | | | 41,598 | |
| Fund accounting fees | | | 27,048 | |
| Professional fees | | | 20,871 | |
| Transfer agent fees | | | 14,283 | |
| Directors’ fees | | | 4,910 | |
| Shareholder reporting fees | | | 4,441 | |
| Custodian fees | | | 4,143 | |
| Other expenses | | | 3,976 | |
| | | | 246,065 | |
| NET INVESTMENT INCOME / (LOSS) | | | 1,765,409 | |
| | | | | |
| REALIZED AND UNREALIZED GAIN / (LOSS) | | | | |
| Net realized gain / (loss) on investments | | | 120,051 | |
| Net change in unrealized appreciation / | | | | |
| (depreciation) on investments | | | 1,151,263 | |
| | | | | |
| NET REALIZED AND UNREALIZED | | | | |
| GAIN / (LOSS) | | | 1,271,314 | |
| | | | | |
| NET INCREASE / (DECREASE) IN | | | | |
| NET ASSETS FROM OPERATIONS | | $ | 3,036,723 | |
| TRANSACTIONS WITH AFFILIATES: | | | |
| Percent of Current | |
| Net Asset Value | |
| | Advisory | Administration | Expense | |
| | Fee | Fee | Limit | |
| | 0.30% | 0.10 % | 0.60% | |
The accompanying notes are an integral part of the financial statements.
Summit Mutual Funds, Inc. – Pinnacle Series |
FINANCIAL STATEMENTS | LEHMAN AGGREGATE LEHMAN AGGREGATE BOND INDEX PORTFOLIO |
STATEMENTS OF CHANGES IN NET ASSETS | | | | | | |
Year Ended December 31, | | | | | | |
| | | 2007 | | | 2006 | |
| OPERATIONS | | | | | | |
| Net investment income / (loss) | | $ | 1,765,409 | | | $ | 1,514,352 | |
| Net realized gain / (loss) on investments | | | 120,051 | | | | (200,587 | ) |
| Net change in unrealized appreciation / (depreciation) on investments | | | 1,151,263 | | | | 59,639 | |
| | | | 3,036,723 | | | | 1,373,404 | |
| | | | | | | | | |
| DISTRIBUTIONS TO SHAREHOLDERS* | | | | | | | | |
| Net investment income | | | (1,780,425 | ) | | | (1,523,171 | ) |
| | | | (1,780,425 | ) | | | (1,523,171 | ) |
| | | | | | | | | |
| FUND SHARE TRANSACTIONS | | | | | | | | |
| Proceeds from shares sold | | | 11,062,969 | | | | 7,341,409 | |
| Reinvestment of distributions | | | 1,780,425 | | | | 1,523,171 | |
| Payments for shares redeemed | | | (8,764,517 | ) | | | (7,211,808 | ) |
| | | | 4,078,877 | | | | 1,652,772 | |
| | | | | | | | | |
| NET INCREASE / (DECREASE) IN NET ASSETS | | | 5,335,175 | | | | 1,503,005 | |
| NET ASSETS | | | | | | | | |
| Beginning of period | | | 39,160,447 | | | | 37,657,442 | |
| End of period | | $ | 44,495,622 | | | $ | 39,160,447 | |
| | | | | | | | | |
| ACCUMULATED UNDISTRIBUTED NET INVESTMENT INCOME | | $ | 281,959 | | | $ | 237,576 | |
| FUND SHARE TRANSACTIONS | | | | | | |
| Sold | | | | | | | 151,422 | |
| Reinvestment of distributions | | | | | | | 31,573 | |
| Redeemed | | | (178,351 | ) | | | (149,030 | ) |
| | | | | | | | | |
| Net increase / (decrease) from fund share transactions | | | | | | | 33,965 | |
| | | | | | | | | |
| TOTAL COST OF PURCHASES OF: | | | | | | | | |
| Preferred and Common Stocks | | $ | | | | $ | 2,937,541 | |
| U.S. Government Securities | | | | | | | 7,459,902 | |
| Corporate Bonds | | | | | | | 1,561,740 | |
| Asset Backed Securities | | | | | | | — | |
| | | | | | | | | |
| | | $ | | | | $ | 11,959,183 | |
| | | | | | | | | |
| TOTAL PROCEEDS FROM SALES OF: | | | | | | | | |
| Preferred and Common Stocks | | $ | | | | $ | 2,454,252 | |
| U.S. Government Securities | | | | | | | 6,156,872 | |
| Corporate Bonds | | | | | | | 1,773,733 | |
| Asset Backed Securities | | | | | | | — | |
| | | | | | | | | |
| | | $ | | | | $ | 10,384,857 | |
| | | | | | | | | |
| *TAX CHARACTER OF DISTRIBUTIONS PAID | | | | | | | | |
| Ordinary income | | $ | | | | $ | 1,523,171 | |
| | | | | | | | | |
| | | $ | | | | $ | 1,523,171 | |
The accompanying notes are an integral part of the financial statements.
Summit Mutual Funds, Inc. – Pinnacle Series INFLATION PROTECTED PLUS PORTFOLIO |
Summit Inflation Portfolio - Total Return |
| |
| |
Past performance is not predictive of future results. Performance does not reflect the deduction of taxes that a shareholder would pay on fund distributions or redemption of fund shares. Separate account expenses are not included. Absent limitation of expenses during certain of the periods shown, performance would have been lower.
| | |
| Managers: | |
| | |
| | |
| Inception Date: | |
| |
| |
| |
| |
| 9.79 years |
| |
| |
Summit Mutual Funds, Inc. – Pinnacle Series INFLATION PROTECTED PLUS PORTFOLIO |
Objective – Seeks to maximize real levels of current income consistent with reasonable investment risk, by investing primarily in inflation adjusted fixed income securities.
Strategy – The Inflation Protected Plus Portfolio (the “Portfolio”) seeks to achieve its objective by investing under normal circumstances at least 80% of the value of its assets in inflation protected fixed income securities. Up to 20% of the Portfolio’s assets may be invested in fixed income securities that are not inflation indexed, including unrated or below investment-grade bonds, convertible debt securities, convertible preferred and preferred stocks, or other securities.
Managers’ Comments:
The Summit Inflation Protected Plus Portfolio had a total return of 10.80% (before the impact of any product or contract level fees) for the year ended December 31, 2007, compared to a total return of 11.64% for the Lehman Brothers U.S. Treasury Inflation Protected Securities (“TIPs”) Index. The primary reason that the Portfolio underperformed the Index is because the Portfolio has expenses and trading costs that the Index does not. In addition, the Portfolio maintains a small cash position to manage cash inflows and outflows of the fund.
Treasury rates in general declined in 2007, as the prospect of a slower economy prompted the Federal Reserve to cut short-term interest rates. In addition, the ongoing credit crunch created a flight to quality in the latter half of 2007, that drove Treasury rates down further. For the year, 10 year Treasury rates declined from 4.70% to 4.02%, while 2 year Treasury rates declined from 4.81% to 3.05%.
The rate of inflation, as measured by the Consumer Price Index for Urban Consumers, rose 4.1% for 2007. This compares to a rate of 2.5% for 2006. The increase in inflation has largely been driven by higher commodity and energy prices. These higher costs have begun to spread into other parts of the economy by affecting component and transportation costs, as well. Core inflation however, which excludes food and energy, advanced at a more moderate 2.4% in 2007.
The difference between the yield on a 10 year Treasury bond and the yield on a 10 year TIPs bond, ranged between 2.0% and 2.5% during 2007, ending the year at about 2.35%. The implication is that the market expects inflation to average a more modest 2.0% to 2.5% over the next 10 years.
The Portfolio is comprised primarily of U.S. Treasury Inflation Protected Securities and maintained an intermediate duration throughout the year. The combination of lower interest rates, higher reported inflation and a modest expectation for future inflation combined to provide a higher return for TIPs than for similar US Treasury securities.
Summit Mutual Funds, Inc. – Pinnacle Series |
| INFLATION PROTECTED PLUS PORTFOLIO | |
FINANCIAL HIGHLIGHTS | | | | | | |
| | | | | | | |
| | | Year Ended | | | Period Ended | |
| | | December 31, | | | December 31, | |
| | | 2007 | | | 2006(1) | |
| | | | | | | |
| Net asset value, beginning of period | | $ | 50.09 | | | $ | 50.00 | |
| | | | | | | | | |
| | | | | | | | | |
| INVESTMENT ACTIVITIES: | | | | | | | | |
| Net investment income / (loss) | | | 2.64 | | | | — | |
| Net realized and unrealized gains / (losses) | | | 2.59 | | | | 0.09 | |
| | | | | | | | | |
| Total from Investment Activities | | | 5.23 | | | | 0.09 | |
| | | | | | | | | |
| | | | | | | | | |
| DISTRIBUTIONS: | | | | | | | | |
| Net investment income | | | (2.32 | ) | | | — | |
| | | | | | | | | |
| Total Distributions | | | (2.32 | ) | | | — | |
| | | | | | | | | |
| Net asset value, end of period | | $ | 53.00 | | | $ | 50.09 | |
| | | | | | | | | |
| Total return | | | 10.80 | % | | | 0.18 | % |
| | | | | | | | | |
| RATIOS/SUPPLEMENTAL DATA: | | | | | | | | |
Ratio of expenses to average net assets – net (2) | | | 0.75 | % | | | 0.75 | %(3) |
| Ratio of expenses to average net assets – gross | | | 5.27 | % | | | 33.70 | %(3) |
| Ratio of net investment income / (loss) to average net assets | | | 5.19 | % | | | (2.28 | )%(3) |
| Portfolio turnover rate | | | 8.46 | % | | | 0.00 | % |
| Net assets, end of period (000’s) | | $ | 1,157 | | | $ | 1,002 | |
| | | | | | | | | |
(1) Portfolio commenced operations on December 28, 2006. | | | | |
(2) Net expenses represent gross expenses reduced by fees waived and/or reimbursed by the Adviser. | | | | |
(3) Annualized. | | | | |
The accompanying notes are an integral part of the financial statements.
Summit Mutual Funds, Inc. – Pinnacle Series |
| SCHEDULE OF INVESTMENTS | INFLATION PROTECTED PLUS PORTFOLIO |
DECEMBER 31, 2007 | | | | | | |
| | | PRINCIPAL | | | | |
| | | AMOUNT | | | VALUE | |
U.S. TREASURY OBLIGATIONS (b) - 93.7% | | | | | | |
U.S. TREASURY NOTES & BONDS | | | | | | |
U.S. Treasury Bonds - 27.5% | | | | | | |
| 2.375%, 01/15/2027 | | $ | 31,080 | | | $ | 32,867 | |
| 3.875%, 04/15/2029 | | | 216,046 | | | | 285,856 | |
| | | | | | | | 318,723 | |
U.S. Treasury Notes - 66.2% | | | | | | | | |
| 3.875%, 01/15/2009 | | | 50,956 | | | | 52,461 | |
| 4.250%, 01/15/2010 | | | 62,089 | | | | 66,250 | |
| 0.875%, 04/15/2010 | | | 55,141 | | | | 54,955 | |
| 3.500%, 01/15/2011 | | | 72,023 | | | | 77,459 | |
| 3.000%, 07/15/2012 | | | 81,338 | | | | 88,093 | |
| 2.000%, 01/15/2014 | | | 180,910 | | | | 186,861 | |
| 1.875%, 07/15/2015 | | | 171,854 | | | | 175,171 | |
| 2.000%, 01/15/2016 | | | 63,157 | | | | 64,815 | |
| | | | | | | | 766,065 | |
| TOTAL U.S. TREASURY OBLIGATIONS | | | | | | | | |
| (Cost $1,027,689) | | | | | | | 1,084,788 | |
| | | | | | | | | |
| | | SHARES | | | VALUE | |
SHORT TERM INVESTMENTS - 5.8% | | | | | | | | |
Money Market Funds - 5.8% | | | | | | | | |
| Northern Institutional Diversified Assets Portfolio | | | 66,450 | | | $ | 66,450 | |
| TOTAL SHORT TERM INVESTMENTS | | | | | | | | |
| (Cost $66,450) | | | | | | | 66,450 | |
Total Investments (Cost $1,094,139) (a) - 99.5% | | | | | | | 1,151,238 | |
Other Assets in Excess of Liabilities - 0.5% | | | | | | | 6,111 | |
TOTAL NET ASSETS - 100.0% | | | | | | $ | 1,157,349 | |
| (a) | For federal income tax purposes, cost is $1,094,139 and gross unrealized appreciation and depreciation of securities as of December 31, 2007, was $57,099 and $0 respectively, with a net appreciation / (depreciation) of $57,099. |
| (b) | Inflation protected security. |
The accompanying notes are an integral part of the financial statements.
Summit Mutual Funds, Inc. – Pinnacle Series |
| INFLATION PROTECTED PLUS PORTFOLIO | |
STATEMENT OF ASSETS AND LIABILITIES | | | |
December 31, 2007 | | | |
| | | | |
| ASSETS | | | |
| Investments in securities, at value | | $ | 1,151,238 | |
| Receivables: | | | | |
| Interest and dividends | | | 10,631 | |
| Receivable from adviser | | | 24,589 | |
| Prepaid expenses and other | | | 20 | |
| | | | 1,186,478 | |
| LIABILITIES | | | | |
| Payables: | | | | |
| Shares redeemed | | | 46 | |
| Professional fees | | | 17,303 | |
| Fund accounting fees | | | 6,027 | |
| Transfer agent fees | | | 5,486 | |
| Custodian fees | | | 31 | |
| Directors’ fees | | | 2 | |
| Other accrued expenses | | | 234 | |
| | | | 29,129 | |
| NET ASSETS* | | | | |
| Paid-in capital | | | 1,094,008 | |
| Accumulated undistributed net investment | | | | |
| income / (loss) | | | 7,007 | |
| Accumulated net realized gain / (loss) | | | | |
| on investments | | | (765 | ) |
| Net unrealized appreciation / (depreciation) | | | | |
| on investments | | | 57,099 | |
| | | $ | 1,157,349 | |
| | | | | |
| Investments at cost | | $ | 1,094,139 | |
| Shares authorized ($.10 par value) | | | 20,000,000 | |
| NET ASSET VALUE (NAV) BY SHARE CLASS | | | | | |
| | | | | | |
| Share Class | Net Assets | Outstanding | | Per Share | |
| Class I | $1,157,349 | | | $ | |
| * | FEDERAL TAX DATA AS OF DECEMBER 31, 2006 | | |
| | Undistributed ordinary income | $ | 7,007 |
| | | $ | |
| |
| Capital Loss Carryforward Expiring December 31: |
STATEMENT OF OPERATIONS | | | |
For the year ended December 31, 2007 | | | |
| | | | |
| INVESTMENT INCOME | | | |
| Interest | | $ | 61,035 | |
| Dividends | | | 910 | |
| | | | 61,945 | |
| EXPENSES | | | | |
| Professional fees | | | 19,100 | |
| Fund accounting fees | | | 15,433 | |
| Transfer agent fees | | | 13,152 | |
| Advisory fees | | | 5,216 | |
| Administration fees | | | 1,043 | |
| Custodian fees | | | 271 | |
| Directors’ fees | | | 132 | |
| Shareholder reporting fees | | | 111 | |
| Other expenses | | | 549 | |
| | | | 55,007 | |
| Reimbursements and waivers | | | (47,184 | ) |
| | | | 7,823 | |
| NET INVESTMENT INCOME / (LOSS) | | | 54,122 | |
| | | | | |
| | | | | |
| REALIZED AND UNREALIZED GAIN / (LOSS) | | | | |
| Net realized gain / (loss) on investments | | | (765 | ) |
| Net change in unrealized appreciation / | | | | |
| (depreciation) on investments | | | 55,056 | |
| | | | | |
| NET REALIZED AND UNREALIZED | | | | |
| GAIN / (LOSS) | | | 54,291 | |
| | | | | |
| | | | | |
| | | | | |
| NET INCREASE / (DECREASE) IN | | | | |
| NET ASSETS FROM OPERATIONS | | $ | 108,413 | |
| TRANSACTIONS WITH AFFILIATES: | | | |
| Percent of Current | | | |
| Net Asset Value | | | |
| Advisory | Administration | Expense | | Reimbursements | |
| Fee | Fee | Limit | | and Waivers | |
| 0.10% | 0.75% | | $47,184 | |
The accompanying notes are an integral part of the financial statements.
Summit Mutual Funds, Inc. – Pinnacle Series |
| FINANCIAL STATEMENTS | INFLATION PROTECTED PLUS PORTFOLIO |
STATEMENTS OF CHANGES IN NET ASSETS | | | | | | |
For the Year Ended December 31, | | | | | | |
| | | 2007 | | | 2006(1) | |
| OPERATIONS | | | | | | |
| Net investment income / (loss) | | $ | 54,122 | | | $ | (188 | ) |
| Net realized gain / (loss) on investments | | | (765 | ) | | | — | |
| Net change in unrealized appreciation / (depreciation) on investments | | | 55,056 | | | | 2,043 | |
| | | | | | | | | |
| | | | 108,413 | | | | 1,855 | |
| | | | | | | | | |
| DISTRIBUTIONS TO SHAREHOLDERS* | | | | | | | | |
| Net investment income | | | (47,115 | ) | | | — | |
| | | | | | | | | |
| | | | (47,115 | ) | | | — | |
| | | | | | | | | |
| FUND SHARE TRANSACTIONS | | | | | | | | |
| Proceeds from shares sold | | | 47,188 | | | | 1,000,000 | |
| Reinvestment of distributions | | | 47,115 | | | | — | |
| Payments for shares redeemed | | | (107 | ) | | | — | |
| | | | | | | | | |
| | | | 94,196 | | | | 1,000,000 | |
| | | | | | | | | |
| NET INCREASE / (DECREASE) IN NET ASSETS | | | 155,494 | | | | 1,001,855 | |
| NET ASSETS | | | | | | | | |
| Beginning of period | | | 1,001,855 | | | | — | |
| | | | | | | | | |
| End of period | | $ | 1,157,349 | | | $ | 1,001,855 | |
| | | | | | | | | |
| ACCUMULATED UNDISTRIBUTED | | | | | | | | |
| NET INVESTMENT INCOME | | $ | 7,007 | | | $ | — | |
| FUND SHARE TRANSACTIONS | | | | | | |
| Sold | | | | | | | 20,000 | |
| Reinvestment of distributions | | | | | | | — | |
| Redeemed | | | (2 | ) | | | — | |
| | | | | | | | | |
| Net increase / (decrease) from fund share transactions | | | | | | | 20,000 | |
| | | | | | | | | |
| TOTAL COST OF PURCHASES OF: | | | | | | | | |
| U.S. Government Securities | | $ | | | | $ | 989,624 | |
| | | | | | | | | |
| | | $ | | | | $ | 989,624 | |
| | | | | | | | | |
| TOTAL PROCEEDS FROM SALES OF: | | | | | | | | |
| U.S. Government Securities | | $ | | | | $ | — | |
| | | | | | | | | |
| | | $ | | | | $ | — | |
| | | | | | | | | |
| *TAX CHARACTER OF DISTRIBUTIONS PAID | | | | | | | | |
| Ordinary income | | $ | | | | $ | — | |
| | | | | | | | | |
| | | $ | | | | $ | — | |
| | | | | | | | | |
(1) Portfolio commenced operations on December 28, 2006. | | | | | | | | |
The accompanying notes are an integral part of the financial statements.
Summit Mutual Funds, Inc. – Pinnacle Series |
| | LIFESTYLE ETF MARKET STRATEGY TARGET PORTFOLIO |
Summit ETF Market Target Portfolio - Total Return |
| |
| |
Past performance is not predictive of future results. Performance does not reflect the deduction of taxes that a shareholder would pay on fund distributions or redemption of fund shares. Separate account expenses are not included. Absent limitation of expenses during certain of the periods shown, performance would have been lower.
| | |
| |
| | |
| | |
| | |
| |
| |
| |
Number of Equity Holdings: | |
Summit Mutual Funds, Inc. – Pinnacle Series |
LIFESTYLE ETF MARKET STRATEGY TARGET PORTFOLIO | |
Objective – Seeks primarily to provide capital growth and secondarily investment income by investing primarily in a portfolio of various exchange traded funds (“ETFs”) representing different market exposures.
Strategy – The Lifestyle ETF Market Strategy Target Portfolio (the “Portfolio”) is a “fund of funds” that pursues its investment objective through asset allocation and fund selection. Under normal market conditions, substantially all of the value of the Portfolio’s total assets will be invested in ETFs and U.S. Treasury Bills.
Managers’ Comments:
For the year ended December 31, 2007 the Lifestyle ETF Market Strategy Target Portfolio returned 5.58% (before the impact of any product or contract fees and expenses) versus 5.49% for the Standard & Poor’s 500 Stock Index (S&P 500) and 6.22% for the hybrid index (“benchmark”) comprised of 60% of the S&P 500 and 40% of Lehman Brothers Aggregate Bond Index return.
The Lifestyle portfolio underperformed the benchmark for a few reasons. The Lifestyle Fund had a greater exposure to equities than the benchmark throughout a year when domestic equities as a class under-performed fixed income securities. While the exposure to international equities (that out performed domestic equities) did boost overall equity performance for the year, it could not compensate for the relatively weak U.S. equity returns. Portfolio expenses, including the impact of acquired fund fees and expenses, and the timing of cash flows into the Portfolio also impacted performance negatively.
The worst performer in the portfolio was the REIT ETF (exchange traded fund) that declined 17% as the real estate market faced a severe downturn. Fortunately, the Portfolio had only a 1% weighting to this investment, and overall performance was not significantly compromised. The best domestic equity performer was the S&P 500 Growth ETF that returned over 9%. The best fixed income performance came from the Treasury Inflation Protected Securities (TIPS) Fund that returned 12%.
Because there were eleven funds representing different asset classes in the Portfolio, there were multiple re-allocations throughout the year. The chief movement was a gradual decrease of equity exposure and an increasing of exposure to fixed income securities. Currently the Federal Reserve is undertaking a massive effort to inject liquidity to the economy by lowering the Fed Funds interest rate. This action should boost fixed income securities first before the benefit filters down into the equity assets. At the end of the year the weightings in the major categories were as follows: Domestic Equities - 46%; International Equities - 16%; Fixed Income - 35%; and Cash - 3%.
Summit Mutual Funds, Inc. – Pinnacle Series |
| LIFESTYLE ETF MARKET STRATEGY TARGET PORTFOLIO | |
FINANCIAL HIGHLIGHTS | | | | | | |
| Computed on the basis of a share of capital stock outstanding throughout the period. | | | | | | |
| | | Year Ended December 31, | |
| | | 2007 | | | 2006(1) | |
| | | | | | | |
| Net asset value, beginning of period | | $ | 49.84 | | | $ | 50.00 | |
| | | | | | | | | |
| | | | | | | | | |
| INVESTMENT ACTIVITIES: | | | | | | | | |
| Net investment income / (loss) | | | 2.33 | (2) | | | — | |
| Net realized and unrealized gains / (losses) | | | 0.45 | | | | (0.16 | ) |
| | | | | | | | | |
| Total from Investment Activities | | | 2.78 | | | | (0.16 | ) |
| | | | | | | | | |
| | | | | | | | | |
| DISTRIBUTIONS: | | | | | | | | |
| Net investment income | | | — | | | | — | |
| Net realized gains | | | — | | | | — | |
| | | | | | | | | |
| Total Distributions | | | — | | | | — | |
| | | | | | | | | |
| | | | | | | | | |
| Net asset value, end of period | | $ | 52.62 | | | $ | 49.84 | |
| | | | | | | | | |
| Total return | | | 5.58 | % | | | -0.32 | % |
| | | | | | | | | |
| RATIOS/SUPPLEMENTAL DATA | | | | | | | | |
Ratio of expenses to average net assets – net (3) | | | 0.75 | % | | | 0.75 | %(4) |
| Ratio of expenses to average net assets – gross | | | 4.09 | % | | | 220.56 | %(4) |
| Ratio of net investment income / (loss) to average net assets | | | 4.46 | % | | | (0.59 | %)(4) |
| Portfolio turnover rate | | | 17.02 | % | | | 0.00 | % |
| Net assets, end of period (000’s) | | $ | 4,686 | | | $ | 150 | |
| | | | | | | | | |
(1) Portfolio commenced operations on December 28, 2006. | | | | |
(2) Per share amounts are based on average shares outstanding. | | | | |
(3) Net expenses represent gross expenses reduced by fees waived and/or reimbursed by the Adviser. | | | | |
(4) Annualized. | | | | |
The accompanying notes are an integral part of the financial statements.
Summit Mutual Funds, Inc. – Pinnacle Series |
SCHEDULE OF INVESTMENTS | LIFESTYLE ETF MARKET STRATEGY TARGET PORTFOLIO |
| | | SHARES | | | VALUE | |
INVESTMENT COMPANIES - 102.1% | | | | | | |
| iShares Lehman Aggregate Bond Fund | | | 14,185 | | | $ | 1,435,097 | |
| iShares Lehman U.S. Treasury Inflation Protected Securities Fund | | | 1,873 | | | | 198,163 | |
| iShares MSCI EAFE Index Fund | | | 9,435 | | | | 740,648 | |
| iShares Russell 2000 Index Fund | | | 1,939 | | | | 147,209 | |
| iShares S&P 500 Growth Index Fund | | | 14,093 | | | | 984,114 | |
| iShares S&P 500 Value Index Fund | | | 11,578 | | | | 885,138 | |
| Midcap SPDR Trust Series 1 | | | 1,264 | | | | 196,046 | |
Summit High Yield Bond Fund (a) | | | 3,579 | | | | 98,450 | |
| Vanguard Emerging Markets Viper | | | 470 | | | | 49,021 | |
| Vanguard REIT ETF | | | 803 | | | | 49,352 | |
| TOTAL INVESTMENT COMPANIES | | | | | | | | |
| (Cost $4,950,241) | | | | | | | 4,783,238 | |
| | | | | | | | | |
SHORT TERM INVESTMENTS - 4.0% | | | | | | | | |
Money Market Funds - 4.0% | | | | | | | | |
| Northern Institutional Diversified Assets Portfolio | | | 188,651 | | | | 188,651 | |
| TOTAL SHORT TERM INVESTMENTS | | | | | | | | |
| (Cost $188,651) | | | | | | | 188,651 | |
Total Investments (Cost $5,138,892) (b) - 106.1% | | | | | | | 4,971,889 | |
Liabilities in Excess of Other Assets - (6.1)% | | | | | | | (285,597 | ) |
TOTAL NET ASSETS - 100.00% | | | | | | $ | 4,686,292 | |
| (a) | Affiliated issuer. Affiliated issuers, as defined under the 1940 Act, include any Fund of Summit Mutual Funds, Inc. and any issuer in which the Portfolio’s holdings of an issuer represent 5% or more of the outstanding voting securities ofthe issuer. A summary oftransactions in the securities ofthese issuers during the period ended Decmeber 31, 2007 is defined as follows: |
| | |
| | | | Balance of shares held Dec. 31, | Gross Purchases | Gross Sales and | Balance of shares held December 31, | Value December 31, | Investment Income Jan. 1, 2007 - December 31, |
| | Fund | | 2006 | and Additions | Reductions | 2007 | 2007 | 2007 |
| | Summit High | | | | | | |
| | Yield Bond Fund | 260 | 3,530 | 211 | 3,579 | $98,450 | $2,879 |
| | | | | | | | |
(b) | For federal income tax purposes, cost is $5,144,710 and gross unrealized appreciation and depreciation of securities as of December 31, 2007 was $28,573, and ($201,394), respectively, with a net appreciation / (depreciation) of ($172,821). |
The accompanying notes are an integral part of the financial statements.
Summit Mutual Funds, Inc. – Pinnacle Series |
| LIFESTYLE ETF MARKET STRATEGY TARGET PORTFOLIO | |
STATEMENT OF ASSETS AND LIABILITIES | | | |
December 31, 2007 | | | |
| | | | |
| ASSETS | | | |
| Investments in securities, at value | | | |
| Unaffiliated issuers | | $ | 4,873,439 | |
| Affiliated issuers | | | 98,450 | |
| Receivables: | | | | |
| Securities sold | | | 63,941 | |
| Shares sold | | | 882 | |
| Interest and dividends | | | 36,760 | |
| Receivable from adviser | | | 28,320 | |
| Prepaid expenses and other | | | 2 | |
| | | | 5,101,794 | |
| | | | | |
| LIABILITIES | | | | |
| Payables: | | | | |
| Shares redeemed | | | 284,359 | |
| Investment securities purchased | | | 104,589 | |
| Professional fees | | | 14,927 | |
| Fund accounting fees | | | 5,784 | |
| Custodian fees | | | 120 | |
| Directors’ fees | | | 5 | |
| Other accrued expenses | | | 5,718 | |
| | | | 415,502 | |
| NET ASSETS* | | | | |
| Paid-in capital | | | 4,797,846 | |
| Accumulated undistributed net investment | | | | |
| income / (loss) | | | 59,200 | |
| Accumulated net realized gain / (loss) | | | | |
| on investments | | | (3,751 | ) |
| Net unrealized appreciation / (depreciation) | | | | |
| on investments | | | (167,003 | ) |
| | | $ | 4,686,292 | |
| | | | | |
| Investments at cost | | | | |
| Unaffiliated issuers | | $ | 5,037,269 | |
| Affiliated issuers | | | 101,623 | |
| Shares authorized ($.10 par value) | | | 20,000,000 | |
| NET ASSET VALUE (NAV) BY SHARE CLASS | | | | | |
| | | | | | |
| Share Class | Net Assets | Outstanding | | Per Share | |
| Class I | $4,686,292 | | | $ | |
| * FEDERAL TAX DATA AS OF DECEMBER 31, 2007 | | | |
| Undistributed ordinary income | | $ | 61,267 | |
| | | | | |
STATEMENT OF OPERATIONS | | | |
For the year ended December 31, 2007 | | | |
| | | | |
| INVESTMENT INCOME | | | |
| Dividend income from unaffiliated issuers | | $ | 66,159 | |
| Dividend income from affiliated issuers | | | 2,879 | |
| Interest | | | 111 | |
| | | | 69,149 | |
| EXPENSES | | | | |
| Professional fees | | | 16,652 | |
| Fund accounting fees | | | 14,828 | |
| Transfer agent fees | | | 13,146 | |
| Advisory fees | | | 7,294 | |
| Administration fees | | | 1,326 | |
| Custodian fees | | | 257 | |
| Directors’ fees | | | 216 | |
| Shareholder reporting fees | | | 142 | |
| Other expenses | | | 332 | |
| | | | 54,193 | |
| Reimbursements and waivers | | | (44,247 | ) |
| | | | 9,946 | |
| NET INVESTMENT INCOME / (LOSS) | | | 59,203 | |
| | | | | |
| REALIZED AND UNREALIZED GAIN / (LOSS) | | | | |
| Net realized gain / (loss) on investments | | | | |
| from unaffiliated issuers | | | (3,819 | ) |
| Net realized gain / (loss) on investments | | | | |
| from affiliated issuers | | | 65 | |
| | | | (3,754 | ) |
| | | | | |
| Net change in unrealized appreciation / | | | | |
| (depreciation) on investments | | | (166,525 | ) |
| | | | | |
| NET REALIZED AND UNREALIZED | | | | |
| GAIN / (LOSS) | | | (170,279 | ) |
| | | | | |
| NET INCREASE / (DECREASE) IN | | | | |
| NET ASSETS FROM OPERATIONS | | $ | (111,076 | ) |
| TRANSACTIONS WITH AFFILIATES: | | | | |
| | Percent of Current | | | | | |
| | Net Asset Value | | | | | |
| Advisory | Administration | Expense | Reimbursements | | | |
| Fee | Fee | Limit | and Waivers | | | |
| 0.55% | 0.10% | 0.75% | $44,247 | | | |
The accompanying notes are an integral part of the financial statements.
Summit Mutual Funds, Inc. – Pinnacle Series |
| FINANCIAL STATEMENTS | LIFESTYLE ETF MARKET STRATEGY TARGET PORTFOLIO |
STATEMENTS OF CHANGES IN NET ASSETS | | | | | | |
| | | | | | | |
| | | Year Ended December 31, | |
| | | 2007 | | | 2006(1) | |
| OPERATIONS | | | | | | |
| Net investment income / (loss) | | $ | 59,203 | | | $ | (7 | ) |
| Net realized gain / (loss) on investments | | | (3,754 | ) | | | — | |
| Net change in unrealized appreciation / (depreciation) | | | | | | | | |
| on investments | | | (166,525 | ) | | | (478 | ) |
| | | | | | | | | |
| | | | (111,076 | ) | | | (485 | ) |
| | | | | | | | | |
| DISTRIBUTIONS TO SHAREHOLDERS* | | | | | | | | |
| Net investment income | | | — | | | | — | |
| Net realized gain on investments | | | — | | | | — | |
| | | | | | | | | |
| | | | — | | | | — | |
| | | | | | | | | |
| FUND SHARE TRANSACTIONS | | | | | | | | |
| Proceeds from shares sold | | | 6,002,427 | | | | 150,000 | |
| Reinvestment of distributions | | | — | | | | — | |
| Payments for shares redeemed | | | (1,354,574 | ) | | | — | |
| | | | | | | | | |
| | | | 4,647,853 | | | | 150,000 | |
| | | | | | | | | |
| NET INCREASE / (DECREASE) IN NET ASSETS | | | 4,536,777 | | | | 149,515 | |
| NET ASSETS | | | | | | | | |
| Beginning of period | | | 149,515 | | | | — | |
| | | | | | | | | |
| End of period | | $ | 4,686,292 | | | $ | 149,515 | |
| | | | | | | | | |
| ACCUMULATED UNDISTRIBUTED | | | | | | | | |
| NET INVESTMENT INCOME | | $ | 59,200 | | | $ | — | |
| FUND SHARE TRANSACTIONS | | | | | | |
| Sold | | | | | | | 3,000 | |
| Reinvestment of distributions | | | — | | | | — | |
| Redeemed | | | | ) | | | — | |
| | | | | | | | | |
| Net increase / (decrease) from fund share transactions | | | | | | | 3,000 | |
| | | | | | | | | |
| TOTAL COST OF PURCHASES OF: | | | | | | | | |
| Investment Companies | | $ | | | | $ | 141,021 | |
| | | | | | | | | |
| | | $ | | | | $ | 141,021 | |
| | | | | | | | | |
| TOTAL PROCEEDS FROM SALES OF: | | | | | | | | |
| Investment Companies | | $ | | | | $ | — | |
| | | | | | | | | |
| | | $ | | | | $ | — | |
| | | | | | | | | |
| | | | | | | | | |
| *TAX CHARACTER OF DISTRIBUTIONS PAID | | | | | | | | |
| Ordinary income | | $ | — | | | $ | — | |
| Long-term capital gains | | | — | | | | — | |
| | | | | | | | | |
| | | $ | — | | | $ | — | |
| | | | | | | | | |
(1) Portfolio commenced operations on December 28, 2006. | | | | | | | | |
The accompanying notes are an integral part of the financial statements.
Summit Mutual Funds, Inc. – Pinnacle Series LIFESTYLE ETF MARKET STRATEGY CONSERVATIVE PORTFOLIO |
Summit ETF Market Strategy Conservative Portfolio - Total Return |
| |
| |
Past performance is not predictive of future results. Performance does not reflect the deduction of taxes that a shareholder would pay on fund distributions or redemption of fund shares. Separate account expenses are not included. Absent limitation of expenses during certain of the periods shown, performance would have been lower.
| Managers: | James McGlynn D. Scott Keller Gary R. Rodmaker Michael J. Schultz Steven R. Sutermeister |
| Inception Date: | |
| Total Net Assets: | $911,000 |
| Number of Equity Holdings: | 10 |
Summit Mutual Funds, Inc. – Pinnacle Series LIFESTYLE ETF MARKET STRATEGY CONSERVATIVE PORTFOLIO |
Objective – Seeks primarily to provide capital growth and secondarily investment income, while managing risk levels to a more conservative level as compared to the Lifestyle ETF Market Strategy Target Portfolio, by investing primarily in a portfolio of various exchange traded funds (“ETFs”) representing different market exposures.
Strategy – The Lifestyle ETF Market Strategy Conservative Portfolio (the “Portfolio”) is a "fund of funds" that pursues its investment objective through asset allocation and fund selection. Under normal market conditions, substantially all of the value of the Portfolio’s total assets will be invested in ETFs and U.S. Treasury Bills.
Managers’ Comments:
For the year ended December 31, 2007 the Lifestyle ETF Market Strategy Conservative Portfolio returned 5.95% (before the impact of any product or contract fees and expenses) versus 5.49% for the Standard & Poor’s 500 Stock Index (S&P 500) and 6.52% for the hybrid index (“benchmark”) comprised of 40% of the S&P 500 and 60% of Lehman Brothers Aggregate Bond Index returns.
The Lifestyle portfolio underperformed the benchmark for a few reasons. The Lifestyle Fund had a greater exposure to equities than the benchmark throughout a year when domestic equities as a class under-performed fixed income securities. While the exposure to international equities (that out performed domestic equities) did boost overall equity performance for the year, it could not compensate for the relatively weak U.S. equity returns. Portfolio expenses, including the impact of acquired fund fees and expenses, also impacted performance negatively.
The worst performer in the portfolio was the REIT ETF (exchange traded fund) that declined 17% as the real estate market faced a severe downturn. Fortunately, the Conservative Portfolio had less than a 1% weighting to this investment, and overall performance was not significantly compromised. The best domestic equity performer was the S&P 500 Growth ETF that returned over 9%. The best fixed income performance came from the Treasury Inflation Protected Securities (TIPS) Fund that returned 12%.
Because there were eleven funds representing different asset classes in the Portfolio, there were multiple re-allocations throughout the year. The chief movement was a gradual decrease of equity exposure and an increasing of exposure to fixed income securities. Currently the Federal Reserve is undertaking a massive effort to inject liquidity to the economy by lowering the Fed Funds interest rate. This action should boost fixed income securities first before the benefit filters down into the equity assets. At the end of the year the weightings in the major categories for the Conservative Portfolio were as follows: Domestic Equities - 30%; International Equities - 10%; Fixed Income - 55%; and Cash - 5%.
Summit Mutual Funds, Inc. – Pinnacle Series |
| LIFESTYLE ETF MARKET STRATEGY CONSERVATIVE PORTFOLIO | FINANCIAL HIGHLIGHTS |
FINANCIAL HIGHLIGHTS | | | | | | |
| Computed on the basis of a share of capital stock outstanding throughout the period. | | | | | | |
| | | | | | | |
| | | Year Ended December 31, | |
| | | 2007 | | | 2006(1) | |
| | | | | | | |
| Net asset value, beginning of period | | $ | 49.89 | | | $ | 50.00 | |
| | | | | | | | | |
| | | | | | | | | |
| INVESTMENT ACTIVITIES: | | | | | | | | |
| Net investment income / (loss) | | | 1.80 | (4) | | | — | |
| Net realized and unrealized gains / (losses) | | | 1.17 | | | | (0.11 | ) |
| | | | | | | | | |
| Total from Investment Activities | | | 2.97 | | | | (0.11 | ) |
| | | | | | | | | |
| | | | | | | | | |
| DISTRIBUTIONS: | | | | | | | | |
| Net investment income | | | — | | | | — | |
| Net realized gains | | | — | | | | — | |
| | | | | | | | | |
| Total Distributions | | | — | | | | — | |
| | | | | | | | | |
| | | | | | | | | |
| Net asset value, end of period | | $ | 52.86 | | | $ | 49.89 | |
| | | | | | | | | |
| Total return | | | 5.95 | % | | | -0.22 | % |
| | | | | | | | | |
| RATIOS/SUPPLEMENTAL DATA: | | | | | | | | |
Ratio of expenses to average net assets – net (2) | | | 0.75 | % | | | 0.75 | %(3) |
| Ratio of expenses to average net assets – gross | | | 7.28 | % | | | 220.34 | %(3) |
| Ratio of net investment income / (loss) to average net assets | | | 3.47 | % | | | (0.52 | %)(3) |
| Portfolio turnover rate | | | 15.36 | % | | | 0.00 | % |
| Net assets, end of period (000’s) | | $ | 911 | | | $ | 150 | |
| | | | | | | | | |
(1) Portfolio commenced operations on December 28, 2006. | | | | |
(2) Net expenses represent gross expenses reduced by fees waived and/or reimbursed by the Adviser. | | | | |
(3) Annualized. | | | | |
(4) Per share amounts are based on average shares outstanding. | | | | |
The accompanying notes are an integral part of the financial statements.
Summit Mutual Funds, Inc. – Pinnacle Series |
SCHEDULE OF INVESTMENTS | LIFESTYLE ETF MARKET STRATEGY CONSERVATIVE PORTFOLIO |
December 31, 2007 | | | | | | |
| | | SHARES | | | VALUE | |
INVESTMENT COMPANIES - 100.5% | | | | | | |
| iShares Lehman Aggregate Bond Fund | | | 4,543 | | | $ | 459,615 | |
| iShares Lehman U.S. Treasury Inflation Protected | | | | | | | | |
| Securities Fund | | | 600 | | | | 63,480 | |
| iShares MSCI EAFE Index Fund | | | 1,177 | | | | 92,394 | |
| iShares Russell 2000 Index Fund | | | 243 | | | | 18,449 | |
| iShares S&P 500 Growth Index Fund | | | 1,760 | | | | 122,901 | |
| iShares S&P 500 Value Index Fund | | | 1,445 | | | | 110,470 | |
| Midcap SPDR Trust Series 1 | | | 159 | | | | 24,661 | |
Summit High Yield Bond Fund (a) | | | 415 | | | | 11,425 | |
| Vanguard Emerging Markets Viper | | | 58 | | | | 6,049 | |
| Vanguard REIT ETF | | | 100 | | | | 6,146 | |
| TOTAL INVESTMENT COMPANIES | | | | | | | | |
| (Cost $913,194) | | | | | | | 915,590 | |
| | | | | | | | | |
SHORT TERM INVESTMENTS - 5.5% | | | | | | | | |
Money Market Funds - 5.5% | | | | | | | | |
| Northern Institutional Diversified Assets Portfolio | | | 49,749 | | | | 49,749 | |
| TOTAL SHORT TERM INVESTMENTS | | | | | | | | |
| (Cost $49,749) | | | | | | | 49,749 | |
Total Investments (Cost $962,943) (b) - 106.0% | | | | | | | 965,339 | |
Liabilities in Excess of Other Assets - (6.0)% | | | | | | | (54,409 | ) |
TOTAL NET ASSETS - 100.0% | | | | | | $ | 910,930 | |
| (a) | Affiliated issuer. Affiliated issuers, as defined under the 1940 Act, include any Fund of Summit Mutual Funds, Inc. and any issuer in which the Portfolio’s holdings of an issuer represent 5% or more of the outstanding voting securities ofthe issuer. A summary oftransactions in the securities ofthese issuers during the period ended December 31, 2007 is defined as follows: |
| | |
| | | | Balance of shares held Dec. 31, | Gross Purchases | Gross Sales and | Balance of shares held December 31, | Value December 31, | Investment Income Jan. 1, 2007 - December 31, |
| | Fund | | 2006 | and Additions | Reductions | 2007 | 2007 | 2007 |
| | Summit High | | | | | | |
| | Yield Bond Fund | 260 | 3,530 | 211 | 3,579 | $98,450 | $2,879 |
| | | | | | | | |
(b) | For federal income tax purposes, cost is $962,998 and gross unrealized appreciation and depreciation of securities as of December 31, 2007 was $13,002, and ($10,661), respectively, with a net appreciation / (depreciation) of $2,341. |
The accompanying notes are an integral part of the financial statements.
Summit Mutual Funds, Inc. – Pinnacle Series |
| LIFESTYLE ETF MARKET STRATEGY CONSERVATIVE PORTFOLIO | |
STATEMENT OF ASSETS AND LIABILITIES | | | |
December 31, 2007 | | | |
| | | | |
| ASSETS | | | |
| Investments in securities, at value | | | |
| Unaffiliated issuers | | $ | 953,914 | |
| Affiliated issuers | | | 11,425 | |
| Receivables: | | | | |
| Securities sold | | | 11,344 | |
| Interest and dividends | | | 6,025 | |
| Receivable from adviser | | | 32,888 | |
| Prepaid expenses and other | | | 2 | |
| | | | 1,015,598 | |
| LIABILITIES | | | | |
| Payables: | | | | |
| Investment securities purchased | | | 17,741 | |
| Shares redeemed | | | 60,323 | |
| Professional fees | | | 14,930 | |
| Fund accounting fees | | | 5,783 | |
| Custodian fees | | | 167 | |
| Other accrued expenses | | | 5,724 | |
| | | | 104,668 | |
| NET ASSETS* | | | | |
| Paid-in capital | | | 884,114 | |
| Accumulated undistributed net investment | | | | |
| income / (loss) | | | 23,728 | |
| Accumulated net realized gain / (loss) | | | | |
| on investments | | | 692 | |
| Net unrealized appreciation / (depreciation) | | | | |
| on investments | | | 2,396 | |
| | | $ | 910,930 | |
| | | | | |
| Investments at cost | | | | |
| Unaffiliated issuers | | $ | 951,364 | |
| Affiliated issuers | | | 11,579 | |
| Shares authorized ($.10 par value) | | | 20,000,000 | |
| NET ASSET VALUE (NAV) BY SHARE CLASS | | | | | |
| | | | | | |
| Share Class | Net Assets | Outstanding | | Per Share | |
| Class I | $910,930 | | | $ | |
| * FEDERAL TAX DATA AS OF DECEMBER 31, 2007 | | | |
| Undistributed ordinary income | | $ | 24,475 | |
| | $ | 2,341 | |
STATEMENT OF OPERATIONS | | | |
For the ended December 31, 2007 | | | |
| | | | |
| INVESTMENT INCOME | | | |
| Dividend income from unaffiliated issuers | | $ | 28,213 | |
| Dividend income from affiliated issuers | | | 486 | |
| Interest | | | 156 | |
| Other income | | | 3 | |
| | | | 28,858 | |
| EXPENSES | | | | |
| Professional fees | | | 16,492 | |
| Fund accounting fees | | | 14,836 | |
| Transfer agent fees | | | 13,157 | |
| Advisory fees | | | 3,761 | |
| Administration fees | | | 684 | |
| Custodian fees | | | 314 | |
| Shareholder reporting fees | | | 102 | |
| Directors’ fees | | | 94 | |
| Other expenses | | | 330 | |
| | | | 49,770 | |
| Reimbursements and waivers | | | (44,640 | ) |
| | | | 5,130 | |
| NET INVESTMENT INCOME / (LOSS) | | | 23,728 | |
| | | | | |
| REALIZED AND UNREALIZED GAIN / (LOSS) | | | | |
| Net realized gain / (loss) on investments | | | | |
| from unaffiliated issuers | | | 828 | |
| Net realized gain / (loss) on investments | | | | |
| from affiliated issuers | | | (136 | ) |
| | | | 692 | |
| Net change in unrealized appreciation / | | | | |
| (depreciation) on investments | | | 2,721 | |
| | | | | |
| NET REALIZED AND UNREALIZED | | | | |
| GAIN / (LOSS) | | | 3,413 | |
| NET INCREASE / (DECREASE) IN | | | | |
| NET ASSETS FROM OPERATIONS | | $ | 27,141 | |
| TRANSACTIONS WITH AFFILIATES: | | | | |
| | Percent of Current | | | | | |
| | Net Asset Value | | | | | |
| Advisory | Administration | Expense | Reimbursements | | | |
| Fee | Fee | Limit | and Waivers | | | |
| 0.55% | 0.10% | 0.75% | $44,640 | | | |
The accompanying notes are an integral part of the financial statements.
Summit Mutual Funds, Inc. – Pinnacle Series |
| FINANCIAL STATEMENTS | LIFESTYLE ETF MARKET STRATEGY CONSERVATIVE PORTFOLIO |
STATEMENTS OF CHANGES IN NET ASSETS | | | | | | |
| | | | | | | |
| | | Year Ended December 31, | |
| | | 2007 | | | 2006(1) | |
| OPERATIONS | | | | | | |
| Net investment income / (loss) | | $ | 23,728 | | | $ | (6 | ) |
| Net realized gain / (loss) on investments | | | 692 | | | | — | |
| Net change in unrealized appreciation / (depreciation) on investments | | | 2,721 | | | | (325 | ) |
| | | | | | | | | |
| | | | 27,141 | | | | (331 | ) |
| | | | | | | | | |
| | | | | | | | | |
| DISTRIBUTIONS TO SHAREHOLDERS* | | | | | | | | |
| Net investment income | | | — | | | | — | |
| Net realized gain on investments | | | — | | | | — | |
| | | | | | | | | |
| | | | — | | | | — | |
| | | | | | | | | |
| | | | | | | | | |
| FUND SHARE TRANSACTIONS | | | | | | | | |
| Proceeds from shares sold | | | 882,001 | | | | 150,000 | |
| Reinvestment of distributions | | | — | | | | — | |
| Payments for shares redeemed | | | (147,881 | ) | | | — | |
| | | | | | | | | |
| | | | 734,120 | | | | 150,000 | |
| | | | | | | | | |
| | | | | | | | | |
| NET INCREASE / (DECREASE) IN NET ASSETS | | | 761,261 | | | | 149,669 | |
| | | | | | | | | |
| NET ASSETS | | | | | | | | |
| Beginning of period | | | 149,669 | | | | — | |
| | | | | | | | | |
| End of period | | $ | 910,930 | | | $ | 149,669 | |
| | | | | | | | | |
| ACCUMULATED UNDISTRIBUTED NET INVESTMENT INCOME | | $ | 23,728 | | | $ | — | |
| FUND SHARE TRANSACTIONS | | | | | | |
| Sold | | | | | | | | |
| Reinvestment of distributions | | | | | | | | |
| Redeemed | | | (2,775 | ) | | | — | |
| | | | | | | | | |
| Net increase / (decrease) from fund share transactions | | | | | | | | |
| | | | | | | | | |
| TOTAL COST OF PURCHASES OF: | | | | | | | | |
| Investment Companies | | $ | | | | $ | | |
| | | | | | | | | |
| | | $ | | | | $ | | |
| | | | | | | | | |
| TOTAL PROCEEDS FROM SALES OF: | | | | | | | | |
| Investment Companies | | $ | | | | $ | | |
| | | | | | | | | |
| | | $ | | | | $ | | |
| | | | | | | | | |
| *TAX CHARACTER OF DISTRIBUTIONS PAID | | | | | | | | |
| Ordinary income | | $ | | | | $ | | |
| Long-term capital gains | | | | | | | | |
| | | | | | | | | |
| | | $ | | | | $ | | |
(1) Portfolio commenced operations on December 28, 2006. | | | | | | | | |
The accompanying notes are an integral part of the financial statements.
Summit Mutual Funds, Inc. – Pinnacle Series LIFESTYLE ETF ETF MARKET STRATEGY AGGRESSIVE PORTFOLIO |
Summit ETF Market Strategy Aggressive Portfolio - Total Return |
| |
| |
Past performance is not predictive of future results. Performance does not reflect the deduction of taxes that a shareholder would pay on fund distributions or redemption of fund shares. Separate account expenses are not included. Absent limitation of expenses during certain of the periods shown, performance would have been lower.
| Managers: | James McGlynn D. Scott Keller Gary R. Rodmaker Michael J. Schultz Steven R. Sutermeister |
| Inception Date: | |
| Total Net Assets: | $978,000 |
| Number of Equity Holdings: | 10 |
Summit Mutual Funds, Inc. – Pinnacle Series LIFESTYLE ETF MARKET STRATEGY AGGRESSIVE PORTFOLIO |
Objective – Seeks primarily to provide capital growth and secondarily investment income, while managing risk levels to a more aggressive level as compared to the Lifestyle ETF Market Strategy Target Portfolio, by investing primarily in a portfolio of various exchange traded funds (“ETFs”) representing different market exposures.
Strategy – The Lifestyle ETF Market Strategy Aggressive Portfolio (the “Portfolio”) is a "fund of funds" that pursues its investment objective through asset allocation and fund selection. Under normal market conditions, substantially all of the value of the Portfolio’s total assets will be invested in ETFs and U.S. Treasury Bills.
Managers’ Comments:
For the year ended December 31, 2007 the Lifestyle ETF Market Strategy Aggressive Portfolio returned 5.00% (before the impact of any product or contract fees and expenses) versus 5.49% for the Standard & Poor’s 500 Stock Index (S&P 500) and 5.88% for the hybrid index (“benchmark”) comprised of 80% of the S&P 500 and 20% of Lehman Brothers Aggregate Bond Index returns.
The Lifestyle portfolio underperformed the benchmark for a few reasons. The Lifestyle Fund had a greater exposure to equities than the benchmark throughout a year when domestic equities as a class under-performed fixed income securities. While the exposure to international equities (that out performed domestic equities) did boost overall equity performance for the year, it could not compensate for the relatively weak U.S. equity returns. Portfolio expenses, including the impact of acquired fund fees and expenses, also impacted performance negatively.
The worst performer in the portfolio was the REIT ETF (exchange traded fund) that declined 17% as the real estate market faced a severe downturn. Fortunately, the Aggressive Portfolio had less than a 2% weighting to this investment, and overall performance was not significantly compromised. The best domestic equity performer was the S&P 500 Growth ETF that returned over 9%. The best fixed income performance came from the Treasury Inflation Protected Securities (TIPS) Fund that returned 12%.
Because there were eleven funds representing different asset classes in the Portfolio, there were multiple re-allocations throughout the year. The chief movement was a gradual decrease of equity exposure and an increasing of exposure to fixed income securities. Currently the Federal Reserve is undertaking a massive effort to inject liquidity to the economy by lowering the Fed Funds interest rate. This action should boost fixed income securities first before the benefit filters down into the equity assets. At the end of the year the weightings in the major categories for the Aggressive Portfolio were as follows: Domestic Equities - 56%; International Equities - 19%; Fixed Income - 23%; and Cash - 2%.
Summit Mutual Funds, Inc. – Pinnacle Series |
| LIFESTYLE ETF MARKET STRATEGY AGGRESSIVE PORTFOLIO | FINANCIAL HIGHLIGHTS |
FINANCIAL HIGHLIGHTS | | | | | | |
| Computed on the basis of a share of capital stock outstanding throughout the period. | | | | | | |
| | | | | | | |
| | | Year Ended December 31, | |
| | | 2007 | | | 2006(1) | |
| | | | | | | |
| Net asset value, beginning of period | | $ | 49.79 | | | $ | 50.00 | |
| | | | | | | | | |
| | | | | | | | | |
| INVESTMENT ACTIVITIES: | | | | | | | | |
| Net investment income / (loss) | | | 1.23 | (2) | | | — | |
| Net realized and unrealized gains / (losses) | | | 1.26 | | | | (0.21 | ) |
| | | | | | | | | |
| Total from Investment Activities | | | 2.49 | | | | (0.21 | ) |
| | | | | | | | | |
| | | | | | | | | |
| DISTRIBUTIONS: | | | | | | | | |
| Net investment income | | | — | | | | — | |
| Net realized gains | | | — | | | | — | |
| | | | | | | | | |
| Total Distributions | | | — | | | | — | |
| | | | | | | | | |
| | | | | | | | | |
| Net asset value, end of period | | $ | 52.28 | | | $ | 49.79 | |
| | | | | | | | | |
| Total return | | | 5.00 | % | | | -0.42 | % |
| RATIOS/SUPPLEMENTAL DATA: | | | | | | | | |
Ratio of expenses to average net assets – net (3) | | | 0.75 | % | | | 0.75 | %(4) |
| Ratio of expenses to average net assets – gross | | | 7.14 | % | | | 220.77 | %(4) |
| Ratio of net investment income / (loss) to average net assets | | | 2.35 | % | | | (0.72 | %)(4) |
| Portfolio turnover rate | | | 27.11 | % | | | 0.00 | % |
| Net assets, end of period (000’s) | | $ | 978 | | | $ | 149 | |
| | | | | | | | | |
(1) Portfolio commenced operations on December 28, 2006. | | | | |
(2) Per share amounts are based on average shares outstanding. | | | | |
(3) Net expenses represent gross expenses reduced by fees waived and/or reimbursed by the Adviser. | | | | |
(4) Annualized. | | | | |
The accompanying notes are an integral part of the financial statements.
Summit Mutual Funds, Inc. – Pinnacle Series |
SCHEDULE OF INVESTMENTS | LIFESTYLE ETF MARKET STRATEGY AGGRESSIVE PORTFOLIO |
December 31, 2007 | | | | | | |
| | | SHARES | | | VALUE | |
INVESTMENT COMPANIES - 97.0% | | | | | | |
| iShares Lehman Aggregate Bond Fund | | | 1,697 | | | $ | 171,686 | |
| iShares Lehman U.S. Treasury Inflation Protected | | | | | | | | |
| Securities Fund | | | 224 | | | | 23,699 | |
| iShares MSCI EAFE Index Fund | | | 2,238 | | | | 175,683 | |
| iShares Russell 2000 Index Fund | | | 456 | | | | 34,620 | |
| iShares S&P 500 Growth Index Fund | | | 3,346 | | | | 233,651 | |
| iShares S&P 500 Value Index Fund | | | 2,747 | | | | 210,008 | |
| Midcap SPDR Trust Series 1 | | | 299 | | | | 46,375 | |
Summit High Yield Bond Fund (a) | | | 1,072 | | | | 29,480 | |
| Vanguard Emerging Markets Viper | | | 111 | | | | 11,577 | |
| Vanguard REIT ETF | | | 190 | | | | 11,677 | |
| TOTAL INVESTMENT COMPANIES | | | | | | | | |
| (Cost $954,834) | | | | | | | 948,456 | |
| | | | | | | | | |
SHORT TERM INVESTMENTS - 3.5% | | | | | | | | |
Money Market Funds - 3.5% | | | | | | | | |
| Northern Institutional Diversified Assets Portfolio | | | 34,958 | | | | 34,958 | |
| TOTAL SHORT TERM INVESTMENTS | | | | | | | | |
| (Cost $34,958) | | | | | | | 34,958 | |
Total Investments (Cost $989,792) (b) - 100.5% | | | | | | | 983,414 | |
Liabilities in Excess of Other Assets - (0.5)% | | | | | | | (5,258 | ) |
TOTAL NET ASSETS - 100.0% | | | | | | $ | 978,156 | |
| (a) | Affiliated issuer. Affiliated issuers, as defined under the 1940 Act, include any Fund of Summit Mutual Funds, Inc. and any issuer in which the Portfolio’s holdings of an issuer represent 5% or more of the outstanding voting securities ofthe issuer. A summary oftransactions in the securities ofthese issuers during the period ended December 31, 2007 is defined as follows: |
| | |
| | | | Balance of shares held Dec. 31, | Gross Purchases | Gross Sales and | Balance of shares held Dec. 31, | Value Dec. 31, | Investment Income Jan. 1, 2007 - Dec. 31, |
| | Fund | | 2006 | and Additions | Reductions | 2007 | 2007 | 2007 |
| | Summit High | | | | | | |
| | Yield Bond Fund | 149 | 1,588 | 665 | 1,072 | $29,480 | $1,251 |
| | | | | | | | |
(b) | For federal income tax purposes, cost is $989,870 and gross unrealized appreciation and depreciation of securities as of December 31, 2007 was $14,043, and ($20,499), respectively, with a net appreciation / (depreciation) of ($6,456). |
The accompanying notes are an integral part of the financial statements.
Summit Mutual Funds, Inc. – Pinnacle Series |
| LIFESTYLE ETF MARKET STRATEGY AGGRESSIVE PORTFOLIO | |
STATEMENT OF ASSETS AND LIABILITIES | | | |
December 31, 2007 | | | |
| | | | |
| ASSETS | | | |
| Investments in securities, at value | | | |
| Unaffiliated issuers | | $ | 953,934 | |
| Affiliated issuers | | | 29,480 | |
| Receivables: | | | | |
| Securities sold | | | 12,478 | |
| Shares sold | | | 697,000 | |
| Interest and dividends | | | 7,757 | |
| Receivable from adviser | | | 32,814 | |
| Prepaid expenses and other | | | 2 | |
| | | | 1,733,465 | |
| LIABILITIES | | | | |
| Payables: | | | | |
| Shares redeemed | | | 696,497 | |
| Investment securities purchased | | | 32,175 | |
| Professional fees | | | 14,927 | |
| Fund accounting fees | | | 5,785 | |
| Custodian fees | | | 149 | |
| Directors’ fees | | | 1 | |
| Other accrued expenses | | | 5,775 | |
| | | | 755,309 | |
| NET ASSETS* | | | | |
| Paid-in capital | | | 968,075 | |
| Accumulated undistributed net investment | | | | |
| income / (loss) | | | 16,422 | |
| Accumulated net realized gain / (loss) | | | | |
| on investments | | | 37 | |
| Net unrealized appreciation / (depreciation) | | | | |
| on investments | | | (6,378 | ) |
| | | $ | 978,156 | |
| | | | | |
| Investments at cost | | | | |
| Unaffiliated issuers | | $ | 959,914 | |
| Affiliated issuers | | | 29,878 | |
| Shares authorized ($.10 par value) | | | 20,000,000 | |
| | | | | |
| NET ASSET VALUE (NAV) BY SHARE CLASS | | | | | |
| | | | | | |
| Share Class | Net Assets | Outstanding | | Per Share | |
| Class I | $978,156 | | | $ | |
| * FEDERAL TAX DATA AS OF DECEMBER 31, 2007 | | | |
| Undistributed ordinary income | | $ | 16,537 | |
STATEMENT OF OPERATIONS | | | |
For the year ended December 31, 2007 | | | |
| | | | |
| INVESTMENT INCOME | | | |
| Dividend income from unaffiliated issuers | | $ | 20,387 | |
| Dividend income from affiliated issuers | | | 1,251 | |
| Interest | | | 22 | |
| Other income from affiliated issuers | | | 8 | |
| | | | 21,668 | |
| EXPENSES | | | | |
| Professional fees | | | 16,512 | |
| Fund accounting fees | | | 14,850 | |
| Transfer agent fees | | | 13,166 | |
| Advisory fees | | | 3,845 | |
| Administration fees | | | 699 | |
| Custodian fees | | | 297 | |
| Shareholder reporting fees | | | 112 | |
| Directors’ fees | | | 97 | |
| Other expenses | | | 330 | |
| | | | 49,908 | |
| Reimbursements and waivers | | | (44,665 | ) |
| | | | 5,243 | |
| NET INVESTMENT INCOME / (LOSS) | | | 16,425 | |
| | | | | |
| REALIZED AND UNREALIZED GAIN / (LOSS) | | | | |
| Net realized gain / (loss) on investments | | | | |
| from unaffiliated issuers | | | 555 | |
| Net realized gain / (loss) on investments | | | | |
| from affiliated issuers | | | (521 | ) |
| | | | 34 | |
| Net change in unrealized appreciation / | | | | |
| (depreciation) on investments | | | (5,759 | ) |
| | | | | |
| NET REALIZED AND UNREALIZED | | | | |
| GAIN / (LOSS) | | | (5,725 | ) |
| NET INCREASE / (DECREASE) IN | | | | |
| NET ASSETS FROM OPERATIONS | | $ | 10,700 | |
| TRANSACTIONS WITH AFFILIATES: | | | | |
| | Percent of Current | | | | | |
| | Net Asset Value | | | | | |
| Advisory | Administration | Expense | Reimbursements | | | |
| Fee | Fee | Limit | and Waivers | | | |
| 0.55% | 0.10% | 0.75% | $44,665 | | | |
The accompanying notes are an integral part of the financial statements.
Summit Mutual Funds, Inc. – Pinnacle Series |
| FINANCIAL STATEMENTS | LIFESTYLE ETF MARKET STRATEGY AGGRESSIVE PORTFOLIO |
STATEMENTS OF CHANGES IN NET ASSETS | | | | | | |
| | | | | | | |
| | | Year Ended December 31, | |
| | | 2007 | | | 2006(1) | |
| OPERATIONS | | | | | | |
| Net investment income / (loss) | | $ | 16,425 | | | $ | (8 | ) |
| Net realized gain / (loss) on investments | | | 34 | | | | — | |
| Net change in unrealized appreciation / (depreciation) on investments | | | (5,759 | ) | | | (619 | ) |
| | | | | | | | | |
| | | | 10,700 | | | | (627 | ) |
| | | | | | | | | |
| | | | | | | | | |
| DISTRIBUTIONS TO SHAREHOLDERS* | | | | | | | | |
| Net investment income | | | — | | | | — | |
| Net realized gain on investments | | | — | | | | — | |
| | | | | | | | | |
| | | | — | | | | — | |
| | | | | | | | | |
| | | | | | | | | |
| FUND SHARE TRANSACTIONS | | | | | | | | |
| Proceeds from shares sold | | | 2,332,014 | | | | 150,000 | |
| Reinvestment of distributions | | | — | | | | — | |
| Payments for shares redeemed | | | (1,513,931 | ) | | | — | |
| | | | | | | | | |
| | | | 818,083 | | | | 150,000 | |
| | | | | | | | | |
| | | | | | | | | |
| NET INCREASE / (DECREASE) IN NET ASSETS | | | 828,783 | | | | 149,373 | |
| | | | | | | | | |
| NET ASSETS | | | | | | | | |
| Beginning of period | | | 149,373 | | | | — | |
| | | | | | | | | |
| End of period | | $ | 978,156 | | | $ | 149,373 | |
| | | | | | | | | |
| ACCUMULATED UNDISTRIBUTED NET INVESTMENT INCOME | | $ | 16,422 | | | $ | — | |
| FUND SHARE TRANSACTIONS | | | | | | |
| Sold | | | | | | | | |
| Reinvestment of distributions | | | | | | | | |
| Redeemed | | | (28,301 | ) | | | — | |
| Net increase / (decrease) from fund share transactions | | | | | | | | |
| | | | | | | | | |
| TOTAL COST OF PURCHASES OF: | | | | | | | | |
| Investment Companies | | $ | | | | $ | | |
| | | $ | | | | $ | | |
| | | | | | | | | |
| TOTAL PROCEEDS FROM SALES OF: | | | | | | | | |
| Investment Companies | | $ | | | | $ | | |
| | | $ | | | | $ | | |
| | | | | | | | | |
| *TAX CHARACTER OF DISTRIBUTIONS PAID | | | | | | | | |
| Ordinary income | | $ | | | | $ | | |
| Long-term capital gains | | | | | | | | |
| | | $ | | | | $ | | |
(1) Portfolio commenced operations on December 28, 2006. | | | | | | | | |
The accompanying notes are an integral part of the financial statements.
Summit Mutual Funds, Inc. – Pinnacle Series NATURAL RESOURCES PORTFOLIO |
Summit Natural Resoures Portfolio - Total Return |
| |
| |
Past performance is not predictive of future results. Performance does not reflect the deduction of taxes that a shareholder would pay on fund distributions or redemption of fund shares. Separate account expenses are not included. Absent limitation of expenses during certain of the periods shown, performance would have been lower.
| Managers: | Steven R. Sutermeister D. Scott Keller James McGlynn Gary R. Rodmaker Michael J. Schultz |
| Inception Date: | |
| Total Net Assets: | $1.25 Million |
| Number of Equity Holdings: | 9 |
Summit Mutual Funds, Inc. – Pinnacle Series NATURAL RESOURCES PORTFOLIO |
Objective – Seeks primarily to provide capital growth, consistent with appropriate risk levels, by investing primarily in a portfolio of various exchange traded funds (“ETFs”) and exchange traded notes (“ETNs”) representing different natural resources exposures.
Strategy – Under normal circumstances, the Natural Resources Portfolio (the “Portfolio”) will invest substantially all of its assets in ETFs and ETNs.
Managers’ Comments:
The Natural Resource Portfolio posted a total return of 21.85% (before the impact of product or contract-level fees and expenses) for the year ended December 31, 2007 compared to 5.49% for the Standard & Poor’s 500 Stock Index (“benchmark”).
2007 was a year of commodity price inflation and volatility not seen in decades, and the bull commodity cycle remained in full swing. The CRB Commodity Index rose over 22%, and the U.S. dollar fell for the second straight year versus the Euro and other major currencies. The price increase in crude oil was significant, doubling its price from January lows to record highs at year-end as geopolitical risk took center stage. Historic annual increases in grain prices came to fruition despite a massive corn crop, as acreage planting shifts, weather issues, and huge global demand propelled grains to record highs. Wheat and soybean prices were higher by 75% in 2007. Gold prices ended the year at 28 year highs and posted a seventh consecutive annual gain. The price for gold, which is set globally, was driven up by soaring commodity prices and a weak U.S. dollar.
Investors who flocked to commodities in recent years to diversify their portfolios were vindicated throughout 2007, as a housing crash, credit fallout, and a new Federal Reserve Chairman caused significant economic fears. Even as fears of a domestic slowdown emerged, significant global demand continued to drive commodity prices up across the board. As a result, the Portfolio’s exposure to commodities was beneficial during the period compared to the benchmark. In addition, natural resource stocks such as Monsanto (+114% in 2007) and Freeport-McMoRan Copper & Gold (+87% in 2007) were outstanding performers. Energy-related stocks provided additional appreciation, and of the portfolio’s underlying holdings, Schlumberger continued its excellent 2007 performance (+57%).
The Portfolio’s allocation was largely unchanged in the fourth quarter as both natural resource sectors and commodities continued to perform well through year-end given the current (but perhaps slowing) expansion of the global economy and related demands from certain countries including China and India.
With 2007 seeing a significant increase in commodity prices and advancing prices for most natural resource stocks, 2008 may be a different story. Some market participants are concerned that global economic weakness may cause a decline in commodity prices, especially in certain commodity sectors where a price correction is long overdue. However if the global economy has a “soft landing” and demand from emerging economies remains strong, new highs may be seen on a number of fronts.
Summit Mutual Funds, Inc. – Pinnacle Series |
| NATURAL RESOURCES PORTFOLIO | FINANCIAL HIGHLIGHTS |
FINANCIAL HIGHLIGHTS | | | | | | |
| Computed on the basis of a share of capital stock outstanding throughout the period. | | | | | | |
| | | | | | | |
| | | Year Ended December 31, | |
| | | 2007 | | | 2006(1) | |
| | | | | | | |
| Net asset value, beginning of period | | $ | 49.98 | | | $ | 50.00 | |
| | | | | | | | | |
| | | | | | | | | |
| INVESTMENT ACTIVITIES: | | | | | | | | |
| Net investment income / (loss) | | | 0.10 | | | | — | |
| Net realized and unrealized gains / (losses) | | | 10.82 | | | | (0.02 | ) |
| | | | | | | | | |
| Total from Investment Activities | | | 10.92 | | | | (0.02 | ) |
| | | | | | | | | |
| | | | | | | | | |
| DISTRIBUTIONS: | | | | | | | | |
| Net investment income | | | — | | | | — | |
| Net realized gains | | | — | | | | — | |
| | | | | | | | | |
| Total Distributions | | | — | | | | — | |
| | | | | | | | | |
| Net asset value, end of period | | $ | 60.90 | | | $ | 49.98 | |
| | | | | | | | | |
| Total return | | | 21.85 | % | | | -0.04 | % |
| | | | | | | | | |
| RATIOS/SUPPLEMENTAL DATA: | | | | | | | | |
Ratio of expenses to average net assets – net (2) | | | 0.75 | % | | | 0.75 | %(3) |
| Ratio of expenses to average net assets – gross | | | 6.33 | % | | | 133.46 | %(3) |
| Ratio of net investment income / (loss) to average net assets | | | 0.23 | % | | | (0.75 | %)(3) |
| Portfolio turnover rate | | | 28.39 | % | | | 0.00 | % |
| Net assets, end of period (000’s) | | $ | 1,255 | | | $ | 250 | |
| | | | | | | | | |
(1) Portfolio commenced operations on December 28, 2006. | | | | |
(2) Net expenses represent gross expenses reduced by fees waived and/or reimbursed by the Adviser. | | | | |
(3) Annualized. | | | | |
The accompanying notes are an integral part of the financial statements.
Summit Mutual Funds, Inc. – Pinnacle Series |
SCHEDULE OF INVESTMENTS | NATURAL RESOURCES PORTFOLIO |
December 31, 2007 | | | | | | |
| | | SHARES | | | VALUE | |
INVESTMENT COMPANIES - 100.6% | | | | | | |
iPath Dow Jones - AIG Commodity Index Total Return ETN (a) | | | 5,447 | | | $ | 306,230 | |
| iShares Dow Jones U.S. Utilities Sector Index Fund | | | 182 | | | | 18,639 | |
| iShares S&P Global Materials Sector Index Fund | | | 413 | | | | 32,036 | |
| iShares S&P Global Utilities Sector Index Fund | | | 433 | | | | 30,042 | |
| iShares S&P Goldman Sachs Natural Resources Index Fund | | | 2,325 | | | | 312,433 | |
| Powershares DB Commodity Index Tracking Fund | | | 9,738 | | | | 307,331 | |
| Powershares Water Resources Portfolio | | | 2,368 | | | | 50,675 | |
| Vanguard Materials ETF | | | 2,175 | | | | 191,661 | |
| Vanguard REIT ETF | | | 208 | | | | 12,784 | |
| TOTAL INVESTMENT COMPANIES | | | | | | | | |
| (Cost $1,089,154) | | | | | | | 1,261,831 | |
| | | | | | | | | |
SHORT TERM INVESTMENTS - 2.0% | | | | | | | | |
Money Market Funds - 2.0% | | | | | | | | |
| Northern Institutional Diversified Assets Portfolio | | | 25,352 | | | | 25,352 | |
| TOTAL SHORT TERM INVESTMENTS | | | | | | | | |
| (Cost $25,352) | | | | | | | 25,352 | |
Total Investments (Cost $1,114,506) (b) - 102.6% | | | | | | | 1,287,183 | |
Liabilities in Excess of Other Assets - (2.6)% | | | | | | | (32,462 | ) |
TOTAL NET ASSETS - 100.0% | | | | | | $ | 1,254,721 | |
(a) | Non-income producing security. |
| For federal income tax purposes, cost is $1,117,005 and gross unrealized appreciation and depreciation of securities as of December 31, 2007 was $178,717, and ($8,539), respectively, with a net appreciation / (depreciation) of $170,178. |
The accompanying notes are an integral part of the financial statements.
Summit Mutual Funds, Inc. – Pinnacle Series |
| NATURAL RESOURCES PORTFOLIO | FINANCIAL STATEMENTS |
STATEMENT OF ASSETS AND LIABILITIES | | | |
December 31, 2007 | | | |
| | | | |
| ASSETS | | | |
| Investments in securities, at value | | $ | 1,287,183 | |
| Receivables: | | | | |
| Securities sold | | | 15,728 | |
| Shares sold | | | 12,854 | |
| Interest and dividends | | | 1,264 | |
| Receivable from adviser | | | 35,175 | |
| Prepaid expenses and other | | | 11 | |
| | | | 1,352,215 | |
| LIABILITIES | | | | |
| Payables: | | | | |
| Shares redeemed | | | 42,598 | |
| Investment securities purchased | | | 24,904 | |
| Professional fees | | | 17,889 | |
| Fund accounting fees | | | 5,775 | |
| Custodian fees | | | 157 | |
| Other accrued expenses | | | 6,171 | |
| | | | 97,494 | |
| NET ASSETS* | | | | |
| Paid-in capital | | | 1,082,962 | |
| Accumulated undistributed net investment | | | | |
| income / (loss) | | | 1,976 | |
| Accumulated net realized gain / (loss) | | | | |
| on investments | | | (2,894 | ) |
| Net unrealized appreciation / (depreciation) | | | | |
| on investments | | | 172,677 | |
| | | $ | 1,254,721 | |
| | | | | |
| | | | | |
| Investments at cost | | $ | 1,114,506 | |
| Shares authorized ($.10 par value) | | | 20,000,000 | |
| NET ASSET VALUE (NAV) BY SHARE CLASS | | | | | |
| | | | | | |
| Share Class | Net Assets | Outstanding | | Per Share | |
| Class I | $1,254,721 | | | $ | |
| * | FEDERAL TAX DATA AS OF DECEMBER 31, 2007 | | |
| | Undistributed ordinary income | $ | |
| | Unrealized appreciation | $ | |
Capital Loss Carryforward Expiring December 31: | |
| | | | | | |
STATEMENT OF OPERATIONS | | | |
For the year ended December 31, 2007 | | | |
| | | | |
| INVESTMENT INCOME | | | |
| Dividends | | $ | 8,438 | |
| EXPENSES | | | | |
| Professional fees | | | 19,657 | |
| Fund accounting fees | | | 14,695 | |
| Transfer agent fees | | | 13,454 | |
| Advisory fees | | | 4,739 | |
| Administration fees | | | 862 | |
| Custodian fees | | | 331 | |
| Shareholder reporting fees | | | 127 | |
| Directors’ fees | | | 122 | |
| Other expenses | | | 540 | |
| | | | 54,527 | |
| Reimbursements and waivers | | | (48,065 | ) |
| | | | 6,462 | |
| NET INVESTMENT INCOME / (LOSS) | | | 1,976 | |
| | | | | |
| REALIZED AND UNREALIZED GAIN / (LOSS) | | | | |
| Net realized gain / (loss) on investments | | | (2,894 | ) |
| | | | | |
| Net change in unrealized appreciation / | | | | |
| (depreciation) on investments | | | 172,737 | |
| | | | | |
| NET REALIZED AND UNREALIZED | | | | |
| GAIN / (LOSS) | | | 169,843 | |
| | | | | |
| NET INCREASE / (DECREASE) IN | | | | |
| NET ASSETS FROM OPERATIONS | | $ | 171,819 | |
| TRANSACTIONS WITH AFFILIATES: | | | | |
| | Percent of Current | | | | | |
| | Net Asset Value | | | | | |
| Advisory | Administration | Expense | Reimbursements | | | |
| Fee | Fee | Limit | and Waivers | | | |
| 0.55% | 0.10% | 0.75% | $48,065 | | | |
The accompanying notes are an integral part of the financial statements.
Summit Mutual Funds, Inc. – Pinnacle Series |
| FINANCIAL STATEMENTS | NATURAL RESOURCES PORTFOLIO |
STATEMENTS OF CHANGES IN NET ASSETS | | | | | | |
| | | | | | | |
| | | Year Ended December 31, | |
| | | 2007 | | | 2006(1) | |
| OPERATIONS | | | | | | |
| Net investment income / (loss) | | $ | 1,976 | | | $ | (16 | ) |
| Net realized gain / (loss) on investments | | | (2,894 | ) | | | — | |
| Net change in unrealized appreciation / (depreciation) on investments | | | 172,737 | | | | (60 | ) |
| | | | | | | | | |
| | | | 171,819 | | | | (76 | ) |
| | | | | | | | | |
| | | | | | | | | |
| DISTRIBUTIONS TO SHAREHOLDERS* | | | | | | | | |
| Net investment income | | | — | | | | — | |
| Net realized gain on investments | | | — | | | | — | |
| | | | | | | | | |
| | | | — | | | | — | |
| | | | | | | | | |
| | | | | | | | | |
| FUND SHARE TRANSACTIONS | | | | | | | | |
| Proceeds from shares sold | | | 1,539,880 | | | | 250,000 | |
| Reinvestment of distributions | | | — | | | | — | |
| Payments for shares redeemed | | | (706,902 | ) | | | — | |
| | | | | | | | | |
| | | | 832,978 | | | | 250,000 | |
| | | | | | | | | |
| | | | | | | | | |
| NET INCREASE / (DECREASE) IN NET ASSETS | | | 1,004,797 | | | | 249,924 | |
| | | | | | | | | |
| NET ASSETS | | | | | | | | |
| Beginning of period | | | 249,924 | | | | — | |
| | | | | | | | | |
| End of period | | $ | 1,254,721 | | | $ | 249,924 | |
| | | | | | | | | |
| ACCUMULATED UNDISTRIBUTED NET INVESTMENT INCOME | | $ | 1,976 | | | $ | — | |
| FUND SHARE TRANSACTIONS | | | | | | |
| Sold | | | | | | | | |
| Reinvestment of distributions | | | | | | | | |
| Redeemed | | | (12,455 | ) | | | — | |
| | | | | | | | | |
| Net increase / (decrease) from fund share transactions | | | | | | | | |
| | | | | | | | | |
| TOTAL COST OF PURCHASES OF: | | | | | | | | |
| Investment Companies | | $ | | | | $ | | |
| | | | | | | | | |
| | | $ | | | | $ | | |
| | | | | | | | | |
| TOTAL PROCEEDS FROM SALES OF: | | | | | | | | |
| Investment Companies | | $ | | | | $ | | |
| | | | | | | | | |
| | | $ | | | | $ | | |
| | | | | | | | | |
| *TAX CHARACTER OF DISTRIBUTIONS PAID | | | | | | | | |
| Ordinary income | | $ | | | | $ | | |
| Long-term capital gains | | | | | | | | |
| | | | | | | | | |
| | | $ | | | | $ | | |
(1) Portfolio commenced operations on December 28, 2006. | | | | | | | | |
The accompanying notes are an integral part of the financial statements.
Summit Mutual Funds, Inc. – Pinnacle Series |
NOTES TO FINANCIAL STATEMENTS |
December 31, 2007
NOTE 1 – SIGNIFICANT ACCOUNTING POLICIES
Summit Mutual Funds, Inc., (“Summit Mutual Funds”), is registered with the Securities and Exchange Commission under the Investment Company Act of 1940, as amended, as an open-end management investment company. Summit Mutual Funds offers the Pinnacle Series and the Apex Series. The shares of the Pinnacle Series (the “Series”) are sold to insurance companies and their separate accounts to fund the benefits under certain variable insurance products. The results of the Series presented exclude the additional fees and expenses of variable annuity or variable life insurance contracts. The Series’ shares are offered in fourteen different portfolios: Zenith Portfolio, Bond Portfolio, S&P 500 Index Portfolio, S&P MidCap 400 Index Portfolio, Balanced Index Portfolio, Nasdaq-100 Index Portfolio, Russell 2000 Small Cap Index Portfolio, EAFE International Index Portfolio, Lehman Aggregate Bond Index Portfolio, Inflation Protected Plus Portfolio, Lifestyle ETF Market Strategy Target Portfolio, Lifestyle ETF Market Strategy Conservative Portfolio, Lifestyle ETF Market Strategy Aggressive Portfolio, and Natural Resources Portfolio (individually a “Portfolio”, collectively the “Portfolios”). The Zenith Portfolio seeks long-term appreciation of capital by investing primarily in common stocks and other equity securities. The Bond Portfolio seeks a high level of current income as is consistent with reasonable investment risk by investing primarily in long-term, fixed-income, investment-grade corporate bonds. The S&P 500 Index Portfolio, S&P MidCap 400 Index Portfolio, Nasdaq-100 Index Portfolio, Russell 2000 Small Cap Index Portfolio, and EAFE International Index Portfolio seek investment results that correspond to the total return performance of common stocks as represented by their respective index. The Balanced Index Portfolio seeks investment results, with respect to 60% of its assets, that correspond to the total return performance of U.S. common stocks, as represented by the S&P 500 Index and, with respect to 40% of its assets, that correspond to the total return performance of investment-grade bonds, as represented by the Lehman Brothers Aggregate Bond Index. The Lehman Aggregate Bond Index Portfolio seeks investment results that correspond to the total return performance of the bond market, as represented by the Lehman Brothers Aggregate Bond Index. The Inflation Protected Plus Portfolio seeks to maximize real levels of current income consistent with reasonable investment risk, by investing primarily in inflation-indexed, fixed-income securities. The Lifestyle ETF Market Strategy Target Portfolio seeks primarily to provide capital growth and, secondarily, investment income by investing primarily in a portfolio of various exchange traded funds, (“ETFs”), representing different market exposures. The Lifestyle ETF Market Strategy Conservative Portfolio seeks primarily to provide capital growth and, secondarily, investment income, while managing risk levels to a more conservative level as compared to the Lifestyle ETF Market Strategy Target Portfolio, by investing primarily in a portfolio of various ETFs representing different market exposures. The Lifestyle ETF Market Strategy Aggressive Portfolio seeks primarily to provide capital growth and, secondarily, investment income, while managing risk levels to a more aggressive level as compared to the Lifestyle ETF Market Strategy Target Portfolio, by investing primarily in a portfolio of ETFs representing different market exposures. The Natural Resources Portfolio seeks primarily to provide capital growth, consistent with appropriate risk levels, by investing primarily in a portfolio of various ETFs and exchange traded notes representing different natural resources exposures. The results of the Portfolio(s) for your investment product are included herein.
The preparation of financial statements in conformity with accounting principles generally accepted in the United States of America (“generally accepted accounting principles”) requires management to make estimates and assumptions that affect the reported amounts of assets and liabilities and disclosure of contingent assets and liabilities at the date of the financial statements and the reported amounts of revenues and expenses during the reporting period. Actual results could differ from those estimates.
Securities valuation – Securities held in each Portfolio, except for money market instruments maturing in 60 days or less, are valued as follows: Securities traded on stock exchanges (including securities traded in both the over-the-counter market and on an exchange), or listed on the NASDAQ Global Market or NASDAQ Global Select Market, are valued at the last sales price as of the close of the New York Stock Exchange on the day the securities are being valued, or, lacking any sales, at the closing bid prices. Alternatively, NASDAQ listed securities may be valued on the basis of the NASDAQ Official Closing Price. Securities traded only in the over-the-counter market are valued at the last bid price, as of the close of trading on the New York Stock Exchange, quoted by brokers that make markets in the securities. Securities for which market quotations are not readily available are valued at fair value as determined in good faith under procedures adopted by the Board of Directors. Examples of valuation bases and factors used to determine securities’ fair value include: a multiple of earnings, a discounted value from freely-traded similar securities, relative yield to maturity calculations, market values for similar securities, utilization of the fair value information service of FT Interactive Data, or a combination of these or other methods. Additionally, general market risk, and credit, yield and other risks particular to a given issue and other factors are considered. Money market instruments with a remaining maturity of 60 days or less held in each Portfolio are valued at amortized cost which approximates market value.
Summit Mutual Funds, Inc. – Pinnacle Series |
NOTES TO FINANCIAL STATEMENTS |
NOTE 1 – SIGNIFICANT ACCOUNTING POLICIES (continued)
Securities transactions and investment income – Securities transactions are recorded on the trade date (the date the order to buy or sell is executed). Dividend income is recorded on the ex-dividend date and interest income is recorded on an accrual basis. All amortization of discount and premium is recognized currently under the effective interest method. Gains and losses on sales of investments are calculated on the identified cost basis for financial reporting and tax purposes. Paydown gains and losses on mortgage and asset-backed securities as well as inflation adjustments to the face amount of inflation-indexed securities are presented as interest income.
Federal taxes – It is the intent of Summit Mutual Funds to comply with the requirements under Subchapter M of the Internal Revenue Code applicable to regulated investment companies and to distribute all of its net investment income and any net realized capital gains. Regulated investment companies, owned by the segregated asset accounts of a life insurance company and held in connection with variable insurance products, are exempt from excise tax on undistributed income. Therefore, no provision for income or excise taxes has been recorded.
Effective June 29, 2007, the Portfolios adopted Financial Accounting Standards Board (FASB) Interpretation No. 48 (FIN 48),” Accounting for Uncertainty in Income Taxes,” a clarification of FASB Statement No. 109, “Accounting for Income Taxes.” FIN 48 establishes financial reporting rules regarding recognition and measurement of tax positions taken or expected to be taken on a tax return. The statute of limitations on the Portfolios’ tax returns remains open for the years ended December 31, 2004 through December 31, 2006. The adoption of FIN 48 had no impact on the Portfolios’ net assets or results of operations.
Distributions – Distributions from net investment income in all fixed income Portfolios generally are declared and paid quarterly. Equity Portfolios generally declare and pay dividends annually. Net realized capital gains are, if any, distributed periodically, no less frequently than annually. Distributions are recorded on the ex-dividend date. All distributions are reinvested in additional shares of the respective Portfolio at the net asset value per share.
The amount of distributions is determined in accordance with federal income tax regulations which may differ from generally accepted accounting principles in the United States of America. These “book/tax” differences are considered either temporary or permanent in nature. To the extent these differences are permanent in nature, such amounts are reclassified within the capital accounts based on their federal tax-basis treatment; temporary differences do not require reclassification. The book/tax differences are primarily related to the tax deferral of losses on wash sales, Section 1256 Mark to Market, paydowns on mortgage-backed securities, post-October capital losses, and partnership adjustments. Distributions that exceed net investment income and net realized capital gains for financial reporting purposes but not for tax purposes are reported as distributions in excess of net investment income or distributions in excess of net realized capital gains. To the extent they exceed net investment income and net realized capital gains for tax purposes, they are reported as distributions of paid-in-capital.
Expenses – Allocable expenses of Summit Mutual Funds are charged to each Portfolio based on the ratio of the net assets of each Portfolio to the combined net assets of Summit Mutual Funds. Nonallocable expenses are charged to each Portfolio based on specific identification.
Foreign currency – Summit Mutual Funds’ accounting records are maintained in U.S. dollars. All Portfolios may purchase foreign securities within certain limitations set forth in the Prospectus. Amounts denominated in, or expected to settle in foreign currencies, are translated into U.S. dollars at the spot rate at the close of the New York Currency Market. Summit Mutual Funds does not isolate the portion of operational results relating to changes in foreign exchange rates on investments from underlying market price fluctuations. All such results are included in net realized and unrealized gain or loss for investments.
Foreign security and currency transactions may involve certain risks not typically associated with those of U.S. companies. Such risks include the level of governmental supervision and regulations of foreign securities markets and the possibility of political and economic instability.
Summit Mutual Funds, Inc. – Pinnacle Series |
NOTES TO FINANCIAL STATEMENTS |
NOTE 1 – SIGNIFICANT ACCOUNTING POLICIES (continued)
Futures contracts – The S&P 500 Index Portfolio, S&P MidCap 400 Index Portfolio, Balanced Index Portfolio, Nasdaq-100 Index Portfolio, Russell 2000 Small Cap Index Portfolio, and EAFE International Index Portfolio (collectively, the “Index Portfolios”) as well as the Lifestyle ETF Market Strategy Target Portfolio, Lifestyle ETF Market Strategy Conservative Portfolio, Lifestyle ETF Market Strategy Aggressive Portfolio, and Natural Resources Portfolio (collectively, the “ETF Portfolios”) and Inflation Protected Plus Portfolio, may enter into futures contracts that relate to securities in which they may directly invest and indexes composed of such securities. Portfolios may also purchase and write call and put options on such contracts. The Index Portfolios, ETF Portfolios, and Inflation Protected Plus Portfolio may invest up to 20% of their assets in such futures and/or options, except that until an Index Portfolio reaches $25 million (or $50 million in the case of the Nasdaq-100 Index Portfolio, the Russell 2000 Small Cap Index Portfolio, and the EAFE International Index Portfolio), it may invest up to 100% in such futures and/or options. These contracts provide for the sale of a specified quantity of a financial instrument at a fixed price at a future date. When a Portfolio enters into a futures contract, it is required to deposit and maintain as collateral such initial margin as required by the exchange on which the contract is traded. Under terms of the contract, a Portfolio agrees to receive from or pay to the broker an amount equal to the daily fluctuation in the value of the contract (known as the variation margin). The variation margin is recorded as unrealized gain or loss until the contract expires or is otherwise closed, at which time the gain or loss is realized. The Index Portfolios invest in futures as a substitute to investing in the common stock positions in the index that they intend to match. The primary potential risk to the Index Portfolios is that the change in the value of the underlying securities may not correlate to the value of the contracts.
Portfolio securities lending – The Portfolios currently lend their securities to approved borrowers to earn additional income and receive cash and/or securities as collateral to secure the loans. Income from securities lending is included in “Other Income” on the Statement of Operations. Collateral is maintained at not less than 100% of the current market value of loaned securities. Although the risk of lending is mitigated by the collateral, the Portfolios could experience a delay in recovering their securities and a possible loss of income or value if the borrower fails to return them. In addition to cash collateral, the Portfolios may accept noncash collateral consisting of government securities and irrevocable letters of credit from domestically domiciled banks.
NOTE 2 – TRANSACTIONS WITH AFFILIATES
Investment advisory fees – Summit Mutual Funds pays investment advisory fees to Summit Investment Partners, Inc. (the “Adviser”) under terms of an Investment Advisory Agreement (the “Agreement”). Certain officers and directors of the Adviser are affiliated with Summit Mutual Funds. Summit Mutual Funds pays the Adviser, as full compensation for all services and facilities furnished, a monthly fee computed separately for each Portfolio on a daily basis.
Approval of Advisory Contract (unaudited) – At its November 12, 2007 meeting, the Board of Directors reviewed in detail written materials related to the proposed continuation of the Portfolios’ investment advisory contracts and the investment sub-advisory contract applicable to the EAFE International Index Portfolio for a one-year period. Following their review and consideration, the Directors determined that the investment advisory contracts and the sub-advisory contract will enable shareholders of each Portfolio to obtain high quality services at a cost that is appropriate, reasonable, and in the best interests of its shareholders. The Board of Directors, including the Independent Directors, unanimously approved the renewal of each investment advisory contract and the sub-advisory contract. In reaching their decision, the Directors requested and obtained from the Adviser and the investment sub-adviser such information as they deemed reasonably necessary to evaluate the proposed continuation of the contracts. The Directors also carefully considered the information that they had received throughout the year from the Adviser and the investment sub-adviser as part of their regular oversight of the Portfolios, as well as: comparative fee, expense and performance information prepared using data from Lipper Inc. (“Lipper”), independent providers of mutual fund performance, fee and expense information; and profitability data. In considering the proposed continuation of the investment advisory contracts and the investment sub-advisory contract, the Directors evaluated a number of considerations that they believed, in light of the legal advice furnished to them by legal counsel to the Portfolios and the Independent Directors and their own business judgment, to be relevant. They based their decisions on the following considerations, among others, although they did not identify any consideration or particular information that was controlling of their decisions:
Summit Mutual Funds, Inc. – Pinnacle Series |
NOTES TO FINANCIAL STATEMENTS |
NOTE 2 – TRANSACTIONS WITH AFFILIATES (continued)
| • | The nature, extent and quality if the advisory services provided. The Board concluded that the Adviser (and sub-adviser, with respect to the EAFE International Index Portfolio) provides high quality services to each Portfolio, as indicated by the nature and quality of services provided in the past, each Portfolio’s competitive investment performance, the high level of correlation of the Index Portfolios to their benchmarks, the compliance track record of the Portfolios, the integrity, capability and professional experience of the Adviser’s personnel, and the Adviser’s (and sub-adviser’s) financial resources. The Board concluded that the Adviser and the sub-adviser provides all facilities and services reasonably necessary to analyze, execute and maintain investments that are consistent with the Portfolios’ objectives, restrictions and limitations. The Board also determined that the Adviser (and sub-adviser) proposed to provide investment and related services that were of the same quality and quantity as services provided to the Portfolios in the past, and that these services are appropriate in scope and extent in light of the Portfolios’ operations, the competitive landscape of the investment company business and investor needs. |
| • | The investment performance of the Portfolios. With respect to each Portfolio, the Board determined that the Adviser (and subadviser, if relevant) has achieved competitive or superior investment performance relative to its benchmark index and comparable portfolios (as determined using Lipper data) over most measurement periods. In this regard, the Board determined that the Index Portfolios achieved the correlation expressed in the Portfolios’ prospectus. On the basis of the Directors’ assessment of the nature, extent and quality of services to be provided, the Directors concluded that the Adviser and sub-adviser are capable of generating a level of investment performance that is appropriate in light of the Portfolios’ investment objectives and strategies, and competitive with many other investment companies. |
| • | The cost of advisory services provided and the level of profitability. The Board examined the investment advisory fees charged to each Portfolio, and noted that the Adviser charges 0.10% for administrative services. The Directors also reviewed the Adviser’s pre-tax operating income, gross revenues, margin (before and after dividends) for 2006 and the first three quarters of 2007, as well as other financial information relevant to an assessment of the Portfolios�� financial relationship with the Adviser and sub-adviser. On the basis of this information, the Board concluded that, with respect to each Portfolio, the level of investment advisory fees (and sub-advisory fees, if relevant) and fund administration fees is appropriate in light of the services provided, the management fees and overall expense ratios of comparable investment companies, and the anticipated profitability of the relationship between each Portfolio and the Adviser and its affiliates. Further, on the basis of comparative information supplied by Lipper, the Board determined that the advisory fees and overall expense ratio of each Portfolio were favorable to or consistent with industry averages. |
| • | Whether the advisory fees reflect economies of scale. The Board determined that the Portfolios have yet to achieve meaningful economies of scale, which, therefore, cannot be reflected in the advisory fees. The Board concluded that the advisory fees reflect the current economic environment for the Adviser and the competitive nature of the mutual fund market. The Directors also noted that Portfolio expenses are managed by the use of fee caps and waivers, as certain of the Portfolios are small and have not reached the size necessary to provide the Adviser its full fee. |
| • | The extent to which economies of scale will be realized as the Portfolios grow. While the advisory fees do not reduce should Portfolio assets grow meaningfully, the Board determined that the advisory fees payable under the advisory arrangements already reflect potential future economies of scale to some extent by virtue of their competitive levels and the Adviser’s profitability at current or foreseeable asset levels. The Board also concluded that it would have the opportunity to periodically re-examine whether a Portfolio had achieved economies of scale, and the appropriateness of advisory fees payable to the Adviser and the subadviser, in the future. |
| • | Benefits (such as soft dollars) to the Adviser or the Sub-Adviser from their relationships with the Portfolios (and any corresponding benefits to the Portfolios). The Board determined that other benefits derived by the Adviser and the subadviser from its relationship with the Portfolios are reasonable and fair, and are consistent with industry practice and the best interest of the Portfolios and their shareholders. In this regard, the Directors noted that fixed income and index trading provide limited opportunities for soft dollars. In addition, the Directors determined that the fund administration fees paid by the Portfolios to the Adviser are reasonable, fair and in the best interests of shareholders in light of the nature and quality of the services provided, the associated costs of providing the services, the impact of the fees on the Portfolios’ overall operating expenses, and the necessity of the services for the Portfolios’ operations. |
Summit Mutual Funds, Inc. – Pinnacle Series |
NOTES TO FINANCIAL STATEMENTS |
NOTE 2 – TRANSACTIONS WITH AFFILIATES (continued)
| • | Other Considerations: In approving the continuation of the investment advisory arrangements, the Board also considered the high quality of existing portfolio management personnel, who will continue to manage the Portfolios, and the Adviser’s overall portfolio management capabilities. The Board determined that the Adviser has made a substantial commitment to the recruitment and retention of high quality personnel, and maintains the financial and operational resources reasonably necessary to manage the Portfolios in a professional manner that is consistent with the best interests of the Portfolios and their shareholders. The Board also concluded that the Adviser has made a significant entrepreneurial commitment to the management and success of the Portfolios, including expense limitation undertakings, which could entail a substantial financial and professional commitment to the successful operation of the Portfolios. |
Administration fees – The Portfolios have entered into an Administrative Services Agreement with the Adviser in which the Adviser, at its expense, maintains certain of the Portfolios’ books and records and furnishes such office space, facilities, equipment, and clerical help as the Portfolios may reasonably require in the conduct of business. In addition, the Adviser pays for the services of all executive, administrative, clerical, and other personnel, including officers of the Portfolios, who are employees of The Union Central Life Insurance Company (“Union Central”). Expenses not expressly assumed by the Adviser under the Agreement will be paid by the Portfolios. A separate administrative service fee of 0.10% of average daily net assets on an annual basis will be imposed for these services.
Directors’ fees – Each director who is not affiliated with the Adviser receives fees from Summit Mutual Funds for service as a director. Members of the Board of Directors who are not affiliated with the Adviser are eligible to participate in a deferred compensation plan. The value of each director’s deferred compensation account will increase or decrease at the same rate as if it were invested in shares of the Summit Money Market Fund.
Other – The Adviser is a wholly-owned subsidiary of The Union Central Life Insurance Company (“Union Central”), an indirect subsidiary of UNIFI Mutual Holding Company. Subject to the direction and authority of Summit Mutual Funds’ board of directors, the Adviser manages the investment and reinvestment of the assets of each Fund and provides administrative services and manages Summit Mutual Funds’ business affairs.
NOTE 3 – MULTIPLE CLASSES OF SHARES
The S&P MidCap 400 Index, Russell 2000 Small Cap Index, and EAFE International Index Portfolios offer Class F and Class I shares. The Class F shares are subject to a Distribution and Shareholder Service Plan (the “Plan”) in accordance with Rule 12b-1 under the 1940 Act. The Plan provides that each class in the Plan shall pay to the Series’ Distributor, Ameritas Investment Corp. , an affiliate of the adviser, a fee for payments the Distributor makes to banks, financial planners, retirement plan service providers, broker/dealers and other institutions for distribution assistance and/or shareholder services in connection with the Class F shares. The fee shall be in an amount not to exceed on an annual basis 0.20% of the average daily net asset value attributable to Class F shares. Because the fee is paid out of the assets of the Class F shares on an ongoing basis, over time the fee will increase the cost and reduce the return of an investment.
The two classes of shares represent interests in the same portfolio of investments, have the same rights, and are generally identical in all respects, except that each class bears its separate class-specific expenses, and has exclusive voting rights with respect to any matter on which a separate vote of any class is required. Income, non-class specific expenses, and realized/unrealized gains and losses are allocated to the respective classes on the basis of the relative daily net assets.
NOTE 4 – FUTURE ADOPTION OF NEW ACCOUNTING STANDARDS
In September 2006, the Financial Accounting Standards Board issued its new Standard No. 157, “Fair Value Measurements,” (“FAS 157”). FAS 157 is designed to unify guidance for the measurement of fair value of all types of assets, including financial instruments, and certain liabilities, throughout a number of accounting standards. FAS 157 also establishes a hierarchy for measuring fair value in generally accepted accounting principles and expands financial statement disclosures about fair value measurements that are relevant to mutual funds. FAS 157 is effective for financial statements issued for fiscal years beginning after November 15, 2007, and earlier adoption is permitted. At this time, management is evaluating the implications of FAS 157 and its impact on the financial statements has not yet been determined.
Summit Mutual Funds, Inc. – Pinnacle Series |
REPORT OF INDEPENDENT REGISTERED PUBLIC ACCOUNTING FIRM |
To the Board of Directors and Shareholders of Summit Mutual Funds, Inc.:
We have audited the accompanying statements of assets and liabilities, including the schedules of investments, of Summit Mutual Funds, Inc. – Pinnacle Series (the “Funds”), including the Zenith Portfolio, Bond Portfolio, S&P 500 Index Portfolio, S&P MidCap 400 Index Portfolio, Balanced Index Portfolio, Nasdaq-100 Index Portfolio, Russell 2000 Small Cap Index Portfolio, EAFE International Index Portfolio, Lehman Aggregate Bond Index Portfolio, Inflation Protected Plus Portfolio, Lifestyle ETF Market Strategy Target Portfolio, Lifestyle ETF Market Strategy Conservative Portfolio, Lifestyle ETF Market Strategy Aggressive Portfolio, and Natural Resources Portfolio, as of December 31, 2007, and the related statements of operations for the year then ended and the statements of changes in net assets and the financial highlights for the periods presented. These financial statements and financial highlights are the responsibility of the Funds' management. Our responsibility is to express an opinion on these financial statements and financial highlights based on our audits.
We conducted our audits in accordance with the standards of the Public Company Accounting Oversight Board (United States). Those standards require that we plan and perform the audit to obtain reasonable assurance about whether the financial statements and financial highlights are free of material misstatement. The Funds are not required to have, nor were we engaged to perform, an audit of their internal control over financial reporting. Our audits included consideration of internal control over financial reporting as a basis for designing audit procedures that are appropriate in the circumstances, but not for the purpose of expressing an opinion on the effectiveness of the Funds' internal control over financial reporting. Accordingly, we express no such opinion. An audit also includes examining, on a test basis, evidence supporting the amounts and disclosures in the financial statements, assessing the accounting principles used and significant estimates made by management, as well as evaluating the overall financial statement presentation. Our procedures included confirmation of securities owned as of December 31, 2007, by correspondence with the custodian and brokers; where replies were not received from brokers, we performed other auditing procedures. We believe that our audits provide a reasonable basis for our opinion.
In our opinion, the financial statements and financial highlights referred to above present fairly, in all material respects, the financial position of the Funds constituting Summit Mutual Funds, Inc. – Pinnacle Series as of December 31, 2007, the results of their operations for the year then ended and the changes in their net assets and the financial highlights for the periods presented, in conformity with accounting principles generally accepted in the United States of America.
DELOITTE & TOUCHE LLP
Chicago, Illinois
February 22, 2008
Summit Mutual Funds, Inc. – Pinnacle Series |
MANAGEMENT OF THE FUND |
| | | Directors and Officers | | |
Independent Directors | | | | | |
| | | | | Number of | |
| | | Term of | | Portfolios in | Other |
| | Position(s) | Office and | | Fund Complex | Directorships |
Name, Year of Birth | with the | Length of | Principal Occupation(s) | Overseen by | Held by |
and Address(1) | Fund | Time Served | During Past Five Years | Director | Director |
| | | | | | |
| Theodore H. Emmerich | Director | Indefinite Term | Consultant | 21 | American Financial |
| (1926) | and Chairman | Director since | | | Group |
| | | 1987 | | | |
| | | | | | |
| Yvonne L. Gray | Director | Indefinite Term | Executive Vice President/ CCO, United | 21 | |
| (1951) | | Director since | Way of Greater Cincinnati (Social Services | | |
| | | 1999 | Provider); prior thereto, Vice President / | | |
| | | | Trust Operations Officer, Fifth Third Bank; | | |
| | | | former Audit Manager, Price Waterhouse | | |
| | | | (Accounting Firm) | | |
| | | | | | |
| Michael K. Keating | Director | Indefinite Term | Managing Director, Keating Vollmer & Co. | 21 | |
| (1955) | | Director since | LLC (Private Equity Investment Firm) | | |
| | | 2005 | | | |
| | | | | | |
| David C. Phillips | Director | Indefinite Term | Co-Founder, Cincinnati Works Inc. (Job | 21 | Meridian Bioscience, |
| (1938) | | Director since | Placement); prior thereto, Chief Executive | | Inc.; Cintas, Inc. |
| | | 2001 | Officer, Downtown Cincinnati Inc. | | |
| | | | (Economic Revitalization of Cincinnati) | | |
| | | | | | |
| Mary W. Sullivan | Director | Indefinite Term | Attorney, Peck, Shaffer & Williams LLP | 21 | Franklin Savings and |
| (1956) | | Director since | (Law Firm) | | Loan Co.; First |
| | | 2001 | | | Franklin Corporation |
Interested Director and Officers | | | | |
| | | | | Number of | |
| | | Term of | | Portfolios in | Other |
| | Position(s) | Office and | | Fund Complex | Directorships |
Name, Year of Birth | with the | Length of | Principal Occupation(s) | Overseen by | Held by |
and Address(1) | Fund | Time Served | During Past Five Years | Director | Director |
| | | | | | |
| Steven R. Sutermeister* | Director, | Indefinite Term | Senior Vice President, Union Central; | 21 | Summit Investment |
| (1954) | President and | Director since | President and Chief Executive Officer, | | Partners, Inc.; Union |
| | Chief Executive | 1999 | Adviser. | | Central Mortgage |
| | Officer | | | | Funding, Inc.; |
| | | | | | Summit Investment |
| | | | | | Advisers, Inc. |
| | | | | | |
| John F. Labmeier | Vice President | Indefinite Term | Consultant; prior thereto Vice President, | NA | |
| 1876 Waycross Rd | and Secretary | Officer since | Associate General Counsel and Assistant | | |
| Cincinnati, OH 45240 | | 1990 | Secretary, Union Central | | |
| (1949) | | | | | |
| | | | | | |
| Thomas G. Knipper | Vice President, | Indefinite Term | Chief Compliance Officer and | NA | NA |
| (1957) | Controller and | Officer since | Treasurer, Adviser | | |
| | Chief Compliance | 1995 | | | |
| | Officer | | | | |
| | | | | | |
| Gerald Q. Herbert | Treasurer | Indefinite Term | Director of Finance and Accounting, | NA | NA |
| (1966) | | Officer since | Adviser; prior thereto, Controller, General | |
| | | 2005 | Factory Supplies Co. | | |
| | | | | | |
| John M. Lucas | Assistant | Indefinite Term | Second Vice President, Counsel and | NA | NA |
| 1876 Waycross Rd. | Secretary | Officer since | Assistant Secretary, Union Central | | |
| Cincinnati, OH 45240 | | 1990 | | | |
| (1951) | | | | | |
| (1) | Except as otherwise indicated, the business address of each listed person is 312 Walnut St., Ste. 2500, Cincinnati, OH 45202 |
| * | Mr. Sutermeister may be considered to be an "interested person" of the Fund (within the meaning of the Investment Company Act of 1940) because of his |
| | affiliation with the Adviser. |
| Note – The Statement of Additional Information includes additional information about Fund directors and is available without charge, upon request, by |
| | calling 1-877-546-FUND. |
This page intentionally left blank.
This page intentionally left blank.
This page intentionally left blank.

Item 2. Code of Ethics.
As of the end of the period covered by this report (December 31, 2007), the Registrant has adopted a code of ethics that applies to its principal executive officer and principal financial officer/controller. A copy of the registrant’s Code of Ethics is filed herewith.
Item 3. Audit Committee Financial Expert.
The Audit Committee of the Summit Mutual Funds, Inc. Board of Directors has named the following financial experts:
- Theodore H. Emmerich, Independent Director
- Yvonne L. Gray, Independent Director
- David C. Phillips, Independent Director
Item 4. Principal Accountant Fees and Services.
| | | Fiscal Year Ended 12/31 |
| | | 2007 | | 2006 |
| | | $236,474 | | $ 147,108 |
| (a) Audit Fees | | | | |
| (b) Audit-related Fees | | | | |
| (c) Tax Fees | | | | |
| (d) All Other Fees | | | | |
| (e) (2) % above that were pre-approved | | 0% | | 0% |
| (f) If greater than 50%, disclose hrs. | | N/A | | N/A |
| (g) Non-audit fees rendered to Adviser | | | | |
| (or affiliate that provided services | | | | |
| to the Funds). | | 249,281 | | 60,900 |
| (h) Disclose whether the Audit Committee | | | | |
| has considered whether the provisions | | | | |
| of non-audit services rendered to the | | | | |
| Adviser that were NOT pre-approved is | | | | |
| compatible with maintaining the | | | | |
| auditor's independence. | | YES | | YES |
*(e) (1) The following discloses the audit committee's pre-approval
policies and procedures, as set forth in the Audit Committee Charter:
"(c) The Committee shall pre-approve all auditing services and permissible non-audit services (e.g., tax services) to be provided to the Fund by the Accountant, including the fees
therefore. The Committee may delegate to one or more of its members the authority to grant pre-approvals. In connection with such delegation, the Committee shall establish pre-approval policies and procedures, including the requirement that the decisions of any member to whom authority is delegated under this section (c) shall be presented to the full Committee at its next scheduled meeting.
(d) Pre-approval for a non-audit service shall not be required if: (1) the aggregate amount of all such non-audit services is not more than 5% of the total revenues paid by the Fund to the Accountant in the fiscal year in which the non-audit services are provided; (2) such services were not recognized by the Fund at the time of the engagement to be non-audit services; and (3) such services are promptly brought to the attention of the Committee and approved prior to the completion of the audit by the Committee or by one or more members of the Committee to whom authority to grant such approvals has been delegated by the Committee.
(e) The Committee shall pre-approve the Accountant's engagements for non-audit services with the Adviser and any affiliate of the Adviser that provides ongoing services to the Fund in accordance with paragraph (c) above, if the engagement relates directly to the operations and financial reporting of the Fund, unless the aggregate amount of all services provided constitutes no more than 5% of the total amount of revenues paid to the Accountant by the Fund, the Adviser and any affiliate of the Adviser that provides ongoing services to the Fund during the fiscal year in which the services are provided that would have to be pre-approved by the Committee pursuant to this paragraph (without regard to this exception)."
Item 5. Audit Committee of Listed Registrants.
Not Applicable.
Item 6. Schedule of Investments.
Included in Report to Shareholders.
Item 7. Disclosure of Proxy Voting Policies and Procedures for Closed-End Management Investment Companies.
Not applicable.
Item 8. Portfolio Managers of Closed-End Management Investment Companies.
Not applicable.
Item 9. Purchases of Equity Securities by Closed-End Management Investment Company and Affiliated Purchasers.
Not applicable.
Item 10. Submission of Matters to a Vote of Security Holders.
Not applicable.
Item 11. Controls and Procedures.
(a) The Registrant's President and Controller have evaluated the Registrant's disclosure controls and procedures within 90 days of this filing and have concluded that the Registrant's disclosure controls and procedures were effective, as of that date, in ensuring that information required to be disclosed by the Registrant in this form N-CSR was recorded, processed, summarized, and reported timely.
(b) There were no significant changes in Registrant's internal controls or other factors that could significantly affect these controls subsequent to the date of their evaluation, including
any corrective actions with regard to significant deficiencies and material weaknesses.
Item 12. Exhibits.
(1) Code of Ethics, filed herewith.
(2) Certifications pursuant to Rule 30a-2(a) under the Act filed herewith.
(3) Certification pursuant to Section 906 of the Sarbanes-Oxley Act of 2002 filed herewith.
SIGNATURES
Pursuant to the requirements of the Securities Exchange Act of 1934 and the Investment Company Act of 1940, the registrant has duly caused this report to be signed on its behalf by the undersigned, thereunto duly authorized.
(Registrant) Summit Mutual Funds, Inc.
By (Signature and Title) /s/ Steven R. Sutermeister
Steven R. Sutermeister, President
Date 3/10/08
Pursuant to the requirements of the Securities Exchange Act of 1934 and the Investment Company Act of 1940, this report has been signed below by the following persons on behalf of the registrant and in the capacities and on the dates indicated.
By (Signature and Title) /s/ Steven R. Sutermeister
Steven R. Sutermeister, President
Date 3/10/08
By (Signature and Title) /s/ Thomas G. Knipper
Thomas G. Knipper, Controller
Date 3/10/08